Managing OO projects better
11
50 IEEE Software July/August 1998 0740-7459/98/$10.00 © 1998 IEEE ver the past decade, the object-oriented paradigm has gained a large following, and in many cases 1 has replaced traditional software devel- opment approaches with OO equivalents. 2,3 New schemes have been proposed for modeling the development life cycle as well. 4 Unfortunately, many of these approaches focus on modeling the system development around a single task or team, rather than considering how to build a specifically object- oriented system in terms of planning, team structure, and project management. Thus, the definition of these new OO development methodologies has yet to be supported by a comparable effort in defining methods and strategies for manag- ing OO projects, or for modeling the life cycle at both the system and the task and subtask levels. OO project management also requires integration in effort planning and process prediction. Traditional models fall short in this regard, too, because they take an almost entirely bottom-up approach and base their project plans on the mechanisms of allocating and deallocating people. O Although OO development methods and models have been in use for several years, management techniques optimized for OO development have not kept pace. The author participated in several OO projects and, based on those experiences and the lessons learned from them, developed a management process tailored to OO development. Paolo Nesi, University of Florence Managing OO Projects Better .
-
Upload
independent -
Category
Documents
-
view
0 -
download
0
Transcript of Managing OO projects better

5 0 I E E E S o f t w a r e J u l y / A u g u s t 1 9 9 8 0 7 4 0 - 7 4 5 9 / 9 8 / $ 1 0 . 0 0 © 1 9 9 8 I E E E
ver the past decade, the object-oriented paradigm has gained a largefollowing, and in many cases1 has replaced traditional software devel-opment approaches with OO equivalents.2,3 New schemes have beenproposed for modeling the development life cycle as well.4 Unfortunately,
many of these approaches focus on modeling the system development around asingle task or team, rather than considering how to build a specifically object-oriented system in terms of planning, team structure, and project management.
Thus, the definition of these new OO development methodologies has yet to besupported by a comparable effort in defining methods and strategies for manag-ing OO projects, or for modeling the life cycle at both the system and the task andsubtask levels. OO project management also requires integration in effort planningand process prediction. Traditional models fall short in this regard, too, because theytake an almost entirely bottom-up approach and base their project plans on themechanisms of allocating and deallocating people.
O
Although OO deve lopment metho ds and mo delshave b een in use for severa l years, managementtechniques opt imized for OO deve lopment have notkept pace. The author par t i c ipated in severa l OOpro jec ts and, based on those exp er iences and thelessons learned f rom them, deve lop ed amanagement pro cess ta i lo red to OO deve lopment.
Paolo Nesi, University of Florence
Managing OOProjects Better
.

As a first step toward alleviating these short-comings, I outline several lessons learned while de-riving a more efficient model for managing OO pro-jects. Summaries of these lessons, which representthe experiences of myself and my colleagues inmanaging several small- and medium-size OO pro-jects over the last seven years, appear in italicsthroughout the sections that follow.
Project Profi les
Table 1 shows the profiles, in chronological order,of some of the projects from which I drew thelessons described in this article:
♦ TOOMS (Tool Object-Oriented Machine State),a CASE tool to specify, verify, test, and assess real-time systems;
♦ ICOOMM (Industrial Control Object-OrientedMilling Machines), a computerized numerical con-trol for milling machines;
♦ QV (Q View), a library providing uniform OOsupport for Motif and X;
♦ LIOO (Lectern Interactive Object-Oriented), alectern and editor for music scores; and
♦ TAC++ (Tool for Analysis of C++), a tool for de-veloping and assessing C/C++ projects.Each profile lists the project’s pertinent data, in-cluding the number of system classes, SCLOC, effort inperson-months, number of non-project-manage-ment people involved, and number of differentteams. SCLOC, or OO system complexity based onlines of code, is an evolution of the LOC metric thatalso considers class attributes, class definition, andmethod interfaces.5
Most of these projects were carried out by het-
erogeneous teams that included staff membersfrom the University of Florence, the Centro SviluppoTecnologicao (CESVIT) research center, and variouscompanies. Although the project partners were inseparate locations, to improve the homogeneity ofresults the various heterogeneous task and subtaskteams assigned to a particular project worked in oneplace. Doing so let them use the same “quality man-ual,”a reference document containing all guidelinesfor project development as prescribed by the com-pany’s general criteria. The teams performed mostof the work using C++, but implemented some projects in TROL (Tempo Reale Object-orientedLanguage), a formal language and model similar toobject-oriented SDL, ObjecTime, and others.1
Team Structure AndOrganization
A project manager coordinates the subsystemmanagers and directs the overall project. When theproject manager adopts the well-known waterfalllife cycle, a clear division is present between thephases of analysis (requirement analysis and de-tailed analysis), design (structural design and de-tailed design), coding (class implementation), test,and so on. The team organization usually replicatesthis division. Different groups work on the same pro-ject in different phases, and communicate via a fewmeetings and documents. These groups may usedifferent notations and methods. Even if an inte-grated quality and methodological model unifiesthese notations, misunderstandings may still occurbetween the many people tasked with drafting andinterpreting the project’s documents. Thus a mis-
J u l y / A u g u s t 1 9 9 8 I E E E S o f t w a r e 5 1
Table 1Signifi cant Statistics For Studied Projects
Project OS Language Tools and Number of SCLOC Person- People TeamsLibraries Classes Months
TOOMS Unix C++ Lex/Yacc, 204 16568 41.5 16 6
CommonView
ICOOMM Windows C++ MFC 193 10870 20 6 3
NT
QV Unix C++ XLIB, Motif 65 3900 7 4 2
LIOO Linux C++ Lex/Yacc, 165 16020 30 11 5
XVGAlib
TAC++ Unix C, C++ Lex/Yacc, 62 2300 for C, 13.5 5 2
QV, XLIB 4340 for C++
.

match between consecutivephases may develop,6 whichcauses teams to work on wrongor unrequired functionalities.Although several integrated ap-proaches to reduce these prob-lems have been tried, their resultshave been limited by the persis-tence of different interpretationsand viewpoints within groupsand between groups.
In many cases, project man-agers adopt Larry Putnam’s re-source allocation model,7 shownin Figure 1. As the project evolves,the dynamic allocation of peoplemay lead to an increase in the
number of subsystems and in the team’s size.Typically, management allocates people dynamically,passing them from one phase to the next to satisfyincoming deadlines. Although training new peoplewould avoid this reshuffling, it is often a costly andself-defeating alternative because it usually entailsthe support of skilled people needed elsewhere onthe project.
♦ In our experience, the hierarchical organiza-tion of a team can be successfully applied to OOprojects. But the project plan, the development lifecycle, and the roles of the project manager and sub-system managers must be revised as described inthe following lessons.
Project Start-Up
As Figure 2 shows, the project start-up consistsof several phases typically performed sequentiallyor only partially overlapped.
We typically perform the requirements acquisi-tion and high-level analysis, also called user needsanalysis and feasibility study, to
♦ evaluate commercial issues such as benefitsand risks;
♦ analyze the technological risks;♦ examine the requirements with respect to in-
dustry trends and general goals;♦ define ultimate targets in terms of end users,
environments, platforms, and so on;♦ define the quality profile of the final prod-
uct; and♦ define project timing, the most important
milestones, and the critical path.
5 2 I E E E S o f t w a r e J u l y / A u g u s t 1 9 9 8
Requirementsanalysis
Analysis
Effo
rt
Maintenance
Modification
Design/code
Total effort
Test/implement/modify Maintain
Time
Design andcode
Test andvalidation
Figure 1. Putnam’s resource allocation model, which shows project effort as a
function of time.
Requirement acquisition & high-level analysis
Project profile
Identification of subsystems
Early subsystems
Analysis of subsystems
First generalclass collection
High-levelreuse analysis
Reuse directives
Selection of tools
Tools
Coarse project planning
Task relationships
Subsystem-resourcesanalysis
Cost of subsystems
Project planning
Planning
Resource evaluation/selection
Detailed plan
Resources allocation
Figure 2. Project start-up structure with the most
important products of each phase.
.

The project manager and subsystem managersidentify the main subsystems according to a struc-tural decomposition. The subsystems are, in mostcases, comprised of multiple classes, many of whichare used by other subsystems. This occurs becausein classical OO analysis methodologies, you usuallymodel the problem domain and not a specific sys-tem or subsystem.2
Typically at this stage, you strive to model ex-actly that part of the domain needed for the sys-tem you’re building, and no more, unless reuse con-siderations prompt you toundertake extra work. On theother hand, during project start-up you usually have limitedknowledge of the problem’sscope, and thus it is best to manage as much of theproblem domain as you can. A too-restrictive mod-eling performed during the early phases of systemdevelopment typically results in hierarchies havingtoo many complex leaf classes. The presence of toomany leaf classes is frequently due to the lack ofspecialization. In turn, the lack of specialization isfrequently due to a poor analysis of the system do-main. This occurs, for example, when the applica-tion’s problem domain has been neglected in favorof a limited analysis of the application under de-velopment. All applications start small and growthroughout their service life. To start with a re-stricted analysis frequently leads to an insufficientclass hierarchy. During the analysis the focus shouldbe on those classes used in several tasks. These areusually the most important ones for the domainunder analysis or are fundamental to the system.They include repositors, model symbols, graphiccomponents, and so on.
In the first part of subsystem analysis, each sub-system manager must identify the most importantclasses of the assigned subsystems. Then, classesidentified by all subsystem managers are organizedin the unique domain model. In OO projects, a sub-system can be
♦ a subtree or tree,♦ a number of independent classes, or♦ a classical subsystem, identified by a structural
composition-decomposition process.♦ We re-extracted the main subsystems from the
general collection of classes by identifying branchesrelated to the most important classes, usually calledkey classes. We reassigned these new versions of sub-systems to subsystem managers. The two-phaseprocess I describe regularizes the identification of sub-
systems, improving efficiency by avoiding class dupli-cation and reducing the dependencies among sub-systems (and thus among subsystem teams). Each sub-system or subtask should have from 15 to 30 classes tobe manageable, depending on the role these classesplay in the system. A larger number usually means thatteam members must learn a lot about the system,while too few classes may lead to people working onthe same class too frequently. A subsystem can include
♦ several small classes (basic objects, part of otherclasses);
♦ a number of so-called “key classes” (such as theroot class for persistent objects, a class implementingthe list) and,
♦ among these key classes, a few very importantclasses, called engine classes. These are more complexthan the other key classes and cannot always be de-composed because their complexity derives mainlyfrom their functional and behavioral aspects.
Instances of engine classes usually control themost important parts of the application, such as thedatabase manager, the state machine editor, thewindow manager, the event manager, or the inter-preter. For such classes, the effort—defined as thehours spent executing a particular task—may be asmuch as five times greater than that for normal keyclasses. The start-up phase continues with reuseanalysis, in which the project manager and the sub-system managers identify sources of existing sub-system parts, classes, or clusters that can be prof-itably reused in the current project. For eachpotential reuse source, the cost of adaptation mustbe evaluated before proceeding.
Next, the subsystem managers and project man-ager identify suitable tools for system development.These decisions may lead to reiterating from thesubsystems analysis step.
The subsequent coarse-grained project plan includes
1. analyzing the overall system,2. defining subsystems (tasks) and subtasks,3. examining dependencies among tasks,4. planning time-to-market, and5. identifying milestones and other target dates.Determining how many staff-hours are needed
to develop each subsystem and its correspondingsubtasks cannot be done yet because the assess-
J u l y / A u g u s t 1 9 9 8 I E E E S o f t w a r e 5 3
Lack of specialization is frequently dueto poor analysis of the system domain.
.

ment effort must be performed later. During thesubsystsem-resource analysis, the effort for devel-oping each subsystem and the corresponding sub-tasks is evaluated in terms of human resources.
♦ The number of identified key classes multipliedby a factor, K, gives an approximate measure of thefinal dimension of each system or subsystem in termsof classes. We found that K is equal to 2 for subsystemswithout a user interface and communication with de-vices, and 4 for subsystems that include the relation-ships with a complex user interface. We use the hy-pothesis for the number of system classes to predictthe effort needed for each task by considering the typ-ical person-hours needed to analyze, design, and im-plement a class. In the projects mentioned, this meanfactor is 15 to 40 hours per class; differences dependon team efficiency and application complexity. Weused the number of class attributes and methods as amore precise predictive measure of class complexity.
You can now prepare the detailed project plan,considering at least the temporal constraints iden-tified in the requirements acquisition and high-levelanalysis phases, as well as the number of peopleneeded for each subsystem and subtask. The planmust also consider the nature of the life cycleadopted. In the case of OOP, the classic life cyclesare evolutionary and typically prototype-oriented,such as the spiral or fountain models.4,6 The foun-tain model leads to an unpredictable number of cy-cles at the system level because it is too rule-free toproduce repeatable results. This makes it difficult topredict the duration of the analysis, design, imple-mentation, and other phases.
♦ At the system level, we used a spiral-orientedproject schedule: two or three cycles of from six toeight months each that produce a milestone and
prototype for progress control.Each cycle can involve severaltasks and includes, at the systemlevel, general assessment and riskanalysis.
Working from the projectplan, management selects andallocates project staff, based onthe skill and experience of avail-able personnel. In our teams, thetypical efficiency was from 2.2 to4 SCLOC points per hour, includ-ing analysis, design, coding, doc-umentation, test, and assess-ment phases.
SYSTEM DEVELOPMENT
After project start-up, the system developmentphase begins by activating tasks and subtasks according to the project plan and the preanalysisperformed during start-up.
Task life cycleThe spiral model is too complex and complete to
be applied at the subsystem level, while the foun-tain model is difficult to control. The adopted mi-crocycle, shown in Figure 3, consists of a simplifiedversion of the spiral model integrated with a modi-fied version of the fountain model. According to thefountain model, the first three steps can be locallyiterated by restarting from the first step when strictlynecessary to achieve the cycle objectives. Unlike thefountain model, the last steps are performed simul-taneously and only once.
Figure 3 shows that, as in the spiral model, atask or subtask is typically completed in one ormore cycles, each with a duration of two to fourweeks depending on fixed subgoals and mile-stones. Given the team members’ typical produc-tivity, you can obtain the number of cycles re-quired by considering that a task or subtask mustcontain from 15 to 30 classes to be manageable.For example, it requires three cycles of two weekseach, with a two-person team—a total of 480hours—to produce from 12 to 32 classes for C++.Less time will be needed if you are producing keyclasses, because fewer classes must be consideredif the subsystem includes key classes. Task andsubtask teams consist of two to three people, in-cluding the subsystem manager. The develop-
5 4 I E E E S o f t w a r e J u l y / A u g u s t 1 9 9 8
i th cycle (i+1) th cycle
i–prototype i+1–prototype
Detailedanalysis
Design Coding
Assessment
Documen-tation
Nextcycle
General& integra-
tion
Test
Task
s
Figure 3. The macrocycle of the task and subtask development life cycle, and the
microcycle—a simplified version of the spiral model integrated with a modified version
of the fountain model.
.

ment process is a sequenceof partially overlappingsteps. We found it advanta-geous to use an analysis anddesign methodology verysimilar to Grady Booch’s,2
because it meshes well withthe management and life-cycle models we selected.After the design phase, thesame team performs testing,documenting, and assess-ment simultaneously. Because consecutive mi-crocycles partially overlap, team members havedifferent roles in different contexts.
♦ We observed that the effort spent in docu-menting and assessing depends quite linearly on thenumber of classes, while testing depends on time fortesting classes and their relationships. The first factoris linear and the second takes a time that dependsmore than quadratically on the number of classes,since interactions among classes exploiting relation-ships of is-part-of and is-referred-by are frequentlymade concrete with several method calls. A smallnumber of classes per subsystem lets you work in thefirst part of the cost evolution curve, where the cost oftesting relationships is much lower than that for test-ing class relationships. This also depends on the num-ber of relationships established among classes (an-other parameter that must be maintained undercontrol along the development process). Moreover, wereduced testing, assessing, and documenting time byimproving these processes.
Test activityTypically, the test activity can last anywhere from
as long as the first three phases combined to lesstime than it takes to complete the first phase. We re-duced the time for testing by preparing test scriptsof test cases and procedures directly in the analysisphases and, in some cases, by using an automatictool for regression testing based on Capture andPlayback.8 This approach is based on two distinctphases: the capture and the playback. During cap-ture, the system collects each computer-user andexternal-device interaction. The histories of theseinteractions are stored in sequential form in a scriptfile. The histories are reproposed during playback tothe computer interfaces, simulating the presence ofreal entities: users, other machines, sensors, and soon. After each simulated stimulus, the computer’sresponses can be tested to verify that the applica-
tion answers correctly according to its predeter-mined behavior.
In subsequent cycles, regression testing is per-formed automatically for those parts that are mainlyunchanged.
Documentation activityDocumentation usually takes much more time
than other activities. Suitable CASE tools for analy-sis and design can generate a draft version of doc-umentation, in which details related to the imple-mentation must be added manually.
♦ The team member who serves as main designerof the classes is the best choice for performing thiswork. The subsystem manager also must help preparethe documentation that describes the task status andevolution, and the decisions carried out in the taskcycle. This part of the documentation helps the projectmanager understand and discuss the project’s statusat a higher level.
Assessment activity and related mechanismsEvolutionary development lets you produce
something that can be automatically measuredright from the early phases of the project, whenclass definitions are available. We used the classstructure’s attributes and method interfaces toapply predictive metrics for estimating develop-ment, maintenance, and other task effort.5,9 We an-alyzed values and corresponding trends of a fewmetrics and indicators for each task and subtaskclass: complexity (as it relates to class effort, main-tainability, and so on), verifiability index, reuseindex, efficiency, and so on.10,11
As Table 2 shows, for classes we imposed specificprofiles, such as number of attributes, number ofmethods, class complexity, inherited class complex-ity, and class interface complexity. When two valuesappear in a cell, they refer to classes not involved andinvolved in the GUI, respectively. Data for these met-
J u l y / A u g u s t 1 9 9 8 I E E E S o f t w a r e 5 5
Table 2Imposed Limits for Class Parameters
Parameter Mean Values Maximum ValuesClass complexity 200 1800
Class complexity, inherited 150 1200
Class complexity, local 50 600
Number of class attributes 9, 27 15, 45
Number of inherited class attributes 6, 18 10, 30
Number of local class attributes 3, 9 5, 15
Number of class methods 36, 90 44, 144
Number of inherited class methods 24, 60 36, 96
Number of local class methods 12, 30 18, 48
Number of superclasses 2 5, 6
Number of subclasses 5 30, 90
.
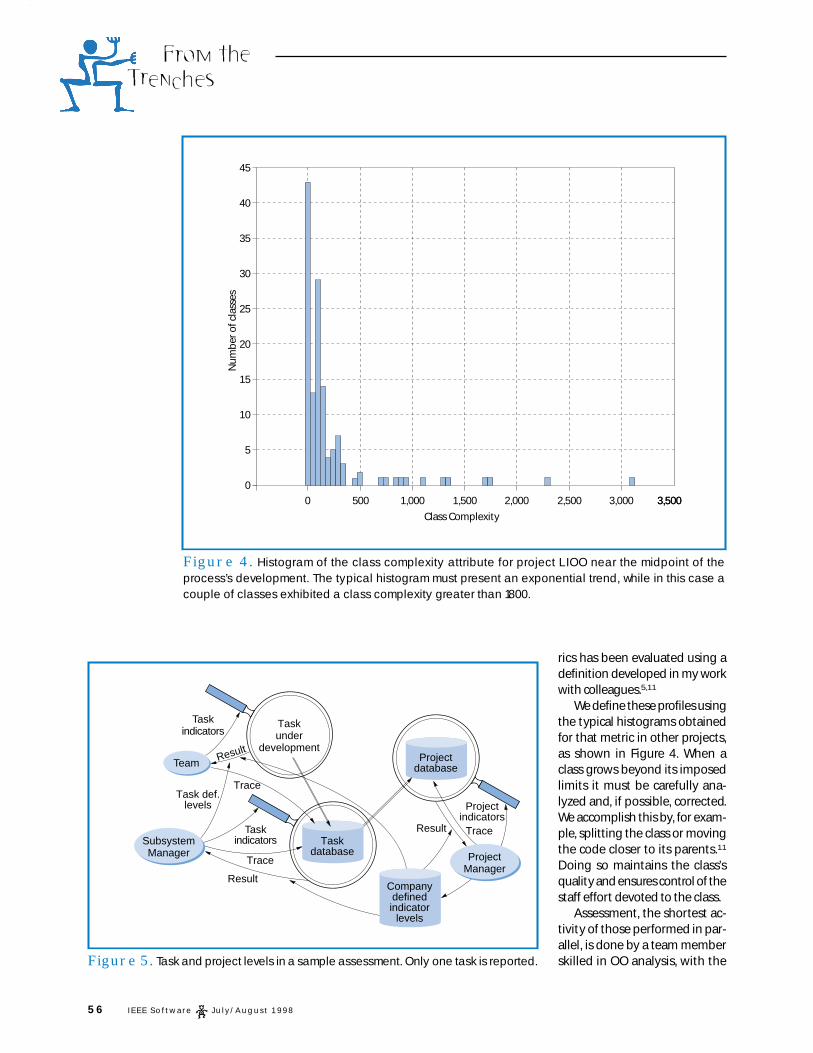
rics has been evaluated using adefinition developed in my workwith colleagues.5,11
We define these profiles usingthe typical histograms obtainedfor that metric in other projects,as shown in Figure 4. When aclass grows beyond its imposedlimits it must be carefully ana-lyzed and, if possible, corrected.We accomplish this by, for exam-ple, splitting the class or movingthe code closer to its parents.11
Doing so maintains the class’squality and ensures control of thestaff effort devoted to the class.
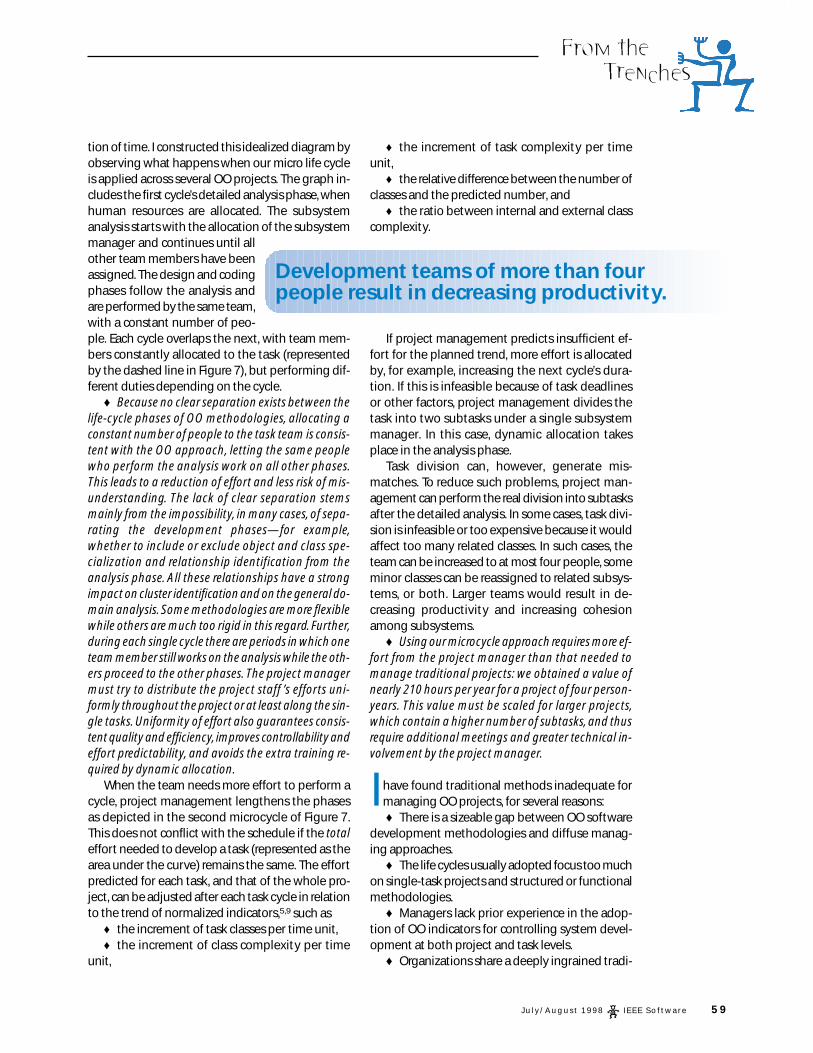
Assessment, the shortest ac-tivity of those performed in par-allel, is done by a team memberskilled in OO analysis, with the
5 6 I E E E S o f t w a r e J u l y / A u g u s t 1 9 9 8
45
40
35
30
25
20
15
10
5
0
Class Complexity
3,5003,0002,5002,0001,5001,0005000 3,500
Nu
mb
er o
f cla
sses
Figure 4. Histogram of the class complexity attribute for project LIOO near the midpoint of the
process’s development. The typical histogram must present an exponential trend, while in this case a
couple of classes exhibited a class complexity greater than 1800.
Taskunder
development
Team Projectdatabase
Task def.levels
Taskindicators
Taskindicators
Result
Result
Result
Projectindicators
Trace
Trace
SubsystemManager
Trace
ProjectManager
Taskdatabase
Companydefinedindicator
levels
Figure 5. Task and project levels in a sample assessment. Only one task is reported.
.

help of the subsystem manager. As Figure 5 shows,the assessment checks that the process satisfiescompany metrics and indicators for controlled soft-ware development. The subsystem managers mustinclude in the documentation and the project data-base any strategies for correcting deviations fromthe plan.5 For our assessments we used a suitabletool for measuring selected metrics and compar-ing the imposed profiles with the current ones.
♦ Continuous metrication must be associatedwith a continuous revalidation of the indicatorsadopted to adjust weights and threshold values, andfor tuning the organization’s metric suite. We collectednon-automatically measurable data by filling in anelectronic questionnaire daily with, for example, theeffort of each class (for detailed analysis, design, cod-ing, and other tasks), the modification of class hier-archy, the effort for the other activities, and a brief de-scription of the work. Real and measured values let usidentify the model.
Generalization and integration activityThis phase partially overlaps the next microcy-
cle. To accomplish generalization and integration,the subsystem manager must first identify the de-tailed goals of the next microcycle. These goals maybe best defined once the subsystem manager fin-ishes the current phase and begins full-time workon the next microcycle.
♦ During this phase each subsystem managermay meet with other subsystem managers and theproject manager, depending on task relationships, to
1. identify new detailed requirements for general-izing classes and clusters developed so that they canbe used in the whole system;
2. provide other teams with the current version ofsoftware developed in the corresponding task or sub-task, along with its documentation, test, and assess-ment reports;
3. discuss with the project manager how to correctproblems identified by the assessment activity.As regards point 2, the other task and subtask teamswill use the results produced starting from their nextdetailed analysis phase, as shown by the arrows inFigure 6.
Task relationshipsThe dotted lines in Figure 6 show that, about
every two to four weeks, depending on the lengthof the microcycle, project task and subtask teamshold periodic meetings to exchange information. Inthese meetings, only the choices made in the analy-sis and design phases are discussed, with the intentof improving integration among classes and clus-ters implemented by different teams. Thus, the pe-riodic meetings address the general aspects ofanalysis and design, while restricted meetings be-tween the team and its subsystem manager address
J u l y / A u g u s t 1 9 9 8 I E E E S o f t w a r e 5 7
TimeGeneral meeting
Task
s/su
bta
sks
Figure 6. Relationships and integrations among project tasks and subtasks. The dotted lines indicate
the intervals for periodic meetings to discuss integration among classes and clusters by different teams.
.

more detailed and technical problems.♦ Periodic meetings avoid class duplication and
facilitate the adoption of uniform notations in theproject database’s quality manual for the selectionof class, method, and attribute names; for compilingdocumentation; for preparing test scripts; and so on.To improve control and uniformity, plan generalmeetings with all team members and subsystemmanagers
♦ when an important task is completed,♦ when an important change to the project struc-
ture and management is needed, or♦ for discussing prototypes of the whole system or
time-consuming milestones and deliverables.At general meetings, everyone explains what
they are doing and are going to do, then commentson issues raised by the others. Such meetings im-prove the code’s uniformity and quality becausethey let all points of view be taken into account.They also have a strongly positive affect on moraleand motivation. General meetings can even help re-duce the fuzzy thinking of programmers who some-times get distracted by a trivial task that could besafely neglected, even if doing so caused inconse-quential errors in the finished product.
Team peopleTraditional project and subsystem managers typ-
ically lack the training and expertise to manage OOprojects. This shortcoming becomes more pro-nounced when using our approach, which requiresmanagement participation in several meetings thataddress technical problems.
♦ As shown, the roles of the project managerand subsystem managers are quite different than intraditional projects where, during the development,
they only supervise the work of all groups, definingdocuments’ structure, instruments, and planning.According to our model, the project manager canprofitably manage the project only if he or she di-rectly knows how the problem domain has been cov-ered in terms of classes and class relationships.Moreover, the subsystem manager must participateactively in the task and subtask development by an-alyzing details and designing and implementingspecific parts, or parts related to other tasks.
Effort planningModels such as the Putnam Resource Allocation
model, Jensen’s model, and COCOMO are mainlysuitable for single-team projects.12 Although someversions of these models can be applied to multi-team projects, they entail considerable dynamic al-location of human resources during the design andcoding phases at the task level, as Figure 1 shows.At the subsystem level, this means it is difficult topredict costs, especially if you use traditional devel-opment models. With OO methodologies, on theother hand, effort is shifted from the design phaseto that of analysis. System development starts byusing a bottom-up approach and then reverts to atop-down one.4 Doing so moves the peak of the ef-fort curve to the analysis phase, but the problemsrelated to dynamic allocation persist because thetraditional effort allocation method remains. Thisproblem becomes more severe when you use thePutnam model for each cycle of the spiral develop-ment life cycle, because it calls for the allocation anddeallocation phases to be performed at each cycle,with a consequent increase in overhead costs.
Using the alternative approach shown in Figure7, we report the effort for a task or subtask as a func-
5 8 I E E E S o f t w a r e J u l y / A u g u s t 1 9 9 8
Detailedanalysis
1st cycle 2nd cycle Total effort
Effo
rt Design & coding
Generalization& integration
Time
Assessment,documentation, & test
Figure 7. The model adopted for task and subtask effort as a function of time. The dashed line represents general effort.
.
tion of time. I constructed this idealized diagram byobserving what happens when our micro life cycleis applied across several OO projects. The graph in-cludes the first cycle’s detailed analysis phase, whenhuman resources are allocated. The subsystemanalysis starts with the allocation of the subsystemmanager and continues until allother team members have beenassigned. The design and codingphases follow the analysis andare performed by the same team,with a constant number of peo-ple. Each cycle overlaps the next, with team mem-bers constantly allocated to the task (representedby the dashed line in Figure 7), but performing dif-ferent duties depending on the cycle.
♦ Because no clear separation exists between thelife-cycle phases of OO methodologies, allocating aconstant number of people to the task team is consis-tent with the OO approach, letting the same peoplewho perform the analysis work on all other phases.This leads to a reduction of effort and less risk of mis-understanding. The lack of clear separation stemsmainly from the impossibility, in many cases, of sepa-rating the development phases—for example,whether to include or exclude object and class spe-cialization and relationship identification from theanalysis phase. All these relationships have a strongimpact on cluster identification and on the general do-main analysis. Some methodologies are more flexiblewhile others are much too rigid in this regard. Further,during each single cycle there are periods in which oneteam member still works on the analysis while the oth-ers proceed to the other phases. The project managermust try to distribute the project staff ’s efforts uni-formly throughout the project or at least along the sin-gle tasks. Uniformity of effort also guarantees consis-tent quality and efficiency, improves controllability andeffort predictability, and avoids the extra training re-quired by dynamic allocation.
When the team needs more effort to perform acycle, project management lengthens the phasesas depicted in the second microcycle of Figure 7.This does not conflict with the schedule if the totaleffort needed to develop a task (represented as thearea under the curve) remains the same. The effortpredicted for each task, and that of the whole pro-ject, can be adjusted after each task cycle in relationto the trend of normalized indicators,5,9 such as
♦ the increment of task classes per time unit,♦ the increment of class complexity per time
unit,
♦ the increment of task complexity per timeunit,
♦ the relative difference between the number ofclasses and the predicted number, and
♦ the ratio between internal and external classcomplexity.
If project management predicts insufficient ef-fort for the planned trend, more effort is allocatedby, for example, increasing the next cycle’s dura-tion. If this is infeasible because of task deadlinesor other factors, project management divides thetask into two subtasks under a single subsystemmanager. In this case, dynamic allocation takesplace in the analysis phase.
Task division can, however, generate mis-matches. To reduce such problems, project man-agement can perform the real division into subtasksafter the detailed analysis. In some cases, task divi-sion is infeasible or too expensive because it wouldaffect too many related classes. In such cases, theteam can be increased to at most four people, someminor classes can be reassigned to related subsys-tems, or both. Larger teams would result in de-creasing productivity and increasing cohesionamong subsystems.
♦ Using our microcycle approach requires more ef-fort from the project manager than that needed tomanage traditional projects: we obtained a value ofnearly 210 hours per year for a project of four person-years. This value must be scaled for larger projects,which contain a higher number of subtasks, and thusrequire additional meetings and greater technical in-volvement by the project manager.
Ihave found traditional methods inadequate formanaging OO projects, for several reasons:♦ There is a sizeable gap between OO software
development methodologies and diffuse manag-ing approaches.
♦ The life cycles usually adopted focus too muchon single-task projects and structured or functionalmethodologies.
♦ Managers lack prior experience in the adop-tion of OO indicators for controlling system devel-opment at both project and task levels.
♦ Organizations share a deeply ingrained tradi-
J u l y / A u g u s t 1 9 9 8 I E E E S o f t w a r e 5 9
Development teams of more than fourpeople result in decreasing productivity.
.

tion of allocating and deallocating human resourcesamong different projects.
♦ Project and subsystem managers lack thetechnical expertise necessary to profitably manageOO projects. Thus, to be effective, the OO approachI’ve proposed must be introduced throughout thewhole organization.
My project experiences and those of my col-leagues have enabled us to create and fine-tune astable OO management and development modelthat addresses these shortcomings. Our method isnow being used by several organizations that man-age internal and multipartner Esprit projects. Onthese projects, the method has predicted final ef-fort with errors lower than 10 percent, satisfying theproject organizations’ early-defined quality andcompany requirements. We obtained these resultsby facilitating strong collaboration among teammembers and increasing gratification and motiva-tion according to the lessons and guidelines I’ve de-scribed. Other, longer-term benefits have resultedfrom our approach as well. For example, some teammembers have exhibited a growing capability tomanage projects after they participated in a projectusing our method, which distributes managementtasks more evenly across the team hierarchy. ❖
ACKNOWLEDGMENTSI thank the following project managers and subsystem
managers. For project TOOMS: U. Paternostro of theDepartment of Systems and Informatics; M. Traversi and M.Campanai of CESVIT; F. Fioravanti, M. Bruno, and C. Guidoccioof DSI. For project TAC++: A. Borri of CESVIT and T. Querci ofDSI; S. Perlini. For project ICOOMM: M. Perfetti and F. Buteraof ELEXA. For the QV/MOOVI project: T. Querci; L. Masini, M.Caciolli, and L. Fabiani. For project LIOO: F. Bellini, N. Baldini,S. Macchi, A. Mengoni, and A. Bennati. For the projects of se-ries MICROTelephone: M. Traversi, G. Conedera, D. Angeli, C.Rogai, and M. Riformetti of OTE S.r.l. For project INDEX-DSP:M. Montanelli and P. Ticciati of SED S.r.l. A warm thanks tothe many developers who have worked and are working onthese and other projects with me.
REFERENCES1. G. Bucci, M. Campanai, and P. Nesi, “Tools for Specifying Real-
Time Systems,” J. Real-Time Systems, Mar. 1995, pp. 117-172.
2. G. Booch, Object-Oriented Design with Applications, AddisonWesley Longman, Reading, Mass., 1994.
3. R.J. Wirfs-Brock, B. Wilkerson, and L. Wiener, Designing ObjectOriented Software, Prentice Hall, Upper Saddle River, N.J., 1990.
4. B. Henderson-Sellers and J. M. Edwards, “The Object OrientedSystems Life Cycle,” Comm. ACM, Sept. 1990, pp. 143-159.
5. P. Nesi and T. Querci, “Effort Estimation and Prediction ofObject-Oriented Systems,” J. Systems and Software, to appear,1998.
6. B.W. Boehm, “A Spiral Model of Software Development andEnhancement,” IEEE Software, Sept. 1988, pp. 61-72.
7. L. H. Putnam, “A General Empirical Solution to the MacroSoftware Sizing and Estimation Problem,” IEEE Trans. SoftwareEng., July 1978, pp. 345-361.
8. P. Nesi and A. Serra, “A Non-Invasive Object-Oriented Tool forSoftware Testing,” Software Quality J., Vol. 4, No. 3, 1995, pp.155-174.
9. W. Li and S. Henry, “Object-Oriented Metrics that PredictMaintainability,” J. Systems Software, Vol. 23, No. 2, 1993, pp.111-122.
10. P. Nesi and M. Campanai, “Metric Framework for Object-Oriented Real-Time Systems Specification Languages,” J.Systems and Software, Vol. 34, No. 1, 1996, pp. 43-65.
11. F. Fioravanti, P. Nesi, and S. Perlini, “Assessment of SystemEvolution Through Characterization,” Proc. IEEE Int’l. Conf.Software Eng., IEEE CS Press, Los Alamitos, Calif., Apr. 1998, pp.456-459.
12. S. D. Conte, H. E. Dunsmore, and V. Y. Shen, SoftwareEngineering Metrics and Models, Benjamin/Cummings, MenloPark, Calif., 1986.
Address questions about this article to Nesi at Department ofSystems and Informatics, Faculty of Engineering, University ofFlorence, Via S. Marta 3, 50139 Florence, Italy; [email protected];http://www.dsi.unifi.it.
6 0 I E E E S o f t w a r e J u l y / A u g u s t 1 9 9 8
Paolo Nesi is an assistant professor of in-formation technology and a researcherwith the Department of Systems andInformatics of the University of Florence.His research interests include OO tech-nology, real-time systems, quality, test-ing, formal languages, physical models,and parallel architectures. He holds the
scientific responsibility for high-performance computer net-working at CESVIT, a high-tech agency for technology trans-fer. He also belongs to the editorial board of the Journal of Real-Time Imaging.
Nesi received a Laurea in electronic engineering from theUniversity of Florence and a PhD in electronics and informat-ics from the University of Padoa, Italy. He is a member of IEEE,the International Association for Pattern Recognition, Taboo(the Italian association for promoting object technologies),and AIIA (the Italian association on artificial intelligence).
About the Author
.