Solving the Rubik's cube with deep reinforcement learning ...
Upload
khangminh22Category
view
0download
0
Noname manuscript No.(will be inserted by the editor)
Minimization of Delay and Collision with CrossCube Spanning Tree in Wireless Sensor Networks
Jing Zhang · Li Xu · Pei-Wei Tsai ·Zhiwei Lin
Received: date / Accepted: date
Abstract The Wireless Sensor Networks (WSNs) is a system containing theevent detection and the data gathering abilities. The data gathering mechanis-m is the fundamental but important procedure in the WSN environment. Theway of the data gathering majorly affects the efficiency of WSNs on retrievingdata at the sink node. It is generally known that the clustering techniques areeffective to reduce the energy consumption in the WSNs. However, the dis-cussion on the packet collision and the transmission delay in the CDS basedrouting algorithms still remains vacant. The packet loss and the transmissiondelay may raise because of the collision and cause the negative impact of theWSNs performance. In addition, the transmission delay phenomenon in theWSNs may cause the inefficient result in the data gathering process. Unfor-tunately, it is usually neglected in the existing literature. To overcome thedrawback of transmission delay and collision, a Cluster-based Converge CastTree (CCCT) structure is proposed in this paper. Furthermore, three majorproblems including the Minimal Connected Documenting Set (MCDS) prob-lem, the delay aware CDS problem, and the CCCT construction problem arerevealed in this study. Finally, the proposed algorithms are examined by thesimulations. The simulation results indicate that the proposed CCCT struc-
J. Zhang (* corresponding author)School of Information Science and Engineering, Fujian University of Technology, and FujianProvincial Key Laboratory of Big Data Mining and Applications, Fuzhou, China, 350118.E-mail: [email protected]
L. XuSchool of Mathematics and Computer Science, Fujian Normal University, Fuzhou, China,350007.P.-W. TsaiDepartment of Computer Science and Software Engineering, Swinburne University of Tech-nology, Hawthorn, Australia, 3122.Z. W. LinSchool of Computing, Ulster University, Jordanstown, Northern Ireland, UK, BT370QB.
brought to you by COREView metadata, citation and similar papers at core.ac.uk
provided by Ulster University's Research Portal
2 Jing Zhang et al.
ture and algorithms outperform the existing approaches significantly in therealistic WSN environment.
Keywords Wireless Sensor Networks · Connected Documenting Set ·Collision · Delay · Spanning Tree
1 Introduction
The inherent characteristics of the Wireless Sensor Networks (WSNs) providestwo major abilities: the first is the sensing capacity for detecting the occur-rence of the concerned events; and the second is the transmission competenceof sending the detected data back to the sink node, which is commonly knownas the data process center in the WSNs. Thus, it is widely used in many ap-plications such as monitoring of the diverse environment and collecting datafor the structural health diagnosis. The WSNs is composed of large amountsof resource-limited wireless sensor nodes[1]. These sensor nodes are usuallydeployed physically nearby the targets of interest in a close range to maximisethe detection coverage. The data of the detected incidents are encapsulatedin packets and are transmitted back to the sink node through the commu-nication mechanisms embedded in the WSNs. Since the transmission of thedata is accomplished via the data transmission channels, the packet collisionproblem always occurs when two or even more sensor nodes attempt to pushthe packet into the communication channels at the same time [2]. Differentfrom the ordinary internet connections, the WSNs is specialised in monitoringthe environments and the energy of the nodes are limited by the battery ca-pacity. Reducing the transmission delay and the energy consumption shouldbe resolved with higher priority to raise up the system efficiency in supportingthe continuous environment control and monitoring.
The WSNs present the characteristics of flexible connection infrastructureand the dynamic data transmission frequency because it is a self-organizablesystem. These characteristics result in the difficulty in the topology control inWSNs because of the topology changes are not easy to be predicted. Neverthe-less, the topology control plays a key role in expanding the lifetime, reducingthe interference and the packet retransmission of the WSNs [3]. Among allexisting methods for the topology control, the tree-based topology structure isthe most popular choice for gathering and aggregating the detected data [4–6].In addition, many discussions on the virtual backbone structure composed ofa Connected Dominating Set (CDS) are revealed, recently, because it presentshigh flexibility and verifiability [7,8]. Many existing literatures have proofedthat the virtual backbone design can improve the routeing performance andreduce the energy consumption of the WSNs. However, the discussion on thepacket collision and the transmission delay in the CDS based routeing algo-rithms still remains vacant. The packet collision occurs when two or moreCHs sharing the same transmission channel attempt to deliver the packet tothe same receiver node (also known as the father CH) at the same time. The

Title Suppressed Due to Excessive Length 3
packet loss and the transmission delay may raise because of the collision andcause the negative impact of the WSNs performance.
In this paper, in order to minimize the delay and to avoid the collision,a CDS-based Data Aggregation Algorithm will be proposed. The core of thisalgorithm is to construct a cross cube spanning tree topology control algorithmsfor the WSNs. An n-cross Cube can be composed of N = 2n nodes and ithas a diameter equal to ⌈(n − 1)/2⌉[13,29]. The network, which fits in theCross Cube structure, has less diameter and higher fault tolerance capabilitythan the ordinary hypercube structure with the same dimension. The maincontribution of our work are concluded as follows:
1) A novel distributed induced tree of Crossed Cube based CDS Con-struction algorithm (C4) is proposed. The induced tree of Crossed Cube isconstructed with the aims of decreasing the number of CDS. After theoreti-cally analysing the crossed cube features, an optimal crossed cube spanningtree is revealed. The optimal crossed cube spanning tree is with the ability toeliminate the packet collision and minimising the transmission delay.
2) A collision-free data gathering protocol called the Cluster based Con-verge Cast Tree (CCCT) is proposed based on the Crossed Cube spanning treefeatures. The protocol performance is analysed theoretically and is followedby the simulations, which demonstrate that the CCCT protocol is efficient inavoiding packet collision and reducing the transmission delay. The simulationresults indicate that the transmission delay can be reduced approximately 40percent in average.
The rest of this paper is organized as follows: the related works in thetopology control based data aggregation is reviewed in Section 2, to motivatethe problem defined in Section 3. The proposed Cluster based Converge CastTree protocol is presented in Section 4. The theoretical analysis and the simu-lation results are discussed in Section 5 and Section 6, respectively. The paperis concluded in Section 7.
2 Related works
There are three important factors, including delay reduction, network life-time prolongation, and transmission reliability, which are fundamental to theWSNs. Many efforts regarding these issues have been made in the related re-search fields [10,14,15]. For instance, Dong et al. [10] propose a data gatheringprotocol called the Broadcasting Combined with Multi-NACK/ACK (BCM-N/A) protocol, which presents the energy and the delay efficiency in the datagathering process in both the intra-cluster and the inter-cluster. Doudou et al.[16] propose a strategy based on placing two sink nodes and a few extra relaynodes, which are close to the sinks areas, in the WSNs. In their design, thedata flow is alternatively sent to those two sinks in the sequential transmissioncycles. However, both of the protocols mentioned above produce many extratransmission demands, which are not counted in the topology of the virtualbackbone, for transmitting the NACK/ACK messages. On the other hand,

4 Jing Zhang et al.
Charalampos et al. [14] present a data collection protocol for the WSNs byutilising a number of sink nodes with mobility. In order to achieve the mostefficient way of delivering the sensory data from the terminal nodes to the mo-bile sink nodes, the sink nodes are limited to visit only an appropriate numberof rendezvous nodes while the remaining nodes sending their data throughmulti-hop communication paths toward these sink nodes. Nevertheless, thetransmission delay caused by the movement of sink nodes are not consideredin this method. Velmani et al. [15] propose a Velocity Energy-efficient andLink-aware Cluster-Tree (VELCT) scheme for data collection in WSNs, whichprovides an efficient way for mitigating the problems of the coverage distance,the mobility, the transmission delay, the traffic, the tree intensity, and theend-to-end connection. Their proposed method, VELCT, constructs the Da-ta Collection Tree (DCT) according to the cluster head’s location. The datacollection nodes in the DCT only equipped with the power source and thecommunication module. In other words, the data collection nodes are not ca-pable of working as a sensor but simply are able to collect the data packetsfrom the cluster heads and deliver them to the sink node.
On the other hand, using the clustering based algorithm to organise sensornodes into clusters has attracted a lot of attention in recent days. The frame-work of the CDS is described as follows: the sensor nodes in the dominatingset are called the Cluster Heads (CHs) or the dominators, and the connect-ed nodes are responsible for forming the connections between the dominatingsets after the CDS-based virtual backbone is constructed. The nodes, whichare adjacent to a dominator, are called the Cluster Members (CMs) or thedominatees. The routeing design can be simpler and is more capable of adapt-ing to the topology changes because the data transmission is limited in thevirtual backbone composed of the CHs. Within each cluster, one node is s-elected as the cluster head. The cluster head is responsible for 1) collectingdata from its cluster members, 2) fusing the data by means of data/decisionfusion techniques, and 3) reporting the fused data to the remote base station.In each cluster, the cluster head is the only node involved in the long distancecommunications. Thus, the total energy consumption of the whole network istherefore reduced.
The topology control algorithms focus on maximising the WSNs lifetimeunder the limited energy source [9,10] and minimising the number of nodes inthe virtual backbone [8,11,12]. However, to the best of our knowledge, onlya few of them utilise the CDS structure to drive a minimising delay topologycontrol. The collision avoidance is yet discussed. Cheng et al. [17] propose aDelay-Aware Data Collection Network Structure (DADCNS), which aims atminimising the duration of a data collection process in the WSNs. A centralisedcontrol algorithm, which uses the top-down approach is proposed. The basestation is assumed to have the coordinates of all sensor nodes in the network.The base station launches commands to the sensor nodes for establishing theessential data links and form the appropriate network structure. As shown inFig. 1 (a), the number of nodes N in the proposed network structure has to berestricted to N = 2k, where k = 1, 2, .... However, this structure is too regular

Title Suppressed Due to Excessive Length 5
to maintain for the dynamic changing in the real-world scenario. For example,if the node framed with a rectangular, which is shown in Fig. 1 (b), is dead.The transmission delay is still 7 clocks for the sink node to receive data fromthe third Cluster Head C3 without any update to a shorter delay because C3is previously designed to idle for 3 clocks to gain enough time for collectingthe data from its cluster members. Without a proper update mechanism, thesink node will have more and more idle clocks when the terminal nodes startdying. The time for the idle clocks is simply wasted and becomes a burdenon the system efficiency. Another drawback of this design is that the wholesystem is constructed under the assumption of all sensor node coordinates areknown. However, the assumption is difficult to be satisfied in the real-worldscenario.
Fig. 1 Data collection in multi-hop network
Cheng et al. [18] propose another algorithm based on the network codingscheme. The sensor nodes with the irresponsibility of forwarding the receiveddata are equipped with the coding ability. They encode all data it received intoone message stream. Thus, the forwarded packages are merged into only onemessage as revealed in Fig. 2 (a). Hence, the number of clocks t(N) requiredfor the sink node to collect data from the whole network is t(N) = log2Nand is equal to the number of clocks required by the cluster heads to collectdata from every child node in their connection. However, the drawback of thisscheme is that all transferred packets under the subnet of a cluster head maybe completely lost once the cluster head is dead. The result of data loss in thesubnet is not reversible. Fig. 2 (b) shows this scenario of data loss happenedwhen the cluster head C3 is out of function.
To reduce the data transmission distance, Khan et al. [19] introduce themobile actor node, which is capable to physically move in the spatiotemporalspace, to cruise to the region with the detected events. Since the data trans-mission distance is reduced from the terminal nodes to the mobile actor node isshrunk, the WSNs presents a better performance with the minimum delay andthe high throughput. Nevertheless, the system has some premise that needs

6 Jing Zhang et al.
Fig. 2 Data gathering by network coding
to be satisfied. For example, the WSNs covered area has to be divided intogrids in the size of 20 times 20 meters. In addition, every grid is numberedwith a unique label for identifying the sensor nodes’ positions. Xu et al. [20]have revealed the theoretical proof and analysis regarding the delay of the ag-gregation schedule in Khan et al.s’ method. Li et al. [21] propose a distributedscheduling method for generating the collision-free schedules, where D is thenetwork diameter. However, the network diameter is too large to be applied inthe real-world scenario. To our best knowledge, the cross cubes’ network di-ameter is the smallest among the homogeneous network [13]. Sidera et al. [23]capture the tradeoff that exists in all mobile wireless delay-tolerant networksbetween the packet delivery delay and the aggregate transmission cost. Never-theless, the consideration to manage the collision effect has remained vacant.Hong et al. [24] propose a hybrid beaconless geographic routeing (HBGR)protocol. In their method, the packets in the WSNs are split into the delaysensitive packet and the normal packet base on the needs of the applications.The HBGR protocol provides different mechanisms for dealing with differen-t packets. However, the HBGR protocol heavily relies upon the geographicposition information of the sensor nodes. The transmission overhead for thegeographic information brings in extra power consumption and transmissionrequirements.
3 Performance Models
The main function of a sensor node is to report the detected event as thesensing data is periodically sent to the sink node within a valid time intervalthrough multi-hop routing in the WSNs. The cluster based routing protocolis one of the efficient methods, where sensor nodes are divided into severalgroups and each group is called a cluster. One representative node is chosen ineach cluster and the representative node is called cluster head (CH). The datais aggregated and forwarded at the CH so that it is finally delivered to the

Title Suppressed Due to Excessive Length 7
sink. Fig. 3 shows the general system model for the clustering based routingin the WSNs. The data is forwarded to the sink node by the converge-casttree structure. The cluster members transmit data to their CH. The CH inlevel mi+1 merges the received data by the network coding method beforeforwarding the collected data to its parent cluster head at level mi.
Fig. 3 The cluster based data converge-cast tree construction
3.1 The Communication Model and Assumptions
In this paper, we assume that the WSN has homogeneous communicationmodel. Sensor nodes are deployed randomly and distributed according to ahomogeneous spatial Poisson process with intensity N
πr2 , where N is the av-erage number of neighbors and r is the sensor node radio range [22]. Sincethe link between any pair of nodes is bidirectional, the WSN is modeled as aconnected bidirectional graph G = (V,E), where V is a set of deployed sensornodes and E is the set of edges. ∀u, v ∈ V , there exists an edge (u, v) ∈ Eand (v, u) ∈ E if and only if u and v are mutually connected and there is noobstacle preventing radio wave transmission between u and v.
Definition 1 (Node neighbourhoods) [8] Consider a node u ∈ V , the openset of 1-hop neighbor nodes covered by u is denoted by N1(u), N1(u) = {v |(v, u) ∈ E} and the close set of 1-hop neighbors of u is N [u] = N(u)∪{u}. Wealso useN2(u) to denote the 2-hop neighbors, i.e.,N2(u) = N1(u)
∪v∈N1(u)
N1(v)
Definition 2 (Maximal Independent Set (MIS)) [8] A Maximal IndependentSet of a graph G = (V,E) is a subset V
′ ⊆ V (G) such that every pair ofvertices in V
′are not adjacent, and no independent vertex can be added into
V′.
Definition 3 (Dominating Set (DS)) [7] A Dominating Set of a graph G =(V,E) is a set of nodes V d ⊆ V (G) such that for every (u, v) ∈ E(G), u ∈ V d
or v ∈ V d.
Definition 4 (Connected Dominating Set (CDS)) [8] A Connected Dominat-ing Set of a graph G = (V,E) is a DS of G such that the subgraph of Ginduced by the nodes in this set is connected.

8 Jing Zhang et al.
In many cases, an MIS construction algorithm is used for finding a DS.The nodes in CDS are called the dominators; on the other hand, nodes, whichare not the dominators are called the dominatees. The size of CDS equals tothe number of the dominators. Our proposed algorithm is utilized to find theMIS nodes by building an Inducted Tree of the Crossed Cube network. Thefound MIS nodes are further connected together to construct a CDS.
Definition 5 (Network Coding (NC)) [27] At each network coding node v,the received messages xu1 , ..., xuk
are firstly combined by a coding method
fv(xu1 , ..., xuk)
and the combined message is forwarded towards its destinations after the cod-ing process.
Since the coding nodes combine the data flows by the mathematical codingoperations before forwarding the encoded packets rather than sending a largenumber of originally collected small packets. It reduces the overheads for thecommunication and is able to remarkably reduce the energy consumption. [28]
3.2 Problem Definition
In this work, the main problems are: 1) in CDS and tree based structure WSN,give the transport delay under reliability constraint from theoretical analysis;2) How to further decrease the network delay and improve the transport delaywhen some error happened in the CDS and tree based structure. That is to say,a fault tolerance structure should be constructed. Since we aim to minimizedelay in WSNs, the definition of the delay is given as follows.
Definition 6 (Transport delay) [10] The transport delay is defined as thetime from a packets first transmission until its successful arrival at the sink.
Fig. 4 The method for some nodes dead

Title Suppressed Due to Excessive Length 9
We also use Fig. 1 and Fig. 2 as examples. In order to improve the transportdelay, when error happened, new CDS should be constructed, which is faulttolerance. As shown in Fig. 4, when the CM of C2 disappeared, one of the CMof C3 closest to C2 will become the CM, then the C3 can forward the datain slot 4-6. As shown in Fig. 5, when the CH C3 disappeared, its CMs’ datacan not be forwarded to the sink, then a new CH new C3 will be selected toforward these data.
Fig. 5 The method for some CHs disappeared
4 CDS-based Data Aggregation Algorithm
Most beaconless cluster routing protocols use traditional handshaking to selectforwarder [24]. Once a sensor has sensing data and need to send the message, itbegins carrier sense until channel is clear for a certain time. It is quit unsuitablefor large-scale WSNs. By contrast, CDS can divides a wireless sensor networkinto several clusters. Within each cluster, the dominating node is as a ClusterHead (CH) and the rest are as Cluster Members (CM). The cluster head willcollect data from its cluster members directly or in a multi-hop manner. In thissection, a CDS-based Converge Cast Tree (CCCT) protocol will be proposed.In order to understand CCCT better, the overview of the protocol is given atfirst, then we will describe each part of the algorithm in detail. There are foursteps in this protocol:
1) CDS construction: CDS has become a well known approach for con-structing a virtual backbone in wireless sensor networks. Traffic can forwardedby virtual backbone and other nodes turn off their radios to save energy. How-ever, the size of the CDS can not be too large. Since there are many packetstransmit in the virtual backbone, the interference will be incurred in the CDS.We need to construct the CDS as small as possible. As we know, constructinga minimum CDS is an NP-hard problem, and thus most researchers concen-trate on how to construct approximate algorithms. In this section, Maximal

10 Jing Zhang et al.
Independent Set (MIS) will be used to form a approximate optimal CDS. Thepriority of an node who will be selected into CDS is determined according to anew parameter, namely the degree of the node in the square of a graph, whichis consistent with the concept of MIS.
2) Inter-cluster transportation: The nodes in the network are divided intomultiple clusters, each comprising a CH and cluster members that communi-cate to the CH. Data of CH is sent to the sink via multi-hop among CHs.
3) Intra-cluster transportation: The top-down approach is a kind of cen-tralized control algorithm. The CH in each cluster can construct a rank levelin each cluster. At the end of the optimization process, the CH will instructthe sensor nodes to establish the essential data links and form the appropri-ate network structure for its own cluster. Coding nodes mix data flow usingmathematical operations, and then forward only encoded packets instead of alarge number of original information.
4) CDS reconstruction: For a fault tolerance structure, new CHs should beselected when there are some errors happen in some of the clusters. It is desiredthat new CDS should be constructed using the available local information suchthat the total coverage of the network by CDS is higher than the coveragethreshold η, which can be set adaptively.
4.1 Cross Cube based CDS Constructed algorithm
This section describes the CDS construction algorithm in detail. There arethree stages in the Cross Cube base CDS Constructed (C4) algorithm. Thefirst stage is to construct the square of the graph, according to the concept ofMIS; The second stage is to find the approximate optimal MIS based on C4
algorithm, which is constructed in local square graph, and then to form a CDSby connecting the nodes in MIS. The third stage is to construct the spanningtree for the cross cube in order to avoid the collision.
Base on the concept Induced Tree of Crossed Cube, the C4 algorithmwhich was proposed in our previous article [8]. Fig. 6 shows the example ofCQ5 (Fig. 6(a)) and the induced tree of cross cube T5 (Fig. 6(b) and (c)).
At the initial stage, Each node has to be given an initial status and thenexchange neighbour information among themselves to get ready for the CDSconstruction. Each node should construct the local graphs G, G2 and G∗ withitself as the center. Each node ui holds the message (id,W (ui)), whereW (ui) =(f(ui), dG∗(ui), dG(ui)) is the weight of the corresponding node, and f(ui) isthe identification of the node status, the numerical value can be obtained byformula (1).
f(ui) =
0, if ui is a normal node1, if ui is in the DS2, if ui is a connected node3, if ui has been eliminated
(1)

Title Suppressed Due to Excessive Length 11
Fig. 6 Cross Cube-5 and its induced tree of cross cube
The degree of the node ui in graph G and its square graph G∗ are denotedas dG(ui) and dG∗(ui), respectively. The node’s weight is the priority for theseelements, for example, some nodes with the same value of f , the higher thedegree of dG∗ , the greater the weight. In other words, the probability of thenode to be elected into the CDS is greater. Detailed description will be givenin Algorithm 1, Cross Cube base CDS Constructed C4 algorithm.
Initialization for the parameters should be conducted before the algorithmstarts, after that, one node is selected to join into the graph of Induced Treesof the Crossed Cube GT , assume node u0 has the maximum weight, whichlabeled by ’0’. A mask named as flag is used to describe whether the algorithmis completed, it is also implemented by judge whether all the nodes in thenetwork have decided their own states, as a dominator or a dominatee. Whenthe algorithm is completed, flag is sat as value 1. Otherwise, the 1-dimensionInduced Tree of the Crossed Cube T1 should be constructed. One sensor nodeu1, which has the maximum weight, is selected from NG∗(u0), labeled byvalue 1, and set f(u1) ⇐ 1, this new node u1 and the related edge are addedinto Induced Tree V (T1) at the same time. Then, the new Induced Tree hasconstructed as V (Tn) ⇐ {u0, u1} and E(Tn) ⇐ E(Tn) ∪ (u0, u1). Accordingto the definition, if induced tree in our previous work [8], the dimension ofthe Induced Tree can be extended. The nodes should be divided into bipartitepartitions, let V1(Tn) ⇐ {u1} and V2(Tn) ⇐ {u0}.
If it is still flag! = 1, the 2-dimension Induced Tree should be con-structed, which is similar to construct the 1-dimension Induced Tree. Afterthat, the nodes and edges are selected, where V (Tn) ⇐ {u0, u1, u2} andE(Tn) ⇐ E(Tn) ∪ (u0, u2), these nodes will be divided into bipartite parti-tions as V1(Tn) ⇐ {u0} and V2(Tn) ⇐ {u1, u2}. If it is still flag! = 1, then-dimension Induced Tree can be extended.

12 Jing Zhang et al.
Algorithm 1: C4 algorithm
1 V (Tn) = ϕ; E(Tn) = ϕ; CDS = ϕ, the set of the dominatees Vd = ϕ; flag = 0; n = 12 for ui ∈ V do3 calculate its weight W (ui)) = (f(ui), dG∗ (ui), dG(ui), re(ui)), set f(ui) = 0;4 end5 select a node u0 randomly and labeled by ’0’, set f(u0) = 1, V (Tn) = u0;6 if (flag! = 1) construction 1-dimensional induced tree; and add all selected node
into V (Tn), then consider whether all node is dominated by V (Tn), if so flag = 1;then
7 end8 if (flag! = 1) n = 2; construction 2-dimensional induced tree; and add all selected
node into V (Tn), consider whether all node is dominated by V (Tn), if so flag = 1;then
9 end10 while (flag! = 1) do11 n++;12 for ui ∈ V1(Tn−2) /∈ ϕ or vi ∈ V2(Tn−2) /∈ ϕ and flag! = 1 and
NG∗ (ui)\(Vd ∪ CDS)! = ϕ and NG∗ (vi)\(Vd ∪ CDS)! = ϕ do13 i = 0;14 V (Tn) = V (Tn−2);15 select a node in NG∗ (ui)\(Vd ∪ CDS), with the maximum weight uj with
f(uj) = 1;16 select a node in NG∗ (vi)\(Vd ∪ CDS), with the maximum weight vj with
f(vj) = 1;17 V (Tn) = V (Tn) ∪ uj , E(Tn) = E(Tn) ∪ (ui, uj);18 V (Tn) = V (Tn) ∪ vj , E(Tn) = E(Tn) ∪ (vi, vj);19 i++;20 call function connect(V (Tn)); consider whether all node is dominated by
CDS, if so flag = 1;21 end22 for ui ∈ V1(Tn−2) or vi ∈ V2(Tn−2) or do23 ui labeled by ui00; vi labeled by vi0024 end25 for uj code of uj01 do26 vj labeled by vj01, and vk labeled by vk10;27 end28 V1(Tn) = {uj01, vi00 : uj ∈ V1(Tn−2), vi ∈ V2(Tn−2)},
V2(Tn) = V (Tn)− V1(Tn);29 end
When at least two nodes are selected into the Induced Tree as DS, a func-tion connect (GT ) is called, which aims to select the connector nodes to makethe DS connected. This function implementations as follows. For each edge(u, v) ∈ E(G∗), according to the definition of graph G∗, there exist some n-odes in NG(u)∩NG(v) if f(u) == f(v) == 1, the one who has the maximumweight named w can be selected as the connector node, thus, node w joinsinto the set of CDS referred to as CDS ⇐ V (Tn) ∪ w, and we set f(w) ⇐ 2,C1 ⇐ CDS at the same time. Later, the algorithm also should be judgedwhether is completed.
Next, spanning trees of crossed cube will be constructed. The nodes whichis in the induced tree but not in the spanning tree, can be selected following our

Title Suppressed Due to Excessive Length 13
Fig. 7 C4 based converge-cave tree construction
previous works [30]. Then the spanning tree can be constructed as following:At first, one CH is selected as the root of the spanning tree, next, we changeone or two bits of the label in turn. For example, if the CH’s label is ‘1010’, itssons’ labels are ‘0010’, ‘1110’, ‘1000’ and ‘1011’. If these nodes are not exist inthe induced tree, they can be elected from the CMs of the CH.
4.2 Inter-cluster Transportation
The data collection tree inter-cluster is an acyclic graph, where sink node is theroot of T at level 0. In a rooted spanning tree T, nodes vi and vj are siblingsif they share the same parent. Assume there are |Nch| cluster members in acluster, then a tree with the high ⌈log2|Nch|⌉ is builded, which is used for datacollection.
The nodes in the network are divided into multiple clusters, each compris-ing a CH and cluster members that communicate via one hop to the CH. Dataof CH is sent to the sink via multi-hop among CHs. A CH with level p willform p−1 data links with p−1 CHs, which these CHs are with different levelsstarting from 1, 2, . . . up to p− 1. All these p− 1 CHs may become the childnodes of the node with level p. The node with level k will form a data linkwith a node with a higher level. This higher level CH will become the parentCH of the node with level k. The sink will be considered as a special case, itis the one with the highest level in the network.
Based on spanning tree in cross cube, the message forward rule should beset. Since the CDS constructed algorithm is builded by Spanning Trees of theCrossed Cube network, then the CDS is a tree based construction and eachcluster head has its own label, and which is unique. Since the tree constructionmake sure there is no situation of the link intersection, and each cluster headcan forward its message to its parents cluster head by some rules. Since eachCH has its own label, according to the routing to the sink builded by theC4 algorithm, then we define that the CH who has the lower label sent themessage first, when conflict happened in one channel.
An example of the proposed tree with |Ncm| = 16 is shown in Fig. 7. In thisexample, it take 4 × T for the base station to collect all data from 16 nodes.

14 Jing Zhang et al.
The leaf nodes forward their data to their father nodes at the first slot time.For example, at slot one, node with make number ‘0110’ forwards data to itsfather node ‘1110’, node with make number ‘0100’ forwards data to its fathernode ‘1100’. At slot 2, node with make number ‘1100’ forwards data to itsfather node ‘1000’, node with make number ‘1101’ forwards data to its fathernode ‘1011’. It is easy to see that there is no collision happened in this kindof construction. The inter-cluster transportation is based on the constructionalgorithm of spanning tree shown in Algorithm 2.
Although there are many spanning trees in one cross cube, it will be decidedas long as the root is selected.
Fig. 8 The inter-cluster transportation by the tree construction
Algorithm 2: Spanning tree based Crossed Cube construction
1 choice one CH0 as the root of the spanning tree of the cross cube; V (T ) = CH0;E(T ) = ϕ; S = log2|Ncm|;
2 each CHs decide their levels according to the spanning tree of cross cube.3 for level = 0 to S − 1 do4 for x ∈ V (T ) do
5 end6 y = NSS−level−1
(x);
7 E(T ) = E(T ) ∪< y, x >;8 V (T ) = V (T ) ∪ y;
9 end
For example, in Fig. 8, suppose that vertices are labeled with binarynotation. There is only one vertex ′10′ in V (T ), during the first iteration(level = 0), vertex N3(
′10′) =′ 11′. As a result, V (T ) = {′10′,′ 11′} and

Title Suppressed Due to Excessive Length 15
E(T ) = <′ 11′,′ 10′ >. During the second iteration (level=1), each vertex vin V (T ) is connected to vertex N2(v), the iteration will be stopped until eachcluster-head is connected when level = S − 1.
4.3 Intra-cluster transportation
After the CDS is constructed, and each node determines its state, as a CH orCM. Each cluster head knows the number of its cluster members. Assume thereare |Ncm| cluster members in a cluster. Those CM is used for data collectionintra-cluster. The CH area is divided into Nr regions A1, A2,..., ANr basedon the lines, such that all CM in Ai will be given a rank, which is an integerbetween 1 and Ncm. CMs are with different ranks starting from 1,2,... up toNcm. All these Ncm sensors will become the child nodes of CH.
Fig. 9 The intra-cluster transportation
Fig. 9 illustrates the rank dividing mechanism. CMs in regions A1 randomselect the rank between 1 and Ncm
Nras initial, CMs in regions A2 select the
rank between Ncm
Nr+ 1 and2Ncm
Nras initial. The rank decides the CMs’ time
slot, that is when they can forward the data to their CHs. The higher the rankis, the more earlier it sents the data. By this way, the collision can be avoided.
Furthermore, since coding nodes mix data flow using mathematical opera-tions, and then forward only encoded packets instead of a large number of theoriginal information, it can reduce energy consumption remarkably. Networkcoding becomes widely significant after it was first proposed by Ahlswede etal. [25]. Many researchers consider it as an efficient technology for improvingnetwork performance [26]. The number of message that be encoded by codingnode in each transmission is called as encoding number. Maximize the encod-ing number is most researches. After the CDS construction, the CHs are actas the coding nodes. They can coding all the received message, then forwardthem to the father CH. In this paper, we do not consider the network codingalgorithm in detail, we use the basis linear network coding algorithm.

16 Jing Zhang et al.
4.4 CDS reconstruction
Two kinds of mistakes will be happened in one cluster. One is CH error,the other is the CM disappeared. If the CM is disappeared, then the CHfind there is no member in its cluster, it will broadcast the member recruitmessage. The closed node who satisfies the condition as CM, it will sent themessage for asking jion into the new cluster. If the error is happened in CH,then new cluster head should be elected. It is desired that new CDS should beconstructed using the available local information such that the total coverageof the network by CDS is higher than the threshold η.
For i > 1, the new CDS is constructed by selecting cluster-head in eachcluster. One cluster example is shown in Fig. 10 (a), node o is the cluster-head which is selected as a node in the CDS by C4 algorithm. When node ohas not enough energy as a cluster-head, it must be replaced. Then the newcluster heads may be constructed. Same cases could happen in each cluster.For instance, three cases are illustrated in Figs. 10 (b) - (d).
Fig. 10 An example of reconstructing clusters
Case 1. As showen in Fig. 10 (b), only one node is needed. If node a1 isselected as a cluster-head, which can cover all the nodes that node o covered.Sub-Induced Tree does not need to be constructed.
Case 2. Two non-adjacent nodes can be selected as the cluster-heads, suchas nodes b1 and b2 which are shown in Fig. 10 (c). 1-dimensional sub-InducedTree needs to be constructed in this cluster.

Title Suppressed Due to Excessive Length 17
Case 3. If two nodes still cannot cover those nodes, three non-adjacent n-odes can be selected as the cluster-heads, such as nodes c1, c2 and c3 illustratedin Fig. 10 (d).
In fact, at most five nodes need to be selected to cover all of the nodes in thesame cluster. In order to guarantee the coverage intensity, 2- or 3-dimensionalsub-Induced Trees must be constructed in these clusters.
5 Theoretical analysis
Under the CCCT protocol, after each data gathering in intra-cluster and theconverge-cast by CHs to the sink, such process is called one round. The follow-ing theorem and simulations give the data load of node in one round. Theorem1 proves the correctness of the algorithm, and Theorem 2 proves that our CC-CT protocol can avoid the collision efficiently. Lemma 1 and Theorem 3 provethe delay time slots approximation ratio complete to the MIS; Lemma 2 andTheorem 4 give the value of the delay which relate to the number of the nodeand the dimensionality of the cross cube.
Theorem 1 The CDS constructed by algorithm C4 is a spanning tree basedcross cube and root at u with the height n+ 1 in CQn.
Proof By algorithm C4, it is easy to verify that there are 1+20+21+...+2n−1 =2n vertices in the tree. Since V (CQn) = 2n and the initial vertex Ni(u) in thetree have n different neighbours including a leaf vertex u, the the height of thetree rooted at u is n+ 1. Thus, the theorem holds.
Theorem 2 Under the CCCT protocol and in the CH-based virtual backbonenetwork, there is no collision happen.
Fig. 11 Some collision
Proof Fig. 11 shows the protocol proposed by [16], which is the communicationsystem with many collisions, it requires application delay 5 clock cycles for 5sensors. With the increase of the number of the sensors, the collisions will be
18 Jing Zhang et al.
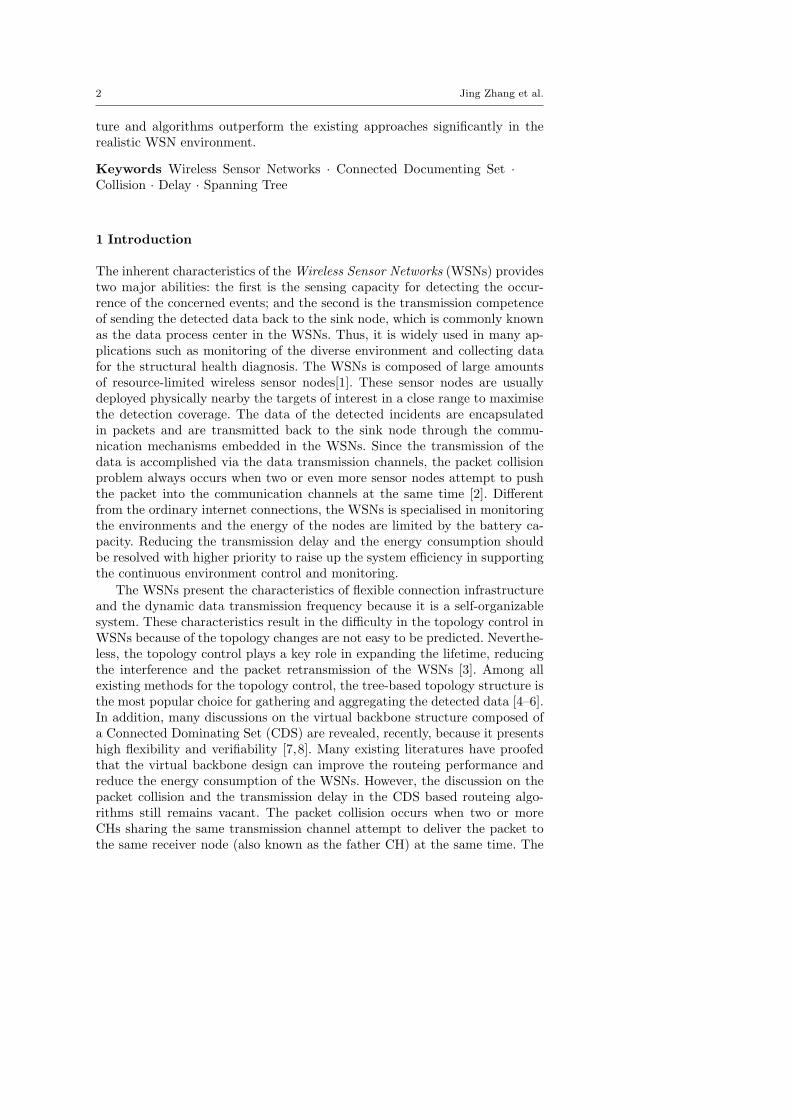
much higher. However, as shown in Fig. 12, in a spanning tree of cross cube,every cluster heads receive and forward messages in different clock cycles. Forexample, at clock cycle 1, CHs 1, 3, 5, 7, 9, 11, 13, 15 forwards message to theirown parent CHs. For CH 2, it receives messages from CH 3 at clock cycle 1,receives messages from CH 10 at clock cycle 2, receives messages from CH 6at clock cycle 3 and forwards the coded messages to the sink in clock cycle 4.There is no collision happened in this spanning tree.
Fig. 12 No collision happen in the spanning tree
Consider a cluster, given a period of t time slots, a CH can collect datafrom at most t directly connected child nodes, as long as these child nodesuse different time slots to communicate. Within these t child nodes, the uth
node will report data at time slot u, which implies the uth node can collectdata from at most u − 1 directly connected child nodes of itself before it hasto report data to its parent node. Therefore, for a period of t time slots, a CHcan receive data from at most 2t nodes (including itself). On the other hand,the minimum number of time slots required for a parent node to collect datafrom nodes (including itself) is log2N . Thus, the minimum number of timeslots required for a sink to collect data from nodes N is t(N) ≤ log2N .
Later, we will analysis the value of the delay in detail.
Lemma 1 [8] Given a graph G = (V,E), let α be the DS obtained from theC4 algorithm. Then
α ≤ 3.2833γ + 4.5590 (2)
where γ is the size of any optimal CDS of G.

Title Suppressed Due to Excessive Length 19
Theorem 3 Given a graph G = (V,E), the upper bound of time slots requiredfor a base station to collect data from nodes N is
t(N) ≤ log2N
(3.2833γ + 4.559)+ log28.64γ (3)
where N ≥ 1 is the number of the nodes in WSN, and γ is the MIS.
Proof According to Theorem 1, the minimum number of time slots requiredfor a base station to collect data from nodes N is t(N) ≤ log2N .
In the CDS-based structure, each cluster has average N|DS| sensors, then
the total minimum number of time slots is:
t(N) ≤ log2N/|DS|+ |CDS|. (4)
According to Lemma 1, the Dominating Set has the size at most
| D1 |≤ 3.2833γ + 4.5590. (5)
then the total minimum number of time slots is:
t(N) ≤ log2N
(3.2833γ + 4.559)+ log28.64γ (6)
where N ≥ 1 is the number of nodes in WSN, and γ is the MIS.
Though Theorem 1 proves the upper bound of delay time slots’ approxi-mation ratio complete to the MIS. However it is not intuitionally. Lemma 2and Theorem 1 give the value of the delay which is related to the number ofthe node and the dimensionality of the cross cube.
Lemma 2 [8] Given a graph G = (V,E), the number of nodes in the DS basedon the Induced Tree of the Crossed Cube is approximately equal to
0.447× [1.618n+2 − (−0.618)n+2] (7)
where n ≥ 1 is the dimensional of the Crossed Cube.
Theorem 4 Given a graph G = (V,E), the maximum number of time slotsrequired for a base station to collect data from node N is
log2N
0.447× (1.618n+2 − (−0.618)n+2)+ n (8)
where n ≥ 1 is the dimensional of the Crossed Cube.

20 Jing Zhang et al.
Proof According to Lemma 1, the Dominating Set has the size at most
| D1 |≤ 3.2833γ + 4.5590. (9)
According to Lemma 2, the number of DS constructed by our C4 algorithmsimilar to the following inequality
| D1 |≈ 0.447× [1.618n+2 − (−0.618)n+2]. (10)
The upper bound of dimensional n can be calculated by formulas (9) and (10),thus there is
0.447× [1.618n+2 − (−0.618)n+2] ≤ 3.2833γ + 4.5590
⇔ 2.618× 1.618n − 0.382(−0.618)n] ≤ 7.35γ + 10.2, (11)
and then
1.618n − 0.156(−0.618)n] ≤ 2.9γ + 3.9. (12)
Since
−0.06 ≤ −0.156(−0.618)n] ≤ 0.1, (13)
and
n ≤ log1.618(2.9γ + 3.96), (14)
and then n ≤ log2(4.64γ+4). It can be simplified as inequality (15) with γ ≥ 1
n ≤ log2(8.64γ). (15)
According to the Theorem 1, the minimum number of time slots required fora base station to collect data from nodes N is
log2N
0.447× (1.618n+2 − (−0.618)n+2)+ n (16)
where n ≥ 1 is the dimensional of the Crossed Cube.
As far as we known, the cross cubes’ network diameter is the smallest oneamong the homogeneous network. Next section shows that the simulationscorresponds with the theoretical value.

Title Suppressed Due to Excessive Length 21
Fig. 13 The data transmission in CDS based networks
6 Simulations
To verify the idea on the scheduling data transmission, the proposed algo-rithms are deployed in a WSN environment shown in Fig. 13. It contains nhomogeneous sensor nodes, which are distributed in a region with a sink nodelocated at the centre of the whole system. The deployment of the sensor nodesfollows a homogeneous Poisson point process with a density of ρ nodes per unitarea. The sensor nodes in the network are divided into several clusters. TheCHs transmit data back to the sink node hop-by-hop in a designed sequence.The transmitting radius of a sensor node is denoted by the symbol R. Forevery node ni, the probability that data transmission from node ni to node nj
is denoted by the symbol pi. The transmission is defined to take 1 clock cycleto complete the transmission of a single packet.
6.1 Competition of the size of the CDS
To evaluate the performance of the designed algorithm with different CDSsizes, the proposed C4 algorithm is compared with the most recently pub-lished algorithms, e.g. the CDS-BD-D [11] and E-MCDS [12]. The sensor nodedistribution presented in the figure is averaged over 100 simulations. The num-ber of sensor nodes deployed in the space and the capable transmission rangeof the sensor nodes is incrementally varied from 10 to 100 by 10 and from 20to 30, respectively, in each simulation. Fig. 14 shows the comparison of thealgorithms with different CDS size. An observable phenomenon in Fig. 14 isthat the required CDS size of C4 algorithm is the smallest among all compared

22 Jing Zhang et al.
(a) r=20 (b) r=30
Fig. 14 The comparison of the algorithms in terms of CDS size
algorithms. In addition, the size of CDS grows as the number of sensor nodesin the system increases. By comparing Fig. 14 (a) and Fig. 14 (b), the trendof the CDS size decreases while the transmission range of the sensor node in-creases. The reason is that a sensor node equipped with higher transmissionrange provides a larger coverage area. Since the whole WSN coverage area isfinite, the CDS size can be reduced, accordingly. Based on the results givenin the figures, which are obtained from the simulations, we conclude that theproposed C4 algorithm is capable of providing the same system coverage anddata transmission ability with the smallest CDS size.
Moreover, several tests on the data transmission delay with different algo-rithms are also carried out in the simulations. Again, our proposed algorithmis compared with the CDS-BD-D and te E-MCDS based data collection algo-rithms.
The probability pi of every node is calculated in a sensing and reportingcycle. In order to simulate the reality in the real-world scenario, we assumethat the probability pi fits in a multi-peak Gaussian Distribution, which canbe described by Formula (17). The simulation results are presented with theaverage values. In addition, the designated area in the simulation environmentis shown in Fig. 15.
P (x, y) =(1− x)2
4e−x2−(y+1)2
−5
6(x
5− x3 − y5)e−x2−y2
− 1
36e−(x+1)2−y2
+1
2. (17)
Events of the packet transmission/receiving and handling the collision allrequire clock cycles (the units for calculating the process time) for the WSN’swireless communication system to execute the coordinating procedures. Theclock cycles required for transmitting the packet is calculated by Formula (18).
T = Ts × α1 + Tc × α2. (18)

Title Suppressed Due to Excessive Length 23
Fig. 15 The probability that data transmission pi
where Ts denotes the time for transporting a package, and Tc denotes the timeoccur by collision. α1 and α2 denote the weight coefficients. In our simulation,the delay slot Tc is set as 20 percents of the transport slots Ts, and the weighercoefficients are set as α1 = α2 = 0.5.
6.2 Throughput of the CCCT algorithm
The task processing ability of the WSN is called the throughput, which isdefined as the total number of bits processed per second. The throughput ofa WSN containing 100 sensor nodes is shown in Fig. 16. The transmissionradius of the sensor nodes is varied from r = 5 to r = 25 by increasing 5units, respectively. The occupied number of clock cycles are averaged over 50repeats. In every repeat, the WSN is randomly assigned to handle 500−10000packets from the terminal nodes to the sink node. According to the simulationresults, the throughput of WSN with different algorithms is almost identicalbecause the number of cluster members in the CDS, of which the size is decidedby the transmission radius, is almost the same. As the matter of fact, morepackets can be collected by the CHs when the throughput is increased by theincrement of the transmission radius.

24 Jing Zhang et al.
Fig. 16 Throughput of the CCCT algorithm
6.3 Competition of the delay
In simulation tests of delay. Similar to the subsection 6.1, first, we assume100 sensors spread over some terrain of 100*100 network. Second, we set thetransmission power at one of the following levels 5, 10, 15, 20, and 25. Later, weassume that in each test, there are 500− 10000 packs need to be forwarded tothe sink. When there are more than two packages transmit in the same route,the collision will happen, and only one package can be transmitted. Figs. 17 (a-e) illustrate the clock cycles in which message are transmitted over the numberof packs. The cluster head in the CDS transmits the package which is coded bythe packs forward from the cluster members. Figs. 17 (a-e) denote the differenttransmit radios of the sensors when r = 5, r = 10, r = 15, r = 20 and r = 25,respectively. Each value is the average number by simulating 50 times. It iseasy to see that CDS-BD-D based and E-MCDS based algorithms need moreclock cycles to transmit the same number of packs than our CCCT algorithmunder different transmit radios. The main reason of these results is that thereare more collisions in the CDS-BD-D based and E-MCDS based algorithms.However, our CCCT algorithm considers the collision features of the transmit,and is designed by the crossed cube tree. This kind of construction has nocollision, which is agree well with Theorem 1 discussed in section 5. Thus, itis more effective when the slot is considered.
Furthermore, Fig. 17 (a) shows that it improves about 20% and 17% com-peting to the CDS-BD-D based and E-MCDS base algorithms to our CCCTalgorithm when r = 5, respectively. The improvements are about 40% and 38%when r = 10 (see Fig. 17 (b)), 52% and 50% when r = 15 (see Fig. 17 (c)),58% and 57% when r = 20 (see Fig. 17 (d)), 63% and 62% when r = 25 (seeFig. 17 (e)), respectively. The lager the radio is, the higher the effectivenessis, and the less clock cycles are, because more packs can be coded into onepacket. While compareing to the CCCT, the collision still happens base on the

Title Suppressed Due to Excessive Length 25
(a) r=5 (b) r=10
(c) r=15 (d) r=20
(e) r=25 (f) Different R for CCCT
Fig. 17 Comparison for delay in 100 sensors
other two algorithms. It means the CCCT is better than the other algorithms.Fig. 17 (f) illustrates the clock cycles in which transmit the message over thedifferent transmit radius. The clock cycles are gradually increasing with thenumber of packs.
In order to show that the proposed algorithm is also suitable when thenumber of the packs is higher. Later, we assume 600 sensors spread over thesame environment which terrain of 100× 100 network. We also set the trans-mission power at one of the following levels 5, 10, 15, 20, and 25. In this sim-ulation, we assume there are 10500-20000 packs needed to forwarded to thesink in each test. Figs. 18(a-e) illustrate the clock cycles in which transmit
26 Jing Zhang et al.
(a) r=5 (b) r=10
(c) r=15 (d) r=20
(e) r=25 (f) Different radius r for CCCT
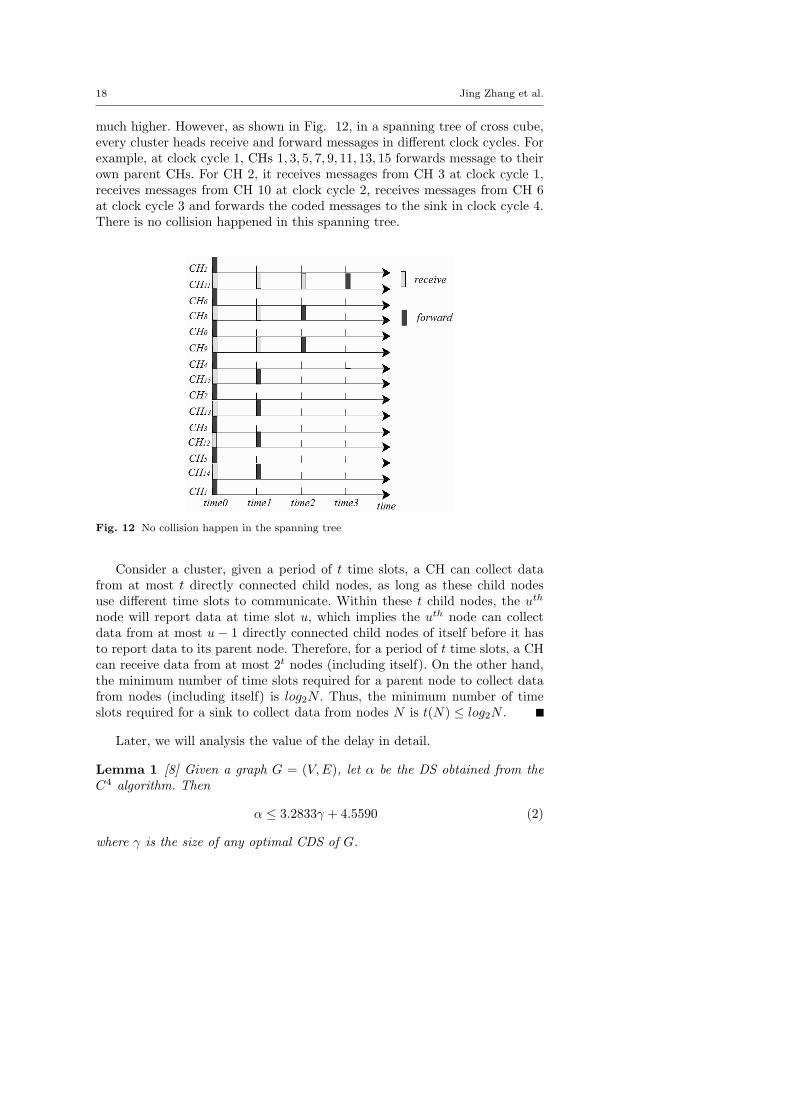
Fig. 18 Comparison for delay in 600 sensors
the message over the number of packs. The same to the Figs. 17, it is easy tosee that our algorithm is better than the other algorithms. Fig. 18 (a) showsthat it improves about 24% and 18% competing to the CDS-BD-D base andE-MCDS based algorithms to our CCCT algorithm when r = 5, respectively.The improvements are about 46% and 40% when r = 10 (see Fig. 18 (b)),57% and 52% when r = 15 (see Fig. 18 (c)), 65% and 60% when r = 20 (seeFig. 18 (d)), 69% and 66% when r = 25 (see Fig. 18 (e)), respectively. Thelager the radio is, the higher the effectiveness is and the less clock cycles arebecause more packs can be coded into one packet. While compareing to theCCCT, the collision still happens base on the other two algorithms. It meansthe CCCT is better than the other algorithms. Fig. 18 (f) illustrates the clock
Title Suppressed Due to Excessive Length 27
cycles in which transmit the message over the different transmit radius. Theclock cycles are gradually increasing with the number of packs.
7 Conclusion
Data gathering is a fundamental task in Wireless Sensor Networks. Clusteringis an effective technique in reducing delay and energy consumption. Currently,most of the existing works focus on constructing Connected Documenting Setbased clustering algorithms according to different user requirements. Howev-er, due to the hard maintain of the virtual backbone, it is more practical toobatian a CDS construction with small number of clusters. Due to the exis-tence of collision and delay in WSNs, a collision avoid data gathering protocolis needed. To solve the problem, a protocol named Cluster based ConvergeCast Tree protocol (CCCT) is presented. Moreover, most literatures neglectthe delay factor when constructing Converge Cast Tree. Differently, in thispaper, we focus on obtaining a Cluster based Converge Cast Tree (CCCT)under the realistic WSNs. More specifically, three problems are investigated,namely, the Minimal Connected Documenting Set (MCDS) problem, the delayaware CDS problem, and the CCCT construction problem. Later, approxima-tion algorithms and comprehensive theoretical analysis of the approximationfactors are presented. Finally, our simulation results show that the proposedalgorithms outperform the existing state-of-the-art approaches significantly.
As WSNs interest in the data collecting or tracking events, when thereare no update data, the data collection is unnecessary in such place. In thefuture work, we will focus on when and where the data collection programsare needed. Secondly, WSNs are easily destroyed. The Fault-Tolerance virtualbackbone is necessary, when some nodes in the virtual backbone are destroyed.we will focus on how to construct a fault tolerance construction in our futurework.
Acknowledgements The authors wish to thank National Natural Science Foundation ofChina (Grant NO: 61072080, 61572010), Natural Science Foundation of Fujian Province ofChina (2017J05098), The Education Department of Fujian Province science and technologyproject (JAT160328, JZ160461), and the science research project in Fujian University ofTechnology (GY-Z160066, GY-Z160130, GY-Z160138).
References
1. Amodu, O. A., and Mahmood, R. A. R.: Impact of the energy-based and location-basedleach secondary cluster aggregation on wsn lifetime, Wireless Networks, 1-24 (2016).
2. Ashu1: Ravikant Kaushik, collision detection in WSN through pattern detection andneural network, International Journal For Technological Research In Engineering, 2(11):2538-2541 (2015)
3. Santi P.: Topology control in wireless ad hoc and sensor networks, Acm ComputingSurveys, 37(2):164-194 (2005).
4. Xu, Y., Zeng, Z. R., and Ding, O.: An energy efficient hole repair node scheduling algo-rithm for wsn, Wireless Networks, 1-14 (2015).
28 Jing Zhang et al.
5. He, J., Ji, S., Pan, Y., and Li, Y.: Constructing Load-Balanced Data Aggregation Treesin Probabilistic Wireless Sensor Networks, IEEE Transactions on Parallel and DistributedSystems, 25(7): 1681-1690 (2014)
6. Marappan, P., and Rodrigues, P.: An energy efficient routing protocol for correlated datausing CL-LEACH in WSN, Wireless Networks, 22 (4): 1-9 (2016).
7. Zhao, Y., Wu, J., Li, F. and Lu, S.: On maximizing the lifetime of wireless sensor net-works using virtual backbone scheduling, IEEE Transactions on Parallel and DistributedSystems, 23(8): 1528-1535 (2012)
8. Zhang, J., Xu, L., Zhou, S., Wu, W., Ye, X.: An efficient connected dominating setalgorithm in WSNs based on the induced tree of the crossed cube, International Journalof Applied Mathematics and Computer Science, 25(2):295-309 (2015)
9. Sert, S. A., Bagci, H., and Yazici, A.: MOFCA: Multi-objective fuzzy clustering algorithmfor wireless sensor networks, Appl. Soft Computing, 30, 151-165 (2015)
10. Dong, M., Ota, K., Liu, A., and Guo, M.: Joint Optimization of Lifetime and Trans-port Delay under Reliability Constraint Wireless Sensor Networks, IEEE Transactions onParallel and Distributed Systems, 27(1): 225-236 (2016)
11. Kim, D., Wu, Y., Li, Y., Zou, F. and Du, D. Z.: Constructing minimum connecteddominating sets with bounded diameters in wireless networks, IEEE Transactions onParallel and Distributed Systems, 20(2): 147-157 (2009)
12. Tang, Q., Yang, K., Li, P., Zhang, J., Luo, Y. and Xiong, B.: An energy efficient m-cds construction algorithm for wireless sensor networks, EURASIP Journal on WirelessCommunications and Networking, 1: 1-15 (2012)
13. Cheng, B., Fan, J., and Jia, X.: Dimensional-Permutation-Based Independent SpanningTrees in Bijective Connection Networks, IEEE Transactions on Parallel and DistributedSystems, 26(1): 45-53 (2015)
14. Konstantopoulos, C., Vathis, N., and Pantziou, G.: Damianos Gavalas Efficient Delay-constrained Data Collection in Wireless Sensor Networks using Mobile Sinks, 2015 8thIFIP Wireless and Mobile Networking Conference (2015)
15. Velmani, R.and Kaarthick, B.: An Efficient Cluster-Tree Based Data Collection Schemefor Large Mobile Wireless Sensor Networks, IEEE SENSORS JOURNAL, 15(4): 2377-2390 (2015)
16. Doudou, M., Djenouri, D., Barceloordinas, J. M., and Badache, N.: Cost effective nodedeployment strategy for energy-balanced and delay-efficient data collection in wireless sen-sor networks, IEEE Wireless Communications and Networking Conference. ”2014 IEEEWireless Communications and Networking Conference (WCNC)”. Istanbul: Institute ofElectrical and Electronics Engineers (IEEE), 2868-2873, (2014)
17. Cheng, C.-T., Tse, C. K., and Lau, F. C. M.: A delay-aware data collection networkstructure for wireless sensor networks, IEEE Sensors J., 11(3): 699C710 (2011)
18. Cheng, C.-T., Tse, C. K., and Lau, F. C. M.: A Delay-Aware Network Structure forWireless Sensor Networks With Consecutive Data Collection Processes, IEEE Sensors J.,13(6): 2413-2422 (2013)
19. Khan, S., Khan, F., and Khan, S.: Delay and Throughput Performance Improvement inWireless Sensor and Actor Networks, The 5th IEEE National Symposium on InformationTechnology: Towards Smart World, 1-5 (2015)
20. Xu, X. H., Li, M., Mao, X. F., Tang, S. J., and Wang, S. G.: A delay efficient algorithmfor data aggregation in multihop wireless sensor networks, IEEE Trans. Parallel Distrib.Syst., 22(1): 163-175 (2011)
21. Li, H. X., Wu, C., Hua, Q. S., and Lau, F. C. M.: Latency-minimizing data aggregationin wireless sensor networks under physical interference model, Ad Hoc Network, 12(1):52-68 (2014)
22. Chen, I., and Wang, Y.: Reliability Analysis of Wireless Sensor Networks with Dis-tributed Code Attestation, IEEE Communications Letters, 16(10): 1640-1643 (2012)
23. Sidera, A., and Toumpis, S.: On the delay/cost tradeoff in wireless mobile Delay-TolerantNetworks, International Symposium on Modeling and Optimization in Mobile, Ad Hoc,and Wireless Networks. IEEE, 452-459 (2014)
24. Hong, C., Xiong, Z., and Zhang, Y.: A hybrid beaconless geographic routing for differentpackets in WSN, Springer-Verlag New York, Inc. 22:1107-1120 (2016)
25. Ahlswede, R., Cai, N., Li, S. Y. R., and Yeung, R. W.: Network information flow, IEEETransactions on Information Theory, 46(4): 1204-1216 (2000)

Title Suppressed Due to Excessive Length 29
26. Ye, X., Li, J., and Xu, L.: Distributed separate coding for continuous data collection inwireless sensor networks, Acm Transactions on Sensor Networks, 11(11): 1-26 (2014)
27. Gadouleau, M., Richard, A., and Fanchon, E.: Reduction and Fixed Points of BooleanNetworks and Linear Network Coding Solvability, IEEE Transactions on InformationTheory, 62(5):2504-2519 (2016)
28. Xu, L., Zhang, J., Xiang, Y., and Huang, X.: Network coding based converge-cast schemein wireless sensor networks, Wireless Personal Communications, 96(4): 4947-4972 (2017)
29. Cheng, B., Fan, J., and Jia, X.: Dimensional-permutation-based independent spanningtrees in bijective connection networks, IEEE Transactions on Parallel and DistributedSystems, 26(1): 45-53 (2014)
30. Zhang, J., Xu, L., Zhou, S., Min, G., Xiang, Y., and Hu, J.: Crossed cube ring: a k-connected virtual backbone for wireless sensor networks, Journal of Network and Com-puter Applications, 91(1): 75-88 (2017)
Copyright © 2022 FDOKUMEN