INSURANCE MOTORCYCLE COLLISION REPORT - IIHS
35
December 2006 MR-06 2002-06 Model Years HIGHWAY LOSS DATA INSTITUTE INSURANCE MOTORCYCLE COLLISION REPORT COPYRIGHTED DOCUMENT, DISTRIBUTION RESTRICTED ©2006 by the Highway Loss Data Institute. All rights reserved. Distribution of this report is restricted. No part of this publication may be reproduced, or stored in a retrieval system, or transmitted, in any form or by any means, electronic, mechanical, photocopying, recording, or otherwise, without the prior written permission of the copyright owner. Possession of this publication does not confer the right to print, reprint, publish, copy, sell, file, or use this report in any manner without the written permission of the copyright owner.
-
Upload
khangminh22 -
Category
Documents
-
view
0 -
download
0
Transcript of INSURANCE MOTORCYCLE COLLISION REPORT - IIHS

December 2006MR-06
2002-06 Model Years
HIGHWAY LOSSDATA INSTITUTE
INSURANCEMOTORCYCLECOLLISIONREPORT
COPYRIGHTED DOCUMENT, DISTRIBUTION RESTRICTED©2006 by the Highway Loss Data Institute. All rights reserved. Distributionof this report is restricted. No part of this publication may be reproduced, orstored in a retrieval system, or transmitted, in any form or by any means,electronic, mechanical, photocopying, recording, or otherwise, without theprior written permission of the copyright owner. Possession of this publicationdoes not confer the right to print, reprint, publish, copy, sell, file, or use thisreport in any manner without the written permission of the copyright owner.

COPYRIGHT NOTICE
©2006 by the Highway Loss Data Institute, 1005 N. Glebe Road, Arlington, VA 22201.All rights reserved.
Distribution of this report is restricted. No part of this publication may be reproduced, orstored in a retrieval system, or transmitted, in any form or by any means, electronic,mechanical, photocopying, recording, or otherwise, without the prior written permissionof the copyright owner. Possession of this publication does not confer the right to print,reprint, publish, copy, sell, file, or use this material in any manner without the writtenpermission of the copyright owner.
Permission is hereby granted to companies that are members of the Highway Loss DataInstitute to reprint, copy, or otherwise use this material for their own business purposes,provided that the copyright notice is clearly visible on the material.
BOARD OF DIRECTORS
z P. Baum, Chairman, Nationwide z A.H. Gannon, Vice Chairman, United ServicesAutomobile Association z R. Birchfield, AIG Agency Auto z H.L. Cohen, GEICO IndemnityInsurance Company z E. Connell, Erie Insurance Company z F.F. Cripe, Allstate InsuranceCompany z T.J. Ellefson, American Family Mutual Insurance Company z J. Feldmeier,Auto Club Group z D. Griffin, Property Casualty Insurers Association of America z S. Kelly,Progressive Insurance z A.R. Ledbetter, Liberty Mutual Insurance Company z S. Lin,Chubb Group of Insurance Companies z S. Miyao, California State Auto Association zT.G. Myers, High Point Insurance Group z D. Pickens, GMAC Insurance Group z B.Reddington, Kentucky Farm Bureau Insurance z J.A. Rochman, American InsuranceAssociation z L. Shepherd, Safeco z L. Stiles, State Farm Mutual Automobile InsuranceCompany z B. Tucker, Farmers Insurance Group of Companies z J. White, The Hartford zA. Lund, Highway Loss Data Institute
The membership of the Highway Loss Data Institute Board of Directors represents insur-ance companies that supply data to HLDI. Financial support for HLDI is providedthrough the Insurance Institute for Highway Safety, which in turn is supported by auto-mobile insurers.

CONTENTS
Summary. . . . . . . . . . . . . . . . . . . . . . . . . . . . . . . . . . . . . . . . . . . . . . . . . . . . . . . . . . . . 1
Introduction . . . . . . . . . . . . . . . . . . . . . . . . . . . . . . . . . . . . . . . . . . . . . . . . . . . . . . . . . 2
Best and Worst Motorcycle Collision Losses . . . . . . . . . . . . . . . . . . . . . . . . . . . . . . . . . 3
Table 1 Best Motorcycle Collision Losses, 2002-06 Model Years . . . . . . . . . . . . . . . . . 4
Table 2 Worst Motorcycle Collision Losses, 2002-06 Model Years . . . . . . . . . . . . . . . . 5
Motorcycle Collision Losses by Class . . . . . . . . . . . . . . . . . . . . . . . . . . . . . . . . . . . . . . 6
Table 3 Motorcycle Collision Losses by Model Year . . . . . . . . . . . . . . . . . . . . . . . . . . . 7
Figure 1 Relative Motorcycle Collision Claim Frequencies by Class, . . . . . . . . . . . . . . 82002-06 Model Years
Figure 2 Relative Motorcycle Collision Average Loss Payments . . . . . . . . . . . . . . . . . . 9per Claim by Class, 2002-06 Model Years
Figure 3 Relative Motorcycle Collision Average Loss Payments . . . . . . . . . . . . . . . . . . 9per Insured Vehicle Year by Class, 2002-06 Model Years
Motorcycle Collision Losses by �Time Period. . . . . . . . . . . . . . . . . . . . . . . . . . . . . . . . 10
Table 4 Motorcycle Collision Losses by Model Year and Calendar Year . . . . . . . . . . . 10
Motorcycle Collision Losses by Engine Displacement . . . . . . . . . . . . . . . . . . . . . . . . . 11
Figure 4 Motorcycle Collision Claim Frequencies by Class . . . . . . . . . . . . . . . . . . . . 11by Displacement Range, 2002-06 Model Years
Figure 5 Motorcycle Collision Average Loss Payments . . . . . . . . . . . . . . . . . . . . . . . . 12per Claim by Class by Displacement Range, 2002-06 Model Years
Figure 6 Motorcycle Collision Average Loss Payments . . . . . . . . . . . . . . . . . . . . . . . . 12per Insured Vehicle Year by Class by Displacement Range, 2002-06 Models
Motorcycle Collision Losses . . . . . . . . . . . . . . . . . . . . . . . . . . . . . . . . . . . . . . . . . . . . 13
Table 5 Motorcycle Collision Losses, 2002-06 Model Years . . . . . . . . . . . . . . . . . . . . 14
Choppers . . . . . . . . . . . . . . . . . . . . . . . . . . . . . . . . . . . . . . . . . . . . . . . . . . . . . . . . . . 16
Table 6 Motorcycle Collision Exposure By Age, 2002-06 Model Years . . . . . . . . . . . 16
Appendix A Complete Motorcycle Series Listing . . . . . . . . . . . . . . . . . . . . . . . . . . . . 17
Appendix B Motorcycle Classes Defined . . . . . . . . . . . . . . . . . . . . . . . . . . . . . . . . . . 28

This Highway Loss Data Institute report presents collision coverage insurance losses formotorcycles produced during model years 2002-06. Results are presented for all streetlegal motorcycle classes with at least 1,000 insured vehicle years of exposure or 100claims.
• The 2002-06 motorcycles combined had a collision claim frequency of 2.3 claims per100 insured vehicle years and an average loss payment per claim of $5,298, resulting ina $124 average loss payment per insured vehicle year.
• As a class, super sport motorcycles had the highest overall losses ($506 per insured vehi-cle year), almost four times higher than losses for touring motorcycles and more than sixtimes higher than those for cruisers.
• High overall collision losses are being driven by claim frequency, not severity. All of themotorcycles that appear on the highest overall losses list also appear on the highest claimfrequencies list. None of the motorcycles that appear on the highest claim severities listappear on the list of motorcycles with the highest overall losses. The Harley ScreamingEagle Deuce, a 1,690 cubic centimeter (cc) cruiser, appears on the highest severity list.However, its claim frequency was so low that it also appears on the lowest frequency list.
• Of the ten motorcycles with highest overall losses, nine were super sport motorcycles.The Kawasaki Ninja ZX-10R, a 1,000 cc super sport motorcycle, had the highest overalllosses of more than nine times the all-motorcycle result. The Suzuki Hayabusa, a 1,300cc sport motorcycle, was the only sport motorcycle among those with the highest over-all losses, with losses more than four times the all-motorcycle result.
• Eight of the ten motorcycles with the highest claim severities were Harleys. The HarleyScreaming Eagle Electra Glide, a 1,690 cc touring motorcycle, had the highest claimseverity of more than two times the all-motorcycle result.
• Of the ten motorcycles with the lowest overall losses, four were scooters. The HondaMetropolitan, a 50 cc scooter, had overall losses that were 5 percent of the all-motorcy-cle result.
• All of the motorcycles with the lowest claim severities had engine displacements at orbelow 500 cc. Five of the ten motorcycles with the lowest severities were scooters.
SUMMARY
© 2006 Highway Loss Data Institute 1

INTRODUCTION
Collision coverage results for all street legal motorcycles produced in model years 2002-06 form the basis of this Highway Loss Data Institute (HLDI) report. To provide informa-tion on as many motorcycles as possible, collision data for 2002-06 models are com-bined for those motorcycles with basic designs that remained unchanged during thesemodel years. Some motorcycle versions are grouped into combined series. Combinedseries never include different engine displacements. These combined series are listed inAppendix A.
Scooters also have been included in this report. It is important to note that some statesdo not require scooters to be registered if their engine displacements are 50 cubic cen-timeters (cc) or less. Results for all 2002-06 motorcycles are included in the overall totalsand in the separate totals for class subgroups in the principal table (Table 5). Results arepresented for individual motorcycles with at least 1,000 insured vehicle years of expo-sure or 100 claims. A total of 88 motorcycles met this reporting criterion.
Loss results for choppers are included on page 16. Results for these motorcycles are notincluded in the all-motorcycle result set because the amount of data HLDI has for indi-vidual choppers is sparse. HLDI has collected coverage and loss data for off-road indi-vidual motorcycles, all-terrain vehicles, snowmobiles, and off-road utility vehicles, butresults for these vehicles are not included in this report.
Results are presented by motorcycle class. A detailed description of classes is containedin Appendix B and the HLDI Motorcycle Technical Appendix. This report is based on col-lision coverage and loss data supplied by 15 insurers: AIG, American Family, AmericanNational Property and Casualty, Auto Club Group, Automobile Insurers Bureau ofMassachusetts, California State Automobile Association, Chubb, Erie, Farmers, GEICO,The Hartford, Liberty, Nationwide, State Farm, and Tennessee Farm Bureau. Coverageand losses from both standard and nonstandard risk are included. Unlike HLDI reportson passenger vehicles, results in this report have not been standardized for age ordeductible. A table that shows age distribution by class has been included on page 16.
2 © 2006 Highway Loss Data Institute

BEST AND WORST MOTORCYCLE COLLISION LOSSES
Results for individual motorcycles are presented in relative terms, with the value 100 rep-resenting the result for all motorcycles combined.
Table 1 lists the motorcycles with the lowest overall collision losses including scooters,dual purpose motorcycles, or cruisers. No standard, unclad sport, sport, or super sportmotorcycles were among those with the lowest losses. The Honda Metropolitan, a 50 ccscooter, had the lowest overall losses, with losses just 5 percent of the all-motorcycleresult. Engine displacements tended to be relatively small among the motorcycles withthe lowest losses. The largest engine (750 cc) was found on the Honda Shadow Ace.
Table 2 lists the motorcycles with the highest collision losses. Nine of the ten motorcy-cles with highest overall losses were in the super sport class. The Kawasaki Ninja ZX-10R, a 1,000 cc super sport motorcycle, had the highest overall losses of more than ninetimes the all-motorcycle result. The Suzuki Hayabusa, a 1,300 cc sport class motorcycle,was the only sport motorcycle among those with the highest overall losses, with lossesmore than four times the all-motorcycle result. Five of the ten motorcycles with the high-est overall losses had engine displacements that were 1,000 cc or larger.
3© 2006 Highway Loss Data Institute

TOTAL EXPOSURE(INSURED VEHICLE
MAKE SERIES DISPLACEMENT CLASS YEARS) RESULT*
RELATIVE CLAIM FREQUENCY
Honda XR650 650 Dual Purpose 1,406 21Kawasaki KLR650 650 Dual Purpose 2,708 25Suzuki DR-Z400S 400 Dual Purpose 2,356 25Honda Metropolitan 50 Scooter 3,210 31BMW R1150RT 1,150 Sport 2,730 39Honda Shadow Ace 750 750 Cruiser 9,843 40Honda Rebel 250 Cruiser 4,938 40Harley Screaming Eagle Deuce 1,690 Cruiser 1,391 40Yamaha Vino 50 Scooter 2,160 42BMW F650GS 650 Dual Purpose 1,492 43
RELATIVE AVERAGE LOSS PAYMENT PER CLAIM
Honda Metropolitan 50 Scooter 3,210 16Honda Elite 80 80 Scooter 1,157 16Yamaha Zuma 50 Scooter 3,171 17Yamaha Vino 50 Scooter 2,160 22Honda Rebel 250 Cruiser 4,938 36Kawasaki Ninja 250 250 Sport 2,136 42Honda Reflex 249 Scooter 1,575 43Buell Blast P3 492 Sport 1,126 43Kawasaki Vulcan 500 500 Cruiser 1,291 44Suzuki DR-Z400S 400 Dual Purpose 2,356 45
RELATIVE AVERAGE LOSS PAYMENT PER INSURED VEHICLE YEAR
Honda Metropolitan 50 Scooter 3,210 5Honda Elite 80 80 Scooter 1,157 7Yamaha Zuma 50 Scooter 3,171 8Yamaha Vino 50 Scooter 2,160 9Suzuki DR-Z400S 400 Dual Purpose 2,356 11Honda XR650 650 Dual Purpose 1,406 12Kawasaki KLR650 650 Dual Purpose 2,708 14Honda Rebel 250 Cruiser 4,938 14Suzuki Boulevard S40 650 Cruiser 1,781 22Honda Shadow Ace 750 750 Cruiser 9,843 22
*100 = all-motorcycle result
TABLE 1 BEST MOTORCYCLE COLLISION LOSSES, 2002-06 MODEL YEARS
4 © 2006 Highway Loss Data Institute

TOTAL EXPOSURE(INSURED VEHICLE
MAKE SERIES DISPLACEMENT CLASS YEARS) RESULT*
RELATIVE CLAIM FREQUENCY
Kawasaki Ninja ZX-10R 1,000 Super Sport 802 732Kawasaki Ninja ZX-6R 636 Super Sport 1,709 602Honda CBR1000RR 1,000 Super Sport 1,459 564Honda CBR600RR 600 Super Sport 3,272 492Suzuki GSX-R750 750 Super Sport 2,380 461Suzuki GSX-R600 600 Super Sport 3,576 449Suzuki GSX-R1000 1,000 Super Sport 3,196 437Suzuki Hayabusa 1,300 Sport 3,229 393Yamaha YZF-R1 1,000 Super Sport 4,230 347Yamaha YZF-R6 600 Super Sport 4,678 318
RELATIVE AVERAGE LOSS PAYMENT PER CLAIM
Harley Screaming Eagle Electra Glide 1,690 Touring 1,273 232Harley Screaming Eagle Deuce 1,690 Cruiser 1,391 173Harley Electra Glide Classic 1,450 Touring 10,199 154Harley Ultra Classic Electra Glide 1,450 Touring 20,167 151Harley Screaming Eagle Road King EFI 1,690 Touring 1,788 148Honda Gold Wing 1,800 Touring 15,108 146Harley Heritage Springer 1,450 Cruiser 3,843 143Harley Electra Glide Standard 1,450 Touring 7,622 141Honda ST1300 1,300 Sport 1,223 137Harley Road Glide 1,450 Touring 4,406 137
RELATIVE AVERAGE LOSS PAYMENT PER INSURED VEHICLE YEAR
Kawasaki Ninja ZX-10R 1,000 Super Sport 802 920Honda CBR1000RR 1,000 Super Sport 1,459 646Kawasaki Ninja ZX-6R 636 Super Sport 1,709 555Suzuki GSX-R1000 1,000 Super Sport 3,196 534Suzuki GSX-R750 750 Super Sport 2,380 497Honda CBR600RR 600 Super Sport 3,272 480Suzuki Hayabusa 1,300 Sport 3,229 423Suzuki GSX-R600 600 Super Sport 3,576 421Yamaha YZF-R1 1,000 Super Sport 4,230 405Yamaha YZF-R6 600 Super Sport 4,678 313
*100 = all-motorcycle result
TABLE 2 WORST MOTORCYCLE COLLISION LOSSES, 2002-06 MODEL YEARS
5© 2006 Highway Loss Data Institute

MOTORCYCLE COLLISION LOSSES BY CLASS
Table 3 lists collision losses for 2002-06 motorcycles by model year and class. The 2002-06 models combined had a claim frequency of 2.3 claims per 100 insured vehicle years,an average loss payment of $5,298, and overall losses of $124 per insured vehicle year.Super sport motorcycles had the highest claim frequency (9.0) and overall losses ($506).Touring motorcycles had the highest average loss payment per claim ($7,176).
As a class, dual purpose motorcycles had the lowest claims frequency (0.8). Scooters hadthe lowest average loss payment per claim ($1,903) and the lowest overall losses ($33).Overall losses for dual purpose motorcycles ($34) were only slightly higher than thosefor scooters.
6 © 2006 Highway Loss Data Institute

TABLE 3 MOTORCYCLE COLLISION LOSSES BY MODEL YEAR
MODEL YEARS
CLASS 2002 2003 2004 2005 2006 2002-06
CLAIM FREQUENCY
PER 100 INSURED VEHICLE YEARS
Cruiser 1.1 1.4 2.0 2.5 4.6 1.7
Touring 1.3 1.5 1.9 2.4 3.1 1.8
Dual Purpose 0.5 0.7 0.9 1.1 — 0.8
Standard 2.0 3.5 — — — 2.8
Unclad Sport 2.6 4.1 4.9 6.7 — 4.2
Sport 2.4 3.7 4.1 6.3 13.4 4.2
Super Sport 5.0 7.6 10.0 12.6 24.3 9.0
Scooter 0.8 1.4 1.7 2.7 — 1.6
All Motorcycles 1.5 1.9 2.6 3.4 7.0 2.3
AVERAGE LOSS PAYMENT PER CLAIM
Cruiser $4,797 $4,799 $4,847 $4,887 $4,726 $4,797
Touring $7,176 $7,337 $7,626 $8,186 $6,548 $7,176
Dual Purpose $3,566 $3,578 $4,668 $4,562 — $3,566
Standard $3,056 $3,791 — — — $3,056
Unclad Sport $4,005 $4,259 $4,487 $4,508 — $4,005
Sport $4,666 $4,788 $5,303 $5,406 $4,779 $4,666
Super Sport $5,434 $5,278 $5,564 $5,859 $5,902 $5,434
Scooter $1,903 $1,952 $1,971 $2,076 — $1,903
All Motorcycles $5,184 $5,156 $5,310 $5,545 $5,322 $5,298
AVERAGE LOSS PAYMENT
PER INSURED VEHICLE YEAR
Cruiser $52 $65 $95 $121 $219 $81
Touring $91 $113 $147 $194 $202 $131
Dual Purpose $20 $24 $42 $52 — $34
Standard $61 $131 — — — $95
Unclad Sport $103 $173 $221 $300 — $182
Sport $111 $177 $219 $343 $638 $212
Super Sport $273 $402 $556 $741 $1,434 $506
Scooter $15 $27 $33 $57 — $33
All Motorcycles $78 $96 $139 $187 $362 $124
7© 2006 Highway Loss Data Institute

Figures 1-3 show the collision claim frequencies, average loss payments per claim, andoverall losses for 2002-06 motorcycles by class, expressed in relative terms where 100equals the all motorcycle result. Claim frequencies range from 36 for dual purposemotorcycles to 386 for super sport motorcycles. Average loss payments per claim rangefrom 38 for scooters to 141 for touring motorcycles. Overall losses range from 27 forscooters to 409 for super sport motorcycles.
8 © 2006 Highway Loss Data Institute
50
100
150
200
250
300
350
400
ScooterSuper SportSportUnclad SportStandardDual PurposeTouringCruiser
All-Motorcycle Result = 2.3
FIGURE 1 RELATIVE MOTORCYCLE COLLISION CLAIM FREQUENCIES BY CLASS, 2002-06 MODEL YEARS

9© 2006 Highway Loss Data Institute
50
100
150
200
250
300
350
400
ScooterSuper SportSportUnclad SportStandardDual PurposeTouringCruiser
All-Motorcycle Result = $124
FIGURE 3 RELATIVE MOTORCYCLE COLLISION AVERAGE LOSS PAYMENTS
PER INSURED VEHICLE YEAR BY CLASS, 2002-06 MODEL YEARS
20
40
60
80
100
120
140
ScooterSuper SportSportUnclad SportStandardDual PurposeTouringCruiser
All-Motorcycle Result = $5,298
FIGURE 2 RELATIVE MOTORCYCLE COLLISION AVERAGE LOSS PAYMENTS
PER CLAIM BY CLASS, 2002-06 MODEL YEARS

© 2006 Highway Loss Data Institute10
Table 4 lists collision losses for 2002-06 motorcycles by calendar year and model year.It is important to note that not all insurers that supplied data for this report were able toprovide the same amount of data. In general, later calendar years have more data thanearlier years.
MOTORCYCLE COLLISION LOSSES BY �TIME PERIOD
TABLE 4 MOTORCYCLE COLLISION LOSSES BY MODEL YEAR AND CALENDAR YEAR
MODEL YEARS
CALENDAR YEAR 2002 2003 2004 2005 2006 2002-06
CLAIM FREQUENCY
PER 100 INSURED VEHICLE YEARS
2002 3.2 1.0
2003 1.4 1.8 1.3
2004 1.6 2.4 3.7 1.9
2005 1.3 1.6 2.4 4.0 3.1 2.2
2006* 1.4 1.7 2.1 2.9 7.1 2.7
Total 1.5 1.9 2.6 3.4 6.8 2.3
AVERAGE LOSS PAYMENT PER CLAIM
2002 $6,006 $5,109
2003 $5,399 $5,632 $6,282
2004 $5,258 $5,309 $5,330 $6,094
2005 $5,104 $5,108 $5,429 $5,495 $6,571 $5,342
2006* $4,568 $4,770 $5,080 $5,587 $5,275 $5,171
Total $5,184 $5,156 $5,310 $5,545 $5,322 $5,298
AVERAGE LOSS PAYMENT
PER INSURED VEHICLE YEAR
2002 $191 $51
2003 $76 $102 $84
2004 $86 $127 $199 $118
2005 $67 $82 $131 $222 $202 $116
2006* $62 $83 $106 $160 $375 $138
Total $78 $96 $139 $187 $362 $124
*2006 is based on coverage and losses thru July 2006

© 2006 Highway Loss Data Institute 11
Figures 4-6 show the collision claim frequencies, average loss payments per claim, andoverall losses for 2002-06 motorcycles by engine displacement. For illustrative purpos-es, results for unclad sports and sports motorcycles were combined, as were results fordual purpose and standard motorcycles. There was no apparent relationship betweenclaim frequency and engine displacement. Claim frequencies were highest for supersport motorcycles, with engine displacements ranging from 750 to 899 cc. For eachclass, average loss payments per claim increased as engine displacements increased. Aswith claim frequencies, there was no apparent relationship between overall losses andengine displacement. Overall losses were highest for super sport motorcycles, withengine displacements ranging from 750 to 899 cc.
MOTORCYCLE COLLISION LOSSES BY
ENGINE DISPLACEMENT
2
4
6
8
10
CruiserTouringDual Purpose & StandardSport & Unclad SportSuper SportScooter
-
Cla
ims
per 1
00 in
sure
d ve
hicl
e ye
ars
> 1,4501,300 - 1,4501,130 - 1,299900 - 1,129750 - 899600 - 749< 600
Displacement range in cubic centimeters (cc)
FIGURE 4 MOTORCYCLE COLLISION CLAIM FREQUENCIES BY CLASS AND
DISPLACEMENT RANGE, 2002-06 MODEL YEARS

12 © 2006 Highway Loss Data Institute
$1,000
$2,000
$3,000
$4,000
$5,000
$6,000
$7,000
$8,000
CruiserTouringDual Purpose & StandardSport & Unclad SportSuper SportScooter
-
> 1,4501,300 - 1,4501,130 - 1,299900 - 1,129750 - 899600 - 749< 600
Displacement range in cubic centimeters (cc)
Aver
age
loss
pay
men
t per
cla
im
FIGURE 5 MOTORCYCLE COLLISION AVERAGE LOSS PAYMENTS
PER CLAIM BY CLASS AND DISPLACEMENT RANGE, 2002-06 MODEL YEARS
$100
$200
$300
$400
$500
$600
CruiserTouringDual Purpose & StandardSport & Unclad SportSuper SportScooter
-
> 1,4501,300 - 1,4501,130 - 1,299900 - 1,129750 - 899600 - 749< 600
Displacement range in cubic centimeters (cc)
Aver
age
loss
pay
men
t per
insu
red
vehi
cle
year
FIGURE 6 MOTORCYCLE COLLISION AVERAGE LOSS PAYMENTS
PER INSURED VEHICLE YEAR BY CLASS AND DISPLACEMENT RANGE, 2002-06 MODELS

Detailed collision coverage results for all 2002-06 motorcycles with at least 1,000insured vehicle years of exposure or 100 claims are listed in Table 5. The values report-ed are total exposure (in insured vehicle years), number of claims, and relative results forthree loss categories: claim frequency, average loss payment per claim, and average losspayment per insured vehicle year. The value 100 corresponds to the average result for allmotorcycles in each loss category. Individual results are listed in ascending order of rel-ative average loss payment per insured vehicle year within each class. The total exposureaccumulated for the five model years was 555,968 insured vehicle years, with claimsnumbering 12,882.
Relative claim frequencies for individual motorcycles ranged from 21 to 732, relativeaverage loss payments per claim ranged from 16 to 232, and relative average loss pay-ments per insured vehicle year ranged from 5 to 920. The Harley Screaming Eagle ElectraGlide, a 1,690 cc touring motorcycle, had the highest claim severity. The Kawasaki NinjaZX-10R, a 1,000 cc super sport motorcycle, had the highest claim frequency and over-all losses.
The highest overall losses by class occurred as follows:
Cruiser Harley V-Rod 1,130 cc
Touring Harley Screaming Eagle Electra Glide 1,690 cc
Dual Purpose BMW R1150GS 1,150 cc
Unclad Sport Suzuki SV650 650 cc
Sport Suzuki Hayabusa 1,300 cc
Super Sport Kawasaki Ninja ZX-10R 1,000 cc
Scooter Honda Silver Wing 600 cc
MOTORCYCLE COLLISION LOSSES
13© 2006 Highway Loss Data Institute

RELATIVE
TOTAL RELATIVE AVERAGE
EXPOSURE RELATIVE AVERAGE LOSS PAYMENT
(INSURED NUMBER CLAIM LOSS PAYMENT PER INSURED
MAKE SERIES DISPLACEMENT VEHICLE YEARS) OF CLAIMS FREQUENCY PER CLAIM VEHICLE YEAR
ALL MOTORCYCLES 551,968 12,882 100=2.3 100=$5,298 100=$124
CRUISER CLASS 328,376 5,500 72 91 65Honda Rebel 250 4,938 46 40 36 14Suzuki Boulevard S40 650 1,781 19 46 47 22Honda Shadow Ace 750 750 9,843 91 40 56 22Kawasaki Vulcan 800 800 4,184 57 58 47 28Honda Shadow VLX 600 6,438 84 56 54 30Suzuki Boulevard S83 1,400 1,277 13 44 73 32Kawasaki Vulcan 500 500 1,291 22 73 44 32Honda Shadow Spirit 1,100 3,496 40 49 75 37Honda Shadow Spirit 750 750 10,761 173 69 54 37Yamaha V-Star 650 650 12,117 173 61 63 39Triumph Bonneville America 800 1,090 12 47 83 39Kawasaki Vulcan 750 750 1,783 25 60 67 40Honda Shadow Sabre 1,100 5,536 69 53 76 40Suzuki Boulevard S50 800 1,934 31 69 60 41Harley Sportster 883 883 20,596 310 64 66 42Suzuki Boulevard M50 800 2,106 36 73 66 48Yamaha V-Star 1100 1,100 15,137 239 68 75 51Suzuki Intruder 800 800 6,240 121 83 64 53Honda Shadow Aero 750 5,458 120 94 63 60Kawasaki Vulcan 1500 1,500 6,852 110 69 90 62Harley Sportster 1200 1,200 20,699 388 80 83 66Honda VTX1800 1,800 14,843 233 67 101 68Harley Fat Boy 1,450 25,237 390 66 103 68Yamaha Road Star 1,700 6,922 113 70 98 68Harley Screaming Eagle Deuce 1,690 1,391 13 40 173 69Honda VTX1300 1,300 10,832 203 80 87 70Harley Heritage Softail 1,450 25,259 391 66 115 76Harley Dyna Low Rider 1,450 9,929 164 71 108 76Kawasaki Vulcan 1600 1,600 3,050 65 91 84 77Harley Softail Standard 1,450 10,500 179 73 108 79Harley Dyna Wide Glide 1,450 12,378 216 75 107 80Suzuki Boulevard C90 1,500 2,989 53 76 109 83Harley Softail Deluxe 1,450 12,434 194 67 124 83Harley Dyna Super Glide 1,450 9,964 205 88 96 85Harley Night Train 1,450 5,175 109 90 95 86Harley Springer Softail 1,450 2,679 53 85 114 97Yamaha Road Warrior 1,700 2,914 71 104 99 104Harley Heritage Springer 1,450 3,843 67 75 143 107Suzuki Boulevard C50 800 2,489 79 136 79 107Harley V-Rod 1,130 8,304 223 115 122 140
TOURING CLASS 107,016 1,874 75 141 106BMW K1200LT 1,200 1,742 25 61 98 61Harley Electra Glide Standard 1,450 7,622 104 58 141 83Honda Gold Wing 1,800 15,108 210 60 146 87Harley Screaming Eagle Road King EFI 1,690 1,788 26 62 148 92Harley Road King 1,450 39,441 651 71 132 94Harley Ultra Classic Electra Glide 1,450 20,167 371 79 151 119Harley Road Glide 1,450 4,406 105 102 137 139
TABLE 5 MOTORCYCLE COLLISION LOSSES, 2002-06 MODEL YEARS
14 © 2006 Highway Loss Data Institute

RELATIVE
TOTAL RELATIVE AVERAGE
EXPOSURE RELATIVE AVERAGE LOSS PAYMENT
(INSURED NUMBER CLAIM LOSS PAYMENT PER INSURED
MAKE SERIES DISPLACEMENT VEHICLE YEARS) OF CLAIMS FREQUENCY PER CLAIM VEHICLE YEAR
TABLE 7 MOTORCYCLE COLLISION LOSSES, 2002-06 MODEL YEARS (CONT’D)
Harley Electra Glide Classic 1,450 10,199 218 92 154 141Yamaha Royal Star 1,294 1,609 46 122 116 143Harley Street Glide 1,450 1,294 46 152 120 182Harley Screaming Eagle Electra Glide 1,690 1,273 26 88 232 203
DUAL PURPOSE CLASS 14,920 124 36 78 28Suzuki DR-Z400S 400 2,356 14 25 45 11Honda XR650 650 1,406 7 21 58 12Kawasaki KLR650 650 2,708 16 25 55 14BMW F650GS 650 1,492 15 43 56 24BMW R1150GS 1,150 1,540 17 47 115 54
STANDARD CLASS 4,644 128 118 65 77
UNCLAD SPORT CLASS 13,760 581 181 81 147BMW R1150R 1,150 1,682 29 74 110 81Yamaha FZS1000 1,000 1,733 52 129 85 109Suzuki V-Strom 1000 1,000 1,015 29 122 90 110Honda 919 919 1,004 35 149 87 130Suzuki SV650 650 3,425 205 256 69 177
SPORT CLASS 25,698 1,092 182 94 172Buell Blast P3 492 1,126 15 57 43 24BMW R1150RT 1,150 2,730 25 39 129 51Kawasaki Ninja 250 250 2,136 82 165 42 69Kawasaki Concours 1000 1,000 1,218 34 120 83 99Yamaha FJR1300 1,300 2,021 44 93 122 114Honda ST1300 1,300 1,223 28 98 137 135Honda Interceptor 800 800 1,274 52 175 103 180Yamaha YZF600R 600 1,109 63 243 84 204Suzuki Hayabusa 1,300 3,229 296 393 108 423
SUPER SPORT CLASS 35,798 3,228 386 106 409Honda CBR600F4i 600 3,088 174 241 92 222Honda CBR954RR 954 2,436 157 276 110 303Yamaha YZF-R6 600 4,678 347 318 98 313Yamaha YZF-R1 1,000 4,230 343 347 117 405Suzuki GSX-R600 600 3,576 375 449 94 421Honda CBR600RR 600 3,272 376 492 97 480Suzuki GSX-R750 750 2,380 256 461 108 497Suzuki GSX-R1000 1,000 3,196 326 437 122 534Kawasaki Ninja ZX-6R 636 1,709 240 602 92 555Honda CBR1000RR 1,000 1,459 192 564 114 646Kawasaki Ninja ZX-10R 1,000 802 137 732 126 920
SCOOTER CLASS 21,756 355 70 38 27Honda Metropolitan 50 3,210 23 31 16 5Honda Elite 80 80 1,157 12 44 16 7Yamaha Zuma 50 3,171 34 46 17 8Yamaha Vino 50 2,160 21 42 22 9Vespa ET4 150 150 1,354 18 57 49 28Honda Reflex 249 1,575 45 122 43 52Honda Silver Wing 600 1,496 40 115 49 56
TABLE 5 MOTORCYCLE COLLISION LOSSES, 2002-06 MODEL YEARS (CONT’D)
15© 2006 Highway Loss Data Institute

The following manufactures produce highly individualized motorcycles, generallyreferred as choppers: American Eagle, American Ironhorse, Big Dog, California Customs,Custom Chrome, Milwaukee Motorcycle, Saxon, and Stroker.
At the time of this report, the amount of data HLDI had for individual choppers wassparse. The total exposure accumulated for all of these manufacturers for the 2002-06model years was 4,317 insured vehicle years, with claims numbering 120. As a group,choppers had a claim frequency of 2.8 claims per 100 insured vehicle years, comparedwith 2.3 claims for all motorcycles. The average loss payment per claim for choppers was$10,743, more than double the claim severity of $5,298 for all motorcycle. The averageloss payment per insured vehicle years (overall losses) for choppers was $299, more thantwice the loss payment of $124 for all motorcycles.
CHOPPERS
16 © 2006 Highway Loss Data Institute
TABLE 6 MOTORCYCLE COLLISION EXPOSURE BY AGE, 2002-06 MODEL YEARS
CLASS YOUTHFUL NON-YOUTHFUL SENIOR
(<25) (25-64) (>64) UNKNOWN
Cruiser 3.7% 86.2% 1.4% 8.7%
Touring 0.6% 87.8% 2.5% 9.2%
Dual Purpose 3.6% 87.2% 1.2% 8.0%
Standard 7.5% 79.8% 1.0% 11.7%
Unclad Sport 9.4% 79.3% 0.8% 10.5%
Sport 6.4% 80.9% 1.4% 11.3%
Super Sport 17.1% 70.5% 0.4% 12.0%
Scooter 7.3% 79.6% 6.6% 6.5%
Total 4.4% 84.8% 1.7% 9.1%

CRUISER CLASS 328,376
BMW R1200C 1,200 491Harley Dyna Defender 1,450 177Harley Dyna Low Rider 1,450 9,929
Dyna Low Rider 7,157Dyna Low Rider EFI 2,772
Harley Dyna Super Glide 1,450 9,964Dyna Super Glide 7,174Dyna Super Glide Custom 231Dyna Super Glide Custom EFI 664Dyna Super Glide EFI 1,818Dyna Super Glide EFI 35th Anniversary 79
Harley Dyna Wide Glide 1,450 12,378Dyna Wide Glide 7,814Dyna Wide Glide 35th Anniversary 1,735Dyna Wide Glide EFI 2,809Dyna Wing Glide 20
Harley Fat Boy 1,450 25,237Fat Boy 9,006Fat Boy EFI 16,176Fat Boy Shrine EFI 55
Harley Heritage Softail 1,450 25,259Heritage Softail 53Heritage Softail Classic 7,443Heritage Softail Classic EFI 17,470Heritage Softail Classic Shrine EFI 125Heritage Softail EFI 168
Harley Heritage Springer 1,450 3,843Heritage Springer 941Heritage Springer Classic 181Heritage Springer Classic EFI 618Heritage Springer EFI 2,103
Harley Night Train 1,450 5,175Night Train 2,189Night Train EFI 2,986
Harley Screaming Eagle Deuce 1,690 1,391
© 2006 Highway Loss Data Institute 17
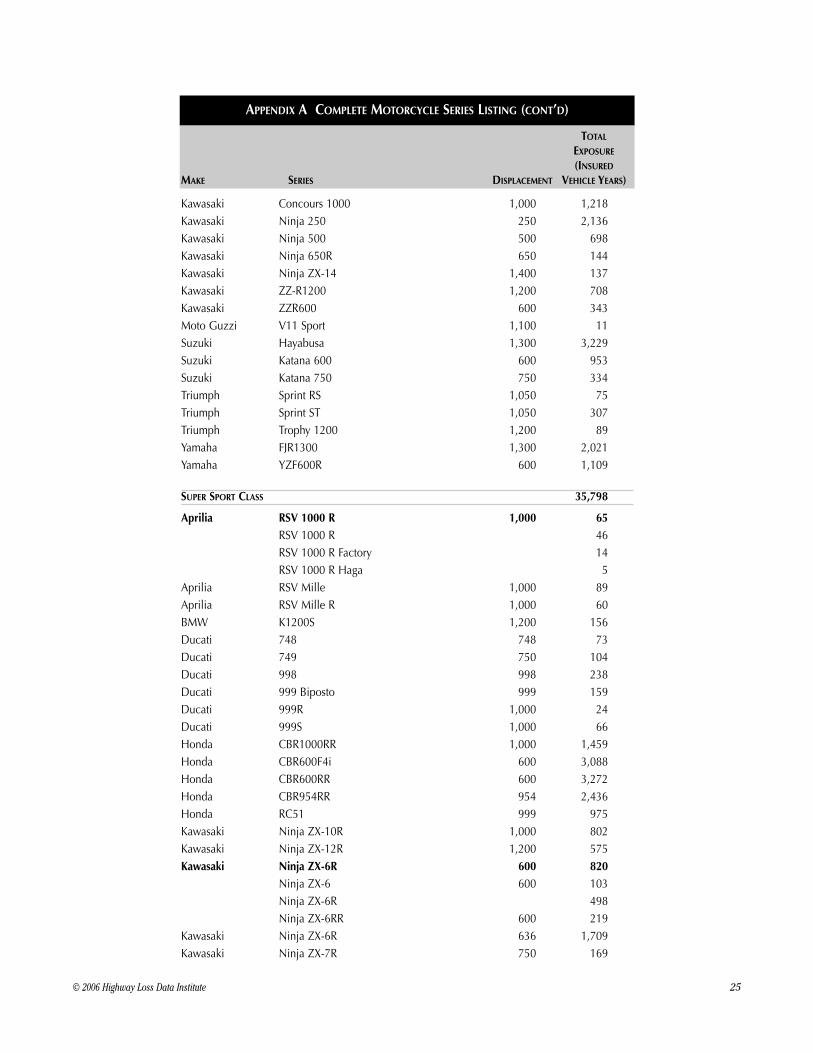
The following table lists all motorcycles that were included in this report regardless ofexposure. Additionally, it identifies the individual motorcycles that were grouped intocombined series. Combined series appear in bold.
APPENDIX A
APPENDIX A COMPLETE MOTORCYCLE SERIES LISTING
TOTAL
EXPOSURE
(INSURED
MAKE SERIES DISPLACEMENT VEHICLE YEARS)

© 2006 Highway Loss Data Institute18
Harley Screaming Eagle Fat Boy 1,690 597Harley Screaming Eagle V-Rod 1,250 310Harley Softail Deluxe 1,450 12,434
Softail Deluxe 487Softail Deluxe EFI 2,683Softail Deuce 2,991Softail Deuce EFI 6,273
Harley Softail Standard 1,450 10,500Softail Standard 5,706Softail Standard EFI 4,794
Harley Sportster 1200 1,200 20,699Sportster 1200 2,276Sportster 1200 Custom 15,879Sportster 1200 Low 228Sportster 1200 Roadster 1,688Sportster 1200 Sport 628
Harley Sportster 883 883 20,596Sportster 883 165Sportster 883 Custom 7,131Sportster 883 Hugger 10,216Sportster 883 low 1,633Sportster 883 R 1,450
Harley Springer Softail 1,450 2,679Springer Softail 1,195Springer Softail EFI 1,484
Harley Street Bob 1,450 641Harley V-Rod 1,130 8,304
Night Rod 106Street Rod 95V-Rod 8,102
Honda Magna 750 755Honda Rebel 250 4,938Honda Shadow Ace 750 750 9,843Honda Shadow Aero 750 5,867
Shadow Aero 5,458Shadow Aero 408
Honda Shadow Sabre 1,100 5,536Honda Shadow Spirit 1,100 3,496Honda Shadow Spirit 750 750 10,761Honda Shadow VLX 600 6,438
Shadow VLX 710Shadow VLX Deluxe 5,728
Honda Valkyrie 1,500 732Honda Valkyrie Rune 1,800 306
APPENDIX A COMPLETE MOTORCYCLE SERIES LISTING (CONT’D)
TOTAL
EXPOSURE
(INSURED
MAKE SERIES DISPLACEMENT VEHICLE YEARS)

© 2006 Highway Loss Data Institute 19
Honda VTX1300 1,300 10,832Honda VTX1800 1,800 14,843Indian Chief 1,650 960Indian Scout 1,450 746Indian Spirit 1,450 563Kawasaki Eliminator 125 125 331Kawasaki Vulcan 1500 1,500 6,852
Vulcan 1500 Classic 1,627Vulcan 1500 Classic Anniversary 18Vulcan 1500 Classic FI 838Vulcan 1500 Drifter 297Vulcan 1500 Mean Streak 2,150Vulcan 1500 Nomad FI 1,923
Kawasaki Vulcan 1600 1,600 3,050Vulcan 1600 99Vulcan 1600 Classic 1,869Vulcan 1600 Mean Streak 646Vulcan 1600 Nomad 436
Kawasaki Vulcan 2000 2,000 793Vulcan 2000 712Vulcan 2000 Classic 8Vulcan 2000 Classic LT 25Vulcan 2000 LTD 48
Kawasaki Vulcan 500 500 1,291Kawasaki Vulcan 750 750 1,783Kawasaki Vulcan 800 800 4,184
Vulcan 800 1,279Vulcan 800 Classic 2,398Vulcan 800 Drifter 507
Kawasaki Vulcan 900 Classic 900 181Vulcan 900 Classic 92Vulcan 900 Classic LT 89
Moto Guzzi California 1,100 149California Stone 48V11 California 101
Moto Guzzi V11 EV 1,100 111Suzuki Boulevard C50 800 2,489
Boulevard C50 534Boulevard C50T 1,954
Suzuki Boulevard C90 1,500 2,989Boulevard C90 906Intruder LC 2,083
Suzuki Boulevard M109R 1,800 194
APPENDIX A COMPLETE MOTORCYCLE SERIES LISTING (CONT’D)
TOTAL
EXPOSURE
(INSURED
MAKE SERIES DISPLACEMENT VEHICLE YEARS)

© 2006 Highway Loss Data Institute20
Suzuki Boulevard M50 800 2,106Boulevard M50 616Marauder 1,490
Suzuki Boulevard S40 650 1,781Boulevard S40 104Savage 650 1,677
Suzuki Boulevard S50 800 1,934Boulevard S50 359Intruder 800 1,575
Suzuki Boulevard S83 1,400 1,277Boulevard S83 202Intruder 1400 1,075
Suzuki GZ250 250 974Suzuki Intruder Volusia 800 6,240Suzuki VZ1600 1,600 179Triumph Bonneville America 800 1,090Triumph Rocket III 2,294 145Triumph Speed Master 900 415Victory 8-Ball 1,650 2Victory Hammer 1,650 101Victory Kingpin 1,500 408Victory Vegas 1,500 987
Vegas 906Vegas Arlen Ness 61Vegas Cory Ness 19Vegas Jackpot 1
Victory Victory Cruiser 1,500 335Yamaha Road Star 1,700 6,922
Road Star 5,290Road Star Classic 1,632
Yamaha Road Warrior 1,700 2,914Yamaha Roadliner 1,854 56Yamaha V-Max 1200 1,198 731Yamaha V-Star 1100 1,100 15,137Yamaha V-Star 650 650 12,117Yamaha Virago 250 250 910
Virago 250 831Virago 250C 80
TOURING CLASS 107,016
BMW K1200LT 1,200 1,742BMW R1200CL 1,200 515Ducati ST3 1,000 73
APPENDIX A COMPLETE MOTORCYCLE SERIES LISTING (CONT’D)
TOTAL
EXPOSURE
(INSURED
MAKE SERIES DISPLACEMENT VEHICLE YEARS)

© 2006 Highway Loss Data Institute 21
Harley Electra Glide Police EFI 1,450 649Harley Electra Glide Classic 1,450 10,199
Electra Glide Classic 2,496Electra Glide Classic EFI 6,889Electra Glide Classic Shrine 278Electra Glide Classic Shrine EFI 535
Harley Electra Glide Standard 1,450 7,622Electra Glide Standard 4,537Electra Glide Standard EFI 3,084
Harley Road Glide 1,450 4,406Road Glide 286Road Glide EFI 4,120
Harley Road King 1,450 39,441Road King 4,526Road King Classic EFI 18,350Road King Custom 1,128Road King Custom EFI 4,146Road King EFI 7,783Road King Police EFI 1,526Road King Police Escort EFI 65Road King Shrine 1,918
Harley Screaming Eagle Electra Glide 1,690 1,273Screaming Eagle Electra Glide 1,116Screaming Eagle Ultra Classic Electra Glide 157
Harley Screaming Eagle Road King EFI 1,690 1,788Harley Street Glide 1,450 1,294
Street Glide 137Street Glide EFI 1,157
Harley Ultra Classic Electra Glide 1,450 20,167Ultra Classic Electra Glide EFI 18,969Ultra Classic Electra Glide EFI w/sidecar 6Ultra Classic Electra Glide Shrine EFI 1,192
Honda Gold Wing 1,800 15,108Gold Wing 12,333Gold Wing ABS 2,361Gold Wing Audio 227Gold Wing Audio/comfort 127Gold Wing Audio/Comfort/Navi/ABS 59
Kawasaki Voyager XII 1,200 436Victory Victory Touring 1,500 621
Victory Touring 291Victory Touring Deluxe 330
APPENDIX A COMPLETE MOTORCYCLE SERIES LISTING (CONT’D)
TOTAL
EXPOSURE
(INSURED
MAKE SERIES DISPLACEMENT VEHICLE YEARS)

© 2006 Highway Loss Data Institute22
Yamaha Royal Star 1,294 1,609Royal Star 1,153Royal Star tour Deluxe 456
Yamaha Stratoliner 1,854 73
DUAL PURPOSE CLASS 14,920
Aprilia Capo Nord 1,000 101BMW F650 650 396
F650 394F650CS 2
BMW F650GS 650 1,492F650GS 999F650GS Dakar 493
BMW HP2 Enduro 1,170 9BMW R1150GS 1,150 1,540
R1150GS 932R1150GS Adventure 609
BMW R1200GS 1,200 616Ducati Multistrada 1000 DS 1,000 114Ducati Multistrada 620 620 6Honda XR650 650 1,406
XR650L 1,406Kawasaki KLR250 250 232
KLR250 232Kawasaki KLR650 650 2,708Kawasaki KLX250S 250 67Kawasaki KLX300R 300 67
KLX300R 67KTM 625 SX 650 140KTM 640 LC4 650 178KTM 950 Adventure 950 190Suzuki DR-Z400S 400 2,356
DR-Z400S 2,145DR-Z400SM 211
Suzuki DR200SE 200 400Suzuki DR250S 250 1Suzuki DR650SE 650 873Triumph Tiger 955 171Yamaha TW200 200 864Yamaha XT225 225 994
APPENDIX A COMPLETE MOTORCYCLE SERIES LISTING (CONT’D)
TOTAL
EXPOSURE
(INSURED
MAKE SERIES DISPLACEMENT VEHICLE YEARS)

© 2006 Highway Loss Data Institute 23
STANDARD CLASS 4,644
Buell Cyclone M2 1,200 218Cyclone M2 78Cyclone M2L 141
Ducati M620 620 575Ducati M750 750 117Ducati M900 900 33Honda Nighthawk 250 241Honda Nighthawk 750 750 375Kawasaki KZ1000 Police 1,000 14Moto Guzzi Breva 750 66Suzuki Bandit 1200 1,200 903Suzuki Bandit 600 600 297Suzuki GS500 500 540Triumph Bonneville 800 523Triumph Speed Four 600 97Triumph T100 Bonneville 885 384Triumph Thruxton (909 ME) 909 127Triumph Thunderbird 885 133
Thunderbird 104Thunderbird Sport 29
UNCLAD SPORT CLASS 13,760
Aprilia SL 1000 1,000 89BMW K1200R 1,200 39BMW R1150R 1,150 1,682
R1150R 1,678R1150R Rockster 4
Buell Thunderbolt S3-T 1,200 49Ducati M900S4 916 80Ducati Monster S2R 800 64Ducati Monster S2R 1000 1,000 18Ducati Monster S4R Testastretta 1,000 99Honda 599 599 194Honda 919 919 1,004Kawasaki Z1000 1,000 599Kawasaki ZR-7S 750 432Kawasaki ZRX 1200R 1,200 830Suzuki SV1000 1,000 822Suzuki SV650 650 3,425
SV650 1,379SV650S 2,046
Suzuki V-Strom 1000 1,000 1,015Suzuki V-Strom 650 650 575
APPENDIX A COMPLETE MOTORCYCLE SERIES LISTING (CONT’D)
TOTAL
EXPOSURE
(INSURED
MAKE SERIES DISPLACEMENT VEHICLE YEARS)

© 2006 Highway Loss Data Institute24
Triumph Speed Triple 955 259Yamaha FZ6 600 751Yamaha FZS1000 1,000 1,733
SPORT CLASS 25,698
Aprilia RST Futura 1,000 141Aprilia Tuono 1000 1,000 50BMW K1200GT 1,200 684BMW K1200RS 1,200 985BMW R1100S 1,100 415BMW R1150RS 1,150 234BMW R1150RT 1,150 2,730BMW R1200RT 1,200 296BMW R1200ST 1,200 1Buell Blast P3 492 1,126Buell Firebolt XB12R 1,200 387Buell Firebolt XB9R 984 521Buell Lightning CityX XB9SX 984 56Buell Lightning X1 1,200 102Buell Lightning XB12S 1,200 191
Lightning XB12S 164Lightning XB12Scg 27
Buell Lightning XB9S 984 479Lightning XB9S 276Lightning XB9SL 204
Ducati 620 Sport 620 5Ducati SS750 750 34Ducati SS800 800 31Ducati SS900 900 53Ducati ST2 944 31Ducati ST4S 996 313Honda CBR1100XX 1,100 377Honda Interceptor 800 800 1,274
Interceptor 800 1,015Interceptor 800 ABS 258
Honda ST1100 1,100 197ST1100 176ST1100A 21ST1100P 0
Honda ST1300 1,300 1,223ST1300 857ST1300 ABS 19ST1300A 348
Honda Superhawk 1,000 250
APPENDIX A COMPLETE MOTORCYCLE SERIES LISTING (CONT’D)
TOTAL
EXPOSURE
(INSURED
MAKE SERIES DISPLACEMENT VEHICLE YEARS)
© 2006 Highway Loss Data Institute 25
Kawasaki Concours 1000 1,000 1,218Kawasaki Ninja 250 250 2,136Kawasaki Ninja 500 500 698Kawasaki Ninja 650R 650 144Kawasaki Ninja ZX-14 1,400 137Kawasaki ZZ-R1200 1,200 708Kawasaki ZZR600 600 343Moto Guzzi V11 Sport 1,100 11Suzuki Hayabusa 1,300 3,229Suzuki Katana 600 600 953Suzuki Katana 750 750 334Triumph Sprint RS 1,050 75Triumph Sprint ST 1,050 307Triumph Trophy 1200 1,200 89Yamaha FJR1300 1,300 2,021Yamaha YZF600R 600 1,109
SUPER SPORT CLASS 35,798
Aprilia RSV 1000 R 1,000 65RSV 1000 R 46RSV 1000 R Factory 14RSV 1000 R Haga 5
Aprilia RSV Mille 1,000 89Aprilia RSV Mille R 1,000 60BMW K1200S 1,200 156Ducati 748 748 73Ducati 749 750 104Ducati 998 998 238Ducati 999 Biposto 999 159Ducati 999R 1,000 24Ducati 999S 1,000 66Honda CBR1000RR 1,000 1,459Honda CBR600F4i 600 3,088Honda CBR600RR 600 3,272Honda CBR954RR 954 2,436Honda RC51 999 975Kawasaki Ninja ZX-10R 1,000 802Kawasaki Ninja ZX-12R 1,200 575Kawasaki Ninja ZX-6R 600 820
Ninja ZX-6 600 103Ninja ZX-6R 498Ninja ZX-6RR 600 219
Kawasaki Ninja ZX-6R 636 1,709Kawasaki Ninja ZX-7R 750 169
APPENDIX A COMPLETE MOTORCYCLE SERIES LISTING (CONT’D)
TOTAL
EXPOSURE
(INSURED
MAKE SERIES DISPLACEMENT VEHICLE YEARS)

© 2006 Highway Loss Data Institute26
Kawasaki Ninja ZX-9R 900 442Suzuki GSX-R1000 1,000 3,196Suzuki GSX-R600 600 3,576Suzuki GSX-R750 750 2,380Suzuki TL1000R 1,000 351Triumph 600 Daytona 600 151Triumph 955 Daytona 955 334Triumph Daytona 650 650 23Triumph TT600 600 99Yamaha YZF-R1 1,000 4,230Yamaha YZF-R6 600 4,678
YZF-R6 4,621YZF-R6S 57
SCOOTER CLASS 21,756
Aprilia Atlantic 200 200 39Aprilia Atlantic 500 500 157Aprilia Mojito 150 Custom 150 50Aprilia Mojito 50 50 26Aprilia Mojito 50 Custom 50 64Aprilia Rally 50 50 27Aprilia RS50 50 26Aprilia Scarabeo 150 150 205Aprilia Scarabeo 50 50 100Aprilia Scarabeo 500 500 0Aprilia SR50 50 110Honda Big Ruckus 250 97Honda Elite 80 80 1,157Honda Helix 250 187Honda Metropolitan 50 3,210
Metropolitan 2,888Metropolitan II 322
Honda Reflex 249 1,575Reflex 1,163Reflex ABS 208Reflex Sport 184Reflex Sport ABS 21
Honda Ruckus 50 922Honda Silver Wing 600 1,496
Silver Wing 1,375Silver Wing ABS 121
Kymco Bet and Win 150 250 80Kymco Cobra 50 49 93Kymco Filly 50 50 26
APPENDIX A COMPLETE MOTORCYCLE SERIES LISTING (CONT’D)
TOTAL
EXPOSURE
(INSURED
MAKE SERIES DISPLACEMENT VEHICLE YEARS)

© 2006 Highway Loss Data Institute 27
Kymco Grand Vista 250 250 30Kymco People 150 150 228Kymco People 250 250 33Kymco People 50 50 406Kymco Super 9 50 138Kymco Venox 250 250 58Kymco Yup 50 50 55Kymco ZX50 50 330Suzuki Burgman 400 400 710Suzuki Burgman 650 650 769
Burgman 650 756Burgman 650 ABS 12
Vento Phantom 150 62Vento Triton 50 216Vento Zip 50 35Vespa BV 200 200 120Vespa BV 500 500 3Vespa ET2 50 50 844Vespa ET4 150 150 1,354Vespa Granturismo 200 200 261Vespa LT 150 150 119Vespa LT 50 50 73Vespa LX 150 150 27Vespa LX 50 50 12Vespa PX 150 150 41Vespa X9 500 9Yamaha Riva 125 125 583Yamaha Vino 50 2,160Yamaha YP400 400 258Yamaha Zuma 50 3,171
APPENDIX A COMPLETE MOTORCYCLE SERIES LISTING (CONT’D)
TOTAL
EXPOSURE
(INSURED
MAKE SERIES DISPLACEMENT VEHICLE YEARS)

© 2006 Highway Loss Data Institute28
STREET LEGAL MOTORCYCLE
Street legal motorcycles are grouped into nine different classes: cruiser, chopper, dualpurpose, sport, super sport, unclad sport, standard, touring, and scooters. There also is asidecar class. Sidecars can be attached to one or more of the street legal motorcycles andsubsequently are exposed to the same hazards inherent in operating motorcycles.Although most motorcycles are designed with the same fundamental components —chassis incorporating two wheels, engine, handle bars, and open riding position — therestill are unique design and operation queues that distinguish the intended riding purposeand performance expectations.
The method used to assign motorcycles to classes includes factors such as ridingergonomics, riding position, body style, features, usability, and driving dynamics. The fol-lowing classes are the variations of street legal motorcycles.
CRUISER
Cruiser motorcycles mimic the style of earlier Americanmotorcycles from the 1930s to the early 1960s, such asthose made by Harley-Davidson and Indian. Althoughcruisers have benefited from advances in metallurgy andtechnology, the basic design is still very similar to early motorcycles. They generally areidentified as having a classic look. The riding position places the feet forward and thehands up, with the spine erect or leaning back slightly. This position allows greater long-distance comfort with some compromise of control. Some cruisers may have limited per-formance and turning ability because of a low-slung design and therefore are not intend-ed for sport riding. Cruisers can be used with a sidecar.
CHOPPER
Chopper-style or extended-fork motorcycles are closelyrelated to cruisers, with the exception of an extendedwheelbase that results from the typically longer front forkconfiguration. The extended wheelbase tends to reducemaneuverability. Choppers generally are highly customized with higher relative costs. Asthe term “chopper” implies, the motorcycle is derived by chopping off or removing partsfrom a typical cruiser with the intent of reducing weight or bulk for the sake of speed. Itsreduced maneuverability typically is further exaggerated by a wider rear tire that assistsin acceleration.
The decreased maneuverability can be directly attributed to the increased rake and trailcreated by the extended forks. Rake is the angle of the steering head measured in degreesfrom a line 90 degrees to the ground. Trail is the distance defined by the vertical line fromthe axle to ground and the intersection of the centerline of the steering neck and ground.Normal trail ranges from 2 to 4 inches, which allows the motorcycle to handle easily atboth high and low speeds. If the trail is more than 4 inches, the motorcycle is less respon-sive to rider input at high speeds and will be difficult to balance at lower speeds or onwinding roads.
APPENDIX B MOTORCYCLE CLASSES DEFINED

© 2006 Highway Loss Data Institute 29
SPORT
Sport motorcycles have a wide range of engine displace-ments. They differ from cruisers in that they are smaller,lighter, and have extensive body paneling and fairingcovers. Some sport motorcycles are capable of havingside bags or a rear trunk attached to provide touring ability. These motorcycles are close-ly related to super sport motorcycles. Their riding position is less aggressive and theirpower-to-weight ratios are lower than sport/super sport motorcycles, making them moreuser friendly. Sport motorcycles are capable of high speeds compared with most vehiclesbut do not offer the acceleration, stability, and handling of super sport motorcycles. Sportmotorcycles generally are not considered racing-specification motorcycles by their man-ufacturers. They are not designed for use with a sidecar.
SUPER SPORT
Super sport motorcycles are considered consumer ver-sions of the motorcycles used by factory racing teamsand typically use racing specifications as benchmarks indesign. Measures are taken to reduce weight andincrease power, thus making these motorcycles quick in acceleration, nimble in han-dling, and capable of high speeds. Like sport motorcycles, super sport motorcycles haveextensive body paneling and fairing coverings. The riding position is tight and forwardleaning to assist in aerodynamics and rider control. They are not designed for use with asidecar.
UNCLAD SPORT
Unclad sport motorcycles are retro in styling and are arelatively new market niche. Commonly referred to as“naked” or “hooligan” motorcycles, unclad sport motor-cycles are derivatives of sport/super sport motorcycles indesign and performance. However, they do not have full body panels or fairings typical-ly found on sport/super sport motorcycles. Compared with sport motorcycles, uncladsport motorcycles generally have lower horsepower and a less aggressive riding position,making them more user friendly and suitable for everyday riding. Some serve as begin-ner motorcycles whereas others are as powerful and agile as super sport motorcycles andare targeted at premium customers (e.g., Ducati and Aprilia).
STANDARD
Standard motorcycles generally are considered to bebeginner motorcycles. Their designs are basic and gener-ally do not utilize technological advances in chassis andengine design. Many standard motorcycles are genericenough to remain in production for 10 years or more without redesign. Riding positionstypically are upright and similar to that of a cruiser and the power-to-weight ratios gen-erally are low resulting in a user friendly motorcycle.

© 2006 Highway Loss Data Institute30
TOURING
Touring motorcycles are characterized by large engines,wind protection for the rider (using a fairing or wind-screen), high-capacity fuel tanks (for extended riding dis-tances), the ability to carry luggage (using side bagsand/or a topbox mounted toward the rear) and a comfortable riding position. Althoughany motorcycle can be equipped and used for touring, specialized touring motorcyclessuch as the Honda Goldwing are designed for this purpose. Touring motorcycles gener-ally are equipped with high-displacement/high-torque engines for traversing hills whilecarrying a passenger and luggage. They also incorporate many technological advancessuch as ABS, audio systems, and other features (such as a reverse gear or cruise control)not typically found on motorcycles.
DUAL PURPOSE
Dual purpose motorcycles are very similar to off-roadmotorcycles with the exception of being street legal.They generally have larger displacement engines andgreater suspension travel than off-road motorcycles,along with more comfortable riding seats and positions. Dual purpose motorcycles areequipped with road-ready features such as turn signals and brake lights for street riding.They also use four-stroke engines for compliance with emissions requirements.
SCOOTER
Scooters are similar to motorcycles and are designed tobe ridden on public roads. They are characterized bysmaller wheels, automatic transmissions, small engines,and a step-through configuration allowing the rider toride with both feet on a running board and knees together. However, larger scooters withengine displacements greater than 250 cc are becoming more popular. The Honda SilverWing, Honda Reflex, and Suzuki Burgman are examples of the increasing displacementsand highway-capable scooters.
SIDECAR
A sidecar is a wheeled passenger carrier that can beattached to the side of a motorcycle. They typically areused in conjunction with a cruiser or touring motorcycle,but recently sidecars are being developed for scooters. A sidecar is not motorized.

© 2006 Highway Loss Data Institute 31
OFF-ROAD VEHICLES
In addition to street legal motorcycles, manufacturers produce similarly powered vehi-cles that serve off-road purposes and are not intended for use on public roads. Thesevehicles are grouped into four distinct classes based on their physical design and intent.
OFF-ROAD MOTORCYCLE
Off-road motorcycles generally are light weight withsmall displacement engines. The suspension travel islonger than for a typical motorcycle, with a higherground clearance. Their construction is rugged, simpleand without bodywork and fairings. Tires typically are knobby for off-road tractabilitybecause the motorcycles are designed to be ridden through rough and muddy terrain.Many off-road motorcycles are produced strictly for recreational or competitive use andare not street legal. Generally, they are equipped with two-stroke engines.
ALL-TERRAIN VEHICLE
All-terrain vehicles (ATVs) are designed with four wheelsand may not be ridden on public roads. There are varia-tions in vehicle designs to allow off-road sport riding orserve utilitarian purposes. Engine displacements tend tobe low, but some engines share the same advanced designs as street legal motorcycles.ATVs generally accommodate one rider and are operated with the use of motorcycle-likecontrols including handle bars. Newer designs include automatic transmissions, electricshifters, GPS navigation systems, and larger engine displacements.
UTILITY VEHICLE
Similar to ATVs, utility vehicles are designed with fourwheels and typical motorcycle engines. Utility vehiclesdiffer in that the steering mechanism incorporates asteering wheel rather than handle bars. The passengercapacity of utility vehicles differs from other off-road motorcycles in that they use abench seat design to accommodate more than one occupant. Although utility vehiclesgenerally do not possess many ATV attributes, they do offer off-road ability with unri-valed cargo capacity.
SNOWMOBILE
Snowmobiles are similar to motorcycles but are intend-ed to be ridden on terrain covered by a layer of snow orice. The basic design provides an open riding position,handle bar steering control, and motorcycle-like engineconfiguration. Instead of a front wheel to control vehicle direction, two ski-like sledspivot with the direction of the handle bars. Propulsion is provided by tank-like treads inlieu of a rear tire. Snowmobiles are not intended to be ridden on public roads.

HIGHWAY LOSSDATA INSTITUTE1005 North Glebe Road
Arlington, VA 22201