Mid-Holocene occupation of Egypt and global climatic change
14
This article appeared in a journal published by Elsevier. The attached copy is furnished to the author for internal non-commercial research and education use, including for instruction at the authors institution and sharing with colleagues. Other uses, including reproduction and distribution, or selling or licensing copies, or posting to personal, institutional or third party websites are prohibited. In most cases authors are permitted to post their version of the article (e.g. in Word or Tex form) to their personal website or institutional repository. Authors requiring further information regarding Elsevier’s archiving and manuscript policies are encouraged to visit: http://www.elsevier.com/copyright
Transcript of Mid-Holocene occupation of Egypt and global climatic change

This article appeared in a journal published by Elsevier. The attachedcopy is furnished to the author for internal non-commercial researchand education use, including for instruction at the authors institution
and sharing with colleagues.
Other uses, including reproduction and distribution, or selling orlicensing copies, or posting to personal, institutional or third party
websites are prohibited.
In most cases authors are permitted to post their version of thearticle (e.g. in Word or Tex form) to their personal website orinstitutional repository. Authors requiring further information
regarding Elsevier’s archiving and manuscript policies areencouraged to visit:
http://www.elsevier.com/copyright

Author's personal copy
Mid-Holocene occupation of Egypt and global climatic change
Rebecca Phillipps a,*, Simon Holdawaya, Willeke Wendrich b, René Cappers c
aAnthropology Department, The University of Auckland, Auckland, New ZealandbCotsen Institute of Archaeology, University of California Los Angeles, Los Angeles, USAcGroningen Institute of Archaeology (GIA), University of Groningen, Groningen, The Netherlands
a r t i c l e i n f o
Article history:Available online 19 April 2011
a b s t r a c t
Occupation of the Egyptian Western Desert during the Holocene is linked with the summer monsoon,the position and intensity of the Inter-Tropical Convergence Zone (ITCZ) and the use of internal lakes andplayas fed by summer rain. In contrast, such correlations are absent for the Fayum region of Egypt whereoccupation instead correlates with mid-Holocene increases in intensity of Mediterranean winter rainfall.Lake Qarun in the Fayumwas the only lake where Near Eastern plant domesticates were used during theearly-mid-Holocene period. Analysis of radiocarbon determinations is presented which suggests that,unlike later agriculture in the Nile Valley, early use of domesticates in the Fayum involved a dependenceon winter rains for cereal cultivation following the Mediterranean growth seasons. It is proposed that theswitch to a winter growing season after summer inundation occurred later, probably as part of key socio-economic changes during the Egyptian Predynastic period.
� 2011 Elsevier Ltd and INQUA. All rights reserved.
1. Introduction
Global teleconnections between sea surface temperatures, theAsian monsoon and movement of the Inter-Tropical ConvergenceZone (ITCZ) are known to have affected human occupation of thesouthern Egyptian Sahara during the early to mid Holocene (Nicoll,2001; Kuper, 2006; Wendorf et al., 2007). Evidence for humanoccupation and movement of the ITCZ are correlated, although thespecifics of regional environmental responses are likely to havevaried (Kröpelin et al., 2008). Occupation of the southern EgyptianSahara declined after 6000 BP when the ITCZ moved south and theSahara dried to its present day hyper-arid state (Hassan et al., 2001;Nicoll, 2001; Kuper, 2006; Kuper and Kröpelin, 2006; Wendorfet al., 2007 cf. Kröpelin et al., 2008). However, environmentalinfluences on the occupation of the Fayum depression, located80 km southwest of modern Giza, were more complex and are thetopic of much interest because the Fayum has long been recognisedas showing early use in Egypt of the southwest Asian domesticates.Radiocarbon determinations indicate that mid-Holocene occupa-tion of the Fayum corresponded with the abandonment of theSahara, movement of southwest Asian populations along theMediterranean coast and occupation of the Nile Delta (e.g. MerimdeBeni Salama). During this period, the fresh water lake Qarun in the
Fayum rose to 10e12m asl, well above its modern level (�44m asl)(Hassan, 1986). However, occupation around Lake Qarun was shortlived with an abrupt abandonment at approximately 6000 BP andonly limited subsequent evidence of resource specific (miningrelated) occupation in the region until the Ptolemaic period some3500e4000 years later.
The development of agricultural societies in the Egypt hasundergone recent revision to develop more sophisticated socio-economic models that emphasize distinctive trajectories (e.g.Wengrow, 2006). The evidence from the Fayum remains critical inunderstanding the nature of the relationship between environ-mental change, the timing of the introduction of domesticates intoEgypt, and the development of Egyptian agriculture as emerging inthe Predynastic Period.
From the beginning of the Holocene until the Roman period,Lake Qarun filled with the influx of water from the Nile and asa consequence lake levels fluctuated with Blue Nile flow frommonsoonal rainfall in Ethiopia, and to a lesser degree central eastAfrican rainfall via the White Nile (Williams et al., 2000). If theFayum occupation was dependent on the Nile influx, a correlationbetween fluctuations in the monsoon, changes in the ITCZ andhuman occupation of the eastern Sahara including the Fayummight be expected. Hassan (1986:489, 1997a, b) for instance, hasattempted to explain the hiatus in occupation of the Fayum bysudden declines in the level of Lake Qarun due to changes in Nileinflux. Alternatively, if a correlation between abandonment andlake level decline cannot be shown, a different set of environmental
* Corresponding author.E-mail address: [email protected] (R. Phillipps).
Contents lists available at ScienceDirect
Quaternary International
journal homepage: www.elsevier .com/locate/quaint
1040-6182/$ e see front matter � 2011 Elsevier Ltd and INQUA. All rights reserved.doi:10.1016/j.quaint.2011.04.004
Quaternary International 251 (2012) 64e76

Author's personal copy
factors may have influenced the Fayum occupation, including thoserelated to shifts in local North African rainfall unrelated to thesummer monsoon.
Recent studies of the process of plant and animal domesticationin the southwest Asia indicate dispersal from northern southwestAsia and central Anatolia (Turkey) into southern areas of southwestAsia and ultimately Egypt via either the Mediterranean coast or theRed Sea. Although Near Eastern domestic species entered Egyptwell after they were present in the southwest Asia, their date ofintroduction makes sense when considered in relation to thetiming and nature of their dispersal into the Mediterranean basin,particularly along the North African littoral. Recent evidenceemphasizes how the uptake of Near Eastern domesticates wassocially and environmentally complex (Zeder, 2008). Date rangesfrom around the Mediterranean suggest the movement of Neolithicpopulations was rapid, and better described as a form of ‘leap-frog’movement rather than the traditional ‘demic-diffusion’ once sug-gested (Zilhão, 2001; Skeates, 2003; Zeder, 2008; Knapp, 2010).This paper argues that the adoption of domesticates by societies inEgypt should be viewed as one of a range of unique low-level food
producing societies that developed around theMediterraneanmid-Holocene (Smith, 2001; Holdaway et al., 2010). Near Easterndomesticates were introduced into Egypt during a period when theenvironment was in some aspects similar to southwest Asia.Environmental change during the late Holocene meant however,that the growing of certain domesticates was no longer sustainablein Egypt and required significant shifts in agricultural strategybefore they were viable long term.
Evaluating the relationship between past environments, use ofdomesticates and the duration and timing of occupation andabandonment of the Fayum is made possible by comparing chro-nologies from different parts of northern Egypt. A series of radio-carbon determinations from hearths discovered in archaeologicaldeposits adjacent to high lake stand shorelines of Lake Qarun iscompared with published radiocarbon determinations from oasesin the Egyptian Western desert. The interest is to determine ifvariation in occupation of the Fayum correlates with shifts in theITCZ, the Nile flood cycles or other climatic shifts and how envi-ronmental correlations may provide information on the nature ofearly crop production in the north of Egypt.
Fig. 1. Locations mentioned in the text.
R. Phillipps et al. / Quaternary International 251 (2012) 64e76 65

Author's personal copy
2. Radiocarbon determinations from the Fayum
Concentrations of burnt stones occur in both surface and buriedcontexts in locations around the ancient Lake Qarun shorelinein the form of hearths that often protect charcoal suitablefor radiocarbon determinations (Fig. 1). Survey results indicate
archaeological deposits close to high stand shorelines of LakeQarun and to a lesser extent the banks of the wadi that flowed intothe lake. In addition, excavations at two stratified deposits, Kom Kand Kom W originally discovered by Caton-Thompson (Caton-Thompson and Gardner, 1934) have revealed a number of buriedhearth features (Wendrich et al., 2010). Radiocarbon determina-tions from these features are presented in Table 1 together withdeterminations obtained from surface hearths excavated at theEpipalaeolithic site of E29H1. To these are added determinationsobtained by Wendorf and Schild (1976), Hassan (1985) andKozlowski and Ginter (1989, 1993).
Hearths were most likely constructed and used over periodsmeasured in days. Reuse is possible but probably occurred overtime periods that cannot be distinguished using radiocarbon. Thus,hearth ages may be treated as the archaeological equivalent ofevents but are ‘dated’ using radiocarbon that returns agesexpressed as distributions, indicating only the probability of whenthe event occurred. Of more interest than the age of the eventsthemselves are the patterns produced by plotting the probabilitiesfor these events. Combining age estimates illustrates changes inoccupation through time around Lake Qarun and in the EasternSaharan locations used for comparison. For this reason radiocarbondeterminations are here displayed as summed probability plotsfrom different regions of the eastern Sahara including the Fayum.
To construct these plots, determinations were initially calibratedusing the Intcal04 terrestrial calibration curve (Reimer et al., 2004)and Oxcal 4.1 software, and the one SD calibrated age range used tocalculate the calibrated age mean (the centre point of the 1 SDrange) and SD (half the 1 SD range). Probabilities were calculatedfor 50 year intervals from 5500 to 9500 BP using the followingformula:
XPðAGEðiÞÞ ¼
X1=SDðjÞ
ffiffiffiffiffiffiffiffiffiffiffiffiffiffiffiffiffiffiffiffiffiffiffiffiffiffiffiffiffiffiffiffiffiffiffiffiffiffiffiffiffiffiffiffiffiffiffiffiffiffiffiffiffiffiffiffiffiffiffiffiffiffiffiffiffiffiffiffiffiffiffi2�
Y�1�ðAGEðiÞ�MEANðjÞ2Þ=2SDðjÞ2r
where Mean is the centre point for the jth calibrated radiocarbonage, SD is half the 1 SD calibrated range for the jth determination,and AGE is the ith 50 year age in calibrated years. Probabilities forall radiocarbon determinations were summed for each 50 yearperiod and normalized before being plotted.
Results for the Fayum (Fig. 2) indicate periods with high prob-abilities reflecting the large number of Neolithic hearths excavatedat Kom K and Kom W as well as a smaller number from Epi-palaeolithic occupations, but separated by long periods for whichno age estimates were returned.
3. Comparison with radiocarbon determinations fromeastern Saharan sites
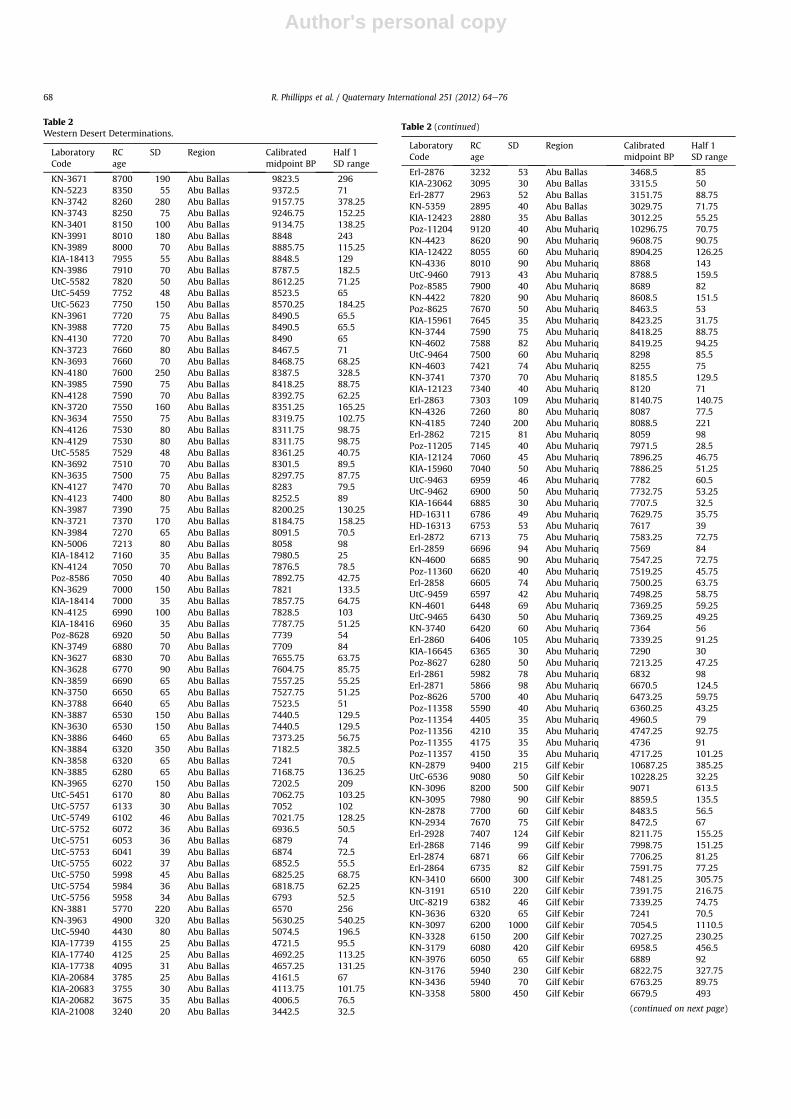
A large number of radiocarbon determinations are availablefrom published sources for sites in the eastern Sahara. Many ofthese come from the ACACIA project (Arid Climate, Adaptation andCultural Innovation in Africa) and reflect samples taken fromhearths and other human modified organic sources (Kuper, 2006).They indicate times when eastern Saharan locations were activelybeing used by people during the early to mid Holocene. Additionaldeterminations were obtained from archaeological projects con-ducted at eastern Saharan oases and playas (Dakhla, McDonald,2001 and Nabta Playa, Wendorf and Schild, 2001). A list of thedeterminations used for comparison with the Fayum is provided inTable 2.
Probability plots were constructed for the eastern Saharandeterminations using the method described above. Determinationswere grouped geographically since Kuper (2006) links occupationof the eastern Sahara to the northerly position of the ITCZ during
Table 1Fayum determinations.
Lab code RC age SD Region Calibratedmidpoint BP
Half 1SD range
UCIAMS-45069 5645 20 Fayum 6425 20UCIAMS-45070 5670 25 Fayum 6443.5 32UCIAMS-45071 5680 20 Fayum 6463 25UCIAMS-45072 5655 20 Fayum 6429 22.5UCIAMS-45073 5660 25 Fayum 6437 29UCIAMS-45074 5640 25 Fayum 6425 26.5UCIAMS-45075 5720 30 Fayum 6500.75 48.75UCIAMS-45076 5680 25 Fayum 6452 38UCIAMS-45077 5675 25 Fayum 6448.25 35.25UCIAMS-45078 5675 25 Fayum 6448.25 35.25UCIAMS-45079 5690 25 Fayum 6466.5 28.5UCIAMS-45080 5685 45 Fayum 6468 62UCIAMS-45081 5570 30 Fayum 6354.5 41UCIAMS-45082 5615 25 Fayum 6379.25 57.25UCIAMS-45083 5670 25 Fayum 6443.5 32UCIAMS-45084 5600 25 Fayum 6363.5 43UCIAMS-45085 5590 25 Fayum 6360.75 41.25UCIAMS-45086 5610 25 Fayum 6365.75 45.75UCIAMS-45088 5655 25 Fayum 6435.75 29.75UCIAMS-33835 5710 20 Fayum 6488.5 41.5UCIAMS-33836 5665 20 Fayum 6437.5 27.5UCIAMS-33838 5660 20 Fayum 6430.25 22.25UCIAMS-33839 5670 15 Fayum 6441.25 28.75UCIAMS-34422 5620 20 Fayum 6381.5 57.5UCIAMS-33840 5680 20 Fayum 6463 25UCIAMS-33841 5640 15 Fayum 6422.5 17.5UKP0775 5350 60 Fayum 6140.5 125.5UKP0775 5440 35 Fayum 6249.75 39.25UKP0468 5640 35 Fayum 6413 59UCIAMS-57206 5570 25 Fayum 6353.5 45.5UCIAMS-57207 5545 20 Fayum 6345.5 44.5UCIAMS-57208 5585 20 Fayum 6358.5 43.5UCIAMS-57209 5620 20 Fayum 6404.5 5.5UCIAMS-57210 5590 15 Fayum 6360.5 41.5UCIAMS-57211 5585 15 Fayum 6358.5 42.5UCIAMS-57212 5945 15 Fayum 6766 24UCIAMS-57213 5630 15 Fayum 6418.5 16.5UCIAMS-57214 5605 20 Fayum 6364.5 41.5UCIAMS-57215 8245 20 Fayum 9209 72UCIAMS-57216 8175 30 Fayum 9080.5 51.5UCIAMS-57217 8200 20 Fayum 9170.5 77.5UCIAMS-57218 8185 20 Fayum 9083 49UCIAMS-57219 8235 20 Fayum 9203.5 70.5UCIAMS-57220 8050 20 Fayum 9000.5 6.5UCIAMS-57221 8245 20 Fayum 9209 72UCIAMS-57222 7430 20 Fayum 8256.5 62.5UCIAMS-57223 6980 20 Fayum 7816 26UCIAMS-57224 6165 20 Fayum 7080.5 76.5GD-693 5990 60 Fayum 6970 240Bln-2325 6075 60 Fayum 7075 180Bln-23335990 5555 60 Fayum 6462.5 82.5Gd-1140 5540 70 Fayum 6272.5 282.5Bln-2334 5645 55 Fayum 6546.5 138.5Gd-2021 6480 70 Fayum 7435 225Gd-1499 6380 60 Fayum 7327.5 232.5Gd-1497 6320 60 Fayum 7282.5 227.5Gd-979 6290 100 Fayum 7242.5 262.5Gd-980 6290 110 Fayum 7242.5 262.5Gd-1495 5650 70 Fayum 6545 140Gd-903 5410 110 Fayum 6167.5 267.5Gd-895 5070 110 Fayum 5885 225Gd-977 5480 100 Fayum 6242.5 297.5Gd-915 5160 120 Fayum 6012.5 332.5Gd-9878 5330 100 Fayum 6145 270
R. Phillipps et al. / Quaternary International 251 (2012) 64e7666

Author's personal copy
the early to mid Holocene. Locations at the same latitude areexpected to show similar patterns of occupation intensity. Iflongitudinal occupational variation occurs within a latitudinalband, it is more likely due to variation in local environmentalconditions, such as the presence of basins and soil conditions.
In addition to the comparison of radiocarbon determinationprobability plots, time series cross-correlation functions werecalculated for the differenced probability values for each 50 yearperiod between selected locations (Holdaway et al., 2010). Differ-encing (i.e. obtaining a value by subtracting p(j) from p(jþ 1)) helpsto remove the effects of increases or decreases in the number ofdeterminations through time that on their own will producecorrelations. Using differenced data, cross-correlation functionsallow inferences to be made concerning which regions in theeastern Sahara show similar histories of occupation compared tothe Fayum and which do not irrespective of the general trend forreduced numbers of radiocarbon determinations through time.
4. Results
The probability plot for the Fayum determinations indicatea substantial peak between 6200 and 6500 BP representing theNeolithic occupation at Kom K and KomWand a smaller number ofpeaks ranging in age back to 9200 BP that represent Epipalaeolithicoccupations. A comparison with a summed probability plot for allthe determinations from the eastern Saharan sites illustrates howgaps in the Fayum record occur during periods when the easternSaharan sites were occupied. When using differenced data, thedisparity in the two plots is even higher (Fig. 3). Some periods showoccupation of both regions while during other periods, one or otherregion shows little evidence of occupation.
Cross-correlation functions (CCF) used in time series analysiswere calculated with the probabilities for the Fayum and all easternSaharan sites combined in SPSS 17 following the method describedin Holdaway et al. (2010). Summed radiocarbon probabilities usingcommon 50 year periods from 5500e9500 BP were compared withthe lag set to five (i.e. allowing correlations to be determined in 50year periods up to 250 years either side of a common AGE) and thedata differenced at one. Results are presented as a cross-correlationfunction plot in Fig. 4.
None of cross-correlation function results for different lag valuesreach the 95% confidence limit. Time series correlations indicatethat the Fayum and eastern Saharan sites were occupied at differenttimes.
Dividing the radiocarbon determinations from the easternSahara by geographic locations permits an analysis that demon-strates the effect of the northesouth movement of the ITCZ as wellas other environmental influences. In Fig. 5, raw probability plots,differenced plots and the results from CCF comparisons with theFayum summed, differenced, radiocarbon probabilities are pre-sented for eastern Saharan geographic regions divided by latitude.
Results from the Qattara Basin and Siwa show no evidence ofa correlation with Fayum, and the large peak in the Fayum radio-carbon probability at ca. 6000e6500 BP is absent in this region.There is only limited correspondence with peaks in determinationsfrom the Fayum for the Epipalaeolithic period. This said, theradiocarbon sample considered for these regions is the smallest ofthose analysed from the eastern Sahara (Table 2), so the lack ofa correlation with the Fayum could reflect sampling bias.
In contrast, comparison between the Delta sites and the Fayumshows a strong, positive correlation with the cross-correlationfunction returning a significant, positive result at zero lag (theequivalent of a Pearson correlation coefficient). Both regions showa peak in the summed radiocarbon probabilities at ca. 6000e6500BP with no evidence that occupation of one region significantlypreceded the other.
Comparison of determinations from Abu Muhariq, furthersouth, and the Fayum are not significant for the CCF although bothregions show a peak in radiocarbon probability at ca. 6000e6500BP, most apparent when the differenced probability plots arecompared.
The results from Abu Ballas provide a significantly negativeresult for the CCF at negative five lags (250 years) reflecting offsetcorrelations for radiocarbon peaks from the two regions during theearly Holocene Epipalaeolithic. The ca. 6000e6500 BP peak atFayum has no equivalent at Abu Ballas.
Determinations from the Great Sand Sea do not correlatesignificantly with those from the Fayum although there is a smallpeak in the radiocarbon probability from the Great Sand Sea at ca.6000e6500 BP most apparent in the differenced probability plot.
Fig. 2. Summed probability plots for the Fayum radiocarbon determinations and those from eastern Saharan sites.
R. Phillipps et al. / Quaternary International 251 (2012) 64e76 67
Author's personal copy
Table 2Western Desert Determinations.
LaboratoryCode
RCage
SD Region Calibratedmidpoint BP
Half 1SD range
KN-3671 8700 190 Abu Ballas 9823.5 296KN-5223 8350 55 Abu Ballas 9372.5 71KN-3742 8260 280 Abu Ballas 9157.75 378.25KN-3743 8250 75 Abu Ballas 9246.75 152.25KN-3401 8150 100 Abu Ballas 9134.75 138.25KN-3991 8010 180 Abu Ballas 8848 243KN-3989 8000 70 Abu Ballas 8885.75 115.25KIA-18413 7955 55 Abu Ballas 8848.5 129KN-3986 7910 70 Abu Ballas 8787.5 182.5UtC-5582 7820 50 Abu Ballas 8612.25 71.25UtC-5459 7752 48 Abu Ballas 8523.5 65UtC-5623 7750 150 Abu Ballas 8570.25 184.25KN-3961 7720 75 Abu Ballas 8490.5 65.5KN-3988 7720 75 Abu Ballas 8490.5 65.5KN-4130 7720 70 Abu Ballas 8490 65KN-3723 7660 80 Abu Ballas 8467.5 71KN-3693 7660 70 Abu Ballas 8468.75 68.25KN-4180 7600 250 Abu Ballas 8387.5 328.5KN-3985 7590 75 Abu Ballas 8418.25 88.75KN-4128 7590 70 Abu Ballas 8392.75 62.25KN-3720 7550 160 Abu Ballas 8351.25 165.25KN-3634 7550 75 Abu Ballas 8319.75 102.75KN-4126 7530 80 Abu Ballas 8311.75 98.75KN-4129 7530 80 Abu Ballas 8311.75 98.75UtC-5585 7529 48 Abu Ballas 8361.25 40.75KN-3692 7510 70 Abu Ballas 8301.5 89.5KN-3635 7500 75 Abu Ballas 8297.75 87.75KN-4127 7470 70 Abu Ballas 8283 79.5KN-4123 7400 80 Abu Ballas 8252.5 89KN-3987 7390 75 Abu Ballas 8200.25 130.25KN-3721 7370 170 Abu Ballas 8184.75 158.25KN-3984 7270 65 Abu Ballas 8091.5 70.5KN-5006 7213 80 Abu Ballas 8058 98KIA-18412 7160 35 Abu Ballas 7980.5 25KN-4124 7050 70 Abu Ballas 7876.5 78.5Poz-8586 7050 40 Abu Ballas 7892.75 42.75KN-3629 7000 150 Abu Ballas 7821 133.5KIA-18414 7000 35 Abu Ballas 7857.75 64.75KN-4125 6990 100 Abu Ballas 7828.5 103KIA-18416 6960 35 Abu Ballas 7787.75 51.25Poz-8628 6920 50 Abu Ballas 7739 54KN-3749 6880 70 Abu Ballas 7709 84KN-3627 6830 70 Abu Ballas 7655.75 63.75KN-3628 6770 90 Abu Ballas 7604.75 85.75KN-3859 6690 65 Abu Ballas 7557.25 55.25KN-3750 6650 65 Abu Ballas 7527.75 51.25KN-3788 6640 65 Abu Ballas 7523.5 51KN-3887 6530 150 Abu Ballas 7440.5 129.5KN-3630 6530 150 Abu Ballas 7440.5 129.5KN-3886 6460 65 Abu Ballas 7373.25 56.75KN-3884 6320 350 Abu Ballas 7182.5 382.5KN-3858 6320 65 Abu Ballas 7241 70.5KN-3885 6280 65 Abu Ballas 7168.75 136.25KN-3965 6270 150 Abu Ballas 7202.5 209UtC-5451 6170 80 Abu Ballas 7062.75 103.25UtC-5757 6133 30 Abu Ballas 7052 102UtC-5749 6102 46 Abu Ballas 7021.75 128.25UtC-5752 6072 36 Abu Ballas 6936.5 50.5UtC-5751 6053 36 Abu Ballas 6879 74UtC-5753 6041 39 Abu Ballas 6874 72.5UtC-5755 6022 37 Abu Ballas 6852.5 55.5UtC-5750 5998 45 Abu Ballas 6825.25 68.75UtC-5754 5984 36 Abu Ballas 6818.75 62.25UtC-5756 5958 34 Abu Ballas 6793 52.5KN-3881 5770 220 Abu Ballas 6570 256KN-3963 4900 320 Abu Ballas 5630.25 540.25UtC-5940 4430 80 Abu Ballas 5074.5 196.5KIA-17739 4155 25 Abu Ballas 4721.5 95.5KIA-17740 4125 25 Abu Ballas 4692.25 113.25KIA-17738 4095 31 Abu Ballas 4657.25 131.25KIA-20684 3785 25 Abu Ballas 4161.5 67KIA-20683 3755 30 Abu Ballas 4113.75 101.75KIA-20682 3675 35 Abu Ballas 4006.5 76.5KIA-21008 3240 20 Abu Ballas 3442.5 32.5
Table 2 (continued)
LaboratoryCode
RCage
SD Region Calibratedmidpoint BP
Half 1SD range
Erl-2876 3232 53 Abu Ballas 3468.5 85KIA-23062 3095 30 Abu Ballas 3315.5 50Erl-2877 2963 52 Abu Ballas 3151.75 88.75KN-5359 2895 40 Abu Ballas 3029.75 71.75KIA-12423 2880 35 Abu Ballas 3012.25 55.25Poz-11204 9120 40 Abu Muhariq 10296.75 70.75KN-4423 8620 90 Abu Muhariq 9608.75 90.75KIA-12422 8055 60 Abu Muhariq 8904.25 126.25KN-4336 8010 90 Abu Muhariq 8868 143UtC-9460 7913 43 Abu Muhariq 8788.5 159.5Poz-8585 7900 40 Abu Muhariq 8689 82KN-4422 7820 90 Abu Muhariq 8608.5 151.5Poz-8625 7670 50 Abu Muhariq 8463.5 53KIA-15961 7645 35 Abu Muhariq 8423.25 31.75KN-3744 7590 75 Abu Muhariq 8418.25 88.75KN-4602 7588 82 Abu Muhariq 8419.25 94.25UtC-9464 7500 60 Abu Muhariq 8298 85.5KN-4603 7421 74 Abu Muhariq 8255 75KN-3741 7370 70 Abu Muhariq 8185.5 129.5KIA-12123 7340 40 Abu Muhariq 8120 71Erl-2863 7303 109 Abu Muhariq 8140.75 140.75KN-4326 7260 80 Abu Muhariq 8087 77.5KN-4185 7240 200 Abu Muhariq 8088.5 221Erl-2862 7215 81 Abu Muhariq 8059 98Poz-11205 7145 40 Abu Muhariq 7971.5 28.5KIA-12124 7060 45 Abu Muhariq 7896.25 46.75KIA-15960 7040 50 Abu Muhariq 7886.25 51.25UtC-9463 6959 46 Abu Muhariq 7782 60.5UtC-9462 6900 50 Abu Muhariq 7732.75 53.25KIA-16644 6885 30 Abu Muhariq 7707.5 32.5HD-16311 6786 49 Abu Muhariq 7629.75 35.75HD-16313 6753 53 Abu Muhariq 7617 39Erl-2872 6713 75 Abu Muhariq 7583.25 72.75Erl-2859 6696 94 Abu Muhariq 7569 84KN-4600 6685 90 Abu Muhariq 7547.25 72.75Poz-11360 6620 40 Abu Muhariq 7519.25 45.75Erl-2858 6605 74 Abu Muhariq 7500.25 63.75UtC-9459 6597 42 Abu Muhariq 7498.25 58.75KN-4601 6448 69 Abu Muhariq 7369.25 59.25UtC-9465 6430 50 Abu Muhariq 7369.25 49.25KN-3740 6420 60 Abu Muhariq 7364 56Erl-2860 6406 105 Abu Muhariq 7339.25 91.25KIA-16645 6365 30 Abu Muhariq 7290 30Poz-8627 6280 50 Abu Muhariq 7213.25 47.25Erl-2861 5982 78 Abu Muhariq 6832 98Erl-2871 5866 98 Abu Muhariq 6670.5 124.5Poz-8626 5700 40 Abu Muhariq 6473.25 59.75Poz-11358 5590 40 Abu Muhariq 6360.25 43.25Poz-11354 4405 35 Abu Muhariq 4960.5 79Poz-11356 4210 35 Abu Muhariq 4747.25 92.75Poz-11355 4175 35 Abu Muhariq 4736 91Poz-11357 4150 35 Abu Muhariq 4717.25 101.25KN-2879 9400 215 Gilf Kebir 10687.25 385.25UtC-6536 9080 50 Gilf Kebir 10228.25 32.25KN-3096 8200 500 Gilf Kebir 9071 613.5KN-3095 7980 90 Gilf Kebir 8859.5 135.5KN-2878 7700 60 Gilf Kebir 8483.5 56.5KN-2934 7670 75 Gilf Kebir 8472.5 67Erl-2928 7407 124 Gilf Kebir 8211.75 155.25Erl-2868 7146 99 Gilf Kebir 7998.75 151.25Erl-2874 6871 66 Gilf Kebir 7706.25 81.25Erl-2864 6735 82 Gilf Kebir 7591.75 77.25KN-3410 6600 300 Gilf Kebir 7481.25 305.75KN-3191 6510 220 Gilf Kebir 7391.75 216.75UtC-8219 6382 46 Gilf Kebir 7339.25 74.75KN-3636 6320 65 Gilf Kebir 7241 70.5KN-3097 6200 1000 Gilf Kebir 7054.5 1110.5KN-3328 6150 200 Gilf Kebir 7027.25 230.25KN-3179 6080 420 Gilf Kebir 6958.5 456.5KN-3976 6050 65 Gilf Kebir 6889 92KN-3176 5940 230 Gilf Kebir 6822.75 327.75KN-3436 5940 70 Gilf Kebir 6763.25 89.75KN-3358 5800 450 Gilf Kebir 6679.5 493
(continued on next page)
R. Phillipps et al. / Quaternary International 251 (2012) 64e7668

Author's personal copy
Table 2 (continued)
LaboratoryCode
RCage
SD Region Calibratedmidpoint BP
Half 1SD range
KN-2935 5780 80 Gilf Kebir 6578.25 91.75KN-2882 5670 75 Gilf Kebir 6438.75 115.25KN-3016 5670 65 Gilf Kebir 6448.75 95.75KN-3361 5650 130 Gilf Kebir 6451.75 148.25KN-2936 5610 60 Gilf Kebir 6377.25 61.75KN-3792 5560 65 Gilf Kebir 6350 51KN-3187 5500 60 Gilf Kebir 6305.75 89.25KN-3791 5460 60 Gilf Kebir 6254 54KN-3106 5440 60 Gilf Kebir 6243.25 52.75KN-3793 5440 60 Gilf Kebir 6243.25 52.75KN-3103 5430 65 Gilf Kebir 6215 85KN-3790 5430 65 Gilf Kebir 6215 85KN-2881a 5420 65 Gilf Kebir 6210.5 85.5Erl-2873 5407 74 Gilf Kebir 6160.5 132.5KN-2881b 5360 210 Gilf Kebir 6153.5 239.5KN-3888 5260 70 Gilf Kebir 6055.75 120.75KN-3104 5250 140 Gilf Kebir 6081.5 179.5KN-3794 5220 65 Gilf Kebir 6042 131.5KN-3079 5180 60 Gilf Kebir 5884.5 115.5KN-2933 5150 125 Gilf Kebir 5952.5 219.5KN-2880b 5150 70 Gilf Kebir 5872.75 117.75KN-3591 5090 60 Gilf Kebir 5830 80.5KN-3149 5070 60 Gilf Kebir 5824 75.5KN-2880a 5060 55 Gilf Kebir 5820.25 73.75KN-4024 4920 60 Gilf Kebir 5654.75 59.25KN-3182 4880 390 Gilf Kebir 5612.75 559.25KN-3098 4820 60 Gilf Kebir 5540.75 68.75KN-3184 4770 130 Gilf Kebir 5480.75 159.75KN-3173 4500 55 Gilf Kebir 5169.25 118.75KN-2926 4300 55 Gilf Kebir 4894.5 65.5KN-2925 4210 60 Gilf Kebir 4738.5 109.5KN-4973 9388 70 Great Sand Sea 10610.25 90.75UtC-7192 9040 60 Great Sand Sea 10211 38.5UtC-7191 8990 60 Great Sand Sea 10093.25 142.25KN-3668 8980 90 Great Sand Sea 10082 153KN-3102 8860 300 Great Sand Sea 9895.75 355.25UtC-6534 8690 50 Great Sand Sea 9619.75 64.75Poz-8587 8660 50 Great Sand Sea 9604.75 58.75KN-3186 8650 80 Great Sand Sea 9617 83.5KN-3726 8620 80 Great Sand Sea 9604.5 77.5KN-5053 8593 70 Great Sand Sea 9575 76.5KN-4218 8480 100 Great Sand Sea 9436.75 112.75KN-3836 8470 75 Great Sand Sea 9485 50KN-3787 8450 80 Great Sand Sea 9471.5 63KN-3968 8440 80 Great Sand Sea 9432.25 99.25KN-3556 8350 75 Great Sand Sea 9377.25 89.75KN-3882 8310 75 Great Sand Sea 9291.5 146.5UtC-7186 8261 43 Great Sand Sea 9251 116.5UtC-7187 8209 43 Great Sand Sea 9174.75 83.75KN-3359 8200 300 Great Sand Sea 9109.25 380.75KN-4025 8040 80 Great Sand Sea 8897.25 132.75UtC-5581 8040 50 Great Sand Sea 8899.75 120.25UtC-7188 7965 48 Great Sand Sea 8854.25 125.75KN-3017 7900 75 Great Sand Sea 8783.75 186.25KN-3724 7840 160 Great Sand Sea 8715 258KIA-16855 7805 30 Great Sand Sea 8575.25 25.25KN-4027 7690 70 Great Sand Sea 8479.5 60.5KN-3983 7640 80 Great Sand Sea 8459.5 77.5KN-3879 7440 320 Great Sand Sea 8264.25 330.75KN-3552 7240 70 Great Sand Sea 8071 89KN-3396 7210 250 Great Sand Sea 8056.25 257.75UtC-7190 7186 49 Great Sand Sea 7992 41.5UtC-9461 7168 45 Great Sand Sea 7983.25 31.75UtC-9458 7160 50 Great Sand Sea 7977.75 36.75KN-3710 7060 70 Great Sand Sea 7895.75 66.25UtC-7189 6978 38 Great Sand Sea 7836.75 80.75KN-3878 6950 180 Great Sand Sea 7785.75 163.25KIA-16646 6855 30 Great Sand Sea 7688.5 32UtC-8218 6841 42 Great Sand Sea 7658 40.5KN-3711 6830 70 Great Sand Sea 7655.75 63.75KIA-16643 6820 30 Great Sand Sea 7649 27KN-3709 6740 65 Great Sand Sea 7615.75 49.25KN-4187 6720 90 Great Sand Sea 7586.75 78.25UtC-7185 6617 46 Great Sand Sea 7516 49KN-3783 6600 60 Great Sand Sea 7499.25 60.75
Table 2 (continued)
LaboratoryCode
RCage
SD Region Calibratedmidpoint BP
Half 1SD range
KN-3198 6530 65 Great Sand Sea 7444.75 110.25KN-3141 6520 65 Great Sand Sea 7415.75 84.75KN-3553 6500 70 Great Sand Sea 7399.25 74.75KN-4026 6480 80 Great Sand Sea 7388.25 73.25KN-4028 6470 70 Great Sand Sea 7374.25 62.25KN-4186 6430 80 Great Sand Sea 7356.75 66.75UtC-9441 6422 41 Great Sand Sea 7367.25 49.75KN-3197 6410 65 Great Sand Sea 7354 63UtC-8452 6409 43 Great Sand Sea 7355.25 61.25KN-3992 6390 60 Great Sand Sea 7341.5 74KN-3142 6380 60 Great Sand Sea 7338.25 77.25KN-3140 6350 500 Great Sand Sea 7177.5 512.5KN-3856 6150 60 Great Sand Sea 7069.75 86.75UtC-8193 6134 38 Great Sand Sea 7052.25 103.25KN-4184 6110 80 Great Sand Sea 7024 132KN-4294 6087 54 Great Sand Sea 7004.5 144.5UtC-8216 6000 36 Great Sand Sea 6839.75 49.75UtC-8451 5983 49 Great Sand Sea 6817 67.5KN-4259 5620 160 Great Sand Sea 6457 174.5UtC-9466 5560 50 Great Sand Sea 6350.5 46.5KN-3855 5370 65 Great Sand Sea 6149 127.5KN-3018 5270 60 Great Sand Sea 6060.25 116.75UtC-8217 4561 38 Great Sand Sea 5194.25 124.25KN-3357 7790 65 Great Sand Sea 8546.25 88.25KN-4258 8320 90 Qattara/Siwa 9304.25 158.75KN-3756 8150 65 Qattara/Siwa 9123.25 114.75KN-3754 8070 75 Qattara/Siwa 8950 171KN-4334 7140 80 Qattara/Siwa 7944.75 85.25KN-4328 6920 85 Qattara/Siwa 7757 83KN-3555 6850 70 Qattara/Siwa 7681.75 69.25KN-3223 6840 65 Qattara/Siwa 7671.25 61.75KN-4280 6820 90 Qattara/Siwa 7659.75 79.75KN-4335 6808 56 Qattara/Siwa 7637.5 43KN-3727 6760 70 Qattara/Siwa 7621.5 49KN-3857 6760 65 Qattara/Siwa 7620.75 45.25KN-3785 6670 65 Qattara/Siwa 7536.5 53KN-3799 6420 65 Qattara/Siwa 7363 57.5KN-3222 6290 665 Qattara/Siwa 7131.75 693.25KN-3589 5940 60 Qattara/Siwa 6761.5 84.5
LaboratoryCode
RC age SD Region Calibratedmidpoint BP
Half 1SD range
Delta DeterminationsU-10A 5430 120 Merimde Beni Salama 6189 253U-10B 5550 100 Merimde Beni Salama 6331.5 299.5U-37 5640 100 Merimde Beni Salama 6331.5 299.5WSU-1846 5260 90 Merimde Beni Salama 6025 255U-6 6130 110 Merimde Beni Salama 7004.5 260.5U-7 5710 700 Merimde Beni Salama 6510 1540U-31 3630 100 Merimde Beni Salama 3944.5 295.5U-32 4560 140 Merimde Beni Salama 5225.5 355.5W-4355 5850 100 Merimde Beni Salama 6656.5 243.5U-8 5580 230 Merimde Beni Salama 6424 524U-9A 5970 120 Merimde Beni Salama 6847 313U-9B 5940 100 Merimde Beni Salama 6821.5 323.5KN-3275 5830 60 Merimde Beni Salama 6637 147KN-3276 5790 60 Merimde Beni Salama 6591.5 140.5KN-3277 5890 60 Merimde Beni Salama 6719 163KN-3278 5590 60 Merimde Beni Salama 6388.5 101.5KN-3279 5760 60 Merimde Beni Salama 6561 151Köln 3934 5500 65 El Omari 6310.5 128.5Köln 3933 5690 70 El Omari 6478 162C-463 5255 230 El Omari 6015.5 526.5Beta-2804 4730 60 Maadi 5454.5 133.5Beta-2805 5010 50 Maadi 5772.5 127.5
LaboratoryCode
RC age SD Region Calibratedmidpoint BP
Half 1SD range
Oasis DeterminationsSMU-750 9820 380 El Adam Playa 7207 188SMU-858 9610 150 El Adam Playa 9494 583.5SMU-928 9440 230 El Adam Playa 8950.5 193.75SMU-757 9350 150 El Adam Playa 8810 292.5SMU-928 9220 120 El Adam Playa 8714 213.5
(continued on next page)
R. Phillipps et al. / Quaternary International 251 (2012) 64e76 69

Author's personal copy
Table 2 (continued)
LaboratoryCode
RCage
SD Region Calibratedmidpoint BP
Half 1SD range
SMU-925 9180 140 El Adam Playa 8500 132SMU-914 9060 80 El Adam Playa 8382 205SMU-861 8960 110 G. El Beid Playa 8253.5 141.75SMU-440 8920 130 El Adam Playa 8080 172SMU-758 8875 75 G. El Beid Playa 7967.5 178.25ETH-8583 8840 90 El Kortein Playa 8000.5 123.25SMU-416 8750 70 Nabta Playa 7953 145.5A-11081 9360 70 Nabta Playa 7889 146SMU-200 8250 140 El Ghorab Playa 8579.5 114.75SMU-750 8190 120 El Ghorab Playa 7174 173.5SMU-744 8300 130 Kiseiba Trench 7319.5 129.75SMU-257 8290 80 Nabta Playa 7302 109.5SMU-734 8240 70 Kharga 7272 97SMU-326 8200 70 Kharga 7255.5 98.25SMU-739 8250 70 Kiseiba Trench 7278 98Gd-6260 8260 100 Nabta Playa 7293 111.5SMU-760 8130 110 El Adam Playa 7089.5 188.25SMU-255 8130 60 Nabta Playa 7092.5 122.75SMU-199 8120 100 Nabta Playa 7082.5 184.75SMU-252 8080 90 Nabta Playa 7011 155.5SMU-253 8070 90 Nabta Playa 7003 152.5SMU-249 8040 90 Nabta Playa 6986.5 153.75SMU-761 8020 190 El Balaad Playa 6983.5 238.75SMU-926 8020 90 El Adam Playa 6916 132.5SMU-915 8020 70 El Adam Playa 6913.5 111.75SMU-203 8010 80 Nabta Playa 6899.5 120.75SMU-864 7990 90 El Ghorab Playa 6893 124SMU-240 7970 70 Nabta Playa 6869.5 95.25Gd-5971 7960 70 Nabta Playa 6858.5 98.75SMU-208 7930 40 Nabta Playa 6857 87.5Gd-6500 7910 110 Nabta Playa 6790.5 141.25SMU-756 7890 90 El Ghorab Playa 6795 130.5Gd-6506 7850 90 Nabta Playa 6769.5 131.75Gd-6498 7830 110 Nabta Playa 6755.5 139.25Gd-6257 7770 110 Nabta Playa 6731 148.5SMU-219 8120 80 Nabta Playa 7118 151.5SMU-924 7920 180 El Adam Playa 6885.5 218.25OxA-3215 8095 120 Nabta Playa 7068.5 191.25OxA-3484 7950 90 Nabta Playa 6843 116OxA-3214 8080 110 Nabta Playa 7016.5 168.75OxA-3222 8060 120 Nabta Playa 6998.5 175.25OxA-3217 8020 160 Nabta Playa 6993.5 229.25OxA-3221 7980 110 Nabta Playa 6917.5 161.25OxA-3216 7960 100 Nabta Playa 6868 134OxA-3219 7950 160 Nabta Playa 6892.5 207.25Gd-6258 7920 100 Nabta Playa 6804.5 135.25OxA-3218 8050 130 Nabta Playa 7044 201.5OxA-3220 8025 120 Nabta Playa 6981 170OxA-3485 7980 95 Nabta Playa 6890.5 125.75Gd-12186 8180 100 Nabta Playa 7163.5 166.25DRI-3525 7935 80 Nabta Playa 6848.5 102.25Gd-9307 7760 240 Nabta Playa 6714 303.5DRI-3526 7740 115 Nabta Playa 6713.5 157.25DRI-3599 7700 170 Nabta Playa 6642 199.5SMU-2741 7695 110 Nabta Playa 6623 179.5DRI-3550 7650 135 Nabta Playa 6613.5 193.75Gd-6507 7610 120 Nabta Playa 6477 129DRI-3548 7610 110 Nabta Playa 6445 106SMU-2741 7595 105 Nabta Playa 6441 100DRI-3555 7590 185 Nabta Playa 6545.5 239.75Gd-6503 7590 110 Nabta Playa 6438.5 103.75DRI-3533 7545 165 Nabta Playa 6410 180.5Gd-6508 7540 110 Nabta Playa 6376 130DRI-3524 7540 100 Nabta Playa 6408.5 96.25SMU-2738 7536 110 Nabta Playa 6371.5 130.25SMU-462 7530 180 El Kortein Playa 6413 199DRI-3527 7503 149 Nabta Playa 6353 143.5Gd-6509 7480 110 Nabta Playa 6320.5 119.75CAMS-17285 7480 80 Nabta Playa 6294.5 90.75Gd-4586 7450 120 Nabta Playa 6308 124.5DRI-3600 7430 120 Nabta Playa 6271.5 110.25DRI-3532 7425 120 Nabta Playa 6257.5 111.75CAMS-17251 7420 70 Gebel Nabta Playa 6266.5 83.25DRI-3356 7380 150 Nabta Playa 6244 157Gd-15027 7360 120 Nabta Playa 6228.5 105.25
Table 2 (continued)
LaboratoryCode
RCage
SD Region Calibratedmidpoint BP
Half 1SD range
Gd-12188 7360 90 Nabta Playa 6237 89Gd-6510 7330 100 Nabta Playa 6209.5 95.25CAMS-17286 7320 70 Nabta Playa 6210 79Gd-10112 7250 110 Nabta Playa 6147 117Gd-10112 7040 80 Nabta Playa 5899.5 75.75Gd-16007 6800 330 Nabta Playa 5730.5 333.25DRI-2843 7270 95 Nabta Playa 6178.5 94.75CAMS-41691 7680 80 Nabta Playa 6529.5 64.25SMU-2743 7850 75 Nabta Playa 6770.5 130.25DRI-3530 7850 70 Nabta Playa 6771 129.5DRI-3528 7785 115 Nabta Playa 6736.5 146.75SMU-807 7780 130 Kiseiba Trench 6735.5 151.25SMU-764 7610 70 Kiseiba Trench 6449 90DRI-3551 6520 290 Nabta Playa 5422 293.5SMU-1224 7360 200 Gebel El Feel Playa 6237.5 197.25SMU-470 7230 100 El Kortein Playa 6132 114.5
DakhlehBeta-23684 8720 100 Dakhleh 9841.5 308.5Beta-23694 8650 150 Dakhleh 9801 376Beta-17022 8270 160 Dakhleh 9159 384Beta-23693 8830 110 Dakhleh 9876.5 314.5Beta-23687 8110 110 Dakhleh 9024 376Beta-23696 8630 130 Dakhleh 9790.5 363.5B 23684 8720 100 Dakhleh 9841.5 308.5Gd 4563 8650 170 Dakhleh 9754.5 440.5B 23694 8650 150 Dakhleh 9801 376B 17022 8270 160 Dakhleh 9159 384TO 2360 8170 110 Dakhleh 9107.5 332.5B 23693 8830 110 Dakhleh 9876.5 314.5B 23687 8110 110 Dakhleh 9024 376B 23696 8630 130 Dakhleh 9790.5 363.5Gd 6320 8950 120 Dakhleh 10005.5 373.5Gd 5720 8340 70 Dakhleh 9311 178Gd 6318 8660 90 Dakhleh 9799 316Gd 5718 8280 80 Dakhleh 9248 216GD 5721 7540 80 Dakhleh 8348 167Gd 4993 8340 150 Dakhleh 9305.5 322.5B 23692 7690 130 Dakhleh 8586.5 385.5Gd 6321 7600 110 Dakhleh 8390.5 209.5Gd 6322 7570 110 Dakhleh 8382.5 207.5Gd 5986 7180 60 Dakhleh 8018 143Gd 5981 7100 60 Dakhleh 7907 113Gd 5717 6970 70 Dakhleh 7807.5 130.5Gd 6170 7360 90 Dakhleh 8186 178Gd 7088 6990 70 Dakhleh 7816 131Gd 6169 7320 120 Dakhleh 8161 215Gd 5792 6950 70 Dakhleh 7801.5 133.5Gd 5799 6930 70 Dakhleh 7778.5 153.5Gd 6632 6650 80 Dakhleh 7542.5 115.5Gd 5984 6640 70 Dakhleh 7523.5 98.5Gd 5654 6990 70 Dakhleh 7816 131Gd 6323 6940 140 Dakhleh 7770 253Gd 6638 6920 80 Dakhleh 7773.5 158.5B 23959 6900 80 Dakhleh 7761 167Gd 6636 6860 80 Dakhleh 7746.5 171.5Gd 5990 6850 50 Dakhleh 7690.5 99.5Gd 6637 6840 80 Dakhleh 7741 175Gd 6645 6640 80 Dakhleh 7741 175Gd 4623 6480 140 Dakhleh 7341 313Gd 5722 6130 70 Dakhleh 7020 221Gd 4622 6380 100 Dakhleh 7253.5 229.5B 17023 6210 130 Dakhleh 7107 310Gd 5992 6370 70 Dakhleh 7297 127Gd 6538 6360 120 Dakhleh 7244.5 256.5Gd 6168 6300 110 Dakhleh 7190 238Gd 5983 5940 70 Dakhleh 6761.5 193.5Gd 6534 6280 100 Dakhleh 7190 230Gd 6545 5930 60 Dakhleh 6784 147Gd 5719 5930 50 Dakhleh 6773 117Gd 5646 5830 70 Dakhleh 6757 190B 6873 5800 60 Dakhleh 6596.5 143.5Gd 4495 6120 250 Dakhleh 6966.5 525.5Gd 5982 5750 50 Dakhleh 6539.5 125.5
(continued on next page)
R. Phillipps et al. / Quaternary International 251 (2012) 64e7670

Author's personal copy
The CCF comparing the Nabta Playa and Fayum determinations ismore complex with positive correlations at �3 and �4 lags (150and 200 years) and negative correlations at 4 and 5 lags (200 and250 years). The plot of the differenced, summed radiocarbonprobabilities illustrates the offset in probability peaks from the tworegions particularly in the period 6000e7000 BP.
CCF comparing determinations from Dakhla and the Fayum donot achieve significance although both regions show a peak in theradiocarbon determination probability at ca. 6000e6500 BP, mostevident in the plot of differenced probabilities.
Finally, the plot for the radiocarbon probabilities from Gilf Kebirand the Fayum, shows offset peaks at 6500 BP and around 6200 BPconfirmed by positive and significant results for the CCF at negativetwo, negative three and negative 4 lags (150 and 200 years). Offsetcorrelations are also indicted in this plot for times during the earlyHolocene.
Comparisons between the Fayum radiocarbon determinationsand those from the eastern Saharan locations indicate that allregions showed changes in the intensity of occupation during theearly to mid Holocene. De-trending the data by differencingemphasizes the shifts in radiocarbon probability and demonstrates
that a number of regions saw relatively abrupt peaks in probabilityaround ca. 6000e6500 BPwith regional differences in the timing ofthis peak. There are strong correlations between the Fayum and theDelta sites and equally strong but offset correlations, sometimesnegatively, between the Fayum and some of the sampling locationsfurther to the south. The following considers environmental shiftsthat might help to account for these results.
5. Inter-Tropical Convergence Zone (ITCZ)
As noted above, Kuper and Kröpelin (2006) connect occupationof the eastern Sahara with the early-mid-Holocene increase inmonsoon intensity and the northward shift of the ITCZ (known asthe African Humid Period). Plots of the de-trended radiocarbondetermination probabilities from the eastern Saharan locationsillustrate occupation, abandonment and subsequent reoccupationof locations at a temporal scale that is consistent with shifts inenvironment that Kuper and Kröpelin discuss (Hassan et al., 2001;Wendorf and Schild, 2001; Marshall and Hildebrand, 2002;Kindermann et al., 2006; McDonald, 2009). The Fayum showsa similar pattern with periods of occupation and abandonmentthroughout the Holocene. There is some suggestion of a negativecorrelation between occupation in the eastern Sahara and occu-pation in the Fayum both in the data presented here and indiscussion by others (e.g. Kindermann, 2002; Bubenzer and Riemer,2007). Hassan (1984:58), for instance, correlates fluctuations in theNile and Lake Qarun with an increase in Nile levels that allowedmid-Holocene reoccupation of the Fayum and the Delta (cf. Stanleyand Warne, 1993). He refers to a hiatus in Fayum archaeologicalevidence between the Epipalaeolithic and the Neolithic periodscaused by a sudden decline in the level of Lake Qarun (Hassan,1997a: Fig. 1). The best evidence for a hiatus is indicated bya shift in the typology of stone tools however Shirai (2010:338)questions whether this break equates with abandonment of theregion. Recent palaeoclimatic reconstructions by Williams et al.(2010) suggests an increase in White and Blue Nile flow atapproximately 6.56e6.25 ka. However, Williams (2009:11)suggests that it was times of lower rather than higher Nile flow andNile incision that would be conducive to agriculture on the Nilefloodplain since this allowed swampy ground to drain. Thus itremains uncertain what impact fluctuations in the level of LakeQarun may have had on the potential for use of domesticatedplants.
Table 2 (continued)
LaboratoryCode
RCage
SD Region Calibratedmidpoint BP
Half 1SD range
S 2149 5745 80 Dakhleh 6543.5 193.5Gd 5985 5630 50 Dakhleh 6459.5 170.5B 23688 5530 120 Dakhleh 6315 313Gd 5994 5810 50 Dakhleh 6613.5 120.5Gd 4624 5770 150 Dakhleh 6613.5 323.5B 17019 5310 160 Dakhleh 6066.5 343.5B 23958 5610 180 Dakhleh 6417.5 426.5B 17020 5170 90 Dakhleh 5952.5 233.5B 23697 5130 120 Dakhleh 5899 285Gd 5993 5240 110 Dakhleh 6014.5 264.5Gd 6529 5180 110 Dakhleh 5962 299Gd 6335 4380 120 Dakhleh 5031 404B 23685 7860 80 Dakhleh 8733.5 254.5B 17018 7100 290 Dakhleh 7973 542B 23690 4720 80 Dakhleh 5452.5 148.5Gd 4492 4310 80 Dakhleh 4948.5 328.5Hv 8317 7755 80 Dakhleh 8575.5 186.5TO 2362 7380 80 Dakhleh 8193.5 167.5SMU 631 6900 75 Dakhleh 7767 160B 17021 4750 330 Dakhleh 5448.5 826.5
Fig. 3. Differenced probability plots for the Fayum radiocarbon determinations and those from eastern Saharan sites.
R. Phillipps et al. / Quaternary International 251 (2012) 64e76 71

Author's personal copy
Palaeoclimatic reconstructions suggest that the northern limitof the ITCZ did not reach the Fayum, even during thewettest phasesof the early Holocene (Haynes, 2001; Kuper and Kröpelin, 2006;McCorriston, 2006). It is possible however, that the Fayum wasinfluenced more from the southward movement of Mediterraneanwinter rains during the early to mid Holocene than the position ofeither the ITCZ or the fluctuating Nile flood (Bryson, 1992; Hassanet al., 2001:42; Arz et al., 2003; Kindermann et al., 2006; Shirai,2010).
While the Fayum does not currently receive regular winterrainfall from the north, there is palaeoclimatic evidence that it oncereceived more winter rainfall from the eastern Mediterranean.Changes in the Arctic Oscillation (the atmospheric circulationpattern over the Arctic that affects the intensity of westerly movingwinds, air temperature and winter precipitation) during the earlyto mid-Holocene pushed eastern Mediterranean winter rainfallfurther south (Goodfriend, 1991; Hafez and Hasanean, 2000; Arzet al., 2003). Higher precipitation levels in the eastern Mediterra-nean are linked to a decrease in temperature from ca. 7000 BP (Bar-Mathews et al., 1997:161). Today, rainfall occurs in the southeasternMediterranean associated with depressions and cold frontaltroughs, while Egypt receives rain when north-northeast andsouthwest winds converge (Arz et al., 2003:119). Changes in RedSea salinity in the early-mid-Holocene are thought to result fromthe southwards shift of Mediterranean winter cyclonic rainfall, andare therefore not the result of a far-reaching ITCZ. While a regionalmonsoon-type circulation pattern did once exist over the southeastMediterranean, it began to dry out earlier than the recession of theITCZ (Arz et al., 2003:121). Lower sea surface temperatures in thenorthern Red Sea and the eastern Mediterranean during the earlyto mid-Holocene resulted from ‘enhanced inflow of cold conti-nental air masses primarily during winter, a pattern that resemblesthe modern high phase of the Arctic Oscillation (AO)’ (Arz et al.,2003:119). The presence of these air masses during the mid-Holocene resulted in increased winter precipitation falling furthersouth than it now does.
A depletion of d180 observed in samples from the Negev6000e6500 BP indicates increased storm frequency over NorthAfrica where dry air masses moving south from northeast Eur-ope produced intense evaporation over the Mediterranean andrainout effects along North Africa before they reached the Negev(Goodfriend, 1991:422). Palaeoclimatic reconstructions for theeasternMediterranean show rapid cooling events at 7900e8600 calBP, with the main cooling events occurring at 6700e5800 cal BPcoinciding with the beginning of Saharan aridity (Rohling et al.,2002:42). These age estimates for periods with both cooler
temperatures and increased storm activity correspond very closelywith the radiocarbon determination probability peak at ca.6000e6500 cal. BP for the Fayum hearths.
Researchers often correlate warming events in the Mediterra-neanwith the northward movement of the ITCZ leading to warmerand wetter conditions in North Africa in general including much ofEgypt (e.g. Rohling et al., 2002:42). But for occupation of northernEgypt, including the Delta and especially the Fayum, it is likely thatcooler conditions were more significant, since they contributed tohigher levels of Mediterranean winter cyclonic rainfall. The exis-tence of these climatic conditions ca. 6700e5800 BP might be anexample of what Williams (2009:11) calls “geological oppor-tunism”; land was not being cultivated until it was physicallypossible to do so.
It is also tempting to correlate the mid-Holocene occupation ofthe Fayum with the Mediterranean dispersal of southwest Asianplant and animal domesticates from Turkey into the northernMediterranean basin (Europe and Cyprus) and the later mid-Holocene spread from southwest Asian into North Africa (Zeder,2008). Ecological conditions may have enabled the use of theNear Eastern species at a time when people were moving aroundthe Mediterranean basin. Discoveries on Cyprus, for instance,suggest multiple waves of migration beginning the Late Epi-palaeolithic (Peltenburg, 2004; Knapp, 2010; Manning and Stewart,2010). Recent literature on the introduction of Near Easterndomesticates around the Mediterranean basin, including Greece,Cyprus, Italy, Spain and Portugal emphasize local variability inenvironmental interaction, and the adoption and adaptation ofagriculture by a range of Neolithic colonists (e.g. Perles, 2001;Gkiastra et al., 2003; Runnels, 2003; Finlayson, 2004; Colledgeand Conolly, 2007; Zeder, 2008). Seen from a Mediterraneanperspective, evidence from the Fayum and perhaps the Delta wouldfill what is otherwise a large geographic hole in the occurrence ofsuch variable Neolithic settlements. Geological opportunismcoupled with migratory Neolithic people may help to explain thearchaeological absence of Near Eastern domesticates prior to thisperiod (Stanley and Warne, 1993; Williams, 2009).
6. Cereal cultivation in the Nile Valley
Stanley and Warne (1993) suggest that the occupation of theDelta was made possible after the Mediterranean sea-level risebetween 8500 and 7500 BP and the creation of the Delta floodplainwith the deposition of Nile silt. Subsequent occupation continuedinto Dynastic period, although it was not always continuous atindividual sites. The Fayum, however, was abandoned quite
Fig. 4. Cross-correlation coefficient functions calculated using probabilities for the Fayum and all eastern Saharan sites.
R. Phillipps et al. / Quaternary International 251 (2012) 64e7672

Author's personal copy
suddenly ca. 6200e6000 BP (Wenke, 2009) suggesting that duringthe Neolithic, cereal cultivation was possible in the Fayum onlyunder certain conditions. Hassan (1986, 497) attributes this to theproblem of draining and irrigating lake margin fields as well asremoving reed thickets to allow cultivation (cf. Harlan andPasquereau, 1969; Butzer, 1976:12; Sherratt, 1980; cf. Kozlowskiand Ginter, 1989:177; Williams, 2009:11). Alternative explana-tions question the sustainability of agriculture in the Fayum due tothe effect of lower sediment loads that flowed into Lake Qarunwiththe Nile flood and the amount of the lake edge that was actuallycovered by flood waters (Wenke et al., 1988; Bard, 2008; Wenke,2009). In addition, increase in Nile floods (due to increases insummer precipitation in Ethiopia) at around 6100 BP (Stanley et al.,2003), actually decreased sediment load in the Nile Valley, furthersuggesting that these periods are not necessarily optimal time ofagriculture (Williams, 2009).
Later during the pharaonic period these effects were alleviatedonce basic irrigation systems were installed increasing the amountof land that could be flooded, but increasing dependence on water.This reversed the earlier situation when high floods createdconditions that were too swampy for cultivation. With irrigation,the agricultural system was susceptible to the impacts of low
floods. This is illustrated by the correlation of the political collapseand famine at the end of the Old Kingdomwith a sudden period ofaridity (ca. 4200 cal BP) in palaeoclimatic records (Hassan, 1997b;Krom et al., 2002; Stanley et al., 2003).
Kozlowski and Ginter (1993:333) report increased wadi activityduring some lake recession periods in the Fayum and attribute thisto the occurrence of ‘seasonal torrential rains in the desert’.Marshall and Hildebrand (2002:122) suggest that the Near Easterndomesticates were confined to the Nile Valley because they werewinter crops, and thus dependent on the availability of waterduring November until April. If so, then the presence of winter rainsin the northern Nile Valley were crucial to the success of thesouthwest Asian domestic grains, based on a winter rain growthcycle and collapse in use of these grains would have ensued ifthe winter rains retreated due to changes in the flow of cold air intothe eastern Mediterranean. Such a collapse would fit better withthe rapid abandonment of the Fayum indicated by the peak andthen decline in radiocarbon determination probabilities thanalternative explanations based on the movement of the ITCZ,changes in the Nile flood levels or silt loads entering Lake Qarunand consequent vegetation changes. A similar situation mayexplain the nature of occupation and abandonment at Merimde
Fig. 5. Raw probability plots, differenced plots and the results from CCF comparisons of differenced data are presented for geographic eastern Saharan regions divided by latitudeand compared to the Fayum determinations.
R. Phillipps et al. / Quaternary International 251 (2012) 64e76 73

Author's personal copy
Beni Salama, another peripheral Nile Valley Neolithic occupation(Wenke, 2009:212). As indicated by the results presented above,the Fayum evidence correlates poorly (or negatively) with easternSaharan sites further to the south. Movement of the ITCZ does notaccount for the apparent rapid onset and equally rapid abandon-ment of cereal use in the Fayum. There is, however, a correlationbetween peaks in the Fayum radiocarbon probability and the age ofcooling events associated with shifts in atmospheric circulationthat brought increased storminess and rain from the Mediterra-nean to Northeast Africa.
If cultivation of domestic grain in the Fayumwas dependent onwinter rains, such a systemwas not viable long term. The length ofthe gap in the radiocarbon chronology for the Fayum Neolithiccompared to the establishment of occupation in the Nile Valley isimportant here since a short period of time might suggest a rapideconomic adaptation to the Nile floodplain environment by thosemoving into the Nile Valley from elsewhere.
The use of the inundation for agriculture in the Nile Valleyrequired additional management strategies, particularly clearanceof vegetation growing along the river margins (Butzer, 1976;Williams, 2009). Trigger (1983:14) suggests that water manage-ment south of Abydos was easier because of the topography of thevalley was characterized by smaller natural basins which could bemodified by people to retainwater. In other places, it is possible thatit was wadi assisted water run-off that was used for agriculturalirrigation during localized periods of increased rainfall continuingagricultural practices from earlier times (Hoffman,1982,141; Kemp,2006, 75, 32 Fig. 21, cf. Harlan, 1992:17).
Art historical evidence of Dynasty 0/1 illustrates agriculturalpractice in objects such as the Scorpion mace-head, dating toNaqada III (ca. 3000 BC) (Fig. 6, Davies, 1992 cf. Libyan TjehenuPalette). Here the king is shown about to break a dyke open to allowthe flood waters through. The depiction suggests the act must haveheld some importance, the more so since the construction of dykesto control flood waters reflected such a fundamental shift in thenature of the agricultural system from previous times in northernEgypt. The flow of the Nile was crucial to the stability of agriculture
systems and political unity in later pharaonic Egypt (Hassan, 1997a;Krom et al., 2002; Stanley et al., 2003).
In Egypt there is a tendency to assume multiple elements of theeastern Sahara and the Near East were simply combined to forma singular Neolithic socio-economic entity, however, as morecomponents of archaeological assemblages in locations like theFayum are considered, reconstructions of the socio-economy havebecome more variable (Wengrow, 2006). Like the colonization ofthe Mediterranean, the Fayum suggests rapid movement anddiscontinuity from previous occupations with the exploitation ofboth Near Eastern species and locally available wild resources.Zeder (2008, 11603) describes the mid-Holocene data fromNorthern Egypt as a ‘terra incognita’. The analysis presented heresuggests that the Fayum Neolithic provides another piece of thepuzzle, possibly representing an ‘inland transfer’ of socio-economyfrom the Delta, if not a colony itself. Additionally lessons learnt inthe Fayum during this early phase of cereal cultivation likelyallowed for the later adaptation of southwest Asian cereal cultiva-tion in Egypt as people rapidly responded to changing environ-mental and socio-economic situations.
7. Conclusion
Radiocarbon determinations from hearths in the Fayum corre-late closely with determinations from the Delta but poorly andsometimes negatively with eastern Saharan locations further to thesouth. This suggests that mid-Holocene occupation of the Fayumwas not related to the southward movement of the ITCZ. The lack ofoccupation before and after ca. 6000e6500 BP in the Fayumcorrelates best with environmental shifts that brought winter rainsto northern Egypt. A reliance on these rains for cultivation of thesouthwest Asian grains would explain the efflorescence of theNeolithic in the Fayum and its subsequent rapid decline as climaticchanges led to the beginnings of the present day Saharan hyper-aridity. Use of cereals in the Fayum preceded agriculture in theNile but was not a prelude to the decrue systemwith its reliance oncontrolling the Nile flood waters. People initially used the domesticgrains when environmental conditions were suitable, but with thechanging climatic circumstances this approach was no longersustainable, and triggered drastic changes of the agriculturalsystem. This went hand in hand with, or perhaps brought about thesubstantial socio-economic changes associated with the Predy-nastic. The Fayum evidence therefore indicates a form of reliance ondomestic species, but one that lacked the long termviability of latersystems. The timing and nature of occupation fits well with theinterpretative framework for the dispersal of Near Easterndomesticates around the Mediterranean basin (Zeder, 2008). It isanother example of the range of relationships that are character-istic of human societies that Smith (2001) has labelled as low-levelfood producers.
Acknowledgements
This study has been made possible by the Supreme Council ofAntiquities in Egypt, and the project is thankful to its SecretaryGeneral, Dr. Zahi Hawass, and the Chief Inspector of the Fayum, insubsequent years: Dr. AbderRahman al-Ayedi andMr. AhmedAbd elAal. The UCLA/RUG/UoA Fayumproject in Egypt has been supportedby the National Geographic Society, the Regents of the University ofCalifornia, The Cotsen Institute of Archaeology, R. E. Taylor, CotsenInstitute of Archaeology, UCLA and Keck Carbon Cycle AcceleratorMass Spectrometry Laboratory, University of California, Irvine. TheUniversity of Auckland, Groningen University, the Apache OilCompany, Deborah Arnold, Jeanne Bailey, Harris Bass, CharlesSteinmetz, and several other private donors.
Fig. 6. Scorpion mace-head, dating to Naqada III (ca. 3000 BC) (Fig. 6, Davies, 1992).The king is shown about to break a dyke open to allow the flood waters through.
R. Phillipps et al. / Quaternary International 251 (2012) 64e7674

Author's personal copy
References
Arz, H.W., Lamy, F., Patzold, J., Muller, P.J., Prins, M., 2003. Mediterranean moisturesource for an Early-Holocene humid period in the northern Red sea. Science300, 118e121.
Bard, K.A., 2008. An Introduction to the Archaeology of Ancient Egypt. Blackwell,Oxford.
Bar-Mathews, M., Ayalon, A., Kaufman, A., 1997. Late Quaternary Paleoclimate in theeastern Mediterranean region from stable isotope analysis of Speleothems atSoreq Cave, Israel. Quaternary Research 47, 155e168.
Bryson, R.A., 1992. A Macrophysical model of the Holocene intertropical conver-gence and jetstream positions and rainfall for the Sahara region. Meteorologyand Atmospheric Physics 47, 247e258.
Bubenzer, O., Riemer, H., 2007. Holocene climatic change and human settlementbetween the central Sahara and the Nile valley: archaeological and geomor-phological results. Geoarchaeology 22 (6), 607e620.
Butzer, K., 1976. Early Hydraulic Civilization in Egypt: a Study in Cultural Ecology.University of Chicago Press, Chicago.
Caton-Thompson, G., Gardner, E.W., 1934. The Desert Fayum. The Royal Anthropo-logical Institute of Great Britain and Ireland, London.
Colledge, S., Conolly, J., 2007. A review and synthesis of the evidence for the originsof farming on Cyprus and Crete. In: Colledge, S., Conolly, J. (Eds.), The Originsand Spread of Domestic Plants in Southwest Asia and Europe. Left Coast Press,Walnut Creek, pp. 53e74.
Davies, W., 1992. Masking the Blow: The Scene of Representation in Late PrehistoricEgyptian Art. University of California Press, Berkeley.
Finlayson, B., 2004. Island Colonization, Insularity or Mainstream? Oxbow Books,Oxford.
Gkiastra, M., Russell, T., Hennan, S., Steele, J., 2003. Neolithic transition in Europe:the radiocarbon record revisited. Antiquity 77, 45e62.
Goodfriend, G.A., 1991. Holocene trends in 18O in land snail shells from the Negevdesert and their implications for changes in rainfall source areas. QuaternaryResearch 35, 417e426.
Hafez, Y.Y., Hasanean, H.M., 2000. The Variability of Wintertime Precipitation in theNorthern Coast of Egypt and Its Relationship with the North Atlantic Oscillation,International Conference for Environmental Hazard Mitigation (ICEHM), 2000.Cairo University, Egypt. 175e186.
Harlan, J., 1992. Crops and Man. American Soceiety of Agronomy, Madison.Harlan, J.R., Pasquereau, J., 1969. Décrue agriculture in Mali. Economic Botany 23 (1),
70e74.Hassan, F.A., 1984. Environment and subsistence in Predynastic Egypt. In:
Clark, J.D., Brandt, S.A. (Eds.), From Hunters to Farmers: The Causes andConsequences of Food Production in Africa. University of California Press,London, pp. 57e64.
Hassan, F.A., 1985. Radiocarbon chronology of Neolithic and Predynastic sites inUpper Egypt and the delta. The African Archaeological Review 3, 95e116.
Hassan, F.A., 1986. Holocene lakes and prehistoric settlements of the WesternFaiyum, Egypt. Journal of Archaeological Science 13, 483e501.
Hassan, F., 1997a. The dynamics of a riverine civilization: a geoarchaeologicalperspective on the Nile valley, Egypt. World Archaeology 29 (1), 51e74.
Hassan, F., 1997b. Holocene palaeoclimates of Africa. African Archaeological Review14 (4), 213e230.
Hassan, F.A., Barich, B., Mahmoud, M., Hemdan, M.A., 2001. Holocene playa depositsof Farafra Oasis, Egypt, and their palaeoclimatic and geoarchaeological signifi-cance. Geoarchaeology 16 (1), 29e46.
Haynes, C.V., 2001. Geochronology and climate change of the PleistoceneeHolocenetransition in the Darb el Arba’in desert, eastern Sahara. Geoarchaeology 16 (1),119e141.
Hoffman, M., 1982. The Predynastic of Hierakonpolis: An Interim Report. CairoUniversity, Cairo.
Holdaway, S.J., Wendrich, W., Phillipps, R., 2010. Variability in low level foodproduction societies as a response to resource uncertainty. Antiquity 84 (323),185e194.
Kindermann, K., 2002. Djara: prehistoric links between the desert and the Nile. In:Hawass, Z. (Ed.), Egyptology at the Dawn of the Twenty-first Century:Proceedings of the Eighth International Congress of Egyptologists Cairo 2000.American University Press, Cairo, pp. 272e279.
Kindermann, K., Bubenzer, O., Nussbaum, S., Riemer, H., Darius, F., Pöllath, N.,Smettan, U., 2006. Palaeoenvironment and Holocene land use of Djara, Westerndesert of Egypt. Quaternary Science Reviews 25, 1619e1637.
Kemp, B., 2006. Ancient Egypt Anatomy of a Civilization. Routledge, London.Knapp, B., 2010. Cyprus’s earliest prehistory: seafarers, foragers and settlers. Journal
of World Prehistory 23, 79e120.Kozlowski, J.K., Ginter, V.B., 1989. The Fayum Neolithic in the light of new discov-
eries. In: Krzyzaniak, L., Kobusiewicz, M. (Eds.), Late Prehistory of the Nile Basinand the Sahara. Muzeum Archeologiczne W. Poznaniu, Poznan, pp. 157e179.
Kozlowski, J.K., Ginter, V.B., 1993. Holocene changes in the Fayum: lake Moeris andthe evolution of climate in Northeastern Africa. In: Krzyzaniak, L.,Kobusiewicz, M., Alexander, J. (Eds.), Environmental Change and HumanCulture in the Nile Basin and Northern Africa until the Second Milennium B.C.Poznan Archaeological Museum, Poznan, pp. 327e336.
Krom, M.D., Stanley, J.D., Cliff, R.A., Woodward, J.C., 2002. Nile River sedimentfluctuations over the past 7000 yr and their key role in sapropel development.Geology 30 (1), 71e74.
Kröpelin, S., Verschuren, D., Lezine, A.-M., Eggermont, H., Cocquyt, C., Francus, P.,Cazet, J.-P., Fagot, M., Rumes, B., Russell, J.M., Darius, F., Conley, D.J., Schuster, M.,Suchodoletz, H., Engstrom, D.R., 2008. Climate-driven ecosystem succession inthe Sahara: the past 6000 Years. Science 320 (765), 765e768.
Kuper, R., 2006. After 5000 BC: the Libyan desert in transition. Comptes RendusPalevol 5, 409e419.
Kuper, R., Kröpelin, S., 2006. Climate-controlled Holocene occupation in the Sahara:motor of Africa’s evolution. Science 313, 803e807.
Manning, S.W., McCartney, C., Kromer, B., Stewart, S.T., 2010. The earlier Neolithic inCyprus: recognition and dating of a Pre-Pottery Neolithic A occupation.Antiquity 84, 693e706.
Marshall, F., Hildebrand, E., 2002. Cattle before crops: the beginning of foodproduction in Africa. Journal of World Prehistory 16 (2), 99e143.
McCorriston, J., 2006. Breaking the rain Barrier and the tropical spread of Neareastern agriculture into southern Arabia. In: Kennett, D.J., Winterhalder, B.(Eds.), Behavioral Ecology and the Transition to Agriculture. University of Cal-ifornia Press, Berkeley, pp. 217e236.
McDonald, M.M.A., 2001. The Late Prehistoric Radiocarbon Chronology for DakhlehOasis within the Wider Environmental and Cultural Setting of the EgyptianWestern Desert, the Oasis Papers 1. The Proceedings of the First Conference ofthe Dakhleh Oasis Project, 2001, pp. 26e42.
McDonald, M.M.A., 2009. Increased sedentism in the central oases of the EgyptianWestern desert in the early to mid-Holocene: evidence from the peripheries.African Archaeological Review 26, 3e43.
Nicoll, K., 2001. Radiocarbon chronologies for prehistoric human occupation andhydroclimatic change in Egypt and northern Sudan. Geoarchaeology 16 (1), 47e64.
Perles, C., 2001. TheEarlyNeolithic inGreece. CambridgeUniversity Press, Cambridge.Peltenburg, E., 2004. Introduction: a revised Cypriot prehistory and some impli-
cations for the study of the Neolithic. In: Peltenburg, E., Wasse, A. (Eds.),Neolithic Revolution: New Perspectives on Southwest Asia in Light of RecentDiscoveries on Cyprus. Oxbow Books, Oxford, pp. xiexx.
Reimer, P.J., Baillie, M.G.L., Bard, E., Bayliss, A., Beck, J.W., Bertrand, C., Blackwell, P.G.,Buck, C.E., Burr, G., Cutler, K.B., Damon, P.E., Edwards, R.L., Fairbanks, R.G.,Friedrich,M.,Guilderson, T.P.,Hughen,K.A.,Kromer, B.,McCormac, F.G.,Manning, S.,Bronk Ramsey, C., Reimer, R.W., Remmele, S., Southon, J.R., Stuiver, M., Talamo, S.,Taylor, F.W., van der Plicht, J., Weyhenmeyer, C.E., 2004. INTCAL04 terrestrialradiocarbon age calibration, 0e26 cal kyr BP. Radiocarbon 46, 1029e1058.
Rohling, E.J., Casford, J., Abu-Zeid, R., Cooke, S., Mercone, D., Thomson, J.,Croudace, I., Jorissen, F.J., Brinkhuis, H., Kallmeyer, J., Wefer, G., 2002. RapidHolocene climate changes in the eastern Mediterranean. In: Hassan, F.A. (Ed.),Droughts, Food and Culture: Ecological Change and Food Security in Africa’sLater Prehistory. Kluwer Academic Plenum Publishers, New York, pp. 35e46.
Runnels, C., 2003. The origins of the Greek Neolithic: a personal view. In:Ammerman, A.J., Biagi, P. (Eds.), The Widening Harvest: The Neolithic Transitionin Europe: Looking Back, Looking Forward. Archaeological Institute of America,Boston, pp. 121e132.
Sherratt, A., 1980. Water, soil and seasonality in early cereal cultivation. WorldArchaeology 11 (3), 313e330.
Shirai, N., 2010. The Archaeology of the First Farmer-Herders in Egypt: New Insightsinto the Fayum Epipalaeolithic and Neolithic. Leiden University Press, Leiden.
Skeates, R., 2003. Radiocarbon dating and interpretations of the Meso-lithiceNeolithic transition in Italy. In: Ammerman, A.J., Biagi, P. (Eds.), TheWidening Harvest: The Neolithic Transition in Europe: Looking Back, LookingForward. Archaeological Institute of America, Boston, pp. 157e188.
Smith, B., 2001. Low-Level food production. Journal of Archaeological Research 9(1), 1e43.
Stanley, J.D., Krom, M.D., Cliff, R.A., Woodward, J.C., 2003. Nile flow failure at the endof the Old Kingdom, Egypt: strontium isotopic and petrologic evidence. Geo-archaeology 18 (3), 395e402.
Stanley, D.J., Warne, A.G., 1993. Sea level and initiation of Predynastic culture in theNile delta. Nature 363, 435e438.
Trigger, B.G., 1983. The rise of Egyptian civilization. In: Trigger, B.G., Kemp, B.J.,O’Connor, D., Lloyd, A.B. (Eds.), Ancient Egypt: a Social History. CambridgeUniversity Press, Cambridge, pp. 1e70.
Wendorf, F., Schild, R., 1976. Prehistory of the Nile Valley. Academic Press, New York.Wendorf, F., Schild, R., 2001. Combined prehistoric expedition’s radiocarbon dates
associated with Neolithic occupations in the southern Western desert of Egypt.In: Wendorf, F., Schild, R. (Eds.), Holocene Settlement of the Egyptian SaharaVolume 1: The Archaeology of Nabta Playa. Kluwer Academic/PlenumPublishers, New York, pp. 51e56.
Wendorf, F., Karlen, W., et al., 2007. Middle Holocene environments of north andeast Africa, with special emphasis on the African Sahara. In: Anderson, D.G.,Maasch, K.A., Sandweiss, D.H. (Eds.), Climate Change and Cultural Dynamics:a Global Perspective on Mid-Holocene Transitions. Elsevier, New York, pp.189e227.
Wendrich, W., Taylor, R.E., Southon, J., 2010. Dating stratified settlement sites atKom K and Kom W: Fifth millennium BCE radiocarbon ages for the FayumNeolithic. Nuclear Instruments and Methods in Physics Research B 268,999e1002.
Wengrow, D., 2006. The Archaeology of Early Egypt: Social Transformations inNorth-East Africa, 10,000 to 2650 BC. Cambridge University Press, Cambridge.
Wenke, R.J., 2009. The Ancient Egyptian State: The Origins of Egyptian Culture (c.8000e2000 BC). Case Studies in Early Societies. Cambridge University Press,Cambridge.
R. Phillipps et al. / Quaternary International 251 (2012) 64e76 75

Author's personal copy
Wenke, R.J., Long, J.E., Buck, P.E., 1988. Epipaleolithic and Neolithic Subsistence andsettlement in the FayyumOasis of Egypt. Journal of Field Archaeology 15, 29e51.
Williams, M.A.J., Adamson, D., Cock, B., McEvedy, R., 2000. Late Quaternary environ-ments in theWhite Nile region, Sudan. Global and Planetary Change 26, 305e316.
Williams, M.A.J., 2009. Late Pleistocene environments in the Nile basin. Global andPlanetary Change 69, 1e15.
Williams, M.A.J., Williams, F.M., Duller, G.A.T., Munro, R.N., El Tom, O.A.M.,Barrows, T.T., Macklin, M., Woodward, J., Talbot, M.R., Haberlah, D., Fluin, J.,2010. Late Quaternary floods and droughts in the Nile valley, Sudan: new
evidence from optically stimulated luminescence and AMS radiocarbon dating.Quaternary Science Reviews 29, 1116e1137.
Zeder, M.A., 2008. Domestication and early agriculture in the Mediterranean Basin:origins, diffusion, and impact. Proceedings of the National Academy of Sciences105 (33), 11597e11604.
Zilhão, J., 2001. Radiocarbon evidence for maritime pioneer colonization at theorigins of farming in west Mediterranean Europe. Proceedings of theNational Academy of Sciences of the United States of America 98 (24),14180e14185.
R. Phillipps et al. / Quaternary International 251 (2012) 64e7676