Large variations in the Holocene marine radiocarbon reservoir effect reflect ocean circulation and...
12
Earth and Planetary Science Letters 422 (2015) 33–44 Contents lists available at ScienceDirect Earth and Planetary Science Letters www.elsevier.com/locate/epsl Large variations in the Holocene marine radiocarbon reservoir effect reflect ocean circulation and climatic changes Quan Hua a,∗ , Gregory E. Webb b , Jian-xin Zhao b , Luke D. Nothdurft c , Matthew Lybolt d , Gilbert J. Price b , Bradley N. Opdyke e a Australian Nuclear Science and Technology Organisation, Locked Bag 2001, Kirrawee DC, NSW 2232, Australia b School of Earth Sciences, The University of Queensland, Brisbane, QLD 4072, Australia c School of Earth, Environmental and Biological Sciences, Queensland University of Technology, GPO Box 2434, Brisbane, QLD 4001, Australia d School of Biological Sciences, The University of Queensland, Brisbane, QLD 4072, Australia e Research School of Earth Sciences, Australian National University, Canberra, ACT 0200, Australia a r t i c l e i n f o a b s t r a c t Article history: Received 1 December 2014 Received in revised form 12 March 2015 Accepted 27 March 2015 Available online xxxx Editor: G.M. Henderson Keywords: marine radiocarbon reservoir effect U–Th dating ocean circulation climate change Holocene corals Accurate radiocarbon dating of marine samples requires knowledge of the marine radiocarbon reservoir effect. This effect for a particular site/region is generally assumed constant through time when calibrating marine 14 C ages. However, recent studies have shown large temporal variations of several hundred to a couple of thousand years in this effect for a number of regions during the late Quaternary and Holocene. Here we report marine radiocarbon reservoir correction (R) for Heron Reef and Moreton Bay in southwestern (SW) Pacific for the last 8 ka derived from 14 C analysis of 230 Th-dated corals. Most of our R for the last ∼5.4 ka agree well with their modern value, but large R variability of ∼410 yr (from trough to peak) with possible decadal/centennial fluctuations is evident for the period ∼5.4–8 ka. The latter time interval also has significant variations with similar features in previously published R values for other sites in the Pacific, including southern Peru–northern Chile in southeastern (SE) Pacific, the South China Sea, Vanuatu and Papua New Guinea, with the largest magnitude of ∼920 yr from SE Pacific. The mechanisms for these large R variations across the Pacific during the mid-Holocene are complex processes involving (1) changes in the quantity and 14 C content of upwelled waters in tropical east Pacific (TEP) (frequency and intensity of ocean upwelling in the TEP, and contribution of Subantarctic Mode Water to the upwelled waters, which is influenced by the intensity and position of southern westerly winds), and (2) variations in ocean circulation associated with climate change (La Niña/El Niño conditions, intensity of easterly trade winds, positions of the Intertropical Convergence Zone and the South Pacific Convergence Zone), which control the spreading of the older upwelled surface waters in the TEP to the western sites. Our results imply the need for employing temporal changes in R values, instead of constant (modern) values, for age calibration of Holocene marine samples not only for the SW Pacific sites but also for other tropical and subtropical sites in the Pacific. Crown Copyright © 2015 Published by Elsevier B.V. All rights reserved. 1. Introduction The accurate dating of marine samples, such as corals, molluscs and foraminifers, is increasingly critical for correlating them with terrestrial and ice-core records, and consequently for better under- standing of palaeoclimate. However, radiocarbon ages of samples drawing carbon from the surface ocean are generally younger than those of contemporaneous intermediate/deep ocean materials and older than those of contemporaneous terrestrial materials. This is * Corresponding author. Tel.: +61 2 97173671; fax: +61 2 97179265. E-mail address: [email protected] (Q. Hua). a result of the interaction between the surface ocean and two other carbon reservoirs – intermediate/deep ocean containing old carbon and the atmosphere containing more ‘young’ carbon. The aging effect of the surface ocean (in comparison with the atmo- sphere) is known as the marine radiocarbon reservoir effect. The magnitude of this effect, termed the marine reservoir age (R), is determined by the difference in radiocarbon ages between the sur- face ocean and contemporaneous terrestrial samples. Alternatively, a regional marine reservoir correction (R), the regional offset in age between a marine sample from a given region and the global marine model (e.g., Marine13; Reimer et al., 2013), can be used to characterise the marine radiocarbon reservoir effect for that re- gion. http://dx.doi.org/10.1016/j.epsl.2015.03.049 0012-821X/Crown Copyright © 2015 Published by Elsevier B.V. All rights reserved.
Transcript of Large variations in the Holocene marine radiocarbon reservoir effect reflect ocean circulation and...

Earth and Planetary Science Letters 422 (2015) 33–44
Contents lists available at ScienceDirect
Earth and Planetary Science Letters
www.elsevier.com/locate/epsl
Large variations in the Holocene marine radiocarbon reservoir effect
reflect ocean circulation and climatic changes
Quan Hua a,∗, Gregory E. Webb b, Jian-xin Zhao b, Luke D. Nothdurft c, Matthew Lybolt d, Gilbert J. Price b, Bradley N. Opdyke e
a Australian Nuclear Science and Technology Organisation, Locked Bag 2001, Kirrawee DC, NSW 2232, Australiab School of Earth Sciences, The University of Queensland, Brisbane, QLD 4072, Australiac School of Earth, Environmental and Biological Sciences, Queensland University of Technology, GPO Box 2434, Brisbane, QLD 4001, Australiad School of Biological Sciences, The University of Queensland, Brisbane, QLD 4072, Australiae Research School of Earth Sciences, Australian National University, Canberra, ACT 0200, Australia
a r t i c l e i n f o a b s t r a c t
Article history:Received 1 December 2014Received in revised form 12 March 2015Accepted 27 March 2015Available online xxxxEditor: G.M. Henderson
Keywords:marine radiocarbon reservoir effectU–Th datingocean circulationclimate changeHolocenecorals
Accurate radiocarbon dating of marine samples requires knowledge of the marine radiocarbon reservoir effect. This effect for a particular site/region is generally assumed constant through time when calibrating marine 14C ages. However, recent studies have shown large temporal variations of several hundred to a couple of thousand years in this effect for a number of regions during the late Quaternary and Holocene. Here we report marine radiocarbon reservoir correction (�R) for Heron Reef and Moreton Bay in southwestern (SW) Pacific for the last 8 ka derived from 14C analysis of 230Th-dated corals. Most of our �R for the last ∼5.4 ka agree well with their modern value, but large �R variability of ∼410 yr (from trough to peak) with possible decadal/centennial fluctuations is evident for the period ∼5.4–8 ka. The latter time interval also has significant variations with similar features in previously published �Rvalues for other sites in the Pacific, including southern Peru–northern Chile in southeastern (SE) Pacific, the South China Sea, Vanuatu and Papua New Guinea, with the largest magnitude of ∼920 yr from SE Pacific. The mechanisms for these large �R variations across the Pacific during the mid-Holocene are complex processes involving (1) changes in the quantity and 14C content of upwelled waters in tropical east Pacific (TEP) (frequency and intensity of ocean upwelling in the TEP, and contribution of Subantarctic Mode Water to the upwelled waters, which is influenced by the intensity and position of southern westerly winds), and (2) variations in ocean circulation associated with climate change (La Niña/El Niño conditions, intensity of easterly trade winds, positions of the Intertropical Convergence Zone and the South Pacific Convergence Zone), which control the spreading of the older upwelled surface waters in the TEP to the western sites. Our results imply the need for employing temporal changes in �R values, instead of constant (modern) values, for age calibration of Holocene marine samples not only for the SW Pacific sites but also for other tropical and subtropical sites in the Pacific.
Crown Copyright © 2015 Published by Elsevier B.V. All rights reserved.
1. Introduction
The accurate dating of marine samples, such as corals, molluscs and foraminifers, is increasingly critical for correlating them with terrestrial and ice-core records, and consequently for better under-standing of palaeoclimate. However, radiocarbon ages of samples drawing carbon from the surface ocean are generally younger than those of contemporaneous intermediate/deep ocean materials and older than those of contemporaneous terrestrial materials. This is
* Corresponding author. Tel.: +61 2 97173671; fax: +61 2 97179265.E-mail address: [email protected] (Q. Hua).
http://dx.doi.org/10.1016/j.epsl.2015.03.0490012-821X/Crown Copyright © 2015 Published by Elsevier B.V. All rights reserved.
a result of the interaction between the surface ocean and two other carbon reservoirs – intermediate/deep ocean containing old carbon and the atmosphere containing more ‘young’ carbon. The aging effect of the surface ocean (in comparison with the atmo-sphere) is known as the marine radiocarbon reservoir effect. The magnitude of this effect, termed the marine reservoir age (R), is determined by the difference in radiocarbon ages between the sur-face ocean and contemporaneous terrestrial samples. Alternatively, a regional marine reservoir correction (�R), the regional offset in age between a marine sample from a given region and the global marine model (e.g., Marine13; Reimer et al., 2013), can be used to characterise the marine radiocarbon reservoir effect for that re-gion.
34 Q. Hua et al. / Earth and Planetary Science Letters 422 (2015) 33–44
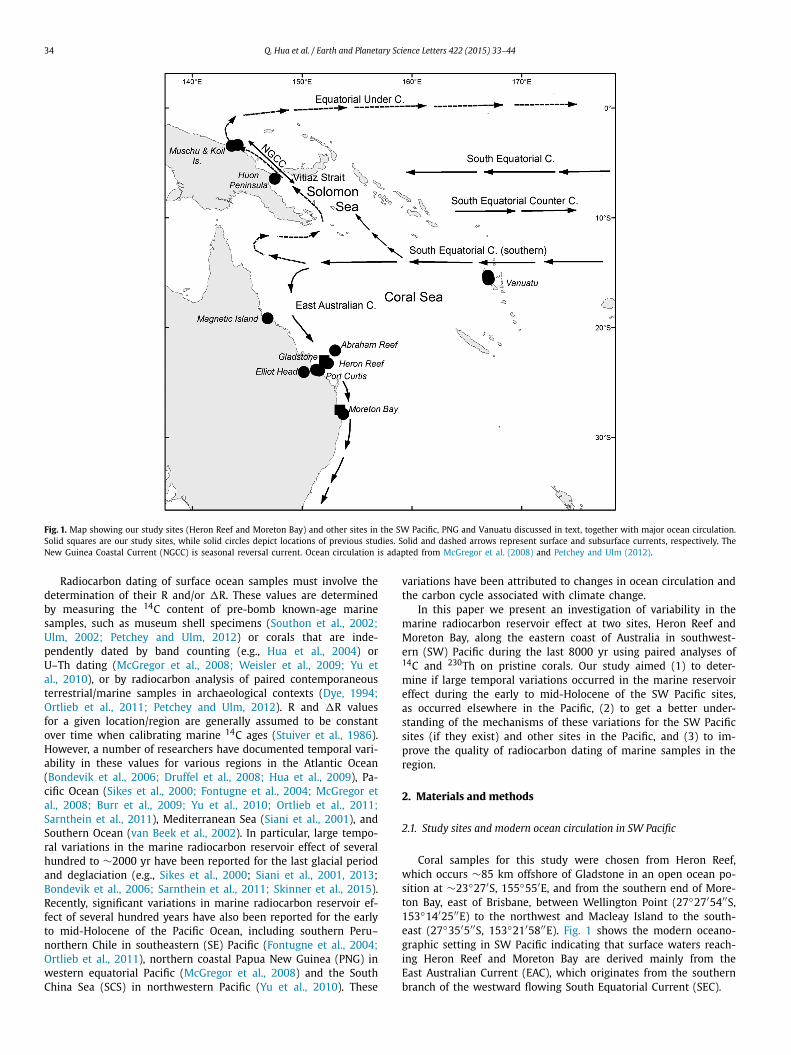
Fig. 1. Map showing our study sites (Heron Reef and Moreton Bay) and other sites in the SW Pacific, PNG and Vanuatu discussed in text, together with major ocean circulation. Solid squares are our study sites, while solid circles depict locations of previous studies. Solid and dashed arrows represent surface and subsurface currents, respectively. The New Guinea Coastal Current (NGCC) is seasonal reversal current. Ocean circulation is adapted from McGregor et al. (2008) and Petchey and Ulm (2012).
Radiocarbon dating of surface ocean samples must involve the determination of their R and/or �R. These values are determined by measuring the 14C content of pre-bomb known-age marine samples, such as museum shell specimens (Southon et al., 2002;Ulm, 2002; Petchey and Ulm, 2012) or corals that are inde-pendently dated by band counting (e.g., Hua et al., 2004) or U–Th dating (McGregor et al., 2008; Weisler et al., 2009; Yu et al., 2010), or by radiocarbon analysis of paired contemporaneous terrestrial/marine samples in archaeological contexts (Dye, 1994;Ortlieb et al., 2011; Petchey and Ulm, 2012). R and �R values for a given location/region are generally assumed to be constant over time when calibrating marine 14C ages (Stuiver et al., 1986). However, a number of researchers have documented temporal vari-ability in these values for various regions in the Atlantic Ocean (Bondevik et al., 2006; Druffel et al., 2008; Hua et al., 2009), Pa-cific Ocean (Sikes et al., 2000; Fontugne et al., 2004; McGregor et al., 2008; Burr et al., 2009; Yu et al., 2010; Ortlieb et al., 2011;Sarnthein et al., 2011), Mediterranean Sea (Siani et al., 2001), and Southern Ocean (van Beek et al., 2002). In particular, large tempo-ral variations in the marine radiocarbon reservoir effect of several hundred to ∼2000 yr have been reported for the last glacial period and deglaciation (e.g., Sikes et al., 2000; Siani et al., 2001, 2013; Bondevik et al., 2006; Sarnthein et al., 2011; Skinner et al., 2015). Recently, significant variations in marine radiocarbon reservoir ef-fect of several hundred years have also been reported for the early to mid-Holocene of the Pacific Ocean, including southern Peru–northern Chile in southeastern (SE) Pacific (Fontugne et al., 2004;Ortlieb et al., 2011), northern coastal Papua New Guinea (PNG) in western equatorial Pacific (McGregor et al., 2008) and the South China Sea (SCS) in northwestern Pacific (Yu et al., 2010). These
variations have been attributed to changes in ocean circulation and the carbon cycle associated with climate change.
In this paper we present an investigation of variability in the marine radiocarbon reservoir effect at two sites, Heron Reef and Moreton Bay, along the eastern coast of Australia in southwest-ern (SW) Pacific during the last 8000 yr using paired analyses of 14C and 230Th on pristine corals. Our study aimed (1) to deter-mine if large temporal variations occurred in the marine reservoir effect during the early to mid-Holocene of the SW Pacific sites, as occurred elsewhere in the Pacific, (2) to get a better under-standing of the mechanisms of these variations for the SW Pacific sites (if they exist) and other sites in the Pacific, and (3) to im-prove the quality of radiocarbon dating of marine samples in the region.
2. Materials and methods
2.1. Study sites and modern ocean circulation in SW Pacific
Coral samples for this study were chosen from Heron Reef, which occurs ∼85 km offshore of Gladstone in an open ocean po-sition at ∼23◦27′S, 155◦55′E, and from the southern end of More-ton Bay, east of Brisbane, between Wellington Point (27◦27′54′′S, 153◦14′25′′E) to the northwest and Macleay Island to the south-east (27◦35′5′′S, 153◦21′58′′E). Fig. 1 shows the modern oceano-graphic setting in SW Pacific indicating that surface waters reach-ing Heron Reef and Moreton Bay are derived mainly from the East Australian Current (EAC), which originates from the southern branch of the westward flowing South Equatorial Current (SEC).

Q. Hua et al. / Earth and Planetary Science Letters 422 (2015) 33–44 35
Fig. 2. Map of Australia showing our study sites. For Heron Reef, solid circles and squares represent the locations of shallow coral cores and storm-uplifted coral blocks, respectively. For Moreton Bay, solid squares depict coral locations.
Heron Reef is a platform reef within the Capricorn Group of reefs in the southern Great Barrier Reef (GBR), occurring on the mid- to outer shelf in water depths of 35–40 m (see Jell and Webb, 2012 for a recent review). Holocene reef facies occur in the upper 12–20 m resting on Pleistocene basement (Davies, 1974). Most of the corals for the present study were obtained from shal-low (<10 m) drill cores on the leeward and windward margins of the reef (Fig. 2). Drill core samples were recovered from depths greater than 1.5 m to avoid the very active diagenetic zone im-mediately beneath the reef flat (Nothdurft and Webb, 2009). Addi-tional younger (<300 yr old) corals (mostly massive faviids) were recovered from blocks thrown up on the northern reef flat during storms (Yu et al., 2012).
Moreton Bay is a shallow, semi-enclosed, mesotidal estuarine embayment separated from the Pacific Ocean by the large barrier islands, Stradbroke and Moreton islands, and a number of smaller islands (Neil, 1998). The major connections to the open ocean are at the northern end of Moreton Island, and between Moreton and North Stradbroke Island to the south, with currents dominated by tidal inflow and outflow. Terrigenous sediment is delivered to the bay on the western margin by four rivers, including the Brisbane River, and several smaller creeks. Corals currently grow primarily around islands in the southern part of the bay, but true reef de-velopment to sea level is absent (Lybolt et al., 2011). However, Holocene reef growth was much more widespread and major fring-ing reefs occupied the western shores of the bay between Welling-ton Point and Cleveland (Leonard et al., 2013). The locations of corals used in this study are shown in Fig. 2. They were recov-
ered from various points along the western margin of the bay from Wellington Point to Cleveland and from Peel, Goat, Coochiemudlo, and Macleay islands, which extend the distribution across the bay (Lybolt et al., 2011; Leonard et al., 2013).
2.2. Modern marine reservoir effect for EAC waters in SW Pacific
Druffel and Griffin (1993, 1999) measured 14C content in bian-nual coral samples from Heron Island (23◦S, 152◦E) and Abraham Reef (22◦06′S, 153◦00′E) in the southern GBR. We converted the pre-bomb portion of these published values to �R and R us-ing the Marine13 (Reimer et al., 2013) and SHCal13 (Hogg et al., 2013) data, respectively. The weighted mean �R (R) values1 for Heron Island and Abraham Reef for the period AD 1849–1950 are −8 ± 36 yr (313 ± 43 yr) and −7 ± 35 yr (313 ± 40 yr), respec-tively, which represent modern values of open sea waters along the EAC path. Ulm (2002) reported �R values for five known-age pre-bomb shell samples collected along the Queensland coast at Gladstone (23◦51′S, 151◦16′E), Port Curtis (23◦55′S, 151◦33′E) and Elliot Head (24◦04′S, 150◦09′E), which are not far from Heron Is-land and Abraham Reef (see Figs. 1–2). The weighted mean �Rvalue of these samples is 5 ± 77 yr when Marine13 data are used, and its weighted mean R value is 319 ± 73 yr. For Moreton Bay, Ulm et al. (2009) analysed two known-age museum shell speci-
1 The weight used in all calculations of weighted mean �R and R values pre-sented in this paper was uncertainties associated with their individual values.

36 Q. Hua et al. / Earth and Planetary Science Letters 422 (2015) 33–44
mens collected from the ‘outer beach’ of North Stradbroke Island (∼27◦50′S, ∼153◦50′E) in AD 1902 (see Fig. 2). These authors re-ported a weighted mean �R (R) value for the shells of 9 ± 19 yr(339 ± 18 yr). These results indicate that the modern reservoir ef-fect for Heron Reef, Abraham Reef and their adjacent areas in the southern GBR and as far south as Moreton Bay are very similar as their mean �R (R) values agree with each other within 1-sigma uncertainties. This suggests that the modern reservoir effect for Moreton Bay represents an open ocean value and the SW Pacific sites including Moreton Bay are mainly influenced by surface wa-ters from the EAC (Fig. 1). In brief, the modern �R value of EAC waters in SW Pacific is close to 0 yr and its modern R value is between 310 and 340 yr (see Supplementary Fig. S1).
2.3. U–Th dating and radiocarbon analysis
Corals from Heron Reef and Moreton Bay were carefully screened in order to select pristine samples for our study. They were checked for deleterious diagenetic products, such as early marine aragonite and marine or meteoric calcite cements and extensive bioerosion using Scanning Electron Microscopy (SEM) (Nothdurft and Webb, 2009). Screening was performed at The Queensland University of Technology using an FEI Quanta™ 200 environmental SEM with energy dispersive spectroscopy. For each coral, the screening was conducted on immediately adjacent sam-ples as to those used for U–Th dating and 14C analysis. The 14C samples were the largest but contained the exact temporal interval of the U–Th samples – again as adjacent bits (see Supplemen-tary Fig. S2 for SEM images of some pristine and altered corals, which were used and unused, respectively, in this study). Sam-ples that passed SEM screening were selected and crushed into chips (1–2 mm diameter) and visually inspected using a com-pound microscope. Individual chips that showed any evidence of microbialite, staining or cement were excluded from dating. Post-analysis screening criteria included initial δ234U of modern sea water values of 147 ± 5� (Reimer et al., 2009 and references therein) and high initial 230Th/232Th values indicating low level of non-radiogenic 230Th.
A total of 40 unaltered coral samples (21 from Heron Reef and 19 from Moreton Bay) were dated by the 230Th/U method in the Radiogenic Isotope Facility at the University of Queensland. Sam-ples were cleaned by treatment in 10% H2O2 for 24 h followed by a rinse in milliQ water with sonication for 15 min before three ad-ditional rinses in milliQ water. The isotopic analysis was performed using a VG Sector-54 thermal ionization mass spectrometer (TIMS) (Zhao et al., 2001) prior to 2010 or a Nu Plasma multi-collector-inductively coupled plasma-mass spectrometer (MC-ICP-MS) from 2010 onwards. For TIMS analyses, approximately 0.5 g of each sam-ple was spiked with a 229Th–233U–236U mixed tracer. The samples were dated following column separation and TIMS analytical pro-cedures as described in detail in Zhao et al. (2009) and Clark et al. (2012). For MC-ICP-MS analyses, 0.15 g samples were spiked with a 229Th–233U mixed tracer and dated following a modified and simplified column separation procedure and a fully-automatic MC-ICP-MS measurement protocol described in detail in Zhou et al. (2011) and Clark et al. (2014). All ages were calculated using Isoplot Program EX/3.0 of Ludwig (2003) using decay constants of Cheng et al. (2000). Typical external age reproducibility for the 230Th/U dating, based on repeated measurements of standards, was better than 0.5% (2σ ).
230Th-dated coral samples containing 3–10 yr of growth were analysed for 14C. This approach aimed to avoid possible large sea-sonal/annual variability in surface ocean 14C (Druffel et al., 2001), which could influence the result of our study. The samples were cut using a diamond saw, cleaned in deionised water, oven dried, and homogenised using a mortar and pestle. The powdered car-
bonate samples were converted to CO2 using 85% H3PO4 then to graphite using the H2/Fe method (Hua et al., 2001). A portion of graphite was used for the determination of δ13C for isotopic fractionation correction using a Micromass IsoPrime elemental an-alyzer/isotope ratio mass spectrometer (EA/IRMS). Accelerator mass spectrometry (AMS) 14C analysis was carried out using the STAR facility at ANSTO (Fink et al., 2004) with a typical analytical preci-sion of better than 0.4% (1σ ). Radiocarbon analyses of known-age Holocene samples indicate that a good accuracy of <0.4% (1σ ) is achieved by the AMS facility (Scott et al., 2010). It is worth noting that radiocarbon ages of carbonate powders may be affected by surface contamination with modern atmospheric CO2. However, Yu et al. (2010) performed a contamination test on their coral sam-ples spanning the period 1.7–7.5 ka and reported that there was no significant difference (at 95% confidence level) between the 14C ages of carbonate powders and those of carbonate chunks (with and without acid etching to remove the outer surface during AMS sample preparation). Therefore, this contamination effect is consid-ered to be negligible for our coral 14C results.
3. Results
The 230Th and 14C results of the 40 coral samples are presented in Supplementary Tables S1 and S2, respectively. 230Th dates rep-resenting absolute ages of corals were reported in years relative to the time of measurement. To be comparable to the radiocar-bon convention, the 230Th dates were converted to years relative to AD 1950 or calendar years before present (cal yr BP). �R, R and �14C (decay-corrected) of the coral samples are also shown in Supplementary Table S2 and illustrated in Fig. 3. These values were calculated using the following equations:
�R(t) = Measured14C age(t) − Marine model 14C age(t), (1)
R(t) = Measured 14C age(t) − Terrestrial 14C age(t), and (2)
�14C(t) = (e(λt− Measured 14C age(t)
8033 ) − 1)1000(�) (3)
where t is 230Th age of the sample in cal yr BP, λ is the 14C decay constant of 1/8267 yr−1, and terrestrial and marine model 14C ages are from SHCal13 and Marine13, respectively.
In general, �R and R of a particular site increase when the 14C content of dissolved inorganic carbon (DIC) in surface waters at the site, expressed as �14C, decreases and vice versa.
Values of �R, R and �14C derived from previous work in More-ton Bay (Ulm et al., 2009) and Magnetic Island off the northeastern Australian coast (Lewis et al., 2012) are also plotted in Fig. 3 for comparison. They consist of two values for Moreton Bay for the interval 0.5–0.9 cal kyr BP based on paired charcoal/shell samples from Peel Island, which is not far from our study sites (see Fig. 2), and two values for Magnetic Island ∼6 cal kyr BP derived from 230Th-dated corals.
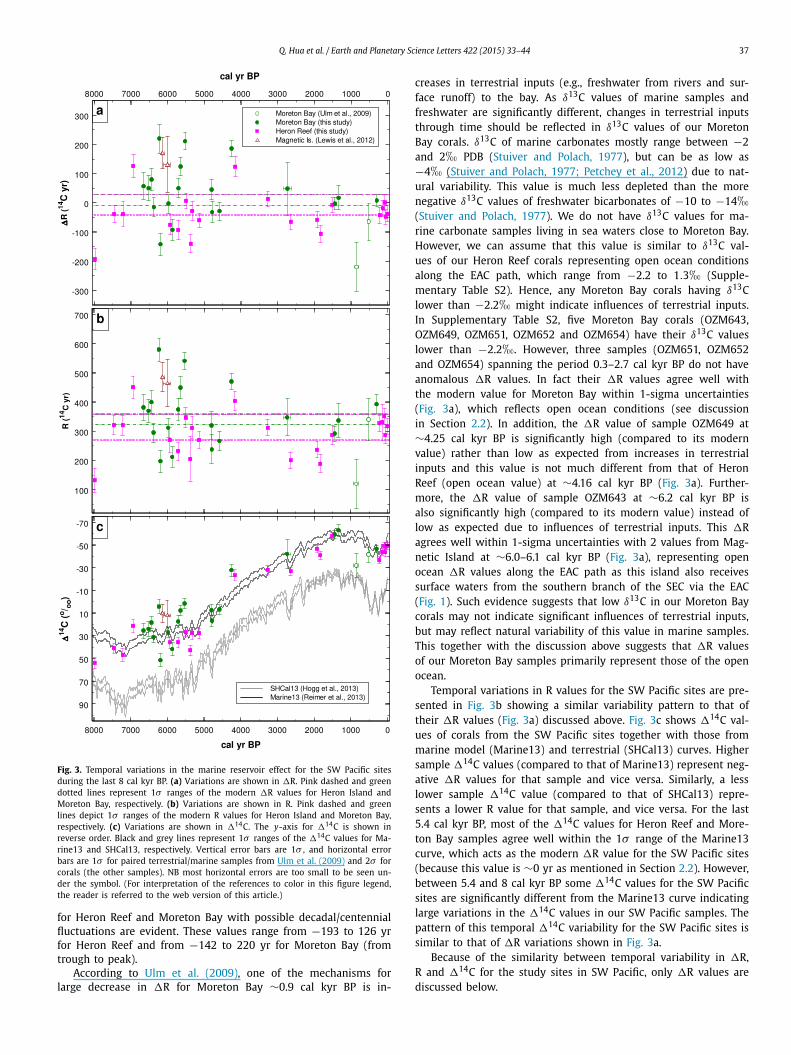
�R values for Heron Reef and Moreton Bay for the last 5.4 cal kyr BP are in good agreement as they overlap with each other within 1σ uncertainties. Most of these �R values also agree well with their modern values (Fig. 3a). These results indicate that the �R values for Moreton Bay reflect those of open ocean along the EAC path and the estuarine effect for Moreton Bay, which is due to interaction and incomplete mixing of 14C from both terrestrial reservoirs (e.g., rivers) and the marine reservoir from tidal action (Ulm, 2002), might be negligible. Within this time interval, only two significant �R variations are observed around 4.2 and 0.9 cal kyr BP. The former time period has two high �R values of 124 and 186 yr recorded in our two samples (one from Heron Reef and one from Moreton Bay), while the latter period experiences a low �R of −220 yr reported by Ulm et al. (2009) for Moreton Bay. For the period between 5.4 and 8 cal kyr BP, large variations in �R
Q. Hua et al. / Earth and Planetary Science Letters 422 (2015) 33–44 37
Fig. 3. Temporal variations in the marine reservoir effect for the SW Pacific sites during the last 8 cal kyr BP. (a) Variations are shown in �R. Pink dashed and green dotted lines represent 1σ ranges of the modern �R values for Heron Island and Moreton Bay, respectively. (b) Variations are shown in R. Pink dashed and green lines depict 1σ ranges of the modern R values for Heron Island and Moreton Bay, respectively. (c) Variations are shown in �14C. The y-axis for �14C is shown in reverse order. Black and grey lines represent 1σ ranges of the �14C values for Ma-rine13 and SHCal13, respectively. Vertical error bars are 1σ , and horizontal error bars are 1σ for paired terrestrial/marine samples from Ulm et al. (2009) and 2σ for corals (the other samples). NB most horizontal errors are too small to be seen un-der the symbol. (For interpretation of the references to color in this figure legend, the reader is referred to the web version of this article.)
for Heron Reef and Moreton Bay with possible decadal/centennial fluctuations are evident. These values range from −193 to 126 yr for Heron Reef and from −142 to 220 yr for Moreton Bay (from trough to peak).
According to Ulm et al. (2009), one of the mechanisms for large decrease in �R for Moreton Bay ∼0.9 cal kyr BP is in-
creases in terrestrial inputs (e.g., freshwater from rivers and sur-face runoff) to the bay. As δ13C values of marine samples and freshwater are significantly different, changes in terrestrial inputs through time should be reflected in δ13C values of our Moreton Bay corals. δ13C of marine carbonates mostly range between −2 and 2� PDB (Stuiver and Polach, 1977), but can be as low as −4� (Stuiver and Polach, 1977; Petchey et al., 2012) due to nat-ural variability. This value is much less depleted than the more negative δ13C values of freshwater bicarbonates of −10 to −14�(Stuiver and Polach, 1977). We do not have δ13C values for ma-rine carbonate samples living in sea waters close to Moreton Bay. However, we can assume that this value is similar to δ13C val-ues of our Heron Reef corals representing open ocean conditions along the EAC path, which range from −2.2 to 1.3� (Supple-mentary Table S2). Hence, any Moreton Bay corals having δ13C lower than −2.2� might indicate influences of terrestrial inputs. In Supplementary Table S2, five Moreton Bay corals (OZM643, OZM649, OZM651, OZM652 and OZM654) have their δ13C values lower than −2.2�. However, three samples (OZM651, OZM652 and OZM654) spanning the period 0.3–2.7 cal kyr BP do not have anomalous �R values. In fact their �R values agree well with the modern value for Moreton Bay within 1-sigma uncertainties (Fig. 3a), which reflects open ocean conditions (see discussion in Section 2.2). In addition, the �R value of sample OZM649 at ∼4.25 cal kyr BP is significantly high (compared to its modern value) rather than low as expected from increases in terrestrial inputs and this value is not much different from that of Heron Reef (open ocean value) at ∼4.16 cal kyr BP (Fig. 3a). Further-more, the �R value of sample OZM643 at ∼6.2 cal kyr BP is also significantly high (compared to its modern value) instead of low as expected due to influences of terrestrial inputs. This �Ragrees well within 1-sigma uncertainties with 2 values from Mag-netic Island at ∼6.0–6.1 cal kyr BP (Fig. 3a), representing open ocean �R values along the EAC path as this island also receives surface waters from the southern branch of the SEC via the EAC (Fig. 1). Such evidence suggests that low δ13C in our Moreton Bay corals may not indicate significant influences of terrestrial inputs, but may reflect natural variability of this value in marine samples. This together with the discussion above suggests that �R values of our Moreton Bay samples primarily represent those of the open ocean.
Temporal variations in R values for the SW Pacific sites are pre-sented in Fig. 3b showing a similar variability pattern to that of their �R values (Fig. 3a) discussed above. Fig. 3c shows �14C val-ues of corals from the SW Pacific sites together with those from marine model (Marine13) and terrestrial (SHCal13) curves. Higher sample �14C values (compared to that of Marine13) represent neg-ative �R values for that sample and vice versa. Similarly, a less lower sample �14C value (compared to that of SHCal13) repre-sents a lower R value for that sample, and vice versa. For the last 5.4 cal kyr BP, most of the �14C values for Heron Reef and More-ton Bay samples agree well within the 1σ range of the Marine13 curve, which acts as the modern �R value for the SW Pacific sites (because this value is ∼0 yr as mentioned in Section 2.2). However, between 5.4 and 8 cal kyr BP some �14C values for the SW Pacific sites are significantly different from the Marine13 curve indicating large variations in the �14C values in our SW Pacific samples. The pattern of this temporal �14C variability for the SW Pacific sites is similar to that of �R variations shown in Fig. 3a.
Because of the similarity between temporal variability in �R, R and �14C for the study sites in SW Pacific, only �R values are discussed below.
38 Q. Hua et al. / Earth and Planetary Science Letters 422 (2015) 33–44
4. Discussion
4.1. �R for the SW Pacific sites vs values previously published for the Pacific
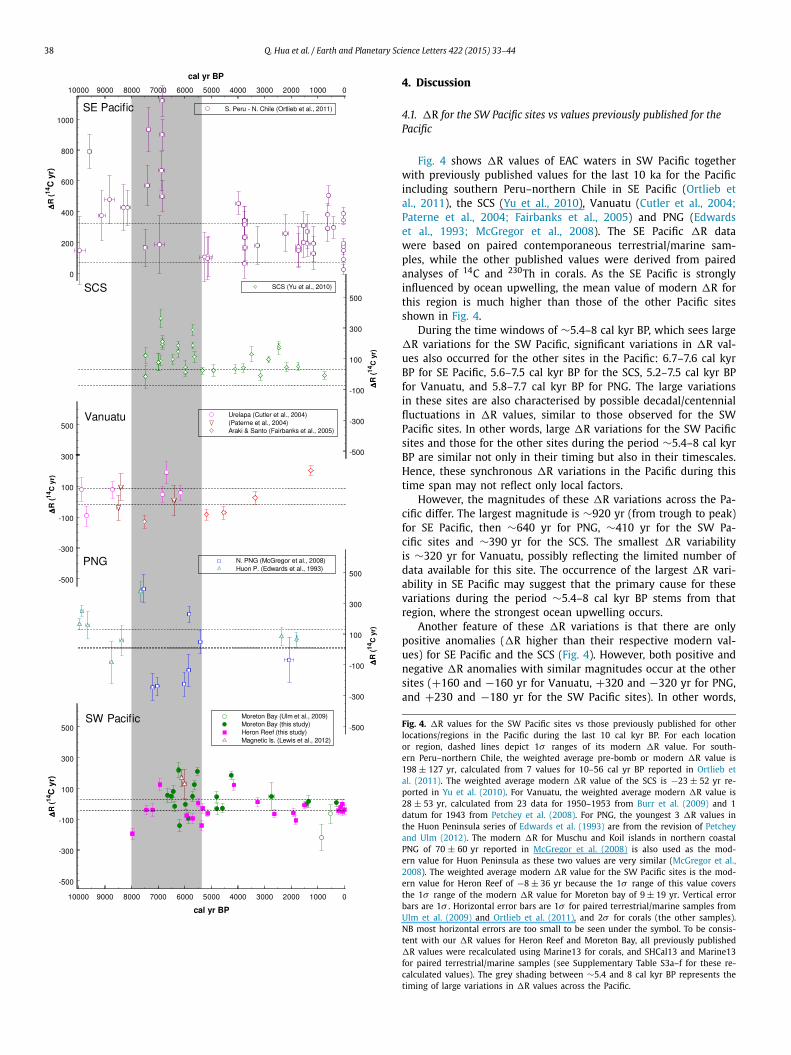
Fig. 4 shows �R values of EAC waters in SW Pacific together with previously published values for the last 10 ka for the Pacific including southern Peru–northern Chile in SE Pacific (Ortlieb et al., 2011), the SCS (Yu et al., 2010), Vanuatu (Cutler et al., 2004;Paterne et al., 2004; Fairbanks et al., 2005) and PNG (Edwards et al., 1993; McGregor et al., 2008). The SE Pacific �R data were based on paired contemporaneous terrestrial/marine sam-ples, while the other published values were derived from paired analyses of 14C and 230Th in corals. As the SE Pacific is strongly influenced by ocean upwelling, the mean value of modern �R for this region is much higher than those of the other Pacific sites shown in Fig. 4.
During the time windows of ∼5.4–8 cal kyr BP, which sees large �R variations for the SW Pacific, significant variations in �R val-ues also occurred for the other sites in the Pacific: 6.7–7.6 cal kyr BP for SE Pacific, 5.6–7.5 cal kyr BP for the SCS, 5.2–7.5 cal kyr BP for Vanuatu, and 5.8–7.7 cal kyr BP for PNG. The large variations in these sites are also characterised by possible decadal/centennial fluctuations in �R values, similar to those observed for the SW Pacific sites. In other words, large �R variations for the SW Pacific sites and those for the other sites during the period ∼5.4–8 cal kyr BP are similar not only in their timing but also in their timescales. Hence, these synchronous �R variations in the Pacific during this time span may not reflect only local factors.
However, the magnitudes of these �R variations across the Pa-cific differ. The largest magnitude is ∼920 yr (from trough to peak) for SE Pacific, then ∼640 yr for PNG, ∼410 yr for the SW Pa-cific sites and ∼390 yr for the SCS. The smallest �R variability is ∼320 yr for Vanuatu, possibly reflecting the limited number of data available for this site. The occurrence of the largest �R vari-ability in SE Pacific may suggest that the primary cause for these variations during the period ∼5.4–8 cal kyr BP stems from that region, where the strongest ocean upwelling occurs.
Another feature of these �R variations is that there are only positive anomalies (�R higher than their respective modern val-ues) for SE Pacific and the SCS (Fig. 4). However, both positive and negative �R anomalies with similar magnitudes occur at the other sites (+160 and −160 yr for Vanuatu, +320 and −320 yr for PNG, and +230 and −180 yr for the SW Pacific sites). In other words,
Fig. 4. �R values for the SW Pacific sites vs those previously published for other locations/regions in the Pacific during the last 10 cal kyr BP. For each location or region, dashed lines depict 1σ ranges of its modern �R value. For south-ern Peru–northern Chile, the weighted average pre-bomb or modern �R value is 198 ± 127 yr, calculated from 7 values for 10–56 cal yr BP reported in Ortlieb et al. (2011). The weighted average modern �R value of the SCS is −23 ± 52 yr re-ported in Yu et al. (2010). For Vanuatu, the weighted average modern �R value is 28 ± 53 yr, calculated from 23 data for 1950–1953 from Burr et al. (2009) and 1 datum for 1943 from Petchey et al. (2008). For PNG, the youngest 3 �R values in the Huon Peninsula series of Edwards et al. (1993) are from the revision of Petchey and Ulm (2012). The modern �R for Muschu and Koil islands in northern coastal PNG of 70 ± 60 yr reported in McGregor et al. (2008) is also used as the mod-ern value for Huon Peninsula as these two values are very similar (McGregor et al., 2008). The weighted average modern �R value for the SW Pacific sites is the mod-ern value for Heron Reef of −8 ± 36 yr because the 1σ range of this value covers the 1σ range of the modern �R value for Moreton bay of 9 ± 19 yr. Vertical error bars are 1σ . Horizontal error bars are 1σ for paired terrestrial/marine samples from Ulm et al. (2009) and Ortlieb et al. (2011), and 2σ for corals (the other samples). NB most horizontal errors are too small to be seen under the symbol. To be consis-tent with our �R values for Heron Reef and Moreton Bay, all previously published �R values were recalculated using Marine13 for corals, and SHCal13 and Marine13 for paired terrestrial/marine samples (see Supplementary Table S3a–f for these re-calculated values). The grey shading between ∼5.4 and 8 cal kyr BP represents the timing of large variations in �R values across the Pacific.

Q. Hua et al. / Earth and Planetary Science Letters 422 (2015) 33–44 39
Fig. 5. Map of the Pacific showing major ocean circulation (modified from Druffel et al., 2007) and study sites. Depicted are �R sites (solid diamonds) discussed in Fig. 4, locations of lake/sediment cores (solid squares) for the study of strength and positions of the SWW belt reported in Lamy et al. (2010) and shown in Fig. 6d–f, and locations of sediment cores (solid circles) for the discussion of seawater salinity changes in the TWP reported in Stott et al. (2004) and shown in Fig. 6g. Two hatched areas in southern Pacific depict the locations where SAMW form as reported by Toggweiler et al. (1991) and Rodgers et al. (2003). Dark grey area represents the surrounding upwelling region of TEP. Solid and dashed arrows represent surface and subsurface currents, respectively. MC – Mindanao Current, ITF – Indonesian throughflow, KC – Kuroshio Current, EUC – Equatorial Under Current and PUC – subsurface Poleward Undercurrent. The position of modern salinity front is from Linsley et al. (2006).
�R values at the latter sites fluctuated above and below their re-spective modern values with similar magnitudes.
For the late Holocene (∼5.4 cal kyr onwards), �R variations across the Pacific sites are significantly reduced and most of the values agree well with their respective modern values (Fig. 4). Sim-ilar observations were reported for other sites in the Pacific during the last millennium, including American Samoa, the southern Cook Islands and the Marquesas in tropical southern Pacific (Petchey et al., 2009), Hawaii in tropical northern Pacific (Weisler et al., 2009), and Palmyra and Christmas Islands in central Pacific (Zaunbrecher et al., 2010).
4.2. Mechanisms for large �R variations for the period∼5.4–8 cal kyr BP
4.2.1. For SE Pacific and the SCSThe region off the coast of Peru between 4◦ and 15◦S in trop-
ical east Pacific (TEP) is a well-known source of unusually cold upwelled waters. This ocean upwelling brings old (14C-depleted) equatorial subsurface water (ESSW) to the surface leading to high �R values for the Peruvian coast. ESSW, mainly derived from the eastward flowing Equatorial Under Current (EUC), is also carried to the south by the subsurface Poleward Undercurrent (PUC) (see Fig. 5) and the shoaling of these water masses during strong coastal upwelling spreads the 14C-depleted waters to southern Peru–northern Chile resulting in high �R values for this region as well (Ortlieb et al., 2011). The 14C content and �R value of sur-face waters along southern Peru–northern Chile are dependent on the 14C level of ESSW and the frequency and magnitude of ocean upwelling in this region.
One of the major sources of ESSW is Subantarctic Mode Water (SAMW; Toggweiler et al., 1991; Rodgers et al., 2003). SAMW is old water that forms by deep convection in winter on the equatorward
side of the Antarctic Circumpolar Current (Rintoul and England, 2002) and then sinks to contribute to the EUC (Fig. 5). Variations in the contribution of SAMW to the EUC result in changes in the 14C content of upwelled waters in TEP and SE Pacific. Production of SAMW in mid- to high latitudes in South Pacific is positively correlated with wind stress intensity and the position and in-tensity of southern westerly winds (Rintoul and England, 2002;Druffel et al., 2007). Fig. 6d–f shows proxy records for the position and intensity of the southern westerly wind (SWW) belt for the Holocene (Lamy et al., 2010). During the early to mid-Holocene the SWW belt contracted, its northern margin located to a more pole-ward position than during the late Holocene (Fig. 6d). The core SWW belt at ∼53◦S (the latitude of SAMW formation) had high intensity during the early Holocene and intermediate during mid-Holocene compared to low during the late Holocene (Fig. 6e–f). This indicates more contribution of SAMW to the EUC and ESSW for the early to mid-Holocene, and less contribution for the late Holocene. Weber et al. (2014) reported a fairly complete biogenic opal flux record – a proxy for ocean upwelling – from the Cen-tral Scotia Sea in western Atlantic sector of the Southern Ocean for the period 7–25 ka showing high values between 7 and 10 ka that correspond to enhanced wind-driven upwelling of deep water masses. This further supports the more poleward position of the SWW and increased 14C-depleted water exports from the South-ern Ocean during the early to mid-Holocene.
Rodgers et al. (2004) used an ocean model to explain a shift to higher values in annual minimum �14C level in Galápagos corals from TEP after AD 1976, which was reported in Guilderson and Schrag (1998). They concluded that this �14C shift of ∼40�(equivalent to ∼32014C yr) reflected a decrease in the SAMW com-ponent of EUC and ESSW. Druffel et al. (2007) also suggested that more contribution of SAMW to upwelled waters in TEP dur-ing the early 1600s and 1800s might be a reason for low �14C

40 Q. Hua et al. / Earth and Planetary Science Letters 422 (2015) 33–44
of ∼−70� observed in their Galápagos corals during these in-tervals. This value is ∼23� (equivalent to ∼18514C yr) lower than the highest �14C value of −47� in their data recorded during the early 1700s. With a greater contribution of SAMW to ESSW during the early to mid-Holocene, as mentioned above, the magnitude of 14C age changes in upwelled waters in TEP dur-ing these periods is expected to be much higher than the level of 185–320 yr changes for Galápagos for the late Holocene, when the SAMW component of the upwelled waters is significantly re-duced.
Higher frequency and stronger ocean upwelling in TEP brings more 14C-depleted ESSW to the surface, which results in higher �R values for SE Pacific. Such ocean upwelling is related to El Niño Southern Oscillation (ENSO) variability. However, there is no clear consensus on ENSO proxy records. Some records document a reduction in ENSO activity during early/mid-Holocene but an increase during late Holocene (Tudhope et al., 2001; Moy et al., 2002; Gagan et al., 2004; Conroy et al., 2008; McGregor et al., 2013; Driscoll et al., 2014; Fig. 6b). Meanwhile other records re-port highly variable ENSO activity throughout the Holocene with-out any systematic trend (Cobb et al., 2013; Carré et al., 2014; Fig. 6c). Liu et al. (2014) recently reported model simulations of ENSO variability using a set of climatic forcing including or-bital, greenhouse gasses, continental ice sheets and meltwater dis-charges. The model results are qualitatively consistent with most proxy records indicating an overall strengthening of ENSO from early to late Holocene with large short-term variations (Liu et al., 2014). Large positive �R anomalies of up to ∼920 yr ob-served in SE Pacific during the early to mid-Holocene (Fig. 4) might indicate higher/stronger ocean upwelling in this region as-sociated with higher/stronger La Niña activity. This argument is further supported as the climate in this region in the early to mid-Holocene favoured intensified coastal upwelling activity related to a strengthened southeastern Pacific subtropical anticyclone (Ortlieb et al., 2011, and references therein).
According to Rodgers et al. (2003) it takes 30–140 yr for SAMW to arrive in mid-tropical Pacific following its subduction in South Pacific. However, the contribution of SAMW to surface waters in TEP varies significantly in a much shorter period of time as it is effectively controlled by immediate changes in southeast trade wind intensity (Druffel et al., 2007). This feature may explain the large �R variations in SE Pacific at decadal timescale for the early to mid-Holocene (Fig. 4). During the early to mid-Holocene, sum-mer insolation in the Northern Hemisphere was greater than that for the late Holocene (Fig. 6a), resulting in larger seasonality for this hemisphere and a more northward position for the Inter-tropical Convergence Zone (ITCZ) compared to its present position (Haug et al., 2001; Wanner et al., 2008). This together with en-hanced easterly winds under higher/stronger La Niña activity dur-ing the early to mid-Holocene, as discussed above, would lead to a strengthened Northern Equatorial Current (NEC), which would
Fig. 6. Climatic and oceanographic records for the Holocene. (a) Summer insola-tion (June) at 60◦N (Berger and Loutre, 1991). (b–c) Proxy records for ENSO fre-quency/intensity. Records from Ecuadorian Lake Pallcacocha (Moy et al., 2002) and Galápagos Lake El Junco (Conroy et al., 2008) indicate rainfall events associated with ENSO activity. Records from Northern Line Island corals (Cobb et al., 2013)and Peruvian shells (Carré et al., 2014) depict ENSO variance (δ18O-based sea sur-face temperature) changes relative to the late 20th century ENSO (lines in Fig. 6c).(d) Precipitation reconstructed from Lake Aculeo (∼34◦S, central Chile; Jenny et al., 2003) as a proxy for the intensity of northern margin SWW (Lamy et al., 2010). Solid and dashed lines represent mean and range of rainfall, respectively. (e–f) Two of the proxies for the strength of the core SWW discussed by Lamy et al. (2010). SK1 and Palm2 are sediment cores collected in different fjord systems (∼53◦S) in southern Chile. Enhanced westerly winds result in a strong surface flow capa-ble of transporting clayey material from mafic metamorphic and plutonic Andean source rocks towards Sk1 site. Accumulation rates (AR) of biogenic CaCO3 (mainly foraminifers) at Palm2 site were used as a proxy for paleosalinity with lower salin-ities being associated with higher rainfall (stronger westerly winds) and vice versa (Lamy et al., 2010). The y-axis for AR of biogenic CaCO3 is shown in reverse order.(g) δ18O-based seawater salinity for the Holocene reconstructed from four ocean sediments in WTP (Stott et al., 2004), three of which are located in southern Philip-pines (core MD81), northwestern PNG (core MD76) and northern Australia (core MD70) and are on the path of the Mindanao Current and ITF originating from the NEC (see Fig. 5). These salinity data may indicate the strength of westward ad-vection of salty seawater in TEP by the NEC, with higher salinity being associated with stronger westward transport and vice versa (Stott et al., 2004). The y-axis for δ18OSW is shown in reverse order. The solid line depicts mean salinity values and dashed lines represent their 1σ uncertainties. The grey shading represents the tim-ing of large �R variations across the Pacific during the interval ∼5.4–8 cal kyr BP.

Q. Hua et al. / Earth and Planetary Science Letters 422 (2015) 33–44 41
bring 14C-depleted waters in the TEP westward. An increased west-ward advection of saltier waters from the TEP to tropical west Pacific (TWP), probably by the NEC, during early to mid-Holocene was also suggested by Stott et al. (2004), who observed an al-most continuous decrease in surface water salinity at several sites in TWP along the path of the Mindanao Current and the Indone-sian throughflow (originating from the NEC; see Fig. 5) since 15 cal kyr BP (see Fig. 6g). The NEC feeds into the SCS via a northward Kuroshio Current (Fig. 5) resulting in positive �R anomalies with possible large decadal/centennial variability for this region for the interval of 5.6–7.5 cal kyr BP (Fig. 4).
4.2.2. For Vanuatu, PNG and the SW Pacific sitesFor the South Pacific, 14C-depleted waters in the TEP are also
spread to the west by the South Equatorial Current (SEC) but this process is more complex than that for the North Pacific. It is be-cause the volume of these old waters reaching the western Pacific sites is controlled by the surface ocean salinity front (Fig. 5), which separates fresher Western Pacific Warm Pool water from saltier and cooler waters in the east, and the complexity of ocean circu-lation in the tropical and subtropical SW Pacific. During La Niña events, the salinity front is stronger, as the South Pacific Con-vergence Zone (SPCZ) moves southwestward (Linsley et al., 2006;Mantsis et al., 2013), thus limiting these old waters reaching the western Pacific sites. In contrast, during El Niño events, the salin-ity front is weaker as the SPCZ moves northeastward and the SEC strengthens, allowing more of these saltier, older waters to spread to the western Pacific sites (Linsley et al., 2006). Vanuatu and the SW Pacific sites receive waters from the southern branch of the SEC, while surface waters at the PNG sites are supplied by both equatorial (McGregor et al., 2008) and southern (Petchey and Ulm, 2012) branches of the SEC from the Solomon Sea via the Vitiaz Strait (Fig. 1). The southern branch of the SEC con-tains 14C-enriched or well-equilibrated waters originating from the subtropical gyre, while the equatorial branch of the SEC carries 14C-depleted waters from the TEP (McGregor et al., 2008, and ref-erences therein).
The higher/stronger La Niña activity during the mid-Holocene, as discussed above, might indicate that limited old surface waters in the TEP were carried to the west by the SEC. During this pe-riod, the southern branch of the SEC might move northward as a result of northward shift in the ITCZ position as discussed above, and its 14C content might be further enriched due to enhanced air–sea exchange of CO2 facilitated by strengthened easterly trade winds (McGregor et al., 2008). These factors may explain nega-tive �R anomalies for the western Pacific sites during the period ∼5.4–8 cal kyr BP (Fig. 4). In contrast, positive �R anomalies for those sites during ∼5.4–7 cal kyr BP might also indicate increased El Niño activity for this period. It is because increased El Niño activity allows more old waters from the TEP spread to west by strengthened SEC, and during El Niño events the equatorial branch of the SEC shifts southward (Druffel and Griffin, 1993, 1999) and supplies these old waters not only to the PNG sites but also to Vanuatu and the SW Pacific sites. Furthermore, changes in the con-tribution of SAMW to surface waters in the TEP; variability in the position of the ITCZ due to changes in the NH summer insolation (Wanner et al., 2008; Fig. 6a); variations in the position of the SPCZ – as it appears to be correlated with the inter-decadal Pa-cific oscillation mode (Linsley et al., 2006; Mantsis et al., 2013); and variations of ENSO at decadal-to-centennial timescales might also contribute to observed large variability in �R values featur-ing possible decadal/centennial fluctuations with both positive and negative anomalies at Vanuatu, PNG and the SW Pacific sites for the period ∼5.4–8 cal kyr BP (Fig. 4).
For the PNG sites, seasonal upwelling along the northern coastal PNG during the northwest monsoon and intermittent upwelling
along the PNG coast near the Vitiaz Strait have been reported (McGregor et al., 2008; Petchey and Ulm, 2012). Such upwelling can result in high �R value of ∼330 yr for Finschafen, Huon Peninsula (Petchey and Ulm, 2012). Variations in this local factor together with the regional mechanisms as mentioned above might explain larger �R variations at the PNG sites (compared to those at Vanuatu and the SW Pacific sites) during the mid-Holocene.
Variability in R at decadal-to-centennial timescale with a mag-nitude of ∼400 yr (from trough to peak) was reported for Van-uatu during the latter Younger Dryas chronozone (11.8–12.3 cal kyr BP; Burr et al., 2009). Such variability with much smaller magnitude was also discussed by Druffel and Griffin (1993, 1999)for SW Pacific during recent time. Those authors suggested that multi-decadal variability in ocean circulation in SW Pacific and centennial changes in ENSO intensity were the causal factors for variations in coral �14C for the southern GBR during the last ∼300 cal yr BP.
Contribution of freshwater and/or rainfall, incorporating more recent carbon (compared to surface ocean DIC) from atmospheric CO2, to a particular site may lower its �R values (Dye, 1994;Southon et al., 2002). Phytoplankton data derived from Lake McKenzie, Fraser Island (between Heron Reef and Moreton Bay; Hembrow et al., 2014), charcoal records from 3 lagoons in North Stradbroke Island, Moreton Bay (Moss et al., 2013), and pollen and charcoal records from Tari basin, PNG and multi-proxies derived from Emaotfer Swamp, Efate Island, Vanuatu (Mantsis et al., 2013and references therein) indicated a wetter climate for these regions during the mid-Holocene compared to that for the late Holocene. This might contribute to negative �R anomalies for Vanuatu, PNG and the SW Pacific sites for the period ∼5.4–8 cal kyr BP. As δ13C values of freshwater bicarbonates of −10 to −14� are much lower than those of marine carbonates being close to 0� (Stuiver and Polach, 1977), lower coral δ13C values should be expected if this mechanism (contribution of freshwater and/or rainfall) is valid. However, it is not the case for our SW Pacific sites because average coral δ13C values associated with negative �R anomalies are not lower than those associated with modern �R values or zero �Ranomalies.2 As no δ13C values were reported for Vanuatu and PNG data (Edwards et al., 1993; Cutler et al., 2004; Paterne et al., 2004;McGregor et al., 2008), we cannot determine whether this mecha-nism is valid for those sites during the mid-Holocene.
4.3. �R across the Pacific for the last ∼5.4 cal kyr BP
During the late Holocene (∼5 cal kyr onwards), the SWW belt expanded with its northern margin reaching ∼35◦S (Fig. 6d), but its core at ∼53◦S was significantly reduced in strength (Fig. 6e–f), indicating a significant reduction in the contribution of SAMW to ESSW. In addition, during the interval from ∼4 cal kyr onwards the upwelling activity in the TEP was significantly reduced because of weaker easterly trade winds related to enhanced El Niño activity as indicated in most ENSO records (Fig. 6b–c). These factors suggest that the upwelled waters in the TEP were not only reduced in vol-ume but also contained less 14C-depleted carbon, leading to much lower and less variable �R values for SE Pacific, which are almost consistent with its modern values. As more ENSO warm events oc-curred and the SPCZ moved northeastward more frequently, more surface waters of higher and less variable 14C content (relative to the early to mid-Holocene) in the TEP were carried to the west by the SEC, resulting in much less �R variability for Vanuatu, PNG and the SW Pacific sites for the late Holocene.
2 The former δ13C values are 0.5 ± 0.3� for Heron Reef (n = 4) and 0.2 ± 2.8�for Moreton Bay (n = 2), and the latter values are −0.2 ± 0.3� for Heron Reef (n = 15) and −1.1 ± 0.5� for Moreton Bay (n = 12).
42 Q. Hua et al. / Earth and Planetary Science Letters 422 (2015) 33–44
�R variations during this period shown in Fig. 4 may re-flect local effects. For example, small positive �R anomalies of ∼260–300 yr at ∼0.6 and ∼4 cal kyr BP for SE Pacific may reflect changes in ocean upwelling for this region (Ortlieb et al., 2011), but these changes are not large enough to be seen in the other Pacific sites. In addition, stronger ocean upwelling in the SCS re-lated to intensified East Asian summer monsoon during the period 2.5–3.5 cal kyr BP was suggested as a causal factor for small posi-tive �R anomalies of 120–200 yr for the SCS for this period (Yu et al., 2010), and a negative �R anomaly of ∼210 yr around 0.9 cal kyr BP for Moreton Bay may be due to changes in regional ocean circulation and terrestrial inputs (Ulm et al., 2009).
4.4. Implications for radiocarbon dating of marine samples in tropical and sub-tropical Pacific
Ortlieb et al. (2011) showed that more accurate radiocarbon dating of marine samples could be achieved if temporal �Rvariability was taken into account when calibrating radiocarbon ages. To illustrate that point, those authors revised the 14C-based chronology of a previously published record of sea surface tem-perature (Kim et al., 2002) that was derived from a sediment core at ∼33◦S in SE Pacific, using temporal changes in their �Rvalues for southern Peru–northern Chile. The results indicated that the revised chronology (with temporal �R) was different than the published chronology (with constant �R). The differ-ence was significant for the early and mid-Holocene, the period where large positive �R anomalies of ∼300–920 yr in SE Pacific occur (Fig. 4), with the revised chronology being ∼300–1000 yr younger than the published one. In other words, the published chronology was ∼300–1000 yr in error for that time interval. Sim-ilar temporal issues apply to the SCS for two periods, 2.5–3.5 and5.6–7.5 cal kyr BP, where positive �R anomalies are evident (Fig. 4; Yu et al., 2010). However, the magnitudes of those errors are smaller, ∼150–250 yr and ∼100–400 yr, respectively.
The situation is different for TWP and SW Pacific regions, where both positive and negative �R anomalies occur for the period ∼5.4–8 cal kyr BP. The weighted mean value for each site is sim-ilar to its modern value, but the uncertainty associated with the former value is larger or much larger than that of the latter value. For example, the weighted mean value for Vanuatu is −25 ±106 yr(n = 6) for 5.2–8 cal kyr BP compared to its modern value of 28 ± 53 yr. These values for PNG and the SW Pacific sites are 52 ± 272 yr (n = 8) and 70 ± 60 yr, and 2 ± 112 yr (n = 19) and −8 ± 36 yr, respectively. If temporal �R variations for the period ∼5.4–8 cal kyr BP are taken into account when calibrating marine samples from these sites, the resulting calibrated age ranges for this time interval may be larger than those using constant (mod-ern) values. However, the newly calibrated age ranges are more reliable because they reflect the true nature of the marine reser-voir effect at these sites.
5. Conclusions
We have investigated the marine reservoir effect for EAC wa-ters in SW Pacific during the last 8 cal kyr BP using 230Th-dated corals from Heron Reef and Moreton Bay, Queensland. Our data to-gether with those previously published in the Pacific show large variability in �R values of several hundred to almost a thousand years with possible decadal/centennial fluctuations during the time period ∼5.4–8 cal kyr BP. Variability in the magnitude and fre-quency of ocean upwelling in the TEP (depending on climatic con-ditions such as La Niña vs El Niño), changes in the contribution of SAMW to these upwelled waters (influenced by the strength and position of the SWW belt) and variations in Pacific wide ocean circulation (depending on climatic conditions and the positions of
the ITCZ and SPCZ) at various (decadal, centennial and millennial) timescales are the mechanisms that drove observed significant �Rvariations across the Pacific. These results not only confirm that radiocarbon is a useful tracer for the study of past changes in climate and ocean circulation as reported by several researchers (e.g., Sikes et al., 2000; Hua et al., 2005; Bondevik et al., 2006;Druffel et al., 2007; Yu et al., 2010; Siani et al., 2013), but also in-dicate an urgent need for using temporal changes in �R values (instead of constant, modern values) for age calibration for im-proved radiocarbon dating of marine samples.
Acknowledgements
Coral cores were collected from Heron Reef under Great Barrier Reef Marine Park Authority permits G03/9787.1, G03/11105.1 and G07/22373.1, and Moreton Bay under Moreton Bay Marine Park permit CVL1394. AMS 14C measurements were supported by AINSE Grants (10/024, 10/076, 10/112 and 11/104). Additional funding was provided by Australian Research Council (ARC) Discovery GrantDP1096184. We thank S. Hankin for the preparation of Figs. 1 and 5 and F. Lamy for the generous provision of tabulated data for Fig. 6e–f. We would also like to thank two anonymous reviewers for their constructive comments, which improved the manuscript.
Appendix A. Supplementary material
Supplementary material related to this article can be found on-line at http://dx.doi.org/10.1016/j.epsl.2015.03.049.
References
van Beek, P., Reyss, J.-L., Paterne, M., Gersonde, R., van der Loeff, M.R., Kuhn, G., 2002. 226Ra in barite: absolute dating of Holocene Southern Ocean sediments and reconstruction of sea-surface reservoir ages. Geology 30, 731–734.
Berger, A., Loutre, M.F., 1991. Insolation values for the climate of the last 10 million years. Quat. Sci. Rev. 10, 297–317.
Bondevik, S., Mangerud, J., Birks, H.H., Gulliksen, S., Reimer, P., 2006. Changes in North Atlantic radiocarbon reservoir ages during the Allerød and Younger Dryas. Science 312, 1514–1517.
Burr, G.S., Beck, J.W., Corrège, T., Cabioch, G., Taylor, F.W., Donahue, D.J., 2009. Mod-ern and Pleistocene reservoir ages inferred from South Pacific corals. Radiocar-bon 51, 319–335.
Carré, M., Sachs, J.P., Purca, S., Schauer, A.J., Braconnot, P., Falcón, R.A., Julien, M., Lavallée, D., 2014. Holocene history of ENSO variance and asymmetry in the eastern tropical Pacific. Science 345, 1045–1048.
Cheng, H., Edwards, R.L., Hoff, J., Gallup, C.D., Richards, D.A., Asmerom, Y., 2000. The half-lives of uranium-234 and thorium-230. Chem. Geol. 169, 17–33.
Clark, T.R., Roff, G., Zhao, J.-X., Feng, Y.-X., Done, T.J., Pandolfi, J.M., 2014. Testing the precision and accuracy of the U–Th chronometer for dating coral mortality events in the last 100 years. Quat. Geochronol. 23, 35–45.
Clark, T.R., Zhao, J.-X., Feng, Y.-X., Done, T.J., Jupiter, S., Lough, J., Pandolfi, J.M., 2012. Spatial variability of initial 230Th/232Th in modern Porites from the inshore re-gion of the Great Barrier Reef. Geochim. Cosmochim. Acta 78, 99–118.
Cobb, K.M., Westphal, N., Sayani, H.R., Watson, J.T., Di Lorenzo, E., Cheng, H., Ed-wards, R.L., Charles, C.D., 2013. Highly variable El Niño–Southern Oscillation throughout the Holocene. Science 339, 67–70.
Conroy, J.L., Overpeck, J.T., Cole, J.E., Shanahan, T.M., Steinitz-Kannan, M., 2008. Holocene changes in eastern tropical Pacific climate inferred from a Galápagos lake sediment record. Quat. Sci. Rev. 27, 1166–1180.
Cutler, K.B., Gray, S.C., Burr, G.S., Edwards, R.L., Taylor, F.W., Cabioch, F., Beck, J.W., Cheng, H., Moore, J., 2004. Radiocarbon calibration and comparison to 50 kyr BP with paired 14C and 230Th dating of corals from Vanuatu and Papua New Guinea. Radiocarbon 46, 1127–1160.
Davies, P.J., 1974. Subsurface solution unconformities at Heron Island, Great Barrier Reef. In: The Proceedings of the 2nd International Coral Reef Symposium, vol. 2, pp. 573–578.
Driscoll, R., Elliot, M., Russon, T., Welsh, K., Yokoyama, Y., Tudhope, A., 2014. ENSO reconstructions over the past 60 ka using giant clams (Tridacna sp.) from Papua New Guinea. Geophys. Res. Lett. 41. http://dx.doi.org/10.1002/2014GL061446.
Druffel, E.R.M., Griffin, S., 1993. Large variations of surface ocean radiocarbon: ev-idence of circulation changes in the southwestern Pacific. J. Geophys. Res. 98 (C11), 20249–20259.
Druffel, E.R.M., Griffin, S., 1999. Variability of surface ocean radiocarbon and stable isotopes in the southwestern Pacific. J. Geophys. Res. 104 (C10), 23607–23613.

Q. Hua et al. / Earth and Planetary Science Letters 422 (2015) 33–44 43
Druffel, E.R.M., Griffin, S., Guilderson, T.P., Kashgarian, M., Southon, J., Schrag, D.P., 2001. Changes of subtropical North Pacific radiocarbon and correlation with cli-mate variability. Radiocarbon 43, 15–25.
Druffel, E.R.M., Griffin, S., Beaupré, S.R., Dunbar, R.B., 2007. Oceanic climate and circulation changes during the past four centuries from radiocarbon in corals. Geophys. Res. Lett. 34, L09601. http://dx.doi.org/10.1029/2006GL028681.
Druffel, E.R.M., Robinson, L.F., Griffin, S., Halley, R.B., Southon, J.R., Adkins, J.F., 2008. Low reservoir ages for the surface ocean from mid-Holocene Florida corals. Pa-leoceanography 23, PA2209. http://dx.doi.org/10.1029/2007PA001527.
Dye, T., 1994. Apparent ages of marine shells: implications for archaeological dating in Hawai’i. Radiocarbon 36, 51–57.
Edwards, R.L., Beck, J.W., Burr, G.S., Donahue, D.J., Chappell, J.M.A., Bloom, A.L., Druffel, E.R.M., Taylor, F.W., 1993. A large drop in atmospheric 14C/12C and re-duced melting in the Younger Dryas, documented with 230Th ages of corals. Science 260, 962–968.
Fairbanks, R.G., Mortlock, R.A., Chiu, T.-C., Cao, L., Kaplan, A., Guilderson, T.P., Fair-banks, T.W., Bloom, A.L., Grootes, P.M., Nadeau, M.-J., 2005. Radiocarbon calibra-tion curve spanning 0 to 50,000 years BP based on paired 230Th/234U/238U and 14C dates on pristine corals. Quat. Sci. Rev. 24, 1781–1796.
Fink, D., Hotchkis, M., Hua, Q., Jacobsen, G., Smith, A.M., Zoppi, U., Child, D., Mifsud, C., van der Gaast, H., Williams, A., Williams, M., 2004. The ANTARES AMS facility at ANSTO. Nucl. Instrum. Methods B 223–224, 109–115.
Fontugne, M., Carré, M., Bentaleb, I., Julien, M., Lavallée, D., 2004. Radiocarbon reser-voir age variations in the South Peruvian upwelling during the Holocene. Radio-carbon 46, 531–537.
Gagan, M.K., Hendy, E.J., Haberle, S.G., Hantoro, W.S., 2004. Post-glacial evolu-tion of the Indo-Pacific Warm Pool and El Niño-Southern Oscillation. Quat. Int. 118–119, 127–143.
Guilderson, T.P., Schrag, D.P., 1998. Abrupt shift in subsurface temperatures in the tropical Pacific associated with changes in El Niño. Science 281, 240–243.
Haug, G.H., Hughen, K.A., Sigman, D.M., Peterson, L.C., Röhl, U., 2001. Southward migration of the Intertropical Convergence Zone through the Holocene. Sci-ence 293, 1304–1308.
Hembrow, S.C., Taffs, K.H., Atahan, P., Parr, J., Zawadzki, A., Heijnis, H., 2014. Diatom community response to climate variability over the past 37,000 years in the sub-tropics of the Southern Hemisphere. Sci. Total Environ. 468–469, 774–784.
Hogg, A.G., Hua, Q., Blackwell, P.G., Niu, M., Buck, C.E., Guilderson, T.P., Heaton, T.J., Palmer, J.G., Reimer, P.J., Reimer, R.W., Turney, C.S.M., Zimmerman, S.R.H., 2013. SHCal13 Southern Hemisphere calibration, 0–50,000 cal yr BP. Radiocarbon 55, 1889–1903.
Hua, Q., Jacobsen, G.E., Zoppi, U., Lawson, E.M., Williams, A.A., Smith, A.M., McGann, M.J., 2001. Progress in radiocarbon target preparation at the ANTARES AMS Cen-tre. Radiocarbon 43, 275–282.
Hua, Q., Woodroffe, C.D., Barbetti, M., Smithers, S.G., Zoppi, U., Fink, D., 2004. Marine reservoir corrections for the Cocos (Keeling) Islands, Indian Ocean. Radiocar-bon 46, 603–610.
Hua, Q., Woodroffe, C.D., Smithers, S.G., Barbetti, M., Fink, D., 2005. Radiocarbon in corals from the Cocos (Keeling) Islands and implications for Indian Ocean circu-lation. Geophys. Res. Lett. 32, L21602. http://dx.doi.org/10.1029/2005GL023882.
Hua, Q., Barbetti, M., Fink, D., Kaiser, K.F., Friedrich, M., Kromer, B., Levchenko, V.A., Zoppi, U., Smith, A.M., Bertuch, F., 2009. Atmospheric 14C variations derived from tree rings during the early Younger Dryas. Quat. Sci. Rev. 28, 2982–2990.
Jell, J.S., Webb, G.E., 2012. Geology of Heron Island and Adjacent Reefs, Great Barrier Reef, Australia. Episodes 35, 110–119.
Jenny, B., Wilhelm, D., Valero-Garces, B.L., 2003. The Southern Westerlies in Cen-tral Chile: Holocene precipitation estimates based on a water balance model for Laguna Aculeo (33◦50′S). Clim. Dyn. 20, 269–280.
Kim, J.-H., Schneider, R., Hebbeln, D., Müller, P.J., Wefer, G., 2002. Last deglacial sea-surface temperature evolution in the Southeast Pacific compared to climate changes on the South American continent. Quat. Sci. Rev. 21, 2085–2097.
Lamy, F., Kilian, R., Arz, H.W., Francois, J.-P., Kaiser, J., Prange, M., Steinke, T., 2010. Holocene changes in the position and intensity of the southern westerly wind belt. Nat. Geosci. 3, 695–699.
Leonard, N.D., Welsh, K.J., Zhao, J.-X., Nothdurft, L.D., Webb, G.E., Major, J., Feng, Y.-X., Price, G.J., 2013. Mid-Holocene sea level and coral reef demise: U/Th dat-ing of subfossil corals in Moreton Bay, Australia. Holocene 23, 1839–1850.
Lewis, S.E., Wüst, R.A.J., Webster, J.M., Shields, G.A., Renema, W., Lough, J.M., Ja-cobsen, G., 2012. Development of an inshore fringing coral reef using textural, compositional and stratigraphic data from Magnetic Island, Great Barrier Reef, Australia. Mar. Geol. 299–302, 18–32.
Linsley, B.K., Kaplan, A., Gouriou, Y., Salinger, J., de Menocal, P.B., Wellington, G.M., Howe, S.S., 2006. Tracking the extent of the South Pacific Convergence Zone since the early 1600s. Geochem. Geophys. Geosyst. 7, Q05003. http://dx.doi.org/10.1029/2005GC001115.
Liu, Z., Lu, Z., Wen, X., Otto-Bliesner, B.L., Timmermann, A., Cobb, K.M., 2014. Evolu-tion and forcing mechanisms of El Niño over the past 21,000 years. Nature 515, 550–553.
Ludwig, K.R., 2003. Users Manual for Isoplot/Ex version 3.0: a Geochronological Toolkit for Microsoft Excel. Berkeley Geochronol. Centre Spec. Pub., vol. 3. Berke-ley.
Lybolt, M., Neil, D., Zhao, J.-x., Feng, Y.-x., Yu, K., Pandolfi, J., 2011. Instability in a marginal coral reef: the shift from natural variability to a human-dominated seascape. Front. Ecol. Environ. 9 (3), 154–160.
Mantsis, D.F., Lintner, B.R., Broccoli, A.J., 2013. Mechanisms of Mid-Holocene precip-itation change in the South Pacific Convergence Zone. J. Climate 26, 6937–6952.
McGregor, H.V., Gagan, M.K., McCulloch, M.T., Hodge, E., Mortimer, G., 2008. Mid-Holocene variability in the marine 14C reservoir age for northern coastal Papua New Guinea. Quat. Geochronol. 3, 213–225.
McGregor, H.V., Fischer, M.J., Gagan, M.K., Fink, D., Phipps, S.J., Wong, H., Woodroffe, C.D., 2013. A weak El Niño/Southern Oscillation with delayed seasonal growth around 4300 years ago. Nat. Geosci. 6, 949–953.
Moss, P.T., Tibby, J., Petherick, L., McGowan, H., Barr, C., 2013. Late Quaternary veg-etation history of North Stradbroke Island, Queensland, eastern Australia. Quat. Sci. Rev. 74, 257–272.
Moy, C.M., Seltzer, G.O., Rodbell, D.T., Anderson, D.M., 2002. Variability of El Niño/Southern Oscillation activity at millennial timescales during the Holocene epoch. Nature 420, 162–165.
Neil, D.T., 1998. Moreton Bay and its catchment: seascape and landscape, develop-ment and degradation. In: Hall, N.J., Tibbetts, I.R., Dennison, W. (Eds.), Moreton Bay and Catchment. School of Marine Science, University of Queensland, Bris-bane, pp. 3–54.
Nothdurft, L., Webb, G., 2009. Earliest diagenesis in scleractinian coral skeletons: implications for palaeoclimate-sensitive geochemical archives. Facies 55 (2), 161–201.
Ortlieb, L., Vargas, G., Saliège, J.-F., 2011. Marine radiocarbon reservoir effect along the northern Chile-southern Peru coast (14–24◦S) throughout the Holocene. Quat. Res. 75, 91–103.
Paterne, M., Ayliffe, L.K., Arnold, M., Cabioch, G., Tisnerat-Laborde, N., Hatté, C., Dou-ville, E., Bard, E., 2004. Paired 14C and 230Th/U dating of surface corals from the Marquesas and Vanuatu (sub-equatorial Pacific) in the 3000 to 15,000 cal yr interval. Radiocarbon 46, 551–566.
Petchey, F., Ulm, S., 2012. Marine reservoir variation in the Bismarck region: an eval-uation of spatial and temporal change in �R and R over the last 3000 years. Radiocarbon 54, 45–58.
Petchey, F., Anderson, A., Zondervan, A., Ulm, S., Hogg, A., 2008. New marine �Rvalues for the South Pacific subtropical gyre region. Radiocarbon 50, 373–397.
Petchey, F., Allen, M.S., Addison, D.J., Anderson, A., 2009. Stability in the South Pacific surface marine 14C reservoir over the last 750 years. Evidence from Ameri-can Samoa, the southern Cook Islands and the Marquesas. J. Archaeol. Sci. 36, 2234–2243.
Petchey, F., Ulm, S., David, B., McNiven, I.J., Asmussen, B., Tomkins, H., Richards, T., Rowe, C., Leavesley, M., Mandui, H., Stanisic, J., 2012. 14C marine reservoir variability in herbivores and deposit-feeding gastropods from an open coastline, Papua New Guinea. Radiocarbon 54, 967–978.
Reimer, P.J., Baillie, M.G.L., Bard, E., Bayliss, A., Beck, J.W., Blackwell, P.G., Bronk Ram-sey, C., Buck, C.E., Burr, G.S., Edwards, R.L., Friedrich, M., Grootes, P.M., Guilder-son, T.P., Hajdas, I., Heaton, T., Hogg, A.G., Hughen, K.A., Kaiser, K.F., Kromer, B., McCormac, F.G., Manning, S.W., Reimer, R.W., Richards, D.A., Southon, J.R., Ta-lamo, S., Turney, C.S.M., van der Plicht, J., Weyhenmeyer, C.E., 2009. IntCal09 and Marine09 radiocarbon age calibration curves, 0–50,000 years cal BP. Radio-carbon 51, 1111–1150.
Reimer, P.J., Bard, E., Bayliss, A., Beck, J.W., Blackwell, P.G., Bronk Ramsey, C., Buck, C.E., Cheng, H., Edwards, R.L., Friedrich, M., Grootes, P.M., Guilderson, T.P., Hafl-idason, H., Hajdas, I., Hatté, C., Heaton, T.J., Hoffmann, D.L., Hogg, A.G., Hughen, K.A., Kaiser, K.F., Kromer, B., Manning, S.W., Niu, M., Reimer, R.W., Richards, D.A., Scott, E.M., Southon, J.R., Staff, R.A., Turney, C.S.M., van der Plicht, J., 2013. Int-Cal13 and Marine13 radiocarbon age calibration curves 0–50,000 years cal BP. Radiocarbon 55, 1869–1887.
Rintoul, S., England, M., 2002. Ekman transport dominates local air–sea fluxes in driving variability of Subantarctic Mode Water. J. Phys. Oceanogr. 32, 1308–1321.
Rodgers, K., Blanke, B., Madec, G., Aumont, O., Ciais, P., Dutay, J., 2003. Extratropical sources of Equatorial Pacific upwelling in an OGCM. Geophys. Res. Lett. 30 (2), 1084. http://dx.doi.org/10.1029/2002GL016003.
Rodgers, K., Aumont, O., Madec, G., Menkes, C., Blanke, B., Monfray, P., Orr, J.C., Schrag, D.P., 2004. Radiocarbon as a thermocline proxy for the eastern equatorial Pacific. Geophys. Res. Lett. 31, L14314. http://dx.doi.org/10.1029/2004GL019764.
Sarnthein, M., Grootes, P.M., Holbourn, A., Kuhnt, W., Kuhn, H., 2011. Tropical warm-ing in the Timor Sea led deglacial Antarctic warming and atmospheric CO2 rise by more than 500 yr. Earth Planet. Sci. Lett. 302, 337–348.
Scott, E.M., Cook, G.T., Naysmith, P., 2010. A report on phase 2 of the Fifth Interna-tional Radiocarbon Intercomparison. Radiocarbon 52, 846–858.
Siani, G., Paterne, M., Michel, E., Sulpizio, R., Sbrana, A., Arnold, M., Haddad, G., 2001. Mediterranean sea surface radiocarbon reservoir age changes since the Last Glacial Maximum. Science 294, 1917–1920.
Siani, G., Michel, E., De Pol-Holz, R., DeVries, T., Lamy, F., Carel, M., Isguder, G., Dewilde, F., Lourantou, A., 2013. Carbon isotope records reveal precise timing of enhanced Southern Ocean upwelling during the last deglaciation. Nat. Com-mun. 4, 2758. http://dx.doi.org/10.1038/ncomms3758.
Sikes, E.L., Samson, C.R., Guilderson, T.P., Howard, W.R., 2000. Old radiocarbon ages in the southwest Pacific Ocean during the last glacial period and deglaciation. Nature 405, 555–559.
44 Q. Hua et al. / Earth and Planetary Science Letters 422 (2015) 33–44
Skinner, L., McCave, I.N., Carter, I., Fallon, S., Scrivner, A.E., Primeau, F., 2015. Reduced ventilation and enhanced magnitude of the deep Pacific carbon pool during the last glacial period. Earth Planet. Sci. Lett. 411, 45–52.
Southon, J., Kashgarian, M., Fontugne, M., Metivier, B., Yim, W.W.S., 2002. Marine reservoir corrections for the Indian Ocean and Southeast Asia. Radiocarbon 44, 167–180.
Stott, L.K., Cannariato, K., Thunell, R., Haug, G.H., Koutavas, A., Lund, S., 2004. Decline in surface temperature and salinity in the western tropical Pacific ocean in the Holocene epoch. Nature 431, 56–59.
Stuiver, M., Polach, H.A., 1977. Discussion: reporting of 14C data. Radiocarbon 19, 355–363.
Stuiver, M., Pearson, G.W., Braziunas, T., 1986. Radiocarbon age calibration of marine samples back to 9000 cal yr BP. Radiocarbon 28, 980–1021.
Toggweiler, J.R., Dixon, K., Broecker, W.S., 1991. The Peru upwelling and the ventila-tion of the South Pacific Thermocline. J. Geophys. Res. 96 (C11), 20467–20497.
Tudhope, A.W., Chilcott, C.P., McCulloch, M.T., Cook, E.R., Chappell, J., Ellam, R.M., Lea, D.W., Lough, J.M., Shimmield, G.B., 2001. Variability in the El Niño – South-ern Oscillation through a glacial-interglacial cycle. Science 291, 1511–1517.
Ulm, S., 2002. Marine and estuarine reservoir effects in Central Queensland, Aus-tralia: determination of �R values. Geoarchaeology 17, 319–348.
Ulm, S., Petchey, F., Ross, A., 2009. Marine reservoir corrections for Moreton Bay, Australia. Archaeol. Ocean. 44, 160–168.
Wanner, H., Beer, J., Bütikofer, J., Crowley, T.J., Cubasch, U., Flückiger, J., Goosse, H., Grosjean, M., Joos, F., Kaplan, J.O., Küttel, M., Müller, S.A., Prentice, I.C., Solom-ina, O., Stocker, T.F., Tarasov, P., Wagner, M., Widmannm, M., 2008. Mid- to Late Holocene climate change: an overview. Quat. Sci. Rev. 27, 1791–1828.
Weber, M.E., Clark, P.U., Kuhn, G., Timmermann, A., Sprenk, D., Gladstone, R., Zhang, X., Lohmann, G., Menviel, L., Chikamoto, M., Friedrich, T., Ohlwein, C., 2014. Millennial-scale variability in Antarctic ice-sheet discharge during the last deglaciation. Nature 510, 134–138.
Weisler, M., Hua, Q., Zhao, J.-x., 2009. Late Holocene 14C marine reservoir correction for Hawaii derived from U-series dated archaeological coral. Radiocarbon 51, 955–968.
Yu, K., Hua, Q., Zhao, J.-x., Hodge, E., Fink, D., Barbetti, M., 2010. Holocene marine 14C reservoir age variability: evidence from 230Th-dated corals from South China Sea. Paleoceanography 25, PA3205. http://dx.doi.org/10.1029/2009PA001831.
Yu, K., Zhao, J.-x., Roff, G., Lybolt, M., Feng, Y.-x., Clark, T., Li, S., 2012. High-precision U-series ages of transported coral blocks on Heron Reef (southern Great Barrier Reef) and storm activity during the past century. Palaeogeogr. Palaeoclimatol. Palaeoecol. 337–338, 23–36.
Zaunbrecher, L.K., Cobb, K.M., Beck, J.W., Charles, C.D., Druffel, E.R.M., Fairbanks, R.G., Griffin, S., Sayani, H.R., 2010. Coral records of central tropical Pacific ra-diocarbon variability during the last millennium. Paleoceanography 25, PA4212. http://dx.doi.org/10.1029/2009PA001788.
Zhao, J.X., Xia, Q.K., Collerson, K.D., 2001. Timing and duration of the last inter-glacial inferred from high resolution U-series chronology of stalagmite growth in Southern Hemisphere. Earth Planet. Sci. Lett. 184 (3–4), 635–644.
Zhao, J., Yu, K., Feng, Y., 2009. High-precision 238U–234U–230Th disequilibrium dating of the recent past: a review. Quat. Geochronol. 4, 423–433.
Zhou, H.Y., Zhao, J.X., Wang, Q., Feng, Y.X., Tang, J., 2011. Speleothem-derived Asian summer monsoon variations in Central China during 54–46 ka. J. Quat. Sci. 26, 781–790.