Response of testate amoeba assemblages to environmental and climatic changes during the...
12
Response of testate amoeba assemblages to environmental and climatic changes during the Lateglacial–Holocene transition at Lake Lautrey (Jura Mountains, eastern France) ADELINE A. J. WALL, 1 * MICHEL MAGNY, 1 EDWARD A. D. MITCHELL, 2,3,4 BORIS VANNIE ` RE 1 and DANIEL GILBERT 1 1 CNRS-UFC UMR 6249, Laboratoire Chrono-Environnement, UFR Sciences et Techniques, Besanc ¸on, France 2 Laboratory of Soil Biology, Institute of Biology, University of Neucha ˆtel, Neucha ˆtel, Switzerland 3 WSL Swiss Federal Research Institute, Ecosystem Boundaries Research Unit, Wetlands Research Group, Lausanne, Switzerland 4 Ecole Polytechnique Fe ´de ´rale de Lausanne, Laboratory of Ecological Systems, Lausanne, Switzerland ABSTRACT: We tested the response of lacustrine testate amoebae (thecamoebians) to climate and environmental changes for the Lateglacial–Holocene transition. The palaeoenvironmental history of the study site (Lake Lautrey, Jura Mountains, eastern France) was previously established based on high- resolution multi-proxy studies of the same core. The present study is characterised by a high taxonomic resolution (54 taxa), inclusion of small species (down to 25 mm) and high total counts (>500 individuals per sample on average). Changes in the composition of testate amoeba assemblages (dominant species and assemblage structure), as well as in the accumulation rate (tests cm 2 a 1 ), corresponded to major climatic phases (i.e. Oldest Dryas, Bølling–Allerød Interstadial, Younger Dryas, Preboreal) as well as changes in organic matter inputs. Furthermore, decreases in the accumulation rate characterised minor short-lived cooling events, such as Older Dryas event or Gerzensee oscillation. However, the Preboreal oscillation, which was well registered by other proxies at Lake Lautrey, could not be recognised in the testate amoeba record. This work demonstrates that lacustrine testate amoebae can be used for palaeoclimatic and palaeoecological reconstructions. Nevertheless, a better understanding of the relation between climate, organic matter and lacustrine testate amoebae requires further high-resolution studies based on multi-proxy approaches and the development of appropriate modern analogues. KEYWORDS: testate amoebae; palaeoclimate; Lateglacial; early Holocene; lake sediments. Introduction Testate amoebae (or thecamoebians) are common unicellular organisms characterised by a decay-resistant and morphologi- cally distinctive test, or shell, enclosing the cytoplasm (Ogden and Hedley, 1980; Tolonen, 1986; Warner, 1990). They have been used for over a century as palaeoenvironmental indicators owing to their high abundance, diversity, environmental sensitivity and excellent preservation in lakes – even where other freshwater benthic fossil indicators, such as ostracods or molluscs, are poorly preserved due to low pH values (Dallimore et al., 2000) – and wetlands (Asioli et al., 1996; Beyens and Meisterfeld, 2001). There has recently been an increasing interest in the use of testate amoebae in reconstruct- ing Quaternary climate history (Medioli and Scott, 1983; Ellison and Ogden, 1987; Dallimore et al., 2000; Charman, 2001; Boudreau et al., 2005). This renewed interest has been particularly evident in peat-based palaeoclimatic studies, where numerous modern and palaeoecological studies have demonstrated the sensitivity of testate amoebae to hydroclimate variability (Tolonen, 1986; Warner, 1990; Booth, 2001, 2002, 2008; Charman, 2001; Mitchell et al., 2001; Booth and Jackson, 2003; Charman et al., 2007; Lamentowicz et al., 2008). In contrast, the climatic sensitivity of testate amoebae inhabiting lake environments has been less thoroughly investigated, although several studies suggest that testate amoebae in these habitats could be used as climatic proxies (Ruzicka, 1982; Medioli and Scott, 1988; McCarthy et al., 1995; Burbidge and Schro ¨ der-Adams, 1998; Boudreau et al., 2005). * Correspondence to: A. A. J. Wall, Laboratoire Chrono-Environnement, UMR 6249 CNRS/UFC, Universite ´ de Franche-Comte ´, Besanc ¸on, France. E-mail: [email protected] Published in Journal of Quaternary Science 25, issue 6, 945-956, 2010 which should be used for any reference to this work 1
Transcript of Response of testate amoeba assemblages to environmental and climatic changes during the...

Response of testate amoeba assemblages to environmentaland climatic changes during the Lateglacial–Holocenetransition at Lake Lautrey (Jura Mountains, eastern France)
ADELINE A. J. WALL,1* MICHEL MAGNY,1 EDWARD A. D. MITCHELL,2,3,4 BORIS VANNIERE1 and DANIEL GILBERT11 CNRS-UFC UMR 6249, Laboratoire Chrono-Environnement, UFR Sciences et Techniques, Besancon, France2 Laboratory of Soil Biology, Institute of Biology, University of Neuchatel, Neuchatel, Switzerland3 WSL Swiss Federal Research Institute, Ecosystem Boundaries Research Unit, Wetlands Research Group, Lausanne, Switzerland4 Ecole Polytechnique Federale de Lausanne, Laboratory of Ecological Systems, Lausanne, Switzerland
ABSTRACT: We tested the response of lacustrine testate amoebae (thecamoebians) to climate andenvironmental changes for the Lateglacial–Holocene transition. The palaeoenvironmental history ofthe study site (Lake Lautrey, Jura Mountains, eastern France) was previously established based on high-resolution multi-proxy studies of the same core. The present study is characterised by a high taxonomicresolution (54 taxa), inclusion of small species (down to 25mm) and high total counts (>500individuals per sample on average). Changes in the composition of testate amoeba assemblages(dominant species and assemblage structure), as well as in the accumulation rate (tests cm�2 a�1),corresponded to major climatic phases (i.e. Oldest Dryas, Bølling–Allerød Interstadial, YoungerDryas, Preboreal) as well as changes in organic matter inputs. Furthermore, decreases in theaccumulation rate characterised minor short-lived cooling events, such as Older Dryas event orGerzensee oscillation. However, the Preboreal oscillation, which was well registered by otherproxies at Lake Lautrey, could not be recognised in the testate amoeba record. This workdemonstrates that lacustrine testate amoebae can be used for palaeoclimatic and palaeoecologicalreconstructions. Nevertheless, a better understanding of the relation between climate, organic matterand lacustrine testate amoebae requires further high-resolution studies based on multi-proxyapproaches and the development of appropriate modern analogues.
KEYWORDS: testate amoebae; palaeoclimate; Lateglacial; early Holocene; lake sediments.
Introduction
Testate amoebae (or thecamoebians) are common unicellularorganisms characterised by a decay-resistant and morphologi-cally distinctive test, or shell, enclosing the cytoplasm (Ogdenand Hedley, 1980; Tolonen, 1986; Warner, 1990). They havebeen used for over a century as palaeoenvironmental indicatorsowing to their high abundance, diversity, environmentalsensitivity and excellent preservation in lakes – even whereother freshwater benthic fossil indicators, such as ostracods ormolluscs, are poorly preserved due to low pH values(Dallimore et al., 2000) – and wetlands (Asioli et al., 1996;
Beyens and Meisterfeld, 2001). There has recently been anincreasing interest in the use of testate amoebae in reconstruct-ing Quaternary climate history (Medioli and Scott, 1983;Ellison and Ogden, 1987; Dallimore et al., 2000; Charman,2001; Boudreau et al., 2005). This renewed interest has beenparticularly evident in peat-based palaeoclimatic studies,where numerous modern and palaeoecological studies havedemonstrated the sensitivity of testate amoebae to hydroclimatevariability (Tolonen, 1986; Warner, 1990; Booth, 2001, 2002,2008; Charman, 2001; Mitchell et al., 2001; Booth andJackson, 2003; Charman et al., 2007; Lamentowicz et al.,2008). In contrast, the climatic sensitivity of testate amoebaeinhabiting lake environments has been less thoroughlyinvestigated, although several studies suggest that testateamoebae in these habitats could be used as climatic proxies(Ruzicka, 1982; Medioli and Scott, 1988; McCarthy et al.,1995; Burbidge and Schroder-Adams, 1998; Boudreau et al.,2005).
* Correspondence to: A. A. J. Wall, Laboratoire Chrono-Environnement, UMR6249 CNRS/UFC, Universite de Franche-Comte, Besancon, France.E-mail: [email protected]
Published in Journal of Quaternary Science 25, issue 6, 945-956, 2010
which should be used for any reference to this work
1
Thanks to their relatively short life cycle (they have ageneration time of a few days), testate amoebae shouldpotentially respond rapidly to environmental changes, includ-ing climatic ones (McCarthy et al., 1995; Booth, 2001).Palaeolimnological studies have shown that testate amoebaecan be used as indicators of trophic status (Scott and Medioli,1983; Tolonen, 1986; Boudreau et al., 2005), pH and oxygenlevel (Boudreau et al., 2005), water pollution by heavy metals(Asioli et al., 1996; Patterson et al., 1996), or land use changesin the catchment area (Patterson et al., 2002). However, theresponse of lake testate amoebae to climate is still a matter ofdebate (Beyens and Meisterfeld, 2001; Charman, 2001;Andreev et al., 2004). Ruzicka (1982) pointed out a possiblerelation between even relatively minor climatic fluctuations,such as the Little Ice Age, and a decrease in the number of taxaobserved in an Austrian lake. Likewise, in Atlantic Canada, acomparison of testate amoeba and pollen biostratigraphiesrevealed synchronous changes suggesting common responsesto climatic changes (McCarthy et al., 1995). However, BeyensandMeisterfeld (2001) questioned the thermophilous characterof some taxa, and Patterson et al. (1985) observed few changesin testate amoeba assemblages during known periods of climatechange in New Brunswick and Nova Scotia. It is thereforeunclear to what extent testate amoebae respond to climate andother environmental changes. The scarcity of availablepalaeolimnological records as well as of high-resolutionmulti-proxy studies clearly limits current understanding ofpossible relations between climate and testate amoebaassemblages in lakes. Two complementary approaches maybe used to address this question: (1) modern ecological studies,either correlative or experimental; (2) multi-proxy palaeoeco-logical studies with independent reconstructions of pastclimatic changes. In this study we follow this second approach.Magny and co-workers recently produced a high-resolution,
multi-proxy palaeoclimate record from Lake Lautrey in easternFrance covering the Lateglacial–Holocene (Magny et al., 2006).This detailed record, unique for this region of the JuraMountainsin west-central Europe (combining analyses of pollen, lakelevel changes, mineralogy, organic matter composition,chironomids, magnetic susceptibility, etc.) provides an idealopportunity to assess the response of lacustrine testate amoebaassemblages to both millennial and multi-millennial-scale
climate changes of the LateglacialHolocene transition, as wellas short-term (i.e., sub-millennial)environmental and climaticchanges. To understand better thepotential responses oflacustrine testate amoebae to climate variability, we directlycompared testate amoeba species richness, species evenness,test accumulation rate and assemblage structure to indepen-dently inferred climate and environmental changes at LakeLautrey, using the same sediment core previously used fordetailed multi-proxy analyses (Magny et al., 2006). The resultsshow a clear correlation between testate amoeba andpalaeoclimatic and other palaeoenvironmental data. Wediscuss these correlations and suggest future research prioritiesto improve the value of lacustrine testate amoebae inpalaeolimnological studies.
Regional setting and methods
Site location and sediment core
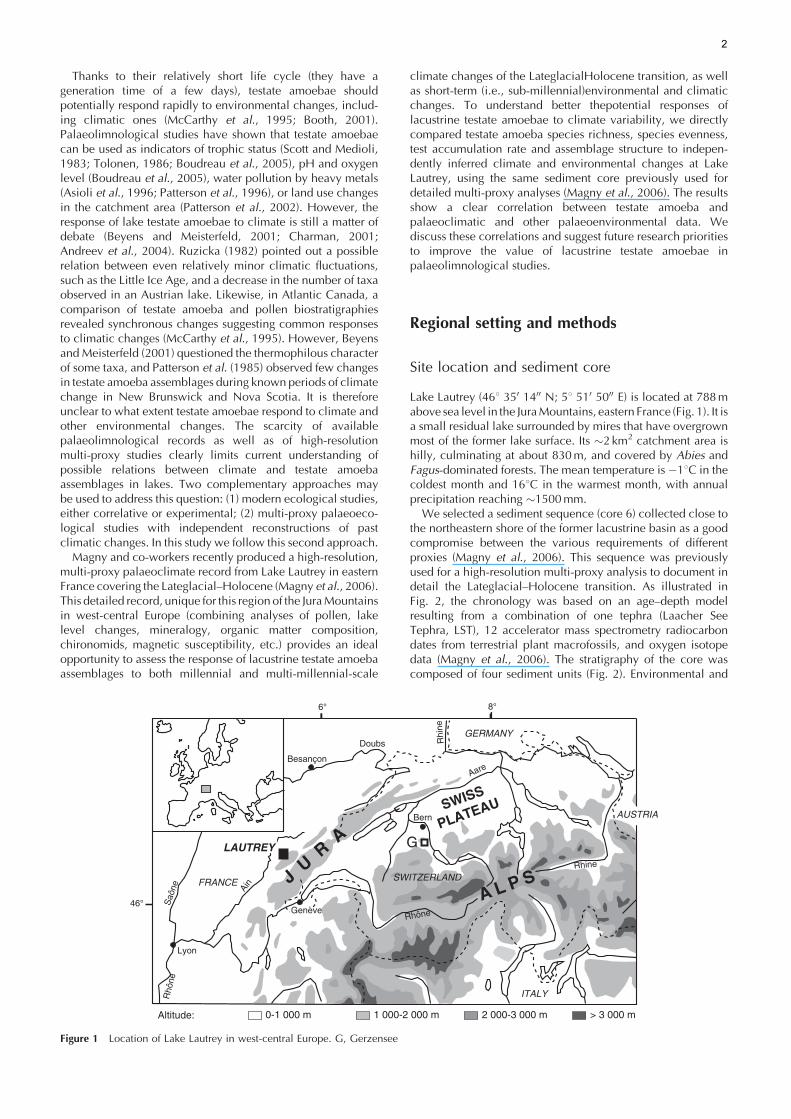
Lake Lautrey (468 350 1400 N; 58 510 5000 E) is located at 788mabove sea level in the JuraMountains, eastern France (Fig. 1). It isa small residual lake surrounded by mires that have overgrownmost of the former lake surface. Its �2 km2 catchment area ishilly, culminating at about 830m, and covered by Abies andFagus-dominated forests. The mean temperature is �18C in thecoldest month and 168C in the warmest month, with annualprecipitation reaching �1500mm.
We selected a sediment sequence (core 6) collected close tothe northeastern shore of the former lacustrine basin as a goodcompromise between the various requirements of differentproxies (Magny et al., 2006). This sequence was previouslyused for a high-resolution multi-proxy analysis to document indetail the Lateglacial–Holocene transition. As illustrated inFig. 2, the chronology was based on an age–depth modelresulting from a combination of one tephra (Laacher SeeTephra, LST), 12 accelerator mass spectrometry radiocarbondates from terrestrial plant macrofossils, and oxygen isotopedata (Magny et al., 2006). The stratigraphy of the core wascomposed of four sediment units (Fig. 2). Environmental and
46°
8°6°
J U R
A
A L P S
SWISS
PLATEAU
G
Lyon
Bern
Besançon
Genève
SWITZERLANDFRANCE
Doubs
Aare
Rhô
neS
aône Ai
n
Rhône
Rhine
Rhi
ne
GERMANY
ITALY
AUSTRIA
LAUTREY
2 000-3 000 m > 3 000 m1 000-2 000 m0-1 000 mAltitude:
Figure 1 Location of Lake Lautrey in west-central Europe. G, Gerzensee
2
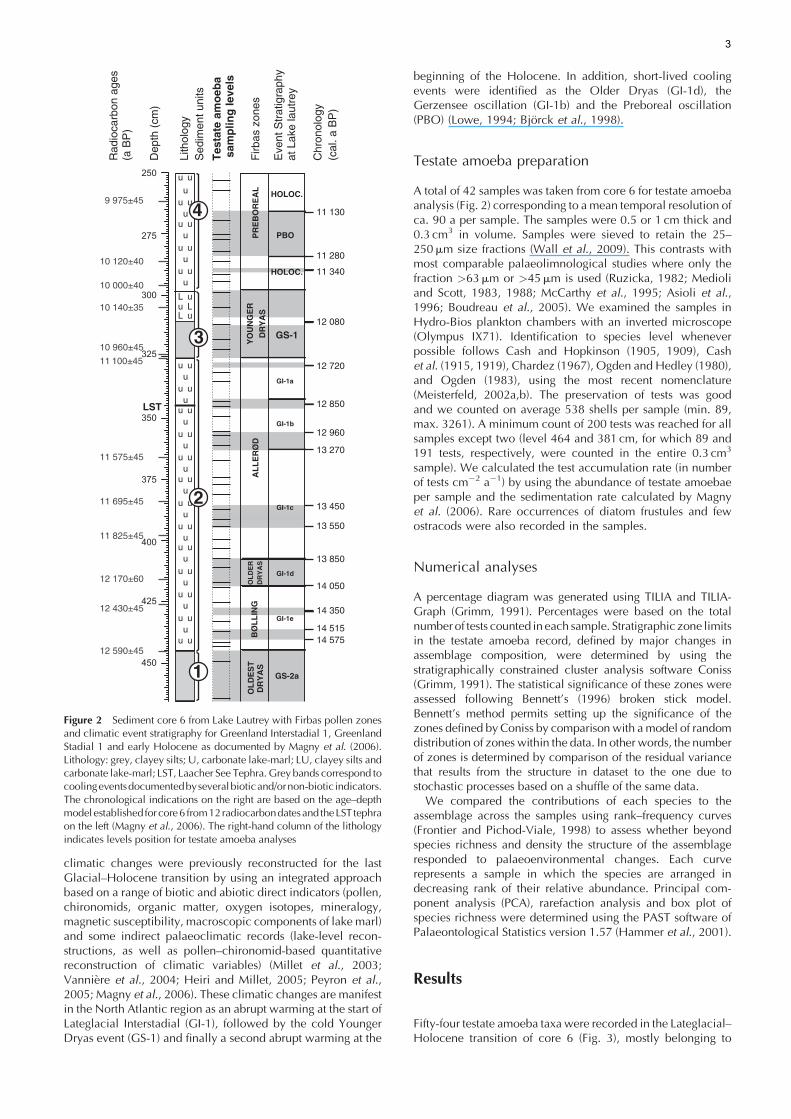
climatic changes were previously reconstructed for the lastGlacial–Holocene transition by using an integrated approachbased on a range of biotic and abiotic direct indicators (pollen,chironomids, organic matter, oxygen isotopes, mineralogy,magnetic susceptibility, macroscopic components of lake marl)and some indirect palaeoclimatic records (lake-level recon-structions, as well as pollen–chironomid-based quantitativereconstruction of climatic variables) (Millet et al., 2003;Vanniere et al., 2004; Heiri and Millet, 2005; Peyron et al.,2005; Magny et al., 2006). These climatic changes are manifestin the North Atlantic region as an abrupt warming at the start ofLateglacial Interstadial (GI-1), followed by the cold YoungerDryas event (GS-1) and finally a second abrupt warming at the
beginning of the Holocene. In addition, short-lived coolingevents were identified as the Older Dryas (GI-1d), theGerzensee oscillation (GI-1b) and the Preboreal oscillation(PBO) (Lowe, 1994; Bjorck et al., 1998).
Testate amoeba preparation
A total of 42 samples was taken from core 6 for testate amoebaanalysis (Fig. 2) corresponding to a mean temporal resolution ofca. 90 a per sample. The samples were 0.5 or 1 cm thick and0.3 cm3 in volume. Samples were sieved to retain the 25–250mm size fractions (Wall et al., 2009). This contrasts withmost comparable palaeolimnological studies where only thefraction >63mm or >45mm is used (Ruzicka, 1982; Medioliand Scott, 1983, 1988; McCarthy et al., 1995; Asioli et al.,1996; Boudreau et al., 2005). We examined the samples inHydro-Bios plankton chambers with an inverted microscope(Olympus IX71). Identification to species level wheneverpossible follows Cash and Hopkinson (1905, 1909), Cashet al. (1915, 1919), Chardez (1967), Ogden and Hedley (1980),and Ogden (1983), using the most recent nomenclature(Meisterfeld, 2002a,b). The preservation of tests was goodand we counted on average 538 shells per sample (min. 89,max. 3261). A minimum count of 200 tests was reached for allsamples except two (level 464 and 381 cm, for which 89 and191 tests, respectively, were counted in the entire 0.3 cm3
sample). We calculated the test accumulation rate (in numberof tests cm�2 a�1) by using the abundance of testate amoebaeper sample and the sedimentation rate calculated by Magnyet al. (2006). Rare occurrences of diatom frustules and fewostracods were also recorded in the samples.
Numerical analyses
A percentage diagram was generated using TILIA and TILIA-Graph (Grimm, 1991). Percentages were based on the totalnumber of tests counted in each sample. Stratigraphic zone limitsin the testate amoeba record, defined by major changes inassemblage composition, were determined by using thestratigraphically constrained cluster analysis software Coniss(Grimm, 1991). The statistical significance of these zones wereassessed following Bennett’s (1996) broken stick model.Bennett’s method permits setting up the significance of thezones defined by Coniss by comparison with amodel of randomdistribution of zones within the data. In other words, the numberof zones is determined by comparison of the residual variancethat results from the structure in dataset to the one due tostochastic processes based on a shuffle of the same data.We compared the contributions of each species to the
assemblage across the samples using rank–frequency curves(Frontier and Pichod-Viale, 1998) to assess whether beyondspecies richness and density the structure of the assemblageresponded to palaeoenvironmental changes. Each curverepresents a sample in which the species are arranged indecreasing rank of their relative abundance. Principal com-ponent analysis (PCA), rarefaction analysis and box plot ofspecies richness were determined using the PAST software ofPalaeontological Statistics version 1.57 (Hammer et al., 2001).
Results
Fifty-four testate amoeba taxa were recorded in the Lateglacial–Holocene transition of core 6 (Fig. 3), mostly belonging to
PBO
HOLOC.
HOLOC.
GS-2a
GI-1e
GI-1d
GI-1c
GI-1b
GI-1a
GS-1
PR
EB
OR
EA
LY
OU
NG
ER
DR
YA
SA
LL
ER
ØD
OL
DE
RD
RY
AS
BØ
LL
ING
OL
DE
ST
DR
YA
S
12 850
12 720
12 080
11 340
11 280
11 130
13 270
12 960
13 450
13 850
13 550
14 050
14 350
14 57514 515
Firb
as z
ones
Eve
nt S
trat
igra
phy
at L
ake
laut
rey
Chr
onol
ogy
(cal
. a B
P)
250
275
300
325
350
375
400
425
450
u u
u uu
u uu
u uu
u uu
u uu
u uu
u uu
u uu
u uu
u uu
u uu
u uu
u uu
u uu
u uu
u u
u u
u
u
L u
L uu L
2
4
LST
1
3
Dep
th (
cm)
Lith
olog
yS
edim
ent u
nits
Tes
tate
am
oeb
a s
amp
ling
leve
ls
9 975±45
10 120±40
10 000±40
10 140±35
10 960±45
11 100±45
11 575±45
11 695±45
11 825±45
12 170±60
12 430±45
12 590±45
Rad
ioca
rbon
age
s(a
BP
)
Figure 2 Sediment core 6 from Lake Lautrey with Firbas pollen zonesand climatic event stratigraphy for Greenland Interstadial 1, GreenlandStadial 1 and early Holocene as documented by Magny et al. (2006).Lithology: grey, clayey silts; U, carbonate lake-marl; LU, clayey silts andcarbonate lake-marl; LST, Laacher See Tephra. Grey bands correspond tocoolingeventsdocumentedbyseveralbioticand/ornon-biotic indicators.The chronological indications on the right are based on the age–depthmodel establishedforcore6 from12radiocarbondatesand theLST tephraon the left (Magny et al., 2006). The right-hand column of the lithologyindicates levels position for testate amoeba analyses
3
uu
uu uuu uuu uuu uuu uuu uuu uuu uuu uuu uuu uuu uuu uuu uuu uuu
uu uu Lu
Lu
uL 1234Lithology
275
250
300
325
350
375
400
425
450
LS
TDepth (cm)
Sediment units
PBO
HO
LOC.
HO
LOC.
GS-
2a
GI-1
e
GI-1
d
GI-1
c
GI-1
b
GI-1
a
GS-
1
Event Stratigraphyat Lake Lautrey(Magny et al., 2006)
Firbaszones
PREBOREAL YOUNGERDRYAS
ALLERØDOLDERDRYAS
BØLLING OLDESTDRYAS
20
Arcella discoides
20
Arcella vulgarisArcella gibbosa
Bullinularia indica
20
Pseudidifflugia gracilis
20
Difflugia rotunda
20
Difflugia globularis v. microstoma
20
Phryganella acropodia
20
Centropyxis aculeata
20
Centropyxis constricta
Centropyxis spDifflugia lucida
20
Centropyxis ecornis
20Cyclopyxis eurystoma
Cyclopyxis kahli
20
Difflugia globulosus
20
Heleopera petricolaHeleopera rosea
Heleopera sylvatica
20
Diplochlamys timida
20
Difflugia type olliformis
20
40
60
80
Paraquadrula irregularis
20
40
60
Centropyxis discoides
20
Difflugia sp2
Difflugia viscidulaDifflugia type decloitreiDifflugia glans
Difflugia elongataDifflugia oblonga nodosaLesquereusia modesta
Difflugia lanceolataDifflugia ampullulaDifflugia avellana
Difflugia manicataDifflugia oblongaDifflugia sp1Centropyxis platystomaDifflugia labiosaDifflugia limneticaLesquereusia spiralisDifflugia urceolataDifflugia acuminataDifflugia elegansDifflugia lacustrisNebela militarisDifflugia curvicaulisDifflugia lithophilaDifflugia mammillarisHyalosphenia elegansDifflugia parvaDifflugia coronaNebela flabellulumPontigulasia elisa
1000
2000
3000
TA
Z-2
a
TA
Z-1
b
TA
Z-1
a
TA
Z-5
c
TA
Z-5
b
TA
Z-5
a
TA
Z-4
TA
Z-3
e
TA
Z-3
d
TA
Z-3
c
TA
Z-3
b
TA
Z-2
b
TA
Z-3
a
Rar
e sp
ecie
s <
2%
Acc
um
ula
tio
nra
te(t
est
cm- 2
a-1)
24
68
1012
Tota
l sum
of
square
s
CONISS
Zo
nes
TA
Centropyxis aerophila
10
15
20
Sp
ecie
sR
ich
nes
s
12 8
50
12 7
20
12 0
80
11 3
40
11 2
80
11 1
30
13 2
70
12 9
60
13 4
50
13 8
50
13 5
50
14 0
50
14 3
50
14 5
7514
515
Chronology(cal. a BP)
Testate amoebasampling levels
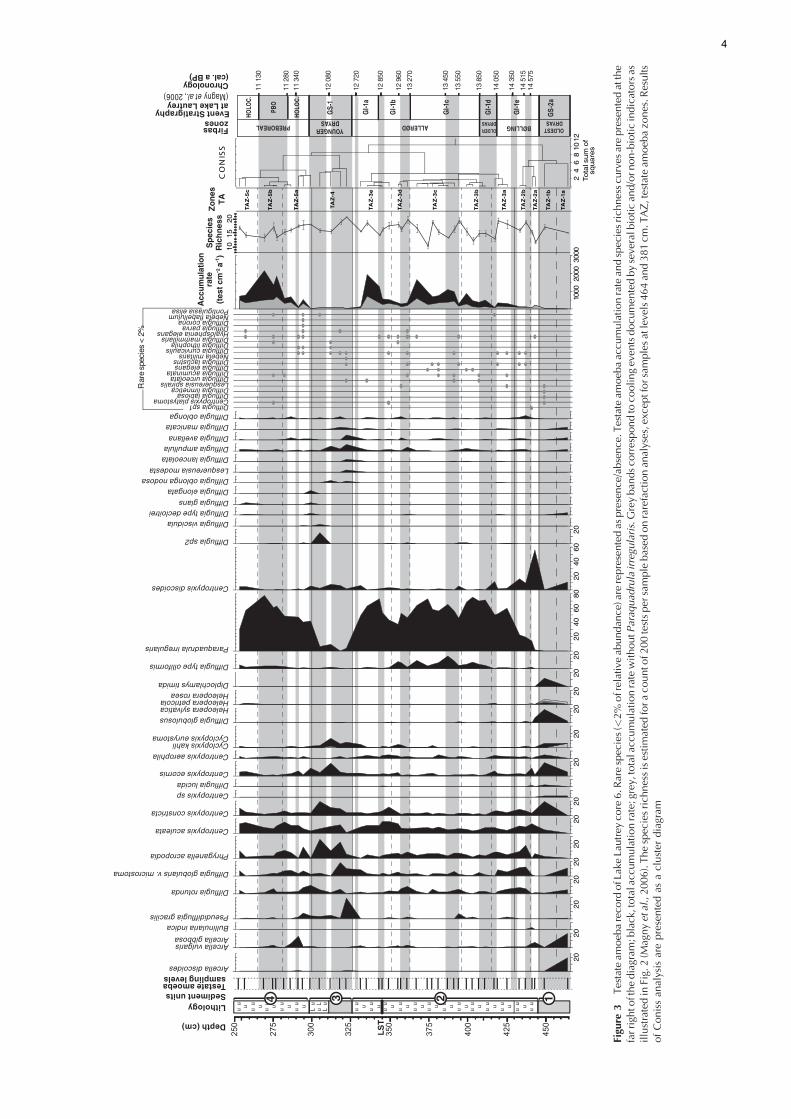
Figu
re3
Testateam
oeb
areco
rdofLak
eLa
utrey
core
6.R
arespec
ies(<
2%
ofrelativeab
undan
ce)are
representedas
presence
/absence
.Testateam
oeb
aac
cumulationratean
dspec
iesrich
nesscu
rves
arepresentedatthe
farrighto
fthediagram
;black,totalacc
umulationrate;grey,totalacc
umulationratewithoutP
araq
uad
rulairregu
laris.Greyban
dsco
rrespondto
coolingev
entsdocu
men
tedbyseveralb
iotican
d/orn
on-bioticindicatorsas
illustratedin
Fig.2(M
agnyetal.,2006).Thespec
iesrich
nessisestimated
fora
counto
f200testsper
samplebased
onrarefactionan
alyses,exc
eptforsam
plesatlevels464an
d381cm
.TAZ,testateam
oeb
azo
nes.R
esults
ofConissan
alysis
arepresentedas
acluster
diagram
4
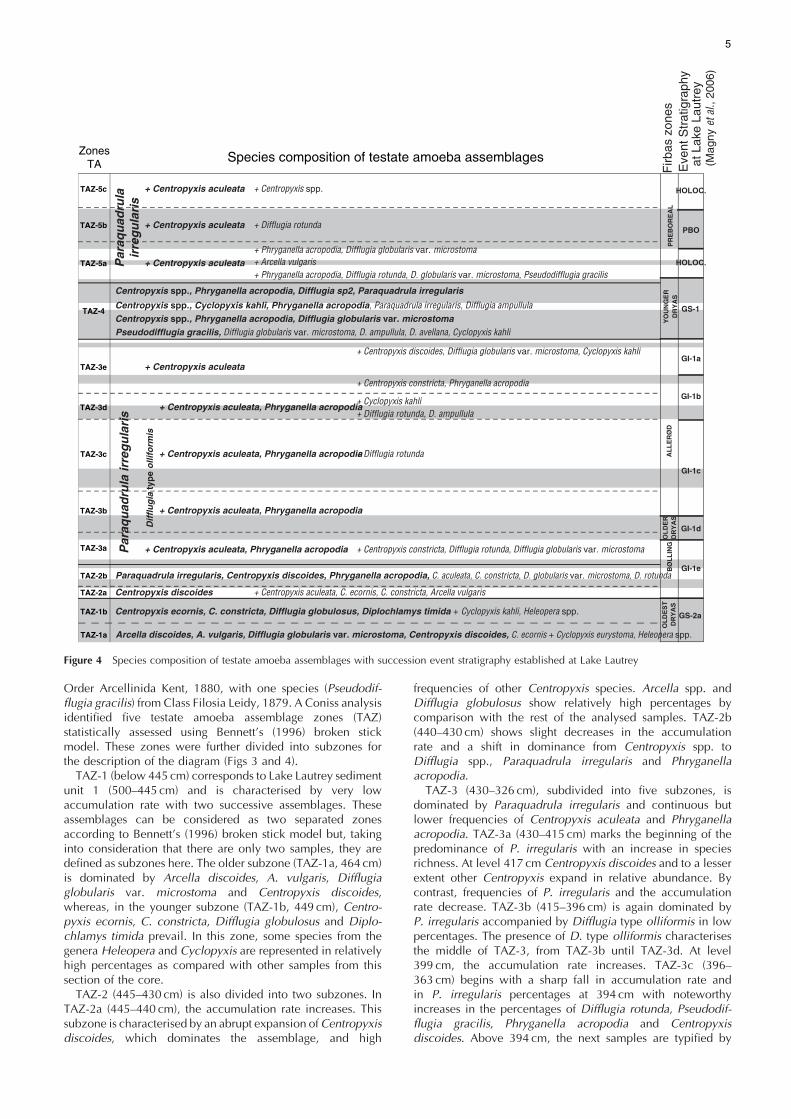
Order Arcellinida Kent, 1880, with one species (Pseudodif-flugia gracilis) from Class Filosia Leidy, 1879. A Coniss analysisidentified five testate amoeba assemblage zones (TAZ)statistically assessed using Bennett’s (1996) broken stickmodel. These zones were further divided into subzones forthe description of the diagram (Figs 3 and 4).TAZ-1 (below 445 cm) corresponds to Lake Lautrey sediment
unit 1 (500–445 cm) and is characterised by very lowaccumulation rate with two successive assemblages. Theseassemblages can be considered as two separated zonesaccording to Bennett’s (1996) broken stick model but, takinginto consideration that there are only two samples, they aredefined as subzones here. The older subzone (TAZ-1a, 464 cm)is dominated by Arcella discoides, A. vulgaris, Difflugiaglobularis var. microstoma and Centropyxis discoides,whereas, in the younger subzone (TAZ-1b, 449 cm), Centro-pyxis ecornis, C. constricta, Difflugia globulosus and Diplo-chlamys timida prevail. In this zone, some species from thegenera Heleopera and Cyclopyxis are represented in relativelyhigh percentages as compared with other samples from thissection of the core.TAZ-2 (445–430 cm) is also divided into two subzones. In
TAZ-2a (445–440 cm), the accumulation rate increases. Thissubzone is characterised by an abrupt expansion ofCentropyxisdiscoides, which dominates the assemblage, and high
frequencies of other Centropyxis species. Arcella spp. andDifflugia globulosus show relatively high percentages bycomparison with the rest of the analysed samples. TAZ-2b(440–430 cm) shows slight decreases in the accumulationrate and a shift in dominance from Centropyxis spp. toDifflugia spp., Paraquadrula irregularis and Phryganellaacropodia.TAZ-3 (430–326 cm), subdivided into five subzones, is
dominated by Paraquadrula irregularis and continuous butlower frequencies of Centropyxis aculeata and Phryganellaacropodia. TAZ-3a (430–415 cm) marks the beginning of thepredominance of P. irregularis with an increase in speciesrichness. At level 417 cm Centropyxis discoides and to a lesserextent other Centropyxis expand in relative abundance. Bycontrast, frequencies of P. irregularis and the accumulationrate decrease. TAZ-3b (415–396 cm) is again dominated byP. irregularis accompanied by Difflugia type olliformis in lowpercentages. The presence of D. type olliformis characterisesthe middle of TAZ-3, from TAZ-3b until TAZ-3d. At level399 cm, the accumulation rate increases. TAZ-3c (396–363 cm) begins with a sharp fall in accumulation rate andin P. irregularis percentages at 394 cm with noteworthyincreases in the percentages of Difflugia rotunda, Pseudodif-flugia gracilis, Phryganella acropodia and Centropyxisdiscoides. Above 394 cm, the next samples are typified by
PBO
HOLOC.
HOLOC.
GS-2a
GI-1e
GI-1d
GI-1c
GI-1b
GI-1a
GS-1
Eve
nt S
trat
igra
phy
at L
ake
Laut
rey
(Mag
nyet
al.,
200
6)
Firb
as z
ones
PR
EB
OR
EA
LY
OU
NG
ER
DR
YA
SA
LL
ER
ØD
OLDER
DRYAS
BØ
LL
ING
OLDEST
DRYAS
TAZ-2a
TAZ-1b
TAZ-1a
TAZ-5c
TAZ-5b
TAZ-5a
TAZ-4
TAZ-3e
TAZ-3d
TAZ-3c
TAZ-3b
TAZ-2b
TAZ-3a
ZonesTA
Arcella discoides, A. vulgaris, Difflugia globularis var. microstoma, Centropyxis discoides, C. ecornis + Cyclopyxis eurystoma, Heleopera spp.
+ Difflugia rotunda
+ Cyclopyxis kahli + Difflugia rotunda, D. ampullula
Par
aqu
adru
la ir
reg
ula
ris
Dif
flu
gia
typ
eo
llifo
rmis
Par
aqu
adru
lair
reg
ula
ris
Paraquadrula irregularis, Centropyxis discoides, Phryganella acropodia, C. aculeata, C. constricta, D. globularis var. microstoma, D. rotunda
Pseudodifflugia gracilis, Difflugia globularis var. microstoma, D. ampullula, D. avellana, Cyclopyxis kahliCentropyxis spp., Phryganella acropodia, Difflugia globularis var. microstoma Centropyxis spp., Cyclopyxis kahli, Phryganella acropodia, Paraquadrula irregularis, Difflugia ampullula
Centropyxis spp., Phryganella acropodia, Difflugia sp2, Paraquadrula irregularis
Centropyxis ecornis, C. constricta, Difflugia globulosus, Diplochlamys timida + Cyclopyxis kahli, Heleopera spp.
Centropyxis discoides
+ Centropyxis constricta, Phryganella acropodia
+ Centropyxis constricta, Difflugia rotunda, Difflugia globularis var. microstoma
+ Centropyxis aculeata
+ Centropyxis aculeata
+ Centropyxis aculeata
+ Centropyxis aculeata
+ Centropyxis aculeata, Phryganella acropodia
+ Centropyxis aculeata, Phryganella acropodia
+ Centropyxis aculeata, Phryganella acropodia
+ Centropyxis aculeata, Phryganella acropodia
+ Centropyxis discoides, Difflugia globularis var. microstoma, Cyclopyxis kahli
+ Phryganella acropodia, Difflugia rotunda, D. globularis var. microstoma, Pseudodifflugia gracilis
+ Phryganella acropodia, Difflugia globularis var. microstoma
+ Centropyxis spp.
+ Difflugia rotunda
+ Arcella vulgaris
+ Centropyxis aculeata, C. ecornis, C. constricta, Arcella vulgaris
Species composition of testate amoeba assemblages
Figure 4 Species composition of testate amoeba assemblages with succession event stratigraphy established at Lake Lautrey
5
a high accumulation rate with two peaks at level 387 and367 cm associated with peaks in Difflugia type olliformispercentages. This subzone is marked by the predominance ofP. irregularis. TAZ-3d (363–351 cm) is characterised by adecrease in the accumulation rate associated with a decline infrequencies of P. irregularis. By contrast, the percentages ofDifflugia rotunda, D. ampullula and P. acropodia rise,followed by those of Centropyxis species, Cyclopyxis kahliand D. type olliformis. During TAZ-3e (351–326 cm), theaccumulation rate increases progressively to a maximum of1915.5 tests cm�2 a�1 at level 335 cm Difflugia type olliformisdisappears. At the beginning of this subzone, Centropyxisaculeata and C. constricta expand until level 345 cm, whenthey disappear until level 331 cm. The end of this zone isdefined by a sharp fall in accumulation rate (level 331 cm)associated with a relative increase in frequencies ofD. globularis var. microstoma, Cyclopyxis kahli and Cen-tropyxis discoides.TAZ-4 (326–300 cm) corresponds globally to sediment unit 3
(i.e. Younger Dryas age) and displays low accumulation ratevalues with a disappearance of P. irregularis. During thisperiod, the most abundant testate amoeba species arePhryganella acropodia, Centropyxis, Cyclopyxis and Difflugia.The beginning of this zone (level 322 cm) is characterised by apredominance of Pseudodifflugia gracilis associated withDifflugia globularis var.microstoma,D. ampullula,D. avellanaand Cyclopyxis kahli. Then, Centropyxis species appear in verylow percentages. At level 318 cm, the dominant species isPhryganella acropodia together with D. globularis var.microstoma. At this level, the percentages of Centropyxisspecies increase. In the middle of TAZ-4, the most abundantspecies is Centropyxis ecornis, with a good representation ofother Centropyxis and Cyclopyxis species. Subsequently,Phryganella acropodia dominates the assemblage. In the sameway, Centropyxis constricta and Difflugia sp.2 show peaks atlevel 305 cm. This zone ends with a return of P. irregularis tohigh frequencies and a decline in Centropyxis speciespercentages, except for C. ecornis.In TAZ-5 (above 300 cm), the accumulation rate of
testate amoebae increases rapidly and reaches a maximumof 2148.4 tests cm�2 a�1 at level 269 cm. In this zone,P. irregularis maintains high percentages, accompanied byCentropyxis aculeata. In TAZ-5a (300–281 cm), the accumu-lation rate reaches 540 tests cm�2 a�1 at level 294 cm.Centropyxis spp. occur in low percentages except forC. aculeata. Paraquadrula irregularis is well represented inthis subzone, and peaks in Phryganella acropodia, Difflugiarotunda, D. globularis var. microstoma and Pseudodifflugiagracilis proportions are observed. At level 291 cm the testateaccumulation rate drops sharply and a peak in Arcellavulgaris and a rise in Centropyxis spp. percentagesoccurs. The upper part of this subzone shows an increasein accumulation rate. This part is characterised by anassemblage composed of P. irregularis, Centropyxisspecies, Phryganella acropodia and D. globularis var.microstoma and by a decline of A. vulgaris. TAZ-5b (281–265 cm) is dominated by P. irregularis, which reaches amaximum of 77.5% of relative abundance abundance atlevel 269 cm (i.e. 1664.6 tests cm�2 a�1). Centropyxisaculeata percentages remain stable. A peak of Difflugiarotunda and a slight increase in Arcella vulgaris percentagesoccur at level 275 cm, where the accumulation rate isminimal for this subzone. The last subzone, TAZ-5c (above265 cm) records a drop in test accumulation rateassociated with a decline in P. irregularis percentagesin favour of Centropyxis aculeata and other Centropyxisspecies.
Figure 3 illustrates how P. irregularis amplifies the variationsin accumulation rates. However, the signal of this species doesnot modify the global fluctuation tendency of the whole testateamoeba assemblages, except in the upper part of the diagram(257 cm and 269 cm).
Discussion
Overall testate amoeba assemblage composition
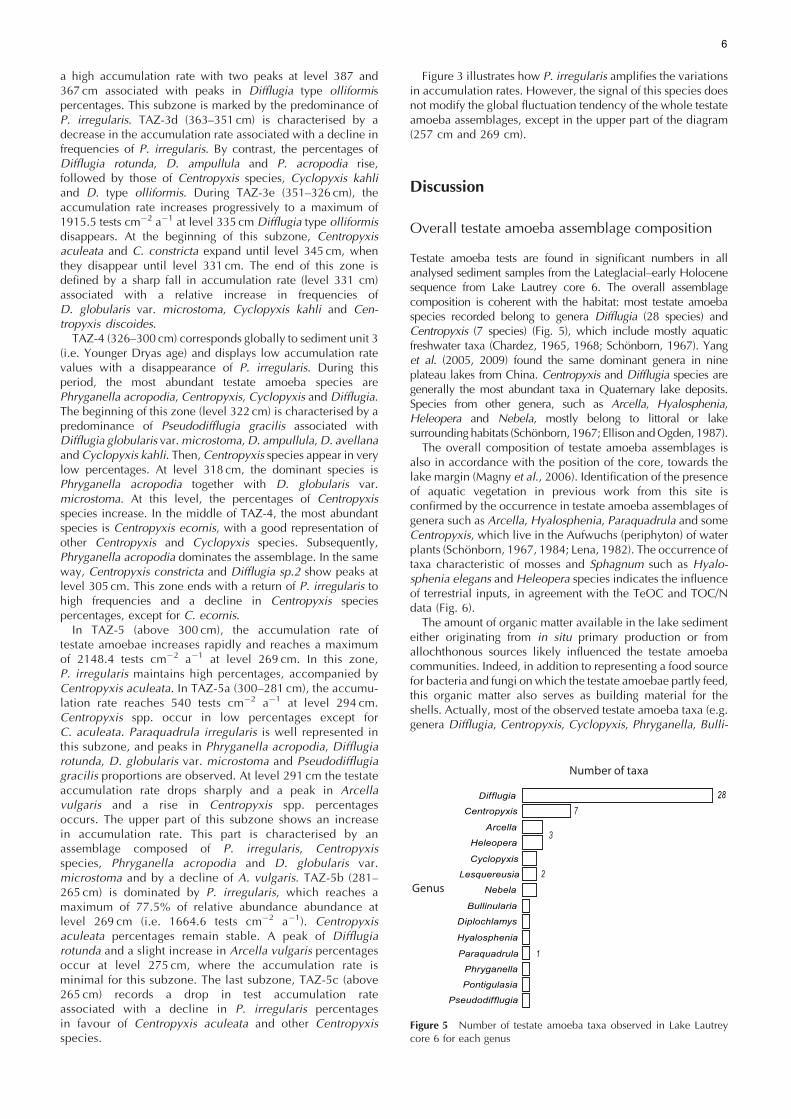
Testate amoeba tests are found in significant numbers in allanalysed sediment samples from the Lateglacial–early Holocenesequence from Lake Lautrey core 6. The overall assemblagecomposition is coherent with the habitat: most testate amoebaspecies recorded belong to genera Difflugia (28 species) andCentropyxis (7 species) (Fig. 5), which include mostly aquaticfreshwater taxa (Chardez, 1965, 1968; Schonborn, 1967). Yanget al. (2005, 2009) found the same dominant genera in nineplateau lakes from China. Centropyxis and Difflugia species aregenerally the most abundant taxa in Quaternary lake deposits.Species from other genera, such as Arcella, Hyalosphenia,Heleopera and Nebela, mostly belong to littoral or lakesurrounding habitats (Schonborn, 1967; Ellison andOgden, 1987).
The overall composition of testate amoeba assemblages isalso in accordance with the position of the core, towards thelake margin (Magny et al., 2006). Identification of the presenceof aquatic vegetation in previous work from this site isconfirmed by the occurrence in testate amoeba assemblages ofgenera such as Arcella, Hyalosphenia, Paraquadrula and someCentropyxis, which live in the Aufwuchs (periphyton) of waterplants (Schonborn, 1967, 1984; Lena, 1982). The occurrence oftaxa characteristic of mosses and Sphagnum such as Hyalo-sphenia elegans and Heleopera species indicates the influenceof terrestrial inputs, in agreement with the TeOC and TOC/Ndata (Fig. 6).
The amount of organic matter available in the lake sedimenteither originating from in situ primary production or fromallochthonous sources likely influenced the testate amoebacommunities. Indeed, in addition to representing a food sourcefor bacteria and fungi onwhich the testate amoebae partly feed,this organic matter also serves as building material for theshells. Actually, most of the observed testate amoeba taxa (e.g.genera Difflugia, Centropyxis, Cyclopyxis, Phryganella, Bulli-
287
3
2
1
Difflugia
Centropyxis
Arcella
Heleopera
Cyclopyxis
Lesquereusia
Nebela
Bullinularia
Diplochlamys
Hyalosphenia
Paraquadrula
Phryganella
Pontigulasia
Pseudodifflugia
Number of taxa
Genus
Figure 5 Number of testate amoeba taxa observed in Lake Lautreycore 6 for each genus
6
nularia, Pseudodifflugia) build their tests from organic ormineral particles available in their immediate environment(Lena, 1982; Ellison and Ogden, 1987). A notable exception isParaquadrula irregularis, which secretes its shell from calcite inagreement with the calcareous origin of the sediments(Schonborn, 1984).
Testate amoeba accumulation rate and speciesrichness
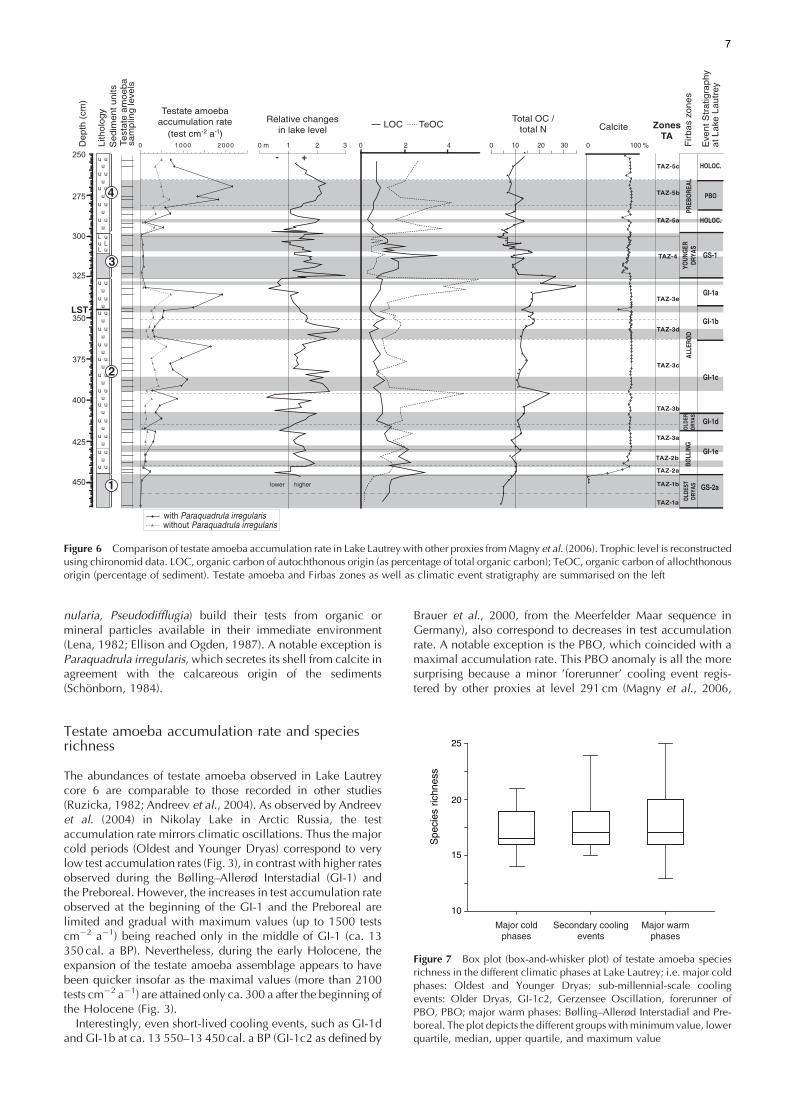
The abundances of testate amoeba observed in Lake Lautreycore 6 are comparable to those recorded in other studies(Ruzicka, 1982; Andreev et al., 2004). As observed by Andreevet al. (2004) in Nikolay Lake in Arctic Russia, the testaccumulation rate mirrors climatic oscillations. Thus the majorcold periods (Oldest and Younger Dryas) correspond to verylow test accumulation rates (Fig. 3), in contrast with higher ratesobserved during the Bølling–Allerød Interstadial (GI-1) andthe Preboreal. However, the increases in test accumulation rateobserved at the beginning of the GI-1 and the Preboreal arelimited and gradual with maximum values (up to 1500 testscm�2 a�1) being reached only in the middle of GI-1 (ca. 13350 cal. a BP). Nevertheless, during the early Holocene, theexpansion of the testate amoeba assemblage appears to havebeen quicker insofar as the maximal values (more than 2100tests cm�2 a�1) are attained only ca. 300 a after the beginning ofthe Holocene (Fig. 3).Interestingly, even short-lived cooling events, such as GI-1d
and GI-1b at ca. 13 550–13 450 cal. a BP (GI-1c2 as defined by
Brauer et al., 2000, from the Meerfelder Maar sequence inGermany), also correspond to decreases in test accumulationrate. A notable exception is the PBO, which coincided with amaximal accumulation rate. This PBO anomaly is all the moresurprising because a minor ’forerunner’ cooling event regis-tered by other proxies at level 291 cm (Magny et al., 2006,
u u
u uu
u uu
u uu
u uu
u uu
u uu
u uu
u uu
u uu
u uu
u uu
u uu
u uu
u uu
u uu
u u
u u
u
u
L u
L uu L
1
2
3
4
Lith
olo
gy
275
250
300
325
350
375
400
425
450
LST
De
pth
(cm
)
Se
dim
en
t u
nits
PBO
HOLOC.
HOLOC.
GS-2a
GI-1e
GI-1d
GI-1c
GI-1b
GI-1a
GS-1
Eve
nt
Str
atig
rap
hya
t L
ake
Lau
trey
Fir
ba
s zo
ne
sPR
EBO
REAL
YOUN
GER
DRYA
SAL
LERØ
DO
LDER
DRY
ASBØ
LLIN
GO
LDES
TDR
YAS
0 100 %
Calcite
TAZ-2a
TAZ-1b
TAZ-1a
TAZ-5c
TAZ-5b
TAZ-5a
TAZ-4
TAZ-3e
TAZ-3d
TAZ-3c
TAZ-3b
TAZ-2b
TAZ-3a
ZonesTA
Testate amoebaaccumulation rate
(test cm-2 a-1)0 1000 2000
with Paraquadrula irregulariswithout Paraquadrula irregularis
Total OC /total N
2010 0300 2 4
LOC TeOCRelative changesin lake level
+-0 m 1 2 3
lower higher
Test
ate
am
oe
ba
sam
plin
g le
vels
Figure 6 Comparison of testate amoeba accumulation rate in Lake Lautrey with other proxies fromMagny et al. (2006). Trophic level is reconstructedusing chironomid data. LOC, organic carbon of autochthonous origin (as percentage of total organic carbon); TeOC, organic carbon of allochthonousorigin (percentage of sediment). Testate amoeba and Firbas zones as well as climatic event stratigraphy are summarised on the left
10
15
20
25
Spe
cies
ric
hnes
s
Major coldphases
Major warmphases
Secondary coolingevents
Figure 7 Box plot (box-and-whisker plot) of testate amoeba speciesrichness in the different climatic phases at Lake Lautrey; i.e. major coldphases: Oldest and Younger Dryas; sub-millennial-scale coolingevents: Older Dryas, GI-1c2, Gerzensee Oscillation, forerunner ofPBO, PBO; major warm phases: Bølling–Allerød Interstadial and Pre-boreal. The plot depicts the different groupswithminimumvalue, lowerquartile, median, upper quartile, and maximum value
7
2007) is clearly defined in the testate amoeba assemblages byboth a decrease in test accumulation rate (Fig. 3) and a peak inArcella vulgaris frequencies. Overall, the response of testateamoebae to climate change seems to bemore rapid andmarkedin assemblage structure and composition (particularly in termsof species dominance), than in the accumulation rate (seebelow).The species richness corresponds to that observed in other
palaeolimnological studies for the Holocene (Andreev et al.,2004; 57 species). However, in contrast to abundance patterns,the variations in species richness observed at Lake Lautrey arenot correlated with climatic oscillations (Figs 3 and 7) as wasthe case in Nikolay Lake (Arctic Russia).
Testate amoeba assemblages and climate eventstratigraphy
The comparison of palaeoenvironmental records from LakeLautrey suggests a tight link between testate amoeba assem-blages and environmental and climatic variations during theLateglacial–Holocene transition: (1) the major testate amoebazones agree well with the Firbas pollen zones and the majorclimatic events, such as, the Oldest Dryas, Bølling–AllerødInterstadial, Younger Dryas and Preboreal; (2) the PCA analysisrevealed a clear correlation between the testate amoeba dataand other climatic proxies (Fig. 8); (3) changes in composition(Figs 3 and 4) and structure (Fig. 9) of testate amoebaassemblages as well as in accumulation rate (Fig. 3) areassociated with major variations in climate.
Variations in dominance patterns
Testate amoeba assemblage dominance patterns revealed twopatterns: (1) a clear difference is observed in the dominantspecies recorded between cold and warm phases (Figs 3 and 4);and (2) several distinct assemblages are observed in cold phasesamples. During the Oldest Dryas, two successive assemblagesare observed, i.e. TAZ-1a and TAZ-1b. These assemblagesdiffer from that of the Younger Dryas (TAZ-4). By contrast,warm periods, i.e. GI-1 (Bølling–Allerød Interstadial) and theearly Holocene, clearly display a more common pattern, with amarked dominance of Paraquadrula irregularis. Moreover, justat the beginning of the Bølling zone, a short-lived warmassemblage, TAZ-2a, is characterised by the dominance ofCentropyxis discoides. This zone can be considered atransitional zone between the Oldest Dryas and the Bølling–Allerød Interstadial, also documented by the chironomid,mineralogy and magnetic susceptibility records (Magny et al.,2006).
Some species observed during specific climatic phases orperiods require further study: Arcella discoides, Cyclopyxiskahli, C. eurystoma, Heleopera species, Diplochlamys timida,Difflugia sp.2, D. globulosus, D. viscidula, D. type decloitrei,D. oblonga nodosa, D. lanceolata and Lesquereusia modestawere recorded mostly in cold periods (Figs 3 and 4), whileParaquadrula irregularis and Difflugia type olliformis wereobserved in warm phases. Other taxa were noted only in aspecific climatic period, e.g. Arcella discoides, Difflugiaglobulosus, Heleopera species and Diplochlamys timida forthe Oldest Dryas; and Difflugia sp.2, D. globulosus,D. viscidula, D. oblonga nodosa, D. lanceolata and Lesquer-eusia modesta for the Younger Dryas.
ChironomidPCA AXIS 1
-0.40.40.8 0
TOM / LOM
0 25 50 75
PollenPCA AXIS 1
1 0 -1-10 -9 -8
δ Ο18 (‰)
PBO
HOLOC.
HOLOC.
GS-2a
GI-1e
GI-1d
GI-1c
GI-1b
GI-1a
GS-1
PREB
OR
EAL
YOU
NG
ERD
RYAS
ALL
ERØ
DO
LDER
DRY
ASB
ØLL
ING
OLD
EST
DRY
AS
12 850
12 720
12 080
11 34011 280
11 130
13 270
12 960
13 450
13 850
13 550
14 050
14 350
14 57514 515
Firb
as z
ones
Even
t Str
atig
raph
yat
Lak
e la
utre
y
Chr
onol
ogy
(cal
. a B
P)
250
275
300
325
350
375
400
425
450
u u
u uu
u uu
u uu
u uu
u uu
u uu
u uu
u uu
u uu
u uu
u uu
u uu
u uu
u uu
u uu
u u
u u
u
u
L u
L uu L
2
4
LST
1
3
Dep
th (c
m)
Lith
olog
ySe
dim
ent u
nits
Test
ate
amoe
basa
mpl
ing
leve
ls
Testate amoebaPCA AXIS 1
0.4 0 -0.4 -0.8
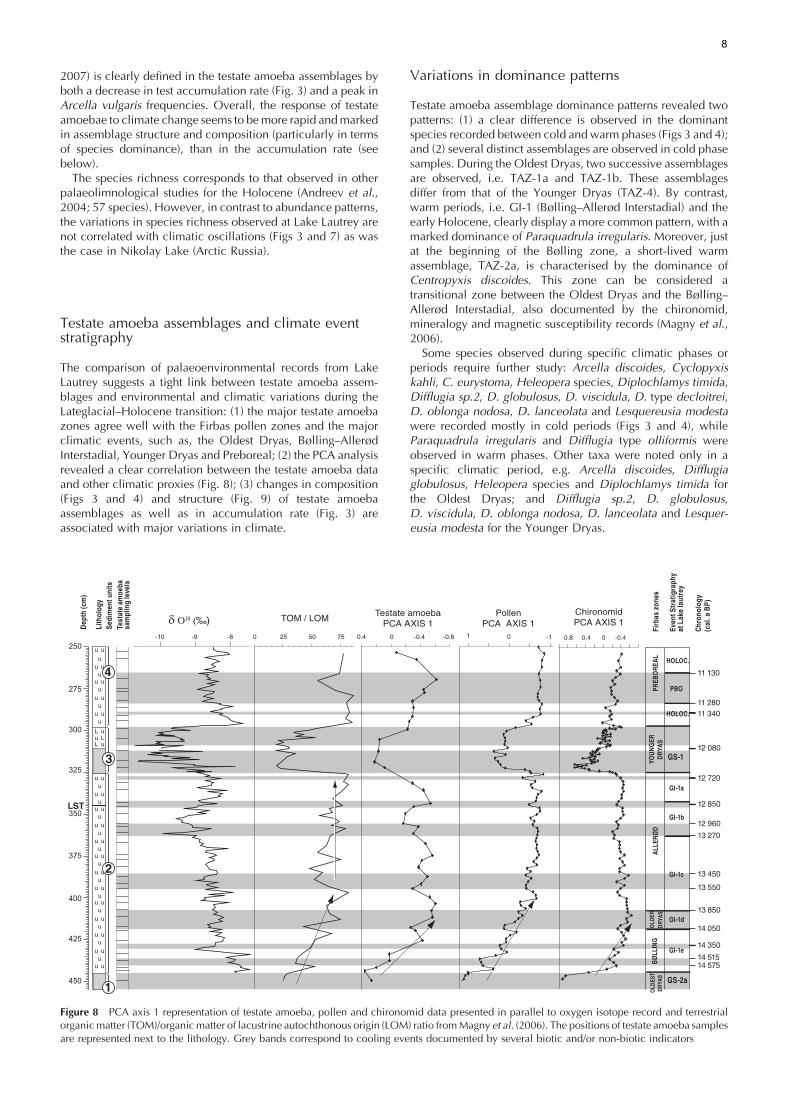
Figure 8 PCA axis 1 representation of testate amoeba, pollen and chironomid data presented in parallel to oxygen isotope record and terrestrialorganicmatter (TOM)/organicmatter of lacustrine autochthonous origin (LOM) ratio fromMagny et al. (2006). The positions of testate amoeba samplesare represented next to the lithology. Grey bands correspond to cooling events documented by several biotic and/or non-biotic indicators
8
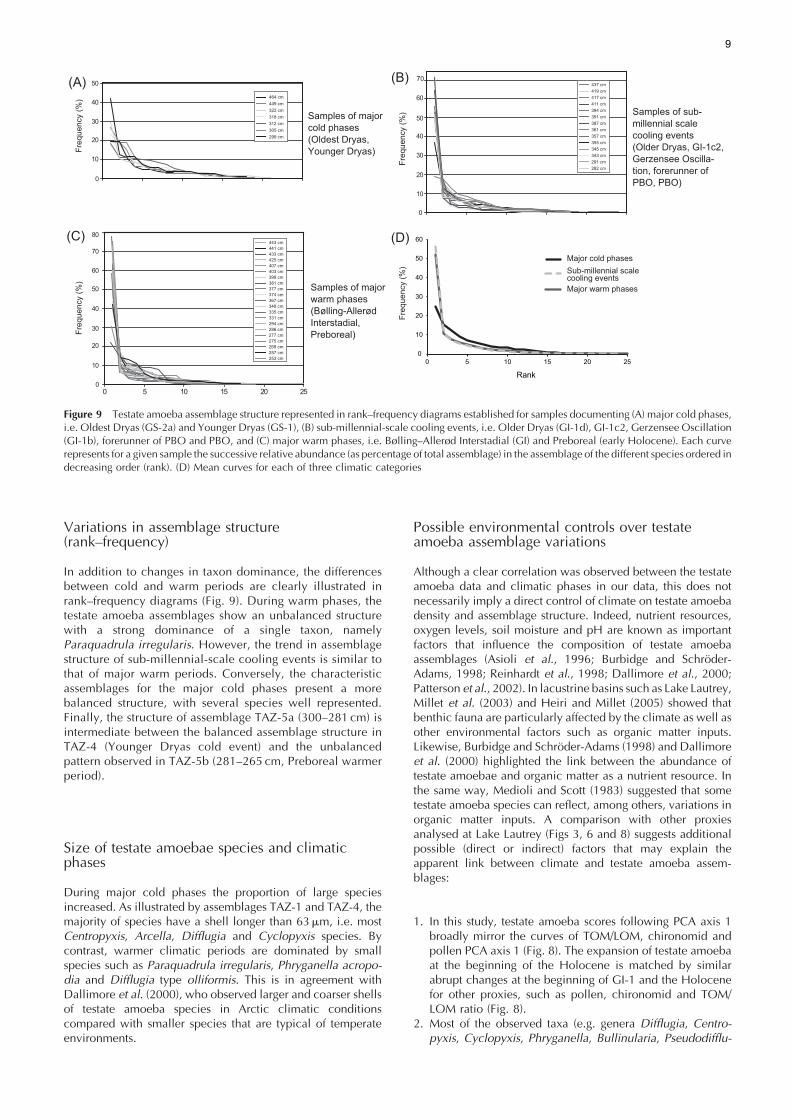
Variations in assemblage structure(rank–frequency)
In addition to changes in taxon dominance, the differencesbetween cold and warm periods are clearly illustrated inrank–frequency diagrams (Fig. 9). During warm phases, thetestate amoeba assemblages show an unbalanced structurewith a strong dominance of a single taxon, namelyParaquadrula irregularis. However, the trend in assemblagestructure of sub-millennial-scale cooling events is similar tothat of major warm periods. Conversely, the characteristicassemblages for the major cold phases present a morebalanced structure, with several species well represented.Finally, the structure of assemblage TAZ-5a (300–281 cm) isintermediate between the balanced assemblage structure inTAZ-4 (Younger Dryas cold event) and the unbalancedpattern observed in TAZ-5b (281–265 cm, Preboreal warmerperiod).
Size of testate amoebae species and climaticphases
During major cold phases the proportion of large speciesincreased. As illustrated by assemblages TAZ-1 and TAZ-4, themajority of species have a shell longer than 63mm, i.e. mostCentropyxis, Arcella, Difflugia and Cyclopyxis species. Bycontrast, warmer climatic periods are dominated by smallspecies such as Paraquadrula irregularis, Phryganella acropo-dia and Difflugia type olliformis. This is in agreement withDallimore et al. (2000), who observed larger and coarser shellsof testate amoeba species in Arctic climatic conditionscompared with smaller species that are typical of temperateenvironments.
Possible environmental controls over testateamoeba assemblage variations
Although a clear correlation was observed between the testateamoeba data and climatic phases in our data, this does notnecessarily imply a direct control of climate on testate amoebadensity and assemblage structure. Indeed, nutrient resources,oxygen levels, soil moisture and pH are known as importantfactors that influence the composition of testate amoebaassemblages (Asioli et al., 1996; Burbidge and Schroder-Adams, 1998; Reinhardt et al., 1998; Dallimore et al., 2000;Patterson et al., 2002). In lacustrine basins such as Lake Lautrey,Millet et al. (2003) and Heiri and Millet (2005) showed thatbenthic fauna are particularly affected by the climate as well asother environmental factors such as organic matter inputs.Likewise, Burbidge and Schroder-Adams (1998) and Dallimoreet al. (2000) highlighted the link between the abundance oftestate amoebae and organic matter as a nutrient resource. Inthe same way, Medioli and Scott (1983) suggested that sometestate amoeba species can reflect, among others, variations inorganic matter inputs. A comparison with other proxiesanalysed at Lake Lautrey (Figs 3, 6 and 8) suggests additionalpossible (direct or indirect) factors that may explain theapparent link between climate and testate amoeba assem-blages:
1. In this study, testate amoeba scores following PCA axis 1broadly mirror the curves of TOM/LOM, chironomid andpollen PCA axis 1 (Fig. 8). The expansion of testate amoebaat the beginning of the Holocene is matched by similarabrupt changes at the beginning of GI-1 and the Holocenefor other proxies, such as pollen, chironomid and TOM/LOM ratio (Fig. 8).
2. Most of the observed taxa (e.g. genera Difflugia, Centro-pyxis, Cyclopyxis, Phryganella, Bullinularia, Pseudodifflu-
10
20
30
40
50
60
70
80
00 5 10 15 20 25
Rank
441 cm
403 cm
374 cm
331 cm
257 cm
277 cm275 cm
349 cm
294 cm
399 cm
425 cm
443 cm
433 cm
407 cm
381 cm377 cm
367 cm
335 cm
286 cm
269 cm
253 cm
Samples of major warm phases(Bølling-AllerødInterstadial,Preboreal)Fr
eque
ncy
(%)
Freq
uenc
y (%
)
(C) (D)
417 cm
437 cm
291 cm
361 cm
394 cm
419 cm
411 cm
391 cm387 cm
357 cm355 cm345 cm343 cm
282 cm
0
10
20
30
40
50
60
Freq
uenc
y (%
)
70
Samples of sub-millennial scale cooling events (Older Dryas, GI-1c2, Gerzensee Oscilla-tion, forerunner of PBO, PBO)
(B)464 cm449 cm
318 cm322 cm
312 cm
299 cm305 cm
0
10
20
30
40
50
Samples of major cold phases (Oldest Dryas, Younger Dryas)Fr
eque
ncy
(%)
(A)
Major cold phases
Major warm phases
Sub-millennial scalecooling events
0
10
20
30
40
50
60
0 5 10 15 20 25
Figure 9 Testate amoeba assemblage structure represented in rank–frequency diagrams established for samples documenting (A) major cold phases,i.e. Oldest Dryas (GS-2a) and Younger Dryas (GS-1), (B) sub-millennial-scale cooling events, i.e. Older Dryas (GI-1d), GI-1c2, Gerzensee Oscillation(GI-1b), forerunner of PBO and PBO, and (C) major warm phases, i.e. Bølling–Allerød Interstadial (GI) and Preboreal (early Holocene). Each curverepresents for a given sample the successive relative abundance (as percentage of total assemblage) in the assemblage of the different species ordered indecreasing order (rank). (D) Mean curves for each of three climatic categories
9
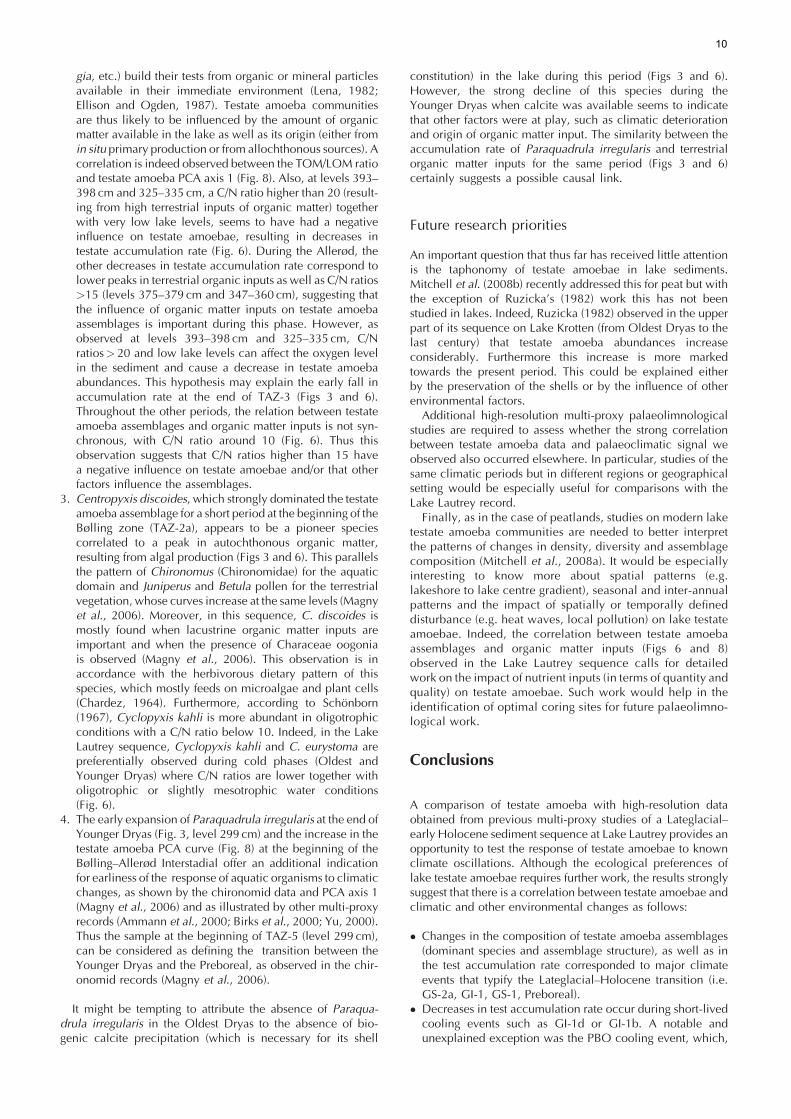
gia, etc.) build their tests from organic or mineral particlesavailable in their immediate environment (Lena, 1982;Ellison and Ogden, 1987). Testate amoeba communitiesare thus likely to be influenced by the amount of organicmatter available in the lake as well as its origin (either fromin situ primary production or from allochthonous sources). Acorrelation is indeed observed between the TOM/LOM ratioand testate amoeba PCA axis 1 (Fig. 8). Also, at levels 393–398 cm and 325–335 cm, a C/N ratio higher than 20 (result-ing from high terrestrial inputs of organic matter) togetherwith very low lake levels, seems to have had a negativeinfluence on testate amoebae, resulting in decreases intestate accumulation rate (Fig. 6). During the Allerød, theother decreases in testate accumulation rate correspond tolower peaks in terrestrial organic inputs as well as C/N ratios>15 (levels 375–379 cm and 347–360 cm), suggesting thatthe influence of organic matter inputs on testate amoebaassemblages is important during this phase. However, asobserved at levels 393–398 cm and 325–335 cm, C/Nratios> 20 and low lake levels can affect the oxygen levelin the sediment and cause a decrease in testate amoebaabundances. This hypothesis may explain the early fall inaccumulation rate at the end of TAZ-3 (Figs 3 and 6).Throughout the other periods, the relation between testateamoeba assemblages and organic matter inputs is not syn-chronous, with C/N ratio around 10 (Fig. 6). Thus thisobservation suggests that C/N ratios higher than 15 havea negative influence on testate amoebae and/or that otherfactors influence the assemblages.
3. Centropyxis discoides, which strongly dominated the testateamoeba assemblage for a short period at the beginning of theBølling zone (TAZ-2a), appears to be a pioneer speciescorrelated to a peak in autochthonous organic matter,resulting from algal production (Figs 3 and 6). This parallelsthe pattern of Chironomus (Chironomidae) for the aquaticdomain and Juniperus and Betula pollen for the terrestrialvegetation, whose curves increase at the same levels (Magnyet al., 2006). Moreover, in this sequence, C. discoides ismostly found when lacustrine organic matter inputs areimportant and when the presence of Characeae oogoniais observed (Magny et al., 2006). This observation is inaccordance with the herbivorous dietary pattern of thisspecies, which mostly feeds on microalgae and plant cells(Chardez, 1964). Furthermore, according to Schonborn(1967), Cyclopyxis kahli is more abundant in oligotrophicconditions with a C/N ratio below 10. Indeed, in the LakeLautrey sequence, Cyclopyxis kahli and C. eurystoma arepreferentially observed during cold phases (Oldest andYounger Dryas) where C/N ratios are lower together witholigotrophic or slightly mesotrophic water conditions(Fig. 6).
4. The early expansion of Paraquadrula irregularis at the end ofYounger Dryas (Fig. 3, level 299 cm) and the increase in thetestate amoeba PCA curve (Fig. 8) at the beginning of theBølling–Allerød Interstadial offer an additional indicationfor earliness of the response of aquatic organisms to climaticchanges, as shown by the chironomid data and PCA axis 1(Magny et al., 2006) and as illustrated by other multi-proxyrecords (Ammann et al., 2000; Birks et al., 2000; Yu, 2000).Thus the sample at the beginning of TAZ-5 (level 299 cm),can be considered as defining the transition between theYounger Dryas and the Preboreal, as observed in the chir-onomid records (Magny et al., 2006).
It might be tempting to attribute the absence of Paraqua-drula irregularis in the Oldest Dryas to the absence of bio-genic calcite precipitation (which is necessary for its shell
constitution) in the lake during this period (Figs 3 and 6).However, the strong decline of this species during theYounger Dryas when calcite was available seems to indicatethat other factors were at play, such as climatic deteriorationand origin of organic matter input. The similarity between theaccumulation rate of Paraquadrula irregularis and terrestrialorganic matter inputs for the same period (Figs 3 and 6)certainly suggests a possible causal link.
Future research priorities
An important question that thus far has received little attentionis the taphonomy of testate amoebae in lake sediments.Mitchell et al. (2008b) recently addressed this for peat but withthe exception of Ruzicka’s (1982) work this has not beenstudied in lakes. Indeed, Ruzicka (1982) observed in the upperpart of its sequence on Lake Krotten (from Oldest Dryas to thelast century) that testate amoeba abundances increaseconsiderably. Furthermore this increase is more markedtowards the present period. This could be explained eitherby the preservation of the shells or by the influence of otherenvironmental factors.
Additional high-resolution multi-proxy palaeolimnologicalstudies are required to assess whether the strong correlationbetween testate amoeba data and palaeoclimatic signal weobserved also occurred elsewhere. In particular, studies of thesame climatic periods but in different regions or geographicalsetting would be especially useful for comparisons with theLake Lautrey record.
Finally, as in the case of peatlands, studies on modern laketestate amoeba communities are needed to better interpretthe patterns of changes in density, diversity and assemblagecomposition (Mitchell et al., 2008a). It would be especiallyinteresting to know more about spatial patterns (e.g.lakeshore to lake centre gradient), seasonal and inter-annualpatterns and the impact of spatially or temporally defineddisturbance (e.g. heat waves, local pollution) on lake testateamoebae. Indeed, the correlation between testate amoebaassemblages and organic matter inputs (Figs 6 and 8)observed in the Lake Lautrey sequence calls for detailedwork on the impact of nutrient inputs (in terms of quantity andquality) on testate amoebae. Such work would help in theidentification of optimal coring sites for future palaeolimno-logical work.
Conclusions
A comparison of testate amoeba with high-resolution dataobtained from previous multi-proxy studies of a Lateglacial–early Holocene sediment sequence at Lake Lautrey provides anopportunity to test the response of testate amoebae to knownclimate oscillations. Although the ecological preferences oflake testate amoebae requires further work, the results stronglysuggest that there is a correlation between testate amoebae andclimatic and other environmental changes as follows:
� Changes in the composition of testate amoeba assemblages(dominant species and assemblage structure), as well as inthe test accumulation rate corresponded to major climateevents that typify the Lateglacial–Holocene transition (i.e.GS-2a, GI-1, GS-1, Preboreal).
� Decreases in test accumulation rate occur during short-livedcooling events such as GI-1d or GI-1b. A notable andunexplained exception was the PBO cooling event, which,
10
although well marked by other proxies, could not be recog-nised in our testate amoeba data.
� This study adds weight to the existence of a cooling event(GI-1c2) between the cool oscillations GI-1d and GI-1b.
� Organic matter inputs (both in quantity and quality) are animportant determining factor for the abundance of testateamoeba assemblages until the Preboreal period. Modernecological studies are needed to understand the mechanismsinvolved.
The demonstration of the value of lacustrine testate amoebaefor palaeoclimatic reconstructions now calls for a major effortto further our understanding of lacustrine testate amoebaecology. We suggest a dual approach with (1) more detailedmulti-proxy high-resolution studies for the same periods atother sites, and (2) the study of present-day ecologyof lacustrine testate amoebae and the development of transferfunctions that can be applied to fossil sequences.
Acknowledgements Financial support for this study was providedby the French CNRS (programme ECLIPSE). The authors thankLaurent Millet for his help in the interpretation of the results. RobertBooth and an anonymous reviewer are thanked for their constructivecomments, which substantially contributed to the improvement ofthis article. Funding to EM by Swiss NSF project no. 205321-109709/1 is kindly acknowledged.
References
Ammann B, Birks HJB, Brooks SJ, Eicher U, von Grafenstein U, HofmanW, Lemdahl G, Schwander J, Tobolski K, Wick L. 2000. Quantifi-cation of biotic responses to rapid climatic changes around theYounger Dryas: a synthesis. Palaeogeography, Palaeoecology,Palaeoclimatology 159: 313–349.
Andreev A, Tarasov P, Schwamborn G, Ilyashuk B, Ilyashuk E, BobrovA, Klimanov V, Rachold V, Hubberten H-W. 2004. Holocenepaleoenvironmental records from Nikolay Lake, Lena River Delta,Arctic Russia. Palaeogeography, Palaeoclimatology, Palaeoecology209: 197–217.
Asioli A, Medioli FS, Patterson RT. 1996. Thecamoebians as a tool forreconstruction of paleoenvironments in some Italian lakes in thefoothills of the southern Alps (Orta, Varese, and Candia). Journal ofForaminiferal Research 26: 248–263.
Bennett KD. 1996. Determination of the number of zones in a bios-tratigraphical sequence. New Phytologist 132: 155–170.
Beyens L, Meisterfeld R. 2001. Protozoa: testate amoebae. In TrackingEnvironmental Change Using Lake Sediments. Vol. 3: Terrestrial,Algal, and Siliceous Indicators, Smol JP, Birks HJB, Last WM (eds).Kluwer Academic: Dordrecht; 121–153.
Birks HH, Battarbee RW, Birks HJB. 2000. The development of theaquatic ecosystem at Krakenes Lake, western Norway, during thelate-glacial and early-Holocene: a synthesis. Journal of Paleolimnol-ogy 23: 91–114.
Bjorck S, Walker MJC, Cwynar LC, Johnsen S, Knudsen K-L, Lowe JL,Wohlfarth B. INTIMATE Members. 1998. An event stratigraphy forthe last termination in the North Atlantic region based on the Green-land ice-core record: a proposal by the INTIMATE group. Journal ofQuaternary Science 13: 283–292.
Booth RK. 2001. Ecology of testate amoebae (Protozoa) in two LakeSuperior coastal wetlands: implications for paleoecology andenvironmental monitoring. Wetlands 21: 564–576.
Booth RK. 2002. Testate amoebae as paleoindicators of surface-moist-ure changes on Michigan peatlands: modern ecology and hydro-logical calibration. Journal of Paleolimnology 28: 329–348.
Booth RK. 2008. Testate amoebae as proxies for mean annual water-table depth in Sphagnum-dominated peatlands of North America.Journal of Quaternary Science 23: 43–57.
Booth RK, Jackson ST. 2003. A high-resolution record of late-Holocenemoisture variability from a Michigan raised bog, USA. The Holocene13: 865–878.
Boudreau REA, Galloway JM, Patterson RT, Kumar A, Michel FA. 2005.A palaeolimnological record of Holocene climate and environmentalchange in the Temagami region, northeastern Ontario. Journal ofPaleolimnology 33: 445–461.
Brauer A, Gunter C, Johnsen SJ, Negendank JFW. 2000. Land–iceteleconnections of cold climatic periods during the last Glacial/Interglacial transition. Climate Dynamics 16: 229–239.
Burbidge SM, Schroder-Adams CJ. 1998. Thecamoebians in LakeWinnipeg: a tool for Holocene paleolimnology. Journal of Paleo-limnology 19: 309–328.
Cash J, Hopkinson J. 1905. The British Freshwater Rhizopoda andHeliozoa. Vol. I: Rhizopoda, Part I. Printed for the Ray Society:London.
Cash J, Hopkinson J. 1909. The British Freshwater Rhizopoda andHeliozoa. Volume II, Rhizopoda, Part II. Printed for the Ray Society:London.
Cash J, Wailes GH, Hopkinson J. 1915. The British Freshwater Rhizo-poda and Heliozoa. Vol. III: Rhizopoda, Part III. Printed for the RaySociety: London.
Cash J, Wailes GH, Hopkinson J. 1919. The British FreshwaterRhizopoda and Heliozoa. Vol. IV: Rhizopoda, Part IV. Printed forthe Ray Society: London.
Chardez D. 1964. Sur la nutrition de Centropyxis discoides (Penard)Deflandre (Rhizopoda testacea).Bulletin de l’Institut Agronomique etdes Stations de Recherche de Gembloux 32: 305–308.
Chardez D. 1965. Ecologie generale des Thecamoebiens (Rhizopodatestacea). Bulletin de l’Institut Agronomique et des Stations deRecherche de Gembloux 33: 307–341.
Chardez D. 1967. Histoire naturelle des Protozoaires Thecamoebiens.Les Naturalistes Belges: Brussels.
Chardez D. 1968. Etudes statistiques sur l’ecologie et la morphologiedes Thecamoebiens. Hydrobiologia 32: 271–287.
Charman DJ. 2001. Biostratigraphic and palaeoenvironmentalapplications of testate amoebae. Quaternary Science Reviews 20:1753–1764.
Charman DJ, Blundell A. ACCROTELM Members. 2007. A new Euro-pean amoebae transfer function for palaeohydrological reconstruc-tion on ombrotrophic peatlands. Journal of Quaternary Science 22:209–221.
Dallimore A, Schroder-Adams CJ, Dallimore SR. 2000. Holoceneenvironmental history of thermokarst lakes on Richards Island,Northwest Territories, Canada: thecamoebians as paleolimnologicalindicators. Journal of Paleolimnology 23: 261–283.
Ellison RL, Ogden CG. 1987. A guide to the study and identification offossil testate amoebae in Quaternary lake sediments. InternationalReview of Hydrobiology 72: 639–652.
Frontier S, Pichod-Viale D. 1998. Ecosystemes: Structure, fonctionne-ment, evolution, (2nd edn). Dunod: Paris.
Grimm EC. 1991. TILIA and TILIAGRAPH Software. Illinois SateMuseum, Springfield, IL.
Hammer Ø, Harper DAT, Ryan PD. 2001. PAST: PaleontologicalStatistics Software ver. 1.57 – Package for Education and DataAnalysis. Palaeontologia Electronica 4: 1–9.
Heiri O, Millet L. 2005. Reconstruction of Late Glacial summer tem-peratures from chironomid assemblages in Lac Lautrey (Jura, France).Journal of Quaternary Science 20: 33–44.
Lamentowicz M, Cedro A, Gaka M, Goslar T, Miotk-Szpiganowicz G,Mitchell EAD, Pawlyta J. 2008. Last millennium palaeoenvironmen-tal changes from a Baltic bog (Poland) inferred from stable isotopes,pollen, plant macrofossils and testate amoebae. Palaeogeography,Palaeoclimatology, Palaeoecology 265: 93–106.
Lena H. 1982. Benthic Testacida (Rhizopoda, Protozoa) of LakeWashington, Brevard County, Florida. Florida Science 45: 101–106.
Lowe J. (ed.). 1994. Climate changes in areas adjacent to the NorthAtlantic during the last Glacial–Interglacial transition. Journal ofQuaternary Science 9: 93–198.
Magny M, Aalbersberg G, Begeot C, Benoit-Ruffaldi P, Bossuet G,Disnar JR, Heiri O, Laggoun-Defarge F, Mazier F, Millet L,Peyron O, Vanniere B, Walter-Simonnet A-V. 2006. Environmental
11

and climatic changes in the Jura mountains (eastern France)during the Lateglacial–Holocene transition: a multi-proxy recordfrom Lake Lautrey. Quaternary Science Reviews 25: 414–445.
Magny M, Vanniere B, de Beaulieu J-L, Begeot C, Heiri O, Millet L,Peyron O, Walter-Simonnet A-V. 2007. Early-Holocene climaticoscillations recorded by lake-level fluctuations in west-centralEurope and in central Italy. Quaternary Science Reviews 26:1951–1964.
McCarthy FMG, Collins ES, McAndrews JH, Kerr HA, Scott DB, MedioliFS. 1995. A comparison of postglacial Arcellacean (Thecamoebian)and pollen succession in Atlantic Canada, illustrating the potential ofArcellaceans for palaeoclimatic reconstruction. Journal of Paleontol-ogy 69: 980–993.
Medioli FS, Scott DB. 1983. Holocene Arcellacea (Thecamoebians)from eastern Canada. Cushman Foundation: Washington, DC.
Medioli FS, Scott DB. 1988. Lacustrine thecamoebians (mainly Arcel-laceans) as potential tools for palaeolimnological interpretations.Paleogeography, Paleoclimatology, Paleoecology 62: 361–386.
Meisterfeld R. 2002a. Order Arcellinida. In The Illustrated Guide to theProtozoa, (2nd edn), Lee JJ, Leedale GF, Bradbury PC (eds). Societyof Protozoologists: Lawrence, KS. 827–860.
Meisterfeld R. 2002b. Testate amoebae with filopodia. In The Illus-trated Guide to the Protozoa, (2nd edn), Lee JJ, Leedale GF,Bradbury PC (eds). Society of Protozoologists: Lawrence, KS.1054–1084.
Millet L, Verneaux V, Magny M. 2003. Lateglacial paleoenviron-mental reconstruction using subfossil chironomid assemblagesfrom Lake Lautrey (Jura, France). Archiv fur Hydrobiologie 156:405–429.
Mitchell EAD, van der Knaap WO, van Leuwen JFN, Buttler A, WarnerBG, Gobat JM. 2001. The palaeoecological history of the Praz-Rodetbog (Swiss Jura) based on pollen, plant macrofossils and testateamoebae (Protozoa). The Holocene 11: 65–80.
Mitchell EAD, Charman DJ, Warner BG. 2008a. Testate amoebaeanalysis in ecological and paleoecological studies of wetlands: past,present and future. Biodiversity and Conservation 17: 2115–2137.
Mitchell EAD, Payne RJ, Lamentowicz M. 2008b. Potential implica-tions of differential preservation of testate amoeba shells for paleoen-vironmental reconstruction in peatlands. Journal of Paleolimnology40: 603–618.
Ogden CG. 1983. Observations on the systematics of the genus Dif-flugia in Britain (Rhizopoda, Protozoa). Bulletin of British Museum ofNatural History (Zoology) 44: 1–73.
Ogden CG,Hedley RH. 1980.AnAtlas of Freshwater Testate Amoebae.British Museum (Natural History) and Oxford University Press:London and Oxford.
Patterson RT, McKinnon KD, Scott DB, Medioli FS. 1985. Arcellaceans(Thecamoebians) in small lakes of New Brunswick and Nova Scotia:modern distribution and Holocene stratigraphic changes. Journal ofForaminiferal Research 15: 114–137.
Patterson RT, Barker T, Burbidge SM. 1996. Arcellaceans (Theca-moebians) as proxies of arsenic and mercury contamination innortheastern Ontario Lakes. Journal of Foraminiferal Research 26:172–183.
Patterson RT, Dalby A, Kumar A, Henderson LA, Boudreau REA. 2002.Arcellaceans (thecamoebians) as indicators of land-use change:settlement history of the Swan Lake area, Ontario as a case study.Journal of Paleolimnology 28: 297–316.
Peyron O, Begeot C, Brewer S, Heiri O, Magny M, Millet L, Ruffaldi P,van Campo E, Yu G. 2005. Late-Glacial climatic changes in EasternFrance (Lake Lautrey) from pollen, lake-levels, and chironomids.Quaternary Research 64: 197–211.
Reinhardt EG, Dalby AP, Kumar A, Patterson RT. 1998. Arcellaceans aspollution indicators in mine tailing contaminated lakes near Cobalt,Ontario, Canada. Micropaleontology 44: 131–148.
Ruzicka E. 1982. Die subfossilen Testaceen des Krottensees (Salzburg,Osterreich). Limnologica 1: 231–254.
Schonborn W. 1967. Taxozonotik der beschalten Susswasser-Rhizopoden: Eine raumstrukturanalytische Untersuchung uberLebensraumerweiterung und Evolution bei der Mikrofauna. Limno-logica 5: 159–207.
Schonborn W. 1984. Studies on remains of Testacea in cores of theGreat Woryty Lake (N.E. Poland). Limnologica 16: 185–190.
Scott DB, Medioli FS. 1983. Agglutinated rhizopods in Lake Erie:modern distribution and stratigraphic implications. Journal ofPaleontology 57: 809–820.
Tolonen K. 1986. Rhizopod analysis. In Handbook of HolocenePalaeoecology and Palaeohydrology, Berglund BE (ed.). Wiley:Chichester; 645–666.
Vanniere B, Bossuet G, Walter-Simonnet A-V, Ruffaldi P, Adatte T,Rossy M, Magny M. 2004. High-resolution record of environmentalchanges and tephrochronological markers of the Last Glacial–Holocene transition at Lake Lautrey (Jura, France). Journal of Qua-ternary Science 19: 797–808.
Wall AAJ, Gilbert D, Magny M, Mitchell EAD. 2009. Testate amoebaanalysis of lake sediments: impact of filter size and total count onestimates of density, species richness and assemblage structure.Journal of Paleolimnology (online first).
Warner BG. 1990. Testate amoebae (Protozoa). In Methods in Qua-ternary Ecology, Warner BG (ed.). Geoscience Canada, reprint series5. Geological Association of Canada: St John’s; 65–74.
Yang J, ZhangW, FengW, Shen Y. 2005. Freshwater testate amoebae ofnine Yunnan Plateau lakes, China. Journal of Freshwater Ecology 20:743–750.
Yang J, Zhang W, Shen Y. 2009. Relationships between testateamoebae assemblages (Protozoa) and geographic factors inYunnan Plateau lakes, China. Journal of Freshwater Ecology 24:437–443.
Yu Z. 2000. Ecosystem response to Lateglacial and early Holoceneclimate oscillations in the Great Lakes region of North America.Quaternary Science Reviews 19: 1723–1747.
12