Microwave dielectric characterization of binary mixture of formamide with N, N -dimethylaminoethanol
11
PRAMANA c Indian Academy of Sciences Vol. 68, No. 5 — journal of May 2007 physics pp. 851–861 Microwave dielectric characterization of binary mixture of formamide with N , N -dimethylaminoethanol PRABHAKAR UNDRE 1,∗ , S N HELAMBE 2 , S B JAGDALE 2 , P W KHIRADE 1 and S C MEHROTRA 3 1 Microwave Research Lab, Department of Physics, Dr. B.A.M. University, Aurangabad 431 004, India 2 Microwave Research Lab, Department of Physics, Deogiri College, Aurangabad 431 005, India 3 Department of Computer Science and Electronics, Dr. B.A.M. University, Aurangabad 431 004, India ∗ Corresponding author. E-mail: prabhakar222@rediffmail.com MS received 8 September 2006; accepted 8 March 2007 Abstract. Dielectric relaxation measurements of formamide (FMD)–N ,N - dimethylaminoethanol (DMAE) solvent mixtures have been carried out over the entire concentration range using time domain reflectometry technique at 25, 35 and 45 ◦ C in the frequency range of 10 MHz to 20 GHz. The mixtures exhibit a principle dispersion of the Davidson–Cole relaxation type at microwave frequencies. Bilinear calibration method is used to obtain complex permittivity ε ∗ (ω) from complex reflection coefficient ρ ∗ (ω) over the frequency range of 10 MHz to 10 GHz. The excess permittivity (ε E ), excess inverse relaxation time (1/τ ) E , Kirkwood correlation factor (g eff ), activation energy and Bruggeman factor (fB) are also calculated to study the solute–solvent interaction. Keywords. Time domain reflectometry; formamide; dimethylaminoethanol; excess pa- rameters; Kirkwood correlation factor; Bruggeman factor; activation energy. PACS No. 77.22.-d 1. Introduction The knowledge of frequency-dependent dielectric properties of binary liquid mix- tures is important both in fundamental studies of solvent structure determination and its dynamics as well as in the practical application of microwave heating process [1,2]. At a fundamental level, the frequency-dependent dielectric behavior of liquid mixtures provides information on molecular interactions and mechanism of mole- cular process. The dielectric relaxation behavior of mixtures of polar molecules under varying conditions of compositions is very important as it helps in obtaining 851
Transcript of Microwave dielectric characterization of binary mixture of formamide with N, N -dimethylaminoethanol

PRAMANA c© Indian Academy of Sciences Vol. 68, No. 5— journal of May 2007
physics pp. 851–861
Microwave dielectric characterizationof binary mixture of formamide withN , N -dimethylaminoethanol
PRABHAKAR UNDRE1,∗, S N HELAMBE2, S B JAGDALE2, P W KHIRADE1
and S C MEHROTRA3
1Microwave Research Lab, Department of Physics, Dr. B.A.M. University,Aurangabad 431 004, India2Microwave Research Lab, Department of Physics, Deogiri College,Aurangabad 431 005, India3Department of Computer Science and Electronics, Dr. B.A.M. University,Aurangabad 431 004, India∗Corresponding author. E-mail: [email protected]
MS received 8 September 2006; accepted 8 March 2007
Abstract. Dielectric relaxation measurements of formamide (FMD)–N ,N -dimethylaminoethanol (DMAE) solvent mixtures have been carried out over the entireconcentration range using time domain reflectometry technique at 25, 35 and 45◦C in thefrequency range of 10 MHz to 20 GHz. The mixtures exhibit a principle dispersion ofthe Davidson–Cole relaxation type at microwave frequencies. Bilinear calibration methodis used to obtain complex permittivity ε∗(ω) from complex reflection coefficient ρ∗(ω)over the frequency range of 10 MHz to 10 GHz. The excess permittivity (εE), excessinverse relaxation time (1/τ)E, Kirkwood correlation factor (geff), activation energy andBruggeman factor (fB) are also calculated to study the solute–solvent interaction.
Keywords. Time domain reflectometry; formamide; dimethylaminoethanol; excess pa-rameters; Kirkwood correlation factor; Bruggeman factor; activation energy.
PACS No. 77.22.-d
1. Introduction
The knowledge of frequency-dependent dielectric properties of binary liquid mix-tures is important both in fundamental studies of solvent structure determinationand its dynamics as well as in the practical application of microwave heating process[1,2]. At a fundamental level, the frequency-dependent dielectric behavior of liquidmixtures provides information on molecular interactions and mechanism of mole-cular process. The dielectric relaxation behavior of mixtures of polar moleculesunder varying conditions of compositions is very important as it helps in obtaining
851
Prabhakar Undre et al
information about relaxation process in mixtures. There have been several investi-gations on the dielectric behavior of solvent mixtures in which dielectric relaxationspectra were used to examine molecular orientations, hydrogen bonded networksand microdynamics of these systems [3–20].
In this paper, we report a systematic investigation of dielectric relaxation inbinary mixture of FMD with DMAE at various concentrations and temperaturesemploying time domain reflectometry [21–23]. The dielectric relaxation spectrahave been obtained for solutions of various compositions in the frequency rangeof 10 MHz to 20 GHz, at temperatures 25, 35 and 45◦C. The experimental dataare fitted to the three different relaxation models [24–27] by the non-linear leastsquares fit method. It is observed that the Davidson–Cole model is adequate todescribe major dispersion of the various solute and solvent mixtures over this fre-quency range. Static dielectric constant and dielectric relaxation time could beobtained by fitting the spectra to the Davidson–Cole model. The static dielectricconstant and relaxation time have been used to determine the excess permittivity,excess inverse relaxation time, Kirkwood correlation factor and Bruggeman fac-tor. Kirkwood correlation factor characterizes the dipole alignment within thesolutions. The excess permittivity, excess inverse relaxation time and Brugge-man factor provide information related to molecular interaction. These parame-ters will provide useful description of the structure and dynamics of the binarymixtures.
Both FMD and DMAE are polar liquids with dipole moments 3.73 and 2.6 Debyerespectively. FMD is a common dipolar aprotic (without –OH group) solvent andDMAE is a protic (with –OH group) solvent. The dielectric study of the binarysystem of these two liquids will give information about the interaction between –OHand –N(CH3)2 groups.
2. Experimental set-up
2.1 Chemicals and sample preparation
FMD and DMAE were obtained commercially with 99.9% purity and were usedwithout further purification. The solutions were prepared at different volume per-centage of FMD in DMAE in the step of 10% at room temperature. The concentra-tions were prepared for 5 ml solution at room temperature assuming ideal mixingbehavior, within 0.02% error limit.
Using these volume per cents, the weight fraction is calculated as
XA =(VA × ρA)
(VA × ρA) + (VB × ρB), (1)
where VA and VB are the volume and ρA and ρB are the density of liquid A and Brespectively.
852 Pramana – J. Phys., Vol. 68, No. 5, May 2007

Microwave dielectric characterization of binary mixture
2.2 TDR set-up and data acquisition
The Hewlett Packard HP54750A sampling oscilloscope with HP54754A TDR plug-in module has been used. After observing TDR response for the sample understudy, the time window was kept to 5 ns. Also by observing TDR response forthe sample under study, the SMA sample cell with 1.35 mm effective pin lengthhas been used. To reduce noise, time-dependent response curve was averaged for64 times and then stored in the memory of the oscilloscope with 1024 points perwave-form. First, the reflected pulse from the empty cell is acquired and stored inthe memory and then, the reflected pulse from the cell with sample is acquired andstored in the memory. The empty cell wave-form is used as the reference wave-form.Both response wave-forms are the reflected wave-forms from the sample cell withopen termination of transmission line.
The data acquisition is carried out for 11 concentrations at 25, 35 and 45◦Cwith an accuracy of ±1◦C. At each time the response wave-forms without sampleand with sample were recorded. The time-dependent response wave-form withoutsample is referred as R1(t) and with sample is referred as Rx(t).
2.3 Data analysis
As explained earlier, the R1(t) and Rx(t) wave-forms are analyzed further to obtainreflection coefficient spectra. In this process, the time-dependent wave-form isconverted to frequency-dependent wave-form using Fourier transformation in thefrequency range of 10 MHz to 10 GHz. The reflection coefficient is related todielectric response of the sample under study for the range of frequency from 10MHz to 10 GHz in terms of complex permittivity spectra [21–23,29]. The value ofε∞ is not sensitive to ε∗(ω) [24] and taken to be fixed as 3.2. A sample complexpermittivity spectra with ε′ and ε′′ are shown in figure 1.
Figure 1. Complex permittivity spectra for pure dimethylaminoethanol.
Pramana – J. Phys., Vol. 68, No. 5, May 2007 853
Prabhakar Undre et al
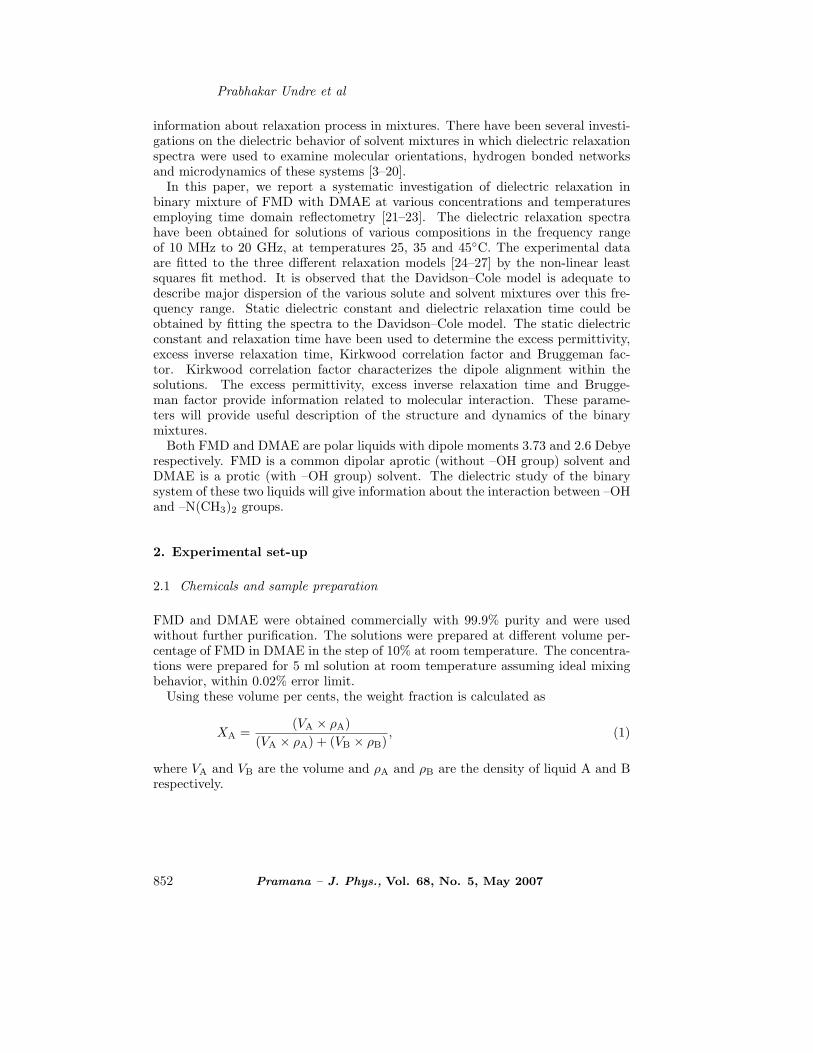
Figure 2. Cole–Cole plot.
Table 1. Physical properties of formamide and dimethylaminoethanol.
Name of Molecular Dipole Liter. value Liter. valuesolvent weight Density moment of (ε0) of τ
FMD 45.04 1.134 3.73 111 51DMAE 89.14 0.8866 2.6 – –
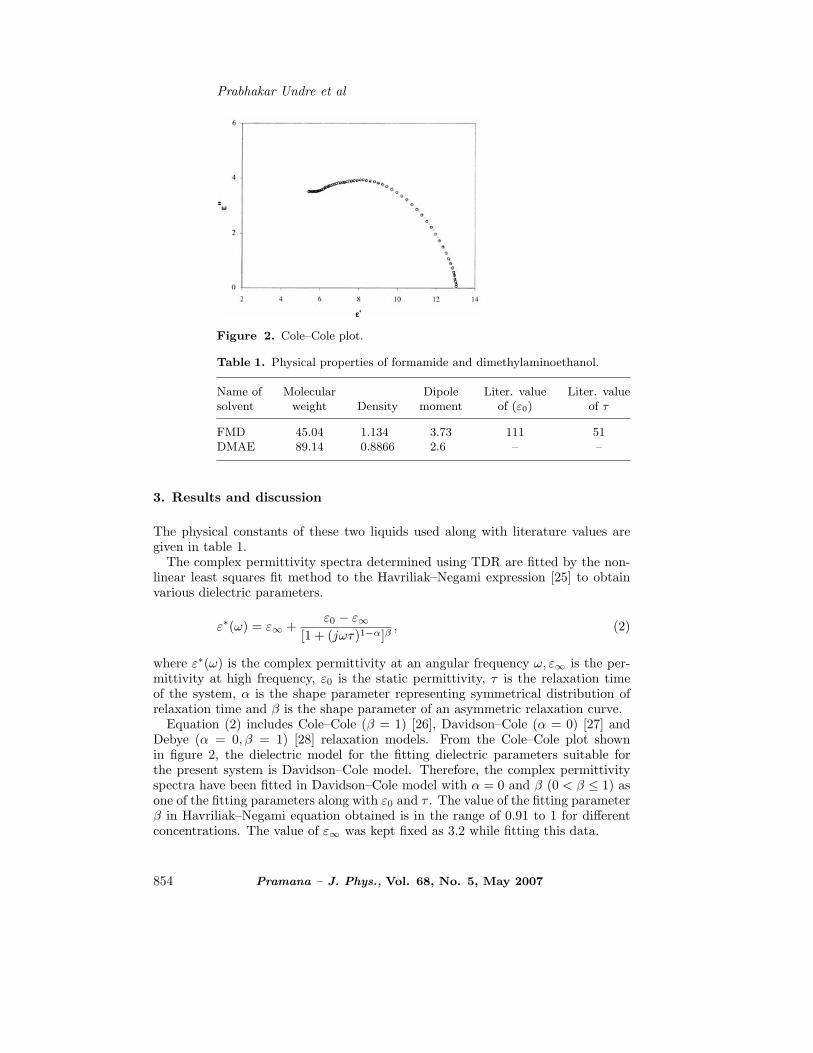
3. Results and discussion
The physical constants of these two liquids used along with literature values aregiven in table 1.
The complex permittivity spectra determined using TDR are fitted by the non-linear least squares fit method to the Havriliak–Negami expression [25] to obtainvarious dielectric parameters.
ε∗(ω) = ε∞ +ε0 − ε∞
[1 + (jωτ)1−α]β, (2)
where ε∗(ω) is the complex permittivity at an angular frequency ω, ε∞ is the per-mittivity at high frequency, ε0 is the static permittivity, τ is the relaxation timeof the system, α is the shape parameter representing symmetrical distribution ofrelaxation time and β is the shape parameter of an asymmetric relaxation curve.
Equation (2) includes Cole–Cole (β = 1) [26], Davidson–Cole (α = 0) [27] andDebye (α = 0, β = 1) [28] relaxation models. From the Cole–Cole plot shownin figure 2, the dielectric model for the fitting dielectric parameters suitable forthe present system is Davidson–Cole model. Therefore, the complex permittivityspectra have been fitted in Davidson–Cole model with α = 0 and β (0 < β ≤ 1) asone of the fitting parameters along with ε0 and τ . The value of the fitting parameterβ in Havriliak–Negami equation obtained is in the range of 0.91 to 1 for differentconcentrations. The value of ε∞ was kept fixed as 3.2 while fitting this data.
854 Pramana – J. Phys., Vol. 68, No. 5, May 2007

Microwave dielectric characterization of binary mixture
Figure 3. Variation of the estimated excess dielectric constant εE as a func-tion of weight fraction of formamide in dimethylaminoethanol at 25, 35 and45◦C.
Figure 4. Variation of the estimated excess inverse relaxation time (1/τ)E
as a function of weight fraction of formamide in dimethylaminoethanol at 25,35 and 45◦C.
Figure 5. The Arrhenius plots of ln(1/τ) vs. (1000/T ) formamide–dimethy-laminoethanol binary system.
Pramana – J. Phys., Vol. 68, No. 5, May 2007 855

Prabhakar Undre et al
Figure 6. Plot of Bruggeman factor (fB) vs. volume fraction of dimethy-laminoethanol.
Table 2. Estimated static dielectric constant for formamide at different tem-peratures.
Volume percentage 25◦C 35◦C 45◦Cof formamide ε0 τ ε0 τ ε0 τ
00 13.59 80.50 12.80 73.21 12.15 66.5010 23.70 127.78 22.82 109.24 22.70 99.5420 33.50 136.24 32.13 116.99 32.00 106.5630 43.60 126.01 40.50 104.41 39.30 92.0140 51.20 107.13 47.89 89.32 47.30 82.1450 61.50 89.44 57.55 77.70 56.20 70.2760 71.10 76.18 67.30 69.97 65.20 58.6070 80.80 63.61 75.11 57.59 72.40 52.7480 90.20 55.41 81.82 49.97 80.70 48.9890 100.00 49.46 91.58 45.67 89.20 44.90
100 110.21 46.30 105.16 43.50 97.77 39.50
Table 2 reports the values of dielectric parameters obtained from fitting eq. (2).It can be seen that by increasing the concentration of FMD in DMAE, the staticpermittivity values increase whereas relaxation time values increase only up to 20%.On increasing the volume percentage of formamide in the solution, the relaxationtime values decrease towards the value corresponding to formamide. With increasein temperature, both static dielectric constant values and relaxation time valuesdecrease maintaining the same type of change with the corresponding change in theconcentration. In the system the values of average relaxation time of the moleculesof the system has a maxima when static dielectric constant of the system is near 30.This indicates that the intermediate structures formed at this stage rotate slowlythereby giving higher values of τ in the solution.
The excess parameters [4,30] related to ε0 and τ provide valuable information re-garding interaction between the (solute–solvent) polar–polar liquid mixtures. Theseproperties are also useful for the detection of the cooperative domain in the mix-ture and may give evidence for the formation of multimers in the mixture due to
856 Pramana – J. Phys., Vol. 68, No. 5, May 2007
Microwave dielectric characterization of binary mixture
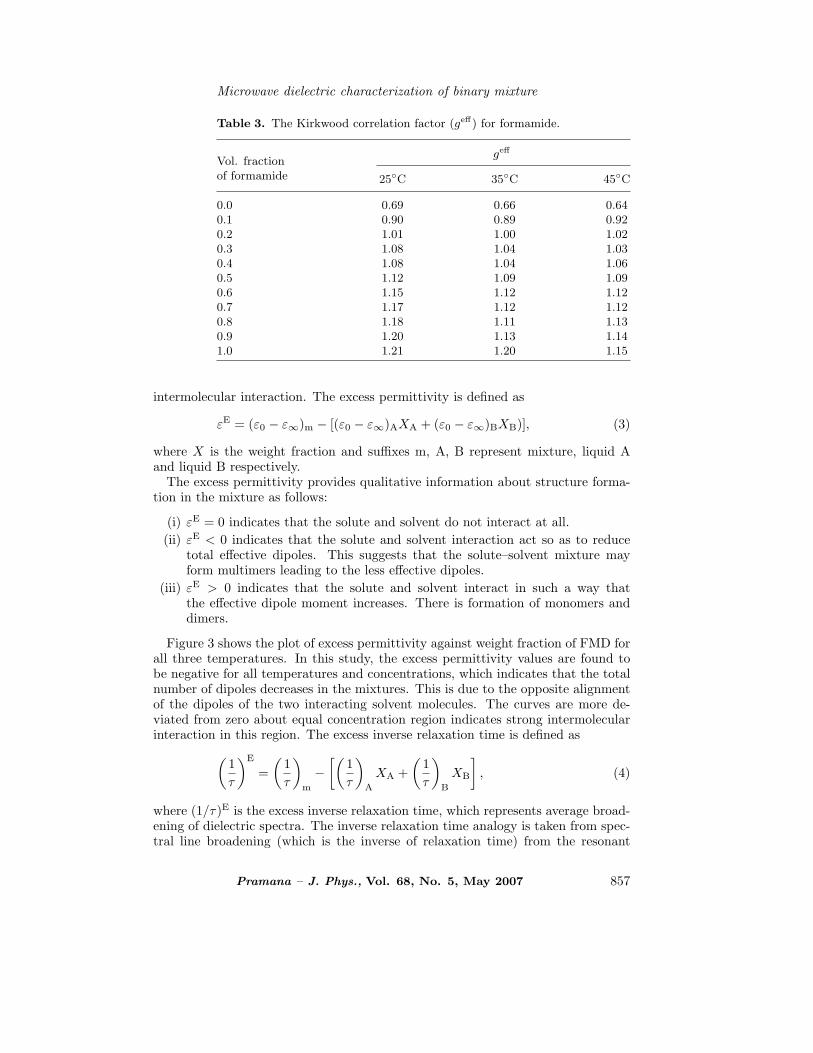
Table 3. The Kirkwood correlation factor (geff) for formamide.
Vol. fractionof formamide
geff
25◦C 35◦C 45◦C
0.0 0.69 0.66 0.640.1 0.90 0.89 0.920.2 1.01 1.00 1.020.3 1.08 1.04 1.030.4 1.08 1.04 1.060.5 1.12 1.09 1.090.6 1.15 1.12 1.120.7 1.17 1.12 1.120.8 1.18 1.11 1.130.9 1.20 1.13 1.141.0 1.21 1.20 1.15
intermolecular interaction. The excess permittivity is defined as
εE = (ε0 − ε∞)m − [(ε0 − ε∞)AXA + (ε0 − ε∞)BXB)], (3)
where X is the weight fraction and suffixes m, A, B represent mixture, liquid Aand liquid B respectively.
The excess permittivity provides qualitative information about structure forma-tion in the mixture as follows:
(i) εE = 0 indicates that the solute and solvent do not interact at all.(ii) εE < 0 indicates that the solute and solvent interaction act so as to reduce
total effective dipoles. This suggests that the solute–solvent mixture mayform multimers leading to the less effective dipoles.
(iii) εE > 0 indicates that the solute and solvent interact in such a way thatthe effective dipole moment increases. There is formation of monomers anddimers.
Figure 3 shows the plot of excess permittivity against weight fraction of FMD forall three temperatures. In this study, the excess permittivity values are found tobe negative for all temperatures and concentrations, which indicates that the totalnumber of dipoles decreases in the mixtures. This is due to the opposite alignmentof the dipoles of the two interacting solvent molecules. The curves are more de-viated from zero about equal concentration region indicates strong intermolecularinteraction in this region. The excess inverse relaxation time is defined as
(1τ
)E
=(
1τ
)m
−[(
1τ
)A
XA +(
1τ
)B
XB
], (4)
where (1/τ)E is the excess inverse relaxation time, which represents average broad-ening of dielectric spectra. The inverse relaxation time analogy is taken from spec-tral line broadening (which is the inverse of relaxation time) from the resonant
Pramana – J. Phys., Vol. 68, No. 5, May 2007 857

Prabhakar Undre et al
spectroscopy [17]. The information regarding the dynamics of solute–solvent inter-action from this excess property is as follows:
(i) (1/τ)E = 0: There is no change in the dynamics of solute–solvent interaction.
(ii) (1/τ)E < 0: The solute–solvent interaction produces a field such that theeffective dipoles rotate slowly.
(iii) (1/τ)E > 0: The solute–solvent interaction produces a field such that theeffective dipoles rotate rapidly, i.e. the field will co-operate in rotation ofdipoles.
The variation of (1/τ)E with weight fraction of FMD for all the three temperatures isshown in figure 4. From this figure it can be seen that, for all the three temperatures,the excess inverse relaxation time values are negative which indicate the formationof linear structure, which rotate slowly under the influence of an external varyingfield. It indicates that addition of FMD to DMAE has created a hindering fieldsuch that the effective dipoles rotate slowly.
The structural information about the liquid by dielectric relaxation parameterscan be obtained by Kirkwood correlation parameter [31]. The Kirkwood correlationfactor g is also a parameter for obtaining information regarding the orientation ofelectric dipoles in polar liquids. The g for pure liquid can be obtained by theexpression
4ΠNμ2ρ
9kTMg =
(ε0 − ε∞)(2ε0 + ε∞)ε0(ε∞ + 2)2
, (5)
where μ is the dipole moment in gas phase, ρ is the density at temperature T,M isthe molecular weight, k is the Boltzmann constant, N is the Avogadro’s number.
The effective angular correlation (geff) between molecules is calculated using themodified form of equation (5) [4,32]. geff has been used to study the orientation ofelectric dipoles in binary mixtures. The Kirkwood equation for the mixture maybe expressed as [4,32]
4ΠN
9kT
(μ2
AρA
MAΦA +
μ2BρB
MBΦB
)geff =
(ε0m − ε∞m)(ε0m + ε∞m)ε0m(ε∞m + 2)2
, (6)
where geff is the effective Kirkwood correlation factor for a binary mixture, andΦA, ΦB are volume fraction of liquid A and liquid B, respectively.
The calculated values of geff are tabulated in table 3. It can be seen from table3 that, geff values are less than unity for pure DMAE and 0.2 volume fraction ofFMD in DMAE, indicating antiparallel orientation of electric dipoles. It can also beseen that the geff values are increased with an increasing concentration of FMD inDMAE. These values are greater than unity at all temperatures suggesting parallelorientation of electric dipoles.
The Arrhenius plots of ln(1/τ) vs. (1000/T ) are plotted in figure 5 for variousconcentrations. The slope of this plot shows linear nature. The ln(1/τ) valuesdecrease up to 20% concentration of FMD and then on further increase in con-centration of FMD, not more change in the slope of the plots is observed, whichindicates that at all concentrations the activation energy remains almost same.
858 Pramana – J. Phys., Vol. 68, No. 5, May 2007

Microwave dielectric characterization of binary mixture
The modified Bruggeman equation [33] gives another parameter, which may beused as an indicator of solute–solvent interaction. The Bruggeman factor fB isgiven by
fB =(
ε0m − ε0B
ε0A − ε0B
) (ε0A
ε0m
)1/3
= (1 − ΦB). (7)
According to eq. (7), a linear relationship is expected which will give a straight linewhen fB is plotted against ΦB. However, here the experimental values of fB werefound to deviate from the linear relationship.
To fit the experimental data, the above equation has been modified [34] as follows:
fB = 1 − [a − (a − 1)ΦB]ΦB, (8)
where a is the numerical fitting parameter.The parameters a were determined for all temperatures. The value a = 1
corresponds to the ideal Bruggeman mixture formula. The deviation from 1relates to the corresponding solute–solvent interaction. Small values of a in-dicate significant rise in effective volume of solvent as well as weak interac-tion between solute and solvent. The Bruggeman factor, which is the ratioof theoretical values of static dielectric constant computed from Bruggemanmixture formula and practically obtained values, has been obtained from eq.(8). The values of Bruggeman factor for all three temperatures are plotted infigure 6.
The Bruggeman factor deviates above the ideal values at all the concentrationsof FMD in the solution. The deviation is more in DMAE-rich region. Same typesof changes in these values have been observed at all temperatures.
4. Conclusion
The dielectric relaxation parameters, the Kirkwood correlation factor, the ex-cess properties and Bruggeman factor have been reported for formamide-N ,N -dimethylaminoethanol mixtures for different concentrations and temperatures. Thestatic dielectric constant of DMAE is found to be in the range of 12 to 13. In themixture of FMD and DMAE, the static dielectric constant increases linearly withincrease in concentration of formamide in the solution.
The relaxation time of DMAE is found to be ∼80 ps at 25◦C. The higher re-laxation time may be due to more association through hydrogen bonding of –OH group in DMAE. The relaxation time of the molecules of the solution in-creases as concentration of FMD is increased up to 20%. On further increasein concentration of FMD in the solution, the relaxation time values decreaseexponentially towards formamide value. This indicates bulky structure forma-tion near 20% concentration of FMD in the solution, i.e. in DMAE-rich re-gion bulky complexes may be formed which gives higher relaxation time in thisregion.
The Arrhenius plots are linear. The slopes of the plots are almost same indicatingno change in activation energy of the system at various concentrations. There is
Pramana – J. Phys., Vol. 68, No. 5, May 2007 859
Prabhakar Undre et al
deviation in Bruggeman factor from linearity in the mixture. This indicates that thestatic permittivity values at different concentrations are not following Bruggemanmixture formula.
Acknowledgements
The authors are thankful to the Department of Science and Technology, New Delhi,India.
References
[1] C Gabriel, S Gabriel, E H Grant, B S J Halstead and D M P Mingos, Chem. Soc.Rev. 27, 213 (1998)
[2] C Kuang and S O Nelson, J. Microw Pow. And E M Energy 32, 114 (1997)[3] R H Fattepur, M T Hosamani, D K Deshpande and S C Mehrotra, J. Chem. Phys.
101, 9956 (1994)[4] A C Kumbharkhane, S M Puranik and S C Mehrotra, J. Sol. Chem. 22, 219 (1993)[5] P Firman, M Marchetti, M Eyrin, E M Xu and S J Petrucci, Phys. Chem. 95, 7055
(1991)[6] S P Patil, A S Chaudhari, M P Lokhande, M K Lande, A G Shankarwar, S N Helambe,
B R Arbad and S C Mehrotra, J. Chem. Eng. Data 44, 875 (1999)[7] J Z Bao, M L Swicord and C C Davies, J. Chem. Phys. 104, 4441 (1996)[8] B M Suryavanshi and S C Mehrotra, Ind. J. Pure Appl. Phys. 29, 442 (1991)[9] A Choudhari, H Chaudhari and S C Mehrotra J. Chin. Chem. Soc. 49, 489 (2002)
[10] A Chaudhari, H Chaudhari and S C Mehrotra, Fluid Phase Equilibr. 201, 107 (2002)[11] V P Pawar and S C Mehrotra, J. Mol. Liq. 95, 63 (2002)[12] V P Pawar, G S Raju and S C Mehrotra, Pramana – J. Phys. 592, 693 (2002)[13] S Ahire, A Chaudhari, M P Lokhande and S C Mehrotra, J. Sol. Chem. 27, 993
(1998)[14] D Bertolini, M Cassettari, C Ferrari and E Tombari, J. Phys. Chem. 108, 6416 (1998)[15] S M Puranic, A C Kumbharkhane and S C Mehrotra, Ind. J. Chem. A32, 613 (1993)[16] J Barthel, K Bachhuber and R Z Buchner, Naturforsch 50, 65 (1995)[17] A Chaudhari, N M More and S C Mehrotra, Bull. Korean Chem. Soc. 22, 357 (2001)[18] A Chaudhari, S Ahire and S C Mehrotra, J. Mol. Liq. 94, 17 (2001)[19] J Lou, T A Hatton and P E Laibinis, J. Phys. Chem. A101, 5262 (1997)[20] J Lou, T A Hatton and P E Laibinis, J. Phys. Chem. A101, 9892 (1997)[21] S Mashimo, S Kuwabara, S Yogihara and K Higasi, J. Chem. Phys. 90, 3292 (1989)[22] R H Cole, J G Berbarian, S Mashimo, G Chryssikos, A Burns and E Tombari, J.
Appl. Phys. 66, 793 (1989)[23] S M Puranik, A C Kumbharkhane and S C Mehrotra, J. Micro. Pow. and EM Energy
26, 196 (1991)[24] Ajay chaudhari, M K Lande, B R Arbad, D V Jahagirdar and S C Mehrotra, J. Mol.
Liqs. 100/3, 207–215 (2002)[25] S Havriliak and S Negami, J. Polym. Sci. C14, 99 (1966)[26] K S Cole and R H Cole, J. Chem. Phys. 9, 341 (1941)[27] D W Davidson and R H Cole, J. Chem. Phys. 18, 1484 (1950)[28] P Debye, Polar molecules (Chem. Catalog. Co., New York, 1929)
860 Pramana – J. Phys., Vol. 68, No. 5, May 2007

Microwave dielectric characterization of binary mixture
[29] A Chaudhari, A Das, G Raju, H Chaudhari, P Khirade, N Narain and S C Mehrotra,Natl. Sci. Counc. ROC(A)25, 205 (2001)
[30] M Tabellout, P Lanceleur and J R Emery, J. Chem. Soc. Farad. Trans. 86, 1493(1990)
[31] H Frolhich, Theory of dielectrics (Oxford University Press, London, 1949)[32] G MouMouzlas, D K Panpoulos and G Ritzoulis, J. Chem. Eng. Data 36, 20 (1991)[33] D A G Bruggeman, Ann. Phys. (Leipzig) 5, 636 (1935)[34] S M Puranik, A C Kumbharkhane and S C Mehrotra, J. Mol. Liq. 59, 173 (1994)
Pramana – J. Phys., Vol. 68, No. 5, May 2007 861