Microstructure and mechanical properties of friction welded joints of a fine-grained hypereutectoid...
16
Microstructure and Mechanical Properties of Fiber-Laser-Welded and Diode-Laser-Welded AZ31 Magnesium Alloy S.M. CHOWDHURY, D.L. CHEN, S.D. BHOLE, E. POWIDAJKO, D.C. WECKMAN, and Y. ZHOU The microstructures, tensile properties, strain hardening, and fatigue strength of fiber-laser- welded (FLW) and diode-laser-welded (DLW) AZ31B-H24 magnesium alloys were studied. Columnar dendrites near the fusion zone (FZ) boundary and equiaxed dendrites at the center of FZ, with divorced eutectic b-Mg 17 Al 12 particles, were observed. The FLW joints had smaller dendrite cell sizes with a narrower FZ than the DLW joints. The heat-affected zone consisted of recrystallized grains. Although the DLW joints fractured at the center of FZ and exhibited lower yield strength (YS), ultimate tensile strength (UTS), and fatigue strength, the FLW joints failed at the fusion boundary and displayed only moderate reduction in the YS, UTS, and fatigue strength with a joint efficiency of ~91 pct. After welding, the strain rate sensitivity basically vanished, and the DLW joints exhibited higher strain-hardening capacity. Stage III hardening occurred after yielding in both base metal (BM) and welded samples. Dimple-like ductile fracture characteristics appeared in the BM, whereas some cleavage-like flat facets together with dimples and river marking were observed in the welded samples. Fatigue crack initiated from the specimen surface or near-surface defects, and crack propagation was characterized by the formation of fatigue striations along with secondary cracks. DOI: 10.1007/s11661-010-0574-y Ó The Minerals, Metals & Materials Society and ASM International 2010 I. INTRODUCTION LIGHT weighting is one of the most important measures for cutting down greenhouse gas emissions, increasing fuel efficiency, and reducing automotive and aircraft component costs. [1–6] Advanced high-strength steels, aluminum alloys, and polymers are being used to reduce weight, but substantial reductions could be achieved by greater applications of magnesium (Mg) alloys. Mg alloys are the lightest structural metallic material with high strength-to-weight ratio and thus are attractive for use in the transportation and mobile electronics applications. Sheet forming processes of wrought Mg alloys have been used to manufacture some sheet-like components, such as door inner com- ponents and outer skins of car bodies. [7] In the application of Mg alloys in the automotive and aircraft industries, welding and joining would inevitably be involved. A variety of welding and joining techniques has been used to join Mg alloys including tungsten-inert gas welding (TIG), metal-arc inert welding, CO 2 laser welding, and solid-state Nd:YAG laser welding. [8–21] For example, Weisheit et al. [17] carried out CO 2 laser welding of different Mg alloys and showed that most Mg alloys could be welded easily without serious defects, except AZ series and AM alloy series, which exhibited extremely high levels of porosity. Zhao and Debroy [18] investigated the formation of porosity in the AM60 Mg alloy during laser welding and concluded that hydrogen in the parent material was the main origin of porosity in the welds. They suggested remelting as a remedial measure. Sun et al. [19] evaluated TIG, CO 2 , and pulsed Nd:YAG laser-welded joints of AZ31 sheet and reported that TIG welding could be used to achieve welds without defects, but they noted that coarser grain sizes in TIG welds could reduce the mechanical prop- erties. Sun et al. [21] employed Nd:YAG laser on AZ31B Mg wrought alloy and observed that weld penetration increased by adding oxide fluxes (TiO 2, SiO 2 , Cr 2 O 3 ) on the materials to be joined. Although the as-welded fusion zone (FZ) with oxide fluxes had a deeper weld penetration, the tensile strengths of the welded joints with activating fluxes were lower because of the presence of larger grain sizes in the FZ. This was attributed to the fact that the absorptivity of laser energy increased, i.e., more energy was absorbed by the flux coat that was transmitted to the specimen in the early period of laser interaction. These observations indicated that significant microstructural changes occurred after welding, including local variations of grain size in the FZ and heat-affected zone (HAZ), S.M. CHOWDHURY, Graduate Student, D.L. CHEN, Professor and Ryerson Research Chair, and S.D. BHOLE, Professor, are with the Department of Mechanical and Industrial Engineering, Ryerson University, Toronto, Ontario M5B 2K3, Canada. Contact e-mail: [email protected] E. POWIDAJKO, Graduate Student, D.C. WECKMAN, Professor, and Y. ZHOU, Professor and Canada Research Chair, are with the Department of Mechanical and Mechatronics Engineering, University of Waterloo, Waterloo, Ontario N2L 3G1, Canada. Manuscript submitted August 2, 2010. Article published online December 15, 2010 1974—VOLUME 42A, JULY 2011 METALLURGICAL AND MATERIALS TRANSACTIONS A
Transcript of Microstructure and mechanical properties of friction welded joints of a fine-grained hypereutectoid...
Microstructure and Mechanical Propertiesof Fiber-Laser-Welded and Diode-Laser-WeldedAZ31 Magnesium Alloy
S.M. CHOWDHURY, D.L. CHEN, S.D. BHOLE, E. POWIDAJKO, D.C. WECKMAN,and Y. ZHOU
The microstructures, tensile properties, strain hardening, and fatigue strength of fiber-laser-welded (FLW) and diode-laser-welded (DLW) AZ31B-H24 magnesium alloys were studied.Columnar dendrites near the fusion zone (FZ) boundary and equiaxed dendrites at the center ofFZ, with divorced eutectic b-Mg17Al12 particles, were observed. The FLW joints had smallerdendrite cell sizes with a narrower FZ than the DLW joints. The heat-affected zone consisted ofrecrystallized grains. Although the DLW joints fractured at the center of FZ and exhibitedlower yield strength (YS), ultimate tensile strength (UTS), and fatigue strength, the FLW jointsfailed at the fusion boundary and displayed only moderate reduction in the YS, UTS, andfatigue strength with a joint efficiency of ~91 pct. After welding, the strain rate sensitivitybasically vanished, and the DLW joints exhibited higher strain-hardening capacity. Stage IIIhardening occurred after yielding in both base metal (BM) and welded samples. Dimple-likeductile fracture characteristics appeared in the BM, whereas some cleavage-like flat facetstogether with dimples and river marking were observed in the welded samples. Fatigue crackinitiated from the specimen surface or near-surface defects, and crack propagation wascharacterized by the formation of fatigue striations along with secondary cracks.
DOI: 10.1007/s11661-010-0574-y� The Minerals, Metals & Materials Society and ASM International 2010
I. INTRODUCTION
LIGHT weighting is one of the most importantmeasures for cutting down greenhouse gas emissions,increasing fuel efficiency, and reducing automotive andaircraft component costs.[1–6] Advanced high-strengthsteels, aluminum alloys, and polymers are being used toreduce weight, but substantial reductions could beachieved by greater applications of magnesium (Mg)alloys. Mg alloys are the lightest structural metallicmaterial with high strength-to-weight ratio and thus areattractive for use in the transportation and mobileelectronics applications. Sheet forming processes ofwrought Mg alloys have been used to manufacturesome sheet-like components, such as door inner com-ponents and outer skins of car bodies.[7]
In the application of Mg alloys in the automotive andaircraft industries, welding and joining would inevitablybe involved. A variety of welding and joining techniqueshas been used to join Mg alloys including tungsten-inert
gas welding (TIG), metal-arc inert welding, CO2 laserwelding, and solid-state Nd:YAG laser welding.[8–21]
For example, Weisheit et al.[17] carried out CO2 laserwelding of different Mg alloys and showed that most Mgalloys could be welded easily without serious defects,except AZ series and AM alloy series, which exhibitedextremely high levels of porosity. Zhao and Debroy[18]
investigated the formation of porosity in the AM60 Mgalloy during laser welding and concluded that hydrogenin the parent material was the main origin of porosity inthe welds. They suggested remelting as a remedialmeasure. Sun et al.[19] evaluated TIG, CO2, and pulsedNd:YAG laser-welded joints of AZ31 sheet andreported that TIG welding could be used to achievewelds without defects, but they noted that coarser grainsizes in TIG welds could reduce the mechanical prop-erties. Sun et al.[21] employed Nd:YAG laser onAZ31B Mg wrought alloy and observed that weldpenetration increased by adding oxide fluxes (TiO2,
SiO2, Cr2O3) on the materials to be joined. Although theas-welded fusion zone (FZ) with oxide fluxes had adeeper weld penetration, the tensile strengths of thewelded joints with activating fluxes were lower becauseof the presence of larger grain sizes in the FZ. This wasattributed to the fact that the absorptivity of laserenergy increased, i.e., more energy was absorbed by theflux coat that was transmitted to the specimen in theearly period of laser interaction. These observationsindicated that significant microstructural changesoccurred after welding, including local variations ofgrain size in the FZ and heat-affected zone (HAZ),
S.M. CHOWDHURY, Graduate Student, D.L. CHEN, Professorand Ryerson Research Chair, and S.D. BHOLE, Professor, are withthe Department of Mechanical and Industrial Engineering, RyersonUniversity, Toronto, Ontario M5B 2K3, Canada. Contact e-mail:[email protected] E. POWIDAJKO, Graduate Student, D.C.WECKMAN, Professor, and Y. ZHOU, Professor and CanadaResearch Chair, are with the Department of Mechanical andMechatronics Engineering, University of Waterloo, Waterloo, OntarioN2L 3G1, Canada.
Manuscript submitted August 2, 2010.Article published online December 15, 2010
1974—VOLUME 42A, JULY 2011 METALLURGICAL AND MATERIALS TRANSACTIONS A
precipitate size, shape of grains and their orientation,and formation of porosity. Such changes could affect theintegrity and reliability of the welded joints and struc-tures drastically because they would have a significantinfluence on the mechanical properties such as tensileand fatigue strength, ductility, and strain-hardeningbehavior. Therefore, the evaluation of mechanical prop-erties in relation to the microstructural changes afterwelding is necessary.
The question remains as to whether a more effectivewelding process is available that could be used tominimize the microstructural changes and enhance thefatigue resistance of welded magnesium alloys. Recently,there has been a rapid increase in the use of fiber lasersbecause of their increased power density, good beamquality, and higher efficiency.[22] The fiber laser canproduce a spot diameter substantially smaller thanconventional lasers, thus allowing the use of longerworking distances. Fiber lasers have been reported to bemore cost effective than equivalent power Nd:YAGlasers when all factors such as floor space, chillers andmaintenance, electrical power, etc., are taken intoconsideration.[23] Although some limited work on thefiber laser welding (FLW) of Mg alloys has beenreported recently,[24,25] no fatigue behavior of fiber-laser-welded Mg joints has been reported in the litera-ture. It is unknown whether the fatigue resistance andother mechanical properties would be improved with theFLW. The aim of the current investigation was, there-fore, to identify fatigue resistance of FLW Mg joints incomparison with diode-laser-welded (DLW) joints alongwith the evaluation of microstructure, tensile properties,and strain-hardening behavior.
II. MATERIAL AND EXPERIMENTALPROCEDURE
In the current study, 2-mm-thick AZ31B-H24 Mgalloy sheet was used. The nominal chemical compositionof this alloy was 2.5 to 3.5 wt pct Al, 0.7 to 1.3 wt pct Zn,0.2 to 1.0 wt pct Mn, and balance Mg. The work pieceswere sheared and then the faying surfaces were milled.Oil and other surface contaminants were removed usingacetone and methanol rinse. Immediately prior towelding, preexisting surface oxides were removed witha stainless steel wire brush and then the surface wascleaned using ethanol. Butt welding was conductedwithout filler metal. There were two major controllingparameters in both the fiber and diode-laser-weldingprocesses: the welding rate and power input. For theDLW process, 3 kW laser power and a welding speed of8.33 mm/s were used, whereas for the FLW process,2 kW laser power and a welding speed of 100 mm/s wereselected as the optimal welding condition in the currentstudy. During welding, helium was used as shielding gas.After welding, the weld quality was evaluated initially byvisual observation and the samples were sectionedsubsequently in the direction perpendicular to thewelding direction. Then, the specimens were coldmounted, ground, and polished carefully. Two types ofetchants were used.[26] Etchant 1 (10-mL acetic acid
[99 pct], 4.2-g picric acid, 10-mL distilled H2O, and 70-mL ethanol (95 pct) was used to reveal the grainboundaries, whereas etchant 2 (10-mL acetic acid(99 pct), 4.2-g picric acid, 70-mL ethanol (95 pct) wasused to reveal the columnar and equiaxed dendritesolidification microstructure in the welded zone. Anoptical microscope coupled with a Clemex image analysissystem (Clemex Technologies, Inc., Quebec, Canada)was used to observe the weld microstructures. Vickersmicrohardness tests were performed on the unetchedsamples. A load of 100 g and a dwell time of 15 secondswere used during hardness testing. All indentations werespaced adequately to avoid any potential effect of strainfields caused by adjacent indentations.Subsized tensile specimens in accordance with ASTM
E8M-08 standard[27] were machined along the rolling (orlongitudinal) direction for the base metal (BM). Thewelded samples that were also oriented in the rollingdirection were machined perpendicular to the weldingdirection. Tensile tests were performed at room temper-ature using a fully computerized universal tensile testingmachine at constant strain rates of 1 9 10–2 seconds–1,1 9 10–3 seconds–1, 1 9 10–4 seconds–1, and 1 9 10–5 seconds–1. An extensometer with a gauge length of25 mm was used to measure the strain during the tensiletests. At least two samples were tested at each strainrate. Fatigue tests were carried out using a fullycomputerized Instron 8801 servo-hydraulic testing sys-tem (Instron, Norwood, MA) under load control atdifferent stress amplitudes. A stress ratio of R (rmin/rmax) equal to 0.1, sinusoidal waveform, and frequencyof 50 Hz were selected in all the tests. At each stresslevel, at least two samples were tested. The base metaland the welded joints after the tensile and fatigue testswere examined via a JSM-6380LV scanning electronmicroscope (SEM) equipped with Oxford energy dis-persive X-ray spectroscopy (EDS) system and three-dimensional fractographic analysis capacity.
III. RESULTS AND DISCUSSION
A. Microstructure
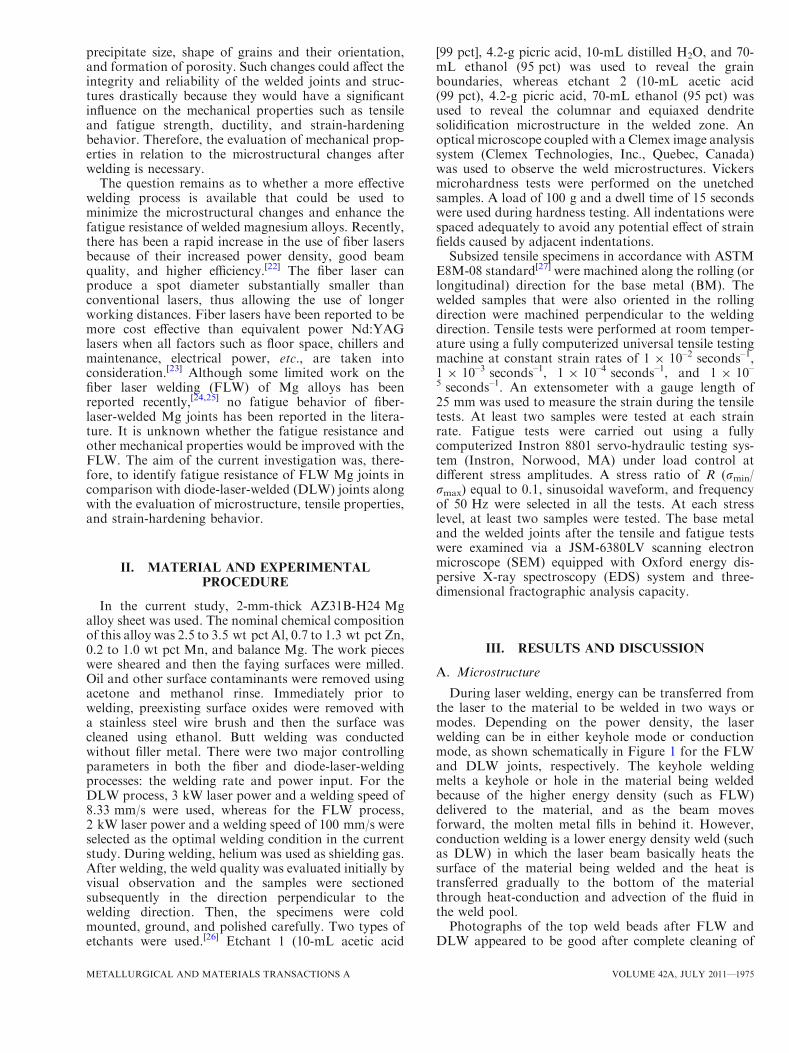
During laser welding, energy can be transferred fromthe laser to the material to be welded in two ways ormodes. Depending on the power density, the laserwelding can be in either keyhole mode or conductionmode, as shown schematically in Figure 1 for the FLWand DLW joints, respectively. The keyhole weldingmelts a keyhole or hole in the material being weldedbecause of the higher energy density (such as FLW)delivered to the material, and as the beam movesforward, the molten metal fills in behind it. However,conduction welding is a lower energy density weld (suchas DLW) in which the laser beam basically heats thesurface of the material being welded and the heat istransferred gradually to the bottom of the materialthrough heat-conduction and advection of the fluid inthe weld pool.Photographs of the top weld beads after FLW and
DLW appeared to be good after complete cleaning of
METALLURGICAL AND MATERIALS TRANSACTIONS A VOLUME 42A, JULY 2011—1975
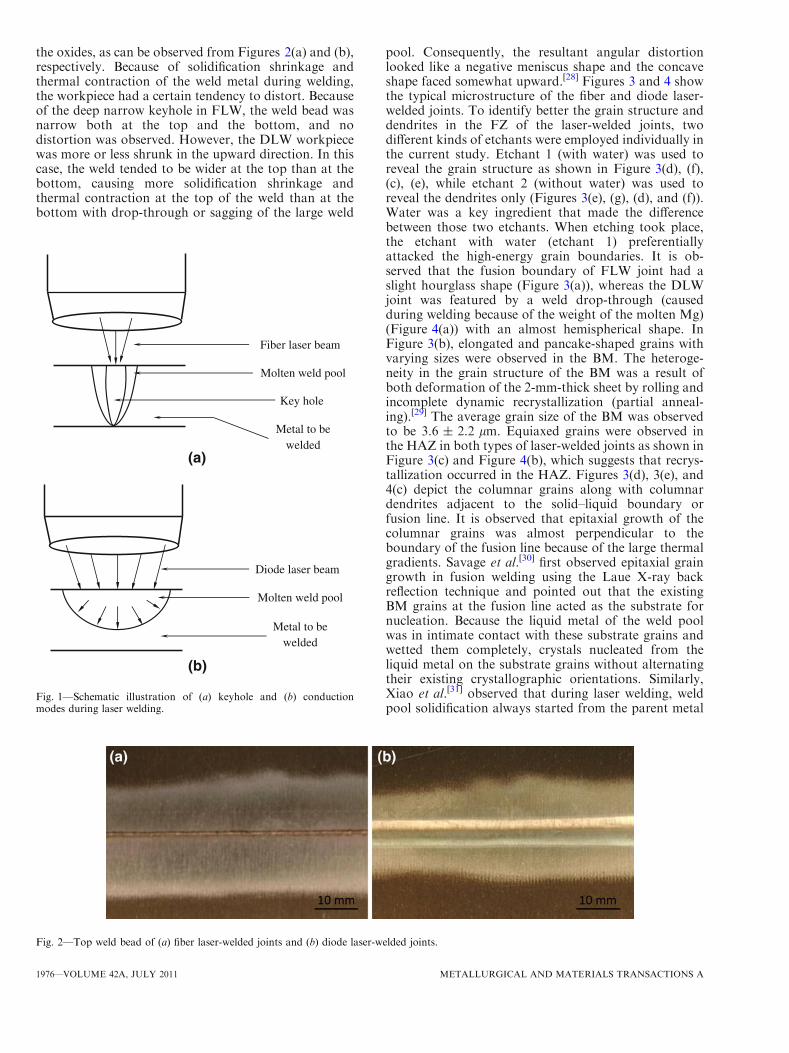
the oxides, as can be observed from Figures 2(a) and (b),respectively. Because of solidification shrinkage andthermal contraction of the weld metal during welding,the workpiece had a certain tendency to distort. Becauseof the deep narrow keyhole in FLW, the weld bead wasnarrow both at the top and the bottom, and nodistortion was observed. However, the DLW workpiecewas more or less shrunk in the upward direction. In thiscase, the weld tended to be wider at the top than at thebottom, causing more solidification shrinkage andthermal contraction at the top of the weld than at thebottom with drop-through or sagging of the large weld
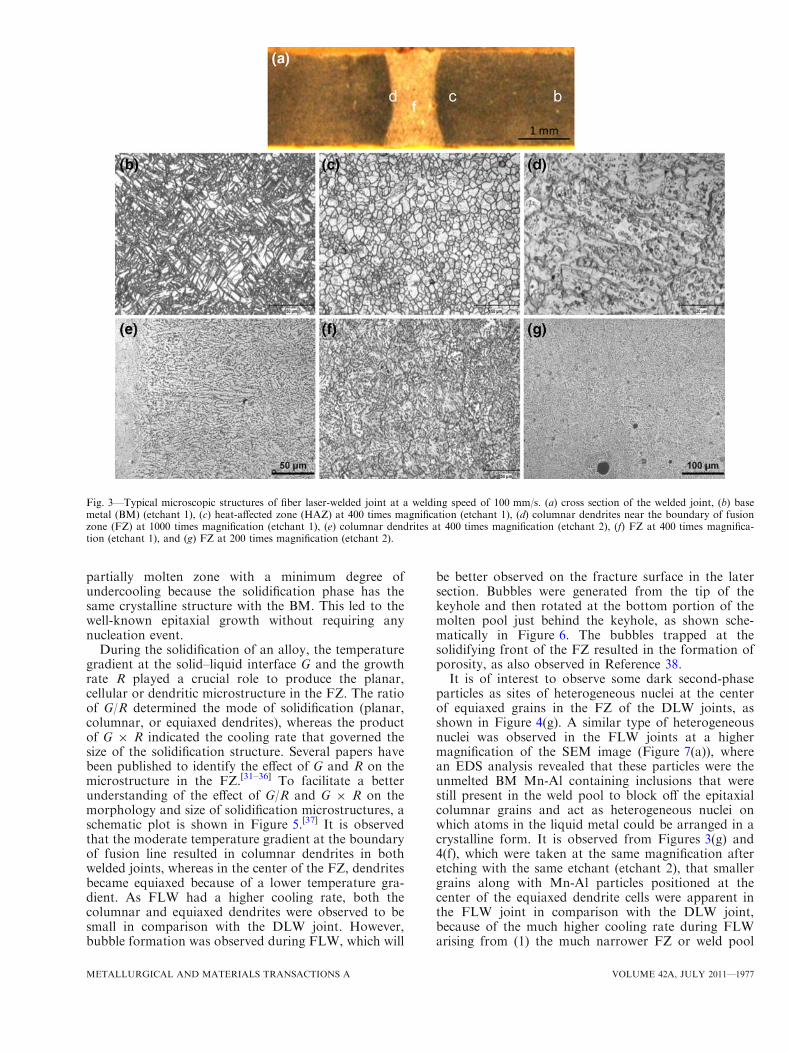
pool. Consequently, the resultant angular distortionlooked like a negative meniscus shape and the concaveshape faced somewhat upward.[28] Figures 3 and 4 showthe typical microstructure of the fiber and diode laser-welded joints. To identify better the grain structure anddendrites in the FZ of the laser-welded joints, twodifferent kinds of etchants were employed individually inthe current study. Etchant 1 (with water) was used toreveal the grain structure as shown in Figure 3(d), (f),(c), (e), while etchant 2 (without water) was used toreveal the dendrites only (Figures 3(e), (g), (d), and (f)).Water was a key ingredient that made the differencebetween those two etchants. When etching took place,the etchant with water (etchant 1) preferentiallyattacked the high-energy grain boundaries. It is ob-served that the fusion boundary of FLW joint had aslight hourglass shape (Figure 3(a)), whereas the DLWjoint was featured by a weld drop-through (causedduring welding because of the weight of the molten Mg)(Figure 4(a)) with an almost hemispherical shape. InFigure 3(b), elongated and pancake-shaped grains withvarying sizes were observed in the BM. The heteroge-neity in the grain structure of the BM was a result ofboth deformation of the 2-mm-thick sheet by rolling andincomplete dynamic recrystallization (partial anneal-ing).[29] The average grain size of the BM was observedto be 3.6 ± 2.2 lm. Equiaxed grains were observed inthe HAZ in both types of laser-welded joints as shown inFigure 3(c) and Figure 4(b), which suggests that recrys-tallization occurred in the HAZ. Figures 3(d), 3(e), and4(c) depict the columnar grains along with columnardendrites adjacent to the solid–liquid boundary orfusion line. It is observed that epitaxial growth of thecolumnar grains was almost perpendicular to theboundary of the fusion line because of the large thermalgradients. Savage et al.[30] first observed epitaxial graingrowth in fusion welding using the Laue X-ray backreflection technique and pointed out that the existingBM grains at the fusion line acted as the substrate fornucleation. Because the liquid metal of the weld poolwas in intimate contact with these substrate grains andwetted them completely, crystals nucleated from theliquid metal on the substrate grains without alternatingtheir existing crystallographic orientations. Similarly,Xiao et al.[31] observed that during laser welding, weldpool solidification always started from the parent metal
Fig. 2—Top weld bead of (a) fiber laser-welded joints and (b) diode laser-welded joints.
Fiber laser beam
Molten weld pool
Metal to be welded
Key hole
Diode laser beam
Molten weld pool
Metal to be welded
(a)
(b)
Fig. 1—Schematic illustration of (a) keyhole and (b) conductionmodes during laser welding.
1976—VOLUME 42A, JULY 2011 METALLURGICAL AND MATERIALS TRANSACTIONS A
partially molten zone with a minimum degree ofundercooling because the solidification phase has thesame crystalline structure with the BM. This led to thewell-known epitaxial growth without requiring anynucleation event.
During the solidification of an alloy, the temperaturegradient at the solid–liquid interface G and the growthrate R played a crucial role to produce the planar,cellular or dendritic microstructure in the FZ. The ratioof G/R determined the mode of solidification (planar,columnar, or equiaxed dendrites), whereas the productof G 9 R indicated the cooling rate that governed thesize of the solidification structure. Several papers havebeen published to identify the effect of G and R on themicrostructure in the FZ.[31–36] To facilitate a betterunderstanding of the effect of G/R and G 9 R on themorphology and size of solidification microstructures, aschematic plot is shown in Figure 5.[37] It is observedthat the moderate temperature gradient at the boundaryof fusion line resulted in columnar dendrites in bothwelded joints, whereas in the center of the FZ, dendritesbecame equiaxed because of a lower temperature gra-dient. As FLW had a higher cooling rate, both thecolumnar and equiaxed dendrites were observed to besmall in comparison with the DLW joint. However,bubble formation was observed during FLW, which will
be better observed on the fracture surface in the latersection. Bubbles were generated from the tip of thekeyhole and then rotated at the bottom portion of themolten pool just behind the keyhole, as shown sche-matically in Figure 6. The bubbles trapped at thesolidifying front of the FZ resulted in the formation ofporosity, as also observed in Reference 38.It is of interest to observe some dark second-phase
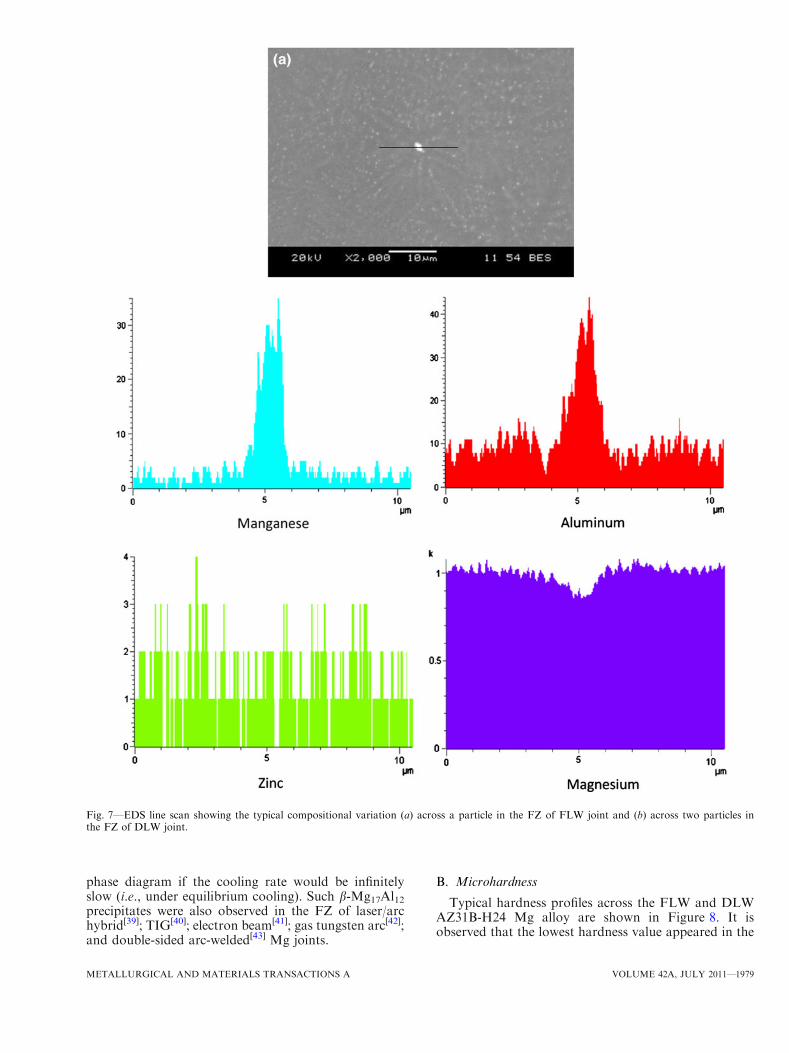
particles as sites of heterogeneous nuclei at the centerof equiaxed grains in the FZ of the DLW joints, asshown in Figure 4(g). A similar type of heterogeneousnuclei was observed in the FLW joints at a highermagnification of the SEM image (Figure 7(a)), wherean EDS analysis revealed that these particles were theunmelted BM Mn-Al containing inclusions that werestill present in the weld pool to block off the epitaxialcolumnar grains and act as heterogeneous nuclei onwhich atoms in the liquid metal could be arranged in acrystalline form. It is observed from Figures 3(g) and4(f), which were taken at the same magnification afteretching with the same etchant (etchant 2), that smallergrains along with Mn-Al particles positioned at thecenter of the equiaxed dendrite cells were apparent inthe FLW joint in comparison with the DLW joint,because of the much higher cooling rate during FLWarising from (1) the much narrower FZ or weld pool
Fig. 3—Typical microscopic structures of fiber laser-welded joint at a welding speed of 100 mm/s. (a) cross section of the welded joint, (b) basemetal (BM) (etchant 1), (c) heat-affected zone (HAZ) at 400 times magnification (etchant 1), (d) columnar dendrites near the boundary of fusionzone (FZ) at 1000 times magnification (etchant 1), (e) columnar dendrites at 400 times magnification (etchant 2), (f) FZ at 400 times magnifica-tion (etchant 1), and (g) FZ at 200 times magnification (etchant 2).
METALLURGICAL AND MATERIALS TRANSACTIONS A VOLUME 42A, JULY 2011—1977
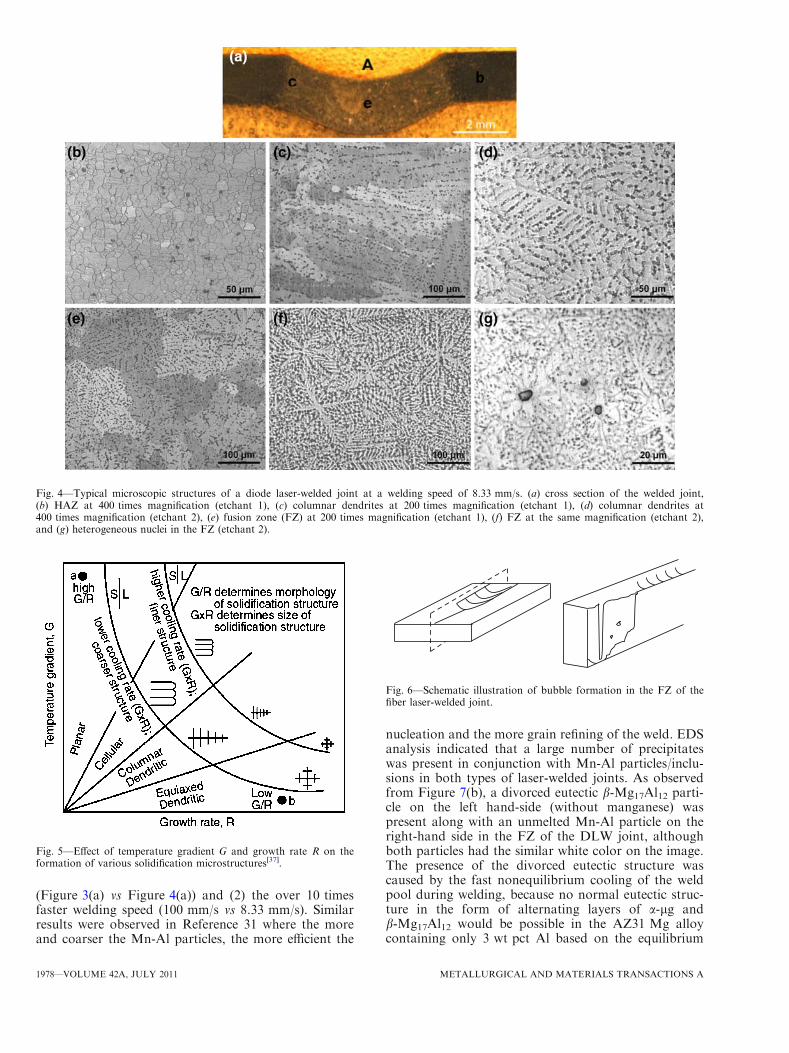
(Figure 3(a) vs Figure 4(a)) and (2) the over 10 timesfaster welding speed (100 mm/s vs 8.33 mm/s). Similarresults were observed in Reference 31 where the moreand coarser the Mn-Al particles, the more efficient the
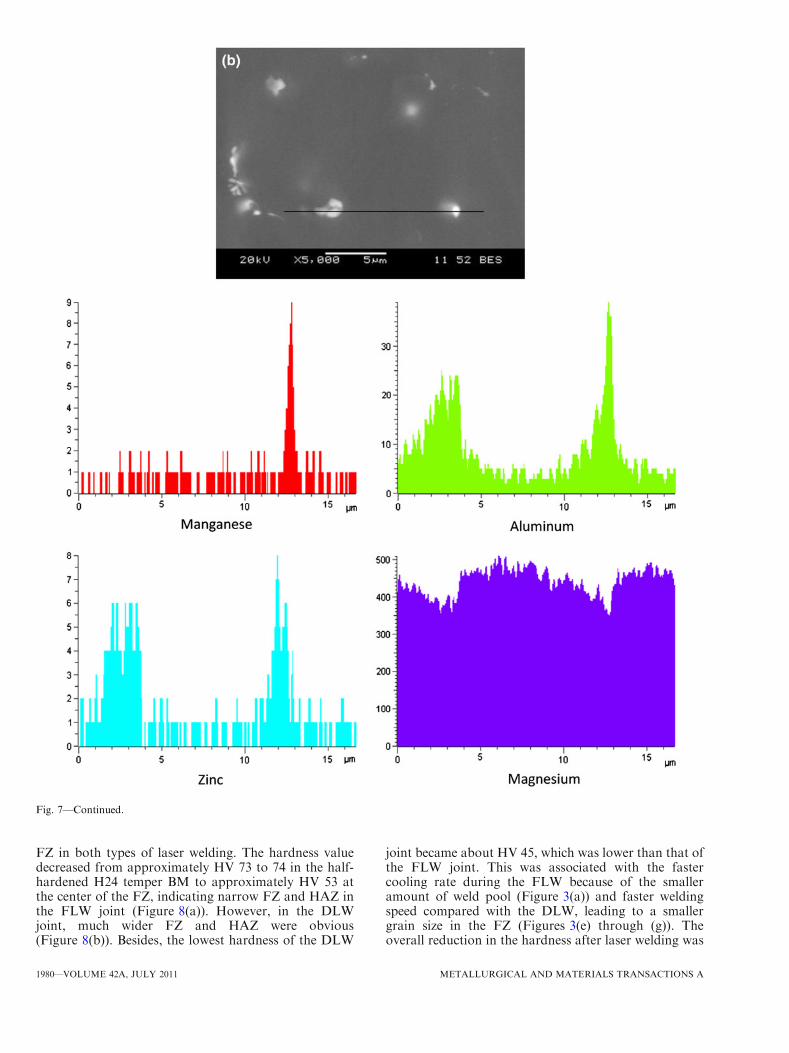
nucleation and the more grain refining of the weld. EDSanalysis indicated that a large number of precipitateswas present in conjunction with Mn-Al particles/inclu-sions in both types of laser-welded joints. As observedfrom Figure 7(b), a divorced eutectic b-Mg17Al12 parti-cle on the left hand-side (without manganese) waspresent along with an unmelted Mn-Al particle on theright-hand side in the FZ of the DLW joint, althoughboth particles had the similar white color on the image.The presence of the divorced eutectic structure wascaused by the fast nonequilibrium cooling of the weldpool during welding, because no normal eutectic struc-ture in the form of alternating layers of a-lg andb-Mg17Al12 would be possible in the AZ31 Mg alloycontaining only 3 wt pct Al based on the equilibrium
Fig. 4—Typical microscopic structures of a diode laser-welded joint at a welding speed of 8.33 mm/s. (a) cross section of the welded joint,(b) HAZ at 400 times magnification (etchant 1), (c) columnar dendrites at 200 times magnification (etchant 1), (d) columnar dendrites at400 times magnification (etchant 2), (e) fusion zone (FZ) at 200 times magnification (etchant 1), (f) FZ at the same magnification (etchant 2),and (g) heterogeneous nuclei in the FZ (etchant 2).
Fig. 5—Effect of temperature gradient G and growth rate R on theformation of various solidification microstructures[37].
Fig. 6—Schematic illustration of bubble formation in the FZ of thefiber laser-welded joint.
1978—VOLUME 42A, JULY 2011 METALLURGICAL AND MATERIALS TRANSACTIONS A
phase diagram if the cooling rate would be infinitelyslow (i.e., under equilibrium cooling). Such b-Mg17Al12precipitates were also observed in the FZ of laser/archybrid[39]; TIG[40]; electron beam[41]; gas tungsten arc[42];and double-sided arc-welded[43] Mg joints.
B. Microhardness
Typical hardness profiles across the FLW and DLWAZ31B-H24 Mg alloy are shown in Figure 8. It isobserved that the lowest hardness value appeared in the
Fig. 7—EDS line scan showing the typical compositional variation (a) across a particle in the FZ of FLW joint and (b) across two particles inthe FZ of DLW joint.
METALLURGICAL AND MATERIALS TRANSACTIONS A VOLUME 42A, JULY 2011—1979
FZ in both types of laser welding. The hardness valuedecreased from approximately HV 73 to 74 in the half-hardened H24 temper BM to approximately HV 53 atthe center of the FZ, indicating narrow FZ and HAZ inthe FLW joint (Figure 8(a)). However, in the DLWjoint, much wider FZ and HAZ were obvious(Figure 8(b)). Besides, the lowest hardness of the DLW
joint became about HV 45, which was lower than that ofthe FLW joint. This was associated with the fastercooling rate during the FLW because of the smalleramount of weld pool (Figure 3(a)) and faster weldingspeed compared with the DLW, leading to a smallergrain size in the FZ (Figures 3(e) through (g)). Theoverall reduction in the hardness after laser welding was
Fig. 7—Continued.
1980—VOLUME 42A, JULY 2011 METALLURGICAL AND MATERIALS TRANSACTIONS A
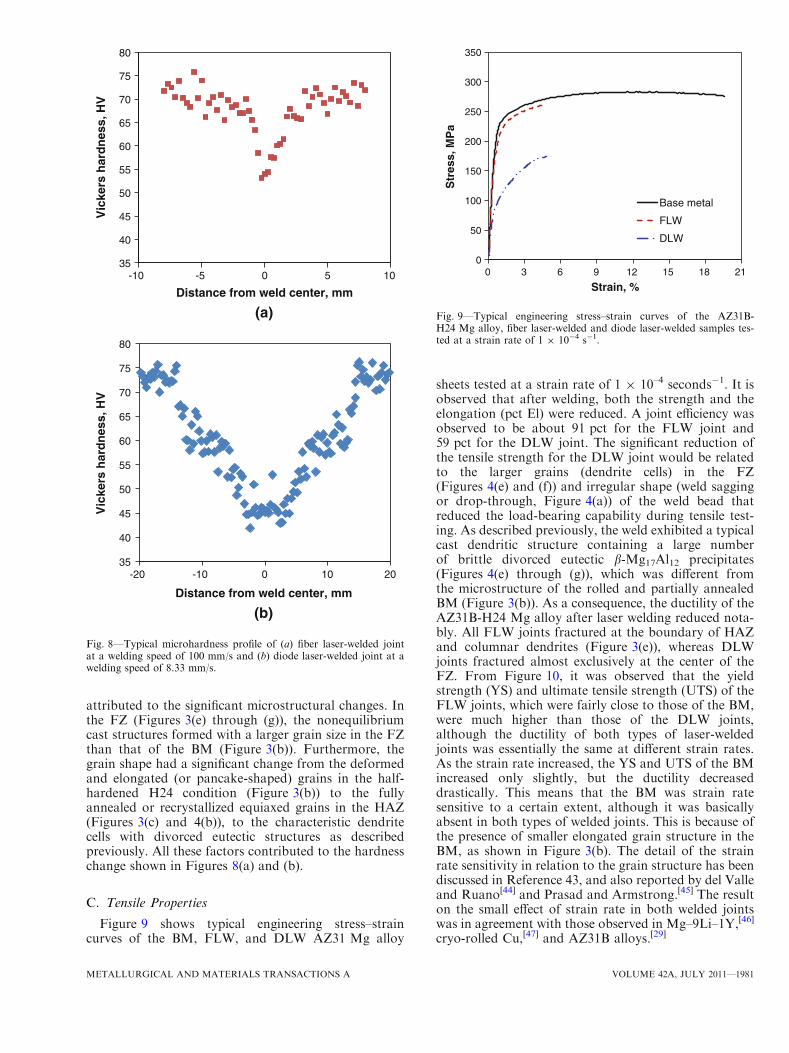
attributed to the significant microstructural changes. Inthe FZ (Figures 3(e) through (g)), the nonequilibriumcast structures formed with a larger grain size in the FZthan that of the BM (Figure 3(b)). Furthermore, thegrain shape had a significant change from the deformedand elongated (or pancake-shaped) grains in the half-hardened H24 condition (Figure 3(b)) to the fullyannealed or recrystallized equiaxed grains in the HAZ(Figures 3(c) and 4(b)), to the characteristic dendritecells with divorced eutectic structures as describedpreviously. All these factors contributed to the hardnesschange shown in Figures 8(a) and (b).
C. Tensile Properties
Figure 9 shows typical engineering stress–straincurves of the BM, FLW, and DLW AZ31 Mg alloy
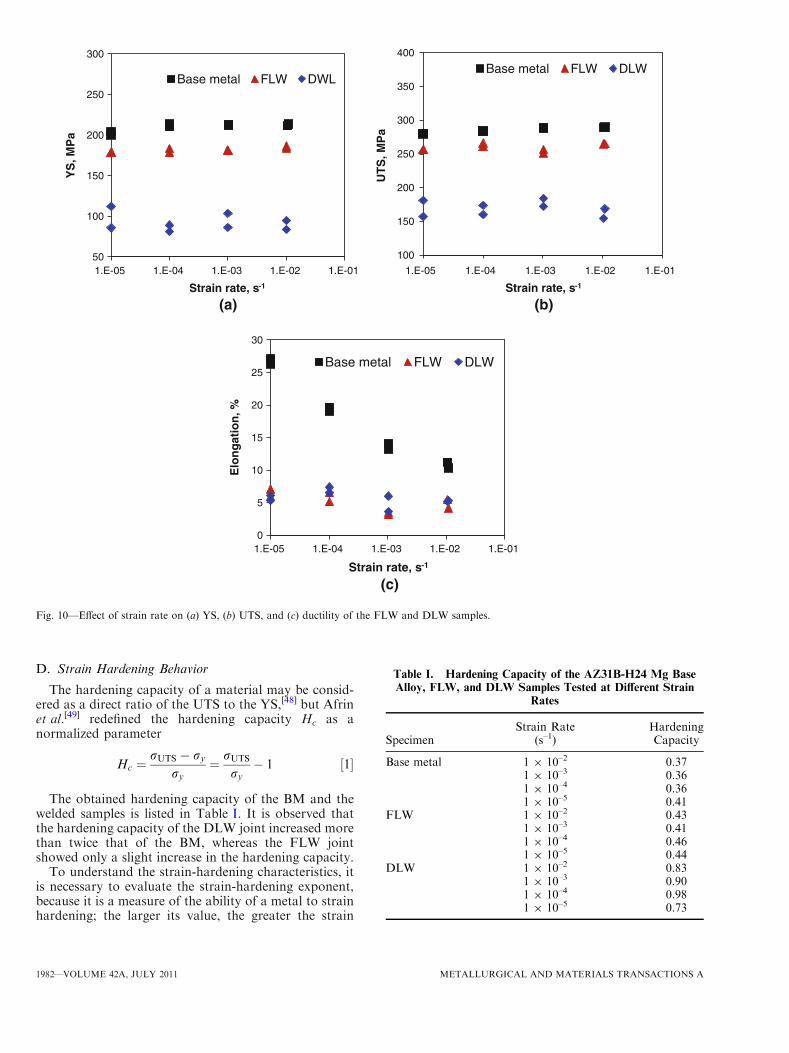
sheets tested at a strain rate of 1 9 10–4 seconds�1. It isobserved that after welding, both the strength and theelongation (pct El) were reduced. A joint efficiency wasobserved to be about 91 pct for the FLW joint and59 pct for the DLW joint. The significant reduction ofthe tensile strength for the DLW joint would be relatedto the larger grains (dendrite cells) in the FZ(Figures 4(e) and (f)) and irregular shape (weld saggingor drop-through, Figure 4(a)) of the weld bead thatreduced the load-bearing capability during tensile test-ing. As described previously, the weld exhibited a typicalcast dendritic structure containing a large numberof brittle divorced eutectic b-Mg17Al12 precipitates(Figures 4(e) through (g)), which was different fromthe microstructure of the rolled and partially annealedBM (Figure 3(b)). As a consequence, the ductility of theAZ31B-H24 Mg alloy after laser welding reduced nota-bly. All FLW joints fractured at the boundary of HAZand columnar dendrites (Figure 3(e)), whereas DLWjoints fractured almost exclusively at the center of theFZ. From Figure 10, it was observed that the yieldstrength (YS) and ultimate tensile strength (UTS) of theFLW joints, which were fairly close to those of the BM,were much higher than those of the DLW joints,although the ductility of both types of laser-weldedjoints was essentially the same at different strain rates.As the strain rate increased, the YS and UTS of the BMincreased only slightly, but the ductility decreaseddrastically. This means that the BM was strain ratesensitive to a certain extent, although it was basicallyabsent in both types of welded joints. This is because ofthe presence of smaller elongated grain structure in theBM, as shown in Figure 3(b). The detail of the strainrate sensitivity in relation to the grain structure has beendiscussed in Reference 43, and also reported by del Valleand Ruano[44] and Prasad and Armstrong.[45] The resulton the small effect of strain rate in both welded jointswas in agreement with those observed in Mg–9Li–1Y,[46]
cryo-rolled Cu,[47] and AZ31B alloys.[29]
35
40
45
50
55
60
65
70
75
80
-10 -5 0 5 10
Vic
kers
har
dn
ess,
HV
Distance from weld center, mm
35
40
45
50
55
60
65
70
75
80
-20 -10 0 10 20
Vic
kers
har
dn
ess,
HV
Distance from weld center, mm
(a)
(b)
Fig. 8—Typical microhardness profile of (a) fiber laser-welded jointat a welding speed of 100 mm/s and (b) diode laser-welded joint at awelding speed of 8.33 mm/s.
0
50
100
150
200
250
300
350
0 3 6 9 12 15 18 21
Str
ess,
MP
a
Strain, %
Base metal
FLW
DLW
Fig. 9—Typical engineering stress–strain curves of the AZ31B-H24 Mg alloy, fiber laser-welded and diode laser-welded samples tes-ted at a strain rate of 1 9 10�4 s�1.
METALLURGICAL AND MATERIALS TRANSACTIONS A VOLUME 42A, JULY 2011—1981
D. Strain Hardening Behavior
The hardening capacity of a material may be consid-ered as a direct ratio of the UTS to the YS,[48] but Afrinet al.[49] redefined the hardening capacity Hc as anormalized parameter
Hc ¼rUTS � ry
ry¼ rUTS
ry� 1 ½1�
The obtained hardening capacity of the BM and thewelded samples is listed in Table I. It is observed thatthe hardening capacity of the DLW joint increased morethan twice that of the BM, whereas the FLW jointshowed only a slight increase in the hardening capacity.
To understand the strain-hardening characteristics, itis necessary to evaluate the strain-hardening exponent,because it is a measure of the ability of a metal to strainhardening; the larger its value, the greater the strain
50
100
150
200
250
300
1.E-05 1.E-04 1.E-03 1.E-02 1.E-01
YS
, MP
a
Strain rate, s-1
Base metal FLW DWL
100
150
200
250
300
350
400
1.E-05 1.E-04 1.E-03 1.E-02 1.E-01
UT
S, M
Pa
Strain rate, s-1
Base metal FLW DLW
0
5
10
15
20
25
30
1.E-05 1.E-04 1.E-03 1.E-02 1.E-01
Elo
ng
atio
n, %
Strain rate, s-1
Base metal FLW DLW
(a) (b)
(c)
Fig. 10—Effect of strain rate on (a) YS, (b) UTS, and (c) ductility of the FLW and DLW samples.
Table I. Hardening Capacity of the AZ31B-H24 Mg BaseAlloy, FLW, and DLW Samples Tested at Different Strain
Rates
SpecimenStrain Rate
(s–1)HardeningCapacity
Base metal 1 9 10–2 0.371 9 10–3 0.361 9 10–4 0.361 9 10–5 0.41
FLW 1 9 10–2 0.431 9 10–3 0.411 9 10–4 0.461 9 10–5 0.44
DLW 1 9 10–2 0.831 9 10–3 0.901 9 10–4 0.981 9 10–5 0.73
1982—VOLUME 42A, JULY 2011 METALLURGICAL AND MATERIALS TRANSACTIONS A
hardening for a given amount of plastic strain. Severalequations have been proposed to evaluate the strain-hardening exponent. Hollomon[50] proposed the follow-ing expression
r ¼ Ken ½2�
where n is the strain-hardening exponent, K is thestrength coefficient, r is the true stress, and e is thetrue strain. To quantify the strain-hardening responsemore accurately, Afrin et al.[49] proposed the followingequation using the net flow stress and the net plasticstrain of a material after yielding,
r ¼ ry þ K� e� ey� �n� ½3�
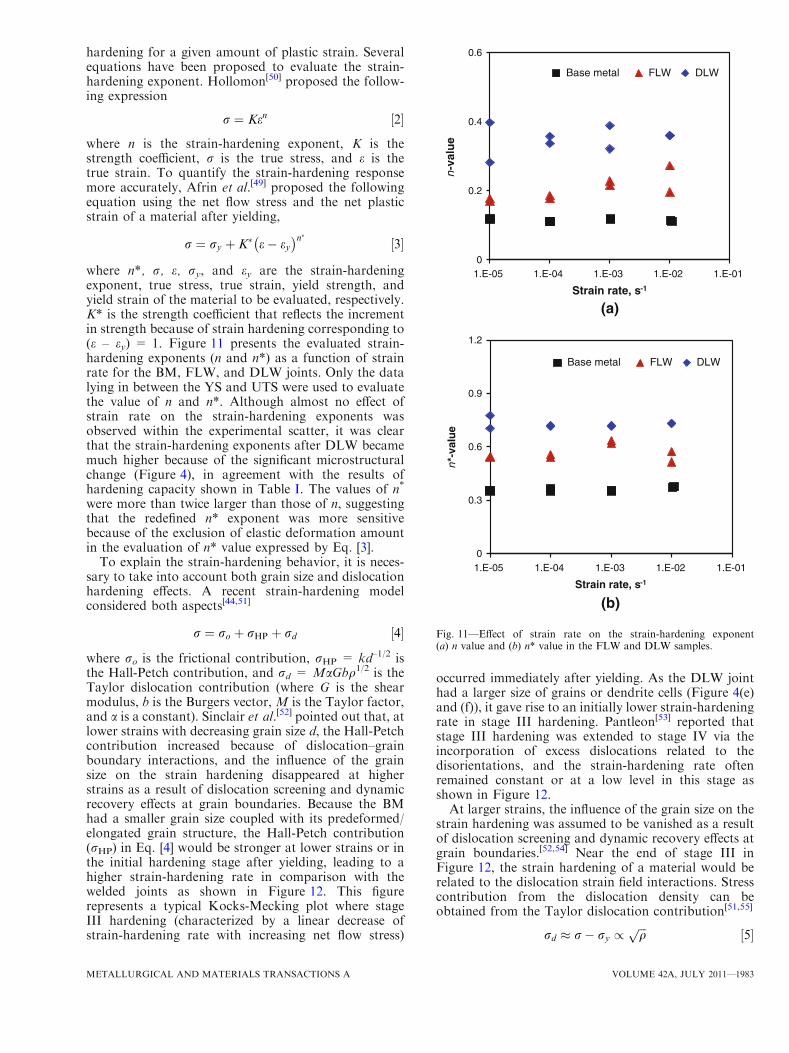
where n*, r, e, ry, and ey are the strain-hardeningexponent, true stress, true strain, yield strength, andyield strain of the material to be evaluated, respectively.K* is the strength coefficient that reflects the incrementin strength because of strain hardening corresponding to(e – ey) = 1. Figure 11 presents the evaluated strain-hardening exponents (n and n*) as a function of strainrate for the BM, FLW, and DLW joints. Only the datalying in between the YS and UTS were used to evaluatethe value of n and n*. Although almost no effect ofstrain rate on the strain-hardening exponents wasobserved within the experimental scatter, it was clearthat the strain-hardening exponents after DLW becamemuch higher because of the significant microstructuralchange (Figure 4), in agreement with the results ofhardening capacity shown in Table I. The values of n*
were more than twice larger than those of n, suggestingthat the redefined n* exponent was more sensitivebecause of the exclusion of elastic deformation amountin the evaluation of n* value expressed by Eq. [3].
To explain the strain-hardening behavior, it is neces-sary to take into account both grain size and dislocationhardening effects. A recent strain-hardening modelconsidered both aspects[44,51]
r ¼ ro þ rHP þ rd ½4�
where ro is the frictional contribution, rHP = kd–1/2 isthe Hall-Petch contribution, and rd = MaGbq1/2 is theTaylor dislocation contribution (where G is the shearmodulus, b is the Burgers vector, M is the Taylor factor,and a is a constant). Sinclair et al.[52] pointed out that, atlower strains with decreasing grain size d, the Hall-Petchcontribution increased because of dislocation–grainboundary interactions, and the influence of the grainsize on the strain hardening disappeared at higherstrains as a result of dislocation screening and dynamicrecovery effects at grain boundaries. Because the BMhad a smaller grain size coupled with its predeformed/elongated grain structure, the Hall-Petch contribution(rHP) in Eq. [4] would be stronger at lower strains or inthe initial hardening stage after yielding, leading to ahigher strain-hardening rate in comparison with thewelded joints as shown in Figure 12. This figurerepresents a typical Kocks-Mecking plot where stageIII hardening (characterized by a linear decrease ofstrain-hardening rate with increasing net flow stress)
occurred immediately after yielding. As the DLW jointhad a larger size of grains or dendrite cells (Figure 4(e)and (f)), it gave rise to an initially lower strain-hardeningrate in stage III hardening. Pantleon[53] reported thatstage III hardening was extended to stage IV via theincorporation of excess dislocations related to thedisorientations, and the strain-hardening rate oftenremained constant or at a low level in this stage asshown in Figure 12.At larger strains, the influence of the grain size on the
strain hardening was assumed to be vanished as a resultof dislocation screening and dynamic recovery effects atgrain boundaries.[52,54] Near the end of stage III inFigure 12, the strain hardening of a material would berelated to the dislocation strain field interactions. Stresscontribution from the dislocation density can beobtained from the Taylor dislocation contribution[51,55]
rd � r� ry /ffiffiffiqp ½5�
0
0.2
0.4
0.6
1.E-05 1.E-04 1.E-03 1.E-02 1.E-01
n-v
alu
e
Strain rate, s-1
Base metal FLW DLW
0
0.3
0.6
0.9
1.2
1.E-05 1.E-04 1.E-03 1.E-02 1.E-01
n*-
valu
e
Strain rate, s-1
Base metal FLW DLW
(a)
(b)
Fig. 11—Effect of strain rate on the strain-hardening exponent(a) n value and (b) n* value in the FLW and DLW samples.
METALLURGICAL AND MATERIALS TRANSACTIONS A VOLUME 42A, JULY 2011—1983

where q is the dislocation density. The net flow stress(r – ry) necessary to continue deformation of a materialwas proportional to the square root of the dislocationdensity. The slope of the dislocation density in a metalincreased with deformation or cold work because ofdislocation multiplication or the formation of newdislocations, which decreased the spacing among dislo-cations and their interactions became repulsive. The netresult would be that the motion of a dislocation wasimpeded by other dislocations. As the dislocationdensity increased, the resistance to dislocation motionby other dislocations became more pronounced. Asshown in Figures 4(e) and (f), the larger dendrite cell/grain size of the DLW sample would provide more spaceto accommodate dislocations and increase the disloca-tion storage capacity, so that a relatively higher strain-hardening rate was capable of maintaining in stage IVafter DLW, as shown in Figure 12. This correspondedwell to the higher strain-hardening capacity (Table I)and larger strain-hardening exponent (Figure 11) in theDLW joints.
E. Fatigue Properties
Load-controlled fatigue tests were conducted on theBM, FLW, and DLW specimens, and the obtainedresults are shown in Figure 13. This allows a directcomparison and gives an indication of the influence ofthe welding on the fatigue life and integrity, which haveto be taken into account in designing welded structuralcomponents made from Mg alloys. It is observed fromFigure 13 that the fatigue life decreased after welding.However, similar to the yield strength and ultimatetensile strength (Figure 10(a) and (b)), the fatiguestrength or life of the FLW joints was close to that ofthe BM, which was much higher than that of DLWjoints. As the stress amplitude decreased, the differenceof fatigue life among the welded joints and the BMbecame smaller in the semilog scale diagram. Theobtained fatigue limit (defined as the fatigue strength
corresponding to 1 9 107 cycles) and calculated fatigueratio (the ratio of the fatigue limit to the ultimate tensilestrength) of the BM and laser-welded joints are listed inTable II.The fatigue limit of the FLW and DLW joints
dropped by 40 pct and 60 pct, respectively, and thefatigue ratio for both types of laser-welded jointsdecreased by approximately 34 pct compared with thatof the BM. This was attributed mainly to the micro-structural change after welding, as illustrated inFigures 3 and 4. In addition, the geometry and shapeof the DLW joints were another important factorresponsible for the considerable decrease in the fatiguelife (Figure 13). The presence of the weld drop throughin the FZ of the DLW joints (Figure 4(a)) would resultin an extra bending moment. This would facilitate theearly fatigue crack initiation and subsequent propaga-tion at the center of the weld drop through in the DLWjoints, as indicated by A in Figure 4(a), thus giving riseto a significantly reduced fatigue strength or fatigue lifeof the DLW joints (Figure 13).The following Basquin-type equation[56] could be used to fit the obtainedfatigue data
ra ¼ r0f 2Nf
� �b ½6�
where ra is the cyclic stress amplitude, r0f is the fatiguestrength coefficient defined by the stress intercept at
0
4000
8000
12000
16000
20000
0 40 80 120
θθ, M
Pa
σ - σy , MPa
Base metal
FLW
DLW
Stage III
Stage IV
Fig. 12—Strain hardening rate (h) vs net flow stress (r – ry) of theFLW and DLW samples tested at a strain rate of 1 9 10–3 s–1.
0
20
40
60
80
100
120
140
160
180
200
1.E+01 1.E+03 1.E+05 1.E+07 1.E+09
Str
ess
amp
litu
de,
MP
a
Number of cycles to failure, N
Base metal
FLW
DLW
Fig. 13—S-N curves of the AZ31B-H24 base metal, FLW and DLWjoints tested at R = 0.1, 50 Hz, and room temperature.
Table II. Ultimate Tensile Strength, Fatigue Limitand Fatigue Ratio of the AZ31B-H24 Mg BM, FLW,
and DLW Joints
SpecimenFatigue
Limit (MPa)Ultimate TensileStrength (MPa)
FatigueRatio
Base metal 50 285 0.175FLW 30 260 0.115DLW 20 169 0.118
1984—VOLUME 42A, JULY 2011 METALLURGICAL AND MATERIALS TRANSACTIONS A
2Nf = 1, Nf is the number of cycles to failure, 2Nf is thenumber of reversals to failure, and b is the fatiguestrength exponent. The obtained r0f and b values arelisted in Table III. Fatigue life was indeed associatedwith both the fatigue strength exponent (b) and the
fatigue strength coefficient (r0f) based on Eq. [6]. Nor-mally, a smaller value of b corresponded to a longerfatigue life.[56] From Table III, it can be observed thatthe values (including the minus sign) of the fatiguestrength exponent were in the following sequence (fromlow to high): DLW joints<FLW joints<BM. If onlythe fatigue strength exponent were considered, the DLWjoints would have a longer fatigue life. However, a bigdifference exists in the fatigue strength coefficient wherethe highest value was obtained for the BM and thelowest for the DLW joints, with the r0f value of the FLWjoints laying in-between those of the BM and DLWjoints. This suggested that Basquin-type equationcould be used to describe the fatigue life of weldedMg joints.
Table III. Fatigue Strength Coefficient r0f and FatigueStrength Exponent b of the AZ31B-H24 Mg Base Metal,
Flwed and Dlwed Joints
Specimen r0f (MPa) b
Base metal 274 –0.115FLW 218 –0.121DLW 153 –0.133
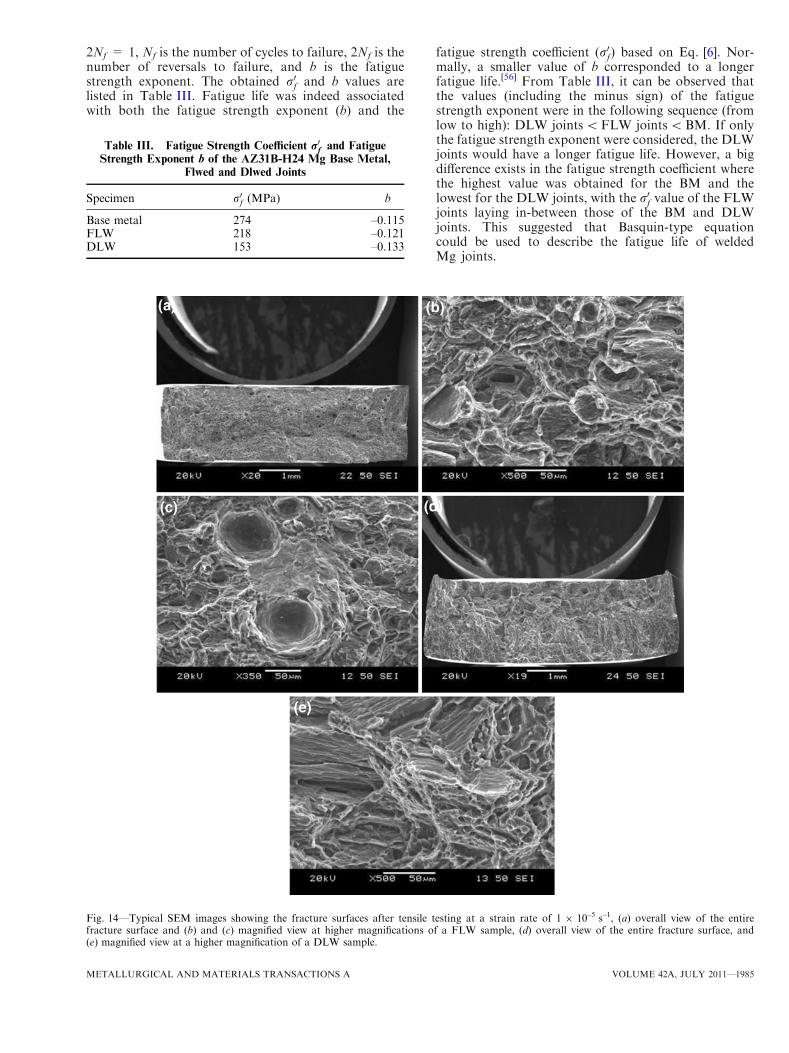
Fig. 14—Typical SEM images showing the fracture surfaces after tensile testing at a strain rate of 1 9 10–5 s–1, (a) overall view of the entirefracture surface and (b) and (c) magnified view at higher magnifications of a FLW sample, (d) overall view of the entire fracture surface, and(e) magnified view at a higher magnification of a DLW sample.
METALLURGICAL AND MATERIALS TRANSACTIONS A VOLUME 42A, JULY 2011—1985
F. Fractography
SEM examinations revealed that dimple-like ductilefracture characteristics appeared in the BM, whereassome cleavage-like flat facets together with dimples andriver marking were observed in the welded samples.Figure 14 shows some typical SEM images of fracturesurfaces of FLW and DLW samples after tensile tests ata strain rate of 1 9 10–5 seconds–1. First, gas pores weremore obvious in the FLW samples than in the DLWsamples, as observed from Figures 14(a) through (c),leading to the decrease of ductility (pct El). Cleavage-like brittle fracture characteristics, i.e., some flat facetsin conjunction with river marking, appeared in both thewelded samples as shown in Figures 14(b), (c), and (e).The river marking was caused by the crack movingthrough the grains along several crystallographic planesthat formed a series of plateaus and connectingledges.[56] The fractographic observations correspondedwell to the relatively low percent elongation of 5 to 6 pctin the welded samples (Figures 9 and 10(c)).
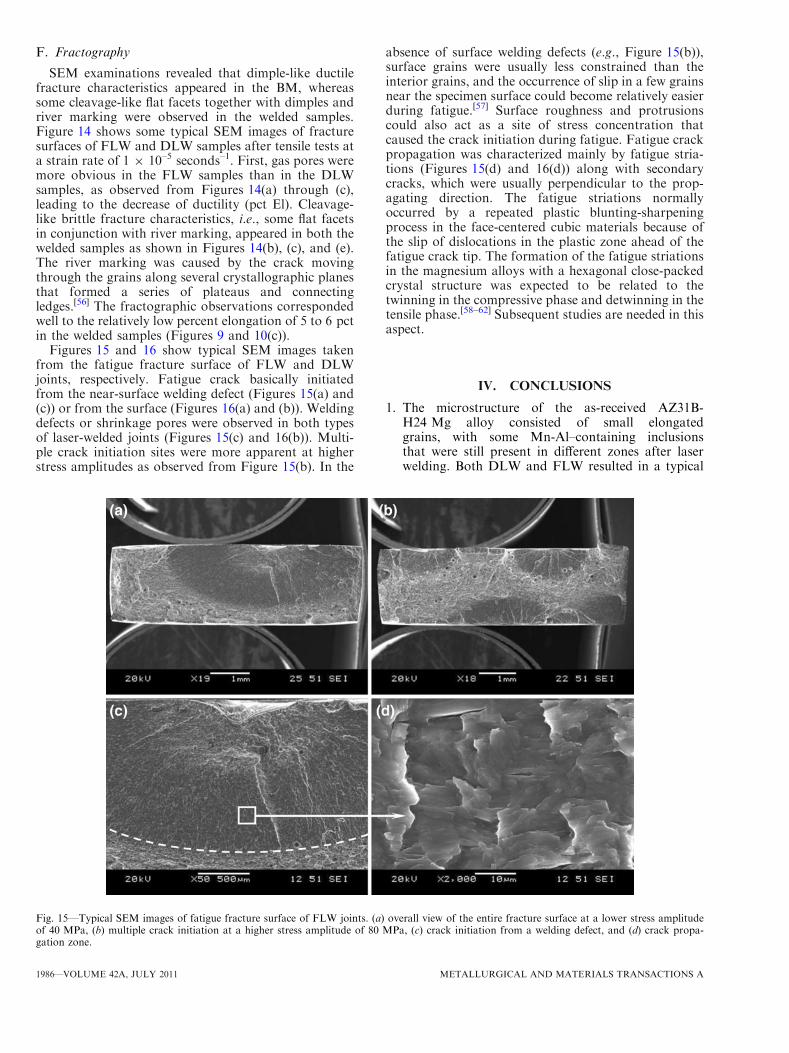
Figures 15 and 16 show typical SEM images takenfrom the fatigue fracture surface of FLW and DLWjoints, respectively. Fatigue crack basically initiatedfrom the near-surface welding defect (Figures 15(a) and(c)) or from the surface (Figures 16(a) and (b)). Weldingdefects or shrinkage pores were observed in both typesof laser-welded joints (Figures 15(c) and 16(b)). Multi-ple crack initiation sites were more apparent at higherstress amplitudes as observed from Figure 15(b). In the
absence of surface welding defects (e.g., Figure 15(b)),surface grains were usually less constrained than theinterior grains, and the occurrence of slip in a few grainsnear the specimen surface could become relatively easierduring fatigue.[57] Surface roughness and protrusionscould also act as a site of stress concentration thatcaused the crack initiation during fatigue. Fatigue crackpropagation was characterized mainly by fatigue stria-tions (Figures 15(d) and 16(d)) along with secondarycracks, which were usually perpendicular to the prop-agating direction. The fatigue striations normallyoccurred by a repeated plastic blunting-sharpeningprocess in the face-centered cubic materials because ofthe slip of dislocations in the plastic zone ahead of thefatigue crack tip. The formation of the fatigue striationsin the magnesium alloys with a hexagonal close-packedcrystal structure was expected to be related to thetwinning in the compressive phase and detwinning in thetensile phase.[58–62] Subsequent studies are needed in thisaspect.
IV. CONCLUSIONS
1. The microstructure of the as-received AZ31B-H24 Mg alloy consisted of small elongatedgrains, with some Mn-Al–containing inclusionsthat were still present in different zones after laserwelding. Both DLW and FLW resulted in a typical
Fig. 15—Typical SEM images of fatigue fracture surface of FLW joints. (a) overall view of the entire fracture surface at a lower stress amplitudeof 40 MPa, (b) multiple crack initiation at a higher stress amplitude of 80 MPa, (c) crack initiation from a welding defect, and (d) crack propa-gation zone.
1986—VOLUME 42A, JULY 2011 METALLURGICAL AND MATERIALS TRANSACTIONS A
solidification dendritic structure in the fusion zoneFZ, coupled with a large number of divorced eutec-tic b-Mg17Al12 particles in the interdendritic andintergranular regions, whereas recrystallized grainsappeared in the HAZ.
2. In both types of laser-welded joints, columnar den-drites were observed near the fusion boundary,whereas equiaxed dendrites occurred at the centerof the FZ. In comparison with the DLW joints, theFLW joints were superior because the weld sagging/drop-through was absent, the FZ was narrower,and the dendrite cell/grain size was smaller as a re-sult of the higher cooling rate and faster weldingspeed.
3. After laser welding, the hardness of the AZ31B-H24 Mg alloy decreased, and the lowest value oc-curred in the FZ. Because of the smaller grain sizein the FZ, the FLW joints exhibited a higher hard-ness than the DLW joints.
4. Although the YS, UTS, and fatigue strength of theDLW joints became much lower because of the lar-ger dendrite cell size and the presence of weld dropthrough in the FZ, the decrease of the YS, UTS,and fatigue strength in the FLW joints was moder-ate. Indeed, the FLW led to a joint efficiency ofapproximately 91 pct because of the narrower FZ,smaller grain size, and absence of weld dropthrough in the FZ. However, the ductility afterboth types of laser welding decreased drastically.
5. Although the strain rate dependence of ductilitywas observed to be strong in the BM, the YS andUTS exhibited only a weak strain rate dependence.After welding, the strain rate sensitivity basicallydisappeared. Besides, the DLW led to a higherstrain-hardening capacity becauase of the softer FZstemming from the larger grain size.
6. An initially higher strain-hardening rate in the BMat lower net flow stresses was observed because ofsmaller and predeformed grains where dislocationshad been generated, coupled with stronger Hall-Petch contribution arising from smaller grain sizes.At higher net flow stresses, the strain-hardening rateof the welded joints became higher because of thelarger grains, providing more space to accommo-date dislocations and increasing the dislocationstorage capacity.
7. In the tensile and fatigue tests, all the FLW jointsbasically fractured at the fusion boundary betweenHAZ and columnar dendrites, whereas the DLWjoints fractured almost exclusively at the center ofthe FZ because of the large dendrite cell size andthe presence of weld drop through. Dimple-likeductile fracture characteristics appeared in the BM,whereas some cleavage-like flat facets together withdimples and river marking were observed in thewelded samples. The gas pores on the fracture sur-face of the FLW joints were observed as a result ofthe keyhole welding process.
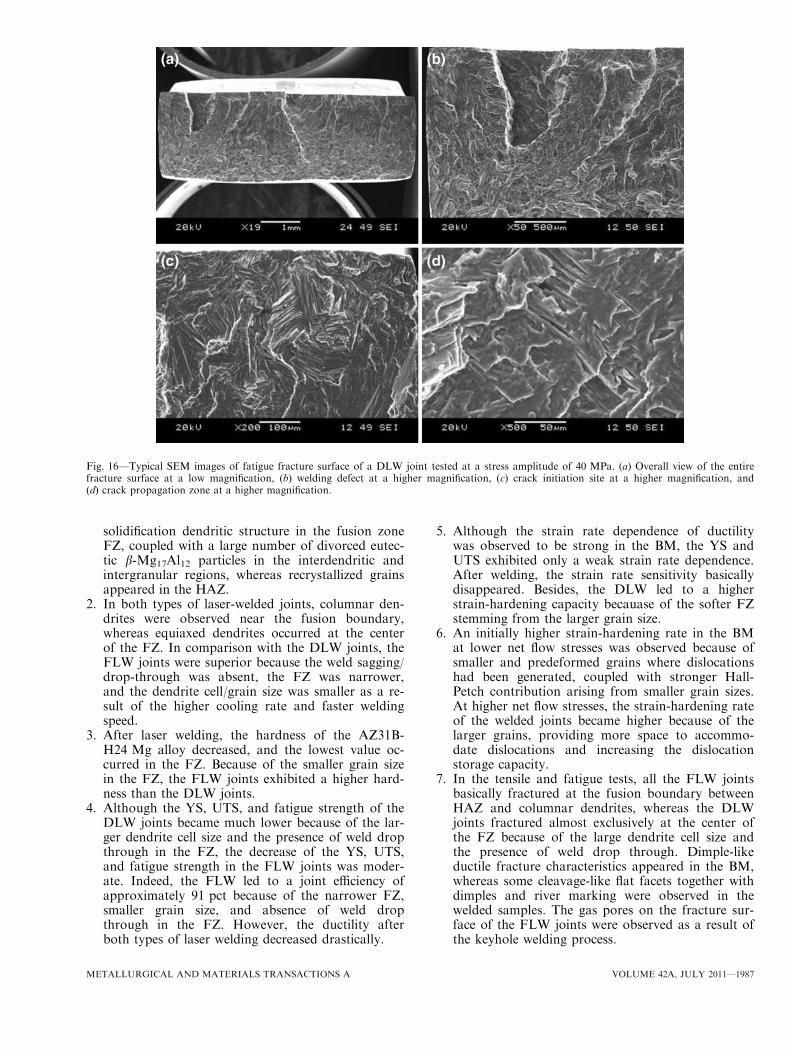
Fig. 16—Typical SEM images of fatigue fracture surface of a DLW joint tested at a stress amplitude of 40 MPa. (a) Overall view of the entirefracture surface at a low magnification, (b) welding defect at a higher magnification, (c) crack initiation site at a higher magnification, and(d) crack propagation zone at a higher magnification.
METALLURGICAL AND MATERIALS TRANSACTIONS A VOLUME 42A, JULY 2011—1987
8. Fatigue crack initiation occurred from the specimensurface or near-surface welding defects in all thewelded joints. Multiple crack initiation was ob-served at higher stress amplitudes. Fatigue crackpropagation was characterized by the formation offatigue striations with the spacing increased withincreasing distance from the initiation site, alongwith the presence of secondary cracks.
ACKNOWLEDGMENTS
The authors would like to thank the Natural Sci-ences and Engineering Research Council of Canada(NSERC) and AUTO21 Network of Centers of Excel-lence for providing financial support. This investiga-tion involves part of Canada-China-USA Collabo-rative Research Project on the Magnesium Front EndResearch and Development (MFERD). The authorsalso thank the General Motors Research and Develop-ment Center for the supply of test materials, and IPGPhotonics Applications Lab, Novi, MI for making andsupplying the fiber laser-welded joints. One author(D.L. Chen) is grateful for the financial support bythe Premier’s Research Excellence Award (PREA),Canada Foundation for Innovation (CFI), andRyerson Research Chair (RRC) program. The assis-tance of Q. Li, A. Machin, J. Amankrah, D. Ostrom,and R. Churaman (Ryerson University) in performingthe experiments is acknowledged gratefully. Theauthors also thank Dr. X. Cao, Dr. S. Xu, Dr.K. Sadayappan, Dr. J. Jackman, Professor N. Atalla,Professor S. Lambert, Professor H. Jahed, ProfessorY.S. Yang, Professor M.F. Horstemeyer, Professor B.Jordon, Dr. A.A. Luo, Mr. R. Osborne, Mr. J.F.Quinn, Dr. J. Allison, Dr. X.M. Su, and Mr. L. Zhangfor the helpful discussion.
REFERENCES1. T.M. Pollock: Science, 2010, vol. 328, pp. 986–87.2. M. Wise, K. Calvin, A. Thomson, L. Clarke, B. Bond-Lamberty,
R. Sands, S.J. Smith, A. Janetos, and J. Edmonds: Science, 2009,vol. 324, pp. 1183–86.
3. L.R. Kump: Nature, 2002, vol. 419, pp. 188–90.4. J.A. Patz, D. Campbell-Lendrum, T. Holloway, and J.A. Foley:
Nature, 2005, vol. 438, pp. 310–17.5. E.A. Nyberg, A.A. Luo, K. Sadayappan, and W.F. Shi: Adv.
Mater. Process., 2008, vol. 166, pp. 35–37.6. S.R. Agnew: JOM, 2004, vol. 56, pp. 20–21.7. E.S. Ng and I.A. Watson: J. Laser Appl., 1999, vol. 11, pp. 273–78.8. P.S. Mohanty and J. Mazumder: Metall. Mater. Trans. A, 1998,
vol. 45A, pp. 1269–79.9. S. Kou and Y. Le: Metall. Trans. A, 1985, vol. 16A, pp. 1887–96.10. M. Rappaz, J.M. Vitek, S.A. David, and L.A. Boatner: Metall.
Trans. A, 1993, vol. 24A, pp. 1433–46.11. K. Somboonsuk, J.T. Mason, and R. Trivedi: Metall. Trans. A,
1984, vol. 15A, pp. 967–75.12. S.H. Wu, J.C. Huang, and Y.N. Wang: Metall. Mater. Trans. A,
2004, vol. 35A, pp. 2455–69.13. Y. Liu, J. Koch, J. Mazumder, and K. Shibata: Metall. Trans. B,
1994, vol. 25B, pp. 425–34.14. Q. Yajie, Z. Chen, Z. Yu, X. Gong, and M. Li: Mater. Charact.,
2008, vol. 59, pp. 1799–804.15. L. Yu, K. Nakata, N, Yamamoto, and J. Liao: Mater. Lett, 2009,
vol. 63, pp. 870–72.
16. Z.H. Yu, H.G. Yan, X.S. Gong, Y.J. Quan, J.H. Chen, and Q.Chen: Mater. Sci. Eng. A, 2009, vol. A523, pp. 220–25.
17. A. Weisheit, R. Galun, and B.L. Mordike: Weld. J., 1998, vol. 77,pp. 149–54.
18. H. Zhao and T. DebRoy: Weld. J., 2001, vol. 80, pp. 204–10.19. Z. Sun, D. Pan, and J. Wei: Sci. Technol. Weld. Join., 2002, vol. 7,
pp. 343–51.20. G. Padmanaban and V. Balasubramanian: Mater. Des., 2010,
vol. 31, pp. 3724–32.21. H. Sun, G. Song, and L.F. Zhang: Sci. Technol. Weld. Join., 2008,
vol. 13, pp. 305–11.22. S. Katayama, H. Nagayama, M. Mizutani, and Y. Kawahito:
J. Light Met. Weld. Construct., 2008, vol. 46, pp. 470–79.23. L. Quintino, A. Costa, R. Miranda, D. Yapp, V. Kumar, and C.J.
Kong: Mater. Des., 2007, vol. 28, pp. 1231–37.24. J. Liu, J.H. Dong, and K. Shinozaki: Mater. Sci. Forum, 2009,
vol. 610-3, pp. 911–14.25. L. Yu, K. Nakata, and J. Liao: Sci. Technol. Weld. Join., 2009,
vol. 14, pp. 554–58.26. G.F. Vander Voort: Metallography Principles and Practice, ASM
International, Materials Park, OH, 1999.27. ASTM Standard E8/E8M: 2008, ‘‘Standard Test Methods for
Tension Testing of Metallic Materials,’’ ASTM International,West Conshohohocken, PA, 2008.
28. American Welding Society, Welding Handbook, 7th ed., vol. 1,American Welding Society, Miami, FL, 1976.
29. X.Z. Lin and D.L. Chen: J. Mater. Eng. Perform., 2008, vol. 17,pp. 894–901.
30. W.F. Savage, C.D. Lundin, and A.H. Aronson: Weld. J., 1965,vol. 44, pp. 175–81.
31. L. Xiao, L. Liu, Y. Zhou, and S. Esmaeili: Metall. Mater. Trans.A, 2010, vol. 41A, pp. 1511–22.
32. L. Liu, L. Xiao, J.C. Feng, Y.H. Tian, S.Q. Zhou, and Y. Zhou:Metall. Mater. Trans. A, in press.
33. A. Munitz: Metall. Trans. B, 1985, vol. 16B, pp. 149–61.34. A.J. Paul and T. Debroy: Rev. Mod. Phys., 1995, vol. 67, pp. 85–
112.35. S. Kou and Y. Le: Metall. Trans. A, 1982, vol. 13A, pp. 1141–52.36. T.S. Plaskett and W.C. Winegard: Can. J. Appl. Physiol, 1960,
vol. 38, pp. 1077–88.37. S. Kou:Welding Metallurgy, 2nd ed., Wiley, New York, NY, 2003.38. Y. Kawahito, M. Mizutani, and S. Katayama: Trans. JWRI.,
2007, vol. 36, pp. 11–16.39. L.M. Liu, G. Song, and M.L. Zhu: Metall. Mater. Trans. A, 2008,
vol. 39A, pp. 1702–11.40. P. Liu, Y.J. Li, H.R. Geng, and J.A. Wang: Mater. Lett., 2007,
vol. 61, pp. 1288–91.41. S.F. Su, J.C. Huang, H.K. Lin, and N.J. Ho:Metall. Mater. Trans.
A, 2002, vol. 33A, pp. 1461–73.42. G. Padmanaban, V. Balasubramanian, and J.K. Sarin Sundar:
JMPEG, 2010, vol. 19 (2), pp. 155–65.43. S.M. Chowdhury, D.L. Chen, S.D. Bhole, X. Cao, E. Powidajko,
D.C. Weckman, and Y. Zhou:Mater. Sci. Eng. A, 2010, vol. A527,pp. 2951–61.
44. J.A. del Valle and O.A. Ruano: Scripta Mater, 2006, vol. 55,pp. 775–78.
45. Y.V.R.K. Prasad and R.W. Armstrong: Phil. Mag., 1974, vol. 29,pp. 1421–25.
46. H. Takuda, S. Kikuchi, N. Yoshida, and H. Okahara: Metall.Mater. Trans. A, 2003, vol. 44A, pp. 2266–70.
47. Y.M. Wang and E. Ma: Mater. Sci. Eng. A, 2004, vols. A375–A377, pp. 46–52.
48. J. Luo, Z. Mei, W. Tian, and Z. Wang: Mater. Sci. Eng. A, 2006,vol. A441, pp. 282–90.
49. N. Afrin, D.L. Chen, X. Cao, and M. Jahazi: Scripta Mater., 2007,vol. 57, pp. 1004–07.
50. J.H. Hollomon: Trans. AIME, 1945, vol. 162, pp. 268–89.51. J.A. del Valle, F. Carreno, and O.A. Ruano: Acta Mater, 2006,
vol. 54, pp. 4247–59.52. C.W. Sinclair, W.J. Poole, and Y. Brechet: Scripta Mater., 2006,
vol. 55, pp. 739–42.53. W. Pantleon: Mater. Sci. Eng. A, 2004, vols. A387–A389, pp. 257–
61.54. I. Kovacs, N.Q. Chinh, and E. Kovacs-Csetenyi: Phys. Status
Solidi A, 2002, vol. 194, pp. 3–18.
1988—VOLUME 42A, JULY 2011 METALLURGICAL AND MATERIALS TRANSACTIONS A
55. U.F. Kocks and H. Mecking: Prog. Mater. Sci., 2003, vol. 48,pp. 171–273.
56. G.E. Dieter: Mechanical Metallurgy, S.I. Metric, ed., McGraw-Hill Columbus, OH, 1988.
57. K.S. Chan, P. Yi-Ming, D. Davidson, and R.C. McClung: Mater.Sci. Eng. A, 1997, vol. A222, pp. 1–8.
58. S. Begum, D.L. Chen, S. Xu, and A.A. Luo: Metall. Mater. Trans.A, 2008, vol. 39A, pp. 3014–26.
59. L.Wu, A. Jain, D.W. Brown, G.M. Stoica, S.R. Agnew, B. Clausen,D.E. Fielden, and P.K. Liaw:ActaMater., 2008, vol. 56, pp. 688–95.
60. X.Y. Lou, M. Li, R.K. Boger, S.R. Agnew, and R.H. Wagoner:Int. J. Plast., 2007, vol. 23, pp. 44–86.
61. S. Begum, D.L. Chen, S. Xu, and A.A. Luo: Int. J. Fatigue, 2009,vol. 31, pp. 726–35.
62. S. Begum, D.L. Chen, S. Xu, and A.A Luo: Mater. Sci. Eng. A,2009, vol. A517 (1–2), pp. 334–43.
METALLURGICAL AND MATERIALS TRANSACTIONS A VOLUME 42A, JULY 2011—1989