Microscale-calibrated modeling of the deformation response of dual-phase steels
17
Microscale-calibrated modeling of the deformation response of dual-phase steels Peng Chen a , Hassan Ghassemi-Armaki a , Sharvan Kumar a , Allan Bower a,⇑ , Shrikant Bhat b , Sriram Sadagopan b a School of Engineering, Brown University, Providence, RI 02912, USA b ArcelorMittal, Global R&D – East Chicago, East Chicago, IN 46312, USA Received 14 August 2013; received in revised form 8 November 2013; accepted 12 November 2013 Available online 27 December 2013 Abstract A combination of micropillar compression tests and microstructure-based numerical simulations were used to determine the flow strength and strain rate partitioning in uniaxial tension in two commercial low-carbon dual-phase sheet steels, DP980 (0.09% C– 2.15% Mn–0.60% Si (wt.%)) and DF140T (0.15% C–1.45% Mn–0.30% Si (wt.%)). The two steels have different microstructures, with the martensite volume fraction in DP980 being 60%, compared to 40% in DF140T. Nevertheless, they exhibit similar uniaxial stress–strain behavior. To determine the microstructural origin of this behavior, micropillar compression specimens from ferrite and mar- tensitic phases in both steels were deformed in uniaxial compression to obtain their individual response. A microstructure-based crystal plasticity model that accounts for non-Schmid behavior in the ferrite phase and contains a detailed description of the hierarchical micro- structure of martensite was developed and material parameters were determined by fitting model predictions to the micropillar compres- sion data. The crystal plasticity model was then used to predict the flow stress and strain rate partitioning during uniaxial tensile deformation of the two steels. The ferrite phase in the two steels was found to have similar flow strength. In contrast, the flow stress of martensite in DF140T was found to be approximately twice that in DP980. This strength difference is offset by the difference in mar- tensite volume fraction in the two steels, resulting in nearly identical uniaxial tensile behavior. The strain rate partitioning and interfacial stress distributions in the two steels differ significantly, however, and have important implications on their tensile ductility. Ó 2013 Acta Materialia Inc. Published by Elsevier Ltd. All rights reserved. Keywords: Martensite; Ferrite; Mechanical properties testing; Crystal plasticity; Finite element modeling 1. Introduction Dual-phase sheet steels have a remarkable combination of strength and ductility. They are particularly widely used in automotive applications such as bumper reinforcement beams, door intrusion beams, seating components and structural cross members. The unusual properties of dual- phase steels can be attributed to their complex and highly heterogeneous microstructure, composed of a hard mar- tensite phase dispersed within a soft ferrite matrix [1–3]. This complexity can be exploited to engineer steels with a wide range of properties, including high tensile-to-yield strength ratio, continuous yielding, high work hardening rate and good ductility. The overall mechanical properties of dual-phase steels depend not only on the individual properties of ferrite and martensite, but also on the micro- structural characteristics such as the ferrite grain size, volume fraction and morphology of martensite [4,5]. The strength of ferrite in general is determined by its composi- tion, grain size and initial dislocation density, while the strength of martensite depends primarily on its carbon con- tent. The yield strength of martensite increases with its car- bon content. Finer ferritic grain size, higher carbon content in martensite and higher volume fraction of martensite principally increase the strength of dual-phase steels. 1359-6454/$36.00 Ó 2013 Acta Materialia Inc. Published by Elsevier Ltd. All rights reserved. http://dx.doi.org/10.1016/j.actamat.2013.11.036 ⇑ Corresponding author. E-mail address: [email protected] (A. Bower). www.elsevier.com/locate/actamat Available online at www.sciencedirect.com ScienceDirect Acta Materialia 65 (2014) 133–149
-
Upload
independent -
Category
Documents
-
view
1 -
download
0
Transcript of Microscale-calibrated modeling of the deformation response of dual-phase steels

Available online at www.sciencedirect.com
www.elsevier.com/locate/actamat
ScienceDirect
Acta Materialia 65 (2014) 133–149
Microscale-calibrated modeling of the deformation responseof dual-phase steels
Peng Chen a, Hassan Ghassemi-Armaki a, Sharvan Kumar a, Allan Bower a,⇑,Shrikant Bhat b, Sriram Sadagopan b
a School of Engineering, Brown University, Providence, RI 02912, USAb ArcelorMittal, Global R&D – East Chicago, East Chicago, IN 46312, USA
Received 14 August 2013; received in revised form 8 November 2013; accepted 12 November 2013Available online 27 December 2013
Abstract
A combination of micropillar compression tests and microstructure-based numerical simulations were used to determine the flowstrength and strain rate partitioning in uniaxial tension in two commercial low-carbon dual-phase sheet steels, DP980 (0.09% C–2.15% Mn–0.60% Si (wt.%)) and DF140T (0.15% C–1.45% Mn–0.30% Si (wt.%)). The two steels have different microstructures, withthe martensite volume fraction in DP980 being �60%, compared to �40% in DF140T. Nevertheless, they exhibit similar uniaxialstress–strain behavior. To determine the microstructural origin of this behavior, micropillar compression specimens from ferrite and mar-tensitic phases in both steels were deformed in uniaxial compression to obtain their individual response. A microstructure-based crystalplasticity model that accounts for non-Schmid behavior in the ferrite phase and contains a detailed description of the hierarchical micro-structure of martensite was developed and material parameters were determined by fitting model predictions to the micropillar compres-sion data. The crystal plasticity model was then used to predict the flow stress and strain rate partitioning during uniaxial tensiledeformation of the two steels. The ferrite phase in the two steels was found to have similar flow strength. In contrast, the flow stressof martensite in DF140T was found to be approximately twice that in DP980. This strength difference is offset by the difference in mar-tensite volume fraction in the two steels, resulting in nearly identical uniaxial tensile behavior. The strain rate partitioning and interfacialstress distributions in the two steels differ significantly, however, and have important implications on their tensile ductility.� 2013 Acta Materialia Inc. Published by Elsevier Ltd. All rights reserved.
Keywords: Martensite; Ferrite; Mechanical properties testing; Crystal plasticity; Finite element modeling
1. Introduction
Dual-phase sheet steels have a remarkable combinationof strength and ductility. They are particularly widely usedin automotive applications such as bumper reinforcementbeams, door intrusion beams, seating components andstructural cross members. The unusual properties of dual-phase steels can be attributed to their complex and highlyheterogeneous microstructure, composed of a hard mar-tensite phase dispersed within a soft ferrite matrix [1–3].This complexity can be exploited to engineer steels with a
1359-6454/$36.00 � 2013 Acta Materialia Inc. Published by Elsevier Ltd. All
http://dx.doi.org/10.1016/j.actamat.2013.11.036
⇑ Corresponding author.E-mail address: [email protected] (A. Bower).
wide range of properties, including high tensile-to-yieldstrength ratio, continuous yielding, high work hardeningrate and good ductility. The overall mechanical propertiesof dual-phase steels depend not only on the individualproperties of ferrite and martensite, but also on the micro-structural characteristics such as the ferrite grain size,volume fraction and morphology of martensite [4,5]. Thestrength of ferrite in general is determined by its composi-tion, grain size and initial dislocation density, while thestrength of martensite depends primarily on its carbon con-tent. The yield strength of martensite increases with its car-bon content. Finer ferritic grain size, higher carbon contentin martensite and higher volume fraction of martensiteprincipally increase the strength of dual-phase steels.
rights reserved.

134 P. Chen et al. / Acta Materialia 65 (2014) 133–149
However, this increase in strength is usually achieved at theexpense of lower ductility [5].
In automotive applications, to reduce cycle time, part-forming feasibility analyses are often carried out throughfinite element analysis-based virtual simulation techniques.While conventional constitutive models based on macro-scopic standard stress–strain curves of steels often serveas inputs, much research effort is being spent on investigat-ing the details of deformation behavior of multi-phasesteels via experimental, analytical and simulation tech-niques to understand the influence of different microstruc-tural length scales on deformation behavior. In this regard,a fundamental understanding of the properties and under-lying deformation mechanisms in the individual phases ofdual-phase steels, and the ability to predict quantitativelythe macroscopic flow behavior and formability of a com-plex dual-phase microstructure, is expected to pave theway for better prediction of forming behavior under com-plex loading paths of practical interest. They may alsoserve as inputs for future development of steels withenhanced strength and ductility. The mechanical behaviorof individual phases of dual-phase steels has been evaluatedby using nanohardness or ultramicrohardness [6,7], in situneutron diffraction [8] or in situ high-energy X-ray diffrac-tion techniques [9–11]. Hardness measurements require avery small indentation contact area, and so are susceptibleto indentation size effects. In addition, it is difficult toensure that the material being indented is homogeneousbelow the indenter. In neutron diffraction, it is difficult toseparate the ferrite and martensite diffraction peaks dueto the similar body-centered cubic (bcc) and body-centeredtetragonal crystal structures in ferrite and martensite. It hasrecently been shown that high-energy X-ray diffraction hasthe capability of separating (200) and (211) diffractionpeaks for the ferrite and martensite phases, but diffractionmeasurements can only measure the average lattice strainin the ferrite and martensite as a function of macroscopicstress, so extracting the mechanical response of the individ-ual phases is difficult. Recently, an alternative to theseapproaches has been developed in which microscale speci-mens are extracted directly from the microstructure andtheir load–displacement relation is subsequently deter-mined using a nanoindenter. For example, Stewart et al.[12] have used this micropillar compression technique tomeasure the constituent behavior of dual-phase steels,while Ghassemi-Armaki et al. [13,14] have measured themechanical response of individual martensite micropillars(composed of blocks and packets) extracted from a fullymartensitic steel and, more recently, of ferrite and martens-ite microconstituents in a dual-phase steel.
Numerical simulations provide a more detailed pictureof the partitioning of strain, strain rate and stress withina microstructure, and of the roles of microstructuralfeatures in controlling macroscopic material behavior.The simplest such models use a 2-D idealization of themicrostructure, together with a phenomenological isotro-pic J2 flow rule and isotropic Ludwik hardening law to
investigate the flow and failure behaviors of dual-phasesteels [5,15]. These models have predicted conditions to ini-tiate shear localization in representative microstructuresthat are in good agreement with experiment. More sophis-ticated models use a crystal plasticity model based on Sch-mid’s law to characterize the phases [6,16]. These generallymodel a ferritic microstructure using rate-dependent singlecrystal plasticity and model the martensitic phase usingeither crystal plasticity [11,16] or an isotropic hardeningJ2 flow model [6]. Most recently, the effect of crystallo-graphic orientation on the microscale flow behavior andplastic localization of dual-phase steel has been investi-gated using a 2-D crystal plasticity model [17]. Determiningthe properties of the individual phases in a complex micro-structure is critical to obtaining accurate predictions of itsmacroscopic behavior. A common approach has been to fitparameters to match lattice strain measurements obtainedusing X-ray or neutron diffraction measurements[11,16,17], or to select a parameter so as to fit the macro-scopic flow behavior [6]. The ability of micropillar experi-ments to determine the properties of the phases directlysignificantly improves the accuracy of microstructure-based simulations. Micropillar-calibrated constitutivemodels have been shown to predict the macroscopic tensileflow curves of fully martensitic steel correctly [13].
In this paper, our objective is to use a combination ofmicropillar compression tests and numerical simulationsto study the flow and hardening behavior of two dual-phase steels, DF140T and DP980, with nominally similartensile strength levels. The two steels have significantly dif-ferent microstructures: for example, the martensite volumefraction in DP980 is approximately 50% greater than thatin DF140T. Surprisingly, despite this difference, they havenearly identical uniaxial tensile stress–strain behavior. Toexplain these observations, the properties of the individualphases in both steels were measured by extracting micro-scale pillars from a bulk sample (using focused ion-beammilling), and then deforming the pillars using a flat-punchnanoindenter to determine their response to uniaxial com-pression. (Experimental details and validation of theapproach for DF140T are presented elsewhere [14].) Theexperimental data were then used to determine materialparameters in crystal-plasticity-based constitutive equa-tions for the ferrite and martensite phases in the steels.Based on these measurements, a 3-D computational modelwas created of each dual-phase steel microstructure andsubjected to loading representing uniaxial tension.
This combination of experiments and computations pre-dicts the uniaxial behavior of both steels accurately. Inaddition, it provides a number of insights into the micro-structural origin of their tensile behavior. In particular,the martensite phase in DF140T is found to have a com-pressive strength approximately twice that of martensitein DP980. This strength difference is offset by the differentvolume fractions of martensite in the two steels, explaininghow they exhibit nearly identical tensile flow strength. Inaddition, our results show that the ferrite micropillars

P. Chen et al. / Acta Materialia 65 (2014) 133–149 135
exhibit a strong orientation dependent flow strength, whichcannot be explained by a conventional crystal plasticitymodel based on Schmid’s law. We find that these discrep-ancies can be resolved by adopting more sophisticated crys-tal plasticity models developed recently for bcc materialswith non-Schmid behavior. The non-Schmid behavior inthe ferrite leads to a small reduction in the tensile flowstress of the dual-phase steels, as well as a recognizable ten-sion–compression asymmetry. Finally, our microstructure-based model predicts the detailed distributions of strainand interfacial stress in both steel microstructures, whichprovide insights into their different tensile ductility.
The remainder of this paper is organized as follows. Theexperimental procedure and results are described in Sec-tion 2. Section 3 describes our microstructure-based simula-tions: in Sections 3.1 and 3.2, we outline the crystal plasticitymodels for ferrite and martensite; Section 3.3 describes howparameters in the crystal plasticity models were determinedusing data from the micropillar experiments; Section 3.4describes the procedure for generating dual-phase steelmicrostructures; and Section 3.5 compares the measuredand predicted uniaxial tensile responses of the steels. Theconclusions of our study are summarized in Section 4.
2. Experiments
In this section, we give a detailed description of ourexperimental methods and results, including both theexperiments designed to characterize the microstructureand bulk behavior of the two steels, as well as the tech-niques designed to extract and test micropillars of eachindividual phase of the steels.
2.1. Experimental methods
Two dual-phase sheet steels were examined in this study:(i) DP980, with nominal chemical composition of 0.09% C–2.15% Mn–0.60% Si (wt.%) and (ii) DF140T with nominalchemical composition of 0.15% C–1.45% Mn–0.30% Si
Fig. 1. Uniaxial tensile stress–strain curves for the as-received (a) DF140T wdirection, and (b) DP980 and DF140T dual-phase steels with loading axis alig
(wt.%). Both steels were produced on a commercialwater–quenched continuous anneal line. The as-receivedsamples had a sheet thickness of 2 mm in both cases.
Macroscopic uniaxial tensile stress–strain curves wereobtained for both steels by testing tensile specimens witha one-inch gauge length and flat dog-bone geometry at astrain rate of 10�3 s�1. Representative stress–strain curvesfor the two steels tested parallel to the rolling directionare compared in Fig. 1 (in-plane anisotropy up to the ulti-mate tensile strength (UTS) was found to be insignificant inboth steels).
To characterize their microstructure, sections were cutfrom the as-received samples, mechanically polished suc-cessively with SiC papers and 1 lm diamond paste, thenelectropolished in an aqueous electrolyte to remove thedeformed layer created during the mechanical polishing.The electrolyte consisted of perchloric acid: ethanol in a1:9 ratio, and electropolishing was conducted at 20 V anda temperature of �40 �C. The etched and polished speci-mens were subsequently examined by field emission scan-ning electron microscopy. Representative microstructuresfor the two steels are shown in Fig. 2(a) and (b) in the planeof the sheet (the horizontal direction in the micrographscoincide with the rolling direction).
The mechanical response of the individual martensiteand ferrite phases in the microstructure was determinedby extracting micropillars from each phase and deformingthe micropillars in uniaxial compression using a nanoind-enter equipped with a flat punch. Prior to extracting themicropillars, the as-received specimens were sectionedand electropolished as described previously. Approxi-mately cylindrical micropillars, with diameters in the range0.3–2 lm and length 0.6–5 lm, were then milled into thepolished surface of the specimen using a dual-beam FEIfocused ion beam (FIB) using 30 keV Ga ions, followedby a final milling current of 9.7 pA. The pillars wereextracted from the centers of ferrite grains or martensitephase, and were at least two pillar diameters away fromany interfaces as observed on the specimen surface. In
ith loading axis aligned parallel, perpendicular and at 45� to the rollingned parallel to the rolling direction.

(a) (b)
Fig. 2. Representative SEM images of the as-received dual-phase sheet steel microstructures composed of ferrite and martensite (a) DF140T and (b)DP980.
136 P. Chen et al. / Acta Materialia 65 (2014) 133–149
instances where the top surface of the micropillar exhibitedroughness (for example due to prior light etching to distin-guish the two phases), a thin layer was milled off the sur-face by the FIB.
The crystallographic orientations of the micropillarswere determined by electron beam back-scattered diffrac-tion (EBSD) measurements in the dual-beam FIB. In theferrite pillars, the EBSD results showed that the orientationof the top surface of the pillar does not spatially vary bymore than two degrees; for martensite, the orientation asmeasured on the top surface of the pillar sometimes variedsignificantly spatially across the pillar and at other timesdid not. Whether it did or not depended on whether thetop surface of the pillar was a single block or multipleblocks. Moreover, even where the top surface is composedof a single block, it is possible that block and packetboundaries are present beneath the surface in thethrough-thickness direction of the pillar.
The micropillars were loaded in uniaxial compression ata nominal strain rate of 10�3 s�1 by indenting their topsurface using a flat-punch nanoindenter. The load–displacement data obtained from the nanoindenter wereconverted to engineering stress and strain in the micropil-lar. If a taper was present in the micropillar, the nominalstress was calculated by averaging the diameters at thetop and the bottom of the micropillar.
2.2. Experimental results
The two commercially available dual-phase steels(DP980 and DF140T) studied in this paper have similaruniaxial tensile strength and comparable tensile ductility.Their uniaxial tensile response is shown in Fig. 1: the onset
of yielding occurs in both steels at around 350 MPa, afterwhich both exhibit a steep strain hardening response upto a stress level of about 800 MPa. Beyond this stress, thehardening rate decreases dramatically, but continues toincrease up to the UTS at �1050 ± 50 MPa. Final fractureoccurs beyond the UTS at a plastic strain of 14% inDF140T and 15.5% in DP980.
Despite their similar mechanical behavior, the two steelshave significantly different microstructures, as shown inFig. 2. In both cases, the microstructures consist of mar-tensite islands dispersed in a ferrite matrix, with the mar-tensite forming necklace-like structures around the ferritegrains. However, the two steels have different volume frac-tions of martensite as determined from multiple scanningelectron microscopy (SEM) images constituting a total areaof �0.04 mm�2; the martensite volume fraction in DP980was �60%, compared to �40% in DF140T. In addition,the grain sizes in the two steels differ by approximately afactor of two: the ferrite grain size in DF140T ranges from4 to 20 lm, while the martensite size in DF140T is in therange 2–10 lm. In contrast, DP980 has a ferrite grain sizeof around 2–10 lm, and martensite islands range in sizefrom 1 to 5 lm.
These observations confirm that the overall flow behav-ior of dual-phase steels is determined not only by the vol-ume fractions of the two constituent phases, but also bythe detailed mechanical properties of the individual phasesthemselves; furthermore, the results suggest that the behav-ior of the individual phases in the two steels is likely to dif-fer significantly, so as to compensate for the difference inmartensite volume fraction.
To investigate these questions further, we measured themechanical behavior of the ferrite and martensite phases in
P. Chen et al. / Acta Materialia 65 (2014) 133–149 137
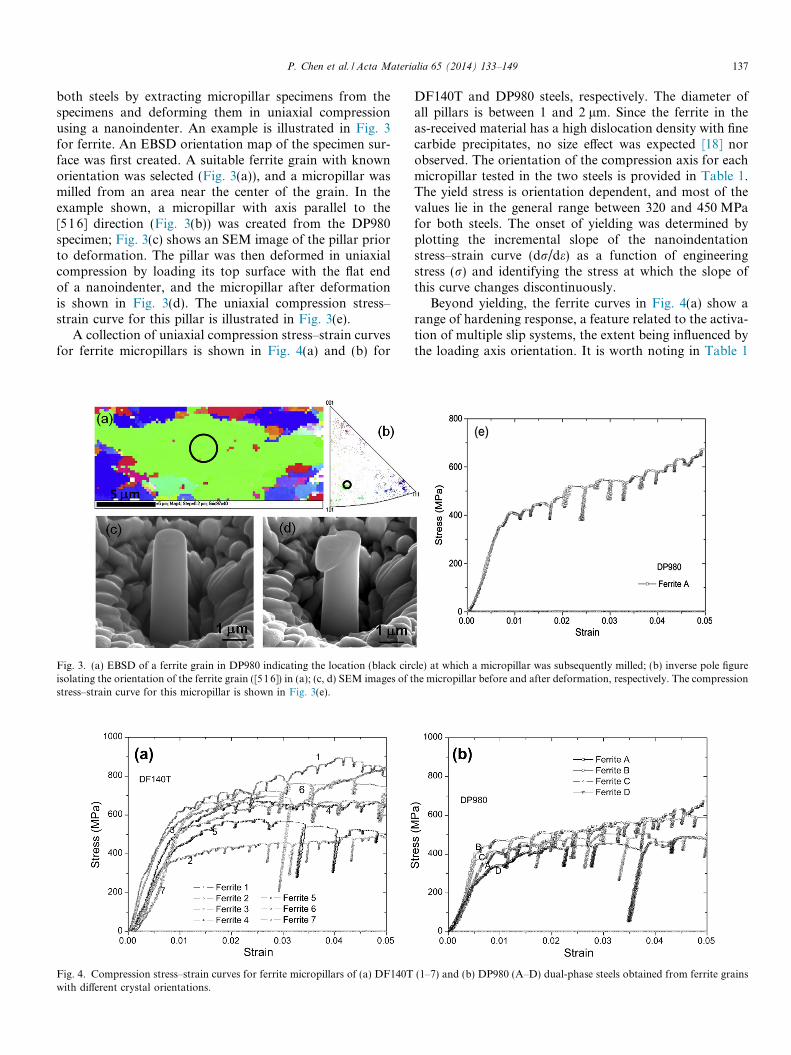
both steels by extracting micropillar specimens from thespecimens and deforming them in uniaxial compressionusing a nanoindenter. An example is illustrated in Fig. 3for ferrite. An EBSD orientation map of the specimen sur-face was first created. A suitable ferrite grain with knownorientation was selected (Fig. 3(a)), and a micropillar wasmilled from an area near the center of the grain. In theexample shown, a micropillar with axis parallel to the[516] direction (Fig. 3(b)) was created from the DP980specimen; Fig. 3(c) shows an SEM image of the pillar priorto deformation. The pillar was then deformed in uniaxialcompression by loading its top surface with the flat endof a nanoindenter, and the micropillar after deformationis shown in Fig. 3(d). The uniaxial compression stress–strain curve for this pillar is illustrated in Fig. 3(e).
A collection of uniaxial compression stress–strain curvesfor ferrite micropillars is shown in Fig. 4(a) and (b) for
Fig. 3. (a) EBSD of a ferrite grain in DP980 indicating the location (black cirisolating the orientation of the ferrite grain ([516]) in (a); (c, d) SEM images of tstress–strain curve for this micropillar is shown in Fig. 3(e).
Fig. 4. Compression stress–strain curves for ferrite micropillars of (a) DF140Twith different crystal orientations.
DF140T and DP980 steels, respectively. The diameter ofall pillars is between 1 and 2 lm. Since the ferrite in theas-received material has a high dislocation density with finecarbide precipitates, no size effect was expected [18] norobserved. The orientation of the compression axis for eachmicropillar tested in the two steels is provided in Table 1.The yield stress is orientation dependent, and most of thevalues lie in the general range between 320 and 450 MPafor both steels. The onset of yielding was determined byplotting the incremental slope of the nanoindentationstress–strain curve (dr/de) as a function of engineeringstress (r) and identifying the stress at which the slope ofthis curve changes discontinuously.
Beyond yielding, the ferrite curves in Fig. 4(a) show arange of hardening response, a feature related to the activa-tion of multiple slip systems, the extent being influenced bythe loading axis orientation. It is worth noting in Table 1
cle) at which a micropillar was subsequently milled; (b) inverse pole figurehe micropillar before and after deformation, respectively. The compression
(1–7) and (b) DP980 (A–D) dual-phase steels obtained from ferrite grains
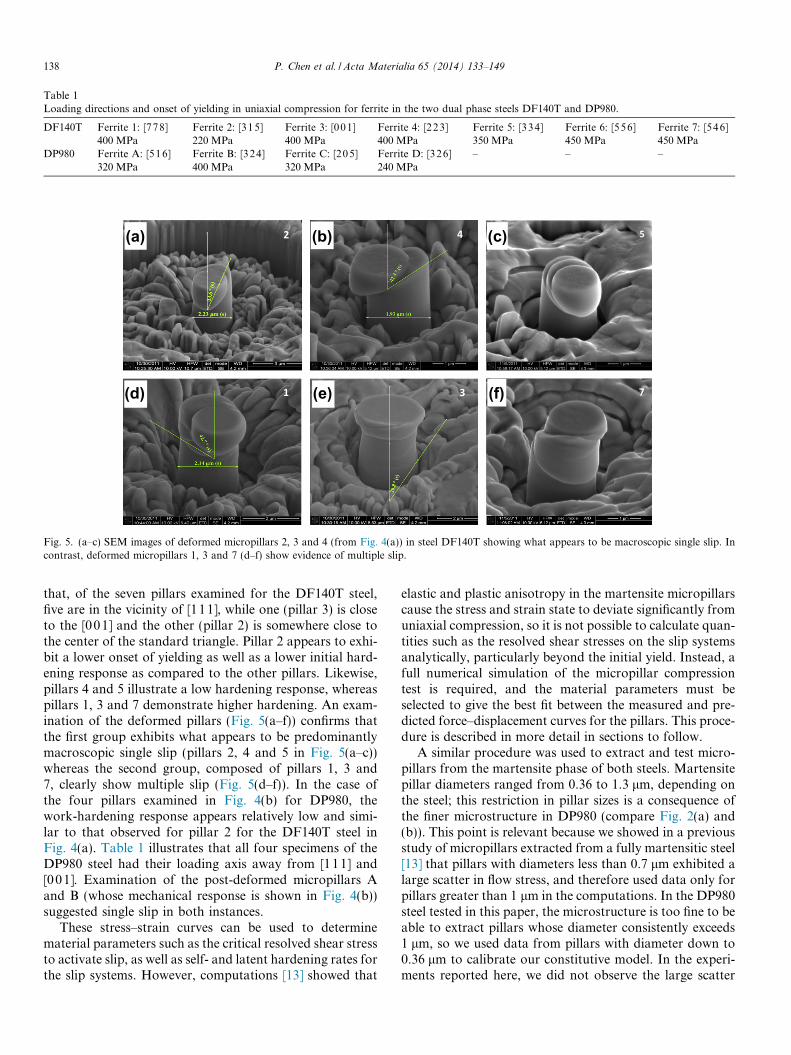
Table 1Loading directions and onset of yielding in uniaxial compression for ferrite in the two dual phase steels DF140T and DP980.
DF140T Ferrite 1: [778]400 MPa
Ferrite 2: [315]220 MPa
Ferrite 3: [001]400 MPa
Ferrite 4: [223]400 MPa
Ferrite 5: [334]350 MPa
Ferrite 6: [556]450 MPa
Ferrite 7: [546]450 MPa
DP980 Ferrite A: [516]320 MPa
Ferrite B: [324]400 MPa
Ferrite C: [205]320 MPa
Ferrite D: [326]240 MPa
– – –
(a) (b) (c)
(d) (e) (f)
Fig. 5. (a–c) SEM images of deformed micropillars 2, 3 and 4 (from Fig. 4(a)) in steel DF140T showing what appears to be macroscopic single slip. Incontrast, deformed micropillars 1, 3 and 7 (d–f) show evidence of multiple slip.
138 P. Chen et al. / Acta Materialia 65 (2014) 133–149
that, of the seven pillars examined for the DF140T steel,five are in the vicinity of [111], while one (pillar 3) is closeto the [001] and the other (pillar 2) is somewhere close tothe center of the standard triangle. Pillar 2 appears to exhi-bit a lower onset of yielding as well as a lower initial hard-ening response as compared to the other pillars. Likewise,pillars 4 and 5 illustrate a low hardening response, whereaspillars 1, 3 and 7 demonstrate higher hardening. An exam-ination of the deformed pillars (Fig. 5(a–f)) confirms thatthe first group exhibits what appears to be predominantlymacroscopic single slip (pillars 2, 4 and 5 in Fig. 5(a–c))whereas the second group, composed of pillars 1, 3 and7, clearly show multiple slip (Fig. 5(d–f)). In the case ofthe four pillars examined in Fig. 4(b) for DP980, thework-hardening response appears relatively low and simi-lar to that observed for pillar 2 for the DF140T steel inFig. 4(a). Table 1 illustrates that all four specimens of theDP980 steel had their loading axis away from [111] and[001]. Examination of the post-deformed micropillars Aand B (whose mechanical response is shown in Fig. 4(b))suggested single slip in both instances.
These stress–strain curves can be used to determinematerial parameters such as the critical resolved shear stressto activate slip, as well as self- and latent hardening rates forthe slip systems. However, computations [13] showed that
elastic and plastic anisotropy in the martensite micropillarscause the stress and strain state to deviate significantly fromuniaxial compression, so it is not possible to calculate quan-tities such as the resolved shear stresses on the slip systemsanalytically, particularly beyond the initial yield. Instead, afull numerical simulation of the micropillar compressiontest is required, and the material parameters must beselected to give the best fit between the measured and pre-dicted force–displacement curves for the pillars. This proce-dure is described in more detail in sections to follow.
A similar procedure was used to extract and test micro-pillars from the martensite phase of both steels. Martensitepillar diameters ranged from 0.36 to 1.3 lm, depending onthe steel; this restriction in pillar sizes is a consequence ofthe finer microstructure in DP980 (compare Fig. 2(a) and(b)). This point is relevant because we showed in a previousstudy of micropillars extracted from a fully martensitic steel[13] that pillars with diameters less than 0.7 lm exhibited alarge scatter in flow stress, and therefore used data only forpillars greater than 1 lm in the computations. In the DP980steel tested in this paper, the microstructure is too fine to beable to extract pillars whose diameter consistently exceeds1 lm, so we used data from pillars with diameter down to0.36 lm to calibrate our constitutive model. In the experi-ments reported here, we did not observe the large scatter

Fig. 6. Compression stress–strain curves of micropillars extracted from martensite of dual-phase steels (a) DF140T (1, 2), (b) DP980 (A–C); (c, d) SEMimages of the micropillars after deformation for micropillar 1 of DF140T steel and micropillar B of DP980 steel, respectively.
P. Chen et al. / Acta Materialia 65 (2014) 133–149 139
in the flow behavior of sub-micron pillars previously seen ina fully martensitic steel [13], but further study is required todetermine the underlying causes of the scatter, and toexplain the variations in scatter between steels.
Although the packet and block sizes in low-carbon mar-tensite have been shown to scale with the prior austenitegrain size over a large range of grain sizes [19], informationon this aspect is not readily available at the fine austenitegrain size end (for example, <10 lm prior austenite grainsize) and such fine grain sizes are often observed in dual-phase steels, including the DP980 examined in this study.An examination in a transmission electron microscope ofthe martensite structure in DF140T and DP980 in the as-received condition confirmed submicron laths, but not sub-micron blocks or packets. Thus, it is conceivable that for atleast some of the martensite pillars examined in this study,particularly those <0.5 lm in diameter, the cross-sectionlikely represents a single block of martensite.
Stress–strain curves for the martensitic phase inDF140T and DP980 are shown in Fig. 6(a) and (b), respec-tively. Specimens 1 and 2 in DF140T and specimen A inDP980 all show visible hardening and appear to deformby multiple slip (see, for example, Fig. 6(c) for specimen1). In contrast, specimen B in Fig. 6(b) does not show
hardening and an examination of the deformed micropillarB (Fig. 6(d)) confirms single slip.
The martensite phases in the two steels differ significantlyin their flow behavior. Considering only the data for multi-ple-slip conditions, martensite extracted from DF140T canreach a flow strength of 2.5 GPa, while the martensite inDP980 exhibits a flow strength of the order of 1.5 GPa(both at 0.1 strain level). An estimation for the carbon levelin the martensite in the two steels based on the assumptionof negligible C solubility in ferrite and known nominal alloycompositions and martensite volume fractions gives valuesof 0.33 wt.% C in martensite in DF140T as opposed to0.15 wt.% C in DP980. This difference in C levels in thetwo martensites can explain the observed strength differ-ences. This observation provides a qualitative explanationfor why the two steels with significantly different micro-structure have similar uniaxial tensile stress–strain response– namely, that DP980 has a higher martensite volume frac-tion than DF1410T but the increase in martensite content inDP980 is evidently offset by a reduction in the strength ofthe martensite. A more quantitative comparison of thestrain rate partitioning and overall response of the twosteels can be achieved using microstructure-level numericalsimulations, to be discussed in the following sections.

140 P. Chen et al. / Acta Materialia 65 (2014) 133–149
3. Numerical simulations
Microstructure-level numerical simulations provide fur-ther insight into the roles of the ferritic and martensiticphases in determining the overall response of dual-phasesteels. A wide variety of different microstructure-basedmodels have been used for this purpose in previous studies,ranging from simple idealizations based on isotropic plas-ticity [5,15] to more sophisticated crystal-plasticity models[6,16]. Our experiments show that micropillars of both fer-rite and martensite frequently deform by single slip, so themicropillar data is best described using a crystal plasticitymodel. Accordingly, we selected appropriate crystal plas-ticity models for both the ferrite and martensite phases inour computations.
To model the ferritic phase, we adopted a crystal plastic-ity model originally developed by Bassani and Wu for face-centered cubic (fcc) materials and extended more recentlyto bcc materials [20–22]. An important feature of thismodel is that it is capable of accounting for the non-Sch-mid behavior commonly exhibited by bcc materials. Ourresults, described below in Section 3.3, show that only amodel of this kind is capable of predicting the orientationdependence of the flow strength of ferrite micropillars.
To model the martensitic phase, we adopted a crystalplasticity model developed by Hatem and Zikry [23]. Thismodel describes martensite at the level of individual blocks,which are represented as single crystals, and the laths(within blocks) are described approximately by an evolvingdislocation density. We have previously shown that thisconstitutive equation provides an excellent description ofthe flow behavior of micropillars extracted from a fullymartensitic steel [13], as well as the overall flow strengthof a fully martensitic microstructure.
The properties of single ferrite grains and individualmartensitic blocks are determined by fitting finite elementsimulations to experimental micropillar tests for specimenscontaining single ferrite grain and single/multiple martens-itic blocks. To validate both models, we then use ourmicrostructure-based model to predict the overall flowbehavior of both dual-phase steels. For this purpose, a full3-D representative volume element, which consists of fer-rite grains and martensitic blocks and packets within a dis-tribution of prior austenite grains, is then generated. Themicrostructure generation procedure allows microstruc-tural variables such as ferrite grain size, prior austenitegrain size, packet size and block size to be fitted toexperimental measurements. The uniaxial stress–strainbehavior of representative volume elements is then com-puted, and the predictions compared with experimentalmeasurements.
We describe this procedure in more detail in the sectionsto follow. We begin by describing the constitutive modelsused to idealize the ferritic and martensitic phases of thedual-phase steels. We then describe how material parame-ters in these models were determined from micropillar tests,and compare the experimentally measured flow curves of
micropillars with model predictions. We then describe theprocedure used to generate 3-D representative volume ele-ments of dual-phase steels. Finally, we compare the pre-dicted uniaxial tensile behavior of representative volumeelements with experimental measurements.
3.1. Crystal plasticity model with non-Schmid effect for
ferrite single crystals
The ferritic phase in dual-phase steels has a bcc crystalstructure. Plastic deformation of bcc metals is dominatedby the glide of screw dislocations, which have a highlynon-planar core structure and a high Peierls barrier todislocation motion [20–22,24–27]. In fcc metals, yield isdetermined by the maximum resolved shear stress onthe candidate slip systems, and the plastic flow conse-quently obeys Schmid’s law. In contrast, for bcc materialsthe stress may modify the non-planar dislocation corestructure, and the flow stress consequently depends onthe full stress tensor [20–22,24]. This is often referred toas “non-Schmid” behavior. Significant progress has beenmade in recent years in modeling slip in bcc materialsboth at the atomic scale and at continuum length scale.For example, Koester et al. confirmed that the non-glidestresses have a strong influence on the hardening behaviorof bcc iron using an atomisticallly informed crystal plas-ticity model [24]. In a polycrystal, this non-Schmid behav-ior leads to non-associated flow, which is well known tomake the material prone to strain localization [22]. Inlight of these developments, we have chosen to modelthe ferrite using a constitutive model developed by Wein-berger et al. [20], which is capable of accounting for non-Schmid behavior in bcc crystals.
The kinematics of deformation is treated using a stan-dard approach: the total deformation gradient F is decom-posed as
F ¼ FeFp ð1Þwhere Fe is the elastic deformation gradient and Fp is theplastic deformation gradient due to slip. The evolution ofthe plastic deformation is described as the cumulative sliprates on all possible slip systems,
_FpFp�1 ¼X
a
_casa �ma ð2Þ
where _ca is the slip rate of slip system a, and sa and ma arethe slip direction vector and slip plane normal vector in thereference configuration, respectively. Following Caillard[25], we assume that plastic flow takes place by shearingon the set of {110}h111i slip systems, with the plastic sliprate on a generic slip system related to the stress acting onthe slip plane by
_ca ¼ _c0
jsajga�
� �m
signðsaÞ ð3Þ
Here, sa is the resolved shear stress on slip system a; _c0;mare material parameters, and ga
� is a modified slip system

P. Chen et al. / Acta Materialia 65 (2014) 133–149 141
strength given by ga� ¼ maxðga � ga
NS ; 0Þ, where ga is anevolving strength representing the effects of self- and foresthardening;
gaNS ¼ a1ma
1 � rsa þ a2ma � rðma � saÞ þ a3ma1 � rðma
1 � saÞð4Þ
is a correction to account for non-Schmid behavior. In Eq.(4), r is the stress tensor, ma
1 is a unit vector perpendicularto the {110} plane in the zone of ma that makes an angle of�60� with the reference plane and (a1, a2, a3) are materialparameters. Note that, more recently, Koester et al. [24]added three more terms to Eq. (4) to account for thenon-Schmid effect of pure bcc iron. Here Eq. (4) can be re-garded as a simplified version of the model in Ref. [24] byignoring the three extra terms. The relevant unit vectors foreach slip system in a bcc crystal are given in Table 1 ofGroeger et al. [21].
Self- and latent hardening in the ferrite are modeledusing the standard crystal plasticity constitutive equations
_ga ¼XN
b¼1
habj _cbj ð5Þ
where the hardening moduli are
hab ¼ qabhð�cÞ qab ¼1; a; b coplanar
q; otherwise
�ð6Þ
The latent hardening factor q is a material parameter, andthe hardening rate is
hð�cÞ ¼ hs þ ðh0 � hsÞsech2 h0 � hs
gs � g0
ca
� �� �GðcbÞ; b – a
GðcbÞ ¼ 1þXb–a
f0 tanhðcb=c0Þ
ð7ÞHere, {h0, hs, g0, gs, f0, c0} are material parameters. Thismaterial model contains 12 material parameters, whichmust be determined from experiment, as described inSection 3.3.
3.2. Dislocation-density-based crystal plasticity model for
martensite blocks
Our approach to model the martensitic phases in thedual-phase steels was described in detail in a previous studyof fully martensitic steels [13], so will only be briefly sum-marized here. The martensite is idealized as a hierarchicalmicrostructure, following an approach proposed by Hatemand Zikry [23,28,29] and Lee et al. [30]. The largest length-scale considered is a martensite particle in the dual-phasesteel (or a micropillar). The particles are sub-divided intomartensite packets. Each packet is further sub-divided intomartensite blocks, which are the smallest microstructuralfeature considered explicitly in our computations. Theblocks are idealized as single crystals, with the lathsrepresented as a high dislocation density (the changes in
crystallographic orientation across low angle lath bound-aries are ignored). The detailed procedure used to generatea computational representation of this microstructure isdescribed in Section 3.4. In this section, we outline the crys-tal plasticity model used to describe deformation within themartensite blocks.
Within each block, plastic flow is assumed to take placeby shearing on the 24 {110}h111i and {112}h111i sys-tems [31]. The shearing rate on each system is given byEq. (3), but we assume that martensite does not displaynon-Schmid behavior, so ga
NS ¼ 0 for martensite. Instead,the strength of each slip system is determined from disloca-tion densities on each slip system according to
ga ¼ Gb
ffiffiffiffiffiffiffiffiffiffiffiffiffiffiffiffiffiffiffiffiffiffiffiffiXN
b¼1aabqb
rð8Þ
where aab = ma � nb and nb is the line direction of the forestdislocations. The dislocation densities evolve according to[30]
dqa
dt¼ j _caj 1
bka
ffiffiffiffiffiffiffiffiffiffiffiffiffiffiXn
bqb
q� kb
bqa
� �ð9Þ
where ka, kb are material parameters and b is the Burgersvector. The dislocation-density-based crystal plasticitymodel has five material parameters (including the initialdislocation density, which is taken to be equal on all slipsystems), which must be determined from experiment, asdescribed in the next section.
In the simulations described here, both constitutivemodels were implemented as user-material subroutines(UMAT) in the commercial finite element code ABAQUSv6.9. The tangent modulus method [32] for rate-dependentcrystal plasticity models was used to update the slip rate,strength of slip, resolved shear stresses and dislocation den-sity of each slip system in the UMAT.
3.3. Comparison of measured and predicted flow behavior inmicropillars
Material parameters for the constitutive modelsdescribed in the preceding sections were determined by fit-ting their predictions to the experimentally measured flowbehavior of micropillars extracted from the ferritic andmartensitic phases of the two steels of interest. Our previ-ous work on fully martensitic steels demonstrated that aninhomogeneous state of stress and strain is developed ina micropillar during the compression test [13]. Therefore,full-scale 3-D finite element simulations are needed tomodel the deformation. A representative simulation of amicropillar indentation test is illustrated in Fig. 7. Themicropillar itself is idealized as either a single crystal of fer-rite or one or more blocks of martensite, as appropriate.The crystallographic orientation of the ferrite micropillarsis taken from experimental measurements. The detailedmicrostructure of the martensitic microstructures cannotbe determined experimentally. Following our previous

Fig. 7. Predicted (a) Von Mises stress and (b) equivalent plastic strain contours of deformed DF140T martensite micropillar 1 at 5% strain. (c) Schematicof the hierarchical microstructure of DF140T martensite micropillar 1. Boundaries between different colors denote packet boundaries. Thick black lines inthe same color regions denote block boundaries. (For interpretation of the references to color in this figure legend, the reader is referred to the web versionof this article.)
Table 2Material parameters determined by 3D finite element simulations ofmicropillar compression tests on the ferritic and martensitic phases ofDF140T and DP980.
Two commercial dual-phase steels DF140T DP980
Material parameters for ferrite
Strain rate, _y0 (s�1) 0.002 0.009Stress exponent, m 41.0 67.8Initial hardening rate, h0 (MPa) 97.1 556.3Saturated hardening rate, hs (MPa) 5.36 188.9Initial flow stress, g0 (MPa) 253.8 238.7Saturated flow stress, gs (GPa) 3.22 0.61Characteristic shear strain, c0 65.1 55.2Latent hardening coefficient, f0 99.9 0.08Latent hardening coefficient, q 1.4 1.0Non-Schmid effect parameter, a1 0.6 0.6Non-Schmid effect parameter, a2 0.01 0.01Non-Schmid effect parameter, a3 0.2 0.2
Material parameter for martensite
Strain rate, _y0 (s�1) 1.6 � 10�3 1.7 � 10�3
Stress exponent, m 63.7 71.2Shear modulus, G (GPa) 75 75Burgers vector, b (nm) 0.3 0.3Dislocation nucleation rate, ka 86.4 73.0Dislocation annihilation rate, kb 0.0935 0.14Initial dislocation density, q0 (m-2) 8.2 � 1013 3.0 � 1013
142 P. Chen et al. / Acta Materialia 65 (2014) 133–149
study of fully martensitic steel [13], we assume that micro-pillars that exhibit little strain hardening (pillar B inDP980) consist of a single martensite block, while thosethat show significant strain hardening (pillar 1 inDF140T and pillar A in DP980) consist of multiple bocks.The hierarchical microstructure of a martensitic pillar usedin computations is illustrated in Fig. 7c.
The boundary conditions applied in the 3-D micropillarsimulations are as follows. The top surface of the micropil-lar is indented by a flat rigid surface representing the flat -punch nanoindenter (the default “Hard Contact”algorithm in ABAQUS was used to enforce the boundarycondition); the base is supported on springs, which approx-imate the elastic deformation of the underlying material.To model the interaction between the nanoindenter andthe micropillars, friction between the rigid surface andmicropillars is also considered in the 3-D micropillarmodel. The friction coefficient is set to 0.5 in all of the fol-lowing micropillar simulations [13]. The friction coefficientvalue was selected so as to prevent slip between the inden-ter and the pillar surface. For low friction coefficient val-ues, slip takes place between the indenter and the pillarsurface, and the predicted deformation in the pillars doesnot match that of experiments. As long as the friction coef-ficient is sufficiently high to prevent slip, predictions areinsensitive to the value selected.
The iterative optimization procedure described in detailin Ref. [13] was used to fit material parameters in the crys-tal plasticity models to the micropillar experiments. Param-eters for ferrite were fitted simultaneously to compressiondata for three separate micropillars with distinct crystallo-graphic orientations in DF140T or four separate micropil-lars with distinct crystallographic orientations in DP980.Parameters for martensite were fitted to pillars with anelastic–perfectly plastic response (which were taken to bea single martensite block) and those with a hardeningresponse (which contained a packet boundary). The result-ing material parameters are listed in Table 2.
Fig. 8 compares the measured and predicted stress–strain curves for martensitic micropillars in both steels.The results are qualitatively similar to previous experimen-tal and simulation results for micropillars extracted fromfully martensitic steels [13]. With an appropriate set ofparameters, the model accurately predicts both the elas-tic–perfectly plastic response of pillars consisting of a singleblock as well as the hardening behavior of pillars that con-tain block or packet boundaries. Interestingly, the optimalset of parameters representing the two steels indicates thatthe largest difference between them is the initial dislocationdensity (8.2 � 1013 m�2 for DF140T and 3.0 � 1013 m�2

(a) (b)
Fig. 8. Comparison of measured and predicted stress–strain curves for martensitic micropillars extracted from (a) DF140T and (b) DP980. Micropillar 1of DF140T and micropillar A of DP980 in the simulations contain several blocks separated by packet boundaries (see Fig. 7(c)), and the interactionbetween them leads to an effective strain hardening behavior. Micropillar B of DP980 is idealized as a single martensitic block, and exhibits elastic–nearlyperfectly plastic behavior.
Fig. 9. Comparison of measured and predicted stress–strain curves for ferrite micropillars extracted from (a) DF140T and (b) DP980. A crystal plasticitymodel with a non-Schmid effect can best fit all ferrite micropillars simultaneously with crystallographic orientations (specified by the initial orientation ofthe compression axis): (a) [315] (pillar 2), [001] (pillar 3) and [556] (pillar 6) of DF140T and (b) [516] (pillar A), [324] (pillar B), [205] (pillar C) and [326](pillar D) of DP980.
P. Chen et al. / Acta Materialia 65 (2014) 133–149 143
for DP980). Martensite in DF140T has a higher initial dis-location density, and consequently exhibits greater flowstrengths at all strain levels than martensite in DP980. Itis worth noting that our prior simulation work [13] esti-mated the initial dislocation density in the fully martensiticsteel M190 to be 5.02 � 1013 m�2. These observations areconsistent with differences in martensite carbon contentbetween the three steels (�0.33 wt.% in DF140T,�0.15 wt.% in DP980 and 0.18 wt.% in M190), since thedislocation density increases with carbon content in low-carbon martensites [33,34].
A similar comparison between predicted and measuredstress–strain curves for ferritic micropillars is shown inFig. 9. The crystal plasticity model with non-Schmid effectyields a good fit to experimentally measured stress–straincurves in both steels (Fig. 4(a) and (b)). The low flowstrength of micropillars (e.g. pillar 2 in DF140T) corre-sponds to the single slip, while the higher flow strength offerritic micropillars (e.g. pillar 3 in DF140T) correspondsto the multiple slip. The resulting material parameters are
listed in Table 2. The non-Schmid parameters are assumedto be the same for both steels, since the dislocation corestructures in the two materials are likely to be similar.The ferrite in DF140T has a higher initial yield stress butlower hardening rate than DP980.
The importance of including non-Schmid behavior inthe constitutive model for ferrite can be demonstrated bymeans of two simple numerical tests. In the first test, wecreate a “virtual” micropillar which is identical toDF140T but displays no non-Schmid behavior (i.e. the vir-tual material has identical material parameters to thoselisted in Table 2 but the coefficients a1 = a2 = a3 = 0).The stress–strain curves for this material are comparedwith experimental data in Fig. 10(a). Non-Schmid behaviorclearly has a significant effect on the orientation depen-dence of the flow strength of the ferritic micropillars. Asa second test, we attempted to fit the predictions of a clas-sical Bassani–Wu crystal plasticity model to the experimen-tally measured flow behavior in the ferritic micropillars(obtained by enforcing a1 = a2 = a3 = 0 during the
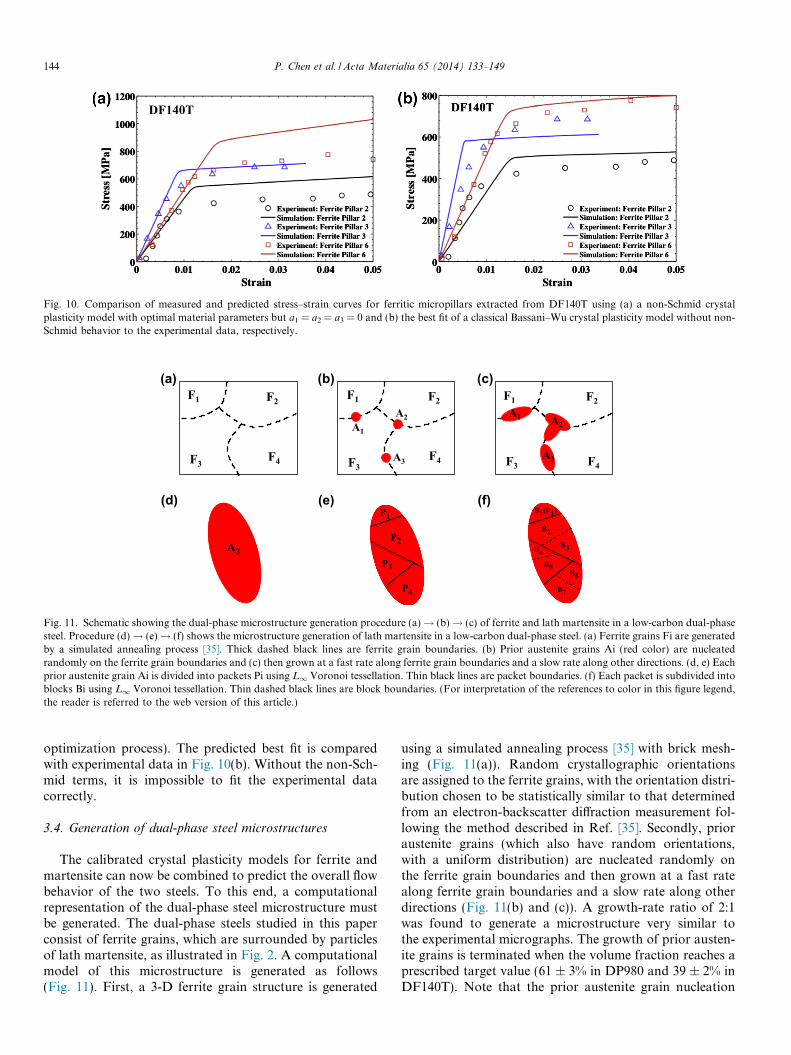
Fig. 10. Comparison of measured and predicted stress–strain curves for ferritic micropillars extracted from DF140T using (a) a non-Schmid crystalplasticity model with optimal material parameters but a1 = a2 = a3 = 0 and (b) the best fit of a classical Bassani–Wu crystal plasticity model without non-Schmid behavior to the experimental data, respectively.
(a) (b) (c)
(d) (e) (f)
Fig. 11. Schematic showing the dual-phase microstructure generation procedure (a)! (b)! (c) of ferrite and lath martensite in a low-carbon dual-phasesteel. Procedure (d)! (e)! (f) shows the microstructure generation of lath martensite in a low-carbon dual-phase steel. (a) Ferrite grains Fi are generatedby a simulated annealing process [35]. Thick dashed black lines are ferrite grain boundaries. (b) Prior austenite grains Ai (red color) are nucleatedrandomly on the ferrite grain boundaries and (c) then grown at a fast rate along ferrite grain boundaries and a slow rate along other directions. (d, e) Eachprior austenite grain Ai is divided into packets Pi using L1 Voronoi tessellation. Thin black lines are packet boundaries. (f) Each packet is subdivided intoblocks Bi using L1 Voronoi tessellation. Thin dashed black lines are block boundaries. (For interpretation of the references to color in this figure legend,the reader is referred to the web version of this article.)
144 P. Chen et al. / Acta Materialia 65 (2014) 133–149
optimization process). The predicted best fit is comparedwith experimental data in Fig. 10(b). Without the non-Sch-mid terms, it is impossible to fit the experimental datacorrectly.
3.4. Generation of dual-phase steel microstructures
The calibrated crystal plasticity models for ferrite andmartensite can now be combined to predict the overall flowbehavior of the two steels. To this end, a computationalrepresentation of the dual-phase steel microstructure mustbe generated. The dual-phase steels studied in this paperconsist of ferrite grains, which are surrounded by particlesof lath martensite, as illustrated in Fig. 2. A computationalmodel of this microstructure is generated as follows(Fig. 11). First, a 3-D ferrite grain structure is generated
using a simulated annealing process [35] with brick mesh-ing (Fig. 11(a)). Random crystallographic orientationsare assigned to the ferrite grains, with the orientation distri-bution chosen to be statistically similar to that determinedfrom an electron-backscatter diffraction measurement fol-lowing the method described in Ref. [35]. Secondly, prioraustenite grains (which also have random orientations,with a uniform distribution) are nucleated randomly onthe ferrite grain boundaries and then grown at a fast ratealong ferrite grain boundaries and a slow rate along otherdirections (Fig. 11(b) and (c)). A growth-rate ratio of 2:1was found to generate a microstructure very similar tothe experimental micrographs. The growth of prior austen-ite grains is terminated when the volume fraction reaches aprescribed target value (61 ± 3% in DP980 and 39 ± 2% inDF140T). Note that the prior austenite grain nucleation
P. Chen et al. / Acta Materialia 65 (2014) 133–149 145
and growth processes are based on brick meshing; that is,brick elements representing ferrite grains will be convertedto represent prior austenite grains.
A martensitic microstructure is then generated withineach of the prior austenite grains, following the proceduredescribed in detail in Ref. [13]. First, random crystallo-graphic orientations [A]c are assigned to each prior austen-ite grain. The prior austenite grains are then divided intopackets using L1 Voronoi tessellation. An element isselected at random within each prior austenite grain toact as the Voronoi center [23,28,29] (Fig. 11(d) and (e)).The distance between Voronoi centers and other elementsin the prior austenite grain is measured by the L1 normor maximum norm [36]. The number of Voronoi centersin each prior austenite grain controls the packet size. Oneof four {111}c habit planes in the Kurdjimov–Sachs (K–S) family of orientations is randomly chosen for eachpacket [37,38]. Finally, each packet is sub-divided intoblocks, using a similar L1 Voronoi tessellation(Fig. 11(f)). The number of Voronoi centers in each packetcontrols the block size. One orientation variant selected atrandom from the six possible K–S orientation variants ofeach packet group is assigned to each block. The orienta-tions of the blocks ½A�a0 are related to the orientations ofprior austenite grains via the transformation½T � ¼ ½A�a0 ½A�
�1c , which can be derived from the 24 K–S ori-
entation variants [39]. Thus, the orientations of the mar-tensite blocks and packets within each prior austenitegrain are related to the initial orientation of the prior aus-tenite grain through the K–S relations; and the misorienta-tions across block and packet boundaries are consistentwith misorientations associated with a martensitic micro-structure. The prior austenite grains themselves have ran-dom orientations, so the misorientations across grainboundaries of the prior austenite structure are random.In addition, the misorientations between ferrite and mar-tensite are random.
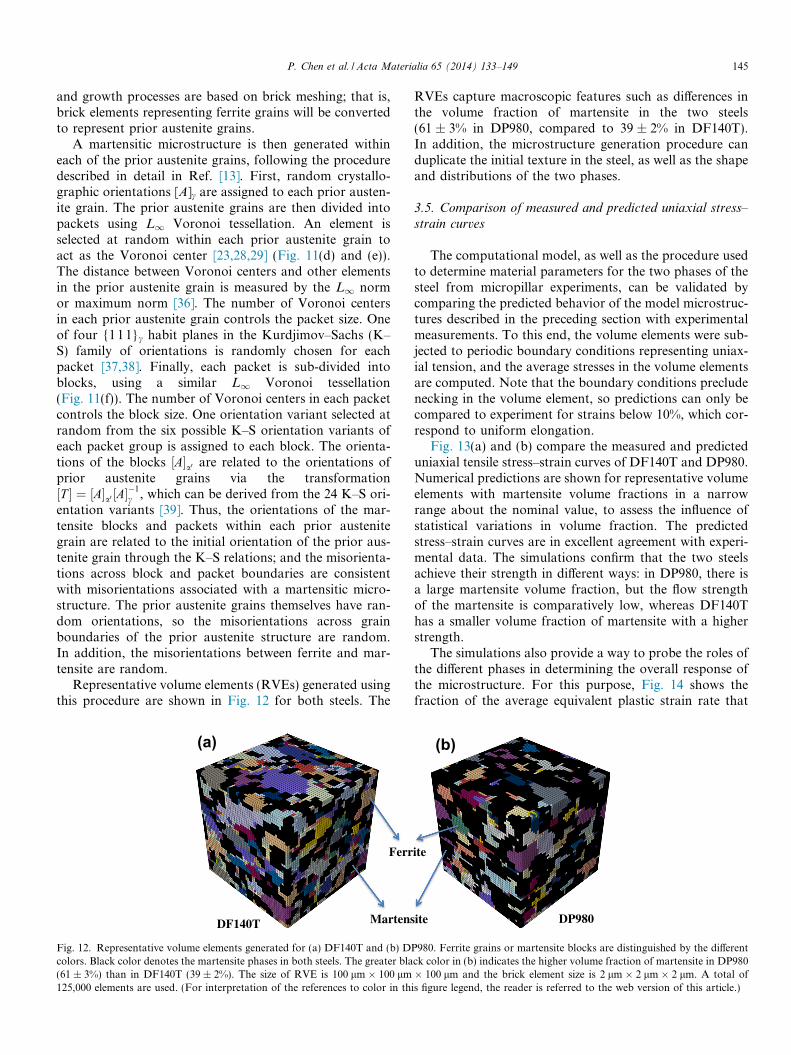
Representative volume elements (RVEs) generated usingthis procedure are shown in Fig. 12 for both steels. The
DF140T
(a)
Martens
Ferr
Fig. 12. Representative volume elements generated for (a) DF140T and (b) Dcolors. Black color denotes the martensite phases in both steels. The greater bla(61 ± 3%) than in DF140T (39 ± 2%). The size of RVE is 100 lm � 100 lm125,000 elements are used. (For interpretation of the references to color in th
RVEs capture macroscopic features such as differences inthe volume fraction of martensite in the two steels(61 ± 3% in DP980, compared to 39 ± 2% in DF140T).In addition, the microstructure generation procedure canduplicate the initial texture in the steel, as well as the shapeand distributions of the two phases.
3.5. Comparison of measured and predicted uniaxial stress–
strain curves
The computational model, as well as the procedure usedto determine material parameters for the two phases of thesteel from micropillar experiments, can be validated bycomparing the predicted behavior of the model microstruc-tures described in the preceding section with experimentalmeasurements. To this end, the volume elements were sub-jected to periodic boundary conditions representing uniax-ial tension, and the average stresses in the volume elementsare computed. Note that the boundary conditions precludenecking in the volume element, so predictions can only becompared to experiment for strains below 10%, which cor-respond to uniform elongation.
Fig. 13(a) and (b) compare the measured and predicteduniaxial tensile stress–strain curves of DF140T and DP980.Numerical predictions are shown for representative volumeelements with martensite volume fractions in a narrowrange about the nominal value, to assess the influence ofstatistical variations in volume fraction. The predictedstress–strain curves are in excellent agreement with experi-mental data. The simulations confirm that the two steelsachieve their strength in different ways: in DP980, there isa large martensite volume fraction, but the flow strengthof the martensite is comparatively low, whereas DF140Thas a smaller volume fraction of martensite with a higherstrength.
The simulations also provide a way to probe the roles ofthe different phases in determining the overall response ofthe microstructure. For this purpose, Fig. 14 shows thefraction of the average equivalent plastic strain rate that
(b)
DP980 ite
ite
P980. Ferrite grains or martensite blocks are distinguished by the differentck color in (b) indicates the higher volume fraction of martensite in DP980� 100 lm and the brick element size is 2 lm � 2 lm � 2 lm. A total of
is figure legend, the reader is referred to the web version of this article.)

(a) (b)
Fig. 13. Comparison of measured and predicted uniaxial stress–strain curves of (a) DF140T and (b) DP980. For each dual-phase steel, three RVEs withmeasured mean volume fraction of martensite (39% for DF140T and 61% for DP980) and its standard variance (2% for DF140T and 3% for DP980) showalmost the same flow and hardening behaviors, and are in good agreement with experiments. The results predicted for the non-Schmid effect being turnedoff show a larger deviation from the experimental results compared to the predicted results with a non-Schmid effect. NSE in the legends means the non-Schmid effect.
Fig. 14. Fraction of average equivalent plastic strain rates in ferrite and martensite phases for (a) DF140T and (b) DP980. Blue and red dashed–dottedlines are the volume fractions of ferrite and martensite, respectively. The chain lines show the volume fraction of martensite, and the long dashed lineshows the volume fraction of ferrite. In DP980, the strain rates in the two phases match the volume fractions closely; in DF140T the ferrite contributes alarger fraction of the strain rate than expected based purely on its volume fraction. (For interpretation of the references to color in this figure legend, thereader is referred to the web version of this article.)
146 P. Chen et al. / Acta Materialia 65 (2014) 133–149
is accommodated by martensite and ferrite in the twosteels. The fraction of the average equivalent plastic strainin the ferrite and martensite are computed as
ff ¼h_ef
eqih_ef
eqi þ h_emeqi
; f m ¼ 1� ff ð10Þ
respectively, where h_efeqi denotes the volume averaged
strain rate in the ferrite phase, which is computed fromthe finite elements using
h_efeqi ¼
1
V f
ZV f
_eeqdV PNf
eli¼1 _ei
eq � V ielPNf
eli¼1V i
el
ð11Þ
Here, Vf is the volume of ferrite phase, V iel; _e
ieq are the vol-
ume and equivalent plastic strain rate of the ith element inthe ferrite, respectively, and Nf
el denotes the total numberof ferrite elements. The average equivalent plastic strain
rate of martensite h_emeqi can be calculated using a similar
formula.In both steels, yield occurs first in ferrite, at a uniaxial
stress of approximately 400 MPa. This point correspondsapproximately to the deviation from linearity in the exper-imental stress–strain curve. For a brief period (up to astrain of 0.6% in DP980 or 0.4% in DF140T) the ferritecontributes 100% of the total plastic strain. Shortly thereaf-ter (at a stress level of approximately 800 MPa), the mar-tensite begins to deform plastically. The onset of plasticflow in the martensite corresponds to the point at whicha substantial decrease in hardening rate occurs in the mac-roscopic stress–strain curves. Thereafter, the strain ratepartition remains approximately constant in both steels.The fraction of plastic strain rate in DP980 roughlyapproaches the volume fraction of individual phases, aspredicted by a simple Taylor model [40]. In contrast, theplastic strain rate fraction in DF140T differs significantlyfrom the volume fraction (the difference is marked by the

P. Chen et al. / Acta Materialia 65 (2014) 133–149 147
double-ended arrows in Fig. 14). The deviation from Tay-lor behavior in DF140T is a consequence of the large differ-ence between the strengths of the martensite and ferritephases in this material. The deviation can be interpretedto quantify the difference between the actual strain rate ineach phase and the imposed macroscopic strain rate, andis thus a measure of the strain incompatibility in the micro-structure. The larger strain incompatibility in the twophases in DF140T may be indirectly related to its lowertensile ductility.
Figs. 13 and 14 also show the influence of non-Schmidbehavior in the ferrite on predicted overall tensile flowstress and strain rate partitioning in the two steels. For pur-poses of comparison, a “virtual material” was created inwhich the ferrite has the same properties as those of theexperimentally calibrated material model, except thatnon-Schmid behavior was removed by setting a1 = a2 =a3 = 0. The uniaxial stress–strain response of this modelmaterial is shown as open symbols and dashed lines inFig. 13, and the strain rate partition is shown as dashedlines in Fig. 14. The effect of non-Schmid behavior in theferrite is to reduce the tensile strength of both steels. Theeffect is greater in DF140T than in DP980 due to the highervolume fraction of ferrite in DF140T. The non-Schmidbehavior of the ferrite has a number of additional implica-tions. It leads to a small tension–compression asymmetryin the dual-phase steels. The strength differential parameter[22] measuring the tension–compression asymmetry is 0.06in DF140T and 0.012 in DP980. In addition, non-Schmidbehavior leads to non-associated flow in a polycrystallinemicrostructure, which tends to make a material more proneto localization [22]. This may provide a partial explanationfor the difference in ductility between the two materials.
In addition to computing the partitioning of strain ratesbetween the two phases the steels, we have calculated quan-titative measures of the stress distribution in their micro-structures. Experiments suggest that fracture generallynucleates at the interface between ferrite and martensitein both steels. The stresses acting on these interfaces aretherefore of particular interest. To this end, we estimated
2 1 0 1 2 30
0.2
0.4
0.6
0.8
1
Interfacial Normal Stress [GPa]
Inte
rfac
ial N
orm
al S
tres
s D
istr
ibut
ion
Den
sity
DF140TDP980DF140TDP980
1.6 1.8 2 2.2 2.4 2.6 2.80
0.02
0.04
0.06
0.08
0.1
Inte
rfac
i alN
o rm
alSt
res s
Di s
t rib
utio
nD
ensi
ty
(a)
Interfacial Normal Stress [GPa]
Fig. 15. Histograms of (a) interfacial normal and (b) interfacial tangential stresis the amplified distribution tail region marked by the rectangle.
the normal and tangential stresses on the ferrite/martensiteinterfaces in both steels. This calculation was complicatedby the rectangular grid used to mesh the microstructuresin our computations, the interfaces following a zigzag pathalong the element boundaries rather than conforming tothe true geometry of the interface. We therefore used thefollowing procedure to compute the normal and tangentialstress along the interfaces. First, we choose a small cube ofmaterial with the point of interest on the interface at thecenter. An average normal vector n to the interface withinthe cube is created using the following definition,
n ¼ 1
Total no: of interfaces
Xinterfaces
ninterface ð12Þ
Two mutually perpendicular tangent vectors t1, t2 thatare perpendicular to n are created randomly. Then the nor-mal and tangent stresses Tn, Tt are calculated by the follow-ing formula,
T n ¼1
V cube
ZV cube
nirijnj; T t ¼ffiffiffiffiffiffiffiffiffiffiffiffiffiffiffiffiT 2
1 þ T 22
q; T a
¼ 1
V cube
ZV cube
tai rijnj ða ¼ 1; 2Þ ð13Þ
where the volume integrals are computed by summing overelements in the cube.
This procedure was used to compute histograms of thevariation of normal and tangential stresses on the ferrite/martensite interfaces in representative volume elements ofboth steels during uniaxial tensile extension. The resultsare shown in Fig. 15. The total areas of histograms are nor-malized to unity for both steels, and are shown at the sameglobal strain (10%). The results show that the peak valuesof normal stress in DF140T reach 2.4 GPa, while in DP980the maximum normal stress reaches only 1.9 GPa. Simi-larly, both the average and peak shear stresses acting oninterfaces in DF140T significantly exceed those in DP980.These differences can be explained by the higher flow stres-ses of the martensite phase in DF140T, and also provide an
0 0.2 0.4 0.6 0.8 1 1.2 1.40
0.5
1
1.5
2
Interfacial Tangent Stress [GPa]
Inte
rfac
ial T
ange
nt S
tres
s D
istr
ibut
ion
Den
sity
DF140TDP980DF140TDP980
(b)
s distributions in DF140T and DP980 at 10% global strain. The inset in (a)

148 P. Chen et al. / Acta Materialia 65 (2014) 133–149
additional possible explanation for the lower ductility ofDF140T compared with DP980.
4. Conclusions
A combination of micropillar compression experimentsand microstructure-based finite element simulations hasbeen used to determine the constitutive behavior, uniaxialtensile response, strain rate partitioning and interfacialstress distributions in two commercial dual-phase steels,DP980 and DF140T. Our studies can be summarized bythe following conclusions:
1. The steels exhibit similar uniaxial tensile stress–strainbehavior, with initial yield occurring at around 350–400 MPa and significant strain hardening up to800 MPa, followed by work hardening at a reducedrate up to 1 GPa.
2. The microstructures of the two steels differ signifi-cantly: the martensite volume fraction in DP980 is�60%, while that of DF140T is �40%. In addition,the ferrite grain size in DP980 ranges between 2 and10 lm, while the martensite grain size is in the range1–5 lm; the corresponding values for DF140T are 4–20 lm (ferrite) and 2–10 lm (martensite).
3. Ferrite micropillars extracted from both steels havesimilar compressive stress–strain behavior. The flowstress in both cases is orientation-dependent, andthe majority of the values lie in the range 320–450 MPa for both steels.
4. The orientation dependence of the flow strength inthe ferritic phases is predicted successfully by a crys-tal plasticity model that accounts for the non-Schmidbehavior commonly exhibited by bcc single crystals.Classical models based on Schmid’s law do not pre-dict the orientation dependence correctly.
5. The compressive response of micropillars extractedfrom the martensite phases of the two steels is quali-tatively similar to behavior observed in prior work onfully martensitic steel [13]. The pillars exhibit eitherelastic–perfectly plastic behavior or a strain harden-ing response. In a previous study, it was shown thatelastic–perfectly plastic behavior occurs in pillars thatconsist of a single block, while hardening behavior isobserved in pillars that contain either a packetboundary or a block boundary.
6. Although qualitatively similar, the martensite phasesextracted from the two steels have significantly differ-ent compressive strengths. Martensite in DP980 has aflow strength in the range 1–1.3 GPa, while the corre-sponding flow stress in DF140T can reach over2 GPa.
7. A crystal plasticity model that accounts for the hier-archical microstructure of martensite, previouslydeveloped for fully martensitic steels [13], predictsbehavior in the martensite micropillars that is in goodagreement with experiments.
8. A 3-D computational representation of the micro-structures of the dual-phase steels, in which crystalplasticity models (calibrated by micropillar experi-ments) are used to describe both the ferritic and mar-tensitic phases, predicts uniaxial tensile stress–straincurves that are in excellent agreement withexperiments.
9. Computations show that features observed in the uni-axial tensile stress–strain curves can be explained bychanges in strain rate partitioning in the steels withincreasing strain. The initial yield occurs in the ferriteat around 350–400 MPa. The period of rapid strainhardening between 400 and 800 MPa is associatedwith continued deformation in the ferrite, while themartensite remains elastic. Above 800 MPa, the mar-tensite yields, leading to a reduction in the strainhardening rate. Beyond this point, the strain rate par-titioning between ferrite and martensite remainsapproximately constant in both steels. Further strainhardening in the steady-state regime is produced pri-marily by the martensite.
10. The strain rate partitioning in the two steels duringsteady-state uniaxial tensile deformation differs sig-nificantly. In DP980, the contribution to the totalplastic strain rate from martensite and ferrite roughlyfollows the individual volume fractions as predictedby a Taylor model; in DF140T, martensite contrib-utes only 25% of the total strain rate, which is muchless than its volume fraction of 39%.
11. The similar uniaxial tensile strengths of DP980 andDF140T can be explained by the competing effectsof the martensite volume fraction and the martensitestrength described in conclusions 2 and 10.
12. The non-Schmid behavior observed in ferrite leads toa 9% reduction in the flow strength of DF40T and a5% reduction in the flow strength of DP980. Thestrength differential parameter measuring the ten-sion–compression asymmetry is 0.06 in DF140Tand 0.012 in DP980. The difference results from thehigher volume fraction of ferrite in DF140T.
Acknowledgements
Brown University is grateful for support for this projectfrom ArcelorMittal Corporation. We thank Dr. E. Bucho-vechy for providing polycrystalline microstructure genera-tion code. The computations were conducted usingOSCAR cluster and services at the Center for Computationand Visualization, Brown University.
References
[1] Kim DH, Kim SJ, Kim SH, Rollett AD, Oh KH, Han HN. ActaMater 2011;59:5462.
[2] Kadkhodapour J, Schmauder S, Raabe D, Ziaei-Rad S, Weber U,Calcagnotto M. Acta Mater 2011;59:4387.

P. Chen et al. / Acta Materialia 65 (2014) 133–149 149
[3] Dillien S, Seefeldt M, Allain S, Bouaziz O, Van Houtte P. Mater SciEng A – Struct Mater Prop Microstruct Process 2010;527:947.
[4] Mazinani M, Poole WJ. Metall Mater Trans A – Phys Metall MaterSci 2007;38A:328.
[5] Sun X, Choi KS, Liu WN, Khaleel MA. Int J Plast 2009;25:1888.[6] Kadkhodapour J, Butz A, Ziaei-Rad S, Schmauder S. Int J Plast
2011;27:1103.[7] Tsipouridis P, Koll L, Krempaszky C, Werner E. Int J Mater Res
2011;102:674.[8] Filippone R, Root J, Jacques P, Yue S. ISIJ Int 2002;42:304.[9] Cong ZH, Jia N, Sun X, Ren Y, Almer J, Wang YD. Metall Mater
Trans A – Phys Metall Mater Sci 2009;40A:1383.[10] Jia N, Cong ZH, Sun X, Cheng S, Nie ZH, Ren Y, et al. Acta Mater
2009;57:3965.[11] Woo W, Em VT, Kim EY, Han SH, Han YS, Choi SH. Acta Mater
2012;60:6972.[12] Stewart JL, Jiang L, Williams JJ, Chawla N. Mater Sci Eng A – Struct
Mater Prop Microstruct Process 2012;534:220.[13] Ghassemi-Armaki H, Chen P, Bhat S, Sadagopan S, Kumar S, Bower
A. Acta Mater 2013;61:3640.[14] Ghassemi-Armaki H, Maaß R, Bhat SP, Sriram S, Greer JR, Kumar
KS. Acta Mater 2014; 62:197.[15] Choi KS, Liu WN, Sun X, Khaleel MA. Metall Mater Trans A – Phys
Metall Mater Sci 2009;40A:796.[16] Kim JH, Kim D, Barlat F, Lee MG. Mater Sci Eng A – Struct Mater
Prop Microstruct Process 2012;539:259.[17] Choi SH, Kim EY, Woo W, Han SH, Kwak JH. Int J Plast
2013;45:85.[18] Girault B, Schneider AS, Frick CP, Arzt E. Adv Eng Mater
2010;12:385.[19] Morito S, Yoshida H, Maki T, Huang X. Mater Sci Eng A – Struct
Mater Prop Microstruct Process 2006;438:237.
[20] Weinberger CR, Battaile CC, Buchheit TE, Holm EA. Int J Plast2012;37:16.
[21] Groeger R, Racherla V, Bassani JL, Vitek V. Acta Mater 2008:56.[22] Bassani JL, Racherla V. Prog Mater Sci 2011:56.[23] Hatem TM, Zikry MA. Philos Mag 2009;89:3087.[24] Koester A, Ma AX, Hartmaier A. Acta Mater 2012;60:3894.[25] Caillard D. Acta Mater 2011;59:4974.[26] Caillard D. Acta Mater 2010;58:3493.[27] Caillard D. Acta Mater 2010;58:3504.[28] Hatem TM, Zikry MA. J Mech Phys Solids 2010;58:1057.[29] Hatem TM, Zikry MA. Acta Mater 2009;57:4558.[30] Lee MG, Lim H, Adams BL, Hirth JP, Wagoner RH. Int J Plast
2010;26:925.[31] Schastlivtsev VM, Rodionov DP, Khlebnikova YV, Yakovleva IL.
Mater Sci Eng A – Struct Mater Prop Microstruct Process1999;273:437.
[32] Peirce D, Shih CF, Needleman A. Comput Struct 1984;18:875.[33] Morito S, Nishikawa J, Maki T. ISIJ Int 2003;43:1475.[34] Furuhara T, Morito S, Maki T. J Phys IV 2003;112:255.[35] Saylor DM, Fridy J, El-Dasher BS, Jung KY, Rollett AD. Metall
Mater Trans A – Phys Metall Mater Sci 2004;35A:1969.[36] Lee DT. J ACM 1980;27:604.[37] Morito S, Tanaka H, Konishi R, Furuhara T, Maki T. Acta Mater
2003;51:1789.[38] Iwashita K, Murata Y, Tsukada Y, Koyama T. Philos Mag
2011;91:4495.[39] Kitahara H, Ueji R, Tsuji N, Minamino Y. Acta Mater 2006;54:1279.[40] Hosford WF. The mechanics of crystals and textured polycrys-
tals. New York: Oxford University Press Inc; 1993.