
On strength of microalloyed steels: an interpretive review
43
Acciaio la metallurgia italiana - n. 11-12/09 35 On the strength of microalloyed steels - An interpretive review C. I. Garcia, M. Hua, K. Cho, A. J. DeArdo In the mid-1950s, hot rolled carbon steels exhibited high carbon contents, coarse ferrite-pearlite microstructures, and yield strengths near 300 MPa. Their ductility, toughness and weldability were poor. Today, a half-century later, hot rolled steels can exhibit microstructures consisting of mixtures of ferrite, bainite and martensite in various proportions. These structures are very fine and can show yield strengths over 900 MPa, with acceptable levels of ductility, toughness and weldability. This advancement was made possible by the combination of improved steelmaking, microalloying technology and better rolling and cooling practices. The purpose of this paper is to chronicle some of the remarkable progress in steel alloy and process design that has resulted in this impressive. Memorie KEYWORDS: Accelerated cooling, direct quenching, EBSD-IQ, HSLA steel, strengthening, thermomechanical processing, transformation C. Issac Garcia, Mingjian Hua, Kengun Cho, A. J. DeArdo BAMPRI (The Basic Metals Processing Research Institute) Department of Mechanical Engineering and Materials Science - Uni- versity of Pittsburgh, Pittsburgh, Pennsylvania 15261, USA Anthony DeArdo Finland Distinguished Professor, Department of Mechanical Engineering University of Oulu, P.O. Box 4200 (Linnanmaa), FIN-90014, Finland Paper presented at the 3 rd International Conference Thermomechanical Processing of Steels, Padova, 10-12 september 2008, organized by AIM INTRODUCTION: MICROALLOYING AND STRENGTH The year 1980 represents a benchmark in the strength of MA ste- els. From the early days of the 1960s to approximately 1980, the steels being microalloyed were low hardenability steels with fer- rite-pearlite (F-P) microstructures and yield strengths up to about 420 MPa (60 Ksi). These were the steels that were used to develop the principles and interrelationships of microalloying, controlled rolling and air cooling. They were characterized by relatively hi- gher carbon contents and moderate Mn levels, and exhibited fer- rite-pearlite (F-P) microstructures after air cooling (1). Around 1980, both the linepipe and the automotive industries desired strengths in excess of the 420 MPA that could be rea- dily supplied with fine grained F-P steels. Clearly higher strength microstructures were required. The obvious choices were the lower temperature transformation products: matrices comprised of non-polygonal ferrite, acicular ferrite, the bainites and martensite, either as monoliths or as mixtures. To achieve these microstructures, the combination of higher hardenability and high cooling rates was required. Furthermore, much addi- tional research was needed to reach the required goals consi- stently and with uniform results. From the processing side, the solution to this dilemma was using water cooling after hot rolling. This was accomplished in the mid-1980s for plate processing by interrupted accelerated coo- ling (IAC) and interrupted direct quenching (IDQ) in plate mills. Runout table water spray cooling to the coiling temperature in hot strip mills had been in practice since the 1960s, but not as a microstructural control tool for increasing strength. This was because of the higher carbon contents of the steels of that era. The benefits of faster rates of cooling and lower coiling tempe- ratures were exploited for achieving higher strengths later with steels of lower carbon contents. Figure 1 shows schematically how the microstructure and pro- perties of plate steels changed over time with advances in alloy design and processing (2). It is obvious from Figure 1, that the accelerated cooling after rol- ling was largely responsible for the very high strengths attaina- ble, practically independent of composition. With suitable cooling practices, yield strengths in excess of 690 MPa (X100) can be achieved in low carbon steels containing less than 2 Wt% Mn and with C. E. and Pcm values near 0.5 and 0.2, respectively (3, 4). One central question is what is the role of the MAE in obtaining these strength levels? Let’s begin with the early steels (pre- 1980), where air cooling of plate and high coiling temperatures of strip were used. As noted above, these were the F-P steels with strengths up to about 420 MPa (X60) for gauges up to 18mm (0.7 inches). The most obvious contributor to strength was grain re- finement, as was clearly shown by quantitative optical micro- FIG. 1 Evolution of plate steel for large diameter linepipe: microstructure and mechanical properties. (2) Evoluzione dell’acciaio per lamiere destinato a condutture di grande diametro: proprietà microstrutturali e meccaniche. (2)
-
Upload
independent -
Category
Documents
-
view
1 -
download
0
Transcript of On strength of microalloyed steels: an interpretive review
Acciaio
la metallurgia italiana - n. 11-12/09 35
On the strength of microalloyed steels- An interpretive review
C. I. Garcia, M. Hua, K. Cho, A. J. DeArdo
In the mid-1950s, hot rolled carbon steels exhibited high carbon contents, coarse ferrite-pearlitemicrostructures, and yield strengths near 300 MPa. Their ductility, toughness and weldability were poor.Today, a half-century later, hot rolled steels can exhibit microstructures consisting of mixtures of ferrite,
bainite and martensite in various proportions. These structures are very fine and can show yield strengths over900 MPa, with acceptable levels of ductility, toughness and weldability.
This advancement was made possible by the combination of improved steelmaking, microalloyingtechnology and better rolling and cooling practices. The purpose of this paper is to chronicle some of the
remarkable progress in steel alloy and process design that has resulted in this impressive.
Memorie
KEYWORDS:Accelerated cooling, direct quenching, EBSD-IQ, HSLA steel, strengthening,
thermomechanical processing, transformation
C. Issac Garcia, Mingjian Hua,Kengun Cho, A. J. DeArdo
BAMPRI (The Basic Metals Processing Research Institute)Department of Mechanical Engineering and Materials Science - Uni-
versity of Pittsburgh, Pittsburgh,Pennsylvania 15261, USA
Anthony DeArdoFinland Distinguished Professor,
Department of Mechanical EngineeringUniversity of Oulu, P.O. Box 4200 (Linnanmaa),
FIN-90014, Finland
Paper presented at the 3rd International Conference ThermomechanicalProcessing of Steels, Padova, 10-12 september 2008, organized by AIM
INTRODUCTION: MICROALLOYING AND STRENGTHThe year 1980 represents a benchmark in the strength of MA ste-els. From the early days of the 1960s to approximately 1980, thesteels being microalloyed were low hardenability steels with fer-rite-pearlite (F-P) microstructures and yield strengths up to about420MPa (60 Ksi). These were the steels that were used to developthe principles and interrelationships of microalloying, controlledrolling and air cooling. They were characterized by relatively hi-gher carbon contents and moderate Mn levels, and exhibited fer-rite-pearlite (F-P) microstructures after air cooling (1).Around 1980, both the linepipe and the automotive industriesdesired strengths in excess of the 420 MPA that could be rea-dily supplied with fine grained F-P steels. Clearly higherstrength microstructures were required. The obvious choiceswere the lower temperature transformation products: matricescomprised of non-polygonal ferrite, acicular ferrite, the bainitesand martensite, either as monoliths or as mixtures. To achievethese microstructures, the combination of higher hardenabilityand high cooling rates was required. Furthermore, much addi-tional research was needed to reach the required goals consi-stently and with uniform results.From the processing side, the solution to this dilemma was usingwater cooling after hot rolling. This was accomplished in themid-1980s for plate processing by interrupted accelerated coo-ling (IAC) and interrupted direct quenching (IDQ) in plate mills.Runout table water spray cooling to the coiling temperature inhot strip mills had been in practice since the 1960s, but not as
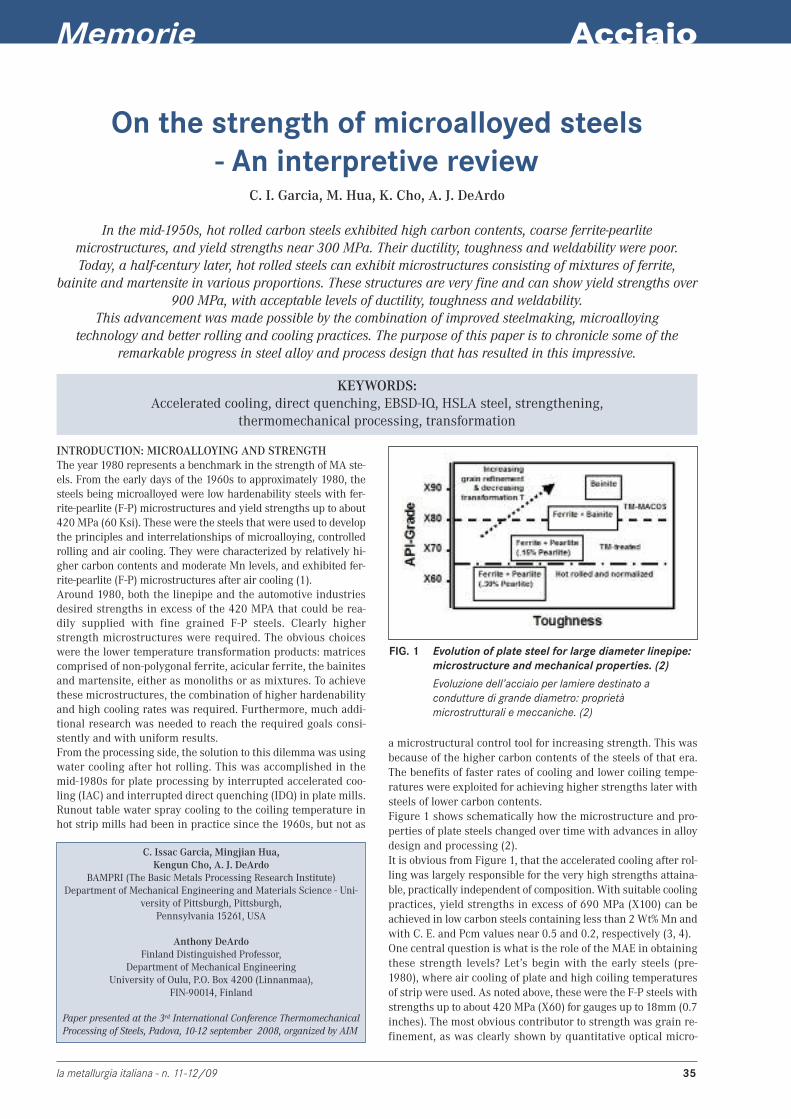
a microstructural control tool for increasing strength. This wasbecause of the higher carbon contents of the steels of that era.The benefits of faster rates of cooling and lower coiling tempe-ratures were exploited for achieving higher strengths later withsteels of lower carbon contents.Figure 1 shows schematically how the microstructure and pro-perties of plate steels changed over time with advances in alloydesign and processing (2).It is obvious from Figure 1, that the accelerated cooling after rol-ling was largely responsible for the very high strengths attaina-ble, practically independent of composition. With suitable coolingpractices, yield strengths in excess of 690 MPa (X100) can beachieved in low carbon steels containing less than 2Wt%Mn andwith C. E. and Pcm values near 0.5 and 0.2, respectively (3, 4).One central question is what is the role of the MAE in obtainingthese strength levels? Let’s begin with the early steels (pre-1980), where air cooling of plate and high coiling temperaturesof strip were used. As noted above, these were the F-P steels withstrengths up to about 420 MPa (X60) for gauges up to 18mm (0.7inches). The most obvious contributor to strength was grain re-finement, as was clearly shown by quantitative optical micro-
FIG. 1 Evolution of plate steel for large diameter linepipe:microstructure and mechanical properties. (2)
Evoluzione dell’acciaio per lamiere destinato acondutture di grande diametro: proprietàmicrostrutturali e meccaniche. (2)
Memorie
36 la metallurgia italiana - n. 11-12/09
NbC NbN VC VN
Lattice Parameter, a0, nm 4.4702 4.39 4.16 4.29[100]ppt // [100] γγ 25.22 22.98 16.53 20.17[010]ppt // [010]�γγ 25.22 22.98 16.53 20.17[001]ppt // [001]�γγ 25.22 22.98 16.53 20.17[100]ppt // [100]�αα 55.95 53.15 45.13 49.67[011]ppt // [010]�αα 10.26 8.28 2.61 5.81[0-11]ppt // [001]�αα 10.26 8.28 2.61 5.81
TAB. 1Lattice mismatch for MXprecipitates in austenite andferrite, % Austenite: fcc, a0 =0.35698 nm; Ferrite: bcc, a0= 0.28664 nm.
Differenze dei parametrireticolari per precipitati MXnell’ austenite e nella ferrite, % Austenite: fcc, a0 = 0.35698 nm;Ferrite: bcc, a0 = 0.28664 nm.
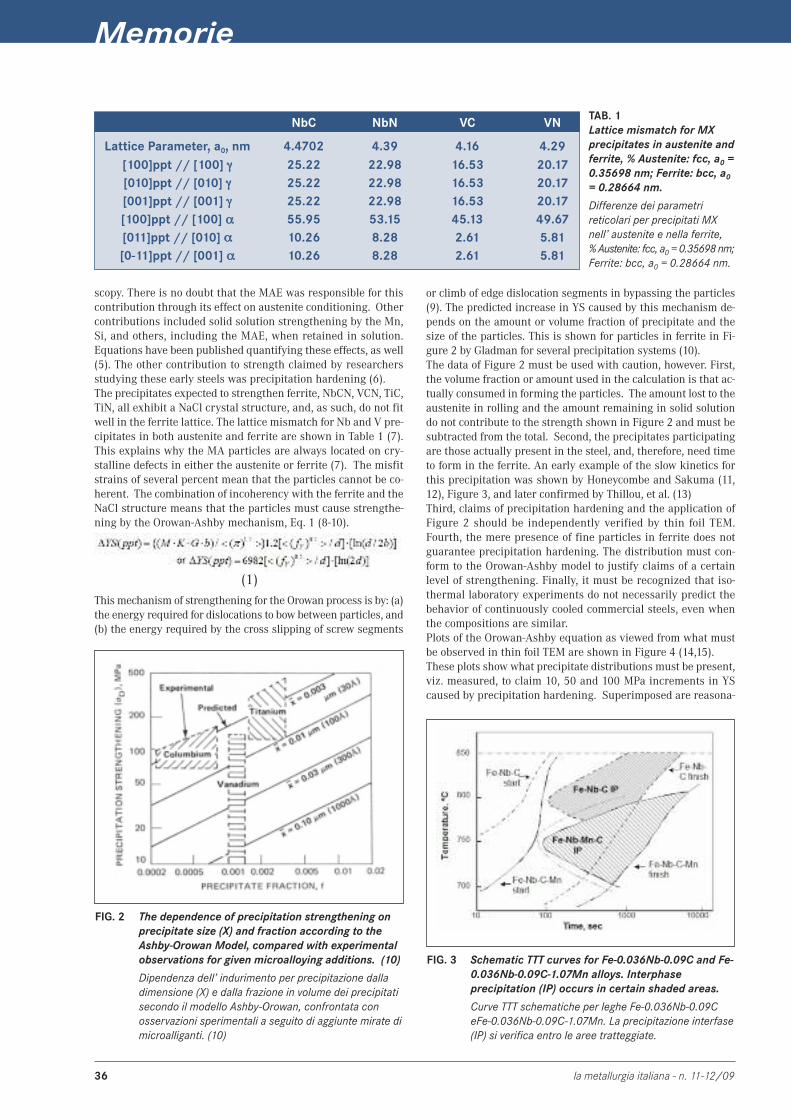
scopy. There is no doubt that the MAE was responsible for thiscontribution through its effect on austenite conditioning. Othercontributions included solid solution strengthening by the Mn,Si, and others, including the MAE, when retained in solution.Equations have been published quantifying these effects, as well(5). The other contribution to strength claimed by researchersstudying these early steels was precipitation hardening (6). The precipitates expected to strengthen ferrite, NbCN, VCN, TiC,TiN, all exhibit a NaCl crystal structure, and, as such, do not fitwell in the ferrite lattice. The lattice mismatch for Nb and V pre-cipitates in both austenite and ferrite are shown in Table 1 (7).This explains why the MA particles are always located on cry-stalline defects in either the austenite or ferrite (7). The misfitstrains of several percent mean that the particles cannot be co-herent. The combination of incoherency with the ferrite and theNaCl structure means that the particles must cause strengthe-ning by the Orowan-Ashby mechanism, Eq. 1 (8-10).
(1)
FIG. 2 The dependence of precipitation strengthening onprecipitate size (X) and fraction according to theAshby-Orowan Model, compared with experimentalobservations for given microalloying additions. (10)
Dipendenza dell’ indurimento per precipitazione dalladimensione (X) e dalla frazione in volume dei precipitatisecondo il modello Ashby-Orowan, confrontata conosservazioni sperimentali a seguito di aggiunte mirate dimicroalliganti. (10)
FIG. 3 Schematic TTT curves for Fe-0.036Nb-0.09C and Fe-0.036Nb-0.09C-1.07Mn alloys. Interphaseprecipitation (IP) occurs in certain shaded areas.
Curve TTT schematiche per leghe Fe-0.036Nb-0.09CeFe-0.036Nb-0.09C-1.07Mn. La precipitazione interfase(IP) si verifica entro le aree tratteggiate.
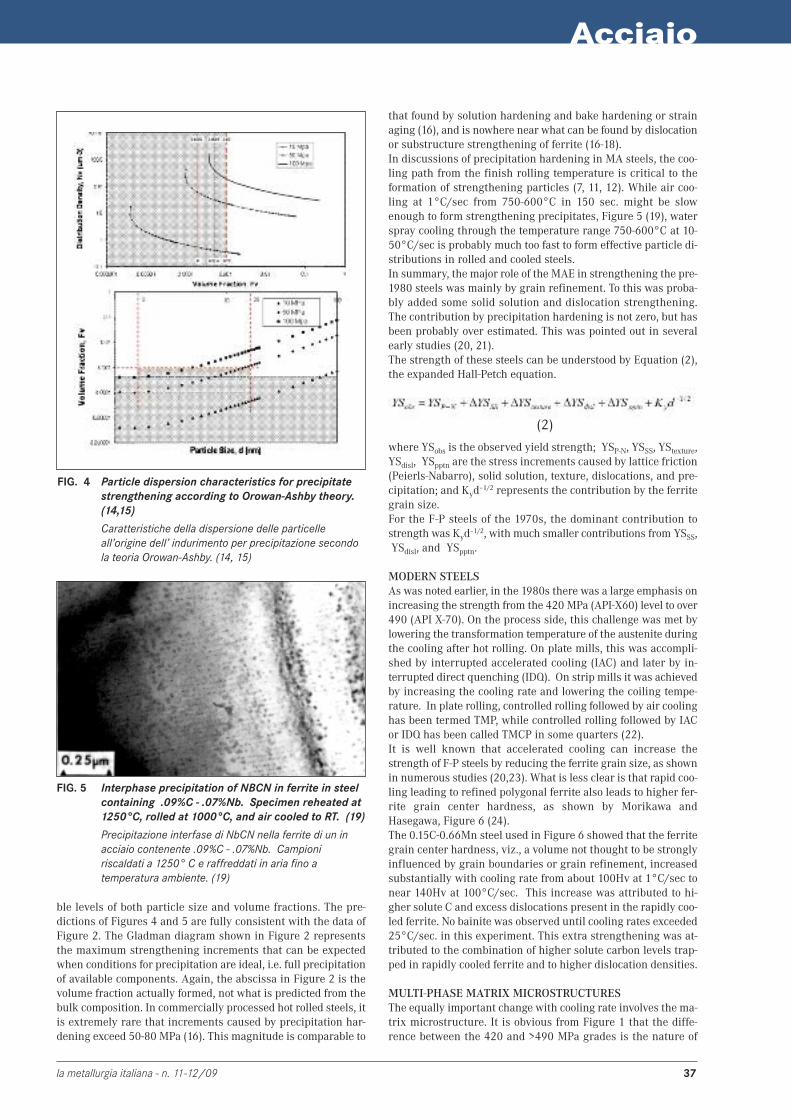
or climb of edge dislocation segments in bypassing the particles(9). The predicted increase in YS caused by this mechanism de-pends on the amount or volume fraction of precipitate and thesize of the particles. This is shown for particles in ferrite in Fi-gure 2 by Gladman for several precipitation systems (10). The data of Figure 2 must be used with caution, however. First,the volume fraction or amount used in the calculation is that ac-tually consumed in forming the particles. The amount lost to theaustenite in rolling and the amount remaining in solid solutiondo not contribute to the strength shown in Figure 2 and must besubtracted from the total. Second, the precipitates participatingare those actually present in the steel, and, therefore, need timeto form in the ferrite. An early example of the slow kinetics forthis precipitation was shown by Honeycombe and Sakuma (11,12), Figure 3, and later confirmed by Thillou, et al. (13) Third, claims of precipitation hardening and the application ofFigure 2 should be independently verified by thin foil TEM.Fourth, the mere presence of fine particles in ferrite does notguarantee precipitation hardening. The distribution must con-form to the Orowan-Ashby model to justify claims of a certainlevel of strengthening. Finally, it must be recognized that iso-thermal laboratory experiments do not necessarily predict thebehavior of continuously cooled commercial steels, even whenthe compositions are similar. Plots of the Orowan-Ashby equation as viewed from what mustbe observed in thin foil TEM are shown in Figure 4 (14,15). These plots show what precipitate distributions must be present,viz. measured, to claim 10, 50 and 100 MPa increments in YScaused by precipitation hardening. Superimposed are reasona-
This mechanism of strengthening for the Orowan process is by: (a)the energy required for dislocations to bow between particles, and(b) the energy required by the cross slipping of screw segments
Acciaio
la metallurgia italiana - n. 11-12/09 37
ble levels of both particle size and volume fractions. The pre-dictions of Figures 4 and 5 are fully consistent with the data ofFigure 2. The Gladman diagram shown in Figure 2 representsthe maximum strengthening increments that can be expectedwhen conditions for precipitation are ideal, i.e. full precipitationof available components. Again, the abscissa in Figure 2 is thevolume fraction actually formed, not what is predicted from thebulk composition. In commercially processed hot rolled steels, itis extremely rare that increments caused by precipitation har-dening exceed 50-80 MPa (16). This magnitude is comparable to
FIG. 4 Particle dispersion characteristics for precipitatestrengthening according to Orowan-Ashby theory.(14,15)
Caratteristiche della dispersione delle particelleall’origine dell’ indurimento per precipitazione secondola teoria Orowan-Ashby. (14, 15)
FIG. 5 Interphase precipitation of NBCN in ferrite in steelcontaining .09%C - .07%Nb. Specimen reheated at1250°C, rolled at 1000°C, and air cooled to RT. (19)
Precipitazione interfase di NbCN nella ferrite di un inacciaio contenente .09%C - .07%Nb. Campioniriscaldati a 1250° C e raffreddati in aria fino atemperatura ambiente. (19)
that found by solution hardening and bake hardening or strainaging (16), and is nowhere near what can be found by dislocationor substructure strengthening of ferrite (16-18).In discussions of precipitation hardening in MA steels, the coo-ling path from the finish rolling temperature is critical to theformation of strengthening particles (7, 11, 12). While air coo-ling at 1°C/sec from 750-600°C in 150 sec. might be slowenough to form strengthening precipitates, Figure 5 (19), waterspray cooling through the temperature range 750-600°C at 10-50°C/sec is probably much too fast to form effective particle di-stributions in rolled and cooled steels. In summary, the major role of the MAE in strengthening the pre-1980 steels was mainly by grain refinement. To this was proba-bly added some solid solution and dislocation strengthening.The contribution by precipitation hardening is not zero, but hasbeen probably over estimated. This was pointed out in severalearly studies (20, 21).The strength of these steels can be understood by Equation (2),the expanded Hall-Petch equation.
(2)
where YSobs is the observed yield strength; �YSP-N, YSSS, YStexture,YSdisl, �YSpptn are the stress increments caused by lattice friction(Peierls-Nabarro), solid solution, texture, dislocations, and pre-cipitation; and Kyd–1/2 represents the contribution by the ferritegrain size.For the F-P steels of the 1970s, the dominant contribution tostrength was Kyd–1/2, with much smaller contributions from�YSSS,�YSdisl, and �YSpptn.
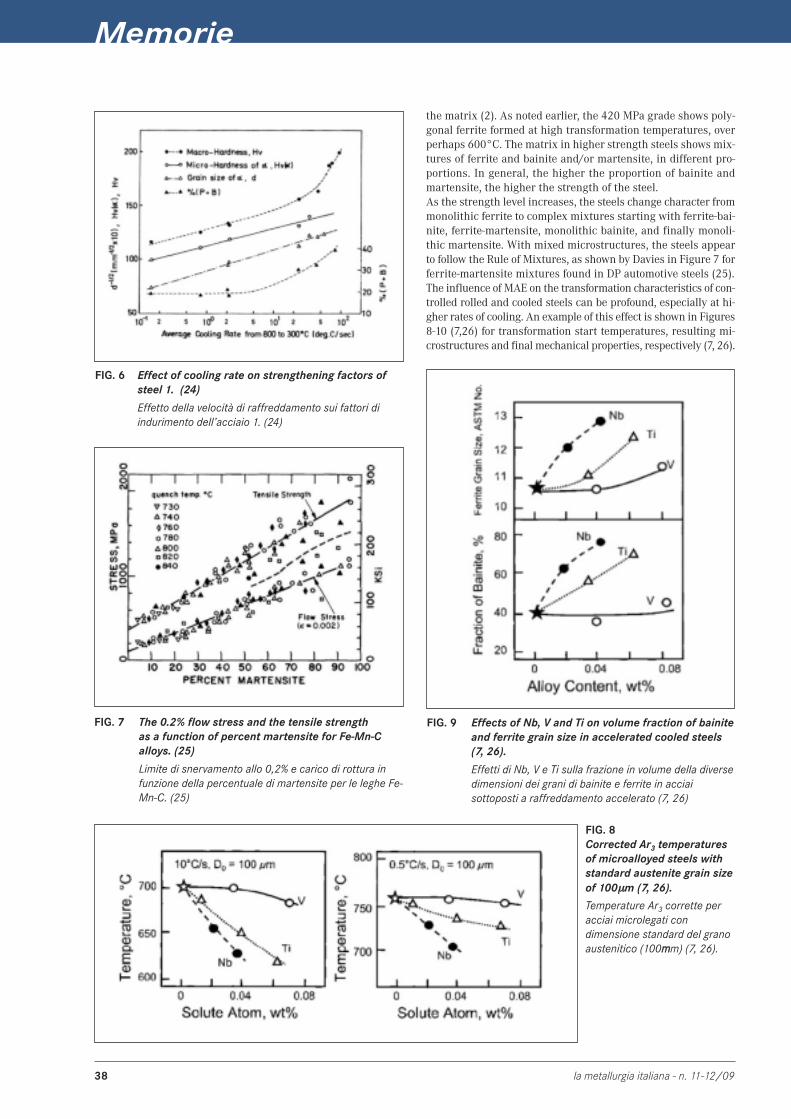
MODERN STEELSAs was noted earlier, in the 1980s there was a large emphasis onincreasing the strength from the 420 MPa (API-X60) level to over490 (API X-70). On the process side, this challenge was met bylowering the transformation temperature of the austenite duringthe cooling after hot rolling. On plate mills, this was accompli-shed by interrupted accelerated cooling (IAC) and later by in-terrupted direct quenching (IDQ). On strip mills it was achievedby increasing the cooling rate and lowering the coiling tempe-rature. In plate rolling, controlled rolling followed by air coolinghas been termed TMP, while controlled rolling followed by IACor IDQ has been called TMCP in some quarters (22). It is well known that accelerated cooling can increase thestrength of F-P steels by reducing the ferrite grain size, as shownin numerous studies (20,23). What is less clear is that rapid coo-ling leading to refined polygonal ferrite also leads to higher fer-rite grain center hardness, as shown by Morikawa andHasegawa, Figure 6 (24). The 0.15C-0.66Mn steel used in Figure 6 showed that the ferritegrain center hardness, viz., a volume not thought to be stronglyinfluenced by grain boundaries or grain refinement, increasedsubstantially with cooling rate from about 100Hv at 1°C/sec tonear 140Hv at 100°C/sec. This increase was attributed to hi-gher solute C and excess dislocations present in the rapidly coo-led ferrite. No bainite was observed until cooling rates exceeded25°C/sec. in this experiment. This extra strengthening was at-tributed to the combination of higher solute carbon levels trap-ped in rapidly cooled ferrite and to higher dislocation densities.
MULTI-PHASE MATRIX MICROSTRUCTURESThe equally important change with cooling rate involves the ma-trix microstructure. It is obvious from Figure 1 that the diffe-rence between the 420 and >490 MPa grades is the nature of
Memorie
38 la metallurgia italiana - n. 11-12/09
FIG. 6 Effect of cooling rate on strengthening factors ofsteel 1. (24)
Effetto della velocità di raffreddamento sui fattori diindurimento dell’acciaio 1. (24)
FIG. 7 The 0.2% flow stress and the tensile strength as a function of percent martensite for Fe-Mn-Calloys. (25)
Limite di snervamento allo 0,2% e carico di rottura infunzione della percentuale di martensite per le leghe Fe-Mn-C. (25)
FIG. 8Corrected Ar3 temperaturesof microalloyed steels withstandard austenite grain sizeof 100µµm (7, 26).
Temperature Ar3 corrette peracciai microlegati condimensione standard del granoaustenitico (100mmm) (7, 26).
FIG. 9 Effects of Nb, V and Ti on volume fraction of bainiteand ferrite grain size in accelerated cooled steels(7, 26).
Effetti di Nb, V e Ti sulla frazione in volume della diversedimensioni dei grani di bainite e ferrite in acciaisottoposti a raffreddamento accelerato (7, 26)
the matrix (2). As noted earlier, the 420 MPa grade shows poly-gonal ferrite formed at high transformation temperatures, overperhaps 600°C. The matrix in higher strength steels shows mix-tures of ferrite and bainite and/or martensite, in different pro-portions. In general, the higher the proportion of bainite andmartensite, the higher the strength of the steel. As the strength level increases, the steels change character frommonolithic ferrite to complex mixtures starting with ferrite-bai-nite, ferrite-martensite, monolithic bainite, and finally monoli-thic martensite. With mixed microstructures, the steels appearto follow the Rule of Mixtures, as shown by Davies in Figure 7 forferrite-martensite mixtures found in DP automotive steels (25). The influence of MAE on the transformation characteristics of con-trolled rolled and cooled steels can be profound, especially at hi-gher rates of cooling. An example of this effect is shown in Figures8-10 (7,26) for transformation start temperatures, resulting mi-crostructures and final mechanical properties, respectively (7, 26).
Acciaio
la metallurgia italiana - n. 11-12/09 39
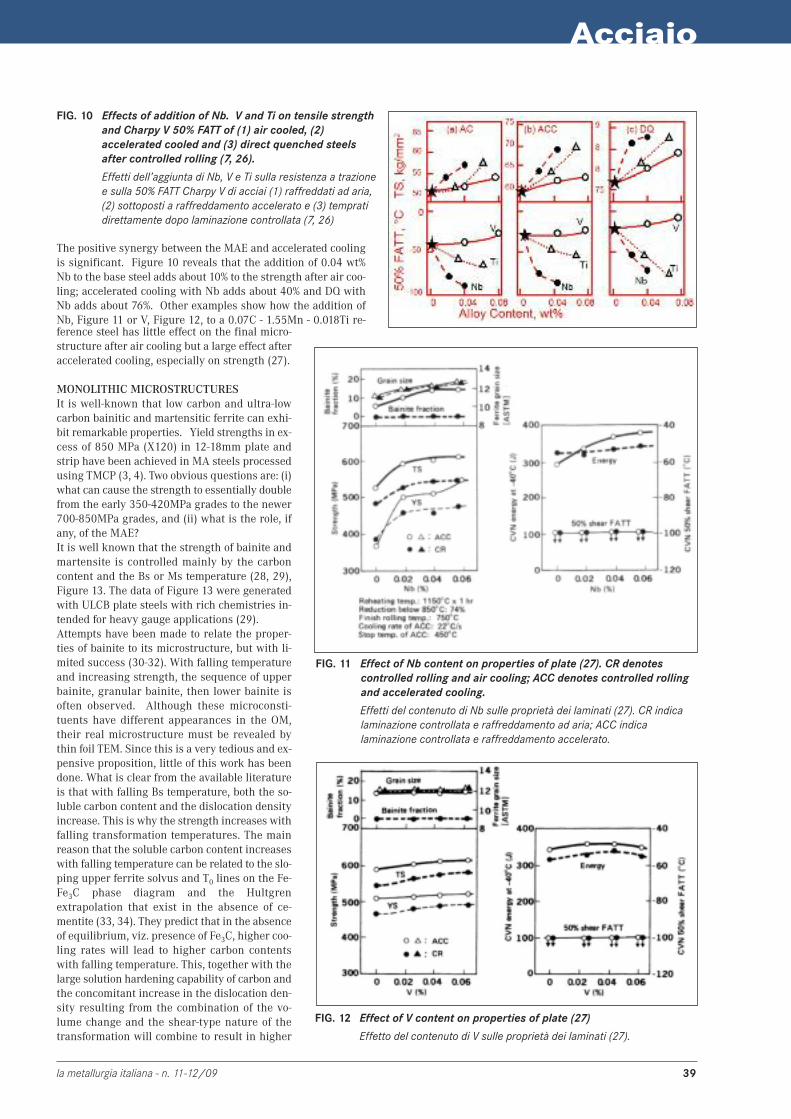
The positive synergy between the MAE and accelerated coolingis significant. Figure 10 reveals that the addition of 0.04 wt%Nb to the base steel adds about 10% to the strength after air coo-ling; accelerated cooling with Nb adds about 40% and DQ withNb adds about 76%. Other examples show how the addition ofNb, Figure 11 or V, Figure 12, to a 0.07C - 1.55Mn - 0.018Ti re-
FIG. 10 Effects of addition of Nb. V and Ti on tensile strengthand Charpy V 50% FATT of (1) air cooled, (2)accelerated cooled and (3) direct quenched steelsafter controlled rolling (7, 26).
Effetti dell’aggiunta di Nb, V e Ti sulla resistenza a trazionee sulla 50% FATT Charpy V di acciai (1) raffreddati ad aria,(2) sottoposti a raffreddamento accelerato e (3) tempratidirettamente dopo laminazione controllata (7, 26)
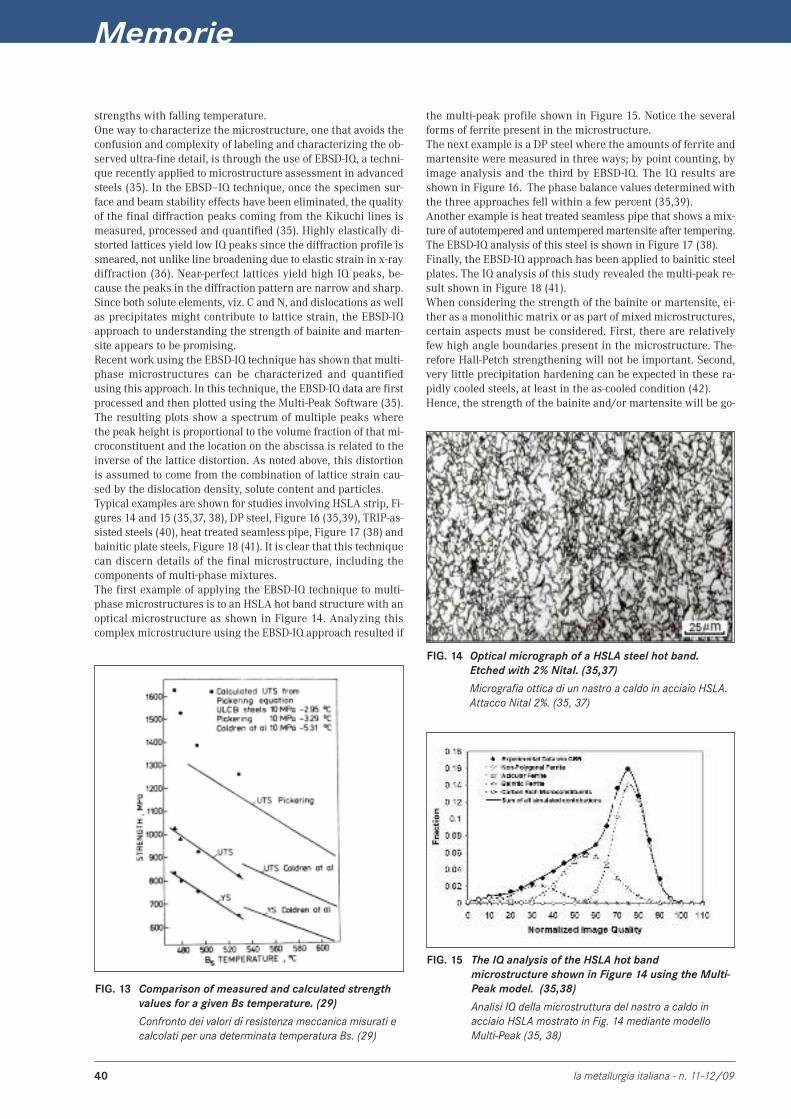
FIG. 11 Effect of Nb content on properties of plate (27). CR denotescontrolled rolling and air cooling; ACC denotes controlled rollingand accelerated cooling.
Effetti del contenuto di Nb sulle proprietà dei laminati (27). CR indicalaminazione controllata e raffreddamento ad aria; ACC indicalaminazione controllata e raffreddamento accelerato.
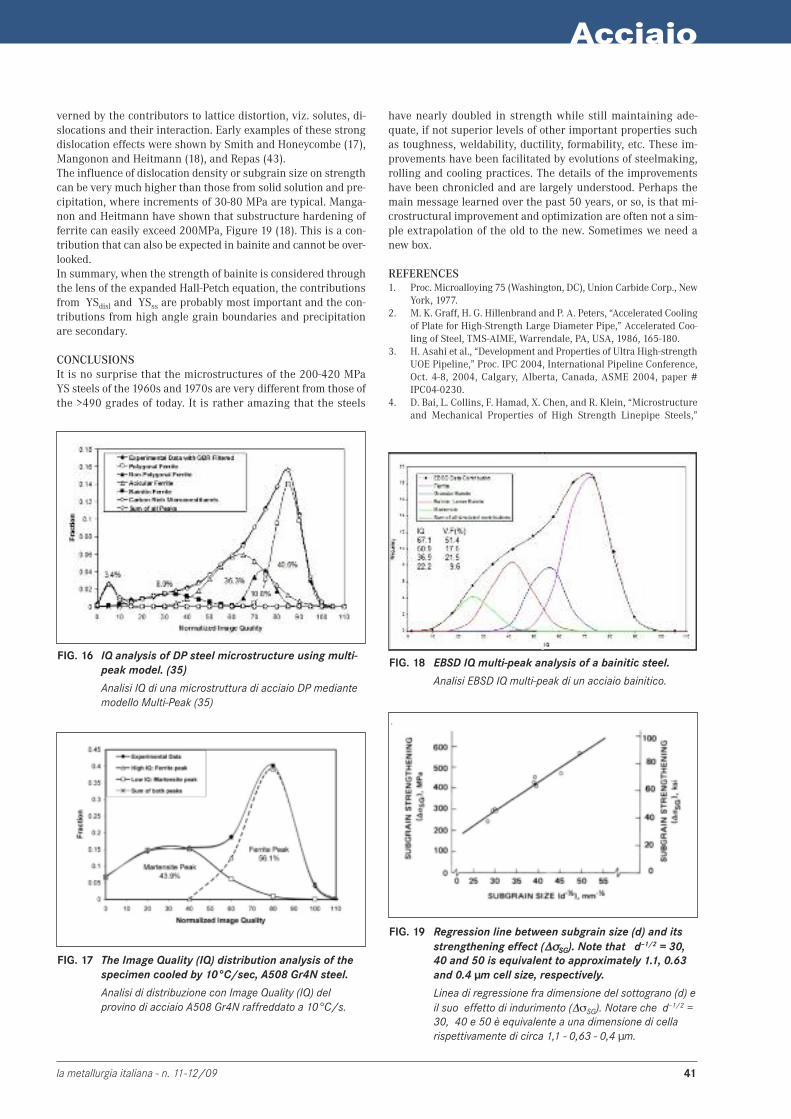
FIG. 12 Effect of V content on properties of plate (27)
Effetto del contenuto di V sulle proprietà dei laminati (27).
ference steel has little effect on the final micro-structure after air cooling but a large effect afteraccelerated cooling, especially on strength (27).
MONOLITHIC MICROSTRUCTURESIt is well-known that low carbon and ultra-lowcarbon bainitic and martensitic ferrite can exhi-bit remarkable properties. Yield strengths in ex-cess of 850 MPa (X120) in 12-18mm plate andstrip have been achieved in MA steels processedusing TMCP (3, 4). Two obvious questions are: (i)what can cause the strength to essentially doublefrom the early 350-420MPa grades to the newer700-850MPa grades, and (ii) what is the role, ifany, of the MAE? It is well known that the strength of bainite andmartensite is controlled mainly by the carboncontent and the Bs or Ms temperature (28, 29),Figure 13. The data of Figure 13 were generatedwith ULCB plate steels with rich chemistries in-tended for heavy gauge applications (29).Attempts have been made to relate the proper-ties of bainite to its microstructure, but with li-mited success (30-32). With falling temperatureand increasing strength, the sequence of upperbainite, granular bainite, then lower bainite isoften observed. Although these microconsti-tuents have different appearances in the OM,their real microstructure must be revealed bythin foil TEM. Since this is a very tedious and ex-pensive proposition, little of this work has beendone. What is clear from the available literatureis that with falling Bs temperature, both the so-luble carbon content and the dislocation densityincrease. This is why the strength increases withfalling transformation temperatures. The mainreason that the soluble carbon content increaseswith falling temperature can be related to the slo-ping upper ferrite solvus and T0 lines on the Fe-Fe3C phase diagram and the Hultgrenextrapolation that exist in the absence of ce-mentite (33, 34). They predict that in the absenceof equilibrium, viz. presence of Fe3C, higher coo-ling rates will lead to higher carbon contentswith falling temperature. This, together with thelarge solution hardening capability of carbon andthe concomitant increase in the dislocation den-sity resulting from the combination of the vo-lume change and the shear-type nature of thetransformation will combine to result in higher
Memorie
40 la metallurgia italiana - n. 11-12/09
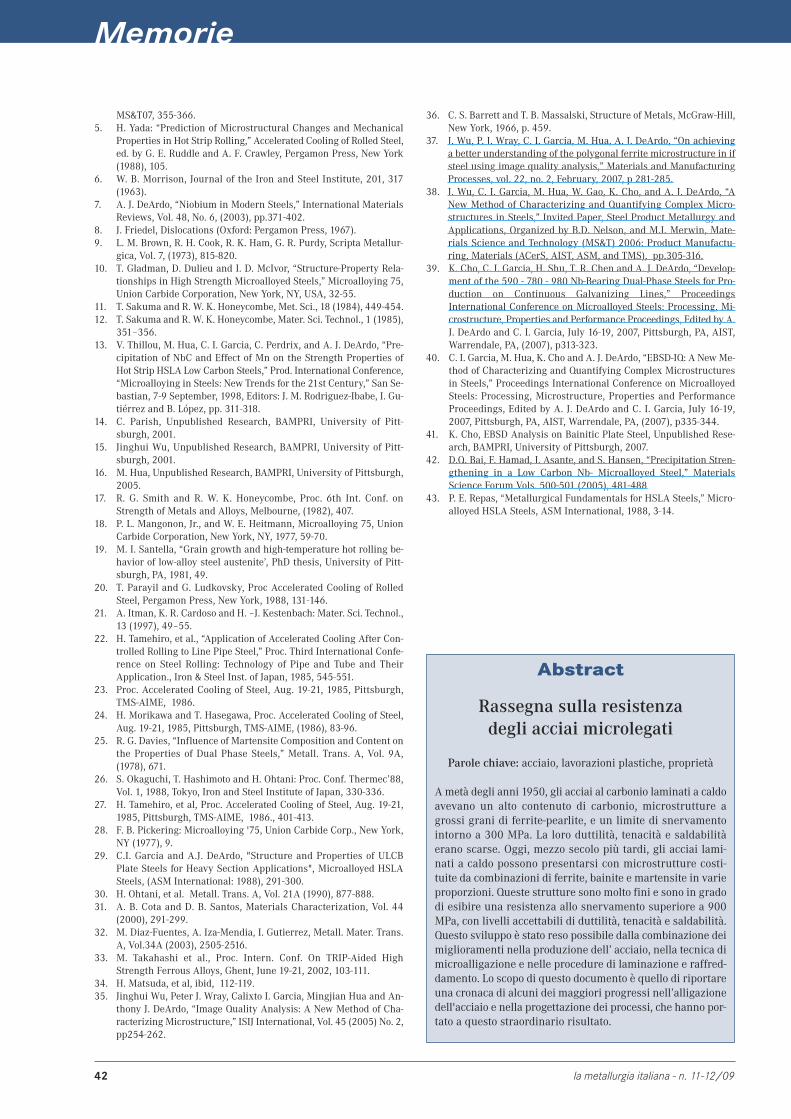
strengths with falling temperature.One way to characterize the microstructure, one that avoids theconfusion and complexity of labeling and characterizing the ob-served ultra-fine detail, is through the use of EBSD-IQ, a techni-que recently applied to microstructure assessment in advancedsteels (35). In the EBSD–IQ technique, once the specimen sur-face and beam stability effects have been eliminated, the qualityof the final diffraction peaks coming from the Kikuchi lines ismeasured, processed and quantified (35). Highly elastically di-storted lattices yield low IQ peaks since the diffraction profile issmeared, not unlike line broadening due to elastic strain in x-raydiffraction (36). Near-perfect lattices yield high IQ peaks, be-cause the peaks in the diffraction pattern are narrow and sharp.Since both solute elements, viz. C and N, and dislocations as wellas precipitates might contribute to lattice strain, the EBSD-IQapproach to understanding the strength of bainite and marten-site appears to be promising. Recent work using the EBSD-IQ technique has shown that multi-phase microstructures can be characterized and quantifiedusing this approach. In this technique, the EBSD-IQ data are firstprocessed and then plotted using the Multi-Peak Software (35).The resulting plots show a spectrum of multiple peaks wherethe peak height is proportional to the volume fraction of that mi-croconstituent and the location on the abscissa is related to theinverse of the lattice distortion. As noted above, this distortionis assumed to come from the combination of lattice strain cau-sed by the dislocation density, solute content and particles. Typical examples are shown for studies involving HSLA strip, Fi-gures 14 and 15 (35,37, 38), DP steel, Figure 16 (35,39), TRIP-as-sisted steels (40), heat treated seamless pipe, Figure 17 (38) andbainitic plate steels, Figure 18 (41). It is clear that this techniquecan discern details of the final microstructure, including thecomponents of multi-phase mixtures.The first example of applying the EBSD-IQ technique to multi-phase microstructures is to an HSLA hot band structure with anoptical microstructure as shown in Figure 14. Analyzing thiscomplex microstructure using the EBSD-IQ approach resulted if
FIG. 13 Comparison of measured and calculated strengthvalues for a given Bs temperature. (29)
Confronto dei valori di resistenza meccanica misurati ecalcolati per una determinata temperatura Bs. (29)
FIG. 14 Optical micrograph of a HSLA steel hot band.Etched with 2% Nital. (35,37)
Micrografia ottica di un nastro a caldo in acciaio HSLA.Attacco Nital 2%. (35, 37)
FIG. 15 The IQ analysis of the HSLA hot bandmicrostructure shown in Figure 14 using the Multi-Peak model. (35,38)
Analisi IQ della microstruttura del nastro a caldo inacciaio HSLA mostrato in Fig. 14 mediante modelloMulti-Peak (35, 38)
the multi-peak profile shown in Figure 15. Notice the severalforms of ferrite present in the microstructure.The next example is a DP steel where the amounts of ferrite andmartensite were measured in three ways; by point counting, byimage analysis and the third by EBSD-IQ. The IQ results areshown in Figure 16. The phase balance values determined withthe three approaches fell within a few percent (35,39). Another example is heat treated seamless pipe that shows a mix-ture of autotempered and untempered martensite after tempering.The EBSD-IQ analysis of this steel is shown in Figure 17 (38).Finally, the EBSD-IQ approach has been applied to bainitic steelplates. The IQ analysis of this study revealed the multi-peak re-sult shown in Figure 18 (41).When considering the strength of the bainite or martensite, ei-ther as a monolithic matrix or as part of mixed microstructures,certain aspects must be considered. First, there are relativelyfew high angle boundaries present in the microstructure. The-refore Hall-Petch strengthening will not be important. Second,very little precipitation hardening can be expected in these ra-pidly cooled steels, at least in the as-cooled condition (42).Hence, the strength of the bainite and/or martensite will be go-
Acciaio
la metallurgia italiana - n. 11-12/09 41
FIG. 16 IQ analysis of DP steel microstructure using multi-peak model. (35)
Analisi IQ di una microstruttura di acciaio DP mediantemodello Multi-Peak (35)
FIG. 17 The Image Quality (IQ) distribution analysis of thespecimen cooled by 10°C/sec, A508 Gr4N steel.
Analisi di distribuzione con Image Quality (IQ) delprovino di acciaio A508 Gr4N raffreddato a 10°C/s.
verned by the contributors to lattice distortion, viz. solutes, di-slocations and their interaction. Early examples of these strongdislocation effects were shown by Smith and Honeycombe (17),Mangonon and Heitmann (18), and Repas (43). The influence of dislocation density or subgrain size on strengthcan be very much higher than those from solid solution and pre-cipitation, where increments of 30-80 MPa are typical. Manga-non and Heitmann have shown that substructure hardening offerrite can easily exceed 200MPa, Figure 19 (18). This is a con-tribution that can also be expected in bainite and cannot be over-looked.In summary, when the strength of bainite is considered throughthe lens of the expanded Hall-Petch equation, the contributionsfrom �YSdisl and �YSss are probably most important and the con-tributions from high angle grain boundaries and precipitationare secondary.
CONCLUSIONSIt is no surprise that the microstructures of the 200-420 MPaYS steels of the 1960s and 1970s are very different from those ofthe >490 grades of today. It is rather amazing that the steels
FIG. 18 EBSD IQ multi-peak analysis of a bainitic steel.
Analisi EBSD IQ multi-peak di un acciaio bainitico.
FIG. 19 Regression line between subgrain size (d) and itsstrengthening effect (∆∆σσSG). Note that d–1/2 = 30,40 and 50 is equivalent to approximately 1.1, 0.63and 0.4 µm cell size, respectively.
Linea di regressione fra dimensione del sottograno (d) eil suo effetto di indurimento (∆σSG). Notare che d–1/2 =30, 40 e 50 è equivalente a una dimensione di cellarispettivamente di circa 1,1 - 0,63 - 0,4 µm.
have nearly doubled in strength while still maintaining ade-quate, if not superior levels of other important properties suchas toughness, weldability, ductility, formability, etc. These im-provements have been facilitated by evolutions of steelmaking,rolling and cooling practices. The details of the improvementshave been chronicled and are largely understood. Perhaps themain message learned over the past 50 years, or so, is that mi-crostructural improvement and optimization are often not a sim-ple extrapolation of the old to the new. Sometimes we need anew box.
REFERENCES1. Proc. Microalloying 75 (Washington, DC), Union Carbide Corp., New
York, 1977.2. M. K. Graff, H. G. Hillenbrand and P. A. Peters, “Accelerated Cooling
of Plate for High-Strength Large Diameter Pipe,” Accelerated Coo-ling of Steel, TMS-AIME, Warrendale, PA, USA, 1986, 165-180.
3. H. Asahi et al., “Development and Properties of Ultra High-strengthUOE Pipeline,” Proc. IPC 2004, International Pipeline Conference,Oct. 4-8, 2004, Calgary, Alberta, Canada, ASME 2004, paper #IPC04-0230.
4. D. Bai, L. Collins, F. Hamad, X. Chen, and R. Klein, “Microstructureand Mechanical Properties of High Strength Linepipe Steels,”
Memorie
42 la metallurgia italiana - n. 11-12/09
MS&T07, 355-366.5. H. Yada: “Prediction of Microstructural Changes and Mechanical
Properties in Hot Strip Rolling,” Accelerated Cooling of Rolled Steel,ed. by G. E. Ruddle and A. F. Crawley, Pergamon Press, New York(1988), 105.
6. W. B. Morrison, Journal of the Iron and Steel Institute, 201, 317(1963).
7. A. J. DeArdo, “Niobium in Modern Steels,” International MaterialsReviews, Vol. 48, No. 6, (2003), pp.371-402.
8. J. Friedel, Dislocations (Oxford: Pergamon Press, 1967).9. L. M. Brown, R. H. Cook, R. K. Ham, G. R. Purdy, Scripta Metallur-
gica, Vol. 7, (1973), 815-820.10. T. Gladman, D. Dulieu and I. D. McIvor, “Structure-Property Rela-
tionships in High Strength Microalloyed Steels,” Microalloying 75,Union Carbide Corporation, New York, NY, USA, 32-55.
11. T. Sakuma and R. W. K. Honeycombe, Met. Sci., 18 (1984), 449-454.12. T. Sakuma and R. W. K. Honeycombe, Mater. Sci. Technol., 1 (1985),
351–356.13. V. Thillou, M. Hua, C. I. Garcia, C. Perdrix, and A. J. DeArdo, “Pre-
cipitation of NbC and Effect of Mn on the Strength Properties ofHot Strip HSLA Low Carbon Steels,” Prod. International Conference,“Microalloying in Steels: New Trends for the 21st Century,” San Se-bastian, 7-9 September, 1998, Editors: J. M. Rodriguez-Ibabe, I. Gu-tiérrez and B. López, pp. 311-318.
14. C. Parish, Unpublished Research, BAMPRI, University of Pitt-sburgh, 2001.
15. Jinghui Wu, Unpublished Research, BAMPRI, University of Pitt-sburgh, 2001.
16. M. Hua, Unpublished Research, BAMPRI, University of Pittsburgh,2005.
17. R. G. Smith and R. W. K. Honeycombe, Proc. 6th Int. Conf. onStrength of Metals and Alloys, Melbourne, (1982), 407.
18. P. L. Mangonon, Jr., and W. E. Heitmann, Microalloying 75, UnionCarbide Corporation, New York, NY, 1977, 59-70.
19. M. I. Santella, “Grain growth and high-temperature hot rolling be-havior of low-alloy steel austenite’, PhD thesis, University of Pitt-sburgh, PA, 1981, 49.
20. T. Parayil and G. Ludkovsky, Proc Accelerated Cooling of RolledSteel, Pergamon Press, New York, 1988, 131-146.
21. A. Itman, K. R. Cardoso and H. –J. Kestenbach: Mater. Sci. Technol.,13 (1997), 49–55.
22. H. Tamehiro, et al., “Application of Accelerated Cooling After Con-trolled Rolling to Line Pipe Steel,” Proc. Third International Confe-rence on Steel Rolling: Technology of Pipe and Tube and TheirApplication., Iron & Steel Inst. of Japan, 1985, 545-551.
23. Proc. Accelerated Cooling of Steel, Aug. 19-21, 1985, Pittsburgh,TMS-AIME, 1986.
24. H. Morikawa and T. Hasegawa, Proc. Accelerated Cooling of Steel,Aug. 19-21, 1985, Pittsburgh, TMS-AIME, (1986), 83-96.
25. R. G. Davies, “Influence of Martensite Composition and Content onthe Properties of Dual Phase Steels,” Metall. Trans. A, Vol. 9A,(1978), 671.
26. S. Okaguchi, T. Hashimoto and H. Ohtani: Proc. Conf. Thermec’88,Vol. 1, 1988, Tokyo, Iron and Steel Institute of Japan, 330-336.
27. H. Tamehiro, et al, Proc. Accelerated Cooling of Steel, Aug. 19-21,1985, Pittsburgh, TMS-AIME, 1986., 401-413.
28. F. B. Pickering: Microalloying '75, Union Carbide Corp., New York,NY (1977), 9.
29. C.I. Garcia and A.J. DeArdo, "Structure and Properties of ULCBPlate Steels for Heavy Section Applications", Microalloyed HSLASteels, (ASM International: 1988), 291-300.
30. H. Ohtani, et al. Metall. Trans. A, Vol. 21A (1990), 877-888.31. A. B. Cota and D. B. Santos, Materials Characterization, Vol. 44
(2000), 291-299. 32. M. Diaz-Fuentes, A. Iza-Mendia, I. Gutierrez, Metall. Mater. Trans.
A, Vol.34A (2003), 2505-2516.33. M. Takahashi et al., Proc. Intern. Conf. On TRIP-Aided High
Strength Ferrous Alloys, Ghent, June 19-21, 2002, 103-111.34. H. Matsuda, et al, ibid, 112-119.35. Jinghui Wu, Peter J. Wray, Calixto I. Garcia, Mingjian Hua and An-
thony J. DeArdo, “Image Quality Analysis: A New Method of Cha-racterizing Microstructure,” ISIJ International, Vol. 45 (2005) No. 2,pp254-262.
36. C. S. Barrett and T. B. Massalski, Structure of Metals, McGraw-Hill,New York, 1966, p. 459.
37. J. Wu, P. J. Wray, C. I. Garcia, M. Hua, A. J. DeArdo, “On achievinga better understanding of the polygonal ferrite microstructure in ifsteel using image quality analysis,” Materials and ManufacturingProcesses, vol. 22, no. 2, February, 2007, p 281-285.
38. J. Wu, C. I. Garcia, M. Hua, W. Gao, K. Cho, and A. J. DeArdo, “ANew Method of Characterizing and Quantifying Complex Micro-structures in Steels,” Invited Paper, Steel Product Metallurgy andApplications, Organized by B.D. Nelson, and M.J. Merwin, Mate-rials Science and Technology (MS&T) 2006: Product Manufactu-ring, Materials (ACerS, AIST, ASM, and TMS), pp.305-316.
39. K. Cho, C. I. Garcia, H. Shu, T. R. Chen and A. J. DeArdo, “Develop-ment of the 590 - 780 - 980 Nb-Bearing Dual-Phase Steels for Pro-duction on Continuous Galvanizing Lines,” ProceedingsInternational Conference on Microalloyed Steels: Processing, Mi-crostructure, Properties and Performance Proceedings, Edited by A.J. DeArdo and C. I. Garcia, July 16-19, 2007, Pittsburgh, PA, AIST,Warrendale, PA, (2007), p313-323.
40. C. I. Garcia, M. Hua, K. Cho and A. J. DeArdo, “EBSD-IQ: A New Me-thod of Characterizing and Quantifying Complex Microstructuresin Steels,” Proceedings International Conference on MicroalloyedSteels: Processing, Microstructure, Properties and PerformanceProceedings, Edited by A. J. DeArdo and C. I. Garcia, July 16-19,2007, Pittsburgh, PA, AIST, Warrendale, PA, (2007), p335-344.
41. K. Cho, EBSD Analysis on Bainitic Plate Steel, Unpublished Rese-arch, BAMPRI, University of Pittsburgh, 2007.
42. D.Q. Bai, F. Hamad, J. Asante, and S. Hansen, “Precipitation Stren-gthening in a Low Carbon Nb- Microalloyed Steel,” MaterialsScience Forum Vols. 500-501 (2005), 481-488
43. P. E. Repas, “Metallurgical Fundamentals for HSLA Steels,” Micro-alloyed HSLA Steels, ASM International, 1988, 3-14.
Abstract
Rassegna sulla resistenza degli acciai microlegati
Parole chiave: acciaio, lavorazioni plastiche, proprietà
A metà degli anni 1950, gli acciai al carbonio laminati a caldoavevano un alto contenuto di carbonio, microstrutture agrossi grani di ferrite-pearlite, e un limite di snervamentointorno a 300 MPa. La loro duttilità, tenacità e saldabilitàerano scarse. Oggi, mezzo secolo più tardi, gli acciai lami-nati a caldo possono presentarsi con microstrutture costi-tuite da combinazioni di ferrite, bainite e martensite in varieproporzioni. Queste strutture sono molto fini e sono in gradodi esibire una resistenza allo snervamento superiore a 900MPa, con livelli accettabili di duttilità, tenacità e saldabilità.Questo sviluppo è stato reso possibile dalla combinazione deimiglioramenti nella produzione dell’ acciaio, nella tecnica dimicroalligazione e nelle procedure di laminazione e raffred-damento. Lo scopo di questo documento è quello di riportareuna cronaca di alcuni dei maggiori progressi nell’alligazionedell'acciaio e nella progettazione dei processi, che hanno por-tato a questo straordinario risultato.
Acciaio
la metallurgia italiana - n. 11-12/09 43
Memorie
Microstructure and mechanical propertiesof thermomechanically processed TRIP steel
I.B. Timokhina, P.D. Hodgson, H. Beladi, E.V. Pereloma
The strengthening mechanism responsible for the unique combination of ultimate tensile strength andelongation in a multiphase Fe-0.2C-1.5Mn-1.2Si-0.3Mo-0.6Al-0.02Nb (wt%) steel was studied. The
microstructures with different volume fractions of polygonal ferrite, bainite and retained austenite weresimulated by controlled thermomechanical processing. The interrupted tensile test was used to study the bainitic
ferrite, retained austenite and polygonal ferrite behaviour as a function of plastic strain. X-ray analysis wasused to characterise the volume fraction and carbon content of retained austenite. Transmission electron
microscopy was utilised to analyse the effect of bainitic ferrite morphology on the strain induced transformationof retained austenite and retained austenite twinning as a function of strain in the bulk material. The study has
shown that the austenite twinning mechanism is more preferable than the transformation induced plasticity(TRIP) mechanism during the early stages of deformation for a microstructure containing 15% polygonal ferrite,while the transformation induced plasticity effect is the main mechanism when there is 50% of polygonal ferritein the microstructure. The bainitic ferrite morphology affects the deformation mode of retained austenite duringstraining. The polygonal ferrite behaviour during straining depends on dislocation substructure formed due to
the deformation and the additional mobile dislocations caused by the TRIP effect. Operation of TRIP ortwinning mechanisms depends not only on the chemical and mechanical stability of retained austenite, but also
on the interaction of the phases during straining.
I.B. Timokhina, P.D. Hodgson, H. BeladiDeakin University, Australia
E.V. PerelomaThe University of Wollongong, Australia
KEYWORDS: Transformation induced plasticity steel, thermomechanical processing, retained austenite,TRIP/TWIP effects, transmission electron microscopy, atom probe tomography
INTRODUCTIONThe demand for high strength and high formability steels hasrecently increased. These steels have found application in themanufacture of automotive wheels, certain brackets and, poten-tially, of high strength drawn bars. Multiphase steels, containingaustenite and bainite, represent a new class of steel with im-proved strength-ductility balance. The Transformation InducedPlasticity (TRIP) effect has been widely cited to be solely re-sponsible for this balance [1, 2]. However, mechanical twinningcan also occur in a steel alloyed with manganese, silicon andaluminium [3, 4]. This could lead to an increase in plasticitythrough the Twinning Induced Plasticity (TWIP) effect. The mainaim of previous investigations has been to obtain the maximumamount of stable retained austenite [5, 6]. However, the currentstate of knowledge regarding the multiphase steels has revea-led certain contradictions to this concept. Firstly, the distributionof carbon within the retained austenite crystals is inhomogene-ous and depends on the position of these crystals in the multi-phase structure. This leads to the formation of retained austenitecrystals with different carbon content [7]. It has been suggestedthat only the retained austenite with an optimum carbon con-tent can provide the TRIP/TWIP effect and improve the elonga-tion [8]. Furthermore, an increase in the volume fraction of theretained austenite leads to a decrease in the average carbon ofthis phase, thereby reducing its chemical stability. Hence, the
optimum volume fraction of the retained austenite is needed toprovide the TRIP/TWIP effect [8].The size of the retained austenite also affects the stability. Co-arse retained austenite blocks have lower stability than films,for example, and tend to transform to martensite at low strain.Hence, retained austenite only with optimum size can providethe TRIP effect [6]. It has been suggested [9, 10] that there isanother mechanism responsible for the unique strength-ducti-lity balance in multiphase steels in addition to the TRIP/TWIP ef-fects. Recent publications have revealed the importance of theeffect of all phases formed in the microstructure and their inte-raction during straining [9, 10].A multiphase microstructure has usually been generated by atwo stage intercritical annealing due to the sensitivity of the mi-crostructure to the thermomechanical processing approach. Inthe current approach, however, thermomechanical processingwas used to avoid the extra step required by the intercritical an-nealing and develop the desirable microstructure directly afterhot rolling.The aim of the current research is to study the effect of the vo-lume fraction of the phases on the structure-property relation-ship and the complex interrelationship between the phasesduring the formation of the final microstructure.
EXPERIMENTAL PROCEDURESteel with composition of Fe-0.2C-1.5Mn-1.2Si-0.3Mo-0.6Al-0.02Nb (wt%) was studied. A laboratory rolling mill was used tosimulate rolling. The thermomechanical processing schedulewas constructed based on analysis of the continuous coolingtransformation data [11], to form 15% and 50% of polygonal fer-rite and non-carbide bainitic ferrite to stabilize the retained au-stenite at room temperature (Fig. 1).
Memorie
44 la metallurgia italiana - n. 11-12/09
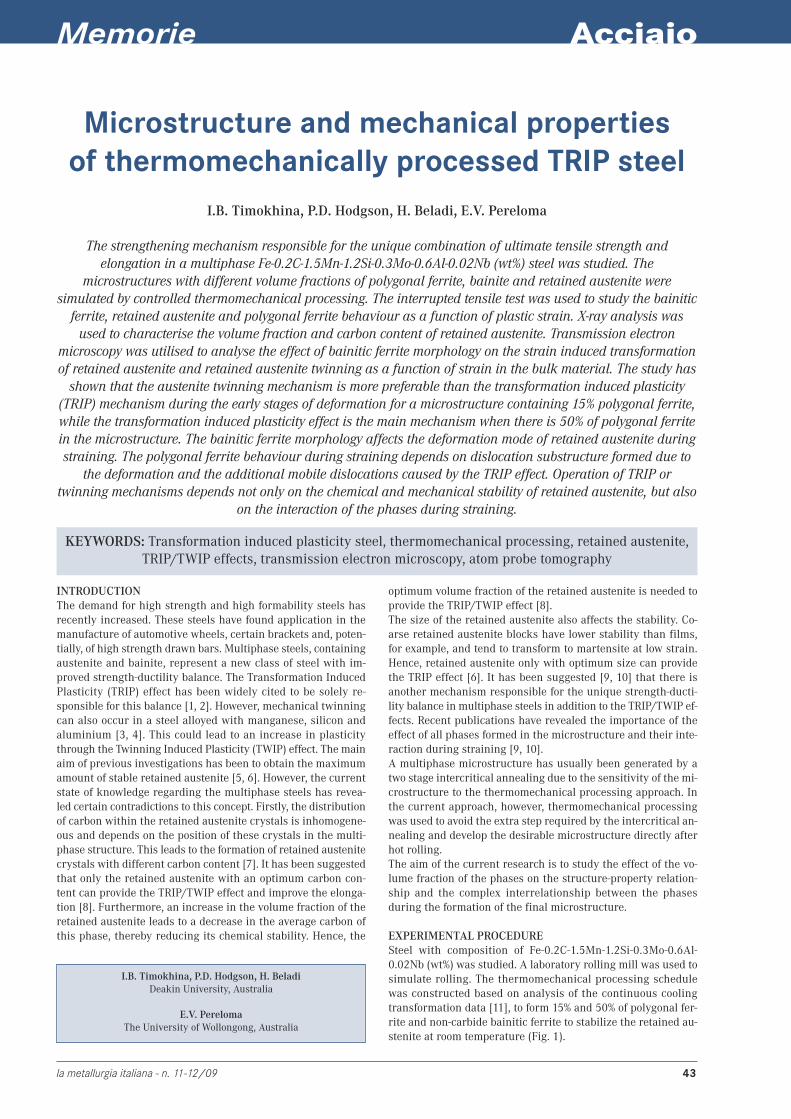
FIG. 1 Thermomechanical processing schedule.
Schema del processo termomeccanico.
The samples with initial thickness of ~ 35mm were austeniti-zed at 1250°C for 120s in a 15kW muffle furnace and then rol-led at 1100°C, where the first deformation (ε1=0.25) took place,followed by the second deformation (ε2=0.47) at 875°C (Fig. 1).After that, the samples air cooled at ~1Ks
-1 to the acceleratedcooling start temperatures (TA) of 780°C and 760°C to form15% and 50% of polygonal ferrite respectively. Two spray gunswere used to cool the samples at ~20Ks
-1 to 520°C to avoid pe-arlite formation and after that the samples were placed in afluidbed furnace and covered with aluminum oxide sand tohold the samples at 470°C for 1200s to form non-carbide bai-nite. After holding the samples were quenched in an iced brinesolution (Fig. 1). The final thickness of the slab after proces-sing was 7 mm.The microstructure of the samples was characterized using op-tical metallography, transmission electron microscopy (TEM)and atom probe tomography (APT). Thin foils for TEM were pre-pared by twin-jet electropolishing using 5% of perchloric acid inmethanol at -25°C and an operating voltage of 50V. Bright anddark-field images and selected area electron diffraction patternswere obtained using a PHILIPS CM 20 microscope operated at200kV. The stability of retained austenite and the transforma-tion behavior of the phases as a function of the plastic strainwere studied on the samples after interrupted tensile testingusing TEM.APT analysis was performed to study the microstructural featu-res formed after TMP, such as carbon distribution within thephases, formation of particles, etc. The standard two-stage elec-tropolishing procedure was used to prepare the atom probe spe-cimens [12]. The local electrode atom probe was operated at apulse repetition rate of 200 kHz, a 20% pulse fraction with a sam-ple temperature of 80K. Iso-concentration surfaces were usedfor easier visualization of the phases and carbides.X-ray diffraction (XRD) analysis was performed using a PHILIPSPW 1130 (40kV and 25mA) diffractometer equipped with a mo-nochromator and CuKα radiation to calculate the volume frac-tion of retained austenite after TMP and for the samples afterdifferent strains. The integrated intensities of the (200)α, (211)α,(200)γ and (220)γ peaks were used in the direct comparison me-thod [13].Room-temperature mechanical properties were determinedusing an Instron 4500 servohydraulic tensile-testing machinewith a 100kN load cell. Subsize samples with a 25mm gagelength were used to minimize the amount of material.
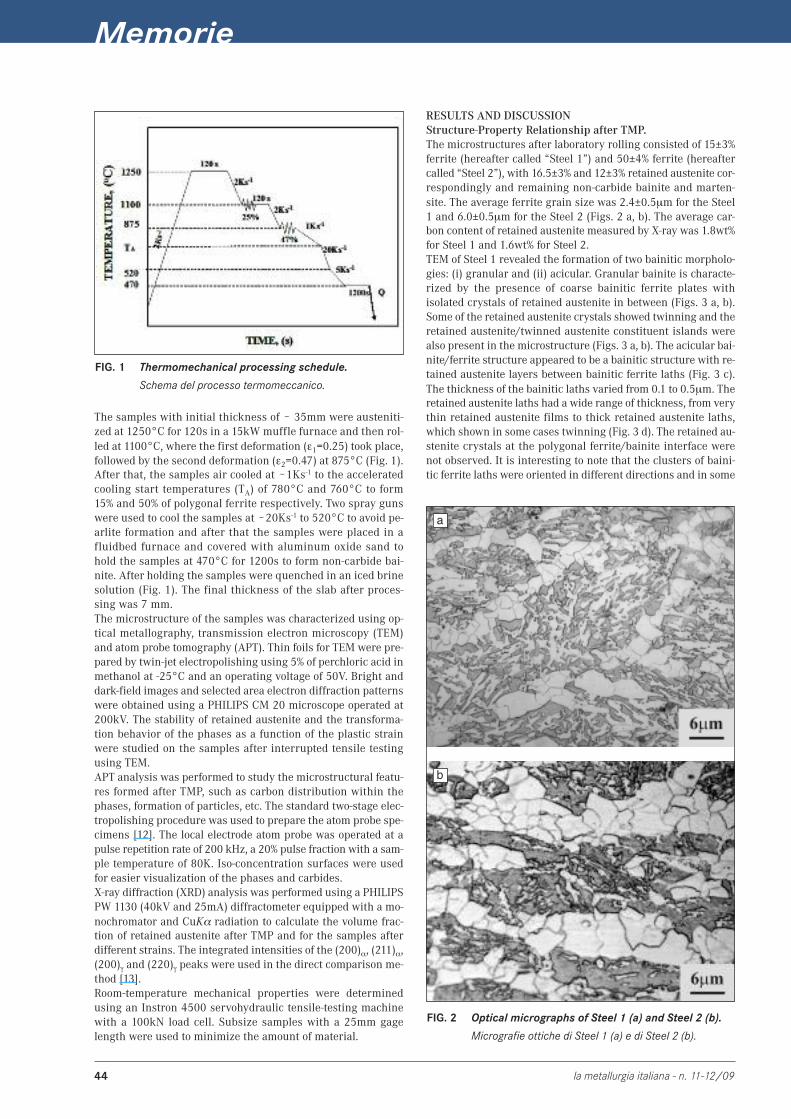
RESULTS AND DISCUSSIONStructure-Property Relationship after TMP.The microstructures after laboratory rolling consisted of 15±3%ferrite (hereafter called “Steel 1”) and 50±4% ferrite (hereaftercalled “Steel 2”), with 16.5±3% and 12±3% retained austenite cor-respondingly and remaining non-carbide bainite and marten-site. The average ferrite grain size was 2.4±0.5µm for the Steel1 and 6.0±0.5µm for the Steel 2 (Figs. 2 a, b). The average car-bon content of retained austenite measured by X-ray was 1.8wt%for Steel 1 and 1.6wt% for Steel 2.TEM of Steel 1 revealed the formation of two bainitic morpholo-gies: (i) granular and (ii) acicular. Granular bainite is characte-rized by the presence of coarse bainitic ferrite plates withisolated crystals of retained austenite in between (Figs. 3 a, b).Some of the retained austenite crystals showed twinning and theretained austenite/twinned austenite constituent islands werealso present in the microstructure (Figs. 3 a, b). The acicular bai-nite/ferrite structure appeared to be a bainitic structure with re-tained austenite layers between bainitic ferrite laths (Fig. 3 c).The thickness of the bainitic laths varied from 0.1 to 0.5µm. Theretained austenite laths had a wide range of thickness, from verythin retained austenite films to thick retained austenite laths,which shown in some cases twinning (Fig. 3 d). The retained au-stenite crystals at the polygonal ferrite/bainite interface werenot observed. It is interesting to note that the clusters of baini-tic ferrite laths were oriented in different directions and in some
a
b
FIG. 2 Optical micrographs of Steel 1 (a) and Steel 2 (b).
Micrografie ottiche di Steel 1 (a) e di Steel 2 (b).

Acciaio
la metallurgia italiana - n. 11-12/09 45
FIG. 3TEM micrographs of Steel 1 after TMP: bright (a) and (b) dark field image ofgranular bainite with twinned austenite (zone axis is [110]γγ), (c) acicular ferrite,(d) twinned austenite (zone axis is [110]γγ), (e) bright and (f) dark field images ofbainitic ferrite laths oriented perpendicular to each other, arrows show the Fe3Ccarbides, (g) lenticular bainitic ferrite, arrows indicate carbides. RA is retainedaustenite, BF is bainitic ferrite, and TA twinned austenite.
Micrografie TEM di Steel 1 dopo processo termo meccanico: (a) immagine in campochiaro e (b) scuro della bainite granulare con austenite geminata (asse di zona [110] γ), (c) ferrite aciculare, (d) austenite geminata (asse di zona [110] γ), (e)immagine in campo chiaro e (f) scuro di lamelle di ferrite bainitica orientatiperpendicolarmente tra loro, la freccia indica i carburi di Fe3C, (g) ferrite bainiticalenticolare, la freccia indica i carburi. RA indica l’austenite residua, BF la ferritebainitica e TA l’austenite geminata.
cases perpendicular to each other (Figs. 3e, f). Rounded Fe3C carbides were obser-ved within these laths (Figs. 3 f). Bainiticferrite laths with a lenticular shape andan average thickness of 0.5µm and withfine, plate-like Fe3C carbides were also ob-served in the microstructure (Fig. 3 g).Martensite crystals were not found duringTEM observation.TEM of Steel 2 also showed the formationof two types of bainite with bainitic ferrite,one in the form of parallel thin laths withan average thickness of 0.6µm and theother in the form of plates (Figs. 4 a, b).Most of the retained austenite was presentas small islands, although coarse blocksof retained austenite were also found inthe vicinity of the martensite (Fig. 4 b). Anumber of the retained austenite crystals
a b c
d e f
g
a b
Fig. 4 TEM micrographs of Steel 2 after TMP: (a) acicular ferrite and (b) granularbainite. BF is bainitic ferrite, RA is retained austenite and M is martensite.
Micrografie TEM di Steel 2 dopo processo termo meccanico: (a) ferriteaciculare e (b) bainite granulare. BF indica la ferrite bainitica, RA l’austeniteresidua, e M la martensite.
Memorie
46 la metallurgia italiana - n. 11-12/09
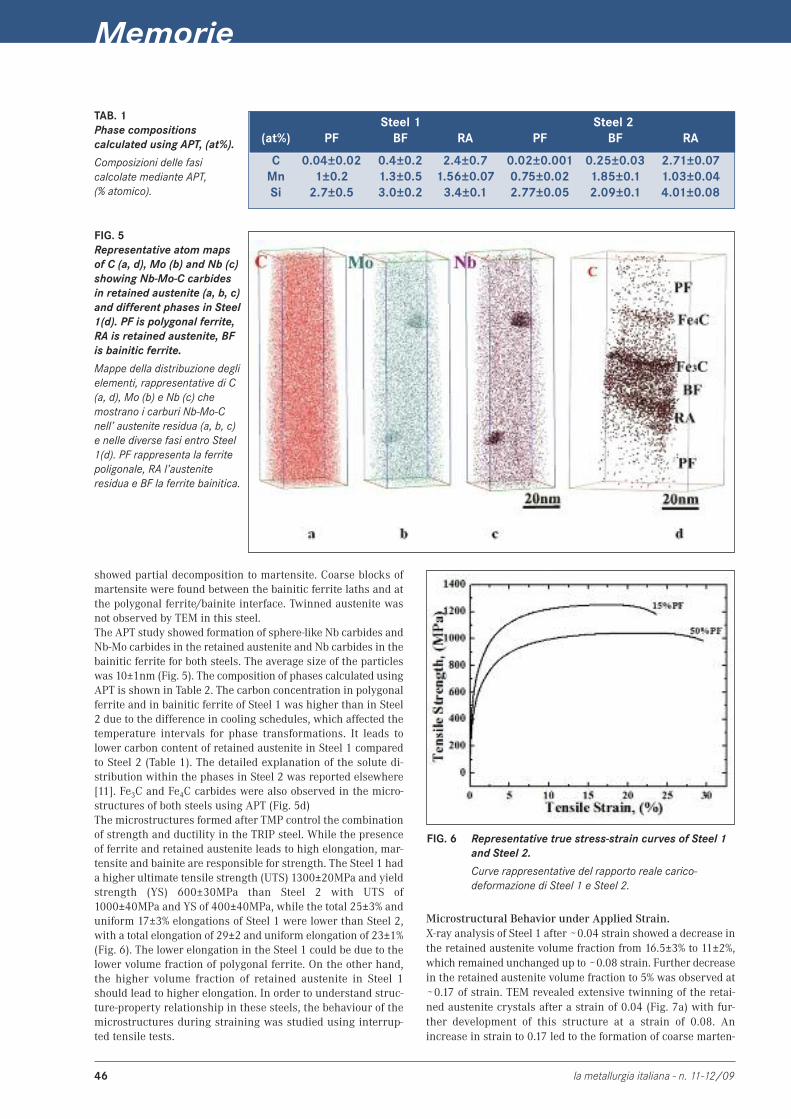
showed partial decomposition to martensite. Coarse blocks ofmartensite were found between the bainitic ferrite laths and atthe polygonal ferrite/bainite interface. Twinned austenite wasnot observed by TEM in this steel.The APT study showed formation of sphere-like Nb carbides andNb-Mo carbides in the retained austenite and Nb carbides in thebainitic ferrite for both steels. The average size of the particleswas 10±1nm (Fig. 5). The composition of phases calculated usingAPT is shown in Table 2. The carbon concentration in polygonalferrite and in bainitic ferrite of Steel 1 was higher than in Steel2 due to the difference in cooling schedules, which affected thetemperature intervals for phase transformations. It leads tolower carbon content of retained austenite in Steel 1 comparedto Steel 2 (Table 1). The detailed explanation of the solute di-stribution within the phases in Steel 2 was reported elsewhere[11]. Fe3C and Fe4C carbides were also observed in the micro-structures of both steels using APT (Fig. 5d)The microstructures formed after TMP control the combinationof strength and ductility in the TRIP steel. While the presenceof ferrite and retained austenite leads to high elongation, mar-tensite and bainite are responsible for strength. The Steel 1 hada higher ultimate tensile strength (UTS) 1300±20MPa and yieldstrength (YS) 600±30MPa than Steel 2 with UTS of1000±40MPa and YS of 400±40MPa, while the total 25±3% anduniform 17±3% elongations of Steel 1 were lower than Steel 2,with a total elongation of 29±2 and uniform elongation of 23±1%(Fig. 6). The lower elongation in the Steel 1 could be due to thelower volume fraction of polygonal ferrite. On the other hand,the higher volume fraction of retained austenite in Steel 1should lead to higher elongation. In order to understand struc-ture-property relationship in these steels, the behaviour of themicrostructures during straining was studied using interrup-ted tensile tests.
Steel 1 Steel 2(at%) PF BF RA PF BF RA
C 0.04±0.02 0.4±0.2 2.4±0.7 0.02±0.001 0.25±0.03 2.71±0.07Mn 1±0.2 1.3±0.5 1.56±0.07 0.75±0.02 1.85±0.1 1.03±0.04Si 2.7±0.5 3.0±0.2 3.4±0.1 2.77±0.05 2.09±0.1 4.01±0.08
TAB. 1Phase compositionscalculated using APT, (at%).
Composizioni delle fasicalcolate mediante APT, (% atomico).
FIG. 5Representative atom mapsof C (a, d), Mo (b) and Nb (c)showing Nb-Mo-C carbidesin retained austenite (a, b, c)and different phases in Steel1(d). PF is polygonal ferrite,RA is retained austenite, BFis bainitic ferrite.
Mappe della distribuzione deglielementi, rappresentative di C(a, d), Mo (b) e Nb (c) chemostrano i carburi Nb-Mo-Cnell’ austenite residua (a, b, c)e nelle diverse fasi entro Steel1(d). PF rappresenta la ferritepoligonale, RA l’austeniteresidua e BF la ferrite bainitica.
FIG. 6 Representative true stress-strain curves of Steel 1and Steel 2.
Curve rappresentative del rapporto reale carico-deformazione di Steel 1 e Steel 2.
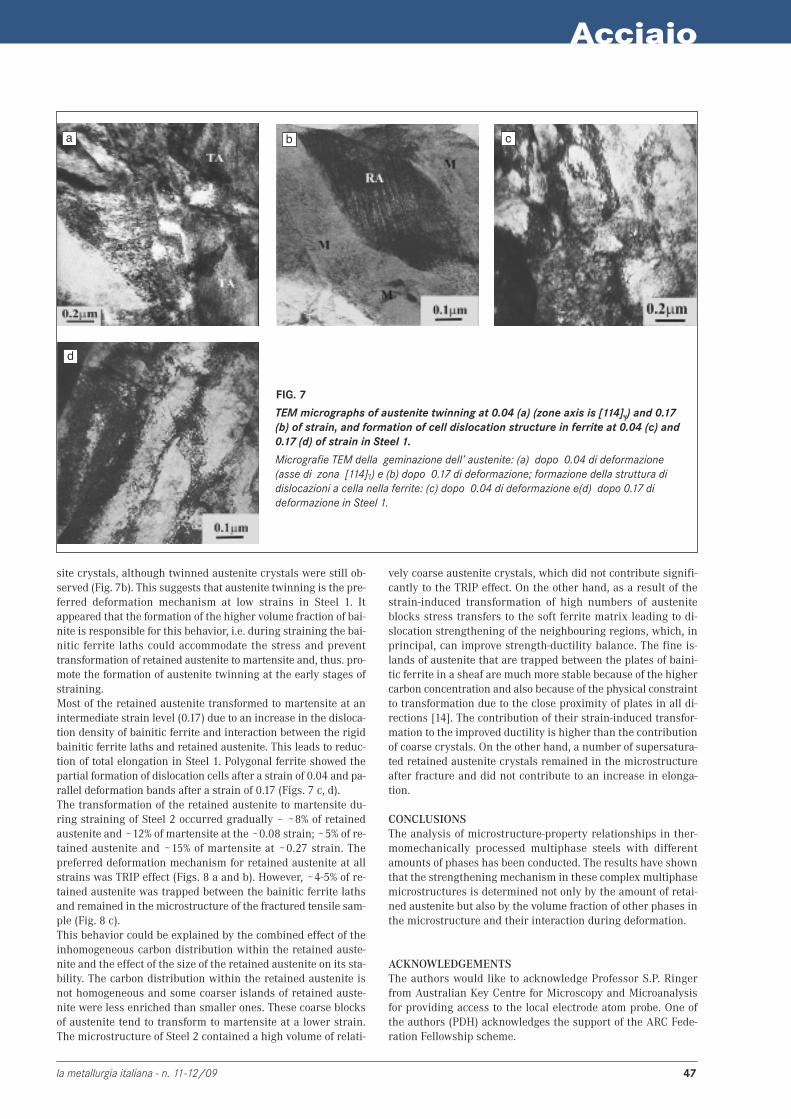
Microstructural Behavior under Applied Strain.X-ray analysis of Steel 1 after ~0.04 strain showed a decrease inthe retained austenite volume fraction from 16.5±3% to 11±2%,which remained unchanged up to ~0.08 strain. Further decreasein the retained austenite volume fraction to 5% was observed at
~0.17 of strain. TEM revealed extensive twinning of the retai-ned austenite crystals after a strain of 0.04 (Fig. 7a) with fur-ther development of this structure at a strain of 0.08. Anincrease in strain to 0.17 led to the formation of coarse marten-
Acciaio
la metallurgia italiana - n. 11-12/09 47
site crystals, although twinned austenite crystals were still ob-served (Fig. 7b). This suggests that austenite twinning is the pre-ferred deformation mechanism at low strains in Steel 1. Itappeared that the formation of the higher volume fraction of bai-nite is responsible for this behavior, i.e. during straining the bai-nitic ferrite laths could accommodate the stress and preventtransformation of retained austenite to martensite and, thus. pro-mote the formation of austenite twinning at the early stages ofstraining.Most of the retained austenite transformed to martensite at anintermediate strain level (0.17) due to an increase in the disloca-tion density of bainitic ferrite and interaction between the rigidbainitic ferrite laths and retained austenite. This leads to reduc-tion of total elongation in Steel 1. Polygonal ferrite showed thepartial formation of dislocation cells after a strain of 0.04 and pa-rallel deformation bands after a strain of 0.17 (Figs. 7 c, d). The transformation of the retained austenite to martensite du-ring straining of Steel 2 occurred gradually – ~8% of retainedaustenite and ~12% of martensite at the ~0.08 strain; ~5% of re-tained austenite and ~15% of martensite at ~0.27 strain. Thepreferred deformation mechanism for retained austenite at allstrains was TRIP effect (Figs. 8 a and b). However, ~4-5% of re-tained austenite was trapped between the bainitic ferrite lathsand remained in the microstructure of the fractured tensile sam-ple (Fig. 8 c).This behavior could be explained by the combined effect of theinhomogeneous carbon distribution within the retained auste-nite and the effect of the size of the retained austenite on its sta-bility. The carbon distribution within the retained austenite isnot homogeneous and some coarser islands of retained auste-nite were less enriched than smaller ones. These coarse blocksof austenite tend to transform to martensite at a lower strain.The microstructure of Steel 2 contained a high volume of relati-
FIG. 7
TEM micrographs of austenite twinning at 0.04 (a) (zone axis is [114]γγ) and 0.17(b) of strain, and formation of cell dislocation structure in ferrite at 0.04 (c) and0.17 (d) of strain in Steel 1.
Micrografie TEM della geminazione dell’ austenite: (a) dopo 0.04 di deformazione(asse di zona [114]γ) e (b) dopo 0.17 di deformazione; formazione della struttura didislocazioni a cella nella ferrite: (c) dopo 0.04 di deformazione e(d) dopo 0.17 dideformazione in Steel 1.
a b c
d
vely coarse austenite crystals, which did not contribute signifi-cantly to the TRIP effect. On the other hand, as a result of thestrain-induced transformation of high numbers of austeniteblocks stress transfers to the soft ferrite matrix leading to di-slocation strengthening of the neighbouring regions, which, inprincipal, can improve strength-ductility balance. The fine is-lands of austenite that are trapped between the plates of baini-tic ferrite in a sheaf are much more stable because of the highercarbon concentration and also because of the physical constraintto transformation due to the close proximity of plates in all di-rections [14]. The contribution of their strain-induced transfor-mation to the improved ductility is higher than the contributionof coarse crystals. On the other hand, a number of supersatura-ted retained austenite crystals remained in the microstructureafter fracture and did not contribute to an increase in elonga-tion.
CONCLUSIONSThe analysis of microstructure-property relationships in ther-momechanically processed multiphase steels with differentamounts of phases has been conducted. The results have shownthat the strengthening mechanism in these complex multiphasemicrostructures is determined not only by the amount of retai-ned austenite but also by the volume fraction of other phases inthe microstructure and their interaction during deformation.
ACKNOWLEDGEMENTSThe authors would like to acknowledge Professor S.P. Ringerfrom Australian Key Centre for Microscopy and Microanalysisfor providing access to the local electrode atom probe. One ofthe authors (PDH) acknowledges the support of the ARC Fede-ration Fellowship scheme.
Memorie
48 la metallurgia italiana - n. 11-12/09
a b c
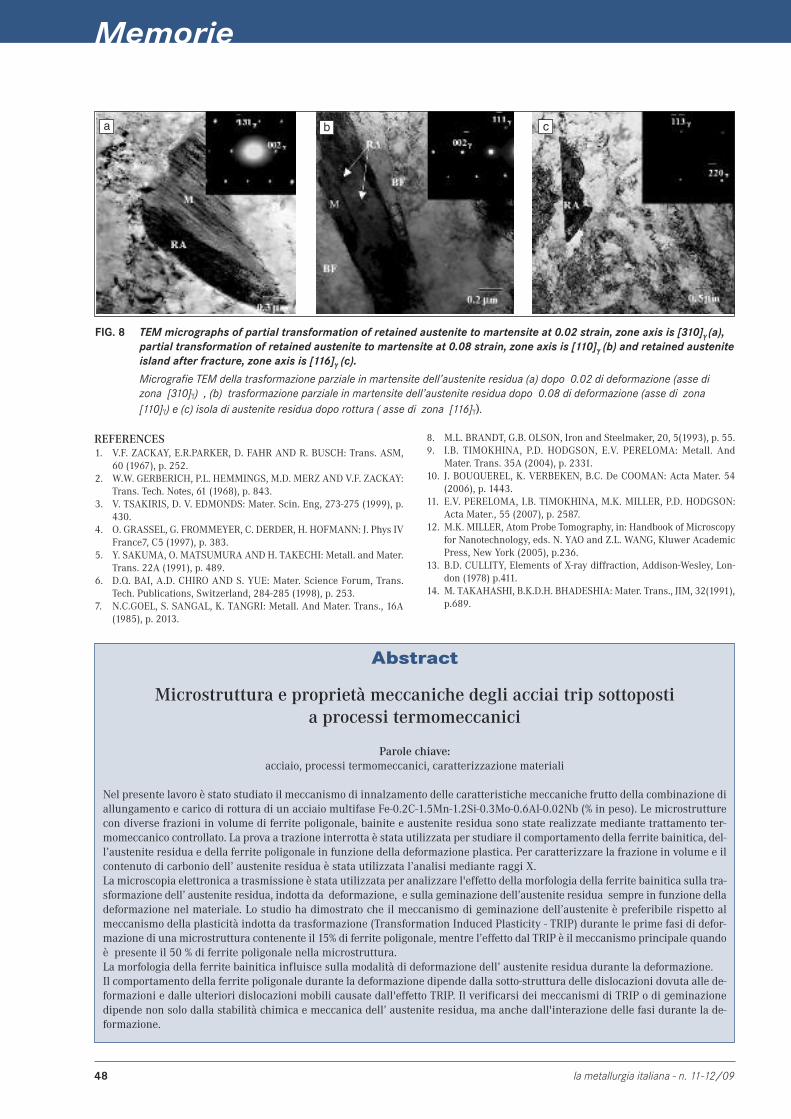
FIG. 8 TEM micrographs of partial transformation of retained austenite to martensite at 0.02 strain, zone axis is [310]γγ (a),partial transformation of retained austenite to martensite at 0.08 strain, zone axis is [110]γγ (b) and retained austeniteisland after fracture, zone axis is [116]γγ (c).
Micrografie TEM della trasformazione parziale in martensite dell’austenite residua (a) dopo 0.02 di deformazione (asse dizona [310]γ) , (b) trasformazione parziale in martensite dell’austenite residua dopo 0.08 di deformazione (asse di zona[110]γ) e (c) isola di austenite residua dopo rottura ( asse di zona [116]γ).
REFERENCES1. V.F. ZACKAY, E.R.PARKER, D. FAHR AND R. BUSCH: Trans. ASM,
60 (1967), p. 252.2. W.W. GERBERICH, P.L. HEMMINGS, M.D. MERZ AND V.F. ZACKAY:
Trans. Tech. Notes, 61 (1968), p. 843.3. V. TSAKIRIS, D. V. EDMONDS: Mater. Scin. Eng, 273-275 (1999), p.
430.4. O. GRASSEL, G. FROMMEYER, C. DERDER, H. HOFMANN: J. Phys IV
France7, C5 (1997), p. 383.5. Y. SAKUMA, O. MATSUMURA AND H. TAKECHI: Metall. and Mater.
Trans. 22A (1991), p. 489.6. D.Q. BAI, A.D. CHIRO AND S. YUE: Mater. Science Forum, Trans.
Tech. Publications, Switzerland, 284-285 (1998), p. 253.7. N.C.GOEL, S. SANGAL, K. TANGRI: Metall. And Mater. Trans., 16A
(1985), p. 2013.
Abstract
Microstruttura e proprietà meccaniche degli acciai trip sottoposti a processi termomeccanici
Parole chiave:acciaio, processi termomeccanici, caratterizzazione materiali
Nel presente lavoro è stato studiato il meccanismo di innalzamento delle caratteristiche meccaniche frutto della combinazione diallungamento e carico di rottura di un acciaio multifase Fe-0.2C-1.5Mn-1.2Si-0.3Mo-0.6Al-0.02Nb (% in peso). Le microstrutturecon diverse frazioni in volume di ferrite poligonale, bainite e austenite residua sono state realizzate mediante trattamento ter-momeccanico controllato. La prova a trazione interrotta è stata utilizzata per studiare il comportamento della ferrite bainitica, del-l’austenite residua e della ferrite poligonale in funzione della deformazione plastica. Per caratterizzare la frazione in volume e ilcontenuto di carbonio dell’ austenite residua è stata utilizzata l’analisi mediante raggi X. La microscopia elettronica a trasmissione è stata utilizzata per analizzare l'effetto della morfologia della ferrite bainitica sulla tra-sformazione dell’ austenite residua, indotta da deformazione, e sulla geminazione dell’austenite residua sempre in funzione delladeformazione nel materiale. Lo studio ha dimostrato che il meccanismo di geminazione dell’austenite è preferibile rispetto almeccanismo della plasticità indotta da trasformazione (Transformation Induced Plasticity - TRIP) durante le prime fasi di defor-mazione di una microstruttura contenente il 15% di ferrite poligonale, mentre l’effetto dal TRIP è il meccanismo principale quandoè presente il 50 % di ferrite poligonale nella microstruttura. La morfologia della ferrite bainitica influisce sulla modalità di deformazione dell’ austenite residua durante la deformazione. Il comportamento della ferrite poligonale durante la deformazione dipende dalla sotto-struttura delle dislocazioni dovuta alle de-formazioni e dalle ulteriori dislocazioni mobili causate dall'effetto TRIP. Il verificarsi dei meccanismi di TRIP o di geminazionedipende non solo dalla stabilità chimica e meccanica dell’ austenite residua, ma anche dall'interazione delle fasi durante la de-formazione.
8. M.L. BRANDT, G.B. OLSON, Iron and Steelmaker, 20, 5(1993), p. 55.9. I.B. TIMOKHINA, P.D. HODGSON, E.V. PERELOMA: Metall. And
Mater. Trans. 35A (2004), p. 2331.10. J. BOUQUEREL, K. VERBEKEN, B.C. De COOMAN: Acta Mater. 54
(2006), p. 1443.11. E.V. PERELOMA, I.B. TIMOKHINA, M.K. MILLER, P.D. HODGSON:
Acta Mater., 55 (2007), p. 2587.12. M.K. MILLER, Atom Probe Tomography, in: Handbook of Microscopy
for Nanotechnology, eds. N. YAO and Z.L. WANG, Kluwer AcademicPress, New York (2005), p.236.
13. B.D. CULLITY, Elements of X-ray diffraction, Addison-Wesley, Lon-don (1978) p.411.
14. M. TAKAHASHI, B.K.D.H. BHADESHIA: Mater. Trans., JIM, 32(1991),p.689.
Acciaio inossidabile
la metallurgia italiana - n. 11-12/09 49
Memorie
Ferritic Nb-alloyed Cr-Steelin simulated strip casting process
S. Lachmann, C. Klinkenberg, A. Weiss, P. R. Scheller
Nb alloyed ferritic Cr-steel is usually produced by continuous casting with following hot and coldrolling procedure. In the laboratory scale the possible new route via strip casting was studied.
The scope of the investigation in simulated process route was the development of microstructure andprecipitations. In the experiments process parameters similar to those of the real strip caster were
chosen, then those of hot rolling and cold rolling of such cast strips. The quickly solidified layer wasproduced by immersion of a steel substrate under vacuum into melt. The microstructure showed
small niobium precipitates in the grain matrix and at the grain boundaries. Their size anddistribution was evaluated for different niobium contents and cooling rates in the as-solidified
structure. The diffusion controlled change of the precipitate morphology was also analysed afterpreheating and rolling. Reprecipitation and precipitate growth, as well as dissolution of
precipitations at the grain boundaries were observed. The effect of various cooling rates and niobiumcontent on the shape and formation of niobium containing precipitates and on the grain boundary is
discussed. Thermodynamic calculations using FactSage were carried out in order to predict theprecipitation of Nb-rich phases in ferritic stainless steels. The effect of the chemical composition and
temperature on the thermodynamic stability of these precipitates was evaluated.
Stefan Lachmann, Andreas Weiss, Piotr R. SchellerInstitute of Iron and Steel Technology, Freiberg University of Mining
and Technology, Germany - E-mail: [email protected]
Christian KlinkenbergSMS-Siemag, Düsseldorf , Germany
KEYWORDS:niobium, niobium carbide, precipitates, ferritic steel, strip casting, rapid solidification
INTRODUCTIONNiobium is a fundamental alloying element in the steelmaking in-dustry.Many of today’s construction steels contain niobiumas ami-croalloying element to reach a desired strength level, high ductilityand creeping strength by precipitation hardening. In stainless steelsniobium is added to prevent a chromium carbide precipitation andtherefore to improve the corrosion resistance and in other applica-tions to improve the high-temperature strength (1-3).For steels with higher amount of precipitates the strip casting te-chnology offers an interesting possibility for material processing.Characteristic for this technology is the high cooling and solidifi-cation rate of the strip as well as the integrated casting and rollingprocess. According to this, laboratory experiments were made toget new information about the fast solidification of niobium-allo-yed, ferritic stainless steel. It was tested which parameters are cri-tical for this procedure. Thus the laboratory experimentparameters were chosen to be similar to the real strip casting pro-cedure.The main issue of this investigation was to describe the precipi-tation behaviour of niobium-containing phases during the castingand rolling process. Size and shape of them are very importantfactors influencing themechanical properties of the final product.From the results of this study it can be stated, how niobium pre-cipitations in the ferritic matrix can be affected by process para-meters.
THERMODYNAMIC CALCULATIONSIn the first stage thermodynamic calculations of niobium preci-pitation in ferritic stainless steel were performed. For this pur-pose the FactSage program was used to identify and model thestable phases during cooling at temperatures between 1550°Cand 1000°C. FactSage is based on the calculation of Gibbs ener-gies of all possible phases. By minimising this Gibbs energy themost stable phase composition of the system is calculated. It isimportant to note that kinetic aspects are not considered – so thereal microstructure can differ from these calculations.In order to approximate real solidification behaviour, segregationof the alloying elements was included in the calculations. Nio-bium for example segregates strongly to the melt which can leadto precipitation directly from the liquid. Its partition coefficientkNb which is defined as cNb, solid / cNb, liquid is around 0.3 (4).A simplified chemical composition with 16% Cr, 0.3 to 0.9% Nb,300ppm C, 250ppm N and Fe as balance was used for the calcu-lation. The model calculates the stable fraction of solid steel andprecipitates at a given temperature. The fraction of liquid steel isthen used as the start composition for the next calculation at alower temperature. In this way segregation is simulated. Additio-nally the formed fraction of solid steel is “cooled down” at thesame temperature steps and the amount of precipitates whichform in solid steel is calculated. The temperature step was set to2 K. Anyway the calculations are simplified as for the model com-plete mixing in liquid and solid phase during cooling is assumed.Additionally there is no possibility to change the partition coeffi-cients ki with respect to the cooling rate when using FactSage.The results for 0.3 and 0.9% Nb are shown in Figure 1 and Figure2.At each niobium content Nb(C,N)x starts to precipitate directlyfrom the melt as it was enriched with niobium up to 2.5% in the
Memorie
50 la metallurgia italiana - n. 11-12/09
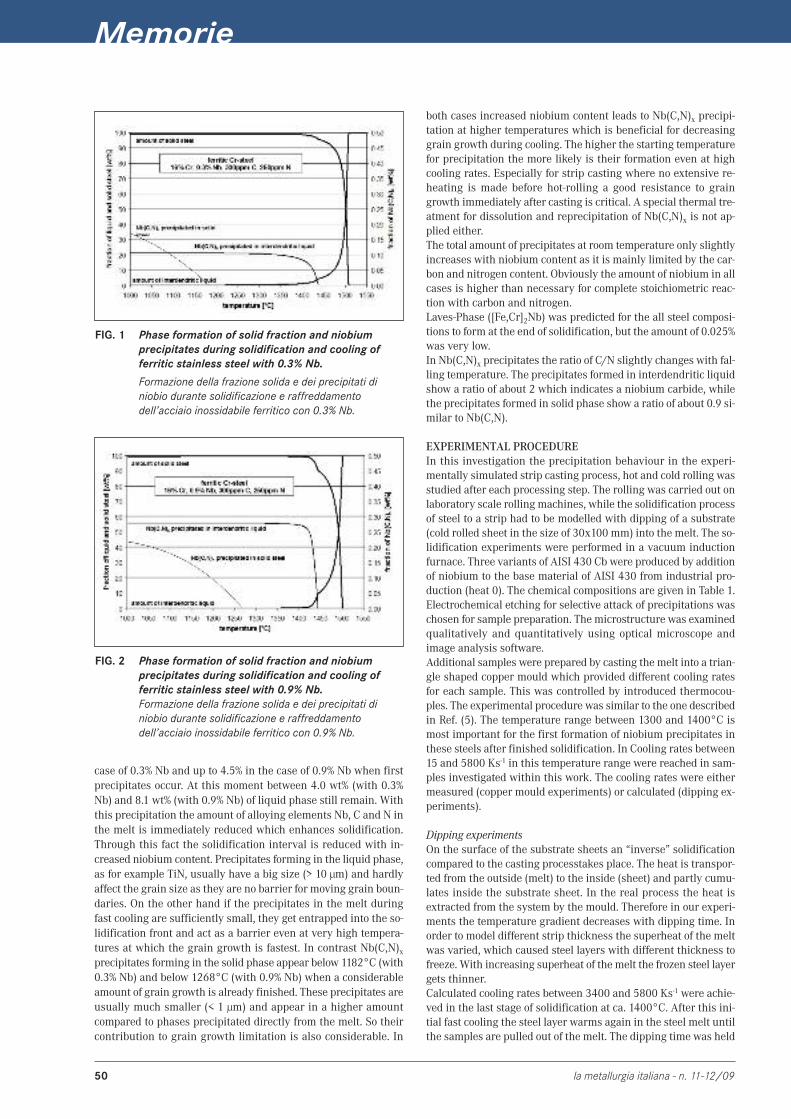
FIG. 1 Phase formation of solid fraction and niobiumprecipitates during solidification and cooling offerritic stainless steel with 0.3% Nb.
Formazione della frazione solida e dei precipitati diniobio durante solidificazione e raffreddamentodell’acciaio inossidabile ferritico con 0.3% Nb.
FIG. 2 Phase formation of solid fraction and niobiumprecipitates during solidification and cooling offerritic stainless steel with 0.9% Nb.Formazione della frazione solida e dei precipitati diniobio durante solidificazione e raffreddamentodell’acciaio inossidabile ferritico con 0.9% Nb.
case of 0.3% Nb and up to 4.5% in the case of 0.9% Nb when firstprecipitates occur. At this moment between 4.0 wt% (with 0.3%Nb) and 8.1 wt% (with 0.9% Nb) of liquid phase still remain. Withthis precipitation the amount of alloying elements Nb, C and N inthe melt is immediately reduced which enhances solidification.Through this fact the solidification interval is reduced with in-creased niobium content. Precipitates forming in the liquid phase,as for example TiN, usually have a big size (> 10 µm) and hardlyaffect the grain size as they are no barrier for moving grain boun-daries. On the other hand if the precipitates in the melt duringfast cooling are sufficiently small, they get entrapped into the so-lidification front and act as a barrier even at very high tempera-tures at which the grain growth is fastest. In contrast Nb(C,N)xprecipitates forming in the solid phase appear below 1182°C (with0.3% Nb) and below 1268°C (with 0.9% Nb) when a considerableamount of grain growth is already finished. These precipitates areusually much smaller (< 1 µm) and appear in a higher amountcompared to phases precipitated directly from the melt. So theircontribution to grain growth limitation is also considerable. In
both cases increased niobium content leads to Nb(C,N)x precipi-tation at higher temperatures which is beneficial for decreasinggrain growth during cooling. The higher the starting temperaturefor precipitation the more likely is their formation even at highcooling rates. Especially for strip casting where no extensive re-heating is made before hot-rolling a good resistance to graingrowth immediately after casting is critical. A special thermal tre-atment for dissolution and reprecipitation of Nb(C,N)x is not ap-plied either.The total amount of precipitates at room temperature only slightlyincreases with niobium content as it is mainly limited by the car-bon and nitrogen content. Obviously the amount of niobium in allcases is higher than necessary for complete stoichiometric reac-tion with carbon and nitrogen.Laves-Phase ([Fe,Cr]2Nb) was predicted for the all steel composi-tions to form at the end of solidification, but the amount of 0.025%was very low.In Nb(C,N)x precipitates the ratio of C/N slightly changes with fal-ling temperature. The precipitates formed in interdendritic liquidshow a ratio of about 2 which indicates a niobium carbide, whilethe precipitates formed in solid phase show a ratio of about 0.9 si-milar to Nb(C,N).
EXPERIMENTAL PROCEDUREIn this investigation the precipitation behaviour in the experi-mentally simulated strip casting process, hot and cold rolling wasstudied after each processing step. The rolling was carried out onlaboratory scale rolling machines, while the solidification processof steel to a strip had to be modelled with dipping of a substrate(cold rolled sheet in the size of 30x100mm) into the melt. The so-lidification experiments were performed in a vacuum inductionfurnace. Three variants of AISI 430 Cb were produced by additionof niobium to the base material of AISI 430 from industrial pro-duction (heat 0). The chemical compositions are given in Table 1.Electrochemical etching for selective attack of precipitations waschosen for sample preparation. Themicrostructure was examinedqualitatively and quantitatively using optical microscope andimage analysis software.Additional samples were prepared by casting themelt into a trian-gle shaped copper mould which provided different cooling ratesfor each sample. This was controlled by introduced thermocou-ples. The experimental procedure was similar to the one describedin Ref. (5). The temperature range between 1300 and 1400°C ismost important for the first formation of niobium precipitates inthese steels after finished solidification. In Cooling rates between15 and 5800 Ks-1 in this temperature range were reached in sam-ples investigated within this work. The cooling rates were eithermeasured (copper mould experiments) or calculated (dipping ex-periments).
Dipping experimentsOn the surface of the substrate sheets an “inverse” solidificationcompared to the casting processtakes place. The heat is transpor-ted from the outside (melt) to the inside (sheet) and partly cumu-lates inside the substrate sheet. In the real process the heat isextracted from the system by the mould. Therefore in our experi-ments the temperature gradient decreases with dipping time. Inorder to model different strip thickness the superheat of the meltwas varied, which caused steel layers with different thickness tofreeze. With increasing superheat of themelt the frozen steel layergets thinner.Calculated cooling rates between 3400 and 5800 Ks-1 were achie-ved in the last stage of solidification at ca. 1400°C. After this ini-tial fast cooling the steel layer warms again in the steel melt untilthe samples are pulled out of the melt. The dipping time was held
Acciaio inossidabile
la metallurgia italiana - n. 11-12/09 51
Heat %C %Si %Mn %Nb %Cr %Ni %N %Al %Ti %P %S
0 0.047 0.24 0.37 0.006 16.2 0.19 0.033 0.003 0.003 0.021 0.00403 0.031 0.20 0.23 0.313 16.2 0.12 0.024 0.005 0.007 0.017 0.00906 0.029 0.21 0.23 0.645 16.0 0.11 0.024 0.006 0.009 0.018 0.00809 0.032 0.18 0.19 0.964 15.8 0.13 0.025 0.008 0.011 0.019 0.009
TAB. 1 Chemical composition of steel melts (0 = base material from industrial production).
Composizione chimica dell’acciaio (0 = materiale di produzione industriale).
FIG. 3 Steel strip after dipping experiment.
Nastro di acciaio dopo l’esperimento di immersione.
constant of 1 s. The temperature at the contact between frozensteel layer and substrate varied between 1280 and 1440°C. Follo-wing a fast air cooling was performed.An example of a substrate sheet with frozen steel after dippingexperiment is shown in Figure 3. The liquidus temperature of thesteel with 0.6% Nb was measured to be 1495°C. The thickness ofthe frozen steel layer depends on melt superheat and varied bet-ween 1.5 and 2.1 mm.
Hot and cold rolling procedureSamples were hot rolled in one pass with the deformation degreebetween 22 and 29% after preheating in 10 min at 900°C. Thecold rolling was performed in three passes with total deformationdegree of 70% with respect to the as cast state. The final thick-ness of the layer was 0.4 to 0.8 mm.
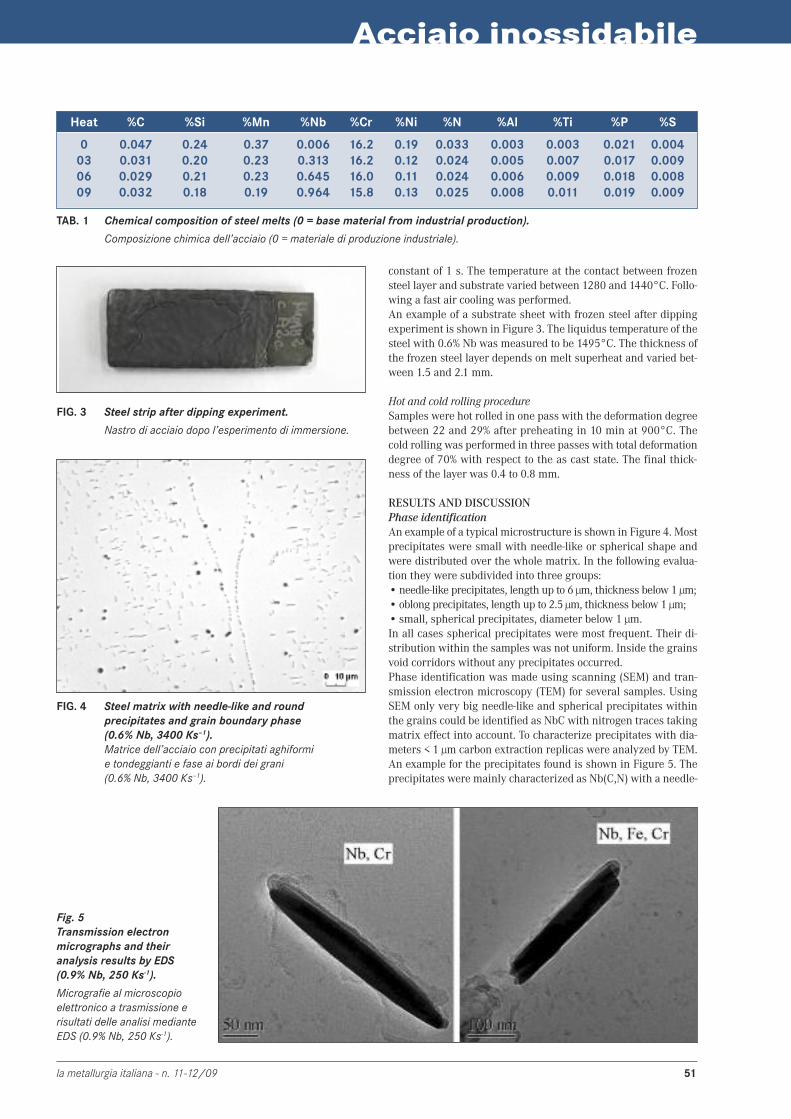
RESULTS AND DISCUSSIONPhase identificationAn example of a typical microstructure is shown in Figure 4. Mostprecipitates were small with needle-like or spherical shape andwere distributed over the whole matrix. In the following evalua-tion they were subdivided into three groups:• needle-like precipitates, length up to 6 µm, thickness below 1 µm;• oblong precipitates, length up to 2.5 µm, thickness below 1 µm;• small, spherical precipitates, diameter below 1 µm.In all cases spherical precipitates were most frequent. Their di-stribution within the samples was not uniform. Inside the grainsvoid corridors without any precipitates occurred.Phase identification was made using scanning (SEM) and tran-smission electron microscopy (TEM) for several samples. UsingSEM only very big needle-like and spherical precipitates withinthe grains could be identified as NbC with nitrogen traces takingmatrix effect into account. To characterize precipitates with dia-meters < 1 µm carbon extraction replicas were analyzed by TEM.An example for the precipitates found is shown in Figure 5. Theprecipitates were mainly characterized as Nb(C,N) with a needle-
FIG. 4 Steel matrix with needle-like and roundprecipitates and grain boundary phase(0.6% Nb, 3400 Ks–1).Matrice dell’acciaio con precipitati aghiformie tondeggianti e fase ai bordi dei grani(0.6% Nb, 3400 Ks–1).
Fig. 5Transmission electronmicrographs and theiranalysis results by EDS(0.9% Nb, 250 Ks-1).
Micrografie al microscopioelettronico a trasmissione erisultati delle analisi medianteEDS (0.9% Nb, 250 Ks-1).
Memorie
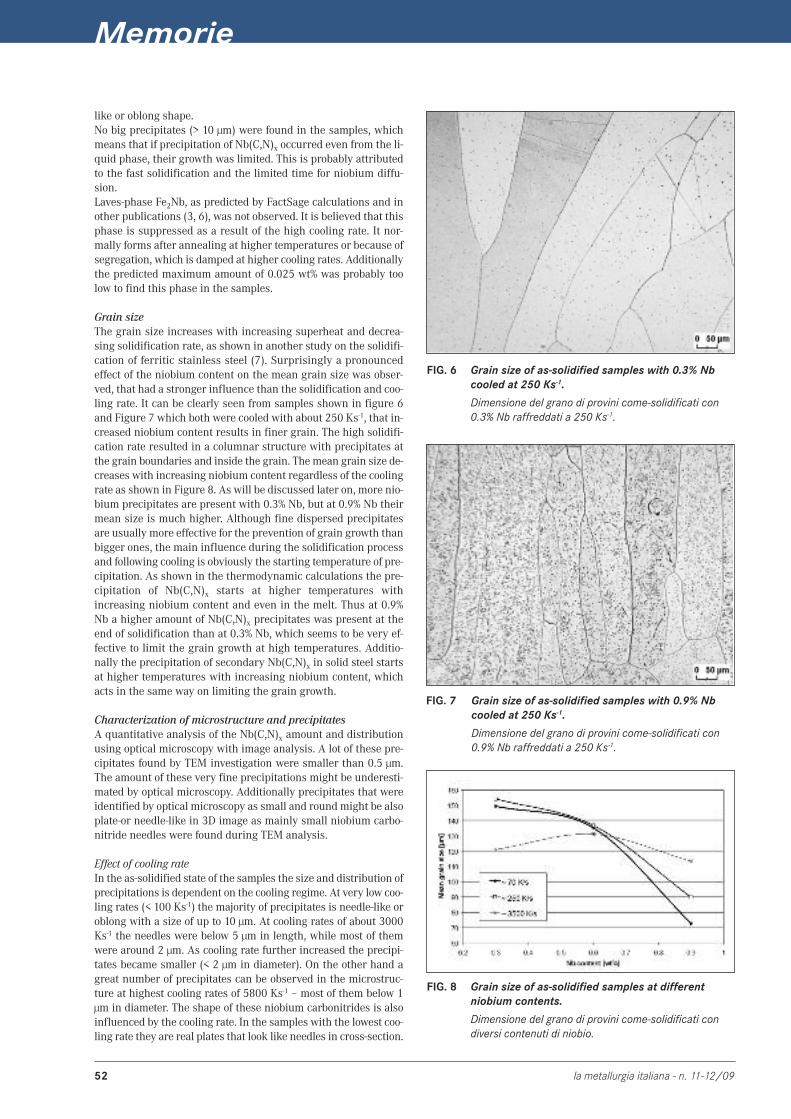
52 la metallurgia italiana - n. 11-12/09
like or oblong shape.No big precipitates (> 10 µm) were found in the samples, whichmeans that if precipitation of Nb(C,N)x occurred even from the li-quid phase, their growth was limited. This is probably attributedto the fast solidification and the limited time for niobium diffu-sion.Laves-phase Fe2Nb, as predicted by FactSage calculations and inother publications (3, 6), was not observed. It is believed that thisphase is suppressed as a result of the high cooling rate. It nor-mally forms after annealing at higher temperatures or because ofsegregation, which is damped at higher cooling rates. Additionallythe predicted maximum amount of 0.025 wt% was probably toolow to find this phase in the samples.
Grain sizeThe grain size increases with increasing superheat and decrea-sing solidification rate, as shown in another study on the solidifi-cation of ferritic stainless steel (7). Surprisingly a pronouncedeffect of the niobium content on the mean grain size was obser-ved, that had a stronger influence than the solidification and coo-ling rate. It can be clearly seen from samples shown in figure 6and Figure 7 which both were cooled with about 250 Ks-1, that in-creased niobium content results in finer grain. The high solidifi-cation rate resulted in a columnar structure with precipitates atthe grain boundaries and inside the grain. Themean grain size de-creases with increasing niobium content regardless of the coolingrate as shown in Figure 8. As will be discussed later on, more nio-bium precipitates are present with 0.3% Nb, but at 0.9% Nb theirmean size is much higher. Although fine dispersed precipitatesare usually more effective for the prevention of grain growth thanbigger ones, the main influence during the solidification processand following cooling is obviously the starting temperature of pre-cipitation. As shown in the thermodynamic calculations the pre-cipitation of Nb(C,N)x starts at higher temperatures withincreasing niobium content and even in the melt. Thus at 0.9%Nb a higher amount of Nb(C,N)x precipitates was present at theend of solidification than at 0.3% Nb, which seems to be very ef-fective to limit the grain growth at high temperatures. Additio-nally the precipitation of secondary Nb(C,N)x in solid steel startsat higher temperatures with increasing niobium content, whichacts in the same way on limiting the grain growth.
Characterization of microstructure and precipitatesA quantitative analysis of the Nb(C,N)x amount and distributionusing optical microscopy with image analysis. A lot of these pre-cipitates found by TEM investigation were smaller than 0.5 µm.The amount of these very fine precipitations might be underesti-mated by optical microscopy. Additionally precipitates that wereidentified by optical microscopy as small and roundmight be alsoplate-or needle-like in 3D image as mainly small niobium carbo-nitride needles were found during TEM analysis.
Effect of cooling rateIn the as-solidified state of the samples the size and distribution ofprecipitations is dependent on the cooling regime. At very low coo-ling rates (< 100 Ks-1) the majority of precipitates is needle-like oroblong with a size of up to 10 µm. At cooling rates of about 3000Ks-1 the needles were below 5 µm in length, while most of themwere around 2 µm. As cooling rate further increased the precipi-tates became smaller (< 2 µm in diameter). On the other hand agreat number of precipitates can be observed in the microstruc-ture at highest cooling rates of 5800 Ks-1 – most of them below 1µm in diameter. The shape of these niobium carbonitrides is alsoinfluenced by the cooling rate. In the samples with the lowest coo-ling rate they are real plates that look like needles in cross-section.
FIG. 6 Grain size of as-solidified samples with 0.3% Nbcooled at 250 Ks-1.
Dimensione del grano di provini come-solidificati con0.3% Nb raffreddati a 250 Ks-1.
FIG. 7 Grain size of as-solidified samples with 0.9% Nbcooled at 250 Ks-1.
Dimensione del grano di provini come-solidificati con0.9% Nb raffreddati a 250 Ks-1.
FIG. 8 Grain size of as-solidified samples at differentniobium contents.
Dimensione del grano di provini come-solidificati condiversi contenuti di niobio.
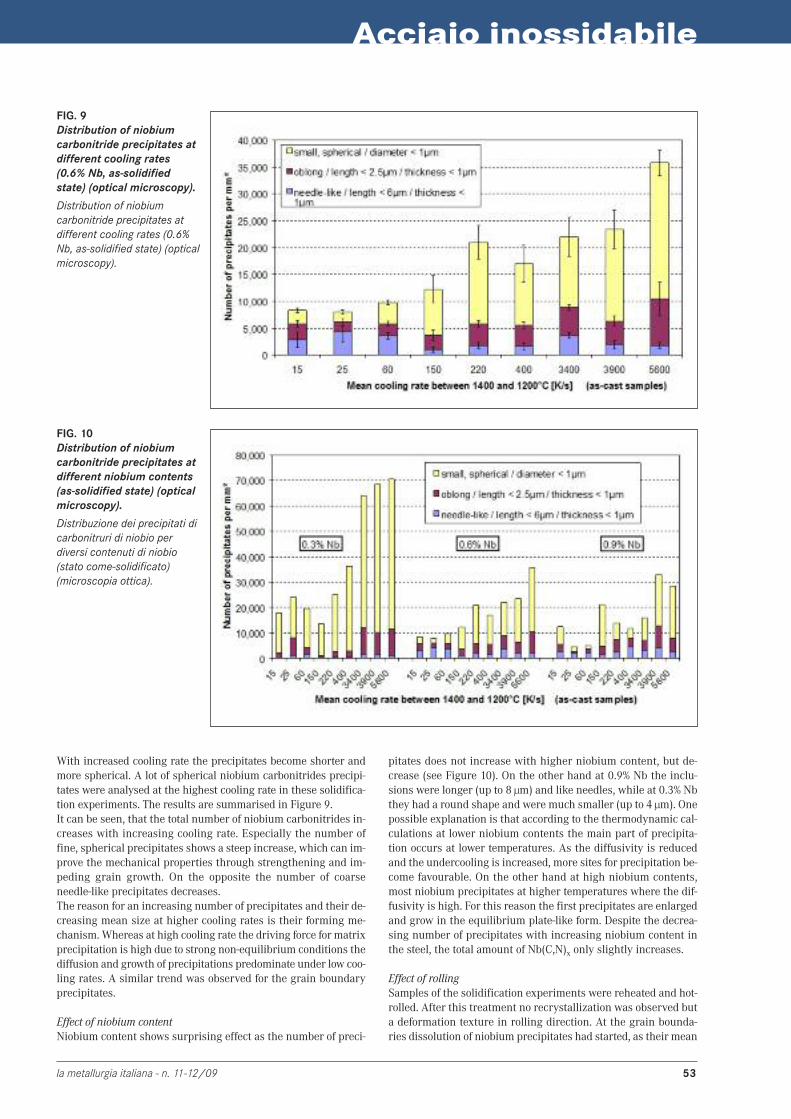
Acciaio inossidabile
la metallurgia italiana - n. 11-12/09 53
FIG. 9Distribution of niobiumcarbonitride precipitates atdifferent cooling rates(0.6% Nb, as-solidifiedstate) (optical microscopy).
Distribution of niobiumcarbonitride precipitates atdifferent cooling rates (0.6%Nb, as-solidified state) (opticalmicroscopy).
FIG. 10Distribution of niobiumcarbonitride precipitates atdifferent niobium contents(as-solidified state) (opticalmicroscopy).
Distribuzione dei precipitati dicarbonitruri di niobio perdiversi contenuti di niobio(stato come-solidificato)(microscopia ottica).
With increased cooling rate the precipitates become shorter andmore spherical. A lot of spherical niobium carbonitrides precipi-tates were analysed at the highest cooling rate in these solidifica-tion experiments. The results are summarised in Figure 9.It can be seen, that the total number of niobium carbonitrides in-creases with increasing cooling rate. Especially the number offine, spherical precipitates shows a steep increase, which can im-prove the mechanical properties through strengthening and im-peding grain growth. On the opposite the number of coarseneedle-like precipitates decreases.The reason for an increasing number of precipitates and their de-creasing mean size at higher cooling rates is their forming me-chanism.Whereas at high cooling rate the driving force for matrixprecipitation is high due to strong non-equilibrium conditions thediffusion and growth of precipitations predominate under low coo-ling rates. A similar trend was observed for the grain boundaryprecipitates.
Effect of niobium contentNiobium content shows surprising effect as the number of preci-
pitates does not increase with higher niobium content, but de-crease (see Figure 10). On the other hand at 0.9% Nb the inclu-sions were longer (up to 8 µm) and like needles, while at 0.3% Nbthey had a round shape and were much smaller (up to 4 µm). Onepossible explanation is that according to the thermodynamic cal-culations at lower niobium contents the main part of precipita-tion occurs at lower temperatures. As the diffusivity is reducedand the undercooling is increased, more sites for precipitation be-come favourable. On the other hand at high niobium contents,most niobium precipitates at higher temperatures where the dif-fusivity is high. For this reason the first precipitates are enlargedand grow in the equilibrium plate-like form. Despite the decrea-sing number of precipitates with increasing niobium content inthe steel, the total amount of Nb(C,N)x only slightly increases.
Effect of rollingSamples of the solidification experiments were reheated and hot-rolled. After this treatment no recrystallization was observed buta deformation texture in rolling direction. At the grain bounda-ries dissolution of niobium precipitates had started, as their mean

Memorie
54 la metallurgia italiana - n. 11-12/09
size decreased and the needle-like precipitates changed towardsa spherical shape. On the other hand the matrix was obviouslystill supersaturated in niobium as many new small precipitates(< 1 µm) were formed. When they reprecipitate at lower tempera-tures they do so on new-formed dislocations or around other pre-cipitates in a more equilibrium form. As a result more and finerprecipitates exist in the steel matrix.Especially at highest cooling rates the precipitates were spreadmore completely in the steel matrix and the voids were smallerafter hot-rolling. Obviously the lower the cooling rate after solidi-fication is the more completely the supersaturation of niobium inthe matrix already decreases. The potential for precipitation isthen lower when hot-rolled. On the other hand at highest coolingrates the supersaturation rests until preheating before rolling andcreates new, fine precipitates in the steel matrix. In result onlyfew differences are found for samples of low cooling rate beforeand after hot rolling.After cold rolling (without any annealing) no significant differencein the microstructure was found between hot-rolled and cold-rol-led samples. As no additional heat treatment except the self-hea-ting during rolling was applied to them, grain growth, precipitatecoarsening or reprecipitation could hardly occur. The size distri-
FIG. 11Evolution of precipitate sizedistribution aftersolidification and hot andcold rolling (opticalmicroscopy).
Evoluzione della distribuzionedella dimensione deiprecipitati doposolidificazione e laminazionea caldo e a freddo(microscopia ottica).
Figure 12: Precipitationbehaviour for differentniobium contents andcooling rates.
Comportamento nellaprecipitazione per diversicontenuti di niobio e diversevelocità di raffreddamento.
bution after hot and cold rolling compared to the as-solidified stateis shown in Figure 11.It can be stated from this study that a short heat treatment at theselow temperatures (900°C) before hot rolling – inmost cases in-lineduring the casting and rolling process – has no negative effect onthe precipitation distribution and is even beneficial.
CONCLUSIONSThe evolution of the shape and distribution of niobium precipita-tes has been studied for ferritic stainless steels. The simulation ofthe strip casting process was performed in dipping experimentswith the aim of fast solidification and high cooling rates (up to5800 Ks-1). The change of microstructure during hot- and cold-rol-ling was examined. The precipitates in the matrix were identifiedusing SEM and TEM analyses as Nb(C,N)x, which occurred in nee-dle-like or round shape with varying size. Fe2Nb-Laves-phase wasnot detected in the microstructure.Using image analysis niobium carbonitride occurrence dependingon niobium content and cooling rate was quantified and compa-red to samples with lower cooling rates (< 500 Ks-1). A short sum-mary is shown in Figure 12. At the performed cooling rates of thesamples differences in precipitate size distribution was observed.
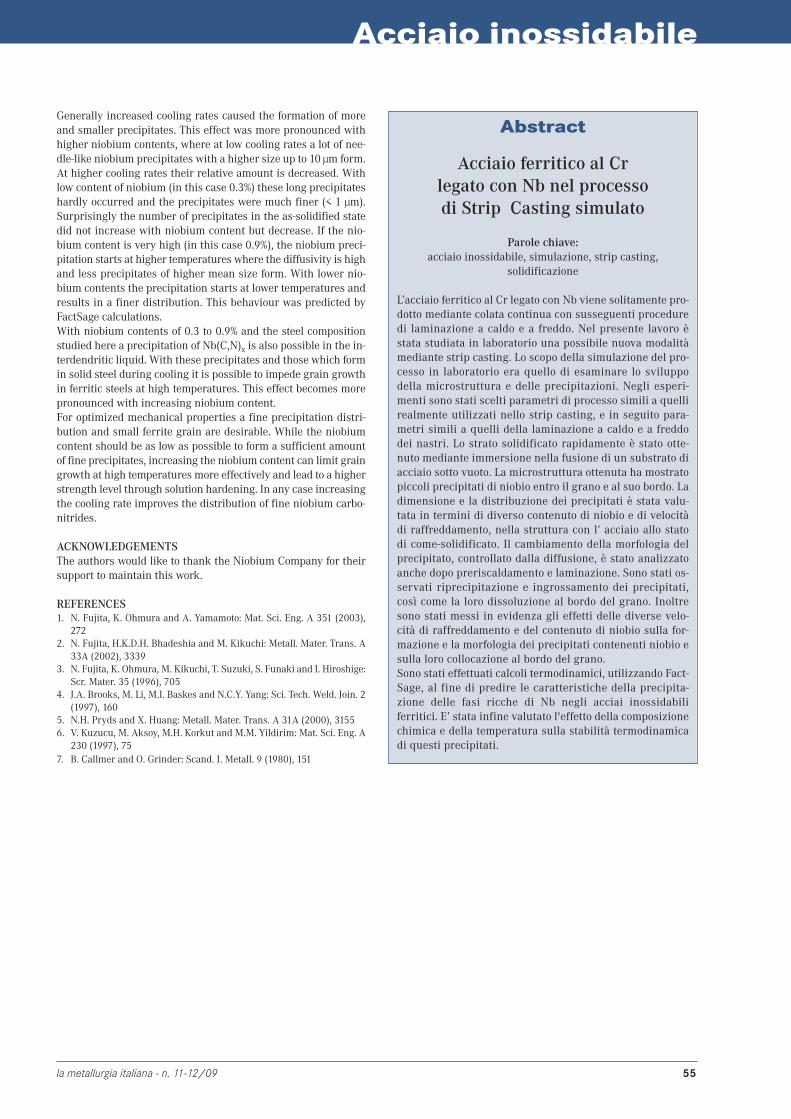
Acciaio inossidabile
la metallurgia italiana - n. 11-12/09 55
Generally increased cooling rates caused the formation of moreand smaller precipitates. This effect was more pronounced withhigher niobium contents, where at low cooling rates a lot of nee-dle-like niobium precipitates with a higher size up to 10 µm form.At higher cooling rates their relative amount is decreased. Withlow content of niobium (in this case 0.3%) these long precipitateshardly occurred and the precipitates were much finer (< 1 µm).Surprisingly the number of precipitates in the as-solidified statedid not increase with niobium content but decrease. If the nio-bium content is very high (in this case 0.9%), the niobium preci-pitation starts at higher temperatures where the diffusivity is highand less precipitates of higher mean size form. With lower nio-bium contents the precipitation starts at lower temperatures andresults in a finer distribution. This behaviour was predicted byFactSage calculations.With niobium contents of 0.3 to 0.9% and the steel compositionstudied here a precipitation of Nb(C,N)x is also possible in the in-terdendritic liquid. With these precipitates and those which formin solid steel during cooling it is possible to impede grain growthin ferritic steels at high temperatures. This effect becomes morepronounced with increasing niobium content.For optimized mechanical properties a fine precipitation distri-bution and small ferrite grain are desirable. While the niobiumcontent should be as low as possible to form a sufficient amountof fine precipitates, increasing the niobium content can limit graingrowth at high temperatures more effectively and lead to a higherstrength level through solution hardening. In any case increasingthe cooling rate improves the distribution of fine niobium carbo-nitrides.
ACKNOWLEDGEMENTSThe authors would like to thank the Niobium Company for theirsupport to maintain this work.
REFERENCES1. N. Fujita, K. Ohmura and A. Yamamoto: Mat. Sci. Eng. A 351 (2003),
2722. N. Fujita, H.K.D.H. Bhadeshia and M. Kikuchi: Metall. Mater. Trans. A
33A (2002), 33393. N. Fujita, K. Ohmura, M. Kikuchi, T. Suzuki, S. Funaki and I. Hiroshige:
Scr. Mater. 35 (1996), 7054. J.A. Brooks, M. Li, M.I. Baskes and N.C.Y. Yang: Sci. Tech. Weld. Join. 2
(1997), 1605. N.H. Pryds and X. Huang: Metall. Mater. Trans. A 31A (2000), 31556. V. Kuzucu, M. Aksoy, M.H. Korkut and M.M. Yildirim: Mat. Sci. Eng. A
230 (1997), 757. B. Callmer and O. Grinder: Scand. J. Metall. 9 (1980), 151
Abstract
Acciaio ferritico al Crlegato con Nb nel processodi Strip Casting simulato
Parole chiave:acciaio inossidabile, simulazione, strip casting,
solidificazione
L’acciaio ferritico al Cr legato con Nb viene solitamente pro-dotto mediante colata continua con susseguenti proceduredi laminazione a caldo e a freddo. Nel presente lavoro èstata studiata in laboratorio una possibile nuova modalitàmediante strip casting. Lo scopo della simulazione del pro-cesso in laboratorio era quello di esaminare lo sviluppodella microstruttura e delle precipitazioni. Negli esperi-menti sono stati scelti parametri di processo simili a quellirealmente utilizzati nello strip casting, e in seguito para-metri simili a quelli della laminazione a caldo e a freddodei nastri. Lo strato solidificato rapidamente è stato otte-nuto mediante immersione nella fusione di un substrato diacciaio sotto vuoto. La microstruttura ottenuta ha mostratopiccoli precipitati di niobio entro il grano e al suo bordo. Ladimensione e la distribuzione dei precipitati è stata valu-tata in termini di diverso contenuto di niobio e di velocitàdi raffreddamento, nella struttura con l’ acciaio allo statodi come-solidificato. Il cambiamento della morfologia delprecipitato, controllato dalla diffusione, è stato analizzatoanche dopo preriscaldamento e laminazione. Sono stati os-servati riprecipitazione e ingrossamento dei precipitati,così come la loro dissoluzione al bordo del grano. Inoltresono stati messi in evidenza gli effetti delle diverse velo-cità di raffreddamento e del contenuto di niobio sulla for-mazione e la morfologia dei precipitati contenenti niobio esulla loro collocazione al bordo del grano.Sono stati effettuati calcoli termodinamici, utilizzando Fact-Sage, al fine di predire le caratteristiche della precipita-zione delle fasi ricche di Nb negli acciai inossidabiliferritici. E’ stata infine valutato l'effetto della composizionechimica e della temperatura sulla stabilità termodinamicadi questi precipitati.
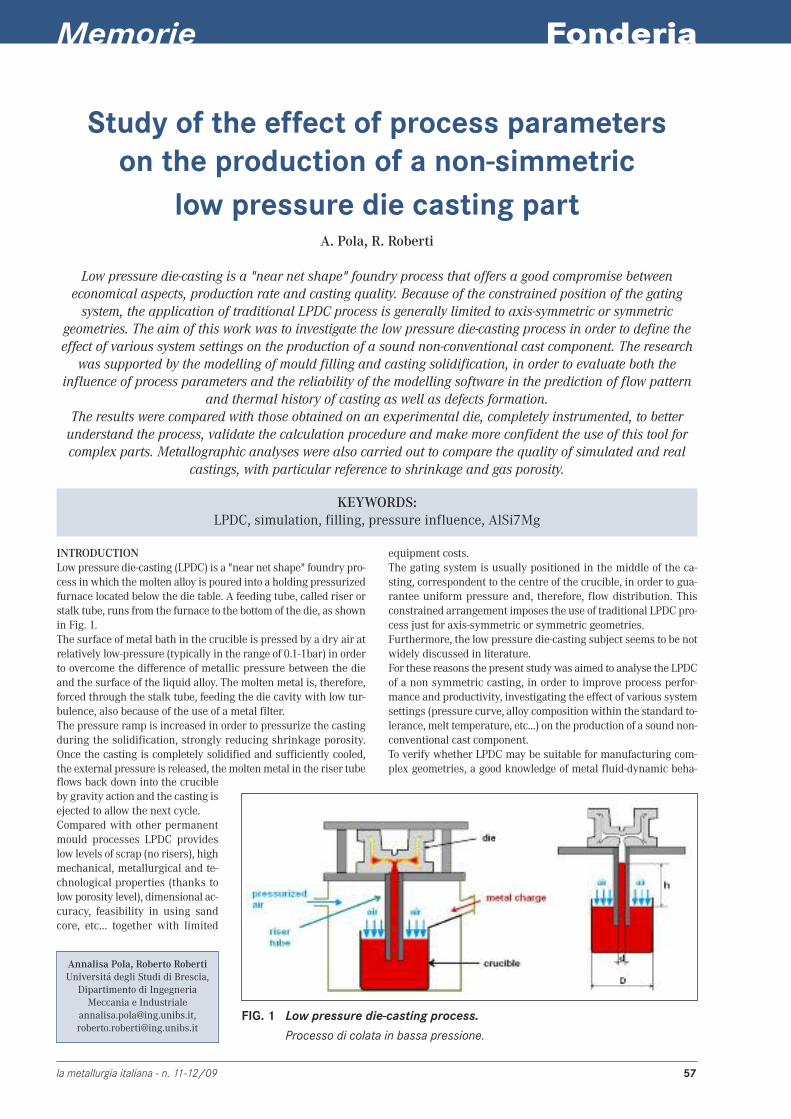
Fonderia
la metallurgia italiana - n. 11-12/09 57
Study of the effect of process parameterson the production of a non-simmetric
low pressure die casting partA. Pola, R. Roberti
Low pressure die-casting is a "near net shape" foundry process that offers a good compromise betweeneconomical aspects, production rate and casting quality. Because of the constrained position of the gating
system, the application of traditional LPDC process is generally limited to axis-symmetric or symmetricgeometries. The aim of this work was to investigate the low pressure die-casting process in order to define theeffect of various system settings on the production of a sound non-conventional cast component. The research
was supported by the modelling of mould filling and casting solidification, in order to evaluate both theinfluence of process parameters and the reliability of the modelling software in the prediction of flow pattern
and thermal history of casting as well as defects formation.The results were compared with those obtained on an experimental die, completely instrumented, to better
understand the process, validate the calculation procedure and make more confident the use of this tool forcomplex parts. Metallographic analyses were also carried out to compare the quality of simulated and real
castings, with particular reference to shrinkage and gas porosity.
KEYWORDS:LPDC, simulation, filling, pressure influence, AlSi7Mg
Annalisa Pola, Roberto RobertiUniversitá degli Studi di Brescia,
Dipartimento di IngegneriaMeccania e Industriale
[email protected],[email protected]
INTRODUCTIONLow pressure die-casting (LPDC) is a "near net shape" foundry pro-cess in which themolten alloy is poured into a holding pressurizedfurnace located below the die table. A feeding tube, called riser orstalk tube, runs from the furnace to the bottom of the die, as shownin Fig. 1.The surface of metal bath in the crucible is pressed by a dry air atrelatively low-pressure (typically in the range of 0.1-1bar) in orderto overcome the difference of metallic pressure between the dieand the surface of the liquid alloy. The molten metal is, therefore,forced through the stalk tube, feeding the die cavity with low tur-bulence, also because of the use of a metal filter.The pressure ramp is increased in order to pressurize the castingduring the solidification, strongly reducing shrinkage porosity.Once the casting is completely solidified and sufficiently cooled,the external pressure is released, themoltenmetal in the riser tube
FIG. 1 Low pressure die-casting process.
Processo di colata in bassa pressione.
flows back down into the crucibleby gravity action and the casting isejected to allow the next cycle.Compared with other permanentmould processes LPDC provideslow levels of scrap (no risers), highmechanical, metallurgical and te-chnological properties (thanks tolow porosity level), dimensional ac-curacy, feasibility in using sandcore, etc… together with limited
equipment costs.The gating system is usually positioned in the middle of the ca-sting, correspondent to the centre of the crucible, in order to gua-rantee uniform pressure and, therefore, flow distribution. Thisconstrained arrangement imposes the use of traditional LPDC pro-cess just for axis-symmetric or symmetric geometries.Furthermore, the low pressure die-casting subject seems to be notwidely discussed in literature.For these reasons the present studywas aimed to analyse the LPDCof a non symmetric casting, in order to improve process perfor-mance and productivity, investigating the effect of various systemsettings (pressure curve, alloy composition within the standard to-lerance, melt temperature, etc...) on the production of a sound non-conventional cast component.To verify whether LPDC may be suitable for manufacturing com-plex geometries, a good knowledge of metal fluid-dynamic beha-
Memorie
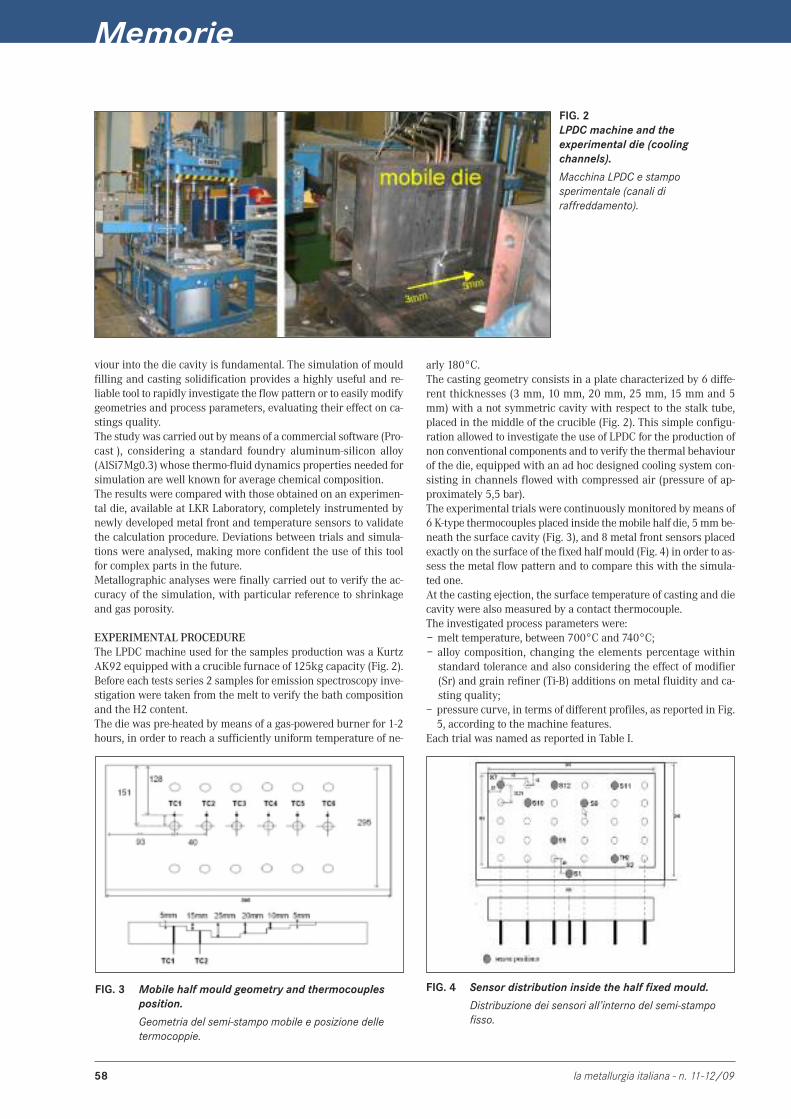
Memorie
58 la metallurgia italiana - n. 11-12/09
viour into the die cavity is fundamental. The simulation of mouldfilling and casting solidification provides a highly useful and re-liable tool to rapidly investigate the flow pattern or to easilymodifygeometries and process parameters, evaluating their effect on ca-stings quality.The studywas carried out bymeans of a commercial software (Pro-cast ), considering a standard foundry aluminum-silicon alloy(AlSi7Mg0.3) whose thermo-fluid dynamics properties needed forsimulation are well known for average chemical composition.The results were compared with those obtained on an experimen-tal die, available at LKR Laboratory, completely instrumented bynewly developed metal front and temperature sensors to validatethe calculation procedure. Deviations between trials and simula-tions were analysed, making more confident the use of this toolfor complex parts in the future.Metallographic analyses were finally carried out to verify the ac-curacy of the simulation, with particular reference to shrinkageand gas porosity.
EXPERIMENTAL PROCEDUREThe LPDC machine used for the samples production was a KurtzAK92 equipped with a crucible furnace of 125kg capacity (Fig. 2).Before each tests series 2 samples for emission spectroscopy inve-stigation were taken from the melt to verify the bath compositionand the H2 content.The die was pre-heated by means of a gas-powered burner for 1-2hours, in order to reach a sufficiently uniform temperature of ne-
FIG. 2LPDC machine and theexperimental die (coolingchannels).
Macchina LPDC e stamposperimentale (canali diraffreddamento).
FIG. 3 Mobile half mould geometry and thermocouplesposition.
Geometria del semi-stampo mobile e posizione delletermocoppie.
arly 180°C.The casting geometry consists in a plate characterized by 6 diffe-rent thicknesses (3 mm, 10 mm, 20 mm, 25 mm, 15 mm and 5mm) with a not symmetric cavity with respect to the stalk tube,placed in the middle of the crucible (Fig. 2). This simple configu-ration allowed to investigate the use of LPDC for the production ofnon conventional components and to verify the thermal behaviourof the die, equipped with an ad hoc designed cooling system con-sisting in channels flowed with compressed air (pressure of ap-proximately 5,5 bar).The experimental trials were continuouslymonitored bymeans of6 K-type thermocouples placed inside themobile half die, 5mmbe-neath the surface cavity (Fig. 3), and 8 metal front sensors placedexactly on the surface of the fixed half mould (Fig. 4) in order to as-sess the metal flow pattern and to compare this with the simula-ted one.At the casting ejection, the surface temperature of casting and diecavity were also measured by a contact thermocouple.The investigated process parameters were:− melt temperature, between 700°C and 740°C;− alloy composition, changing the elements percentage within
standard tolerance and also considering the effect of modifier(Sr) and grain refiner (Ti-B) additions on metal fluidity and ca-sting quality;
− pressure curve, in terms of different profiles, as reported in Fig.5, according to the machine features.
Each trial was named as reported in Table I.
FIG. 4 Sensor distribution inside the half fixed mould.
Distribuzione dei sensori all’interno del semi-stampofisso.

Fonderia
la metallurgia italiana - n. 11-12/09 59
Samples Chemical composition Casting T° Pressure
A Si7.11%, Mg0.4%, Sr, TiB2 740 °C 0.4-0.8 barB Si7.11%, Mg0.4%, Sr, TiB2 700 °C 0.4-0.8 barC Si7.13%, Mg0.4%, Sr, TiB2 720 °C 0.4-0.8 barD Si7.13%, Mg0.4%, Sr, TiB2 720 °C 0.4-0.8 or 0.4-0.5 barE Si7.07%, Mg0.4%, Sr, TiB2 720 °C 0.4-0.5 barF Si7.07%, Mg0.4%, Sr, TiB2 700 °C 0.5-0.6 or 0.6-0.7 barG Si6.5%, Mg0.2%, Sr, TiB2 720 °C combinations of 0.4-0.5, 0.6-0.8 barH Si7.5%, Mg0.2% 720 °C 0.6-0.8 bar higher holding time
TAB. I Investigated process parameters during casting trials.
Parametri di processo indagati durante le prove di colata.
MODELThe simulation tool used in this study to evaluate the feasibility ofthe non symmetric cavity die design is represented by the finiteelement ProCast® software, developed by ESI Group.A FE mesh was created using tetrahedral elements; Fig. 6 showsshape and mesh of the component.Temperature dependent thermo-dynamic properties of the castingalloy (A356) and mould material (H13 steel) used in the analyseswere available in the software database.Initially the temperature was set to 180°C for all nodes of the die,according to the data measured by the thermocouples at the endof the pre-heating period, and equal to 720°C for the liquid alloy,as detected by the thermocouple dipped into the melt (Table I forthe H family of samples).The boundary conditions for the calculations were set as follows:− a heat transfer coefficient, h, equal to 10 W/m2K on all the ex-
ternal surfaces of the die in contact with ambient air;− a heat exchange coefficient on the air cooling channels walls,
calculated by the well known equation:
Nu = 0.023.Re0.88.Pr0.33 if Re > 6000, Pr > 0.7 [1]
where Re, Pr e Nu are respectively the Reynolds, Prandtl and Nus-selt numbers;− pressure ramp, called inlet boundary condition, at the bottom of
the ingate cylinder, established on the basis of the experimen-tal pressure curves and in particular the pressure curve used forsamples H production (Fig. 5), which resulted to be the best con-dition during casting trials. It must be noticed that, since thebottom of the ingate cylinder does not correspond to the liquidsurface in the furnace, the pressure ramp measured in the realprocess should be shifted of a ∆P value (Fig. 1), according to thefollowing equation:
[2]
ture. Notwithstanding the almost complete filling, the A familysamples showed surface defects associated to shrinkage pheno-mena (piping in the thicker sections) as well as some distortions,both due to the high melt temperature. Therefore, the A trials setrevealed that, in these working conditions, care must be taken to
where ρ is the liquid metal density, ∆h is the height of the metalinto the riser tubewith respect to the bath surface, and D and d arerespectively the crucible and riser tube diameter.
EXPERIMENTAL RESULTSReal steady state thermal conditions were reached after some in-jections with air cooling enabled; no complete castings were pro-duced in the warm-up period, until steady state conditions wereachieved. In Fig. 7 the warm-up phase of the C production is shownas an example.The samples cast at higher melting temperature (A) were comple-tely filled (Fig. 8A), thanks to the increased fluidity with tempera-
FIG. 5 Experimental pressure profiles.
Profili di pressione sperimentali.
FIG. 6 3D geometry and mesh.
Geometria e mesh 3D.
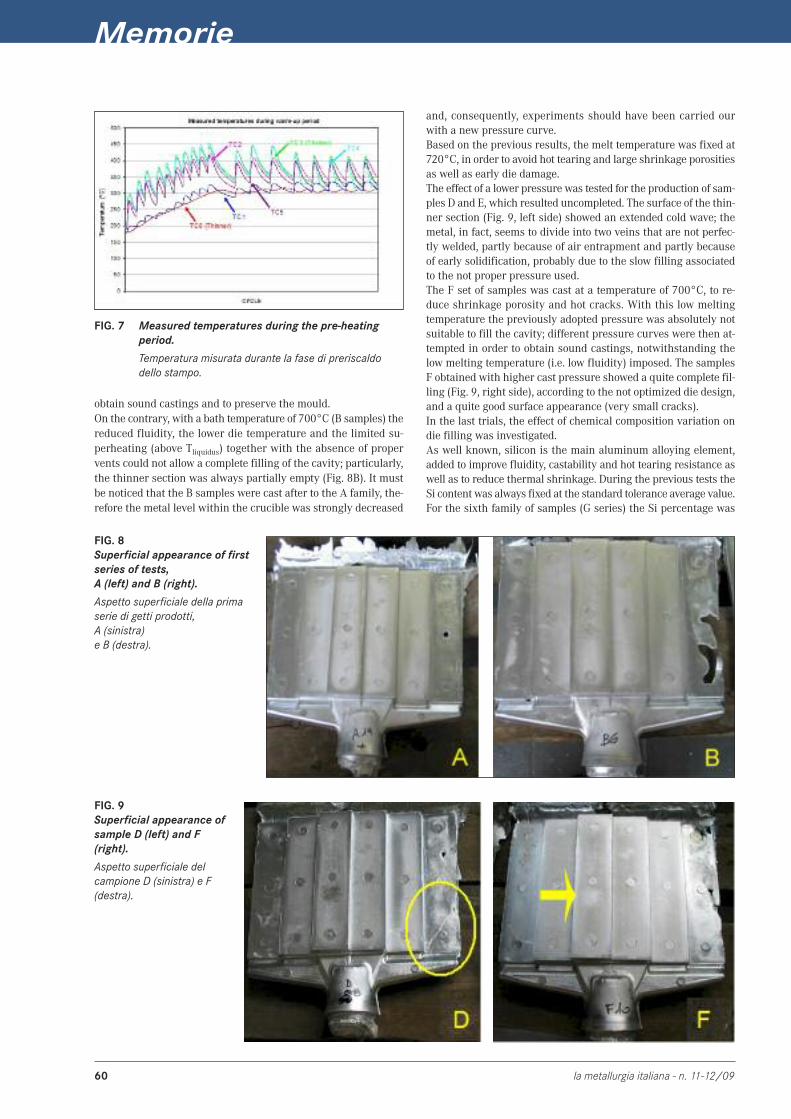
Memorie
60 la metallurgia italiana - n. 11-12/09
obtain sound castings and to preserve the mould.On the contrary, with a bath temperature of 700°C (B samples) thereduced fluidity, the lower die temperature and the limited su-perheating (above Tliquidus) together with the absence of propervents could not allow a complete filling of the cavity; particularly,the thinner section was always partially empty (Fig. 8B). It mustbe noticed that the B samples were cast after to the A family, the-refore the metal level within the crucible was strongly decreased
FIG. 7 Measured temperatures during the pre-heatingperiod.
Temperatura misurata durante la fase di preriscaldodello stampo.
and, consequently, experiments should have been carried ourwith a new pressure curve.Based on the previous results, the melt temperature was fixed at720°C, in order to avoid hot tearing and large shrinkage porositiesas well as early die damage.The effect of a lower pressure was tested for the production of sam-ples D and E, which resulted uncompleted. The surface of the thin-ner section (Fig. 9, left side) showed an extended cold wave; themetal, in fact, seems to divide into two veins that are not perfec-tly welded, partly because of air entrapment and partly becauseof early solidification, probably due to the slow filling associatedto the not proper pressure used.The F set of samples was cast at a temperature of 700°C, to re-duce shrinkage porosity and hot cracks. With this low meltingtemperature the previously adopted pressure was absolutely notsuitable to fill the cavity; different pressure curves were then at-tempted in order to obtain sound castings, notwithstanding thelow melting temperature (i.e. low fluidity) imposed. The samplesF obtained with higher cast pressure showed a quite complete fil-ling (Fig. 9, right side), according to the not optimized die design,and a quite good surface appearance (very small cracks).In the last trials, the effect of chemical composition variation ondie filling was investigated.As well known, silicon is the main aluminum alloying element,added to improve fluidity, castability and hot tearing resistance aswell as to reduce thermal shrinkage. During the previous tests theSi content was always fixed at the standard tolerance average value.For the sixth family of samples (G series) the Si percentage was
FIG. 8Superficial appearance of firstseries of tests,A (left) and B (right).
Aspetto superficiale della primaserie di getti prodotti,A (sinistra)e B (destra).
FIG. 9Superficial appearance ofsample D (left) and F(right).
Aspetto superficiale delcampione D (sinistra) e F(destra).
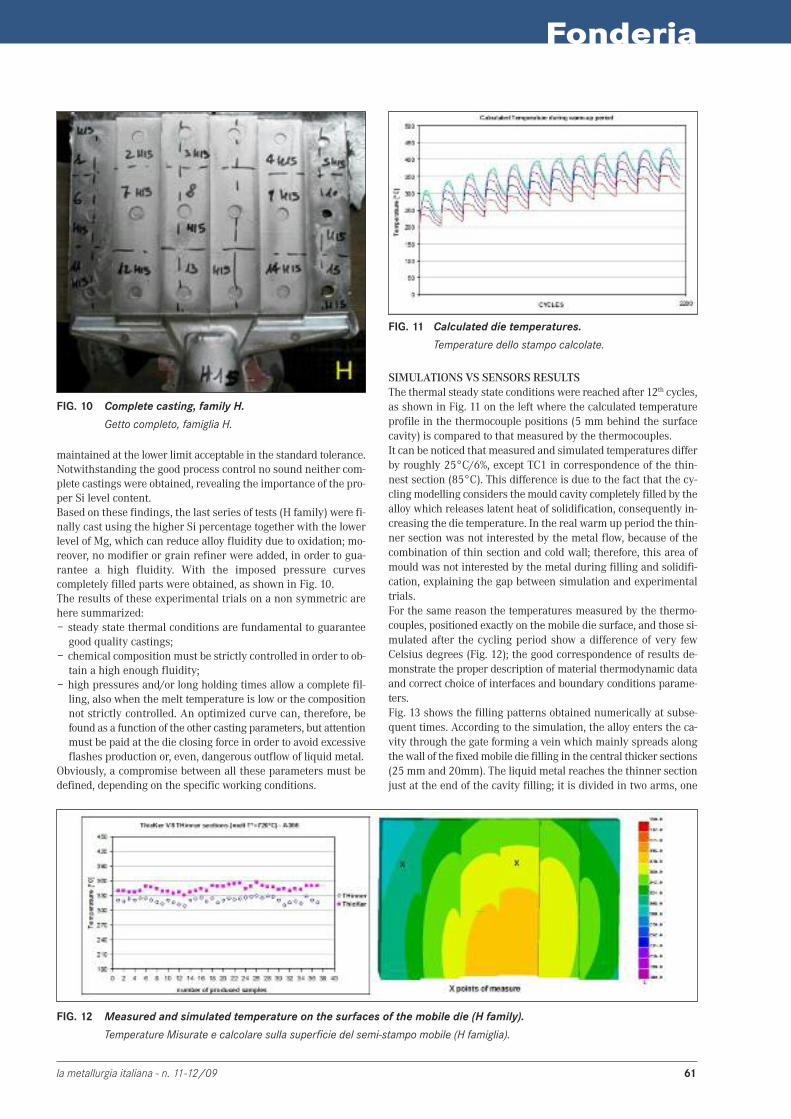
Fonderia
la metallurgia italiana - n. 11-12/09 61
FIG. 10 Complete casting, family H.
Getto completo, famiglia H.
maintained at the lower limit acceptable in the standard tolerance.Notwithstanding the good process control no sound neither com-plete castings were obtained, revealing the importance of the pro-per Si level content.Based on these findings, the last series of tests (H family) were fi-nally cast using the higher Si percentage together with the lowerlevel of Mg, which can reduce alloy fluidity due to oxidation; mo-reover, no modifier or grain refiner were added, in order to gua-rantee a high fluidity. With the imposed pressure curvescompletely filled parts were obtained, as shown in Fig. 10.The results of these experimental trials on a non symmetric arehere summarized:− steady state thermal conditions are fundamental to guarantee
good quality castings;− chemical composition must be strictly controlled in order to ob-
tain a high enough fluidity;− high pressures and/or long holding times allow a complete fil-
ling, also when the melt temperature is low or the compositionnot strictly controlled. An optimized curve can, therefore, befound as a function of the other casting parameters, but attentionmust be paid at the die closing force in order to avoid excessiveflashes production or, even, dangerous outflow of liquid metal.
Obviously, a compromise between all these parameters must bedefined, depending on the specific working conditions.
SIMULATIONS VS SENSORS RESULTSThe thermal steady state conditions were reached after 12th cycles,as shown in Fig. 11 on the left where the calculated temperatureprofile in the thermocouple positions (5 mm behind the surfacecavity) is compared to that measured by the thermocouples.It can be noticed that measured and simulated temperatures differby roughly 25°C/6%, except TC1 in correspondence of the thin-nest section (85°C). This difference is due to the fact that the cy-clingmodelling considers themould cavity completely filled by thealloy which releases latent heat of solidification, consequently in-creasing the die temperature. In the real warm up period the thin-ner section was not interested by the metal flow, because of thecombination of thin section and cold wall; therefore, this area ofmould was not interested by the metal during filling and solidifi-cation, explaining the gap between simulation and experimentaltrials.For the same reason the temperatures measured by the thermo-couples, positioned exactly on the mobile die surface, and those si-mulated after the cycling period show a difference of very fewCelsius degrees (Fig. 12); the good correspondence of results de-monstrate the proper description of material thermodynamic dataand correct choice of interfaces and boundary conditions parame-ters.Fig. 13 shows the filling patterns obtained numerically at subse-quent times. According to the simulation, the alloy enters the ca-vity through the gate forming a vein which mainly spreads alongthewall of the fixedmobile die filling in the central thicker sections(25 mm and 20mm). The liquid metal reaches the thinner sectionjust at the end of the cavity filling; it is divided in two arms, one
FIG. 11 Calculated die temperatures.
Temperature dello stampo calcolate.
FIG. 12 Measured and simulated temperature on the surfaces of the mobile die (H family).
Temperature Misurate e calcolare sulla superficie del semi-stampo mobile (H famiglia).
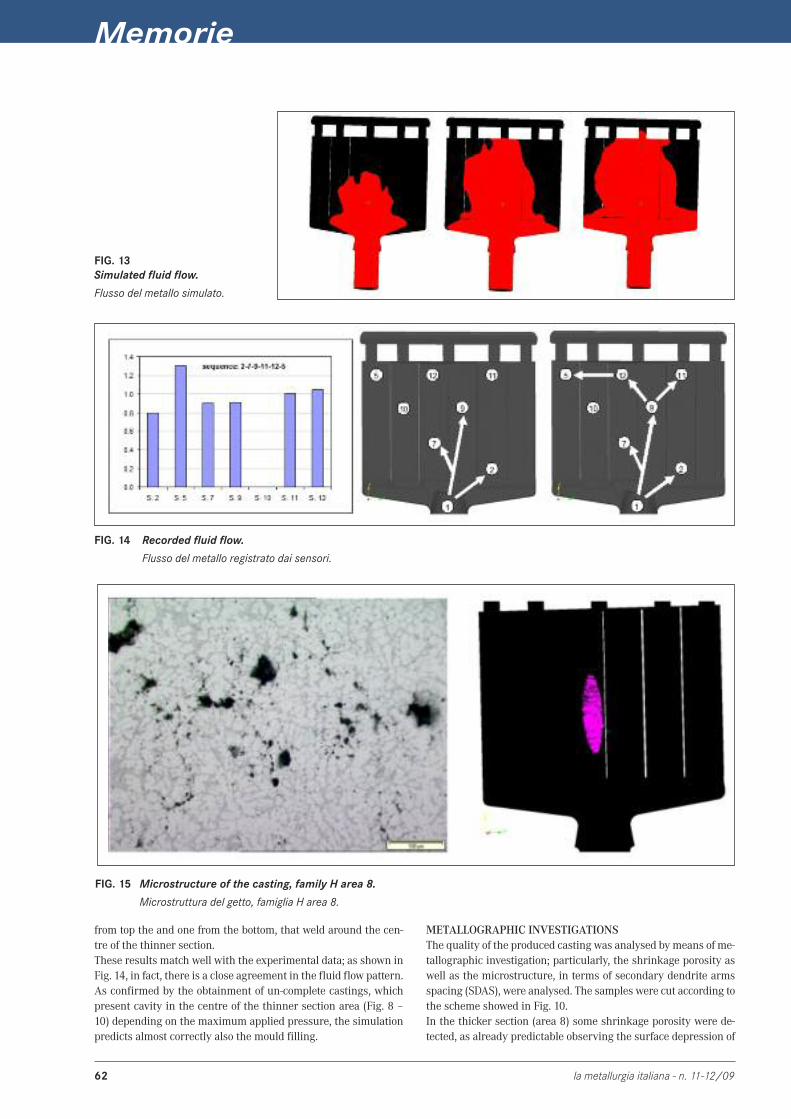
Memorie
62 la metallurgia italiana - n. 11-12/09
FIG. 13Simulated fluid flow.
Flusso del metallo simulato.
from top the and one from the bottom, that weld around the cen-tre of the thinner section.These results match well with the experimental data; as shown inFig. 14, in fact, there is a close agreement in the fluid flow pattern.As confirmed by the obtainment of un-complete castings, whichpresent cavity in the centre of the thinner section area (Fig. 8 –10) depending on the maximum applied pressure, the simulationpredicts almost correctly also the mould filling.
METALLOGRAPHIC INVESTIGATIONSThe quality of the produced casting was analysed bymeans of me-tallographic investigation; particularly, the shrinkage porosity aswell as the microstructure, in terms of secondary dendrite armsspacing (SDAS), were analysed. The samples were cut according tothe scheme showed in Fig. 10.In the thicker section (area 8) some shrinkage porosity were de-tected, as already predictable observing the surface depression of
FIG. 14 Recorded fluid flow.
Flusso del metallo registrato dai sensori.
FIG. 15 Microstructure of the casting, family H area 8.
Microstruttura del getto, famiglia H area 8.
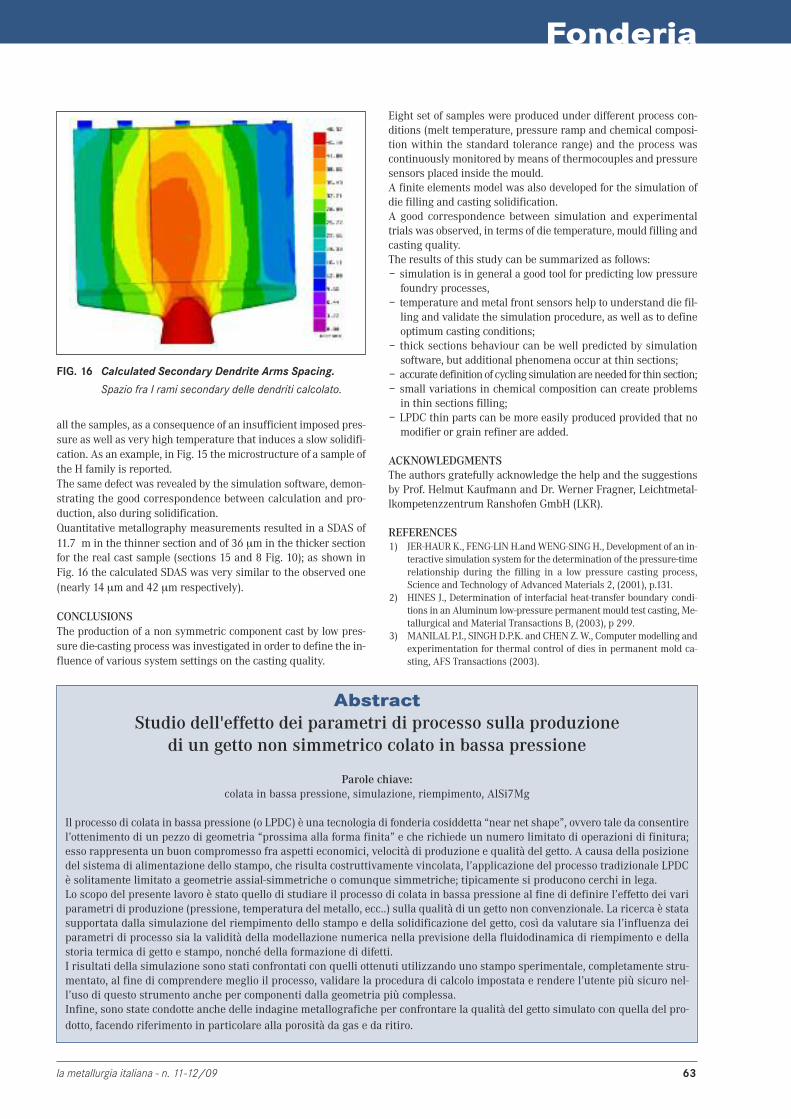
Fonderia
la metallurgia italiana - n. 11-12/09 63
FIG. 16 Calculated Secondary Dendrite Arms Spacing.
Spazio fra I rami secondary delle dendriti calcolato.
all the samples, as a consequence of an insufficient imposed pres-sure as well as very high temperature that induces a slow solidifi-cation. As an example, in Fig. 15 the microstructure of a sample ofthe H family is reported.The same defect was revealed by the simulation software, demon-strating the good correspondence between calculation and pro-duction, also during solidification.Quantitative metallography measurements resulted in a SDAS of11.7 m in the thinner section and of 36 µm in the thicker sectionfor the real cast sample (sections 15 and 8 Fig. 10); as shown inFig. 16 the calculated SDAS was very similar to the observed one(nearly 14 µm and 42 µm respectively).
CONCLUSIONSThe production of a non symmetric component cast by low pres-sure die-casting process was investigated in order to define the in-fluence of various system settings on the casting quality.
Eight set of samples were produced under different process con-ditions (melt temperature, pressure ramp and chemical composi-tion within the standard tolerance range) and the process wascontinuously monitored bymeans of thermocouples and pressuresensors placed inside the mould.A finite elements model was also developed for the simulation ofdie filling and casting solidification.A good correspondence between simulation and experimentaltrials was observed, in terms of die temperature, mould filling andcasting quality.The results of this study can be summarized as follows:− simulation is in general a good tool for predicting low pressure
foundry processes,− temperature and metal front sensors help to understand die fil-
ling and validate the simulation procedure, as well as to defineoptimum casting conditions;
− thick sections behaviour can be well predicted by simulationsoftware, but additional phenomena occur at thin sections;
− accuratedefinitionof cyclingsimulationareneeded for thin section;− small variations in chemical composition can create problems
in thin sections filling;− LPDC thin parts can be more easily produced provided that no
modifier or grain refiner are added.
ACKNOWLEDGMENTSThe authors gratefully acknowledge the help and the suggestionsby Prof. Helmut Kaufmann and Dr. Werner Fragner, Leichtmetal-lkompetenzzentrum Ranshofen GmbH (LKR).
REFERENCES1) JER-HAURK., FENG-LIN H.andWENG-SINGH., Development of an in-
teractive simulation system for the determination of the pressure-timerelationship during the filling in a low pressure casting process,Science and Technology of Advanced Materials 2, (2001), p.131.
2) HINES J., Determination of interfacial heat-transfer boundary condi-tions in an Aluminum low-pressure permanentmould test casting,Me-tallurgical and Material Transactions B, (2003), p 299.
3) MANILAL P.I., SINGHD.P.K. and CHEN Z.W., Computermodelling andexperimentation for thermal control of dies in permanent mold ca-sting, AFS Transactions (2003).
AbstractStudio dell'effetto dei parametri di processo sulla produzione
di un getto non simmetrico colato in bassa pressione
Parole chiave:colata in bassa pressione, simulazione, riempimento, AlSi7Mg
Il processo di colata in bassa pressione (o LPDC) è una tecnologia di fonderia cosiddetta “near net shape”, ovvero tale da consentirel’ottenimento di un pezzo di geometria “prossima alla forma finita” e che richiede un numero limitato di operazioni di finitura;esso rappresenta un buon compromesso fra aspetti economici, velocità di produzione e qualità del getto. A causa della posizionedel sistema di alimentazione dello stampo, che risulta costruttivamente vincolata, l’applicazione del processo tradizionale LPDCè solitamente limitato a geometrie assial-simmetriche o comunque simmetriche; tipicamente si producono cerchi in lega.Lo scopo del presente lavoro è stato quello di studiare il processo di colata in bassa pressione al fine di definire l’effetto dei variparametri di produzione (pressione, temperatura del metallo, ecc..) sulla qualità di un getto non convenzionale. La ricerca è statasupportata dalla simulazione del riempimento dello stampo e della solidificazione del getto, così da valutare sia l’influenza deiparametri di processo sia la validità della modellazione numerica nella previsione della fluidodinamica di riempimento e dellastoria termica di getto e stampo, nonché della formazione di difetti.I risultati della simulazione sono stati confrontati con quelli ottenuti utilizzando uno stampo sperimentale, completamente stru-mentato, al fine di comprendere meglio il processo, validare la procedura di calcolo impostata e rendere l’utente più sicuro nel-l’uso di questo strumento anche per componenti dalla geometria più complessa.Infine, sono state condotte anche delle indagine metallografiche per confrontare la qualità del getto simulato con quella del pro-dotto, facendo riferimento in particolare alla porosità da gas e da ritiro.
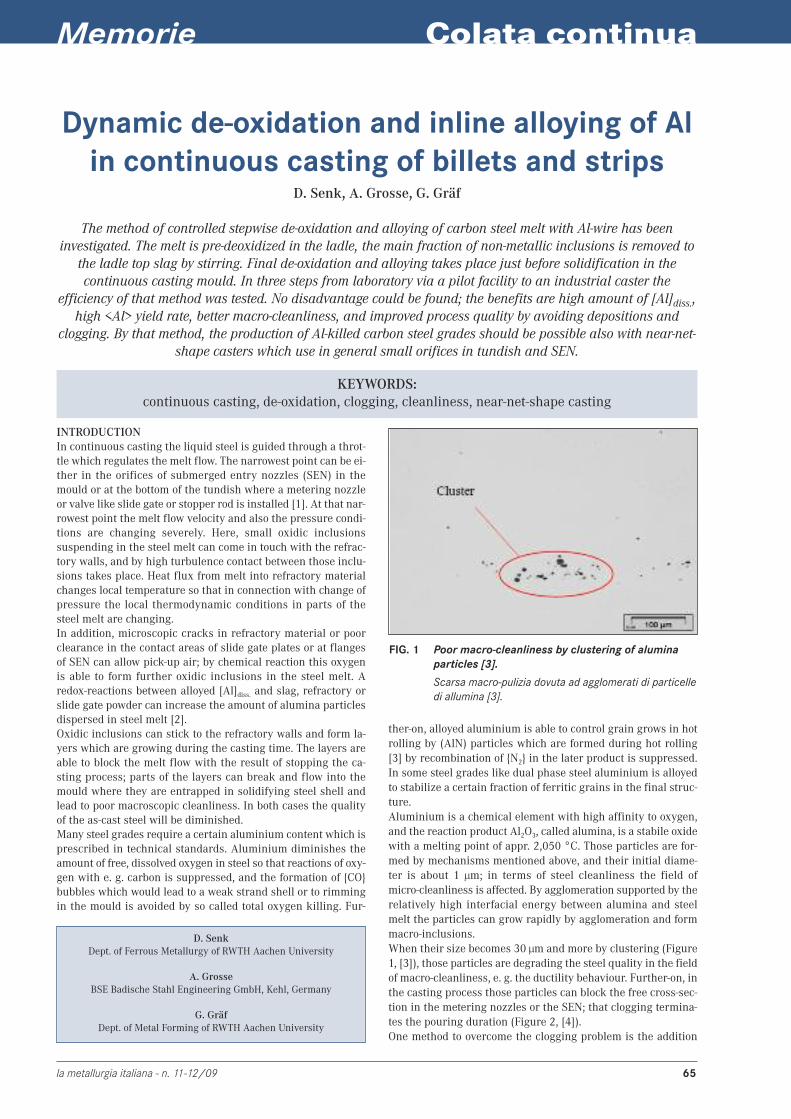
Colata continua
la metallurgia italiana - n. 11-12/09 65
Dynamic de-oxidation and inline alloying of Alin continuous casting of billets and strips
D. Senk, A. Grosse, G. Gräf
The method of controlled stepwise de-oxidation and alloying of carbon steel melt with Al-wire has beeninvestigated. The melt is pre-deoxidized in the ladle, the main fraction of non-metallic inclusions is removed to
the ladle top slag by stirring. Final de-oxidation and alloying takes place just before solidification in thecontinuous casting mould. In three steps from laboratory via a pilot facility to an industrial caster the
efficiency of that method was tested. No disadvantage could be found; the benefits are high amount of [Al]diss.,high <Al> yield rate, better macro-cleanliness, and improved process quality by avoiding depositions and
clogging. By that method, the production of Al-killed carbon steel grades should be possible also with near-net-shape casters which use in general small orifices in tundish and SEN.
KEYWORDS:continuous casting, de-oxidation, clogging, cleanliness, near-net-shape casting
D. SenkDept. of Ferrous Metallurgy of RWTH Aachen University
A. GrosseBSE Badische Stahl Engineering GmbH, Kehl, Germany
G. GräfDept. of Metal Forming of RWTH Aachen University
INTRODUCTIONIn continuous casting the liquid steel is guided through a throt-tle which regulates the melt flow. The narrowest point can be ei-ther in the orifices of submerged entry nozzles (SEN) in themould or at the bottom of the tundish where a metering nozzleor valve like slide gate or stopper rod is installed [1]. At that nar-rowest point the melt flow velocity and also the pressure condi-tions are changing severely. Here, small oxidic inclusionssuspending in the steel melt can come in touch with the refrac-tory walls, and by high turbulence contact between those inclu-sions takes place. Heat flux from melt into refractory materialchanges local temperature so that in connection with change ofpressure the local thermodynamic conditions in parts of thesteel melt are changing.In addition, microscopic cracks in refractory material or poorclearance in the contact areas of slide gate plates or at flangesof SEN can allow pick-up air; by chemical reaction this oxygenis able to form further oxidic inclusions in the steel melt. Aredox-reactions between alloyed [Al]diss. and slag, refractory orslide gate powder can increase the amount of alumina particlesdispersed in steel melt [2].Oxidic inclusions can stick to the refractory walls and form la-yers which are growing during the casting time. The layers areable to block the melt flow with the result of stopping the ca-sting process; parts of the layers can break and flow into themould where they are entrapped in solidifying steel shell andlead to poor macroscopic cleanliness. In both cases the qualityof the as-cast steel will be diminished.Many steel grades require a certain aluminium content which isprescribed in technical standards. Aluminium diminishes theamount of free, dissolved oxygen in steel so that reactions of oxy-gen with e. g. carbon is suppressed, and the formation of {CO}bubbles which would lead to a weak strand shell or to rimmingin the mould is avoided by so called total oxygen killing. Fur-
ther-on, alloyed aluminium is able to control grain grows in hotrolling by (AlN) particles which are formed during hot rolling[3] by recombination of {N2} in the later product is suppressed.In some steel grades like dual phase steel aluminium is alloyedto stabilize a certain fraction of ferritic grains in the final struc-ture.Aluminium is a chemical element with high affinity to oxygen,and the reaction product Al2O3, called alumina, is a stabile oxidewith a melting point of appr. 2,050 °C. Those particles are for-med by mechanisms mentioned above, and their initial diame-ter is about 1 µm; in terms of steel cleanliness the field ofmicro-cleanliness is affected. By agglomeration supported by therelatively high interfacial energy between alumina and steelmelt the particles can grow rapidly by agglomeration and formmacro-inclusions.When their size becomes 30 µm and more by clustering (Figure1, [3]), those particles are degrading the steel quality in the fieldof macro-cleanliness, e. g. the ductility behaviour. Further-on, inthe casting process those particles can block the free cross-sec-tion in the metering nozzles or the SEN; that clogging termina-tes the pouring duration (Figure 2, [4]).One method to overcome the clogging problem is the addition
FIG. 1 Poor macro-cleanliness by clustering of aluminaparticles [3].
Scarsa macro-pulizia dovuta ad agglomerati di particelledi allumina [3].
Memorie

Memorie
66 la metallurgia italiana - n. 11-12/09
FIG. 2Diminished cross sections ofSEN by deposition of alumina[4].
Riduzione della sezione trasversaledel SEN a causa del deposito diallumina [4].
of calcium by ladle metallurgy [5]; the formed calcium-alumi-nates are liquid at pouring temperature so that plating effectsare avoided. Concerning macro-cleanliness that method is notthe ultimate solution, but helps to prevent of clogging during ca-sting sequences.Particularly, small cross-sections of metering nozzles and SEN ofbillet or strip casters are affected by clogging problems on alu-mina basis. In many cases aluminium addition has to be avoided,and the oxygen in steel is killed by [Si] and [Mn]. The steel gra-des containing higher concentrations of aluminium cannot beproduced in those cases. To overcome this problem a method ofadding aluminium in several subsequent steps in the processchain has been investigated; the required dissolved aluminiumcontent is alloyed by ‘DDA, Dynamic-Deoxidation-Alloying’ or‘alloying on demand’.
THEORETICAL BACKGROUNDThe formation of dangerous alumina particles starts spontane-ously by almost homogeneous nucleation in the melt when thesolubility product of the reaction
2 [Al] + 3 [O] -> (Al2O3) with LAl2O3= [aAl]2 · [aO]3 (1)
L: solubility product at chemical equilibrium[Al], [O]: dissolved elements(Al2O3): solid alumina[ai]: thermodynamic activity in the steel melt, a<Al2O3> = 1
is reached. This temperature depending reaction is described bylog10KAl2O3
=-64,000/T+20.57 [6]and L=1/K (2a)
of an inline-measurement of oxygen activity e. g. using a Celox®-system. Here, not the [O]diss. is minimized, but the [Al]diss. to pre-vent of alumina formation. The following example shows the wayof estimation of aluminium mass flow into the melt which is re-quired to meet correctly the demanded final [Al]diss. value in thesteel just before solidification (Figure 3).1) start-up oxygen content in the melt before de-oxidation,
[O]start: 100 ppmdemanded oxygen content at solidification, [O]final: 3 ppmdemanded diss. aluminium content in the as-cast strand,[Al]final: 400 ppm
2) Aluminium is added into the melt to diminish [O]diss. to about20 ppm, and the alumina is removed to the ladle top slag bystirring: ∆[O]=80 ppm; the corresponding [Al]diss. concen-tration at 1,600 °C is about 0.002 wt% (resp. eq. (1) and (2)).
3) The demanded <Al> is fed by Al-wire into the melt duringpouring:∆[Al]added = [Al]demand. - [Al]de-ox. = 400-20 = 380 ppm; (3)if there is a leakage of oxygen the unwanted oxygen flux rateof d[O]/dt must be taken into account.
The mass flow of aluminium is calculated by
at 1,600 °C. (2b)
The following steps of formation of micro- or macro-inclusions onthe basis of stabile nuclei are [7]:- growth by diffusion,- Ostwald ripening,- gradient, Brown, turbulence, or Stokes collisions.The idea of control the particle formation is the application ofaluminium to the steel in the ladle up to an amount which di-minishes the oxygen concentration to about [aO]=20 ppm (totallykilled steel), remove the particles as far as possible by ladle me-tallurgical treatment e. g. by soft bubbling Ar stirring, and addthe required dissolved aluminium by alloying in tundish, SEN,and in mould. The dynamic alloying shall be based on the result
(4)
(5)
(6)
The DDA method can be carried out by spot measurement of oxy-gen activity or by using a continuously working probe. For fullyautomated [Al]-feeding that continuous method would be pre-ferred but there are no commercial probes available. To over-come that lack a development of probes has been started by thecompany Heraeus-Electronite and RWTH Aachen Universitywhere the measuring period of a Celox®-probe based on elec-tromotive forces was extended from regularly 15 s to 2 min [3].
EXPERIMENTAL SET-UPThe DDA method has been tested in 3 steps:1) In the beginning the twin roll casting process was the goal toapprove castability and macro-cleanliness of carbon steel grades.The near-net-shape casting process and laboratory experimentalsimulations have been described in an earlier publication [8]: Thefurnace, the runner system and the casting tundish including theSEN of the RWTH Aachen twin roll caster at the Dept. of MetalForming were copied for pouring experiments at the Dept. of Fer-rous Metallurgy. There, a 500 kg induction furnace prepared the
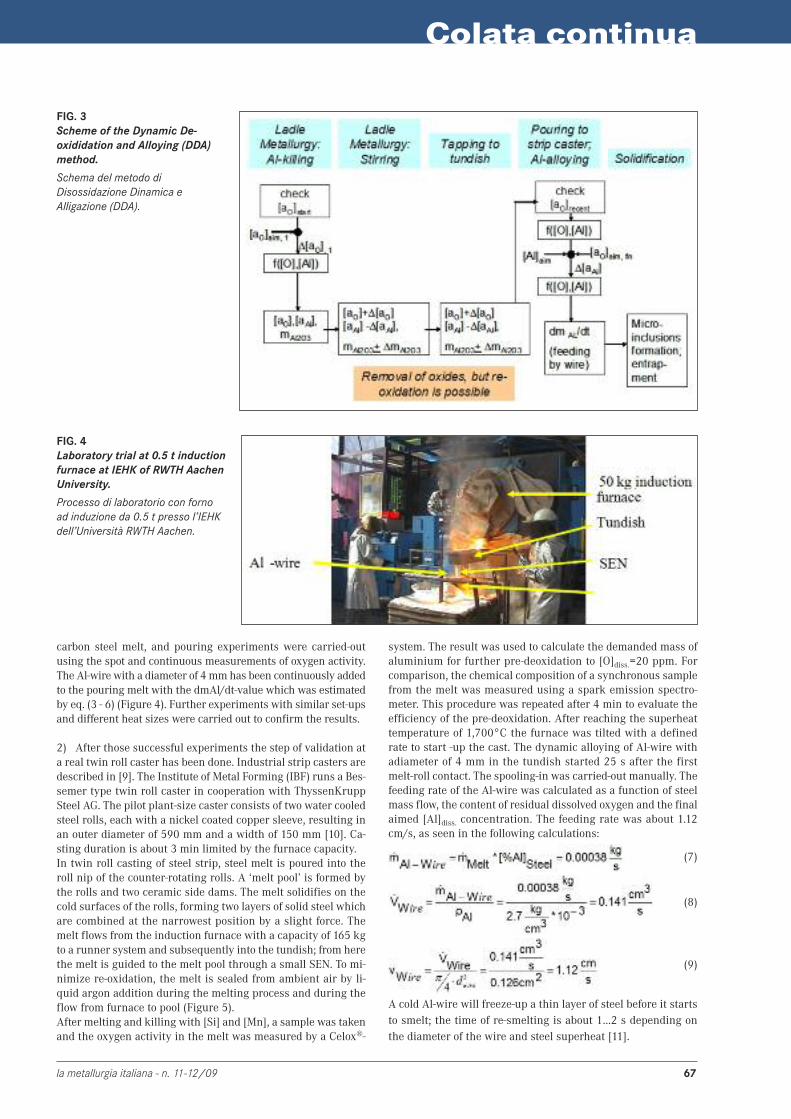
Colata continua
la metallurgia italiana - n. 11-12/09 67
FIG. 3Scheme of the Dynamic De-oxididation and Alloying (DDA)method.
Schema del metodo diDisossidazione Dinamica eAlligazione (DDA).
FIG. 4Laboratory trial at 0.5 t inductionfurnace at IEHK of RWTH AachenUniversity.
Processo di laboratorio con fornoad induzione da 0.5 t presso l’IEHKdell’Università RWTH Aachen.
carbon steel melt, and pouring experiments were carried-outusing the spot and continuous measurements of oxygen activity.The Al-wire with a diameter of 4 mm has been continuously addedto the pouring melt with the dmAl/dt-value which was estimatedby eq. (3 - 6) (Figure 4). Further experiments with similar set-upsand different heat sizes were carried out to confirm the results.
2) After those successful experiments the step of validation ata real twin roll caster has been done. Industrial strip casters aredescribed in [9]. The Institute of Metal Forming (IBF) runs a Bes-semer type twin roll caster in cooperation with ThyssenKruppSteel AG. The pilot plant-size caster consists of two water cooledsteel rolls, each with a nickel coated copper sleeve, resulting inan outer diameter of 590 mm and a width of 150 mm [10]. Ca-sting duration is about 3 min limited by the furnace capacity.In twin roll casting of steel strip, steel melt is poured into theroll nip of the counter-rotating rolls. A ‘melt pool’ is formed bythe rolls and two ceramic side dams. The melt solidifies on thecold surfaces of the rolls, forming two layers of solid steel whichare combined at the narrowest position by a slight force. Themelt flows from the induction furnace with a capacity of 165 kgto a runner system and subsequently into the tundish; from herethe melt is guided to the melt pool through a small SEN. To mi-nimize re-oxidation, the melt is sealed from ambient air by li-quid argon addition during the melting process and during theflow from furnace to pool (Figure 5).After melting and killing with [Si] and [Mn], a sample was takenand the oxygen activity in the melt was measured by a Celox®-
system. The result was used to calculate the demanded mass ofaluminium for further pre-deoxidation to [O]diss.=20 ppm. Forcomparison, the chemical composition of a synchronous samplefrom the melt was measured using a spark emission spectro-meter. This procedure was repeated after 4 min to evaluate theefficiency of the pre-deoxidation. After reaching the superheattemperature of 1,700°C the furnace was tilted with a definedrate to start -up the cast. The dynamic alloying of Al-wire withadiameter of 4 mm in the tundish started 25 s after the firstmelt-roll contact. The spooling-in was carried-out manually. Thefeeding rate of the Al-wire was calculated as a function of steelmass flow, the content of residual dissolved oxygen and the finalaimed [Al]diss. concentration. The feeding rate was about 1.12cm/s, as seen in the following calculations:
(7)
(8)
(9)
A cold Al-wire will freeze-up a thin layer of steel before it startsto smelt; the time of re-smelting is about 1…2 s depending onthe diameter of the wire and steel superheat [11].
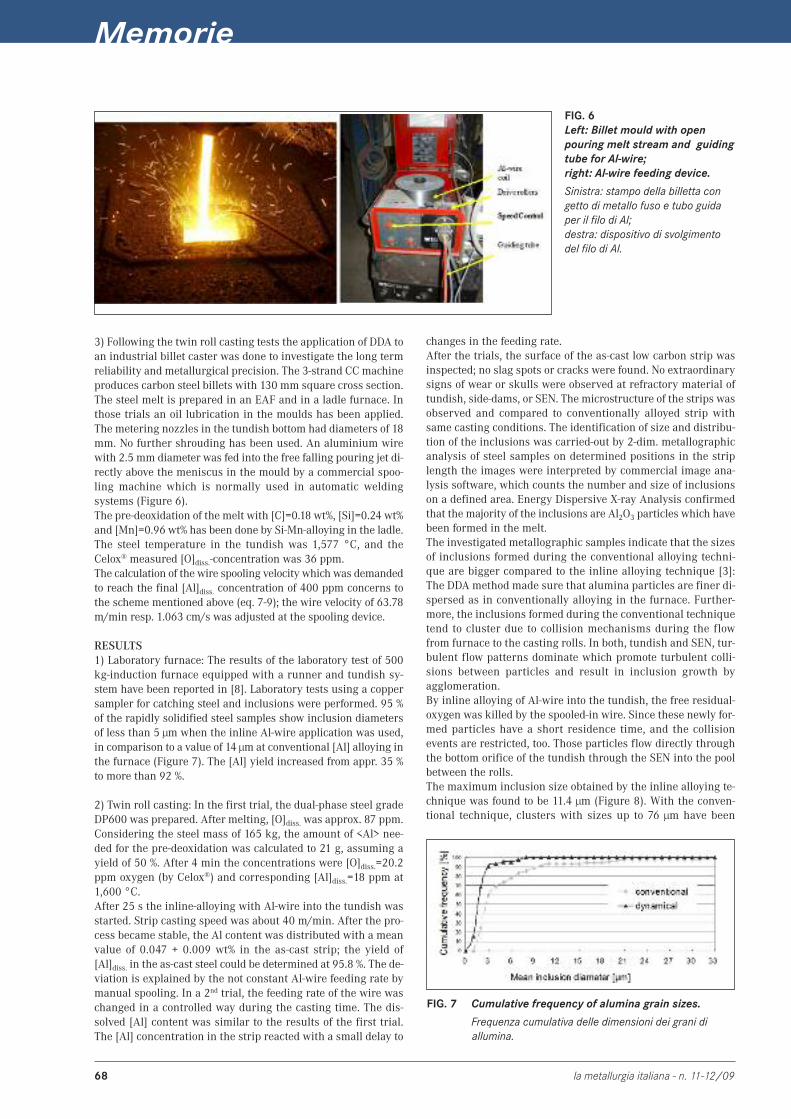
Memorie
68 la metallurgia italiana - n. 11-12/09
3) Following the twin roll casting tests the application of DDA toan industrial billet caster was done to investigate the long termreliability and metallurgical precision. The 3-strand CC machineproduces carbon steel billets with 130 mm square cross section.The steel melt is prepared in an EAF and in a ladle furnace. Inthose trials an oil lubrication in the moulds has been applied.The metering nozzles in the tundish bottom had diameters of 18mm. No further shrouding has been used. An aluminium wirewith 2.5 mm diameter was fed into the free falling pouring jet di-rectly above the meniscus in the mould by a commercial spoo-ling machine which is normally used in automatic weldingsystems (Figure 6).The pre-deoxidation of the melt with [C]=0.18 wt%, [Si]=0.24 wt%and [Mn]=0.96 wt% has been done by Si-Mn-alloying in the ladle.The steel temperature in the tundish was 1,577 °C, and theCelox® measured [O]diss.-concentration was 36 ppm.The calculation of the wire spooling velocity which was demandedto reach the final [Al]diss. concentration of 400 ppm concerns tothe scheme mentioned above (eq. 7-9); the wire velocity of 63.78m/min resp. 1.063 cm/s was adjusted at the spooling device.
RESULTS1) Laboratory furnace: The results of the laboratory test of 500kg-induction furnace equipped with a runner and tundish sy-stem have been reported in [8]. Laboratory tests using a coppersampler for catching steel and inclusions were performed. 95 %of the rapidly solidified steel samples show inclusion diametersof less than 5 µm when the inline Al-wire application was used,in comparison to a value of 14 µm at conventional [Al] alloying inthe furnace (Figure 7). The [Al] yield increased from appr. 35 %to more than 92 %.
2) Twin roll casting: In the first trial, the dual-phase steel gradeDP600 was prepared. After melting, [O]diss. was approx. 87 ppm.Considering the steel mass of 165 kg, the amount of <Al> nee-ded for the pre-deoxidation was calculated to 21 g, assuming ayield of 50 %. After 4 min the concentrations were [O]diss.=20.2ppm oxygen (by Celox®) and corresponding [Al]diss.=18 ppm at1,600 °C.After 25 s the inline-alloying with Al-wire into the tundish wasstarted. Strip casting speed was about 40 m/min. After the pro-cess became stable, the Al content was distributed with a meanvalue of 0.047 + 0.009 wt% in the as-cast strip; the yield of[Al]diss. in the as-cast steel could be determined at 95.8 %. The de-viation is explained by the not constant Al-wire feeding rate bymanual spooling. In a 2nd trial, the feeding rate of the wire waschanged in a controlled way during the casting time. The dis-solved [Al] content was similar to the results of the first trial.The [Al] concentration in the strip reacted with a small delay to
FIG. 6Left: Billet mould with openpouring melt stream and guidingtube for Al-wire;right: Al-wire feeding device.
Sinistra: stampo della billetta congetto di metallo fuso e tubo guidaper il filo di Al;destra: dispositivo di svolgimentodel filo di Al.
FIG. 7 Cumulative frequency of alumina grain sizes.
Frequenza cumulativa delle dimensioni dei grani diallumina.
changes in the feeding rate.After the trials, the surface of the as-cast low carbon strip wasinspected; no slag spots or cracks were found. No extraordinarysigns of wear or skulls were observed at refractory material oftundish, side-dams, or SEN. The microstructure of the strips wasobserved and compared to conventionally alloyed strip withsame casting conditions. The identification of size and distribu-tion of the inclusions was carried-out by 2-dim. metallographicanalysis of steel samples on determined positions in the striplength the images were interpreted by commercial image ana-lysis software, which counts the number and size of inclusionson a defined area. Energy Dispersive X-ray Analysis confirmedthat the majority of the inclusions are Al2O3 particles which havebeen formed in the melt.The investigated metallographic samples indicate that the sizesof inclusions formed during the conventional alloying techni-que are bigger compared to the inline alloying technique [3]:The DDA method made sure that alumina particles are finer di-spersed as in conventionally alloying in the furnace. Further-more, the inclusions formed during the conventional techniquetend to cluster due to collision mechanisms during the flowfrom furnace to the casting rolls. In both, tundish and SEN, tur-bulent flow patterns dominate which promote turbulent colli-sions between particles and result in inclusion growth byagglomeration.By inline alloying of Al-wire into the tundish, the free residual-oxygen was killed by the spooled-in wire. Since these newly for-med particles have a short residence time, and the collisionevents are restricted, too. Those particles flow directly throughthe bottom orifice of the tundish through the SEN into the poolbetween the rolls.The maximum inclusion size obtained by the inline alloying te-chnique was found to be 11.4 µm (Figure 8). With the conven-tional technique, clusters with sizes up to 76 µm have been
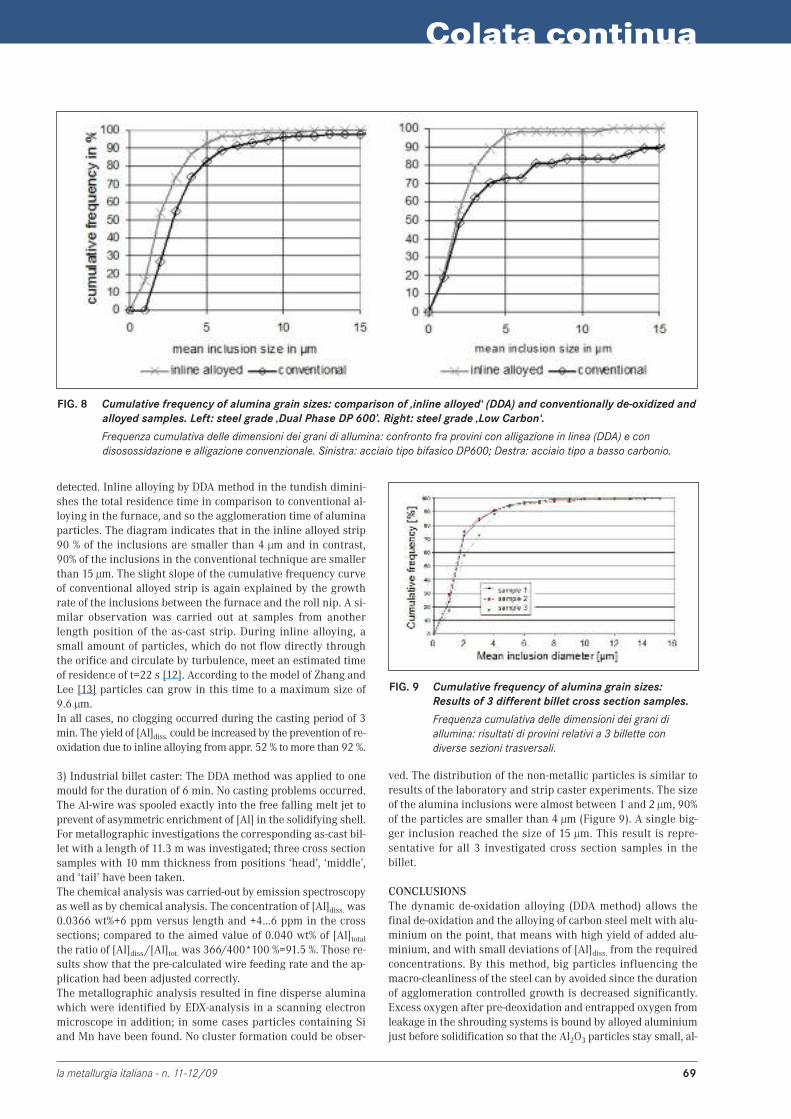
Colata continua
la metallurgia italiana - n. 11-12/09 69
detected. Inline alloying by DDA method in the tundish dimini-shes the total residence time in comparison to conventional al-loying in the furnace, and so the agglomeration time of aluminaparticles. The diagram indicates that in the inline alloyed strip90 % of the inclusions are smaller than 4 µm and in contrast,90% of the inclusions in the conventional technique are smallerthan 15 µm. The slight slope of the cumulative frequency curveof conventional alloyed strip is again explained by the growthrate of the inclusions between the furnace and the roll nip. A si-milar observation was carried out at samples from anotherlength position of the as-cast strip. During inline alloying, asmall amount of particles, which do not flow directly throughthe orifice and circulate by turbulence, meet an estimated timeof residence of t=22 s [12]. According to the model of Zhang andLee [13] particles can grow in this time to a maximum size of9.6 µm.In all cases, no clogging occurred during the casting period of 3min. The yield of [Al]diss. could be increased by the prevention of re-oxidation due to inline alloying from appr. 52 % to more than 92 %.
3) Industrial billet caster: The DDA method was applied to onemould for the duration of 6 min. No casting problems occurred.The Al-wire was spooled exactly into the free falling melt jet toprevent of asymmetric enrichment of [Al] in the solidifying shell.For metallographic investigations the corresponding as-cast bil-let with a length of 11.3 m was investigated; three cross sectionsamples with 10 mm thickness from positions ‘head’, ‘middle’,and ‘tail’ have been taken.The chemical analysis was carried-out by emission spectroscopyas well as by chemical analysis. The concentration of [Al]diss. was0.0366 wt%+6 ppm versus length and +4…6 ppm in the crosssections; compared to the aimed value of 0.040 wt% of [Al]total
the ratio of [Al]diss./[Al]tot. was 366/400*100 %=91.5 %. Those re-sults show that the pre-calculated wire feeding rate and the ap-plication had been adjusted correctly.The metallographic analysis resulted in fine disperse aluminawhich were identified by EDX-analysis in a scanning electronmicroscope in addition; in some cases particles containing Siand Mn have been found. No cluster formation could be obser-
FIG. 8 Cumulative frequency of alumina grain sizes: comparison of ‚inline alloyed‘ (DDA) and conventionally de-oxidized andalloyed samples. Left: steel grade ‚Dual Phase DP 600’. Right: steel grade ‚Low Carbon‘.
Frequenza cumulativa delle dimensioni dei grani di allumina: confronto fra provini con alligazione in linea (DDA) e condisosossidazione e alligazione convenzionale. Sinistra: acciaio tipo bifasico DP600; Destra: acciaio tipo a basso carbonio.
ved. The distribution of the non-metallic particles is similar toresults of the laboratory and strip caster experiments. The sizeof the alumina inclusions were almost between 1 and 2 µm, 90%of the particles are smaller than 4 µm (Figure 9). A single big-ger inclusion reached the size of 15 µm. This result is repre-sentative for all 3 investigated cross section samples in thebillet.
CONCLUSIONSThe dynamic de-oxidation alloying (DDA method) allows thefinal de-oxidation and the alloying of carbon steel melt with alu-minium on the point, that means with high yield of added alu-minium, and with small deviations of [Al]diss. from the requiredconcentrations. By this method, big particles influencing themacro-cleanliness of the steel can by avoided since the durationof agglomeration controlled growth is decreased significantly.Excess oxygen after pre-deoxidation and entrapped oxygen fromleakage in the shrouding systems is bound by alloyed aluminiumjust before solidification so that the Al2O3 particles stay small, al-
FIG. 9 Cumulative frequency of alumina grain sizes:Results of 3 different billet cross section samples.
Frequenza cumulativa delle dimensioni dei grani diallumina: risultati di provini relativi a 3 billette condiverse sezioni trasversali.
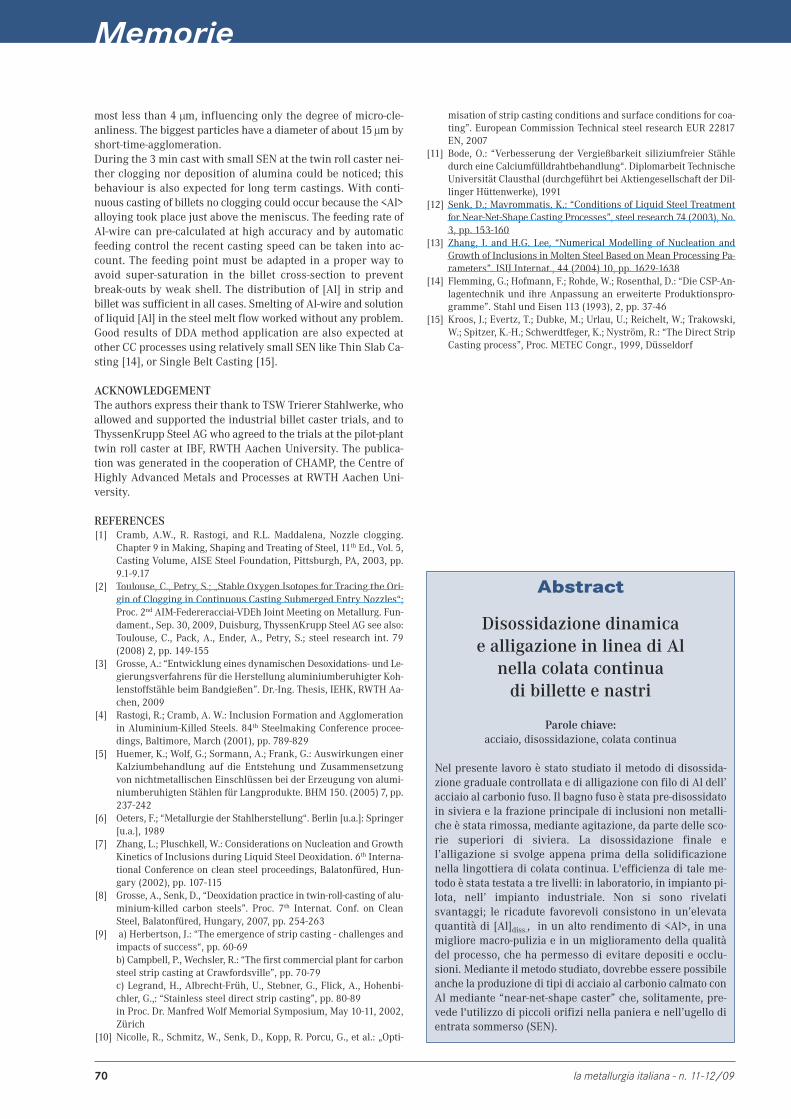
Memorie
70 la metallurgia italiana - n. 11-12/09
most less than 4 µm, influencing only the degree of micro-cle-anliness. The biggest particles have a diameter of about 15 µm byshort-time-agglomeration.During the 3 min cast with small SEN at the twin roll caster nei-ther clogging nor deposition of alumina could be noticed; thisbehaviour is also expected for long term castings. With conti-nuous casting of billets no clogging could occur because the <Al>alloying took place just above the meniscus. The feeding rate ofAl-wire can pre-calculated at high accuracy and by automaticfeeding control the recent casting speed can be taken into ac-count. The feeding point must be adapted in a proper way toavoid super-saturation in the billet cross-section to preventbreak-outs by weak shell. The distribution of [Al] in strip andbillet was sufficient in all cases. Smelting of Al-wire and solutionof liquid [Al] in the steel melt flow worked without any problem.Good results of DDA method application are also expected atother CC processes using relatively small SEN like Thin Slab Ca-sting [14], or Single Belt Casting [15].
ACKNOWLEDGEMENTThe authors express their thank to TSW Trierer Stahlwerke, whoallowed and supported the industrial billet caster trials, and toThyssenKrupp Steel AG who agreed to the trials at the pilot-planttwin roll caster at IBF, RWTH Aachen University. The publica-tion was generated in the cooperation of CHAMP, the Centre ofHighly Advanced Metals and Processes at RWTH Aachen Uni-versity.
REFERENCES[1] Cramb, A.W., R. Rastogi, and R.L. Maddalena, Nozzle clogging.
Chapter 9 in Making, Shaping and Treating of Steel, 11th Ed., Vol. 5,Casting Volume, AISE Steel Foundation, Pittsburgh, PA, 2003, pp.9.1-9.17
[2] Toulouse, C., Petry, S.; „Stable Oxygen Isotopes for Tracing the Ori-gin of Clogging in Continuous Casting Submerged Entry Nozzles“;Proc. 2nd AIM-Federeracciai-VDEh Joint Meeting on Metallurg. Fun-dament., Sep. 30, 2009, Duisburg, ThyssenKrupp Steel AG see also:Toulouse, C., Pack, A., Ender, A., Petry, S.; steel research int. 79(2008) 2, pp. 149-155
[3] Grosse, A.: “Entwicklung eines dynamischen Desoxidations- und Le-gierungsverfahrens für die Herstellung aluminiumberuhigter Koh-lenstoffstähle beim Bandgießen”. Dr.-Ing. Thesis, IEHK, RWTH Aa-chen, 2009
[4] Rastogi, R.; Cramb, A. W.: Inclusion Formation and Agglomerationin Aluminium-Killed Steels. 84th Steelmaking Conference procee-dings, Baltimore, March (2001), pp. 789-829
[5] Huemer, K.; Wolf, G.; Sormann, A.; Frank, G.: Auswirkungen einerKalziumbehandlung auf die Entstehung und Zusammensetzungvon nichtmetallischen Einschlüssen bei der Erzeugung von alumi-niumberuhigten Stählen für Langprodukte. BHM 150. (2005) 7, pp.237-242
[6] Oeters, F.; “Metallurgie der Stahlherstellung“. Berlin [u.a.]: Springer[u.a.], 1989
[7] Zhang, L.; Pluschkell, W.: Considerations on Nucleation and GrowthKinetics of Inclusions during Liquid Steel Deoxidation. 6th Interna-tional Conference on clean steel proceedings, Balatonfüred, Hun-gary (2002), pp. 107-115
[8] Grosse, A., Senk, D., “Deoxidation practice in twin-roll-casting of alu-minium-killed carbon steels”. Proc. 7th Internat. Conf. on CleanSteel, Balatonfüred, Hungary, 2007, pp. 254-263
[9] a) Herbertson, J.: “The emergence of strip casting - challenges andimpacts of success“, pp. 60-69b) Campbell, P., Wechsler, R.: “The first commercial plant for carbonsteel strip casting at Crawfordsville”, pp. 70-79c) Legrand, H., Albrecht-Früh, U., Stebner, G., Flick, A., Hohenbi-chler, G.,: “Stainless steel direct strip casting”, pp. 80-89in Proc. Dr. Manfred Wolf Memorial Symposium, May 10-11, 2002,Zürich
[10] Nicolle, R., Schmitz, W., Senk, D., Kopp, R. Porcu, G., et al.: „Opti-
misation of strip casting conditions and surface conditions for coa-ting”. European Commission Technical steel research EUR 22817EN, 2007
[11] Bode, O.: “Verbesserung der Vergießbarkeit siliziumfreier Stähledurch eine Calciumfülldrahtbehandlung“. Diplomarbeit TechnischeUniversität Clausthal (durchgeführt bei Aktiengesellschaft der Dil-linger Hüttenwerke), 1991
[12] Senk, D.; Mavrommatis, K.: “Conditions of Liquid Steel Treatmentfor Near-Net-Shape Casting Processes”, steel research 74 (2003), No.3, pp. 153-160
[13] Zhang, J. and H.G. Lee, “Numerical Modelling of Nucleation andGrowth of Inclusions in Molten Steel Based on Mean Processing Pa-rameters”. ISIJ Internat., 44 (2004) 10, pp. 1629-1638
[14] Flemming, G.; Hofmann, F.; Rohde, W.; Rosenthal, D.: “Die CSP-An-lagentechnik und ihre Anpassung an erweiterte Produktionspro-gramme”. Stahl und Eisen 113 (1993), 2, pp. 37-46
[15] Kroos, J.; Evertz, T.; Dubke, M.; Urlau, U.; Reichelt, W.; Trakowski,W.; Spitzer, K.-H.; Schwerdtfeger, K.; Nyström, R.: “The Direct StripCasting process”, Proc. METEC Congr., 1999, Düsseldorf
Abstract
Disossidazione dinamicae alligazione in linea di Al
nella colata continuadi billette e nastri
Parole chiave:acciaio, disossidazione, colata continua
Nel presente lavoro è stato studiato il metodo di disossida-zione graduale controllata e di alligazione con filo di Al dell’acciaio al carbonio fuso. Il bagno fuso è stata pre-disossidatoin siviera e la frazione principale di inclusioni non metalli-che è stata rimossa, mediante agitazione, da parte delle sco-rie superiori di siviera. La disossidazione finale el’alligazione si svolge appena prima della solidificazionenella lingottiera di colata continua. L'efficienza di tale me-todo è stata testata a tre livelli: in laboratorio, in impianto pi-lota, nell’ impianto industriale. Non si sono rivelatisvantaggi; le ricadute favorevoli consistono in un’elevataquantità di [Al]diss., in un alto rendimento di <Al>, in unamigliore macro-pulizia e in un miglioramento della qualitàdel processo, che ha permesso di evitare depositi e occlu-sioni. Mediante il metodo studiato, dovrebbe essere possibileanche la produzione di tipi di acciaio al carbonio calmato conAl mediante “near-net-shape caster” che, solitamente, pre-vede l'utilizzo di piccoli orifizi nella paniera e nell’ugello dientrata sommerso (SEN).
Metallografia
la metallurgia italiana - n. 11-12/09 71
Metallographic Specimen Preparationfor Electron Backscattered Diffraction
G. F. Vander Voort
Electron backscattered diffraction (EBSD) is performed with the scanning electron microscope (SEM) toprovide a wide range of analytical data; e.g., crystallographic orientation studies, phase identification andgrain size measurements. The quality of the diffraction pattern, which influences the confidence of theindexing of the diffraction pattern, depends upon removal of damage in the lattice due to specimen
preparation. It has been claimed that removal of this damage can only be obtained using electrolytic polishingor ion-beam polishing. However, the use of modern mechanical preparation methods, equipment and
consumables does yield excellent quality diffraction patterns. The experiments discussed here covered a widevariety of metals and alloys prepared mechanically using three to five steps, based on straightforward methods
that generally require less than about twenty-five minutes.
KEYWORDS:mechanical specimen preparation, diffraction patterns, deformation, relief control, flatness
George F. Vander VoortBuehler Ltd, 41 Waukegan Rd, Lake Bluff, Il 60044 USA
INTRODUCTIONElectron backscattered diffraction (EBSD) is performed with thescanning electron microscope (SEM) to provide a wide range ofanalytical data; e.g., crystallographic orientation studies, phaseidentification and grain size measurements. A diffraction patterncan be obtained in less than a second, but image quality is impro-ved by utilizing a longer scan time. Grain mapping requires deve-lopment of diffraction patterns at each pixel in the field and is aslower process. The quality of the diffraction pattern, which in-fluences the confidence of the indexing of the diffraction pattern,depends upon removal of damage in the lattice due to specimenpreparation. It has been claimed that removal of this damage canonly be obtained using electrolytic polishing or ion-beampolishing.However, the use of modern mechanical preparation methods,equipment and consumables does yield excellent quality diffrac-tion patterns without use of dangerous electrolytes and the pro-blems and limitations associated with electropolishing andion-beam polishing. Basically, if mechanical preparation results inquality polarized light images of non-cubic crystal structure ele-ments and alloys (e.g., Sb, Be, Hf, α-Ti, Zn, Zr), or color tint etchingof cubic, or non-cubic crystal structure elements or alloys produceshigh-quality color images, then the surface is free of harmful resi-dual preparation damage and EBSD patterns with high patternquality indexes will be obtained. Because of the acute angle bet-ween the specimen and the electron beam (70 – 74°), exceptionalsurface flatness is also necessary for best results.Polarized light image quality is dependent upon the eliminationof preparation damage and upon the quality of the microscopeoptics [1]. Consequently, always check the polarized light re-sponse of metals that will respond to polarized light, to verifypreparation quality before performing EBSD. For cubic metals,etch first with a general-purpose reagent to confirm the natureof the expected microstructure. Then, repeat the final polishingstep and use a color tint etch [1,2] to verify freedom from da-mage. EBSD is best performed with an as-polished, non-etchedspecimen due to the steep angle to the electron beam, as sur-
face roughness can degrade the diffraction pattern. A well-pre-pared, un-etched specimen will exhibit a good grain-contrastimage with a backscattered electron detector [3]; another goodtest for freedom from surface damage.
DEVELOPMENT OF PREPARATION METHODSSpecimen preparation methods for metals and alloys have beendeveloped [4] that yield excellent results using straightforwardmethods that generally require less than about twenty-five mi-nutes. High-purity metals require more preparation time thanalloys. Automated preparation equipment is recommended, asthe methods will be performed accurately and reproducibly. Ma-nual (“hand”) preparation cannot produce flatness, phase re-tention and damage removal as easily as automated processingand is less reproducible.Successful preparation requires that sectioning be performedwith equipment and consumables that minimize damage. Sec-tioning is a violent process and it can introduce massive damage.Crystal structure does influence damage depth; face-centeredcubic metals exhibit greater damage than body-centered cubicmetals for the same preparation procedure because fcc metalsslip more readily than bcc metals. Use only abrasive blades de-signed for metallography that are recommended for the specificmetal/alloy in question. A precision saw yields even less damageas the blades are much thinner and the applied loads are muchlower. Cutting with machines and blades/wheels that introduceminimal damage is the most critical step in generating damage-free metallographic surfaces; this cannot be over-emphasized.Then, commence grinding with the finest possible abrasive andsurface that will make all of the specimens in the holder co-pla-nar and remove the sectioning damage in reasonable time. Thisis the second critical rule for obtaining damage-free polished sur-faces. The proposed methods utilize flat, woven cloths or padsthat minimize relief problems. To minimize damage, use less ag-gressive surfaces, such as silk, nylon, polyester or polyurethane.The specimen preparation method must remove all scratches. Ifscratches are present, so to is damage below the scratch. Scratchdepths produced in grinding and polishing are not uniform. Adeep scratch will have deep deformation below it. The prepara-tion method must remove the scratches and the underlying da-
Memorie
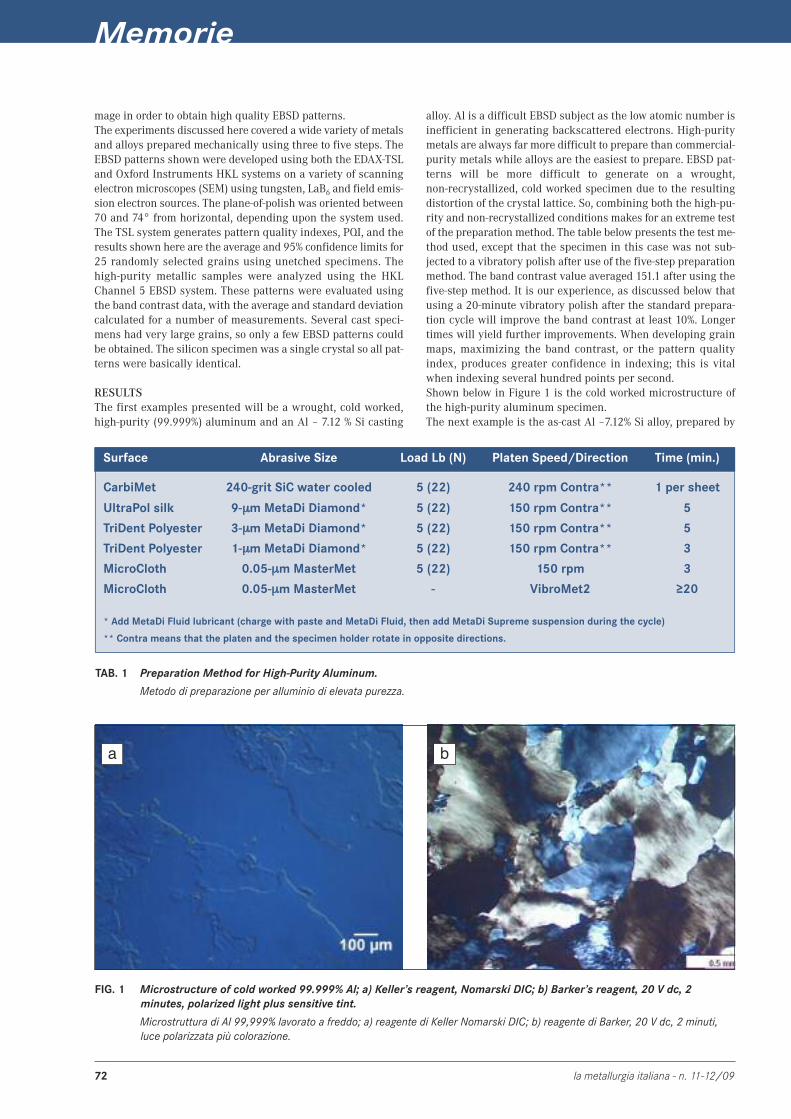
Memorie
72 la metallurgia italiana - n. 11-12/09
mage in order to obtain high quality EBSD patterns.The experiments discussed here covered a wide variety of metalsand alloys prepared mechanically using three to five steps. TheEBSD patterns shown were developed using both the EDAX-TSLand Oxford Instruments HKL systems on a variety of scanningelectron microscopes (SEM) using tungsten, LaB6 and field emis-sion electron sources. The plane-of-polish was oriented between70 and 74° from horizontal, depending upon the system used.The TSL system generates pattern quality indexes, PQI, and theresults shown here are the average and 95% confidence limits for25 randomly selected grains using unetched specimens. Thehigh-purity metallic samples were analyzed using the HKLChannel 5 EBSD system. These patterns were evaluated usingthe band contrast data, with the average and standard deviationcalculated for a number of measurements. Several cast speci-mens had very large grains, so only a few EBSD patterns couldbe obtained. The silicon specimen was a single crystal so all pat-terns were basically identical.
RESULTSThe first examples presented will be a wrought, cold worked,high-purity (99.999%) aluminum and an Al – 7.12 % Si casting
alloy. Al is a difficult EBSD subject as the low atomic number isinefficient in generating backscattered electrons. High-puritymetals are always far more difficult to prepare than commercial-purity metals while alloys are the easiest to prepare. EBSD pat-terns will be more difficult to generate on a wrought,non-recrystallized, cold worked specimen due to the resultingdistortion of the crystal lattice. So, combining both the high-pu-rity and non-recrystallized conditions makes for an extreme testof the preparation method. The table below presents the test me-thod used, except that the specimen in this case was not sub-jected to a vibratory polish after use of the five-step preparationmethod. The band contrast value averaged 151.1 after using thefive-step method. It is our experience, as discussed below thatusing a 20-minute vibratory polish after the standard prepara-tion cycle will improve the band contrast at least 10%. Longertimes will yield further improvements. When developing grainmaps, maximizing the band contrast, or the pattern qualityindex, produces greater confidence in indexing; this is vitalwhen indexing several hundred points per second.Shown below in Figure 1 is the cold worked microstructure ofthe high-purity aluminum specimen.The next example is the as-cast Al –7.12% Si alloy, prepared by
Surface Abrasive Size Load Lb (N) Platen Speed/Direction Time (min.)
CarbiMet 240-grit SiC water cooled 5 (22) 240 rpm Contra** 1 per sheet
UltraPol silk 9-µµm MetaDi Diamond* 5 (22) 150 rpm Contra** 5
TriDent Polyester 3-µµm MetaDi Diamond* 5 (22) 150 rpm Contra** 5
TriDent Polyester 1-µµm MetaDi Diamond* 5 (22) 150 rpm Contra** 3
MicroCloth 0.05-µµm MasterMet 5 (22) 150 rpm 3
MicroCloth 0.05-µµm MasterMet - VibroMet2 ≥20
* Add MetaDi Fluid lubricant (charge with paste and MetaDi Fluid, then add MetaDi Supreme suspension during the cycle)
** Contra means that the platen and the specimen holder rotate in opposite directions.
TAB. 1 Preparation Method for High-Purity Aluminum.
Metodo di preparazione per alluminio di elevata purezza.
FIG. 1 Microstructure of cold worked 99.999% Al; a) Keller’s reagent, Nomarski DIC; b) Barker’s reagent, 20 V dc, 2minutes, polarized light plus sensitive tint.
Microstruttura di Al 99,999% lavorato a freddo; a) reagente di Keller Nomarski DIC; b) reagente di Barker, 20 V dc, 2 minuti,luce polarizzata più colorazione.
a b
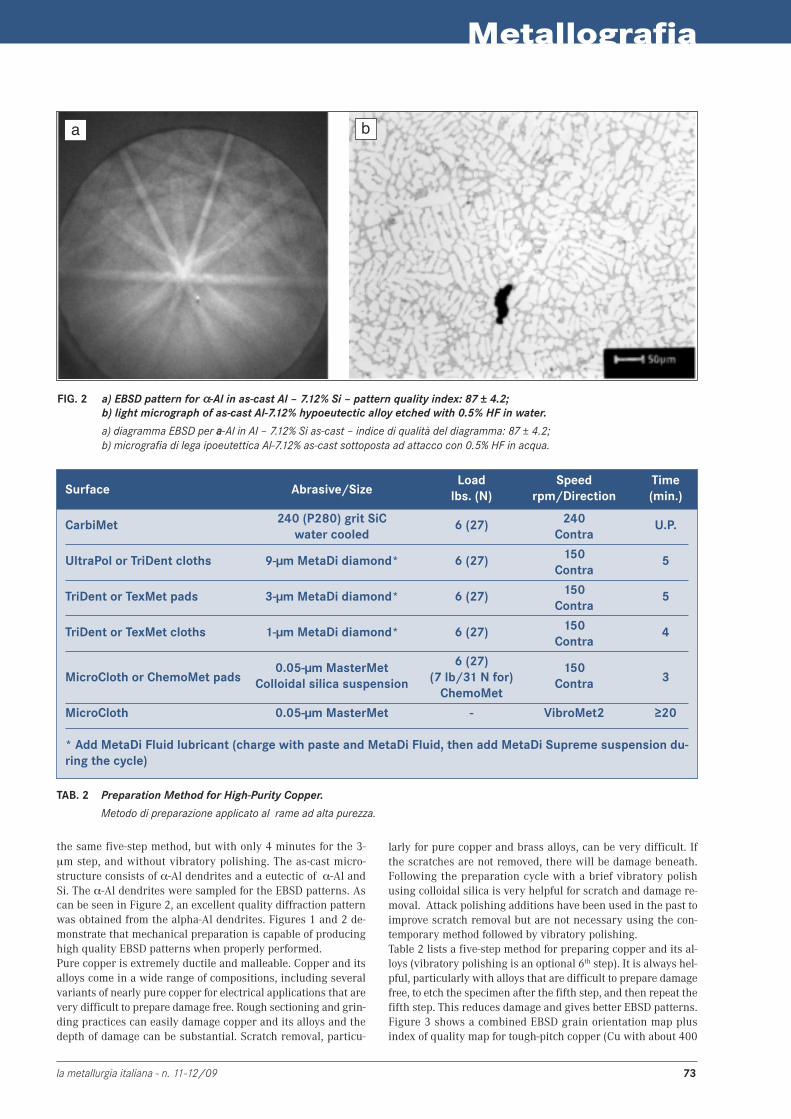
Metallografia
la metallurgia italiana - n. 11-12/09 73
a b
FIG. 2 a) EBSD pattern for�αα-Al in as-cast Al – 7.12% Si – pattern quality index: 87 ± 4.2;b) light micrograph of as-cast Al-7.12% hypoeutectic alloy etched with 0.5% HF in water.
a) diagramma EBSD per aa-Al in Al – 7.12% Si as-cast – indice di qualità del diagramma: 87 ± 4.2; b) micrografia di lega ipoeutettica Al-7.12% as-cast sottoposta ad attacco con 0.5% HF in acqua.
the same five-step method, but with only 4 minutes for the 3-µm step, and without vibratory polishing. The as-cast micro-structure consists of α-Al dendrites and a eutectic of �α-Al andSi. The α-Al dendrites were sampled for the EBSD patterns. Ascan be seen in Figure 2, an excellent quality diffraction patternwas obtained from the alpha-Al dendrites. Figures 1 and 2 de-monstrate that mechanical preparation is capable of producinghigh quality EBSD patterns when properly performed.Pure copper is extremely ductile and malleable. Copper and itsalloys come in a wide range of compositions, including severalvariants of nearly pure copper for electrical applications that arevery difficult to prepare damage free. Rough sectioning and grin-ding practices can easily damage copper and its alloys and thedepth of damage can be substantial. Scratch removal, particu-
Surface Abrasive/SizeLoad Speed Time
lbs. (N) rpm/Direction (min.)
CarbiMet 240 (P280) grit SiC 6 (27) 240 U.P.water cooled Contra
UltraPol or TriDent cloths 9-µm MetaDi diamond* 6 (27) 150 5Contra
TriDent or TexMet pads 3-µm MetaDi diamond* 6 (27) 150 5Contra
TriDent or TexMet cloths 1-µm MetaDi diamond* 6 (27) 150 4Contra
0.05-µm MasterMet 6 (27) 150MicroCloth or ChemoMet pads Colloidal silica suspension (7 lb/31 N for) Contra 3
ChemoMet
MicroCloth 0.05-µm MasterMet - VibroMet2 ≥20
* Add MetaDi Fluid lubricant (charge with paste and MetaDi Fluid, then add MetaDi Supreme suspension du-ring the cycle)
TAB. 2 Preparation Method for High-Purity Copper.
Metodo di preparazione applicato al rame ad alta purezza.
larly for pure copper and brass alloys, can be very difficult. Ifthe scratches are not removed, there will be damage beneath.Following the preparation cycle with a brief vibratory polishusing colloidal silica is very helpful for scratch and damage re-moval. Attack polishing additions have been used in the past toimprove scratch removal but are not necessary using the con-temporary method followed by vibratory polishing.Table 2 lists a five-step method for preparing copper and its al-loys (vibratory polishing is an optional 6th step). It is always hel-pful, particularly with alloys that are difficult to prepare damagefree, to etch the specimen after the fifth step, and then repeat thefifth step. This reduces damage and gives better EBSD patterns.Figure 3 shows a combined EBSD grain orientation map plusindex of quality map for tough-pitch copper (Cu with about 400
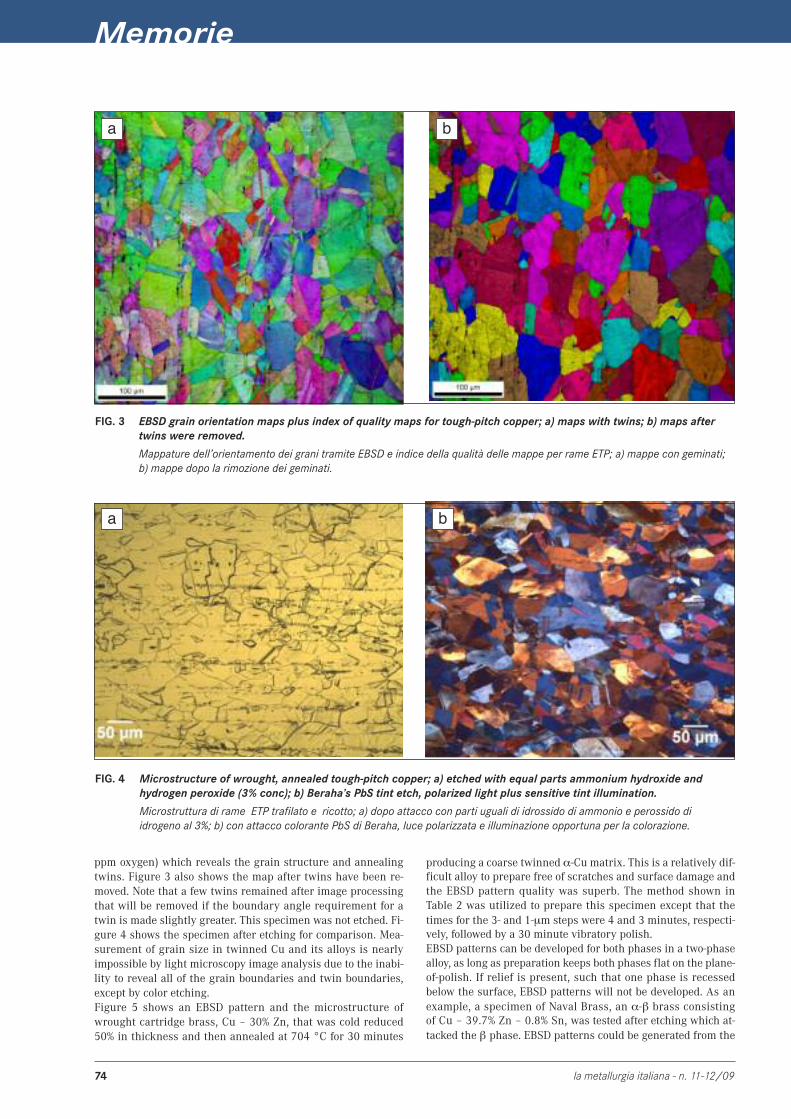
Memorie
74 la metallurgia italiana - n. 11-12/09
ppm oxygen) which reveals the grain structure and annealingtwins. Figure 3 also shows the map after twins have been re-moved. Note that a few twins remained after image processingthat will be removed if the boundary angle requirement for atwin is made slightly greater. This specimen was not etched. Fi-gure 4 shows the specimen after etching for comparison. Mea-surement of grain size in twinned Cu and its alloys is nearlyimpossible by light microscopy image analysis due to the inabi-lity to reveal all of the grain boundaries and twin boundaries,except by color etching.Figure 5 shows an EBSD pattern and the microstructure ofwrought cartridge brass, Cu – 30% Zn, that was cold reduced50% in thickness and then annealed at 704 °C for 30 minutes
FIG. 3 EBSD grain orientation maps plus index of quality maps for tough-pitch copper; a) maps with twins; b) maps aftertwins were removed.
Mappature dell’orientamento dei grani tramite EBSD e indice della qualità delle mappe per rame ETP; a) mappe con geminati;b) mappe dopo la rimozione dei geminati.
a b
a b
FIG. 4 Microstructure of wrought, annealed tough-pitch copper; a) etched with equal parts ammonium hydroxide andhydrogen peroxide (3% conc); b) Beraha’s PbS tint etch, polarized light plus sensitive tint illumination.
Microstruttura di rame ETP trafilato e ricotto; a) dopo attacco con parti uguali di idrossido di ammonio e perossido diidrogeno al 3%; b) con attacco colorante PbS di Beraha, luce polarizzata e illuminazione opportuna per la colorazione.
producing a coarse twinned α-Cu matrix. This is a relatively dif-ficult alloy to prepare free of scratches and surface damage andthe EBSD pattern quality was superb. The method shown inTable 2 was utilized to prepare this specimen except that thetimes for the 3- and 1-µm steps were 4 and 3 minutes, respecti-vely, followed by a 30 minute vibratory polish.EBSD patterns can be developed for both phases in a two-phasealloy, as long as preparation keeps both phases flat on the plane-of-polish. If relief is present, such that one phase is recessedbelow the surface, EBSD patterns will not be developed. As anexample, a specimen of Naval Brass, an α-β brass consistingof Cu – 39.7% Zn – 0.8% Sn, was tested after etching which at-tacked the β phase. EBSD patterns could be generated from the
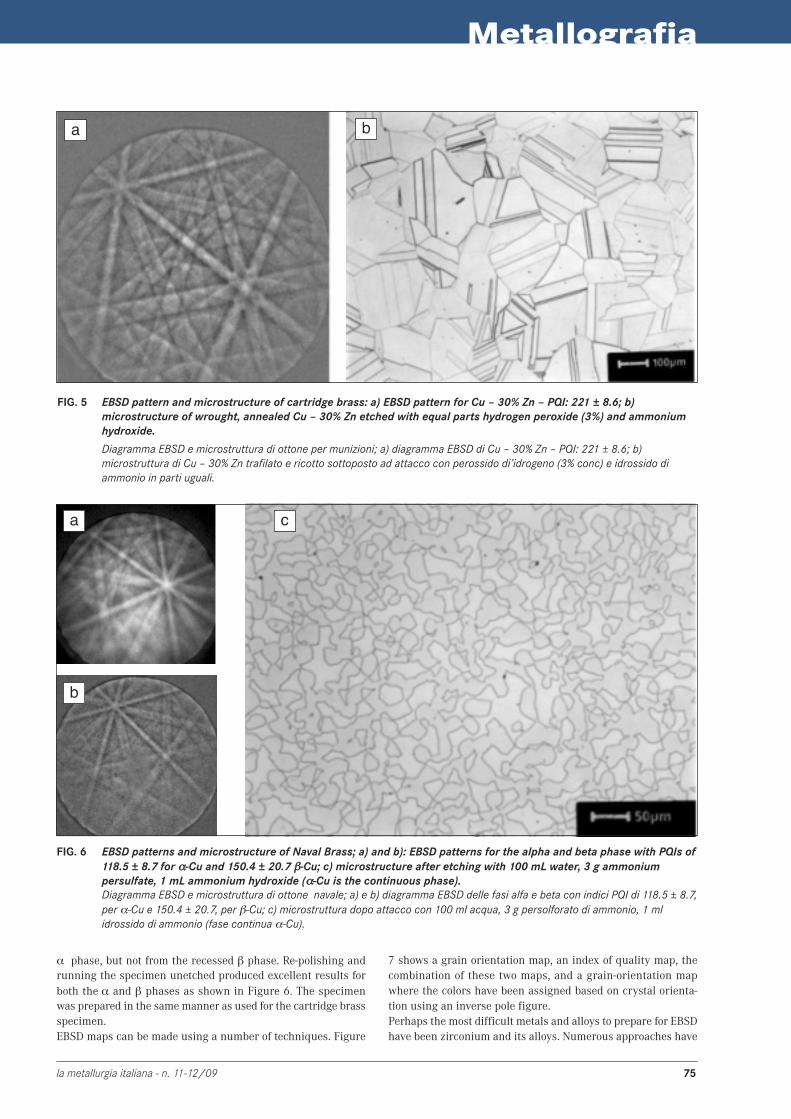
Metallografia
la metallurgia italiana - n. 11-12/09 75
a b
FIG. 5 EBSD pattern and microstructure of cartridge brass: a) EBSD pattern for Cu – 30% Zn – PQI: 221 ± 8.6; b)microstructure of wrought, annealed Cu – 30% Zn etched with equal parts hydrogen peroxide (3%) and ammoniumhydroxide.
Diagramma EBSD e microstruttura di ottone per munizioni; a) diagramma EBSD di Cu – 30% Zn – PQI: 221 ± 8.6; b)microstruttura di Cu – 30% Zn trafilato e ricotto sottoposto ad attacco con perossido di’idrogeno (3% conc) e idrossido diammonio in parti uguali.
a
b
c
FIG. 6 EBSD patterns and microstructure of Naval Brass; a) and b): EBSD patterns for the alpha and beta phase with PQIs of118.5 ± 8.7 for αα-Cu and 150.4 ± 20.7 ββ-Cu; c) microstructure after etching with 100 mL water, 3 g ammoniumpersulfate, 1 mL ammonium hydroxide (αα-Cu is the continuous phase).Diagramma EBSD e microstruttura di ottone navale; a) e b) diagramma EBSD delle fasi alfa e beta con indici PQI di 118.5 ± 8.7,per α-Cu e 150.4 ± 20.7, per β-Cu; c) microstruttura dopo attacco con 100 ml acqua, 3 g persolforato di ammonio, 1 mlidrossido di ammonio (fase continua α-Cu).
α� phase, but not from the recessed β phase. Re-polishing andrunning the specimen unetched produced excellent results forboth the�α and β phases as shown in Figure 6. The specimenwas prepared in the same manner as used for the cartridge brassspecimen.EBSD maps can be made using a number of techniques. Figure
7 shows a grain orientation map, an index of quality map, thecombination of these two maps, and a grain-orientation mapwhere the colors have been assigned based on crystal orienta-tion using an inverse pole figure.Perhaps the most difficult metals and alloys to prepare for EBSDhave been zirconium and its alloys. Numerous approaches have
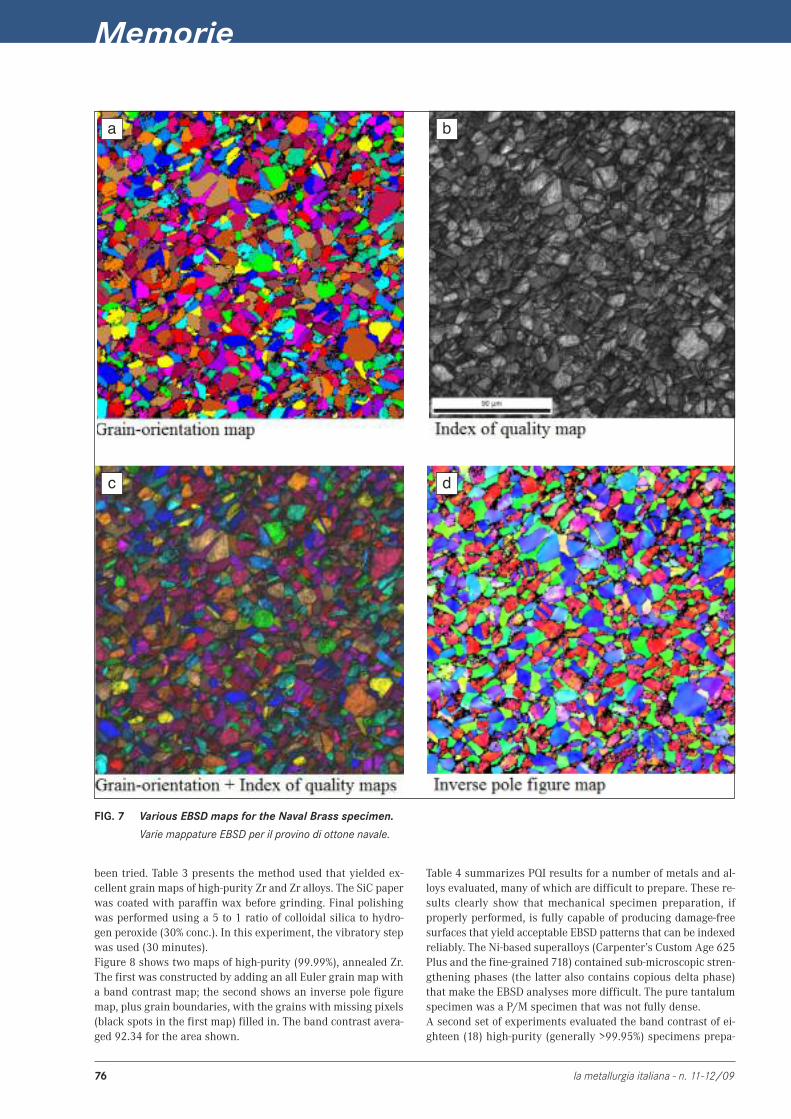
Memorie
76 la metallurgia italiana - n. 11-12/09
a b
c d
FIG. 7 Various EBSD maps for the Naval Brass specimen.
Varie mappature EBSD per il provino di ottone navale.
been tried. Table 3 presents the method used that yielded ex-cellent grain maps of high-purity Zr and Zr alloys. The SiC paperwas coated with paraffin wax before grinding. Final polishingwas performed using a 5 to 1 ratio of colloidal silica to hydro-gen peroxide (30% conc.). In this experiment, the vibratory stepwas used (30 minutes).Figure 8 shows two maps of high-purity (99.99%), annealed Zr.The first was constructed by adding an all Euler grain map witha band contrast map; the second shows an inverse pole figuremap, plus grain boundaries, with the grains with missing pixels(black spots in the first map) filled in. The band contrast avera-ged 92.34 for the area shown.
Table 4 summarizes PQI results for a number of metals and al-loys evaluated, many of which are difficult to prepare. These re-sults clearly show that mechanical specimen preparation, ifproperly performed, is fully capable of producing damage-freesurfaces that yield acceptable EBSD patterns that can be indexedreliably. The Ni-based superalloys (Carpenter’s Custom Age 625Plus and the fine-grained 718) contained sub-microscopic stren-gthening phases (the latter also contains copious delta phase)that make the EBSD analyses more difficult. The pure tantalumspecimen was a P/M specimen that was not fully dense.A second set of experiments evaluated the band contrast of ei-ghteen (18) high-purity (generally >99.95%) specimens prepa-
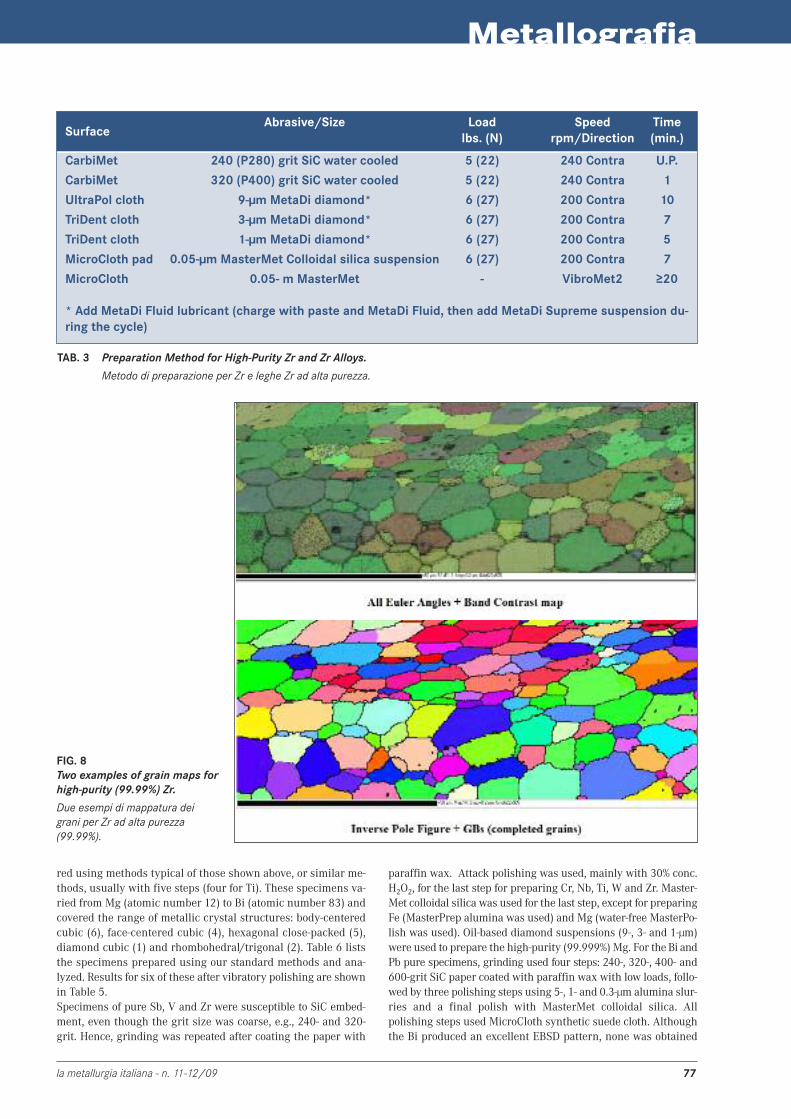
Metallografia
la metallurgia italiana - n. 11-12/09 77
SurfaceAbrasive/Size Load Speed Time
lbs. (N) rpm/Direction (min.)
CarbiMet 240 (P280) grit SiC water cooled 5 (22) 240 Contra U.P.
CarbiMet 320 (P400) grit SiC water cooled 5 (22) 240 Contra 1
UltraPol cloth 9-µm MetaDi diamond* 6 (27) 200 Contra 10
TriDent cloth 3-µm MetaDi diamond* 6 (27) 200 Contra 7
TriDent cloth 1-µm MetaDi diamond* 6 (27) 200 Contra 5
MicroCloth pad 0.05-µm MasterMet Colloidal silica suspension 6 (27) 200 Contra 7
MicroCloth 0.05-�m MasterMet - VibroMet2 ≥20
* Add MetaDi Fluid lubricant (charge with paste and MetaDi Fluid, then add MetaDi Supreme suspension du-ring the cycle)
TAB. 3 Preparation Method for High-Purity Zr and Zr Alloys.
Metodo di preparazione per Zr e leghe Zr ad alta purezza.
FIG. 8Two examples of grain maps forhigh-purity (99.99%) Zr.
Due esempi di mappatura deigrani per Zr ad alta purezza(99.99%).
red using methods typical of those shown above, or similar me-thods, usually with five steps (four for Ti). These specimens va-ried from Mg (atomic number 12) to Bi (atomic number 83) andcovered the range of metallic crystal structures: body-centeredcubic (6), face-centered cubic (4), hexagonal close-packed (5),diamond cubic (1) and rhombohedral/trigonal (2). Table 6 liststhe specimens prepared using our standard methods and ana-lyzed. Results for six of these after vibratory polishing are shownin Table 5. Specimens of pure Sb, V and Zr were susceptible to SiC embed-ment, even though the grit size was coarse, e.g., 240- and 320-grit. Hence, grinding was repeated after coating the paper with
paraffin wax. Attack polishing was used, mainly with 30% conc.H2O2, for the last step for preparing Cr, Nb, Ti, W and Zr. Master-Met colloidal silica was used for the last step, except for preparingFe (MasterPrep alumina was used) and Mg (water-free MasterPo-lish was used). Oil-based diamond suspensions (9-, 3- and 1-µm)were used to prepare the high-purity (99.999%) Mg. For the Bi andPb pure specimens, grinding used four steps: 240-, 320-, 400- and600-grit SiC paper coated with paraffin wax with low loads, follo-wed by three polishing steps using 5-, 1- and 0.3-µm alumina slur-ries and a final polish with MasterMet colloidal silica. Allpolishing steps used MicroCloth synthetic suede cloth. Althoughthe Bi produced an excellent EBSD pattern, none was obtained
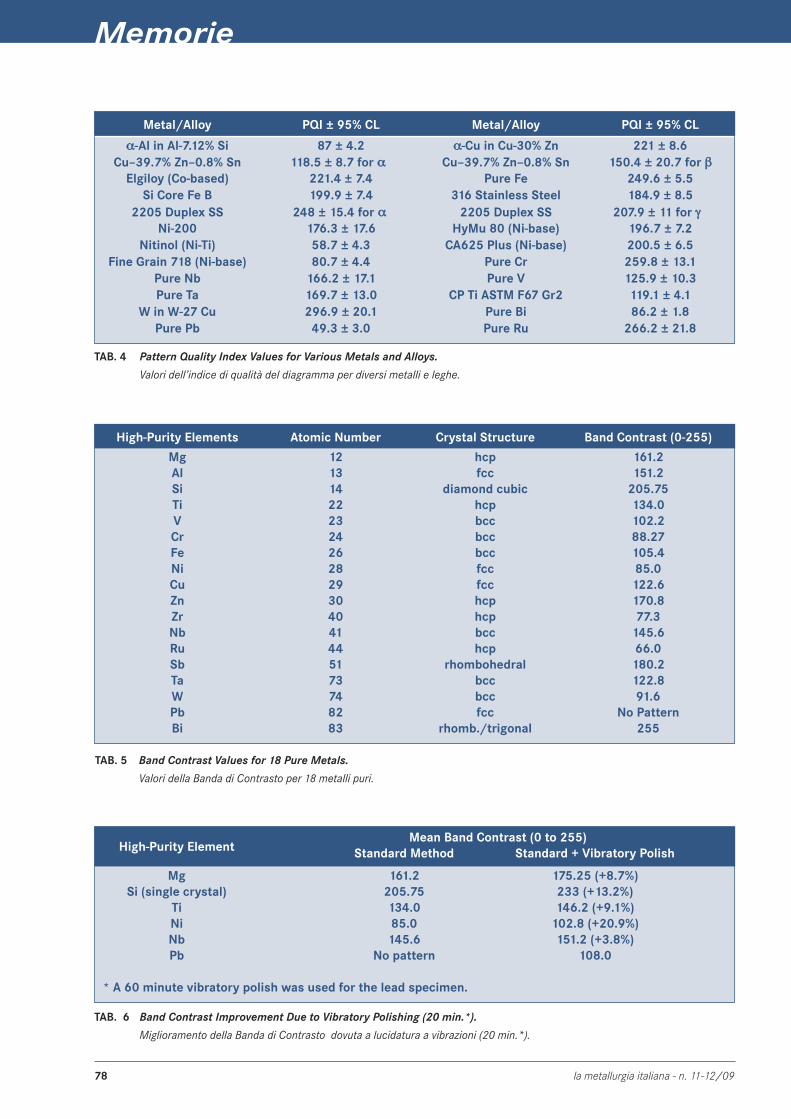
Memorie
78 la metallurgia italiana - n. 11-12/09
Metal/Alloy PQI ± 95% CL Metal/Alloy PQI ± 95% CL
αα-Al in Al-7.12% Si 87 ± 4.2 αα-Cu in Cu-30% Zn 221 ± 8.6Cu–39.7% Zn–0.8% Sn 118.5 ± 8.7 for αα � Cu–39.7% Zn–0.8% Sn 150.4 ± 20.7 for ββ
Elgiloy (Co-based) 221.4 ± 7.4 Pure Fe 249.6 ± 5.5Si Core Fe B 199.9 ± 7.4 316 Stainless Steel 184.9 ± 8.5
2205 Duplex SS 248 ± 15.4 for αα� 2205 Duplex SS 207.9 ± 11 for γγ �Ni-200 176.3 ± 17.6 HyMu 80 (Ni-base) 196.7 ± 7.2
Nitinol (Ni-Ti) 58.7 ± 4.3 CA625 Plus (Ni-base) 200.5 ± 6.5Fine Grain 718 (Ni-base) 80.7 ± 4.4 Pure Cr 259.8 ± 13.1
Pure Nb 166.2 ± 17.1 Pure V 125.9 ± 10.3Pure Ta 169.7 ± 13.0 CP Ti ASTM F67 Gr2 119.1 ± 4.1
W in W-27 Cu 296.9 ± 20.1 Pure Bi 86.2 ± 1.8Pure Pb 49.3 ± 3.0 Pure Ru 266.2 ± 21.8
TAB. 4 Pattern Quality Index Values for Various Metals and Alloys.
Valori dell’indice di qualità del diagramma per diversi metalli e leghe.
High-Purity Elements Atomic Number Crystal Structure Band Contrast (0-255)
Mg 12 hcp 161.2Al 13 fcc 151.2Si 14 diamond cubic 205.75Ti 22 hcp 134.0V 23 bcc 102.2Cr 24 bcc 88.27Fe 26 bcc 105.4Ni 28 fcc 85.0Cu 29 fcc 122.6Zn 30 hcp 170.8Zr 40 hcp 77.3Nb 41 bcc 145.6Ru 44 hcp 66.0Sb 51 rhombohedral 180.2Ta 73 bcc 122.8W 74 bcc 91.6Pb 82 fcc No PatternBi 83 rhomb./trigonal 255
TAB. 5 Band Contrast Values for 18 Pure Metals.
Valori della Banda di Contrasto per 18 metalli puri.
Mean Band Contrast (0 to 255)High-Purity Element Standard Method Standard + Vibratory Polish
Mg 161.2 175.25 (+8.7%)Si (single crystal) 205.75 233 (+13.2%)
Ti 134.0 146.2 (+9.1%)Ni 85.0 102.8 (+20.9%)Nb 145.6 151.2 (+3.8%)Pb No pattern 108.0
* A 60 minute vibratory polish was used for the lead specimen.
TAB. 6 Band Contrast Improvement Due to Vibratory Polishing (20 min.*).
Miglioramento della Banda di Contrasto dovuta a lucidatura a vibrazioni (20 min.*).
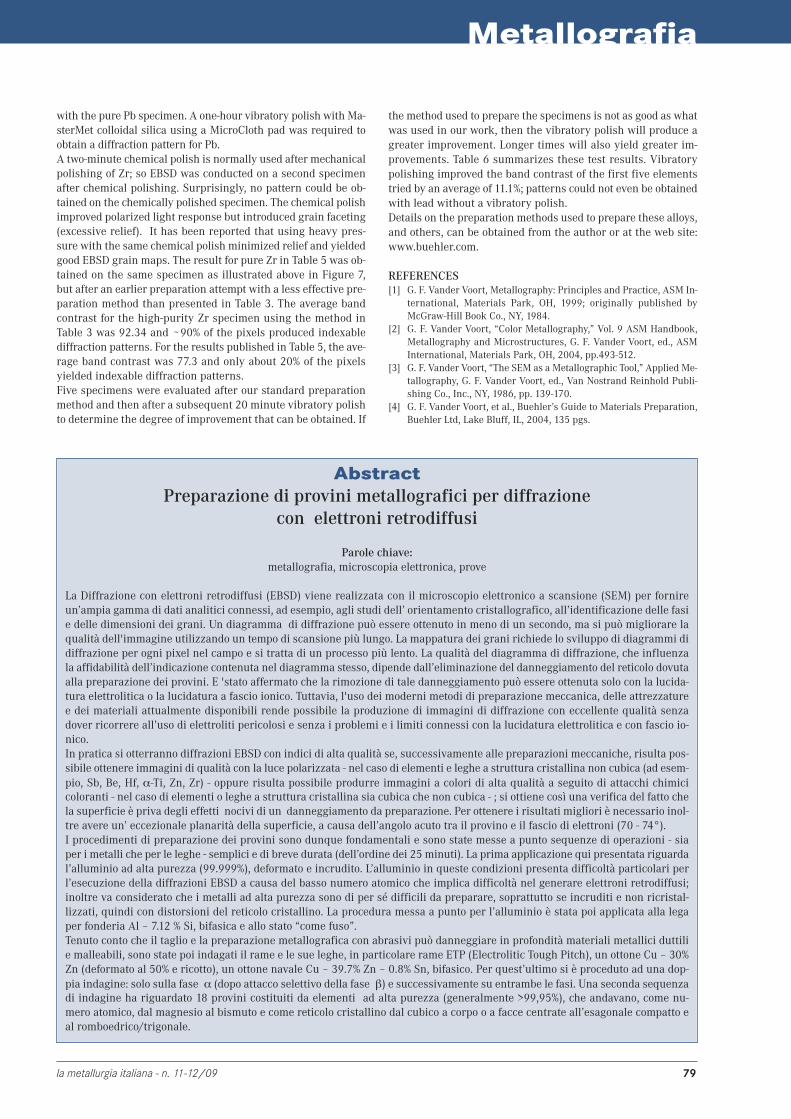
Metallografia
la metallurgia italiana - n. 11-12/09 79
with the pure Pb specimen. A one-hour vibratory polish with Ma-sterMet colloidal silica using a MicroCloth pad was required toobtain a diffraction pattern for Pb. A two-minute chemical polish is normally used after mechanicalpolishing of Zr; so EBSD was conducted on a second specimenafter chemical polishing. Surprisingly, no pattern could be ob-tained on the chemically polished specimen. The chemical polishimproved polarized light response but introduced grain faceting(excessive relief). It has been reported that using heavy pres-sure with the same chemical polish minimized relief and yieldedgood EBSD grain maps. The result for pure Zr in Table 5 was ob-tained on the same specimen as illustrated above in Figure 7,but after an earlier preparation attempt with a less effective pre-paration method than presented in Table 3. The average bandcontrast for the high-purity Zr specimen using the method inTable 3 was 92.34 and ~90% of the pixels produced indexablediffraction patterns. For the results published in Table 5, the ave-rage band contrast was 77.3 and only about 20% of the pixelsyielded indexable diffraction patterns. Five specimens were evaluated after our standard preparationmethod and then after a subsequent 20 minute vibratory polishto determine the degree of improvement that can be obtained. If
AbstractPreparazione di provini metallografici per diffrazione
con elettroni retrodiffusi
Parole chiave:metallografia, microscopia elettronica, prove
La Diffrazione con elettroni retrodiffusi (EBSD) viene realizzata con il microscopio elettronico a scansione (SEM) per fornireun’ampia gamma di dati analitici connessi, ad esempio, agli studi dell’ orientamento cristallografico, all’identificazione delle fasie delle dimensioni dei grani. Un diagramma di diffrazione può essere ottenuto in meno di un secondo, ma si può migliorare laqualità dell'immagine utilizzando un tempo di scansione più lungo. La mappatura dei grani richiede lo sviluppo di diagrammi didiffrazione per ogni pixel nel campo e si tratta di un processo più lento. La qualità del diagramma di diffrazione, che influenzala affidabilità dell’indicazione contenuta nel diagramma stesso, dipende dall’eliminazione del danneggiamento del reticolo dovutaalla preparazione dei provini. E 'stato affermato che la rimozione di tale danneggiamento può essere ottenuta solo con la lucida-tura elettrolitica o la lucidatura a fascio ionico. Tuttavia, l'uso dei moderni metodi di preparazione meccanica, delle attrezzaturee dei materiali attualmente disponibili rende possibile la produzione di immagini di diffrazione con eccellente qualità senzadover ricorrere all’uso di elettroliti pericolosi e senza i problemi e i limiti connessi con la lucidatura elettrolitica e con fascio io-nico. In pratica si otterranno diffrazioni EBSD con indici di alta qualità se, successivamente alle preparazioni meccaniche, risulta pos-sibile ottenere immagini di qualità con la luce polarizzata - nel caso di elementi e leghe a struttura cristallina non cubica (ad esem-pio, Sb, Be, Hf, α-Ti, Zn, Zr) - oppure risulta possibile produrre immagini a colori di alta qualità a seguito di attacchi chimicicoloranti - nel caso di elementi o leghe a struttura cristallina sia cubica che non cubica - ; si ottiene così una verifica del fatto chela superficie è priva degli effetti nocivi di un danneggiamento da preparazione. Per ottenere i risultati migliori è necessario inol-tre avere un’ eccezionale planarità della superficie, a causa dell’angolo acuto tra il provino e il fascio di elettroni (70 - 74°). I procedimenti di preparazione dei provini sono dunque fondamentali e sono state messe a punto sequenze di operazioni - siaper i metalli che per le leghe - semplici e di breve durata (dell’ordine dei 25 minuti). La prima applicazione qui presentata riguardal’alluminio ad alta purezza (99.999%), deformato e incrudito. L’alluminio in queste condizioni presenta difficoltà particolari perl’esecuzione della diffrazioni EBSD a causa del basso numero atomico che implica difficoltà nel generare elettroni retrodiffusi;inoltre va considerato che i metalli ad alta purezza sono di per sé difficili da preparare, soprattutto se incruditi e non ricristal-lizzati, quindi con distorsioni del reticolo cristallino. La procedura messa a punto per l’alluminio è stata poi applicata alla legaper fonderia Al – 7.12 % Si, bifasica e allo stato “come fuso”. Tenuto conto che il taglio e la preparazione metallografica con abrasivi può danneggiare in profondità materiali metallici duttilie malleabili, sono state poi indagati il rame e le sue leghe, in particolare rame ETP (Electrolitic Tough Pitch), un ottone Cu – 30%Zn (deformato al 50% e ricotto), un ottone navale Cu – 39.7% Zn – 0.8% Sn, bifasico. Per quest’ultimo si è proceduto ad una dop-pia indagine: solo sulla fase �α (dopo attacco selettivo della fase �β) e successivamente su entrambe le fasi. Una seconda sequenzadi indagine ha riguardato 18 provini costituiti da elementi ad alta purezza (generalmente >99,95%), che andavano, come nu-mero atomico, dal magnesio al bismuto e come reticolo cristallino dal cubico a corpo o a facce centrate all’esagonale compatto eal romboedrico/trigonale.
the method used to prepare the specimens is not as good as whatwas used in our work, then the vibratory polish will produce agreater improvement. Longer times will also yield greater im-provements. Table 6 summarizes these test results. Vibratorypolishing improved the band contrast of the first five elementstried by an average of 11.1%; patterns could not even be obtainedwith lead without a vibratory polish.Details on the preparation methods used to prepare these alloys,and others, can be obtained from the author or at the web site:www.buehler.com.
REFERENCES[1] G. F. Vander Voort, Metallography: Principles and Practice, ASM In-
ternational, Materials Park, OH, 1999; originally published byMcGraw-Hill Book Co., NY, 1984.
[2] G. F. Vander Voort, “Color Metallography,” Vol. 9 ASM Handbook,Metallography and Microstructures, G. F. Vander Voort, ed., ASMInternational, Materials Park, OH, 2004, pp.493-512.
[3] G. F. Vander Voort, “The SEM as a Metallographic Tool,” Applied Me-tallography, G. F. Vander Voort, ed., Van Nostrand Reinhold Publi-shing Co., Inc., NY, 1986, pp. 139-170.
[4] G. F. Vander Voort, et al., Buehler’s Guide to Materials Preparation,Buehler Ltd, Lake Bluff, IL, 2004, 135 pgs.