Cryptic speciation in a Holarctic passerine revealed by genetic and bioacoustic analyses
Upload
independentCategory
view
0download
0
�������� ����� ��
Microsatellite markers uncover cryptic species of Odontotermes (Termitoidae:Termitidae) from Peninsular Malaysia
S. Cheng, C.T. Lee, M.N. Wan, S.G. Tan
PII: S0378-1119(12)01643-5DOI: doi: 10.1016/j.gene.2012.12.084Reference: GENE 38232
To appear in: Gene
Accepted date: 19 December 2012
Please cite this article as: Cheng, S., Lee, C.T., Wan, M.N., Tan, S.G., Microsatellitemarkers uncover cryptic species of Odontotermes (Termitoidae: Termitidae) from Penin-sular Malaysia, Gene (2013), doi: 10.1016/j.gene.2012.12.084
This is a PDF file of an unedited manuscript that has been accepted for publication.As a service to our customers we are providing this early version of the manuscript.The manuscript will undergo copyediting, typesetting, and review of the resulting proofbefore it is published in its final form. Please note that during the production processerrors may be discovered which could affect the content, and all legal disclaimers thatapply to the journal pertain.
ACC
EPTE
D M
ANU
SCR
IPT
ACCEPTED MANUSCRIPT
1
Microsatellite markers uncover cryptic species of Odontotermes (Termitoidae:
Termitidae) from Peninsular Malaysia
Cheng S*, Lee CT*, Wan MN‡ & Tan SG
†
*Genetics Laboratory, Forest Research Institute Malaysia (FRIM), 52109 Kepong, Selangor, Malaysia,
‡Recreational Impact & Management Branch, FRIM, 52109 Kepong, Selangor, Malaysia,
†Faculty of
Biotechnology & Biomolecular Sciences, Universiti Putra Malaysia, 43400 Serdang, Selangor, Malaysia.
Correspondence: Shawn Cheng. Tel: +60 3 6279 7110, E-mail: [email protected]
Soon-Guan Tan. Tel: +60 3 8946 8098, E-mail: [email protected]
Abstract
Termites from the genus Odontotermes are known to contain numerous species complexes
that are difficult to tell apart morphologically or with mitochondrial DNA sequences. We
developed markers for one such cryptic species complex, that is, O. srinakarinensis sp. nov.
from Maxwell Hill Forest Reserve (Perak, Malaysia), and characterised them using a sample
of 41 termite workers from three voucher samples from the same area. We then genotyped
150 termite individuals from 23 voucher samples/colonies of this species complex from
several sites in Peninsular Malaysia. We analysed their population by constructing
dendograms from the proportion of shared-alleles between individuals and genetic distances
between colonies; additionally, we examined the Bayesian clustering pattern of their
genotype data. All methods of analysis indicated that there were two distinct clusters within
our data set. After the morphologies of specimens from each cluster were reexamined, we
ACC
EPTE
D M
ANU
SCR
IPT
ACCEPTED MANUSCRIPT
2
were able to separate the two species morphologically and found that a single diagnostic
character found on the mandibles of its soldiers could be used to separate the two species
quite accurately. The additional species in the clade was identified as O. denticulatus after it
was matched to type specimens at the NHM London and Cambridge Museum of Zoology.
Abbreviations: bp, base pair(s); CD-Hit, Cluster Database at High Identity with Tolerance;
F.R., Forest Reserve; FIS, inbreeding coefficient of an individual relative to the
subpopulation; FIT, inbreeding coefficient of an individual relative to the total population;
FRIM, Forest Research Institute Malaysia; FST, fixation index; He, expected heterozygosity;
Ho, observed heterozygosity; HWE, Hardy-Weinberg equilibrium; LB, Luria-Bertani
(medium); MISA, Microsatellite Identification tool; mtDNA, mitochondrial DNA; NHM,
Natural History Museum; NJ, neighbour-joining; PCR, polymerase chain reaction; STR,
short tandem repeat; UPGMA, unweighted paired group method with arithmetic mean; X-gal,
5-Bromo-4-chloro-3-indolyl- -D-galactoside.
Keywords
Odontotermes, microsatellites, Macrotermitinae, cryptic species, taxonomy
Introduction
The Odontotermes belong to the Macrotermitinae subfamily of termites, well-known for their
symbiosis with basidiomycete fungi from the genus Termitomyces which they cultivate in
order to digest plant materials into food for their colonies. The Odontotermes is also the most
species-rich and, incidentally, better studied compared to its other relatives within the
Macrotermitinae. Their taxonomy however is poorly resolved because of the limited number
ACC
EPTE
D M
ANU
SCR
IPT
ACCEPTED MANUSCRIPT
3
of morphological characters available to separate them. Species within the Odontotermes are
usually separated based on differences in the size and shape of the head capsules of its
soldiers and the variable position of an apical tooth that is located along the inner margin of
the left mandible of these forms (Ahmad, 1958; Holmgren, 1913).
Several closely related and morphologically similar species are found within the genus and to
add to this complexity, many species have been described based on small differences that
could be attributed to intraspecific variation (Tho, 1991). Additionally, many of these
characters constantly overlap between species. Although data on behaviour, nest architecture
and mitochondrial DNA sequences have been used to illuminate species boundaries in the
Odontotermes, they have not been able to differentiate between the numerous cryptic species
found within the genus (see Darlington, 1997; Davison et al., 2001; Darlington et al., 2008;
Cheng et al., 2011).
Microsatellite markers or short tandem repeats (STRs) are increasingly being applied to study
cryptic speciation in birds (Förschler et al., 2009), frogs (Elmer et al., 2007), giraffes (Brown
et al., 2007), termites (Roy et al., 2006) and tsetse flies (Dyer et al., 2011). Because STR
regions are also among the most variable in the genome, primer-binding sites are generally
not well conserved among distantly related species. There are, however, instances of
successful cross-species microsatellite amplification in birds (Pinheiro et al., 2009),
chameleons (Feldheim et al., 2012), and flowering plants (Primmer et al., 2005) to name a
few. It is often the case that microsatellite markers need to be isolated de novo for each
species or group of closely related species. But methods where DNA libraries of the focal
species are enriched for the microsatellite motif of interest can increase the efficiency and
lower the cost of microsatellite isolation. Once a microsatellite-containing fragment of
ACC
EPTE
D M
ANU
SCR
IPT
ACCEPTED MANUSCRIPT
4
interest is isolated and its nucleotide sequence determined, primers can be designed to
produce a sequence-tagged microsatellite marker.
Here we report on the isolation and characterisation of microsatellites for Odontotermes
srinakarinensis sp. nov (Takematsu, submitted), a species complex thought to contain more
than one species unit (Cheng et al., 2011). We also report its subsequent use in teasing apart
cryptic species within this clade of Odontotermes from Peninsular Malaysia which was
assigned the morphospecies rank of Odontotermes sp. 1 in Cheng et al. (2011),. Initially, we
tested primers developed for Amitermes meridionalis (Schmidt et al., 2007) and Macrotermes
michaelseni (Kaib et al., 2000) on this focal group. However, these markers proved to be
unspecific as polymerase chain reaction (PCR) amplicons showed multiple banding patterns
when visualised on agarose gel even after repeated optimisation experiments.
We utilised synthetic oligonucleotide probes bound to magnetic beads in a hybridisation
solution to obtain a DNA library enriched for microsatellite core sequences (Kijas et al.,
1994) and adopted a microsatellite isolation protocol detailed in Lee et al. (2004) for Shorea
leprosula (Dipterocarpaceae) to isolate microsatellite markers for O. srinakarinensis. Once
these markers have been isolated, they may also be used to solve the problem of cryptic
species complexes in other species of Odontotermes. It is also to date, the first attempt at
developing microsatellite markers for the genus.

ACC
EPTE
D M
ANU
SCR
IPT
ACCEPTED MANUSCRIPT
5
Materials and methods
Isolation of microsatellites
Briefly, DNA from five O. srinakarinensis soldiers from Maxwell Hill Forest Reserve (F.R.),
Maxwell Hill (Figure 1) were pooled and digested with NdeII. Fragments between 300 and
1000 bp were then isolated and ligated to Sau3A1 linkers. DNA fragments were hybridised
with (CT)15 and (GT)15 biotinylated repeat oligonucleotides and bound to Streptavidin
MagnaSphere® Paramagnetic Particles (Promega). The streptavidin beads were then rinsed
repeatedly to remove unwanted DNA fragments. Repeat–enriched DNA fragments were
recovered and amplified with the C1 cassette primer using PCR conditions described in Lee
et al. (2004). Sau3A1 linkers were removed before the DNA fragments were ligated into the
plasmid vector pUC118 Bam HI/BAP (Takara, Tokyo). DNA fragments were then amplified
in a PCR reaction using the M13 forward primer. The ligated plasmids were subsequently
cloned into TOP10 Escherichia coli (Invitrogen) competent cells and positive clones were
identified using blue/white screening on LB-agar plates containing ampicillin and X-gal.
Randomly selected positive clones were then subcultured and the plasmids sequenced in Big-
Dye®
Terminator ver 3.1. cycle-sequencing reactions on an ABI PRISM 3130xl genetic
analyzer.
After correcting for ambiguous nucleotide base calls in Sequencher ver. 4.9 (Gene Codes
Corp., Ann Arbor, MI), redundant clone sequences were removed using CD-Hit (Li &
Godzik 2006). Microsatellite sequences were then identified using Micro-FamilyWIN ver 1.2
(Meglécz 2007) and MISA (Thiel et al., 2003) before PCR primers were designed using
OLIGO6 (Molecular Biology Insights Inc.). An initial screen was performed on four termite
individuals to determine if the primers amplified fragments within the expected size ranges.
ACC
EPTE
D M
ANU
SCR
IPT
ACCEPTED MANUSCRIPT
6
Optimisation experiments were performed to determine the appropriate annealing
temperatures for some of the primer sets, where it was necessary. Primer pairs that could
amplify the targeted fragments and which could be interpreted robustly were then labeled
fluorescently.
Microsatellite genotyping
The markers were characterised using 41 termite individuals from three collection sources in
Maxwell Hill F.R. Following this, 150 termite individuals from 23 collection sources from
Behrang F.R., Bukit Rengit Wildlife Reserve, Pasoh F.R. and Semangkok F.R. (see Figure 1)
were genotyped with an ABI Prism 3130xl Genetic Analyzer using ROX400 (GeneScan) as
an internal size standard. Samples from the O. srinakarinensis species complex from four of
the other study sites, that is, Kledang Saiong F.R., Bukit Kinta F.R., Angsi F.R. and Mount
Ledang F.R. were not genotyped because only a limited amount of morphological samples
preserved in 70% ethanol could be obtained from these sites (see Figure 1). Sites shown in
Figure 1 were systematically sampled for Odontotermes between 2006 and 2009 as part of a
larger study to understand their diversity, abundance and ecology in Peninsular Malaysia.
Allele sizes were assigned based on the internal size standard of ROX400 and individuals
were genotyped using GeneMapper ver. 3.7 (Applied Biosystems). Microsatellite loci were
amplified in multiplex reactions using the Type-It®
Microsatellite PCR Kit (Qiagen) or
individually in singleplex reactions. Multiplex reactions were prepared according to the
protocol detailed in the Qiagen Type-It® Microsatellite PCR handbook. However, annealing
temperatures were adjusted to temperatures lower than the one recommended by the
optimised Qiagen cycling protocol to enable the amplification of the microsatellite loci.
ACC
EPTE
D M
ANU
SCR
IPT
ACCEPTED MANUSCRIPT
7
Genetic data analysis
The Excel Microsatellite Toolkit (Park 2001) was used to check the data set for errors and to
create input files for subsequent analyses. The program MICRO-CHECKER (Van Oosterhout
et al. 2004) was then used to identify and correct genotyping errors in the data set caused
either by large allele dropout, short allele dominance or stutter products resulting from
slippage during PCR amplification. We also identified the presence of null alleles in the
multi-locus data set using MICRO-CHECKER. The program PowerMarker ver 3.0 (Liu and
Muse 2005) was used to draw dendograms from the proportion of shared-alleles in the total
data set. Population trees using Nei et. al.’s (1983) DA distance and Goldstein et al.’s (1995)
( µ)2 distance were also constructed using PowerMarker ver 3.0. We used STRUCTURE
(Pritchard et al. 2000) to infer the actual number of populations in the microsatellite genotype
data. Lastly, F-Stat ver. 2.9.3 (Goudet 2001) was used to obtain diversity statistics such as
allelic richness and differentiation statistics such as FIS, FST and FIT.
ACC
EPTE
D M
ANU
SCR
IPT
ACCEPTED MANUSCRIPT
8
Results
Microsatellite identification and characterisation
Starting initially with 263 clone sequences, 184 were found to be unique and non-redundant.
From these clone sequences, 73 were found to contain microsatellites. Primers could only be
designed for 46 of these clones because in the rest of the clones, the microsatellite sequences
were either too close to the 5’- or the 3’- end. Out of the 46 primer pairs, 29 showed potential
to be used for a panel of microsatellite markers for O. srinakarinensis. Details on the
microsatellite loci that were isolated, primer pairs and GenBank accession numbers of the
sequences are in Table 1.
Close to 90% of the 29 microsatellite loci that were isolated contained dinucleotide repeats
motifs with 14 of the loci containing CT/TC/AG/GA repeats motifs and the other 11
containing GT/TG/CA/AC repeat motifs (Table 1). The dinucleotide repeats were either
simple or compound repeat motifs (uninterrupted and interrupted). A trinucleotide repeat
(GAA)7, was found at locus Oskar 37-3 while a compound repeat of (AGTA)4 (AAGTA)4
was found at locus Oskar 59-2 (Table 1).
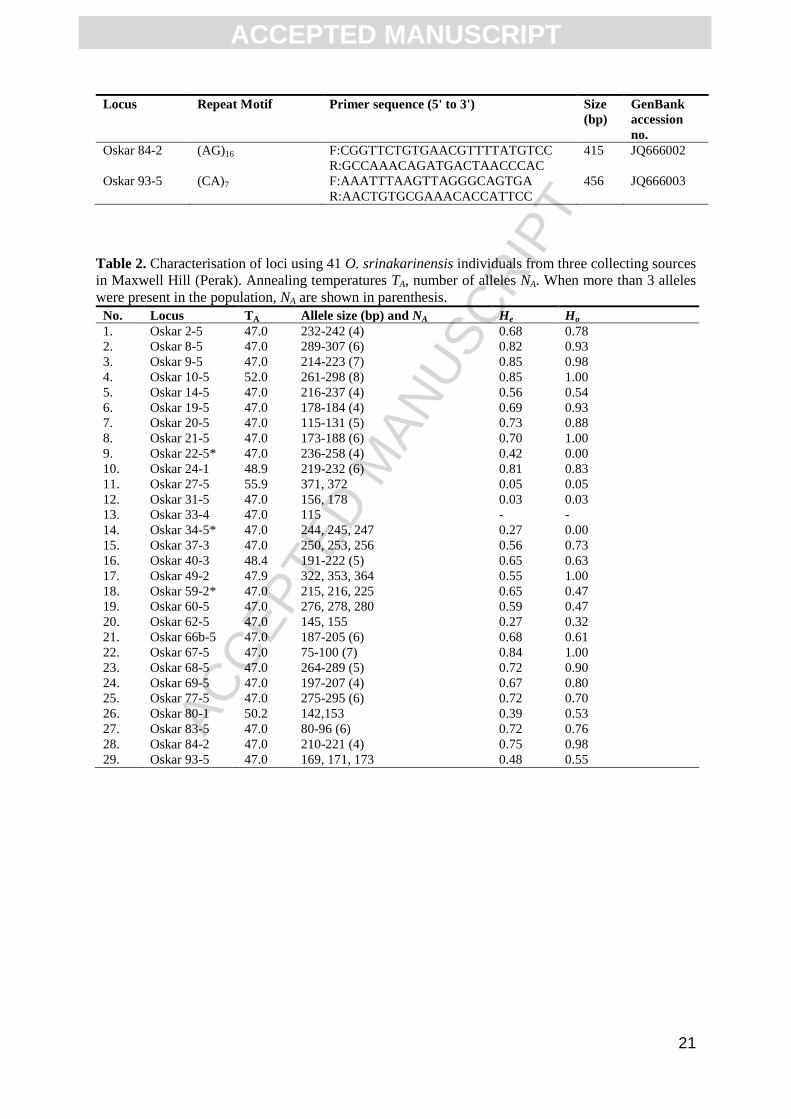
The results of the marker characterisation experiment are shown in Table 2. A single locus,
Oskar 33-4, was monomorphic while the rest of the loci had between 2 and 8 alleles or an
average of 4.28 alleles per locus (Table 2). Three of the loci, Oskar 22-5, Oskar 34-5 and
Oskar 59-2, showed signs of null alleles as there were significant departures from the Hardy-
Weinberg equilibrium or HWE (p < 0.05), indicated by an excess of homozygotes at these
loci (see Table 2). After removing these loci, the population was found to be in Hardy-
Weinberg equilibrium. Three loci, Oskar 9-5, Oskar 10-5 and Oskar 67-5, particularly, were
ACC
EPTE
D M
ANU
SCR
IPT
ACCEPTED MANUSCRIPT
9
the most variable with 7 to 8 alleles found at these loci (Table 2). Observed heterozygosity
(Ho), was also found to be equal or higher than expected heterozygosity (He), at 20 of the 29
loci that were analysed.
Population analysis
For the population genotyping experiments, primers that could be multiplexed with the
Qiagen Type-It® Microsatellite PCR are listed in Supplementary Table 1 together with the
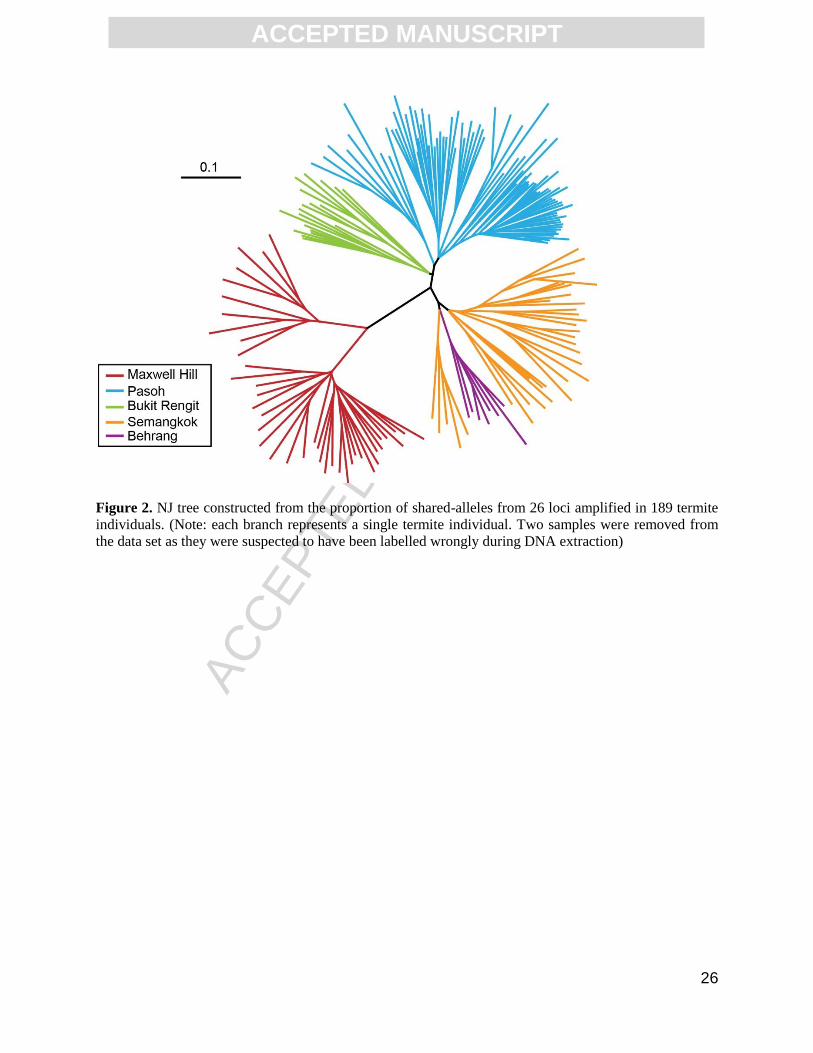
annealing temperature for each primer combination. The neighbour-joining (NJ) tree
calculated from the proportion of shared-alleles among 189 termite individuals is shown in
Figure 2. The individuals that were genotyped clustered according to their collection sources
and their sampling locations (Fig 2). Two major clusters were evident in the NJ tree. The first
cluster consisted solely of samples from Maxwell Hill (Perak) while the second cluster
consisted of samples from Semangkok, Behrang, Pasoh and Bukit Rengit (Figure 2). Within
the second cluster, the Semangkok and Behrang samples formed one subgroup while the
Pasoh and Bukit Rengit colonies formed another subgroup. The unweighted pair-group
method with arithmetic mean (UPGMA) tree which was also calculated from the proportion
of shared-alleles produced a similar tree (Supplementary Figure S1).
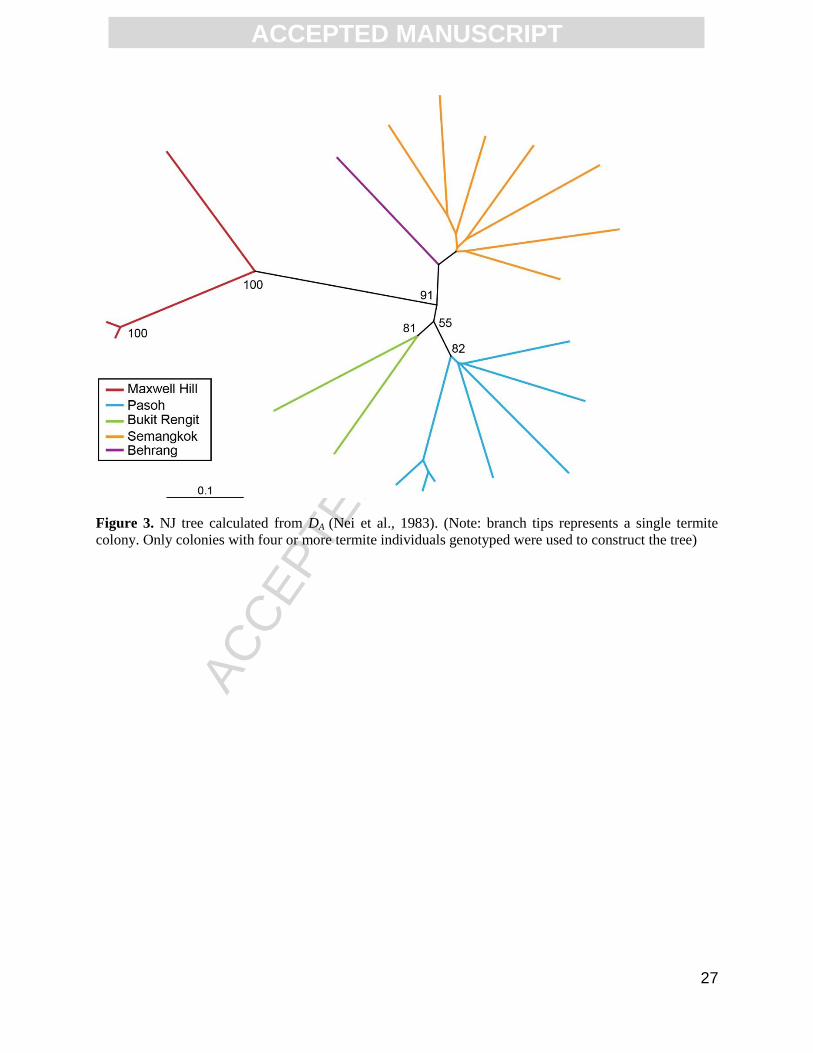
The NJ tree calculated from Nei et al.’s (1983) DA for 20 of the O. srinakarinensis colonies
also grouped the Semangkok and Behrang in one cluster and the Pasoh and Bukit Rengit
colonies in another cluster; the Maxwell Hill colonies formed a distinct cluster that had a high
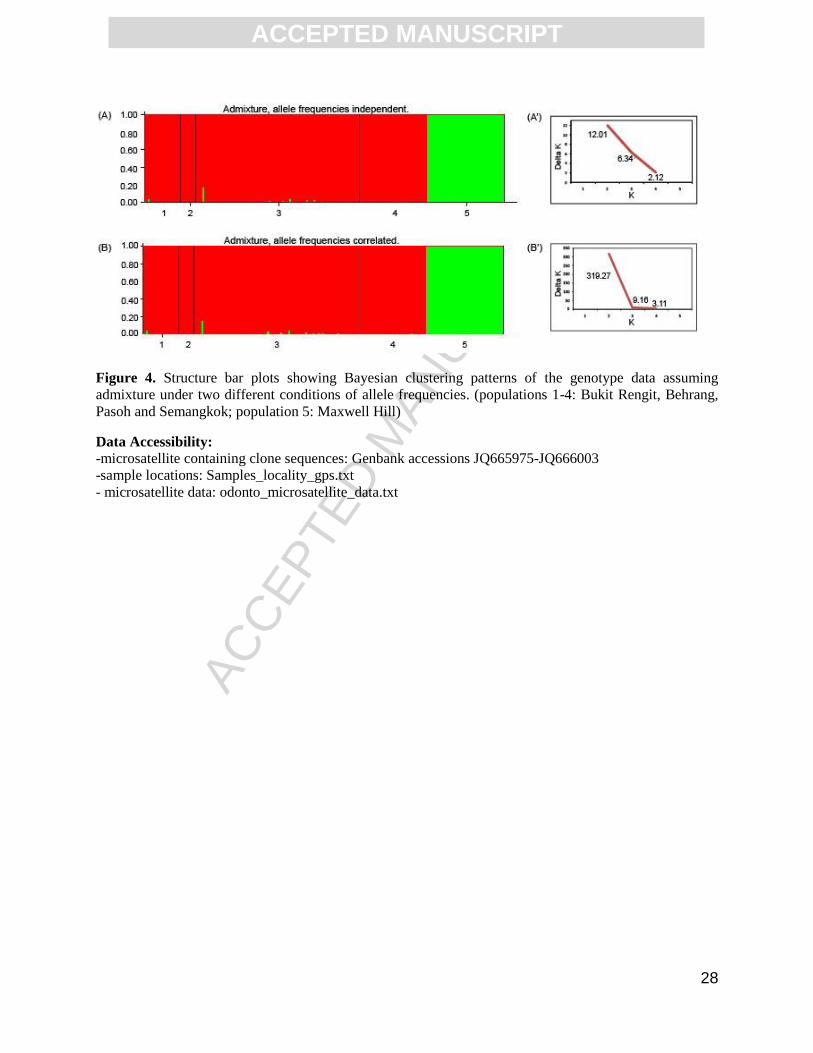
bootstrap support (Figure 3). The bar plot output from STRUCTURE ver 2.3 (Pritchard et al.
2000) together with the corresponding delta K versus K plots (Earl 2011; Evanno et al., 2005)
is shown in Figure 4. When admixture was assumed and allele frequencies were set to be
independent or correlated, two clusters were recovered (Fig 4). The Maxwell Hill samples
ACC
EPTE
D M
ANU
SCR
IPT
ACCEPTED MANUSCRIPT
10
formed a single cluster while the Pasoh, Bukit Rengit, Semangkok and Behrang samples
formed another cluster (Fig 4). When allele frequencies were correlated, the likelihood of
K=2 was about 30 times higher than the corresponding value when K was equal to 3 (Fig 4).
Relationship between populations assuming the presence of two species
The various methods of analysis indicate the presence of two major population clusters in the
data set. The Maxwell Hill population appeared to be highly distinct based on the shared-
alleles tree, NJ tree based on the genetic distances between colonies and the Bayesian
clustering analysis (Figs 2-4). When the genotype data of the Pasoh population were
reanalysed with MICRO-CHECKER, null alleles were found at at six loci, that is, Oskar 8-5,
Oskar 9-5, Oskar 27-5, Oskar 31-5, Oskar 40-3 and Oskar 68-5. Nevertheless, the population
was still in Hardy-Weinberg equilibrium after the Pasoh population data set was reanalysed
with these loci removed.
The NJ and UPGMA trees based on the proportion of shared alleles, rebuilt after the
additional 6 loci were excluded, showed that two clusters were still evident, one comprising
the Maxwell Hill samples and the other comprising the Pasoh, Bukit Rengit, Semangkok and
Behrang samples (Supplementary Figure S2). UPGMA and NJ trees constructed from DA and
( µ)2
distances using the reduced loci data set also showed that the Maxwell Hill samples
had the highest genetic distance from the rest of the population pairs (not shown). This was
still consistent with the findings made earlier when the loci with null alleles were included in
the analysis.
ACC
EPTE
D M
ANU
SCR
IPT
ACCEPTED MANUSCRIPT
11
Following this, we reexamined the morphology of the specimens in light of the genetic data
and found morphological differences between samples from the two clusters. Comparisons
made with identified materials at the NHM London and Cambridge Museum of Zoology
(United Kingdom) matched the soldier samples from Pasoh, Bukit Rengit, Semangkok and
Behrang F.R.’s to O. denticulatus Holmgren while soldier samples from Maxwell Hill were
matched to O. srinakarinensis sp. nov (Takematsu, submitted). A single character, that is, the
shape of the internal margin of the left mandible of its soldiers could be used quite accurately
to differentiate O. denticulatus from O. srinakarinensis.
Examination of our records show that the actual O. srinakarinensis occured in three of the
nine study sites in Peninsular Malaysia, that is, Maxwell Hill F.R., Bukit Kinta F.R. and
Angsi F.R (Fig 1). The species appears to primarily inhabit hill forests which is, similarly,
where the type specimen O. srinakarinensis was found in. Srinakarin Dam (Thailand), the
type locality of this species is a high elevation site and the only site where Takematsu has
found O. srinakarinensis (Takematsu, submitted). O. denticulatus on the other hand was
found in both lowland and hill forests. However, our collection records also show that O.
srinakarinensis and O. denticulatus occur sympatrically in Bukit Kinta F.R. and Angsi F.R.;
samples from Bukit Kinta F.R. and Angsi F.R. could not included in the microsatellite
analysis because insufficient samples for DNA analysis were obtained from these sites.
Table 3 shows the allelic richness, gene diversity and FIS values for populations of O.
denticulatus and O. srinakarinensis that were analysed in this study. The Pasoh population of
O. denticulatus appeared to have the highest allelic richness followed by the Semangkok and
Bukit Rengit colonies. Although gene diversity values were comparable in populations of
ACC
EPTE
D M
ANU
SCR
IPT
ACCEPTED MANUSCRIPT
12
both species, the inbreeding coefficient (FIS) in O. denticulatus was larger compared to O.
srinakarinensis indicating that the former species had a tendency to inbreed.
Discussion
Microsatellites were developed for O. srinakarinensis, a species-group or clade that were
previously found to consist of samples with highly divergent DNA sequences (Cheng et al.,
2011). The basis of the application of microsatellite markers to study this clade was that it
would allow us to determine the genetic structure of the population, that is, whether it
consisted of a population of randomly mating individuals or if the genetic variation seen in
the mtDNA data was due to significant genetic structure at the population level of the species.
Alternately, it could provide us with evidence of the existence of cryptic species within this
clade. The shared alleles trees, population trees and bayesian clustering of the genotype data
showed that the O. srinakarinensis species complex was actually composed of two distinct
clusters (Figs 2-4). Samples from the first cluster belonged to O. srinakarinensis while
samples from the second cluster belonged to O. denticulatus. The finding of a diagnostic
morphological character that could be used to diferentiate between the species provided
further support that they were indeed distinct.
There was, as well, an indication of a difference in breeding behaviour in that O. denticulatus
tended to inbreed to a larger extent compared to O. srinakarinensis. This was based on the
strongly negative FIS value in the single O. srinakarinensis population in Maxwell Hill
compared to the FIS values in the three populations of O. denticulatus from Pasoh,
Semangkok and Behrang F.R.s (Table 3). A higher rate of inbreeding in organisms such as
termites, indicates that the species has a shorter mating flight range and hence are more likely
ACC
EPTE
D M
ANU
SCR
IPT
ACCEPTED MANUSCRIPT
13
to pair with relatives during colony–founding. However, additonal samples or colonies of O.
srinakarinensis need to be analysed in order to confirm this postulation.
O. srinakarinensis primarily inhabited hill forests however O. denticulatus was found in
lowland and hill forests. Both species were found occurring in sympatry in two sites, that is,
Bukit Kinta F.R. and Angsi F.R., however, insufficient samples were obtained from these
sites for genetic analysis. If additional samples are obtained from these sites in the future, we
will be able to examine if O. srinakarinensis and O. denticulatus remain reproductively
isolated here, or if these areas represent hybrid zones for them. Cryptic or sibling species are
often difficult to differentiate based on morphological characters alone. This is probably due
to their rather recent origin that has not allowed them sufficient time to become
morphologically divergent.
Molecular markers such as microsatellites, hence, are very useful in such situations because it
can be used to quickly assess the species status of closely related populations either through
the use of population genetics distances or genotype clustering patterns of their microsatellite
data. Roy et al. (2006) utilised a combination of DNA markers which included microsatellites
on Cubitermes sp. affinis subaquartus in Gabon, Africa, to detect the presence of distinct
species clusters within this complex, some of which were found to occur in sympatry with
one another. Palaegeographic events were thought to be responsible for causing the isolation
and the subsequent formation of the Cubitermes species inhabiting this region (Roy et al.,
2006). This has similarly been suggested for a new species of Reticulitermes found in France
and Italy (Uva et al., 2004).
ACC
EPTE
D M
ANU
SCR
IPT
ACCEPTED MANUSCRIPT
14
In this study, it was evident that O. srinakarinensis and O. denticulatus were closely related
because many of the microsatellite loci developed for O. srinakarinensis could be amplified
in O. denticulatus; additionally, both species were even found to share some similar alleles.
However, there were differences in terms of their distribution and the habitats they occupied.
Lastly, it would be useful to date the split between these two species using a molecular clock
on the phylogenetic tree or by calibrating the tree with a known palaegeographic event as this
would allow us to better understand some of the factors that may have been responsible for
the origins of these species.
Conclusion
A total of 29 microsatellites were isolated from O. srinakarinensis sp. nov to investigate the
presence of cryptic species within this clade of Odontotermes. Primers were then designed
and screened on 41 termite individuals using three voucher samples that represented different
colonies from Maxwell Hill (Perak, Malaysia). Except for one monomorphic locus, the rest
were polymorphic with an average of 4.28 alleles per locus. One-hundred and fifty termite
individuals from 23 other collecting sources representing members of Odontotermes from
this cryptic species complex were then genotyped at these loci. Trees of relationships
reconstructed from the proportion of shared-alleles between these samples, genetic distances
between their colonies, and Bayesian clustering of their genotype data showed the presence
of two clusters that corresponded to two different species, that is, O. srinakarinensis and O.
denticulatus. Both species were genetically and morphologically different and showed almost
no overlap in their distribution except in Bukit Kinta and Angsi F.R.s.
ACC
EPTE
D M
ANU
SCR
IPT
ACCEPTED MANUSCRIPT
15
Acknowledgments
We thank Azmi Mahyudin, Mohd Shah Fadir Ishak, Saimas Ariffin, Shaiful Amri, and Wan
Shaina Mazuin Wan Mamat for collecting termite samples and for their assistance in the
laboratory. We thank Lee Soon-Leong for providing support during the marker development
and genotyping phase of the study. Thanks are also due to Paul Eggleton (NHM) and Joanna
Darlington (University of Cambridge) for permission to reference the termite collections at
their respective institutes. The first author also wishes to specially acknowledge the financial
assistance provided by Universiti Putra Malaysia and Mr and Mrs. Cheng Poh-Heng which
enabled him to travel to the NHM London and Cambridge Museum of Zoology for a one-
month attachment in 2011 to complete this research for his doctoral degree. This study was
funded by a grant from the Ministry of Natural Resources and Environment, Malaysia.

ACC
EPTE
D M
ANU
SCR
IPT
ACCEPTED MANUSCRIPT
16
References
Aanen, D.K., Eggleton, P., Rouland-Lefevre, C., Guldberg-Froslev, T., Rosendahl, S.,
Boomsma, J.J., 2002. The evolution of fungus-growing termites and their mutualistic fungal
symbionts. P. Natl. Acad. Sci. USA 99, 14887–14892.
Ahmad, M., 1958. Key to the Indo-Malayan termites. Biologia 4, 33–198.
Brown, D.M., Brenneman, R.A., Koepfli, K.P., Pollinger, J.P. et al., 2007. Extensive
population genetic structure in the giraffe. BMC Biol. 5, 57.
Cheng, S., Kirton, L.G., Panandam, J.M., Siraj, S.S., Ng, K.K.S., Tan, S.G., 2011. Evidence
for a higher number of species of Odontotermes (Isoptera) than currently known from
Peninsular Malaysia from mitochondrial DNA phylogenies. PLoS ONE 6, e20992.
Darlington, J.P.E.C., 1997. Comparison of nest structure and nest parameters of sympatric
species of Odontotermes (Termitidae: Macrotermitinae) in Kenya. Insect Soc. 44, 393–408.
Darlington, J.P.E.C., Benson, R.B., Cook, C.E., Walker, G., 2008. Resolving relationships in
some African fungus-growing termites (Termitidae, Macrotermitinae) using molecular,
morphology and field parameters. Insect Soc. 55, 256–265.
ACC
EPTE
D M
ANU
SCR
IPT
ACCEPTED MANUSCRIPT
17
Davison, D., Darlington, J.P.E.C., Cook, C.E., 2001. Species-level systematics of some
Kenyan termites of the genus Odontotermes (Termitidae: Macrotermitinae) using
mitochondrial DNA, morphology and behaviour. Insect Soc. 48, 138–43.
Elmer, K.R., Davila, J.A., Lougheed, S.C., 2007. Cryptic diversity and deep divergence in an
upper Amazonian frog, Eleutherodactylus ockendeni. BMC Evol Biol 7, e247.
Feldheim, K.A., da Silva, J.M., Tolley, K.A., 2012. Isolation of novel microsatellite loci in
dwarf chameleons from KwaZulu-Natal province, South Africa and their cross-amplification
in other Bradypodion species. Conserv Genet Resour. 4, 205–211.
Förschler, M.I., Senar, J.C., Perret, P., Björklund, M., 2009. The species status of the
Corsican finch Carduelis corsicana assessed by three genetic markers with different rates of
evolution. Molecular Phylogenet. Evol. 52, 234–240.
Goldstein, D.B., Ruíz-Linares, A., Feldman, M. , Cavalli-Sforza L.L., 1995. An evaluation of
genetic distances for use with microsatellite loci. Genetics 139, 463-471.
Holmgren, N. 1913. Termitenstudiesn. 4. Versuch einer systematischen Monographie der
Termiten der orientalischen Region. Kungl Svenska Vetensk-Akad Handl. 50, 1–276.

ACC
EPTE
D M
ANU
SCR
IPT
ACCEPTED MANUSCRIPT
18
Kaib, M., Hacker, M., Over, I., Hardt, C., Epplen, J.T., Baginess, R.K., Brandl, R. 2000.
Microsatellite loci in Macrotermes michaelseni (Isoptera: Termitidae). Mol. Ecol. 9, 502–
504.
Kijas, J.M., Fowler, J.C., Garbett, C.A., Thomas, M.R. 1994. Enrichment of microsatellites
from the citrus genome using biotinylated oligonucleotide sequences bound to streptavidin-
coated magnetic particles. Biotechniques 16, 656–662.
Lee, S.L., Tani, N., Ng, K.K.S., Tsumura, Y. Isolation and characterisiation of 20
microsatellite loci for an important tropical tree Shorea leprosula (Dipterocarpaceae) and
their applicability to S. parvifolia. Mol. Ecol. Notes 4, 222–225.
Li, W., Godzik, A. 2006. Cd-hit: a fast program for clustering and comparing large sets of
protein or nucleotide sequences. Bioinformatics Applications Note 22, 1658–1659.
Meglécz, E. 2007. MICROFAMILY: A computer program for detecting flanking region
similarities among different microsatellite loci. Mol. Ecol. Notes 7, 18–20.
Park, S.D.E., 2001. Trypanotolerance in west african cattle and the population genetic effects
of selection. Ph.D. thesis. University of Dublin, Dublin, Ireland.
Pinheiro, F., Palma-Silva, C., Barros, F.D., Cozzolino, S., 2009. Cross-amplification and
characterization of microsatellite loci for the Neotropical orchid genus Epidendrum. Genet.
Mol. Biol. 32, 337–339.
ACC
EPTE
D M
ANU
SCR
IPT
ACCEPTED MANUSCRIPT
19
Pritchard J.K., Stephens M., Donnelly P., 2000. Inference of population structure using
multilocus genotype data. Genetics 155, 945–959.
Primmer, C.R., Painter, J.N., Koskinen, M.T., Palo, J.U., Merilä, J. 2005. Factors affecting
avian cross-species microsatellite amplification. J. Avian Biol. 36, 348–360.
Rouland-Lefèvre C (2000) Symbiosis with fungi, in: Abe, T., Bignell, D.E., Higashi, M.
(Eds.), Termites: Evolution, Sociality, Symbioses, Ecology. Kluwer Academic Publishers,
Dordrecht, pp. 289–306
Roy, V., Demanche, C., Livet, A., Harry, M., 2006. Genetic differentiation in the soil-feeding
termite Cubitermes sp. affinis subarquatus: occurrence of cryptic species revealed by nuclear
and mitochondrial markers. BMC Evol. Biol. 6, 102.
Schmidt, A.M., Trindl, A., Korb, J. 2007. Isolation and characterization of 10 microsatellite
loci in the magnetic termite, Amitermes meridionalis (Isoptera: Termitidae). Mol. Ecol. Notes
7, 1045–1047.
Thiel, T., Michalek, W., Varshney, R.K., Graner, A., 2003. Exploiting EST databases for the
development and characterisation of gene-derived SSR-markers in barley (Hordeum vulgare
L.). Theor. Appl. Genet. 106, 411–422.

ACC
EPTE
D M
ANU
SCR
IPT
ACCEPTED MANUSCRIPT
20
Table 1. Characteristics of 29 microsatellite loci and primers developed for Odontotermes srinakarinensis sp.
nov
Locus Repeat Motif Primer sequence (5' to 3') Size
(bp)
GenBank
accession
no.
Oskar 2-5 (TC)16 F:CAACTATGTACCGCCGTGCTA 327 JQ665975
R:ATTTCCCGCAAGACGCATTC
Oskar 8-5 (CT)14TTT (TC)7 F:GGGCAGATTAAGGAATGAATA 418 JQ665976
R:ACATAGCCCTGAATGAGCA
Oskar 9-5 (AG)15C (GA)7 F:CGTACACCGCACAACT 618 JQ665977
R:TACCTGCATTGTTTTAACTCC
Oskar 10-5 (TG)27(AG)12 F:CCAACAACAGCGCCTACAGAC 313 JQ665978
R:CCCGTTATTATTGTCAGATTT
Oskar 14-5 (TC)14 F:TTCGACTGCACACTGCCATTC 342 JQ665979
R:GACGCATTTGCACTCCATCA
Oskar 19-5 (AG)14(GA)8 F:ATGGGTGAGGTGGCAGA 275 JQ665980
R:GTCCATTGCATTTGATTGTCC
Oskar 20-5 (AG)24 F:AATGGACCGAGTTTCGAGATG 281 JQ665981
R:TGCGTGCCAATATGCGTGTA
Oskar 21-5 (GA)10GG (GA)7 F:TTACAGCCCTCTGGATGTCTT 302 JQ665982
R:CAGCCCATGCAGTACAGTTT
Oskar 22-5 (TC)25 F:GTTAGTTTCCCAAGGTCTTGT 345 JQ665983
R:CGCAGTAAGAAAGCAGAA
Oskar 24-1 (AG)15 F:AGGGTTTCACAGCAGCGTGAC 317 JQ665984
R:AGCCGTGGAACAATTATCTC
Oskar 27-5 (AC)9 F:AAGGGCCATCGTGCATTC 461 JQ665985
R:CATCCAGTTGGGCTCCGACAT
Oskar 31-5 (GT)16 F:TAATCAGTCATGAAGCAGCAG 209 JQ665986
R:CGGGAAGCGATTGAGA
Oskar 33-4 (CA)6 F: GTTGCACGTGTGATGGTATAG 325 JQ665987
R: GAACGCTTGGAGAGGA
Oskar 34-5 (TG)6 F:CGTATCGACTGTGGATTGAGT 339 JQ665988
R:TGCGTACACGTCACAATG
Oskar 37-3 (GAA)7 F:TAGCGGTGAGAGGTGGAACGTCTA 340 JQ665989
R:GAATGTGGCCTCATCCCTAGTTCA
Oskar 40-3 (AGTA)19 F:CGCTTGTGTGTACGGTAA 318 JQ665990
R:GATTCTAACCGACAAATG
Oskar 49-2 (GT)4 F:GCGCTGTAAACACT 456 JQ665991
R:CAGGTAGCAGGAATTAAC
Oskar 59-2 (AGTA)4 (AAGTA)4 F:TGGATGGAGTTGGCTCAGGATAGG 454 JQ665992
R:CCTATCCTGAGCCCACTCCATCCA
Oskar 60-5 (AC)11 F:GACACAAAGCCTCGGTTAGTA 305 JQ665993
R:TTGGTGCAAACGGAAAGTA
Oskar 62-5 (GT)6n(TG)8 F:TCCTACCGGGTTAGTG 446 JQ665994
R:TATCCCGAATACCTAGCATAG
Oskar 66b-5 (AG)14 F:AGTGAGTGAGTGGCCTCT 316 JQ665995
R:GTTCCATCAGCGATAAGTCAG
Oskar 67-5 (GA)15 F:CATGGCACGGATGAGTCAGTC 369 JQ665996
R:TGGCGTCAGTACACTCGTA
Oskar 68-5 (TC)13 F:TAGTAGGCATTCCCTGA 335 JQ665997
R:AGGCAAAAACATACACTCTAT
Oskar 69-5 (AG)19 F:GAACCCACGCATTCTCCTAGT 366 JQ665998
R:GTTGTAACAAGTGCCCAGTA
Oskar 77-5 (AC)9 F:GCAACGAATGAGCGCAGTTAT 345 JQ665999
R:CATGGGGAGTACGCAGTGGA
Oskar 80-1 (GT)29 F:CCGCTACACAAAGTGCCTGATACT 326 JQ666000
R:GGCCACCACTGACTGTCGAAACAT
Oskar 83-5 (TG)9 F:TGAAAAACAGTGCGTGCGTAT 183 JQ666001
R:CGCTTTGCTTCAGGGTATCAC
ACC
EPTE
D M
ANU
SCR
IPT
ACCEPTED MANUSCRIPT
21
Locus Repeat Motif Primer sequence (5' to 3') Size
(bp)
GenBank
accession
no.
Oskar 84-2 (AG)16 F:CGGTTCTGTGAACGTTTTATGTCC 415 JQ666002
R:GCCAAACAGATGACTAACCCAC
Oskar 93-5 (CA)7 F:AAATTTAAGTTAGGGCAGTGA 456 JQ666003
R:AACTGTGCGAAACACCATTCC
Table 2. Characterisation of loci using 41 O. srinakarinensis individuals from three collecting sources
in Maxwell Hill (Perak). Annealing temperatures TA, number of alleles NA. When more than 3 alleles
were present in the population, NA are shown in parenthesis.
No. Locus TA Allele size (bp) and NA He Ho
1. Oskar 2-5 47.0 232-242 (4) 0.68 0.78
2. Oskar 8-5 47.0 289-307 (6) 0.82 0.93
3. Oskar 9-5 47.0 214-223 (7) 0.85 0.98
4. Oskar 10-5 52.0 261-298 (8) 0.85 1.00
5. Oskar 14-5 47.0 216-237 (4) 0.56 0.54
6. Oskar 19-5 47.0 178-184 (4) 0.69 0.93
7. Oskar 20-5 47.0 115-131 (5) 0.73 0.88
8. Oskar 21-5 47.0 173-188 (6) 0.70 1.00
9. Oskar 22-5* 47.0 236-258 (4) 0.42 0.00
10. Oskar 24-1 48.9 219-232 (6) 0.81 0.83
11. Oskar 27-5 55.9 371, 372 0.05 0.05
12. Oskar 31-5 47.0 156, 178 0.03 0.03
13. Oskar 33-4 47.0 115 - -
14. Oskar 34-5* 47.0 244, 245, 247 0.27 0.00
15. Oskar 37-3 47.0 250, 253, 256 0.56 0.73
16. Oskar 40-3 48.4 191-222 (5) 0.65 0.63
17. Oskar 49-2 47.9 322, 353, 364 0.55 1.00
18. Oskar 59-2* 47.0 215, 216, 225 0.65 0.47
19. Oskar 60-5 47.0 276, 278, 280 0.59 0.47
20. Oskar 62-5 47.0 145, 155 0.27 0.32
21. Oskar 66b-5 47.0 187-205 (6) 0.68 0.61
22. Oskar 67-5 47.0 75-100 (7) 0.84 1.00
23. Oskar 68-5 47.0 264-289 (5) 0.72 0.90
24. Oskar 69-5 47.0 197-207 (4) 0.67 0.80
25. Oskar 77-5 47.0 275-295 (6) 0.72 0.70
26. Oskar 80-1 50.2 142,153 0.39 0.53
27. Oskar 83-5 47.0 80-96 (6) 0.72 0.76
28. Oskar 84-2 47.0 210-221 (4) 0.75 0.98
29. Oskar 93-5 47.0 169, 171, 173 0.48 0.55

ACC
EPTE
D M
ANU
SCR
IPT
ACCEPTED MANUSCRIPT
22
Table 3. Allelic richness, gene diversity and FIS values for populations of O. denticulatus and O.
srinakarinensis, abbrev. as O. sri (p=0.05).
No Locus Allelic richness, RS Gene diversity FIS*
O. denticulatus O. sri O. denticulatus O. sri O. denticulatus O. sri
Psh. Br. Smk. Tpg. Psh. Br. Smk. Tpg. Psh. Br. Smk. Tpg.
1
Oskar
49-2 3.00 2.00 2.00 3.00
0.50 0.50 0.39 0.55
-
0.44
-
0.67 -0.35 -0.83
2
Oskar
67-5 3.00 2.90 3.00 6.88
0.49 0.32 0.29 0.84
-
0.45
-
0.17 -0.14 -0.19
3
Oskar
24-1 7.00 4.00 3.78 5.99
0.69 0.63 0.27 0.81
0.03
-
0.09 -0.13 -0.02
4
Oskar
80-1 1.00 1.00 1.00 2.00
0.00 0.00 0.00 0.39
NA NA NA -0.35
5
Oskar
14-5 7.00 3.83 3.00 3.95
0.15 0.16 0.50 0.56
-
0.04
-
0.03 -0.12 0.04
6
Oskar
10-5 5.95 4.00 5.94 8.00
0.54 0.54 0.66 0.85
-
0.39
-
0.18 -0.30 -0.18
7
Oskar
19-5 8.93 6.88 6.94 4.00
0.77 0.69 0.63 0.69
0.01
-
0.38 -0.07 -0.35
8
Oskar
20-5 17.71 8.58 8.88 4.98
0.89 0.84 0.84 0.73
-
0.06
-
0.06 -0.15 -0.20
9
Oskar
84-2 4.96 3.00 4.00 4.00
0.57 0.53 0.64 0.75
-
0.74
-
0.89 -0.01 -0.31
10
Oskar
93-5 12.89 10.00 5.74 3.00
0.82 0.89 0.65 0.48
0.04
-
0.13 -0.32 -0.15
11
Oskar
60-5 6.00 5.00 5.83 3.00
0.58 0.68 0.73 0.59
0.15 0.23 0.14 0.20
12
Oskar
62-5 5.96 5.00 5.00 2.00
0.73 0.77 0.73 0.27
-
0.07 0.23 0.02 -0.18
13
Oskar
2-5 13.87 8.67 11.76 4.00
0.86 0.83 0.88 0.68
0.07
-
0.15 0.05 -0.15
14
Oskar
77-5 10.85 6.78 6.83 5.87
0.76 0.79 0.48 0.72
0.02 0.33 0.35 0.03
15
Oskar
21-5 6.92 10.87 13.41 6.00
0.67 0.90 0.81 0.70
0.10
-
0.05 0.01 -0.44
16
Oskar
66b- 7.00 5.90 5.94 5.85
0.79 0.82 0.76 0.68
0.09 0.36 -0.09 0.10
17
Oskar
69-5 9.00 7.00 15.91 4.00
0.72 0.85 0.93 0.66
0.05 0.03 0.18 -0.21
18
Oskar
37-3 3.00 2.00 4.00 3.00
0.59 0.47 0.62 0.56
-
0.38 0.21 -0.08 -0.32
19
Oskar
83-5 6.99 6.00 5.00 5.83
0.81 0.79 0.73 0.72
-
0.08
-
0.05 0.31 -0.04
20
Oskar
8-5 - - - 6.00
- - - 0.82
- - - -0.13
21
Oskar
40-3 - - - 5.00
- - - 0.65
- - - 0.02
22
Oskar
31-5 - - - 1.88
- - - 0.03
- - - 0.00
23
Oskar
27-5 - - - 1.99
- - - 0.05
- - - -0.01
24
Oskar
9-5 - - - 8.00
- - - 0.85
- - - -0.14
25
Oskar
68-5 - - - 4.85
- - - 0.72
- - - -0.26

ACC
EPTE
D M
ANU
SCR
IPT
ACCEPTED MANUSCRIPT
23
Mean 7.42 5.44 6.21 4.52 0.63 0.63 0.61 0.61 -
0.09
-
0.05 -0.02 -0.17
Note: *FIS was calculated overall from the loci, and is not equivalent to the mean value. Allelic richness estimates
were based on minimum samples of 32 individuals for Semangkok (n=36); 78 for Pasoh (n=87); 17 for Bukit Rengit
(n=19); and 35 for Maxwell Hill (n=41). Population names abbreviated as follows: Pasoh (Psh.); Bukit Rengit (Br.);
Semangkok (Smk.) and Maxwell Hill (Tpg.). Number of voucher collections included in this analysis are as follows:
Pasoh (8); Bukit Rengit (5); Semangkok (9) and Maxwell Hill (3).

ACC
EPTE
D M
ANU
SCR
IPT
ACCEPTED MANUSCRIPT
24
Legends
Figure 1. Sampling sites in Peninsular Malaysia (broken circles). Microsatellites were isolated
and characterised using voucher samples of O. srinakarinensis from the area highlighted in blue.
Figure 2. NJ tree constructed from the proportion of shared-alleles from 26 loci amplified in 189
termite individuals. (Note: each branch represents a single termite individual. Two samples were
removed from the data set as they were suspected to have been labelled wrongly during DNA
extraction)
Figure 3. NJ tree calculated from DA (Nei et al., 1983). (Note: branch tips represents a single
termite colony. Only colonies with four or more termite individuals genotyped were used to
construct the tree)
Figure 4. Structure bar plots showing Bayesian clustering patterns of the genotype data
assuming admixture under two different conditions of allele frequencies. (populations 1-4: Bukit
Rengit, Behrang, Pasoh and Semangkok; population 5: Maxwell Hill)

ACC
EPTE
D M
ANU
SCR
IPT
ACCEPTED MANUSCRIPT
25
Figure 1. Sampling sites in Peninsular Malaysia (broken circles). Microsatellites were isolated and
characterised using voucher samples of O. srinakarinensis from the area highlighted in blue.
ACC
EPTE
D M
ANU
SCR
IPT
ACCEPTED MANUSCRIPT
26
Figure 2. NJ tree constructed from the proportion of shared-alleles from 26 loci amplified in 189 termite
individuals. (Note: each branch represents a single termite individual. Two samples were removed from
the data set as they were suspected to have been labelled wrongly during DNA extraction)
ACC
EPTE
D M
ANU
SCR
IPT
ACCEPTED MANUSCRIPT
27
Figure 3. NJ tree calculated from DA (Nei et al., 1983). (Note: branch tips represents a single termite
colony. Only colonies with four or more termite individuals genotyped were used to construct the tree)
ACC
EPTE
D M
ANU
SCR
IPT
ACCEPTED MANUSCRIPT
28
Figure 4. Structure bar plots showing Bayesian clustering patterns of the genotype data assuming
admixture under two different conditions of allele frequencies. (populations 1-4: Bukit Rengit, Behrang,
Pasoh and Semangkok; population 5: Maxwell Hill)
Data Accessibility:
-microsatellite containing clone sequences: Genbank accessions JQ665975-JQ666003
-sample locations: Samples_locality_gps.txt
- microsatellite data: odonto_microsatellite_data.txt
ACC
EPTE
D M
ANU
SCR
IPT
ACCEPTED MANUSCRIPT
29
Highlights
We developed microsatellites to identify cryptic species in a fungus-growing termite.
Dendrograms from allele frequencies and Bayesian clustering identified two distinct clusters.
Morphologies of specimens from each cluster were reexamined.
A diagnostic character was found that could separate the two species.
The identity of the additional species was reconciled to a rare type specimen.
Copyright © 2022 FDOKUMEN