MicroRNA9 inhibition of cell proliferation and identification of novel miR9 targets by transcriptome...
22
MiR-9 inhibits proliferation of breast cancer cells 1 MicroRNA-9 inhibition of cell proliferation and identification of novel miR-9 targets by transcriptome profiling in breast cancer cells S. Duygu Selcuklu 1 , Mark T.A. Donoghue 1 , Kristina Rehmet 1§ , Matheus de Souza Gomes 1§ , Antoine Fort 1 , Prasad Kovvuru 1 , Mohan K. Muniyappa 1 , Michael J. Kerin 2 , Anton J. Enright 3 and Charles Spillane 1 1 Genetics and Biotechnology Lab., Centre for Chromosome Biology, National University of Ireland Galway, Ireland. 2 National Breast Cancer Institute (NBCI) and Division of Surgery, School of Medicine, National University of Ireland Galway, Ireland. 3 European Bioinformatics Institute, Wellcome Trust Genome Campus, Hinxton, Cambridge, UK. Running title: MiR-9 inhibits proliferation of breast cancer cells To whom correspondence should be addressed: Charles Spillane, Genetics and Biotechnology Lab., C306 Áras de Brún, National University of Ireland Galway, Galway, Ireland, Tel: +35391494148; Email: [email protected] Keywords: microRNA-9, breast cancer, microarray profiling, MTHFD2 Background: Dysregulation of miRNAs is associated with breast cancer. Results: MiR-9 overexpression and transcriptome analysis reveals novel miR-9 targets, including MTHFD2, which can recapitulate anti-proliferative effects of miR-9 overexpression. Conclusion: MiR-9 displays tumor-suppressor like activity in breast cancer cells, MTHFD2 contributes to this activity. Significance: Understanding miR-9 directed regulation of the breast cancer transcriptome is important for diagnosis and therapeutics. SUMMARY Although underexpression of miR-9 in cancer cells is reported in many cancer types, it is currently difficult to classify miR-9 as a tumor suppressor or an oncomir. We demonstrate that miR-9 expression is downregulated in MCF-7 and MDA-MB-231 breast cancer cells compared to MCF-10-2A normal breast cell line. Increasing miR-9 expression levels in breast cancer cells induced anti-proliferative, anti-invasive and pro-apoptotic activity. In addition, microarray profiling of the transcriptome of MCF-7 cells overexpressing miR-9 identified six novel direct miR-9 targets (AP3B1, CCNG1, LARP1, MTHFD1L, MTHFD2 and SRPK1). Amongst these, MTHFD2 was identified as a miR-9 target gene that affects cell proliferation. Knock-down of MTHFD2 mimicked the effect observed when miR-9 was overexpressed, by decreasing cell viability and increasing apoptotic activity. Despite variable effects on different cell lines, proliferative and anti-apoptotic activity of MTHFD2 was demonstrated whereby it could escape from miR-9 directed suppression (by overexpression of MTHFD2 with mutated miR- 9 binding sites). Furthermore, endogenous expression levels of miR-9 and MTHFD2 displayed inverse expression profiles in primary breast tumor samples compared to normal breast samples; miR-9 was downregulated and MTHFD2 was upregulated. These results indicate anti-proliferative and pro-apoptotic activity of miR-9 and that direct targeting of MTHFD2 can contribute to tumor suppressor- like activity of miR-9 in breast cancer cells. http://www.jbc.org/cgi/doi/10.1074/jbc.M111.335943 The latest version is at JBC Papers in Press. Published on July 2, 2012 as Manuscript M111.335943 Copyright 2012 by The American Society for Biochemistry and Molecular Biology, Inc. by guest, on July 9, 2012 www.jbc.org Downloaded from
-
Upload
independent -
Category
Documents
-
view
4 -
download
0
Transcript of MicroRNA9 inhibition of cell proliferation and identification of novel miR9 targets by transcriptome...
MiR-9 inhibits proliferation of breast cancer cells
1
MicroRNA-9 inhibition of cell proliferation and identification of novel miR-9 targets by transcriptome profiling in breast cancer cells
S. Duygu Selcuklu 1, Mark T.A. Donoghue 1, Kristina Rehmet 1§, Matheus de Souza Gomes 1§,
Antoine Fort 1, Prasad Kovvuru 1, Mohan K. Muniyappa 1, Michael J. Kerin 2, Anton J. Enright 3 and Charles Spillane1
1 Genetics and Biotechnology Lab., Centre for Chromosome Biology, National University of Ireland Galway, Ireland.
2 National Breast Cancer Institute (NBCI) and Division of Surgery, School of Medicine, National
University of Ireland Galway, Ireland.
3 European Bioinformatics Institute, Wellcome Trust Genome Campus, Hinxton, Cambridge, UK.
Running title: MiR-9 inhibits proliferation of breast cancer cells
To whom correspondence should be addressed: Charles Spillane, Genetics and Biotechnology Lab., C306 Áras de Brún, National University of Ireland Galway, Galway, Ireland, Tel: +35391494148; Email: [email protected] Keywords: microRNA-9, breast cancer, microarray profiling, MTHFD2 Background: Dysregulation of miRNAs is associated with breast cancer. Results: MiR-9 overexpression and transcriptome analysis reveals novel miR-9 targets, including MTHFD2, which can recapitulate anti-proliferative effects of miR-9 overexpression. Conclusion: MiR-9 displays tumor-suppressor like activity in breast cancer cells, MTHFD2 contributes to this activity. Significance: Understanding miR-9 directed regulation of the breast cancer transcriptome is important for diagnosis and therapeutics. SUMMARY Although underexpression of miR-9 in cancer cells is reported in many cancer types, it is currently difficult to classify miR-9 as a tumor suppressor or an oncomir. We demonstrate that miR-9 expression is downregulated in MCF-7 and MDA-MB-231 breast cancer cells compared to MCF-10-2A normal breast cell line. Increasing miR-9 expression levels in breast cancer cells induced anti-proliferative, anti-invasive and pro-apoptotic activity. In addition, microarray profiling of the transcriptome of MCF-7 cells overexpressing
miR-9 identified six novel direct miR-9 targets (AP3B1, CCNG1, LARP1, MTHFD1L, MTHFD2 and SRPK1). Amongst these, MTHFD2 was identified as a miR-9 target gene that affects cell proliferation. Knock-down of MTHFD2 mimicked the effect observed when miR-9 was overexpressed, by decreasing cell viability and increasing apoptotic activity. Despite variable effects on different cell lines, proliferative and anti-apoptotic activity of MTHFD2 was demonstrated whereby it could escape from miR-9 directed suppression (by overexpression of MTHFD2 with mutated miR-9 binding sites). Furthermore, endogenous expression levels of miR-9 and MTHFD2 displayed inverse expression profiles in primary breast tumor samples compared to normal breast samples; miR-9 was downregulated and MTHFD2 was upregulated. These results indicate anti-proliferative and pro-apoptotic activity of miR-9 and that direct targeting of MTHFD2 can contribute to tumor suppressor-like activity of miR-9 in breast cancer cells.
http://www.jbc.org/cgi/doi/10.1074/jbc.M111.335943The latest version is at JBC Papers in Press. Published on July 2, 2012 as Manuscript M111.335943
Copyright 2012 by The American Society for Biochemistry and Molecular Biology, Inc.
by guest, on July 9, 2012w
ww
.jbc.orgD
ownloaded from
MiR-9 inhibits proliferation of breast cancer cells
2
INTRODUCTION MicroRNAs (miRNAs) are small non-coding RNAs that regulate gene expression post-transcriptionally. They mediate fundamental cellular processes such as differentiation, proliferation and apoptosis and are actively involved in carcinogenesis (1,2). Dysregulation of miRNAs can contribute to tumorigenesis (3) and miRNA expression patterns can classify tumor subtypes (4). Several miRNAs have been experimentally validated to function as oncomirs (5-7) or tumor suppressor miRNAs (8,9). MiR-9, initially shown to function in neurogenesis (10), is recently implicated in cancer. Although most evidence indicates tumor suppressor activity for miR-9 in cancer cells (11,12), conflicting findings exist (13). Currently it is difficult to classify miR-9 as a tumor suppressor miRNA or an oncomir. For example, miR-9 is overexpressed in brain tumors (14), induced by MYC in breast cancer cells enhancing metastasis (13,15), and knock-down of miR-9 decreased invasion of hepatocellular carcinoma cells (16), all of which is indicative of an oncogenic potential. Conversely, in gastric cancer tissues miR-9 was shown to be downregulated (17). Decreased expression of miR-9 has been also reported in gastric adenocarcinoma (18), ovarian cancer (11,19) and in malignant mesothelioma (20,21). Moreover, epigenetic inactivation of the miR-9 gene has been shown in breast cancer (22-24), colorectal cancer (22), renal cell carcinoma (25) and several other cancer cell lines and tumor tissues (12), all of which is indicative of a tumor suppressor potential. To date, few miR-9 targets of relevance to cancer have been experimentally validated (26,27); CBX7 in human glioma (28), CDX2 in gastric cancer (29), NFKB1 in ovarian cancer (19) and in gastric adenocarcinoma (18) and E-Cadherin when induced by MYC (15). It remains unclear how miR-9 contributes to cancer cell growth or how cancer transcriptomes respond to loss/gain of miR-9 expression. This study investigates the effects of miR-9 over-expression on cancer cell growth and apoptosis, and further identifies global changes and novel direct targets in the transcriptome of the MCF-7 breast cancer cell line using a microarray profiling approach. We demonstrate that several cancer-associated genes are responsive to miR-9 overexpression and that miR-9 directly targets AP3B1, CCNG1, LARP1, MTHFD1L, MTHFD2
and SRPK1 post-transcriptionally. We also demonstrate that targeting MTHFD2 can be partially responsible for the anti-proliferative activity of miR-9 in breast cancer cells. EXPERIMENTAL PROCEDURES Patient samples and cell lines-Primary tumor (n=16) and normal breast (n=14) samples were obtained from patients at NUI Galway University hospital (Suppl. Table 3). Human breast adenocarcinoma cell lines MCF-7, MDA-MB-231 were cultured as previously described (30) and normal breast epithelial cell line MCF-10-2A was cultured based on ATCC recommendations. Constructs and transfections-For the microarray experiments, synthetic oligonucleotides (pre-9 and pre-ctr) (ABI, UK) were transfected at two dosages: 12.5 nM (1X) and 25 nM (2X) final concentrations. For all other experiments, a final concentration of 50 nM was used. SiRNAs for AP3B1, MTHFD1L, MTHFD2 and siControl (Qiagen, USA) were used in final 5 nM concentrations. The MTHFD2 ORF construct pCMV-MTHFD2-UTR (with full length 3’UTR) (Origene, USA) was used as wild type construct and pCMV-AC (Origene, USA) vector was used as empty vector (EV) control. A construct with mutated miR-9 binding sites on 3’UTR was generated (QuikChange Lightning Kit, Agilent Technologies, UK) designated as pCMV-MTHFD2-UTRmut. One µg of each plasmid (as well as pCMV empty vector (EV) control) and pre-9 (or pre-ctr) oligonucleotide were co-transfected into MCF-7, MDA-MB-231 and MCF-10-2A cells in 6-well plates using Lipofectamine 2000 reagent according to manufacturer’s protocol (Invitrogen, USA). Quantitative RT-PCR-Total RNA and small RNAs were isolated using Nucleospin miRNA kit (Macherey-Nagel, Germany) and reverse-transcribed using a RevertAid H-Minus First Strand cDNA Synthesis Kit (Fermentas, USA). Quantitative RT-PCR was performed using SYBR green assays (ABI, UK) and the reaction was run in a CFX96 system (Bio-Rad, USA). !-Actin and GAPDH were used as housekeeping controls. QRT-PCR analysis of miR-9 and RNU6B (housekeeping control) were conducted using Taqman miRNA assays (ABI, UK). Relative quantification of expression was calculated using
by guest, on July 9, 2012w
ww
.jbc.orgD
ownloaded from
MiR-9 inhibits proliferation of breast cancer cells
3
the 2!""CT method in CFX96 system software. T-test was used to determine statistical significance. Microarray Profiling and data analysis-RNA integrity number (RIN) was measured using Bioanalyzer (Agilent, UK) and good quality samples (RIN>8) were processed for hybridization into whole human genome Illumina bead arrays (Illumina, USA) in biological triplicates (Wellcome Trust Sanger Institute microarray core facility). All data was variance stabilizing transformed and robust spline normalized using the lumi package (Bioconductor). Differentially expressed genes were identified using LIMMA (p < 0.05, Signal Log Ratio (SLR) > 1.2). Putative microRNA targets were identified using MAMI microRNA target meta-predictor and TargetScan. MiR-9 seed region enrichment was identified using Sylamer. Enrichment analysis was performed using conditional hypergeometric tests. The microarray data is deposited at NCBI/GEO; accession number: GSE33952. Western blot and antibodies-Cells were washed with PBS and lysed in protein lysis buffer (0.1% TritonX-100, 0.1% SDS, 0.5% DOC in PBS). MTHFD1L protein (localized to mitochondria) was isolated using Mitochondria Isolation Kit (Thermo Scientific, USA) followed by lysis using RIPA buffer (31). Proteins were quantified (Bradford Assay, Bio-Rad, USA) and 30 #g of each protein was separated on 10% SDS-PAGE and transferred to PVDF membrane. Blots were blocked in 5% milk-TBS-Tween-20. Following antibodies are used: primary antibodies (1:500-1000 dilution) anti-AP3B1 (#GTX113878S), anti-MTHFD2 (#GTX115482S) (GeneTex, USA), anti-MTHFD1L (32), anti-CCNG1 (#AP11209b) (Abgent, USA), anti-SRPK1 (#H00006732-A01) (Abnova, USA), anti-$-Actin (#A9169), secondary antibodies (1:10,000 dilution) anti-rabbit (#A9169), anti-mouse (#A0168) (Sigma, UK). Immunodetection was performed using enhanced chemiluminescence (ECL Plus Kit, Perkin Elmer) and visualized in G:Box Chemi imaging system (Syngene, UK). Cell viability and caspase-3/7 assays- For viability, cytotoxicity and caspase-3/7 analyses, cells were grown in 96-well plates and 48 hours post-transfection of overexpression constructs or oligonucleotides, ApoTox-Glo Triplex Assay was performed according to manufacturer’s protocol (Promega, USA). This assay detects fluorogenic,
cell-permanent peptide substrate (GF-AFC) for live-cell activity and cell-impermanent, fluorogenic peptide substrate (bis-AAF-R110) for dead-cell protease activity, resulting in ratiometric, inversely correlated measures of cell viability and cytotoxicity. Each well is normalized as live/dead cells making results comparable (well-to-well, plate-to-plate and day-to-day) since the ratio of viable cells to dead cells is independent of cell number. This followed addition of luminogenic DEVD-peptide substrate for caspase-3/7 and Ultra-Glo™ Recombinant Thermostable Luciferase onto cells. The luminescence output was measured with a luminometer. One µM of staurosporine (STS) treatment for three hours was used as positive control for apoptosis induction (33) to confirm the accuracy of the assay. Wound healing and invasion assays-Cells were grown to full confluence, transfected with pre-9 or pre-ctr and wounded by a sterile pipette tip. Images of the cells were taken under an inverted microscope at 0 hour, 24 hours and 48 hours time points after wounding. For invasion, following transfections, 2.5x10⁴ MCF-7 or MDA-MB-231 cells (in serum starving medium; 0.1% FBS DMEM) were transferred into invasion chambers (BD Biosciences, Germany) fixed and stained according to manufacturer’s protocol. The images of invaded and stained cells were taken from an inverted microscope and counted. Luciferase Reporter Assay-Full-length 3’UTR reporter constructs for AP3B1, CCNG1, MTHFD1L, MTHFD2, LARP1 and SRPK1 were obtained from Switchgear Genomics, USA. Constructs containing mutated miR-9 seed binding site were generated (QuikChange Lightning Kit, Agilent Technologies, UK). Each 3’UTR or mutated 3’UTR construct (100 ng) was co-transfected with pre-9 or pre-ctr synthetic oligonucleotides (50 nM) in 24-well plates. 48 hours post-transfection, LightSwitch luciferase assay solution (Switchgear Genomics, USA) was added onto cells, incubated for 30 min at room temperature and luminescence was read for 2 seconds in luminometer plate reader. Log2 ratios of targeting/non-targeting microRNA (pre-9/pre-ctr) luciferase activity for each construct were plotted.
by guest, on July 9, 2012w
ww
.jbc.orgD
ownloaded from
MiR-9 inhibits proliferation of breast cancer cells
4
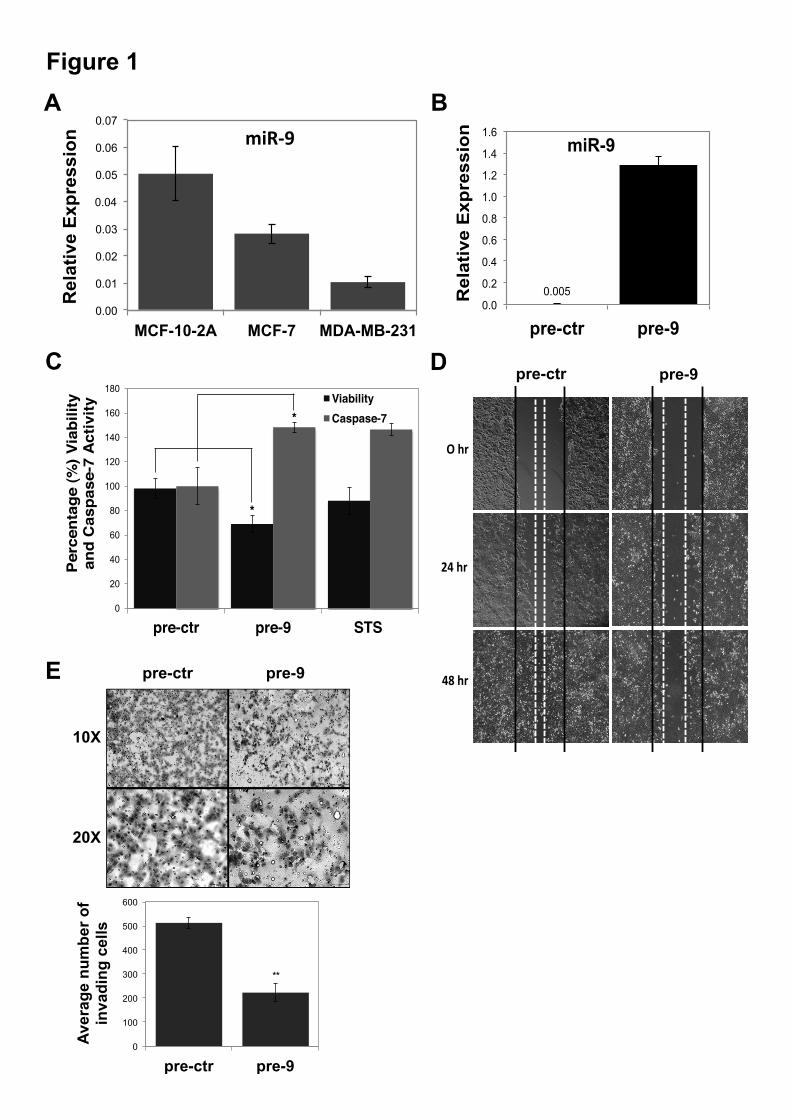
RESULTS Increasing miR-9 levels leads to decrease in cell viability and increase in apoptosis in MCF-7 cells-Quantitative analysis (Taqman qRT-PCR) of miR-9 expression levels in breast cancer cell lines MCF-7 and MDA-MB-231 and normal epithelial breast cell line MCF-10-2A indicated lower levels of miR-9 in cancer cell lines compared to MCF-10-2A (Figure 1A). The effect of miR-9 overexpression on tumor cell growth was investigated. MiR-9 expression levels could be increased up to 250 fold in the pre-9 synthetic oligonucleotide transfected MCF-7 cells compared to pre-ctr (scrambled control) transfected cells (Figure 1B). MiR-9 overexpressing cells lead to decreased viability and increased caspase-7 activity as an indicator of apoptosis (Figure 1C). Although staurosporine (STS) treatment did not cause a significant change in the viability of the MCF-7 cells, it was sufficient to increase caspase-7 activity as a positive control of apoptosis (Figure 1C). MCF-7 cells lack caspase-3 (34), and previous reports indicate that activation of caspase-7 occurs independent of caspase-3 in MCF-7 cells (35,36). Hence, similar to STS treatment effects observed, in the miR-9 overexpression (pre-9) caspase-7 activity was increased compared to control (pre-ctr) indicating caspase-3 independent caspase-7 activation in MCF-7 cells (Figure 1C). In addition to anti-proliferation and pro-apoptotic effects, miR-9 overexpressing MCF-7 cells (pre-9) had slower motility (wound healing) compared to control (pre-ctr) (Figure 1D). To further examine the phenotypic effects of miR-9 overexpression on breast cancer cells, the invasion of MCF-7 (non-invasive, ER+) and MDA-MB-231 (highly invasive, ER-) cells was tested following miR-9 overexpression. No cell invasion was observed in MCF-7 cells. However, miR-9 overexpression (pre-9) significantly decreased the invasiveness of the highly invasive cell line MDA-MB-231 compared to control (pre-ctr) treatments (Figure 1E). Genome-wide effects of miR-9 overexpression on MCF-7 transcriptome-To determine the global effects of miR-9 overexpression on the transcriptome of MCF-7 breast cancer cells microarray profiling was performed. MiR-9 was delivered at two dosages, designated 1X and 2X.
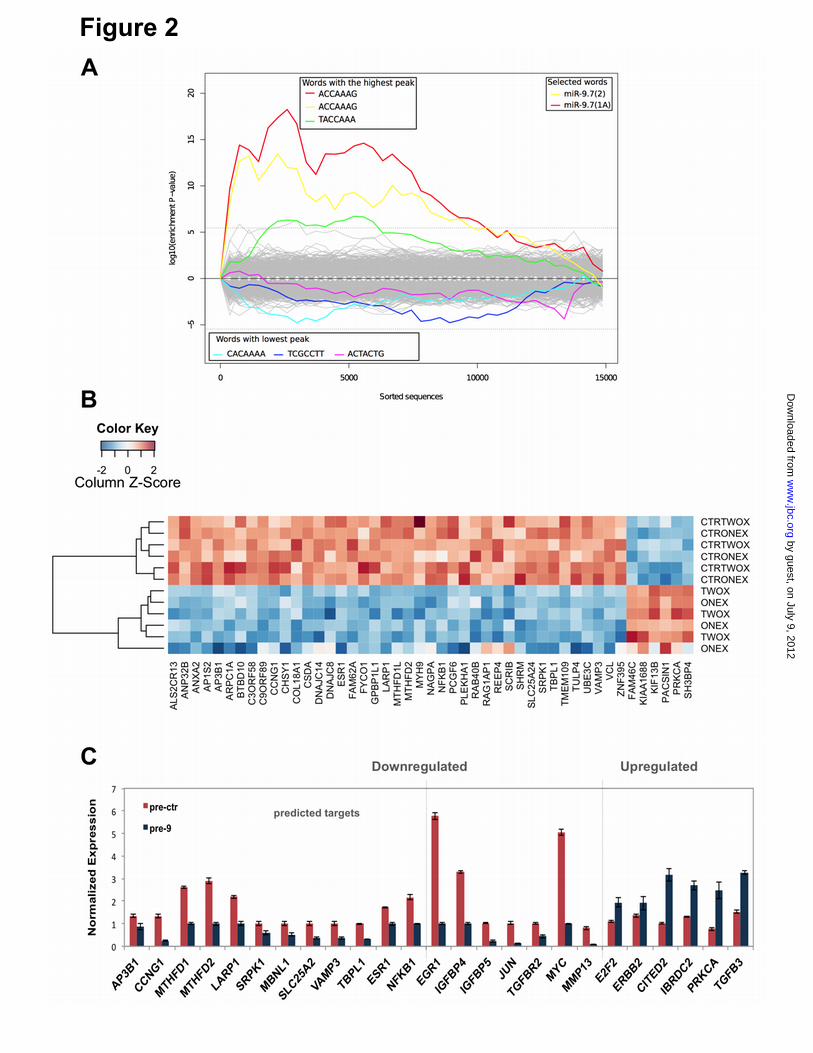
Quantitative analysis of miR-9 prior to the microarray analysis showed that the overexpression of miR-9 by providing a 2X dosage of the microRNA (pre-9) did not increase intracellular levels by two fold. However, there was a significant increase in miR-9 levels up to 1.5 fold compared to the 1X microRNA dosage (data not shown). Differentially expressed genes were identified for the 1X and 2X treatments separately (compared to their corresponding controls). A total of 516 differentially expressed genes were identified in miR-9 overexpressing MCF-7 cells compared to controls (p < 0.05, SLR > log2 1.2). Among these, 145 differentially expressed genes were specific to 1X dosage and 121 genes were specific to 2X dosage treatments. Two hundred and fifty genes were commonly differentially expressed in 1X and 2X (124 upregulated and 126 downregulated). There was no relationship observed between fold changes and dosages in the common differentially expressed genes, with both dosages displaying approximately the same fold change differences (Suppl. Figure S1), possibly due to saturation of miR-9 overexpression levels. Furthermore, a direct comparison of 1X (pre-9) versus 2X (pre-9) was performed, which identified no differential expression, indicating no observable dosage effect. Downregulated genes responsive to miR-9 overexpression are enriched with miR-9 seed region binding sequences-To identify enrichment of miR-9 seed region binding sites in the 3’UTRs of differentially expressed genes Sylamer (SylArray) (37,38) analysis was performed. Briefly, all genes on the microarray were first ranked based by t-statistic. Sylamer detected significantly over- and under-represented words in the 3’UTRs of the ranked list of genes. Results showed significant enrichment (p-value < 1x10-15) for canonical miR-9 seeds (6-mer, 7-mer and 8-mer) in downregulated genes in both dosages, 7-mer enrichment is shown (Figure 2A). Analysis of all the differentially expressed genes (union of 1X and 2X; 516 genes) in the MAMI microRNA meta-predictor (mami.med.harvard.edu) identified predicted miR-9 targets (41 downregulated and 6 upregulated) (Figure 2B). The specific effects of direct miR-9 targeting are highlighted by the enrichment of miR-9 seed region binding sites in the 3’UTRs of genes observed to be
by guest, on July 9, 2012w
ww
.jbc.orgD
ownloaded from
MiR-9 inhibits proliferation of breast cancer cells
5
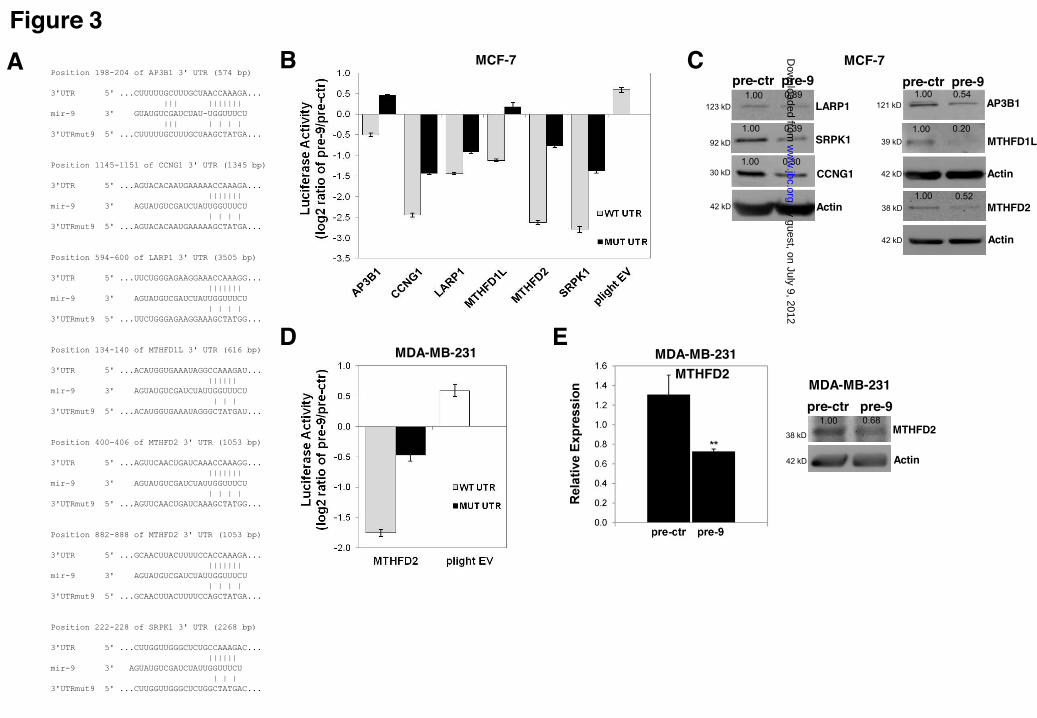
downregulated, indicating that the post-transcriptional regulatory role of miR-9 likely involves the direct targeting of multiple genes. Twenty six differentially expressed genes (20 downregulated and six upregulated genes) were selected for further analysis based on genes classified for enriched cancer related GO terms (e.g. cell proliferation, apoptosis, cell death) (Suppl. Table 1) or those that are predicted targets and displayed the greatest extreme in differential expression (independent of the GO term, based on lowest p-values) including 13 predicted targets of miR-9 (12 downregulated, one upregulated) (Suppl. Table 2). The differential regulation of 26 genes (20 downregulated and six upregulated) including NFKB1 as a known miR-9 target (19) in response to miR-9 overexpression was confirmed by Sybr green qRT-PCR for pre-9 treated samples compared to pre-ctr (t-test; p < 0.05) (Figure 2C). Identification of six novel targets of miR-9-In most instances, microRNAs negatively regulate gene expression (i.e. reduce levels of mRNAs/proteins) (39,40). From the validated (downregulated) predicted targets, AP3B1, CCNG1, LARP1, MTHFD1L, MTHFD2 and SRPK1 were tested for direct miR-9 targeting using a 3’UTR luciferase-based reporter system (where one luciferase construct would contain a wild type 3’UTR while the other construct contains a disruption of the seed region of the miR-9 binding site) (Figure 3A). CCNG1, MTHFD2, LARP1 and SRPK1 were selected on the basis of their previous implications in breast cancer (41-44), while AP3B1 and MTHFD1L were selected as potential biomarkers. All of these genes were predicted to have one miR-9 binding site except MTHFD2, which has two predicted miR-9 binding sites (Figure 3A). All the predicted sites are annotated as conserved except for the miR-9 binding site in SRPK1, which is poorly conserved (TargetScan Release 5.2 June 2011) (Figure 3A). For the luciferase reporter analysis, in addition to construction of 3’UTR constructs where wild type miR-9 binding occurs, site-directed mutations in the miR-9 seed region in full-length 3’UTRs were introduced (MUT UTR) to perturb miR-9 binding. For all the six genes tested, the wild type 3’UTR (WT UTR) constructs displayed significant (p<0.001) downregulation in luciferase activity when co-transfected with pre-9 (normalized to pre-
ctr) (Figure 3B) in MCF-7 cells. In contrast, in the mutated 3’UTR constructs (MUT UTR) luciferase activity was restored significantly, confirming the functionality of miR-9 binding sites in the 3’UTR of these genes (Figure 3B). In addition, the effect of miR-9 binding was also tested at the protein level for all six genes, which indicated miR-9 overexpression induced reductions in protein levels for AP3B1, CCNG1, LARP1, MTHFD1L, MTHFD2 and SRPK1 (Figure 3C). Since MTHFD2 3’UTR contains two putative miR-9 binding sites and there is no detailed research reported on its activity in cancer cells, we focused on identification of the effects of MTHFD2 on three cell lines: MCF-7, MDA-MB-231 (breast cancer) and MCF-10-2A (normal breast) (see Suppl. Figure S2 for all the MCF-10-2A results). In addition to MCF-7 cells (Figure 3B), luciferase assay for MTHFD2 3’UTR was also performed in MDA-MB-231 and MCF-10-2A cells. In MCF-10-2A cells, despite the decreased luciferase activity in wild type construct (WT), the mutated construct (MUT) displayed no significant restoration of luciferase activity (Suppl. Figure S2A). However, a slight suppression at mRNA and protein levels of MTHFD2 was observed upon miR-9 overexpression in MCF-10-2A cells (Suppl. Figure S2B). In contrast, in MDA-MB-231 cells, the wild type construct (WT UTR) displayed lower luciferase activity whereas mutated construct (MUT UTR) restored the luciferase activity significantly (Figure 3D), suggesting that a miR-9:MTHFD2 regulatory interaction occurs in two different breast cancer cell lines. The suppressive effect of miR-9 on MTHFD2 in MDA-MB-231 cells was also confirmed at mRNA and protein levels (Figure 3E). Overall, these results indicate that AP3B1, CCNG1, LARP1, MTHFD1L, MTHFD2, and SRPK1 are direct targets of miR-9, negatively regulated by miR-9 at the mRNA and protein levels. Depletion of the miR-9 target MTHFD2 recapitulates the anti-proliferative effect of miR-9 overexpression in MCF-7 cells-To test whether the anti-proliferative effect of miR-9 overexpression is due to downregulation of its identified targets; siRNA knock-downs were performed for three genes AP3B1, MTHFD1L and MTHFD2 followed by viability and caspase-3/7 activity analyses. Successful knock-down in MCF-
by guest, on July 9, 2012w
ww
.jbc.orgD
ownloaded from
MiR-9 inhibits proliferation of breast cancer cells
6
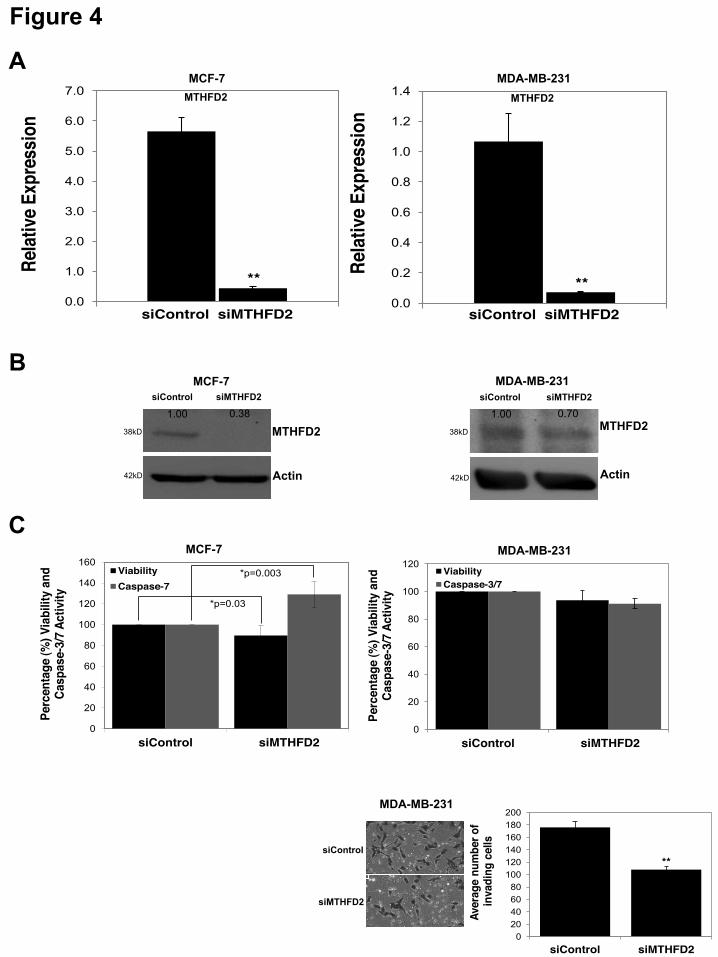
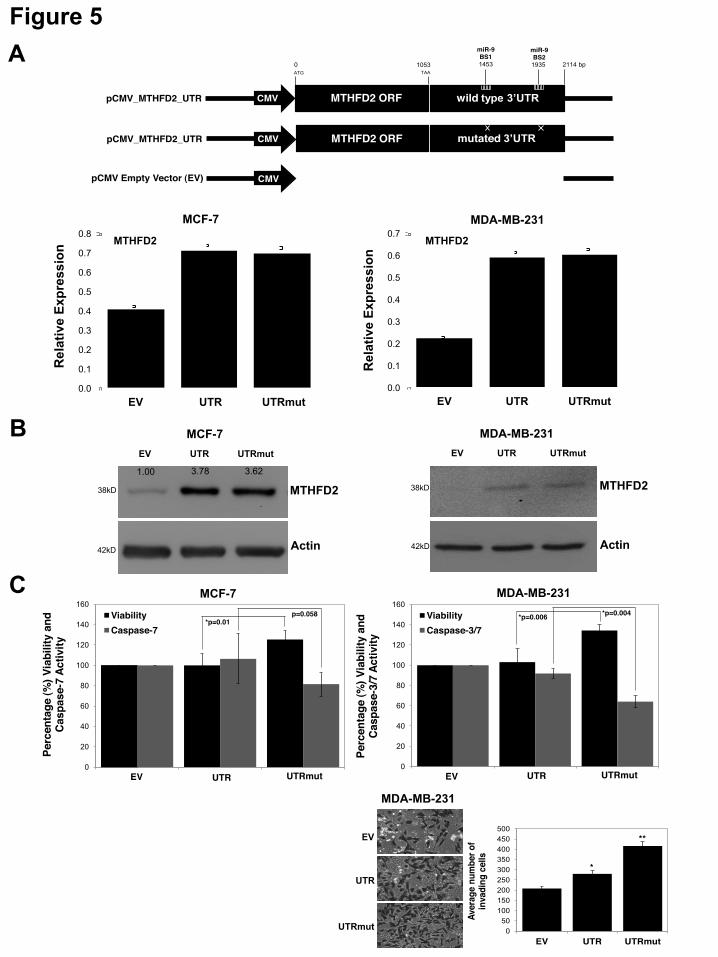
7 cells was confirmed for AP3B1 and MTHFD1L by qRT-PCR (Suppl. Figure S3A). The viability of siMTHFD1L-transfected MCF-7 cells was significantly decreased whereas the siAP3B1-transfected cells showed no significant change in viability compared to the siControl (Suppl. Figure S3B). Analysis of caspase-3/7 activity indicated no significant change in siAP3B1- and siMTHFD1L- transfected MCF-7 cells compared to siControl (Suppl. Figure S3B). The knock-down of MTHFD2 (siMTHFD2) was performed in three cell lines: MCF-7, MDA-MB-231 and MCF-10-2A. In MCF-10-2A cells successful knock-down was confirmed at mRNA level (Suppl. Figure S2C). The viability displayed no significant change, however caspase-3/7 activation was significantly (p=0.01) increased in the siMTHFD2-transfected MCF-10-2A cells (Suppl. Figure S2D). Successful knock-down of MTHFD2 in MCF-7 and MDA-MB-231 cells was confirmed at mRNA (Figure 4A) and protein levels (Figure 4B). In MCF-7 cells, the viability was decreased (p=0.03) and caspase-3/7 activation was increased (p=0.003) upon MTHFD2 knock-down (siMTHFD2) (Figure 4C). There was no significant change in the viability or caspase-3/7 activation in MDA-MB-231 cells (Figure 4C). However, MDA-MB-231 cells displayed reduced invasiveness (Figure 4C) upon MTHFD2 knock-down suggesting that MTHFD2 contributes to promoting invasiveness. These results indicate that (while displaying variable effects in different cell lines) MTHFD2 knock-down (siMTHFD2) can recapitulate the anti-proliferative, anti-invasive and pro-apoptotic activity of mir-9 overexpression (pre-9) (Figure 1). Overexpression of MTHFD2 with mutated miR-9 binding sites displays proliferative activity-To test for opposite effects to those observed in MTHFD2 knock-down, and to identify the contribution of miR-9-directed regulation on the potential oncogenic activity of MTHFD2, overexpression constructs for MTHFD2 with wild type 3’UTR (pCMV-MTHFD2-UTR) or 3’UTR with mutated miR-9 binding sites (pCMV-MTHFD2-UTRmut) or empty vector control (pCMV) (Figure 5A) were transfected in MCF-7, MDA-MB-231 and MCF-10-2A cells. The overexpression of MTHFD2 (via both wild type 3’UTR and mutated 3’UTR) was detected at mRNA and/or protein
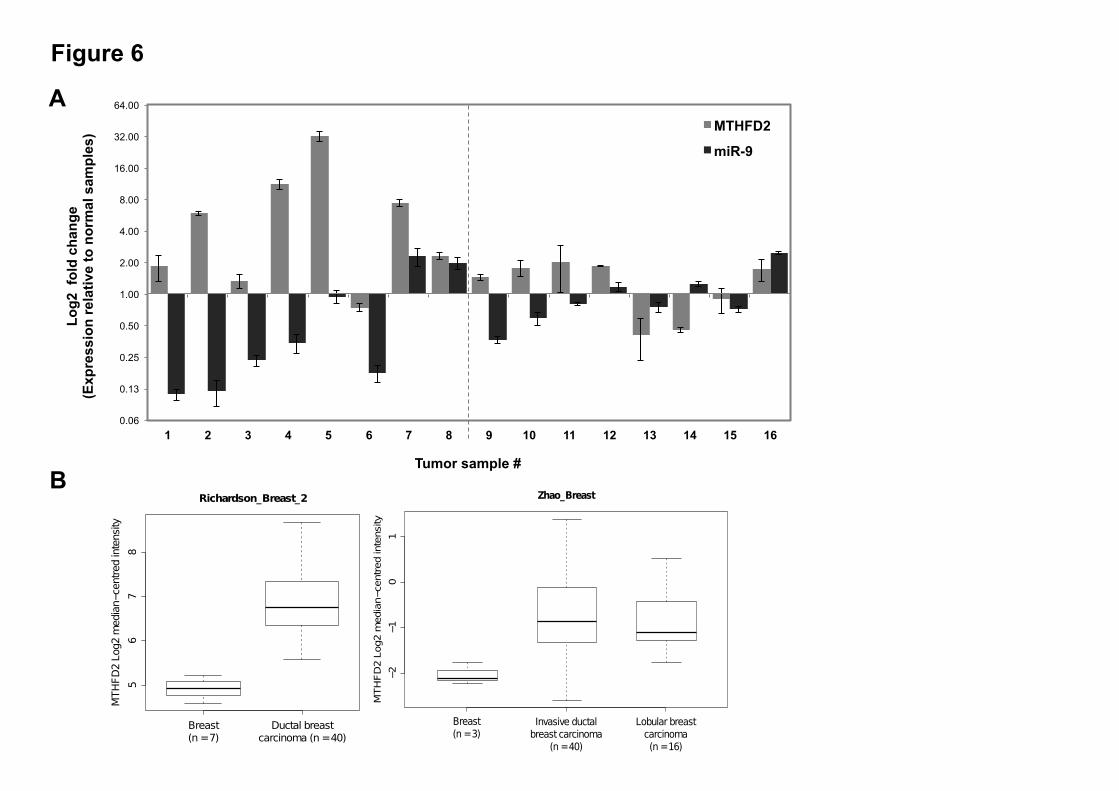
levels in all the cells (Figure 5A-B) (Suppl. Figure S2E for MCF-10-2A). The MCF-10-2A cells ectopically overexpressing miR-9 (pre-9) and MTHFD2 with mutated miR-9 binding sites (UTRmut) displayed higher MTHFD2 expression that may indicate the escape of MTHFD2 from miR-9 directed suppression due to the mutated binding sites. However, the viability and caspase-3/7 activity displayed no significant change upon MTHFD2 overexpression (Suppl. Figure S2F). In contrast, despite the similar ectopic expression profile of MTHFD2 in UTR or UTRmut transfected samples, both MCF-7 and MDA-MB-231 cells displayed significantly greater viability and reduced apoptosis when MTHFD2 was overexpressed with mutated miR-9 binding sites (UTRmut) (Figure 5C). These findings highlight the significant contribution of miR-9-directed regulation on reducing the proliferative, and anti-apoptotic capacity of MTHFD2. Furthermore, compared to control (EV), the invasiveness of MDA-MB-231 cells was increased when MTHFD2 was overexpressed with wild type 3’UTR (UTR) (Figure 5C) and this effect was greater (i.e. more invasiveness) when MTHFD2 was overexpressed with ablated miR-9 binding sites (UTRmut) (Figure 5C), indicating that miR-9-directed regulation can limit the pro-invasive potential of MTHFD2. MiR-9 and MTHFD2 show inverse expression levels in primary breast cancer samples-To test whether miR-9 and MTHFD2 expression levels are inversely correlated in clinical cancer samples, expression levels of miR-9 and MTHFD2 in 30 samples (16 primary breast cancer samples; eight non-metastatic tumor and eight metastatic tumor and 14 normal breast samples) were analyzed. The relative fold changes of miR-9 and MTHFD2 in tumor samples were normalized against the mean expression of normal breast tissue samples which were set to one, and presented as relative fold changes (Log2 ± SE) (Figure 6A). In six out of eight non-metastatic samples, miR-9 and MTHFD2 showed an inverse expression profile whereas in metastatic samples the trend was less obvious; three out of eight samples showed an inverse expression profile. Furthermore, two publically available datasets, Richardson_breast_2 (n=47) (45) and Zhao_breast (n=64) (46), available through the OncomineTM database (v4.4
by guest, on July 9, 2012w
ww
.jbc.orgD
ownloaded from
MiR-9 inhibits proliferation of breast cancer cells
7
Compendia Bioscience, Ann Arbor, MI) (47), confirmed higher expression levels of MTHFD2 in breast tumor samples compared to normal breast tissue (Figure 6B). This is consistent with increased MTHFD2 expression levels in breast cancer that was recently reported in a proteomics study with 21T breast cancer cell lines (derived from a single patient with metastatic breast cancer) (42). DISCUSSION The role of miR-9 in cancer biology is not well understood. This study demonstrates that endogenous miR-9 levels are lower in breast cancer cells compared to normal cells. It also provides evidence of direct miR-9 targets previously implicated in cancer. While miR-9 overexpression has been associated with colorectal cancer metastasis (48), its significant downregulation in gastric and clear cell renal carcinomas (17,25) has also been reported. These conflicting findings on miR-9 expression (downregulation or overexpression in cancer cells) may be due to differential mature miR-9 processing from three different primary precursors where downregulation of miR-9 due to aberrant hypermethylation of any of the miR-9-1, miR-9-2 and miR-9-3 precursor regions have been reported in independent studies in different cancer types (25,49,50). Our findings that endogenous miR-9 levels are lower in breast cancer cells compared to normal cells (for both cell lines and primary tumor samples), is similar to previous reports of lower levels of miR-9 associated with ovarian cancer, gastric carcinoma and clear cell renal carcinomas (17,25,51). Changes in cell proliferation and apoptosis are key phenotypes observed in malignant transformation (52). Our results demonstrate that miR-9 overexpression decreases cell viability and increases apoptosis in MCF-7 breast cancer cells. As a caspase-3 null cell line (53), previous studies have shown that DEVDase activity can be increased in MCF-7 cells independent of caspase-3 whereby caspase-7 cleaves DEVD substituting caspase-3 (54-57). In this study, caspase-7 activity was increased indicating pro-apoptotic activity of miR-9 in MCF-7 cells. The anti-proliferative and pro-apoptotic effects of miR-9 are supportive of a tumor-suppressor-like role of miR-9 in the context
of breast cancer cell proliferation, migration and apoptosis. Invasiveness is one of the hallmarks of cancer (58). Overexpression of some miRNAs (e.g. miR-21) has been shown to increase the invasiveness of normal and cancer cells (59,60). In some instances, non-invasive cell lines can be transformed into invasive cells, while in other cases the invasiveness of a cell line can be increased due to changes in the expression levels of specific miRNAs (or genes) (61,62). While our study demonstrates no effect of miR-9 overexpression on the invasiveness of the non-invasive MCF-7 cell line, the overexpression of miR-9 elicited a significant reduction in the invasiveness of the highly invasive MDA-MB-231 cell line. The lack of invasion observed in MCF-7 cells could be due to the poorly invasive nature of MCF-7 cells (63). The reduction of invasion observed in the MDA-MB-231 cell line could be due to miR-9 directed downregulation or inactivation of pro-invasive genes, and indicates that miR-9 levels can affect invasiveness. Although miR-9 has been implicated in cancer biology in several studies, no genome-wide transcriptome analysis of miR-9 expression effects in cancer cells has been reported to date. This study demonstrates that miR-9 overexpression in breast cancer cells in two dosages (1X and 2X) identifies 250 genes whose expression levels are responsive to miR-9, including 47 predicted miR-9 targets. The cancer relevance of miR-9 induced effects on the MCF-7 transcriptome is highlighted by cancer related GO terms (e.g. cell proliferation, apoptosis) being enriched in the genes differentially regulated. The identification of predicted miR-9 target genes displaying reduced expression levels in MCF-7 cells when miR-9 is overexpressed suggests such genes are potential direct targets of miR-9. This study identifies and validates six genes as novel direct miR-9 targets, including five targets with previously identified roles in cancer (AP3B1, CCNG1, LARP1, MTHFD2 and SRPK1) and one target that not previously implicated in cancer (MTHFD1L) in MCF-7 cells. MTHFD2 was tested also in MDA-MB-231 and MCF-10-2A cells and confirmed as a direct target of miR-9 in MDA-MB-231 cells in addition to MCF-7. Interestingly, in MCF-10-2A cells luciferase activity remained
by guest, on July 9, 2012w
ww
.jbc.orgD
ownloaded from
MiR-9 inhibits proliferation of breast cancer cells
8
suppressed in the construct with mutated miR-9 binding sites, indicating no significant miR-9 contribution on MTHFD2 suppression in these cells, which may be a result of different cellular context in combination with other regulatory relationships. For CCNG1, LARP1 and SRPK1, a functional role in cancer has been previously reported by knock-down experiments. CCNG1 (Cyclin-G1), a p53 target, has been implicated in cancer (64-68) and silencing of CCNG1 displayed decreased cell growth rate and invasion in hepatocarcinoma cells (65). LARP1 (La ribonucleoprotein domain family, member 1), functions in vesicle transport. Silencing of LARP1 increased apoptosis in HeLa cells (69). SRPK1 (SRSF protein kinase 1) functions in alternative splicing and has been implicated in many cancer types (70-74). Silencing of SRPK1 increased apoptotic potential in breast and colonic tumor cell lines (70), and decreased proliferative capacity in leukemic cells (75). The observed reduction in mRNA and protein levels highlights that due to direct targeting by miR-9, the reduced activity of these oncogenic targets can potentially lead to suppression of tumorigenesis. In addition, our study also provides the first knock-down experiments for three additional direct targets of miR-9, namely AP3B1, MTHFD1L and MTHFD2. We considered that the lack of experimental evidence of loss-of-function effects of these genes on cancer cells made them good candidates to investigate their possible involvement in breast carcinogenesis using a siRNA approach. AP3B1 (AP-3 complex subunit beta-1), involved in organelle biogenesis, has been investigated in relation to cancer in only a few studies (76,77). MTHFD1L (methylenetetrahydro-folate dehydrogenase (NADP+ dependent) 1-like) has been previously implicated in neural tube defects (78). MTHFD2 (methylenetetrahydrofolate dehydrogenase (NADP+ dependent) 2), a mitochondrial bifunctional enzyme, is known to involve in folate metabolism (79) and loss- or gain-of function studies have not been described yet. A possible link between MTHFD2 and cancer; such as a SNP in MTHFD2 associated with increased risk of bladder cancer (80), and a correlation of MTHFD2 expression with artesunate
resistance in tumor cell lines (81) have been reported. The individual effects of knock-down of MTHFD1L and AP3B1 showed only a small 15% decrease in viability in MCF-7 cells. In contrast, the knock-down of MTHFD2 significantly decreased cell viability and increased apoptosis in both MCF-7 and MDA-MB-231 cells, mimicking the phenotypic effect of miR-9 overexpression. Apart from the significant increase in caspase-3/7 activation in MCF-10-2A cells, no significant effect was observed in viability of MCF-10-2A cells or viability and caspase-3/7 activity of MDA-MB-231 cells following MTHFD2 knock-down. Similar findings indicating that overexpression or knock-down of a gene may not have an impact on cell proliferation but affect cancer cell invasion have been described (82,83). While the extent of the effect of MTHFD2 knock-down may not completely account for the overall extent of the phenotypic effects of miR-9, it is clear that knock-down of MTHFD2 can contribute to the phenotypic effects as seen for miR-9 overexpression in MCF-7 cells. The overexpression of MTHFD2 with the wild type (UTR) or mutated (UTRmut) miR-9 binding sites displayed similar expression levels. MTHFD2 overexpression with mutated miR-9 binding sites (UTRmut) could be expected to display higher MTHFD2 levels due to “escaping” from miR-9 directed suppression. In the UTR transfected cells ectopically expressed miR-9 can target both endogenous and ectopically introduced MTHFD2, whereas in UTRmut transfected cells miR-9 can only target endogenous MTHFD2. We consider that due to high endogenous levels of MTHFD2, ectopically expressed miR-9 can still be captured by the endogenous MTHFD2 resulting in overall similar MTHFD2 expression compared to UTRmut. Potentially, much greater miR-9 ectopic expression in UTR-transfected cells should be sufficient for suppression of both endogenous and ectopically expressed MTHFD2, resulting in less MTHFD2 expression compared to UTRmut- transfected cells. MTHFD2 overexpression with wild type 3’UTR (UTR) had no effect on viability or apoptosis compared to empty vector control (EV). In contrast, MTHFD2 lacking miR-9 binding sites (UTRmut) displayed increased viability and
by guest, on July 9, 2012w
ww
.jbc.orgD
ownloaded from
MiR-9 inhibits proliferation of breast cancer cells
9
decreased apoptosis. This effect may indicate that the escape of MTHFD2 from miR-9 directed suppression potentiates its anti-proliferative activity. Indeed, the increased invasiveness observed for MDA-MB-231 cells during wild type MTHFD2 3’UTR (UTR) overexpression and the highest invasiveness observed with MTHFD2 mutated 3’UTR (UTRmut) highlight a contribution of miR-9 in balancing MTHFD2 levels (via suppression) to reduce invasiveness. Overall, the results suggest that, despite the variable effects of MTHFD2 on cell viability, apoptosis and invasion, the decreased MTHFD2 levels may be partially responsible for the effects observed during miR-9 overexpression in MCF-7 cells. In addition, MTHFD2 escape of the miR-9-directed suppression (3’UTR with no miR-9 binding sites) leads to a trend towards proliferative, anti-apoptotic and pro-invasive activity, indicating that miR-9-directed MTHFD2 regulation is a contributor to anti-proliferative activity of miR-9. The results in our study suggest a tumor suppressor-like activity of miR-9 when ectopically expressed in breast cancer cells. Moreover,
transcriptome profiling of miR-9 overexpression identifies six novel direct targets of miR-9, including MTHFD2 (which when subject to knock-down recapitulated the anti-proliferative and pro-apoptotic activity of miR-9 overexpression in MCF-7 breast cancer cells). Furthermore, overexpression of MTHFD2 escaping miR-9 regulation suggests that miR-9 contributes to suppression of the potential oncogenic activity of MTHFD2. Taken together, our study highlights underexpression of miR-9 and overexpression of MTHFD2 in breast tumor tissues as potential expression level biomarkers. The expression levels of MTHFD2 can be controlled (downregulated) via increasing miR-9 expression in cancer cells, thereby reducing cell viability and enhancing apoptosis. In addition to the individual and negatively correlated expression profiles of miR-9 and MTHFD2, the interaction between miR-9 and MTHFD2 is significant in breast cancer cells and will next be subjected to further screening in population-size sample groups and possibly in combination with other miRNAs, which display promise as targets for breast cancer diagnosis and therapeutics.
by guest, on July 9, 2012w
ww
.jbc.orgD
ownloaded from

MiR-9 inhibits proliferation of breast cancer cells
10
REFERENCES 1. Schickel, R., Boyerinas, B., Park, S. M., and Peter, M. E. (2008) MicroRNAs: key players in the
immune system, differentiation, tumorigenesis and cell death. Oncogene 27, 5959-5974 2. Zhang, B., Pan, X., Cobb, G. P., and Anderson, T. A. (2007) microRNAs as oncogenes and tumor
suppressors. Dev Biol 302, 1-12 3. He, L., Thomson, J. M., Hemann, M. T., Hernando-Monge, E., Mu, D., Goodson, S., Powers, S.,
Cordon-Cardo, C., Lowe, S. W., Hannon, G. J., and Hammond, S. M. (2005) A microRNA polycistron as a potential human oncogene. Nature 435, 828-833
4. Lu, J., Getz, G., Miska, E. A., Alvarez-Saavedra, E., Lamb, J., Peck, D., Sweet-Cordero, A., Ebert, B. L., Mak, R. H., Ferrando, A. A., Downing, J. R., Jacks, T., Horvitz, H. R., and Golub, T. R. (2005) MicroRNA expression profiles classify human cancers. Nature 435, 834-838
5. Ma, L., Teruya-Feldstein, J., and Weinberg, R. A. (2007) Tumour invasion and metastasis initiated by microRNA-10b in breast cancer. Nature 449, 682-688
6. Selcuklu, S. D., Donoghue, M. T., and Spillane, C. (2009) miR-21 as a key regulator of oncogenic processes. Biochem Soc Trans 37, 918-925
7. Jiang, S., Zhang, H. W., Lu, M. H., He, X. H., Li, Y., Gu, H., Liu, M. F., and Wang, E. D. (2010) MicroRNA-155 functions as an OncomiR in breast cancer by targeting the suppressor of cytokine signaling 1 gene. Cancer Res 70, 3119-3127
8. Yu, S., Lu, Z., Liu, C., Meng, Y., Ma, Y., Zhao, W., Liu, J., Yu, J., and Chen, J. (2010) miRNA-96 suppresses KRAS and functions as a tumor suppressor gene in pancreatic cancer. Cancer Res 70, 6015-6025
9. Welch, C., Chen, Y., and Stallings, R. L. (2007) MicroRNA-34a functions as a potential tumor suppressor by inducing apoptosis in neuroblastoma cells. Oncogene 26, 5017-5022
10. Krichevsky, A. M., Sonntag, K. C., Isacson, O., and Kosik, K. S. (2006) Specific microRNAs modulate embryonic stem cell-derived neurogenesis. Stem cells 24, 857-864
11. Laios, A., O'Toole, S., Flavin, R., Martin, C., Kelly, L., Ring, M., Finn, S. P., Barrett, C., Loda, M., Gleeson, N., D'Arcy, T., McGuinness, E., Sheils, O., Sheppard, B., and J, O. L. (2008) Potential role of miR-9 and miR-223 in recurrent ovarian cancer. Mol Cancer 7, 35
12. Lujambio, A., Calin, G. A., Villanueva, A., Ropero, S., Sanchez-Cespedes, M., Blanco, D., Montuenga, L. M., Rossi, S., Nicoloso, M. S., Faller, W. J., Gallagher, W. M., Eccles, S. A., Croce, C. M., and Esteller, M. (2008) A microRNA DNA methylation signature for human cancer metastasis. Proc Natl Acad Sci U S A 105, 13556-13561
13. Khew-Goodall, Y., and Goodall, G. J. (2010) Myc-modulated miR-9 makes more metastases. Nat Cell Biol 12, 209-211
14. Nass, D., Rosenwald, S., Meiri, E., Gilad, S., Tabibian-Keissar, H., Schlosberg, A., Kuker, H., Sion-Vardy, N., Tobar, A., Kharenko, O., Sitbon, E., Lithwick Yanai, G., Elyakim, E., Cholakh, H., Gibori, H., Spector, Y., Bentwich, Z., Barshack, I., and Rosenfeld, N. (2009) MiR-92b and miR-9/9* are specifically expressed in brain primary tumors and can be used to differentiate primary from metastatic brain tumors. Brain Pathol 19, 375-383
15. Ma, L., Young, J., Prabhala, H., Pan, E., Mestdagh, P., Muth, D., Teruya-Feldstein, J., Reinhardt, F., Onder, T. T., Valastyan, S., Westermann, F., Speleman, F., Vandesompele, J., and Weinberg, R. A. (2010) miR-9, a MYC/MYCN-activated microRNA, regulates E-cadherin and cancer metastasis. Nat Cell Biol 12, 247-256
16. Tan, H. X., Wang, Q., Chen, L. Z., Huang, X. H., Chen, J. S., Fu, X. H., Cao, L. Q., Chen, X. L., Li, W., and Zhang, L. J. (2010) MicroRNA-9 reduces cell invasion and E-cadherin secretion in SK-Hep-1 cell. Med Oncol 27, 654-660
17. Luo, H., Zhang, H., Zhang, Z., Zhang, X., Ning, B., Guo, J., Nie, N., Liu, B., and Wu, X. (2009) Down-regulated miR-9 and miR-433 in human gastric carcinoma. J Exp Clin Cancer Res 28, 82
by guest, on July 9, 2012w
ww
.jbc.orgD
ownloaded from
MiR-9 inhibits proliferation of breast cancer cells
11
18. Wan, H. Y., Guo, L. M., Liu, T., Liu, M., Li, X., and Tang, H. (2010) Regulation of the transcription factor NF-kappaB1 by microRNA-9 in human gastric adenocarcinoma. Mol Cancer 9, 16
19. Guo, L. M., Pu, Y., Han, Z., Liu, T., Li, Y. X., Liu, M., Li, X., and Tang, H. (2009) MicroRNA-9 inhibits ovarian cancer cell growth through regulation of NF-kappaB1. FEBS J 276, 5537-5546
20. Guled, M., Lahti, L., Lindholm, P. M., Salmenkivi, K., Bagwan, I., Nicholson, A. G., and Knuutila, S. (2009) CDKN2A, NF2, and JUN are dysregulated among other genes by miRNAs in malignant mesothelioma -A miRNA microarray analysis. Genes Chromosomes Cancer 48, 615-623
21. Zhao, C., Sun, G., Li, S., and Shi, Y. (2009) A feedback regulatory loop involving microRNA-9 and nuclear receptor TLX in neural stem cell fate determination. Nat Struct Mol Biol 16, 365-371
22. Bandres, E., Agirre, X., Bitarte, N., Ramirez, N., Zarate, R., Roman-Gomez, J., Prosper, F., and Garcia-Foncillas, J. (2009) Epigenetic regulation of microRNA expression in colorectal cancer. Int J Cancer 125, 2737-2743
23. Lehmann, U., Hasemeier, B., Christgen, M., Muller, M., Romermann, D., Langer, F., and Kreipe, H. (2008) Epigenetic inactivation of microRNA gene hsa-mir-9-1 in human breast cancer. J Pathol 214, 17-24
24. Hsu, P. Y., Deatherage, D. E., Rodriguez, B. A., Liyanarachchi, S., Weng, Y. I., Zuo, T., Liu, J., Cheng, A. S., and Huang, T. H. (2009) Xenoestrogen-induced epigenetic repression of microRNA-9-3 in breast epithelial cells. Cancer Res 69, 5936-5945
25. Hildebrandt, M. A., Gu, J., Lin, J., Ye, Y., Tan, W., Tamboli, P., Wood, C. G., and Wu, X. (2010) Hsa-miR-9 methylation status is associated with cancer development and metastatic recurrence in patients with clear cell renal cell carcinoma. Oncogene 29, 5724-5728
26. Packer, A. N., Xing, Y., Harper, S. Q., Jones, L., and Davidson, B. L. (2008) The bifunctional microRNA miR-9/miR-9* regulates REST and CoREST and is downregulated in Huntington's disease. J Neurosci 28, 14341-14346
27. Zhao, C., Sun, G., Li, S., and Shi, Y. (2009) A feedback regulatory loop involving microRNA-9 and nuclear receptor TLX in neural stem cell fate determination. Nature structural & molecular biology 16, 365-371
28. Chao, T. F., Zhang, Y., Yan, X. Q., Yin, B., Gong, Y. H., Yuan, J. G., Qiang, B. Q., and Peng, X. Z. (2008) [MiR-9 regulates the expression of CBX7 in human glioma]. Zhongguo Yi Xue Ke Xue Yuan Xue Bao 30, 268-274
29. Rotkrua, P., Akiyama, Y., Hashimoto, Y., Otsubo, T., and Yuasa, Y. (2011) MiR-9 down-regulates CDX2 expression in gastric cancer cells. Int J Cancer
30. Godbey, W. T., and Atala, A. (2003) Directed apoptosis in Cox-2-overexpressing cancer cells through expression-targeted gene delivery. Gene therapy 10, 1519-1527
31. Ngoka, L. C. (2008) Sample prep for proteomics of breast cancer: proteomics and gene ontology reveal dramatic differences in protein solubilization preferences of radioimmunoprecipitation assay and urea lysis buffers. Proteome Sci 6, 30
32. Prasannan, P., and Appling, D. R. (2009) Human mitochondrial C1-tetrahydrofolate synthase: submitochondrial localization of the full-length enzyme and characterization of a short isoform. Archives of biochemistry and biophysics 481, 86-93
33. Xue, L. Y., Chiu, S. M., and Oleinick, N. L. (2003) Staurosporine-induced death of MCF-7 human breast cancer cells: a distinction between caspase-3-dependent steps of apoptosis and the critical lethal lesions. Exp Cell Res 283, 135-145
34. Kurokawa, H., Nishio, K., Fukumoto, H., Tomonari, A., Suzuki, T., and Saijo, N. (1999) Alteration of caspase-3 (CPP32/Yama/apopain) in wild-type MCF-7, breast cancer cells. Oncol Rep 6, 33-37
35. Mc Gee, M. M., Hyland, E., Campiani, G., Ramunno, A., Nacci, V., and Zisterer, D. M. (2002) Caspase-3 is not essential for DNA fragmentation in MCF-7 cells during apoptosis induced by the pyrrolo-1,5-benzoxazepine, PBOX-6. FEBS letters 515, 66-70
36. Kottke, T. J., Blajeski, A. L., Meng, X. W., Svingen, P. A., Ruchaud, S., Mesner, P. W., Jr., Boerner, S. A., Samejima, K., Henriquez, N. V., Chilcote, T. J., Lord, J., Salmon, M., Earnshaw,
by guest, on July 9, 2012w
ww
.jbc.orgD
ownloaded from

MiR-9 inhibits proliferation of breast cancer cells
12
W. C., and Kaufmann, S. H. (2002) Lack of correlation between caspase activation and caspase activity assays in paclitaxel-treated MCF-7 breast cancer cells. The Journal of biological chemistry 277, 804-815
37. van Dongen, S., Abreu-Goodger, C., and Enright, A. J. (2008) Detecting microRNA binding and siRNA off-target effects from expression data. Nat Methods 5, 1023-1025
38. Bartonicek, N., and Enright, A. J. (2010) SylArray: a web server for automated detection of miRNA effects from expression data. Bioinformatics 26, 2900-2901
39. Sun, R., Fu, X., Li, Y., Xie, Y., and Mao, Y. (2009) Global gene expression analysis reveals reduced abundance of putative microRNA targets in human prostate tumours. BMC Genomics 10, 93
40. Lim, L. P., Lau, N. C., Garrett-Engele, P., Grimson, A., Schelter, J. M., Castle, J., Bartel, D. P., Linsley, P. S., and Johnson, J. M. (2005) Microarray analysis shows that some microRNAs downregulate large numbers of target mRNAs. Nature 433, 769-773
41. Gramantieri, L., Ferracin, M., Fornari, F., Veronese, A., Sabbioni, S., Liu, C. G., Calin, G. A., Giovannini, C., Ferrazzi, E., Grazi, G. L., Croce, C. M., Bolondi, L., and Negrini, M. (2007) Cyclin G1 is a target of miR-122a, a microRNA frequently down-regulated in human hepatocellular carcinoma. Cancer research 67, 6092-6099
42. Xu, X., Qiao, M., Zhang, Y., Jiang, Y., Wei, P., Yao, J., Gu, B., Wang, Y., Lu, J., Wang, Z., Tang, Z., Sun, Y., Wu, W., and Shi, Q. (2010) Quantitative proteomics study of breast cancer cell lines isolated from a single patient: discovery of TIMM17A as a marker for breast cancer. Proteomics 10, 1374-1390
43. Burrows, C., Abd Latip, N., Lam, S. J., Carpenter, L., Sawicka, K., Tzolovsky, G., Gabra, H., Bushell, M., Glover, D. M., Willis, A. E., and Blagden, S. P. (2010) The RNA binding protein Larp1 regulates cell division, apoptosis and cell migration. Nucleic acids research 38, 5542-5553
44. Hayes, G. M., Carrigan, P. E., and Miller, L. J. (2007) Serine-arginine protein kinase 1 overexpression is associated with tumorigenic imbalance in mitogen-activated protein kinase pathways in breast, colonic, and pancreatic carcinomas. Cancer research 67, 2072-2080
45. Richardson, A. L., Wang, Z. C., De Nicolo, A., Lu, X., Brown, M., Miron, A., Liao, X., Iglehart, J. D., Livingston, D. M., and Ganesan, S. (2006) X chromosomal abnormalities in basal-like human breast cancer. Cancer Cell 9, 121-132
46. Zhao, H., Langerod, A., Ji, Y., Nowels, K. W., Nesland, J. M., Tibshirani, R., Bukholm, I. K., Karesen, R., Botstein, D., Borresen-Dale, A. L., and Jeffrey, S. S. (2004) Different gene expression patterns in invasive lobular and ductal carcinomas of the breast. Mol Biol Cell 15, 2523-2536
47. Rhodes, D. R., Yu, J., Shanker, K., Deshpande, N., Varambally, R., Ghosh, D., Barrette, T., Pandey, A., and Chinnaiyan, A. M. (2004) ONCOMINE: a cancer microarray database and integrated data-mining platform. Neoplasia 6, 1-6
48. Zhu, L., Chen, H., Zhou, D., Li, D., Bai, R., Zheng, S., and Ge, W. (2011) MicroRNA-9 up-regulation is involved in colorectal cancer metastasis via promoting cell motility. Med Oncol
49. Trankenschuh, W., Puls, F., Christgen, M., Albat, C., Heim, A., Poczkaj, J., Fleming, P., Kreipe, H., and Lehmann, U. (2010) Frequent and distinct aberrations of DNA methylation patterns in fibrolamellar carcinoma of the liver. PLoS One 5, e13688
50. Lujambio, A., Calin, G. A., Villanueva, A., Ropero, S., Sanchez-Cespedes, M., Blanco, D., Montuenga, L. M., Rossi, S., Nicoloso, M. S., Faller, W. J., Gallagher, W. M., Eccles, S. A., Croce, C. M., and Esteller, M. (2008) A microRNA DNA methylation signature for human cancer metastasis. Proc Natl Acad Sci U S A 105, 13556-13561
51. Guo, L. M., Pu, Y., Han, Z., Liu, T., Li, Y. X., Liu, M., Li, X., and Tang, H. (2009) MicroRNA-9 inhibits ovarian cancer cell growth through regulation of NF-kappaB1. Febs J 276, 5537-5546
52. Hanahan, D., and Weinberg, R. A. (2000) The hallmarks of cancer. Cell 100, 57-70 53. Janicke, R. U., Sprengart, M. L., Wati, M. R., and Porter, A. G. (1998) Caspase-3 is required for
DNA fragmentation and morphological changes associated with apoptosis. J Biol Chem 273, 9357-9360
by guest, on July 9, 2012w
ww
.jbc.orgD
ownloaded from

MiR-9 inhibits proliferation of breast cancer cells
13
54. Talanian, R. V., Quinlan, C., Trautz, S., Hackett, M. C., Mankovich, J. A., Banach, D., Ghayur, T., Brady, K. D., and Wong, W. W. (1997) Substrate specificities of caspase family proteases. J Biol Chem 272, 9677-9682
55. Spruce, B. A., Campbell, L. A., McTavish, N., Cooper, M. A., Appleyard, M. V., O'Neill, M., Howie, J., Samson, J., Watt, S., Murray, K., McLean, D., Leslie, N. R., Safrany, S. T., Ferguson, M. J., Peters, J. A., Prescott, A. R., Box, G., Hayes, A., Nutley, B., Raynaud, F., Downes, C. P., Lambert, J. J., Thompson, A. M., and Eccles, S. (2004) Small molecule antagonists of the sigma-1 receptor cause selective release of the death program in tumor and self-reliant cells and inhibit tumor growth in vitro and in vivo. Cancer Res 64, 4875-4886
56. Twiddy, D., Cohen, G. M., Macfarlane, M., and Cain, K. (2006) Caspase-7 is directly activated by the approximately 700-kDa apoptosome complex and is released as a stable XIAP-caspase-7 approximately 200-kDa complex. J Biol Chem 281, 3876-3888
57. Mc Gee, M. M., Hyland, E., Campiani, G., Ramunno, A., Nacci, V., and Zisterer, D. M. (2002) Caspase-3 is not essential for DNA fragmentation in MCF-7 cells during apoptosis induced by the pyrrolo-1,5-benzoxazepine, PBOX-6. FEBS Lett 515, 66-70
58. Dalmay, T., and Edwards, D. R. (2006) MicroRNAs and the hallmarks of cancer. Oncogene 25, 6170-6175
59. Zhu, S., Wu, H., Wu, F., Nie, D., Sheng, S., and Mo, Y. Y. (2008) MicroRNA-21 targets tumor suppressor genes in invasion and metastasis. Cell research 18, 350-359
60. Asangani, I. A., Rasheed, S. A., Nikolova, D. A., Leupold, J. H., Colburn, N. H., Post, S., and Allgayer, H. (2008) MicroRNA-21 (miR-21) post-transcriptionally downregulates tumor suppressor Pdcd4 and stimulates invasion, intravasation and metastasis in colorectal cancer. Oncogene 27, 2128-2136
61. Kumar, M. S., Lu, J., Mercer, K. L., Golub, T. R., and Jacks, T. (2007) Impaired microRNA processing enhances cellular transformation and tumorigenesis. Nature genetics 39, 673-677
62. Fang, X. J., Jiang, H., Zhao, X. P., and Jiang, W. M. (2011) The role of a new CD44st in increasing the invasion capability of the human breast cancer cell line MCF-7. BMC cancer 11, 290
63. Fox, B. P., and Kandpal, R. P. (2004) Invasiveness of breast carcinoma cells and transcript profile: Eph receptors and ephrin ligands as molecular markers of potential diagnostic and prognostic application. Biochem Biophys Res Commun 318, 882-892
64. Gramantieri, L., Ferracin, M., Fornari, F., Veronese, A., Sabbioni, S., Liu, C. G., Calin, G. A., Giovannini, C., Ferrazzi, E., Grazi, G. L., Croce, C. M., Bolondi, L., and Negrini, M. (2007) Cyclin G1 is a target of miR-122a, a microRNA frequently down-regulated in human hepatocellular carcinoma. Cancer Res 67, 6092-6099
65. Fornari, F., Gramantieri, L., Giovannini, C., Veronese, A., Ferracin, M., Sabbioni, S., Calin, G. A., Grazi, G. L., Croce, C. M., Tavolari, S., Chieco, P., Negrini, M., and Bolondi, L. (2009) MiR-122/cyclin G1 interaction modulates p53 activity and affects doxorubicin sensitivity of human hepatocarcinoma cells. Cancer Res 69, 5761-5767
66. Perez, R., Wu, N., Klipfel, A. A., and Beart, R. W., Jr. (2003) A better cell cycle target for gene therapy of colorectal cancer: cyclin G. J Gastrointest Surg 7, 884-889
67. Gordon, E. M., Liu, P. X., Chen, Z. H., Liu, L., Whitley, M. D., Gee, C., Groshen, S., Hinton, D. R., Beart, R. W., and Hall, F. L. (2000) Inhibition of metastatic tumor growth in nude mice by portal vein infusions of matrix-targeted retroviral vectors bearing a cytocidal cyclin G1 construct. Cancer Res 60, 3343-3347
68. Liang, J., Bian, M. L., Chen, Q. Y., Liu, X., Ou, H., Li, M., and Liu, J. (2006) Relationship between cyclin G1 and human papilloma virus infection in cervical intraepithelial neoplasia and cervical carcinoma. Chin Med Sci J 21, 81-85
69. Burrows, C., Abd Latip, N., Lam, S. J., Carpenter, L., Sawicka, K., Tzolovsky, G., Gabra, H., Bushell, M., Glover, D. M., Willis, A. E., and Blagden, S. P. (2010) The RNA binding protein Larp1 regulates cell division, apoptosis and cell migration. Nucleic Acids Res 38, 5542-5553
by guest, on July 9, 2012w
ww
.jbc.orgD
ownloaded from

MiR-9 inhibits proliferation of breast cancer cells
14
70. Hayes, G. M., Carrigan, P. E., and Miller, L. J. (2007) Serine-arginine protein kinase 1 overexpression is associated with tumorigenic imbalance in mitogen-activated protein kinase pathways in breast, colonic, and pancreatic carcinomas. Cancer Res 67, 2072-2080
71. Krishnakumar, S., Mohan, A., Kandalam, M., Ramkumar, H. L., Venkatesan, N., and Das, R. R. (2008) SRPK1: a cisplatin sensitive protein expressed in retinoblastoma. Pediatr Blood Cancer 50, 402-406
72. Schenk, P. W., Boersma, A. W., Brandsma, J. A., den Dulk, H., Burger, H., Stoter, G., Brouwer, J., and Nooter, K. (2001) SKY1 is involved in cisplatin-induced cell kill in Saccharomyces cerevisiae, and inactivation of its human homologue, SRPK1, induces cisplatin resistance in a human ovarian carcinoma cell line. Cancer Res 61, 6982-6986
73. Plasencia, C., Martinez-Balibrea, E., Martinez-Cardus, A., Quinn, D. I., Abad, A., and Neamati, N. (2006) Expression analysis of genes involved in oxaliplatin response and development of oxaliplatin-resistant HT29 colon cancer cells. Int J Oncol 29, 225-235
74. Thorsen, K., Mansilla, F., Schepeler, T., Oster, B., Rasmussen, M. H., Dyrskjot, L., Karni, R., Akerman, M., Krainer, A. R., Laurberg, S., Andersen, C. L., and Orntoft, T. F. (2011) Alternative splicing of SLC39A14 in colorectal cancer is regulated by the Wnt pathway. Mol Cell Proteomics 10, M110 002998
75. Sanidas, I., Kotoula, V., Ritou, E., Daans, J., Lenz, C., Mairhofer, M., Daniilidou, M., Kolbus, A., Kruft, V., Ponsaerts, P., and Nikolakaki, E. (2010) The ratio of SRPK1/SRPK1a regulates erythroid differentiation in K562 leukaemic cells. Biochim Biophys Acta 1803, 1319-1331
76. Petrenko, A. A., Pavlova, L. S., Karseladze, A. I., Kisseljov, F. L., and Kisseljova, N. P. (2006) Downregulation of genes encoding for subunits of adaptor complex-3 in cervical carcinomas. Biochemistry (Mosc) 71, 1153-1160
77. Mantripragada, K. K., Diaz de Stahl, T., Patridge, C., Menzel, U., Andersson, R., Chuzhanova, N., Kluwe, L., Guha, A., Mautner, V., Dumanski, J. P., and Upadhyaya, M. (2009) Genome-wide high-resolution analysis of DNA copy number alterations in NF1-associated malignant peripheral nerve sheath tumors using 32K BAC array. Genes Chromosomes Cancer 48, 897-907
78. Parle-McDermott, A., Pangilinan, F., O'Brien, K. K., Mills, J. L., Magee, A. M., Troendle, J., Sutton, M., Scott, J. M., Kirke, P. N., Molloy, A. M., and Brody, L. C. (2009) A common variant in MTHFD1L is associated with neural tube defects and mRNA splicing efficiency. Hum Mutat 30, 1650-1656
79. Christensen, K. E., and Mackenzie, R. E. (2008) Mitochondrial methylenetetrahydrofolate dehydrogenase, methenyltetrahydrofolate cyclohydrolase, and formyltetrahydrofolate synthetases. Vitam Horm 79, 393-410
80. Andrew, A. S., Gui, J., Sanderson, A. C., Mason, R. A., Morlock, E. V., Schned, A. R., Kelsey, K. T., Marsit, C. J., Moore, J. H., and Karagas, M. R. (2009) Bladder cancer SNP panel predicts susceptibility and survival. Hum Genet 125, 527-539
81. Sertel, S., Eichhorn, T., Sieber, S., Sauer, A., Weiss, J., Plinkert, P. K., and Efferth, T. (2010) Factors determining sensitivity or resistance of tumor cell lines towards artesunate. Chem Biol Interact 185, 42-52
82. Bigelow, R. L., Williams, B. J., Carroll, J. L., Daves, L. K., and Cardelli, J. A. (2009) TIMP-1 overexpression promotes tumorigenesis of MDA-MB-231 breast cancer cells and alters expression of a subset of cancer promoting genes in vivo distinct from those observed in vitro. Breast cancer research and treatment 117, 31-44
83. Ang, J., Fang, B. L., Ashman, L. K., and Frauman, A. G. (2010) The migration and invasion of human prostate cancer cell lines involves CD151 expression. Oncology reports 24, 1593-1597
by guest, on July 9, 2012w
ww
.jbc.orgD
ownloaded from
MiR-9 inhibits proliferation of breast cancer cells
15
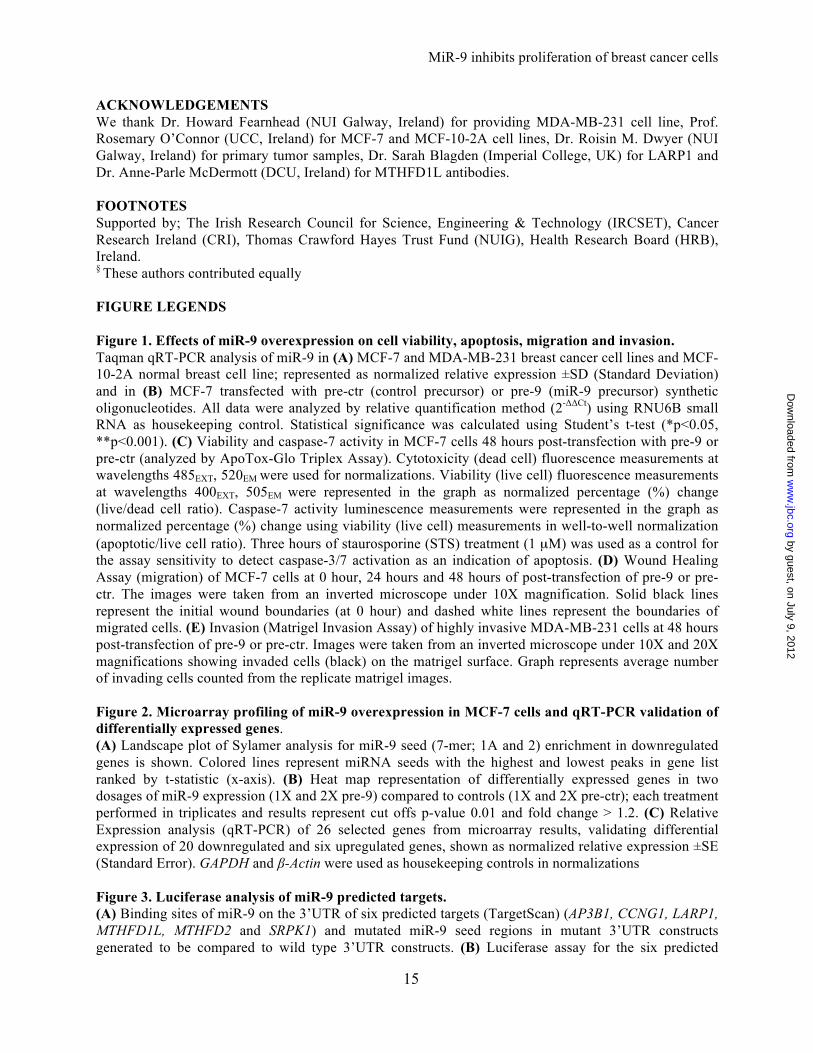
ACKNOWLEDGEMENTS We thank Dr. Howard Fearnhead (NUI Galway, Ireland) for providing MDA-MB-231 cell line, Prof. Rosemary O’Connor (UCC, Ireland) for MCF-7 and MCF-10-2A cell lines, Dr. Roisin M. Dwyer (NUI Galway, Ireland) for primary tumor samples, Dr. Sarah Blagden (Imperial College, UK) for LARP1 and Dr. Anne-Parle McDermott (DCU, Ireland) for MTHFD1L antibodies. FOOTNOTES Supported by; The Irish Research Council for Science, Engineering & Technology (IRCSET), Cancer Research Ireland (CRI), Thomas Crawford Hayes Trust Fund (NUIG), Health Research Board (HRB), Ireland. § These authors contributed equally FIGURE LEGENDS Figure 1. Effects of miR-9 overexpression on cell viability, apoptosis, migration and invasion. Taqman qRT-PCR analysis of miR-9 in (A) MCF-7 and MDA-MB-231 breast cancer cell lines and MCF-10-2A normal breast cell line; represented as normalized relative expression ±SD (Standard Deviation) and in (B) MCF-7 transfected with pre-ctr (control precursor) or pre-9 (miR-9 precursor) synthetic oligonucleotides. All data were analyzed by relative quantification method (2-""Ct) using RNU6B small RNA as housekeeping control. Statistical significance was calculated using Student’s t-test (*p<0.05, **p<0.001). (C) Viability and caspase-7 activity in MCF-7 cells 48 hours post-transfection with pre-9 or pre-ctr (analyzed by ApoTox-Glo Triplex Assay). Cytotoxicity (dead cell) fluorescence measurements at wavelengths 485EXT, 520EM were used for normalizations. Viability (live cell) fluorescence measurements at wavelengths 400EXT, 505EM were represented in the graph as normalized percentage (%) change (live/dead cell ratio). Caspase-7 activity luminescence measurements were represented in the graph as normalized percentage (%) change using viability (live cell) measurements in well-to-well normalization (apoptotic/live cell ratio). Three hours of staurosporine (STS) treatment (1 µM) was used as a control for the assay sensitivity to detect caspase-3/7 activation as an indication of apoptosis. (D) Wound Healing Assay (migration) of MCF-7 cells at 0 hour, 24 hours and 48 hours of post-transfection of pre-9 or pre-ctr. The images were taken from an inverted microscope under 10X magnification. Solid black lines represent the initial wound boundaries (at 0 hour) and dashed white lines represent the boundaries of migrated cells. (E) Invasion (Matrigel Invasion Assay) of highly invasive MDA-MB-231 cells at 48 hours post-transfection of pre-9 or pre-ctr. Images were taken from an inverted microscope under 10X and 20X magnifications showing invaded cells (black) on the matrigel surface. Graph represents average number of invading cells counted from the replicate matrigel images. Figure 2. Microarray profiling of miR-9 overexpression in MCF-7 cells and qRT-PCR validation of differentially expressed genes. (A) Landscape plot of Sylamer analysis for miR-9 seed (7-mer; 1A and 2) enrichment in downregulated genes is shown. Colored lines represent miRNA seeds with the highest and lowest peaks in gene list ranked by t-statistic (x-axis). (B) Heat map representation of differentially expressed genes in two dosages of miR-9 expression (1X and 2X pre-9) compared to controls (1X and 2X pre-ctr); each treatment performed in triplicates and results represent cut offs p-value 0.01 and fold change > 1.2. (C) Relative Expression analysis (qRT-PCR) of 26 selected genes from microarray results, validating differential expression of 20 downregulated and six upregulated genes, shown as normalized relative expression ±SE (Standard Error). GAPDH and !-Actin were used as housekeeping controls in normalizations Figure 3. Luciferase analysis of miR-9 predicted targets. (A) Binding sites of miR-9 on the 3’UTR of six predicted targets (TargetScan) (AP3B1, CCNG1, LARP1, MTHFD1L, MTHFD2 and SRPK1) and mutated miR-9 seed regions in mutant 3’UTR constructs generated to be compared to wild type 3’UTR constructs. (B) Luciferase assay for the six predicted
by guest, on July 9, 2012w
ww
.jbc.orgD
ownloaded from
MiR-9 inhibits proliferation of breast cancer cells
16
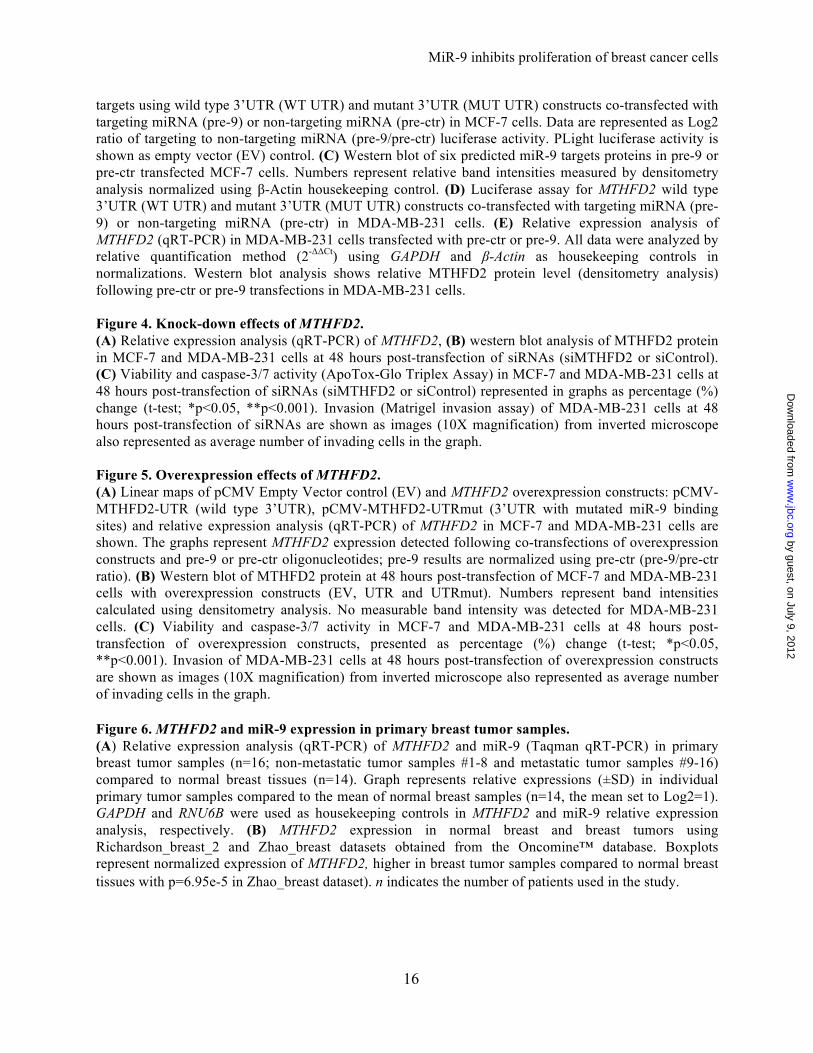
targets using wild type 3’UTR (WT UTR) and mutant 3’UTR (MUT UTR) constructs co-transfected with targeting miRNA (pre-9) or non-targeting miRNA (pre-ctr) in MCF-7 cells. Data are represented as Log2 ratio of targeting to non-targeting miRNA (pre-9/pre-ctr) luciferase activity. PLight luciferase activity is shown as empty vector (EV) control. (C) Western blot of six predicted miR-9 targets proteins in pre-9 or pre-ctr transfected MCF-7 cells. Numbers represent relative band intensities measured by densitometry analysis normalized using $-Actin housekeeping control. (D) Luciferase assay for MTHFD2 wild type 3’UTR (WT UTR) and mutant 3’UTR (MUT UTR) constructs co-transfected with targeting miRNA (pre-9) or non-targeting miRNA (pre-ctr) in MDA-MB-231 cells. (E) Relative expression analysis of MTHFD2 (qRT-PCR) in MDA-MB-231 cells transfected with pre-ctr or pre-9. All data were analyzed by relative quantification method (2-""Ct) using GAPDH and !-Actin as housekeeping controls in normalizations. Western blot analysis shows relative MTHFD2 protein level (densitometry analysis) following pre-ctr or pre-9 transfections in MDA-MB-231 cells. Figure 4. Knock-down effects of MTHFD2. (A) Relative expression analysis (qRT-PCR) of MTHFD2, (B) western blot analysis of MTHFD2 protein in MCF-7 and MDA-MB-231 cells at 48 hours post-transfection of siRNAs (siMTHFD2 or siControl). (C) Viability and caspase-3/7 activity (ApoTox-Glo Triplex Assay) in MCF-7 and MDA-MB-231 cells at 48 hours post-transfection of siRNAs (siMTHFD2 or siControl) represented in graphs as percentage (%) change (t-test; *p<0.05, **p<0.001). Invasion (Matrigel invasion assay) of MDA-MB-231 cells at 48 hours post-transfection of siRNAs are shown as images (10X magnification) from inverted microscope also represented as average number of invading cells in the graph. Figure 5. Overexpression effects of MTHFD2. (A) Linear maps of pCMV Empty Vector control (EV) and MTHFD2 overexpression constructs: pCMV-MTHFD2-UTR (wild type 3’UTR), pCMV-MTHFD2-UTRmut (3’UTR with mutated miR-9 binding sites) and relative expression analysis (qRT-PCR) of MTHFD2 in MCF-7 and MDA-MB-231 cells are shown. The graphs represent MTHFD2 expression detected following co-transfections of overexpression constructs and pre-9 or pre-ctr oligonucleotides; pre-9 results are normalized using pre-ctr (pre-9/pre-ctr ratio). (B) Western blot of MTHFD2 protein at 48 hours post-transfection of MCF-7 and MDA-MB-231 cells with overexpression constructs (EV, UTR and UTRmut). Numbers represent band intensities calculated using densitometry analysis. No measurable band intensity was detected for MDA-MB-231 cells. (C) Viability and caspase-3/7 activity in MCF-7 and MDA-MB-231 cells at 48 hours post-transfection of overexpression constructs, presented as percentage (%) change (t-test; *p<0.05, **p<0.001). Invasion of MDA-MB-231 cells at 48 hours post-transfection of overexpression constructs are shown as images (10X magnification) from inverted microscope also represented as average number of invading cells in the graph. Figure 6. MTHFD2 and miR-9 expression in primary breast tumor samples. (A) Relative expression analysis (qRT-PCR) of MTHFD2 and miR-9 (Taqman qRT-PCR) in primary breast tumor samples (n=16; non-metastatic tumor samples #1-8 and metastatic tumor samples #9-16) compared to normal breast tissues (n=14). Graph represents relative expressions (±SD) in individual primary tumor samples compared to the mean of normal breast samples (n=14, the mean set to Log2=1). GAPDH and RNU6B were used as housekeeping controls in MTHFD2 and miR-9 relative expression analysis, respectively. (B) MTHFD2 expression in normal breast and breast tumors using Richardson_breast_2 and Zhao_breast datasets obtained from the Oncomine™ database. Boxplots represent normalized expression of MTHFD2, higher in breast tumor samples compared to normal breast tissues with p=6.95e-5 in Zhao_breast dataset ). n indicates the number of patients used in the study.
by guest, on July 9, 2012w
ww
.jbc.orgD
ownloaded from
**
0
100
200
300
400
500
600
pre-ctr pre-9
Ave
rage
num
ber
of
inva
ding
cel
ls
0.00
0.01
0.02
0.03
0.04
0.05
0.06
0.07
MCF-10-2A MCF-7 MDA-MB-231
Rel
ativ
e E
xpre
ssio
n !"#$%&
0.005 0.0
0.2
0.4
0.6
0.8
1.0
1.2
1.4
1.6
pre-ctr pre-9
Rel
ativ
e E
xpre
ssio
n
miR-9
B
C
A
D
E
*
*
0
20
40
60
80
100
120
140
160
180
pre-ctr pre-9 STS
Per
cent
age
(%)
Via
bilit
y an
d C
aspa
se-7
Act
ivity
Viability Caspase-7
*
!"
#!"
$!"
%!"
&!"
'!!"
'#!"
pre-ctr pre-9 STS
Viab
ility
(%)
!"!!#$ !"!!%$!"!$
!"&$
!"'$
!"($
!")$
*"!$
*"&$
*"'$
*"($
pcDNA pc-9-1 pre-ctr pre-9
No
rmal
ized
Exp
ress
ion
!!"
#$#"
#$%"
#$&"
#$'"
#$("
)$#"
)$%"
)$&"
pcDNA pc-9-1
Abs
orba
nce
495n
m;r
ef:6
20nm
(c
ell p
rolif
erat
ion)
B
C
A
D
E F
!"
#!!"
$!!"
%!!"
&!!"
'!!"
(!!"
pre-ctr pre-9
Av
era
ge
# o
f in
va
din
g c
ells
!"#$"
%&"#$"
&'"#$"
!"#$%&'()'*)+,*-.),/001)232455)
Pre-9 Pre-ctr
*
!"
#!"
$!"
%!"
&!"
'!!"
'#!"
'$!"
'%!"
pre-ctr pre-9 STS
Casp
ase-
7 ac
tivity
(%)
pre-ctr pre-9
10X
20X
pre-ctr pre-9
Figure 1
B
MDA-MB-231
pre-ctr pre-9 1.00 0.68
MDA-MB-231
MTHFD2
Actin
38 kD
42 kD
MTHFD1L
38 kD
42 kD
1.00 0.52 MTHFD2
Actin
LARP1 AP3B1
39 kD
Actin 42 kD
121 kD
SRPK1 92 kD
Actin 42 kD
123 kD
CCNG1 30 kD
pre-ctr pre-9 pre-ctr pre-9 1.00 0.54
1.00 0.20
1.00 0.89
1.00
1.00
0.39
0.30
MCF-7
Figure 3 A
Position 198-204 of AP3B1 3' UTR (574 bp)
3'UTR 5' ...CUUUUUGCUUUGCUAACCAAAGA... ||| ||||||| mir-9 3' GUAUGUCGAUCUAU-UGGUUUCU ||| | | | |3'UTRmut9 5' ...CUUUUUGCUUUGCUAAGCTATGA...
Position 1145-1151 of CCNG1 3' UTR (1345 bp)
3'UTR 5' ...AGUACACAAUGAAAAACCAAAGA... ||||||| mir-9 3' AGUAUGUCGAUCUAUUGGUUUCU | | | |3'UTRmut9 5' ...AGUACACAAUGAAAAAGCTATGA...
Position 594-600 of LARP1 3' UTR (3505 bp)
3'UTR 5' ...UUCUGGGAGAAGGAAACCAAAGG... ||||||| mir-9 3' AGUAUGUCGAUCUAUUGGUUUCU | | | |3'UTRmut9 5' ...UUCUGGGAGAAGGAAAGCTATGG...
Position 134-140 of MTHFD1L 3' UTR (616 bp)
3'UTR 5' ...ACAUGGUGAAAUAGGCCAAAGAU... |||||| mir-9 3' AGUAUGUCGAUCUAUUGGUUUCU | | |3'UTRmut9 5' ...ACAUGGUGAAAUAGGGCTATGAU...
Position 400-406 of MTHFD2 3' UTR (1053 bp)
3'UTR 5' ...AGUUCAACUGAUCAAACCAAAGG... ||||||| mir-9 3' AGUAUGUCGAUCUAUUGGUUUCU | | | |3'UTRmut9 5' ...AGUUCAACUGAUCAAAGCTATGG...
Position 882-888 of MTHFD2 3' UTR (1053 bp)
3'UTR 5' ...GCAACUUACUUUUCCACCAAAGA... ||||||| mir-9 3' AGUAUGUCGAUCUAUUGGUUUCU | | | |3'UTRmut9 5' ...GCAACUUACUUUUCCAGCTATGA...
Position 222-228 of SRPK1 3' UTR (2268 bp)
3'UTR 5' ...CUUGGUUGGGCUCUGCCAAAGAC... |||||| mir-9 3' AGUAUGUCGAUCUAUUGGUUUCU | | |3'UTRmut9 5' ...CUUGGUUGGGCUCUGGCTATGAC...
C
D MTHFD2
E MDA-MB-231
MCF-7
by guest, on July 9, 2012w
ww
.jbc.orgD
ownloaded from
0.0
0.2
0.4
0.6
0.8
1.0
1.2
1.4
Rela
tive E
xpre
ssio
n
siControl siMTHFD2
** 0.0
1.0
2.0
3.0
4.0
5.0
6.0
7.0
Relat
ive E
xpre
ssio
n
siControl siMTHFD2
**
B
MCF-7 MDA-MB-231
C
MTHFD2
Actin
siControl siMTHFD2
1.00 0.38
MCF-7
38kD
42kD
0
20
40
60
80
100
120
140
160
siControl siMTHFD2
Perc
enta
ge (%
) Via
bilit
y an
d Ca
spas
e-3/
7 Act
ivity
Viability Caspase-7
*p=0.03
*p=0.003
0
20
40
60
80
100
120
siControl siMTHFD2
Perc
enta
ge (%
) Via
bilit
y an
d Ca
spas
e-3/
7 Ac
tivity
Viability Caspase-3/7
0 20 40 60 80
100 120 140 160 180 200
siControl siMTHFD2
Aver
age
num
ber o
f in
vadi
ng c
ells
** siControl
siMTHFD2
MCF-7 MDA-MB-231
MTHFD2
siControl siMTHFD2
1.00 0.70
MDA-MB-231
MTHFD2
Actin 42kD
38kD
MDA-MB-231
MTHFD2
A
Figure 4
by guest, on July 9, 2012w
ww
.jbc.orgD
ownloaded from
0.0
0.1
0.2
0.3
0.4
0.5
0.6
0.7
EV UTR UTRmut
Rel
ativ
e E
xpre
ssio
n 0.0
0.1
0.2
0.3
0.4
0.5
0.6
0.7
0.8
EV UTR UTRmut
Rel
ativ
e E
xpre
ssio
n A
C
MCF-7 MDA-MB-231
B
EV
UTR
UTRmut 0
50 100 150 200 250 300 350 400 450 500
EV UTR UTRmut
Aver
age
num
ber o
f in
vadi
ng c
ells
**
*
0
20
40
60
80
100
120
140
160
Perc
enta
ge (%
) Via
bilit
y an
d C
aspa
se-7
Act
ivity
Viability Caspase-7
EV UTR UTRmut
*p=0.01 p=0.058
EV UTR UTRmut 0
20
40
60
80
100
120
140
160
Perc
enta
ge (%
) Via
bilit
y an
d C
aspa
se-3
/7 A
ctiv
ity
Viability Caspase-3/7
EV UTR UTRmut
*p=0.006 *p=0.004
MCF-7 MDA-MB-231
EV UTR UTRmut
1.00 3.78 3.62
38kD
42kD
MTHFD2
Actin
EV UTR UTRmut
MCF-7 MDA-MB-231
38kD
42kD
MTHFD2
Actin
MDA-MB-231
CMV pCMV Empty Vector (EV)
CMV MTHFD2 ORF wild
miR-9 BS1
ATG 0 1053 2114 bp
pCMV_MTHFD2_UTR
1453 1935
CMV MTHFD2 ORF mutated pCMV_MTHFD2_UTR
miR-9 BS2
TAA
MTHFD2 MTHFD2
Figure 5
by guest, on July 9, 2012w
ww
.jbc.orgD
ownloaded from
0.06
0.13
0.25
0.50
1.00
2.00
4.00
8.00
16.00
32.00
64.00
1 2 3 4 5 6 7 8 9 10 11 12 13 14 15 16
Log2
fol
d ch
ange
(E
xpre
ssio
n re
lativ
e to
nor
mal
sam
ples
)
Tumor sample #
MTHFD2
miR-9
B
Figure 6
A