
Microbial and Chemical Characterization of Underwater Fresh Water Springs in the Dead Sea
21
Microbial and Chemical Characterization of Underwater Fresh Water Springs in the Dead Sea Danny Ionescu 1 *, Christian Siebert 2 , Lubos Polerecky 1 , Yaniv Y. Munwes 3 , Christian Lott 1,4 , Stefan Ha ¨ usler 1 , Mina Biz ˇic ´ -Ionescu 1,5 , Christian Quast 1 , Jo ¨ rg Peplies 6 , Frank Oliver Glo ¨ ckner 1,7 , Alban Ramette 1 , Tino Ro ¨ diger 2 , Thorsten Dittmar 1,8 , Aharon Oren 9 , Stefan Geyer 2 , Hans-Joachim Sta ¨ rk 10 , Martin Sauter 11 , Tobias Licha 11 , Jonathan B. Laronne 3 , Dirk de Beer 1 1 Max Planck Institute for Marine Microbiology, Bremen, Germany, 2 Department of Catchment Hydrology, Helmholtz-Centre for Environmental Research Halle/Saale, Germany, 3 Department of Geography & Environmental Development, Ben Gurion University of the Negev, Beer Sheva, Israel, 4 HYDRA Institute for Marine Sciences, Elba Field Station, Campo nell’Elba (LI), Italy, 5 Department of Stratified Lakes, Leibniz Institute of Freshwater Ecology and Inland Fisheries Berlin, Stechlin, Germany, 6 Ribocon GmbH, Bremen, Germany, 7 Jacobs University Bremen GmbH, Bremen, Germany, 8 Institute for Chemistry and Biology of the Marine Environment, Carl von Ossietzky University, Oldenburg, Germany, 9 Department of Plant and Environmental Sciences, Institute of Life Sciences, The Hebrew University of Jerusalem, Jerusalem, Israel, 10 Department of Analytical Chemistry, Helmholtz-Centre for Environmental Research – UFZ, Leipzig, Germany, 11 Geoscientific Centre, University of Go ¨ ttingen, Go ¨ ttingen, Germany Abstract Due to its extreme salinity and high Mg concentration the Dead Sea is characterized by a very low density of cells most of which are Archaea. We discovered several underwater fresh to brackish water springs in the Dead Sea harboring dense microbial communities. We provide the first characterization of these communities, discuss their possible origin, hydrochemical environment, energetic resources and the putative biogeochemical pathways they are mediating. Pyrosequencing of the 16S rRNA gene and community fingerprinting methods showed that the spring community originates from the Dead Sea sediments and not from the aquifer. Furthermore, it suggested that there is a dense Archaeal community in the shoreline pore water of the lake. Sequences of bacterial sulfate reducers, nitrifiers iron oxidizers and iron reducers were identified as well. Analysis of white and green biofilms suggested that sulfide oxidation through chemolitotrophy and phototrophy is highly significant. Hyperspectral analysis showed a tight association between abundant green sulfur bacteria and cyanobacteria in the green biofilms. Together, our findings show that the Dead Sea floor harbors diverse microbial communities, part of which is not known from other hypersaline environments. Analysis of the water’s chemistry shows evidence of microbial activity along the path and suggests that the springs supply nitrogen, phosphorus and organic matter to the microbial communities in the Dead Sea. The underwater springs are a newly recognized water source for the Dead Sea. Their input of microorganisms and nutrients needs to be considered in the assessment of possible impact of dilution events of the lake surface waters, such as those that will occur in the future due to the intended establishment of the Red Sea2Dead Sea water conduit. Citation: Ionescu D, Siebert C, Polerecky L, Munwes YY, Lott C, et al. (2012) Microbial and Chemical Characterization of Underwater Fresh Water Springs in the Dead Sea. PLoS ONE 7(6): e38319. doi:10.1371/journal.pone.0038319 Editor: Stefan Bertilsson, Uppsala University, Sweden Received January 21, 2012; Accepted May 8, 2012; Published June 5, 2012 Copyright: ß 2012 Ionescu et al. This is an open-access article distributed under the terms of the Creative Commons Attribution License, which permits unrestricted use, distribution, and reproduction in any medium, provided the original author and source are credited. Funding: Funding for this study was obtained from the German Federal Ministry of Education and Science through the project SUMAR (grant code: 02WM0848). The funder had no role in study design, data collection and analysis, decision to publish, or preparation of the manuscript. No additional external funding received for this study. Competing Interests: JP is an employee of Ribocon German Federal Ministry of Education and Science. There are no patents, products in development or marketed products to declare. This does not alter the authors’ adherence to all the PLoS ONE policies on sharing data and materials, as detailed online in the guide for authors. * E-mail: [email protected] Introduction The Dead Sea is a terminal lake located on the border between Jordan, the Palestinian Authority and Israel, and is part of a larger geological system known as the Jordan Dead Sea Rift. The lake consists of a deeper northern basin (deepest point at ,725 m below sea level) and a southern basin, which has dried out but is kept shallow by continuous transfer of water from the northern basin as it is used for commercial mineral production. Until 1979 the Dead Sea was a meromictic lake with hypersaline, anoxic and sulfidic deep waters and a seasonally varying mixolimnion [1]. Since the beginning of the 20th century the water budget of the Dead Sea has been negative, leading to a continuous decrease in the water level [1,2]. The extensive evaporation in the absence of major water input led to an increase in the density of the upper water layer, which caused the lake to overturn in 1979 [3] Since then, except after two rainy seasons in 1980 and 1992, the Dead Sea remained holomictic and has been characterized by a NaCl supersaturation and halite deposition on the lake bottom, with total dissolved salt concentrations reaching 347 g L 21 . Due to the continuous evaporation of the Dead Sea, Na + precipitates out as halite while Mg 2+ ,whose salts are more soluble, is further concentrated and has become the dominant cation [2]. The increased salinity and the elevated concentration of divalent ions make the Dead Sea an extreme environment that is not tolerated by most organisms. This is reflected in a generally PLoS ONE | www.plosone.org 1 June 2012 | Volume 7 | Issue 6 | e38319 – UFZ,
Transcript of Microbial and Chemical Characterization of Underwater Fresh Water Springs in the Dead Sea
Microbial and Chemical Characterization of UnderwaterFresh Water Springs in the Dead SeaDanny Ionescu1*, Christian Siebert2, Lubos Polerecky1, Yaniv Y. Munwes3, Christian Lott1,4,
Stefan Hausler1, Mina Bizic-Ionescu1,5, Christian Quast1, Jorg Peplies6, Frank Oliver Glockner1,7,
Alban Ramette1, Tino Rodiger2, Thorsten Dittmar1,8, Aharon Oren9, Stefan Geyer2, Hans-Joachim Stark10,
Martin Sauter11, Tobias Licha11, Jonathan B. Laronne3, Dirk de Beer1
1 Max Planck Institute for Marine Microbiology, Bremen, Germany, 2 Department of Catchment Hydrology, Helmholtz-Centre for Environmental Research Halle/Saale,
Germany, 3 Department of Geography & Environmental Development, Ben Gurion University of the Negev, Beer Sheva, Israel, 4 HYDRA Institute for Marine Sciences, Elba
Field Station, Campo nell’Elba (LI), Italy, 5 Department of Stratified Lakes, Leibniz Institute of Freshwater Ecology and Inland Fisheries Berlin, Stechlin, Germany, 6 Ribocon
GmbH, Bremen, Germany, 7 Jacobs University Bremen GmbH, Bremen, Germany, 8 Institute for Chemistry and Biology of the Marine Environment, Carl von Ossietzky
University, Oldenburg, Germany, 9 Department of Plant and Environmental Sciences, Institute of Life Sciences, The Hebrew University of Jerusalem, Jerusalem, Israel,
10 Department of Analytical Chemistry, Helmholtz-Centre for Environmental Research – UFZ, Leipzig, Germany, 11 Geoscientific Centre, University of Gottingen,
Gottingen, Germany
Abstract
Due to its extreme salinity and high Mg concentration the Dead Sea is characterized by a very low density of cells most ofwhich are Archaea. We discovered several underwater fresh to brackish water springs in the Dead Sea harboring densemicrobial communities. We provide the first characterization of these communities, discuss their possible origin,hydrochemical environment, energetic resources and the putative biogeochemical pathways they are mediating.Pyrosequencing of the 16S rRNA gene and community fingerprinting methods showed that the spring communityoriginates from the Dead Sea sediments and not from the aquifer. Furthermore, it suggested that there is a dense Archaealcommunity in the shoreline pore water of the lake. Sequences of bacterial sulfate reducers, nitrifiers iron oxidizers and ironreducers were identified as well. Analysis of white and green biofilms suggested that sulfide oxidation throughchemolitotrophy and phototrophy is highly significant. Hyperspectral analysis showed a tight association betweenabundant green sulfur bacteria and cyanobacteria in the green biofilms. Together, our findings show that the Dead Sea floorharbors diverse microbial communities, part of which is not known from other hypersaline environments. Analysis of thewater’s chemistry shows evidence of microbial activity along the path and suggests that the springs supply nitrogen,phosphorus and organic matter to the microbial communities in the Dead Sea. The underwater springs are a newlyrecognized water source for the Dead Sea. Their input of microorganisms and nutrients needs to be considered in theassessment of possible impact of dilution events of the lake surface waters, such as those that will occur in the future due tothe intended establishment of the Red Sea2Dead Sea water conduit.
Citation: Ionescu D, Siebert C, Polerecky L, Munwes YY, Lott C, et al. (2012) Microbial and Chemical Characterization of Underwater Fresh Water Springs in theDead Sea. PLoS ONE 7(6): e38319. doi:10.1371/journal.pone.0038319
Editor: Stefan Bertilsson, Uppsala University, Sweden
Received January 21, 2012; Accepted May 8, 2012; Published June 5, 2012
Copyright: � 2012 Ionescu et al. This is an open-access article distributed under the terms of the Creative Commons Attribution License, which permitsunrestricted use, distribution, and reproduction in any medium, provided the original author and source are credited.
Funding: Funding for this study was obtained from the German Federal Ministry of Education and Science through the project SUMAR (grant code: 02WM0848).The funder had no role in study design, data collection and analysis, decision to publish, or preparation of the manuscript. No additional external funding receivedfor this study.
Competing Interests: JP is an employee of Ribocon German Federal Ministry of Education and Science. There are no patents, products in development ormarketed products to declare. This does not alter the authors’ adherence to all the PLoS ONE policies on sharing data and materials, as detailed online in theguide for authors.
* E-mail: [email protected]
Introduction
The Dead Sea is a terminal lake located on the border between
Jordan, the Palestinian Authority and Israel, and is part of a larger
geological system known as the Jordan Dead Sea Rift. The lake
consists of a deeper northern basin (deepest point at ,725 m
below sea level) and a southern basin, which has dried out but is
kept shallow by continuous transfer of water from the northern
basin as it is used for commercial mineral production. Until 1979
the Dead Sea was a meromictic lake with hypersaline, anoxic and
sulfidic deep waters and a seasonally varying mixolimnion [1].
Since the beginning of the 20th century the water budget of the
Dead Sea has been negative, leading to a continuous decrease in
the water level [1,2]. The extensive evaporation in the absence of
major water input led to an increase in the density of the upper
water layer, which caused the lake to overturn in 1979 [3] Since
then, except after two rainy seasons in 1980 and 1992, the Dead
Sea remained holomictic and has been characterized by a NaCl
supersaturation and halite deposition on the lake bottom, with
total dissolved salt concentrations reaching 347 g L21. Due to the
continuous evaporation of the Dead Sea, Na+ precipitates out as
halite while Mg2+,whose salts are more soluble, is further
concentrated and has become the dominant cation [2].
The increased salinity and the elevated concentration of
divalent ions make the Dead Sea an extreme environment that
is not tolerated by most organisms. This is reflected in a generally
PLoS ONE | www.plosone.org 1 June 2012 | Volume 7 | Issue 6 | e38319
– UFZ,
low diversity and very low abundance of microorganisms. The
microbiology of the lake has been subject for research since the
1930s when Benjamin Elazari-Volcani (Wilkansky at the time)
isolated the first microorganisms from the sediment of the Dead
Sea [4]. Besides Bacteria and Archaea [5] these isolates included
algae [6], protozoa [7], and ciliates [8]. Since then, several
Bacterial and Archaeal isolates have been obtained in culture,
both from the sediment and from the water body [2]. The general
cell abundance in the Dead Sea water is very low (,56104 cells
mL21; this study), except for two blooms in 1980 and 1992, when
after severe winters the upper meter of the water column was
diluted by 15–30%, floods provided an input of phosphate, and
the cell concentrations reached 20–356106 cells mL21 [9].
Recently, we discovered a complex system of underwater
springs in the Dead Sea. A more detailed exploration revealed that
these springs harbor microbial communities with much higher
diversity and cell density than reported to date for the Dead Sea,
including dense biofilms covering sediments and rocks around the
springs. In this study we provide the first description of these
habitats and the associated microbial communities. Based on
comparative analyses of the community structure and geochemical
reconstruction of the spring water sources, we propose hypotheses
about the main energy resources and metabolic pathways that
drive these microbial ecosystems, as well as discuss their possible
origins and environmental adaptations.
Methods
Site DescriptionThe underwater springs are located in the Darga area on the
western coast of the Dead Sea, and are divided into two systems
(Fig. 1). The northern system (springs 1–5) consists of one or more
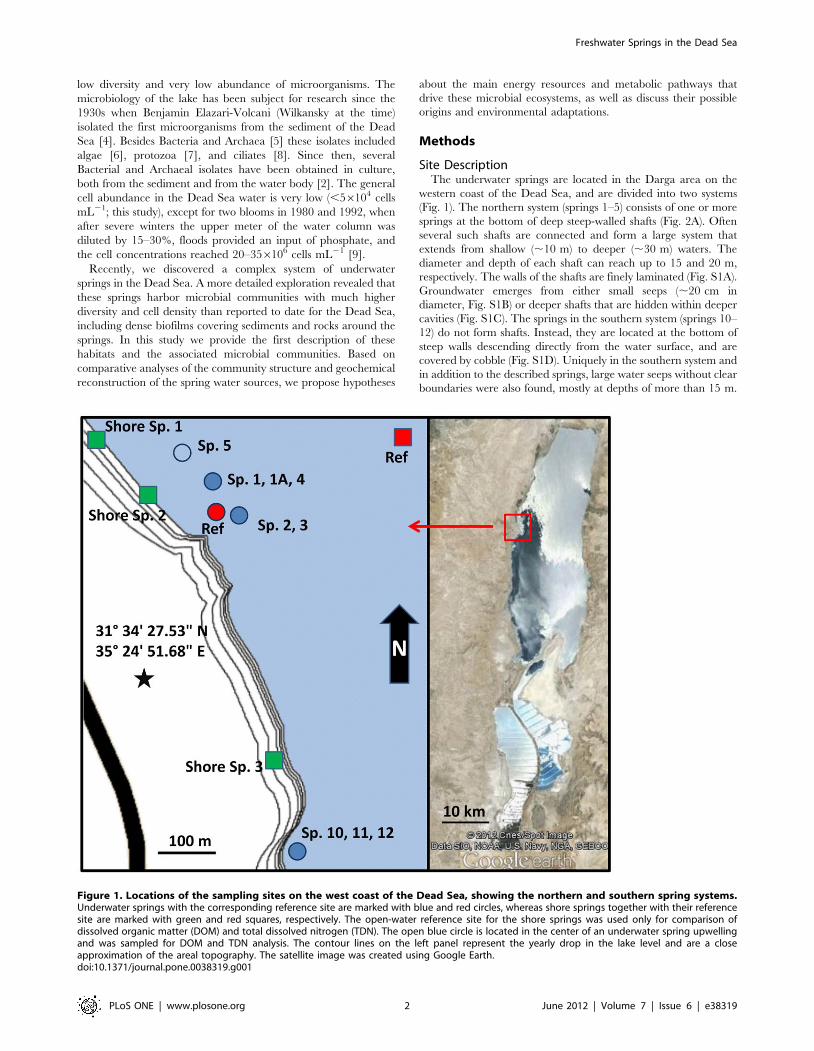
springs at the bottom of deep steep-walled shafts (Fig. 2A). Often
several such shafts are connected and form a large system that
extends from shallow (,10 m) to deeper (,30 m) waters. The
diameter and depth of each shaft can reach up to 15 and 20 m,
respectively. The walls of the shafts are finely laminated (Fig. S1A).
Groundwater emerges from either small seeps (,20 cm in
diameter, Fig. S1B) or deeper shafts that are hidden within deeper
cavities (Fig. S1C). The springs in the southern system (springs 10–
12) do not form shafts. Instead, they are located at the bottom of
steep walls descending directly from the water surface, and are
covered by cobble (Fig. S1D). Uniquely in the southern system and
in addition to the described springs, large water seeps without clear
boundaries were also found, mostly at depths of more than 15 m.
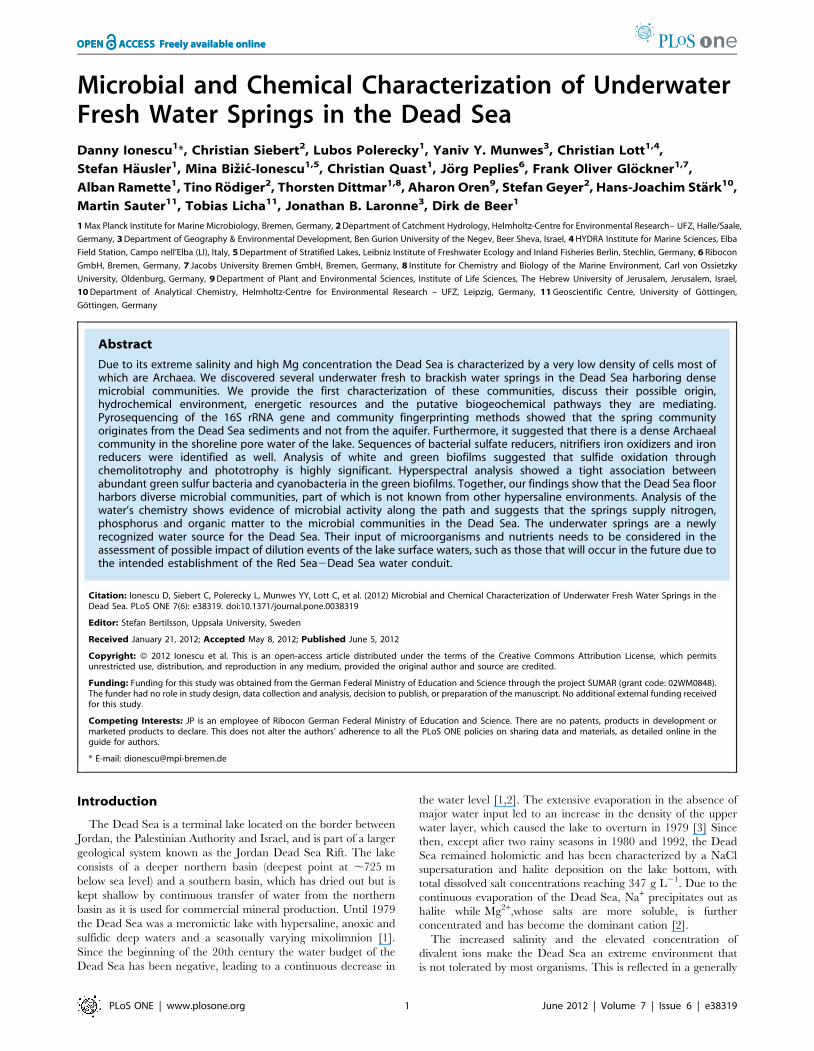
Figure 1. Locations of the sampling sites on the west coast of the Dead Sea, showing the northern and southern spring systems.Underwater springs with the corresponding reference site are marked with blue and red circles, whereas shore springs together with their referencesite are marked with green and red squares, respectively. The open-water reference site for the shore springs was used only for comparison ofdissolved organic matter (DOM) and total dissolved nitrogen (TDN). The open blue circle is located in the center of an underwater spring upwellingand was sampled for DOM and TDN analysis. The contour lines on the left panel represent the yearly drop in the lake level and are a closeapproximation of the areal topography. The satellite image was created using Google Earth.doi:10.1371/journal.pone.0038319.g001
Freshwater Springs in the Dead Sea
PLoS ONE | www.plosone.org 2 June 2012 | Volume 7 | Issue 6 | e38319
Detailed hydrological and geological maps of the area can be
found in Laronne Ben-Itzhak and Gvritzman [10].
SamplingSampling of underwater springs for the analysis of microbial
diversity, cell counts, pigments and water chemistry took place in
June 2010 (Table 1). Samples for sulfide, ammonium, and
phosphate quantification as well as for the analysis of dissolved
organic carbon (DOC) and total dissolved nitrogen (TDN) were
additionally collected from the same springs in October 2011.
Prior to sampling, springs were marked by SCUBA divers based
on light refraction in the mixing zone of the groundwater and the
ambient Dead Sea water. Sediment and microbial mat samples
were collected by SCUBA divers in cores and sterile 50 mL tubes,.
Water samples from all springs except spring 5 were collected
using a 40 m long hose connected to a peristaltic pump. A type K
thermocouple cable was attached on the hose and connected to a
thermometer (TM-747D, Tenmars, Taiwan) on the boat. Based
on the difference in temperature, the submerged end of the
pumping hose was placed into the spring by a SCUBA diver.
Samples were collected once the density of the pumped water was
stable and significantly lower than that of the Dead Sea, allowing
several minutes (2–3 hose volumes) for washing of the hose with
the spring water to minimize chemical and bacterial cross
contamination. The pumping speed was kept low to prevent
uptake of sediments or of the ambient Dead Sea water.
Approximately 10 L of water were pumped from each spring. A
water sample from the underwater spring 5 was collected from the
surface of the Dead Sea where the emerging spring water formed
an upwelling due to its low density compared to the Dead Sea
water. This sample is therefore to an unknown extent mixed with
ambient Dead Sea water. To allow a comparison between the
native Dead Sea microbial communities and those associated with
the underwater springs, reference sediment samples were addi-
tionally collected from an area without groundwater seepage (Fig. 1
Red Circle).
To reveal the possible origin of the underwater springs water,
samples for water chemistry analysis were collected from these
auxiliary sites (Table 1): freshwater wells from the Upper and
Lower Judea Group Aquifer (JGA); brackish springs emerging at
the shore close to the sampling site at distances 1290 m from the
Dead Sea shore line (shore sp. 1–3 in Fig. 1); and shore springs in
the Qedem area south of the sampling site, discharging hot brines
from Lower Cretaceous or even Jurassic strata [11]. Pore water
from the Dead Sea Group (DSG) sediment next to the shore spring
3 was sampled at depth of 0.7 m, which was 0.3 m above the 2010
Dead Sea water level. The pore water was squeezed from a
sediment core on site using a mechanical, stainless steel, screw
press. Thus the pore water represents interstitial waters transport-
ed by gravity from the exposed DSG sediments towards the Dead
Sea. The term Dead Sea Group sediments will be used here on to
describe all sediments which at some point throughout the history
of the Dead Sea, were covered by its water.
Dead Sea water for dissolved organic matter (DOC) and total
dissolved nitrogen (TDN) analysis was sampled away from the
shore (Fig. 1 Square ref). To prevent influence of coastal and
underwater spring waters, the samples were collected from a depth
of 5 m.
All samples were kept at 4uC until further processing. Water
samples for DNA extraction were filtered within 12 h, and the
filters were kept at 220uC until further analysis, whereas
sediments and microbial mats were transferred to 220uC within
24 h. The samples were transferred to Germany on dry ice for
further processing.
Samples for water chemistry analysis were transported within
10 h of sampling to storage and 4uC; however, brine samples were
stored at ambient conditions to prevent salt crystallization. Storage
conditions were maintained during shipping to Germany for
further analysis. Samples for cation analysis were pre acidified on
site.
Water Chemistry AnalysisWater (4 L) and pore water (0.6 L) samples were filtered on site
through 0.22 mm cellulose-acetate filters and filled into separate
bottles for cation and anion analyses. Cation analysis was
conducted as previously described [12]. Shortly, the samples were
additionally acidified by adding 0.3 mL of 6 M HCl. Determina-
tion of Mg, Ca, Sr, Rb, Cs, Mn was done by ICP-MS (Elan-DRC,
Perkin Elmer, Germany)., whereas Na, K, Ba, B, Li, Si were
analyzed with ICP-AES (Spectro Ciros CCD, Spectro Analytical
Instruments,Germany)Both analyses were calibrated with matrix-
adjusted standard solutions. Cl, Br and SO4 were analyzed by ion
chromatography. HCO3- was Gran-titrated adjusting the waters to
pH 4.3 with H2SO4. For interpretation, ion concentrations were
normalized to those in seawater, since seawater is a major source
of brines and evaporates. H2S was analyzed colorimetrically using
Figure 2. Sketch of the northern spring system. The water seep shown on the slope of the sketch is found only in deeper parts of the southernsystem where water seeps through the sediment surface over a large area without defined boundaries. The shafts have steep, laminated walls (seeFig. S1A) and contain one or more springs (blue). Localized water sources are either directly visible on the shaft bottom (Fig. S1B) or are hidden withindeeper cavities (Fig. S1C). In the southern spring system (not shown in the sketch) springs do not form shafts and are covered by cobbles (Fig. S1D).doi:10.1371/journal.pone.0038319.g002
Freshwater Springs in the Dead Sea
PLoS ONE | www.plosone.org 3 June 2012 | Volume 7 | Issue 6 | e38319
the methylene blue method [13]. pH temperature and Eh were
measured on site, with a SenTix41 gel and SenTix platinum
electrode, respectively connected to a WTW 350i field meter.
Analysis of Dissolved Organic Carbon (DOC) and TotalDissolved Nitrogen (TDN)
DOC and TDN were analyzed in samples (250 mL) collected in
acid-cleaned polycarbonate bottles, which were stored at 220uCuntil analysis at the Max Planck Research Group for Marine
Geochemistry (Oldenburg, Germany). Samples were thawed,
acidified with HCl (p.a. quality) to pH = 2 and purged with
ultrapure synthetic air to remove inorganic carbon. DOC and
TDN were measured with a total organic carbon analyzer (TOC-
VCPH, Shimadzu) equipped with a TNM-1 module for nitrogen
analyses and an ASI-V auto-sampler. A subset of samples was also
filtered through pre-combusted Whatman GF/F filters. Because
there was no detectable difference between filtered and non-
filtered samples, our analyses of total dissolved organic carbon and
nitrogen represents DOC and TDN. To test for possible matrix
effects of the high salt content, a standard addition experiment was
performed by adding NH4Cl and potassium phthalate to a subset
of samples. The added amounts of DOC and TDN could be
reproduced with an external calibration, demonstrating that the
Dead Sea water matrix did not affect our analyses. Additionally
the catalysts of the TOC analyzer where optically controlled for
signs of chlorine breakthrough. The analyses of DOC and TDN
were validated with consensus deep-sea reference material (CRM
Program, http://yyy.rsmas.miami.edu/groups/biogeochem/
CRM.html) provided by the University of Miami.
Rare Earth Elements and Yttrium (REY)REY were measured using ICP-MS (Elan-DRC, Perkin Elmer,
Germany) as previously described [14]. Low concentrations of
REY in the water made pre-concentration necessary. Approxi-
mately 3 L of filtrated water (0.22 mm, cellulose acetate Sartobran
capsule filter, Sartorius, Germany) were spiked with a Tm-spike
for recovery analysis and adjusted to pH 2 by using sub-boiled
suprapure HCl (HClsp Merck, Germany) and within 2 h passed
through a pre-conditioned C18 Sep-Pak cartridge (waters, USA) at
a rate of 1 L h21. Cartridges were pre-conditioned in the
laboratory by cleaning them with 10 mL of 6 M sub-boiled
HClsp, rinsing in ultra-pure water (Merck Millipore, Germany) to
neutral pH and loading with a liquid ion exchanger (a mixture of
two different ethylhexylphosphates, Merck, Germany). The REY-
loaded cartridges were washed with 50 mL of 0.01 M sub-boiled
HClsp and eluted by 40 mL of 6 M sub-boiled HClsp at a rate of
3 mL min21. The eluates were evaporated to incipient dryness
and the residues dissolved in 3 mL of sub-boiled suprapure HNO3
(Merck, Germany) and spiked with a Ru-Re mixture that was later
used to correct the internal drift of the response factors in the ICP-
MS measurements, if necessary. The interference of molecular
ions with the desired mono-charged ions of the REY were
routinely corrected as previously described [12]. REY values are
given in Table S1.
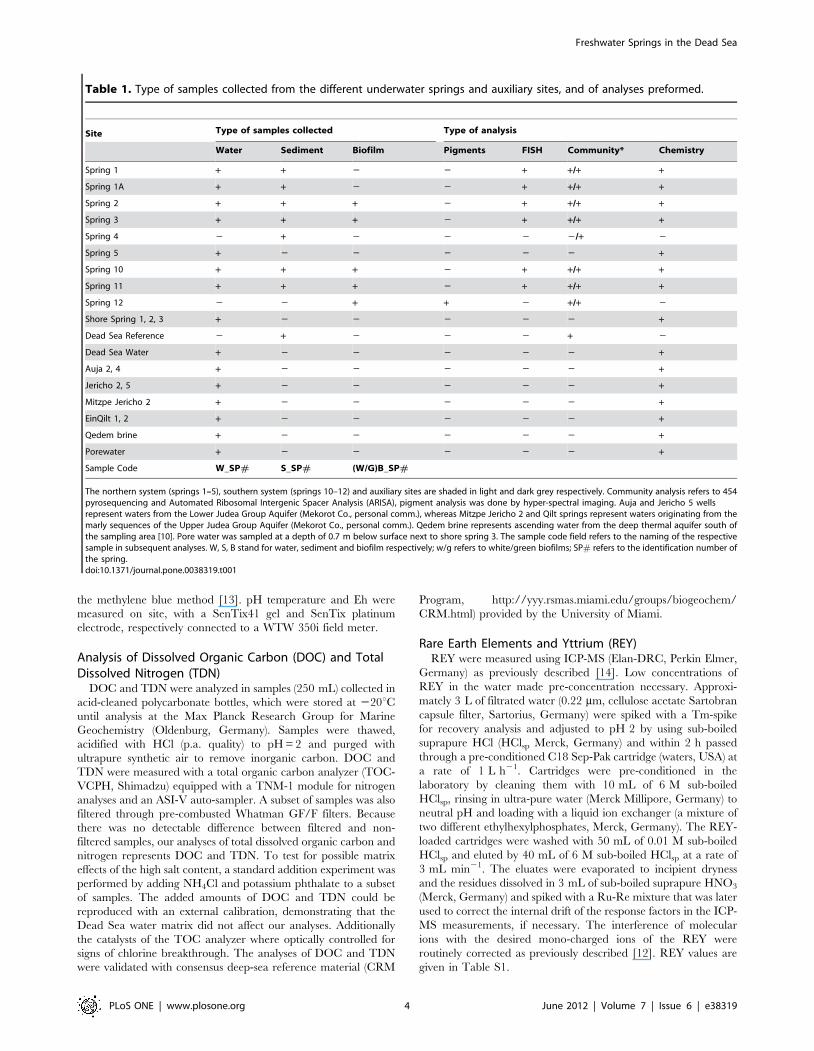
Table 1. Type of samples collected from the different underwater springs and auxiliary sites, and of analyses preformed.
Site Type of samples collected Type of analysis
Water Sediment Biofilm Pigments FISH Community* Chemistry
Spring 1 + + 2 2 + +/+ +
Spring 1A + + 2 2 + +/+ +
Spring 2 + + + 2 + +/+ +
Spring 3 + + + 2 + +/+ +
Spring 4 2 + 2 2 2 2/+ 2
Spring 5 + 2 2 2 2 2 +
Spring 10 + + + 2 + +/+ +
Spring 11 + + + 2 + +/+ +
Spring 12 2 2 + + 2 +/+ 2
Shore Spring 1, 2, 3 + 2 2 2 2 2 +
Dead Sea Reference 2 + 2 2 2 + 2
Dead Sea Water + 2 2 2 2 2 +
Auja 2, 4 + 2 2 2 2 2 +
Jericho 2, 5 + 2 2 2 2 2 +
Mitzpe Jericho 2 + 2 2 2 2 2 +
EinQilt 1, 2 + 2 2 2 2 2 +
Qedem brine + 2 2 2 2 2 +
Porewater + 2 2 2 2 2 +
Sample Code W_SP# S_SP# (W/G)B_SP#
The northern system (springs 1–5), southern system (springs 10–12) and auxiliary sites are shaded in light and dark grey respectively. Community analysis refers to 454pyrosequencing and Automated Ribosomal Intergenic Spacer Analysis (ARISA), pigment analysis was done by hyper-spectral imaging. Auja and Jericho 5 wellsrepresent waters from the Lower Judea Group Aquifer (Mekorot Co., personal comm.), whereas Mitzpe Jericho 2 and Qilt springs represent waters originating from themarly sequences of the Upper Judea Group Aquifer (Mekorot Co., personal comm.). Qedem brine represents ascending water from the deep thermal aquifer south ofthe sampling area [10]. Pore water was sampled at a depth of 0.7 m below surface next to shore spring 3. The sample code field refers to the naming of the respectivesample in subsequent analyses. W, S, B stand for water, sediment and biofilm respectively; w/g refers to white/green biofilms; SP# refers to the identification number ofthe spring.doi:10.1371/journal.pone.0038319.t001
Freshwater Springs in the Dead Sea
PLoS ONE | www.plosone.org 4 June 2012 | Volume 7 | Issue 6 | e38319
DNA ExtractionBased on preliminary cell counts, 4 L of water and 25 g of
spring sediments were used for DNA extraction as previously
described [15]. All samples were incubated for 30 min in lysis
buffer (0.1 M Tris, 0.05 M EDTA, 100 mM NaCl, 1% SDS,
pH 8) at 100uC in a dry heating block or a water bath depending
on sample size. Phenol was added (half of total volume) and
samples were incubated at 60uC for 15 min. An identical volume
of chloroform was added and, following 10 min of incubation at
room temperature (RT) and 10 min of centrifugation, the aqueous
phase was transferred. After a second chloroform extraction the
DNA was precipitated overnight at 220uC with 1 volume of
isopropanol and 0.05 volume of 5 M Sodium Acetate (pH 5.0).
After a 20 min centrifugation the pellet was washed in 75%
ethanol, recollected by centrifugation, and dissolved in 50 mL of
molecular grade water. Due to the high salt content the DNA from
the sediment samples was desalted using the Qiaex II gel
extraction kit (Cat: 20021, Qiagen). DNA was quantified using a
Nanodrop (Thermo Scientific) and subsamples of equal concen-
tration were used for further analysis.
PyrosequencingDNA extracts from a total of 18 samples were analyzed by 454
pyrosequencing for Bacterial and Archaeal diversity. Primer sets
28F and 519R [16] were used for Bacterial sequences and 341F
[17] and 958R [18] for Archaeal sequences. Pyrosequencing was
done by Research and Testing Laboratories, Lubbock, Texas,
using a Roche 454 FLX Genome Sequencer system. Shortly, Tag-
encoded FLX amplicon pyrosequencing (bTEFAP) was carried
out as previously described by Dowd et al. [19]. A 20 ng (1 ml)
aliquot of each DNA sample was used for a 25 ml PCR reaction. A
30 cycle PCR using HotStarTaq Plus Master Mix Kit (Qiagen,
USA) were used under the following conditions: 94uC for 3
minutes, followed by 30 cycles of 94uC for 30 seconds; 55uC for 40
seconds and 72uC for 1 minute; and a final elongation step at 72uCfor 5 minutes. Following PCR, all amplicon products from
different samples were mixed in equal volumes and purified using
Agencourt Ampure beads (Agencourt Bioscience Corporation,
USA).
Sequence AnalysisDiversity and community structure analyses were performed on
90,320 Bacterial and 41,111 Archaeal sequences obtained from
samples of spring waters and sediments, biofilms and reference
sediment. Sequence reads from PCR amplicon pyrosequencing
were preprocessed (aligned and quality-controlled) by the
bioinformatics pipeline of the SILVA rRNA gene database project
[20]. Briefly, all reads were aligned using the SILVA Incremental
Aligner against the SILVA SSU rRNA seed [20]. Non-aligned
reads (putative contaminations/artifacts) have not been considered
for further downstream analysis. Additionally, all remaining reads
shorter than 50 aligned nucleotides and reads with more than 2%
of ambiguities or 2% of homopolymers, respectively, were
removed. Subsequently, reads of the filtered datasets were
dereplicated, clustered and classified in parallel on a sample by
sample basis. Dereplication (identification of identical reads
ignoring overhangs) and clustering (OTU definition based on a
non-redundant subset of reads) was done using cd-hit-est (http://
www.bioinformatics.org/cd-hit) applying identity criteria of 1.00
and 0.98, respectively, both times with a wordsize of 8. For each
OTU/cluster, the longest read was then used as a reference of this
cluster for taxonomic classification. The classification was
performed by a local nucleotide BLAST search against the non-
redundant version of the SILVA SSURef dataset (release 106;
http://www.arb-silva.de) using blast-2.2.22+ http://blast.ncbi.
nlm.nih.gov/Blast.cgi) with standard settings. To filter out low
identity and artificial BLAST hits, hits for which the function
‘(%sequence identity +%alignment coverage)/2’ did not exceed
the value of 93.0 were discarded. For the analyzed reads with
sufficiently good BLAST hits, the taxonomic classification of the
best BLAST hit according to the SILVA taxonomy has been
assigned to the read. Reads without any BLAST hits, or reads with
weak BLAST hits only, were classified as ‘No Relatives’. Finally,
the taxonomic path of each cluster reference was mapped to all
reads within the corresponding cluster as well as to their
corresponding replicates. This last step allowed to obtain
quantitative information (number of individual reads representing
a taxonomic path), within the bounds of PCR and pyrosequencing
biases. To confirm the taxonomic affiliation of the sequences, all
cluster references were imported into ARB [21] and inserted into
the guide tree of the SILVA SSURef dataset (release 108).
A detailed summary of the 16S rRNA gene pyrosequencing
data analysis process for each sample, including the total number
of reads and length distribution, as well as the results of quality
management, dereplication, and clustering, can be found in Table
S2. A detailed list of the final taxonomic affiliation of all analyzed
sequences together with their relative abundances within the
amplicon pool are given in Tables S3 (Bacteria) and S4 (Archaea).
The sequences were deposited at the Sequences Read Archive
(SRA) under study accession number ERA116549.
Rarefaction AnalysisRarefaction curves [22] were calculated for each sample. For
each curve 100 data points were calculated choosing random sub
sets of classified reads from the sample. Reads excluded by the
aligner or the quality control, were not considered for the
calculation of rarefaction curves. The first calculated data point
always used a sample size of 1, while the last data point included
all reads from the sample. The simulated sample sizes for the
remaining 98 data points were evenly distributed between 1 and
the size of the sample.
Automated Ribosomal Intergenic Spacer Analysis (ARISA)ARISA was done as previously described [23] using 3 replicates
for each DNA extract. Several sediment samples from each spring
were used as biological replicates. No biological replicates are
available for the water samples.
Fluorescence in Situ Hybridization (FISH)Samples for FISH were fixed within minutes of sampling
termination using fresh formaldehyde (1% final concentration),
and stored at 4uC. Several replicates of 100 mL were filtered from
each spring. Prior to permeabilization filters were embedded in
low-gelling-point agarose (0.2% [wt/vol] in Milli-Q water), dried
for 15 minutes at 37uC and dehydrated in 95% (vol/vol) ethanol.
Subsequently, filter pieces were incubated in lysozyme solution
(10 mg/ml lysozyme in 0.1 M Tris-HCL [pH 7.4] and 0.05 M
EDTA [pH 8]) for 1 hour at 37uC. After two washing steps in
Milli-Q water, a second permeabilization step was carried out
using achromopeptidase (30 U mL21 achromopeptidase in
0.01 M NaCl and 0.05 Tris-HCl [pH 7.4]) for 30 minutes at
37uC. For inactivation of intracellular peroxidases, filters were
incubated for 30 minutes at RT in methanol containing 0.15%
H2O2, washed in Milli-Q water, dehydrated for 1 minute in 95%
(vol/vol) ethanol, and air-dried at room temperature. Filters were
cut in sections and hybridized with the oligonucleotide probes
EUB338 I–III [24], Arch915a and NON338 [25]. Formamide
Freshwater Springs in the Dead Sea
PLoS ONE | www.plosone.org 5 June 2012 | Volume 7 | Issue 6 | e38319
concentration in the hybridization buffers was 35% (vol/vol) for all
probes used.
Hybridization and amplification was performed as described by
Tujula et al. [26], with the following modifications. Hybridization
was performed overnight (12–15 h) at 46uC. Amplification was
increased by adding 3 parts of Alexa 488 (1 mg mL21) labeled
tyramides to 1000 parts of amplification buffer. The amplification
time was elongated to 30 minutes at 46uC. The filters were
counter-stained and mounted using a DAPI (49,6-diamidino22-
phenylindole) mix as described by Teira et al. [27].
The samples were examined with a Zeiss Axioplan microscope
with a 100-W Hg lamp and filter sets for DAPI and Alexa488.
From each filter 5 to 10 different fields of view (around 1000 to
5000 cells) were enumerated using the ACME software by Michael
Zeder (http://www.technobiology.ch).
Hyper-spectral ImagingHigh spatial resolution distributions of pigments in green
biofilms covering cobble from spring 12 were measured using
hyper-spectral imaging [28]. This method provides full spectral
data per pixel of acquired image thus enabling a non-intrusive
study of pigment distribution across the sample. Undisturbed
biofilm samples were illuminated with a halogen lamp emitting in
visible and near-infrared regions (400–1000 nm), and scanned
with a hyper-spectral camera (Pika II, Resonon) from a distance of
,5 cm at velocity 200 mm s21. Subsequently, a biofilm subsample
was placed on a microscope slide and scanned in a transmission
mode under a Zeiss Axiophot microscope at velocity 2 mm s21.
Pigments were identified based on their in vivo absorption maxima
(676 nm for chlorophyll a, 625 nm for phycocyanin, and 740 nm
for bacteriochlorophyll c), and localized by calculating in every
pixel of the image the second derivative of the spectral reflectance
at the corresponding maximal absorption [28].
Cluster AnalysisThe different samples of the water and sediment microbial
communities were compared by cluster analysis. The clustering
was done using the DICE algorithm as implemented in the PAST
software [29], using stress factors 13% and 7% for the 454 data
and ARISA data, respectively.
Results
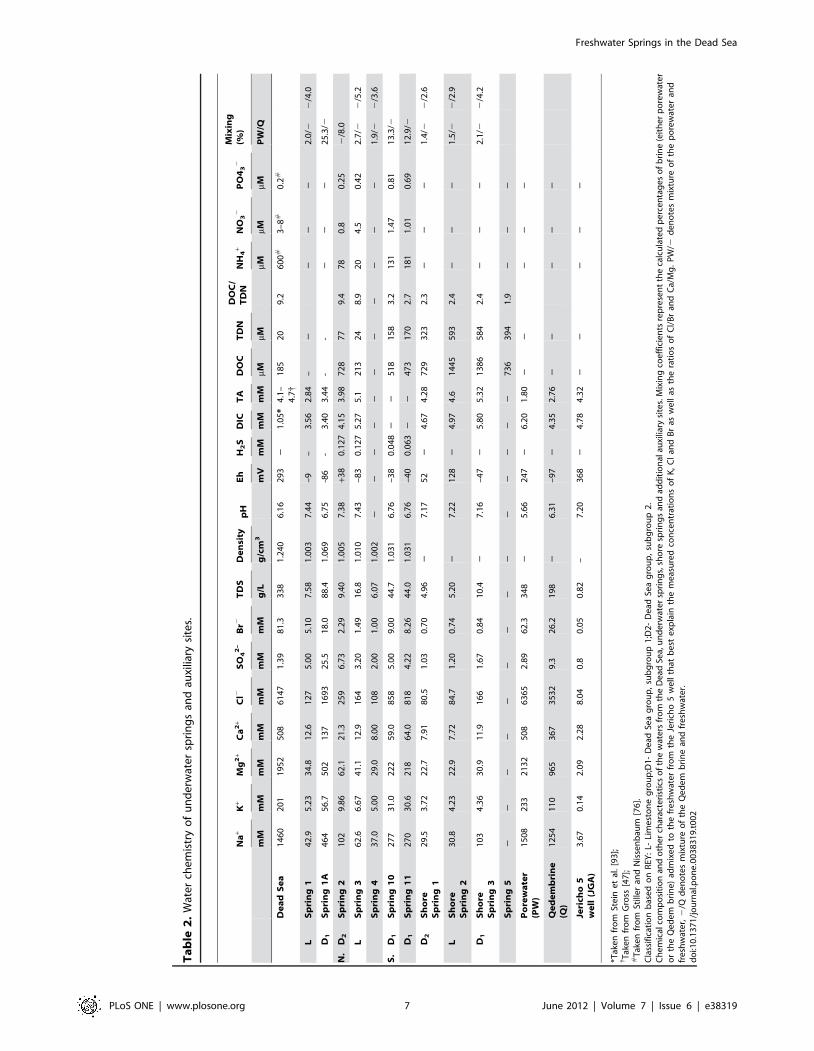
Water ChemistryCompared to the Dead Sea water (data taken from Moller et al.
[30]), underwater springs were significantly less saline and had a
higher pH (Table 2). The southern springs were more saline and
had a lower pH than the northern ones, with the exception of
spring 1A, which was inactive at the beginning of the campaign
and was sampled after it became active. All underwater springs
except spring 2 had negative redox potential. Sulfide was detected
in springs from both systems and ranged between 50–130 mM.
DIC concentrations in the shore and underwater springs were 3–5
times higher than in the Dead Sea. DOC and TDN concentra-
tions in underwater and shore springs as well as in the mixture of
waters from the underwater spring 5 and the Dead Sea were also
higher, however the DOC:TDN ratios were about 4 times lower
than in the Dead Sea (Table 2).
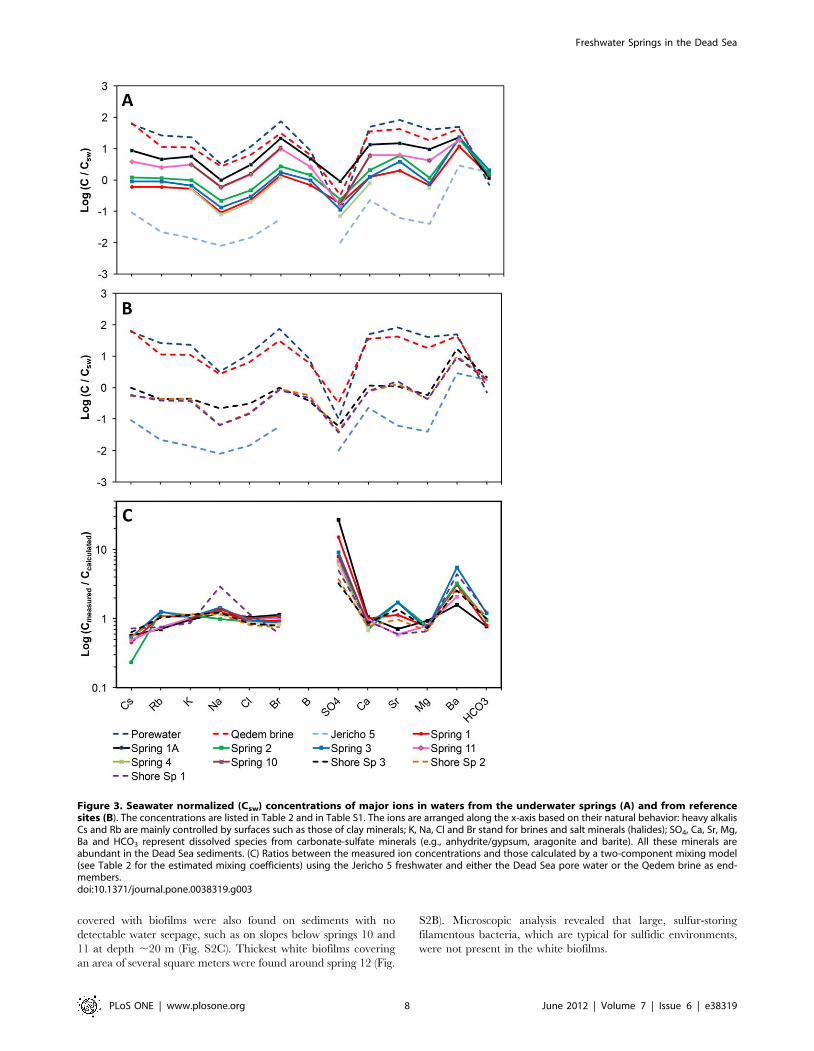
Concentrations of major ions (Table 2) and trace elements
(Table S6) varied significantly amongst the underwater springs.
Seawater-normalized concentrations (hereafter denoted by sub-
script SW) exhibited sub-parallel patterns that were similar for all
underwater springs (Fig. 3A). These patterns resembled those
found in the shore springs from the area as well as in locally
occurring brines, such as the pore water from the exposed Dead
Sea Group (DSG) sediment or the thermal brines from the Qedem
area (Fig. 3B). Both spring waters and local brines had higher Brsw
and Bsw compared to Clsw and SO4sw, and depleted Nasw and
SO4sw. The chemical similarity of the spring waters and brines led
to the assumption that spring waters emerging on the shore and
underwater are the result of (i) mixing of brines with the fresh
groundwater component available from the mountain aquifers and
(ii) dissolution and precipitation of evaporates which are abundant
in the surrounding of the Dead Sea.
To assess the contribution of mixing, we used a two-component
mixing model to calculate the ionic composition of the spring
waters. The local brine (either pore water or the Qedem brine) was
used as the first component, whereas freshwater from the Lower
JGA (represented by the Jericho 5 well) was used as the second
component. The latter is justified based on the hydraulic studies of
Laronne Ben-Itzhak and Gvirtzman [31], which modeled the flow
from the buried Lower JGA to Darga, and of Moller et al. [30],
which proved a considerable supply of freshwater from the
northwest to the Darga region. The calculation revealed that
springs 1A, 10 and 11 contained between 12.9% and 25.3% of
pore water admixed to the JGA freshwater, whereas spring 2 was
better explained as a mixture of 8% Qedem brine and JGA
freshwater (Table 2). The composition of the less saline
underwater springs 1, 3 and 4 and shore springs 1–3 was equally
well explained by mixing the JGA freshwater with either
1.422.7% of pore water or 2.625.2% of the Qedem brine
(Table 2).
These mixing coefficients could explain measured concentra-
tions for most but not all components (Fig. 3C). For example, the
measured concentrations of SO4 and Ba were clearly higher
(4225 fold for SO4, 1.525.5 fold for Ba) than the calculated ones
in all springs, whereas the measured Sr content was slightly higher
in springs 2 and 3 and lower in springs 1A and 11 than calculated.
The shore and underwater spring waters were characterized by
distinct REY patterns, which allowed their classification into two
groups (Fig. 4, Table 2, Table S1). In the ‘‘Limestone’’ group,
which included underwater springs 1 and 3 and shore spring 2, the
REY pattern continuously decreased from La to Lu, with positive
Ce-, small positive Y- and small negative Eu-anomalies (Fig. 4A).
These patterns resembled those found in waters from the Lower
JGA (Auja and Jericho 5 wells) and in the whole Judea Group
limestone [30,32]. In the ‘‘Dead Sea’’ group, which included
springs 1A, 11, 2 and shore springs 1 and 3, REY patterns had a
patelliform shape. The subgroup that included springs 1A and 11
was characterized by significantly decreased medium REE
resulting in a patelliform shaped pattern and positive Ce- and Y-
anomalies (Fig. 4B), similar to the pattern found in the Qedem
brine and the Cretaceous marl from the Judea Mountains [30,32].
The second subgroup, which included spring 2 and shore spring 1
(Fig. 4C), was characterized by a gentler decrease from La to Gd
and a stronger increase towards Lu. Such patterns are typical for
waters coming from marly sequences of the Upper JGA, as
represented by the Mitzpe Jericho 2 and Qilt springs, and similar
to the whole rock composition of a Cretaceous marl from the
Judea Mountains.
BiofilmsDense white biofilms covered sediments around the underwater
springs at all sites. The biofilms around the northern springs 1–5
formed small thin patches adjacent to the water outlet (Fig. S2A).
In contrast, biofilms around the southern springs covered relatively
large (2–10 m2) patches of sediment next to areas where water
seeped out without clear boundaries (Fig. S2B). Large areas
Freshwater Springs in the Dead Sea
PLoS ONE | www.plosone.org 6 June 2012 | Volume 7 | Issue 6 | e38319
Ta
ble
2.
Wat
er
che
mis
try
of
un
de
rwat
er
spri
ng
san
dau
xilia
rysi
tes.
Na
+K
+M
g2
+C
a2
+C
l2S
O4
2–
Br2
TD
SD
en
sity
pH
Eh
H2
SD
ICT
AD
OC
TD
ND
OC
/T
DN
NH
4+
NO
32
PO
43
2
Mix
ing
(%)
mM
mM
mM
mM
mM
mM
mM
g/L
g/c
m3
mV
mM
mM
mM
mMmM
mMmM
mMP
W/Q
De
ad
Se
a1
46
02
01
19
52
50
86
14
71
.39
81
.33
38
1.2
40
6.1
62
93
21
.05
*4
.1–
4.7{
18
52
09
.26
00
#3
–8
#0
.2#
LS
pri
ng
14
2.9
5.2
33
4.8
12
.61
27
5.0
05
.10
7.5
81
.00
37
.44
–9
–3
.56
2.8
4–
22
22
2.0
/22
/4.0
D1
Sp
rin
g1
A4
64
56
.75
02
13
71
69
32
5.5
18
.08
8.4
1.0
69
6.7
5-8
6-
3.4
03
.44
--
22
22
5.3
/2
N.
D2
Sp
rin
g2
10
29
.86
62
.12
1.3
25
96
.73
2.2
99
.40
1.0
05
7.3
8+3
80
.12
74
.15
3.9
87
28
77
9.4
78
0.8
0.2
52
/8.0
LS
pri
ng
36
2.6
6.6
74
1.1
12
.91
64
3.2
01
.49
16
.81
.01
07
.43
–8
30
.12
75
.27
5.1
21
32
48
.92
04
.50
.42
2.7
/22
/5.2
Sp
rin
g4
37
.05
.00
29
.08
.00
10
82
.00
1.0
06
.07
1.0
02
22
22
22
22
22
21
.9/2
2/3
.6
S.
D1
Sp
rin
g1
02
77
31
.02
22
59
.08
58
5.0
09
.00
44
.71
.03
16
.76
–3
80
.04
82
25
18
15
83
.21
31
1.4
70
.81
13
.3/2
D1
Sp
rin
g1
12
70
30
.62
18
64
.08
18
4.2
28
.26
44
.01
.03
16
.76
–4
00
.06
32
24
73
17
02
.71
81
1.0
10
.69
12
.9/2
D2
Sh
ore
Sp
rin
g1
29
.53
.72
22
.77
.91
80
.51
.03
0.7
04
.96
27
.17
52
24
.67
4.2
87
29
32
32
.32
22
1.4
/22
/2.6
LS
ho
reS
pri
ng
23
0.8
4.2
32
2.9
7.7
28
4.7
1.2
00
.74
5.2
02
7.2
21
28
24
.97
4.6
14
45
59
32
.42
22
1.5
/22
/2.9
D1
Sh
ore
Sp
rin
g3
10
34
.36
30
.91
1.9
16
61
.67
0.8
41
0.4
27
.16
–4
72
5.8
05
.32
13
86
58
42
.42
22
2.1
/22
/4.2
Sp
rin
g5
22
22
22
22
22
22
22
73
63
94
1.9
22
2
Po
rew
ate
r(P
W)
15
08
23
32
13
25
08
63
65
2.8
96
2.3
34
82
5.6
62
47
26
.20
1.8
02
22
22
Qe
de
mb
rin
e(Q
)1
25
41
10
96
53
67
35
32
9.3
26
.21
98
26
.31
–9
72
4.3
52
.76
22
22
2
Jeri
cho
5w
ell
(JG
A)
3.6
70
.14
2.0
92
.28
8.0
40
.80
.05
0.8
2–
7.2
03
68
24
.78
4.3
22
22
22
*Tak
en
fro
mSt
ein
et
al.
[93
];{ T
ake
nfr
om
Gro
ss[4
7];
#T
ake
nfr
om
Still
er
and
Nis
sen
bau
m[7
6].
Cla
ssif
icat
ion
bas
ed
on
REY
:L-
Lim
est
on
eg
rou
p;D
1-
De
adSe
ag
rou
p,
sub
gro
up
1;D
2-
De
adSe
ag
rou
p,
sub
gro
up
2.
Ch
em
ical
com
po
siti
on
and
oth
er
char
acte
rist
ics
of
the
wat
ers
fro
mth
eD
ead
Sea,
un
de
rwat
er
spri
ng
s,sh
ore
spri
ng
san
dad
dit
ion
alau
xilia
rysi
tes.
Mix
ing
coe
ffic
ien
tsre
pre
sen
tth
eca
lcu
late
dp
erc
en
tag
es
of
bri
ne
(eit
he
rp
ore
wat
er
or
the
Qe
de
mb
rin
e)
adm
ixe
dto
the
fre
shw
ate
rfr
om
the
Jeri
cho
5w
ell
that
be
ste
xpla
inth
em
eas
ure
dco
nce
ntr
atio
ns
of
K,
Cl
and
Br
asw
ell
asth
era
tio
so
fC
l/B
ran
dC
a/M
g.
PW
/2d
en
ote
sm
ixtu
reo
fth
ep
ore
wat
er
and
fre
shw
ate
r,2
/Qd
en
ote
sm
ixtu
reo
fth
eQ
ed
em
bri
ne
and
fre
shw
ate
r.d
oi:1
0.1
37
1/j
ou
rnal
.po
ne
.00
38
31
9.t
00
2
Freshwater Springs in the Dead Sea
PLoS ONE | www.plosone.org 7 June 2012 | Volume 7 | Issue 6 | e38319
covered with biofilms were also found on sediments with no
detectable water seepage, such as on slopes below springs 10 and
11 at depth ,20 m (Fig. S2C). Thickest white biofilms covering
an area of several square meters were found around spring 12 (Fig.
S2B). Microscopic analysis revealed that large, sulfur-storing
filamentous bacteria, which are typical for sulfidic environments,
were not present in the white biofilms.
Figure 3. Seawater normalized (Csw) concentrations of major ions in waters from the underwater springs (A) and from referencesites (B). The concentrations are listed in Table 2 and in Table S1. The ions are arranged along the x-axis based on their natural behavior: heavy alkalisCs and Rb are mainly controlled by surfaces such as those of clay minerals; K, Na, Cl and Br stand for brines and salt minerals (halides); SO4, Ca, Sr, Mg,Ba and HCO3 represent dissolved species from carbonate-sulfate minerals (e.g., anhydrite/gypsum, aragonite and barite). All these minerals areabundant in the Dead Sea sediments. (C) Ratios between the measured ion concentrations and those calculated by a two-component mixing model(see Table 2 for the estimated mixing coefficients) using the Jericho 5 freshwater and either the Dead Sea pore water or the Qedem brine as end-members.doi:10.1371/journal.pone.0038319.g003
Freshwater Springs in the Dead Sea
PLoS ONE | www.plosone.org 8 June 2012 | Volume 7 | Issue 6 | e38319
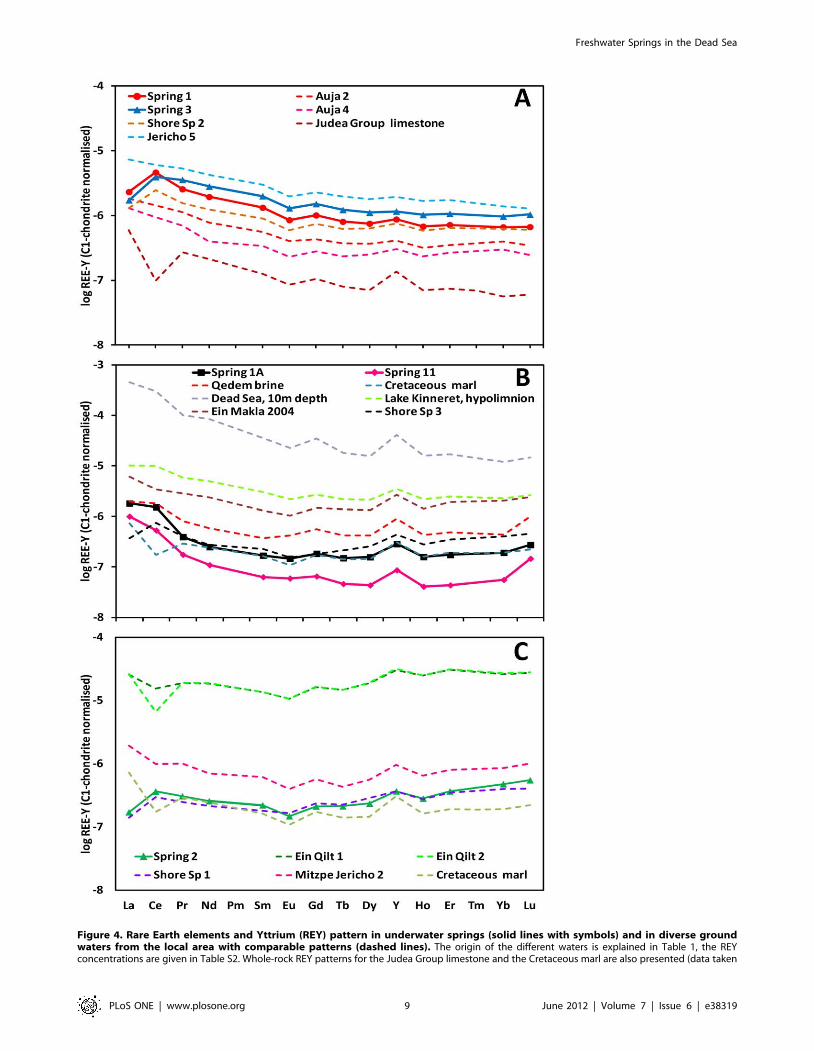
Figure 4. Rare Earth elements and Yttrium (REY) pattern in underwater springs (solid lines with symbols) and in diverse groundwaters from the local area with comparable patterns (dashed lines). The origin of the different waters is explained in Table 1, the REYconcentrations are given in Table S2. Whole-rock REY patterns for the Judea Group limestone and the Cretaceous marl are also presented (data taken
Freshwater Springs in the Dead Sea
PLoS ONE | www.plosone.org 9 June 2012 | Volume 7 | Issue 6 | e38319
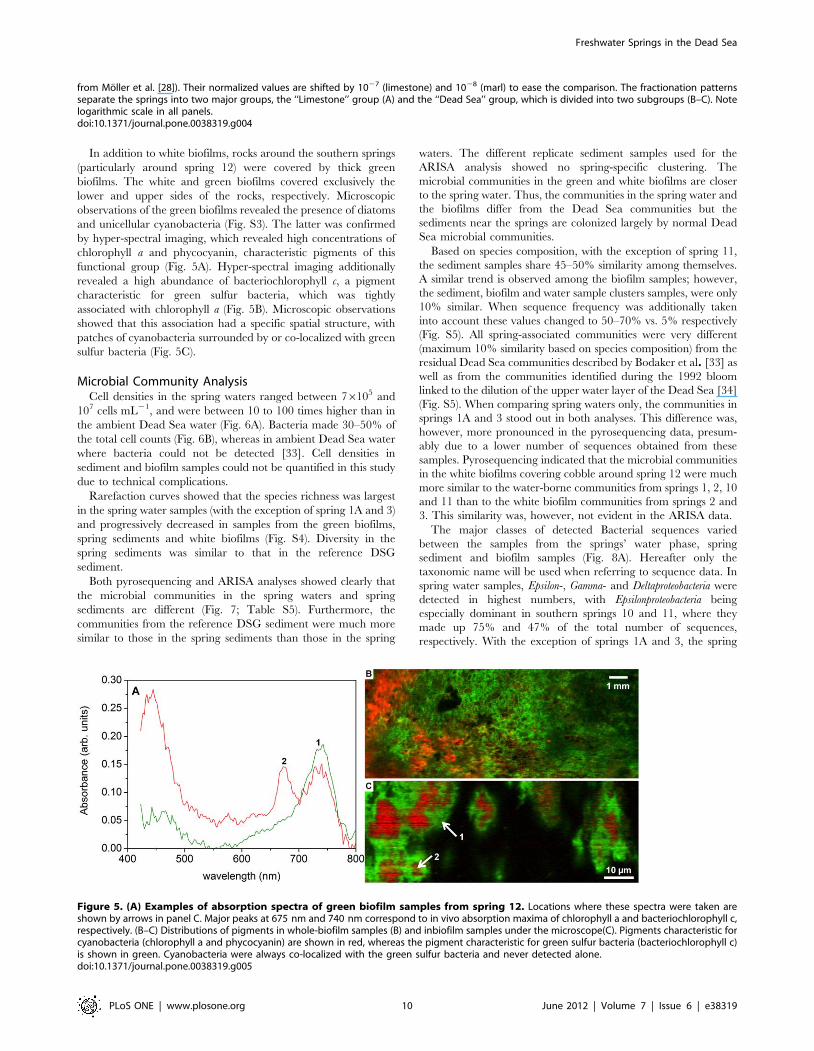
In addition to white biofilms, rocks around the southern springs
(particularly around spring 12) were covered by thick green
biofilms. The white and green biofilms covered exclusively the
lower and upper sides of the rocks, respectively. Microscopic
observations of the green biofilms revealed the presence of diatoms
and unicellular cyanobacteria (Fig. S3). The latter was confirmed
by hyper-spectral imaging, which revealed high concentrations of
chlorophyll a and phycocyanin, characteristic pigments of this
functional group (Fig. 5A). Hyper-spectral imaging additionally
revealed a high abundance of bacteriochlorophyll c, a pigment
characteristic for green sulfur bacteria, which was tightly
associated with chlorophyll a (Fig. 5B). Microscopic observations
showed that this association had a specific spatial structure, with
patches of cyanobacteria surrounded by or co-localized with green
sulfur bacteria (Fig. 5C).
Microbial Community AnalysisCell densities in the spring waters ranged between 76105 and
107 cells mL21, and were between 10 to 100 times higher than in
the ambient Dead Sea water (Fig. 6A). Bacteria made 30–50% of
the total cell counts (Fig. 6B), whereas in ambient Dead Sea water
where bacteria could not be detected [33]. Cell densities in
sediment and biofilm samples could not be quantified in this study
due to technical complications.
Rarefaction curves showed that the species richness was largest
in the spring water samples (with the exception of spring 1A and 3)
and progressively decreased in samples from the green biofilms,
spring sediments and white biofilms (Fig. S4). Diversity in the
spring sediments was similar to that in the reference DSG
sediment.
Both pyrosequencing and ARISA analyses showed clearly that
the microbial communities in the spring waters and spring
sediments are different (Fig. 7; Table S5). Furthermore, the
communities from the reference DSG sediment were much more
similar to those in the spring sediments than those in the spring
waters. The different replicate sediment samples used for the
ARISA analysis showed no spring-specific clustering. The
microbial communities in the green and white biofilms are closer
to the spring water. Thus, the communities in the spring water and
the biofilms differ from the Dead Sea communities but the
sediments near the springs are colonized largely by normal Dead
Sea microbial communities.
Based on species composition, with the exception of spring 11,
the sediment samples share 45–50% similarity among themselves.
A similar trend is observed among the biofilm samples; however,
the sediment, biofilm and water sample clusters samples, were only
10% similar. When sequence frequency was additionally taken
into account these values changed to 50–70% vs. 5% respectively
(Fig. S5). All spring-associated communities were very different
(maximum 10% similarity based on species composition) from the
residual Dead Sea communities described by Bodaker et al. [33] as
well as from the communities identified during the 1992 bloom
linked to the dilution of the upper water layer of the Dead Sea [34]
(Fig. S5). When comparing spring waters only, the communities in
springs 1A and 3 stood out in both analyses. This difference was,
however, more pronounced in the pyrosequencing data, presum-
ably due to a lower number of sequences obtained from these
samples. Pyrosequencing indicated that the microbial communities
in the white biofilms covering cobble around spring 12 were much
more similar to the water-borne communities from springs 1, 2, 10
and 11 than to the white biofilm communities from springs 2 and
3. This similarity was, however, not evident in the ARISA data.
The major classes of detected Bacterial sequences varied
between the samples from the springs’ water phase, spring
sediment and biofilm samples (Fig. 8A). Hereafter only the
taxonomic name will be used when referring to sequence data. In
spring water samples, Epsilon-, Gamma- and Deltaproteobacteria were
detected in highest numbers, with Epsilonproteobacteria being
especially dominant in southern springs 10 and 11, where they
made up 75% and 47% of the total number of sequences,
respectively. With the exception of springs 1A and 3, the spring
from Moller et al. [28]). Their normalized values are shifted by 1027 (limestone) and 1028 (marl) to ease the comparison. The fractionation patternsseparate the springs into two major groups, the ‘‘Limestone’’ group (A) and the ‘‘Dead Sea’’ group, which is divided into two subgroups (B–C). Notelogarithmic scale in all panels.doi:10.1371/journal.pone.0038319.g004
Figure 5. (A) Examples of absorption spectra of green biofilm samples from spring 12. Locations where these spectra were taken areshown by arrows in panel C. Major peaks at 675 nm and 740 nm correspond to in vivo absorption maxima of chlorophyll a and bacteriochlorophyll c,respectively. (B–C) Distributions of pigments in whole-biofilm samples (B) and inbiofilm samples under the microscope(C). Pigments characteristic forcyanobacteria (chlorophyll a and phycocyanin) are shown in red, whereas the pigment characteristic for green sulfur bacteria (bacteriochlorophyll c)is shown in green. Cyanobacteria were always co-localized with the green sulfur bacteria and never detected alone.doi:10.1371/journal.pone.0038319.g005
Freshwater Springs in the Dead Sea
PLoS ONE | www.plosone.org 10 June 2012 | Volume 7 | Issue 6 | e38319
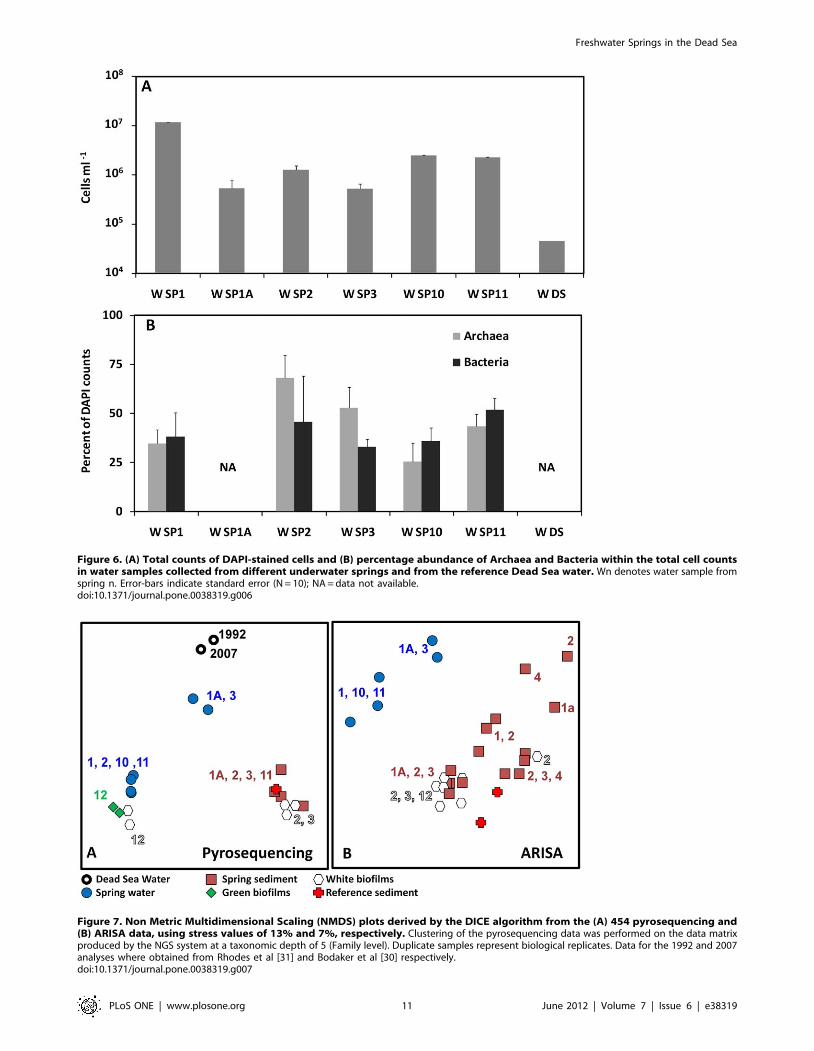
Figure 6. (A) Total counts of DAPI-stained cells and (B) percentage abundance of Archaea and Bacteria within the total cell countsin water samples collected from different underwater springs and from the reference Dead Sea water. Wn denotes water sample fromspring n. Error-bars indicate standard error (N = 10); NA = data not available.doi:10.1371/journal.pone.0038319.g006
Figure 7. Non Metric Multidimensional Scaling (NMDS) plots derived by the DICE algorithm from the (A) 454 pyrosequencing and(B) ARISA data, using stress values of 13% and 7%, respectively. Clustering of the pyrosequencing data was performed on the data matrixproduced by the NGS system at a taxonomic depth of 5 (Family level). Duplicate samples represent biological replicates. Data for the 1992 and 2007analyses where obtained from Rhodes et al [31] and Bodaker et al [30] respectively.doi:10.1371/journal.pone.0038319.g007
Freshwater Springs in the Dead Sea
PLoS ONE | www.plosone.org 11 June 2012 | Volume 7 | Issue 6 | e38319
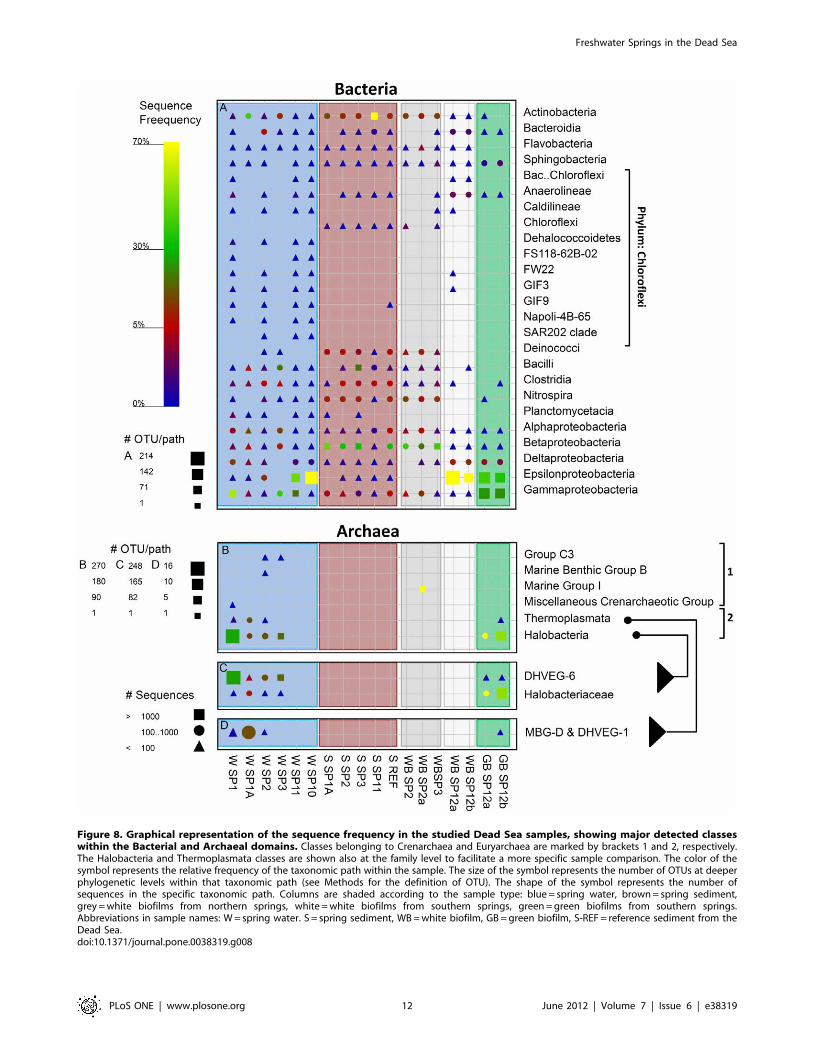
Figure 8. Graphical representation of the sequence frequency in the studied Dead Sea samples, showing major detected classeswithin the Bacterial and Archaeal domains. Classes belonging to Crenarchaea and Euryarchaea are marked by brackets 1 and 2, respectively.The Halobacteria and Thermoplasmata classes are shown also at the family level to facilitate a more specific sample comparison. The color of thesymbol represents the relative frequency of the taxonomic path within the sample. The size of the symbol represents the number of OTUs at deeperphylogenetic levels within that taxonomic path (see Methods for the definition of OTU). The shape of the symbol represents the number ofsequences in the specific taxonomic path. Columns are shaded according to the sample type: blue = spring water, brown = spring sediment,grey = white biofilms from northern springs, white = white biofilms from southern springs, green = green biofilms from southern springs.Abbreviations in sample names: W = spring water. S = spring sediment, WB = white biofilm, GB = green biofilm, S-REF = reference sediment from theDead Sea.doi:10.1371/journal.pone.0038319.g008
Freshwater Springs in the Dead Sea
PLoS ONE | www.plosone.org 12 June 2012 | Volume 7 | Issue 6 | e38319
water samples exhibited a large diversity within the Chloroflexi
phylum. This was in contrast to sediment samples, where many
classes from this phylum were absent, except for the Chloroflexi class
itself, which was found exclusively in spring sediments. Another
major difference was that the sediment samples contained many
more sequences of Deinococci, Clostridia, Nitrospira, Betaproteobacteria
and Actinobacteria. Except for Clostridia, these classes were frequent
also in white biofilms from the northern springs 2 and 3.
Sequences detected in the white biofilms from the southern
springs were very different from those in the northern springs.
They were dominated by Epsilon- and Deltaproteobacteria (on average
73% and 10%, respectively) and contained Bacteroidia (1.9%) and
Anaerolineae (2.9%), unlike in other samples where these groups
were not detected. Similar classes were detected also in the green
biofilms from these springs, with Gammaproteobacteria and Sphingo-
bacteria being additionally relatively abundant (25% and 1.5% on
average, respectively).
Archaeal sequences were amplified successfully from only 11 out
of the 18 samples. They contained a significant number of
Bacterial false-positives (Table S4), which were excluded from the
final analysis. Compared to Bacteria, the diversity of Archaea
detected in the spring-associated samples was much lower, though
in many samples (especially in spring sediments) no Archea were
detected (Fig. 8B). Crenarchaea were detected in significant amounts
only in one sample and clustered with sequences of uncultured
deep subsurface Crenarchaea [35] within the Marine Group 1
Crenarchaea. The Euryarchaea comprised mainly Halobacteria and
Thermoplasmata. Both of these groups clustered with sequences
found in deep-sea hydrothermal vents (Fig. 8C), and their possible
significance will be discussed later. The Euryarcheal community
from the more saline spring 1A differed from the communities
found in the other northern springs. While Euryarchea were
detected only in water samples from the northern springs, in
southern springs they were detected only in the green biofilms.
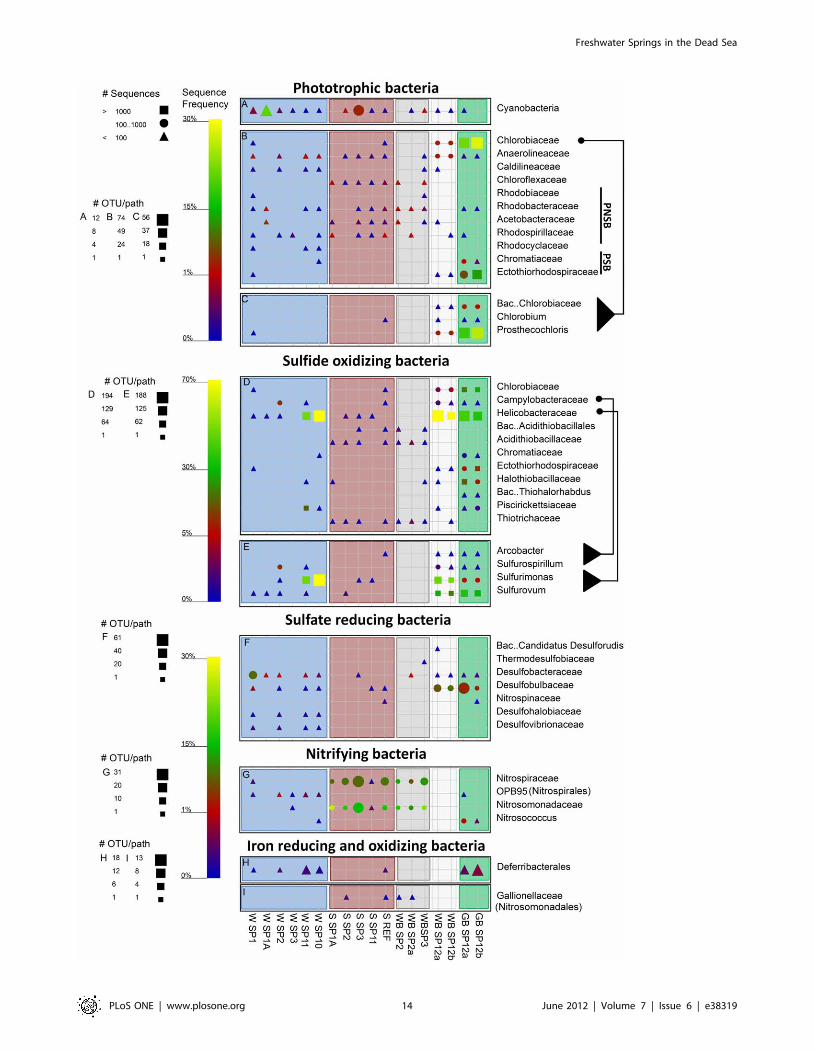
The studied samples differed also in functional groups of
Bacteria (Fig. 9). Phototrophic bacteria were detected in large
numbers in green biofilms from spring 12 and in lower amounts
elsewhere. Cyanobacterial sequences were detected in most
samples usually making up less than 1% of the sequences. Only
water from spring 1A and the sediment of spring 3 comprised 20%
and 3.6% cyanobacterial sequences respectively (Fig. 9A). Al-
though cyanobacterial pigments, as detected by hyper-spectral
imaging, were often detected in the green biofilms of spring 12,
only few cyanobacterial sequences were obtained from these
samples. Attempts to use different sets of cyanobacteria-specific
primers to identify these organisms resulted always in non-related
sequences (Halanerobiales). Most abundant phototrophs in the green
biofilms were green sulfur bacteria (25%), consistent with the
presence of bacteriochlorophyll c (Fig. 6), and purple sulfur
bacteria (10%) (Fig. 9B–C). Purple non-sulfur bacteria and
Chloroflexaceae were common in sediment samples, but not in
biofilms and spring water.
Chemolithotrophic sulfide oxidizers from the class Epsilonproteo-
bacteria were very frequent and diverse in the green and white
biofilms from spring 12 (on average 37% and 72%, respectively;
Fig. 9D). The high abundance of this group was shown also by
FISH analysis (Fig. S6). The water of the nearby springs 10 and 11
contained Epsilonproteobacteria as well; however, only from the
Sulfurimonas genus and almost no sequences of Sulfurovum or the
Campylobacteraceae (Fig. 9E). Few (,3%) Acidithiobacillaceae and
Thiotrichaceae (recently renamed as Beggiatoaceae [36]) were found
around most springs, except around spring 11.
Sulfate reducers were found at relatively higher numbers mainly
in the water samples and in the biofilms from spring 12 (Fig. 9F).
Within this group, Desulfobacteraceae were dominant in the water
samples (0.4–8%) while Desulfobulbaceae were dominant in the
biofilms (2.7–9%). The sulfate reducers in the spring water were
more diverse but 4–8 times less frequent than in the biofilms
associated with spring 12.
Nitrifying bacteria were highly abundant in the spring
sediments from the northern system (11–27%) and in lower
amounts in spring waters (,2%; Fig. 9G). The water samples
contained mainly an unnamed family of Nitrospirales (OPB95),
whereas Nitrospiraceae and Nitrosomonadaceae were abundant in the
sediment samples and white biofilms around springs 2 and 3.
Nitrosococcus were identified in the green biofilms of spring 12 (0.5–
1.2%). Remarkably, nitrifiers were found with an equally high
frequency in the Dead Sea reference sample as well. The ammonia
oxidizing bacteria from the family Nitrospinaceae (Deltaproteobacteria)
were found exclusively in the reference sediments (0.4%; not
shown in Fig. 9G).
Deferribacterales (iron and nitrate reducing bacteria) were found in
the green biofilms of spring 12 (0.6%), in the reference sediments
(0.4%), and in all spring water samples (,0.41%) except for
springs 1A and 3 (Fig. 9H). A low amount of sequences of iron
oxidizing bacteria belonging to the Gallionellaceae (,0.1%) was
detected in sediments and white biofilms around spring 2 and in
the Dead Sea sediment (Fig. 9).
Discussion
This study provides the first description of dense microbial
communities in the Dead Sea. It shows that these communities are
exclusively linked to groundwater seepage at the lake floor. Here
we discuss the possible source of these organisms and the putative
biogeochemical pathways they are mediating. Furthermore we
discuss the origin and chemical properties of the spring waters and
their importance for the microbial communities.
Origin and Properties of the Underwater SpringsThe major elements composition as well as the rare earth
elements and yttrium (REY) patterns are markers of biotic and
abiotic processes that occur along the flowpath of the groundwa-
ters before they emerge as springs at the Dead Sea floor. We
combine these data with the results of the bacterial community
analysis to identify these processes.
Generally, in groundwater systems, REY are mainly released
from accessory minerals, among which phosphates and carbonates
predominate [37]. After dissolution of REY-bearing minerals, the
majority becomes immediately adsorbed onto mineral surfaces
[38]. Consequently, along the flow path, mineral surfaces in
contact with passing water are continuously equilibrated to the
concentration of REY in the water. Once a hydrological system is
well established, changes in REY no longer occur or they are at
least insignificant. Hence, REY patterns of such waters represent
the initial water-rock interaction in the recharge area of the aquifer
that defines the primary REY pattern of the groundwater [30,32].
The REY patterns of the studied springs are evidence of
freshwater running from the Judea Group Aquifer (JGA) to the
Dead Sea. However, they show distinct features from which their
contact with the DSG sediment can be inferred. Waters from the
‘‘Limestone’’ group springs show similar REY pattern as
freshwaters pumped from the Lower JGA (wells Auja 2 and 4,
Jericho 5). We therefore assume that these waters flow from the
limestone aquifer to the Dead Sea through well-developed open
cracks with negligible contact to the unconsolidated DSG
sediments. By flushing trough these cracks and by admixing of
interstitial brines, the waters are further enriched with dissolved
Freshwater Springs in the Dead Sea
PLoS ONE | www.plosone.org 13 June 2012 | Volume 7 | Issue 6 | e38319
Freshwater Springs in the Dead Sea
PLoS ONE | www.plosone.org 14 June 2012 | Volume 7 | Issue 6 | e38319
and suspended minerals, as well as species such as H2S, but only in
marginal amounts.
In contrast, we suggest that waters in the ‘‘Dead Sea’’ group
springs migrate from the JGA through small fissures and less open
cracks, with their flow paths through the DSG sediment possibly
still developing. Consequently, their interaction with DSG
minerals and interstitial brines is much more intense. This is
supported by the similarity of their ‘‘soup-bowl’’-like REY pattern
to that of the Qedem brine, for which the intense contact with
DSG sediments has been shown [39]. However, this similarity
cannot be explained by simple admixing of the local brines to the
JGA freshwater. If the mixing coefficients estimated from the
major ion composition (Table 2) were used, the resulting REY
patterns would be much closer to that of the JGA than those of the
pore water or Qedem brines (Fig. S7). Therefore, additional
processes need to be considered. First, the pattern with consider-
ably decreased medium REE’s (MREE) and positive Y-anomalies
can be the result of long-term leaching of phosphates and sulfates.
This process releases predominantly MREE [37]; thus, if it
occurred in the past, the MREE would now be lacking and thus
lead to MREE depletion in the passing water. Second, the
observed pattern can be due to FeOOH precipitation [40] and
subsequent weathering. If FeOOH complexes at pH.6, a relevant
value for these springs, Ce, Nd and Sm as well as heavy REE have
a higher affinity to co-precipitate than the rest of the REE and Y
[40]. Therefore, the remaining waters show depletion in medium
REE and slight increase towards Lu with a positive Y-anomaly.
However, if FeOOH become reduced, heavy REE and Ce are
predominantly released and become enriched in the water [26].
Indeed, spring waters 1A and 11 are reducing (Table 2) and show
patterns with positive Ce-anomalies, which are comparable to
those in waters from the anoxic hypolimnion in Lake Kinneret and
from strongly reducing Ein Makla spring in Hammat Gader
(Fig. 4B), where redox-cycling of Fe plays an important role
[32,41]. Water of spring 2 interacts with FeOOH as well.
However, in contrast to the other ‘‘Dead Sea’’ group members,
recycling of Fe-oxihydroxides is unlikely in this spring due to its
oxidizing conditions (Table 2). Instead, FeOOH precipitated along
the flow path is weathered and not reduced, releasing heavy REE
first and preventing Ce-anomalies, the latter because Ce is still in
an oxidized state (Ce(IV)) and therefore more stably fixed in the Fe
complexes [42]. Hence the REY pattern for spring 2 shows a less
decreasing trend from La to Eu than the pattern of springs 1A and
11 (compare Figs. 4B and 4C). The initial source of iron, which is
necessary for complexation of FeOOH, may be the weathering of
Fe-bearing cherts. These are abundant in the Senonian rocks of
the Judea Mountains [43] and in the eroded wadi debris, therefore
also in the DSG-sediments [44].
The ionic composition of the spring waters indicates that the
JGA freshwaters are affected by mixing at different proportions
with the locally occurring brines (either the Dead Sea pore water
or the ascending Qedem brine) before they emerge at the Dead
Sea floor. The estimated pore water content in the more saline
springs 1A, 10 and 11 was relatively high (13–25%). The less saline
springs 1–4 could be equally well explained by mixing of JGA
water with either 1.4–4.1% of pore water or with 2.6–8.0% of
Qedem brine. This uncertainty was due to the relative similarity of
the two brines with respect to their major ion composition.
However, it could be resolved by considering molar Mg/Ca-ratios,
which were quite distinct for the two brines (4.11 in the pore
water, 2.6 in the Qedem brines). Since spring waters mainly
comprise JGA freshwater with molar Mg/Ca,1, their high molar
Mg/Ca ratios (2.76 to 3.76), which are higher than that for the
Qedem brine, must be the result of a significant Mg-source. This
could be either the admixed pore water or dissolved Mg-rich
minerals. Such minerals (e.g. carnallite, bischofite) have been
described for sinkholes [45] and most probably exist also within
the thin DSG-sediment crust [46],where evaporation lead to the
precipitation of such minerals However, they cannot be found in
depths where the groundwater emerging in the studied springs is
assumed to flow. Hence, the high molar Mg/Ca ratios in the
spring waters indicate a significant contribution of the Mg-rich
pore water as the preferential mixing partner, but do not exclude
the contribution of Qedem brines as a possible third component.
The ionic composition additionally indicates that the ground-
waters are affected by interactions with clays and by dissolution of
evaporates such as aragonite, gypsum, anhydrite and halite, all of
which are present in DSG-sediments [47]. Since Cs and Rb are
highly controlled by surfaces, intense clay-water interaction is
suggested by the marked differences between the measured Cs and
Rb concentrations and those calculated by the mixing model
(Fig. 3C). The moderately high DIC in the spring waters is
predominantly in the form of HCO3, suggesting dissolution of
calcite (in the JGA) and aragonite (in the DSG sediment). The
HCO3 content in the brines stays stable suggesting the high DIC
(up to 6.2 mmol L-1) is not a result of additional mineral
dissolution. Instead, the higher DIC concentration is due to
increased CO2, originating probably from bacterial decomposition
of organic matter in the DSG-sediment.
The DOC in the underwater springs is high. This is probably
due to mixing of the spring water with the pore water (see above),
which is rich in organics (Siebert, unpublished data) due to
continuous burial of terrestrial organic material during the
sedimentation process of the Dead Sea sediments [44]. High
DOC was also detectable in the buoyancy-forced flow of
underwater spring 5 as sampled on the surface. This suggests the
underwater springs are a source of organic matter input into the
Dead Sea. The low DOC:TDN ratios (,3) in the majority of the
springs suggest that most of the dissolved nitrogen is inorganic
[48]. The high concentration of ammonium is derived probably
from the oxidation of organic matter during the process of sulfate
reduction, as described for other subsurface aquifers in the Dead
Sea area [49]. Although exhibiting the same major ions and REY
pattenrs, the underwater springs in the northern system (2 and 3)
have a higher DOC/TDN ratio compared to the other springs;
however, as most of the N is accounted for as ammonium we
suggest that a large part of it was consumed as a nutrient by the
microbial community along the aquifer flow path through the
DSG sediments.
In some underwater springs, H2S was detected in relatively high
concentrations. This H2S possibly originates from bacterial sulfate
reduction that occurs along the flow path of the spring water, as
shown for other sulfidic spring systems [49,50]. This process
requires organics and dissolved SO4. The latter may be provided
Figure 9. Graphical representation of the sequence frequency in the studied Dead Sea samples, showing major detected phyla andfamilies of different functional groups of Bacteria. PSB and PNSB in panel B refer to purple sulfur and non sulfur bacteria, respectively. Thedifferent genera within the families Chlorobiaceae,Campylobacteraceae and Helicobacteraceaeare shown to facilitate a more specific samplecomparison. The symbols and sample naming are explained in detail in Fig. 8. Note different legends for OTU/path for each panel, and scale-bars forrelative sequence frequency for several combined panels.doi:10.1371/journal.pone.0038319.g009
Freshwater Springs in the Dead Sea
PLoS ONE | www.plosone.org 15 June 2012 | Volume 7 | Issue 6 | e38319
to the hydro-biological system by mineral dissolution, or by active
bacterial leaching of anhydrite from the DSG sediment, as
indicated by the high BSW/SO4SW ratios. The dissolution of
anhydrite and gypsum is possible, since spring waters are
undersaturated with respect to these minerals (Table S6). Indeed,
spring waters show elevated SO4SW concentrations, which exceed
those in the Dead Sea, the pore water and the JGA groundwater,
but are lower than in the Qedem brine (except for spring 1A).
Accompanying the dissolution of anhydrite (CaSO4) is the release
of Ca. However, enrichment in Ca-ions in spring waters is
prevented by simultaneous precipitation of aragonite, supported
by the fact that, in their outlets, all spring waters are supersatu-
rated with respect to calcite and aragonite (Table S6).
Underwater spring waters showed remarkably high SrSW/CaSW
ratios (.1). These can be explained by several processes, such as (i)
dissolution of celestite (Table S6), which is found among the
precipitated minerals in the Dead Sea [51,52], (ii) dissolution of Sr-
containing anhydrite [42], or (iii) release of Sr during transforma-
tion of aragonite to calcite [53].
In conclusion, the freshwater input in the brackish underwater
springs originates from the Judea Group Aquifers (JGA). However,
as suggested by our water chemistry data and argued in detail
above, the JGA waters are affected by a number of processes
before they emerge at the Dead Sea floor. These include
interaction with clay minerals, fine clastics and FeOOH complex-
es, dissolution or precipitation of different types of evaporates (e.g.,
aragonite, gypsum, anhydrite, halite, celestite, barite), bacterial
degradation of organic matter (by sulfate reduction), and mixing
with interstitial and ascending brines in the Dead Sea Group
sediment. The sum of these processes results in water with high
concentrations of dissolved ammonium and organic matter,
sulfide, sulfate and phosphorus; all of which are necessary to
support the microbial communities at the springs outlets in the
Dead Sea, as discussed below. Although the springs emerge over a
relatively small area at the Dead Sea floor, our data indicate that
their flow between the graben shoulders and the lake occurs
through pathways of different hydraulic conductivities. This leads
to various residence times, which in turn results in a variable
extent to which the above processes affect the spring waters’
chemical composition. Overall, spring waters in the ‘‘Limestone’’
group (springs 1,3, shore spring 2, and likely also spring 4)
probably flow through well-developed open cracks, allowing
marginal water-mineral interaction. In contrast, waters in the
‘‘Dead Sea’’ group (springs 1A,2,11, shore springs 1 and 3, and
likely also spring 10) are likely to flow from the JGA through
smaller fissures and less open cracks, with their flow paths through
the DSG sediment possibly still developing. Consequently, their
interaction with minerals and interstitial brines is much more
intense.
Source of Microorganisms in Spring WatersMicrobial communities in the spring waters contained high cell
densities. The close match between the total cell counts obtained
by FISH and DAPI staining is a good indication that the majority
of these cells were alive at the time of sampling [54,55]. Although
the microbial community in the Judea Group Aquifer has not been
studied yet, pristine aquifers always have very low numbers of
microbial cells [56–58]. Therefore, we suggest that these cells
detected in the spring waters grew and were collected along the
path of the groundwater flow from the aquifer to the Dead Sea
and did not grow in the aquifer itself.
This conclusion is supported by the fact that the spring waters
contain solutes that can be utilized or produced by microbial
metabolisms. The sulfide in the spring waters probably originates
from sulfate reduction, which is a feasible process as both sulfate
and DOC are available. The high ammonium concentrations are
probably the result of organic matter oxidation and are a further
support for microbial activity along the aquifer’s flow path. The
REY patterns further suggest that redox cycling of Fe occurs along
the flow path of the ‘‘Dead Sea’’ group springs. The requirement
for Fe reduction are met by the availability of DOC and FeOOH,
while Fe oxidation may occur anaerobically [59,60] or in parts of
the aquifer that are still oxygenated. Oxidation of organic matter is
further supported by the high concentration of inorganic nitrogen.
The source of microorganisms in the spring waters by collection
along the path is further supported by the relatively high fraction
of detected Archaea, which was much higher than in other
groundwater aquifers and freshwater bodies [61,62]. These
Archaea may originate from two different possible sources.
Shoreline pore water can be the first source as suggested by the
fact that majority of the detected Archaeal sequences were from
the halophilic group Halobacteria, which usually require a minimum
salinity of 15%. The pore water of the Dead Sea shoreline is
saturated with brine and contains organic matter from flood
carried debris (C. Siebert, unpublished), which provides suitable
conditions for Halobacteria. Furthermore, no Halobacteria were
detected in springs far from the sandy shoreline, i.e. at the bottom
of a steep cliff (springs 10 and 11).
An additional or alternative origin of the Archaea could be a
second water source. This is suggested by the fact that the majority
of Halobacteria detected in the spring water fall within a cluster of
organisms associated with deep hydrothermal vents and differ
from the Halobacteraceae found in the springs sediments (Fig. 8C). It
has been shown before that this deep sea group of the Halobacteria
can thrive in less saline environments [63,64]. The Thermoplasmata-
associated sequences from the springs cluster with samples from
deep hydrothermal vents as well. The Dead Sea is located in a
tectonically active environment [65] and ascending hydrothermal
brines are often observed as thermal springs(e.g. Ein Gedi and
Mitzpe Shalem) [41,65,66,67]. From their REY patterns and
composition of major ions it cannot be excluded that ascending
hydrothermal brines, as observed in the Qedem area, are
intruding into the waters of the studied spring system.
Source of Microorganisms in Spring SedimentsOur data show that majority of organisms brought in by the
springs do not colonize the sediments around them. Instead, the
dense and diverse microbial communities found in the sediments
around the springs consist largely of organisms that are resident in
the Dead Sea sediments. This conclusion follows from a detailed
comparison between the microbial communities detected in spring
waters, spring sediments, Dead Sea water column [33] and the
Dead Sea during a bloom [34]. First, microbial communities in
spring sediments were much more similar to those found in the
ambient Dead Sea sediment than to those detected in the spring
waters The larger spread of sediment samples in the ARISA
analysis could be a result of the higher number of samples,
compared to the 454 analysis, as well as of the higher resolution of
an ITS based method in comparison with partial sequencing of the
16S rRNA gene. The spread away from, rather than around, the
Dead Sea reference sediments is probably due to an uneven
number samples of Dead Sea reference sediments as compared to
spring sediments Second, microbial communities associated with
springs differed from those induced by freshwater input into the
Dead Sea during surface floods. Bodaker et al. [33] showed that
the bloom community of the Dead Sea differed from the residual
community in the water column. Our data shows that these two
communities resemble each other more than they resemble the
Freshwater Springs in the Dead Sea
PLoS ONE | www.plosone.org 16 June 2012 | Volume 7 | Issue 6 | e38319
communities associated with spring waters or sediments. Whether
the dense microbial communities found associated with the springs
on the lake’s bottom are a result of lowered salinity or an input of
nutrients dissolved in the spring water needs to be further
investigated.
Putative Biogeochemical PathwaysThe importance of a certain metabolic pathway is linked to the
abundance and activity of the cells involved. Therefore, solid data
on the actual abundance of cells (obtained by FISH), as well as
direct evidence that the cells detected by FISH actually perform
this metabolism in situ, is required. As we at present do not have all
this information, we base the following discussion on the
assumption that the importance of a given metabolism is
approximated by the relative frequency of detected sequences
that are closely related to species for which the metabolism in
question was proven. Exceptions to this approach are phototrophy
and sulfide oxidation, whose importance is further supported by
our pigment analyses and visual in-situ observations of thick white
biofilms, respectively. Overall, our complete dataset suggests that
photosynthesis, sulfide oxidation, sulfate reduction, nitrification,
and iron reduction most probably occur in the underwater spring
ecosystems.
Phototrophy appears to be of significance only in the vicinity of
spring 12, as thick green biofims were found only there, mostly
adhered to cobble. Between 30–40% of the sequences obtained
from these biofilms are of known phototrophs. Spring 12 is
shallower (12–14 m below water level, on a slope), not located
within a crater structure, and the water flows through pebbles and
cobble, thus not creating clouds of fine sediments. This was
probably the only site where the light intensity (up to 45 mmol
photons m22 s21 in mid day) was sufficient to fuel a dense
phototrophic community. The dominant phototrophs in these
biofilms were green sulfur bacteria, which are known to adapt well
to low light intensities [68]. Sequences of purple sulfur bacteria,
mainly represented by the Ectothiorhodospiraceae, were also highly
abundant, making up 6–12% of the sequences. Though we could
identify cyanobacteria microscopically (based on specific absorp-
tion and autofluorescence of their pigments), we obtained only a
few sequences of a Chroococcidiopsis-like organism.
Hyper-spectral imaging showed a peculiar association between
the green sulfur bacteria and the cyanobacteria, with patches of
cyanobacteria surrounded by or co-localized with green sulfur
bacteria. A co-localization of cyanobacteria and green sulfur
bacteria was not described before. Green sulfur bacteria are
usually strictly anaerobic organisms, and contain a quenching
mechanism for protection against oxidation [69]. On the other
hand, although cyanobacteria that are able to switch to
anoxygenic photosynthesis are also known [70,71], cyanobacteria
are oxygenic phototrophs.The nature of the association found in
this study is unclear and will be the subject of future studies.
Sulfide oxidation appears to be the key metabolism in this
ecosystem, as suggested by the presence of a large variety of sulfide
oxidizing bacteria. In the biofilms from the southern system 75–
85% of the sequences are associated with known sulfide oxidizing
bacteria. In the northern system the percentage is much lower
(1.5–4.5%). Hydrogen sulfide (H2S) was measured in significant
concentrations in the underwater springs (Table 2) and could be
often smelled from the freshly retrieved sediment cores and from
shore springs. Oxygen is present in the Dead Sea waters (20–
40 mM; [72]); thus the process of aerobic sulfide oxidation is
feasible. The sulfide oxidizing communities in the southern springs
are different from those in the northern springs. The southern
springs consist mainly of Epsilonproteobacteria and phototrophic
sulfide oxidizers, while the Thiotrichaceae and Acidithiobacillaceae
inhabit sediments and biofilms around the northern springs. The
difference in sequence abundance between these spring sites
suggests that sulfide plays a more important role in the southern
system. This is also evident by the significantly larger size of white
biofilms in the southern springs. Interestingly, sulfide oxidizers
were not found in the water of all springs. The large number of
sequences obtained from the water of springs 10 and 11 suggests a
thriving community of sulfide oxidizing bacteria along the path of
the water flow. The genera of sulfide oxidizing Epsilonproteobacteria
found in the water of springs 10 and 11 differ from those found in
the biofilms of spring 12. This supports the hypothesis mentioned
above that only a few of the organisms found in the spring-
associated biofilms and sediments, originate from the spring water.
Epsilonproteobacteria are common among the non-phototrophic
sulfide oxidizing bacteria in moderate saline environments [73]
and were found to be main players in salt gradient systems such as
the deep sea Mediterranean brines [74,75].
Sulfate reduction is probably the source of the sulfide both in
the spring waters and in the biofilms. This is consistent with the
presence of diverse groups of sulfate reducers detected in most
water samples. In the green and white biofilms of spring 12
sequences of sulfate reducers make 4% and 11% of total sequences
respectively. The latter was confirmed by FISH using a specific
probe for Deltaproteobacteria (Fig. S2). Along the water flow path
sulfate necessary for the process originates from gypsum and
anhydrite dissolution. In the biofilms, the co-existence of sulfate
reducers with sulfide oxidizers suggests that an internal sulfur cycle
exists in these communities.
Sulfate reducers are generally missing from the sediments of the
northern springs. Sulfate reduction was never convincingly
measured in the Dead Sea sediments (Oren A, unpublished
results), and to date no extreme halophilic sulfate reducers are
known. The fluctuating water flow, observed in the northern
system, may not allow halotolerant sulfate reducers to develop
there, as the salinity is regularly too high. In turn, the lack of
sulfate reducers, the fluctuating water flow and the sediment
instability are probably the reasons for the low abundance of
sulfide oxidizers in the northern springs.
Nitrification appears to be significant in the sediments and
biofilms of the northern springs and is absent in the southern
system. Nitrogen is not limiting in the Dead Sea or in the
underwater springs (Table 2). Furthermore, up to 400 mM of
ammonia were measured previously in the Dead Sea water
column [76]. As nitrogen is plentiful, the reason for the absence of
this group from the southern springs cannot be explained at this
moment.
Reduction of iron, and possibly of other metals, may also be
significant in the spring system. The Acidithiobacillaceae sequences
(0.9–3%) from the northern springs are affiliated with the genus
Acidithiobacillus and more specifically with Acidithiobacillus thiooxidans
and Acidithiobacillus caldus, which are both known for dissolution of
metal sulfides [77–79]. There are several other groups of
organisms detected that suggest the role of metal reducing and
oxidizing bacteria in the system. For example, members of the
phylum Deferribacteres [80–82] were found in most of the water
samples and in the green biofilms of spring 12. Sequences affiliated
with Gallionella sp. were found uniquely in samples from spring 2,
which is the only spring with favorable chemical conditions for
iron oxidation (Eh .0 mV). Additionally, several species of the
genus Pelobacter, sequences of which were found in higher
frequency in the biofilms of spring 12 (0.4–1.5%), are known as
S0 as well as iron reducers [83,84].
Freshwater Springs in the Dead Sea
PLoS ONE | www.plosone.org 17 June 2012 | Volume 7 | Issue 6 | e38319
Microbial iron reduction is further supported by the detection of
reduced Fe in the deeper parts of the lake prior to its overturn.
Nishri and Stiller [85] reported up to 4 mM Fe2+ in the water
column prior to the 1979 Dead Sea overturn and up to
1200 mM Fe2+ in the pore water of the Dead Sea. During 1978–
1980, following the oxygenation of the water column, reduced Fe
was not detected and only particulate Fe was reported. This
suggests that oxidized iron as a substrate for iron reduction is
abundant in the Dead Sea sediment. Due to the abundant supply
of DOC from the spring water, a community of iron reducing
bacteria can be sustained.
The majority of the microbial lineages described here are
known from environments of various salinities [86], usually in well
established microbial mats or in overlaying waters with a constant
salinity. The fluctuating nature of the Dead Sea spring system does
not permit the establishment of neither a constant salinity nor a
permanent gradient. Hence, a full comparison between the
microbial communities in this system to those in any other system
is difficult. We believe that the described flow regime prevents the
growth of organisms which are adapted to a narrow range of
salinities but leading to a specialized community that can cope
with drastic salinity shifts.
Environmental FitnessAlthough adaptation to salinity was not investigated in this
study, we expect to find two types of organisms in these
environments: moderate halophiles and extreme halophiles. This
is based on our underwater observations, which indicate constant
and fluctuating water flow regimes. Springs 10,11, and 12 are
characterized by a continuous flow with occasional changes in flow
intensity. Therefore we can expect moderate halophiles to be able
to grow in such a system. Indeed, the cultured green sulfur
bacteria, whose 16S rRNA sequence is identical with the partial
sequence of the dominant green sulfur bacteria in the biofilms of
spring 12, grew best at seawater salinity (data not shown). Spring
1A, as were the large, borderless, seeping areas on the slopes below
springs 10,11, and 12, were inactive for part of the time. In the
center of the spring the fresher water flows directly to the surface;
however, the water often seeps through the sediments at the
periphery or through larger undefined areas. This suggests that the
organisms in the spring sediment are exposed directly to these
waters. Sudden and drastic changes in salinity, such as those
induced by the onset and offset of the water flow, would call for an
extreme halophile with rapidly responding osmoregulation and the
ability to survive in a broad spectrum of salinities. Our data
suggests that the organisms in the spring sediments are naturally
found in the Dead Sea sediments; therefore an extreme halophile
that can withstand freshwater would be an intriguing finding.
Significance of the Springs for the Dead SeaThe underwater springs described here are part of one system of
springs. To this date there is no information available on the
number of similar spring systems on both coasts of the Dead Sea,
nor about their contribution to the water budget of the Dead Sea.
This is partly because deeper springs, such as those in the northern
system, cannot be detected from the shore. Recent findings of
Siebert and Mallast (unpublished data) indicate that thermal
infrared imaging allows indirect localization of underwater springs,
even deeper ones. Additional, remote sensing, studies have shown
that similar systems exist on the eastern coast of the Dead Sea [87].
However, further direct underwater exploration is necessary to
collect information regarding their distribution, size, and the input
of water and the accompanying microbiota that these systems
provide for the Dead Sea.
The economic significance of the Dead Sea lies in mineral
harvesting and tourism. Both industries can suffer due to changes
in the microbiology of the Dead Sea. The information about the
microbial input from the springs is especially relevant in the light
of the currently discussed Red Sea–Dead Sea canal. The possible
outcome of diluting the Dead Sea with the Red Sea water has
recently been investigated [88]. These predictions took into
consideration insufficient factors: a) mixing of only two microbial
communities, the residual community in the Dead Sea water
column and the microbial community in the water of the Gulf of
Aqaba; b) the nutrient input from the planned desalination plant.
If such a water connection will be formed and the brine of the
proposed desalination plant will flow into the Dead Sea, a water
lens with a relatively low salinity will form on the surface of the
Dead Sea. Bacteria, organic matter and other nutrients from the
underwater springs are rapidly transported to the less saline water
layer at the surface. This may lead to massive blooms of either
spring or Dead Sea bacteria. Such blooms will alter the visual
appearance of the water thus directly affecting it’s touristic value.
Furthermore, the lowered salinity and increased microbial activity
may promote biofilm growth and thus lead to biofouling of the
equipment used by the Dead Sea Works company to pump water
from the northern basin to the southern basin. We suggest that the
previously conducted experiments [74] be complemented with the
addition of spring water as part of the assessment of the
environmental impact of the proposed Dead Sea-Red Sea water
canal.
We hypothesize that the dense hydrogeochemical network of
channels and the associated microbial communities in association
play an important role in the overall land stability in the area. It is
likely that mineral dissolution by freshwater alone is not solely
responsible for the formation of the large sinkholes on the coasts of
the Dead Sea [89]. Microbial activity such as sulfate reduction and
oxidation leads to faster dissolution of gypsum and carbonate
layers via processes know from sulfuric acid speleogenesis [90].
Sulfate released from anhydrite either by dissolution or by
bacterial leaching [90,91] is used for sulfate reduction. The
produced sulfide is oxidized by bacteria into sulfuric acid which
leads to the dissolution of carbonate minerals [90]. Sulfide
oxidizing Epsilonproteobacteria as found in the water of springs 10
and 11 were suggested to be involved in sulfuric acid speleogenesis
[50,92]. Our data indicates that dense microbial communities may
exist in the area between the graben shoulder and the Dead Sea.
The bacterial activity coupled with the freshwater flow may lead to
the enlargement of channels and the formation of underground
cavities, locations where the overlaying soil may become unstable.
Conclusions and OutlookWe have found a new microbial ecosystem in the Dead Sea,
tightly associated with underwater springs that emerge at the lake
floor at depths between 10–30 m. The ecosystem is diverse, and
the presence of multiple major biogeochemical pathways is
indicated. However, as demonstrated by our data, the springs do
not serve as an input of this diversity, but more likely as a source of
nourishment for the native Dead Sea community. The dominat
microroganizms in the ecosystem as implicated by our microbial
community and water chemistry data are phototrophs, sulfide
oxidizers, sulfate reducers, nitrifiers and iron reducers. However,
direct measurements of the rates of these processes are necessary to
better understand the function of this microbial ecosystem and its
impact on the Dead Sea ecosystem as a whole. Also detailed
measurements of salinity, iron, nutrients, oxygen and stable
isotopes of d34S and d18O in sulfate and sulfides in water as well
as in and near the benthic communities are needed to elucidate the
Freshwater Springs in the Dead Sea
PLoS ONE | www.plosone.org 18 June 2012 | Volume 7 | Issue 6 | e38319
nature of the biogeochemical processes. Our data further suggest
the existence of a dense microbial community within the DSG
sediments and mineral bed located between the former and
current Dead Sea water level line. However, the activity of this
community and their role in the dissolution of minerals in these
sediments remain to be determined. The underwater system of
springs described here is the first out of several in the Dead Sea.
Together, they are an unknown factor in its water budget as well
as an unknown source of diversity and metabolic potential.
Supporting Information
Figure S1 A) Lamination on the walls of the shafts created by
the springs in the northern system. B) An example of a single water
source out of several at the bottom of a shaft in the northern
system. C) An example of an in-shaft cavity from which water
springs out. D) Cobble covered spring in the southern system.
Biofillms are visible on the cobble. Scale bar 0.2 m.
(TIF)
Figure S2 Different types of biofilms found near theunderwater springs. (A) Small patches of thin white biofilms
covered sediments adjacent to the water source in springs 1–5. (B)
Thick white biofilms covered sediments around spring 12, whereas
top and bottom surfaces of rocks found within this spring were
covered with green and white biofilms, respectively. (C) Large
white biofilms covered slopes below springs 10 and 11 at depths
ca. 20 m, although no water seepage was detected. Scale bar:
0.2 m
(TIF)
Figure S3 Chlorophyll a autofluorescence confocal laserscanning microscopy of samples from the green biofilmsof spring 12 showing small unicellular cyanobacteria (A)and diatoms (B). The images were acquired by Mr. Assaf
Lowenthal.
(TIF)
Figure S4 Rarefaction curves for the different sedi-ment, biofilm and water samples, as derived from thepyrosequencing data by the NGS pipeline. Samples names
are given at the end of the curve: W, S, WB, GB stand for water,
sediment, white biofilm and green biofilm respectively, followed by
the spring number.
(TIF)
Figure S5 Comparison of underwater spring waters,sediments and biofilms based on the taxonomy assignedto the pyrosequecnig results at the 6th taxonomic depth.Panel A considers only sequence identity, whereas panel B takes
additionally into account sequence frequency. The diagrams show
that the reference microbial community shared 45% of the taxa
with the spring sediments (expect of spring 11) as opposed to 10%
with the spring waters. The similarity between the reference
sediments and springs sediments increased 50%–70% when
sequence frequency was additionally taken into account, with
the exception of spring 11. The reference Dead Sea sediments
were collected in the northern spring system, whereas spring 11
belongs to the southern system
(TIF)
Figure S6 Percent abundance of total Bacteria, Epsilon-proteobacteria, Cytofaga/Flavobacteria and Deltaproteo-bacteria out of total DAPI stained cells as obtained byFluorescent In-Situ Hybridization on a white biofilmfrom spring 12. FISH was conducted using the EUBI, II, II,
Eps404, CF119a and Delta* 495a, b, c probes. *Competitor
probes were used. Total cell number as calculated from the cell
counts is 2.861010 cells g21.
(TIF)
Figure S7 Calculated REY concentrations based on themixing coefficients in Table 2 using the JGA as a sourceand the Dead Sea (A) and Qedem brine (B) as admixingwaters. Extracted porewater was not sufficient to measure REY
concentration, hence, Dead Sea water was used instead for the
purpose of this calculation alone. The ratio between the measured
REY concentration and those calculated with Dead Sea water (C)
and Qedem brine (D) show a clear separation between the
‘‘Limestone’’ group (full lines) and the ‘‘Dead Sea’’ group (dashed
line). The flat lines of the ‘‘Limestone’’ group suggest mainly
mixing is involved, whereas the decreasing lines of the ‘‘Dead Sea’’
group point to the involvement of other processes in the
determination of the REY pattern. The three water source,
JGA, Dead Sea and Qedem brine are shown in full line with
symbols.
(TIF)
Table S1 REY concentration in sampled waters andwhole rock analyses. Tm is not listed, since it was addedas spike.
(DOCX)
Table S2 Sequence statistics per sample as obtainedfrom the NGS analysis: #Seqs :The number of reads in this
sample; Min: The shortest read in this sample (number of
nucleotides); Max: The longest read in this sample (number of
nucleotides); Average: The average length of a read in this sample
(number of nucleotides); Rejected: Number of reads rejected by
the aligner (possible contamination); Homopolymer: Number of
reads rejected by the quality control because of a problematic
amount of homopolymeric stretches in the read; Clustered: The
number of reads assigned to a cluster within the same sample (98%
identity); Replicates: The number of reads identical to another
read within the the sample sample (100% identity); False Hit: The
number of reads outside the target group of the used primers;
OTUs (total): The total number of unique reads, at 98% sequence
similarity, in each sample; OTUs (class.): The number of unique
reads with an assigned taxonomic classification; #Seqs (class.):
The total number of reads with an assigned taxonomic
classification; OTUs (unclass.): The number of unique reads
without an assigned taxonomic classification; #Seqs (unclass.):
The total number of reads without an assigned taxonomic
classification. Good’s coverage [94] was calculated as 1– (ni/N)
where ni is the number of OTUs containing only one sequence
and N is the total number of sequences. The false positive Bacterial
sequences obtained while using Archaea specific primers, were not
used for the calculation.
(DOCX)
Table S3 A list of Bacterial taxonomic paths and theirrelative abundance in the samples. Where possible, the
taxonomic path is resolved down to the genus level (depth 6). The
table is available as a separate file.
(XLS)
Table S4 A list of Archaeal taxonomic paths and theirrelative abundance in the samples. Where possible, the
taxonomic path is resolved down to the genus level (depth 6). The
list contains also the Bacterial (Bacteria*) sequences obtained using
the Archaeal specific primers. The table is available as a separate
file
(XLS)
Freshwater Springs in the Dead Sea
PLoS ONE | www.plosone.org 19 June 2012 | Volume 7 | Issue 6 | e38319
Table S5 Analysis of similarity (ANOSIM) of the 454 (A)and ARISA (B) data using the DICE algorithm asimplemented in the PAST software. R and p values are
shown in the lower and upper half of the square matrix
respectively. An R value of 1 between two groups represents total
dissimilarity, whereas values closer to 0 suggest a high similarity.
The significance of the similarity analysis (p) was done by
permutation of group memberships using 10,000 replicates. P
values of significance are marked in bold and italics.
(DOCX)
Table S6 Trace element concentrations in sampledwaters. Si* is the sum of Si(II) and Si(III). ** Mn is the
total sum of all Mn-species. Saturation indices were calculated by
Geochemist’s Workbench (using LLNL thermo database and
Harvie-Møller-Weare activity model, as implemented in the
USGS program PHREEQPITZ.
(DOCX)
Author Contributions
Conceived and designed the experiments: DI CS. Performed the
experiments: DI CS YYM CL SH MBI TR TD. Analyzed the data: DI
CS LP CQ. Contributed reagents/materials/analysis tools: CQ JP FOG
AR AO SG HJS MS TL JBL DdB. Wrote the paper: DI CS LP CQ JP AR
DdB.
References
1. Anati DA, Stiller M, Shasha S, Gat, Joel R (1987) Changes in the thermo-haline
structure of the Dead Sea?: 1979–1984. Earth Planet Sci Lett 84: 109–121.
2. Oren A (2010) The dying Dead Sea: The microbiology of an increasingly
extreme environment. Lakes Reservoirs: Res Manage 15: 215–222.
3. Steinhorn I, Assaf G, Gat, JR, Nishry A, Nissenbaum A, et al. (1979) The dead
sea: deepening of the mixolimnion signifies the overture to overturn of the water
column. Science 206: 55–57.
4. Wilkansky B (1936) Life in the Dead Sea. Nature 138: 467–467.
5. Elazari-Volcani B (1940) Algae in the bed of the Dead Sea. Nature 145: 975–
975.
6. Elazari-Volcani B (1943) Bacteria in the bottom sediments of the Dead Sea.
Nature 152: 301–302.
7. Elazari-Volcani B (1943) A dimastigamoeba in the bed of the Dead Sea. Nature
152: 301–302.
8. Elazari-Volcani B (1944) A ciliate from the Dead Sea. Nature 154: 335–335.
9. Oren A, Gurevich P (1995) Dynamics of a bloom of halophilic archaea in the
Dead Sea. Hydrobiologia 315: 149–158.
10. Laronne Ben-Itzhak L, Gvirtzman H (2005) Groundwater flow along and across
structural folding: an example from the Judean Desert, Israel. J Hydrol 312: 51–
69.
11. Gvirtzman H, Stanislavsky E (2000) Large-scale flow of geofluids at the Dead
Sea Rift. J Geochem Explor 69: 207–211.
12. Dulski P (1994) Interferences of oxide, hydroxide and chloride analyte species in
the determination of rare earth elements in geological samples by inductively
coupled plasma-mass spectrometry. Fresenius J Anal Chem 350: 194–203.
13. Cline JD (1969) Spectrophotometric determination of hydrogen sulfide in
natural waters. Limnol Oceanogr 14: 454–458.
14. Dulski P (2001) Reference Materials for Geochemical Studies?: New Analytical
Data by ICP-MS and Critical Discussion of Reference Values. Geostandard
Newslett 25: 87–125.
15. Ionescu D, Penno S, Haimovich M, Rihtman B, Goodwin A, et al. (2009)
Archaea in the Gulf of Aqaba. FEMS Microbiol Ecol 69: 425–438.
16. Lane, D J (1991) 16S/23S rRNA sequencing. In: Stackebrandt E, , Goodfellow
M, eds. , editors. Nucleic Acid Techniques in Bacterial Systematics. John Wiley
and Sons, New York., 115–175.
17. Ovreas L, Forney L, Daae FL, Torsvik V (1997) Distribution of bacterioplank-
ton in meromictic Lake Saelenvannet, as determined by denaturing gradient gel
electrophoresis of PCR-amplified gene fragments coding for 16S rRNA. Appl
Environ Microbiol 63: 3367–3373.
18. Delong EF (1992) Archaea in coastal marine environments. Proc Natl Acad
Sci U S A 89: 5685–5689.
19. Dowd SE, Sun Y, Wolcott RD, Domingo A, Carroll JA (2008) Bacterial tag-
encoded FLX amplicon pyrosequencing (bTEFAP) for microbiome studies:
bacterial diversity in the ileum of newly weaned Salmonella-infected pigs.
Foodborne Pathogens And Disease 5: 459–472. doi: 10.1089/fpd.2008.0107.
20. Pruesse E, Quast C, Knittel K, Fuchs BM, Ludwig W, et al. (2007) SILVA: a
comprehensive online resource for quality checked and aligned ribosomal RNA
sequence data compatible with ARB. Nucleic Acids Res 35: 7188–7196.
21. Ludwig W, Strunk O, Westram R, Richter L, Meier H, et al. (2004) ARB: a
software environment for sequence data. Nucleic Acids Research 32: 1363–
1371.
22. Gart JJ, Siegel AF, German RZ (1982) Rarefaction and Taxonomic Diversity.
Biometrics 38: 235–241.
23. Ramette A (2009) Quantitative community fingerprinting methods for
estimating the abundance of operational taxonomic units in natural microbial
communities. Appl Environ Microbiol 75: 2495–2505.
24. Amann RI, Krumholz L, Stahl DA (1990) Fluorescent-oligonucleotide probing
of whole cells for determinative, phylogenetic, and environmental studies in
microbiology. J Bacteriol 172: 762–770.
25. Amann RI, Ludwig W, Schleifer KH (1995) Phylogenetic identification and in
situ detection of individual microbial cells without cultivation. Microbiol Rev 59:
143–169.
26. Tujula NA, Holmstro C, Mußmann M, Amann RI, Kjelleberg S, et al. (2006) A
CARD – FISH protocol for the identification and enumeration of epiphytic
bacteria on marine algae. J Microbiol Methods 65: 604–607.
27. Teira E, Reinthaler T, Pernthaler A, Pernthaler J, Herndl GJ (2004) Combining
Catalyzed Reporter Deposition-Fluorescence In Situ Hybridization and
Microautoradiography To Detect Substrate Utilization by Bacteria and Archaea
in the Deep Ocean. Appl Environ Microbiol 70: 4411–4414.
28. Polerecky L, Bissett A, Al-Najjar M, Faerber P, Osmers H, et al. (2009) Modular
spectral imaging system for discrimination of pigments in cells and microbial
communities. Appl Environ Microbiol 75: 758–771.
29. Hammer Ø, Harper DAT, Ryan PD (2009) PAST: Paleontological Statistics
Software Package for Education and Data Analysis. 2001. Palaeontol
Electronica 4.
30. Moller P, Rosenthal E, Dulski P, Geyer S, Guttman Y (2003) Rare earths and
yttrium hydrostratigraphy along the Lake Kinneret–Dead Sea–Arava transform
fault, Israel and adjoining territories. Appl Geochem 18: 1613–1628.
31. Laronne Ben-Itzhak L, Gvirtzman H (2005) Groundwater flow along and across
structural folding: an example from the Judean Desert, Israel. J Hydrol 312: 51–
69.
32. Siebert C, Geyer S, Moller P, Berger D, Guttman Y (2009) Lake Tiberias and its
dynamic hydrochemical environment. In: Moller P, , Rosenthal E, eds. , editors.
The Water of The Jordan Valley. Berlin-Heidelberg: Springer-Verlag., 219–
246.
33. Bodaker I, Sharon I, Suzuki MT, Feingersch R, Shmoish M, et al. (2010)
Comparative community genomics in the Dead Sea: an increasingly extreme
environment. ISME J 4: 399–407.
34. Rhodes ME, Fitz-Gibbon ST, Oren A, House CH (2010) Amino acid signatures
of salinity on an environmental scale with a focus on the Dead Sea. Environ
Microbiol 12: 2613–2623.
35. Waddell E, Elliott T, Vahrenkamp J, Roggenthen W, Sani R, et al. (2010)
Phylogenetic evidence of noteworthy microflora from the subsurface of the
former Homestake gold mine, Lead, South Dakota. Environ Technol 31: 979–
991.
36. Salman V, Amann RI, Girnth A-C, Polerecky L, Bailey JV, et al. (2011) A
single-cell sequencing approach to the classification of large, vacuolated sulfur
bacteria. Syst Appl Microbiol 34: 243–259.
37. Hannigan RE, Sholkovitz ER (2001) The development of middle rare earth
element enrichments in freshwaters: weathering of phosphate minerals. Chem
Geol 175: 495–508.
38. Johannesson KH, Farnham IM, Guo C, Stetzenbach KJ (1999) Rare earth
element fractionation and concentration variations along a groundwater flow
path within a shallow, basin-fill aquifer, southern Nevada, USA. Geochim
Cosmochim Acta 63: 2697–2708.
39. Gavrieli I, Yechieli Y, Halicz L, Spiro B, Bein A, et al. (2001) The sulfur system
in anoxic subsurface brines and its implication in brine evolutionary pathways:
the Ca-chloride brines in the Dead Sea area. Earth Planet Sci Lett 186: 199–
213.
40. Bau M (1999) Scavenging of dissolved yttrium and rare earths by precipitating
iron oxyhydroxide?: Experimental evidence for Ce oxidation, Y-Ho fraction-
ation, and lanthanide tetrad effect. Geochim Cosmochim Acta 63: 67–77.
41. Siebert C (2006) Seasonal chemical variations of lake Genezareth, its inflows and
their cause. Unpublished PhD thesis, Freiei Universitaet Berlin, in German:
Saisonale chemische Variationen des See Genezareth, seiner Zuflusse und deren
Ursachen.
42. Moller P, Rosenthal E, Geyer S, Guttman J, Dulski P, et al. (2007)
Hydrochemical processes in the lower Jordan valley and in the Dead Sea area.
Chem Geol 239: 27–49.
43. Gross S (1977) The mineralogy of the Haturim Formation, Israel. Bull Geol
Surv Israel 70: 1–80.
44. Nissenbaum A, Baedecker MJ, Kaplan IR (1972) Organic geochemistry of Dead
Sea sediments. Geochim Cosmochim Acta 36: 709–727.
45. Katz A, Starinsky A (2009) Geochemical history of the Dead Sea. Aquat
Geochem 15: 159–194.
Freshwater Springs in the Dead Sea
PLoS ONE | www.plosone.org 20 June 2012 | Volume 7 | Issue 6 | e38319
46. Yechieli Y, Ronen D (1997) Early diagenesis of highly saline lake sediments after
exposure. Chem Geol 138: 93–106.47. Barkan E, Luz B (2001) Dynamics of the carbon dioxide system in the Dead Sea.
Geochim Cosmochim Acta 65: 355–368.
48. Hansell DA, Carlson CA (2002) Biogeochemistry of marine dissolved organicmatter. Hansell DA, Carlson CA, editors San Diego: Academic Press. 774 p.
49. Gavrieli I, Yechieli Y, Halicz L, Spiro B, Bein A, et al. (2001) The sulfur systemin anoxic subsurface brines and its implication in brine evolutionary pathways:
the Ca-chloride brines in the Dead Sea area. Earth Planet Sci Lett 186: 199–
213.50. Macalady JL, Jones DS, Lyon EH (2007) Extremely acidic, pendulous cave wall
biofilms from the Frasassi cave system, Italy. Environ Microbiol 9: 1402–1414.51. Katz A, Agnon A, Marco S (2009) Earthquake-induced barium anomalies in the
Lisan Formation, Dead Sea Rift Valley, Israel. Earth Planet Sci Lett 286: 219–229.
52. Reznik IJ, Gavrieli I, Ganor J (2009) Kinetics of gypsum nucleation and crystal
growth from Dead Sea brine. Geochim Cosmochim Acta 73: 6218–6230.53. Usdowski E (1973) Das geochemische Verhalten des Strontiums bei der Genese
und Diagenese von Ca-Karbonat-und Ca-Sulfat-Mineralen. Contrib MineraPetrol 38: 177–195.
54. DeLong EF, Taylor LT, Marsh TL, Preston CM (1999) Visualization and
enumeration of marine planktonic archaea and bacteria by using polyribonu-cleotide probes and fluorescent in situ hybridization. Appl Environ Microbiol 65:
5554–5563.55. Ravenschlag K, Sahm K, Knoblauch C, Jorgensen BB, Amann RI (2000)
Community structure, cellular rRNA content, and activity of sulfate-reducingbacteria in marine Arctic sediments. Appl Environ Microbiol 66: 3592–3602.
doi: 10.1128/AEM.66.8.3592–3602.2000.Updated.
56. Pedersen K (1990) Distribution and activity of bacteria in deep graniticgroundwaters of southeastern Sweden. Microb Ecol 20: 37–52.
57. Haveman SA, Pedersen K (2010) Distribution and Metabolic Diversity ofMicroorganisms in Deep Igneous Rock Aquifers of Finland. Mol Biol: 37–41.
58. Goldscheider N, Hunkeler D, Rossi P (2006) Review: Microbial biocenoses in
pristine aquifers and an assessment of investigative methods. Hydrogeol J 14:926–941.
59. Straub KL, Benz M, Schink B, Widdel F (1996) Anaerobic, nitrate-dependentmicrobial oxidation of ferrous iron. Appl Environ Microbiol 62: 1458–1460.
60. Clement J, Shrestha J, Ehrenfeld J, Jaffe P (2005) Ammonium oxidation coupledto dissimilatory reduction of iron under anaerobic conditions in wetland soils.
Soil Biol Biochem 37: 2323–2328.
61. Keough BP, Schmidt TM, Hicks RE (2003) Archaeal nucleic acids inpicoplankton from great lakes on three continents. Microb Ecol 46: 238–248.
62. O’Connell SP, Lehman RM, Snoeyenbos-West O, Winston VD, CummingsDE, et al. (2003) Detection of Euryarchaeota and Crenarchaeota in an oxic
basalt aquifer. FEMS Microbiol Ecol 44: 165–173.
63. Elshahed MS, Najar FZ, Roe BA, Oren A, Dewers TA, et al. (2004) Survey ofarchaeal diversity reveals an abundance of halophilic Archaea in a low-salt,
sulfide-and sulfur-rich spring. Appl Environ Microbiol 70: 2230–2239.64. Gracas DA, Miranda PR, Barauna RA, McCulloch JA, Ghilardi R, et al. (2011)
Microbial Diversity of an Anoxic Zone of a Hydroelectric Power StationReservoir in Brazilian Amazonia. Microbial Ecology 62: 853–861.
65. Lazar M, Ben-Avraham Z (2002) First images from the bottom of the Dead Sea–
Indications of recent tectonic activity. Israel J Earth Sci 51; 3–4: 211–218.66. Swarieh A (2000) Geothermal energy resources in Jordan, country update
report. Proceedings World Geothermal Geothermal Congress. 469–474.67. Shalev E, Levitte D, Gabay R, Zemach E (2008) Assessment of geothermal
resources in Israel. Geological Survey of Israel. 23 p.
68. Overmann J (2006) The family Chlorobiaceae. In: Dworking M, , Falkow S, ,Rosenberg S, , Schleifer K-H, , E S, eds. , editors. The Prokaryotes. Springer,
Vol., 7. 359–378.69. Frigaard NU, Bryant DA (2004) Seeing green bacteria in a new light: genomics-
enabled studies of the photosynthetic apparatus in green sulfur bacteria and
filamentous anoxygenic phototrophic bacteria. Arch Microbiol 182: 265–276.70. Cohen Y, Jørgensen BB, Revsbech NP, Poplawski R (1986) Adaptation to
Hydrogen Sulfide of Oxygenic and Anoxygenic Photosynthesis amongCyanobacteria. Appl Environ Microbiol 51: 398–407.
71. Oren A, Ionescu D, Lipski A, Altendorf K (2005) Fatty acid analysis of a layered
community of cyanobacteria developing in a hypersaline gypsum crust. Arch
Hydrobiol Suppl Algol Stud 117: 339–347.
72. Shatkay M, Anati DA, Gat JR (1993) Dissolved oxygen in the Dead Sea -
seasonal changes during the holomictic stage. Int J Salt Lake Res 2: 93–110.
73. Benlloch S, Lopez-Lopez A, Casamayor EO, Øvreas L, Goddard V, et al. (2002)
Prokaryotic genetic diversity throughout the salinity gradient of a coastal solar
saltern. Environ Microbiol 4: 349–360.
74. van der Wielen PWJJ, Bolhuis H, Borin S, Daffonchio D, Corselli C, et al. (2005)
The enigma of prokaryotic life in deep hypersaline anoxic basins. Science 307:
121–123.
75. La Cono V, Smedile F, Bortoluzzi G, Arcadi E, Maimone G, et al. (2011)
Unveiling microbial life in new deep-sea hypersaline Lake Thetis. Part I:
Prokaryotes and environmental settings. Environ Microbiol 13: 2250–2268.
76. Stiller M, Nissenbaum A (1999) Geochemical investigation of phosphorus and
nitrogen in the hypersaline Dead Sea. Geochim Cosmochim Acta 63: 3467–
3475.
77. Sand W, Gerke T, Hallmann R (1995) Sulfur chemistry, biofilm, and the
(in)direct attack mechanism – a critical evaluation of bacterial leaching. Appl
Microbiol Biotechnol 43: 961–966.
78. Bosecker K (1997) Bioleaching: metal solubilization by microorganisms. FEMS
Microbiol Rev 20: 591–604.
79. Semenza M, Viera M, Curutchet G (2002) The role of Acidithiobacillus Caldud
in the bioleaching of metal sulfides. Latin Am Appl Res 32: 303–306.
80. Caccavo FJ, Coates JD, Rossello-Mora RA, Ludwig W, Schleifer K-H, et al.
(1996) Geovibrio ferrireducens, a phylogenetically distinct dissimilatory Fe (III)-
reducing bacterium. Arch Microbiol 165: 370–376.
81. Greene AC, Patel BKC, Sheehy AJ (1997) Deferribacter thermophilus gen. nov.,
sp. nov., a novel thermophilic manganese-and iron-reducing bacterium isolated
from a petroleum reservoir. Int J Syst Bacteriol 47: 505–509.
82. Huber H, Stetter, K O (2002) Class I. Deferribacteres class. nov. In: Boone, , D
R, , Castenholz, , R W, eds. , editors. Bergey’s Manual of Systematic
Bacteriology. New York: Springer-Verlag,. p., 465.
83. Lovley DR, Phillips EJ, Lonergan DJ, Widman PK (1995) Fe(III) and S0
reduction by Pelobacter carbinolicus. Appl Environ Microbiol 61: 2132–2138.
84. Schink B (2006) The genus Pelobacter. In: Dworkin M, , Falkow S, , Rosenberg
E, , Schleifer K-H, eds. , editors. The Prokaryotes. New York: Springer, Vol., 7.
5–11.
85. Nishri A, Stiller M (1984) Iron in the Dead Sea. Earth Planet Sci Lett 71: 405–
414.
86. Oren A (2002) Halophilic microorganisms and their environments. Seckbach J,
editor Dordrecht (Nl): Kluwer Academic Press. 600 p.
87. Akawwi E, Al-zouabi A, Kakish M, Koehn F, Sauter M, et al. (2008) Using
Thermal Infrared Imagery (TIR ) for illustrating the submarine groundwater
discharge into the eastern shoreline of the Dead Sea-Jordan. Am J Environ Sci 4:
693–700.
88. Oren A, Gavrieli I, Gavrieli J, Kohen M, Lati J, et al. (2004) Biological effects of
dilution of Dead Sea brine with seawater: implications for the planning of the
Red Sea–Dead Sea ‘‘Peace Conduit.’’ J Marine Syst 46: 121–131.
89. Closson D, Abou Karaki N (2009) Salt karst and tectonics: sinkholes
development along tension cracks between parallel strike-slip faults, Dead Sea,
Jordan. Earth surface processes and landforms 34: 1408–1421.
90. Engel AS, Stern LA, Bennett PC (2004) Microbial contributions to cave
formation: New insights into sulfuric acid speleogenesis. Geology 32: 369.
91. Shen Y, Buick R (2004) The antiquity of microbial sulfate reduction. Earth-Sci
Rev 64: 243–272.
92. Engel AS, Lee N, Porter ML, Stern LA, Bennett PC, et al. (2003) Filamentous
‘‘Epsilonproteobacteria’’ dominate microbial mats from sulfidic cave springs.
Appl Environ Microbiol 69: 5503.
93. Stein M, Migowski C, Bookman R (2004) Temporal changes in radiocarbon
reservoir age in the Dead Sea-Lake Lisan system. Radiocarbon 46: 649–655.
94. Good IJ, Toulmin GH (1956) The number of new species, and the increase in
population coverage, when a sample is increased.Biometrika 43: 45–63.
Freshwater Springs in the Dead Sea
PLoS ONE | www.plosone.org 21 June 2012 | Volume 7 | Issue 6 | e38319
All in-text references underlined in blue are linked to publications on ResearchGate, letting you access and read them immediately.