Microarrays and high-throughput transcriptomic analysis in species with incomplete availability of...
8
REVIEW New Biotechnology Volume 25, Number 5 June 2009 Microarrays and high-throughput transcriptomic analysis in species with incomplete availability of genomic sequences Lorraine Pariset 1 , Giovanni Chillemi 2 , Silvia Bongiorni 1 , Vincenzo Romano Spica 3 and Alessio Valentini 1 1 Department of Animal Production, Universita ` della Tuscia, Viterbo, Italy 2 CASPUR (Inter-University Consortium for the Application of Super-Computing for Universities and Research), Rome, Italy 3 Istituto Universitario di Scienze Motorie, Universita ` degli Studi di Roma per lo Sport e il Movimento, Rome, Italy Microarrays produce a measurement of gene expression based on the relative measures of dye intensities that correspond to the amount of target RNA. This technology is fast developing and its application is expanding from Homo sapiens to a wide number of species, where enough information on sequences and annotations exist. Anyway, the number of species for which a dedicated platform exists is not high. The use of heterologous array hybridization, screening for gene expression in one species using an array developed for another one, is still quite frequent, even though cross-species microarray hybridization has raised many arguments. Some methods which are high throughput and do not rely on knowledge of the DNA/RNA sequence exist, namely serial analysis of gene expression (SAGE), Massively Parallel Signature Sequencing (MPSS) and deep sequencing of full transcriptome. Although very powerful, particularly the latter, they are still quite costly and cumbersome methods. In some species where genome sequences are largely unknown, several anonymous sequences are deposited in gene banks as a result of Expressed Sequence Tags (ESTs) sequencing projects. The ESTs databases represent a valuable knowledge that can be exploited with some bioinformatic effort to build species-specific microarrays. We present here a method of high-density in situ synthesized microarrays starting from available EST sequences in, Ovis aries. Our data indicate that the method is very efficient and can be easily extended to other species of which genetic sequences are present in public databases, but neglected so far with advanced devices like microarrays. As a perspective, the approach can be applied also to species of which no sequences are available to date, thanks to high- throughput deep sequencing methods. Contents Microarray technology .............................................................................. 273 Microarray experiments .............................................................................. 273 Species with limited knowledge of DNA sequences.......................................................... 274 Microarrays from homologous species ................................................................. 274 High-throughput mRNA analysis without microarrays ..................................................... 274 Deep cDNA sequencing............................................................................ 276 Review Corresponding author: Valentini, A. ([email protected]) 272 www.elsevier.com/locate/nbt 1871-6784/$ - see front matter ß 2009 Elsevier B.V. All rights reserved. doi:10.1016/j.nbt.2009.03.013
-
Upload
independent -
Category
Documents
-
view
2 -
download
0
Transcript of Microarrays and high-throughput transcriptomic analysis in species with incomplete availability of...
Review
REVIEW New Biotechnology � Volume 25, Number 5 � June 2009
Microarrays and high-throughputtranscriptomic analysis in specieswith incomplete availability of genomicsequencesLorraine Pariset1, Giovanni Chillemi2, Silvia Bongiorni1, Vincenzo Romano Spica3 andAlessio Valentini1
1Department of Animal Production, Universita della Tuscia, Viterbo, Italy2CASPUR (Inter-University Consortium for the Application of Super-Computing for Universities and Research), Rome, Italy3 Istituto Universitario di Scienze Motorie, Universita degli Studi di Roma per lo Sport e il Movimento, Rome, Italy
Microarrays produce a measurement of gene expression based on the relative measures of dye
intensities that correspond to the amount of target RNA. This technology is fast developing and its
application is expanding from Homo sapiens to a wide number of species, where enough information
on sequences and annotations exist. Anyway, the number of species for which a dedicated platform
exists is not high. The use of heterologous array hybridization, screening for gene expression in one
species using an array developed for another one, is still quite frequent, even though cross-species
microarray hybridization has raised many arguments. Some methods which are high throughput and
do not rely on knowledge of the DNA/RNA sequence exist, namely serial analysis of gene expression
(SAGE), Massively Parallel Signature Sequencing (MPSS) and deep sequencing of full transcriptome.
Although very powerful, particularly the latter, they are still quite costly and cumbersome methods. In
some species where genome sequences are largely unknown, several anonymous sequences are
deposited in gene banks as a result of Expressed Sequence Tags (ESTs) sequencing projects. The ESTs
databases represent a valuable knowledge that can be exploited with some bioinformatic effort to
build species-specific microarrays. We present here a method of high-density in situ synthesized
microarrays starting from available EST sequences in, Ovis aries. Our data indicate that the method is
very efficient and can be easily extended to other species of which genetic sequences are present in
public databases, but neglected so far with advanced devices like microarrays. As a perspective, the
approach can be applied also to species of which no sequences are available to date, thanks to high-
throughput deep sequencing methods.
Contents
Microarray technology . . . . . . . . . . . . . . . . . . . . . . . . . . . . . . . . . . . . . . . . . . . . . . . . . . . . . . . . . . . . . . . . . . . . . . . . . . . . . . 273
Microarray experiments. . . . . . . . . . . . . . . . . . . . . . . . . . . . . . . . . . . . . . . . . . . . . . . . . . . . . . . . . . . . . . . . . . . . . . . . . . . . . . 273
Species with limited knowledge of DNA sequences. . . . . . . . . . . . . . . . . . . . . . . . . . . . . . . . . . . . . . . . . . . . . . . . . . . . . . . . . . 274
Microarrays from homologous species . . . . . . . . . . . . . . . . . . . . . . . . . . . . . . . . . . . . . . . . . . . . . . . . . . . . . . . . . . . . . . . . . 274
High-throughput mRNA analysis without microarrays . . . . . . . . . . . . . . . . . . . . . . . . . . . . . . . . . . . . . . . . . . . . . . . . . . . . . 274
Deep cDNA sequencing. . . . . . . . . . . . . . . . . . . . . . . . . . . . . . . . . . . . . . . . . . . . . . . . . . . . . . . . . . . . . . . . . . . . . . . . . . . . 276
Corresponding author: Valentini, A. ([email protected])
272 www.elsevier.com/locate/nbt 1871-6784/$ - see front matter � 2009 Elsevier B.V. All rights reserved. doi:10.1016/j.nbt.2009.03.013
Species specific microarrays. . . . . . . . . . . . . . . . . . . . . . . . . . . . . . . . . . . . . . . . . . . . . . . . . . . . . . . . . . . . . . . . . . . . . . . . . 276
A pipeline for in situ oligonucleotide generation on chip. The sheep example . . . . . . . . . . . . . . . . . . . . . . . . . . . . . . . . . . . . . 277
References. . . . . . . . . . . . . . . . . . . . . . . . . . . . . . . . . . . . . . . . . . . . . . . . . . . . . . . . . . . . . . . . . . . . . . . . . . . . . . . . . . . . . . . . 278
New Biotechnology �Volume 25, Number 5 � June 2009 REVIEW
Review
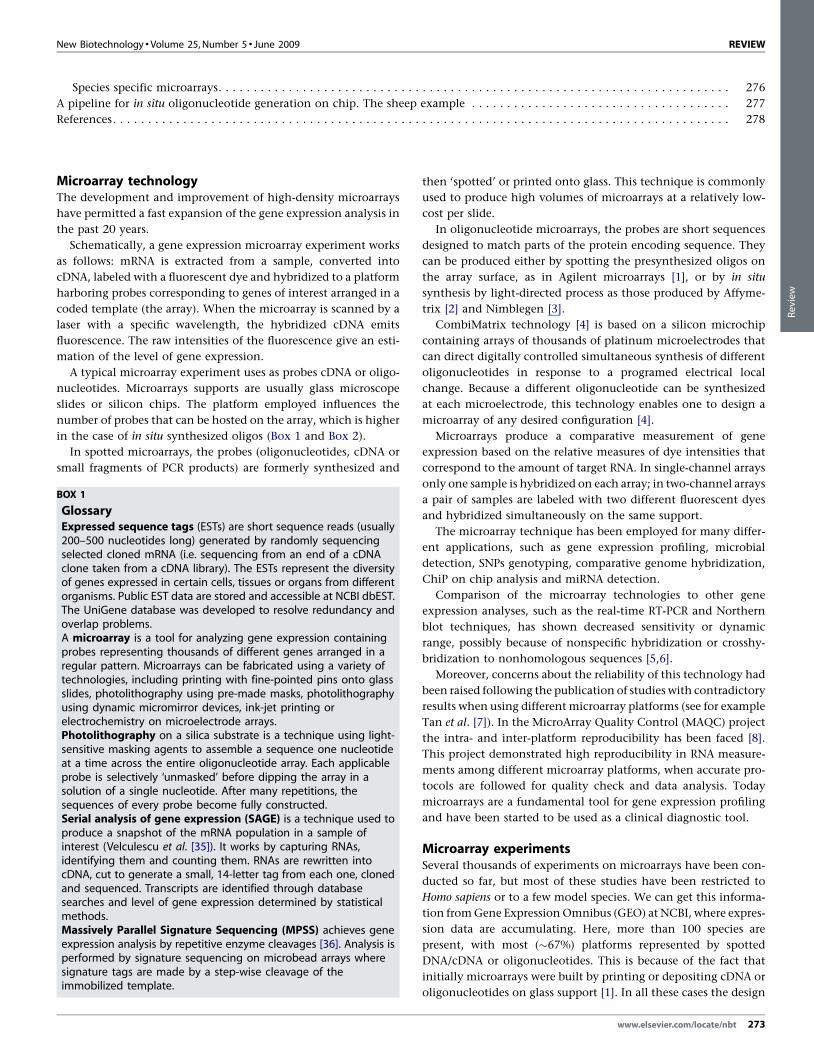
Microarray technologyThe development and improvement of high-density microarrays
have permitted a fast expansion of the gene expression analysis in
the past 20 years.
Schematically, a gene expression microarray experiment works
as follows: mRNA is extracted from a sample, converted into
cDNA, labeled with a fluorescent dye and hybridized to a platform
harboring probes corresponding to genes of interest arranged in a
coded template (the array). When the microarray is scanned by a
laser with a specific wavelength, the hybridized cDNA emits
fluorescence. The raw intensities of the fluorescence give an esti-
mation of the level of gene expression.
A typical microarray experiment uses as probes cDNA or oligo-
nucleotides. Microarrays supports are usually glass microscope
slides or silicon chips. The platform employed influences the
number of probes that can be hosted on the array, which is higher
in the case of in situ synthesized oligos (Box 1 and Box 2).
In spotted microarrays, the probes (oligonucleotides, cDNA or
small fragments of PCR products) are formerly synthesized and
BOX 1
GlossaryExpressed sequence tags (ESTs) are short sequence reads (usually200–500 nucleotides long) generated by randomly sequencingselected cloned mRNA (i.e. sequencing from an end of a cDNAclone taken from a cDNA library). The ESTs represent the diversityof genes expressed in certain cells, tissues or organs from differentorganisms. Public EST data are stored and accessible at NCBI dbEST.The UniGene database was developed to resolve redundancy andoverlap problems.A microarray is a tool for analyzing gene expression containingprobes representing thousands of different genes arranged in aregular pattern. Microarrays can be fabricated using a variety oftechnologies, including printing with fine-pointed pins onto glassslides, photolithography using pre-made masks, photolithographyusing dynamic micromirror devices, ink-jet printing orelectrochemistry on microelectrode arrays.Photolithography on a silica substrate is a technique using light-sensitive masking agents to assemble a sequence one nucleotideat a time across the entire oligonucleotide array. Each applicableprobe is selectively ‘unmasked’ before dipping the array in asolution of a single nucleotide. After many repetitions, thesequences of every probe become fully constructed.Serial analysis of gene expression (SAGE) is a technique used toproduce a snapshot of the mRNA population in a sample ofinterest (Velculescu et al. [35]). It works by capturing RNAs,identifying them and counting them. RNAs are rewritten intocDNA, cut to generate a small, 14-letter tag from each one, clonedand sequenced. Transcripts are identified through databasesearches and level of gene expression determined by statisticalmethods.Massively Parallel Signature Sequencing (MPSS) achieves geneexpression analysis by repetitive enzyme cleavages [36]. Analysis isperformed by signature sequencing on microbead arrays wheresignature tags are made by a step-wise cleavage of theimmobilized template.
then ‘spotted’ or printed onto glass. This technique is commonly
used to produce high volumes of microarrays at a relatively low-
cost per slide.
In oligonucleotide microarrays, the probes are short sequences
designed to match parts of the protein encoding sequence. They
can be produced either by spotting the presynthesized oligos on
the array surface, as in Agilent microarrays [1], or by in situ
synthesis by light-directed process as those produced by Affyme-
trix [2] and Nimblegen [3].
CombiMatrix technology [4] is based on a silicon microchip
containing arrays of thousands of platinum microelectrodes that
can direct digitally controlled simultaneous synthesis of different
oligonucleotides in response to a programed electrical local
change. Because a different oligonucleotide can be synthesized
at each microelectrode, this technology enables one to design a
microarray of any desired configuration [4].
Microarrays produce a comparative measurement of gene
expression based on the relative measures of dye intensities that
correspond to the amount of target RNA. In single-channel arrays
only one sample is hybridized on each array; in two-channel arrays
a pair of samples are labeled with two different fluorescent dyes
and hybridized simultaneously on the same support.
The microarray technique has been employed for many differ-
ent applications, such as gene expression profiling, microbial
detection, SNPs genotyping, comparative genome hybridization,
ChiP on chip analysis and miRNA detection.
Comparison of the microarray technologies to other gene
expression analyses, such as the real-time RT-PCR and Northern
blot techniques, has shown decreased sensitivity or dynamic
range, possibly because of nonspecific hybridization or crosshy-
bridization to nonhomologous sequences [5,6].
Moreover, concerns about the reliability of this technology had
been raised following the publication of studies with contradictory
results when using different microarray platforms (see for example
Tan et al. [7]). In the MicroArray Quality Control (MAQC) project
the intra- and inter-platform reproducibility has been faced [8].
This project demonstrated high reproducibility in RNA measure-
ments among different microarray platforms, when accurate pro-
tocols are followed for quality check and data analysis. Today
microarrays are a fundamental tool for gene expression profiling
and have been started to be used as a clinical diagnostic tool.
Microarray experimentsSeveral thousands of experiments on microarrays have been con-
ducted so far, but most of these studies have been restricted to
Homo sapiens or to a few model species. We can get this informa-
tion from Gene Expression Omnibus (GEO) at NCBI, where expres-
sion data are accumulating. Here, more than 100 species are
present, with most (�67%) platforms represented by spotted
DNA/cDNA or oligonucleotides. This is because of the fact that
initially microarrays were built by printing or depositing cDNA or
oligonucleotides on glass support [1]. In all these cases the design
www.elsevier.com/locate/nbt 273

REVIEW New Biotechnology � Volume 25, Number 5 � June 2009
BOX 2
Microarray technology was introduced in 1995 by Schena et al.[62] and during the past decade the use of DNA chip technologyhas shown the power of this high-throughput parallel analysis.Microarray manufacturing is based on spotting of presynthesizedoligonucleotides, ink-jet depositing technologies (Agilent) [1], light-directed synthesis processes (Affymetrix and Nimblegen) [7], andlocal electrochemistry (CombiMatrix) [4].Affymetrix pioneered the microarray platform and their high-density oligonucleotide arrays (GeneChip) are made of shortoligonucleotide sequences. The precise construction of this highlyordered matrix of DNA oligomers on a small glass chip is allowedby light-directed synthesis using programed masking. TheGeneChip microarrays are designed in silico, thus bypassing themanagement of clone libraries; this represents the main advantageof GeneChip over traditional microarray.Agilent uses the ink-jet technology to print oligos and wholecDNAs onto glass slides. Agilent platforms consist of 60-mersprobes, longer than the 25-mers probes employed by Affymetrix.Roche NimbleGen System uses a digital light processor tosynthesize microarrays. NimbleGen technology is maskless. Besidesthe use in transcriptomic analysis, NimbleGen arrays carryingspecific sequences are used to capture larger genomic fragmentsthat are afterward sequenced by the GS FLX System.CombiMatrix technology is based on a semiconductor siliconmicrochip, which contains arrays of platinum microelectrodes. TheCombiMatrix oligonucleotide microarray platform contains 12.544(12k) or 90.000 (90k) individually addressable microelectrodes in asemiconductor matrix. This semiconductor directs theelectrochemical synthesis of different oligonucleotides atthousands of electrodes in response to a computer softwareprogram. Because a different oligonucleotide can be synthesized ateach microelectrode, this technology enables one to design amicroarray of any desired configuration The technology platformdetects hybridization signal with both fluorescent andelectrochemical-detection techniques, using conventionalfluorescent scanner or the ElectraSense Reader [4].
Review
of a microarray was a long and costly process. The very high cost
and huge amount of work involved in developing and producing a
DNA array or microarray for nonstandard animal models is gen-
erally prohibitive [9]. To build DNA/cDNA microarrays, libraries
have to be prepared and sequenced, while oligonucleotides must
be synthesized on a large scale before spotting. Also lithographic
masks need time and money to be built [10]. Moreover, besides
costs, a considerable lag was expected between the starting of
information collection and the microarray applications. There-
fore, specific applied microarrays can be afforded only under large
projects involving widely investigated species. As a result, the
platforms deposited up today in GEO are 65% human, 37% model
species, 8% pathogens and 3% agricultural species. Recently, in situ
generated oligonucleotides (�29% of GEO platforms) have
appeared, which are quicker to prepare and can be produced in
scale as reduced as a single piece (Box 2). Compared to cDNA
arrays, in situ synthesized oligonucleotides offer increased speci-
ficity and sensitivity and minimize chip-to-chip variations, even if
one drawback is the price that can be up to tenfold higher than in
house spotted arrays [11]. In any cases, sequences had to be known
previously of the microarray experiment both for microarray
generation, for oligo-based microarray and for the interpretation
of the outcomes.
274 www.elsevier.com/locate/nbt
Species with limited knowledge of DNA sequencesMicroarrays from homologous speciesTraditional analysis of mRNA relied on the detection of single or
few transcripts based on partial knowledge of the nucleic acid
sequence: the hybridizing probe in Northern blot, the annealing
primers in real-time PCR had to be set using known sequences.
Slight relaxations on the perfect knowledge of the sequences were
permitted as nonstringent hybridization and degenerate primers
were used to investigate closed species or orthologous genes [12–
14]. When multiple detection was introduced for hundreds – if not
thousands – of transcripts in microarrays, the requirement of the
knowledge of the nucleic acid sequence was even more important.
In fact, all spotted probes had to be known to refer the fluorescent
read to the appropriate gene.
For many species there is no representative microarray platform.
For such species, cross-species hybridization has recently become a
popular tool.
The use of heterologous array hybridization, screening for gene
expression in one species using an array developed for another
species, is still quite frequent [15–25], even though cross-species
microarray hybridization has raised many arguments [26–33].
Problems encountered with cross-species hybridization, including
signal reduction and crosshybridization and evaluations of micro-
array platforms, experimental designs, performance of hybridiza-
tions, data analysis and validations have been recently reviewed by
Bar-Or [34] and Eddy and Storey [9]. Moreover, the hybridization
with nonperfectly complementary nucleic acids would led to
severe bias because of the high number of interactions among
probes and templates. However, for many species there is no need
to use microarrays from other species to have a high-throughput
analysis of the transcriptome since several techniques are today
available that may be used in species with limited or even with
absolutely no information on their genomes.
High-throughput mRNA analysis without microarraysSome methods which are high throughput and do not rely on
knowledge of the DNA/RNA sequence exist.
Serial analysis of gene expression (SAGE) provides a rapid and
comprehensive approach for elucidation of quantitative gene
expression patterns that does not depend on the prior availability
of transcript information. The SAGE method is based on the
isolation of unique sequence tags from individual transcripts
and concatenation of tags serially into long DNA molecules. Rapid
sequencing of concatemer clones reveals individual tags and
allows quantification and identification of cellular transcripts
[35]. Unlike microarrays, SAGE is a sequence-based sampling
technique not based on hybridization. Genes that are not known
can be discovered because with SAGE mRNA sequences do not
need to be known a priori. Anyway, microarray experiments are
much cheaper to perform, so large-scale studies do not typically
use SAGE.
Massively Parallel Signature Sequencing (MPSS) achieves gene
expression analysis by repetitive enzyme cleavages [36]. Analysis is
performed by signature sequencing on microbead arrays, where
signature tags are made by a step-wise cleavage of the immobilized
template. MPSS produce data in digital format (microarrays pro-
duce analogic data) and, compared to SAGE, leads to a higher
percentage of unique locations on the genome [37].
New Biotechnology �Volume 25, Number 5 � June 2009 REVIEW
BOX 3
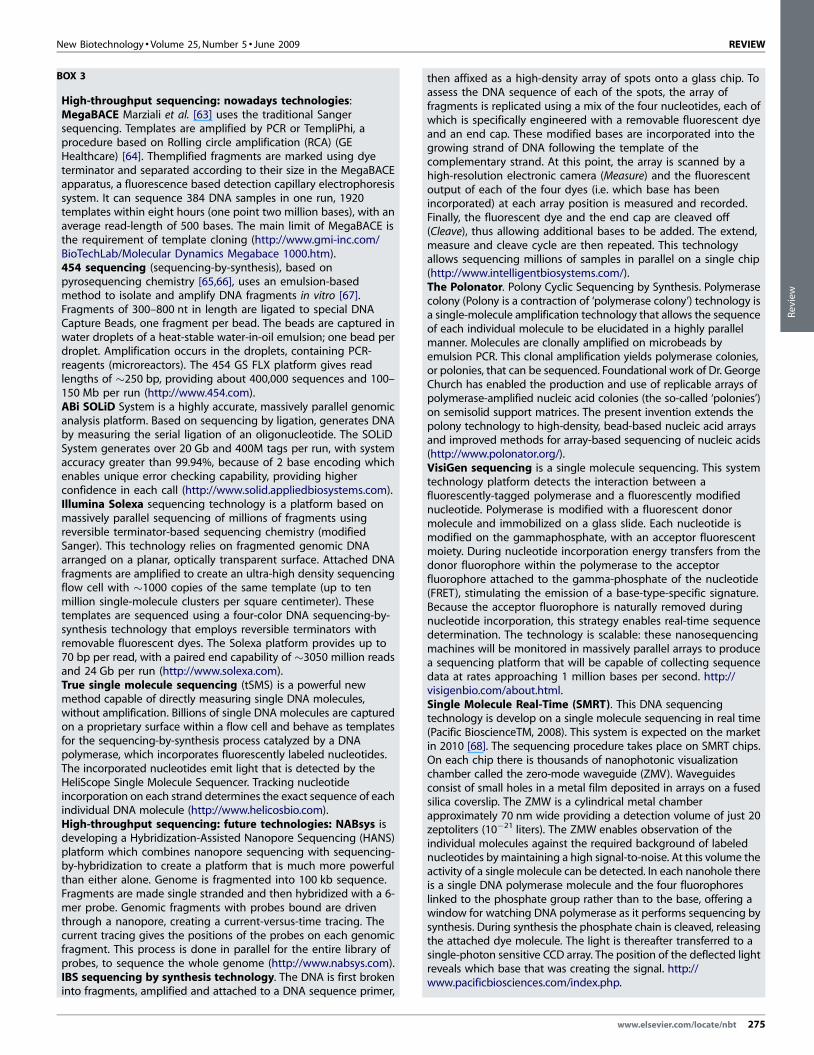
High-throughput sequencing: nowadays technologies:MegaBACE Marziali et al. [63] uses the traditional Sangersequencing. Templates are amplified by PCR or TempliPhi, aprocedure based on Rolling circle amplification (RCA) (GEHealthcare) [64]. Themplified fragments are marked using dyeterminator and separated according to their size in the MegaBACEapparatus, a fluorescence based detection capillary electrophoresissystem. It can sequence 384 DNA samples in one run, 1920templates within eight hours (one point two million bases), with anaverage read-length of 500 bases. The main limit of MegaBACE isthe requirement of template cloning (http://www.gmi-inc.com/BioTechLab/Molecular Dynamics Megabace 1000.htm).454 sequencing (sequencing-by-synthesis), based onpyrosequencing chemistry [65,66], uses an emulsion-basedmethod to isolate and amplify DNA fragments in vitro [67].Fragments of 300–800 nt in length are ligated to special DNACapture Beads, one fragment per bead. The beads are captured inwater droplets of a heat-stable water-in-oil emulsion; one bead perdroplet. Amplification occurs in the droplets, containing PCR-reagents (microreactors). The 454 GS FLX platform gives readlengths of �250 bp, providing about 400,000 sequences and 100–150 Mb per run (http://www.454.com).ABi SOLiD System is a highly accurate, massively parallel genomicanalysis platform. Based on sequencing by ligation, generates DNAby measuring the serial ligation of an oligonucleotide. The SOLiDSystem generates over 20 Gb and 400M tags per run, with systemaccuracy greater than 99.94%, because of 2 base encoding whichenables unique error checking capability, providing higherconfidence in each call (http://www.solid.appliedbiosystems.com).Illumina Solexa sequencing technology is a platform based onmassively parallel sequencing of millions of fragments usingreversible terminator-based sequencing chemistry (modifiedSanger). This technology relies on fragmented genomic DNAarranged on a planar, optically transparent surface. Attached DNAfragments are amplified to create an ultra-high density sequencingflow cell with �1000 copies of the same template (up to tenmillion single-molecule clusters per square centimeter). Thesetemplates are sequenced using a four-color DNA sequencing-by-synthesis technology that employs reversible terminators withremovable fluorescent dyes. The Solexa platform provides up to70 bp per read, with a paired end capability of �3050 million readsand 24 Gb per run (http://www.solexa.com).True single molecule sequencing (tSMS) is a powerful newmethod capable of directly measuring single DNA molecules,without amplification. Billions of single DNA molecules are capturedon a proprietary surface within a flow cell and behave as templatesfor the sequencing-by-synthesis process catalyzed by a DNApolymerase, which incorporates fluorescently labeled nucleotides.The incorporated nucleotides emit light that is detected by theHeliScope Single Molecule Sequencer. Tracking nucleotideincorporation on each strand determines the exact sequence of eachindividual DNA molecule (http://www.helicosbio.com).High-throughput sequencing: future technologies: NABsys isdeveloping a Hybridization-Assisted Nanopore Sequencing (HANS)platform which combines nanopore sequencing with sequencing-by-hybridization to create a platform that is much more powerfulthan either alone. Genome is fragmented into 100 kb sequence.Fragments are made single stranded and then hybridized with a 6-mer probe. Genomic fragments with probes bound are driventhrough a nanopore, creating a current-versus-time tracing. Thecurrent tracing gives the positions of the probes on each genomicfragment. This process is done in parallel for the entire library ofprobes, to sequence the whole genome (http://www.nabsys.com).IBS sequencing by synthesis technology. The DNA is first brokeninto fragments, amplified and attached to a DNA sequence primer,
then affixed as a high-density array of spots onto a glass chip. Toassess the DNA sequence of each of the spots, the array offragments is replicated using a mix of the four nucleotides, each ofwhich is specifically engineered with a removable fluorescent dyeand an end cap. These modified bases are incorporated into thegrowing strand of DNA following the template of thecomplementary strand. At this point, the array is scanned by ahigh-resolution electronic camera (Measure) and the fluorescentoutput of each of the four dyes (i.e. which base has beenincorporated) at each array position is measured and recorded.Finally, the fluorescent dye and the end cap are cleaved off(Cleave), thus allowing additional bases to be added. The extend,measure and cleave cycle are then repeated. This technologyallows sequencing millions of samples in parallel on a single chip(http://www.intelligentbiosystems.com/).The Polonator. Polony Cyclic Sequencing by Synthesis. Polymerasecolony (Polony is a contraction of ‘polymerase colony’) technology isa single-molecule amplification technology that allows the sequenceof each individual molecule to be elucidated in a highly parallelmanner. Molecules are clonally amplified on microbeads byemulsion PCR. This clonal amplification yields polymerase colonies,or polonies, that can be sequenced. Foundational work of Dr. GeorgeChurch has enabled the production and use of replicable arrays ofpolymerase-amplified nucleic acid colonies (the so-called ‘polonies’)on semisolid support matrices. The present invention extends thepolony technology to high-density, bead-based nucleic acid arraysand improved methods for array-based sequencing of nucleic acids(http://www.polonator.org/).VisiGen sequencing is a single molecule sequencing. This systemtechnology platform detects the interaction between afluorescently-tagged polymerase and a fluorescently modifiednucleotide. Polymerase is modified with a fluorescent donormolecule and immobilized on a glass slide. Each nucleotide ismodified on the gammaphosphate, with an acceptor fluorescentmoiety. During nucleotide incorporation energy transfers from thedonor fluorophore within the polymerase to the acceptorfluorophore attached to the gamma-phosphate of the nucleotide(FRET), stimulating the emission of a base-type-specific signature.Because the acceptor fluorophore is naturally removed duringnucleotide incorporation, this strategy enables real-time sequencedetermination. The technology is scalable: these nanosequencingmachines will be monitored in massively parallel arrays to producea sequencing platform that will be capable of collecting sequencedata at rates approaching 1 million bases per second. http://visigenbio.com/about.html.Single Molecule Real-Time (SMRT). This DNA sequencingtechnology is develop on a single molecule sequencing in real time(Pacific BioscienceTM, 2008). This system is expected on the marketin 2010 [68]. The sequencing procedure takes place on SMRT chips.On each chip there is thousands of nanophotonic visualizationchamber called the zero-mode waveguide (ZMV). Waveguidesconsist of small holes in a metal film deposited in arrays on a fusedsilica coverslip. The ZMW is a cylindrical metal chamberapproximately 70 nm wide providing a detection volume of just 20zeptoliters (10�21 liters). The ZMW enables observation of theindividual molecules against the required background of labelednucleotides bymaintaining a high signal-to-noise. At this volume theactivity of a single molecule can be detected. In each nanohole thereis a single DNA polymerase molecule and the four fluorophoreslinked to the phosphate group rather than to the base, offering awindow for watching DNA polymerase as it performs sequencing bysynthesis. During synthesis the phosphate chain is cleaved, releasingthe attached dye molecule. The light is thereafter transferred to asingle-photon sensitive CCD array. The position of the deflected lightreveals which base that was creating the signal. http://www.pacificbiosciences.com/index.php.
www.elsevier.com/locate/nbt 275
Review
REVIEW New Biotechnology � Volume 25, Number 5 � June 2009
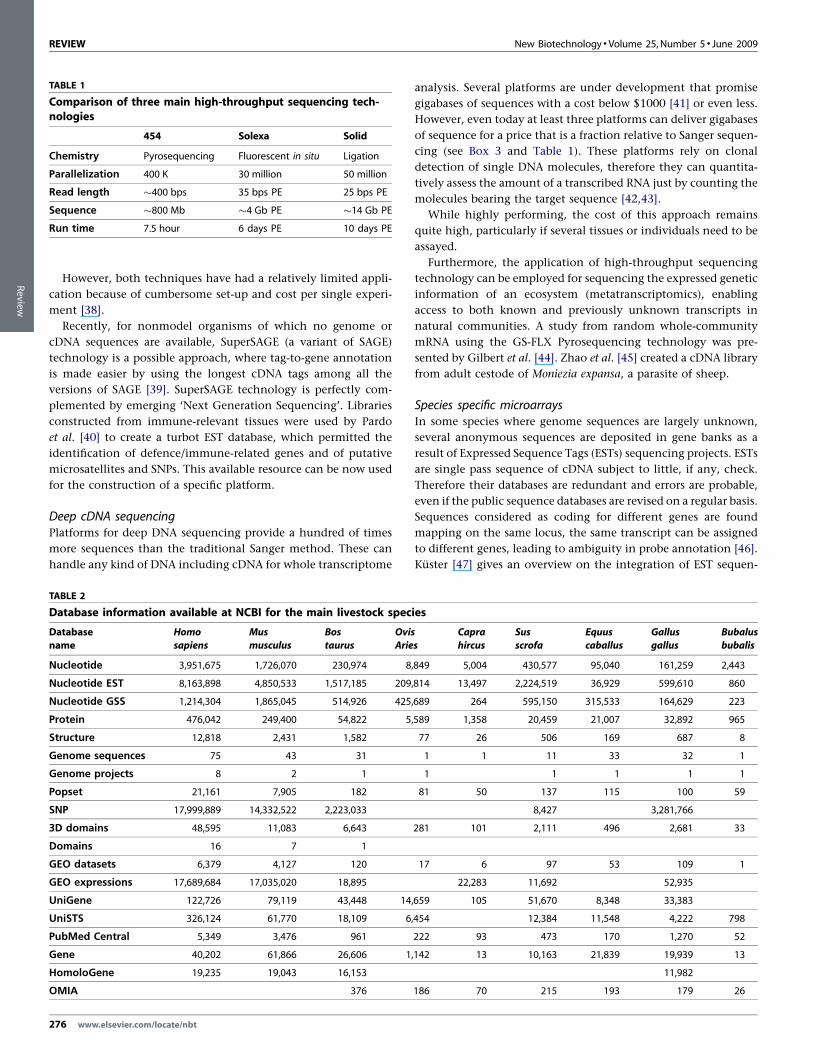
TABLE 1
Comparison of three main high-throughput sequencing tech-nologies
454 Solexa Solid
Chemistry Pyrosequencing Fluorescent in situ Ligation
Parallelization 400 K 30 million 50 million
Read length �400 bps 35 bps PE 25 bps PE
Sequence �800 Mb �4 Gb PE �14 Gb PE
Run time 7.5 hour 6 days PE 10 days PE
Review
However, both techniques have had a relatively limited appli-
cation because of cumbersome set-up and cost per single experi-
ment [38].
Recently, for nonmodel organisms of which no genome or
cDNA sequences are available, SuperSAGE (a variant of SAGE)
technology is a possible approach, where tag-to-gene annotation
is made easier by using the longest cDNA tags among all the
versions of SAGE [39]. SuperSAGE technology is perfectly com-
plemented by emerging ‘Next Generation Sequencing’. Libraries
constructed from immune-relevant tissues were used by Pardo
et al. [40] to create a turbot EST database, which permitted the
identification of defence/immune-related genes and of putative
microsatellites and SNPs. This available resource can be now used
for the construction of a specific platform.
Deep cDNA sequencingPlatforms for deep DNA sequencing provide a hundred of times
more sequences than the traditional Sanger method. These can
handle any kind of DNA including cDNA for whole transcriptome
TABLE 2
Database information available at NCBI for the main livestock spec
Database
name
Homo
sapiens
Mus
musculus
Bos
taurus
Ovis
Arie
Nucleotide 3,951,675 1,726,070 230,974 8
Nucleotide EST 8,163,898 4,850,533 1,517,185 209
Nucleotide GSS 1,214,304 1,865,045 514,926 425
Protein 476,042 249,400 54,822 5
Structure 12,818 2,431 1,582
Genome sequences 75 43 31
Genome projects 8 2 1
Popset 21,161 7,905 182
SNP 17,999,889 14,332,522 2,223,033
3D domains 48,595 11,083 6,643
Domains 16 7 1
GEO datasets 6,379 4,127 120
GEO expressions 17,689,684 17,035,020 18,895
UniGene 122,726 79,119 43,448 14
UniSTS 326,124 61,770 18,109 6
PubMed Central 5,349 3,476 961
Gene 40,202 61,866 26,606 1
HomoloGene 19,235 19,043 16,153
OMIA 376
276 www.elsevier.com/locate/nbt
analysis. Several platforms are under development that promise
gigabases of sequences with a cost below $1000 [41] or even less.
However, even today at least three platforms can deliver gigabases
of sequence for a price that is a fraction relative to Sanger sequen-
cing (see Box 3 and Table 1). These platforms rely on clonal
detection of single DNA molecules, therefore they can quantita-
tively assess the amount of a transcribed RNA just by counting the
molecules bearing the target sequence [42,43].
While highly performing, the cost of this approach remains
quite high, particularly if several tissues or individuals need to be
assayed.
Furthermore, the application of high-throughput sequencing
technology can be employed for sequencing the expressed genetic
information of an ecosystem (metatranscriptomics), enabling
access to both known and previously unknown transcripts in
natural communities. A study from random whole-community
mRNA using the GS-FLX Pyrosequencing technology was pre-
sented by Gilbert et al. [44]. Zhao et al. [45] created a cDNA library
from adult cestode of Moniezia expansa, a parasite of sheep.
Species specific microarraysIn some species where genome sequences are largely unknown,
several anonymous sequences are deposited in gene banks as a
result of Expressed Sequence Tags (ESTs) sequencing projects. ESTs
are single pass sequence of cDNA subject to little, if any, check.
Therefore their databases are redundant and errors are probable,
even if the public sequence databases are revised on a regular basis.
Sequences considered as coding for different genes are found
mapping on the same locus, the same transcript can be assigned
to different genes, leading to ambiguity in probe annotation [46].
Kuster [47] gives an overview on the integration of EST sequen-
ies
s
Capra
hircus
Sus
scrofa
Equus
caballus
Gallus
gallus
Bubalus
bubalis
,849 5,004 430,577 95,040 161,259 2,443
,814 13,497 2,224,519 36,929 599,610 860
,689 264 595,150 315,533 164,629 223
,589 1,358 20,459 21,007 32,892 965
77 26 506 169 687 8
1 1 11 33 32 1
1 1 1 1 1
81 50 137 115 100 59
8,427 3,281,766
281 101 2,111 496 2,681 33
17 6 97 53 109 1
22,283 11,692 52,935
,659 105 51,670 8,348 33,383
,454 12,384 11,548 4,222 798
222 93 473 170 1,270 52
,142 13 10,163 21,839 19,939 13
11,982
186 70 215 193 179 26

New Biotechnology �Volume 25, Number 5 � June 2009 REVIEW
FIGURE 1
Pipeline starting from unannotated, redundant sequences to yieldoligonucleotides suitable for in situ generation on chip.
Review
cing, in silico- and microarray-based transcriptome profiling
approaches.
However, the ESTs represent a valuable knowledge that can be
exploited with some bioinformatic effort.
Part of it is already carried out by NCBI, which eliminates the
redundancy by converting raw sequences in the Reference
Sequence (RefSeq) collection. However, most of the work still
remains to be done since the great majority of the known ESTs
have to be annotated, that is all the features of the DNA sequence
such as gene description, chromosome coordinates, transcripts
and proteins need to be found, described and consistently asso-
ciated to the sequence.
Particularly in agricultural species transcriptome from several
tissues has been sequenced by many folds. As proof of principle, we
report here sheep as an example. It was based on public sequences,
but it could easily be carried out with sequences generated by deep
sequencing of transcriptome obtained by the platforms described
in Box 3.
An approach was proposed by Schmid and Blaxter [48], who
developed ‘annot8r’, a friendly tool for the annotation of non-
model species EST datasets with well-defined ontologies, a plat-
form for the rapid annotation of EST datasets with GO-terms, EC-
numbers and KEGG-pathways. A relational database (SoyXpress)
designed for exploring potential transcriptome differences in dif-
ferent plant genotypes, suitable for retrieving data and results of
the microarray experiment with crossreferenced annotations of
ESTs and hyperlinks to external public databases, was developed
by Cheng and Stromvik [49].
Cerda et al. [50] generated ESTs from a Senegalese sole multi-
tissue normalized cDNA library. The sequence of the 5208 uni-
genes obtained after Assembly of the entire EST collection was used
to design an oligonucleotide microarray and a novel interactive
bioinformatic platform. Koop et al. [21] obtained 298,304 Salmo-
nid ESTs and created a new expanded Salmonid 32K cDNA micro-
array, representing a useful resource for 68 Salmonid species.
Ferraresso et al. [51] constructed a public database from gilthead
sea bream (Sparus aurata) mRNA and, using Agilent SurePrint
technology, developed platform despite the presently limited
knowledge of the species transcriptome.
A combination of deep cDNA sequencing in one or few samples
and a construction of microarrays afterward, based on the knowl-
edge of the obtained sequences may sum up the benefits of the
deep knowledge of full sequences and of limited costs of micro-
array experiments. Jung et al. [52] constructed a low-cost rice
oligonucleotide genome array from available sequences, to com-
pare gene expression profiles across multiple rice microarray plat-
forms and defined a method to identify functionally redundant
genes.
A pipeline for in situ oligonucleotide generation onchip. The sheep exampleThe design of microarray probes with high hybridization specifi-
city is a time-consuming multicriteria problem for which there is
not yet an ultimate solution [53]. Many software programs are
available for microarray probe design: OligoArray [54], ROSO [55],
GoArray [56], and OligoRankPick [57].
We have developed a pipeline of software instruments that
allow starting from unannotated, redundant sequences as those
www.elsevier.com/locate/nbt 277
REVIEW New Biotechnology � Volume 25, Number 5 � June 2009
Review
found in public databases or generated by deep sequencing
(Table 2), to yield oligonucleotides suitable for in situ generation
on chip (Fig. 1). With this procedure, even a microarray in single
copy can be generated with a moderate cost. Therefore, we believe
it will be feasible to study several species so far neglected with
advanced devices like microarrays. The fast increase in the number
of transcript sequences deposited in public databases makes the
designed microarrays of not fully annotated genome to become
quickly obsolete. Our developed pipeline software answers this
problem, since the probe oligonucleotides can be easily regener-
ated, just before the microarray production, to include new knowl-
edge or to meet specific questions such as the alternative splicing
of specific genes.
We used this pipeline to generate a chip from sheep (Ovis aries)
ESTs deposited at NCBI [58]. Oligos were then designed using the
GoArrays software [56], which envisages the design of two short
sequences interleaved by a random DNA spacer to achieve a better
annealing of the cDNA and in situ generated using the CombiMatrix
(Seattle, WA, USA) equipment. A probe length of 40 nucleotides was
chosen to obtain a good efficiency of the synthesis and specific
and sensitive hybridization [59]. The chip, named Aristaeus, carries
278 www.elsevier.com/locate/nbt
21,743 nonredundant features in quadruplicate, 73.4% of which are
fully annotated corresponding to 10,190 genes, thus representing a
good coverage of the sheep genome [58]. The NCBI sheep sequences
have been annotated in a sequential procedure that envisaged the
blasting of anonymous ESTs firstly on the (scant) sheep specific
database, and furthermore on databases of homologous species in
phylogenetic order but only for sequences that were not covered by
the closer database. We used close livestock species plus Homo
sapiens and Mus musculus (Table 2).
The novel microarray efficiency was assessed by performing
pilot experiments using RNA of two sheep breeds [60] performing
at least eight replicates per sample, where from literature a mini-
mum of five is recommended [61]. The in situ synthesized chips
produced with the CombiMatrix technology permit to measure
the hybridization signal with both fluorescent and electrochemi-
cal methods, using conventional fluorescent scanner or the Elec-
traSenseTM Reader [4]. To test the Aristaeus chip, we have used a
standard two cyanine dye method since the fluorescent scanner is
more easily available in research laboratories. Very good technical
outcomes have been achieved (in slide replicates show a coefficient
of variation<0.25 for differentially expressed genes with P < 0.01).
References
1 Hughes, T.R. et al. (2001) Expression profiling using microarrays fabricated by an
ink-jet oligonucleotide synthesizer. Nat. Biotechnol. 19, 342–347
2 Pease, A.C., Solas, D., Sullivan, E.J., Cronin, M.T., Holmes, C.P., Fodor, S.P., (1994)
Light-generated oligonucleotide arrays for rapid DNA sequence analysis. Proc. Natl.
Acad. Sci. U. S. A. 91, 5022–5026
3 Nuwaysir, E.F. et al. (2002) Gene expression analysis using oligonucleotide arrays
produced by maskless photolithography. Genome Res. 12, 1749–1755
4 Ghindilis, A.L. et al. (2007) CombiMatrix oligonucleotide arrays: genotyping and
gene expression assays employing electrochemical detection. Biosens. Bioelectron.
22, 1853–1860
5 Yuen, T. et al. (2002) Accuracy and calibration of commercial oligonucleotide and
custom cDNA arrays. Nucleic Acids Res. 30, e48
6 Kothapalli, R. et al. (2002) Microarray results: how accurate are they? BMC
Bioinform. 3, 22
7 Tan, P.K. et al. (2003) Evaluation of gene expression measurements from
commercial microarray platforms. Nucleic Acids Res. 3119, 5676–5684
8 Consortium, M.A.Q.C. (2006) The MicroArray Quality Control (MAQC) project
shows inter- and intraplatform reproducibility of gene expression measurements.
Nat. Biotechnol. 24, 1151–1161
9 Eddy, S.F. and Storey, K.B. (2008) Comparative molecular physiological genomics
heterologous probing of cDNA arrays. Methods Mol. Biol. 410, 81–110
10 Truskett, V.N. and Watts, M.P. (2006) Trends in imprint lithography for biological
applications. Trends Biotechnol. 24, 312–317
11 Lee, N.H. and Saeed, A.I. (2007) Microarrays: an overview. Methods Mol. Biol. 353,
265–300
12 Beard, C.E. et al. (2001) Screening for novel cry genes by hybridization. Lett. Appl.
Microbiol. 33, 241–245
13 Chalaya, T. et al. (2004) Improving specificity of DNA hybridization-based
methods. Nucleic Acids Res. 32, e130
14 Ellwood, S.R. et al. (2008) Construction of a comparative genetic map in faba bean
(Vicia faba L.); conservation of genome structure with Lens culinaris. BMC Genomics
9, 380
15 Moody, D.E. et al. (2002) Cross-species hybridisation of pig RNA to human nylon
microarrays. BMC Genomics 3, 27
16 Chitko-McKown, C.G. et al. (2004) Gene expression profiling of bovine
macrophages in response to Escherichia coli O157:H7 lipopolysaccharide. Dev.
Comp. Immunol. 28, 635–645
17 Adjaye, J. et al. (2004) Cross-species hybridisation of human and bovine
orthologous genes on high density cDNA microarrays. BMC Genomics 5, 83
18 Grigoryev, D.N. et al. (2005) In vitro identification and in silico utilization of
interspecies sequence similarities using GeneChip technology. BMC Genomics 6,
62
19 Khaitovich, P. et al. (2004) A neutral model of transcriptome evolution. PLoS Biol.
2, E132
20 Magness, C.L. et al. (2005) Analysis of the Macaca mulatta transcriptome and the
sequence divergence between Macaca and human. Genome Biol. 6, R60
21 Koop, B.F. et al. (2008) A salmonid EST genomic study: genes, duplications,
phylogeny and microarrays. BMC Genomics 9, 545
22 Chain, F.J.J. et al. (2008) Single-species microarrays and comparative
transcriptomics. PLoS ONE 3, e3279
23 Norris, B.J. et al. (2005) Gene expression profiling of ovine skin and wool follicle
development using a combined ovine-bovine skin cDNA microarray. Aust. J. Exp.
Agric. 45, 867–877
24 Cao, H. et al. (2006) Characterization of ovine hepatic gene expression profiles in
response to Escherichia coli lipopolysaccharide using a bovine cDNA microarray.
BMC Vet. Res. 2, 34
25 Rowe, A. et al. (2008) Genomic analyses of Haemonchus contortus infection in
sheep: abomasal fistulation and two Haemonchus strains do not substantially
confound host gene expression in microarrays. Vet. Parasitol. 154, 71–81
26 Chismar, J.D. et al. (2002) Analysis of result variability from high-density
oligonucleotide arrays comparing same-species and cross-species hybridizations.
Biotechniques 33, 516–522
27 Gilad, Y. et al. (2005) Multi-species microarrays reveal the effect of sequence
divergence on gene expression profiles. Genome Res. 15, 674–680
28 Wong, C.W. et al. (2007) Optimization and clinical validation of a pathogen
detection microarray. Genome Biol. 8, R93
29 Buckley, B.A. (2007) Comparative environmental genomics in non-model species:
using heterologous hybridization to DNA-based microarrays. J. Exp. Biol. 210,
1602–1606
30 Flynn, S.M. and Carr, S.M. (2007) Interspecies hybridization on DNA resequencing
microarrays: efficiency of sequence recovery and accuracy of SNP detection in
human, ape, and codfish mitochondrial DNA genomes sequenced on a human-
specific MitoChip. BMC Genomics 8, 339
31 Cohen, R. et al. (2007) Estimating the efficiency of fish cross-species cDNA
microarray hybridization. Mar. Biotechnol. 9, 491–499
32 Nieto-Dıaz, M. et al. (2007) Cross-species analysis of gene expression in non-model
mammals: reproducibility of hybridization on high density oligonucleotide
microarrays. BMC Genomics 8, 89
33 Benovoy, D. et al. (2008) Effect of polymorphisms within probe-target sequences
on olignonucleotide microarray experiments. Nucleic Acids Res. 36, 4417–4423
34 Bar-Or, C. et al. (2007) Cross-species microarray hybridizations: a developing tool
for studying species diversity. Trends Genet. 23, 200–207
35 Velculescu, V.E. et al. (1995) Serial analysis of gene expression. Science 270, 484–
487

New Biotechnology �Volume 25, Number 5 � June 2009 REVIEW
Review
36 Brenner, S. et al. (2000) Gene expression analysis by massively parallel signature
sequencing (MPSS) on microbead arrays. Nat. Biotechnol. 18, 630–634
37 Reinartz, J. et al. (2002) Massively parallel signature sequencing (MPSS) as a tool for
in-depth quantitative gene expression profiling in all organisms. Brief Funct.
Genomic Proteomic 1, 95–104
38 Patino, W.D. et al. (2002) Serial analysis of gene expression: technical
considerations and applications to cardiovascular biology. Circ. Res. 91, 565–569
39 Matsumura, H. et al. (2008) SuperSAGE: a modern platform for genome-wide
quantitative transcript profiling. Curr. Pharm. Biotechnol. 9, 368–374
40 Pardo, B.G. et al. (2008) Expressed sequence tags (ESTs) from immune tissues of
turbot (Scophthalmus maximus) challenged with pathogens. BMC Vet. Res. 4, 37
41 Rothberg, J.M. and Leamon, J.H. (2008) The development and impact of 454
sequencing. Nat. Biotechnol. 26, 1117–1124
42 Toth, A.L. et al. (2007) Wasp gene expression supports an evolutionary link
between maternal behavior and eusociality. Science 318, 441–444
43 Hornshoj, H. et al. (2009) Transcriptomic and proteomic profiling of two porcine
tissues using high-throughput technologies. BMC Genomics 10, 30
44 Gilbert, J.A. et al. (2008) Detection of large numbers of novel sequences in the
metatranscriptomes of complex marine microbial communities. PLoS ONE 3,
e3042
45 Zhao, W.J. et al. (2009) Generation and analysis of expressed sequence tags from a
cDNA library of Moniezia expansa. Mol. Biochem. Parasitol. 164, 80–85
46 Roberts, P.C. (2008) Gene expression microarray data demystified. Biotechnol.
Annu. Rev. 14, 29–61
47 Kuster, H. et al. (2007) Development of bioinformatic tools to support EST-
sequencing, in silico- and microarray-based transcriptome profiling in
mycorrhizal symbioses. Phytochemistry 68, 19–32
48 Schmid, R. and Blaxter, M.L. (2008) annot8r: GO EC and KEGG annotation of EST
datasets. BMC Bioinform. 9, 180
49 Cheng, K.C. and Stromvik, M.V. (2008) SoyXpress: a database for exploring the
soybean transcriptome. BMC Genomics 9, 368
50 Cerda, J. et al. (2008) Genomic resources for a commercial flatfish, the Senegalese
sole (Solea senegalensis): EST sequencing, oligo microarray design, and
development of the Soleamold bioinformatic platform. BMC Genomics 9, 508
51 Ferraresso, S. et al. (2008) Development and validation of a gene expression oligo
microarray for the gilthead sea bream (Sparus aurata). BMC Genomics 9, 580
52 Jung, K.H. et al. (2008) Refinement of light-responsive transcript lists using rice
oligonucleotide arrays: evaluation of gene-redundancy. PLoS ONE 3, e3337
53 Koltai, H. and Weingarten-Baror, C. (2008) Specificity of DNA microarray
hybridization: characterization, effectors and approaches for data correction.
Nucleic Acids Res. 36, 2395–2405
54 Rouillard, J.M. et al. (2003) OligoArray 2.0: design of oligonucleotide probes for
DNA microarrays using a thermodynamic approach. Nucleic Acids Res. 31,
3057–3062
55 Reymond, N. et al. (2004) ROSO: optimizing oligonucleotide probes for
microarrays. Bioinformatics 20, 271–273
56 Rimour, S. et al. (2005) GoArrays: highly dynamic and efficient microarray probe
design. Bioinformatics 21, 1094–1103
57 Hu, G. et al. (2007) Selection of long oligonucleotides for gene expression
microarrays using weighted rank-sum strategy. BMC Bioinform 8, 350
58 Pariset, L. et al. (2008) From public sequences to custom microarrays: an easy and
affordable tool. XXXI Conference of the International Society for Animal Genetics,
Amsterdam, The Netherlands
59 Kane, M.D. et al. (2000) Assessment of the sensitivity and specificity of
oligonucleotide (50mer) microarrays. Nucleic Acids Res. 28, 4552–4557
60 Bongiorni, S. et al. (2009) Transcriptomic analysis of two sheep breeds
during lactation, using a new custom microarray platform. Ital. J. Anim. Sci.,
in press
61 Wei, C. et al. (2004) Sample size for detecting differentially expressed genes in
microarray experiments. BMC Genomics 5, 87
62 Schena, M. et al. (1995) Quantitative monitoring of gene expression patterns with
a complementary DNA microarray. Science 270, 467–470
63 Marziali, A. and Akeson, M. (2001) New DNA sequencing methods. Annu. Rev.
Biomed. Eng. 3, 195–223
64 Reagin, M.J. et al. (2003) TempliPhi: a sequencing template preparation procedure
that eliminates overnight cultures and DNA purification. J. Biomol. Tech. 14,
143–148
65 Ronaghi, M. et al. (1998) A sequencing method based on real-time pyrophosphate.
Science 281, 363–365
66 Ronaghi, M. et al. (1996) Real-time DNA sequencing using detection of
pyrophosphate release. Anal. Biochem. 242, 84–89
67 Margulies, M. et al. (2005) Genome sequencing in microfabricated high-density
picolitre reactors. Nature 437, 376–380
68 Karow, J. (2008) PacBio to Start Selling Next-Gen Sequencer To Early Users in 2010;
Goal is 100 Gb/Hour. In sequence http://www.genomeweb.com/sequencing/
pacbio-start-selling-next-gen-sequencer-early-users-2010-goal-100-gbhour
www.elsevier.com/locate/nbt 279