
Microarray analysis after RNA amplification can detect pronounced differences in gene expression...
14
BioMed Central Page 1 of 14 (page number not for citation purposes) BMC Genomics Open Access Research article Microarray analysis after RNA amplification can detect pronounced differences in gene expression using limma Ilhem Diboun* 1 , Lorenz Wernisch 2 , Christine Anne Orengo 1 and Martin Koltzenburg 3 Address: 1 Bioinformatics Unit, Department of Biochemistry and Molecular Biology, University College London, Gower Street, London, WC1E 6BT, UK, 2 School of Crystallography, Birkbeck College, University of London, Malet Street, London WC1 7HX, UK and 3 Neural Plasticity Unit, UCL Institute of Child Health, 30 Guilford St, London WC1N 1EH, UK Email: Ilhem Diboun* - [email protected]; Lorenz Wernisch - [email protected]; Christine Anne Orengo - [email protected]; Martin Koltzenburg - [email protected] * Corresponding author Abstract Background: RNA amplification is necessary for profiling gene expression from small tissue samples. Previous studies have shown that the T7 based amplification techniques are reproducible but may distort the true abundance of targets. However, the consequences of such distortions on the ability to detect biological variation in expression have not been explored sufficiently to define the true extent of usability and limitations of such amplification techniques. Results: We show that expression ratios are occasionally distorted by amplification using the Affymetrix small sample protocol version 2 due to a disproportional shift in intensity across biological samples. This occurs when a shift in one sample cannot be reflected in the other sample because the intensity would lie outside the dynamic range of the scanner. Interestingly, such distortions most commonly result in smaller ratios with the consequence of reducing the statistical significance of the ratios. This becomes more critical for less pronounced ratios where the evidence for differential expression is not strong. Indeed, statistical analysis by limma suggests that up to 87% of the genes with the largest and therefore most significant ratios (p < 10e -20 ) in the unamplified group have a p-value below 10e -20 in the amplified group. On the other hand, only 69% of the more moderate ratios (10e -20 < p < 10e -10 ) in the unamplified group have a p-value below 10e -10 in the amplified group. Our analysis also suggests that, overall, limma shows better overlap of genes found to be significant in the amplified and unamplified groups than the Z-scores statistics. Conclusion: We conclude that microarray analysis of amplified samples performs best at detecting differences in gene expression, when these are large and when limma statistics are used. Background Microarray technology offers a high throughput approach to transcriptional profiling on a genome wide scale. How- ever, the relatively large amount of starting material required for standard hybridization has limited its full potential. In complex biological systems such as the nerv- ous system, the utility of this approach is complicated by the fact that even in anatomically discrete regions, many divergent cell types are intermingled. It is often desirable to investigate gene expression profiles of distinct cell types Published: 09 October 2006 BMC Genomics 2006, 7:252 doi:10.1186/1471-2164-7-252 Received: 01 September 2006 Accepted: 09 October 2006 This article is available from: http://www.biomedcentral.com/1471-2164/7/252 © 2006 Diboun et al; licensee BioMed Central Ltd. This is an Open Access article distributed under the terms of the Creative Commons Attribution License (http://creativecommons.org/licenses/by/2.0 ), which permits unrestricted use, distribution, and reproduction in any medium, provided the original work is properly cited.
Transcript of Microarray analysis after RNA amplification can detect pronounced differences in gene expression...

BioMed CentralBMC Genomics
ss
Open AcceResearch articleMicroarray analysis after RNA amplification can detect pronounced differences in gene expression using limmaIlhem Diboun*1, Lorenz Wernisch2, Christine Anne Orengo1 and Martin Koltzenburg3Address: 1Bioinformatics Unit, Department of Biochemistry and Molecular Biology, University College London, Gower Street, London, WC1E 6BT, UK, 2School of Crystallography, Birkbeck College, University of London, Malet Street, London WC1 7HX, UK and 3Neural Plasticity Unit, UCL Institute of Child Health, 30 Guilford St, London WC1N 1EH, UK
Email: Ilhem Diboun* - [email protected]; Lorenz Wernisch - [email protected]; Christine Anne Orengo - [email protected]; Martin Koltzenburg - [email protected]
* Corresponding author
AbstractBackground: RNA amplification is necessary for profiling gene expression from small tissuesamples. Previous studies have shown that the T7 based amplification techniques are reproduciblebut may distort the true abundance of targets. However, the consequences of such distortions onthe ability to detect biological variation in expression have not been explored sufficiently to definethe true extent of usability and limitations of such amplification techniques.
Results: We show that expression ratios are occasionally distorted by amplification using theAffymetrix small sample protocol version 2 due to a disproportional shift in intensity acrossbiological samples. This occurs when a shift in one sample cannot be reflected in the other samplebecause the intensity would lie outside the dynamic range of the scanner. Interestingly, suchdistortions most commonly result in smaller ratios with the consequence of reducing the statisticalsignificance of the ratios. This becomes more critical for less pronounced ratios where the evidencefor differential expression is not strong. Indeed, statistical analysis by limma suggests that up to 87%of the genes with the largest and therefore most significant ratios (p < 10e-20) in the unamplifiedgroup have a p-value below 10e-20 in the amplified group. On the other hand, only 69% of the moremoderate ratios (10e-20 < p < 10e-10) in the unamplified group have a p-value below 10e-10 in theamplified group. Our analysis also suggests that, overall, limma shows better overlap of genes foundto be significant in the amplified and unamplified groups than the Z-scores statistics.
Conclusion: We conclude that microarray analysis of amplified samples performs best atdetecting differences in gene expression, when these are large and when limma statistics are used.
BackgroundMicroarray technology offers a high throughput approachto transcriptional profiling on a genome wide scale. How-ever, the relatively large amount of starting materialrequired for standard hybridization has limited its full
potential. In complex biological systems such as the nerv-ous system, the utility of this approach is complicated bythe fact that even in anatomically discrete regions, manydivergent cell types are intermingled. It is often desirableto investigate gene expression profiles of distinct cell types
Published: 09 October 2006
BMC Genomics 2006, 7:252 doi:10.1186/1471-2164-7-252
Received: 01 September 2006Accepted: 09 October 2006
This article is available from: http://www.biomedcentral.com/1471-2164/7/252
© 2006 Diboun et al; licensee BioMed Central Ltd.This is an Open Access article distributed under the terms of the Creative Commons Attribution License (http://creativecommons.org/licenses/by/2.0), which permits unrestricted use, distribution, and reproduction in any medium, provided the original work is properly cited.
Page 1 of 14(page number not for citation purposes)

BMC Genomics 2006, 7:252 http://www.biomedcentral.com/1471-2164/7/252
and although laser microdissection provides a solution tothe problem of tissue procurement, the small amount ofRNA that can be harvested has precluded a straightfor-ward combination of both technologies. This limitation iscompounded by the need of replication essential for sta-tistical analysis.
Another scenario in which the lack of sufficient tissueavailability has been challenging is the correlation of thephenotype in individual experimental animals with com-prehensive gene expression profiles. For example, so far ithas not been possible to correlate the inter-individualbehavioural variability in animal models of chronic painwith the corresponding correlates in gene expression inthe principal anatomical components of the pain pathwayas such structures in individual animals do not yield suffi-cient amounts of RNA for standard hybridization proto-cols.
To overcome these issues, increasingly sophisticatedapproaches to RNA amplification from small tissue sam-ples have been developed for use with microarrays. Thesefall principally into two categories. One is based on PCRand is characterized by an exponential increase in copynumber while the other is based on the T7-polymerase in-vitro transcription (IVT) to achieve a linear amplificationof targets. For maximum fidelity, linearity of target ampli-fication is desirable. Thus, substantial work has focusedon exploring the T7 linear techniques [1-4], in particularthe Affymetrix small sample protocol II has been assessedby numerous studies with interesting results. Analysisbased on correlating intensity levels and assessing con-cordance in detection calls has indicated a high level ofreproducibility [2,3,5,6]. However, occasional failure tomaintain the true abundance level of transcripts was alsofound [3,5,6] due to the protocol 3'bias [1,2,4,6,7]. Suchbias is thought to be related to the use of random hexam-ers to prime the RT reaction in the additional round ofamplification. With priming that is remote from the3'end, RT may not be successfully completed causing adiminution in the signal from the 5' regions.
These observations are useful indicators of protocol valid-ity; though, the ultimate fidelity criterion is the ability tomaintain differential expression between different tissuesor under varying experimental conditions. Some previousstudies have reported a 50% drop in significant changes ingene expression using RNA amplification [4], suggestingthat RNA amplification may suffer major problems and ispotentially unsuitable for microarray analysis.
In this study, we critically appraise the suitability and mer-its of transcript amplification from small biological sam-ples for microarray expression profiling using theAffymetrix small sample protocol II. We confirm previous
findings on the reproducibility and fidelity of the proto-col. We present compelling evidence for the 3' bias intro-duced by RNA amplification. We show how distortions inintensity may be reflected in the expression ratios frombiologically different samples. Importantly, we explorethe effect of distortions in expression ratios on their statis-tical significance.
ResultsIn this study, we undertake a detailed analysis of targetamplification for microarrays using the Affymetrix smallsample protocol II. This analysis was performed usingcontrol data from standard protocol preparations as refer-ence. For the rest of the article, we refer to the standardprotocol as the OneRA (one round amplification) proto-col and the small sample protocol as the TwoRA (tworounds amplification) protocol. TwoRA and OneRA sam-ples from three different biological groups were used inthis study: the DRG (dorsal root ganglia) group, the SN(spinal cord from normal animals) group and the SA (spi-nal cord from animals with axotomised sciatic nerve)group. In each group, there are 4 replicates from theTwoRA and 3 replicates from the OneRA (Figure 1a).While, the main objective of this study is to assess theextent to which biologically relevant variation in geneexpression can be detected in the TwoRA, we begin byassessing the reproducibility of the TwoRA protocol andits fidelity in maintaining the relative abundance of tar-gets.
Reproducibility and fidelity in maintaining expression levelsScatter plots of log2 intensities from paired TwoRA repli-cates show expectedly high level of consistency similar tothat observed with the OneRA replicates (Figure 1b &1c)((r) ranging from 0.990 to 0.994 among all possible pairsof the TwoRA replicates and the OneRA replicates from allbiological groups). However, comparing the average log2intensity values from the OneRA and the TwoRA (Figure1d) for a single tissue, we see evidence of variabilityimplying that the TwoRA protocol may distort the signal.
We used an ANOVA approach to confirm that the variabil-ity between protocol groups is greater than that amongreplicates within each group. In particular, a one-way,two-levels ANOVA analysis was performed for each geneseparately, with 3 measurements from the OneRA (level1) and 4 measurements from the TwoRA (level 2). First,the between group mean sum of squares MSA as well asthe mean residual sum of squares MSE were calculated.The median of the MSA was higher than the median of theMSE (given in parenthesis) in all biological groups: DRG0.050 (0.023), SN 0.062 (0.016), SA 0.068.
Page 2 of 14(page number not for citation purposes)

BMC Genomics 2006, 7:252 http://www.biomedcentral.com/1471-2164/7/252
To test whether protocol variability is significantly greaterthan the residual variability, we derived p-values from theF-values (MSA/MSE) for each gene (using the upper tail ofan F-distribution with 1 and 3 + 4 – 2 degrees of freedom).In fact, the p-values were far from uniformly distributed.Storey suggests the following estimate of the proportionof hypotheses from the null using p-values: the fraction ofp-values above the median p-value m, divided by (1-m)[38]. This results in the following estimate of the propor-tion of genes with significantly higher amplification vari-ability: DRG 47%, SN 50%, SA 41%. That is, in all cases atleast 40% of genes show differences between protocols,which are not explained by variability within replicates.
Signal distortion following TwoRATo investigate signal distortion by the TwoRA protocol, welooked at the well-documented 3' bias feature of the pro-tocol in the DRG dataset (similar results were obtained
with the SA and SN). Bias arises from greater 3' represen-tation of targets during TwoRA while 5' regions are oftenlost. This causes amplified RNA to be shorter than normal.Previously published work explored the increase in the 3'/5' signal ratios only from control genes (GAPDH, Actin)to prove that such effect occurred)[2,4,7]. In this study, weundertook a more comprehensive analysis by using infor-mation from all probesets on the array. More specifically,we correlated the deviation in log2 intensity followingTwoRA (Δlog2IN) – obtained by subtracting the log2intensity in the OneRA from that of the TwoRA – with theprobesets 3' locations on corresponding targets (see meth-ods for a description of how these locations wereobtained) (Figure 2). The trend suggests that probesetsdistal from the 3' end are more likely to endure an atten-uation of signal intensity following TwoRA whilst thoseclose to the 3' end are likely to show intensification of sig-nal.
A, experimental designFigure 1A, experimental design. B&C&D, correlation of log2 intensities within and between protocol groups. B&C, scat-ter plots of log2 signal intensities from a pair of replicates treated with the OneRA and the TwoRA protocol respectively. D, scatter plot of log2 signal intensities averaged across the OneRA replicates versus that from the TwoRA replicates. The coeffi-cient of correlation (r) value is given for each pair. Similar results were obtained with the SN and SA sample groups.
Page 3 of 14(page number not for citation purposes)

BMC Genomics 2006, 7:252 http://www.biomedcentral.com/1471-2164/7/252
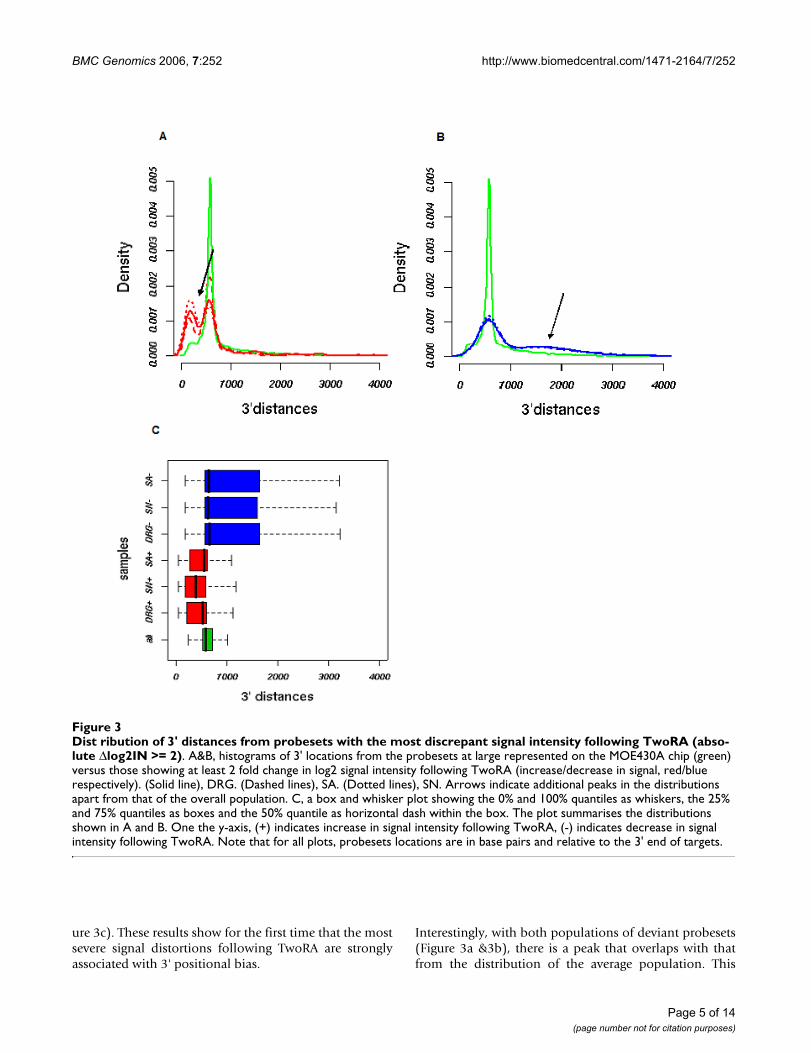
In a separate but related analysis, probesets whose abso-lute Δlog2IN values were greater than 2 were reviewed fortheir 3' location distribution (Figure 3). This was com-pared to the distribution of 3'location of all probesets onthe array. The distribution for all probesets appears to beskewed and peaks at around 600 bp. The distribution ofprobesets with intensified signal shows an additionalpeak to the left suggesting a distinct population of
probesets closer than average to the 3' end (Figure 3a).This is further highlighted by a decrease in the 25% quan-tile relative to the overall population in the boxplots onfigure 3c. Conversely, the distribution from probesetswith attenuated signal shows a second peak to the rightindicating an overrepresentation of more distal interroga-tion points relative to the 3' end of targets (Figure 3b).This corresponds to an increase in the 75% quantile (Fig-
Deviation in log2 intensity following TwoRA (Δlog2IN) as a function of probeset 3' distance rankFigure 2Deviation in log2 intensity following TwoRA (Δlog2IN) as a function of probeset 3' distance rank. Δlog2IN values on the y-axis were calculated by subtracting the mean OneRA from the mean TwoRA probeset log2 intensities. The x-axis shows the ranks of probesets locations. Probesets locations are relative to the 3' end of the transcripts (refer to methods for more details). Since the probesets locations have a skewed distribution, their ranks were plotted instead of their absolute val-ues; this allows dispersion of data points. The actual probesets locations that correspond to the rank intervals on the x-axis are shown on the blue horizontal axis on the top of the figure. The regression line is shown in red. Only data from the DRG prep-aration were used, similar results were obtained with the SN and
Page 4 of 14(page number not for citation purposes)
BMC Genomics 2006, 7:252 http://www.biomedcentral.com/1471-2164/7/252
ure 3c). These results show for the first time that the mostsevere signal distortions following TwoRA are stronglyassociated with 3' positional bias.
Interestingly, with both populations of deviant probesets(Figure 3a &3b), there is a peak that overlaps with thatfrom the distribution of the average population. This
Distribution of 3' distances from probesets with the most discrepant signal intensity following TwoRA (absolute Δlog2IN >= 2)Figure 3Dist ribution of 3' distances from probesets with the most discrepant signal intensity following TwoRA (abso-lute Δlog2IN >= 2). A&B, histograms of 3' locations from the probesets at large represented on the MOE430A chip (green) versus those showing at least 2 fold change in log2 signal intensity following TwoRA (increase/decrease in signal, red/blue respectively). (Solid line), DRG. (Dashed lines), SA. (Dotted lines), SN. Arrows indicate additional peaks in the distributions apart from that of the overall population. C, a box and whisker plot showing the 0% and 100% quantiles as whiskers, the 25% and 75% quantiles as boxes and the 50% quantile as horizontal dash within the box. The plot summarises the distributions shown in A and B. One the y-axis, (+) indicates increase in signal intensity following TwoRA, (-) indicates decrease in signal intensity following TwoRA. Note that for all plots, probesets locations are in base pairs and relative to the 3' end of targets.
Page 5 of 14(page number not for citation purposes)
BMC Genomics 2006, 7:252 http://www.biomedcentral.com/1471-2164/7/252
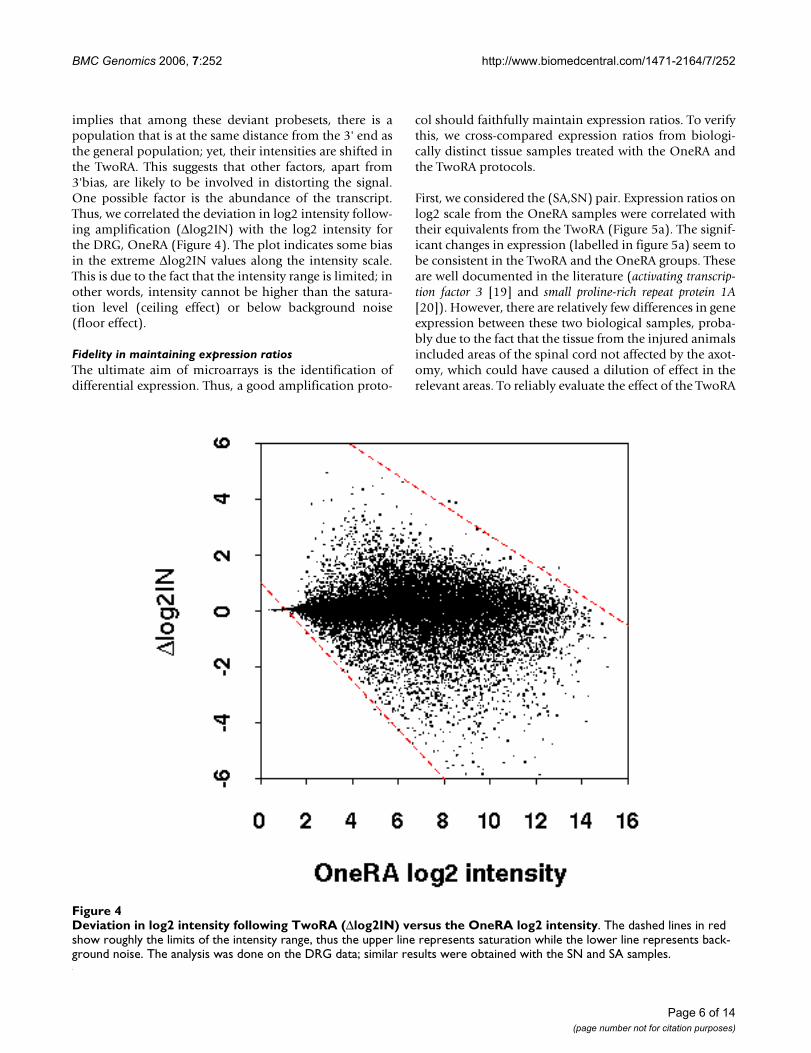
implies that among these deviant probesets, there is apopulation that is at the same distance from the 3' end asthe general population; yet, their intensities are shifted inthe TwoRA. This suggests that other factors, apart from3'bias, are likely to be involved in distorting the signal.One possible factor is the abundance of the transcript.Thus, we correlated the deviation in log2 intensity follow-ing amplification (Δlog2IN) with the log2 intensity forthe DRG, OneRA (Figure 4). The plot indicates some biasin the extreme Δlog2IN values along the intensity scale.This is due to the fact that the intensity range is limited; inother words, intensity cannot be higher than the satura-tion level (ceiling effect) or below background noise(floor effect).
Fidelity in maintaining expression ratiosThe ultimate aim of microarrays is the identification ofdifferential expression. Thus, a good amplification proto-
col should faithfully maintain expression ratios. To verifythis, we cross-compared expression ratios from biologi-cally distinct tissue samples treated with the OneRA andthe TwoRA protocols.
First, we considered the (SA,SN) pair. Expression ratios onlog2 scale from the OneRA samples were correlated withtheir equivalents from the TwoRA (Figure 5a). The signif-icant changes in expression (labelled in figure 5a) seem tobe consistent in the TwoRA and the OneRA groups. Theseare well documented in the literature (activating transcrip-tion factor 3 [19] and small proline-rich repeat protein 1A[20]). However, there are relatively few differences in geneexpression between these two biological samples, proba-bly due to the fact that the tissue from the injured animalsincluded areas of the spinal cord not affected by the axot-omy, which could have caused a dilution of effect in therelevant areas. To reliably evaluate the effect of the TwoRA
Deviation in log2 intensity following TwoRA (Δlog2IN) versus the OneRA log2 intensityFigure 4Deviation in log2 intensity following TwoRA (Δlog2IN) versus the OneRA log2 intensity. The dashed lines in red show roughly the limits of the intensity range, thus the upper line represents saturation while the lower line represents back-ground noise. The analysis was done on the DRG data; similar results were obtained with the SN and SA samples.
Page 6 of 14(page number not for citation purposes)

BMC Genomics 2006, 7:252 http://www.biomedcentral.com/1471-2164/7/252
Page 7 of 14(page number not for citation purposes)
Correlation of log2 expression ratios from the OneRA and TwoRA and that of Δlog2IN from the two compared samplesFigure 5Correlation of log2 expression ratios from the OneRA and TwoRA and that of Δlog2IN from the two com-pared samples. A&C, scatter plots of log2 expression ratios from the OneRA and the TwoRA for the (SA,SN), (DRG,SN) pairs respectively. For instance, the log2 OneRA expression ratio for the (DRG,SN) pair is log2 OneRA DRG – log2 OneRA SN. For the (SN, SA) pair, the most significant differences in gene expression (ATF3 and SPRR1A) are consistent in both pro-tocol groups. For the (DRG,SN), the ratios are more varying, the regression line (shown in blue) appears to be shifted from the diagonal towards smaller values of expression ratios in The TwoRA. B&D, scatter plots of Δlog2IN values for the (DRG,SN) pair and the (SA,SN) pair respectively. Δlog2IN were calculated by subtracting the log2 OneRA intensity from the log2 TwoRA intensity. Points in red in 'C' are probesets where the intensity in one sample could not be shifted as much as in the other sample because the intensity cannot lie outside the dynamic range of the scanner. These are referred to as FCE (floor & ceiling effect) probesets and have varying expression ratios following TwoRA. The FCE probesets also show the most varying DRG and SN Δlog2IN values (points in red, D). Though, for these same probesets, the Δlog2IN values in the SA and the SN are fairly consistent (points in red, B).

BMC Genomics 2006, 7:252 http://www.biomedcentral.com/1471-2164/7/252
protocol on ratios, a larger profile of differential expres-sion is needed. This was possible with the (DRG,SN) pair.Thus, we decided to base our assessment of the effect ofthe TwoRA on ratios on the (DRG,SN) dataset.
Encouragingly, log2 expression ratios from the (DRG,SN)treated with the OneRA and the TwoRA protocols arecomparable; though they show more variability than theircounterparts from the (SA,SN) pair (Figure 5c). Moreover,the regression line (shown in blue) appears to be shiftedfrom the diagonal in a way that suggests that the expres-sion ratios are on average slightly lower in the TwoRA rel-ative to the OneRA.
Variation in ratiosFrom our previous analysis, we know that the TwoRA pro-tocol may shift the absolute intensity levels. However, thisonly affects expression ratios if the intensity is shifted une-qually in the two biological samples. That is, deviations inintensity (Δlog2IN) following TwoRA, that differ in thetwo samples, can result in variability in the expressionratios from the OneRA and the TwoRA groups.
To get further insights into how unequal shifts in theintensity level following amplification of different biolog-ical samples affect the expression ratios, we rankedprobesets by the absolute difference in their OneRA andTwoRA log2 expression ratios and selected the top 100 forfurther analysis (partly listed in Table 1). Specifically, weexamined the intensities of these selected probesets acrossall four groups: the OneRA and the TwoRA DRG, SN. Theresulting intensity profiles were classified into four catego-ries depending on the direction of change in intensity andthe tissue where this change occurred (Figure 6). The mostpopulated categories show a significant reduction in theintensity in one of the samples whilst the intensity in the
other sample is minimally reduced (Figure 6a &6c). Lessfrequently, the intensity increases with amplification inone of the samples but not in the other sample (Figure 6b&6d).
Interestingly, with all four categories, expression ratios arereduced following TwoRA. Moreover, the majority of theselected probesets have varying intensity levels in the DRGversus SN, OneRA. Frequently these genes are absent inone sample but highly expressed in the other sample(shown as coloured lines in figure 6), which may explainthe deviation in expression ratios following TwoRA. If onetakes the example of HipK2, the log2 intensity in the SNwas reduced from 8.20 in the OneRA to 0.73 in theTwoRA. However, HipK2 is absent in the DRG (theOneRA log2 intensity is 0.87), thus an equivalent reduc-tion in the intensity level in this sample is not possible(floor effect). As such the log2 expression ratio is shiftedfrom -7.33 in the OneRA to 0.15 in the TwoRA. Alterna-tively, in other cases, if amplification increases the inten-sity in one sample, an equal shift in the other samplewould not be possible if the intensity was close to satura-tion (ceiling effect).
Thus, distortions in the expression ratios may occur whena shift in intensity (Δlog2IN) in one sample cannot bemirrored in the other sample because it would cause theintensity to fall outside the dynamic range of the scanner.This relates to the previous analysis presented in Figure 4.Certainly, this phenomenon does not apply to genes withsimilar intensity levels in the two samples since a shift inintensity in one sample is equally possible in the othersample.
To assess the extent to which this phenomenon explainsthe deviation in expression ratios observed across the
Table 1: Summary of the top 10 discrepant probesets whose (DRG,SN) expression ratios from the TwoRA deviate most from the OneRA.
ProbeSet ID (Gene Symbol) Log 2 intensity
DRG SN SA
1R 2R 1R 2R 1R 2R
1425983_x_at (Hipk2) 0.87 0.89 8.20 0.73 7.79 0.701422277_at (Glra1) 2.35 2.40 9.65 2.46 9.87 2.461422009_at (Atp1b2) 2.98 2.56 12.73 5.50 12.57 4.491450177_at (Ngfr) 8.98 2.63 2.25 2.33 2.23 2.271425337_at (Slc12a5) 2.34 2.33 9.89 3.50 9.63 3.541425963_at (Cabp7) 1.94 1.98 7.88 2.07 7.80 2.031439083_at (Ahi1) 2.14 2.17 7.77 2.05 7.96 2.541429566_a_at (Hipk2) 1.62 1.55 11.01 5.60 10.78 5.711456637_at (Lrrtm2) 8.57 3.35 3.92 4.00 4.59 4.071423669_at (Col1a1) 11.06 5.86 2.76 2.81 2.74 2.74
Listed are gene annotations (probeset ID and gene symbol) and log2 intensities from all biological versus protocol groups.
Page 8 of 14(page number not for citation purposes)

BMC Genomics 2006, 7:252 http://www.biomedcentral.com/1471-2164/7/252
whole set of targets on the chip, we undertook an alterna-tive analysis. We selected all probesets where a shift inintensity following TwoRA in one sample would cause theintensity in the other sample to fall outside the intensityrange, that is below the background noise or higher thanthe saturation level. These limits were chosen to be the 3%and 98% quantiles of the distribution of signal intensity
on the chip, respectively. The analysis was conducted byfirst determining the maximum Δlog2IN (log2 TwoRA –log2 OneRA) across the two samples for each gene. Thus,if the maximum Δlog2IN is found in sample A, we add thesame Δlog2IN to the OneRA log 2 intensity from sampleB. If the resulting value is outside the chosen limits, theprobeset is selected by our analysis.
Intensity profiles of probesets with top 100 most deviant expression ratios following TwoRAFigure 6Intensity profiles of probesets with top 100 most deviant expression ratios following TwoRA. The profiles are classified into four categories: A&C, the intensity is reduced in the tissue sample where the gene is more expressed (DRG, SN respectively). B&D, the intensity is increased in the sample where the gene is less expressed (SN, DRG respectively). Solid lines mark the shift in intensity from OneRA to TwoRA for one tissue sample. Dashed lines link the intensity data for equivalent probesets in the two biological samples. In colour are probesets with absent call 'A' in the SN (red) and DRG (blue).
Page 9 of 14(page number not for citation purposes)

BMC Genomics 2006, 7:252 http://www.biomedcentral.com/1471-2164/7/252
Since the selected probesets suffer from a floor and ceilingeffect, we shall refer to them as FCE probesets for the rest ofthe article. Clearly, the FCE probesets are the sameprobesets that show the most deviant expression ratiosfollowing TwoRA (coloured in red, Figure 5c) and corre-spondingly the most pronounced variation in shifts inintensity (Δlog2IN) in the DRG and SN samples (in red,Figure 5d). In fact, the correlation in the (DRG,SN)expression ratios across protocols (r) = 0.89 is improvedto 0.93 when the FCE probesets are excluded. Interest-ingly, we found that the FCE probesets show consistentΔlog2IN following TwoRA in the SA and SN groups (inred, Figure 5b). This is because their intensities are similarin the (SA,SN) but different in the (DRG,SN) datasets.
Similarity in inferring significance in ratiosThe primary aim of a microarray experiment is to detectsignificant changes in gene expression. Our results suggestthat ratios are most commonly reduced among the geneswith large expression ratios in the OneRA, thus likely to bedifferentially expressed. Indeed, we found good evidencefrom the literature to suggest that 9 genes of those with the10 most discrepant ratios following TwoRA are indeed dif-ferentially expressed between the SN and DRG (Table 2).Despite reductions in the ratios, genes can remain signifi-cant following TwoRA if their ratios are still large relativeto the average population in the TwoRA. Moreover,among the population of genes with high expressionratios in the OneRA (Figure 5c), many do maintain theirratios in the TwoRA, most likely due to a faithful TwoRAof the transcripts in the two biological samples.
Table 2: Evidence of differential expression for the genes with the 10 most discrepant (DRG,SN) tissue ratios from the OneRA and the TwoRA.
ProbeSet ID Gene Symbol) Log2 expression ratios Evidence for differential expression
OneRA TwoRA
1425983_x_at (Hipk2) -7.33 0.15 Hipk2 encodes Homeodomain-interacting protein kinase 2. On the chip, there are two interrogation sites and in both the results from the OneRA indicates that the gene is more strongly expressed in the spinal cord. In the embryo, Hipk2 is expressed in DRG and spinal cord [24] but it is strongly downregulated prenatally in sensory neurons [25]. Judging from LacZ expression in transgenic mice, Hipk2 is highly expressed in the spinal cord, especially in the motor neurons [26].
1429566_a_at (Hipk2) -9.40 -4.061422277_at (Glra1) -7.29 -0.06 Glra1 encodes the alpha1 subunit of the glycine receptor. Although it is found in
some neurons of the DRG, it is very strongly expressed in the spinal cord [27].1422009_at (Atp1b2) -9.75 2.94 ATP1b2 encodes the beta2 subunit of the Na+/K+ transporting ATPase, which is
mainly located in glial cells [28]. It is not found in the DRG using immunohistochemistry [29].
1450177_at (Ngfr) 6.73 0.30 Ngfr encodes the low affinity neurotrophin receptor p75. In the adult it is expressed in many neurons of the DRG [30], but largely absent in the spinal cord [31]. A second probeset (ID: 1421241_at) interrogating the same gene reported similar results i.e. the log2 expression ratio in the TwoRA is reduced (3.62, 0.22 OneRA, TwoRA respectively).
1425337_at (Slc12a5) -7.54 1.16 Slc12a5 is the Solute carrier family 12 member 5, also known as the Neuronal K-Cl cotransporter 2 (KCC2). It is strongly expressed in neurons of the adult CNS including the spinal cord but it is absent in DRG neurons [32].
1425963_at (Cabp7) -5.95 -0.09 Cabp7 encodes the calcium binding protein 7, which is strongly expressed in spinal cord [33].
1439083_at (Ahi1) -5.63 0.12 Ahi1, Abelson helper integration site 1, encodes a cytoplasmic adaptor protein [34]. It is primarily expressed in the CNS including the spinal cord [35]. Mutation of this gene causes Joubert syndrome, a congenital malformation of the cerebellum and brainstem with axonal decussating abnormalities of the corticospinal tract [35].
1456637_at (Lrrtm2) 4.65 -0.65 Lrrtm2 is leucine-reach repeat protein 2, also known as neuronal leucine-rich repeat protein 2. It is found in DRG and spinal cord [36] and on the basis of available in situ hybridisation data appears to have stronger expression in the DRG than in spinal cord [36].
1423669_at (Col1a1) 8.30 3.05 Col1a1, is collagen type 1. It is ubiquitously expressed, but prominent in bone and connective tissue. It is possible that the increase in the DRG sample is due to a contamination during the dissection of the DRG (which were harvested after cutting the vertebral column).
The genes have large expression ratios in the OneRA that are reduced in the TwoRA. The log2 expression ratios are calculated as log2 intensity from the DRG group – log2 intensity from the SN group. Thus, if the ratio is positive, the gene is more expressed in the DRG whilst if negative, the gene is more expressed in the SN.
Page 10 of 14(page number not for citation purposes)
BMC Genomics 2006, 7:252 http://www.biomedcentral.com/1471-2164/7/252
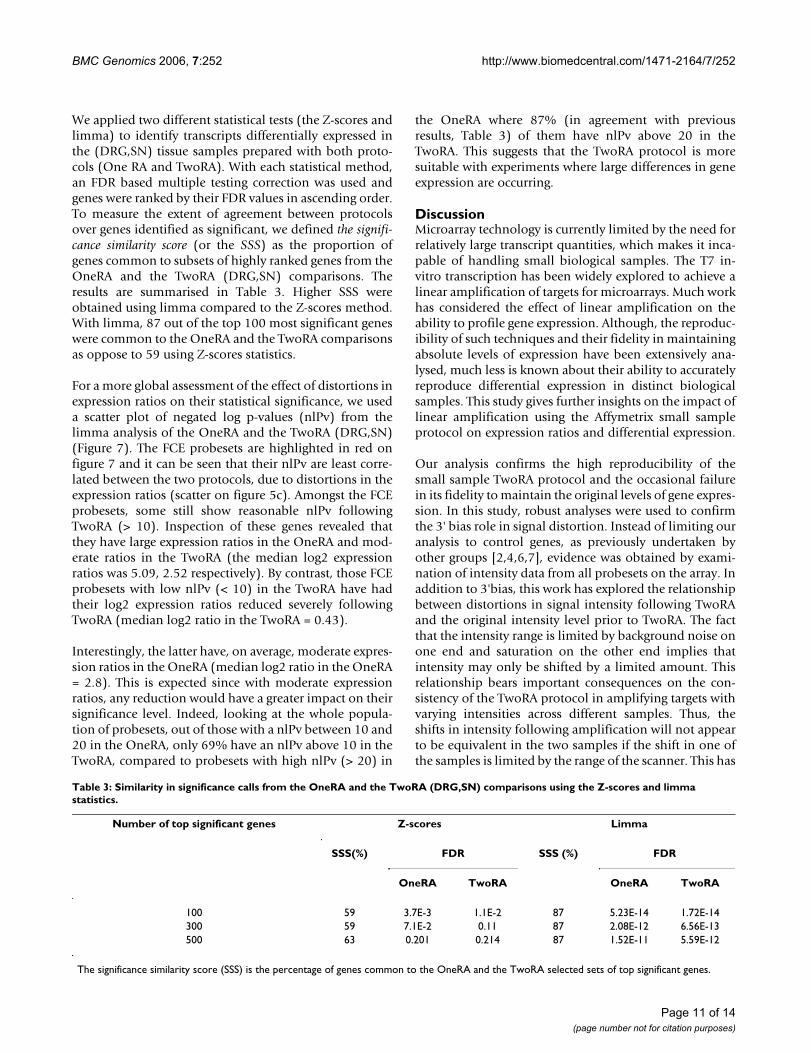
We applied two different statistical tests (the Z-scores andlimma) to identify transcripts differentially expressed inthe (DRG,SN) tissue samples prepared with both proto-cols (One RA and TwoRA). With each statistical method,an FDR based multiple testing correction was used andgenes were ranked by their FDR values in ascending order.To measure the extent of agreement between protocolsover genes identified as significant, we defined the signifi-cance similarity score (or the SSS) as the proportion ofgenes common to subsets of highly ranked genes from theOneRA and the TwoRA (DRG,SN) comparisons. Theresults are summarised in Table 3. Higher SSS wereobtained using limma compared to the Z-scores method.With limma, 87 out of the top 100 most significant geneswere common to the OneRA and the TwoRA comparisonsas oppose to 59 using Z-scores statistics.
For a more global assessment of the effect of distortions inexpression ratios on their statistical significance, we useda scatter plot of negated log p-values (nlPv) from thelimma analysis of the OneRA and the TwoRA (DRG,SN)(Figure 7). The FCE probesets are highlighted in red onfigure 7 and it can be seen that their nlPv are least corre-lated between the two protocols, due to distortions in theexpression ratios (scatter on figure 5c). Amongst the FCEprobesets, some still show reasonable nlPv followingTwoRA (> 10). Inspection of these genes revealed thatthey have large expression ratios in the OneRA and mod-erate ratios in the TwoRA (the median log2 expressionratios was 5.09, 2.52 respectively). By contrast, those FCEprobesets with low nlPv (< 10) in the TwoRA have hadtheir log2 expression ratios reduced severely followingTwoRA (median log2 ratio in the TwoRA = 0.43).
Interestingly, the latter have, on average, moderate expres-sion ratios in the OneRA (median log2 ratio in the OneRA= 2.8). This is expected since with moderate expressionratios, any reduction would have a greater impact on theirsignificance level. Indeed, looking at the whole popula-tion of probesets, out of those with a nlPv between 10 and20 in the OneRA, only 69% have an nlPv above 10 in theTwoRA, compared to probesets with high nlPv (> 20) in
the OneRA where 87% (in agreement with previousresults, Table 3) of them have nlPv above 20 in theTwoRA. This suggests that the TwoRA protocol is moresuitable with experiments where large differences in geneexpression are occurring.
DiscussionMicroarray technology is currently limited by the need forrelatively large transcript quantities, which makes it inca-pable of handling small biological samples. The T7 in-vitro transcription has been widely explored to achieve alinear amplification of targets for microarrays. Much workhas considered the effect of linear amplification on theability to profile gene expression. Although, the reproduc-ibility of such techniques and their fidelity in maintainingabsolute levels of expression have been extensively ana-lysed, much less is known about their ability to accuratelyreproduce differential expression in distinct biologicalsamples. This study gives further insights on the impact oflinear amplification using the Affymetrix small sampleprotocol on expression ratios and differential expression.
Our analysis confirms the high reproducibility of thesmall sample TwoRA protocol and the occasional failurein its fidelity to maintain the original levels of gene expres-sion. In this study, robust analyses were used to confirmthe 3' bias role in signal distortion. Instead of limiting ouranalysis to control genes, as previously undertaken byother groups [2,4,6,7], evidence was obtained by exami-nation of intensity data from all probesets on the array. Inaddition to 3'bias, this work has explored the relationshipbetween distortions in signal intensity following TwoRAand the original intensity level prior to TwoRA. The factthat the intensity range is limited by background noise onone end and saturation on the other end implies thatintensity may only be shifted by a limited amount. Thisrelationship bears important consequences on the con-sistency of the TwoRA protocol in amplifying targets withvarying intensities across different samples. Thus, theshifts in intensity following amplification will not appearto be equivalent in the two samples if the shift in one ofthe samples is limited by the range of the scanner. This has
Table 3: Similarity in significance calls from the OneRA and the TwoRA (DRG,SN) comparisons using the Z-scores and limma statistics.
Number of top significant genes Z-scores Limma
SSS(%) FDR SSS (%) FDR
OneRA TwoRA OneRA TwoRA
100 59 3.7E-3 1.1E-2 87 5.23E-14 1.72E-14300 59 7.1E-2 0.11 87 2.08E-12 6.56E-13500 63 0.201 0.214 87 1.52E-11 5.59E-12
The significance similarity score (SSS) is the percentage of genes common to the OneRA and the TwoRA selected sets of top significant genes.
Page 11 of 14(page number not for citation purposes)

BMC Genomics 2006, 7:252 http://www.biomedcentral.com/1471-2164/7/252
the consequence of distorting the expression ratios, asclearly demonstrated by our data.
Unsurprisingly, the statistical significance of expressionratios is only affected when the expression ratio in theTwoRA is reduced to the point where it can no longer bedistinguished from noise. Importantly, large ratios are lesslikely to be critically diminished and more likely toremain significant following TwoRA. This explains whydespite the distortions in ratios in our dataset, there wasup to 87% agreement in the top significant genes (nlPv >20) from the TwoRA and OneRA (DRG,SN). On the otherhand, less agreement was observed among the less pro-nounced ratios (69%) since distortions are more critical.This leads us to the important conclusion that TwoRAmay affect the statistical significance of genes with moder-ate expression ratios to a greater extent. Another impor-tant finding by this study is that limma performs best atrecognising similarity in differential expression betweenthe OneRA and the TwoRA. Thus, the choice of statisticswill also affect the quality of information obtained frommicroarray analysis of amplified samples.
ConclusionWe conclude that the Affymetix small sample amplifica-tion protocol is useful with the following caveats: First, itshould be only used when tissue homogeneity is a crucialfactor and sufficient amounts of starting material cannotbe obtained by any other means. Secondly, target amplifi-cation using the small sample protocol appears to be suit-able in situations where big differences in gene expressionare expected. Fortunately, it is reasonable to expect largedifferential expressions with experiments characterisingdifferent cells within a mixed tissue where amplificationof transcript is necessary. Finally, application of such tech-nique in combination with limma statistical analysis isuseful in experiments where the ultimate purpose is toexperimentally characterise a finite number of targets, forexample the top 100 differentially expressed genes.
However, expression data obtained from amplified sam-ples might be less suitable for more comprehensivenumerical analysis, for example characterising regulatorynetworks, due to the problems caused by possible shifts insignal and expression ratios.
Methods- Tissue isolation and RNA extractionThree pools of tissue were prepared from C57/B6 adultmale mice after cervical dislocation or decapitation. Tissuefrom each animal was dissected within 10 minutes of kill-ing and collected on dry ice. One sample consisted of dor-sal root ganglia (DRG) of all spinal levels from 10 naïvemice. Another sample (SA) was the lumbar enlargementof the spinal cord of 5 animals that had undergone a uni-lateral sciatic nerve transection at mid-thigh level underisoflurane anesthesia 7 days previously. A third sample(SN) was the lumbar enlargement of the spinal cord of 5normal mice. RNA was prepared using the Trizol method(Invitrogen) followed by a cleanup step using the RNAe-asy Mini kit (Qiagen). RNA quality and quantity wasmeasured by microfluidic electrophoresis (Nanochip run-ning on a 2100 Bioanalyzer, Agilent Technologies, PaloAlto, USA). The 28S/18S RNA ranged from 1.3 to 1.4 in allsamples. The total amount of RNA was 42.2 μg, 40.1 μg,and 25.3 μg for the DRG, SN, SA samples respectively. Thecorresponding RNA integrity numbers (RINs) were 8.3,9.3 and 9.4. RINs larger than 8 are considered to be perfectfor downstream applications [37].
- RNA amplification and chip hybridisationRNA processing and hybridization followed the Affyme-trix methodology. In brief, the Affymetrix standard proto-col [8] (in the article referred to as the OneRA protocol)was used to generate three labelled cRNA samples fromeach tissue pool using 5 μg of total RNA as starting mate-rial (Figure 1a). The Affymetrix small sample protocol ver-sion 2 [9] (referred to as the TwoRA protocol) that
Effect of variation in expression ratios on their statistical sig-nificanceFigure 7Effect of variation in expression ratios on their statis-tical significance. Scatter plots of FDR corrected nlPv (negated log transformed p-value) from the Limma analysis of the OneRA and the TwoRA DRG and SN samples. As a result of negating the p-values, large nlPv indicate stronger evidence of differential expression. Data points in red repre-sent the FCE probesets. The dashed line is at nlPv = 10 in the TwoRA, above which genes may be considered significant.
Page 12 of 14(page number not for citation purposes)

BMC Genomics 2006, 7:252 http://www.biomedcentral.com/1471-2164/7/252
incorporates one extra round of IVT was used to generate4 labelled samples using 50 ng of starting material fromeach pool (Figure 1a). The quality of cRNA from all tissuepools and various treatments was assessed using microflu-idic electrophoresis. Similar profiles were obtained,although there was a significant shift towards smaller RNAfragments with the TwoRA protocol. Material from the 21target preparations was then hybridized to MOE430Achips.
- Data capture and data processingScanned images were first inspected for quality control(QC) using a variety of built-in QC tools from the Biocon-ductor package [10] of R, the open source environmentfor statistical analysis. QC consisted of visual examinationof probe array images, scatter plots from replicates, hierar-chical clustering of array hybridizations, RNA degradationplots and MvA plots. Feature intensity values fromscanned arrays were normalised and reduced to expres-sion summaries using the GC Robust Multiarray Algo-rithm (GCRMA) [11,12] implemented as a function in theBioconductor GCRMA library [13]. Detection calls indi-cating the presence or absence of signal from each probeset were obtained by processing the raw data with theMicroarray Analysis Suite 5.0 (MAS5). To obtain a consen-sus detection call across replicate hybridizations, a probeset was considered to be present if it received a P (present)detection call from all replicates or n-1 replicates with anM (marginal) call from the remaining replicate. A(absent) detection calls were determined in the same way.
For further analysis, probesets 3' locations were obtainedby downloading the MOE430a probe tab files made avail-able by the Affymetrix online support [39]. A probesetlocation was considered equal to the 3' distance of theprobe that is most distal from the 3' end of the corre-sponding target within the set.
To test for differential expression, two statistical methodswere used. The bayesian adjusted t-statistics from the lin-ear models for Micoarray data (limma) package [14,15]and the Z-scores method as described by Quackenbush[16]. With both methods, a multiple testing correctionbased on the false discovery rate (FDR) was performed.
Authors' contributionsID participated in experiment design, performed allnumerical analysis and produced the manuscript. LW hashad an essential input into the statistical analysis of thedata and contributed in writing up the manuscript. CAOcontributed advice on the analysis and critically reviewedthe manuscript. MK designed and implemented the exper-imental work, participated in the analysis and the draftingof the manuscript. All authors read and approved the finalmanuscript.
AcknowledgementsWe wish to thank Andrew Harrison, Mike Hubank, Caroline Johnston and Klio Maratou for helpful discussions, Danielle Fletcher and Nipurna Jina for preparation of the chips and Nick Jones and Stephen McMahon for help with the spinal cord dissection. This work was supported by the Wellcome Trust's Integrative Animal and Human Physiology Initiative, London Pain Consortium.
References1. Dumur CI, Garrett CT, Archer KJ, Nasim S, Wilkinson DS, Ferreira-
Gonzalez A: Evaluation of a linear amplification method forsmall samples used on high-density oligonucleotide microar-ray analysis. Anal Biochem 2004, 331:314-321.
2. King C, Guo N, Frampton GM, Gerry NP, Lenburg ME, RosenbergCL: Reliability and reproducibility of gene expression meas-urements using amplified RNA from laser-microdissectedprimary breast tissue with oligonucleotide arrays. J Mol Diagn2005, 7:57-64.
3. Li L, Roden J, Shapiro BE, Wold BJ, Bhatia S, Forman SJ, Bhatia R:Reproducibility, fidelity, and discriminant validity of mRNAamplification for microarray analysis from primary hemat-opoietic cells. J Mol Diagn 2005, 7:48-56.
4. McClintick JN, Jerome RE, Nicholson CR, Crabb DW, Edenberg HJ:Reproducibility of oligonucleotide arrays using small sam-ples. BMC Genomics 2003, 4:4.
5. Klur S, Toy K, Williams MP, Certa U: Evaluation of proceduresfor amplification of small-size samples for hybridization onmicroarrays. Genomics 2004, 83:508-517.
6. Wilson CL, Pepper SD, Hey Y, Miller CJ: Amplification protocolsintroduce systematic but reproducible errors into geneexpression studies. Biotechniques 2004, 36:498-506.
7. Singh R, Maganti RJ, Jabba SV, Wang M, Deng G, Heath JD, Kurn N,Wangemann P: Microarray-based comparison of three amplifi-cation methods for nanogram amounts of total RNA. Am JPhysiol Cell Physiol 2005, 288:C1179-C1189.
8. Tsujino H, Kondo E, Fukuoka T, Dai Y, Tokunaga A, Miki K, Yone-nobu K, Ochi T, Noguchi K: Activating transcription factor 3(ATF3) induction by axotomy in sensory and motoneurons:A novel neuronal marker of nerve injury. Mol Cell Neurosci2000, 15:170-182.
9. Bonilla IE, Tanabe K, Strittmatter SM: Small proline-rich repeatprotein 1A is expressed by axotomized neurons and pro-motes axonal outgrowth. J Neurosci 2002, 22:1303-1315.
10. Affymetrix SCCA: Affymetrix GeneChip Expression AnalysisTechnical Manual. 2001.
11. Affymetrix SCCA: GeneChip Eukaryotic Small Sample TargetLabeling Assay version II. 2001.
12. Gentleman RC, Carey VJ, Bates DM, Bolstad B, Dettling M, Dudoit S,Ellis B, Gautier L, Ge Y, Gentry J, Hornik K, Hothorn T, Huber W,Iacus S, Irizarry R, Leisch F, Li C, Maechler M, Rossini AJ, Sawitzki G,Smith C, Smyth G, Tierney L, Yang JY, Zhang J: Bioconductor: opensoftware development for computational biology and bioin-formatics. Genome Biol 2004, 5:R80.
13. Naef F, Magnasco MO: Solving the riddle of the bright mis-matches: labeling and effective binding in oligonucleotidearrays. Phys Rev E Stat Nonlin Soft Matter Phys 2003, 68:011906.
14. Wu ZIRAGRMFMSF: Model Based Background Adjustment forOligonucleotide Expression Arrays. John Hopkins University,Department of Biostatistics Working Papers, Baltimore, MD; 2003.
15. Wu A IR: Description of gcrma. 2005 [http://www.bioconductor.org/repository/devel/vignette/gcrma.pdf].
16. K.Smyth G: Linear Models and Empirical Bayes Methods forAssessing Differential Expression in Microarray Experi-ments. Statistical Applications in Genetics and Molecular Biology 2004,3:.
17. Gordon Smyth NTJW: limma: Linear Models for MicroarrayData User's Guide. The Walter and Eliza Hall Institute of medicalResearch; 2005.
18. Quackenbush J: Microarray data normalization and transfor-mation. Nat Genet 2002, 32 Suppl:496-501.
19. Wiggins AK, Wei G, Doxakis E, Wong C, Tang AA, Zang K, Luo EJ,Neve RL, Reichardt LF, Huang EJ: Interaction of Brn3a andHIPK2 mediates transcriptional repression of sensory neu-ron survival. J Cell Biol 2004, 167:257-267.
Page 13 of 14(page number not for citation purposes)

BMC Genomics 2006, 7:252 http://www.biomedcentral.com/1471-2164/7/252
Publish with BioMed Central and every scientist can read your work free of charge
"BioMed Central will be the most significant development for disseminating the results of biomedical research in our lifetime."
Sir Paul Nurse, Cancer Research UK
Your research papers will be:
available free of charge to the entire biomedical community
peer reviewed and published immediately upon acceptance
cited in PubMed and archived on PubMed Central
yours — you keep the copyright
Submit your manuscript here:http://www.biomedcentral.com/info/publishing_adv.asp
BioMedcentral
20. Wright DE, Snider WD: Neurotrophin receptor mRNA expres-sion defines distinct populations of neurons in rat dorsal rootganglia. J Comp Neurol 1995, 351:329-338.
Page 14 of 14(page number not for citation purposes)
http://www.ncbi.nlm.nih.gov/entrez/query.fcgi?cmd=Retrieve&db=PubMed&dopt=Abstract&list_uids=7706545
http://www.ncbi.nlm.nih.gov/entrez/query.fcgi?cmd=Retrieve&db=PubMed&dopt=Abstract&list_uids=7706545