
Copy number amplification of ENSA promotes ... - LIDE Biotech
16
ARTICLE Copy number amplification of ENSA promotes the progression of triple-negative breast cancer via cholesterol biosynthesis Yi-Yu Chen 1,2 , Jing-Yu Ge 1 , Si-Yuan Zhu 1 , Zhi-Ming Shao 1 & Ke-Da Yu 1 ✉ Copy number alterations (CNAs) are pivotal genetic events in triple-negative breast cancer (TNBC). Here, our integrated copy number and transcriptome analysis of 302 TNBC patients reveals that gene alpha-endosulfine (ENSA) exhibits recurrent amplification at the 1q21.3 region and is highly expressed in TNBC. ENSA promotes tumor growth and indicates poor patient survival in TNBC. Mechanistically, we identify ENSA as an essential regulator of cholesterol biosynthesis in TNBC that upregulates the expression of sterol regulatory element-binding transcription factor 2 (SREBP2), a pivotal transcription factor in cholesterol biosynthesis. We confirm that ENSA can increase the level of p-STAT3 (Tyr705) and acti- vated STAT3 binds to the promoter of SREBP2 to promote its transcription. Furthermore, we reveal the efficacy of STAT3 inhibitor Stattic in TNBC with high ENSA expression. In con- clusion, the amplification of ENSA at the 1q21.3 region promotes TNBC progression and indicates sensitivity to STAT3 inhibitors. https://doi.org/10.1038/s41467-022-28452-z OPEN 1 Department of Breast Surgery, Shanghai Cancer Center and Cancer Institute, Shanghai Medical College, Fudan University, 200032 Shanghai, P. R. China. 2 Human Phenome Institute, Fudan University, 825 Zhangheng Road, 201203 Shanghai, P. R. China. ✉ email: [email protected] NATURE COMMUNICATIONS | (2022)13:791 | https://doi.org/10.1038/s41467-022-28452-z | www.nature.com/naturecommunications 1 1234567890():,;
-
Upload
khangminh22 -
Category
Documents
-
view
2 -
download
0
Transcript of Copy number amplification of ENSA promotes ... - LIDE Biotech

ARTICLE
Copy number amplification of ENSA promotes theprogression of triple-negative breast cancer viacholesterol biosynthesisYi-Yu Chen1,2, Jing-Yu Ge1, Si-Yuan Zhu1, Zhi-Ming Shao1 & Ke-Da Yu 1✉
Copy number alterations (CNAs) are pivotal genetic events in triple-negative breast cancer
(TNBC). Here, our integrated copy number and transcriptome analysis of 302 TNBC patients
reveals that gene alpha-endosulfine (ENSA) exhibits recurrent amplification at the 1q21.3
region and is highly expressed in TNBC. ENSA promotes tumor growth and indicates poor
patient survival in TNBC. Mechanistically, we identify ENSA as an essential regulator of
cholesterol biosynthesis in TNBC that upregulates the expression of sterol regulatory
element-binding transcription factor 2 (SREBP2), a pivotal transcription factor in cholesterol
biosynthesis. We confirm that ENSA can increase the level of p-STAT3 (Tyr705) and acti-
vated STAT3 binds to the promoter of SREBP2 to promote its transcription. Furthermore, we
reveal the efficacy of STAT3 inhibitor Stattic in TNBC with high ENSA expression. In con-
clusion, the amplification of ENSA at the 1q21.3 region promotes TNBC progression and
indicates sensitivity to STAT3 inhibitors.
https://doi.org/10.1038/s41467-022-28452-z OPEN
1 Department of Breast Surgery, Shanghai Cancer Center and Cancer Institute, Shanghai Medical College, Fudan University, 200032 Shanghai, P. R. China.2 Human Phenome Institute, Fudan University, 825 Zhangheng Road, 201203 Shanghai, P. R. China. ✉email: [email protected]
NATURE COMMUNICATIONS | (2022) 13:791 | https://doi.org/10.1038/s41467-022-28452-z | www.nature.com/naturecommunications 1
1234
5678
90():,;
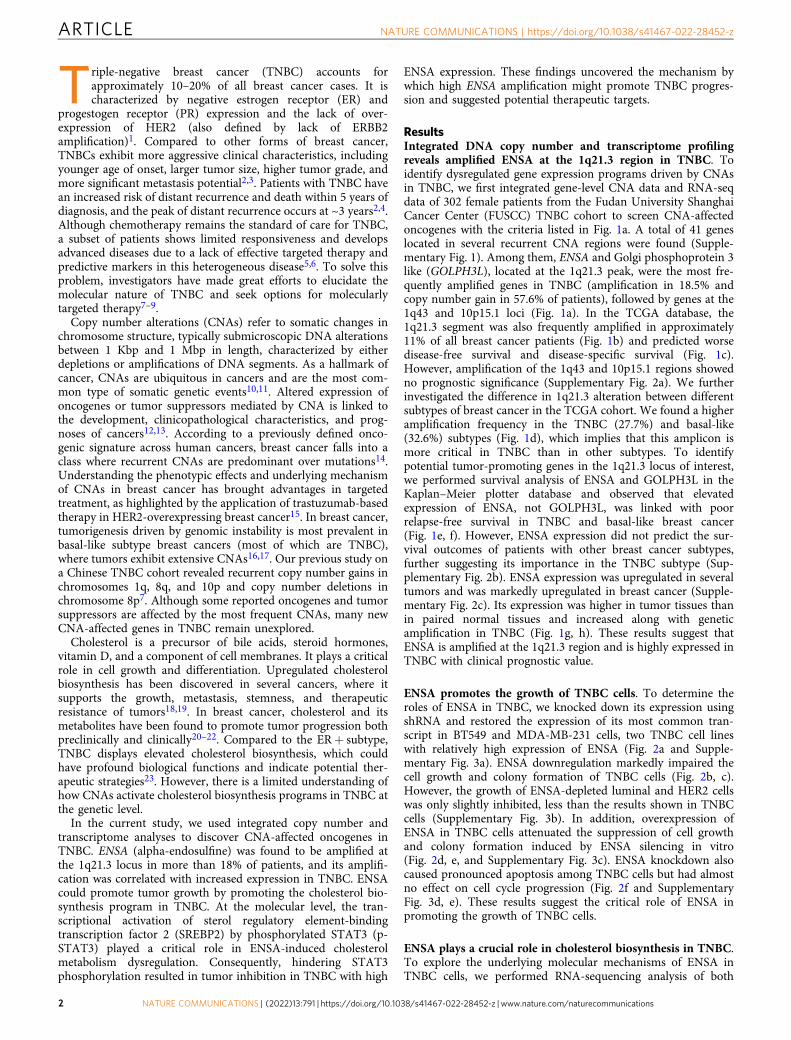
Triple-negative breast cancer (TNBC) accounts forapproximately 10–20% of all breast cancer cases. It ischaracterized by negative estrogen receptor (ER) and
progestogen receptor (PR) expression and the lack of over-expression of HER2 (also defined by lack of ERBB2amplification)1. Compared to other forms of breast cancer,TNBCs exhibit more aggressive clinical characteristics, includingyounger age of onset, larger tumor size, higher tumor grade, andmore significant metastasis potential2,3. Patients with TNBC havean increased risk of distant recurrence and death within 5 years ofdiagnosis, and the peak of distant recurrence occurs at ~3 years2,4.Although chemotherapy remains the standard of care for TNBC,a subset of patients shows limited responsiveness and developsadvanced diseases due to a lack of effective targeted therapy andpredictive markers in this heterogeneous disease5,6. To solve thisproblem, investigators have made great efforts to elucidate themolecular nature of TNBC and seek options for molecularlytargeted therapy7–9.
Copy number alterations (CNAs) refer to somatic changes inchromosome structure, typically submicroscopic DNA alterationsbetween 1 Kbp and 1 Mbp in length, characterized by eitherdepletions or amplifications of DNA segments. As a hallmark ofcancer, CNAs are ubiquitous in cancers and are the most com-mon type of somatic genetic events10,11. Altered expression ofoncogenes or tumor suppressors mediated by CNA is linked tothe development, clinicopathological characteristics, and prog-noses of cancers12,13. According to a previously defined onco-genic signature across human cancers, breast cancer falls into aclass where recurrent CNAs are predominant over mutations14.Understanding the phenotypic effects and underlying mechanismof CNAs in breast cancer has brought advantages in targetedtreatment, as highlighted by the application of trastuzumab-basedtherapy in HER2-overexpressing breast cancer15. In breast cancer,tumorigenesis driven by genomic instability is most prevalent inbasal-like subtype breast cancers (most of which are TNBC),where tumors exhibit extensive CNAs16,17. Our previous study ona Chinese TNBC cohort revealed recurrent copy number gains inchromosomes 1q, 8q, and 10p and copy number deletions inchromosome 8p7. Although some reported oncogenes and tumorsuppressors are affected by the most frequent CNAs, many newCNA-affected genes in TNBC remain unexplored.
Cholesterol is a precursor of bile acids, steroid hormones,vitamin D, and a component of cell membranes. It plays a criticalrole in cell growth and differentiation. Upregulated cholesterolbiosynthesis has been discovered in several cancers, where itsupports the growth, metastasis, stemness, and therapeuticresistance of tumors18,19. In breast cancer, cholesterol and itsmetabolites have been found to promote tumor progression bothpreclinically and clinically20–22. Compared to the ER+ subtype,TNBC displays elevated cholesterol biosynthesis, which couldhave profound biological functions and indicate potential ther-apeutic strategies23. However, there is a limited understanding ofhow CNAs activate cholesterol biosynthesis programs in TNBC atthe genetic level.
In the current study, we used integrated copy number andtranscriptome analyses to discover CNA-affected oncogenes inTNBC. ENSA (alpha-endosulfine) was found to be amplified atthe 1q21.3 locus in more than 18% of patients, and its amplifi-cation was correlated with increased expression in TNBC. ENSAcould promote tumor growth by promoting the cholesterol bio-synthesis program in TNBC. At the molecular level, the tran-scriptional activation of sterol regulatory element-bindingtranscription factor 2 (SREBP2) by phosphorylated STAT3 (p-STAT3) played a critical role in ENSA-induced cholesterolmetabolism dysregulation. Consequently, hindering STAT3phosphorylation resulted in tumor inhibition in TNBC with high
ENSA expression. These findings uncovered the mechanism bywhich high ENSA amplification might promote TNBC progres-sion and suggested potential therapeutic targets.
ResultsIntegrated DNA copy number and transcriptome profilingreveals amplified ENSA at the 1q21.3 region in TNBC. Toidentify dysregulated gene expression programs driven by CNAsin TNBC, we first integrated gene-level CNA data and RNA-seqdata of 302 female patients from the Fudan University ShanghaiCancer Center (FUSCC) TNBC cohort to screen CNA-affectedoncogenes with the criteria listed in Fig. 1a. A total of 41 geneslocated in several recurrent CNA regions were found (Supple-mentary Fig. 1). Among them, ENSA and Golgi phosphoprotein 3like (GOLPH3L), located at the 1q21.3 peak, were the most fre-quently amplified genes in TNBC (amplification in 18.5% andcopy number gain in 57.6% of patients), followed by genes at the1q43 and 10p15.1 loci (Fig. 1a). In the TCGA database, the1q21.3 segment was also frequently amplified in approximately11% of all breast cancer patients (Fig. 1b) and predicted worsedisease-free survival and disease-specific survival (Fig. 1c).However, amplification of the 1q43 and 10p15.1 regions showedno prognostic significance (Supplementary Fig. 2a). We furtherinvestigated the difference in 1q21.3 alteration between differentsubtypes of breast cancer in the TCGA cohort. We found a higheramplification frequency in the TNBC (27.7%) and basal-like(32.6%) subtypes (Fig. 1d), which implies that this amplicon ismore critical in TNBC than in other subtypes. To identifypotential tumor-promoting genes in the 1q21.3 locus of interest,we performed survival analysis of ENSA and GOLPH3L in theKaplan–Meier plotter database and observed that elevatedexpression of ENSA, not GOLPH3L, was linked with poorrelapse-free survival in TNBC and basal-like breast cancer(Fig. 1e, f). However, ENSA expression did not predict the sur-vival outcomes of patients with other breast cancer subtypes,further suggesting its importance in the TNBC subtype (Sup-plementary Fig. 2b). ENSA expression was upregulated in severaltumors and was markedly upregulated in breast cancer (Supple-mentary Fig. 2c). Its expression was higher in tumor tissues thanin paired normal tissues and increased along with geneticamplification in TNBC (Fig. 1g, h). These results suggest thatENSA is amplified at the 1q21.3 region and is highly expressed inTNBC with clinical prognostic value.
ENSA promotes the growth of TNBC cells. To determine theroles of ENSA in TNBC, we knocked down its expression usingshRNA and restored the expression of its most common tran-script in BT549 and MDA-MB-231 cells, two TNBC cell lineswith relatively high expression of ENSA (Fig. 2a and Supple-mentary Fig. 3a). ENSA downregulation markedly impaired thecell growth and colony formation of TNBC cells (Fig. 2b, c).However, the growth of ENSA-depleted luminal and HER2 cellswas only slightly inhibited, less than the results shown in TNBCcells (Supplementary Fig. 3b). In addition, overexpression ofENSA in TNBC cells attenuated the suppression of cell growthand colony formation induced by ENSA silencing in vitro(Fig. 2d, e, and Supplementary Fig. 3c). ENSA knockdown alsocaused pronounced apoptosis among TNBC cells but had almostno effect on cell cycle progression (Fig. 2f and SupplementaryFig. 3d, e). These results suggest the critical role of ENSA inpromoting the growth of TNBC cells.
ENSA plays a crucial role in cholesterol biosynthesis in TNBC.To explore the underlying molecular mechanisms of ENSA inTNBC cells, we performed RNA-sequencing analysis of both
ARTICLE NATURE COMMUNICATIONS | https://doi.org/10.1038/s41467-022-28452-z
2 NATURE COMMUNICATIONS | (2022) 13:791 | https://doi.org/10.1038/s41467-022-28452-z | www.nature.com/naturecommunications

MDA-MB-231 ENSA knockdown cells and control cells. Gene setenrichment analysis (GSEA) revealed that the cholesterol path-way was the most enriched downregulated pathway in ENSA-silenced cells (Fig. 3a, b). GO analysis also indicated that thecholesterol biosynthesis pathway was strongly suppressed byENSA knockdown (Supplementary Fig. 4a). In addition, GSEA
revealed an upregulated apoptosis pathway in ENSA-silencedcells, in accordance with the proapoptotic phenotype induced byENSA depletion (Fig. 3c). We further explored the correlationbetween ENSA expression and cholesterol biosynthesis pathwayactivity in the FUSCC TNBC cohort using gene set variationanalysis. We found a significant positive association between
1q21.3 amp
1q21
.3 a
ltera
tion
frequ
ency
%
1.00
0.75
0.50
0.25
0.00
1.00
0.75
0.50
0.25
0.00Dis
ease
-free
sur
viva
l
0 50 100 150 200
Dis
ease
-spe
cific
sur
viva
l
P = 0.0088 P = 0.013
0 50 100 200
9.6 15.8 20.9 27.7 9.7 8.9 16.4 32.6
150
b
c
d
e f
Months Months
hg FUSCC TNBC TCGA TNBC
ENSA
mR
NA
expr
essi
onLo
g2(R
SEM
+1)
Norm Gain AmpN= 29 84 40
10
11
12
13
14
15
FUSCC TNBC
9P < 0.0001
ENSA
mR
NA
expr
essi
onlo
g2(F
PKM
+1)
Normal Tumor5
6
7
8
N= 88 88
TCGA-BRCA
1q21.3 not amp
N=93N=836
N=106N=944
0
50
100
DownNormUpAmp
0 %
TCGA-BRCA
58 302 99
RNA-seqN=360
OncoScanN=401
Higher expression in amplified group(Pearson r>0.3, p<0.05)
n = 103
Higher expression in tumor(p<0.05)n = 41
41 genes
FUSCC
Amplified genes n = 514
Rank by Amp and Gain
frequency
AmpN=
GainN=
5646482241
2935
……
174169145152123
133113……
1q21.31q43
10p15.12p25.33q26.31
6p22.313q34……
a
2002000.0
0.2
0.4
0.6
0.8
1.0
Rel
apse
- lavivrus eerf
HR=1.9 (1.1-1.328)P =0.019
Expression— Low ENSA— High ENSA
TNBC
0 50 100 150 0 50 100 150
Expression— Low ENSA— High ENSA
HR=1.48 (1.07-2.05)P =0.016
Basal-like
MonthsMonths
0.0
0.2
0.4
0.6
0.8
1.0
50 100 150 200Months
0
Expression— Low GOLPH3L— High GOLPH3L
HR = 0.59 (0.38−0.92)P = 0.018
TNBC
Rel
apse
-free
sur
viva
l
50 100 150 2000
Expression— Low GOLPH3L— High GOLPH3L
HR = 0.84 (0.68−1.06)P = 0.14
Basal-like
Months
Amplification (11%) No amplification1q21.3
TCGA-BRCA
Down Norm Gain Amp 5
6
7
8
9
noisserpxe AN
Rm AS
NElo
g2(F
PKM
+1)
N= 9 64 173 56
P = 0.0459
P = 0.0017P = 0.0068
P < 0.0001P < 0.0001
P < 0.0001
P = 0.0031
P < 0.0001
P < 0.0001
NATURE COMMUNICATIONS | https://doi.org/10.1038/s41467-022-28452-z ARTICLE
NATURE COMMUNICATIONS | (2022) 13:791 | https://doi.org/10.1038/s41467-022-28452-z | www.nature.com/naturecommunications 3

ENSA mRNA expression and the cholesterol biosynthesis pro-gram in TNBC (Fig. 3d), which was further validated in TheCancer Genome Atlas (TCGA), Molecular Taxonomy of BreastCancer International Consortium (METABRIC) and Koreanbreast cancer (SMC) cohorts (Supplementary Fig. 4b). Decreasedexpression of cholesterol biosynthesis enzymes and SREBP2, acrucial transcription factor that preferentially activates genesinvolved in cholesterol biosynthesis, was further validated at themRNA and protein levels in TNBC cells expressing ENSA shRNA(Fig. 3e, f). Importantly, the protein levels of the full and cleavedforms of SREBP2 were both decreased, which was consistentwith the decreased mRNA level of SREBP2 upon ENSA silencing(Fig. 3f). Overexpression of ENSA in ENSA knockdownTNBC cells restored the expression of cholesterol biosynthesisgenes (Supplementary Fig. 4c). Intriguingly, the expression ofSREBP2 and downstream enzymes was not altered by ENSAknockdown in non-TNBC cell lines, suggesting a critical role ofthe ENSA-regulated cholesterol pathway in TNBC (Supplemen-tary Fig. 4d). To determine whether the main products of thecholesterol biosynthesis pathway had changed, we detected thecontents of cholesterol and intermediate metabolites by liquidchromatography-mass spectrometry. Consistent with the down-regulated mRNA and protein expression of genes involved incholesterol biosynthesis, the concentration of total cholesterol andmost intermediates decreased upon ENSA silencing in TNBCcells (Fig. 3g, h). In addition, ENSA knockdown caused a sig-nificant decrease in free cholesterol content in TNBC cells(Fig. 3i). We next examined whether the ENSA knockdown-induced phenotype was attributable to cholesterol depletion. Theaddition of cholesterol (2.5 μg/ml) partially attenuated the inhi-bition of cell growth and increased apoptosis in ENSA-depletedTNBC cells (Fig. 3j and Supplementary Fig. 4e, f). Together, thesefindings support the notion that ENSA might promote the growthof TNBC cells by regulating cellular cholesterol biosynthesis.
Activated STAT3 is involved in ENSA-induced tumor growth.To elucidate the molecular mechanism of the ENSA depletion-induced phenotype in TNBC cells, we performed transcriptionfactor (TF) analysis of the RNA-seq data and hypothesized thatSTAT3 was a key TF responsible for the downstream alteration(Fig. 4a). In TNBC cells, p-STAT3 (Tyr705), but not p-STAT3(Ser727) or total STAT3, was markedly decreased upon ENSAknockdown (Fig. 4b). Overexpression of ENSA restored the levelof p-STAT3 (Tyr705) (Fig. 4c). Next, we confirmed the involve-ment of STAT3 in ENSA knockdown-induced growth inhibitionby overexpressing STAT3 in ENSA-silenced TNBC cells to inducethe constitutive activation/phosphorylation of STAT3. Our resultsshowed that the overexpression of STAT3 could partiallyattenuate TNBC cell growth inhibition induced by ENSA deple-tion (Fig. 4d, e).
In mouse mammary fat pad xenografts, ENSA knockdownresulted in a significant reduction in the tumor growth of MDA-MB-231 cells, which could be completely rescued by
overexpression of ENSA and mostly rescued by overexpressionof STAT3 (Fig. 4f, g, and Supplementary Fig. 5a). Immunohis-tochemical (IHC) staining of p-STAT3 (Tyr705) significantlydecreased upon ENSA silencing. However, in ENSA-depletedTNBC tumors, overexpression of either ENSA or STAT3increased p-STAT3 (Tyr705) staining (Fig. 4h and SupplementaryFig. 5b). In accordance with the proapoptotic phenotype inducedby ENSA depletion in vitro, IHC staining of cleaved caspase 3displayed a corresponding change in each group of xenografts(Fig. 4h and Supplementary Fig. 5c). In addition, we also observeddecreased lung metastasis incidence in the ENSA-depleted group(Supplementary Fig. 5d). Taken together, these data suggest thecritical role of ENSA-STAT3 signaling in promoting the growthof triple-negative tumors.
ENSA activates STAT3 to regulate cholesterol biosynthesis. Wenext questioned whether activated STAT3 participated in ENSA-induced alterations in the cholesterol biosynthesis pathway. Theprediction from the JASPAR database showed that STAT3 waslikely to bind to the promoter of SREBP2 (Fig. 5a). ChIP-seq dataanalysis from GSE152203 also showed a STAT3-binding peak inSREBP2 in MDA-MB-231 cells (Supplementary Fig. 6a). Using aChIP assay, we confirmed that STAT3 occupied a site in thepromoter region of SREBP2 (Fig. 5b). Moreover, STAT3 silencingin TNBC cells suppressed the mRNA and protein expression ofSREBP2 (Fig. 5c and Supplementary Fig. 6b). These resultsindicate that STAT3 could bind to the promoter of SREBP2 andalter the expression of SREBP2 at the transcriptional level inTNBC cells. We next validated that the promoter activity ofSREBP2 was restrained by ENSA depletion and rescued bySTAT3 overexpression based on the luciferase reporter assay(Fig. 5d). Consistently, the expression level of SREBP2 andenzymes involved in cholesterol biosynthesis decreased afterENSA knockdown, but this effect was reversed by the over-expression of STAT3 (Fig. 5e). In addition, the cellular freecholesterol levels, which were decreased with ENSA depletion,could also be restored by overexpression of STAT3 (Fig. 5f andSupplementary Fig. 6c). In mouse mammary fat pad xenograftmodels, the expression of SREBP2 and FDPS decreased afterENSA knockdown and was restored when exogenous STAT3 wasoverexpressed (Supplementary Fig. 6d).
We next explored whether the inhibitory effect of ENSAknockdown on p-STAT3 was dependent on protein phosphatase2A (PP2A), a known protein phosphatase whose function isinhibited by direct interaction with ENSA. We silenced PP2Ausing its catalytic subunit-targeting siRNA (siPPP2CA) in MDA-MB-231 cells and observed an increase in p-STAT3 (Tyr705)expression (Fig. 5g). However, p-STAT3 (Ser727) was notinfluenced by PP2A silencing. Furthermore, the inhibition ofp-STAT3 (Tyr705) and SREBP2 expression by ENSA depletionwas weakened by an additional knockdown of PP2A in TNBCcells (Fig. 5h). These results suggest that ENSA might promote
Fig. 1 ENSA is amplified at the 1.21.3 region, is highly expressed and predicts poor survival in TNBC. a Schematic diagram depicting the screening forcopy number alteration-affected genes in TNBC. b Copy number alteration profile of the 1q21.3 region in the TCGA breast cancer cohort. c Kaplan–Meiersurvival analysis of 1q21.3 copy number alterations in TCGA breast cancer patients. Log-rank test. d 1q21.3 alteration frequency in the TCGA cohort withdifferent breast cancer subtypes. e, f Kaplan–Meier plots of ENSA and GOLPH3L in TNBC or basal-like BC (https://kmplot.com/analysis/). Log-rank test.g ENSA expression of samples with different ENSA copy number in FUSCC and TCGA TNBC cohorts. n= 302 in FUSCC TNBC cohort and n= 153 in TCGATNBC cohort. Data are presented as mean ± SD. Two-tailed one-way ANOVA tests and adjustments were made for multiple comparisons. h ENSAexpression of 88 paired tumor tissues versus adjacent normal tissues in FUSCC cohort. n= 88 paired samples. Data are presented as mean ± SD. Two-tailed paired Student’s t test. Source data are provided as a Source Data file. FUSCC Fudan University Shanghai Cancer Center, TCGA The Cancer GenomeAtlas, TNBC triple-negative breast cancer, BRCA breast cancer, FPKM fragments per kilobase million, RSEM RNA-seq by expectation maximization, Ampamplification, Norm normal.
ARTICLE NATURE COMMUNICATIONS | https://doi.org/10.1038/s41467-022-28452-z
4 NATURE COMMUNICATIONS | (2022) 13:791 | https://doi.org/10.1038/s41467-022-28452-z | www.nature.com/naturecommunications

the phosphorylation of STAT3 to regulate cholesterol biosynth-esis in TNBC cells in a PP2A-dependent manner.
ENSA determines therapeutic sensitivity to STAT3 inhibitors.As ENSA regulates the activity of STAT3, we sought to evaluatewhether ENSA could be a therapeutic marker of STAT3 inhibitorsensitivity in TNBC cells. We used Stattic as a small molecule
inhibitor of STAT3 activation. Compared to the ENSA knock-down group, the control group with higher ENSA levels was moresensitive to Stattic and exhibited significantly reduced growthafter Stattic treatment (Fig. 6a, b, and Supplementary Fig. 7a, b).In organoids derived from three TNBC patients with diverselevels of ENSA expression, we also found that the sensitivity oforganoids to Stattic increased along with the increase in the
15
a b
c
MDA-MB-231BT549
shENSA - #1 #2 - #1 #2
ENSA
TUBA1B
DaysDays
60
e f
shENSAENSA
Col
ony
num
ber
Col
ony
num
ber
d
kDa
- +shENSA
Vector
ENSA
BT549 MDA-MB-231
- +shENSA
Vector
ENSA
MDA-MB-231
- #1 #2shENSA
Col
ony
num
ber
BT549
- #1 #2shENSA
Col
ony
num
ber
- - + +- + - +
shENSAENSA
- - + +- + - +
P < 0.0001
P < 0.0001
MDA-MB-231BT549
Perc
enta
ge o
f An
nexi
n V+
cel
ls (%
)
- +shENSA - +0
5
10
15
20 P = 0.0004
0
5
10
15 P < 0.0001
P < 0.0001P < 0.0001
0
50
100
150
200
- #1 #2shENSA - #1 #2shENSA
P = 0.0004P = 0.0006
0
50
100
150
200P < 0.0001
P = 0.0002
0
100
200
300
MDA-MB-231
Rel
ativ
e gr
owth
rate
BT549
1 2 3 4 5 60
2
4
6
8shCtrlshENSA#1shENSA#2
1 2 3 4 5 6
shCtrlshENSA#1shENSA#2
0
2
4
6
8
10P<0.0001
P<0.0001
MDA-MB-231BT549
0
100
200
300
etarht
worge vital e
R
1 2 3 4 5 60
2
4
6
8
10
Days
shCtrl+VecshCtrl+ENSAshENSA+VecshENSA+ENSA
P < 0.0001
P < 0.0001
1 2 3 4 5 60
2
4
6
8
10
Days
shCtrl+VecshCtrl+ENSAshENSA+VecshENSA+ENSA
P < 0.0001
P < 0.0001
P<0.0001
P<0.0001
Fig. 2 ENSA is a major driver of TNBC cell growth. a Stable silencing of ENSA expression in the TNBC cell lines BT549 and MDA-MB-231. b In vitrogrowth curves of BT549 and MDA-MB-231 cells expressing control or ENSA shRNA. n= 6. Data are presented as mean ± SD. Two-tailed two-way ANOVAtests. c Colony formation of BT549 and MDA-MB-231 cells expressing control or ENSA shRNA. n= 3. Data are presented as mean ± SD. Two-tailedunpaired Student’s t tests. d Colony formation of BT549 and MDA-MB-231 cells ± ENSA knockdown and ± ENSA overexpression. n= 3. Data are presentedas mean ± SD. Two-tailed unpaired Student’s t tests. e In vitro growth curves of BT549 and MDA-MB-231 cells ± ENSA knockdown and ± ENSAoverexpression. n= 6. Data are presented as mean ± SD. Two-tailed two-way ANOVA tests. f Apoptosis levels were measured in BT549 and MDA-MB-231 cells expressing control or ENSA shRNA. Percentage of annexin V+ cells are shown. n= 3. Data are presented as mean ± SD. Two-tailed unpairedStudent’s t tests. Source data are provided as a Source Data file.
NATURE COMMUNICATIONS | https://doi.org/10.1038/s41467-022-28452-z ARTICLE
NATURE COMMUNICATIONS | (2022) 13:791 | https://doi.org/10.1038/s41467-022-28452-z | www.nature.com/naturecommunications 5
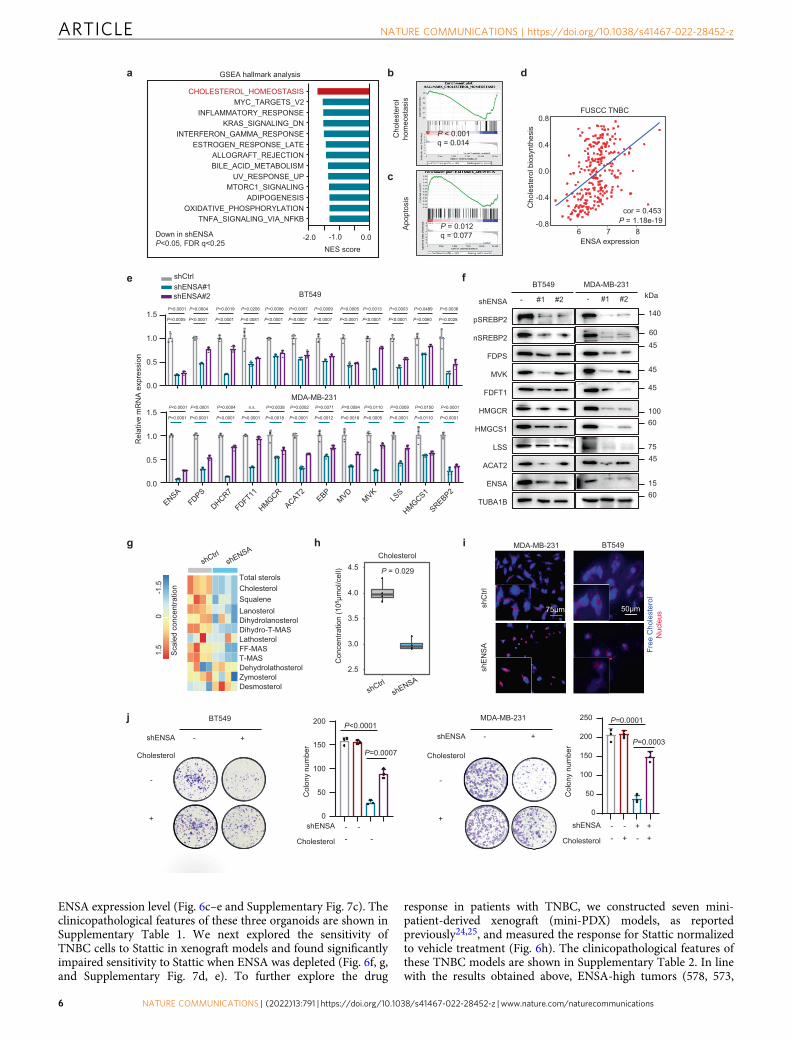
ENSA expression level (Fig. 6c–e and Supplementary Fig. 7c). Theclinicopathological features of these three organoids are shown inSupplementary Table 1. We next explored the sensitivity ofTNBC cells to Stattic in xenograft models and found significantlyimpaired sensitivity to Stattic when ENSA was depleted (Fig. 6f, g,and Supplementary Fig. 7d, e). To further explore the drug
response in patients with TNBC, we constructed seven mini-patient-derived xenograft (mini-PDX) models, as reportedpreviously24,25, and measured the response for Stattic normalizedto vehicle treatment (Fig. 6h). The clinicopathological features ofthese TNBC models are shown in Supplementary Table 2. In linewith the results obtained above, ENSA-high tumors (578, 573,
Cho
lest
erol
bio
synt
hesi
s
a GSEA hallmark analysis
-2.0
TNFA_SIGNALING_VIA_NFKBOXIDATIVE_PHOSPHORYLATION
ADIPOGENESISMTORC1_SIGNALING
UV_RESPONSE_UPBILE_ACID_METABOLISMALLOGRAFT_REJECTION
ESTROGEN_RESPONSE_LATEINTERFERON_GAMMA_RESPONSE
KRAS_SIGNALING_DNINFLAMMATORY_RESPONSE
MYC_TARGETS_V2CHOLESTEROL_HOMEOSTASIS
-1.0 0.0NES score
Down in shENSAP<0.05, FDR q<0.25
j
g
f
2.5
3.0
3.5
4.0
4.5Cholesterol
h i
P < 0.001q = 0.014
Cho
lest
erol
ho
meo
stas
isAp
opto
sis
P = 0.012q = 0.077
b d
shENSA
Col
ony
num
ber
Cholesterol
c
e shCtrlshENSA#1shENSA#2
140
60
45
45
10060
7545
1560
MDA-MB-231
- #1 #2
45
TUBA1B
ENSA
FDPS
FDFT1
HMGCR
HMGCS1
LSS
MVK
pSREBP2
nSREBP2
ACAT2
BT549
shENSA - #1 #2 kDa
- +shENSA
-
+
Cholesterol
BT549 MDA-MB-231
- +shENSA
-
+
Cholesterol
shC
trlsh
ENSA
MDA-MB-231
75μm 50μm
BT549
Free
Cho
lest
erol
Nuc
leus
P = 0.029
0
50
100
150
200
- -- -
P<0.0001
P=0.0007
0
50
100
150
200
250
shENSA
Col
ony
num
ber
Cholesterol
- - + +- + - +
P=0.0001
P=0.0003
P = 1.18e-19cor = 0.453
-0.8
-0.4
0.0
0.4
0.8
6 7 8ENSA expression
FUSCC TNBC
LanosterolDihydrolanosterolDihydro-T-MAS
Zymosterol
Scal
ed c
once
ntra
tion
1.5
0-1
.5 CholesterolSqualene
LathosterolFF-MAST-MASDehydrolathosterol
Desmosterol
Total sterols
Con
cent
ratio
n (1
08μm
ol/c
ell)
P=0.0005 P<0.0001 P<0.0001 P=0.0081 P<0.0001 P<0.0001P=0.0007 P=0.0007 P<0.0001 P<0.0001 P=0.0060 P=0.0028
P=0.0001 P=0.0004 P=0.0019 P=0.0206 P=0.0006 P=0.0005P=0.0007 P=0.0009 P=0.0013 P=0.0003 P=0.0489 P=0.0036
P<0.0001 P<0.0001 P<0.0001 P<0.0001 P=0.0018 P=0.0018P<0.0001 P=0.0012 P=0.0005 P<0.0001 P=0.0110 P<0.0001
P<0.0001 P<0.0001 P=0.0004 n.s. P=0.0038 P=0.0084P=0.0002 P=0.0071 P=0.0110 P=0.0009 P=0.0150 P<0.0001
0.0
0.5
1.0
1.5
0.0
0.5
1.0
1.5
noisserpxeA
NR
mevitale
R
BT549
MDA-MB-231
ARTICLE NATURE COMMUNICATIONS | https://doi.org/10.1038/s41467-022-28452-z
6 NATURE COMMUNICATIONS | (2022) 13:791 | https://doi.org/10.1038/s41467-022-28452-z | www.nature.com/naturecommunications

543, 553) showed higher sensitivity to Stattic than those withrelatively low-ENSA expression (554, 584, 552) (Fig. 6i, j, andSupplementary Fig. 7f, g). Together, the results from our TNBCcell lines, organoids, animal models and mini-PDX modelsstrongly suggest that ENSA expression can be a biomarker foreffective treatment with STAT3 inhibitors.
Correlations among ENSA, p-STAT3, and SREBP2 expressionin clinical samples and patient outcomes. To investigate theclinical relevance of our findings, we first evaluated the proteinexpression levels of ENSA in 8 paired primary TNBC specimensand adjacent normal tissues by IHC assay. The results revealedthat the ENSA protein levels were much higher in TNBC speci-mens than in normal tissues (Fig. 7a, b). To investigate the cor-relation of ENSA protein expression with patient survival, wecollected surgical samples from 138 TNBC patients and detectedthe expression level of ENSA by performing IHC analysis.Representative IHC images are shown in Fig. 7c. Kaplan–Meieranalysis of specimens revealed that patients harboring tumorswith high ENSA levels tended to have worse relapse-free survivaland overall survival than patients harboring low-ENSA levels(Fig. 7d, P < 0.05). Multivariable analysis showed that ENSAexpression still showed prognostic value for relapse-free survival(P= 0.04) and tended to correlate with worse overall survival(P= 0.07) after adjustment for age, tumor size, and lymph nodestatus (Supplementary Tables 3 and 4). We further examined theprotein expression levels of SREBP2, HMGCR, and p-STAT3(Tyr705). Representative IHC images are shown in Fig. 7e andSupplementary Fig. 8a. The IHC results showed that ENSAexpression was positively correlated with p-STAT3 (Tyr705),SREBP2, and HMGCR (Fig. 7f and Supplementary Fig. 8b). Inaddition, the survival analysis of SREBP2 expression showed thathigh SREBP2 expression was correlated with worse relapse-freesurvival of TNBC patients in internal and external cohorts(Supplementary Fig. 8c, d). The expression correlation betweenENSA and SREBP2 was also validated in an external cohort(Supplementary Fig. 8e). Together, these results indicate that theexpression of ENSA is positively correlated with that of down-stream molecules and is a poor prognostic factor in TNBC.
DiscussionMultiple lines of evidence have proven that CNAs promote theinitiation and progression of cancers by altering the expressionlevels of oncogenes and tumor suppressors. In this study, wefound significant amplification of the chromosome 1q21.3 regionin TNBC, and gene ENSA at this locus was highly expressed.ENSA regulates TNBC cell growth in vitro and in vivo through
STAT3-mediated transcriptional activation of SREBP2 anddownstream cholesterol biosynthesis (Fig. 7g).
TNBC exhibits high genomic instability, resulting in frequentCNAs at the chromosome level. Identification of the CNA-drivenphenotype and the underlying mechanisms provides new insightsinto the pathogenesis of TNBC and facilitates the discovery oftherapeutic treatments. The gain of 1q is one of the most frequentgenomic imbalances in breast carcinomas and exhibits a higherCNA frequency in basal tumors than in luminal tumors26–28. Ourprevious research on the FUSCC cohort also indicated thewidespread occurrence of 1q amplification in Chinese TNBCpatients7. Here, we further showed that 1q21.3 was the exactregion that harbored the highest frequency of gains in the 1qchromosome band (>18% in FUSCC TNBC patients), and thisalteration frequency was just below that of the 8q amplicon(where MYC is located). Based on the analysis of the TCGAbreast cancer cohort, we found amplification of the 1q21.3 regionin all breast cancer subtypes, but the amplification rate was higherin TNBC than in other subtypes, which suggests the significanceof this amplicon in TNBC. Evidence has indicated that CNAspromote the progression of tumors by altering the expression ofgenes within those affected genomic regions29. For example,1q21.3 amplification upregulates the expression of severalencompassing genes that form a regulatory loop to drive tumorgrowth30. Herein, we utilized copy number and gene expressiondata of primary tumors, including 88 paired tumor tissues andperitumor tissues from the FUSCC TNBC cohort, to discoverpotential oncogenes within amplicons. Among the 41 candidatesidentified, ENSA was located in the frequently amplified 1q21.3region and indicated a poor prognosis in TNBC.
The ENSA-encoding protein belongs to the highly conserved c-AMP-regulated phosphoprotein (ARPP) family and was initiallyidentified as an endogenous ligand for the sulfonylurea receptorthat modulates insulin secretion and glucose metabolism31,32. Ithas previously been shown that in Xenopus egg extracts, ENSA andits close relative ARPP19 are substrates of great wall (GWL) kinaseand act as competitor inhibitors to prevent PP2A-B55 fromdephosphorylating substrates such as cyclin B-CDK1, which resultsin mitotic entry33,34. A subsequent study on human cells identifiedthe ability of ENSA to control the length of the S phase35. WhileGWL and PP2A have been heavily studied, the genomic alterationand molecular function of ENSA have rarely been reported in thecontext of cancer36. To test these findings, we generated ENSAknockdown TNBC cells and found that these cells exhibited pro-nounced growth inhibition. Surprisingly, altered expression ofENSA did not significantly influence the cell cycle distribution ofTNBC cells at the S phase or G2/M phase, which implies that thefunction of ENSA is context-dependent. Interestingly, cholesterol
Fig. 3 ENSA plays a crucial role in cholesterol biosynthesis in TNBC. a GSEA of downregulated pathways after ENSA knockdown in MDA-MB-231 cells.The top 10 pathways (P < 0.05 and FDR q < 0.25) ranked by absolute normalized enrichment scores are shown. NES score and nominal P-value were givenby GSEA software. b Enrichment plot of the cholesterol homeostasis pathway after ENSA knockdown in MDA-MB-231 cells. c Enrichment plot of theapoptosis pathway after ENSA knockdown in MDA-MB-231 cells. d Scatter plot showing the correlation of ENSA expression with the cholesterolbiosynthesis pathway score in FUSCC TNBC data identified by ‘gsva’ method. Correlation coefficients were calculated using the Pearson test. Two-tailed P-values were given. e qRT-PCR analysis of the relative transcript levels of cholesterol biosynthesis pathway genes after ENSA knockdown in MDA-MB-231cells. n= 4. Data are presented as mean ± SD. Two-tailed unpaired Student’s t tests. fWestern blotting images showing proteins involved in the cholesterolbiosynthesis pathway after ENSA knockdown in MDA-MB-231 cells. n= 3 independent experiments. g Heatmap displaying the concentration of cholesteroland intermediates in the cholesterol biosynthesis pathway after ENSA knockdown in MDA-MB-231 cells. n= 4. h Total cellular cholesterol contents inMDA-MB-231 cells were analyzed by LC-MS with normalization to cell quantity. n= 4. The center line corresponded to the median, the lower and upperhinges corresponded to the first and third quartiles, and the upper/lower whisker extends from the hinge to the largest/smallest value no further than 1.5times interquartile range. Two-tailed unpaired Wilcoxon test. i Filipin III staining showing the cellular free cholesterol content in MDA-MB-231 and BT549cells with ENSA knockdown. n= 3 independent experiments. j Colony formation of BT549 and MDA-MB-231 cells expressing control or ENSA shRNA aftertreatment with 2.5 μg/ml exogeneous cholesterol. n= 3. Data are presented as mean ± SD. Two-tailed unpaired Student’s t tests. Source data are providedas a Source Data file. GSEA gene set enrichment analysis, NES normalized enrichment score.
NATURE COMMUNICATIONS | https://doi.org/10.1038/s41467-022-28452-z ARTICLE
NATURE COMMUNICATIONS | (2022) 13:791 | https://doi.org/10.1038/s41467-022-28452-z | www.nature.com/naturecommunications 7

biosynthesis was the most enriched pathway, and cholesteroladdition abolished the impaired growth effect induced by ENSAknockdown in TNBC cells. These preliminary results link ENSA tolipid metabolic programming in TNBC.
The mevalonate (MVA) pathway is a critical metabolic path-way responsible for de novo cholesterol biosynthesis and the
production of other metabolites, such as isoprenoids, dolichol,and ubiquinone, to support multiple cellular processes37. Theimportance of the MVA pathway and its metabolites in sup-porting cancer cell survival and growth has been increasinglyappreciated38. Cholesterol is a vital metabolite for the biologicalfunctions of mammalian cells. Its concentration at both the
STAT3
pSTAT3(Tyr705)
GAPDH
MDA-MB-231
shENSA
ENSA
a b
c
BT549
pSTAT3(Ser727)
shENSASTAT3
Col
ony
num
ber
Col
ony
num
ber
f h
75
75
25
60
d
e
g
ENSApSTAT3Tyr705
CleavedCaspase 3
shC
trlsh
ENSA
shEN
SA+
ENSA
shEN
SA+
STAT
3
100μm
kDa
STAT3
shENSA
Flag-ENSA
- +- +
- -+ +
BT549
Flag
TUBA1B
- +- +
- -+ +
MDA-MB-231
pSTAT3(Tyr705)
kDa
- +shENSA
Vector
STAT3
BT549 MDA-MB-231
- +shENSA
Vector
STAT3
35
15
75
75
75
- #1 #2 - #1 #2
MIER1
SRF
EGR2
AP1
RUVBL2
STAT3
Regulated genes
CCL2, ICAM1, IRF1
SNAIL, DHRS2, ENPP3
TNFRSF9, BTK, DMKN
PTPN7, MYB, EGR1
LCP1, LMCD1, EGR1
NYAP2, GDAP1, RAB39A
Predicted transcription factors
shENSA vs. shCtrlP<0.050.0 0.5 1.0 1.5 2.0
-NES
Days Days
Rel
ativ
e gr
owth
rate
1 2 3 4 5 60
2
4
6
8
BT549
P<0.0001P<0.0001
1 2 3 4 5 60
2
4
6
8
10
MDA-MB-231
shCtrl+VectorshCtrl+STAT3shENSA+VectorshENSA+STAT3 P<0.0001
P<0.0001
shCtrl+VectorshCtrl+STAT3shENSA+VectorshENSA+STAT3
0
50
100
150
200 P=0.0004
P=0.0004
- - + +- + - +
0
50
100
150
200
250P<0.0001
P<0.0001
shENSASTAT3
- - + +- + - +
Days
Tum
or v
olum
e (m
m3 )
shCtrl
shENSA
shENSA+ENSA
shENSA+STAT3
18 25 32 390
500
1000
1500
2000
P<0.0001
P<0.0001
P<0.0001
Tumor weight (g)0.0 0.4 0.8 1.2 1.6
shENSA+STAT3
shENSA+ENSA
shENSA
shCtrl P<0.0001 P <0.0001
P<0.0001
ARTICLE NATURE COMMUNICATIONS | https://doi.org/10.1038/s41467-022-28452-z
8 NATURE COMMUNICATIONS | (2022) 13:791 | https://doi.org/10.1038/s41467-022-28452-z | www.nature.com/naturecommunications

cellular and systemic levels has been linked to many diseases,such as obesity, heart disease and cancer. Several groups haveaddressed the relationship between hypercholesterolemia andincreased breast cancer risk based on clinical data21,39,40.Importantly, 27-hydroxycholesterol is a key molecule that linkshypercholesterolemia with breast cancer pathophysiology20. Inaddition to systemic cholesterol, dysregulated cellular cholesterol,derived from increased biosynthesis or uptake, fuels the malig-nant phenotypes of cancer cells, including proliferation, anti-apoptosis, migration, stemness, and immune escape41–46. Severalother MVA pathway metabolites and enzymes have also beenidentified as oncogenic. For example, MVA-derived farnesyl-diphosphate and geranylgeranyl-diphosphate are critical for theisoprenylation of proteins, supporting their proper localizationand function in cancer cells38. Metabolite quinone coenzyme Q isinvolved in cancer cell energy metabolism47. High-resolutionCRISPR screens also identified several MVA pathway enzymesessential for the survival of cancer cells48. In the current study, wefound significantly decreased concentrations of cholesterol andsuppressed expression of cholesterol biosynthesis enzymes uponENSA silencing. However, the addition of cholesterol alone wasnot able to completely rescue impaired cell growth induced byENSA depletion, implying the possibility of other MVK pathwayenzymes or metabolites regulating ENSA-induced cell growth.Together, these results suggest the importance of the MVKpathway, primarily cholesterol biosynthesis, in the regulation ofTNBC growth by ENSA.
De novo cholesterol biosynthesis is mainly controlled bySREBP2, the pivotal transcription factor for genes encodingenzymes involved in the cholesterol biosynthesis program49.SREBP-2 is synthesized as a 125 kDa inactive precursor andsequentially cleaved into the NH2-terminal form with nucleartranslocation and transcription factor activity50. It was previouslyfound that SREBP2 was altered by several oncogenic pathways,including p53, PI3K/AKT/mTOR, and AMPK51–55. However, therelationship between STAT3 and cholesterol biosynthesis remainsunclear. Only a few studies have described a decrease in themRNA expression of SREBP1/2 with the deletion of STAT3, butthere is limited knowledge on the underlying mechanism56,57.Intriguingly, we used ChIP-qPCR to identify that STAT3 bounddirectly to the promoter sequences of SREBP2 and promoted thetranscription of SREBP2 in TNBC cells. The decrease in tumorgrowth and the expression of SREBP2 by ENSA silencing couldbe abolished by ectopic STAT3 expression, which confirmed thecentral role of STAT3 in cholesterol biosynthesis in TNBC.Additionally, the STAT3-independent pathway cannot beneglected since ectopic STAT3 expression alone could rescuemost of but not all the growth inhibition induced by ENSAdepletion. Other important oncogenic pathways, such as theMYC pathway, were also enriched in ENSA-depleted TNBC cells.Taken together, ENSA might promote TNBC progression
through multiple pathways, of which the STAT3-SREBP2 axiswas the most important.
The phosphorylation level of STAT3 can be regulated in dif-ferent ways. On the one hand, phosphorylation of STAT3 atTyr705 by tyrosine kinases such as JAK and SRC or at Ser727 byJNK and other MAPKs results in its activation in cancer. On theother hand, inhibition of negative regulators such as PIAS3, SOCS1and 3 and several cellular phosphatases (SHP1 and 2, PTPRD,PTPRT, PTPN1 and 2, DUSP22) can also lead to STAT3 activationin cancer. To determine how ENSA impacts the phosphorylationof STAT3, we focused on PP2A, a serine/threonine phosphatasewhose functions can be suppressed by direct interaction withENSA. It has been reported that pharmacologic inhibition of PP2Ainduces the phosphorylation of STAT3 on serine residues in T cellsand vascular smooth muscle cells58,59. Unlike previous studies, wefound that genetic inhibition of the PP2A catalytic subunit incontrol or ENSA knockdown TNBC cells could alter the phos-phorylation of STAT3 at the Tyr705 residue instead of the Ser727residue, which implied that ENSA-PP2A affects p-STAT3 (Tyr705)expression in TNBC cells. The reason the observations for PP2Awere different in our study might be related to the distinct cellularcontext, and PP2A might indirectly impact the tyrosine residue ofSTAT3 in TNBC cells. The underlying mechanism by whichENSA-PP2A acts on the tyrosine residue of STAT3 remains to beaddressed in the near future.
Some limitations of the current study should be acknowledged.Firstly, one cell line derived xenograft models and a limitednumber of mini-PDX models might not fully represent tumorfeatures in vivo, more preclinical models are needed to verify theconclusions of this study. Secondly, while mini-PDX models couldovercome the time-consuming disadvantage of traditional PDXmodels and retained the accuracy and efficiency in drug sensitivitytesting, they still have some limitations compared to PDX models.Unlike PDX models which represent a more realistic tumormicroenvironment, tumors grown as mini-PDXs lack interactionswith human microenvironmental components due to the removalof blood cells and fibroblasts in the sample preparation process60.Thus, the involvement of microenvironmental components inENSA-induced tumor progression and drug sensitivity deservefurther investigation in proper preclinical models.
In summary, our current research reveals that ENSA, a genewith recurrent CNA at the 1q 21.3 locus, is a trigger for tumorgrowth that acts by promoting cholesterol biosynthesis in TNBC.Further characterization of the potential mechanism of theENSA-PP2A-STAT3-SREBP2 regulatory axis might support ourfindings. We propose that the STAT3 inhibitor Stattic might bean apt option for treating ENSA-expressing TNBC.
MethodsClinical samples. FUSCC TNBC cohort data (Sequence Read Archive (SRA)dataset: SRP157974; Gene Expression Omnibus (GEO) dataset: GSE118527) and
Fig. 4 ENSA promotes tumor growth by activating STAT3. a Candidate transcription factor (TF) prediction performed by GSEA of regulatory target genesets. The top 6 TFs (P < 0.05) ranked by absolute normalized enrichment scores are shown. NES score and nominal P-value were given by GSEA software.b Western blotting images showing the protein levels of phosphorylated STAT3 (pSTAT3)-Tyr705, pSTAT3-Ser727 and total STAT3 after ENSAknockdown in BT549 and MDA-MB-231 cells. n= 3 independent experiments. c Western blotting images showing the protein levels of pSTAT3-Tyr705and total STAT3 in BT549 and MDA-MB-231 cells ± ENSA knockdown and ± ENSA overexpression. n= 3 independent experiments. d In vitro growthcurves of BT549 and MDA-MB-231 cells ± ENSA knockdown and ± STAT3 overexpression. n= 6. Data are presented as mean ± SD. Two-tailed two-wayANOVA tests. e Colony formation of BT549 and MDA-MB-231 cells ± ENSA knockdown and ± STAT3 overexpression. n= 3. Data are presented asmean ± SD. Two-tailed unpaired Student’s t tests. f In vivo growth curve of tumors (n= 6) generated by injecting MDA-MB-231 cells expressing control orENSA shRNA and rescued by ENSA or STAT3 overexpression. n= 6 mice per group. Data are presented as mean ± SD. Two-tailed two-way ANOVA tests.g Tumor weight of MDA-MB-231 cells (n= 6) expressing control or ENSA shRNA rescued by ENSA or STAT3 overexpression. n= 6 mice per group. Dataare presented as mean ± SD. Two-tailed unpaired Student’s t tests. h Immunohistochemical images of ENSA, pSTAT3-Tyr705, and cleaved caspase 3 inmammary fat pad xenograft models. Scale bar: 100 µm. Source data are provided as a Source Data file. NES normalized enrichment score.
NATURE COMMUNICATIONS | https://doi.org/10.1038/s41467-022-28452-z ARTICLE
NATURE COMMUNICATIONS | (2022) 13:791 | https://doi.org/10.1038/s41467-022-28452-z | www.nature.com/naturecommunications 9

data analyses were performed according to a previous study7. In brief, 465 femaleChinese TNBC patients who underwent surgery at FUSCC were retrospectivelyselected, and their RNA-sequencing (RNA-seq) data, whole-exome sequencing,and OncoScan microarray copy number data were obtained. Among these 465patients, 302 patients who had both RNA-seq data and copy number data were
included in our study for screening candidate CNA-affected genes. Analysis ofgene-level CNAs was performed according to a previous study7. In brief, probe-level output from the OncoScan Console was analyzed by ASCAT (v2.4.3), and theproduced segment data were imported into GISTIC2.0 (v2.0.22) to acquire gene-level CNA data.
siSTAT3
SREB
P2 m
RN
A
BT549 MDA-MB-231b
Rel
ativ
e to
% in
put
IgG STAT3SREBP2 promoter
oitar ineR/cuL evitale
R
MDA-MB-231
pSTAT3(Tyr705)
++
+
shENSA
siPPP2CA
- -
- + -
PP2A-C
ENSA
TUBA1B
pSREBP2
1560
75
35
140
a c
shENSA
STAT3
BT549 MDA-MB-231
Predicted STAT3 binding sequence of SREBP2 by JASPAR
d f
e g h
kDakDa
pSREBP2
ACAT2
FDPS
ENSA
TUBA1B
STAT3
60
45
45
140
75
75
pSTAT3(Tyr705)
15
60HMGCS1
Score Predicted sequence
14.1268 CTTCTAGGAAT
10.0287 CAGCTGGGAAG8.88842 ATTCCTAGAAG
0.000.050.100.150.200.25
P=0.0004
0.0
0.5
1.0
1.5
- #1 #2
P=0.0052P=0.0013
0.0
0.5
1.0
1.5
- #1 #2
P=0.0056P=0.0022
0.0
0.5
1.0
1.5
- + - +- - + +
shENSASTAT3
P=0.0009
P=0.0002
Vector STAT3
MDA-MB-231
shC
trlsh
ENSA
Free
Cho
lest
erol
Nuc
leus
Vector STAT3
BT549
75μm 75μm
siPPP2CA
35
60
75
75
60
75
PP2A-C
pSTAT3(Ser727)
TUBA1B
MDA-MB-231
- #1 #2pSTAT3(Tyr705)
STAT3
TUBA1B
kDa- - + +- + - +
- - + +- + - +
Fig. 5 ENSA activates STAT3 to promote the transcription of SREBP2 in a PP2A-dependent manner. a JASPAR prediction of STAT3-binding sites on thesequence of SREBP2. b qRT-PCR and PCR analysis of STAT3 at the SREBP2 promoter after ChIP assays in MDA-MB-231 cells expressing control or ENSAshRNA. n= 3. Data are presented as mean ± SD. Two-tailed unpaired Student’s t tests. c qRT-PCR detecting relative SREBP2 mRNA expression in BT549and MDA-MB-231 cells after STAT3 transient silencing. n= 3. Data are presented as mean ± SD. Two-tailed unpaired Student’s t tests. d Luciferasereporter assay detecting the activity of the SREBP2 promoter in BT549 cells ± ENSA knockdown and ± STAT3 overexpression. n= 3. Data are presented asmean ± SD. Two-tailed unpaired Student’s t tests. e Western blotting images showing the expression of enzymes involved in cholesterol biosynthesis,SREBP2, pSTAT3-Tyr705 and total STAT3 in BT549 and MDA-MB-231 cells with ± ENSA knockdown and ± STAT3 overexpression. n= 3 independentexperiments. f Filipin III staining showing the cellular free cholesterol contents of BT549 and MDA-MB-231 cells ± ENSA knockdown and ± STAT3overexpression. n= 3 independent experiments. g Western blotting images showing the expression of STAT3, pSTAT3-Tyr705, and pSTAT3-Ser727 inMDA-MB-231 cells expressing control or PPP2CA siRNA. n= 3 independent experiments. h Western blotting images showing the expression of pSTAT3-Tyr705 and SREBP2 in MDA-MB-231 cells ± ENSA knockdown and ± transient PPP2CA knockdown. n= 3 independent experiments. Source data areprovided as a Source Data file.
ARTICLE NATURE COMMUNICATIONS | https://doi.org/10.1038/s41467-022-28452-z
10 NATURE COMMUNICATIONS | (2022) 13:791 | https://doi.org/10.1038/s41467-022-28452-z | www.nature.com/naturecommunications

Bioinformatic analyses. Gene set variation analysis of FUSCC TNBC tran-scriptome data was carried out to calculate the enrichment score of the cholesterolbiosynthesis pathway in each sample with the R (v4.0.3) ‘GSVA’ package. ThePearson correlation metric was computed to assess the associations among theexpression of different genes and between gene expression levels and cholesterolsynthesis pathway scores by using the ‘cor’ function in R.
Cell lines. The TNBC cell lines BT549, MDA-MB-231, MCF7, T47D, SKBR3, andBT474 and embryonic kidney cells (HEK293T) were obtained from the AmericanType Culture Collection (ATCC) and cultured in DMEM supplemented with 10%FBS. The cell lines were regularly confirmed to be negative for mycoplasma con-tamination with a Mycoplasma Detecting Kit (Vazyme).
Short hairpin RNA (shRNA) vectors and lentiviral infections of cells. The twoshRNAs with the best knockdown efficiency (shENSA-1: GAGCTGAAGAGGCAAAGCTAA; shENSA-2: CTGCCAGATCCTGAGACGCTT) were cloned intothe pLKO.1 vector and introduced into HEK293T cells together with packingplasmids (psPAX2 and pMD2. G) and standard Lipofectamine 2000 transfectionreagent (Thermo Fisher Scientific) to generate lentiviruses. The viral supernatantswere collected and applied to infect TNBC cell lines in the presence of polybrene(10 µg/ml; Sigma-Aldrich). A plasmid expressing a nontargeting shRNA was usedas the negative control.
Small interfering RNA (siRNA) delivery. siRNAs targeting human STAT3(siSTAT3-1: GCAAAGAATCACATGCCACTT; siSTAT3-2: GGCGTCCAGT
a
c
shENSAStattic
Col
ony
num
ber
MDA-MB-231b
Organoid
0515
Stattic, μM
pSTAT3(Tyr705)
TUBA1B
ENSA
Organoid #1 #2 #3
pSREBP2
f
d e
Inhi
bitio
n ra
te
of t
umor
wei
ght
g
ENSA
stattic, μM
0 5 15
High
Low200μm
#1
#2
#3
Inhi
bitio
n ra
te
of tu
mor
vol
ume
60
kDa
140
15
75
DMSO
2.5μM stattic
shNC shENSA
Surgery Mini-PDX
Capsulize&
Transplant
Drug treatmentMeasure viability
Rel
ativ
e vi
abilit
y
h
RLU
i jlow high
ENSA
0
50
100
150
Rel
ativ
e vi
abilit
y (%
)
Low High
- - + +- + - +
shENSA - +
P=0.0019
IC50
of S
tatti
c (μ
M)
0
100
200
300 P<0.0001
P=0.0425
#1 #2 #3
Rel
ativ
e su
rviv
al
0.0
0.5
1.0
1.5P=0.0001 P=0.0023 n.s.
P<0.0001 P<0.0001 P=0.0137
shENSA - +
P=0.0021
0.0
0.5
1.0
1.5
- - + +- + - +
shENSAStattic
P<0.0001
P=0.0026
Tum
or w
eigh
t (g)
P=0.0010
578 573 543 553
P=0.7642
vehicle
Stattic
050
100150200250
P=0.2952 P=0.3385
554 584 552P=0.0648
050
100150200250
P<0.0001 P=0.0026 P=0.0079
P=0.0066
ytilibaiv lleC
shCtrl (IC50=1.796μM)shENSA (IC50=3.282μM)
log10 (stattic) μM-0.5 0.0 0.5 1.0 1.5
0.0
0.5
1.0
1.5
MDA-MB-231
0
1
2
3
4
0.0
0.2
0.4
0.6
0.8
1.0
0.0
0.2
0.4
0.6
0.8
1.0
shENSA - +
Weeks after treatment
mm( e
mulov romu T
3 ) P=0.0080
0 1 2 30
500
1000
1500
2000 shCtrl+vehicleshCtrl+StatticshENSA+vehicleshENSA+Stattic
P<0.0001
NATURE COMMUNICATIONS | https://doi.org/10.1038/s41467-022-28452-z ARTICLE
NATURE COMMUNICATIONS | (2022) 13:791 | https://doi.org/10.1038/s41467-022-28452-z | www.nature.com/naturecommunications 11

TCACTACTAAA) and PPP2CA (siPPP2CA-1: CCGTGAACGCATCACCATT;siPPP2CA-2: GATACAAATTACTTGTTTA) were purchased from RiboBio.siRNA transfection was conducted with Lipofectamine RNAIMAX TransfectionReagent (Thermo Fisher Scientific) according to the manufacturer’s instructions.
Plasmid and cloning. Human ENSA cDNA was purchased from GeneChem(Catalog number: NM_004436-GV492) and subcloned into the pCDH-CMV-MCS-EF1-puro plasmid (System Biosciences, Catalog number: CD510B-1).Human full-length STAT3 cDNA was purchased from Vigenebio (Catalog number:CH801341) and subcloned into the pCDH-CMV-MCS-EF1-GFP plasmid (mod-ified from pCDH-CMV-MCS-EF1-puro). The SREBP2 promoter was amplified byusing a pair of primers (forward: TGGTATTCCATCGTGTGGATGT; reverse:GAGTGAAGGGTTAACAGGCCA) in the BT549 cell line and cloned into thepGL3-basic vector (Promega). All transfections were performed using Lipofecta-mine 2000 transfection reagent (Thermo Fisher Scientific).
Cell growth and colony formation assay. For the cell growth assay, 2 × 10³
(BT549, MDA-MB-231, and MCF7) and 4 × 10³ (T47D, SKBR3, and BT474) cellswere preseeded in 96-well plates in triplicate and incubated with 10% CellCounting Kit-8 (CCK-8) solution (Vazyme, #A311-02) at 37 °C for 2 h, and thenthe absorbance was measured at 450 nm using a microplate reader. For the colonyformation assay, 1 × 10³ BT549 cells and 2 × 10³ MDA-MB-231 cells were seededinto 6-well plates in triplicate, fixed after 12 days, and stained with 0.25% crystalviolet staining solution. Colonies consisting of more than 50 cells were counted.
Cell survival assay. To assess the effect of chemicals on breast cancer viability,cells were grown in 96-well plates at 2 × 10³ cells per well and exposed to differentconcentrations of the test chemicals. After 72 h, the cells were incubated with 10%CCK-8 (Vazyme, #A311-02) solution at 37 °C for 2 h. The cell survival percentagesat different concentrations were calculated by dividing the optical density (OD) ofchemical-containing wells by that of DMSO-contacting wells.
Flow cytometry analysis. For cell cycle analysis, a total of 1 × 10⁶ cells were fixedwith precooled 70% ethanol overnight and then processed using the Cell Cycle andApoptosis Analysis Kit (Yeasen, #40301ES50) according to the manufacturer’sinstructions. For the cell apoptosis assay, 5 × 10⁵ cells were collected and incubatedwith annexin V-fluorescin isothiocyanate (FITC) and propidium iodide (PI)staining solution from the Annexin V-FITC/PI Apoptosis Detection Kit (Yeasen,#40302ES50). The flow cytometry data were generated on a Beckman Cytomics FC500 BD FACSCanto II and analyzed with FlowJo v10 software.
Mouse models. The animal protocols were approved by the Animal WelfareCommittee of Shanghai Medical College at Fudan University (Protocol number:20210510011). Female 6-week-old NOD.CB17-Prkdc scid/JSlac mice were used forthe in vivo mouse xenograft models. Mice were exposed to 12 h light, 12 h darknesscycle at a temperature of 21 ± 3 °C and an average of 55% humidity. To evaluate therole of ENSA on tumor growth, 2 × 10⁶ shCtrl or shENSA MDA-MB-231 cellswere harvested and resuspended in a 100 µl volume (PBS: Matrigel=1:1) and theninjected into the mammary fat pads of the mice (n= 6 each group). For thetreatment groups, 2 × 10⁶ shCtrl or shENSA MDA-MB-231 cells were injected intothe mammary fat pads of the mice (n= 5 each group). When the tumor volumesreached 50–100 mm3, vehicle or Stattic (10 mg/kg) was intraperitoneally admi-nistered three times a week for two weeks. The tumor volumes were calculated asfollows: V= L × W2 × 1/2, where L is length (longest dimension) and W is the
width (shortest dimension). After the endpoint, the mice were euthanized, andtumors were excised for analysis. Bioluminescence imaging was performed usingthe Multimodal Animal Rotation System (Bruker). Relative bioluminescence signalquantitation was performed by the respective imaging system software packages.
Organoid. Patient-derived organoids used in the current study were derived frompost-surgery specimens of three female patients who underwent surgery at theDepartment of breast, Fudan University Shanghai Cancer Center. The organoidswere cultured based on previously described methods61,62. The organoids weresuspended in Basement Membrane Extract (BME) Type 2 (Trevigen, 3533-010-02)and cultured in breast cancer organoid medium (Advanced DMEM/F12 supplemented with R-spondin-1 [Peprotech], noggin [Peprotech], neuregulin[Peprotech], estradiol [Sigma], HEPES [Gibco], GlutaMAX [Gibco], nicotinamide[Sigma], N-acetylcysteine [Sigma], B-27 [Gibco], A83-01 [Tocris], primocin[InvivoGen], SB-202190 [Selleck], Y27632 [Selleck], FGF10 [Peprotech], FGF7[Peprotech] and EGF [Peprotech]). After 3-5 passages, the organoids were added toeach well of a 384-well plate, and different concentrations of Stattic (0, 5, and 15μmol) were added to each well in duplicate and incubated for 5 days. Photos weretaken on the last day to observe the changes in organoids under drug treatments.Acquisition of all clinical samples was approved by the Ethics Committee ofFUSCC (Protocol number: 050432-4-1911D) and agreed to by each patient viasigned informed consent.
Mini-patient-derived xenograft (mini-PDX) model. In vivo pharmacologicaltests were conducted using OncoVee mini-PDX assay (LIDE Biotech, Shanghai,China) according to the previous papers24,25,60,63. In brief, fresh surgical tumorspecimens were acquired from seven female breast cancer patients (average age: 55years) at FUSCC. Specimens were then washed with Hank’s balanced salt solution(HBSS) to remove non-tumor tissues and necrotic tumor tissues. A fraction oftissue was retained for RNA extraction. The rest of the tissue was fragmented anddigested with collagenase at 37 °C for 1–2 h. After centrifugation and removal offibroblasts and blood cells with magnetic beads, tumor cells were collected andsuspended to fill OncoVee capsules (LIDE Biotech, Shanghai, China). Each capsulecontained 2000 cells and capsules derived from the same specimen were assigned tothe baseline, vehicle control and Stattic treatment groups. Capsules were implantedsubcutaneously into 5-week-old female nu/nu mice (3 capsules per mouse). Micebearing capsules were treated with vehicle control or Stattic (10 mg/kg, intraper-itoneal injection) for seven continuous days. Each treatment (vehicle control orStattic) was performed in quintuplicate or sextuplicate capsules. Finally, the cap-sules were removed to measure cell viability in terms of relative luminance unit(RLU) using the CellTiter-Glo Luminescent Cell Viability Assay (Promega).Relative viability was calculated using the formula: Relative viability= (RLU ofStattic D7- RLU of bassline)/(RLU of vehicle D7- RLU of bassline) *100. Acqui-sition of all clinical samples was approved by the Ethics Committee of FUSCC(Protocol number: 050432-4-1911D) and agreed to by each patient via signedinformed consent. The mini-PDX study protocol was approved by the InstitutionalEthics Committee of Shanghai LIDE Biotech (Protocol number: LWIACUC002).
RNA preparation and real-time quantitative reverse transcription (RT-qPCR).A RNeasy mini kit (Qiagen) was used for the purification of total RNA from breastcancer cells following the manufacturer’s protocol. The extracted total RNA wassubjected to cDNA synthesis using HiScript III RT SuperMix for qPCR (Vazyme).RT-qPCR was performed using ChamQ SYBR Color qPCR Master Mix (Vazyme)on a QuantStudio 6 Flex Real-Time PCR System (Applied Biosystems). Theexpression of genes was calculated using the 2−ΔΔCt method, and the GAPDH was
Fig. 6 ENSA is linked to Stattic sensitivity in TNBC. a Dose–response curves and half maximal inhibition concentration values of Stattic in MDA-MB-231cells expressing control or ENSA shRNA. Dose-response curves: n= 6; Data are presented as mean ± SD. Bar plot: n= 3 independent experiments; Dataare presented as mean ± SD; Two-tailed unpaired Student’s t test. b Clonogenic survival assays of MDA-MB-231 cells expressing control or ENSA shRNAand treated with 2.5 μM Stattic. n= 3. Data are presented as mean ± SD. Two-tailed unpaired Student’s t test. c Western blotting images showing theexpression of pSTAT3-Tyr705, SREBP2, and ENSA in three organoids. n= 3 independent experiments. d, e Results of the cell viability assay in three TNBCpatient-derived organoid models treated with 0, 5, and 15 µM Stattic. d Cell viability assay and (e) Representative bright-field images of organoids afterdrug treatment in three organoids. Scale bars, 200 µm. n= 3. Data are presented as mean ± SD. Two-tailed unpaired Student’s t test. f–g Stattic treatmentof MDA-MB-231 cells expressing control or ENSA shRNA. Briefly, we injected shCtrl or shENSA MDA-MB-231 cells into the mammary fat pad of femaleNOD/SCID mice (n= 10 each). When the tumor volume reached 50–100 mm3, each group was randomly assigned to two treatment groups: vehicle andStattic. All groups (n= 5 each) received treatment (vehicle or 10 mg/kg Stattic) three times per week after randomization. The gray arrows indicate thetreatments. f The growth curve (left) and the inhibition rate of tumor volume (right). n= 5 mice per group. Data are presented as mean ± SD. Two-wayANOVA test for growth curve and two-tailed unpaired Student’s t test for inhibition rate. g The tumor weight (left) and the inhibition rate of tumor weight(right). n= 5 mice per group. Data are presented as mean ± SD. Two-tailed unpaired Student’s t test. h Scheme of the generation of the mini-PDX modelsfor the in vivo pharmacological tests. i The relative viability of seven TNBC mini-PDX models with Stattic treatment, as normalized to vehicle treatment.n= 3 in low-ENSA group and n= 4 in high-ENSA group. Data are presented as mean ± SD. Two-tailed unpaired Student’s t test. j The relative luminanceunit of each TNBC mini-PDX model treated with Stattic or vehicle. n= 5 or 6 independent capsules; Data are presented as mean ± SD. Two-tailed unpairedStudent’s t test. Source data are provided as a Source Data file. n.s. not significant, Mini-PDX mini-patient-derived xenograft, RLU relative luminance unit.
ARTICLE NATURE COMMUNICATIONS | https://doi.org/10.1038/s41467-022-28452-z
12 NATURE COMMUNICATIONS | (2022) 13:791 | https://doi.org/10.1038/s41467-022-28452-z | www.nature.com/naturecommunications

used for normalization. The sequences of the primers used for RT-qPCR are shownin Supplementary Table 5.
RNA-seq and data analysis. A total of 1 mg RNA samples were treated withVAHTS mRNA capture beads (Vazyme, China) to enrich polyA+ RNAs prior toconstructing the RNA-seq libraries. The VAHTS mRNA-seq v2 library preparation
kit of the Illumina Xten system (Vazyme, Nanjing, China) was used to prepare theRNA-seq libraries according to the manufacturer’s instructions. Briefly, polyA+RNA samples (~100 ng) were fragmented and reverse transcribed into doublestrand cDNA. Then these cDNA fragments went through end repair, the additionof adenine tails, and ligation of the adaptors processes. The purified products weresubjected to 12 cycles of PCR amplification to create the final cDNA libraries.These libraries were sequenced on 150 bp paired-end Illumina sequencing run.
a b
c
d
e
f
ENSA IHC score
SREB
P2IH
C s
core
TN N T
#1
TN N T
TN N T TN N T
#2 #3 #4
#5 #6 #7 #8
100μm
g
1q21.3 Amp
ENSA
PP2A
STAT3
PP2AENSA
STAT3
STAT3SREBF2
SREBP2SRE
Promoter
HMGCS1, MVK, …
Cholesterol
TNBC growthStattic
ENSA
IHC
sco
re
P=0.0028
Normal Tumor0
2
4
6
8
10
Ove
rall
surv
ival
IHC High n=42IHC Low n=96
P = 0.018
ENSAENSA
lavivrus eerf espaleR
P = 0.014
IHC High n=42IHC Low n=96
++ ++++++++++++++++++++++ +
+++ + +++++++++++++++++++++++++++++++++++++++++++++++++++++++++++++++++++++++++
0.00
0.25
0.50
0.75
1.00
0 12 24 36 48 60Months
+++++++ +++++++++++++++++++++++ +++++++ ++ +++++++++++++++++++++++++++++++++++++++++++++++++++++++++++++++++++++++++++++++
0.00
0.25
0.50
0.75
1.00
0 12 24 36 48 60Months
r = 0.517, P<0.001
0
2
4
6
8
2 4 6 8ENSA IHC score
pSTA
T3 IH
C s
core
r = 0.523 , P<0.001
0
2
4
6
8
2 4 6 8
ENSA low expressionENSA High expression
SREB
P2
ASNE fo ytisnetni gniniats
CHI
1
2
3
pSTA
T3
100μm
100μm
NATURE COMMUNICATIONS | https://doi.org/10.1038/s41467-022-28452-z ARTICLE
NATURE COMMUNICATIONS | (2022) 13:791 | https://doi.org/10.1038/s41467-022-28452-z | www.nature.com/naturecommunications 13
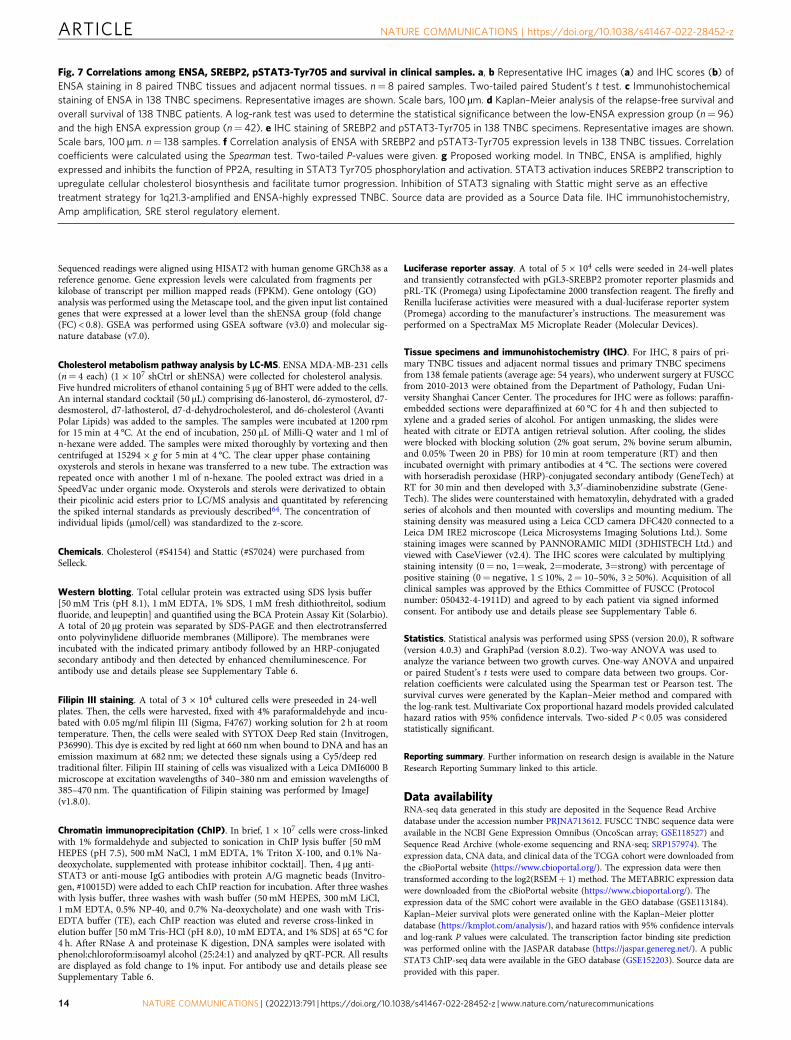
Sequenced readings were aligned using HISAT2 with human genome GRCh38 as areference genome. Gene expression levels were calculated from fragments perkilobase of transcript per million mapped reads (FPKM). Gene ontology (GO)analysis was performed using the Metascape tool, and the given input list containedgenes that were expressed at a lower level than the shENSA group (fold change(FC) < 0.8). GSEA was performed using GSEA software (v3.0) and molecular sig-nature database (v7.0).
Cholesterol metabolism pathway analysis by LC-MS. ENSA MDA-MB-231 cells(n= 4 each) (1 × 10⁷ shCtrl or shENSA) were collected for cholesterol analysis.Five hundred microliters of ethanol containing 5 µg of BHT were added to the cells.An internal standard cocktail (50 µL) comprising d6-lanosterol, d6-zymosterol, d7-desmosterol, d7-lathosterol, d7-d-dehydrocholesterol, and d6-cholesterol (AvantiPolar Lipids) was added to the samples. The samples were incubated at 1200 rpmfor 15 min at 4 °C. At the end of incubation, 250 µL of Milli-Q water and 1 ml ofn-hexane were added. The samples were mixed thoroughly by vortexing and thencentrifuged at 15294 × g for 5 min at 4 °C. The clear upper phase containingoxysterols and sterols in hexane was transferred to a new tube. The extraction wasrepeated once with another 1 ml of n-hexane. The pooled extract was dried in aSpeedVac under organic mode. Oxysterols and sterols were derivatized to obtaintheir picolinic acid esters prior to LC/MS analysis and quantitated by referencingthe spiked internal standards as previously described64. The concentration ofindividual lipids (μmol/cell) was standardized to the z-score.
Chemicals. Cholesterol (#S4154) and Stattic (#S7024) were purchased fromSelleck.
Western blotting. Total cellular protein was extracted using SDS lysis buffer[50 mM Tris (pH 8.1), 1 mM EDTA, 1% SDS, 1 mM fresh dithiothreitol, sodiumfluoride, and leupeptin] and quantified using the BCA Protein Assay Kit (Solarbio).A total of 20 µg protein was separated by SDS-PAGE and then electrotransferredonto polyvinylidene difluoride membranes (Millipore). The membranes wereincubated with the indicated primary antibody followed by an HRP-conjugatedsecondary antibody and then detected by enhanced chemiluminescence. Forantibody use and details please see Supplementary Table 6.
Filipin III staining. A total of 3 × 10⁴ cultured cells were preseeded in 24-wellplates. Then, the cells were harvested, fixed with 4% paraformaldehyde and incu-bated with 0.05 mg/ml filipin III (Sigma, F4767) working solution for 2 h at roomtemperature. Then, the cells were sealed with SYTOX Deep Red stain (Invitrogen,P36990). This dye is excited by red light at 660 nm when bound to DNA and has anemission maximum at 682 nm; we detected these signals using a Cy5/deep redtraditional filter. Filipin III staining of cells was visualized with a Leica DMI6000 Bmicroscope at excitation wavelengths of 340–380 nm and emission wavelengths of385–470 nm. The quantification of Filipin staining was performed by ImageJ(v1.8.0).
Chromatin immunoprecipitation (ChIP). In brief, 1 × 10⁷ cells were cross-linkedwith 1% formaldehyde and subjected to sonication in ChIP lysis buffer [50 mMHEPES (pH 7.5), 500 mM NaCl, 1 mM EDTA, 1% Triton X-100, and 0.1% Na-deoxycholate, supplemented with protease inhibitor cocktail]. Then, 4 μg anti-STAT3 or anti-mouse IgG antibodies with protein A/G magnetic beads (Invitro-gen, #10015D) were added to each ChIP reaction for incubation. After three washeswith lysis buffer, three washes with wash buffer (50 mM HEPES, 300 mM LiCl,1 mM EDTA, 0.5% NP-40, and 0.7% Na-deoxycholate) and one wash with Tris-EDTA buffer (TE), each ChIP reaction was eluted and reverse cross-linked inelution buffer [50 mM Tris-HCl (pH 8.0), 10 mM EDTA, and 1% SDS] at 65 °C for4 h. After RNase A and proteinase K digestion, DNA samples were isolated withphenol:chloroform:isoamyl alcohol (25:24:1) and analyzed by qRT-PCR. All resultsare displayed as fold change to 1% input. For antibody use and details please seeSupplementary Table 6.
Luciferase reporter assay. A total of 5 × 10⁴ cells were seeded in 24-well platesand transiently cotransfected with pGL3-SREBP2 promoter reporter plasmids andpRL-TK (Promega) using Lipofectamine 2000 transfection reagent. The firefly andRenilla luciferase activities were measured with a dual-luciferase reporter system(Promega) according to the manufacturer’s instructions. The measurement wasperformed on a SpectraMax M5 Microplate Reader (Molecular Devices).
Tissue specimens and immunohistochemistry (IHC). For IHC, 8 pairs of pri-mary TNBC tissues and adjacent normal tissues and primary TNBC specimensfrom 138 female patients (average age: 54 years), who underwent surgery at FUSCCfrom 2010-2013 were obtained from the Department of Pathology, Fudan Uni-versity Shanghai Cancer Center. The procedures for IHC were as follows: paraffin-embedded sections were deparaffinized at 60 °C for 4 h and then subjected toxylene and a graded series of alcohol. For antigen unmasking, the slides wereheated with citrate or EDTA antigen retrieval solution. After cooling, the slideswere blocked with blocking solution (2% goat serum, 2% bovine serum albumin,and 0.05% Tween 20 in PBS) for 10 min at room temperature (RT) and thenincubated overnight with primary antibodies at 4 °C. The sections were coveredwith horseradish peroxidase (HRP)-conjugated secondary antibody (GeneTech) atRT for 30 min and then developed with 3,3′-diaminobenzidine substrate (Gene-Tech). The slides were counterstained with hematoxylin, dehydrated with a gradedseries of alcohols and then mounted with coverslips and mounting medium. Thestaining density was measured using a Leica CCD camera DFC420 connected to aLeica DM IRE2 microscope (Leica Microsystems Imaging Solutions Ltd.). Somestaining images were scanned by PANNORAMIC MIDI (3DHISTECH Ltd.) andviewed with CaseViewer (v2.4). The IHC scores were calculated by multiplyingstaining intensity (0= no, 1=weak, 2=moderate, 3=strong) with percentage ofpositive staining (0= negative, 1 ≤ 10%, 2= 10–50%, 3 ≥ 50%). Acquisition of allclinical samples was approved by the Ethics Committee of FUSCC (Protocolnumber: 050432-4-1911D) and agreed to by each patient via signed informedconsent. For antibody use and details please see Supplementary Table 6.
Statistics. Statistical analysis was performed using SPSS (version 20.0), R software(version 4.0.3) and GraphPad (version 8.0.2). Two-way ANOVA was used toanalyze the variance between two growth curves. One-way ANOVA and unpairedor paired Student’s t tests were used to compare data between two groups. Cor-relation coefficients were calculated using the Spearman test or Pearson test. Thesurvival curves were generated by the Kaplan–Meier method and compared withthe log-rank test. Multivariate Cox proportional hazard models provided calculatedhazard ratios with 95% confidence intervals. Two-sided P < 0.05 was consideredstatistically significant.
Reporting summary. Further information on research design is available in the NatureResearch Reporting Summary linked to this article.
Data availabilityRNA-seq data generated in this study are deposited in the Sequence Read Archivedatabase under the accession number PRJNA713612. FUSCC TNBC sequence data wereavailable in the NCBI Gene Expression Omnibus (OncoScan array; GSE118527) andSequence Read Archive (whole-exome sequencing and RNA-seq; SRP157974). Theexpression data, CNA data, and clinical data of the TCGA cohort were downloaded fromthe cBioPortal website (https://www.cbioportal.org/). The expression data were thentransformed according to the log2(RSEM+ 1) method. The METABRIC expression datawere downloaded from the cBioPortal website (https://www.cbioportal.org/). Theexpression data of the SMC cohort were available in the GEO database (GSE113184).Kaplan–Meier survival plots were generated online with the Kaplan–Meier plotterdatabase (https://kmplot.com/analysis/), and hazard ratios with 95% confidence intervalsand log-rank P values were calculated. The transcription factor binding site predictionwas performed online with the JASPAR database (https://jaspar.genereg.net/). A publicSTAT3 ChIP-seq data were available in the GEO database (GSE152203). Source data areprovided with this paper.
Fig. 7 Correlations among ENSA, SREBP2, pSTAT3-Tyr705 and survival in clinical samples. a, b Representative IHC images (a) and IHC scores (b) ofENSA staining in 8 paired TNBC tissues and adjacent normal tissues. n= 8 paired samples. Two-tailed paired Student’s t test. c Immunohistochemicalstaining of ENSA in 138 TNBC specimens. Representative images are shown. Scale bars, 100 µm. d Kaplan–Meier analysis of the relapse-free survival andoverall survival of 138 TNBC patients. A log-rank test was used to determine the statistical significance between the low-ENSA expression group (n= 96)and the high ENSA expression group (n= 42). e IHC staining of SREBP2 and pSTAT3-Tyr705 in 138 TNBC specimens. Representative images are shown.Scale bars, 100 µm. n= 138 samples. f Correlation analysis of ENSA with SREBP2 and pSTAT3-Tyr705 expression levels in 138 TNBC tissues. Correlationcoefficients were calculated using the Spearman test. Two-tailed P-values were given. g Proposed working model. In TNBC, ENSA is amplified, highlyexpressed and inhibits the function of PP2A, resulting in STAT3 Tyr705 phosphorylation and activation. STAT3 activation induces SREBP2 transcription toupregulate cellular cholesterol biosynthesis and facilitate tumor progression. Inhibition of STAT3 signaling with Stattic might serve as an effectivetreatment strategy for 1q21.3-amplified and ENSA-highly expressed TNBC. Source data are provided as a Source Data file. IHC immunohistochemistry,Amp amplification, SRE sterol regulatory element.
ARTICLE NATURE COMMUNICATIONS | https://doi.org/10.1038/s41467-022-28452-z
14 NATURE COMMUNICATIONS | (2022) 13:791 | https://doi.org/10.1038/s41467-022-28452-z | www.nature.com/naturecommunications

Received: 25 February 2021; Accepted: 26 January 2022;
References1. Venkitaraman, R. Triple-negative/basal-like breast cancer: clinical, pathologic
and molecular features. Expert Rev. Anticancer Ther. 10, 199–207 (2010).2. Dent, R. et al. Triple-negative breast cancer: clinical features and patterns of
recurrence. Clin. Cancer Res. 13, 4429–4434 (2007).3. Garrido-Castro, A. C., Lin, N. U. & Polyak, K. Insights into molecular
classifications of triple-negative breast cancer: improving patient selection fortreatment. Cancer Discov. 9, 176–198 (2019).
4. Yin, W. J. et al. Clinicopathological features of the triple-negative tumorsin Chinese breast cancer patients. Breast Cancer Res Treat. 115, 325–333(2009).
5. Bianchini, G., Balko, J. M., Mayer, I. A., Sanders, M. E. & Gianni, L. Triple-negative breast cancer: challenges and opportunities of a heterogeneousdisease. Nat. Rev. Clin. Oncol. 13, 674–690 (2016).
6. Carey, L., Winer, E., Viale, G., Cameron, D. & Gianni, L. Triple-negativebreast cancer: disease entity or title of convenience? Nat. Rev. Clin. Oncol. 7,683–692 (2010).
7. Jiang, Y.-Z. et al. Genomic and transcriptomic landscape of triple-negativebreast cancers: subtypes and treatment strategies. Cancer Cell 35, 428–440(2019). e425.
8. Lehmann, B. D. et al. Identification of human triple-negative breast cancersubtypes and preclinical models for selection of targeted therapies. J. Clin.Invest. 121, 2750–2767 (2011).
9. Lehmann, B. D. et al. Refinement of triple-negative breast cancer molecularsubtypes: implications for neoadjuvant chemotherapy selection. PLoS ONE 11,e0157368 (2016).
10. Beroukhim, R. et al. The landscape of somatic copy-number alteration acrosshuman cancers. Nature 463, 899–905 (2010).
11. Stratton, M. R., Campbell, P. J. & Futreal, P. A. The cancer genome. Nature458, 719–724 (2009).
12. Hieronymus, H. et al. Copy number alteration burden predicts prostate cancerrelapse. Proc. Natl Acad. Sci. USA 111, 11139–11144 (2014).
13. Bergamaschi, A. et al. Distinct patterns of DNA copy number alteration areassociated with different clinicopathological features and gene-expressionsubtypes of breast cancer. Genes Chromosomes Cancer 45, 1033–1040 (2006).
14. Ciriello, G. et al. Emerging landscape of oncogenic signatures across humancancers. Nat. Genet. 45, 1127–1133 (2013).
15. Goutsouliak, K. et al. Towards personalized treatment for early stage HER2-positive breast cancer. Nat. Rev. Clin. Oncol. 17, 233–250 (2020).
16. Chin, K. et al. Genomic and transcriptional aberrations linked to breast cancerpathophysiologies. Cancer Cell 10, 529–541 (2006).
17. Cancer Genome Atlas, N. Comprehensive molecular portraits of humanbreast tumours. Nature 490, 61–70 (2012).
18. Pelton, K., Freeman, M. R. & Solomon, K. R. Cholesterol and prostate cancer.Curr. Opin. Pharm. 12, 751–759 (2012).
19. Kuzu, O. F., Noory, M. A. & Robertson, G. P. The role of cholesterol in cancer.Cancer Res 76, 2063–2070 (2016).
20. Nelson, E. R. et al. 27-Hydroxycholesterol links hypercholesterolemia andbreast cancer pathophysiology. Science 342, 1094–1098 (2013).
21. Borgquist, S. et al. Cholesterol, cholesterol-lowering medication use, and breastcancer outcome in the BIG 1-98 Study. J. Clin. Oncol. 35, 1179–1188 (2017).
22. Baek, A. E. et al. The cholesterol metabolite 27 hydroxycholesterol facilitatesbreast cancer metastasis through its actions on immune cells. Nat. Commun.8, 864 (2017).
23. Cai, D. et al. RORgamma is a targetable master regulator of cholesterolbiosynthesis in a cancer subtype. Nat. Commun. 10, 4621 (2019).
24. Li, C. et al. Integrated omics of metastatic colorectal cancer. Cancer Cell 38,734–747 (2020). e739.
25. Xu, S. et al. Genome-wide CRISPR screen identifies ELP5 as a determinant ofgemcitabine sensitivity in gallbladder cancer. Nat. Commun. 10, 5492 (2019).
26. Mesquita, B. et al. Frequent copy number gains at 1q21 and 1q32 areassociated with overexpression of the ETS transcription factors ETV3 andELF3 in breast cancer irrespective of molecular subtypes. Breast Cancer ResTreat. 138, 37–45 (2013).
27. Teixeira, M. R. et al. Evaluation of breast cancer polyclonality by combinedchromosome banding and comparative genomic hybridization analysis.Neoplasia 3, 204–214 (2001).
28. Adelaide, J. et al. Integrated profiling of basal and luminal breast cancers.Cancer Res. 67, 11565–11575 (2007).
29. Bhattacharya, A. et al. Transcriptional effects of copy number alterations in alarge set of human cancers. Nat. Commun. 11, 715 (2020).
30. Goh, J. Y. et al. Chromosome 1q21.3 amplification is a trackable biomarkerand actionable target for breast cancer recurrence. Nat. Med. 23, 1319–1330(2017).
31. Thameem, F. et al. The transcribed endosulfine alpha gene is located within atype 2 diabetes-linked region on 1q: sequence and expression analysis in PimaIndians. Mol. Genet. Metab. 81, 16–21 (2004).
32. Héron, L., Virsolvy, A., Apiou, F., Le Cam, A. & Bataille, D. Isolation,characterization, and chromosomal localization of the human ENSA gene thatencodes alpha-endosulfine, a regulator of beta-cell K(ATP) channels. Diabetes48, 1873–1876 (1999).
33. Mochida, S., Maslen, S. L., Skehel, M. & Hunt, T. Greatwall phosphorylates aninhibitor of protein phosphatase 2A that is essential for mitosis. Science 330,1670–1673 (2010).
34. Gharbi-Ayachi, A. et al. The substrate of Greatwall kinase, Arpp19, controlsmitosis by inhibiting protein phosphatase 2A. Science 330, 1673–1677 (2010).
35. Charrasse, S. et al. Ensa controls S-phase length by modulating Treslin levels.Nat. Commun. 8, 206 (2017).
36. Chen, Y. L. et al. ENSA expression correlates with attenuated tumor propagationin liver cancer. Biochem. Biophys. Res. Commun. 442, 56–61 (2013).
37. Buhaescu, I. & Izzedine, H. Mevalonate pathway: a review of clinical andtherapeutical implications. Clin. Biochem. 40, 575–584 (2007).
38. Mullen, P. J., Yu, R., Longo, J., Archer, M. C. & Penn, L. Z. The interplaybetween cell signalling and the mevalonate pathway in cancer. Nat. Rev.Cancer 16, 718–731 (2016).
39. Kitahara, C. M. et al. Total cholesterol and cancer risk in a large prospectivestudy in Korea. J. Clin. Oncol. 29, 1592–1598 (2011).
40. Johnson, K. E. et al. The relationship between circulating lipids and breastcancer risk: a Mendelian randomization study. PLoS Med. 17, e1003302 (2020).
41. Huang, B., Song, B.-l & Xu, C. Cholesterol metabolism in cancer: mechanismsand therapeutic opportunities. Nat. Metab. 2, 132–141 (2020).
42. Liu, Z., Liu, X., Liu, S. & Cao, Q. Cholesterol promotes the migration andinvasion of renal carcinoma cells by regulating the KLF5/miR-27a/FBXW7pathway. Biochem. Biophys. Res. Commun. 502, 69–75 (2018).
43. Wang, Y., Liu, C. & Hu, L. Cholesterol regulates cell proliferation andapoptosis of colorectal cancer by modulating miR-33a-PIM3 pathway.Biochem. Biophys. Res. Commun. 511, 685–692 (2019).
44. Ehmsen, S. et al. Increased cholesterol biosynthesis is a key characteristic ofbreast cancer stem cells influencing patient outcome. Cell Rep. 27, 3927–3938(2019). e3926.
45. Novak, A. et al. Cholesterol masks membrane glycosphingolipid tumor-associated antigens to reduce their immunodetection in human cancerbiopsies. Glycobiology 23, 1230–1239 (2013).
46. Li, H. Y., Appelbaum, F. R., Willman, C. L., Zager, R. A. & Banker, D. E.Cholesterol-modulating agents kill acute myeloid leukemia cells and sensitizethem to therapeutics by blocking adaptive cholesterol responses. Blood 101,3628–3634 (2003).
47. Maiuri, M. C. & Kroemer, G. Essential role for oxidative phosphorylation incancer progression. Cell Metab. 21, 11–12 (2015).
48. Hart, T. et al. High-resolution CRISPR screens reveal fitness genes andgenotype-specific cancer liabilities. Cell 163, 1515–1526 (2015).
49. Brown, M. S. & Goldstein, J. L. The SREBP pathway: regulation of cholesterolmetabolism by proteolysis of a membrane-bound transcription factor. Cell 89,331–340 (1997).
50. Horton, J. D., Goldstein, J. L. & Brown, M. S. SREBPs: activators of thecomplete program of cholesterol and fatty acid synthesis in the liver. J. Clin.Investig. 109, 1125–1131 (2002).
51. Moon, S. H. et al. p53 represses the mevalonate pathway to mediate tumorsuppression. Cell 176, 564–580 (2019). e519.
52. Wang, B. T. et al. The mammalian target of rapamycin regulates cholesterolbiosynthetic gene expression and exhibits a rapamycin-resistanttranscriptional profile. Proc. Natl Acad. Sci. USA 108, 15201–15206 (2011).
53. Li, Y. et al. AMPK phosphorylates and inhibits SREBP activity to attenuatehepatic steatosis and atherosclerosis in diet-induced insulin-resistant mice.Cell Metab. 13, 376–388 (2011).
54. Ricoult, S. J., Yecies, J. L., Ben-Sahra, I. & Manning, B. D. Oncogenic PI3K andK-Ras stimulate de novo lipid synthesis through mTORC1 and SREBP.Oncogene 35, 1250–1260 (2016).
55. Porstmann, T. et al. PKB/Akt induces transcription of enzymes involved incholesterol and fatty acid biosynthesis via activation of SREBP. Oncogene 24,6465–6481 (2005).
56. Xu, Y., Ikegami, M., Wang, Y., Matsuzaki, Y. & Whitsett, J. A. Geneexpression and biological processes influenced by deletion of Stat3 inpulmonary type II epithelial cells. BMC Genomics 8, 455 (2007).
57. Chen, J. et al. Blocking of STAT-3/SREBP1-mediated glucose-lipidmetabolism is involved in dietary phytoestrogen-inhibited ovariectomized-induced body weight gain in rats. J. Nutr. Biochem. 61, 17–23 (2018).
58. Woetmann, A. et al. Inhibition of protein phosphatase 2A induces serine/threonine phosphorylation, subcellular redistribution, and functionalinhibition of STAT3. Proc. Natl Acad. Sci. USA 96, 10620–10625 (1999).
59. Liang, H. et al. Regulation of angiotensin II-induced phosphorylation of STAT3in vascular smooth muscle cells. J. Biol. Chem. 274, 19846–19851 (1999).
NATURE COMMUNICATIONS | https://doi.org/10.1038/s41467-022-28452-z ARTICLE
NATURE COMMUNICATIONS | (2022) 13:791 | https://doi.org/10.1038/s41467-022-28452-z | www.nature.com/naturecommunications 15

60. Zhang, F. et al. Characterization of drug responses of mini patient-derivedxenografts in mice for predicting cancer patient clinical therapeutic response.Cancer Commun. (Lond.) 38, 60 (2018).
61. Sachs, N. et al. A living biobank of breast cancer organoids captures diseaseheterogeneity. Cell 172, 373–386 (2018). e310.
62. Gong, Y. et al. Metabolic-pathway-based subtyping of triple-negative breastcancer reveals potential therapeutic targets. Cell Metab. 33, 51–64 (2021). e59.
63. Zhan, M. et al. Guided chemotherapy based on patient-derived mini-xenograftmodels improves survival of gallbladder carcinoma patients. Cancer Commun.(Lond.) 38, 48 (2018).
64. Lam, S. M. et al. A multi-omics investigation of the composition and functionof extracellular vesicles along the temporal trajectory of COVID-19. Nat.Metab. 3, 909–922 (2021).
AcknowledgementsThe authors are grateful to Yi-Zhou Jiang and Ding Ma for their excellent data man-agement. Cartoons in Figs. 6h, 7g were created with BioRender.com. This work wassupported by grants from the National Natural Science Foundation of China (grants81672600, 81722032, 82072916, and 91959207, received by K.-D.Y.), the 2018 ShanghaiYouth Excellent Academic Leader (received by K.-D.Y.), and the Fudan ZHUOSHIProject (received by K.-D.Y.).
Author contributionsK.-D.Y. and Y.-Y.C. designed the study; Y.-Y.-C. conducted and analyzed most of theexperiments; J.-Y.G. and S.-Y.Z. conducted the remaining experiments; K.-D.Y. and Z.-M.S. provided crucial reagents and conduct management; Y.-Y.C. and K.-D.Y. preparedthe manuscript. The authors read and approved the final manuscript.
Competing interestsThe authors declare no competing interests.
Additional informationSupplementary information The online version contains supplementary materialavailable at https://doi.org/10.1038/s41467-022-28452-z.
Correspondence and requests for materials should be addressed to Ke-Da Yu.
Peer review information Nature Communications thanks Carlos Fernández-Hernandoand the other, anonymous, reviewer(s) for their contribution to the peer review of thiswork. Peer reviewer reports are available.
Reprints and permission information is available at http://www.nature.com/reprints
Publisher’s note Springer Nature remains neutral with regard to jurisdictional claims inpublished maps and institutional affiliations.
Open Access This article is licensed under a Creative CommonsAttribution 4.0 International License, which permits use, sharing,
adaptation, distribution and reproduction in any medium or format, as long as you giveappropriate credit to the original author(s) and the source, provide a link to the CreativeCommons license, and indicate if changes were made. The images or other third partymaterial in this article are included in the article’s Creative Commons license, unlessindicated otherwise in a credit line to the material. If material is not included in thearticle’s Creative Commons license and your intended use is not permitted by statutoryregulation or exceeds the permitted use, you will need to obtain permission directly fromthe copyright holder. To view a copy of this license, visit http://creativecommons.org/licenses/by/4.0/.
© The Author(s) 2022
ARTICLE NATURE COMMUNICATIONS | https://doi.org/10.1038/s41467-022-28452-z
16 NATURE COMMUNICATIONS | (2022) 13:791 | https://doi.org/10.1038/s41467-022-28452-z | www.nature.com/naturecommunications