EU versus US regulation: Biotech
47
1 U.S. versus E.U. Biotechnology Regulations and Comparative Advantage: Implications for Future Conflicts and Trade By Gal Hochman, Gordon Rausser, and David Zilberman October 2008 1. Introduction In the 1990s, a new and important industry emerged; namely, the plant biotechnology industry. As the industry matured, US based firms became more dominant and their market shares increased. Although many former chemical companies in the US moved away from development of new chemicals into development of new biotechnology traits (e.g., Monsanto, followed by Pioneer/DuPont and Dow Chemical/Mycogen), European companies continued to heavily invest in chemicals well into the 21 st century (e.g., Syngenta, BASF, Bayers). The different patterns of investment in R&D caused the US firms to dominate the industry, and affected the two
-
Upload
khangminh22 -
Category
Documents
-
view
2 -
download
0
Transcript of EU versus US regulation: Biotech

1
U.S. versus E.U. Biotechnology
Regulations and Comparative Advantage:
Implications for Future Conflicts and
Trade
By
Gal Hochman, Gordon Rausser, and David Zilberman
October 2008
1. Introduction
In the 1990s, a new and important industry emerged; namely, the plant biotechnology industry.
As the industry matured, US based firms became more dominant and their market shares
increased. Although many former chemical companies in the US moved away from development
of new chemicals into development of new biotechnology traits (e.g., Monsanto, followed by
Pioneer/DuPont and Dow Chemical/Mycogen), European companies continued to heavily invest
in chemicals well into the 21st century (e.g., Syngenta, BASF, Bayers). The different patterns of
investment in R&D caused the US firms to dominate the industry, and affected the two

2
countries’ comparative advantage. Whereas the Europeans became more competitive in
agricultural chemicals, the US became more competitive in biotechnology.
In the United States, biotech crops under development are evaluated extensively before being
approved for commercialization. The specific regulatory process stems from the Regulation of
Biotechnology Products (1986) (Cast, 2007). Risks associated with biotechnology crops are
considered not to be fundamentally different from risks of conventionally derived products, and
regulation should be on a case-by-case bases. Regulation should, therefore, follow existing rules,
which provide adequate authority for regulation of biotechnology crops.
On the other hand, European Union efforts in the 1990s initially attempted to develop a uniform
EU-wide policy for approvals and trade in GM crops and foods, which was controversial in
several member states. Widespread media coverage of anti-GM activists helped move the issue
of GM foods quickly to the forefront of political debate in Europe. Increased representation of
the Green Party in member state parliaments and cabinets, as well as in the European Parliament,
ensured that these concerns would reflect national and European politics. Almost overnight,
GMOs became politically unpopular and politicians found it difficult to approve GM crops and
foods despite scientific reviews that should have ameliorated safety concerns.
By 1997, the effort to craft a uniform EU-wide policy on GMOs came apart. Despite EU
approvals for commercialization of several GM crops under Directive 90/220/EEC, a few
member states invoked a “safeguard clause” to ban the use of the approved GM crops in their
respective countries. In 1997, Austria and Luxembourg banned several EU-approved GM crops.
Over the next several years, additional bans on EU-approved crops followed in Austria, Italy,
Greece and Germany. While the Commission could have taken legal action to force compliance,

3
it chose not to do so. Europeans faced growing opposition to GM foods and a concern about an
inadequate regulatory system. In response to these concerns, the European Commission did not
approve any new GM foods or crops between 1998 and 2004, despite general scientific
consensus that they posed no food safety or environmental risks (Evenson, 2007). Regulation of
the introduction of biotechnology in Europe took a different approach than the United States;
whereas the Europeans adopted the ‘precautionary principle' toward the late 1990s, the United
States adopted the ‘substantial equivalence' principle.1
The decision to apply regulatory measures and the incentives of the different groups to influence
this decision is not, however, limited to a certain sector. Regulation is determined by a
bargaining process, which is political in nature and attempts to incorporate the well being of the
different groups affected by the proposed regulation. The challenge is to address different
incentives without slipping into protectionist policy. To keep political considerations at bay, and
to protect the public’s general interests (not the income of a well-connected sector), a
transparent and coherent methodology needs to be developed. The risk assessment model strives
to meet this challenge, as illustrated in Zilberman et al. 2008. Harmonizing the method used, not
the standard levels, seems to us a more promising approach.2 Harmonizing the methodology
introduces transparency to the decision process, while allowing nations to respond differently to
environmental and health risk.
1 The substantial equivalent approach measures, whether biotech food or crop shares similar health and nutritional characteristics with its conventional counterpart. Substantially equivalent biotech foods are determined to be as safe as their conventional counterparts. Not substantially equivalent products may still be safe, but must undergo a broader range of tests before approved for commercial use. The zero risk-tolerance regulatory regime, coined the precautionary principle, is a moral and political principle which states that if an action or policy might cause severe or irreversible harm to the public, in the absence of a scientific consensus that harm would not ensue, the burden of proof falls on those who would advocate taking the action. For more on the differences between the two regulatory regimes see Hochman et al. (2008). 2 See also Hochman et al. (2008).
4
In the paper, we extend political economic models to formally incorporate risk, and show that
setting of regulations in the biotech industry reflects political economic interactions, largely
driven in food safety regulations by comparative advantage. To this end, technical regulations
may be designed to discriminate against foreign suppliers both in their construction and in their
outcomes. They may be used to gain strategic international trade advantages for domestic firms
relative to foreign competitors. Regulation preserved and protected Europe’s comparative
advantage; regulation self-sustained the European chemical industry’s comparative advantage
and kept at bay investment in the emerging biotech industry.3 We further argue that regulation
spillover, particularly from the EU to developing countries, ill-served the developing countries
respective public interests.
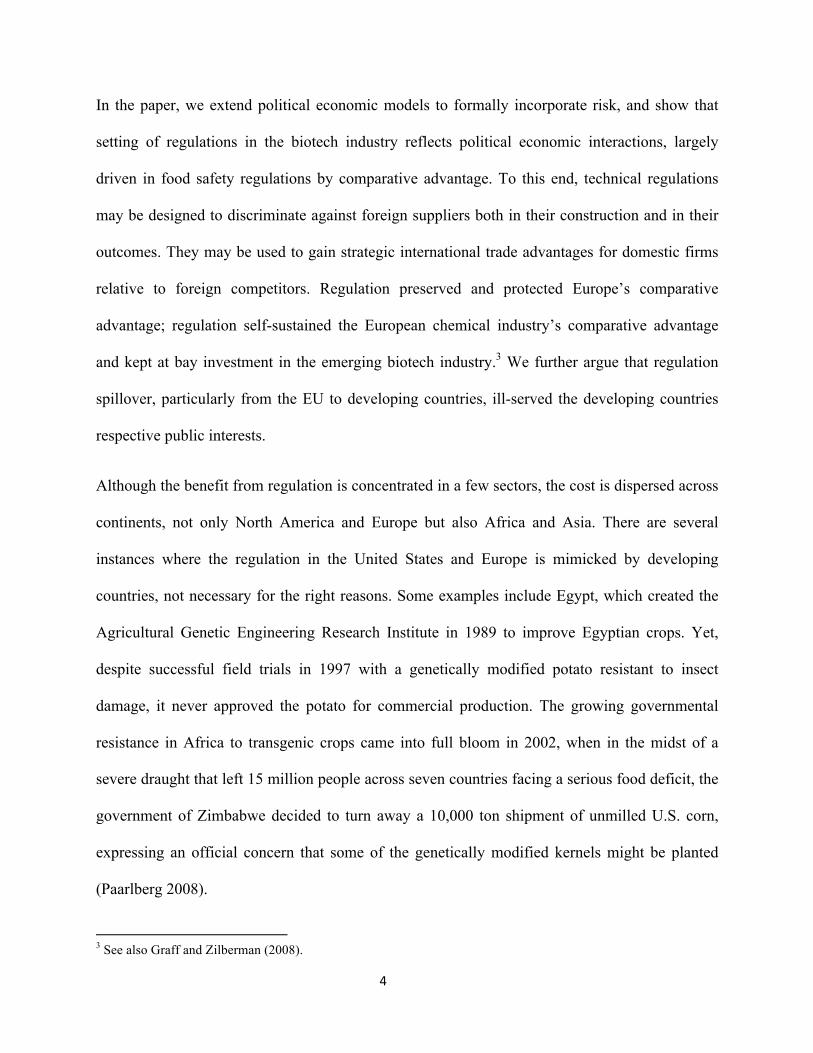
Although the benefit from regulation is concentrated in a few sectors, the cost is dispersed across
continents, not only North America and Europe but also Africa and Asia. There are several
instances where the regulation in the United States and Europe is mimicked by developing
countries, not necessary for the right reasons. Some examples include Egypt, which created the
Agricultural Genetic Engineering Research Institute in 1989 to improve Egyptian crops. Yet,
despite successful field trials in 1997 with a genetically modified potato resistant to insect
damage, it never approved the potato for commercial production. The growing governmental
resistance in Africa to transgenic crops came into full bloom in 2002, when in the midst of a
severe draught that left 15 million people across seven countries facing a serious food deficit, the
government of Zimbabwe decided to turn away a 10,000 ton shipment of unmilled U.S. corn,
expressing an official concern that some of the genetically modified kernels might be planted
(Paarlberg 2008).
3 See also Graff and Zilberman (2008).
5
The balance of our paper is organized into four remaining sections. Biotech regulation in both
the European Union and the United States, as well as environmental and food safety concerns,
are described in Section 2. A conceptual framework illustrating how regulation has affected
production and trade is presented in Section 3, and Section 4 offers empirical support for the
arguments presented in the paper. The implication for policy, emphasizing the importance of
harmonizing methodology, and not the standards, is discussed in Section 5.
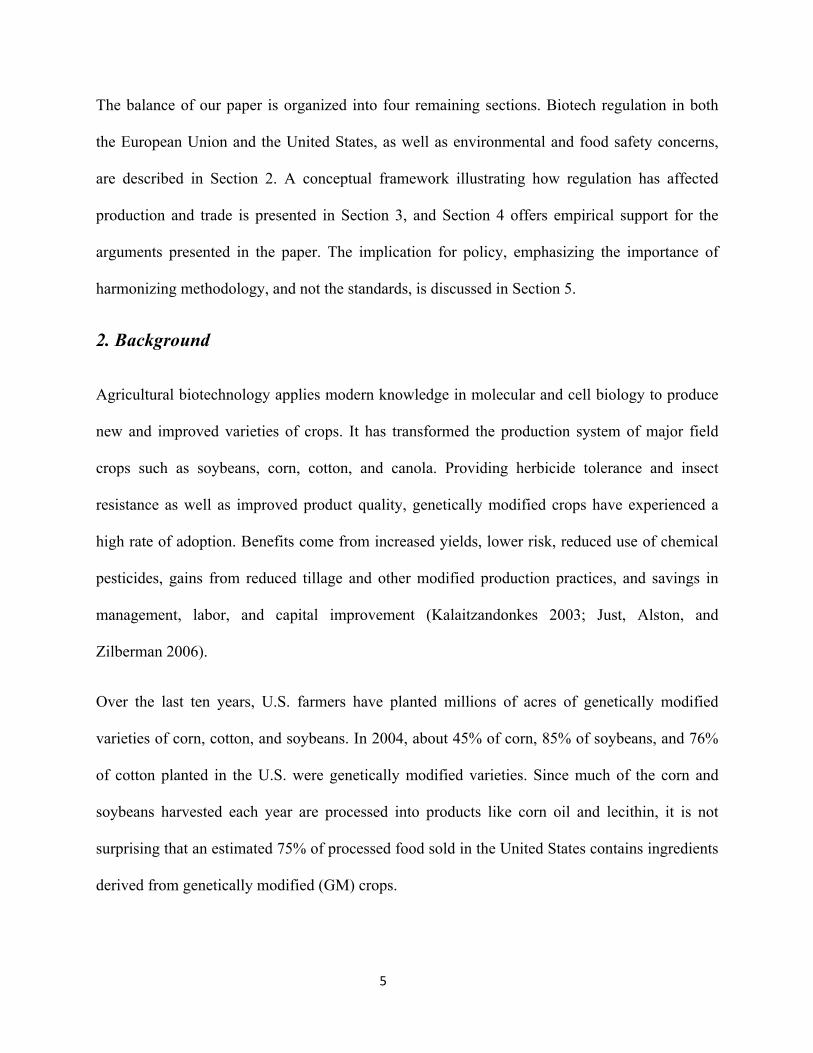
2. Background
Agricultural biotechnology applies modern knowledge in molecular and cell biology to produce
new and improved varieties of crops. It has transformed the production system of major field
crops such as soybeans, corn, cotton, and canola. Providing herbicide tolerance and insect
resistance as well as improved product quality, genetically modified crops have experienced a
high rate of adoption. Benefits come from increased yields, lower risk, reduced use of chemical
pesticides, gains from reduced tillage and other modified production practices, and savings in
management, labor, and capital improvement (Kalaitzandonkes 2003; Just, Alston, and
Zilberman 2006).
Over the last ten years, U.S. farmers have planted millions of acres of genetically modified
varieties of corn, cotton, and soybeans. In 2004, about 45% of corn, 85% of soybeans, and 76%
of cotton planted in the U.S. were genetically modified varieties. Since much of the corn and
soybeans harvested each year are processed into products like corn oil and lecithin, it is not
surprising that an estimated 75% of processed food sold in the United States contains ingredients
derived from genetically modified (GM) crops.

6
Notably, however, the adoption of biotechnology has varied across location, and was initially
concentrated in a small number of countries, partly due to regulatory regimes (Zilberman 2006;
James 2007). Agricultural biotechnology has recently begun to expand. In 2007, as a
consequence of consistent and substantial benefit from biotech and changes in the regulatory
regime in Europe, 114.3 million hectares (282.4 million acres) of biotech crops were planted by
12 million farmers in 23 countries. Still, the U.S. accounted for 50% of biotech production,
planting 57.7 million hectares to GM seed (James 2007).
2.1 Biotechnology and regulation
In the United States, the introduction of GM foods—foods derived from GM crops or containing
ingredients derived from GM crops—has not elicited strong public concern or widespread
opposition. Indeed, most Americans are unaware of the extent to which genetically modified
foods have been introduced into the marketplace. Europe, however, is a different matter. With
public confidence in food safety shaken by a series of food scares unrelated to GM foods,
including a serious outbreak of Mad Cow disease (Bovine Spongiform Encephalopathy),
European consumers are wary of GM foods.
European Union (EU) member states grow few GM crops (for instance, in 2003, France, the
largest wheat producer in Europe, grew less than 2 percent of world production whereas the
world largest producer by far, the United States, grew more than 40 percent – NUEweb 2008),
and very few (if any) foods carrying the required GM label appear to be available for sale in the
EU marketplace. Faced with popular opposition to GM foods and a concern about an inadequate
regulatory system, the European Commission did not approve any new GM foods or crops
between 1998 and 2004, despite general scientific consensus that they posed no food safety or

7
environmental risks (Evenson, 2007).4 In 2004, new EU laws went into effect providing for the
approval of GM crops, as well as GM food and feed, and establishing new requirements for
labeling and traceability.
Since then, the Commission has moved through a lengthy process to approve several GM crops,
as well as human food and animal feeds derived from GM crops. In June 2005, however, a
qualified majority of the Council of Ministers refused to lift certain EU member state bans on
GM products that had been approved by the Commission, creating new doubts about the viability
of an EU-wide policy on GM crops, foods and feeds.5
In the United States, risks associated with biotechnology crops are considered not to be
fundamentally different from risks of conventionally derived products, and regulation should be
on a case-by-case bases. Regulation should, therefore, follow existing rules which provide
adequate authority for regulation of biotechnology crops.
The Environmental Protection Agency (EPA) and the USDA-Animal and Plant Health
Inspection Service (USDA-APHIS) oversee the environmental safety of commercial releases of
biotech plants in the United States. The Endangered Species Act also applies to biotech plants.
The Food and Drug Administration (FDA) serves in a consultative manner on issues related to
food and feed safety issues, though regulation are pending that would make the consultation
process mandatory. The combined activities of EPA, USDA-APHIS, and FDA assess the
potential risks to human health and the environment through a comprehensive process prior to
the general release and potential commercial use of a biotech crop (see Appendix A). Biotech
products can be produced and sold only if no unacceptable risks are identified. After the biotech
4 See also Just et al. (2007), and reference therein. 5 For more on the regulatory regimes in the European Union and in the United States, see Hochman et al. (2008).
8
crop is approved for commercial use, government regulatory and monitoring mechanisms allow
products to be pulled from the market if new data relating to safety justify such action, although
no official mechanism for systematic post-commercial monitoring of biotech crops exists.
The goal of food policy regulations ought to be the provision, subject to resource constraints, of
readily available food with characteristics demanded by consumers in a manner that is minimally
distorting (Josling, Roberts, and Orden 2004). There is a strong economic rationale for food
safety regulation to respond to market failures, which in part include information asymmetries
that preclude consumers from making fully informed decisions. Food safety regulations can be
aimed at reducing risk of bad health outcomes or ensuring minimum quality. Some regulate the
content of food, such as the absence of disease or particular chemicals. Others regulate the
production process, mandating rinsing and cleaning or banning the use of chemical pesticides or
hormones. From an economic efficiency standpoint, content regulations are considered superior
to process regulations. They permit the achievement of desired food outcomes without limiting
the freedom of producers to use the most cost-effective processes.
There are a number of mechanisms by which countries regulate their food supplies. Quantity
restrictions, including bans, are a severe method and generally favored only if other mechanisms
are not feasible because of technical limitations. Technical standards provide conditions that
importers must meet to have access to markets. They may include limitations on the size and
weight of commodities or the use of specified processing technologies. While such standards can
be justified on health and safety grounds, they may also be used to shift the comparative costs of
producers and thereby discriminate against certain producers, such as those from a particular
country. Finally, regulation can also be classified as information requirements and include
mandates that food products disclose certain information, such as the presence of carcinogens or

9
other ingredients deemed hazardous to health. Information requirements may also limit the use of
voluntary claims about food products to ensure credible information is conveyed to consumers.
Claims of nutritional attributes, for instance, must be substantiated. In response to demand for
organic products, many governments have imposed standards with which producers must comply
if they are to receive government certification that products are organic.
Despite strong economic justification for the regulation of food safety, countries may choose
suboptimally restrictive food safety laws. Governments tend to be afraid of low-probability high-
risk events occurring. National governments often adopt a decision-making process that
considers the risk effects of policy, as well as the costs and benefits. Incremental reductions of
risk, therefore, may be favored regardless of the cost to domestic consumers and foreign
producers. Regulation may also be used by interest groups to extract rents. Producers may use
food regulation to reduce competition from imports. Consumer advocacy groups may use the
political process to achieve narrow agendas that are not consistent with the public interest. The
design of mechanisms that reduce the potential for food safety policy to be used for ulterior
purposes, like protectionism, is an important element of a regulation regime. It is estimated that
in 1995, $2.1 billion of U.S. exports were blocked by animal and plant safety regulations that had
little or no merit (Josling, Roberts, and Orden 2004).
Hypothetically, biotechnology may adversely impact food safety. It may introduce allergens and
toxins, and have a negative effect from the consumption of antibiotic-resistant marker genes and
viral-promoters genes used in the transformation process. Hypothetically, it may also negatively
impact environmental safety through gene transfer to related crops or wild species, and/or the
emergence of resistant pests. In practice, however, only gene flow became a real problem, and
only in a few local regions (2003-04 SOFA).

10
2.2 Gene Transfer
The transfer of genetic material and species among nations is central to the protection of natural
resources and human health. Such transfers can be intentional or accidental and can be
responsible for significant environmental and health benefits or for costly damage. For instance,
in many parts of the world, nutritional needs are primarily met by the cultivation of crops
intentionally introduced from other regions (Hoyt 1992). The United States is the leading
producer of corn and soybean, crops with origins in Mexico and China, respectively. On the
other hand, 80 percent of endangered species worldwide are threatened by invasive alien species,
which are responsible for nearly half of all invertebrate extinctions with known causes (Stein and
Flack 1996; Wilcove et al. 1998).
The two most material benefits of international gene and species transfer are their contributions
to food provision and chemical pest control reduction. As noted, much of the world’s food is
produced by crops that humans introduced from foreign lands. None of the staple crops in North
America are indigenous. The grasses that occupy U.S. pastureland were intentionally introduced
to provide better livestock grazing. Many of the fruits consumed today are the product of plant
breeding with genes from different regions. Genes from Andean corn, carefully bred in Mexico
City, ended a century-long effort to improve the nutritional content of corn and yielded modern
maize germ plasm. The assault of rusts on cereal crops has led to famine across human history.
An intense international effort to develop rust resistance in wheat has yielded a partial solution
and perhaps averted untold human misery. The work of transferring rust resistance in rice to
other cereals proceeds. Gene transfer will be integral to developing the agricultural productivity
gains necessary to feed a world of 10 billion people.
11
In addition to improving agricultural production, international species transfer can also benefit
the environment by offering alternatives to chemical pest control. The use of predator species to
control pest populations is fundamental to biological control, a relatively environmentally
friendly practice that uses natural methods to suppress pests. In many cases, predator species are
introduced to ecosystems. In other cases, indigenous predator populations are protected to
control pest populations. As environmental awareness has grown, demand for chemical-free
alternatives to pest control has increased. Alien species can be substitutes to chemical herbicides,
fungicides, and pesticides, which can cause wide-ranging changes in ecosystems by affecting
nontarget species and polluting water resources. For instance, several parasitoids were
successfully introduced in the United States to control the alfalfa weevil, itself an invasive alien
species from Europe. Absent biological control, the alfalfa weevil caused damage throughout the
United States and induced farmers to spray crops one or more times per year (Stoner 2006).
While species introductions can provide a valuable method of pest control, they can also backfire
and cause significant damage to ecosystems and native species. In some cases, biological control
has led to the extinction of native species, and in at least one case, the extinction of an entire
genus (Strong and Pemberton 2000).
Not all species and gene transfers are beneficial and many can be quite costly. Nonnative species
are spreading at faster and faster rates, imposing costs on the global economy on the order of
$1.4 trillion every year (Pimentel 2002). Despite the increasing rate of invasions, only 10 percent
of introduced species will become established, and only 10 percent of those will become pests
(Williamson 1996). Regardless, the spread of invasive alien species has altered ecosystems,
reduced biodiversity, endangered human health, fouled water sources, destroyed agricultural
land, and significantly altered the evolutionary process. These potential costs, combined with the

12
fact that an established invasive species can seldom be eliminated and that the extinction of
species threatened by invasives is irreversible, make the control of invasive species one of the
most critical issues facing the global community.
The spread of invasive species and the consequent homogenization of the earth’s ecosystems are
accelerating with the pace of movement of people and commodities across countries. Trade is the
primary pathway by which nonnative species are introduced to a region, often accidentally by
piggy-backing on traded commodities.
2.3 The environment
Nations may attempt to preserve environmental quality at home and abroad by intervening in
international trade via two primary mechanisms: enforcing process and production methods
(PPM) standards and blocking the importation of invasive species. Under existing trade
agreements, PPM standards can be used to influence environmental activities in foreign countries
and to reduce the effects of global environmental externalities so long as they do not discriminate
against particular producers. Intervention throughout the trade system can reduce the risk of
species invasion, though it may be combined with monitoring and control of the invaders.
In alien species and disease invasion management, governments seek policies that maximize
total social welfare, subject to many constraints. Policies should seek to balance the use of
incentives, monitoring, and control along the species-movement process. The ability to reject
imports prior to shipment, as well as reject imports and the impose fines at the border provide
importers with incentives to ensure their shipments are uncontaminated. After alien species have
entered the importing country, farmers can be subsidized to detect invasions and protect against
them. Monitoring to detect invasions can be done overseas, at the border, and within the country.

13
Control of invasive species includes treatment of shipments overseas and at the border, as well as
chemical spraying to control or eradicate populations within the country.
Cost-benefit analyses are typically used to determine which projects should be pursued. A
project should be undertaken if expected present value of a control or environmental project
exceeds or equals the expected present value of the cost of the project. A common response by
decisionmakers to the risk of invasion is to ban imports of any commodity that poses such a risk.
Such a response ignores the benefits of imports and invasive species themselves, and also
ignores less blunt policy options that may be available, such as control or financial incentives.
The determination of optimal policy response for species invasions is difficult for several
reasons, not the least of which is the difficulty of assigning value to nonmarketed environmental
services. The challenge of determining the full range of effects of invasions has yet to be
overcome in the literature. It is compounded by the diverse effects of invasions on other species
and the time-dependent magnitude of effects. Evaluation is further hindered by the endogeneity
of control dynamics. Risk of invasion and cost of invasion, for instance, are functions of human
impacts on ecosystems and human effort to reduce risk (Dalmazzone 2000). In general, lands
altered for agriculture or other uses are more susceptible to invasion and support fast growth of
invasive species. Mitigation and adaptation efforts, on the other hand, reduce invasion risk.
Besides the endogeneity of risk, the nature of invasion risk poses additional challenges. The
probability of invasion is typically low, but the consequences of invasion are quite high. A single
invasion can be calamitous. The power of expected utility is diminished with low-probability
catastrophic events (Chichilinsky 1998). People treat very unlikely events by either
overestimating their probabilities of realization or setting their probabilities to zero. Invasions are

14
also one-time events often independent of history, making estimation of probability density
functions impossible (Horan et al. 2002).
Because invasion is uncertain and a low-probability event, and because prevention efforts do not
stop invasions with certainty, it may be preferable to expend limited resources on control of
invasions once they occur. In some cases, it may be optimal to undertake considerable control
effort as soon as an invasion is detected in the hope of exterminating the invasive species before
exponential growth begins. In other cases, it may be optimal to try to maintain the invasive
species population at an acceptable level over an indefinite period of time.
While economics can address the market failures posed by species invasions, it is important to
realize the role of political institutions in determining responses to the problem. The Doha Round
was intended to address issues of food safety and the environment. In part, these objectives are
necessitated by the development of new technologies, new outbreaks of disease, and consumer
concerns. Increasingly, consumers are demanding greater levels of food safety and
environmental protection. The growing number of these regulations may be a response to
evolving consumer preferences, but they are also prone to political capture and may be used by
protectionists to reduce competitive pressure from imports. Policies can potentially be influenced
by consumers demanding cheap, safe food and domestic producers concerned about competition
and the availability of cheap inputs, as well as exporters, taxpayers, and environmentalists. The
principal food safety regulations related to trade involve attempts by importing countries to
reduce the risk of adverse health outcomes to acceptable levels. The most important
environmental regulations impacting trade include attempts by importing countries to reduce the
risk of alien species invasions and demand higher environmental quality provision in source
countries through the use of process and production methods (PPM) standards.

15
3. A conceptual framework
Using a multi-market approach to model the agriculture biotech and chemical industries, we
illustrate the benefits from biotech to the different groups. If (i) the chemical industry is not
diversifying its output to include biotech products and investing in genetic engineering, but
focusing only on chemicals, and (ii) the benefits to domestic consumers from biotech is small
(e.g., consumers in rich developed countries spend only a small percentage of their disposable
income on food), then a country does not benefit from biotech; a precautionary regulatory
regime, or even a preventive regime, maximizes the benefit to domestic producers while
imposing a very small cost on the country’s constituencies. Regulation preserves the chemical
industry’s market share, and therefore its profitability (as illustrated empirically in Section 4). On
the other hand, if a domestic biotech industry emerges and becomes a lucrative and dominant
industry, then a country will benefit from biotech and choose a more supportive regulatory
regime.
Formally, consider a product (e.g., staple crop seeds) that can be produced using two alternative
techniques: one uses genetic engineering and the other does not. If the seed is not genetically
modified, then to grow the crop agriculture chemicals are needed; the genetically modified crop,
on the other hand, does not require chemicals. Clearly, these assumptions oversimplify reality.
The conclusions, however, do not change if instead we assume genetically modified crops
consume less agriculture chemicals per hectare, when compared to the crop grown using
traditional techniques. Assume all markets are competitive – i.e., price equals marginal cost.
More specifically, farmers produce y units using two alternative technologies: traditional
technologies (denoted with subscript 0) and genetically engineered technologies (denoted with
subscript 1). Product y (e.g., staple crop) faces a price py and uses a subset of the variable inputs

16
with prices and . The subset of variable
inputs depends on the technology applied. A farmer that uses traditional production methods
consumes inputs x1 (e.g., agriculture chemicals), x2 and x3 (e.g., labor and land), as well as seeds
produced using traditional technology, s0; in other words, . On the other hand, a farmer
that uses the genetic modified technology utilizes only inputs s1, x2, and x3; in other words,
and . The aggregate profit for farmers using technology i for is
,
We assume the staple crop produced with genetic engineering is the same as the crop produced
using traditional technology.
The profit function of the seed producers is
whereas the profits of the agriculture chemical producers, x1, is
.
Now suppose prices in all industries in the sector are related through competition at the industry
level, and the introduction of genetically engineered traits reduces demand for variable input s0.
On the other hand, input purchased from other sectors, i.e., x2 and x3, are available in elastic
supply to the sector. The profit-maximizing levels of output and inputs, given prices, are
therefore , and , respectively.

17
Following the literature on multi-markets (Just and Hueth 1979; Alston and James 2002; among
others), we know that evaluating the welfare impact of such a change requires looking beyond
the buyers and sellers in market s0 and s1. Introducing seeds produced using genetically modified
techniques reduces quasi-rents to firms producing traditional seeds; it reduces the price to
traditional seeds. Using the envelope theorem, we know that
.
To compute the change in the producer surplus we integrate over the change in profits from
to :
The change in profits equals the change in the area under the equilibrium price and above the
supply curve. Because supply is upward slopping, a decline in prices implies . The
change in the producer surplus of genetically modified seed producers is clearly positive, and
equals their profits
In contrast to Just and Hueth (1979), the structure of the industry described in the paper is not
only vertical, it is also horizontal. The change in the price of seeds affects the agriculture
chemical industry, in addition to the farmers that grow the crop. The change in the producer
18
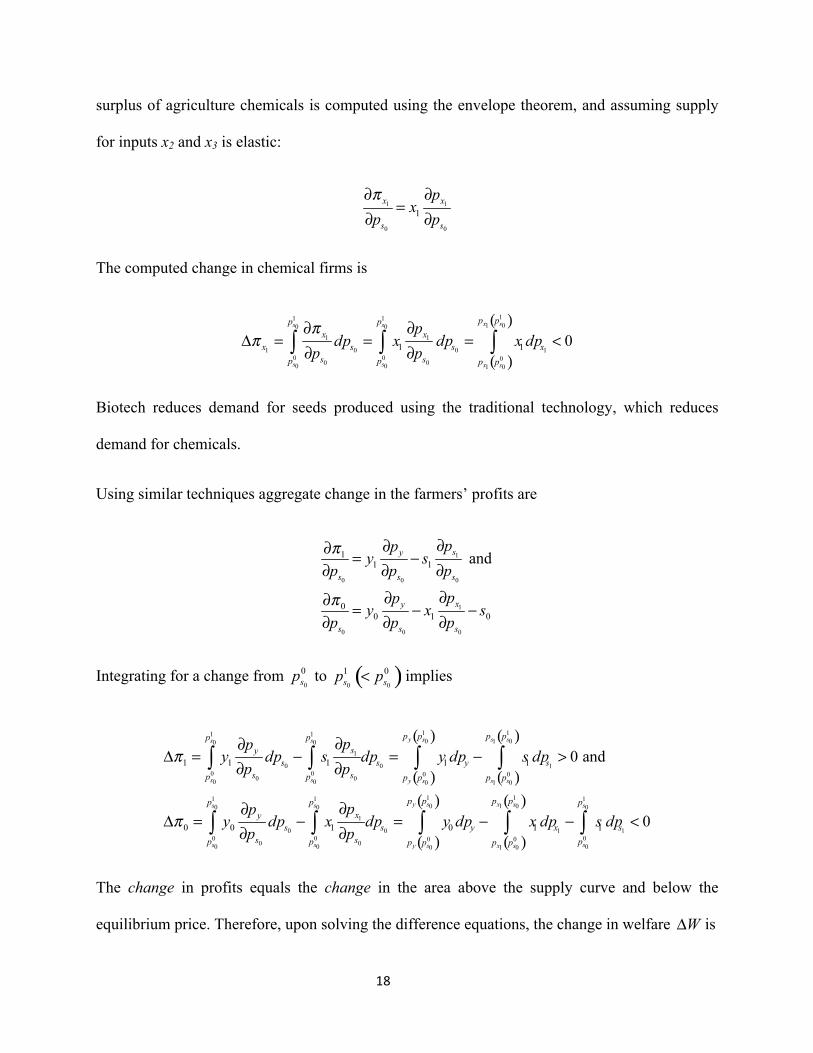
surplus of agriculture chemicals is computed using the envelope theorem, and assuming supply
for inputs x2 and x3 is elastic:
The computed change in chemical firms is
Biotech reduces demand for seeds produced using the traditional technology, which reduces
demand for chemicals.
Using similar techniques aggregate change in the farmers’ profits are
Integrating for a change from to implies
The change in profits equals the change in the area above the supply curve and below the
equilibrium price. Therefore, upon solving the difference equations, the change in welfare is

19
where the change in final consumer’s surplus is . The gains from biotech, however, are not
distributed between the two countries. Europe developed a strong chemical industry when the
United States developed a prosperous agriculture biotechnology industry. In what follows,
assume the industry producing the traditional technology is located in country F, whereas the
industry producing the genetically engineered technology is located in country H. Farmers are
distributed evenly between the two countries, and consumers are identical within and between
countries. Therefore
Moreover, because (i) the percentage of total expenditure on food in the developed world is
small, and (ii) the amount of genetically modified staple crops grown in Europe is small, in
contrast to the United States, the net welfare change from biotechnology is approximately
The United States stands to gain from agriculture biotech, much more than Europe does.
In figure 1 we depict an extreme scenario: only Europe produces chemicals and only the United
States produces genetically modifies seeds. The chemical industry, the seed markets, and the
staple crop market are depicted in the figures below. First, we describe the staple crop market in
Figure 1a. Let py denote the price of a unit of staple crop (e.g., the price of a bushel of corn), and
let y denote the quantity supplied. Let Sy denote the supply function of the staple crop, and Dy the
demand function. The market for staple crops is depicted in figure 1a, where superscript 0

20
denotes the equilibrium values prior to the introduction of genetically modified seeds (the black
curves) and superscript 1 denotes the equilibrium values after the introduction of genetically
modified seeds (the red curves). Biotechnology makes production more efficient, and therefore
the supply curve shifts down and to the right. Figure 1b depicts the market for agricultural
chemicals, where Sx denotes the supply function of the agricultural chemicals, and Dx the
demand function. The equilibrium price and quantity in the chemical market are px and x1,
respectively. Finally, Figure 1c depicts the market for traditional seeds, s0, and Figure 1d the
market for genetically modified seeds, s1. The notation follows the one used to construct Figures
1a and 1b.
Introducing genetically modified seeds (Figure 1d), affects the market for traditional seeds; it
reduces demand, and therefore the price, for traditional seeds (Figure 1c). The reduction in
traditional seeds, and the increase in genetically modified seeds that are more resilient to
pesticides and herbicides, reduces demand for chemicals. The demand function for agriculture
chemicals shifts down and to the left (Figure 1b). Introducing a more efficient technology to
produce staple crops implies that the supply of staple crops shifts down and to the right, the
economic surplus from producing and consuming staple crop increases (Figure 1a).

21
Px0
x10
Py0
Py1
y0 y1
PyPx
yx1
Figure 1b: The market for agricultural chemicals
Figure 1a: The market for staple crops
Px1
x11
Sx
Dx0
Dx1 Dy
Sy0
Sy1

22
Figure 1: Seeds, chemicals and staple crop
The country that wins the patent race benefits from the introduction of biotechnology. The
economic surplus of the country specializing in the traditional technology declines, whereas the
economic surplus of the country specializing in the new and more efficient technology increases.
The incentive to limit transgenic crops is then amplified if consumer surplus from staple crops is
very small, i.e., the amount spent on the staple crops is very small, especially given the
hypothetical health risk associated with consumption of genetically modified crops. Finally,
introducing a third country that does not produce agriculture chemicals but mimic EU’s
regulation (e.g., Africa), increases the global cost from banning transgenic crops.
Ps11
s11
Ps00
Ps01
s00
s01
1
Ps0
Ps1
s0s1
Figure 1d: The market for genetically modified seeds
Figure 1c: The market for traditional seeds
Ds1
Ss1
Ss0
Ds00
Ds01
23
The multi-market framework illustrates the economic incentives of the different groups in the
economy. Although global welfare is higher with biotechnology, EU's direct benefit is not clear;
especially given that food and environmental risks from biotech are not yet known.
While science and public health establish much of the intellectual foundation for intervention,
regulatory measures are the outcome of a bargaining process between the regulator and various
interest groups. This political process can affect the margin of safety and the computed benefit
from the regulatory measures.
Formally, the political process can be modeled as a cooperative game, à la Harsanyi (1963) and
Zusman (1976),6 or as a noncooperative game, à la Bernheim and Whinston (1986) and
Grossman and Helpman (1994). The fundamental assumption guiding both models is that any
individual affected by government policy has an incentive to influence the policymaker. Food
safety regulation affects the regulatory agency, consumers, farmers, the retail food sector,
incumbent firms, start-up firms and new entrants, and firms in competing sectors. The regulatory
measures, for example, affect consumer’s surplus from food consumption, CS, and the
agriculture biotech and chemical industries’ profits, π s1
and π x1 respectively. The regulatory
measures affect each group differently and therefore create different, and in many times
opposing, incentives. The regulator political economic objective function places different
weights on the different groups, where the chosen policy is constrained by the level of risk and
uncertainty a country is willing to put up with.
To keep political considerations at bay, and to maximize social welfare (not the income of a
well-connected sector), a transparent and coherent methodology needs to be developed. The risk
6 See also Rausser and Zusman (1998), and references therein.

24
assessment model strives to meet this challenge. If countries can agree on the model’s key
parameters, harmonizing the methodology used seems to us a more promising approach than the
standard levels (see Zilberman et al. 2008). It makes the decision process transparent, and yet
allows countries to choose the margin of safety, as long as the same margin is chosen for all food
and health related regulations.
In the context of transgenic crops, Zilberman (2006) argued that a major flaw in the current
regulatory process is that each new trait is evaluated separately, without taking alternatives into
account. Lichtenberg (2006), on the other hand, argued that uncertainty is the principle cause of
concern regarding these crops. This better understanding of policymakers' risk assessment, as
well as the realization that conducting risk assessment and risk-benefit analysis in isolation is
suboptimal, implies that incorporating economics into the risk assessment process is the
preferred alternative, either in a general equilibrium or in a partial equilibrium analysis.
To date, the pest and disease exclusion policies previously discussed have been developed
primarily on the basis of scientific risk assessment without economic analysis of the response of
importers to border enforcement policies. Existing policies are based on the reasoning that
increased enforcement effort will result in higher detection levels, or more specifically that
increased inspection will result in a higher number of interceptions and, in turn, higher
compliance. In addition to a deterrence effect under which importers respond to increased
enforcement with increased care, importers may respond in ways that yield unintended effects.
For example, importers may respond to the increased costs imposed by inspections by choosing
not to bring goods into a country, or they may ship a reduced amount. Moreover, different types
of firms are likely to respond to enforcement in different ways, affecting socially optimal
enforcement and social welfare.

25
Human behavior should be factored into the decision process. Consumers may respond to stricter
regulation by undertaking fewer personal safety measures (a similar effect is also observed in
insurance markets). They also react to safety information, although responses will vary by
consumer (e.g., Viscusi, Magat, and Huber 1987). Firm behavior should also be factored into the
decision process. Melcher (2003), for example, argues that firm compliance with regulatory
measures is imperfect. Monsanto and its partners, for example, violated federal regulation by
planting transgenic crops 44 times between 1990 and 2001.
4. The empirical analysis
Large technological innovations, as do smaller technical innovations, are usually invented and
commercialized not by the leading firms, but by firms that follow. The leading firms under-
invest in research and development (Grossman and Helpman 1991, Chapter 4). This conceptual
framework is used to explain business cycles in international trade. The agriculture
chemical/biotech industry is no exception.
One example is Monsanto, where in the 1980s’ sold mainly insecticides, herbicides, and
fungicides and operated the chemical business independent from the seeds industry. Monsanto
predicted that the agriculture chemical business would reach a plateau, and contemplated with
the idea that existing germplasm or seeds would be carriers of one or two useful foreign genes
(Charles 2001). During that time, Monsanto made a strategic decision: rather then attempting to
protect its chemical business, it embraced the vision in which chemicals would play a declining
but increasingly complementary role in agriculture (Hoover’s Company Records – In-depth
Records, June 27, 2006).
26
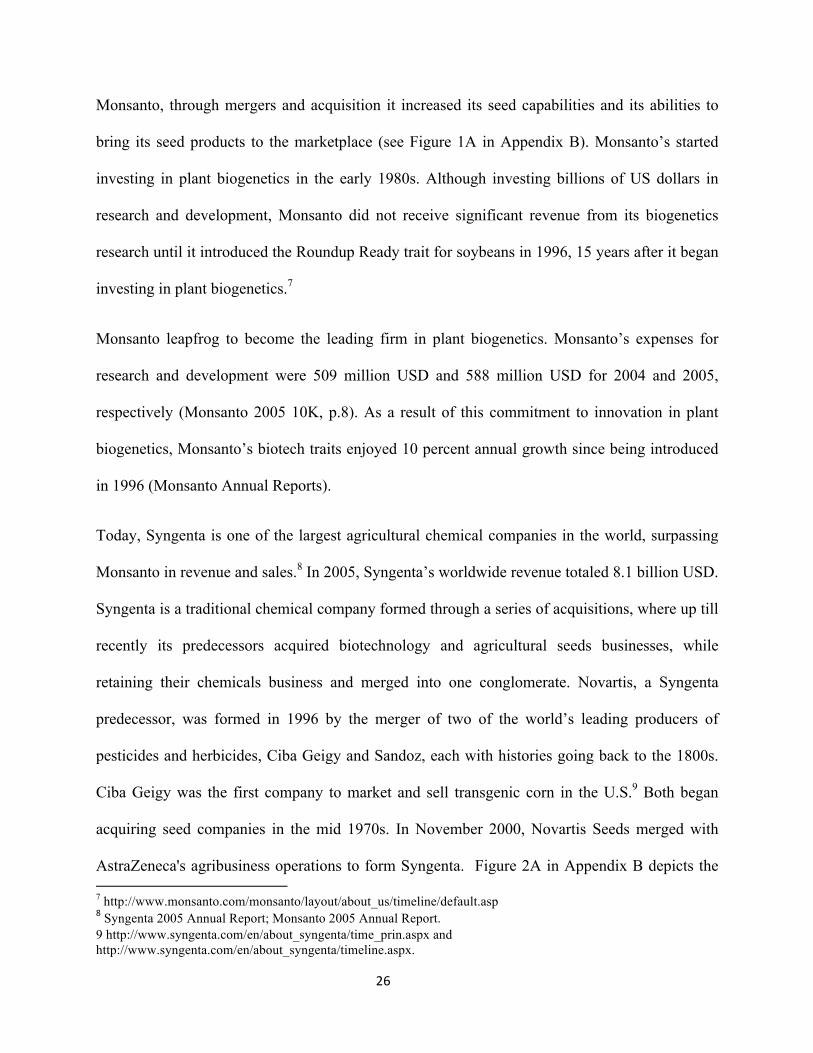
Monsanto, through mergers and acquisition it increased its seed capabilities and its abilities to
bring its seed products to the marketplace (see Figure 1A in Appendix B). Monsanto’s started
investing in plant biogenetics in the early 1980s. Although investing billions of US dollars in
research and development, Monsanto did not receive significant revenue from its biogenetics
research until it introduced the Roundup Ready trait for soybeans in 1996, 15 years after it began
investing in plant biogenetics.7
Monsanto leapfrog to become the leading firm in plant biogenetics. Monsanto’s expenses for
research and development were 509 million USD and 588 million USD for 2004 and 2005,
respectively (Monsanto 2005 10K, p.8). As a result of this commitment to innovation in plant
biogenetics, Monsanto’s biotech traits enjoyed 10 percent annual growth since being introduced
in 1996 (Monsanto Annual Reports).
Today, Syngenta is one of the largest agricultural chemical companies in the world, surpassing
Monsanto in revenue and sales.8 In 2005, Syngenta’s worldwide revenue totaled 8.1 billion USD.
Syngenta is a traditional chemical company formed through a series of acquisitions, where up till
recently its predecessors acquired biotechnology and agricultural seeds businesses, while
retaining their chemicals business and merged into one conglomerate. Novartis, a Syngenta
predecessor, was formed in 1996 by the merger of two of the world’s leading producers of
pesticides and herbicides, Ciba Geigy and Sandoz, each with histories going back to the 1800s.
Ciba Geigy was the first company to market and sell transgenic corn in the U.S.9 Both began
acquiring seed companies in the mid 1970s. In November 2000, Novartis Seeds merged with
AstraZeneca's agribusiness operations to form Syngenta. Figure 2A in Appendix B depicts the 7 http://www.monsanto.com/monsanto/layout/about_us/timeline/default.asp 8Syngenta 2005 Annual Report; Monsanto 2005 Annual Report. 9 http://www.syngenta.com/en/about_syngenta/time_prin.aspx and http://www.syngenta.com/en/about_syngenta/timeline.aspx.

27
various acquisitions and mergers that lead to today’s Syngenta. Figure 2, on the other hand,
depicts the ratio of investment in seeds to total investment in seeds and crop protection
(chemicals), which is substantially lower than the relative amount Monsanto invested in plant
transgenic. Other examples, summarized by a flowchart, and which include BASF, Du Pont and
Dow Chemicals presents a similar picture where these very successful companies began moving
toward the biotech industry only toward the beginning of the current century (Figures 1c to 1e in
Appendix B). US-based firms established a comparative advantage in the biotech industry. To
this end, Bayer, a leading chemical company, invested in crop protection 548, 500 and 506
million Euros, whereas it invested in plant science only 113, 114 and 116 million Euros in 2005,
2006, and 2007 respectively.10
When assessing the impact of regulation on biotech and trade in genetically modified crops and
agricultural Chemicals, we should first identify the winners and losers from the infant industry.
Using data on traits collected from the OECD BioTrack website (2008), we show that the
majority of traits came from firms with headquarters based in the U.S. The number of traits
10 Bayer Annual Reports.
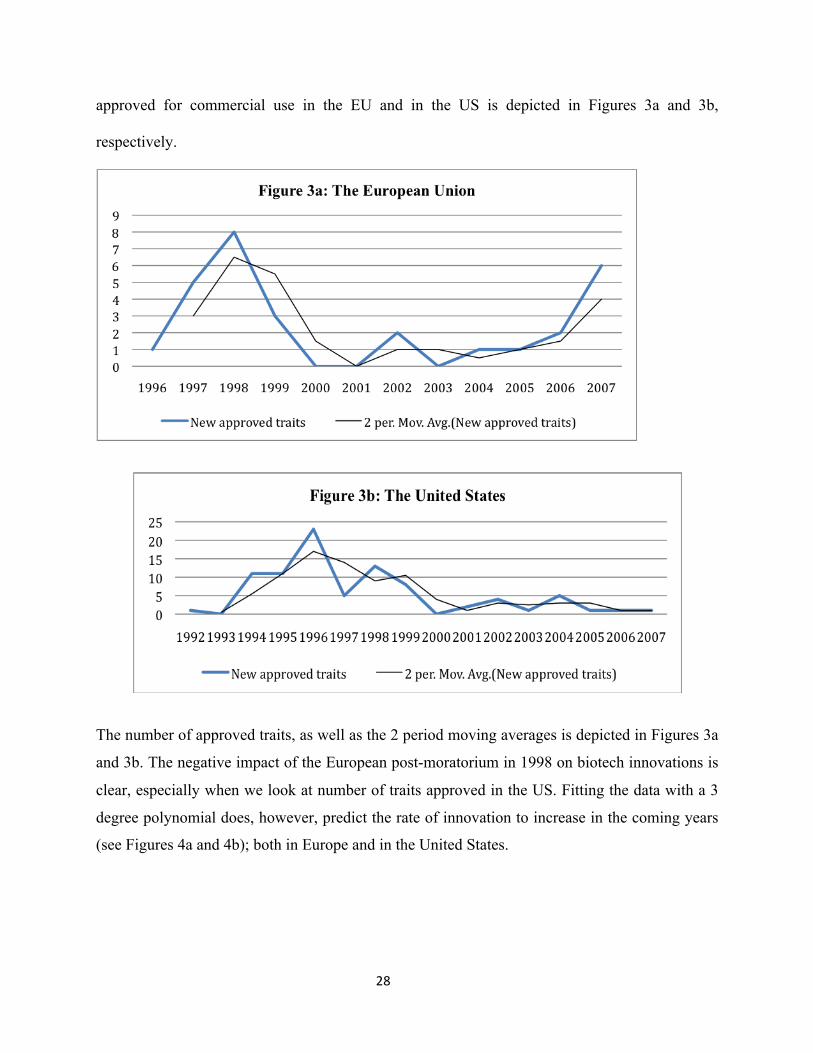
28
approved for commercial use in the EU and in the US is depicted in Figures 3a and 3b,
respectively.
The number of approved traits, as well as the 2 period moving averages is depicted in Figures 3a
and 3b. The negative impact of the European post-moratorium in 1998 on biotech innovations is
clear, especially when we look at number of traits approved in the US. Fitting the data with a 3
degree polynomial does, however, predict the rate of innovation to increase in the coming years
(see Figures 4a and 4b); both in Europe and in the United States.

29
Whereas in Europe 44 percent of traits approved for commercial use originated in the United
States (38 percent came from Australia, and the rest from the European Union), in the United
States 66 percent came from U.S.-based firms. By 1997, the regulatory authority in the United
States approved 37 different traits for U.S.-based firms, but only 14 traits for European firms. By
the end of the 1990s, the success of U.S. firms in biotech placed them well ahead of the
competition, with followers more than several steps behind. Figures 5a and 5b depict the
accumulated number of traits approved in the EU and in the US, for EU and US based firms. In
Europe, during 1995 to 1997 the total number of traits for a European based firm was larger than
the total number for a US based firm (Figure 3a), although this difference is small when we look
at the US market (Figure 3b).

30
Figure 5a: Competition and traits – the EU
Figure 5b: Competition and traits – the US
The US-based firms are emerging toward the end of the 1990s with a clear competitive
advantage in the biotech industry. In 1998, a number of EU member states led by France vowed
to block approval of GM crops unless existing labeling and safety regulations were further
tightened. As a result, no new GM foods or crops were approved from 1998 through 2004,
constituting a de facto moratorium on GMO approvals while the EU was working to develop
new EU-wide legislation more acceptable to the member states.
The EU regulatory regime hampered progress in the biotech industry. Similar to Graff et al.
(2008), we identify a structural break in 1998. The change of the regulatory environment in
Europe severely dampened innovation in the biotech industry. The introduction of new traits
31
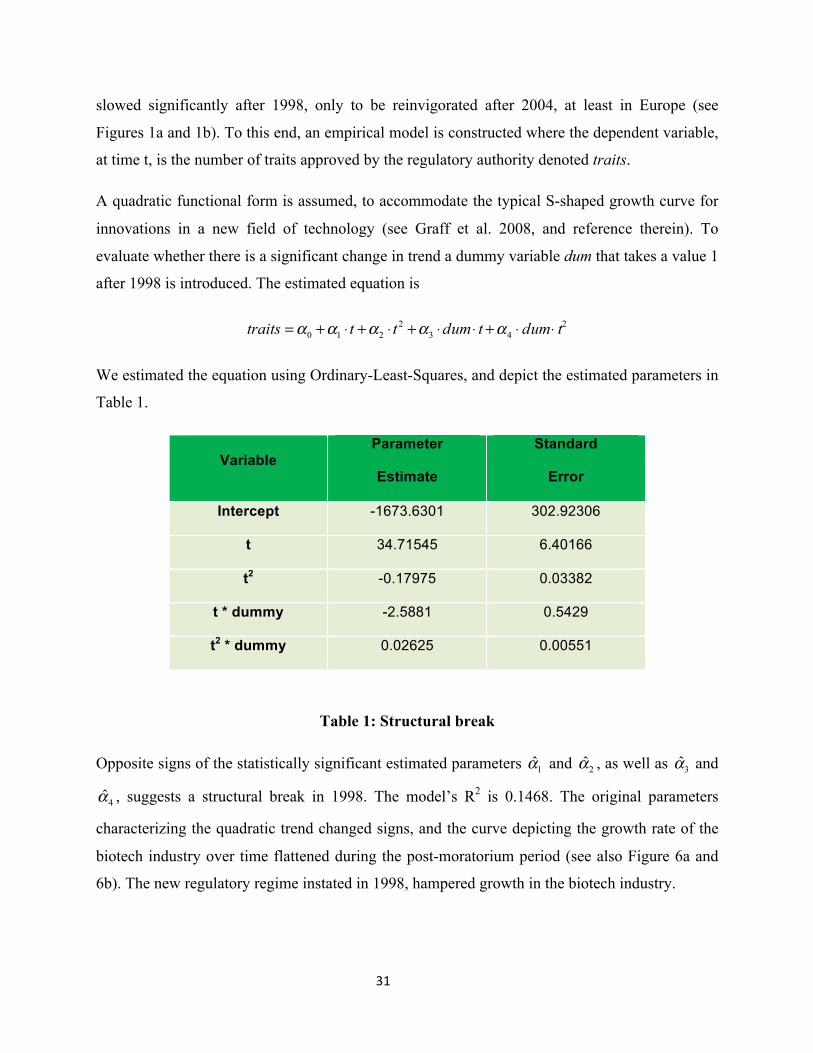
slowed significantly after 1998, only to be reinvigorated after 2004, at least in Europe (see
Figures 1a and 1b). To this end, an empirical model is constructed where the dependent variable,
at time t, is the number of traits approved by the regulatory authority denoted traits.
A quadratic functional form is assumed, to accommodate the typical S-shaped growth curve for
innovations in a new field of technology (see Graff et al. 2008, and reference therein). To
evaluate whether there is a significant change in trend a dummy variable dum that takes a value 1
after 1998 is introduced. The estimated equation is
We estimated the equation using Ordinary-Least-Squares, and depict the estimated parameters in
Table 1.
VariableParameter
Estimate
Standard
Error
Intercept -1673.6301 302.92306
t 34.71545 6.40166
t2 -0.17975 0.03382
t * dummy -2.5881 0.5429
t2 * dummy 0.02625 0.00551
Table 1: Structural break
Opposite signs of the statistically significant estimated parameters and , as well as and
, suggests a structural break in 1998. The model’s R2 is 0.1468. The original parameters
characterizing the quadratic trend changed signs, and the curve depicting the growth rate of the
biotech industry over time flattened during the post-moratorium period (see also Figure 6a and
6b). The new regulatory regime instated in 1998, hampered growth in the biotech industry.
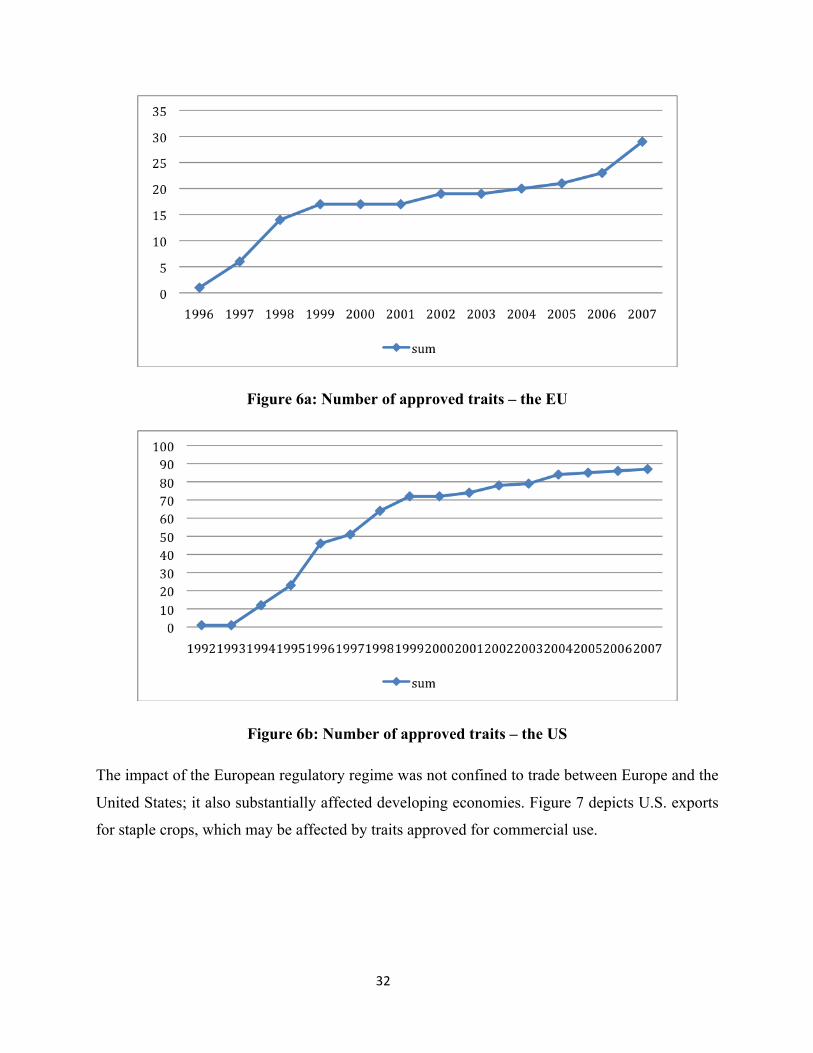
32
Figure 6a: Number of approved traits – the EU
Figure 6b: Number of approved traits – the US
The impact of the European regulatory regime was not confined to trade between Europe and the
United States; it also substantially affected developing economies. Figure 7 depicts U.S. exports
for staple crops, which may be affected by traits approved for commercial use.

33
Figure 7: Staple crop exports to the US
The impact of the regulatory regime on the volume of trade affected U.S. agricultural exports.
Although agricultural production of staple crops has become much more competitive, regulation
and concerns in developing economies, which mimic European concerns, prevented the benefits
of biotech from spilling over to developing countries. The benefits of biotech do not reach those
who would have benefited the most from the new technology.
Despite strong economic justification for the regulation of food safety, countries may choose
overly restrictive food safety laws relative to conditions of optimality. Regulation may be used
by interest groups to extract rents. To this end, the chemical industry in Europe stands to lose the
most from the introduction of biotech. Transgenic plants have been developed for various
purposes, including resistance to pests, herbicides or harsh environmental conditions.

34
Figure 8: Exports from Europe to the US
Insecticides, fungicides and herbicides will be replaced by more resilient crops, which will
reduce demand for these chemicals. From 1999 to 2003, thee value of herbicides imported to the
United States from Europe increased, from 84,000 USD to 840,000 USD (see Figure 8).
Clearly, the agriculture chemical industry in Europe benefited enormously from the change in the
European regulatory regime. It not only curtailed competition within Europe, but it also
hampered future technological innovation and therefore future growth of the biotech industry.
Paarlberg (2008) argued that the urban elite in developing countries benefited from adopting
European's regulatory regime. Many developing countries dragged their feet and emphasized
food safety (Paarlberg 2002). By hiding behind food safety, they imposed restrictions which do
not make sense economically, although they do make sense politically. Although there might be
a hypothetical risk to consuming and growing GMO crops, there is a clear and immediate risk
from hunger in many of these countries. To this end, the European Union is by far the largest
donor to many of these countries. Figure 9 depicts aid from European countries, and contrast

35
these amounts with other donor countries. An interesting comparison, not done in the paper,
would be to compute the added value to Africa countries from reducing trade barriers to GMO
crops. The increased benefit can be used to reduce the amount of aid going into these countries.
Note that this scheme will distribute aid to rural populations, which need it the most, and not to
the urban elite.
Figure 9: Donor countries and amount donated11
5. Policy Discussion and Conclusion
Big technological changes require new policy choices, which are gradients between promotion
and prevention. Policies that accelerate the spread of plant transgenic can be termed
“promotional.” Policies that are neutral toward the new technology, intending neither to speed
nor to slow its spread are coined “permissive.” Policies that intend to slow the adoption of the
new technology, for various reasons, are coined “precautionary,” whereas policies that intend to
11 Source: IDS Online- DAC Database - Destination of Official Development Assistance and Official Aid - Disbursements (Table 2a).

36
block or ban entirely the spread of the new technology are called “preventive.”12 Using this
terminology, we now characterize the regulatory regimes in the European Union and in the
United States.
Specifically, in this paper we argue that regulation is a function of existing technology. The
current state of technology affects regulation, and regulation affects future innovations (see
Figure 10). Investment in research and development during the early stages of the biotech
industry established a comparative advantage to US-based firms. On the one hand, agriculture
chemical companies, located in the United States, recognized the potential of plant transgenic,
and invested aggressively in biotech. On the other hand, most of the research in biotech during
the early 1980s took place at land grant Universities in the US. To this end, internationally, the
public sector has generated 24% of the IP in agricultural biotechnology, much more than the
average number of IPs per industry generated by the public sector (Graff et al. 2003).
Differences in the pattern of investment led the agribusiness industry in the United States to
diverge from the traditional agriculture chemical industry, which led to two polar regulatory
regimes. Regulation in the US became permissive to biotech, whereas regulation in Europe
became precautionary. The precautionary regulatory framework reinstated in Europe in 1998,
kept progress in the biotech industry at bay and supported its domestic chemical industry – while
imposing a small cost on its constituencies.
12 See Paarlberg (2000).

37
Figure 10: Technological innovation and regulation
International trade has important effects on food safety and environmental preservation that
should be taken into account in the Doha Round of trade talks. From the spread of disease and
other biological material to the ability of trade partners to influence environmental and food
safety practices in source countries, the effects are wide-ranging and can be beneficial or quite
costly. Food safety and environmental regulation can efficiently solve market imperfections to
assure acceptable levels of risk to human health and protect valued natural resources. They can
also be used to protect producers from the competitive pressures of trade and thereby distort
trade considerably.
In terms of policy recommendations, we propose risk assessment as a framework for the efficient
regulation of trade with respect to food safety and environmental health risks. However, political
economy considerations may interfere with the implementation of efficient regulation. It is
38
important, therefore, to identify where the political economy has produced inefficient regulation
and to determine who wins and who loses. While the use of uniform standards would preclude
the subversion of safety regulations by interest groups, it would also reduce efficiency in the
presence of heterogeneity across countries. Rather than requiring all countries to follow the same
standards (and in effect value life, safety, and domestic environmental resources equally), we
suggest imposing a uniform decision process for countries to follow. To the extent that trading
countries can agree on a decision-making process that uses a risk assessment model and the best
available science and empirical findings, the capture of food safety and environmental regulation
by special interests and protectionists can be mitigated. Where politics is thought to have
overcome science, trade organizations should demand to know the decision rules that produced
suspect regulation. A decision rule that deviates from a consistent and rational procedure based
on the best available science should be easy to identify.
References
Alston, J.M. and James, J.S. “The Incidence of Agricultural Policy,” in Handbook of Agriculture Economics chapter 18 volume 2B, 1689 –1750, (2002)
Bernheim,BDandMDWhinston.“MenuAuctions,ResourceAllocationandEconomicInfluence.”
Quarterly Journal of Economics 101(1986):1‐31.
Charles, Daniel. Lord of the Harvest: Biotech, Big Money, and the Future of Food. 2001
Chichilnisky,G.1998.“TheEconomicsofGlobalEnvironmentalRisks,”InThe International Yearbook of
Environmental and Resource Economics 1998/9,eds.T.TietenbergandH.Folmer,Cheltenham: EdwardElgar.
Dalmazzone,S.2000.“EconomicFactorsAffectingtheVulnerabilitytoBiologicalInvasions,”InThe Economics of Biological Invasions,eds.C.Perrings,M.Williamson,andS.Dalmazzone,Cheltenham, UK:
EdwardElgarPublishing.

39
Evenson,RobertE.“StatusofAgriculturalBiotechnology:AnInternationalPerspective,”Chapter6inRegulating Agricultural Biotechnology: Economics and PolicyREJustJMAlstonandDZilbermanEditors
Springer,NewYork103‐123.
Graff, G.D. and Cullen, S.E. and Bradford, K.J. and Zilberman, D. and Bennett, A.B. “The public-private structure of intellectual property ownership in agricultural biotechnology” Nature Biotechnology, 21(9) 989 – 995, 2003
Graff,Greg,DavidZilbermanandAlanB.Bennett.“TheContractionofProductQualityInnovationinAgriculturalBiotechnology”2008
Grealy,R.David,KentJ.Bradford,LindaHall,RichardHellmich,AlanRaybould,JefreyWolt,andDavidZilberman."ImplicationsofGeneFlowintheScale‐upandCommercialUseofBiotechnology‐derived
Crops:EconomicandPolicyConsiderations,"CastIssuePaper,37(December,2007).
Grossman,GMandEHelpman.“Innovation and Growth in the Global Economy,”Cambridge,MA:MITPress,1991.
Grossman,GMandEHelpman.“ProtectionforSale.”The American Economic Review84(1994):833‐850.
Harsanyi,JC.“ASimplifiedBargainingModelforn‐personCooperativeGame.International Economic
Review4(1963):194–220.
Hochman,Gal,GordonRausser,SteveSextonandDavidZilberman.“AgriculturalbiotechnologyinCaliforniaandtheEU”CIGWorkingPaperNo.65,February2008
Horan,RD,CPerrings,FLupi,andEHBulte.“TheEconomicsofInvasiveSpeciesManagement:BiologicalPollutionPreventionStrategiesunderIgnorance:TheCaseofInvasiveSpecies.”American Journal of
Agricultural Economics84(2002):1303–1310.
Hoyt,E.1992.Conserving the Wild Relatives of Crops.IBPGR,IUCN,andWWF.
James,Clive."GlobalStatusofCommercializedBiotech/GMCrops:2007,"ISAAABriefNo.37,2007
Josling,T,DRobertsandDOrden.Food Regulation and Trade: Toward a Safe and Open Global Food System.PetersonInstituteforInternationalEconomics.Washington,D.C.2004.
Just,RichardE.,JulianM.AlstonandDavidZIlberman.Regulating Agriculture Biotechnology; Economics
and Policy.Eds.RichardJust,JulianM.AlstonandDavidZIlberman.SpringerScience+BusinessMedia,LLC.2006
Just,R.E.andHueth,D.L.“WelfareMeasuresinaMultimarketFramework,”The American Economic Review69(5)947–954,1979

40
Kalaitzandonakes, N. and Bijman, J. “Who is driving biotechnology acceptance?,” Nature Biotechnology, 21, 366 –369, 2003
Lichtenberg,E.“RegulatingofTechnologyintheContextofRiskGeneration.”Chapter14inRegulating Agricultural Biotechnology: Economics and PolicyREJustJMAlstonandDZilbermanEditorsSpringer,
NewYork,2006.243‐262.
MelcherR.“MonsantoBrokeU.S.Patentingrules44timesover12Years”St. Louis Post‐Dispatch,October18,2003.p.3ofBusinesssection.
NUEweb. http://www.nue.okstate.edu/.2008
Paarlberg,RobertL.“GoverningtheGMCropRevolution;PolicyChoicesforDevelopingCountries,”
Food, Agriculture, and the Environment,DiscussionPaper33,December2000
Paarlberg,RobertL.The Politics of Precaution: Genetically Modified Crops in Developing Countries.TheJohnHopkinsUniversityPress:BaltimoreandLondon.2001
Paarlberg,RobertL.Starved for Science: How Biotechnology is Being Kept Out of Africa.HarvardUniversityPress.2008
Pimentel,D.2002.“NonnativeSpeciesintheWorld,”InBiological Invasions: Economic and
Environmental Costs of Alien Plant, Animal and Microbe Species,ed.D.Pimentel,BocaRaton,FL:CRC Press.
Rausser,GordonandP.Zusman.Political Power and Endogenous Policy Formation,1998
SOFA: The State of Food and Agriculture 2003-04, FAO
SteinBAandSRFlack,eds.1996.America’s Least Wanted: Alien Species Invasions of U.S. Ecosystems.Arlington,Virginia:TheNatureConservancy.
Stoner,K.“ApproachestotheBiologicalControlofInsects.”NortheastRegionSustainableAgricultureResearchandEducation(SARE)andUniversityofMaineCooperativeExtension.2006.
Strong,DR.andRWPemberton.“BiologicalControlofInvadingSpecies:RiskandReform.”Science 16(2000):1969‐1970.
Viscusi,WK,WAMagatandJHuber.The RAND Journal of Economics18(1987):465‐479.
Wilcove,DS,DRothstein,JDubow,APhillipsandELosos.“QuantifyingThreatstoImperiledSpeciesin
theUnitedStates.”BioScience 48(1998):607–615.
Williamson,M.1996.Biological Invasions.London:ChapmanandHall.
Zusman,P.“TheIncorporationandMeasurementofSocialPowerinEconomicModels.”International Economic Review17(1976.):447–462.

41
Zilberman,D.“TheEconomicsofBiotechnologyRegulation.”Chapter12inRegulating Agricultural Biotechnology: Economics and PolicyREJustJMAlstonandDZilbermanEditorsSpringer,NewYork243‐
262.
Zilberman,David,GalHochmanandSteveSexton.“FoodSafety,Trade,andtheEnvironment,”WorldBankJune30,2008.
Appendix A
The following overview of the movement of biotech organisms through the U.S. regulatory
system is based on Cast (2007):
1) Research and Development (contained):
a. National Institutes of health (NIH) Guidelines for work with biotech organisms
b. Voluntarily adopted by many organizations, compulsory for recipients of NIH
grants.
2) Field Trials:
a. Proposed release must be approved by APHIS either under notification (for crops
and traits with great familiarity through direct experience; confidence of very low
risk) or permit (more restrictive; for less familiar crops and traits with potential
elevated risk – e.g., plants expressing pharmaceuticals or industrial proteins).
b. Trials may be inspected by APHIS or state department of agriculture officials.
c. Summary reports of trial must be submitted and APHIS promptly informed if
anything unusual occurs in the trial.
d. Gene flow and inadvertent environmental release must be minimized. (Trials must
be confined).

42
e. APHIS oversees storage and transport of seed to and from trial sites.
f. For plants expressing pesticidal proteins, an Experimental Use Permit (EUP) from
EPA is required if the trial exceed 10 acres (4 ha) in a calendar year.
g. Public notification and comment is required for an EUP, but not for pesticide field
trials generally.
3) General Environmental Release:
a. Applicants submit data to APHIS to allow determination of likely environmental
effects and the potential for the biotech organism to become a plant pest.
b. APHIS reviews data and solicit public comments.
c. APHIS determines whether to grant non-regulated status or impose other
conditions.
d. Non-regulated status required for general release, although regulated articles can
be grown commercially (but not for general release) under permits, with
restriction similar to field trials.
e. For plants expressing pesticides proteins, the EPA must grant the protein and the
material required for its production (promoters, marker genes, etc.) a registration
under Section III of FIFRA
4) Use as Food
a. As is done for all non-biotech foods, the FDA works through voluntary
consultation with the developer of the biotech crop to ensure that food safety
questions are addressed during development. The extent of consultation applied to
foods derived from biotech crops generally exceeds that undergone by any
conventional food.
43
b. Based on a favorable review of summary data and a presentation to FDA
scientists, the FDA issues a letter saying it has no further questions.
5) Post-commercialization
a. The USDA, the EPA, and the FDA have limited legal authority to demand
immediate removal from market should new and valid data bring into question the
safety of the product to human health or the environment. [USDA/APHIS/FSIS
ability in these areas is quite limited. This was the focus of much congressional
scrutiny in 2007 due to melamine contamination of pet food.] APHIS issuances of
non-regulated status are contingent on an ongoing requirement that unusual or
adverse events must be reported to APHIS even after a determination is issued.
Such new information can serve as the basis for modification or revocation of the
determination if APHIS warrants. Thus, the initial favorable determination for a
product does not give it a carte blanche release from any further oversight.
Appendix B
Each figure displays the acquisition, divestiture and merger activity with companies operating
within one or more of the following bio-life industries: chemicals, seeds,
pharmaceuticals/agrochemicals. In some cases, activity involving a company outside these areas
is also shown. The primary industry of each company is represented by the color of the
company’s title box in the figure. Additionally, the line connecting them shows the type of
activity taking place – acquisition, divestiture, joint venture or merger – as well as the
hierarchical relationship between different entities. Solid lines with arrows pointing in the
direction of the company of interest represent acquisitions, those pointing away from it,
divestitures. The acquisition and divestiture activity of Monsanto are tracked on two separate

44
figures. Dashed lines joining two companies represent joint ventures and lastly, solid lines
connecting one entity with another show one company to be the subsidiary of the other. In these
cases, the entity closer to the company of interest is the immediate parent of the other. Sources
relied upon primarily include the corporate websites of industry companies as well as the
database Thomson Financial Mergers & Acquisitions.

Confidential
16
¹http://www.monsanto.com/monsanto/layout/about_us/timeline/default.asp²Thomson Financial Mergers & Acquisitions3http://www.monsanto.com/monsanto/layout/media/04/11-16-04.asp
Agricultural assets(Icoria Inc.)
2005 Acquisition2
Seminis Inc.
2005 Subsidiary2
Interstate Seed Co. (Advanta Seeds)
2004 Acquisition2
Jacob Hartz Seed Co.
1982 Acquisition1
Continental PharmaSA
1986 Acquisition2
GD Searle & Co.
1985 Acquisition2
Heumann PharmaGmbH & Co Generica
KG1989 Acquisition2
Schiapparelli Searle
1992 Acquisition2
Syntex Corp-Oral-Contraceptive
Business1995 Acquisition2
Schwarz Pharma(Schwarz Pharma)
1997 Acquisition2
Pharmaceutical Division (Chemotecnica Sintyal
SA)
1997 Acquisition2
Exac Corp.
1987 Acquisition2
Defender Home Garden (Select Harvests Ltd.)
1992 Acquisition2
Diamonex Inc.
1992 Acquisition2
Devex SA
1992 Acquisition2
AES Polymer Tech. (Dow Chem. Co.)
1992 Acquisition2
Kelco Biopolymers (Merck & Co.)
1995 Acquisition2
Agracetus Inc. (W.R. Grace)
1996 Acquisition2
Corn States Hybrid
1997 Acquisition2
Calgene
1997 Acquisition1
Asgrow
1997 Acquisition1
Holden’s Foundation Seed
1997 Acquisition2
DeKalb
1998 Acquisition1
Cargill Inc.
1998 Acquisition2
Plant Breeding Int’l Cambridge Ltd.
1998 Acquisition2
Est. 19011
2000 Merger1
2000 Monsanto becomes subsidiary of Pharmacia Corp.1
Monsanto Pharmacia
American Seeds, Inc.
2004 Formation3
NC + Hybrids Inc.
2005 Acquisition2
2004 Acquisition3
Channel Bio Corp.
MonsantoToday
Pharmacia Corporation
2002 Spin-off of Phamacia Corp. Agriculture Bus. Division1
Monsanto
Sintefina
2005 Acquisition2
Limagrain Canada Seeds Inc.
2001 Acquisition2
GD Searle & Co.
Chemical
Seed
Chem./Seed
Other
Pharmaceut-Ical/Agrochem
¹http://www.monsanto.com/monsanto/layout/about_us/timeline/default.asp²Thomson Financial Mergers & Acquisitions3http://www.monsanto.com/monsanto/layout/media/04/11-16-04.asp
Agricultural assets(Icoria Inc.)
2005 Acquisition2
Seminis Inc.
2005 Subsidiary2
Interstate Seed Co. (Advanta Seeds)
2004 Acquisition2
Agricultural assets(Icoria Inc.)
2005 Acquisition2
Agricultural assets(Icoria Inc.)
2005 Acquisition2
Seminis Inc.
2005 Subsidiary2
Seminis Inc.
2005 Subsidiary2
Interstate Seed Co. (Advanta Seeds)
2004 Acquisition2
Interstate Seed Co. (Advanta Seeds)
2004 Acquisition2
Jacob Hartz Seed Co.
1982 Acquisition1
Jacob Hartz Seed Co.
1982 Acquisition1
Continental PharmaSA
1986 Acquisition2
Continental PharmaSA
1986 Acquisition2
GD Searle & Co.
1985 Acquisition2
GD Searle & Co.
1985 Acquisition2
Heumann PharmaGmbH & Co Generica
KG1989 Acquisition2
Heumann PharmaGmbH & Co Generica
KG1989 Acquisition2
Schiapparelli Searle
1992 Acquisition2
Schiapparelli Searle
1992 Acquisition2
Syntex Corp-Oral-Contraceptive
Business1995 Acquisition2
Syntex Corp-Oral-Contraceptive
Business1995 Acquisition2
Schwarz Pharma(Schwarz Pharma)
1997 Acquisition2
Schwarz Pharma(Schwarz Pharma)
1997 Acquisition2
Pharmaceutical Division (Chemotecnica Sintyal
SA)
1997 Acquisition2
Pharmaceutical Division (Chemotecnica Sintyal
SA)
1997 Acquisition2
Exac Corp.
1987 Acquisition2
Exac Corp.
1987 Acquisition2
Defender Home Garden (Select Harvests Ltd.)
1992 Acquisition2
Defender Home Garden (Select Harvests Ltd.)
1992 Acquisition2
Diamonex Inc.
1992 Acquisition2
Diamonex Inc.
1992 Acquisition2
Devex SA
1992 Acquisition2
Devex SA
1992 Acquisition2
AES Polymer Tech. (Dow Chem. Co.)
1992 Acquisition2
AES Polymer Tech. (Dow Chem. Co.)
1992 Acquisition2
Kelco Biopolymers (Merck & Co.)
1995 Acquisition2
Kelco Biopolymers (Merck & Co.)
1995 Acquisition2
Agracetus Inc. (W.R. Grace)
1996 Acquisition2
Agracetus Inc. (W.R. Grace)
1996 Acquisition2
Corn States Hybrid
1997 Acquisition2
Corn States Hybrid
1997 Acquisition2
Calgene
1997 Acquisition1
Calgene
1997 Acquisition1
Asgrow
1997 Acquisition1
Asgrow
1997 Acquisition1
Holden’s Foundation Seed
1997 Acquisition2
Holden’s Foundation Seed
1997 Acquisition2
DeKalb
1998 Acquisition1
DeKalb
1998 Acquisition1
Cargill Inc.
1998 Acquisition2
Cargill Inc.
1998 Acquisition2
Plant Breeding Int’l Cambridge Ltd.
1998 Acquisition2
Plant Breeding Int’l Cambridge Ltd.
1998 Acquisition2
Est. 19011
2000 Merger1
2000 Monsanto becomes subsidiary of Pharmacia Corp.1
Monsanto Pharmacia
2000 Merger1
2000 Monsanto becomes subsidiary of Pharmacia Corp.1
Monsanto Pharmacia
American Seeds, Inc.
2004 Formation3
NC + Hybrids Inc.
2005 Acquisition2
2004 Acquisition3
Channel Bio Corp.
American Seeds, Inc.
2004 Formation3
NC + Hybrids Inc.
2005 Acquisition2
NC + Hybrids Inc.
2005 Acquisition2
2004 Acquisition3
Channel Bio Corp.
2004 Acquisition3
Channel Bio Corp.
MonsantoToday
Pharmacia Corporation
2002 Spin-off of Phamacia Corp. Agriculture Bus. Division1
Monsanto
MonsantoToday
Pharmacia Corporation
2002 Spin-off of Phamacia Corp. Agriculture Bus. Division1
Monsanto
Sintefina
2005 Acquisition2
Sintefina
2005 Acquisition2
Limagrain Canada Seeds Inc.
2001 Acquisition2
Limagrain Canada Seeds Inc.
2001 Acquisition2
GD Searle & Co.
Chemical
Seed
Chem./Seed
Other
Pharmaceut-Ical/Agrochem
Chemical
Seed
Chem./Seed
Other
ChemicalChemical
SeedSeed
Chem./Seed
OtherOther
Pharmaceut-Ical/AgrochemPharmaceut-Ical/Agrochem
Figure 1. Monsanto’s M&A Activities—Acquisitions
Chemical
Seed
Chem./Seed
Other
Pharmaceut-Ical/Agrochem
MonsantoToday
¹http://www.monsanto.com/monsanto/layout/about_us/timeline/default.asp²Thomson Financial Mergers & Acquisitions3http://www.monsanto.com/monsanto/layout/media/04/11-16-04.asp
Pharmacia Corporation
2002 Spin-off of Phamacia Corp. Agriculture Bus. Division1
Icoria Inc. (agri-culture assets)2005 Acquisition2
Seminis Inc.
2005 Subsidiary2
Interstate Seed Co. (Advanta Seeds)
2004 Acquisition2
American Seeds, Inc.
2004 Formation3
NC + Hybrids Inc.
2005 Acquisition2
2004 Acquisition3
Channel Bio Corp.
Radiation Dynamics Mnf Division
1986 Sale2
NSC Technologies LLC
1999 Sale2
GD Searle & Co.
1985 Acquisition2
FRP Paper Chem. Div.
1986 Sale2
Cast and Blown Polyethylene Film Bus.
1989 Sale2
Form-Cor Board Bus.
1993 Sale2
Chlorinated Isocyanurate Bus.
1992 Sale2
Thermoplastic Elastomers Bus.
1991 Merger with Division of Exxon Corp. to form Advanced Elastomer Systems2
Animal Feed Ingredients Business
1990 Sale2
Fisher Controls
1995 Sale2
2000 Merger1
2000 Monsanto becomes subsidiary of Pharmacia Corp.1
Est. 19011
MonsantoPharmacia
Monsanto Electronics Materials
1989 Sale2
Polyvinyl Formal Mnf & Product Line
1991, 1992 Sale2
Pyridine Chemical Bus.
1993 Sale2
Styrenics Plastics Bus.
1996 Sale2
TCC Business
1996 Sale2
Metallized Materials Division
1996 Sale2
Lexant
1998 Merger with Personal Health Connections2
Algin Bus.
1999 Sale2
Strawberry Dev’lProgram
1999 Sale2
Skybond Bus.
1999 Sale2
Stoneville Pedigreed Seed Co.
1999 Sale2
Solutia
1997 Spin-off1
Mont-St-Guibert Unit
1993 Sale2
Monsanto Oil Co.
1985 Sale2
Chemical
Seed
Chem./Seed
Other
Pharmaceut-Ical/Agrochem
Chemical
Seed
Chem./Seed
Other
ChemicalChemical
SeedSeed
Chem./Seed
OtherOther
Pharmaceut-Ical/AgrochemPharmaceut-Ical/Agrochem
MonsantoToday
¹http://www.monsanto.com/monsanto/layout/about_us/timeline/default.asp²Thomson Financial Mergers & Acquisitions3http://www.monsanto.com/monsanto/layout/media/04/11-16-04.asp
Pharmacia Corporation
2002 Spin-off of Phamacia Corp. Agriculture Bus. Division1
Icoria Inc. (agri-culture assets)2005 Acquisition2
Seminis Inc.
2005 Subsidiary2
Interstate Seed Co. (Advanta Seeds)
2004 Acquisition2
American Seeds, Inc.
2004 Formation3
NC + Hybrids Inc.
2005 Acquisition2
2004 Acquisition3
Channel Bio Corp.
Radiation Dynamics Mnf Division
1986 Sale2
NSC Technologies LLC
1999 Sale2
GD Searle & Co.
1985 Acquisition2
FRP Paper Chem. Div.
1986 Sale2
Cast and Blown Polyethylene Film Bus.
1989 Sale2
Form-Cor Board Bus.
1993 Sale2
Chlorinated Isocyanurate Bus.
1992 Sale2
Thermoplastic Elastomers Bus.
1991 Merger with Division of Exxon Corp. to form Advanced Elastomer Systems2
Animal Feed Ingredients Business
1990 Sale2
Fisher Controls
1995 Sale2
2000 Merger1
2000 Monsanto becomes subsidiary of Pharmacia Corp.1
Est. 19011
MonsantoPharmacia
Monsanto Electronics Materials
1989 Sale2
Polyvinyl Formal Mnf & Product Line
1991, 1992 Sale2
Pyridine Chemical Bus.
1993 Sale2
Styrenics Plastics Bus.
1996 Sale2
TCC Business
1996 Sale2
Metallized Materials Division
1996 Sale2
Lexant
1998 Merger with Personal Health Connections2
Algin Bus.
1999 Sale2
Strawberry Dev’lProgram
1999 Sale2
Skybond Bus.
1999 Sale2
Stoneville Pedigreed Seed Co.
1999 Sale2
Solutia
1997 Spin-off1
Mont-St-Guibert Unit
1993 Sale2
Monsanto Oil Co.
1985 Sale2
MonsantoToday
¹http://www.monsanto.com/monsanto/layout/about_us/timeline/default.asp²Thomson Financial Mergers & Acquisitions3http://www.monsanto.com/monsanto/layout/media/04/11-16-04.asp
Pharmacia Corporation
2002 Spin-off of Phamacia Corp. Agriculture Bus. Division1
Icoria Inc. (agri-culture assets)2005 Acquisition2
Seminis Inc.
2005 Subsidiary2
Interstate Seed Co. (Advanta Seeds)
2004 Acquisition2
Icoria Inc. (agri-culture assets)2005 Acquisition2
Icoria Inc. (agri-culture assets)2005 Acquisition2
Seminis Inc.
2005 Subsidiary2
Seminis Inc.
2005 Subsidiary2
Interstate Seed Co. (Advanta Seeds)
2004 Acquisition2
Interstate Seed Co. (Advanta Seeds)
2004 Acquisition2
American Seeds, Inc.
2004 Formation3
NC + Hybrids Inc.
2005 Acquisition2
NC + Hybrids Inc.
2005 Acquisition2
2004 Acquisition3
Channel Bio Corp.
2004 Acquisition3
Channel Bio Corp.
Radiation Dynamics Mnf Division
1986 Sale2
Radiation Dynamics Mnf Division
1986 Sale2
NSC Technologies LLC
1999 Sale2
NSC Technologies LLC
1999 Sale2
GD Searle & Co.
1985 Acquisition2
GD Searle & Co.
1985 Acquisition2
FRP Paper Chem. Div.
1986 Sale2
FRP Paper Chem. Div.
1986 Sale2
Cast and Blown Polyethylene Film Bus.
1989 Sale2
Cast and Blown Polyethylene Film Bus.
1989 Sale2
Form-Cor Board Bus.
1993 Sale2
Form-Cor Board Bus.
1993 Sale2
Chlorinated Isocyanurate Bus.
1992 Sale2
Chlorinated Isocyanurate Bus.
1992 Sale2
Thermoplastic Elastomers Bus.
1991 Merger with Division of Exxon Corp. to form Advanced Elastomer Systems2
Thermoplastic Elastomers Bus.
1991 Merger with Division of Exxon Corp. to form Advanced Elastomer Systems2
Animal Feed Ingredients Business
1990 Sale2
Animal Feed Ingredients Business
1990 Sale2
Fisher Controls
1995 Sale2
Fisher Controls
1995 Sale2
2000 Merger1
2000 Monsanto becomes subsidiary of Pharmacia Corp.1
2000 Merger1
2000 Monsanto becomes subsidiary of Pharmacia Corp.1
Est. 19011
MonsantoEst. 19011
MonsantoPharmacia
Monsanto Electronics Materials
1989 Sale2
Monsanto Electronics Materials
1989 Sale2
Polyvinyl Formal Mnf & Product Line
1991, 1992 Sale2
Polyvinyl Formal Mnf & Product Line
1991, 1992 Sale2
Pyridine Chemical Bus.
1993 Sale2
Pyridine Chemical Bus.
1993 Sale2
Styrenics Plastics Bus.
1996 Sale2
Styrenics Plastics Bus.
1996 Sale2
TCC Business
1996 Sale2
TCC Business
1996 Sale2
Metallized Materials Division
1996 Sale2
Metallized Materials Division
1996 Sale2
Lexant
1998 Merger with Personal Health Connections2
Lexant
1998 Merger with Personal Health Connections2
Algin Bus.
1999 Sale2
Algin Bus.
1999 Sale2
Strawberry Dev’lProgram
1999 Sale2
Strawberry Dev’lProgram
1999 Sale2
Skybond Bus.
1999 Sale2
Skybond Bus.
1999 Sale2
Stoneville Pedigreed Seed Co.
1999 Sale2
Stoneville Pedigreed Seed Co.
1999 Sale2
Solutia
1997 Spin-off1Solutia
1997 Spin-off1
Mont-St-Guibert Unit
1993 Sale2
Mont-St-Guibert Unit
1993 Sale2
Monsanto Oil Co.
1985 Sale2
Monsanto Oil Co.
1985 Sale2

Confidential
61
pesticides and herbicides, Ciba Geigy and Sandoz, each with histories going back to the
1800s.250 Ciba Geigy was the first company to market and sell transgenic corn in the U.S.251
Both began acquiring seed companies in the mid 1970s.252 In November 2000, Novartis Seeds,
described as “the first global group focusing exclusively on agribusiness,”253 merged with
AstraZeneca's agribusiness operations to form Syngenta. Figure 9 depicts the various
acquisitions and mergers that lead to today’s Syngenta:
¹http://www.syngenta.com/en/about_syngenta/timeline.aspx²http://www.garstseed.com/GarstClient/AboutGarst/Timeline.aspx³http://www.nk-us.com/helper/1998/12_28_history_northrupking.asp4http://www.syngenta.com/en/downloads/040220_chs_e.pdf5http://www.astrazeneca-us.com/content/aboutUs/history/1990to1999.asp
2004 Acquisition of North American Corn and Soybean Businesses1
ICI
SyngentaToday
Geigy
Est. 19581
Ciba
Est. 18841
SandozEst. 18761
Ciba-Geigy
1970 Merger1
ICI Established in 19261
1994 Demerge1
1996 Merger1
1996 Joint Venture1
1999 Merger1
2000 Merger of Novartis and AstraZeneca agrochemicals
businesses5
Golden Harvest
2004 Acquisition1
Cosun
ZenecaAstra
Zeneca Seeds Royal VanderHave
Advanta Group
Novartis AstraZeneca
1976 Acq.3
2004 Acquisition4
CHS Research Corn Breeding Program
Rogers Seed Co.
1975 Acq.1
NK1974 Acq.1
XXX Acq.1
La. Seed Company
Funk Seeds
XXX Acq.1
Columbiana Farm Seeds
XXX Acq.1Germain’s
Peterson-Biddick
XXX Acq.1
Shissler
XXX Acq.1
XXX Acq.1Hoffman
Stewart Seeds
XXX Acq.1
New Farm Crops (UK)
XXX Acq.1
SESXXX Acq.1
MMGXXX Acq.1
ContiSeedXXX Acq.1
Garst Seed1975 Acq.1
Sinclair McGrillXXX Acq.1
2001 Sell
Nordic Cereal Fungicide Business
2001 Sell
Mikado Brand SulcotrioneHerbicide Business
2001 Sell
Zeneca Fungicide Flutriafol
2001 Sell
Toxicology Division
2002 Sell
Tomono Agrica Co Ltd
2003 Sell
Evital (R) 5G Cranberry Herbicide Business
2003 Sell
Torrey Mesa Research Institute Division
2005 Sell
Resende Business
2006 Sell
Cottonseed Business
Chemical
Seed
Chem./Seed
Other
Pharmaceut-Ical/Agrochem
2004 Acquisition of North American Corn and Soybean Businesses1
ICI
SyngentaToday
Geigy
Est. 19581
Ciba
Est. 18841
SandozEst. 18761
Ciba-Geigy
1970 Merger1
ICI Established in 19261
1994 Demerge1
1996 Merger1
1996 Joint Venture1
1999 Merger1
2000 Merger of Novartis and AstraZeneca agrochemicals
businesses5
Golden Harvest
2004 Acquisition1
Cosun
ZenecaAstra
Zeneca Seeds Royal VanderHave
Advanta Group
Novartis AstraZeneca
1976 Acq.3
2004 Acquisition4
CHS Research Corn Breeding Program
Rogers Seed Co.
1975 Acq.1
NK1974 Acq.1
XXX Acq.1
La. Seed Company
XXX Acq.1
La. Seed Company
Funk Seeds
XXX Acq.1
Columbiana Farm Seeds
XXX Acq.1
Columbiana Farm Seeds
XXX Acq.1Germain’s
XXX Acq.1Germain’s
Peterson-Biddick
XXX Acq.1
Peterson-Biddick
XXX Acq.1
Shissler
XXX Acq.1Shissler
XXX Acq.1
XXX Acq.1Hoffman
XXX Acq.1Hoffman
Stewart Seeds
XXX Acq.1
Stewart Seeds
XXX Acq.1
New Farm Crops (UK)
XXX Acq.1
New Farm Crops (UK)
XXX Acq.1
SESXXX Acq.1
SESXXX Acq.1
MMGXXX Acq.1
MMGXXX Acq.1
ContiSeedXXX Acq.1
Garst Seed1975 Acq.1
Garst Seed1975 Acq.1
Sinclair McGrillXXX Acq.1
2001 Sell
Nordic Cereal Fungicide Business
2001 Sell
Mikado Brand SulcotrioneHerbicide Business
2001 Sell
Zeneca Fungicide Flutriafol
2001 Sell
Toxicology Division
2002 Sell
Tomono Agrica Co Ltd
2003 Sell
Evital (R) 5G Cranberry Herbicide Business
2003 Sell
Torrey Mesa Research Institute Division
2005 Sell
Resende Business
2006 Sell
Cottonseed Business
Chemical
Seed
Chem./Seed
Other
Pharmaceut-Ical/Agrochem
Chemical
Seed
Chem./Seed
Other
ChemicalChemical
SeedSeed
Chem./Seed
OtherOther
Pharmaceut-Ical/AgrochemPharmaceut-Ical/Agrochem
Figure 9. Syngenta’s M&A Activities
250 http://www.syngenta.com/en/about_syngenta/timeline.aspx.
251 http://www.syngenta.com/en/about_syngenta/time_prin.aspx. 252 Novartis web site, accessed 6-6-06, http://www.novartis.com/about_novartis/en/2companies.shtml; Fernandez-Cornejo, Jorge, “The Seed Industry in U.S. Agriculture: An Exploration of Data and Information on Crop Seed Markets, Regulation, Industry Structure, and Research and Development,” Agriculture Information Bulletin Number 786, USDA ERS, p. 26; see also Kimle, Kevin and Marvin L. Hayenga, “Structural Change among Agricultural Input Industries,” Agribuisness, January 1993; 9, 1, p. 19-20. 253 Novartis web site, accessed 6-6-06. http://www.novartis.com/about_novartis/en/1company.shtml.

2004 Rhone Poulenc Biochimie Crop
2006 Crop Design
2001 Cynamid Agro Ltd
2007 Spiess Urania Chemicals Gmbh
2008 Albermarle Corp
1998 Microflo
2003 Bayer CropScience units
2001 Algoflash
BASF SE
2000 American Home Products Corp
1999 Compo GmbH
1999 Svalof Weibull AB
2006 Microflo Company LLC
2007 BASF Corp Surround Crop
2005 BASF AG Triforine Fungicide business
2001 Rho Mid LLC
2005 BASF AG Cereal Herbicide product line
2005 BASF AG Phorate Insecticide business
2004 BASF AG Global Herbicide business
2003 BASF AG Ag. Soil Fumigant business
2008 BASF Plant Science acq. completed
acq/jv sells
Legend Ag. Chemicals Ag. Biotech Ag Chem/Biotech