Metro navigation for the blind
12
Metro navigation for the blind Jaime Sánchez * , Mauricio Sáenz Department of Computer Science, Center for Advanced Research in Education (CARE), University of Chile, Blanco Encalada 2120, Santiago, Chile article info Article history: Received 4 April 2009 Received in revised form 17 April 2010 Accepted 20 April 2010 Keywords: Navigation Orientation and mobility People who are blind abstract This study evaluates the impact of using the software program AudioMetro, a tool that supports the orientation and mobility of people who are blind in the Metro system of Santiago de Chile. A quasi- experimental study considering experimental and control groups and using the paired Student’s t in a two sample test analysis (pretest-posttest) was carried out to measure the learner’s performance and progress in the navigation through the Metro. Participants completed a number of cognitive tasks related to their navigation through the metro system using the tool designed. Results indicate that AudioMetro could be an adequate and complementary tool for the development of cognitive and sensory skills, which are fundamental axes for orientation and mobility. Ó 2010 Elsevier Ltd. All rights reserved. 1. Introduction People with visual disabilities must make an extra effort to insert themselves into society and to participate as citizens in the world around them (Engelbrektsson et al., 2004). They have difficulties with planning and moving about in an autonomous exploration of the world due to the lack of information technology that can supply access to spatial knowledge. They also have problems acquiring descriptions from relief maps and associating these with their actual positions in real environments (Kulyukin, Gharpure, Nicholson, & Pavithran, 2004; Vogel, 2003). This limits the possibilities that people who are blind have to take part in educational, professional or leisure activities. In the year 2005 the global population of people who are blind reached 37 million (Solano, 2005). Of this total, 70% are elderly people over 70 years old. According to Vanderhaiden (1990), 30% of people with visual disabilities that want to work are unemployed, because they are not able to access the work force. In the U.S., the unemployment rate among the visually impaired is 74%, making this the most unemployed minority segment of the population (Kulyukin et al., 2004). In the case of Chile, 15% of people who are legally blind do not participate in any productive activities, while practically 50% perform only unpaid domestic work (Fonadis, 2004). As a result of this situation, the majority of people with visual disabilities in Chile belong to middle to lower socio-economic stratum, and only a few enjoy a high socio-economic status (Fonadis, 2004). In everyday life, people who are blind have a series of problems with moving around in both familiar and unknown environments. Specifically, people with visual disabilities have problems using public transportation independently (Baudoin et al., 2005; Engelbrektsson et al., 2004). One of the biggest problems that they face has to do with the development of abilities that aid in their orientation and mobility in different contexts, as the majority of the information required for mental mapping is generally collected through visual channels. In lacking such channels, blind people encounter many difficulties with representing environments mentally and navigating through them effectively (Lahav & Mioduser, 2004). People who are blind use physical objects, such as walls and railings, as well as special sounds and smells (such as water sources and bakeries) in order to determine their location and direction in a determined environment. Additional information can be obtained from the texture of the floor, such as the end of the pavement or changes in the surface of the sidewalk (Ienaga et al., 2006). Mental representation is a process used to represent the external world internally, as it is perceived by the sensory systems (Greca & Moreira, 2000). A related concept can be found in the mental image, which according to Bishop (1989) is obtained from the combina- tion of an individual’s visual processing with his or her interpretation of the figurative information perceived. Lahav and Mioduser (2008) propose that, in providing real spatial information to people who are blind through complementary sensory channels, it is possible to contribute to the creation of their mental representations of space and to improve their navigational skills. The * Corresponding author. Fax.: þ56 2 6731297. E-mail address: [email protected] (J. Sánchez). Contents lists available at ScienceDirect Computers & Education journal homepage: www.elsevier.com/locate/compedu 0360-1315/$ – see front matter Ó 2010 Elsevier Ltd. All rights reserved. doi:10.1016/j.compedu.2010.04.008 Computers & Education 55 (2010) 970–981
-
Upload
independent -
Category
Documents
-
view
3 -
download
0
Transcript of Metro navigation for the blind

Computers & Education 55 (2010) 970–981
Contents lists available at ScienceDirect
Computers & Education
journal homepage: www.elsevier .com/locate/compedu
Metro navigation for the blind
Jaime Sánchez*, Mauricio SáenzDepartment of Computer Science, Center for Advanced Research in Education (CARE), University of Chile, Blanco Encalada 2120, Santiago, Chile
a r t i c l e i n f o
Article history:Received 4 April 2009Received in revised form17 April 2010Accepted 20 April 2010
Keywords:NavigationOrientation and mobilityPeople who are blind
* Corresponding author. Fax.: þ56 2 6731297.E-mail address: [email protected] (J. Sánchez
0360-1315/$ – see front matter � 2010 Elsevier Ltd. Adoi:10.1016/j.compedu.2010.04.008
a b s t r a c t
This study evaluates the impact of using the software program AudioMetro, a tool that supports theorientation and mobility of people who are blind in the Metro system of Santiago de Chile. A quasi-experimental study considering experimental and control groups and using the paired Student’s t ina two sample test analysis (pretest-posttest) was carried out to measure the learner’s performance andprogress in the navigation through the Metro. Participants completed a number of cognitive tasks relatedto their navigation through the metro system using the tool designed. Results indicate that AudioMetrocould be an adequate and complementary tool for the development of cognitive and sensory skills, whichare fundamental axes for orientation and mobility.
� 2010 Elsevier Ltd. All rights reserved.
1. Introduction
People with visual disabilities must make an extra effort to insert themselves into society and to participate as citizens in the worldaround them (Engelbrektsson et al., 2004). They have difficulties with planning and moving about in an autonomous exploration of theworld due to the lack of information technology that can supply access to spatial knowledge. They also have problems acquiring descriptionsfrom relief maps and associating these with their actual positions in real environments (Kulyukin, Gharpure, Nicholson, & Pavithran, 2004;Vogel, 2003). This limits the possibilities that people who are blind have to take part in educational, professional or leisure activities.
In the year 2005 the global population of people who are blind reached 37 million (Solano, 2005). Of this total, 70% are elderly peopleover 70 years old. According to Vanderhaiden (1990), 30% of people with visual disabilities that want to work are unemployed, because theyare not able to access the work force. In the U.S., the unemployment rate among the visually impaired is 74%, making this the mostunemployed minority segment of the population (Kulyukin et al., 2004).
In the case of Chile, 15% of people who are legally blind do not participate in any productive activities, while practically 50% perform onlyunpaid domestic work (Fonadis, 2004). As a result of this situation, themajority of peoplewith visual disabilities in Chile belong tomiddle tolower socio-economic stratum, and only a few enjoy a high socio-economic status (Fonadis, 2004).
In everyday life, people who are blind have a series of problems with moving around in both familiar and unknown environments.Specifically, people with visual disabilities have problems using public transportation independently (Baudoin et al., 2005; Engelbrektssonet al., 2004). One of the biggest problems that they face has to do with the development of abilities that aid in their orientation andmobilityin different contexts, as the majority of the information required for mental mapping is generally collected through visual channels. Inlacking such channels, blind people encounter many difficulties with representing environments mentally and navigating through themeffectively (Lahav & Mioduser, 2004). People who are blind use physical objects, such as walls and railings, as well as special sounds andsmells (such as water sources and bakeries) in order to determine their location and direction in a determined environment. Additionalinformation can be obtained from the texture of the floor, such as the end of the pavement or changes in the surface of the sidewalk (Ienagaet al., 2006).
Mental representation is a process used to represent the external world internally, as it is perceived by the sensory systems (Greca &Moreira, 2000). A related concept can be found in the mental image, which according to Bishop (1989) is obtained from the combina-tion of an individual’s visual processing with his or her interpretation of the figurative information perceived.
Lahav and Mioduser (2008) propose that, in providing real spatial information to people who are blind through complementary sensorychannels, it is possible to contribute to the creation of their mental representations of space and to improve their navigational skills. The
).
ll rights reserved.
J. Sánchez, M. Sáenz / Computers & Education 55 (2010) 970–981 971
authors present a study of a virtual environment that allows users who are blind to learn about real spaces that they then must navigate inreal life.
Loomis, Lippa, Klatzky, and Golledge (2002) performed a series of experiments in which an auditory stimulus was used to help usersspecify locations and objects. The authors determined that once a route has been internally represented by individuals who are blind,updating the route during the walk is an action that takes place independently of whatever sensory perception is used (sound coming froma loudspeaker or verbal instructions).
There are various solutions that seek to help pedestrians who are blind navigate urban areas, such as through the use of GPS or othersimilar technologies (Loomis, Golledge & Klatzky,1998). For example, PONTES (Pressl &Wieser, 2005) is a location and navigation system foruse in an urban environment that is designed for blind users. The system was developed based on the needs of these users, which weretaken into account for the development of all the different components of the system. It consists of a GPS device and a navigational map thatcontains all the information necessary for problem-free navigation, and to be able to monitor the user’s movements. Another example isambientGPS (aGPS) (Sánchez, Aguayo, & Hassler, 2007), which utilizes mobile technology together with GPS, and allows the user to obtainmore accurate information on his/her location.
In the case of aMetro network, GPS is not a viable solution because its signal does not penetrate underground. Another way to resolve theorientation and mobility (O&M) issue is by using tactile maps (De Felice, Renna, Attolico, & Distante, 2007), but this solution is limited anddifficult to maintain up do date. Some studies demonstrate the importance of using sound-based interfaces (Amandine, Katz, Blum,Jacquemin, & Denis, 2005; Kehoe, Neff, & Pitt, 2007; Pitt & Edwards, 2003; Röber & Masuch, 2004; Sánchez, Noriega, & Farías, 2008) andhaptic interfaces (Crommentuijn & Winberg, 2006; Crossan & Brewster, 2006; Edwards, 2002) to achieve a desired degree of navigation invirtual spaces. Another research project introduces a tactile map using a Braille system (Project ACTION (U.S.), & Computer Center for theVisually Impaired, 1995). This map presents information on the New York City transit system for people who are blind. The results obtainedin these from such studies have led to the development of virtual environments that visually disabled users can interact with in order tofulfill certain objectives and resolve certain problems.
Massof (2003) presents a review of the different technology and assisting devices for users who are blind, including interfaces that usesound. He concludes that users who are legally blind are capable of interpreting the sounds around them as a representation of an image ofthe virtual environment. The study also concludes that the emphasis on the use of sounds exists to help users who are blind codify theinformation coming from the virtual environment through the use of different frequencies, tones and volumes.
Coroama (2006) presents a user interface for a system of assistance for users who are blind that uses ubiquitous computing technology.The system is a chatty environment, a paradigm introduced by Coroama (2003) that provides the user with information that he/she cannotcollect by his/her own means.
Frauenberger, Putz, and Holdrich (2004) evaluate a display prototype with high-definition spatial audio. The display is used to presentinformation about food in a supermarket, thus helping people with disabilities to do their shopping. This research indicates that traditionalapplications that provide for interactions through menus, text entry and dialogues can be presented efficiently through the use of spatialsound. The results obtained also allowed the authors to conclude that there is no significant difference between its effectiveness for userswho are blind and sighted users. In the end, the authors propose that spatial audio is able to provide the visually impaired with access tocurrent technology in a very efficient manner.
The results obtained from these studies have contributed to the development of virtual environments that visually disabled users caninteract with in order to fulfill certain objectives and resolve certain problems. Themain idea of these tools is to help blind people to developproblem-solving methodologies (Kapi�c, 2003; Sánchez & Sáenz, 2006).
In addition, there have been several studies geared towards designing and developing different tools that would allow users who arelegally blind to be able to plan for and get to know new spaces virtually. Simonnet, Guinard, and Tisseau (2006) propose a system of haptic(using PHANToM�) and vocal navigation for people who are blind to be able to create and simulate their own itineraries on a trip. This kindof virtual navigation is supported by the use of maps. Another study uses a force feedback joystick so that users who are blind can explorespaces virtually and internalize a representation of the space (Feintuch, Ha & Weis, 2006).
Evett et al. (2008) describes the design, development and evaluation of a system in which people who are blind are able to explorea virtual environment by using Nintendo Wii devices, including auditory and haptic feedback. Using this technology has many advantages,such as the fact that it is mainstream, readily available and cheap. Results strongly suggest that it allows for and supports the development ofspatial maps and strategies.
The research that has been done by Kildal and Brewster (2007) presents EMA-Tactons as a method for confronting common problemsregarding the presentation of information, through the use of sound and a haptic interface. The tactons were evaluated on a TableVis, whichis an interactive data sonification interface designed to explore tabular, numerical data non-visually. The results show that these haptic iconslead to significant improvements in the ability to complete the task more effectively.
A study developed by Transantiago (2004) revealed that 41.5% of all the people in Chile with disabilities use public transportation inSantiago de Chile, making an average of 2.97 trips per day, per person. Of this total, half travel by some kind of motorized vehicle (54.8%) andthe rest represent non-motorized trips (45.2%) (Transantiago, 2004). In seeking to improve the public transportation situation, at thebeginning of the year 2007 a new system of public transportation, called Transantiago (The Economist Web Version, 2007), was imple-mented in Santiago, incorporating the use of buses and an underground Metro train. In this new system users are obligated to use thecombined Metro and bus routes as a means of locomotion in order to move around the city. The current Metro stations have Braille aids andcertain textures on the floor in order to help users who are blind with their orientation (Ministerio Armonía Internet, 2005). These bits ofassistance are useful for users who are blind to be able to orient themselves in a particular station, but they do not provide enough help inthe context of the entire network of Metro stations.
Through our knowledge of the advantages of using audio-based software as well as of the problems faced by users who are blind, wedeveloped AudioMetro, a standalone solution for planning, practicing, simulating and learning about the underground Metro system. Thepurpose of this study was to analyze the impact of the use of the AudioMetro software on the development of cognitive, sensory andpsychomotor skills in people who are legally blind. Such skills lead to their learning how to navigate, and their ability to use the SantiagoMetro Network as a means for daily transportation.
J. Sánchez, M. Sáenz / Computers & Education 55 (2010) 970–981972
2. Method
2.1. Design
A quasi-experimental designwas used, including pre and post-testing. The application of this methodological design allowed researchersto control for some aspects such as: when to make observations, when to apply the main independent variable (the software), and which ofthe groups would be able to use the software.
The activities were divided into four steps: 1. Pretest Application, 2. Software Interaction/Classroom Teaching, 3. Cognitive Tasks, and 4.Posttest Application.
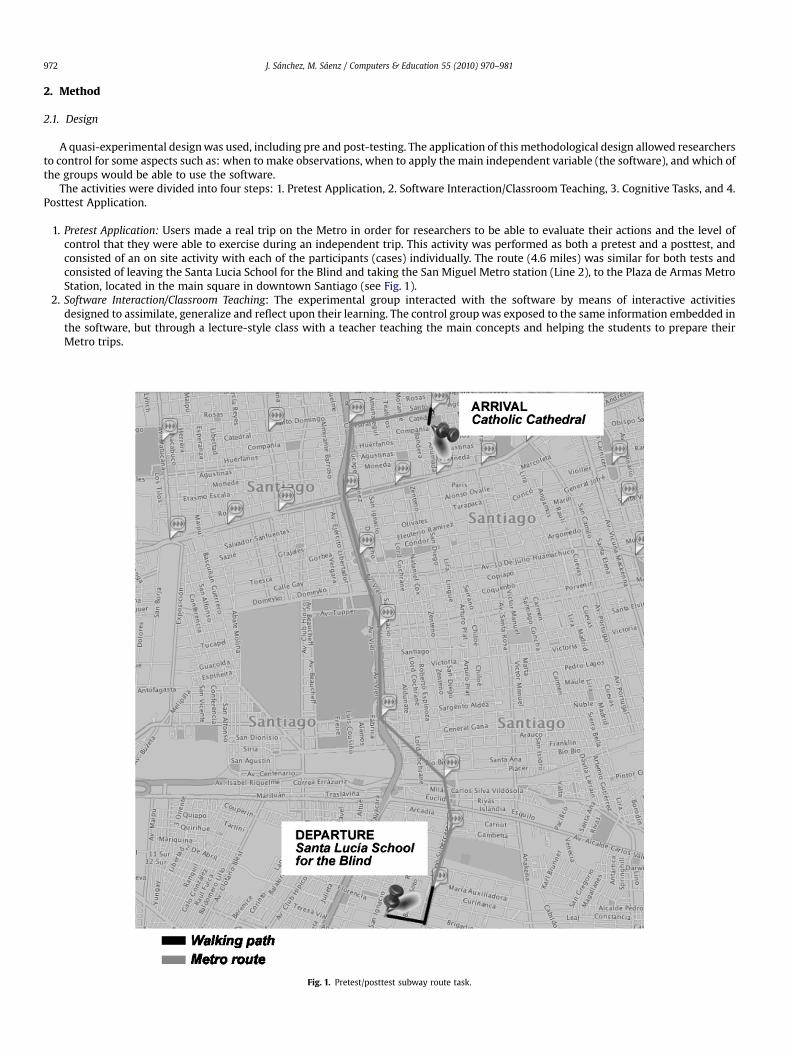
1. Pretest Application: Users made a real trip on the Metro in order for researchers to be able to evaluate their actions and the level ofcontrol that they were able to exercise during an independent trip. This activity was performed as both a pretest and a posttest, andconsisted of an on site activity with each of the participants (cases) individually. The route (4.6 miles) was similar for both tests andconsisted of leaving the Santa Lucia School for the Blind and taking the San Miguel Metro station (Line 2), to the Plaza de Armas MetroStation, located in the main square in downtown Santiago (see Fig. 1).
2. Software Interaction/Classroom Teaching: The experimental group interacted with the software by means of interactive activitiesdesigned to assimilate, generalize and reflect upon their learning. The control groupwas exposed to the same information embedded inthe software, but through a lecture-style class with a teacher teaching the main concepts and helping the students to prepare theirMetro trips.
Fig. 1. Pretest/posttest subway route task.

J. Sánchez, M. Sáenz / Computers & Education 55 (2010) 970–981 973
3. Cognitive Tasks: Four cognitive tasks were designed to observe the development of the sensory-perceptual, psychomotor, cognitive andaffective skills. These tasks, along with the interactionwith AudioMetro, were created in order to develop orientation andmobility skillsthat would allow a legally blind person to move about efficiently and autonomously by Metro.a) Cognitive Task 1: How I see the Metro. The learners had to reconstruct the physical structure of the Metro network that they had in
their minds with concrete materials. The material used included a base made of Lego pieces, onwhich they had to fit other pieces inorder to create models of their mental representations. They could use different pieces or figures in order to represent what theyconsidered to be important landmarks, such as terminal or transfer stations based on their own criteria (see Fig. 2A). Before takingpart in this task, none of the students had any experience interacting with the software (experimental group) or their regular classes(control group).
b) Cognitive Task 2: That’s how theMetro network is. Once the participants hadworkedwith AudioMetro or attended their classes, eachoneworked on his/her initial concrete representation. The ideawas to improve upon the original representation, ending up with theexplanation for why they considered that their work needed to be improved. The facilitators were open to the possibility thatsomeone might think that his or her initial, concrete representation was perfectly fine and did not require any improvement (seeFig. 2B). To model the mental image of the geographic distribution of the Metro in Santiago de Chile that users had created, we usedtwo types of materials: a cardboard base with LEGO� bricks, and a cardboard base with stakes.
c) Cognitive Task 3: I choose my route and destination challenge. In this task, teachers assigned three different trips to the participantsfrom both groups. In the case of the experimental group, the trips were assigned using AudioMetro. The control group had to makethe trips using a mental representation of each route, and by expressing it verbally (see Fig. 2C). Once the trips had been assigned,each participant chose a starting station and a destination. The route chosen had to be taken by means of the software in the case ofthe experimental group, or by mental representation in the case of the control group. Each participant’s chosen route would be thesame used in cognitive task 4, corresponding to an individual, on-site trip.
d) Cognitive Task 4: Traveling on the Metro System. In order to take a pre-defined route in the real world using the Metro system, eachparticipant had to leave the SantaLucia School for the Blind, get to the closest station and travel from there to their chosen desti-nation. The task is successfully completed only if the user is able to get to the destination, and visit the place that is required of him/her (see Fig. 2D).
4. Post-test Application: In the same way as in the pretest, users made a real trip on the Metro so that researchers could evaluate theiractions and the level of control that they were able to exercise during an independent journey. The whole activity was similar to item 1(pretest application).
2.2. Participants
The study group consisted of an intentional sample with an integral population of cases assigned to the experimental group. Thisexperimental group was paired with a non-equivalent, control group that shared similar aspects regarding age and level of vision. Thesample was chosen in such a way that it would be possible to minimize the differences between the experimental and the control group.
A total of ten participants, nine males and one female, were divided into two groups with five members each. In each group there werefour people who are totally blind and one with low, partial vision. All of the blind users attended the “rehabilitation level” of the Santa LucíaSchool for the Blind in Santiago, Chile. The ages of the participants ranged from 21 to 32 years old. The experimental group had an averageage of 23 years old, while the control group had an average age of 27. The breakdown of their ophthalmologic diagnoses is described in
Fig. 2. (A) Representation of the metro network. (B) Improvement of the Representation. (C) Using AudioMetro. (D) Real Travel through the Metro Network.

Table 1Characteristics and ophthalmologic diagnoses of participants.
# Experimental group
Age Gender Ophthalmologic diagnostic Level of vision
1 25 F Diabetic Retinopathy Totally blind2 22 M Loosening of Bilateral Retina Totally blind3 20 M Astigmatism, Strabismus Totally blind4 27 M Retinitis Pigmentosa Totally blind5 20 M Bilateral Glaucoma, Cilitis Residual vision
Control group6 32 M Leber Syndrome, Keratoconus, Nistagmos Totally blind7 26 M Glaucoma Totally blind8 26 M Retinitis Pigmentosa Totally blind9 29 m Progressive Uveitis Totally blind10 21 M Degenerative Retinitis Pigmentosa Residual vision
J. Sánchez, M. Sáenz / Computers & Education 55 (2010) 970–981974
Table 1. There were no congenitally blind people in either group, and all the participants had acquired blindness over five years prior to thestudy. Due to their previous participation in other projects carried out by our research center, all of the participants in this research projecthad similar skills regarding the use of technology and modeling with concrete material. Thus, we can be assured that we are working witha homogenous participant base.
People who have been blind since birth or since they were very young receive orientation and mobility courses where they learn to usetheir other senses in order to guide and orient themselves, in addition to techniques for being able to detect corners, objects and variousspecific areas that assist in their navigation. When they are older they learn techniques using the cane, with which they can improve theirmobility. As all of the participants in our research had acquired blindness later in life and therefore had not received formal orientation andmobility training, the general ability of the participants to orient themselves andmove about in spacewas not very acute. Themajority of theparticipants had not yet begun the orientation and mobility course at the SantaLucia School for the Blind, and understood only very basicconcepts, if any, in this area. This meant that most of the participants in the study group had little or no orientation and mobility education.Participants were observed and rated by four evaluators during the experience. The evaluators consisted of teacher facilitators that had in-school experience working with visually disabled learners.
2.3. Audiometro system description
AudioMetro is an audio-based educational software program for desktop computers that allows blind users to plan and simulate trips ona Metro Network. The reasonwhy the solutionwas developed for use on a desktop computer is the low cost and the access that people whoare blind have to such devices in centers for the blind. The software is based on a development model that incorporates various functions inorder to evaluate and identify the best possible feedback, and which establishes differences in the development of educational software forpeople who are blind or those who are sighted (Sánchez & Baloian, 2006).
The user can perform three actions with the software: 1. User registration, 2. Prepare travel and 3. Travel. User registration impliesidentifying oneself as a user by entering personal background information. Prepare travel means the selection of a startingMetro station andthe destination. Travel implies a simulated trip through the Metro network. The objective of actions 1 and 2 is to configure the software forthe trip that the user will take. The third action consists of a representation of the previously defined trip. This representation is a user-controlled simulation in which the user makes decisions with regards to the route that he/she wants to take (see Fig. 3).
The graphical interface was designed by keeping the teacher facilitators that support users who are blind in mind, but the software itselfuses audio to transmit information to blind users (see Fig. 4).
The entire interface contains both traditional elements of digital formatting; including audio for use by users who are blind, as well asvisual for the facilitators. Through the use of audio, users are able to recognize the different interactive elements and enter informationwiththe keyboard. Each usable key is associated with a specific sound, and each of the different elements of the graphic interface has a repre-sentative iconic sound so as to be recognizable to users who are blind (Fig. 5).
Fig. 3. Screenshot of the activities interface.

Fig. 4. Screenshot of the AudioMetro travel interface.
J. Sánchez, M. Sáenz / Computers & Education 55 (2010) 970–981 975
The sounds were designed, produced and evaluated with the support of the program’s end-users so that it would be simple andstraightforward to identify and interact with them. The majority of the sounds correspond to pre-recorded sentences that provide infor-mation about the different metro stations and environments, as well as data that is useful in order to operate the software.When navigatingthe menu hierarchies, the user interacts with a text box. This box picks up on keyboard commands without changing the focus between thedifferent graphic components.
AudioMetro is based on a metaphor that represents simulations of a trip on a Metro train. Trips are implemented logically because thesoftware does not consider virtual, spatial representations. All of the sounds used are representations of a real Metro system, but do notrecreate the real Metro environment. Some sounds are stereo sounds in order to help with orientationwithin the environment. The soundsdo recreate the sequence of the trip through dynamic sounds corresponding to certain situations that will occur on the trip. For example, thesounds heard for any given trip have the same duration as the real trip would have. At the same time, the sounds are reproduced in stereo tothe right, in the middle, or to the left of the user’s location. The metaphor includes consecutive stops, transfers and terminal stations.AudioMetro guides the user in making decisions, orienting him or her to take the most appropriate and efficient route.
Thanks to this controlled simulation, the user becomes familiar with the structure of the Metro network, learning the different Metrolines, directions and stations.
In the case of the ChileanMetro network in Santiago, trains travel between two stations on a specific line that runs in both directions. Thestations have two platforms, one on each side of the rail. On these platforms, passengers wait for Metro trains going in specific directions.
Fig. 5. User interaction with AudioMetro.

J. Sánchez, M. Sáenz / Computers & Education 55 (2010) 970–981976
Transfer stations consist of different levels; each level has a specific line and each line crosses the other, allowing for the association of eachline to a level.
The basic logic for the model of the software was designed in such a way that it is feasible for the AudioMetro engine to represent anyMetro system, identifying the different stations and lines by specifying boarding and terminal stations.
In a typical software simulation session, the user has to choose the departure and arrival stations in advance. In order to check the currentstate of the software at any given time and to allow for the use of all the functions needed to execute a virtual trip, AudioMetro utilizesobject-oriented programming techniques tomodel the stations, lines, network lines, and trips. This helps the user to be aware of the state ofthe software at any given time, and to provide the functions used for a virtual trip. The model calculates the optimal route from the currentstation to the final station in order for both the user and the software to be able to make strategic decisions during simulations.
The application presents the user with audio information in the form of an interactive menu hierarchy, used to transfer information onthe three levels of complexity for mapping theMetro. The audio information can be complemented with contextual aids for interactingwiththe software.
Fig. 6 shows a trip from the Pedro de Valdivia station (line 1) to the Toesca station (line 2) on the Santiago de Chile Metro system.To make it even more viable within the current context of access by blind Chilean usersto computers, the interaction with the system is
carried out through the use of the keyboard and with audio feedback. The system is also very simple and intuitive to use, which was a resultof a blind user-centered design in which users evaluated the usability of each module of the software and the various prototypes from thevery beginning of the software creation process. The keys used are the plus sign, minus sign, enter, the right, left up and down arrows, thespace bar, control, tab, escape, F1, F2 and F3.
A software program that has a Graphic User Interface (GUI) always maintains the cursor focused on one of the interface’s components(for example the button, text field, combo box, etc.). This focus is where the user interacts and performs actions. Normally this focus isachieved through the use of the mouse; however we can also access and change the focus through the use of the keyboard using the tab key.In the case of users who are blind, it is by using the tab key that they are able to navigate through the different elements of the interface. In
Fig. 6. Screenshot of the AudioMetro Travel Interface.
J. Sánchez, M. Sáenz / Computers & Education 55 (2010) 970–981 977
AudioMetro, the focus sequence for the different components of the GUI is defined by a circular list that we call the “tab cycle”. Once the userhas gone through this sequence, the focus is placed on the OK button of each panel. In pressing the ENTER key, the focus moves to theheading of the panel, from where the user can navigate through the different panels by using the TAB key.
The Function keys work to activate the program’s help menu. By pressing F1, a menu explains how to get from the station in which theuser is currently located to the final destination station. The key F2 informs the user of nearby streets, access points and places of interestaround the station in which he or she is virtually located. Finally, the F3 key provides the user with basic concepts about a Metro network.
The software was programmed in Java using the Swing library. The software code is divided into four main packages: 1. Metro. Definesthe objects that represent the subway system, 2. DomArea. Groups all classes related to XML document management, 3. Navigation.Represents navigation through menu hierarchies, feedback, sound coordination, and other software functions, and 4. Sound. Groups allmethods related to the use of sound.
The Navigation package acts as an API that allows for the quick structuring of hierarchical menus in audio-based software. Although theAPI was designed and developed for this software, the API logic may be reused in other audio-based software, regardless of theprogramming language, framework, end user, or purpose of the software.
The menu hierarchy of this API contains a header and a group of items. These items can be linked to other menus in order to create menuhierarchies and menu networks. The messages associated with each header and each item in any given menu are displayed as a sequence ofsound files.
The logic of the sound sequence is managed by the Sound package. This logic allows a message to belong to: 1. Always the same soundsequence, 2. A sound sequence chosen randomly from a set of sound sequences, or 3. A sound sequence chosen from a play list (notrandomly).
2.4. Research instruments
1). Pretest and posttest: As was previously described, the activity used a pretest and a posttest consisting of an on-site trip with each of theparticipants (cases) individually. The route (4.6 miles) was similar for both tests and consisted of leaving the Santa Lucía School for theBlind and taking the San Miguel Metro station (Line 2)to the Catholic Cathedral of Santiago, located near the Plaza de Armas Metrostation in downtown Santiago (see Fig. 1). This route involves passing through 10 different stations, and the use of 2 different lines of theMetro network, for which reason the usermust make at least one transfer, as there are several ways tomake the same trip. This generallyresulted in the fact that, on the pretest, the user did not use the shortest possible route in order to get to the destination. Researchersevaluated the participants’ performance on any given Metro route through the use of a set of 108 statements describing the actionsperformed and the skills used, in which each statement was organized on an appreciating scale of evaluation. This instrument is anadaptation of an O&M test for blind users utilized by the school itself. The aspects evaluated in both the pretest and the posttest were:Sensory-perceptual (“Recognizes sounds from the environment”, “Recognizes different elements of the environment”), psychomotor(“Moves independently”, “Finds different objects in theMetro network”), cognitive (“Orientation inside theMetro station”) and affectiveskills (“Is motivated to perform the activities”), as well as their general performance according to the level of difficulty of each task(“Leaves the train at the correct station”). There were three levels of complexity: Level 1: Being able to choose Metro directions; Level 2:Being able to change between Metro lines; and Level 3: Being able to arrive at the destination. Each participant was observed and ratedby 4 different evaluators.
Answers to each itemwere scored as “attained,” “not attained,” or “uncertain capacity”. Also, each the participants were given an overallrating for each of these three categories by each evaluator.
2). Cognitive task evaluation test: For each cognitive task an evaluative test was created to observe and record the orientation and mobilityskills that would be developed, stimulated or enhanced through the activities. This test consisted of a set of 50 evaluative statementsregarding the O&M skills involved in the tasks, evaluated on a scale of appreciation. Some of the statements were: “Spatially organizeslines, terminals stations and transfer stations”, “Chooses the right direction for completing routes”, “Uses cardinal points for locating lines,stations and streets”. Each participant was observed and rated by 4 different evaluators. Answers to each itemwere scored as “attained,”“not attained,” or “uncertain capacity”. Also, the participants were given an overall rating for each of these three tasks by each evaluator.
2.5. Procedure
The research procedurewas carried out over threemonths, in three different stages. During the first stage, users had to take the pretest intwo, 1.5-h sessions. The second stage consisted of performing the cognitive tasks in order, from task 1 to task 4. Each student in both groupsperformed each cognitive task during three sessions. For tasks 1 and 2, the duration of the sessions was 45 min each, while for tasks 3 and 4the duration was 1 h and 20 min each. Once the cognitive testing stage was finished, the third and final stage was held in which the userstook the posttest during two, 1.5-h sessions.
The pretests and posttests were applied in situ as the stages of the methodology were carried out. Users from the experimental groupinteracted with the software in a computer lab, whereas the users from the control group attended classes in a lecture-style classroom. Bothgroups performed cognitive tasks with concrete materials. In order to avoid distortions in the results of the cognitive testing, only theexperimental group interacted with the software, and all users utilized the same version of the software.
2.6. Quantitative results
Both the control group and the experimental group were considered in the analysis of the results. The analysis was based on the meanscores obtained by each group for each of the skills under evaluation, and for the varying levels of difficulty used in the study.
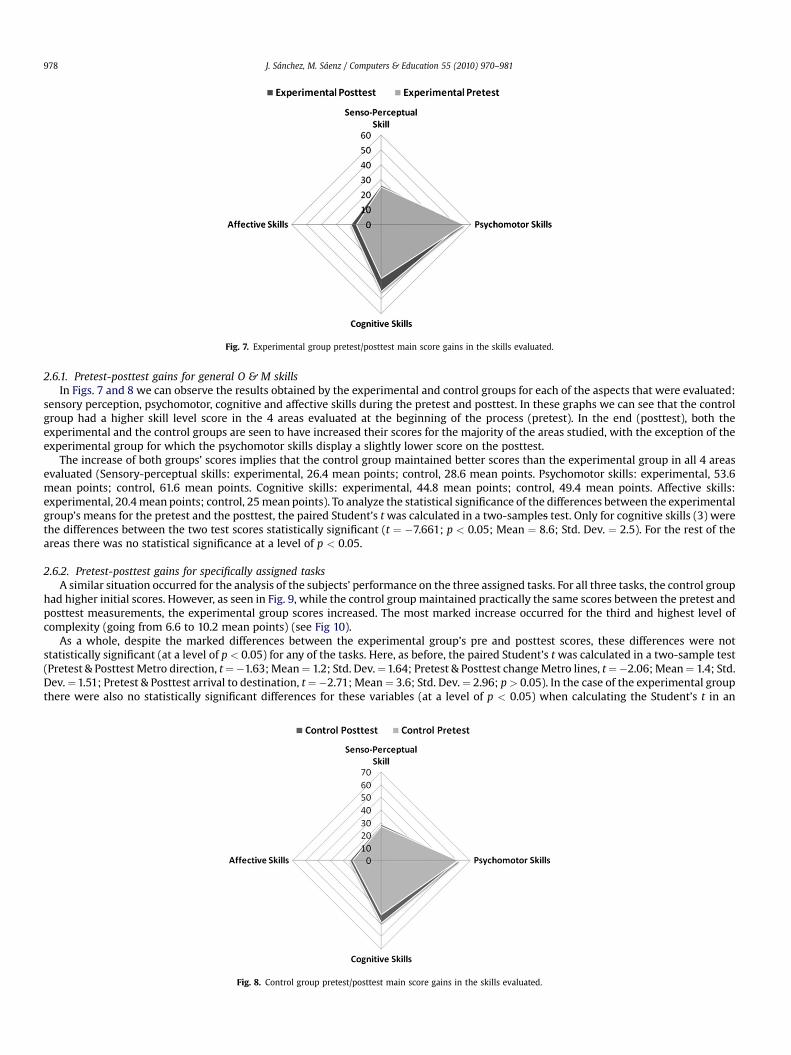
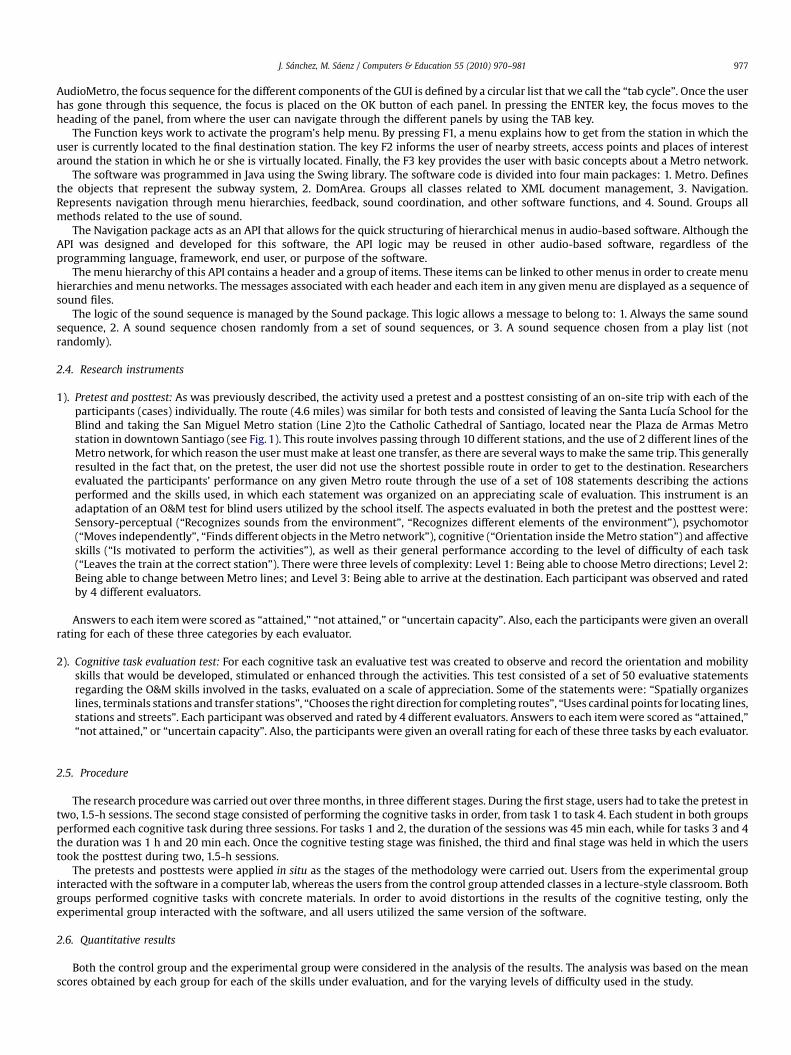
Fig. 7. Experimental group pretest/posttest main score gains in the skills evaluated.
J. Sánchez, M. Sáenz / Computers & Education 55 (2010) 970–981978
2.6.1. Pretest-posttest gains for general O & M skillsIn Figs. 7 and 8 we can observe the results obtained by the experimental and control groups for each of the aspects that were evaluated:
sensory perception, psychomotor, cognitive and affective skills during the pretest and posttest. In these graphs we can see that the controlgroup had a higher skill level score in the 4 areas evaluated at the beginning of the process (pretest). In the end (posttest), both theexperimental and the control groups are seen to have increased their scores for the majority of the areas studied, with the exception of theexperimental group for which the psychomotor skills display a slightly lower score on the posttest.
The increase of both groups’ scores implies that the control group maintained better scores than the experimental group in all 4 areasevaluated (Sensory-perceptual skills: experimental, 26.4 mean points; control, 28.6 mean points. Psychomotor skills: experimental, 53.6mean points; control, 61.6 mean points. Cognitive skills: experimental, 44.8 mean points; control, 49.4 mean points. Affective skills:experimental, 20.4mean points; control, 25mean points). To analyze the statistical significance of the differences between the experimentalgroup’s means for the pretest and the posttest, the paired Student’s twas calculated in a two-samples test. Only for cognitive skills (3) werethe differences between the two test scores statistically significant (t ¼ �7.661; p < 0.05; Mean ¼ 8.6; Std. Dev. ¼ 2.5). For the rest of theareas there was no statistical significance at a level of p < 0.05.
2.6.2. Pretest-posttest gains for specifically assigned tasksA similar situation occurred for the analysis of the subjects’ performance on the three assigned tasks. For all three tasks, the control group
had higher initial scores. However, as seen in Fig. 9, while the control group maintained practically the same scores between the pretest andposttest measurements, the experimental group scores increased. The most marked increase occurred for the third and highest level ofcomplexity (going from 6.6 to 10.2 mean points) (see Fig 10).
As a whole, despite the marked differences between the experimental group’s pre and posttest scores, these differences were notstatistically significant (at a level of p < 0.05) for any of the tasks. Here, as before, the paired Student’s twas calculated in a two-sample test(Pretest & Posttest Metro direction, t¼�1.63; Mean¼ 1.2; Std. Dev.¼1.64; Pretest & Posttest changeMetro lines, t¼�2.06; Mean¼ 1.4; Std.Dev.¼1.51; Pretest & Posttest arrival to destination, t¼�2.71; Mean¼ 3.6; Std. Dev.¼ 2.96; p> 0.05). In the case of the experimental groupthere were also no statistically significant differences for these variables (at a level of p < 0.05) when calculating the Student’s t in an
Fig. 8. Control group pretest/posttest main score gains in the skills evaluated.

Fig. 9. Control group pretest/posttest score gains for the levels of complexity evaluated.
J. Sánchez, M. Sáenz / Computers & Education 55 (2010) 970–981 979
independent samples test. When using Levene’s test, the difference is only significant for Task 2 (software) (F¼ 5.77; p< 0.05; Mean¼ 2.34;Std. Error. ¼ 8.27).
For all the cognitive tasks, the students of both the experimental and control groups obtained similar pretest-posttest gains, althoughnone of these gains were statistically significant.
2.7. Qualitative results
The greatest difficulties were reflected in the students’ scarce exploration of the material and in their problems with manipulatingmaterial during the construction of the model.
As far as the interaction with concrete material, each participant was able to improve his/her initial representation. In the case of theexperimental group, the students were able to manage a higher degree of knowledge regarding the names of the stations, the terminalstations and the stations for transfers to different lines. This was very useful for them to be able to improve upon the initial representation,which was a difficult task for both groups.
For the learning of orientation andmobility (sensory-perceptual skills), the results varied regarding the senses of hearing and touch, bothof which were fundamental for the development of the cognitive tasks applied to the experimental group. The importance of the soundreferences provided by the software during the execution of the activities for people who are blind or who have low-vision was madeabundantly clear by observing the subjects’ use of the software. The sounds used in AudioMetro constituted a fundamental element formotivating and encouraging the users.
In addition to audio, touchwas indispensable for interacting with the keyboard. In this way, the greatest difficulties resulted from the factthat some students were not very good at typing, for which reason they made typographical mistakes. This is an aspect that must beconsidered when using this kind of software, in that there must be some help or prior training in keyboard use.
Another activity for which touch was important was in representing the Metro network with concrete material. During these tasks,certain complications emerged due to the users’ lack of initiative to explore the material, as well as difficulties in manipulating and creatingshapes with the materials provided.
Fig. 10. Experimental group pretest/posttest score gains for the levels of complexity evaluated.

J. Sánchez, M. Sáenz / Computers & Education 55 (2010) 970–981980
3. Conclusions
The purpose of this research was to evaluate the impact of using the AudioMetro software on the development of cognitive, sensory andpsychomotor skills for the learning of orientation and mobility by users who are legally blind. These skills and abilities are prerequisites forusing the Santiago Metro System as a means of transportation.
For the control group, all the necessary information about the Metro network was obtained through a traditional, lecture-style class, inwhich learning was basically imparted through memorization and not by application. In having to apply this knowledge, difficulties wereobserved regarding how to correctly execute the routes defined in task 4. As it was a lecture class, therewas a low level of studentmotivationto learn, which produced a low level of retention of the content.
Basically, the progress achieved by the experimental group depended on the degree to which they explored the software during theinteractive cognitive tasks. In addition, within the entire study group there were some users that did not habitually use the Metro fortransportation, and others that did. None of the users in the experimental group used theMetro habitually, and those from the control groupwere mixed.
The relevance of sound references provided by the software for users who are blind or low-vision users during the execution of theactivities was clear by observing the subjects’ use of the software. The sounds used in AudioMetro constituted a fundamental element inmotivating and encouraging the users.
Psychomotor skills are fundamental for learning orientation and mobility. This area includes concepts such as independent movement,which is the final objective of this learning process. It is important to point out that the software’s influence in this area is incipient, giventhat through the use of the keyboard, fine motor skills were developed. AudioMetro does influence the cognitive and sensory perception.Through these axes, the users in the experimental group were able to plan different routes and carry them out in virtual trips.
The users’ scarce or lack of any knowledge regarding orientation andmobility techniques, as well as their lack of spatial orientation skillsto move about in order to locate the final destination, made traveling on the Metro considerably more difficult for both of the study groups.Another problemwas their reluctance to ask for help from any one. For these reasons, during the on-site exercises constant supervisionwasnecessary in order to prevent dangerous situations that could have emerged during the trip. In spite of this, the users appeared to be calmwhen using the Metro, and at no time were they observed to be nervous or out of control of the situation. This implies that despite nothaving any orientation and mobility training, they were confident in what they had learned and trained for by using the AudioMetrosoftware. This provided themwith a higher degree of autonomy when using the Metro network. In the same way, the users were generallymore concerned with their navigation than with their orientation.
Finally, in addition to the beneficial tools that AudioMetro provides, it is necessary to master the fundamentals of knowing, learning andadopting the necessary techniques for orientation and mobility that would allow the user to take advantage of the software more fully. Assuch, the software can be used for learning orientation and mobility in the Santiago Metro Transportation System. Overall, the impact of thesoftware falls mainly within the cognitive and sensory areas, and represents a contribution in the form of a complementary tool for thelearning of orientation and mobility skills.
Acknowledgment
This report was funded by the Chilean National Fund of Science and Technology, Fondecyt #1090352 and Project CIE-05 Program CenterEducation PBCT-CONICYT
References
Amandine, A., Katz, B., Blum, A., Jacquemin, C., & Denis, M. (2005). A study of spatial cognition in an immersive virtual audio environment: comparing blind and blindfoldedindividuals. In: Proc. of 11th ICAD, Limerick, Ireland, July 6–9, 2005, pp. 228–235.
Baudoin, G., Venard, O., Uzan, G., Rousseau, A., Benabou, Y., Paumier A., et al. (2005). How can blinds get information in public transports using PDA? The RAMPE auditive manmachine interface. In: Proc. 8th AAATE 2005, Lille, Sept. 2005, pp. 304–316.
Bishop, A. (1989). Review of research on visualization in mathematics education. Focus on Learning Problems in Mathematics, 11(1–2), 7–16.Coroama, V. (2003). The chatty environment – a world explorer for the visually impaired. In: Proceedings of Ubicomp, 2003, pp. 1–2. http://www.vs.inf.ethz.ch/res/papers/
ubicomp2003-chatty-env.pdf, Last Accessed Febraury 2009.Coroama, V. (2006). Experiences from the design of a ubiquitous computing system for the blind. Montréal, Québec, Canada, April 22–27, 2006 ACM CHI ’06 (pp. 664–669).Crommentuijn, K., Winberg, F. (2006). Designing auditory displays to facilitate object localization in virtual haptic 3D environments. In: Proc.. of the 8th international ACM
ASSETS, Portland, Oregon, USA, 2006, pp. 255–256.Crossan, A., Brewster, S. (2006). Two-handed navigation in a haptic virtual environment. In: Extended Proceedings of CHI, Montreal, Canada, pp. 676–681.De Felice, F., Renna, F., Attolico, G., & Distante, A. (2007) A haptic/acoustic application to allow blind the access to spatial information. Second Joint EuroHaptics Conference
and Symposium on Haptic Interfaces for Virtual Environment and Teleoperator Systems (WHC’07), pp. 1–6.Edwards, A. (2002). Multimodal interaction and people with disabilities. In B. Granström, D. House, & I. Karlsson (Eds.), Multimodality in language and speech systems (pp. 27–
44). Dordrecht: Kluwer Academic Publishers.Engelbrektsson, P., Karlsson, M., Gallagher, B., Hunter, H., Petrie, H., & O’Neill, A. (2004). Developing a navigation aid for the frail and visually impaired. Oct. 2004. Universal
Access in the Information Society, 3(3), 194–201.Evett, L., Brown, D., Battersby, S., Ridley, A., & Smith, P. (2008). Accessible virtual environments for people who are blind – creating an intelligent virtual cane using the
Nintendo Wii controller. In Proc. 7th ICDVRAT with ArtAbilitation, Maia, Portugal, 2008 (pp. 271–278). UK: ICDVRAT/University of Reading.Feintuch, U., Ha, J., & Weis, P. (2006). Low-cost haptic-aural virtual environments for way-finding by children with congenital blindness: feasibility study. In: Proc.. of the 5th
IWVR ’06. New York, USA. August 29–30, pp. 78–81.Fonadis. (2004). Primer Estudio Nacional de la Discapacidad, Discapacidad Visual. ENDISC Chile 2004. Gobierno de Chile. http://www.fonadis.cl/index.php?
seccion¼9¶metro¼79 Last Accessed, February 2009.Frauenberger, C., Putz, V., & Holdrich, R. (2004). Spatial auditory displays – a study on the use of virtual audio environments as interfaces for users with visual disabilities, In:
7th DAFx04 Proceedings, Naples, Italy, October 5–8 2004, pp. 384–389.Greca, I., & Moreira, M. (2000). Mental models, conceptual models, and modeling. International Journal of Science Education, 22(1), 1–11.Ienaga, T., Matsumoto, M., Shibata, M., Toyoda, N., Kimura, Y., Gotoh, H., et al. (2006). A study and development of the auditory route map providing system for the visually
impaired. Lecture Notes in Computer Science, 4061, 1265–1272.Kapi�c, T. (2003). Indoor navigation for visually impaired. A project realized in collaboration with NCCR-MICS. July–October 2003, pp. 1–10.Kehoe, A., Neff, F., & Pitt, I. (2007). Extending traditional user assistance systems to support an auditory interface. In: Proceedings of the 25th IASTED international multi-
conference: Artificial intelligence and applications, Innsbruck, Austria, pp. 637–642.

J. Sánchez, M. Sáenz / Computers & Education 55 (2010) 970–981 981
Kildal, J., & Brewster, S. A. (2007). EMA-tactons: vibrotactile external memory aids in an auditory display. Lecture Notes in Computer Science, 4663, 71–84.Kulyukin, V., Gharpure, C., Nicholson, J., & Pavithran, S. (2004). RFID in robot-assisted indoor navigation for the visually impaired. 28 Sept.-2 Oct. 2004 Intelligent robots and
systems, 2004. (IROS 2004). Proceedings. of IEEE/RSJ international conference, Vol. 2 (pp. 1979–1984). Sendai, Japan: Sendai Kyodo Printing.Lahav, O., Mioduser, D. (2004). Blind persons’ acquisition of spatial cognitive mapping and orientation skills supported by virtual environment. In: Proceedings of the 5th
ICDVRAT 2004, Oxford, UK, 2004. pp. 131–138.Lahav, O., & Mioduser, D. (2008). Haptic-feedback support for cognitive mapping of unknown spaces by people who are blind. International Journal of Human-Computer
Studies, 2008, 66(1), 23–35.Loomis, J. M., Golledge, R. G., & Klatzky, R. L. (1998). Navigation system for the blind: auditory display modes and guidance. PRESENCE – CAMBRIDGEMASSACHUSETTS, 7(2),
193–203.Loomis, M., Lippa, Y., Klatzky, R., & Golledge, R. (2002). Spatial updating of locations specified by 3-D sound and spatial language. Journal of Experimental Psychology: Learning,
Memory, and Cognition 2002, 28(2), 335–345.Massof, R. (2003). Auditory assistive devices for the blind. In: Proc.. of the 2003 international conference on auditory display, Boston, MA, USA, 6–9 July, pp. 1–5.Ministerio Armonía Internet. (2005). ¿Qué hay en las plaquitas del Metro de Santiago? http://www.armonia.cl/extras/conferencia/temas/090902_ciegos_metro.htm Last
Accessed, February 2009.Pitt, I., & Edwards, A. (2003). Design of speech-based devices: A practical guide. In Practitioner series. London [u.a.]: Springer.Pressl, B., Wieser, M. (2005) A computer-based navigation system tailored to the needs of blind people. In: Proceedings of the 15th international conference on electronics,
communications and computers, 2006. pp. 1280–1286.Project ACTION (U.S.), & ComputerCenter for the Visually Impaired. (1995). Tactual maps: Accessible information for transit users with disabilities: Final report. Washington, D.C.:
Project ACTION/NIAT.Röber, N., Masuch, M. (2004). Interacting with sound. An interaction paradigm for virtual auditory worlds. In: Proc.. of 10th ICAD, Sydney, Australia, July 6–9, 2004, pp. 1–7.Sánchez, J., Aguayo, F., & Hassler, T. (2007). Independent outdoor mobility for the blind. Virtual Rehabilitation 2007, September 27-29, Venice, Italy, pp. 114–120.Sánchez, J., Baloian, N., et al. (2006). Modeling 3D interactive environments for learners with visual disabilities. 2006. In K. Miesenberger (Ed.), Lecture notes in computer
science, LNCS 4061 (pp. 1326–1333). Springer-Verlag Berlin Heidelberg 2006.Sánchez, J., Noriega, G., & Farías, C. (2008). Mental representation of navigation through sound-based virtual environments. 2008 AERA Annual Meeting. New York (NY), USA,
March 24–28, pp. 1–19.Sánchez, J., & Sáenz, M. (2006). 3D sound interactive environments for blind children problem solving skills. July–August 2006. Behaviour & Information Technology, 25(4),
367–378.Simonnet, M., Guinard, J-Y., & Tisseau, J. (2006). Preliminary work for vocal and haptic navigation software for blind sailors. In: Proceedings 6th ICDVRAT 2006, Esbjerg,
Denmark, pp. 255–262.Solano, L. (2005). Para 2020, más de 75 millones de ciegos en el mundo, estima la OMS. La Jornada, diario electrónico. 28 de Abril, 2005. Last Accessed March 2009. http://
www.jornada.unam.mx/2005/04/28/a02n1cie.php.The Economist Web Version. (2007). Transport in Chile. From the economist print edition, February 15th. Last Accessed March 2009. http://www.economist.com/world/la/
displaystory.cfm?story_id¼8706618.Transantiago Noticias. (2004). Plan de integración: transantiago implementa nuevas medidas para discapacitados. Last Accessed March 2009. http://www.transantiago.cl/
noticias/noticias_113.htm.Vanderhaiden, G. (1990). Thirty-something million: should they be exceptions? n. 4, 1990Human factors, Vol. 32 (pp. 383–396) Santa Monica: Human Factors and Ergonomics
Society.Vogel, S. (2003). A PDA-based navigation system for the blind (Retrieved April 6, 2006) (2003), from. http://www.cs.unc.edu/wvogel/IP/IP/IP_versions/IPfinal_SuzanneVogel_
Spring2003.pdf.