Methamphetamine-Induced Dopamine-Independent Alterations in Striatal Gene Expression in the...
16
Methamphetamine-Induced Dopamine-Independent Alterations in Striatal Gene Expression in the 6- Hydroxydopamine Hemiparkinsonian Rats Jean Lud Cadet 1 *, Christie Brannock 1 , Irina N. Krasnova 1 , Bruce Ladenheim 1 , Michael T. McCoy 1 , Jenny Chou 1 , Elin Lehrmann 2 , William H. Wood 2 , Kevin G. Becker 2 , Yun Wang 1 1 Molecular Neuropsychiatry Research Branch, Intramural Research Program, National Institute on Drug Abuse/National Institutes of Health/Department of Health and Human Services, Baltimore, Maryland, United States of America, 2 Gene Expression and Genomics Unit, Intramural Research Program, National Institute on Drug Abuse/ National Institutes of Health/Department of Health and Human Services, Baltimore, Maryland, United States of America Abstract Unilateral injections of 6-hydroxydopamine into the medial forebrain bundle are used extensively as a model of Parkinson’s disease. The present experiments sought to identify genes that were affected in the dopamine (DA)–denervated striatum after 6-hydroxydopamine-induced destruction of the nigrostriatal dopaminergic pathway in the rat. We also examined whether a single injection of methamphetamine (METH) (2.5 mg/kg) known to cause changes in gene expression in the normally DA-innervated striatum could still influence striatal gene expression in the absence of DA. Unilateral injections of 6-hydroxydopamine into the medial forebrain bundle resulted in METH-induced rotational behaviors ipsilateral to the lesioned side and total striatal DA depletion on the lesioned side. This injection also caused decrease in striatal serotonin (5- HT) and 5-hydroxyindoleacetic acid (5-HIAA) levels. DA depletion was associated with increases in 5-HIAA/5-HT ratios that were potentiated by the METH injection. Microarray analyses revealed changes (6 1.7-fold, p,0.025) in the expression of 67 genes on the lesioned side in comparison to the intact side of the saline-treated hemiparkinsonian animals. These include follistatin, neuromedin U, and tachykinin 2 which were up-regulated. METH administration caused increases in the expression of c-fos, Egr1, and Nor-1 on the intact side. On the DA-depleted side, METH administration also increased the expression of 61 genes including Pdgf-d and Cox-2. There were METH-induced changes in 16 genes that were common in the DA-innervated and DA-depleted sides. These include c-fos and Nor-1 which show greater changes on the normal DA side. Thus, the present study documents, for the first time, that METH mediated DA-independent changes in the levels of transcripts of several genes in the DA-denervated striatum. Our results also implicate 5-HT as a potential player in these METH-induced alterations in gene expression because the METH injection also caused significant increases in 5-HIAA/5-HT ratios on the DA-depleted side. Citation: Cadet JL, Brannock C, Krasnova IN, Ladenheim B, McCoy MT, et al. (2010) Methamphetamine-Induced Dopamine-Independent Alterations in Striatal Gene Expression in the 6-Hydroxydopamine Hemiparkinsonian Rats. PLoS ONE 5(12): e15643. doi:10.1371/journal.pone.0015643 Editor: David I. Finkelstein, The Mental Health Research Institute of Victoria, Australia Received September 23, 2010; Accepted November 18, 2010; Published December 13, 2010 This is an open-access article distributed under the terms of the Creative Commons Public Domain declaration which stipulates that, once placed in the public domain, this work may be freely reproduced, distributed, transmitted, modified, built upon, or otherwise used by anyone for any lawful purpose. Funding: The study was supported by Intramural Research Programs of National Institute on Drug Abuse and National Institute of Aging, National Institutes of Health (NIH)/Department of Health and Human Services (DHHS). The funders had no role in study design, data collection and analysis, decision to publish, or preparation of the manuscript. Competing Interests: The authors have declared that no competing interests exist. * E-mail: [email protected] Introduction Dysfunctions of basal ganglionic structures are the substrates for Huntington’s and Parkinson’s diseases [1,2]. Rats that received unilateral injections of 6-hydroxydopamine (6-OHDA) in the nigrostriatal dopaminergic system are used as a model for Parkinson’s disease. These animals exhibit ipsilateral rotations after administration of indirect dopamine (DA) agonists and contralateral rotations after direct DA agonists [3–8]. These behaviors are related to unilateral changes in the expression of striatal dopaminergic markers [3–5,9–12]. In addition, striatal DA depletion is associated with changes in the expression of mRNA precursors for some neuropeptides including enkephalin, sub- stance P, and dynorphin [13–15]. Moreover, injections of direct DA receptor agonists that stimulate postsynaptic DA receptors cause substantial changes in the expression of several genes in the DA-depleted striatum [16–20]. However, it is not clear to what extent indirect agonists, such as the amphetamines that release DA and other neurotransmitters [21–25] might also influence gene expression in the DA-depleted striatum. Methamphetamine (METH) is an indirect agonist that induces release of DA and serotonin (5-HT) in the brain [21,22,24–26]. Repeated injections of large METH doses also cause delayed increases in glutamate release in the striatum [23,27,28]. In addition, METH administration influences striatal gene expression in animals with normal dopaminergic innervation [29–33]. The METH-induced transcriptional changes depend on stimulation of DA and glutamate receptors [29,31,33]. However, the extent to which METH might also induce changes in gene expression in the absence of DA innervation has not been clarified. Studies that have examined the effects of indirect agonists on striatal gene expression in hemiparkinsonian rodents have measured the expression of only a few genes or proteins. For example, repeated injections of amphetamine (5 mg/kg) to rats with unilateral nigral PLoS ONE | www.plosone.org 1 December 2010 | Volume 5 | Issue 12 | e15643
-
Upload
independent -
Category
Documents
-
view
0 -
download
0
Transcript of Methamphetamine-Induced Dopamine-Independent Alterations in Striatal Gene Expression in the...

Methamphetamine-Induced Dopamine-IndependentAlterations in Striatal Gene Expression in the 6-Hydroxydopamine Hemiparkinsonian RatsJean Lud Cadet1*, Christie Brannock1, Irina N. Krasnova1, Bruce Ladenheim1, Michael T. McCoy1, Jenny
Chou1, Elin Lehrmann2, William H. Wood2, Kevin G. Becker2, Yun Wang1
1 Molecular Neuropsychiatry Research Branch, Intramural Research Program, National Institute on Drug Abuse/National Institutes of Health/Department of Health and
Human Services, Baltimore, Maryland, United States of America, 2 Gene Expression and Genomics Unit, Intramural Research Program, National Institute on Drug Abuse/
National Institutes of Health/Department of Health and Human Services, Baltimore, Maryland, United States of America
Abstract
Unilateral injections of 6-hydroxydopamine into the medial forebrain bundle are used extensively as a model of Parkinson’sdisease. The present experiments sought to identify genes that were affected in the dopamine (DA)–denervated striatumafter 6-hydroxydopamine-induced destruction of the nigrostriatal dopaminergic pathway in the rat. We also examinedwhether a single injection of methamphetamine (METH) (2.5 mg/kg) known to cause changes in gene expression in thenormally DA-innervated striatum could still influence striatal gene expression in the absence of DA. Unilateral injections of6-hydroxydopamine into the medial forebrain bundle resulted in METH-induced rotational behaviors ipsilateral to thelesioned side and total striatal DA depletion on the lesioned side. This injection also caused decrease in striatal serotonin (5-HT) and 5-hydroxyindoleacetic acid (5-HIAA) levels. DA depletion was associated with increases in 5-HIAA/5-HT ratios thatwere potentiated by the METH injection. Microarray analyses revealed changes (6 1.7-fold, p,0.025) in the expression of 67genes on the lesioned side in comparison to the intact side of the saline-treated hemiparkinsonian animals. These includefollistatin, neuromedin U, and tachykinin 2 which were up-regulated. METH administration caused increases in theexpression of c-fos, Egr1, and Nor-1 on the intact side. On the DA-depleted side, METH administration also increased theexpression of 61 genes including Pdgf-d and Cox-2. There were METH-induced changes in 16 genes that were common inthe DA-innervated and DA-depleted sides. These include c-fos and Nor-1 which show greater changes on the normal DAside. Thus, the present study documents, for the first time, that METH mediated DA-independent changes in the levels oftranscripts of several genes in the DA-denervated striatum. Our results also implicate 5-HT as a potential player in theseMETH-induced alterations in gene expression because the METH injection also caused significant increases in 5-HIAA/5-HTratios on the DA-depleted side.
Citation: Cadet JL, Brannock C, Krasnova IN, Ladenheim B, McCoy MT, et al. (2010) Methamphetamine-Induced Dopamine-Independent Alterations in StriatalGene Expression in the 6-Hydroxydopamine Hemiparkinsonian Rats. PLoS ONE 5(12): e15643. doi:10.1371/journal.pone.0015643
Editor: David I. Finkelstein, The Mental Health Research Institute of Victoria, Australia
Received September 23, 2010; Accepted November 18, 2010; Published December 13, 2010
This is an open-access article distributed under the terms of the Creative Commons Public Domain declaration which stipulates that, once placed in the publicdomain, this work may be freely reproduced, distributed, transmitted, modified, built upon, or otherwise used by anyone for any lawful purpose.
Funding: The study was supported by Intramural Research Programs of National Institute on Drug Abuse and National Institute of Aging, National Institutes ofHealth (NIH)/Department of Health and Human Services (DHHS). The funders had no role in study design, data collection and analysis, decision to publish, orpreparation of the manuscript.
Competing Interests: The authors have declared that no competing interests exist.
* E-mail: [email protected]
Introduction
Dysfunctions of basal ganglionic structures are the substrates for
Huntington’s and Parkinson’s diseases [1,2]. Rats that received
unilateral injections of 6-hydroxydopamine (6-OHDA) in the
nigrostriatal dopaminergic system are used as a model for
Parkinson’s disease. These animals exhibit ipsilateral rotations
after administration of indirect dopamine (DA) agonists and
contralateral rotations after direct DA agonists [3–8]. These
behaviors are related to unilateral changes in the expression of
striatal dopaminergic markers [3–5,9–12]. In addition, striatal DA
depletion is associated with changes in the expression of mRNA
precursors for some neuropeptides including enkephalin, sub-
stance P, and dynorphin [13–15]. Moreover, injections of direct
DA receptor agonists that stimulate postsynaptic DA receptors
cause substantial changes in the expression of several genes in the
DA-depleted striatum [16–20]. However, it is not clear to what
extent indirect agonists, such as the amphetamines that release DA
and other neurotransmitters [21–25] might also influence gene
expression in the DA-depleted striatum.
Methamphetamine (METH) is an indirect agonist that induces
release of DA and serotonin (5-HT) in the brain [21,22,24–26].
Repeated injections of large METH doses also cause delayed
increases in glutamate release in the striatum [23,27,28]. In
addition, METH administration influences striatal gene expression
in animals with normal dopaminergic innervation [29–33]. The
METH-induced transcriptional changes depend on stimulation of
DA and glutamate receptors [29,31,33]. However, the extent to
which METH might also induce changes in gene expression in the
absence of DA innervation has not been clarified. Studies that
have examined the effects of indirect agonists on striatal gene
expression in hemiparkinsonian rodents have measured the
expression of only a few genes or proteins. For example, repeated
injections of amphetamine (5 mg/kg) to rats with unilateral nigral
PLoS ONE | www.plosone.org 1 December 2010 | Volume 5 | Issue 12 | e15643

6-OHDA lesions caused increased striatal dynorphin-like immu-
noreactivity on the intact but not on the lesioned side [34]. Neither
did amphetamine administration induce any changes in met-
enkephalin expression on the lesioned side [34]. In contrast,
Chritin et al. [35] reported that amphetamine caused up-regulated
Fos protein expression on both sides of hemiparkinsonian rats,
with the increases being of smaller magnitude on the DA-
denervated side.
Given the importance of DA in the mediation of striatal
synaptic plasticity and striatum-dependent behaviors, we thought
it is likely that DA depletion might be associated with changes in
the expression of a larger number of genes than those described so
far in intrinsic striatal cells [13–15]. The possibility also existed
that indirect DA agonists including METH, which causes release
of other neurotransmitters such as 5-HT [22], might affect the
expression of some genes in a DA-independent fashion. Therefore,
the present study was undertaken to analyze global gene
expression in the DA-denervated striatum and to quantify striatal
METH-induced transcriptional responses after 6-OHDA-induced
lesions of the nigrostriatal dopaminergic pathway. Our results
show that there are other genes that are affected in the DA-
depleted striatum in addition to those previously reported [13–15].
We also found that METH administration does indeed cause
changes in the expression of several genes in the DA-depleted
striatum. Our observations further suggest that METH-induced
increased 5-HT turnover might, in part, be responsible for the
later changes.
Methods
AnimalsMale Sprague-Dawley rats (Charles Rivers Laboratories,
Raleigh, NC), weighing 270–300 g at the beginning of the
experiments were used in the present study. Animals were housed
in a humidity- and temperature-controlled room and were given
free access to food and water. All animal procedures were
performed according to the National Institutes of Health Guide for
the Care and Use of Laboratory Animals and were approved by the
Animal Care and Use Committee of the National Institute on
Drug Abuse, Intramural Research Program. The research was
conducted under Animal Study Protocol #09-CNRB-25.
6-OHDA lesioningUnilateral lesions were performed under anesthesia with chloral
hydrate (400 mg/kg, i.p.). After immobilization on a stereotaxic
frame (model 940; David Kopf Instruments), a hole was drilled in
the skull for injections of 6-OHDA in the medial forebrain bundle
(MFB). 6-OHDA (2 mg/ml 65 ml in 0.9% NaCl containing
0.2 mg/ml ascorbic acid) was unilaterally injected into the left
MFB (24.4 mm AP, 1.2 mm ML relative to bregma and 8.4 mm
below skull) over 4 minutes. At the end of each injection, the
micropipette was left in place for an additional 5 min and then
withdrawn slowly to prevent reflux of the solution.
RotationRotational behavior was evaluated using a multichannel
rotometer system (RotoMax, AccuScan Instruments, Inc). Contra-
versive or ipsiversive rotational behaviors were induced by
subcutaneous injection of apomorphine (APO) (0.05 mg/kg) on
day 24 or (6) METH HCl (2.5 mg/kg, s.c) on day 31,
respectively, after the 6-OHDA injection. Each animal was placed
in a cylindrical test chamber for 90 min. The highest consecutive
clockwise and counter-clockwise rotations over 60 min were used
for analysis.
METH treatment and tissue collectionOne week after measuring METH-induced rotation, the
animals were divided into two groups based on rotational
behavior. The two matched groups of animals were injected with
either saline or METH (2.5 mg/kg, i.p.) and then euthanized
2 hours after the injection. Additional control animals that did not
get 6-OHDA injections were also used. Their brains were quickly
removed, tissues were dissected on ice, snap frozen on dry ice, and
stored at 280uC until used in HPLC, microarray, and quantitative
PCR (qPCR) experiments. The experimental groups were: saline-
treated controls (SC), METH-treated controls (MC), non-lesioned
side of saline-treated 6-OHDA-injected rats (SNL), lesioned side of
saline-treated 6-OHDA-injected rats (SL), non-lesioned side of
METH-treated 6-OHDA-injected animals (MNL), and lesioned
side of METH-treated 6-OHDA-injected animals (ML).
HPLCFor monoamine analysis, the brain regions were homogenized
in 0.01 M HClO4 and centrifuged at 14, 0006g for 15 min. DA,
3,4-dihydroxyphenylacetic acid (DOPAC), homovanillic acid
(HVA), 5-HT and 5-hydroxyindoleacetic acid (5-HIAA) levels
were analyzed in the brain tissue extracts using HPLC with
electrochemical detector [36,37].
RNA extraction, microarray hybridization, and dataanalysis
Total RNA was isolated using RNeasy Midi kit (Qiagen,
Valencia, CA). RNA integrity was assessed using an Agilent 2100
Bioanalyzer (Agilent, Palo Alto, CA) and showed no degradation.
Microarray hybridization was carried out using RatRef-12
Expression BeadChips arrays (22, 523 probes) (Illumina Inc.,
San Diego, CA). In brief, a 600 ng aliquot of total RNA from each
striatal sample was amplified using Illumina RNA Amplification
kit (Ambion, Austin, TX). Single-stranded RNA (cRNA) was
generated and labeled by incorporating biotin-16-UTP (Roche
Diagnostics, Indianapolis, IN). 750 ng of each cRNA sample were
hybridized to Illumina arrays at 55uC overnight according to the
Whole-Genome Gene Expression Protocol for BeadStation
(Illumina Inc.). Hybridized biotinylated cRNA was detected with
Cyanine3-streptavidin (GE Healthcare, Piscataway, NJ) and
quantified using Illumina’s BeadStation 500GX Genetic Analysis
Systems scanner.
The microarray data reported in the manuscript are in
accordance with MIAME guidelines. The raw data for the
analyses have been deposited in the NCBI GEO database, series
record GSE24233 (http://www.ncbi.nlm.nih.gov/geo/query/acc.
cgi?acc = GSE24233). The Illumina BeadStudio software was used
to measure fluorescent hybridization signals. Data were extracted
by BeadStudio (Illumina) and analyzed using GeneSpring software
v. 7.3.1 (Silicon Genetics, Redwood City, CA). Raw data were
imported into GeneSpring and normalized using global normal-
ization. The normalized data were used to identify changes in gene
expression in the 4 group comparisons: SL vs SNL, ML vs SNL,
MNL vs SNL, and ML vs SL. A gene was identified as significantly
changed if it showed increased or decreased expression according
to an arbitrary cut-off of 1.7-fold changes at p,0.025, according
to GeneSpring statistical package (unpaired t-test). In previous
studies, genes identified by similar criteria were consistently
validated by qPCR [31,38,39].
qPCRTotal RNA extracted from the striatum was used to confirm the
expression of genes of interest by qRT-PCR. In brief, unpooled
METH and DA-Independent Gene Expression
PLoS ONE | www.plosone.org 2 December 2010 | Volume 5 | Issue 12 | e15643
total RNA obtained from 8–12 striata per group was reverse-
transcribed with oligo dT primers and RT for PCR kit (Clontech,
Palo Alto, CA). PCR experiments were done using the Chroma4
RT-PCR Detection System and iQ SYBR Green Supermix
(BioRad, Hercules, CA). Sequences for gene-specific primers
corresponding to PCR targets were obtained using LightCycler
Probe Design software (Roche). The primers were synthesized and
HPLC-purified at the Synthesis and Sequencing Facility of Johns
Hopkins University (Baltimore, MD). The primers are listed in
Table S1. qPCR values were normalized using light chain of
clathrin and quantified. The results are reported as relative
changes calculated as the ratios of normalized gene expression
data of each group compared to the control group injected with
saline (SC).
Statistical AnalysisStatistical analysis for the HPLC and PCR data was performed
using analysis of variance (ANOVA) followed by Fisher’s protected
least significant difference post-hoc comparison (StatView 4.02,
SAS Institute, Cary, NC). Values are shown as means 6 SEM.
The null hypothesis was rejected at p,0.05.
Results
Functional characterization of the unilateral 6-OHDAnigrostriatal lesion
Rotation. We assessed the effectiveness of the 6-OHDA
lesions by both behavioral and biochemical means. Figure 1 shows
the effects of APO and METH on contraversive and ipsiversive
rotational behaviors, respectively. We found time-dependent
changes in APO-induced turns, which peaked within the first
6 min after injection of the drug (Figure 1A). APO-induced
contralateral turns were stable for the first 30 min and then rapidly
tapered to being nonexistent by 54 min after drug. METH-
induced ipsiversive turns became apparent within the first 12 min
after the drug injection and peaked at around 30 min. METH-
induced rotations remained prominent for about 1 hour and were
still measurable at 90 min after METH injection (Figure 1B).
Biochemistry. We found no differences in the levels of either
DA or its metabolites, DOPAC and HVA on the intact side of
hemiparkinsonian rats in comparison to control animals (Table 1).
Unilateral injections of 6-OHDA in the MFB caused complete loss
of DA, DOPAC, and HVA (Table 1). Injection of METH prior to
euthanizing the animals did not affect DA, DOPAC, and HVA
levels. METH did not cause any significant changes in DOPAC/
DA or HVA/DA ratios in any of the groups (data not shown).
Table 1 also shows the effects of unilateral 6-OHDA lesions on 5-
HT and 5-HIAA levels as well as 5-HIAA/5-HT ratios in the
striatum. We found significant decreases in 5-HT concentrations
on the side of the 6-OHDA injections in the saline- (237%) and in
METH-treated (251%) rats. 5-HIAA levels were also affected on
the lesioned side of the saline- (226.5%) and METH-treated
(226.4%) animals. In addition, injections of METH caused
significant increases in 5-HIAA levels in the control group (+33%)
and on the intact side of the hemiparkinsonian rats (+24%). We
also found increases in 5-HIAA/5-HT ratios on the 6-OHDA-
lesioned side of the saline- (+24.4%) and METH-treated animals
(+54.7%). The increases in 5-HIAA/5-HT ratios on the DA-
depleted side of animals treated with METH were significantly
higher than the ratios in all other groups. These findings are
consistent with those of other investigators who have reported
increases in 5-HIAA/5-HT ratios in animals that had suffered
greater than 90% loss of striatal DA [40]. However, the
potentiating effects of METH on 5-HIAA/5-HT ratios in the
lesioned striatum have not been reported before.
Dopamine depletion and METH-induced changes inmRNA levels in the striatum
Microarray analysis. In order to provide a panoramic view
of METH effects on gene expression in the DA-depleted striatum,
we used large scale microarray analysis with rat Illumina arrays
that contain about 23, 000 genes. Figure 2 shows a Venn diagram
of the comparisons between 4 groups of interest: SL vs SNL, ML
vs SNL, MNL vs SNL, and ML vs SL. The identity of the affected
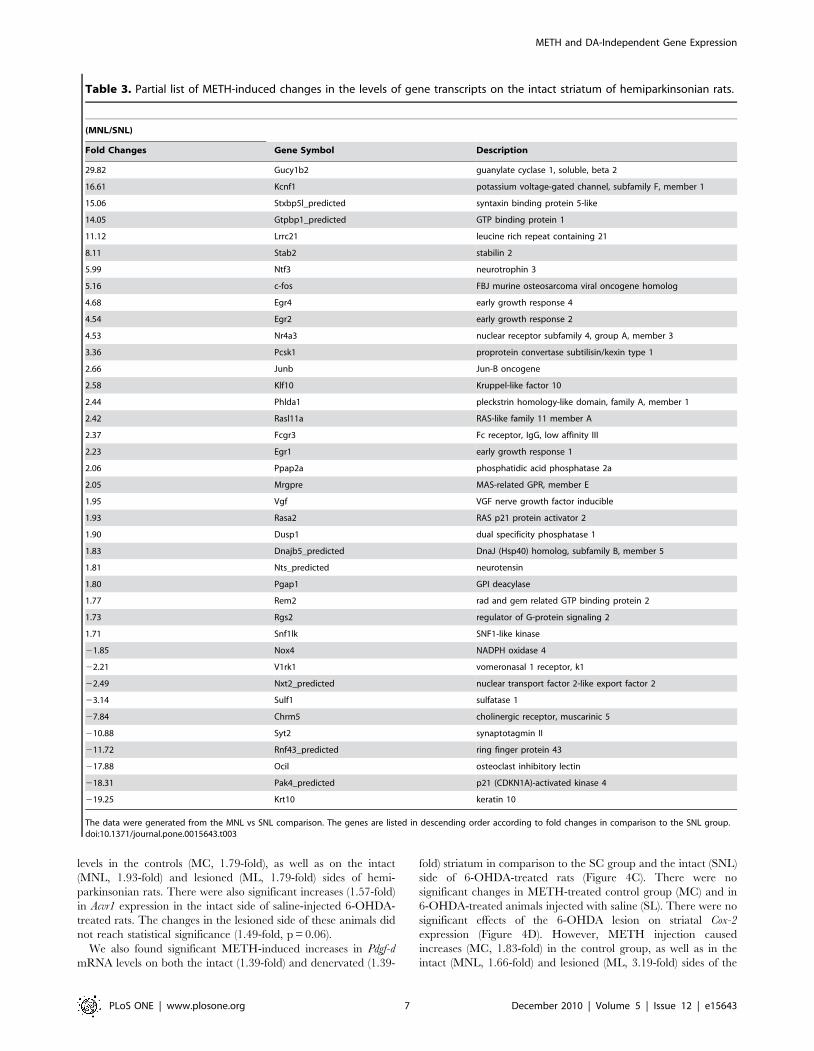
genes is given in Tables 2, 3, 4, and 5 which list the full names of
the genes. The Venn diagram shows 67 genes that were affected in
the DA-denervated side in comparison to the intact side (SL vs
SNL). Of these, 45 were up-regulated whereas 22 were down-
regulated (Table 2). Up-regulated genes include Ldhc, Stab2, Nmu,
Fst, Nts, and Tac2 whereas down-regulated transcripts included
Tac1 (Table 2). METH injection caused changes in the expression
of 86 genes in the intact side (MNL) in comparison to the SNL side
(Table 3). Genes of interest that were up-regulated include
transcription factors c-fos, Junb, Egr2, and Nr4a3 (Nor-1). METH
administration caused alterations in mRNA levels for 98 genes on
the lesioned side in comparison to the SNL side (ML vs SNL)
(Table 4). These include 61 up-regulated and 37 down-regulated
genes, with only 16 of these genes being also affected in the MNL
vs SNL comparison (Tables 3 and 4). Of the 98 genes affected in
the ML vs SNL group, 28 were also found in the SL vs SNL
comparison, with their expression, for the most part, not being
further affected by the METH administration (Tables 2 and 4).
Genes of interest found only in the ML vs SNL comparison were
Syt10 and Cox-2, which were up-regulated by the METH injection.
One of the common genes between the two sets of comparisons
(MNL vs SNL and ML vs SNL) is Nr4a3 (Nor-1) which shows
higher expression in the MNL vs SNL group. When we evaluated
gene expression in the ML versus SL group, another set of 55
genes was identified, with 30 being up-regulated and 25 being
down-regulated (Table 5). As shown in the Venn diagram, only 5
of these transcripts were also found in the ML vs SNL group.
These include c-fos and Hcst (Tables 4 and 5). We also compared
gene expression between the MNL and ML groups and found that
several transcription factors including c-fos, Egr1, Egr2, and Junb
were significantly up-regulated in the MNL group (data not
shown, see Table 6 for qPCR validation).
qPCR. Figure 3 shows the results of the qPCR validation for
some of the genes affected on the lesioned side of the
hemiparkinsonian rats treated with saline (SL vs SNL
comparison). Consistent with the array data, DA depletion was
associated with significant decreases (268% of SC group) in Tac1
(also called tachykinin 1, preprotachykinin A, substance P)
expression on the DA depleted side (SL). The injection of
METH did not significantly influence Tac1 expression on the
lesioned side (250% of SC group). In contrast, the single METH
injection caused small increases in normal animals (1.4-fold) and
on the intact side (1.3-fold) of the 6-OHDA-treated rats
(Figure 3A). In contrast to the effects on Tac1, DA depletion
resulted in significant increases (2.2-fold) in the expression of Tac2
(neurokinin B) (Figure 3B). METH administration did not induce
any changes in Tac2 expression in the control animals nor in the
intact side of 6-OHDA lesioned animals. METH did not
potentiate the effects of 6-OHDA on Tac2 expression on the
lesioned side (compare SL to ML groups in Figure 3B). There were
also significant 6-OHDA-induced decreases in Pdyn expression in
the SL group (Figure 3C). These 6-OHDA-induced changes were
not affected by METH. In contrast, METH injection caused
METH and DA-Independent Gene Expression
PLoS ONE | www.plosone.org 3 December 2010 | Volume 5 | Issue 12 | e15643

Figure 1. Apomorphine- and methamphetamine-induced rotations in 6-OHDA hemiparkinsonian rats. The animals were injected with6-OHDA as described in the text. Rotation was measured after injection of apomorphine (APO) (0.05 mg/kg) (A) or methamphetamine (METH)(2.5 mg/kg) (B).doi:10.1371/journal.pone.0015643.g001
METH and DA-Independent Gene Expression
PLoS ONE | www.plosone.org 4 December 2010 | Volume 5 | Issue 12 | e15643

increases in Pdyn mRNA levels in the control animals and in the
intact side of 6-OHDA-injected rats. Striatal DA depletion also
induced significant increases (2.86-fold) in Nts mRNA levels
(Figure 3D). The METH injection caused increases (2.21-fold) in
Nts mRNA in the control animals (MC group), confirming
previous results, which showed that METH induced a dramatic
increase in striatal Nts mRNA levels [41]. METH injection did not
cause further increases in Nts expression on the side of the lesion
when compared to the saline-treated 6-OHDA-injected animals
(compare SL to ML group). Nevertheless, the data for the ML
group were significantly higher than those measured for the MC
group (Figure 3D). There were also significant DA depletion-
induced increases (4.36-fold) in Nmu mRNA levels in the 6-
OHDA-treated animals (Figure 3E). METH injection did not
change Nmu expression in the control animals (MC group) nor on
the intact side of the lesioned animals. However, METH
treatment enhanced the increases (6.04-fold) in Nmu expression
on the DA- depleted side (compare SL to ML group). The qPCR
experiment also replicated the array data for Fst expression, which
showed significant increases (3.39-fold) on the DA-depleted side of
hemiparkinsonian rats (Figure 3F). The METH-treated animals
also showed increases (4.78-fold) in the lesioned side, with these
changes being significantly higher than those observed in the
saline-treated 6-OHDA-lesioned animals. The observations that
the small METH dose caused further increases in Fst mRNA levels
on the lesioned side of 6-OHDA-treated rats suggest that these
METH-induced alterations in Fst expression might be
independent of METH-induced DA release.
Table 6 shows the qPCR validation of the microarray data
which identified multiple transcription factors affected on the
intact side of the 6-OHDA-treated rats after METH injection (see
Table 3). The effects of METH on the expression of immediate-
early genes in the normally DA innervated striatum have been the
subjects of several reports ([31] and references therein). However,
because these studies were conducted in animals with normal
neurotransmitter contents, conclusions drawn from these investi-
gations might not help to fully characterize the role of DA and
other neurotransmitters in these transcriptional responses. There-
fore, for the purpose of thoroughness, we performed qPCR on
other genes that fall within similar classes of transcription factors
and that had been identified as affected by injections of higher
METH doses [30,31]. Except for Fra1, c-jun, and Nr4a2 (Nurr1),
METH injection caused significant increases in the expression of
the other members of these classes of transcription factors. We
found that METH caused increases in c-fos mRNA levels on both
the intact (2.7-fold) and on the DA-denervated (1.7-fold) side
(Table 6). Another gene of interest is Jund. METH injection caused
similar increases in Jund expression on both the intact (2.2-fold)
and lesioned (1.9-fold) striata of the hemiparkinsonian rats
(Table 6). We found significant increases in the expression of
Nr4a1 (Nur77) in the denervated striatum in comparison to the
intact side (SL vs SNL) of hemiparkinsonian rats. These data are
different from the findings of microarray analysis that did not
identify Nr4a1 as being changed in the SL group. These might be
related to the somewhat stringent criteria used in the array analysis
and/or to the greater sensitivity of qPCR. The values in the SL
group were also comparable to those measured on the lesioned
side after METH (ML group) administration, implying that
METH did not influence Nr4a1 expression in the absence of DA.
Figure 2. Differential profiles of transcript levels in saline- andMETH-treated 6-OHDA-induced hemiparkinsonian rats. TheVenn diagram shows the distinctiveness and the overlap of genesidentified by the four separate comparisons shown in the figure. Therats were treated and euthanized as described in the text. RNA wasextracted from striatal tissues obtained from both sides of the brains ofsaline- and METH-injected hemiparkinsonian rats. Microarray analyseswere performed as described in the text. Genes were identified asdifferently expressed if they showed greater than 61.7-fold changes atp,0.025.doi:10.1371/journal.pone.0015643.g002
Table 1. Effects of 6-OHDA and METH on striatal monoamine levels.
Monoamine Control rats Hemiparkinsonian rats
Saline METH Saline METH
SC MC SNL (Contra) SL (Ipsi) MNL (Conta) ML (Ipsi)
DA 100.067.9 95.5613.6 114.9612.4b 0.060.0a 110.0612.8b 0.060.0a
DOPAC 100.0613.6 84.8612.2 116.0610.3b 0.360.3a 91.1613.8b 0.060.0a
HVA 100.068.8 113.4614.9 111.7610.7b 0.060.0a 113.2611.5b 0.060.0a
5-HT 100.068.0 123.6613.9 95.366.0b 62.6611.5a 115.2612.4b 49.167.4a
5-HIAA 100.064.0 133.369.2a 108.463.0b 73.468.0a 124.069.3a,b 73.667.7a
5-HIAA/5-HT 100.065.9 109.566.9c 111.865.6c 124.4610.3a,c 107.065.4b 154.7611.5a
The values represent means 6 SEM (percentage changes with respect to the SC group) of 8–10 measurements per group. The groups are as described in the text.Statistical analyses were done by ANOVA followed by PLSD. Key to statistics:ap,0.05 in comparison to the SC group;bp,0.05, in comparison to the ipsilateral (Ipsi) side of similarly treated groups;cp,0.05 in comparison to the 5-HIAA/5-HT ratio in the ML group.doi:10.1371/journal.pone.0015643.t001
METH and DA-Independent Gene Expression
PLoS ONE | www.plosone.org 5 December 2010 | Volume 5 | Issue 12 | e15643

Other transcription factors of interest are the EGRs [42]. Egr2
expression was substantially more induced by METH injection in
the intact side (6.1-fold) of the hemiparkinsonian rats in
comparison to control animals (3.8-fold) (Table 6). Similar
differential responses were observed for Egr3 expression after
METH administration to the control and 6-OHDA-injected
animals. This is in contrast to the effects of METH on Egr1
which were almost identical in the control and lesioned rats.
Figure 4 illustrates the expression of some genes that showed
METH-induced changes in the DA-depleted striatum. METH
injection caused increases in Inhba in the intact (2.35-fold) (MNL)
and denervated (2.21-fold) (ML) sides of the striatum in
hemiparkinsonian rats (Figure 4A). METH injection also induced
increases in Inhba in the control animals but these changes were of
smaller magnitude than the increases in the lesioned animals
(compare the MC to the MNL and ML groups). Figure 4B shows
the effects of METH on the activin receptor, Acvr1 [43]. Although
not found on the array, we wanted to know if there were changes
in this receptor in view of METH-induced changes in Inhba. We
found that METH caused significant increases in Acvr1 mRNA
Table 2. Partial list of genes showing changes in the DA-depleted striatum of hemiparkinsonian rats.
(SL/SNL)
Fold Changes Gene Symbol Description
22.47 Gucy1b2 guanylate cyclase 1, soluble, beta 2
21.85 Igsf7 immunoglobulin superfamily, member 7
16.31 Tyms thymidylate synthase
13.28 Ldhc lactate dehydrogenase C
8.63 Stab2 stabilin 2
8.44 Nav2 neuron navigator 2
8.42 Mcpt4 mast cell protease 4
8.13 Bcl9l_predicted B-cell CLL/lymphoma 9-like
6.41 Nmu neuromedin U
5.62 Msln mesothelin
3.86 Pcsk1 proprotein convertase subtilisin/kexin type 1
3.49 Fst follistatin
3.08 Upb1 ureidopropionase, beta
2.99 Nts_predicted neurotensin
2.84 Tac2 tachykinin 2
2.71 Plek2_predicted pleckstrin 2
2.59 Pctp phosphatidylcholine transfer protein
2.50 Slc26a2 solute carrier family 26 (sulfate transporter), member 2
2.48 Pkp2 plakophilin 2
2.40 Olr35 olfactory receptor 35
2.19 E2f1 E2F transcription factor 1
1.96 Il3ra interleukin 3 receptor, alpha chain
1.89 Inhba inhibin beta-A
1.85 Lama5 laminin, alpha 5
1.83 Kif22 kinesin family member 22
1.80 Amhr2 anti-Mullerian hormone type 2 receptor
1.74 Sox11 SRY-box containing gene 11
1.72 Cflar CASP8 and FADD-like apoptosis regulator
1.71 Fxyd5 FXYD domain-containing ion transport regulator 5
21.91 Tac1 tachykinin 1
22.07 Plekhg2_predicted pleckstrin homology domain containing, family G member 2
22.89 Cd44 CD44 antigen
23.08 P2ry1 purinergic receptor P2Y, G-protein coupled 1
25.06 Il1r2 interleukin 1 receptor, type II
26.47 Sox5 SRY-box containing gene 5
27.60 Kcnmb3_predicted potassium large conductance calcium-activated channel, M beta 3
212.77 Hoxa1 homeo box A1
This partial list of genes was generated from the SL vs SNL comparison. To be included the genes had to meet the inclusion criteria: 61.7-fold at p,0.025. The genes arelisted in descending order according to fold changes.doi:10.1371/journal.pone.0015643.t002
METH and DA-Independent Gene Expression
PLoS ONE | www.plosone.org 6 December 2010 | Volume 5 | Issue 12 | e15643
levels in the controls (MC, 1.79-fold), as well as on the intact
(MNL, 1.93-fold) and lesioned (ML, 1.79-fold) sides of hemi-
parkinsonian rats. There were also significant increases (1.57-fold)
in Acvr1 expression in the intact side of saline-injected 6-OHDA-
treated rats. The changes in the lesioned side of these animals did
not reach statistical significance (1.49-fold, p = 0.06).
We also found significant METH-induced increases in Pdgf-d
mRNA levels on both the intact (1.39-fold) and denervated (1.39-
fold) striatum in comparison to the SC group and the intact (SNL)
side of 6-OHDA-treated rats (Figure 4C). There were no
significant changes in METH-treated control group (MC) and in
6-OHDA-treated animals injected with saline (SL). There were no
significant effects of the 6-OHDA lesion on striatal Cox-2
expression (Figure 4D). However, METH injection caused
increases (MC, 1.83-fold) in the control group, as well as in the
intact (MNL, 1.66-fold) and lesioned (ML, 3.19-fold) sides of the
Table 3. Partial list of METH-induced changes in the levels of gene transcripts on the intact striatum of hemiparkinsonian rats.
(MNL/SNL)
Fold Changes Gene Symbol Description
29.82 Gucy1b2 guanylate cyclase 1, soluble, beta 2
16.61 Kcnf1 potassium voltage-gated channel, subfamily F, member 1
15.06 Stxbp5l_predicted syntaxin binding protein 5-like
14.05 Gtpbp1_predicted GTP binding protein 1
11.12 Lrrc21 leucine rich repeat containing 21
8.11 Stab2 stabilin 2
5.99 Ntf3 neurotrophin 3
5.16 c-fos FBJ murine osteosarcoma viral oncogene homolog
4.68 Egr4 early growth response 4
4.54 Egr2 early growth response 2
4.53 Nr4a3 nuclear receptor subfamily 4, group A, member 3
3.36 Pcsk1 proprotein convertase subtilisin/kexin type 1
2.66 Junb Jun-B oncogene
2.58 Klf10 Kruppel-like factor 10
2.44 Phlda1 pleckstrin homology-like domain, family A, member 1
2.42 Rasl11a RAS-like family 11 member A
2.37 Fcgr3 Fc receptor, IgG, low affinity III
2.23 Egr1 early growth response 1
2.06 Ppap2a phosphatidic acid phosphatase 2a
2.05 Mrgpre MAS-related GPR, member E
1.95 Vgf VGF nerve growth factor inducible
1.93 Rasa2 RAS p21 protein activator 2
1.90 Dusp1 dual specificity phosphatase 1
1.83 Dnajb5_predicted DnaJ (Hsp40) homolog, subfamily B, member 5
1.81 Nts_predicted neurotensin
1.80 Pgap1 GPI deacylase
1.77 Rem2 rad and gem related GTP binding protein 2
1.73 Rgs2 regulator of G-protein signaling 2
1.71 Snf1lk SNF1-like kinase
21.85 Nox4 NADPH oxidase 4
22.21 V1rk1 vomeronasal 1 receptor, k1
22.49 Nxt2_predicted nuclear transport factor 2-like export factor 2
23.14 Sulf1 sulfatase 1
27.84 Chrm5 cholinergic receptor, muscarinic 5
210.88 Syt2 synaptotagmin II
211.72 Rnf43_predicted ring finger protein 43
217.88 Ocil osteoclast inhibitory lectin
218.31 Pak4_predicted p21 (CDKN1A)-activated kinase 4
219.25 Krt10 keratin 10
The data were generated from the MNL vs SNL comparison. The genes are listed in descending order according to fold changes in comparison to the SNL group.doi:10.1371/journal.pone.0015643.t003
METH and DA-Independent Gene Expression
PLoS ONE | www.plosone.org 7 December 2010 | Volume 5 | Issue 12 | e15643

hemiparkinsonian rats. The METH-induced increases on the
lesioned side (ML) were significantly higher than those observed in
the MNL and MC groups (Figure 4D).
We found no significant changes in Syt10 expression on the side
of the lesion in animals treated with saline (Figure 4E). In addition,
injection of METH caused no changes in striatum of controls
animals (MC group). In contrast, the drug caused significant
increases in Syt10 expression in both the intact (1.68-fold) and DA-
denervated (2.13-fold) sides of 6-OHDA-treated rats in compar-
ison to the SC group and to the SNL side of hemiparkinsonian
rats. Figure 4F shows that 6-OHDA did not cause any significant
changes in the expression of Synj2bp in the saline-treated animals
(SL). However, METH induced small but significant increases
(1.35-fold) in Synj2bp in the DA depleted side (ML), but not on the
Table 4. Partial list of genes showing METH-induced changes in the DA-depleted striatum.
(ML/SNL)
Fold Changes Gene Symbol Description
14.20 Ung_predicted uracil-DNA glycosylase
13.08 Kcnf1 potassium voltage-gated channel, subfamily F, member 1
10.21 Mrgprb5 MAS-related G protein-coupled receptor, member B5
8.82 Stab2 stabilin 2
8.11 Stxbp5l_predicted syntaxin binding protein 5-like
6.70 Nmu neuromedin U
6.09 Eln elastin
4.85 Pcsk1 proprotein convertase subtilisin/kexin type 1
3.90 Nts_predicted neurotensin
3.24 Upb1 ureidopropionase, beta
3.12 Fst follistatin
3.03 c-fos FBJ murine osteosarcoma viral oncogene homolog
2.99 Plk1 polo-like kinase 1 (Drosophila)
2.87 Inhba inhibin beta-A
2.84 Tac2 tachykinin 2
2.79 Ptgs2 prostaglandin-endoperoxide synthase 2
2.29 Phex phosphate regulating gene homologus to endopeptidases on X chrom
2.23 Nr4a3 nuclear receptor subfamily 4, group A, member 3
2.19 Apbb1ip amyloid beta precursor protein-binding, B1 interacting protein
2.18 Cflar CASP8 and FADD-like apoptosis regulator
2.11 Syt10 synaptotagmin X
1.96 Klf10 Kruppel-like factor 10
1.93 Kif22 kinesin family member 22
1.90 Syk spleen tyrosine kinase
1.87 Egr4 early growth response 4
1.83 Mmp9 matrix metallopeptidase 9
1.73 Penk1 proenkephalin 1
1.72 E2f1 E2F transcription factor 1
21.71 Tac1 tachykinin 1
21.73 Top1 topoisomerase (DNA) I
21.80 Il1r2 interleukin 1 receptor, type II
21.97 Opn4 opsin 4 (melanopsin)
22.20 V1rk1 vomeronasal 1 receptor, k1
22.39 Art5 ADP-ribosyltransferase 5
22.44 Aox1 aldehyde oxidase 1
22.63 Dfna5h deafness, autosomal dominant 5 homolog (human)
210.37 Prm1 protamine 1
212.17 Krt10 keratin 10; type I keratin KA10
216.05 Hcst hematopoietic cell signal transducer
The partial list was generated from the ML vs SNL comparison. Inclusion criteria are as described in Table 2. The genes are listed in descending order according to foldchanges in comparison to expression in the SNL group.doi:10.1371/journal.pone.0015643.t004
METH and DA-Independent Gene Expression
PLoS ONE | www.plosone.org 8 December 2010 | Volume 5 | Issue 12 | e15643

intact side (MNL), of hemiparkinsonian rats. Unexpectedly,
METH injection also caused small increases (1.35-fold) in Synj2bp
in the control animals (MC group).
Discussion
Injections of 6-OHDA in the MFB caused complete loss of DA
and significant decreases in 5-HT content on the lesioned side of
the striatum. The 6-OHDA lesion was also associated with
METH-induced increases in 5-HIAA/5-HT ratios. 6-OHDA-
induced striatal DA depletion resulted in substantial changes in
transcript levels on the lesioned side. We also found that METH
dose that caused changes in mRNA levels on the intact side
elicited alterations in the expression of, mostly, different transcripts
on the DA-depleted side. METH injection also failed to impact the
expression of several genes whose mRNA levels were modulated
by DA depletion in the saline-treated hemiparkinsonian rats.
Effects of unilateral 6-OHDA-induced MFB lesions onstriatal gene expression
We found significant increases in the expression of Nts, Nmu, and
Tac2 and decreases in Tac1 expression in the DA-depleted striata
of rats treated with saline. These results are consistent with
previous reports of lesion-induced increases in Nmu [44], Nts
[45,46] and Tac2 [47] as well as decreases in Tac1 [18,48].
Interestingly, although METH injection did not further influence
the changes observed in Tac1 and Tac2 mRNA levels on the DA-
depleted side, the drug did cause further increases in Nmu
expression on the lesioned side, suggesting that Nmu expression
is regulated by additional neurotransmitters in the absence of DA
innervation. The observations that the small dose of METH
caused significant increases in Nts mRNA levels in the control
animals (MC) that were of lesser magnitude than those induced by
the drug on the lesioned striatum suggest that METH might
enhance Nts gene expression in association with or via increased 5-
Table 5. METH-induced changes in levels of gene transcripts on the lesioned side of hemiparkinsonian rats.
(ML/SL)
Fold Changes Gene Symbol Description
17.49 Olr784 olfactory receptor 784
14.27 Olr597 olfactory receptor 597
13.75 Papd4 PAP associated domain containing 4
11.86 Kirrel2 kin of IRRE like 2 (Drosophila)
11.69 Pdgfd platelet-derived growth factor, D polypeptide
11.08 Espn espin
10.37 V1rc1 vomeronasal V1r-type receptor V1rc1
9.72 Cd34 CD34 antigen
8.64 Olr1616 olfactory receptor 1616
7.14 Olr1332 olfactory receptor 1332
6.80 Psd2 pleckstrin and Sec7 domain containing 2
3.96 Fut9 fucosyltransferase 9
3.46 Wnt9b wingless related MMTV integration site 9B
2.17 Cd44 CD44 antigen
2.02 Ptpns1l3 protein tyrosine phosphatase, non-receptor type substrate 1-like 3
1.97 Mmachc methylmalonic aciduria cblC type, with homocystinuria
1.87 Synj2bp synaptojanin 2 binding protein
1.82 c-fos FBJ murine osteosarcoma viral oncogene homolog
21.88 Daam2 dishevelled associated activator of morphogenesis 2
22.07 Igfbp6 insulin-like growth factor binding protein 6
22.14 Abcg2 ATP-binding cassette, sub-family G (WHITE), member 2
27.70 Olr630 olfactory receptor 630
29.16 Zfp697 zinc finger protein 697
210.50 Msh5 mutS homolog 5 (E. coli)
211.62 Cubn cubilin (intrinsic factor-cobalamin receptor)
212.03 Taar7e trace-amine-associated receptor 7e
212.80 V1rc6 vomeronasal V1r-type receptor V1rc6
214.24 Arl12 ADP-ribosylation factor-like 12
229.82 Hcst hematopoietic cell signal transducer
The data were generated from the ML vs SL comparison. The genes are listed in descending order according to fold changes in comparison to expression in the SLgroup.doi:10.1371/journal.pone.0015643.t005
METH and DA-Independent Gene Expression
PLoS ONE | www.plosone.org 9 December 2010 | Volume 5 | Issue 12 | e15643

HT release, given that METH caused increased 5-HIAA/5-HT
ratios on the 6-OHDA lesioned side. When taken together, our
results suggest that the expression of Tac2, Nmu, and Nts might be
under tonic inhibitory control by DA. The findings that this dose
of METH did not cause any significant increases in Tac2 and Nmu
transcripts in the intact striatum suggest a potential DA-mediated
floor effect under these conditions. The situation appears more
complex for Nts mRNA which showed METH-mediated increases
in both the presence and absence of DA. Increases in Nts mRNA
after METH have been reported previously and are thought to be
related to stimulation of DA D1 receptors [49]. However, the fact
that METH caused greater increases in Nts transcript levels on the
lesioned side suggests that both DA and 5-HT might be involved
in regulating Nts transcript levels after injection of METH since
methylenedioxymethamphetamine (MDMA) which causes 5-HT
release can also increase Nts mRNA levels [50]. Other potential
regulators of gene expression after 6-OHDA lesions might include
changes in glutamatergic functions because hemiparkinsonian rats
exhibit increases in extracellular glutamate [51–54] and changes in
glutamate synapses [52] within the lesioned striatum. It is also
possible to suggest the DA depletion-mediated changes in
transcript levels might be related to alterations in the levels of
Nur77 (Nr4a1) [55], the only transcription factor that showed 2-
fold increases on the DA-denervated side (see Table 6). Therefore,
there might exist a certain correspondence between DA depletion,
Nur77 expression, and up-regulated transcripts of some of the
identified genes in the hemiparkinsonian brain.
It is also of interest to discuss the substantial increases in Nmu
mRNA observed after DA depletion reported in the present study
and in a previous microarray paper [44] because NMU is a
neuropeptide which is found ubiquitously in the body, with very
high levels reported in the gastrointestinal tract and the pituitary
gland [56]. NMU was first isolated from porcine spinal cord [57].
Subsequently, NMU was located in the rodent brain and in other
tissues [58–60]. Using radioimmunoassay, Domin et al. [59]
reported high concentrations of NMU in the nucleus accumbens,
septum, and hypothalamus but moderate levels in the substantia
nigra and the globus pallidus and much lower levels in the
striatum. Fujii et al. [61] used RT-PCR and reported that Nmu
mRNA levels were very high in the pituitary. Other structures
such as the medulla oblongata, hypothalamus and striatum
showed moderate Nmu mRNA levels whereas the cerebral cortex,
hippocampus, and the cerebellum had very low levels. NMU has
also been reported to participate in several physiological functions
including release of corticotrophin releasing hormone, excitation
of nociceptive neurons, and regulation of body weight [62,63].
NMU exerts its physiological effects by stimulation of the NMUR1
[61,64] and NMUR2 [65] receptors. In the brain, the effects of
this peptide might occur through NMUR2 because qPCR analysis
failed to detect much Nmur1 in the brain whereas moderate-to-
high levels of Nmur2 were found in the substantia nigra, the
nucleus accumbens, and the striatum [66]. Because Nmu mRNA is
expressed in the striatum and because its level is substantially
regulated after DA depletion [44] and by METH administration
(present study), it is possible to suggest that this neuropeptide
might play important roles in striatal functions. This idea is
supported by the report that intra-cerebroventricular NMU
injections cause increased motor activity in rats [66].
The DA depletion-induced increases in Fst mRNA levels are
consistent with those reported in a recent microarray study [44].
FST, a monomeric glycoprotein which is co-expressed with the
activins, irreversibly binds with activins and prevents their
interactions with their receptors [67–69]. Interestingly, we also
found increases in Inhba transcript which encodes a subunit of
inhibins and activins; both of which are members of a family of
polypetides that also include transforming growth factor-beta
Table 6. Effects of METH on striatal expression of transcription factors in hemiparkinsonian rats.
Transcription factor Control rats Hemiparkinsonian rats
Saline METH Saline METH
SC MC SNL SL MNL ML
c-fos 1.0060.11 3.2660.35a,b 0.8060.19c 1.0960.17c 2.7460.34a,b 1.7560.24a,d
fos-b 1.0060.13 2.9660.43a,b 0.6660.07c 0.8660.12c 3.5960.59a,b 1.5960.26d
Fra1 1.0060.12 0.9560.05 1.2060.17 0.9760.17 0.8360.07 0.9860.11
Fra2 1.0060.13 4.5661.09a,b 0.7560.09c 0.8460.10c 4.1960.73a,b 1.6860.25
c-jun 1.0060.12 1.3260.14 1.3360.25 1.2960.16 1.2460.17 1.4560.21
Junb 1.0060.19 1.7060.17a,b 0.6560.12c 0.5960.07 1.5860.19a,b 1.0360.15
Jund 1.0060.12 1.0460.13b,c 1.3760.16c 1.4360.16c 2.2460.20a 1.8860.34a
Egr1 1.0060.17 2.0960.25a,b 0.7860.08c 0.7760.11c 2.0860.23a,b 0.8460.12
Egr2 1.0060.18 3.8260.60a,b,c 0.6160.08c 0.6060.09c 6.0561.14a,b 1.0860.20
Egr3 1.0060.14 1.6160.22a,c 0.8860.08c 0.7260.09c 2.1860.32a,b 1.1860.18
Nr4a1 1.0060.20 4.6060.58a,b 0.6860.09c 2.0960.30c,d 5.0160.81a,b 2.2660.31d
Nr4a2 1.0060.27 1.6060.51 1.3260.24 1.5960.32 1.2460.36 1.2860.50
Nr4a3 1.0060.16 5.3060.71a,b 1.1060.19c 1.2660.08c 6.2860.72a,b 2.9660.87a,d
The values represent means 6 SEM (fold changes with respect to the SC group) of 8–10 measurements per group. The groups are as described in the text. Statisticalanalyses were done by ANOVA followed by PLSD. Key to statistics:ap,0.05, in comparison to the SC group;bp,0.05, in comparison to the ML group;cp,0.05, in comparison to the MNL group;dp,0.05 in comparison to the SNL group.doi:10.1371/journal.pone.0015643.t006
METH and DA-Independent Gene Expression
PLoS ONE | www.plosone.org 10 December 2010 | Volume 5 | Issue 12 | e15643

and bone morphogenic proteins [70,71]. Activins are disulfide-
linked homodimers of INHBA (activin A) and of INHBB (activin
B) and can form the heterodimer, activin AB [72]. Activin A is
up-regulated in the brain consequent to kainate- [73] and
ischemia- [74] induced insults. Because activins are also thought
to have neurotrophic properties [75], the METH-induced
increases in Inhba expression, and by extension of activins (or
inhibins), suggest the possibility that this family of proteins might
Figure 3. Effects of DA depletion and METH on striatal expression of Tac1, Tac2, Pdyn, Nts, Nmu and Fst. The values represent means 6SEM (fold changes in comparison to the SC group) of 6–10 measurements. Statistical analyses were done by ANOVA followed by PLSD. Key tostatistics: Key to statistics: *p,0.05, in comparison to the SC group; #p,0.05, in comparison to the SNL group; !p,0.05, in comparison to the MCgroup; ^p,0.05, in comparison to the SL group; $p,0.05, in comparison to the MNL group.doi:10.1371/journal.pone.0015643.g003
METH and DA-Independent Gene Expression
PLoS ONE | www.plosone.org 11 December 2010 | Volume 5 | Issue 12 | e15643

Figure 4. Effects of METH on the expression of Inhba, Acvr1, Pdgf-d, Cox-2, Syt and Synj2bp in DA-depleted striatum. The valuesrepresent means 6 SEM (fold changes in comparison to the SC group) of 6–10 measurements. Statistical analyses were done by ANOVA followed byPLSD. Key to statistics: *p,0.05,in comparison to the SC group; #p,0.05, in comparison to the SNL group; !p,0.05, in comparison to the MC group;^p,0.05, in comparison to the SL group; $p,0.05, in comparison to the MNL group.doi:10.1371/journal.pone.0015643.g004
METH and DA-Independent Gene Expression
PLoS ONE | www.plosone.org 12 December 2010 | Volume 5 | Issue 12 | e15643

participate in METH-induced neuroplastic changes in the brain
[37].
Effects of METH injections on the expression oftranscription factors in the rat striatum
Previous studies have also shown that the expression of several
transcription factors is affected by injections of larger doses of METH
in normal animals [29–31,76]. These genes are similar to those
reported by Berke et al. [16] who had used the DA D1 agonist,
SKF38393, to report changes in gene expression mainly on the side of
the 6-OHDA-induced DA depletion. In the present study, we used
the indirect agonist, METH, which is dependent on DA release to
exert its actions on DA receptors [21,22,24–26]. Interestingly, we
found that the METH injection caused increases in c-fos mRNA levels
on both sides of the hemiparkinsonian rats, with more prominent
increases on the intact side (2.7-fold) than on the lesioned (1.75-fold)
side (Table 6). The observations of increased c-fos mRNA levels on the
lesioned side are consistent with previous reports that METH caused
increase in c-Fos protein levels in the DA-depleted striatum [77].
Together, these observations suggest that METH-induced changes in
c-fos mRNA levels might dependent on both DA and non-DA,
presumably 5-HT, systems in the rodent striatum [78,79]. The role of
glutamate in these responses needs to be also considered since
amphetamine-induced changes in striatal responses involves stimu-
lation of NMDA receptors [80].
As reported above, we found that Egr2 and Egr3 transcripts were
more induced by the METH injection on the intact side of the
lesioned rats than in the control animals, whereas those in Egr1
mRNA levels were similar in these two METH-treated groups.
These results suggest that Egr2 and Egr3 transcription might be co-
regulated in the rodent striatum in a manner comparable to
observations in T cells [81]. The differential responses between the
control animals and the hemiparkinsonian rats might be due, in
part, to higher levels of baseline DA released in dialysates collected
on the intact side of unilaterally 6-OHDA-lesioned rats in
comparison to DA levels measured in control animals [24,82].
Thus, the steady-state increases in DA released in the synaptic cleft
of the 6-OHDA-treated animals might cause potentiated tran-
scriptional sensitivity to METH-mediated DA-induced changes in
Egr2 and Egr3 expression in the intact striatum.
Differential effects of METH on gene expression betweenthe DA-innervated and -depleted striatum ofhemiparkinsonian rats
METH administration also caused substantial changes in the
expression of several genes on the DA- depleted side of
hemiparkinsonian rats (Figure 4). The Pdgf-d transcript is of interest
because the PDGF-D protein belongs to a family of trophic factors
that are involved in the growth and survival of mesenchymal cells
[83,84]. These factors include PDGF-A, PDGF-B, PDGF-C, and
PDGF-D [85]. Although the effects of the PDGF-A and PDGF-B
have been studied on diverse cell types of the nervous system
[86,87], little is known about the functions of PDGF-D in the brain.
A previous study had found early and prolonged increases in
neuronal Pdgf-a and Pdgf-b mRNA levels on the side ipsilateral to a
unilateral 6-OHDA injection in the rat median forebrain bundle
[88]. There were also more gradual increases in these transcripts on
the contralateral side of the lesion [88]. Those findings differ from
our present data because we found increases in Pdgf-d mRNA on
both sides of the METH-treated hemiparkinsonian rats. Our
observations that METH can cause increases in Pdgf-d mRNA levels
on the lesioned side of hemiparkinsonian rats suggest that the
PDGF-D protein might play a role in 5-HT-mediated changes after
striatal DA depletion because of METH-induced increases in 5-HT
turnover on the lesioned side. Because PDGF proteins act as
proliferative factors for glial cells [89,90], it will be of interest to
examine to what extent PDGF-D might participate in METH-
induced reactive astrocytosis or microgliosis [91]. Of related
interest, we found that METH caused increases in the Cox-2
transcript on both sides of the brains in hemiparkinsonian rats.
These data are consistent with reports by other authors who have
previously tabulated METH-induced changes in COX-2 protein
expression [92,93]. These METH-induced increases in COX-2
might be related, in part, to the increases in PDGF-D because Cox-2
mRNA is induced during activation of microglial cells [94] and
because PDGFs are proliferative factors for glial cells [89,90].
Although we have focused the discussion on the known
biochemical effects of METH on neurotransmitter release, it
could also be argued that some of the changes in gene expression
might be secondary to rotational behaviors, independent of drug
effects. This is an important issue because immobilization of
animals after apomorphine injection prevented priming responses
to the direct DA D1 agonist, SKF38393, thus suggesting
movement-mediated induction of these behavioral changes [95].
However, the fact that the pattern of changes in gene expression is
similar in the striatum of the METH-treated control rats and the
nonlesioned striatal side of the METH-treated hemiparkinsonian
rats suggests that the changes in mRNA levels are secondary to
drug effects not to intense turning behaviors since control rats
exhibited no METH-induced rotation. The latter argument is
consistent with the report that DA D1-induced behavioral
responses are dissociated from changes in c-Fos protein expression
[96]. This contention is also supported by the fact that
administration of the indirect DA agonist, amphetamine, whose
actions like those of METH [21–25] are also dependent on DA
release from nerve terminals, did not cause priming to DA D1
receptor stimulation [96]. Nevertheless, the veracity of this claim
will have to await results of time-dependent experiments in which
animals are euthanized during the time of peak METH-induced
rotation which occurred at around 30–45 min after the METH
injection (see Figure 1B). The results of the proposed studies will be
need to be contrasted to the present findings which were obtained
in animals euthanized at 2 hours after the METH injection at a
time when METH-induced rotation had subsided.
ConclusionIn summary, we have reported that a single injection of a
relatively low METH dose that caused substantial changes in gene
expression in the intact striatum also triggered alterations in the
expression of a different set of genes in the striatum that was
completely lacking of DA. Because the 6-OHDA-induced lesion
completely depleted dopamine in the striatum, these METH-
induced changes on the lesioned are probably not related to
disuse-induced supersensitivity of striatal DA receptors because
METH is an indirect agonist that depends on intact DA terminals
for its action on DA receptors. Thus, these observations implicate
DA-independent phenomena in the METH-mediated regulation
of these transcripts and point to the possibility that the absence of
DA might cause plastic changes that render the striatum
differentially responsive to the effects of METH on transcript
levels in intrinsic striatal cells. This idea is consistent with the
results of some studies that have documented differential
physiological responses in the striatum of hemiparkinsonian rats
[97-99]. It remains to be determined to what extent these changes
might serve as substrates for synaptic plasticity observed in the
lesioned striatum. Finally, our observations of METH-mediated
DA-independent alterations in transcript levels suggest that other
METH and DA-Independent Gene Expression
PLoS ONE | www.plosone.org 13 December 2010 | Volume 5 | Issue 12 | e15643
molecular pathways should be taken into consideration when
discussing therapeutic approaches to METH abusers who show
pathological changes, including DA depletion, in their brains.
Supporting Information
Table S1 List of rat primers used in quantitative PCRexperiments.(PDF)
Author Contributions
Conceived and designed the experiments: JLC INK KGB YW. Performed
the experiments: CB BL MTM JC EL WHW KGB. Analyzed the data:
JLC CB INK BL MTM JC EL WHW KGB YW. Contributed reagents/
materials/analysis tools: JLC CB INK BL MTM JC EL WHW KGB YW.
Wrote the paper: JLC CB INK KGB YW.
References
1. Cardoso F (2009) Huntington disease and other choreas. Neurol Clin 27:
719–736.
2. Fahn S (2008) The history of dopamine and levodopa in the treatment of
Parkinson’s disease. Mov Disord 23(Suppl 3): S497–S508.
3. Berger K, Przedborski S, Cadet JL (1991) Retrograde degeneration of
nigrostriatal neurons induced by intrastriatal 6-hydroxydopamine injection in
rats. Brain Res Bull 26: 301–307.
4. Cadet JL, Zhu SM (1992) The intrastriatal 6-hydroxydopamine model of
hemiparkinsonism: quantitative receptor autoradiographic evidence of correla-
tion between circling behavior and presynaptic as well as postsynaptic
nigrostriatal markers in the rat. Brain Res 595: 316–326.
5. Cadet JL, Zhu SM, Angulo JA (1992) Quantitative in situ hybridization evidence
for differential regulation of proenkephalin and dopamine D2 receptor mRNA
levels in the rat striatum: effects of unilateral intrastriatal injections of 6-
hydroxydopamine. Brain Res Mol Brain Res 12: 59–67.
6. Herrera-Marschitz M, Arbuthnott G, Ungerstedt U (2010) The rotational model
and microdialysis: Significance for dopamine signalling, clinical studies, and
beyond. Prog Neurobiol 90: 176–189.
7. Ungerstedt U (1971) Postsynaptic supersensitivity after 6-hydroxy-dopamine
induced degeneration of the nigro-striatal dopamine system. Acta Physiol Scand
Suppl 367: 69–93.
8. Ungerstedt U, Arbuthnott GW (1970) Quantitative recording of rotational
behavior in rats after 6-hydroxy-dopamine lesions of the nigrostriatal dopamine
system. Brain Res 24: 485–493.
9. Altar CA, Marien MR, Marshall JF (1987) Time course of adaptations in
dopamine biosynthesis, metabolism, and release following nigrostriatal lesions:
implications for behavioral recovery from brain injury. J Neurochem 48:
390–399.
10. Angulo JA, Coirini H, Ledoux M, Schumacher M (1991) Regulation by
dopaminergic neurotransmission of dopamine D2 mRNA and receptor levels in
the striatum and nucleus accumbens of the rat. Brain Res Mol Brain Res 11:
161–166.
11. Chritin M, Feuerstein C, Savasta M (1993) Time-course of changes in striatal
levels of DA uptake sites, DA D2 receptor and preproenkephalin mRNAs after
nigrostriatal dopaminergic denervation in the rat. Brain Res Mol Brain Res 19:
318–322.
12. Graham WC, Crossman AR, Woodruff GN (1990) Autoradiographic studies in
animal models of hemi-parkinsonism reveal dopamine D2 but not D1 receptor
supersensitivity. I. 6-OHDA lesions of ascending mesencephalic dopaminergic
pathways in the rat. Brain Res 514: 93–102.
13. Angulo JA, Davis LG, Burkhart BA, Christoph GR (1986) Reduction of striatal
dopaminergic neurotransmission elevates striatal proenkephalin mRNA.
Eur J Pharmacol 130: 341–343.
14. Campbell K, Wictorin K, Bjorklund A (1992) Differential regulation of
neuropeptide mRNA expression in intrastriatal striatal transplants by host
dopaminergic afferents. Proc Natl Acad Sci U S A 89: 10489–10493.
15. Morris BJ, Herz A, Hollt V (1989) Localization of striatal opioid gene
expression, and its modulation by the mesostriatal dopamine pathway: an in situ
hybridization study. J Mol Neurosci 1: 9–18.
16. Berke JD, Paletzki RF, Aronson GJ, Hyman SE, Gerfen CR (1998) A complex
program of striatal gene expression induced by dopaminergic stimulation.
J Neurosci 18: 5301–5310.
17. El Atifi-Borel M, Buggia-Prevot V, Platet N, Benabid AL, Berger F, et al. (2009)
De novo and long-term l-Dopa induce both common and distinct striatal gene
profiles in the hemiparkinsonian rat. Neurobiol Dis 34: 340–350.
18. Gerfen CR, Engber TM, Mahan LC, Susel Z, Chase TN, et al. (1990) D1 and
D2 dopamine receptor-regulated gene expression of striatonigral and striato-
pallidal neurons. Science 250: 1429–1432.
19. Konradi C, Westin JE, Carta M, Eaton ME, Kuter K, et al. (2004)
Transcriptome analysis in a rat model of L-DOPA-induced dyskinesia.
Neurobiol Dis 17: 219–236.
20. Paul ML, Graybiel AM, David JC, Robertson HA (1992) D1-like and D2-like
dopamine receptors synergistically activate rotation and c-fos expression in the
dopamine-depleted striatum in a rat model of Parkinson’s disease. J Neurosci 12:
3729–3742.
21. Bustamante D, You ZB, Castel MN, Johansson S, Goiny M, et al. (2002) Effect
of single and repeated methamphetamine treatment on neurotransmitter release
in substantia nigra and neostriatum of the rat. J Neurochem 83: 645–654.
22. Kuczenski R, Segal DS, Cho AK, Melega W (1995) Hippocampus norepineph-
rine, caudate dopamine and serotonin, and behavioral responses to the
stereoisomers of amphetamine and methamphetamine. J Neurosci 15:
1308–1317.
23. Stephans SE, Yamamoto BK (1994) Methamphetamine-induced neurotoxicity:
roles for glutamate and dopamine efflux. Synapse 17: 203–209.
24. Zetterstrom T, Herrera-Marschitz M, Ungerstedt U (1986) Simultaneous
measurement of dopamine release and rotational behaviour in 6-hydroxydopa-
mine denervated rats using intracerebral dialysis. Brain Res 376: 1–7.
25. Zetterstrom T, Sharp T, Marsden CA, Ungerstedt U (1983) In vivo
measurement of dopamine and its metabolites by intracerebral dialysis: changes
after d-amphetamine. J Neurochem 41: 1769–1773.
26. Shimada A, Yamaguchi K, Yanagita T (1996) Neurochemical analysis of the
psychotoxicity of methamphetamine and cocaine by microdialysis in the rat
brain. Ann N Y Acad Sci 801: 361–370.
27. Abekawa T, Ohmori T, Koyama T (1994) Effects of repeated administration of
a high dose of methamphetamine on dopamine and glutamate release in rat
striatum and nucleus accumbens. Brain Res 643: 276–281.
28. Nash JF, Yamamoto BK (1992) Methamphetamine neurotoxicity and striatal
glutamate release: comparison to 3,4-methylenedioxymethamphetamine. Brain
Res 581: 237–243.
29. Beauvais G, Jayanthi S, McCoy MT, Ladenheim B, Cadet JL (2010) Differential
effects of methamphetamine and SCH23390 on the expression of members
of IEG families of transcription factors in the rat striatum. Brain Res 1318: 1–
10.
30. Cadet JL, Jayanthi S, McCoy MT, Vawter M, Ladenheim B (2001) Temporal
profiling of methamphetamine-induced changes in gene expression in the mouse
brain: evidence from cDNA array. Synapse 41: 40–48.
31. Jayanthi S, McCoy MT, Beauvais G, Ladenheim B, Gilmore K, et al. (2009)
Methamphetamine induces dopamine D1 receptor-dependent endoplasmic
reticulum stress-related molecular events in the rat striatum. PLoS One 4: e6092.
32. Wang JQ, McGinty JF (1995) Dose-dependent alteration in zif/268 and
preprodynorphin mRNA expression induced by amphetamine or methamphet-
amine in rat forebrain. J Pharmacol Exp Ther 273: 909–917.
33. Wang JQ, McGinty JF (1996) Acute methamphetamine-induced zif/268,
preprodynorphin, and preproenkephalin mRNA expression in rat striatum
depends on activation of NMDA and kainate/AMPA receptors. Brain Res Bull
39: 349–357.
34. Li SJ, Jiang HK, Stachowiak MS, Hudson PM, Owyang V, et al. (1990)
Influence of nigrostriatal dopaminergic tone on the biosynthesis of dynorphin
and enkephalin in rat striatum. Brain Res Mol Brain Res 8: 219–225.
35. Chritin M, Blanchard V, Raisman-Vozari R, Feuerstein C, Agid Y, et al. (1996)
DA uptake sites, D1 and D2 receptors, D2 and preproenkephalin mRNAs and
Fos immunoreactivity in rat striatal subregions after partial dopaminergic
degeneration. Eur J Neurosci 8: 2511–2520.
36. Krasnova IN, Betts ES, Dada A, Jefferson A, Ladenheim B, et al. (2007)
Neonatal dopamine depletion induces changes in morphogenesis and gene
expression in the developing cortex. Neurotox Res 11: 107–130.
37. Krasnova IN, Justinova Z, Ladenheim B, Jayanthi S, McCoy MT, et al. (2010)
Methamphetamine self-administration is associated with persistent biochemical
alterations in striatal and cortical dopaminergic terminals in the rat. PLoS One
5: e8790.
38. Cadet JL, McCoy MT, Cai NS, Krasnova IN, Ladenheim B, et al. (2009)
Methamphetamine preconditioning alters midbrain transcriptional responses to
methamphetamine-induced injury in the rat striatum. PLoS One 4: e7812.
39. Krasnova IN, Li SM, Wood WH, McCoy MT, Prabhu VV, et al. (2008)
Transcriptional responses to reinforcing effects of cocaine in the rat
hippocampus and cortex. Genes Brain Behav 7: 193–202.
40. Karstaedt PJ, Kerasidis H, Pincus JH, Meloni R, Graham J, et al. (1994)
Unilateral destruction of dopamine pathways increases ipsilateral striatal
serotonin turnover in rats. Exp Neurol 126: 25–30.
41. Adams DH, Hanson GR, Keefe KA (2001) Differential effects of cocaine and
methamphetamine on neurotensin/neuromedin N and preprotachykinin
messenger RNA expression in unique regions of the striatum. Neuroscience
102: 843–851.
42. O’Donovan KJ, Tourtellotte WG, Millbrandt J, Baraban JM (1999) The EGR
family of transcription-regulatory factors: progress at the interface of molecular
and systems neuroscience. Trends Neurosci 22: 167–173.
METH and DA-Independent Gene Expression
PLoS ONE | www.plosone.org 14 December 2010 | Volume 5 | Issue 12 | e15643

43. Cameron VA, Nishimura E, Mathews LS, Lewis KA, Sawchenko PE, et al.(1994) Hybridization histochemical localization of activin receptor subtypes in
rat brain, pituitary, ovary, and testis. Endocrinology 134: 799–808.
44. Meurers BH, Dziewczapolski G, Shi T, Bittner A, Kamme F, et al. (2009)Dopamine depletion induces distinct compensatory gene expression changes in
DARPP-32 signal transduction cascades of striatonigral and striatopallidal
neurons. J Neurosci 29: 6828–6839.
45. Bean AJ, During MJ, Deutch AY, Roth RH (1989) Effects of dopamine
depletion on striatal neurotensin: biochemical and immunohistochemicalstudies. J Neurosci 9: 4430–4438.
46. Hanson GR, Keefe KA (1999) Dopamine D-1 regulation of caudate neurotensin
mRNA in the presence or absence of the nigrostriatal dopamine pathway. BrainRes Mol Brain Res 66: 111–121.
47. Burgunder JM, Young WS (1989) Distribution, projection and dopaminergic
regulation of the neurokinin B mRNA-containing neurons of the rat caudate-putamen. Neuroscience 32: 323–335.
48. Gerfen CR, McGinty JF, Young WS (1991) Dopamine differentially regulates
dynorphin, substance P, and enkephalin expression in striatal neurons: in situhybridization histochemical analysis. J Neurosci 11: 1016–1031.
49. Castel MN, Morino P, Dagerlind A, Hokfelt T (1994) Up-regulation of
neurotensin mRNA in the rat striatum after acute methamphetamine treatment.Eur J Neurosci 6: 646–656.
50. Adams DH, Hanson GR, Keefe KA (2005) 3,4-Methylenedioxymethampheta-
mine increases neuropeptide messenger RNA expression in rat striatum. BrainRes Mol Brain Res 133: 131–142.
51. Garcia-Arencibia M, Ferraro L, Tanganelli S, Fernandez-Ruiz J (2008)
Enhanced striatal glutamate release after the administration of rimonabant to6-hydroxydopamine-lesioned rats. Neurosci Lett 438: 10–13.
52. Meshul CK, Emre N, Nakamura CM, Allen C, Donohue MK, et al. (1999)
Time-dependent changes in striatal glutamate synapses following a 6-hydroxydopamine lesion. Neuroscience 88: 1–16.
53. Touchon JC, Holmer HK, Moore C, McKee BL, Frederickson J, et al. (2005)Apomorphine-induced alterations in striatal and substantia nigra pars reticulata
glutamate following unilateral loss of striatal dopamine. Exp Neurol 193:
131–140.
54. Yang J, Hu LF, Liu X, Zhou F, Ding JH, et al. (2006) Effects of iptakalim on
extracellular glutamate and dopamine levels in the striatum of unilateral 6-
hydroxydopamine-lesioned rats: a microdialysis study. Life Sci 78: 1940–1944.
55. Paulsen RF, Granas K, Johnsen H, Rolseth V, Sterri S (1995) Three related
brain nuclear receptors, NGFI-B, Nurr1, and NOR-1, as transcriptional
activators. J Mol Neurosci 6: 249–255.
56. Budhiraja S, Chugh A (2009) Neuromedin U: physiology, pharmacology and
therapeutic potential. Fundam Clin Pharmacol 23: 149–157.
57. Minamino N, Kangawa K, Matsuo H (1985) Neuromedin U-8 and U-25: noveluterus stimulating and hypertensive peptides identified in porcine spinal cord.
Biochem Biophys Res Commun 130: 1078–1085.
58. Conlon JM, Domin J, Thim L, DiMarzo V, Morris HR, et al. (1988) Primarystructure of neuromedin U from the rat. J Neurochem 51: 988–991.
59. Domin J, Ghatei MA, Chohan P, Bloom SR (1987) Neuromedin U—a study of
its distribution in the rat. Peptides 8: 779–784.
60. Minamino N, Kangawa K, Honzawa M, Matsuo H (1988) Isolation and
structural determination of rat neuromedin U. Biochem Biophys Res Commun156: 355–360.
61. Fujii R, Hosoya M, Fukusumi S, Kawamata Y, Habata Y, et al. (2000)
Identification of neuromedin U as the cognate ligand of the orphan G protein-coupled receptor FM-3. J Biol Chem 275: 21068–21074.
62. Malendowicz LK, Nussdorfer GG, Markowska A, Tortorella C, Nowak M, et al.
(1994) Effects of neuromedin U (NMU)-8 on the rat hypothalamo-pituitary-adrenal axis. Evidence of a direct effect of NMU-8 on the adrenal gland.
Neuropeptides 26: 47–53.
63. Peier A, Kosinski J, Cox-York K, Qian Y, Desai K, et al. (2009) The antiobesityeffects of centrally administered neuromedin U and neuromedin S are mediated
predominantly by the neuromedin U receptor 2 (NMUR2). Endocrinology 150:3101–3109.
64. Howard AD, Wang R, Pong SS, Mellin TN, Strack A, et al. (2000) Identification
of receptors for neuromedin U and its role in feeding. Nature 406: 70–74.
65. Shan L, Qiao X, Crona JH, Behan J, Wang S, et al. (2000) Identification of anovel neuromedin U receptor subtype expressed in the central nervous system.
J Biol Chem 275: 39482–39486.
66. Gartlon J, Szekeres P, Pullen M, Sarau HM, Aiyar N, et al. (2004) Localisationof NMU1R and NMU2R in human and rat central nervous system and effects
of neuromedin-U following central administration in rats. Psychopharmacology(Berl) 177: 1–14.
67. Bilezikjian LM, Blount AL, Corrigan AZ, Leal A, Chen Y, et al. (2001) Actions
of activins, inhibins and follistatins: implications in anterior pituitary function.Clin Exp Pharmacol Physiol 28: 244–248.
68. Bilezikjian LM, Blount AL, Leal AM, Donaldson CJ, Fischer WH, et al. (2004)
Autocrine/paracrine regulation of pituitary function by activin, inhibin andfollistatin. Mol Cell Endocrinol 225: 29–36.
69. Harrison CA, Gray PC, Vale WW, Robertson DM (2005) Antagonists of activin
signaling: mechanisms and potential biological applications. Trends EndocrinolMetab 16: 73–78.
70. Bernard DJ, Chapman SC, Woodruff TK (2001) Mechanisms of inhibin signal
transduction. Recent Prog Horm Res 56: 417–450.
71. Bilezikjian LM, Blount AL, Donaldson CJ, Vale WW (2006) Pituitary actions of
ligands of the TGF-beta family: activins and inhibins. Reproduction 132:
207–215.
72. Xia Y, Schneyer AL (2009) The biology of activin: recent advances in structure,
regulation and function. J Endocrinol 202: 1–12.
73. Tretter YP, Munz B, Hubner G, ten Bruggencate G, Werner S, et al. (1996)
Strong induction of activin expression after hippocampal lesion. Neuroreport 7:
1819–1823.
74. Bottner M, Dubal DB, Rau SW, Suzuki S, Wise PM (2006) Stroke injury in rats
causes an increase in activin A gene expression which is unaffected by oestradiol
treatment. J Neuroendocrinol 18: 97–103.
75. Mukerji SS, Katsman EA, Wilber C, Haner NA, Selman WR, et al. (2007)
Activin is a neuronal survival factor that is rapidly increased after transient
cerebral ischemia and hypoxia in mice. J Cereb Blood Flow Metab 27:
1161–1172.
76. Thomas DM, Francescutti-Verbeem DM, Liu X, Kuhn DM (2004) Identifica-
tion of differentially regulated transcripts in mouse striatum following
methamphetamine treatment—an oligonucleotide microarray approach.
J Neurochem 88: 380–393.
77. Ishida Y, Todaka K, Kuwahara I, Ishizuka Y, Hashiguchi H, et al. (1998)
Methamphetamine induces fos expression in the striatum and the substantia
nigra pars reticulata in a rat model of Parkinson’s disease. Brain Res 809:
107–114.
78. Gardier AM, Moratalla R, Cuellar B, Sacerdote M, Guibert B, et al. (2000)
Interaction between the serotoninergic and dopaminergic systems in d-
fenfluramine-induced activation of c-fos and jun B genes in rat striatal neurons.
J Neurochem 74: 1363–1373.
79. Rouillard C, Bovetto S, Gervais J, Richard D (1996) Fenfluramine-induced
activation of the immediate-early gene c-fos in the striatum: possible interaction
between serotonin and dopamine. Brain Res Mol Brain Res 37: 105–115.
80. Konradi C, Leveque JC, Hyman SE (1996) Amphetamine and dopamine-
induced immediate early gene expression in striatal neurons depends on
postsynaptic NMDA receptors and calcium. J Neurosci 16: 4231–4239.
81. Collins S, Lutz MA, Zarek PE, Anders RA, Kersh GJ, et al. (2008) Opposing
regulation of T cell function by Egr-1/NAB2 and Egr-2/Egr-3. Eur J Immunol
38: 528–536.
82. Zhang WQ, Tilson HA, Nanry KP, Hudson PM, Hong JS, et al. (1988)
Increased dopamine release from striata of rats after unilateral nigrostriatal
bundle damage. Brain Res 461: 335–342.
83. Bergsten E, Uutela M, Li X, Pietras K, Ostman A, et al. (2001) PDGF-D is a
specific, protease-activated ligand for the PDGF beta-receptor. Nat Cell Biol 3:
512–516.
84. Heldin CH, Westermark B (1999) Mechanism of action and in vivo role of
platelet-derived growth factor. Physiol Rev 79: 1283–1316.
85. Andrae J, Gallini R, Betsholtz C (2008) Role of platelet-derived growth factors in
physiology and medicine. Genes Dev 22: 1276–1312.
86. Enge M, Wilhelmsson U, Abramsson A, Stakeberg J, Kuhn R, et al. (2003)
Neuron-specific ablation of PDGF-B is compatible with normal central nervous
system development and astroglial response to injury. Neurochem Res 28:
271–279.
87. Woodruff RH, Fruttiger M, Richardson WD, Franklin RJ (2004) Platelet-
derived growth factor regulates oligodendrocyte progenitor numbers in adult
CNS and their response following CNS demyelination. Mol Cell Neurosci 25:
252–262.
88. Funa K, Yamada N, Brodin G, Pietz K, Ahgren A, et al. (1996) Enhanced
synthesis of platelet-derived growth factor following injury induced by 6-
hydroxydopamine in rat brain. Neuroscience 74: 825–833.
89. Dai C, Celestino JC, Okada Y, Louis DN, Fuller GN, et al. (2001) PDGF
autocrine stimulation dedifferentiates cultured astrocytes and induces oligoden-
drogliomas and oligoastrocytomas from neural progenitors and astrocytes in
vivo. Genes Dev 15: 1913–1925.
90. Sjoborg M, Pietz K, Ahgren A, Yamada N, Lindvall O, et al. (1998) Expression
of platelet-derived growth factor after intrastriatal ibotenic acid injury. Exp
Brain Res 119: 245–250.
91. Krasnova IN, Cadet JL (2009) Methamphetamine toxicity and messengers of
death. Brain Res Rev 60: 379–407.
92. Kita T, Shimada K, Mastunari Y, Wagner GC, Kubo K, et al. (2000)
Methamphetamine-induced striatal dopamine neurotoxicity and cyclooxygen-
ase-2 protein expression in BALB/c mice. Neuropharmacology 39: 399–406.
93. Thomas DM, Kuhn DM (2005) Cyclooxygenase-2 is an obligatory factor in
methamphetamine-induced neurotoxicity. J Pharmacol Exp Ther 313: 870–876.
94. Thomas DM, Francescutti-Verbeem DM, Kuhn DM (2006) Gene expression
profile of activated microglia under conditions associated with dopamine
neuronal damage. Faseb J 20: 515–517.
95. Simola N, Di Chiara G, Daniels WM, Schallert T, Morelli M (2009) Priming of
rotational behavior by a dopamine receptor agonist in Hemiparkinsonian rats:
movement-dependent induction. Neuroscience 158: 1625–1631.
96. Paul ML, Currie RW, Robertson HA (1995) Priming of a D1 dopamine receptor
behavioural response is dissociated from striatal immediate-early gene activity.
Neuroscience 66: 347–359.
97. Azdad K, Chavez M, Don Bischop P, Wetzelaer P, Marescau B, et al. (2009)
Homeostatic plasticity of striatal neurons intrinsic excitability following
dopamine depletion. PLoS One 4: e6908.
METH and DA-Independent Gene Expression
PLoS ONE | www.plosone.org 15 December 2010 | Volume 5 | Issue 12 | e15643

98. Centonze D, Gubellini P, Rossi S, Picconi B, Pisani A, et al. (2005) Subthalamic
nucleus lesion reverses motor abnormalities and striatal glutamatergic overac-tivity in experimental parkinsonism. Neuroscience 133: 831–840.
99. Day M, Wang Z, Ding J, An X, Ingham CA, et al. (2006) Selective elimination
of glutamatergic synapses on striatopallidal neurons in Parkinson disease models.Nat Neurosci 9: 251–259.
METH and DA-Independent Gene Expression
PLoS ONE | www.plosone.org 16 December 2010 | Volume 5 | Issue 12 | e15643