Rural Methamphetamine Abuse: An Ethnographic Perspective
383
Wright State University Wright State University CORE Scholar CORE Scholar Population and Public Health Sciences Faculty Publications Population and Public Health Sciences 6-2005 Rural Methamphetamine Abuse: An Ethnographic Perspective Rural Methamphetamine Abuse: An Ethnographic Perspective Rocky L. Sexton Wright State University - Main Campus, [email protected] Robert G. Carlson Wright State University - Main Campus, [email protected] Follow this and additional works at: https://corescholar.libraries.wright.edu/comhth Part of the Community Health Commons, and the Community Health and Preventive Medicine Commons Repository Citation Repository Citation Sexton, R. L., & Carlson, R. G. (2005). Rural Methamphetamine Abuse: An Ethnographic Perspective. Epidemiologic Trends in Drug Abuse: Proceedings of the Epidemiology Work Group, 2, 328-329. https://corescholar.libraries.wright.edu/comhth/148 This Abstract is brought to you for free and open access by the Population and Public Health Sciences at CORE Scholar. It has been accepted for inclusion in Population and Public Health Sciences Faculty Publications by an authorized administrator of CORE Scholar. For more information, please contact [email protected].
-
Upload
khangminh22 -
Category
Documents
-
view
0 -
download
0
Transcript of Rural Methamphetamine Abuse: An Ethnographic Perspective

Wright State University Wright State University
CORE Scholar CORE Scholar
Population and Public Health Sciences Faculty Publications Population and Public Health Sciences
6-2005
Rural Methamphetamine Abuse: An Ethnographic Perspective Rural Methamphetamine Abuse: An Ethnographic Perspective
Rocky L. Sexton Wright State University - Main Campus, [email protected]
Robert G. Carlson Wright State University - Main Campus, [email protected]
Follow this and additional works at: https://corescholar.libraries.wright.edu/comhth
Part of the Community Health Commons, and the Community Health and Preventive Medicine
Commons
Repository Citation Repository Citation Sexton, R. L., & Carlson, R. G. (2005). Rural Methamphetamine Abuse: An Ethnographic Perspective. Epidemiologic Trends in Drug Abuse: Proceedings of the Epidemiology Work Group, 2, 328-329. https://corescholar.libraries.wright.edu/comhth/148
This Abstract is brought to you for free and open access by the Population and Public Health Sciences at CORE Scholar. It has been accepted for inclusion in Population and Public Health Sciences Faculty Publications by an authorized administrator of CORE Scholar. For more information, please contact [email protected].

EPIDEMIOLOGIC TRENDS
IN DRUG ABUSE
VOLUME II
EPIDEMIOLOGIC TRENDS
IN DRUG ABUSE
VOLUME IIProceedings of the Community
Epidemiology Work Group
June 2005
U.S. DEPARTMENT OF HEALTH AND HUMAN SERVICES
NATIONAL INSTITUTES OF HEALTH

NATIONAL INSTITUTE ON DRUG ABUSE
EPIDEMIOLOGIC TRENDS IN DRUG ABUSE
Volume II Proceedings of the Community Epidemiology Work Group
June 2005
U.S. DEPARTMENT OF HEALTH AND HUMAN SERVICES NATIONAL INSTITUTES OF HEALTH
Division of Epidemiology, Services and Prevention Research
National Institute on Drug Abuse 6001 Executive Boulevard
Bethesda, Maryland 20892

EPIDEMIOLOGIC TRENDS IN DRUG ABUSE
Proceedings of the Community Epidemiology Work Group, Vol. II, June 2005 ii
The National Institute on Drug Abuse (NIDA) ac-knowledges the contributions made by the members of: the Community Epidemiology Work Group (CEWG) who have voluntarily invested their time and resources in preparing the reports presented at the meetings; representatives from agencies that contribute data and technical knowledge; and other researchers who participate in the meetings. This publication was prepared by MasiMax Resources, Inc., under contract number N01-DA-1-5514 from NIDA. This publication, Epidemiologic Trends in Drug Abuse, Volume II, contains papers presented and data reported at the June 2005 CEWG meeting by CEWG represen-
tatives from 21 areas in the United States. In addition, Volume II contains papers by international presenters on drug abuse trends in Mexico, Southern Africa, and Taiwan. All material in this volume is in the public domain and may be reproduced or copied without permission from the Institute or the authors. Citation of the source is appreciated. The U.S. Government does not endorse or favor any specific commercial product. Trade or proprietary names appearing in this publica-tion are used only because they are considered essen-tial in the context of the studies reported herein.
National Institute on Drug Abuse
NIH Publication No. 06-5282A
Printed February 2006
For more information about the Community Epidemiology Work Group and other re-search-based publications and information on drug abuse and addiction, visit NIDA’s Web site at: http://www.drugabuse.gov Both Volumes I and II (available in limited supply) can be obtained by contacting the National Clearinghouse for Alcohol and Drug Information by mail: P.O. Box 2345, Rockville, MD 20852-2345 by phone: (301) 468-2600 (800) 729-6686 by fax: (301) 468-6433

EPIDEMIOLOGIC TRENDS IN DRUG ABUSE—Foreword
Proceedings of the Community Epidemiology Work Group, Vol. II, June 2005 iii
Foreword This publication includes papers presented at the 58th semiannual meeting of the Community Epidemiology Work Group (CEWG) held in Denver, Colorado, on June 14–17, 2005, under the sponsorship of the Na-tional Institutes of Health, National Institute on Drug Abuse (NIDA). Representing 21 sentinel areas in the United States, CEWG representatives presented reports, citing the most recent data on drug abuse patterns, trends, and emerging problems in their areas. To enhance nonur-ban representation, guest researchers from Maine and Ohio presented information on drug abuse patterns and trends in their areas. The meeting also included presen-tations by two panels. One, comprised of NIDA-
supported researchers, presented findings on metham-phetamine/stimulant abuse among youth and young adults. A second panel was comprised of international researchers who presented findings on drug abuse pat-terns and emerging trends in Australia, Europe, Mex-ico, Southern Africa, and Taiwan. Information reported at each CEWG meeting is dis-seminated to drug abuse prevention and treatment agencies, public health officials, researchers, and poli-cymakers. The information is intended to alert authori-ties at the local, State, regional, and national levels and the general public to current drug abuse patterns and trends and emerging drug problems so that appropriate and timely action can be taken. Researchers also use this information to develop research hypotheses that might explain social, behavioral, and biological issues related to drug abuse.
Moira P. O’Brien
Division of Epidemiology, Services and Prevention Research National Institute on Drug Abuse
National Institutes of Health Department of Health and Human Services

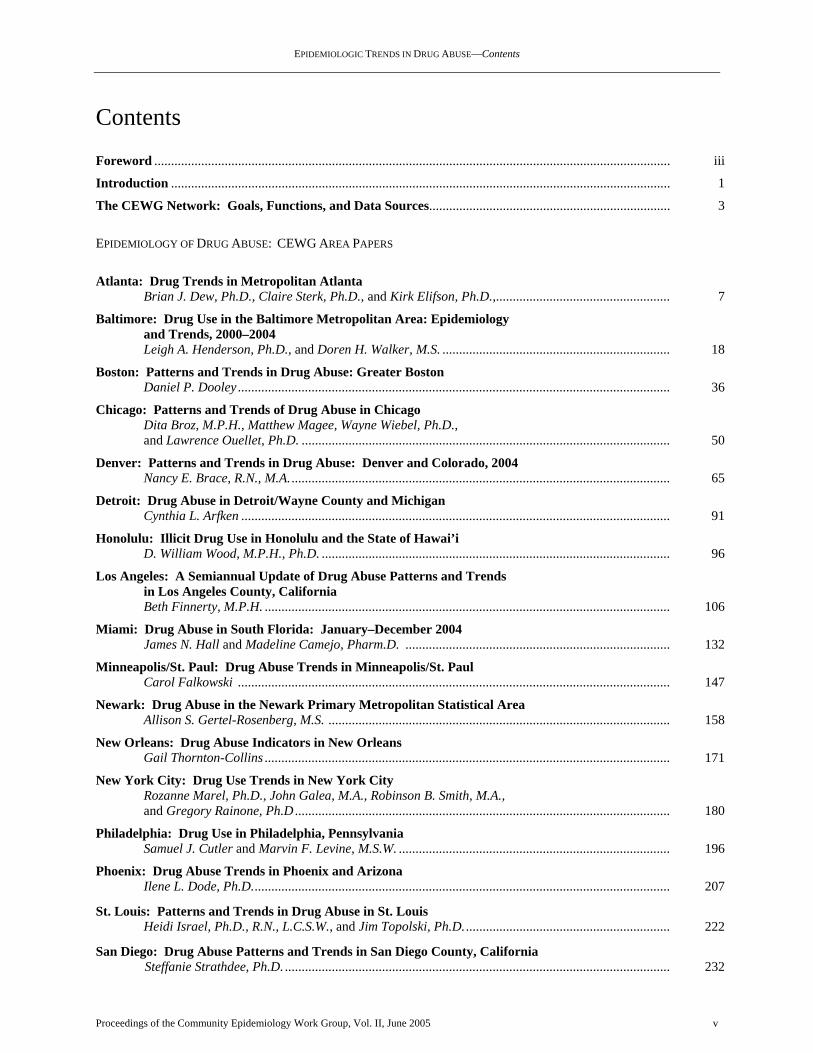
EPIDEMIOLOGIC TRENDS IN DRUG ABUSE—Contents
Proceedings of the Community Epidemiology Work Group, Vol. II, June 2005 v
Contents
Foreword .......................................................................................................................................................... iii
Introduction ..................................................................................................................................................... 1
The CEWG Network: Goals, Functions, and Data Sources........................................................................ 3
EPIDEMIOLOGY OF DRUG ABUSE: CEWG AREA PAPERS
Atlanta: Drug Trends in Metropolitan Atlanta Brian J. Dew, Ph.D., Claire Sterk, Ph.D., and Kirk Elifson, Ph.D.,.................................................... 7
Baltimore: Drug Use in the Baltimore Metropolitan Area: Epidemiology and Trends, 2000–2004 Leigh A. Henderson, Ph.D., and Doren H. Walker, M.S. .................................................................... 18
Boston: Patterns and Trends in Drug Abuse: Greater Boston Daniel P. Dooley ................................................................................................................................. 36
Chicago: Patterns and Trends of Drug Abuse in Chicago Dita Broz, M.P.H., Matthew Magee, Wayne Wiebel, Ph.D., and Lawrence Ouellet, Ph.D. .............................................................................................................. 50
Denver: Patterns and Trends in Drug Abuse: Denver and Colorado, 2004 Nancy E. Brace, R.N., M.A.................................................................................................................. 65
Detroit: Drug Abuse in Detroit/Wayne County and Michigan Cynthia L. Arfken ................................................................................................................................ 91
Honolulu: Illicit Drug Use in Honolulu and the State of Hawai’i D. William Wood, M.P.H., Ph.D. ........................................................................................................ 96
Los Angeles: A Semiannual Update of Drug Abuse Patterns and Trends in Los Angeles County, California Beth Finnerty, M.P.H. ......................................................................................................................... 106
Miami: Drug Abuse in South Florida: January–December 2004 James N. Hall and Madeline Camejo, Pharm.D. ............................................................................... 132
Minneapolis/St. Paul: Drug Abuse Trends in Minneapolis/St. Paul Carol Falkowski ................................................................................................................................. 147
Newark: Drug Abuse in the Newark Primary Metropolitan Statistical Area Allison S. Gertel-Rosenberg, M.S. ...................................................................................................... 158
New Orleans: Drug Abuse Indicators in New Orleans Gail Thornton-Collins ......................................................................................................................... 171
New York City: Drug Use Trends in New York City Rozanne Marel, Ph.D., John Galea, M.A., Robinson B. Smith, M.A., and Gregory Rainone, Ph.D ................................................................................................................ 180
Philadelphia: Drug Use in Philadelphia, Pennsylvania Samuel J. Cutler and Marvin F. Levine, M.S.W. ................................................................................. 196
Phoenix: Drug Abuse Trends in Phoenix and Arizona Ilene L. Dode, Ph.D............................................................................................................................. 207
St. Louis: Patterns and Trends in Drug Abuse in St. Louis Heidi Israel, Ph.D., R.N., L.C.S.W., and Jim Topolski, Ph.D.............................................................. 222
San Diego: Drug Abuse Patterns and Trends in San Diego County, California Steffanie Strathdee, Ph.D. ................................................................................................................... 232

EPIDEMIOLOGIC TRENDS IN DRUG ABUSE—Contents
Proceedings of the Community Epidemiology Work Group, Vol. II, June 2005 vi
San Francisco: Patterns and Trends of Drug Use in the San Francisco Bay Area John A. Newmeyer, Ph.D..................................................................................................................... 241
Seattle: Recent Drug Abuse Trends in the Seattle-King County Area Caleb Banta-Green, T. Ron Jackson, Michael Hanrahan, Susan Kingston, David H. Albert, Steve Freng, Ann Forbes, Richard Harruff, Richard Burt, and Hanne Thiede ....... 249
Texas: Substance Abuse Trends in Texas, June 2005 Jane Carlisle Maxwell, Ph.D. ............................................................................................................. 278
Washington, D.C.: Patterns and Trends of Drug Abuse in Washington, DC Erin Artigiani, M.A., Margaret Hsu, M.H.S., and Eric Wish, Ph.D. ................................................... 311
PANEL ON METHAMPHETAMINE AND OTHER STIMULANT ABUSE AMONG YOUTH AND YOUNG ADULTS
Stimulant Abuse in Ohio and the Rural South Robert G. Carlson, Ph.D...................................................................................................................... 327
Rural Methamphetamine Abuse: An Ethnographic Perspective Rocky L. Sexton, Ph.D., and Robert G. Carlson, Ph.D. ....................................................................... 328
Stimulant Use Among New York City Area Club-Going Young Adults Brian C. Kelly....................................................................................................................................... 329
Stimulant Use Among Young People in Hartford, Connecticut Jean J. Schensul, Ph.D. ....................................................................................................................... 330
PANEL ON INTERNATIONAL DRUG ABUSE
Monitoring Drug Abuse Trends in Australia Louisa Degenhardt, Ph.D.................................................................................................................... 335
EMCDDA Report on Europe Paul Griffiths....................................................................................................................................... 336
Update of the Epidemiological Surveillance System of Addictions (SISVEA) in Mexico: 2004 Roberto Tapia-Conyer, Ph.D., Patricia Cravioto, Ph.D., Pablo Kuri, M.D., Mario Cortés, M.Sc., Santiago Zaragoza, M.D., and Fernando Galván, M.Sc. .................................................................... 337
Southern African Development Community Epidemiology Network on Drug Use (SENDU): Findings July 2001–June 2004 Charles D.H. Parry, Ph.D., and Andreas Plüddemann, M.A. ............................................................. 349
Patterns and Trends of Drug Abuse in Taiwan: A Brief History and Report from 2000 through 2004 Jih-Heng Li, Ph.D., Shu-Fen Liu, M.S., and Wen-Jing Yu, B.S. .......................................................... 361
PARTICIPANTS
Participant List ................................................................................................................................................ 369

EPIDEMIOLOGIC TRENDS IN DRUG ABUSE—Introduction and the CEWG Network: Goals, Functions, and Data Sources
Proceedings of the Community Epidemiology Work Group, Vol. II, June 2005 1
Introduction This publication includes papers based on informa-tion and findings on drug abuse that were presented at the June 2005 Community Epidemiology Work Group meeting in Denver, Colorado.
The papers of the CEWG representatives provided the most recent indicator data on the abuse of co-caine/crack, heroin, methamphetamine, narcotic an-algesics/other opiates, and marijuana in 21 CEWG areas and in the guest States of Ohio and Maine. The meeting also included two panel presentations. One panel focused on methamphetamine/stimulant abuse among youth and young adults, based on findings from NIDA-supported community-based research studies. The second focused on drug abuse patterns and emerging trends in other countries, namely Aus-tralia, Europe, Mexico, Southern Africa, and Taiwan.
Timothy Condon, Ph.D., Deputy Director, NIDA, welcomed participants and provided an update on
NIDA research activities. The update included infor-mation on NIDA’s collaboration with other Federal agencies in building partnerships to test NIDA’s re-search findings at the community level.
Wilson Compton, M.D., M.P.E., NIDA, led the dis-cussion for the Panel on Methamphetamine and Other Stimulant Abuse among Youth and Young Adults. The Panel on International Drug Abuse Emerg-ing/Current Trends was led by Steve Gust, Ph.D., NIDA.
At the June meeting, updates were presented on the Drug Abuse Warning Network by Judy Ball, Ph.D., and on the National Forensic Laboratory Information System, by James Tolliver, Ph.D. A session by Ed-ward Boyer, M.D., focused on Using the Internet as a Tool for Identifying and Monitoring Drugs of Abuse. Jamie Van Leeuwan, M.D., M.P.H., C.A.C. II, Direc-tor of Development and Public Affairs, Urban Peak, addressed the problem of homeless and runaway youth and hosted a field trip for participants to visit Urban Peak.


EPIDEMIOLOGIC TRENDS IN DRUG ABUSE—Introduction and the CEWG Network: Goals, Functions, and Data Sources
Proceedings of the Community Epidemiology Work Group, Vol. II, June 2005 3
The CEWG Network: Goals, Functions, and Data Sources The CEWG is a unique epidemiologic network that informs drug abuse prevention and treatment agen-cies, public health officials, policymakers, and the general public about current and emerging drug abuse patterns. The network is comprised of researchers from 21 areas: Atlanta, Baltimore, Boston, Chi-cago, Denver, Detroit, Honolulu, Los Angeles, Mi-ami/Ft. Lauderdale, Minneapolis/St. Paul, New Orleans, New York City, Newark, Philadelphia, Phoenix, St. Louis, San Diego, San Francisco, Se-attle, Texas, and Washington, DC.
Interactive semiannual meetings are a major and dis-tinguishing feature of the CEWG and provide a foun-dation for continuity in monitoring and surveillance of current and emerging drug problems and related health and social consequences. Through the meet-ings, the CEWG…
• Identifies changing drug abuse patterns within and across CEWG areas
• Plans followup on problems identified, e.g., emerging drug problems
• Disseminates information on drug abuse patterns and trends in each CEWG area
Papers presented by CEWG representatives include quantitative and qualitative drug abuse indicator data. Representatives go beyond publicly accessible data and provide a broader perspective obtained from both public records and qualitative research. Information is most often obtained from local substance abuse treatment providers and administrators, personnel of other health-related agencies, law enforcement offi-cials, and drug abusers.
Time at each meeting is devoted to presentations by…
• Guest researchers, including NIDA grantees, who provide data/findings on a current or emerg-
ing drug problem identified in prior CEWG meetings
• Federal personnel who provide updates on data sets used by CEWG members
• Researchers from other countries who provide recent drug abuse data/findings
The primary data sources used by CEWG representa-tives and cited in this report include the following:
• National Forensic Laboratory Information System (NFLIS) data, maintained by the Drug Enforcement Administration (DEA)
• Treatment data from State and local sources and the Treatment Episode Data Set (TEDS), main-tained by the Office of Applied Studies (OAS), Substance Abuse and Mental Health Services Administration (SAMHSA)
• Drug Abuse Warning Network (DAWN) emergency department data, accessed through DAWN Live!, a restricted-access online service administered by OAS, SAMHSA
• DAWN and local drug-related mortality data from OAS, SAMHSA, and/or local medical ex-aminers/coroners
• Law enforcement data from various sources, e.g., DEA’s Domestic Monitor Program, local DEA offices, Threat Assessment data from the Nation Drug Intelligence Center (NDIC), U.D. Department of Justice, and price and purity data from Narcotics Digest Weekly, and local police and sheriff’s offices
Other data sources used by CEWG representatives, when available, include poison control centers, help-lines, and surveys.


Epidemiology of
Drug Abuse:
Area
Papers


EPIDEMIOLOGIC TRENDS IN DRUG ABUSE—Metropolitan Atlanta
Proceedings of the Community Epidemiology Work Group, Vol. II, June 2005 7
Drug Trends in Metropolitan Atlanta Brian J. Dew, Ph.D.,1 Claire E. Sterk, Ph.D.,2 and Kirk W. Elifson, Ph.D.1 ABSTRACT Drug abuse indicators showed that cocaine/crack remained a primary drug of abuse in Atlanta during 2004, with the drug dominant among ED reports, treatment admissions, and seized items analyzed by NFLIS. Marijuana use was widespread as well, with the drug accounting for 21.7 percent of public treatment admissions. This proportion, however, was consistent with previous years. Methampheta-mine abuse appeared to be increasing, with treat-ment admissions continuing to rise faster than for any other classification of drug. Treatment admis-sions for methamphetamine remained low, at 8.5 percent, however, compared to admissions for other drugs. Heroin indicators continued to reflect low levels of use of this drug in the metropolitan Atlanta area. INTRODUCTION Area Description The metropolitan Atlanta area is located in the northwest corner of the State of Georgia and includes 20 of the State’s 159 counties. The metropolitan area comprises more than 6,100 square miles, or 10.5 per-cent of Georgia’s total size. Currently, Georgia is the 10th most populous State in the Nation. From April 2000 to July 2002, the State’s population grew 4.6 percent, ranking fourth among all States. With an estimated 4.4 million residents, the metro-politan Atlanta area includes nearly 52 percent of the State’s population of nearly 8.4 million residents (U.S. Bureau of the Census, 2003). The Atlanta met-ropolitan area ranks ninth among the Nation’s major population centers. The city of Atlanta, with a popu-lation of approximately 369,000, represents 8.2 per-cent of the overall metropolitan population (Ameri-can Community Survey, 2003). The city is divided into two counties, Fulton County and DeKalb County, which include 18.8 and 15.9 percent of the metropolitan population, respectively.
1 Drs. Brian Dew and Kirk Elifson are affiliated with Georgia State University, Atlanta, Georgia. 2Dr. Claire Sterk is affiliated with Emory University, Atlanta, Georgia.
There are demographic differences between the city of Atlanta and the larger metropolitan area, which more closely reflects the State as a whole. African-Americans are the largest ethnic group within the city (60 percent), followed by Whites (37 percent), His-panics (6 percent), and Asians (2 percent). When examining the overall metropolitan Atlanta area, those numbers reverse. Whites account for the major-ity (62.5 percent), followed by African-Americans (29 percent), Hispanics (7.9 percent), and Asians (3.7 percent). Per capita family income in 2003 for the city of Atlanta was higher at $32,635 than in the met-ropolitan area, at $26,145. The poverty rate inside the city is 24 percent, compared with only 9.6 percent in the metropolitan area. The housing vacancy rate out-side the city (8.9 percent) is much lower than in the city (17.5 percent). In fiscal year (FY) 2004, the Georgia Bureau of In-vestigation (GBI)’s statewide drug enforcement ef-forts were led by 3 regional drug offices and 13 mul-tijurisdictional task force programs. As a result of these combined efforts, 2,979 drug offenders were arrested. As of December 2004, there were 23 exist-ing drug courts in Georgia (of these, 13 were for adult felony drug offenses, 3 were for adult misde-meanor drug offenses, and 7 were for juvenile drug offenses). One adult felony drug court was located in Atlanta. In 2004, 34 percent of those on probation in Georgia, 19 percent of prisoners, and 37 percent of parolees had been convicted of a drug-related of-fense. Additional factors that influence substance use in the State:
• Georgia is both a final destination point for drug
shipments and a smuggling corridor for drugs transported along the east coast. Extensive inter-state highway, rail, and bus transportation net-works, as well as international, regional, and pri-vate air and marine ports of entry, serve the State.
• The State is strategically located on the I-95 cor-ridor between New York City and Miami, the key wholesale-level drug distribution centers on the east coast and major drug importation hubs. In addition, Interstate Highway 20 runs directly into Georgia from drug entry points along the southwest border and gulf coast.
• The city of Atlanta has become an important strategic point for drug trafficking organizations, as it is the largest city in the South. It is consid-ered a convenient nexus for all east/west and north/south travel. The city’s major international

EPIDEMIOLOGIC TRENDS IN DRUG ABUSE—Metropolitan Atlanta
Proceedings of the Community Epidemiology Work Group, Vol. II, June 2005 8
airport also serves as a distribution venue for il-licit substances.
• The entire State, Atlanta in particular, has ex-perienced phenomenal growth over the last sev-eral years, with a corresponding increase in drug crime and violence. With Georgia bordering North Carolina, South Carolina, Tennessee, Ala-bama, and Florida, Atlanta is the base for several major dealers who maintain trafficking cells in these States, especially Mexican-based traffick-ers who hide within legitimate Hispanic en-claves.
Data Sources Principal data sources for this report include the fol-lowing: • Emergency department (ED) data were de-
rived for calendar year 2004 from the Drug Abuse Warning Network (DAWN) Live! re-stricted-access online query system administered by the Office of Applied Studies (OAS), Sub-stance Abuse and Mental Health Services Ad-ministration (SAMHSA). Eligible hospitals in the Atlanta area totaled 39; hospitals in the DAWN sample numbered 30, with the number of emergency departments in the sample totaling 33. (Some hospitals have more than one emer-gency department.) During this 12-month period, between 16 and 18 EDs reported data each month. The completeness of data reported by participating EDs varied by month (see exhibit 1). Exhibits in this paper primarily reflect cases that were received by DAWN as of April 14, 2005; an update on June 4, 2005, was also ac-cessed for selected data (as shown in exhibit 3). All DAWN cases are reviewed for quality con-trol. Based on this review, cases may be cor-rected or deleted. Therefore, these data are sub-ject to change. Data derived from DAWN Live! represent drug reports in drug-related ED visits. Drug reports exceed the number of ED visits, since a patient may report use of multiple drugs (up to six drugs and alcohol). The DAWN Live! data are unweighted, and, thus, are not estimates for the reporting area. These data cannot be compared to DAWN data from 2002 and before, nor can preliminary data be used for comparison with future data. Only weighted DAWN data re-leased by SAMHSA can be used for trend analy-sis. A full description of the DAWN system can be found at <http://dawninfo.samhsa.gov>.
• Drug abuse treatment program data are from the Georgia Department of Human Resources for
primary drugs of abuse among clients admitted to Atlanta’s public drug treatment programs be-tween January and December 2004. Data for non-metropolitan Atlanta counties of Georgia were also reported.
• Drug price, purity, and trafficking data are from the Drug Enforcement Administration (DEA), the National Drug Intelligence Center (NDIC), and the Office of National Drug Control Policy (ONDCP). Information for 2004 on the price, purity, and source of heroin was provided by the DEA’s Domestic Monitoring Program (DMP). Additional information came from Nar-cotics Digest Weekly published by the NDIC. Other data are from the Atlanta High Intensity Drug Trafficking Area (HIDTA) Task Force, a coordination unit for drug-related Federal, State, and local law enforcement agencies.
• Forensic drug analysis data are from the Na-tional Forensic Laboratory Information System (NFLIS) and represent evidence in suspected drug cases throughout metropolitan Atlanta that were tested by the GBI Forensic Laboratory from January through December 2004.
• Ethnographic information was collected from local drug use researchers and is used for several purposes: (1) to corroborate the epidemiologic drug indicators, (2) to signal potential drug trends, and (3) to place the epidemiologic data in a social context.
• Acquired immunodeficiency syndrome (AIDS) data are from the Department of Human Re-sources and represent AIDS cases in Georgia and a 20-county Atlanta metropolitan from January 1981 through August 2004. Additional informa-tion was provided by the Centers for Disease Con-trol and Prevention (CDC).
DRUG ABUSE PATTERNS AND TRENDS Cocaine/Crack With 5,758 reports in 2004, cocaine continues to be the most frequently reported ED drug in the metro-politan Atlanta area according to unweighted DAWN Live! data (exhibit 2). Cocaine ED reports were higher among men than women (exhibit 3), with a ratio of 2.4:1. There were 991 cocaine ED reports by White patients, 3,714 by African-Americans, 65 by Hispanics, and 988 by persons of unknown race/ethnicity. ED cocaine reports among patients between the ages of 35 and 54 totaled 3,838 (67 per-cent of all ED reports).

EPIDEMIOLOGIC TRENDS IN DRUG ABUSE—Metropolitan Atlanta
Proceedings of the Community Epidemiology Work Group, Vol. II, June 2005 9
In 2004, cocaine continued to be the primary drug of choice for individuals seeking assistance at publicly funded treatment centers in metropolitan Atlanta. However, the number of primary admissions in met-ropolitan Atlanta for cocaine (n=3,162) in this period reflects a continuing downward trend (exhibit 4). In 2000 and 2001, more than one-half of all treatment admissions in metropolitan Atlanta were cocaine-related. In 2003, this percentage decreased to 42.8 percent, and in 2004, cocaine-related admissions de-clined to 39.5 percent. The ratio of men to women in treatment for cocaine was 1.27:1, a proportion that was considerably lower than the 1.65:1 found in 2003. A smaller percentage of African-Americans entered treatment for cocaine-related issues in 2004 than in previous years. Approximately 7 out of every 10 cocaine-related admissions were African-American in 2004 (exhibit 5). In 2002–2003, Afri-can-Americans accounted for 75 percent of treatment admissions. Whites accounted for a larger proportion of statewide cocaine treatment admissions outside metropolitan Atlanta. Whites represented 45 percent of the treatment population outside the Atlanta area, and African-Americans represented 55 percent. In 2004, those older than 35 accounted for the largest number of both metropolitan and non-metropolitan cocaine admissions (80 percent). In Atlanta, there was a 31-percent increase in admissions among those age 18–25 and an 18-percent increase in admissions among those age 26–34 from 2003 to 2004. In met-ropolitan Atlanta, smoking continued to be the most preferred route of administration (77 percent), fol-lowed by inhalation (13 percent), oral (3 percent), and injection (2 percent). According to the DEA and Atlanta HIDTA, cocaine remains readily available in Atlanta. Atlanta is a growing distribution hub for surrounding States and Europe. Atlanta also serves as part of a smuggling corridor along the east coast. Powder cocaine and crack dominate the Georgia drug scene. The primary sources for cocaine are Texas and California. HIDTA intelligence analysts implicate Mexico-based drug trafficking organizations, whose members blend within enclaves of Hispanic workers. According to HIDTA and NDIC, cocaine prices remain relatively stable in Atlanta. Powdered cocaine typically sells for $75–$100 per gram. Crack rocks sell for as little as $3. In 2003, members of the Atlanta HIDTA Task Force seized 186.69 kilograms of powdered cocaine and 7.56 kilograms of crack cocaine. Both quantities were similar to what was seized in 2002. The Georgia Threat Assessment (DEA 2003) reports that other than marijuana, crack is the most available drug in the city. Officials estimate that 75 percent of all drug-related arrests involve crack cocaine. How-
ever, crack has become more difficult for undercover officers to purchase, and it seems to have decreased somewhat in popularity. Powder cocaine availability at the retail level in Georgia is limited, except in large cities such as Atlanta. NFLIS reported that cocaine accounted for more than 44 percent of confiscated substances in suspected drug cases that were tested in forensic laboratories in 2004 (exhibit 6). In 2003, cocaine had accounted for nearly 40 percent of all confiscated substances in suspected drug cases. Heroin Heroin indicators for Atlanta are mixed. However, ethnographic data obtained through corroboration with local street outreach workers suggests that her-oin use is increasing. According to unweighted data accessed from DAWN Live!, the number of ED reports of heroin in 2004 (n=483) was less than reports for cocaine, marijuana, methamphetamine, and benzodiazepines (exhibit 2). A sizeable majority of these patients were males (ex-hibit 3), with a 3.4:1 male-to-female ratio. African-American heroin ED patients exceeded White pa-tients (1.6:1). The ED heroin reports that involved Hispanics represented approximately 1 percent (n=5). More than one-half of all patients were age 35–54 (n=274). Twelve percent of reports occurred among 18–24-year-olds. Although injection remains by far the most frequent route of heroin administration (74.4 percent), approximately 10 percent of those with a documented route of administration reported inhal-ing, sniffing, or snorting their heroin. In 2004, treatment admissions for individuals who reported heroin as their primary drug of choice ac-counted for 2.5 percent of all treatment admissions in the State; these admissions were mostly concentrated in metropolitan regions. Nearly 6 percent of metro-politan Atlanta admissions in 2004 were for heroin (exhibit 4), compared with 1.3 percent in non-metropolitan areas. Admission rates for men were double those for women in metropolitan regions, with a non-metropolitan male-to-female ratio of 1.3:1. African-Americans outnumbered Whites (230 to 206) in metropolitan Atlanta treatment admissions (exhibit 5). Outside of metropolitan Atlanta, Whites repre-sented an overwhelmingly high percentage (87 per-cent) of heroin-related treatment admissions, fol-lowed by African-Americans (9 percent) and Hispan-ics (2.2 percent). A significant majority of heroin treatment admissions in both metropolitan (81 per-cent) and non-metropolitan (79 percent) Atlanta were age 35 and older, as in previous reporting periods. While treatment admissions for heroin are relatively low for persons younger than 35, it is important to

EPIDEMIOLOGIC TRENDS IN DRUG ABUSE—Metropolitan Atlanta
Proceedings of the Community Epidemiology Work Group, Vol. II, June 2005 10
note that 8 percent of heroin treatment admissions were for individuals younger than 17. Treatment data suggest that oral and inhalation ad-ministration rates may be on the rise in both metro-politan and non-metropolitan regions and that injec-tion use of heroin may be declining. More than 35 percent of all individuals admitted for heroin treat-ment report smoking, oral, or inhalation as their pri-mary method of administration. Nevertheless, anec-dotal reports from non-profit street outreach workers suggest that rates of heroin injection, particularly in metropolitan Atlanta, may be on the rise and are likely underreported. Most heroin users admitted to treatment did not report having a secondary drug of choice, although metropolitan users were overall more likely than non-metropolitan users to report a secondary drug of choice. Among heroin users in metropolitan Atlanta, 32 percent reported cocaine as a secondary drug of choice, compared with 14.6 per-cent for non-metropolitan users. The Georgia De-partment of Public Health estimates the rate of heroin addicts in Atlanta to be 159 per 100,000 population (n=approximately 7,000). The NDIC’s Georgia Threat Assessment (April 2003) reports that heroin is readily available in metropolitan Atlanta and that the city is a high traffic area for her-oin distribution. The majority of heroin available in Atlanta is South American, followed by heroin from southwest Asia. The DEA (February, 2005) reported that local purity ranged from 31 to 57 percent in 2003. According to the ONDCP, in the first half of 2003 heroin sold for $10–$20 per bag, $462 per gram, $6,160 per ounce, and $112,000 per kilogram in Atlanta. Law enforcement groups, including HIDTA and the DEA, report local heroin is supplied via sources in Chicago, New York, and the southwest border, and that there has been increased Hispanic involvement in trafficking. Reports from outlying metropolitan Atlanta counties suggest an increase in heroin traffic in their jurisdictions. Approximately 1 percent (n=194) of NFLIS seized drug items tested positive for heroin in 2004 (exhibit 6). Law enforcement groups, including HIDTA and the DEA, report that Mexican criminal groups are pri-marily responsible for the trafficking of South American heroin in Georgia. These groups use com-mercial and private vehicles to bring the drugs into the State. Heroin also enters the State through Co-lombian and Nigerian groups that transport the drug via airline couriers. Additionally, NDIC and the DEA mention that Dominican criminal groups drive heroin into Georgia from New York and Philadelphia. Some of that heroin is sold in Atlanta and some is shipped elsewhere.
Other Opiates/Narcotics Most indicators suggest that narcotic pain relievers are growing in popularity in metropolitan Atlanta. Unweighted DAWN Live! data show 212 ED oxy-codone/combinations reports and 268 hydro-codone/combinations reports in 2004 (exhibit 7). A greater percentage of oxycodone/combinations ED reports involved men and Whites than other groups (exhibit 3). African-Americans represented 16 per-cent of all opiate/opioid ED reports (exhibit 3). Treatment data for other opiates or narcotics were only available for secondary and tertiary drug abuse categories. Continuing a stable trend, other opiates accounted for about 2–3 percent of secondary drugs abused statewide and about 1 percent of tertiary drugs abused in 2004. The use of opiates as a secon-dary abuse category was cited more often in non-metropolitan areas (2.6 percent) than in metropolitan Atlanta (1 percent). According to NFLIS data, oxycodone and hydro-codone each accounted for about 1–2 percent of lab identifications of drugs seized by law enforcement from January through December 2004 (exhibit 6). OxyContin, the most widely recognized oxycodone product, is a growing drug threat in Georgia, accord-ing to the DEA. Twenty-milligram tablets sold in the illegal market for $20 in 2004. Hydrocodone (Vi-codin) and hydromorphone (Dilaudid) are also abused in Atlanta. These drugs are obtained by “doc-tor-shopping” or by purchasing from dealers. Some dealers steal prescription pads or rob pharmacies. Several such incidents were reported in Georgia in 2004. Marijuana Ethnographic sources consistently confirm that mari-juana is the most commonly abused drug in Atlanta. Most epidemiological indicators show an upward trend in marijuana use, particularly among individu-als younger than 17. According to unweighted data accessed from DAWN Live!, there were 2,001 marijuana ED reports in 2004 (exhibit 2). There were more than twice as many marijuana reports for men as for women. The number of ED reports involving African-Americans was higher than that of Whites (1.4:1). Sixty-two percent of all ED reports for marijuana were distributed evenly among individuals age 18–35, with 35–44 year-olds representing the largest percentage by age group (27 percent of all ED reports). Eight percent of reports were among 12–17-year-olds, and no reports occurred among those younger than 12 (exhibit 3).

EPIDEMIOLOGIC TRENDS IN DRUG ABUSE—Metropolitan Atlanta
Proceedings of the Community Epidemiology Work Group, Vol. II, June 2005 11
Nearly 22 percent of public treatment admissions in 2004 in metropolitan Atlanta were for those who considered marijuana their primary drug of choice (exhibit 4). Male admissions were just slightly less than double those of females in metropolitan Atlanta (1.9:1), with the gap narrowing in non-metropolitan regions (1.6:1). In 2004, the proportion of African-Americans who identified marijuana as their primary drug of choice increased in metropolitan Atlanta (56 percent vs. 46 percent in 2003) (exhibit 5) and de-creased in non-metropolitan Atlanta (24 percent vs. 39 percent in 2003). Similar to 2003, the vast major-ity of users (81 percent) in 2004 were at least 35 years old. In metropolitan Atlanta, treatment admis-sions of individuals 17 and younger (n=112) were more frequent than admissions age 18–25 (109). This trend was consistent in non-metropolitan public treatment facilities where individuals 17 and younger (n=401) were more likely to enter treatment than in-dividuals 18–25 (391). Alcohol was the most popular secondary drug of choice for marijuana users, fol-lowed by cocaine and methamphetamine for both metropolitan and non-metropolitan Atlanta admis-sions. Marijuana, which is readily available in Atlanta and the rest of Georgia, retails for about $10–$20 per gram and $100–$350 per ounce, according to the DEA. Atlanta serves as a regional distribution center for marijuana. Most of the marijuana in Georgia comes from Mexico, although locally grown mari-juana is also on the market. Colombian and Jamaican marijuana are purportedly present but less available. Mexican drug cartels are the primary transporters and wholesale distributors of Mexican-grown marijuana. Local gangs (African-American and Hispanic) and local independent dealers (African-American and White) are the primary resale distributors. Marijuana seizures increased 150 percent between 2002 and 2003, with HIDTA Task Force officers confiscating 1,741.17 kilograms of bulk marijuana and 210 cannabis plants. The NFLIS report for 2004 indicates that 14.4 percent of all drug-related items confiscated test positive for marijuana (exhibit 6). This proportion indicates a decrease from 2003, when 23 percent of all drug-related items tested positive for marijuana. According to The Georgia Governor's Task Force on Drug Suppression, 58 percent of Georgia’s 159 counties have been reported as signifi-cant locations for marijuana cultivation. Ethnographic data continue to support treatment and law enforcement data that indicate the widespread availability and use of marijuana in Atlanta. Hydro-ponic cultivation of marijuana has become more
popular due in part to the DEA’s eradication pro-gram. Stimulants Methamphetamine is the most abused stimulant in Atlanta, and its use is increasing. Law enforcement efforts to stop the spread of this drug have involved seizures and closures of clandestine labs. Metham-phetamine is an increasing threat in the suburban areas because of the drug’s price and ease of avail-ability, and it is replacing some traditional drugs as a less expensive, more potent alternative. Moreover, frequent media reports; recent strengthening of crimi-nal penalties for the manufacture, transfer, and possession of methamphetamine; and the statewide illegalization of transporting materials used in its production have fueled the growing concerns over the dangers the drug poses. Methamphetamine is not only a party drug, but it is also used for weight loss or as a way to keep up with demanding work schedules. There were 567 ED reports of methamphetamine in the Atlanta metropolitan area from January through December 2004 according to unweighted data ac-cessed from DAWN Live! (exhibit 2). During this same period, the ratio of men to women among methamphetamine ED reports was nearly 2:1. Al-though race/ethnicity was not documented for 19 percent of these patients, Whites represented nearly 70 percent of the methamphetamine ED reports (ex-hibit 3). ED reports among patients between the ages of 25 and 44 totaled 346 (61 percent of all metham-phetamine ED reports). There were 367 ED amphetamine reports in the At-lanta metropolitan area in 2004 (exhibit 2). The gap between male and female ED reports for ampheta-mine was narrow (exhibit 3), with a male-to-female ratio of 1.3:1. More than three out of four ampheta-mine-related ED patients were White, while African-Americans represented 8 percent of these patients. The proportion of treatment admissions in metropoli-tan and non-metropolitan areas for methamphetamine continues to rise faster than for any other classifica-tion of drug. In 2004, 8.5 percent (n=680) of public treatment admissions reported methamphetamine as the primary drug of choice, compared with 5.1 per-cent (543) in 2003 and 3.1 percent (377) in 2002 (ex-hibit 4). The proportion of admissions for metham-phetamine in non-metropolitan Atlanta was more than 14 percent, the highest percentage ever reported. The number of women in metropolitan Atlanta who reported to treatment for methamphetamine-related causes increased in 2004 and represented more than 53 percent of all admissions. In treatment centers

EPIDEMIOLOGIC TRENDS IN DRUG ABUSE—Metropolitan Atlanta
Proceedings of the Community Epidemiology Work Group, Vol. II, June 2005 12
outside of metropolitan Atlanta, the percentage of women entering treatment (56 percent) remained nearly identical to 2003. Most users were White; in fact, Whites accounted for 96 percent of treatment admissions in metropolitan Atlanta during 2004 (ex-hibit 5). Nevertheless, the proportions of African-American and Hispanic users are growing. Regard-less of demographic area, more than 78 percent of statewide treatment admissions were individuals older than 35. Metropolitan Atlanta treatment admis-sions were most likely to smoke methamphetamine (47 percent), followed by snort (23 percent), and in-ject (13 percent). Non-metropolitan Atlanta treatment admissions preferred to smoke (56 percent), inject (15 percent), and orally consume methamphetamine (14 percent). According to the DEA and HIDTA, methampheta-mine popularity continues to rise, in part because of its low price and ready availability. In 2004, methamphetamine typically sold for $110 per gram, $1,316 per ounce, and $8,250 per pound. Law enforcement officials report that methampheta-mine has emerged as the primary drug threat in sub-urban communities in neighboring Fulton and DeKalb Counties. The Atlanta HIDTA task force found that more than 68 percent of participating law enforcement agencies identified methamphetamine as posing the greatest threat to their areas. Metham-phetamine accounted for more than 30 percent of NFLIS tests of seized drugs in 2004, compared with 23 percent in 2003. In 2004, the proportion of posi-tive methamphetamine tests among seized drugs ranked second behind only cocaine (exhibit 6). In 2003, the proportion of methamphetamine-related items had ranked third behind cocaine and marijuana. The HIDTA task force seized more methampheta-mine in 2004 than in previous years. These seizures in 2004 included 14.6 kilograms of methampheta-mine and 11.4 kilograms of crystal methamphetamine or “ice.” HIDTA investigators also report an increase among African-Americans using methamphetamine in Atlanta. Ethnographic data from Atlanta-area drug research studies among individuals age 18–25 sup-port this trend. Depressants The use of depressants, especially benzodiazepines, is on the rise in Atlanta. The most commonly abused benzodiazepine is alprazolam (Xanax). Only a few people admitted for drug treatment chose benzodi-azepines as their secondary or tertiary drug of choice, but ME reports for these drugs continued to increase.
The number of unweighted ED reports in metropoli-tan Atlanta consists of the following: 96 barbiturates, 814 benzodiazepines, and 268 miscellaneous other depressants. The treatment data from publicly funded programs included depressants such as barbiturates and benzo-diazepines only as secondary and tertiary drug choices for 2004. In metropolitan Atlanta, nearly 1 percent of primary heroin and methamphetamine users chose benzodiazepines as a secondary drug choice. These percentages are consistent with the figures from the previous 3 years. The DEA considers benzodiazepines and other pre-scription depressants to be a minor threat in Georgia. The pills are widely available on the street, but their abuse does not seem to have reached the levels of oxycodone and hydrocodone abuse. According to the NDIC and DEA Georgia Threat Assessment (April 2003), local dealers tend to work independently and typically sell to “acquaintances and established cus-tomers.” These primarily White dealers and abusers steal prescription pads, rob pharmacies, and attempt to convince doctors to prescribe the desired pills. Hallucinogens The epidemiological indicators and law enforcement data do not indicate much hallucinogen use in At-lanta. Despite these data, there was an increase in ethnographic reports of phencyclidine (PCP) in the past 12 months. In 2004, there were 24 total ED reports for lysergic acid diethylamide (LSD) according to the unweighted DAWN Live! data. Most of the 2004 ED reports in-volved men rather than women, with a ratio of 5:1. Whites and African-Americans represented equal numbers (n=9) of ED patients for LSD. In 2004, the majority of LSD patients were age 18–29 (67 per-cent). The total number of ED reports for PCP in 2004 was 47. PCP reports were highest among White males between the ages of 35 and 44 and 18 and 24. Treatment data for hallucinogens are only available for secondary and tertiary drug abuse categories, and these are listed as PCP and “other hallucinogens.” In 2004, hallucinogens were listed 14 times as a secon-dary or tertiary drug of choice in metropolitan At-lanta. “Other hallucinogens” were listed 30 times as a secondary drug of abuse and 41 times as a tertiary drug in non-metropolitan areas, also consistent with previous years.

EPIDEMIOLOGIC TRENDS IN DRUG ABUSE—Metropolitan Atlanta
Proceedings of the Community Epidemiology Work Group, Vol. II, June 2005 13
In 2004, LSD accounted for only 0.04 percent of drugs analyzed by NFLIS. The DEA reports an in-crease in the availability of LSD, especially among White traffickers/users age 18–25. LSD is usually encountered in school settings and is imported through the U.S. Postal Service. No PCP items were reported by NFLIS in FY 2004. Club Drugs While so-called club drugs—methylenedioxymeth-amphetamine (MDMA or ecstasy), gamma hydroxy-butyrate (GHB), and ketamine—appear relatively infrequently in epidemiological data, ethnographic and sociologic research suggests continued frequency in use, particularly among metropolitan Atlanta’s young adult population. According to unweighted data accessed from DAWN Live!, there were 75 ED MDMA reports in 2004 (ex-hibit 2). MDMA reports by males exceeded those by females by almost double (1.6:1 ratio) (exhibit 3). There was an approximately even ratio (1:1.1) among Whites and African-Americans; there were no ED MDMA reports involving Hispanics. Young adults (age 21–29) represent 56 percent of ED MDMA pa-tients. The reported route of administration for MDMA was almost exclusively oral. More than one-half of ED MDMA cases were referred to other treat-ment or admitted for detoxification or psychiatric treatment. Atlanta serves as a distribution point for MDMA to other U.S. cities. According to the NDIC, most of the MDMA available in Georgia is produced in northern Europe and flown into major U.S. cities, including Atlanta. The NFLIS reported that in 2004, MDMA accounted for 2.0 percent of substances tested in suspected drug cases (exhibit 6); methyl-enedioxyamphetamine (MDA) accounted for another 0.4 percent. The April 2003 NDIC and DEA Geor-gia Threat Assessment indicated that most dealers are White middle and upper class high school and col-lege students between the ages of 18 and 25. The drug retails at $20–$30 per tablet, according to a July 2003 report by the NDIC, although ethnographic data indicate that many users buy ecstasy in bulk. Users report that bulk ecstasy rates are $5–$10 per pill. An emerging trend among young adults is “candy flip-ping,” or combining MDMA and LSD, according to a local university report. There were a total of 50 unweighted GHB ED reports in 2004. GHB reports for males exceeded those for females (exhibit 3), at a ratio of 4.6:1. GHB ED re-
ports were also predominantly White (8 to 1 African-American, with only 2 Hispanic reports in this time period). Seventy-six percent of GHB reports occurred among those age 25–44. There were no ED GHB reports for those younger than 18, and there was only one report for the 45 and older category. The reported preferred route of administration was almost exclu-sively oral. The NDIC reports that the primary distributors and abusers of GHB are White young adults. The DEA Atlanta Division reports that in 2003, liquid GHB sold for $500 to $1,000 per gallon and $15 to $20 per dose (one dose is usually the equivalent of a capful from a small water bottle). In 2004, there were five unweighted ED ketamine reports among males and none among females. INFECTIOUS DISEASES RELATED TO SUBSTANCE ABUSE At the end of 2003, Georgia ranked eighth in the Na-tion for cumulative AIDS cases. At the end of 2001, the State was ninth. The number of overall AIDS cases was significantly higher in 2003 (22 per 100,000 population) than in 2002 (17.2 per 100,000 population). Approximately 1,907 new AIDS cases were reported in the State in 2003, for a cumulative total of 14,023 persons living with AIDS. HIV sur-veillance nationwide indicates a consistent increase in new infections. In 2003, nearly 73 percent of all new AIDS diagnoses were male, while African- Americans accounted for 74 percent of these total cases. In Georgia, nearly 73 percent of the new HIV/AIDS cases were older than 25, with the highest prevalence occurring among 35–44 year-olds. The majority of new AIDS cases in Georgia continue to come from Atlanta’s Fulton and DeKalb Counties. New cases of sexually transmitted diseases identified in Georgia in 2003 included chlamydia (n=35,686), gonorrhea (n=17,686), and syphilis (n=585). In 2003, there were 484 statewide total cases of hepatitis B and 64 statewide reports of hepatitis C; the majority of cases originated in the Atlanta metropolitan area. For inquiries concerning this report, please contact Brian J. Dew, Ph.D., LPC, Assistant Professor, Georgia State University, De-partment of Counseling and Psychological Services, P.O. Box 3980, Atlanta, GA 30302-3980, Phone: (404)651-3409, Email: <[email protected]>.

EPIDEMIOLOGIC TRENDS IN DRUG ABUSE—Metropolitan Atlanta
Proceedings of the Community Epidemiology Work Group, Vol. II, June 2005 14
Exhibit 1. Data Completeness for Atlanta Metropolitan Area DAWN Live! Emergency Departments (n=30),1 by Month: 2004
No. of EDs Reporting per Month: Completeness of Data (%) Total Eligible
Hospitals1 No. of Hospi-tals in DAWN
Sample
Total EDs in DAWN Sam-
ple2 90–100% 50–89% <50%
No. of EDs Not Reporting
39 30 33 16–18 0–2 0–1 14–16 1Short-term, general, non-Federal hospitals with 24-hour emergency departments based on the American Hospital Association Annual Survey. 2Some hospitals have more than one emergency department. SOURCE: DAWN Live!, OAS, SAMHSA, updated 4/13–4/14, 2005 Exhibit 2. Number of Drug Reports in Drug-Related ED Visits, by Drug Category (Unweighted): 20041
5,758
2,001
934
567 Methamphetamine
367 Amphetamines
483
75
0 500 1000 1500 2000 2500 3000 3500 4000 4500 5000 5500 6000 6500 7000
MDMA
Heroin
Stimulants
Marijuana
Cocaine
1The unweighted data are from 16–18 EDs reporting to Atlanta hospitals reporting to DAWN in 2004. All DAWN cases are re-viewed for quality control. Based on this review, cases may be corrected or deleted, and, therefore, are subject to change. SOURCE: DAWN Live!, OAS, SAMHSA; updated 4/13–4/14/2005

EPIDEMIOLOGIC TRENDS IN DRUG ABUSE—Metropolitan Atlanta
Proceedings of the Community Epidemiology Work Group, Vol. II, June 2005 15

Proceedings of the Community Epidemiology Work Group, Vol. II, June 2005 16
0
500
1,000
1,500
2,000
2,500
White 632 834 656 206 653
Black 1,300 2,265 978 230 14
Hispanic 19 44 63 10 7
Other 20 32 52 4 5
Alcohol-in-Combination
Cocaine Marijuana Heroin Methamphetamine
1
0
500
1,000
1,500
2,000
2,500
White 632 834 656 206 653
Black 1,300 2,265 978 230 14
Hispanic 19 44 63 10 7
Other 20 32 52 4 5
Alcohol-in-Combination
Cocaine Marijuana Heroin Methamphetamine
1
Exhibit 4. Percentages of Primary Treatment Admissions in Atlanta: FYs 2000–2004 Drug FY 2000 FY 2001 FY 2002 FY 2003 FY 2004 Cocaine/Crack 58.3 58.5 43.1 42.8 39.5 Heroin 6.6 6.7 7.6 6.3 5.6 Marijuana 16.0 15.5 18.7 20.0 21.7 Methamphetamine 1.5 1.6 3.1 5.1 8.5 Other Drugs1 17.6 26.1 21.3 25.8 24.6 Total Admissions (N=) (6,990) (7,996) (7,909) (7,178) 7,996 1Includes “alcohol-in-combination.” SOURCE: Georgia Department of Human Resources Exhibit 5. Metropolitan Atlanta Public Substance Abuse Treatment Admissions, Selected Drugs by Race:
2004 1Other Category includes Asian, American Indian, multicultural, or other race. SOURCE: Georgia Department of Human Resources Exhibit 6. Number of Analyzed Items and Percentage of All Items Tested in Atlanta: 2004 Drug Number Percent Cocaine 7,923 44.2 Methamphetamine 5,434 30.3 Cannabis 2,578 14.4 Alprazolam 380 2.1 MDMA/MDA 424 2.4 Hydrocodone 315 1.8 Heroin 194 1.1 Oxycodone 159 0.9 Methadone 83 0.5 Diazepam 65 0.4 Other1 301 1.9 Total 17,922 100.0
1Includes carisoprodol, amphetamine, clonazepam, morphine, codeine, psilocin, non-controlled non-narcotic drug, methylphenidate, ketamine, gamma hydroxybutyrate, hydromorphone, 1-(3-trifluoromethylphenyl)-piperazine, lorazepam, and lysergic acid diethyla-mide. SOURCE: NFLIS, DEA

EPIDEMIOLOGIC TRENDS IN DRUG ABUSE—Metropolitan Atlanta
Proceedings of the Community Epidemiology Work Group, Vol. II, June 2005 17
Exhibit 7. Number of Prescription Drug Misuse Reports in Drug-Related ED Visits, by Case Type (Unweighted1): 2004 1The unweighted data are from 16–18 EDs reporting to Atlanta hospitals reporting to DAWN in 2004. All DAWN cases are reviewed for quality control. Based on this review, cases may be corrected or deleted, and, therefore, are subject to change. SOURCE: DAWN Live!, OAS, SAMHSA; updated 06/04/205
212
268
814
Oxycodone
Hydrocodone
Benzodiazepines

EPIDEMIOLOGIC TRENDS IN DRUG ABUSE—Baltimore
Proceedings of the Community Epidemiology Work Group, Vol. II, June 2005 18
Drug Use in the Baltimore Metropolitan Area: Epidemi-ology and Trends, 2000–2004 Leigh A. Henderson, Ph.D., and Doren H. Walker, M.S.1 ABSTRACT Heroin indicators for the Baltimore metropolitan area as a whole have generally indicated an in-crease over 2001 levels. In 2004, heroin was respon-sible for 52 percent of drug-related treatment ad-missions. Heroin use in the Baltimore metropolitan area is complex. There are several groups of heroin users differing by urbanicity, route of administra-tion, age, and race. Baltimore has a core of older African-American heroin users, both intranasal users (37 percent of all 2004 heroin treatment ad-missions) and injectors (19 percent all 2004 heroin treatment admissions). White users entering treat-ment for heroin were younger and were predomi-nantly injectors (29 percent of all 2004 heroin treatment admissions) rather than intranasal users (10 percent of all heroin treatment admissions). Cocaine indicators also began to increase in 2001. In 2004, cocaine use was reported by 50 percent of drug-related treatment admissions in the Baltimore PMSA, with 14 percent reporting primary use and 36 percent reporting use secondary to use of alcohol or another drug. Cocaine smoking was the most prevalent route of administration among both pri-mary and secondary users, followed by injection and intranasal use. Cocaine use was associated with heroin use, but the preferred route of administra-tion of heroin differed with the preferred route of administration of cocaine. More than one-third (37 percent) of cocaine smokers used intranasal heroin. Almost all cocaine injectors (90 percent) injected heroin. More than one-third (35 percent) of intra-nasal cocaine users used heroin intranasally. Indi-cators of marijuana use have tended to increase since 2000. Like cocaine, marijuana was reported more frequently as a secondary substance than as a primary substance—34 percent of drug-related treatment admissions used marijuana, 15 percent as a primary substance and 19 percent as a secondary substance. More often than not, marijuana use in the indicator data sets was associated with the use of alcohol or other drugs—in 2004, 61 percent of marijuana treatment admissions reported use of 1 The authors are affiliated with Synectics for Management Deci-sions, Inc., Arlington, Virginia.
additional substances. Persons entering treatment for primary marijuana use were young—44 percent were less than age 18. A large proportion of 2004 marijuana treatment admissions (62 percent) repre-sented referrals through the criminal justice system. Indicators for opiates and narcotics other than her-oin have increased over the past several years. Stimulants other than cocaine are rarely mentioned as the primary substance of abuse by treatment ad-missions. INTRODUCTION Area Description The Baltimore primary metropolitan statistical area (PMSA) was home to some 2.6 million persons in 2004. It comprises Baltimore City and the suburban counties of Anne Arundel, Baltimore, Carroll, Har-ford, Howard, and Queen Anne’s. Baltimore City is the largest independent city in the United States. The city’s population declined from 735,000 in 1990 to 629,000 in 2003. The population of the surrounding counties has grown from approximately 1.7 million in 1990 to 2.0 million in 2004. The city and the suburban counties represent dis-tinctly different socioeconomic groups. In 2000, me-dian household income in the city was $30,000, and 23 percent of the population lived in poverty. In the suburban counties, however, median household in-come ranged from $51,000 to $74,000, and the pov-erty rate averaged 5 percent. In 2000, the median value of a single-family home was $69,100 in the city and averaged $152,000 in the suburban counties. The 2000 population composition of the city differed markedly from that of the surrounding counties: 32 percent White and 64 percent African-American, versus 80 percent White and 15 percent African-American, respectively. Two percent of the popula-tion in the city and 3 percent of the population in the suburban counties was Asian. Two percent of the population in both the city and the suburban counties was Hispanic. The Baltimore area is a major node on the north-south drug trafficking route. It has facilities for entry of drugs into the country by road, rail, air, and sea. Balti-more is located on Interstate 95, which continues north to Philadelphia, New York, and Boston, and south to Washington, DC, Richmond, and Florida. Frequent daily train service is available on this route. The area is served by three major airports (Baltimore-Washington International Airport in Baltimore County and Reagan National and Dulles Airports in the vicinity of Wash-ington, DC, approximately 50 miles from the Balti-

EPIDEMIOLOGIC TRENDS IN DRUG ABUSE—Baltimore
Proceedings of the Community Epidemiology Work Group, Vol. II, June 2005 19
more City center). Baltimore is also a significant active seaport. The area has numerous colleges and universi-ties and several military bases. Data Sources • Population and demographic data, including
population estimates for 1990–2003 and income, poverty, and housing cost estimates for 2000 for Maryland counties, were derived from U.S. Bu-reau of the Census data (electronic access: <http://factfinder.census.gov> last accessed June 13, 2004).
• Treatment admissions data were provided by
the Maryland Alcohol and Drug Abuse Admini-stration, Department of Health and Mental Hy-giene, for 1992 through 2004. Data are presented for the PMSA as a whole, as well as separately for Baltimore City and the suburban counties. Included are those programs receiving both pub-lic and private funding. All clients are reported, regardless of individual source of funding. Sig-nificant omissions are the Baltimore City and Fort Howard Veterans’ Administration Medical Centers, which do not report to the State data collection system. Treatment data in this report exclude admissions for abuse of alcohol alone (about 15 percent of all treatment admissions). Admissions with primary abuse of alcohol and secondary/tertiary abuse of drugs (about 12 per-cent of all admissions) are included.
• Emergency department (ED) drug mentions
data were provided by the Drug Abuse Warning Network (DAWN), Office of Applied Studies (OAS), Substance Abuse and Mental Health Services Administration (SAMHSA), for the Baltimore PMSA for 2004. Data reflect cases that have been received by DAWN as of: 4/13-14/2005. All DAWN cases are reviewed for quality control. Based on this review, cases may be corrected or deleted. Data are unweighted, noncomparable across areas, and subject to change. DAWN data are reported for the follow-ing case types: Suicide attempt, Seeking detox, Alcohol only (age<21), Adverse reaction, Over-medication, Malicious poisoning, Accidental in-gestion, and Other. Data are reported for all case types combined (except Seeking detox, which is reported for all major substances combined) for major substances of abuse (Cocaine, Heroin, Marijuana, Amphetamines, Methamphetamine, MDMA (Ecstasy), GHB, Ketamine, LSD, PCP, Miscellaneous hallucinogens, Inhalants, and Combinations NTA). For other substances, only
the case types Seeking detox, Overmedication, and Other are included. In the Baltimore PMSA, there were 21 hospitals with 24 EDs in the DAWN sample, reporting for 182 of a possible 288 months, a response rate of 63 percent.
• Mortality data were provided by the Drug Abuse
Warning Network (DAWN), Office of Applied Studies (OAS), Substance Abuse and Mental Health Services Administration (SAMHSA), for the Baltimore PMSA for 2003. Drug Abuse Warn-ing Network, 2003. Area Profiles of Drug Mortal-ity. DAWN Series D-27, DHHS Pub. No. (SMA) 05-4023. Rockville, MD, 2005.
• Illicit drug prices were provided by the Na-
tional Drug Intelligence Center, Narcotics Digest Weekly 3(52), December 28, 2004, for July 2004–December 2004.
• Data on drug seizures were provided by the
National Forensic Laboratory Information Sys-tem (NFLIS), for January-December, 2004.
DRUG ABUSE PATTERNS AND TRENDS Polydrug use in general is the norm in the Baltimore PMSA. About three-quarters of drug-related treat-ment admissions in 2004 reported problems with at least one substance other than their primary sub-stance. In 2003, 87 percent of the 538 drug-related deaths reported to the area’s medical examiners in-volved multiple substances. DAWN emergency de-partment (ED) data for 2004 (see notes under Data Sources above) reported 3,876 DAWN non-detox cases, and 10,528 mentions of major substances of abuse among these cases, an average of 2.7 sub-stances per case. Cocaine/Crack Cocaine indicators (treatment admission rates, rates of ED mentions, and cocaine-involved deaths) all began to increase in 2001 (exhibit 1). Cocaine was present in 226 (42 percent) of drug-related deaths in 2003. The cocaine treatment admission rate increased from 162 per 100,000 population age 12 and over in 2000 to 225 per 100,000 in 2003 (exhibit 2). The rate declined slightly, to 203 per 100,000, in 2004. In 2004, cocaine was mentioned by 43 percent of the DAWN non-detox ED cases (see notes under Data Sources above), a proportion similar to the 43 percent of ED cases involving heroin. The cocaine and heroin cases were demographically similar—64 percent male, 44 percent and 46 percent White, respectively,

EPIDEMIOLOGIC TRENDS IN DRUG ABUSE—Baltimore
Proceedings of the Community Epidemiology Work Group, Vol. II, June 2005 20
and twenty-one percent of each aged 45 or older. It is likely that many of the ED cases reflect co-use of cocaine and heroin (see Exhibit 4, below). Smoked cocaine (crack) represented 79 percent of the treatment admissions for primary cocaine use in the Baltimore PMSA in 2004 (exhibit 2). The population in treatment for cocaine smoking has aged (exhibit 3). About three-quarters (72 percent) were age 35 or older in 2004, an increase from 59 percent in 2000. The median age at admission to treatment was 39 years, compared with 36 in 2000. Almost one-half (45 percent) of those in treatment for smoking co-caine were women, and about two-thirds (65 percent) were African-American. The majority (62 percent) of the cocaine smokers had been in treatment before, and most (67 percent) were referred through sources other than the criminal justice system. Daily use of smoked cocaine was reported by 42 percent, and use of other drugs in addition to smoked cocaine was reported by more than two-thirds (69 percent). Alco-hol was the most common secondary drug (used by 47 percent), followed by marijuana (23 percent) and heroin used intranasally (14 percent). Only 3 percent of crack smokers reported heroin injection. Primary use of cocaine represented 14 percent of drug-related treatment admissions in 2004, well be-hind the 52 percent of admissions represented by primary use of heroin (exhibit 2). Despite the appar-ent dominance of heroin in the Baltimore PMSA, testing of some 40,000 items in FY 2004 by the Na-tional Forensics Laboratory found that 43 percent were cocaine and 26 percent were heroin. This appar-ent discrepancy may be explained by the use of co-caine as a secondary substance. Cocaine was reported as a secondary substance by 36 percent of treatment admissions in 2004 (exhibit 2), meaning that 50 per-cent of treatment admissions reported cocaine abuse as a primary or secondary problem. Exhibit 4 compares the characteristics of treatment admissions for primary and secondary cocaine use according to the route of administration of cocaine. Cocaine smoking was the most prevalent among both primary and secondary users, followed by injection and intranasal use. Differences between primary and secondary users were generally small, although sec-ondary users were consistently less likely to be enter-ing treatment for the first time than primary users. User characteristics were more pronounced between routes of administration. Cocaine smokers were more likely to be female (50 percent of cocaine smokers, compared to 39 percent of injectors and 32 percent of intranasal users), African-American (67 percent, 51 percent, and 42 percent, respectively), age 35 and
older (70 percent, 60 percent, and 54 percent, respec-tively). Cocaine smokers were less likely to be age 25 and younger (9 percent, compared with 18 percent of injectors and 25 percent of intranasal users). Cocaine smokers and injectors were more likely to be treated in the City (67 percent and 69 percent, respectively, compared to 44 percent of the intranasal users). Cocaine use was associated with heroin use, but the preferred route of administration of heroin differed with the preferred route of administration of cocaine (exhibit 4). More than one-third (37 percent) of co-caine smokers used intranasal heroin—50 percent as their primary substance, and 14 percent as a secon-dary substance. Almost all cocaine injectors (90 per-cent) injected heroin—93 percent as their primary, and 60 percent of as a secondary substance. More than one-third (35 percent) of intranasal cocaine users used heroin intranasally—41 percent as their primary substance problem, and 10 percent as a secondary problem. Thirty-seven percent of the cocaine smokers reported cocaine smoking as their primary problem (exhibit 4). Secondary cocaine smokers were somewhat more likely to be female (53 percent of secondary smokers, compared to 45 percent of primary smokers), and more likely to be treated in Baltimore City (71 per-cent and 60 percent, respectively). Other primary problems reported by secondary cocaine smokers were alcohol (21 percent) and heroin injection (21 percent). Only 7 percent of the cocaine injectors reported co-caine injection as their primary problem (exhibit 4). Secondary cocaine injectors were somewhat older (49 percent of secondary injectors, compared to 37 percent of primary injectors). They were less likely to be experiencing a first treatment episode (26 percent of secondary injectors, compared to 33 percent of primary injectors). They were less likely to enter treatment through a criminal justice referral (25 per-cent of secondary injectors, compared to 31 percent of primary injectors). Secondary injectors were somewhat more likely to be treated in Baltimore City (70 percent and 64 percent, respectively). About one-fifth (22) percent of the cocaine inhalers reported cocaine inhalation as their primary problem (exhibit 4). Secondary cocaine inhalers were less likely to be experiencing a first treatment episode (41 percent of secondary inhalers, compared to 49 per-cent of primary inhalers). They were more likely to enter treatment through a criminal justice referral (38 percent of secondary inhalers, compared to 19 per-cent of primary inhalers). Secondary inhalers were

EPIDEMIOLOGIC TRENDS IN DRUG ABUSE—Baltimore
Proceedings of the Community Epidemiology Work Group, Vol. II, June 2005 21
somewhat less likely to be treated in the suburban counties (55 percent and 63 percent, respectively). Exhibit 5 compares the number of cocaine treatment admissions (primary, secondary, or tertiary use) in 2004 by route of administration, age, and race. For all three routes of administration, the younger users tended to be White rather than African-American. Prices for powdered cocaine for the second half of 2004 were reported as $20,000–$32,000 per kilogram at the wholesale level; $900–$1,200 per ounce at midlevel; and $0–$200 per gram at the retail level. Prices for crack cocaine were reported as $20,000–$26,000 per kilogram at the wholesale level; $600–$1,200 per ounce at midlevel; and $40–$200 per gram at the retail level. For powdered cocaine, the price range at the wholesale kilogram level was un-changed from the second half of 2003, while the lower limit for a retail-level gram was less. For crack cocaine, the lower limit for a wholesale kilogram was unchanged from the second half of 2003, while the lower limit for a retail-level gram was less. Heroin Heroin indicators for the Baltimore metropolitan area as a whole generally indicated an increase over 2001 levels (exhibit 1). Opiates were present in 469 (87 percent) of drug-related deaths in 2003. The heroin treatment admission rate increased from 652 per 100,000 population age 12 and over in 2001 to 893 per 100,000 in 2003 (exhibit 2). However, it declined slightly to 770 per 100,000 in 2004. In 2004, heroin was mentioned by 43 percent of the DAWN non-detox ED cases (see notes under Data Sources above), a proportion similar to the 43 percent of ED cases involving cocaine. The heroin and co-caine cases were demographically similar—64 per-cent male, 44 percent and 46 percent White, respec-tively, and twenty-one percent of each aged 45 or older. It is likely that many of the ED cases reflect co-use of heroin and cocaine (see Exhibit 4, below). Heroin use in the Baltimore metropolitan area is complex. There are several groups of heroin users differing by urbanicity, route of administration, age, and race. In 2004, the heroin treatment admission rate was about seven times higher in Baltimore City than in the suburban counties (exhibit 2). In Baltimore City, intranasal use was the preferred route of administration among treatment admissions (exhibit 2), and the admission rate for intranasal use was 26 percent higher than for injection. In the sub-
urban counties, however, the rate for heroin injection was 86 percent higher than for inhalation. Exhibit 6 compares the number of treatment admis-sions in 2004 by route of administration, age, and race. Baltimore has a core of older African-American heroin users, both injectors and intranasal users. White users entering treatment for heroin were younger and were predominantly injectors. African-American heroin intranasal users made up 37 percent of the heroin-using treatment admissions in the Baltimore PMSA in 2004, and most (89 percent) were treated in Baltimore City. Among heroin intra-nasal users in the city (exhibit 7), most admissions were African-American (88 percent) and were age 35 and older (74 percent). Almost half (47 percent) of the intranasal heroin users were women. The median age at admission was 39, and the median duration of use before first entering treatment was 14 years. Sev-enty percent reported daily heroin use. About one-third (31 percent) entered treatment through the criminal justice system, and about one-third (34 per-cent) were receiving treatment for the first time. Two-thirds (68 percent) reported use of other drugs—42 percent smoked cocaine, 24 percent used alcohol, 11 percent used marijuana, and 9 percent used co-caine intranasally. White heroin injectors made up 29 percent of the heroin-using treatment admissions in the Baltimore PMSA in 2004, and more than half were (59 percent) were treated in the suburban counties. Among heroin injectors in the suburban counties (exhibit 8), most admissions were White (86 percent). More than one-third (38 percent) of suburban injectors were age 25 and younger. Sixty percent of the suburban heroin injectors were male. The median age at admission was 28, and the median duration of use before first entering treatment was 6 years. About two-thirds (68 percent) reported daily heroin use. About one in five (23 percent) entered treatment through the criminal justice system, and one-third (31 percent) were re-ceiving treatment for the first time. More than two-thirds (70 percent) reported use of other drugs—, 29 percent injected cocaine, 28 percent used marijuana, 21 percent used alcohol, 15 percent smoked cocaine, and 8 percent used opiates other than heroin. African-American heroin injectors made up 19 per-cent of the heroin-using treatment admissions in the Baltimore PMSA in 2004. Most (88 percent) were treated in Baltimore City. Among heroin injectors in the city (exhibit 8), the majority of admissions (58 percent) were African-American, and were age 35 and older (66 percent), although the proportion of

EPIDEMIOLOGIC TRENDS IN DRUG ABUSE—Baltimore
Proceedings of the Community Epidemiology Work Group, Vol. II, June 2005 22
injection users age 25 and younger increased from 9 percent in 2000 to 14 percent in 2004. Some 43 per-cent of the city’s heroin injectors were women. The median age at admission was 40, and the median du-ration of use before first entering treatment was 14 years. Most (79 percent) reported daily heroin use. Less than one-quarter (20 percent) entered treatment through the criminal justice system, and about one-quarter (27 percent) were receiving treatment for the first time. Most (76 percent) reported use of other drugs—47 percent injected cocaine, 23 percent used alcohol, 15 percent smoked cocaine, and 7 percent used marijuana. White heroin intranasal users made up 10 percent of the heroin-using treatment admissions in the Balti-more PMSA in 2004. Almost two-thirds (63 percent) were treated in the suburban counties. Among heroin intranasal users in the suburban counties (exhibit 7), more than half (59 percent) were White, and 49 per-cent were age 35 and older, although the proportion of intranasal users age 25 and younger was 23 per-cent in 2004. Some 35 percent of the suburban intra-nasal users were women. The median age at admis-sion was 34, and the median duration of use before first entering treatment was 7 years. Most (63 per-cent) reported daily heroin use. About one-quarter (27 percent) entered treatment through the criminal justice system, and 43 percent were receiving treat-ment for the first time. A majority (66 percent) re-ported use of other drugs—21 percent each smoked cocaine, used alcohol, and/or used marijuana, 17 per-cent used cocaine intranasally, and 11 percent used opiates other than heroin. In 2004, there were 4,531 DAWN heroin ED cases, a number similar to the 4,511 cases involving cocaine. Given the co-use of heroin and cocaine demonstrated in Exhibit 4, it is likely that these cases represent use of both these drugs by the individual seeking ED care. The heroin and cocaine cases were demographi-cally similar as well—64 percent male, 44 percent and 46 percent White, respectively. Twenty-one per-cent of both heroin and cocaine cases were aged 45 or older, and 56 percent of heroin cases were 35 or older, as were 61 percent of cocaine cases. Of the 37,000 items from Baltimore tested by the National Forensic Laboratory in 2004, 26 percent were heroin. Most of the heroin sold in Baltimore is from South America. Its purity for 2003 was reported by the DEA’s Domestic Monitor Program as 35 percent (based on 24 samples), and the price as $0.31 per mil-ligram pure. Both priority and price were lower than the national average of 42 percent putity and $0.77 per
milligram pure. One Southeast Asian sample was pur-chased (purity, 20 percent; price $0.31 per milligram pure, and one Southwest Asian sample was purchased (purity, 2.8%, price $1.55 per milligram pure). Other Opiates and Narcotics For opiates and narcotics other than heroin, indicators have increased over the past several years (exhibit 1). Treatment admission rates for opiates other than her-oin more than doubled between 2000 and 2003, from 23 per 100,000 population age 12 and over to 55 per 100,000 in 2003 and 2004 (exhibit 2). In 2004, there were 1,307 ED cases involving opiates/opioids among a subset of the DAWN ED cases (see notes under Data Sources above). Forty-one percent of these cases specified oxycodone, 7 percent specified hydrocodone, 32 percent specified other opiates, and the opiate was unspecified in 21 percent of cases Opiates other than heroin were reported by 4 percent of admissions as the primary substance of abuse, and were reported by an additional 4 percent as a secon-dary or tertiary substance (exhibit 2). Exhibit 9 com-bines all admissions reporting opiates other than her-oin as primary, secondary, or tertiary substances. Treatment admissions involving opiates other than heroin were primarily White (88 percent). Just over half (57 percent) were male. Almost half (44 percent) were ages 35 or older, although the proportion age 25 and younger increased from 21 percent in 2000 to 34 percent in 2004. The median age at admission was 32, and the mediation duration of use of opiates other than heroin before first entering treatment was 4 years. Daily use of opiates other than heroin was re-ported by 67 percent. Only a small proportion (13 percent) entered treatment through the criminal jus-tice system, and 44 percent were entering treatment for the first time. Marijuana Indicators of marijuana use have tended to increase since 2000 (exhibit 1). The rates of marijuana ED mentions increased significantly in 2002 over 2001. The annual marijuana treatment admission rate in-creased from 200 per 100,000 population age 12 and over in 2000 to 249 per 100,000 in 2003, then de-clined slightly to 222 in 2004 (exhibit 2). The propor-tion of marijuana treatment admissions in 2004 was higher in the suburban counties (20 percent of county admissions) than in Baltimore City (11 percent of City admissions), but the admission rate for 2004 was higher in the city (380 per 100,000 population age 12 and over, compared with 173 per 100,000 in the counties).

EPIDEMIOLOGIC TRENDS IN DRUG ABUSE—Baltimore
Proceedings of the Community Epidemiology Work Group, Vol. II, June 2005 23
In 2004, marijuana was mentioned by 12 percent of the DAWN non-detox ED cases (see notes under Data Sources above). Two-thirds (65 percent) were male and 65 percent were White. Twenty-three per-cent were less than 18 years of age, and another 30 percent were aged 18 to 24. More often than not, marijuana use in the indicator data sets was associated with the use of alcohol or other drugs. Marijuana was more frequently reported as a secondary substance than as a primary substance by treatment admissions in the total PMSA in 2004, at 15 percent and 19 percent, respectively (exhibit 2). Among treatment admissions for primary marijuana use in the total PMSA, 61 percent reported using ad-ditional substances (exhibit 10). More than one-half (53 percent) reported alcohol use, 8 percent reported cocaine use, 3 percent reported use of heroin, and 3 percent reported use of opiates other than heroin. Some 7 percent of admissions used other secondary substances, primarily hallucinogens, stimulants, PCP, tranquilizers, and sedatives. Persons entering treatment for marijuana use were young: 44 percent were less than age 18, and the me-dian age at admission to treatment was 18 (exhibit 10). Marijuana admissions were primarily male (82 percent) and increasingly likely to be African-American (51 percent in 2004, compared with 46 percent in 2000). A large proportion of marijuana treatment admissions (62 percent) represented refer-rals through the criminal justice system. Admissions were likely to be experiencing their first treatment episode (66 percent), and more than one-third (35 percent) reported daily marijuana use. Of the 37,000 items from Baltimore tested by the National Forensic Laboratory in 2004, 30 percent were cannabis. Prices for marijuana for the second half of 2004 were reported as $2,390–$4,000 per pound for hydroponic marijuana or $1,000–$1,600 per pound for commer-cial grade marijuana at the wholesale level. Midlevel prices were $275 per ounce for hydroponic and $130 per ounce for commercial grade. At the retail level, prices were $35–$60 per one-quarter ounce or $20–$40 per bag. The price range for hydroponic mari-juana was slightly more for the wholesale-level kilo-gram than in the second half of 2003. The lower limit for commercial-grade marijuana at the wholesale-level kilogram was more than in the second half of 2003, but the upper limit was unchanged. The price range was unchanged for a retail-level one-quarter ounce or bag.
Stimulants Stimulants other than cocaine were rarely mentioned as the primary substance of abuse by treatment ad-missions (exhibit 2). Nevertheless, the numbers, al-though small, increased from 42 admissions in 2000 to 76 in 2004. The majority (68 percent) of the 2004 stimulant admissions were for methamphetamine, and 24 percent were for amphetamine. The treatment admission rate for stimulants increased from 2.0 per 100,000 population age 12 and over in 2000 to 3.5 per 100,000 in 2004. In 2004, all stimulants combined were mentioned by 1 percent of the DAWN non-detox ED cases (see notes under Data Sources above). Other Drugs Drugs other than alcohol, cocaine, heroin, opiates (other than heroin), marijuana, and stimulants were responsible for less than 2 percent of treatment ad-missions in 2004 (exhibit 2). In 2004, in a subset of DAWN ED cases (see notes under Data Sources above), there were 59 cases involving methylenedi-oxymethamphetamine (MDMA), 34 involving phen-cyclidine (PCP), 19 involving inhalants, 18 involving lysergic acid diethylamide (LSD), 7 involving keta-mine, and 4 involving gamma hydroxylbutyrate (GHB). Treatment admissions for benzodiazepines and other tranquilizers increased slightly, from 4.0 per 100,000 population age 12 and over in 2003 to 4.8 per 100,000 in 2004. In 2004, there were 888 DAWN ED cases involving benzodiazepines. Treatment admissions for barbiturates and other seda-tives decreased slightly, from 4.2 per 100,000 popu-lation age 12 and over in 2003 to 3.7 per 100,000 in 2004. Treatment admissions for lysergic acid diethylamide (LSD) increased from 2.4 per 100,000 population age 12 and over in 2003 to 3.1 per 100,000 in 2004. Treatment admissions for PCP declined from 4.3 per 100,000 population age 12 and over in 2003 to 2.0 per 100,000 in 2004. Between 2003 and 2004, treat-ment admissions for inhalants were relatively stable, at 0.7 per 100,000 population age 12 and over in 2003 and 0.6 per 100, 000 in 2004. Treatment admis-sions for over-the-counter drugs were unchanged at 0.5 per 100,000 population age 12 and over in 2003 and 2004.

EPIDEMIOLOGIC TRENDS IN DRUG ABUSE—Baltimore
Proceedings of the Community Epidemiology Work Group, Vol. II, June 2005 24
INFECTIOUS DISEASES RELATED TO DRUG ABUSE The annual AIDS case report rate for 2003 for the Baltimore PMSA (39 cases per 100,000) ranked fifth behind New York City (59 per 100,000), Miami (46 per 100,000), San Francisco (45 per 100,000) and Fort Lauderdale (40 per 100,000) (CDC 2003). The Baltimore PMSA accounted for 64 percent and 63 percent, respectively, of Maryland’s incident and prevalent human immunodeficiency virus (HIV) cases, 59 percent of its incident AIDS case, and 60 percent of its prevalent AIDS cases (AIDS Admini-stration 2004). Baltimore City by itself accounted for 51 percent of Maryland’s 2003 incident and prevalent HIV cases, 46 percent of its incident AIDS cases, and 47 percent of its prevalent AIDS cases. The Balti-more metropolitan area had an AIDS incidence rate of 33 per 100,000 population for 2003, and an HIV incidence rate of 49 per 100,000. The AIDS preva-lence rate in the Baltimore metropolitan area in 2003 was 298 per 100,000 population, and the HIV preva-lence rate was 382 per 100,000. In 2003, Baltimore City’s prevalent HIV/AIDS cases were about 62 percent male and 81 percent African-American (AIDS Administration 2004). Forty-four percent were aged 40–49 years, and another 24 per-cent were aged 30–39 years. Fifty-six percent of the prevalent HIV/AIDS cases in Baltimore City in which the risk category was determined were injec-tion drug users (IDUs), 15 percent were non-IDU men who had sex with men, and 26 percent involved heterosexual transmission. In the suburban counties, prevalent HIV/AIDS cases were 66 percent male and 55 percent African-American. Forty-one percent were aged 40–49, and another 29 percent were aged 30–39. For cases in which the risk category was de-termined, 36 percent of prevalent HIV/AIDS cases in the suburban counties were IDUs, 29 percent were non-IDU men who had sex with men, and 31 percent involved heterosexual transmission. In Maryland as a whole, IDUs represented 47 percent of prevalent HIV/AIDS cases in 2003. In 1999, Baltimore City ranked highest among the 20 cities most burdened by sexually transmitted diseases (STDs) for gonorrhea (949 per 100,000 population), fifth for chlamydia (819 per 100,000 population), and third for syphilis (38 per 100,000 population) (CDC 2000). By 2003, STD rates for Baltimore City had decreased for gonorrhea (to 617 per 100,000) and for syphilis (to 23 per 100,000), but had increased for chlamydia (to 1,001 per 100,000) (AIDS Administra-tion 2004).
Voluntary HIV testing is offered to Maryland prison entrants. Among those tested in 2003, 5 percent were positive for HIV (AIDS Administration 2004). A 2002 survey of entrants to Baltimore City detention facilities and Maryland State prison entrants found that newly incarcerated females had much higher HIV rates than newly incarcerated males (13 percent and 4 percent, respectively) (AIDS Administration 2004). The survey of prison entrants also found that 25 per-cent had been infected by hepatitis B and 30 percent had antibodies to hepatitis C (Solomon et al. 2004). REFERENCES AIDS Administration. Maryland Department of
Health and Mental Hygiene and Maryland De-partment of Public Safety and Correctional Ser-vices, 2003. Examination of HIV, Syphilis, Hepa-titis B and Hepatitis C in Maryland Correctional Facilities. Cited in: AIDS Administration, Mary-land Department of Health and Mental Hygiene. The Maryland 2004 HIV/AIDS Annual Report, 2004:85.
AIDS Administration. Maryland Department of
Health and Mental Hygiene, 2004. The Maryland 2004 HIV/AIDS Annual Report, 2004: 7, 9, 31–33 (electronic access: <http://www.dhmh.state. md.us/AIDS/epictr.htm> last accessed March 5, 2005).
Center for Substance Abuse Research (CESAR).
DEWS–Drug Early Warning System, 2004: 5(8). University of Maryland, College Park, Md. (elec-tronic access <http://www.dewsonline.org>).
Center for Substance Abuse Research (CESAR).
Warning Signs for Early Marijuana Users among Maryland’s Public School Students, DEWS In-vestigates, 2003. University of Maryland, Col-lege Park, Md. (electronic access <http://www. dewsonline.org>).
Centers for Disease Control and Prevention (CDC),
2000. Tracking the Hidden Epidemics: Trends in STDs in the United States, 2000. U.S. Depart-ment of Health and Human Services. Cited in: AIDS Administration, Maryland Department of Health and Mental Hygiene. The Maryland 2004 HIV/AIDS Annual Report, 2004:82.
Centers for Disease Control and Prevention (CDC).
2003.Cases of HIV Infection and AIDS in the United States, 2003. HIV/AIDS Surveillance Re-

EPIDEMIOLOGIC TRENDS IN DRUG ABUSE—Baltimore
Proceedings of the Community Epidemiology Work Group, Vol. II, June 2005 25
port Vol. 15. U.S. Department of Health and Human Services. Cited in: AIDS Administration, Maryland Department of Health and Mental Hy-giene. The Maryland 2004 HIV/AIDS Annual Report, 2004:54-5.
Solomon L, Flynn C, Muck K, et al., 2004. Preva-
lence of HIV, syphilis, hepatitis B, and hepatitis C among entrants to Maryland correctional fa-
cilities. J Urban Health 81(1). Cited in: AIDS Administration, Maryland Department of Health and Mental Hygiene. The Maryland 2004 HIV/AIDS Annual Report, 2004:81.
For inquiries concerning this report, please contact Leigh A. Hen-derson, Ph.D., Synectics for Management Decisions, Inc., 1901 N. Moore St., Suite 900, Arlington VA 22209, Phone: (703) 807-2328, Fax: (703) 528-6430, or E-mail: [email protected].

EPIDEMIOLOGIC TRENDS IN DRUG ABUSE—Baltimore
Proceedings of the Community Epidemiology Work Group, Vol. II, June 2005 26
Exhibit 1. Annual Rates of Drug-Related Treatment Admissions and ED Mentions per 100,000 Population, and Numbers of Drug-Related Deaths in Baltimore: 1994–2004
Heroin
0
300
600
900
1994 1996 1998 2000 2002 2004
Per
100
,000
ED Treatment Deaths (no.)
Cocaine
0
100
200
300
400
1994 1996 1998 2000 2002 2004
Per
100
,000
ED Treatment Deaths (no.)
Marijuana
0
50
100
150
200
250
1994 1996 1998 2000 2002 2004
Per
100
,000
ED Treatment
Other Opiates
0
50
100
150
200
250
1994 1996 1998 2000 2002 2004
Per
100
,000
ED Treatment Deaths (no.)
SOURCES: DAWN, OAS, SAMHSA, and Alcohol and Drug Abuse Administration, Maryland Department of Health and Mental Hygiene

EPIDEMIOLOGIC TRENDS IN DRUG ABUSE—Baltimore
Proceedings of the Community Epidemiology Work Group, Vol. II, June 2005 27

EPIDEMIOLOGIC TRENDS IN DRUG ABUSE—Baltimore
Proceedings of the Community Epidemiology Work Group, Vol. II, June 2005 28

EPIDEMIOLOGIC TRENDS IN DRUG ABUSE—Baltimore
Proceedings of the Community Epidemiology Work Group, Vol. II, June 2005 29

EPIDEMIOLOGIC TRENDS IN DRUG ABUSE—Baltimore
Proceedings of the Community Epidemiology Work Group, Vol. II, June 2005 30
Exhibit 5. Numbers of Primary, Secondary, and Tertiary Cocaine Treatment Admissions in Baltimore, by Route of Administration, Age, and Race: 2004
Smoking
0500
1,0001,5002,0002,5003,0003,5004,000
10 20 30 40 50 60
Age
Num
ber
White African-American
Injection
0500
1,0001,5002,0002,5003,0003,5004,000
10 20 30 40 50 60
Age
Num
ber
White African-American
Intranasal
0500
1,0001,5002,0002,5003,0003,5004,000
10 20 30 40 50 60
Age
Num
ber
White African-American
SOURCE: Alcohol and Drug Abuse Administration, Maryland Department of Health and Mental Hygiene

EPIDEMIOLOGIC TRENDS IN DRUG ABUSE—Baltimore
Proceedings of the Community Epidemiology Work Group, Vol. II, June 2005 31
Exhibit 6. Numbers of Primary Heroin Treatment Admissions in Baltimore, by Route of Administration, Age, and Race: 2004
Injection
050
100150200250300350400
10 20 30 40 50 60
Age
Num
ber
White African-American
Intranasal
050
100150200250300350400
10 20 30 40 50 60
Age
Num
ber
White African-American
SOURCE: Alcohol and Drug Abuse Administration, Maryland Department of Health and Mental Hygiene

EPIDEMIOLOGIC TRENDS IN DRUG ABUSE—Baltimore
Proceedings of the Community Epidemiology Work Group, Vol. II, June 2005 32

EPIDEMIOLOGIC TRENDS IN DRUG ABUSE—Baltimore
Proceedings of the Community Epidemiology Work Group, Vol. II, June 2005 33

EPIDEMIOLOGIC TRENDS IN DRUG ABUSE—Baltimore
Proceedings of the Community Epidemiology Work Group, Vol. II, June 2005 34

EPIDEMIOLOGIC TRENDS IN DRUG ABUSE—Baltimore
Proceedings of the Community Epidemiology Work Group, Vol. II, June 2005 35

EPIDEMIOLOGIC TRENDS IN DRUG ABUSE—Greater Boston
Proceedings of the Community Epidemiology Work Group, June 2005 36
Patterns and Trends in Drug Abuse: Greater Boston Daniel P. Dooley1 ABSTRACT Heroin and cocaine indicators remain at very high and stable, if not increasing, levels of abuse. Mari-juana indicators show widespread use and stable levels of abuse. Prescription drugs, most notably narcotic analgesics including oxycodone (OxyCon-tin) and benzodiazepines, show stable levels of mis-use and abuse as well. With the exception of substance abuse treatment admissions, indicators show no signs of overall decreasing misuse and abuse. The number of treatment admissions has fallen considerably during the past three years, but field sources say reductions in funding caused re-ductions in available services and, consequently, fewer admissions. In 2003, there were 269 adult HIV/AIDS cases diagnosed in Boston. The primary transmission risk factors for these cases included 12 percent who were IDUs, 5 percent who had sex with IDUs, and 35 percent with an unknown/undeter-mined risk factor. INTRODUCTION Area Description This report presents data from a number of different sources with varied Boston-area geographical pa-rameters. A description of the relevant boundary pa-rameters is included with each data source description. For simplicity, these are all referred to as “Boston” throughout the text. According to the 2000 U.S. census, Massachusetts ranks 13th in population (6,349,097 people). The 746,914 people in the metropolitan Boston area rep-resent 12 percent of the total Massachusetts popula-tion. The 2000 census data show that there were 589,141 residents of the city of Boston. The racial composition includes 50 percent White non-Hispanic, 23 percent Black non-Hispanic, 14 percent Hispanic/ Latino, and 8 percent Asian. Several characteristics influence drug trends in Bos-ton and throughout Massachusetts:
1The author is affiliated with the Boston Public Health Commis-sion, Boston, Massachusetts.
• Contiguity with five neighboring States (Rhode Island, Connecticut, New York, Vermont, and New Hampshire) linked by a network of State and interstate highways
• Proximity to Interstate 95, which connects Boston
to all major cities on the east coast, particularly New York
• A well-developed public transportation system
that provides easy access to communities in east-ern Massachusetts
• A large population of college students in both the
greater Boston area and western Massachusetts • Several seaport cities with major fishing industries
(now in decline) and harbor areas • Logan International Airport and several regional
airports within a 1-hour drive of Boston
• State budget cutbacks on social services
• A high number of homeless individuals seeking shelter
Data Sources Data sources for this report include the following: • Emergency department (ED) drug mentions
data were provided by the Drug Abuse Warning Network (DAWN), Office of Applied Studies (OAS), Substance Abuse and Mental Health Ser-vices Administration (SAMHSA), for a Boston metropolitan area consisting of five Massachusetts counties: Essex, Middlesex, Norfolk, Plymouth, and Suffolk. DAWN weighted estimates for 2002 are presented in this paper and are the most recent final estimates. In 2003, OAS instituted a redes-igned ED system. The data from the new system cannot be compared with those for 2002 and be-fore. In the Boston metropolitan area, 29 of the 41 eligible hospitals are in the new DAWN sample (exhibit 1). The EDs in the new sample total 34. (Some hospitals have more than one ED.) For this report, data were accessed from the DAWN Live! restricted-access online query system for 2004, updated on May 13, 2005. The 2004 data are un-weighted. They are not estimates for the Boston area and cannot be used for comparison with fu-ture data. Only weighted data released by SAMHSA can be used in trend analysis. The data

EPIDEMIOLOGIC TRENDS IN DRUG ABUSE—Greater Boston
Proceedings of the Community Epidemiology Work Group, June 2005 37
reported here are incomplete. Between 18 and 23 EDs reported each month during the year. Since all DAWN cases are reviewed for quality control, and cases may be corrected or deleted based on the review, the data are subject to change. Data presented in this paper represent drug reports in drug-related visits in 2004. Drug reports exceed the number of visits, since a patient may report use of multiple drugs (up to six drugs plus alco-hol). A full description of the DAWN system can be found at <http://dawninfo.samhsa.gov>.
• Drug-related death data were provided by
DAWN, OAS, SAMHSA, for 2003 for a Boston metropolitan area consisting of five Massachusetts counties, including Essex, Middlesex, Norfolk, Plymouth, and Suffolk, and two New Hampshire counties, including Rockingham and Strafford.
• State-funded substance abuse treatment ad-
missions data for a Boston region comprising the cities of Boston, Brookline, Chelsea, Revere, and Winthrop (Community Health Network Area [CHNA] 19), for fiscal year (FY) 1997 through FY 2004 (July 1, 1996, through June 30, 2004) and the first half of FY 2005 (July 1, 2004–December 31, 2004) were provided by the Massa-chusetts Department of Public Health (DPH), Bu-reau of Substance Abuse Services.
• Analysis of seized drug samples for a Boston
region comprising the cities of Boston, Brookline, Chelsea, Revere, and Winthrop (CHNA 19) for 1997 through 2004 was provided by the Massa-chusetts Department of Public Health Drug Analysis Laboratory in Amherst, Massachusetts. The Boston area drug sample counts do not in-clude samples analyzed at the Worcester County or State Police laboratories.
• Information on drug mentions in Helpline calls
for a Boston region comprising the cities of Bos-ton, Brookline, Chelsea, Revere, and Winthrop (CHNA 19) for FY 2000 through FY 2004 were provided by the Massachusetts Substance Abuse Information and Education Helpline.
• Drug arrests data for the city of Boston for
1997–2004 were provided by the Boston Police Department, Drug Control Unit and Office of Re-search and Evaluation. For arrest data only, Black and White racial designations include those who identify themselves as Hispanic.
• Drug price, purity, and availability data for
New England were provided by the Drug En-
forcement Administration (DEA), New England Field Division Intelligence Group, June 2005.
• Data on Massachusetts pharmacy OxyContin
thefts for 2001 through 2004 were provided by the Massachusetts Pharmacy Board of Registra-tion.
• Adult acquired immunodeficiency syndrome
(AIDS) and human immunodeficiency virus (HIV) data for 2003, and cumulative data through May 1, 2005, were provided by the Massachusetts Department of Public Health AIDS Surveillance Program.
Cocaine/Crack Cocaine and crack are among the most heavily abused drugs in Boston. Recent cocaine/crack indica-tors are stable at high levels of use and abuse. In 2003, cocaine was indicated in 216 of the 486 drug misuse deaths in greater Boston (44.4 percent)—more than any other drug. Seventy-two of those were single-drug deaths. The cocaine/crack ED mentions rate of 156 per 100,000 population in 2002 was similar to that of the 2 previous years. Exhibit 2 shows 5,611 cocaine ED mentions in 2002.
The 2002 ED rates by gender show that the co-caine/crack rate for males was almost 1.8 times the rate for females (200 vs. 113 per 100,000 popula-tion). The highest rate by an age group (358 per 100,000 population) occurred among those age 26–34. Within that group, those age 26–29 experienced a rate of 403 per 100,000 population. A 2-year rate increase of 76 percent was reported among those age 18–25. Similarly, a 2-year rate increase of 70 percent occurred among those age 45–54. In the unweighted data accessed from DAWN Live! for 2004, cocaine reports totaled 3,348. In the first half of FY 2005, there were 674 treatment admissions (8 percent of all admissions) with clients reporting cocaine or crack as their primary drug (ex-hibit 3). Of these, 401 (60 percent) indicated crack as the client’s primary drug. There were 2,230 men-tions (25 percent of all admissions) of current (past- month) cocaine/crack use among those admitted to State-funded treatment programs (exhibit 3). A comparison of the last full year of data (FY 2004) to previous years shows the proportion reporting co-

EPIDEMIOLOGIC TRENDS IN DRUG ABUSE—Greater Boston
Proceedings of the Community Epidemiology Work Group, June 2005 38
caine/crack as their primary drug decreased 10 per-cent from FY 2003, 16 percent from FY 2002, and 62 percent from FY 1997. The proportion of mentions of current (past-month) cocaine/crack use decreased 6 percent from FY 2003 and 33 percent from FY 1997.
Exhibit 4 shows demographic characteristics of all treatment admissions, and exhibit 5a shows them for cocaine/crack treatment admissions in Boston. For further demographic comparisons of annual treatment admissions, see “Patterns and Trends in Drug Abuse: Greater Boston” in Proceedings of the Community Epidemiology Work Group, Volume II, January 2005. There were 1,650 Class B (mainly cocaine and crack) drug arrests in 2004 (exhibit 6). Class B arrests ac-counted for the largest proportion of drug arrests (43 percent) in the city of Boston in 2004, similar to 2003. However, the proportion of Class B arrests decreased 9 percent from 1997 to 2004. The proportion of White Class B arrests (31 percent) decreased 20 percent from 1997 to 2004, while the proportion of Black Class B arrests (68 percent) in-creased 13 percent. The proportion of Class B arrests represented by those age 40 and older (27 percent) increased 66 percent from 1997, while arrests for those age 25–39 (44 percent) decreased 19 percent and arrests for those younger than 20 decreased 27 percent during the same period. In 2004, 2,632 seized samples of cocaine/crack were analyzed. The proportion of cocaine/crack samples among all drug samples analyzed (30 percent) did not change from 2003, but it decreased 14 percent from 1997. Cocaine/crack was self-identified as a substance of abuse in 1,017 calls to the Helpline in FY 2004. The proportion of Helpline calls with mentions of co-caine/crack (18 percent) decreased 9 percent from FY 2003 to FY 2004. The DEA reports that cocaine costs $50–$90 per gram and purity is increasing in Boston (exhibit 7). A rock of crack costs $10–$20. Cocaine is considered “readily available at all levels” throughout Massa-chusetts. Heroin Heroin sits solidly among the most abused drugs in Boston. A few of the most recent indicators show heroin abuse possibly stabilizing at very high levels after years of continued growth. Heroin was men-tioned often among drug abuse deaths. Heroin ED
mentions were stable at high levels. The proportion of heroin treatment admissions continued to rise, with more than one-half of all clients in treatment report-ing heroin as their primary drug. In 2003, heroin/morphine was indicated in 109 of the 486 drug misuse deaths (22.4 percent). Fifty of those were single-drug misuse deaths. In 2002, there were 3,999 heroin ED mentions; her-oin was a factor in 22.3 percent of all drug episodes (exhibit 2). The heroin ED mentions rate of 111 per 100,000 population was similar to that of the 2 previ-ous years. The 2002 ED rates by gender show that the heroin rate for males is more than two times the rate for females (152 vs. 72 per 100,000 population). The highest rate by an age group (311 per 100,000 population) oc-curred among those age 26–29. A 2-year rate increase of 215 percent was seen among those age 18–19. In the unweighted data accessed from DAWN Live! for 2004, heroin reports totaled 3,341. In the first half of FY 2005, 4,589 treatment admis-sions (51 percent of all admissions) indicated heroin as the primary drug, and there were 4,338 mentions (48 percent of all admissions) of current (past-month) heroin use among those admitted to State-funded treatment programs (exhibit 3). A comparison of the last full year of data (FY 2004) to previous years shows the proportion of admissions reporting heroin as the primary drug in FY 2004 was stable from FY 2003 but reflected increases of 11 percent from FY 2002 and 68 percent from FY 1997. Similarly, the proportion of mentions of current (past-month) heroin use in FY 2004 was stable from FY 2003, but this reflected increases of 7 percent from FY 2002 and 62 percent from FY 1997 Exhibit 5b shows demographic characteristics of her-oin or other opiates primary treatment admissions in Boston. For further demographic comparisons of annual treatment admissions, see “Patterns and Trends in Drug Abuse: Greater Boston” in Proceed-ings of the Community Epidemiology Work Group, Volume II, January 2005. There were 791 Class A (mainly heroin and other opiates) drug arrests in 2004 (exhibit 6). The propor-tion of Class A drug arrests among all drug arrests in the city of Boston in 2004 (21 percent) was a de-crease of 8 percent from 1997. The proportion of Class A male arrests in 2004 (82 percent) reflected a

EPIDEMIOLOGIC TRENDS IN DRUG ABUSE—Greater Boston
Proceedings of the Community Epidemiology Work Group, June 2005 39
6-percent decrease from 2003 but is similar to 2002 and 1997. The proportion of Class A arrests among those age 20–24 in 2004 (18 percent) reflected an 88-percent increase from 1997. In 2004, 1,139 seized samples of heroin (13 percent of all drug samples) were analyzed. The proportion of heroin samples among all drug samples analyzed de-creased 17 percent from 2003 to 2004. Heroin was self-identified as a substance of abuse in 2,230 calls to the Helpline in FY 2004 (40 percent of all mentions). The proportion of heroin Helpline call mentions in FY 2004 represented increases of 9 per-cent from FY 2003, 13 percent from FY 2002, and 21 percent from FY 2001. The DEA reports that in Boston, street heroin costs $6–$20 per bag, with an average purity between 40 and 60 percent (exhibit 5). Boston’s heroin is typi-cally from South America and transported to the area from the New York metropolitan area. Heroin is considered “readily available throughout New Eng-land” and is available in all forms: bag, bundle, gram, ounce, kilogram, and cylinder-shaped bullets/eggs. Narcotic Analgesics After years of growing narcotic analgesic abuse, a couple of indicators suggest that this trend may be starting to stabilize. Narcotic analgesics were mentioned 223 times among 486 drug misuse deaths in 2003. Forty-nine of those mentions were single-drug deaths, representing 24 percent of the 206 total single-drug deaths. Morphine was identified in 85 of the total 486 drug misuse deaths. Of these, 15 were single-drug deaths. Oxycodone was identified in 72 drug misuse deaths (15 percent of the total). Of these, 13 were single-drug deaths. Methadone was identified in 35 drug misuse deaths; 8 of these were single-drug deaths. Fentanyl was mentioned in 13 drug misuse deaths, of which six were single-drug deaths. There were an estimated 3,479 narcotic analge-sics/combinations ED mentions in 2002. This number represents a 73-percent increase from 2000 and 153-percent increase from 1995. The 2002 narcotic anal-gesics/combinations rate of 97 ED mentions per 100,000 population is twice the national rate of 46 and fourth highest among all 21 DAWN sites. In 2002, Boston had the highest oxycodone/combina-tions ED rate (a subset of the narcotic analge-
sics/combinations category) among all 21 DAWN sites. Boston’s rate of 34 was 3.8 times the national rate of 9 and an increase of 118 percent from 2000. Preliminary unweighted data from DAWN Live! show 2,968 ED reports of opiates/opioids in 2004; there were 1,587 oxycodone reports and 355 reports for hy-drocodone. In the first half of FY 2005, there were 195 clients (2 percent of all admissions) admitted to treatment who identified other opiates/synthetics as their primary drug, and there were 466 mentions (5 percent of all admis-sions) of current other opiate use among those admitted to State-funded treatment programs (exhibit 3). Though the half-year treatment data suggest de-creases in the proportion and number of opiate ad-missions, a comparison of the last full year of data (FY 2004) to previous years shows the number of clients reporting other opiates as their primary drug (n=781) increased 243 percent from FY 2000 to FY 2004 and 830 percent from FY 1997 to FY 2004. The number of mentions of current other opiate use in FY 2004 (n=1,529) represented increases of 65 percent from FY 2000 and 166 percent from FY 1997. In 2004, 246 seized samples of oxycodone (3 percent of all drug samples) were analyzed. The proportion of oxycodone samples among all drug samples analyzed was stable from 2003 to 2004. In FY 2004, there were 1,025 calls to the Helpline during which opiates were mentioned (18 percent of all calls). Oxycodone (including OxyContin) was men-tioned in 691 calls. Helpline calls with oxycodone mentions in FY 2004 (12 percent of total) reflected increases of 25 percent from FY 2003, 52 percent from FY 2002, and 261 percent from FY 2001. Other nar-cotic analgesics, including methadone, codeine, mor-phine, Percocet, Vicodin, and Roxicet, were mentioned among 401 calls (7 percent of total calls). Statewide OxyContin thefts continued to decrease in number. There were 33 statewide OxyContin thefts from pharmacies reported during 2004, compared with 62 in 2003, 93 in 2002, and the peak of 139 thefts in 2001. Changes in pharmacy supply proce-dures are believed to have played a major role in pre-venting thefts. The DEA reports that OxyContin is “available” on the street and typically costs about $1 per milligram (exhibit 7).

EPIDEMIOLOGIC TRENDS IN DRUG ABUSE—Greater Boston
Proceedings of the Community Epidemiology Work Group, June 2005 40
Marijuana The most recent marijuana indicators for greater Bos-ton are stable at relatively high levels. Marijuana was identified in 18 of the 486 drug mis-use deaths in 2003. In 2002, there were 4,273 marijuana ED mentions; marijuana was a factor in 24 percent of all drug epi-sodes (exhibit 2). The marijuana ED mentions rate of 119 per 100,000 population was similar to that of the 2 previous years. The 2002 marijuana ED rates by gender show that the rate for males was almost two times the rate for fe-males (156 vs. 83 per 100,000 population). The high-est rate by an age group (321 per 100,000 population) occurred among those age 18–25. Within that group, those age 18–19 experienced a rate of 630 per 100,000 population. The unweighted data from DAWN Live! indicate there were 1,801 ED reports for marijuana in 2004. In the first half of FY 2005, there were 296 treatment admissions (3 percent of all admissions) with clients reporting marijuana as their primary drug (exhibit 3), and 839 mentions (9 percent of all admissions) of current marijuana use among those admitted to State-funded treatment programs (exhibit 3). A comparison of the last full year of data to previous years shows the proportion of treatment admissions reporting marijuana as their primary drug in FY 2004 was similar to the proportions in FY 2003, FY 2002, and FY 1997. The proportion of mentions of current marijuana use decreased 10 percent from FY 2003 to FY 2004 and 34 percent from FY 1997 to FY 2004. Exhibit 5c shows demographic characteristics of marijuana treatment admissions in Boston. For fur-ther demographic comparisons of annual treatment admissions, see “Patterns and Trends in Drug Abuse: Greater Boston” in Proceedings of the Community Epidemiology Work Group, Volume II, January 2005. There were 1,247 Class D (mainly marijuana) drug arrests in 2004 (exhibit 6). The proportion of Class D arrests among all drug arrests (33 percent) in the city of Boston in 2004 remained stable from 2003 and 2002 but increased 14 percent from 2001. The proportion of Black (including Hispanics) Class D arrests (70 percent) in 2004 increased 6 percent from 2003, 13 percent from 2002, and 25 percent from 1997. The proportion of White (including His-
panics) Class D arrests (29 percent) decreased 10, 21, and 32 percent, respectively, during the same periods. There were 3,358 seized samples of marijuana, more than any other drug, analyzed by the drug lab in 2004. The proportion of marijuana samples analyzed in 2004 (38 percent of all drug samples) was similar to 2003 and 2002. Marijuana was mentioned in 253 calls to the Helpline in FY 2004. The proportion of helpline calls with marijuana mentions remained stable at 5 percent from FY 2003 to FY 2004. The DEA reports that marijuana is readily available in Massachusetts and sells for $800–$1,500 per pound for “commercial grade” and $1,000–$1,200 per pound for “sinsemilla grade.” A marijuana ciga-rette or “joint” typically costs $5. Commercial grade is said to be “readily available,” and high potency hydroponic marijuana termed “Hydro” is said to be “available” throughout New England. Benzodiazepines As a group, benzodiazepines are showing high levels of abuse. Benzodiazepines were mentioned in 88 of 486 drug misuse deaths in 2003. Of these, 16 were single-drug deaths. There were an estimated 3,665 benzodiazepines ED mentions in 2002. Boston’s 2002 rate of 102 benzo-diazepines ED mentions per 100,000 population was highest among all 21 DAWN sites and nearly 2½ times the national rate of 42. In the unweighted DAWN Live! data for 2004, there were 2,095 benzodiazepine reports. Clonazepam, alprazolam, lorazepam, and diazepam were the most often indicated benzodiazepines in preliminary ED data for 2004. In FY 2004, there were 98 treatment admissions (less than 1 percent of all admissions) with clients report-ing benzodiazepines as their primary drug, but 1,613 mentions (8 percent of all admissions) of current (past-month) benzodiazepine use among those admit-ted to State-funded treatment programs. Of treatment admissions reporting current benzodiazepine use, 85 percent were White, 56 percent were younger than age 35, and 66 percent were male. Arrest and drug lab data are currently unavailable for benzodiazepines.

EPIDEMIOLOGIC TRENDS IN DRUG ABUSE—Greater Boston
Proceedings of the Community Epidemiology Work Group, June 2005 41
In FY 2004, there were 175 calls to the Helpline dur-ing which benzodiazepines (including Ativan, Val-ium, Xanax, Klonopin, Rohypnol, Halcion, and others) were self-identified as substances of abuse (3 percent of all calls). The number and proportion of Helpline call mentions attributable to benzodiazepi-nes remained fairly stable from 2000 to 2003. Methylenedioxymethamphetamine (MDMA) MDMA (ecstasy) indicators show stable and rela-tively low levels of abuse. There were an estimated 116 MDMA ED mentions in 2002 (down slightly from 140 in 2001) (exhibit 2). Of these, 59 percent were among males, and 79 per-cent were among those younger than 26. The unweighted data from DAWN Live! for 2004 show 101 MDMA reports. Drug lab submissions show the number of MDMA samples has decreased steadily from a peak of 106 in 2000 to 24 (fewer than 1 percent of the 8,901 total samples) in 2004. In FY 2004, there were 24 calls to the Helpline dur-ing which MDMA was self-identified as a substance of abuse (fewer than 1 percent of all mentions). The number of MDMA Helpline calls has decreased 47 percent from a peak of 45 calls in FY 2002. The DEA reports that one MDMA tablet costs be-tween $20 and $25 retail (exhibit 7). Distributed at clubs and on college campuses, MDMA has re-mained widely available “in spite of law enforcement seizures.” Other Drugs Amphetamines There were an estimated 541 amphetamine ED men-tions in 2002. The 2002 rate of 15 mentions per 100,000 population was the highest amphetamines ED mentions rate that Boston has experienced in 8 years of DAWN reporting. Unweighted DAWN Live! data for 2004 show 184 amphetamine reports. The number of amphetamine lab samples decreased from 47 in 2003 to 14 in 2004. The number of Helpline calls with stimulant mentions remained sta-ble from 60 in FY 2003 to 49 in FY 2004.
Methamphetamine There were only 13 estimated ED mentions of methamphetamine in 2002 (exhibit 2). This number is similar to each of the 2 previous years. In the unweighted DAWN Live! data for 2004, there were 39 methamphetamine ED reports.
Though still relatively small in number, metham-phetamine treatment admissions increased from 5 in FY 2001 to 66 in FY 2003 and 53 in FY 2004. In FY 2004, there were 14 methamphetamine men-tions among calls to the Helpline. The DEA reports that methamphetamine costs $250 per gram and is available “in limited (user-level) quantities” in New England (exhibit 7). The purity level is unknown. Ketamine There were an estimated 13 ketamine ED mentions in 2002. This number is similar to each of the 2 previ-ous years. Only three ketamine ED reports appear in the un-weighted DAWN Live! data for 2004. Ketamine lab samples have decreased in number from 43 in 2002 to 11 in 2003 and 8 in 2004. The DEA reports that a vial of ketamine costs $55 to $100. Barbiturates There were an estimated 637 barbiturates ED mentions in 2002. Boston’s ED rate of 18 barbiturates mentions per 100,000 population was the highest barbiturates rate among the 8 years of DAWN reporting and 4½ times the national rate of 4. In the unweighted DAWN Live! data for 2004, there were 115 barbiturate ED reports. Lysergic Acid Diethylamide (LSD), Phencyclidine (PCP), and Gamma Hydroxybutyrate (GHB) There were few estimated LSD, PCP, or GHB ED mentions in Boston during 2002 (19, 20, and 27, re-spectively) (exhibit 2). The DEA reports that LSD costs $5 per dose. GHB costs $150 per ounce.

EPIDEMIOLOGIC TRENDS IN DRUG ABUSE—Greater Boston
Proceedings of the Community Epidemiology Work Group, June 2005 42
INFECTIOUS DISEASES RELATED TO DRUG ABUSE In 2003, there were 269 adult HIV and AIDS cases diagnosed in Boston. The primary risk factor for these cases included 12 percent who were injection drug users (IDUs), 5 percent who had sex with IDUs, and 35 percent with an unknown/undetermined transmission status. As of May 1, 2005, cumulative
adult AIDS cases numbered 6,054. By primary risk factor, these included 26 percent who were IDUs, 7 percent who had sex with IDUs, and 13 percent for whom the risk behavior was unknown/undetermined. For inquiries concerning this report, please contact Daniel P. Dooley, Boston Public Health Commission, 1010 Massachusetts Avenue, Boston, MA 02118, Phone: (617) 534-2360, Fax: (617) 534-2422, E-mail: [email protected].

EPIDEMIOLOGIC TRENDS IN DRUG ABUSE—Greater Boston
Proceedings of the Community Epidemiology Work Group, June 2005 43
Exhibit 1. DAWN ED Sample and Reporting Information: January–December 2004
No. of EDs Reporting per Month: Completeness of Data (%) CEWG Area Total Eligible
Hospitals1
No. of Hos-pitals in DAWN Sample
Total EDs in DAWN
Sample2 90–100% 50–89% <50%
No. of EDs Not
Reporting
Boston 41 29 34 15–23 0–3 0–4 11–16 1Short-term, general, non-Federal hospitals with 24-hour emergency departments based on the American Hospital Association An-nual Survey. 2Some hospitals have more than one emergency department. SOURCE: DAWN Live!, OAS, SAMHSA, updated 5/13/2005 Exhibit 2. Estimated Emergency Department Mentions for Selected Drugs as a Percentage of Total Drug Episodes1: 1995–2002
1995 1996 1997 1998 1999 2000 2001 2002 Drug
No. (%) No. (%) No. (%) No. (%) No. (%) No. (%) No. (%) No. (%)
Alcohol-in-comb. 6,297 (39) 5,351 (40) 4,890 (40) 5,130 (38) 4,438 (38) 4,975 (33) 5,818 (35) 5,916 (33)Cocaine/ Crack 5,267 (33) 4,106 (30) 3,332 (27) 4,526 (33) 3,560 (31) 4,099 (28) 4,933 (29) 5,611 (31)
Marijuana/ Hashish 2,401 (15) 2,127 (16) 1,768 (15) 2,907 (21) 1,960 (17) 2,945 (20) 3,423 (20) 4,273 (24)
Heroin/ Morphine 2,956 (18) 2,729 (20) 2,500 (21) 2,738 (20) 2,861 (25) 3,867 (26) 4,358 (26) 3,999 (22)
Oxycodone/ comb. 276 (2) 241 (2) 231 (2) 247 (2) 294 (3) 598 (4) 948 (6) 1,239 (7)
Hydrocodone/ comb. 85 (<1) 74 (<1) 93 (<1) 97 (<1) 106 (<1) 201 (1) 208 (1) 288 (2)
PCP 81 (<1) 18 (<1) 22 (<1) 21 (<1) 7 (<1) 11 (<1) 23 (<1) 20 (<1)
LSD 184 (1) 82 (<1) 37 (<1) 53 (<1) 44 (<1) 41 (<1) 33 (<1) 19 (<1)Methampheta-mine 7 (<1) …. —2 …. —2 6 (<1) 12 (<1) 14 (<1) 14 (<1) 13 (<1)
MDMA 7 (<1) 9 (<1) 16 (<1) 39 (<1) 87 (<1) 125 (<1) 140 (<1) 116 (<1)Total drug Episodes 16,065 13,530 12,224 13,656 11,668 14,901 16,853 17,965
Total drug Mentions 30,026 24,904 22,383 24,875 21,217 25,854 29,795 32,488
1Percentage of episodes for which each drug was mentioned (mentions/total drug episodes) rounded to the nearest whole number, except when <1 percent. 2Estimate does not meet standard of precision. SOURCE: Office of Applied Studies, SAMHSA, Drug Abuse Warning Network, 2002 (03/2003 update); prepared by the Boston Public Health Commission, Research Office

EPIDEMIOLOGIC TRENDS IN DRUG ABUSE—Greater Boston
Proceedings of the Community Epidemiology Work Group, June 2005 44
Exhibit 3. Percentages of Admissions to State-Funded Substance Abuse Treatment Programs by Primary Drug and Drug Used in the Past Month in Greater Boston1: FY 1997–1H FY 20052 FY 1997 FY 1998 FY 1999 FY 2000 FY 2001 FY 2002 FY 2003 FY 2004 1H FY
2005 Primary Drug Alcohol Heroin and/or Other Opiates Heroin Other Opiates Cocaine and/or Crack Cocaine (powder) Crack Marijuana Other3
46 29
29 0
19 9
10 4 1
45 35
35 0
14 7 7 4 1
45 36
36 1
13 7 6 5 1
45 37
36 1
12 5 6 5 1
44 42
40 2 9 4 5 4 1
40 46
43 3 9 4 5 4 1
36 50
47 3 8 3 5 4 1
35 52
48 4 7 3 4 4 1
34 53
51 2 8 3 4 3 1
Total (N) 25,470 23,008 24,653 24,478 25,334 25,586 24,440 20,041 8,948 Drug Used Past Month Alcohol Heroin and/or Other Opiates Heroin Other Opiates Cocaine and/or Crack Cocaine (powder) Crack Marijuana
60 29
28 2
34 22 19 16
59 34
33 3
30 21 16 14
59 35
34 3
30 21 15 14
58 37
35 4
28 20 13 13
56 42
39 5
25 18 12 13
53 45
42 6
24 17 11 11
50 48
45 7
24 18 11 11
47 49
46 8
23 16 11 10
47 51
48 5
25 16 13 9
Total (N) 25,470 23,008 24,653 24,478 25,334 25,586 24,440 20,041 8,948 1Excluding prisoners and out-of-State admissions. 2Fiscal years (FYs) run July 1–June 30, with the year named for the January–June portion of the year. 1H FY 2005 runs July 2004–December 2004. 3Includes barbiturates, other sedatives, tranquilizers, hallucinogens, amphetamines, “over-the-counter,” and other drugs. SOURCE: Massachusetts Department of Public Health, Bureau of Substance Abuse Services; prepared by the Boston Public Health Commission, Research Office

EPIDEMIOLOGIC TRENDS IN DRUG ABUSE—Greater Boston
Proceedings of the Community Epidemiology Work Group, June 2005 45
Exhibit 4. Demographic Characteristics of Admissions to Greater Boston State-Funded Substance Abuse Treatment Programs1, by Percent: FY 1997–FY 20042
Characteristic FY 1997 FY 1998 FY 1999 FY 2000 FY 2001 FY 2002 FY 2003 FY 2004 Gender Male Female
72 28
75 25
74 26
76 24
77 23
77 23
74 26
73 27
Race White Black Hispanic Other
47 35 14
3
49 32 15
4
48 33 16
4
49 32 16
4
48 30 18
4
49 29 18
4
50 28 18
4
54 26 17
3 Age at Admission (Average age) 18 and younger 19–29 30–39 40–49 50 and older
(35.1)
3 25 43 22
7
(35.6)
3 24 42 23
8
(36.5)
2 22 41 27
9
(36.7)
2 21 40 29
9
(36.5)
2 22 38 29
9
(36.5)
2 24 37 28 10
(36.7)
2 24 34 30 10
(36.9)
2 26 31 30 11
Marital Status Married Separated/divorced Never married
10 22 68
10 22 68
10 21 69
10 19 71
10 18 72
10 18 72
10 18 72
9
17 74
Annual Income None $1–$1,000 $1,000–$9,999 $10,000 and higher
56
3 26 15
56
3 24 16
54
4 26 16
59
3 21
17
61
2 19 18
69
2 14 16
68
2 14 16
63
3 18 16
Homeless 32 31 31 30 34 37 37 36 Criminal Justice System Involvement 26 26 28 27 26 27 24 23
Mental Health No prior treatment Prior treatment (counseling or hospitalization)
82
18
80
20
79
21
80
20
81
19
80
20
80
20
78
22
Needle Use in Past Year 22 25 26 26 27 32 37 38 Total (N) (25,470) (23,008) (24,653) (24,478) (25,334) (25,586) (24,440) (20,041)
1Excludes prisoners and out-of-State admissions. 2Fiscal years (FYs) run July 1–June 30, with the year named for the January–June portion of the year. SOURCE: Massachusetts Department of Public Health, Bureau of Substance Abuse Services; prepared by the Boston Public Health Commission, Research Office

EPIDEMIOLOGIC TRENDS IN DRUG ABUSE—Greater Boston
Proceedings of the Community Epidemiology Work Group, June 2005 46
Exhibit 5a. Demographic Characteristics of Clients1 in Greater Boston State-Funded Substance Abuse Treatment Programs with a Primary Problem with Cocaine/Crack, by Percent: FY 1997–FY 20042
Characteristic FY 1997 FY 1998 FY 1999 FY 2000 FY 2001 FY 2002 FY 2003 FY 2004 Gender Male Female
60 40
61 39
59 41
59 41
62 38
63 37
56 44
57 43
Race White Black Latino Other
25 63 10
2
24 64 10
3
23 63 11
3
23 65 10
3
26 60 12
3
25 61 11
3
27 58 11
4
27 58 12
3 Age at Admission (Average age) 18 and younger 19–29 30–39 40–49 50 and older
(32.8)
1 31 53 13
2
(33.6)
1 28 53 16
2
(35.2)
1 19 56 21
4
(35.5)
<1 18 55 23
4
(36.0)
1 15 55 26
4
(36.7)
<1 15 51 29
5
(37.1)
1 15 49 31
5
(38.0)
1 13 45 35
7 Marital Status Married Separated/divorced Never married
9
17 75
10 19 71
11 19 71
10 16 74
11 17 72
12 19 69
12 19 70
10 21 69
Annual Income $0–$999 $1,000–$9,999 $10,000 and higher
59 28 13
57 27 17
56 29 16
59 24 17
58 22 21
60 23 18
56 26 18
54 29 17
Homeless 28 26 23 21 23 28 24 24 Criminal Justice System Involvement 20 25 30 29 30 33 31 31 Mental Health Problem 21 22 27 28 29 31 36 36
Needle Use in Past Year 5 6 6 5 7 7 9 8 Total (N) (4,920) (3,266) (3,165) (2,837) (2,291) (2,230) (1,985) (1,470)
1Excludes prisoners and out-of-State admissions. 2Fiscal years (FYs) run July 1–June 30, with the year named for the January–June portion of the year. SOURCE: Massachusetts Department of Public Health, Bureau of Substance Abuse Services; prepared by the Boston Public Health Commission, Research Office

EPIDEMIOLOGIC TRENDS IN DRUG ABUSE—Greater Boston
Proceedings of the Community Epidemiology Work Group, June 2005 47
Exhibit 5b. Demographic Characteristics of Clients1 in Greater Boston State-Funded Substance Abuse Treatment Programs with a Primary Problem with Heroin or Other Opiates, by Percent: FY 1997–FY 20042
Characteristic FY 1997 FY 1998 FY 1999 FY 2000 FY 2001 FY 2002 FY 2003 FY 2004 Gender Male Female
69 31
72 28
72 28
75 25
76 24
77 23
74 26
72 28
Race White Black Latino Other
49 26 21
4
48 24 22
6
49 24 22
5
51 22 23
5
50 21 25
5
53 19 25
4
56 18 22
5
61 15 21
3 Age at Admission (Average age) 18 and younger 19–29 30–39 40–49 50 and older
(34.5)
1 28 45 24
3
(34.6)
1 29 42 24
4
(35.2)
1 27 42 25
6
(35.3)
1 27 40 27
5
(35.1)
1 29 39 26
6
(34.6)
1 32 37 24
6
(35.2)
1 31 35 26
7
(35.1)
1 33 32 26
8 Marital Status Married Separated/divorced Never married
11 22 68
11 21 68
10 20 70
11 19 71
10 17 73
10 15 75
9
16 75
7
16 77
Annual Income $0–$999 $1,000–$9,999 $10,000 and higher
67 23 10
69 21 10
67 23 10
72 16 12
73 15 12
78 11 11
78 12 10
74 16 10
Homeless 28 25 26 22 29 35 40 39 Criminal Justice System Involvement 16 18 20 19 19 19 16 16
Mental Health Problem 17 17 18 16 16 16 16 18
Needle Use in Past Year 64 63 63 63 58 62 68 68 Total (N) (7,372) (8,145) (8,932) (9,151) (10,613) (11,850) (12,210) (10,402)
1Excludes prisoners and out-of-State admissions. 2Fiscal years (FYs) run July 1–June 30, with the year named for the January–June portion of the year. SOURCE: Massachusetts Department of Public Health, Bureau of Substance Abuse Services; prepared by the Boston Public Health Commission, Research Office

EPIDEMIOLOGIC TRENDS IN DRUG ABUSE—Greater Boston
Proceedings of the Community Epidemiology Work Group, June 2005 48
Exhibit 5c. Demographic Characteristics of Clients1 in Greater Boston State-Funded Substance Abuse Treatment Programs with a Primary Problem with Marijuana, by Percent: FY 1997–FY 20042
Characteristic FY 1997 FY 1998 FY 1999 FY 2000 FY 2001 FY 2002 FY 2003 FY 2004 Gender Male Female
76 24
78 22
76 24
73 27
78 22
77 23
77 23
71 29
Race White Black Latino Other
37 39 20
4
32 42 22
4
28 44 23
4
28 47 21
4
29 47 22
3
27 48 20
5
26 49 22
4
29 47 20
3 Age at Admission (Average age) 18 and younger 19–29 30–39 40–49 50 and older
(24.0)
33 43 18
5 1
(24.2)
29 48 18
5 1
(25.1)
24 50 17
6 2
(25.4)
19 56 18
5 2
(24.3)
27 51 16
6 1
(24.8)
24 50 19
6 1
(25.2)
22 52 18
7 2
(26.3)
17 52 21
7 2
Marital Status Married Separated/divorced Never married
6 5
89
6 6
89
4 6
90
5 7
88
5 6
90
6 7
88
6 6
89
6 6
88 Annual Income $0–$999 $1,000–$9,999 $10,000 and higher
58 28 15
50 31 19
59 27 14
55 27 18
57 22 21
60 21 19
64 21 16
53 28 19
Homeless 8 8 9 10 11 12 9 11 Criminal Justice System Involvement 38 47 53 48 48 50 43 44
Mental Health Problem 25 31 23 27 25 29 31 35
Needle Use in Past Year 1 2 2 2 2 2 2 2 Total (N) (1,119) (928) (1,125) (1,109) (1,100) (1,054) (1,046) (857)
1Excludes prisoners and out-of-State admissions. 2Fiscal years (FYs) run July 1–June 30, with the year named for the January–June portion of the year. SOURCE: Massachusetts Department of Public Health, Bureau of Substance Abuse Services; prepared by the Boston Public Health Commission, Research Office

EPIDEMIOLOGIC TRENDS IN DRUG ABUSE—Greater Boston
Proceedings of the Community Epidemiology Work Group, June 2005 49
Exhibit 6. Boston Police Department Arrests, by Substance,1 Number, and Percent: 1997–2004
1997 1998 1999 2000 2001 2002 2003 2004 Drug Class Number
(%) Number
(%) Number
(%) Number
(%) Number
(%) Number
(%) Number
(%) Number
(%) A
(Mostly Heroin)
1,392 (22.7)
1,061 (22.5)
984 (24.0)
1,022 (27.1)
905 (26.4)
947 (22.5)
939 (22.5)
791 (20.8)
B (Mostly
Cocaine) 2,918 (47.5)
2,225 (47.1)
1,847 (45.1)
1,532 (40.6)
1,428 (41.7)
1,762 (41.9)
1,736 (41.6)
1,650 (43.3)
D (Mostly
Marijuana)
1,617 (26.3)
1,211 (25.6)
1,133 (27.7)
1,093 (29.0)
982 (28.7)
1,375 (32.7)
1,366 (32.7)
1,247 (32.8)
Other 216 (3.5)
226 (4.8)
133 (3.3)
123 (3.3)
111 (3.2)
125 (3.0)
133 (3.2)
119 (3.1)
Total Drug Arrests 6,143 4,723 4,097 3,770 3,426 4,209 4,174 3,807
Total Arrests 27,843 25,481 23,592 22,216 20,470 21,025 20,686 19,577 Drug Per-centage of Total Arrests
(23.7) (18.5) (17.4) (17.0) (16.7) (20.0) (20.2) (19.4)
1Includes all arrests made by the Boston Police Department (i.e., arrests for possession, distribution, manufacturing, trafficking, possession of hypodermic needles, conspiracy to violate false substance acts, and forging prescriptions). SOURCE: Boston Police Department, Office of Planning and Research; prepared by the Boston Public Health Commission, Re-search Office Exhibit 7. Drug Street Price, Purity, and Availability in Boston: November 2003–December 2004
Drug Price Purity Availability
Heroin $53–$100 per gram $60–$100 per bundle $6–$20 per bag
High (bag-40%-60%) Readily
Cocaine (powder) $50–$90 per gram retail Increasing Steady, available Crack $10–$20 per rock
Marijuana $5 per joint $200–$250 per ounce Commercial Grade Readily
Methamphetamine $250 per gram Unknown Limited quantities MDMA (Ecstasy) $20–$25 per tablet High (clubs & colleges) OxyContin $1 per milligram LSD $5 per dose Ketamine $50–$100 per vial
GHB $5 per capful, $150 per ounce
SOURCES: New England Field Division, Drug Enforcement Administration (DEA) as of June 2005; prepared by the Boston Public Health Commission, Research Office

EPIDEMIOLOGIC TRENDS IN DRUG ABUSE—Chicago
Proceedings of the Community Epidemiology Work Group, Vol. II, June 2005 50
Patterns and Trends of Drug Abuse in Chicago Dita Broz, M.P.H., Matthew Magee, Wayne Wiebel, Ph.D., and Lawrence Ouellet, Ph.D.1 ABSTRACT Most indicators suggest that heroin and cocaine continue to pose a serious problem for Chicago and Illinois. According to preliminary unweighted data from DAWN Live!, cocaine and heroin were the top two illicit drugs most reported in emergency de-partments in 2003 and 2004. Heroin-related treat-ment episodes increased between FYs 2000 and 2004, indicating continued high levels of use. The purity of street-level heroin decreased between 2001 and 2003 from about 24 percent to 16 percent, though ethnographic reports suggest a recent in-crease. Many cocaine indicators remain the highest for all substances except alcohol. Cocaine-related treatment episodes increased between FYs 2002 and 2003 by 20 percent, but they decreased slightly in FY 2004. Marijuana remains the most widely avail-able and used illicit drug. Methamphetamine indi-cators continued to show low but increasing levels of use in some areas of Chicago, especially on the north side, where young gay men and clubgoers congregate. Methamphetamine use is significantly higher in downstate Illinois. MDMA (ecstasy) ED mentions decreased 60 percent between 2000 and 2002, but increases in use have been reported among young African-Americans. LSD and PCP indicators suggest a downward trend in use. The proportion of new AIDS cases attributed to injection drug use peaked at 33 percent in 1996 then steadily decreased to 24 percent in 2002. Prospective studies of young heroin users in Chicago conducted by the authors of this report suggest low HIV and HCV seroprevalence, but substantial levels of risk prac-tices that place them at high risk for acquiring these infections. INTRODUCTION Area Description Due to its geographic location and multifaceted transportation infrastructure, Chicago is a major transportation hub and distribution center for illegal drugs throughout the Midwest. Located in northeast-ern Illinois, the city of Chicago stretches for 25 miles
1The authors are affiliated with the University of Illinois at Chi-cago, School of Public Health, Chicago, Illinois.
along the southern tip of Lake Michigan's shore. The 2000 U.S. census estimated the population of Chi-cago at 2.9 million and Cook County (which includes Chicago) at 5.4 million. In June 2003, the U.S. Office of Management and Budget (OMB) revised defini-tions for the Nation’s Metropolitan Statistical Areas (MSA). The Chicago-Naperville-Joliet, Illinois, MSA includes Cook, DeKalb, DuPage, Grundy, Kane, Kendall, McHenry, and Will Counties, and its popu-lation size was estimated at slightly more than 9 mil-lion (ranking third in the Nation). According to the U.S. Census Bureau, the city popu-lation increased about 4 percent between 1990 and 2000, but it is estimated to have decreased about 1 percent in 2003. The number of Hispanics living in Chicago increased 38 percent between 1990 and 2000, while the number of Whites and African-Americans declined by 14 and 2 percent, respec-tively. Based on the 2000 census, the Chicago population is 36 percent African-American, 31 percent White, 26 percent Hispanic, and 4 percent Asian-American/Pacific Islander. In 2000, the median age of Chicagoans was 31.5, with 26 percent of the pop-ulation younger than 18 and 10 percent age 65 or older. The unemployment rate is 6.2 percent, and the percentage of families living below the poverty level with children younger than 18 is 11.4 percent. Data Sources This report is based on the most recent data available from the various sources detailed below: • Drug-related mortality data were derived from
the Drug Abuse Warning Network (DAWN), Of-fice of Applied Studies (OAS), Substance Abuse and Mental Health Services Administration (SAMHSA), mortality system for 1998–2003. The DAWN system recently restructured its data col-lection methods; mortality estimates produced as of 2003 are not comparable to previous years. In 2003, 122 jurisdictions in 35 metropolitan areas and 6 States reported mortality data to DAWN. Of the 14 targeted counties in the Chicago metropoli-tan area, only 5 (DuPage, Kane, Kendall, Lake, McHenry) reported mortality data to DAWN in 2003, covering about 26 percent of the population. A full description of the DAWN system can be found on the DAWN Web site: http://dawn info.samhsa.gov. Data on pediatric toxicity and on deaths related to accidental drug poisonings have not been available from the Illinois Depart-ment of Public Health (IDPH) Adverse Pregnancy Outcome Reporting System (APORS) and from

EPIDEMIOLOGIC TRENDS IN DRUG ABUSE—Chicago
Proceedings of the Community Epidemiology Work Group, Vol. II, June 2005 51
the Chicago Department of Public Health, respec-tively, since 2002.
• Emergency department (ED) data were pro-
vided by DAWN, OAS, SAMHSA, for 1994 through 2002. The 2000 ED data were unavailable for methamphetamine. Also presented in this pa-per are preliminary unweighted data from the DAWN Live! restricted-access online query sys-tem administered by OAS, beginning in 2003. The 2003–2004 data represent a redesign of DAWN, and the data are not comparable to those from 2002 and before. The redesigned system has 74 of the 88 eligible hospitals in the Chicago sample, with 76 EDs in the sample. (Some hospi-tals have more than one ED.) Data completeness differs considerably for the 2 years (see exhibit 1) due, in part, to limitations associated with im-plementing a new system in 2003. During 2004, between 24 and 32 EDs reported data each month. The completeness of data reported by participating EDs varied by month. The 2003–2004 data are incomplete (not all EDs reported each month) and unweighted; these data cannot be used as estimates, nor can they be used for comparison with future data. Only weighted data released by SAMHSA can be used for trend analysis. All DAWN cases are reviewed for quality control; based on the review, cases may be corrected or deleted. Therefore, data pre-sented in this report are subject to change. The 2003–2004 data were accessed from the DAWN Live! update between April 14, 2005, and June 9, 2005, and represent drug reports. Drug reports exceed the number of visits, since a patient may report use of multiple drugs (up to six drugs plus alcohol). For the purpose of this report, drug-related reports include all DAWN case types, and drug misuse reports include only the follow-ing three DAWN case types: “seeking detox,” “overmedication,” and “other.” The latter is used in the “Other Opiates” and “Depressants” sec-tions of this report. A full description of the DAWN system can be found on the DAWN Web site: http://dawninfo.samhsa.gov.
• Treatment data for the State of Illinois for fis-
cal years (FYs) 2000–2004 (July 1–June 30) were provided by the Illinois Division of Alco-holism and Substance Abuse (DASA). National and State-specific treatment admissions data for 1992–2002 were provided by the Treatment Epi-sode Data Set (TEDS) maintained by SAMHSA.
• Arrestee drug testing data were provided by the
Arrestee Drug Abuse Monitoring (ADAM) pro-gram, National Institute of Justice (NIJ), and are
also described in the June 2004 Chicago CEWG report.
• Incidence data on drug-related calls were pro-
vided by the Illinois Poison Center (IPC) in Chi-cago for Cook County for 2001 through 2003. The IPC answered more than 93,000 calls in 2003 on household products, herbal products, medication overdoses, adverse reactions to medications, alcohol or drug misuse, occupa-tional accidents, chemical spills, and other poi-sonings.
• Price and purity data were provided by the Drug
Enforcement Administration (DEA), Domestic Monitor Program (DMP), for heroin for 1991–2003. Price and purity data on drug samples ana-lyzed through April 2005 were provided by the Il-linois State Police (ISP), Division of Forensic Sci-ence. National and Illinois data on drug availabil-ity, demand, production, cultivation, and distribu-tion were available from the National Drug Threat Assessment February 2005 and the Illinois Drug Threat Assessment May 2002 reports, National Drug Intelligence Center, U.S. Department of Jus-tice. The Office of National Drug Control Policy (ONDCP) report on Profile of Drug Indicators, Chicago, Illinois, published in April 2004, as well as the National Drug Intelligence Center 2003 Il-licit Drug Prices: July 2003–December 2003 re-port, were reviewed. Data from the National Fo-rensic Laboratory Information System (NFLIS) for FY 2003 and FY 2004 were used to report dif-ferences between different drugs in the relative amounts submitted for testing in Illinois and Chi-cago. Ethnographic data on drug availability, prices, and purity are from observations and inter-views conducted by the Community Outreach Intervention Projects (COIP), School of Public Health, University of Illinois at Chicago (UIC).
• Criminal justice data were available from the
Illinois Criminal Justice Information Authority (ICJIA), which collects, maintains, and updates a variety of criminal justice data to support its re-search and evaluation efforts. ICJIA regularly publishes criminal justice research, evaluation reports, and statistical profiles. ICJIA’s drug ar-rest data for 1990–2002 and the special report on methamphetamine trends in Illinois were re-viewed.
• Survey data on student and household popu-
lations were derived from several sources. Stu-dent drug use data were provided by the national Monitoring the Future (MTF) Study, the Youth Risk Behavior Surveillance System (YRBSS)

EPIDEMIOLOGIC TRENDS IN DRUG ABUSE—Chicago
Proceedings of the Community Epidemiology Work Group, Vol. II, June 2005 52
survey, and the Illinois Youth Survey and are de-scribed in the June 2004 Chicago CEWG report. National data on substance use and abuse were provided by SAMHSA’s 2002 National Survey on Drug Use and Health.
• Most recent drug use estimates were derived
from two currently ongoing studies of young heroin users in metropolitan Chicago conducted by COIP at the UIC School of Public Health. The Family Process and Risk Reduction Study (Family Process), funded by the National Insti-tute on Drug Abuse (NIDA), assesses a human immunodeficiency virus (HIV) prevention inter-vention that targets young injection drug users (IDUs) and their parents. Participants are age 18–25 and have injected in the last 6 months (n=636 as of June 2005). All data from the Fam-ily Process Study are preliminary. Current non-injecting heroin users (NIHUs) age 16–30 were recruited for the NIDA-funded NIHU Study to evaluate the rate of transition to injecting and drug and sexual practices associated with HIV, hepatitis B (HBV), and hepatitis C (HCV) infec-tions (n=649 as of June 2005).
• Acquired immunodeficiency syndrome (AIDS)
and HIV data were derived from both agency sources and UIC studies. IDPH and CDPH sur-veys provided statistics on AIDS and HIV through October 2004 and December 2003, re-spectively. The CDPH Office of HIV/AIDS Sur-veillance provided data through 2003 (2003 data are preliminary). CDC’s “HIV/AIDS Surveil-lance Report,” December 2001, provided addi-tional data on HIV and AIDS. The agency data are complemented by UIC’s studies of IDUs conducted by COIP at UIC’s School of Public Health. One is the NIDA-funded “AIDS Inter-vention Study,” based on a panel of IDUs par-ticipating from 1988 to 1996. The second is the CDC-funded HIV Incidence Study (CIDUS I and II). The CIDUS data are from analyses of a 1994–1996 study of 794 IDUs, age 18–50, in Chicago (Ouellet et al. 2000) and a 1997–1999 study of 700 IDUs, age 18–30, in Chicago and its suburbs (Thorpe et al. 2000; Bailey et al. 2001). Most sources have not been updated since the Chicago CEWG December 2002 report.
Several of the sources traditionally used for this re-port have not been updated by their authors or were unavailable at the time this report was generated. Because some information has not changed—and to avoid redundancy—this report occasionally refers readers to a previous Chicago CEWG report for more information in a particular area. For a discussion of
the limitations of survey data, the reader is referred to the December 2000 Chicago CEWG report. DRUG ABUSE PATTERNS AND TRENDS This report of drug abuse patterns and trends is or-ganized by major pharmacologic categories. Readers are reminded, however, that multidrug consumption is the normative pattern among a broad range of sub-stance abusers in Chicago. Various indicators suggest that drug combinations play a substantial role in drug use prevalence. Preliminary unweighted DAWN data show that 26 percent of all ED drug reports in Chi-cago in 2004 were alcohol-in-combination mentions. During FY 2004, heroin was the most often men-tioned reason for seeking treatment in Chicago. Among these treatment episodes, the most common secondary substances reported were cocaine (37 per-cent) and alcohol (13 percent). According to DAWN ED data, Chicago was report-ing the highest ED drug mentions among the 21 DAWN sites between 2000 and 2002. Both DAWN mortality cases and CDPH death certificates suggest that total drug-related deaths remained stable at high numbers between 2000 and 2002. According to APORS, 718 children in Chicago were exposed to some drug at birth in 2002, which corresponds to an annual rate of 150 exposures per 10,000 live births. In 2003, DAWN reported a rate of 57 drug misuse-related deaths per 1,000,000 and 14 drug-related sui-cide deaths per 1,000,000 in the Chicago MSA. Drug-related deaths were more common among males and those age 35–54. Cocaine/Crack The majority of quantitative and qualitative cocaine indicators suggest that use remains stable at high lev-els and that cocaine continues to be a serious drug problem for Chicago and Illinois. In 2002, both the DAWN ME drug-induced or drug-related death data and CDPH death certificate data showed that cocaine remains a factor in more deaths in the Chicago area than any other illicit drug. How-ever, multiple drug use was involved in 65 percent of these cases. According to the new 2003 DAWN ME report, 77 percent (67 deaths) of all drug-related deaths recorded that year were related to cocaine. Five of the 67 cocaine-related deaths were ruled as suicide. Multidrug use was involved in the majority (64 percent) of cocaine-related deaths. In 2002, ED mentions for cocaine remained at high levels, and they represented a 52-percent increase over 10,702 mentions in 1995. Chicago continued to

EPIDEMIOLOGIC TRENDS IN DRUG ABUSE—Chicago
Proceedings of the Community Epidemiology Work Group, Vol. II, June 2005 53
have the most cocaine ED mentions among DAWN sites in 2002 (16,227 mentions) and the highest rate of mentions (275 per 100,000 population) (exhibit 2). Preliminary unweighted data accessed from DAWN Live! for 2003 and 2004 show that slightly more than one-third of total ED reports were cocaine related (33 and 34 percent, respectively). ED cocaine reports totaled 5,981 in 2004 (exhibit 3). In 2004, the major-ity of the cocaine reports involved males (65 per-cent), African-Americans (56 percent), and those between 35 and 54 years of age (64 percent). According to the Illinois Poison Center, approxi-mately 120 cocaine-related calls were received annu-ally in Chicago for 2001–2003. During this period, cocaine generated more calls than any other “street drug” (approximately 25 percent of all “street drugs”). The FY 2004 Illinois drug treatment report indicates that cocaine abuse remains one of the top three rea-sons for entering treatment (excluding primary alco-hol-only abuse) (exhibit 4). A total of 31,430 persons were treated for cocaine-related problems in Illinois during FY 2004, of which 48 percent occurred in Chicago. Cocaine was the most commonly mentioned secondary drug among persons treated for primary heroin-related problems. In FY 2004, African-Americans remained the largest group among total persons treated (60 percent) for cocaine abuse. Males accounted for more services rendered (57 percent) than females. Smoking continued to be the most common route of cocaine administration (85 percent) in FY 2004. According to the 2003 ADAM report, 51 percent of adult male arrestees (exhibit 5) and 33 percent of adult female arrestees tested cocaine positive. Cocaine use appears common among heroin users in Chicago. In an ongoing study of non-injecting heroin users (NIHU Study), 70 percent of participants re-ported ever using powder cocaine, and 34 percent used it in the past 6 months. Crack cocaine use was reported by 67 percent of the study participants, and 52 percent reported using crack in the past 6 months. Among injecting drug users (Family Process study), 84 percent reported ever using powder cocaine, and 64 percent of them used it in the past 12 months. Somewhat fewer participants had ever used crack cocaine (75 percent), but 83 percent of lifetime users reported using it in the past 12 months. According to IDPH’s Adverse Pregnancy Outcome Reporting System, cocaine exposure among children
at birth in Chicago decreased between 1999 and 2002 by 29 percent, from 95.2 to 73.8 per 10,000 live births. Nonetheless, cocaine continued to be the most often cited drug exposure among children in Chicago. In 2002, the highest proportion of such births oc-curred among African-American mothers (approxi-mately 78 percent) and to mothers between 25 and 34 years of age. State (ISP) and Federal (NFLIS) labs reported that cocaine was the drug most often received for testing after cannabis. Cocaine purity for samples weighing 2–25 grams tested by the ISP was 81 percent in 2003 and 77 percent in 2004, but analyses were conducted on only a few samples, and reasonable comparison with earlier data is not possible. Cocaine prices have not changed since the June 2003 report. Ounce prices for powder cocaine were reported by street sources to be between $400 and $800, de-pending on the drug’s quality and the buyer’s relation-ship to the seller. Gram prices for powder and rock cocaine ranged from $50 to $150, with most reports around $75. Ounces of crack cocaine (“rock”) sold for about the same price as ounces of powder cocaine, with reports ranging from $900 to $1,600. The NDIC reported the wholesale price of a kilogram of cocaine in Chicago was $18,000–$20,000 for powdered co-caine and $22,000–$24,000 for crack. The June 2003 report contains more detailed information about drug prices in Chicago. According to the 2003 YRBSS study, the proportion of lifetime cocaine/crack use among Chicago-area 9th through 12th grade students remained level at about 5 percent between 1995 and 2003. Male students re-ported cocaine/crack use nearly twice as often as their female counterparts during this period. The 2002 Illi-nois Youth Survey of Chicago-area 8th through 12th grade students reported a similar level of use (about 5 percent) between 1998 and 2002. The June 2004 Chi-cago CEWG report provides a more complete discus-sion of the 2002 Illinois Youth Survey. Heroin Similar to cocaine, heroin abuse indicators in this reporting period continue to suggest high levels of use in the Chicago area. Of the 711 total drug-induced or drug-related deaths reported by the DAWN ME for Cook County in 2002, 48 percent (339) had a mention of her-oin/morphine. After reporting 1 death per year in 2000 and 2001 caused by accidental heroin exposure, CDPH reported 18 deaths in 2002. The new DAWN

EPIDEMIOLOGIC TRENDS IN DRUG ABUSE—Chicago
Proceedings of the Community Epidemiology Work Group, Vol. II, June 2005 54
ME system recorded 27 heroin-related deaths in 2003 in the Chicago MSA, and 5 of those were single-drug deaths. The rate of heroin ED mentions in Chicago increased significantly from 83 per 100,000 population in 1995 to 220 in 2002 (exhibit 2), an increase of 167 percent. This rate was the highest in the contiguous United States. Preliminary unweighted DAWN Live! ED data for 2003 and 2004 indicate that heroin is the second most frequently reported drug, following only cocaine (ex-hibit 3). In the DAWN Live! 2004 data, the majority of heroin ED reports involved males (63 percent), African-Americans (52 percent), and those between ages 35 and 54 (58 percent). The number of persons treated for heroin use in State-supported programs in FY 2004 was 30,531, a 12-percent decrease from 2003. (exhibit 4). Nonetheless, 28 percent of treatment services rendered during 2004 in Illinois were for heroin. Seventy-one percent of the total heroin treatment episodes reported in FY 2004 occurred in Chicago alone, supporting other indicators of high levels of heroin use in the city. The majority (73 percent) of persons treated for heroin in 2004 re-ported intranasal “snorting” as the primary route of administration. In Chicago, 81 percent reported snort-ing as their primary route of administration (14 percent injected), compared with 52 percent of patients report-ing snorting (41 percent injected) in the rest of the Illi-nois. Demographic differences between patients from Chicago and the rest of the State may account for some of this difference. Patients entering treatment in Chi-cago were more likely to be African-American (81 percent), while patients from the rest of Illinois were more likely to be White (58 percent). Preliminary analysis of data collected for the currently ongoing study of young non-injecting heroin users in Chicago (NIHU), conducted by COIP at UIC, found that at followup, White study participants and those younger than 23 were significantly more likely to initiate injec-tion. African-Americans in the study appeared resistant to injection initiation despite a longer duration of use. A recent report (Kane-Willis and Schmitz-Bechteler 2004) examined age and race trends among persons treated for heroin use in Illinois and found that Whites were far more likely to be age 18–24 (41 percent) than were African-Americans (2 percent) and Hispanics (20 percent). According to the 2003 ADAM report, 25 percent of adult male arrestees tested opiate positive (exhibit 5). The proportion of adult female arrestees testing opi-ate positive decreased significantly between 2000 and 2003, from 40 to 22 percent, respectively. The June
2004 Chicago CEWG report provides a more com-plete discussion of the ADAM data. According to the 2003 DMP report, availability of heroin in Chicago, especially South American and Southeast Asian heroin, continued (exhibit 6). Heroin from other geographic source areas, including South-west Asia and Mexico, was also available. The consis-tent availability of heroin from all four of these source areas makes Chicago unique among other U.S. cities. The purity of street-level heroin peaked in 1997 at about 31 percent and has since declined. In 2003, South American heroin exhibits purchased by DMP in Chicago averaged 16.6 percent pure, a 19-percent de-crease from 2002. However, the average price per mil-ligram pure remained consistent, with a low in 2003 of $0.45 for South American heroin. Recent ethnographic reports suggest a new source of heroin on the south side of Chicago that is said to offer a higher purity level. On the street, this heroin has been referred to as “tornado” for its strength or “retro-dope,” as it reminds older users of higher-purity heroin from years past. According to ISP, the amount of heroin analyzed in Cook County decreased slightly from 21 kilograms in 2003 to 18 kilograms in 2004. Participants in a study of young non-injecting heroin users reported high availability of heroin on the streets of Chicago. Sixty-three percent reported “a lot” (the highest rating) of heroin on the street in the past 30 days. Use of brand name heroin was reported by 29 percent of participants. Most (80 percent) paid $10 per bag in the 30 days prior to interview. Regard-ing heroin quality in the past 30 days, only 10 percent gave the highest quality rating (“very good”); 31 per-cent thought the quality was “good,” and 50 percent perceived the heroin quality as “fair.” Heroin prices have not changed since the June 2003 report. On the street, heroin is commonly sold in $10 and $20 units (bags), though bags for as little as $5 are available. Prices for larger quantities varied greatly, depending on the type and quality of heroin, the buyer, and the area of the city where the heroin was sold. At outdoor drug markets, purchases of multibag quanti-ties—versus grams and fractions of ounces—were the most common means of buying larger amounts of her-oin. Data indicated that buyers on the West Side could obtain 11–13 $10 bags for $100 (sometimes called a “jab”). Recent ethnographic reports suggest that some dealers offer regular customers a free piece of crack cocaine along with their heroin purchase (typically on Fridays) and distribute free samples when they have “new product,” practices that indicate a potential in-crease in competition.

EPIDEMIOLOGIC TRENDS IN DRUG ABUSE—Chicago
Proceedings of the Community Epidemiology Work Group, Vol. II, June 2005 55
Among Illinois high school students, increases in heroin use have not yet been evidenced in periodic representative surveys. The Illinois Youth Survey indicates that heroin use among Chicago-area stu-dents is still relatively rare. In 2003, 3.7 percent of students reported lifetime use of heroin, compared with 2.5 percent in 2001 and 3.1 percent in 1999. More information is available in the December 2004 Chicago CEWG report. APORS data indicated that opioid toxicity was de-creasing between 2000 and 2002 among infants tested for controlled substances, from 22.4 per 10,000 live births to 16.1 per 10,000 live births, respectively. In 2002, and similarly in 2000 and 2001, most infants who tested positive to heroin exposure at birth were born to African-American mothers (69 percent) and to mothers age 25–34. Other Opiates In 2003, 50 deaths related to opiate/opioid (other than heroin and methadone) misuse were recorded in the DAWN ME system. Multidrug use was associated with 86 percent of deaths, and 11 were ruled as sui-cide. Methadone misuse was responsible for 15 deaths during the same year. According to unweighted data accessed from DAWN Live!, 1,399 opiate/opioid misuse-related ED reports were recorded in Chicago in 2004. Hydrocodone ac-counted for 22 percent of the overall opiate/opioid reports. A substantial proportion (46 percent) of hy-drocodone ED reports were classified as “overmedi-cation.” Six percent of the opiate/opioid-related re-ports were specifically attributed to oxycodone mis-use. Unlike hydrocodone mentions, the largest pro-portion of oxycodone mentions (36 percent) were classified as “seeking detox.” Between 2001 and 2003, the Illinois Poison Center reported a 55-percent increase in calls involving rec-reational abuse of Coricidin HBP, which contains 30 milligrams of dextromethorphan HBr (DXM) per tab-let. DXM is a synthetically produced substance that is chemically related to codeine, though it is not an opi-ate. The majority of the cases involving DXM (ap-proximately 90 percent) were among those age 13–19. The occasional use of other opiates is common among young non-injecting heroin users in Chicago. Fifty-seven percent of NIHU Study participants re-ported ever trying codeine, Tylenol 3 and 4, Dilaudid, Demerol, morphine, or methadone without a legal prescription. Ethnographic reports suggest that co-deine may be used by heroin users to moderate with-drawal symptoms or to help kick a drug habit.
In Illinois, treatment services rendered related to the use of other opioids, tranquilizers, or sedatives in FY 2004 accounted for 2 percent of total treatment epi-sodes (excluding alcohol). The majority (80 percent) of treatment for other opiates occurred outside Chi-cago and among Whites (75 percent); the majority (62 percent) reported administering these drugs orally. Readers are referred to the June 2004 and De-cember 2004 Chicago CEWG reports for more details regarding other opioids, tranquilizers, or sedatives treatment data. Marijuana Marijuana continues to be the most widely available and used illicit drug in Chicago and Illinois. According to the 2003 DAWN ME report, 11 percent of total deaths recorded mentioned marijuana. All of these deaths were multidrug related. The rate of marijuana ED mentions per 100,000 population was 89 for both 2000 and 2001 and de-creased to 78 per 100,000 in 2002 (exhibit 2), a change of nearly 12 percent from 2001. Preliminary unweighted data accessed from DAWN Live! show that ED reports of marijuana in 2003 and 2004 represented 10 percent and 13 percent of all drug-related reports, respectively. In 2004, marijuana ED reports totaled 2,222 (exhibit 3). Marijuana pa-tients in 2004 most often were African-Americans (49 percent), followed by Whites (26 percent); males (66 percent); and younger than 30 (52 percent). Marijuana users represented 20 percent of all treatment episodes in Illinois in FY 2004 and 28 percent of epi-sodes when those for primary alcohol abuse were ex-cluded. The number of treatment episodes for mari-juana increased from 20,705 in FY 2000, to 26,371 in FY 2003, but fell to 30,650 in FY 2004 (exhibit 4). Alcohol was the most commonly reported secondary drug among persons receiving treatment for marijuana. During FY 2004, treatment episodes for marijuana were highest for males (76 percent) and for Whites (48 percent). Approximately 25 percent of Illinois treat-ment episodes of marijuana occur in Chicago. According to 2003 ADAM data, 53 percent of adult male arrestees tested positive for marijuana (exhibit 5), a level close to proportions in 2002 and 2001. The proportion of adult female arrestees who tested posi-tive for marijuana increased from 25 percent in 2000 to 39 percent in 2003. Marijuana use was common among the young heroin users participating in local studies. Sixty-seven per-

EPIDEMIOLOGIC TRENDS IN DRUG ABUSE—Chicago
Proceedings of the Community Epidemiology Work Group, Vol. II, June 2005 56
cent of non-injecting heroin users and 73 percent of young injectors smoked marijuana in the 6–12 months prior to their interview. The 2003 YRBSS data and the 2002 Illinois Youth Survey both reported a recent decrease in lifetime use of marijuana among 8th through 12th grade students. For more information about results from these youth surveys, readers are referred to the December 2004 CEWG report. According to DEA, the bulk of marijuana shipments are transported by Mexico-based polydrug trafficking organizations that conceal marijuana among legiti-mate goods in tractor-trailers coming into the Chi-cago areas from the southwest border. The primary wholesalers of marijuana are the same Mexico-based organizations that supply most of the cocaine, methamphetamine, and Mexican heroin in the Mid-west. Marijuana produced locally (indoor and out-door) by independent dealers is also available. Ac-cording to the DEA Domestic Cannabis Eradica-tion/Suppression Program, 14,409 outdoor and 1,273 indoor cultivated plants were eradicated in 2000. In general, currently available marijuana is of vari-able quality. The abundance and popularity of mari-juana across the city has led to an increased array of varieties and prices. Marijuana prices, which re-mained level since the June 2003 report, ranged from $650 to $4,000 per pound, depending on the type and quality. Ounces typically sold for about $80−$250. On the street, marijuana was most often sold in bags for $5–$20 or as blunts. The NDIC reported the fol-lowing prices for marijuana in Chicago in 2003: $900–$1,200 per pound, $50–$75 per ounce, and $3–$5 per gram. Both ISP and NFLIS laboratories analyzed more mari-juana samples than samples for any other drug. Forty-nine percent of drug samples analyzed by the NFLIS for Chicago in 2004 were identified as cannabis. Stimulants
Since the mid-1990s, many indicators of metham-phetamine (“speed”) use in Illinois increased steadily. The most significant increases occurred from 1998 to 2002 in rural areas of Illinois. Methamphetamine ED mentions in Chicago slowly increased during the 1990s but remained stable be-tween 2001 and 2002, when they totaled 45 and 42, respectively. During 2004, unweighted DAWN Live! data showed 47 ED methamphetamine reports for Chicago (ex-hibit 3). Males (81 percent), persons age 25–45 (74
percent), and Whites (51 percent) accounted for the majority of the 2004 ED methamphetamine reports. As reported in the January 2005 report, metham-phetamine calls to the Illinois Poison Center in Chi-cago are infrequent. From 2001 to 2003, the Poison Center received a total of 29 such calls. Like methamphetamine, amphetamine ED mentions increased steadily in Chicago since 1995. By 2002, 415 amphetamine ED mentions were reported, an in-crease of 188 percent from 1995. A rate of 7 mentions per 100,000 persons was reported for 2002. According to unweighted data accessed from DAWN Live!, there were 81 amphetamine ED reports for Chicago in 2004 (exhibit 3). Sixty-five percent of reports were among males, 42 percent were White, and 48 percent were among persons younger than 25. Since FY 2000, treatment for methamphetamine as a proportion of all State treatment episodes (excluding primary abuse of alcohol only) increased steadily from 1 percent to 4 percent in 2004. Treatment services ren-dered for amphetamine also increased during this pe-riod but remained stable between 2003 and 2004 (ex-hibit 4). In FY 2003, the number of methamphetamine treatment episodes (3,582) greatly outnumbered those for amphetamines (476). Methamphetamine treatment episodes totaled 4,628 during FY 2004, while those for amphetamine remained stable at 485. Only 1 percent of treatment episodes for methamphetamine were from Chicago. Exhibit 7 illustrates the substantial difference between the number of methamphetamine treatment episodes recorded in the city of Chicago and those in the rest of the State for the period of FYs 2000 to 2004. This trend in treatment supports other indicators that suggest lower use of methamphetamine in Chicago compared to the rural parts of the State. Most treatment episodes for methamphetamine during 2004 involved Whites (97 percent) and males (53 percent); a similar trend was observed for amphetamine patients (89 and 54 percent, respectively). According to 2002 ADAM data, only 0.3 percent of male arrestees in Chicago tested positive for metham-phetamine, but 1.0 percent tested positive during the first quarter of 2003, suggesting an increase in use. The 2003 YRBSS data indicated that 3.7 percent of high school students in Chicago used methampheta-mine one or more times during their life. Male students were nearly six times more likely to have tried methamphetamine than female students. For more in-formation about methamphetamine use among students in Chicago, readers are referred to the December 2004 Chicago CEWG report.

EPIDEMIOLOGIC TRENDS IN DRUG ABUSE—Chicago
Proceedings of the Community Epidemiology Work Group, Vol. II, June 2005 57
Data from the ISP indicated that more metham-phetamine continued to be seized than cocaine or her-oin in nearly 50 percent of Illinois counties in 2004. In 2004, the amount of methamphetamine received by ISP from Cook County was about 8 kilograms, while the total methamphetamine received from all Illinois coun-ties was about 24 kilograms, similar to the previous year. According to the NFLIS 2004 report, 0.41 per-cent of the items analyzed in Chicago were metham-phetamine, which is a considerable increase from 0.21 percent reported the year before. According to ICJIA, the number of methamphetamine-related arrests in Illinois increased significantly be-tween 1997 (3 arrests) and 2003 (1,112 arrests). While methamphetamine arrests increased across all regions during this period, rural task force units experienced the greatest increase in arrests (from 0 to 514 arrests), fol-lowed by mixed urban/rural units (from 3 to 373 ar-rests) and by mostly urban units (from 0 to 225 arrests). Since 1994, the ICJIA has reported a dramatic increase in the quantity of methamphetamine seized, from 3,433 grams in 1994 to 26,597 grams in 2003, with a peak of 28,002 in 2002. Similarly, clandestine methampheta-mine labs seizures increased from 24 in 1997 to 971 in 2003. Seventy-seven percent of lab seizures in 2003 were in rural counties. Within Chicago, a low but stable prevalence of methamphetamine use has been reported in some areas of the city for a number of years, especially on the North Side, where young gay men, homeless youth, and White clubgoers congregate. Of note, ethnographic data suggest that methamphetamine availability in-creased substantially since June 2001 among at least some networks of gay White men on the North Side, who may use the drug to enhance sexual experiences. There were also reports from persons who said they began to use methamphetamine in order to lose weight but became addicted to the drug. In the NIHU Study, 19 percent of participants reported ever trying amphetamine or methamphetamine, and only 5 percent reported using it in the 6 months prior to the interview. Among injectors in the Family Process study, 20 percent of participants reported amphetamine use, and 8 percent used it in the previous 12 months. It is likely that participants’ use of the drug often took place somewhere other than Chicago or Illinois. Methylphenidate (Ritalin) remained readily available in some South Side neighborhoods, where it could be purchased for injection, either alone or in combi-nation with heroin. Pills, often referred to as “beans” in these areas, are sold for $1.50 to $5.00 each, de-pending on the quantity being purchased. The cost of Ritalin on the West Side of Chicago was reported to
be $10 per pill. Some study participants report that Ritalin was readily available in their schools and that students knew which students had been prescribed Ritalin and often requested the drug from them. Methamphetamine prices have not changed since June 2003, when it was reported that bags of metham-phetamine sold for $20. Most drug users reported that the drug remained difficult to obtain. However, police and street reports suggest that some Mexico-based drug dealers are attempting to introduce methamphetamine for local consumption by offering free samples, which may eventually change the low and stable trend of methamphetamine use in Chicago. Furthermore, one street-level report suggested a limited availability of methamphetamine on the West Side. There was also one report of methamphetamine being sold at a South Side street drug market. According to the NDIC 2003 report, methamphetamine cost $1,000–$1,300 per ounce and $80–$100 per gram. Depressants Three patterns of depressant-in-combination use have been common in Chicago and throughout Illinois: • Depressants are taken with narcotics to poten-
tiate the effect of opiates. Pharmaceutical depres-sants are frequently combined with heroin.
• Depressants are taken with stimulants to mod-
erate the undesirable side effects of chronic stimulant abuse. Chronic cocaine and speed abusers often take depressants along with stimu-lants, or when concluding “runs,” to help induce sleep and to reduce the craving for more stimu-lants (especially in the case of cocaine).
• Alcohol, also a central nervous system depres-
sant, is taken with pharmaceutical depressants (such as hypnotics or tranquilizers). The practice of mixing alcohol with other depressants may indicate illicit pharmaceutical depressant use.
In 2003, 17 benzodiazepine misuse-related deaths were reported to the DAWN ME system from the Chicago MSA. Fourteen of these deaths were ruled as suicide. Benzodiazepine ED mentions increased significantly between 1995 (n=1,959) and 2002 (2,776), a 42-percent change. Both ED mentions and ethnographic reports indicate that alprazolam appears to be the benzodiazepine most readily available on the street, closely followed by clonazepam and lorazepam, with variations in different areas of the city.

EPIDEMIOLOGIC TRENDS IN DRUG ABUSE—Chicago
Proceedings of the Community Epidemiology Work Group, Vol. II, June 2005 58
Preliminary unweighted data accessed from DAWN Live! showed that 907 ED reports were related to the misuse of benzodiazepines in 2004. Nearly one-half of these mentions were classified as overmedication. Benzodiazepine-related calls to the Illinois Poison Center in Chicago repeatedly represented nearly one-half of all substance misuse calls between 2001 and 2003. On average, approximately 500 calls annually were reported during this time period. Treatment data suggest depressants are not the pri-mary drugs of choice for most users. In FY 2004, DASA reported 2,472 treatment episodes for other opioids, tranquilizers, and sedatives/hypnotics. The majority of treatment episodes for depressants oc-curred outside of Chicago (80 percent) and among Whites (75 percent). Primary opioid, tranquilizer, and sedative/hypnotics users represented only about 2 percent of all treatment episodes, excluding alcohol. Lifetime use of tranquilizers or barbiturates without a prescription (Valium, Elavil, Ativan, Xanax) was reported by 31 percent of young non-injecting heroin users in the NIHU study. Thirteen percent reported use in the past 30 days. In the Family Process study, 43 percent of young injectors reported ever using barbiturates, and 30 percent used them during the previous 12 months. The 2002 APORS data indicate that the rate of in-fants testing positive for barbiturates has been de-creasing since 2000. In 2002, the rate of children ex-posed to barbiturates at birth was 0.4 per 10,000 live births, compared with 0.8 per 10,000 in 2001 and 1.4 per 10,000 in 2000. No updated prices for depressants were available. As stated in past Chicago CEWG reports, alprazolam typically sells for $2–$3 for 0.5-milligram tablets and $5–$10 for 1-milligram tablets. Hallucinogens Recent declines in lysergic acid diethylamide (LSD) ED mentions suggest a downward trend in LSD use in Chicago. Between 1995 and 2002, LSD ED men-tions declined by 92 percent. The rate of LSD ED mentions per 100,000 population was less than 1 in 2002 for the first time in the prior 7 years. As observed with LSD, phencyclidine (PCP) ED data showed declines in Chicago. After a peak in 2000, when 1,003 ED mentions were reported, PCP ED mentions decreased to 874 in 2001 and to 459 in 2002. Similarly, ED rates declined between 2001 and
2002 from 15 to 8 (per 100,000), a 48-percent change. According to unweighted data accessed from DAWN Live!, there were 17 LSD and 158 PCP ED reports in 2004. No deaths related to hallucinogens were reported to the DAWN ME system in 2003. Recent trends in hallucinogen treatment have varied, but overall the number of episodes in publicly funded treatment programs in Illinois has been relatively high, compared with trends in the 1990s. In FY 2003, 472 treatment episodes were reported, while there were 324 in FY 2004. The percentage of Illinois hal-lucinogen treatment episodes occurring in Chicago has increased since 2000, and during 2004, the ma-jority of episodes occurred in Chicago (57 percent). According to the 2003 ADAM report, the percentage of adult male arrestees testing positive for PCP de-creased between 2002 and 2003, from 2.2 percent to 1.3 percent. PCP use appears to be more common among adult female arrestees; 5.6 percent of female arrestees tested positive for PCP in 2003. In the study of young non-injecting heroin users, 36 percent of participants reported ever trying LSD, mescaline, mushrooms, or other hallucinogens, but only a few (6 percent) reported use in the 6 months prior to their interview. Among young injectors, 74 percent of participants reported ever trying hallucino-gens, and 32 percent reported use in the 12 months prior to their interview. Whites were much more likely than African-Americans to report recent use of hallucinogens. Recent reports from young heroin snorters indicate that in this population, PCP use is more common than LSD use. Fifty-one percent of study participants reported ever trying PCP, and 15 percent used in the 6 months prior to their interview. According to the 2002 Illinois Youth Survey, 5 per-cent of students in grades 8 through 12 reported life-time use of “any hallucinogen” (including LSD and PCP). This is a considerable decrease in use from 2000 (7 percent) and 1998 (8.5 percent). Further dis-cussion of the Illinois Youth Survey is provided in the December 2003 CEWG report. The amount of PCP samples received by the ISP labo-ratory for analysis decreased significantly between 2002 and 2004, from 4.2 kilograms to 0.59 kilograms.

EPIDEMIOLOGIC TRENDS IN DRUG ABUSE—Chicago
Proceedings of the Community Epidemiology Work Group, Vol. II, June 2005 59
Ethnographic reports on PCP use are available in the June 2003 Chicago CEWG report. On the West side, 2–3 PCP “sticks” about the size of toothpicks were reportedly available for $5–$10, according to the June 2003 CEWG report. Some “wicky sticks” are said to also include embalming fluid, and these cost more. Sherm sticks typically are cigarettes or small cigars dipped in PCP, drained, and dried. The ciga-rettes—most often Mores®—are sold for about $20–$30 each and are mainly available on the far South Side. PCP was also said to be sold in sugar cubes for $20 each. Liquid PCP (“water”) was said to sell for $120 for a vial. LSD hits typically cost $5–$10. LSD is available in the city and suburbs. According to some accounts by White youth, hallu-cinogenic mushrooms remain available. Reported prices were $20–$40 per mushroom. Club Drugs In the Chicago area, methylenedioxymethamphet-amine (MDMA or ecstasy) continues to be the most prominently identified of the club drugs, and its use appears to have increased among African-Americans. Of all the CEWG sites, Chicago had the most MDMA ED mentions in 2000 (215), but it ranked 10th in 2002 (87). The preliminary unweighted data extracted from DAWN Live! show 27 MDMA reports in 2003 and 63 in 2004. MDMA ED reports in 2004 were more com-mon among male patients (77 percent) and those younger than 30 (84 percent). ED reports by race/ethnicity were fairly evenly distributed between African-Americans (38 percent) and Whites (29 per-cent), but race/ethnicity in 23 percent of reports was unknown. Illinois DASA treatment data related to “club drugs” has been increasing slightly since FY 2002, when 50 such episodes were reported. In FY 2003 and 2004, 79 and 81 episodes were reported, respectively. Dur-ing FY 2004, 69 percent of “club drug” treatment episodes were among males, and 56 percent were among Whites. Twenty-nine percent of treatment episodes occurred in Chicago during FY 2003; this proportion rose to 37 percent in FY 2004. In 2002, the Illinois Youth Survey for the first time included separate questions regarding MDMA use. Lifetime and past-year ecstasy use appears to be low among 8th through 12th grade students (0.6 percent and 0.4 percent, respectively).
MDMA samples sent to ISP from Cook County had been decreasing since 2000, when 6.7 kilograms were analyzed in the State laboratory. The amount of MDMA samples then increased from 0.8 kilograms in 2003 to 3.1 kilograms in 2004. Similarly, the NFLIS reported an increase in the proportion of all items analyzed for Chicago that were MDMA, from 0.16 in FY 2003 to 0.35 percent in FY 2004. Drugs sold as ecstasy remained available in most mainstream dance clubs and at many house parties. “Raves” featuring ecstasy use are said to be close to nonexistent. Recent ethnographic reports suggest that ecstasy may be purchased in some “open air” street markets on the west side of Chicago. It contin-ued to be sold in pill or capsule form, and the price range remained unchanged from December 2002: $20–$40 per pill. Individuals with connections to suppliers or producers reported prices as low as $12–$15 per pill. These prices parallel the 2003 NDIC report: wholesale prices ranged between $10 and $12 per tablet and the retail price was $25–$35 per dosage unit. Along with other club drugs, ecstasy may con-tinue to be used predominantly by White youth, but there have been increasing reports of ecstasy use from African-Americans in their twenties and thirties who have been involved in club scenes. Among par-ticipants in the NIHU Study, 36 percent reported MDMA use. Gamma hydroxybutyrate (GHB), a central nervous system depressant with hallucinogenic effects, is used infrequently in Chicago, mainly by young White males. ED mentions for GHB decreased 43 percent, from 139 in 2000 to 79 in 2002. According to preliminary unweighted data accessed from DAWN Live!, there were only 6 GHB ED re-ports in 2003 and 45 reports in 2004. GHB is sold as a liquid (also referred to as “Liquid G”), in amounts ranging from drops (from a dropper at raves or parties) to capfuls. Prices for a capful have been reported at $5–$25. Compared with other club drugs, overdoses are more frequent with GHB, espe-cially when used in combination with alcohol. GHB is not tracked in most quantitative indicators, but its use is perceived to be low compared with ecstasy. Ketamine, an animal tranquilizer, is another depres-sant with hallucinogenic properties and is often re-ferred to as “Special K.” Ketamine ED mentions to-taled 10 in 2002, compared with 14 in 2001. The rate of ketamine ED mentions per 100,000 population (0.1) also remained unchanged. DASA reported only five patients served for ketamine use in FY 2004 in publicly funded treatment programs in Illinois. As

EPIDEMIOLOGIC TRENDS IN DRUG ABUSE—Chicago
Proceedings of the Community Epidemiology Work Group, Vol. II, June 2005 60
reported in the June 2004 Chicago CEWG report, street reports indicate that ketamine is usually sold in $5–$30 bags of powder or in liquid form. The drug is somewhat available at rave parties or in clubs fre-quented by younger adolescents. INFECTIOUS DISEASES RELATED TO DRUG ABUSE Most sources regarding trends in HIV/AIDS and other infectious diseases have not been updated by their authors or were not available during this report-ing period. Readers are referred to the December 2004 Chicago CEWG report for a more detailed re-view of the available information for Chicago and the State. As reported previously, findings suggest that the rate of new HIV infections has declined among IDUs in Chicago since peaking in the late 1980s. Through October 2004, 30,865 diagnosed AIDS cases were reported to the State. More than one-quarter of adult AIDS cases occurred among IDUs, while an additional 6.5 percent involved male IDUs who had sex with men. Within Illinois, 79 percent of the cumulative AIDS cases reported originate in the Chicago metropolitan area. HIV cases may represent more recent trends in risk behaviors. From January to October 2004, 2,193 HIV cases and 1,095 AIDS cases were reported to the State. Of newly reported HIV cases, 82 percent were in Cook County. Overall, IDUs accounted for 17 per-cent of cases in Illinois, while 3.5 percent occurred among male IDUs who had sex with other men. The most recent report on HIV/AIDS cases in Chi-cago indicated that by the end of 2003, 7,590 HIV cases and 21,420 AIDS cases were reported. An es-timated 17,169 individuals are living with HIV and AIDS in Chicago. In 2002, the number of deaths from AIDS declined 5 percent in Illinois and 9 percent in Chicago compared to 2001, a level approximately equal to the number of deaths in 2000. Given the long latency between HIV infection and AIDS diagnosis, these figures do not reflect the full scope of the epidemic. Data from the authors’ studies provide additional information on the extent of HIV infection among IDUs. In studies of IDUs cited in previous CEWG reports, HIV preva-lence ranged from 18 to 25 percent at baseline, with reported incidence rates of 1 to 2 percent per person-year. Recent studies of young IDUs indicate high levels of HIV risk behaviors but very low levels of HIV infection, particularly among those who reside in the suburbs. It should be noted, however, that the
studies are not directly comparable, because each had unique sampling and recruitment strategies. Analysis of the NIHU Study (n=571) of young noninjecting heroin users found an HIV and HCV seroprevalence of 4 and 2 percent, respectively. During the 12-month followup period, no HIV seroconversions and eight HCV seroconversions were observed. ACKNOWLEDGEMENTS
The authors wish to thank the field staff of the Com-munity Outreach Intervention Projects, School of Pub-lic Health, University of Illinois at Chicago, for their contributions to this report. We particularly thank site supervisors Raquel Rondon, Ed Snulligan, Mary Bonilla, Otillo Green, and Otis McCoy, and outreach workers James Crues, Hermenegildo ‘Armando’ Lira, and Robert Banks for assisting with preparing the re-port. The authors also wish to thank staff at the agen-cies and organizations that contributed data used in this report. REFERENCES Bailey, S.L.; Huo, D.; Garfein R.S.; and Ouellet, L.J.
2003. Needle exchange as a harm reduction strat-egy for young injection drug users. Journal of Ac-quired Immune Deficiency Syndromes 34(1):67–70.
Johnston, L.D.; O’Malley, P.M.; and Bachman, J.G.
2001. Monitoring the Future: National Survey Re-sults on Drug Use, 1975–2000. Volume I. (NIH Publication No. 01-4924.) Rockville, MD: Na-tional Institute on Drug Abuse.
Kane-Willis, K.; Schmitz-Bechteler S. 2004. A Multi-
ple Indicator Analysis of Heroin Use in the Chi-cago Metropolitan Area: 1995 to 2002. Institute for Metropolitan Affairs, Roosevelt University.
National Drug Intelligence Center, Department of Jus-
tice. 2003. Illicit drug prices: July 2003-December 2003. Narcotics Digest Weekly (Special Issue) 2(50):1-36, December 16.
Ouellet, L.J.; Thorpe, L.E.; Huo, D.; Bailey, S.L.;
Jimenez, A.D.; Johnson, W.A.; Rahimian, A.; and Monterroso, E. 2000. Prevalence and incidence of human immunodeficiency virus infection among a cohort of injecting drug users: Chicago, 1994–1996. Journal of Acquired Immune Deficiency Syndromes 25(5):443–450.
Thorpe, L.E.; Ouellet, L.J.; Hershow, R.; Bailey, S.L.;
Williams, I.T.; Williamson, J.; Monterroso, E.; and Garfein, R. 2002. Risk of hepatitis C virus in-

EPIDEMIOLOGIC TRENDS IN DRUG ABUSE—Chicago
Proceedings of the Community Epidemiology Work Group, Vol. II, June 2005 61
fection among young adult injection drug users who share injection equipment. American Journal of Epidemiology 155(7):645–653.
Thorpe, L.E.; Bailey, S.L.; Huo, D.; Monterroso,
E.R.; and Ouellet, L.J. 2001. Injection-related risk behaviors in young urban and suburban in-jection drug users in Chicago (1997–1999). Journal of Acquired Immune Deficiency Syn-dromes 27(1):71–8.
Thorpe, L.E.; Ouellet, L.J.; Levy, J.R.; Williams,
I.T.; and Monterroso, E. 2000. Hepatitis C virus infection: prevalence and prevention opportun-ities among young injection drug users in Chi-cago, 1997–1999. Journal of Infectious Diseases 182(6):1588–1594.
Wiebel, W.W.; Jimenez, A.D.; Johnson, W.A.; Ouellet, L.J.; Jovanovic, B.; Lampinen, T.; Murray, J.; and O’Brien, M.U. 1996. Risk behav-ior and HIV seroincidence among out-of-treat-ment injection drug users: a four-year prospective study. Journal of Acquired Immune Deficiency Syndromes 12: 282–289.
For inquiries concerning this report, please contact Lawrence Ouellet, Ph.D., Director, Community Outreach Intervention Pro-jects, Epidemiology and Biostatistics (MC923), School of Public Health, University of Illinois at Chicago, 1603 West Taylor Street, Chicago, Illinois 60612-4394, Phone: (312) 996-5523, Fax: (312) 996-1450, E-mail: <[email protected]>.

EPIDEMIOLOGIC TRENDS IN DRUG ABUSE—Chicago
Proceedings of the Community Epidemiology Work Group, Vol. II, June 2005 62
Exhibit 1. Range of Emergency Departments (EDs) Reporting to DAWN: Monthly in 2003 and 20043
No. of EDs Reporting per Month: Completeness of Data (%) Year Total Eligible
Hospitals1
No. of Hos-pitals in DAWN Sample
Total EDs in DAWN
Sample2 90–100% 50–89% <50%
No. of EDs Not
Reporting
2003 88 74 76 9–15 0–4 0–4 60–66 2004 88 74 76 19–31 0–6 0–7 44–52 1Short-term, general, non-Federal hospital with 24-hour emergency departments based on the American Hospital Association An-nual Survey. 2Some hospitals have more than one emergency department. 3January through December. SOURCE: DAWN Live!, OAS, SAMHSA, updated 4/14-6/9, 2005 Exhibit 2. Estimated Rates of ED Mentions Per 100,000 Population in Chicago for Selected Drugs: 1995–20021 Year Cocaine Heroin Marijuana Metham-
phetamine Amphetamines
1995 188 83 51 1 3 1996 220 109 61 0 3 1997 247 148 76 0 4 1998 232 158 85 1 3 1999 225 162 77 0 3 2000 246 206 89 …2 6 2001 277 203 89 1 7 2002 275 220 78 1 7 1Data collected between 1995 and 2002 are not comparable to estimates produced on or after 2003. 2Dots (…) indicate that an estimate with a relative standard of error greater than 50 percent has been suppressed. SOURCE: DAWN, OAS, SAMHSA Exhibit 3. Numbers of Selected Illicit Drug Reports in Chicago EDs (Unweighted1): 2004
5,981
4,163
2,222
81
47
Cocaine
Heroin
Marijuana
Amphetamine
Methamphetamine
1Unweighted data are from 24–32 Chicago EDs reporting to DAWN in 2004. All DAWN cases are reviewed for quality control. Based on this review, cases may be corrected or deleted and, therefore, are subject to change. SOURCE: DAWN Live!, OAS, SAMHSA, updated 4/14/2005–6/9/2005

EPIDEMIOLOGIC TRENDS IN DRUG ABUSE—Chicago
Proceedings of the Community Epidemiology Work Group, Vol. II, June 2005 63
Exhibit 4. Numbers of Patients Served in Publicly Funded Treatment Programs in Illinois1 and Chicago, by Primary Drug of Abuse: FY 2000–FY 2004
FY 2000 FY 2001 FY 2002 FY 2003 FY 2004 Primary Drug Chicago Illinois Chicago Illinois Chicago Illinois Chicago Illinois Chicago Illinois Cocaine 15,327 15,957 15,734 14,430 13,426 13,238 16,443 17,439 15,034 16,396 Heroin 14,952 4,822 16,790 6,232 15,136 5,649 24,396 10,219 21,758 8,773 Marijuana 5,905 14,800 6,512 17,748 6,649 17,526 7,959 18,412 7,539 23,111 Meth2 33 698 31 1,373 29 1,955 35 3,547 47 4,581 Amp3 50 217 48 246 45 272 32 444 48 437 1Illinois data exclude Chicago 2Meth = Methamphetamine 3Amp = Amphetamine SOURCE: Illinois Department of Human Services, Division of Alcoholism and Substance Abuse Exhibit 5. Percentages of ADAM Adult Male Arrestees Testing Positive in Chicago for Selected Drugs by Year: 2000–20031
45
50 4953
3741
4851
27
2226 25
0
10
20
30
40
50
60
2000 2001 2002 2003
Percent
Marijuana
Cocaine
Opiates
1Data for 2000 are for the first through third quarters; data for 2001 are for the fourth quarter only; and data for 2003 are for the first three quarters. SOURCE: ADAM, NIJ

EPIDEMIOLOGIC TRENDS IN DRUG ABUSE—Chicago
Proceedings of the Community Epidemiology Work Group, Vol. II, June 2005 64
Exhibit 6. Heroin Price and Purity Trends in Chicago, by Geographic Origin of the Heroin: 2000–2003
2000 2001 2002 20034 Trend SEA1 SWA2 SA3 SEA SWA SA SEA SWA SA SWA SA Purity (%) 16.9 20.2 23.8 20.7 20.8 19.5 20.8 19.8 20.4 18.4 16.6 Price Per Milligram Pure $1.16 $0.32 $0.48 $0.45 $0.41 $0.71 $0.71 $0.39 $0.43 $0.52 $0.45 1Southeast Asia. 2Southwest Asia. 3South America. 4SEA data are not available for 2003. SOURCE: DMP, DEA Exhibit 7. Number of Patients Served in Publicly Funded Treatment Programs in Illinois for Methampheta-
mine: FY 2000–FY 2004
33 31 29 35 47
698
1,373
1,955
3,547
4,581
0
1,000
2,000
3,000
4,000
5,000
FY 2000 FY 2001 FY 2002 FY 2003 FY 2004
Patients Served
ChicagoIllinois
SOURCE: Illinois Department of Human Services, Division of Alcoholism and Substance Abuse

EPIDEMIOLOGIC TRENDS IN DRUG ABUSE—Denver and Colorado
Proceedings of the Community Epidemiology Work Group, Vol. II, June 2005 65
Patterns and Trends in Drug Abuse: Denver and Colorado, 2004 Nancy E. Brace, R.N., M.A.1 ABSTRACT Alcohol remained Colorado’s most frequently abused substance, and tobacco is responsible for 4,200 deaths in Colorado annually. Excluding alco-hol and tobacco, the use and trafficking of illegal drugs continues to be an expanding problem for Colorado, with much of the transporting, distribu-tion, and selling of illegal substances supported by organized crime entities. Cocaine consistently had the highest drug incidence rate per 100,000 popula-tion for emergency department visits, drug-related hospital discharges, and drug-related mortality rates for 1996 through 2002. In 2003, opiate-related drug misuse mortalities exceeded those that were co-caine-related. Cocaine accounted for the highest number of drug-related calls to the Rocky Mountain Poison and Drug Center for 2001–2003 for the Denver area. In 2004, amphetamines, metham-phetamine, and other stimulants combined exceeded cocaine in the number of these calls statewide. In 2003 and 2004, methamphetamine surpassed co-caine in the number of treatment admissions. Drug enforcement officials and treatment providers have corroborated this increase in methamphetamine use and trafficking in Colorado. Marijuana has ac-counted for the highest number of treatment admis-sions annually since 1997 and in the highest per-centage of users entering treatment within 4 years of initial use. Methamphetamine ranks second in the latter category, surpassing both cocaine and heroin. Most indicators for heroin are decreasing, with the exception of mortality data. Experts in the field report an increase in opiate prescription diver-sion, especially among adolescents. Initial use for most of these illegal substances seems to be occur-ring at a younger age. INTRODUCTION Area Description Denver, the capital of Colorado, is located slightly northeast of the State's geographic center. Covering only 154.6 square miles, Denver is bordered by sev-
1 The author is affiliated with the Alcohol and Drug Abuse Divi-sion, Colorado department of Human Services, Denver, Colorado.
eral suburban counties: Arapahoe on the southeast, Adams on the northeast, Jefferson on the west, Broomfield on the northwest, and Douglas on the south. These areas made up the Denver Population and Metropolitan Statistical Area (PMSA) through 2004. In 2005 the Federal Office of Management and Budget (OMB) added four new counties (Elbert, Park, Clear Creek, and Gilpin) and renamed the area the Denver-Aurora MSA. The Denver-Aurora MSA covers 8,390 square miles. These additions should be noted in the future when comparing 2005 with previ-ous years’ data. Denver and the surrounding counties experienced rapid population growth from the 1990s through 2003. According to the 2004 Colorado census fore-cast, the Denver-PMSA population was 2,348,764. The city of Denver accounts for 12 percent of Colo-rado's total population. The Denver PMSA accounts for 50 percent of the total State population. By the end of 2006, the Denver-Aurora MSA population is expected to increase by 4.0 percent to 2,415,156. Colorado was the third fastest growing State in the United States until 2004, when the growth rate de-clined. The population more than doubled from 1960 to 2000. Recently, however, the population that moved from Colorado to the surrounding States ex-ceeded new arrivals. Colorado now ranks among those States with the lowest rates of net domestic immigration and is 14th on the list of fastest growing States. Statewide, the population is expected to in-crease from the 2004 census projection of 4,642,589 to 4,706,754 by the end of 2005, or by 1 percent. The median age in the Denver area is 33.1. Males accounted for 50.5 percent and females represent 49.5 percent of the population. Ethnic and racial characteristics of the area are as follows: 65 percent White, 11 percent Black or African-American, 3 per-cent Native American Indian, 3 percent Asian, and 0.1 percent Native Hawaiian and Other Pacific Is-landers. Hispanics or Latinos of any race compose 32 percent of the area’s population. The average household size is 2.27, and the average family size is 3.14. For the population age 25 and older, 79 percent are high school graduates or higher, and 35 percent have bachelor’s degrees or higher. The major industries in Colorado are communica-tions, utilities, agriculture, and transportation. The employment growth rate in the State exceeded the Nation’s at the end of 2004, with the United States and Colorado employment rates growing at 1.6 and

EPIDEMIOLOGIC TRENDS IN DRUG ABUSE—Denver and Colorado
Proceedings of the Community Epidemiology Work Group, Vol. II, June 2005 66
2.1 percent, respectively. The per capita income for Denver is $24,101. The median household income is $55,883, and the median family income is $47,203. Eleven percent of families and 14 percent of indi-viduals in the area live below the poverty level. The unemployment rate as of March 2005 was 5.7; na-tionally, it was 5.6. Two major interstate highways, I-25 and I-70, bisect Denver. I-25 runs north-south from Wyoming through New Mexico, and I-70 runs east-west from Maryland through Utah. The Violent Crime Rate National Ranking for Colo-rado is 27 out of 50. Several considerations may influence drug use in Denver and Colorado: • Easy transit across multiple States is possible via
the interstate highways. • The area’s major international airport is nearly at
the midpoint of the continental United States. • The area is marked by population growth and
expanding economic opportunities. • Remote rural areas are ideal for the undetected
manufacture, cultivation, and transport of illicit drugs.
• A young citizenry is drawn to the recreational
lifestyle available in Colorado. • The large tourism industry draws millions of
people to the State each year. • Several major universities and small colleges are
in the area. • The Denver-Aurora MSA unemployment rate
was 5.0 percent as of November 2004, a decrease of 1 percent from a year earlier.
Data Sources Unless otherwise specified, the data in this report are for calendar year (CY) 2004 and were collected and analyzed in May 2005. Although these indicators reflect trends throughout Colorado, they are domi-nated by the Denver metropolitan area. • Qualitative and ethnographic data for this
report were available mainly from clinicians from treatment programs across the State, local researchers, and street outreach workers.
• Emergency department (ED) data were derived for 2004 from the Drug Abuse Warning Network (DAWN) Live! restricted-access online query sys-tem administered by the Office of Applied Studies (OAS), Substance Abuse and Mental Health Ser-vices Administration (SAMHSA). Eligible hospi-tals in the Denver area totaled 14; hospitals in the DAWN sample numbered 14, with the number of EDs in the sample totaling 14. During this 12-month period, between 5 and 8 EDs reported data each month. The completeness of data reported by participating EDs varied by month (see exhibits 1a and 1b). Exhibits in this paper reflect cases that were received by DAWN as of April 13–14, 2005. All DAWN cases are reviewed for quality control. Based on this review, cases may be corrected or deleted. Therefore, the data presented in this paper are subject to change. Data derived from DAWN Live! represent drug reports in drug-related ED visits. Drug reports exceed the number of ED vis-its, since a patient may report use of multiple drugs (up to six drugs and alcohol). The DAWN Live! data are unweighted and, thus, are not esti-mates for the reporting area. These data cannot be compared to DAWN data from 2002 and before, nor can preliminary data be used for comparison with future data. Only weighted DAWN data re-leased by SAMHSA can be used for trend analy-sis. Exhibit 1c shows the number of unweighted DAWN ED cases by case type. A full description of the DAWN system can be found at the DAWN Web site: http://dawninfo.samhsa.gov.
• Drug related mortality data for the Denver
metropolitan area for 2003 were provided by SAMHSA’s Drug Abuse Warning Network, 2003: Area Profiles of Drug Related Mortalities. The Colorado Department of Public Health and Environment (CDPHE) provided statewide mor-tality data for 2003. Data for 2004 were unavail-able at the time of document completion. Data for the Denver metropolitan area for 1996–2002 are also reported.
• Hospital discharge data statewide for 1997–
2003 were provided by the Colorado Hospital Association through the CDPHE Health Statis-tics Section. Data included diagnoses (ICD-9-CM codes) for inpatient clients at discharge from all acute care hospitals and some rehabilitation and psychiatric hospitals. These data did not in-clude ED care.
• Drug/Alcohol Coordinated Data System
(DACODS) reports are completed on clients at admission and discharge from all Colorado alco-hol and drug treatment agencies licensed by

EPIDEMIOLOGIC TRENDS IN DRUG ABUSE—Denver and Colorado
Proceedings of the Community Epidemiology Work Group, Vol. II, June 2005 67
ADAD, Colorado Department of Human Ser-vices. Annual figures are given for 1997 through 2004. DACODS data are collected and analyzed by ADAD.
• Data regarding methamphetamine use in men
who have sex with men (MSM) in Denver were provided by Dr. Mark Thrun, Medical Director, HIV Prevention, Denver Public Health.
• Availability, price, and distribution data were
collected from local Drug Enforcement Admini-stration (DEA) Denver Field Division (DFD) of-ficials in their fourth quarter fiscal year (FY) 2004 report, the Office of National Drug Control Policy (ONDCP), Drug Policy Information Clearinghouse, “Denver, Colorado, Profile of Drug Indicators, June 2004” and from the De-cember 28, 2004 issue of Narcotics Digest Weekly, Volume 3, Number 52.
• Communicable disease data were obtained
from the CDPHE. Data are presented from 1997 through 2004.
• Rocky Mountain Poison and Drug Center
(RMPDC) data are presented for the Denver area for 2001–2003 and for Colorado for 2004. The data represent the number of calls to the cen-ter regarding "street drugs."
• Arrestee urinalysis results were provided by
the Arrestee Drug Abuse Monitoring (ADAM) program, based on quarterly studies conducted under the auspices of the National Institute of Justice. ADAM data in Colorado were collected and analyzed by the Division of Criminal Justice. In 2000, NIJ changed its procedures from a con-venience to a probability sample. Thus, no ADAM data trend analysis is presented. Rather, 2001, 2002, and 2003 use percentages by drug type were included as a historical reference.
• Sentencing data on Federal drug convictions in
the State of Colorado for Federal fiscal year (FY) 2002 were compiled by the United States Sen-tencing Commission, Office of Policy Analysis.
• Information about offenders in the Colorado
correctional system for substance abuse-related crimes was supplied by The Colorado Depart-ment of Corrections, Overview of Substance Abuse Treatment Services, FY 2004.
• Statistics on seized and forensically analyzed
drug items were provided by the DEA, Office of Diversion Control, National Forensic Laboratory
Information System (NFLIS) for Denver for 2004; the Rocky Mountain High Intensity Drug Trafficking Area (HIDTA) Taskforce; and from information reported by the Denver Police De-partment Crime Laboratory.
• Alcohol data were obtained from the “U.S. Ap-
parent Consumption of Alcoholic Beverages Based on State Sales” by the U.S. Department of Health and Human Services, June 2004, the Rocky Mountain Insurance Information Associa-tion (RMIIA), the Department of Transportation Fatality Analysis Reporting System (FARS), and Colorado State Patrol statistics.
• Drug testing index data for 2004 were provided
by Quest Diagnostics. The positivity rate is the number of positive test results compared to the total number of drug tests performed by Quest Diagnostics (7.2 million workplace drug tests na-tionally) in 2004. Quest Diagnostics performs workplace testing for three major populations: federally mandated, safety-sensitive workers (such as pilots, bus and truck drivers, and work-ers in nuclear power plants); the general work-force, and the combined workforce. (Note: The positivity rate may also reflect the availability and type of employment opportunities for differ-ent geographic areas of Colorado.)
• Tobacco statistics for 2004 were excerpted from
the “State of Tobacco Control 2004” by the American Lung Association. Statistics for 2003 were provided by the CDPHE, “Health Watch 2003.”
• Crime statistics for Colorado in 2003 were
taken from the Colorado Bureau of Investigation crime reports.
• Cost estimates for untreated substance abuse
in Colorado were taken from National Estimates of Expenditures for Substance Abuse Treatment, 1997, SAMHSA, February 2001.
• Population statistics were obtained from the
Colorado Demography Office, Census 2000 in-cluding estimates and projections, and fact-finder.census.gov.
DRUG ABUSE PATTERNS AND TRENDS Cocaine/Crack Cocaine indicators remained mixed, with some in-creasing and some decreasing during this period. Co-caine was the most common illegal drug noted in

EPIDEMIOLOGIC TRENDS IN DRUG ABUSE—Denver and Colorado
Proceedings of the Community Epidemiology Work Group, Vol. II, June 2005 68
Denver-area emergency department reports and sec-ond only to alcohol among all drug reports. Denver PMSA ED mentions for cocaine increased steadily from 1996 (53 per 100,000) through 2002 (82 per 100,000). Unweighted DAWN Live! data showed 1,569 ED reports for cocaine in 2004 (exhibit 2). Males represented 63 percent of all ED cocaine pa-tients; 47 percent were age 30–44 (exhibits 3 and 4). Overall, those age 21–64 accounted for 89 percent of all cocaine patients. Statewide hospital discharges showed that cocaine-related visits per 100,000 population rose steadily from 1997 (56 per 100,000) through 2003 (80 per 100,000) (exhibit 5). Cocaine was second only to alcohol in drug-related hospital discharges in 2003. The number of cocaine-related calls to the Rocky Mountain Poison and Drug Center for the Denver area rose from 2001 (59) through 2003 (68); during that period, cocaine was the most common drug of concern (second only to alcohol) (exhibit 6a). In 2004, the number (316) of statewide calls about stimulants and amphetamines exceeded those for cocaine (120). There were 95 methamphetamine calls statewide in 2004. CDPHE cocaine-related mortality data for the Denver PMSA showed an increase in such deaths from 1996 (68) to 2001 (126); they declined slightly in 2002 to 108 (exhibit 7). Throughout this entire time period, cocaine-related deaths were higher than those for any other drug (including alcohol) in the area. Statewide, cocaine deaths climbed from 92 in 1997 (23.6 per million) to 146 in 1999 (36.1 per million). While they declined to 116 in 2000 (27 per million), they increased again to 134 in 2001 (30.4 per million) and to 153 in 2002 (34.1 per million). CDPHE data from 2003 places cocaine deaths at 180 (39.2 per million), the highest number and rate in the time pe-riod indicated. In spite of this increase, cocaine ranked behind alcohol (1,141) and the opiates (her-oin, morphine, other opioids, and narcotics combined for a total of 247). Reports from clinicians, research-ers, and street outreach workers around the State cor-roborate the continuing cocaine problems reflected in the indicator data. However, qualitative reports indi-cate a shift to methamphetamine among some stimu-lant users, especially the younger population. Clini-cians report cocaine is rarely a primary drug for those younger than 18, regardless of urban or rural setting. Cocaine use is slightly higher among 18–25-year-
olds, but it is a major drug of abuse for those age 26–64, especially in urban areas. Cocaine was the primary drug for 21 percent of all treatment admissions (excluding alcohol) in 2004 (exhibit 8). The proportion of clients admitted to treatment with cocaine as their primary drug de-creased slightly from 1997 (24 percent of all drug admissions) to 2004. Since 2001, primary cocaine admissions have remained in the 19–21 percent range. Since 1997, marijuana as a primary drug has exceeded cocaine, and this trend continued in 2004. In 2003 and 2004, methamphetamine exceeded co-caine as a primary drug of abuse. The majority of cocaine admissions were clients who had been using this drug for 4 or more years. The proportion of admissions of “new” cocaine users (those using less than 4 years) rose from 17 percent in 1997 to 19 percent in 2003 and 18 percent in 2004 (exhibit 9a). It takes an average of 10.7 years after first use for the majority of those users with cocaine as their primary drug to seek treatment (exhibit 9b). The percentages of clients who smoke cocaine de-clined steadily from 65 percent in 1997 to 58 percent in 2001, but rebounded in 2003 and 2004 to 63 and 62 percent, respectively. The proportion of clients who inhale cocaine has been steadily increasing, from 19 percent in 1997, to 26 percent in 2001, to 30 percent in 2004. Whites accounted for the largest percentage of co-caine admissions in 2003 and 2004 (45 percent for both years), showing a small decline from 2000 (48 percent). Hispanic cocaine admissions increased dramatically from 19 percent in 1997 to 29 percent in 2000 and 33 percent in 2004. The proportion of African-American cocaine admis-sions dropped sharply from 33 percent in 1997 to 20 percent in 2001, with a mild increase in 2003 (24 percent), followed by a decline in 2004 (to 18 per-cent). However, crack cocaine is fairly well en-trenched in the African-American urban communi-ties. African-American admission percentages for all other drugs remain in the single digits, with the ex-ception of marijuana (13 percent). In 1997, 56 percent of cocaine treatment admissions were younger than 36; this decreased to 50 percent in both 2003 and 2004. The majority (68.5 percent) of 2004 cocaine admissions were between the ages of 26 and 45. Two percent of cocaine admissions in 2004 were younger than 18, and only 12 percent were older than 45.

EPIDEMIOLOGIC TRENDS IN DRUG ABUSE—Denver and Colorado
Proceedings of the Community Epidemiology Work Group, Vol. II, June 2005 69
Cocaine admissions remain predominately male, with their proportion growing slightly from 1997 (57 per-cent male) to 2004 (61 percent). Sixty-nine percent were admitted to treatment for cocaine dependence, compared with 26 percent for abuse. Thirty-eight percent of cocaine users indicated they used alcohol as a secondary drug, and 24 percent used marijuana. Treatment providers indicated that marijuana is commonly used with cocaine to lessen the effects of withdrawal and to potentiate the effects of the co-caine. In Federal FY 2002, 34 percent of those sentenced to Federal correctional systems in Colorado had drugs as their primary offense category, compared with 41 percent nationally. Of the 34 percent, powder and crack cocaine were each involved. Thirty-one percent were sentenced because of drug trafficking. According to recent ADAM data for a sample of Denver arrestees, 35.4 percent of males and 46.5 per-cent of females had cocaine-positive urine samples in 2001. These numbers were down slightly in 2002, with 32.7 percent of males and 43.6 percent of fe-males testing positive. However, in 2003, 38.3 per-cent of males and 52.5 percent of females tested posi-tive for cocaine (exhibit 10). According to the National Forensic Laboratory In-formation System, in Denver, cocaine accounted for 49 percent of all drugs seized by law enforcement and submitted to a forensic laboratory for analysis in 2004. When drug testing for employment in Colorado, Quest Diagnostics ranked cocaine lowest on the Quest Drug Test Index (0-2.54 percent), possibly indicating that few individuals undergoing screening for employment that requires testing in Colorado used cocaine (exhibit 11). According to the National Drug Intelligence Center and the DEA, powder cocaine was readily available throughout the State in 2004. Crack cocaine was more available in urban population centers. In gen-eral, Caucasians prefer powder cocaine and African-Americans prefer crack. Cocaine was the drug most often associated with violent crime in Colorado in 2004. The majority of cocaine is Mexican; it is imported into Colorado by organized Mexican nationals or family groups who have connections to gangs on the west coast. In the last year, two significant drug or-ganizations began to compete to control the whole-sale supply. They transport the cocaine from the
Mexican border or from western States, such as Cali-fornia and Arizona, to Denver, using automobiles with hidden compartments, commercial and cargo airlines, delivery services, and other mail carriers. Denver serves as a major distribution center for co-caine for the entire country, especially the Midwest and east coast States. Proceeds from cocaine sales are transported to Mexico or the western States via the same means. In Colorado, street distribution is controlled by gangs. There are more than 10,000 gang members in the Denver area, with an average of 1,500 new mem-bers added each year. According to the Denver Drug Enforcement Agency and treatment providers, gangs also control the market for distribution of cocaine in the southern, northern, and western slope areas of the State. Gangs are ubiquitous throughout Colorado, but they are less dominant in the eastern region, where the population is much less dense. Cocaine prices depend on the purity of the product. In 2004, powder cocaine sold for $16,000–$20,000 per kilogram and $600–$700 per ounce in the Denver metropolitan area (exhibit 12). These prices are slightly lower than in previous years. Crack cocaine prices have remained relatively stable at $700–$1,200 per ounce, while “rock” prices on the street are $20–$60 in Denver. Prices are slightly higher outside of the Denver metropolitan area. Purity ranges from 60 to 75 percent for crack and 16 to 90 percent for pow-der. Treatment providers stated that crack is fairly rare on the western slope, and its use remains en-trenched in the African-American communities in southern Colorado. Overall, Colorado has seen a decrease in the whole-sale price of powder cocaine, because some users switched to methamphetamine. Treatment providers indicate this switch is due to the cheaper prices and a longer lasting “high” of methamphetamine. Heroin and Other Opiates Heroin and other opiate use pose a considerable threat to Colorado, although indicators for both were mixed. The number of heroin-related ED mentions in Denver was 22 per 100,000 in 1996, with a gradual increase to 43 per 100,000 in 2002. In 2004, unweighted DAWN Live! data revealed 609 heroin ED reports (exhibit 2). Males represented 74 percent of these patients; 40 percent were age 30–44, and 99 percent were age 21–64 (exhibits 3 and 4). Opiates other than heroin include hydrocodone, hy-dromorphone, codeine, and oxycodone. ED mentions

EPIDEMIOLOGIC TRENDS IN DRUG ABUSE—Denver and Colorado
Proceedings of the Community Epidemiology Work Group, Vol. II, June 2005 70
related to narcotic analgesics for Denver rose steadily from 18 in 1996 to 41 in 2001, with a drop to 34 in 2002. In 2004, unweighted DAWN Live! data show 699 ED reports for prescription drug misuse of opiates and opioids; 43 percent were classified as overmedication case types, 40 percent were “other,” and 17 percent were seeking detoxification (exhibit 13). ED reports for hydrocodone totaled 174, with 64 percent of case types being overmedication. Oxycodone ED reports totaled 191, with 48 percent of these classified as overmedication. CDPHE statewide hospital discharge data for 1997–2003 combined all narcotic analgesics, including her-oin (exhibit 5). These discharges have been steadily increasing, with the rate almost doubling in 7 years, from 37 per 100,000 in 1997 to 73 per 100,000 in 2003. Treatment providers indicated a rapid rise in popularity in the abuse of prescription narcotics such as OxyContin and hydrocodone, especially among youth; these discharge data may reflect that. CDPHE’s heroin/morphine-related mortality data for the Denver PMSA showed that such deaths increased from 34 in 1996 to 79 in 1999, declined to 66 in 2000, rose to 77 in 2001, and declined to 64 in 2002 (exhibit 7). CDPHE reported that opiate-related deaths increased from 53 (3 per 100,000 population) in 1997 to 79 (4 per 100,000) in 1999 for the Denver PMSA. From this peak, deaths declined back to 3 per 100,000 in 2002. CDPHE statewide data for 2003 show there were 247 opiate-related deaths. DAWN mortality data for the Denver-Aurora Metro-politan Area for 2003 identified opiates/opioids as having the highest frequency in the top five drugs related to drug misuse deaths, with 113 multiple drug and 25 single-drug deaths (exhibit 14). Heroin and other narcotic analgesic-related calls to the Rocky Mountain Poison and Drug Center for the Denver area have remained fairly steady, with 19 calls in 2001 and 22 calls in 2003 (exhibit 6a). In 2004, there were 20 heroin/morphine calls statewide (exhibit 6b). According to recent ADAM data for a sample of Denver arrestees, 5.2 percent of males and 2.4 per-cent of females tested positive for opiates in 2001. However, in 2002, 5.3 percent of females and 4 per-cent of males tested positive for opiates. In 2003, male arrestees again showed a slightly higher per-
centage of opiate-positive urines (6.8 percent) than female arrestees (6.1 percent) (exhibit 10). The proportion of Colorado treatment admissions (excluding alcohol) for clients with heroin as their primary drug has steadily declined. In 1997, 16 per-cent of all drug treatment admissions identified her-oin as their primary substance, while in 2004 only 9 percent did so (exhibit 8) Admissions for primary “other opiates” abuse remained steady during this period, representing 3 and 4 percent, respectively. Admissions for “new” heroin and other opiate users entering treatment within 4 years of initial use fluctu-ated since 1997 at 17.9 percent, to 21.6 percent in 2000 and 16.1 percent in 2004 (exhibit 9a). The ma-jority of those in treatment for heroin are long-time users. According to ADAD’s 2004 data, it takes these clients an average of 14 years from first use before they enter treatment (exhibit 9b). Opiates (heroin and other opiates combined) ranked low for all four generations of users, from 2 percent for the Y generation, to 8 percent for the X generation, and 13 percent for the Baby Boomers (exhibit 15). Nearly all (99.6 percent) heroin and other opiate us-ers were older than 18 at the time of admission to treatment. Sixty-one percent were male, and 88 per-cent lived in urban settings. Treatment providers reported an increasingly young population in their early teens using OxyContin and any other drug they can obtain, usually stolen from their parents. Providers also stated they are seeing more polysubstance abuse in clients. Sixty-nine percent of treatment admissions for heroin and other opiates were White, 20 percent were His-panic, and 7 percent were Black or African-American. Forty-two percent had completed the 12th grade, and 3 percent completed college. Wages were the primary source of income for 46 percent. Twenty-seven percent had no prior treatment, while 29 per-cent had three or more treatment episodes before this admission. Fifty-four percent of these clients self-referred into treatment. Eighty-six percent were dependent upon heroin or other opiates, while 12 percent received the diagnostic impression of abuse. Twenty-nine percent had no use of heroin or other opiates in the 30 days prior to treatment admission, while 44 percent used daily. Sixty-two percent injected, and 29 percent re-ported the oral route of administration.

EPIDEMIOLOGIC TRENDS IN DRUG ABUSE—Denver and Colorado
Proceedings of the Community Epidemiology Work Group, Vol. II, June 2005 71
Twenty-eight percent of these clients were younger than 18 when they first tried heroin or other opiates, and 48 percent were 21 or older. Forty-three percent had no secondary drug, while 23 percent used co-caine as their secondary drug. Fifty-one percent of clients indicated they began to use their secondary drug before the age of 18, and 28 percent began at or after age 21. Seven percent of those in Colorado who were sen-tenced to Federal facilities were heroin or other opi-ate users, and this percentage mirrors the national percentage for Federal FY 2002. Heroin represented only 5 percent of all items seized by law enforcement in Denver and submitted to forensic laboratories for analysis in 2004. Mexican black tar and brown powdered heroin are the most common types available in Denver, with black tar being slightly more available in Colorado. Most new users are young adults who smoke or snort it. Mexican drug trafficking organizations transport heroin into Colorado and serve as the primary whole-sale distributors and frequently as retail sellers, con-trolling the street-level market for heroin. Gang-related crimes are frequently associated with the sale of heroin. It is widely available in both urban and rural settings. While typical users are older White males living in the lower downtown Denver area, new suburban users are emerging. Prices for illegal drugs vary widely depending on source, geographic area, purity, and risk. One ounce of Mexican heroin at 40 percent purity costs $2,000–$3,000. One gram of heroin that is 8–64 percent pure costs $100–$150. Costs in Denver are slightly lower than in the rest of the State. Heroin can be obtained in Denver for $440 per one-quarter ounce or $100–$150 per gram (exhibit 12). Pharmaceutical diversions of OxyContin and other narcotic analgesics are increasing, as they provide the abuser with reliable strength and dosage levels. A $4 prescription dose of OxyContin sells on the street for $40, or $1 per milligram, 10 times the legal prescrip-tion price. One pill sells for $6.50 in Denver (exhibit 12). More abusers are using the Internet to obtain prescription medications. Drug enforcement officials have found a severe, systemic failure in pharmacies and physicians’ offices related to keeping proper re-cords, reporting thefts, and maintaining controlled substances in Colorado. In response, Colorado re-cently passed Prescription Drug Tracking legislation to monitor the use of controlled substances.
Marijuana Marijuana indicators are mixed. Marijuana is second to alcohol in the number of users in Colorado, yet ED data fall far below those for cocaine or narcotic anal-gesics. ED mentions increased steadily from 1996 (19) through 2001 (50). In 2004, unweighted DAWN Live! data showed 755 ED marijuana reports (exhibit 2). Males represented 61.6 percent of the patients, and smoking was the primary route of administration. Marijuana ED pa-tients involved the widest age groups (exhibit 14). Marijuana-related hospital discharges increased steadily from 53 per 100,000 in 1997 to 71 per 100,000 in 2003 (exhibit 5). Marijuana-related calls to the Rocky Mountain Poi-son and Drug Center remained fairly static from 1996 through 2003 for the Denver area (exhibit 6a). In 2004, there were 68 calls related to marijuana for the entire State (exhibit 6b). CDPHE reported that marijuana-related deaths for the Denver PMSA have been quite few in number, from 1 in 1996 to a peak of 31 in 2001, with a decline to 5 in 2002 (exhibit 7). The number of cases in 2003 and 2004 were too small to report. According to DAWN mortality data, marijuana was not one of the top five drugs involved in drug misuse deaths for 2003. ADAM data indicated that 40 percent of the male arrestee sample and 33 percent of the female arrestee sample had positive marijuana urine screens in 2001. These percentages remained stable in 2002 (with 40.3 percent of males and 32.6 percent of females testing positive), but increased slightly in 2003 (42.3 percent positives for males and 34.3 percent positives for females) (exhibit 10). Overall, marijuana is second only to alcohol as an entry substance to illegal drug use and abuse. Excluding alcohol, Colorado has more treatment ad-missions for marijuana than for any other drug (ex-hibit 8). The percentage of clients admitted to treat-ment with marijuana as their primary drug has been fairly steady from 1997 (41 percent) to 2004 (38 per-cent). More “new” marijuana users seek treatment within 4 years of first use than for any other drug (exhibit 9a). This finding has been consistent since 1997 (42.4

EPIDEMIOLOGIC TRENDS IN DRUG ABUSE—Denver and Colorado
Proceedings of the Community Epidemiology Work Group, Vol. II, June 2005 72
percent) through 2004 (30.5 percent). Marijuana us-ers take an average of 8 years from time of first use to first treatment, which is a shorter time frame than for any other drug discussed here, except metham-phetamine (also 8 years) (exhibit 9b). Males accounted for 74 percent of treatment admis-sions in 2004, maintaining the historical male-to-female ratio of approximately 3 to 1 since 1997. Thirty-nine percent were younger than 18 at time of admission to treatment. This figure has been fluctuat-ing between 45 and 35 percent since 1997. Sixty-seven percent of treatment admissions with marijuana as their primary drug were living in urban settings. Race proportions for marijuana admissions remain relatively stable. In 2004 53 percent were White, 30 percent were Hispanic, and 13 percent were African-American. Whites represented 56 percent in 2003, followed by Hispanics (27 percent) and African-Americans (11 percent). Sixty-five percent used to-bacco products daily. Fifty-six percent had no prior treatment episodes, while 27 percent had one. Sixty-seven percent were unemployed, and 62 percent were living in a dependent setting (the majority with their parents). Only 8 percent self-referred to treatment, while 21 percent were referred by Social Services and 52 percent were referred by non-DUI criminal justice. Forty-six percent of marijuana treatment admissions were considered abusers, while 41 percent were de-pendent on marijuana. Smoking was the route of ad-ministration for 95 percent of treatment admissions with marijuana as primary drug. Ninety percent of all clients stated they started to use marijuana before age 18. Thirty-two percent had no secondary drug, while 44 percent used alcohol and 12 percent used methamphetamine as their secondary drug. Of those with a secondary drug, 76 percent started using it before the age of 18. Among persons 18 or older, 28 percent of those who first used marijuana before age 12 were assessed at treatment admission as having a mental health prob-lem in addition to a substance abuse problem, com-pared with 21 percent of those who first used mari-juana at age 18 or older. In both 2003 and 2004, 79 percent of treatment clients aged 18 or older reported first use before age 18, and 9 percent reported initiat-ing use before the age of 12. Quest Diagnostics reported that their employment testing showed marijuana with a higher positivity rate in Denver than any other drug in 2004 (exhibit 11). Of those individuals sentenced to Federal facilities in Colorado, 17 percent had use of marijuana as their
primary offense, which was lower than the national percentage at 29. Cannabis represented 19 percent of all items seized in Denver and submitted to NFLIS for analysis in 2004. Both Mexican imported and locally grown marijuana were readily available statewide. The marijuana used in Colorado was primarily pro-duced in and imported from Mexico. A small portion was grown in Colorado or other western States, par-ticularly California. It was distributed primarily by Mexican drug trafficking organizations and criminal groups at the wholesale level and by Hispanic and African-American street gangs at the retail level. Caucasian criminal groups and local independent dealers were the primary distributors of the marijuana and sinsemilla produced in Colorado. BC Bud, a Canadian import with a high level of tet-rahydrocannabinol (THC), was available only in lim-ited quantities and relatively hard to obtain in Colo-rado until 2003. Since then, an increase in availability of BC Bud has contributed to an increased THC level in both the Denver and Boulder areas. BC Bud sells for $700–$1,000 per ounce and $3,200–$4,500 per pound. On the street, BC Bud costs $10 per joint. Locally produced sinsemilla sold for $1,000–$3,000 per ounce and $50–$200 per gram in 2004 (exhibit 12). Domestic marijuana grown indoors was preferred over Mexican grown marijuana and sold for $1,000–$3,000 per pound and $200–$300 per ounce. This price range remained static from 2003 to 2004. DEA officials report “grow” operations are becoming in-creasingly sophisticated and technical. Outdoor mari-juana is most likely a product of eastern Colorado. Prices of marijuana are slightly cheaper in Colorado than in surrounding States. Trafficking on the western slope is dominated by Hispanics importing it into Colorado from Mexico. Officials are noticing more individual Mexican nationals independent of the large drug organizations trafficking marijuana statewide. Treatment providers almost uniformly indicated that marijuana use is socially accepted in their areas and that the perception of risk associated with marijuana use is declining. Treatment providers felt this decline is related to national media coverage of marijuana as a medicinal drug, and to a high frequency of parental use of marijuana. Methamphetamine Most indicators for methamphetamine increased over the past few years, and this drug was and remains a

EPIDEMIOLOGIC TRENDS IN DRUG ABUSE—Denver and Colorado
Proceedings of the Community Epidemiology Work Group, Vol. II, June 2005 73
rapidly expanding social problem for Colorado. Vio-lent crime related to methamphetamine use has been increasing, and the social consequences, particularly as related to children residing in methamphetamine cook houses, are major concerns. DAWN ED data for methamphetamine was fairly static, shifting between 5 and 8 mentions per 100,000 since 1996, with the exception of 1997, when there were inexplicably 19 mentions per 100,000 population. The unweighted DAWN Live! data show 475 ED methamphetamine reports in the Denver PMSA in 2004 (exhibit 2). Sixty-three percent of all ED stimu-lant reports for 2004 were related to methampheta-mine. Fifty-eight percent of the ED methampheta-mine patients were male (exhibit 3). Seventy percent of methamphetamine ED patients were age 21–44. Methamphetamine was not broken out from other stimulants for hospital discharge data, but overall amphetamine-related hospital discharges have in-creased since 1999 from 16 per 100,000 to 40 per 100,000 in 2003 (exhibit 5). There were 39 methamphetamine-related calls to the Rocky Mountain Poison and Drug Center for the Denver area in 2003 (exhibit 6a). In 2004, there were 95 such calls statewide (exhibit 6b). CDPHE reported a small but steady increase in methamphetamine-related mortality since 1996 (3 deaths). In 1999, there were 8 methamphetamine-related deaths, compared with 10 in 2000, 19 in 2001, and 17 in 2002 (exhibit 7). However, deaths related to amphetamines increased only slightly from 5 in 1997 to 13 in 2002. Though amphetamine-related deaths in Colorado are far fewer than those for opi-ates or cocaine, the number increased sharply from only 20 between 1996 and 1999 to 37 between 2000 and 2003 (an 85-percent increase). In 2003, there were 47 deaths related to amphetamines statewide. Colorado treatment providers reported that metham-phetamine is the most popular illegal drug, and it is frequently used in combination with alcohol, mari-juana, and cocaine. It was readily available, inexpen-sive, and at times free. Potency was reported to be good. Providers noted an increasing problem with methamphetamine use statewide, especially in younger populations. They indicated this increase was in part related to easy access, difficulty obtaining other amphetamines, and relatively low prices. Con-sistent with this trend, providers noted use of other amphetamines has dropped in popularity.
According to ADAM data, only a small percentage of positive methamphetamine urine screens were re-ported in 2001: 3.4 percent of the male arrestee sam-ple and 4.3 percent of the female arrestee sample. These figures increased slightly for males in 2002 (3.8 percent) and slightly more for females (6.6 per-cent). Again, only small changes were noted in 2003, with 4.7 percent of males and 5.0 percent of females testing positive for methamphetamine (exhibit 10). In 2004, staff at the Public Health Sexually Transmit-ted Disease (STD) Clinic in Denver surveyed clien-tele (N=981) and noted an increased use of metham-phetamine among men who have sex with men (MSM) (exhibit 16a). They found that MSM methamphetamine users are typically younger than non-users (exhibit 16b) and more likely to have been arrested in the 12 months preceding the survey, use erectile dysfunction drugs, be homeless, have more sexual partners in the last 12-month period, have more unprotected sex, and use the Internet for con-necting with casual partners. Methamphetamine users seen in the STD clinic were twice as likely to have gonorrhea or HIV than non-users. At the Denver Health Infectious Disease/AIDS Clinic in 2004, 11 percent of randomly surveyed patients (n=202) re-ported use of methamphetamine in the 3 months pre-ceding the survey. Colorado treatment admissions for clients using methamphetamine as their primary drug have risen dramatically. Methamphetamine is now second only to marijuana in the number of treatment admissions (excluding alcohol). Exhibit 8 shows that in 1997 there were 1,081 admissions for methamphetamine. This number has since tripled to 3,209 in 2004. The proportion of treatment admissions for new users (those using less than 4 years at time of treatment) does not reflect this steady rise (exhibit 9a), with 34 percent in 1997, dropping to 22 percent in 2001, and rising slightly to 24 percent in 2004. According to 2004 treatment data, methamphetamine users take an average of 8 years from first use to first treatment (exhibit 9b). A comparison of 2004 treatment admissions involv-ing new (using less than 4 years, n=562) versus more longstanding users (using 4 or more years, n=2,647) shows some notable differences between these two groups. New users were more likely than longstand-ing users to be female (56 percent vs. 41 percent, respectively) and non-White (22 percent vs. 15 per-cent, respectively). Also, as expected, new users had a higher proportion of those age 25 and younger (56 percent) than longstanding users (31 percent). Ac-

EPIDEMIOLOGIC TRENDS IN DRUG ABUSE—Denver and Colorado
Proceedings of the Community Epidemiology Work Group, Vol. II, June 2005 74
cordingly, new users were more likely than long-standing users to have never married (58 percent vs. 44 percent, respectively) and to be unemployed (67 percent vs. 61 percent, respectively). Looking at “severity” data, new users were less likely to inject methamphetamine (10 percent vs. 25 per-cent) and more likely to ingest the drug by smoking (74 percent vs. 60 percent, respectively) than were long-standing users. Fewer new users were diagnosed as drug dependent (57 percent vs. 73 percent), but they had a higher proportion of concurrent mental health problems (33 percent) than longstanding users (29 percent). Methamphetamines were combined with all other stimulants in the generational snapshot of treatment. Both the X generation and the Baby Boomers used stimulants (36 percent and 25 percent, respectively) more than the Y generation or seniors (18 percent and 5 percent, respectively) (exhibit 15). During 2004, 4 percent of treatment admissions with methamphetamine as a primary drug were for clients younger than 18. The majority of those in treatment (69 percent) were between ages 18 and 35. During 2004, 56 percent of treatment admissions for methamphetamines were male. Methamphetamine use was found in both urban (60 percent) and rural (40 percent) areas of Colorado. Treatment providers stated they are seeing an increase in methampheta-mine use in both rural and urban areas and an in-crease in the social and community problems related to this use. Whites dominated among methamphetamine admis-sions (83 percent) in Colorado. Few Hispanics (13 percent) and even fewer African-Americans (1 per-cent) used methamphetamine as their primary drug. However, treatment providers indicated that Hispan-ics, who have traditionally been involved in the traf-ficking of methamphetamine, were beginning to use it in greater numbers. Fifty-two percent of all methamphetamine users were referred to treatment by the non-DUI criminal justice system, and 18 per-cent were referred by Social Services. Injecting had been the most common route of ad-ministration for methamphetamine. However, the proportion of those injecting declined from 1997 (32.6 percent) to 2004 (21 percent), while smoking increased in the last 7 years. In 1997, only 29.1 per-cent smoked methamphetamine; in 2003, 61 percent of methamphetamine treatment admissions smoked the drug. In 2004, 63 percent smoked it, while 21 percent injected it.
Forty-one percent of clients began to use metham-phetamine before the age of 18. Most (72 percent) used a secondary drug in addition to methampheta-mine, usually marijuana (37 percent), alcohol (21 percent), or cocaine (10 percent). Seventy-nine per-cent of those using a secondary drug initiated use of this secondary drug before the age of 18. Treatment outcomes for methamphetamine users are as good as or better than outcomes for users of other drugs. Federal sentencing data report that methamphetamine was the primary substance for 34 percent of the drug convictions in Federal FY 2002. This is almost dou-ble the percentage of offenders sentenced because of cocaine (powder and crack) and marijuana and four times greater than heroin. The DEA describes widespread methamphetamine availability, with a majority of the drug originating from Mexico or from large-scale laboratories in Cali-fornia. However, methamphetamine lab seizures in Colorado increased significantly from around 25 in 1997 to 464 in 2002. These laboratories, generally capable of manufacturing an ounce or less per “cook,” varied from being primitive to quite sophisti-cated. The ephedrine reduction method remains the primary means of manufacturing methamphetamine in the area. In spite of law enforcement pressure, there has been an increase in the number of small, local methamphetamine labs, with the occasional use of trucks for mobile labs. Most lab operators are able to get the precursor chemicals from legitimate businesses (e.g., discount stores, drug stores, chemical supply companies, etc.). Treatment providers report that the current practice is for separate individuals or groups to each acquire one of the key ingredients and then deliver it to the “cook,” thereby decreasing the risk involved when one party obtains all the ingredients. In 2005, Colo-rado passed legislation limiting public access to methamphetamine precursor drugs. Impact from this legislation has yet to be determined. During 2004, several major cocaine and metham-phetamine trafficking organizations that had been transporting drugs to Denver from Arizona and Cali-fornia were shut down. Methamphetamine from one of these organizations had purity levels of 95 percent. An organization on the western slope of Colorado employed a number of drivers who transported any-where from 2 to 10 pounds from Sinaloa, Mexico, or California. Federal drug seizures in Colorado in 2004 included 28.8 kilograms of methamphetamine.

EPIDEMIOLOGIC TRENDS IN DRUG ABUSE—Denver and Colorado
Proceedings of the Community Epidemiology Work Group, Vol. II, June 2005 75
Methamphetamine prices fluctuated from 2003 to 2004, with prices in some geographic areas of the State increasing while others decreased. In general, methamphetamine could be obtained for $700–$1,500 per ounce, $4,500–$5,600 per one-half pound, and $16,000 per pound in the Denver area (exhibit 12). In southern Colorado, prices are $600 per ounce and $13,000 per pound. On the western slope, it sells for $1,000–$1,200 per ounce. Purity varied from 0 to 100 percent, with most in the 50–95 percent range. In Denver “ice,” a smokable form of methamphetamine that looks like rock candy or rock salt, is nearly 100 percent pure and widely available. Street prices for methamphetamine in Denver rose from $80–$125 per gram in 2003 to $150 per gram in 2004. Other Amphetamines and Stimulants Indicators for other amphetamines and stimulants in Colorado were mixed, but overall use of other am-phetamines and stimulants (excluding cocaine and methamphetamine) is approximately one-half that of cocaine or methamphetamine. There were 280 unweighted ED reports of ampheta-mines in 2004 in the Denver PMSA (exhibit 2). The age group most represented among patients was 30–44-year-olds (exhibit 4). CDPHE hospital discharge data did not differentiate between methamphetamine and other amphetamines. The statewide number of amphetamine-related hospi-tal discharges rose steadily from 1997 (959) to 2003 (1,814) (exhibit 5). Denver-area amphetamine-related calls (which exclude methamphetamine) to the Rocky Mountain Poison and Drug Center were the smallest of any of the major drug groups: 3 in 2001 and 6 in 2003 (exhibit 6a). In 2004, there were 316 such calls statewide (excluding methamphetamine and cocaine) (exhibit 6b). In 1997, there were 52 (0.7 percent of the treatment admissions) admissions to treatment with some other amphetamine or stimulant as primary drug (exhibit 8). In 2003, there were a total of 78 (0.7 percent of the treatment population) admissions. Such admis-sions declined to 46 (or 0.4 percent) in 2004. CDPHE mortality data for the Denver PMSA showed an increase in amphetamine and other stimulant-related deaths, from 2 in 1996 to 13 in 2002 (exhibit 7). In 2003, the number of statewide deaths for other stimulants/amphetamines was 47, more than deaths for methamphetamine but only one-fourth the amount of the deaths related to cocaine.
Quest Diagnostics noted that in 2004, 0.14–0.33 per-cent of employment drug tests in the Denver area were positive for amphetamines (exhibit 11). Barbiturates, Sedatives, and Tranquilizers According to DAWN Live! data, there were 409 ED prescription drug misuse reports related to benzodi-azepines in the Denver area in 2004. Fifty-nine per-cent of these reports were related to overmedication, 9 percent to those seeking detox, and 32 percent were related to “other” (exhibit 13). CDPHE data on drug-related mortality data for the Denver PMSA were not available for 2003 or 2004. DAWN mortality data identified benzodiazepines as one of the top five drugs involved in drug misuse deaths for the Denver-Aurora Metropolitan Area for 2003, with 30 multidrug deaths (exhibit 14). During 2004, there were 87 treatment admissions for barbiturates, sedatives, or tranquilizers as a primary drug. Fifty-one percent were female, and 90 percent were older than 18. Seventy-three percent were ur-ban, and 69 percent were White. When comparing this group to all clients who reported other primary drugs, this group used daily tobacco the least and had the highest percentage of married clients; unemploy-ment (the category “unemployment” includes those out of the workforce, such as students, homemakers, persons with disabilities, etc.); mental health prob-lems; and visits to medical and psychiatric emer-gency rooms. They also had the highest percentage of slight to moderate socialization issues or concerns. Sixty-four percent administered their drug orally, 25 percent smoked it, 7 percent inhaled it, and 1 percent injected it. Forty-eight percent were younger than 18 when they began to use this category of drugs, and 41 percent were age 21 or older. Sixty-eight percent used a secondary drug, such as alcohol (34 percent), opiates (13 percent), and marijuana (6 percent); 59 percent of those with a secondary drug were younger than 18 when they first used it. These drugs are frequently obtained as prescription medications and fall into the diverted pharmaceutical class as well. Local independent dealers and Internet services are the principal distributors of diverted pharmaceuticals. Club Drugs Club drugs are a group of synthetic drugs commonly associated with all-night dance clubs called raves. These drugs include methylenedioxymethampheta-

EPIDEMIOLOGIC TRENDS IN DRUG ABUSE—Denver and Colorado
Proceedings of the Community Epidemiology Work Group, Vol. II, June 2005 76
mine (MDMA, or ecstasy), gamma hydroxybutyrate (GHB), flunitrazepam (Rohypnol or “roofies”), and ketamine (Special K). Information on use of these drugs in Colorado, while still limited, is expanding. ADAD added club drugs to the enhanced DACODS data set in July 2002. Also, there are currently three sources of institutional indicator data that include the club drugs (DAWN, CDPHE mortality, and the Rocky Mountain Poison and Drug Center). In addition, ADAD has worked with OMNI Research and Training, a Denver-based firm, to add club drug questions to the Colorado Youth Survey. Unweighted DAWN Live! ED data showed 64 MDMA-related reports in 2004, 5 reports for GHB, and 2 reports for ketamine (exhibit 2). The Rocky Mountain Poison and Drug Center re-corded 30 calls related to club drugs in 2001, 55 in 2002, and 40 in 2003 for the Denver area (exhibit 6a). In 2004, there were 11 calls statewide concern-ing club drugs (exhibit 6b). CDPHE club drug-related mortality data for the Den-ver PMSA showed two deaths in 2000, four in 2001, and two in 2002 (exhibit 7). These data were unavail-able for 2003 and 2004. MDMA, or ecstasy, originally developed as an appe-tite suppressant, is chemically similar to the stimulant amphetamine and the hallucinogen mescaline and thus produces both stimulant and psychedelic effects. MDMA is readily obtainable at raves, nightclubs, strip clubs, or private parties. The traffickers are typi-cally White and in their twenties or early thirties. They obtain their MDMA from Nevada or California, with source connections in Europe, and target young adults and adolescents as users. Mexican trafficking organizations were making inroads in the Colorado MDMA market. The DEA reported one tablet or cap-sule costs $6–$25, with larger quantities selling for $8–$16 per tablet (exhibit 12). These price ranges have dropped slightly from 2003. GHB is a central nervous system depressant that can sedate the body, and at higher doses, can slow breath-ing and heart rate dangerously. It can be produced in clear liquid, white powder, tablet, and capsule forms and is often used in combination with alcohol—making it even more dangerous. The DEA reported that the majority of GHB custom-ers were White and in their twenties or thirties. Past
DEA reports placed the GHB price at $5–$10 per dosage unit (i.e., one bottle cap full). Rohypnol (roofies) is a benzodiazepine sedative ap-proved as a treatment for insomnia in more than 60 countries, but not in the United States. Rohypnol is tasteless, odorless, and dissolves easily in carbonated beverages, and its effects are aggravated by alcohol use. There does not appear to have been widespread use of Rohypnol among either the general population or those in the rave scene in Colorado. What use there was occurred in the adolescent to mid-thirties age range. Ketamine, often called Special K on the street, is an injectable anesthetic that has been approved for both human and animal use in medical settings. However, about 90 percent of the ketamine legally sold today is intended for veterinary use. Produced in liquid form or white powder, it can be injected, inhaled, or swal-lowed. Similar to phencyclidine (PCP) in its effects, it can bring about dream-like states and hallucina-tions. Club drugs were primarily used by young adults and adolescents, and either these clients did not enter treatment or their small numbers did not draw the attention of indicator organizations. Certain club drugs are also used as “date rape” drugs and their use in this manner may be underreported. In 2002, there were 12 treatment admissions for club drugs statewide, or 0.1 percent of all treatment ad-missions. In 2003 and 2004, there were 37 (0.3 per-cent) and 48 (0.4 percent), respectively. Alcohol Alcohol continues to be the most abused substance in the State. Colorado ranks 19 percent higher than the national average and 5th in the Nation in per capita consumption of beverage alcohol. Alcohol use disor-ders are medically based disorders related to abuse of or dependence on alcohol. Alcohol has consistently been the most frequently mentioned drug in EDs the Denver PMSA. Prior to 2003, DAWN data for ED mentions for alcohol in the Denver area peaked in 1999 and 2000, with rates of 107 per 100,000 population and 109 per 100,000, respectively. Unweighted DAWN Live! data show that alcohol was involved in 38 percent of all drug-related visits in 2004. Five-hundred-fifteen (22 percent) adults sought detoxification through the emergency department,

EPIDEMIOLOGIC TRENDS IN DRUG ABUSE—Denver and Colorado
Proceedings of the Community Epidemiology Work Group, Vol. II, June 2005 77
and 45 percent had other alcohol-related issues (ex-hibit 17). Alcohol-related emergency department visits for those younger than 21 (n=755) represented 33 per-cent of all alcohol-related visits and 12 percent of all drug-related emergency department visits. Of these youth, 61 percent were male; 53 percent irrespective of gender were age 12–17; and 46 percent were age 18–20 (exhibit 18). Statewide alcohol-related hospital discharges rose yearly from 418 per 100,000 in 1998 to 518 per 100,000 in 2003 (exhibit 5). Discharge data for 2004 were unavailable for this report. According to DAWN 2003 mortality data, alcohol ranked second in multidrug deaths in 2003 and was third among the top five drugs related to drug misuse deaths (exhibit 14) for the Denver-Aurora metropoli-tan area. During 2004, 41 percent of all clients admitted to treatment stated their primary drug of abuse was al-cohol (exhibit 19). This figure has been steadily in-creasing since 2001. Six percent of these clients were younger than 18. Of those age 18 or older, 72 percent began to use alcohol before age 18. Anecdotal infor-mation from clinicians in the treatment field indicated that alcohol was one of two major gateway drugs (the other being marijuana) Colorado youth used to enter the drug culture. During 2004, ADAD reported 44,514 detoxification discharges and 20,452 discharges from the Drinking Driver DUI education and therapy program. Un-treated alcoholism accounts for some of Colorado’s greatest concerns, such as violent crimes, homeless-ness, domestic violence, vehicular crashes, over-crowded jails, poverty, and overcrowded emergency and foster care systems. Each year Colorado spends $4.4 billion in costs related to untreated substance abuse, adding a substantial financial burden to taxes and already stressed governmental resources. Even though laws exist that prohibit selling alcoholic beverages to minors, alcohol is the number one drug for adolescents in Colorado. It is readily available and inexpensive, and purveyors target younger age groups. Recent marketing trends include marijuana and alcohol-flavored lollypops and gum, “jello shots” (a mixture of alcohol and fruit-flavored gelatin), sweet soda-pop-flavored alcoholic beverages, and inhaled alcohol. Colorado’s Youth Risk Behavior Survey noted that almost 50 percent of students in grades 9–12 during
2003 currently were using alcohol, and 80 percent had had one or more drinks of alcohol in their life-time. Abuse of alcohol at an early age is frequently a pre-cursor to use and abuse of illegal substances. During 2004, deaths related to binge drinking on college campuses brought national notoriety to Colorado, with five confirmed deaths of college-age individuals from alcohol poisoning. Moderate use of alcohol among adults is culturally acceptable, and denial of abuse is particularly diffi-cult to overcome. The average treatment client in Colorado with alcohol as a primary drug uses or abuses it for 16.5 years before seeking treatment. For detoxification clients, that time period expands to 20 years. In 2003, the Colorado State Patrol (CSP) investigated approximately 30 percent of all vehicular crashes in the State, including about 70 percent of all traffic crashes involving fatalities. CSP reported that the majority of fatal crashes involved inebriated drivers. Some 2,161 vehicular crashes were directly caused by individuals driving under the influence of alcohol, and 116 crashes were caused by individuals driving under the influence of drugs. Seven percent of all crashes were DUI-related. In 2004, CSP made 9,509 DUI arrests and investi-gated 87 fatal crashes and 2,117 non-fatal crashes. DUI-caused crashes usually were more severe than other types, because of higher speeds, and often the occupants were not wearing seat belts. In 2003, 56.7 percent of DUI-caused crashes resulted in fatalities or injuries, compared with 29.6 percent when DUI was not the cause of the crash. One-hundred-eight of these DUI-related crashes were fa-tality cases, 1,184 were injury cases, and 985 were property damage cases. In 39 percent of alcohol-related crashes, the blood alcohol content (BAC) was greater than 0.01; it was greater than 0.08 in 35 per-cent. CSP reported 8,600 DUI citations for 2003. In 2003, FARS data indicated that 39 percent (246) of the 632 individuals killed in Colorado in vehicular crashes involved alcohol. In 2004, 665 individuals were killed in motor vehicle crashes in Colorado. In 2003, the CDPHE reported 1,141 alcohol-induced deaths unrelated to motor vehicular accidents state-wide.

EPIDEMIOLOGIC TRENDS IN DRUG ABUSE—Denver and Colorado
Proceedings of the Community Epidemiology Work Group, Vol. II, June 2005 78
The number of alcohol-related calls statewide to the Rocky Mountain Poison and Drug Center increased markedly from 110 in 2001 to 150 in 2003 for the Denver PMSA (exhibit 6a). In 2004, there were 764 alcohol calls statewide. Drug use by “generation” was analyzed for 2004 us-ing four age groups: Generation Y, Generation X, Baby Boomers, and Seniors. Exhibit 15 shows that sedatives and tranquilizers, including alcohol, are the primary drug types for the X generation, Baby Boomers, and Seniors. Tobacco Tobacco use is the leading cause of preventable death and disability in the State and one of Colorado’s most serious public health problems. Tobacco use is re-sponsible for more than 4,200 deaths and the devel-opment of 130,000 tobacco-related illnesses in adults annually. Smoking tobacco causes 30 percent of all cancer deaths, 21 percent of coronary heart disease-related deaths, and 18 percent of stroke deaths. Re-ports show that 193,000 children in the State are ex-posed to secondhand smoke at home, resulting in asthma and respiratory illnesses. Annual health care costs directly related to smoking exceed $1 billion (or $259 per capita) in the State. Every Colorado household incurs more than $511 per year in State and Federal taxes to pay for smoking-related health care costs. Approximately 630,000 (19 percent) of all Colorado adults use tobacco products, compared with the 23 percent nationwide average. Sixty-eight percent of clients who received substance abuse treatment and/or detoxification services in State fiscal year 2004 used tobacco products daily. The American Lung Association Tobacco Report Card for Colorado indicated a failing (“F”) grade for smoke-free air, youth access, and prevention and con-trol spending. Colorado was mediocre (a “C”) on the cigarette tax. Laws enacted in Colorado prohibit the sale of to-bacco products to adolescents (those younger than 18). In spite of that, the Youth Risk Behavior Survey identified 27 percent of students in grades 9–12 as current cigarette smokers. Adolescents who smoke are more likely to smoke as adults and be at risk for tobacco-related illnesses. The sale of tobacco products is monitored by Colo-rado’s Department of Revenue Tobacco Enforcement Division, and tobacco prevention efforts fall primar-
ily under the purview of the Department of Public Health and Environment. In 2004, several cities in Colorado passed legislation prohibiting the smoking of tobacco in certain public areas, and advocacy groups are initiating a statewide awareness campaign. Colorado also increased the tobacco tax from $0.20 to $0.84, with monies going to health care-related concerns. INFECTIOUS DISEASES AMONG INJECTING DRUG USERS Of the 8,088 acquired immunodeficiency syndrome (AIDS) cases reported in Colorado through Decem-ber 31, 2004, 9.2 percent were classified as injection drug users (IDUs), and 10.7 percent were classified as homosexual or bisexual males and IDUs (exhibit 20). CORRECTIONS: THE HIDDEN POPULATION The Colorado Department of Corrections reports an-nually on new court commitments and parole popula-tions. Unfortunately, data for substance abusers are not broken out by primary drug. However, this popu-lation is large enough that to exclude it would mean giving a skewed picture of Colorado’s substance abuse problem. As of December 31, 2004, there were 20,144 adult offenders incarcerated, 7,383 on parole, and 225 youthful offenders. In State FY 2004, there were 5,240 new court com-mitments. Eighty-two percent of these individuals were identified as substance abusers. Substance abus-ers were more likely to be female, Caucasian, single, and younger. Substance abusers had significantly more crimes on their current incarceration and aver-aged more than six times as many drug crimes as non-abusers. Substance abusers were also more likely to have prior Department of Corrections (DOC) in-carcerations. When assessed for measure of criminal risk, substance abusers scored substantially higher, indicating that they have more serious criminal histo-ries than non-abusers. Substance abusers were, how-ever, less likely to be identified as sex offenders or to have medical needs. New court commitment female offenders were more likely to have higher substance abuse treatment needs overall than males. Substance abusers accounted for 89 percent of the parole returns during State FY 2004. When compared with non-abusing parole returns, no significant dif-ferences were noted in demographic characteristics.
EPIDEMIOLOGIC TRENDS IN DRUG ABUSE—Denver and Colorado
Proceedings of the Community Epidemiology Work Group, Vol. II, June 2005 79
Seventy-eight percent of the prison population (N=16,191, an increase of 826 individuals from FY 2003) were identified as substance abusers. These individuals were more likely to be Latino, single or common-law married, and younger. In the prison population, substance abusers were significantly dif-ferent from non-abusers on several needs areas. Sub-stance users demonstrated higher needs in the follow-ing areas: academic, vocation, psychological, seri-ously mentally ill, and mental retardation. Substance abusers demonstrated lower needs than non-abusers in the following areas: sex offender, self-destruction, assault/anger management, and medical.
Substance abusers represented 85 percent of all prison releases. There were no differences between abusers and non-abusers on gender, marital status, or age. However, releases with substance abuse prob-lems were more likely to be African-American than were non-abusers. For inquiries concerning this report, please contact Nancy E. Brace, R.N., M.A., Evaluation and Information Director, Alcohol and Drug Abuse Division, Colorado Department of Human Ser-vices, 4055 South Lowell Boulevard, Denver, CO 80236-3120, Phone: 303-866-7502, Fax: 303-866-7481, E-mail: nancy.brace@ state.co.us.

EPIDEMIOLOGIC TRENDS IN DRUG ABUSE—Denver and Colorado
Proceedings of the Community Epidemiology Work Group, Vol. II, June 2005 80
Exhibit 1a. Denver DAWN ED Sample and Reporting Information: January–December 2004
No. of EDs Reporting per Month: Com-pleteness of Data (%) Total Eligible
Hospitals1 No. of Hospi-tals in DAWN
Sample
Total EDs in DAWN Sam-
ple2 90–100% 50–89% <50%
No. of EDs Not Report-
ing
14 14 14 5–8 0–1 0–1 6–9
1Short-term, general, non-Federal hospitals with 24-hour emergency departments based on the American Hospital Association An-nual Survey. 2Some hospitals have more than one emergency department. All DAWN cases are reviewed for quality control. Based on this re-view, cases may be corrected or deleted. Therefore these data are subject to change. SOURCE: DAWN Live! OAS, SAMHSA, updated 4/13–14/05. Exhibit 1b. Data Completeness for Denver Metropolitan Area DAWN Live! Emergency Departments (n=14) by Month, 2004 Data Com-pleteness
Jan. Feb. Mar. Apr. May June July Aug. Sep. Oct. Nov. Dec.
Basically complete1
5 5 5 5 5 5 5 7 7 8 7 7
Partially Complete2
0 0 0 0 0 0 1 0 0 0 1 1
Incomplete3 1 0 0 0 0 0 0 0 0 0 0 0 No Data Reported
8 9 9 9 9 9 8 7 7 6 6 6
Total EDs in Sample4
14 14 14 14 14 14 14 14 14 14 14 14
1Total eligible hospitals in area=14, Hospitals in DAWN sample=14. Tables reflect cases that have been received by DAWN as of 4/13–14/05. Unweighted data from Denver hospitals reporting to DAWN. 290%+ Complete; 350–89% Complete; 4Less than 50% Complete. Some hospitals in the DAWN sample have more than one emergency department. All DAWN cases are reviewed for quality control. Based on this review, cases may be corrected or deleted. Therefore these data are subject to change. SOURCE: DAWN Live! OAS, SAMHSA, updated 4/13–14/05 Exhibit 1c. Number of Unweighted DAWN ED Cases, by Case Type (Unweighted1): 2004
Case Type Number Suicide attempt 600 Seeking detox 412 Alcohol only (age<21) 755 Adverse reaction 1,370 Overmedication 1,235 Malicious poisoning 12 Accidental ingestion 196 Other 2,979
1Unweighted data are from 5–8 Denver EDs reporting to DAWN in 2004. All DAWN cases are reviewed for quality control. Based on this review, cases may be corrected or deleted. Therefore these data are subject to change. SOURCE: DAWN Live!, OAS, SAMHSA, updated 4/13–14/05

EPIDEMIOLOGIC TRENDS IN DRUG ABUSE—Denver and Colorado
Proceedings of the Community Epidemiology Work Group, Vol. II, June 2005 81
Exhibit 2. Number of Unweighted1 Drug Reports in Drug-Related ED Visits,2 by Drug Category: 2004
Drug Category and Selected Drugs3 Drug Reports Major Substances of Abuse 6,186 Alcohol 2,304 Alcohol-in-combination with other drugs 1,549 Alcohol only (age<21) 755 Cocaine 1,569 Heroin 609 Marijuana 755 Stimulants 755 Amphetamines 280 Methamphetamine 475 MDMA (ecstasy) 64 GHB 5 Ketamine 2 LSD 9 PCP 12 Miscellaneous hallucinogens 32 Inhalants 62 Combinations not tabulated above 8
1Unweighted data are from 5–8 Denver EDs reporting to DAWN in 2004. All DAWN cases are reviewed for quality control. Based on this review, cases may be corrected or deleted. Therefore these data are subject to change. 2Drug-related ED visits often involve multiple drugs (e.g., both cocaine and heroin may be reported for the same case). Therefore, the number of drug reports will exceed the number of ED visits. 3This classification of drugs is derived from the Multum Lexicon, Copyright 2003, Multum Infomation Services, Inc. The classification has been modified to meet DAWN's unique requirements (2004). The Multum Licensing Agreement governing use of the Lexicon is provided in most DAWN publications and can be found on the Internet at http://www.multum.com. SOURCE: DAWN Live!, OAS, SAMHSA, updated 4/13–14/05 Exhibit 3. Unweighted Gender Percentages by Drug Type for ED Patients (Unweighted1), by Drug Type: 2004
63.174.2
61.6 58.1
36.925.8
38.4 41.9
0
20
40
60
80
100
Cocaine Heroin Marijuana Methamphetamine
Male Female
1Unweighted data are from 5–8 Denver EDs reporting to DAWN in 2004. All DAWN cases are reviewed for quality control. Based on this review, cases may be corrected or deleted. Therefore these data are subject to change. SOURCE: DAWN Live!, OAS, SAMHSA, updated 4/13–14/05

EPIDEMIOLOGIC TRENDS IN DRUG ABUSE—Denver and Colorado
Proceedings of the Community Epidemiology Work Group, Vol. II, June 2005 82
Exhibit 4. Unweighted1 ED Patient Age Data, by Selected Drugs: 2004 Age Cocaine Heroin Marijuana Amphetamines Methamphetamine 5 and younger 4 1 4 2 0 6–11 1 0 1 1 0 12–17 61 3 178 26 52 18–20 94 22 115 33 49 21–29 399 151 186 84 159 30–44 736 246 195 108 172 45–64 268 182 73 26 43 65 and older 6 4 2 0 0 1Unweighted data are from 5–8 Denver EDs reporting to DAWN in 2004. All DAWN cases are reviewed for quality control. Based on this review, cases may be corrected or deleted. Therefore these data are subject to change. SOURCE: DAWN Live!, OAS, SAMHSA, updated 4/13–14/05 Exhibit 5. Drug-Related Hospital Discharges per 100,000 Population for Selected Drugs in Colorado: 1997–2003
Drug/Rate per 100,000 Population 1997 1998 1999 2000 2001 2002 2003
Alcohol NA1 17,154 18,577 18,744 20,644 21,433 23,750 Rate per 100,000 418.0 440.6 432.3 464.3 474.02 518.0 Amphetamines 959 815 682 942 1161 1463 1814 Rate per 100,000 24.0 20.0 16.2 21.7 26.1 32.3 39.6 Cocaine 2,245 2,492 2,517 2,732 2,787 3,305 3,658 Rate per 100,000 56.1 60.7 59.7 63.0 63.0 73.1 80.3 Marijuana 2,118 2,227 2,204 2,455 2,755 3,016 3,246 Rate per 100,000 53.0 54.3 52.3 56.6 62.0 66.7 71.0 Narcotic Analgesics 1,458 1,566 1,639 2,053 2,237 2,605 3,368 Rate per 100,000 36.5 38.2 39.0 47.3 50.3 57.6 73.4 Population 3,995,923 4,102,491 4,215,984 4,335,540 4,446,529 4,521,484 4,586,455
1NA=Not available. SOURCE: Colorado Department of Public Health and Environment, Colorado Hospital Association Exhibit 6a. Number of Drug-related Calls to the Rocky Mountain Poison and Drug Center for Denver, Colorado: 2001–2003
Drug 2001 2002 2003 Alcohol 110 149 150 Cocaine/crack 59 66 68 Heroin/morphine 19 16 22 Marijuana 34 37 36 Methamphetamine 20 39 39 Other Stimulants/ Am-phetamines 3 3 6
Club Drugs 30 55 40 Inhalants 4 16 10
SOURCE: Rocky Mountain Poison and Drug Center

EPIDEMIOLOGIC TRENDS IN DRUG ABUSE—Denver and Colorado
Proceedings of the Community Epidemiology Work Group, Vol. II, June 2005 83
Exhibit 6b. Number of Drug-Related Calls to the Rocky Mountain Poison and Drug Center for Colorado: 2004
Drug 2004 Alcohol 764 Cocaine/Crack 120 Heroin/Morphine 20 Marijuana 68 Methamphetamine 95 Other Stimulants Amphetamines 316 Club Drugs 11 Hallucinogens 29
SOURCE: Rocky Mountain Poison and Drug Center Exhibit 7. Drug-Related Mortality Numbers for the Denver PMSA: 1996–2002
Drug 1996 1997 1998 1999 2000 2001 2002 Alcohol 47 49 61 74 75 99 86 Cocaine/Crack 68 56 66 82 80 126 108 Heroin/Morphine 34 53 51 79 66 77 64 Marijuana 1 4 3 20 20 31 5 Methamphetamine 3 6 3 8 10 19 17 Other Stimulants Amphetamines
2 5 3 5 9 8 13
Club Drugs -- -- -- -- 2 4 2 Inhalants -- 1 2 -- 1 -- 1
SOURCE: Colorado Department of Public Health and Environment

EPIDEMIOLOGIC TRENDS IN DRUG ABUSE—Denver and Colorado
Proceedings of the Community Epidemiology Work Group, Vol. II, June 2005 84
Exhibit 8. Numbers and Percentages of Treatment Admissions in Colorado (Excluding Alcohol) by Primary Drug Type: 1997–2004 Drug 1997 1998 1999 2000 2001 2002 2003 2004 Heroin
N 1,200 1,418 1,585 1,577 1,482 1,415 1,640 1,093 % 15.7 14.4 16.3 16.3 14.7 13.1 14.0 8.9
Non-Rx Methadone N 4 15 15 16 9 17 15 20 % 0.1 0.2 0.2 0.2 0.1 0.2 0.1 0.2
Other Opiates N 195 230 274 304 386 394 519 514 % 2.6 2.3 2.8 3.1 3.8 3.6 4.4 4.2
Methamphetamine N 1,081 1,436 1,214 1,314 1,659 2,070 2,744 3,209 % 14.2 14.6 12.5 13.6 16.5 19.2 23.3 26.1
Other Amphetamines/Stimulants N 52 61 89 107 91 104 78 46 % 0.7 0.6 0.9 1.1 0.9 1.0 0.7 0.4
Cocaine N 1,797 2,309 2,099 1,916 1,888 2,193 2,330 2,572 % 23.6 23.5 21.6 19.8 18.8 20.3 19.8 20.9
Marijuana N 3,152 4,126 4,061 4,135 4,248 4,343 4,159 4,610 % 41.3 42.0 41.8 42.8 42.3 40.2 35.4 37.5
Hallucinogens N 40 56 68 72 71 38 23 21 % 0.5 0.6 0.7 0.7 0.7 0.4 0.2 0.2
PCP N 0 0 4 5 2 5 8 5 % 0.0 0.0 0.0 0.1 0.0 0.0 0.1 0.0
Barbiturates N 7 11 15 5 6 20 14 12 % 0.1 0.1 0.2 0.1 0.1 0.2 0.1 0.1
Sedatives N 4 17 16 21 13 89 63 29 % 0.1 0.2 0.2 0.2 0.1 0.8 0.5 0.2
Tranquilizers N 37 40 40 38 44 49 52 46 % 0.5 0.4 0.4 0.4 0.4 0.5 0.4 0.4
Inhalants N 28 50 28 26 31 21 20 20 % 0.4 0.5 0.3 0.3 0.3 0.2 0.2 0.2
Club Drugs N NA NA NA NA NA 12 37 48 % NA NA NA NA NA 0.1 0.3 0.4
Other N 31 51 218 123 119 37 54 54 % 0.4 0.5 2.2 1.3 1.2 0.3 0.5 0.4
Total N 7,628 9,820 9,726 9,659 10,049 10,807 11,756 12,299 SOURCE: Drug/Alcohol Coordinated Data System (DACODS) from the Alcohol and Drug Abuse Division, Colorado Department of Human Services

EPIDEMIOLOGIC TRENDS IN DRUG ABUSE—Denver and Colorado
Proceedings of the Community Epidemiology Work Group, Vol. II, June 2005 85
Exhibit 9a. New Users of Selected Drugs Among Colorado Treatment Admissions: 1997–2004
Drug2 1997 1998 1999 2000 2001 2002 2003 2004 Heroin N 214 314 342 340 283 267 255 176 % 17.9 22.3 21.7 21.6 19.1 18.9 15.5 16.1 Methamphetamine N 362 472 308 311 367 475 676 777 % 33.6 33.0 25.5 23.7 22.1 23.0 24.6 24.2 Cocaine N 310 423 390 374 348 394 438 460 % 17.3 18.4 18.6 19.5 18.4 18.0 18.8 17.9 Marijuana N 1,326 1,584 1,434 1,552 1,505 1,403 1,464 1,408 % 42.4 39.1 35.9 37.7 35.7 32.3 35.2 30.5 Total New Users (N) 2,212 2,793 2,474 2,577 2,503 2,539 2,833 2,821 % of Total Admissions 30.8 30.4 27.9 28.9 27.1 25.3 26.1 24.6 Total Admissions 7,190 9,188 8,880 8,915 9,241 10,016 10,871 11,484
1New Users are those reporting using for less than 4 years at the time of treatment 2Reported primary drug of use SOURCE: Drug/Alcohol Coordinated Data System (DACODS) from the Alcohol and Drug Abuse Division, Colorado Department of Human Services Exhibit 9b. Average Number of Years Between First Use of Drug and First Treatment1: 2004
Drug2 Years Marijuana 7.9 Methamphetamine 8.1 Other Opiates 10 Cocaine/Crack 10.7 Heroin 14.3 Alcohol 16.5
1Includes only for those reporting no prior treatment admissions. 2Reported primary drug of use. SOURCE: Drug/Alcohol Coordinated Data System (DACODS) from the Alcohol and Drug Abuse Division, Colorado Department of Human Services Exhibit 10. Percentages of Denver Adult Arrestees Testing Positive for Drugs: 2003
Drug Type Males Females Cocaine 38.3 52.5 Opiates 6.8 6.1 Marijuana 42.3 34.3 Methamphetamine 4.7 5.0 Any Drug 66.4 69.1 Multiple Drugs 23.3 24.9
SOURCE: ADAM, NIJ, February 2005

EPIDEMIOLOGIC TRENDS IN DRUG ABUSE—Denver and Colorado
Proceedings of the Community Epidemiology Work Group, Vol. II, June 2005 86
Exhibit 11. Quest Diagnostics Drug Testing Index Positivity Rate for Colorado1 Combined Workforce and the Combined U.S. Workforce: 2004
Positivity Rate Range for States
Denver Area
North Central
CO North.
West CO South
Central CO
South West CO
South East CO U.S.
Amphetamines 0–2.63 0.14–0.33 0.14–0.33 0.6–1.01 0–0.14 0.33–0.6 0.14–0.33 10.2
Cocaine 0–2.54 0.25–0.51 0.25–0.51 0.25–0.51 0.51–0.81 0–0.25 0.81–1.28 14.7
Marijuana 0–8.4 2.1–2.7 2.1–2.7 2.7–3.7 2.1–2.7 2.1–2.7 2.1–2.7 54.8
Opiates 0–7.53 0.09–0.24 0.09–0.24 0.24–0.49 0.24–0.49 0.24–0.49 0.24–0.49 6.2 N=7.2 million tests. 1No statistical data available for North East Colorado. SOURCE: Quest Diagnostics Drug Test Index Exhibit 12. Drug Price and Purity in Denver: 2004 Drug Wholesale Price Retail Price Street Price Purity at Retail Powder Cocaine $16,000–$20,000/kg $600–$700/oz $70–$125/gm 16–90%
Crack Cocaine $14,000–$18,500/kg $700–$1,200/oz $20–$60/rock 60–75% Heroin $15,000–$60,000/kg $2,000–$3000/oz $100–$150/gm 8–64% Methamphetamine $4,500–$16,000/lb $700–$1,500/oz $80–$150/gm 0–100% Marijuana $16,000/lb $1,000–$3,000/oz $50–$200/gm -- Ecstasy -- -- $6–$25/pill -- OxyContin -- -- $6.50/pill Prescription SOURCE: DEA, treatment providers, National Drug Intelligence Center, local law enforcement Exhibit 13. Number of Unweighted1 Prescription Drug Misuse Drug Reports in Denver, by Case Type: 2004 1Unweighted data are from 5–8 Denver EDs reporting to DAWN in 2004. All DAWN cases are reviewed for quality control. Based on this review, cases may be corrected or deleted. Therefore these data are subject to change. SOURCE: DAWN Live!, OAS, SAMHSA, updated 4/13–14/05
30
282
132
47
33
116
35
72
92
111
301
242
52
89
174
699
409
191
Muscle relaxants
Oxycodone
Hydrocodone
Opiates/Opioids
Benzodiazepines
2
OvermedicationSeeking detoxOther
30
282
132
47
33
116
35
72
92
111
301
242
52
89
174
699
409
191
Muscle relaxants
Oxycodone
Hydrocodone
Opiates/Opioids
Benzodiazepines
2
30
282
132
47
33
116
35
72
92
111
301
242
52
89
174
699
409
191
Muscle relaxants
Oxycodone
Hydrocodone
Opiates/Opioids
Benzodiazepines
2
OvermedicationSeeking detoxOther
OvermedicationSeeking detoxOther

EPIDEMIOLOGIC TRENDS IN DRUG ABUSE—Denver and Colorado
Proceedings of the Community Epidemiology Work Group, Vol. II, June 2005 87
Exhibit 14. Top Five Drugs Involved in Drug Misuse Deaths in the Denver-Aurora Metropolitan Area: 2003
25 25
113
74
83
30 280
50
100
150
Opiates Cocaine Alcohol Benzodiazepines Antidepressants
Single-drug deaths Multi-drug deaths
SOURCE: DAWN 2003 Area Profiles of Drug-Related Mortality
Exhibit 15. Numbers and Percentages of Generational Primary Drug Use: FY 2004
Age Ranges Sedatives Tranquilizers1 Stimulants Opiates Marijuana Hallucin-
ogens Club
Drugs Other Drugs Total
Y Generation2 1,512 28%
1,008 18%
107 2%
2,754 50%
12 <1%
20 <1%
38 1%
5,451 26%
X Generation3 3,805 40%
3,397 36%
773 8%
1,480 16%
9 <1%
23 <1%
21 <1%
9,508 47%
Baby Boom-ers4
3,067 55%
1,408 25%
719 13%
364 6%
5 <1%
4 <1%
13 <1%
5,580 27%
Seniors5 234 81%
14 5%
28 10%
12 4% 0 1
<1% 1
<1% 290
<1%
Total 8,618 41%
5,827 28%
1,627 8%
4,610 22%
26 <1%
48 <1%
73 <1%
20,829 100%
1Sedatives Tranquilizers include alcohol 2Y Generation includes anyone born after 1981 3X Generation includes anyone born between 1965 and 1981 4Baby Boomers include anyone born between 1946 and 1964 5Seniors include anyone born before 1946 SOURCE: Drug/Alcohol Coordinated Data System (DACODS) from the Alcohol and Drug Abuse Division, Colorado Department of Human Services Exhibit 16a. Methamphetamine Use Among MSM in Denver Community Survey: 2004–2005
Number Percent MSM, N=981 108 11.0 HIV negative MSM, n=763 69 9.0 HIV positive MSM, n=153 32 20.9
SOURCE: Dr. Mark Thrun, Denver Public Health 2004–2005 NHBS MSM Survey

EPIDEMIOLOGIC TRENDS IN DRUG ABUSE—Denver and Colorado
Proceedings of the Community Epidemiology Work Group, Vol. II, June 2005 88
Exhibit 16b. Sexual Risk and Methamphetamine Use: 2004–2005
Meth Users N=108
Non-users N=873 Odds Ratio
Mean age 33.1 39.4 Mean number of male/female partners last 12 months 12.5 / 5.0 7.7 / 2.3
Any unprotected sex last 12 months 76 (70.4%) 380 (43.5%) 3.1
(2.0-4.8) Ever tested for HIV 101 (93.5%) 815 (93.4%) Most recent HIV test result was positive 32 (31.7%) 121 (14.9%) 2.7
(1.7-4.2) SOURCE: Dr. Mark Thrun, Denver Public Health 2004–2005 NHBS MSM Survey Exhibit 17. Number of Unweighted1 Alcohol-Related ED Reports, by Case Type: 2004 Case Type Number of Cases Percent of Alcohol
Cases Percent of all Drug-Related
Cases Seeking detox 515 22 8 Alcohol only, <21 years of age 755 33 12 Other Alcohol 1,034 45 17 1Unweighted data are from 5–8 Denver EDs reporting to DAWN in 2004. All DAWN cases are reviewed for quality control. Based on this review, cases may be corrected or deleted. Therefore these data are subject to change. SOURCE: DAWN Live!, OAS, SAMHSA, updated 4/13–14/05 Exhibit 18. Gender and Age of Alcohol Only (Age <21) ED Patients (Unweighted1), by Number and Percent: 2004
Number Percent Gender Male 461 61 Female 293 39 Age 5 and younger 0 0 6–11 4 0.5 12–17 402 53 18–20 349 46
1Unweighted data are from 5–8 Denver EDs reporting to DAWN in 2004. All DAWN cases are reviewed for quality control. Based on this review, cases may be corrected or deleted. Therefore these data are subject to change. SOURCE: DAWN Live!, OAS, SAMHSA, updated 4/13–14/05

EPIDEMIOLOGIC TRENDS IN DRUG ABUSE—Denver and Colorado
Proceedings of the Community Epidemiology Work Group, Vol. II, June 2005 89
Exhibit 19. Numbers and Percentages of Treatment Admissions in Colorado (Including Alcohol), by Primary Drug Type: 1997–2004
Drug 1997 1998 1999 2000 2001 2002 2003 2004 Alcohol
n 6,353 7,833 6,573 6,577 6,311 6,839 7,044 8,531 % 45.4 44.4 40.3 40.5 38.6 38.8 37.5 40.9
Heroin N 1,200 1,418 1,585 1,577 1,482 1,415 1,640 1,093 % 8.6 8.0 9.7 9.7 9.1 8.0 8.7 5.2
Non-Rx Methadone N 4 15 15 16 9 17 15 20 % 0.0 0.1 0.1 0.1 0.1 0.1 0.1 0.1
Other Opiates N 195 230 274 304 386 394 519 514 % 1.4 1.3 1.7 1.9 2.4 2.2 2.8 2.5
Methamphetamine N 1,081 1,436 1,214 1,314 1,659 2,070 2,744 3,209 % 7.7 8.1 7.4 8.1 10.1 11.7 14.6 15.4
Other Amphetamines/Stimulants N 52 61 89 107 91 104 78 46 % 0.4 0.3 0.5 0.7 0.6 0.6 0.4 0.2
Cocaine N 1,797 2,309 2,099 1,916 1,888 2,193 2,330 2,572 % 12.9 13.1 12.9 11.8 11.5 12.4 12.4 12.3
Marijuana N 3,152 4,126 4,061 4,135 4,248 4,343 4,159 4,610 % 22.5 23.4 24.9 25.5 26.0 24.6 22.1 22.1
Hallucinogens N 40 56 68 72 71 38 23 26 % 0.3 0.3 0.4 0.4 0.4 0.2 0.1 0.1
PCP N 0 0 4 5 2 5 8 5 % 0.0 0.0 0.0 0.0 0.0 0.0 0.0 0.0
Barbiturates N 7 11 15 5 6 20 14 12 % 0.1 0.1 0.1 0.0 0.0 0.1 0.1 0.1
Sedatives N 4 17 16 21 13 89 63 29 % 0.0 0.1 0.1 0.1 0.1 0.5 0.3 0.1
Tranquilizers N 37 40 40 38 44 49 52 46 % 0.3 0.2 0.2 0.2 0.3 0.3 0.3 0.2
Inhalants N 28 50 28 26 31 21 20 20 % 0.2 0.3 0.2 0.2 0.2 0.1 0.1 0.1
Club Drugs N NA NA NA NA NA 12 37 48 % NA NA NA NA NA 0.1 0.2 0.2
Other N 31 51 218 123 119 37 54 54 % 0.2 0.3 1.3 0.8 0.7 0.2 0.3 0.3
Total N 13,981 17,653 16,299 16,236 16,360 17,646 18,800 20,830
SOURCE: Drug/Alcohol Coordinated Data System (DACODS) from the Alcohol and Drug Abuse Division, Colorado Department of Human Services

EPIDEMIOLOGIC TRENDS IN DRUG ABUSE—Denver and Colorado
Proceedings of the Community Epidemiology Work Group, Vol. II, June 2005 90
Exhibit 20. Colorado Cumulative AIDS Cases by Gender and Exposure Category Through December 31, 2004
Number of AIDS Casesa
Percent of AIDS Cases
Number of Indi-viduals Testing Positive for HIV
Percent of Indi-viduals Testing Positive for HIV
Gender Male 7,452 92.1% 5,394 89.8% Female 636 7.9% 612 10.2% Total 8,088 100% 6,006 100% Exposure Category Men/sex/men (MSM) 5,446 67.3% 3,807 63.4% Injecting drug user (IDU) 747 9.2% 525 8.7% MSM and IDU 866 10.7% 555 9.2% Heterosexual contact 482 6.0% 397 6.6% Other 182 2.2% 64 1.1% Risk not identified 365 4.5% 658 11.0%
1In October 2004, Colorado omitted cases who moved to other States, thereby reducing their HIV/AIDS database by 758 cases. Thus reports produced before October 2004 show higher numbers of AIDS cases than reports produced after October, 2004. SOURCE: The Colorado Department of Public Health and Environment

EPIDEMIOLOGIC TRENDS IN DRUG ABUSE—Detroit/Wayne County and Michigan
Proceedings of the Community Epidemiology Work Group, Vol. II, June 2005 91
Drug Abuse in Detroit/Wayne County and Michigan Cynthia L. Arfken1 ABSTRACT Cocaine and heroin are the two major drugs of abuse in the area. Cocaine treatment admissions continued to stabilize; a high percentage of ED drug reports and a high number of items reviewed by forensic laboratories involved cocaine. Heroin treatment ad-missions, especially as the primary substance of abuse, are high and climbing, but there are few her-oin ED drug reports and few heroin items reviewed by forensic laboratories. Indicators for metham-phetamine point to less involvement than for other major drugs of abuse. INTRODUCTION Area Description Detroit and surrounding Wayne County are located in the southeast corner of Michigan’s Lower Peninsula. In 2000, the Wayne County population totaled 2.1 million residents (of whom 46 percent live in Detroit) and represented 21 percent of Michigan’s 9.9 million population. Currently, Michigan is the eighth most populous State in the Nation. In 2000, Detroit ranked 10th in population among cities with 951,000 people, but the population has since dropped below 900,000. It has the highest percentage of African-Americans (82 percent) of any major city in the country. The follow-ing factors contribute to probabilities of substance abuse in the State: • Michigan has a major international airport, with a
new terminal that opened 2002; 10 other large air-ports that also have international flights; and 235 public and private small airports. Long-term pro-jections for the Detroit Metropolitan Airport fore-cast a 31-percent increase in flights during the next 10 years.
• The State has an international border of 700
miles with Ontario, Canada; land crossings at Detroit (bridge and a tunnel), Port Huron, and Sault Ste. Marie; and water crossings through three Great Lakes and the St. Lawrence Seaway,
1The author is affiliated with Wayne State University, Detroit, Michigan.
which connects to the Atlantic Ocean. Many places along the 85 miles of heavily developed waterway between Port Huron and Monroe County are less than one-half mile from Canada. Michigan has more than 1 million registered boats. In fiscal year (FY) 2002, three major bridge crossings from Canada (Windsor Tunnel, Ambassador Bridge, and Port Huron) had 9.7 million cars, 2.6 million trucks, and 93,000 buses cross into Michigan. Southeast Michigan is the busiest port on the northern U.S. border with Canada. Detroit and Port Huron also have nearly 10,000 trains entering from Canada each year. The Foreign Mail Branch in Detroit processes 275,000 foreign parcels and about 900,000 letter-class pieces monthly.
• Additional factors influence substance use in
Detroit: • The percentage of individuals living below pov-
erty line (26.1 percent) is more than twice the na-tional level (12.4 percent).
• The percentage of working age individuals (age
21–64) with disability is substantially higher than the national level (32.1 versus 19.2 percent).
• There are chronic structural unemployment prob-
lems. At the State level, the unemployment rate has been among the highest in the country since 2002. Within the State, Detroit has one of the lowest rates of employed adults.
Data Sources Data for this report were drawn from the sources shown below: • Emergency department (ED) data were de-
rived for 2004 from the Drug Abuse Warning Network (DAWN) Live! restricted-access online query system administered by the Office of Applied Studies (OAS), Substance Abuse and Mental Health Services Administration (SAMHSA). Eligible hospitals in the Detroit area totaled 38; hospitals in the DAWN sample numbered 23, with the number of EDs in the sample totaling 24. (Some hospitals have more than one emergency department.) During this 12-month period, between 17 and 19 EDs re-ported data each month. The completeness of data reported by participating EDs varied by month (see exhibit 1a). Exhibits in this paper reflect cases that were received by DAWN as of April 13–14, 2005. All DAWN cases are re-viewed for quality control. Based on this re-

EPIDEMIOLOGIC TRENDS IN DRUG ABUSE—Detroit/Wayne County and Michigan
Proceedings of the Community Epidemiology Work Group, Vol. II, June 2005 92
view, cases may be corrected or deleted. There-fore, the data presented in this paper are subject to change. Data derived from DAWN Live! rep-resent drug reports in drug-related ED visits. Drug reports exceed the number of ED visits, since a patient may report use of multiple drugs (up to six drugs and alcohol). The DAWN Live! data are unweighted and, thus, are not estimates for the reporting area. These data cannot be compared to DAWN data from 2002 and be-fore, nor can preliminary data be used for com-parison with future data. Only weighted DAWN data released by SAMHSA can be used for trend analysis. A full description of the DAWN system can be found at the DAWN Web site: http://dawninfo.samhsa.gov.
• Treatment admissions data were provided by
the Bureau of Substance Abuse and Addiction Services, Division of Substance Abuse and Gambling Services, Michigan Department of Community Health (MDCH), for the State and Detroit/Wayne County, as reported by State and federally funded programs. MDCH, following revised Treatment Episode Data Set (TEDS) Federal guidelines, is converting to an episode-based reporting system in which changes in lev-els of care that are part of the treatment plan (moving from residential treatment to outpatient, for example) are not reported as new separate admissions but rather as transfers within an epi-sode. This transition has not been fully imple-mented by all publicly funded programs. As this change is fully implemented, it is expected that total admissions will decline, and comparisons of admissions trends before and after this change are not recommended. In contrast to including previously reported ED data in this report, dis-cussions included regarding treatment data in this report will be limited to instances where treatment is the only indicator source for a par-ticular drug or group of drugs.
• Mortality data on drug-related deaths were ob-
tained from DAWN, OAS, SAMHSA for 2003. • Drug intelligence data were provided by the
Michigan State Police. • Data on drug seizures were provided by the
National Forensic Laboratory Information Sys-tem (NFLIS) for January–December 2004.
• Information on the number of prescriptions was
obtained from a special report by the Michigan Board of Pharmacists, 2004.
DRUG ABUSE PATTERNS AND TRENDS Cocaine/Crack For FY 2004, 24.6 percent of Detroit/Wayne County treatment admissions listed cocaine/crack as the pri-mary drug of abuse (exhibit 2). An additional 20.7 percent of treatment admission listed cocaine/crack as the secondary drug. Between 1994 and 2003, statewide treatment admissions for cocaine crept from 2.1 percent to 2.8 percent (exhibit 3). In con-trast, treatment admissions for crack declined from 17.7 to 13.9 percent during the same period. Cocaine constituted 42 percent of drug items re-viewed by forensic laboratories in 2004 (exhibit 4). According to unweighted DAWN Live! data, cocaine was the most frequent major substance of abuse re-ported in DAWN ED data in the metropolitan Detroit area in 2004. The number of metropolitan Detroit ED cocaine reports was 3,287, or 33 percent of the total reports (including alcohol reports). Patients reporting cocaine were most likely to be male (61 percent), African-American (75 percent), and age 35–44 (37 percent). Cocaine represented 53 percent of drugs involved in drug misuse deaths in 2003. Availability, prices, and purity for powder cocaine and crack remained relatively stable during the most recent reporting period. Ounce and kilogram prices have been stable over the past decade. There are some reports of decreases in prices at the kilogram quantity level and above. The cost of crack rocks is approximately $20 (exhibit 5). Ounce amounts of cocaine and crack generally have sold for the same price ($750–$1,500) since 2001 in Detroit. Heroin In FY 2004, 31.8 percent of Detroit/Wayne County treatment admissions listed heroin as the primary drug of abuse (exhibit 2). An additional 3.1 percent of treatment admissions listed heroin as the secon-dary drug. Between 1994 and 2003, the proportion of statewide treatment admissions for heroin almost doubled, from 7.3 to 12.6 percent (exhibit 3). Only 12 percent of drug items reviewed by forensic laboratories were found to be heroin in 2004 (exhibit 4). According to DAWN Live! unweighted data, 19 per-cent of ED reports for major substances of abuse in the metropolitan Detroit area were for heroin. Patients re-

EPIDEMIOLOGIC TRENDS IN DRUG ABUSE—Detroit/Wayne County and Michigan
Proceedings of the Community Epidemiology Work Group, Vol. II, June 2005 93
porting heroin were most likely to be male (61 percent), African-American (62 percent), and between the ages of 45 and 54 (45 percent). Heroin deaths steadily increased in Detroit/Wayne County between 1992 and 2002. In 1996, there were 240 heroin-present deaths; by 2000, the annual num-ber had nearly doubled. Deaths with heroin metabo-lites present in 1999 represented a 24-percent in-crease from 1998, while in 2000, heroin cases increased again, by 23 percent over the 1999 total. The 465 heroin-present deaths in 2001 were a slight decrease from the 473 deaths in 2000. During 2002, 496 heroin-present deaths were identified, which again exceeded the number of cocaine-involved deaths. In 2003, the Wayne County ME identified 446 heroin deaths, a level slightly below the 2001 findings. Heroin and prescription opioids, however, were the drugs most likely involved in drug misuse deaths. In Wayne County, they accounted for 75 per-cent, while in nearby affluent Oakland County heroin and prescription opiates accounted for 78 percent. Heroin street prices remained stable and relatively low in Detroit. Packets or “hits” available in Detroit are typically sold in $10 units (exhibit 5). Other Opiates/Narcotic Analgesics Other opiates represented 2.8 percent of primary treatment admissions in Detroit/Wayne County in FY 2004 (exhibit 2). The percentage of statewide treat-ment admissions listing other opiates as the primary drug of abuse increased from 1.2 percent in 1994 to 4.0 percent in 2003 (exhibit 3). According to the number of prescriptions filled in 2002 and 2003, oxycodone products were most common; they represented 38 percent of all opioids prescriptions in 2002 and 34 percent in 2003 (exhibit 6). Prescriptions for fentanyl products, however, in-creased by 95 percent between 2002 and 2003 to rep-resent 25 percent of the opioid prescriptions being filled in 2003. Marijuana Marijuana indicators remain mostly stable but at highly elevated levels. The proportion of primary marijuana treatment admis-sions has plateaued since 1997–1998. Marijuana ac-counted for 9.3 percent of all substance abuse admis-sions (including alcohol) in FY 2004 in Detroit/Wayne County (exhibit 2). Statewide marijuana admissions increased from 9.7 percent in 1994 to 15.9 percent in 2003 (exhibit 3).
In 2004, marijuana accounted for 45 percent of items analyzed by forensic laboratories in Detroit (exhibit 4). Mexican marijuana continued to be the dominant form available, but there have been reports of increases in marijuana from Canada. According to unweighted DAWN Live! data, metro-politan Detroit-area ED marijuana reports represented 15 percent of the total reports for major substances of abuse in 2004 (n=1,525). Marijuana ED patients were most likely to be male (65 percent), African-American (72 percent), and between the ages of 35 and 44 (23 percent). Prices for marijuana at the retail level are $20 per gram for commercial grade (exhibit 5). Stimulants The latest treatment data show that admissions for primary drugs of abuse for stimulants other than co-caine included 0.9 percent for amphetamines and two admissions for other stimulants in Detroit/Wayne County in FY 2004. Unweighted DAWN Live! ED data for 2004 show 115 reports of stimulants (99 for amphetamines and 16 for methamphetamine). Michigan’s border with Canada has been the focus of efforts to stop the flow of large amounts of pseu-doephedrine and ephedrine into the United States. These imports are the necessary ingredients for mak-ing methamphetamine and have been destined for the western United States and Mexico. Indictments of numerous individuals and seizures of millions of pseudoephedrine dosage units have continued. Club Drugs The club drugs category includes methylenedioxyme-thamphetamine (MDMA or ecstasy), gamma hy-droxybutyrate (GHB), flunitrazepam (Rohypnol), and ketamine. Indicators seem to be stabilizing for ec-stasy and ketamine and declining for GHB. The drug known as ecstasy is typically MDMA or methylenedioxyamphetamine (MDA). Both drugs have been identified in past lab testings of ecstasy samples, sometimes in combination. There have been many anecdotal reports of widespread and increasing use since about 1997, but these drugs rarely appear in traditional indicators identifying abuse. For inquiries concerning this report, please contact Cynthia L. Arfken PhD, Wayne State University, 2761 E. Jefferson, Detroit, Michigan 48207 E-mail: [email protected].

EPIDEMIOLOGIC TRENDS IN DRUG ABUSE—Detroit/Wayne County and Michigan
Proceedings of the Community Epidemiology Work Group, Vol. II, June 2005 94
Exhibit 1. Detroit DAWN ED Sample and Reporting Information: January–December 2004
No. of EDs Reporting per Month: Com-pleteness of Data (%) Total Eligible
Hospitals1 No. of Hospi-tals in DAWN
Sample
Total EDs in DAWN Sam-
ple2 90–100% 50–89% <50%
No. of EDs Not Report-
ing
38 23 24 7–21 0–2 0–2 3–15 1Short-term, general, non-Federal hospitals with 24-hour emergency departments based on the American Hospital Association An-nual Survey. 2Some hospitals have more than one emergency department. SOURCE: DAWN Live!, OAS, SAMHSA, updated 4/13-4/14, 2005 Exhibit 2. Treatment Admissions in Detroit/Wayne County, by Primary and Secondary Drugs of Abuse and Percent: FY 2004 Drug Primary Drug of Abuse (%) Secondary Drug of Abuse (%) Alcohol 30.9 20.8 Heroin 31.8 3.1 Cocaine 24.6 20.7 Other Opiates 2.8 3.1 Marijuana 9.3 11.0 Other Drugs 0.5 1.2 N=15,243 SOURCE: Michigan Department of Community Health, Division of Substance Abuse and Gambling Services, Bureau of Substance Abuse and Addiction Services Exhibit 3. Treatment Admissions in Michigan, by Primary Drug of Abuse and Percent: 1994–2003 SOURCE: Michigan Department of Community Health, Division of Substance Abuse and Gambling Services, Bureau of Substance Abuse and Addiction Services
17.7
15.7
13.9
2.1 2.8
9.7
16.2
7.3
13.2
4.0
1.20
2
4
6
8
10
12
14
16
18
20
1994 1995 1996 1997 1998 1999 2000 2001 2002 2003
Cocaine (Smoked)Cocaine (Other)MarijuanaHeroinOther Opiates
Percent

EPIDEMIOLOGIC TRENDS IN DRUG ABUSE—Detroit/Wayne County and Michigan
Proceedings of the Community Epidemiology Work Group, Vol. II, June 2005 95
Exhibit 4. Numbers and Percentages of Seized Drug Items Analyzed in Detroit: 2004 Substance Number of Items Seized Percent of Items Seized Cannabis 2,041 45.25 Cocaine 1,890 41.91 Heroin 546 12.11 Codeine 24 0.53 Propoxyphene 4 0.09 MDMA 3 0.07 Methadone 1 0.02 Methamphetamine 1 0.02 Total Items Reported 4,510 100.0 SOURCE: National Forensic Laboratory Information System Exhibit 5. Illegal Drug Prices in Detroit: December 2004 Drug Wholesale Midlevel Retail
Cocaine (Powder) $17,000–$26,000 per kilogram
$750–$1,500 per ounce
$100 per gram
Crack NR1 NR $20 per rock
Heroin $65,000–$80,000 per kilogram
$3,300–$6,000 per ounce
$10 per dosage unit
MDMA $5.25 per dosage unit
$7.25 per dosage unit
$17–$25 per dosage unit
Marijuana $4,000–$4,500 per pound
$150 per ounce CG2
$20 per gram CG
Methamphetamine $16,000 per pound
$1,200 per ounce
$175 per gram
1NR=Not reported. 2CG=Commercial grade SOURCE: Michigan State Police Exhibit 6. Number of Drug Prescriptions for Opioids in Michigan: 2003–2004 Drug 2002 2003 Fentanyl 112,158 218,872 MS Contin 48,410 59,562 Dilaudid 14,367 21,393 Demerol 7,314 7,760 Morphine 107,302 113,521 Oxycodone 246,091 296,629 Methadone 47,846 79,845 Percodan 58,301 103,687 Total 641,789 863,100 SOURCE: Michigan Board of Pharmacists

EPIDEMIOLOGIC TRENDS IN DRUG ABUSE—Honolulu and Hawai'i
Proceedings of the Community Epidemiology Work Group, Vol. II, June 2005 96
Illicit Drug Use in Honolulu and the State of Hawai'i D. William Wood, M.P.H., Ph.D.1
ABSTRACT Substance use in the State of Hawai'i in 2004 was mixed in terms of its indicators, yet consequences of substance use remained clear. Little change oc-curred for cocaine treatment admissions; decedents with positive cocaine toxicology results were down, while police cases related to cocaine were up. Both treatment admissions and positive toxicology reports on decedents were down for heroin, but police cases increased in number. Marijuana data show de-creased admissions to treatment, fewer positive toxi-cology reports for decedents, but more police cases. For Hawai'i’s drug of choice, methamphetamine, data from treatment providers and the Medical Ex-aminer are consistently higher than in previous reports for previous time periods, while police cases are lower. While the ice labs in Hawai'i are not large, more were closed and more ice was seized than in any previous reporting period. INTRODUCTION This report presents current information on illicit drug use in Hawai'i, based on the Honolulu Commu-nity Epidemiology Work Group (CEWG), described later in this section. Area Description Hawai'i, the Aloha State, had a population of 1,211,537 as of April 1, 2000, and by July 1, 2004, the population was estimated to be 1,262,840.
1The author is affiliated with the Department of Sociology, Univer-sity of Hawai’i at Manoa, Honolulu, Hawai’i.
The State’s population is differentially distributed across the seven major islands of the Hawaiian chain, shown in the figure above. In fact, there are 26 is-lands within the State’s boundaries, which extend from South Point on the Big Island of Hawai'i (the most southerly point in the United States) to Kure atoll, near Midway Island. The chain spans a total of 1,200 miles from one end to the other. Hawai'i is unique within the Nation in that there is no one majority race or ethnicity. Hawai’i has the fourth largest foreign-born population in the Nation. Seventeen percent are foreign born, with 27.8 percent speaking a language other than English as the primary language in the home. Using U.S. Census categories, the ethnic distribution of the population is 24.3 percent White, 1.8 percent Black, 0.3 percent American Indian and Alaska Native, 9.4 percent Na-tive Hawaiian and Other Pacific Islanders, 41.6 per-cent Asian, and 1.3 percent “Others.” Single-race-only described 79.6 percent of the population. In Hawai'i, ethnicity data are collected using many more categories than the U.S. Census (for a total of 28 categories). The distribution of population of the larger groups is as follows: Primary Ethnic Group Percent White 24.3 Japanese 16.7 Filipino 14.1 Native Hawaiian 6.6 Chinese 4.7 Korean 1.9 Black or African-American 1.8 Samoan 1.3 Vietnamese 0.6 Tongan 0.3 Micronesian/Other Pacific Islander 0.8 American Indian/Native Alaskan 0.3 Other Asian 0.7
The history of the State of Hawai'i is rooted in a lack of intolerance, a collective identity, and a strong sense of group problem solving. The population af-fected by drug use also has strong ties throughout all levels of the society; it is common for family mem-bers to enforce the laws of society on their own ex-tended family members. The State’s strong multicul-tural history leaves many frustrated and unable to act, for fear of offending the family or bringing shame to relatives. The year 2004 was to be a pivotal year for substance abuse prevention, treatment, interdiction, and re-search in the State of Hawai'i. More monies were
City and County of Honolulu
Maui CountyCity and County of Honolulu
Maui County
Kaua’i County 61,929
City and County of Honolulu 899,593
Maui County 138,347
Hawai’i County 162,971
State of Hawai’i

EPIDEMIOLOGIC TRENDS IN DRUG ABUSE—Honolulu and Hawai'i
Proceedings of the Community Epidemiology Work Group, Vol. II, June 2005 97
appropriated for substance abuse prevention and treatment by the State legislature than ever before. Data Sources Much of the data presented in this report are from the Honolulu CEWG, which met on May 6, 2005. The meeting was hosted by the Hawai'i High Intensity Drug Trafficking Area (HIDTA) program office, whose staff facilitated the attendance of the Drug Enforcement Administration (DEA) representatives, as well as persons knowledgeable about drug data from Honolulu and neighbor islands. The State of Hawai'i Narcotics Enforcement Division, although invited, did not participate in the CEWG meeting. The Honolulu Police Department submitted data and was able to attend and participate in the CEWG meet-ing. This report is focused only on drug activities in O'ahu for calendar year 2004, with the exception of State treatment data, which were available for all of the State only. Other specific data sources are listed below: • Treatment admissions and demographic data
were provided by the Hawai’i State Department of Health, Alcohol and Drug Abuse Division (ADAD). Previous data from ADAD are updated for this report whenever ADAD reviews its re-cords. These data represent all State-supported treatment facilities (90 percent of all facilities). About 5–10 percent of these programs and two large private treatment facilities do not provide data. During this reporting period, approximately 45 percent of the treatment admissions were paid for by ADAD; the remainder was covered by State health insurance agencies or by private in-surance. The rate of uninsurance for the State is about 10 percent.
• Drug-related death data were provided by the
Honolulu City and County Medical Examiner (ME) Office. These data are based on toxicology screens performed by the ME Office on bodies brought to them for examination. The sorts of circumstances that would lead to the body being examined by the ME include unattended deaths, deaths by suspicious cause, and clear drug-related deaths. In short, while the ME data are consistent, they are not comprehensive and ac-count for only about one-third of all deaths on O’ahu. To allow a direct comparison between ME data and treatment data, the ME data were multiplied by a factor of 10 on the exhibits.
• Law enforcement case data for 2004 were re-
ceived from the Honolulu Police Department (HPD), Narcotics/Vice Division only.
• Drug price data were provided for 2004 by the HPD, Narcotics/Vice Division.
• Uniform Crime Reports (UCR) data were ac-
cessed from the State’s Attorney General’s Web site for 1975–2003.
Emergency department (ED) drug mentions data have not been available in Hawai'i since 1994. Dis-cussions with the Healthcare Association of Hawai'i regarding inclusion in the Drug Abuse Warning Net-work (DAWN) program have resulted in a briefing of all hospital CEOs and the sharing of DAWN infor-mation. Over the past 2 years, the healthcare industry of the State has been hoping for a meeting with this program. To date nothing is scheduled.
DRUG ABUSE PATTERNS AND TRENDS Hawaiians and Whites remain the majority user groups among the 17 identified ethnic groups (plus 2 other categories: "other" and "unknown/blank") who access ADAD facilities for substance abuse treatment. During the first half of 2004, 46.6 percent and 22.5 percent of the admissions were Hawaiians/Part Hawaiians or Whites, respectively. All other groups represented significantly lower proportions of admissions. Methamphetamine remains the leading primary sub-stance of abuse for those admitted to treatment, ac-counting for 45.0 percent of admissions. Marijuana remained the third most frequently reported primary substance for treatment admissions (21.1 percent) behind alcohol (22.9 percent). It is important to point out, however, that almost all polydrug treatment ad-missions list alcohol as a substance of abuse. The 25–44 age group had the highest representation among treatment admissions and accounted for 25.0 percent of admissions; 35–44-year-olds accounted for 24.3 percent. While marijuana abuse accounts for the ma-jority of treatment admissions among those younger than 18 (the third most frequently admitted age group), the abuse of ice or crystal methamphetamine still looms as a major treatment category for this group. During this reporting period, drug prices have been stable, except for some minor upward price adjust-ments for crystal methamphetamine in smaller amounts (exhibit 1). The size of the drug supply ap-pears to make for a relatively stable drug market, with only a few market adjustments caused by sei-zures of specific drugs or oversupply of others. Ice continues to dominate the Hawaiian drug market. Prices have increased slightly during the reporting period, and this is likely reflective of several seizures.

EPIDEMIOLOGIC TRENDS IN DRUG ABUSE—Honolulu and Hawai'i
Proceedings of the Community Epidemiology Work Group, Vol. II, June 2005 98
It is now easier, however, to purchase larger quanti-ties than in the past. The final police evidence of in-creased ice availability is that of clandestine labs—almost exclusively reprocessing labs that continue to be closed at a regular pace. Marijuana has been a drug of choice in the islands for decades. All police departments in the State partici-pate in the joint State-Federal “Operation Green Har-vest.” However, police are now reporting that “Com-petition from Mainland marijuana growers and con-tinuing law enforcement efforts have drastically re-duced the state's outdoor production from the 1980s.” During the latest “Operation Green Harvest,” more than 10,400 plants were seized on the Big Island; in Maui County, more than 16,800 plants were seized, with about 10,000 recovered within a couple miles of the Moloka'i airport; on O'ahu, 1,500 plants were seized; and on Kaua'i, 250 plants were seized. The most recent 10-day statewide sweep recovered about 39,000 marijuana plants, an indication that marijuana cultivation has dropped dramatically from the 1980s. Federal officials have said that marijuana cultivation was a major problem during that decade; 1.9 million plants were recovered in 1987 alone, mostly from the Big Island. The Hawai'i DEA continues its efforts with the Honolulu Police Department to deal with crystal methamphetamine and, in particular, to break the supply route from California for the chemicals neces-sary to operate Hawai'i’s ice labs. During this period, the HPD seized and closed 24 clandestine metham-phetamine laboratories. In 2000, 8 labs were closed, compared with 7 in 2001, 15 in 2002, and 10 in 2003. The police data used in this report are only for the Honolulu Police Department. In previous reports, attempts have been made to include whatever data were available from Neighbor Island police depart-ments. The frequency and consistency of reporting made it impossible to continue the practice, and from this point forward only HPD data will be reported. Cocaine/Crack Powder cocaine and crack treatment admissions were relatively stable during the current period. There were 363 primary cocaine treatment admissions in 2004, compared with 355 in 2003, 428 in 2002, and 433 in 2001 (exhibit 2). This shows that the number of clients listing cocaine as the primary drug, after being quite stable for several years, began a decline in 1999 that has now stabilized with data for 2004. Powder cocaine/crack now ranks fourth among pri-mary drugs of treatment admissions, after metham-phetamine, alcohol, and marijuana.
The Honolulu ME reported 22 deaths with cocaine-positive toxicology screens in 2004, compared with 26 in 2003 and 22–24 in 1999–2002 (exhibit 2). It should be remembered that data on the chart have been adjusted to allow for their presentation on the same axes by multiplying all death data by a constant of 10. According to the HPD, cocaine prices have remained relatively stable over the past several years. One-quarter gram of crack currently sells for $25–$30, and the same amount of cocaine powder costs $25–$35 (exhibit 1). Police cases for cocaine/crack in-creased slightly in 2004 to 239 (exhibit 3). Over the past several years, the number of HPD cocaine cases plummeted from more than 1,200 cases in 1996 to 202 in 2003. Heroin and Other Opiates China white heroin has been uncommon in Hawai’i for many years, but it is occasionally available for a premium price. The heroin market for Honolulu is dominated by black tar heroin, and it is readily avail-able in all areas of the State. HPD data show 1,251 grams of black tar and 1.699 grams of China white powder were seized in 2004. This is lower than the 3,502 grams of black tar seized in 2003 but higher than the 0.019 grams of powder seized in 2003. For 2002, 992 grams of black tar and 494 grams of pow-der were seized. In 2001, 530 grams of powder were seized, along with 3,258 grams of black tar heroin. According to the HPD, black tar heroin prices re-mained stable in Honolulu at $50–$75 per one-quarter gram, $150–$200 per half “teen” (1/6 ounce), and $2,500–$3,000 per ounce (exhibit 1). Heroin treatment admissions continued the decline begun in 1999 (exhibit 4). In 1998, record levels of treatment admissions were recorded, with more than 500 individual admissions that year. In 2004, how-ever, heroin ranked fifth among treatment admissions at 2.1 percent (n=175). The Honolulu ME reported that deaths in which opi-ates were detected have declined in 2004, however, the residuals of heroin versus other opiates could not be definitively separated for several cases. For now, only 12 heroin deaths are confirmed for 2004 (exhibit 4). Decedents with a positive toxicological result for other opiates were primarily comprised of those in whom oxycodone or methadone were detected. The exact medication (OxyContin® or another) used was not specified. However, the 15 decedents with oxy-codone in their toxicology screens represent a death rate for the city and county of Honolulu of 17.2 per 1,000,000 persons. An additional concern was ex-

EPIDEMIOLOGIC TRENDS IN DRUG ABUSE—Honolulu and Hawai'i
Proceedings of the Community Epidemiology Work Group, Vol. II, June 2005 99
pressed by the Medical Examiner’s office this year, and that was with respect to methadone. Previously, the ME had been asked to review its records and to monitor the appearance of methadone among dece-dents. In 2004, there were 25 decedents with a posi-tive toxicology screen for methadone, compared with 22 in 2003 and 28 in 2002. The HPD reported 25 heroin cases in 2001, 44 in 2002, 30 in 2003, and 34 in 2004 (exhibit 5). In spite of the very high number of cases reported in 1998, the decade-long trend in heroin cases is a downward one from the 54 cases reported in 1995. According to the Domestic Monitor Program 2003 Report, “In response to reports of a black tar heroin problem in Hawaii, a Geo-Probe was conducted in Honolulu in July and August 2003. This probe marked the first instance of DMP purchases made outside of the continental United States. Black tar heroin is popular in the islands because of the price—approximately $100 to $200 per gram. This price is substantially cheaper than that for white powder her-oin, which is very rarely encountered, but which is sold locally for approximately double the price of black tar. The Geo-Probe resulted in the purchase of five exhibits, three of which were qualified samples determined to be MEX heroin averaging approxi-mately 51.3 percent pure. The samples cost, on aver-age, $0.95 per milligram pure. Honolulu’s average price was comparable to San Francisco’s, but the purity levels were more than four times as high as San Francisco’s, and higher than other Pacific coast DMP cities.” Marijuana Statewide, marijuana treatment admissions decreased slightly in 2004, with only 1,461 reported for the year (exhibit 6). There was an increase in 2003, following the slight decline in admissions in 2002. Those ad-mitted for treatment in 2004 continue to be younger persons referred by the courts. In examining these treatment data, it is important to remember that the number of persons in treatment for marijuana use in 2004 was triple the number in treatment in 1992. It is also important to note that while marijuana is listed as the primary drug of use at admission, many users of other drugs use marijuana as a secondary or terti-ary drug of choice. Between 1994 and 1999, the O'ahu ME reported 12–21 deaths per year in which marijuana was found in the specimens submitted for toxicology screening (exhibit 6). Those numbers increased to 25 in 2000, 36 in 2001, 30 in 2002, 32 in 2003, and 31 in 2004.
Again, in most instances, marijuana was used with other drugs if there was a drug-related death. The HPD continues to monitor, but to not specifically report, case data for marijuana. As mentioned in pre-vious CEWG reports, possession cases are steady at about 650 per year, although distribution cases have continued to increase. Law enforcement sources speculate that much of the Big Island's marijuana is brought to O'ahu for sale. Exhibit 7 shows Honolulu police case data for marijuana. As shown in exhibit 1, marijuana cost $5–$20 per joint, $25 per gram, and $6,000–$9,000 per pound in 2004. Methamphetamine Hawai'i’s drug of choice among the 18–34-year-old population group remains crystal methamphetamine. The California-based Mexican sources use Hawai'i’s cultural diversity to facilitate smuggling and distribu-tion to and within the islands. Analysis of confiscated methamphetamine reveals that the product is still a high-quality d-methamphetamine hydrochloride in the 90–100-percent purity range, which makes it ideal for smoking (the route of admission of choice). Methamphetamine treatment admissions remained extremely high (accounting for 45 percent of admis-sions in 2004), continuing the increase in admissions observed for the past 13 years (exhibit 8). In 2003, there were 3,182 such admissions, up from 2,677 in 2002. The rate of increase in demand for treatment space for methamphetamine abusers has been nearly 2,000 percent since 1991. This situation has so far outstripped the treatment system's capacity, that peo-ple who might want treatment for alcohol or any other drug would not likely receive it in a timely manner. With court diversion programs in place, the available treatment slots for non-judicial treatment admissions are extremely tight. Between 1994 and 2000, the O'ahu ME mentioned crystal methamphetamine in 24–38 cases per year (exhibit 8). In 2001, that number jumped to 54, and methamphetamine-positive decedents increased to 62 in 2002. In 2003, the number of decedents with ice detected in their toxicology reports was 56. For 2004, there were 67 deaths with positive toxicology results for methamphetamine, representing 76.5 deaths per 1,000,000 for the island of O'ahu. Crystal methamphetamine prices remained stable in 2004. The drug is sold in the islands as "clear" (a clear, white form) or "wash" (a brownish, less proc-essed form). Prices for ice vary widely according to

EPIDEMIOLOGIC TRENDS IN DRUG ABUSE—Honolulu and Hawai'i
Proceedings of the Community Epidemiology Work Group, Vol. II, June 2005 100
these two categories and availability, as illustrated by prices on O'ahu: $50 (wash) or $75 (clear) per 0.25 gram; $200–$300 (wash) or $600–$900 (clear) per gram; $450–$600 (wash) or $1,000–$2,000 (clear) per one-quarter ounce; and $2,200–$3,000 (wash) per ounce. HPD methamphetamine case data peaked at 984 in 1995 (exhibit 9). The annual number of cases subse-quently declined annually, and they totaled 616 in 2002 and 964 in 2003. In 2004, a total of 883 cases were reported. Minimal data are available from the neighbor islands, but they also show an increase in cases. NFLIS data for FY 2003 and FY 2004 show that methamphetamine was the most often seized sub-stance, with 62 percent of the FY 2003 and 57 per-cent of the FY 2004 samples testing positive for methamphetamine. Depressants Barbiturates, sedatives, and sedatives/hypnotics are combined into this category. Few data were provided about these drugs in the islands. ADAD maintains three categories under this heading: benzodiazepines, other tranquilizers, and barbiturates. Treatment admissions for these drugs are minimal in terms of impact on the system. Annually, the num-bers admitted to treatment for these drugs total less than 10. The number of ME mentions for depressants has re-mained stable for several years at five or less. The HPD has not reported depressant case data since 1991. Neighbor island police reported fewer than 15 cases per year since 1996.
Prices remain stable at $3–$20 per unit for barbitu-rates and $2–$3 per pill for secobarbital (Seconal or "reds"). Hallucinogens Hallucinogen treatment admissions total less than five per year. No hallucinogen ME mentions have been reported since the beginning of data collection. Prices for lysergic acid diethylamide (LSD) were $4–$6 per "hit" and $225–$275 per 100 dosage unit sheets (a "page") in this reporting period. A Final Point An examination of Exhibit 10 shows that over the past 13 years, Honolulu Police Department drug cases have varied considerably. Brief descriptions of drug trends, as seen from the interdiction view, were very complex in the early 1990s, with similar num-bers of cases for cocaine, methamphetamine, and marijuana. In addition it is important to note that the accumulation of drug cases in 1993–1995 was quite high (1,752 for marijuana, cocaine, and metham-phetamine). With no marijuana cases reported by HPD in 1996, the accumulated numbers for metham-phetamine and cocaine was 1,720 cases, with cocaine accounting for 70 percent of the cases. By 2000, cocaine, methamphetamine, and marijuana accounted for only 1,097 cases, with methampheta-mine accounting for more cases than the other two drugs combined. In 2004, there were 1,257 cases for these three drugs, with methamphetamine represent-ing 70 percent of the cases. For inquiries concerning this report, please contact D. William Wood, Ph.D., Department of Sociology, University of Hawai’i at Manoa, 265 North Kalaheo Avenue, Honolulu, HI 96822, Phone: 250-384-3748, Fax: 808-965-3707, E-mail: [email protected].

EPIDEMIOLOGIC TRENDS IN DRUG ABUSE—Honolulu and Hawai'i
Proceedings of the Community Epidemiology Work Group, Vol. II, June 2005 101
150
300
210
380
230
320
230
290240
220
260
230240
220
355
363
433
428
550
291
422
531
560
662656
662647
162
0
100
200
300
400
500
600
700
1991 1992 1993 1994 1995 1996 1997 1998 1999 2000 2001 2002 2003 2004Year
Cases
O'ahu Deaths (x10) Treatment Admissions
Exhibit 1. Drug Prices in Honolulu: 2004
Drug Paper (1/4 Gram)
½ Teen (0.88 Grams)
8 Ball (1/8 Ounce)
Quarter (1/4 Ounce)
“O” (1 Ounce)
“LBs” (1 Pound)
“Kilos” (1 Kilogram)
Heroin (White) $50 $200–$300 $2,000–$3,000 $5,000 $50,000 $100,000
Heroin (Black Tar) $50–$75 $150–$200 $750 $2,500–
$3,000 N/A1 N/A
Cocaine $25–$35 $100–$120 $500–$600 $250–$350 $1,100–
$1,500 $13,500–$25,000
$26,500–$52,000
Rock Cocaine $100 $200–$300 N/A
Crack Cocaine $25–$30 $100–$250 $1,000–$1,500 $24,000
Crystal Methampheta-mine (Wash)
$50 $200–$300 $450–$600 $2,200–$3,000 $30,000 $50,000–
$70,000
LSD $4–$6 per hit $225–$275per 100 hits
Marijuana $5–$20 per joint $25 $100–$200 $400–$800 $6,000–
$9,000 N/A
Hashish N/A $10 $40–$60 $150–$300 $1,400–$1,800
Dilaudids $40–$80 per capsule
MDMA $25–$40 each
Phencyclidine (PCP) $10–$20 $100 $350–$550 $900–$1,200 N/A N/A
1N/A= Not available. SOURCE: Honolulu Police Department Exhibit 2. Cocaine-Related Death1 and Treatment Data in Hawaii: 1991–2004 1To allow direct comparison between ME data and treatment data, the ME data have been multiplied by 10. SOURCES: Honolulu Medical Examiner and Department of Health, Alcohol and Drug Abuse Division

EPIDEMIOLOGIC TRENDS IN DRUG ABUSE—Honolulu and Hawai'i
Proceedings of the Community Epidemiology Work Group, Vol. II, June 2005 102
613
23920
2
12215
322
538
5
874
1,045
1,218
1,056
901
648
316
0
200
400
600
800
1,000
1,200
1,400
1991 1992 1993 1994 1995 1996 1997 1998 1999 2000 2001 2002 2003 2004
Cases
0
100
200
300
400
500
600
700
Cases
O'ahu Heroin Deaths (x10) 140 120 220 400 210 130 140 190 190 140 160 140 180 120
Treatment Admissions 134 209 190 236 416 346 330 521 487 441 278 253 201 175
O'ahu Opiate Deaths (x10) 400 340 340 350 420 470 590 570 400 400
1991 1992 1993 1994 1995 1996 1997 1998 1999 2000 2001 2002 2003 2004
Exhibit 3. Cocaine-Related Police Cases in Honolulu: 1991–2004 SOURCE: Honolulu Police Department Exhibit 4. Heroin and Opiate Deaths1 and Heroin Treatment Admissions in Hawaii: 1991–2004
1To allow direct comparison between O’ahu ME data and treatment data, the O’ahu ME data have been multiplied by 10. SOURCES: Honolulu Medical Examiner and Department of Health, Alcohol and Drug Abuse Division

EPIDEMIOLOGIC TRENDS IN DRUG ABUSE—Honolulu and Hawai'i
Proceedings of the Community Epidemiology Work Group, Vol. II, June 2005 103
414
310320300360
250210150200190170608010
120
249
489
642
565
948
1,132
1,301 1,4
181,4
43 1,544
1,514 1,5
93
1,461
0
200
400
600
800
1,000
1,200
1,400
1,600
1,800
1991 1992 1993 1994 1995 1996 1997 1998 1999 2000 2001 2002 2003 2004
Cases
Oahu Deaths (x10) Treatment Admissions
Exhibit 5. Heroin-Related Police Case Data in Honolulu: 1991–2004
4335
5449
39
87
71
53
25
443430
0102030405060708090
100
1993 1994 1995 1996 1997 1998 1999 2000 2001 2002 2003 2004
Cases
SOURCE: Honolulu Police Department Exhibit 6. Marijuana-Related Deaths1 and Treatment Admissions in Hawaii: 1991–2004 1To allow direct comparison between O’ahu ME data and treatment data, the O’ahu ME data have been multiplied by 10. SOURCES: Honolulu Medical Examiner and Department of Health, Alcohol and Drug Abuse Division

EPIDEMIOLOGIC TRENDS IN DRUG ABUSE—Honolulu and Hawai'i
Proceedings of the Community Epidemiology Work Group, Vol. II, June 2005 104
13598
146115173
13692
569
492
237
670
608
0
100
200
300
400
500
600
700
800
1991 1992 1993 1994 1995 1996 1997 1998 1999 2000 2001 2002 2003 2004
Cases
670560620540350270360
240380360140
200110340
152268
454
628
1,008 909
1,478
1,450
1,922
2,419
2,644
2,677
3,182
3,328
0
500
1,000
1,500
2,000
2,500
3,000
3,500
1991 1992 1993 1994 1995 1996 1997 1998 1999 2000 2001 2002 2003 2004
Cases
Oahu Deaths (x10) Treatment Admissions
Exhibit 7. Marijuana-Related Police Case Data in Honolulu: 1991–2004 SOURCE: Honolulu Police Department Exhibit 8. Methamphetamine-Related Deaths1 and Treatment Admissions in Hawaii: 1991–2004
1To allow direct comparison between O’ahu ME data and treatment data, the O’ahu ME data have been multiplied by 10. SOURCES: Honolulu Medical Examiner and Department of Health, Alcohol and Drug Abuse Division

EPIDEMIOLOGIC TRENDS IN DRUG ABUSE—Honolulu and Hawai'i
Proceedings of the Community Epidemiology Work Group, Vol. II, June 2005 105
883
260
589
434
631583602502
699742
984915
964
616
0
200
400
600
800
1,000
1,200
1991 1992 1993 1994 1995 1996 1997 1998 1999 2000 2001 2002 2003 2004
Cases
Exhibit 9. Methamphetamine-Related Police Case Data in Honolulu: 1991–2004
SOURCE: Honolulu Police Department Exhibit 10. Honolulu Police Department Cases, by Drug and Year: 1991–2004
0
200
400
600
800
1,000
1,200
1,400
Cases
Cocaine 316 648 613 901 1056 1218 1045 874 385 225 153 122 202 239
Heroin 43 35 54 49 39 87 71 53 25 44 30 34
Marijuana 608 670 237 492 569 92 136 173 115 146 98 135
Methamphetamine 260 434 915 589 984 502 742 602 583 699 631 616 964 883
1991 1992 1993 1994 1995 1996 1997 1998 1999 2000 2001 2002 2003 2004
SOURCE: Honolulu Police Department

EPIDEMIOLOGIC TRENDS IN DRUG ABUSE—Los Angeles County
Proceedings of the Community Epidemiology Work Group, Vol. II, January 2005 106
A Semiannual Update of Drug Abuse Patterns and Trends in Los Angeles County, California Beth Finnerty, M.P.H.1
ABSTRACT Two main themes dominate Los Angeles County-level substance abuse indicator data in the current reporting period (through December 2004): (1) a relatively stable or mixed pattern for many drugs and (2) increasing patterns for methamphetamine. Los Angeles is the only city that is a primary drug market (i.e., distribution hub, transshipment area, and final destination) for all five major drugs (i.e., heroin, cocaine/crack, marijuana, methampheta-mine, and MDMA). With regards to treatment admis-sions, for the first time, a higher proportion of Los Angeles County treatment admissions were for pri-mary methamphetamine abuse (5,395 admissions; 23.4 percent of the total) than for primary heroin abuse (5,341 admissions; 23.2 percent of the total). The proportion of cocaine/crack admissions re-mained stable at 18 percent, and primary marijuana admissions continued to creep to 14.4 percent of the total. Once again, the Los Angeles HIDTA led all California HIDTAs in terms of clandestine metham-phetamine laboratory seizures, accounting for more than one-half of the 449 seizures made in California in 2004. Even though four States had more labora-tory seizures than California, and despite the steady decline in the number of methamphetamine labora-tories throughout the State, California remains the home of the domestic methamphetamine ‘superlab.’ Seventy-five percent of the 48 superlabs seized throughout the United States were located in Cali-fornia; 64 percent of those were located in four southern California counties: Los Angeles, San Ber-nardino, Orange, and Riverside. Drug prices and purities were relatively stable in the second half of 2004, with small changes occurring at the midlevel and retail level for certain drugs. Los Angeles County-level California Poison Control System major drug exposure calls in the first half of 2004 were dominated by cocaine/crack, methampheta-mine/amphetamine, ecstasy, and heroin. Further-more, among prescription and over-the-counter medication-related exposure calls, benzodiazepines were the most frequently mentioned category, fol- 1 The author is affiliated with UCLA Integrated Substance Abuse Programs, Los Angeles, California.
lowed by opiates/analgesics and Coricidin HBP. Ado-lescent substance use data gathered from the Cali-fornia Healthy Kids Survey for the 2003–2004 school year illustrated that lifetime and past-month usage percentages among Los Angeles County secondary school students in grades 7, 9, and 11 were either the same or lower than percentages reported in previous school years. Aside from alcohol, students were most likely to report lifetime marijuana use (20 percent), followed by inhalants (13 percent), cocaine or methamphetamine (each at 7 percent), and LSD/ other psychedelics or ecstasy (each at 6 percent). In-dicator data for prescription drugs, PCP, LSD, MDMA (ecstasy), and GHB remained limited, but use and abuse are reported among some of the non-traditional indicators. INTRODUCTION Area Description Los Angeles County has the largest population (9,937,739, 2004 estimate) of any county in the Na-tion. If Los Angeles County were a State, it would rank ninth in population behind California, New York, Texas, Florida, Pennsylvania, Illinois, Ohio, and Michigan. Approximately 29 percent of Califor-nia’s residents live in Los Angeles County. The population of Los Angeles County has increased 3.7 percent since the 2000 Census. Nearly 90 percent of all Los Angeles County residents live within 88 in-corporated cities; the remaining 10 percent reside in unincorporated areas of the county. The five most populated cities are, in descending order of population, Los Angeles (3,694,820), Long Beach (461,522), Glendale (194,973), Santa Clarita (151,088), and Pomona (149,473). Just over one-half of all Los Angeles County resi-dents are female (50.6 percent) (exhibit 1). More than one-quarter (28.0 percent) are younger than 18; 9.7 percent are older than 65. The racial and ethnic com-position of Los Angeles County residents is quite diverse. Of those residents who report being of one race, just under one-half identify as White (48.7 per-cent), followed by Asians (11.9 percent), Blacks/Afri-can-Americans (9.8 percent), American Indians/Alaska Natives (0.8 percent), and Native Hawaiians/Other Pacific Islanders (0.3 percent). About one-quarter of residents (23.5 percent) identify with another race (not specified). Furthermore, 5 percent report two or more races. Residents of Hispanic/Latino origin may be of any race. Therefore, they are included in the appropri-ate racial categories above. Nearly 45 percent of Los Angeles County residents are of Hispanic/Latino origin; approximately 31 percent of Whites are not of Hispanic/Latino origin.

EPIDEMIOLOGIC TRENDS IN DRUG ABUSE—Los Angeles County
Proceedings of the Community Epidemiology Work Group, Vol. II, June 2005 107
According to an April 2004 Policy Brief from United American Indian Involvement and the UCLA Ralph and Goldy Lewis Center for Regional Policy Studies, 3 percent of the Nation’s 3.7 million American Indi-ans/Alaska Natives (AIs/ANs) reside in the Los An-geles area. The largest concentration of urbanized AIs/ANs is located in the county. Furthermore, the local AI/AN population grew 35 percent from the 1990 to the 2000 U.S. census, compared to the over-all county growth of 7 percent. Los Angeles County encompasses approximately 4,080 square miles and includes the islands of San Clemente and Santa Catalina. The county is bordered on the east by Orange and San Bernardino Counties, on the north by Kern County, on the west by Ventura County, and on the south by the Pacific Ocean. Los Angeles County’s coastline is 81 miles long. Two of the busiest maritime ports in the world—Long Beach and Los Angeles—are located in Los Angeles County. The Port of Long Beach is the Na-tion’s busiest maritime cargo container facility, while the Port of Los Angeles ranks second, according to a report by the National Drug Intelligence Center (NDIC) in 2001. Los Angeles County is also home to the world’s third busiest airport—Los Angeles Inter-national Airport. The airport handles more than 1,000 cargo flights each day; 50 percent of this activity is international in origin or destination (NDIC 2001). Residents of Los Angeles County primarily rely on automobiles for transportation, and the Los Angeles area has one of the most intricate highway systems in the world. Of these, Interstates 5, 10, and 15 connect the area to the rest of the Nation. Interstate 5 runs from the U.S.-Canada border to the U.S.-Mexico border and links Los Angeles to other key west coast cities, such as San Diego, Oakland, San Francisco, Sacramento, Portland, and Seattle. Interstate 10 originates in Santa Monica, California, and runs across the United States to I-95 in Jacksonville, Flor-ida; Interstate 15 originates in the area and runs northeast through Las Vegas, Nevada, to the U.S.-Canada border in Montana. In addition, State high-ways 1 and 101 are extensively traveled roadways.
The National Drug Threat Assessment 2005 identi-fied 12 primary drug market areas throughout the United States that serve as major consumption and distribution centers of cocaine, marijuana, metham-phetamine, heroin, and methylenedioxymetham-phetamine (MDMA or ecstasy). California is one of the most active drug smuggling and production areas in the United States and contains three market ar-eas—Los Angeles, San Diego, and San Francisco. This is caused, in part, by the State’s proximity to the
Pacific Ocean and Mexico. Los Angeles is a national-level transportation hub and distribution center, and it is the only primary market for all five of the major drugs of abuse listed above (NDIC 2005). Data Sources This report describes drug abuse trends in Los Ange-les County from January 1998 to December 2004. Information was collected from the following sources: • Drug treatment data were derived from the
California Department of Alcohol and Drug Pro-grams (ADP), California Alcohol and Drug Data System (CADDS), and correspond to Los Ange-les County alcohol and other drug treatment and recovery program admissions for July 2001 to December 2004. This is the first semiannual re-port for which user demographic data are pre-sented by route of administration for the major drugs of abuse (including cocaine/crack, heroin, and methamphetamine). It should be noted that admissions for heroin treatment are dispropor-tionately represented because of reporting re-quirements for facilities that use narcotic re-placement therapy to treat heroin users. Both pri-vate and publicly funded narcotic treatment providers must report their admissions to the State, while for other drug types, only publicly funded providers must report.
• DAWN emergency department (ED) data for
the Los Angeles division (i.e., Los Angeles County only) of the Los Angeles metropolitan area were accessed from the Office of Applied Studies (OAS), Substance Abuse and Mental Health Services Administration (SAMHSA)’s restricted-access database—DAWN Live!—for calendar year 2004 (based on updates from April 13–14, 2005, and June 10, 2005). Thirty-four of the 79 eligible hospitals in the Los Angeles area are in the DAWN sample. The sample includes 37 emergency departments (some hospitals have more than 1 ED). The data are incomplete and are based on 9 to 14 EDs reporting each month over the 12-month period (exhibit 2). The data are unweighted and, thus, are not estimates for the Los Angeles area. The data cannot be com-pared to DAWN data for 2002 and before, nor can the preliminary data be used for comparison with future data. Only weighted DAWN data re-leased by SAMHSA can be used for trend analy-sis. The preliminary unweighted data for calen-dar year 2004 represent drug reports in drug-related visits; reports exceed the number of vis-its, since a patient may report use of multiple

EPIDEMIOLOGIC TRENDS IN DRUG ABUSE—Los Angeles County
Proceedings of the Community Epidemiology Work Group, Vol. II, January 2005 108
drugs (up to six drugs and alcohol). The analysis for this paper includes the “major substances of abuse,” as well as prescription drug misuse. For major substances of abuse, all case types are in-cluded (i.e., suicide attempt, seeking detoxifica-tion, alcohol only [<21], adverse reaction, over-medication, malicious poisoning, accidental in-gestion, and other) (exhibit 3). For pharmaceuti-cals (nonmedical use), only overmedication, ma-licious poisoning, and other case types are in-cluded. As noted earlier, the data included in this report are preliminary. All DAWN cases are re-viewed for quality control. Based on this review, cases may be corrected or deleted. Therefore, preliminary data are subject to change. A full de-scription of DAWN can be found at <http://www.dawninfo.samhsa.gov>.
• Poison control center call data were accessed
from the California Poison Control System (CPCS) for 2000 through June 2004. The CPCS provides poison information and telephone man-agement advice and consultation about toxic ex-posures; hazard surveillance to achieve hazard elimination; and professional and public educa-tion on poison prevention, diagnosis, and treat-ment. The information obtained from the CPCS includes calls in which there was a confirmed exposure to an illicit substance (e.g., cocaine, heroin, marijuana, ecstasy, etc.), a prescription drug or substance with common household uses, or a combination of both. The statistical analysis contained in this report is preliminary and fo-cuses mostly on illicit substances; more indepth analyses of the prescription and household sub-stance categories will be conducted for future area reports.
• Drug availability, price, purity, seizure, and
distribution data were derived from the Los An-geles Police Department (LAPD), the Los Ange-les High Intensity Drug Trafficking Area (HIDTA), the Los Angeles County Regional Criminal Information Clearinghouse (LA CLEAR), the National Drug Intelligence Center, and the Drug Enforcement Administration (DEA).
• Drug analysis results from local forensic labo-
ratories were derived from the Drug Enforce-ment Administration, National Forensic Labora-tory Information System (NFLIS). The statistics correspond to items analyzed between January 1, 2004, and December 31, 2004. It is important to note that data from the Los Angeles County Sheriff’s Department laboratory are complete, but data from the LAPD laboratory are not com-plete for some months.
• Demographic and geographic data were pro-vided by the United Way of Greater Los Ange-les, Los Angeles County Online, United Ameri-can Indian Involvement, the UCLA Ralph and Goldy Lewis Center for Regional Policy Studies, and the U.S. Census Bureau (State and County QuickFacts).
• Adolescent substance use statistics were ac-
cessed from the Los Angeles County-level Cali-fornia Healthy Kids Survey (CHKS) data for the 1997–1998, 1998–1999, 1999–2000, 2000–2001, 2001–2002, 2002–2003, and 2003–2004 school years from WestEd. The CHKS is a modular survey that assesses the overall health of secon-dary school students (in grades 7, 9, 11, and a small sample of nontraditional school students). In California, Local Education Agencies (LEAs) and County Offices of Education (COEs) that accept funds under the Federal Title IV Safe and Drug Free Schools and Communities (SDFSC) program or the State Tobacco Use Prevention Education (TUPE) program must administer the CHKS at least once every 2 years. Individual school districts are given the opportunity to ad-minister the survey in every school year, how-ever, if the resources exist to do so. Section A (Core Module) includes questions on lifetime and past-30-day use of alcohol, drugs, and to-bacco. Another module (Section C) is comprised of additional questions related to alcohol and drug use, violence, and safety.
• Acquired immunodeficiency syndrome (AIDS)
and human immunodeficiency virus (HIV) data (cumulative through December 2004) were provided by the Los Angeles County Department of Health Services, HIV Epidemiology Program, Advanced HIV (AIDS) Quarterly Surveillance Summary, January 2005.
DRUG ABUSE PATTERNS AND TRENDS Cocaine/Crack Approximately 18 percent of all Los Angeles County treatment and recovery program admissions in July–December 2004 reported a primary crack or powder cocaine problem (exhibit 4). The total number of primary cocaine/crack admissions decreased 20 per-cent from the first to the second half of 2004. But as a percentage of the total, cocaine admissions have re-mained quite stable at 18–20 percent for several CEWG reporting periods (exhibit 5). Alcohol was the most commonly reported secondary drug problem among primary cocaine admissions (37 percent) (ex-hibit 6), followed by marijuana (18 percent). Smok-

EPIDEMIOLOGIC TRENDS IN DRUG ABUSE—Los Angeles County
Proceedings of the Community Epidemiology Work Group, Vol. II, June 2005 109
ing is the reported route of administration for 86 per-cent of all cocaine admissions, followed by inhalation (10 percent). When asked whether they had used any drug intravenously in the year prior to admission, approximately 4 percent of all primary cocaine ad-missions reported that they had used needles to ad-minister one or more drugs intravenously at least once during the specified time period (exhibit 6a). Sixty-six percent of the primary cocaine admissions reported in the second half of 2004 were male, simi-lar to the gender breakdown seen in the first half of the year. Black non-Hispanics continued to dominate cocaine admissions (at 56 percent), followed by His-panics (22 percent) and White non-Hispanics (16 percent). In terms of age at admission, nearly 40 per-cent were concentrated in the 36–45 year age group; an additional 23 percent of all primary cocaine ad-missions were between the ages of 26 and 35. Primary cocaine treatment admissions are more likely than treatment admissions for any other substance (alcohol, prescription medications, or illicit drugs) to report being homeless at admission (28 percent). The proportion of cocaine admissions referred to treat-ment through the criminal justice system in the sec-ond half of 2004 continued to decrease to 16 percent of all admissions (down from 20 percent in the first half of the year). More frequently mentioned referral sources included self-referral (33 percent) or referral through Proposition 36 (a.k.a., SACPA) court/probation (31 percent). Although slightly more than one-third of primary cocaine admissions had never been admitted to treatment for a primary co-caine problem, 44 percent had one or two prior treatment episodes. Forty-three percent had earned a high school diploma or GED. At the time of admis-sion, approximately 15 percent were employed either full- or part-time. Cocaine injectors were more likely than cocaine in-halers or crack smokers to be White non-Hispanic (70 percent), 36 or older (70 percent), homeless (53 percent), or to have been through four or more prior treatment episodes (21 percent). Crack smokers were more likely than cocaine inhalers or injectors to be male (64 percent), Black non-Hispanic (63 percent), or have a high school diploma/GED (43 percent). Lastly, cocaine inhalers were more likely than their counterparts to be Hispanic (56 percent) or employed full- or part-time (40 percent). Preliminary unweighted data accessed from DAWN Live! for calendar year 2004 indicate that of the 8,982 major substances of abuse reported in the Los Ange-
les division, 2,348 (26 percent) were cocaine/crack (exhibit 7). Cocaine was the second most likely major substance to be reported, following alcohol. Sixty-eight percent of the patients reporting cocaine use were male; 44 percent were Black (followed by 28 percent Hispanic and 23 percent White); 33 percent were age 35–44; and 54 percent reported smoking crack. A total of 5,067 chief complaints were logged for patients reporting cocaine. The top three specific complaints were intoxication (973 complaints), psy-chiatric condition (943 complaints), and altered men-tal status (868 complaints). Cocaine-using patients were most likely to be discharged home (44 percent) or admitted to a psychiatric unit (25 percent). California Poison Control System calls involving the use of cocaine/crack by Los Angeles County resi-dents increased from 69 in 2000 to a high of 97 in 2003. In the first 6 months of 2004 alone, 41 calls involving cocaine/crack were received (exhibit 8a). Between January 2003 and June 2004, 68 percent of the cocaine-exposed callers were male, and 51 per-cent were between the ages of 26 and 44 (exhibit 9). An additional 21 percent were between the ages of 18 and 25. According to CHKS data for the 2003–2004 school year (exhibit 10), 7.4 percent of all Los Angeles County secondary school students (including 7th, 9th, and 11th graders, and a small sample of nontradi-tional students) who responded to the survey had ever used cocaine (crack or powder), and 3.8 percent were current cocaine users (defined as any use in the past 30 days). A breakdown of the data by grade level illustrated that among responding ninth graders, 5.4 percent had ever used cocaine and 3.0 percent were current cocaine users. A higher percentage of 11th graders than 9th graders reported current co-caine/crack use in the past 30 days. Of the lifetime cocaine users, 55 percent were male and 45 percent were female. The gender distribution was slightly wider for past-30-day use of cocaine (63 percent male vs. 37 percent female). Frequent cocaine use is defined as 20 or more days of use in the previous 30 days. Twenty-four percent of the current cocaine us-ers reported frequent use. Among the frequent users, 74 percent were male. When asked about past-6-month use of cocaine (any form), methamphetamine, or other stimulants, 7.1 percent of 9th graders and 6.5 percent of 11th graders responded in the affirmative (exhibit 11). According to long-term trends calculated from CHKS data spanning over the most recent 5 school years (exhibit 12), the pattern of past-30-day cocaine

EPIDEMIOLOGIC TRENDS IN DRUG ABUSE—Los Angeles County
Proceedings of the Community Epidemiology Work Group, Vol. II, January 2005 110
(powder or crack) use among responding secondary school students was similar to usage patterns for some of the other licit and illicit drugs, such as lyser-gic acid diethylamide (LSD)/other psychedelics and methamphetamine. Past-30-day cocaine/crack use decreased consistently from the peak level seen in 1999–2000 (4.9 percent) to 3.8 percent in 2002–2003. In 2003–2004, current cocaine use remained stable at 3.8 percent of all respondents. A total of 10,717 cocaine arrests were made within the city of Los Angeles in calendar year 2004. This repre-sented a 3-percent deficit from the number of cocaine arrests made during the same time period in 2003. Co-caine arrests accounted for 30 percent of all narcotics arrests made between January 1 and December 31, 2004. Citywide cocaine (including crack and powder) sei-zures increased 31 percent, from 1,835 pounds seized in the first half of 2003 to 2,404 pounds seized in 2004. The street value of the seized cocaine accounted for 29 percent of the total street value of all drugs seized in 2004. Data from NFLIS for calendar year 2004 showed that out of 54,916 analyzed items reported by participating laboratories within Los Angeles County, 38.3 percent (21,037) of all items analyzed were found to be co-caine/crack. Cocaine/crack was the most likely illicit drug to be found among items tested in the county, followed closely by methamphetamine and more dis-tantly by cannabis. Los Angeles remains one of the primary markets for cocaine (in addition to Houston, Chicago, New York, Atlanta, and Miami; NDIC 2004). Mexican and Co-lombian traffickers control the wholesale distribution of cocaine and crack in Los Angeles; African-American and Hispanic street gangs control distribu-tion at the retail level. All substance use and abuse indicators are higher for crack than for powder co-caine. Despite this, powder cocaine availability and use is reported in the area. Current midlevel prices of crack cocaine remained level (as compared to the January 2005 report) at $500–$1,200 per ounce (ex-hibit 13), as did the retail price range ($10–$40 per rock). The current wholesale price for 1 kilogram of powder cocaine ranges from $14,000 to $17,000, which is identical to the wholesale price cited in the past few CEWG reports. The current midlevel and retail prices of powder cocaine remained stable, as well, at $500–$600 per ounce and $80 per gram. The purity of powder cocaine is approximately 78 percent, similar to the purity cited in the last few CEWG re-ports.
Heroin From July to December 2004, 5,341 Los Angeles County treatment and recovery program admissions were attributable to primary heroin abuse, compared with 6,942 admissions reported in the county in the first half of 2004 (exhibit 4). In 2003, it was thought that heroin admissions were leveling off at roughly 25.4 percent of all admissions, after several half-year decreases. In the first half of 2004, however, the pro-portion of primary heroin admissions among all Los Angeles County treatment and recovery programs decreased slightly to 24.5 percent of all admissions. And in the second half of 2004, the percentage of primary heroin admissions continued to fall to 23.2 percent of all admissions. For the first time ever, methamphetamine surpassed heroin as the most fre-quently mentioned primary drug among treatment admissions (by a very small margin). Demographics of heroin admissions have remained stable over recent reporting periods. In the second half of 2004, primary heroin admissions were predominantly male (72 percent), most likely to be age 45–50 (22 percent), and somewhat more likely to be Hispanic (42 percent) than White non-Hispanic (39 percent) or Black non-Hispanic (11 percent) (exhibit 6). Compared with other major types of illicit drug admissions, primary heroin admissions in the first half of 2004 had the largest proportion of users age 36 and older (74 percent). Just over one-third (36 percent) of all primary heroin admissions initiated their heroin use prior to age 18, which is quite low compared to other primary substances, such as alco-hol, marijuana, methamphetamine, and phencyclidine (PCP). If primary heroin admissions abused another drug secondarily to heroin, it was most likely to be cocaine/crack (24 percent), followed by alcohol (11 percent). Heroin administration patterns remained relatively stable in the second half of 2004, with injectors ac-counting for 85 percent, smokers accounting for 8 percent, and inhalers (snorters) accounting for 5 per-cent (exhibit 6). When asked whether they had used any drug intravenously in the year prior to admission, 88 percent of all primary heroin admissions reported that they had used needles to administer one or more drugs intravenously at least once during the specified time period. Sixteen percent of all primary heroin admissions were homeless at time of admission, and only 4 per-cent were referred by the court or criminal justice system. Primary heroin users were most likely to

EPIDEMIOLOGIC TRENDS IN DRUG ABUSE—Los Angeles County
Proceedings of the Community Epidemiology Work Group, Vol. II, June 2005 111
have self-referred for the current treatment episode (77 percent of all heroin admissions, up from 72 per-cent in the first half of 2004). In a measure of current legal status, the majority (77 percent) were not in-volved at all with the criminal justice system. This corroborates with the very low proportion of criminal justice referrals among primary heroin users. Seven-teen percent indicated that they had never received treatment for their heroin problem, whereas 51 per-cent reported three or more primary heroin treatment episodes. Forty-five percent of all primary heroin admissions graduated from high school (down from 49 percent), and, at the time of admission, 24 percent were employed full- or part-time (an increase from 20 percent in the first half of 2004). Heroin injectors were more likely than their inhaler or smoker counterparts to be Black non-Hispanic (22 percent), homeless (16 percent), or to have been through four or more prior treatment episodes (42 percent). Heroin smokers were more likely than her-oin inhalers or injectors to be White non-Hispanic (65 percent), employed full- or part-time (39 per-cent), or have a high school diploma/GED (53 per-cent). Lastly, heroin inhalers were more likely than their counterparts to be male (76 percent), Hispanic (61 percent), and 36 and older (89 percent). Preliminary unweighted data accessed from DAWN Live! for calendar year 2004 indicate that of the 8,982 major substances of abuse reported in the Los Ange-les division, 712 (8 percent) were heroin (exhibit 7). Heroin was the fifth most likely major substance to be reported, following alcohol, cocaine, stimulants (amphetamines and methamphetamine), and mari-juana. Seventy-three percent of the patients reporting heroin use were male; 43 percent were Hispanic (fol-lowed by 35 percent White and 20 percent Black); 35 percent were age 45–54; and 82 percent reported in-jecting heroin. A total of 1,438 chief complaints were logged for individuals reporting heroin. The top three complaints were altered mental status (235 com-plaints), abscess/cellulitis/skin/tissue (231 com-plaints), and intoxication (213 complaints). Heroin-using patients were most likely to be discharged home (45 percent) or admitted to a psychiatric unit (17 percent). Los Angeles County-based California Poison Control System calls involving exposure to heroin fluctuated between 15 and 20 from 2000 to 2003 (exhibit 8a). In the first half of 2004 alone, 11 heroin exposure calls were reported, which may indicate a shifting upward trend. Between January 2003 and June 2004, 79 per-cent of the heroin-exposed callers were male, and 67 percent were between the ages of 26 and 54. An addi-
tional 11 percent of the callers were between the ages of 18 and 25. According to CHKS data for the 2003–2004 school year (exhibit 10), 3.3 percent of all Los Angeles County secondary school students (including 7th, 9th, and 11th graders, and a small sample of nontradi-tional students) who responded to the survey had ever used heroin. A breakdown of the data by grade level illustrated that lifetime heroin use was nearly identi-cal among responding 9th graders (3.1 percent) and 11th graders (3.0 percent). When asked about past-6-month use of other drugs, heroin, or sedatives, 6.3 percent of 9th graders and 5.2 percent of 11th graders responded in the affirmative (exhibit 11). A total of 934 heroin arrests were made within the city of Los Angeles during calendar year 2004. This represented a 24-percent increase from the number of heroin arrests made in 2003. Heroin arrests accounted for approximately 2.6 percent of all narcotics arrests made from January 1 to December 31, 2004. Twenty pounds of black tar heroin were seized within the city of Los Angeles in 2004, a slight decrease of 7 percent compared with the amount seized during the same time in 2003. Seizures of other types of heroin remained stable at approximately 16 pounds seized in 2004. The street value of all seized heroin accounted for approximately 1 percent of the total street value of all drugs seized in 2004. According to NFLIS data based on 54,916 analyzed items reported by participating laboratories within Los Angeles County between January 1 and December 31, 2004, only 4.1 percent (2,236) of all items analyzed were found to be heroin. This small proportion corre-sponds to the small proportion of heroin (black tar and other forms) reported among Los Angeles City sei-zures. As in the past, Los Angeles is the primary market for Mexican black tar heroin, and to a lesser extent, brown powder heroin distributed to other Western States (NDIC 2004). In addition, Mexican black tar heroin remains the predominant type of heroin used by Los Angeles County users. Mexican criminal groups control the transportation and wholesale, mid-level, and retail activity (NDIC 2004). According to LA CLEAR, the wholesale price per kilogram of Mexican black tar heroin is approximately $20,000 (the same price reported in the last few CEWG re-ports) (exhibit 13). The current mid-level and retail prices are $500–$800 per “pedazo” (Mexican ounce) and $90–$100 per gram, which are stable since the last report. A regular ounce is 28.5 grams, whereas a pedazo is 25.0 grams.

EPIDEMIOLOGIC TRENDS IN DRUG ABUSE—Los Angeles County
Proceedings of the Community Epidemiology Work Group, Vol. II, January 2005 112
Mexican brown powder heroin sells for a wholesale price of $25,000 per kilogram, when available in the area. Retail distribution of Southeast Asian heroin remains limited, but it is associated with a wholesale price range of $70,000–$80,000 per kilogram. The lack of China white on the streets is related, in part, to local users’ preference for black tar. The LA HIDTA and NDIC continue to report that Co-lombian drug trafficking organizations may be estab-lishing networks within the Los Angeles area to dis-tribute South American heroin. The wholesale price for a kilogram of Colombian heroin is $86,000–$100,000. This type of heroin has a purity level of 94 percent. The LA HIDTA also reports that because the Los Angeles metropolitan area has one of the largest Middle Eastern populations in the United States, Southwest Asian opium trafficking activities have in-creased in the area. Southwest Asian opium is associ-ated with a cost of $650–$800 for an 18-gram stick. Other Opiates/Narcotics Other opiates/synthetics continue to constitute a mar-ginal proportion of all Los Angeles County treatment admissions. Recently, their representation as a pri-mary drug of abuse increased slightly in the local treatment data, rising from 1.5 percent of all admis-sions in 1999 to 2.1 percent (583 admissions) in the first half of 2004. In the second half of 2004, how-ever, the proportion of other opiates/synthetics dipped down to 1.6 percent of all admissions (373 admissions). Despite the small overall numbers of admissions, it will be important to carefully monitor future treatment admissions data, given the increase in prescription opiate abuse/misuse in other major CEWG areas. Other opiates/synthetics admissions were typically male (64 percent), White non-Hispanic (76 percent), and age 36–50 (54 percent). None of the primary other opiate/synthetic admissions were younger than 18. Interestingly, 82 percent adminis-tered other opiates/synthetics orally, but an additional 15 percent reported smoking. Fifty-nine percent of primary other opiate/synthetic admissions reported no secondary or tertiary substance use. An additional 11 percent reported secondary alcohol use, and 4 percent reported secondary cocaine/crack use. Reports of primary non-prescription methadone admissions con-tinued to be minimal among Los Angeles County treatment admissions (23 admissions, 0.1 percent of all admissions). According to reports from many CEWG representa-tives, non-heroin opiate users across the Nation have a definite preference of hydrocodone (i.e., Vicodin) over oxycodone (i.e., OxyContin) or vice versa. In Los Angeles, hydrocodone is much more likely to
show up in the indicator data than oxycodone. This is evidenced by the fact that among NFLIS exhibits, 25 percent of the analgesic samples were found to be hydrocodone (vs. 6 percent oxycodone); among DAWN opiate/opioid drug reports, 33 percent were hydrocodone (vs. 2 percent oxycodone); and among poison control calls for opiate/analgesic exposure, 60 percent were for hydrocodone (vs. 11 percent for oxycodone). In addition to encompassing major substances of abuse, unweighted data accessed from DAWN Live! cover pharmaceutical drug categories, such as psy-chotherapeutic agents (antidepressants, antipsychot-ics, anxiolytics, sedatives and hypnotics, and central nervous system [CNS] stimulants), CNS agents (an-algesics, anticonvulsants, antiparkinson agents, and muscle relaxants), respiratory agents, cardiovascular agents, and anti-infectives. The case types that are of interest for pharmaceuticals include seeking detoxifi-cation, overmedication, and other. Of the 2,255 pharmaceuticals falling within these three case types in calendar year 2004 in the Los Angeles division, 387 (17 percent) were opiates/opioids (exhibit 14), and an additional 296 were other analgesics. For the opiates/opioids, “other” was the most frequently stated case type (56 percent of opiates/opioids), fol-lowed by overmedication (35 percent) and more dis-tantly by seeking detoxification (9 percent). Among other analgesics, 73 percent (215) of the drugs were reported as overmedication cases. Los Angeles County-based California Poison Control System calls involving exposure to opiates/analgesics increased from a low of 25 in 2000 to a high of 67 in 2003 (exhibit 8b). In the first half of 2004 alone, 31 opiate/analgesic exposure calls were reported, which may indicate a stabilizing of the trend line. Between January 2003 and June 2004, calls involving an expo-sure to hydrocodone were more likely than calls in-volving an exposure to oxycodone (58 calls vs. 11 calls, respectively). Approximately 950 of the 54,916 items analyzed and reported to NFLIS between January 1 and December 31, 2004, were identified as pharmaceuticals/prescrip-tion/non-controlled non-narcotic medications (as op-posed to illicit substances). Of those, a large proportion (401 items; 43 percent) were found to be narcotic/other analgesics. The most frequently cited analgesics were hydrocodone (224 items; 56 percent) and codeine (64 items; 16 percent). Other analgesics identified included methadone (33 items), oxycodone (23 items), and pro-poxyphene (11 items). To put these numbers/per-centages into perspective, analgesics accounted for 0.7 percent of all items analyzed by participating Los An-geles County laboratories.

EPIDEMIOLOGIC TRENDS IN DRUG ABUSE—Los Angeles County
Proceedings of the Community Epidemiology Work Group, Vol. II, June 2005 113
Efforts are underway throughout Los Angeles to quan-tify the extent of pharmaceutical diversion to the street. One result of this effort is the availability of expanded prices for diverted opiates/analgesics. According to LA CLEAR, Vicodin, a member of the hydrocodone fam-ily of opiate pain relievers, retails for $1 per 10-milligram tablet in Los Angeles County (down from $5 per 5-milligram tablet reported in January 2005; exhibit 13). OxyContin, the trade name for the power-ful analgesic oxycodone hydrochloride, sells on the streets for $50 to $80 per 80-milligram tablet. Percocet sells for $1–$5 per 5-milligram tablet (down from $5–$10); MS Contin sells for $20 per 60-milligram tablet; codeine sells for $1–$2.50 per tablet (and $80–$200 for a pint of liquid codeine); Dilaudid (hydromor-phone) sells for $20–$60 per 4-milligram tablet (down from $100); fentanyl patches sell for $25–$100 each; and methadone sells for $10 per tablet. Marijuana The number of primary marijuana treatment admis-sions has fluctuated over several semi-annual reporting periods (exhibit 4), but the proportion of the total has remained somewhat fixed between 11 and 13 percent. In the second half of 2004, 3,318 primary marijuana admissions were reported in Los Angeles County. As a percentage of the total, marijuana accounted for 14.4 percent of all admissions (up 1 percentage point from the proportion reported in January–June 2004). Like many of the other major drugs of abuse, the user demographics of primary marijuana admissions were relatively stable in the second half of 2004. Three out of four primary marijuana admissions were male, and individuals younger than 18 constituted 48 percent of these admissions (exhibit 6). Primary marijuana ad-missions were most likely to be Hispanic (49 percent), followed by Black non-Hispanics (29 percent) and White non-Hispanics (15 percent). Alcohol was identified as a secondary drug problem for 39 percent of the primary marijuana admissions in the second half of 2004. An additional 16 percent re-ported methamphetamine, and 9 percent reported co-caine/crack as their secondary drug problem. Com-pared with other major illicit drug admissions, primary marijuana admissions had the largest proportion of males (75 percent) and users age 17 and younger (48 percent). When asked whether they had used any drug intravenously in the year prior to admission, only 1 percent of all primary marijuana admissions answered affirmatively.
Approximately 7 percent of the primary marijuana treatment admissions in the second half of 2004 were homeless at the time of admission, and 30 percent
were referred to treatment by the court or criminal justice system (most likely by the juvenile justice system, given the large proportion of adolescents represented among primary marijuana admissions). Sixty-nine percent were entering treatment for the first time. Twenty-five percent had graduated from high school, and, at the time of admission, 14 percent were employed full- or part-time. Such characteristics reflect the fact that just under one-half of all primary marijuana admissions were younger than 18 at the time of admission. Preliminary unweighted data accessed from DAWN Live! for calendar year 2004 indicate that of the 8,982 major substances of abuse reported in the Los Ange-les division, 1,067 (12 percent) were marijuana re-ports (exhibit 7). Marijuana was the fourth most likely major substance to be reported, following al-cohol, cocaine, and stimulants. Seventy-two percent of the patients reporting marijuana use were male; 37 percent were Hispanic (followed by 30 percent Black and 24 percent White); and 57 percent were age 12–29. A total of 2,148 chief complaints were logged for individuals reporting marijuana. The top three com-plaints were intoxication (544 complaints), psychiat-ric condition (334 complaints), and altered mental status (316 complaints). Marijuana-using patients were most likely to be discharged home (54 percent) or admitted to a psychiatric unit (17 percent). California Poison Control System calls involving exposure to marijuana among Los Angeles County residents were stable at 35–39 calls between 2000 and 2003 (exhibit 8a). In the first half of 2004, mari-juana-related exposure calls plummeted to eight calls. Between January 2003 and June 2004, 74 percent of the marijuana-exposed callers were male, and 81 per-cent were age 25 or younger. According to CHKS data for the 2003–2004 school year (exhibit 10), 19.8 percent of all Los Angeles County secondary school students (including 7th, 9th, and 11th graders, and a small sample of nontradi-tional students) who responded to the survey had ever used marijuana, and 10.3 percent were current mari-juana users (defined as any use in the past 30 days). A breakdown of the data by grade level illustrated that among responding seventh graders, 7.3 percent had ever used marijuana and 4.3 percent were current marijuana users. A higher percentage of 9th graders than 7th graders and a higher percentage of 11th graders than 9th graders reported marijuana use in the past 30 days. When asked about past-6-month use of marijuana, 9.2 percent of 7th graders, 15.9 percent of 9th graders, and 22.7 percent of 11th graders re-sponded in the affirmative (exhibit 11).

EPIDEMIOLOGIC TRENDS IN DRUG ABUSE—Los Angeles County
Proceedings of the Community Epidemiology Work Group, Vol. II, January 2005 114
According to long-term trends calculated from CHKS data spanning over the 5 most recent school years (exhibit 12), the pattern of past-30-day marijuana use among responding secondary school students was more likely than the use of many other drugs, but slightly less likely than binge drinking. Past-30-day marijuana use has decreased consistently from the peak level of 13.2 percent seen in 1999–2000 to 10.3 percent in 2003–2004. According to NFLIS data based on 54,916 analyzed items reported by participating laboratories within Los Angeles County between January and December 2004, 22 percent (12,327) of all items analyzed were found to be cannabis. Cannabis was the third most frequently identified substance in Los Angeles County. A total of 6,139 marijuana arrests were made within the city of Los Angeles in 2004; this represents a 14-percent increase over the number of marijuana arrests made during the same time period in 2003 (5,369). Marijuana arrests accounted for approximately 17 per-cent of all narcotics arrests made between January 1 and December 31, 2004. Marijuana continues to dominate drug seizures in the city of Los Angeles. The amount of marijuana seized increased nearly 115 percent, from 14,823 pounds in 2003 to 31,758 pounds in 2004. Between January and December 2004, the amount of marijuana seized ac-counted for 92 percent of the total weight of drugs (in pounds) seized. Cocaine was a very distant second, accounting for an additional 7 percent of the total weight. The street value of the seized marijuana ac-counted for approximately 59 percent of the total street value of all drugs seized in calendar year 2004. According to NDIC, California and Mexico appear to supply most of the marijuana available throughout the United States. In addition, cultivation of mari-juana on U.S. public lands is widespread, especially in California. This is evidenced by the fact that more than two-thirds of all cannabis plants eradicated from National Forest System lands were located in Cali-fornia (NDIC 2004). Caucasian, Mexican, and Jamai-can trafficking groups are responsible for the whole-sale distribution of marijuana to Los Angeles. Street gangs and independent dealers distribute domestic and Mexican-grown marijuana in both Los Angeles and San Diego (NDIC 2004). The wholesale price of Mexican-grade marijuana ranges from $300 to $400 per pound (exhibit 13). The midlevel and retail prices of commercial grade marijuana are $60–$80 per ounce and $10 per gram. All prices have been stable since early 2003. The wholesale price of domestic mid-grade marijuana ranges from $1,000 to $1,200 per pound. Midlevel and retail prices are $200–$250
per ounce and $25 per gram. The wholesale price of high-grade sinsemilla is $2,500–$6,000 per pound. An ounce of sinsemilla sells for $300–$600, and one-eighth ounce sells for $60–$80. Indications regarding the local availability of “BC Bud,” a hybrid type of cannabis bud grown in Cana-dian British Columbia, continue to circulate. A pound of BC Bud, which would cost approximately $1,500 in Vancouver, has a wholesale per pound value of $6,000 in Los Angeles. Supposedly, a pound of BC Bud can be swapped straight across for a pound of cocaine. Demand for hashish, the compressed form of tetrahydrocannabinol (THC)-rich resinous cannabis material, remained limited throughout the Los Ange-les HIDTA. When it is available, it has a wholesale price of $8,000 per pound. Stimulants The proportion of primary methamphetamine admis-sions to Los Angeles County treatment and recovery programs increased further from the first to second half of 2004, surpassing heroin for the first time ever (exhibit 4). The 5,395 primary methamphetamine admissions reported in July–December 2004 ac-counted for 23.4 percent of all admissions. Meth-amphetamine is the one illicit drug that has con-tinually increased among treatment admissions over the past 4 years (exhibit 5). Compared with other major illicit drug admissions, primary methampheta-mine admissions had the largest proportion of fe-males (40.1 percent), White Non-Hispanics (39.2 percent), Asian/Pacific Islanders (2.6 percent), 18–25-year-olds (30.4 percent), and 26–35-year-olds (33.7 percent) (exhibit 6). For the past few years, the proportion of Hispanics among primary methamphetamine admissions has been growing, as the proportion of Whites has been shrinking. In the first half of 2004, the proportion of White non-Hispanics was 41.4 percent, whereas the proportion of Hispanics was 41.9 percent among all primary methamphetamine admissions. In the second half of 2004, the racial/ethnic gap once again wid-ened, with Hispanics accounting for 47 percent of all primary methamphetamine admissions vs. 39 percent for Whites. At one time, females accounted for 49 percent of both primary methamphetamine and other ampheta-mine admissions. This practically equal distribution of males and females was unique to metham-phetamine and other amphetamines. The shifting gender distribution with methamphetamine treatment admissions has been discussed in detail in recent re-ports. In the second half of 2003, the percentage of

EPIDEMIOLOGIC TRENDS IN DRUG ABUSE—Los Angeles County
Proceedings of the Community Epidemiology Work Group, Vol. II, June 2005 115
females among primary other amphetamine admis-sions plummeted to 36.8 percent. In early 2004, how-ever, the proportion of females climbed back up a bit to 40 percent of all admissions. But in the second half of 2004, the proportion of females decreased once again, this time to 32.1 percent of all amphetamine admissions. It is important to monitor this drug cate-gory to see if the gender distribution will return to equitable proportions. In the second half of 2003, primary amphetamine admissions were most likely to fall within the 31–35 age group (23.6 percent), which was the modal age group in the second half of 2002. Between January and June 2004, however, primary amphetamine ad-missions were most likely to fall within the 26–30 age group (20.6 percent). In the second half of 2004, 18–25-year-olds and 26–30-year-olds each accounted for 17 percent of all primary amphetamine admis-sions. Primary amphetamine admissions were mar-ginally more likely to be Hispanic (36.9 percent) than White non-Hispanic (34.5 percent). Primary metham-phetamine and other amphetamine admissions tended to most frequently report secondary abuse of alcohol or marijuana. As shown in exhibit 6, smoking continued as the most frequently mentioned way for primary meth-amphetamine admissions to administer the drug. In 1999, one-half of all primary methamphetamine admissions smoked the drug. By the second half of 2004, 66.7 percent reported this mode of administra-tion. Conversely, the proportions of injectors and inhalers continued to decline, from 15.2 and 29.5 percent, respectively, in 1999, to 6.7 and 22.6 per-cent, respectively, in the second half of 2004. Like primary methamphetamine admissions, the mode of other amphetamine administration has shifted in recent years, as well. Two-thirds of all other ampheta-mine admissions in the second half of 2004 smoked amphetamines, followed by 22.6 percent who inhaled, 8.3 percent who ingested orally, and 1.2 percent who injected. In 1999, a lower percentage smoked, and higher percentages injected, inhaled, and used other amphetamines orally. Eleven percent of all primary methamphetamine ad-missions reported past-year intravenous use of one or more drugs. Approximately one-fifth of the primary methamphetamine treatment admissions were home-less (21.6 percent) and referred by the court or crimi-nal justice system (18.1 percent). Forty-eight percent were entering treatment for the first time. Forty-three percent had graduated from high school, and, at the time of admission, 19.2 percent were employed full- or part-time.
Methamphetamine injectors were more likely than their inhaler or smoker counterparts to be male (67 percent), White non-Hispanic (75 percent), 36 or older (41 percent), homeless (41 percent), or to have been through four or more prior treatment episodes (12 percent). They were, by far, the most impaired of all primary methamphetamine abusers. Metham-phetamine smokers were more likely than metham-phetamine inhalers or injectors to be referred by the criminal justice system (19 percent). Lastly, metham-phetamine inhalers were more likely than their coun-terparts to be Hispanic (56 percent) or employed (25 percent). No differences existed among the three modes of administration with regards to the percent-age of Black non-Hispanics or the percentage of ad-missions with a high school diploma/GED. Preliminary unweighted data accessed from DAWN Live! for calendar year 2004 indicate that of the 8,982 major substances reported in the Los Angeles divi-sion, 1,235 (14 percent) were stimulants (exhibit 7). The stimulant category encompasses amphetamines (326 reports, 26 percent of stimulant reports) and methamphetamine (909 reports, 74 percent of stimu-lant reports). Stimulants were the third most likely major substance to be reported, following alcohol and cocaine. For the remainder of the DAWN discussion, stimulant user demographics will be broken out for methamphetamine and amphetamines. Seventy-five percent of the patients reporting methamphetamine use to the DAWN Live! system were male, and 48 percent were Hispanic (followed by 35 percent White and 6 percent Black). More than one-half (55 percent) were age 25–44, and an addi-tional 33 percent were 18–24. The three most fre-quently reported complaints were intoxication (412 complaints), psychiatric condition (392 complaints), and altered mental status (350 complaints). Metham-phetamine-using patients were most likely to be dis-charged home (47 percent) or admitted to a psychiat-ric unit (30 percent). Nearly 50 percent of the patients reporting methamphetamine use indicated that they smoked the drug, followed by 13 percent reporting inhalation. Sixty percent of the patients reporting amphetamine use to DAWN were male, and 47 percent were His-panic (followed by 34 percent White and 9 percent Black). More than one-half (53 percent) were age 25–44, and an additional 25 percent were 18–24. California Poison Control System calls involving ex-posure to methamphetamine/amphetamine among Los Angeles County residents have fluctuated over the years, with 48 calls logged for 2000, a high of 63 calls in 2001, and approximately 55 calls in 2002 and 2003

EPIDEMIOLOGIC TRENDS IN DRUG ABUSE—Los Angeles County
Proceedings of the Community Epidemiology Work Group, Vol. II, January 2005 116
(exhibit 8a). In the first half of 2004 alone, 33 metham-phetamine/amphetamine-related exposure calls were made to the system. If an equal number of calls are made in the second half of 2004, the overall number will exceed the peak level seen in 2001. Between January 2003 and June 2004, slightly more callers reporting exposure to methamphetamine or other am-phetamines were male (53 percent) than female (44 percent), and 64 percent were between the ages of 18 and 34 (exhibit 9). In addition to calls relating to methamphetamine and amphetamine exposure, a total of 37 Ritalin/Adderall exposure calls were recorded between January 2000 and June 2004. According to CHKS data for the 2003–2004 school year (exhibit 10), 7.3 percent of all Los Angeles County secondary school students (including 7th, 9th, and 11th graders, and a small sample of nontradi-tional students) who responded to the survey had ever used methamphetamine, and 3.7 percent were current methamphetamine users (defined as any use in the past 30 days). A breakdown of the data by grade level illustrated that among responding ninth graders, 5.4 percent had ever used methamphetamine and 2.9 per-cent were current users. A higher percentage of 11th than 9th graders reported methamphetamine use in the past 30 days. A nearly equal proportion of males and females identified as lifetime methamphetamine users (51 percent were male and 49 percent were fe-male). The gender gap widened with past-30-day use of methamphetamine (63 percent male vs. 37 percent female). Frequent methamphetamine use is defined as 20 or more days of use in the previous 30 days. Twenty-three percent of the current methampheta-mine users reported frequent use. Among the fre-quent users, 68 percent were male and the remaining 32 percent were female. When asked about past-6-month use of cocaine, methamphetamine, or other stimulants, 7.1 percent of 9th graders and 6.5 percent of 11th graders responded in the affirmative (exhibit 11). According to long-term trends calculated from CHKS data spanning over the most recent 5 school years (ex-hibit 12), the pattern of past-30-day methamphetamine use among responding secondary school students was similar to patterns seen for cocaine and LSD/other psychedelics. From 1999–2000 to 2001–2002, past-30-day methamphetamine use decreased consistently from the peak level of 4.6 percent in 1999–2000 to 4.1 per-cent in 2001–2002. In 2002–2003, the percentage of current methamphetamine users increased slightly to 4.3 percent, but it decreased to 3.7 percent (the lowest level yet) in 2003–2004. According to NFLIS data based on 54,916 analyzed items reported by participating laboratories within Los
Angeles County between January and December 2004, 32 percent (17,789) of all items analyzed were found to be methamphetamine/amphetamine. Methampheta-mine accounted for the second largest proportion of samples positively identified by NFLIS. An additional 18 items were identified as amphetamine, and 15 items were identified as pseudoephedrine (each accounting for less than one-tenth of a percent). Throughout calendar year 2004, 458 amphetamine arrests were made within the city of Los Angeles, exceeding the number of arrests made during the same period in 2003 (274 arrests) by 67 percent. De-spite this large increase in the overall number of am-phetamine arrests, as a class, such arrests continued to account for slightly less than 1 percent of the total. Arrests for methamphetamine are included in the category “other narcotics.” In early 2004, 17,825 arrests for other narcotics were made (many of which could be attributable to methamphetamine, but there is no way of knowing from the LAPD report), ac-counting for 49 percent of all arrests. While methamphetamine is not reported separately in citywide drug arrests, it is broken out in citywide seizures. Citywide methamphetamine seizures actu-ally decreased 33 percent, from 535 pounds seized in 2003 to 356 pounds seized in 2004. The street value of the seized methamphetamine accounted for ap-proximately 10 percent of the total street value of all drugs seized in 2004. Los Angeles is considered by NDIC to be one of the largest methamphetamine markets in the United States. Mexican criminal groups based in both Mex-ico and California control the wholesale and midlevel distribution of methamphetamine and distribute the drug via private vehicles and commercial trucks. Not only does a large quantity of the drug stay in the southern California region, but methamphetamine is transported to other major cities and regions, includ-ing San Francisco and Phoenix, and the West Central, Southwest, and Southeast areas of the United States. Hispanic gangs, independent dealers, outlaw motor-cycle gangs (OMGs), and Asian gangs control the retail distribution of methamphetamine within and beyond California. The wholesale price per pound of methamphetamine ranged from $5,000 to $7,000 (exhibit 13), which is similar to the range reported in January 2005, but higher than the wholesale price reported in 2002–2003 ($3,700 to $5,000). The midlevel and retail prices are $500–$800 per ounce (up from $450–$550 reported in January 2005), $50 per gram, $60–$75 per one-sixteenth ounce (“teener”), and $100–$120 per one-eighth ounce. According to one intelligence

EPIDEMIOLOGIC TRENDS IN DRUG ABUSE—Los Angeles County
Proceedings of the Community Epidemiology Work Group, Vol. II, June 2005 117
source, the purity of finished methamphetamine available in the Los Angeles area remains at ap-proximately 30–35 percent. Given the many different production “recipes” and the multiple types of methamphetamine entering into and staying in the Los Angeles area (locally produced and Mexican produced), however, it is very possible that there is a wide range of purity (especially since such a high percentage of users report smoking methampheta-mine). Crystal methamphetamine has a wholesale price of $8,000–$11,000 per pound in Los Angeles. The mid-level price for an ounce of crystal methamphetamine is $600–$900, which represents a slight widening of the range reported in January 2005. A double case of pseudoephedrine (17,000 60-milligram tablets per case) sells for $3,250–$4,000. In parts of the United States, the number of metham-phetamine clandestine laboratory seizures has consis-tently increased. According to Rudy Lovio, Criminal Intelligence Specialist in the LA CLEAR Research and Analysis Unit, this increase is due to the prolif-eration of “Nazi” methamphetamine labs (small-scale labs capable of producing gram to ounce quantities of finished product) in the Midwest and rural South. Since calendar year 1999, however, the number of clandestine laboratory incidents has decreased consis-tently in both the LA HIDTA and in California over-all. In 1999, 2,090 labs were seized in California (1,187 of which occurred in the 4-county LA HIDTA region). By 2004, only 449 labs were seized state-wide (263 in the LA HIDTA). Possible explanations for the decrease in seizures include precursor chemi-cal restrictions, chemical control laws, increased methamphetamine production in Mexico, and the downsizing of clandestine laboratory enforcement teams. Despite the decrease in the number of sei-zures, the wholesale and retail prices for metham-phetamine have remained relatively stable over the same time period, which is a barometer for metham-phetamine availability in Los Angeles County. According to EPIC’s National Clandestine Labora-tory Seizure System, California had the fifth highest number of laboratory-only seizures in 2004 (449), following Missouri (906), Tennessee (798), Arkansas (563), and Indiana (517). Within California, the Los Angeles HIDTA once again led the State in the over-all number of methamphetamine seizures (including laboratories, dumpsites, and chemicals/glass/equip-ment) made in 2004, accounting for 59 percent of all seizures made in California (236 of 449 total inci-dents). Of the 4 counties in the LA HIDTA, Los An-geles County had the third highest number of inci-dents during that time period (60), lagging behind
San Bernardino County (115) and Riverside County (70). Orange County rounded out the HIDTA with 18 incidents. Even though four States exceed California in terms of laboratory seizures, California leads the country in the number of domestic “superlabs.” Thirty-six of 48 U.S. superlabs (75 percent) seized in 2004 were in California. In the past, these large-scale labs were capable of producing 10 or more pounds of finished methamphetamine in a single production cycle, but superlabs have stepped up the pace and are now ca-pable of producing 20 or more pounds of finished drug in a single production cycle (NDIC 2004). The LA HIDTA reported the highest proportion of super-labs seized throughout California (23 out of 36 super-labs seized between January 1 and December 31, 2004, or 64 percent). Within the LA HIDTA, Los Angeles County led with 13 superlab seizures, fol-lowed by Riverside County (5), San Bernardino County (4), and Orange County (1). Furthermore, totals reported in the LA HIDTA exceeded totals reported by all States outside of California. The cost to clean up labs located in the LA HIDTA in 2004 totaled $759,672. Thirty percent of this total corresponds to the cost of cleaning up Los Angeles County laboratories, second only to Riverside County (38 percent of the cleanup costs). It is important to note that these cleanup figures do not encompass building and environment remediation, which each cost taxpayers even more money. A negative consequence of clandestine metham-phetamine laboratory activity is the effect on children living in or around the makeshift, often home- or apartment-based, laboratories. Local, statewide, and national efforts, known as Drug Endangered Children Programs, have been launched to address the issue of what happens to children who are found at a methamphetamine laboratory when it is seized. Na-tionally, in 2004, 2,900 children were “affected” by methamphetamine laboratories. Seven percent of the affected children resided in California. Within Cali-fornia, 98 of the 200 affected children resided in the 4 LA HIDTA counties. The highest proportion was reported in Riverside County (77 of the 98 children), followed by San Bernardino County (26), Los Ange-les County (9), and Orange County (8). It is impor-tant to note that these numbers are underreported, due to differences in county- and State-level reporting procedures. Depressants In the second half of 2004, treatment and recovery program admissions associated with primary barbitu-

EPIDEMIOLOGIC TRENDS IN DRUG ABUSE—Los Angeles County
Proceedings of the Community Epidemiology Work Group, Vol. II, January 2005 118
rate, benzodiazepine, or other sedative/hypnotic abuse continued to account for less than 1 percent of all admissions in Los Angeles County. Of the 2,255 pharmaceuticals reported among those seeking detoxification, overmedication, and other cases accessed from DAWN Live! for calendar year 2004 in the Los Angeles division, 249 (11 percent) were antidepressants, 249 were antipsychotics (11 percent), 51 were barbiturates (2 percent), and 450 were benzodiazepines (20 percent) (exhibit 14). For all of the above categories except for barbiturates, overmedication was the most frequently stated reason for visiting the emergency department. The propor-tion of overmedication cases ranged from a low of 51 percent (for antipsychotics) to a high of 73 percent (antidepressants). Los Angeles County-based California Poison Control System calls involving exposure to benzodiazepines fluctuated. From 2000 to 2001, benzodiazepine-related exposure calls increased from 64 to 83 (ex-hibit 8b). In 2002, the number of calls decreased to 52, and such calls then increased to 70 in 2003. In the first half of 2004 alone, 52 benzodiazepine exposure calls were reported, which may indicate a further increase from the number of calls seen in 2003. Be-tween January 2003 and June 2004, 19 of the benzo-diazepine-related exposure calls were for alprazolam, 29 were for clonazepam, and 20 were for diazepam. In addition to calls for benzodiazepine exposures, a total of 52 antidepressant exposure calls and 25 an-tipsychotic calls were reported between January 2000 and June 2004. Approximately 944 of the 54,916 items analyzed and reported to the NFLIS system in calendar year 2004 were identified as pharmaceuticals/prescription/non-controlled non-narcotic medications (as opposed to illicit substances). Of those, roughly 21 percent (195 items) were found to be benzodiazepines. The most frequently cited benzodiazepines were diazepam (65 items; 33 percent) and clonazepam (58 items; 30 per-cent). According to LA CLEAR, Valium retails for $1 per 5-milligram tablet (exhibit 13), which is one-half the cost reported in the January 2004 report. Xanax re-tails for $1 per 4-milligram tablet. Phencyclidine and Hallucinogens Primary PCP treatment admissions accounted for 0.6 percent of all admissions in the second half of 2004 (exhibit 4). The proportion of PCP admissions among all admissions has been stable for several years, but the overall number of PCP admissions increased 89
percent from 1999 to the first half of 2003. In the second half of 2003, however, the number of PCP admissions decreased slightly (16 percent) to 262 admissions, and they continued to decrease further (12 percent) in the first half of 2004 to 230 admissions, and in the second half of 2004 to 135 admissions (41 percent decrease from the first half of the year). Alco-hol (20 percent), marijuana (22 percent), and co-caine/crack (15 percent) were the three most frequently reported secondary drugs among primary PCP admis-sions. The majority (88 percent) of the primary PCP admissions smoked the drug. Interestingly, 6 percent reported taking PCP orally, and 4 percent reported injecting PCP. This is the first time that such high per-centages reported modes other than smoking. There were no notable changes from the previous reporting period in terms of user demographics. Other hallu-cinogens, such as LSD, peyote, and mescaline, contin-ued to account for approximately 0.1 percent of the total treatment admissions. Preliminary unweighted data accessed from DAWN Live! for calendar year 2004 indicate that of the 8,982 major substances of abuse reported in the Los Ange-les County division, 164 (2 percent) were PCP (ex-hibit 7). Seventy-nine percent of the patients report-ing PCP use were male and 46 percent were White (followed by 29 percent Black and 22 percent His-panic). Sixty-seven percent were age 30–54, and an additional 11 percent were between 18 and 24. A total of 398 chief complaints were logged for patients reporting PCP. The top three complaints were intoxication (95 complaints), altered mental status (87 complaints), and psychiatric condition (65 com-plaints). Patients were more likely to smoke PCP (62 percent) than inject (10 percent). PCP-using patients were most likely to be either be discharged home or admitted to a psychiatric ward (each at 31 percent). California Poison Control System calls involving exposure to PCP among Los Angeles County resi-dents fluctuated between 10 and 20 calls from 2000 to 2003 (exhibit 8a). In the first half of 2004, there were five PCP-related exposure calls. According to CHKS data for the 2003–2004 school year, 5.8 percent of all Los Angeles County secon-dary school students (including 7th, 9th, and 11th graders, and a small sample of nontraditional stu-dents) who responded to the survey had ever used LSD or another psychedelic, and 2.9 percent had used LSD/other psychedelics in the past 30 days (ex-hibit 10). A breakdown of the data by grade level illustrated that among responding ninth graders, 4.4 percent had ever used LSD/other psychedelics, and 2.5 percent were current users. Among 11th graders, 5.9 percent had ever used LSD/other psychedelics,

EPIDEMIOLOGIC TRENDS IN DRUG ABUSE—Los Angeles County
Proceedings of the Community Epidemiology Work Group, Vol. II, June 2005 119
and 2.5 percent used a psychedelic at least once within the past 30 days. According to long-term trends calculated from CHKS data spanning over the last 5 school years (exhibit 12), the pattern of past-30-day LSD/other psychedel-ics use among responding secondary school students (in grades 7, 9, and 11) was similar to usage patterns seen with other licit and illicit drugs. Current use of LSD/other psychedelics has been trending downward since the late 1990s, to a low of 2.8 percent in 2002–2003. In 2003–2004, the percentage was slightly higher at 2.9 percent of all respondents. According to NFLIS data based on 54,916 analyzed items reported by participating laboratories within Los Angeles County between January and December 2004, 0.5 percent (n=280) of all items analyzed were found to be PCP. One hundred and forty-eight PCP arrests were made within the city of Los Angeles in calendar year 2004, which represented a 12-percent decline from 2003 (169 arrests). Like amphetamine arrests, PCP arrests accounted for a very low proportion (less than 1 per-cent). The street value of the PCP seized between January and December 2004 represented approximately 3.2 percent of the total street value of all drugs seized during that period. The total amount of PCP seized throughout 2004 (26.5 pounds) was 15 percent lower than the amount seized during the same period in 2003 (31 pounds). The wholesale price for a gallon of PCP remains at the high level reported in January 2005, ranging from $15,000 to $20,000 (exhibit 13). The ounce price, however, decreased recently, from $600 to $300–$350. A sherm cigarette dipped in liquid PCP continues to sell for $20–$30. A tight-knit group of Los Angeles-based African-American street gang members contin-ues to produce, supply, and distribute PCP in the Los Angeles area. A sheet of approximately 100 doses of LSD has a wholesale price range of $150–$200. Typically, a single dose sells for $5–$10. At the retail level, psilo-cybin mushrooms cost about $20 per one-eighth ounce. Club Drugs Comprehensive indicator data relating to the use and abuse of club drugs is still lacking for Los Angeles County. Therefore, it is difficult to accurately and com-prehensively describe the use and abuse patterns of club
drugs in Los Angeles County. Despite this lack of tradi-tional indicator information, anecdotal evidence from a variety of sources continues to circulate with regard to the availability of club drugs in Los Angeles County, particularly MDMA (ecstasy) and gamma hydroxybu-tyrate (GHB). Collectively, club drugs played a limited role in pre-liminary unweighted data accessed from DAWN Live! in 2004. Sixty-five of the 8,982 major substances of abuse reported in the Los Angeles division were MDMA (ecstasy), 5 were GHB, and 1 was ketamine (exhibit 7). Rohypnol did not have a presence at all. The demographics of patients reporting MDMA use were interesting, when compared to the demographics for many other drug users in Los Angeles. Fifty-four percent of the patients reporting MDMA use were fe-male, and 35 percent were Hispanic (followed by 26 percent White and 22 percent Black). More than one-half of the MDMA users (55 percent) were between 12 and 24 years of age. Of the 148 complaints, the three most frequently reported complaints were altered men-tal status (47 complaints), intoxication (40 complaints), and psychiatric condition (35 complaints). Metham-phetamine-using patients were most likely to be admit-ted to a psychiatric unit (43 percent) or discharged home (26 percent). California Poison Control System calls involving exposure to ecstasy among Los Angeles County resi-dents have decreased consistently over recent years, from a high of 56 in 2000 to a low of 16 in 2003 (ex-hibit 8a). In the first half of 2004 alone, however, 12 calls relating to ecstasy exposure were reported. If an equal number of calls are made in the second half of 2004, the overall number will exceed the 2003 level. Between January 2003 and June 2004, more callers reporting exposure to ecstasy were male (57 percent) than female (43 percent), and 64 percent were be-tween the ages of 13 and 25 (exhibit 9). In addition to calls relating to ecstasy exposure, a total of 14 GHB exposure calls, 4 ketamine calls, and 3 Rohypnol calls were recorded between January 2003 and June 2004. The California Poison Control System also kept track of calls relating to Coricidin HBP and dextromethor-phan (DXM) exposures. Between January 2003 and June 2004, 50 Coricidin HBP calls and 17 DXM calls were logged in the system (exhibit 8a). Fifty-two percent of Coricidin HBP calls and 59 percent of DXM calls were male. Furthermore, 84 percent of the Coricidin HBP calls and 65 percent of the DXM calls were made because of exposure to individuals younger than 18. Those age 18–25 represented an

EPIDEMIOLOGIC TRENDS IN DRUG ABUSE—Los Angeles County
Proceedings of the Community Epidemiology Work Group, Vol. II, January 2005 120
additional 16 percent of the Coricidin HBP calls and 23 percent of the DXM calls (exhibit 9). According to CHKS data for the 2003–2004 school year (exhibit 10), 5.5 percent of all Los Angeles County secondary school students (including 7th, 9th, and 11th graders, and a small sample of nontradi-tional students) who responded to the survey had ever used ecstasy. Current use of ecstasy was not assessed, although a question regarding past-6-month use of psychedelics, ecstasy, or other club drugs was in-cluded in the survey. Overall, 6.2 percent of all re-spondents reported use of these drugs (exhibit 11). By grade, 6 percent of 9th graders and 5 percent of 11th graders answered in the affirmative. According to NFLIS data based on 54,916 analyzed items reported by participating laboratories within Los Angeles County between January and December 2004, less than 1 percent (277) of all items analyzed were found to be MDMA, GHB, or ketamine. Of those three club drugs, MDMA was most likely to be detected; it represented 81 percent of the club drug samples ana-lyzed by NFLIS. GHB represented an additional 10 percent of the samples, and ketamine accounted for 8 percent. According to NDIC, the majority of MDMA avail-able in Los Angeles is transported directly from Western Europe. Los Angeles is a source of both wholesale and midlevel amounts of MDMA, which are destined for markets around the United States, including Pacific, Southwest, and West Central States (NDIC 2004). Israeli and Russian criminal groups control the wholesale distribution, and independent dealers (usually White males) are responsible for retail marketing and distribution. Mail service and air travel are the two most likely ways to transport the product into Los Angeles. Within Los Angeles, Is-raeli and Russian traffickers control the distribution at the wholesale level. Wholesale and retail prices for club drugs remained stable since the January 2005 report. In multiple quantities, MDMA has a wholesale price of $12 per pill or capsule (exhibit 13). At the retail level, ecstasy usually sells for $20–$40 per pill. A standard dose of ecstasy is 60–150 milligrams, which is equivalent to one or two pills. In Los Angeles, ecstasy “boats” con-tinue to be mentioned. A boat contains 1,000 MDMA pills and sells for $8,000. Flunitrazepam (Rohypnol), when available, has a retail value of $6–$10 for a 1-milligram pill. On the street, ketamine sells for $100–$200 per 10-milliliter vial. In addition, ketamine re-tails for $20 for two-tenths of a gram of powder. The wholesale price for GHB is $275–$350 per gallon,
and a liter sells for $80–$100. A 16-ounce bottle of GHB, which once ranged from $65 to $100, now sells for $120. Capfuls can still be purchased for $5–$20 each. The vast majority of GHB users ingested the drug as a liquid, either in straight shots or mixed with a drink. When available, gamma butyrolactone (GBL) sells for $600 per liter. INFECTIOUS DISEASES RELATED TO DRUG ABUSE A cumulative total of 49,116 adult/adolescent AIDS cases were reported in Los Angeles County through December 31, 2004. Of those cases, 1,384 were re-ported between July 1, 2004, and December 31, 2004. Currently, approximately 20,316 Los Angeles County residents are living with advanced HIV dis-ease. Los Angeles County cumulative cases represent approximately 36 percent of the 135,975 cumulative cases in California and approximately 5 percent of the 929,985 cumulative cases nationwide. Of the cu-mulative cases reported in Los Angeles County, 47 percent were White, 30 percent were Hispanic, 20 percent were African-American, 44 percent were age 30–39, and 92 percent were male. The proportion of newly diagnosed males solely ex-posed through injection drug use has ranged between 4 and 6 percent from 1998 to 2004 (exhibit 15). The proportions for other exposure categories, such as the combination of male-to-male sexual contact and in-jection drug use, heterosexual contact, blood transfu-sion, and hemophilia/coagulation disorder, have re-mained relatively stable since 1998. The proportion of men exposed to AIDS through male-to-male sex-ual contact has decreased slowly but steadily, from 65 percent in 1998 to 61 percent in 2004. The propor-tion of male cases with an “other” or “undetermined” exposure category accounted for 28 percent of all male cases diagnosed in 2004. Since the 2004 data are preliminary, it is possible that some of the cases in the “other/undetermined” category will be trans-ferred into the other exposure categories. The modal exposure category for females diagnosed with AIDS in 1998 was heterosexual contact (46 per-cent). This exposure category has been associated with a lower proportion of female AIDS cases since 1999; in 2004, it was associated with 34 percent of all newly diagnosed female AIDS cases. Female cases attributable to injection drug use, which were stable at 17–19 percent of all female cases from 2000 to 2002, decreased to 13 percent in 2003 and remained there in 2004. The proportion of female cases with an “other” or “undetermined” exposure category continued to increase, accounting for 49 percent of all female cases diagnosed in 2004.

EPIDEMIOLOGIC TRENDS IN DRUG ABUSE—Los Angeles County
Proceedings of the Community Epidemiology Work Group, Vol. II, June 2005 121
In Los Angeles County in 2004, approximately 7 percent of all AIDS cases involved injection drug use (alone) as the primary route of exposure. Among the 3,387 cumulative cases primarily attributable to in-jection drug use, 72 percent occurred among males. African-Americans are the modal group of male in-jection drug users (IDUs) (accounting for 37 per-cent), followed by Hispanics (32 percent) and Whites (30 percent). A similar pattern was seen with female IDU AIDS cases. African-Americans continued to constitute the greatest proportion (44 percent), fol-lowed by Whites (31 percent) and Hispanics (22 per-cent). An additional 7 percent of the total cumulative cases were attributable to a combination of male-to-male sexual contact and injection drug use. Fifty-one per-cent of the male-to-male sexual contact and injection drug use cases were White. ACKNOWLEDGEMENTS The author wishes to thank those individuals and agencies that provide the wide array of valuable alco-
hol- and drug-related data, statistics, and information. Los Angeles County’s participation in and contribution to the Community Epidemiology Work Group would be extremely difficult without the continuous coopera-tion of several local, State, and national agencies. In particular, the author wishes to thank Craig Chaffee (California Department of Alcohol and Drug Pro-grams), Rudy Lovio and Jeff Sharon (Los Angeles Criminal Information Clearinghouse), the LAPD Staff Services Unit staff (Narcotics Division), Valley Rachal and Liqun Wong (NFLIS), Judy Ball and Erin Mal-lonee (DAWN), Stu Heard and Terry Carlson (Cali-fornia Poison Control System), Greg Austin and Kiku Annon (WestEd), and Gordon Bunch and the LACDHS HIV Epidemiology Program staff. For inquiries concerning this report, please contact Beth Finnerty, M.P.H., University of California at Los Angeles, Integrated Sub-stance Abuse Programs, 1640 South Sepulveda Blvd., Suite 200, Los Angeles, CA 90025, Phone: 310-445-0874 ext. 376, Fax: 310-312-0538, E-mail: <[email protected]>.

EPIDEMIOLOGIC TRENDS IN DRUG ABUSE—Los Angeles County
Proceedings of the Community Epidemiology Work Group, Vol. II, January 2005 122
Exhibit 1. Population Characteristics, Los Angeles County and the State of California, by Percent: 2000 U.S. Census Population Characteristics Los Angeles County California Population, 2003 estimate (N) (9,871,506) (35,484, 453) Population, percent change, April 1, 2000, to July 1, 2003
3.7 4.8
Population, year 2000 (N) (9,519,338) (33,871,648) Persons younger than 5 7.7 7.3 Persons younger than 18 28.0 27.3 Persons age 65 and older 9.7 10.6 Female 50.6 50.2 White 48.7 59.5 Black or African-American 9.8 6.7 American Indian or Alaska Native 0.8 1.0 Asian persons 11.9 10.9 Native Hawaiian or Other Pacific Islander 0.3 0.3 Persons reporting some other race 23.5 16.8 Persons reporting two or more races 4.9 4.7 White, not Hispanic/Latino origin 31.1 46.7 Persons of Hispanic/Latino origin 44.6 32.4 SOURCE: U.S. Census Bureau, State and County QuickFacts Exhibit 2. Data Completeness for Los Angeles County DAWN Live! Emergency Departments (n=37)1, by Month: 2004
Number of EDs by Month Data Completeness Jan-
04 Feb- 04
Mar- 04
Apr- 04
May- 04
Jun- 04
Jul- 04
Aug- 04
Sep- 04
Oct- 04
Nov- 04
Dec- 04
Basically Complete2 12 12 12 10 9 7 7 7 8 7 7 9
Partially Complete3 0 0 0 1 1 1 2 1 1 2 3 2
Incomplete4 1 2 2 2 1 3 0 1 2 3 2 1 No Data Reported 24 23 23 24 26 26 28 28 26 25 25 25
Total EDs in Sample5 37 37 37 37 37 37 37 37 37 37 37 37
1Total eligible hospitals in area=79; Hospitals in DAWN sample=34; Hospitals not in DAWN Sample = 45. Tables reflect cases that have been received by DAWN as of either 4/13–14/2005 or of 6/10/05; the exact date will be indicated in future tables. 290% Complete; 350% to 89% Complete; 4Less than 50% Complete; 5Some hospitals in the DAWN sample have more than one emergency department. All DAWN cases are reviewed for quality control. Based on this review, cases may be corrected or deleted. Therefore, these data are subject to change. SOURCE: DAWN Live!, OAS, SAMHSA, update 4/13–14/05 and 6/10/05

EPIDEMIOLOGIC TRENDS IN DRUG ABUSE—Los Angeles County
Proceedings of the Community Epidemiology Work Group, Vol. II, June 2005 123
Exhibit 3. Number of ED Visits, by Case Type, in the Los Angeles County Division (Unweighted1) and Percent of All ED Visits: January–December 2004
Case Type Number of ED Visits1 (%)
Suicide Attempt 516 (6) Seeking Detoxification 190 (2) Alcohol Only (age <21) 531 (6) Adverse Reaction 1,467 (17) Overmedication 894 (11) Malicious Poisoning 28 (<1) Accidental Ingestion 119 (1) Other 4,739 (57) Total 8,484 (100)
1The unweighted data are from 9 to 14 EDs reporting to Los Angeles area hospitals. All DAWN cases are reviewed for quality con-trol. Based on this review, cases may be corrected or deleted. Therefore, these data are subject to change. SOURCE: DAWN Live!, OAS, SAMHSA, updated 4/13–14/05 Exhibit 4. Number and Proportion of Semiannual Treatment Admissions in Los Angeles County, by Primary
Illicit Drug of Abuse: January 2002–December 2004
Primary Drug 01/02–06/02
Number (%)
07/02–12/02 Number
(%)
01/03–06/03 Number
(%)
07/03–12/03 Number
(%)
01/04–06/04 Number
(%)
07/04–12/04 Number
(%) Cocaine/Crack 4,655
(19.6) 4,354 (19.0)
5,242 (19.3)
4,815 (18.2)
5,137 (18.1)
4,124 (17.8)
Heroin 7,767 (32.8)
7,096 (30.9)
6,891 (25.4)
6,704 (25.4)
6,942 (24.5)
5,341 (23.2)
Marijuana 2,686 (11.3)
2,816 (12.3)
3,669 (13.5)
3,452 (13.1)
3,812 (13.4)
3,318 (14.4)
Methamphetamine 3,453 (14.6)
3,692 (16.1)
4,961 (18.3)
5,095 (19.3)
5,840 (20.6)
5,395 (23.4)
PCP 196 (0.8)
219 (0.9)
314 (1.2)
262 (1.0)
230 (0.8)
135 (0.6)
Total Admissions 23,695 22,934 27,110 26,393 28,371 23,059 SOURCE: California Alcohol and Drug Data System (CADDS) Exhibit 5. Number and Proportion of Annual/Semiannual Treatment Admissions in Los Angeles County, by
Primary Illicit Drug of Abuse: 2001–2004
2001 2002 2003 2004 Primary Drug
Number (%) Number (%) Number (%) Number (%) Cocaine/Crack 8,703 (18.9) 9,009 (19.3) 10,057 (18.8) 9,261 (18.0) Heroin 17,560 (38.1) 14,863 (31.9) 13,595 (25.4) 12,283 (23.9) Marijuana 4,286 (9.3) 5,502 (11.8) 7,121 (13.3) 7,130 (13.9) Methamphetamine 5,418 (11.7) 7,145 (15.3) 10,056 (18.8) 11,235 (21.8) PCP 405 (0.9) 415 (0.9) 576 (1.1) 365 (0.7) Total Admissions 46,127 46,629 53,503 51,430 SOURCE: California Alcohol and Drug Data System (CADDS)

EPIDEMIOLOGIC TRENDS IN DRUG ABUSE—Los Angeles County
Proceedings of the Community Epidemiology Work Group, Vol. II, January 2005 124
Exhibit 6. Characteristics of Treatment Admissions in Los Angeles County, by Primary Illicit Drug of Abuse and Percent: July–December 2004 Characteristics Cocaine/Crack Heroin Marijuana Metham-
phetamine All
Admissions Gender Male 65.7 71.5 75.2 59.9 67.2 Female 34.3 28.5 24.8 40.1 32.8 Race/Ethnicity White, non-Hispanic 15.6 38.7 14.7 39.2 30.7 Black, non-Hispanic 56.4 11.4 29.1 3.2 22.7 Hispanic 21.5 42.2 48.5 47.3 38.4 American Indian 0.6 0.8 0.8 0.9 0.8 Asian/Pacific Islander 1.4 1.0 1.6 2.6 1.8 Other 4.5 5.9 5.3 6.8 5.6 Age 17 and younger 1.3 0.2 48.1 8.2 12.2 18–25 9.3 7.7 23.4 30.4 16.4 26–35 22.8 18.4 15.6 33.7 22.2 36 and older 66.6 73.7 12.9 27.7 49.2 Route of Administration Oral 2.2 1.4 2.5 3.1 21.5 Smoking 86.0 8.3 96.8 66.7 48.8 Inhalation 10.4 4.5 0.6 22.6 7.7 Injection 1.1 85.3 0.1 6.7 21.6 Unknown/other 0.3 0.5 0.1 0.7 0.4
Secondary Drug Alcohol Cocaine/ Crack Alcohol Marijuana Alcohol
Positive for Intravenous Drug Use in Past Year 4.4 87.9 1.1 10.9 24.9
Homeless 27.8 15.7 7.1 21.6 18.8 Employed Full- or Part-Time 14.8 24.0 13.5 19.2 18.3
Graduated from High School 42.5 44.8 24.9 42.6 39.9
Referred by Court/Criminal Justice System (Not Including SACPA1 Referrals)
16.4 3.6 30.1 18.1 15.3
First Treatment Episode 36.0 17.0 68.5 47.8 42.7 Total Admissions (N) (4,124) (5,341) (3,318) (5,395) (23,059)
1SACPA = Substance Abuse and Crime Prevention Act of 2000 (a.k.a., Proposition 36) SOURCE: California Alcohol and Drug Data System (CADDS)

EPIDEMIOLOGIC TRENDS IN DRUG ABUSE—Los Angeles County
Proceedings of the Community Epidemiology Work Group, Vol. II, June 2005 125
Exhibit 7. Number of ED Reports, by Drug and Drug Category (Major Substances of Abuse), in the Los Angeles County Division (Unweighted1): January–December 2004
Major Substance of Abuse Number of ED Reports1
Alcohol Alcohol only (age <21)
3,307 531
Cocaine 2,348 Heroin 712 Marijuana 1,067 Stimulants Amphetamines Methamphetamine
1,235 326 909
MDMA (Ecstasy) 65 GHB 5 Ketamine 1 LSD 5 PCP 164 Miscellaneous hallucinogens 3 Inhalants 44 Combinations NTA 26 Total 8,982
1The unweighted data are from 9 to 14 EDs reporting to the Los Angeles area hospitals. All DAWN cases are reviewed for quality control. Based on this review, cases may be corrected or deleted. Therefore, these data are subject to change. SOURCE: DAWN Live!, OAS, SAMHSA, updated 4/13–14/05 Exhibit 8a. Los Angeles County Poison Control Center Exposure Calls for Major Substances of Abuse:
January 2000–June 2004 Major Substance 2000
Number 2001
Number 2002
Number 2003
Number 1H2004 Number
Total Number
Cocaine/Crack1 69 66 77 97 41 350 Heroin1 20 15 20 17 11 83 Marijuana1 35 35 39 39 8 156 Ecstasy (MDMA)1 56 50 33 16 12 167 Rohypnol/flunitrazepam1 7 4 4 1 2 18 GHB1 57 35 25 10 4 131 PCP1 10 17 13 16 5 61 LSD1
Mushrooms Other hallucinogens
18 2 2
2 1 0
6 0 2
1 2 2
1 0 1
28 5 7
Other Illicit1 2 1 2 0 0 5 Inhalants2 1 0 3 2 2 8 Methamphetamine/ Amphetamine2 48 63 51 54 33 249
Ketamine2 3 2 3 1 3 12
1Includes calls for all exposure reasons. 2Includes calls for the following exposure reasons: intentional misuse, intentional abuse, intentional unknown, contamina-tion/tampering, and other malicious. SOURCE: California Poison Control System

EPIDEMIOLOGIC TRENDS IN DRUG ABUSE—Los Angeles County
Proceedings of the Community Epidemiology Work Group, Vol. II, January 2005 126
Exhibit 8b. Los Angeles County Poison Control Center Exposure Calls for Prescription and Over-the- Counter Medications and Common Household Substances: January 2000–June 2004 Substance1 2000
Number 2001
Number 2002
Number 2003
Number 1H2004 Number
Total Number
Antidepressants 10 8 12 15 7 52 Antipsychotics 4 5 5 4 7 25 Benzodiazepines Alprazolam Clonazepam Diazepam Other
10 14 16 24
14 23 17 29
8
10 8
26
12 15 16 27
7
14 4
27
51 76 61
133 Barbiturates 0 1 0 2 1 4 Opiates/Analgesics Codeine Hydrocodone Methadone Oxycodone Narcotic analgesics Other (non-narcotic)
2 5 3 1 5 9
6
10 4 4 6
14
2
32 5 7 6
10
4
39 3 9 8 4
1
19 1 2 3 5
15
105 16 23 28 42
Fentanyl 1 1 2 0 1 5 Dextromethorphan 8 10 10 12 5 45 Coricidin HBP 4 13 26 28 22 93 Miscellaneous Anxiolytics 1 4 2 8 1 16
Muscle Relaxants 7 6 8 13 8 42 Ritalin/Adderall 5 10 11 9 2 37 Other Stimulants 2 4 2 1 0 9 Other 13 20 23 16 12 84 Unknown 2 2 3 4 2 13
1Includes calls for the following exposure reasons: intentional misuse, intentional abuse, intentional unknown, contamina-tion/tampering, and other malicious. SOURCE: California Poison Control System

EPIDEMIOLOGIC TRENDS IN DRUG ABUSE—Los Angeles County
Proceedings of the Community Epidemiology Work Group, Vol. II, June 2005 127
Exhibit 9. Los Angeles County Poison Control Center Exposure Calls for Select Substances, by Gender, Age, and Percent: January 2003–June 2004
Cocaine/ Crack
Meth/ Ampheta-
mine Ritalin/
Adderall Ecstasy Coricidin HBP
Dextro- methorphan
Gender Male Female Unknown
68 32 0
53 44 3
64 36 0
57 43 0
52 48 0
59 35 6
Age Group Younger than 13 13–17 18–25 26–34 35–44 45–54 55 and older
9 7
21 25 26 12 <1
14 10 39 25 7 4 1
18 36 28 18 0 0 0
7
14 50 18 11 0 0
6
78 16 0 0 0 0
12 53 23 6 6 0 0
Total Number of Calls
138
87
11
28
50
17
SOURCE: California Poison Control System Exhibit 10. Reported Drug Use Among Los Angeles County Secondary School Students, by Percent: 2003–
2004 School Year
Usage Patterns Among Survey Respondents 7th Grade1 9th Grade 11th Grade All Respondents2
Cocaine (any form) Lifetime Past 30 days
*** ***
5.4 3.0
7.5 3.5
7.4 3.8
Ecstasy Lifetime Past 30 days
***
N/A3
4.3 N/A
5.7 N/A
5.5 N/A
Heroin Lifetime Past 30 days
*** ***
3.1 N/A
3.0 N/A
3.3 N/A
Inhalants Lifetime Past 30 days
12.5
5.5
13.7
5.3
12.6
4.1
13.4
5.3
LSD/Other Psychedelics Lifetime Past 30 days
*** ***
4.4 2.5
5.9 2.5
5.8 2.9
Marijuana Lifetime Past 30 days
7.3 4.3
20.4 10.9
32.8 15.1
19.8 10.3
Methamphetamine Lifetime Past 30 days
*** ***
5.4 2.9
7.2 3.4
7.3 3.7
1The 7th grade data for several drugs (i.e., cocaine/crack, ecstasy, heroin, LSD/other psychedelics, and methamphetamine) were based on responses from a very small subset of 7th graders. Therefore, these results have been suppressed (***). 2All respondents include responding 7th graders (when applicable), 9th graders, 11th graders, and a small sample of nontraditional students (enrolled in continuation or alternative schooling programs). 3 N/A=Not applicable. SOURCE: California Healthy Kids Survey, Los Angeles County Sample, WestEd

EPIDEMIOLOGIC TRENDS IN DRUG ABUSE—Los Angeles County
Proceedings of the Community Epidemiology Work Group, Vol. II, January 2005 128
Exhibit 11. Past-6-Month Substance Use Among Los Angeles County Secondary School Students, by Percent: 2003–2004 School Year Usage Patterns Among Survey Respondents 7th Grade1 9th Grade 11th Grade All Respondents2
Any Alcohol 22.1 36.7 52.5 34.7 Inhalants 10.4 9.2 6.2 9.2 Marijuana 9.2 15.9 22.7 15.4 Cocaine (any form), Metham-phetamine, or Other Stimulants
*** 7.1 6.5 7.5
Psychedelics, Ecstasy, or Other Club Drugs *** 6.2 5.0 6.2
Other Drugs, Heroin, or Sedatives *** 6.3 5.2 6.2
Two or More Drugs at the Same Time 9.9 9.4 12.4 11.4
1The 7th grade data for several drug categories were based on responses from a very small subset of 7th graders. Therefore, these results have been suppressed (***). 2All respondents include responding 7th graders (when applicable), 9th graders, 11th graders, and a small sample of nontraditional students (enrolled in continuation or alternative schooling programs). SOURCE: California Healthy Kids Survey, Los Angeles County Sample, WestEd Exhibit 12. Long-Term Trends in the Percentage of Current Substance Users Among a Sample of Los Angeles County Secondary School Students, by Percent: 1999–2004
School Year Respondents1 Reporting Past 30-Day Use of… 1999–2000 2000–2001 2001–2002 2002–2003 2003–2004 At Least One Drink of Alcohol 29.2 28.4 25.4 24.8 24.6 5+ Alcoholic Drinks/Occasion (a.k.a., Binge Drinking)
14.4
13.4
12.4
12.4
12.3
Cocaine (any form) 4.9 4.3 3.9 3.8 3.8 Inhalants 5.7 5.1 5.0 5.3 5.3 LSD/Other Psychedelics 5.0 4.4 3.3 2.8 2.9 Marijuana 13.2 13.0 12.0 10.9 10.3 Methamphetamine 4.6 4.3 4.1 4.3 3.7
1All respondents include responding 7th graders (when applicable), 9th graders, 11th graders, and a small sample of nontraditional students (enrolled in continuation or alternative schooling programs). SOURCE: California Healthy Kids Survey, Los Angeles County Sample, WestEd

EPIDEMIOLOGIC TRENDS IN DRUG ABUSE—Los Angeles County
Proceedings of the Community Epidemiology Work Group, Vol. II, June 2005 129
Exhibit 13. Illicit and Prescription Drug Prices in Los Angeles: July–December 2004
Price Type of Drug Wholesale Midlevel Retail Cocaine Powder Crack Cocaine
$14,000–$17,000 per kilogram N/R1
$500–$600 per ounce $500–$1,200 per ounce
$80 per gram $10–$40 per rock
Heroin Mexican Black Tar Mexican Brown Powder Southeast Asian Southwest Asian Opium South American
$20,000 per kilogram $25,000 per kilogram $70,000–$80,000 per kilogram $30,000 per kilogram $86,000–$100,000 per kilogram
$500–$800 per 25 grams
N/R N/R N/R N/R
$90–$100 per gram N/R N/R $650–$800 per 18-gram stick N/R
Marijuana Mexico-produced Domestic Sinsemilla BC Bud
$300–$400 per pound $1,000–$1,200 per pound $2,500–6,000 per pound $6,000 per pound
$60–$80 per ounce $200–$250 per ounce $300–$600 per ounce N/R
$10 per gram $25 per gram $60–$80 per 1/8 ounce N/R
Hashish $8,000 per pound N/R N/R Methamphetamine Crystal Methamphetamine
$5,000–$7,000 per pound $8,000–$11,000 per pound
$500–$800 per ounce $600–$900 per ounce
$50 per gram $60–75 per 1/16 ounce $100–$120 per 1/8 ounce $100–125 per gram
Pseudoephedrine $3,250–$4,000 double case (1 case=17,000 60-mg tablets)
N/R N/R
PCP $15,000–$20,000 per gallon $300–$350 per ounce $20–$30 per sherm ciga-rette
LSD $150–$200 per sheet (100 doses)
N/R $5–$10 per dose
Psilocybin Mushrooms N/R N/R $20 per 1/8 ounce
MDMA (ecstasy) $8,000 per boat (1,000 tablets) $12 per tablet (multiple quanti-ties) $20–$40 per tablet
GHB $275–$350 per gallon $80–$100 per liter $120 per 16 ounce bottle
N/R $5–$20 per capful
GBL $600 per liter NR N/R Ketamine N/R $100–$200 per 10 milliliter vial $20 per two-tenths gram Rohypnol (flunitrazepam) N/R N/R $6–$10 per 1-mg pill Steroids N/R N/R $10 per dose Valium (diazepam) N/R N/R $1 per 5-mg tablet Vicodin ES (hydrocodone) N/R N/R $1 per 10-mg tablet OxyContin (oxycodone) N/R N/R $50–$80 per 80-mg tablet MS Contin N/R N/R $20 per 60-mg tablet Percocet/Percodan N/R N/R $1–$5 per 5-mg tablet Dilaudid (hydromorphone) N/R N/R $20–$60 per 4-mg tablet Methadone N/R N/R $10 per tablet Codeine N/R $80–200 per liquid pint $1–$2.5 per tablet Duragesic Patch (fentanyl) N/R N/R $25–$100 per patch Xanax (alprazolam) N/R N/R $1 per 4-mg tablet
1N/R=Not reported. SOURCE: National Drug Intelligence Center and LA County Regional Criminal Information Clearinghouse

EPIDEMIOLOGIC TRENDS IN DRUG ABUSE—Los Angeles County
Proceedings of the Community Epidemiology Work Group, Vol. II, January 2005 130
Exhibit 14. Number of ED Reports, by Drug Category and Case Type (Selected Drugs) in the Los Angeles County Division (Unweighted1): January–December 2004
Selected Drug Categories, by Case Type Number of ED Reports1
Antidepressants Seeking detoxification Overmedication Other
249 2
181 66
Antipsychotics Seeking detoxification Overmedication Other
249 0
204 45
Benzodiazepines Seeking detoxification Overmedication Other
450 25
251 174
Barbiturates Seeking detoxification Overmedication Other
51 2 6
43 Opiates/Opioids Seeking detoxification Overmedication Other
387 35
134 218
Muscle Relaxants Seeking detoxification Overmedication Other
81 3
72 6
Total of Other Substances 2,255
1The unweighted data are from 9 to 14 EDs reporting to Los Angeles area hospitals. All DAWN cases are reviewed for quality con-trol. Based on this review, cases may be corrected or deleted. Therefore, these data are subject to change. SOURCE: DAWN Live!, OAS, SAMHSA, updated 4/13–14/05

EPIDEMIOLOGIC TRENDS IN DRUG ABUSE—Los Angeles County
Proceedings of the Community Epidemiology Work Group, Vol. II, June 2005 131
Exhibit 15. Annual Adult/Adolescent AIDS Cases by Gender, Year of Diagnosis, and Exposure Category: 1998–2004
Adult/Adolescent Exposure Category1
1998 Number
(%)
1999 Number
(%)
2000 Number
(%)
2001 Number
(%)
2002 Number
(%)
20032 Number
(%)
20042
Number(%)
Males Male-to-Male Sexual Contact
1,117 (65)
1,039 (66)
943 (64)
914 (64)
1,001 (65)
871 (68)
451 (61)
Injection Drug Use 102 (6)
76 (5)
92 (6)
92 (6)
83 (5)
56 (4)
41 (6)
Male-to-Male Sexual Contact/Injection Drug Use
115 (7)
97 (6)
110 (7)
100 (7)
101 (7)
81 (6)
22 (3)
Hemophilia or Coagulation Disorder
<5 (-)
<5 (-)
<5 (-)
5 (<1)
<5 (-)
<5 (-)
<5 (-)
Heterosexual Contact 61 (4)
57 (4)
53 (4)
72 (5)
60 (4)
56 (4)
18 (2)
Transfusion Recipient 5 (<1)
<5 (-)
<5 (-)
5 (<1)
6 (<1)
<5 (-)
<5 (-)
Mother with/at Risk for HIV <5 (-)
<5 (-)
<5 (-)
<5 (-)
<5 (-)
<5 (-)
<5 (-)
Other/Undetermined 304 (18)
300 (19)
273 (18)
249 (17)
291 (19)
221 (17)
206 (28)
Male Subtotal 1,706 1,573 1,481 1,437 1,543 1,290 738 Females
Injection Drug Use 47 (22)
42 (20)
39 (17)
42 (19)
43 (19)
22 (13)
14 (13)
Hemophilia or Coagulation Disorder
<5 (-)
<5 (-)
<5 (-)
<5 (-)
<5 (-)
<5 (-)
<5 (-)
Heterosexual Contact 99 (46)
101 (47)
103 (46)
85 (37)
79 (36)
71 (41)
35 (34)
Transfusion Recipient <5 (-)
<5 (-)
<5 (-)
7 (3)
8 (4)
<5 (-)
<5 (-)
Mother with/at Risk for HIV <5 (-)
<5 (-)
<5 (-)
<5 (-)
<5 (-)
<5 (-)
<5 (-)
Other/Undetermined 64 (30)
67 (31)
82 (36)
92 (41)
90 (41)
79 (46)
51 (49)
Female Subtotal 215 214 226 227 221 173 104 Total 1,921 1,787 1,707 1,664 1,764 1,463 842
1Exposure categories are ordered hierarchically. Cases with multiple exposure categories are included in the category listed first. 2Data are provisional due to reporting delay. SOURCE: Los Angeles County Department of Health Services, HIV Epidemiology Program

EPIDEMIOLOGIC TRENDS IN DRUG ABUSE—Miami-Ft. Lauderdale, Florida
Proceedings of the Community Epidemiology Work Group, Vol. II, June 2005 132
Drug Abuse in South Florida: January–December 2004 James N. Hall1 and Madeline Camejo, Pharm.D.2 ABSTRACT Cocaine continues to dominate the consequences of drug abuse across South Florida as the epidemic enters its fourth decade. Its steady flow into the re-gion fuels consequences with widely available, cheap cocaine. The majority of morbidity and mor-tality cocaine indicators are among those older than 35. Cocaine’s prevalence among selected popula-tions is linked to poly-substance abuse patterns that are reflected in rising consequences of intentional medication abuse and the introduction of metham-phetamine. Miami was ranked second to Jackson-ville in the number of cocaine-related deaths in 2004. Broward and Palm Beach Counties led the State in the number of heroin deaths in 2004. Over-all, however, heroin deaths are down statewide, as narcotic analgesic fatalities are steadily increasing. Methadone-related deaths rose 40 percent between 2003 and 2004 statewide, as deaths caused by methadone increased 51 percent. Problems linked to the club drugs, GHB and MDMA, continue the de-cline observed since 2001. Five vectors of metham-phetamine trafficking are spreading its abuse to new populations. Benzodiazepine deaths are second only to alcohol deaths in the State. Medication abuse appears to be a significantly greater problem in Broward County than in Miami-Dade. INTRODUCTION This report addresses drug abuse in Miami-Dade and Broward Counties, Florida, during 2004. It includes data on drug-related deaths, medical emergencies, addiction treatment admissions, and law enforcement intelligence. Information is presented by primary substance of abuse, with topics including cocaine, heroin, other opiates, marijuana, gamma hydroxybu-tyrate (GHB), methylendioxymethamphetamine (MDMA or “ecstasy”), methamphetamine, and ben-zodiazepines. While the information is classified by a single drug or category, the reader should note an underlying problem of polysubstance abuse as men-
1Mr. Hall is the director of the Center for the Study and Prevention of Substance Abuse at Nova Southeastern University and is execu-tive director of Up Front Drug Information Center in Miami, Florida. 2Dr. Camejo is affiliated with the Memorial Regional Hospital, Hollywood, Florida, and the United Way of Broward County Com-mission on Substance Abuse, Ft. Lauderdale, Florida.
tioned throughout this report. Exhibits for the report follow the narrative text. Area Description Located in the extreme southern portion of the Florida peninsula, Miami-Dade County has a population of nearly 2.6 million; 56 percent are Hispanic, 21 percent are Black, 21 percent are White, and 2 percent are Asian/Pacific Islander. Miami is Dade County’s largest city, with 360,000 residents. More than 100,000 immi-grants arrive in Florida each year; one-half establish residency in Miami-Dade County. Broward County, situated due north of Miami-Dade, is composed of Ft. Lauderdale plus 28 other municipali-ties and an unincorporated area. The county covers 1,197 square miles, including 25 miles of coastline. According to the 2000 census, the population was 1,649,925. The population is roughly 63 percent White non-Hispanic, 21 percent Black non-Hispanic, and 17 percent Hispanic. Broward County is the second most populated county in Florida and accounts for approximately 10 percent of Florida’s population. Broward was the top growth county in Florida in the 1990s and added 367,000 more people during that decade. Palm Beach County (popu-lation 1,154,464) is located due north of Broward County and is the third most populated county in the State. Together, the 5.4 million people of these 3 coun-ties constitute one-third of the State’s 16.3 million population. Starting in 2003, these three counties constitute the new federally designated Metropolitan Statistical Area (MSA) for South Florida, making it the sixth largest in the Nation. Previously, the MSA included only Miami-Dade County. This means that Broward County will now be included in more national data sets tracking health-related conditions and criminal justice informa-tion. One change is that more local hospitals will be-come a part of the national Drug Abuse Warning Net-work (DAWN) that monitors emergency department (ED) reports of drug-related episodes. Approximately 25 million tourists visit South Florida annually. The region is a hub of international transpor-tation and the gateway to commerce between the Americas, accounting for sizable proportions of the Nation’s trade: 40 percent with Central America, 37 percent with the Caribbean region, and 17 percent with South America. South Florida’s airports and seaports remain among the busiest in the Nation for both cargo and international passenger traffic. These ports of entry make this region a major gateway for illicit drugs. Smuggling by cruise ship passengers is an important
EPIDEMIOLOGIC TRENDS IN DRUG ABUSE—Miami-Ft. Lauderdale, Florida
Proceedings of the Community Epidemiology Work Group, Vol. II, June 2005 133
trend in South Florida drug trafficking and has appar-ently been growing because of airline security increases after September 11, 2001. Several factors impact the potential for drug abuse problems in South Florida, including the following: • Proximity to the Caribbean and Latin America
exposes South Florida to the entry and distrib-ution of illicit foreign drugs destined for all re-gions of the United States. Haiti remains a link with Colombian traffickers.
• South Florida is a designated High Intensity Drug
Trafficking Area and one of the Nation’s leading cocaine importation centers. It also became a gateway for Colombian heroin in the 1990s. Mil-lions of MDMA (“ecstasy,” or “XTC”) tablets originate in the Benelux countries and often—more recently—are flown to the Caribbean before entering the United States in South Florida.
• Extensive coastline and numerous private air and
sea vessels make it difficult to pinpoint drug im-portation routes into Florida and throughout the Caribbean region.
• Lack of a prescription monitoring system in
Florida now makes the State a source for di-verted medications throughout the southeastern United States.
Data Sources This report describes current drug abuse trends in South Florida, using the data sources summarized below: • Drug-related mortality data were provided by
the Florida Department of Law Enforcement (FDLE), Medical Examiners Commission’s 2004 Report of Drugs Identified in Deceased Persons by the Florida Medical Examiners’ Commission.
• Emergency department data were derived for
calendar year 2004 from the DAWN Live! re-stricted-access online query system administered by the Office of Applied Studies (OAS), Sub-stance Abuse and Mental Health Services Ad-ministration (SAMHSA). Eligible hospitals in only the Miami-Dade County Division totaled 21; hospitals in the DAWN sample numbered 17, with the number of emergency departments in the sample also totaling 17. (Some hospitals have more than one emergency department.) During this 12-month period, 8 to 10 EDs reported data each month. The completeness of data reported
by participating EDs varied by month (see ex-hibit 1). Exhibits in this paper for Miami-Dade County reflect cases that were received by DAWN as of April 13–14, 2005. Eligible hospi-tals in the Ft. Lauderdale Division only (that in-cludes Broward and Palm Beach Counties) to-taled 27; there were 22 hospitals in the DAWN sample, and the number of emergency depart-ments in the sample also totaled 22. During this 12-month period, 4 to 7 EDs reported data each month. The completeness of data reported by participating EDs varied by month (see exhibit 2). Exhibits in this paper for Broward and Palm Beach Counties reflect cases that were received by DAWN as of the dates described below. Data from the two Broward County EDs for the first half of 2004 were accessed by the CEWG repre-sentative directly on December 7, 2004, from the two participating hospitals, since at least four EDs in an area must report before the data are accessi-ble through DAWN Live!. Data for the second half of 2004 for the Ft. Lauderdale Division were accessed from DAWN Live! on April 22, 2005, for cocaine, heroin, marijuana, and MDMA (ec-stasy). Data for the second half of 2004 for the Ft. Lauderdale Division were accessed from DAWN Live! for oxycodone, hydrocodone, and benzodi-azepines on May 10, 2005. Data for the second half of 2004 for the Ft. Lauderdale Division were accessed from DAWN Live! for amphetamine, methamphetamine, GHB, lysergic acid diethyla-mide (LSD), and phencyclidine (PCP) on June 10, 2005. All DAWN cases are reviewed for quality control. Based on this review, cases may be cor-rected or deleted. Therefore, the data presented in this paper are subject to change. Data derived from DAWN Live! represent drug reports in drug-related ED visits. Drug reports exceed the number of ED visits, since a patient may report use of multiple drugs (up to six drugs and alco-hol). The DAWN Live! data are unweighted and, thus, are not estimates for the reporting area. These data cannot be compared to DAWN data from 2002 and before, nor can preliminary data be used for comparison with future data. Only weighted DAWN data released by SAMHSA can be used for trend analysis. A full description of the DAWN system can be found at DAWN Web site http://dawninfo.samhsa.gov/.
• Drug treatment data for 2004 were provided by
the Broward Addiction Recovery Centers (BARC) of the Broward County Department of Human Services.
• Crime lab drug analyses data were derived
from the Drug Enforcement Administration’s

EPIDEMIOLOGIC TRENDS IN DRUG ABUSE—Miami-Ft. Lauderdale, Florida
Proceedings of the Community Epidemiology Work Group, Vol. II, June 2005 134
(DEA) National Forensic Laboratory Information System (NFLIS) 2004 Annual Report for Miami-Dade County (January 2004 through December 2004) and by the Broward Sheriff’s Office (BSO) Crime Lab for 2004 in Broward County.
• Drug pricing data for South Florida were de-
rived from the National Drug Intelligence Center (NDIC), Narcotics Digest Weekly, December 28, 2004.
• Heroin price and purity information is from
the U.S. DEA Domestic Monitoring Program 2003 Report.
• Survey data on prevalence of drug use among
middle and high school students are from the 2004 Florida Youth Substance Abuse Survey.
Other information on drug use patterns was derived from ethnographic research and callers to local drug information hotlines. DRUG ABUSE PATTERNS AND TRENDS Beginning in 2003, SAMHSA’s national DAWN Live! increased the number of hospitals reporting to the national system and enhanced the surveillance of drug-related hospital ED mentions to provide ex-panded and more rapid local reporting on such activ-ity. In South Florida, DAWN is growing, with new emergency departments for the system in Broward and Palm Beach Counties to complete coverage for the region’s newly expanded national MSA. The new area is named the Miami/Ft. Lauderdale MSA. DAWN will also expand to the Tampa/St. Petersburg MSA in Florida, as well. Cocaine/Crack Now entering its fourth decade, South Florida’s co-caine epidemic is characterized by morbidity and mortality rates that rank among the highest in the Nation. The steady flow of cocaine into the region fuels the epidemic with widely available cheap co-caine. Cocaine abuse indicators dominate conse-quences of drug abuse at high, yet stable rates. The majority of cocaine deaths, medical emergencies, and addiction treatment reports are among those older than 35. Many of the indicators reflect cocaine use in combination with other drugs, including opiates and benzodiazepines. Throughout Florida, the number of cocaine-related deaths increased in 2004, continuing a rising trend since 2000. There were 1,702 cocaine-related fatali-ties during 2004 across Florida (exhibit 3), a 5-
percent increase from the 1,614 deaths in 2003. Co-caine-related deaths in 2004 were at their highest peak statewide since the drug has been tracked in the late 1980s. Among the 2004 cases, 75 percent in-volved the use of another drug, thus reflecting preva-lent polydrug abuse patterns with cocaine. A large proportion of cocaine ED episodes also involved at least one other substance. In Florida, a drug is considered to be the cause of death if it can be detected in an amount considered to be a lethal dose by the local medical examiner (ME). Statewide, the number of lethal cocaine-induced death cases increased 9 percent from 541 in 2003 to 591 in 2004. There were 160 deaths related to cocaine abuse in Miami-Dade County during 2004 (exhibit 4), repre-senting a 15-percent decrease over the total from 2003. Cocaine was detected at a lethal level in 35 percent of the 2004 cases, up from 25 percent of the 2003 cases and 21 percent of the 2002 cocaine-related deaths. Cocaine was found in combination with an-other drug in 62 percent of the 2004 cases. Three of the 2004 cocaine-related fatalities were younger than 18; 16 percent were age 18–25, 17 percent were 26–34, 40 percent were 35–50, and 26 percent were older than 50. Cocaine-related deaths in Miami-Dade County totaled 189 in 2003, 151 in 2002, 149 in 2001, 144 in 2000, 226 in 1999, and 273 in 1998. There were 120 deaths related to cocaine abuse in Broward County during 2004 (exhibit 5), represent-ing a 13-percent decrease over the 138 cases from 2003. Cocaine was detected at a lethal level in 37 percent of the 2004 cases in Broward County, a pro-portion that is down from 45 percent of 2003 cases and 53 percent of the 2002 cases. Cocaine was found in combination with another drug in 85 percent of the 2004 cases. None of the 2004 cocaine-related fatali-ties was younger than 18; 12.5 percent were age 18–25, 12.5 percent were 26–34, 50 percent were 35–50, and 25 percent were older than 50. Cocaine-related deaths in Broward County totaled 138 in 2003, 121 in 2002, 94 in 2001, 80 in 2000, and a record high 139 in 1999. The Jacksonville area had the highest number of co-caine-related deaths in the State during 2004, with 205 cases, followed by Miami with 160, West Palm Beach with 151, St. Petersburg with 150, Orlando with 136, and Broward County with 120. Jacksonville reported the highest number of cocaine deaths with 74, fol-lowed by Palm Beach County with 68. Unweighted data on ED cocaine reports in Miami-Dade County were accessed from DAWN Live! for
EPIDEMIOLOGIC TRENDS IN DRUG ABUSE—Miami-Ft. Lauderdale, Florida
Proceedings of the Community Epidemiology Work Group, Vol. II, June 2005 135
2004. Cocaine was the most commonly involved il-licit drug in local emergency department visits, ac-counting for 59 percent of the 9,225 Miami-Dade major substances of abuse reports (not including al-cohol-in-combination with another drug, any alcohol below the age of 21, and medications) in 2004 (ex-hibit 6). Most (71 percent) of the 5,420 Miami-Dade cocaine-involved ED patients were male. Non-Hispanic Blacks accounted for 46 percent of the cocaine pa-tients; 30 percent were non-Hispanic Whites; and 17 percent were Hispanics. Race/ethnicity was not documented or unknown for 6 percent of the patients. Cocaine-involved ED patients were age 35 or older in 61 percent of the reports, which continues a pattern of older cocaine ED patients. The patients’ ages were as follows: less than 1 percent (25) were age 12–17, 12 percent were 18–24, 26 percent were 25–34, 37 percent were age 35-44, and 24 percent were 45 or older. Broward County drug-related ED episodes are based on a record review of two Broward County hospitals participating in DAWN during the first 6 months of 2004 and from 4 to 6 hospitals through DAWN Live! in the second half of the year. The network is expand-ing, and data from more hospitals will be included in future reports. Cocaine was clearly the most com-monly reported illicit drug in local emergency de-partment visits, accounting for 58 percent of the 3,383 Broward major substances of abuse reports (not including alcohol-in-combination with another drug, any alcohol below the age of 21, and medica-tions) in 2004 (exhibit 7). Most (69 percent) of the 1,953 Broward cocaine ED patients were male. Fifty-seven percent were non-Hispanic Whites, 32 percent were non-Hispanic Blacks, and 10 percent were Hispanic/other. Cocaine-involved ED patients were age 35 or older in 48 per-cent of these cases. The patients’ ages were as fol-lows: 1 percent were in their teens, 15 percent were age 18–24, and 37 percent were 25–34. Cocaine accounted for 2,924 (or 41 percent) of pri-mary, secondary, and tertiary treatment drug men-tions (excluding alcohol) among the 3,609 BARC patients who cited as least 1 drug of abuse at time of admission during 2004. Of the cocaine mentions, 51 percent were as the primary drug of abuse, 39 percent were as secondary drug, and 9 percent were as the tertiary drug problem. One-half of the cocaine treat-ment mentions were from White, non-Hispanic cli-ents, 37 percent were from Black, non-Hispanic pa-tients, and 13 were from Hispanics. BARC client data are for clients age 18 and older. Those age 18–24
accounted for 7 percent of the cocaine treatment mentions; 20 percent were age 25–34 years; and 73 percent were older than 34. If alcohol clients were included, the number of total patients citing at least 1 substance of abuse rises to 6,114, of whom 37 per-cent cited alcohol as a primary, secondary, or tertiary problem. The inclusion of alcohol lowers the propor-tion of cocaine mentions to 26 percent of all BARC mentions including alcohol. Powder cocaine and crack are still described as “widely available” throughout Florida. Cocaine is still the most commonly analyzed substance by the Miami-Dade and Broward Sheriff’s Office crime labs. It accounted for 10,972 cases (or 69 percent of all items tested) in Miami-Dade for 2004 and for 5,458 cases or 68 percent of all items analyzed in Broward County in 2004. The second most com-monly analyzed substance was marijuana in both counties. According to the National Drug Intelligence Center, in South Florida powder cocaine sells for $18,000–$26,000 per kilogram wholesale, $700–$800 per ounce, and $40–$110 per gram retail. Crack cocaine sells for $700–$800 per ounce, $100 per gram, and $10–$20 per “rock” in South Florida. In 2004, current (past-30-day) cocaine use was re-ported in results of the Florida Youth Substance Abuse Survey by 0.9 percent of Broward County middle and high school students (down from 1.4 per-cent in 2000) (exhibit 8a). Current crack cocaine use was reported by 0.6 percent of Broward students in 2004 (down from 0.9 percent in 2000). Among Mi-ami-Dade County middle and high school students, 1.2 percent reported current cocaine use in 2004 (down from 1.5 percent in 2000). Current crack co-caine use was reported by 0.6 percent of Miami-Dade students in 2004 (down from 0.8 percent in 2000). Current cocaine use was reported by 1.6 percent of Palm Beach County middle and high school students in 2004 (up from 0.9 percent in 2000 and 2002). Cur-rent crack cocaine use was reported by 0.6 percent of Palm Beach students in 2004 (up from 0.4 percent in 2000 and 0.3 in 2002). The proportion for the middle and high school students in all of Florida reporting current cocaine use was 1.5 percent in 2004, and 0.6 percent reported crack use. Heroin The wholesale and retail prices of heroin have de-clined locally recently, as the area has experienced a diversification of opioid abuse to include oxycodone, methadone, hydrocodone, heroin, and other opioids. Frequently, benzodiazepines are involved as well.

EPIDEMIOLOGIC TRENDS IN DRUG ABUSE—Miami-Ft. Lauderdale, Florida
Proceedings of the Community Epidemiology Work Group, Vol. II, June 2005 136
Most deaths, ED visits, and addiction treatment ad-missions continue to be among older, White males. South American heroin has been entering the area over the past decade. Abuse of narcotic pain medica-tion has fueled opioid consequences. Polydrug abuse patterns have facilitated first-time use of opiate drugs, including heroin. Throughout Florida, there were 180 heroin-related deaths in 2004, representing a 31-percent decline from 261 such deaths in 2003; heroin-related deaths totaled 326 in 2002 and 328 in 2001. Yet, heroin was found to be the most lethal drug, with 83 percent (n=150) of heroin-related deaths being caused by the drug in 2004, a 35-perent decline from 2003. Heroin deaths continued a 4-year decline, but deaths from prescrip-tion narcotic opiates have increased over the same period. Polysubstance abuse was noted in 83 percent of the heroin-related deaths statewide (exhibit 3). In 2004, Broward County (n=35) and Palm Beach County (n=29) had the greatest number of heroin-related deaths in the State. They were followed by Orlando (22 cases), Miami-Dade County (18), Sara-sota (15), and Tampa and St. Petersburg (each with 14 cases).
In Miami-Dade County, heroin was found at a lethal dose level in all of the 18 deaths in which heroin was detected. Other drugs were detected in 14 (78 per-cent) of the cases (exhibit 4). None of the heroin-related fatalities was younger than 26; 33 percent were age 26–34, 56 percent were 35–50, and 11 per-cent were older than 50. The 18 heroin-related deaths in Miami-Dade during 2004 reflected a 44-percent decrease over the 32 in 2003. Heroin deaths peaked in Miami-Dade County in 2000 with 61 fatalities.
In Broward County, the 35 deaths in which heroin was detected included 22 cases (63 percent) in which the drug was found at a lethal dose level. Other drugs were detected in 33 (94 percent) of the cases (exhibit 5). None of the heroin-related fatalities was younger than 18; 11 percent were age 18–25, 20 percent were 26–34, 49 percent were 35–50, and 20 percent were older than 50. The 35 heroin-related deaths during 2004 in Broward County reflected a 29-percent decrease over the 49 in 2003. There were 50 heroin-related deaths in 2002 and 41 in 2001. The relatively low number of 24 her-oin-related deaths in 2000 was attributed to a sharp rise in other opioid deaths linked to prescription nar-cotics. Heroin-related deaths rose from 9 in 1995 to 49 in 2003.
Based on unweighted data accessed from DAWN Live! from Miami-Dade County emergency depart-ments during 2004, there were a total of 1,387 heroin reports, representing 15 percent of major substances of abuse reports (not including alcohol-in-combination with another drug, any alcohol below the age of 21, and medications) (exhibit 6). Males accounted for 79 percent of these patients, and 47 percent were non-Hispanic Whites. Blacks repre-sented 22 percent of the heroin ED patients, and His-panics accounted for 21 percent of the patients. There were two patients younger than 5 and three age 12–17, while 12 percent were age 18–24, 37 percent were 25–34, and 51 percent were older than 34. Unweighted data for 2004 from the Broward emer-gency departments identified a total of 399 heroin reports, representing 12 percent of major substances of abuse reports (not including alcohol-in-combination with another drug, any alcohol below the age of 21, and medications) (exhibit 7). The her-oin ED patients were predominantly older White males seeking detoxification. Males accounted for 66 percent of the patients, and 77 percent were non-Hispanic Whites. Hispanics accounted for 12 percent of the heroin ED patients, and Blacks also repre-sented 12 percent of the patients. There were no pa-tients younger than 18, while 12 percent were age 18–24, 33 percent were age 25–34, and 54 percent were older than 34. The most common reason for a heroin patient to visit the ED was dependence and withdrawal or seeking detoxification in 64 percent of the cases. Heroin accounted for 956 (or 13 percent) of primary, secondary, and tertiary treatment drug mentions (ex-cluding alcohol) among the 3,609 BARC patients who cited as least 1 drug of abuse at time of admis-sion during 2004. Of the heroin mentions, 80 percent were as the primary drug of abuse, 12 percent were as secondary drug, and 7 percent were as the tertiary drug problem. Two-thirds (66 percent) of the heroin treatment mentions were from White, non-Hispanic clients, 23 percent were from Hispanics, and 11 per-cent were from Black, non-Hispanic patients. BARC client data are for clients age 18 and older. Those age 18–24 accounted for 9 percent of the heroin treatment mentions; 30 percent were age 25–34, and 61 percent were older than 34. Heroin accounted for 658 crime lab cases in Miami-Dade for 2004 according to the NFLIS, representing 4 percent of all drugs tested. There were 153 heroin cases worked by the Broward Sheriff’s Office Crime Lab in 2004, a 40-percent decrease from the 254 her-oin cases in 2003. The U.S. DEA Domestic Monitor-ing Program analyzed 40 street-level samples of her-

EPIDEMIOLOGIC TRENDS IN DRUG ABUSE—Miami-Ft. Lauderdale, Florida
Proceedings of the Community Epidemiology Work Group, Vol. II, June 2005 137
oin in South Florida in 2003. All of the samples were South American heroin, and they averaged 25.8 per-cent pure heroin. The average price per milligram pure was $0.90. Compared with 2002 purities, the average purity of samples declined modestly, while the price per milligram pure rose by 50 percent ($0.29) and thus returned to levels recorded in 2001. Nationally, there were 470 South American heroin samples tested by the program in 2003. The average purity was 41.8 percent heroin, and the average price was $0.77 per milligram pure. Colombian heroin is widely available in South Flor-ida as described by law enforcement officials and epidemiologists/ethnographers. According to NDIC, 1 kilogram of heroin sells for $45,000–$65,000 in the region and for $2,500 per ounce; retail prices are roughly $100–$150 per gram. The top price for her-oin has dropped 19 percent at the kilogram level and 25 percent at the gram level in the past 12 months. The most common street unit of heroin is a bag of heroin (roughly 20 percent purity) weighing about one-tenth of a gram that sells for $10. In 2004, current (past-30-day) heroin use was re-ported in results of the Florida Youth Substance Abuse Survey by 0.3 percent of Broward County middle and high school students, down from 0.5 per-cent in 2000 and equal to the proportion in 2002. Among Miami-Dade County middle and high school students, 0.6 percent reported current heroin use in 2004, up from 0.5 percent in 2000 and 0.3 percent in 2002. Current heroin use was also reported by 0.6 percent of Palm Beach County middle and high school students, in 2004, up from 0.5 percent in 2000 and 0.3 percent in 2002. The proportion for the mid-dle and high school students in all of Florida report-ing current heroin use was 0.3 percent in 2004. Other Opiates Following inhalants, the group of drugs mostly likely to be cited across Florida at lethal levels as the cause of death in cases where the drug was detected was opiates. As mentioned above, in 2004 heroin was considered the cause of death in 83 percent of the cases where it was detected, followed by 66 percent of the methadone deaths, 63 percent of fentanyl cases, and 50 percent of oxycodone deaths. Deaths from opiates other than heroin (including hydro-codone, oxycodone, and methadone) have been tracked in Florida since 2000. Beginning in 2003, morphine, propoxyphene, fentanyl, hydromorphone, meperidine, and other opioids were included in the Florida Medical Examiners Commission’s surveil-lance monitoring program. Deaths for all opiates
tracked, including heroin, totaled 279 in Broward County and 140 in Miami-Dade in 2004. Methadone-related deaths statewide increased sig-nificantly in 2004, rising by 40 percent when com-pared to 2003, and deaths caused by methadone rose 51 percent over the same period. This continues a steady increase of methadone-related deaths since 2001. Methadone was considered the cause of death in 66 percent of the 849 deaths related to the drug in 2004. The number of oxycodone-related deaths increased 7 percent statewide between 2003 and 2004, when they totaled 674. Oxycodone was the cause of death in 50 percent of the deaths related to it in 2004, causing a 14-percent increase in oxycodone-induced deaths compared to 2003. The number of hydrocodone deaths increased 10 per-cent statewide between 2003 and 2004, when they reached 572. Hydrocodone was the cause of death in 36 percent of the hydrocodone-related deaths during 2004, representing a 27-percent increase in hydro-codone-induced deaths compared to 2003. Additional opiate-related analgesic deaths statewide in 2004 included morphine (597), propoxyphene (347), fentanyl (182), hydromorphone (98), meperidine (42), and other opioids (194). When the ME mentions for all opiate analgesics are added to those for heroin, these opioid-related ME mentions in Florida during 2004 total 3,915 cases. This total is even greater than the 3,575 alcohol-related deaths during the same year. Most of the statewide opioid cases were polydrug epi-sodes, including 88 percent of the oxycodone ME cases, 87 percent of the methadone ME cases, 87 per-cent of the hydrocodone ME cases, 83 percent of the heroin deaths, 78 percent of propoxyphene deaths, and 74 percent of morphine ME cases (exhibit 3). Miami-Dade County recorded 30 oxycodone-related deaths during 2004, of which 11 (37 percent) were oxycodone induced. Fourteen of these deaths (88 per-cent) involved oxycodone found in combination with at least one other drug (exhibit 4). Miami-Dade County recorded 19 hydrocodone-related deaths dur-ing 2004, and 5 (26 percent) were hydrocodone in-duced. Miami-Dade County recorded 17 methadone-related deaths in 2004, with 7 (41 percent) considered methadone induced. Miami-Dade recorded 41 mor-phine-related deaths during 2004, of which 8 (20 per-cent) were morphine induced. There were 15 pro-poxyphene-related deaths in Miami-Dade County in 2004, of which 4 (27 percent) were propoxyphene induced.

EPIDEMIOLOGIC TRENDS IN DRUG ABUSE—Miami-Ft. Lauderdale, Florida
Proceedings of the Community Epidemiology Work Group, Vol. II, June 2005 138
Broward County recorded 71 oxycodone-related deaths during 2004, of which 48 (68 percent) were oxycodone induced. All but two of these deaths in-volved oxycodone found in combination with at least one other drug (exhibit 5). Broward County recorded 38 hydrocodone-related deaths in 2004, and 18 (47 percent) were hydrocodone induced. Broward County recorded 73 methadone-related deaths during 2004, with 45 (62 percent) considered methadone induced. Broward County recorded 44 morphine-related deaths during 2004, of which 12 (27 percent) were morphine induced. Broward County recorded 18 propoxyphene-related deaths in 2004, of which 4 (22 percent) were propoxyphene induced. Unweighted data accessed from DAWN Live! for Miami-Dade County EDs for 2004 show 158 oxy-codone ED reports. There were also 45 hydrocodone ED reports and 215 ED reports for other narcotic analgesics. Of the total 418 narcotic analgesic ED reports, 40 percent of the patients were seeking de-toxification, 17 percent were considered overmedica-tion cases, and 44 percent were considered drug abuse cases. Unweighted data from the Broward County EDs for 2004 show 329 oxycodone ED reports. Males ac-counted for 58 percent of these patients. White, non-Hispanics represented 74 percent of the patients; 14 percent were Black, non-Hispanics; and 12 percent were Hispanic/other. There were no patients younger than 18, while 24 percent of the oxycodone ED pa-tients were age 18–24, 29 percent were 25–34, and 46 percent were older than 34. The most common rea-sons or chief complaints for the oxycodone ED pa-tients to visit the ED were seeking detoxification (35 percent) and overdose (14 percent). Unweighted data from the Broward County EDs for 2004 show 151 hydrocodone ED reports. Males ac-counted for 51 percent of these patients. White, non-Hispanics represented 62 percent of the patients; 14 percent were Black, non-Hispanics; and 24 percent were Hispanic/other. There were no patients younger than 18, while 21 percent of the hydrocodone ED patients were age 18–24, 35 percent were 25–34, and 44 percent were older than 34. The most common reasons or chief complaints for the hydrocodone ED patients to visit the ED were overdose (27 percent) and seeking detoxification (24 percent), while 21 percent had adverse reactions. Prescription opiates accounted for 714 (or 10 percent) of primary, secondary, and tertiary treatment drug mentions (excluding alcohol) among the 3,609 BARC patients who cited as least 1 drug of abuse at time of admission during 2004. Of the prescription
opiate mentions, 67 percent were as the primary drug of abuse, 14 percent were as secondary drug, and 18 percent were as the tertiary drug problem. The NFLIS reported 59 oxycodone crime lab cases, 26 hydrocodone cases, and 9 methadone cases in 2004 in Miami-Dade County. The Broward Sheriff’s Office Crime Lab worked 250 oxycodone cases in 2004. There were also 173 hydrocodone cases, 15 hydromorphone cases, and 2 buprenorphine cases in 2004. In 2004, current (past-30-day) use of oxycodone was reported in results of the Florida Youth Substance Abuse Survey by 0.4 percent of Miami-Dade County middle and high school students, up from 0.2 percent in 2002. Among Miami-Dade County middle and high school students, 1.7 percent reported use of other prescription pain medications in 2004 (exhibit 8a), up from 1.4 percent in 2002. Current (past-30-day) use of oxycodone was reported in results of the 2004 Florida Youth Substance Abuse Survey by 0.3 percent of Broward County middle and high school students, down from 0.6 percent in 2002. Among Broward middle and high school students, 1.8 percent reported use of other prescription pain medications in 2004, just above the 1.7 percent reported in 2002. In Palm Beach County, current (past-30-day) use of oxycodone was reported by 0.9 percent of middle and high school students, up from 0.7 percent in 2002. Among Palm Beach County middle and high school students, 2.3 percent reported use of other prescrip-tion pain medications in 2004, down from 3.5 percent in 2002. The proportion for the middle and high school students in all of Florida reporting current oxycodone use was 0.8 percent in 2004, and 3 per-cent reported current use of other prescription pain medication. Marijuana Marijuana is abused by more Americans, particularly youth, than any other illicit drug. Consequences of its abuse and addiction continue, even as rates of its use are declining among youth. Cannabinoids were detected in 871 deaths statewide in Florida during 2004, representing an increase of 21 percent from the 722 such cases during the year. Unweighted data from DAWN Live! for 2004 show that marijuana accounted for 2,098, or 23 percent, of the 9,225 Miami-Dade major substances of abuse reports (not including alcohol-in-combination with another drug, any alcohol below the age of 21, and medications) in 2004 (exhibit 6). Seventy-six percent of the marijuana ED patients were male. Non-

EPIDEMIOLOGIC TRENDS IN DRUG ABUSE—Miami-Ft. Lauderdale, Florida
Proceedings of the Community Epidemiology Work Group, Vol. II, June 2005 139
Hispanic Blacks accounted for 44 percent of these patients; non-Hispanic Whites accounted for 29 per-cent; and Hispanic/others accounted for 21 percent. Race/ethnicity was not documented or was unknown for 6 percent of the patients. There were 79 patients (4 percent) younger than 18, while 29 percent of the patients were age 18–24, 30 percent were 25–34, and 36 percent were older than 34. Unweighted ED data from Broward County show that marijuana was involved in 25 percent, or 849, of the 3,383 drug abuse ED reports (not including alco-hol-in-combination with another drug, any alcohol below the age of 21, and medications) in 2004 (ex-hibit 7). Sixty-eight percent of the marijuana ED pa-tients were male. Non-Hispanic Whites accounted for 61 percent of these patients, non-Hispanic Blacks for 25 percent, and Hispanics/other for 13 percent. Mari-juana is still the most commonly abused illicit drug among young people visiting the emergency depart-ment. Two-thirds of marijuana ED reports were among the 12–34 age group. There were 68 patients (8 percent) younger than 18, while 27 percent of pa-tients were age 18–24, 32 percent were 25–34, and 33 percent were older than 34. Marijuana accounted for 1,949 (or 27 percent) of primary, secondary, and tertiary treatment drug men-tions (excluding alcohol) among the 3,609 BARC patients who cited as least 1 drug of abuse at time of admission during 2004. Of the marijuana mentions, 37 percent were as the primary drug of abuse, 34 percent were as secondary drug, and 29 percent were as the tertiary drug problem. One-half (49 percent) of the marijuana treatment mentions were from White, non-Hispanic clients, 37 percent were from Black, non-Hispanic patients, and 14 percent were from Hispanics. BARC client data are for clients age 18 and older. Those age 18–24 accounted for 20 percent of the marijuana treatment mentions; 32 percent were age 25–34; and 48 percent were older than 34. The NFLIS reported 3,250 marijuana crime lab cases in Miami-Dade County in 2004, representing 20 per-cent of all exhibits analyzed. There were 979 mari-juana cases worked by the BSO Crime Lab during 2004 (12 percent of all cases). Statewide, marijuana was seized more frequently than any other illicit drug in Florida. Marijuana is still described as widely available throughout Florida, with local commercial, sinsemilla, and hydroponic grades available. A pound of commercial grade marijuana sells for $450–$1,000 per pound. Hydroponic grades sell for $2,500–$4,000 per pound. Commerical grade prices range from $100 to $150 per ounce, while hydroponic grade marijuana sells for $350–$450 per ounce. Depending on its po-tency, marijuana may sell for $5–$18 per gram.
In 2004, current (past-30-day) marijuana use was reported in results of the Florida Youth Substance Abuse Survey by 10.2 percent of Broward County middle and high school students (exhibit 8b), up slightly from 10.0 percent in 2002 but down from 11.5 percent in 2000. Among Miami-Dade County middle and high school students, 8.6 percent reported current marijuana use in 2004, up from 6.5 percent in 2002. In 2000, 8.9 percent of Miami-Dade middle and high school students reported current marijuana use. Current marijuana use was also reported by 11.4 percent of Palm Beach County middle and high school students in 2004, down from 13.5 percent in 2000 and 14.1 percent in 2002. The proportion for the middle and high school students in all of Florida re-porting current marijuana use was 11.5 percent in 2004. Gamma Hydroxybutyrate GHB, an anesthetic, has been a commonly abused substance in South Florida for the past 8 years. There are several compounds that are converted by the body to GHB, including gamma butyrolactone (GBL) and 1,4 butanediol (1,4 BD). Most recently, GHB abuse involves the abuse of 1,4 BD. Indicators of abuse of these drugs continue to decline. Commonly used with alcohol, they have been implicated in drug-facilitated rapes and other crimes. They have a short duration of action and are not easily detectable on routine hospi-tal toxicology screens. GHB was declared a federally controlled Schedule I drug in March 2000, and indi-cators of its abuse have declined since that time. More recently, GHB and its related substances are reported to be used by those seeking to come down from stimulant effects of methamphetamine. There were 11 GHB-related deaths statewide during 2004. The drug was considered the cause of death in six (55 percent) of these cases. There were also 11 GHB-related deaths reported statewide during 2003, of which 27 percent were considered to have been caused by the drug. In all of Florida, GHB-related deaths increased from 23 in 2000 to 28 in 2001 and then declined to 19 in 2002 before declining to 11 in 2003 and again in 2004. Unweighted data accessed from DAWN Live! for Miami-Dade County show 21 GHB-related ED re-ports in 2004. There were six such DAWN Live! re-ports in Broward County during 2004. From the previous tracking system for drug-related hospital ED episodes in Broward County, there had been a dramatic decrease in the number of GHB emergency department cases treated in emergency

EPIDEMIOLOGIC TRENDS IN DRUG ABUSE—Miami-Ft. Lauderdale, Florida
Proceedings of the Community Epidemiology Work Group, Vol. II, June 2005 140
departments from 2000 to 2003. The Broward Gen-eral Medical Center (BGMC) Emergency Department treated three people with GHB or GHB precursor overdose in 1996. The number of these cases in-creased to 48 in 1999 and peaked at 77 in 2000. There were 71 GHB cases in 2001 and 34 cases in 2002. In 2003, there were 30 GHB ED cases at BGMC. This downward trend reflects the national pattern with GHB since 2000, when the drug was banned by Federal legislation. The NFLIS reported 23 crime lab cases of 1,4 BD in Miami-Dade County during 2004, along with 2 GHB cases and 2 GBL cases. The Broward Sheriff’s Office crime lab reported six cases of 1,4 BD, two cases of GHB, and one case of GBL in 2004. Methylenedioxymethamphetamine (MDMA, or “Ecstasy”) Measures of MDMA abuse suggest problems may have peaked in 2001, declined thereafter, and then stabilized between 2003 and 2004. Ecstasy pills generally contain 75–125 milligrams of MDMA, although pills are often adulterated and may contain other drugs being sold as “ecstasy.” The ma-jor sources of the designer logo-emblazoned pills seem to be clandestine labs in Western Europe, espe-cially the Netherlands and Belgium (and more re-cently Spain). The pills enter South Florida from the Caribbean and are brought in by cruise ship passen-gers because of post 9-11 airline security. There were 41 MDMA-related deaths statewide in Florida during 2004, with the drug being cited as the cause of death in 8 of these cases. There were also 27 methylenedioxyamphetamine (MDA)-related deaths statewide in Florida in 2004, with that drug being cited as the cause of death in 5 of the cases. An addi-tional six deaths were related to other unidentified methylated amphetamines in 2004, with those sub-stances being the cause of two of the deaths. In 2003, there were 34 MDMA-related deaths, 20 MDA-related deaths, and 1 other death from an unidentified methylated amphetamine in Florida. Unweighted DAWN data show 106 MDMA ED re-ports from Miami-Dade County during 2004, repre-senting only 1 percent of major substances of abuse ED reports. In the unweighted DAWN data for Broward County during 2004, there were 24 MDMA-related ED re-ports. Males accounted for 58 percent of these pa-tients; 79 percent were non-Hispanic Whites, 13 per-cent were Hispanics, and 8 percent were non-
Hispanic Blacks. Thirteen percent were younger than 18, 38 percent were age 18–24, 46 percent were age 25–34, and one patient was older than 35. The NFLIS reported the Miami-Dade Crime Lab ana-lyzed 250 MDMA exhibits and 42 MDA exhibits during 2004, representing 2 percent of all substances analyzed. In 2004, MDMA was the ninth most com-mon case worked at the Broward Sheriff’s Office Crime Lab, with 89 MDMA cases analyzed, and there were also 22 MDA cases. In the last half of 2003, the Crime Lab analyzed 58 MDMA cases and 10 MDA cases. The number of MDMA cases peaked in the first half of 2001, with 132 cases; such cases declined to 42 in the second half of 2004. In South Florida, ecstasy tablets sell for $5–$7 per tablet wholesale (in bulk), $10–$20 retail for a single pill, or up to $50 per pill at expensive nightclubs. These prices have remained the same since 2002. In 2004, current (past-30-day) MDMA use was re-ported in results of the Florida Youth Substance Abuse Survey by 0.6 percent of Broward County middle and high school students (exhibit 8a), down from 1.3 percent in 2002. Among Miami-Dade County middle and high school students, 1.0 percent reported current MDMA use in 2004, down from 1.4 percent in 2002. Current MDMA use was also re-ported by 1.3 percent of Palm Beach County middle and high school students in 2004, down from 1.9 percent in 2002. The proportion of middle and high school students in all of Florida reporting current MDMA use was 1.1 percent in 2004. Methamphetamine Methamphetamine abuse continues to be a local problem, as new supply sources have been identified. “Crystal,” or smokable, methamphetamine has been shipped by overnight delivery from California for sev-eral years. Law enforcement sources confirm in-creased trafficking from Atlanta and North Carolina of high-grade Mexican-manufactured methamphetamine in the last year. There have also been several seizures of local methamphetamine labs. Mexican drug traf-ficking organizations are supplying powered metham-phetamine directly to local Latino populations of Cen-tral and South American nationalities. Outlaw motor-cycle gang activity involved with local lab production and distribution has also been noted in the past year. Signs of methamphetamine abuse spreading to new populations indicate the local epidemic has progressed from the incubation period of the past 3 years to an expansion phase with growing numbers of users.

EPIDEMIOLOGIC TRENDS IN DRUG ABUSE—Miami-Ft. Lauderdale, Florida
Proceedings of the Community Epidemiology Work Group, Vol. II, June 2005 141
Methamphetamine-related deaths totaled 93 during 2004 statewide in Florida, representing a 21-percent increase from the 77 such deaths in the previous year. Methamphetamine was considered the cause of death in 19 of the 93 cases in 2004. There were also 95 am-phetamine-related deaths in 2004 across Florida, a 28-percent increase over 2003. Amphetamine was consid-ered the cause of death in 7 of the 95 cases in 2004. Unweighted data accessed from DAWN Live! show 38 methamphetamine-related ED reports during 2004 in Miami-Dade County. Among those patients, 92 percent were males, 55 percent were non-Hispanic Whites, 26 percent were Hispanics, and 8 percent were non-Hispanic Blacks. No methamphetamine ED patients were younger than 18; 26 percent were age 18–24, 50 percent were age 25–34, and 24 percent were older than 34. Unweighted data accessed from DAWN Live! show 18 methamphetamine-related ED reports during 2004 in Broward County. Among those patients, 61 per-cent were males, 67 percent were non-Hispanic Whites, 17 percent were Hispanics, and 11 percent were non-Hispanic Blacks. One methamphetamine ED patient was between 12 and 18 years of age; 28 percent were age 18–24, 44 percent were age 25–34, and 22 percent were older than 34. Methamphetamine and other amphetamines accounted for 81 or (1 percent) of primary, secondary, and terti-ary treatment drug mentions (excluding alcohol) among the 3,609 BARC patients who cited as least 1 drug of abuse at time of admission during 2004. Of these mentions, 46 percent were as the primary drug of abuse, 22 percent were as secondary drug, and 32 per-cent were as the tertiary drug problem. The NFLIS reported the Miami-Dade Crime Lab ana-lyzed 153 methamphetamine exhibits during 2004, representing 1 percent of all substances analyzed. In 2004, there were 96 Broward Sheriff’s Office Crime Lab methamphetamine cases analyzed. In 2003, there were 90 such cases. The number of these cases has more than doubled since 2001. Statewide, the number of clandestine methampheta-mine labs or equipment seizures has risen from 30 cases in fiscal year (FY) 2000 (October 1999 to Sep-tember 2000) to 332 in the FY ending September 30, 2004. In South Florida, methamphetamine has some of the highest prices in the Nation: $15,000–$20,000 per pound and $900–$1,200 per ounce. Higher potency “crystal” methamphetamine sells for $1,800–$2,000 per ounce and $50 per quarter gram.
In 2004, current (past-30-day) methamphetamine use was reported in results of the Florida Youth Sub-stance Abuse Survey by 0.6 percent of Broward County middle and high school students (exhibit 8a), down from 0.9 percent in 2000. Among Miami-Dade County middle and high school students, 1.3 percent reported current methamphetamine use in 2004, up from 1.0 percent in 2000. Current methamphetamine use was also reported by 0.7 percent of Palm Beach County middle and high school students in 2004, down from 1.1 percent in 2000. The proportion for the middle and high school students in all of Florida reporting current methamphetamine use was 0.9 per-cent in 2004. Hallucinogens Unweighted data accessed from DAWN Live! show 35 LSD ED reports in Miami-Dade County in 2004 and 6 in Broward County. There were 13 miscellane-ous hallucinogen-related ED reports in Miami-Dade and 2 in Broward in 2004. There were 10 PCP ED reports in Miami-Dade during 2004 and 1 in Broward County. The NFLIS reported the Miami-Dade Crime Lab ana-lyzed four LSD exhibits during 2004, and the Bro-ward Sheriff’s Office crime lab analyzed three LSD samples. Benzodiazepines Benzodiazepines in general and alprazolam (Xanax) in particular are a substantial problem. Benzodiazepi-nes were second only to alcohol in their involvement in drug-related deaths throughout Florida for the past several years. There were 2,011 benzodiazepine-related deaths across Florida in 2004, representing a 12-percent increase over the 1,794 such deaths in the previous year. Of the benzodiazepine-related deaths in 2004, a benzodiazepine was identified as the cause of death in 460 cases (or 23 percent). In Miami-Dade County, there were 64 alprazolam-related deaths during 2004, of which 13 (20 percent) were alprazolam induced. Seventy-eight percent of the deaths involved at least one other drug (exhibit 4). There were also 25 diazepam-related deaths in Miami-Dade County, of which 2 (8 percent) were caused by the drug; 64 percent of these deaths involved at least 1 other drug. Broward County recorded 115 alprazolam-related deaths during 2004, of which 38 (33 percent) were induced by the drug. Only 10 (9 percent) of the deaths involved alprazolam alone (exhibit 5). In the same

EPIDEMIOLOGIC TRENDS IN DRUG ABUSE—Miami-Ft. Lauderdale, Florida
Proceedings of the Community Epidemiology Work Group, Vol. II, June 2005 142
year, Broward County recorded 101 diazepam-related (Valium) deaths, of which 17 (17 percent) were di-azepam induced. All but six of these cases involved at least one other drug. Unweighted data on ED benzodiazepine reports in Miami-Dade County show 917 such reports for 2004. Overmedication accounted for 33 percent of the re-ports, while seeking detoxification was the reason for 27 percent of the benzodiazepine reports. Unweighted ED data from Broward County show that there were 1,171 benzodiazepine ED cases in 2004, ranking third behind alcohol and cocaine in the number of ED reports. Fifty-four of the benzodi-azepine ED patients were male. Non-Hispanic Whites accounted for 77 percent of these patients, non-Hispanic Blacks for 10 percent, and Hispanics/other for 14 percent. Nearly one-fifth of these patients were younger than 25, including 4 percent of total users younger than 18. Fifteen percent of patients were age 18–24, 21 percent were 25–34, and 61 percent were older than 34.
Benzodiazepines accounted for 616 (or 9 percent) of primary, secondary, and tertiary drug treatment men-tions (excluding alcohol) among the 3,609 BARC patients who cited as least 1 drug of abuse at the time of admission during 2004. Of these mentions, 17 per-cent were as the primary drug, 46 percent were as secondary drug, and 37 percent were as the tertiary problem. The NFLIS reported that the Miami-Dade Crime lab analyzed 265 alprazolam exhibits in 2004, as well as 18 diazepam exhibits and 11 clonazepam cases. In Broward, the BSO crime lab analyzed 553 alprazolam cases, 67 unnamed benzodiazepine cases, and 29 clonazepam samples. In 2004, current (past-30-day) depressant use (nam-ing “Xanax” as an example) was reported in results of the Florida Youth Substance Abuse Survey by 1.6 percent of Broward County middle and high school students (exhibit 8a), down from 2.7 percent in 2002 but equal to the proportion in 2000. Among Miami-Dade County middle and high school students, the proportion doubled between 2000 and 2004, rising from 0.6 to 1.2 percent. Current depressant use was also reported by 2.9 percent of Palm Beach County middle and high school students in 2004, down from 3.6 percent in 2002 but nearly double the 2000 pro-portion of 1.5 percent. The proportion for the middle and high school students in all of Florida reporting current depressant use was 2.8 percent in 2004. For inquiries regarding this report, please contact James N. Hall, Center for the Study and Prevention of Substance Abuse, Up Front Drug Information Center, Nova Southeastern University, Suite 215, 12360 Southwest 132nd Court, Miami, FL 33186, Phone: (786) 242-8222, E-mail: [email protected].

EPIDEMIOLOGIC TRENDS IN DRUG ABUSE—Miami-Ft. Lauderdale, Florida
Proceedings of the Community Epidemiology Work Group, Vol. II, June 2005 143
Exhibit 1. DAWN ED Miami-Dade County Sample and Reporting Information: January–December 2004
No. of EDs Reporting per Month: Completeness of Data (%) Total Eligible
Hospitals1 No. of Hospitals in DAWN Sample
Total EDs in DAWN Sample2
90–100% 50–89% <50%
No. of EDs Not Reporting
21 17 17 5–9 1–3 0–1 7–9 1Short-term, general, non-Federal hospitals with 24-hour emergency departments based on the American Hospital Association An-nual Survey. 2Some hospitals have more than one emergency department. SOURCE: DAWN Live!, OAS, SAMHSA, updated 4/13-4/14, 2005 Exhibit 2. DAWN ED Ft. Lauderdale Sample and Reporting Information: January–December 2004
No. of EDs Reporting per Month: Completeness of Data (%) Total Eligible
Hospitals1 No. of Hospitals in DAWN Sample
Total EDs in DAWN Sample2
90–100% 50–89% <50%
No. of EDs Not Reporting3
27 22 22 0–6 0–2 0–1 15–20 1Short-term, general, non-Federal hospitals with 24-hour emergency departments based on the American Hospital Association An-nual Survey. 2Some hospitals have more than one emergency department. 3Note that only 2 EDs participated in the first half of 2004. SOURCE: DAWN Live!, OAS, SAMHSA, updated 4/22, 2005 Exhibit 3. Numbers of Drug-Related Deaths in Florida, by Single Drug or In Combination: 2004 SOURCE: Florida Department of Law Enforcement, Florida Medical Examiners Commission Report 2004
0
500
1,000
1,500
2,000
In Combination 1,269 886 580 596 736 547 441 271 150
Single Drug 433 79 54 78 113 85 156 76 30
Cocaine Alpra-zolam
Diaze-pam
Oxyco-done
Metha-done
Hydro-codone
Morphine Propoxy-phene
Heroin

EPIDEMIOLOGIC TRENDS IN DRUG ABUSE—Miami-Ft. Lauderdale, Florida
Proceedings of the Community Epidemiology Work Group, Vol. II, June 2005 144
0
50
100
150
200
In Combination 99 50 16 26 14 17 31 11 14
Only Drug 61 14 9 4 3 2 10 4 4
Cocaine Alpra-zolam
Diaze-pam
Oxyco-done
Metha-done
Hydro-codone
Morphine Propoxy-phene
Heroin
0
20
40
60
80100
120
140
160
180
In Combination 102 105 95 69 62 34 32 13 33
Only Drug 18 10 6 2 11 4 12 5 2
Cocaine Alpra-zolam
Diaze-pam
Oxyco-done
Metha-done
Hydro-codone
Morphine Propoxy-phene
Heroin
Exhibit 4. Numbers of Drug-Related Deaths in Miami-Dade County, by Single Drug or In Combination: 2004 SOURCE: Florida Department of Law Enforcement, Florida Medical Examiners Commission Report 2004 Exhibit 5. Numbers of Drug-Related Deaths in Broward County, by Single Drug or In Combination: 2004 SOURCE: Florida Department of Law Enforcement, Florida Medical Examiners Commission Report 2004 Exhibit 6. Numbers of Selected Drug Reports in Miami-Dade County DAWN ED Data (Unweighted1), by Drug Category: 2004

EPIDEMIOLOGIC TRENDS IN DRUG ABUSE—Miami-Ft. Lauderdale, Florida
Proceedings of the Community Epidemiology Work Group, Vol. II, June 2005 145
2,098
1,387
5,420
232
3,671
Marijuana
Heroin
Cocaine
Alcohol only (age <21)
Alcohol
849
399
1,953
150
2,109
Marijuana
Heroin
Cocaine
Alcohol Only (age < 21)
Alcohol
1The unweighted data are from 8–10 Miami-Dade EDs reporting to DAWN in 2004. All DAWN cases are reviewed for quality control. Based on this review, cases may be corrected or deleted, and, therefore, are subject to change. SOURCE: DAWN Live!, OAS, SAMHSA, updated 4/13–4/14, 2005 Exhibit 7. Numbers of Selected Drug Reports in Broward County DAWN ED Data (Unweighted1), by Drug Category: 2004 1The unweighted data are from 4–7 Ft. Lauderdale Division EDs reporting to DAWN in 2004. All DAWN cases are reviewed for qual-ity control. Based on this review, cases may be corrected or deleted, and, therefore, are subject to change. SOURCE: Broward EDs, first half of 2004; DAWN Live!, OAS, SAMHSA, updated 4/22, 2005

EPIDEMIOLOGIC TRENDS IN DRUG ABUSE—Miami-Ft. Lauderdale, Florida
Proceedings of the Community Epidemiology Work Group, Vol. II, June 2005 146
1.6
1.8
0.9
0.6 0.6
1.2
1.7
1.2
1.0
1.3
2.9
2.3
1.6
1.3
0.7
2.8
3.0
1.5
1.1
0.9
0.0
0.5
1.0
1.5
2.0
2.5
3.0
3.5
Depressants Narcotic Pain Rx Cocaine Ecstasy Methamphetamine
Broward
Miami-Dade
Palm Beach
All Florida
Percent
1.6
1.8
0.9
0.6 0.6
1.2
1.7
1.2
1.0
1.3
2.9
2.3
1.6
1.3
0.7
2.8
3.0
1.5
1.1
0.9
0.0
0.5
1.0
1.5
2.0
2.5
3.0
3.5
Depressants Narcotic Pain Rx Cocaine Ecstasy Methamphetamine
Broward
Miami-Dade
Palm Beach
All Florida
Percent
30.3
13.3
7.8
4.6
30.9
14.6
8.6 8.1
3.7
35.1
15.6
11.49.6
4.4
32.3
16
11.5 11.4
4.2
0
5
10
15
20
25
30
35
40
Alcohol Binge Alcohol Marijuana Cigarettes Inhalants
Broward
Miami-Dade
Palm Beach
All Florida
Percent
30.3
13.3
10.2
7.8
4.6
30.9
14.6
8.6 8.1
3.7
35.1
15.6
11.49.6
4.4
32.3
16
11.5 11.4
4.2
0
5
10
15
20
25
30
35
40
Alcohol Binge Alcohol Marijuana Cigarettes Inhalants
Broward
Miami-Dade
Palm Beach
All Florida
Percent
Exhibit 8a. Percentages of Middle and High School Students Reporting Past-30-Day Substance Abuse: 2004 SOURCE: Florida Youth Substance Abuse Survey 2004 Exhibit 8b. Percentages of Middle and High School Students Reporting Past-30-Day Substance Abuse: 2004 SOURCE: Florida Youth Substance Abuse Survey 2004

EPIDEMIOLOGIC TRENDS IN DRUG ABUSE—Minneapolis/St. Paul
Proceedings of the Community Epidemiology Work Group, Vol. II, June 2005 147
Drug Abuse Trends in Minneapolis/St. Paul Carol Falkowski1 ABSTRACT The far-reaching consequences and public expense related to the abuse and manufacture of metham-phetamine remained apparent in the Twin Cities and throughout the State in 2004, placing increased demands on law enforcement, the corrections sys-tem, environmental health officials, child protection workers, hospital emergency rooms, and treatment centers. Ten percent of admissions to addiction treatment programs were for methamphetamine in 2004—a record high. The number of overdose deaths, methamphetamine labs, and children af-fected by methamphetamine labs declined slightly. Cocaine abuse resulted in more hospital emergency department reports than any other drug of abuse, with 3,046 in 2004 (compared with 874 for metham-phetamine and 779 for heroin), and accounted for 13.3 percent of treatment admissions. Opiate-related accidental overdose deaths outnumbered those for any other illicit drug, with 72 in 2004 (compared with 49 for cocaine, 20 for methamphetamine, and 8 for MDMA, ‘ecstasy’). The accidental OxyContin overdose death of a suburban high school student brought heightened public attention to the non-medical, recreational abuse of prescription painkill-ers by young people. Marijuana accounted for 19.9 percent of treatment admissions, and there were 2,556 emergency department reports of marijuana in 2004. Nearly one-half of those receiving addic-tion treatment services were younger than 18, as were 26 percent of the marijuana-involved patients at hospital emergency departments. INTRODUCTION This report is produced twice annually for participa-tion in the Community Epidemiology Work Group of the National Institute on Drug Abuse, an epidemiol-ogical surveillance network comprised of researchers from 21 U.S. areas who monitor emerging patterns and trends in drug abuse. It is compiled using the most recent data and information obtained from mul-tiple sources. This report is also available online at www.hazelden.org/research.
1The author is affiliated with Hazelden Foundation, Butler Center for Research, Center City, Minnesota.
Area Description The Minneapolis/St. Paul, “Twin Cities,” metropoli-tan area includes Minnesota’s largest city, Minneapo-lis (Hennepin County), the capital city of St. Paul (Ramsey County), and the surrounding counties of Anoka, Dakota, and Washington. Recent estimates of the population of each county are as follows: Anoka, 313,197; Dakota, 375,462; Hennepin, 1,239,837; Ramsey, 515,274; and Washington, 213,395. The population of these counties totals 2,557,165, or roughly one-half of the Minnesota State population. In the five-county metropolitan area, 84 percent of the population is White. African-Americans constitute the largest minority group in Hennepin County, while Asians are the largest minority group in Ramsey, Anoka, Dakota, and Washington Counties. St. Paul has the largest Hmong population of any U.S. city. The Hmong were Laotian residents who were re-cruited by the CIA to fight in the “secret war” for the United States during the Vietnam War. Later, after their communist opponents won a long civil war, many fled to Thailand and eventually resettled in the United States and other countries. The remainder of the State is less densely populated and more rural in character than the “Twin Cities” area. Minnesota shares an international border with Canada, a southern border with Iowa, an eastern bor-der with Wisconsin, and a western border with North Dakota and South Dakota, two of the country’s most sparsely populated States. Illicit drugs are sold and distributed within Minnesota by Mexican drug traf-ficking organizations, street gangs, independent en-trepreneurs, and other criminal groups. Drugs are typically shipped or transported into the Minneapo-lis/St. Paul area for further distribution across the State. Data Sources Data for this report were drawn from the following sources: • Mortality data on drug-related deaths are from
the Hennepin County Medical Examiner and the Ramsey County Medical Examiner (through March 2005). Hennepin County cases include those in which drug toxicity was the immediate cause of death and those in which the recent use of a drug was listed as a significant condition contributing to the death. Ramsey County cases include those in which drug toxicity was the immediate cause of death and those in which drugs were present at the time of death.

EPIDEMIOLOGIC TRENDS IN DRUG ABUSE—Minneapolis/St. Paul
Proceedings of the Community Epidemiology Work Group, Vol. II, June 2005 148
• Hospital emergency department (ED) data were derived from the Drug Abuse Warning Network (DAWN) Live!, a restricted-access online query system administered by the Office of Applied Studies (OAS) of the Substance Abuse and Mental Health Services Administra-tion (SAMHSA). These unweighted data are from participating hospital emergency depart-ments in the Minneapolis and St. Paul Standard Metropolitan Statistical Area from January 1, 2004, through December 31, 2004, as accessed on April 14, 2005. The DAWN sample includes 26 of the 28 eligible hospitals in the area, with 26 emergency departments (exhibit 1). The data re-ported in this paper are incomplete. Over the ap-proximately 12-month period, between 7 and 13 EDs reported data each month, with almost all reporting basically complete data (90 percent or greater). All DAWN cases are reviewed for qual-ity control and based on the review, they may be corrected or deleted. Therefore, the data reported in this paper are subject to change. Data accessed from DAWN Live! represent drug reports in drug-related visits. Reports exceed the number of visits, because a patient may report use of multi-ple drugs (up to six drugs plus alcohol). The un-weighted data are not estimates for the Minnea-polis/St. Paul area and cannot be compared with data from 2002 and before, nor can these pre-liminary data be used for comparison with future DAWN data. Only weighted DAWN data re-leased by SAMHSA can be used for trend analy-sis. See a full description of DAWN online at http://dawninfo.samhsa.gov.
• Addiction treatment data are from addiction
treatment programs (residential, outpatient, and extended care) in the five-county metropolitan area as reported on the Drug and Alcohol Abuse Normative Evaluation System (DAANES) of the Performance Measurement and Quality Im-provement Division, Minnesota Department of Human Services, from 1993 through 2004. Data on methadone treatment programs are from the Chemical Health Division, Minnesota Depart-ment of Human Services (as of May 23, 2005).
• Law enforcement data and information are
from various county, city, State, and Federal agencies.
• Crime lab data for St. Paul are from the National
Forensic Laboratory Information System (NFLIS). This system, which began in 1997, is sponsored by the U.S. Drug Enforcement Ad-ministration and collects solid dosage drug analyses conducted by State and local forensic
laboratories across the country on drugs seized by law enforcement. Minnesota data on methamphetamine labs are from the El Paso In-telligence Center (EPIC), U.S. Drug Enforce-ment Administration.
• Human immunodeficiency virus (HIV) infec-
tion data for cases diagnosed in 2004 are from the Minnesota Department of Health.
• Additional information is from interviews with
treatment program staff, poison control special-ists, narcotics agents, and school-based drug and alcohol specialists conducted in May 2005.
DRUG ABUSE PATTERNS AND TRENDS Cocaine/Crack Accidental overdose deaths involving cocaine de-creased from 2003 to 2004 in Hennepin County (from 44 to 39) and remained stable in Ramsey County (10), as shown in exhibit 2. Unweighted DAWN Live! data show cocaine reports at Twin Cities emergency departments outnumbered those for any other illegal drug in 2004 (see exhibit 3). Of the 3,046 cocaine-related ED reports in 2004, 65.2 percent of the patients were male and 34.8 per-cent were female. More than one-half of the patients (62.3 percent) were older than 35, 27.0 percent were age 25–34, 8.4 percent were age 18–24, and 2.2 per-cent were younger than 18. Of those with known race/ethnicity, 41.7 percent were White, 55.0 percent were African-American, and 3.2 percent were His-panic. Admissions to addiction treatment programs with cocaine as the primary substance problem declined very slightly in recent years (see exhibit 4). In 2004, treatment admissions involving cocaine as the pri-mary substance problem accounted for 13.3 percent of all admissions, compared with 14.9 percent in 1998. Most cocaine admissions in 2004 were for crack cocaine; 31.6 percent were female and 47.4 percent were African-American (exhibit 5). The av-erage age of first crack use was 25.8. Most (86.9 per-cent) patients receiving treatment for cocaine were age 25 or older; 62.1 percent were older than 35. More than four out of five patients (81.5 percent) had prior treatment episodes. Cocaine accounted for 21.4 percent of the drug sei-zures reported to NFLIS in St. Paul in 2004 (exhibit 6). Gangs continued to play a considerable role in the street-level, retail distribution of crack cocaine. A
EPIDEMIOLOGIC TRENDS IN DRUG ABUSE—Minneapolis/St. Paul
Proceedings of the Community Epidemiology Work Group, Vol. II, June 2005 149
recent sweep of drug dealers in Minneapolis in April resulted in 31 warrants for felony sales of crack co-caine and 7 for misdemeanor marijuana sales. The suspects came from 8 different gangs and all but one, a juvenile female, had prior criminal records. Cocaine generally sold for $100 per gram, $200 per “eightball” (one-eighth ounce), $700–$800 per ounce, and up to $22,000 per kilogram. The price of a rock of crack was $10–$20. Heroin/Opiates/Other Narcotics Opiate-related deaths, mostly accidental heroin over-doses, outnumbered cocaine-related deaths in 2004. In Hennepin and Ramsey Counties combined, there were 72 opiate-related deaths in 2004, compared with 69 in 2003 and 77 in 2002 (exhibit 2). Eleven of the 47 accidental opiate-related deaths in Hennepin County in 2004 involved methadone, as did 3 of the 25 deaths in Ramsey County. According to unweighted DAWN Live! data, there were 779 heroin ED reports in 2004 (exhibit 3). Of these patients, two-thirds were male. More than one-half of these heroin patients (54.7 percent) were older than 35; 31.8 percent were age 25–34, 13.0 percent were age 18–24, and 0.5 percent were younger than 18. Of those with known race/ethnicity, 61.8 percent were White, 35.3 percent were African-American, and 2.8 percent were Hispanic. Prescription narcotic analgesics, used medically in the treatment of pain, were increasingly used non-medically as drugs of abuse for the heroin-like high they produce. Of particular concern within this cate-gory were drugs containing oxycodone: Percodan, Percocet (oxycodone combined with aspirin or aceta-minophen), and the long-acting OxyContin. The recent (May 2005) accidental death of a 17-year-old suburban boy from apparent overdose of Oxy-Contin brought heightened public awareness of the growing abuse of prescription painkillers and other prescription drugs among Twin Cities-area high school students. In 2004, there were 1,361 hospital ED reports involving narcotic analgesics in the un-weighted DAWN Live! data; 475 of these involved oxycodone. Of the patients receiving treatment for heroin in 2004 at programs that reported on the DAANES system, 78.7 percent were older than 25 (exhibit 5). Whites accounted for 55.2 percent and African-Americans represented 36.1 percent; 31.3 percent were women. The most common route of administration was injec-tion (64.2 percent), followed by sniffing (31.8 per-
cent) and smoking, also known as “foiling” (4.0 per-cent). The average age of first heroin use was 22.5. Most heroin admissions (88.4 percent) reported prior treatment episodes. Five methadone maintenance programs serve 1,636 patients in the metropolitan area. Because the private, for-profit methadone programs do not report to DAANES, exhibits 4 and 5 do not reflect the total number of patients receiving treatment for her-oin/opiate addiction in the Twin Cities. However, effective July 1, 2005, all methadone maintenance programs will report on DAANES. The newest innovation in methadone service delivery is the Mobile Medication Unit operated in Minneapo-lis by Hennepin Faculty Associates. This service-based (versus program-based) delivery system in-creases treatment access while reducing the burden and inconvenience often associated with methadone treatment. It is a mobile methadone van that operates in two locations. Since it began operations in October 2004, 66 patients who would otherwise have been remanded to a waiting list received treatment. Similar mobile units have been established in the Netherlands (1979), Boston (1987), Baltimore (1993), Seattle (1999), and Vermont (2004). Heroin seized by law enforcement officers included white, off-white, or tan powder, in addition to dark-colored Mexican “black tar” heroin. Four Nigerians apprehended in April 2004 at the Minneapolis/St. Paul International Airport were on a flight from Am-sterdam carrying suitcases filled with 25 pounds of heroin valued at $25 million. Retail and mid-level heroin prices remained at $20–$40 per dosage unit or “paper,” $300–$400 per gram, and $900–$2,000 per ounce. Law enforcement seizures of oxycodone in-creased, as did pharmacy robberies involving Oxy-Contin. A very small segment of Minnesota’s Hmong immi-grant population regularly smokes opium. Packages concealing opium continued to be shipped from Asia to residents of that Twin Cities community. One case involved 30 pounds of seized opium, with a reported street value of $1.3 million, which was delivered to a suburban Woodbury couple in January. Luggage with opium-soaked fabric was delivered to their house after arriving in the country on a Korean Airlines flight from Laos to Atlanta and being driven to Min-nesota by car. Marijuana Marijuana remained the overwhelmingly popular drug of abuse among adolescents and young adults.
EPIDEMIOLOGIC TRENDS IN DRUG ABUSE—Minneapolis/St. Paul
Proceedings of the Community Epidemiology Work Group, Vol. II, June 2005 150
According to unweighted DAWN Live! data, there were 2,556 marijuana reports at Twin Cities-area hospital emergency departments in 2004 (exhibit 3). Of these patients, two-thirds were male. Roughly one-half were younger than 25, and one-half were older than 25. Specifically, 26 percent were younger than 18, 26 percent were age 18–24, 23 percent were age 25–34, and 25 percent were age 35 and older. Of those with known race/ethnicity, 65.7 percent were White, 31.7 percent were African-American, and 2.6 percent were Hispanic. Marijuana accounted for more admissions into addic-tion treatment programs than any other illicit drug in the Twin Cities, with 3,856 admissions in 2004 (ex-hibit 4). One out of five (19.9 percent) patients enter-ing addiction treatment programs reported marijuana as the primary substance problem, compared with only 8 percent in 1991. Most (76 percent) were males; 65.8 percent were White, 22.0 percent were African-American, 5.3 percent were Hispanic, 2.9 percent were American Indian, and 1.1 percent were Asian (exhibit 5). For many, it was the first treatment experience (45.2 percent). The average age of first marijuana use was 13.9. Marijuana was easily accessible, according to multi-ple sources, and sold for $5 per joint. Standard, commercial-grade marijuana sold for $50 per quarter ounce, $150–$175 per ounce, and $600–$900 per pound. Higher potency “BC Bud” from British Co-lumbia was increasingly available and sold for $100 per quarter ounce, up to $600 per ounce, and $3,200 per pound. One international marijuana smuggling case involved the seizure of 827 pounds of BC Bud near the U.S.-Canadian border in northern Minnesota in April 2005. According to Border Patrol officials, it was one of the largest cases of its kind to date. The marijuana was valued at more than $4 million. Marijuana joints that are dipped in formaldehyde, which is often mixed with phencyclidine (PCP), are known as “wets,” “wet sticks,” “water,” or “wet dad-dies.” Marijuana joints containing crack cocaine are known as “primos.” Methamphetamine/Other Stimulants Aside from cocaine, methamphetamine, also known as “meth,” “crystal,” “speed,” or “crank,” is the major stimulant of abuse in the area. Prolonged abuse can result in addiction, which is characterized by long pe-riods (up to 2 weeks) of continual drug use, sleep and food deprivation, weight loss, and extreme paranoid delusions.
In Ramsey County in 2004, there were 9 accidental deaths related to methamphetamine abuse, compared with 10 in 2003 and 3 in 2002 (exhibit 2). Excluding methylenedioxymethamphetamine (MDMA)- related deaths, there were 8 methamphetamine-related deaths in Hennepin County in 2002, 14 in 2003, and 11 in 2004 (exhibit 1). Hospital ED reports of methamphetamine totaled 874 in 2004 according to unweighted DAWN Live! data (exhibit 3). Women accounted for 41.8 percent. Of these methamphetamine patients, roughly one-half were younger than 25, and one-half were older than 25. Specifically, 18.8 were younger than 18, 28.0 percent were 18–24, 32.4 percent were 25–34, and 20.7 percent were age 35 and older. Of those with known race/ethnicity, almost all (93.4 percent) were White; 4.6 percent were African-American and 1.9 percent were Hispanic. Patients addicted to methamphetamine accounted for 10.0 percent of total treatment admissions in the Twin Cities in 2004 (exhibit 4), compared with 2.9 percent in 1998 and less than 1 percent in 1991. Women accounted for 38.4 percent of methampheta-mine admissions, the highest percentage within any drug category (exhibit 5). Almost all were White (91.0 percent), and the average age of first use was 20.4. One-third (32.5 percent) were in treatment for the first time. Methamphetamine abuse took hold among a younger population in 2004. All onsite, school-based drug abuse counselors reported growing methampheta-mine abuse by students who attend metropolitan-area high schools. Smoking was the most common route of first methamphetamine use. The use of light bulbs as pipes for smoking methamphetamine was com-monplace, especially among youth. The appetite sup-pressant effects, in particular, attracted young girls. More than one-half (52.5 percent) of those receiving treatment for methamphetamine were age 25 or younger: 16.2 percent were younger than 18 and 36.3 percent were age 18–25 (exhibit 5). Among treatment admissions, smoking was the most common route of administration (63.6 percent), followed by sniffing (18.2 percent) and injection (13.0 percent). Methamphetamine dominated law enforcement ef-forts and criminal justice actions in the metropolitan and non-metropolitan areas of the State. For example, in Ramsey County, the number of methamphetamine prosecutions rose from 20 cases in 1999 (2.7 percent of drug cases) to 301 in 2004 (29 percent of drug
EPIDEMIOLOGIC TRENDS IN DRUG ABUSE—Minneapolis/St. Paul
Proceedings of the Community Epidemiology Work Group, Vol. II, June 2005 151
cases). Statewide, methamphetamine was involved in 14 percent of all felony cases in 2004. According to the Minnesota Department of Corrections, there were 139 methamphetamine offenders in Minnesota pris-ons in 2001, compared with 1,100 inmates in April 2005. Seizures of methamphetamine by law enforcement continued upward trends and accounted 60.8 percent of the samples reported to the National Forensic Laboratory Information System (exhibit 6), which are cases from the State crime lab. Seizures by metro-politan-area law enforcement agencies increased as well in 2004. Methamphetamine prices were as low as $70 per gram, $200 for a “teener,” (one-sixteenth ounce), $240–$280 for an “eightball” (one-eighth ounce), and $1,800 per ounce. Pound prices ranged from $6,000 to $14,000. “Glass,” or “ice,” the high-purity form that is smoked, typically sold for twice as much. Methamphetamine came in the form of crystals, powder, or chunks that were white, off-white, tan, orange, reddish, greenish, or light purple-colored. The number of clandestine, makeshift methampheta-mine labs dismantled with the assistance of the U.S. Drug Enforcement Administration in the State de-creased dramatically between 2003 and 2004 (from 182 to 96), but dismantled labs decreased only slightly in the Twin Cities area (from 23 in 2003 and 21 in 2004) (exhibit 7). One rural county reported more than $1 million in costs associated with methamphetamine lab cleanup in 2004. The bulk of methamphetamine consumed in the State is still im-ported from Mexico, however, not manufactured in small labs. The presence of minor children in locations where methamphetamine was being made also declined statewide and in the Twin Cities in 2004. Statewide, there were 54 affected children in 2003 and 14 in 2004 (exhibit 8). However, child protection workers all over the State reported larger caseloads attribut-able to drug abuse; they reported that most, up to 90 percent in some counties, involved methampheta-mine-abusing or addicted caregivers. Legislative efforts focused on restricting the sale of over-the-counter cold preparations containing pseu-doephedrine, a nasal decongestant used in the manu-facture of methamphetamine. In April 2005, four people were arrested in New Ulm, a small town less than an hour south of the Twin Cities, after police discovered nearly 7,000 pseudoephedrine pills in their possession. Even though many stores voluntar-ily limit sales to two packages per customer, the
group was traveling across Iowa, Minnesota, North Dakota, and South Dakota purchasing the two-box limit. They had amassed 6,738 pills in less than 2 days. If convicted of acquiring the pills to manufac-ture methamphetamine, they could face up to 8 years in prison. The abuse of MDMA, a stimulant with mild hallu-cinogenic properties known as “ecstasy,” “X,” or “e,” by young people continued and contributed to the death of seven African-American males in their twenties in Hennepin County in 2004. All were homicide victims with “recent MDMA use” listed as an “other significant condition.” Effects of MDMA include tactile sensitivity, hallucina-tions, and, at high doses, nausea, jaw clenching, hyper-thermia, and muscle tension. According to unweighted DAWN Live! data, there were 102 MDMA ED reports in 2004. Khat, a plant that is chewed or brewed in tea for its stimulant effects in East Africa and the Middle East, remained within the Somali refugee community in the Twin Cities and Rochester, Minnesota. Its active ingredients, cathinone and catheine, are controlled substances in the United States. Methylphenidate (Ritalin), a prescription drug used in the treatment of attention deficit hyperactive disorder, is also used nonmedically as a drug of abuse to in-crease alertness and suppress appetite by some ado-lescents and young adults. The pills are crushed and snorted or ingested orally. Each pill is sold for $5 or simply shared with fellow middle school or high school students at no cost. Ritalin is sometimes known as a “hyper pill” or “the study drug.” Hallucinogens Products that contain dextromethorphan, a cough suppressant common in most over-the-counter cough syrups, are ingested by adolescents in doses many times in excess of the recommended amount for the long-acting, hallucinogenic effects. Dextromethor-phan (also known as “DXM”) is also the active in-gredient in some over-the-counter cold preparations in pill form, such as Coricidin HBP Cough and Cold (known as “Triple Cs”). People intoxicated on dex-tromethorphan experience profound hallucinations and altered time perception, slurred speech, sweating, un-coordinated movements, and high blood pressure. Recent growth in the abuse of these products by younger teenagers prompted many pharmacies, dis-count stores, and grocery stores to place these prod-ucts behind the counter to prevent shoplifting. Being

EPIDEMIOLOGIC TRENDS IN DRUG ABUSE—Minneapolis/St. Paul
Proceedings of the Community Epidemiology Work Group, Vol. II, June 2005 152
under the influence of these products is known as “Robo-tripping” or “Skittle-ing.” Lysergic acid diethylamide (LSD or “acid”) is a strong, synthetically produced hallucinogen, typically sold as saturated, tiny pieces of paper known as “blotter acid,” for $5–$10 per dosage unit. There were 20 hospital ED reports of LSD in 2004 accord-ing to unweighted DAWN Live! data. PCP, a dissociative anesthetic, is most often used in combination with marijuana, but it can also be in-jected or snorted. In 2004, there were 20 ED reports for PCP according to unweighted DAWN Live! data. In May 2004, a 28-year-old African-American male died as the result of drug-induced excited delirium involving PCP and MDMA. Sedative/Hypnotics Gamma hydroxybutyrate (GHB), known as "G,” “Gamma,” “Liquid E,” or “Liquid X,” is a concen-trated liquid abused for its stupor-like, depressant effects. It is also used as a predatory knockout, drug-induced rape drug and sells for $10 by the capful. There were 22 hospital ED reports of GHB in 2004 according to unweighted DAWN Live! data. Other Drugs Alcohol remained the most widely used mood-altering substance. There were 760 ED reports in-volving underage drinking in 2004 according to un-weighted DAWN Live! data (exhibit 3). Overall, one-half of all admissions to Twin Cities addiction treatment programs (49.1 percent) were attributable to alcohol in 2004, compared with 57.2 percent in 1998 (exhibit 4). Of the 9,490 treatment
admissions for alcohol in 2004, 28.3 percent were women, 77.9 percent were White, and 71.0 percent had prior treatment experience (exhibit 5). The aver-age age of first intoxication was 15.8. Roughly 80 percent of alcohol-related treatment ad-missions were age 26 and older, with 61.5 percent being age 35 or older. Among patients reporting al-cohol as the primary substance of abuse, only 3.1 percent were younger than 18. Daily nicotine use remained widespread among pa-tients in addiction treatment programs (exhibit 5). Adolescents who smoke tobacco are many times more likely to use alcohol and other drugs than ado-lescents who do not use tobacco. INFECTIOUS DISEASES RELATED TO SUBSTANCE ABUSE Most cases of HIV infection and acquired immunode-ficiency syndrome (AIDS) in Minnesota are in the Minneapolis/St. Paul area. Of the 307 cases of new HIV infection in 2004, the exposure categories were as follows: men who have sex with men (39 percent), injection drug use (4 percent), men who have sex with men and injection drug use (4 percent), hetero-sexual contact (11 percent), unspecified (19 percent), and no interview (21 percent) (exhibit 9). The level of hepatitis C virus (HCV), a blood-borne liver disease, among injection drug abusers remained high, with estimated rates as high as 90 percent among patients in methadone treatment programs. For inquiries concerning this report, please contact Carol Falkowski, Director of Research Communications, Hazelden Foundation, Butler Center for Research, 15245 Pleasant Valley Road, Box 11, Center City, MN 55012-0011, Phone: 651-213-4566, Fax: 651-213-4344, E-mail: [email protected].

EPIDEMIOLOGIC TRENDS IN DRUG ABUSE—Minneapolis/St. Paul
Proceedings of the Community Epidemiology Work Group, Vol. II, June 2005 153
Exhibit 1. Minneapolis/St. Paul DAWN ED Sample and Reporting Information: 2004
No. of EDs Reporting per Month: Completeness of Data (%) CEWG Area Total Eligible
Hospitals1
No. of Hos-pitals in DAWN Sample
Total EDs in DAWN
Sample2 90–100% 50–89% <50%
No. of EDs Not
Reporting
Minneapolis/ St. Paul 28 26 26 6–13 0–1 0–1 13–19
1Short-term, general, non-Federal hospitals with 24-hour emergency departments based on the American Hospital Association An-nual Survey. 2Some hospitals have more than one emergency department. SOURCE: DAWN Live!, OAS, SAMHSA, updated 4/13-4/14, 2005 Exhibit 2. Number of Drug-Related Deaths in Hennepin and Ramsey Counties: 2000–2004 County 2000 2001 2002 2003 2004 Hennepin County
Cocaine 43 37 34 44 39 Opiates 41 58 59 50 47 Methamphetamine 6
(includes 3 MDMA)
8 (includes 1
MDMA)
11 (includes 3
MDMA)
15 (includes 1
MDMA)
19 (includes 8
MDMA) Ramsey County
Cocaine 17 11 11 10 10 Opiates 17 19 18 19 25 Methamphetamine 11
(includes 3 MDMA)
2 3 10 9
SOURCE: Hennepin County Medical Examiner and Ramsey County Medical Examiner, 2005

EPIDEMIOLOGIC TRENDS IN DRUG ABUSE—Minneapolis/St. Paul
Proceedings of the Community Epidemiology Work Group, Vol. II, June 2005 154
Exhibit 3. Number of Drug Reports (Unweighted)1 in Drug-Related Emergency Department Visits in Minneapolis/St. Paul, by Drug Category: 2004
3,046
2,556
1,361
874 779 760475
184 102 89 57 22 21 200
500
1,000
1,500
2,000
2,500
3,000
3,500
Cocain
e
Marijua
na
Rx Opia
tes
Metham
pheta
mine
Heroin
Undera
ge D
rinkin
g
Oxyco
done
Ampheta
mines
MDMA
Inhala
nts
Misc. H
alluc
inoge
nsGHB
PCPLS
D
1Unweighted data are from 7–13 Minneapolis/St. Paul EDs reporting to DAWN. All DAWN cases are reviewed for quality control. Based on this review, cases may be corrected or deleted, and, therefore, are subject to change. SOURCE: DAWN Live!, OAS, SAMHSA, updated 4/14/2005 Exhibit 4. Admissions to Twin Cities-Area Addiction Treatment Programs, by Primary Substance Problem and Percent: 1998–2004 SOURCE: Drug and Alcohol Abuse Normative Evaluation System, Minnesota Department of Human Services, 2005
57.2
20.1
14.9
2.9
2.5
57.
0
21.
3
14.
6
2.2 2.7
54.5
22. 4
13.7
3.1
3.2
55.
6
21.
5
11
.8
4.8
3.0
54.0
21.
4
12. 8
5.2
3.5
49.
7
22
.1
13.2
7.6
3.6
49.
1
19.
9
13.
3
10.
0
3.3
0
10
20
30
40
50
60
70
1998
2000
2002
2004
1998
2000
2002
2004
1998
2000
2002
2004
1998
2000
2002
2004
1998
2000
2002
2004
Alcohol Marijuana Cocaine Metham-phetamine
Heroin
Percent of Total Admissions
57.2
20.1
14.9
2.9
2.5
57.
0
21.
3
14.
6
2.2 2.7
54.5
22. 4
13.7
3.1
3.2
55.
6
21.
5
11
.8
4.8
3.0
54.0
21.
4
12. 8
5.2
3.5
49.
7
22
.1
13.2
7.6
3.6
49.
1
19.
9
13.
3
10.
0
3.3
0
10
20
30
40
50
60
70
1998
2000
2002
2004
1998
2000
2002
2004
1998
2000
2002
2004
1998
2000
2002
2004
1998
2000
2002
2004
1998
2000
2002
2004
1998
2000
2002
2004
1998
2000
2002
2004
1998
2000
2002
2004
1998
2000
2002
2004
Alcohol Marijuana Cocaine Metham-phetamine
Heroin
Percent of Total Admissions

EPIDEMIOLOGIC TRENDS IN DRUG ABUSE—Minneapolis/St. Paul
Proceedings of the Community Epidemiology Work Group, Vol. II, June 2005 155
Exhibit 5. Characteristics of Persons Admitted to Twin Cities Area Addiction Treatment Programs, by Primary Substance of Abuse and Percent: 2004
Total Admissions (N=19,340)
Alcohol (n=9,490)
49.1
Marijuana (n=3,856)
19.9
Cocaine (n=2,570)
13.3
Methamphetamine (n=1,928)
10.0
Heroin (n=640)
3.3 Gender Male Female
71.7 29.3
76.0 24.0
68.4 31.6
61.6 38.4
68.8 31.3
Race/Ethnicity White African-American Hispanic American Indian Asian
77.9 11.3
6.1 3.2 0.6
65.8 22.0
5.3 2.9 1.1
43.6 47.4
4.5 2.3 0.9
91.0
1.2 3.4 1.6 1.6
55.2 36.1
4.9 2.9 0.2
Age Group 17 and younger 18–25 26–34 35 and older
3.1
15.3 20.0 61.5
47.6 29.0 13.2 10.2
2.6
10.5 24.8 62.1
16.2 36.3 25.2 22.3
0.9
20.3 24.4 54.3
Route of Administra-tion Smoking Sniffing Injecting Oral
78.4 19.7
1.9
63.6 18.2 13.0
5.2
4.0 31.8 64.2
Secondary Drug Marijuana 57.0
Alcohol 71.4
Alcohol 52.2
Marijuana 53.4
Cocaine 43.2
Tertiary Drug Cocaine 33.1
Alcohol 33.9
Marijuana 41.7
Alcohol 48.8
Cocaine 29.6
First Treatment Epi-sode 29.0 45.2 18.5 32.5 11.6
Average Age First Use (in Years) (15.8) (13.9) (25.8) (20.4) (22.5)
Daily Nicotine Use 59.8 59.7 68.6 74.5 70.5 SOURCE: Drug and Alcohol Abuse Normative Evaluation System, Minnesota Department of Human Services, 2005 Exhibit 6. Number of Items Analyzed in St. Paul, Minnesota, and Percentage of Total Items: January– December 2004 Substance Number of Items Percent of Total Items Methamphetamine 2,256 60.8 Cocaine 794 21.4 Cannabis 208 5.6 MDMA 62 1.7 Psilocyn 56 1.5 Acetaminophen 55 1.5 Oxycodone 38 1.0 Hydrocodone 34 0.9 Heroin 32 0.9 Amphetamine 30 0.8 All Other 146 3.9 Total Items Reported 3,711 100.0 SOURCE: NFLIS, DEA

EPIDEMIOLOGIC TRENDS IN DRUG ABUSE—Minneapolis/St. Paul
Proceedings of the Community Epidemiology Work Group, Vol. II, June 2005 156
Exhibit 7. Number of Methamphetamine Lab Seizures in Minnesota and Twin Cities: 2000–2004
Twin Cities1 Year Minnesota
(Number) (Number) (Percent of State Total) 2000 105 23 21.9 2001 103 30 29.1 2002 174 40 22.9 2003 182 23 12.6 2004 96 21 21.8 1Includes the counties of Anoka, Dakota, Hennepin, Ramsey, and Washington. SOURCE: El Paso Intelligence Center (EPIC), National Clandestine Laboratory Seizure System, 2005 Exhibit 8. Number of Children Affected1 by Methamphetamine Labs in Minnesota and Twin Cities: 2000–2004
Twin Cities2 Year Minnesota
(Number) (Number) (Percent of State Total) 2000 17 1 5.8 2001 20 3 15.0 2002 48 14 29.2 2003 54 10 18.5 2004 14 2 14.2 1Children affected includes children exposed to chemicals, children present, children in protective custody, and children residing in a methamphetamine lab. 2Includes the counties of Anoka, Dakota, Hennepin, Ramsey, and Washington. SOURCE: El Paso Intelligence Center (EPIC), National Clandestine Laboratory Seizure System, 2005

EPIDEMIOLOGIC TRENDS IN DRUG ABUSE—Minneapolis/St. Paul
Proceedings of the Community Epidemiology Work Group, Vol. II, June 2005 157
Exhibit 9. Number of Cases and Rates per 100,000 Population of HIV Infection, by Mode of Exposure1 in Minnesota: 2004
Males Females Total Exposure Category Cases Percent Rate2 Cases Percent Rate2 Cases Percent Rate3 MSM4 121 56 X -- -- X 121 39 X IDU5 8 4 X 5 6 X 13 4 X MSM/IDU 13 6 X -- -- X 13 4 X Heterosexual6 (Total) (9) 4 X (25) 28 X (34) 11 X
with IDU 3 -- X 1 -- X 4 -- X with Bisexual Male -- -- X 3 -- X 3 -- X with Hemophiliac/other 0 -- X 0 -- X 0 -- X with HIV-positive, un-known risk 6 -- X 21 -- X 27 -- X
Perinatal7 0 0 X 0 1 X 1 0 X Other 0 0 X 1 1 X 1 0 X Unspecified8 31 14 X 27 30 X 58 19 X No Interview 9 35 16 X 31 34 X 66 21 X Total 217 100 8.9 90 100 3.6 307 100 6.2 1HIV infection includes all new cases of HIV infection (both HIV [non-AIDS] and AIDS at first diagnosis) among Minnesota residents in 2004.
2U.S. Census 2000 data necessary to calculate race-specific rates (specifically a breakdown of the State population by "Race alone or in Combination with one or more races" by gender) have not yet been released for Minnesota. When these data become avail-able, this table will be updated. Numbers exclude Federal and private prisoners and refugees in the HIV-Positive Refugee Reset-tlement Program.
3Rates calculated using U.S. Census 2000 data. Accurate population estimates for Black, African-born persons living in Minnesota are unavailable – anecdotal (50,000) and 2000 U.S. Census data (35,188)) were used to create the range of rates reported for Afri-can-born persons. The population estimate for Black, African-American persons (167,784) was calculated by subtracting the U.S. Census estimate for African-born persons (35,188) from the total Black population (202,972). Note that this assumes that all Afri-can-born persons are Black (as opposed to another race).
4MSM = Men who have sex with men. 5IDU = Injection drug user. 6Heterosexual = For males: heterosexual contact with a female known to be HIV-positive, an injecting drug user, or a hemophiliac/blood product or organ transplant recipient. For females: heterosexual contact with a male known to be HIV-positive, bisexual, an injecting drug user, or a hemophiliac/blood product or organ transplant recipient.
7Perinatal = Mother-to-child HIV transmission; birth may have occurred in a previous year. 8Unspecified = Cases who did not acknowledge any of the risks listed above. 9No Interview = Cases who refused to be, could not be, or have not yet been interviewed. SOURCE: Minnesota Department of Health

EPIDEMIOLOGIC TRENDS IN DRUG ABUSE—Newark PMSA
Proceedings of the Community Epidemiology Work Group, Vol. II, June 2005 158
Drug Abuse in the Newark Primary Metropolitan Statistical Area Allison S. Gertel-Rosenberg, M.S.1 ABSTRACT In this report, drug abuse indicators in the Newark primary metropolitan statistical area (Newark PMSA) are presented using substance abuse treat-ment data, emergency department data, medical examiner cases, and other information. Most pri-mary treatment admissions (72.4 percent) in 2004 were for illicit drugs. Heroin accounted for 72.7 percent of all primary admissions for illicit drugs in the Newark PMSA, compared with 11.3 percent of admissions for primary crack/cocaine, and 11.8 percent of admissions for primary marijuana use. Consistent with the treatment data, emergency de-partment reports of heroin in the Newark PMSA accounted for the largest proportion of drug reports. Heroin purity remains high, at 61.3 percent in 2003. Between January and December 2004, cocaine ac-counted for 45.5 percent of items analyzed by NFLIS, followed by heroin (34.3 percent) and mari-juana (9.0 percent). INTRODUCTION Area Description The Newark primary metropolitan statistical area (PMSA) consists of five counties (Essex, Morris, Sussex, Union, and Warren). In 2003, there were an estimated 2,069,188 residents in the PMSA, with 38 percent living in Essex County (which contains New-ark City), 26 percent in Union County, 23 percent in Morris County, and the rest residing in the remaining counties. According to the 2000 Census, the popula-tion of the Newark PMSA is diverse with respect to race: 66 percent are White, 22 percent are Black, and 4 percent are Asian. Hispanics accounted for 13 per-cent of the PMSA population in 2000. There is also a wide variation in racial/ethnic breakdowns for each county. In Essex County, 45 percent of the popula-tion is White and 41 percent are Black. Union County is 65 percent White and 21 percent Black. By com-parison, Morris County is 87 percent White and 3 percent Black; Sussex County is 96 percent White
1The author is affiliated with the Division of Addiction Services, New Jersey Department of Human Services, Trenton, New Jersey.
and 1 percent Black; and Warren County is 95 per-cent White and 2 percent Black. Hispanics accounted for 15 percent of the population in Essex, 8 percent in Morris, 3 percent in Sussex, 20 percent in Union, and 4 percent in Warren. The counties are also very di-verse by socioeconomic status. In the Newark PMSA as a whole, 5.8 percent of families with children younger than 18 live below the poverty level. For counties within the PMSA, the poverty status for families with children younger than 18 is 18 percent in Essex, 3 percent in Morris, 4 percent in Sussex, 9 percent in Union, and 5 percent in Warren. These social, demographic, and economic variations suggest substantial differences in drug use behaviors of resi-dents by county. New Jersey is situated between major industrial mar-kets in New York and Pennsylvania and has been referred to as the “crossroads of the east.” It is a gateway State, with major interstate highways, road-ways, airports, seaports, and other infrastructures capable of accommodating large amounts of passen-ger and cargo traffic from both the eastern and west-ern parts of the United States. New Jersey can there-fore be considered an ideal strategic, as well as vul-nerable, corridor for the transportation of drug con-traband and illicit currency.2 New Jersey has one of the highest concentrations of pharmaceutical and biochemical manufacturing firms in the country. According to the Drug Enforcement Administration (DEA), the most prevalent sources of diverted pharmaceutical drugs in New Jersey include doctor shopping, prescription forgery, and organized prescription rings. The forging of prescriptions is a continuing problem among employees in the medical field who use their positions to gain access to blank prescription pads. The most commonly diverted pharmaceuticals are the benzodiazepines and opiates, especially the hydrocodone products, with Percocet, Percodan, Xanax, Dilaudid, Valium, and Vicodin representing the most common brand-name drugs diverted. The DEA is also reporting an increase in the diversion of OxyContin, both in Newark and South Jersey, where it has become a particular problem among teenagers and young adults. Illicit Substances in the News In January and February 2005, the New Jersey Poison Information and Education System (NJPIES) re-ported eight cases of probable cyanide intoxication in heroin users. The heroin users were hospitalized in three different healthcare facilities in New Jersey. 2 DEA Briefs and Background State Fact Sheets. New Jersey 2004. http://www.usdoj.gov/dea/pubs/states/newjersey.html.

EPIDEMIOLOGIC TRENDS IN DRUG ABUSE—Newark PMSA
Proceedings of the Community Epidemiology Work Group, Vol. II, June 2005 159
The source of the heroin was reported as dealers in Easton, Pennsylvania, Plainfield, New Jersey, and Asbury Park, New Jersey.3 In March 2005, the New Jersey State Police and the DEA combined forces to break up a nationwide crys-tal methamphetamine operation, arresting four indi-viduals and seizing cash, narcotics, and weapons from locations in New Jersey and California. The investigation targeted the crystal methamphetamine distribution activities of a member and past president of the Bandanas Motorcycle Club, headquartered in Monmouth County. As a result of the New Jersey investigation, a total of 4.5 kilograms of metham-phetamine was seized, with a street value of ap-proximately $350,000.4 Data Sources This report uses data from various sources, as indi-cated below: • Drug treatment data were obtained from the
New Jersey Substance Abuse Monitoring System (NJSAMS) and the Alcohol and Drug Abuse Data System (ADADS), statewide, episode-based data systems operated by the Division of Addiction Services of the Department of Human Services. The preliminary data for calendar year 2004 in-clude profiles by primary drug of abuse in Newark City, the Newark PMSA, and the State. The 2003 Treatment Episode Data Set (TEDS), Office of Applied Studies (OAS), was used to depict demo-graphic characteristics of statewide admissions and was accessed May 27, 2005.
• Emergency department (ED) drug reports data
were derived for calendar year 2004 from the Drug Abuse Warning Network (DAWN) Live! re-stricted-access online query system administered by the OAS, Substance Abuse and Mental Health Services Administration (SAMHSA). Eligible hospitals in the Newark metropolitan area totaled 47; hospitals in the DAWN sampled numbered 39, with the number of emergency departments in the sample totaling 43. (Some hospitals may have more than one emergency department.) During this 12-month period, between 10 and 12 EDs re-ported data each month. The completeness of data reported by participating EDs varied by month (exhibit 1). Exhibits in this paper reflect cases that were received by DAWN as of April 13–14, 2005. All DAWN cases are reviewed for quality control. Based on this review, cases may be corrected or
3 Perspectives: A journal on addiction research and public policy. NCADD New Jersey, February 2005. 4 NJ State Police Press Release. March 21, 2005.
deleted. Therefore, the data presented in this paper are subject to change. Data derived from DAWN Live! represent drug reports in drug-related ED visits. Drug reports exceed the number of ED vis-its, since a patient may report use of multiple drugs (up to six drugs and alcohol). The DAWN Live! data are unweighted and, thus, are not esti-mates for the reporting area. These data cannot be compared to DAWN data from 2002 and before, nor can preliminary data be used for comparison with future data. Only weighted DAWN data re-leased by SAMHSA can be used for trend analy-sis. A full description of the DAWN system can be found at http://dawn info.samhsa.gov.
• Drug seizure and law enforcement data were
provided by the National Drug Intelligence Cen-ter’s “New Jersey Drug Threat Assessment Up-date” released in April 2004. Updated data on Federal drug-related sentences were gathered from the United States Sentencing Commission, Office of Policy Analysis, for fiscal year (FY) 2002.
• Forensic analysis data on specific drugs were
provided by the Drug Enforcement Administra-tion’s National Forensic Laboratory Information System (NFLIS) for January through December 2004.
• Mortality data were obtained from the
SAMHSA January 2004 report entitled “Mortal-ity Data From the Drug Abuse Warning Network 2002.” The DAWN system compiled data for counties in the Newark PMSA. The DAWN sys-tem covered 88 percent of the metropolitan sta-tistical area (MSA) population in 2002. Addi-tional mortality data were analyzed from the New Jersey Department of Health and Senior Services, Center for Health Statistics. The addi-tional mortality data are for calendar year 2002.
• Illicit drug price and purity data were ob-
tained from the Current Intelligence Unit at the National Drug Intelligence Center. The data for July through December 2004 were reported in the December 28, 2004, edition of Narcotics Di-gest Weekly. Additional information on heroin purity was provided by the Domestic Monitor Program (DMP) and represents the time period of January through December 2003.
• Human immunodeficiency virus (HIV) and
acquired immunodeficiency syndrome (AIDS) data were obtained from the statewide AIDS Registry maintained by the New Jersey Depart-ment of Health and Senior Services, Division of

EPIDEMIOLOGIC TRENDS IN DRUG ABUSE—Newark PMSA
Proceedings of the Community Epidemiology Work Group, Vol. II, June 2005 160
AIDS Prevention and Control, HIV/AIDS Sur-veillance Program. Data on the State, Newark PMSA, and Newark City compiled as of Decem-ber 31, 2004, are used in this report.
SPECIAL CONSIDERATIONS: DAWN LIVE! EMERGENCY DEPARTMENT REPORTS DATA Preliminary analysis of ED visit data indicate 5,785 drug-related visits for major substances of abuse (in-cluding alcohol) in the Newark metropolitan area between January and December 2004. Visits are identified as belonging to one of eight categories. These categories are related to ED visits associated with substance abuse and drug misuse, both inten-tional and accidental. The case types are suicide at-tempt, seeking detoxification, alcohol only in patients under 21, adverse reaction, overmedication, mali-cious poisoning, accidental ingestion, and other. The “other” category is designed to capture all of the drug-related ED visits that could not be classified in any of the other categories—this category captures most of the drug abuse cases. In the Newark metropolitan area, the majority (44.7 percent) of DAWN visits are classified as “other,” a category that includes most illicit drugs. This is to be expected, given the protocol for assigning visits to categories. “Overmedication” plus “other” plus “seeking detoxification” accounted for 62.3 percent of all visits. For a breakdown of all visits by type, see exhibit 2. DRUG ABUSE PATTERNS AND TRENDS Cocaine/Crack In preliminary data for January through December 2004, primary cocaine/crack treatment admissions accounted for 7.2 percent of all admissions in New-ark City (compared to 6.2 percent in 2003) and for 7.9 percent of admissions for illicit drugs (i.e., ex-cluding alcohol, compared to 6.8 percent in 2003) (exhibits 3 and 4). In the Newark PMSA, the proportion of primary crack/cocaine admissions (excluding alcohol) was somewhat higher than in the city—11.3 percent in 2004, up slightly from 9.8 percent in 2003. The pro-portion of crack/cocaine admissions among all ad-missions was higher in the PMSA as well: 9.0 per-cent in 2004 and 7.8 percent in 2003. The proportion of primary cocaine/crack admissions (excluding alcohol) statewide increased slightly from 14.0 percent in 2003 to 15.1 percent in 2004. In 2004, the proportion of statewide primary crack/cocaine
admissions was much higher than reported in Newark City (7 percentage points higher) and almost 4 per-centage points higher than in the PMSA (exhibit 3). TEDS data for the State for 2003 show crack admis-sions were somewhat more likely to be Black than White (53 versus 43 percent) and male rather than female (58 versus 42 percent). Admissions for pri-mary abuse of powder cocaine, however, were sub-stantially more likely to be White than Black (65 versus 30 percent) and male rather than female (70 versus 30 percent) (exhibit 5). According to unweighted data accessed from DAWN Live!, cocaine ranked second to heroin in the number of ED reports for major substances of abuse in the Newark PMSA in 2004 (exhibit 6). The data for 2004 collected from the DAWN Live! system on April 13–14, 2005, indicate 1,505 cocaine ED reports for all causes. Approximately 68 percent of the cocaine ED patients were Black (exhibit 7), and 83 percent were age 30 and older. The most recently available mortality data from 2002 indicated 127 cocaine/crack-related deaths. Between January and December 2004, cocaine/crack accounted for 45.5 percent of the 2,858 items ana-lyzed by NFLIS, the highest proportion for any drug (exhibit 8). According to the National Drug Intelligence Center (NDIC) National Drug Threat Survey (NDTS) 2003, 80.1 percent of law enforcement agency respondents in New Jersey reported that powder cocaine was readily available (availability described as either high or moderate), while 73.0 percent reported that crack cocaine was readily available. Additionally, 29.2 per-cent of law enforcement officials throughout New Jersey identified cocaine, either powder (12.1 per-cent) or crack (17.1 percent), as their greatest drug threat. More cocaine is seized in the State than any other illicit drug except marijuana. According to Federal-wide Drug Seizure System (FDSS) data, Federal law enforcement officials seized 480 kilograms of co-caine in 2002. Data from the United States Sentenc-ing Commission (USSC) indicate that the percentage of drug-related Federal sentences in New Jersey that were related to cocaine in FY 2001 (45.1 percent) surpassed the percentage nationwide (42.5 percent) for the first time in the previous 5 years. In FY 2002, the percentage of drug-related Federal sentences at-tributable to cocaine rose to 56 percent (exhibit 9), once again surpassing the national average (42.7 per-cent) (exhibit 9).

EPIDEMIOLOGIC TRENDS IN DRUG ABUSE—Newark PMSA
Proceedings of the Community Epidemiology Work Group, Vol. II, June 2005 161
Cocaine, particularly crack, is the drug most often associated with violent crime in New Jersey. Federal, State, and local law enforcement in New Jersey re-port that dealers frequently carry firearms and com-mit drive-by shootings, assaults, and murders. Ac-cording to the NDTS, 49.5 percent of New Jersey law enforcement agencies identified cocaine, either pow-der (15 percent) or crack (34.5 percent), as the drug that most contributes to violent crime. The Essex County Narcotics Task Force reported major in-creases in the number of cocaine-related homicides in 2003. As of June 5, 2003, there were 60 drug-related homicides in Essex County; most were attributable to powder or crack cocaine distribution. Between July and December 2004, the retail price for powder cocaine in Newark was $9–$100 per gram; crack sold for $20–$100 per gram (exhibit 10). Heroin As a proportion of illicit drug treatment admissions, primary heroin accounted for 81.8 percent in Newark City in 2004, which was slightly lower than the 85.4 percent in 2003 (exhibits 3 and 4). In the Newark PMSA, primary heroin admissions accounted for 72.7 percent of illicit drug admissions in 2004, slightly lower than the 77.3 percent in 2003, and for 58.2 percent of all treatment admissions (including alcohol). Primary heroin admissions predominated across the State in 2004, accounting for 59.2 percent of all ad-missions for drugs other than alcohol (exhibit 3). This is down from 64.2 percent in 2003 (exhibit 4) and represents the second annual decrease in the propor-tion of primary heroin admissions statewide since 1996. TEDS data for 2003 indicate that, statewide, 56.4 percent of primary heroin admissions were White and 37.6 percent were Black (exhibit 5). Sixteen percent were Hispanic. Primary heroin users were also pre-dominately male (65.5 percent) (exhibit 5). The unweighted data accessed from DAWN Live! show that the number of ED reports for heroin in 2004 was higher than the number of reports for other single illicit drugs, at 1,764 reports between January and December 2004 (as of April 13–14, 2005). Of the 1,764 heroin ED reports, 55.2 percent were for male patients, 62.5 percent were for patients who were Black (exhibit 7), and 82.5 percent were for patients age 30 and older. Although heroin is the leading drug among treat-ment admissions and ED reports in Newark, it ac-
counted for only 34.3 percent of the 2,858 items analyzed by NFLIS between January and December 2004 (exhibit 8). The most recently available mortality data from 2002 indicate 149 heroin death mentions. The number of death mentions was down from 177 reported in 2001, however, and 179 reported in 2000. The slight downward trend in death mentions in 2002 is consis-tent with recent patterns in both treatment and ED data. According to the NDTS 2003, 73.4 percent of New Jersey law enforcement agencies reported that heroin was readily available, while 31.6 percent of agencies identified heroin as the greatest drug threat. According to FDSS data, Federal law enforcement officials in New Jersey seized 91 kilograms of heroin in 2000, 169 kilograms in 2001, and 188 kilograms in 2002. USCC data indicate that in FY 2001, heroin-related Federal sentences accounted for a signifi-cantly higher percentage of all drug-related Federal sentences in New Jersey (31.5 percent) than nation-wide (7.2 percent). This trend continued in FY 2002, when heroin-related Federal sentences accounted for 25.6 percent of New Jersey’s drug-related Federal sentences, compared with 7.1 percent nationally (ex-hibit 9). Heroin purity is still very high, but it decreased somewhat in 2003 in the Newark PMSA. In 2001, heroin was 70.5 percent pure, and in 2002, it was 71.4 percent pure. In 2003, however, heroin purity dropped to 61.3 percent pure. The price per gram between July and December 2004 was $25–$320 (exhibit 10). In 2003, despite the drop in heroin pu-rity, the Newark PMSA had the highest heroin purity coupled with the lowest price among the 21 DAWN cities. According to the DMP, almost all of the heroin sold in the Newark PMSA is South American. Marijuana Primary marijuana treatment admissions represented 7.1 percent of all treatment admissions in Newark City in 2004, compared with 9.4 percent in the New-ark PMSA and 12.0 percent in the State as a whole. As a proportion of illicit drug treatment admissions, marijuana accounted for 7.8 percent in Newark City and 11.8 percent in the Newark PMSA (exhibit 3) in 2004, both approximately 1 percentage point higher than in 2003 (exhibit 4). Statewide primary marijuana admissions (excluding alcohol) were more than twice the proportion of those in Newark City (16.6 vs. 7.8 percent) and about 5
EPIDEMIOLOGIC TRENDS IN DRUG ABUSE—Newark PMSA
Proceedings of the Community Epidemiology Work Group, Vol. II, June 2005 162
percentage points higher than those in the Newark PMSA (16.6 percent vs. 11.8 percent)(exhibit 3). Statewide TEDS data for 2003 indicate that 81.7 per-cent of primary marijuana admissions were male, 51.3 percent were White, and 42.5 percent were Black. About 17.2 percent of primary marijuana ad-missions statewide were Hispanic. Across the State, 30.9 percent of primary marijuana admissions were younger than 18, and 72.2 percent were younger than 26 (exhibit 5). According to unweighted data accessed from DAWN Live!, the number of marijuana ED reports between January and December 2004 was 505 (exhibit 6). Individuals younger than 30 represented approxi-mately 60 percent of the marijuana patients. Among the 2,858 items analyzed by NFLIS between January and December 2004, marijuana accounted for 9.0 percent (258 items) (exhibit 8). Marijuana is the most widely available and most fre-quently seized illicit drug in New Jersey. According to the NDTS 2003, 96.9 percent of New Jersey law enforcement agencies report that marijuana is readily available, although only 30.6 percent of New Jersey law enforcement agencies identified marijuana as their greatest drug threat. According to FDSS data, marijuana accounted for 57.0 percent (1,626 kilograms) of illicit drugs seized by law enforcement officials in New Jersey in 2002. Data from the DEA Domestic Cannabis Eradica-tion/Suppression Program indicate that law enforce-ment officials eradicated 831 plants from outdoor grows in New Jersey in 2001 and 957 in 2002. In addition, law enforcement officials eradicated 182 plants from indoor grows in the State in 2001 and 1,345 in 2002. USSC data indicate that the percent-age of drug-related Federal sentences related to mari-juana in New Jersey in FY 2001 (8.4 percent) was significantly lower than the percentage nationwide (32.8 percent). The percentage of drug-related Fed-eral sentences related to marijuana in New Jersey decreased in FY 2002 to 4.9 percent, compared with 28.9 percent nationally (exhibit 9). Between July and December 2004, locally produced marijuana sold in Newark for $5–$30 per bag (ex-hibit 10). Pharmaceuticals The distribution and abuse of pharmaceuticals is growing at an increasing rate in New Jersey. Accord-ing to the NDTS 2003, 60.4 percent of New Jersey
law enforcement agencies reported that pharmaceuti-cals were readily available. NDTS 2003 data further indicate that New Jersey law enforcement agencies reported OxyContin, Percocet, and Xanax as the most commonly diverted or illicitly used pharmaceuticals in the State. Diverted pharmaceuticals often are sold behind closed doors and occasionally at open-air drug markets, primarily in Essex (Newark and Irvington), Camden, and Salem Counties. According to the DEA Newark Division, diverted OxyContin sold for $15 per 20-milligram tablet and $30 per 40-milligram tablet during the second quarter of FY 2003. Diverted Percocet sold for $1 to $10 per tablet, and diverted Xanax sold for $1 to $2 per tablet during that same period. Opiates Other Than Heroin In 2004, primary treatment admissions for “other opiates or synthetics” in Newark City totaled nine (or 0.2 percent of the admissions, excluding alcohol ad-missions). The number was higher in the PMSA—137 (1.2 percent of the admissions, excluding alco-hol). This is unchanged from 2003, when figures for the city and PMSA, respectively, were 0.2 and 1.3 percent. In the State as a whole, primary admissions for other opiates in 2004 totaled 1,142, or 2.9 percent of all admissions, excluding alcohol. In 2003, the number of primary admissions for other opiates to-taled 1,112, representing more than double the ad-missions reported in 1997 (513). The biggest increase in numbers of other opiate admissions occurred be-tween 2000 (592) and 2002 (1,124). In 2003, admis-sions reporting other opiates as primary, secondary, or tertiary drug of abuse numbered 2,303 and ac-counted for nearly 6 percent of all drug admissions statewide. In the TEDS data for 2003, 91 percent of the primary “other opiate” admissions were White and 6 percent were Black (exhibit 5). Only 5 percent of the primary “other opiate” admissions were His-panic; about 62 percent were male. In an analysis run April 13–14, 2005, the DAWN Live! system recorded 469 opiates/opioids ED reports related to seeking detoxification, overmedication, and “other” between January and December 2004. Of those reports in the ED, 10.4 percent were patients seeking detoxification, 26.0 percent had overmedi-cated, and 63.5 percent were classified in the “other” category (exhibit 11). In 2002, there were 151 ME death mentions for nar-cotic analgesic/combinations, representing the largest number of death mentions for any drug. Although the number of mentions was down from 190 in 2001, the number of mentions was more than twice that re-

EPIDEMIOLOGIC TRENDS IN DRUG ABUSE—Newark PMSA
Proceedings of the Community Epidemiology Work Group, Vol. II, June 2005 163
ported in 2000 (75) and more than 3 times the num-ber in 1999 (44). Benzodiazepines In an analysis run April 13–14, 2005, the DAWN Live! system recorded 383 benzodiazepine ED re-ports related to seeking detoxification, overmedica-tion, and “other” between January and December 2004. Of those, 6.3 percent were patients seeking detoxification, 39.4 percent had overmedicated, and 54.3 percent were classified in the “other” category (exhibit 11). The proportion of ED benzodiazepine reports to opiates/opioids reports is 0.8. The 2002 DAWN mortality data show only 54 ben-zodiazepine mentions in the Newark PMSA. How-ever, this represents an increase from 33 mentions in 2001 and 35 mentions in 2000. Benzodiazepines ac-counted for approximately 7.8 percent of all ME death mentions in 2002, up from 4.2 percent in 2001. Methamphetamine and Amphetamines In 2004, only 31 primary amphetamine treatment ad-missions, including 5 primary methamphetamine ad-missions, were reported in the Newark PMSA. As a primary drug of abuse, amphetamines were also rare in the State. There were 149 primary amphetamine ad-missions in 2004, including 47 admissions for methamphetamine. The number of total admissions for primary amphetamine abuse demonstrated an increase from the 112 admissions reported in 2003. According to the 2003 TEDS data, amphetamine users are much more likely to be male than female (68 percent versus 32 percent, respectively). Amphetamine users are also significantly more likely to be White (81 percent) than Black (10 percent) or Hispanic (11 percent). Approxi-mately one-third of amphetamine users are age 25 or younger (37 percent); one-third are between the ages of 26 and 35 (34 percent); and one-third are older than 35 (29 percent). Preliminary unweighted data accessed through DAWN Live! for January through December 2004 show only four methamphetamine ED reports. ED reports for amphetamines, however, were higher, at 42 (exhibit 6). Patients younger than 25 accounted for approximately 50 percent of amphetamine reports.
Methamphetamine availability is limited in New Jer-sey. According to the NDTS 2003, 17.1 percent of New Jersey law enforcement agencies reported that methamphetamine was readily available, and 1.3 per-cent of agencies identified methamphetamine as their greatest drug threat. According to FDSS data, Federal
law enforcement officials in New Jersey seized 0.8 kilograms of methamphetamine in 2002.
USSC data indicate that the percentage of drug-related Federal sentences related to methampheta-mine in New Jersey in FY 2001 (5.2 percent) was lower than the percentage nationwide (14.2 percent). Sentencing data from FY 2002 indicate that metham-phetamine-related sentences in New Jersey repre-sented 3.4 percent of all drug-related sentences (ex-hibit 9). This continues to be significantly lower than the nationwide average of 15.5 percent in FY 2002.
Methamphetamine prices at the wholesale and mid-level have fluctuated in New Jersey. These price variations resulted primarily from increased costs associated with obtaining methamphetamine (particu-larly crystal methamphetamine) from other regions of the country and other countries and transporting the drug to New Jersey. Methamphetamine previously sold for $8,500 to $20,000 per kilogram and $800 to $1,000 per ounce; between July and December 2004, methamphetamine sold for $15,000–$25,000 per kilogram and $800–$1,500 per ounce (exhibit 10). On the retail level, methamphetamine sold for between $20 and $180 per gram. Methylenedioxymethamphetamine (MDMA or Ecstasy) The number of unweighted MDMA ED reports in 2004 in the DAWN Live! system was 21. Between July and December 2004, MDMA sold for between $20 and $30 per tablet (exhibit 10). Phencyclidine (PCP) The unweighted number of PCP ED reports in 2004 accessed from the DAWN Live! system was 22 (ex-hibit 6). Alcohol In the Newark PMSA, alcohol-only treatment admis-sions as a proportion of all admissions decreased from 12.3 percent in 2003 to 10.2 percent in 2004, while alcohol-in-combination admissions increased slightly from 8.0 percent to 9.8 percent during the same time period. Alcohol-in-combination with other drugs or alcohol alone for those younger than 21 accounted for 1,273 ED reports in the DAWN system for the Newark PMSA in 2004 (exhibit 6).

EPIDEMIOLOGIC TRENDS IN DRUG ABUSE—Newark PMSA
Proceedings of the Community Epidemiology Work Group, Vol. II, June 2005 164
INFECTIOUS DISEASES RELATED TO DRUG ABUSE In 2003, New Jersey ranked fifth nationally in cumula-tive AIDS cases, third in cumulative pediatric AIDS cases, and ninth in cases reported in 2003. As of De-cember 31, 2004, there were 65,404 cumulative HIV/AIDS cases reported in New Jersey, about 1,182 of which were reported in 2004. Of the cumulative cases, 25,880 (39.6 percent of the State total) were in the Newark PMSA, and 12,527 (19.2 percent of the State total) were in Newark City. A total of 64,167 cumulative HIV/AIDS cases statewide, and 12,244 in Newark City, were adults/adolescents age 13 or older. Statewide, the proportion of HIV/AIDS cases involv-ing injection drug use has declined substantially. Thus, approximately 41 percent of cumulative HIV/AIDS cases statewide historically involved in-jection drug use alone, compared with 14 percent of the cases diagnosed between January and December 2004. In Newark City, 49 percent of cumulative cases involved injection drug use alone (only cumulative transmission mode data are available for Newark). The proportion of cases linked to heterosexual trans-mission in New Jersey has increased dramatically. Approximately 29 percent of cumulative cases and 46 percent of cases reported between January and De-cember 2004 can be attributable to heterosexual transmission. The majority of this difference can be found in the “partners of unknown HIV risk” cate-gory. There has been a slight increase in the propor-tion of transmission cases among men having sex with men (MSM). The cumulative proportion is 19 percent, while the proportion for this mode of trans-mission between January and December 2004 is 22 percent. Additionally, 15 percent of cases reported between January and December 2004 are still re-corded in the “other or unknown” transmission mode category. In Newark City, 10 percent of cumulative HIV/AIDS cases involved MSM, 20 percent involved heterosex-ual contact, and 19 percent involved “other or un-known” transmission. A larger proportion of females
(34 percent of cumulative cases in Newark and 53 percent in the State) were infected through hetero-sexual contact than males (11 percent and 19 percent in Newark and the State, respectively). There has been a steady increase in the number of persons living with HIV/AIDS in Newark and in the State as a whole. The total number statewide has in-creased from 25,343 in 1997 to 32,746 as of Decem-ber 31, 2004. Among people living with HIV/AIDS as of Decem-ber 31, 2004, about 35 percent statewide and 41 per-cent in Newark City are female (exhibits 12 and 13). Compared to the State as a whole, a substantially higher proportion of people living with HIV/AIDS in Newark are non-Hispanic Black (79 vs. 56 percent) (exhibits 12 and 14). About 17 percent among those living with HIV/AIDS in Newark and 21 percent statewide are Hispanic, and about 3 percent in New-ark and 22 percent statewide are non-Hispanic White. With respect to transmission mode among people living with HIV/AIDS, injection drug use alone ac-counted for 31 percent of cases statewide and 38 per-cent in Newark. Heterosexual contact accounted for 21 percent of cases statewide and 25 percent in New-ark. Male-to-male sexual contact alone accounted for 19 percent statewide and 10 percent in Newark, while such behavior and injection drug use combined were involved in 3 percent of cases statewide and 3 percent of cases in Newark. The continued increase in heroin injection by the young (age 18–25) and the very high levels of heroin abuse and heroin-related deaths con-tinue to pose a serious risk for an increase in the prevalence of infectious diseases. However, no data are yet available to document any rise in the preva-lence of HIV/AIDS in New Jersey. For inquiries concerning this report, please contact Allison Gertel-Rosenberg, M.S., Program Manager, Division of Addition Ser-vices, Office of Policy Management, New Jersey Department of Human Services, 120 South Stockton Street, 3rd Floor, P.O. Box 362, Trenton, NJ 08625, Phone: 609-984-4050, Fax: 609-292-1045, E-mail: [email protected].

EPIDEMIOLOGIC TRENDS IN DRUG ABUSE—Newark PMSA
Proceedings of the Community Epidemiology Work Group, Vol. II, June 2005 165
Malicious poisoning0.3%
Accidental ingestion2.1%
Adverse reaction27.7%
Other44.7%
Alcohol only (<21)4.3%
Seeking detox8.9%
Suicide attempt3.2%
Overmedication8.7%
Exhibit 1. Newark DAWN ED Sample and Reporting Information: January–December 2004
No. of EDs Reporting per Month: Completeness of Data (%) Total Eligible
Hospitals1 No. of Hospitals in DAWN Sample
Total EDs in DAWN Sample2 90–100% 50–89% <50%
No. of EDs Not Reporting
47 39 43 7–10 0–2 0–3 31–33 1Short-term, general, non-Federal hospitals with 24-hour emergency departments based on the American Hospital Association An-nual Survey. 2Some hospitals have more than one emergency department. SOURCE: DAWN Live!, OAS, SAMHSA, updated 4/13-4/14, 2005 Exhibit 2: Distribution of DAWN ED Visits, by Visit Type (Unweighted1): 2004 1The unweighted data are from the 10–12 Newark EDs reporting to DAWN in 2004. All DAWN cases are reviewed for quality con-trol. Based on this review, cases may be corrected or deleted. Therefore, these data are subject to change. SOURCE: Dawn Live!, OAS, SAMHSA, updated April 13–14, 2005 Exhibit 3. Percentages of Primary Treatment Admissions (Excluding Alcohol) for Selected Drugs in Newark City, Newark PMSA, and New Jersey: January–December 2004 SOURCE: Alcohol and Drug Abuse Data System, New Jersey Substance Abuse Monitoring System, Division of Addiction Services, NJ Department of Human Services
16.6
15.1
59.2
11.8
11.3
72.7
7.8
7.9
81.8
0 10 20 30 40 50 60 70 80 90
Marijuana
Cocaine/Crack
Heroin
City
PMSA
State

EPIDEMIOLOGIC TRENDS IN DRUG ABUSE—Newark PMSA
Proceedings of the Community Epidemiology Work Group, Vol. II, June 2005 166
Exhibit 4. Percentages of Primary Treatment Admissions (Excluding Alcohol) for Selected Drugs in Newark City, Newark PMSA, and New Jersey: 2003 SOURCE: Alcohol and Drug Abuse Data System, New Jersey Substance Abuse Monitoring System, Division of Addiction Services, NJ Department of Human Services Exhibit 5. Characteristics of Primary Substance Abuse Treatment Admissions in the State, by Percent: 20031 Characteristic Alcohol
Only Alcohol-in-
Combination Crack Cocaine Marijuana Heroin Other Opiates
Gender Male 73.7 74.7 58.0 69.4 81.7 65.5 61.9 Female 26.1 25.2 41.9 30.4 18.2 34.4 37.9
Race/Ethnicity White 81.8 67.4 42.6 64.8 51.3 56.4 91.4 Black 13.1 28.1 53.2 29.5 42.5 37.6 6.0 Hispanic 11.2 10.1 8.8 17.6 17.2 16.0 5.2
Age at Admission 17 and younger 1.1 5.1 0.7 2.4 30.9 0.4 1.7 18–25 9.0 20.4 11.1 19.3 41.3 19.0 17.4 26–35 17.5 25.8 33.2 32.6 19.1 31.5 30.5 36 and older 72.4 48.7 55.0 45.7 8.7 49.1 50.4
1Percentages may not add to 100 due to rounding or missing values. SOURCE: TEDS, OAS, SAMHSA, accessed May 27, 2005
15.2
14.0
64.2
10.1
9.8
77.3
7.0
6.8
85.4
0 10 20 30 40 50 60 70 80 90
Marijuana
Cocaine/Crack
Heroin
City
PMSA
State

EPIDEMIOLOGIC TRENDS IN DRUG ABUSE—Newark PMSA
Proceedings of the Community Epidemiology Work Group, Vol. II, June 2005 167
21
22
27
42
505
1,273
1,505
1,764
MDMA
PCP
Inhalants
Amphetamines
Marijuana
Exhibit 6. Number of Drug Reports in Drug-Related ED Visits in the Newark PMSA, by Drug Category (Unweighted1): 2004
1The unweighted data are from the 10–12 Newark EDs reporting to DAWN in 2004. All DAWN cases are reviewed for quality con-trol. Based on this review, cases may be corrected or deleted. Therefore, these data are subject to change. SOURCE: Dawn Live!, OAS, SAMHSA, updated April 13–14, 2005 Exhibit 7. Race/Ethnicity of ED Reports for Selected Drugs (Unweighted1): 2004
Cocaine Heroin Race/Ethnicity
N (%) N (%) White 251 16.7 354 20.1 Black 1,024 68.0 1,102 62.5 Hispanic 128 8.5 186 10.5 Race/Ethnicity NTA 3 0.2 3 0.2 Not Documented 99 6.6 119 6.7 TOTAL 1,505 100 1,764 100 1The unweighted data are from the 10–12 Newark EDs reporting to DAWN in 2004. All DAWN cases are reviewed for quality con-trol. Based on this review, cases may be corrected or deleted. Therefore, these data are subject to change. SOURCE: Dawn Live!, OAS, SAMHSA, updated April 13–14, 2005 Exhibit 8. Number of Items Analyzed for Specific Drugs in Newark and Percentage of Total Items: 20041
Substance Count Percent (%) Cocaine 1301 45.52 Heroin 980 34.29 Marijuana 258 9.03
1N = 2,858 SOURCE: NFLIS, DEA
(250 are alcohol only for patients younger than 21)
Heroin
Cocaine
Alcohol

EPIDEMIOLOGIC TRENDS IN DRUG ABUSE—Newark PMSA
Proceedings of the Community Epidemiology Work Group, Vol. II, June 2005 168
Other10.2%
Marijuana4.9%Heroin
25.6%Crack Cocaine
19.5%
Pow der Cocaine36.5%
Methamphetamine3.4%
Exhibit 9. Drug-Related Federal Sentences in New Jersey, by Drug and Percent: FY 2002 N=266 SOURCE: United States Sentencing Commission, Office of Policy Analysis, 2002 Datafile Exhibit 10. Illicit Drug Prices for Newark City: July 2004–December 2004
Price in Dollars ($) Drug
Wholesale Midlevel Retail Powder Cocaine $15,000–$34,000 per kilogram $600–$1,800 per ounce $9–$100 per gram
Crack Cocaine $20,000–$35,000 per kilogram $644–$2,000 per ounce $20–$100 per gram $150–$200 per 1/8 ounce
Heroin $52,000–$120,000 per kilogram $1,600–$3,360 per ounce $25–$320/g
Marijuana
$500–$1,700 per pound (boogie) $3,500–$6,500 per pound (hydro-ponic) $6,000–$7,000 per pound (purple haze)
$50–$600 per ounce $100–$400 per ounce (hydro-ponic) $400–$1,100 per 1/4 pound $250–$1,750 per 1/4 pound (hydroponic) $400–$2,000 per 1/2 pound $500–$2,500 per 1/2 pound (hydroponic)
$2–$5 per joint $5–$20 per blunt $5–$30 per bag $10–$30 per bag (hydroponic) $20–$50 per gram
Methamphetamine $8,000–$20,000 per pound $15,000–$25,000 per kilogram $800–$1,500 per ounce
$20–$180 per gram $9–$180 per gram (crystal meth) $140–$300 per 1/8 ounce $400–$1,200 per 1/2 ounce
MDMA $7–$12 per tablet NA $20–$30 per tablet SOURCE: Narcotics Digest Weekly Dec. 28, 2004, National Drug Intelligence Center

EPIDEMIOLOGIC TRENDS IN DRUG ABUSE—Newark PMSA
Proceedings of the Community Epidemiology Work Group, Vol. II, June 2005 169
38
16
122
151
49
24
38
7
298
208
14
0 100 200 300 400 500 600
Muscle Relaxants
Oxycodone
Hydrocodone
Opiates/Opioids
Benzodiazepines
Overmedication
Seeking Detox
Other
2
3
383
469
27
90
14
38
16
122
151
49
24
38
7
298
208
14
0 100 200 300 400 500 600
Muscle Relaxants
Oxycodone
Hydrocodone
Opiates/Opioids
Benzodiazepines
Overmedication
Seeking Detox
Other
2
3
383
469
27
90
14
Exhibit 11. Prescription Drug Misuse – Number of Drug Reports in Drug-Related ED Visits, Selected Drugs, by Case Type (Unweighted1): 2004 1The unweighted data are from the 10–12 Newark EDs reporting to DAWN in 2004. All DAWN cases are reviewed for quality con-trol. Based on this review, cases may be corrected or deleted. Therefore, these data are subject to change. 2Hydrocodone: 4 seeking detox. 3Muscle relaxants: 10 overmedication, 0 seeking detox, 4 other. SOURCE: Dawn Live!, OAS, SAMHSA, updated April 13–14, 2005 Exhibit 12. Numbers and Percentages of Adult/Adolescent Cases Living with HIV/AIDS in New Jersey by Exposure Category, Race/Ethnicity and Gender as of December 31, 2004
Males Females Total N (%) N (%) N (%)
Exposure Category Men/sex/men (MSM) 6,100 29 0 0 6,100 19 Injection drug user (IDU) 6,484 31 3,555 31 10,039 31 IDU/MSM 860 4 0 0 860 3 Heterosexual Contact 2,350 11 4,468 39 6,818 21 Other/Unknown 4,891 24 3,319 29 8,210 26 TOTAL1 20,685 100 11,342 100 32,027 100 Race/Ethnicity White 5,216 25 1,951 17 7,167 22 Black 10,724 51 7,457 64 18,181 56 Hispanic 4,710 22 2,085 18 6,795 21 Asian/Pacific Islander 157 1 67 1 224 1 Other/Unknown 236 1 143 1 379 1 TOTAL2 21,043 100 11,703 100 32,746 100 1Does not include pediatric cases. 2Includes pediatric cases. SOURCE: NJ Department of Health and Senior Services, Division of AIDS Prevention and Control

EPIDEMIOLOGIC TRENDS IN DRUG ABUSE—Newark PMSA
Proceedings of the Community Epidemiology Work Group, Vol. II, June 2005 170
Exhibit 13. Adult/Adolescent Cases Living with HIV/AIDS in Newark City by Exposure Category and Gender as of December 31, 2004
Males Females Total Exposure Category N (%) N (%) N (%) Men/sex/men (MSM) 565 17 0 0 565 10 Injection drug user (IDU) 1,292 39 852 36 2,144 38 IDU/MSM 159 5 0 0 159 3 Heterosexual Contact 506 15 908 39 1,414 25 Other/Unknown 822 25 596 25 1,418 25 TOTAL 3,344 100 2,356 100 5,700 100 SOURCE: NJ Department of Health and Senior Services, Division of AIDS Prevention and Control Exhibit 14. Race/Ethnicity of Cases Living with HIV/AIDS in Newark City: Through December 31, 2004
Adult/Adolescent Pediatric Total Race/Ethnicity N (%) N (%) N (%) White, Non-Hispanic 198 3 0 0 198 3 Black, Non-Hispanic 4,546 79 82 92 4,628 79 Hispanic 980 17 7 8 987 17 Other 52 1 0 0 52 1 TOTAL 5,776 100 89 100 5,865 100 SOURCE: NJ Department of Health and Senior Services, Division of AIDS Prevention and Control

EPIDEMIOLOGIC TRENDS IN DRUG ABUSE—New Orleans
Proceedings of the Community Epidemiology Work Group, Vol. II, June 2005 171
Drug Abuse Indicators in New Orleans Gail Thornton-Collins1 ABSTRACT Although indicators continue to show a decline in cocaine abuse, they remain high. In 2004, cocaine accounted for 38 percent of drug items analyzed by forensic laboratories, nearly 32 percent of treatment admissions in Orleans Parish, and more than 49 percent of the (unweighted) ED illicit drug reports. Marijuana abuse indicators are also high, account-ing for nearly 53 percent of items analyzed by fo-rensic labs, 32 percent of treatment admissions, and 25 percent of the (unweighted) illicit drug reports. Heroin abuse indicators continue to be relatively low. A growing problem is the abuse of narcotic analgesics, especially hydrocodone. While not a problem in Orleans Parish, methamphetamine ac-counts for around 4 to 6 percent of primary treat-ment admissions in four other large parishes, and small clandestine methamphetamine labs are re-portedly increasing in some rural areas. INTRODUCTION Area Description Located in southern Louisiana, the city of New Or-leans covers 366 square miles, of which 164 are wa-ter. Nearly one-half of the metropolitan area’s 1.3 million inhabitants live in Orleans Parish, the largest of Louisiana’s 64 parishes. The total State population is about 4.5 million people, based on 2003 census projections (exhibit 1). As shown in exhibit 1, New Orleans has a much higher percentage of African-Americans than the State overall (67.2 vs. 32.1 per-cent) and a much lower percentage of Whites (28.1 vs. 64.0 percent). Nearly 21 percent of individuals in New Orleans live below the poverty level, a propor-tion similar to the State overall. Serviced by several deep-water ports, New Orleans is located at the connection of two principal waterways: the Gulf Intracoastal Waterway and the Mississippi River. Barge lines, ocean carriers, and truck lines serve the Port of New Orleans.
1The author is affiliated with the New Orleans Health Department, New Orleans, Louisiana.
Data Sources Information for this report was collected from the sources described below: • Forensic laboratory testing data were provided
by the Drug Enforcement Administration (DEA) for 2004, as reported to the National Forensic Laboratory Information System (NFLIS). Data for 2003 are also included in this paper.
• Drug treatment data were provided by the Lou-
isiana State Office for Addictive Disorders and by not-for-profit treatment facilities for Orleans Parish for fiscal year (FY) 1995 through FY 2004, when 2,306 persons were treated in New Orleans Parish. (Fiscal years run July through June.) Data for FY 2004 in another eight of the largest parishes in the State are also reported.
• Emergency department (ED) data for calendar
year 2004 were accessed through the Drug Abuse Warning Network (DAWN) Live! re-stricted-access online query system, which is administered by the Office of Applied Studies (OAS), Substance Abuse and Mental Health Services Administration (SAMHSA). Nineteen of the 21 eligible hospitals in the New Orleans metropolitan area are in the DAWN sample, with a total of 21 EDs in the sample. (Some hospitals have more than one ED.) The data reported in this paper were not complete. During the 12-month period, between 8 and 11 EDs reported data to DAWN each month (exhibit 2). Com-pleteness of the data is summarized in exhibit 2. The data in this paper were updated by OAS on January 13–14, 2005; they are unweighted and are not estimates for the New Orleans area. Since all DAWN cases are reviewed for quality con-trol, and may be corrected or deleted, the data reported here are subject to change. The informa-tion derived from DAWN Live! represent drug reports in drug-related visits; reports exceed the number of ED visits because a patient may report use of multiple drugs (up to six drugs and alco-hol may be represented in DAWN). This paper presents data on “Illicit Drugs of Abuse” (ex-cluding “Alcohol Only” for patients younger than 21), reports for prescription-type drugs, and reports on visits involving alcohol. These data cannot be compared with DAWN data from 2002 and before, nor can these preliminary data be used for comparison with future data. Only weighted ED data released by SAMHSA can be used for trend analysis. A full description of the DAWN system can be found at the DAWN Web site: <http://dawninfo.samhssa.gov>.
EPIDEMIOLOGIC TRENDS IN DRUG ABUSE—New Orleans
Proceedings of the Community Epidemiology Work Group, Vol. II, June 2005 172
• Drug arrest data were provided by the New Orleans Police Department (NOPD) for 2003–2004. Anecdotal information on arrests in 2004 was also provided by NOPD.
• Drug price, purity, and seizure information
was extracted from Narcotics Digest Weekly, Volume 3, Number 52, December 28, 2004, Na-tional Drug Intelligence Center (NDIC), and the DEA for the last quarter of 2004. Data for heroin purity were derived from the DEA’s Domestic Monitor Program (DMP) for 2003.
• Acquired immunodeficiency syndrome (AIDS)
and human immunodeficiency virus (HIV) data were provided by the Louisiana HIV/AIDS Surveillance System and represent cases reported in the third quarter of 2004.
No recent drug-related mortality or survey data were available for this reporting period. Trends in drug-related mortality data (DAWN) and trends in data from the Youth Risk Behavior Surveillance (YRBS) survey, Centers for Disease Control and Prevention, can be found in “Overview of Drug Abuse Indicators in New Orleans,” Epidemiologic Trends in Drug Abuse, Pro-ceedings Vol. II, published by NIDA, June 2004. DRUG ABUSE PATTERNS AND TRENDS Cocaine/Crack Crack has been and continues to be the most serious drug problem in New Orleans; it is associated with high rates of violence and crime in the city. In 2004, the DEA reported that crack and cocaine hydrochlo-ride (HCl) were widely available in New Orleans in quantities ranging from kilograms to grams. Approximately 41.0 percent of all items analyzed by NFLIS laboratories in New Orleans in 2004 were co-caine (exhibit 3), compared with 38.4 percent in 2003. The proportion of primary cocaine/crack treatment admissions in Orleans Parish has been declining since 1993. Cocaine/crack treatment admissions in the par-ish decreased from 40.4 percent of all admissions in FY 1995 to 31.6 percent in FY 2004 (exhibit 4). A possible reason for the decrease in the proportion of cocaine admissions includes increases in court refer-rals of marijuana abusers to treatment. A relatively high proportion (39.8 percent) of pri-mary cocaine/crack treatment admissions in Orleans Parish in 2004 was female. Most (80.3 percent) of the male and female primary cocaine/crack admissions were African-American. A relatively large percentage
(41.4 percent) of the African-American female co-caine/crack admissions was age 35–44. Across eight other Louisiana parishes in 2004, pri-mary cocaine admissions were highest in East Baton Rouge Parish (45.5 percent) and lowest in Calcasieu Parish (15.8 percent) (exhibit 5). Preliminary unweighted data accessed from DAWN Live! show that cocaine ED reports totaled 1,607 in 2004, accounting for 49.5 percent of the illicit drug reports (exhibit 6a), another indicator of the cocaine problem in New Orleans. Patients involved in these visits were most likely to be male (69.2 percent), 35 or older (56.0 percent), and African-American (59.1 percent) (exhibit 6b). In 2004, there were fewer arrests for cocaine posses-sion (n=2,249) than in 2003 (2,941) (exhibit 7), con-tinuing the pattern from 2002. In New Orleans, Mexican and Caribbean drug traf-ficking organizations (DTOs) are the primary dis-tributors of cocaine HCl at the wholesale level. DTOs usually do not sell cocaine in the crack form because of the more severe Federal sentencing guidelines for the distribution of cocaine in this form. Street dealers generally assume responsibility for converting co-caine HCl to crack. The dominant street-level crack dealers in New Orleans are African-Americans. At the retail level, crack is commonly sold in the form of rocks and cookies in small plastic bags, clear plastic vials, and 35-millimeter film canisters. In the last half of 2004, the DEA reported that purity levels for crack ranged from 40 to 90 percent, while purity levels for HCl were more variable in the 17–90 per-cent range. Powder cocaine is commonly sold in quarter, one-half, and 1 ounce quantities. Prices range from $800 to $1,200 per ounce at the midlevel and approxi-mately $18,000 to $25,000 per kilogram at the wholesale level (see exhibit 8). When cut/mixed with adulterants, and less potent, powder cocaine can be purchased at low prices at the street level. Crack has been available at $5 to $25 per rock and can be pur-chased on the street for $900 to $1,200 per ounce. Heroin Heroin indicators remained relatively stable in New Orleans from 2001 to 2004. In 2004, 5.3 percent of all drug items (n=651) ana-lyzed by forensic labs in New Orleans were heroin (exhibit 3).

EPIDEMIOLOGIC TRENDS IN DRUG ABUSE—New Orleans
Proceedings of the Community Epidemiology Work Group, Vol. II, June 2005 173
After increasing from 12.2 percent of all treatment admissions in 1999 to 14.8 percent in 2001, heroin treatment admissions remained level, at about 11 percent, from 2002 to 2004 (exhibit 4). As in the prior 3 years, most of the heroin admissions in 2004 were male (74.5 percent). Of the males, 80.5 percent were African-American and 52.6 percent were in the 25–34 age category. More than one-half (53.8 per-cent) of the female heroin admissions were African-American. St. Tammany (3.3 percent) was the only other parish in which more than 1 percent of admis-sions were primary heroin abusers (exhibit 5). The 2004 preliminary unweighted DAWN Live! data show 490 ED reports involved heroin, accounting for 15.1 percent of illicit drug reports (exhibit 6a). More than 76 percent of these patients were male (exhibit 6b). The patients were slightly more likely to be age 25–34 (37.1 percent), but 28.0 percent were younger than 25. Most were African-American (59 percent) or White (37 percent). The DEA reported that the primary heroin traffickers for the heroin that is marketed in New Orleans are Colombian, Nigerian, and African-American. Much of the heroin is transported into the area from Texas in privately owned vehicles. Some of the heroin is also brought into the ports near New Orleans via ves-sels. Like crack cocaine, heroin distribution and abuse has a major impact on the homicide and robbery rates in New Orleans. In 2004, the NOPD reported that a relatively high percentage of individuals arrested for robbery in 2004 were African-Americans in the 25–36 age category. The 2004 arrest data show that Afri-can-American males predominated in arrests involv-ing heroin (exhibit 7). In 2004, there were 309 arrests for heroin possession and 87 for heroin distribution. Arrests for heroin distribution in 2004 were 50 per-cent lower than in 2003. African-American trafficking organizations distribute heroin in government-supported housing projects and in other low-income neighborhoods. Heroin is most commonly sold on the streets of New Orleans in “bags” or “papers.” Mixtures containing 0.3–0.5 grams are wrapped in small foil packages which are placed in plastic sandwich bags for multiple sales. Bags or papers are sold for $20 to $25 each at the retail level (exhibit 8), but it is possible to buy a bun-dle (25) of bags for about $300. In 2003, most of the DMP heroin street buys in New Orleans were of South American origin. The purity of the heroin averaged 31.8 percent and sold for $1.62 per milligram pure.
Other Opiates/Narcotics Indicators for opiates other than heroin remained low. Hydromorphone (Dilaudid) is being replaced by OxyContin as the most popular opiate of abuse in the New Orleans area, but hydrocodone (Vicodin), pro-poxyphene (Darvon), alprazolam (Xanax), oxyco-done (Percodan), and hydromorphone are the most widely diverted opiates. Of the 12,290 items analyzed by NFLIS in 2004, 152 (1.2 percent) were “other opiates/narcotics” (exhibit 3); 91 (60 percent) of these other opiate items were hydrocodone. The percentage of other opiates/narcot-ics in 2004 was the same as in 2003. Among treatment admissions in Orleans Parish in FY 2004, 82 (3.6 percent) were for primary abuse of “other opiates or synthetic opioids” or non-prescription methadone. All but seven were White: 57 percent were White females and 35 percent were White males. Whites also dominated among these other opiate admissions in other parishes. The pro-portions of these admissions in East Baton Rouge and Ouachita Parishes (ranging from 4.7 to 5.0 percent) were similar to that in Orleans Parish, while those in the other parishes were higher, ranging from ap-proximately 7 to 21 percent (exhibit 5). In St. Tam-many Parish, 21 of the 216 other opiate admissions were for nonprescribed methadone, the highest num-ber in any of the 9 parishes represented in exhibit 5. Across the other seven parishes (excluding Orleans Parish), other opiates admissions were highest in St. Tammany Parish (21.1 percent) and Lafayette Parish (11.5 percent). According to news reports, a large number of persons abusing methadone were from pain management clin-ics. Because of the large number of deaths, many of which involved methadone and other opiates, the State of Louisiana asked for an investigation of pain clinics in the New Orleans area. The legislative branch has closed down many of these clinics and placed stricter guidelines on others. The unweighted DAWN ED data for 2004 show 1,221 reports of opiates/opioids. Of the opiate/opioid reports, 46.7 percent were hydrocodone reports and 8.7 percent were oxycodone reports. Fifty-four percent of the hy-drocodone-involved visits were for overmedication, as were 46 percent of the oxycodone-involved visits. In 2004, there were 1,087 arrests for possession of Schedule II narcotic drugs and 366 for distribution of Schedule II narcotics. Of the possession arrests, 55.6 percent were African-American males and 26.0 per-cent were White males (exhibit 9). More than 46 per-

EPIDEMIOLOGIC TRENDS IN DRUG ABUSE—New Orleans
Proceedings of the Community Epidemiology Work Group, Vol. II, June 2005 174
cent of these arrestees for possession were between the ages of 21 and 33, nearly 41 percent were 36 or older, and nearly 13 percent were younger than 21. Of the 366 arrests for distribution of Schedule II narcotics, 241 (65.8 percent) were African-American males. Nearly 30 percent of those arrested for distribution of Schedule II narcotics were younger than 21, with 34 percent being age 21–35, and 36 percent being 36 and older. Marijuana Marijuana indicators were stable in 2004, but mari-juana is still the most readily available illicit drug in New Orleans and the State of Louisiana. The price of marijuana decreased in recent years as the supply from Mexico increased. Mexican DTOs dominate the wholesale distribution of marijuana, which flows up through the Southwest border and through such Texas hub sites as Houston, Dallas, San Antonio, Brownsville, and El Paso. African-American and Mexican criminal groups transport large quantities of the drug and make it available to local dealers. Local independent dealers, street gangs, and other small groups are the local distributors. One-half of the items analyzed in NFLIS labs in 2004 contained cannabis (exhibit 3), down from 52.2 per-cent in 2003. In FY 2004, primary marijuana admissions in Or-leans Parish exceeded those for other substances for the first time, accounting for nearly one-third (32.1 percent, n=740) of the 2,306 treatment admissions (exhibit 4). Most (80.5 percent) were male. Mari-juana treatment admissions increased sharply from 11.5 percent in 1993 to 16.5 percent in 1994 to 28.2 percent in 1995. However, from 1995 to 2004, the percentage of marijuana treatment admissions re-mained relatively stable. In the other eight parishes in FY 2004, primary mari-juana admissions were proportionately highest in Terrebonne (37.3 percent), Calcasieu (30.0 percent), and Ouachita (26.6 percent) (exhibit 5). There were 821 DAWN marijuana ED reports identi-fied through DAWN Live! in 2004, accounting for 25.3 percent of unweighted illicit drug reports (ex-hibit 6a). Nearly two-thirds of the patients involved in these visits were male, and 57 percent were White (exhibit 6b). Nearly 41 percent were younger than 25. In 2004, there were 5,967 arrests for marijuana pos-session and 1,048 arrests for marijuana distribution, reflecting little change from 2003 (exhibit 7).
According to NDIC, the price of marijuana was sta-ble in 2004. Joints sold for as low as $2, and grams could be purchased for $10 (exhibit 8). Marijuana was sold by the ounce at the retail level for $125–$160 and by the pound wholesale for $800–$1,000. Methamphetamine/Amphetamines Methamphetamine indicators remained at low levels in New Orleans in 2003–2004. However, metham-phetamine may be gaining popularity in some small towns and communities in the State, according to the DEA New Orleans Field Division (NOFD). Small clandestine methamphetamine labs have reportedly increased in some rural areas. Most methampheta-mine seized in Louisiana came from Mexico and was transported from California or Texas in private and commercial vehicles. Of the items analyzed by NFLIS labs in 2004, 58 (0.5 percent of all items analyzed) were methampheta-mine or amphetamines (exhibit 3). In FY 2004, only five primary methamphetamine abusers entered treatment programs in Orleans Par-ish, representing only 0.2 percent of all admissions. Primary methamphetamine admissions were higher in eight other parishes, based on the assessment of the Louisiana State Epidemiology Work Group. As shown in exhibit 5, the parishes with the highest numbers and percentages of primary methampheta-mine admissions in 2004 included Rapides (6.7 per-cent), Bossier (6.2 percent), Calcasieu (4.2 percent), and Ouachita (3.8 percent). Rapides is located near the Texas border, through which most of the methamphetamine in Louisiana was transported. Of the preliminary unweighted DAWN emergency department reports for illicit drugs in New Orleans in 2004, 112 involved amphetamines and 25 involved methamphetamine (exhibit 6a). Club Drugs Use of club drugs continues to be reported in clubs and bars around the city’s French Quarter. Drugs such as methylenedioxymethamphetamine (MDMA or ecstasy) and gamma hydroxybutyrate (GHB) are most likely to be abused near metropolitan areas of the State where there are large college populations. Use of drugs such as ecstasy and flunitrazepam (Ro-hyphnol) and similar “date rape” drugs are on the rise among youth in the city. Youth continue to be lured to these drugs because of their “hipness” and the myth that club drugs are safe. Ketamine abuse ap-pears to have declined in the city, with little mention

EPIDEMIOLOGIC TRENDS IN DRUG ABUSE—New Orleans
Proceedings of the Community Epidemiology Work Group, Vol. II, June 2005 175
of the drug other than among teenagers experiment-ing with it. Of the 12,290 items analyzed by NFLIS in 2004, 126 (1 percent) were MDMA (exhibit 3). Another five were ketamine, and one was lysergic acid diethylamide (LSD). The unweighted DAWN Live! ED data for 2004 show 98 MDMA reports, representing 3.0 percent of illicit drug reports (exhibit 6a). ED reports for other drugs sometimes used in the “club scene” were few in num-ber: 19 phencyclidine (PCP) reports, 13 GHB reports, 5 LSD reports, and 2 ketamine reports. The retail cost of MDMA in the second half of 2004 was $15–$20 per tablet (exhibit 8). Benzodiazepines Benzodiazepines accounted for 0.7 percent of the items analyzed by NFLIS in 2004 (exhibit 3). Of the 88 benzodiazepine-type items, 49 (56 percent) were alprazolam, and 35 percent were diazepam. In 2003, 1.0 percent of all drug items analyzed were a benzo-diazepine. Of these 120 items, 62 percent were alpra-zolam. Preliminary unweighted data accessed from DAWN Live! show that ED reports of benzodiazepines to-taled 1,134 in 2004; 36 percent of the benzodi-azepine-involved visits were for overmedication. Alcohol Alcohol abuse is a serious problem in New Orleans, as it is in many cities and towns in the United States. Alcohol and drugs are often used together, also a common pattern across the Nation.
In Orleans Parish, primary alcohol admissions ac-counted for nearly 19 percent of all admissions in FY 2004 (exhibit 4). Primary alcohol admissions in eight other parishes in 2004 ranged from a low of 25 per-cent in St. Tammany Parish to a high of 41 percent in Bossier Parish (exhibit 5). In the unweighted data accessed from DAWN Live! for 2004, there were 1,217 reports involving alcohol-in-combination with other drugs and another 133 “alcohol only” reports involving patients younger than 21. Sixty-two percent of the alcohol-only reports involved patients who were male; 74 percent in-volved patients who were White, and 19 percent rep-resented Black patients. In this patient group, 69 per-cent were age 18–20, with the remainder being age 12–17. INFECTIOUS DISEASES RELATED TO DRUG ABUSE In the first quarter of 2005, there were 7,545 persons living with HIV (n=3,702) or AIDS (3,843) in metro-politan New Orleans. Of the 4,866 for whom expo-sure risk was known, 16 percent (489 men and 275 women) were exposed through injection drug use. Another 8 percent of the exposed cases were men who have sex with men and inject drugs. In addition, approximately 18 percent of the cases (650 women and 240 men) were exposed through heterosexual contact. Of the total 7,545 cases, 60 percent were Black non-Hispanic and 35 percent were White non-Hispanic. More than three-quarters (77.2 percent) were older than 34. For inquiries concerning this report, please contact Gail Thorn-ton-Collins, New Orleans Health Department, 2025 Canal Street, Suite 200, New Orleans, LA 70112, Phone:(504) 528-1912, E-mail <[email protected]>.

EPIDEMIOLOGIC TRENDS IN DRUG ABUSE—New Orleans
Proceedings of the Community Epidemiology Work Group, Vol. II, June 2005 176
Exhibit 1. Population Demographics for the City of New Orleans vs. the State of Louisiana, by Percent: 2000 and 2003 (Estimates)
2000 2003 (Estimates) Population Demographic New Orleans Louisiana New Orleans Louisiana Total Population (N) (484,674) (4,468,976) (451,316) (4,361,271)
Male 46.9 48.4 46.1 48.1 Female 53.1 51.6 53.9 51.9
Median Age (Years) (33.1) (34.0) (34.3) (34.7) One Race 98.7 98.9 99.3 98.9
White 28.1 63.9 28.1 64.0 Black or African-American 67.3 32.5 67.2 32.1 Asian 2.3 1.2 2.6 1.5 Other 1.1 1.3 1.4 1.2
Two or More Races 1.3 1.1 0.7 1.1 Hispanic or Latino (of any race) 3.1 2.4 3.1 2.5 Average Household Size (n) (2.48) (2.62) (2.49) (2.61) Median Household Income ($) ($27,133) ($32,566) ($35,677) ($34,141) Individuals Living Below Poverty Level 27.9 19.6 20.8 20.3 SOURCE: U.S. Census Bureau Exhibit 2. New Orleans DAWN ED Sample and Reporting Information: 2004 Total Eligible
Hospitals1 No. of Hospitals in DAWN Sample
Total EDs in DAWN Sample2
No. of EDs Reporting per Month: Completeness of Data (%)
No. of EDs Not Reporting
90–100% 50–89% <50% 21 19 21 9–11 0–2 0–2 10–13
1Short-term, general, non-Federal hospitals with 24-hour emergency departments based on the American Hospital Association An-nual Survey. 2Some hospitals have more than one emergency department. SOURCE: DAWN Live!, OAS, SAMHSA, updated 4/13–4/14, 2005 Exhibit 3. Number of Analyzed Items and Percentage of All Items Tested1 in New Orleans, by Drug: 2004 Drug Number Percent Cannabis 6,174 50.2 Cocaine 5,013 40.8 Heroin 651 5.3 Other Opiates 152 1.2 Benzodiazepines 88 0.7 MDMA/MDA 126 1.0 Methamphetamine/Amphetamines 58 0.5 1A total of 12,290 items were reported. SOURCE: NFLIS, DEA

EPIDEMIOLOGIC TRENDS IN DRUG ABUSE—New Orleans
Proceedings of the Community Epidemiology Work Group, Vol. II, June 2005 177
Exhibit 4. Percentages of Treatment Admissions in Orleans Parish, by Selected Drug: FY 1995–2004 SOURCE: Louisiana State Office of Alcohol and Drug Abuse Exhibit 5. Treatment Admissions for Selected Drugs in Eight Parishes Outside Orleans Parish, by Percent: 2004
Parish Drug
Bossier Calcasieu East Baton Rouge
Lafay-ette Ouachita Rapides St. Tam-
many Terre-bonne
Cocaine 26.7 15.8 45.5 32.3 24.8 26.5 28.4 17.3 Heroin 0.0 0.3 0.8 0.9 0.3 0.7 3.3 0.3 Other Opiates 8.9 11.4 5.0 11.5 4.7 11.4 21.1 7.5 Marijuana 15.4 30.0 13.2 13.3 26.6 17.5 17.3 37.3 Methampheta-mine 6.2 4.2 2.1 1.0 3.8 6.7 1.6 1.0
Alcohol 40.8 30.7 32.6 37.8 36.1 32.9 24.7 34.2 Other Drugs 2.0 7.6 0.8 3.2 3.7 4.3 3.6 2.4 Total (N=)1 (292) (983) (3,432) (885) (914) (1,295) (1,026) (986)
1Excludes a few admissions for whom a primary drug was not reported. SOURCE: Louisiana State Office of Alcohol and Drug Abuse
0.0
5.0
10.0
15.0
20.0
25.0
30.0
35.0
40.0
45.0
Cocaine 40.4 41.1 36.2 38.1 35.5 34.4 32.5 34.5 34.0 31.6
Heroin 3.5 3.6 6.2 8.4 12.2 11.2 14.8 11.8 10.6 11.1
Marijuana 28.2 31.3 30.9 30.2 33.0 29.2 30.5 29.8 28.9 32.1
Alcohol 25.5 22.3 24.9 21.4 17.8 20.5 18.6 19.3 21.2 18.7
1995 1996 1997 1998 1999 2000 2001 2002 2003 2004

EPIDEMIOLOGIC TRENDS IN DRUG ABUSE—New Orleans
Proceedings of the Community Epidemiology Work Group, Vol. II, June 2005 178
Exhibit 6a. Number and Percent of Selected Illicit1 Drug Reports in DAWN ED (Unweighted2): 20042 Drug Number Percent Cocaine 1,607 49.5 Heroin 490 15.1 Marijuana 821 25.3 Amphetamines 112 3.4 Methamphetamine 25 0.8 MDMA 98 3.0 Other Illicit Drugs 94 2.9 1Excludes “Alcohol Only” reports for persons younger than 21. 2Unweighted data are from 8–11 New Orleans EDs reporting to DAWN in 2004. All DAWN cases are reviewed for quality control. Based on this review, cases may be corrected or deleted and, therefore, are subject to change. SOURCE: DAWN Live!, OAS, SAMHSA, updated 1/13–1/14, 2005 Exhibit 6b. Demographic Characteristics of Patients Reporting Abuse of Illicit Drugs in New Orleans DAWN EDs, by Percent (Unweighted1): 2004 Characteristic Cocaine Heroin Marijuana Gender Male 69.2 76.3 66.4 Female 30.7 23.32 33.6 Age Group Younger than 25 16.6 28.0 40.6 25–34 27.4 37.1 28.0 35 and older 56.0 34.9 31.4 Race/Ethnicity White 36.8 36.9 57.4 Black 59.1 59.0 35.8 Hispanic 1.0 1.2 2.1 Other 0.1 0.2 0.1 Not documented 3.0 2.7 4.6 1Unweighted data are from 8–11 New Orleans EDs reporting to DAWN. All DAWN cases are reviewed for quality control. Based on this review, cases may be corrected or deleted and, therefore, are subject to change. 2Gender was not documented for 2 heroin-involved visits. SOURCE: DAWN Live!, OAS, SAMHSA, updated 1/13–1/14, 2005 Exhibit 7. Drug Arrests in Orleans Parish by Race/Ethnicity, Gender, and Offense: 2003–2004
Males Females Black White Other Black White Other Total Drug/ Of-
fense 2003 2004 2003 2004 2003 2004 2003 2004 2003 2004 2003 2004 2003 2004
Cocaine Possession Distribution
2,134 1,086
1,662 1,106
306 38
140 11
14 6
7 6
385 120
367 156
101 11
72 7
1 1
1 0
2,941 1,262
2,249 1,286
Heroin Possession Distribution
230 155
220 76
66 5
42 3
0 0
0 0
24 16
22 6
38 0
25 2
0 0
0 0
358 176
309 87
Marijuana Possession Distribution
4,389
832
4,468
860
1,034
80
925 67
18 1
9
10
447 119
412 94
182 23
152 16
0 2
1 1
6,070 1,057
5,967 1,048
Other Drugs 197 198 51 58 1 1 24 239 25 17 0 0 298 513 Drug Para-phernalia 1,404 1,435 631 524 18 12 402 541 195 188 2 2 2,652 2,702
SOURCE: New Orleans Police Department

EPIDEMIOLOGIC TRENDS IN DRUG ABUSE—New Orleans
Proceedings of the Community Epidemiology Work Group, Vol. II, June 2005 179
Exhibit 8. Illicit Drug Prices in New Orleans: July–December 2004
Price in Dollars Drug
Wholesale Midlevel Retail
Powder Cocaine $18,000–$25,000 per kilogram $9,000–$10,000 per pound $800–$1,200 per ounce $250 per ¼ ounce
$80–$150 per gram
Crack $20,000–$28,000 per kilogram $8,000 per pound $900–$1,200 per ounce $5–$25 per rock
$80–$125 per gram
Heroin $80,000–$100,000 per kilo-gram $4,000–$9,000 per ounce $20–$25 per paper
$300–$600 per gram
Marijuana $2,000 per kilogram $800–$1,000 per pound $125–$160 per ounce $10 per gram
$2 per joint
Methamphetamine $20,000 per pound $1,400–$1,600 per ounce $400–$500 per ¼ ounce $100 per gram
MDMA $8–$12 per tablet $12–$15 per tablet $15–$20 per tablet SOURCE: DEA and Narcotics Digest Weekly, NDIC Exhibit 9. Arrests for Possession and Distribution of Schedule II Narcotics in New Orleans, by Age Group and Race/Ethnicity: 2004
Possession Males Females Age Group
Black White Other Black White Other Total
<17 56 0 0 2 0 0 58 17–20 43 24 2 7 7 0 83 21–25 96 50 2 19 15 0 182 26–30 76 53 0 16 18 0 163 31–35 72 60 0 16 12 0 160 36–40 80 31 0 21 10 0 143 >41 181 65 0 36 16 0 298
Distribution Males Females Age Group
Black White Other Black White Other Total
<17 57 1 1 2 0 0 61 17–20 37 5 1 4 1 0 48 21–25 49 16 0 5 4 0 74 26–35 39 4 0 5 4 0 52 ≥36 59 37 1 20 14 0 131 SOURCE: New Orleans Police Department

EPIDEMIOLOGIC TRENDS IN DRUG ABUSE—New York City
Proceedings of the Community Epidemiology Work Group, Vol. II, June 2005 180
Drug Use Trends in New York City Rozanne Marel, Ph.D., John Galea, M.A., Robinson B. Smith, M.A., and Gregory Rainone, Ph.D.1 ABSTRACT
Drug use trends were again mixed for this reporting period. Admissions to treatment with cocaine as a primary drug rose again this reporting period. Al-though both cocaine powder and crack remain of good quality, many crack locations are seeing a de-cline in buyers and sellers. Heroin indicators remained stable. Heroin remains widely available, although the purity levels have fallen recently. Mari-juana indicators, which had been reaching new peaks, seem to have stabilized. Marijuana continues to be available in a wide variety of flavors and colors. Al-though the numbers remain small, there is concern about methamphetamine. Many kinds of prescription drugs continue to be available on the street, and they seem to be growing in popularity, based on indicator data and street observations. Of the 92,021 New York-ers living with HIV or AIDS, men having sex with men and injection drug use history remain the two major transmission risk factors.
INTRODUCTION Area Description New York City, with 8 million people, is by far the largest city in the United States. It is situated in the southeastern corner of the State on the Atlantic coast and encompasses an area of 320 square miles. It has nearly 600 miles of waterfront and one of the world’s largest harbors. Historically, New York City has been home to a large multiracial, multiethnic population. New York City is the largest and most racially/ethnically diverse city in the country. As has been true throughout its history, immigration continues to shape the character of New York City. It has contributed to a substantial shift in the race/ethnic composition of New York. Findings from the 2000 census show that the population diversity con-tinues: 35 percent are White; 27 percent are Black; 27 percent are Hispanic of any race; and 10 percent are Asian and Pacific Islander. The five largest Asian groups in the city are Chinese, Asian Indian, Korean,
1The authors are affiliated with the New York State Office of Alco-holism and Substance Abuse Services, New York, New York.
Filipino, and Pakistani, and the five largest groups of Hispanic origin are Dominican, Mexican, Puerto Rican, Colombian, and Ecuadorian. Moreover, New York City includes people who identify with races/ethnicities from all over the world. It is estimated, for example, that in Queens alone more than 120 languages are spoken. Nearly 3 million New York City residents are foreign born (2,871,032), which represents 36 percent of the resident population, and about 1.2 million legal immi-grants became New York City residents between 1990 and 2000. The Dominican Republic remains the city’s largest source of immigrants. The city remains the economic hub of the Northeast. Its main industries include services and wholesale and re-tail trade. Of the more than 3.7 million people em-ployed in the city, 22 percent commute from surrounding areas. Overall, the unemployment rate in New York City for April 2005 was 5.7 percent, com-pared with 4.9 percent in New York State and 5.2 percent in the Nation. According to the Bureau of Labor Statistics, the New York City rate is dramatically lower than it was in October 2003, when it was 8.3, but it is higher than the unemployment rate for October 2000, when the rate was 5.4. New York City is still experi-encing the economic aftereffects of the September 11, 2001, attacks on the World Trade Center. Many jobs in New York City were lost as a result of decreased busi-ness activity and the relocation of business firms. Census 2000 data showed that the median household income for New York City residents was $38,323, as compared to $43,393 for State residents and $41,994 for U.S. residents as a whole. The percentages of per-sons living below the poverty level for New York City and the State as a whole were 21.2 percent and 14.6 percent, respectively. The comparable figure for U.S. residents as a whole in 2000 was 12.4 percent. Data Sources This report describes current drug abuse trends in New York City from 1995 to 2004, using the data sources summarized below: • Emergency department (ED) data were derived
for calendar year 2004 from the Drug Abuse Warn-ing Network (DAWN) Live! restricted-access online query system administered by the Office of Applied Studies (OAS), Substance Abuse and Men-tal Health Services Administration (SAMHSA). Eligible hospitals in the New York 5 Boroughs Di-vision totaled 52; hospitals in the DAWN sample numbered 39, with the number of emergency de-partments in the sample totaling 60. (Some hospitals have more than one emergency depart-ment.) During this 12-month period, between 29

EPIDEMIOLOGIC TRENDS IN DRUG ABUSE—New York City
Proceedings of the Community Epidemiology Work Group, Vol. II, June 2005 181
and 37 EDs reported data each month. The com-pleteness of data reported by participating EDs varied by month (see exhibit 1). Exhibits in this paper reflect cases that were received by DAWN as of May 31, 2005–June 2, 2005. All DAWN cases are reviewed for quality control. Based on this review, cases may be corrected or deleted. Therefore, the data presented in this paper are sub-ject to change. Data derived from DAWN Live! represent drug reports in drug-related ED visits. Drug reports exceed the number of ED visits, since a patient may report use of multiple drugs (up to six drugs and alcohol). The DAWN Live! data are unweighted and, thus, are not estimates for the re-porting area. These data cannot be compared to DAWN data from 2002 and before, nor can pre-liminary data be used for comparison with future data. Only weighted DAWN data released by SAMHSA can be used for trend analysis. A full description of the DAWN system can be found at http://dawninfo.samhsa.gov/. ED drug mentions data before 2003 were derived from the DAWN, OAS, SAMHSA, for 1995 through 2002. The weighted data are based on a representative sample of hospitals in New York City and Westchester, Rockland, and Putnam Counties.
• Drug abuse-related death data are from the
DAWN mortality system. Data from 2003 covered New York, New York, Newark, New Jersey, and Edison, Pennsylvania. For 2003, the following nine counties participated: Morris, New Jersey; Union, New Jersey; Bronx, New York; Kings, New York; New York, New York; Putnam, New York; Queens, New York, Richmond, New York; and Suffolk, New York. Data from 1995 covered New York City, Long Island, and Putnam County and included her-oin/morphine and unspecified types of opiates. Between 1996 and 2002, DAWN covered only New York City, and the category for heroin/morphine no longer included other opiates. According to Mortal-ity Data From the Drug Abuse Warning Network, 2001, incomplete data were received for the New York metropolitan area, so data for New York are not presented for 2001.
• Treatment admissions data were provided by the
New York State Office of Alcoholism and Sub-stance Abuse Services (OASAS) for 1995 through 2004 and included both State-funded and nonfunded admissions. Demographic data are for 2004.
• Drug-related arrest data were provided by the
New York City Police Department (NYPD) for 1994–2002.
• Forensic laboratory testing data for New York City were provided by the Drug Enforcement Ad-ministration (DEA)’s National Forensic Laboratory Information System (NFLIS) for January through December 2004.
• Drug price, purity, and trafficking data were pro-
vided by the DEA’s Domestic Monitor Program (DMP) for heroin. These data are supplemented by information from the OASAS Street Studies Unit (SSU) reports.
• Cocaine use during pregnancy data were provided
by the New York City Department of Health for 1995–2003.
• Acquired immunodeficiency syndrome (AIDS)
and human immunodeficiency virus (HIV) data were provided by the New York City Department of Health and Mental Hygiene, HIV Epidemiology Program, for 1984 through June 30, 2004.
DRUG ABUSE PATTERNS AND TRENDS Cocaine/Crack In general, many cocaine indicators, which had been declining, are beginning to show increases, and the drug still accounts for major problems in New York City (exhibit 2). For the five boroughs of New York City, there were 10,134 unweighted DAWN Live! reports for cocaine in January–December 2004. Of these reports for cocaine, 39 percent of the patients were seeking detoxification. While primary cocaine treatment admissions to State-funded and nonfunded programs in New York City had declined from 17,572 in 1998 to 14,059 in 2000, they increased to 16,642 in 2004—the highest total in 6 years. It should be noted that even when the cocaine treatment admissions were in decline, they did not show the same type of dramatic long-term decline that was seen in the other indicators. In 2004, cocaine admis-sions constituted 24 percent of all New York City’s 69,065 drug and alcohol treatment admissions (exclud-ing alcohol-only). Exhibit 3 shows demographic characteristics of cocaine treatment admissions for 2004 by the two primary modes of use: smoking crack (representing 62 percent of cocaine admissions) and using cocaine intranasally (representing 35 percent). Those who smoke crack are more likely than intranasal users to be female (36 vs. 25 percent), Black (69 vs. 42 percent), readmissions to

EPIDEMIOLOGIC TRENDS IN DRUG ABUSE—New York City
Proceedings of the Community Epidemiology Work Group, Vol. II, June 2005 182
treatment (83 vs. 71 percent), and without income (34 vs. 25 percent), although for both groups, there were fewer clients with no source of income than in the pre-vious reporting period. Those using intranasally are more likely to be Hispanic or White and to have some criminal justice status. The two groups are similar in secondary drugs of abuse, primarily alcohol and mari-juana. It should be noted that all admissions for primary cocaine abuse represent an aging population, and those smoking crack tend to be older than those using cocaine intranasally. Another data source, the DEA’s National Forensic Laboratory Information System, showed that of the 45,514 items reported for New York City in 2004, 22,264 (49 percent) were cocaine. According to the Street Studies Unit, cocaine hydro-chloride (HCl) buying and use continues at a stable pace. Although cocaine has traditionally been sold from indoor locations, field observers report that there has been a steady increase in the number of street sellers offering powder cocaine in various parts of New York City, and they expect the trend to continue during the summer. Cocaine prices can fluctuate, as sellers vary the purity of the product and offer several different-sized packages. Cocaine is sold in $20, $25, $30, and $60 packages. The most common price on the street is the $20 packet, which contains approximately 0.25 ounces of cocaine powder. A number of different methods are used in the packag-ing of cocaine in New York City, including vials, nail-sized plastic bags, aluminum foil glassine bags, light plastic wrap knotted at both ends, cellophane, folded paper, magazine pages, and balloons. Of these, the tra-ditional method of aluminum foil continues to the most frequently used method, followed by plastic wrap and cellophane. Although users prefer the malleability of aluminum, they dislike the fact that the cocaine can “cook-up” (melt) in the foil from simple body heat. The use of brand names in association with the sale of co-caine is becoming increasingly rare, since brand names may attract attention from law enforcement and may be easily duplicated by competitors. According to the DEA, the majority of the cocaine in New York City is supplied by Colombians. Dominican drug gangs continue to dominate the distribution of cocaine in New York City. Many cocaine sellers appear to be part of an extended organization composed of family, relatives, and long-term friendships. At the street level, most sellers are of the same ethnic identity as the largest ethnic group in the community. There are three basic methods used to sell cocaine HCl. The techno-method or virtual connection method, in which the buyer contacts the seller (via beeper, cell-phone, or
Internet), places an order, and arranges a meeting and location, seems to be enjoying great popularity. In the second method, sellers work out of their own apart-ments. The third method is selling cocaine on the street. These sellers deal solely with the “personal use” buyer who may want to buy less than $50 of cocaine. Cocaine selling is typically found in Black and His-panic low-income communities, and the majority of the cocaine HCl street buyers are Hispanic and Black. Compared with heroin and crack, however, cocaine also has a large number of White street buyers. Cocaine users as a whole tend to have a higher social-economic status (SES). This is probably the result of cocaine’s popularity among young, white-collar professionals. According to field observations, cocaine users appear to be almost evenly split in terms of gender, but the major-ity of the individuals actually making the buys continue to be males. Cocaine users appear to be younger on average than either heroin or crack users. Observations of large clusters of young buyers age 18–25 may sug-gest a new generation of cocaine HCl users. According to street interviews, most cocaine HCl users report that they “only” snort the drug. Some recent re-ports from the street, however, suggest that because of “speedballing” cocaine and heroin, injecting may be increasing. Most users report that they use cocaine solely for recreational purposes, typically in group set-tings, at special events (such as parties or at clubs), and only on weekends. Field workers have also reported names of combinations involving cocaine and other drugs. “Russian” refers to a combination of cocaine HCl, crack, and Viagra; “Honey Devil” is a combina-tion of cocaine, Viagra, and marijuana, or just Viagra and marijuana. Crack users report that crack cocaine continues to be highly available; however, because of police pressure, crack selling is less overt. Although there has been a decline in “open-air” markets, the Street Studies Unit expects that as the weather continues to get warmer, there will be a gradual shift to outdoor selling. Field researchers report that street-level crack in New York City is being sold in $5, $10, and $20 packages. The most common price/package combination is the $10 packet. During the summer, the $5 amount be-comes more popular. There are three basic packaging methods associated with crack in New York City. They are thumb-nail size plastic bags, plastic vials, and glassine bags. Of these, the thumbnail-size bag continues to be the most popular packaging method. The field staff, however, reports an increase in the appearance of thin, 1-inch plastic vials with tops of various colors. Street contacts indicate that

EPIDEMIOLOGIC TRENDS IN DRUG ABUSE—New York City
Proceedings of the Community Epidemiology Work Group, Vol. II, June 2005 183
these containers serve to protect the product from body heat and humidity, an issue of obvious importance dur-ing the summer. The downside, according to some street contacts, is that the vials tend to be easier to find and more difficult to get rid of when one is trying to avoid arrest. What currently serves as a brand name in the selling of crack on the street is the color of the package or top—(“blue bag” or “green tops,” etc.). The use of brand names, in general, is becoming increasingly rare. Street crack sellers are typically African-American or Hispanic males, between 17 and 35 years old. Although the sellers usually reflect the racial composition of the community, there appear to be slightly more Hispanic sellers than Black sellers. According to street contacts, Dominican drug gangs are the midlevel suppliers of the street sellers. The street-level sellers tend to be inde-pendent entrepreneurs with no direct connection with the midlevel dealer. Based on field observations of both high and medium volume selling sites, there seems to be a trend away from the large extended organizations controlling mul-tiple sites. Most crack sellers are part of a two- or three-person partnership that serves a specific location. This street-level cooperative reduces overhead, extends selling hours, enables larger and cheaper inventory buys, provides mutual security for the sellers from rip-offs, and decreases challenges to the selling site by rival sellers. The truly independent single seller may best be described as a floater, who serves a small general area but does not claim a specific location. The single seller usually has a smaller client list and is more likely to extend credit or other allowances to keep his clients. Although midlevel dealers offer ready-made crack, most street sellers would prefer to buy cocaine HCl and cook their own crack. Preparing their own crack allows them to control the purity or quality of their product, thereby increasing profit margins. Field researchers report that many of the heavy crack selling locations around the city continue to be found in or around public housing developments. While police presence has pressured many “open-air” street locations to move indoors, the SSU expects an increase in outside selling locations during the summer. Operating in the open is also becoming more difficult, because the po-lice are installing more special surveillance cameras, suspended from buildings and street lights, to monitor heavy selling locations. As a rule, street crack sellers do not sell other drugs. Other drug sellers, however, may operate from the same street corner. Crack sellers operating from indoor loca-
tions, on the other hand, have the room, time, and op-portunity to offer a secondary product line. The most common secondary drug is marijuana, which many us-ers smoke in conjunction with crack or use to reduce the “crash-effect” after the prolonged use of crack. The majority of the crack users are African-American or Hispanic males with low socio-economic status. Field researchers report that most observed buyers ap-pear to be in their thirties. The SSU has not observed young or new users; most buyers observed appear to be veteran users. Every crack user interviewed reported smoking crack, typically using an old broken glass stem or tobacco leaves. Field workers also report the use of the phrase “Chasing the Dragon” again to refer to the use of crack and heroin in a pipe together, with the crack first at the bottom on a bed of ashes. Reportedly, this method helps the drugs burn more slowly. There continues to be talk on the street about some individuals injecting crack, and there have been reports of users injecting crack with alcohol. The DEA reports that prices for cocaine powder for July to December 2003 were $22,000–$26,000 per kilogram and $800–$1,600 per ounce. The DEA reports that crack sells for about $28,000–$30,000 per kilo-gram, $800–$1,600 per ounce, $27–$45 per gram, and $7–$10 per rock. DAWN figures for cocaine-involved deaths showed 520 cocaine-involved drug misuse deaths in 2003 (ex-hibit 2). For the cocaine drug-related deaths in 2003, 18 percent involved one drug. The NYPD reports a decline in cocaine arrests since 1995 (n=40,846) (exhibit 2). The number of cocaine arrests in 2002 was 13,574, a 67-percent decrease since 1995. Of the cocaine arrests in 2002, 79 percent in-volved crack. Another important indirect indicator of cocaine in-volvement is the number of births in New York City to women who admit using cocaine during pregnancy. This not only indicates use among women, but it under-scores a serious aspect of the cocaine problem. For several years, the number of women using cocaine dur-ing pregnancy increased. In 1989, the number of births to women who used cocaine peaked at 3,168. After 1989, the number steadily declined to 354 in 2003—an 89-percent decline over 14 years (exhibit 2). It should be noted, however, that the change between 2002 and 2003, 2 percent, was the smallest decline in recent years. Heroin

EPIDEMIOLOGIC TRENDS IN DRUG ABUSE—New York City
Proceedings of the Community Epidemiology Work Group, Vol. II, June 2005 184
Heroin indicators remained stable during this reporting period (exhibit 4). For the five boroughs of New York City, there were 6,374 preliminary unweighted DAWN Live! heroin ED reports for January through December 2004. Of these heroin reports, 52 percent of the patients were seeking detoxification. Primary heroin admissions to treatment programs in New York City gradually increased between 1995 and 2004, from 18,287 to 23,687, an increase of almost 30 percent (exhibit 4). Primary heroin admissions in 2004 constituted 34 percent of New York City’s 69,065 drug and alcohol treatment admissions (excluding alcohol-only). Intranasal heroin use may have peaked in the second half of 1998, with 62 percent of heroin admissions to all New York City drug treatment programs reporting this as their primary route of administration. Since then, the proportions reporting intranasal use declined slightly, to 60 percent in 1999 through 2002, 59 percent in 2003, and 60 percent in 2004. Meanwhile, heroin injection increased among heroin admissions, from 32 percent in the second half of 1998 to 37 percent in 2004. Exhibit 5 highlights general demographic characteris-tics of heroin abusers admitted to all New York City treatment programs in 2004 by mode of use. In general, primary heroin admissions were overwhelmingly male (75 percent), older than 35 (71 percent), more likely to be Hispanic (53 percent) than Black (27 percent) or White (18 percent), usually readmissions to treatment (89 percent), and likely to report cocaine as a secondary drug of abuse (40 percent). Compared with heroin in-jectors, intranasal users were more likely to be Black (32 vs. 16 percent) and have some criminal justice status (37 vs. 25 percent). In contrast, primary heroin injectors were more likely than intranasal users to be White (30 vs. 11 percent), to report cocaine as a secon-dary drug of abuse (46 vs. 36 percent), and to have started use before reaching age 20 (56 vs. 41 percent). In addition to heroin admissions to traditional treatment programs, heroin admissions for detoxification or crisis services in New York City have become sizable in number. These special services are usually short term, provided in a hospital or community-based setting, and medically supervised. In 1995, 4,503 such admissions were reported for heroin abuse; by 2004 that figure in-creased to 15,913, slightly less than in 2003 (16,067). DAWN medical examiner (ME) figures for heroin-involved deaths in the New York metropolitan area show 104 drug misuse deaths in 2003 (exhibit 4). Of these, 13 percent were single-drug deaths. The category of opiates/opioids, which includes heroin (specified),
methadone, and all other opiates/opioids, accounted for more drug misuse deaths than any other category in 2003. NFLIS data show that 12 percent of the 45,514 cases for New York City in 2004 (5,313) were related to heroin. From 1992 to 2000, the DMP found average heroin purities to be generally above 60.0 percent. Findings for 2003, however, show an average purity of 53.5 percent, down from 61.4 percent in 2002. The associated price is $0.48 per milligram pure, an increase from $0.36 per milligram pure in 2002. According to the DEA, kilo-gram prices for January to June 2004 were $60,000–$70,000 for South American heroin and $60,000–$90,000 for Southwest Asian heroin. According to the SSU field staff, heroin in New York City continues to be highly available and accessible, with no shortage of selling locations. The “count” or amount sold in a $10 bag appears unchanged, and comments from buyers appear to suggest that dealers do not appear to be trying to stretch their supply. The ma-jority of heroin copping locations are inside or off-the-street operations. With the advent of warmer weather, however, the SSU predicts a substantial increase in heroin street dealing. Field staff members continue to report seeing nodding behavior by heroin users. While the quality of the heroin can vary by location and seller, most street contacts indicate that the current quality on the street is still fairly high, although the quality has been higher in recent years. The source of most of the heroin sold and used in New York City is South America. According to the DEA, Colombians are the principal importers and smugglers. Street sources indicate that the high and middle level distribution of heroin in New York City is done by Dominican drug gangs. The majority of the low-level distributors and street sellers continue to be Hispanics in some sections of New York and Blacks in other sections. The most common price for heroin bought on the street is $10 per packet. Each package contains approximately 0.10 grams of powder. Regular heroin users report that they spend approximately $40 per day. Many of these individuals pay for their habit through panhandling or selling cigarettes or other articles on the street. Many of the females often exchange sexual favors for money or drugs. There are five basic packaging methods associated with heroin in New York. These methods include the glass-ine bag, plastic wrap, and cellophane. The color of the bag usually identifies a given dealer’s product without identifying the dealer to the police.

EPIDEMIOLOGIC TRENDS IN DRUG ABUSE—New York City
Proceedings of the Community Epidemiology Work Group, Vol. II, June 2005 185
The heroin user is typically older (thirties to fifties). While the majority of the heroin users are Black or His-panic males, most street contacts report that heroin sellers, regardless of where they operate, have frequent White buyers. Although, at one time, heroin sellers did not sell other drugs, the SSU reports that more heroin dealers are selling crack in addition to heroin. There is an increasing trend for heroin users to use both drugs in or-der to produce a speedball effect. Until very recently, most heroin users would have described themselves as snorters. There are reports, however, of greater use of needles, particularly among users younger than 30. There is less use of brand names in the marketing of heroin on the street because these names or symbols either attract too much police attention or they can be easily duplicated by competitors. Much like cocaine arrests, heroin arrests reached a high of 28,083 in 1989, declined for a few years, and then peaked in 1995 (n=38,131) (exhibit 4). Heroin arrests decreased from 33,665 in 2000 to 27,863 in 2001, but they increased again in 2002 to 34,098, an increase of 22 percent in the year. Other Opiates/Narcotics According to preliminary unweighted DAWN Live! data for the five boroughs of New York City for Janu-ary through December 2004, there were 3,732 ED reports of opiates/opioids. Of these reports for opi-ates/opioids, 35 percent were for detoxification. Street researchers are reporting more use and diversion of OxyContin. Some users are using it by itself, while others are injecting it with cocaine for a speedball ef-fect. Reports indicate that to remove the special coating on OxyContin in order to inject, some users are soaking the tablet in hot water. Although street researchers have not observed people hawking OxyContin, they have encountered a number of street buyers asking for Oxy-Contin and claiming that the tablets are selling for $10 per pill. Among ME deaths for the New York metropolitan area reported by DAWN, the category of opiates/opioids, which includes all legal and illegal narcotic analgesics and combinations, accounted for more drug misuse deaths than any other category. For specific narcotic-type drugs in DAWN ME reports, methadone ac-counted for 250 deaths in the New York metropolitan area in 2003, while all other opiates, excluding heroin, accounted for 532 deaths. Marijuana
In New York City, marijuana indicators, which had recently increased steadily and dramatically, appear to be stabilizing (exhibit 6). For the five boroughs of New York City, there were 3,118 preliminary unweighted DAWN Live! ED reports for marijuana for January through December 2004. Primary marijuana admissions to all treatment programs had been increasing steadily over the past several years. The number increased more than ninefold between 1991 and 2002, from 1,374 to 14,310, the highest an-nual number (exhibit 6). Although the number fell again to 13,247 in 2004, that is still among the highest yearly totals for primary marijuana admissions. In 1991, pri-mary marijuana admissions represented less than 5 percent of all treatment admissions; by 2004, these ad-missions represented 17 percent of admissions (excluding alcohol-only) to all New York City treat-ment programs. Exhibit 7 shows demographic characteristics of primary marijuana admissions to all New York City treatment programs in 2004. The vast majority were male (79 percent), and 28 percent were younger than 21. More than one-half (57 percent) were Black, about one-third (32 percent) were Hispanic, and 8 percent were White. Alcohol was the secondary drug of abuse for 38 percent of the marijuana admissions, and almost two-thirds had some criminal justice status (65 percent). Marijuana continues to be the most widely abused illicit drug in New York City. According to street contacts, marijuana is readily available at levels similar to those reported in the previous study period. Street contacts also report that most of the marijuana currently avail-able in New York City is of good to very good quality, the same assessment as the last reporting period. Field researchers report that street-level marijuana is associated with three basic prices: $10, $20–$25 (half-ounce), and $50–$60 (ounce) amounts. During the pre-sent study period, field researchers were unable to find any location offering marijuana for $5 or in loose joints. The most common street selling price continues to be $10. Unlike most other drug users, marijuana users commonly pool their money and share the drug. The $50 amounts of marijuana are rarely sold on the street; they are usually made through house connections. The pricing pattern has not changed since the last reporting period. There are several packaging methods associated with marijuana street sales in New York City: the thumbnail-size plastic bags, glassine bags, aluminum foil, and ma-nila envelopes. The thumb-nail-size plastic bag is currently the most popular packaging method. Since

EPIDEMIOLOGIC TRENDS IN DRUG ABUSE—New York City
Proceedings of the Community Epidemiology Work Group, Vol. II, June 2005 186
buyers prefer to examine the marijuana before buying, the manila envelopes and aluminum foil have fallen out of favor with sellers. Marijuana sellers are on average the youngest group of drug sellers. Most are adolescents and young adults (16–30 years old). As is true for most drug sellers, the marijuana sellers tend to reflect the ethnic make-up of the community, and most sellers operate in the area where they live. Most street-level sellers tend to be very young, African-American or Hispanic males. In more affluent communities, however, the seller is usually White and operates out of his parents’ home. Most of those selling marijuana are independent sellers, and their customers tend to be from their circle of acquaint-ances. Most sellers initially start selling marijuana in order to support their own habit. The general availabil-ity of marijuana, its low-price, and the perception of minor legal consequences tend to attract sellers, who with a small amount of money to invest can start their own business. In cases in which marijuana sellers are associated with large organizations, marijuana is typi-cally a secondary product, and the organization’s principal interest is another drug (i.e., heroin, crack, or cocaine). As with other drugs, there are three basic selling meth-ods associated with marijuana. The techno/virtual method remains very popular. A buyer makes a connec-tion with a seller through the use of a beeper, cell-phone, or Internet. An order is made, and a meeting is arranged or a delivery is scheduled. Another method is the use of a private residence. Marijuana sellers typi-cally work out of their own apartments, and for many sellers, this constitutes a part-time avocation that helps supplement their income and habit. Many of these indi-viduals develop a client list and require an introduction before they sell to a stranger. The third method, street sales, is associated with the highest risk but is still quite common in some communities. Although the majority of marijuana selling is done from indoor locations because of police pressure, marijuana selling is also found in outside locations. Sellers, par-ticularly during the summer, tend to gravitate toward outside venues that attract crowds of young people (i.e., the park, beach, concerts). As a rule, street marijuana sellers do not sell other drugs; however, on occasion, phencyclidine (PCP) and methylenedioxymetham-phetamine (MDMA or ecstasy) have been known to be sold from the same location. The use of marijuana cuts across all social demarcations (age, race, ethnicity, social class). Nevertheless, this drug seems to be most popular among adolescent and young adult users. In general, from any given location, the buyer and the seller tend to be from the same ethnic
group. According to street observations, the majority of marijuana buyers are Hispanics and African-Americans. Marijuana users appear to be the youngest of any of the buyers of the main drug categories. Many of the buyers are currently in college or high school. Most users re-ported having tried marijuana for the first time in high school or junior high school at the urging of a friend. According to observations by field staff, the majority of buyers are male, although there are a substantial num-ber of lone female buyers. As a group, marijuana users are somewhat higher than other drug users in terms of socio-economic status. Most of the buyers interviewed on the street indicate that they use marijuana for purely recreational pur-poses. The younger users indicate that most of their friends smoke the drug, and the most frequently offered reason for using marijuana is to “wind-down,” “loosen-up,” or “chill” (relax). Almost all use some form of alcohol in conjunction with smoking marijuana. Most users indicated that they saw nothing wrong with mari-juana use and felt that the legal penalties for using marijuana were less severe than those associated with other illicit drugs. Traditionally, marijuana was smoked in a joint. This method is no longer very popular, and many stores no longer even stock rolling paper. Currently, the most popular method involves the use of blunts: hollowed-out cigars or marijuana wrapped in cigar leaves. Very often, the leaves are dipped in brandy or some other aromatic liquor. The tobacco industry has responded to this by developing a large and varied selection of cigars for the adolescent marijuana user, featuring such selec-tions as grape or vanilla cigars. A popular type of marijuana is called “Haze,” and it comes in a variety of flavors, including strawberry and bubblegum. Another street term is “Combo,” referring to a mixture of two or three different flavors of “Haze” mixed with cocaine and smoked in a blunt. Marijuana users seem to be equally comfortable using the drug in a group setting or in private. In private, the drug serves to reduce tension; in social gatherings, it serves to lower social inhibi-tions. DAWN ME mentions for marijuana-involved drug mis-use deaths in the New York City metropolitan area numbered 53 in 2003. None of these was a single-drug death. According to National Forensic Laboratory Information System data, 25 percent of the cases for New York City in 2004 (11,523) were related to cannabis. According to the DEA, marijuana prices can range from

EPIDEMIOLOGIC TRENDS IN DRUG ABUSE—New York City
Proceedings of the Community Epidemiology Work Group, Vol. II, June 2005 187
$1,000 to $2,000 per pound wholesale and from $3,000 to $5,000 per pound for hydroponic marijuana. In spite of decriminalizing possession of small amounts of marijuana, the NYPD continues to make a large number of marijuana-related arrests in New York City. The number of arrests has stabilized, however (exhibit 6). Cannabis-involved arrests had reached a low of 4,762 in 1991, but they increased more than 12 times in the next 9 years to 60,455 in 2000. Arrests for 2002 (47,250) were at the same level as in 2001, which was the second largest yearly total. For arrests in 2002, ap-proximately 98 percent were for misdemeanors, and 32 percent involved persons age 20 or younger. Moreover, cannabis arrests accounted for 48 percent of all drug arrests in New York City in 2002, a dramatic change from earlier years and a continuation of the trend seen in the last 5 years. Stimulants Although methamphetamine is popular in other parts of the Nation, there were relatively few arrests, ED reports, deaths, or treatment admissions related to the drug in New York City. For example, in 2003, only seven stimu-lant deaths were reported in the New York metropolitan area. In the five boroughs of New York City, there were 154 DAWN Live! ED reports for stimulants for January through December 2004, according to preliminary un-weighted data. According to the SSU, numerous sources in the gay community talk of the growing concern about the use of methamphetamine among young gay males and the relationship between the use of this drug and the spread of HIV. A number of gay male users have reported ex-periencing crystal methamphetamine binges during which they have engaged in unsafe sexual activity. There are also indications that the use of metham-phetamine has spread and is increasing among the “non gay” club-going crowd and college students. Metham-phetamine is also known as crystal, Tina, Christina, crank, ice, speed, and chalk. Since the use of methamphetamine continues to appeal to a small segment of the general population, most sales involve mutual acquaintances making the initial interac-tions. The closest thing to street sales is found at raves or other public events. Methamphetamine use appears to be especially on the rise among young males in the gay community. The recent growth in Crystal Meth Anonymous (CMA) meetings in New York City is one indicator of this. In 1999, CMA had one meeting per week with six atten-dees. By 2002, CMA had 4 meetings per week with an average of 20–30 attendees per meeting, and in 2005,
CMA has 22 meetings per week with an average of 30–50 attendees per meeting. Many experts worry about the implications methamphetamine has for the spread of HIV and other sexually transmitted diseases (STDs). Depressants While some indicators of the nonmedical use of psy-choactive prescription drugs (e.g., hospital emergencies, deaths, and treatment admissions) have not been increasing, the SSU continues to report a vari-ety of drugs readily available on the street for $1 or more per pill. For the five boroughs of New York City, there were 1,751 benzodiazepine ED reports from January through December 2004 according to preliminary unweighted DAWN Live! data. Of these benzodiazepine reports, 25 percent were for patients seeking detoxification. According to the SSU, pill selling, the street diversion of legitimately manufactured pharmaceuticals, seems to be increasing. The three most frequently sold pills on the street are Xanax, Elavil, and Catapres. The prices of these three medications range from $1 to $5 per pill. Although some pill buyers attributed their use of these and other drugs to some physical or emotional medical condition, most users indicated that their primary rea-son for buying these medications was to get “high.” Very few respondents indicated that they used these medications or others to reduce withdrawal symptoms. Most street pill sellers appear to obtain their inventory from their physician through Medicaid at no cost to them-selves. Although there are exceptions, most pills are sold individually and not in bottles. Most buyers seem to pre-fer or are only able to afford to buy 1 day’s supply. In contrast to medication associated with pain, the diversion of HIV medication has less to do with getting high and more to do with making money. HIV medications are not usually sold individually; rather they are sold in sealed (unopened) bottles. In many cases, the price of a bottle (or 30-day supply) of the medication may sell for as much as $700. The buyers of the HIV medication do not seem to be interested in buying the medication for their own use or the use of a loved one. Instead, these medica-tions appear to be bought in an effort to stockpile a supply of the medication which is eventually either sold back to a pharmacy for “re-sale” to another customer or shipped out of the country to a less developed nation with an AIDS problem. There continue to be few (about 1 percent) treatment admissions with a psychoactive prescription drug as a primary drug of abuse.
EPIDEMIOLOGIC TRENDS IN DRUG ABUSE—New York City
Proceedings of the Community Epidemiology Work Group, Vol. II, June 2005 188
Among ME deaths reported by DAWN, benzodi-azepine-involved drug misuse deaths numbered 201 in 2003—among the top five categories of drug misuse deaths. Antidepressants were also in the top five cate-gories of drug misuse deaths, accounting for 210 such deaths in 2003. Moreover, antidepressants were the number one category in suicide deaths in the New York metropolitan area in 2003, with 29 such deaths. Since these drugs are manufactured by legitimate phar-maceutical companies, purity is not an issue. Most of these medications come in a variety of strengths, how-ever, and not all strengths are found on the street. Observations indicate that the following pills are sold on the street: 1-milligram ($3) and 2-milligram ($5) Xanax tablets; 1-milligram ($1) Elavil tablets; and 2-milligram ($1) and 3-milligram ($2) Catapres tablets. Hallucinogens For the five boroughs of New York City, there were 294 preliminary unweighted DAWN Live! ED reports for PCP for January through December 2004. According to DAWN ME data for the New York met-ropolitan area for 2003, hallucinogens (including PCP, lysergic acid diethylamide [LSD], and other hallucino-gens) accounted for 12 drug misuse deaths. Street sources continue to report that PCP is becoming more readily available in the city. One method of use is to pour liquid PCP on marijuana by placing the mari-juana in a glass jar with a rubber cap. The PCP is “injected” through the rubber top onto the marijuana. Hydroponic marijuana is especially popular in this method. Reports are that the caps on these PCP jars are usually red or orange with a picture of a butterfly. Some street sources say the butterfly symbolizes an angel, as in angel dust, another name for PCP, while others say the butterfly stands for “how high you can get.” Club Drugs Club drugs are a collection of various synthetic chemi-cal compounds that are often abused by young people in festive social settings, such as dance clubs, after-hour clubs, “raves,” and other special events. Club drugs include MDMA, methamphetamine, gamma hydroxy-butyrate (GHB), and ketamine. Raves and other all-night parties are about endurance and sensory over-stimulation, and, not surprisingly, many of the club drugs have stimulant or hallucinogenic properties. Since many of club drugs are synthetic and manufac-tured, purity is not a real issue, but the quality of these products poses a serious concern. The chemical exper-tise of the producers, the ingredients used, and laboratory conditions used to manufacture these sub-stances are uncertain and potentially dangerous.
According to preliminary unweighted DAWN Live! ED data for the five boroughs of New York City, there were 157 reports for MDMA for January through De-cember 2004. Although the club drugs are, in fact, part of the New York drug scene at some level, street research suggests that their use is limited to a small segment of the New York City drug-using population. Of these drugs, ec-stasy seems to be the most popular and frequently used club drug in the city. Lagging somewhat behind are GHB and ketamine. LSD is a strong hallucinogen that has not been a major problem in New York City since the late 1960s and early 1970s. It is also known as acid, boomer, and yellow sunshine. Most contacts indicated that they never used LSD, nor did they know where it could be obtained. The price for a single pill of ecstasy ranges between $5 and $30. The prices tend to run at the high end if these substances are purchased inside a club or rave. The most common sales unit for ecstasy is the single white pill or tablet. No additional packaging is required. Club drug sellers are usually young (early twenties or younger) White males, and many are attending college. Many of the sellers are middle-class or higher. This profile, however, is beginning to expand across racial, ethnic, and social class boundaries. In a club setting, a seller may also have marijuana, cocaine HCl, and other club drugs for sale. Club drug users tend to be White and young (ranging between 15 and 30). According to street contacts, ec-stasy is almost as popular among females as males. Many of the users are older high school students, col-lege students, or young working professionals. The latter group tends to be of a mid-to-high socio-economic status. The socio-economic status of the younger users, who appear to be the fastest growing group of users, seems to be more widely spread. Ac-cording to some informants, the appeal for these drugs is strongest among suburban White youth, who regu-larly venture into the city for entertainment, fun, and excitement. There are, however, indications that club drugs, particularly ecstasy, are making greater inroads among New York residents, especially non-White us-ers. There are reports that some Hispanic groups are becoming involved in the distribution of ecstasy, which may suggest that more Hispanics and other inner-city residents are beginning to use this drug. The route of administration varies with the drug. Club drug use typically involves the ingestion of multiple substances. Typically, a club drug user will also use alcohol, marijuana, cocaine, or other club drugs.

EPIDEMIOLOGIC TRENDS IN DRUG ABUSE—New York City
Proceedings of the Community Epidemiology Work Group, Vol. II, June 2005 189
These club drugs continue to be used primarily for rec-reational purposes, with use largely limited to weekends and special events. Except for clubs and other special events, most connections are made through a network of acquaintances that very often revolve around the user’s high school or college. The number of DAWN deaths involving the category of club drugs (including MDMA, ketamine, GHB, and Rohypnol) totaled 10 in 2003 for the New York metro-politan area. INFECTIOUS DISEASES RELATED TO DRUG ABUSE The AIDS epidemic, with its impact on injection drug users (IDUs), has played a crucial role in shaping the New York City drug scene over the last two decades. HIV first entered New York City in the mid- to late-1970s. AIDS reporting was mandated in 1983, but re-porting of HIV infection began in June 2000. According to the New York City Department of Health, as of June 30, 2004, 92,021 New Yorkers were diagnosed with HIV or AIDS; 32,688 were living with HIV (non-AIDS), and 59,333 were living with AIDS. The true number of persons living with HIV/AIDS (PLWHA) is actually higher, since the New York City Department of Health and Mental Hygiene estimates that 25 percent of persons living with HIV have never been tested and do not know that they are infected. AIDS incidence in New York City peaked in 1993, with 12,649 cases. Mortality dropped sharply beginning in 1996, but New York City residents continue to die of HIV. Between January 1, 2004, and June 30, 2004, 1,051 people with HIV or AIDS died of all causes. In 2002, HIV/AIDS was the leading cause of death among New Yorkers age 35–44 and the third leading cause among those age 25–34. In 2003, the age-adjusted HIV-mortality rate in adults with AIDS declined by 12 percent. Of the 92,021 PLWHA in New York City as of June 30, 2004, 64 percent were diagnosed with AIDS, and 36 percent were diagnosed with non-AIDS HIV. Sev-
enty percent were male, and 30 percent were female. In terms of race/ethnicity, 44 percent were Black, 32 per-cent were Hispanic, and 21 percent were White. For transmission risk factors, 27 percent (25,066) were men who have sex with men, 24 percent (21,881) had an injection drug use history, 18 percent reported a hetero-sexual transmission factor, 3 percent had a perinatal transmission risk factor, 1 percent had another risk fac-tor, and 28 percent had an unknown risk factor or were under investigation. Men and women showed different patterns of HIV transmission in 2003. Among women with known risk, heterosexual sex was the predominant risk for HIV, accounting for 75 percent of new HIV (non-AIDS) diagnoses. Among men with known risk, sex with men accounted for 71 percent of new HIV (non-AIDS) diagnoses. In 2003, 4,205 New Yorkers were diagnosed with HIV; 1,050 (25 percent) first learned they were HIV-positive at the time they learned they had already progressed to AIDS. Also in 2003, 5,056 AIDS cases were diagnosed. New AIDS diagnoses increased by 13 percent from the previous year, with the largest increases occurring among Hispanic women (26 percent) and White men (29 percent). The majority (81 percent) of new HIV (non-AIDS) diagnoses and 80 percent of new AIDS diagnoses were among Blacks and Hispanics in 2003. Black women accounted for 61 percent of AIDS cases of women. Among Black men, the prevalence of HIV/AIDS was 2.8, significantly higher than the city-wide average of 1.1 percent. HIV/AIDS is concentrated in the poorest neighborhoods of New York City.
The New York City Department of Health and Mental Hygiene, Bureau of Communicable Diseases, also has a surveillance of hepatitis C data. As of December 2004, there were 15,129 newly reported individuals with a diagnosis date (or specimen collection date) in 2003. For 2002, that figure was 13,940. For inquiries concerning this report, please contact Rozanne Marel, Ph.D., Chief of Epidemiology, New York State Office of Alcoholism and Substance Abuse Services, 501 7th Avenue, 9th Floor, New York, New York 10018, Phone: (646) 728-4605, Fax: (646) 728-4685, or E-mail: [email protected].

EPIDEMIOLOGIC TRENDS IN DRUG ABUSE—New York City
Proceedings of the Community Epidemiology Work Group, Vol. II, June 2005 190
Exhibit 1: New York City DAWN ED Sample and Reporting Information: January–December 2004
No. of EDs Reporting per Month: Completeness of Data
(%) Total
Eligible Hospitals1
No. of hospitals in
DAWN Sample
Total EDs in DAWN Sample2 90–100% 50–89% <50%
No. of EDs Not
Reporting
52 39 60 20–31 2–11 1–5 23–31 1Short-term, general, non-Federal hospitals with 24-hour emergency departments based on the American Hospital Association Annual Survey. 2Some hospitals have more than one emergency department SOURCE: DAWN Live!, OAS, SAMHSA, updated 5/31/2005–6/2/2005 Exhibit 2. Semiannual Cocaine Trends for Selected Indicator Data in New York City: 1995–2004
Year Semiannual/
Annual Periods
Deaths Involv-ing Cocaine1
Cocaine ED Mentions/ Reports2
Treatment Admissions: Cocaine as
Primary Drug of Abuse3
Cocaine Arrests4
Births to Women Using
Cocaine5
1995 1H 2H
Total
908
9,915 9,808
19,715
8,371 7,836 16,207
40,846
1,059
1996 1H 2H
Total
659
11,070 10,522 21,592
8,561 8,817 17,378
38,813
1,005
1997 1H 2H
Total
501
10,233 9,969 20,202
9,048 8,401 17,449
35,431
864
1998 1H 2H
Total
438
9,989 9,560 19,549
8,999 8,573 17,572
35,577
742
1999 1H 2H
Total
394
7,386 7,413
14,799
8,346 7,567
15,913
31,781
626
2000 1H 2H
Total
492
6,883 7,367
14,250
7,337 6,722
14,059
31,919
490
2001 1H 2H
Total –
7,449 6,450
13,898
7,343 7,032
14,375
23,498
438
2002 1H 2H
Total 421
6,679 7,282
13,961
7,736 7,872
15,608 13,574
363
2003 1H 2H
Total 520
8,203 7,911
16,114
354
2004 1H 2H
Total
10,134
8,395 8,247
16,642
SOURCES: 1DAWN, OAS, SAMHSA, including New York City, Long Island, and Putnam County through 1995; starting with 1996 the data include New York City only. In 2003, data are for the 5 boroughs of New York City plus Suffolk and Putnam Counties in New York, and Union and Morris Counties in New Jersey.
2DAWN, OAS, SAMHSA, updated 5/31/2005-6/02/2005. The 2004 number of reports are unweighted data and are from 60 EDs in the 5 boroughs of New York City reporting to DAWN in 2004. During this 12-month period, however, between 29 and 37 EDs reported data each month. All DAWN cases are reviewed for quality control. Based on this review, cases may be corrected or deleted, and, therefore, are subject to change. Prior to 2003, DAWN, OAS, SAMHSA, weighted data, based on a representative sample of hospitals for New York City and Westchester, Rock-land, and Putnam Counties 3New York State Office of Alcoholism and Substance Abuse Services (OASAS)-funded and nonfunded treatment ad-missions
4New York City Police Department 5New York City Department of Health

EPIDEMIOLOGIC TRENDS IN DRUG ABUSE—New York City
Proceedings of the Community Epidemiology Work Group, Vol. II, June 2005 191
Exhibit 3. Characteristics of Primary Cocaine Admissions1 to State-Funded2 and Nonfunded3 Treatment Programs in New York City, by Route of Administration and Percent: 2004
Demographic Characteristic
Percent Total (N=16,642)
Percent Smoking Crack
(n=10,262)
Percent Using Cocaine Intranasally
(n=5,754) Gender Male Female
68 32
64 36
75 25
Age at Admission 25 and younger 26–35 36 and older (Average age)
6
23 71
(39.2 years)
4
21 75
(39.9 years)
11 27 62
(38.0 years) Race Black Hispanic White
59 25 14
69 18 11
42 36 19
No Source of Income4 30 34 25 Some Criminal Justice Status 41 38 48 Readmissions 79 83 71 Age of First Use 14 and younger 15–19 20–29 30 and older
6 29 43 22
5 25 46 24
8 36 39 18
Secondary Drug of Abuse Alcohol Marijuana Heroin
43 23 6
45 21 6
39 26 5
1Figures on this table may differ somewhat from figures cited on other tables, because computer runs may have been executed at different times and files are being updated continuously. 2State-funded programs receive some or all funding through the New York State Office of Alcoholism and Substance Abuse Ser-vices (OASAS). 3Nonfunded programs receive funding through sources other than OASAS. 4Defined as not earning income, not receiving support from family or significant others, and not receiving any public assistance. SOURCE: New York State Office of Alcoholism and Substance Abuse Services

EPIDEMIOLOGIC TRENDS IN DRUG ABUSE—New York City
Proceedings of the Community Epidemiology Work Group, Vol. II, June 2005 192
Exhibit 4. Semiannual Heroin Trends for Selected Indicator Data in New York City: 1995–2004
Year Semiannual/
Annual Period
Deaths Involving Her-
oin1
Heroin/ Morphine
ED Mentions/ Reports2
Treatment Admis-sions: Heroin as Primary Drug of
Abuse3
Heroin Arrests4
Average Purity of
Street Heroin (%)5
1995 1H 2H
Total
751
5,288 5,440
10,706
9,286 9,001 18,287
38,131
(69.4)
1996 1H 2H
Total
192
5,654 5,478
11,132
9,161 9,617 18,778
37,901
(56.3)
1997 1H 2H
Total
272
4,900 4,581 9,481
10,276 10,431 20,707
35,325
(62.5)
1998 1H 2H
Total
230
4,613 4,605 9,218
10,793 10,203 20,996
37,483
(63.6)
1999 1H 2H
Total
174
4,153 5,150 9,302
10,690 10,189 20,879
32,949
(61.8)
2000 1H 2H
Total 194
5,378 5,630
11,009
10,944 10,672 21,616
33,665
(62.9)
2001 1H 2H
Total –
5,428 5,216
10,644
11,324 11,455 22,779
27,863
(56.0)
2002 1H 2H
Total 224
4,954 5,443
10,397
11,357 11,157 22,514 34,098 (61.4)
2003 1H 2H
Total 104
11,540 12,023 23,563
(53.5)
2004 1H 2H
Total 6,374
12,029 11,658 23,687
SOURCES: 1DAWN, OAS, SAMHSA, including New York City, Long Island, and Putnam County through 1995. (Between 1996 and
2002, the data include New York City only. Prior to 1996, the data include heroin/morphine deaths as well as opiates not
specified by type. Between 1996 and 2002, the data include only heroin/morphine deaths.) In 2003, data are for the 5 boroughs of New York City plus Suffolk and Putnam Counties in New York, and Union and Morris Counties in New Jersey.
2DAWN, OAS, SAMHSA, updated 5/31/2005-6/02/2005. The 2004 number of reports are unweighted data and are from 60 EDs in the 5 boroughs of New York City reporting to DAWN in 2004. During this 12-month period, however, between 29 and 37 EDs reported data each month. All DAWN cases are reviewed for quality control. Based on this re-view, cases may be corrected or deleted, and, therefore, are subject to change. Prior to 2003, DAWN, OAS, SAMHSA, weighted data, based on a representative sample of hospitals for New York City and Westchester, Rockland, and Put-nam Counties. 3New York State Office of Alcoholism and Substance Abuse Services (OASAS)-funded and nonfunded treatment ad-mis-sions 4New York City Police Department 5U.S. Drug Enforcement Administration

EPIDEMIOLOGIC TRENDS IN DRUG ABUSE—New York City
Proceedings of the Community Epidemiology Work Group, Vol. II, June 2005 193
Exhibit 5. Characteristics of Primary Heroin Admissions1 to State-Funded2 and Nonfunded3 Treatment Programs in New York City, by Route of Administration and Percent: 2004
Demographic Characteristic
Percent Total (N=23,687)
Percent Using Heroin Intranasally (n=14,146)
Percent Injecting Heroin
(n=8,775) Gender Male Female
75 25
75 25
75 25
Age at Admission 25 and younger 26–35 36 and older (Average age)
7
22 71
(40.2 years)
5
20 75
(40.8 years)
10
25 65
(39.3 years) Race
Black Hispanic White
27 53 18
32 55 11
16 52 30
No Source of Income4 27 28 25 Some Criminal Justice Status 33 37 25 Readmissions 89 88 92 Age of First Use
14 and younger 15–19 20–29 30 and older
12 34 35 19
10 31 36 23
16 40 32 12
Secondary Drug of Abuse Alcohol Marijuana Cocaine
13 8
40
13 9 36
12 6 46
1Figures on this table may differ somewhat from figures cited on other tables, because computer runs may have been executed at different times and files are being updated continuously. 2State-funded programs receive some or all funding through the New York State Office of Alcoholism and Substance Abuse Ser-vices (OASAS). 3Nonfunded programs receive funding through sources other than OASAS. 4Defined as not earning income, not receiving support from family or significant others, and not receiving any public assistance. SOURCE: New York State Office of Alcoholism and Substance Abuse Services
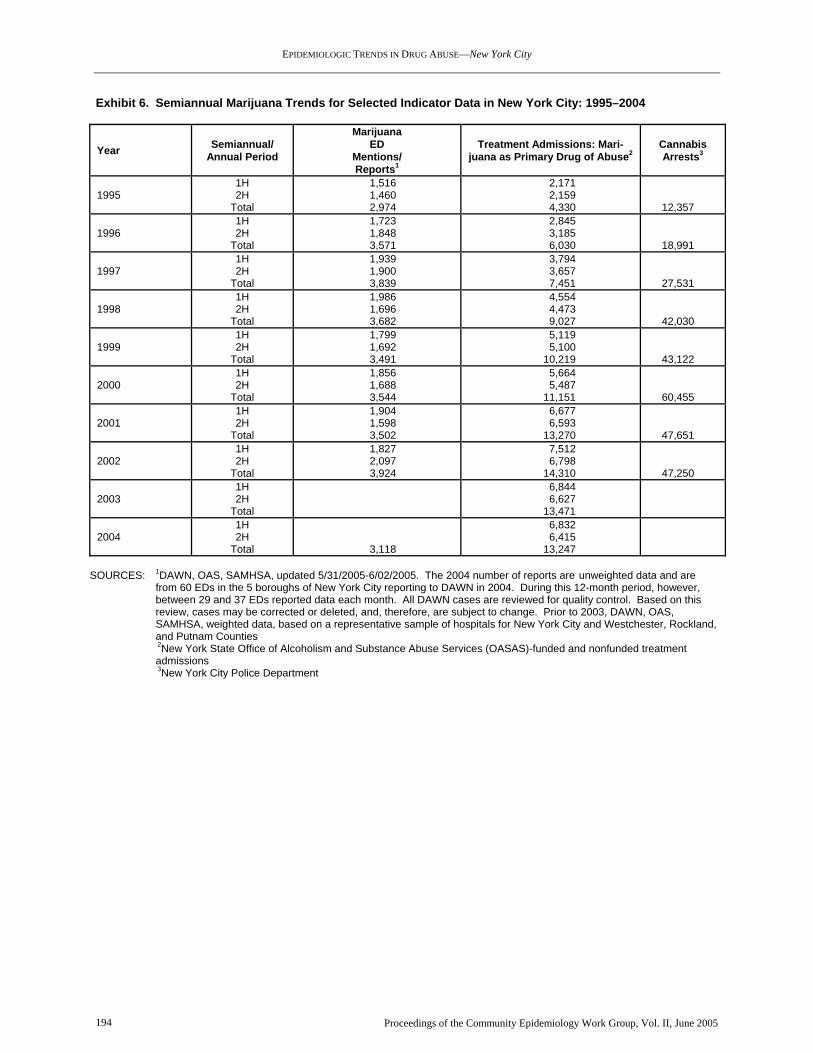
EPIDEMIOLOGIC TRENDS IN DRUG ABUSE—New York City
Proceedings of the Community Epidemiology Work Group, Vol. II, June 2005 194
Exhibit 6. Semiannual Marijuana Trends for Selected Indicator Data in New York City: 1995–2004
Year Semiannual/ Annual Period
Marijuana ED
Mentions/ Reports1
Treatment Admissions: Mari-juana as Primary Drug of Abuse2
Cannabis Arrests3
1995 1H 2H
Total
1,516 1,460 2,974
2,171 2,159 4,330
12,357
1996 1H 2H
Total
1,723 1,848 3,571
2,845 3,185 6,030
18,991
1997 1H 2H
Total
1,939 1,900 3,839
3,794 3,657 7,451
27,531
1998 1H 2H
Total
1,986 1,696 3,682
4,554 4,473 9,027
42,030
1999 1H 2H
Total
1,799 1,692 3,491
5,119 5,100 10,219
43,122
2000 1H 2H
Total
1,856 1,688 3,544
5,664 5,487 11,151
60,455
2001 1H 2H
Total
1,904 1,598 3,502
6,677 6,593
13,270
47,651
2002 1H 2H
Total
1,827 2,097 3,924
7,512 6,798
14,310 47,250
2003 1H 2H
Total
6,844 6,627
13,471
2004 1H 2H
Total
3,118
6,832 6,415
13,247
SOURCES: 1DAWN, OAS, SAMHSA, updated 5/31/2005-6/02/2005. The 2004 number of reports are unweighted data and are
from 60 EDs in the 5 boroughs of New York City reporting to DAWN in 2004. During this 12-month period, however, between 29 and 37 EDs reported data each month. All DAWN cases are reviewed for quality control. Based on this review, cases may be corrected or deleted, and, therefore, are subject to change. Prior to 2003, DAWN, OAS, SAMHSA, weighted data, based on a representative sample of hospitals for New York City and Westchester, Rockland, and Putnam Counties
2New York State Office of Alcoholism and Substance Abuse Services (OASAS)-funded and nonfunded treatment admissions
3New York City Police Department

EPIDEMIOLOGIC TRENDS IN DRUG ABUSE—New York City
Proceedings of the Community Epidemiology Work Group, Vol. II, June 2005 195
Exhibit 7. Characteristics of Primary Marijuana Admissions1 to State-Funded2 and Nonfunded3 Treatment Programs in New York City, by Percent: 2004
Demographic Characteristic Percent of Total (N=13,247)
Gender Male Female
79 21
Age at Admission 20 and younger 21–25 26–35 36 and older (Average Age)
28 26 28 18
(26.8 years) Race Black Hispanic White
57 32 8
No Source of Income4 22 Some Criminal Justice Status 65 Readmissions 56 Age of First Use 14 and younger 15–19 20–29 30 and older
49 41 8 2
Secondary Drug of Abuse Alcohol Cocaine
38 13
1Figures on this table may differ somewhat from figures cited on other tables, because computer runs may have been executed at different times and files are being updated continuously. 2State-funded programs receive some or all funding through the New York State Office of Alcoholism and Substance Abuse Ser-vices (OASAS). 3Nonfunded programs receive funding through sources other than OASAS. 4Defined as not earning income, not receiving support from family or significant others, and not receiving any public assistance. SOURCE: New York State Office of Alcoholism and Substance Abuse Services

EPIDEMIOLOGIC TRENDS IN DRUG ABUSE—Philadelphia
Proceedings of the Community Epidemiology Work Group, Vol. II, June 2005 196
Drug Use in Philadelphia, Pennsylvania Samuel J. Cutler and Marvin F. Levine, M.S.W.1 ABSTRACT Indicators in Philadelphia remain highest for co-caine, heroin, alcohol, and marijuana. There has been an increase in the number of drugs used in combination and an expansion in the number of dif-ferent drugs being used. During 2002, 2003, and 2004, the average number of drugs detected in dece-dents increased from 2.68 to 3.18 to 3.75 per case. In 2004, 47 percent of decedents testing positive for her-oin/morphine also tested positive for cocaine. In 2004, 73 percent of male cocaine treatment admis-sions and 84 percent of female cocaine treatment admissions were crack smokers. There are indica-tions that PCP use is declining. Negative conse-quences associated with the use of benzodiazepines are increasing. INTRODUCTION Area Description Philadelphia, the largest city in the State, is located in the southeastern corner of Pennsylvania. The 2000 U.S. census count of 1,517,550 Philadelphia residents represents 12.4 percent of the State’s population and a 7-percent increase from the 1990 census count. The 2000 Philadelphia population was 45.0 percent White, 43.2 percent African-American, 4.5 percent Asian, 0.3 percent American Indian and Alaska Native, 4.8 per-cent other race, and 2.2 percent two or more races. Hispanics (of various races) accounted for an estimated 8.5 percent of the population, and persons age 18 and older accounted for 74.7 percent. The unemployment rate was 6.1 percent for persons age 16 and older, and 49.8 percent of the population was employed. Data Sources This report focuses primarily on the city/county of Philadelphia and includes data from the sources shown below. For the purposes of this report, fiscal
1The authors are affiliated with the City of Philadelphia, Office of Behavioral Health/Mental Retardation Services, Coordinating Office for Drug and Alcohol Abuse Programs (CODAAP), Philadelphia, Pennsylvania. John H. Gossard, Richard C. Jones, and Nelson E. Mar-tin provided assistance in preparing this paper.
year (FY) refers to a year starting July 1 and ending the following June 30. • Treatment admissions data for programs in
Philadelphia County were provided by the Penn-sylvania Department of Health, Client Information System, for January 1, 1998, through December 31, 2004. Data for 2004 are preliminary and sub-ject to revision because of the treatment reporting schedule, which results in frequent delays between a treatment admission and the reporting of that event.
• Mortality data were provided by the Philadel-
phia Medical Examiner’s (ME) Office. These data cover mortality cases with toxicology re-ports indicating the detection of drugs among decedents in Philadelphia. The time period is 1994 through 2004. (The cases include persons who died from the adverse affects of one or mul-tiple drugs, as well as persons who exhibited some substance presence but died from other causes. The Philadelphia ME also distinguishes between persons who appeared to have a lethal reaction to what might be considered a light or moderate amount of drugs and persons whose toxicology reports showed a high level of drugs in their systems.) Mortality cases with positive toxicology reports for alcohol are only reported if the alcohol was to be found in combination with one or more other drugs.
• Arrestee urinalysis data for booked adults were
derived from reports from the First Judicial Dis-trict of Pennsylvania, Adult Probation/Parole Department (APPD), for the period June 15, 2004, through December 15, 2004.
• Drug price information was provided by the
National Drug Intelligence Center for the period January 1, 2004, through June 30, 2004, and fo-cus group participants in the spring of 2005.
• Heroin purity data were provided by the Drug
Enforcement Administration (DEA), Domestic Monitor Program (DMP), through the first half of 2004.
• Information on the identification of drug sam-ples seized and analyzed by local law enforce-ment as reported to the DEA’s National Forensic Laboratory Information System (NFLIS) during 2004 were provided for this report.
• Acquired immunodeficiency syndrome (AIDS)
data were provided by the Philadelphia Depart-ment of Public Health’s AIDS Activities Coor-

EPIDEMIOLOGIC TRENDS IN DRUG ABUSE—Philadelphia
Proceedings of the Community Epidemiology Work Group, Vol. II, June 2005 197
dinating Office on AIDS cases reported from No-vember 1, 1981, to December 31, 2004.
• Population and demographic data describing
the city of Philadelphia emanated from the U.S. Census Bureau.
In addition to these sources, this report draws on fo-cus group and key informant discussions with former drug users currently enrolled in treatment programs, as well as outreach workers assigned to homeless populations, substance abusers, persons with human immunodeficiency virus (HIV) infection, and law enforcement officials. A note to those accustomed to reading past editions of this report: Due to the levels of incomplete and inaccurate data from the Drug Abuse Warning Net-work (DAWN) Live! hospital emergency department data set, the Office of Applied Studies (OAS) of the Substance Abuse and Mental Health Services Ad-ministration (SAMHSA) suspended reporting from Philadelphia metropolitan statistical area emergency departments, and no such data will appear in the Philadelphia paper until problems have been rectified to the satisfaction of SAMHSA and DAWN. DRUG ABUSE PATTERNS AND TRENDS The four major drugs of abuse in Philadelphia con-tinue to be cocaine, heroin, marijuana, and alcohol. These are frequently used in combination with each other and with other supplemental drugs. In 2003 and 2004, 91.7 percent of people entering treatment iden-tified one of these drugs as their primary drug of abuse. In 2004, the average number of drugs detected in de-cedents by the ME (3.75) was the highest on record. The average over the previous 10-year period (1994 to 2003) was 2.43 drugs per case (exhibit 1). The number of mortality cases with positive toxicology reports (n=888) in 2004 exceeded the previous record high of 841 in 2003. Of the 888 deaths in 2004, adverse reac-tion to drugs accounted for 31.0 percent, overdose represented 10.1 percent, violence accounted for 24.7 percent, and “other causes” constituted 34.2 percent (exhibit 2). In 2004, African-American male decedents (n=292) and White male decedents (n=292) exceeded all other race/ethnicity and gender totals. White females (n=121) outnumbered African-American females (n=109). The remaining 74 deaths were among His-panics, Asians, and American Indians. Overall,
Whites accounted for 46.5 percent of the deaths; Af-rican-Americans accounted for 45.2 percent of the deaths; Hispanics represented 7.5 percent; and Asians and American Indians accounted for 0.8 percent. Urinalysis data of booked arrestees from Philadel-phia’s APPD in the second half of 2004 showed that 39 percent (n=9,330) of the 23,913 tested arrestees in the sample were positive for at least 1 drug. The Pennsylvania Client Information System is limited to the identification of a maximum of three substances as drugs of abuse at treatment intake. The highest av-erage number of drugs of abuse identified at admission to treatment occurred in the first half of 1999 (2.06). In 2002, the average was 1.45 drugs of abuse, in 2003, the average was 1.74 drugs of abuse, and in 2004, the average was 1.73 drugs of abuse at admission to treat-ment. Cocaine/Crack Cocaine/crack remains the major drug of abuse in Philadelphia. ME data show that the proportion of cases with cocaine present was 46 percent in 2002, 39 percent in 2003, and 45 percent in 2004 (exhibit 1). Cocaine was detected in 3,357 decedents from January 1994 through December 2004, a total higher than that for any other drug appearing in the toxicol-ogy reports. In 2004, the average age of mortality cases with positive toxicology reports for cocaine was 40. At least one other drug was detected in 83 percent of cocaine-positive cases in 2001and 2002, 85 per-cent in 2003, and 87 percent in 2004. The treatment data for 2003 show that cocaine, as a primary drug, accounted for 25.8 percent of all treatment admissions, the same as in 2001 (exhibit 3). In 2003, cocaine was mentioned by an additional 15.9 percent of clients as a secondary drug and by 2.8 percent as a tertiary drug. In 2004, cocaine accounted for 26.4 percent of all primary drug mentions and was mentioned by an additional 14.7 percent of cli-ents as a secondary drug and by 3.1 percent as a tertiary drug. The proportion of cocaine treatment admissions peaked in 1991, at 63 percent of all pri-mary drugs mentioned at admission to treatment. In 2003 and 2004, males accounted for 59 and 60 percent of primary cocaine drug treatment admis-sions, respectively (exhibit 4). During these time periods, African-Americans accounted for 79 and 80 percent of primary cocaine treatment admissions, respectively, followed by Whites (16 and 15 per-cent), Hispanics (4 and 4 percent), and Asians and “others” (1 and 1 percent). Among primary cocaine

EPIDEMIOLOGIC TRENDS IN DRUG ABUSE—Philadelphia
Proceedings of the Community Epidemiology Work Group, Vol. II, June 2005 198
treatment admissions in 2003, the average number of drugs of abuse noted upon entering treatment was 1.85; in 2004, the average was 1.68. Since 2000, an average of 81.5 percent of the pri-mary cocaine admissions reported smoking the drug, 15.5 percent reported intranasal use, 1.6 percent re-ported injecting, and 1.4 percent reported administering the drug through other/unknown routes (exhibit 4). Since the first half of 1990, at least 77 per-cent of cocaine treatment admissions have reported smoking the drug. Of all male cocaine admissions in 2003 and 2004, 77 and 73 percent, respectively, re-ported smoking the drug; the comparable figures for females were 86 and 84 percent. Urinalysis data of booked arrestees from Philadel-phia’s APPD in 2004 showed that 13.8 percent (n=6,808) of the 49,200 tested arrestees in the sample were positive for cocaine or cocaine metabolites. Co-caine was the second most frequently detected drug; marijuana ranked first. According to the 2004 NFLIS report, 42 percent of samples analyzed were positive for cocaine. The predominant form of crack sold in Philadelphia is the “rock,” which costs $5. The $5 rock ranged in size from 6 to 9 millimeters from 1996 until 2002. Since then, the size of the $5 rock was reduced to 5–6 milli-meters. Treys ($3 rocks) ranged in size from 3 to 5 millimeters since 1996. They were reduced to 3 to 4 millimeters from the latter half of 2002 through the spring of 2005, when it was reported that treys are not as commonly available as in the past. Shapes of crack range from circular, to bumpy-circular, to pieces cut into the shape of a parallelogram. Powder cocaine is not as readily available in small ($5) quantities; as of the spring of 2005, $10 bags became scarcer, with the $20 bag becoming the standard retail unit on the street. According to the National Drug Intelligence Center, the retail/street-level price per ounce of crack ranged from $3 to $20 per rock and from $28 to $125 per gram of powdered cocaine in the first half of 2004. Focus group participants from the spring of 2002 through the spring of 2005 estimated that about 55–65 percent of powder cocaine buys are for intranasal use, 20–25 percent is injected straight, and 15–20 percent is injected in a “speedball.” In the spring of 2005, crack users continued to report frequent use in combination with 40-ounce bottles of malt liquor, beer, wine, or other drugs, including alpra-
zolam (Xanax), marijuana, or heroin. Powder cocaine, oxycodone, cigarettes, and methamphetamine were less frequently mentioned as drugs used with crack. Heroin/Morphine According to the DEA’s DMP, the average street-level purity of heroin in Philadelphia was 71 percent in 2001, 66.3 percent in 2002, 59.6 percent in 2003, and 53 percent in the first half of 2004 (based on only 70 percent of the samples analyzed). The au-thors pose that declining purity at the retail/street level might have a causal relationship for the afore-mentioned increase in the average number of drugs in mortality cases since 2001. With lower heroin purity, users may perceive a need for more drugs to achieve the desired effect. Heroin was detected in 3,036 decedents from 1994 through 2004, making it the second most commonly detected drug in decedents (exhibit 1). For the 4-year period 1999 through 2002, positive heroin toxicology reports occurred in 47 percent of all deaths with the presence of drugs. In 2003, heroin was detected in only 25 percent of all decedents with drug-positive toxicology reports; the proportion was 24 percent in 2004. From 2000 through 2003, heroin alone was identified in 14, 11, 10, and 7 percent, respectively, of the re-spective heroin toxicology reports. In 2004, heroin alone was identified in only 3 percent of the heroin-positive toxicology reports. The combination of her-oin and cocaine was detected in 20, 19, 17, 10, and 11 percent of all decedents, respectively, from 2000 through 2004. Cocaine was detected in 47 percent of heroin toxicology reports in 2004. In 2004, heroin treatment admissions ranked second highest after ranking first in 2003 (exhibit 3). Heroin admissions accounted for 22 percent of all admissions in 2002, 27 percent in 2003, and 26 percent in 2004. During 2003 and 2004, 65 percent of all treatment admissions for heroin, illegal methadone, and other opiates were male (exhibit 5). In 2004, 60 percent were White, 26 percent were African-American, 12 percent were Hispanic, and 2 percent were Asian/other. Indi-viduals who identified heroin as the primary drug of abuse in 2003 used an average of 1.63 drugs; in 2004, the average was 1.67. As depicted in exhibit 5, the preferred routes of ad-ministration for heroin, illegal methadone, and other opiates have been relatively stable among treatment admissions.

EPIDEMIOLOGIC TRENDS IN DRUG ABUSE—Philadelphia
Proceedings of the Community Epidemiology Work Group, Vol. II, June 2005 199
Heroin treatment admissions data from the second half of 1997 through 2004 revealed that there was a slow, but steady decline in the proportion of heroin injectors entering treatment. It was determined that the injection percentages were influenced by an in-flux of relatively new users who entered treatment for the first time prior to converting to injection from intranasal use, which is characteristic of new users. However, most heroin users make the conversion to injecting before entering treatment for the first time. Urinalysis data of booked arrestees from Philadel-phia’s APPD in 2004 showed that 6.2 percent (n=3,035) of the 49,200 tested arrestees in the sample were positive for opiates. Opiates were the third most frequently detected drugs behind marijuana and co-caine. According to the 2004 NFLIS report, 9 percent of samples analyzed were positive for heroin. Key informants in the spring of 2005 continued to re-port that the $10 bag of heroin remained the standard unit of purchase. The $10 bag usually yields one hit; $5 and $20 bags reportedly remain available. Accord-ing to the National Drug Intelligence Center, the retail/street-level prices for heroin were $10–$20 per bag, $180–$250 per bundle, and $65–$300 per gram of heroin in the first half of 2004. Focus group participants in 2004 reported that the av-erage age of new users is 20. In the spring of 2005, the average age of new users was reported as the late teens. All groups since autumn 2000 reported that the average heroin user injects the drug four or five times per day. Narcotic Analgesics Oxycodone The use of oxycodone products, including OxyCon-tin, Percocet/Percodan, Roxicet, and Tylox, continues to appear problematic in Philadelphia. Oxycodone was detected in 421 decedents from 1994 through 2004 (the ninth most frequently detected drug during that time period) (exhibit 1). Detections of oxycodone have been rapidly increasing since 2000. In 2003, oxycodone was present in 9.6 percent of all drug-positive deaths; in 2004, oxycodone was present in 11.6 percent of drug-positive mortality cases. Focus group participants since spring 2002 reported the use of oxycodone by all racial/ethnic groups, with
an age range of mid-teens to 40, with the largest user group being people in their twenties. Hydrocodone The presence of hydrocodone in mortality cases has also increased. There were 40 positive toxicology ME reports for hydrocodone in 2003, 51 reports in 2004, and a total of 239 cases in the 11-year period from 1994 through 2004. Hydrocodone detections now rank 14th among all deaths with positive toxi-cology reports. Opioid Analgesics Fentanyl In the spring of 2004, the Pennsylvania State Attor-ney General’s Office issued information about the diversion and nonmedical use of fentanyl citrate. In particular, Actiq lozenges were cited as being sold on the streets of Philadelphia for $20 each. Actiq con-tains fentanyl citrate and is indicated for patients who continue to experience pain while being treated with synthetic opiates. Actiq resembles a lollipop, as the medication lozenge is at the end of a small stick and it is used by rubbing against the inside soft tissue of the mouth. Locally, users call it “Perca-pop” or “Narco-pop.” From 1994 through 2004, the ME re-corded 70 deaths with the presence of fentanyl. Of these, 16 occurred in 2003 and 35 occurred in 2004. Marijuana Marijuana continued to be readily available and widely used in Philadelphia in the second half of 2004. The proportion of clients who cited marijuana as the pri-mary drug of abuse upon entering treatment was 17 percent in 2003 and 2004 (exhibit 3). Among all ad-missions in 2003 and 2004, an additional 10 and 11 percent, respectively, mentioned marijuana as a sec-ondary drug. During the same time periods, marijuana was mentioned as a tertiary drug by 7 per-cent and 6 percent, respectively. In 2003, among primary marijuana admissions, males accounted for 78 percent; African-Americans accounted for 63 per-cent, Whites accounted for 21 percent, Hispanics accounted for 13 percent, and Asians and others ac-counted for 3 percent. In 2004, the comparable figures were 77 percent male, 62 percent African-American, 24 percent White, 11 percent Hispanic, and 3 percent Asians and others. Among primary marijuana treatment admissions in 2003, the average number of drugs of abuse noted upon entering treat-ment was 1.63. The average in 2004 was 1.71.

EPIDEMIOLOGIC TRENDS IN DRUG ABUSE—Philadelphia
Proceedings of the Community Epidemiology Work Group, Vol. II, June 2005 200
Urinalysis data of booked arrestees from Philadel-phia’s APPD in 2004 showed that 17.9 percent (n=8,786) of the 49,200 tested arrestees in the sample were positive for marijuana or marijuana metabolites. Marijuana was the most frequently detected drug by APPD. According to the 2004 NFLIS report, 32 percent of samples analyzed were positive for cannabis/tetra-hydrocannabinol (THC). Key informants continue to report the widespread and increasing use of blunts, especially utilizing fla-vored cigars. The combination of marijuana and phencyclidine (PCP) continues to be frequently re-ported. Blunts laced with crack (called “Turbo”) are still common, but less so than the marijuana/PCP combination. Blunt users commonly ingest beer, wine coolers, whiskey, alprazolam, or diazepam along with the blunt. Less commonly, blunt smokers use powder cocaine, vodka, barbiturates, clonaze-pam, oxycodone, cough syrup, and/or methampheta-mine. These comments by users continue to underscore the common practice of multiple drug use, either simultaneously or sequentially. According to the National Drug Intelligence Center, the retail/street-level prices per bag of marijuana ranged from $5 to $35 in the first half of 2004. Phencyclidine (PCP) PCP began to gain popularity as an additive to blunts in 1994, and its use increased from 2000 to 2003. Users describe its effects as making them hallucinate and feel “invincible,” “crazy,” “numb,” or “violent.” PCP was detected in 449 decedents from 1994 through 2004, making it the seventh most frequently detected drug during that period. In 2004, deaths with the pres-ence of PCP declined to the second lowest annual total in the past 11 years (exhibit 1). In 2003, PCP was mentioned as a primary, secondary, or tertiary drug by 4.3 percent of all treatment admis-sions. The average number of drugs of abuse men-tioned by primary PCP treatment admissions was 1.92. In the first half of 2004, PCP was mentioned as a pri-mary, secondary, or tertiary drug in 4.6 percent of all admissions, and the average number of drugs of abuse mentioned by primary PCP treatment admissions was 1.89. Urinalysis data of booked arrestees from Philadel-phia’s APPD in 2004 showed that 3.5 percent (n=1,731) of the 49,200 tested arrestees in the sample
were positive for PCP, making this drug the sixth most frequently detected drug by APPD. PCP remains readily available. It is more commonly found on mint leaves for use in lacing blunts or for rolling and smoking. Additionally, some users prefer PCP in liquid form that is used by applying the drug to cigarettes. This method is referred to as “sherms” or “dip sticks.” Focus group participants in the spring of 2005 reported the application of PCP oil to the outside of blunts before smoking. Benzodiazepines Benzodiazepines, particularly alprazolam (Xanax) and diazepam (Valium), continue to be used in com-bination with other drugs. Diazepam, having been detected by the ME in 585 decedents from 1994 through 2004, ranks fourth among drugs present in mortality cases in Philadelphia. While users new to treatment report that diazepam has become less popu-lar in recent years, alprazolam use has increased. Alprazolam was the 11th most frequently detected drug among decedents by the Philadelphia ME (n=285) from 1994 through 2004, including 72 cases in 2004 (exhibit 1). Treatment admission reports for 2003 show benzodi-azepines as primary drugs of abuse in 67 cases, compared with 31 in 2004 (exhibit 3); however, these drugs were reported as secondary or tertiary drugs of abuse in 382 additional cases in 2003 and 311 addi-tional cases in 2004. Fifty-seven percent of the mentions of benzodiazepines as secondary or tertiary drugs of abuse in 2004 occurred with heroin as the primary drug. Those who reported using benzodi-azepines as their primary drugs of abuse used an average of two drugs in 2003 and 2004. Benzodi-azepine abuse was reported by focus group participants as common among users of heroin, oxy-codone, cocaine, marijuana, and cough syrup. Since spring 2000, all focus groups have reported that al-prazolam has overtaken diazepam as the “most popular pill” on the street. Alprazolam represented 3 percent of the drugs ana-lyzed by the Philadelphia Police Department and reported to the NFLIS. Deaths with the presence of oxazepam (Serax) have been increasing. In 2003, there were 16 positive toxi-cology reports for oxazepam, and there were 38 in 2004. In the 11-year period 1994 through 2004, there were 167 mortality cases testing positive for this drug, making oxazepam the 20th most frequently detected drug (exhibit 2).

EPIDEMIOLOGIC TRENDS IN DRUG ABUSE—Philadelphia
Proceedings of the Community Epidemiology Work Group, Vol. II, June 2005 201
Deaths with the presence of olanzapine (Zyprexa) have been increasing. There were 43 positive toxi-cology reports for olanzapine in 2003 and 34 in 2004. In the 11-year period, 1994 through 2004, there were 153 mortality cases testing positive for this drug, making olanzapine the 23rd most frequently detected drug. Urinalysis data of booked arrestees from Philadel-phia’s APPD in 2004 showed that 5.7 percent (n=2,794) of the 49,200 tested arrestees in the sample were positive for benzodiazepines, making this class of drugs the fourth most frequently detected drug by APPD. Other Prescription Drugs of Note Prescription drugs are most frequently detected among decedents in combination with other drugs of the same type and/or in combination with cocaine, heroin, or alcohol. ME mentions for the most fre-quently detected prescription drugs among decedents in 2004 (not already discussed) included methadone (n=132), diphenhydramine (n=129), and codeine (n=120). With 493 detections from 1994 through 2004, codeine ranks as the fifth most frequently de-tected drug. Methadone ranks sixth (n=479), and diphenhydramine ranks eighth (n=447). Regarding codeine and diphenhydramine, each of which is an ingredient in numerous over-the-counter medications that are abused in Philadelphia, negative conse-quences appear most markedly among decedents in combination with other drugs. Deaths with the presence of fluoxetine (Prozac) began to increase in the late 1990s. With 176 positive toxi-cology reports for fluoxetine from 1994 through 2004, fluoxetine ranks as the 18th most frequently detected drug. Dextromethorphan is a common ingredient in numer-ous cough and cold medications. Key informants indicated that its use is increasing among people age 30–40, particularly in combination with alprazolam and diazepam. The Philadelphia ME detected dex-tromethorphan in 40 cases in 2003 and in an additional 53 cases in 2004. There were 140 dextro-methorphan-positive cases from 1994 through 2004, ranking it as the 26th most frequently detected drug. Quetiapine (Seroquel), an antipsychotic, has only been on the market for 3–4 years. Twenty of the total 56 quetiapine detections by the ME occurred in 2003, and an additional 23 detections were in 2004.
Methamphetamine/Amphetamines Methamphetamine and amphetamines remain a rela-tively minor problem in Philadelphia. There were 98 deaths with the presence of methamphetamine (ranked 31st) from 1994 through 2004 and 90 deaths with the presence of amphetamine (ranked 35th) during that same period. Annual treatment admissions for methamphetamine/ amphetamines as the primary drug of abuse from 1998 to 2003 totaled 31, 33, 27, 83, 67, and 33, respectively (exhibit 3). There were 37 such admissions in 2004. Methamphetamine/amphetamines are rarely identified as a secondary or tertiary drug of choice among treat-ment admissions in Philadelphia. Urinalysis data of booked arrestees from Philadel-phia’s APPD in 2004 showed that 0.2 percent (n=97) of the 49,200 tested arrestees in the sample were positive for methamphetamine or amphetamines. This was the lowest result in the APPD data. According to the National Drug Intelligence Center, the retail/street-level price of methamphetamine was $100 per gram in the first half of 2004. For the second consecutive half-year, key informants indicated a growing popularity of methamphetamine among men who have sex with men. Methampheta-mine continues to be reported as difficult to obtain, not usually sold outdoors, and requiring a connection, but it is reported that use has increased since 2001. Club Drugs There has been relatively little consequence data for methylenedioxymethamphetamine (MDMA). MDMA was present in 6 mortality cases in 1999 (the first year this drug was detected by the ME) and in a total of 42 from 1999 through 2004, including none in the latter-most 6-month period. MDMA is reportedly used in combination with mari-juana and lysergic acid diethylamide (LSD), which, along with its users generally ranging in age from teens to early twenties, helps describe its use among club-goers. According to the National Drug Intelligence Center, the retail/street-level price per MDMA tablet ranged from $9 to $35 in the first half of 2004. The Philadelphia ME first detected methylenedioxy-amphetamine (MDA) in the second half of 1999. There were 30 positive toxicology reports for MDA through

EPIDEMIOLOGIC TRENDS IN DRUG ABUSE—Philadelphia
Proceedings of the Community Epidemiology Work Group, Vol. II, June 2005 202
2004, including 6 cases in the first half of 2004 and zero in the second half. Ketamine was first detected in decedents in Philadel-phia in 1996; it was detected in four decedents in 2000, four in 2001, two in 2002, three in 2003, and in only one in 2004. It is not reported to be widely available, and it is difficult to obtain. There is almost no familiarity of gamma hydroxybu-tyrate (GHB) reported by treatment clients. The Philadelphia ME does not test for GHB. INFECTIOUS DISEASES RELATED TO DRUG ABUSE As of December 31, 2004, Philadelphia recorded 17,084 cumulative AIDS cases among adults (exhibit
6). Among those cases, 6,019 involved injection drug users (IDUs) (needle-sharers). Another 859 were in the dual exposure category of IDUs who were also men who had (unprotected) sex with other men (MSM). Cases reported with (unprotected) heterosexual con-tact as a risk factor continued to exceed the historical average. Heterosexual contact was the identified ex-posure category in 19.6 percent of all AIDS cases reported through December 31, 2004. For inquiries concerning this report, please contact Samuel Cutler, City of Philadelphia, Office of Behavioral Health/Mental Retardation Services, Coordinating Office for Drug and Alcohol Abuse Programs (CODAAP), 1101 Market Street, Suite 800, Philadelphia, Pennsylvania 19107-2908, Phone: (215) 685-5414, Fax: (215) 685-4977, E-mail: <[email protected]>.

EPIDEMIOLOGIC TRENDS IN DRUG ABUSE—Philadelphia
Proceedings of the Community Epidemiology Work Group, Vol. II, June 2005 203
Exhibit 1. Annual Mortality Cases in Philadelphia with the Presence of the 20 Most Frequently Detected Drugs by the Medical Examiner: 1994–2004
Year ME-Identified Drugs
1994 1995 1996 1997 1998 1999 2000 2001 2002 2003 2004 TOTAL
1. Cocaine 368 336 277 304 218 238 321 300 270 326 399 3,357
2. Heroin/Morphine 262 318 290 336 249 236 332 316 275 208 214 3,036
3. Alcohol-in-Combination 253 254 182 214 157 179 197 185 153 290 219 2,283
4. Diazepam 69 44 35 58 39 67 46 56 28 66 88 585
5. Codeine 34 39 19 20 3 15 19 45 57 120 120 493
6. Methadone 23 12 26 24 10 36 36 46 55 79 132 479
7. Phencyclidine (PCP) 46 44 29 46 19 35 48 45 51 58 20 449
8. Diphenhydramine 19 13 5 4 9 25 33 53 42 116 129 447
9. Oxycodone 4 2 1 14 29 17 49 53 68 81 103 421
10. Propoxyphene 30 30 27 32 21 22 40 43 31 41 48 365
11. Alprazolam 24 8 17 18 19 8 16 31 27 45 72 285
12. Nortriptylene 14 11 15 18 24 29 20 32 32 50 35 277
13. Amitriptylene 11 14 13 16 21 23 20 24 35 48 35 263
14. Hydrocodone 6 1 9 8 15 13 27 38 31 40 51 239
15. Temazepam 10 4 21 30 20 18 18 23 11 30 41 226
16. Doxepin 23 8 16 6 16 29 19 18 19 21 28 219
17. Ibuprofen 2 1 0 2 1 7 8 18 10 53 85 189
18. Fluoxetine 4 7 9 10 24 14 23 27 13 28 28 176
19. Phenobarbital 18 17 15 4 10 10 18 26 5 18 27 171
20. Oxazepam 5 3 9 26 19 11 12 17 11 16 38 167
Total Drugs Mentioned 1,346 1,245 1,121 1,282 1,039 1,232 1,637 1,857 1,589 2,672 3,334 18,354
Total Mortality Cases 617 632 565 592 484 533 675 660 593 841 888 7,080 Average Number of Drugs Per Death 2.18 1.97 1.98 2.17 2.15 2.31 2.43 2.81 2.68 3.18 3.75 2.59
SOURCE: Philadelphia Medical Examiner’s Office Exhibit 2. Causes of Annual Mortality Cases in Philadelphia, as Determined by the Medical Examiner, by Percent: 1998–2004 ME-Identified Cause 1998 1999 2000 2001 2002 2003 2004 Adverse Effect of Drugs 60.6 55.7 56.6 56.4 57.7 30.4 31.0
Overdose 3.7 3.8 2.1 3.8 2.5 6.3 10.1
Violence by Another Person 10.7 9.6 13.0 10.0 11.6 17.2 16.3
Violence to Oneself 7.2 6.6 5.6 6.2 5.6 10.5 8.3
Other Causes1 17.8 24.3 22.7 23.6 22.6 35.6 34.2 1Other Causes include deaths with the presence of drugs caused by accident, injury, drowning, fire, or a health or physical malady. SOURCE: Philadelphia Medical Examiner’s Office

EPIDEMIOLOGIC TRENDS IN DRUG ABUSE—Philadelphia
Proceedings of the Community Epidemiology Work Group, Vol. II, June 2005 204
Exhibit 3. Treatment Admissions by Primary Drug of Abuse in Philadelphia: 1998–2004 Primary Drug 1998 1999 2000 2001 2002 2003 20041 Cocaine 1,942 2,232 2,497 2,996 3,649 2,225 1,961 Alcohol 1,477 1,943 1,826 2,366 3,425 1,896 1,640 Heroin 872 2,272 2,041 4,279 2,679 2,352 1,939 Other Opiates 48 46 73 92 187 174 162 Marijuana 791 862 910 1,428 2,025 1,448 1,276 PCP 32 49 43 74 188 142 116 Other Hallucinogens 9 9 7 12 12 7 9 Methamphetamine/ Amphetamines 31 33 27 83 67 33 37
Benzodiazepines 32 46 37 89 66 67 31 Other Tranquilizers 6 4 8 1 3 3 5 Barbiturates 13 8 3 8 23 13 17 Other Sedatives/Hypnotics 13 18 16 36 19 20 19 Inhalants 2 0 4 1 0 0 1 Over-the-Counter 7 24 5 2 2 4 8 Other (Not Listed) 17 1 60 154 111 253 215 Total 5,292 7,547 7,557 11,621 12,456 8,637 7,436
1Data for this period are preliminary and subject to revision. SOURCE: Pennsylvania Department of Health, Client Information System

EPIDEMIOLOGIC TRENDS IN DRUG ABUSE—Philadelphia
Proceedings of the Community Epidemiology Work Group, Vol. II, June 2005 205
Exhibit 4. Cocaine Treatment Admissions in Philadelphia by Route of Administration and Gender: 2000–2004
2000 2001 2002 2003 20041 Route of Administra-
tion and Gender No. (%) No. (%) No. (%) No. (%) No. (%) Smoked
Male 1,112 (44.5) 1,377 (46.0) 1,802 (49.4) 1,014 (45.6) 857 (43.7) Female 1,002 (40.1) 1,039 (34.7) 1,212 (33.2) 786 (35.3) 657 (33.5)
Intranasal Male 198 (7.9) 371 (12.4) 384 (10.5) 256 (11.5) 274 (14.0) Female 104 (4.2) 140 (4.7) 139 (3.8) 105 (4.7) 98 (5.0)
Injected Male 38 (1.5) 30 (1.0) 28 (0.8) 37 (1.7) 26 (1.3) Female 12 (0.5) 14 (0.5) 8 (0.2) 8 (0.4) 8 (0.4)
Other/Unknown Male 16 (0.6) 18 (0.6) 71 (1.9) 9 (0.4) 19 (1.0) Female 15 (0.6) 7 (0.2) 5 (0.1) 10 (0.4) 22 (1.1)
Total Male 1,364 (54.6) 1,796 (59.9) 2,285 (62.6) 1,316 (59.1) 1,176 (60.0) Total Female 1,133 (45.4) 1,200 (40.1) 1,364 (37.4) 909 (40.9) 785 (40.0) Total 2,497 2,996 3,649 2,225 1,961 1Data for this period are preliminary and subject to revision. SOURCE: Pennsylvania Department of Health, Client Information System Exhibit 5. Heroin, Illegal Methadone, and Other Opiate Treatment Admissions in Philadelphia by Route of Administration and Gender: 2000–2004
2000 2001 2002 2003 20041 Route of Administration and Gender No. (%) No. (%) No. No. No. (%) No. (%) Injected Male Female
870 408
(41.2) (19.3)
1,917
805
(43.9) (18.4)
1,219
541
(42.5) (18.9)
978 522
(38.7) (20.7)
741 391
(35.3) (18.6)
Intranasal Male Female
411 266
(19.4) (12.6)
733 577
(16.8) (13.2)
564 260
(19.7)
(9.1)
479 247
(19.0)
(9.9)
399 207
(19.0) (9.9)
Swallowed Male Female
45 42
(2.1) (2.0)
99 55
(2.3) (1.3)
114
66
(4.0) (2.3)
113
64
(4.5) (2.5)
82 66
(3.9) (3.1)
Smoked Male Female
37 11
(1.8) (0.5)
63 40
(1.4) (0.9)
44 17
(1.5) (0.6)
35 15
(1.4) (0.6)
19 9
(0.9) (0.4)
Other/Unknown Male Female
13 11
(0.6) (0.5)
49 33
(1.1) (0.8)
32
9
(1.1) (0.3)
48 25
(1.9) (1.0)
126 61
(6.0) (2.9)
Total Male Total Female
1,376 738
(65.1) (34.9)
2,861 1,510
(65.5) (34.5)
1,973 893
(68.8) (31.2)
1,653 873
(65.4) (34.6)
1,367 734
(65.1) (34.9)
Total 2,114 4,371 2,866 2,526 2,101 1Data for this period are preliminary and subject to revision. SOURCE: Pennsylvania Department of Health, Client Information System

EPIDEMIOLOGIC TRENDS IN DRUG ABUSE—Philadelphia
Proceedings of the Community Epidemiology Work Group, Vol. II, June 2005 206
Exhibit 6. Cumulative AIDS Cases in Philadelphia by Exposure Category: November 1, 1981, through 2004
November 1, 1981, to December 31, 2004 Exposure Category Number Percent Injection Drug Use 6,019 (35.2) Male-to-Male Sex and Injection Drug Use 859 (5.0)
Male-to-Male Sex 6,341 (37.1) Heterosexual Contact 3,352 (19.6) Blood Products 92 (0.5) No Identified Risk Factor 421 (2.5) Total Adult Cases 17,084 (99.9) SOURCE: Philadelphia Department of Public Health, AIDS Activities Coordinating Office

EPIDEMIOLOGIC TRENDS IN DRUG ABUSE—Phoenix and Arizona
Proceedings of the Community Epidemiology Work Group, Vol. II, June 2005 207
Drug Abuse Trends in Phoenix and Arizona Ilene L. Dode, Ph.D.1 ABSTRACT During FY 2004, 36,375 adults and children in Ari-zona received treatment through the Arizona De-partment of Health Services behavioral health sys-tem for substance use, abuse, or dependence. Ex-cluding alcohol admissions, 37.5 percent were for methamphetamine abuse, 21.4 percent were for marijuana abuse, 19.6 percent were for heroin abuse, 16.1 percent were for cocaine abuse, and 5.4 percent were for abuse of all other illicit drugs. In 2004, there were 8,116 (unweighted) drug reports in drug-related ED visits; of these, 2,165 were am-phetamine and methamphetamine combined, which was slightly less than drug reports for alcohol. In the last quarter of 2004, NFLIS forensic lab analy-sis of 2,009 drug items revealed that 32.3 percent contained methamphetamine, followed by 32.2 per-cent for cocaine, 26.8 percent for cannabis, and 6 percent for heroin. A report based on 2002–2003 Arrestee Drug Abuse Monitoring program data from Maricopa and Pima Counties concluded that community prevention efforts based on the assump-tion that social disorganization and methampheta-mine use go hand in hand may be ineffective and not the best use of scarce resources. Methampheta-mine was the primary drug of adolescents entering intensive treatment. INTRODUCTION Area Description The population of the State is 64 percent White, 25 percent Hispanic, 3 percent African-American, 5 per-cent Native American, 2 percent Asian American, and 2 percent other groups. Since 1990, the Hispanic population has increased by 88 percent statewide. The population of Maricopa County (Phoenix) is 3,389,260 (60.7 percent of State population); 66 per-cent are White, followed by 25 percent Hispanic, 4 percent African-American, 2 percent Native Ameri-can, 2 percent Asian American, and 2 percent other groups.
1The author is affiliated with Emergency Mobile Pediatric and Adult Crisis Team (EMPACT) – Suicide Prevention Center, Phoe-nix, Arizona.
Nearly one in four (23 percent) of Arizona’s residents live in a county that borders Mexico. While border residents are similar to other Arizonans, there are notable differences. Despite a high percentage of working families, and the fact that border residents are more likely to be in school, families along the border are poorer than other Arizonans; the median income ($35,421) is 13 percent lower than the State average of $40,558. Non-Hispanic White children are 37 percent more likely to live in poverty. Data Sources This report is based on the most recent available data obtained from sources shown below: • Drug-related death data are from the 2003 Drug
Abuse Warning Network (DAWN) medical/ coroner (ME/C) system, maintained by the Office of Applied Studies (OAS), Substance Abuse and Mental Health Services Administration (SAMHSA), updated in September 2004. The DAWN system covered 94 percent of the Phoe-nix-Mesa-Scottsdale area population in 2003. The redesigned DAWN ME/C system covers any death, accidental or intentional, related to recent drug use among decedents age 6–97. The deaths may be caused/induced by the drug, deemed to have contributed to the death, or simply impli-cated in the death. A DAWN case may involve multiple drugs; thus, the number of cases across drug categories exceeds the number of deaths. Rates for the area were provided for (combined) “drugs of misuse,” estimated at 114.8 per 100,000 population; rates for males (177.5) exceeded those for females (52.4). Data on specific drugs, as pre-sented in this paper, were reported only by un-weighted numbers. The 2003 data are not compa-rable to data for 2002 and before because of changes in the ME/C system.
• Drug treatment data are from four sources. Statewide admissions data were provided by the Arizona Department of Health Services (ADHS), Division of Behavioral Health Services (DBHS), Bureau of Substance Abuse Treatment and Pre-vention Services, through fiscal year (FY) 2004. Treatment admissions data for adults and juve-niles in the Treatment and Assessment Screening Center (TASC) programs in Phoenix were de-rived from the Maricopa County Juvenile Proba-tion Program’s report, March 2004, and the Adult Deferred Prosecution Program’s Cumula-tive Statistical Report, March 1989–March 2004. Data on detoxification admissions to Community Bridges in Phoenix cover the period from July 2004 to April 2005, and data on persons treated

EPIDEMIOLOGIC TRENDS IN DRUG ABUSE—Phoenix and Arizona
Proceedings of the Community Epidemiology Work Group, Vol. II, June 2005 208
for methadone and nonmedical use of nonpre-scription drugs at Phoenix’s Valle del Sol Opioid Treatment Program cover FY 2004–2005.
• Emergency department (ED) drug data for 2004 were accessed from the DAWN Live! re-stricted-access online system, maintained by OAS, SAMHSA, on April 13–14, 2005. All 25 eligible hospitals in the Phoenix area are in the DAWN sample, with the number of EDs in the sample totaling 26. (Some hospitals have more than one ED.) The data were incomplete (see ex-hibit 1). During this 12-month period, between 11 and 13 EDs reported data each month. DAWN covers eight case types; case data for Phoenix appear in exhibit 2. All DAWN cases are reviewed for quality control. Based on this review, cases may be corrected or deleted. Therefore, the data presented in this paper are subject to change. Data derived from DAWN Live! represent drug reports in drug-related ED visits. Drug reports exceed the number of ED visits, since a patient may report use of multiple drugs (up to six drugs and alcohol). The DAWN Live! data are unweighted and, thus, are not es-timates for the reporting area. These data cannot be compared to DAWN data from 2002 and be-fore, nor can preliminary data be used for com-parison with future data. Only weighted DAWN data released by SAMHSA can be used for trend analysis. A full description of the DAWN system can be found at DAWN Web site: http://dawninfo.samhsa.gov.
• Drug arrest data are from the Arizona Depart-ment of Public Safety (ADPS), “Crime in Ari-zona Annual Report 2003.” The data show statewide trends for trafficking/manufactur-ing/sale arrests and arrests for possession of opi-ates/cocaine, synthetic narcotics, marijuana, and other nonnarcotic drugs from 1993 through 2003.
• Forensic drug data are from the National Fo-rensic Laboratory Information System (NFLIS), Drug Enforcement Agency (DEA), for the last quarter of 2004.
• Drug seizure data are from the DEA for 2003 and 2004.
• Data on drug prices are from the DEA, Phoenix Office, in its “Trends in Traffic” First Quarter FY 2005 report, and the U.S. Customs Service, the ADPS, Phoenix Police Department, and the Maricopa County Sheriff’s Department. Data on
heroin price and purity are from DEA’s Domes-tic Monitor Program for 2003. Price data on me-thylenedioxymethamphetamine (MDMA) are from the National Drug Intelligence Center Col-lection Unit for the State overall from January through June 2004.
• Employee drug screening data on heroin were provided by laboratories for 1998–2003 and re-ported by the DEA.
• Student drug use data are from the Arizona Youth Survey supported by the Arizona Criminal Justice Commission. The survey covered stu-dents, statewide, in grades 8, 10, and 12 in 2004 and prior years. The survey is designed to assess school safety, adolescent substance use, antiso-cial behavior, and risk and protective factors that predict adolescent problem behaviors.
• Data on drug-endangered children were ob-tained from the Arizona Office of the Attorney General, “Multidisciplinary/Integrated Protocol,” September 2003.
• Human immunodeficiency virus (HIV) and acquired immunodeficiency syndrome (AIDS) data are from the Arizona Department of Health Services (DHS), Division of Public Health Ser-vices, Bureau of Epidemiology and Disease Con-trol, Office of HIV/STD Services “HIV/AIDS Annual Report,” March 2004, and represent new and total cases for the State overall from 1998–2002.
• Chronic hepatitis C data for the State overall
from 1998 through 2003 are from the Arizona Department of Health Services (DHS), Division of Public Health Services, Office of Infectious Disease Services, Chronic Hepatitis Infection, Surveillance Report, 2003.
DRUG ABUSE PATTERNS AND TRENDS Cocaine/Crack According to 2003 DAWN mortality data, there were 130 cocaine-related deaths in the Phoenix area in 2003, with 30 being single-drug deaths (exhibit 3). The ADHS, DBHS, Bureau for Substance Abuse Treatment and Prevention, reported that 9 percent of all clients admitted to State treatment programs (in-cluding alcohol admissions) in FY 2004 were for primary cocaine abuse (exhibit 4). This reflects a 44-percent decline in cocaine admissions from 2003.

EPIDEMIOLOGIC TRENDS IN DRUG ABUSE—Phoenix and Arizona
Proceedings of the Community Epidemiology Work Group, Vol. II, June 2005 209
For the past 7 reporting periods, cocaine treatment admissions (4,703) to the TASC Adult Deferred Prosecution Program remained unchanged, at 29 per-cent of cumulative treatment admissions (10,238) (exhibit 5a). Six percent of juveniles tested positive for cocaine during the first quarter of 2005 (exhibit 5b). The number of unweighted cocaine drug reports in DAWN Live! was 1,591 in 2004 (exhibit 6). Cocaine represented 27.5 percent of major substances of abuse drug reports (excluding alcohol). Between 2002 and 2003, the ADPS reported a 6-percent decline in arrests for trafficking/manufac-ture/sale of opiates and cocaine. Arrests decreased by 1 percent for possession of opiates/cocaine in 2003 (exhibit 7). The DEA reported numerous seizures at the Ari-zona/Mexico border that involved mixed loads of cocaine and methamphetamine. A comparison of FY 2003 and FY 2004 seizure statistics revealed a 47-percent increase in the amount of cocaine seized. In FY 2004, 3,459 kilograms of cocaine were seized, compared with 2,159 kilograms in 2003. Cocaine remains readily available in Phoenix, Tuc-son, and Nogales. An ounce of crack cocaine that sold for $400–$480 in Phoenix in 2002 sold for $540–$600 in 2004 (exhibit 8). Demand for crack cocaine remains consistently high. Crack is available in ounce and pound quantities. In the Phoenix African-American community, half-ounce quantities of crack are called “half birds,” and ounce quantities are referred to as “full birds.” Heroin According to DAWN mortality data for 2003, 227 drug misuse deaths involved opiates/opioids; 37 were single-drug deaths (exhibit 3). Of these illicit drug deaths, 13 involved heroin, with heroin being the only drug found in 4 cases. The ADHS, DBHS, Bureau of Substance Abuse Treatment and Prevention, identified heroin as the primary substance of abuse for 11 percent of treat-ment admissions (including alcohol) in FY 2004 (ex-hibit 4). Among the 10,653 clients treated at Community Bridges detoxification services from July 1, 2004, through April 30, 2005, 10 percent identified heroin as their drug of choice (exhibit 9).
At the Valle del Sol Opioid Treatment Program, which served an average of 350 clients per month in FY 2004/2005, individuals seeking methadone treat-ment reported heroin as the first drug of choice, and prescription opiates/opioids and benzodiazepines as the second and third drugs of choice, respectively. The number of unweighted heroin ED reports in Phoenix in 2004 was 755 (exhibit 6). Excluding alco-hol, heroin represented 13 percent of DAWN Live! major illicit drug reports. The DEA reported increased availability of black tar heroin in the Phoenix area. There were continued reports of the presence of South American white her-oin. Heroin abuse was reportedly increasing because of higher purity levels, lower cost, and the increase in noninjecting heroin users. Kilogram quantities of black tar heroin are readily available with 1–2 days notice when the purchase is 1 kilogram or larger. In 2003, the retail purity of heroin, before cutting agents were added, averaged 58 percent pure heroin. A review of the DEA’s Domestic Monitoring Pro-gram for the recent 5-year period revealed that the average retail purity fluctuated between 41.3 and 48.9 percent pure heroin. In Phoenix, the price of heroin in 2004 was $60–$110 per gram (exhibit 8). Drug screening laboratories in Arizona reported a steady increase in the number of employees testing positive for heroin. In 1999, 8 percent of all drug screenings were positive for heroin, compared with 17 percent in 2003. Other Opiates The unweighted number of ED drug reports for “other drugs” in DAWN Live! in 2004 included 1,226 for opiates/opioids, 232 for hydrocodone, and 291 for oxycodone (exhibit 6). Case types included over-medication, seeking detox, and other. The most commonly abused pharmaceutical con-trolled substances in Phoenix in 2004 included Vi-codin ($5 per tablet), Lortab ($5–$6 per 10-milligram tablet), and other hydrocodone products: Percocet ($5 per tablet), OxyContin ($20–$80 per 80-milligram tablet and $20–$25 per 40-milligram tablet), and other oxycodone products (exhibit 8). Also com-monly abused are methadone, hydromorphone, mor-phine, Demerol, codeine products, and anabolic ster-oids. Soma ($2–$5 per tablet) in combination with other analgesic controlled substances, Ultram and Nubain, continue to be highly abused prescription-only substances.

EPIDEMIOLOGIC TRENDS IN DRUG ABUSE—Phoenix and Arizona
Proceedings of the Community Epidemiology Work Group, Vol. II, June 2005 210
The ADPS 2003 arrest data on trafficking/manu-facture/sale of synthetic narcotics revealed a 21.3-percent increase from 2001. Arrests for possession of synthetic narcotics continued a steady upward trend, increasing 38.3 percent from 2001 to 2003 (exhibit 7). Marijuana The seeding of marijuana fields in Mexico takes place in March or April, and the drug is harvested from June through August. Availability of marijuana increased between July and September 2004. South-ern Arizona law enforcement reported an increase in the number of vehicles being driven by Hispanic males between the ages of 15 and 17. The young males are recruited from the border communities of Douglas, Nogales, and Naco. It was speculated that the vehicle driving was a “summer job” for some young males. Marijuana remains readily available in quantities up to hundreds of kilograms packaged for delivery, de-spite large quantities of seizures by the U.S. Customs Service and the U.S. Border Patrol at the Ports of Entry and at remote sites along the international bor-der. In 2004, the Phoenix Police Department seized large quantities of “BC bud” also known as “chronic.” In 2004, 1 pound bricks of BC bud sold for $4,500 each, compared with $500 to $750 for a pound of ordinary marijuana. ADHS/DBHS Bureau for Substance Abuse and Pre-vention data revealed that 12 percent of treatment admissions (including alcohol) in FY 2004 were for marijuana (exhibit 4). Marijuana was reported as the primary drug of choice by 23.6 percent of clients in the TASC Adult De-ferred Prosecution Program from March 1989 through March 2005 (exhibit 5a). Seventy-three per-cent (4,194) of juvenile admissions to the TASC Ju-venile Probation Program were for marijuana treat-ment during the first quarter of FY 2005 (exhibit 5b). The unweighted number of marijuana ED drug re-ports in DAWN Live! in 2004 was 1,122 (exhibit 6). Excluding alcohol, marijuana represented 19.4 per-cent of major substances of abuse drug reports in Phoenix. The DPS data show an 8.4-percent increase in arrests for trafficking/manufacture/sale of marijuana and a 13.9-percent increase in arrests for marijuana posses-sion from 2002 to 2003 (exhibit 7). In the 2004 Arizona Youth Survey, the percentage of students reporting ever using marijuana was nearly
46 percent (exhibit 10), down from the nearly 51 per-cent in 2002. Past-30-day use also declined, from approximately 25 percent in 2002 to 19 percent in 2004. Nevertheless, marijuana continued to be the most frequently reported illicit drug among Arizona students in grades 8, 10, and 12. Stimulants In 2003, there were 104 deaths involving misuse of stimulants (amphethamine and methamphetamine) reported to DAWN; 23 were single-drug deaths (ex-hibit 3). The ADHS/DBHS, Bureau for Substance Abuse Treatment and Prevention, reported that 21 percent of all clients admitted to State substance abuse treatment programs during FY 2004 were for primary metham-phetamine abuse (exhibit 4). TASC Adult Deferred Prosecution Program data re-vealed that 26.9 percent (4,436) of the March 1989 through March 2005 treatment admissions (10,238) were for methamphetamine abuse (exhibit 5a). Eight-een percent of the juveniles (1,034) in first quarter of 2005 (who submitted urine samples) tested positive for methamphetamine/amphetamine (exhibit 5b). Slightly more than 11 percent of the admissions to Community Bridges detoxification programs from July 2004 through April 2005 were for metham-phetamine abuse. Methamphamine (11 percent) was the second drug of choice after alcohol (61 percent), followed by heroin (10 percent), crack (6 percent), and cocaine (3 percent) (exhibit 9). The unweighted number of stimulant ED drug reports in DAWN Live! in 2004 was 2,165 (exhibit 6). Ex-cluding alcohol, stimulants (methamphetamine/am-phetamines) represented 37.4 percent of major sub-stances of abuse drug reports in Phoenix. The NFLIS report for the last quarter of 2004 re-vealed that 32.3 percent of drug items tested by fo-rensic labs in Phoenix contained methamphetamine. Methamphetamine, cocaine, and cannabis together accounted for 97.2 percent of all drug samples. Methamphetamine is the number one drug threat in the State of Arizona, according to the National Drug Intelligence Center 2005 report. It has been a public health crisis that crosses all socioeconomic levels and all racial and ethnic groups. It is a statewide epi-demic, not just a rural or just an urban problem. Methamphetmine is the number one illegal drug con-tributing to violent crime in Arizona.

EPIDEMIOLOGIC TRENDS IN DRUG ABUSE—Phoenix and Arizona
Proceedings of the Community Epidemiology Work Group, Vol. II, June 2005 211
Other Drugs DAWN ME/C cases in 2003 included 54 deaths in-volving benzodiazepine misuse (exhibit 3). The unweighted number of benzodiazepine drug re-ports in DAWN Live! totaled 963 in 2004 (exhibit 6). The National Drug Intelligence Center Collection Unit reported street-level prices for MDMA in Ari-zona from January through June 2004. The wholesale price was $7–$12 per tablet per 1,000 tablets, and the retail price was $20–$30 per tablet. The DEA reported substantial seizures of gamma hydroxybutyrate (GHB) and gamma butyrolactone (GBL). INFECTIOUS DISEASES RELATED TO DRUG ABUSE HIV/AIDS In 2002, there were 9,710 persons in Arizona known to be living with HIV Disease (HIV or AIDS): 4,402 with a diagnosis of AIDS, and 5,250 with a diagnosis of HIV. In the State as a whole, the known HIV disease prevalence rate was 184.1 per 100,000 persons. Based on these prevalence estimates, at least 1 of every 543 persons in Arizona carries HIV. Maricopa County, the State’s most populous urban county, had the second highest prevalence rate of reported HIV Disease (207 per 100,000 population). With 60 percent of the State’s population, it has 67.8 percent of known AIDS cases and 66.7 percent of known HIV cases. The rate for new AIDS diagnoses in Arizona has shown a steady decline and was 5.31 per 100,000
population in 2002 (exhibit 10). The rate for new HIV diagnoses appeared to be increasing, from 1999 to 2002 from 7.0 to nearly 8.0 per 100,000 popula-tion, respectively. The predominant reported mode of transmission of HIV/AIDS in Phoenix continues to be contact among men who have sex with men (MSM), which ac-counted for 57.5 percent of all reported new cases of HIV in 2002 (exhibit 10). Injection drug use (with and without male-to-male sex) accounted for 22.2 percent, and heterosexual exposure accounted for 9.6 percent of reported new cases of HIV/AIDS in Phoe-nix during 2002 (exhibit 10). Chronic Hepatitis Infection From 1998 through 2003, there were 40,427 cases of chronic hepatitis C infection (HCV) reported in Ari-zona. Of the reported cases, 41.37 percent were con-firmed by recombinant immunoblot assay (RIBA) or polymerase chain reaction (PCR) test. Based on the Center for Disease Control and Prevention (CDC) estimates for the Nation, 92,000 individuals are living with HCV in Arizona. During 2003, there were 9,516 newly reported chronic cases of HCV in Phoenix, of which 37 per-cent were confirmed. Most HCV-infected Arizonans are between the ages of 31 and 50. For inquiries concerning this report, please contact Ilene Dode, EMPACT-Suicide Prevention Center, Inc., 1232 East Broadway, #120, Tempe, AZ 85282, Phone: 480-784-1514, ext. 1116, Fax: 480-967-3528, E-mail <[email protected]>.

EPIDEMIOLOGIC TRENDS IN DRUG ABUSE—Phoenix and Arizona
Proceedings of the Community Epidemiology Work Group, Vol. II, June 2005 212
Adverse reaction20.9%
Overmedication20.9%
Other41.8%
Seeking detox4.6%
Suicide attempt5.8%
Alcohol only (age <21)3.7%
Malicious poisoning0.4%
Accidental ingestion2.0%
Exhibit 1. DAWN ED Sample and Reporting Information in Phoenix: 2004
1Short-term, general, non-Federal hospitals with 24-hour emergency departments based on the American Hospital Association An-nual Survey. 2One hospital has more than one emergency department. SOURCE: DAWN Live!, OAS, SAMHSA, updated 4/13–14, 2005 Exhibit 2. Drug-Related ED Visits in Phoenix, by Case Type (Unweighted1):2004 1The unweighted data are from 11–13 EDs reporting to DAWN in 2004. All DAWN cases are reviewed for quality control. Based on this review, cases may be corrected or deleted, and, therefore, are subject to change. SOURCE: DAWN Live!, OAS, SAMHSA, updated 4/13–14, 2005
No. of EDs Reporting per Month: Com-pleteness of Data (%) Total Eligible
Hospitals1 No. of Hospi-tals in DAWN
Sample2
Total EDs in DAWN Sample 90-100% 50-89% <50%
No. of EDs Not Reporting
25 25 26 9-13 1-2 0-1 13-15

EPIDEMIOLOGIC TRENDS IN DRUG ABUSE—Phoenix and Arizona
Proceedings of the Community Epidemiology Work Group, Vol. II, June 2005 213
Suicide21%
Could not be determined
8%
Overmedication4%
All Other accidental67%
Exhibit 3. Drug-Related Mortality Cases in Phoenix, by Case Type and Drug: 2003 SOURCE: DAWN, OAS, SAMHSA, updated 9/24, 2004
0
50
100
150
200
250
300
Multi-drug deaths 227 130 110 104 6
Single Drug deaths 37 30 10 23 0
Opiates/Opioids Cocaine Alcohol Stimulants Misc. Analgesics/ Combinations
264
160
120 127
6

EPIDEMIOLOGIC TRENDS IN DRUG ABUSE—Phoenix and Arizona
Proceedings of the Community Epidemiology Work Group, Vol. II, June 2005 214
Exhibit 4. Treatment Admissions in Arizona, by Primary Substance of Abuse and Percent: FY 2004 SOURCE: Arizona Department of Health Services, Division of Behavioral Health Services, Bureau for Substance Abuse Treatment and Prevention
Methamphetamine21%
Marijuana12%
Cocaine9%Heroin
11%
All Other3%
Alcohol44%

EPIDEMIOLOGIC TRENDS IN DRUG ABUSE—Phoenix and Arizona
Proceedings of the Community Epidemiology Work Group, Vol. II, June 2005 215
Exhibit 5a. Adult Deferred Prosecution Program Admissions in Phoenix, by Primary Drug: March 1, 1989–March 31, 2005 SOURCE: Adult Treatment and Assessment Screening Center (TASC) – Deferred Prosecution Program
Primary Drug Problem (may include more than one drug)28.5% 26.9%
23.6%
11.4%
5.0% 4.5%
0%
5%
10%
15%
20%
25%
30%
Cocaine (4,703) Meth (4,436) Marijuana (3,886) Polydrug (1,881) Opiate (832) Denies Drug Problem(739)
Ethnicity
61.1%
29.6%
2.1% 1.2%6.1%
0%
10%
20%
30%
40%
50%
60%
70%
Caucasian (6,2550) Hispanic (3,029) African American (621) Native American (215) Other (118)
Gender
70.5%
29.5%
0%10%20%30%40%50%60%70%80%
Male (7,213) Female (3,025)
Marital Status54.1%
23.8%
7.4%14.7%
0%10%20%30%40%50%60%
Single (5,535) Married (2,436) Divorced (760) Separated (1,507)
Employment
31.2%
11.7%
53.2%
3.8%
0%
10%
20%
30%
40%
50%
60%
Unemployed (3,197) Part-Time (1,198) Full-Time (5,449) Disabled (394)

EPIDEMIOLOGIC TRENDS IN DRUG ABUSE—Phoenix and Arizona
Proceedings of the Community Epidemiology Work Group, Vol. II, June 2005 216
THC (n=4,194)73.46%
PCP (n=2)0.04%
Amphetamine (n=1,034)18.11%
Cocaine (n=362)6.34%
Opiates (n=109)1.91%
Alcohol (n=8)0.14%
Exhibit 5b. Positive Tests Among Phoenix TASC Juvenile Clients, by Drug and Percent: January–March 2005 N=5,709 SOURCE: Treatment and Assessment Screening Center (TASC), Maricopa County Juvenile Probation

EPIDEMIOLOGIC TRENDS IN DRUG ABUSE—Phoenix and Arizona
Proceedings of the Community Epidemiology Work Group, Vol. II, June 2005 217
Exhibit 6. Number of Drug Reports in Drug-Related ED Visits in Phoenix (Unweighted1): 2004 Selected Drugs Case Type Total Major Substances of Abuse All 8,116 Seeking Detox Seeking Detox 671 Alcohol All 2,333 Alcohol only (age <21) Alcohol-only 409 Cocaine All 1,591 Heroin All 755 Marijuana All 1,122 Stimulants All 2,165 Amphetamines All 819 Methamphetamine All 1,346 MDMA (Ecstasy) All 20 GHB All 4 Ketamine All 1 LSD All 16 PCP All 39 Miscellaneous Hallucinogens All 28 Inhalants All 30 Combinations NTA All 12 Other Substances All 5,805 Seeking Detox 288 Overmedication 3,686 Other 1,831 Benzodiazepines All 963 Seeking Detox 45 Overmedication 562 Other 356 Opiates/Opioids All 1,226 Seeking Detox 155 Overmedication 496 Other 575 Opiates/Opioids, Unspecified All 229 Seeking Detox 19 Overmedication 18 Other 192 Hydrocodone All 232 Seeking Detox 24 Overmedication 155 Other 53 Oxycodone All 291 Seeking Detox 63 Overmedication 162 Other 66 Muscle Relaxants All 281 Seeking Detox 8 Overmedication 214 Other 59 1The unweighted data are from 11–13 EDs reporting to Phoenix hospitals reporting to DAWN in 2004. All DAWN cases are reviewed for quality control. Based on this review, cases may be corrected or deleted, and, therefore, are subject to change. SOURCE: DAWN Live!, OAS, SAMHSA, updated 4/13–14, 2005

EPIDEMIOLOGIC TRENDS IN DRUG ABUSE—Phoenix and Arizona
Proceedings of the Community Epidemiology Work Group, Vol. II, June 2005 218
Exhibit 7. Arrests in Arizona for Trafficking/Manufacture/Sale and Possession of Drugs, by Drug Category: 1993–2003 1Data for 1995 are unavailable. SOURCE: Arizona Department of Public Safety
No. (%) No. (%) No. (%) No. (%) No. (%) No. (%)
Trafficking/Manufacture/ SaleOpiates/Cocaine 1,048 27.6% 1,030 21.5% 1,606 33.0% 564 12.9% 1,776 33.3% 1,788 35.4%Syn. Narcotics 507 13.4% 629 13.1% 596 12.3% 641 14.6% 760 14.2% 578 11.4%Marijuana 1,376 36.2% 1,456 30.4% 1,343 27.6% 1,404 32.0% 1,084 20.3% 1,150 22.7%Other Drugs-Non Narcotics 866 22.8% 1,675 35.0% 1,320 27.1% 1,778 40.5% 1,716 32.2% 1,540 30.5%Total 3,797 4,790 4,865 4,387 5,336 5,056PossessionOpiates/Cocaine 1,917 16.1% 1,842 11.0% 2,752 13.5% 3,263 14.5% 4,088 17.3% 4,081 17.1%Syn. Narcotics 1,225 10.3% 1,812 10.8% 1,803 8.8% 2,107 9.4% 2,223 9.4% 2,316 9.7%Marijuana 7,326 61.7% 10,356 61.8% 12,939 63.2% 13,970 62.2% 13,576 57.6% 13,519 56.6%Other Drugs-Non Narcotics 1,403 11.8% 2,743 16.4% 2,965 14.5% 3,127 13.9% 3,678 15.6% 3,975 16.6%Total 11,871 16,753 20,459 22,467 23,565 23,891
Trafficking/Manufacture/ Sale and Possession Grand Total 15,668 21,543 25,324 26,854 28,901 28,947
No. (%) No. (%) No. (%) No. (%)
Trafficking/Manufacture/ SaleOpiates/Cocaine 1,635 32.4% 1,602 31.6% 1,489 29.4% 1,405 25.5% -5.6%Syn. Narcotics 542 10.7% 573 11.3% 607 12.0% 695 12.6% 14.5%Marijuana 1,283 25.4% 1,310 25.8% 1,132 22.3% 1,227 22.2% 8.4%Other Drugs-Non Narcotics 1,587 31.4% 1,588 31.3% 1,840 36.3% 2,193 39.7% 19.2%Total 5,047 5,073 5,068 5,520PossessionOpiates/Cocaine 3,770 14.7% 3,056 12.1% 2,972 11.9% 2,938 10.5% -1.1%Syn. Narcotics 2,581 10.1% 2,613 10.4% 3,196 12.8% 3,615 13.0% 13.1%Marijuana 14,947 58.3% 15,097 59.9% 13,936 56.0% 15,867 56.9% 13.9%Other Drugs-Non Narcotics 4,334 16.9% 4,436 17.6% 4,779 19.2% 5,446 19.5% 14.0%Total 25,632 25,202 24,883 27,866
Trafficking/Manufacture/ Sale and Possession Grand Total 30,679 30,275 29,951 33,386
2002 2003
Arrests
% Change: 2002–2003Arrests
1998 1999
2000 2001
1993 1994 1996 1997

EPIDEMIOLOGIC TRENDS IN DRUG ABUSE—Phoenix and Arizona
Proceedings of the Community Epidemiology Work Group, Vol. II, June 2005 219
Exhibit 8. Drug Prices in Phoenix and Tucson: 2001 and 2004
2001 2004 Drug Phoenix Tucson Phoenix Tucson Marijuana Grams $10–$25 $5–$10 Ounce $75–$150 $65–$105 $75–$150 $65–$105 Pound $500–$750 $400–$600 $500–$750 $400–$600 Methamphetamine 1/8 Ounce $150 (ice)
$120–$150 $100–$120
1/2 Teener N/A N/A $40 $80–$135 1/4 Ounce $125 $275 $250 (ice) $120–$300 Ounce $300–$600 $500–$900 $500–$600 $650–$1000 Pound $3,500–$12,000
(higher for ice) $3,800–$6,000 $5,000–8,600 $6,500–$7,500
Cocaine Rock–1/3 gram crack N/A N/A $20 $20 Eightball $100–$140 $80–$130 $80–$100 $80–$130 Ounce $500–$600 $500–$650 $400–$600 $500–$650 Ounce Crack N/A N/A $540–$600 $550–$700 Kilogram $15,000–$17,000 $15,000–$18,000 $13,500–$16,000 $14,000–$16,000 Heroin A "20" "BB" (80–100 milligrams)
$20 $20–$25 $20 $20–$25
A "paper" (.25 gram) $20–30 $20–$25 $10–$15 $20–$25 Gram $70–$100 $60–$110 $40–$47 $60–$110 Ounce ("piece", 28 grams) $1,100–$1,500 $1,075–$1,300 $750–$950 $1,075–$1,300 Kilogram $32,000–$40,000 N/A $28,000–$35,000 $43,000 Dosage Price MDMA 1 Tablet $20–$30 OxyContin 80 mg Tablet $20–$80 Percocet 1 Tablet $5 Vicodin ES 1 Tablet $5 Valium 10 mg Tablet $4 Lortab 10 mg Tablet $5–$6 Soma 1 Tablet $2–$5 SOURCES: DEA Phoenix Division Offices, U.S. Customs, Arizona Department of Public Safety, Phoenix Police Department, Mari-copa County Sheriff Department
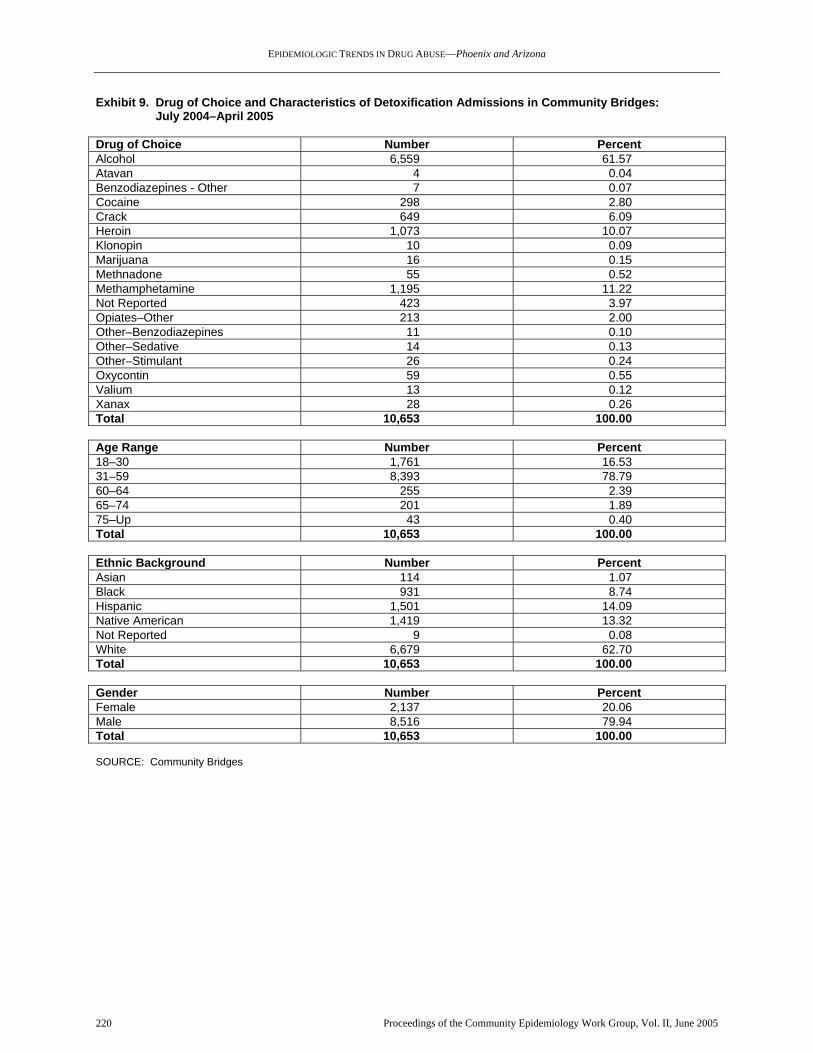
EPIDEMIOLOGIC TRENDS IN DRUG ABUSE—Phoenix and Arizona
Proceedings of the Community Epidemiology Work Group, Vol. II, June 2005 220
Exhibit 9. Drug of Choice and Characteristics of Detoxification Admissions in Community Bridges: July 2004–April 2005 Drug of Choice Number Percent Alcohol 6,559 61.57 Atavan 4 0.04 Benzodiazepines - Other 7 0.07 Cocaine 298 2.80 Crack 649 6.09 Heroin 1,073 10.07 Klonopin 10 0.09 Marijuana 16 0.15 Methnadone 55 0.52 Methamphetamine 1,195 11.22 Not Reported 423 3.97 Opiates–Other 213 2.00 Other–Benzodiazepines 11 0.10 Other–Sedative 14 0.13 Other–Stimulant 26 0.24 Oxycontin 59 0.55 Valium 13 0.12 Xanax 28 0.26 Total 10,653 100.00 Age Range Number Percent 18–30 1,761 16.53 31–59 8,393 78.79 60–64 255 2.39 65–74 201 1.89 75–Up 43 0.40 Total 10,653 100.00 Ethnic Background Number Percent Asian 114 1.07 Black 931 8.74 Hispanic 1,501 14.09 Native American 1,419 13.32 Not Reported 9 0.08 White 6,679 62.70 Total 10,653 100.00 Gender Number Percent Female 2,137 20.06 Male 8,516 79.94 Total 10,653 100.00 SOURCE: Community Bridges

EPIDEMIOLOGIC TRENDS IN DRUG ABUSE—Phoenix and Arizona
Proceedings of the Community Epidemiology Work Group, Vol. II, June 2005 221
Exhibit 10. HIV/AIDS Annual Report—Arizona Incidence: 1998–2002
NEW HIV NEW AIDS TOTAL NEW HIV/AIDS
Characteristics
Cases %
State Total
Rate Per
100,000 Cases
% State Total
Rate Per
100,000 Cases
% State Total
Rate Per
100,000
Gender
Male 1,738 84.4% 13.48 1,204 87.7% 9.34 2,942 85.7% 22.82 Female 321 15.6% 2.48 169 12.3% 1.31 490 14.3% 3.79
Total 2,059 100.0% 7.97 1,373 100.0% 5.31 3,432 100.0% 13.28
Age Group
12 and younger 14 0.7% 0.27 7 0.5% 0.14 21 0.6% 0.41 13–19 45 2.2% 1.73 7 0.5% 0.27 52 1.5% 2 20–24 212 10.3% 11.67 41 3.0% 2.26 253 7.4% 13.93 25–29 338 16.4% 18.11 128 9.3% 6.86 466 13.6% 24.97 30–34 415 20.2% 22.06 255 18.6% 13.56 670 19.5% 35.62 34–39 420 20.4% 21.57 314 22.9% 16.13 734 21.4% 37.69 40–44 288 14.0% 15.26 264 19.2% 13.98 552 16.1% 29.24 45–49 170 8.3% 10.16 163 11.9% 9.75 333 9.7% 16.91 50–54 86 4.2% 5.81 104 7.6% 7.03 190 5.5% 12.84 55–59 37 1.8% 3.07 55 4.0% 4.57 92 2.7% 7.64 60 and older 34 1.7% 0.77 35 2.5% 0.8 69 2.0% 1.57
Total 2,059 100% 7.97 1,373 100% 5.31 3,432 100% 13.28
Race/Ethnicity
White non-Hispanic 1,204 58.5% 7.23 735 53.5% 4.41 1,939 56.5% 11.64 Black non-Hispanic 236 11.5% 28.64 150 10.9% 18.2 386 11.2% 46.84 Hispanic 514 25.0% 7.8 399 29.1% 6.06 913 26.6% 13.86 A/PI/H1 non-Hispanic 18 0.9% 3.39 11 0.8% 2.07 29 0.8% 5.46 AI/AN2 non-Hispanic 81 3.9% 6.5 77 5.6% 6.18 158 4.6% 12.69 Multiple race/other non-Hispanic 6 0.3% N/A 1 0.1% N/A 7 0.2% N/A
Total 2,059 100.0% 7.97 1,373 100.0% 5.31 3,432 100.0% 13.28
Mode of Transmission
Men having sex with men (MSM) 1,151 55.9% N/A 827 60.2% N/A 1,978 57.6% N/A Injection drug use (IDU) 291 14.1% N/A 209 15.2% N/A 500 14.6% N/A MSM/IDU 172 8.4% N/A 87 6.3% N/A 259 7.5% N/A Heterosexual contact 275 13.4% N/A 171 12.5% N/A 446 13.0% N/A O/H/TF/TPR3 28 1.4% N/A 29 2.1% N/A 57 1.7% N/A No reported risk/unknown risk 142 6.9% N/A 50 3.6% N/A 192 5.6% N/A
Total 2,059 100.0% 7.97 1,373 100.0% 5.31 3,432 100% 13.28 1Asian/Pacific Islander/Hawaiian. 2American Indian/Alaskan Native. 3Other/hemophilia/transfusion and blood products/transplant recipient. SOURCE: Arizona Department of Health Services, Division of Public Health Services, Bureau of Epidemiology and Disease Con-trol, Office of HIV/STD Services

EPIDEMIOLOGIC TRENDS IN DRUG ABUSE—St. Louis
Proceedings of the Community Epidemiology Work Group, Vol. II, June 2005 222
Patterns and Trends in Drug Abuse in St. Louis Heidi Israel, Ph.D., R.N., L.C.S.W.,1 and Jim Topolski, Ph.D.2 ABSTRACT Heroin and cocaine indicators remained mixed, while methamphetamine has increased in St. Louis indicators. St. Louis and St. Louis County law en-forcement personnel continued to devote many re-sources to methamphetamine, and labs in rural ar-eas continued to be a problem. Club drug use/abuse continued to be sparse and decreasing. Marijuana indicators have stabilized during this reporting pe-riod. Primary marijuana treatment admissions more than doubled between 1997 and 2001 and remained at this elevated level in 2003 and 2004. State budget cuts may distort the actual degree of treatment need in the future because of a reduction of available treatment. In the St. Louis area, 5 percent of HIV cases had a risk factor of injection drug use, and another 5 percent were among men who have sex with men and also inject drugs. INTRODUCTION Area Description The St. Louis metropolitan statistical area (MSA) includes approximately 2.6 million people living in the city of St. Louis; St. Louis County; the surround-ing rural Missouri counties of Franklin, Jefferson, Lincoln, St. Charles, and Warren; in Illinois, East St. Louis; and St. Clair County. St. Louis City’s popula-tion has continued to decrease to approximately 350,000, many of whom are indigent and minorities. Violent crime increased in 2004, and it remains high in drug-trafficking areas. St. Louis County, which surrounds St. Louis City, has more than 1 million residents, many of whom fled the inner city. The county is a mix of established affluent neighborhoods and middle and lower class housing areas on the north and south sides of the city. The most rapidly expanding population areas are in St. Charles and Jefferson Counties in Missouri and St. Clair and Madison Counties in southern Illinois, which have a mixture of classes and both small towns and farming areas. The populations in these rural counties total 1Dr. Israel is affiliated with the Division of Infectious Diseases, Saint Louis University School of Medicine, St. Louis, Missouri. 2Dr. Topolski is affiliated with the Division of Evaluation, Policy, and Ethics, Missouri Institute of Mental Health, St. Louis, Mis-souri.
more than 800,000. The living conditions and cultural differences have resulted in contrasting drug use pat-terns. Much of the information included in this report is specific to St. Louis City and County, with caveats that apply to the total MSA. Anecdotal information and some treatment data are provided for rural areas and for the State. Limited data are also available for other parts of Missouri and offer a contrast to the St. Louis drug use picture. Policy Issues Methamphetamine production and use is a major concern for both law enforcement and the legislature. Small labs continue to place a hardship on law en-forcement in terms of personnel and resources. The legislature has taken bold moves to require precursor drugs, such as pseudoephedrine, that are sold in local retail stores to be locked up or placed behind phar-macy counters. While this policy may now slow down local producers, it does not address the major source of methamphetamine in the Midwest—Mexico, a fact that gets lost in the local problem of small “mom and pop” lab seizures. Missouri has been in a budget crisis for years, result-ing in cuts in services, particularly in health services including drug treatment and mental health. Limited treatment continues to be available for drug abusers. The addiction model as understood through experi-ence and research has shown that treatment services are cost effective to both society and the individual, yet the trend is to offer these services on a limited outpatient basis. The result is that some of these indi-cators cannot fully reflect the degree of use or abuse of the substances tracked. Data Sources The sources used in this report are indicated below: • Emergency department (ED) drug reports
data were derived for 2004 from the Drug Abuse Warning Network (DAWN) Live! restricted-access online query system administered by the Office of Applied Studies (OAS), Substance Abuse and Mental Health Services Administra-tion (SAMHSA). Eligible hospitals in the St. Louis area totaled 37; hospitals in the DAWN sample numbered 38, with the number of emer-gency departments in the sample totaling 38 (ex-hibit 1). (Some hospitals have more than one emergency department.) During this 12-month period, between 15 and 18 EDs reported data each month. The completeness of data reported
EPIDEMIOLOGIC TRENDS IN DRUG ABUSE—St. Louis
Proceedings of the Community Epidemiology Work Group, Vol. II, June 2005 223
by participating EDs varied by month. Exhibits in this paper reflect cases that were received by DAWN as of June 3, 2005. All DAWN cases are reviewed for quality control. Based on this re-view, cases may be corrected or deleted. There-fore, the data presented in this paper are subject to change. Data derived from DAWN Live! rep-resent drug reports in drug-related ED visits. Drug reports exceed the number of ED visits, since a patient may report use of multiple drugs (up to six drugs and alcohol). The DAWN Live! data are unweighted and, thus, are not estimates for the reporting area. These data cannot be com-pared to DAWN data from 2002 and before, nor can preliminary data be used for comparison with future data. Only weighted DAWN data re-leased by SAMHSA can be used for trend analy-sis. A full description of the DAWN system can be found at the DAWN Web site: http://dawninfo.samhsa.gov.
• Drug treatment data were derived from the
Treatment Episode Data Set (TEDS) database through 2004. Private treatment programs in St. Louis County provided anecdotal information.
• Heroin price and purity information was pro-
vided by the Drug Enforcement Administration (DEA), Domestic Monitor Program (DMP), through 2004.
• Drug-related mortality data were provided by
the St. Louis City Medical Examiner’s Office through 2004.
• Intelligence data were provided by the Missouri
Highway Patrol and the DEA. • Data on drug seizures were provided by the
National Forensic Laboratory Information Sys-tem (NFLIS) for 2004.
• Human immunodeficiency virus (HIV), ac-
quired immunodeficiency syndrome (AIDS), and sexually transmitted disease (STD) data were derived from the HIV Vaccine Trials Unit at Saint Louis University and the St. Louis Met-ropolitan Health Department and AIDS Program.
Linda Cottler, Ph.D., of Washington University, who has multiple behavioral research grants, provided additional data. DRUG ABUSE PATTERNS AND TRENDS Cocaine indicators are stable in St. Louis. While methamphetamine has become a prominent drug of
abuse in other cities and in the rural areas of Missouri, cocaine has retained its dominance in the St. Louis urban area. Possible reasons for this situation include racial differences, with Caucasians using metham-phetamine and African-Americans using cocaine, and the strong influence of the distribution networks. The distribution of cocaine and heroin is primarily con-ducted by African-Americans. Methamphetamine is imported into St. Louis from Mexico or produced lo-cally in the rural areas of the county and State. Two types of heroin have continued to be available in the area, but the heroin is not as pure and is more ex-pensive when compared with other cities. This Mid-western city is a destination market, with small entre-preneurial groups marketing the drug. Heroin is avail-able in the suburbs and in some of the surrounding rural areas on a limited basis, thus illustrating that this drug is not confined to the lower socioeconomic strata in the city. Drug education and prevention activities have con-tinued at the community level. The National Council on Alcoholism and Drug Abuse (NCADA) and other local education programs target prevention of drug use in the area. Faith-based initiatives are being im-plemented. These groups are particularly active in the surrounding counties of St. Louis. The poor city economy continues to foster drug abuse and distri-bution. Marijuana continues to be a very popular drug of abuse among younger adults. Gangs continue to be involved in the drug trade and related violence, with Latino, African-American, and Asian youth and young adults involved in these groups. Interdiction programs include Operation Jetway and Operation Pipeline. While not reported separately, alcohol abuse and un-derage use of alcohol are community concerns. Many traffic accidents and violence against persons include alcohol use in the situation. In St. Louis, 15 percent of treatment admissions are for alcohol alone, with alcohol used in combination with drugs in another 12.5 percent of the treatment admissions. In the un-weighted DAWN ED data, underage alcohol use represents 6.5 percent of the reports in 2004. With the severe cuts in services in this State over the next year, the treatment admissions data, an important indicator of longer term use of drugs, may not accu-rately reflect the severity of the drug abuse problem. Cocaine/Crack The St. Louis City/County Medical Examiner (ME) reported that cocaine-related deaths trended down-ward from 128 in 1994 to 38 in 2004 (exhibit 2a).

EPIDEMIOLOGIC TRENDS IN DRUG ABUSE—St. Louis
Proceedings of the Community Epidemiology Work Group, Vol. II, June 2005 224
Many of the recent deaths involved alcohol and other drugs. According to DAWN, the number of cocaine men-tions increased significantly between 2000 (n=2,403) and 2002 (3,536). The numbers of mentions among those age 45–54 and 55 and older increased signifi-cantly. For 2004, the unweighted DAWN Live! data indicate that ED reports for cocaine had the following characteristics: more than one-half (51.8 percent) of the patients were White, and 58.6 percent of the pa-tients were older than 34. The top two reasons for the ED visit were seeking detox or overmedication. The dispositions for most of these patient visits included referral to treatment, admission to the psychiatric unit, or discharge to home; only three resulted in im-mediate death. Among treatment admissions for illicit drug abuse in 2004, the proportion for primary cocaine abuse re-flected a slight decrease compared with all of 2003 (exhibit 2a). Cocaine remained the most common primary drug of abuse among all admissions (29.1 percent), followed by marijuana (25.0 percent) and heroin (10.4 percent). The typical cocaine admission was an African-American male age 35 or older who smoked the drug. Although the DEA’s emphasis has shifted from co-caine to methamphetamine and heroin, law enforce-ment sources, the DEA, and street informants contin-ued to report high quality, wide availability, and low prices for cocaine. Cocaine is used and most avail-able in the urban areas. Powder cocaine grams sold for $100–$125; purity averaged 70 percent (exhibit 2b). Crack prices remain at $20 per rock on the street corner. All cocaine in St. Louis is initially in the powder form and is converted to crack for distribu-tion. Cocaine was readily available on the street cor-ner in rocks or grams. The price of a gram of crack in Kansas City was lower than in St. Louis (at $100–$120). The “rock” price is the same in smaller cities outside St. Louis when it is available, but the gram price is higher. NFLIS data indicated 2,389 (41.5 percent) of items analyzed in 2004 were cocaine. The continued use of cocaine has potentially severe long-term consequences by contributing to the spread of STDs through multiple partners. Crack cocaine is considered to be a primary risk for HIV in many re-search trials. Most cocaine users smoke crack cocaine, though some use powder cocaine. Only injection drug users (IDUs) who combine cocaine and heroin (“speed-
ball”) use cocaine intravenously. Younger users tend to smoke cocaine. Polydrug use is also evident in the treatment data. The reported use of marijuana, heroin, and alcohol in addition to cocaine suggests this trend will likely continue. Heroin Heroin-related deaths reported by the St. Louis City/County ME leveled off in recent years. In 2004, there were 64 heroin-related deaths (exhibit 2a). Statewide heroin deaths caused by overdose alone were not much higher, because heroin purity is higher in the St. Louis area than in other cities in Missouri. While available primarily in the St. Louis and Kansas City areas, heroin is found among small pockets of IDUs who reside in small university towns through-out the State. More heroin deaths occurred in St. Louis County than in the inner city in 2004 (32 ver-sus 20); these deaths support other reports that heroin use is increasing in the suburbs. Heroin consistently appears in all indicators. Un-weighted data accessed from DAWN Live! show that heroin ED reports for 2004 had patient demographics of 60.1 percent White and 28.8 percent age 18–24. Heroin ED mentions had risen steadily from 1995 to 2002, when mentions totaled 1,167. The increase in heroin mentions among many age groups over this earlier 7-year period (1995–2002) indicates the wide availability of this drug in this MSA. While heroin treatment admissions increased dra-matically as a proportion of all admissions between 1996 and 2000, they leveled off in 2001–2003. In 2004, this trend appeared to continue. There are lim-ited slots for admissions to State-funded methadone or modified medical detoxification in Missouri, which may influence these data. While heroin avail-ability increased throughout the region, the decrease in admissions may in fact be a result of lack of ade-quate treatment resources; alternatively, the decrease could be related to new users of heroin not yet seek-ing treatment. When queried, private treatment pro-grams stated that 25 percent of their admission screens were for heroin abuse, but admission de-pended on “ability to pay.” Some heroin abusers in need of treatment utilize “private pay” methadone programs. Rapid detoxification, using naltrexone, is still a treatment option at private hospitals, but it is expensive. About 35 percent of heroin admissions were younger than 25 in 2004. Of all heroin admis-sions, intravenous use was the primary method of administration in St. Louis County, but inhalation was more popular among admissions in St. Louis City. The increased availability of higher purity her-oin has led to a wider acceptance of the drug in social

EPIDEMIOLOGIC TRENDS IN DRUG ABUSE—St. Louis
Proceedings of the Community Epidemiology Work Group, Vol. II, June 2005 225
circles. One of the reasons for its acceptance is that it does not have to be injected to get the desired effects. A steady supply of Mexican heroin remains available. The DEA has made buys of heroin in the region in addition to buys through the DMP. Mexican black tar heroin showed a peak of 24.0 percent purity in 1998; purity dropped to 15.1 percent in 2004. South Ameri-can (Colombian) heroin, which is also white, is of poorer quality, averaging around 10 percent. Most heroin is purchased in aluminum foil or the number-5 gel capsule (one-tenth-gram packages of heroin in plastic wrap and aluminum foil) for $10 (exhibit 2b). Heroin costs were about $1.89 per milligram for Mexican heroin in the 2003 DMP analysis. The city is an end-user market and is dependent on transporta-tion of the heroin from points of entry into the Mid-west. The wholesale price remains at $250–$600 per gram. On street corners, heroin sells for $250 per gram or $10 per “button.” Most business is handled by cellular phone, which has decreased the seller’s need to have a regular location. Runners continue to be used as “middlemen” between users and sellers to deliver small quantities of drug. In St. Louis and other smaller urban areas, small distribution networks sell heroin. NFLIS reported that 10 percent of the items analyzed in 2004 were heroin. Kansas City’s heroin supply differs from that of St. Louis. Most heroin in Kansas City is black tar and is typically of poorer quality. The supply is consistent, and a $10 bag of heroin is available. Heroin has also become available in the smaller, more rural cities of Springfield and Joplin, each of which has a small IDU population that uses heroin and methamphetamine. Other Opiates/Narcotics Other opiates continue to represent less than 1 percent of all treatment admissions. Methadone remains avail-able, which is probably a result of prescription abuse as well as patient diversion. The unweighted DAWN data for 2004 accessed from DAWN Live! indicate 797 reports for other opiates; 40 percent were for overmedication and only 18 percent were for patients seeking detoxification. Reasons for the ED visit were not delineated for 40 percent of the reports. OxyContin (a long-lasting, time-release version of oxycodone) abuse remained a concern for treatment providers and law enforcement officials. Prescription practices are closely monitored for abuse, and iso-
lated deaths have been reported, but no consistent reports are available on the magnitude of this poten-tial problem. OxyContin costs $40 for an 80-milli-gram tablet on the street (exhibit 2b). The DAWN data indicate 247 oxycodone reports in 2004, with 38 percent of these patients coming to the ED for over-medication. The use of hydromorphone (Dilaudid) remained common among a small population of White chronic addicts. The drug costs $30–$75 per 4-milligram pill. Marijuana According to unweighted data accessed from DAWN Live!, marijuana ED reports in 2004 (n=1,230) repre-sented 20 percent of the total ED reports for major substances of abuse. More than 45 percent of the pa-tients who reported cocaine in 2004 were younger than 25. Marijuana treatment admissions more than doubled from 1997 (1,573 admissions) to 2001 (3,210 admis-sions) and remained stable in 2003 and 2004, when they represented 27.2 percent and 25.0 percent of all admissions, respectively (exhibit 2a). Marijuana, viewed by young adults as acceptable to use, is often combined with alcohol. The 25-and-younger age group accounted for 65.6 percent of primary mari-juana treatment admissions in 2004. Some of the pre-vention organizations report a resurgence in mari-juana popularity and a belief by users that it is not harmful. Prevention programs are targeting this belief through education. Because of the heroin, cocaine, and methamphet-amine abuse problems and the recent “club drug” scare in St. Louis, law enforcement officials have focused less attention on marijuana abuse. Limited resources require establishing enforcement priorities. Often, probation for marijuana offenders requires participation in treatment for younger users who do not identify themselves as drug dependent. In focus groups with African-American adults from various social groups, more than one-half identified regular use of marijuana but did not identify this use as prob-lematic. This ethnographic information supports the idea of cultural acceptance of marijuana use. A col-lege town made possession of small quantities of marijuana a misdemeanor, further supporting these beliefs. Marijuana is available from Mexico or domestic in-door growing operations. Indoor production makes it possible to produce marijuana throughout the year. In addition to the Highway Patrol Pipeline program, which monitors the transportation of all types of

EPIDEMIOLOGIC TRENDS IN DRUG ABUSE—St. Louis
Proceedings of the Community Epidemiology Work Group, Vol. II, June 2005 226
drugs on interstate highways, Operations Green Mer-chant and Cash Crop identify and eradicate crops. Much of the marijuana grown in Missouri is shipped out of the State. NFLIS reported that 40 percent of the items analyzed in 2004 were marijuana. Stimulants Methamphetamine, along with alcohol, remained a primary drug of abuse in both the outlying rural areas and statewide. (Most of Missouri, outside of St. Louis and Kansas City, is rural.) Methamphetamine contin-ued to be identified as a huge problem in rural com-munities, with a focus on “mom and pop” box labs and intergenerational use of the drug. In 2004, unweighted DAWN Live! data show methamphetamine ED reports totaled 286 (exhibit 2a). Ninety-two percent were White, with no pre-dominant age group. ED methamphetamine mentions in St. Louis increased in the late 1990s and totaled 150 in 2002. Methamphetamine (“crystal” or “speed”) was found at very low levels in city indicators in 1995, but reported use has slowly increased over the last 8 years. In rural areas, methamphetamine appeared regularly in the treatment data, but methamphetamine has been identi-fied as a problem in all parts of the State. The urban, street-level distributors in St. Louis deal in cocaine, so amphetamine use is not as widespread in the St. Louis area; this could indicate differences in dealing networks and access to locally produced drugs (“mom and pop” local production). However, an increase in availability and purity of Mexican methamphetamine and a growth in Hispanic groups in the St. Louis metropolitan area may change this trend. Methamphetamine use is re-ported in the gay male and club communities in the city. An increase in treatment admissions may signal this change. Traditionally, cocaine and meth-amphetamine use have been split along racial lines in the State. The number of methamphetamine treatment admissions in St. Louis was 544 in 2004. In rural treatment programs, methamphetamine was the drug of choice after alcohol. The Midwest Field Division of the DEA decreased its cleanup of clandestine methamphetamine labs after training local enforcement groups; 2,788 labs were reported for 2004. The intensity of these law en-forcement efforts is based on the availability of funds for local police departments to clean up box labs un-der Community Oriented Policing Service (COPS) funding. Thefts of anhydrous ammonia continued to be identified as an issue in rural areas.
In the current methamphetamine scene, Hispanic traf-fickers, rather than the old network of motorcycle gangs, are the predominant distributors. Shipments from “super labs” in the Southwest are trucked in via the interstate highway system. This network is in contrast to the local “mom and pop” labs that produce personal quantities for family and friends. These lo-cal labs tend to use the Nazi method of production, with an output of 60 percent of the quantity of the starting products, although the red phosphorus method has been seen more frequently. Purity of the drugs produced by these labs and the amount of fin-ished product depends on the experi-ence/attentiveness of the “cooker” but tends to be higher (greater than 80 percent). Most of the avail-able methamphetamine is produced in Mexico and trafficked through the Hispanic traffickers, with less pure methamphetamine obtained through this source. While much of the law enforcement resources and personnel are directed at the local production, the majority of methamphetamine that is available in the area comes through these Hispanic organizations. As the purity increases among the methamphetamine obtained from these groups and precursor drugs are less available, less local production may be seen. Some crystallized methamphetamine has been noted in the local market, usually indicating increased pu-rity in the product. The term “ice” has been applied to all methampheta-mine with a crystalline appearance. Methamphetamine sold for $700–$1,300 per ounce in St. Louis and for as little as $100–$120 per gram in some areas. Metham-phetamine was represented in only 1.5 percent of the NFLIS analysis. Use of methamphetamine and its derivatives has be-come more widespread among high school and col-lege students, who do not consider these drugs as dangerous as others. Because methamphetamine is so inexpensive and appeals to a wide audience, it is likely that its use will continue to spread. Depressants Benzodiazepine abuse by prescription continues. In 2004, unweighted DAWN Live! data showed 808 benzodiazepine ED reports, with slightly more than one-half of the patients indicating overmedication. In the ED data, the ratio of benzodiazepines to opi-ates/opioid drugs is 1.0, indicating a significant de-gree of usage of this class of drug. The remaining few private treatment programs often provide treatment for benzodiazepine, antidepressant,

EPIDEMIOLOGIC TRENDS IN DRUG ABUSE—St. Louis
Proceedings of the Community Epidemiology Work Group, Vol. II, June 2005 227
and alcohol abusers. Social setting detoxification has become the treatment of choice for individuals who abuse these substances. Since many of the private treatment admissions are polysubstance abusers, par-ticular drug problems are not clearly identified. Hallucinogens Over the years, lysergic acid diethylamide (LSD) has sporadically reappeared in local high schools and rural areas. Blotters sell for $5–$7 per 35-microgram dose (exhibit 2b). Unweighted DAWN Live! data for 2004 showed a small number of LSD ED reports: 9. Phencyclidine (PCP) has been available in limited quantities in the inner city and has generally been used as a dip on marijuana joints. While PCP is not seen in quantity, it remains in most indicator data, including ED reports (29 in unweighted 2004 DAWN Live! data), police exhibits, and as a secondary drug in ME data. Most of the users of this drug in the inner city are African-American. Club Drugs Unweighted DAWN Live! ED data show few reports of methylenedioxymethamphetamine (MDMA)—only 27 in 2004. Reports of other club drugs were almost non-existent; one ketamine and three gamma hydroxybutyrate (GHB) ED reports occurred in 2004. MDMA is less available at dance parties and costs $20–$30 per tablet. Most of the reports about MDMA abuse are anecdotal or are part of a polydrug user’s history. Public treatment programs reported no ad-missions for MDMA INFECTIOUS DISEASES RELATED TO DRUG ABUSE HIV HIV seropositivity among IDUs remained low in St. Louis. While the predominant number of cases occur among men who have sex with men (MSM), the larg-est increase was found among young African-American females, who were infected through hetero-sexual or bisexual contact, and young homosexual Af-rican-American males. As a result, increased special-ized minority prevention efforts have been initiated.
Of the total 6,672 persons living with HIV disease identified through June 2004, 5 percent were IDUs and 5 percent involved men who have sex with men and are also IDUs (MSM/IDUs) (exhibit 3). The number of infected African-Americans was increas-ing disproportionately among males and females. HIV Research
Saint Louis University has continued research on HIV prevention vaccines. Most of the prevention vaccine trials have been Phase I trials in low-risk individuals, and MSM and high-risk women in the United States and high-risk heterosexuals in the Car-ibbean are being recruited for a new expanded Phase II trial. Another Phase II trial is slated to begin later this year. STDs and Hepatitis C A resurgence of syphilis among MSM has led to in-creased surveillance and targeted prevention pro-grams to this population. Rates of gonorrhea and chlamydia remain stable and high in the urban STD clinics. St. Louis ranks third in the country for gonor-rhea, with cases remaining at approximately 1,000 per year, and second for chlamydia. HIV and syphi-lis/gonorrhea rates are high in neighborhoods known to have high levels of drug abuse, underscoring the concept of assortative mixing in cohorts. Inconsistent reporting of hepatitis C has made estimation of the problem and tracking of hepatitis C cases difficult REFERENCES Herlig, C. Strategic Intelligence, St. Louis Office of
the Drug Enforcement Administration. Personal communication.
Cottler, L.; et al. St. Louis, Missouri: Washington Uni-
versity. Personal communication. For inquires concerning this report, please contact Heidi Israel, Ph.D., R.N., L.C.S.W., Saint Louis University School of Medicine, 3691 Rutger–Suite 103, St. Louis, MO 63110, Phone: (314) 977-9644, Fax: (314) 977-1781, E-mail: [email protected].

EPIDEMIOLOGIC TRENDS IN DRUG ABUSE—St. Louis
Proceedings of the Community Epidemiology Work Group, Vol. II, June 2005 228
Exhibit 1. St. Louis DAWN ED Sample and Reporting Information: 2004
No. of EDs Reporting per Month: Com-pleteness of Data (%) Total Eligible
Hospitals1 No. of Hospitals
in DAWN Sample
Total EDs in DAWN Sample2 90–100% 50–89% <50%
No. of EDs Not Reporting
37 36 38 15–18 0–2 0–2 20–23 1Short-term, general, non-Federal hospitals with 24-hour emergency departments based on the American Hospital Association An-nual Survey. 2Some hospitals have more than one emergency department. SOURCE: DAWN Live!, OAS, SAMHSA, updated 4/13-4/14, 2005

EPIDEMIOLOGIC TRENDS IN DRUG ABUSE—St. Louis
Proceedings of the Community Epidemiology Work Group, Vol. II, June 2005 229
Exhibit 2a. Indicators for Cocaine, Heroin, Marijuana, and Methamphetamine in St. Louis: 1996−2004
Indicator Cocaine Heroin Marijuana Metham-phetamine
Number of Deaths by Year 1996 93 51 NA1 9 1997 43 67 NA 11 1998 47 56 NA 9 1999 51 44 NA 4 2000 66 47 NA 9 2001 75 20 NA 3 2002 76 50 NA – 2003 78 61 NA -- 2004 38 64 NA -- DAWN ED Data—Weighted Data4 Number of Mentions (2002) 3,536 1,167 2,866 150 Number of Mentions (2001) 3,080 1,309 2,311 115 Rate per 100,000 Population (2002) 153 51 124 7
Gender of Mentions (%) (2002) Male Female
63.3 36.1
63.8 36.2
63.4 35.8
63.3 36.0
Age (%) (2002) 12–17 18–34 35 and older
1.5
36.9 61.5
1.4
56.0 42.4
8.4
52.2 39.5
15.3 53.3 31.3
Race (%) (2002) White African-American Hispanic Other/unknown
39.1 56.3
0.6 2.9
55.6 39.9
…2 3.1
54.9 40.7
0.4 2.7
91.0
---3 0.7 4.7
Route of Administration (%) (2000) Smoking Intranasal Injection Unknown/other
62.3 25.9
7.0 4.8
6.4
22.2 71.5
–
NA
18.8 15.6 46.9 18.8
DAWN Live! ED Data—Unweighted Data4 Number of Reports (2004) 1,702 601 1,230 286
Gender of Reports (%) (2004) Male Female
63.3 36.7
69.2 30.8
63.3 36.7
56.6 43.4
Age (%) (2004) 12–17 18-24 25–34 35 and older
<1
14.0 27.4
58.6
<1
30.3 30.9 38.8
---
45.0 23.5 31.5
0
38.1 30.8 31.1
Race (%) (2004) White African-American Hispanic Other/unknown
51.8 49.2
0.0 0.0
60.1 34.4
…2 5.5
68.6
27.8 <.1 <3
91.6
<1 <1 <1
Route of Administration (%) ( 2004) Smoking Intranasal Injection Unknown/other
21.4 --
2.4 9.0
67.8
0 9
35.2 52
34.9
62.3
7.9 8.6 7.5
73.6
1NA=Not applicable. 2Dots (…) indicate that an estimate with a relative standard error greater than 50 percent has been suppressed. 3Dashes (---) indicate than an estimate has been suppressed because of incomplete data. 4Unweighted data are from 15–18 St. Louis EDs reporting to DAWN. All DAWN cases are reviewed for quality control. Based on this review, cases may be corrected or deleted and, therefore, are subject to change.

EPIDEMIOLOGIC TRENDS IN DRUG ABUSE—St. Louis
Proceedings of the Community Epidemiology Work Group, Vol. II, June 2005 230
Exhibit 2a. Indicators for Cocaine, Heroin, Marijuana, and Methamphetamine in St. Louis: 1996−2004 (Cont’d)
Indicator Cocaine Heroin Marijuana Metham-phetamine
Treatment Admissions Data Percent of All Admissions (2003) 34.6 10.1 27.2 4.7 Percent of All Admissions (2004) 29.1 10.4 25.0 4.6 Gender (%) (2004) Male Female
54.9 45.1
62.5 37.5
74.0 26.0
54.2 45.8
Age (%) (2004) 12–17 18–25 26–34 35 and older
0.6 8.0
24.0 67.4
0.8
34.9 25.6 38.6
25.5 40.1 20.3 14.1
4.4 32.6 36.5 26.5
Race/Ethnicity (%) (2004) White African-American Hispanic
26.1 73.3
1.1
40.1 59.0
0.9
41.1 57.9
1.0
98.9
0.2 0.0
Route of Administration (%) (2004) Smoking Intranasal Injecting Oral other
90.5
5.1 1.7 1.6
1.7
46.7 50.4
1.0 4.9
96.7
0.3 0.1 1.6
48.9 15.1 32.5
4.0
SOURCES: DAWN, OAS, SAMHSA; DAWN Live!, OAS, SAMHSA, updated 6/03/2005; TEDS database Exhibit 2b. Other Combined Indicators for Cocaine, Heroin, Marijuana, and Methamphetamine in St. Louis:
2002–2004 Indicator Cocaine Heroin Marijuana Methamphetamine
and Other Drugs Multisubstance Combinations
Older users com-bine with heroin, alcohol
Older users com-bine with cocaine, alcohol
Alcohol Marijuana commonly used in combination
Market Data (2004) Powder $100–$125/g, 70% pure; Crack $20/rock, 50–90% pure; eightball $300
$20/cap or foil; $10 per number-5 gel capsule; $3.17/mg pure—depending if MBT, SA, SWA, $250–$600/g, 13.9–23.2% pure
Sinsemilla $700–$1,800/lb, 20% THC; Imported $2,000−$4,000/lb
Methamphetamine $100–$120/g, Mexican (20–30%) and local (70–80% pure); hy-dromorphone $30–$50/4-mg pill; LSD blotters $5–$7/35 mi-crogram, OxyContin $40 mg
Qualitative Data Readily available, urban choice
Younger users, 1/3 younger than 25
Readily available, younger users in treatment
Rural/suburban users of amphetamine
Other Data of Note N/R1 Primarily Mexican black tar; young users smoke/snort
N/R Methamphetamine lab seizures plateaued; producers are super-labs–controlled by Hispanic groups; mom and pop labs
1N/R=Not reported. SOURCES: DEA; client ethnographic information

EPIDEMIOLOGIC TRENDS IN DRUG ABUSE—St. Louis
Proceedings of the Community Epidemiology Work Group, Vol. II, June 2005 231
Exhibit 3. Persons Living with HIV Disease in St. Louis Metropolitan Area by Exposure Category, Gender, Race/Ethnicity, and Age: Year-to-Date and Cumulative Totals Reported Through June 2004
HIV-Positive Test Results
Jan 2004–June 2004 Cumulative Through June 2004 Category
Number Percent Number Percent Exposure Category
MSM 61 50.0 4,583 70.0 IDU 6 5.0 301 5.0 IDU/MSM 3 2.0 319 5.0 Hemophilia 0 0.0 58 1.0 Heterosexual 12 10.0 920 14.0 Blood transfusion 0 0.0 34 0.2 Perinatal 0 0.0 41 1.0 Unknown 41 33.0 416 6.0 Total 123 6,672
Gender and Race/Ethnicity Male White 40 33.0 2,914 45.0 African-American 62 51.0 2,582 40.0 Hispanic 1 0.0 79 1.0 Other 1 0.0 19 0.0 Unknown 0 0 208 3.0 Female White 4 3.0 170 2.0 African-American 14 12.0 671 10.0 Hispanic 2 0.0 15 0.0 Other 0 0.0 13 0.0
Age 12 and younger 0 0.0 53 1.0 13−19 5 4.0 160 2.4 20−29 39 32.0 1,644 25.2 30−39 30 24.0 2,799 43.0 40−49 41 33.0 1332 20.4 50 and older 8 7.0 522 8.0 Unknown 0 0 162 2.0
Total 123 6,672 SOURCE: St. Louis Metropolitan AIDS Program

EPIDEMIOLOGIC TRENDS IN DRUG ABUSE—San Diego County, California
Proceedings of the Community Epidemiology Work Group, Vol. II, June 2005 232
Drug Abuse Patterns and Trends in San Diego County, California Steffanie Strathdee, Ph.D.1 ABSTRACT Methamphetamine abuse indicators continue to be high in San Diego. Forty-five percent of the 2004 treatment admissions (excluding alcohol) in San Diego County were for primary methamphetamine abuse; approximately 27 percent of all items ana-lyzed by forensic laboratories and nearly 27 percent of the (unweighted) illicit drug reports accessed through the DAWN Live! ED system involved methamphetamine. Cocaine/crack indicators re-mained relatively low and stable in 2004. Marijuana continued to be a serious problem, accounting for 50 percent of drug items analyzed by forensic labs in 2004, nearly 18 percent of the county’s primary illicit drug admissions, and more than 21 percent of the (unweighted) illicit drug ED reports. Heroin accounted for one-quarter of primary treatment admissions (excluding alcohol) and for 16 percent of ED reports for illicit drugs, but it represented less than 2 percent of all drug items reported by forensic laboratories. INTRODUCTION Area Description According to the 2000 census, more than 2.8 million persons resided in San Diego County (exhibit 1); 55 percent were White and 27 percent were Hispanic. In 2004, the county population was projected to increase to slightly more than 3.0 million, with a decrease in the White population (to 52 percent) and a slight in-crease (1 percent) in the Asian and Hispanic/Latino populations. The median household income was nearly $46,000 in 2000 and was projected at $50,543 in 2004. Methamphetamine is a major drug problem in the area. Several geographic and social factors foster the manufacture, trafficking, and abuse of the drug in San Diego County. The county is isolated from the rest of California. There are 80 miles of border to the south, 70 miles of ocean to the west, mountain ranges to the east and northeast, and a military base to the 1The author is affiliated with the University of California San Diego, School of Medicine, San Diego, California, and The Johns Hopkins University Bloomberg School of Public Health.
north. The three border crossings to Mexico include the Tijuana crossing, which is the busiest in the world. Mexico contributes 90 percent of all metham-phetamine entering the United States and 98 percent of all heroin west of the Mississippi river. The border and the coastline represent a particular challenge in attempts to control the import of illicit drugs. Isolated rural areas provide an ideal setting for the establish-ment of small methamphetamine clandestine labs. In addition, there was a 78-percent increase in opium poppy cultivation in Mexico, from 2,700 hectares in 2002 to 4,800 in 2003, suggesting that heroin traf-ficking from Mexico will continue to be an important problem for U.S.-Mexico border States. Before 1989, there were many small methampheta-mine labs in San Diego; these were operated by local “cookers” and outlaw motorcycle clubs. Over the years, the production and abuse of methamphetamine “waxed and waned.” The Chemical Diversion and Trafficking Act of 1988 and the Chemical Control Diversion Act of 1993 helped curtail access to the precursors used in making methamphetamine. A DEA sting effort, Operation Triple Neck, resulted in arrests and the closing of stores that supplied equip-ment and chemicals to methamphetamine cookers. Most methamphetamine indicators declined for a time, but new sources and distribution networks emerged. Mexican nationals and Mexican-Americans, operating on both sides of the border, began to produce large quantities of high-purity methamphetamine. Already established networks that distribute other illicit drugs are used to distribute methamphetamine. The profits from these operations have been large. Data Sources Data for this paper were provided by the sources shown below: • Forensic laboratory data were provided by the
National Forensic Laboratory Information Sys-tem (NFLIS), Drug Enforcement Administration (DEA), for 2004, when 15,773 drug items were analyzed by county laboratories. Percentages of drug items analyzed in 2003 are also reported.
• Treatment data for San Diego County were provided by the California Alcohol and Drug Data System (CADDS) on 14,105 admissions in 2004, of which 2,877 were primary alcohol ad-missions. The 2004 data from the State system are not totally consistent with CADDS data ac-cessed from San Diego County in prior years.

EPIDEMIOLOGIC TRENDS IN DRUG ABUSE—San Diego County, California
Proceedings of the Community Epidemiology Work Group, Vol. II, June 2005 233
• Emergency department (ED) data for calendar year 2004 were accessed through the Drug Abuse Warning Network (DAWN) Live!, which is a restricted-access online query system administered by the Office of Applied Studies (OAS), Substance Abuse and Mental Health Services Administration (SAMHSA). Sixteen of the 17 eligible hospitals in the San Diego metropolitan area are in the DAWN sample, with a total of 16 EDs in the sample. The data reported in this paper were not complete. During the 12-month period, between 6 and 10 EDs reported data to DAWN each month (exhibit 2). The data in this paper were updated by OAS on January 13–14, 2005; they are unweighted and are not estimates for the San Diego area. All DAWN cases are reviewed for quality control. Based on the review, cases may be corrected or deleted; therefore, the data reported in this paper are subject to change. The information derived from DAWN Live! for San Diego in 2004 represents 6,214 cases, 2,999 reports of illicit drugs (excluding alcohol), reports on nonmedical use of selected prescription-type drugs, and reports on alcohol-related visits. The number of drug reports in drug-related visits exceeds the number of ED visits, since a patient may report use of multiple drugs (up to six drugs and alcohol may be represented in DAWN). These data cannot be compared with DAWN data from 2002 and before, nor can these preliminary data be used for comparison with future data. Only weighted ED data released by SAMHSA can be used for trend analysis. A full description of the DAWN system can be found on the DAWN Web site: <http://dawninfo.samhsa.gov>.
• Drug-related mortality data were provided by the San Diego Medical Examiner for 2003.
• Drug price information is from the National Drug Intelligence Center (NDIC) for July through December 2004.
• Heroin price and purity data are from the Do-mestic Monitor Program (DMP), DEA, for 2003. The data are based on 38 qualified samples.
• Acquired immunodeficiency syndrome (AIDS) data were taken from the San Diego County Health and Human Services Agency (HHSA), “Acquired Immunodeficiency Syndrome (AIDS) Surveillance Report,” April 30, 2005. Data on the human immunodeficiency virus (HIV) are from the HHSA “Human Immunodeficiency Virus (HIV) Surveillance Report,” 2004.
DRUG ABUSE PATTERNS AND TRENDS Cocaine/Crack Cocaine indicators remained relatively stable over the past decade, although this stimulant is still a problem in San Diego and cocaine hydrochloride (HCl) and crack remain readily available. More than 14 percent of the drug items analyzed by forensic labs in 2004 were cocaine items (exhibit 3), up slightly from the 13 percent reported in 2003. Treatment admissions for primary cocaine abuse, excluding alcohol, accounted for 8.7 percent of ad-missions in 2004, according to State data; the county CADDS data for prior years suggest a decline in co-caine admissions from 2001 to 2003 (exhibit 4). Eighty percent of the cocaine admissions in 2004 smoked the drug, indicating most cocaine admissions were for crack abuse (exhibit 5). Nearly 70 percent of the primary cocaine admissions in 2004 were male. Nearly 71.0 percent were age 35 or older, and 58.5 percent were Black non-Hispanic. More than 30 per-cent of the primary cocaine abusers reportedly used only cocaine; alcohol and marijuana were the sub-stances most likely to be used as a secondary drug (32.1 and 22.0 percent, respectively). Preliminary unweighted data accessed through DAWN Live! show that cocaine was the most promi-nent drug in visits involving illicit drugs (excluding alcohol). ED reports of cocaine totaled 558 in 2004 and accounted for 18.6 percent of the illicit drug re-ports (exhibit 6). Nearly two-thirds of the patients in the cocaine-involved reports were male, 60 percent were 35 or older, 48 percent were White, and 30 per-cent were Black (exhibit 7). In 2003, there were 56 deaths involving cocaine, as reported by the county medical examiner (exhibit 8). In the last half of 2004, a gram of powder cocaine, retail, sold for $60–$80, and one-quarter gram sold for $25–$35 (exhibit 9). A “rock” of crack sold for $10–$20. Heroin In 2004, 1.5 percent of the 15,773 drug items ana-lyzed by forensic labs were heroin items (exhibit 3), approximately the same percentage as in 2003 (1.7 percent). Treatment admissions for primary heroin abuse (ex-cluding alcohol) represented 25 percent of the illicit drug admissions in 2004, based on the State CADDS

EPIDEMIOLOGIC TRENDS IN DRUG ABUSE—San Diego County, California
Proceedings of the Community Epidemiology Work Group, Vol. II, June 2005 234
data (exhibit 4). Of the 2,810 primary heroin admis-sions in 2004, the majority were male (70.6 percent), age 35 or older (57.9 percent), and White (52.0 per-cent) (exhibit 5). Hispanics represented 38.4 percent of these admissions. Eighty-seven percent injected the drug. More than 61 percent reported using only heroin. Cocaine/crack (12.9 percent) and metham-phetamine (11.7 percent) were the most frequently reported secondary drugs used by primary heroin admissions. Unweighted data accessed from the DAWN Live! system for 2004 show 492 heroin reports, represent-ing16.4 percent of illicit drug reports from participat-ing San Diego emergency departments (exhibit 6). Nearly 70.0 percent of patients involved in these vis-its were male, 70.5 percent were 35 or older, 54.5 percent were White, and 30.7 percent were Hispanic (exhibit 7). In 2003, the county medical examiner reported 62 heroin-involved deaths (exhibit 8). In 2003, DMP reported that most heroin in San Diego was black tar heroin, which was 44.9 percent pure and sold for $0.25 per milligram pure. This heroin was the cheapest of any recorded across the Nation. Most of this heroin originates in Mexico. NDIC reports that Mexican brown powder heroin costs $60–$100 per gram, while Mexican black tar heroin costs $50–$100 per gram (exhibit 9). Other Opiates Opiates other than heroin accounted for 2.2 percent (n=344) of the drug items analyzed by forensic labs in 2004 (exhibit 3). Of the other opiate items, 173 (50.3 percent) were hydrocodone items, 45 (13.1 per-cent) were oxycodone, 30 (8.7 percent) were codeine, and 20 (5.8 percent) were methadone. In 2004, there were 221 admissions for primary abuse of opiates/synthetics other than heroin. These ac-counted for 2 percent of all illicit drug admissions. The preliminary unweighted DAWN data for 2004 show 643 ED reports of opiates/opioids. Of the 643 reports, 208 (32.3 percent) were hydrocodone reports and 94 (14.6 percent) were oxycodone reports. In 2003, the county medical examiner reported a siz-able number of deaths involving opiates/narcotic anal-gesics. The highest number involved morphine/com-binations (67), followed by hydrocodone/combinations (44) (exhibit 8). Codeine/combinations, methadone, and oxycodone/combinations were involved in 22–24
deaths, propoxyphene/combinations were involved in 19, and fentanyl/combinations were involved in 12. Marijuana Marijuana continues to be a serious problem in San Diego. Fifty percent of the items analyzed by forensic labs in 2004 were cannabis (exhibit 3), down slightly from 2003 (52.7 percent). Primary marijuana abuse accounted for nearly one-fifth (17.6 percent) of treatment admissions (exclud-ing alcohol) in 2004 (exhibit 4). Three-quarters were male, 41 percent were White, and 34 percent were Hispanic (exhibit 5). Seventy-two percent of the pri-mary marijuana admissions were 25 or younger. Slightly more than 26 percent reported using only marijuana; 39.2 percent used alcohol as a secondary drug, and 26.2 percent used methamphetamine. Unweighted data accessed from DAWN Live! show 641 marijuana reports in 2004; these represented 21.4 percent of the illicit drug reports (exhibit 6). Male patients accounted for nearly two-thirds of the visits involving marijuana (exhibit 7). These patients were most likely to be younger than 25 (46.8 percent) and White (52.7 percent). One death involving marijuana was reported by the medical examiner in 2003 (exhibit 8). In the last 6 months of 2004, an ounce of marijuana cost $60–$100 retail (exhibit 9). Methamphetamine In 2004, methamphetamine accounted for 26.9 per-cent of all drug items reported by NFLIS; ampheta-mines accounted for less than 1.0 percent (exhibit 3). In 2004, 45.2 percent of illicit drug admissions in the county were for primary abuse of methamphetamine (exhibit 4). Nearly 61 percent of these patients were male, 56 percent were White, and 27 percent were Hispanic (exhibit 5). Approximately 72 percent were 26 or older, with 38.5 percent being 35 or older. Smoking was the most frequently reported route of administration for methamphetamine, characterizing 68.6 percent of this admissions group. Slightly more than 37 percent reportedly used only methampheta-mine prior to treatment entry; marijuana (29 percent) and alcohol (24 percent) were the most frequently used secondary drugs. Unweighted DAWN data show 797 ED reports of methamphetamine in 2004, representing nearly 27 percent of illicit drug reports. There were also 388

EPIDEMIOLOGIC TRENDS IN DRUG ABUSE—San Diego County, California
Proceedings of the Community Epidemiology Work Group, Vol. II, June 2005 235
amphetamine reports; these represented nearly 13 percent of illicit drug reports (exhibit 6). Demo-graphic data on methamphetamine-involved ED visits show that approximately 69 percent were male, 45 percent were age 35 or older, 63 percent were White, and 20 percent were Hispanic (exhibit 7). In 2003, the county medical examiner reported 118 methamphetamine-involved deaths and 41 ampheta-mine-involved deaths (exhibit 8). Price data from NDIC show that methamphetamine cost $60 per gram in the last half of 2004 (exhibit 9). San Diego County has had considerable experience over many years in assessing and addressing prob-lems associated with methamphetamine production and abuse. The Methamphetamine Strike Force (MSF), established in March 1996 as a collaborative “assessment and action” effort involving more than 60 members and 10 data sources, continues to assess the methamphetamine problem at the community level, determine appropriate actions to take, and evaluate results. The MSF has developed effective plans and policies, controlled the availability of pre-cursor chemicals, taken steps to protect endangered children, made effective use of the media, and devel-oped and used training at all levels. The two newest initiatives include a focus on women and the border. The MSF Web site is <www.no2meth.org>. Club Drugs There were few indicators of club drugs in recent data sources. In 2004, 61 methylenedioxymethampheta-mine (MDMA) and methylenedioxyamphetamine (MDA) items were reported by forensic labs. These MDMA/MDA items accounted for 0.4 percent of all drug items analyzed (exhibit 3). Twenty-seven phen-cyclidine (PCP) items were also reported by forensic labs, representing 0.2 percent of the total items. The retail price of MDMA per tablet was $15–$30 in the last half of 2004 (exhibit 9). Treatment admissions for primary PCP abuse totaled 39 in 2004, or nearly 0.3 percent of illicit drug ad-missions. In the 2004 unweighted DAWN data, small percent-ages of the illicit drug reports involved MDMA (0.8 percent, n=23), PCP (0.8 percent, n=23), and gamma hydroxybutyrate (GHB) (0.4 percent, n=11) (exhibit 6). There were also three reports each for ketamine and lysergic acid diethylamide (LSD), drugs that are sometimes included in the “club drug” category.
Benzodiazepines Benzodiazepine-type drugs accounted for 1.5 percent (n=241) of the drug items analyzed by forensic labs in 2004 (exhibit 3). Of the 241 items, 38.2 percent were diazepam items, 30.3 percent were clonazepam, 25.7 percent were alprazolam, and 9.1 percent were lorazepam. Unweighted data accessed from DAWN Live! for 2004 show 545 benzodiazepine ED reports. Alcohol As in other areas of the Nation, alcohol abuse is a serious problem in San Diego. In 2004, primary alcohol abuse accounted for one-fifth of all treatment admissions (n=2,877). Across San Diego EDs participating in DAWN, the preliminary unweighted data show 975 reports for alcohol-in-combination with other drugs; another 184 visits involved “alcohol only” among patients younger than 21. Of these alcohol-only involved vis-its, 48 percent were male, 58 percent were White, 38 percent were Black, and 14 percent were Hispanic. (Race/ethnicity was not documented for 15 patients, and 3 other patients were in an “other” category.) Fifty-one percent of alcohol-only reports represented patients age 18–20, with the remaining patients being between the ages of 12 and 17. INFECTIOUS DISEASES RELATED TO DRUG ABUSE AIDS From 1981, when the first AIDS cases in San Diego County were diagnosed, through April 2004, there were 12,273 adult/adolescent AIDS cases reported in the county. The State has the second highest number of AIDS cases in the Nation, and San Diego has the third highest number of cases in the State. Since 1999, the number of annual AIDS cases reported in San Diego has been in the mid-400 range. The 2004 report shows that, of the adult/adolescent AIDS cases, 63 percent were White, 12 percent were Afri-can-American, and 22 percent were Hispanic (all races). Eighty percent of male San Diego AIDS cases have been attributed to male-to-male sex, 10 percent to male-to-male sex and injection drug use, and 7 percent to injection drug use alone. For San Diego females, heterosexual contact was the most common mode of transmission (53 percent), followed by injec-tion drug use.
EPIDEMIOLOGIC TRENDS IN DRUG ABUSE—San Diego County, California
Proceedings of the Community Epidemiology Work Group, Vol. II, June 2005 236
HIV From July 1, 2002, to December 31, 2003, a total of 4,155 HIV cases were reported for San Diego County. Of these, 89 percent were male, 62 percent were White, 43 percent were age 30–39, and 72 per-cent were infected by male-to-male sex.
For inquiries concerning this report, please contact Steffanie Strathdee, Ph.D., Professor and Harold Simon Chair, Chief, Divi-sion of International Health and Cross Cultural Medicine, De-partment of Family and Preventive Medicine, Adjunct Professor, Department of Epidemiology, Johns Hopkins Bloomberg School of Public Health, University of California San Diego, School of Medicine, 9500 Gilman Drive, Mailstop 0622, San Diego, CA 92093, Phone: 858-822-1952, Fax: 858-534-4642, E-mail: [email protected].

EPIDEMIOLOGIC TRENDS IN DRUG ABUSE—San Diego County, California
Proceedings of the Community Epidemiology Work Group, Vol. II, June 2005 237
Exhibit 1. Total Population and Population by Race/Ethnicity for San Diego County, by Percent: 2000, 2004
Race/Ethnicity 2000 (N=2,813,833)
2004 (N=3,017,204)
White 55 52 Black or African-American 5 5 Asian 9 10 Other Race 4 4 Hispanic/Latino (of Any Race) 27 28 Median Household Income $45,871 $50,543 Single Family Home Median Price $525,000 SOURCE: San Diego Association of Governments Census Publications Exhibit 2. San Diego DAWN ED Sample and Reporting Information: 2004
Number of EDs Reporting per Month: Completeness of Data (%) Total Eligible
Hospitals1 Number of Hospitals
in DAWN Sample Total EDs in
DAWN Sample290–100% 50–89% <50%
Number of EDs Not Reporting
17 16 16 6–9 0–1 0–1 6–10 1Short-term, general, non-Federal hospitals with 24-hour emergency departments based on the American Hospital Association An-nual Survey. 2Some hospitals have more than one emergency department. SOURCE: DAWN Live!, OAS, SAMHSA, updated 4/13-4/14, 2005 Exhibit 3. Number and Percentage of Selected Items Analyzed by Forensic Laboratories in San Diego: 2004 Drug Number Percent Cocaine 2,259 14.3 Heroin 239 1.5 Other Opiates 344 2.2 Cannabis 7,888 50.0 Methamphetamine 4,248 26.9 Amphetamine 15 0.1 Benzodiazepines 241 1.5 MDMA/MDA 61 0.4 PCP 27 0.2 N=15,773 items analyzed. SOURCE: NFLIS, DEA

EPIDEMIOLOGIC TRENDS IN DRUG ABUSE—San Diego County, California
Proceedings of the Community Epidemiology Work Group, Vol. II, June 2005 238
Exhibit 4. Percentages of Primary Treatment Admissions (Excluding Alcohol) for Selected Drugs in San Diego County: 2001–2004 Drug 2001 2002 2003 20041 Cocaine 12.1 10.2 9.6 8.7 Heroin 12.3 11.7 10.9 25.0 Marijuana 25.9 25.3 24.5 17.6 Methamphetamine 46.7 49.7 52.8 45.2 Amphetamines 0.6 0.6 0.5 0.4 1Data for 2004 are not totally compatible with data from prior years (see Data Sources). SOURCES: San Diego County Alcohol and Drug Data System for the years 2001–2003 and the California Alcohol and Drug Data System for 2004 Exhibit 5. Sociodemographic Characteristics and Drug Use Behaviors of San Diego County Treatment Admissions for 4 Primary Drugs of Abuse, by Percent: 2004
Characteristic Cocaine/ Crack Heroin Marijuana Methamphetamine
Number 976 2,810 1,979 5,079 Gender Male Female
69.5 30.5
70.6 29.4
75.3 24.7
60.8 39.2
Age Group 25 and younger 26–34 35 and older
10.2 19.0 70.9
18.1 24.0 57.9
72.0 15.0 13.0
27.6 33.7 38.5
Race/Ethnicity White non-Hispanic Black non-Hispanic Hispanic Other
26.6 58.5 11.6
3.2
52.0
5.1 38.4
4.5
40.7 18.1 33.8
7.4
55.8
7.0 27.0 10.2
Route of Administration Oral Smoking Inhalation Injection Other
0.8
80.1 13.9
4.9 0.2
1.0 7.6 4.0
87.1 0.4
1.6
98.0 0.3 0.2 0.0
1.6
68.6 13.3 16.2
0.3 Most Frequently Used Sec-ondary Drugs Cocaine/crack Methamphetamine Heroin Marijuana Alcohol None
– 10.7
3.0 22.0 32.1 30.3
12.9 11.7
– 3.7 6.6
61.5
4.9 26.2
0.9 –
39.2 26.2
5.0 –
2.8 29.0 24.0 37.3
SOURCE: California Alcohol and Drug Data System
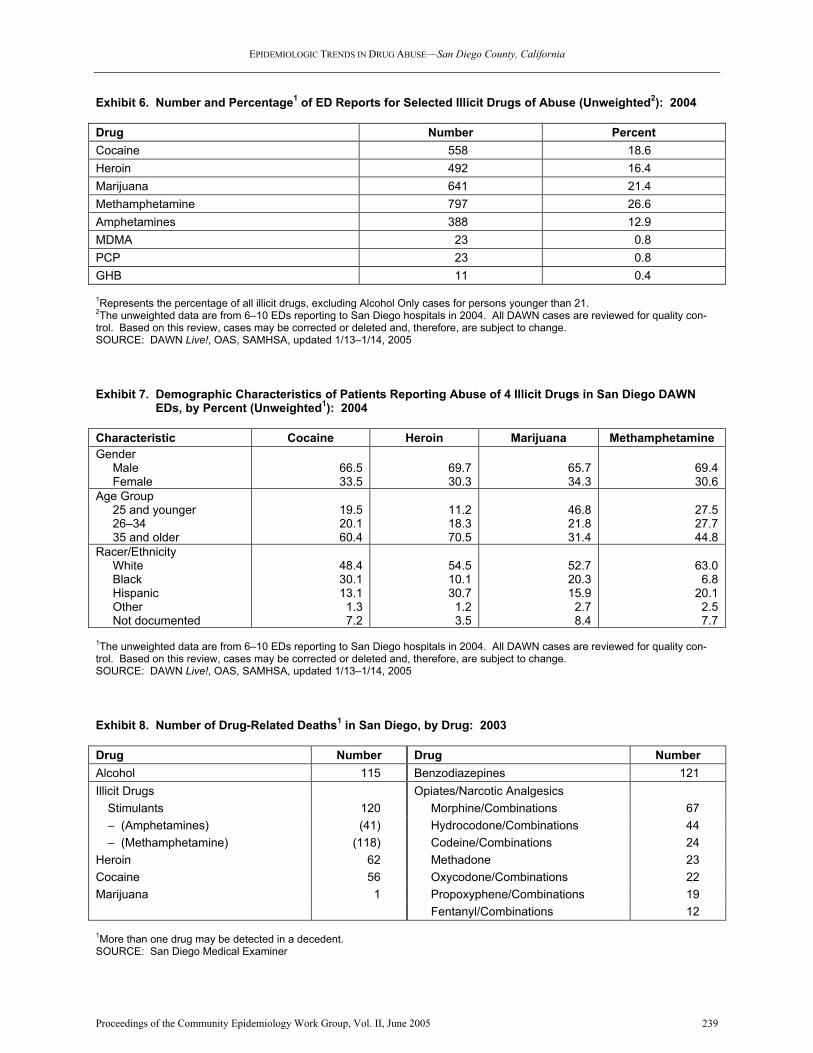
EPIDEMIOLOGIC TRENDS IN DRUG ABUSE—San Diego County, California
Proceedings of the Community Epidemiology Work Group, Vol. II, June 2005 239
Exhibit 6. Number and Percentage1 of ED Reports for Selected Illicit Drugs of Abuse (Unweighted2): 2004 Drug Number Percent Cocaine 558 18.6 Heroin 492 16.4 Marijuana 641 21.4 Methamphetamine 797 26.6 Amphetamines 388 12.9 MDMA 23 0.8 PCP 23 0.8 GHB 11 0.4 1Represents the percentage of all illicit drugs, excluding Alcohol Only cases for persons younger than 21. 2The unweighted data are from 6–10 EDs reporting to San Diego hospitals in 2004. All DAWN cases are reviewed for quality con-trol. Based on this review, cases may be corrected or deleted and, therefore, are subject to change. SOURCE: DAWN Live!, OAS, SAMHSA, updated 1/13–1/14, 2005 Exhibit 7. Demographic Characteristics of Patients Reporting Abuse of 4 Illicit Drugs in San Diego DAWN EDs, by Percent (Unweighted1): 2004 Characteristic Cocaine Heroin Marijuana Methamphetamine Gender Male Female
66.5 33.5
69.7 30.3
65.7 34.3
69.4 30.6
Age Group 25 and younger 26–34 35 and older
19.5 20.1 60.4
11.2 18.3 70.5
46.8 21.8 31.4
27.5 27.7 44.8
Racer/Ethnicity White Black Hispanic Other Not documented
48.4 30.1 13.1
1.3 7.2
54.5 10.1 30.7
1.2 3.5
52.7 20.3 15.9
2.7 8.4
63.0
6.8 20.1
2.5 7.7
1The unweighted data are from 6–10 EDs reporting to San Diego hospitals in 2004. All DAWN cases are reviewed for quality con-trol. Based on this review, cases may be corrected or deleted and, therefore, are subject to change. SOURCE: DAWN Live!, OAS, SAMHSA, updated 1/13–1/14, 2005 Exhibit 8. Number of Drug-Related Deaths1 in San Diego, by Drug: 2003 Drug Number Drug Number Alcohol 115 Benzodiazepines 121 Illicit Drugs Opiates/Narcotic Analgesics Stimulants 120 Morphine/Combinations 67 – (Amphetamines) (41) Hydrocodone/Combinations 44 – (Methamphetamine) (118) Codeine/Combinations 24 Heroin 62 Methadone 23 Cocaine 56 Oxycodone/Combinations 22 Marijuana 1 Propoxyphene/Combinations 19 Fentanyl/Combinations 12 1More than one drug may be detected in a decedent. SOURCE: San Diego Medical Examiner

EPIDEMIOLOGIC TRENDS IN DRUG ABUSE—San Diego County, California
Proceedings of the Community Epidemiology Work Group, Vol. II, June 2005 240
Exhibit 9. Retail Prices for Selected Drugs in San Diego: July–December 2004 Drug Price Unit and Type Powder Cocaine $60–$80 Gram $25–$35 One-quarter gram Crack $10–$20 Rock Heroin $60–$100 Gram (Mexican brown powder) $10–$15 One-tenth gram (Mexican brown powder) $50–$100 Gram (Mexican black tar) Marijuana $60–$100 Ounce Methamphetamine $60 Gram $20–$25 One-quarter gram $150–$300 One-quarter ounce MDMA $15–$30 Tablet SOURCE: National Drug Information Center

EPIDEMIOLOGIC TRENDS IN DRUG ABUSE—San Francisco Bay Area
Proceedings of the Community Epidemiology Work Group, Vol. II, June 2005 241
Patterns and Trends of Drug Use in the San Francisco Bay Area John A. Newmeyer, Ph.D.1
ABSTRACT Cocaine use in the bay area remains low compared with the rest of the United States. For the 2002–2005 period, no consistent upward or downward trend is evident. The cocaine user population is pre-dominantly older than 30. Heroin indicators point to a significant decline in use between 2000 and 2005; users remain predominantly White. The me-dian age of heroin users remains high, perhaps as high as 40. Local observers report that Internet traf-ficking in pharmaceutical opiates, such as Vicodin, hydrocodone, and oxycodone, is ‘mushrooming.’ Indicators of marijuana use peaked in 2001 and have declined significantly since then. Metham-phetamine use is high compared with other metro-politan areas of the United States, though it may now be leveling off after significant increases dur-ing 2001–2004. Among some vulnerable popula-tions (youths, arrestees, gay men), ‘speed’ is far more prevalent than heroin. Indicators of use of ‘club drugs’ reached peaks in 2001 and then de-clined in 2002; ED and medical examiner reports remain few compared to those for cocaine, heroin, or ‘speed.’ The prevalence of HIV among hetero-sexual drug injectors appears to have stabilized at a low level (6 to 10 percent), but hepatitis C appears to be close to full saturation of that population. INTRODUCTION Area Description The San Francisco Bay area consists of the following counties: San Francisco, San Mateo, Alameda, Con-tra Costa, and Marin. The population was 4,154,000 as of July 2004. The population is among the most multicultural of any urban region of the United States, with a particularly large, varied, and long-established Asian-American representation (19 per-cent of the total). The Hispanic population represents a wide cross-section of persons of Latin American origin. Blacks account for some 11 percent of bay area residents. San Francisco County has long been a
1The author is affiliated with Haight-Ashbury Free Clinics, Inc., San Francisco, California.
mecca for gays: gay men constitute more than 15 percent of the adult male population. The bay area experienced its initial growth during the California gold rush. In the succeeding century and a half, it expanded greatly as a center for shipping, manufacturing, finance, and tourism. In recent years, Pacific Basin trade and high technology such as software and biotechnology development have led to further expansion and to a highly diversified econ-omy. From 1994 to 2001, there was a steep rise in the cost of rental housing in the bay area, especially in San Francisco, Marin, and San Mateo Counties. This caused significant out-migration of lower income people, which may be exerting downward pressure on local drug-use prevalence. However, rental rates declined significantly from 2001 to 2003, which may have blunted these out-migration pressures. Unem-ployment rose from 2 to 6 percent during these 2 years, but it eased back to 5 percent in 2004 and early 2005. Data Sources The sources of data for the drug abuse indicators within this report are described below: • Emergency department (ED) data were ac-
cessed from the Drug Abuse Warning Network (DAWN) Live!, a restricted-access online query system administered by the Office of Applied Studies (OAS), Substance Abuse and Mental Health Services Administration (SAMHSA). The unweighted data are for three counties of the San Francisco Bay area (San Francisco, Marin, and San Mateo) for 2004. Seventeen of the 18 eligi-ble hospitals in the area are in the DAWN sam-ple. There are 19 emergency departments in the sample (some hospitals have more than 1 ED). The data for 2004 were incomplete. Over the 12-month period, between 8 and 11 EDs reported data each month, with most reporting data that were basically complete (90 percent or greater) (exhibit 1). Data are preliminary and are not es-timates for the San Francisco area. The DAWN Live! data were accessed on April 13–14, 2005. Since all DAWN cases are reviewed for quality control, and may be corrected or deleted, the data reported here are subject to change. The informa-tion derived from DAWN Live! represents drug reports in drug-related visits; reports exceed the number of ED visits because a patient may report use of multiple drugs (up to six drugs and alco-hol may be presented in DAWN). This paper fo-cuses on demographic characteristics of different

EPIDEMIOLOGIC TRENDS IN DRUG ABUSE—San Francisco Bay Area
Proceedings of the Community Epidemiology Work Group, Vol. II, June 2005 242
drugs in drug-related visits. Race/ethnicity data were absent in 11 to 18 percent of the total cases within a drug category; percentages are shown for those whose race/ethnicity is known. These data cannot be compared with DAWN data from 2002 and before, nor can these preliminary data be used for comparison with future data. Only weighted ED data released by SAMHSA can be used for trend analysis. A full description of the DAWN system can be found at the DAWN Web site http://dawninfo.samhsa.gov.
• Treatment admissions data were available for
all five bay area counties for 1999 through 2004. These data were compiled by the California De-partment of Alcohol and Drug Programs (DADP). In addition, admissions data for San Francisco County were provided by the San Francisco Department of Public Health for fiscal years (FYs) 2000 through 2004.
• Medical examiner (ME) data on drug men-
tions in decedents in three counties (San Fran-cisco, Marin, and San Mateo) were provided by the DAWN mortality system for 2002, along with comparable data for 1997–2001. The DAWN system covered 100 percent of the met-ropolitan statistical area (MSA) jurisdiction and 100 percent of the MSA population in 2002. Data were also available from the San Francisco County Medical Examiner for that county for FYs 2000 and 2003.
• Reports of arrests for drug law violations and
counts of reported burglaries were provided by the San Francisco Police Department (SFPD) for 2001 through the first 4 months of 2005.
• Arrestee drug testing data are from the Ar-
restee Drug Abuse Monitoring (ADAM) pro-gram, National Institute of Justice, for San Jose and Sacramento for 2003 for adult males and for San Jose for adult females.
• Price and purity data came from the Drug En-
forcement Administration (DEA), Domestic Monitor Program (DMP), and referenced heroin “buys,” mostly made in San Francisco County. Data for 2003 were compared with those for 1994–2002. Data on trafficking in heroin and other drugs were available from the National Drug Intelligence Center’s (NDIC) report, Nar-cotics Digest Weekly, December 28, 2004. Addi-tional data on trafficking and production were provided by the National Drug Threat Assess-ment 2005 publication of the NDIC.
• Ethnographic information was obtained through interviews with treatment program staff and out-reach workers in June 2005. Their observations were compared with those they made in May 2004 and January 2005 and pertained mostly to San Francisco County.
• Acquired immunodeficiency syndrome (AIDS)
surveillance data were provided by the San Fran-cisco Department of Public Health (SFDPH) and covered the period through March 31, 2005. Be-ginning in 2005, the SFDPH provided counts only of AIDS cases who were San Francisco residents; this resulted in surveillance counts about one-eighth less than previous counts, which had in-cluded all persons, resident or non-resident, diag-nosed in San Francisco.
• A survey of younger gay men was conducted by
the San Francisco AIDS Office during 2004. Sixty percent of this sample were younger than 35.
• Hepatitis B (HBV) data for San Francisco
County were available for 1996 through 2004 and were provided by the SFDPH.
• Hepatitis C (HBC) virus prevalence estimates
were provided by the Urban Health Study for 2003.
DRUG ABUSE PATTERNS AND TRENDS Cocaine/Crack Local observers note an upsurge in crack use among young (under 30) San Franciscans. Some of these young people prefer to dissolve this cocaine for injec-tion, instead of smoking it. During 2004, there were almost twice as many un-weighted DAWN Live! reports of cocaine as of her-oin (2,456 vs. 1,278). The patient characteristics for cocaine reports in 2004 were predominantly Black (49 percent) and 65 percent male. There were twice as many older than 45 (35 percent) as younger than 30 (17 percent). Smoking was the preferred route of use for three-fifths of these patients. In the five-county bay area, the overall number of admissions for drug treatment, other than alcohol, declined steadily between 1999 and 2004 (exhibit 2). The proportion of cocaine/crack admissions among these admissions rose from 24 percent to 26 percent between 2001 and 2004, although the actual number declined from 7,428 to 6,814. Among these admis-sions, more than 87 percent cited smoking—presumably of crack—as the preferred route of use.

EPIDEMIOLOGIC TRENDS IN DRUG ABUSE—San Francisco Bay Area
Proceedings of the Community Epidemiology Work Group, Vol. II, June 2005 243
During FYs 2000 to 2004, San Francisco County co-caine admissions fluctuated narrowly, with no particu-lar trend, in the range of 2,250 to 2,600 (exhibit 3). According to DAWN data, ME death mentions in-volving cocaine in three bay area counties fluctuated within a narrow range, with no particular trend, be-tween 1997 and 2000 (exhibit 4). In 2002, however, total mentions were 39 percent below the 1997–2000 average. In San Francisco County, cocaine-related deaths declined by 28 percent (95 to 68) between FY 2000 and FY 2003. In FY 2003, these decedents were 79 percent male, 49 percent White, and 33 percent Black; they had a mean age of 40. Cocaine-positive tests among arrestees in San Jose and Sacramento, nearby metropolises which are ADAM sites, may give some indication of cocaine use prevalence in San Francisco. During 2003, 13 percent of adult male arrestees in San Jose and 22 percent of those in Sacramento tested positive for cocaine. The two areas had, respectively, the fourth and ninth lowest proportions of cocaine-positive ar-restees among all 39 ADAM sites. For adult female arrestees in San Jose, 10 percent tested positive—the second lowest proportion among 25 ADAM sites. A 2004 survey of young San Francisco gay men showed 17 percent reported use of cocaine in the past year, and 4 percent reported use of crack. There were nearly 3,800 arrests on cocaine-related charges in San Francisco in 2004. The rate of arrests in the first 4 months of 2005 was about 12 percent less than during a similar period of 2004. According to the NDIC, local prices for powder co-caine in 2004 were $16,000–$21,000 per kilogram, $530–$800 per ounce, and as low as $10 per quarter gram. Crack prices were around $600 per ounce and $20–$50 per “rock.” These prices were up slightly from 2002. In summary, cocaine use in the bay area remains low compared with the rest of the United States. For the 2002–2005 period, no consistent upward or down-ward trend is evident from the indicators. The user population is predominantly older than 30. Heroin Ethnographic observers note that young people seem to represent a larger portion of heroin users, although most users are well past age 35. Whites still pre-dominate over all other ethnicities.
ME death mentions involving heroin in 2002 were at their lowest level in 6 years (exhibit 4). The count for 2002 was 43 percent below the average for 1997–2000. Males accounted for 87 percent of the heroin-related death mentions in 2000. The median age of the decedents was 40. Heroin-related deaths in San Francisco County declined by 37 percent (122 to 77) between FY 2000 and FY 2003. In FY 2003, dece-dents were 79 percent male, 67 percent White, and 22 percent Black; they had a median age of 40. According to preliminary unweighted DAWN Live! data, reports of heroin during 2004 were two-thirds male and 59 percent White. Thirty-nine percent were older than 45 and only 18 percent were younger than 30. For some 93 percent, injection was the preferred route of use. The number of treatment admissions for primary her-oin problems in the five-county bay area fell by more than one-half between 1999 and 2004 (exhibit 1). As a proportion of all primary drug admissions exclud-ing alcohol, heroin constituted 64 percent in 1994, 55 percent in 1999, and only 34 percent in 2004. Injec-tion remains by far the predominant route of use: 80 percent reported that route, compared with 14 percent who reported inhalation as the preferred route. San Francisco County heroin admissions fell by 9 percent between FYs 2002 and 2004 (exhibit 3). In the ADAM program in 2003, 3.1 percent of adult male arrestees in San Jose and 6.9 percent of those in Sacramento tested opiate positive; the median across the 39 ADAM sites was 5.8 percent. Among female arrestees in San Jose, 3.4 percent tested positive, well below the 25-city median of 6.6 percent. A 2004 survey of young San Francisco gay men showed only 0.4 percent reported use of heroin in the past year. Arrests for heroin-related offenses totaled 6,136 in 2002, 16 percent higher than in 2001 and 3 percent higher than in 2000. However, in 2003, such arrests were about 30 percent below, and in 2004 about 55 percent below, the 2002 level. The rate of arrests in the first 4 months of 2005 showed a significant fur-ther decline. Because many heroin users support their habits through property crimes, reported burglaries may be a good indicator of use. The number of such reports in San Francisco fell by 49 percent between 1993 and 1999 (11,164 to 5,704). After that low point, the count rose to 6,706 in 2001, fell to 5,507 in 2003, and rose again to nearly the 2001 level in 2004. The rate

EPIDEMIOLOGIC TRENDS IN DRUG ABUSE—San Francisco Bay Area
Proceedings of the Community Epidemiology Work Group, Vol. II, June 2005 244
for the first 4 months of 2005 was higher by 10 per-cent than that for a similar period of 2004. These changes may reflect the price of heroin more than the prevalence of users; it is noteworthy that reported burglaries and the local price of heroin are both barely one-quarter of what they were 20 years ago. The DEA’s DMP tested heroin street buys in the San Francisco area during 2003. The 27 buys were all of Mexican origin. The 2003 samples averaged 11 per-cent pure and $0.98 per pure milligram (exhibit 5). Of the last 10 years, 2001, 2002, and 2003 were the 3 with the highest average price and lowest average purity. Prices of Mexican black tar heroin ranged from $9,200 to $30,000 per kilogram and from $230 to $850 per ounce in 2004. Gram prices ranged from $50 to $75. In 2002, prices were $16,000–$30,000 per kilogram, $450–$850 per ounce, and around $60 per gram. To summarize, most indicators point to a significant decline in heroin use in the period from 2000 to 2005. Users remain predominantly White. There are indica-tions of more younger users, but the median age of users remains high, perhaps as high as 40. Other Opiates Local observers state that Internet trafficking in pharmaceutical opiates is “mushrooming.” Vicodin is the most frequently cited in this regard; Tylenol-with-codeine is also prominent. Sources appear to be “all over” the world—mostly outside of the United States. ME death mentions in the overall “narcotic analge-sics” category fluctuated within a narrow range in 1997–2000, but then they dropped in 2001 and 2002 to a level 29 percent below the 1997–2000 average (exhibit 4). The combined count of hydrocodone and oxycodone DAWN ED reports during 2004 was 14 percent that of heroin. The hydrocodone count was nearly twice that of oxycodone. Marijuana Arrests for marijuana-related offenses in San Fran-cisco County numbered 1,736 in 2000. The count of arrests ranged between 1,300 and 1,450 in the next 3 years before returning to the 2000 level in 2004. The count of arrests for 2005 will be about one-quarter lower than that for 2004, if the trend from the Janu-ary–April period is sustained. Among adult male arrestees in the ADAM program in 2003, 35 percent of those in San Jose and 49 per-cent of those in Sacramento tested positive for mari-
juana. The median across the 39 ADAM sites was 44 percent. Among female arrestees in San Jose, 29 per-cent tested positive, near the 25-site median of 32 percent. Marijuana treatment admissions in San Francisco County reached a peak in FY 2003, then dropped by 14 percent in FY 2004 (exhibit 3). In 2004, sinsemilla marijuana sold for $3,000–$6,000 per pound, and domestic marijuana sold for $4,000–$5,000 per pound. Domestic marijuana sold for about $200 per ounce. A large, and increasing, quantity of marijuana is sold legally from medical marijuana outlets to certified purchasers. There appears to be effective regulation of price and quality in that new “market.” In November 2004, Oakland voters passed Measure Z by a margin of 65 percent to 35 percent. This may portend an important development in American pol-icy on marijuana, in that Measure Z explicitly in-structs the city of Oakland to create systems for the regulation and taxation of adult use of marijuana. The overall indications are that marijuana use peaked in 2001 and has declined significantly since then. Stimulants Local observers report that the “speed” scene has leveled off after the increases of recent years. White users predominate, though there has been a recent surge in use among Filipinos. Gay males remain a very prominent portion of the user population, but not so much as in the past. In the three-county bay area, ME death mentions in-volving methamphetamine fell from 58 in 1999 to 32 in 2001 and 38 in 2002 (exhibit 4). Of the metham-phetamine-related death mentions in 2000, males accounted for 93 percent, and the median age was 40. Amphetamine-related deaths in San Francisco County increased by 87 percent (15 to 28) between FY 2000 and FY 2003. In FY 2003, decedents were 83 percent male and 70 percent White; they had a median age of 38. Nearly as many preliminary unweighted metham-phetamine reports as heroin reports (1,092 vs. 1,278) were recorded in the DAWN Live! system during 2004. Four-fifths of the patients involved in metham-phetamine ED reports in 2004 were male, two-thirds were White, and fully 68 percent were older than 30. The number of treatment admissions for primary speed problems in the five-county bay area increased
EPIDEMIOLOGIC TRENDS IN DRUG ABUSE—San Francisco Bay Area
Proceedings of the Community Epidemiology Work Group, Vol. II, June 2005 245
steadily between 1999 and 2004 (exhibit 2). The pro-portion of primary speed users among all nonalcohol drug admissions rose from 13 percent in 1999 to 25 percent in 2004. It was noteworthy that fully 64 per-cent of speed users claimed smoking as the preferred route; the proportions reporting injection or inhala-tion as preferred routes were each about one in six. Amphetamine treatment admissions in San Francisco County rose steadily from FY 2001 to FY 2004, with the later year’s count 25 percent higher than the ear-lier year’s. Two nearby metropolises that are ADAM sites may give some indication of the methamphetamine situa-tion in San Francisco. In Sacramento and San Jose, respectively, 38 and 37 percent of male adult arrest-ees tested positive for methamphetamine in 2003. These were the third and fourth highest proportions of methamphetamine-positives among male adults in all the 39 ADAM sites. Among the female arrestees, 45 percent tested positive, the fourth highest among 25 ADAM sites. A 2004 survey of young San Francisco gay men showed 21 percent reported use of methamphetamine in the past year. According to the NDIC, in 2004 pounds of “crystal” methamphetamine sold in the $10,000–$13,000 range, ounces in the $600–$1,500 range, and grams in the $80–$100 range. In 1999, comparable price ranges were $3,500 to $10,000 for pounds and $500 to $1,000 for ounces. The DEA San Francisco Field Division reports that Mexican criminal groups con-trol the local wholesale and midlevel distribution. Several counties near the bay area (Alameda, San Mateo, Santa Clara, Sacramento, San Joaquin, and Stanislaus) have been sites of “superlabs,” capable of producing 10 pounds or more of methamphetamine per production cycle. The National Drug Threat As-sessment surveys indicate that Mexican criminal gangs control most wholesale and midlevel distribu-tion, though Hawaiian, Filipino, and other Asian drug trafficking organizations produce and distribute sig-nificant quantities of “ice.” Methamphetamine use in the bay area is high com-pared with other metropolitan areas of the United States. Among some vulnerable populations (youths, arrestees, gay men) “speed” is far more prevalent than heroin. There are indications of a leveling off after significant increases during the 2001–2004 period. Depressants According to preliminary unweighted data accessed from DAWN Live!, ED reports of benzodiazepines in
2003–2004 were mostly White (77 percent), male (63 percent), and older than 35 (69 percent). ME men-tions dropped from a 1999–2001 average of 54 to 34 in 2002 (exhibit 4). Hallucinogens Lysergic acid diethylamide (LSD) ED reports among the preliminary unweighted DAWN Live! data were rare during 2004. Reports of phencyclidine (PCP) were about five times more common. Club Drugs The NDIC reports that in 2004, street prices of me-thylenedioxymethamphetamine (MDMA or “X”) were in the range of $15–$40 per “tab.” The prelimi-nary unweighted Dawn Live! ED reports of this drug were predominantly (69 percent) among people younger than 30. A 2004 survey of young San Fran-cisco gay men showed 20 percent reported use of MDMA in the past year. ED reports of gamma hy-droxybutyrate (GHB) were on average older, with 64 percent older than 30. Ketamine reports were very rare. The actual number of club drug ED mentions remains small compared with mentions for cocaine or methamphetamine. The same is the case for club drug ME mentions (exhibit 4). INFECTIOUS DISEASES RELATED TO DRUG ABUSE AIDS San Francisco County had a cumulative total of 26,117 AIDS cases among city residents through March 31, 2005. Of these cases, 1,911 (7.3 percent) were heterosexual injection drug users (IDUs). An-other 3,572 AIDS cases (13.7 percent) were among men who have sex with other men (MSM) and also injected drugs. There were just 42 reported cases among lesbian IDUs, barely one-hundredth the num-ber among MSM/IDUs. A total of 321 AIDS cases have been reported for transgender San Franciscans. Among San Franciscans diagnosed in 2003 through 2005, heterosexual IDUs accounted for 15 percent, up from 10 percent among those diagnosed in 1994–1996, 14 percent of those diagnosed in 1997–1999, and 14 percent of those diagnosed in 2000–2002. However, the overall case numbers in 2003–2004 were far lower than those of the late 1980s and early 1990s. As a result, the percentage of heterosexual IDUs among the cumulative AIDS caseload will probably not increase significantly from the current level of 7 percent.

EPIDEMIOLOGIC TRENDS IN DRUG ABUSE—San Francisco Bay Area
Proceedings of the Community Epidemiology Work Group, Vol. II, June 2005 246
The demography of the cumulative heterosexual IDU caseload with AIDS has changed very little in the past 14 years. This caseload is 68 percent male, 51 percent Black, 35 percent White, 11 percent His-panic, and 2 percent Asian/Pacific Islander. By con-trast, the gay/bisexual IDU caseload is 71 percent White, 16 percent Black, 10 percent Hispanic, and 1.5 percent Asian/Pacific Islander. The heterosexual IDU demography is like that of heroin users except for over-representation of Blacks, while the gay male IDU demography is similar to that for male speed users. Data from the Urban Health Study (UHS), which conducts semiannual surveys, indicate that in 2004, seroprevalence of heterosexual IDUs in San Fran-cisco remained within the same 6–10 percent range that has prevailed for the past 16 years. By contrast, HIV prevalence among MSM/IDUs had ranged around 40 percent in the late 1980s, dropped to around 25 percent in the late 1990s, and rose again to the 30–35 percent range in 2004. Recent UHS data show extensive self-reported past-month injection of cocaine (21 percent) and amphetamines (30 percent) as well as heroin (68 percent). A surprisingly low proportion (c. 15 percent) of heterosexual HIV-positive IDUs reported being on drug treatment for their condition. Passage of SB1159, which enables California phar-macies to sell hypodermic equipment without pre-scriptions, has the potential for significant effects
upon disease transmission. Many large pharmacies have decided to opt into this activity. Hepatitis B Virus From 1997 through 2001, reported cases of HBV in San Francisco County rarely deviated from a pace of a bit more than one per week. The pace dropped in 2002 and 2003 to about one every 10 days, then dropped further in 2004 to about one every 14 days. Hepatitis C Virus UHS data from 2003 disclosed that fully two-thirds of all IDUs in the sample self-reported HCV sero-positivity. UHS staff believe, on the basis of earlier HCV antibody testing, that true prevalence is be-tween 90 and 95 percent. This has enormous implica-tions for the long-term health of San Francisco’s IDU population—not only the current user population estimated at 18,700, but also the possibly much larger number with past (or future) injection drug use. “Coinfection” is also a serious problem; a 2003 study by the University of California at San Francisco found that 73 percent of homeless and marginally housed people with HIV were also infected with hepatitis C. For inquiries concerning this report, please contact John A. Newmeyer, Ph.D., Haight-Ashbury Free Clinics, Inc., 612 Clayton Street, 2nd Floor, San Francisco, CA 94117, Phone: (415) 931-5420, Fax: (415) 864-6162, E-mail: [email protected].

EPIDEMIOLOGIC TRENDS IN DRUG ABUSE—San Francisco Bay Area
Proceedings of the Community Epidemiology Work Group, Vol. II, June 2005 247
Exhibit 1. San Francisco DAWN ED Sample and Reporting Information: January–December 2004
No. of EDs Reporting per Month: Completeness of Data (%) CEWG Area Total Eligible
Hospitals1
No. of Hospitals in
DAWN Sample
Total EDs in DAWN
Sample2 90–100% 50–89% <50%
No. of EDs Not
Reporting
San Francisco 18 17 19 7–10 0–1 0–3 8–11 1Short-term, general, non-Federal hospitals with 24-hour emergency departments based on the American Hospital Association An-nual Survey. 2Some hospitals have more than one emergency department. SOURCE: DAWN Live!, OAS, SAMHSA, updated 4/13-4/14, 2005 Exhibit 2. Admissions to Drug Treatment Programs in the San Francisco Bay Area, by Primary Drug of Abuse: 1999–2004 Drug 1999 2000 2001 2002 2003 2004 Cocaine 8,727 7,718 7,428 6,746 7,114 6,814 Heroin 19,763 17,416 14,673 11,461 9,898 9,089 Amphetamine 4,595 4,469 5,073 5,636 6,438 6,701 All Drugs 36,069 32,034 30,920 28,329 27,626 26,381 SOURCE: California Department of Alcohol and Drug Programs (DADP) Exhibit 3. Admissions to Drug Treatment Programs in San Francisco County, by Primary Drug of Abuse: FYs 2000–2004 Drug FY 2000 FY 2001 FY 2002 FY 2003 FY 2004 Cocaine 2,600 2,306 2,440 2,274 2,527 Heroin 4,030 3,867 4,002 3,700 3,646 Amphetamine 1,008 991 1,053 1,144 1,235 Marijuana 915 867 1,067 1,110 950 All Drugs 8,690 8,191 8,764 8,406 8,520 SOURCE: San Francisco Department of Public Health Exhibit 4. Medical Examiner Drug Mentions in Three Counties (Including San Francisco): 1997–2002 Drug 1997 1998 1999 2000 2001 2002 Cocaine 127 158 158 146 106 90 Heroin/Morphine 159 164 192 148 117 95 Methamphetamine 49 45 58 45 32 38 Narcotic Analgesics 156 185 198 164 124 125 Benzodiazepines 71 62 50 55 56 34 Club Drugs1 6 6 5 4 1Includes MDMA, ketamine, GHB, GBL, and Rohypnol SOURCE: DAWN, OAS, SAMHSA

EPIDEMIOLOGIC TRENDS IN DRUG ABUSE—San Francisco Bay Area
Proceedings of the Community Epidemiology Work Group, Vol. II, June 2005 248
Exhibit 5. Price and Purity of Heroin Samples, 1994-2003
Year Price Per Pure Milligram Purity (Percent) 1994 $0.95 29 1995 $0.83 35 1996 $0.83 24 1997 $0.63 26 1998 $0.33 26 1999 $0.47 20 2000 $0.70 15 2001 $1.40 10 2002 $0.99 12 2003 $0.98 11
SOURCE: Drug Enforcement Agency, Domestic Monitor Program
EPIDEMIOLOGIC TRENDS IN DRUG ABUSE—Seattle-King County Area
Proceedings of the Community Epidemiology Work Group, Vol. II, June 2005 249
Recent Drug Abuse Trends in the Seattle-King County Area
Caleb Banta-Green,1 T. Ron Jackson,
2
Michael Hanrahan,3 Susan Kingston,
3 David
H. Albert,4 Steve Freng,
5 Ann Forbes,
6
Richard Harruff,7 Richard Burt,
8 and Hanne
Thiede8
ABSTRACT The total number of drug-involved deaths increased 36 percent in 2004, due primarily to cocaine, pre-scription-type opiates, and prescription and over-the-counter depressants/anxiolytics/sedatives. Cocaine-involved deaths are at their highest level in at least 10 years, with 92 cocaine-involved deaths in 2004. Cocaine is the most common illegal drug among ED reports. Treatment admissions for heroin are begin-ning to increase, along with the increased treatment capacity. Heroin-involved deaths totaled 75 in 2004, up a bit from 2003 but well below the peak of 144 in 1998. Deaths and treatment admissions involving prescription-type opiates continue to rise steadily. Methamphetamine mortality indicators have leveled off in King County, while treatment admissions have begun to increase again. Negative consequences re-lated to prescription stimulants appear low, but the number of prescriptions has increased substantially, and anecdotal reports of youth and young adult mis-use are common. Marijuana is widely used, particu-larly by youth. Prescription depressant-involved deaths increased substantially. In 2004, 1 in 5 drug-related deaths involved the combination of prescrip-tion-type opiates and depressants (and usually other drugs as well). Hepatitis B and C infect the majority of IDUs. HIV among IDUs is generally low, with the exception of methamphetamine-injecting men who have sex with men.
INTRODUCTION Area Description Located on Puget Sound in western Washington, King County spans 2,130 square miles, of which the city of Seattle occupies 84 square miles. The combined ports of
The authors affiliations are as follows: 1Alcohol and Drug Abuse Institute, University of Washington 2Evergreen Treatment Services 3HIV/AIDS Program, Public Health – Seattle & King County 4Division of Alcohol and Substance Abuse, Washington State De-partment of Social and Health Services 5Northwest High Intensity Drug Trafficking Area 6Washington State Alcohol and Drug Help Line 7Medical Examiner’s Office, Public Health – Seattle & King County 8HIV/AIDS Epidemiology, Public Health – Seattle & King County
Seattle and nearby Tacoma make Puget Sound the second largest combined loading center in the United States. Seattle-Tacoma International Airport, located in King County, is the largest airport in the Pacific Northwest. The Interstate 5 corridor runs from Ti-juana, Mexico, in the south, passes through King County, and continues northward to Canada. Inter-state 90’s western terminus is in Seattle; it runs east over the Cascade Mountain range, through Spokane, and across Idaho and Montana. According to the 2000 census, the population of King County is 1,737,034. King County’s popula-tion is the 12th largest in the United States. Of Washington’s 5.9 million residents, 29 percent live in King County. The city of Seattle’s population is 563,374; the suburban population of King County is growing at a faster rate than Seattle itself. The county’s population is 75.7 percent White, 10.8 percent Asian/Pacific Islander, 5.5 percent Hispanic, 5.4 percent African-American, 0.9 percent Native American or Alaska Native, 0.5 percent Native Ha-waiian and Other Pacific Islander, and 2.6 percent “some other race.” Those reporting two or more races constitute 4.1 percent of the population. In-come statistics show that 8.0 percent of adults and 12.3 percent of children in the county live below the Federal poverty level, lower than the State averages of 10.2 percent and 15.2 percent, respectively.
Data Sources
Information for this report was obtained from the sources described below:
• Emergency department (ED) drug data were obtained from the DAWN Live! restricted-access online query system administered by the Drug Abuse Warning Network (DAWN), Of-fice of Applied Studies (OAS), Substance Abuse and Mental Health Services Administra-tion (SAMHSA). Preliminary unweighted data for 2004 are presented. Eligible hospitals in the Seattle area total 22; hospitals in the DAWN sample number 22, with the number of emer-gency departments in this sample totaling 23. (Some hospitals have more than one ED.) Dur-ing this 12-month period, between 10 and 13 EDs reported data each month. The complete-ness of data reported by participating EDs var-ied by month (see exhibit 1). Exhibits in this paper reflect cases that were received by DAWN as of April 13–14, 2005, unless other-wise noted. All DAWN cases are reviewed for quality control. Based on this review, cases may be corrected or deleted. Therefore, the data in
EPIDEMIOLOGIC TRENDS IN DRUG ABUSE—Seattle-King County Area
Proceedings of the Community Epidemiology Work Group, Vol. II, June 2005 250
this paper are subject to change. Data derived from DAWN Live! represent drug reports in drug-related ED visits. Drug reports exceed the number of ED visits, since a patient may report use of multiple drugs (up to six drugs plus alcohol). These data are preliminary, meaning that they may change. Data represent unweighted drug reports and are not es-timates or rates for the reporting area. Data are util-ized for descriptive purposes only. Data cannot be compared to DAWN data from 2002 and before, nor can preliminary data be used for comparison with future data. Only weighted data released by OAS may be used for trend analyses. Available data are for King and neighboring Snohomish Counties combined, Pierce County is part of the statistical sample, but no EDs in Pierce were re-porting during 2004. There are new case types in DAWN, with the primary one presented here being the “other” case type, which includes “all ED visits related to recreational use, drug abuse, drug de-pendence, withdrawal, and any misuse” not classi-fied in other categories such as over-medication and seeking detox/treatment. For the sake of clarity “other” will be referred to as “drug abuse/other” in this report. Unless specifically stated, data pre-sented are for the drug abuse/other case type. A full description of the DAWN system can be found online at http://dawninfo.samhsa.gov.
• Treatment data were extracted from the Wash-
ington State Department of Social and Health Services, Division of Alcohol and Substance Abuse’s Treatment and Assessment Report Gen-eration Tool (TARGET) via the Treatment Ana-lyzer system. TARGET is the department’s state-wide alcohol/drug treatment activity database sys-tem. Data were compiled for King County resi-dents from January 1, 1999, through December 31, 2004. Data are included for all treatment ad-missions that had any public funding. Department of Corrections (only a few cases) and private pay clients (at methadone treatment programs) are also included. Methadone waiting list data for those seen at syringe exchanges are administered and provided by Public Health—Seattle & King County (PHSKC).
• Drug-related mortality data were provided by the
King County Medical Examiner (ME). Data for 2004 are preliminary. The data include deaths di-rectly caused by licit or illicit drug overdose and exclude deaths caused by antidepressants in isola-tion and by poisons. Totals may differ slightly from drug death reports published by the King County ME’s office, which include fatal poisonings. Test-ing is not done for marijuana. Because more than
one drug is often identified per individual drug overdose death, the total number of drugs identi-fied exceeds the number of actual deaths. A cor-rection to the coding for alcohol-involved deaths was made in August 2005. Data from 1997–2000 previously under-reported the number of deaths in which alcohol was identified.
• Toxicology and driving under the influence
(DUI) data were provided by the Washington State Patrol’s Forensic Toxicology Laboratory for methamphetamine-involved cases. Note that the laboratory’s identification of a substance in a death is not equivalent to the medical exam-iner’s ruling that a drug was causative in the death. The toxicology lab is reporting on chemical analysis for cases, whereas the ME’s office utilizes these data along with their own investigation to make a ruling as to the cause of death. The number of positive toxicology cases for a substance will invariably surpass the num-ber of deaths ruled to be caused by a substance.
• School drug use survey data are available from the Seattle Public School’s Communities That Care survey for 2002 and 2004. Response rates were 50 percent in 2002 and 60 percent in 2004. Trends cannot be determined from these data.
• Prescription drug sales data are extracted from
the Drug Enforcement Administration’s Auto-mation of Reports and Consolidated Orders System (ARCOS) reports. The data provide re-tail drug distribution data by ZIP Code, cover-ing primarily sales to hospitals and pharmacies. ARCOS data presented here are for the 3-digit ZIP Code areas of 980 and 981, which roughly correspond with King County boundaries. The population in these two ZIP Code areas is 1,969,348, compared with 1,737,034 for King County in 2000. Available data report the “grams of active ingredient” by year; this is complicated to translate into the number of pre-scriptions or users, so data are reported in terms of proportional change over time.
• Methamphetamine production data are from
the Washington State Department of Ecology (DOE), which is mandated to respond to and document all “Methamphetamine Incidents,” including operating labs, dump sites, and other sites associated with the manufacture of methamphetamine.
• Forensic drug analysis data are from the Na-
tional Forensic Laboratory Information System

EPIDEMIOLOGIC TRENDS IN DRUG ABUSE—Seattle-King County Area
Proceedings of the Community Epidemiology Work Group, Vol. II, June 2005 251
(NFLIS), which distributes data from the Wash-ington State Patrol’s Toxicology Laboratory on drug test results on local law enforcement sei-zures. These data include the top 25 drugs identi-fied in fiscal year (FY) 2003 and FY 2004. Data are presented for the Seattle-area lab in compari-son to the rest of the State.
• Data on infectious diseases related to drug use
and injection drug use, including the human im-munodeficiency virus (HIV), acquired immunode-ficiency syndrome (AIDS), and hepatitis, were provided by three sources. One source is “HIV/ AIDS Epidemiology Report.” Data on HIV and AIDS cases (including exposure related to injection drug use) in Seattle-King County, other Wash-ington counties, and Washington State (2001 through 2004) are provided by PHSKC, the Wash-ington State Department of Health. HIV cases were reported to PHSKC or the Washington State De-partment of Health between 2000 and 2004. The third source of information, on 18–30-year-old in-jecting drug users’ preferred drugs over time, was provided by the HIV epidemiology unit of PHSKC. These data are based upon four studies conducted from 1994 to 2003; they included the RAVEN (1994–1997), RAVEN II (1998), Kiwi (1998–2002) and DUIT (2002–2003) studies.
• Syringe exchange data on the number of sy-
ringes exchanged and the number of encounters with clients are provided by PHSKC’s HIV/AIDS program.
• Drug-related helpline data are from the Washing-
ton State Alcohol/Drug Help Line (ADHL), which provides confidential 24-hour telephone-based treatment referral and assistance for Washington State. Data are presented for January 2001 to De-cember 2004 for calls originating within King County. Data presented are for drugs mentioned. A caller may refer to multiple drugs; therefore, there are more drug mentions than there are calls. The data exclude information on alcohol and nicotine, which account for more than one-half of the calls. Data are presented primarily for illicit drugs only, prescription drugs have not been coded consistently over time, therefore limiting trend analyses. The large number of unknown drugs in 2001 and 2002 may obscure some trends as well.
• Key informant interview data are obtained from
discussions with treatment center staff, street out-reach workers, and drug users.
DRUG ABUSE PATTERNS AND TRENDS
Cocaine/Crack
The proportion of treatment admissions involving cocaine (i.e., cocaine was mentioned as the primary, secondary, or tertiary drug of abuse at the time of en-try into treatment) increased for the first time in sev-eral years from 38.7 percent in 2003 to 40.1 percent in 2004 (exhibit 2a). Those entering treatment were older in 2004 than those entering in 1999, with 22.6 percent age 45–54 in 2004, compared with 10.4 percent in 1999 (exhibit 2b). Use is quite low among those younger than 18: less than 3 percent in both years. The largest group remained those age 30–44, representing 60 percent of admissions in 2004. Unweighted cocaine ED drug reports for all case types totaled 2,725 in 2004, more than those for heroin, marijuana, and methamphetamine (exhibits 3a and 3b). For cocaine, drug abuse/other represented the largest proportion of case types (89 percent), followed by those seeking detox/treatment (10 percent). Almost two-thirds were male, with almost as many Blacks as Whites (note substantial missing data). They were an older group, with 38 percent age 35–44 and 22 percent age 45–54. Psychiatric conditions (24 percent) were the predominant complaint, followed by altered men-tal status (16 percent). Route of administration data were missing for 73 percent of reports, with 13 per-cent smoking, 10 percent injecting, and 2 percent in-haling/sniffing/snorting. Cocaine was the most common drug mentioned by adults calling the ADHL, representing 32 percent of calls in 2004 (exhibit 4). For youth, 12 percent of calls were for cocaine in 2004. Cocaine was not commonly used by high school seniors in the past 30 days (exhibit 5). Use levels were 1.7 percent in 2002 and 2.5 percent in 2004 (not significantly different). Cocaine was the most common substance identified in the Seattle area according to NFLIS data on local law enforcement drug seizure testing (exhibit 6). Cocaine was the second most common drug de-tected in the laboratories for the rest of the State, with about one-half of the level found in the Seattle-area lab. Minimal change occurred in the proportion of cocaine-positive tests from FY 2003 to FY 2004. Cocaine-involved deaths are at their highest level in at least 10 years, with 92 cocaine-involved deaths in 2004 (exhibit 7a). The most common drugs com-

EPIDEMIOLOGIC TRENDS IN DRUG ABUSE—Seattle-King County Area
Proceedings of the Community Epidemiology Work Group, Vol. II, June 2005 252
bined with cocaine included heroin, representing 14 percent of all drug-involved deaths, prescription-type opiates (10 percent), and depressants/sedatives/ anxio-lytics (9 percent) (exhibit 7e). Twenty-one deaths in-volved only cocaine in 2004, accounting for 23 per-cent of all cocaine-involved deaths. The number and proportion of cocaine-only deaths is second only to 2000, when 31 of 89 (35 percent) cocaine-involved deaths were from cocaine only. More than three-quarters of cocaine-involved decedents were male, a higher proportion than for all drug deaths (exhibit 7d). The average age for cocaine decedents (41.2) was similar to the age for all drug decedents and increased from 39.7 to 43.3 from 1997 to 2004. A dis-proportionate number of decedents were African-American, 21 percent, higher than 11 percent for all drugs and much higher than the county’s overall Afri-can-American population. Almost all deaths were ruled accidental (94 percent). The level of cocaine indicators is disproportionately high for African-Americans relative to their representation in King County. Though African- Americans represent approximately 5 percent of the county’s population, they represent 21 percent of cocaine-involved deaths, 47 per-cent of cocaine treatment admissions (exhibit 2c), and 42 percent of cocaine ED reports. Note that even though African-Americans are overrepresented in the ED (26 percent of reports with race documented) and in treat-ment (22 percent of admits), their levels of cocaine use are still disproportionately high. The Seattle DEA field division reports that powder cocaine availability is increasing. They also have no-ticed increasing availability of crack in smaller com-munities in Washington State.
Heroin
The proportion of treatment admissions involving any use of heroin increased after several years of decline, from 19.8 percent in 2003 to 21.6 percent in 2004 (ex-hibit 2a). Opiate treatment program capacity was sub-stantially increased in the later part of 2004; there were 673 admissions in the first half of 2004 and 997 in the second half. The caseload increased by ap-proximately 200 from January to December of 2004 to a total of 2,536 in public and private pay programs governed by King County. Heroin users are older than other drug users entering treatment on average and they continued to get older during the timeframe from 1999 to 2004; the proportion of those age 45–54 in-creased from 27 to 34 percent (exhibit 2b). An in-crease was also seen among those age 55–64, from 3 to 6 percent of admissions involving heroin.
Among those entering opiate substitution treatment, the proportion reporting heroin as their primary drug decreased from 95 to 87 percent from 1999 to 2004 (exhibit 8). Heroin/opiate/morphine-involved deaths increased in 2004 to 75; only 2 years had lower numbers since 1997 (exhibit 7a). (The category of heroin/opiate/ morphine is the best approximation of heroin deaths; it excludes all deaths known to involve specific pre-scription-type opiates.) Heroin/opiate/morphine combination deaths most commonly involved co-caine (14 percent of all drug- involved deaths), al-cohol (8 percent), a depressant/anxiolytic/sedative (8 percent), and prescription-type opiates (6 percent) (exhibit 7e). In 2004, 17 percent of heroin/opi-ate/morphine-involved deaths had no other drug present, slightly lower than the 20 percent average for all years. Heroin/opiate/morphine-involved decedents were male 81 percent of the time, the highest proportion for any substance (exhibit 7d). The average age of 40.6 was slightly lower than for all drugs, and that average increased substantially from 38.0 to 43.8 from 1997 to 2004. Eighty-four percent of decedents were White, and 10 percent were African-American. The vast majority of deaths were ruled accidental: 92 percent. The average number of drugs involved was 2.4, similar to the average for all drugs (2.3). (Note that heroin/opiate/morphine-involved deaths consti-tuted almost one-half of all deaths, so the averages for all deaths are heavily influenced by these data.) The waiting list for methadone treatment programs (which primarily use methadone) was at 487 at the end of 2004 and 156 by June 2005 (exhibit 9). Re-cent increases in treatment capacity have resulted in this decreased number on the waiting list. The predominant form of heroin on the streets is Mexican black tar. All DEA DMP buys of heroin that have been positively identified were found to be Mexican in origin. China white, a common form in Vancouver, British Columbia, and on the east coast of the United States, is uncommon in the local area according to regional HIDTA and DEA information. Historically, DMP data were reported for the Seattle area, which included buys in Seattle and Tacoma, and just the average purity was reported. Prelimi-nary data for the Seattle area showed a spike in the average purity of heroin for the Seattle area. The Seattle DEA Field Division provided additional de-tailed data that included the city of purchase as well the purity for each buy. This allowed the computa-tion of medians in addition to averages. These de-

EPIDEMIOLOGIC TRENDS IN DRUG ABUSE—Seattle-King County Area
Proceedings of the Community Epidemiology Work Group, Vol. II, June 2005 253
tailed data revealed that the median heroin purity of DMP buys in the city of Seattle was 14 percent in FY 2004, similar to the prior year, higher than in FY 2001–2002, and below the 17 percent seen in FY 2000 (exhibit 10). Most important are the four purchases in FY 2004 that ranged from 37 to 46 percent pure; this is a much larger range and higher purity than seen in the prior 3 years. Followup discussions with local DEA indicated that these buys were not different than any others (i.e., high purity heroin was not being sought). This large of a range is potentially dangerous, because users may be getting much more potent heroin than they are used to, which, particularly when used in combination with other depressants, could prove deadly. This is a very small number of samples, but it does raise concerns about another potential cause of heroin overdoses. Unweighted data show heroin drug reports in the DAWN Live! system were second only to cocaine among illegal drug reports (exhibits 3a and 3b). Ninety percent of heroin reports were of the drug/abuse other case type, with almost all of the remaining reports for seeking detox/treatment. Sixty percent were male, with five times as many Whites as Blacks. However, 60 percent of reports did not have race/ethnicity docu-mented. The group was relatively old, with one-third age 35–44 and almost one-quarter age 45–54. By far the most common chief complaint was abscess/cellu-litis/skin/tissue at 39 percent, far higher than for any other substance. Overdose was second, with 10 per-cent of documented complaints. Injection was noted in almost all reports for which the route of administration was documented. Heroin mentions in calls to the Help Line represented 15 percent of adult calls and 4 percent of youth calls in 2004 (exhibit 4). NFLIS results show similar levels of law enforcement seizures for heroin in the Seattle area (5 percent) and the rest of the State (5–7 percent) in FYs 2003 and 2004. Heroin was the fourth most common substance detected in each of these regions (exhibit 6). Price data for King County from the Northwest HIDTA for 2003 for Mexican black tar heroin include $30–$150 per gram, $400–$900 per ounce, $8,000–$10,000 per pound, and $16,000–$25,000 per kilogram.
Other Opiates/Prescription-Type opiates
For the purposes of this report, “other opiates/pre-scripttion-type opiates” include codeine, dihydroco-deine, fentanyl, hydrocodone (e.g., Vicodin), metha-done (source, whether pain medication or opiate treat-ment program is rarely available), oxycodone (e.g., Per-
cocet and OxyContin), propoxyphene (e.g., Darvon), sufentanil, tramadol (e.g., Ultram), hydromorphone (e.g., Dilaudid, Palladone), meperidine (e.g., Deme-rol) pharmaceutical morphine, acetylmethadol, and the “narcotic analgesics/combinations” reported in the DAWN ED data. Treatment admissions to any treatment modality increased from 81 to 264 for other opiates as the primary drug from 1999 to 2004. A substantial in-crease was seen for the 18–29 age group, rising from 16 to 40 percent of other opiate admissions from 1999 to 2004. These numbers are an underes-timate, as prescription-type opiate use is often noted as secondary or tertiary to other substances. Among those entering opiate substitution treatment, the proportion reporting prescription-type opiates as their primary drug increased from 3 percent in 1999 to 12 percent in 2004 (exhibit 8). The number of deaths involving prescription-type opiates continues to increase and has surpassed all other drugs; prescription-type opiates were identi-fied in 118 deaths in 2004, up from 84 in 2003 and 28 in 1997 (exhibit 7a). Thirteen deaths in 2004 (11 percent) involved just a prescription-type opiate, a proportion similar to the prior 3 years, but about one-half the level seen from 1998 to 2000. Demographics for prescription-type opioid deaths point to a relatively high proportion of females and a group older than all drugs users on average (exhibit 7d). This group was also disproportionately White and had a larger average number of total drugs pre-sent, 3.0, than among all drug decedents, 2.1. Three specific prescription-type opiates make up the majority of all cases, with methadone present in 57 percent of prescription-type opiate-involved deaths in 2004 (exhibit 7b). Oxycodone was the next most common, present in more than one-quarter of such deaths in 2004. Hydrocodone was present in 14 deaths in 2004, with all of the remaining prescrip-tion-type opiates totaling 33 cases in 2004. Demographics of oxycodone and methadone dece-dents are similar in terms of gender and the average numbers of drugs present (exhibit 7d). Oxycodone users were older on average, 44.7, compared with 41.4 for methadone, and the manner of death was much more often suicide for oxycodone users (22 percent versus 1 percent for methadone cases). The most common class of drugs found in combina-tion with prescription-type opiates in deaths was depressants (exhibit 7e). This combination was

EPIDEMIOLOGIC TRENDS IN DRUG ABUSE—Seattle-King County Area
Proceedings of the Community Epidemiology Work Group, Vol. II, June 2005 254
found in 20 percent of all deaths, the highest propor-tion of any drug combination deaths in 2004. Fifteen percent of deaths involving a combination of prescription-type opiates and depressants were deter-mined to be suicides, slightly higher than 11 percent for all drug-involved deaths and much lower than the 24 percent for all depressant-involved deaths. These differences indicate that this combination is not just part of the commonly seen multiple drug-involved suicides, but appear to be also involved in accidental deaths from those seeking to get high from this com-bination. These two classes of drugs are CNS depres-sants and their effects combine, or potentiate, to create a dangerous physiological state. In 2004, 62 percent of depressant-involved deaths also involved a prescrip-tion-type opiate, while 43 percent of all prescription-type opiate-involved deaths also involved a depressant (exhibit 7c). This drug combination has been common in the past as well. Single-drug deaths were infrequent for prescription-type opiates (13 percent), compared with all drug-involved deaths (29 percent) (exhibit 7f). Thus, the vast majority of prescription-type opiate-involved deaths involved multiple substances. Illegal drugs were present in two-thirds of all drug-involved deaths (exhibit 7g), but in only a minority of prescription-type opiate-involved deaths (35 percent). It is likely that most people using prescription-type opiates in combination with illegal drugs were attempting to get “high.” The proportion of accidental over-medications versus those seeking a high is not known. What constitutes a prescription-type opiate-related death is unclear, however, particularly among opiate-tolerant individuals. Issues of tolerance, potentiation with other drugs, and overlapping therapeutic and le-thal dose levels complicate assigning causation in pre-scription-type opiate-involved fatalities. The source and form of prescription-type opiates involved in deaths are sometimes undetermined. According to unweighted data accessed from DAWN Live!, ED drug reports for prescription-type opiates totaled 1,956 in 2004, with the drug abuse/other case type representing the largest proportion (41 percent), followed by overmedication (25 percent) and adverse reaction (21 percent) (exhibit 3a). Some misclassifica-tion of case type may remain, however it is believed that the other/drug abuse case type is likely the most accurate category, given that all other case types must be ruled out prior to assigning this case type. To ex-plain more about those who are intentionally misusing prescription-type opiates, the drug abuse/other case type is discussed further below.
ED drug reports for the drug abuse/other case type indicate that prescription-type opiate patients were mostly age 35–54 (58 percent); about one-half were male; most used orally, though some injected; and withdrawal (23 percent) was the most common pre-senting complaint (exhibit 3c). A comparison of drug abuse/other ED reports for the two most common prescription-type opiates, oxycodone (n=171, 21 percent) and methadone (n=234, 29 percent) revealed a few differences. The most notable difference was the age distribution, with oxycodone patients being younger; 27 percent were 18–29, compared with 16 percent for metha-done patients. Methadone-involved patients tended to be on the older end of the scale, with 44 percent being age 45 and older, compared with 26 percent of oxycodone patients. This is the inverse of the pattern seen in deaths with regards to age. Route of inges-tion information was missing for a substantial pro-portion reporting each drug. The most common route was oral for both. Two people reported in-haled/snorted/sniffed for oxycodone (compared with 0 for methadone), and six people reported they in-jected methadone, compared with none for oxy-codone. In 2004, 198 calls about adults to the Help Line in-volved OxyContin, compared with 9 for youth (ex-hibit 4). There were 397 calls for “prescription pain pills” for adults in 2004 and 6 for youth. As a point of comparison, there were 589 calls about adult use of heroin in 2004. Categorization of calls to the Help Line for other opiates and prescription pain pills has changed over time, and categories are not mutually exclusive. Three types of prescription-type opiates are among the top 25 substances reported in the NFLIS data: oxycodone, hydrocodone, and methadone (exhibit 6). For the Seattle area, these three substances to-taled 2 percent in FY 2003 and 3 percent in FY 2004. For the rest of the State, about 3 percent of seizures tested positive for these substances in both years. DEA data on sales of prescription-type opiates to hospitals and pharmacies in the King County area indicate that methadone sales have steadily in-creased each year, with a total increase of 359 per-cent from 1997 to 2003 (exhibit 11). Note that these data for methadone only include prescriptions for pain written by physicians; they do not include methadone provided in opiate treatment programs. Oxycodone prescriptions have continued to increase in recent years. Prescriptions for hydromorphone (80 percent), hydrocodone (93 percent), morphine

EPIDEMIOLOGIC TRENDS IN DRUG ABUSE—Seattle-King County Area
Proceedings of the Community Epidemiology Work Group, Vol. II, June 2005 255
(88 percent), and fentanyl (174 percent) have all in-creased as well. Codeine and meperidine prescriptions have both steadily declined, decreasing 27 percent and 30 percent, respectively, between 1997 and 2003. Several diverse factors may impact these prescribing patterns: 1) increased advertising and promotion of pharmaceuticals generally, 2) guidelines promoting adequate use of opiates for management of pain re-leased in 1996 by the Washington State Medical Qual-ity Assurance Commission, and 3) recent efforts to shift to methadone and morphine as less expensive alternatives to other opiates by Washington State agencies administering publicly financed health care services.
Marijuana
Nearly one-half (47.8 percent) of those admitted to treatment in 2004 reported current marijuana use (ex-hibit 2a). This represented a slight decline, but mari-juana is still the most commonly reported illegal drug. Those reporting marijuana as their primary drug are much younger than other drug users overall: 45 per-cent of users were younger than 18 in 2004 (exhibit 2b). However, primary marijuana users are aging, as those younger than 18 represented 63 percent of users in 1999. Unweighted DAWN Live! data show marijuana ED reports totaled 1,160 in 2004, with 92 percent being drug abuse/other case type, followed by 6 percent seeking detox/treatment (exhibit 3a). More than two-thirds were male, and patients were much younger than for other illegal drugs. Eleven percent were age 12–17, and 42 percent were 18–29. Psychiatric condi-tion was reported most commonly (27 percent), fol-lowed by altered mental status (20 percent). Calls to the Help Line for marijuana constituted 51 percent of youth-related calls and 21 percent of adult calls in 2004, similar to prior years (exhibit 4). Marijuana was the most commonly identified illegal drug used by high school seniors in Seattle’s school survey. Use in the prior 30 days was reported by 27.0 percent in 2002 and 25.4 percent in 2004 (exhibit 5). Cannabis was the third most commonly identified sub-stance in NFLIS data for both the Seattle area and the rest of Washington State in FYs 2003 and 2004 (ex-hibit 6). In the Seattle area, 17 percent and 15 percent of seizures tested positive for cannabis in FYs 2003 and 2004, respectively. Similar levels were seen in the rest of the State: almost 16 percent for both years.
HIDTA data collected from King County law en-forcement in 2003 show the following prices for marijuana: $10–$40 per gram, $250–$500 per ounce, and $2,200–$4,000 per pound. Price depends on the quality and a variety of other factors, but “BC Bud” from British Columbia, Canada, is widely available and the most expensive of the marijuana varieties available in King County.
Stimulants
Stimulants encompass a range of drugs, including methamphetamine, which is available almost exclu-sively as an illicit drug. Amphetamines are primarily prescription drugs, d amphetamine (e.g., Dexedrine) for weight control, and dl amphetamine (e.g., Ad-derall) for attention deficit disorder/ attention defi-cit-hyperactivity disorder (ADD/ADHD). Another prescription medication for ADD/ADHD is methyl-phenidate (e.g., Ritalin). Prescriptions for stimulant medications are up sub-stantially. DL amphetamine (e.g., Adderall) sales increased 1,108 percent in the King County area from 1997 to 2003 (exhibit 12). D amphetamine (e.g., Dexedrine) sales increased 134 percent, and methylphenidate sales increased 66 percent over this same period. Note that Adderall was approved by the U.S. Food and Drug Administration (FDA) in 1996 (i.e., fairly recently), while methylphenidate was approved in 1956 and Dexedrine was approved in 1948. The proportion of ADHL calls related to metham-phetamine represented 18 percent of both adult and youth calls in 2004 (exhibit 4). Methamphetamine is the only substance for which youth and adults call in the same proportion. It is the second most common substance for youth and third most common for adult calls, similar to previous years. The proportion of treatment admissions for King County residents involving methamphetamine (ex-hibit 2a) increased in 2004 after several years of stability. Approximately 14 percent of all people entering treatment mentioned methamphetamine as one of the drugs they used between 2001 and 2003; this increased to 16 percent in 2004. Treatment data indicate that primary methampheta-mine users are much younger than heroin and cocaine users and older than marijuana users overall (exhibit 2b). Only 5 percent of methamphetamine users were older than 45 in 2004, compared with 25 percent of cocaine, 40 percent of heroin, and 3 percent of mari-

EPIDEMIOLOGIC TRENDS IN DRUG ABUSE—Seattle-King County Area
Proceedings of the Community Epidemiology Work Group, Vol. II, June 2005 256
juana users. Methamphetamine users showed the small-est shift in age distribution from 1999 to 2004, with the only group showing any change being those age 45–54; their proportion increased from 3 to 5 percent. Deaths involving methamphetamine were level in 2003 and 2004 at a new high of 18 per year, up from 3 in 1997 (exhibit 7a). Since 1997, the average age of decedents with methamphetamine involved was 37.9, lower than the average for all drugs (exhibit 7d). How-ever, the average age in 2004 was 42.8, higher than any previous year. Deaths involving the category of prescription stimu-lants totaled 12 for the 8 years of detailed data (exhibit 7a). This is a small number, but it appears to have in-creased slightly; given the increase in prescriptions for these substances, as well as national survey data show-ing increasing use and misuse, these cases were exam-ined. The fact that these data are based on tiny num-bers should be kept in mind. Overall, prescription stimulant-involved deaths had the lowest average age for all substances: 33.8, compared with 41.6 for all drugs (exhibit 7d). Whites represented 92 percent of deaths—the highest of any drug. Cause of death was accident 92 percent of the time, among the highest for all drugs, and the average number of drugs was much higher than for any other substance: 4.2 compared with 2.3 on average for all drugs. The use patterns of the two prescription stimulants are characterized below. Amphetamine deaths totaled six from 1997 to 2004, with a roughly even distribution over that time. The average age of decedents was 31 (range=22–41). One death involved only amphetamine. The average num-ber of drugs involved was 3.3 All combination deaths included an opiate plus at least one other drug. Methylphenidate-involved deaths also totaled six from 1997 to 2004. However, three were in 2004 and one was in 2003. Decedents were age 36.7 on average (range=28–53), and the average number of drugs de-tected was 5.0. All but one death also involved an opi-ate of some kind. According to unweighted data accessed from DAWN Live!, 89 percent of methamphetamine ED reports in 2004 were because of drug abuse/other, and 10 percent were seeking detox/treatment (exhibit 3a). Seventy percent were male, and most patients were White. Methamphetamine patients were younger than heroin and cocaine patients, but older than marijuana patients overall. Similar proportions, just under one- quarter, of complaints were for psychiatric condition and altered mental status. The next most common complaint was
abscess/cellulitis/skin/tissue (8 percent). Fifteen per-cent of methamphetamine-involved patients were referred to detox/treatment, a larger proportion than for the other common illegal drugs. Use of methamphetamine in the past 30 days was relatively low among Seattle high school seniors: 1.1 percent in 2002 and 2.0 percent in 2004 (exhibit 5). A category of amphetamine was added to the Help Line data in 2003 (exhibit 4). There were 18 adult calls and 0 youth calls about amphetamine in 2004, though there may be underreporting because of an overlapping category of “prescription drugs.” Federal law enforcement sources report that less methamphetamine is being manufactured in Wash-ington, but that demand is being met by an increase in supply from Mexico and Mexican groups in Cali-fornia. Anecdotal information from both users and law en-forcement indicates that “ice” (crystal metham-phetamine) distribution has increased in Seattle and that in some areas of Seattle, “ice” has supplanted powder methamphetamine in terms of availability. The DEA reports that crystal methamphetamine is increasingly available and that prices are slowly declining. Regarding purity, the DEA reports: “The overall purity of exhibits collected in Washington for the first six months of FY 2004 has averaged 50 percent, up from the average purity of 45 percent seen during FY03 and surpassing the 30 percent seen during FY01 and FY02. Of the DEA offices in Washington, Seattle exhibits have currently yielded the highest purity at nearly 66 percent.” Methamphetamine incidents, a combination of ac-tive labs used for manufacturing and dump sites of lab equipment or inactive labs, decreased for Wash-ington State as a whole in 2004 (exhibit 13). The peak in incidents for the State and the two most populated counties was in 2001. In King County, the number of incidents remained flat in 2003 and 2004, while Pierce County to the south experienced in-creases, Snohomish County to the north had a slight increase, and Kitsap County to the west experienced a small decline. The rate of methamphetamine inci-dents per 100,000 population was 11 in King County, 77 in Pierce County, 17 in Snohomish County, 19 in Kitsap County, and 23 for Washing-ton State in 2004. It is important to note that these data do not indicate the manufacturing methods or the quantities manu-factured at the site of individual incidents. Reports
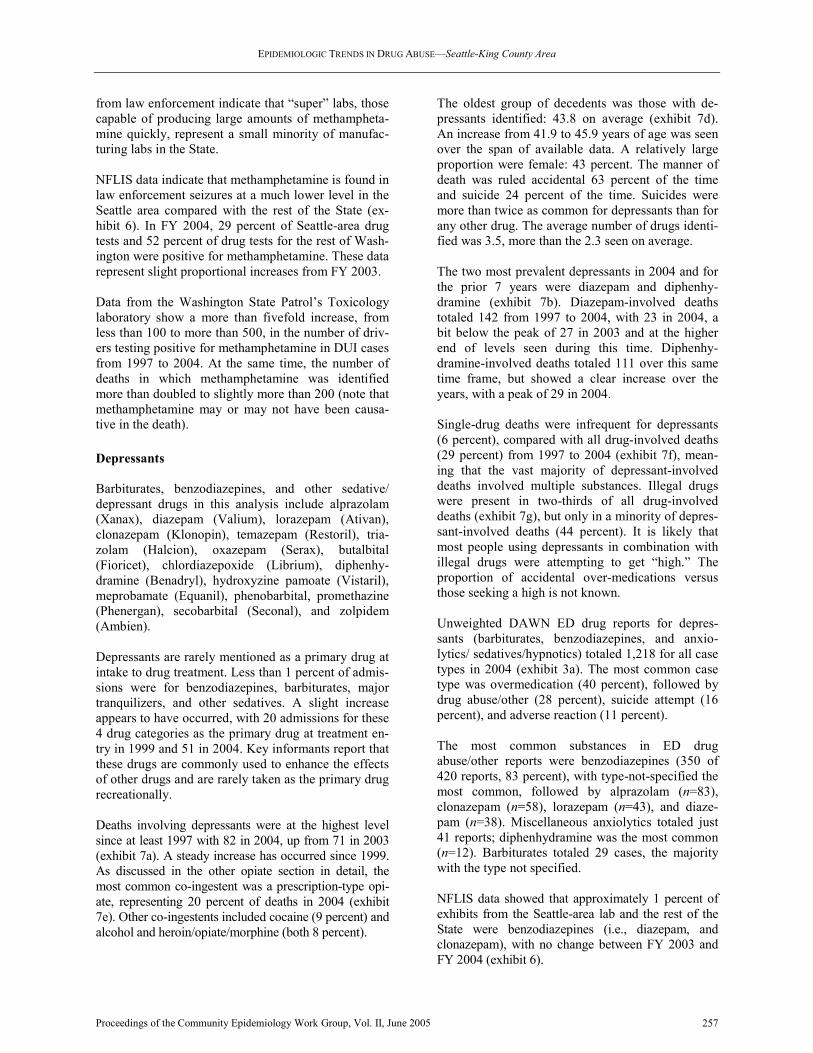
EPIDEMIOLOGIC TRENDS IN DRUG ABUSE—Seattle-King County Area
Proceedings of the Community Epidemiology Work Group, Vol. II, June 2005 257
from law enforcement indicate that “super” labs, those capable of producing large amounts of methampheta-mine quickly, represent a small minority of manufac-turing labs in the State. NFLIS data indicate that methamphetamine is found in law enforcement seizures at a much lower level in the Seattle area compared with the rest of the State (ex-hibit 6). In FY 2004, 29 percent of Seattle-area drug tests and 52 percent of drug tests for the rest of Wash-ington were positive for methamphetamine. These data represent slight proportional increases from FY 2003. Data from the Washington State Patrol’s Toxicology laboratory show a more than fivefold increase, from less than 100 to more than 500, in the number of driv-ers testing positive for methamphetamine in DUI cases from 1997 to 2004. At the same time, the number of deaths in which methamphetamine was identified more than doubled to slightly more than 200 (note that methamphetamine may or may not have been causa-tive in the death).
Depressants
Barbiturates, benzodiazepines, and other sedative/ depressant drugs in this analysis include alprazolam (Xanax), diazepam (Valium), lorazepam (Ativan), clonazepam (Klonopin), temazepam (Restoril), tria-zolam (Halcion), oxazepam (Serax), butalbital (Fioricet), chlordiazepoxide (Librium), diphenhy-dramine (Benadryl), hydroxyzine pamoate (Vistaril), meprobamate (Equanil), phenobarbital, promethazine (Phenergan), secobarbital (Seconal), and zolpidem (Ambien). Depressants are rarely mentioned as a primary drug at intake to drug treatment. Less than 1 percent of admis-sions were for benzodiazepines, barbiturates, major tranquilizers, and other sedatives. A slight increase appears to have occurred, with 20 admissions for these 4 drug categories as the primary drug at treatment en-try in 1999 and 51 in 2004. Key informants report that these drugs are commonly used to enhance the effects of other drugs and are rarely taken as the primary drug recreationally. Deaths involving depressants were at the highest level since at least 1997 with 82 in 2004, up from 71 in 2003 (exhibit 7a). A steady increase has occurred since 1999. As discussed in the other opiate section in detail, the most common co-ingestent was a prescription-type opi-ate, representing 20 percent of deaths in 2004 (exhibit 7e). Other co-ingestents included cocaine (9 percent) and alcohol and heroin/opiate/morphine (both 8 percent).
The oldest group of decedents was those with de-pressants identified: 43.8 on average (exhibit 7d). An increase from 41.9 to 45.9 years of age was seen over the span of available data. A relatively large proportion were female: 43 percent. The manner of death was ruled accidental 63 percent of the time and suicide 24 percent of the time. Suicides were more than twice as common for depressants than for any other drug. The average number of drugs identi-fied was 3.5, more than the 2.3 seen on average. The two most prevalent depressants in 2004 and for the prior 7 years were diazepam and diphenhy-dramine (exhibit 7b). Diazepam-involved deaths totaled 142 from 1997 to 2004, with 23 in 2004, a bit below the peak of 27 in 2003 and at the higher end of levels seen during this time. Diphenhy-dramine-involved deaths totaled 111 over this same time frame, but showed a clear increase over the years, with a peak of 29 in 2004. Single-drug deaths were infrequent for depressants (6 percent), compared with all drug-involved deaths (29 percent) from 1997 to 2004 (exhibit 7f), mean-ing that the vast majority of depressant-involved deaths involved multiple substances. Illegal drugs were present in two-thirds of all drug-involved deaths (exhibit 7g), but only in a minority of depres-sant-involved deaths (44 percent). It is likely that most people using depressants in combination with illegal drugs were attempting to get “high.” The proportion of accidental over-medications versus those seeking a high is not known. Unweighted DAWN ED drug reports for depres-sants (barbiturates, benzodiazepines, and anxio-lytics/ sedatives/hypnotics) totaled 1,218 for all case types in 2004 (exhibit 3a). The most common case type was overmedication (40 percent), followed by drug abuse/other (28 percent), suicide attempt (16 percent), and adverse reaction (11 percent). The most common substances in ED drug abuse/other reports were benzodiazepines (350 of 420 reports, 83 percent), with type-not-specified the most common, followed by alprazolam (n=83), clonazepam (n=58), lorazepam (n=43), and diaze-pam (n=38). Miscellaneous anxiolytics totaled just 41 reports; diphenhydramine was the most common (n=12). Barbiturates totaled 29 cases, the majority with the type not specified. NFLIS data showed that approximately 1 percent of exhibits from the Seattle-area lab and the rest of the State were benzodiazepines (i.e., diazepam, and clonazepam), with no change between FY 2003 and FY 2004 (exhibit 6).

EPIDEMIOLOGIC TRENDS IN DRUG ABUSE—Seattle-King County Area
Proceedings of the Community Epidemiology Work Group, Vol. II, June 2005 258
A benzodiazepine category was added to the Help Line data in 2003; there were 81 adult calls and 1 youth call in 2004 (exhibit 4).
Hallucinogens, Club Drugs, and
Dextromethorphan
Hallucinogens include lysergic acid diethylamide (LSD), mescaline, peyote, psilocybin (mushrooms), phencyclidine (PCP), and inhalants. “Club drugs” is a general term used for drugs that are popular at night-clubs and raves, including the hallucinogens, methyl-enedioxymethamphetamine (MDMA) (ecstasy), gamma hydroxybutyrate (GHB), gamma butyrolactone (GBL), ketamine, and nitrous oxide. Dextromethorphan, com-monly found in over-the-counter cough medicines, can have dissociative effects at high dosages. Research chemicals are another important class of drugs used locally, however few indicator data are currently able to monitor these substances. Limitations in tracking these substances include a lack of aware-ness of these substances by many providers, the con-tinually fluctuating substances utilized locally, and the multiple, often confusing, names of these substances (e.g., foxy methoxy, 2CB, 2CT7). A community-based survey conducted in the summer of 2003 found that 21 percent of subjects surveyed at rave venues in King County had ever used research chemicals. An important new development involving dextro-methorphan occurred in April 2005 in Whatcom County, Washington, north of Seattle. Two teenage boys, ages 17 and 19, died after consuming dextro-methorphan obtained in “wholesale quantities” from a chemical company on the Internet, based in Indiana. Three other deaths in the United States were also linked to this company; as of this writing, the FDA has shut down the Web page. These local boys mixed the dextromethorphan in an energy drink, and high levels of taurine and caffeine from the drink were detected along with marijuana. Treatment admissions in which hallucinogens are mentioned as primary drug are infrequent, with just 44 in 2004, up from 16 in 1999. Unweighted ED reports in DAWN Live! for all case types totaled 85 for PCP, 91 for ecstasy, 17 for GHB, 23 for LSD, and 53 for psilocybin. Help Line calls regarding PCP and LSD were infre-quent, representing less than 1 percent of both youth and adult calls in recent years (exhibit 4). Calls involv-ing MDMA have declined in terms of number and proportion since 2001 for both adults and youth,
though the large number of calls for unknown sub-stances limits trend analysis. In 2001, MDMA rep-resented 2.5 percent of adult calls; this proportion declined to 1.2 percent in 2004. A similar decline was seen for youth calls, from 8.7 percent in 2001 to 4.4 percent of calls in 2004. Calls mentioning the more general term “hallucinogens” have remained small, but consistent, for adults (about 1 percent of calls over time). For youth, hallucinogen-related calls appear to have declined from 4 percent to 2 percent of calls from 2001 to 2004. School survey data indicate that hallucinogens and MDMA are the second most common illicit sub-stances used in the past month following marijuana (exhibit 5). Hallucinogens, broadly defined, were reported by 2.5 percent of seniors and MDMA was reported by 2.8 percent in 2004. The combined category of dextromethorphan, MDMA, GHB, and PCP was identified in 37 deaths since 1997. This group was younger, 36.3, than for all drugs on average and had the largest proportion of females (43 percent). There were two MDMA-involved deaths in 2004. There have been between one and two MDMA-involved deaths since 1999, with none in 1997 or 1998. GHB/GBL-involved deaths totaled three in 2002; none have been reported since, and none were noted prior. There were 5 dextromethorphan-involved deaths in 2004, a decrease from the 10 in 2003 (which was by far the highest level since at least 1997). PCP deaths totaled two in 2004 and one in 2002. According to the NFLIS, MDMA was detected at slightly higher levels in the Seattle-area lab than the rest of the State (exhibit 6). The Seattle-area lab reported 1.4 and 1.0 percent of evidence tested posi-tive for MDMA in FY 2003 and FY 2004, while for the rest of the State the levels were 0.5 percent in each year. Psilocin, the active ingredient in psyche-delic mushrooms, was seen at similar levels for each region and in each year, between 0.5 and 0.7 per-cent. PCP was not among the top 25 drugs detected in Washington, not including Seattle, while in Seat-tle it represented a bit less than 1 percent of evi-dence in each year.
Pill presses, necessary for tableting ecstasy, are still occasionally seized locally according to Federal law enforcement sources. Past customs seizure data in-dicated that much of the MDMA entering Washing-ton was in powder form, suggesting that it was to be used in creating ecstasy tablets.

EPIDEMIOLOGIC TRENDS IN DRUG ABUSE—Seattle-King County Area
Proceedings of the Community Epidemiology Work Group, Vol. II, June 2005 259
Federal law enforcement reports that “…crime related to MDMA distribution has increased in areas such as Seattle because of the introduction of polydrug traf-fickers distributing MDMA.” Additionally, the U.S. Postal Inspection Service reported that Seattle had the third highest amount of MDMA dosages seized in 2003. Limited availability of LSD was reported by Federal law enforcement sources. However, in February 2004, DEA and the Seattle Police Department arrested an individual who had chemicals, glassware, and instruc-tions for making LSD. INFECTIOUS DISEASES RELATED TO DRUG ABUSE AND
INJECTION DRUG USE TRENDS Available data for people diagnosed with HIV infec-tion between 1996 and 2004 are presented in exhibit 14. In King County, injection drug users (IDUs) and men who have sex with men and also inject drugs (MSM/IDUs) both represent 7 percent of recent HIV cases. For Washington State as a whole, IDUs repre-sent 10 percent and MSM/IDUs represent 6 percent. Excepting male drug injectors who also have sex with men, the rate of HIV infection among the 15,000–18,000 IDUs who reside in King County has remained low and stable over the past 14 years. Various serosur-veys conducted in methadone treatment centers and correctional facilities and through street and commu-nity-targeted sampling strategies over this period indi-cate that 4 percent or less of IDUs who are not MSM in King County are infected with HIV. Data from a CDC-funded HIV Incidence Study (HIVIS 1996–2001) suggest that the rate of new infections among non-MSM/non-IDUs in King County is less than 0.1 percent per year. Syringes exchanged and numbers of encounters have remained high in King County, with more than 2 mil-lion syringes exchanged and more than 60,000 en-counters in 2004 (exhibit 15). Hepatitis B and C are endemic among Seattle-area injectors. Epidemiologic studies conducted among
more than 4,000 IDUs by Public Health’s HIV-AIDS Epidemiology Program between 1994 and 1998 reveal that 85 percent of King County IDUs may be infected with hepatitis C (HCV), and 70 percent show markers of prior infection with hepati-tis B (HBV). Local incidence studies indicate that 21 percent of non-infected IDUs acquire HCV each year, and 10 percent of IDUs who have not had hepatitis B acquire HBV.
Trends In Primary Injection Drug Use In Seattle-
Area Idus Age 18–30 Participating In 4 Studies,
1994–2003 (Authored by Richard Burt and Hanne Thiede, Public Health-Seattle & King County)
Four different studies of Seattle-area IDUs were conducted by Public Health – Seattle & King County from 1994 to 2003. They are the RAVEN (1994–1997), RAVEN II (1998), Kiwi (1998–2002), and DUIT (2002–2003) studies. The four study populations were each recruited by different strate-gies, and there are statistically significant differ-ences among the study populations in age, race, sex, and primary injection drug. The data show trends in primary injection drug by year of study enrollment among 18–30-year-old IDUs who had injected in the 6 months prior to enrollment (exhibit 16). Heroin was the most common primary injection drug in all study populations and in all years. There was a clear increase in the proportion of participants reporting amphetamine as their primary injection drug, from 7 percent in 1994 to 32 percent in 2003. The proportion reporting cocaine as their primary drug declined from 19 percent in 1994 to 5 percent in 2004. There does not appear to be a single consis-tent trend in heroin or speedball use.
For inquiries concerning this report, please contact Caleb Banta-Green, MPH, MSW, Alcohol and Drug Abuse Institute, Univer-sity of Washington, 1107 NE 45th St, Suite 120; Seattle, WA
98105, Phone: (206) 685-3919, Fax: (206) 543-5473, E-mail:
<calebbg@ u.washington.edu>, Web: http://adai.washington.edu or Ron Jackson, MSW, Evergreen Treatment Services, Phone
(206) 223-3644, E-mail: [email protected].
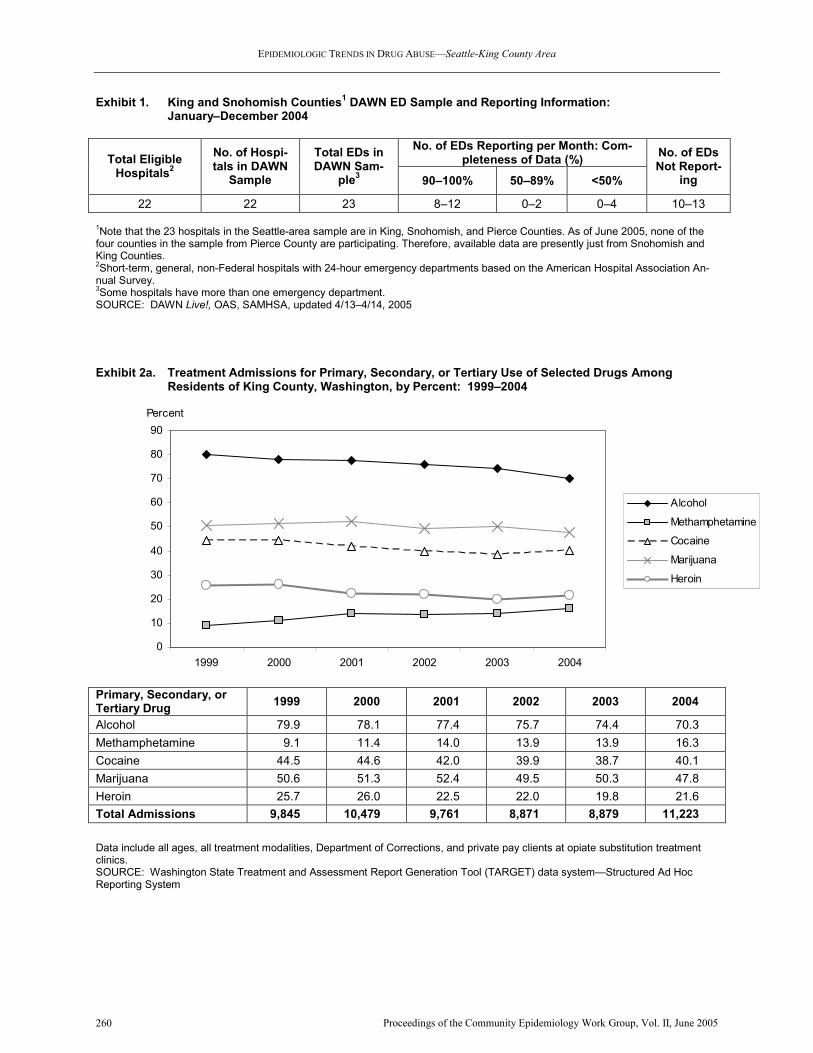
EPIDEMIOLOGIC TRENDS IN DRUG ABUSE—Seattle-King County Area
Proceedings of the Community Epidemiology Work Group, Vol. II, June 2005 260
0
10
20
30
40
50
60
70
80
90
1999 2000 2001 2002 2003 2004
Percent
Alcohol
Methamphetamine
Cocaine
Marijuana
Heroin
Exhibit 1. King and Snohomish Counties1 DAWN ED Sample and Reporting Information:
January–December 2004
No. of EDs Reporting per Month: Com-
pleteness of Data (%) Total Eligible Hospitals
2
No. of Hospi-tals in DAWN
Sample
Total EDs in DAWN Sam-
ple3 90–100% 50–89% <50%
No. of EDs Not Report-
ing
22 22 23 8–12 0–2 0–4 10–13
1Note that the 23 hospitals in the Seattle-area sample are in King, Snohomish, and Pierce Counties. As of June 2005, none of the four counties in the sample from Pierce County are participating. Therefore, available data are presently just from Snohomish and King Counties. 2Short-term, general, non-Federal hospitals with 24-hour emergency departments based on the American Hospital Association An-nual Survey. 3Some hospitals have more than one emergency department. SOURCE: DAWN Live!, OAS, SAMHSA, updated 4/13–4/14, 2005
Exhibit 2a. Treatment Admissions for Primary, Secondary, or Tertiary Use of Selected Drugs Among Residents of King County, Washington, by Percent: 1999–2004
Primary, Secondary, or Tertiary Drug
1999 2000 2001 2002 2003 2004
Alcohol 79.9 78.1 77.4 75.7 74.4 70.3
Methamphetamine 9.1 11.4 14.0 13.9 13.9 16.3
Cocaine 44.5 44.6 42.0 39.9 38.7 40.1
Marijuana 50.6 51.3 52.4 49.5 50.3 47.8
Heroin 25.7 26.0 22.5 22.0 19.8 21.6
Total Admissions 9,845 10,479 9,761 8,871 8,879 11,223
Data include all ages, all treatment modalities, Department of Corrections, and private pay clients at opiate substitution treatment clinics. SOURCE: Washington State Treatment and Assessment Report Generation Tool (TARGET) data system—Structured Ad Hoc Reporting System

EPIDEMIOLOGIC TRENDS IN DRUG ABUSE—Seattle-King County Area
Proceedings of the Community Epidemiology Work Group, Vol. II, June 2005 261
Exhibit 2b. Age at Treatment Entry by Primary Drug, for King County, Washington, Admissions: 1999 and 2004
Cocaine Alcohol Marijuana Heroin Methamphetamine Age at Treatment Entry 1999 2004 1999 2004 1999 2004 1999 2004 1999 2004
17 and younger 2.7 2.5 7.7 7.3 62.8 44.9 0.5 0.5 7.4 6.8
18–29 15.6 12.4 20.5 22.6 23.8 33.2 16.6 16.8 41.5 39.6
30–44 69.9 60.4 51.9 44.5 11.5 18.6 53.0 42.3 48.2 48.4
45–54 10.4 22.6 15.9 20.6 1.8 2.8 27.2 34.0 2.8 5.0
55–64 1.1 2.1 3.6 4.6 0.1 0.5 2.5 5.8 0.0 0.3
65 and older 0.2 0.1 0.5 0.4 0.0 0.1 0.3 0.7 0.0 0.0
SOURCE: Washington State Treatment and Assessment Report Generation Tool (TARGET) data system—Structured Ad Hoc Reporting System
Exhibit 2c. Racial Categories of Treatment Admissions
1 in King County, Washington, by Primary Drug and
Percent: 2004
Racial Category Alcohol (n=3,912)
Cocaine (n=1,592)
Heroin (n=2,000)
Metham-phetamine (n=1,109)
Marijuana (n=2,064)
Other (n=572)
Percent of Total
Admissions by Race
White 53 37 67 83 46 73 56
African-American 18 47 17 2 31 9 22
Asian/Pacific Islander 5 2 2 2 4 4 3
Native American 7 2 4 2 3 3 4
Hispanic 10 6 7 5 8 5 8
Multiple Race 3 3 2 3 6 4 3
Other 5 3 2 3 2 3 3
1N=11,249 SOURCE: Washington State Treatment and Assessment Report Generation Tool (TARGET) data system—Structured Ad Hoc Reporting System

EPIDEMIOLOGIC TRENDS IN DRUG ABUSE—Seattle-King County Area
Proceedings of the Community Epidemiology Work Group, Vol. II, June 2005 262
Exhibit 3a. Drug Reports1 in Drug-Related ED Visits in King and Snohomish Counties, by Drug Category
(Unweighted2) and Percent: 2004
Major Sub-
stances of Abuse
3
Cocaine Heroin Meth Marijuana Rx Opiates Anx/Sed/
Hyp
Number of Drug Reports 10,002 2,725 2,171 857 1,160 1,956 1,218
Type of Case
Suicide attempt 3.7 1.2 0.5 1.2 2.1 4.6 15.9
Seeking detox 8.3 9.9 9.5 9.5 5.8 8.4 4.4
Adverse reaction 0.8 0.1 0.2 0.0 0.2 21.0 11.2
Overmedication 2.5 0.0 0.0 0.0 0.0 24.7 39.8
Malicious poisoning 0.1 0.1 0.0 0.0 0.2 0.2 0.1
Accidental ingestion 0.1 0.0 0.0 0.0 0.0 0.3 0.7
"Drug Abuse"/Other 80.5 88.7 89.7 89.4 91.8 40.8 27.9
Gender
Male 63.6 64.4 60.1 69.8 68.9 47.4 40.8
Race/Ethnicity
White 23.8 18.2 32.2 27.7 24.0 23.6 27.4
Black 8.6 14.9 6.1 3.7 8.8 4.4 2.2
Hispanic 1.0 1.3 0.9 0.8 1.0 0.8 0.4
Race/ethnicity NTA 1.6 1.4 1.2 2.8 1.8 1.5 1.1
Not documented 65.1 64.3 59.6 65.0 64.4 69.6 68.9
Age Group
12–17 4.8 1.1 0.3 1.9 10.7 2.4 4.2
18–20 8.9 3.2 2.9 12.8 15.2 4.6 3.4
21–24 9.1 6.6 6.8 17.2 13.2 7.1 8.7
25–29 12.3 10.6 12.6 18.7 13.7 9.5 12.9
30–34 13.5 14.5 16.1 13.4 14.3 10.2 11.9
35–44 30.0 37.8 33.3 25.7 20.6 26.3 28.6
45–54 17.7 22.5 24.3 8.5 9.9 23.8 20.2
55–64 2.9 3.3 3.2 1.4 1.7 8.0 6.2
65 and older 0.5 0.3 0.5 0.1 0.5 7.9 3.0
Chief Complaint
Overdose 8.5 5.1 9.8 4.1 5.3 17.7 32.7
Intoxication 7.9 4.7 1.6 4.4 6.6 2.5 5.0
Seizures 1.2 1.9 0.6 0.7 0.9 0.6 1.1
Altered mental status 15.7 15.7 9.1 22.8 20.3 15.0 14.8
Psychiatric condition 18.6 23.6 7.2 23.9 27.0 10.6 18.1
Withdrawal 2.7 2.3 4.7 1.8 2.0 11.6 4.6
Seeking detox 5.4 6.4 6.3 6.1 3.9 5.2 2.6
Accident/injury/assault 3.9 3.6 2.1 3.2 5.3 1.8 1.3
Abscess/cellulitis/skin/tissue 11.6 7.1 39.1 8.4 1.8 3.9 1.5
Chest pain 3.8 6.3 1.6 4.8 3.6 1.8 1.4
Respiratory problems 3.4 4.3 3.2 2.3 3.1 3.1 2.0
Digestive problems 4.1 4.3 4.2 1.8 4.1 10.6 3.5
Other 13.2 14.8 10.6 15.6 16.2 15.8 11.3
Number of Complaints 14,646 3,940 2,891 1,259 1,688 2,909 1,959
(Continued)
1Drug-related ED visits often involve multiple drugs (e.g., both cocaine and heroin may be reported for the same visit). Therefore, the number of drug reports will exceed the number of ED visits. 2Unweighted data are from 10–13 Seattle EDs reporting to DAWN. All DAWN cases are reviewed for quality control. Based on this review, cases may be deleted and corrected and, therefore, are subject to change. Data are duplicated; a person may have used multiple drugs. This can lead to odd data, such as suicide attempts that appear to involve marijuana. These data are not estimates or rates. 3Major Substances include all of the illegal drugs, as well as amphetamine and GHB. SOURCE: DAWN Live!, OAS, SAMHSA, updated 5/23/05

EPIDEMIOLOGIC TRENDS IN DRUG ABUSE—Seattle-King County Area
Proceedings of the Community Epidemiology Work Group, Vol. II, June 2005 263
Exhibit 3a. Drug Reports1 in Drug-Related ED Visits in King and Snohomish Counties, by Drug Category
(Unweighted2) and Percent: 2004 (Continued)
Major Sub-
stances of
Abuse3
Cocaine Heroin Meth Marijuana Rx Opiates Anx/Sed/
Hyp
Patient Disposition
Discharged home 54.1 49.6 55.5 52.5 58.5 60.7 48.9
Released to police/jail 2.3 2.6 2.3 3.6 2.2 1.5 1.1
Referred to detox/treatment 10.2 12.4 6.8 14.6 11.2 7.7 6.2
Admitted to ICU/Critical care 4.1 4.0 1.6 3.6 4.3 5.5 12.6
Admitted to surgery 2.1 1.1 6.3 1.3 0.3 0.5 0.2
Admitted to chem. dependency/detox 2.4 2.8 2.8 1.6 1.6 1.9 1.6
Admitted to psychiatric unit 4.3 5.7 1.8 4.7 5.3 3.3 7.6
Admitted to other inpatient unit 9.9 10.6 13.8 7.4 6.1 10.6 11.8
Transferred 3.4 3.8 1.7 2.8 4.3 4.0 4.5
Left against medical advice 1.8 1.4 3.0 2.9 0.9 1.3 1.6
Died 0.0 0.1 0.0 0.0 0.0 0.0 0.0
Other 2.3 2.6 1.2 2.9 2.8 1.2 1.4
Not documented 3.1 3.4 3.2 2.1 2.4 1.8 2.4
Route of Administration
Oral 19.8 1.8 0.8 2.0 1.7 44.1 49.8
Injected 18.1 9.7 61.1 17.9 0.3 3.4 1.0
Inhaled, sniffed, snorted 1.2 2.5 0.6 2.0 0.4 0.4 0.0
Smoked 7.9 12.7 0.6 7.0 29.4 0.1 0.0
Other 0.2 0.3 0.2 0.6 0.3 1.6 0.3
Not documented 52.8 73.0 36.8 70.6 67.9 50.4 48.9
1Drug-related ED visits often involve multiple drugs (e.g., both cocaine and heroin may be reported for the same visit). Therefore, the number of drug reports will exceed the number of ED visits. 2Unweighted data are from 10–13 Seattle EDs reporting to DAWN. All DAWN cases are reviewed for quality control. Based on this review, cases may be deleted and corrected and, therefore, are subject to change. Data are duplicated; a person may have used multiple drugs. This can lead to odd data, such as suicide attempts that appear to involve marijuana. These data are not estimates or rates. 3Major Substances include all of the illegal drugs, as well as amphetamine and GHB. SOURCE: DAWN Live!, OAS, SAMHSA, updated 5/23/05

EPIDEMIOLOGIC TRENDS IN DRUG ABUSE—Seattle-King County Area
Proceedings of the Community Epidemiology Work Group, Vol. II, June 2005 264
Exhibit 3b. Number of Drug Reports1 in Drug-Related ED Visits in King and Snohomish Counties, by Drug
Category (Unweighted2): 2004
1Drug-related ED visits often involve multiple drugs (e.g., both cocaine and heroin may be reported for the same visit). Therefore, the number of drug reports will exceed the number of ED visits. 2Unweighted data are from 10–13 Seattle EDs reporting to DAWN. All DAWN cases are reviewed for quality control. Based on this review, cases may be deleted and corrected and, therefore, are subject to change. Data are duplicated; a person may have used multiple drugs. This can lead to odd data, such as suicide attempts that appear to involve marijuana. These data are not estimates or rates. SOURCE: DAWN Live!, OAS, SAMHSA, updated 4/13–4/14, 2005
18
91
85
855
213
1,068
1,159
2,171
2,725
403
2,172
2,575
Inhalants
Ecstasy
PCP
Stimulants
Marijuana
Heroin
Cocaine
Alcohol
Amphetamines
Alcohol-in-combination
Alcohol only (age<21)
Methamphetamine
18
91
85
855
213
1,068
1,159
2,171
2,725
403
2,172
2,575
Inhalants
Ecstasy
PCP
Stimulants
Marijuana
Heroin
Cocaine
Alcohol
Amphetamines
Alcohol-in-combination
Alcohol only (age<21)
Methamphetamine

EPIDEMIOLOGIC TRENDS IN DRUG ABUSE—Seattle-King County Area
Proceedings of the Community Epidemiology Work Group, Vol. II, June 2005 265
Exhibit 3c. Characteristics of Drug Abuse/Other Case Type Drug Reports1 for Prescription-Type Opiates and
Depressants (Unweighted2) in King and Snohomish Counties, by Percent: 2004
Rx Opiate Anx/Sed/Hyp Characteristic # of Drug Reports
n=799 n=340
Gender Male 53 55
Age 12–17 years 1 2
18–20 years 4 3
21–24 years 7 8
25–29 years 10 12
30–34 years 13 14
35–44 years 31 31
45–54 years 27 22
55–64 years 8 6
65 years and older 1 1
Chief Complaint Overdose 8 15
Intoxication 3 6
Seizures 1 3
Altered mental status 15 15
Psychiatric condition 14 21
Withdrawal 23 13
Seeking detox 0 0
Accident/injury/assault 2 2
Abscess/cellulitis/skin/tissue 4 1
Chest pain 2 3
Respiratory problems 3 1
Digestive problems 9 4
Other 16 15
Total Complaints (N) 1,205 539
Patient Disposition Discharged home 62 53
Released to police/jail 3 3
Referred to detox/treatment 10 13
Admitted to ICU/Critical care 3 4
Admitted to surgery 1 1
Admitted to chemical dependency/detox 2 1
Admitted to psychiatric unit 4 4
Admitted to other inpatient unit 10 9
Transferred 2 4
Left against medical advice 2 3
Died 0 0
Other 1 1
Not documented 2 4
Route Of Administration Oral 33 32
Injected 5 1
Inhaled, sniffed, snorted 0 0
Smoked 0 0
Other 1 0
Not documented 61 67
1Drug-related ED visits often involve multiple drugs (e.g., both cocaine and heroin may be reported for the same case). Therefore, the number of drug reports will exceed the number of ED visits. 2Unweighted data are from 10–13 Seattle-area EDs reporting to DAWN. All DAWN cases are reviewed for quality control. Based on this review, cases may be corrected or deleted and, therefore, are subject to change. These are not estimates or rates. SOURCE: DAWN Live!, OAS, SAMHSA, updated 5/23/05

EPIDEMIOLOGIC TRENDS IN DRUG ABUSE—Seattle-King County Area
Proceedings of the Community Epidemiology Work Group, Vol. II, June 2005 266
Helpline Calls, Adults
King County, WA
0% 20% 40% 60%
Marijuana
Heroin
Cocaine
Ecstasy
Methamphetamine
% of Illicit, Rx and OTC Calls
Helpline Calls, Youth
King County, WA
0% 20% 40% 60%
Marijuana
Heroin
Cocaine
Ecstasy
Methamphetamine
% of Illicit, Rx and OTC Calls
2001
2002
2003
2004
Exhibit 4. Illicit Drug Help Line Calls for King County Residents, by Drug and Percent: 2001–2004
Percent of Adult Calls, by Drug Percent of Youth Calls, by Drug Drug
2001 2002 2003 2004 2001 2002 2003 2004
RX 9.5 11.0 5.4 4.4 4.1 3.1 3.0 2.4
Methadone 2.0 2.0 3.2 3.9 0.5 0.0 0.4 0.0
Other 1.2 1.3 2.2 1.6 0.9 2.0 2.5 1.6
LSD 0.5 0.1 0.1 0.1 0.0 0.0 0.0 0.5
Marijuana 21.0 20.3 18.2 20.5 42.3 49.6 52.9 50.6
Inhalant 0.2 0.3 0.1 0.1 1.0 1.0 0.7 0.2
Unknown 9.1 11.2 2.5 2.1 11.3 11.0 3.7 3.8
Heroin 11.2 12.3 16.0 14.8 1.9 1.7 2.5 3.8
Cocaine 23.5 23.6 32.6 31.6 7.8 9.7 9.8 11.7
Ecstasy 2.5 1.4 1.0 1.2 8.7 4.9 3.3 4.4
Hallucinogens 0.6 0.6 0.6 0.8 3.8 1.0 2.5 1.6
PCP 0.1 0.1 0.1 0.3 0.0 0.0 0.4 0.5
Methamphetamine 18.2 15.6 17.9 18.4 17.0 15.5 17.3 17.7
OTC 0.4 0.2 0.3 0.2 0.6 0.6 1.2 0.9
Total 100.0 100.0 100.0 100.0 100.0 100.0 100.0 100.0
Total Number of Calls 4,639 4,760 3,508 3,978 1,162 711 571 547
Newer Drug Categories
OxyContin 20 198 16 9
Rx Pain Pills 366 397 16 6
Amphetamine 31 18 2 0
Benzodiazepine 59 81 1 1
SOURCE: Washington State 24-Hour Alcohol and Drug Helpline

EPIDEMIOLOGIC TRENDS IN DRUG ABUSE—Seattle-King County Area
Proceedings of the Community Epidemiology Work Group, Vol. II, June 2005 267
Exhibit 5. Drug Use in Prior 30 Days by 12th Graders in the Seattle Public Schools Communities That Care Survey: 2002 and 2004
Prevalence Response Rate
2002 2004 Substance 2002 2004
% N % N
Alcohol 47.9 51.1 51.3 1,287 61.0 1,475
Cigarettes 22.8 16.1 52.0 1,305 61.3 1,481
Chewing Tobacco 3.9 3.2 51.8 1,301 61.3 1,481
Inhalants 2.1 1.4 50.0 1,256 60.0 1,451
Marijuana 27.0 25.4 50.7 1,273 60.6 1,464
Hallucinogens 3.6 2.5 50.4 1,265 60.5 1,462
Cocaine 1.7 2.5 50.4 1,266 60.3 1,457
MDMA (Ecstasy) 3.4 2.8 50.3 1,263 60.4 1,461
Stimulants (Amphetamines, Methamphetamine)
1.1 2.0 49.8 1,250 59.8 1,445
SOURCE: Communities That Care Survey, http://www.seattleschools.org/area/ctc/survey/survey.xml

EPIDEMIOLOGIC TRENDS IN DRUG ABUSE—Seattle-King County Area
Proceedings of the Community Epidemiology Work Group, Vol. II, June 2005 268
Exhibit 6. National Forensic Laboratory Information System Drug Test Results for Local Law Enforcement Seizures in Seattle and the State of Washington: FYs 2003 and 2004 Seattle-Area Lab WA State Without Seattle-Area Lab
Substance FY 2003 FY 2004 Substance FY 2003 FY 2004
Acetaminophen 0.3 0.2 Acetaminophen 0.2 0.1 Alprazolam** 0.3 0.1 Alprazolam** 0.2 0.2 Amphetamine 0.3 0.2 Amphetamine 0.3 0.4 Caffeine 0.3 0.2 Caffeine 0.2 0.2 Cannabinol Cannabinol 0.2 Cannabis 17.2 15.3 Cannabis 15.5 15.6 Carisoprodol 0.3 Carisoprodol 0.2 0.1 Cathinone 0.3 Cathinone Clonazepam** 0.5 0.3 Clonazepam** 0.3 0.3 Cocaine 40.5 40.4 Cocaine 20.6 18.2 Codeine* 0.2 Codeine* 0.2 0.1 Diazepam** 0.4 0.3 Diazepam** 0.4 0.3 Heroin 5.0 4.7 Heroin 6.5 4.8 Hydrocodone* 0.7 0.9 Hydrocodone* 1.1 1.3 Hydromorphone* 0.1 Hydromorphone* Ibuprofen Ibuprofen 0.1 Ketamine 0.1 Ketamine Lorazepam** 0.1 Lorazepam** MDA 0.3 0.3 MDA 0.1 MDMA 1.4 1.0 MDMA 0.5 0.5 Methadone* 0.4 0.7 Methadone* 0.4 0.6 Methamphetamine 27.2 29.4 Methamphetamine 47.8 51.7 Methandrostenolone (Methandienone) 0.1
Methandrostenolone (Methandienone)
Methylphenidate 0.3 Methylphenidate 0.1 0.1 Morphine* 0.2 0.3 Morphine* 0.3 0.4 Non-Controlled Non-Narcotic Drug 0.3 0.3 Non-Controlled Non-Narcotic Drug 0.5 0.7 Oxycodone* 0.9 1.4 Oxycodone* 1.2 1.1 PCP 0.9 0.6 PCP Propoxyphene* 0.1 Propoxyphene* 0.1 Pseudoephedrine 0.7 0.4 Pseudoephedrine 0.8 0.7 Psilocin 0.7 0.6 Psilocin 0.5 0.7 Psilocybine 0.3 Psilocybine 0.3 0.2 Sodium Bicarbonate Sodium Bicarbonate 0.2 0.2
Total of Top 25 (#) 99.25 (3,188)
98.83 (3,454)
Total of Top 25 (#) 98.62 (12,162)
98.63 (11,926)
Subtotals: *Other opiates 2.43 3.55 Subtotals: *Other opiates 3.25 3.51 **Benzodiazepines 1.18 0.93 **Benzodiazepines 0.85 0.81
Illicit drugs are italicized. Data for cannabinol/cannabis and psilocin/psilocybine may be duplicated. SOURCE: National Forensic Laboratory Information Systems
Seattle-Area Lab
Pseudoephedrine
PCP
Oxy codone
Methadone
Methamphetamine
MDMA
Hydrocodone
Heroin
Diazepam
Cocaine
Clonazepam
Cannabis
FY 2003
FY 2004
Washington State (Without Seattle-Area) Lab
Pseudoephedrine
PCP
Oxy codone
Methadone
Methamphetamine
MDMA
Hy drocodone
Heroin
Diazepam
Cocaine
Clonazepam
Cannabis
FY 2003
FY 2004
Law Enforcement Seizure Drug Test Results

EPIDEMIOLOGIC TRENDS IN DRUG ABUSE—Seattle-King County Area
Proceedings of the Community Epidemiology Work Group, Vol. II, June 2005 269
Exhibit 7a. Drug-Involved Deaths1 in King County, Washington, Related to Illicit and Prescription Drugs:
1997–2004
Drug 1997 1998 1999 2000 2001 2002 2003 2004 Total of Each Drug
Cocaine 66 69 76 89 49 79 52 92 572
Heroin/Opiates/Morphine 111 144 117 102 61 87 62 75 759
Rx Opiate 28 44 32 50 53 66 84 118 475
Depressant 45 51 28 33 40 54 71 82 404
Methamphetamine 3 3 13 10 5 13 18 18 83
Rx Stimulant 3 0 1 2 0 1 1 4 12
DXM/MDMA/PCP 2 0 1 2 3 9 11 9 37
Alcohol 82 103 67 76 50 61 58 71 568
Total # of Deaths 178 220 196 213 146 195 186 253 1,587
1Data are duplicated, most deaths involve multiple drugs. SOURCE: Medical Examiners Office, Public Health Seattle & King County.
0
20
40
60
80
100
120
140
160
1997 1998 1999 2000 2001 2002 2003 2004
Number of Times Drug
Identif ied
Cocaine
Heroin/Op/Morphine
Rx Opiate
Depressant
Methamphetamine
Rx Stimulant
DXM/MDMA/PCP
Alcohol

EPIDEMIOLOGIC TRENDS IN DRUG ABUSE—Seattle-King County Area
Proceedings of the Community Epidemiology Work Group, Vol. II, June 2005 270
Exhibit 7b. Numbers of Depressant and Prescription-Type Opiate-Involved Deaths in King County, Washington: 1997–2004
Rx Opiates 1997 1998 1999 2000 2001 2002 2003 2004 Total # of Rx
Opiates
Oxycodone 2 5 4 12 18 20 14 32 107
Methadone 14 20 19 25 24 37 47 67 253
Hydrocodone 0 3 1 1 4 4 12 14 39
Other Rx Opiates 18 21 12 17 13 18 20 33 152
Total # of Rx Opiates
34 49 36 55 59 79 93 146 551
Total # Deaths Involving Rx Opiates
28 44 32 50 53 66 84 118 475
Depressants 1997 1998 1999 2000 2001 2002 2003 2004 Total # of
Depressants
Diazepam 17 22 10 9 11 23 27 23 142
Diphenhydramine 11 10 7 6 7 16 25 29 111
Promethazine 3 3 3 5 5 9 11 39
Meprobamate 2 5 1 4 6 2 5 7 32
Alprazolam 1 5 1 3 3 4 5 9 31
Cyclobenzaprine 3 1 1 3 8 6 22
Chlordiazepoxide 4 1 2 2 3 4 4 20
Phenobarbital 4 5 3 1 4 3 20
Zolpidem 1 1 1 3 3 3 4 16
Other Depressants 19 10 9 10 12 13 13 17 103
Total # of Depressants
55 67 36 39 51 72 103 113 536
Total # of Deaths Involving Depressants
45 51 28 33 40 54 71 82 404
SOURCE: Medical Examiners Office, Public Health Seattle & King County
Exhibit 7c. Combination Depressant and Prescription-Type Opiate-Involved Deaths in King County, Washington: 1997–2004 SOURCE: Medical Examiners Office, Public Health Seattle & King County
0
20
40
60
80
100
120
140
Combo Rx Opiate/Depressant 10 17 9 16 23 26 41 51
Rx Opiate 28 44 32 50 53 66 84 118
Depressant 45 51 28 33 40 54 71 82
1997 1998 1999 2000 2001 2002 2003 2004

EPIDEMIOLOGIC TRENDS IN DRUG ABUSE—Seattle-King County Area
Proceedings of the Community Epidemiology Work Group, Vol. II, June 2005 271
Exhibit 7d. Demographics of Drug-Involved Deaths in King County, Washington: 1997–2004
Demographic All
Drugs Cocaine
Depres- sant
Rx Stim.
Metham.
DXM/ MDMA/ GHB/ PCP
Heroin/ Opiates/ Morphine
Rx Opiate
Oxyco- done1
Metha- done1
Number of Times Identified 1,584 572 404 12 83 37 759 475 107 253
Percent Male 71 78 57 75 80 57 81 58 60 61
Average Age 41.6 41.2 43.8 33.8 37.9 36.3 40.6 43 44.7 41.4
Race/Ethnicity
White 83 73 88 92 88 81 84 88 89 85
African-American 11 21 7 0 5 17 10 8 7 12
Asian/Pacific Islander 1 1 1 0 2 0 0 1 1 1
Native American 3 2 2 0 2 0 3 2 3 2
Hispanic 1 1 1 0 0 3 2 0 0 0
Other/Multiple 1 2 1 8 2 0 2 1 1 0
Manner of Death
Accident 81 94 63 92 94 68 92 79 70 90
Suicide 11 1 24 0 1 11 2 11 22 1
Homicide 0 0 0 0 0 0 0 0 0 0
Undetermined 9 5 14 8 5 22 6 11 8 9
Avg. Number of Drugs2 2.3 2.6 3.5 4.2 2.4 3.4 2.4 3.1 3.2 3.0
1Oxycodone and Methadone are also included in the Rx Opiate category 2Includes Alcohol, Cocaine, Heroin/Op/Mor, Rx Opiates, Depressants, Rx Stimulants, Meth., Hallucinogens. Excludes drugs such as NSAIDS and anti-depressants. SOURCE: Medical Examiner, Public Health & Seattle-King County.

EPIDEMIOLOGIC TRENDS IN DRUG ABUSE—Seattle-King County Area
Proceedings of the Community Epidemiology Work Group, Vol. II, June 2005 272
Exhibit 7e. Proportions of King County Deaths1 Involving at Least 2 Drugs: 2004
1These data are duplicated. A person could have multiple 2-way drug combinations if, for example, they had used heroin, cocaine, a prescription-type opiate, and a depressant. SOURCE: Medical Examiner’s Office, Public Health-Seattle & King County
Exhibit 7f. King County Prescription-Type Opiate- and Depressant-Involved Deaths and Proportion of Single-Drug Deaths: 1997–2004
Depressants Prescription-type
Opiates All Drugs
N % N % N %
No other drugs1 26 6% 60 13% 622 29%
All deaths involving substance 404 25% 475 30%
Total # of drug involved deaths 1,587 1,587 1,587 1Other drug=Illegal; prescription: muscle relaxants, opiates, depressants, and diphenhydramine. SOURCE: Medical Examiner- Public Health- Seattle & King County
Exhibit 7g. Illegal Drug Presence in Prescription-Type Opiate- and Depressant-Involved Deaths in King County: 1997–2004
Depressants Prescription-type
Opiates All Drugs
N % N % N %
Illegal drugs present1 177 44% 164 35% 1056 67%
All deaths involving substance 404 25% 475 30%
Total # of drug involved deaths 1,587 1,587 1,587 1Illegal=Heroin, cocaine, and/or methamphetamine SOURCE: Medical Examiner- Public Health- Seattle & King County
20%
14%
11%
10%
9%
8%
8%
8%
8%
6%
3%
1%
Depressant & Rx Opiate
Cocaine & Heroin/Opiate
Alcohol & Rx Opiate
Cocaine & Rx Opiate
Cocaine & Depressant
Heroin/Opiate & Alcohol
Alcohol & Depressant
Alcohol & Cocaine
Heroin/Opiate & Depressant
Heroin/Opiate & Rx Opiate
Rx Opiate & Methamphetamine
Heroin/Opiate & Methamphetamine

EPIDEMIOLOGIC TRENDS IN DRUG ABUSE—Seattle-King County Area
Proceedings of the Community Epidemiology Work Group, Vol. II, June 2005 273
17.3
13.7
38.4
45.8
44.9
37.0
11.8
8.58.3
18.9
6.3
12.9
7.4
16.8
0
5
10
15
20
25
30
35
40
45
50
1999 2000 2001 2002 2003 2004 2005
Fiscal year
% Purity
Exhibit 8. Opiate Substitution Treatment1 for King County Residents: 1999–2004
1999 2000 2001 2002 2003 2004 Total
Admits 1,333 1,560 1,238 1,175 1,085 1,660 8,051
Discharges 632 924 890 794 633 743 4,616
Primary Drug at Admission (%)
Heroin 94.6 93.3 92.8 90.4 87.7 86.6 90.9
Prescription-type Opiates 3.0 6.1 6.5 8.8 11.3 11.6 7.9
1Note-Treatment Capacity Increased by 350 in 2000 and by approximately 200 in 2004. SOURCE: Washington State Treatment and Assessment Report Generation Tool (TARGET) data system—Structured Ad Hoc Reporting System Run Date: 05/23/2005
Exhibit 9. Methadone Waiting List Managed by Syringe Exchange Program, King County: 1997–June 2005
1
1997 1998 1999 2000 2001 2002 2003 2004 June 2005
Number on Wait List 198 307 548 624 495 663 638 487 156
1Note- Figures are for the close of each year. SOURCE: Public Health- Seattle & King County, HIV/AIDS Program
Exhibit 10. Heroin Purity and Street-Level Purchases in the City of Seattle: 1997–June 2005
Data differ from national reports due to exclusion of Tacoma data. Each black dot=1 purchase. Purchases totaled 124 for 5 years. SOURCE: Seattle Drug Enforcement Administration (2005), Domestic Monitor Program (used with permission)
Average
Median

EPIDEMIOLOGIC TRENDS IN DRUG ABUSE—Seattle-King County Area
Proceedings of the Community Epidemiology Work Group, Vol. II, June 2005 274
66%
1,108%
134%
0%
200%
400%
600%
800%
1000%
1200%
DL Amphetamine D Amphetamine Methylphenidate
Exhibit 11. Percent Change in Amount of Prescription Opiates Sold to Hospitals and Pharmacies in the King County Area
1: 1997–2003
TOTAL
68%
Fentanyl
174%
Morphine
88%
Methadone
359%
Meperidine
-30%
Hydrocodone
93%Hydromorphone
80%
Oxycodone
312%
Codeine
-27%-100%
0%
100%
200%
300%
400%
500%
600%
1 Data for ZIP Codes 980xx and 981xx, which approximate King County boundaries. SOURCE: Automation of Reports and Consolidated Orders System and DEA, http://www.deadiversion.usdoj.gov/arcos/retail_drug_summary/index.html
Exhibit 12. Percent Change in Amount of Prescription Stimulants Sold to Hospitals and Pharmacies in the King County Area
1: 1997–2003
1 Data for ZIP Codes 980xx and 981xx, which approximate King County boundaries. SOURCE: Automation of Reports and Consolidated Orders System and DEA, http://www.deadiversion.usdoj.gov/arcos/retail_drug_summary/index.html
e.g. Adderall e.g. Dexedrine e.g. Ritalin

EPIDEMIOLOGIC TRENDS IN DRUG ABUSE—Seattle-King County Area
Proceedings of the Community Epidemiology Work Group, Vol. II, June 2005 275
Exhibit 13. Number of Methamphetamine Labs and Dump Sites Reported in King and Neighboring Counties: 1990–2004
0
200
400
600
800
1000
1200
1400
1600
1800
2000
#
King 6 10 2 7 7 10 23 17 48 107 231 271 241 202 199
Kitsap 1 1 2 1 3 1 21 45 54 60 50 44
Pierce 10 18 18 12 17 17 53 42 129 318 545 589 438 466 541
Snohomish 2 2 2 7 6 5 13 37 69 83 98 101
WA State TOTAL 38 43 40 42 36 54 153 203 349 789 1454 1890 1693 1480 1337
1990 1991 1992 1993 1994 1995 1996 1997 1998 1999 2000 2001 2002 2003 2004
SOURCE: Washington State Department of Ecology

EPIDEMIOLOGIC TRENDS IN DRUG ABUSE—Seattle-King County Area
Proceedings of the Community Epidemiology Work Group, Vol. II, June 2005 276
Exhibit 14. New HIV Infections in King County and Washington State, by Year of Diagnosis and Demographic Characteristics: 1996–2004
King County WA State
2002–20041 Trend
2 2002–2004
1 Trend
2
No (%) 1996–2004 No (%) 1996–2004
TOTAL 1,006 (100) 1,576 (100)
HIV Exposure Category
MSM 651 (65) 901 (57)
IDU 67 (7) 153 (10)
MSM-IDU 71 (7) 102 (6)
Heterosexual contact 109 (11) up 218 (14) up
Blood product exposure 3 (0) 6 (0)
Perinatal exposure 0 (0) 2 (0)
Undetermined3 105 (10) 194 (12)
Sex & Race/Ethnicity
Male 889 (88) 1,319 (84)
White Male4 571 (57) down 877 (56) down
Black Male4 155 (15) up 207 (13) up
Hispanic Male 103 (10) 149 (9)
Other Male4 60 (6) 86 (5)
Female 117 (12) 257 (16)
White Female4 33 (3) 103 (7)
Black Female4 62 (6) up 95 (6)
Hispanic Female 8 (1) 25 (2)
Other Female4 14 (1) 34 (2)
Race/Ethnicity
White4 604 (60) down 980 (62) down
Black4 217 (22) up 302 (19) up
Hispanic 111 (11) 174 (11)
Asian & Pacific Islander4 33 (3) 56 (4)
American Indian/ Alaska Native4 21 (2) 40 (3)
Multi Race4 16 (2) up 16 (1) up
Unknown 4 (0) 8 (1)
Age at Diagnosis of HIV
0–19 10 (1) 19 (1) down
20–24 72 (7) 129 (8) up
25–29 141 (14) down 218 (14) down
30–34 191 (19) down 277 (18) down
35–39 244 (24) 343 (22)
40–44 173 (17) up 266 (17) up
45–49 90 (9) 159 (10)
50–54 47 (5) 84 (5)
55–59 24 (2) up 47 (3) up
60–64 8 (1) 18 (1)
65 and older 6 (1) 16 (1)
1Due to delays in reporting, data from recent years are incomplete 2Statistical trends were identified from the chi-square test for trend, calculated for the periods 1996–98, 1999–2001, and 2002–04. 3Includes persons for whom exposure information is incomplete (due to death, refusal to be interviewed, or loss to follow-up), pa-tients still under investigation, patients whose only risk was heterosexual contact and where the risk of the sexual partner(s) was (were) undetermined, persons exposed to HIV through their occupation, and patients whose mode of exposure remains undeter-mined. 4And not Hispanic. The groups Asian, Native Hawaiian, and other Pacific Islanders were grouped due to small cell sizes. All catego-ries are mutually exclusive. SOURCES: Public Health—Seattle & King County, HIV/AIDS Epidemiology

EPIDEMIOLOGIC TRENDS IN DRUG ABUSE—Seattle-King County Area
Proceedings of the Community Epidemiology Work Group, Vol. II, June 2005 277
Exhibit 15. Syringes Exchanged and Number of Encounters for King County Syringe Exchanges: 2002–2004
2002 2003 2004
Syringes Exchanged 1,801,151 1,969,522 2,183,150
Encounters1 73,752 65,593 63,898
Average Number of Syringes per Encoun-ter
24 30 34
1Encounters are duplicated SOURCE: Public Health- Seattle & King County, HIV/AIDS Program
Exhibit 16. Trends in Primary Injection Drug in Seattle-Area IDUs Age 18–30 Participating in 4 Studies
1:
1994–2003 1The number of cases ranged from 27-333 per year, with an average of 164 in each year. 2Speedballs refers specifically to the combination of heroin and cocaine. SOURCE: Public Health-Seattle & King County, HIV/AIDS Epidemiology Unit
1994, 18.9
1994, 54.9
1994, 18.9
1994, 7.4
2003, 6.6
2003, 55.8
2003, 5.4
2003, 32.2
1997, 2.8
1997, 84.5
2000, 25.9
2001, 33.7
0.0
10.0
20.0
30.0
40.0
50.0
60.0
70.0
80.0
90.0
100.0
Speedballs Heroin Cocaine Amphetamines
Primary Injection Drug
Percent
2

EPIDEMIOLOGIC TRENDS IN DRUG ABUSE—Texas
Proceedings of the Community Epidemiology Work Group, Vol. II, June 2005 278
Substance Abuse Trends in Texas, June 2005 Jane Carlisle Maxwell, Ph.D.1
ABSTRACT
Cocaine continues to be readily available, and it is the primary illicit drug for which Texans enter treatment. It remains a problem on the border with Mexico, as documented in the school survey and treatment data. Use of crack cocaine continues to move beyond Black users to White and Hispanic users. Alcohol is the primary drug of abuse in Texas in terms of dependence, deaths, and treatment ad-missions; of minors treated in emergency depart-ments for a problem with alcohol, some 37–38 per-cent were younger than 18. Heroin addicts entering treatment are primarily injectors. In Texas, hydro-codone is a much larger problem than oxycodone or methadone. Codeine cough syrup, ‘Lean,’ continues to be abused. Treatment data show that marijuana clients admitted with criminal justice problems are less impaired than those who are referred from other sources. Methamphetamine is a growing prob-lem, particularly in north and east Texas, according to the indicators, and smoking ice is increasing, while the price of the drug continues to drop. Xanax and Soma continue to be widely abused pharmaceu-tical drugs. Club drug users differ in their sociode-mographic characteristics, just as the properties of these drugs differ. Ecstasy use is moving out of the White club scene, and indicators increased from 2003 to 2004. Ketamine continues as a problem. GHB, GBL, and similar precursor drugs remain a problem, particularly in the Dallas-Fort Worth Metroplex area. Although indicators are down, Ro-hypnol remains a problem along the Texas-Mexico border. PCP indicators are mixed; dextromethor-phan is a problem with adolescents; and carisopro-dol (Soma) is a growing problem and is often abused in combination with other prescription drugs. Inhalants remain a problem with different types of users. The number of AIDS cases involving females and persons of color is growing. The pro-portion of cases due to the heterosexual mode of transmission now exceeds the proportion of cases due to injecting drug use.
1 The author is affiliated with the University of Texas at Austin, Center for Social Work Research, Austin, Texas.
INTRODUCTION
Area Description
The population of Texas in 2004 is 22,158,126, with 51 percent White, 12 percent Black, 34 percent His-panic, and 3 percent “Other.” Illicit drugs continue to enter from Mexico through cities such as El Paso, Laredo, McAllen, and Brownsville, as well as through smaller towns along the border. The drugs then move northward for distribution through Dallas-Fort Worth and Houston. In addition, drugs move eastward from San Diego through Lubbock and from El Paso to Amarillo and Dallas-Fort Worth.
There are multiple routes by which drugs enter Texas. The international airports in Houston and Dallas-Fort Worth are major ports for the distribu-tion of drugs into and out of the State, and seaports are used to import heroin and cocaine via commer-cial cargo vessels. Both private and express mail companies are used to traffic narcotics and smuggle money, and drugs are transported across the border by private vehicles and couriers who walk the drugs across on their bodies. Another problem is that U.S. citizens can buy controlled substances in Mexican pharmacies and then bring them into the States.
Data Sources
Substance Abuse Trends in Texas is an ongoing se-ries which is published every 6 months as a report for the Community Epidemiology Work Group meetings sponsored by the National Institute on Drug Abuse (NIDA). This report updates the January 2005 report. To compare the June 2005 report with earlier periods, please access http://www.utexas.edu/ research/cswr/gcattc/drugtrends.html. The information on each drug is discussed in the following order of sources:
• Student substance use data came from the Texas School Survey of Substance Abuse: Grades 7-12, 2004 and the Texas School Survey of Substance Abuse: Grades 4-6, 2004, which are published by the Texas Department of State Health Services (DSHS), formerly the Texas Commission on Alcohol and Drug Abuse.
• Adult substance use data came from DSHS’s 2000 Texas Survey of Substance Use Among Adults.

EPIDEMIOLOGIC TRENDS IN DRUG ABUSE—Texas
Proceedings of the Community Epidemiology Work Group, Vol. II, June 2005 279
• Data on use by Texans age 12 and older came from the Substance Abuse and Mental Health Services Administration’s (SAMHSA) State Es-timates of Substance Use from the 2002-2003 National Survey on Drug Use and Health.
• Poison control center data came from the Texas Poison Center Network, DSHS, for 1998–2004. Analysis was provided by Mathias Forres-ter, epidemiologist with the Texas Poison Center Network, and by the author. In addition, findings from four papers authored by Forrester, “Cariso-prodol Abuse in Texas, 1998-2003,” “Fluni-trazepam Abuse and Malicious Use in Texas, 1998-2003,” “Oxycodone Abuse in Texas, 1998-2003,” and “Methylphenidate Abuse in Texas, 1998-2004,” were used in this report.
• Emergency department (ED) data were de-rived for calendar year 2004 from the Drug Abuse Warning Network (DAWN) Live! re-stricted-access online query system administered by the Office of Applied Studies (OAS), SAMHSA. Eligible hospitals in the Dallas-Fort Worth DAWN area totaled 49, with 48 in the DAWN sample, and 49 EDs in the sample. Dur-ing 2004, between 10 and 16 Dallas emergency departments reported data each month. Eligible hospitals in the Houston DAWN area totaled 44, with 37 in the DAWN sample, and 39 EDs in the sample. During 2004, between 14 and 15 Hous-ton EDs reported data each month. The response rates in both Dallas and Houston were relatively low (exhibit 1). In Houston, this was because it was new and, in Dallas, it was because few hos-pitals agreed to participate. Exhibits in this paper reflect cases that were received by DAWN as of April 13, 2005 and May 18, 2005. All DAWN cases are reviewed for quality control. Based on this review, cases may be corrected or deleted. Therefore, the data presented in this paper are subject to change. Data derived from DAWN Live! represent drug reports in drug-related ED visits. Drug reports exceed the number of drug visits, since a patient may report use of multiple drugs (up to six drugs plus alcohol). The DAWN Live! data are unweighted and, thus, are not es-timates for the reporting area. These data cannot be compared to DAWN data from 2002 or be-fore, nor can preliminary data be used for com-parison with future data. Only weighted DAWN data released by SAMHSA can be used for trend analysis. A full description of the DAWN system can be found at the DAWN Web site: <http://dawninfo.samhsa.gov>.
• Treatment data were provided by DSHS’s cli-ent data system on clients at admission to treat-ment in DSHS-funded facilities from the first quarter of 1987 through December 31, 2004. For most drugs, the characteristics of clients entering with a primary problem with the drug are dis-cussed, but in the case of emerging club drugs, information is provided on any client with a pri-mary, secondary, or tertiary problem with that drug. Analysis was by the author.
• Overdose death data statewide on drug over-dose deaths came from death certificates from the Bureau of Vital Statistics, DSHS; analysis was by the author. Findings are also presented from Maxwell, J.C.; Pullum, T.W.; and Tannert, K. “Deaths of Clients in Methadone Treatment in Texas: 1994-2002,” Drug and Alcohol Depend-ence, 78(1); 73-82, 2005.
• Drug and alcohol arrests data come from the Uniform Crime Reports of the Texas Department of Public Safety (DPS).
• Information on drugs identified by laboratory tests are from the Texas Department of Public Safety, which submitted results from toxicologi-cal analyses of substances submitted in law en-forcement operations for 1998 through Decem-ber 31, 2004, to the National Forensic Labora-tory Information System (NFLIS) of the Drug Enforcement Administration (DEA). Analysis was by the author.
• Price, purity, trafficking, distribution, and supply information was provided by first and second quarter 2005 reports on trends in traffick-ing from the Dallas, El Paso, and Houston Field Divisions of the DEA and from DEA’s 2003 Domestic Monitor Program.
• Reports by users and street outreach workers regarding drug trends for 2005 were reported to DSHS by workers at local human immunodefi-ciency syndrome (HIV) counseling and testing programs.
• Acquired immunodeficiency syndrome (AIDS) data were provided by DSHS for annual periods through December 2004.
• Hepatitis C (HCV) data were provided by DSHS on HCV counseling and testing for the pe-riod January 1, 2003, to December 31, 2003.

EPIDEMIOLOGIC TRENDS IN DRUG ABUSE—Texas
Proceedings of the Community Epidemiology Work Group, Vol. II, June 2005 280
DRUG ABUSE PATTERNS AND TRENDS
Cocaine/Crack
The Texas School Survey of Substance Abuse: Grades 7-12, 2004 reported that lifetime use of pow-der and crack cocaine had dropped from a high of 9 percent in 1998 to 8 percent in 2004, while past-month use dropped from 4 percent in 1998 to 3 per-cent in 2004. Some 7.0 percent of students in non-border counties had ever used powder or crack co-caine, and 2.5 percent had used it in the past month. In comparison, students in schools on the Texas bor-der reported higher levels of cocaine use: 13 percent lifetime and 6 percent past-month use (exhibit 2).
The 2000 Texas Survey of Substance Use Among Adults reported 12 percent of Texas adults had ever used powder cocaine. Some 2 percent had used it in the past year. In 2002–2003, the National Survey on Drug Use and Health estimated that 2 percent of Texans age 12 and older had used cocaine in the past year. Use by age group included 3 percent of those age 12–17, 7 percent of those 18–25, and 2 percent of those 26 and older.
Texas Poison Control Center calls involving the use of cocaine increased from 503 in 1998 to 1,405 in 2004. Some 65 percent were male, and the average age was 30.
Cocaine is the major illicit drug in terms of emergency department reports. It represented 33 percent of the unweighted DAWN ED reports for “major substances of abuse” (including alcohol) in Dallas-Fort Worth and 38 percent of the reports in Houston. In Dallas, 67 percent of the patients were male, 36 percent were Anglo, 44 percent were Black, and 15 percent were Hispanic; 35 percent were age 35–44 and 18 percent were 45–54. In Houston, 64 percent of the patients were male, 36 percent were Anglo, 42 percent were Black, and 19 percent were Hispanic; 33 percent were age 35–44 and 17 percent were 45–54.
Cocaine (crack and powder) together represented 26 percent of all admissions to DSHS-funded treatment programs in 2004. With 18 percent of all admissions, crack cocaine is the primary illicit drug problem of clients admitted to publicly funded treatment pro-grams in Texas (exhibit 30).
Abusers of powder cocaine represented 8 percent of all admissions to treatment. Cocaine inhalers were the youngest and most likely to be Hispanic and in-volved in the criminal justice or legal systems. Co-caine injectors were older than inhalers but younger
than crack smokers and were most likely to be White (exhibit 3).
The term “lag” refers to the period from first consis-tent or regular use of a drug to the date of admission to treatment. Powder cocaine inhalers average 9 years between first regular use and entrance to treat-ment, while injectors average 15 years of use before they enter treatment.
Between 1987 and 2004, the percentage of Hispanic treatment admissions using powder cocaine in-creased from 23 percent to 51 percent, while for Whites and Blacks, the proportions dropped from 48 percent to 36 percent, and from 28 percent to 11 per-cent, respectively. Exhibit 4 shows these changes by route of administration. It also shows that the propor-tion of Black crack cocaine admissions fell from 75 percent in 1993 to 49 percent in 2004, while the pro-portion of Whites increased from 20 percent in 1993 to 33 percent in 2004. Hispanic admissions rose from 5 percent to 16 percent in the same time period.
Cocaine is also a problem on the border. Eighteen per-cent of treatment admissions on the Texas border in 2004 were for problems with powder cocaine (86 per-cent inhaled the drug and 13 percent injected it). An-other 11 percent of admissions smoked crack cocaine. The number of deaths statewide in which cocaine was mentioned has increased over the years—from 223 in 1992 to 541 in 2002—but decreased to 477 in 2003 (exhibit 5). The average age of the decedents was 39 in 2003, and 43 percent were White, 25 per-cent were Hispanic, and 31 percent were Black. Eighty percent were male.
Exhibit 6 shows that the proportion of substances identified as cocaine by the DPS labs is decreasing. In 1998, cocaine accounted for 40 percent of all items examined, compared with 31 percent in 2004.
In the second quarter of 2005, powder and crack co-caine were reported by the Dallas DEA Field Division as being readily available in the Metroplex, in Lub-bock, and in small towns and rural communities in north Texas. In Dallas, crack was particularly popular in the predominantly Black and Hispanic neighbor-hoods, and it was the most visible drug trafficked in Tyler. In Fort Worth, crack and methamphetamine were reported as the drugs of choice by young users; in Lubbock, crack was used by all ethnic groups, al-though it was more prevalent in the Black community. Both forms of cocaine were readily available in the El Paso Field Division. Cocaine availability has re-mained constant in the Houston Field Division, with

EPIDEMIOLOGIC TRENDS IN DRUG ABUSE—Texas
Proceedings of the Community Epidemiology Work Group, Vol. II, June 2005 281
availability up in rural areas east of Austin (Elgin and Bastrop). Crack availability and use is minimal in Laredo. Cocaine is transshipped thorough the Lower Rio Grande Valley to large metropolitan centers using smaller private vehicles. Vehicle transport fees have averaged $500–$700 per kilogram, with a fee of $1,000–$1,500 for body carriers.
In addition to continuing to be readily available, the price for a kilogram of powder cocaine remained stable at $11,000–$22,500 in the first half of 2005 (exhibit 7). A gram of powder cocaine costs $50–$80 in Dallas, $50–$60 in El Paso, and $100 in Amarillo and Lubbock. An ounce costs $400–$600 in McAllen, $400–$650 in Houston, $500–$600 in Austin, $800–$900 in Midland, $500–$600 in El Paso, $400–$650 in Houston, $600–$950 in Dallas, $600 in Alpine, $500–$700 in Waco, $650–$850 in Amarillo, $500–$850 in Lubbock, $300–$750 in Tyler, and $600–$750 in Fort Worth.
Across the State, a rock of crack costs $10–$50, with $10–$20 being the most common price. An ounce of crack cocaine costs $325–$450 in Houston, $500 in Galveston, $400–$600 in San Antonio, $500–$600 in Austin, $500–$700 in Waco, $700–$1,100 in Dallas, $450–$550 in Tyler, $500–$800 in Beaumont, $450–$1,000 in Amarillo and Lubbock, $400–$600 in San Antonio, $830 in El Paso, $800–$900 in Midland, $500 in McAllen, and $650–$750 in Fort Worth.
In Austin, street outreach workers report crack is being sold for $200 per half-ounce or $150 for a quarter piece. The quality is reported to be declining, and the pieces of crack are becoming smaller and the price increasing. A $10-size piece now costs $20. Cocaine is being “cut” with baking soda and B-12 vitamins or a mixture of dishwashing liquid and ammonia that is hardened and then combined with cocaine to produce crack. BC powder for pain-relief is also combined with powder cocaine to produce crack. The baking soda and B-12 mixture is reported to produce crack of a higher quality. Injecting crack users use citric acid break down the crack. They re-port it is a “clean” shot and is less likely to cause abscesses or swollen veins than crack that has been dissolved in Kool Aid or lemon juice. Injecting crack is also reported in Fort Worth.
In the Galveston-Brazoria area, powder cocaine use is up, but crack is more commonly used, especially in situations involving trading sex for drugs. Crack cocaine continues to be the most visible drug on the street.
Alcohol
Alcohol is the primary drug of abuse in Texas. The 1998 secondary school survey found that 72 percent of students had ever drunk alcohol and 38 percent had drunk alcohol in the last month. In 2004, 68 per-cent had ever used alcohol and 33 percent had drunk alcohol in the last month.
Of particular concern is heavy consumption of alco-hol, or binge drinking, defined as drinking five or more drinks at one time. In 2004, 15 percent of all secondary students said that when they drank, they usually drank five or more beers at one time, and 13 percent reported binge drinking of liquor. Binge drinking increased with grade level. Among seniors, 27 percent binged on beer and 21 percent on liquor. While the percentage binge drinking wine or wine coolers has fallen from its peak in 1994, it is still higher than in 1988 (exhibit 8). The percentage of binge drinking of hard liquor has remained relatively stable since 1994.
Among students in grades 4–6 in 2004, 26 percent had ever drunk alcohol and 16 percent had drunk alcohol in the past school year.
The 2000 Texas adult survey found that 50 percent of Texas adults reported drinking alcohol in the past month. Some 17 percent reported binge drinking, 6 percent reported heavy drinking in the past month, and 5 percent of all adults met the criteria for being dependent on alcohol. This estimate was based on the Diagnostic and Statistical Manual of Mental Dis-orders, III-R (DSM III-R).
The 2002–2003 National Survey on Drug Use and Health estimated that 47 percent of Texans age 12 and older had drunk alcohol in the past month (18 percent of those age 12–17, 58 percent of those 18–25, and 50 percent of those 26 and older). Some 24 percent had drunk five or more drinks on at least 1 day (binge drinking) in the past month (10 percent of those 12–17, 40 percent of those 18–24, and 23 per-cent of those age 26 and older). Some 8 percent met the criteria for alcohol dependence based on the Di-agnostic and Statistical Manual of Mental Disorders-IV (DSM-IV). The level of alcohol dependence was estimated at 6 percent of those age 12–17, 17 percent for those 18–25, and 6 percent of those 26 and older.
Of all the unweighted DAWN emergency depart-ment reports for major substances of abuse in 2004, 26 percent in Dallas-Fort Worth and 27 percent in

EPIDEMIOLOGIC TRENDS IN DRUG ABUSE—Texas
Proceedings of the Community Epidemiology Work Group, Vol. II, June 2005 282
Houston involved alcohol. In Dallas-Fort Worth, 321 (4.5 percent) of the reports involved alcohol-only among patients younger than 21. In Houston, 2.6 percent of the reports involved patients younger than 21. In Dallas-Fort Worth, 53 percent of the minors were male, 53 percent were Anglo, 6 percent were Black, and 30 percent were Hispanic; 63 percent of these reports involved youths age 18–20, with 37 percent being 12–17. In Houston, 62 percent were male, 38 percent were White, 8 percent were Black, and 47 percent were Hispanic; 61 percent of these reports involved youths age 18–20, and 38 percent were 12–17.
In 2004, 27 percent of all clients admitted to publicly funded treatment programs had a primary problem with alcohol (exhibit 30). They were among the old-est of the clients (average age of 37), and more likely to be male. Of the 14,410 alcohol admissions, 901 (6 percent) were younger than age 21. Of these minors, the average age was 17 and their average age of first use was 13. Seventy percent of the minors were male, 52 percent were Hispanic, 40 percent were White, and 6 percent were Black. Seventy-three per-cent were referred to treatment by the criminal jus-tice or legal system; average education was 9.7 years. In comparison, among adult alcohol clients, 68 percent were male, 24 percent were Hispanic, 59 percent were White, and 14 percent were Black. Forty-four percent were referred by the criminal jus-tice or legal system, and average education level was 12 years.
Minors entering treatment were more likely to report problematic use of other substances: 71 percent re-ported a second drug of abuse, while among adults, 50 percent reported a second problem. Marijuana was a problem for 48 percent of minors and 14 per-cent of adults, powder cocaine was a problem for 10 percent of minors and 12 percent of adults, and crack cocaine was a problem for 2 percent of minors and 15 percent of adults.
The characteristics of alcohol admissions have changed over the years. In 1988, 82 percent of the clients were male, compared with 68 percent in 2004. The proportion of White clients declined from 63 percent in 1988 to 58 percent in 2004; the propor-tion of Hispanic clients declined from 28 percent to 26 percent, while the proportion of Black clients increased from 7 percent to 14 percent. The average age increased from 35 to 37 years. The proportion of alcohol clients reporting no secondary drug problem dropped from 67 to 49 percent, while marijuana dropped from 18 percent to 16 percent, but stimu-
lants remained level at 4 percent, and cocaine in-creased from 7 percent to 25 percent. Consuming cocaine and alcohol at the same time produces co-caethylene, which intensifies cocaine's euphoric ef-fects.
More Texans are arrested for public intoxication (PI) than for any other substance abuse offense, although the arrest rate for PI per 100,000 population is de-creasing. The rates for the other substance abuse offenses are fairly level (exhibit 9).
Heroin
The proportion of Texas secondary students reporting lifetime use of heroin dropped from 2.4 percent in 1998 to 1.6 percent in 2004. Past-month use dropped from 0.7 percent in 1998 to 0.5 percent in 2004.
The 2000 Texas adult survey found that 1.2 percent of adults reported lifetime use of heroin and 0.1 per-cent reported past-month use.
Calls to Texas Poison Control Centers involving confirmed exposures to heroin ranged from 181 in 1998 to a high of 296 in 2000 and dropped to 208 in 2003 and 184 in 2004. In 2004, the average age was 34, and 60 percent were male. Nine percent of heroin exposures involved inhalation (snorting or smoking).
Heroin represented 5 percent of the unweighted DAWN ED reports for major substances of abuse in Dallas-Fort Worth and 2 percent of the reports in Houston in 2004. In Dallas-Fort Worth, 70 percent of the patients were male, 53 percent were Anglo, 28 percent were Black, and 12 percent were Hispanic; 22 percent were age 35–44, 19 percent were 45–54, and 18 percent were 25–29. In Houston, 68 percent were male, 63 percent were Anglo, 10 percent were Black, and 23 percent were Hispanic; 36 percent were 35–44, 20 percent were 45–54, and 10 percent were 25–29 or 30–34.
Heroin is the primary drug of abuse for 10 percent of clients admitted to treatment. The characteristics of these addicts vary by route of administration, as ex-hibit 10 illustrates. Most heroin addicts entering treatment inject heroin. While the number of indi-viduals who inhale heroin is small, it is important to note that the lag period from first use and seeking treatment is 8 years rather than 16 years for injectors. This shorter lag period means that contrary to street rumors that “sniffing or inhaling is not addictive,” inhalers can become addicted. They will either enter treatment sooner while still inhaling or they will shift

EPIDEMIOLOGIC TRENDS IN DRUG ABUSE—Texas
Proceedings of the Community Epidemiology Work Group, Vol. II, June 2005 283
to injecting, increase their risk of hepatitis C and HIV infection, become more impaired, and enter treatment later.
Exhibit 11 shows that the proportion of treatment clients who are Hispanic has increased since 1996, but there has been little change since 2002.
There were 278 deaths statewide with a mention of heroin or narcotics in 2003 (exhibit 12). Some 56 percent were White, 33 percent were Hispanic, and 9 percent were Black; 72 percent were male. The aver-age age was 39.
Exhibit 6 shows that the proportion of items identi-fied as heroin by DPS labs has remained constant at 1–2 percent over the years.
The predominant form of heroin in Texas is black tar, which has a dark gummy, oily texture that can be diluted with water and injected. Exhibit 13 shows the decline in price over the years. Depending on the location, black tar heroin sells on the street for $10–$20 per capsule, $50–$350 per gram, $400–$4,500 per ounce, and $40,000–$80,000 per kilogram. An ounce costs $1,000–$1,500 in Dallas, $1,200–$1,700 in Fort Worth, $1,000–$1,500 in El Paso, $2,100–$2,200 in Alpine, $1,800–$4,000 in Midland, $3,500–$4,500 in Lubbock, $1,200–$1,500 in Hous-ton, $1,300 in Laredo, $400–$1,500 in McAllen, $1,400–$1,600 in Austin, and $1,600–$2,400 in San Antonio.
Mexican brown heroin, which is black tar that has been cut with lactose or another substance and then turned into a powder to inject or snort, costs $10 per cap and $70–$300 per gram. An ounce costs $500–$800 in San Antonio, $1,100 in McAllen, $800–$1,600 in Dallas, and $2,200–$3,000 in Lubbock.
Colombian heroin sells for $10 per cap, $2,000–$4,000 per ounce, and $65,000–$80,000 per kilogram in Dallas and $35,000–$80,000 in Houston. Asian heroin costs $200–$350 per gram, $2,000–$4,000 per ounce, and $70,000 per kilogram in Dallas.
In the Dallas area, black tar is readily available and Colombian is available in multikilogram quantities. Sources report white and beige-colored heroin is now being produced in Mexico using Colombian production methods, and Colombian heroin organi-zations are interested in developing a greater market presence in the Dallas area. In 2003, 31 exhibits of Mexican heroin purchased through the Domestic Monitor Program (DMP) were 13.3 percent pure and
cost $0.98 per milligram pure, compared with 17.2 percent pure and $0.75 per milligram pure in 2002.
In El Paso in 2003, heroin was reported by DEA as being available, although not plentiful. It could be purchased for about $100 per gram. In 2003, 13 samples of Mexican heroin were purchased under the DEA program, and of these, purity averaged 44.7 percent and cost was $0.40 per milligram pure. The price rose from $0.13 and the purity rose from 40.3 percent in 2002. Colombian heroin is also being mentioned in El Paso
The DEA Houston Field Division reported the sup-ply of brown and black tar heroin was stable. There were 44 DMP purchases of heroin, at a purity of 28.2 percent and cost of $0.45 per milligram pure in 2003, compared with 28.2 percent pure and $0.64 per mil-ligram pure in 2002. Mexican black tar and brown are the primary types seen in the Houston Division, although Colombian heroin is transported through Houston to the Northeastern United States.
Street outreach workers in Austin report that heroin supplies are plentiful and the drug is cut with lactose, brown sugar, and instant coffee. A balloon, which is equal to 0.3 gram, costs $15, with two balloons sell-ing for $30, four selling for $40, and five selling for $50. Amarillo street outreach workers report that there is an increase in injecting heroin.
Other Opiates
This group excludes heroin but includes opiates such as methadone, codeine, hydrocodone (Vicodin, Tus-sionex), oxycodone (OxyContin, Percodan, Percocet-5, Tylox), d-propoxyphene (Darvon), hydromor-phone (Dilaudid), morphine, meperidine (Demerol), and opium.
The 2004 Texas secondary school survey found that 8 percent reported ever having drunk codeine cough syrup to get high. Some 9 percent of Black and White students reported lifetime use, as did 9 percent of Native American students and 5 percent of His-panic students. There was no difference by gender, but lifetime use increased with grade level (from 3 percent of 7th graders to 11 percent of 12th graders).
The 2000 Texas adult survey found that lifetime use of other opiates was 4 percent, and past-month use was 0.5 percent in 2000. Some 2 percent of Texas adults in 2000 reported ever having used codeine, and 0.7 percent used in the past year. Lifetime use of hydrocodone was 0.7 percent, and past-year use was 0.4 percent.

EPIDEMIOLOGIC TRENDS IN DRUG ABUSE—Texas
Proceedings of the Community Epidemiology Work Group, Vol. II, June 2005 284
Hydrocodone is a larger problem in Texas than is oxycodone, but use of oxycodone is growing, as ex-hibit 14 shows. Among poison control center cases of abuse and misuse, the average age of hydrocodone callers was 33 and oxycodone callers was 32. A study of oxycodone cases reported through the Texas Poi-son Center Network found that the proportion of calls that involved abuse of the drug more than doubled from 1998 to 2003. Oxycodone abuse involved males, adolescents, exposures at other residences and public areas, referral by the poison center to a health care facility, and some sort of clinical effect; one-half involved no other substance (Forrester, 2004).
Cases involving methadone are increasing. Metha-done is not only used in liquid and 50-milligram diskette forms in narcotic treatment programs, but 5- and 10-milligram pills are used for pain management. The poison control center, death certificate, and fo-rensic laboratory data usually do not report the form of methadone being abused. The form of the drug could be an overdose by new patients in narcotic treatment programs, liquid methadone which has been diverted from treatment, pain pills diverted from patients, or overdoses by pain patients who took too many of the pills or took other drugs in combination with the methadone pills. The number of poison con-trol center cases involving misuse or abuse of metha-done increased from 16 in 1998 to 106 in 2004. The average age in 2004 was 33.
The unweighted 2004 DAWN ED reports showed 598 hydrocodone and hydrocodone combination re-ports in Dallas-Fort Worth and 664 in Houston. Of the reports in Dallas-Fort Worth, 40 percent were male, 67 percent were Anglo, 14 percent were Black, and 8 percent were Hispanic; 22 percent of the pa-tients were age 35–44 and 18 percent were 45–54. In Houston, 48 percent were male, 67 percent were An-glo, 13 percent were Black, and 11 percent were His-panic; 27 percent were age 35-44 and 20 percent were 45-54. In comparison, there were 86 oxycodone and oxycodone/combination reports in Dallas and 68 in Houston. Of the oxycodone patients in Dallas-Fort Worth, 56 percent were male, 73 percent were Anglo, 28 percent were age 35–44 and 23 percent were 45–54. In Houston, 53 percent were male, 74 percent were Anglo, 26 percent were 45–54 and 19 percent were 25–29. There were also 107 reports of metha-done in Dallas-Fort Worth and 91 in Houston. Of the methadone patients in Dallas-Fort Worth, 48 percent were male, 77 percent were Anglo, 31 percent were age 35–44, 21 percent were 45–54, and 19 percent were 30–34. In Houston, 73 percent were male, 80 percent were Anglo, 33 percent were age 45–54, and 23 percent were 35–44.
Some 5 percent of all clients who entered publicly funded treatment during 2004 used opiates other than heroin. Of these, 55 used illegal methadone and 2,759 used other opiates (exhibit 14). Those who reported a primary problem with illicit methadone or other opiates were different from those who reported a problem with heroin. They were much more likely to be female, to be White, to have recently visited an emergency department, and to report more sickness and health problems in the month prior to entering treatment.
Of the hydrocodone deaths statewide, 49 percent were male, 90 percent were White, and the average age was 42. Of the oxycodone deaths, 67 percent were male, 88 percent were White, and the average age was 36—younger than the hydrocodone dece-dents. Of the methadone deaths, 66 percent were male, 84 percent were White, and the average age was 35. There were 10 deaths with a mention of fen-tanyl in 2003.
Narcotic treatment programs are required to report deaths of their clients. Between 1994 and 2002, 776 deaths were reported. Twenty percent died of liver disease, 18 percent of cardiovascular disease, and 14 percent of drug overdose. Compared with the stan-dardized Texas population, narcotic treatment pa-tients were 4.6 times more likely to die of a drug overdose, 3.4 times more likely to die of liver dis-ease, 1.7 times more likely to die of a respiratory disease, 1.5 times more likely to die of a homicide, and 1.4 times more likely to die of AIDS (Maxwell et al., 2005).
In the Dallas DEA Field Division, there has been an increase in seizures of codeine cough syrup and in Tyler, OxyContin has surpassed hydrocodone as the drug of choice among abusers of pharmaceuticals. Dilaudid sells for $20–$80 per tablet, and hydro-codone (Vicodin) sells for $4–$6 per tablet. OxyCon-tin sells for $1 per milligram. Methadone sells for $10 per 10-milligram tablet. Codeine cough syrup is mixed with Sprite or 7-Up and drunk in a soda bottle to avoid police attention. Promethazine syrup with codeine (“lean”) sells for $200–$300 per pint in Dal-las and $20 per ounce in Fort Worth. In the Houston Field Division, hydrocodone, promethazine with co-deine, and other codeine cough syrups are the most commonly abused pharmaceutical drugs. In Houston, promethazine or phenergan cough syrup with codeine sells for $75–$100 for 4 ounces, $125 for 8 ounces, and $1,600 for a gallon. In San Antonio, hydro-codone sells for $3 per pill and OxyContin costs $1 per milligram; one OxyContin pill costs $25 in

EPIDEMIOLOGIC TRENDS IN DRUG ABUSE—Texas
Proceedings of the Community Epidemiology Work Group, Vol. II, June 2005 285
McAllen. Dilaudid sells for $10–$15 per dose in McAllen.
DPS labs report increases in the number of exhibits of hydrocodone, oxycodone, and methadone each year from 1998 through 2004 (exhibit 14). There were 2 fentanyl exhibits in 2003 and 13 in 2004.
Outreach workers in Fort Worth and Galveston re-port codeine cough syrup remains a popular drug.
Marijuana
The proportion of Texas students in grades 4–6 who have ever used marijuana dropped from 2.8 percent in 2000 to 2.5 percent in 2004, and use in the past school year dropped from 2.1 percent to 1.7 percent. Among Texas secondary students (grades 7–12), 30 percent had ever tried marijuana and 13 percent had used in the past month, levels lower than in 2000 (exhibit 15).
In comparison, the 2000 Texas adult survey found that 37 percent of adults reported lifetime and 4 per-cent past-month marijuana use, compared with 34 percent lifetime and 3 percent past-month use in 1996. The prevalence was much higher among younger adults. Thirteen percent of those age 18–24 reported past-month use, compared with 6 percent of those 25–34 and 2 percent of those 35 and older. The increase in past-year use between 1996 and 2000 (6 percent to 7 percent) is statistically significant.
The 2002–2003 National Survey on Drug Use and Health estimated that 4.8 percent of Texans age 12 and older had used marijuana in the past month, with 6.4 percent of those 12–17, 12.9 percent of those 18–25, and 3.0 percent of those 26 and older reporting past-month use.
The Texas Poison Control Centers reported there were 135 calls confirming exposure to marijuana in 1998, compared with 5,060 in 2004. The average age was 24.
Marijuana represented 18 percent of all unweighted DAWN ED reports for major substances of abuse in Dallas-Fort Worth and 24 percent of the reports in Houston. Of the Dallas-Fort Worth patients, 67 per-cent were male, 45 percent were Anglo, 36 percent were Black, and 13 percent were Hispanic; 19 per-cent were age 35–44, 14 percent were 12–17, and 16 percent were 21–24. In Houston, 66 percent were male, 43 percent were Anglo, 34 percent were Black, and 18 percent were Hispanic. Some 17 percent of
the Houston patients were age 35–44, and another 17 percent were 21–24.
Marijuana was the primary problem for 19 percent of admissions to treatment programs in 2004 (exhibit 30). The average age was 22. Some 43 percent were Hispanic, 33 percent were White, and 22 percent were Black; 53 percent had legal problems or had been re-ferred from the criminal justice system, and these cli-ents were less frequent users of marijuana than those who came to treatment for other reasons. The criminal justice-referred clients reported using marijuana on 6.6 days in the month prior to admission, compared with 11 days for the non-criminal justice referrals. The same differences were reported for number of days in the past month that a second problem drug was used (2.9 vs. 5.5 days) and the number of days a third prob-lem drug was used (2.5 vs. 4.7 days). All these differ-ences were significant at p<.0001. Criminal justice referrals were more likely to report no second problem drug (42 vs. 35 percent for non-criminal justice refer-rals); 31 percent of the criminal justice and 29 percent of the non-criminal justice referrals reported a second problem with alcohol; 1.3 percent of criminal justice and 6 percent of non-criminal justice referrals had a second problem with crack cocaine; and 10 percent of criminal justice and 11 percent of non-criminal justice referrals had a second problem with powder cocaine.
The Addiction Severity Index (ASI) scores were lower for justice referrals: 30 percent of the criminal justice referrals reported employment problems ver-sus 45 percent non-criminal justice referred clients; for sickness or health problems, 14 percent versus 20 percent; for family problems, 26 percent versus 45 percent; for social problems with peers, 20 percent versus 32 percent; for emotional problems, 18 per-cent versus 36 percent; and for substance abuse prob-lems, 37 percent versus 56 percent. These differ-ences, all of which were significant at p<.0001, indi-cate that marijuana users who are referred to treat-ment by the criminal justice system may be more appropriate for short-term intervention, with the more impaired marijuana users in need of more in-tensive treatment services.
Cannabis was identified in 35 percent of all the exhib-its analyzed by DPS laboratories in 2000, but its rep-resentation dropped to 27 percent in 2004 (exhibit 6).
The Houston DEA Field Division reports hydroponic marijuana is especially available in Asian communi-ties and that multi-kilogram amounts are available in the Austin area. In the Dallas-Fort Worth area, Mexican marijuana is readily available, but there are continuing seizures of domestically grown marijuana

EPIDEMIOLOGIC TRENDS IN DRUG ABUSE—Texas
Proceedings of the Community Epidemiology Work Group, Vol. II, June 2005 286
(both indoor and outdoor grown). Mexican “sin-semilla” is also plentiful. Marijuana is reported as stable in the El Paso Division. In the Dallas Division, Mexican marijuana is readily available, along with domestically grown marijuana. Prices are reported to be dropping to below the cost to dealers because of increased availability, and indoor grown marijuana is producing THC content as high as 15 percent.
High quality sinsemilla sells for $900–$1,200 per pound in the Dallas-Fort Worth area, $800 per pound in Lubbock, and $600 per pound in Houston. Cana-dian BC Bud sells for $3,300 in Houston. Hydroponic sells for $3,500 per pound in Houston, $4,600 in McAllen, $3,000 in Austin, and $3,800 in Dallas. The average price for a pound of commercial grade mari-juana is $140–$160 in Laredo, $100–$200 in McAllen, $350–$450 in San Antonio, $350–$375 in Austin, $350–$425 in Houston, $500 in El Paso, $500–$700 in Alpine, $375–$600 in Midland, $350–$800 in the Dallas-Fort Worth area, $500–$600 in Lubbock, and $340–$500 in Tyler. Locally grown indoor marijuana sells for $3,800 per pound in Dallas. Exhibit 16 shows the decline in prices since 1992.
Stimulants
Amphetamine-type substances come in different forms and with different names. “Speed” (“meth,” “crank”) is a powdered methamphetamine of rela-tively low purity and is sold in grams or ounces. It can be snorted or injected. “Pills” can be pharmaceu-tical grade stimulants, such as dextroamphetamine, Dexedrine, Adderall, or Ritalin (methylphenidate), or they can be methamphetamine powder that has been pressed into tablets and sold as amphetamines or ec-stasy. Pills can be taken orally, crushed for inhala-tion, or dissolved in water for injection. There is also a damp, sticky powder of higher purity than “Speed” that is known as “Base” in Australia and “Peanut Butter” in parts of the United States. “Ice,” also known as “Crystal” or “Tina,” is methamphetamine that has been “washed” in a solvent to remove impu-rities; it has longer-lasting physical effects and purity levels above 80 percent. Ice can be smoked in a glass pipe, “chased” on aluminum foil, mixed with mari-juana and smoked through a bong, or injected.
The secondary school survey reported that lifetime use of uppers was 8.1 percent in 1998 and 6.0 per-cent in 2004. Past-month use was 3.1 percent in 1998 and 2.5 percent in 2004.
Among Texas adults, 12 percent reported lifetime use of uppers and 1 percent reported past-month use in 2000. In comparison, lifetime use was 10 percent
and past-month use was 1 percent in 1996. The dif-ference in past-year use from 1996 to 2000 (1.1 to 1.9 percent) was statistically significant.
There were 144 calls to Texas poison control centers involving exposure to methamphetamines in 1998, 183 in 1999, 264 in 2000, 321 in 2001, 382 in 2002, 389 in 2003 and 423 in 2004. Of these 2004 calls, there were 104 mentions of “ice” or “Crystal.” There were also 187 calls involving abuse or misuse of am-phetamine pills, phentermine, or Adderall, and an-other 21 calls involving abuse or misuse of Ritalin. Forrester’s study of all calls involving Ritalin to poi-son control centers in Texas between 1998 and 2004 found that 8.5 percent involved misuse and abuse. Of these abuse/misuse calls, 62 percent involved males, 20 percent were younger than 13, 55 percent were age 13–19, and 25 percent were older than 19. Ninety-three percent had swallowed the drug, 7 per-cent had inhaled it, and 67 percent of these abuse/misuse calls also had used other substances. As compared to non-abuse calls, abusers were signifi-cantly more likely to be older and to have misused the drug while at school and to suffer minor, moder-ate, or major effects from using the drug. DAWN ED reports test specifically for amphetamine as compared to methamphetamine. In Dallas-Fort Worth, methamphetamine represented 8 percent of the reports for major substances of abuse, and am-phetamine accounted for 6 percent of the reports. In Houston, methamphetamine represented 1 percent of all reports, with amphetamine representing 4 percent. Of the methamphetamine patients in Dallas-Fort Worth, 66 percent were male, 74 percent were An-glo, 3 percent were Black, and 13 percent were His-panic; 22 percent were age 35–44 and 20 percent were 25–29. In Houston, 63 percent were male, 75 percent were Anglo, 7 percent were Black, and 10 percent were Hispanic; 23 percent were age 21–24 and 22 percent were 25–29. Patients reporting am-phetamines were less likely than methamphetamine patients to be male: in Dallas-Fort Worth, 58 percent were male and in Houston, 57 percent were male. In Dallas-Fort Worth, 74 percent were Anglo, 8 percent were Black, and 12 percent were Hispanic, but in Houston, 60 percent were Anglo, 23 percent were Black, and 12 percent were Hispanic. In Dallas-Fort Worth, the most common age group was 35–44, (24 percent of admissions). In Houston, the population was younger; 18 percent were 21–24 and 17 percent were 25–29.
Methamphetamine/amphetamine admissions to treat-ment programs increased from 5 percent of all ad-missions in 2000 to 10 percent in 2004, and the aver-

EPIDEMIOLOGIC TRENDS IN DRUG ABUSE—Texas
Proceedings of the Community Epidemiology Work Group, Vol. II, June 2005 287
age age of clients admitted for a primary problem with stimulants increased. In 1985, the average age was 26; in 2004, it was 30. The proportion of White clients rose from 80 percent in 1985 to 89 percent in 2004, while the proportion of Hispanics dropped from 11 percent to 8 percent and the proportion of Blacks dropped from 9 percent to 1 percent. Unlike the other drug categories, more than one-half of these clients entering treatment were women (53 percent) (exhibit 30). The proportion smoking ice also increased from less than 1 percent in 1988 to 37 percent in 2004. The percentage of clients injecting methamphetamine dropped from 84 percent in 1988 to 45 percent in 2004 (exhibit 17).
Users of amphetamines or methamphetamine tend to differ depending on their route of administration, as exhibit 18 shows. Those who took the substance orally tended to be users of pills. Methamphetamine injectors were more likely to have been in treatment before (60 percent readmissions) compared with amphetamine pill takers (48 percent), ice smokers (40 percent), or inhalers (37 percent).
Statewide, there were 17 deaths in which ampheta-mines or methamphetamines were mentioned in 1997, 20 in 1998, 21 in 1999, 39 in 2000, 51 in 2001, 69 in 2002, and 80 in 2003. Of the decedents in 2003, 70 percent were male, 84 percent were White, and the average age was 35.
To make methamphetamine, local labs are using the “Nazi method,” which includes ephedrine or pseu-doephedrine, lithium, and anhydrous ammonia, and the “cold method,” which uses ephedrine, red phos-phorus, and iodine crystals. The “Nazi method” is the most common method used in North Texas. Be-fore these methods became common, most illicit labs used the “P2P method,” which is based on 1-phenyl-2-propanone. The most commonly diverted chemi-cals are 60-milligram pseudoephedrine tablets such as Xtreme Relief, Mini-Thins, Zolzina, Two-Way, and Ephedrine Release.
Methamphetamine and amphetamine together repre-sented 16 percent of all items examined by DPS laboratories in 2000, but the percentage increased to 24 percent in 2004 (exhibit 6). Twenty-three percent of the exhibits were methamphetamine, and less than 1 percent was amphetamine.
Methamphetamine is more of a problem in the north-ern half of the State, as exhibit 19 shows. In Abilene, 54 percent of all of the drug items examined by the DPS laboratory were methamphetamine, while in
McAllen and Laredo, only 1 percent were. Labs in the northern part of the State were also more likely to report analyzing substances that turned out to be ammonia or pseudoephedrine, chemicals used in the manufacture of methamphetamine. The NFLIS re-port shows that methamphetamine is also more of a problem in the West than in the rest of the country: 38 percent of all items examined in the western United States were methamphetamine, compared with 8 percent in the South and the Midwest and less than 1 percent in the East.
The Houston Field Division reports that the avail-ability of both Mexican and locally produced methamphetamine is increasing. Ice comes from California via Houston and Dallas. Ice also comes from the State of Jalisco, and methamphetamine is produced in the States of Aguascalientes, Zacatecas, Michoacan, and Guadalajara. Methamphetamine is also manufactured in Texas by motorcycle gangs and independent producers using small mobile pseu-doephedrine labs that produce small amounts for distribution in the local area.
The Dallas Field Division reports that the availability of methamphetamine, especially ice, is steady or rising at the retail level and has emerged as the pri-mary problem in the Lubbock and Amarillo areas. There is continued reporting of use of ice in the club and rave scene, with some reports that sales of ice rival ecstasy sales. Mexican methamphetamine dominates this market, and it is available for pur-chase in multipound quantities and at a lower price than 6 months ago. Mexican ice has a larger profit margin than locally produced methamphetamine, so low quality methamphetamine may be sold as “ice” by some dealers. High-purity methamphetamine is primarily distributed by Mexican nationals, but Asian gangs are also involved.
The purity for 1–10 grams has risen from 46 percent pure in the Dallas area in 2000 to 65 percent pure in 2004, according to NFLIS data. At the same time, the number of labs seized has risen from 1,707 to 3,908, yet prices are dropping. The price for a pound of methamphetamine was $8,000 in Houston 6 months ago; now it is $7,000. A pound sells for $4,500–$5,500 in Laredo, $6,000–$8,000 in San Antonio, $8,000 in Midland, $4,000–$10,000 in Dal-las and in Fort Worth, and $7,000–$8,000 in Lub-bock. An ounce of domestic methamphetamine sells for $600–$800 in Dallas (it was $700–$1,000 a year ago), while an ounce of Mexican sells for $400. An ounce of methamphetamine sells for $600 in Fort Worth, $600–$1,200 in Tyler, $700 in Lubbock,

EPIDEMIOLOGIC TRENDS IN DRUG ABUSE—Texas
Proceedings of the Community Epidemiology Work Group, Vol. II, June 2005 288
$960 in El Paso, $600 in Alpine, $700 in Midland, $500–$850 in Houston, $700–$1,000 in San Anto-nio, and $900–$1,250 in Waco.
The price of ice has dropped even more, from $13,000–$17,000 to $8,000–$12,000 in a year in Houston. It costs $8,500–$16,000 in Dallas, $9,000–$10,000 in Fort Worth, and $10,000–$18,000 in Ty-ler. An ounce of ice sells for $1,000–$1,400 in Dal-las, $800–$1,000 in Fort Worth, $1,200 in Tyler, $700–$1,200 in Houston, and $1,000–$1,500 in San Antonio.
In the Galveston area, outreach workers reported the amount of crystal methamphetamine on the street is increasing each month, and there is more abuse of pseudoephedrine products. In Fort Worth, ice is used more often than regular methamphetamine.
Depressants
This “downer” category includes three groups of drugs: barbiturates, such as phenobarbital and se-cobarbital (Seconal); nonbarbiturate sedatives, such as methaqualone, over-the-counter sleeping aids, chloral hydrate, and tranquilizers; and benzodiazepines, such as diazepam (Valium), alprazolam (Xanax), fluni-trazepam (Rohypnol), clonazepam (Klonopin or Rivotril), flurazepam (Dalmane), lorazepam (Ativan), and chlordiazepoxide (Librium and Librax). Rohypnol is discussed separately in the Club Drugs section of this report.
The 2004 secondary school survey reported lifetime use of downers decreased from 7.1 percent in 2002 to 5.9 percent in 2004. Past-year use decreased from 3.4 percent in 2002 to 2.6 percent in 2004.
The 2000 adult survey reported lifetime use of downers at 6.9 percent and past-month use at 0.6 percent; in 1996, lifetime use was 6.2 percent and past-month use was 0.3 percent. The difference in past-year use between 1996 and 2000 (1 percent to 1.8 percent) was statistically significant.
About 1 percent of the clients entering treatment in 2004 had a primary problem with barbiturates, seda-tives, or tranquilizers. These clients were the most likely to be female and highly impaired, based on their ASI scores (see exhibit 30).
Alprazolam, clonazepam, and diazepam are among the 15 most commonly identified substances accord-ing to DPS lab reports, although none of them repre-sent more than 3 percent of all items examined in a
year. The proportion of cases that are alprazolam (Xanax) continues to increase (exhibit 20).
Alprazolam sells for $2–$5 in Dallas, Fort Worth, and Houston, and for $5–$10 in Tyler. Depending on the dosage unit, diazepam sells for $1–$10 in Dallas, Fort Worth, and Tyler.
Street outreach workers in the Galveston area report Xanax is becoming more popular with young adults
Club Drugs and Hallucinogens
Exhibit 21 shows the demographic characteristics of clients entering DSHS-funded treatment programs statewide with a problem with a club drug. The row “Primary Drug” shows the percentage of clients cit-ing a primary problem with the club drug shown at the top of the column. The rows under the heading “Other Primary Drug” show the percentage of clients who had a primary problem with another drug, such as marijuana, but who had a secondary or tertiary problem with one of the club drugs shown at the top of the table. Note that the treatment data uses a broader category, “Hallucinogens,” that includes ly-sergic acid diethylamide (LSD), dimethyltryptamine (DMT), STP, mescaline, psilocybin, and peyote.
Excluding ketamine (due to the small number of cases), exhibit 21 shows that hallucinogen and Ro-hypnol admissions are the most likely to be male, gamma hydroxybutyrate (GHB) clients are the most likely to be White, phencyclidine (PCP) clients are the most likely to be Black, Rohypnol clients are the youngest, and GHB clients are the oldest. While us-ers of PCP are the most likely to have a primary problem with PCP, users of Rohypnol, ecstasy, and hallucinogens are more likely to have primary prob-lems with marijuana. Users of GHB tend to have a primary problem with methamphetamine.
Exhibit 22 shows the percentage of exhibits identified by DPS laboratories that contained various club drugs. Only the proportion of PCP exhibits has not decreased over time, although the increase in MDMA exhibits between 2003 and 2004 is of concern.
Dextromethorphan
The most popular dextromethorphan (DXM) prod-ucts are Robitussin-DM, Tussin, and Coricidin Cough and Cold Tablets HBP, which can be pur-chased over the counter and can produce hallucino-genic effects if taken in large quantities. Coricidin HBP pills are known as “Triple C’s” or “Skittles.”

EPIDEMIOLOGIC TRENDS IN DRUG ABUSE—Texas
Proceedings of the Community Epidemiology Work Group, Vol. II, June 2005 289
The 2004 Texas school survey reported that 4.3 per-cent of secondary students indicated they had used DXM. Use increased from 2.5 percent in 7th grade to 5.8 percent in 12th grade. There was no difference by gender, but Whites reported higher lifetime use (6.1 percent) than Native Americans (5.8 percent), Hispanics (3.6 percent), or Blacks (2.4 percent).
Poison control centers reported the number of abuse and misuse cases involving dextromethorphan rose from 99 in 1998 to a high of 432 in 2002, and dropped to 232 in 2004. Average age was 21.6. The number of cases involving abuse or misuse of Cori-cidin HBP was 7 in 1998 and rose to 268 in 2002 and then decreased to 229 cases in 2004. Average age in 2004 was 16.5 years, which shows that youths can easily access and misuse this substance.
DPS labs examined 2 substances in 1998 that were dextromethorphan, 13 in 1999, 36 in 2000, 18 in 2001, 42 in 2002, 10 in 2003, and 15 in 2004.
Ecstasy (Methylenedioxymethamphetamine or MDMA)
The 2004 Texas secondary school survey reported that lifetime ecstasy use dropped from a high of 8.6 percent in 2002 to 5.5 percent in 2004, while past-year use dropped from 3.1 percent to 1.8 percent.
The 2000 adult survey reported that 3.1 percent had ever used ecstasy and 1.0 percent had used in the past year.
Texas Poison Control Centers reported 23 calls involv-ing misuse or abuse of ecstasy in 1998, 46 in 1999, 119 in 2000, 155 in 2001, 172 in 2002, 284 in 2003, and 302 in 2004. In 2004, the average age was 21.
There were 45 reports in Dallas-Fort Worth and 109 reports in Houston of ecstasy as one of the major substances of abuse recorded in EDS reporting to DAWN. In Dallas-Fort Worth, 62 percent of the un-weighted ecstasy reports involved males, as did 58 percent of the Houston reports. Anglos accounted for 38 percent of the Dallas-Fort Worth patients and 44 percent of the Houston patients, while 27 percent in Dallas-Fort Worth were Black, as were 35 percent in Houston. Thirteen percent of the patients in Dallas-Forth Worth and 14 percent of the patients in Hous-ton were Hispanic. Fifty-eight percent of the patients in Dallas-Fort Worth and 56 percent of the patients in Houston were age 18–24, with another 13 percent in Dallas-Fort Worth and 20 percent in Houston be-ing 12–17.
There were 63 admissions for a primary, secondary, or tertiary problem with ecstasy in 1998, 114 in 1999, 199 in 2000, 349 in 2001, 521 in 2002, 502 in 2003, and 561 in 2004. Approximately 36 percent reported marijuana as their primary problem drug, compared with 14 percent who reported ecstasy as their primary problem drug. Ecstasy has spread out-side the White club scene and into the Hispanic and Black communities, as evidenced by the declining proportion of White treatment clients.
In 1999, there were two deaths that involved ecstasy in Texas. There was one death in 2000, five in 2001, five in 2002, and two in 2003.
Exhibit 22 shows the substances identified by DPS labs. The labs identified MDMA in 107 exhibits in 1999, 387 in 2000, 814 in 2001, 503 in 2002, 484 in 2003, and 691 in 2004. Methylenedioxyampheta-mine (MDA) was identified in 31 exhibits in 1999, 27 in 2000, 48 in 2001, 90 in 2002, 94 in 2003, and 60 in 2004.
According to the Houston DEA Field Division, ec-stasy is more available at clubs, raves, and gyms, and use is increasing in the Galveston, Beaumont, and Fort Hood areas. Logos on the tablets include A&E, Blue Dolphins, Bear, Music Notes, Crescent Moon, Yellow Dolphins, Aladdin Lamp, Yellow Alligator, Yellow Trumpets, Omega, X-5 (BMW), JJ, Spade, and Footprints. While most tablets contain MDMA, some have high concentrations of caffeine or methamphetamine, with traces of ketamine in some tablets. Ecstasy is stable in Austin, but use has in-creased in the Waco area among soldiers stationed at Fort Hood.
The Dallas DEA Field Division reports that ecstasy made in Europe is transshipped through other U.S. ports into the Metroplex area. The club drug distribu-tion in the Dallas and Houston Divisions is domi-nated by Asian traffickers who are also involved with hydroponic marijuana and methamphetamine. Combinations of drugs mentioned in Dallas include “candy flipping” (LSD and MDMA), “hippie flip-ping” (mushrooms and MDMA), “love flipping” (mescaline and MDMA), “robo flipping” (DXM and MDMA), and “elephant flipping” (PCP and MDMA).
Single dosage units of ecstasy sell for $6–$20 in Dal-las, $5–$12.50 in Fort Worth, $12–$25 in Tyler, $4.75–$25 in Houston, $20–$30 in McAllen, $20 in Laredo, and $11–$20 in San Antonio. Multiple dos-age units (1,000 tablets) sell for $5,000–$8,000 in Houston.

EPIDEMIOLOGIC TRENDS IN DRUG ABUSE—Texas
Proceedings of the Community Epidemiology Work Group, Vol. II, June 2005 290
Gamma Hydroxybutyrate (GHB), Gamma Butyrate Lactone (GBL), 1-4 Butanediol (1,4 BD)
The 2000 Texas adult survey reported that 0.4 per-cent had ever used GHB and 0.1 percent had used in the past year.
The number of cases of misuse or abuse of GHB or its precursors reported to Texas Poison Control Cen-ters was 110 in 1998, 150 in 1999, 120 in 2000, 119 in 2001, 100 in 2002, 66 in 2003, and 84 in 2004. The average age of the abusers in 2004 was 26, and of the callers whose gender was known, 52 percent were male.
The unweighted DAWN data show there were 41 GHB reports in Dallas-Fort Worth, and there were 4 in Houston. Of the patients in Dallas-Fort Worth, 49 percent were male, 78 percent were Anglo, 27 per-cent were age 18–24 years old, 39 percent were 25–34, and 29 percent were 35–54.
Adult and adolescent clients with a primary, secon-dary, or tertiary problem with GHB, GBL, or 1,4 butanediol (1,4 BD) are seen in treatment. In 1998, 2 were admitted, compared with 17 in 1999, 12 in 2000, 19 in 2001, 35 in 2002, 31 in 2003, and 45 in 2004. Clients who used GHB tended to be the oldest of all the club drug users (average age 29) and were the most likely to be White (89 percent) and female (67 percent). GHB users were more likely to have used the so-called “hard-core” drugs; 47 percent had a history of injecting drug use and 56 percent had a primary problem with amphetamines or metham-phetamine. Because of the sleep-inducing properties of GHB, users will also use methamphetamine so they can stay awake while they are “high” on GHB or they use GHB to “come down” from their use of methamphetamine (exhibit 21).
In 1999, there were three deaths that involved GHB, compared with five in 2000, three in 2001, two in 2002, and two in 2003.
In 1998, there were 18 items identified by DPS labs as being GHB; in 1999 112 were GHB, 4 were GBL, and 4 were 1,4 BD (exhibit 22). In 2000, 45 were GHB, 7 were GBL, and 4 were 1,4 BD. In 2001, 34 were GHB, 7 were GBL, and 19 were 1,4 BD. In 2002, 81 were GHB, 6 were GBL, and 4 were 1,4 BD. In 2003, 150 were GHB, 5 were GBL, and none was 1,4 BD. In 2004, 95 were GHB, 1 was GBL, and none was 1,4 BD. In 2004, 96 percent of the GHB items were identified in the DPS lab in the Dallas area, which shows use of GHB is centered in this area of the State.
In Dallas, the price of GHB had increased from $100–$200 per gallon to $250–$500 per gallon. A dose of GHB costs $20 in Dallas and $5–$10 in Lubbock and San Antonio. A 16-ounce bottle costs $100 in San Antonio and two 2-ounce bottles cost $110 in Fort Worth. The DEA Field Division in Dal-las reports that GHB is being manufactured in home laboratories where GBL ordered over the Internet is mixed with other chemicals and water to produce GHB.
Ketamine
The 2000 adult survey reported that 0.3 percent had ever used ketamine and 0.1 percent had used it in the last year.
Eight cases of misuse or abuse of ketamine were reported to Texas Poison Control Centers in 1998, compared with 7 in 1999, 15 in 2000, 14 in 2001, 10 in 2002, 17 in 2003, and 7 in 2004.
There was one report of ketamine in the unweighted 2004 Dallas-Fort Worth DAWN emergency depart-ment reports and zero in Houston.
Seven clients were admitted to DSHS-funded treat-ment programs in 2004 with a secondary or tertiary problem with ketamine (exhibit 21). Forty-three per-cent had a history of injecting drug use, and all had problems with the legal or criminal justice system.
There were two deaths in 1999 that involved use of ketamine, none in 2000, one in 2001, and one in 2002.
In 1999, 25 substances were identified as ketamine by DPS labs. There were 29 in 2000, 119 in 2001, 78 in 2002, 84 in 2003, and 73 in 2004 (exhibit 21).
Ketamine costs $2,200–$2,500 per liter in Fort Worth and $65 per vial in Tyler, with a dose selling for $20 per pill or gram. It costs $60 retail for a 10-milliliter vial and $15–$20 for 0.2 grams of powder.
LSD and Other Hallucinogens
The secondary school survey shows that use of hal-lucinogens (defined as LSD, PCP, mushrooms, etc.) continues to decrease. Lifetime use peaked at 7.4 percent in 1996 and dropped to 4.8 percent by 2004. Past-month use dropped from 2.5 percent in 1998 to 1.6 percent in 2004.

EPIDEMIOLOGIC TRENDS IN DRUG ABUSE—Texas
Proceedings of the Community Epidemiology Work Group, Vol. II, June 2005 291
The 2000 adult survey reported that 8.8 percent of Texas adults had ever used LSD and 0.9 percent had used in the past year.
Texas Poison Control Centers reported 82 mentions of abuse or misuse of LSD in 1998, 113 in 1999, 97 in 2000, 70 in 2001, 129 in 2002, 20 in 2003, and 22 in 2004. There were also 98 cases of intentional mis-use or abuse of hallucinogenic mushrooms reported in 1998, 73 in 1999, 110 in 2000, 94 in 2001, 151 in 2002, 130 in 2003, and 172 in 2004. Average age in 2004 was 21 for the LSD cases and 19.6 for the mushroom cases.
There were 29 unweighted reports in Dallas-Fort Worth DAWN and 30 in Houston which involved LSD or other hallucinogens. Of the Dallas-Fort Worth patients, 76 percent were male, 59 percent were Anglo, 7 percent were Black, and 14 percent were Hispanic; 10 percent were younger than 18, 66 percent were 18–24, and 21 percent were 25–34. In Houston, 75 percent were male, 43 percent were Anglo, 10 percent were Black, and 33 percent were Hispanic; 20 percent were younger than 18, 33 per-cent were 18–24, and 20 percent were 25–34.
The number of adults and youths with a primary, secondary, or tertiary problem with hallucinogens entering treatment is decreasing. There were 636 such admissions in 2000, 486 in 2001, 436 in 2002, 319 in 2003, and 266 in 2004. Of the admissions in 2004, the average age was 23, 75 percent were male, 61 percent were White, 25 percent were Hispanic, and 12 percent were Black. Sixty-four percent were referred from the criminal justice or legal system, and 25 percent had a history of injecting drug use (exhibit 21).
Statewide, there were two deaths in 1999 with a mention of LSD. No deaths with a mention of LSD have been reported since.
DPS labs identified 69 substances as LSD in 1998, compared with 406 in 1999, 234 in 2000, 122 in 2001, 10 in 2002, 10 in 2003, and 24 in 2004 (exhibit 22).
A dosage unit of LSD is selling for $1–$10 in Dallas, $5–$10 in Tyler, $6–$10 in Fort Worth, $7 in Lub-bock, and $8–$12 in San Antonio. A dosage sheet of 100 sells for $800 in San Antonio.
Phencyclidine (PCP)
The 2000 Texas adult survey reported that 0.9 per-cent of adults had ever used PCP or Angel Dust, and 0.1 percent had used it in the past year.
Texas Poison Control Centers reported cases of “Fry,” “Amp,” “Water,” “Wack,” or “PCP.” Often, marijuana joints are dipped in formaldehyde that contains PCP or PCP is sprinkled on the joint. The number of cases involving PCP increased from 102 in 1998 to a high of 237 in 2002 and decreased to 160 in 2004. There were also 18 cases involving misuse or abuse of formaldehyde or formalin in 2003 and 55 in 2004. These formaldehyde or formalin cases may be linked to the use of PCP, but the re-cords were not clear.
There were 71 unweighted reports of PCP in Dallas-Fort Worth DAWN emergency departments and 240 in Houston in 2004. Of these patients, 82 percent in Dallas-Fort Worth and 69 percent in Houston were male. Some 63 percent in Dallas-Fort Worth were Black, as were 72 percent in Houston. Twenty-five percent in Dallas-Fort Worth were Anglo, as were 13 percent in Houston, and 4 percent in Dallas-Fort Worth and 10 percent in Houston were Hispanic. PCP patients were not young; only 7 percent in each area were younger than 18. Thirty-two percent in Dallas-Fort Worth and 42 percent in Houston were age 18–24; 39 percent in Dallas-Fort Worth and 40 percent in Houston were 25–34; and 20 percent in Dallas-Fort Worth and 9 percent in Houston were 35–54.
Adolescent and adult admissions to treatment with a primary, secondary, or tertiary problem with PCP have varied over time, rising from 164 in 1998 to 417 in 2003 and then dropping to 295 in 2004 (ex-hibit 21). Of these clients in 2004, 81 percent were Black, 57 percent were male, 56 percent were in-volved in the criminal justice system, 22 percent were employed, and 14 percent were homeless. While 43 percent reported a primary problem with PCP, another 30 percent reported a primary problem with marijuana, which demonstrates the link between these two drugs and “Fry.”
There were three deaths in 1999, three in 2000, five in 2001, eight in 2002, and two in 2003 that involved PCP.
DPS labs identified 10 substances as PCP in 1998, 84 in 1999, 104 in 2000, 163 in 2001, 95 in 2002, 143 in 2003, and 161 in 2004 (exhibit 22).
PCP costs $700–$1,200 per ounce in San Antonio and $30 per dosage unit in McAllen. In Dallas, it costs $3,800 for a 16-ounce bottle, $375–$450 per ounce, $25 per cigarette, and $10 for a piece of a "sherm" stick. In Fort Worth, it costs $26,000–$28,000 per gallon.

EPIDEMIOLOGIC TRENDS IN DRUG ABUSE—Texas
Proceedings of the Community Epidemiology Work Group, Vol. II, June 2005 292
Street outreach workers in the Galveston/Brazoria area report “Water” is a problem.
Rohypnol
Rohypnol (flunitrazepam) is a benzodiazepine that was never approved for use in the United States. The drug is legal in Mexico, but since 1996, it has been illegal to bring it into the United States. It continues to be a problem along the Texas-Mexico border. As shown in exhibit 23, the 2004 secondary school sur-vey found that students from the border area were about three times more likely to report Rohypnol use than those living elsewhere in the State (9.1 percent vs. 2.5 percent lifetime, and 3.5 percent vs. 2.5 per-cent current use). Use on both the border and non-border has declined since its peak in 1998.
The 2000 Texas adult survey found that 0.8 percent reported lifetime use and 0.1 percent reported past-year use of Rohypnol.
The number of confirmed exposures to Rohypnol reported to the Texas Poison Control Centers peaked at 102 in 1998; 62 cases were reported in 2004. The average age in 2004 was 17; 52 percent were male; and 84 percent lived in counties on the border. A study of all the exposure calls between 1998 and 2003 found a significantly higher proportion of fluni-trazepam abuse and malicious use calls occurred in border counties. The majority of the abuse calls in-volved males, while the majority of malicious use calls involved females. Most abuse calls involved adolescents, while the majority of the malicious calls involved adults. Abuse cases occurred most fre-quently at the patient’s own residence or at school, while malicious use occurred most often in public areas, with the patient’s own residence ranking sec-ond (Forrester 2004). This analysis provides evi-dence of two patterns of Rohypnol use: (1) recrea-tional use and abuse by adolescent males and (2) use of the drug with criminal intent on adult women.
There were no reports of Rohypnol in the Dallas-Fort Worth DAWN data in 2004, and there were four in Houston.
The number of youths and adults admitted into treatment with a primary, secondary, or tertiary prob-lem with Rohypnol has varied: 247 in 1998, 364 in 1999, 324 in 2000, 397 in 2001, 368 in 2002, 331 in 2003, and 221 in 2004. In 2004, clients abusing Ro-hypnol were among the youngest of the club drug patients (average age 19), and they were predomi-nately Hispanic (97 percent), which reflects the availability and use of this drug along the border
(exhibit 21). Some 67 percent were involved with the criminal justice or legal system. While 13 percent of these clients said that Rohypnol was their primary problem drug, 48 percent reported a primary problem with marijuana.
DPS lab exhibits for Rohypnol numbered 43 in 1988, 56 in 1999, 32 in 2000, 35 in 2001, 22 in 2002, 17 in 2003, and 16 in 2004. The decline in the percentage of Rohypnol seizures, as shown in exhibit 22, paral-lels the declines seen in other indicators.
Although Roche is reported to no longer be making the 2-milligram Rohypnol tablet (a favorite with abusers), generic versions are still produced. The blue dye added to the Rohypnol tablet to warn poten-tial victims is not in the generic version. Unfortu-nately, the dye is not proving effective, since people intent on committing sexual assault may employ blue tropical drinks and blue punches into which Rohyp-nol can be slipped.
Rohypnol sells for $2–$4 per pill in San Antonio.
Other Abused Substances
Inhalants
The 2004 elementary school survey found that 11 percent of students in grades 4 to 6 had ever used inhalants, and 8 percent had used in the school year. The 2004 secondary school survey found that 17 percent of students in grades 7–12 had ever used inhalants and 7 percent had used in the past month.
Inhalant use exhibits a peculiar age pattern not ob-served with any other substance. The prevalence of lifetime and past-month inhalant use was higher in the lower grades and lower in the upper grades (ex-hibit 24). This decrease in inhalant use as students age may be partially related to the fact that inhalant users drop out of school early and hence are not in school in later grades to respond to school-based surveys.
The 2004 poison control center data show that auto-motive products such as carburetor cleaner and transmission fluid were the inhalants abused or mis-used the most often, with 67 calls (exhibit 25). Aver-age age was 29. There were 30 calls of abuse or mis-use of paint (average age 29), 29 calls of misuse of Freon or other propellants (average age 21), 22 calls for misuse of air fresheners or dusting sprays (aver-age age of 18), 21 calls of misuse of gasoline (aver-age age 24), and 13 calls about abuse of toluene or mineral spirits of thinning agents (average age 22).

EPIDEMIOLOGIC TRENDS IN DRUG ABUSE—Texas
Proceedings of the Community Epidemiology Work Group, Vol. II, June 2005 293
There were 42 unweighted reports of inhalants in Dallas-Fort Worth and 52 in Houston in the 2004 DAWN emergency department reports. In Dallas-Fort Worth, 71 percent were male, 48 percent were Anglo, 21 percent were Black, and 31 percent were Hispanic, while in Houston, 71 percent were male, 31 percent were Anglo, 17 percent were Black, and 52 percent were Hispanic. In Dallas-Fort Worth, 26 percent were age 30–34 and 24 percent were younger than 21, whereas in Houston, 23 percent were 35–44, 21 percent were 25–29, and 21 percent were younger than 21.
Inhalant abusers represented 0.2 percent of the ad-missions to treatment programs in 2004. The clients tended to be male (60 percent) and Hispanic (77 per-cent). The overrepresentation of Hispanics is related to the fact that DSHS had developed and funded treatment programs targeted specifically to this group. The average age of the clients was 22. Sixty-five percent were involved with the criminal justice system; average education level was 8.7 years; 10 percent were homeless; and 17 percent had a history of injection drug use.
In 2000, there were 12 deaths involving misuse of inhalants, compared with 15 in 2001, 8 in 2002, and 13 in 2003. The categorization of inhalant deaths is difficult and leads to underreporting. However, of those reported in 2003, the average age was 34; 85 percent were male; 69 percent were White; and 31 percent were Hispanic.
A new trend in McAllen is the use of “Whip-It” ni-trous oxide capsules by teenagers.
Steroids
The Texas school survey reported that 2 percent of all secondary students surveyed in 2004 had ever used steroids and that less than 1 percent had used steroids during the month before the survey. Although ster-oids can be bought across the border, the school sur-vey found lifetime usage lower among border stu-dents (1.4 percent) than among non-border students (2.1 percent).
There were 17 persons admitted to DSHS-funded treatment in 2004 with a primary, secondary, or terti-ary problem with steroids. Sixty-five percent were male, 59 percent were Anglo, and 35 percent were Hispanic; the average age was 26. Some 65 percent were involved with the criminal justice or legal sys-tem; 29 percent had a primary problem with alcohol, 24 percent had a primary problem with marijuana, and 18 percent had a primary problem with steroids.
The NFLIS data for Texas reported testosterone was the steroid most likely to be seized and submitted for forensic testing.
Carisoprodol (Soma)
Poison control centers confirmed exposure cases of intentional misuse or abuse of the muscle relaxant carisoprodol (Soma) increased from 83 in 1998 to 298 in 2004. In addition to these abuse and misuse cases, there were another 667 cases in which the reason for the call was suspected suicide.
Between 1998 and 2003, 51 percent of these poison control center cases involved males and 83 percent involved persons older than 19. Carisoprodol is a substance that tends to be abused in combination with other substances. Only 39 percent of the cases involved that one drug; all the others involved com-binations of drugs (Forrester, 2004).
The unweighted DAWN emergency department re-ports showed that in 2004, there were 160 reports of Soma in Dallas-Fort Worth and 429 in Houston. In Dallas-Fort Worth, 38 percent were male, 78 percent were Anglo, 30 percent were age 45–54 and 26 per-cent were 35–44. In Houston, 46 percent were male, 75 percent were White, 29 percent were age 35–44, 10 percent were 45–54, and 18 percent were 30–34.
In 2003, carisoprodol was mentioned on 51 death certificates. Only one of the deaths involved only carisoprodol. Hydrocodone, propoxyphene, alcohol, and benzodiazepines were also substances that were mentioned along with carisoprodol on the other death certificates.
DPS lab exhibits of carisoprodol reported to NFLIS increased from 13 in 1998 to 90 in 1999, 153 in 2000, 202 in 2001, 179 in 2002, 278 in 2003, and 249 in 2004.
According to the Dallas DEA Field Division, Soma sells for $2–$5 per tablet.
INFECTIOUS DISEASES RELATED TO DRUG ABUSE
Hepatitis C
Exhibit 26 shows that 18 percent of the 8,798 tests for HCV exposure given in 2003 were positive. Some 41 percent of those with positive tests were exposed through injection drug use. The rates were higher for males, for American Indians and Blacks, and for persons age 40 and older. The highest HCV

EPIDEMIOLOGIC TRENDS IN DRUG ABUSE—Texas
Proceedings of the Community Epidemiology Work Group, Vol. II, June 2005 294
positivity rates were reported by persons tested at sexually transmitted disease clinics and drug treat-ment centers (22 percent each) and field outreach centers and corrections and probation settings (20 percent each).
Forty-eight percent of the 200 clients in narcotic treatment programs who were interviewed by the author as part of NIDA Grant R21 DA014744 said they were positive for hepatitis C, and 54 percent said a doctor had told them they had liver problems. However, only 5 percent reported they were HIV positive.
HIV and AIDS Cases
In 2004, the percentage of AIDS cases involving heterosexual exposures was greater than the percent-age of cases related to injection drug use (exhibit 27). The proportion related to heterosexual contact rose from 1 percent in 1987 to 26 percent in 2004,
while the proportion attributed to injection drug use was 15 percent in 2004.
In 1987, 3 percent of the AIDS cases were females older than 12; in 2004, 23 percent were female. As exhibit 28 shows, the proportion of Whites has dropped, while the proportion of Blacks and Hispan-ics increased.
The proportion of adult needle users entering DSHS-funded treatment programs has decreased from 32 percent in 1988 to 19 percent in 2004. Heroin injec-tors are most likely to be older, and nearly two-thirds are people of color, while injectors of stimulants and cocaine are far more likely to be White (exhibit 29). For inquiries concerning this report, please contact Jane C. Max-well, Ph.D., Research Professor, Center for Social Work Re-search, The University of Texas at Austin, Suite 335, 1717 West 6th Street, Austin, TX 78703, Phone: 512-232-0610, Fax: 512-232-0617, E-mail: [email protected].

EPIDEMIOLOGIC TRENDS IN DRUG ABUSE—Texas
Proceedings of the Community Epidemiology Work Group, Vol. II, June 2005 295
8% 12% 16% 20% 23%
5% 4%3% 6% 9% 10%11%
0%10%20%30%40%50%60%70%80%90%
100%
Grade 7 Grade 8 Grade 9 Grade 10 Grade 11 Grade 12
Cocaine-Border
Cocaine-Non-Border
Exhibit 1. Dallas/Ft. Worth and Houston ED Data Summary: 2004
No. of EDs Reporting per Month: Completeness of Data ( percent) CEWG Area Total Eligible
Hospitals1 No. of
Hospitals in DAWN Sample
Total EDs in DAWN
Sample2 90–100 percent
50–89 percent
<50 percent
No. of EDs Not
Reporting
Dallas/ Ft. Worth 49 48 49 8–13 0–4 0–2 33–39
Houston 44 37 39 9–14 0–4 0–1 24–25 1Short-term, general, non-Federal hospitals with 24-hour emergency departments based on the American Hospital Association Annual Survey. 2Some hospitals have more than one emergency department. SOURCE: DAWN Live!, OAS, SAMHSA, updated 4/13-4/14, 2005 Exhibit 2. Percentage of Border and Nonborder Texas Secondary Students Who Had Ever Used Powder or Crack Cocaine, by Grade: 2004 SOURCE: Texas Department of State Health Services Exhibit 3. Characteristics of Clients Admitted to TDSHS-Funded Treatment with a Primary Problem with Cocaine, by Route of Administration: 2004
Characteristics Crack Cocaine Smoke
Powder Cocaine Inject
Powder Cocaine Inhale Cocaine All1
# Admissions 9,131 900 3,256 13,863 Percent of Cocaine Admissions 66 6 23 100 Lag-1st Use to Treatment (Years) 12 15 9 11 Average Age 37 35 29 35 Percent Male 54 62 54 55 Percent Black 50 5 13 37 Percent White 33 63 29 34 Percent Hispanic 16 29 57 27 Percent CJ-Involved 36 46 52 41 Percent Employed 12 13 33 18 Percent Homeless 18 11 5 14
1Includes clients with “other” routes of administration. SOURCE: Texas Department of State Health Services

EPIDEMIOLOGIC TRENDS IN DRUG ABUSE—Texas
Proceedings of the Community Epidemiology Work Group, Vol. II, June 2005 296
0%10%20%30%40%50%60%70%80%90%
100%
Crack-93 Crack-04 IDU-93 IDU-04 Inhale-93 Inhale-04
HispanicWhiteBlack
0
100
200
300
400
500
600
1992 1993 1994 1995 1996 1997 1998 1999 2000 2001 2002 2003
Numb
er of
Dea
ths
31
32
33
34
35
36
37
38
39
40
Age (
Year
s)BlackHispanicWhiteAge
Exhibit 4. Routes of Administration of Cocaine by Race/Ethnicity from TDSHS Treatment Admissions: 1993–2004 SOURCE: Texas Department of State Health Services Exhibit 5. Age and Race/Ethnicity of Persons Dying with a Mention of Cocaine in Texas: 1992–2003 SOURCE: Bureau of Vital Statistics, Texas Department of State Health Services

EPIDEMIOLOGIC TRENDS IN DRUG ABUSE—Texas
Proceedings of the Community Epidemiology Work Group, Vol. II, June 2005 297
0%
5%
10%
15%
20%
25%
30%
35%
40%
45%
1998 1999 2000 2001 2002 2003 2004
Cocaine
Marijuana
Methamphetamine &Amphetamine
Heroin
$-
$5,000
$10,000
$15,000
$20,000
$25,000
$30,000
$35,000
$40,000
$45,000
$50,000
1987 1989 1991 1h93 1h94 1h95 1h96 1h97 1h98 1h99 1h00 1h01 1h02 1h03 1h04 1h05
Exhibit 6. Substances Identified by Texas DPS Labs: 1998–2004 SOURCE: NFLIS Exhibit 7. Price of a Kilogram of Cocaine in Texas as Reported by the DEA: 1987–2004 1Prices reported by half year since 1993. SOURCE: DEA

EPIDEMIOLOGIC TRENDS IN DRUG ABUSE—Texas
Proceedings of the Community Epidemiology Work Group, Vol. II, June 2005 298
0%
5%
10%
15%
20%
25%
1988 1990 1992 1994 1996 1998 2000 2002 2004
Beer
Wine Coolers
Liquor
Wine
0
200
400
600
800
1,000
1,200
1994 1995 1996 1997 1998 1999 2000 2001 2002 2003 2004
DWILLVPIDrug TrafficDrug Possess
Exhibit 8. Percentage of Texas Secondary Students Who Reported They Normally Consumed Five or More Drinks at One Time, by Specific Alcoholic Beverage: 1988–2004 SOURCE: Texas Department of State Health Services Exhibit 9. Substance Abuse Arrests Per 100,000 Population in Texas: 1994–2004 SOURCE: Texas Department of Public Safety

EPIDEMIOLOGIC TRENDS IN DRUG ABUSE—Texas
Proceedings of the Community Epidemiology Work Group, Vol. II, June 2005 299
0%10%20%30%40%50%60%70%80%90%
100%
86 87 88 89 90 91 92 93 94 95 96 97 98 99 00 01 02 03 04
Black White Hispanic
Exhibit 10. Characteristics of Clients Admitted to TDSHS-Funded Treatment with a Primary Problem with Heroin, by Route of Administration: 2004
Characteristic Inject Inhale Smoke All1 # Admissions 4,651 521 51 5,424 Percent of Heroin Admissions 86 10 1 100 Lag-1st Use to Treatment (Years) 16 8 9 15 Average Age 37 29 30 36 Percent Male 71 51 51 65 Percent Black 6 33 16 9 Percent White 37 16 35 36 Percent Hispanic 55 49 47 54 Percent CJ Involved 31 33 20 31 Percent Employed 12 14 10 13 Percent Homeless 12 8 8 11
1Includes clients with “other” routes of administration. SOURCE: Texas Department of State Health Services Exhibit 11. Heroin Admissions to TDSHS-Funded Treatment by Race/Ethnicity: 1986–2004 SOURCE: Texas Department of State Health Services

EPIDEMIOLOGIC TRENDS IN DRUG ABUSE—Texas
Proceedings of the Community Epidemiology Work Group, Vol. II, June 2005 300
0
50
100
150
200
250
300
350
400
1993 1994 1995 1996 1997 1998 1999 2000 2001 2002 2003
Numb
er of
Dea
ths
36
36.5
37
37.5
38
38.5
39
39.5
40
Age (
Year
s)
BlackHispanicWhiteAge
$-
$1,000
$2,000
$3,000
$4,000
$5,000
$6,000
$7,000
$8,000
$9,000
1987 1989 1991 1h93 1h94 1h95 1h96 1h97 1h98 1h99 1h00 1h01 1h02 1h03 1h04 1h05
Exhibit 12. Age and Race/Ethnicity of Persons Dying with a Mention of Heroin in Texas: 1992–2003 SOURCE: Texas Department of State Health Services Exhibit 13. Price1 of an Ounce of Mexican Black Tar Heroin in Texas as Reported by the DEA: 1987–2004
1Prices reported by half year since 1993 SOURCE: DEA

EPIDEMIOLOGIC TRENDS IN DRUG ABUSE—Texas
Proceedings of the Community Epidemiology Work Group, Vol. II, June 2005 301
0%
5%
10%
15%
20%
1988 1990 1992 1994 1996 1998 2000 2002 2004
Grade 7
Grade 8
Grade 9
Grade 10
Grade 11
Grade 12
Exhibit 14. Hydrocodone, Oxycodone, and Methadone Indicators in Texas: 1998–2004
1”Other Opiates” refers to those other than heroin. SOURCES: Texas Poison Center Network, Texas Department of State Health Services, and Texas Department of Public Safety Exhibit 15. Percentage of Texas Secondary Who Had Used Marijuana in the Past Month, by Grade: 1988–2004 SOURCE: Texas Department of State Health Services
Indicator 1998 1999 2000 2001 2002 2003 2004 Poison Control Center Cases of Abuse and Misuse
Hydrocodone 192 264 286 339 429 414 516 Oxycodone 12 26 22 34 68 64 77 Methadone 16 19 21 26 50 41 106
TDHSH Treatment Admissions "Other Opiates"1 542 802 879 1,336 1,752 2,227 2,759 Methadone 53 68 44 50 63 66 55
Deaths with Mention of Substance (TDSHS) Hydrocodone 25 52 107 168 140 Oxycodone 8 20 40 56 60 Methadone 30 36 62 93 131 122
Drug Exhibits Identified by DPS Laboratories Hydrocodone 479 629 771 747 1,212 1,534 Oxycodone 36 72 115 106 174 241 Methadone 19 22 42 49 63 116

EPIDEMIOLOGIC TRENDS IN DRUG ABUSE—Texas
Proceedings of the Community Epidemiology Work Group, Vol. II, June 2005 302
0102030405060708090
1988 1989 1990 1991 1992 1993 1994 1995 1996 1997 1998 1999 2000 2001 2002 2003 2004
Perce
nt SmokingInhalingInjecting
Exhibit 16. Price of a Pound of Commercial Grade Marijuana in Texas, as Reported by the DEA: 1992–2004 SOURCE: DEA Exhibit 17. Route of Administration of Methamphetamine by Clients Admitted to TDSHS-Funded Programs: 1988–2004 SOURCE: Texas Department of State Health Services
$-
$200
$400
$600
$800
$1,000
$1,200
$1,400
$1,600
$1,800
1992 1993 1994 1995 1996 1997 1998 1999 2000 2001 2002 2003 2004
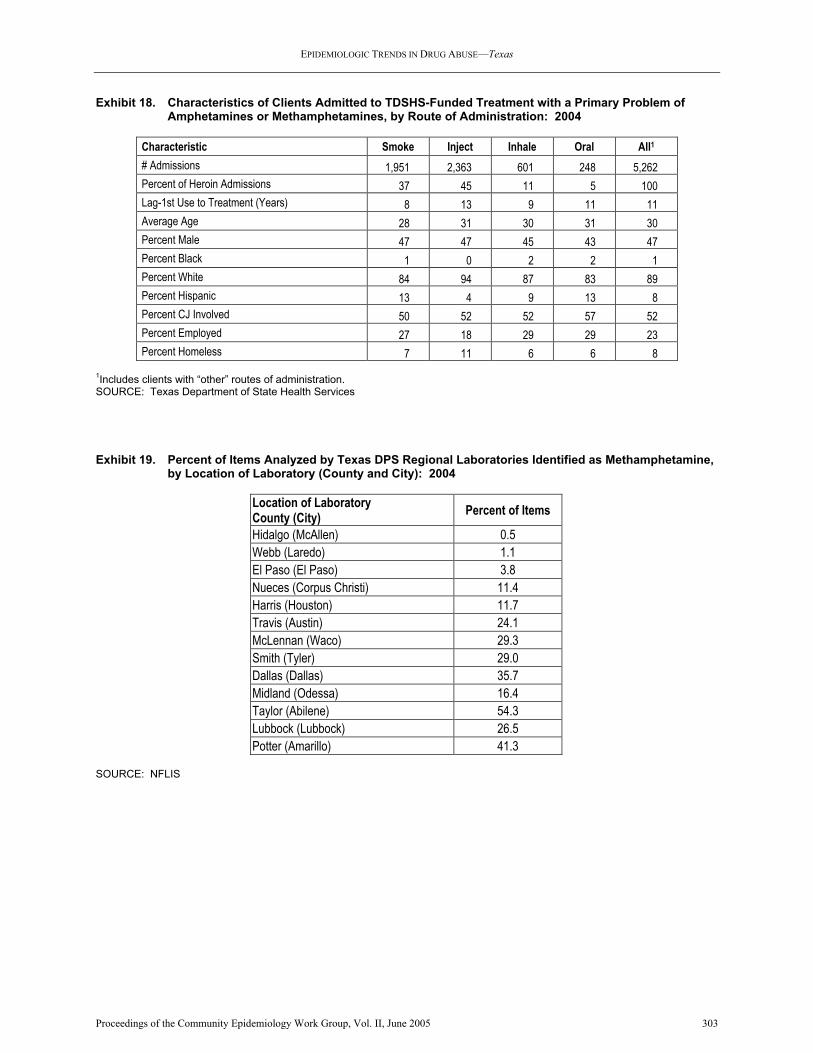
EPIDEMIOLOGIC TRENDS IN DRUG ABUSE—Texas
Proceedings of the Community Epidemiology Work Group, Vol. II, June 2005 303
Exhibit 18. Characteristics of Clients Admitted to TDSHS-Funded Treatment with a Primary Problem of Amphetamines or Methamphetamines, by Route of Administration: 2004
Characteristic Smoke Inject Inhale Oral All1 # Admissions 1,951 2,363 601 248 5,262 Percent of Heroin Admissions 37 45 11 5 100 Lag-1st Use to Treatment (Years) 8 13 9 11 11 Average Age 28 31 30 31 30 Percent Male 47 47 45 43 47 Percent Black 1 0 2 2 1 Percent White 84 94 87 83 89 Percent Hispanic 13 4 9 13 8 Percent CJ Involved 50 52 52 57 52 Percent Employed 27 18 29 29 23 Percent Homeless 7 11 6 6 8
1Includes clients with “other” routes of administration. SOURCE: Texas Department of State Health Services Exhibit 19. Percent of Items Analyzed by Texas DPS Regional Laboratories Identified as Methamphetamine, by Location of Laboratory (County and City): 2004 SOURCE: NFLIS
Location of Laboratory County (City) Percent of Items
Hidalgo (McAllen) 0.5 Webb (Laredo) 1.1 El Paso (El Paso) 3.8 Nueces (Corpus Christi) 11.4 Harris (Houston) 11.7 Travis (Austin) 24.1 McLennan (Waco) 29.3 Smith (Tyler) 29.0 Dallas (Dallas) 35.7 Midland (Odessa) 16.4 Taylor (Abilene) 54.3 Lubbock (Lubbock) 26.5 Potter (Amarillo) 41.3

EPIDEMIOLOGIC TRENDS IN DRUG ABUSE—Texas
Proceedings of the Community Epidemiology Work Group, Vol. II, June 2005 304
1998
, 1.1%
1998
, 1.7%
1998
, 1.4%
1999 19
99
199920
00
2000
2000
2001
2001
2001
2002
2002
2002
2003
2003
2003
2004
, 3.4%
2004
, 0.7%
2004
, 0.9%
0.0%
0.5%
1.0%
1.5%
2.0%
2.5%
3.0%
3.5%
4.0%
4.5%
5.0%
Alprazolam Diazepam Clonazepam
Exhibit 20. Benzodiazepines Identified by DPS Labs in Texas: 1998–2004 SOURCE: NFLIS Exhibit 21. Characteristics of Clients Admitted to TDSHS-Funded Treatment with a Primary, Secondary, or Tertiary Problem with Club Drugs: 2004 Characteristic GHB Hallucinogens Ecstasy PCP Ketamine Rohypnol # Admissions 45 266 561 295 7 221 Percent Male 33 75 54 57 100 75 Percent White 89 61 55 9 57 1 Percent Hispanic 4 25 21 10 43 97 Percent Black 0 12 20 81 0 0 Average Age (Years) 29 23 23 25 18 19 Percent Criminal Justice Involved 44 64 63 56 100 67 Percent History Needle Use 47 25 23 4 43 15 Percent Primary Drug=Club Drug 24 20 14 43 14 13 Other Primary Drug Percent Marijuana 2 42 36 30 43 48 Percent Alcohol 11 12 8 8 0 9 Percent Methamphet/Amphetamines 56 8 16 1 0 1 Percent Powder Cocaine 0 7 12 6 14 11 Percent Crack Cocaine 2 3 6 10 0 7 Percent Heroin 0 2 1 1 8 9 SOURCE: Texas Department of State Health Services

EPIDEMIOLOGIC TRENDS IN DRUG ABUSE—Texas
Proceedings of the Community Epidemiology Work Group, Vol. II, June 2005 305
1998
, 1.0%
1998
, 0.1%
1998
, 0.2%
1998
, 0.6%19
99
1999
1999 19
99
1999
2000
2000
2000
2000
2000
2001
2001
2001
2001
2001
2001
2002
2002
2002
2002
2002
2002
2003
2003
2003
2003 20
03
2003
2004
, 0.0%
2004
, 1.2%
2004
, 0.3%
2004
, 0.1%
2004
, 0.2%
2004
, 0.0%
0.0%
0.2%
0.4%
0.6%
0.8%
1.0%
1.2%
1.4%
1.6%
1.8%
LSD Ecstasy PCP Ketamine GHB, GBL, 1-4BD Rohypnol
0%
2%
4%
6%
8%
10%
12%
14%
Grade 7 Grade 8 Grade 9 Grade 10 Grade 11 Grade 12
NonborderBorder
Exhibit 22. Club Drugs Identified by DPS Labs in Texas: 1998–2004 SOURCE: NFLIS Exhibit 23. Percentage of Border and Nonborder Texas Secondary Students Who Had Ever Used Rohypnol, by Grade: 2004 SOURCE: Texas Department of State Health Services

EPIDEMIOLOGIC TRENDS IN DRUG ABUSE—Texas
Proceedings of the Community Epidemiology Work Group, Vol. II, June 2005 306
20% 21%18%
16%14% 13%
0%
5%
10%
15%
20%
25%
Grade 7 Grade 8 Grade 9 Grade 10 Grade 11 Grade 12
Lifetime UsePast-Month Use
Exhibit 24. Percentage of Texas Secondary Students Who Had Used Inhalants Ever or in the Past Month, by Grade: 2004 SOURCE: Texas Department of State Health Services Exhibit 25: Exposures Involving Misuse or Abuse of Inhalants: 1998–2004 Product 1998 1999 2000 2001 2002 2003 2004 Total Aerosol 4 3 9 3 10 4 22 55 Amyl/Butyl Nitrite 1 2 1 1 8 2 15 Carburetor Cleaner, Auto Fluids 11 12 19 30 34 46 67 219 Freon/Other Propellants 23 24 21 20 23 15 29 155 Gasoline 24 19 16 18 18 6 21 122 Lighter Fluid/Propane 19 15 12 5 11 7 8 77 Nitrous Oxide 4 4 2 5 4 2 7 28 Paint 46 35 33 26 31 15 31 217 Toluene/Mineral Spirits 13 25 19 16 14 6 13 106 Correction Fluid 2 4 3 1 3 2 3 18 SOURCE: Texas Poison Center Network

EPIDEMIOLOGIC TRENDS IN DRUG ABUSE—Texas
Proceedings of the Community Epidemiology Work Group, Vol. II, June 2005 307
0%10%20%30%40%50%60%70%80%90%
100%
1987 1988 1989 1990 1991 1992 1993 1994 1995 1996 1997 1998 1999 2000 2001 2002 2003 2004
MSM-BiSexualMSM&IDUIDUHeterosexual
Exhibit 26. Texas HCV Exposures and Their Demographics: 2004
Demographic Percent Overall 17.8 By Mode of Exposure
Injection Drug Exposure 40.7 Medical exposure 13.3 Tattoo or piercing 5.3 Occupational 2.8 Other blood/needle 3.4 Sexual risk 7.6 Shared snorting equipment 3.3 No disclosed risk 5.1
Gender (%) Male 19.3 Female 15.3
Race/Ethnicity (%) Hispanic 12.1 Non-Hispanic 20.8 White 16.8 Black 20.4
Age Group (%) 13–19 2.3 20–24 6.3 25–29 11.5 30–39 23.8 40 and older 35.3
SOURCE: Texas Department of State Health Services Exhibit 27. AIDS Cases1 in Texas by Mode of Exposure: 1987–2004 SOURCE: Texas Department of State Health Services

EPIDEMIOLOGIC TRENDS IN DRUG ABUSE—Texas
Proceedings of the Community Epidemiology Work Group, Vol. II, June 2005 308
0%
20%
40%
60%
80%
100%
1987 1988 1989 1990 1991 1992 1993 1994 1995 1996 1997 1998 1999 2000 2001 2002 2003 2004
Hispanic MaleBlack MaleWhite MaleHispanic FemaleBlack FemaleWhite Female
Exhibit 28. Texas Male and Female AIDS Cases by Race/Ethnicity: 1987–2004 SOURCE: Texas Department of State Health Services Exhibit 29. Characteristics of Clients Admitted to TDSHS-Funded Treatment Who Used Needles: 2004
Characteristics Heroin Cocaine Stimulants # Admissions 4,651 900 2,363 Percent of Needle Admits\Drug 86 6 45 Lag-1st Use to Treatment (Years)-Yrs. 16 15 13 Average Age 37 35 31 Percent Male 71 62 47 Percent Black 6 5 0 Percent White 37 63 94 Percent Hispanic 55 29 4 Percent CJ Involved 31 46 52 Percent Employed 12 13 18 Percent Homeless 12 11 11
SOURCE: Texas Department of State Health Services

EPIDEMIOLOGIC TRENDS IN DRUG ABUSE—Texas
Proceedings of the Community Epidemiology Work Group, Vol. II, June 2005 309
Exhibit 30. Adult and Youth Admissions to TDSHS-Funded Programs: 2004
Primary Substance Total Admissions
% of All Admissions Average Age Average Age
1st Use Avg. Lag-1st
Use to Admission
% First Treatment
Percent Married
Total 53,204 100.0 32.5 19.2 14.0 43.8 20.4 Opiates 8,238 15.5 35.7 22.6 14.0 25.9 19.9 Alcohol 14,410 27.1 37.2 15.6 23.0 41.4 19.0 Depressants 706 1.3 28.8 21.8 8.0 42.8 22.0 Amphetamines 5,268 9.9 29.7 19.7 11.0 50.8 20.3 Cocaine 4,339 8.2 30.5 20.7 10.0 50.3 23.3 Marijuana 10,254 19.3 21.6 13.9 8.0 66.9 25.5 Hallucinogens 180 0.3 25.1 18.9 7.0 38.9 8.3 Other Drugs 285 0.5 23.7 18.5 6.0 53.0 24.2 Crack Cocaine 9,524 17.9 37.2 26.0 12.0 31.0 16.4
Primary Substance Percent Male
% Use Needles
% History of IV Drug Use
Percent Black
Percent White
Percent Hispanic
% Involved With CJ or
Legal System
Total 61.0 19.0 32.7 19.4 48.9 29.7 26.9 Opiates 57.2 62.8 73.1 8.6 51.6 38.2 12.7 Alcohol 67.7 5.9 23.1 13.8 57.9 26.1 26.9 Depressants 37.4 6.5 21.2 5.4 76.2 17.0 22.5 Amphetamines 46.5 45.5 57.6 0.9 88.9 8.2 23.1 Cocaine 55.9 21.8 29.9 11.2 36.0 50.8 28.9 Marijuana 72.3 1.8 6.7 21.9 32.5 43.1 53.1 Hallucinogens 56.7 6.1 7.8 70.0 19.4 10.6 27.2 Other Drugs 55.8 9.1 15.8 15.4 35.8 43.5 32.6 Crack Cocaine 54.2 5.1 29.3 49.0 33.3 16.3 12.2
Primary Substance Percent Employed
% Employed Over Last 12
Months
Average Education
(Years) Percent
Homeless Average
Income at Admission
# of Women Pregnant at Admission
% On Medication
Total 3.8 48.5 11.3 11.1 $5,716 1,081 21.5 Opiates 2.9 30.1 11.6 9.5 $4,394 115 34.0 Alcohol 4.6 45.8 11.9 12.7 $7,250 99 22.5 Depressants 3.3 44.2 11.5 6.4 $4,823 14 32.2 Amphetamines 3.8 51.6 11.6 8.4 $5,570 185 17.4 Cocaine 4.3 50.7 11.2 7.0 $5,986 152 17.0 Marijuana 4.8 75.7 10.0 7.4 $5,834 242 12.5 Hallucinogens 3.1 58.9 11.0 9.4 $3,312 8 17.8 Other Drugs 2.8 62.8 10.3 7.7 $8,495 9 24.2 Crack Cocaine 2.9 36.4 11.7 17.8 $4,539 257 22.5
(Continued)

EPIDEMIOLOGIC TRENDS IN DRUG ABUSE—Texas
Proceedings of the Community Epidemiology Work Group, Vol. II, June 2005 310
Exhibit 30. Adult and Youth Admissions to TDSHS-Funded Programs: 2004 (Continued)
Primary Substance %
Emergency Room Visit
% Sickness or Health Problems
% Employment
Problems
% Family or Marital
Problems
% Social/ Peer
Problems
% Psych/ Emotional Problems
% Drug/ Alcohol
Problems Total 33.8 24.8 51.2 48.9 39.9 41.6 67.6 Opiates 40.0 29.5 63.7 60.4 51.9 45.8 84.5 Alcohol 38.2 26.3 52.0 48.4 40.5 45.9 69.7 Depressants 46.5 31.0 53.3 55.1 40.5 52.5 71.2 Amphetamines 40.3 27.3 56.5 56.1 43.6 52.8 73.4 Cocaine 32.6 21.9 46.5 46.4 34.7 37.5 61.5 Marijuana 14.9 15.0 33.7 30.4 23.1 22.2 42.0 Hallucinogens 37.8 18.9 46.1 45.0 33.3 33.9 56.1 Other Drugs 22.8 20.4 35.1 35.8 28.4 30.9 48.1 Crack Cocaine 38.8 28.8 57.7 57.0 47.2 47.7 77.2
SOURCE: Texas Department of State Health Services

EPIDEMIOLOGIC TRENDS IN DRUG ABUSE—Washington, DC
Proceedings of the Community Epidemiology Work Group, Vol. II, June 2005 311
Patterns and Trends of Drug Abuse in Washington, DC Erin Artigiani, M.A., Margaret Hsu, M.H.S., and Eric Wish, Ph.D.1
ABSTRACT Cocaine/crack, marijuana, and heroin continued to be the main illicit drug problems in Washington, DC, in 2004, while the use and availability of PCP has declined. Although cocaine/crack treatment admis-sions declined, cocaine remained one of the most se-rious drugs of abuse in the District as evidenced by the fact that more adult arrestees tested positive for cocaine than for any other drug in 2004. Pretrial Ser-vices test results indicate that PCP positives dropped sharply during this time. Juvenile arrestees were more likely to test positive for marijuana than for any other drug, but the percentage testing positive decreased slightly. Heroin treatment admissions increased slightly. While other parts of the country have seen shifts in the use of methamphetamine, use remains low and confined to isolated populations in DC. INTRODUCTION Area Description The Nation’s capital is home to approximately 570,898 people residing in 8 wards that remain largely distinguishable by race and economic status (U.S. Bureau of the Census, 2001 update). The northwest part of the city tends to be home to resi-dents who are wealthy and White, while the northeast and southeast tend to be home to residents who are poor and African-American. Slightly more females than males live in DC, and the majority of the Dis-trict’s population continues to be African-American (60 percent). Nearly one-third of the population is White (31 percent), and the remainder is primarily Hispanic and/or Asian (U.S. Bureau of the Census, 2000 Census). The population of the District is slightly older than the general U.S. population. One in five residents are younger than 18, and slightly more than 12 percent are age 65 and older. More than one-third (39.1 percent) of adults age 25 or older have at least a bachelor’s degree. (Pach et al. 2002).
1The authors are affiliated with the Center for Substance Abuse Research, College Park, Maryland. Some background material was taken from prior CEWG reports.
Data from the 2000 census reveal several key demo-graphic changes since 1990. The total population decreased by 5.7 percent during the 1990s, from 606,900 in 1990 to 572,059 in 2000. The number of African-Americans decreased by 14.1 percent, the number of Asians grew by 38.6 percent, and the number of Hispanic residents grew by 37.4 percent. The White population also grew by a much more modest 2 percent during this time period (Pach et al. 2002). Despite a nationwide economic recession, wealth distributions in the District became more polarized during 2002. Buoyed by the draw of potential income from service employment, government spending, and an established technology industry, measures of wealth such as median household income ($40,127 in the District in 1999) increased in the DC metropoli-tan region. The percentage of persons living in pov-erty also increased in many areas in and around Washington (Pach et al. 2002). One in five residents was living in poverty in 1999 (U.S. Census Bureau). Alcohol abuse costs the District approximately $700 million per year, and illicit drug use costs about $500 million per year. In fiscal year (FY) 2005, the city spent approximately $360 million to address the problem. Nearly 1 in 10 residents (approximately 60,000) are addicted to illegal drugs and/or alcohol. At least one-half (26,000–42,000) of these individu-als have co-occurring substance abuse and mental health disorders. The DC Household Survey indicates that first-time drug use occurs at a younger age in the District than in the rest of the Nation (Citywide Comprehensive Substance Abuse Strategy for the District of Columbia, 2003). Homicides in the District decreased sharply from 248 in 2003 to 198 in 2004. Drugs are still listed as one of the four most common motives behind these homi-cides, along with arguments, retaliation, and robberies. Narcotic drug law violations account for 32 percent of crime in 14 crime HotSpots identified by the Metro-politan Police Department (MPD 2/1/04–12/29/04). The major drug problems in the District continue to be cocaine/crack, marijuana, and heroin. The use and availability of phencyclidine (PCP) increased from 2000 to 2002 but decreased in 2004. The use of club drugs like methylenedioxymethamphetamine (MDMA) also appears to be decreasing. Information from the Department of Justice’s Na-tional Drug Intelligence Center (NDIC) suggests that the District has a wide variety of drug transportation options, including an extensive highway system, three major airports, and rail and bus systems. While

EPIDEMIOLOGIC TRENDS IN DRUG ABUSE—Washington, DC
Proceedings of the Community Epidemiology Work Group, Vol. II, June 2005 312
both NDIC and ethnographic information suggest that traffickers extensively use all of these options, Washington appears to be a secondary drug distribu-tion center; most drugs intended for distribution in DC are distributed first to larger cities, such as New York and Miami (Pach et al. 2002). The street-level dealing in DC was described as less organized and more free-flowing than the organized networks in these larger cities. Information from the NDIC sug-gests that Colombian drug trafficking organizations continue to play a major role in supplying opiates and cocaine to DC criminal groups of Colombian and Do-minican descent. Data Sources A number of sources were used to obtain compre-hensive information regarding the drug use trends and patterns in Washington, DC. Data for this report were obtained from the sources shown below. In ad-dition, interviews were conducted with a sample of substance abuse professionals in the fields of criminal justice, public health, and recovery. • Emergency department (ED) data were de-
rived for 2004 from the Drug Abuse Warning Network (DAWN) Live! restricted-access online query system administered by the Office of Ap-plied Studies (OAS), Substance Abuse and Men-tal Health Services Administration (SAMHSA). Eligible hospitals in the Washington, DC, area totaled 34; hospitals in the DAWN sample num-bered 29, with the number of EDs in the sample totaling 30. (Some hospitals have more than one emergency department.) During this 12-month period, between 11 and 15 EDs reported data each month. The completeness of data reported by participating EDs varied by month (see ex-hibit 1a). Exhibits in this paper reflect cases that were received by DAWN as of April 13–14, 2005. All DAWN cases are reviewed for quality control. Based on this review, cases may be cor-rected or deleted. Therefore, the data presented in this paper are subject to change. Data derived from DAWN Live! represent drug reports in drug-related ED visits. Drug reports exceed the number of ED visits, since a patient may report use of multiple drugs (up to six drugs and alco-hol). The DAWN Live! data are unweighted and, thus, are not estimates for the reporting area. These data cannot be compared to DAWN data from 2002 and before, nor can preliminary data be used for comparison with future data. Only weighted DAWN data released by SAMHSA can be used for trend analysis. A full description of the DAWN system can be found at the DAWN Web site: http://dawninfo.samhsa.gov.
• Drug-related death data were derived from DAWN, OAS, SAMHSA, and annual medical ex-aminer (ME) data for 1997 to 2003. Because of changes in methodology, DAWN mortality data from 2003 cannot be compared to DAWN mortal-ity data prior to that year.
• Drug treatment data for 2000 to 2003 were ob-
tained from the Treatment Episode Data Set (TEDS), OAS, SAMHSA.
• Arrest, crime, and law enforcement action data
were derived from the Metropolitan Police De-partment (MPD) crime statistics and press releases pertaining to law enforcement action through De-cember 2004, available at www.mpdc.dc.gov.
• Arrestee urinalysis data were derived from the
District of Columbia Pretrial Services Agency for adult and juvenile arrestees for 2000 to 2004.
• Drug prices and trafficking trends were ob-
tained from the NDIC Narcotics Digest Weekly Special Issue: Illicit Drug Prices January 2004-June 2004 and the Washington-Baltimore High Intensity Drug Trafficking Area (HIDTA) “Wash-ington/Baltimore Threat Assessment” reports re-leased in 2003 and 2004.
• General information on drug use was derived from the University of Maryland’s Center for Substance Abuse Research Drug Early Warning System County indicators, DEWS Investigates re-ports, and CESAR Briefings available at www.dewsonline.org and www.cesar.umd.edu.
• Census data for the District of Columbia were
derived from the “Council of the District of Co-lumbia; Subcommittee on Labor, Voting Rights, and Redistricting; Testimony of the Office of Planning/State Data Center on Bill 14-137, The Ward Redistricting Amendment Act of 2002.”
• Test results on drug items analyzed by local
crime lab(s) were obtained from the National Fo-rensic Laboratory Information System (NFLIS).
• Regional counts on methamphetamine labs
seized were obtained from the El Paso Intelli-gence Center’s (EPIC) National Clandestine Laboratory Seizure Database.
• Additional information was provided by the
human immunodeficiency virus (HIV)/acquired immunodeficiency syndrome (AIDS) Administra-tion and members of the DC Epidemiology Workgroup.

EPIDEMIOLOGIC TRENDS IN DRUG ABUSE—Washington, DC
Proceedings of the Community Epidemiology Work Group, Vol. II, June 2005 313
DRUG ABUSE PATTERNS AND TRENDS Cocaine/Crack Cocaine, particularly in the form of crack, remains the most serious drug of abuse in the District, ac-counting for more ED reports, adult arrestee positive drug tests, and drug-related deaths than any other drug. Only heroin has a higher percentage of treat-ment admissions. Cocaine is most often sold at open-air markets in the poorer parts of the city and is de-creasing in price. The NDIC reported that powder cocaine sold for $27,500 to $28,000 per kilogram and $60 to $100 per gram during the first 6 months of 2004. Crack sells for slightly more: $28,000 to $34,000 per kilogram and $80 to $100 per gram. NFLIS data for 2004 show that analyzed drug items were more likely to test positive for cocaine than for any other drug; cocaine-positive items represented 44 percent of all items analyzed by NFLIS. Cocaine is smuggled into the District from New York, Miami, Los Angeles, or Philadelphia. Unweighted DAWN Live! data show that cocaine was the most frequently involved substance in ED reports. Of the 2,849 ED reports for cocaine in 2004, 61 percent were male, 74 percent were Black, and 20 percent were White (exhibits 1b and 1c). Nearly three-quarters (74 percent) were age 35 or older, 19 percent were age 25–34, and 7 percent were between the ages of 18 and 25. Cocaine-involved deaths totaled 58 in 2002, 27 of which were single-drug deaths (exhibit 2a). These 58 deaths represented an increase from 2001, when the total was 42, and from 2000, when the total was 54. In 2003, 87 cocaine-related deaths occurred (exhibit 2b). Due to changes in methodology, however, this number cannot be compared to prior years. Nearly one-half (43 percent) of these deaths in 2003 were single-drug deaths. In 2003, cocaine was the primary substance of abuse among approximately 29 percent of treatment admis-sions reported to TEDS, with 19 percent reporting smoked cocaine (referred to as “crack” here) (exhibit 3a). The percentage of primary admissions for non-smoked cocaine (referred to as “powder” here) in-creased 51 percent from 474 admissions in 2001 to 717 in 2002, while those for crack decreased 19 per-cent from 1,450 to 1,172 during this time. In 2003, the number of admissions for crack (912) continued to decrease. Admissions for powder cocaine de-creased for the first time since 2000. Treatment ad-missions in 2003 with powder cocaine and crack co-caine as the primary drugs of abuse were more likely to be male (65.7 and 64.7 percent, respectively) than
female (exhibit 3b). More than 94 percent of both cocaine admissions groups were Black, and more than one-half were age 36 to 45. Reports from the DC Pretrial Services Agency indi-cate that the percentage of adult arrestees testing positive for cocaine has remained about the same since 2000 (exhibits 4a and 5). In 2004, 37 percent of adult arrestees in DC tested positive for cocaine; in 2004, 3.3 percent of juveniles tested positive. The percentage of juveniles testing positive for cocaine appears to have decreased slightly from 2003 to 2004 (exhibits 4b and 6). Heroin Heroin is one of the three leading drug problems in the District, along with cocaine and marijuana. The MPD describes crack as a weekend drug, but heroin as having a more steady ongoing market. The NDIC reported that heroin sold for $74,000–$110,000 per kilogram and $100–$110 per gram during the first 6 months of 2004. NFLIS data for 2004 show that ap-proximately 10 percent of analyzed drug items tested positive for heroin. The number of heroin abusers in the District contin-ued to increase in 2003, with estimates of 14,000 to 18,000 abusers according to the Washing-ton/Baltimore HIDTA. Most heroin is from South America, although Southeast Asian and Southwest African heroin are still distributed by various groups. Purity ranged from 20.8 percent (South American) to 22.7 percent pure (Southeast Asian). Northwest Washington is frequented by White suburban users purchasing high-purity heroin, while eastern Wash-ington is frequented by more well-established sellers and long-term addicts. Eastern Washington experi-ences higher levels of trafficking and associated vio-lence. Unweighted DAWN Live! data show that there were 1,486 heroin ED reports in 2004 (exhibit 1b). Nearly two-thirds (65 percent) of these patients were male; 71 percent were Black and 24 percent were White (exhibit 1c). More than three-quarters (78 percent) were age 35 or older. Of the 20 heroin-involved deaths in 2002, 4 were single-drug deaths (exhibit 2a). The number of deaths in 2002 was substantially lower than in 1997–2000, but it was an increase from 2001; deaths peaked at 53 in 1998. Eighty-one opiate-related deaths occurred in 2003 (exhibit 2b); five were specified as heroin. Be-cause of changes in methodology, however, these numbers can not be compared to prior years. All of the heroin deaths in 2003 involved multiple drugs.

EPIDEMIOLOGIC TRENDS IN DRUG ABUSE—Washington, DC
Proceedings of the Community Epidemiology Work Group, Vol. II, June 2005 314
In 2003, heroin was the primary substance of abuse for 41.9 percent of treatment admissions, a steady increase from 2000 (exhibit 3a). Of the 2,023 primary heroin admissions in 2003, approximately 72 percent were male and 96 percent were Black (exhibit 3b). More than three-quarters (84 percent) were age 36–55. As with cocaine, reports from the DC Pretrial Ser-vices Agency indicate that the percentage of adult arrestees testing positive for opiates has remained about the same since 2001 (exhibits 4a and 5). In 2004, 10 percent of adult arrestees tested positive for opiates. Juvenile arrestees were not tested for opiates during this time. Other Opiates/Narcotics Unweighted DAWN Live! data show 836 ED reports for opiates/opioids in 2004. Of these 836 reports, oxycodone/combinations accounted for 296 (35 per-cent) and hydrocodone/combinations accounted for 78 (9 percent). More than one-quarter (28 percent) of opiates/opioids reports were for overmedication, and 20 percent involved individuals seeking detox. More than one-half (53 percent) were designated “other.” Twenty-six deaths involving narcotic analgesics were reported in 2002. This is a substantial increase from the 6 in 2001 and the 15–22 reported in the prior 3 years (exhibit 2a). The number of deaths involving methadone in the DC Metropolitan Area increased from 15 in 2001 to 18 in 2002. Two of the 2002 deaths occurred in DC. Eighty-one opiate-related deaths occurred in 2003; 20 were specified as metha-done and 63 were listed as other opiates (exhibit 2b). Because of changes in methodology, however, these numbers cannot be compared to prior years. Five of the methadone deaths in 2003 were single-drug deaths. Other opiates were the primary substance of abuse among 0.3 percent of the 4,832 treatment admissions in 2003. This percentage has remained about the same since 2000 (exhibit 3a). Oxycodone and metha-done combined accounted for less than 1 percent of analyzed drug items reported to NFLIS. Marijuana Marijuana is widely used in the District as it is in many other jurisdictions. Commercial-grade and high-grade marijuana are available for wide ranging, but relatively stable, prices. Most of the marijuana is transported into the District via package delivery ser-vices by Mexican and Jamaican trafficking organiza-tions, according to the most recent NDIC and HIDTA threat assessments. Marijuana is most often smoked
in blunts or joints, which can be combined with rocks of cocaine or dipped in liquid PCP. Popular types of marijuana in the District and Maryland suburbs in-clude “chronic,” “kind bud,” “purple haze,” “blue-berry,” and “orange tulip.” All of these types are re-puted to have high levels of tetrahydrocannabinol (THC). The NDIC reported that commercial grade marijuana sold for $1,800 per pound and Hydro sold for $5,000 per pound during the first 6 months of 2004. Joints sold for $5 to $10 during this time. NFLIS data for 2004 show that approximately 35 percent of analyzed drug items tested positive for marijuana, which makes marijuana the second most frequently found drug. Unweighted DAWN Live! data show 1,255 ED mari-juana reports in 2004 (exhibit 1b). More than two-thirds of these patients were male (68 percent), 58 percent were Black, and 34 percent were White (ex-hibit 1c). Twenty-nine percent were patients age 18–24, 23 percent were patients age 25–34, and 31 per-cent were those age 35 and older. Seventeen percent of the marijuana ED patients were age 12–17. Marijuana in combination with other drug(s) was involved in one death in the District in 2001 and one in 2000 (exhibit 2a). No marijuana-involved deaths were reported in 2002 or in 2003. Marijuana was the primary substance of abuse for 7.0 percent of the 2003 treatment admissions, compared with 6.4 percent in 2001 and 8.0 percent in 2000 (ex-hibit 3a). More than three-quarters of the 336 primary marijuana admissions in 2003 were male, and nearly 87.8 percent were Black (exhibit 3b). Approximately one-third (32.7 percent) of these admissions were age 12–17, and more than one-quarter (28.6 percent) were age 18–25. The DC Pretrial Services Agency does not test adult arrestees for marijuana, but more than one-half of juveniles tested positive for marijuana each year be-tween 2000 and 2003. During 2004, 49 percent of juveniles tested positive for marijuana (exhibits 4b and 6). The proportion of juveniles testing positive for marijuana has been decreasing slowly since 1999. Phencyclidine According to the MPD, the number of adult arrests related to PCP increased 65 percent between 2001 and 2002 (from 142 to 234). According to the Washing-ton/Baltimore HIDTA 2003 Threat Assessment, PCP was rapidly becoming the drug of choice at raves and nightclubs, sometimes used in combination with mari-juana and/or MDMA (ecstasy). In 2004, however, PCP

EPIDEMIOLOGIC TRENDS IN DRUG ABUSE—Washington, DC
Proceedings of the Community Epidemiology Work Group, Vol. II, June 2005 315
use began to decline, and PCP use is still well behind that of crack and marijuana. While most PCP is transported to the District from southern California, the seizure of precursor chemi-cals and PCP at a clandestine laboratory in Baltimore in 2004 indicates the drug has been produced in the region. No clandestine labs have been identified to date in the District. NFLIS data for 2004 show that approximately 2 percent of analyzed drug items tested positive for PCP, making it the fifth most fre-quently found drug after cocaine, marijuana, heroin, and methamphetamine. According to unweighted DAWN Live! data, there were 289 ED PCP reports in 2004 (exhibit 1b). There were 27 PCP deaths in the metropolitan area in 2002, including 8 in the District and 14 in Prince George’s County, Maryland. The number of deaths in the District increased from three in 2001 (data not shown). In 2003, the DAWN methodology was changed. PCP-related deaths are now only included in the hallucinogens category. There were five hallu-cinogens-related deaths in 2003. (DAWN Metro Area Profiles and Area Spotlights, 2001, 2002, 2003.) In 2003, PCP was the primary substance of abuse among 3.9 percent of treatment admissions, an in-crease from 2001 (1.8 percent) and 2000 (0.7 per-cent) (exhibit 3a). Of the 189 primary PCP admis-sions in 2003, nearly two-thirds were male, and nearly all were Black (exhibit 3b). More than one-half (55 percent) were age 18–25, and one-third (33 percent) were 26–35. Data from the DC Pretrial Services Agency show a rise in PCP use, from the low single digits in the late 1990s to the mid-teens (exhibits 5 and 6) in 2002 and 2003. But PCP use among adult arrestees declined in 2004 to 6 percent (a steady decrease from 10.6 per-cent in January to 3 percent in May; for the remain-der of the year, positives ranged between 4 and 7 percent). Trend data from 1987 to the present indicate that PCP use in the juvenile arrestee population has mirrored that of the adult arrestee population (exhib-its 4a and 4b), with spikes in the late 1980s, mid-1990s, and again in the current decade. The propor-tion of juveniles testing positive for PCP decreased from 13.4 percent in 2002 to 1.9 percent in 2004 (ex-hibits 4b and 6). Amphetamine/Methamphetamine Abuse of amphetamines and methamphetamine does not appear to be a major problem in the District. Five deaths involving amphetamines (2) or methampheta-
mine (3) were reported from 1997 to 2002. One methamphetamine-involved death and one ampheta-mine-involved death were reported in 2002 (exhibit 2a). Methamphetamine and amphetamine were not included in the DAWN 2003 Area Profile. From 2000 through 2003, amphetamines accounted for less than 1 percent of all treatment admissions in the District (exhibit 3a). Admissions involving methamphetamine as a substance of abuse increased steadily from 1 in 1998 to 47 in 2001 (exhibit 3c). In 2002, only 29 methamphetamine mentions occurred among treatment admissions, a decrease of 38 per-cent from 2001 (exhibit 3c). Unweighted DAWN Live! data show amphetamine ED reports totaled 79 in 2004 and methamphetamine ED reports totaled 31 (exhibit 1b). Nearly two-thirds (61 percent) of the methamphetamine patients were White and 87 percent were male. Nearly one-third (32 percent) of the methamphetamine ED patients were age 18–24, 48 percent were 25–34, and 16 per-cent were 35 and older. Three percent were age 12–17. The Washington/Baltimore HIDTA and other mem-bers of the DC Epidemiological Workgroup report that methamphetamine use is established in the ho-mosexual community. The Whitman Walker Addic-tion Services Clinic, which specializes in treating the gay/lesbian/bisexual/transsexual community, cur-rently reports that 75 percent of outpatient admissions report crystal methamphetamine use. This is an in-crease from 50–60 percent in 2001 and 35 percent in 2000. Detectives from the Metropolitan Police De-partment report that both tablet and powder metham-phetamine is visible in the Washington, DC, club scenes. NFLIS data for 2004 show that approximately 3 per-cent of analyzed drug items tested positive for methamphetamine, making it the fourth most fre-quently found drug. The NDIC reported that methamphetamine sold for $4,800 per one-half pound, and 8-balls sold for $400 during the first 6 months of 2004. The DC Pre-trial Services Agency does not regularly test for methamphetamine, but a special study testing for methamphetamine and am-phetamine found a positive rate of less than 1 percent among all specimens tested.
As in the District, the demand for and availability of methamphetamine in Maryland is extremely low compared to other drugs. Methamphetamine users in Maryland tend to be Caucasian males, particularly youth, those involved with the rave and club scenes, and middle- to lower-class blue collar workers.
EPIDEMIOLOGIC TRENDS IN DRUG ABUSE—Washington, DC
Proceedings of the Community Epidemiology Work Group, Vol. II, June 2005 316
Methamphetamine use is more prevalent in the rural western, eastern, and southern parts of the State. From January 2003 to May 2004, law enforcement officials report that there were eight methampheta-mine labs seized in Maryland: two in Garrett, one in Washington, three in Charles, one in Prince George's, and one in Cecil Counties. Additional information on methamphetamine trends in Maryland is available in the CESAR Briefing: Methamphetamine in Maryland at www.cesar.umd.edu. Although there is little indication that methampheta-mine is an emerging problem in the District, there have been increases in the number of methampheta-mine labs seized in several of the States surrounding the District. For example, 8 methamphetamine labs were seized in Virginia in 1999, compared to 23 in 2003. In West Virginia and Pennsylvania, the number of labs seized has increased even more dramatically during this period, from 3 to 52 and 1 to 49, respec-tively. The Washington Post reported that nearly all of the methamphetamine seized in Virginia in 2004 was found in the Shenandoah Valley, and methampheta-mine is the primary drug seized along the north-south corridor between Winchester and Harrisonburg. A special report on methamphetamine from the Wash-ington/Baltimore HIDTA explains this trend further. The cities of Harrisonburg and Strasburg, Virginia, in particular, are highlighted by law enforcement as having a substantial methamphetamine presence. According to law enforcement, the primary users in these areas are rural, White, working-class adults, while the sellers are primarily Latino. Rival Hispanic criminal groups such as MS-13 and South Side Locos in Strasburg have collaborated in the sale of metham-phetamine since early 2004, increasing the chance that methamphetamine may increase in the area be-cause of the presence of MS-13 in Maryland. Prescription Stimulants Drug Early Warning System (DEWS) staff at CESAR recently launched the Student Drug Research (SDR) survey, a new tool for monitoring drug trends among college students. The SDR survey provides a unique opportunity to collect useful and timely in-formation about emerging drugs and patterns of use among college students. A panel of 26 undergraduate student reporters (SRs) at the University of Maryland College Park has participated in 2 surveys of their perceptions of drug availability and use by their peers. In the March and April 2005 surveys, nearly all re-spondents reported that alcohol, marijuana, and Ad-
derall® were easy or very easy to get around campus. Another prescription stimulant, Ritalin®, was rated as easy or very easy to get by more than one-half of the respondents. Non-medical use of prescription stimulants was perceived to be widespread. Prescrip-tion stimulants were used most often to study for and focus on exams. Student reporters rated the use of prescription stimulants for studying to be much less harmful than using them to party or mix with alcohol or other drugs. The SDR findings are obtained from a panel of stu-dents oversampled to include students likely to be familiar with drug use. They are not representative of the general student population. In the coming year, DEWS staff plan to expand the sample of SRs to in-clude “lower risk” students who may have little knowledge or experience with drug use. The larger sample will enable staff to put the responses from the higher risk group into the context of the general stu-dent population. Monthly reports are available on the CESAR Web site at www.cesar.umd.edu. A DEWS Investigates report on these results will also be re-leased. Other Drugs Abuse of club drugs, such as MDMA, gamma hydroxybutyrate (GHB), and ketamine, is also relatively low in the District. MDMA is the most readily available and frequently abused “club drug,” selling for $18 to $25 per tablet in the fourth quarter of 2002, according to the DEA Washington Division. The Washington/Baltimore HIDTA estimated a slightly lower range for the cost per dosage unit: $10 to $20. MDMA is most frequently used and distributed by teens and young adults at raves and nightclubs. MDMA is typically driven to the District from New York, Philadelphia, Orlando, and Miami by Dominican and Asian trafficking organizations. According to unweighted DAWN Live! data, there were 83 ED reports for MDMA, 9 for GHB, and 8 for lysergic acid diethylamide (LSD) in 2004 (exhibit 1b). Only one ED report was for ketamine. MDMA and methylenedioxyamphetamine (MDA) each ac-counted for approximately 1 percent of analyzed drug items tested through NFLIS in 2004. GHB and keta-mine were each found in less than 1 percent of ana-lyzed drug items tested through NFLIS in 2004. No drug items tested positive for LSD. No deaths involv-ing club drugs were reported in the DAWN mortality data for 1997–2002 (exhibit 2a). No deaths involving club drugs were reported in 2003, but five hallucino-gen-related deaths were reported. All of these deaths involved multiple drugs. Because of changes in

EPIDEMIOLOGIC TRENDS IN DRUG ABUSE—Washington, DC
Proceedings of the Community Epidemiology Work Group, Vol. II, June 2005 317
methodology, however, these numbers can not be compared to prior years. Benzodiazepines are reported in the DAWN ED and mortality reports. In 2004, unweighted DAWN Live! data show 549 ED benzodiazepines reports. One death in 2001 was attributed solely to benzodiazepines (ex-hibit 2a); however, in the 1997 to 2000 time period, mentions of benzodiazepines in the mortality data ranged between 10 and 13. In 2002, four deaths were attributed to multiple drugs including benzodiazepines. In 2003, five deaths involving benzodiazepines and multiple drugs were reported (exhibit 2b). Unweighted 2004 DAWN Live! data show 2,518 ED alcohol reports (exhibit 1b). DAWN mortality data show a decrease in mentions of deaths involving alco-hol in combination with other drugs—from 29 in 1997 to 17 in 2001, with a peak of 44 in 1998. Alcohol-involved deaths more than doubled in 2002 to 37 (ex-hibit 2a). Fifty-one deaths in 2003 involved alcohol (exhibit 2b). In 2003, primary alcohol admissions ac-counted for approximately 18 percent of all treatment admissions, a slight decline from 2000 and 2001. INFECTIOUS DISEASES RELATED TO SUBSTANCE ABUSE The diagnosis of AIDS cases increased rapidly from 1982 to 1993, when they peaked at 1,342 cases. The number of cases decreased 49 percent from 1993 to 2001, but increased 37.5 percent between 2001 and 2002. There were 943 diagnosed cases in 2002, the last year for which data are available. The number of male cases decreased steadily from 1998 to 2001, but increased in 2002. Males accounted for 70 percent of cases diagnosed in 2002. Almost three-quarters of the diagnoses in 2002 occurred among 30–49-year-olds (exhibit 7). Almost two-thirds (62 percent) of people in DC diagnosed with AIDS in 2002 were Black, and about 21 percent had a history of injection drug use. The rate of AIDS deaths decreased from 47 per 100,000 in 1998 to 25 per 100,000 in 2003, according to the HIV/AIDS Epidemiologic Profile for the Dis-trict of Columbia 2004. Of the new AIDS diagnoses in 2004, 150 were related to intravenous drug use. DC EPIDEMIOLOGY WORKGROUP In 2003, the Mayor’s Interagency Task Force on Sub-stance Abuse Prevention, Treatment, and Control was established and charged with four goals: educate and
empower DC residents to live healthy and drug-free lifestyles; develop and maintain a continuum of care that is efficient, effective, and accessible to individuals needing treatment; increase the public’s safety and improve treatment access for offenders to ensure fair and effective administration of justice in the District; and encourage a coordinated and focused regional response to the problem of substance abuse. The task force is chaired by the District’s Addiction Prevention and Recovery Administration (APRA) and co-chaired by the Metropolitan Police Department. The first Citywide Comprehensive Substance Abuse Strategy was released in 2004 and was updated ear-lier this year. To assess progress on implementing the strategy and reaching the goals, APRA convened the DC Epidemiology workgroup. The Workgroup has assessed national and local data sources and iden-tified more than 40 indicators of the consumption of alcohol, tobacco, and other drugs and the health and social consequences of drug use. Topics covered in-clude current use, lifetime use, age of initial use, cigarette and ethanol consumption per capita, treat-ment admissions, drug intoxication deaths, drug law violations, AIDS diagnoses related to injection drug use, poison center calls, motor vehicle crashes, and substance abuse issues in child neglect and abuse investigations. The indicators are based on indicators developed by the Center for Substance Abuse Pre-vention (CSAP) as a part of the SPF SIG program and indicators monitored by CESAR in Maryland as a part of the Drug Early Warning System. Future issues of this report will begin to highlight the data collected and analyzed by the Workgroup. REFERENCES Citywide Comprehensive Substance Abuse Strategy
for the District of Columbia, 2003 Pach, A.; Brown, J.; Hendrickson, J.; Odom, T.; and
Nemes, S. “Patterns and Trends of Drug Abuse in Washington, D.C.” Epidemiologic Trends in Drug Abuse, Volume II: Proceedings of the Community Epidemiology Work Group June 2002. Washington, D.C.: National Institute on Drug Abuse, 2002.
For inquiries concerning this report, please contact Eric Wish, Ph.D., Director, Center for Substance Abuse Research, University of Maryland, 4321 Hartwick Road, Suite 501, College Park, MD 20740, Phone: 301-405-9770, Fax: 301-403-8342, E-mail: <[email protected]>.

EPIDEMIOLOGIC TRENDS IN DRUG ABUSE—Washington, DC
Proceedings of the Community Epidemiology Work Group, Vol. II, June 2005 318
1
8
9
15
18
31
60
79
83
289
1,255
1,486
2,518
2,849
Ketamine
LSD
GHB
Combinations NTA
Misc. Hallucinogens
Methamphetamines
Inhalants
Amphetamines
MDMA
PCP
Marijuana
Heroin
Alcohol
Cocaine
Exhibit 1a. Data Completeness for Washington, DC, Metropolitan Area DAWN Live! Emergency Depart- ments (n=30),1 by Month: 2004
Number of EDs, by Month and Year Data Completeness Jan-
04 Feb-04
Mar-04
Apr-04
May-04
Jun-04
Jul-04
Aug-04
Sep-04
Oct-04
Nov-04
Dec-04
Basically Complete2 9 11 11 12 10 11 13 8 8 9 10 9
Partially Complete3 4 2 2 1 3 2 2 5 3 3 3 4
Incomplete4 0 0 2 0 0 1 0 2 0 2 0 1
No Data Reported 17 17 15 17 17 16 15 15 19 16 17 16 Total EDs in Sample5 30 30 30 30 30 30 30 30 30 30 30 30
1Total eligible hospitals in area = 34; Hospitals in DAWN sample = 29; Hospitals not in DAWN Sample = 5. Tables reflect cases that have been received by DAWN as of 4/14/05. 290%+ Complete; 350% to 89% Complete; 4Less than 50% Complete; 5Some hospitals in the DAWN sample have more than one emergency department. All DAWN cases are reviewed for quality control. Based on this review, cases may be corrected or de-leted. Therefore, these data are subject to change. SOURCE: DAWN Live!, OAS, SAMHSA, update 4/13–4/14/2005 Exhibit 1b. Number of Selected Drug Reports in Washington, DC, Metropolitan Area DAWN EDs (Unweighted1): 2004 1The unweighted data are from Washington, DC, metropolitan area hospitals reporting to DAWN. During calendar year 2004, be-tween 11 and 15 EDs reported data each month. All DAWN cases are reviewed for quality control. Based on this review, cases may be corrected or deleted. Therefore, these data are subject to change. 2NTA=Not tabulated above. SOURCE: DAWN Live!, OAS, SAMHSA, updated 4/13–4/14/2005

EPIDEMIOLOGIC TRENDS IN DRUG ABUSE—Washington, DC
Proceedings of the Community Epidemiology Work Group, Vol. II, June 2005 319
Exhibit 1c. Demographic Characteristics of Patients Reporting Cocaine, Heroin, and Marijuana Abuse in Washington, DC, Metropolitan Area DAWN EDs, by Percent (Unweighted1): 2004
Characteristic Cocaine Reports (n=2,849)
Heroin Reports (n=1,486)
Marijuana Reports (n=1,255)
Gender Male 61.3 65.0 68.0 Female 38.6 35.0 32.0 Race/Ethnicity White 19.5 23.6 34.2 Black 73.6 71.0 58.2 Hispanic 1.6 1.1 2.5 Race/ethnicity NTA2 0.4 0.7 1.4 Not documented 4.8 3.6 3.7 Age 17 and younger 0.7 0.2 17.4 18–24 7.1 7.2 28.7 25–34 18.5 14.4 23.3 35–44 42.8 32.0 19.3 45–54 26.3 39.0 9.6 55 and older 4.4 7.1 1.9 Not documented 0.2 0.1 0.0
1The unweighted data are from Washington, DC, metropolitan area hospitals reporting to DAWN. During calendar year 2004, between 11 and 15 EDs reported data each month. All DAWN cases are reviewed for quality control. Based on this review, cases may be corrected or deleted. Therefore, these data are subject to change. 2NTA=Not tabulated above. SOURCE: DAWN Live!, OAS, SAMHSA, updated 4/13–4/14/2005 Exhibit 2a. Drug-Related Deaths in Washington, DC: 1997–2002
Drug 1997 1998 1999 2000 2001 2002 Single-Drug
Deaths, 2002
Alcohol-in-Combination 29 44 37 26 17 37 N/A Cocaine 33 63 64 54 42 58 27 Heroin/Morphine 41 53 41 36 15 20 4 Marijuana – – – 1 1 _ _ Amphetamines – – – 1 – 1 _ Methamphetamine – 1 – 1 – 1 _ Club Drugs1 – – – – – _ _ Hallucinogens2 1 – 2 1 3 8 2 Inhalants – – – – – _ _ Narcotic Analgesics3 6 22 15 20 6 26 6 Other Analgesics 2 3 3 2 1 1 1 Benzodiazepines 13 13 11 10 1 4 _ Antidepressants 4 14 11 4 1 _ _ All Other3 7 30 18 10 1 5 1 Total Drug Deaths 79 145 121 100 53 91 41 Total Drug Mentions 136 243 202 166 88 161 41 Total Deaths Certified 1,414 1,607 1,763 1,751 1,582 1,754 N/A
1Includes ecstasy (MDMA), ketamine, GHB-GBL, and Rohypnol®. 2Includes PCP, LSD, and miscellaneous hallucinogens. 3Not tabulated above. SOURCES: DAWN, OAS, SAMHSA, updated September 2003

EPIDEMIOLOGIC TRENDS IN DRUG ABUSE—Washington, DC
Proceedings of the Community Epidemiology Work Group, Vol. II, June 2005 320
Exhibit 2b. Multidrug vs. Single-Drug Deaths in Washington, DC: 2003 SOURCE: DAWN, 2003: Area Profiles of Drug-Related Mortality Exhibit 3a. Percentages of Treatment Admissions in Washington, DC, with Abuse of Selected Substances (Primary Substance of Abuse), by Year: 2000–2003
Drug 2000 2001 2002 2003 Total Admissions (N) (6,025) (5,755) (5,659) (4,832) Cocaine (Smoked) 27.0 25.2 20.7 18.9 Cocaine (Other Form) 7.4 8.2 12.7 9.6 Heroin 35.2 37.9 39.2 41.9 Other Opiates 0.2 0.4 0.3 0.3 Marijuana 8.0 6.4 4.8 7.0 PCP 0.7 1.8 3.6 3.9 Alcohol 21.1 19.3 18.4 18.2 Amphetamines1 0.2 0.6 0.3 0.2
1Amphetamines includes methamphetamines, Benzedrine, Dexedrine, Preludin, Ritalin, and any other amines and related drugs. SOURCE: TEDS, SAMHSA
010
2030
4050
6070
8090
100
Cocaine Opiates/opioids Alcohol Antidepressants Benzodiazepines
Number
Multidrug deaths
Single drug deaths

EPIDEMIOLOGIC TRENDS IN DRUG ABUSE—Washington, DC
Proceedings of the Community Epidemiology Work Group, Vol. II, June 2005 321
0 0 2 2 110
19
47
29
010203040506070
1994 1995 1996 1997 1998 1999 2000 2001 2002
Exhibit 3b. Demographic Characteristics of Treatment Admissions in Washington, DC, by Selected Primary Drugs of Abuse and Percent: 20031
Drug Cocaine (Smoked)
Cocaine (Other Form) Heroin Marijuana PCP Ampheta-
mines3 (N=) (912) (466) (2,023) (336) (189) (10) Gender Male Female
64.7 35.3
65.7 34.3
72.0 28.0
75.9 24.1
63.0 37.0
90.0 10.0
Race/Ethnicity Black White Other2
94.8
1.2 4.0
94.4
0.9 4.8
95.8
1.8 2.3
87.8
0.9 11.3
98.4
0 1.6
10.0 90.0
0 Age Group 17 and younger 18–25 26–35 36–45 46–55 56 and older
0.2 2.7
18.3 58.2
18 2.4
0 4.5
15.8 54.5 21.9
3.2
0 1.7 9.9
45.6 38.4
4.4
32.7 28.6 20.8 12.2
5.1 0.6
2.1 55
32.8 6.3 2.7 1.1
0
10.0 30.0 60.0
0 0
1May not add up to 100 percent due to rounding. 2Primarily Hispanic or Latino. 3Amphetamines includes methamphetamines, Benzedrine®, Dexedrine®, Preludin®, Ritalin®, and any other amines
and related drugs. SOURCE: TEDS, SAMHSA Exhibit 3c. Numbers of Treatment Admissions in Washington, DC, Who Mentioned Methamphetamine as a Substance of Abuse: 1994–2002 SOURCE: TEDS, SAMHSA

EPIDEMIOLOGIC TRENDS IN DRUG ABUSE—Washington, DC
Proceedings of the Community Epidemiology Work Group, Vol. II, June 2005 322
Exhibit 4a. Percentages of Adult Arrestees in Washington, DC, Testing Positive for Selected Drugs: 2000–2004 Drug 2000 2001 2002 2003 2004 (N=) (15,630) (17,350) (17,952) (17,742) (19,531) Cocaine 33.6 34.2 35.2 34.8 36.6 PCP 9.3 12.7 14.2 13.5 6.2 Opiates 9.5 10.5 10.5 10.0 9.8 Any Drug 43.2 46.1 48.0 47.3 43.5 SOURCE: District of Columbia Pretrial Services Agency Exhibit 4b. Percentages of Juvenile Arrestees in Washington, DC, Testing Positive for Selected Drugs:
2000–2004 Drug 2000 2001 2002 2003 2004 (N=) (2,162) (2,165) (1,896) (1,899) (2,001) Marijuana 60.7 56.9 54.2 50.8 49 Cocaine 5.7 4.8 5.5 3.7 3.3 PCP 9.8 13.5 13.4 11.1 1.9 Any Drug 62.0 59.1 56.4 53.1 49.6 SOURCE: District of Columbia Pretrial Services Agency

EPIDEMIOLOGIC TRENDS IN DRUG ABUSE—Washington, DC
Proceedings of the Community Epidemiology Work Group, Vol. II, June 2005 323
Exhibit 5. Percentages of Washington, DC, Adult Arrestees Testing Positive for Any Drug, Cocaine, PCP, and Opiates: 1984–2004 SOURCE: Adapted by the Center for Substance Abuse Research (CESAR) from data from the District of Columbia Pretrial Services Agency Exhibit 6. Percentages of Washington, DC, Juvenile Arrestees Testing Positive for Any Drug,1 Cocaine, PCP, and Marijuana: 1987–2004 1Any Positive includes opiates from 1987 through mid-1994 (<1%) SOURCE: Adapted by the Center for Substance Abuse Research (CESAR) from data from the District of Columbia Pretrial Services Agency
0%
10%
20%
30%
40%
50%
60%
70%
80%
1984
1985
1986
1987
1988
1989
1990
1991
1992
1993
1994
1995
1996
1997
1998
1999
2000
2001
2002
2003
2004
Any Positive
Cocaine
Opiates
PCP
0%
10%
20%
30%
40%
50%
60%
70%
80%
1987
1988
1989
1990
1991
1992
1993
1994
1995
1996
1997
1998
1999
2000
2001
2002
2003
2004
Any Positive
Cocaine
Marijuana
PCP

EPIDEMIOLOGIC TRENDS IN DRUG ABUSE—Washington, DC
Proceedings of the Community Epidemiology Work Group, Vol. II, June 2005 324
Exhibit 7. District of Columbia Diagnosed AIDS Cases by Gender, Race/Ethnicity, Age, and Exposure: 1981–2002 1998 1999 2000 2001 2002 Cumulative
1981-2002 Characteristic # % # % # % # % # % # % Gender Male 719 72 526 74 471 69 468 68 658 70 12,098 80 Female 278 28 188 26 210 31 218 32 285 30 3,034 20 Total Cases 997 715 681 686 943 15,132 Race/Ethnicity White 112 11 88 12 68 10 59 9 46 5 2,962 20 Black 837 84 591 83 562 83 567 83 584 62 11,286 75 Hispanic 42 4 27 4 32 5 28 4 22 2 485 3 Asian/Pacific Islander <5 <1 5 <1 <5 <1 <5 <1 <5 <1 48 <1 Undisclosed/Unknown <5 <1 <5 <1 15 2 29 4 289 31 351 2 Age Group 0–12 8 <1 <5 <1 0 0 <5 <1 <5 <1 179 1 13–19 8 <1 <5 <1 7 1 <5 <1 8 <1 71 <1 20–29 120 12 89 12 89 13 75 11 85 9 2,248 15 30–39 395 40 265 37 253 97 235 34 319 34 6,327 42 40–49 330 33 249 35 231 34 251 37 347 37 4,575 30 50-59 107 11 83 12 78 11 94 14 149 16 1,363 9 60 and older 29 3 20 3 23 3 26 4 32 3 369 2 Mode of Exposure MSM 353 35 268 38 200 29 195 28 271 28 7,204 48 IDU/MSM 22 2 14 2 14 2 20 3 16 2 673 4 IDU 312 31 165 23 163 24 146 21 179 19 3,939 26 Heterosexual contact 191 19 169 24 176 26 149 22 253 27 2,095 14 Mother with HIV 8 <1 <5 <1 0 0 <5 <1 <5 <1 172 <1 Hemophilia 0 0 0 0 0 0 0 0 <5 <1 22 <1 Transfusion/transplant <5 <1 <5 <1 <5 <1 <5 <1 <5 <1 104 <1 Unknown/other 108 11 90 13 126 19 172 25 219 23 923 6 Deaths During Period 156 130 89 48 41 6,932 SOURCE: District of Columbia Department of Health, Division of Epidemiology, Administration for HIV/AIDS

Panel on
Methamphetamine and
Other Stimulant
Abuse Among
Youth and
Young Adults


EPIDEMIOLOGIC TRENDS IN DRUG ABUSE—Panel on Methamphetamine and Other Stimulant Abuse Among Youth and Young Adults
Proceedings of the Community Epidemiology Work Group, Vol. II, June 2005 327
Stimulant Abuse in Ohio and the Rural South Robert G. Carlson, Ph.D. INTRODUCTION This paper summarizes the methods and findings from two NIDA-supported studies of metham-phetamine (MA) abuse in rural Ohio, Kentucky, and Arkansas, conducted by researchers at the Wright State University Boonshoft School of Medicine, the University of Arkansas for Medical Sciences, and the University of Kentucky. In addition, patterns of MA abuse among young adult MDMA/ecstasy users in urban central Ohio are described. Finally, preliminary findings from the Ohio Substance Abuse Monitoring Network on trends in methamphetamine abuse in Dayton, Ohio, are presented. SAMPLES AND METHODS One natural history study focused on “MDMA/Club Drug Use and STD/HIV Sex Risk Behavior in Ohio” [NIDA grant RO1DA14488; R. Carlson, Principal Investigator]. As part of this study, respondents were asked about methamphetamine use. The other natural history study, “Rural Stimulant Use and Mental Health: Services and Outcomes” [RO1DA15363; Brenda Booth, PI, Carl Leukefeld, Co-PI; R01DA14340; Harvey Siegal/Carlson, PI], focused on rural stimulant users and health services needs in Ohio, Arkansas, and Kentucky. Finally, funded by the Ohio Department of Alcohol and Drug Addiction Services, the Ohio Substance Abuse Monitoring Network (OSAM), was a targeted study of metham-phetamine abuse in the first half of 2005; the prelimi-nary findings are based on research conducted in Dayton, Ohio. For the urban MDMA study, 402 active ecstasy users were recruited using respondent-driven sampling (RDS) from May 2002 through June 2003. Partici-pants completed an extensive baseline structured in-terview, including drug use patterns, mental health, adverse consequences, and sex risk behaviors. Eth-nographic interviews were conducted with a smaller sample. For this study, the correlates of MA use were examined using logistic regression. The study on rural methamphetamine abuse was based on a sample of 711 active (prior 30-day) stimu-lant (powder cocaine, crack, methamphetamine) users recruited using RDS in rural Ohio, Arkansas, and Kentucky. Data were collected from October 2002–
March 2004 (Ohio), June 2003–June 2004 (Arkan-sas), and July 2003–September 2004 (Kentucky). Participants completed an extensive baseline struc-tured interview focusing on drug use, mental health, and health services needs and use. Preliminary analy-ses were conducted using bivariate statistics. For the OSAM study, qualitative interviews were conducted with a convenience sample of 17 people recruited in Dayton, Ohio, who had used metham-phetamine in the previous 12 months. Interviews fo-cused on trends in methamphetamine use during the first half of 2005, initiation patterns, reasons for use, and characteristics of users. SELECTED FINDINGS The MDMA Study Among 402 young adult MDMA users recruited in an urban setting in central Ohio, 91 had used metham-phetamine (MA) in the 6 months prior to the baseline interview. Logistic regression revealed that MA users were significantly more likely than non-MA users to not be enrolled in college and to have used cocaine, hallucinogens, and inhalants in the previous 6 months. Participants who had used MDMA on 50 or more lifetime occasions were also more likely to have used MA than participants who had used MDMA 1–10 times. The Rural Stimulant Abuse Study Among the 711 rural stimulant users in Ohio, Arkan-sas, and Kentucky, 342 (48.1 percent) had used MA in the 30 days prior to interview. Compared with co-caine-only (n=367) and users of both MA and co-caine (249), MA-only users (93) were more likely to be employed and on probation or parole. Cocaine-only users were more likely to be older, of non-White ethnicity, and to have used alcohol in the past 30 days. Users of both MA and cocaine were more likely than the other two groups to have less than a high school diploma, to have engaged in illegal acts for profit in the past 30 days, and to have used mari-juana, OxyContin, other non-prescribed analgesics, and non-prescribed tranquilizers. The Ohio Substance Abuse Monitoring Network Ethnographic interviews with 17 recent (past-12 months) MA users in Dayton revealed that the avail-ability of MA is increasing. Respondents ranged in age from 21 to 57; 10 were men. Five participants inhaled MA, seven smoked it, three inhaled and smoked, and two injected. Seven were “old gen-

EPIDEMIOLOGIC TRENDS IN DRUG ABUSE—Panel on Methamphetamine and Other Stimulant Abuse Among Youth and Young Adults
Proceedings of the Community Epidemiology Work Group, Vol. II, June 2005 328
eration” users who were first introduced to MA about 15 years ago; 10 were “new generation” users who had initiated use 2–5 years ago. Five, sometimes overlapping, pathways to MA use were identified (powder cocaine to MA, crack to MA, MDMA to MA, non-prescribed amphetamines to MA, and mari-juana to MA). CONCLUSIONS Preliminary findings from these diverse studies indi-cate that there is a wide range of people who abuse methamphetamine. MA user groups identified in-cluded gay men, young Whites, primarily in the “party/rave” scene, and young/middle-aged Whites in urban and rural settings. Findings from the OSAM study suggest that after years of low levels of abuse, MA use appears to be increasing in the Dayton area among diverse populations. However, these reported increases are not yet being observed by treatment providers. In summary, the field is confronted with multiple methamphetamine epidemics, each with its own dynamic trajectory; different kinds of MA users have different reasons for use, associated risks, and prevention and treatment needs. At the same time, barriers to intervention and treatment include para-noia associated with prolonged MA abuse and fear of legal sanctions.
Rural Methamphetamine Abuse: An Ethnographic Perspective Rocky L. Sexton, Ph.D., and Robert G. Carlson, Ph.D.
INTRODUCTION
This paper summarizes preliminary ethnographic findings from a NIDA-supported study of stimulant abuse and health service needs in rural areas [RO1DA15363; Brenda Booth, Principal Investiga-tor].
SAMPLE AND METHODS
All interviewees were part of the larger natural his-tory study that used respondent-driven sampling to select participants in Kentucky and Arkansas. They were selected to provide a diversified sample in terms of gender, age, ethnicity, primary stimulant used, and mode of use.
Thirty-four persons whose primary stimulant of use was methamphetamine (MA) participated in qualita-tive interviews: 12 men and 9 women from Kentucky and 8 women and 5 men from Arkansas. Thirty-two participants were White and 2 were African-American. The average age for men and women was 32.2 and 29.3, respectively. Most participants earned $10,000 per year or less.
The average age of first MA use for men and women was 21.4 and 21.8, respectively. Men had used MA for 10.6 years and women 7.6 years. The average days of MA use per month was 7.8 for men and 7.9 for women. Thirty-three participants used other drugs, including marijuana, cocaine, and diverted prescription-type drugs, and 26 reported regular use of alcohol and tobacco. The sample included six White MA producers (“cookers”).
SUMMARY OF SOME KEY FINDINGS
Small-scale production (“cooking”) of MA using the Birch/Nazi method has increased over the last dec-ade. Primary ingredients like pseudoephedrine pills and lithium batteries are obtained through purchases or theft by drug users who trade them for MA. The volatile chemical fertilizer anhydrous ammonia is another key ingredient and is often stolen from farms or distribution centers. MA is distributed within rela-tively small networks through sales, gift-giving, and barter for cooking ingredients or other items. Smok-ing the drug on aluminum foil is the most common route of use, followed by injecting, inhaling, and oral use.
The participants identified a variety of reasons for using MA, including the following:
• Peer pressure and regular interactions with methamphetamine-using acquaintances
• Boredom with rural life
• Availability and flexible distribution mecha-nisms
• MA is more cost-effective than other stimulants (e.g., cocaine) since its psychoactive effects last exponentially longer
• The psychoactive and physiological effects (e.g., enhanced energy, weight loss, enhanced sex) of methamphetamine
Although the sample of African-Americans in this study was small, the preliminary findings suggest potential barriers to African-American use of MA…

EPIDEMIOLOGIC TRENDS IN DRUG ABUSE—Panel on Methamphetamine and Other Stimulant Abuse Among Youth and Young Adults
Proceedings of the Community Epidemiology Work Group, Vol. II, June 2005 329
• Fear of MA’s ingredients
• Dislike of MA’s prolonged effects
• Isolation/avoidance in regard to White-dominated production and distribution networks
• Well-established preference for cocaine
Pathways to limited use of MA by African-Americans include…
• Using MA while believing that it is powder co-caine
• Situationally substituting MA for cocaine
• Introduction to MA by a White friend or signifi-cant other
• Involvement in a largely White social network where MA use is common
Largely self-reported adverse consequences of MA production and use include…
• Chemical spills from attempts to steal anhydrous ammonia, accidents in MA “labs,” and toxic lab waste
• Dependence (e.g. uncontrollable cravings)
• Paranoia, hallucinations, and violence associated with binge use of MA
• Tremors, feelings of paralysis, and back pain caused by improperly prepared MA
• Risky sexual behaviors
• Dramatic and unhealthy weight loss
• Dental problems, respiratory problems, and feel-ings of poor health in general
Stimulant Use Among New York City Area Club-Going Young Adults Brian C. Kelly INTRODUCTION This paper presents preliminary findings from two NIDA-supported studies [R03-DA016171-01; B. Kelly, P.I.] and [R01-DA014925-02; J. Parsons, P.I.] • The Club Drugs and Health Project (CDHP),
which focuses on club drug use among young adults in the New York City club scene
• The Bridge and Tunnel Project (BTP), which
focused on club drug use among suburban youth who attend clubs in New York City
Brief descriptions and findings from each project are presented below. THE CLUB DRUGS AND HEALTH PROJECT CDHP was designed to study the patterns and con-texts of club drug use and its associated risks among young adults in the club scene with the intent of gain-ing data to guide prevention and educational efforts. Three randomized elements (location, time, and indi-vidual) were used to select study participants. Inter-cept survey data from the first 1,828 adults who agreed to participate in the screening interview reveal that 70.8 percent had ever used (lifetime) any drug - not counting alcohol or tobacco. Of the 1,828 partici-pants, 46.4 percent had used ecstasy, 44.8 percent cocaine, 22.0 percent ketamine, 16.6 percent crystal methamphetamine (CM), and 11.5 percent gamma hydroxybutyrate (GHB). One out of six were active club drug users. Gender differences for CM use were identified (males 19.5 percent vs. females 13.7 percent) as were sexual orientation differences for CM use (gay/bisexual 21.4 percent vs. heterosexual 12.3 per-cent). The use of CM use among heterosexuals indi-cates that this phenomenon is not limited to the

EPIDEMIOLOGIC TRENDS IN DRUG ABUSE—Panel on Methamphetamine and Other Stimulant Abuse Among Youth and Young Adults
Proceedings of the Community Epidemiology Work Group, Vol. II, June 2005 330
gay/bisexual community. Racial and ethnic differ-ences were also identified. White young adults were most likely to have used CM (18.9 percent). Differ-ences in CM use among other racial and ethnic groups were 9.3 percent among Black participants, 13.5 percent among Asian/Pacific Islanders (APIs), 15.8 percent among participants of "Mixed" ra-cial/ethnic origin, and 16.5 percent among Latinos. Cocaine remains more prevalent in New York than CM. Unlike CM, cocaine use showed no significant gender differences (43.2 vs. 45.7 for females and males, respectively). Gay men and women reported higher rates of cocaine use, albeit with less statistical significance than the CM difference (gay/bisexual 47.1 percent vs. heterosexual 41.7 percent). Much like CM, Whites were significantly more likely to have used cocaine (50 percent). Differences among other racial and ethnic groups were Blacks 31.5 per-cent, Latinos 38.8 percent; APIs 27.8 percent and Mixed 42.6 percent. THE BRIDGE AND TUNNEL PROJECT BTP was an ethnographic research project focused on club drug-using suburban youth who attended clubs in New York City. All 40 youth participants had used ecstasy and 33 reported using some sort of stimulant drug, not including ecstasy. The main stimulant drug was cocaine. About one-half reported cocaine use, almost one-quarter CM use, and approximately one-third had used prescription (Rx) stimulants non-medically. Other than ecstasy, Rx drugs were the most prevalent substances among these youth. More than one-third of these youth abused Rx stimulants. More than one-half had used any type of Rx drug; the most popular non-stimulants were Vicodin, codeine, Xanax, and other benzodiazepines. There were also some youth who preloaded or postloaded with SSRIs (Selective Serotonin Re-uptake Inhibitors) to reduce or elimi-nate the post-ecstasy crash, though this use pattern appeared to be less frequent than abuse of the other Rx drugs. Some youth who would not "use drugs" relied on over-the-counter stimulants for the same purposes. Rx stimulants have proliferated because of a "triple-engine" of availability, reliability, and utility. Rx stimulants are widely available to youth. Youth indi-cate they can more regularly predict the achievement of the high they desire with Rx drugs and that Rx drugs feel familiar to them. Rx stimulants were viewed as very functional drugs by youth in the BTP; they perceived Rx stimulants as useful outside the partying milieu.
Increased interest in and use of Rx drugs may be tied to shifting ecstasy markets in the Nation. As adultera-tion of ecstasy increases, youth shift to Rx stimulants. The shifts in ecstasy markets relate to other trends including those that have allowed some youth to "graduate up" to use of other stimulants, such as co-caine and methamphetamine. The shifting ecstasy markets have also enabled the rise of new club drugs such as tryptamines, especially 5-methoxy-N,N-diisopropyltryptamine (5-MeO-DIPT, "foxy," or "foxy methoxy") and alpha-methyltryptamine (IT-290 or "AMT"), both tryptamines with hallucino-genic and stimulant qualities.
Stimulant Use Among Young People in Hartford, Connecticut Jean J. Schensul INTRODUCTION This paper on stimulant use among urban youth in Hartford is based on methods and findings from NIDA-supported studies [1R01DA11421 and DA01010]. SAMPLES AND METHODS One study involved polydrug users (n=410); the other involved a general population of urban youth (n=548). The study methods included participant observation, indepth interviews, contextual monitor-ing, and surveys. The first survey was conducted at 2 points in time, 15 months apart, and involved 400 young people age 16–24. The second survey was also conducted at 2 points in time, 12 months apart, and involved 500 young people age 16–30. In the study of polydrug users, 70 percent were male, 38 percent were African-American, and 45 percent were Puerto Rican; 62 percent had less than a high school education and 57 percent were unemployed. This study focused on polydrug and hard drug use; a supplemental study focused on the sale and use of ecstasy in clubs and other party settings. In the study of the general population, 59 percent were male, 37 percent were African-American, and 47 percent were Puerto Rican; 60 percent had less than a high school education and 51 percent were unemployed. This study focused on club drugs and stimulant use.

EPIDEMIOLOGIC TRENDS IN DRUG ABUSE—Panel on Methamphetamine and Other Stimulant Abuse Among Youth and Young Adults
Proceedings of the Community Epidemiology Work Group, Vol. II, June 2005 331
SUMMARY OF SOME KEY FINDINGS Ecstasy and cocaine are the primary stimulants used among youth in Harford. The media and club-rave marketing expanded the market for MDMA, which diffused from suburban to urban youth networks through urban clubs serving mixed clientele, the first of which catered to Latinos. Club closings sent the social scene “underground,” but it remained part of the youth party drug repertoire. MDMA continues to be firmly embedded in urban youth networks and is readily available and affordable. In the polydrug use study, 33 percent of the respon-dents reported ever using ecstasy, compared with nearly 14 percent of 18–25-year-old respondents in the 2002 National Survey on Drug Use and Health maintained by the Substance Abuse and Mental Health Services Administration. These Hartford MDMA-using polydrug users were significantly more likely than other respondent groups to be La-tino, have less income and education, to be less opti-mistic about the future, to take more risks, and to bear more legal consequences. In the second study, differences between ecstasy users (“ever used”) and nonusers showed that one-half of Whites, 25 percent of the Latinos, and only 14 percent of African-Americans reported ever using MDMA (p=.008). Ecstasy users tended to be party goers and were sig-nificantly more likely than non-ecstasy users to fre-
quent clubs, rave-like events, and no-pay parties. Users expected ecstasy use to make them feel good, enhance their mood, feel less stressed, and feel like having sex and also expecting sex; fewer reported expecting verbal and physical aggression to be part of the ecstasy experience. Ecstasy users were more likely than nonusers to be involved in risky sex, to deal drugs, and to report negative consequences from their drug use. Other data from the studies show that phencyclidine (PCP), alcohol, and marijuana use continue to be stable parts of the drug repertories of young people in Hartford. In a 1–year followup, alcohol use had in-creased by 4 percent and marijuana by 3 percent. Ecstasy use, on the other hand, had increased by 8.5 percent; 18.5 percent reported using the drug in the 30 days prior to interview. Cocaine use decreased. Continuing at relatively high levels were initiation and past 30-day use of “dust” (a PCP derivative or substitute of embalming fluid or formaldehyde). One finding in both studies is that methamphetamine use was not reported by these young people. The question is: If methamphetamine abuse occurs in Hartford, will it follow the same route as MDMA (methylenedioxymethamphetamine, commonly re-ferred to as ecstasy)?


Panel on
International Drug
Abuse:
Emerging/ Current Trends


EPIDEMIOLOGIC TRENDS IN DRUG ABUSE—Panel on International Drug Abuse: Emerging/Current Trends
Proceedings of the Community Epidemiology Work Group, Vol. II, June 2005 335
Monitoring Drug Abuse Trends in Australia Louisa Degenhardt, Ph.D. OVERVIEW OF THE DRUG MONITORING SYSTEM IN AUSTRALIA The Illicit Drug Reporting System (IDRS), Austra-lia’s national drug monitoring system, was estab-lished in 1996. IRDS is funded by the Australian Government Department of Health and Aging and the National Drug Law Enforcement Research Fund. This paper provides an overview of the sys-tem used to monitor drug abuse patterns and trends in Australia and past and current drug abuse trends. The IDRS is conducted every year in every State and territory by participating research institutions and is coordinated by the National Drug and Alco-hol Research Center. The IRDS monitors the price, purity, availability, and patterns of use of illicit drugs, and serves as an early warning system for identifying and assessing emerging trends in illicit drug markets through the triangulation of three data sources… • A qualitative annual survey of approximately
950 injection drug users (IDUs) who serve as a sentinel group for the detection of emerging il-licit drug use trends
• A qualitative survey of key experts (KEs) who work in the illicit drug field
• A synthesis of extant indicator data sources such as Customs data, drug seizure purity data, and arrest data
One information source, the Party Drugs Initiative (PDI) survey targeted to ecstasy users and related drug markets, provides data/information on emerg-ing drug trends in Australia’s illicit drug markets. The PDI, like the IDRS, consists of three compo-nents: interviews with individuals (about 850 ec-stasy users) in sentinel groups of drug users in every capital city; interviews with KEs; and drug use indicator data such as numbers of treatment admissions, arrests, overdoses, and seizures. In addition, valuable data are provided through the National Drug Strategy Household Survey. In 2004, the stratified sample for the household survey in-volved nearly 30,000 persons age 14 and older. DRUG ABUSE PATTERNS AND TRENDS Some major findings from the 2004 Household Survey on Australians age 14 and older show that…
• More than 2 million had recently used canna-bis, 18,000 fewer that in 2004; 1 in 5 teenagers had used cannabis in the 12 months prior to the 2004 survey
• 17,000 persons reported using cocaine in the 12 months prior to the 2004 survey
• 25,800 persons (14,800 males and 11,000 fe-males) reported use of heroin in the 12 months prior to the 2004 survey, approximately 12,000 fewer than in 2001
• Nearly 560,000 persons reporting using ec-stasy at least once in the 12 months prior to the 2004 survey, roughly 100,000 more than in 2001
Past and recent drug abuse trends in Australia show that the heroin market increased in scale in the 1990s. There were approximately 1,000 opioid deaths in 1999. A number of steps were taken to address the heroin problem including seizures of large shipments of heroin destined to Australia, arrests of facilitators, and the disruption of heroin networks. By 2001, the supply of heroin was cut off and there was a growing shortage of the drug. The purity of heroin at the street level was halved and the price doubled. Other drug trends identified by IDUs in different parts of Australia show… • Illicit morphine use in the Northern Territory
• Illicit methadone use in Tasmania
• Injection of benzodiazepines, particularly in Tasmania and Victoria
• Injection of cocaine in New South Wales (2001)
The most recent trends identified include the fol-lowing:
• A stable cannabis market
• Increased use of psychostimulants including ecstasy and crystal methamphetamine, with some reports of regular users developing psy-chotic symptoms
• Nonmedical use of pharmaceuticals among regular IDUs
• Decreases in heroin overdose and other harm-ful consequences
EPIDEMIOLOGIC TRENDS IN DRUG ABUSE—Panel on International Drug Abuse: Emerging/Current Trends
Proceedings of the Community Epidemiology Work Group, Vol. II, June 2005 336
EMCDDA Report on Europe Paul Griffiths OVERVIEW OF THE EMCDDA Established in 1993, the European Monitoring Cen-tre for Drugs and Drug Addiction (EMCDDA), based in Lisbon, Portugal, serves as the central reference point for drug information in the Euro-pean Union (EU). The EMCDDA collects data/information on the drug situation, responses to drug use, and policy developments through its Reitox reporting network. This report is restricted to the first of these tasks; reporting on the drug situation. This network con-sists of “government nominated” focal points in each member State, which are linked to expert technical groups. Data are collected on the drug situation, responses to drug use, and policy devel-opment. An additional specific task of the EMCDDA is also to coordinate the EU mechanism for monitoring the emergence of new synthetic drugs that are not currently controlled under inter-national or European agreements. Reporting on the drug situation is based on five key indicators for epidemiological monitoring. These indicators provide a common reporting standard for EU member States and methodological guidelines. The indicators cover the following topics: • Prevalence and patterns of drug use in the gen-
eral population, as measured by population surveys
• Problem drug use estimates (statistical esti-mates of number of long-term and chronic us-ers of drugs like heroin and cocaine)
• Drug-related infectious diseases (HIV, HCV, HBV)
• Drug-related mortality of drug users (registry data and cohort studies)
• Demand for treatment (first treatment demands and all demands)
In addition to these data, other important sources of information for monitoring the drug situation in-clude statistics on drug law offenses and market information, studies of young people and school survey data (ESPAD), and reports from the Early Warning System on new synthetic drugs.
Data are synthesized into an Annual Report cover-ing developments across the EU. The system cov-ers the 25 member States of the European Union and Norway, which participates by special agree-ment. Bulgaria, Romania, and Turkey also now provide some data. SUMMARY OF FINDINGS Cannabis indicators continue trending upward in Europe with some signs of convergence and possi-bly stabilization among some countries where there is a high prevalence of cannabis abuse. Histori-cally, the United Kingdom (UK) reported the high-est rates of cannabis use. Currently, cannabis use in the UK appears stable and a number of other coun-tries, notably France, the Czech Republic and Spain, report cannabis use similar to that reported in the UK, and on some measures, high rates of use. Three waves (1996, 1999, and 2003) of the school survey data for 15–year-olds from the ESPAD are now available for comparison of time trends in most European countries. The surveys show increases in cannabis prevalence in almost all countries between 1996 and 2003, with the greatest changes occurring in the 1996 to 1999 period. Can-nabis issues of concern include the need to better assess trends in intensive and regular use, and the factors behind reports of rising treatment demands. Ecstasy indicators also continue to trend upwards in most countries. A notably exception is the UK where rates are high but stable. Overall, ecstasy has replaced amphetamine as Europe’s second most commonly used drug. Currently, significant methamphetamine use is only reported from the Czech Republic. The use of powder cocaine is increasing in many European countries, and in some countries cocaine preva-lence rates are already high. Estimates of recent use (past-year prevalence) of powder cocaine in Spain and the UK, for example, are similar to estimates reported in the United States, although lifetime prevalence estimates remain considerably lower in European countries than in the United States. Crack cocaine use remains rare with significant use lim-ited to a few major cities. In most countries, heroin and injecting indicators were stable or decreasing. Opiate-related deaths are now declining but are still at historically high lev-els. The age of heroin-related deaths is also rising and the proportion of those younger than 25 has decreased substantially, suggesting an aging popu-lation. This observation does not apply to some of the new EU member States where the more limited data available suggest that opiate-related deaths are representing younger users and the overall trend may still be upwards.

EPIDEMIOLOGIC TRENDS IN DRUG ABUSE—Panel on International Drug Abuse: Emerging/Current Trends
Proceedings of the Community Epidemiology Work Group, Vol. II, June 2005 337
Surveys of at-risk populations show far higher prevalence rates of drug use; however, making generalizations from these data is difficult. How-ever, they do give some indication of the current relative popularity of different types of drug. For example, a 2004 survey of “clubbers” who were regular recreational drug users in the UK found that the most commonly used drugs were cannabis, ec-stasy, and powder cocaine, followed by ampheta-mine, amyl nitrates, magic mushrooms, and keta-mine. Much more limited use was reported of other substances. (e.g. salvia, GHB [gamma hydroxybu-tyrate], crack, heroin, methamphetamine, and new synthetics).
Update of the Epidemi-ologic Surveillance System of Addictions (SISVEA) in Mexico: 2004 Roberto Tapia-Conyer, Patricia Cravioto, Pablo Kuri, Mario Cortés, Santiago Zaragoza, and Fernando Galván1 ABSTRACT Alcohol was the most common drug of onset among treatment clients at GTCs and NGCs in 2004, followed by marijuana. Alcohol was also the most commonly detected substance among drug-related decedents in 2004. For the current primary drug of abuse, cocaine ranked first at GTCs, while crystal (methamphetamine) surpassed heroin as the most common current drug of abuse at NGCs in 2004. Among infractors at Juvenile Detention Cen-ters in 2004, marijuana was the most common drug of abuse, representing 35 percent. INTRODUCTION The Epidemiological Surveillance System of Ad-dictions (SISVEA) is a permanent monitoring sys-tem of the use and abuse of tobacco, alcohol, and medical or illegal drugs, as well as their effects on morbidity and mortality and their association with juvenile infractors. SISVEA was created in 1990 by the General Directorate of Epidemiology to in-vestigate and document drug consumption in Mex-ico. Originally, SIVEA included eight cities located at Mexico’s northern border; currently, SISVEA provides information from 31 States of Mexico.
1The authors are affiliated with the Ministry of Health of Mex-ico, Tlanepantla Edo. De Mexico.
Initially, SISVEA was based conceptually and op-erationally on three strategies, which have evolved and been reinforced to form the present system. The five main indicators of the present system give continuity to the original model. The indicators and data sources are shown below: • Information on consumption of tobacco, alco-
hol, and medical and illegal drugs is obtained from treatment centers.
• Data on diseases and accidental mortality are
provided by emergency rooms. • Information on mortality among drug users is
provided by coroners’ offices. • Statistics on crimes against health are obtained
from law enforcement agencies. • General information on consumption of to-
bacco, alcohol, and medical and illegal drugs in the general population and risk groups is ob-tained from surveys and qualitative studies.
Data Sources This report includes information on recent activities of SISVEA during 2004. The sources of data used for this are described below: • Treatment data are obtained from the govern-
ment treatment centers (the Centers of Juvenile Integration) and from the nongovernment treat-ment centers that participate in SISVEA cities. Treatment data cover the characteristics and consumption patterns related to the first drug of use and primary drug of use for clients for 2004.
• Drug consumption data are reported for the
general population and for targeted population groups. Juvenile arrest data were provided by Juvenile Detention Centers for 2004.
• Medical examiner (ME) data are provided
for 2004 for drug-related deaths, including ac-cidental or violent deaths (homicides or sui-cides) in cases in which drug abuse may be the direct cause of death or a contributing factor.
DRUG ABUSE PATTERNS AND TRENDS Marijuana GTC Data Marijuana was the second most common drug of first choice (11.6 percent) among clients at gov-ernment treatment centers (GTCs) in 2004. As a primary drug, marijuana also ranked second among 2004 GTC patients (17.7 percent) (exhibit 1).

EPIDEMIOLOGIC TRENDS IN DRUG ABUSE—Panel on International Drug Abuse: Emerging/Current Trends
Proceedings of the Community Epidemiology Work Group, Vol. II, June 2005 338
According to GTCs, marijuana users during 2004 were mostly male (92.1 percent); 27.1 percent were age 15–19 (exhibit 2). Forty-six percent had only a middle school education; 61.4 percent were single; and 49.0 percent came from a middle-low socio-economic level. The age of onset for 49.1 percent of marijuana users occurred between ages 10 and 14; 43.4 percent began to use between ages 15 and 19. Two-thirds reported daily use. Based on natural history data for 2004, 10.4 per-cent of these marijuana GTC patients were monodrug users upon treatment entry, and 89.6 percent had already begun to use a second drug, usually alcohol (32.9 percent) or tobacco (21.4 percent) (exhibit 3a). Of multiple drug users, 84.8 percent had advanced to a third drug, usually alco-hol (24.1 percent), tobacco (21.2 percent), or co-caine (20.4 percent). NGC Data Among patients at nongovernment treatment cen-ters (NGCs) in 2004, marijuana was the second most common drug of first choice (26.6 percent) and the fourth most common primary drug of abuse (9.9 percent) (exhibit 4). The overwhelming majority of the marijuana clients at NGCs were male (95.6 percent); 24.6 percent were age 35 and older (exhibit 5). Forty-one percent had a middle school education, and 59.4 percent were single. The age of onset for marijuana use among these patients was between 10 and 14 for 48.3 percent, and 82.6 percent reported daily use. According to the natural history data of marijuana consumption for these clients, 12.5 percent were still monodrug users upon treatment entry, while the remaining 87.5 percent had progressed to a second drug, usually cocaine (26.1 percent) or al-cohol (17.0 percent) (exhibit 3a). Of this group, 73.6 percent were already using a third drug, mainly cocaine (21.9 percent) heroin (18.4 per-cent), and crystal (15.5 percent). Juvenile Detention Center Data Information from the Juvenile Detention Centers showed that 34.8 percent of the 10,555 juveniles arrested during 2004 had used marijuana (exhibit 6). Most of this population were male (95.2 percent); 52.6 percent had an elementary school education; 41.6 percent were subemployed; 36.5 percent had a tattoo; and 30.2 percent were gang members. Nearly one-third (31.6 percent) of the offenses were com-mitted while the offender was intoxicated, and 44.0 percent of the offenses were robberies. ME Data ME data indicated that 3.63 percent of deaths re-ported were associated with marijuana. This dece-
dent group was primarily male; 21.3 percent were age 40 and older and 40.0 percent were age 25–34 (exhibit 7). The main cause of death in these cases was asphyxia (20.8 percent), followed by run over (12.5 percent). These deaths most commonly oc-curred on the street (36.1 percent) or at home (25.0 percent). Inhalants GTC Data During 2004, inhalants ranked as the third most commonly reported drug of onset among GTC cli-ents (7.4 percent) and fourth as a current primary drug of abuse (10.6 percent) (exhibit 1). Inhalant users attending GTCs were mostly male (85.1 percent); nearly one-third (31.3 percent) were age 15–19 (exhibit 2). Most patients had a middle school education (55.3 percent); 76.4 percent were single; and 55.1 percent were from a middle-low socioeconomic level. Most began to use inhalants between ages 10 and 14 (65.9 percent); 42.2 per-cent used them daily and 41.3 percent used them once per week. GTC data on the natural history of inhalant use show that 25.7 percent of these clients were monodrug users when they entered treatment; 74.3 percent were already using a second drug, mainly marijuana (33.8 percent), alcohol (22.4 percent), and tobacco (20.9 percent). Of the multiple drug users, 81.0 percent used a third drug, mainly alco-hol (27.9 percent), marijuana (20.0 percent), to-bacco (17.9 percent), or cocaine (13.3 percent) (ex-hibit 3b). NGC Data Inhalants ranked third (11.8 percent) as drug of onset and sixth (8.7 percent) as a primary drug among clients in NGCs in 2004 (exhibit 4). NGCs report that of the patients who used inha-lants, most of them were male (93.2 percent), and 33.3 percent were age 15–19. Sixty percent had an elementary school education, and 72.3 percent were single (exhibit 4). More than one-half began to use inhalants between ages 10 and 14 (58.5 per-cent), and 87.0 percent reported daily use. Regarding the natural history of inhalants users, 55.0 percent of the patients had progressed to a second drug upon treatment entry, which in order of importance were marijuana (53.1 percent), alco-hol (15.5 percent), and other inhalants (7.2 percent) (exhibit 3b). Of these patients, 72.2 percent had also begun to use a third drug, usually cocaine (25.1 percent), marijuana (17.2 percent), or alcohol (13.7 percent).

EPIDEMIOLOGIC TRENDS IN DRUG ABUSE—Panel on International Drug Abuse: Emerging/Current Trends
Proceedings of the Community Epidemiology Work Group, Vol. II, June 2005 339
Juvenile Detention Center Data Of the juveniles arrested during 2004, 13.5 percent used inhalants (exhibit 6). Most of these juveniles were male (95.0 percent), had an elementary school education (63.6 percent), and were subemployed (46.0 percent). Thirty-nine percent had tattoos, and 38.8 percent belonged to a gang. More than one-third (37.6 percent) of these juveniles committed their offense while intoxicated, and robbery was the most common offense (44.7 percent). Alcohol GTC Data Alcohol was the most commonly reported drug of onset (33.3 percent), but it ranked third (17.4 per-cent) as a primary drug of abuse among GTC pa-tients in 2004 (exhibit 1). Of the 3,582 primary alcohol patients attending GTCs in 2004, 82.6 percent were male, 24.0 per-cent were age 15–19, and 20.9 percent were age 35 or older (exhibit 2). Most had a middle school edu-cation (41.8 percent); 54.9 percent were single; and more than one-half (54.5 percent) were from a middle-low socioeconomic level. Nearly one-half (47.0 percent) began to use alcohol between ages 15 and 19; 48.2 percent reported weekly use; and 31.3 percent reported using alcohol 1–3 times per month. According to the natural history data for alcohol, 91.4 percent had progressed to a second drug upon treatment entry, usually tobacco (57.8 percent), marijuana (17.3 percent), and cocaine (13.2 per-cent) (exhibit 3c). Of the multiple drug user group, 74.6 percent reported using a third drug, usually marijuana (33.1 percent), cocaine (26.6 percent), and inhalants (10.5 percent). NGC Data Among NGC clients in 2004, alcohol ranked first as the drug of onset (30.0 percent) and second as a current primary drug (19.5 percent) (exhibit 4). Most of the 12,360 patients who were alcohol cli-ents in 2004 were male (92.1 percent); 42.5 percent were age 35 or older; and 32.2 percent had only an elementary school education (exhibit 5). Forty-three percent were single, and most (46.5 percent) started to use alcohol between ages 15 and 19. One-half reported daily use, and 37.2 percent used alcohol once per week. The natural history of alcohol abuse provided by NGCs during 2004 shows that 28.7 percent of these clients were monodrug users upon treatment entry, while the remaining 71.3 percent had progressed to a second drug, typically marijuana (36.2 percent),
cocaine (22.0 percent), and tobacco (14.8 percent) (exhibit 3c). Sixty-five percent of these clients had progressed to a third drug, usually cocaine (31.5 percent), marijuana (17.1 percent), and crystal (15.1 percent). Juvenile Detention Center Data Among juvenile infractors, 14 percent reported alcohol abuse (exhibit 6). They were mostly male (92.5 percent), and 44.8 percent had an elementary school education. Forty percent were subemployed; 30.2 percent had tattoos; and 24.1 percent were gang members. More than one-third of the juve-niles (44.8 percent) committed the offense while intoxicated, and robbery (42.2 percent) was the most common offense. ME Data According to MEs, the abuse of alcohol is associ-ated with 83.8 percent of drug-related deaths. Most decedents were male (93.8 percent), and 39.4 per-cent were age 40 or older (exhibit 7). The main cause of death was asphyxia (18.2 percent), fol-lowed by traffic accidents (18.1 percent). Deaths typically occurred on the street (39.5 percent) or at home (30.4 percent). Cocaine Among patients at GTCs in 2004, cocaine ranked fourth as the first drug of choice (3.8 percent) and first as primary drug of abuse (25.8 percent) (ex-hibit 1). GTCs report that cocaine users during 2004 were mostly male (78.6 percent); 26.3 percent each were age 15–19 and 20–24 (exhibit 2). Nearly one-half (45.6 percent) had a middle school education; 51.8 percent were single; and 26.7 percent were married. More than one-half (56.9 percent) were members of a middle-low socioeconomic level; 49.3 percent initiated cocaine use between ages 15 and 19. Forty-two percent reported weekly cocaine use, and 35.8 percent reported daily use. The natural history data for GTC cocaine patients in 2004 show that 25.7 percent were monodrug users upon entering treatment, while the rest were already using a second drug, usually alcohol (31.3 percent), marijuana (20.0 percent), and tobacco (18.3 percent) (exhibit 3d). Of the multiple drug users, 69.3 percent had started to use a third drug: alcohol (28.4 percent), tobacco (26.9 percent), and marijuana (19.7 percent). NGC Data In 2004, cocaine ranked fourth as the drug of onset (5.9 percent) and fourth as current primary drug (17.9 percent) among NGC patients (exhibit 4).

EPIDEMIOLOGIC TRENDS IN DRUG ABUSE—Panel on International Drug Abuse: Emerging/Current Trends
Proceedings of the Community Epidemiology Work Group, Vol. II, June 2005 340
Ninety-two percent of the cocaine users who at-tended NGCs in 2004 were male; 24.8 percent were age 20–24; 38.6 percent had a middle school edu-cation; and 30.0 percent had an elementary school education (exhibit 5). One-half of these cocaine patients were single. Forty-four percent began to use cocaine between ages 15 and 19; 60.4 percent reported daily use and 29.6 percent reported weekly use of the drug. The natural history of cocaine abuse reported by NGCs during 2004 shows that 34.2 percent were still monodrug users upon treatment entry, and 65.8 percent had progressed to a second drug—usually marijuana (25.3 percent), crystal (21.0 percent), and alcohol (15.4 percent) (exhibit 3d). Of the mul-tiple drug users, 47.7 percent had started to use a third drug, generally crystal (21.7 percent), mari-juana (17.4 percent), or alcohol (13.3 percent). Juvenile Detention Center Data Juvenile Detention Centers reported cocaine use among 14.3 percent of these younger arrestees in 2004 (exhibit 6). They were mostly male (94.3 per-cent); more than one-half had an elementary school education (55.8 percent); and 42.1 percent were subemployed. Thirty-six percent had tattoos, and 30.6 percent were gang members. More than one-quarter of the juvenile infractors (28.9 percent) committed the offense while intoxicated; robbery was the most common offense (49.1 percent). Heroin GTC Data Of the patients attending GTCs during 2004, only 0.1 percent reported heroin as their drug of onset, but as primary drug it ranked in fifth place (2.4 percent) (exhibit 1). All of the heroin users at GTCs in 2004 were male; 27.3 percent were age 20–24; and 18.2 percent were age 15–19 (exhibit 2). Thirty percent each of these patients had an elementary, middle, or high school education. Similar proportions (27.3 percent each) were single, married, or divorced. Sixty per-cent were from a middle-low and 30.0 were from a low socioeconomic level. The age of onset for 45.5 percent of heroin users occurred between ages 10 and 14; 100.0 percent reported daily use. NGC Data Among patients at NGCs, heroin as a drug of onset has been increasing since 1994; 1.9 percent of pa-
tients in 2004 reported heroin as their first drug of use (exhibit 4). Heroin ranked third as a primary drug of abuse among NGC patients in 2004 (38.4 percent). The overwhelming majority of heroin patients at NGCs in 2004 were male (91.8 percent), and 43.5 percent were age 35 and older (exhibit 5). More than one-third (37.7 percent) of these patients had only a middle school education, and 53.2 percent were single. The age of first use of heroin among these patients was between 15 and 19 (38.4 per-cent); 91.7 percent reported daily use. Juvenile Detention Center Data Information from the Juvenile Detention Centers showed that 0.4 percent of the juveniles arrested during 2004 used heroin (exhibit 6). Most of this population were male (87.8 percent); 47.5 percent had an elementary school education; and 36.6 per-cent were unemployed. Approximately one-third (30.6 percent) had tattoos or were gang members (34.1 percent). One-half of the offenses were com-mitted under intoxication, and robbery was the most common offense (58.5 percent). CONCLUSIONS Alcohol abuse remains a problem in Mexico. It is still the most common drug of onset, although this frequency varies in the different regions of the coun-try. Alcohol is also the most frequently detected drug in emergency rooms and by medical examiners. Crystal surpassed heroin as the most common pri-mary drug at NGCs in 2004, while cocaine remained the most common primary drug among NGC pa-tients. The proportion of cocaine patients at NGCs has declined, however, since the peak of 40.3 per-cent in 1998 to 25.8 percent in 2004. Among offenders at the Juvenile Detention Centers, marijuana remains the most frequently abused sub-stance; it represented 35 percent of the offenders in 2004. Offenders who abused cocaine, alcohol, and inhalants remained at about 14 percent each. Although SISVEA currently includes 31 States and 53 cities, the system has to be strengthened and expanded to include to the rest of Mexico. For inquiries concerning this report, please contact Santiago Zaragoza, Especialista en Epidemiologia, Direccion General de Epidemiologia, Llanura #48 Col. Plazas de la Colina, Tlanep-antla Edo. De Mexico 54080, Phone: 55-55-93-1011, Fax: 55-56-51-8338, E-mail: [email protected].

EPIDEMIOLOGIC TRENDS IN DRUG ABUSE—Panel on International Drug Abuse: Emerging/Current Trends
Proceedings of the Community Epidemiology Work Group, Vol. II, June 2005 341
Exhibit 1. Comparison Between First Drug of Use and Current Drug of Use Among Patients at Government Treatment Centers, by Percentage: 1991–2004 SOURCE: SISVEA—Government treatment centers
0
5
10
15
20
25
30
35
40
45
1991
1992
1993
1994
1995
1996
1997
1998
1999
2000
2001
2002
2003
2004
0
5
10
15
20
25
30
35
40
45
1991
1992
1993
1994
1995
1996
1997
1998
1999
2000
2001
2002
2003
2004
Marijuana
Inhalants
AlcoholCocaine
Heroin
First Drug Current Drug

EPIDEMIOLOGIC TRENDS IN DRUG ABUSE—Panel on International Drug Abuse: Emerging/Current Trends
Proceedings of the Community Epidemiology Work Group, Vol. II, June 2005 342
Exhibit 2. Demographic Characteristics of Government Treatment Center Patients, by First Drug of Use and Percent: 2004
Global Marijuana Inhalants Alcohol Cocaine1 Heroin Tobacco Demographic Characteristic N=10,761 n=1,250 n=799 n=3,582 n=404 n=11 n=4,460 Gender Male 82.4 92.1 85.1 82.6 78.6 100.0 79.3 Female 17.6 7.9 14.9 17.4 21.4 0.0 20.7 Age 5–14 Years 8.7 6.6 28.6 7.0 6.5 0.0 7.2 15–19 26.8 27.1 31.3 24.0 26.3 18.2 28.3 20–24 18.5 19.7 15.3 18.9 26.3 27.3 17.7 25–29 15.1 18.0 11.0 16.5 22.1 9.1 13.3 30–34 11.1 12.9 6.5 12.7 11.7 0.0 10.2 35 and older 19.8 15.8 7.3 20.9 7.1 45.4 23.2 Schooling Elementary school 19.4 22.9 33.2 16.8 15.9 30.0 18.2 Middle school 43.9 46.0 55.3 41.8 45.6 30.0 43.0 High school 22.1 21.3 8.1 24.8 25.9 30.0 22.4 College studies 9 6.5 0.5 10.3 6.5 10.0 10.4 No formal education 0.4 0.5 0.9 0.6 0.3 0.0 0.2 Other 5.1 2.7 2.0 5.8 5.8 0.0 5.8 Marital Status Single 57.9 61.4 76.4 54.9 51.8 27.3 56.6 Married 23.4 18.4 10.2 26.2 26.7 27.3 24.8 Divorced 2.1 1.8 0.6 2.3 1.6 27.3 2.3 Widowed 0.6 0.2 0.0 0.4 0.0 0.0 1.0 Living together 10.4 11.9 8.9 10.4 13.7 18.2 10.0 Other 5.6 6.3 3.9 5.8 6.2 0.0 5.4 Socioeconomic Level High, middle-high 15.3 14.0 8.4 15.4 12.2 10.0 16.9 Middle-low 54.2 49.0 55.1 54.5 56.9 60.0 54.9 Middle 7.4 9.5 4.5 7.6 5.1 0.0 7.4 Low 23.2 27.5 32.0 22.5 25.9 30.0 20.7 Age Of Onset 9 and younger 5.2 2.1 6.5 5.2 1.7 0.0 6.1 10–14 48.4 49.1 65.9 39.5 29.1 45.5 53.5 15–19 40.2 43.4 26.6 47.0 49.3 27.3 35.7 20–24 4.3 4.5 0.8 6.1 8.6 18.2 3.2 25–29 1.1 0.6 0.1 1.3 7.6 0.0 0.9 30–34 0.4 0.2 0.0 0.5 2.3 9.1 0.3 35 and older 0.4 0.1 0.0 0.5 1.3 0.0 0.3 Frequency Daily 53.9 66.1 42.2 16.7 35.8 100.0 79.2 Once a Week 27.6 21.1 41.3 48.2 42.3 0.0 12.4 1–3 times per month 16.8 11.2 14.6 31.3 20.9 0.0 8.0 1–11 times per year 1.7 1.6 1.9 3.8 1.0 0.0 0.4
1Cocaine, basuco, crack SOURCE: SISVEA—Centers for Juvenile Attention (government treatment centers)

EPIDEMIOLOGIC TRENDS IN DRUG ABUSE—Panel on International Drug Abuse: Emerging/Current Trends
Proceedings of the Community Epidemiology Work Group, Vol. II, June 2005 343
Exhibit 3a. Natural History of Marijuana Use: 2004
Governmental Centers
89.6% 84.8%Marijuana Use a 2nd drug Use a 3rd drug
Alcohol 32.9% Alcohol 24.1%Tobacco 21.4% Tobacco 21.2%Cocaine 14.6% Cocaine 20.4%
10.4% Inhalants 11.7% Crack 5.7%Monodrug users Others 19.4% 15.2% Others 28.6%
Nongovernmental Centers
87.5% 73.6%Marijuana Use a 2nd drug Use a 3rd drug
Cocaine 26.1% Cocaine 21.9%Alcohol 17.0% Heroin 18.4%Inhalants 14.7% Crystal 15.5%
12.5% Crystal 11.9% Alcohol 9.5%Monodrug users Tranquilizers 8.1% 26.4% Tranquilizers 7.6%
Others 23.7% Others 25.3%
SOURCE: SISVEA—Government and nongovernment treatment centers Exhibit 3b. Natural History of Inhalants Use: 2004
Governmental Centers
74.3% 81.0%Inhalants Use a 2nd drug Use a 3rd drug
Marijuana 33.8% Alcohol 27.9%Alcohol 22.4% Marijuana 20.0%Tobacco 20.9% Tobacco 17.9%
25.7% Inhalants 11.4% 19.0% Cocaine 13.3%Monodrug users Others 11.5% Others 20.9%
Nongovernmental Centers
55.0% 72.2%Inhalants Use a 2nd drug Use a 3rd drug
Marijuana 53.1% Cocaine 25.1%Alcohol 15.5% Marijuana 17.2%Inhalants 7.2% Tranquilizers 11.3%
45.0% Cocaine 6.3% 27.8% Alcohol 13.7%Monodrug users Tranquilizers 5.8% Heroin 9.4%
Others 11.1% Others 26.3%
SOURCE: SISVEA—Government and nongovernment treatment centers

EPIDEMIOLOGIC TRENDS IN DRUG ABUSE—Panel on International Drug Abuse: Emerging/Current Trends
Proceedings of the Community Epidemiology Work Group, Vol. II, June 2005 344
Exhibit 3c. Natural History of Alcohol Use: 2004
Governmental Centers
91.4% 74.6%Alcohol Use a 2nd drug Use a 3rd drug
Tobacco 57.8% Marijuana 33.1%Marijuana 17.3% Cocaine 26.6%Cocaine 13.2% Inhalants 10.5%
8.6% Inhalants 5.2% 25.4% Tobacco 9.6%Monodrug users Others 6.5% Others 20.2%
Nongovernmental Centers
71.3% 65.0%Alcohol Use a 2nd drug Use a 3rd drug
Marijuana 36.2% Cocaine 31.5%Cocaine 22.0% Marijuana 17.1%Tobacco 14.8% Crystal 15.1%
28.7% Crystal 5.8% 35.0% Inhalants 6.4%Monodrug users Inhalants 4.5% Heroin 4.4%
Others 14.6% Others 24.4%
SOURCE: SISVEA—Government and nongovernment treatment centers Exhibit 3d. Natural History of Cocaine Use: 2004
Governmental Centers
74.3% 69.3%Cocaine Use a 2nd drug Use a 3rd drug
Alcohol 31.3% Alcohol 28.4%Marijuana 20.0% Tobacco 26.9%Tobacco 18.3% Marijuana 19.7%
25.7% Crystal 6.0% 30.7% Inhalants 7.2%Monodrug users Others 24.4% Others 17.8%
Nongovernmental Centers
65.8% 47.7%Cocaine Use a 2nd drug Use a 3rd drug
Marijuana 25.3% Crystal 21.7%Crystal 21.0% Marijuana 17.4%Alcohol 15.4% Alcohol 13.3%
34.2% Heroin 12.1% 52.3% Heroin 9.2%Monodrug users Crack 9.3% Inhalants 8.2%
Others 17.7% Others 29.9%
SOURCE: SISVEA—Government and nongovernment treatment centers

EPIDEMIOLOGIC TRENDS IN DRUG ABUSE—Panel on International Drug Abuse: Emerging/Current Trends
Proceedings of the Community Epidemiology Work Group, Vol. II, June 2005 345
Exhibit 4. Comparison Between First Drug of Use and Current Drug of Use Among Patients at Nongovern- ment Treatment Centers, by Percent: 1994–2004 SOURCE: SISVEA—Nongovernment treatment centers
0
5
10
15
20
25
30
35
40
45
1994 1995 1996 1997 1998 1999 2000 2001 2002 2003 2004
years MarijuanaInhalantsAlcoholCocaineHeroinCrystal
0
5
10
15
20
25
30
35
40
45
1994 1995 1996 1997 1998 1999 2000 2001 2002 2003 2004
years

EPIDEMIOLOGIC TRENDS IN DRUG ABUSE—Panel on International Drug Abuse: Emerging/Current Trends
Proceedings of the Community Epidemiology Work Group, Vol. II, June 2005 346
Exhibit 5. Demographic Characteristics of Nongovernment Treatment Center Patients, by First Drug of Use and Percent: 2004
Global Marijuana Inhalants Alcohol Cocaine1 Heroin Tobacco Demographic Characteristic N=41,135 n=10,927 n=4,857 n=12,360 n=2,447 n=800 n=7,663 Gender Male 93.1 95.6 93.2 92.1 91.7 91.8 91.5 Female 6.9 4.4 6.8 7.9 8.3 8.3 8.5 Age 5–14 Years 2.0 1.6 6.5 0.9 1.3 0.1 1.7 15–19 15.7 16.5 33.3 9.2 17.7 3.6 14.4 20–24 19.2 21.7 22.9 14.5 24.8 14.9 19.8 25–29 18.0 19.3 16.3 16.5 20.8 20.4 18.6 30–34 15.7 16.3 9.8 16.4 18.3 17.5 16.2 35 and older 29.4 24.6 11.2 42.5 17.2 43.5 29.3 Schooling Elementary school 36.6 36.6 60.3 32.2 30.0 37.4 34.6 Middle school 41.0 41.0 27.1 31.7 38.6 37.7 40.2 High school 16.4 16.4 4.6 20.4 23.4 16.7 18.7 College studies 2.6 2.6 0.5 9.4 5.8 3.8 3.7 No formal education 3.2 3.2 7.5 5.5 1.9 4.3 2.7 Other 0.2 0.2 0.7 0.3 0.1 0.2 Marital Status Single 54.1 59.4 72.3 42.6 50.0 53.2 54.9 Married 22.7 18.4 11.7 31.0 28.1 19.7 20.9 Divorced 4.1 4.0 1.6 5.2 3.2 4.9 4.3 Widowed 6.5 5.9 4.5 7.9 5.6 7.8 6.6 Living together 0.9 0.6 0.3 1.6 0.6 1.1 0.9 Other 11.7 11.8 9.6 11.6 12.6 13.2 12.4 Age Of Onset 9 and younger 5.6 4.8 8.5 4.4 1.2 0.9 8.8 10–14 43.4 48.3 58.5 34.8 20.6 16.2 50.9 15–19 40.1 39.8 30.2 46.5 44.0 38.4 35.4 20–24 6.7 4.7 2.1 9.3 17.0 20.8 3.7 25–29 2.3 1.5 0.5 2.8 9.8 11.2 0.7 30–34 1 0.6 0.1 1.2 4.3 6.4 0.3 35 and older 0.8 0.4 0.2 0.9 3.2 6.1 0.2 Frequency Daily 73.2 82.6 87.0 49.8 60.4 91.7 90.9 Once a Week 19.5 11.9 9.0 37.2 29.6 5.3 6.7 1–3 times per month 5.3 3.4 2.5 10.2 6.9 2.9 1.6 1–11 times per year 2.0 2.0 1.5 2.7 3.1 0.1 0.9
1Cocaine, basuco, crack SOURCE: Nongovernment treatment centers

EPIDEMIOLOGIC TRENDS IN DRUG ABUSE—Panel on International Drug Abuse: Emerging/Current Trends
Proceedings of the Community Epidemiology Work Group, Vol. II, June 2005 347
Exhibit 6. Social Characteristics and Type of Offense Committed by Juvenile Drug-Using Arrestees, by Percent: 2004
Total Marijuana Inhalants Alcohol Cocaine Heroin
N=10,555 n=3,671 n=1,429 n=1,473 n=1,505 n=41
Male 91.4
Male 95.2
Male 95.0
Male 92.5
Male 94.3
Male 87.8
Elementary school 47.3
Elementary school 52.6
Elementary school 63.6
Elementary school 44.8
Elementary school 55.8
Elementary school 47.5
Subemployed 32.6
Subemployed 41.6
Subemployed 46.0
Subemployed 40.2
Subemployed 42.1
Unemployed 36.6
Tattoo 22.7
Tattoo 36.5
Tattoo 39.0
Tattoo 30.2
Tattoo 36.0
Tattoo 30.6
Belong to a gang 19.8
Belong to a gang 30.2
Belong to a gang 38.8
Belong to a gang 24.1
Belong to a gang 30.6
Belong to a gang 34.1
Offense under intoxication
17.8
Offense under intoxication
31.6
Offense under intoxication
37.6
Offense under intoxication
44.8
Offense under intoxication
28.9
Offense under intoxication
50.0
Frequent Offenses
Robbery Against health Injuries Damages Other
45.2 14.9 8.5 6.3
25.1
Robbery Against health Drug Consumption Injuries Other
44.0 27.8
8.8 3.6
15.8
Robbery Against healthDrug ConsumptionArms bearing Other
44.721.8
12.52.7
18.3
Robbery Injuries Against healthDamages Other
42.211.110.96.9 28.9
Robbery Against health Drug Consumption Injuries Other
49.1 30.0
5.5 3.6
11.8
Robbery Against health Drug Consumption Other
58.524.4
2.44.99.8
SOURCE: SISVEA—Juvenile detention centers

EPIDEMIOLOGIC TRENDS IN DRUG ABUSE—Panel on International Drug Abuse: Emerging/Current Trends
Proceedings of the Community Epidemiology Work Group, Vol. II, June 2005 348
Exhibit 7. Type of Death Under Intoxication of Selected Drugs1 in Mexico by Percent: 2004
Total Alcohol Marijuana Opioids2 Type of Death N=2,061 n=1,727 n=75 n=82
Gender Male 92.2 93.8 93.3 92.7 Female 7.8 6.2 6.7 7.3 Age Group 10–14 0.6 0.5 0.0 0.0 15–19 8.0 7.6 12.0 9.8 20–24 13.0 13.4 17.3 12.2 25–29 13.2 13.5 20.0 20.7 30–34 13.4 12.9 20.0 23.2 35–39 12.6 12.7 9.3 13.4 40 and older 39.2 39.4 21.3 20.7 Cause of Death Run over 12.3 13.6 12.5 0.0 Traffic accident 16.2 18.1 11.1 1.2 Fall 4.8 5.1 4.2 0.0 Electrocuted 0.6 0.5 1.4 0.0 Burned 1.2 0.8 0.0 0.0 Beaten 2.9 3.2 2.8 0.0 Asphyxia 17.2 18.2 20.8 1.2 Crushed 0.2 0.2 1.4 0.0 Fire arm 8.8 9.4 9.7 1.2 Steel knife 4.2 4.8 8.3 0.0 Violation 0.1 0.1 0.0 0.0 Intoxicated 9.7 6.1 5.6 93.9 Poisoned 0.5 0.4 0.0 1.2 Other 21.1 19.0 22.2 1.2 Place of Death Traffic 15.4 16.8 8.3 0.0 Home 30.0 30.4 25.0 23.2 Street 38.0 39.5 36.1 51.2 Public baths 0.1 0.1 1.4 1.2 Recreational areas 3.5 3.8 6.9 0.0 At work 0.8 0.9 2.8 0.0 Service areas 8.4 5.7 8.3 20.7 Other 3.7 2.7 11.1 3.7
1Deaths fro all causes totaled 10,304. 2Indicates opium, morphine, and heroin. SOURCE: SISVEA—Medical examiner

EPIDEMIOLOGIC TRENDS IN DRUG ABUSE—Panel on International Drug Abuse: Emerging/Current Trends
Proceedings of the Community Epidemiology Work Group, Vol. II, June 2005 349
Southern African Development Community Epidemiology Network on Drug Use (SENDU): Findings July 2001–June 2004 Charles D.H. Parry, Ph.D., and Andreas Plüddemann, M.A2 ABSTRACT The Southern African Development Community (SADC) Regional Drug Control Program provides for the establishment of a regional drug surveil-lance network (SADC Epidemiology Network on Drug Use—SENDU) in the 13 SADC member states. At the end of June 2004, data were available from 11 countries: Botswana, Lesotho, Malawi, Mozambique, Mauritius, Namibia, South Africa, Swaziland, Tanzania, Zambia, and Zimbabwe. Dur-ing this period, data on treatment demand were col-lected from 98 specialist drug treatment centres and psychiatric hospitals in 9 countries and law en-forcement agencies in 11 countries. Overall, the region saw an increase in the demand for treatment for substances other than alcohol and cannabis in the first half of 2004 compared with the second half of 2003 and an increase in police seizures of heroin. Seizures of methaqualone (Mandrax), cocaine, and amphetamine-type stimulants), however, showed a decline. The most alarming findings reported were the very high level of HIV/AIDS cases associated with intravenous drug use in Mauritius and the dramatic increase in treatment demand related to methamphetamine use in one of the South Africa sites, Cape Town. Among the policy recommenda-tions requiring urgent attention at national and regional levels are the need to (i) increase access to substance abuse treatment outside of the psychiatric hospital system, (ii) improve the training of person-nel involved in treatment and prevention, (iii) in-crease interventions targeting high-risk populations, (iv) ensure that law enforcement agencies are ade-quately equipped to enforce anti-drug legislation, and (v) review and, if necessary, update relevant legislation.
2The authors are affiliated with the Medical Research Council, Cape Town, South Africa.
INTRODUCTION Background Information on SENDU The South African Community Epidemiology Net-work on Drug Use (SACENDU) is an alcohol and other drug (AOD) sentinel surveillance system com-prising a network of researchers, practitioners, and policymakers from five sites in South Africa. The network, managed by the Medical Research Council (MRC) of South Africa, has been operational since July 1996. In 2000, with funding from the South African Development Community (SADC) via the European Commission, the MRC was contracted to establish sentinel or country surveillance systems in the other SADC member states. The project forms part of the 5-year SADC Drug Control Program. The broader (regional) network has been named the SADC Epidemiology Network on Drug Use (SENDU). This initiative has been driven by the following: (1) the view that the burden of harm from AOD use in Southern Africa is likely to increase with development; (2) the realization that various global, regional, and local factors have high-lighted the need for monitoring substance use in Southern Africa at this time; and (3) the SADC Drug Protocol, signed in 1996, which highlights the impor-tance of information and research to inform interdic-tion and demand reduction activities. The overall goal of SENDU is to improve the infor-mation base for policymakers in SADC member states in order to address the health and socioeco-nomic burden caused by misuse of AODs. SENDU’s immediate purpose is to develop, establish, and evaluate a substance abuse sentinel surveillance sys-tem in each of the SADC member states, building on the SACENDU model operational in three cities and two provinces in South Africa. The SENDU initiative has the following core compo-nents: • Ongoing training and technical support • site- or country-specific network, and, if possi-
ble, the in (The “basic” system comprises treat-ment demand data from specialist substance abuse treatment facilities [if available] and psy-chiatric hospitals, as well as information from the police on arrests, seizures, and drug prices. Additional components might include school studies, mortuary or trauma unit studies, etc.)
• Validation and collation of data during 6-month
country and regional report-back meetings

EPIDEMIOLOGIC TRENDS IN DRUG ABUSE—Panel on International Drug Abuse: Emerging/Current Trends
Proceedings of the Community Epidemiology Work Group, Vol. II, June 2005 350
• Dissemination of findings via reports, newslet-
ters, press briefings, and a Web site Between 2001 and 2004, technical support visits were undertaken to all SADC member states. The focus of these visits was to learn more about patterns of AOD use in the countries, inform government of-ficials about the SENDU initiative, assist countries in developing instruments to collect and collate secon-dary data on AOD use/associated consequences, pro-vide technical support in other areas related to estab-lishing and maintaining an AOD surveillance system, support country coordinators in running an initial meeting of potential members of an AOD surveil-lance network, conduct visits to agencies where data are to be collected, and identify other areas requiring technical or other forms of support. Area Description SADC was established in 1992 and comprises 13 member states (exhibit 1). These countries differ greatly in land area, population, income levels, and official languages (exhibit 2). The surveillance sys-tems in Botswana, Lesotho, Malawi, Mauritius, Na-mibia, Swaziland, Zambia, and Zimbabwe are coun-try-level systems. In Mozambique, the surveillance system has been established in Maputo, and in Tan-zania, systems are established in Dar es Salaam and Zanzibar. SACENDU comprises six sentinel sites, four of which are large port cities (Cape Town, Dur-ban, Port Elizabeth, and East London); the other two are provinces: Gauteng (a largely urban province which includes the cities of Pretoria and Johannes-burg) and Mpumalanga (a largely rural province bor-dered by Swaziland and Mozambique). The South African sites cover just over one-third of country’s population. Data Sources A summary of the data sources accessed in the above countries during the first half of 2004 is indicated in exhibit 3. The major sources of data are specialist treatment centres, psychiatric hospitals, and the po-lice. With regard to detailed information on treatment demand, in the first half of 2004 data were obtained from 98 treatment centres/hospitals in 9 countries (on 8,675 patients), up from 92 treatment centres (and 7,569 patients) in the second half of 2003. The focus of this report is on the findings of Phase 16 of the SACENDU Project, Phase 1 of the AOD abuse surveillance system established in Zimbabwe, Phase 2 of the surveillance systems established in Swazi-land and Zambia, Phase 3 of the surveillance system established in Tanzania, Phase 4 of the surveillance systems established in Malawi and Mozambique,
tems established in Malawi and Mozambique, Phase 5 of the surveillance systems established in Botswana and Namibia, and Phase 6 of the AOD abuse surveil-lance systems established in Lesotho and Mauritius. This report covers the period January to June 2004 and preceding 6-month periods (if applicable).
DRUG ABUSE PATTERNS AND TRENDS Treatment Demand Data Information on primary drug of abuse reported at specialist AOD treatment centres3 is provided in ex-hibits 4 and 5. To facilitate country comparisons, data for South Africa are averaged over the six sentinel sites in the country, and treatment data for Tanzania are averaged over Dar es Salaam and Zanzibar. In summary, in Mauritius, Mozambique (Maputo), Namibia, South Africa, Swaziland, Tanzania, and Zambia, there appears to be demand for (and supply of) treatment for a greater range of substances of abuse than in the other countries (i.e., Botswana, Le-sotho, and Malawi), where alcohol and cannabis are the primary drugs of abuse reported. Specifically, based on treatment demand data, South Africa has a greater range of substances available than other SADC countries. South Africa also has the largest number of treatment centres (in general, and included in the SENDU project) and the largest number of patients entering substance abuse treatment facilities. Alcohol is the primary substance of abuse most likely to be reported by patients at specialist substance abuse treatment centres in six SADC countries; among all SADC countries, the proportion of primary alcohol admissions ranges from 18 percent in Tanza-nia to 62 percent in Swaziland. Averaging across the nine countries for which data are available, just over one-third (38 percent) of patients listed alcohol as a primary drug of abuse. This is a decrease of 7 per-centage points compared with the second half of 2003. Decreases were noted in six of the nine coun-tries for which comparative data were available. The implication of this is that there is an increase in the demand for treatment for substances other than alco-hol in these countries. The proportion of patients entering treatment centres with cannabis as their primary drug of abuse varied greatly in the first half of 2004, ranging from 7 per-cent in Mauritius and Namibia to 79 percent in Ma-lawi. In the nine countries, just over one-third (37 percent) of patients had cannabis as a primary drug of abuse. This is similar to the previous reporting pe-
3 For Botswana, Malawi, Tanzania and Zambia information comes from psychiatric hospitals/units only

EPIDEMIOLOGIC TRENDS IN DRUG ABUSE—Panel on International Drug Abuse: Emerging/Current Trends
Proceedings of the Community Epidemiology Work Group, Vol. II, June 2005 351
riod. The increase over time reported previously for Malawi has not continued; the proportion of cannabis admissions there declined from 85 percent in the sec-ond half of 2003 to 79 percent in the first half of 2004. An increase in treatment demand for problems related to cannabis use was noted in Tanzania during the same period (from 39 to 50 percent), while con-versely a decrease was noted in Swaziland (from 60 to 36 percent). Treatment demand for problems related to the use of Mandrax (methaqualone) is confined to Namibia and South Africa. In the previous reporting period, treat-ment demand for problems related to Mandrax use was noted in Swaziland and Zambia, but this was no longer the case in the first half of 2004. Over the past three reporting periods, an increase in treatment de-mand related to this drug was noted in Namibia, whereas in South Africa there appears to be no dis-cernable trend. Treatment demand for problems related to the use of cocaine is mainly confined to Mozambique, Namibia, and South Africa, and to a lesser extent in Swaziland and Zambia, with increases being noted in all five countries between the second half of 2003 and the first half of 2004. Treatment demand for problems related to the use of heroin is confined to Mauritius, Mozambique, South Africa, Tanzania, Zambia, and to a much lesser ex-tent Swaziland, where it appeared in the treatment demand data set for the first time since data were collected in Swaziland as part of the SENDU project. Mauritius has by far the greatest proportion of pa-tients in treatment whose primary drug of abuse is heroin (58.9 percent). Increases in treatment demand related to heroin use were noted in all six countries, especially in Mauritius, Mozambique, Tanzania, and Zambia (by at least five percentage points since the second half of 2003). Injection use of heroin is extremely high in Mauritius (more than 90 percent), but it is also high in the South African sites (28 percent in Cape Town, 55 percent in Gauteng, and 32 percent in Mpumalanga), in Maputo, Mozambique (23 percent), and in Tanza-nia (29 percent). During the first half of 2004, ecstasy (methylenedi-oxymethamphetamine) was only reported as a pri-mary substance of abuse in treatment centres in South Africa (0.8 percent). Over-the-counter and prescrip-tion medicines (primarily benzodiazepines and anal-gesics) were only reported as primary drugs of abuse in Mauritius, South Africa, and Swaziland, ranging between 0.5 and 4 percent of admissions.
Other drugs reflected in treatment demand data in-cluded khat, methcathinone (CAT), lysergic acid di-ethylamide (LSD), methamphetamine, and inhalants (e.g., glue, petrol). A dramatic increase in treatment demand for methamphetamine was noted in Cape Town (South Africa), especially in the first half of 2004 and particularly among patients younger than 20. Almost 4 out of every 10 patients younger than 20 who attended drug treatment in Cape Town re-ported methamphetamine as a primary or secondary drug of abuse. Age and Mode of Drug Use Across countries and sites, the proportion of patients in treatment who are younger than 20 averages 12 percent and ranges from 0.5 percent (Mauritius) to 27 percent (Zambia). This has declined substantially since the last reporting period. With the exception of Mauritius, across sites the predominant mode of in-gesting substances is by swallowing or smoking. In Mauritius, however, more than one-half of persons in treatment injected their primary drug of abuse. Over-all, only 3 percent of patients in treatment centres in the South African sites reported injection as their primary mode of ingesting their primary substance. The only other countries where intravenous drug use was reported were Mozambique, Tanzania, and Zam-bia. Increases in intravenous drug use were noted in Mauritius, South Africa, Tanzania, and Zambia.
Law Enforcement Data Arrests In Botswana and Swaziland, no arrests for drug deal-ing/trafficking were recorded in the first half of 2004 (exhibit 6). In Lesotho, Malawi, and Mozambique (Maputo) in the first half of 2004, all arrests for drug dealing (trafficking) involved cannabis. For South Africa, information on cannabis arrests is not avail-able, but information on police cases (by drug) for drugs other than cannabis is available from the police forensic science laboratories. The highest number of arrests for dealing in cannabis in the first half of 2004 was noted in Tanzania (2,219), followed by Zambia (1,423). Increases in the number of persons arrested for dealing in cannabis were noted for five of the nine countries for which comparative data were available: Lesotho, Malawi, Mauritius, Mozambique, and Zam-bia, but in all cases except Maputo, there was no in-crease in the proportion of arrests for dealing in can-nabis in the first half of 2004. Over the eight coun-tries where arrests were made for dealing in cannabis (excluding South Africa), on average 85 percent of all arrests for dealing in drugs involved cannabis.

EPIDEMIOLOGIC TRENDS IN DRUG ABUSE—Panel on International Drug Abuse: Emerging/Current Trends
Proceedings of the Community Epidemiology Work Group, Vol. II, June 2005 352
Arrests for dealing in Mandrax (methaqualone) were only made in Namibia (n=63, including arrests for drug possession), South Africa (4,829), and Tanzania (1) during this period. The proportion of arrests for dealing in this drug stayed much the same in both Namibia and South Africa in the last two reporting periods. Arrests for dealing in cocaine were made in Namibia, South Africa, Tanzania, Zambia, and Zim-babwe, though in the latter three countries the propor-tion of arrests for dealing in cocaine represented less than 1 percent of all arrests. The largest increase in the proportion of cocaine arrests was noted in Na-mibia, from 2.9 percent of all arrests in the second half of 2003 to 12.4 percent in the first half of 2004. In Mauritius, more than 6 out of every 10 arrests for drug trafficking involved heroin. This is substantially greater than for Namibia, South Africa, Tanzania, and Zambia, the only other countries where arrests for dealing in heroin were recorded. In these coun-tries, the corresponding proportions were 0.3 percent, 3.3 percent, 9.9 percent, and 0.5 percent, respec-tively. Increases in the proportion of heroin arrests across these five countries ranged from 0.3 percent-age points in Namibia to 6.3 percentage points in Tanzania. With regard to ecstasy and other amphetamine-type stimulants, a substantial number of cases relating to dealing in ecstasy and methamphetamine have been reported in South Africa over the past five reporting periods. They accounted for 21.5 percent of all cases (n=1,789) in the first half of 2004. A large increase in arrests related to ecstasy dealing/possession was also noted in Namibia. Of the 11 countries for which data on drug-related arrests were recorded as part of the SENDU project in 2004, only in South Africa were persons arrested for dealing in LSD (fewer than 1 percent in the first half of 2004). Arrests for dealing in prescription medicines were noted in Zambia and South Africa, and arrests for dealing in khat were reported in Tanzania (4 percent of all arrests) and in Zambia. Seizures The largest amount of cannabis seized during the first half of 2004 occurred in Tanzania: 234,045 kilo-grams. No seizure information regarding cannabis is available for South Africa. Increased cannabis sei-zures were noted in three countries, while decreases occurred in four. Heroin seizures were noted in Mau-ritius, Namibia, South Africa, Swaziland, Tanzania, and Zambia. The quantity seized, however, was very low in most countries, except for Mauritius, South Africa, and Zambia. The amount of heroin seized over the 11 countries was 17.5 kilograms, with in-
creases being noted in Mauritius, South Africa, and Zambia (off a fairly low base). Seizures of Mandrax (methaqualone) were noted in Botswana, Namibia, South Africa, and Tanzania, with the equivalent of 592,968 Mandrax tablets being recorded by the four police forensic science laboratories in South Africa. Mandrax seizures were down in Namibia and South Africa, but they substantially increased in Botswana and Tanzania. Cocaine seizures in the region overall (67 kilograms) were less than in the previous report-ing period and totalled more than 10 kilograms in only Namibia and South Africa. Seizures of am-phetamine-type stimulants (mainly ecstasy) were noted in four countries (147,809 units in total), with the largest seizures being noted in South Africa and Zambia. A small quantity of LSD was seized in South Africa, and 251 kilograms of khat were seized in Tanzania, substantially less than was seized in the second half of 2003. DISCUSSION Cannabis and alcohol continue to dominate treatment demand and community concern in most SADC countries. They both represent more than one-third of the demand for drug treatment in the region. Across the region, there continues to be strong evidence of the burden placed by alcohol and cannabis on health and law enforcement sectors, and the number of per-sons arrested for dealing/trafficking in cannabis in-creased in more than one-half of the countries. There is also evidence of substantial use of other drugs such as Mandrax (methaqualone), heroin, cocaine, and amphetamine-type stimulants in certain countries and trafficking of these drugs in many countries (not just those where use has been reported). Heroin use is particularly high in countries in the south and east of the region, including South Africa, Mozambique, Tanzania, and Mauritius. In addition, use of heroin and dealing/trafficking in this drug was increasing in the landlocked country of Zambia in the first half of 2004. Increases in treatment demand, seizures,4 and in the proportion of arrests for deal-ing/trafficking in this drug were noted in most coun-tries where heroin use was reported. Treatment demand and/or law enforcement indicators for cocaine are highest in Mozambique, Namibia, and South Africa (i.e., in the coastal countries in the south and east of the SADC region). There was an increase in problems associated with cocaine in all countries where there was a demand for treatment for the drug. Regionally, however, there was a decline in seizures for cocaine in the first half of 2004. One of the big-gest changes noted was the increase in the proportion 4 Except Tanzania. In addition it should be noted that the increase in heroin seizures in Swaziland was negligible.

EPIDEMIOLOGIC TRENDS IN DRUG ABUSE—Panel on International Drug Abuse: Emerging/Current Trends
Proceedings of the Community Epidemiology Work Group, Vol. II, June 2005 353
of arrests related to cocaine relative to other drugs in Namibia. Treatment demand and law enforcement indicators related to Mandrax (methaqualone) continue to be high in Namibia and South Africa. However, as com-pared to the previous 6-month period, there appears to have been a shift in countries where there is lesser evidence of use of Mandrax and/or in dealing in this drug, with such evidence no longer being noted in Mozambique, Swaziland, and Zambia. Evidence of use in Botswana and Tanzania is now apparent. Treatment demand and law enforcement indicators indicate use of and trafficking in amphetamine-type stimulants, especially ecstasy and methamphetamine in South Africa. Trafficking of these substances was also noted in Botswana, Namibia and Zambia. Across sites, just over 1 in 10 patients receiving treatment for alcohol or drug related problems is younger than 20, but this proportion has decreased over time. Drug price information is provided in ex-hibit 8, and a rough comparison of levels of sub-stance use and associated consequences to society based on treatment demand and law enforcement indicators is provided in exhibit 8. Various policy implications were raised in the coun-try reports for January–June 2004 and at the sixth SENDU Regional Report-Back Meeting. These are indicated below, with reference to specific target groups and intervention approaches: • Primary Prevention
- Target children at a young age, focusing on gateway drugs such as alcohol, tobacco and cannabis.
- Intensify AOD education.
- Intervene to address the abuse of drugs by sex workers.
- Reduce alcohol-related violence in and around liquor outlets, and educate the public that abuse of alcohol can put them at risk for being a victim of a violent assault.
• Treatment/Rehabilitation
- Increase the availability of affordable treat-ment centres, especially outside of the psy-chiatric system.
- Provide special facilities for female drug ad-dicts.
- Create special interventions that cater to the needs of unemployed persons.
- Increase training in management of sub-stance abuse and in mental health problems to workers in the health and social services.
- Provide training to emergency/trauma per-sonnel to ensure that they are equipped to deal with cases involving heroin and methamphetamine (selected countries).
- Increase treatment and prevention programs aimed at workers.
- Pilot test harm reduction strategies to reduce infections and other problems, such as over-doses.
• Other
- Review and increase the enforcement of drug trafficking and related legislation.
- Ensure that police have adequate resources to enforce anti-drug legislation.
Across countries, various issues requiring further monitoring or more indepth research were also raised, including… • Reasons for use of AODs by youth (Malawi)
• Impact of AOD use on mental health (Malawi, Namibia), violence (Mauritius), overdose deaths (Mauritius), and crime (Botswana)
• Poly-drug use (Mauritius)
• Strategies to combat inhalant use among children (Mauritius)
• Incidence of human immunodeficiency virus (HIV), hepatitis B (HBV), and hepatitis C (HCV) among injection drug users (IDUs) and non-injection drug users (non-IDUs) (Mauritius)
• The relationship between drug abuse and HIV/AIDS (Swaziland, Zambia)
• Barriers to treatment for women and other sec-tors of the population (Mauritius, Namibia, South Africa)

EPIDEMIOLOGIC TRENDS IN DRUG ABUSE—Panel on International Drug Abuse: Emerging/Current Trends
Proceedings of the Community Epidemiology Work Group, Vol. II, June 2005 354
Seychelles
Mauritius
South Africa
Lesotho
Swaziland
Mozambique
BotswanaNamibia
Zimbabwe
ZambiaAngola
DR CongoTanzania
Malawi
Seychelles
Mauritius
South Africa
Lesotho
Swaziland
Mozambique
BotswanaNamibia
Zimbabwe
ZambiaAngola
DR CongoTanzania
Malawi
• Female drug traffickers (Botswana, Mauritius)
• Relationship between drug use, tuberculosis (TB), and HIV/AIDS (DRC, Swaziland, Zambia)
• The relationship between patterns of drug abuse and expulsions from school (Zimbabwe)
• Treatment models for resource-poor countries The first phase of the SENDU project is scheduled to be completed at the end of June 2005. By the comple-tion of this phase, at least one 6-month data collec-tion period should have been should have been com-pleted at each site, including the DRC and Angola. Challenges facing the SENDU project include the following: • Persuading all available treatment centres in the
sentinel sites to contribute treatment demand data and to continue participation in the network
• Adding additional sources of data to complement existing sources (mainly treatment demand and law enforcement)
• Ensuring that data on the links between sub-stance use and infectious diseases and crime are also collected
• Improving the quality of written and oral reports, particularly moving from more descriptive re-porting to more analytical reporting
• Getting the SENDU findings to have a greater impact on local, national, and regional alco-hol/drug policy and practice
• Ensuring the long-term sustainability and matu-ration of the national networks, as well as SENDU as a whole
ACKNOWLEDGEMENTS The financial support of the European Commission (EDF and EPRD-South Africa) for the SENDU pro-ject is acknowledged, as is the support of the staff at the SADC Secretariat. We also recognize the support of the SADC Drug Control Committee and the SADC National Contact Points in facilitating our work on this project, and in addition acknowledge the important contribution of the SENDU Country Coor-dinators of the 13 SADC member states visited be-tween 2001 and 2004. For inquiries concerning this report, please contact Charles D.H. Parry, M.Sc., M.A., Ph.D., Director, Alcohol and Drug Abuse Research Unit, Medical Research Council, P.O. Box 19070, Ty-gerberg, Cape Town, 7505 South Africa, Phone: 27-21-938-0419, Fax: 27-21-938-0342, E-mail: [email protected].
Exhibit 1. Member States of SADC1 1The Seychelles left SADC in 2003.

EPIDEMIOLOGIC TRENDS IN DRUG ABUSE—Panel on International Drug Abuse: Emerging/Current Trends
Proceedings of the Community Epidemiology Work Group, Vol. II, June 2005 355
Exhibit 2. Description of SADC Member States, by Selected Indicators
SADC Member State
Land Area (sq kms)
Population (2003 est.)
GDP per capita1 Official Language
Population Age 14 and Younger
(%) Angola 1,246,700 10,978,552 $1,900 Portuguese 43.5 Botswana 600,370 1,561,973 $8,800 English 39.2 Congo (DRC) 2 2,345,410 55,225,478 $590 French - Lesotho 30,355 1,865,040 $3,000 English 37.3 Malawi 118,480 11,906,855 $600 English, Chichewa 46.8 Mauritius 1,860 1,220,481 $11,400 English 24.8 Mozambique 801,590 18,811,731 $1,200 Portuguese 43.6 Namibia 825,418 1,954,033 $7,100 English 42.4 South Africa 1,219,919 42,718,530 $10,700 11 official languages3 29.5 Swaziland 17,363 1,169,241 $4,900 English, Swati 41.0 Tanzania 945,087 36,588,225 $600 English, Swahili 44.2 Zambia 752,614 10,462,436 $800 English 46.1 Zimbabwe 390,580 12,671,860 $1,900 English 39.4 Total 9,296,201 207,134,435
1Purchasing power parity (2003 estimate) 22002 estimate 3English predominates SOURCE: U.S. Central Intelligence Agency. The World Fact Book 2001. Washington, DC: Author, 2002. Exhibit 3. Data Sources, by Sites: January–June 2004
Source
Bot
swan
a1
Leso
tho
Mal
awi
Mau
ritiu
s
Moz
ambi
que
Nam
ibia
S. A
fric
a
Swaz
iland
Tanz
ania
Zam
bia
Zim
babw
e
Treatment Centres (patients in period Jan–Jun 2004) N/A2 9
(63) 7
(556) 8
(596) 5
(151) 3
(54) 58
(6,680) 2
(223) 3
(169) 3
(183) N/A
Police Drug Data/Forensic Y Y Y Y Y Y Y Y Y Y Y
Psychiatric Hospitals N/A ITC3 ITC Y ITC N/A Y ITC ITC ITC N/A
Prisons – – – Y – – – – – – -
Mortuaries – – – – – – Y – – – -
Orthopedic Unit – – – – – – – – Y – -
Surveys, Studies – – – – – – Y – – – -
Other Health Statistics – – – Y – – – – – – -
Education Ministry – – – – – – – – – – Y 1No data were available as data collection system was being revamped. 2N/A=Not applicable 3ITC=Included with treatment centre data

EPIDEMIOLOGIC TRENDS IN DRUG ABUSE—Panel on International Drug Abuse: Emerging/Current Trends
Proceedings of the Community Epidemiology Work Group, Vol. II, June 2005 356
Exhibit 4. Treatment Demand Data, by Primary Drug of Abuse1: January 2002–June 2004
Country Period Alco-hol
Can-nabis
Metha-qualone
(Mtq) Co-
caine Heroin Ec-stasy
OTC/ Rx2 Other N # Tx.
Ctrs
Jan–Jun ‘02 70.3 23.8 0.5 0.5 0.0 0.0 0.0 4.9 188 9 Jul–Dec ‘02 69.6 29.0 0.0 0.0 0.0 0.0 0.0 1.5 72 5 Jan–Jun ‘03 83.6 16.4 0.0 0.0 0.0 0.0 0.0 0.0 73 4 Jul–Dec ‘03 73.7 26.3 0.0 0.0 0.0 0.0 0.0 0.0 19 4
Botswana
Jan–Jun ‘04 N/A N/A N/A N/A N/A N/A N/A N/A N/A N/A Jul–Dec ‘01 54.3 45.7 0.0 0.0 0.0 0.0 0.0 0.0 45 6 Jan–Jun ‘02 85.0 15.0 0.0 0.0 0.0 0.0 0.0 0.0 20 5 Jul–Dec ‘02 97.8 2.2 0.0 0.0 0.0 0.0 0.0 0.0 46 3 Jan–Jun ‘03 70.2 29.8 0.0 0.0 0.0 0.0 0.0 0.0 67 7 Jul–Dec ‘03 51.0 49.0 0.0 0.0 0.0 0.0 0.0 0.0 49 6
Lesotho
Jan–Jun ‘04 52.4 47.6 0.0 0.0 0.0 0.0 0.0 0.0 63 9 Jul–Dec ‘02 32.7 67.3 0.0 0.0 0.0 0.0 0.0 0.0 445 3 Jan–Jun ‘03 19.6 79.8 0.0 0.0 0.0 0.0 0.0 0.6 361 5 Jul–Dec ‘03 14.9 85.1 0.0 0.0 0.0 0.0 0.0 0.0 417 7
Malawi
Jan–Jun ‘04 20.7 79.3 0.0 0.0 0.0 0.0 0.0 0.0 556 7 Jul–Dec ‘01 21.8 14.1 0.0 0.0 70.7 0.0 1.3 1.5 467 8 Jan–Jun ‘02 32.7 6.6 0.0 0.0 59.3 0.0 1.1 0.2 452 8 Jul–Dec ‘02 33.0 10.3 0.0 0.0 52.9 0.0 2.8 0.5 427 8 Jan–Jun ‘03 36.5 8.2 0.0 0.0 51.7 0.0 3.2 0.4 561 8 Jul–Dec ‘03 36.7 6.1 0.0 0.0 53.5 0.0 3.2 0.5 591 8
Mauritius
Jan–Jun ‘04 28.4 7.4 0.0 0.0 58.9 0.0 4.2 1.2 596 8 Oct–Dec ‘02 63.7 20.5 0.0 0.9 15.0 0.0 0.0 0.0 234 7 Jan–Jun ‘03 68.3 20.2 0.0 0.0 10.6 0.0 0.0 1.0 104 4 Jul–Dec ‘03 54.3 16.5 0.0 3.2 25.2 0.0 0.0 0.8 127 6
Mozamb.
Jan–Jun ‘04 39.1 19.2 0.0 8.6 33.1 0.0 0.0 0.0 151 5 Jan–Jun ‘02 74.0 8.0 12.0 6.0 0.0 0.0 0.0 0.0 50 2 Jul–Dec ‘02 78.0 8.7 8.7 2.2 0.0 2.2 0.0 0.0 46 3 Jan–Jun ‘03 82.9 0.0 14.3 2.9 0.0 0.0 0.0 0.0 35 2 Jul–Dec ‘03 66.7 3.7 22.2 7.4 0.0 0.0 0.0 0.0 54 2
Namibia
Jan–Jun ‘04 53.7 7.4 26.0 13.0 0.0 0.0 0.0 0.0 54 3 Jul–Dec ‘01 52.2 21.4 10.1 5.1 5.1 1.1 3.1 1.6 5,667 48 Jan–Jun ‘02 54.0 19.3 10.3 5.7 5.3 1.0 3.1 1.2 6,108 50 Jul–Dec ‘02 54.1 21.0 9.5 5.3 4.6 1.1 2.7 1.7 5,830 50 Jan–Jun ‘03 51.7 18.2 12.6 5.8 5.5 0.9 3.1 2.1 5,886 52 Jul–Dec ‘03 48.7 18.9 14.1 6.2 5.2 0.8 2.8 2.3 5,726 50
South Africa
Jan–Jun ‘04 47.9 16.6 11.9 8.2 6.2 0.8 2.9 5.0 6,680 58 Jul–Dec ‘03 30.6 59.7 9.7 0.0 0.0 0.0 0.0 0.0 62 2 Swaziland Jan–Jun ‘04 61.9 36.3 0.0 0.5 0.5 0.0 0.5 0.5 223 2 Jul–Dec ‘03 39.1 38.8 0.0 0.0 18.2 0.0 0.0 3.9 330 3 Tanzania Jan–Jun ‘04 17.8 50.3 0.0 0.0 30.2 0.0 0.0 1.8 169 3 Aug–Dec ‘03 34.6 61.8 0.5 0.5 0.5 0.0 1.6 0.5 191 4 Zambia Jan–Jun ‘04 24.0 64.5 0.0 1.1 8.2 0.0 0.0 2.2 183 3
1Row percentages add to 100 percent. Information on drug treatment demand is not yet available for Zimbabwe. 2Includes psychotropic medicines.

EPIDEMIOLOGIC TRENDS IN DRUG ABUSE—Panel on International Drug Abuse: Emerging/Current Trends
Proceedings of the Community Epidemiology Work Group, Vol. II, June 2005 357
Exhibit 5. Treatment Demand Data, by Primary or Secondary Drugs of Abuse for Selected Substances and Selected Sites: January–June 2004
60.3
31.9
41.1
59.5
7168.3
26.5
26.5 29
.3
68.9
0 0 0
20.9
00 0
19.2
17.5
2.7
0
67.5
39.1
8.8
8.2
0
10
20
30
40
50
60
70
80
Lesotho Mauritius Mozambique South Africa Zambia
Percent
Alcohol Cannabis Methaq Cocaine Heroin

EPIDEMIOLOGIC TRENDS IN DRUG ABUSE—Panel on International Drug Abuse: Emerging/Current Trends
Proceedings of the Community Epidemiology Work Group, Vol. II, June 2005 358
Exhibit 6. Police Arrests for Drug Dealing, by Drug1: January 2002–June 2004
Country Period Cannabis/ Hashish
Metha-qualone
Co-caine/ Crack
Ec-stasy/ ATS
Heroin Rx LSD Khat N
Jan-Jun ‘02 100.0 0.0 0.0 0.0 0.0 0.0 0.0 - 226 Jul-Dec ‘02 100.0 0.0 0.0 0.0 0.0 0.0 0.0 - 183 Jan-Jun ‘03 96.5 1.2 1.2 1.2 0.0 0.0 0.0 - 170 Jul-Dec ‘03 0.0 0.0 0.0 0.0 0.0 0.0 0.0 - 0
Botswana2
Jan-Jun ‘04 0.0 0.0 0.0 0.0 0.0 0.0 0.0 0.0 0 Jul-Dec ‘01 100.0 0.0 0.0 0.0 0.0 0.0 0.0 - 108 Jan-Jun ‘02 100.0 0.0 0.0 0.0 0.0 0.0 0.0 - 87 Jul-Dec ‘02 100.0 0.0 0.0 0.0 0.0 0.0 0.0 - 93 Jan-Jun ‘03 100.0 0.0 0.0 0.0 0.0 0.0 0.0 - 103 Jul-Dec ‘03 100.0 0.0 0.0 0.0 0.0 0.0 0.0 - 56
Lesotho
Jan-Jun ‘04 100.0 0.0 0.0 0.0 0.0 0.0 0.0 0.0 146 Jul-Dec ‘02 100.0 0.0 0.0 0.0 0.0 0.0 0.0 - 431 Jan-Jun ‘03 100.0 0.0 0.0 0.0 0.0 0.0 0.0 - 348 Jul-Dec ‘03 100.0 0.0 0.0 0.0 0.0 0.0 0.0 0.0 182
Malawi
Jan-Jun ‘04 100.0 0.0 0.0 0.0 0.0 0.0 0.0 0.0 355 Jul-Dec ‘01 47.0 0.0 0.0 0.0 53.0 0.0 0.0 - 156 Jan-Jun ‘02 37.0 0.0 0.0 0.0 63.0 0.0 0.0 - 125 Jul-Dec ‘02 59.1 0.0 0.0 0.0 40.9 0.0 0.0 - 149 Jan-Jun ‘03 46.0 0.0 0.0 0.0 54.0 0.0 0.0 - 153 Jul-Dec ‘03 41.0 0.0 0.0 0.0 59.0 0.0 0.0 0.0 122
Mauritius
Jan-Jun ‘04 37.2 0.0 0.0 0.0 62.8 0.0 0.0 0.0 199 Oct-Dec ‘02 N/A N/A N/A N/A N/A N/A N/A - N/A Jan-Jun ‘03 100.0 0.0 0.0 0.0 0.0 0.0 0.0 - 4 Jul-Dec ‘03 0.0 0.0 100.0 0.0 0.0 0.0 0.0 0.0 0
Mozam-bique (Maputo) 2
Jan-Jun ‘04 100.0 0.0 0.0 0.0 0.0 0.0 0.0 0.0 44 Jan-Jun ‘02 84.4 14.1 1.0 0.5 0.0 0.0 0.0 - 397 Jul-Dec ‘02 84.9 9.3 3.5 2.2 0.0 0.0 0.0 - 226 Jan-Jun ‘03 88.9 9.6 1.0 0.5 0.0 0.0 0.0 - 208 Jul-Dec ‘03 79.8 16.5 2.9 0.8 0.0 0.0 0.0 0.0 491
Namibia2
Jan-Jun ‘04 64.2 17.7 12.4 5.4 0.3 0.0 0.0 0.0 355 Jul-Dec ‘01 - 65.7 16.2 13.8 3.0 0.0 1.3 - 4,756 Jan-Jun ‘02 - 60.5 19.1 15.2 4.8 0.0 0.4 - 4,818 Jul-Dec ‘02 - 61.3 16.5 16.8 4.6 0.0 0.8 - 5,131 Jan-Jun ‘03 - 66.2 13.5 16.6 2.9 0.0 0.8 - 5,910 Jul-Dec ‘03 - 59.9 12.0 24.5 3.0 0.0 0.6 0.0 7,373
South Africa3
Jan-Jun ‘04 - 58.0 16.8 21.5 3.3 0.0 0.4 0.0 8,321 Jul-Dec ‘03 0.0 0.0 0.0 0.0 0.0 0.0 0.0 0.0 0 Swaziland Jan-Jun ‘04 0.0 0.0 0.0 0.0 0.0 0.0 0.0 0.0 0 Jan-Jun ‘032 85.8 0.2 0.7 0.0 5.7 0.0 0.0 7.5 2,701 Jul-Dec ‘03 90.4 0.0 0.0 0.0 3.6 0.0 0.0 6.1 3,418 Tanzania Jan-Jun ‘04 85.7 0.04 0.1 0.0 9.9 0.0 0.0 4.2 2,590 Aug-Dec ‘03 98.0 0.1 0.1 0.0 0.2 1.0 0.0 0.6 1,247 Zambia Jan-Jun ‘04 95.7 0.0 0.5 0.0 0.5 2.0 0.0 1.4 1,487
Zimbabwe2 Jan-Jun ‘04 99.8 0.0 0.2 0.0 0.0 0.0 0.0 0.0 568
1Row percentages add to 100 percent. 2Including possession. 3South African data refer to national cases seen by the Forensic Science Laboratory rather than arrests per se. These laboratories do not routinely analyse all cases involving seizures of cannabis.

EPIDEMIOLOGIC TRENDS IN DRUG ABUSE—Panel on International Drug Abuse: Emerging/Current Trends
Proceedings of the Community Epidemiology Work Group, Vol. II, June 2005 359
Exhibit 7. Police Seizures, by Drug: January 2002–June 2004
Country Period Cannabis (kg)
Metha-qualone (tablets)1
Cocaine (g)
Ampheta-mine
(tablets) 1 Heroin
(g) LSD
(units) Khat (kg)
Jan-Jun ‘02 1,471 0 0 0 0 0 - Jul-Dec ‘02 1,471 0 0 0 0 0 - Jan-Jun ‘03 1,189 5 1.77 31 0 0 - Jul-Dec ‘03 1,359 0 0 0 0 0 0
Botswana
Jan–Jun ‘04 581 2 784 0 29 0 0 0 Jul-Dec ‘01 19,671 0 0 10 045 0 0 - Jan-Jun ‘02 4,154 0 0 0 0 0 - Jul-Dec ‘02 4,417 0 0 0 0 0 - Jan-Jun ‘03 5,380 0 0 0 0 0 - Jul-Dec ‘03 2,020 0 0 0 0 0 0
Lesotho
Jan–Jun ‘04 7,349 0 0 0 0 0 0 Jul-Dec ‘02 4,659 0 0 0 0 0 - Jan-Jun –03 6,242 0 0 0 0 0 - Jul-Dec ‘03 4,527 0 0 0 0 0 0
Malawi
Jan–Jun ‘04 7,808 0 0 0 0 0 0 Jul-Dec ‘01 30 0 0 0 22 441 0 - Jan–Jun ‘02 23 0 0 0 4995 0 - Jul-Dec ‘02 44 0 0 0 6 973 0 - Jan-Jun ‘03 9 0 0 0 15 432 0 - Jul-Dec ‘03 34 0 0 0 517 0 0
Mauritius
Jan–Jun ‘04 39 0 0 0 2 357 0 0 Oct-Dec ‘02 N/A N/A N/A N/A N/A N/A - Jan-Jun ‘03 10 0 5 100 0 0 0 - Jul-Dec ‘03 23 1 000 9 200 0 15 0 0
Mozambique (Maputo)
Jan–Jun ‘04 22 0 0 0 0 0 0 Jan-Jun ‘02 775 9179 78 rocks 10 0 0 - Jul-Dec ‘02 147 679 189 rocks 36 0 0 - Jan-Jun ‘03 532 2 714 96 rocks 14 0 0 - Jul-Dec ‘03 96 6 426 55 162 0 0 0
Namibia
Jan–Jun ‘04 434 1 185 15 350 + 141 rocks 169 2 0 0
Jul-Dec ‘01 N/A 12 872 000 191 143 121 562 1 856 6 632 - Jan-Jun ‘02 N/A 2 668 595 375 535 150 324 6 273 322 - Jul-Dec ‘02 N/A 750 099 67 148 275 362 77 041 1 303 - Jan-Jun ‘03 N/A 630 844 237 728 256 927 16 340 532 - Jul-Dec ‘03 N/A 10 935 182 188 298 257 406 2 190 756 0
South Africa
Jan-Jun ‘04 N/A 592 968 46 305 76 407 13 655 235 Jul-Dec ‘03 8,463 473 3 832 0 0.02 0 0 Swaziland Jan–Jun ‘04 3,919 0 0 0 0.05 0 0 Jan-Jun ‘03 413,361 212 1.335 0 2 531 0 1 454 Jul-Dec ‘03 599,613 0 1 392 0 2 000 0 10 548 Tanzania Jan–Jun ‘04 234,043 1000 620 0 10.65 0 251 Aug-Dec ‘03 1,322 8 0.1 69 152 55.5 0 0 Zambia Jan–Jun ‘04 2,510 0 0.7 71 204 1 446 0 0
Zimbabwe Jan–Jun ‘04 555 0 0.7 0 0 0 0
1Or equivalent (calculated from powder seized): 1g = 2 tablets.
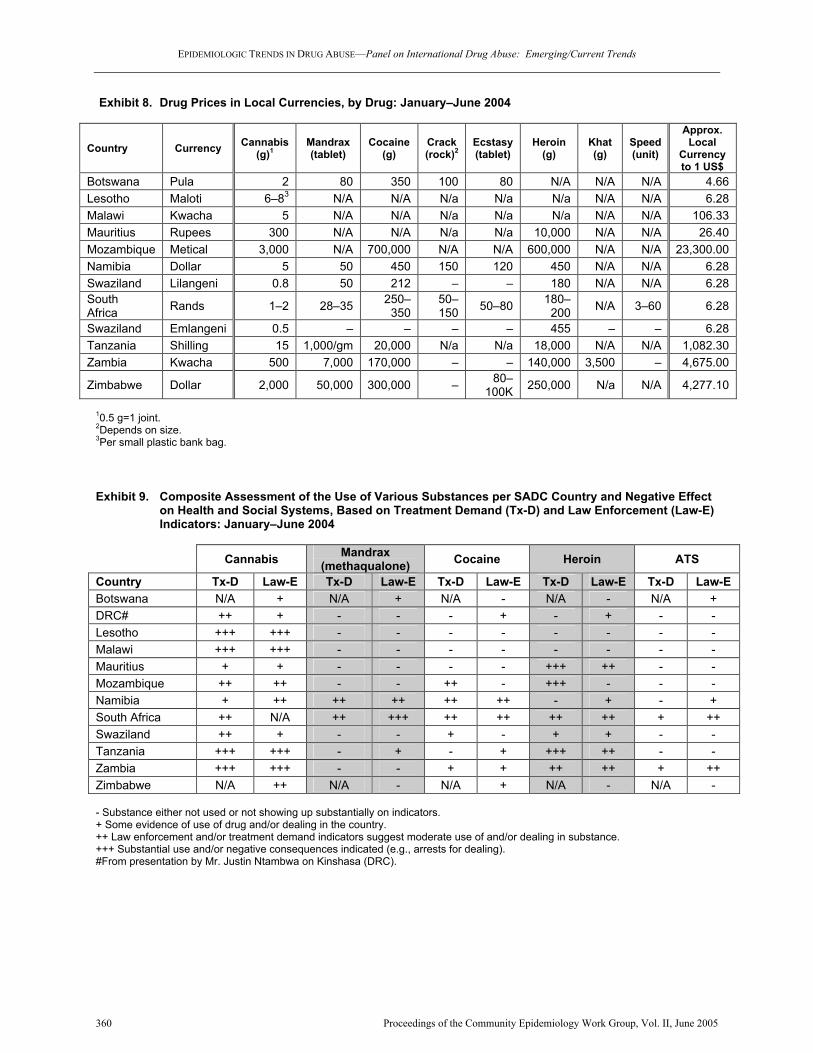
EPIDEMIOLOGIC TRENDS IN DRUG ABUSE—Panel on International Drug Abuse: Emerging/Current Trends
Proceedings of the Community Epidemiology Work Group, Vol. II, June 2005 360
Exhibit 8. Drug Prices in Local Currencies, by Drug: January–June 2004
Country Currency Cannabis (g)1
Mandrax (tablet)
Cocaine (g)
Crack (rock)2
Ecstasy (tablet)
Heroin (g)
Khat (g)
Speed (unit)
Approx. Local
Currency to 1 US$
Botswana Pula 2 80 350 100 80 N/A N/A N/A 4.66 Lesotho Maloti 6–83 N/A N/A N/a N/a N/a N/A N/A 6.28 Malawi Kwacha 5 N/A N/A N/a N/a N/a N/A N/A 106.33 Mauritius Rupees 300 N/A N/A N/a N/a 10,000 N/A N/A 26.40 Mozambique Metical 3,000 N/A 700,000 N/A N/A 600,000 N/A N/A 23,300.00 Namibia Dollar 5 50 450 150 120 450 N/A N/A 6.28 Swaziland Lilangeni 0.8 50 212 – – 180 N/A N/A 6.28 South Africa Rands 1–2 28–35 250–
350 50–150 50–80 180–
200 N/A 3–60 6.28
Swaziland Emlangeni 0.5 – – – – 455 – – 6.28 Tanzania Shilling 15 1,000/gm 20,000 N/a N/a 18,000 N/A N/A 1,082.30 Zambia Kwacha 500 7,000 170,000 – – 140,000 3,500 – 4,675.00
Zimbabwe Dollar 2,000 50,000 300,000 – 80–100K 250,000 N/a N/A 4,277.10
10.5 g=1 joint. 2Depends on size. 3Per small plastic bank bag. Exhibit 9. Composite Assessment of the Use of Various Substances per SADC Country and Negative Effect on Health and Social Systems, Based on Treatment Demand (Tx-D) and Law Enforcement (Law-E) Indicators: January–June 2004
Cannabis Mandrax (methaqualone) Cocaine Heroin ATS
Country Tx-D Law-E Tx-D Law-E Tx-D Law-E Tx-D Law-E Tx-D Law-E Botswana N/A + N/A + N/A - N/A - N/A + DRC# ++ + - - - + - + - - Lesotho +++ +++ - - - - - - - - Malawi +++ +++ - - - - - - - - Mauritius + + - - - - +++ ++ - - Mozambique ++ ++ - - ++ - +++ - - - Namibia + ++ ++ ++ ++ ++ - + - + South Africa ++ N/A ++ +++ ++ ++ ++ ++ + ++ Swaziland ++ + - - + - + + - - Tanzania +++ +++ - + - + +++ ++ - - Zambia +++ +++ - - + + ++ ++ + ++ Zimbabwe N/A ++ N/A - N/A + N/A - N/A - - Substance either not used or not showing up substantially on indicators. + Some evidence of use of drug and/or dealing in the country. ++ Law enforcement and/or treatment demand indicators suggest moderate use of and/or dealing in substance. +++ Substantial use and/or negative consequences indicated (e.g., arrests for dealing). #From presentation by Mr. Justin Ntambwa on Kinshasa (DRC).

EPIDEMIOLOGIC TRENDS IN DRUG ABUSE—Panel on International Drug Abuse: Emerging/Current Trends
Proceedings of the Community Epidemiology Work Group, Vol. II, June 2005 361
Patterns and Trends of Drug Abuse in Taiwan: A Brief History and Report from 2000 through 2004 Jih-Heng Li, Ph.D., Shu-Fen Liu, M.S., and Wen-Jing Yu, B.S.5 ABSTRACT Taiwan encountered the first wave of drug abuse in the late nineteenth century, when 6.3 percent of the total population consumed opium. The Japanese colonial government adopted the ‘gradual prohibi-tion’ policy to grant an opium quota for addicts. The measure is similar to today’s methadone main-tenance program, and the opium problem was alle-viated eventually. The second wave of drug abuse in Taiwan began in the early 1990s, when metham-phetamine abuse became prevalent among young-sters. Methamphetamine and heroin remained the two predominant illicit drugs of abuse from 2000 through 2004. The abuse of club drugs such as MDMA and ketamine has been increasing rapidly. Cannabis seizures exceeded 100 kilograms per year in 2001 and 2003, but cannabis abuse was still a minor problem as evidenced by urine testing. A high proportion of drug administration through injection was observed: 34.7 percent of the drug addicts con-sumed drugs by injection in 2000, and the percent-age surged to 63.9 percent in 2004. In addition, the percentage of needle sharing among addiction treatment admissions increased from 4.0 percent in 2000 to 15 percent in 2004. In order to prevent the spread of infectious diseases such as AIDS and hepatitis B and hepatitis C through drug abuse, the Department of Health has been implementing harm reduction measures, including substitution treat-ment, education programs for jail inmates, and pos-sibly needle exchange programs. INTRODUCTION Area Description Located in the West Pacific, Taiwan is separated from Mainland China by the Taiwan Strait. Taiwan consists of the Taiwan Island proper and some 85 islets, with a total land area of 36,000 square kilome-ters (14,400 square miles). Although Taiwan is rela-
5The authors are affiliated with the National Bureau of Controlled Drugs, Department of Health, Taiwan.
tively small, it is densely populated, with a popula-tion of 22,604,550 (2003 census). Such a high popu-lation density (625 people per square kilometer of land area or 3,750 people per square kilometer of arable land) has made life on this tiny island very crowded and competitive. Nevertheless, the economy of Taiwan has been rapidly improved. The per capita national income in 2003 was New Taiwan (NT) $452,820 (US$13,156), which was a fivefold increase over the income of US$2,669 in 1981.6 Brief History of Drug Abuse in Taiwan In the late nineteenth century, opium smoking was a common practice in the Ching Dynasty of China. Taiwan, under the reign of Ching Dynasty at that time, also suffered from the same problem. After the Sino-Japan War, Taiwan was ceded to Japan for 50 years (1895–1945). Realizing the severe problem of opium smoking, the Japanese colonial government adopted the “gradual prohibition” policy. Based upon the opinion of public physicians, opium addicts were issued opium licenses to obtain an opium quota. Ac-cording to license issuance records, it was estimated that there were some 169,000 opium addicts, or ap-proximately 6.3 percent of the total 2,500,000 inhabi-tants, in 1900. The opium license system, which is similar to today's methadone maintenance program except that the opium quota system was distributed by the government monopoly, brought a fortune for the colonial government and alleviated the problem of opium smoking to a manageable situation.7 When the Republic of China reclaimed Taiwan after World War II, only 2,000 addicts remained. Chiang Kai-Shek, after being defeated by the Chinese Com-munists, soon retreated with his army and imple-mented martial law in Taiwan. In the subsequent two decades (1940s–1950s), Taiwan was practically a drug-free society. However, inhalant abuse (glue sniffing) began to emerge among young people in the early 1960s. It was not until the 1970s that pentazo-cine replaced glue as the drug of choice. The abuse of pentazocine was eliminated after it was enlisted and controlled as a narcotic by the Department of Health. In the early 1980s, the trend of abuse switched to psychotropic agents. Two barbiturates (secobarbital and amobarbital) and methaqualone, all of which were legal medicines, became the predominant drugs of abuse. This was soon brought under control after
6Accessed June 3, 2005, from “My E-Government” at http://www. gov.tw/EBOOKS/TWANNUAL. 7Li, Jih-Heng (1998). Drug Abuse Situation and Anti-Drug Pro-grammes in Taiwan, R.O.C., in International Monograph Series 11, Report of the Asian Multicity Epidemiology Work Group 1997, edited by V. Navaratnam and A.A. Baker, pp151–156. Center for Drug Research, Universiti Sains Malaysia, Minden, Pulau Pinang, Malaysia.

EPIDEMIOLOGIC TRENDS IN DRUG ABUSE—Panel on International Drug Abuse: Emerging/Current Trends
Proceedings of the Community Epidemiology Work Group, Vol. II, June 2005 362
methaqualone was banned and the two barbiturates were enlisted as controlled drugs. Although these substances were abused during 1960s, 1970s, and 1980s, drug abuse was not regarded as a serious problem in these three decades.8 In 1987, the martial law that had been implemented in Taiwan since 1949 was lifted. Being a young democratic country with flourishing economy, Taiwan has witnessed a deluge of methamphetamine and heroin abuse since early 1990s. In the past several years, abuse of club drugs such as methylenedioxymethamphetamine (MDMA), fluni-trazepam (FM2, Rohypnol), and ketamine has been reported in pubs and karaoke parlors. Facing the worsening drug abuse situation, the obsolete “Act for Eradication of Illicit Narcotics” was revised into “Drugs Hazard Control Act” in 1998. The new act states that the “illicit use” of Schedule I and II drugs is a criminal offence. A positive result of urine testing for Schedule I or II drugs serves as evidence of drug use. Once convicted, the penalty for using illicit drugs is relatively harsh. The maximum penalties for use of Schedule I and II drugs can be imprisonment for 5 and 3 years, respectively. Al-though the first-time offender who is not addicted may be released without being indicted, a drug user is generally reluctant to reveal his/her drug use behaviors to strangers. As a result, the epidemiologic data of drug abuse may be underestimated, and this should be taken into account. Data Sources For this report, data were collected from the National Bureau of Controlled Drugs (NBCD), Department of Health. In cooperation with all the incumbent agen-cies, the NBCD has established a systematic surveil-lance system to monitor the drug abuse trends and situations since 1999. Information from the following sources was compiled for the Monthly Drug Abuse Report collected and prepared by the NCBD, Febru-ary 2005: • Data for court referrals on arrests, seizures,
and laboratory reports on urine samples of drug abusers from 2000 to 2004 were obtained from the Investigation Bureau, Ministry of Jus-tice; the National Police Administration, Minis-try of Interior; the Military Police Command, Ministry of National Defense; the Coastal Guard, Executive Yuan; the National Bureau of Con-trolled Drugs, Department of Health; and all lo-cal health departments.
8Ibid.
• Information from the Surveillance System of Drug Abuse and Addiction Treatment from 2000 to 2004 was provided by NCBD, Depart-ment of Health. The Bureau has, in collaboration with the designated medical care institutions and private institutions for addiction treatment, set up the surveillance system. Cases of drug abuse and addiction have been reported online since 2002.
• Data on acquired immunodeficiency syndrome
(AIDS), human immunodeficiency virus (HIV) infection, and routes of drug administration from December 1984 to December 2004 were ob-tained from the Center for Disease Control, De-partment of Health, Taiwan.
DRUG ABUSE PATTERNS AND TRENDS From 2000 through 2004, methamphetamine and heroin were the two most prevalent illicit drugs used in Taiwan, while the abuse of club drugs such as MDMA and ketamine has been increasing rapidly. The drug abuse situation from 2000 through 2004 is described in the following sections. Methamphetamine An average of 37,500 methamphetamine abusers were identified each year during the past 5 years, according to the results of urine tests for court refer-rals, performed by all local health departments, certi-fied laboratories, National Police Administration, and the Investigation Bureau of the Ministry of Justice. Methamphetamine was identified in 62.7 percent of the total positive cases of urine testing in 2004 (ex-hibit 1). Methamphetamine seizures have increased nearly fourfold since 2000. Methamphetamine re-mained the most commonly seized drug in 2004 (at 3,165.5 kilograms), and the quantity has been in-creasing (exhibit 2). Both the methamphetamine-positive urines and methamphetamine seizures dem-onstrate the efforts exerted by the judicial systems to identify and combat methamphetamine abuse. Among the total treatment admissions from 2000 to 2004, methamphetamine remained the second most commonly reported substance, following only heroin (exhibit 3). The wholesale price of methamphetamine has increased nearly twofold from NT$310,000 (US$10,000) per kilogram in 2000 to NT$520,000 (US$16,774) per kilogram in 2004 (exhibit 4). Heroin Among the 51,429 urine tests in 2004, 32,295 (or 62.8 percent) were positive for morphine (heroin) (exhibit 1). The quantity of heroin seized in Taiwan increased by 132 percent between 2000 (277 kilo-

EPIDEMIOLOGIC TRENDS IN DRUG ABUSE—Panel on International Drug Abuse: Emerging/Current Trends
Proceedings of the Community Epidemiology Work Group, Vol. II, June 2005 363
grams) and 2004 (644 kilograms) (exhibit 2). Heroin remained the most frequently mentioned drug among treatment admissions during the past 5 years. In 2004, 94 percent of all treatment admissions men-tioned heroin as a drug of abuse (exhibit 3). The wholesale price of heroin has sharply increased, from NT$1,270,000 (US$40,968) per kilogram in 2000 to NT$2,710,000 (US$87,419) per kilogram in 2004 (exhibit 4). It is worth noting that most heroin users administered the drug by injection, a practice that has posed a threat of spreading infectious diseases, such as AIDS. MDMA The amount of seized MDMA totaled about 5 kilo-grams in 2000, compared with 303 kilograms in 2004, thus demonstrating the expanding supply of the drug (exhibit 2). MDMA-positive urine cases in-creased from 266 in 2000 to 2,245 in 2004 (exhibit 1). Polydrug use is very common among MDMA users; since 2001, MDMA-positive urine cases have frequently been positive for other substances. MDMA abuse cases among treatment admissions peaked at 251 in 2002, before declining to 152 in 2003 and 103 in 2004 (exhibit 3). Ketamine The amount of seized ketamine totaled 9.5 kilograms in 2001; this increased to 613 kilograms in 2004 (ex-hibit 2). Ketamine now ranks as the third most com-monly seized drug in Taiwan. Meanwhile, the com-bined use of ketamine with methamphetamine, MDMA, and FM2 (Rohypnol) has been detected among urine tests since 2003. Although the first case of ketamine abuse among treatment admissions was identified in 2002, ketamine abuse cases increased to 49 in 2004—thus demonstrating the increasing abuse of the drug. Benzodiazepines Abuse of depressants is a relatively new concern in Taiwan. Triazolam was the predominant drug among seized benzodiazepines in 2000, accounting for 92.4 percent. However, flunitrazepam (Rohypnol, also nicknamed as FM2) replaced triazolam as the most frequently seized benzodiazepine in 2001, and the amounts of seized FM2 have continued to increase. In 2003, the amount of seized FM2 totaled 12 kilo-
grams, representing 90.4 percent of total benzodi-azepines seized. The amount of benzodiazepines seized has dramatically increased, from 3.4 kilograms in 2000 to 141.3 kilograms in 2004 (exhibit 2); ni-metazepam replaced FM2 as the most commonly seized benzodiazepine in 2004 and represented 97.4 percent of these seizures. Among addiction treatment admissions, the abuse of benzodiazepines has consis-tently ranked third (exhibit 3), with FM2 being the most abused benzodiazepine. Cannabis According to the United Nations Office on Drugs and Crime (UNODC) 2004 World Drug Report, cannabis is the most prevalent drug of abuse in the world. The amounts of cannabis seized exceeded 100 kilograms each year in 2001 and 2003 (exhibit 2), but cannabis does not seem to be a main concern in Taiwan. Among the 51,429 drug-positive urine tests in 2004, only 119 were positive for cannabis (exhibit 1), and only 43 treatment admissions reported cannabis abuse in 2004 (exhibit 3). INFECTIOUS DISEASES RELATED TO SUBSTANCE ABUSE Positive cases of HIV and AIDS increased rapidly in Taiwan from December 1984 through December 2004 (exhibit 5). Between 1984 and 2004, 646 HIV/AIDS cases in Taiwan (approximately 10 per-cent) were among injection drug users (IDUs) (ex-hibit 6). According to reports by addiction treatment admissions, 34.7 percent administered drugs by injec-tion in 2000; this percentage increased to 63.9 per-cent in 2004 (exhibit 7). In addition, the percentage of users sharing needles increased from 4.0 percent in 2000 to 15 percent in 2004. In response to the new drug abuse situation, the Department of Health has been implementing harm reduction measures, includ-ing pilot studies on buprenorphine substitution treat-ments, education programs for jail inmates, and pos-sibly needle exchange program through outreach groups, to avoid the spread of HIV. For inquiries concerning this report, please contact Jih-Heng Li, Ph.D., Director General, National Bureau of Controlled Drugs, Department of Health, No. 6. Linsen South Road, Taipei City 100, Taiwan, R.O.C., Phone: 886-2-2-351-7109, Fax: 886-2-2-341-1635, E-mail: [email protected].

EPIDEMIOLOGIC TRENDS IN DRUG ABUSE—Panel on International Drug Abuse: Emerging/Current Trends
Proceedings of the Community Epidemiology Work Group, Vol. II, June 2005 364
Exhibit 1. Results of Laboratory Urine Testing in Taiwan: 2000–2004
2000 2001 2002 2003 2004 Drug Case % Case % Case % Case % Case %
All morphine positives 16,655 19.8 21,816 42.8 23,385 52.4 27,741 62.8 32,295 62.8 All methamphetamine positives 71,891 85.5 36,575 71.7 22,567 50.6 24,632 55.7 32,240 62.7
Morphine-only 2,838 3.4 8,838 17.3 13,341 29.9 13,916 31.5 9,140 17.8
Methamphetamine-only 45,187 53.8 23,597 46.3 12,523 28.1 10,807 34.5 16,109 31.3 Methamphetamine and Morphine 12,885 15.3 11,706 22.9 8,260 18.5 9,947 22.5 8,849 17.2
Methamphetamine, Mor-phine, and other drugs 932 1.1 1,272 2.5 1,784 4.0 3,878 8.8 7,006 13.6
MDMA 266 0.3 1,388 2.8 4,878 10.9 2,159 4.9 2,245 4.4
Ketamine 0 0.0 0 0.0 98 0.2 208 0.5 476 0.9
Cannabis 0 0.0 3 0.0 42 0.1 81 0.2 119 0.2
Total 84,044 51,017 44,634 44,200 51,429 SOURCES: Certified laboratories for Urine Testing; National Bureau of Controlled Drugs, Department of Health; all local health de-partments; Investigation Bureau, Ministry of Justice; National Police Administration, Ministry of Interior and Military Police Com-mand, Ministry of National Defense
Exhibit 2. Drug Seizures in Taiwan: 2000–2004
Seizures in Kilograms Year
Heroin Metham-phetamine MDMA (Ecstasy) Cannabis Benzo-
diazepines Ketamine
2000 277.33 836.24 4.93 73.98 3.44 -
2001 362.50 1,421.01 44.65 106.99 6.51 9.54
2002 599.09 1,298.06 132.65 11.06 2.54 63.16
2003 532.64 3,980.51 405.63 121.17 13.40 600.48
2004 644.50 3,165.51 303.28 38.65 141.28 613.41
SOURCES: Investigation Bureau, Ministry of Justice; Police Administration, Ministry of Interior; Military Police Command, Ministry of National Defense; Directorate General of Customs, Ministry of Finance; Coastal Guard, Executive Yuan
Exhibit 3. Reported Cases of Drug Addicts Admitted for Treatment in Psychiatric Hospitals/Clinics in
Taiwan: 2000–2004 Year Total No. of
Cases Heroin Metham-phetamine
MDMA (Ec-stasy) Cannabis Benzo-
diazepines Ketamine
2000 2,871 1,513 1,452 9 23 315 0
2001 3,545 2,265 1,490 164 145 344 0
2002 7,654 6,233 2,152 251 62 386 18
2003 8,283 7,353 1,551 152 47 441 42
2004 12,232 11,479 2,663 103 43 431 49 SOURCE: National Bureau of Controlled Drugs, Department of Health

EPIDEMIOLOGIC TRENDS IN DRUG ABUSE—Panel on International Drug Abuse: Emerging/Current Trends
Proceedings of the Community Epidemiology Work Group, Vol. II, June 2005 365
Exhibit 4. Wholesale Prices of Heroin and Methamphetamine in Taiwan: 2000–2004 SOURCE: Investigation Bureau, Ministry of Justice Exhibit 5. Reported Cases of HIV/AIDS in Taiwan, by Year of Diagnosis: 1984–2004 SOURCE: Center for Disease Control, Department of Health
0
500
1,000
1,500
2,000
2,500
3,000
NT$ (in Thousands)per Kilogram
Heroin 1,270 1,360 1,460 1,510 1,430 1,630 1,970 2,710
Methamphetamine 310 320 370 360 380 380 430 520
2H 2000 1H 2001 2H 2001 1H 2002 2H 2002 1H 2003 2H 2003 1H 2004
9 15 11 12 29 43 36
91
136
137 17
4 228 27
7
350 40
1
479 53
5
654
774
861
1,52
1
0 0 1 1 4 9 6 16 23 35
65
98
160
136
153 17
9
180
161
180 22
9 257
0
200
400
600
800
1,000
1,200
1,400
1,600
1,800
1984
1985
1986
1987
1988
1989
1990
1991
1992
1993
1994
1995
1996
1997
1998
1999
2000
2001
2002
2003
2004
Number of Cases
HIV (+)
AIDS

EPIDEMIOLOGIC TRENDS IN DRUG ABUSE—Panel on International Drug Abuse: Emerging/Current Trends
Proceedings of the Community Epidemiology Work Group, Vol. II, June 2005 366
Exhibit 6. Reported Cases of HIV/AIDS in Taiwan, by Exposure Category: 1984–2004
HIV Infection1 AIDS Death Exposure Category
Total % Total % Total % Heterosexuals 2,396 35.4 927 49.3 516 50.3 Homosexuals 2,334 34.5 532 28.3 234 22.8 Bisexuals 687 10.2 291 15.5 169 16.5 Hemophiliacs 53 0.8 20 1.1 34 3.3 Injection Drug Users 603 8.9 43 2.3 25 2.4 Blood recipients 14 0.2 4 0.2 7 0.7 Vertical transmission 11 0.2 2 0.1 1 0.1 Unknown 664 9.8 61 3.2 39 3.8 Total 6,762 100.0 1,880 100.0 1,025 100.0
1AIDS cases are included; foreigners are not included. SOURCE: Center for Disease Control, Department of Health Exhibit 7. Routes of Drug Administration1 Among Patients Admitted for Addiction Treatment in Psychiatric
Hospitals/Clinics in Taiwan: 2000–2004
1A drug user may administer drugs through more than one route. SOURCE: National Bureau of Controlled Drugs, Department of Health
0
10
20
30
40
50
60Percent
Oral 10.3 9.5 6.7 6.8 4.7
Injection w ith Needle-Sharing 4.0 4.6 6.0 15.3 15.0
Injection w ithout Needle-Sharing
30.7 29.8 50.7 47.9 48.9
Smoking 14.8 18.8 14.2 13.9 16.1
Inhalation 33.3 27.4 18.4 12.7 12.6
Snorting 0.7 4.0 1.9 0.4 0.6
Sniff ing 0.0 0.0 1.0 1.9 0.7
Other 6.3 5.2 2.2 1.0 0.6
2000 2001 2002 2003 2004

Participants


EPIDEMIOLOGIC TRENDS IN DRUG ABUSE—Participant List
Proceedings of the Community Epidemiology Work Group, Vol. II, June 2005 369
Participant List National Institute on Drug Abuse Community Epidemiology Work Group Meeting Denver, Colorado June 14–17, 2005 Cynthia L. Arfken, Ph.D. Associate Professor Psychiatry and Behavioral Neurosciences Wayne State University 2761 East Jefferson Detroit, MI 48207 Phone: 313-993-3490 Fax: 313-993-1372 E-mail: [email protected] Erin Artigiani Deputy Director Policy and Governmental Affairs Coordinator, Maryland Drug Early Warning System Center for Substance Abuse Research Suite 501 4321 Hartwick Road College Park, MD 20740 Phone: 301-405-9794 Fax: 301-403-8342 E-mail: [email protected] Judy K. Ball, Ph.D., M.P.A. Project Director Drug Abuse Warning Network Office of Applied Studies Substance Abuse and Mental Health Services Administration Department of Health and Human Services 1 Choke Cherry Road, Room 7-1044 Rockville, MD 20857 Phone: 240-276-1256 Fax: 240-276-1260 E-mail: [email protected] Caleb Banta-Green, M.P.H., M.S.W. Research Scientist Alcohol and Drug Abuse Institute University of Washington Suite 120 1107 N.E. 45th Street Seattle, WA 98105 Phone: 206-685-3919 Fax: 206-543-5473 E-mail: [email protected]
George Beschner, M.S.W. MasiMax Resources, Inc. Suite 175 1375 Piccard Drive Rockville, MD 20850 Phone: 240-683-1757 Fax: 301-926-3156 E-mail: [email protected] Edward W. Boyer, M.D., Ph.D. Associate Professor Department of Emergency Medicine University of Massachusetts 93 Martin Street Boston, MA 02132 Phone: 617-469-8890 Fax: 508-856-6609 E-mail: [email protected] Nancy E. Brace, R.N., M.A. Evaluation and Information Director Alcohol and Drug Abuse Division Colorado Department of Human Services 4055 South Lowell Boulevard Denver, CO 80236-3120 Phone: 303-866-7502 Fax: 303-866-7481 E-mail: [email protected] Robert G. Carlson, Ph.D. Professor and Acting Director Department of Community Health Center for Interventions, Treatment, and Addictions Research Wright State University School of Medicine P.O. Box 927 Dayton, OH 45435 Phone: 937-775-2850 Fax: 937-775-2171 E-mail: [email protected] Usha Charya MasiMax Resources, Inc. 1375 Piccard Drive, Suite 175 Rockville, MD 20850 Phone: 240-683-1746 Fax: 301-926-3156 E-mail: [email protected]

EPIDEMIOLOGIC TRENDS IN DRUG ABUSE—Participant List
Proceedings of the Community Epidemiology Work Group, Vol. II, June 2005 370
Wilson M. Compton, M.D., M.P.E. Director Division of Epidemiology, Services and Prevention Research National Institute on Drug Abuse National Institutes of Health Neuroscience Center, Room 5153 6001 Executive Boulevard, MSC-9589 Bethesda, MD 20892-9589 Phone: 301-443-6504 Fax: 301-443-2636 E-mail: [email protected] Timothy P. Condon, Ph.D. Deputy Director National Institute on Drug Abuse National Institutes of Health Room 5230, MSC-9591 6001 Executive Boulevard Bethesda, MD 20892 Phone: 301-443-6036 Fax: 301-443-6277 E-mail: [email protected] Christine R. Crossland Senior Social Science Analyst National Institute of Justice 810 Seventh Street, NW Washington, DC 20531 Phone. 202-616-5166 Fax: 202-354-4080 Email: [email protected] Samuel J. Cutler Program Manager Coordinating Office for Drug and Alcohol Abuse Programs Office of Behavioral Health City of Philadelphia Suite 800 1101 Market Street Philadelphia, PA 19107-2908 Phone: 215-685-5414 Fax: 215-685-5427 E-mail: [email protected] Janie B. Dargan, M.S.W. Policy Analyst Office of National Drug Control Policy Executive Office of the President 750 17th Street, N.W., 5th Floor Washington, DC 20503 Phone: 202-395-6714 Fax: 202-395-6729 E-mail: [email protected]
Susan L. David, M.P.H. Public Health Consultant DAWN Project Westat 9127 Kirkdale Road Bethesda, MD 20817 Phone: 301-530-2621 E-mail: [email protected] Louisa Degenhardt, Ph.D. Senior Lecturer National Drug and Alcohol Research Centre University of NSW Sydney NSW 2052 Australia Phone: 61 2 9385 0230 Fax: 61 2 9385 0222 Brian J. Dew, Ph.D., L.P.C. Assistant Professor Department of Counseling and Psychological Services Georgia State University P.O. Box 3980 Atlanta, GA 30308 Phone: 404-808-5436 Fax: 404-651-1160 E-mail: [email protected] Ilene L. Dode, Ph.D. EMPACT-Suicide Prevention Center, Inc. 2528 East Geneva Drive Tempe, AZ 85282 Phone: 480-784-1514, ext. 1116 Fax: 480-967-3528 E-mail: [email protected] Daniel P. Dooley Boston Public Health Commission 1010 Massachusetts Avenue Boston, MA 02118 Phone: 617-534-2360 Fax: 617-534-2422 E-mail: [email protected] Erin D. Erb MA Candidate Department of Anthropology Campus Box 103 University of Colorado-Denver P.O. Box 173364 Denver, CO 80217-3364 Phone: 303-556-3554 Fax: 303-556-8501 E-mail: [email protected]

EPIDEMIOLOGIC TRENDS IN DRUG ABUSE—Participant List
Proceedings of the Community Epidemiology Work Group, Vol. II, June 2005 371
Carol L. Falkowski Director Research Communications Hazelden Foundation Butler Center for Research 15245 Pleasant Valley Road, Box 11 Center City, MN 55012-0011 Phone: 651-213-4566 Fax: 651-213-4344 E-mail: [email protected] Aimee Ferraro Doctoral Candidate University of Colorado – Denver Health and Behavioral Sciences 11614 Quivas Way Westminster, CO 80234 Phone: 303-912-3051 E-mail: [email protected] Beth A. Finnerty, M.P.H. Associate Director of Training/Epidemiologist ATTC/NIDA Liaison Integrated Substance Abuse Programs University of California, Los Angeles Suite 200 1640 South Sepulveda Boulevard Los Angeles, CA 90025 Phone: 310-445-0874, ext. 376 Fax: 310-312-0538 E-mail: [email protected] Allison S. Gertel-Rosenberg, M.S. Program Manager Division of Addiction Services Office of Policy Development New Jersey Department of Human Services 120 South Stockton Street, 3rd Floor P.O. Box 362 Trenton, NJ 08625 Phone: 609-984-4050 Fax: 609-292-1045 E-mail: [email protected] Paul Griffiths Programme Coordinator - Situation Analysis European Monitoring Centre for Drugs and Drug Addiction Rua Cruz de Santa Apolónia 23-25 1149-045 Lisbon Portugal Phone: 00351 21811 3006 Fax: 00351 21358 4441
Steve Gust, Ph.D. Director International Program National Institute on Drug Abuse National Institutes of Health Room 5274 6001 Executive Boulevard Bethesda, MD 20892 Phone: 301-443-6480 Fax: 301-442-9127 E-mail: [email protected] James N. Hall Director Center for the Study and Prevention of Substance Abuse Up Front Drug Information Center Nova Southeastern University Suite 215 12360 Southwest 132nd Court Miami, FL 33186 Phone: 786-242-8222 Fax: 786-242-8759 E-mail: [email protected] Linda Harrison Researcher Colorado Division of Criminal Justice 700 Kipling Denver, CO 80215 Phone: 303-239-5857 E-mail: [email protected] Leigh A. Henderson, Ph.D. Project Director Synectics for Management Decisions, Inc. 3001 Guilford Avenue Baltimore, MD 21218-3926 Phone: 410-235-3096 Fax: 703-528-6421 E-mail: [email protected] Tamara Hoxworth Research Analyst Colorado Alcohol and Drug Abuse Division 4055 S. Lowell Boulevard Denver, CO 80236 Phone: 303-866-7497 E-mail: [email protected]

EPIDEMIOLOGIC TRENDS IN DRUG ABUSE—Participant List
Proceedings of the Community Epidemiology Work Group, Vol. II, June 2005 372
Heidi Israel, Ph.D. Division of Infectious Diseases St. Louis University School of Medicine 1200 South Grand Avenue St. Louis, MO 63104-1017 Phone: 314-268-5448 Fax: 314-268-5196 E-mail: [email protected] Craig Kapral Research Assistant Colorado University – Denver 100 E. Highline Circle, #305 Centennial, CO 80122 Phone: 303-880-3384 E-mail: [email protected] Sandeep Kasat, M.P.H. Epidemiologist Office of Substance Abuse State of Maine University of Southern Maine 22 Amherst Street #18 Augusta, ME 04330 Phone: 207-287-4372 Fax: 207-287-8910 E-mail: [email protected] Brian C. Kelly Project Director Department of Sociomedical Sciences Center for HIV Educational Studies and Training Columbia University/City University of New York Suite 300 250 West 26th Street New York, NY 10001 Phone: 212-206-7919, ext. 231 Fax: 212-206-7994 E-mail: [email protected] Steve Koester Professor University of Colorado Box 188, AD-280G Denver, CO 80217 Phone: 303-556-6795 Fax: 303-556-8501 E-mail: [email protected]
Jih-Heng Li, Ph.D. Director General National Bureau of Controlled Drugs Department of Health Taiwan Phone: 886-2-23517109 Fax: 886-2-23411635 E-mail: [email protected] Matthew Magee Research Specialist Division of Epidemiology and Biostatistics MC 923 School of Public Health University of Illinois at Chicago 1603 West Taylor Chicago, IL 60622 Phone: 319-996-3198 Fax: 312-996-1450 E-mail: [email protected] Erin Mallonee Office of Applied Studies Substance Abuse and Mental Health Services Administration 1 Choke Cherry Road, Room 7-1044 Rockville, MD 20857 Phone: 240-276-1274 Fax: 240-276-1260 E-mail: [email protected] Rozanne Marel, Ph.D. Head, Epidemiology and Needs Assessment New York State Office of Alcoholism and Substance Abuse Services 501 7th Avenue, 9th Floor New York, NY 10018 Phone: 646-728-4605 Fax: 646-728-4685 E-mail: [email protected] Jane C. Maxwell, Ph.D. Research Professor Center for Social Work Research University of Texas at Austin Suite 335 1717 West 6th Street Austin, TX 78703 Phone: 512-232-0610 Fax: 512-232-0616 E-mail: [email protected]

EPIDEMIOLOGIC TRENDS IN DRUG ABUSE—Participant List
Proceedings of the Community Epidemiology Work Group, Vol. II, June 2005 373
John A. Newmeyer, Ph.D. Epidemiologist Haight-Ashbury Free Clinics, Inc. 612 Clayton Street, 2nd Floor San Francisco, CA 94117 Phone: 415-931-5420 Fax: 415-864-6162 E-mail: [email protected] Moira P. O'Brien, M. Phil. Program Director Research on Emerging and Current Trends Epidemiology Research Branch Division of Epidemiology, Services and Prevention Research National Institute on Drug Abuse National Institutes of Health Room 5153, MSC-9589 6001 Executive Boulevard Bethesda, MD 20892-9589 Phone: 301-402-1881 Fax: 301-443-2636 E-mail: [email protected] Charles D.H. Parry, M.Sc., M.A., Ph.D. Director Alcohol and Drug Abuse Research Unit Medical Research Council P.O. Box 19070, Tygerberg Cape Town, 7505 South Africa Phone: +27-21-9380419 Fax: +27-21-938-0342 E-mail: [email protected] Jodi Radke Regional Prevention Specialist OMNI 504 Weisenhouer Boulevard Suite 201, Box 1 Loveland, CO 80537 Phone: 970-278-4091 Fax: 970-278-4091 E-mail: [email protected] Jean J. Schensul, Ph.D. Executive Director The Institute for Community Research Suite 100 Two Hartford Square West Hartford, CT 06106-5128 Phone: 860-278-2044, ext. 227 Fax: 860-278-2141 E-mail: [email protected]
Rocky Sexton, Ph.D. Research Scientist Department of Community Health Center for Interventions, Treatment, and Addictions Research Wright State University School of Medicine P.O. Box 927 Dayton, OH 45401-0927 Phone: 937-775-2066 Fax: 937-775-2214 E-mail: [email protected] Marcella H. Sorg, R.N., Ph.D. Research Associate Margaret Chase Smith Center for Public Policy Rural Drug and Alcohol Research Program University of Maine 5715 Coburn Hall Orono, ME 04469-5715 Phone: 207-581-2596 Fax: 207-581-1266 E-mail: [email protected] Barbara Sowder, Ph.D. 5606 Hogen Hill Terrace Rockville, MD 20853 Phone: 301-460-9329 Fax: 301-460-9329 E-mail: [email protected] Steffanie Strathdee, Ph.D. Professor and Harold Simon Chair Chief, Division of International Health and Cross Cultural Medicine Department of Family and Preventive Medicine Adjunct Professor Department of Epidemiology Johns Hopkins Bloomberg School of Public Health University of California San Diego School of Medicine, 9500 Gilman Drive, Mailstop 0622 San Diego, CA 92093 Phone: 858-822-1952 Fax: 858-534-4642 E-mail: [email protected]

EPIDEMIOLOGIC TRENDS IN DRUG ABUSE—Participant List
Proceedings of the Community Epidemiology Work Group, Vol. II, June 2005 374
Gail Thornton-Collins Program Director New Orleans Department of Health Suite 200 2025 Canal Street New Orleans, LA 70112 Phone: 504-528-1900 Fax: 504-528-1904 E-mail: [email protected] James M. Tolliver, M.S., Ph.D. Pharmacologist Office of Diversion Control Drug Enforcement Administration U.S. Department of Justice 600 Army Navy Drive Arlington, VA 22202 Phone: 202-307-7180 Fax: 202-353-1263 E-mail: [email protected] Jamie Van Leeuwen, MA, MPH, CAC II Director of Development & Public Affairs Urban Peak, 730 21st Street Denver, CO 80205 Phone: 303-777-9198, ext. 247 Fax: 303-295-6116 E-mail: [email protected] Orlando Velazco Community Researcher Institute for Community Research Two Hartford Square West Suite 100 Hartford, CT 06106 Phone: 860-278-2044 ext. 244 E-mail: [email protected]
Janet Wood Director Colorado Alcohol and Drug Abuse Division 4055 S. Lowell Boulevard Denver, CO 80236 Phone: 303-866-7486 Fax: 303-866-7481 E-mail: [email protected] D. William Wood, Ph.D. Department of Sociology University of Hawaii at Manoa 265 North Kalaheo Avenue Honolulu, HI 96822 Phone: 250-384-3748 Fax: 808-9565-3707 E-mail: [email protected] Santiago Zaragoza, M.D. Especialista en Epidemiologia Direccion General de Epidemiologia Llanura #48 Col. Plazas de la Colina Tlanepantla Edo. De Mexico 54080 Phone: 55 55-93-10-11 Fax: 55 56-51-83-38 E-mail: [email protected]

NIH Publication No. 06-5282A
February 2006