Metal and polycyclic aromatic hydrocarbon contaminants in benthic sediments of Port Curtis
76
Transcript of Metal and polycyclic aromatic hydrocarbon contaminants in benthic sediments of Port Curtis


Metal and polycyclic aromatic hydrocarbon contaminants in benthic sediments of Port Curtis
Vicky Vicente-Beckett1,3, Damon Shearer2, Niels Munksgaard4, Gary Hancock5 and Helen Morrison1,3
1 Centre for Environmental Management, Central Queensland University, Rockhampton, Queensland 4702 2 Centre for Environmental Management, Central Queensland University, Gladstone, Queensland 4680 3 School of Chemical & Biomedical Sciences, Central Queensland University, Gladstone, Queensland 4680 4 Environmental Analytical Chemistry Unit, School of Science, Charles Darwin University, Darwin NT 0909 5 CSIRO Land and Water, Canberra, ACT, 2601
June 2006
Metal and polycyclic aromatic hydrocarbon contaminants in benthic sediments of Port Curtis Copyright © 2006: Cooperative Research Centre for Coastal Zone, Estuary and Waterway Management Written by:
Vicki Vicente-Beckett Damon Shearer Niels Munksgaard Gary Hancock Helen Morrison Published by the Cooperative Research Centre for Coastal Zone, Estuary and Waterway Management (Coastal CRC)
Indooroopilly Sciences Centre 80 Meiers Road Indooroopilly Qld 4068 Australia
www.coastal.crc.org.au The text of this publication may be copied and distributed for research and educational purposes with proper acknowledgment. Disclaimer: The information in this report was current at the time of publication. While the report was prepared with care by the authors, the Coastal CRC and its partner organisations accept no liability for any matters arising from its contents. National Library of Australia Cataloguing-in-Publication data
Metal and polycyclic aromatic hydrocarbon contaminants in benthic sediments of Port Curtis
QNRM06336
ISBN 1 921017 63 5 (print and online)

iii
Acknowledgments
The study was funded by the CRC for Coastal Zone, Estuary and Waterway
Management; in-kind staff contribution was provided by the Central Queensland
University (CQU).
Sampling assistance and helpful technical inputs from other members of the
Coastal Zone CRC project (Contaminant Pathways in Port Curtis), especially
Simon Apte and Stuart Simpson, are greatly appreciated.
Ellen Klop, Hnin Ei Phyu and Clayton Plummer (Centre for Environmental
Management, CQU, Rockhampton and Gladstone campuses) assisted in
sediment sample preparations and some physico-chemical analyses. Kevin
Wormington (Centre for Environmental Management, CQU, Rockhampton
campus) kindly helped prepare some of the GIS maps.
The use of the facilities of CQU�s School of Chemical & Biomedical Sciences and
the administrative support of the Centre for Environmental Management are also
gratefully acknowledged.

iv

v
Table of contents
Executive summary .....................................................................................................................ix
1.0 Introduction ......................................................................................................................... 1
1.1 Description of the study area ..................................................................................... 2
1.1.1 Physiography and hydrodynamics of Gladstone harbour ......................................... 4
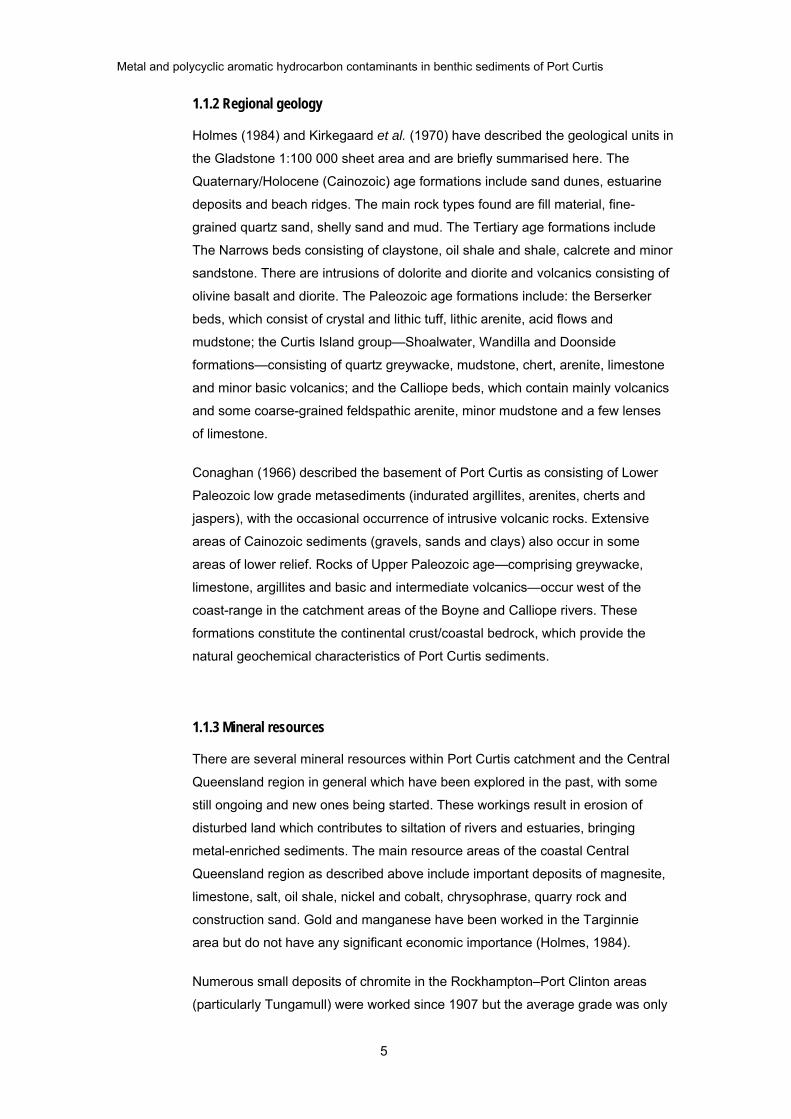
1.1.2 Regional geology....................................................................................................... 5
1.1.3 Mineral resources ...................................................................................................... 5
1.1.4 Acid sulfate soils ........................................................................................................ 6
1.2 Potential sources of metals and polycyclic aromatic hydrocarbons .......................... 7
1.2.1 Natural sources.......................................................................................................... 7
1.2.2 Anthropogenic sources.............................................................................................. 8
2.0 Methods ............................................................................................................................ 11
2.1 Sampling .................................................................................................................. 11
2.2 Analysis of metals and stable lead isotopes in sediments....................................... 11
2.3 Sediment geochronology ......................................................................................... 12
2.4 Analyses of PAHs in sediments............................................................................... 13
2.5 Total organic carbon in sediments........................................................................... 13
3.0 Results and discussion..................................................................................................... 15
3.1 Metals in surficial sediments and sediment cores ................................................... 15
3.1.1 Sediment depositional zones................................................................................... 19
3.1.2 Estimates of background metal concentrations in sediments ................................. 23
3.1.3 Predicting the natural gradient of metal concentration in sediments....................... 26
3.2 Sediment geochronology and sedimentation rate ................................................... 30
3.3 Stable lead isotope ratios (PbIRs) ........................................................................... 33
3.4 PAHs in sediments................................................................................................... 36
3.4.1 Sources of PAHs ..................................................................................................... 41
4.0 Conclusions and recommendations for further study ....................................................... 43
5.0 References ....................................................................................................................... 45
Appendixes................................................................................................................................ 53
Appendix 1: Sources of chemical stressors in Port Curtis estuary ................................. 53
Appendix 2: Sediment Samples (2003�2005) ................................................................ 54
Appendix 3: Quality assurance: Analyses of certified sediment reference materials ..... 55
Appendix 4: Metal concentrations and other sediment parameters ............................... 57
Appendix 5: Polycyclic aromatic hydrocarbons and their properties .............................. 62
Appendix 6: Concentration of PAHs in Port Curtis sediments........................................ 63
vi
List of figures Figure 1. Geographical zones of the Port Curtis Estuary and known major sources
of chemical stressors. .....................................................................................3
Figure 2. Variation of metal concentration with depth (Calliope River mouth core)............ 19
Figure 3. Distribution of sediments showing their particle size fraction < 60 µm
(% Mud). .............................................................................................................. 21
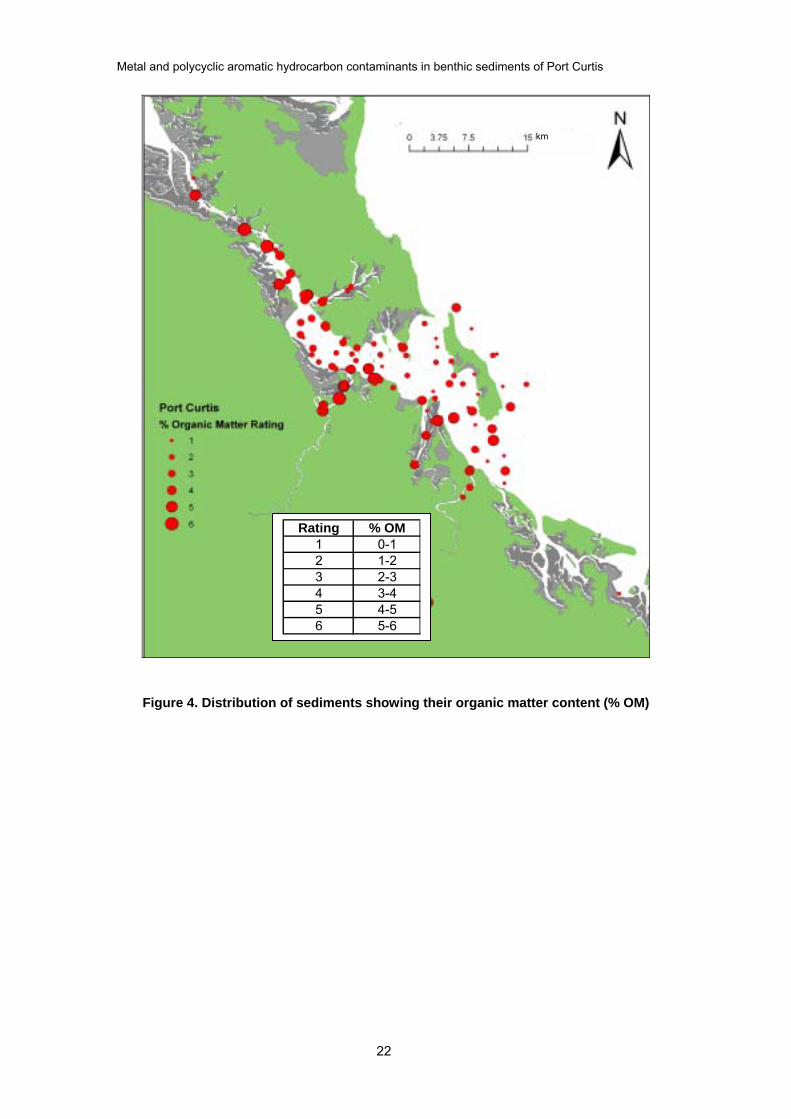
Figure 4. Distribution of sediments showing their organic matter content (% OM)............. 22
Figure 5. Plots of observed metal concentrations versus predicted concentrations
for As, Cr, Ni and Zn. ........................................................................................... 29
Figure 6. Excess 210Pb activity and 137Cs activity in Port Curtis sediment cores. ............... 32
Figure 7. Pb isotope ratios in Port Curtis sediments and other samples and the
relationship of PbIRs with Pb concentration. ....................................................... 35
Figure 8. Distribution of low-MW and high-MW PAHs in Port Curtis benthic sediments.... 38
Figure 9. Naphthalene in Port Curtis benthic sediments. ................................................... 39
Figure 10. Benzo[b+k]Fluoranthene in Port Curtis benthic sediments. ................................ 39
Figure 11. Total PAHs in Port Curtis benthic sediments....................................................... 40
Figure 12. Depth profile of PAHs in Munduran Creek core. ................................................. 40
List of tables Table 1. Acid sulfate soils in Port Curtis region. .............................................................7
Table 2. Total emissions in the Gladstone area ................................................................ 10
Table 3. Metal concentrations in Port Curtis sediments .................................................... 16
Table 4. Pearson correlations between metal concentrations and other sediment
parameters........................................................................................................... 20
Table 5. Metal concentrations in sediments from various locations .................................. 25
Table 6. Regression models to predict sediment metal concentration.............................. 28
Table 7. Linear sedimentation rates measured in sediment cores from various
estuaries .............................................................................................................. 31
Table 8. PAH isomer ratios and origins ............................................................................. 42
vii
Terms and acronyms used Al Aluminium
Anthropogenic Any activities involving humans (as opposed to natural events) activities
ANZECC Australian and New Zealand Environment and Conservation Council
ARMCANZ Agriculture and Resource Management Council of Australia and New Zealand
As Arsenic
ASE Accelerated solvent extraction
ASS Acid sulfate soils
Ca Calcium
Cd Cadmium
Cu Copper
Cr Chromium
CRC Cooperative Research Centre
CV-AAS Cold-vapour atomic absorption spectroscopy
Detection limit Method detection limit is the concentration of a substance that, when processed through the complete analytical method, produces a signal that has a 99% probability of being different from the blank
Fe iron
GC-MS Gas chromatography-mass spectroscopy
Guideline Numerical concentration limit or narrative statement recommended to support and maintain a designated water use
Guideline trigger The concentrations (or loads) for each water quality parameter, below levels which there exists a low risk that adverse biological (or ecological) effects will occur. They are the levels that trigger some action, either continued monitoring in the case of low risk situations or further ecosystem-specific investigations in the case of high risk situations
Hg mercury
ICP-MS Inductively-coupled plasma-mass spectroscopy
ICP-OES Inductively-coupled plasma � optical emission spectroscopy
ISQG Interim sediment quality guideline
Limit of detection See detection limit (LOD)
Mn Manganese
MW Molecular weight
NAA Neutron activation analysis

viii
NATA National Association of Testing Authorities
Ni Nickel
PAHs Polycyclic aromatic hydrocarbons
PASS Potential acid sulfate soils
Pb Lead
PbIR Lead isotope ratio
QA Quality assurance: The implementation of checks on the success of quality control (e.g. replicate samples, analysis of samples of known concentration)
QC Quality control: The establishment and implementation of procedures to maximise the integrity of monitoring data (e.g. cleaning procedures, contamination avoidance, sample preservation methods)
S Sulfur
Sediment Unconsolidated mineral and organic particulate material that has settled to the bottom of aquatic environments
SEE Standard error of the estimate
SLRA Screening level risk assessment
STP Sewage treatment plant
TOC Total organic carbon
Trigger value A guideline value that if exceeded triggers further investigations
UCC Upper continental crust
UCI Upper confidence interval
Zn: Zinc

ix
Executive summary Fine sediments (mud-clay) are excellent repositories of contaminants from the
water column, catchment surface run-off and atmospheric deposition.
Contaminants (metals, polycyclic aromatic hydrocarbons or PAHs, etc.) may be
remobilised from sediments into the water column when environmental conditions
change, and hence they pose potential threats to aquatic organisms and possibly
humans. Estuarine and marine sediments serve as sinks for various contaminants
transported from the land (catchment).
Metals may come from natural sources such as the continental crust/coastal
bedrock. They are also introduced into the environment by various industrial and
other anthropogenic activities. PAHs are organic compounds consisting of two or
more fused rings in their chemical structure. They have natural origins, such as
forest fires, and are natural constituents of fossil fuels. They are also produced in
many industrial and anthropogenic activities, particularly during incomplete high-
temperature combustion of pyrolytic (e.g. biomass) and petrogenic sources.
Metals have different toxicities to biota and humans; many PAHs are toxic to
aquatic organisms and a number have potentially carcinogenic, mutagenic or
teratogenic impacts on humans.
In this study, benthic sediments and sediment cores from Port Curtis were
analysed for 10 metals and 17 PAHs. The concentrations were compared to the
ANZECC (2000) interim sediment quality guidelines. The study confirmed that
intertidal (mangrove) sediments tended to collect fine sediments, which contained
higher levels of metals and PAHs than did estuarine sediments. The top 28 cm
of subsurface sediments at intertidal or subtidal sites were estimated to have
been deposited since 1958 in Port Curtis, which is roughly the start of the
industrialisation of Gladstone. The rate of sediment deposition was at least
0.6 cm/yr. The sediment depositional zones were demonstrated to be largely at
the intertidal (mangrove) sites, particularly at the northern Narrows, lower Calliope
River and South Trees Inlet�Boyne River areas.
Sediment cores exhibited fairly constant metal concentrations with depth. Stable
lead isotope ratios suggested generally low lead contamination in the region.
ANZECC (2000) trigger values for nickel, arsenic and chromium were exceeded
in many sediment samples. Background metal levels were established using
a statistical elimination procedure. Concentrations of nickel, arsenic and
chromium appeared to be related to local geology and not to contamination by
anthropogenic sources. Linear regression models provided prediction equations

x
which modelled the natural variation of metal concentrations between sites. The
observed metal concentrations and predicted values correlated reasonably well
for chromium, copper, nickel, lead and zinc, but only moderately for the other
metals tested. Natural levels of nickel, arsenic and chromium were confirmed to
be fairly close to their respective ANZECC (2000) trigger values. This is important
to remember when undertaking sediment quality assessments.
PAHs from combustion or pyrolytic sources were dominant around intertidal sites
along the industrial area of Gladstone, particularly at the Clinton Coal Facility,
QAL�Red Mud Dam outlet, Auckland Creek, Calliope River near NRG power
station and at the marina. Perylene, a naturally-occurring PAH, dominated
sediments in the northern Narrows. Naphthalene levels were below 5 µg/kg, in
contrast to high levels (exceeding the ANZECC guideline of 160 µg/kg) reported
in 2000.
In terms of the contaminants studied Port Curtis may be considered as still a
relatively low to moderately polluted estuary. It would be important to monitor
changes in levels of the metal and PAH contaminants and their ecological
impacts in the estuary, especially with the continuing rapid industrialisation of
Gladstone and the expansion of port activities in the harbour.

Metal and polycyclic aromatic hydrocarbon contaminants in benthic sediments of Port Curtis
1
1 Introduction Fine sediments (mud-clay) are excellent repositories of contaminants from the
water column, catchment surface run-off and atmospheric deposition.
Contaminants (metals, polycyclic aromatic hydrocarbons or PAHs, etc.) may be
remobilised from sediments into the water column when environmental conditions
change, and hence they pose potential threats to aquatic organisms and possibly
humans.
The screening level risk assessment (SLRA) of contaminants in Port Curtis
(Jones, 2003; Apte et al., 2005) found elevated arsenic, nickel and chromium in
benthic sediments of Port Curtis. It was suspected that the observed metal
enrichment could be a natural phenomenon reflecting the local geology of the
region, and further studies were recommended to substantiate this possibility. The
SLRA also identified the polycyclic aromatic hydrocarbon (PAH), naphthalene,
in sediment as a contaminant of potential concern. This finding was based on
the results of a study conducted in 2000 where elevated concentrations of
naphthalene (200�501 µg/kg) were found in 5 out of 20 sediment samples
from Port Curtis (WBM Oceanics Australia, 2000). The samples exceeded the
ANZECC & ARMCANZ (2000) sediment guideline for naphthalene of 160 µg/kg.
Other PAHs were detected only at <10�20 µg/kg.
The current study sought to determine:
• the sources of arsenic, nickel and chromium in benthic sediments;
• the concentrations of PAH contaminants, particularly naphthalene in
benthic sediments; and
• the main contaminant deposition zones in Port Curtis and the
deposition rates of particulate contaminants.
To assist in the determination of sediment sources, stable lead isotope ratio
(207Pb/206Pb and 208Pb/206Pb) measurements on sediment samples from Port
Curtis, as well as some sediments from Fitzroy catchment, were performed. Lead
isotope ratios have been successfully used to provide evidence of lead sources in
sediments (Munksgaard et al., 2003). Sediment geochronology using Pb-210 and
Cs-137 gamma spectrometry was also pursued to help estimate the age of
intertidal sediments and their deposition rates.
The SLRA study (Apte et al., 2005) investigated metal concentrations in estuarine
surficial sediments alone. Figure 1 shows the Port Curtis estuary and the
geographical zones used in the SLRA study. In this study, sediment cores,

Metal and polycyclic aromatic hydrocarbon contaminants in benthic sediments of Port Curtis
2
especially from intertidal mangrove sites, were collected and analysed, as well
as additional grab samples. Mangroves or intertidal sites generally trap fine
sediments and hence may exhibit higher metal concentrations than estuarine
benthic sediments. Sediment cores can provide evidence and history of
contaminant accumulation provided they are not substantially disturbed by
natural forces (e.g. mixing or bioturbation) or human activities (e.g. dredging or
infrastructure and development works).
1.1 Description of the study area
The coastal area of Port Curtis is subject to tidal influence involving the waters of
the interconnected Port Curtis and Fitzroy River estuaries and is protected from
the open ocean by Curtis and Facing Islands. The area comprises a complex of
inlets, channels, shoals, tidal marshes, river and stream mouths small islands and
shorelines (Conaghan, 1966). The Boyne and Calliope rivers, as well Auckland
Creek and several smaller creeks, drain the upper catchment and enter the
estuary through its south-western coast near Gladstone Harbour. Boyne River
flow, however, has been greatly altered since 1966 when the first stage of the
Awoonga weir began. The original Awoonga Dam was completed in 1984 to meet
the water demand of the community and industries in Gladstone, with the dam
level subsequently raised by 10 metres in 2002 to meet the increasing domestic
and industrial water demand (GAWB, 2005).
The Gladstone harbour is a significant port for several major exports of
Queensland such as coal, magnesite, calcite and wood chips. Several industries
operate in Gladstone including Queensland Alumina Limited, Boyne Smelters
Limited, Orica Australia, Ticor Chemical Company Limited, Cement Australia
Proprietary Limited, Queensland Energy Resources Ltd (formerly Southern
Pacific Petroleum) and Comalco Alumina Refinery. The port facilities are currently
undergoing expansion and new industries are being established at a very rapid
pace in Gladstone.
Figure 1 shows the study area: zones 1�7 were used in the SLRA study (Apte et
al., 2005), while zones 8�13 are additional sites (largely mangrove or intertidal)
used this study. Zone 13 is located at Rodds Harbour and may be considered as
a reference site, since it is reasonably removed from the influences of the Fitzroy
estuary and the industrial areas of Gladstone.

Metal and polycyclic aromatic hydrocarbon contaminants in benthic sediments of Port Curtis
3
FacingIsland
CurtisIsland
Boyn
e R
iverSo
uth
Tr e
es In
let
Graham Creek
Cal liope
Riv
er
Wil d C
at tle Creek
Auck
land
Cr.
South
Pacific
Ocean
Gladstone
Wild CattleIsland
Black SwanIsland
Mount Larcom R
anges
151°10'0"E
151°10'0"E
151°20'0"E
151°20'0"E
24°0'0"S 24°0'0"S
23°50'0"S 23°50'0"S
23°40'0"S 23°40'0"S
StudyArea
0 2 4 Kilometers
11
2233
44
7755
66GatcombeChannel
North Channel
The Narrows
88
99
1010
1111
1212
1313
Legend:
Zone Name Known major sources of chemical stressors 1 The Narrows Horticulture 2 Targinnie section of the harbour Oil shale, cement and cyanide industries, shipping, horticulture 3 Middle harbour Shipping, urban run-off, downstream of other zones 4 Southern and outer harbour Alumina industries, shipping, urban run-off 5 Calliope River Catchment run-off, STP, urban run-off, power station 6 Boyne River and South Trees Inlet Catchment run-off, STP, urban run-off, alumina industries 7 Eastern side of Facing Island Control site 8�12 Largely mangrove sites Various 13 Rodds Harbour Reference mangrove site
Figure 1. Geographical zones of the Port Curtis Estuary and known major sources of chemical stressors (adapted from Apte et al., 2005)
km

Metal and polycyclic aromatic hydrocarbon contaminants in benthic sediments of Port Curtis
4
1.1.1 Physiography and hydrodynamics of Gladstone harbour
The physiography and hydrodynamics of the Gladstone harbour is complex and
may be divided into three broad areas (Conaghan, 1966):
• North-eastern shoals�including the intertidal flats, mangrove swamps,
saltpans, tidal creeks and marshes at the northern and eastern shores.
This area includes Pelican Banks, Shoal Bay and the large intertidal
area of the south coast of Curtis Island
• Central channels and banks�this zone is separated from the north-
eastern shoal by the North Channel. The shipping channel (Gatcombe
Channel) and its north-western extension towards The Narrows
separate the zone from the south-western shoals. The physiography
and bathymetry of this zone is the most complex of the three. It is
characterised by deep tidal channels, numerous small islands,
submerged areas of rocks and large sandbanks. Deep scour pits
commonly occur in the confined parts of the channel.
• South-western shoals�this zone occurs along the mainland coastline.
It exhibits intertidal elements similar to those found on the north-
eastern shoals. Sandflats and mudflats occur between low and high
tides. Mean high tide level is characterised by a prodigious growth of
mangrove trees.
Port Curtis is a macrotidal estuary with tides up to 4 m (Conaghan, 1966). Tidal
waters approaching Port Curtis through the southern channel are deflected into
the estuary and enter the harbour from the south-south-east. Within the harbour,
in the zone of the central channels and banks, a further deflection to the north-
west occurs, reaching the south-west corner of Curtis Island. A north-north-west
flow is maintained within the channel of The Narrows. Flood tide setting
southward from the Fitzroy River estuary at Keppel Bay meets the northward
flowing Port Curtis flood at the tidal watershed of The Narrows (Conaghan, 1966).
The hydrodynamics of the Port Curtis region was modelled by Herzfeld et al.
(2004); however, the region at The Narrows where the Fitzroy River waters and
Port Curtis waters meet was apparently not included. The model showed that
currents in the estuary were predominantly due to the effects of the tide. The
large tides mixed the water vertically so that any dissolved material would show
little variation from the surface to the bottom. The flow regime within the estuary
allowed dissolved material to be dispersed evenly throughout the estuary;
however, material appeared to have difficulty leaving the estuary into the offshore
environment.
Metal and polycyclic aromatic hydrocarbon contaminants in benthic sediments of Port Curtis
5
1.1.2 Regional geology
Holmes (1984) and Kirkegaard et al. (1970) have described the geological units in
the Gladstone 1:100 000 sheet area and are briefly summarised here. The
Quaternary/Holocene (Cainozoic) age formations include sand dunes, estuarine
deposits and beach ridges. The main rock types found are fill material, fine-
grained quartz sand, shelly sand and mud. The Tertiary age formations include
The Narrows beds consisting of claystone, oil shale and shale, calcrete and minor
sandstone. There are intrusions of dolorite and diorite and volcanics consisting of
olivine basalt and diorite. The Paleozoic age formations include: the Berserker
beds, which consist of crystal and lithic tuff, lithic arenite, acid flows and
mudstone; the Curtis Island group�Shoalwater, Wandilla and Doonside
formations�consisting of quartz greywacke, mudstone, chert, arenite, limestone
and minor basic volcanics; and the Calliope beds, which contain mainly volcanics
and some coarse-grained feldspathic arenite, minor mudstone and a few lenses
of limestone.
Conaghan (1966) described the basement of Port Curtis as consisting of Lower
Paleozoic low grade metasediments (indurated argillites, arenites, cherts and
jaspers), with the occasional occurrence of intrusive volcanic rocks. Extensive
areas of Cainozoic sediments (gravels, sands and clays) also occur in some
areas of lower relief. Rocks of Upper Paleozoic age�comprising greywacke,
limestone, argillites and basic and intermediate volcanics�occur west of the
coast-range in the catchment areas of the Boyne and Calliope rivers. These
formations constitute the continental crust/coastal bedrock, which provide the
natural geochemical characteristics of Port Curtis sediments.
1.1.3 Mineral resources
There are several mineral resources within Port Curtis catchment and the Central
Queensland region in general which have been explored in the past, with some
still ongoing and new ones being started. These workings result in erosion of
disturbed land which contributes to siltation of rivers and estuaries, bringing
metal-enriched sediments. The main resource areas of the coastal Central
Queensland region as described above include important deposits of magnesite,
limestone, salt, oil shale, nickel and cobalt, chrysophrase, quarry rock and
construction sand. Gold and manganese have been worked in the Targinnie
area but do not have any significant economic importance (Holmes, 1984).
Numerous small deposits of chromite in the Rockhampton�Port Clinton areas
(particularly Tungamull) were worked since 1907 but the average grade was only

Metal and polycyclic aromatic hydrocarbon contaminants in benthic sediments of Port Curtis
6
about 28% chromic oxide, which is not high enough to make the deposit
commercial (Kirkegaard et al., 1970). The nickeliferous laterite on the ultramafic
rocks has been explored since late 1960s (Kirkegaard et al., 1970). There are
continuing nickel explorations in Canoona�Marlborough, north of Rockhampton
in the upper Fitzroy River catchment. Further north, high nickel values are
associated with supratidal flats and coastal grasslands cracking clay in
Broadsound, with a well defined nickel anomaly to the west of Herbert Creek with
values up to 600 ppm in soils (Cook & Mayo, 1980). However this site is quite
removed from Port Curtis and may not have any significant impact on Port Curtis.
Arsenic anomalies have been reported in reefs in the Targinnie Field (Archer and
Old Scottish) and Targinnie Creek. Arsenic in stream sediments showed strong
association with the historical gold workings at Targinnie (Archer Reefs) and
Targinnie Scottish (Pope, 1994).
Organic mineral resources include important coal deposits at Blackwater, Moura,
Baralaba and in the Peak Downs area. Immense coal reserves occur in the
Bowen Basin (Stevens, 1984; Day et al., 1983). The Narrows beds consist
dominantly of shale and oil shale, and minor argillaceous sandstone (Kirkegaard
et al., 1970). A typical oil shale consists dominantly of finely divided clay minerals
but also contains elongated irregularly shaped reddish-brown organic masses
derived from the decay of vascular plant tissues which form about 20% of the
rock. Deposits of oil shale were proved at Rundle and Stuart (Holmes, 1984). Oil
shale explorations began in 1973 and pilot scale production by Southern Pacific
Petroleum (now Queensland Energy Resources Ltd) commenced in the late
1990s. These activities could be potential sources of polycyclic aromatic
hydrocarbons (PAHs) in the Port Curtis estuary. PAHs are organic compounds
with at least two fused benzene rings, which are toxic to many aquatic organisms;
higher molecular weight PAHs are particularly of concern because they are
potential carcinogens, mutagens and/or teratogens in humans (see Appendix 5).
1.1.4 Acid sulfate soils
Ross (2002) reported a survey of acid sulfate soils (ASS) in the Central
Queensland coast, from Tannum Sands to St Lawrence. ASS are soils containing
sulfides or acid-producing soil layer resulting from the oxidation of sulfides. When
exposed to air, sulfides are oxidised, producing sulfuric acid. Disturbed or
excavated acid sulfate land can also release iron, aluminium, and other heavy
metals into drainage waters and affect aquatic plants and animals. Ross (2002)
found high occurrence of these soils on the coastal plain along the Curtis and
Capricorn coasts, near Shoalwater Bay and Broadsound. The semi-tropical/

Metal and polycyclic aromatic hydrocarbon contaminants in benthic sediments of Port Curtis
7
tropical climate combined with the high tides apparently favour the formation of
ASS or potential ASS (PASS). Very high levels of oxidisable sulfur of up to 6.1%
were recorded on supratidal flats or saltpans, while levels of up to 5.1% were
recorded for intertidal flats or mangrove mudflats. Very high levels of sulfur at
shallow depth were associated with the mangrove genus Rhizophora, which is
quite dominant in Port Curtis (Houston, 1999).
1.2 Potential sources of metals and polycyclic aromatic hydrocarbons
1.2.1 Natural sources
The international literature identifies several natural and anthropogenic sources of
metals and polycyclic aromatic hydrocarbons (PAHs).
Natural and diffuse sources of metal contaminants include rock formations which
undergo weathering, assisted by semi-tropical humid climatic conditions and high
tidal action (such as found in the Central Queensland coast). These natural
processes are continuous but may be heightened by episodic storm events.
PAHs on the other hand are known to enter the atmosphere and the aquatic
environment from forest fires and volcanic activity (Kennish, 1997; Connell, 1997).
As mentioned above, acid sulfate soils could generate acidity and cause leaching
of metals from rocks, soils and contaminated sediments. Illustrative data from a
few sites located near the coastal areas of concern in this study are summarised
in Table 1.
Table 1. Acid sulfate soils in Port Curtis region (Source: Ross, 2002)
Location Depth (m) Landform Acid sulfate hazard*
South Trees Inlet 0.2�0.3 Intertidal flat Very high to extreme
Tannum 0.4�0.5 Tidal flat Very high
Calliope River 0.4�0.5 Supratidal flat Extreme
Fisherman�s Landing 0.5�0.6 Intertidal flat Extreme
Kangaroo Island 0.3�0.4 Intertidal flat Extreme
Wiggins Island 0.3�0.5 Intertidal flat Extreme
Curtis Island 0.5�0.7 Supratidal flat Very high
* For this survey area only: Very high: Peroxide oxidisable sulfur content (SPOS) >0.9%, total potential acidity (TPA) = 600�1000 mol H+ per tonne of soil; Extreme: SPOS >1.5%, TPA >1000 mol H+ per tonne of soil.

Metal and polycyclic aromatic hydrocarbon contaminants in benthic sediments of Port Curtis
8
1.2.2 Anthropogenic sources
Metals are released into the environment in many industrial operations such as
mining, metal production and refining, power generation and manufacturing.
Similarly, PAHs are produced by coal-fired electricity power plants, incinerators,
open burning and motor vehicle emissions. The industrial city of Gladstone
produces significant emissions (air, land and water) from fossil fuel electricity
production, coal and ash handling and storage (see Table 2) which include both
types of contaminants. Diffuse sources of metals and PAHs reportedly also
include sewage treatment plant discharges and run-off, especially during storm
events (Kennish, 1997).
The continuing port development and expansion of Gladstone harbour has seen
the loss of large mangrove areas due to both port reclamation and natural infilling
of coastal wetland areas (Duke et al., 2003). Mangroves have significant
ecological roles; as well, they can trap fine sediments and hence act as natural
filters of the estuary. The Gladstone Harbour�s shipping channel is dredged
periodically (about every 2�3 years), to restore the channel depth to safe levels
for ships which use the port daily. There are also two spoil grounds in Port Curtis
located east and south-east of Facing Island, with the latter no longer in use. The
most recent dredging occurred in early 2002 and dredged materials were pumped
into the Port Authority�s port development site near the Clinton Coal Facility.
Dredging can expose metal sulfides to air, causing their oxidation and the release
of metals and acidity into the water column (Kennish, 1997), similar to what
occurs in acid mine drainage.
Central Queensland also has a substantial cattle industry. Arsenic compounds
(e.g. arsenic trioxide), together with other organochlorine or organophosphorus
pesticides, have been used in cattle dips to control ticks. Other consumer
products containing arsenic include fungicides, weed killers, preserved wood and
wood treatment products. These represent potential diffuse sources of arsenic;
for example, amended soil from an ex-cattle dip site in Stanwell in the lower
Fitzroy catchment was still found to contain 229�354 mg/kg arsenic (S. Hanggi,
N. Aswath and V. Vicente-Beckett, unpublished data).
PAHs generally enter the air, and are produced through incomplete burning of
organic substances such as coal, oil and gas, garbage and other substances like
tobacco or charbroiled meat. They can be produced by forest fires caused by
humans, coal-fired electricity power plants, petrol and diesel combustion engines,
incineration and burning of wood and coal. PAHs can attach to dust particles in
the air. They can enter water through discharges from industrial and wastewater
Metal and polycyclic aromatic hydrocarbon contaminants in benthic sediments of Port Curtis
9
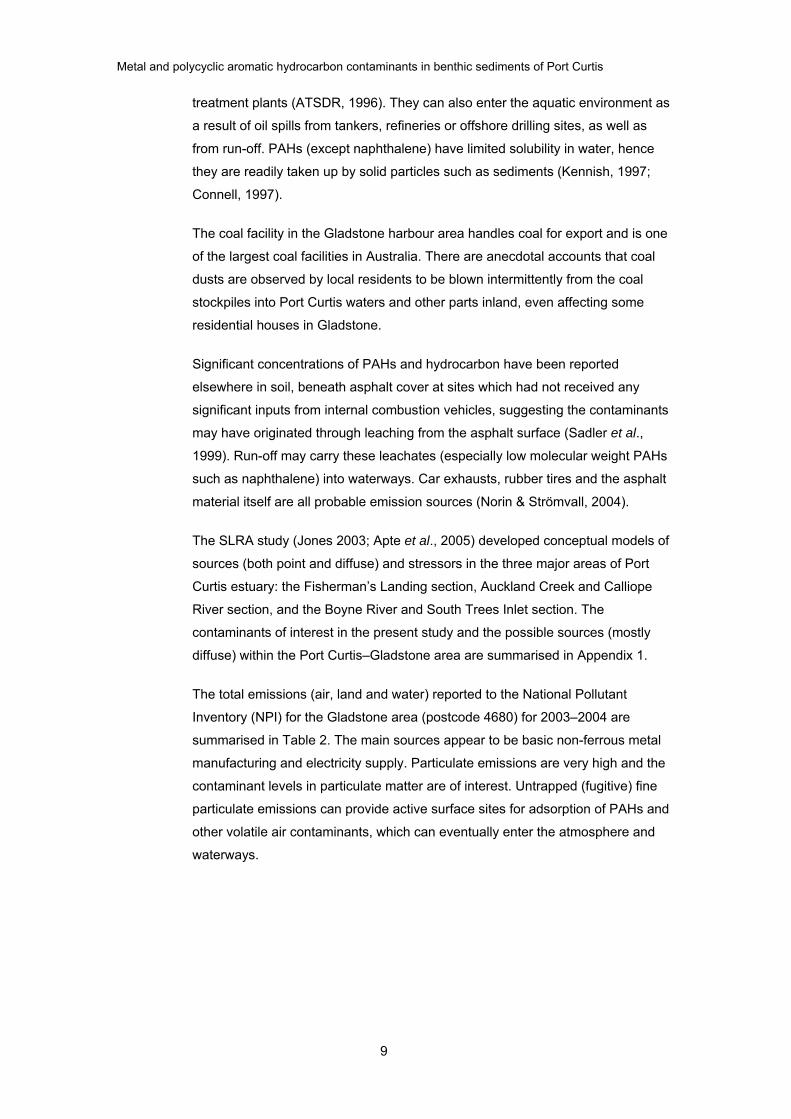
treatment plants (ATSDR, 1996). They can also enter the aquatic environment as
a result of oil spills from tankers, refineries or offshore drilling sites, as well as
from run-off. PAHs (except naphthalene) have limited solubility in water, hence
they are readily taken up by solid particles such as sediments (Kennish, 1997;
Connell, 1997).
The coal facility in the Gladstone harbour area handles coal for export and is one
of the largest coal facilities in Australia. There are anecdotal accounts that coal
dusts are observed by local residents to be blown intermittently from the coal
stockpiles into Port Curtis waters and other parts inland, even affecting some
residential houses in Gladstone.
Significant concentrations of PAHs and hydrocarbon have been reported
elsewhere in soil, beneath asphalt cover at sites which had not received any
significant inputs from internal combustion vehicles, suggesting the contaminants
may have originated through leaching from the asphalt surface (Sadler et al.,
1999). Run-off may carry these leachates (especially low molecular weight PAHs
such as naphthalene) into waterways. Car exhausts, rubber tires and the asphalt
material itself are all probable emission sources (Norin & Strömvall, 2004).
The SLRA study (Jones 2003; Apte et al., 2005) developed conceptual models of
sources (both point and diffuse) and stressors in the three major areas of Port
Curtis estuary: the Fisherman�s Landing section, Auckland Creek and Calliope
River section, and the Boyne River and South Trees Inlet section. The
contaminants of interest in the present study and the possible sources (mostly
diffuse) within the Port Curtis�Gladstone area are summarised in Appendix 1.
The total emissions (air, land and water) reported to the National Pollutant
Inventory (NPI) for the Gladstone area (postcode 4680) for 2003�2004 are
summarised in Table 2. The main sources appear to be basic non-ferrous metal
manufacturing and electricity supply. Particulate emissions are very high and the
contaminant levels in particulate matter are of interest. Untrapped (fugitive) fine
particulate emissions can provide active surface sites for adsorption of PAHs and
other volatile air contaminants, which can eventually enter the atmosphere and
waterways.

Metal and polycyclic aromatic hydrocarbon contaminants in benthic sediments of Port Curtis
10
Table 2. Total emissions in the Gladstone area (source: NPI, 2004)
Substance Total emission (kg/year)
Antimony and compounds 0.79
Arsenic and compounds 340
Cadmium and compounds 19
Chromium (III and VI) compounds 411
Copper and compounds 340
Lead and compounds 160
Mercury and compounds 230
Nickel and compounds 370
Zinc and compounds 1 100
Polycyclic aromatic hydrocarbons 30 000
Particulate matter (10.0 µm) 2 700 000
This study considered measuring atmospheric particulates but abandoned the
idea due to constraints in time and resources. To date, there is no known
documented contaminant data on atmospheric particulate emissions within the
region. Industries in the area that monitor their atmospheric emissions measure
only the quantities of particulate emissions and do not undertake analyses of the
particulates for presence of metals or PAH contaminants. Some idea of the
contribution of airborne contaminants to sediment load may be obtained from
a recent study which found that the fraction of metal contaminants in lake
sediments attributed to atmospheric fallout into Lake Moondarra in western
Queensland was found to be <2% (Biffra, 2005).

Metal and polycyclic aromatic hydrocarbon contaminants in benthic sediments of Port Curtis
11
2 Methods 2.1 Sampling
Benthic sediment samples were collected using a Van Veen grab sampler, which
is designed for the collection of fine sediments from soft-bottomed locations
(Mudroch & Azcue, 1995). The samples were kept frozen until analysis. Sediment
cores were collected using 50 mm id x1 m PVC pipes. They were pushed
manually through intertidal or subtidal sediment beds. The sediment cores were
extruded from the pipes and sliced into two 1 cm slices from the top of the core,
followed by 2 cm slices for the next 8 cm, then 4 cm slices until the end of the
core. The slices were kept frozen until analysis.
The list of samples (see Appendix 2) for this study included 28 sediment grab
samples and 31 push cores (depths varying between 14 and 45 cm). Archived
benthic sediments from the SLRA surveys (2001-2002; Apte et al., 2005) were
also included in measurements of stable lead isotope ratios.
2.2 Analysis of metals and stable lead isotopes in sediments
Frozen sediment samples were thawed at room temperature shortly before
analysis. Particle size distribution was determined gravimetrically on oven-dried
(at 40oC) fractions following wet-sieving through a 1 mm or 60 µm nylon sieve.
Dried sediments of particles ≤1 mm in size were subjected to hot multi-acid
digestion and analysed for total metals using ICP-OES (Cu, Ni, Zn, Al, Ca, S) or
ICP-MS (Ag, Cd, Pb), CV-AAS (Hg) and NAA (As, Cr, Fe and Sb). The ICP-OES
and ICP-MS analyses were performed by NATA-accredited laboratory, Genalysis
Laboratory Services (Gosnells, Western Australia), while NAA were done by
Becquerel Laboratories (Lucas Heights, NSW). PACS-2 and BCSS-1 (both from
National Research Council Canada, Ottawa) were marine sediment reference
materials used in the analysis of trace metals. Spiked recoveries were 87�107%
for most metals in identified quality control samples, except in the case of
chromium using ICP-MS (see Appendix 3).
For the analysis of stable Pb isotope ratios (PbIRs), sediments <60 µm size were
digested in 1 mL concentrated nitric acid + 4 mL concentrated perchloric acid in
an open tube block digester at 200oC for 6 h. PbIRs were analysed as 208Pb/206Pb
and 207Pb/206Pb calibrated to NIST standard reference material 981 (common
lead); the digests were also used to determine pseudo-total analyses of other
Metal and polycyclic aromatic hydrocarbon contaminants in benthic sediments of Port Curtis
12
metals using ICP-MS. Experimental procedures used were similar to those given
in Munksgaard et al. (2003), and were carried out at the Environmental Analytical
Chemistry Unit, School of Science, Charles Darwin University in Darwin.
Appendix 3 provides quality assurance (QA) data for the analytical methods used.
2.3 Sediment geochronology
Sediment cores were sliced into 2 cm slices and dried at 40oC. Unfractionated
bulk dry sediment from each depth section was ground in a ring mill and a known
weight (50�150g, depending on density of particles) was pressed into a sealed
container of known geometry. Sediment core samples were analysed for 210Pb, 226Ra and 137Cs by gamma-ray spectrometry using the methods of Murray et al.
(1987). 210Pb and 137Cs were determined from their direct decay lines, whereas 226Ra was determined from its daughter products after allowing 3 weeks for
ingrowth of 222Rn. Measurements were performed in the laboratories of CSIRO
Land and Water in Canberra.
The fundamentals of 210Pb geochronology are described in Robbins (1978).
Briefly, 210Pb is continually deposited from the atmosphere in association with
rainfall and dust, and is seen as �excess� 210Pb in surface soils and sediments; the
excess component being determined by the difference between the activities 210Pb and 226Ra in the soil/sediment. In water bodies, the accumulation of
sediment laden with excess 210Pb results in high activities at the sediment
surface, decreasing with depth. The rate of decrease is determined by the rate of
sediment accumulation and the radioactive half-life of 210Pb (22.3 years). Under
favourable conditions the decay profile of excess 210Pb can be modelled to
provide estimates of sediment accumulation and sediment age over a time frame
corresponding to 4�5 210Pb half-lives (90�110 years).
In the absence of an interpretable 210Pb profile, or where corroboration of
modelled 210Pb ages is required, the 137Cs activity profile is often utilised. 137Cs
is a man-made (anthropogenic) nuclide originating from atmospheric nuclear
weapons testing in the mid-1950s to early 1970s. In the Australian landscape the
presence of measurable 137Cs in the sediment profile dates that sediment horizon
as being post ~1958 (Olley et al., 1990).

Metal and polycyclic aromatic hydrocarbon contaminants in benthic sediments of Port Curtis
13
2.4 Analyses of PAHs in sediments
About 50 g of wet sediment was mixed with hydromatrix (diatomaceous earth) to
form a free-flowing powder which was then extracted using Dionex ASE100 or
ASE300 (accelerated solvent extraction). The extraction solvent mixture was
dichloromethane�acetone 50�50. The sample was heated to 125°C with a static
cycle of 5 minutes. Following extraction the solvent extract was cleaned up using
gel permeation chromatography (Waters Envirogel). The extract was then
concentrated and analysed by gas chromatography-mass spectroscopy (GC-MS)
for PAHs, using either a DB5 or HT8 column.
Each batch of samples included a solvent blank and a sample spiked with a
mixture of PAHs. All samples and QA samples were spiked with a mixture of
compounds which acted as a surrogate. The recovery of the surrogates was
calculated and the results compared with in-house long-term recovery for this
method of analysis.
All sample preparations and analyses were performed by the NATA-accredited
analytical laboratories of the Queensland Health & Pathology Scientific Services
in Brisbane.
2.5 Total organic carbon in sediments
Sediments were prepared according to the Standards Australia method AS4479.
Sediments <2.00 mm fraction were ground to fine powder in a TEMA swing mill
(Fe/Cr or zirconia). An accurately weighed portion of the sample was pretreated
with acid to remove inorganic carbon. The total organic carbon was determined
by a thermal process where the sample was rapidly heated by an induction coil
(Leco C200 carbon analyser). The sample underwent induction furnace
combustion with iron and copper accelerator in a stream of oxygen. Carbon in the
sample was converted to carbon dioxide by a platinum-on-silica catalyst and the
amount of carbon dioxide was then measured by a thermal conductivity detector
for direct digital display of carbon content. A reagent blank and secondary
reference material was run with each batch of samples analysed.
The analyses were performed by the analytical laboratories of the Queensland
Health & Pathology Scientific Services in Brisbane.

Metal and polycyclic aromatic hydrocarbon contaminants in benthic sediments of Port Curtis
14

Metal and polycyclic aromatic hydrocarbon contaminants in benthic sediments of Port Curtis
15
3 Results and discussion 3.1 Metals in surficial sediments and sediment cores
The SLRA study (Apte et al., 2005) investigated metal levels in estuarine surficial
sediments in Port Curtis, whereas this study looked at sediment cores, especially
from intertidal mangrove sites. Mangroves or intertidal sites generally trap fine
sediments and hence may exhibit higher metal concentrations than subtidal or
estuarine benthic sediments. Sediment cores can provide evidence and history of
contaminant accumulation provided they are not disturbed by natural forces (such
as mixing or bioturbation) or human activities (e.g. dredging, port infrastructure
and other development works).
The study obtained several push cores from mangrove sites around the Port
Curtis area, with the majority taken from the Gladstone side of the port. Details
about the sediment cores and other grab samples are given in Appendix 2. The
analyses of the core slices are summarised in Table 3, together with the mean
data for surficial sediments from the main estuary obtained during the SLRA
surveys (Apte et al., 2005). Zones 1�7 represent sections of the estuary, as
designated in the two SLRA surveys (see Figure 1). New zone designations in
Table 3 are zones 8�13 which include additional sites largely at mangrove sites,
plus a few subtidal/estuarine sites from Boyne River and one site at Awoonga
Dam (upstream Boyne River). The concentration of other elements (Fe, Al, Ca, S)
and sediment parameters (mud fraction or sub-60 µm particles, % organic matter)
are also included in the table. Altogether, 245 samples (sediment grabs and core
slices) were analysed, although the analyses for some metals and other sediment
parameters were not completed for some samples due to limited time or funds.
The full dataset are given in Appendix 4. Because of the varying number of
samples or core slices, the standard error of the mean is presented in Table 3.
Table 3 shows the wide range of metal concentrations and other parameters
obtained at each zone. Notably, Ag and to a lesser degree Cd showed several
high readings, with the highest registered by the freshwater grab sample from
Awoonga Dam, although the levels were still below ANZECC ISQG-low criteria
(trigger values). Ni, As and Cr exceeded the ANZECC trigger values in 91, 63 and
39 samples (grabs or core slices), respectively.

Metal and polycyclic aromatic hydrocarbon contaminants in benthic sediments of Port Curtis
16
Table 3. Metal concentrations (µg/kg, dry weight for Ag, Cd and Hg; mg/kg d w for all others ) in Port Curtis sediments.
Zone Sample DescriptionTotal no. samples Ag As Cd Cr Cu Hg Ni Pb Sb Zn
1 grabs; subtidal 10 mean 69 20.3 52.7 59.7 24.6 16.7 20.2 11.7 0.672 63.0std. error 8.0 2.8 0.5 7.4 3.3 3.6 2.9 1.1 0.060 8.3min 51 6.0 50.5 22.0 8.4 2.1 7.0 5.8 0.380 19.5max 108 38.0 55.0 85.0 36.0 31.2 35.0 15.5 1.09 99.0
2 grabs; subtidal 15 mean 98 14.7 52.2 54.2 21.5 19.4 17.3 11.7 0.579 62.6std. error 16 0.9 0.3 4.1 2.7 3.4 2.3 0.66 0.025 6.4min 50 6.0 50.0 26.0 5.0 4.0 6.0 6.0 0.430 23.0max 215 21.0 53.7 74.0 35.0 55.3 32.0 15.0 0.750 98.9
3 grabs; subtidal 15 mean 91 15.7 51.3 42.3 14.7 9.1 12.1 9.2 0.484 46.5std. error 29 2.0 0.2 4.3 1.9 1.7 1.3 0.68 0.040 4.2min 50 5.0 50.4 16.0 4.0 1.7 4.0 3.0 0.200 19.0max 496 33.0 53.5 69.0 31.4 23.4 23.0 12.3 0.760 74.8
4 grabs; subtidal 27 mean 53 20.9 51.1 40.3 12.7 5.4 10.6 10.0 0.479 39.7std. error 1.9 4.1 0.2 4.1 1.9 0.66 1.0 0.64 0.033 4.4min 50 5.0 50.0 8.0 3.3 1.6 4.0 5.7 0.200 13.0max 101 122.0 54.0 73.0 35.0 12.9 20.0 18.0 1.030 95.0
5 grabs; subtidal 14 mean 92 16.5 52.9 58.6 27.7 18.3 19.3 13.0 0.603 71.3std. error 31 1.6 0.4 5.6 3.6 3.2 2.3 0.90 0.038 7.7min 50 5.0 50.2 13.0 7.4 1.7 5.0 6.7 0.320 20.4max 493 24.0 55.0 80.0 45.2 38.2 32.0 19.0 0.820 113.0
6 grabs; subtidal 11 mean 66 17.6 73.7 45.6 16.7 12.9 14.2 11.1 0.465 48.4std. error 7.4 2.3 17.1 6.3 3.6 3.0 2.7 1.2 0.050 7.5min 50 6.0 50.2 8.0 2.7 0.90 2.0 3.7 0.100 8.4max 107 36.0 236.0 77.0 36.0 25.4 27.0 16.8 0.600 81.2
7 grabs; subtidal 8 mean 51 18.6 51.3 63.5 13.1 1.7 10.6 10.0 0.489 41.1std. error 0.73 2.6 0.7 28.5 5.2 0.24 3.0 1.9 0.088 13.5min 50 10.0 50.0 5.0 1.0 0.90 2.0 3.0 0.100 6.4max 55 31.0 55.0 250.0 43.0 2.9 26.0 18.0 0.770 113.0
8 Narrows; intertidal 50 mean 82.9 21.3 59.3 79.7 30.3 40.6 (n=47) 38.4 (n=45) 17.7 0.631 (n=47) 69.8 (n=44)std. error 15.1 0.6 3.9 1.9 0.7 1.2 1.0 0.3 0.012 1.1min 51.0 8.7 51.0 36.1 17.3 30.0 7.0 11.4 0.430 45.3max 618.0 30.7 216.0 90.5 40.7 70.0 50.9 22.6 0.750 84.1
9Targinnie Ck, Graham Creek, BS,SB, BC 14 mean 226.6 19.5 61.0 38.6 31.2 nd 27.1 13.7 nd 83.5intertidal std. error 44.7 1.5 13.8 2.8 0.7 1.2 0.3 2.3
min 50.0 12.6 22.0 28.2 25.4 20.3 10.8 67.0max 526.0 34.8 226.0 58.5 36.3 40.3 15.6 104.0

Metal and polycyclic aromatic hydrocarbon contaminants in benthic sediments of Port Curtis
17
Table 3. (continued)
Zone Sample DescriptionNo. of
samples Ag As Cd Cr Cu Hg Ni Pb Sb Zn
10Calliope River-CCF-Marina-AC; intertidal or subtidal 31 mean 226.2 11.9 43.0 30.3 35.7 nd 21.2 11.6 nd 80.3
std. error 25.8 0.5 3.3 1.7 1.2 0.6 0.3 2.1min 50.0 6.4 25.0 14.4 27.9 15.7 7.0 49.5max 544.0 20.0 117.0 49.4 54.2 28.4 14.6 108.0
11QAL/RMDO- Spillway Creek; intertidal 9 mean 164.7 12.1 31.1 36.8 17.5 nd 14.0 9.2 nd 57.7
std. error 41.0 1.3 5.2 2.3 0.8 1.2 0.5 5.0min 50.0 7.9 22.0 29.2 14.4 9.8 7.5 43.3max 343.0 18.2 72.0 48.2 22.4 19.5 11.6 92.6
12Boyne River (subtidal); Awoonga Dam - freshwater 6 mean 165.7 11.9 31.9 43.1 14.9 nd 11.8 9.9 nd 43.4
std. error 115.7 1.2 6.9 7.3 2.8 1.2 1.3 5.2min 50.0 8.0 25.0 20.4 8.2 8.2 5.8 30.3max 744.0 15.0 66.2 67.1 27.1 16.6 15.0 64.4
13 Rodds Harbour; intertidal 35 mean 51.0 13.2 52.5 50.4 13.9 26.0 13.0 (n=33) 10.7 0.463 38.0 (n=34)std. error 0.1 0.5 1.5 1.8 0.6 1.1 0.4 0.3 0.015 1.2min 50.0 9.0 50.0 39.6 8.1 20.0 9.1 7.0 0.310 24.2max 54.0 23.3 104.0 84.7 22.4 40.0 21.9 14.1 0.640 67.4
Total samples 245 mean 106.0 16.9 52.6 52.2 22.8 21.8 (N=182) 20.5 (N=241) 12.4 0.543 58.8 (N=241)std. error 7.6 0.58 1.5 1.7 0.73 1.1 0.74 0.25 0.011 1.5min 50 5 22 5 1.0 0.90 2.0 3.0 0.10 6.4max 744 122 236 250 54.2 70.0 50.9 15.0 1.09 113.0
1000 20 1500 80 65 21 20 50 2 20063 39 91
nd = no datan, N = number of data
ANZECC ISQG-lowNo. of exceedances
Metal and polycyclic aromatic hydrocarbon contaminants in benthic sediments of Port Curtis
18
Four replicate cores each were taken at The Narrows (northern end of the Port
Curtis estuary) and at Rodds Harbour (southern end of the estuary). The slices
showed reasonably constant concentrations with depth. Unusually high Ni
(130�176 mg/kg) and Zn (321�380 mg/kg) were initially reported in five slices of
5 cores from these two sites at depths between 6 cm and 8 cm (Vicente-Beckett
& Shearer, 2005). However, unreported NAA data taken at the time on the same
cores indicated that Zn levels in all slices were <100 mg/kg. Recent recheck
analyses by AAS of one slice from each site concerned gave much lower levels of
Ni (13�31 mg/kg) and Zn (36�58 mg/kg), suggesting that the high values reported
earlier may have been due to sample contamination in the laboratory and were
therefore deleted from the dataset. Insufficient remaining sample material
prevented reanalysis of the other suspect slices.
The push cores (depths varied between 14 and 45 cm) taken from mangrove
sites generally showed constant metal concentration levels with depth, as
illustrated in Figure 2 for the Calliope River mouth core. The relatively constant
concentration�depth profile does not indicate accumulation in the upper layers of
the core. The mangroves sites are also subjected to strong mixing by tidal and
natural wave action, possibly enhanced by shipping and other marine activities
around the main port area, as well as bioturbation, resulting in sediment mixing.
A comparison of the average metal concentrations of sediments from the
mangrove cores with the average concentration of estuarine surficial sediments
from the main estuary given in Table 3 using one-way ANOVA suggests that
there was generally no significant difference (p<0.05) between samples, with a
few exceptions in some zones in the case of Ag, As, Cr, Cu, Ni and Pb.
As mentioned in section 1.1.3 there are Ni resources in the Fitzroy River
catchment and in northern Queensland which are currently explored
commercially. Surficial sediments from the Fitzroy River estuary were found to
contain up to 0.5% chalcopyrite (CuFeS2) (L. Radke, personal communication,
2004), which may explain the high Cu contents in some sediments at The
Narrows.

Metal and polycyclic aromatic hydrocarbon contaminants in benthic sediments of Port Curtis
19
Calliope River Mouth
-30
-25
-20
-15
-10
-5
0
0.01 0.10 1.00 10.00 100.00[Metal], mg/kg
App
roxi
mat
e de
pth
of c
ore
slic
e, c
m
Ag Cd Cr Cu Ni Pb Zn As
Figure 2. Variation of metal concentration with depth (Calliope River mouth core)
3.1.1 Sediment depositional zones
Bottom sediments consisting of fine particulates have highly reactive surfaces
which lead to accumulation of contaminants (both metallic and organic). Table 4
gives the Pearsons correlation coefficients between the different metals and other
sediment parameters. The table shows moderate to strong correlations exist
between several metals, and between metals and the mud fraction (particle size
<60 µm) and organic content of sediments. Figure 3 shows the distribution of
sediments of sub-60 µm particle size (% Mud), while Figure 4 maps the organic
matter content (% OM) of Port Curtis sediments. Superimposed dots in the figures
represent data for core slices; the most inland sample shown in the figures was
taken from the Awoonga Dam. Figure 3 indicates that the fine sediment
depositional zones in the estuary were largely found in the intertidal and subtidal
sites, particularly along The Narrows, Calliope River and the South Trees Inlet�
Boyne River, with some accumulation also occurring at the North Entrance. The
distribution of sediments with high organic matter content (Figure 4) is seen to
closely parallel the distribution of mud content in sediments. These observations
are consistent with the view that mangroves are sinks of suspended particulates
from coastal ocean, organic production (e.g. leaf litter) and catchment and
shoreline erosion (Allison & Lee, 2004).

Metal and polycyclic aromatic hydrocarbon contaminants in benthic sediments of Port Curtis
20
Table 4. Pearson correlations between metal concentrations and other sediment parameters.
As Cd Cr Cu Hg Ni Pb Sb Zn Fe Al Ca S % Mud % OMN 245 245 182 245 182 245 245 245 245 245 245 245 245 180 238
Ag .430** .871** .687** .602** .344** .610** .651** .532** .617** .574** .560** -.228** .518** .474** .278**As .393** .624** .265** .320** .547** .618** .460** .332** .507** .404** .346** .207**Cd .682** .622** .350** .601** .656** .555** .677** .599** .605** -.269** .475** .561** .340**Cr .812** .621** .845** .895** .647** .810** .781** .624** -0.169 .688** .730**Cu .470** .695** .662** .496** .884** .777** .680** -0.504 .457** .715** .466**Hg .634** .612** .276** .343** .274** .267** .603** .386** -.395**Ni .865** .519** .691** .655** .664** -0.184 .652** .582**Pb .593** .684** .657** .674** .647** .589**Sb .535** .579** .519** -.214** .395** .448** .234**Zn .877** .689** -0.528 .406** .735** .579**Fe .677** -.476** .318** .596** .548**Al -.274** .421** .524** .289**Ca -.308** -0.664S .428**
% Mud .393**N = number of samples.**Correlation is significant at the 0.01 level (2-tailed).*Correlation is significant at the 0.05 level (2-tailed).Non-significant correlations and redundant cells have been excluded.

Metal and polycyclic aromatic hydrocarbon contaminants in benthic sediments of Port Curtis
21
Figure 3. Distribution of sediments showing their particle size fraction <60 µm (% Mud)
Rating % Mud1 0-20 2 20-40 3 40-55 4 55-70 5 70-85 6 85-100
km
Metal and polycyclic aromatic hydrocarbon contaminants in benthic sediments of Port Curtis
22
Figure 4. Distribution of sediments showing their organic matter content (% OM)
Rating % OM1 0-12 1-23 2-34 3-45 4-56 5-6
km

Metal and polycyclic aromatic hydrocarbon contaminants in benthic sediments of Port Curtis
23
3.1.2 Estimates of background metal concentrations in sediments
To determine whether sediments (from either the main estuary or mangrove sites)
are enhanced or enriched in metals (or other contaminants) by anthropogenic
influences and to verify contaminant depositional zones, knowledge of
background metal concentrations in sediments is needed. The ANZECC (2000)
guidelines do not give much detail on how to measure background sediment
concentrations. There are at least three possible approaches:
(1) Measure the metal concentrations in adjacent areas not affected by
industry.
(2) Study sediment core profiles from quiescent environments and use
bottom-of-core metal concentrations.
(3) Use a statistical approach on a dataset from a relatively unpolluted
site (see for example Roussiez et al., 2005; Doherty et al., 2000a,b;
Liu et al., 2003).
With the first approach, the recent estimate by Kamber et al. (2005) of the
elemental composition of the earth�s upper continental crust (UCC) from alluvial
sediments of Queensland, or shale composition (Liaghati et al., 2003; Reimann &
de Caritat, 2005; Selvaraj et al., 2004) may be used as background reference
level. However, this approach would not be altogether valid because of variations
in bedrock mineralogy and other sediment geochemical properties between the
reference and the study area, as well as local catchment properties that further
contribute to the complexity and heterogeneity of sediments. As this study did not
have any sediment cores from quiescent environments, the third option was
pursued, that is, using a statistical elimination method to derive background
concentrations.
The statistical approach involved elimination of outliers, which was adopted (with
modification) from those reported in the literature (e.g. Roussiez et al., 2005;
Doherty et al., 2000a,b; Liu et al., 2003) and applied to the dataset on the Port
Curtis estuarine surficial sediments reported in the SLRA study (Apte et al.,
2005). Data on mangrove/intertidal sites reported in this study could have some
influential values (as gleaned from Table 3) and hence were excluded in the
statistical analysis The mean metal concentrations (and other sediment
parameters) were calculated from the Port Curtis dataset (N=100). Samples
whose concentrations exceeded the upper 95% confidence interval (UCI) of the
mean of this original dataset were removed. A new mean value was calculated
from the reduced dataset, giving a new UCI; any outliers (values exceeding UCI)
Metal and polycyclic aromatic hydrocarbon contaminants in benthic sediments of Port Curtis
24
were again removed. The elimination process was repeated until there were no
more outliers compared to the UCI of the final dataset.
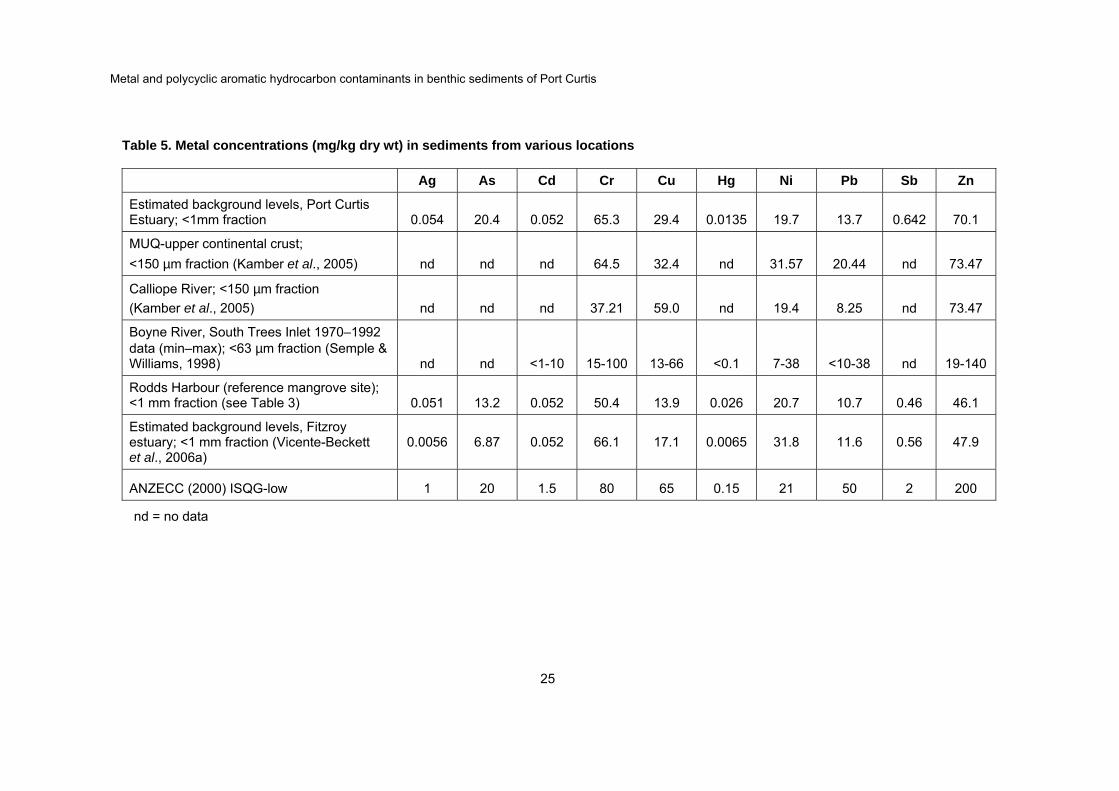
Table 5 gives the mean values of this final dataset (reduced to n=11), which
represent estimates of the background levels of the Port Curtis estuarine surficial
sediments. Also included in Table 5 for comparison are some historical data for
Calliope and Boyne Rivers (which contribute to the Port Curtis estuary), the most
recent estimate of the composition of the upper continental crust of Queensland
(UCC-MUQ) based on 25 river and 30 alluvial sediments around Queensland
(Kamber et al., 2005), the mean levels found in the reference mangrove site
(Rodds Harbour), and estimates of background concentrations of Fitzroy estuary
sediments (Vicente-Beckett et al., 2006a).
The Port Curtis background estimates are seen to be consistent with the range of
reported values for UCC-MUQ, the Calliope and Boyne Rivers, and the reference
mangrove site (Rodds Harbour), indicating that the statistical approach used in
this study was reasonable. The UCC-MUQ values are greater than the estimated
background Ni and Pb concentrations, suggesting that the upper catchment or
upstream sources (particularly Calliope River) could be potential sources of these
metals.
It is noted that the background levels obtained for As and Ni are very close to the
lower trigger values of ANZECC (2000) interim sediment quality guidelines, which
must be taken into consideration when undertaking sediment quality
assessments. The estimated background concentrations in Fitzroy estuary
sediments (Vicente-Beckett et al., 2006a) on the other hand gave slightly lower
levels of As, Cu, Hg, Sb and Zn than in Port Curtis sediments. The statistical
procedure used has provided likely background levels of Ag, As, Cd, Hg and Sb
in Port Curtis sediments, which are lacking in the UCC-MUQ dataset.
Metal and polycyclic aromatic hydrocarbon contaminants in benthic sediments of Port Curtis
25
Table 5. Metal concentrations (mg/kg dry wt) in sediments from various locations Ag As Cd Cr Cu Hg Ni Pb Sb Zn
Estimated background levels, Port Curtis Estuary; <1mm fraction 0.054 20.4 0.052 65.3 29.4 0.0135 19.7 13.7 0.642 70.1
MUQ-upper continental crust; <150 µm fraction (Kamber et al., 2005) nd nd nd 64.5 32.4 nd 31.57 20.44 nd 73.47
Calliope River; <150 µm fraction (Kamber et al., 2005) nd nd nd 37.21 59.0 nd 19.4 8.25 nd 73.47
Boyne River, South Trees Inlet 1970�1992 data (min�max); <63 µm fraction (Semple & Williams, 1998) nd nd <1-10 15-100 13-66 <0.1 7-38 <10-38 nd 19-140
Rodds Harbour (reference mangrove site); <1 mm fraction (see Table 3) 0.051 13.2 0.052 50.4 13.9 0.026 20.7 10.7 0.46 46.1
Estimated background levels, Fitzroy estuary; <1 mm fraction (Vicente-Beckett et al., 2006a)
0.0056 6.87 0.052 66.1 17.1 0.0065 31.8 11.6 0.56 47.9
ANZECC (2000) ISQG-low 1 20 1.5 80 65 0.15 21 50 2 200
nd = no data

Metal and polycyclic aromatic hydrocarbon contaminants in benthic sediments of Port Curtis
26
3.1.3 Predicting the natural gradient of metal concentration in sediments
Preda and Cox (2002) reported a baseline study of the trace metal distribution in
the Pumicestone coastal area of south-east Queensland. They showed that
regardless of the sample origin and composition, metal accumulation appeared
systematic, suggesting relationships between metals and certain sediment
parameters (e.g. Fe and Al contents, or particle size). Liaghati et al. (2003)
showed that natural processes were more dominant than anthropogenic inputs in
concentrating metals. The spatial variability exhibited by the metal data probably
reflects the influence of other sediment variables such Fe and/or Al contents,
organic matter content, particle size etc. on the metal concentration.
Such influences are indicated by the Pearsons correlations shown in Table 4. To
minimise variability of analytical data, as well as to obtain a better estimate of the
maximum potentially labile metal, the common practice involves using only the
fine sediment fractions (i.e. <63 µm) for chemical analysis. However, this
procedure of size normalisation cannot fully deal with the variability due to
complex interactions within the sediment. Linear regression models have been
used to describe the natural gradient (i.e. the natural variation between sites) of
metal concentration in sediments as well as to minimise the effects of multiple
sources of variance (Doherty et al., 2000a,b; Roussiez et al., 2005; Liu et al.,
2003) in sediments from different sites.
A multivariate analysis was undertaken on the combined sediment dataset of the
SLRA study (Apte et al., 2005) and this study, to model the natural variation in
metal concentration of Port Curtis sediments. The procedure is discussed in detail
elsewhere (Vicente-Beckett et al., 2006a,b). Table 6 summarises the unique
prediction equations obtained for each metal, showing the different predictors (or
independent variables) which influence the metal concentration in the sediments.
Log-transformed data were used for the analysis to reduce skewness. These
regression equations were used to predict metal concentrations of the sediment
samples using the measured values of the corresponding predictors.
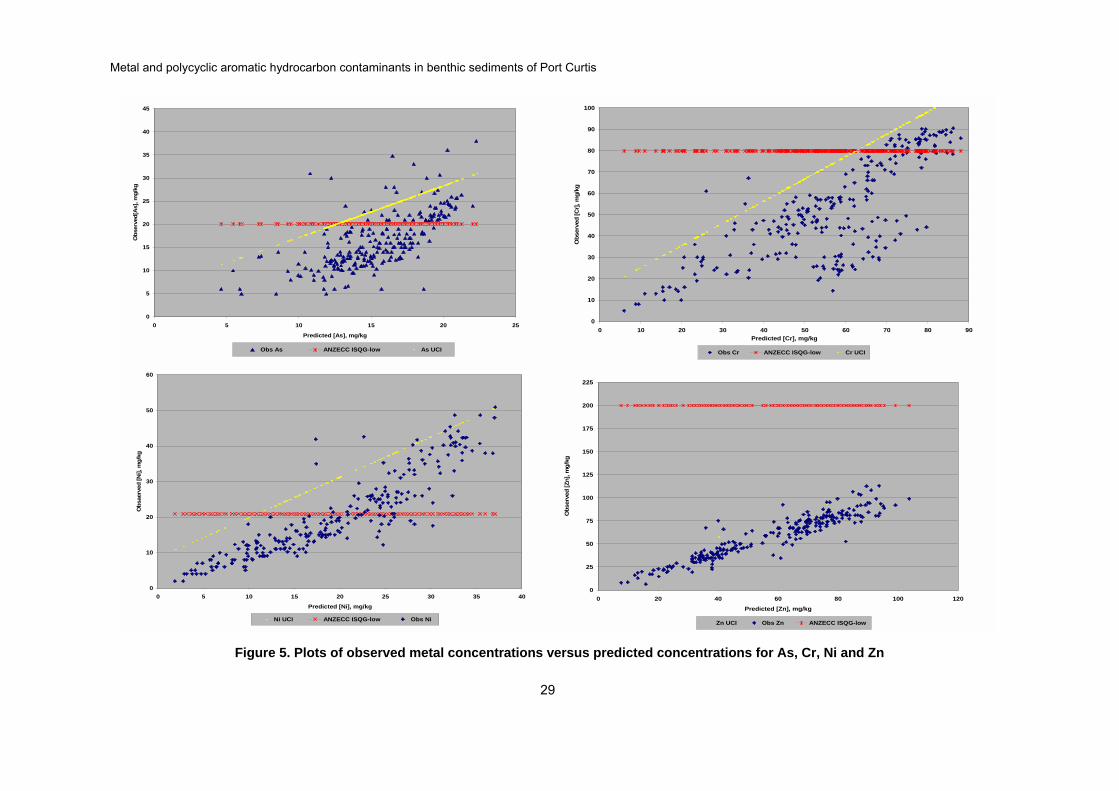
Figure 5 shows typical plots of the predicted concentration versus the observed
sediment metal concentrations for four of the 10 metals analysed, together with
their respective ANZECC (2000) trigger values. The UCI line defines the upper
limit of the natural variation of sediment concentration. The adjusted correlation
coefficients obtained for these plots are also given in Table 6, as well as the
standard error of the estimate (SEE), which is a measure of the variation in the
predicted value that is analogous to the standard deviation of a variable around its
mean (Hair et al., 1998). It is seen that good correlations between the predicted

Metal and polycyclic aromatic hydrocarbon contaminants in benthic sediments of Port Curtis
27
metal concentration and the observed values were obtained for Zn, Cr, Ni, Cu and
Pb, while only weak-to-moderate correlations were obtained for As, Sb, Hg, Ag
and Cd. The limits of detection for Hg, Ag and Cd analyses probably contributed
to the limitations of the models obtained. The regression analysis has confirmed
that the natural levels of Ni, Cr and As are very close to the ANZECC (2000)
trigger values, and may actually exceed the guideline (i.e. the samples falling
below the UCI but above the trigger values).
In their study on Cleveland Bay (northern Queensland) sediments, Doherty et al.
(2000a,b) considered all observed values exceeding the UCI as sediments with
enhanced metal concentrations, although they may still fall below the ANZECC
(2000) guidelines. The enhanced metal concentrations may be indicative of:
anthropogenic inputs, the presence of sediments which are not typical of the
modelled gradient, or of sediments which contained some irregular predictor(s)
not accommodated within the regression model (Doherty et al., 2000b). More
sediment data (e.g. from less contaminated sites upstream of the two major
tributaries, the Calliope and Boyne Rivers, additional mangrove sites and deeper
sediment cores) are needed to resolve these questions and to improve the
regression models.

Metal and polycyclic aromatic hydrocarbon contaminants in benthic sediments of Port Curtis
28
Table 6. Regression models to predict sediment metal concentration
Element Prediction equation AdjustedR2
SEE N
Ag log Ag = 1.56 + 0.011*log Fe + 0.015*log Al + 0.01*log S + 0.002*log OM 0.477 0.00689 245
As log As = -2.471 + 0.597*log Fe + 0.095*log S + 0.179*log Ca - 0.075*log OM 0.452 0.115 245
Cd log Cd = 1.542 + 0.009*log Fe + 0.02*log Al + 0.011*log S + 0.003*log OM 0.493 0.00717 245
Cr log Cr = -1.111+ 0.719*log Fe - 0.244*log Al + 0.094*log S + 0.056*log Ca - 0.053*log OM + 0.142*log Mud 0.859 0.0783 245
Cu log Cu = -3.098 + 0.508*log Fe + 0.436*log Al + 0.137*log S - 0.154*log Ca + 0.159*log Mud 0.843 0.111 245
Hg log Hg = 0.706 + 0.605*log Fe - 0.652*log Al + 0.399*log S - 0.157*log Ca - 0.233*log OM + 0.123*log Mud 0.458 0.306 182
Ni log Ni = -4.582 + 0.812*log Fe + 0.286*log Al + 0.208*log S - 0.077*log OM + 0.076*log Mud 0.844 0.107 245
Pb log Pb = -2.641 + 0.452*log Fe + 0.245*log Al + 0.0.086*log S + 0.044*log Ca - 0.045*log OM + 0.025*logMud 0.759 0.0724 245
Sb log Sb = -2.276 + 0.216*log Fe + 0.205*log Al + 0.042*log Mud 0.469 0.0800 182
Zn log Zn = -2.006 + 0.072*log Fe + 0.104*log Al + 0.047*log S -0.071*log Ca + 0.108*log Mud 0.894 0.0712 245
SEE = standard error of the estimate
N = number of samples
Metal and polycyclic aromatic hydrocarbon contaminants in benthic sediments of Port Curtis
29
0
5
10
15
20
25
30
35
40
45
0 5 10 15 20 25
Predicted [As], mg/kg
Obs
erve
d[A
s], m
g/kg
Obs As ANZECC ISQG-low As UCI
0
10
20
30
40
50
60
0 5 10 15 20 25 30 35 40
Predicted [Ni], mg/kg
Obs
aerv
ed [N
i], m
g/kg
Ni UCI ANZECC ISQG-low Obs Ni
0
25
50
75
100
125
150
175
200
225
0 20 40 60 80 100 120Predicted [Zn], mg/kg
Obs
erve
d [Z
n], m
g/kg
Zn UCI Obs Zn ANZECC ISQG-low
0
10
20
30
40
50
60
70
80
90
100
0 10 20 30 40 50 60 70 80 90Predicted [Cr], mg/kg
Obs
erve
d [C
r], m
g/kg
Obs Cr ANZECC ISQG-low Cr UCI
Figure 5. Plots of observed metal concentrations versus predicted concentrations for As, Cr, Ni and Zn

Metal and polycyclic aromatic hydrocarbon contaminants in benthic sediments of Port Curtis
30
3.2 Sediment geochronology and sedimentation rate
Studies on chronology and/or sedimentation rate are often based on excess or
unsupported 210Pb activity. The natural fallout radionuclide 210Pb, a member of the
uranium decay series, is found on all surfaces exposed to the atmosphere. This
atmospherically derived excess 210Pb is scavenged from the atmosphere by both
wet and dry processes, subsequently being incorporated in sedimentary deposits
and decaying with a half-life of about 22 years (Madsen et al., 2005). The
unsupported 210Pb activity or excess 210Pb is the measured activity of 210Pb which
exceeds the activity in equilibrium with 226Ra in the sediment. 137Cs fallout
resulted from nuclear bomb detonations in 1945�1980 and is globally distributed
(Pfitzner et al., 2004). Using several cores from northern Queensland, Pfitzner et
al., (2004) demonstrated that 137Cs is also a useful independent tracer for
sediment dating purposes.
In this study four sediment cores from intertidal mangrove sites spread across the
harbour were taken for dating and the results are shown in Figure 6. No
pronounced 210Pb excess or 137Cs activity was observed particularly at the top
sections (0�10 cm) of all cores, although somewhat higher activity at depths
below 10 cm was observed. The lack of 210Pb excess count in the upper layers of
the cores may be attributed to sediment mixing, a phenomenon which has been
observed in estuarine sediment cores (Pfitzner et al., 2004). This mixing may be
gleaned from the fluctuating activities of either radionuclide with depth of core
slice. Longer cores would have provided better estimates of the sedimentation
history. Taking a much deeper core further out in the estuary using divers was
considered but was not carried out due to time and budget limitations, lack of
effective equipment for underwater coring and anticipated problems of visibility for
the divers at the water depths involved. A research vessel such as that used by
Geoscience Australia would be ideal but could not be organised due to time and
budget limitations, although it may also be unsuitable for the relatively low water
depths near the intertidal sites.
The Narrows and Calliope River cores exhibited 210Pb excess activity which
decreased with depth of core; such trend was reasonably apparent only in 137Cs
activity observed in the Calliope River core. Taking the year 1958 as the time
when 137Cs activity above background levels was detected in the southern
hemisphere (Pfitzner et al., 2004), it appears that 28 cm of sediments were
deposited over the past 47 years (core sampled in 2005). This gives an estimated
sediment accumulation rate of at least 0.60 cm/yr. Table 7 shows the range of
linear sedimentation rates observed at other estuaries for comparison. In
particular, sedimentation rate of about 1.9 cm/yr (based on 137Cs activity) for a

Metal and polycyclic aromatic hydrocarbon contaminants in benthic sediments of Port Curtis
31
1.2 m sediment core from offshore Keppel Bay, Central Queensland sampled in
2000 (V. Vicente-Beckett, unpublished data) is about threefold higher. This
difference is not surprising considering the differences in the catchment size,
the nature of land use, flow volume and hydrodynamics between the two
locations. The sedimentation rate is highly variable both spatially and temporally
as demonstrated by another Coastal CRC study, which found recently that
the average sedimentation rates in the Fitzroy River estuary within the last
100�200 years were: 1 mm/year at the floodplains, 1.5 cm/year at the mangroves
and tidal creeks at the river mouth, and 0.13 cm/year within the inner Keppel Bay
(Helen Bostock, personal communication, 2006).
Table 7. Linear sedimentation rates measured in sediment cores from various estuaries
Location Sedimentation rate, cm/year
Reference
Port Curtis >0.6 This study
Fitzroy Estuary (core 3419) 1.9 V. Vicente-Beckett, unpublished data
Crescent Lagoon (Fitzroy Estuary) 1.3 G. Hancock, personal communication, 2005
Upstart and Rockingham Bays (northern Queensland), core 1241
~0.9 Pfitzner et al., 2004
Hong Kong SAR, mangrove swamps 0.4�0.5 Ke et al., 2005
Jiulongjang estuary (China) 1.75 Alongi et al., 2005
French Guiana coast 0.7 Allison and Lee, 2004
Wadden Sea (Denmark) 1.2 Madsen et al., 2005

Metal and polycyclic aromatic hydrocarbon contaminants in benthic sediments of Port Curtis
32
-35
-30
-25
-20
-15
-10
-5
0
0 5 10 15 20 25 30
Excess 210Pb Activity, Bq/Kg dry weight
Dep
th o
f top
end
of c
ore
slic
e, c
m
Narrows Calliope River South Trees Inlet Rodds Harbour
-35
-30
-25
-20
-15
-10
-5
0
0.0 0.5 1.0 1.5 2.0 2.5 3.0
137Cs Activity, Bq/Kg dry weight
Dep
th o
f top
end
of c
ore
slic
e, c
m
Narrows Calliope River South Trees Inlet Rodds Harbour
Figure 6. Excess 210Pb activity (top) and 137Cs activity (bottom) in Port Curtis sediment cores (indicative error bars (± standard error) are shown)

Metal and polycyclic aromatic hydrocarbon contaminants in benthic sediments of Port Curtis
33
3.3 Stable lead isotope ratios (PbIRs)
The variety of lead ores used in various industrial applications has led to the
introduction of lead in the environment with distinct relative isotope abundance.
The relative ratios of the four stable lead isotopes 206Pb (from radioactive decay of 238U), 207Pb (from 235U decay), 208Pb (from 232Th decay) and 204Pb (no known
radioactive parent) depends upon the age and U/Pb and Th/Pb ratios of the ore
from which the lead was derived. Very old ores such as those from Broken Hill,
New South Wales, contain small amounts of radiogenic Pb isotopes; younger
ores derived from high U/Pb sources such as mined in Missouri have much higher
proportions of 206Pb, 207Pb and 208Pb relative to 204Pb (Chillrud et al., 2003).
Muñoz et al. (2004) used the stable lead isotope ratios (206Pb/207Pb, 208Pb/207Pb)
to trace main Pb sources to coastal sediments considering various forms of
environmental samples (e.g. industrial effluents, leaded petrol, riverine and
marine suspended particulate materials). Gallon et al. (2005) have tracked the
sources and chronology of atmospheric lead deposition using stable PbIRs.
PbIRs of sediments from Port Curtis estuary (plus a grab from Awoonga Dam)
and a few soils and sediments from the lower Fitzroy catchment are plotted in
Figure 7. The mean Pb content found for Port Curtis estuarine and intertidal
sediments was 12.4 ± 3.9 mg/kg dry wt. Among the cores, The Narrows
registered Pb concentration which was significantly different (p<0.05) from those
in the other mangrove zones. The mean PbIRs for all Port Curtis sediments were 208Pb/206Pb = 2.0758 ± 0.0111 and 207Pb/206Pb = 0.8368 ± 0.0068. These ratios
were not significantly correlated (p<0.05) to the Pb concentration, which is evident
from Figure 7 (bottom plot). Plots of the PbIRs against Pb concentration also
showed little correlation; the y-intercepts of these plots may be taken as the
background values: 208Pb/206Pb = 2.0711 and 207Pb/206Pb = 0.8333. The observed
mean 208Pb/206Pb ratio is comparable to the value of 2.0635 measured for near-
pristine estuarine and marine tropical northern Australia, bordering the Timor
and Arafura Seas and the Gulf of Carpentaria (Munksgaard & Parry, 2002).
Reported PbIRs for Murray River (Australia) suspended sediments converted in
terms of measured ratios reported in this study were 208Pb/206Pb = 2.0757 and 207Pb/206Pb = 0.8451 (Millot et al., 2004).
The modelled present-day average crustal value of these ratios was reported by
Stacey and Kramers (1975) as 208Pb/206Pb = 2.0606 and 207Pb/206Pb = 0.8357
(converted values from other stable Pb isotope ratios reported). This point was
included in Figure 7, as well as the Pb isotope ratios for Mount Isa (Queensland)
Pb deposits and those for oceanic sediments (Atlantic and Pacific) (Stacey &
Kramers, 1975). Also included in the figure are the measured ratios from an
Metal and polycyclic aromatic hydrocarbon contaminants in benthic sediments of Port Curtis
34
upstream Fitzroy River sediment, three samples of contaminated soils (former
cattle dip) and a wastewater sludge sample from the Fitzroy catchment
(Pb concentration range for these samples was 30�153 mg/kg, indicating Pb
contamination), with the sludge sample showing the highest PbIRs.
The plot shows that the Port Curtis sediments fall within a linear trend
(r2 = 0.6497) starting from average modern or present-day Pb and ending at the
most radiogenic Mount Isa Pb (Munksgaard et al., 2003), with the Port Curtis
sediments being closer to the PbIRs for present-day Pb. Higher PbIRs indicate
more anthropogenic Pb inputs, probably via atmospheric lead (e.g. leaded petrol
emissions) and industrial sources (e.g. coal-fired operations) and other
anthropogenic inputs, such as found for the contaminated Fitzroy soils and
sludge samples. Duzgoren-Aydin et al. (2004) reported (in converted ratios) 208Pb/206Pb = 2.2190 for alkyl Pb sources from Australian ores; the range of this
ratio for Australia and New Zealand atmospheric lead in 1997 was 2.1565�2.1847
(Bollhöfer & Rosman, 2000). The lower observed ratio (208Pb/206Pb = 2.0711) in
Port Curtis appears to reflect the decrease in these ratios which started in the
1970s (when leaded petrol was outlawed). Such decrease was clearly
demonstrated elsewhere, for example, in the top 2.5 cm layer of sediments from a
fairly isolated Canadian lake (Gallon et al., 2005). Sediment mixing in the Port
Curtis mangrove cores may have caused dispersal of lead, obviating any
evidence of decreasing PbIRs with depth of core.
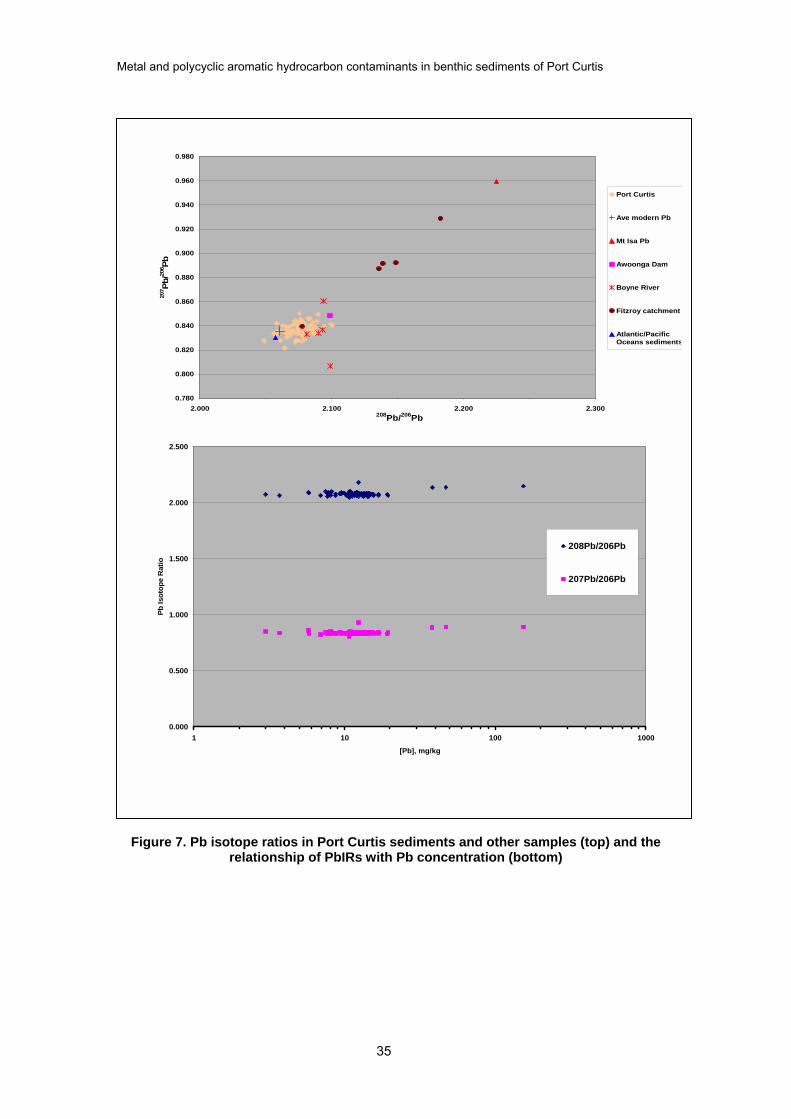
Metal and polycyclic aromatic hydrocarbon contaminants in benthic sediments of Port Curtis
35
Figure 7. Pb isotope ratios in Port Curtis sediments and other samples (top) and the
relationship of PbIRs with Pb concentration (bottom)
0.000
0.500
1.000
1.500
2.000
2.500
1 10 100 1000
[Pb], mg/kg
Pb Is
otop
e R
atio
208Pb/206Pb
207Pb/206Pb
0.780
0.800
0.820
0.840
0.860
0.880
0.900
0.920
0.940
0.960
0.980
2.000 2.100 2.200 2.300208Pb/206Pb
207 Pb
/206 Pb
Port Curtis
Ave modern Pb
Mt Isa Pb
Awoonga Dam
Boyne River
Fitzroy catchment
Atlantic/PacificOceans sediments

Metal and polycyclic aromatic hydrocarbon contaminants in benthic sediments of Port Curtis
36
3.4 PAHs in sediments
Polycyclic aromatic hydrocarbons (PAHs) are organic compounds consisting of at
least two fused aromatic rings (see Appendix 5). They are natural constituents of
crude oils, accounting for about 20% of total hydrocarbons (Kennish, 1997).
They are of concern because of their potential carcinogenicity, mutagenecity and
teratogenicity, particularly of the higher molecular weight (MW) PAHs (PAHs
containing four rings or more), and the toxicity of the lower MW PAHs (2�3 rings)
to aquatic animals. PAHs are the most biologically toxic of all hydrocarbon
compounds (Haynes & Johnson, 2000). Their low solubility in water makes them
attractive to hydrophobic organic matter, suspended particulates and sediments
where they may remain for extended periods. They appear to degrade only very
slowly, mainly by microbial action and photodegradation (Kennish, 1997).
Seventeen polycyclic aromatic hydrocarbons, representing mainly the priority
pollutants identified in the ANZECC/ARMCANZ (2000) interim sediment quality
guidelines, were tested in 25 sediment grabs and in one shallow core. Appendix 2
summarises the locations and descriptions of the samples and Appendix 5 gives
the list of acronyms used for the PAHs and some information on their
carcinogenicity potential and toxicity. Appendix 6 provides all the PAH data
obtained in this study.
Figure 8 plots the PAH data for samples taken from the northern end of Port
Curtis (left side of the figure) to the southern end of the estuary (right side of the
figure). The highest concentrations of the different PAHs were clearly found near
the industrial centre of Gladstone, that is, along Calliope River and its mouth and
the South Trees Inlet. Sediments from the Clinton Coal Facility (CCF) contained
the greatest amount of PAHs, followed by sediments from Red Mud Dam Outlet
(RMDO), Auckland Creek (AC), downstream of the NRG Power Station
(CR-NRG) and the marina (M). Sediments from the northern and southern ends
of the estuary contained relatively low PAHs and only a few types of PAH; no
detectable levels of PAHs were found at Boyne River and Rodds Harbour.
Figures 9 and 10 show detected levels of naphthalene (which has known toxicity
to aquatic organisms; see Appendix 5) and of benz[b+k]fluoranthene (which has
low-to-moderate carcinogenicity potential; see Appendix 5), respectively.
Figure 11 maps the total PAHs detected in the estuary. The ANZECC trigger
values for PAHs were not exceeded in any of the samples. The naphthalene
levels were ≤5 µg/kg, in contrast to 200�501 µg/kg reported earlier (WBM
Oceanics Australia, 2000). Naphthalene constitutes a significant fraction of crude
Metal and polycyclic aromatic hydrocarbon contaminants in benthic sediments of Port Curtis
37
oils and petroleum products with lighter fractions. The high levels reported in 2000
(WBM, Oceanics Australia, 2000) could be indicative of the presence of a
petroleum-source PAH contamination at the time the study was performed
(Tam et al., 2001).
Sediment from The Narrows and Munduran Creek and from Awoonga Dam
(upstream Boyne River) contained high levels of perylene (53�99% and 79%,
respectively); other grab samples (except QAL-RMDO) likewise contained
significant levels of perylene (mean ± sd for all grabs = 91 ± 27%). Figure 12
shows the PAHs found in a short core (core #1, 18-cm long) from Munduran
Creek, which is seen to predominantly contain perylene.
Perylene is not included in the ANZECC (2000) sediment quality guidelines. It
appears to be produced naturally although the process is not yet fully understood.
It is largely viewed that perylene is diagenetic in origin, being formed after the
sediments have been buried. It has been suggested that fungi are major
precursor carriers for perylene in sediments (Jiang et al., 2000), that diatom
decomposition is the origin of perylene in marine sediments (Venkatesan, 1988),
and that perylene is formed from non-specific precursor materials by biotic or
abiotic transformation processes (Silliman et al., 2001). It is also claimed that high
concentrations of perylene are often associated with anoxic marine sediments
and/or terrigenous peaty deposits (Dahle et al., 2003).
The concentration of perylene in sediments is thought to be proportional to the
amount of terrestrial input (Jiang et al., 2000). It has been observed to be present
at higher concentrations in deeper sediment core sections taken from various
locations in the world (Jiang et al., 2000), as well as from some cores (2.2�2.6 m
long) in the Fitzroy Estuary (Vicente-Beckett et al., 2006a). Silliman et al. (1998)
argued that the low-to-absent perylene concentrations in upper, oxic sediments
and its increasing concentrations with depth indicate that in situ diagenesis is
responsible for the formation of perylene.

Metal and polycyclic aromatic hydrocarbon contaminants in benthic sediments of Port Curtis
38
Low MW PAHs
0
10
20
30
40
50
60
Narrows1
Narrows2
Munduran C
reek (
MC2a)
BC BS TC GC FPNPI
PB SB FL WICCF M
CR-U/S
CR-NRG
CR-STP AC
RMDOSPWC
Boyne R
iver
Collose
um Inlet
Rodd's Harb
our
Awoonga Dam
Site
[PA
H],
ug/k
g d
w, n
orm
alis
ed to
1%
OC
AEN AYL F NA PN
High MW PAHs
0
50
100
150
200
250
Narrow
s1
Narrows2
Munduran
Cree
k (MC2a
)BC BS TC GC FP
NPIPB SB FL WI
CCF M
CR-U/S
CR-NRG
CR-STP AC
RMDOSPWC
Boyne R
iver
Collose
um Inlet
Rodd's
Harbour
Awoonga Dam
Site
[PA
Hs]
, ug/
kg d
w, n
orm
alis
ed to
1%
OC
.
BaA BaP CH DhA FL Py IP PER BeP BbkF Bghi
Figure 8. Distribution of low-MW (top) and high-MW (bottom) PAHs in Port Curtis benthic sediments
(AEN = Acenaphthene; AYL = Acenaphthylene; BbkF = Benzo[b+k]Fluoranthene; BaA = Benz[a]Anthracene; BaP = Benz[a]Pyrene; BeP = Benz[e]Pyrene; Bghi = Benzo[ghi]Perylene; CH = Chrysene; DbA = Dibenz[ah]Anthracene; F = Fluorene; FL = Fluoranthene; IP = Indeno[123cd]Pyrene; NA = Naphthalene; PN = Phenanthrene; PER = Perylene; PY = Pyrene)

Metal and polycyclic aromatic hydrocarbon contaminants in benthic sediments of Port Curtis
39
Figure 9. Naphthalene in Port Curtis benthic sediments
Figure 10. Benzo[b+k]Fluoranthene in Port Curtis benthic sediments
kilometres km
km

Metal and polycyclic aromatic hydrocarbon contaminants in benthic sediments of Port Curtis
40
Figure 11. Total PAHs in Port Curtis sediments
0 10 20 30 40 50 60 70 80 90
0
-3
-7
-11
-15
Top
dept
h of
cor
e sl
ice,
cm
[PAH], ug/kg normalised to 1%TOC
NA AEN AYN F AN PN FL PY BaA CH BbkF BaP BeP PER IP Bghi DbA
Figure 12. Depth profile of PAHs in Munduran Creek core
km
Metal and polycyclic aromatic hydrocarbon contaminants in benthic sediments of Port Curtis
41
3.4.1 Sources of PAHs
PAH isomer ratios have been used to infer sources of PAHs in sediments. For
example, for PAHs of MW= 178, a concentration ratio of anthracene to the sum
of anthracene and phenanthrene <0.10 (both having MW = 178; see Appendix 5)
is taken as an indication of petrogenic sources (e.g. fossil fuels), while a ratio
>0.10 indicates a dominance of pyrolytic sources (i.e. PAHs formed from high-
temperature and incomplete combustion of biomass or fossil fuels) (Yunker
et al., 2002). A third source category is diagenetic, such as the case of perylene
(a 5-ring PAH). It has been suggested that concentrations of perylene which are
higher than 10% of the total penta-aromatic isomers indicate a probable
diagenetic input, whereas those in which perylene is less than 10% indicate a
probable pyrolytic origin of the compound (Readman et al., 2002).
Table 8 lists the PAH isomer ratios observed in Port Curtis benthic sediments,
and reported empirical ratios for the three types of PAH sources. A colour code
has been added to more easily differentiate the source types. It is seen from the
table that combustion-derived PAHs were predominant in most samples, and
perylene was consistently from a diagenetic source, except for one sample taken
at red mud dam outlet which was of pyrolytic origin. The samples which indicated
PAHs from petrogenic sources clustered around Fisherman�s Landing, Calliope
River, the marina and the red mud dam outlet.
The potential human health effects and toxicity of PAHs to aquatic organisms are
briefly indicated in Appendix 5. Other aquatic organisms such as mussels and
scallops are used as biomonitors for PAH contamination (Boehm et al., 2005; Pan
et al., 2005). It would be important to monitor the presence of PAHs in Central
Queensland coastal waters especially in the Gladstone area in view of its rapidly
increasing industrialisation and urbanisation, as well as to investigate the impacts
of PAHs on aquatic organisms in Port Curtis. PAHs have been consistently shown
to increase in levels in industrialised and urbanised areas, in addition to sites
which receive oil spills (Law et al., 2002). There is high potential for PAH
contamination from fossil fuel sources (particularly coal, which is continually being
transported to the port area). The coal facility at the Gladstone harbour also
stockpiles coal (while awaiting loading onto ships for export), which could be
blown by wind into the harbour; indeed a few sediment grab samples were
observed to contain some tiny particles of coal in them.

Metal and polycyclic aromatic hydrocarbon contaminants in benthic sediments of Port Curtis
42
Table 8. PAH isomer ratios and origins.
Sample ID AN/(AN+PH) FL/(FL+PY) BaA/(BaA+CH) IP/(IP+Bghi) PN/AN FL/PY BaA/CHPER/(sum 5-
rings)Narrows1 1.00Narrows2 0.600 1.50 0.81MunduranCk2a 0.571 1.00 1.33 0.94BC 0.500 1.00 0.64BS 0.500 0.500 1.00 1.00 0.29TC 0.545 0.375 1.18 0.60 0.30GC 0.533 0.333 1.20 0.56 0.30FP 0.556 0.300 1.20 0.50 0.24NPI 0.533 0.375 1.18 0.63 0.28PBSB 0.500 0.400 1.08 0.60 0.25FL 0.059 0.567 0.368 12 1.25 0.56 0.19WI 0.567 1.33 0.22CCF 0.063 0.568 0.366 13 1.32 0.59 0.12M 0.111 0.529 0.364 8 1.13 0.57 0.21CR-U/S 0.077 0.500 0.350 9 1.05 0.77 0.28CR-NRG 0.528 0.333 16 1.12 0.52 0.17CR-STP 0.500 0.368 1.06 0.56 0.15AC 0.100 0.537 0.370 12 1.16 0.59 0.17RMDO 0.083 0.516 0.360 9.5 1.04 0.59 0.08SPWC 0.536 0.381 1.15 0.62 0.17Boyne RiverColloseum Inlet 0.538 0.400 0.40 1.17 0.67 0.36Awoonga Dam 1.00Rodd's Harbour
Pyrolytic sources (high-T combustion of fossil fuels and biomass) > 0.10 > 0.5 > 0.35 > 0.5 < 10 > 1 > 0.9 < 0.1Petrogenic sources (eg fossil fuels, petroleum, shale oil etc) < 0.10 < 0.5 < 0.2 < 0.2 > 15 < 1 < 0.4Diagenetic sources (formed from plant or biogenic precursors) > 0.1
PAH Ratios
Metal and polycyclic aromatic hydrocarbon contaminants in benthic sediments of Port Curtis
43
4 Conclusions and recommendations for further study The study confirmed that intertidal (mangrove) sites collect fine sediments, which
contained higher concentrations of metals and PAHs than did estuarine
sediments. Using radiochemical dating methods (210Pb or 137Cs activity), the
upper 28 cm of subsurface sediments were found to have been deposited since
1958, which is roughly the start of the industrialisation of Gladstone. The rate of
sediment deposition was at least 0.60 cm/year. The sediment depositional zones
identified were: the northern Narrows, lower Calliope River and South Trees Inlet�
Boyne River areas. Stable lead isotope ratios in Port Curtis sediments were
consistent with those reported for other sediments from northern Queensland and
indicated no significant lead pollution sources.
Mangrove cores showed relatively constant metal concentrations with depth.
Estimates of background metal levels in Port Curtis estuarine sediments were
consistent with the latest reported estimates of the upper continental crust in
Queensland (Kamber et al., 2005). The estimated background levels of As, Cr
and Ni were found to be very close to the ANZECC ISQG-low guidelines, which
was further corroborated by a multivariate analysis to determine the natural
gradient of metals in sediments from different sites of the estuary. These lines of
evidence indicated that particulate arsenic, chromium and nickel are related to the
local geology and do not reflect metal contamination by anthropogenic sources.
It would be important to consider this when undertaking sediment quality
assessments. PbIR data indicated no significant lead pollution in Port Curtis.
However, there is still a need to investigate the role of acid sulfate soils in
enhancing sediment metal concentrations, particularly at the mangrove sites.
PAH contaminants in sediments were highest around the industrial area of
Gladstone with hardly any detected at Rodds Harbour, indicating that the latter
site has relatively limited anthropogenic impacts. Several types of PAHs
characteristic of pyrolytic or combustion sources were detected at the middle
harbour largely at the Clinton Coal Facility, along Calliope River, at the marina
and the South Trees Inlet-Boyne River area. Naturally occurring perylene was
found in all sediments and were highest at The Narrows and Munduran Creek.
Several types of PAHs, characteristic of combustion sources, were detected at
the middle harbour, Calliope River, South Trees Inlet�Boyne River. The presence
of these PAHs (although still below ANZECC trigger values) signals the need to
monitor aquatic organisms (e.g. bivalves, crustaceans and fish) for any PAH
ecological impacts. PAHs believed to be petrogenic in origin have been found in

Metal and polycyclic aromatic hydrocarbon contaminants in benthic sediments of Port Curtis
44
several aquatic organisms in the more highly urbanised Brisbane River estuary
(Kayal & Connell, 1989, 1995).
There is very little information on both metal and PAH contaminants in particulate
atmospheric industrial emissions in Port Curtis. This gap needs to be addressed,
especially in view of the current rapid growth of industries in Port Curtis.
Metal and polycyclic aromatic hydrocarbon contaminants in benthic sediments of Port Curtis
45
5 References Allison, M.A. & Lee, M.T. (2004) Sediment exchange between Amazon mudbanks
and shore-fringing mangroves in French Guiana. Marine Geology, 208,
169�190.
Alongi, D.M., Pfitzner, J., Trott, L.A., Tirendi, F., Dixon, P. & Klumpp, D.W. (2005)
Rapid sediment accumulation and microbial mineralization in forests of the
mangrove Kandelia candel in the Jiulonjiang Estuary, China. Estuarine,
Coastal and Shelf Science, 63, 605�618.
ANZECC & ARMCANZ (Australian and New Zealand Environment and
Conservation Council [ANZECC] and Agriculture and Resource Management
Council of Australia and New Zealand [ARMCANZ] (2000) Australian and
New Zealand guidelines for fresh and marine water quality. National Water
Quality Management Strategy, Paper No. 4. Volume 1, The Guidelines.
Australian and New Zealand Environment and Conservation Council and
Agriculture and Resource Management Council of Australia and New
Zealand, Canberra.
Apte, S., Duivenvoorden, L., Johnson, R., Jones, M.-A., Revill, A., Simpson, S.,
Stauber, J. & Vicente-Beckett, V. (2005) Contaminants in Port Curtis:
Screening level risk assessment. Technical Report No. 25, CRC for Coastal
Zone, Estuary and Waterway Management, Brisbane, 146 pages.
ATSDR (Agency for Toxic Substances and Disease Registry) (1996) ToxFAQs
for polycyclic aromatic hydrocarbons (PAHs).
<http://www.atsdr.cdc.gov/tfacts69.html> (accessed June 2006).
Biffra, T.E. (2005) The partitioning of trace metals in the sediments of Lake
Moondarra. PhD Thesis, James Cook University, Townsville, 204 pages.
Boehm, P.D., Page, D.S., Brown, J.S., Neff, J.M. & Bence, A.E. (2005)
Comparison of mussels and semi-permeable membrane devices as intertidal
monitors of polycyclic aromatic hydrocarbons at oil spill sites. Marine
Pollution Bulletin, 50, 740�750.
Bollhöfer, A. & Rosman, K.J.R. (2000) Isotopic signatures for atmospheric
lead: the Southern Hemisphere. Geochimica et Cosmochimica Acta, 64,
3251�3262.
Metal and polycyclic aromatic hydrocarbon contaminants in benthic sediments of Port Curtis
46
Chillrud S., Hemming S., Shuster E., Simpson H., Bopp R., Ross J., Pederson D.,
Chaky D., Tolley L.-R. & Estabrooks F. (2003) Stable lead isotopes,
contaminant metals and radionuclides in upper Hudson River sediment
cores: Implications for improved time stratigraphy and transport processes.
Chemical Geology, 199, 53�70.
Conaghan, P.J. (1966) Sediments and sedimentary processes in Gladstone
Harbour, Queensland. University of Queensland Press, St Lucia.
Connell, D.W. (1997) Basic concepts of environmental chemistry, CRC Press,
Boca Raton.
Cook, P. & Mayo, W. (1980) Geochemistry of a tropical estuary and its catchment
– Broadsound, Queensland. Commonwealth of Australia, Canberra.
Dahle, S., Savinov, V.M., Matishov, G.G., Evenset, A. & Naes, K. (2003)
Polycyclic aromatic hydrocarbons (PAHs) in bottom sediments of the Kara
Sea shelf, Gulf of Ob and Yenisei Bay. Science of the Total Environment,
306, 57�71.
Day, R.W., Whitaker, W.G., Murray, C.G., Wilson, I.H. & Grimes, K.G. (1983)
Queensland geology, A companion volume to the 1:250,000 scale geological
map (1975). Publication 383, Geological Survey of Queensland, Brisbane.
Doherty, G.B., Coomans, D. & Brunskill, G.J. (2000a) Modelling natural and
enhanced trace metal concentrations in sediments of Cleveland Bay,
Australia. Marine & Freshwater Research, 51, 739�747.
Doherty, G.B., Brunskill, G.J. & Ridd, M.J. (2000b) Natural and enhanced
concentrations of trace metals in sediments of Cleveland Bay, Great Barrier
Reef lagoon, Australia. Marine Pollution Bulletin, 41, 337�344.
Duke, N., Lawn, P., Zahmel, K.N., Pedersen, D., Harris, C., Steggles, N. &
Tack, C. (2003) Assessing historical change in coastal environments – Port
Curtis, Fitzroy River Estuary and Moreton Bay regions. CRC for Coastal
Zone, Estuary and Waterway Management, Brisbane.
Duzgoren-Aydin, N.S., Li, X.D. & Wong, S.C. (2004) Lead contamination and
isotope signatures in the urban environment of Hong Kong. Environment
International, 30, 209�217.
Gallon, C., Tessier, A., Gobeil, C. & Beaudin, L. (2005) Sources and chronology
of atmospheric lead deposition to a Canadian Shield lake: Inferences from
Pb isotopes and PAH profiles. Geochimica et Cosmochimica Acta, 69(13),
3199�3210.
Metal and polycyclic aromatic hydrocarbon contaminants in benthic sediments of Port Curtis
47
GAWB (Gladstone Area Water Board) (2005) Awoonga dam.
<http://www.gawb.qld.gov.au/awoonga.htm> (accessed 27 September 2005).
Hair, J.F., Anderson, R.E., Tatham, R.L. & Black, W.C. (1998) Multivariate data
analysis, 5th edn. Prentice-Hall, Upper Saddle River.
Haynes, D. & Johnson, J.E. (2000) Organochlorine, heavy metal and
polyaromatic hydrocarbon pollutant concentrations in the Great Barrier Reef
(Australia) environment: a review. Marine Pollution Bulletin, 41, 267�278.
Herzfeld, M., Parslow, J., Andrewartha, J., Sakov, P. & Webster, I.T. (2004).
Hydrodynamic modelling of the Port Curtis region. Technical Report No. 7,
CRC for Coastal Zone, Estuary and Waterway Management, Brisbane.
Holmes, K.H. (1984) Industrial rock and mineral resources of the Gladstone
1:100000 sheet area. Record 1984/42, Geological Survey of Queensland,
Brisbane.
Houston, W. (1999) Severe hail damage to mangroves at Port Curtis, Australia.
Mangroves and Salt Marshes, 3, 29�40.
Jiang, C., Alexander, R., Kagi, R.I. & Murray, A.P. (2000) Origin of perylene in
ancient sediments and its geological significance. organic geochemistry, 31,
1545�1559.
Jones, M.-A. (2003) Assessing the risk from chemical contaminants in Port Curtis
Estuary, Australia. Master of Applied Science Thesis, Central Queensland
University, 226 pages.
Kamber, B.S., Greig, A. & Collerson, K.D. (2005) A new estimate for the
composition of weathered young upper continental crust from alluvial
sediments. Queensland, Australia. Geochimica et Cosmochimica Acta, 69,
1041�1058.
Kayal, S. & Connell, D.W. (1989) Occurrence and distribution of polycyclic
aromatic hydrocarbons in surface sediments and water from the Brisbane
River estuary, Australia. Estuarine, Coastal and Shelf Science, 29, 473�487.
Kayal, S. & Connell, D.W. (1995) Polycyclic aromatic hydrocarbons in biota from
the Brisbane River estuary, Australia. Estuarine, Coastal and Shelf Science,
40, 475�493.
Ke, L., Yu, K.S.H., Wong, Y.S. & Tam, N.F.Y. (2005) Spatial and vertical
distribution of polycyclic aromatic hydrocarbons in mangrove sediments.
Science of the Total Environment, 340, 177�187.
Kennish, M.J. (1997) Practical handbook of estuarine and marine pollution, CRC
Press, Boca Raton.

Metal and polycyclic aromatic hydrocarbon contaminants in benthic sediments of Port Curtis
48
Kirkegaard, A.G., Shaw, R.D. & Murray, C.G. (1970) Geology of the
Rockhampton and Port Clinton 1:250,000 sheet areas. Geological Survey of
Queensland, Brisbane.
Law, R., Kelly, C., Baker, K., Jones, J., McIntosh, A.D. & Moffat, C.F. (2002)
Toxic equivalency factors for PAH and their applicability in shellfish pollution
monitoring studies. Journal of Environmental Monitoring, 4, 383�388.
Liaghati, T., Preda, M. & Cox, M. (2003) Heavy metal distribution and controlling
factors within coastal plain sediments, Bell Creek catchment, southeast
Queensland, Australia. Environment International, 29, 935�948.
Liu, W.X., Li, X.D., Shen, Z.G., Wang, D.C., Wai, O.W.H. & Li, Y.S. (2003)
Multivariate statistical study of heavy metal enrichment in sediments of the
Pearl River estuary. Environmental Pollution, 121, 377�388.
Madsen, A.T., Murray, A.S., Andersen, T.J., Pejrup, M. & Breuning-Madsen, H.
(2005) Optically stimulated luminescence dating of young estuarine
sediments: a comparison with 210Pb and 137Cs dating. Marine Geology, 214,
251�268.
Millot, R., Alle gre, C.-J., Gaillardet, J. & Roy, S. (2004) Lead isotopic systematics
of major river sediments: A new estimate of the Pb isotopic composition of
the upper continental crust. Chemical Geology, 203(1�2), 75�90.
Mudroch, A. & Azcue J.M. (1995) Manual of aquatic sediment sampling. Lewis
Publishers, Boca Raton, 219 pages.
Munksgaard, N.C. & Parry, D.L. (2002) Metals, arsenic and lead isotopes in near-
pristine estuarine and marine coastal sediments from northern Australia.
Marine & Freshwater Research, 53, 719�729.
Munksgaard, A.C., Brazier, J.A., Moir, C.M. & Parry, D.L. (2003) The use of lead
isotopes in monitoring environmental impacts of uranium and lead mining in
Northern Australia. Australian Journal of Chemistry, 56, 233�238.
Munoz, P.N.V., Garbe-Scho�nberg, C.-D. & Salamanca, M.A. (2004) Tracing the
anthropogenic lead sources in coastal sediments of SE-Pacific (36° Lat. S)
using stable lead isotopes. Marine Pollution Bulletin, 48(7�8), 688�697.
Murray, A.S., Marten, R., Johnston, A. & Martin P. (1987) Analysis for naturally
occurring radionuclides at environmental levels by gamma spectrometry.
Journal of Radioactive and Nuclear Chemistry 115, 263�288.
Norin, M. & Strömvall, A.-M. (2004) Leaching of organic contaminants from
storage of reclaimed asphalt pavement. Environmental Technology, 25,
323�340.

Metal and polycyclic aromatic hydrocarbon contaminants in benthic sediments of Port Curtis
49
NPI (National Pollutant Inventory) (2004) Location report: all sources, postcode
4680. http://www.npi.gov.au/cgibin/npireport.pl?proc=location_detail;
instance =public;year=2005;loc_type=postcode;loc_postcode=4680
(accessed June 2006).
Olley, J.M., Murray, A.S., Wallbrink, P.J., Stanton, R.K. & Caitcheon, G.G. (1990)
The use of fallout nuclides as chronometers. Quaternary dating workshop,
ANU, 11–12 October 1990, pp. 51�55.
Pan, L., Ren, J. & Liu, J. (2005) Effects of benzo(k)fluoranthene exposure on the
biomarkers of the scallop Chlamys farreri. Comparative Biochemistry and
Physiology, Part C, 141, 248�256.
Pfitzner, J., Brunskill, G. & Zagorskis, I. (2004) 137Cs and excess 210Pb deposition
patterns in estuarine and marine sediment in the central region of the Great
Barrier Reef lagoon, north-eastern Australia. Journal of Environmental
Radioactivity, 76 (1�2), pp. 81�102.
Pope, G.J. (1994) Review of non-oil shale exploration in EPMs 3215 & 3436 –
Stuart oil shale deposit. Report Q1636, Central Pacific Minerals, Brisbane.
Preda, M. & Cox, M.E. (2002) Trace metal occurrence and distribution in
sediments and mangroves, Pumicestone region, south-east Queensland.
Environment International, 28, 433�449.
Readman, J.W., Fillmann, G., Tolosa, I., Bartocci, J., Villeneuve, J.-P., Catinni, C.
& Mee, D.L. (2002) Petroleum and PAH contamination of the Black Sea.
Marine Pollution Bulletin, 44, 48�62.
Reimann, C. & de Caritat, P. (2005) Distinguishing between natural and
anthropogenic sources for elements in the environment: regional
geochemical surveys versus enrichment factors. Science of the Total
Environment, 337, 91�107.
Robbins, J. A. (1978) Geochemical and geophysical applications of radioactive
lead. In: The biogeochemistry of lead in the environment, Part A,
ed. J.O. Nriagu, pp 285�393, Elsevier Scientific, Amsterdam.
Ross, D.J. (2002) Acid sulfate soils – Tannum Sands to St Lawrence, Central
Queensland Coast. Queensland Department of Natural Resources and
Mines, Rockhampton.
Roussiez, V., Ludwig, W., Probst, J.-L. & Monaco, A. (2005) Background levels of
heavy metals in surficial sediments of the Gulf of Lions (NW Mediterranean):
An approach based on 133Cs normalisation and lead isotope measurements.
Environmental Pollution, 138, 167�177.

Metal and polycyclic aromatic hydrocarbon contaminants in benthic sediments of Port Curtis
50
Sadler, R., Delamont, C., White, P. & Connell, D. (1999) Contaminants in soil as a
result of leaching from asphalt. Toxicological and Environmental Chemistry,
68, 71�81.
Selvaraj, K., Ram Mohan, V. & Szefer, P. (2004) Evaluation of metal
contamination in coastal sediments of the Bay of Bengal, India: Geochemical
and statistical approaches. Marine Pollution Bulletin, 49(3), 174�185.
Semple, P. & Williams, R.L. (1998) Metals in sediment data – Queensland, 1970
to 1992. Department of Environment and Heritage, Brisbane.
Silliman, J.E., Meyers, P.A., Eadie, B.J. & Klump, J.V. (2001) An hypothesis for
the origin of perylene based on its low abundance in sediments of Green
Bay, Wisconsin. Chemical Geology, 177, 309�322.
Singh, K.P., Malik, A., Sinha, S., Singh, V.K. & Murthy, R.C. (2005) Estimation of
source of heavy metal contamination in sediments of Gomti River (India)
using principal component analysis. Water, Soil and Air Pollution, 116,
321�341.
Stacey, J.S. & Kramers, J.D. (1975) Approximation of terrestrial lead isotope
evolution by a two-stage model. Earth and Planetary Science Letters, 26,
207�221.
Stevens, N.C. (1984) Queensland field geology guide. Geological Society of
Australia, Brisbane.
Tam, N.F.Y., Ke, L., Wang, X.H. & Wong, Y.S. (2001) Contamination of polycyclic
aromatic hydrocarbons in surface sediments of mangrove swamps.
Environmental Pollution, 114, 255�263.
Venkatesan, M.I. (1988) Occurrence and possible sources of perylene in marine
sediments � a review. Marine Chemistry, 25, 1�17.
Vicente-Beckett, V. & Shearer, D. (2005) Industrial-contaminant pathways in Port
Curtis. IC 10.1 Milestone Report, CRC for Coastal Zone, Estuary and
Waterway Management, Brisbane.
Vicente-Beckett, V., Packett, R., Noble, R., Verwey, P., Ruddle, L., Munksgaard,
N. & Morrison, H. (2006a) Pesticides, polycyclic aromatic hydrocarbons and
metal contamination in the Fitzroy Estuary, Queensland, Australia. Technical
Report No. 37, CRC for Coastal Zone, Estuary and Waterway Management,
Brisbane, 60 pages.

Metal and polycyclic aromatic hydrocarbon contaminants in benthic sediments of Port Curtis
51
Vicente-Beckett, V., Shearer, D., Munksgaard, N., Hancock, G. & Morrison, H.
(2006b) Trace metal distribution in benthic sediments of Port Curtis, Central
Queensland (Australia). Manuscript in preparation, for submission to Marine
Pollution Bulletin.
WBM Oceanics Australia (2000) Gladstone harbour channel sediment analyses,
WBM Oceanics Australia.
Yunker, M.B., Macdonald R.W., Vingarzan, R., Mitchell, R.H., Goyette, D. &
Sylvestre, S. (2002) PAHs in the Fraser River Basin: a critical appraisal of
PAH ratios as indicators of PAH source and composition. Organic
Geochemistry, 33, 489�515.

Metal and polycyclic aromatic hydrocarbon contaminants in benthic sediments of Port Curtis
52
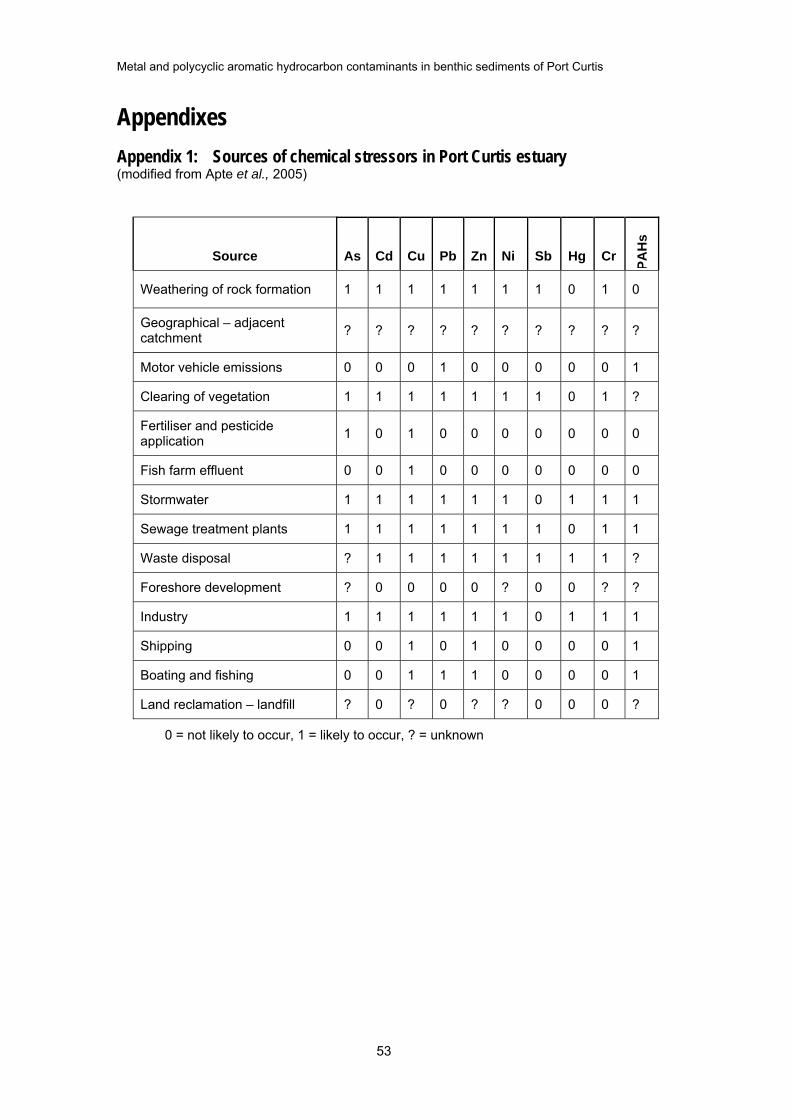
Metal and polycyclic aromatic hydrocarbon contaminants in benthic sediments of Port Curtis
53
Appendixes Appendix 1: Sources of chemical stressors in Port Curtis estuary (modified from Apte et al., 2005)
Source As Cd Cu Pb Zn Ni Sb Hg Cr
PAH
s
Weathering of rock formation 1 1 1 1 1 1 1 0 1 0
Geographical � adjacent catchment ? ? ? ? ? ? ? ? ? ?
Motor vehicle emissions 0 0 0 1 0 0 0 0 0 1
Clearing of vegetation 1 1 1 1 1 1 1 0 1 ?
Fertiliser and pesticide application 1 0 1 0 0 0 0 0 0 0
Fish farm effluent 0 0 1 0 0 0 0 0 0 0
Stormwater 1 1 1 1 1 1 0 1 1 1
Sewage treatment plants 1 1 1 1 1 1 1 0 1 1
Waste disposal ? 1 1 1 1 1 1 1 1 ?
Foreshore development ? 0 0 0 0 ? 0 0 ? ?
Industry 1 1 1 1 1 1 0 1 1 1
Shipping 0 0 1 0 1 0 0 0 0 1
Boating and fishing 0 0 1 1 1 0 0 0 0 1
Land reclamation � landfill ? 0 ? 0 ? ? 0 0 0 ?
0 = not likely to occur, 1 = likely to occur, ? = unknown

Metal and polycyclic aromatic hydrocarbon contaminants in benthic sediments of Port Curtis
54
Appendix 2: Sediment samples (2003–2005)
Date sampled
Sample ID
Lat. Long. Location No of grabs
No of cores
Dec 2003 N S 23o35.925 E 151o02.343 Narrows 4 Dec 2003 RH S 24o05.088 E 151o31.509 Rodds Harbour 4 7/12/04 N1 S 23o33.898 E 151o00.940 Narrows, near mouth of
Fitzroy River 1
7/12/04 N2 S 23o37.136 E 151o02.482 Narrows near mouth of Fitzroy
1
28/02/05 SPWC S 23o52.948 E 151o19.069 Spillway Creek 1 2 28/02/05 RMDO S 23o51.629 E 151o18.006 QAL red mud dam outlet 1 2 28/02/05 PB S 23o45.825 E 151o17.506 Pelican Bank 1 2 28/02/05 CR-U/S S 23o51.863 E 151o11.249 Upstream Calliope River 2 2 28/02/05 CR-NRG S 23o50.562 E 151o12.639 Calliope River, few kms
downstream of NRG outlet 2 2
28/02/05 CR-STP S 23o50.142 E 151o13.379 Calliope River, ~1 km downstream of STP outlet
2 2
28/02/05 FL S 23o47.355 E 151o10.486 Fishermans Landing, close to outfall (Orica, QCL, QERL)
1
28/02/05 BC S 23o39.539 E 151o05.837 Northside Boatway Ck 1 28/02/05 BS S 23o40.726 E 151o07.396 Black Swan 1 28/02/05 TC S 23o43.376 E 151o08.216 Targinnie Ck 1 2 28/02/05 GC S 23o44.135 E 151o10.178 Grahams Ck 1 2 28/02/05 FP S 23o45.280 E 151o09.523 North Friend Point Flat 1 28/02/05 NPI S 23o45.682 E 151o10.604 North Passage Island 1 28/02/05 SB S 23o46.919 E 151o12.509 Stockyard Bay 1 28/02/05 WI S 23o48.936 E 151o12.865 Wiggins Island 1 28/02/05 CCF S 23o49.319 E 151o14.340 Clinton Coal Facility 1 28/02/05 M S 23o49.968 E 151o14.962 Marina 1 28/02/05 AC S 23o50.286 E 151o15.000 Auckland Ck 1
April 2005 MC1, MC2 S 23 o39.465 E 151o02.933 Munduran Creek 2 2 Aug 2005 N 23.61954 151.04142 Narrows (for dating) 1 Aug 2005 CRM 23.82677 151.22049 Calliope River mouth (for
dating) 1
Aug 2005 CRM 23.82244 151.21905 Calliope River mouth, subtidal (for metals)
1
Aug 2005 STI 23.85932 151.30191 South Trees Inlet (for dating) 1 Aug 2005 RH 24.04133 151.607 Rodds Harbour (for dating
and PAHs analyses) 1 1
Aug 2005 CI 24.01597 151.442 Colloseum Inlet (for PAHs) 1 Aug 2005 BR 23.94191 151.35429 Boyne River (for PAHs) 1 Aug 2005 AD 24.0951 151.3062 Awoonga Dam (for PAHs
and metals) 1
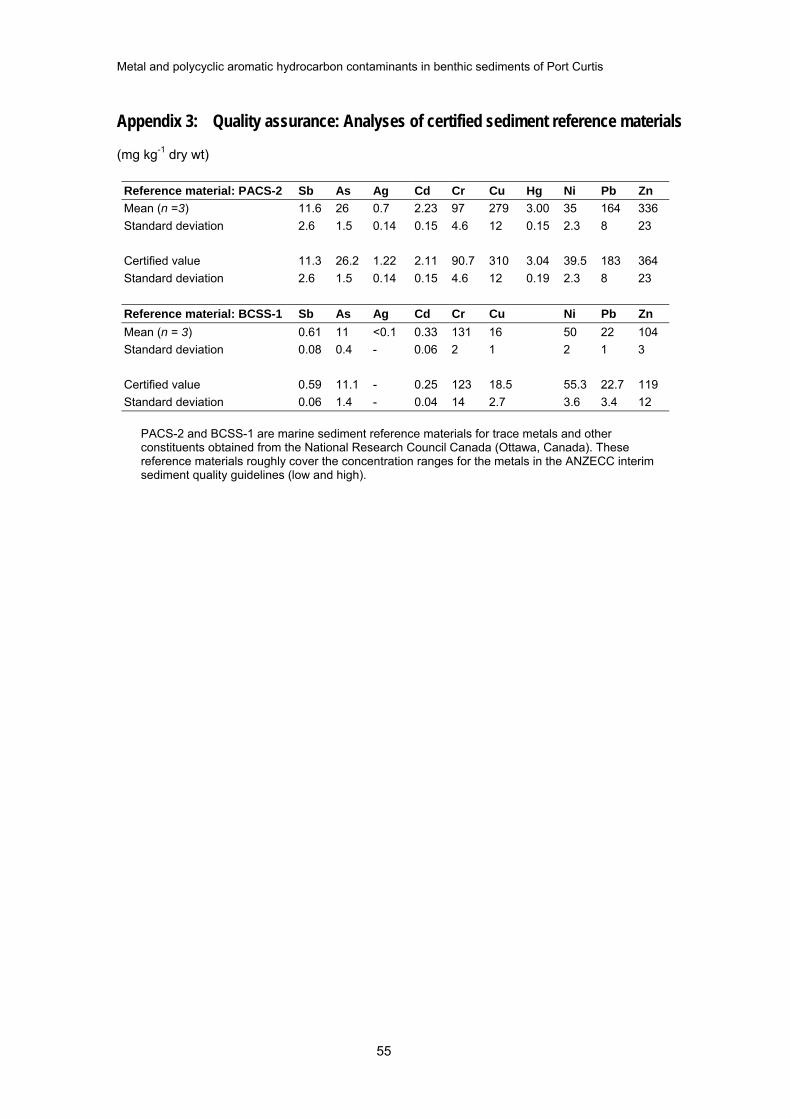
Metal and polycyclic aromatic hydrocarbon contaminants in benthic sediments of Port Curtis
55
Appendix 3: Quality assurance: Analyses of certified sediment reference materials
(mg kg-1 dry wt)
Reference material: PACS-2 Sb As Ag Cd Cr Cu Hg Ni Pb Zn Mean (n =3) 11.6 26 0.7 2.23 97 279 3.00 35 164 336 Standard deviation 2.6 1.5 0.14 0.15 4.6 12 0.15 2.3 8 23
Certified value 11.3 26.2 1.22 2.11 90.7 310 3.04 39.5 183 364 Standard deviation 2.6 1.5 0.14 0.15 4.6 12 0.19 2.3 8 23
Reference material: BCSS-1 Sb As Ag Cd Cr Cu Ni Pb Zn Mean (n = 3) 0.61 11 <0.1 0.33 131 16 50 22 104 Standard deviation 0.08 0.4 - 0.06 2 1 2 1 3
Certified value 0.59 11.1 - 0.25 123 18.5 55.3 22.7 119 Standard deviation 0.06 1.4 - 0.04 14 2.7 3.6 3.4 12
PACS-2 and BCSS-1 are marine sediment reference materials for trace metals and other constituents obtained from the National Research Council Canada (Ottawa, Canada). These reference materials roughly cover the concentration ranges for the metals in the ANZECC interim sediment quality guidelines (low and high).

Metal and polycyclic aromatic hydrocarbon contaminants in benthic sediments of Port Curtis
56
ICP-MS Pb isotope ratios Quality control Al Ca Cr* Fe Ni Cu Zn Ag Cd Pb 208/206 207/206 MESS-3 av. (n=4) 84200 15300 37.9 42000 47.3 33.9 163 <DL 0.227 21.3 2.0322 0.8123 stdev. 1770 642 5.4 2150 3.4 0.6 14 0.019 0.4 0.0075 0.0022 RSD% 2.1 4.2 14.3 5.1 7.3 1.8 8.5 8.4 1.7 0.37 0.27 Certified value 85800 14700 105 43400 46.9 33.9 159 nc 0.240 21.1 nc nc
NMI Biosoil av. (n=3) 35700 4820 43.3 26900 21.2 148 196 6.60 0.798 34.1 2.1486 0.8839 stdev. 2320 273 3.6 1690 0.6 6 5 0.27 0.115 0.9 0.0058 0.0016 RSD% 6.5 5.7 8.4 6.3 2.9 3.8 2.5 4.0 14.4 2.6 0.27 0.18 Certified value** 13100 4370 33.0 24900 16.6 150 182 5.63 0.770 31.4 nc nc
Detection limit 80 100 1.00 100 0.050 0.200 0.300 0.100 0.050 0.030
Digest blank av. (n=4) <DL <DL 1.70 <DL 0.422 0.225 1.55 <DL <DL 0.079 *: Subject to interference (positive bias) in organic-rich sediments. <DL: less than detection limit, nc: not certified **: Reference values based on aqua-regia extraction (excludes silicates)
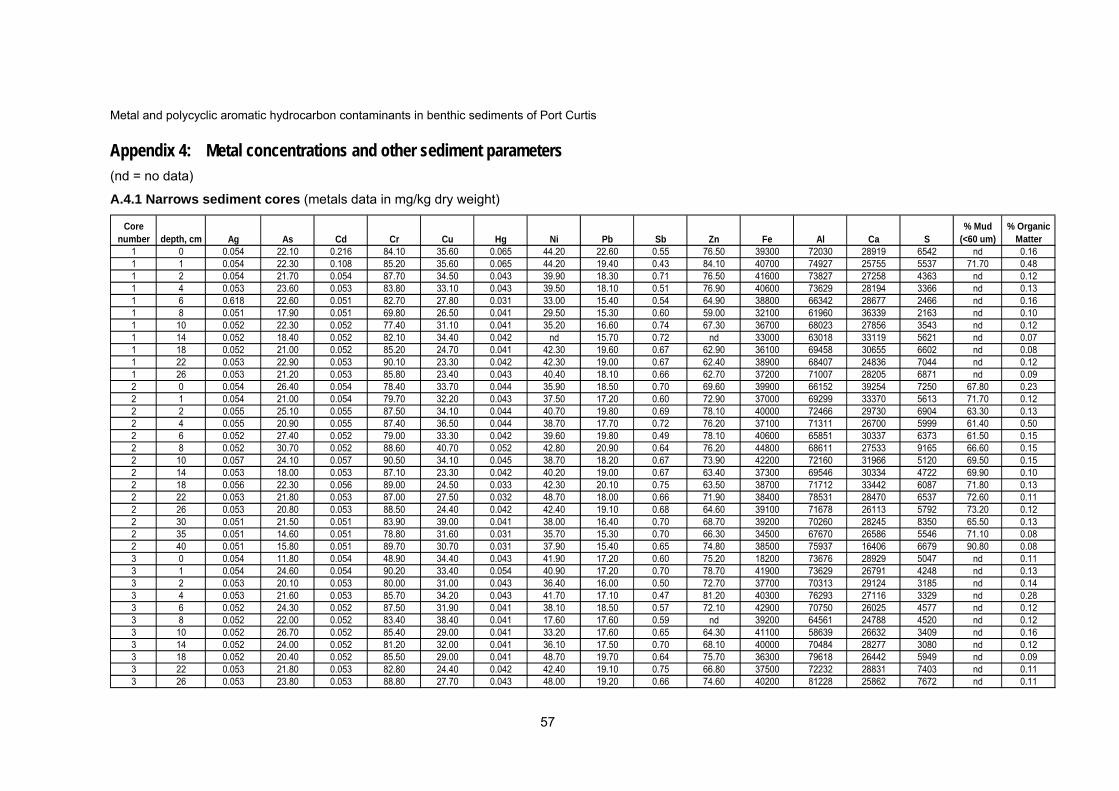
Metal and polycyclic aromatic hydrocarbon contaminants in benthic sediments of Port Curtis
57
Appendix 4: Metal concentrations and other sediment parameters (nd = no data)
A.4.1 Narrows sediment cores (metals data in mg/kg dry weight)
Core number depth, cm Ag As Cd Cr Cu Hg Ni Pb Sb Zn Fe Al Ca S
% Mud (<60 um)
% Organic Matter
1 0 0.054 22.10 0.216 84.10 35.60 0.065 44.20 22.60 0.55 76.50 39300 72030 28919 6542 nd 0.161 1 0.054 22.30 0.108 85.20 35.60 0.065 44.20 19.40 0.43 84.10 40700 74927 25755 5537 71.70 0.481 2 0.054 21.70 0.054 87.70 34.50 0.043 39.90 18.30 0.71 76.50 41600 73827 27258 4363 nd 0.121 4 0.053 23.60 0.053 83.80 33.10 0.043 39.50 18.10 0.51 76.90 40600 73629 28194 3366 nd 0.131 6 0.618 22.60 0.051 82.70 27.80 0.031 33.00 15.40 0.54 64.90 38800 66342 28677 2466 nd 0.161 8 0.051 17.90 0.051 69.80 26.50 0.041 29.50 15.30 0.60 59.00 32100 61960 36339 2163 nd 0.101 10 0.052 22.30 0.052 77.40 31.10 0.041 35.20 16.60 0.74 67.30 36700 68023 27856 3543 nd 0.121 14 0.052 18.40 0.052 82.10 34.40 0.042 nd 15.70 0.72 nd 33000 63018 33119 5621 nd 0.071 18 0.052 21.00 0.052 85.20 24.70 0.041 42.30 19.60 0.67 62.90 36100 69458 30655 6602 nd 0.081 22 0.053 22.90 0.053 90.10 23.30 0.042 42.30 19.00 0.67 62.40 38900 68407 24836 7044 nd 0.121 26 0.053 21.20 0.053 85.80 23.40 0.043 40.40 18.10 0.66 62.70 37200 71007 28205 6871 nd 0.092 0 0.054 26.40 0.054 78.40 33.70 0.044 35.90 18.50 0.70 69.60 39900 66152 39254 7250 67.80 0.232 1 0.054 21.00 0.054 79.70 32.20 0.043 37.50 17.20 0.60 72.90 37000 69299 33370 5613 71.70 0.122 2 0.055 25.10 0.055 87.50 34.10 0.044 40.70 19.80 0.69 78.10 40000 72466 29730 6904 63.30 0.132 4 0.055 20.90 0.055 87.40 36.50 0.044 38.70 17.70 0.72 76.20 37100 71311 26700 5999 61.40 0.502 6 0.052 27.40 0.052 79.00 33.30 0.042 39.60 19.80 0.49 78.10 40600 65851 30337 6373 61.50 0.152 8 0.052 30.70 0.052 88.60 40.70 0.052 42.80 20.90 0.64 76.20 44800 68611 27533 9165 66.60 0.152 10 0.057 24.10 0.057 90.50 34.10 0.045 38.70 18.20 0.67 73.90 42200 72160 31966 5120 69.50 0.152 14 0.053 18.00 0.053 87.10 23.30 0.042 40.20 19.00 0.67 63.40 37300 69546 30334 4722 69.90 0.102 18 0.056 22.30 0.056 89.00 24.50 0.033 42.30 20.10 0.75 63.50 38700 71712 33442 6087 71.80 0.132 22 0.053 21.80 0.053 87.00 27.50 0.032 48.70 18.00 0.66 71.90 38400 78531 28470 6537 72.60 0.112 26 0.053 20.80 0.053 88.50 24.40 0.042 42.40 19.10 0.68 64.60 39100 71678 26113 5792 73.20 0.122 30 0.051 21.50 0.051 83.90 39.00 0.041 38.00 16.40 0.70 68.70 39200 70260 28245 8350 65.50 0.132 35 0.051 14.60 0.051 78.80 31.60 0.031 35.70 15.30 0.70 66.30 34500 67670 26586 5546 71.10 0.082 40 0.051 15.80 0.051 89.70 30.70 0.031 37.90 15.40 0.65 74.80 38500 75937 16406 6679 90.80 0.083 0 0.054 11.80 0.054 48.90 34.40 0.043 41.90 17.20 0.60 75.20 18200 73676 28929 5047 nd 0.113 1 0.054 24.60 0.054 90.20 33.40 0.054 40.90 17.20 0.70 78.70 41900 73629 26791 4248 nd 0.133 2 0.053 20.10 0.053 80.00 31.00 0.043 36.40 16.00 0.50 72.70 37700 70313 29124 3185 nd 0.143 4 0.053 21.60 0.053 85.70 34.20 0.043 41.70 17.10 0.47 81.20 40300 76293 27116 3329 nd 0.283 6 0.052 24.30 0.052 87.50 31.90 0.041 38.10 18.50 0.57 72.10 42900 70750 26025 4577 nd 0.123 8 0.052 22.00 0.052 83.40 38.40 0.041 17.60 17.60 0.59 nd 39200 64561 24788 4520 nd 0.123 10 0.052 26.70 0.052 85.40 29.00 0.041 33.20 17.60 0.65 64.30 41100 58639 26632 3409 nd 0.163 14 0.052 24.00 0.052 81.20 32.00 0.041 36.10 17.50 0.70 68.10 40000 70484 28277 3080 nd 0.123 18 0.052 20.40 0.052 85.50 29.00 0.041 48.70 19.70 0.64 75.70 36300 79618 26442 5949 nd 0.093 22 0.053 21.80 0.053 82.80 24.40 0.042 42.40 19.10 0.75 66.80 37500 72232 28831 7403 nd 0.113 26 0.053 23.80 0.053 88.80 27.70 0.043 48.00 19.20 0.66 74.60 40200 81228 25862 7672 nd 0.11
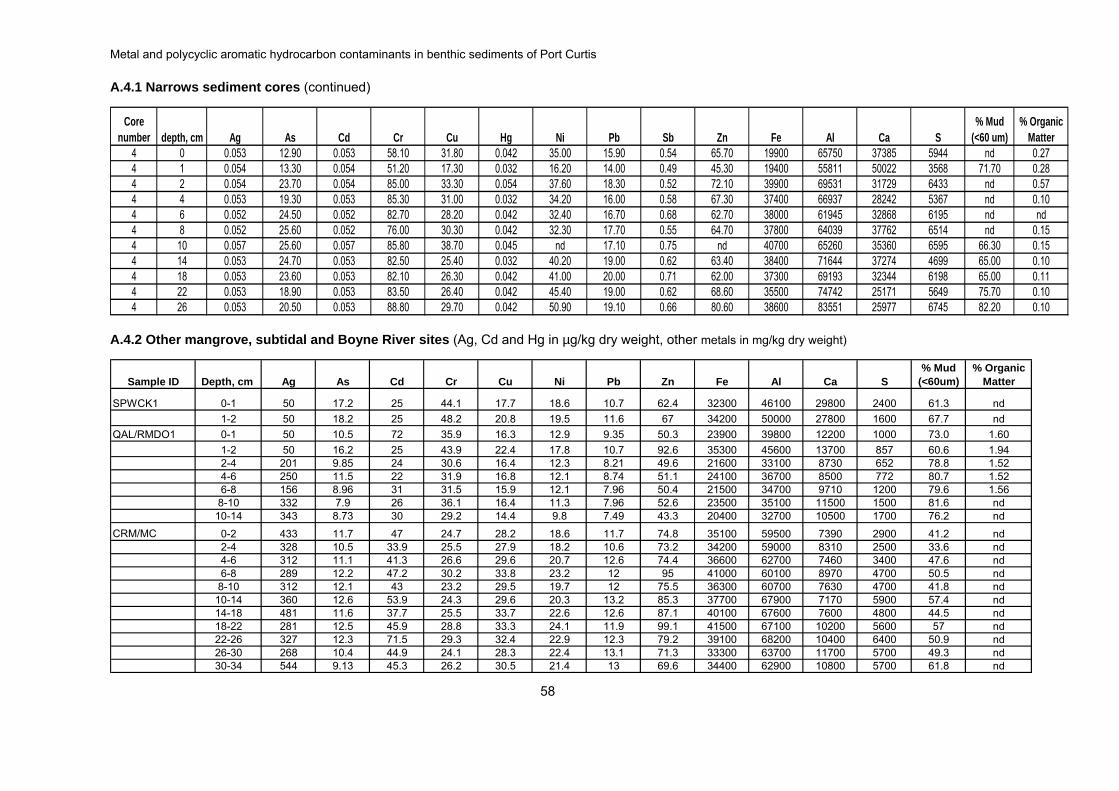
Metal and polycyclic aromatic hydrocarbon contaminants in benthic sediments of Port Curtis
58
A.4.1 Narrows sediment cores (continued)
Core number depth, cm Ag As Cd Cr Cu Hg Ni Pb Sb Zn Fe Al Ca S
% Mud (<60 um)
% Organic Matter
4 0 0.053 12.90 0.053 58.10 31.80 0.042 35.00 15.90 0.54 65.70 19900 65750 37385 5944 nd 0.274 1 0.054 13.30 0.054 51.20 17.30 0.032 16.20 14.00 0.49 45.30 19400 55811 50022 3568 71.70 0.284 2 0.054 23.70 0.054 85.00 33.30 0.054 37.60 18.30 0.52 72.10 39900 69531 31729 6433 nd 0.574 4 0.053 19.30 0.053 85.30 31.00 0.032 34.20 16.00 0.58 67.30 37400 66937 28242 5367 nd 0.104 6 0.052 24.50 0.052 82.70 28.20 0.042 32.40 16.70 0.68 62.70 38000 61945 32868 6195 nd nd4 8 0.052 25.60 0.052 76.00 30.30 0.042 32.30 17.70 0.55 64.70 37800 64039 37762 6514 nd 0.154 10 0.057 25.60 0.057 85.80 38.70 0.045 nd 17.10 0.75 nd 40700 65260 35360 6595 66.30 0.154 14 0.053 24.70 0.053 82.50 25.40 0.032 40.20 19.00 0.62 63.40 38400 71644 37274 4699 65.00 0.104 18 0.053 23.60 0.053 82.10 26.30 0.042 41.00 20.00 0.71 62.00 37300 69193 32344 6198 65.00 0.114 22 0.053 18.90 0.053 83.50 26.40 0.042 45.40 19.00 0.62 68.60 35500 74742 25171 5649 75.70 0.104 26 0.053 20.50 0.053 88.80 29.70 0.042 50.90 19.10 0.66 80.60 38600 83551 25977 6745 82.20 0.10
A.4.2 Other mangrove, subtidal and Boyne River sites (Ag, Cd and Hg in µg/kg dry weight, other metals in mg/kg dry weight)
Sample ID Depth, cm Ag As Cd Cr Cu Ni Pb Zn Fe Al Ca S% Mud
(<60um)% Organic
Matter
SPWCK1 0-1 50 17.2 25 44.1 17.7 18.6 10.7 62.4 32300 46100 29800 2400 61.3 nd1-2 50 18.2 25 48.2 20.8 19.5 11.6 67 34200 50000 27800 1600 67.7 nd
QAL/RMDO1 0-1 50 10.5 72 35.9 16.3 12.9 9.35 50.3 23900 39800 12200 1000 73.0 1.601-2 50 16.2 25 43.9 22.4 17.8 10.7 92.6 35300 45600 13700 857 60.6 1.942-4 201 9.85 24 30.6 16.4 12.3 8.21 49.6 21600 33100 8730 652 78.8 1.524-6 250 11.5 22 31.9 16.8 12.1 8.74 51.1 24100 36700 8500 772 80.7 1.526-8 156 8.96 31 31.5 15.9 12.1 7.96 50.4 21500 34700 9710 1200 79.6 1.568-10 332 7.9 26 36.1 16.4 11.3 7.96 52.6 23500 35100 11500 1500 81.6 nd10-14 343 8.73 30 29.2 14.4 9.8 7.49 43.3 20400 32700 10500 1700 76.2 nd
CRM/MC 0-2 433 11.7 47 24.7 28.2 18.6 11.7 74.8 35100 59500 7390 2900 41.2 nd2-4 328 10.5 33.9 25.5 27.9 18.2 10.6 73.2 34200 59000 8310 2500 33.6 nd4-6 312 11.1 41.3 26.6 29.6 20.7 12.6 74.4 36600 62700 7460 3400 47.6 nd6-8 289 12.2 47.2 30.2 33.8 23.2 12 95 41000 60100 8970 4700 50.5 nd8-10 312 12.1 43 23.2 29.5 19.7 12 75.5 36300 60700 7630 4700 41.8 nd10-14 360 12.6 53.9 24.3 29.6 20.3 13.2 85.3 37700 67900 7170 5900 57.4 nd14-18 481 11.6 37.7 25.5 33.7 22.6 12.6 87.1 40100 67600 7600 4800 44.5 nd18-22 281 12.5 45.9 28.8 33.3 24.1 11.9 99.1 41500 67100 10200 5600 57 nd22-26 327 12.3 71.5 29.3 32.4 22.9 12.3 79.2 39100 68200 10400 6400 50.9 nd26-30 268 10.4 44.9 24.1 28.3 22.4 13.1 71.3 33300 63700 11700 5700 49.3 nd30-34 544 9.13 45.3 26.2 30.5 21.4 13 69.6 34400 62900 10800 5700 61.8 nd

Metal and polycyclic aromatic hydrocarbon contaminants in benthic sediments of Port Curtis
59
A.4.2 Other mangrove, subtidal and Boyne River sites (continued)
Sample ID Depth, cm Ag As Cd Cr Cu Ni Pb Zn Fe Al Ca S% Mud
(<60um)% Organic
Matter
CR-US core1 0-1 50 9.53 25 39.3 37.5 20.7 12.3 83.7 39000 60800 6470 3200 94.6 3.72
1-2 50 12.6 25 34.8 36 20.5 12 88.3 40300 63700 6030 3900 93.7 3.52
2-4 177 10.3 37 20.3 33.2 19 11.7 74.2 33600 59100 4370 4400 91.8 3.57
4-6 421 10.2 35 25.8 32.6 19.6 11.7 84.8 34700 59600 4780 3600 94.6 3.25
6-8 158 11.3 37 24.3 35.7 20.7 13 87.4 37600 61400 4740 4500 90.9 3.808-10 262 10.6 31 19.2 31.6 16.9 10.7 67.9 31300 53900 5500 4300 92.0 3.05
10-14 146 9.45 46 26.4 28.5 15.7 9.31 77.8 32900 43000 7680 4000 92.3 2.77CR-NRG core1 0-1 50 16.7 117 48.7 37.7 26.2 14.6 92.1 46300 76200 8710 2000 95.2 4.21
1-2 50 16.3 25 47.1 38.5 25.8 14.5 94.5 48500 60000 7280 1600 93.6 3.660-1 50 11.6 56 42.2 41.9 21.5 10.4 79 45000 58400 6630 1700 83.7 2.921-2 340 11.2 63 30.7 44.3 21.4 10.3 78 43600 57300 6300 1500 84.1 3.162-4 220 10.4 49 23.9 48.5 19.9 10 80.3 41600 59700 5050 1700 86.2 2.764-6 274 11.1 47 24.6 39.5 19.1 9.83 72.4 40500 58100 5090 1300 85.7 3.086-8 176 10.4 51 25.9 36.6 17.1 9.54 66.9 34600 51400 5590 1700 85.6 2.748-10 228 6.35 40 21.9 48.9 15.7 6.95 60.2 34700 57600 6310 3200 90.7 2.3110-14 225 6.65 38 14.4 54.2 18.9 7.64 49.5 30200 50500 7140 5800 94.1 nd
CR-STP core1 0-1 50 11.6 56 42.2 41.9 21.5 10.4 79.0 45000 58400 6630 1700.0 83.7 2.921-2 340 11.2 63 30.7 44.3 21.4 10.3 78.0 43600 57300 6300 1500.0 84.1 3.162-4 220 10.4 49 23.9 48.5 19.9 10 80.3 41600 59700 5050 1700.0 86.2 2.764-6 274 11.1 47 24.6 39.5 19.1 9.83 72.4 40500 58100 5090 1300.0 85.7 3.086-8 176 10.4 51 25.9 36.6 17.1 9.54 66.9 34600 51400 5590 1700.0 85.6 2.748-10 228 6.35 40 21.9 48.9 15.7 6.95 60.2 34700 57600 6310 3200.0 90.7 2.3110-14 225 6.65 38 14.4 54.2 18.9 7.64 49.5 30200 50500 7140 5800.0 94.1 nd
TC core1 0-1 434 18.6 71 39.9 31.2 25.4 13.6 80.3 46300 73700 5110 2800 93.0 4.141-2 421 18.9 62 34.4 33.8 27.1 13.4 83.2 46600 69800 4860 3000 91.5 4.142-4 526 19.4 30 31.4 32 26.2 13.2 80.7 45400 70900 3130 2600 94.1 4.574-6 186 18.3 29 28.2 30 24.9 13.3 81.2 44300 71100 2930 2700 93.7 4.436-8 192 18.4 34 30.2 31.3 27.9 14.5 104 44300 71000 2970 3000 93.1 4.128-10 183 17.5 26 30.4 32.4 24.3 13.6 80.9 42900 72900 2880 3300 95.2 4.210-14 169 14.1 22 30.1 31 25.8 13.2 77.9 39300 74500 2870 4000 92.7 4.01
GC core1 0-1 374 17.7 56 29.7 32.2 25.7 13.4 80.6 46200 72300 5460 2500 96.0 4.551-2 382 18.4 59 32.4 31.9 26.3 13.7 93.4 45800 75800 4140 2500 95.5 4.84
N1 0-10 328 16.4 56 37.7 17.5 35.3 13.2 60.2 36200 61100 25500 6800 nd ndN2 0-10 360 17.6 53 40.2 22.5 42.6 15.6 72.3 43700 78300 7480 1500 nd ndMC1 0-10 396 8.73 147 36.1 35.3 18.3 11.4 52.6 40000 53400 2890 10800 69.7 5.04
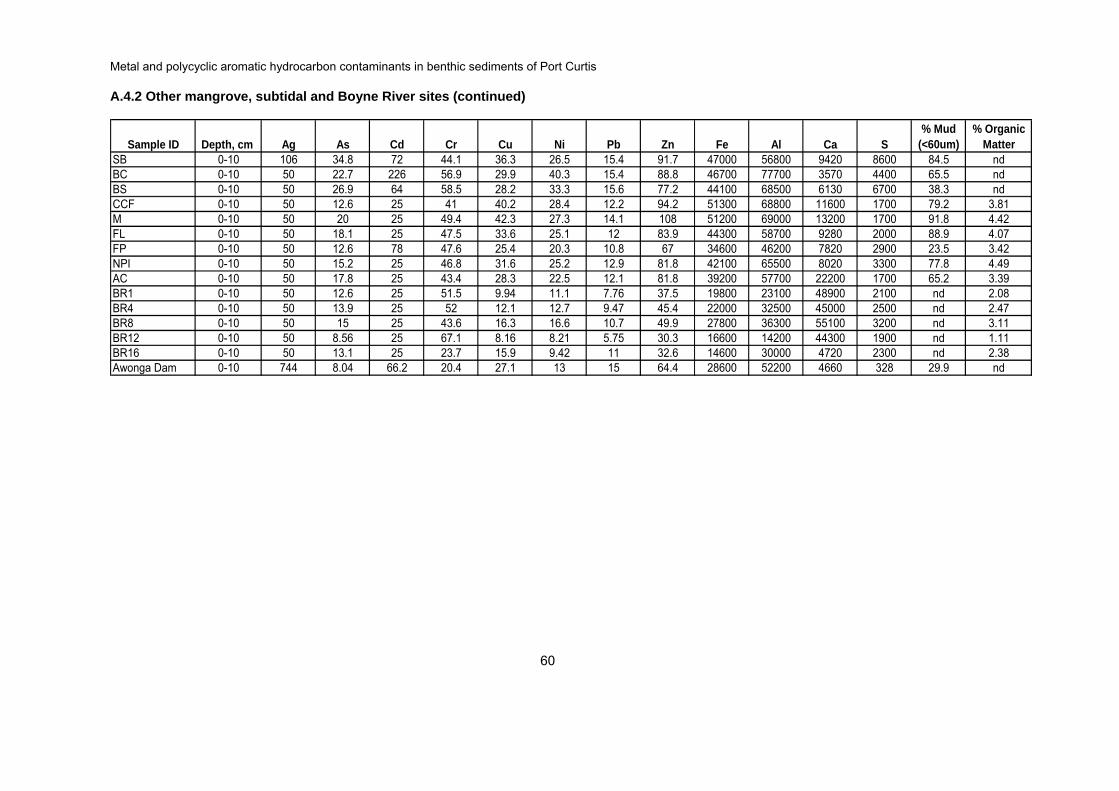
Metal and polycyclic aromatic hydrocarbon contaminants in benthic sediments of Port Curtis
60
A.4.2 Other mangrove, subtidal and Boyne River sites (continued)
Sample ID Depth, cm Ag As Cd Cr Cu Ni Pb Zn Fe Al Ca S% Mud
(<60um)% Organic
MatterSB 0-10 106 34.8 72 44.1 36.3 26.5 15.4 91.7 47000 56800 9420 8600 84.5 ndBC 0-10 50 22.7 226 56.9 29.9 40.3 15.4 88.8 46700 77700 3570 4400 65.5 ndBS 0-10 50 26.9 64 58.5 28.2 33.3 15.6 77.2 44100 68500 6130 6700 38.3 ndCCF 0-10 50 12.6 25 41 40.2 28.4 12.2 94.2 51300 68800 11600 1700 79.2 3.81M 0-10 50 20 25 49.4 42.3 27.3 14.1 108 51200 69000 13200 1700 91.8 4.42FL 0-10 50 18.1 25 47.5 33.6 25.1 12 83.9 44300 58700 9280 2000 88.9 4.07FP 0-10 50 12.6 78 47.6 25.4 20.3 10.8 67 34600 46200 7820 2900 23.5 3.42NPI 0-10 50 15.2 25 46.8 31.6 25.2 12.9 81.8 42100 65500 8020 3300 77.8 4.49AC 0-10 50 17.8 25 43.4 28.3 22.5 12.1 81.8 39200 57700 22200 1700 65.2 3.39BR1 0-10 50 12.6 25 51.5 9.94 11.1 7.76 37.5 19800 23100 48900 2100 nd 2.08BR4 0-10 50 13.9 25 52 12.1 12.7 9.47 45.4 22000 32500 45000 2500 nd 2.47BR8 0-10 50 15 25 43.6 16.3 16.6 10.7 49.9 27800 36300 55100 3200 nd 3.11BR12 0-10 50 8.56 25 67.1 8.16 8.21 5.75 30.3 16600 14200 44300 1900 nd 1.11BR16 0-10 50 13.1 25 23.7 15.9 9.42 11 32.6 14600 30000 4720 2300 nd 2.38Awonga Dam 0-10 744 8.04 66.2 20.4 27.1 13 15 64.4 28600 52200 4660 328 29.9 nd

Metal and polycyclic aromatic hydrocarbon contaminants in benthic sediments of Port Curtis
61
A.4.3. Rodds Harbour sediment cores (metal data in mg/kg dry weight)
Core Depth, cm Ag As Cd Cr Cu Hg Ni Pb Sb Zn Fe Al Ca S % Mud % OM1 0 0.0510 11.5 0.0510 45.2 14.3 0.040 13.3 10.2 0.378 36.7 17044 47037 44189 2534 nd 0.0501 1 0.0517 14.5 0.0517 52.7 16.5 0.030 15.5 12.4 0.424 44.5 21714 54158 41438 2937 nd 0.0841 2 0.0516 13.1 0.0516 49.1 15.5 0.030 14.5 10.3 0.403 41.3 20246 52940 40638 3167 nd 0.0621 4 0.0510 11.1 0.0510 46.1 14.3 0.020 13.3 9.2 0.377 39.8 19170 47260 33243 2504 nd 0.0791 6 0.0504 13.4 0.0504 46.6 18.1 0.020 nd 8.1 0.514 24.2 18732 44595 32805 3710 nd 0.0411 8 0.0503 9.9 0.0503 41.1 12.1 0.020 10.1 14.1 0.352 33.2 16281 42056 33542 2641 nd 0.0611 10 0.0503 10.2 0.0503 39.6 11.1 0.020 9.1 7.0 0.403 31.2 14902 39565 34267 2802 nd 0.0551 14 0.0503 9.0 0.0503 42.8 11.1 0.020 9.1 8.1 0.372 30.2 15295 40352 35272 2678 nd 0.0402 0 0.0510 20.0 0.0510 78.8 14.3 0.040 12.2 11.2 0.408 34.7 37964 47377 44366 2477 43.5 0.0682 1 0.0512 11.1 0.0512 47.2 13.3 0.030 13.3 11.3 0.410 40.0 16390 46800 40852 2264 35.3 0.2992 2 0.0514 13.4 0.0514 47.7 14.4 0.030 11.3 10.3 0.422 35.0 19234 47042 42665 2108 40.3 0.0492 4 0.0514 11.0 0.0514 49.0 13.4 0.030 13.4 9.3 0.452 37.0 17472 46336 41760 2286 33.1 0.0472 6 0.0506 11.8 0.0506 49.8 13.2 0.030 11.1 9.1 0.466 33.4 18834 43790 42398 2359 35.3 0.0562 8 0.0505 11.4 0.0505 45.3 12.1 0.030 11.1 9.1 0.323 34.3 17971 43989 36836 2378 25.6 0.0512 10 0.0508 12.7 0.0508 46.2 12.2 0.040 10.2 8.1 0.467 34.5 18693 43803 41211 3756 32.9 0.0902 14 0.0505 13.3 0.0505 41.2 11.1 0.030 15.2 11.1 0.424 35.4 18595 49996 51494 5792 20.0 0.0472 18 0.0539 15.1 0.0539 48.0 10.8 0.030 16.2 11.9 0.464 39.9 21145 54130 55274 7390 26.3 0.0522 22 0.0508 13.1 0.0508 43.6 9.1 0.030 13.2 11.2 0.406 34.5 19194 48222 48319 6450 30.4 0.0563 0 0.0511 21.7 0.0511 76.8 14.3 0.020 14.3 11.2 0.573 37.8 34976 48835 39428 2705 nd 0.0613 1 0.0511 12.3 0.0511 49.9 13.3 0.020 12.3 11.3 0.522 37.8 18307 48273 38603 2232 nd 0.0473 2 0.0511 12.4 0.0511 43.2 13.3 0.020 11.2 9.2 0.337 35.8 17485 44358 43933 2743 nd 0.3813 4 0.0513 12.0 0.0513 45.1 13.3 0.020 12.3 10.3 0.431 39.0 16617 46862 40704 3473 nd 0.0223 6 0.0503 12.3 0.0503 43.9 12.1 0.020 11.1 10.1 0.583 35.2 18609 42857 34653 4928 nd 0.0533 8 0.0503 12.0 0.0503 41.7 12.1 0.020 12.1 10.1 0.312 38.2 18392 42446 30380 6318 nd 0.0613 10 0.0505 12.7 0.0505 44.2 13.1 0.020 10.1 8.1 0.445 34.4 19406 42995 36260 4837 nd 0.0554 0 0.0511 12.2 0.0511 52.7 21.4 0.020 11.2 13.3 0.521 67.4 17870 47045 52146 3269 49 0.0634 1 0.0520 23.3 0.1041 84.7 20.8 0.030 21.9 13.5 0.406 48.9 38920 56742 43735 4002 nd nd4 2 0.0513 13.5 0.0513 55.0 16.4 0.030 14.4 11.3 0.585 43.1 21864 54358 45118 3306 54.2 0.0614 4 0.0524 13.4 0.0524 57.1 16.8 0.030 14.7 12.6 0.639 42.9 22514 56000 45948 3285 56.9 0.2714 6 0.0508 12.2 0.0508 58.0 16.3 0.030 16.3 13.2 0.529 43.7 22568 53115 41908 3645 57.7 0.0814 8 0.0508 10.9 0.0508 57.2 16.2 0.030 15.2 12.2 0.620 44.7 22242 53993 37729 4195 57.4 0.0674 10 0.0508 14.5 0.0508 57.2 22.4 0.020 13.0 11.2 0.610 36.0 23875 52375 44736 5195 nd 0.0904 14 0.0505 11.2 0.0505 41.9 9.1 0.020 13.1 11.1 0.485 33.4 16776 47551 49519 4171 18.7 0.0474 18 0.0508 14.8 0.0508 47.2 8.1 0.020 13.2 11.2 0.569 32.5 19289 44668 57132 5909 25.1 0.0484 22 0.0511 15.0 0.0511 46.4 10.2 0.020 14.3 11.2 0.572 36.8 20742 48615 64455 7570 22.1 0.062

Metal and polycyclic aromatic hydrocarbon contaminants in benthic sediments of Port Curtis
62
Appendix 5: Polycyclic aromatic hydrocarbons and their properties
PAH Acronym MWNumber of rings
Relative carcinogenecity
index (a)
Toxic to aquatic
organisms (b)
Naphthalene NA 128 2 ? Y
Acenaphthylene AYL 152 3 ? ?
Acenaphthene AEN 154 3 ? ?
Fluorene F 166 3 ? YAnthracene AN 178 3 ? ?Phenanthrene PH 178 3 ? YFluoranthene FL 202 4 ? Y
Pyrene PY 202 4 ? ?
Benz[a]Anthracene BaA 228 4 1 ?
Chrysene CH 228 4 ? Y
Benz[a]Pyrene BaP 252 5 3 YBenz[e]Pyrene BeP 252 5 ? ?
Benzo[b+k]Fluoranthene BbkF 252 5 2 ?Perylene PER 252 5 ? ?Benzo[ghi]Perylene Bghi 276 6 ? ?Indeno[123cd]Pyrene IP 276 6 1 ?
Dibenz[ah]Anthracene DbA 278 5 1 Ya. Index: 4 = high; 3 = moderate; 2 = low-moderate; 1= low; ? = unknownb. Y=yes; ? = unknown
List of PAHs and Some Properties (source: Kennish, 1997)
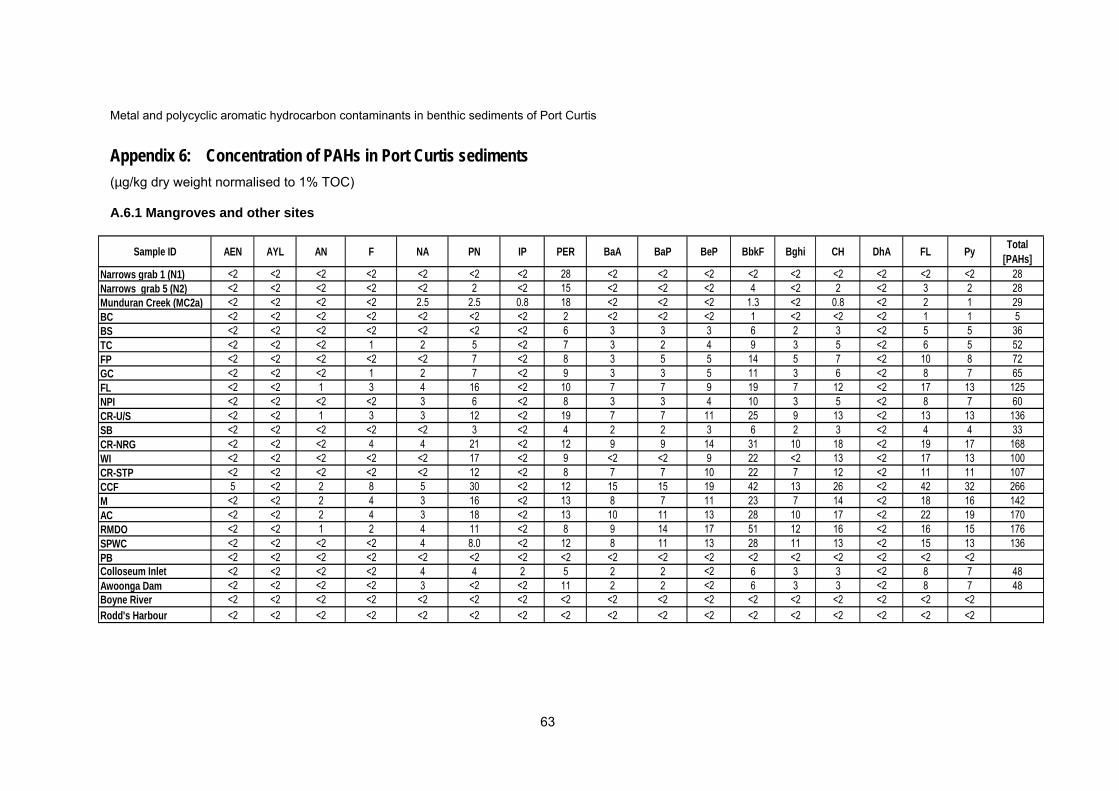
Metal and polycyclic aromatic hydrocarbon contaminants in benthic sediments of Port Curtis
63
Appendix 6: Concentration of PAHs in Port Curtis sediments (µg/kg dry weight normalised to 1% TOC)
A.6.1 Mangroves and other sites
Sample ID AEN AYL AN F NA PN IP PER BaA BaP BeP BbkF Bghi CH DhA FL Py Total [PAHs]
Narrows grab 1 (N1) <2 <2 <2 <2 <2 <2 <2 28 <2 <2 <2 <2 <2 <2 <2 <2 <2 28Narrows grab 5 (N2) <2 <2 <2 <2 <2 2 <2 15 <2 <2 <2 4 <2 2 <2 3 2 28Munduran Creek (MC2a) <2 <2 <2 <2 2.5 2.5 0.8 18 <2 <2 <2 1.3 <2 0.8 <2 2 1 29BC <2 <2 <2 <2 <2 <2 <2 2 <2 <2 <2 1 <2 <2 <2 1 1 5BS <2 <2 <2 <2 <2 <2 <2 6 3 3 3 6 2 3 <2 5 5 36TC <2 <2 <2 1 2 5 <2 7 3 2 4 9 3 5 <2 6 5 52FP <2 <2 <2 <2 <2 7 <2 8 3 5 5 14 5 7 <2 10 8 72GC <2 <2 <2 1 2 7 <2 9 3 3 5 11 3 6 <2 8 7 65FL <2 <2 1 3 4 16 <2 10 7 7 9 19 7 12 <2 17 13 125NPI <2 <2 <2 <2 3 6 <2 8 3 3 4 10 3 5 <2 8 7 60CR-U/S <2 <2 1 3 3 12 <2 19 7 7 11 25 9 13 <2 13 13 136SB <2 <2 <2 <2 <2 3 <2 4 2 2 3 6 2 3 <2 4 4 33CR-NRG <2 <2 <2 4 4 21 <2 12 9 9 14 31 10 18 <2 19 17 168WI <2 <2 <2 <2 <2 17 <2 9 <2 <2 9 22 <2 13 <2 17 13 100CR-STP <2 <2 <2 <2 <2 12 <2 8 7 7 10 22 7 12 <2 11 11 107CCF 5 <2 2 8 5 30 <2 12 15 15 19 42 13 26 <2 42 32 266M <2 <2 2 4 3 16 <2 13 8 7 11 23 7 14 <2 18 16 142AC <2 <2 2 4 3 18 <2 13 10 11 13 28 10 17 <2 22 19 170RMDO <2 <2 1 2 4 11 <2 8 9 14 17 51 12 16 <2 16 15 176SPWC <2 <2 <2 <2 4 8.0 <2 12 8 11 13 28 11 13 <2 15 13 136PB <2 <2 <2 <2 <2 <2 <2 <2 <2 <2 <2 <2 <2 <2 <2 <2 <2Colloseum Inlet <2 <2 <2 <2 4 4 2 5 2 2 <2 6 3 3 <2 8 7 48Awoonga Dam <2 <2 <2 <2 3 <2 <2 11 2 2 <2 6 3 3 <2 8 7 48Boyne River <2 <2 <2 <2 <2 <2 <2 <2 <2 <2 <2 <2 <2 <2 <2 <2 <2Rodd's Harbour <2 <2 <2 <2 <2 <2 <2 <2 <2 <2 <2 <2 <2 <2 <2 <2 <2
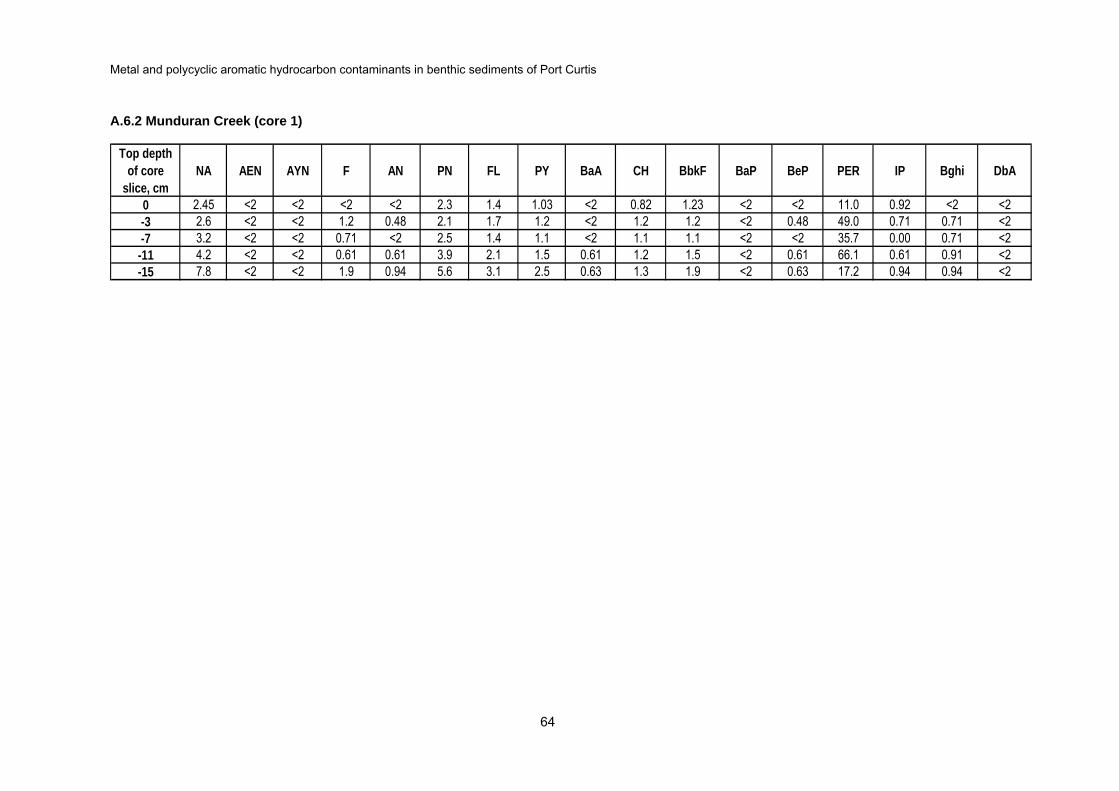
Metal and polycyclic aromatic hydrocarbon contaminants in benthic sediments of Port Curtis
64
A.6.2 Munduran Creek (core 1)
Top depth of core
slice, cmNA AEN AYN F AN PN FL PY BaA CH BbkF BaP BeP PER IP Bghi DbA
0 2.45 <2 <2 <2 <2 2.3 1.4 1.03 <2 0.82 1.23 <2 <2 11.0 0.92 <2 <2-3 2.6 <2 <2 1.2 0.48 2.1 1.7 1.2 <2 1.2 1.2 <2 0.48 49.0 0.71 0.71 <2-7 3.2 <2 <2 0.71 <2 2.5 1.4 1.1 <2 1.1 1.1 <2 <2 35.7 0.00 0.71 <2-11 4.2 <2 <2 0.61 0.61 3.9 2.1 1.5 0.61 1.2 1.5 <2 0.61 66.1 0.61 0.91 <2-15 7.8 <2 <2 1.9 0.94 5.6 3.1 2.5 0.63 1.3 1.9 <2 0.63 17.2 0.94 0.94 <2