Plants metabolome study: emerging tools and ... - Preprints.org

www.neoplasia.com
Volume 17 Number 1 January 2015 pp. 55–65 55
AbbreviatiNMR, nucSDH, succAddress alland NucleStrasbourgE-mail: ale1This articTables 1 tneoplasia.c2This worAlsace, OséBruker Biointerests: Twriter, stu
Metabolome Profiling by HRMASNMR Spectroscopy ofPheochromocytomas andParagangliomas Detects SDHDeficiency: Clinical andPathophysiological Implications1,2
ons: GSH, glutathione; HRMAS, 1H high-resolution magic angle spinning;lear magnetic resonance; PGL, paraganglioma; PHEO, pheochromocytoma;inate dehydrogenasecorrespondence to: Alessio Imperiale, MD, PhD, Department of Biophysicsar Medicine, Hautepierre University Hospital, 1, Avenue Molière, 67098Cedex, [email protected] refers to supplementary materials, which are designated by Supplementaryo 4 and Supplementary Figures 1 and 2 and are available online at www.om.k is part of the CARMeN project and was supported by grants from Régiono, Communauté Urbaine de Strasbourg, Conseil Départemental du Bas-Rhin,Spin, University of Strasbourg, and StrasbourgUniversityHospital. Competinghe authors have declared no competing interests. Author contributions: A.I.—dy design, spectra and data analysis, bibliographic research, and manuscript
Alessio Imperiale*,†, François-Marie Moussallieh†,Philippe Roche‡, Stéphanie Battini*,†,A. Ercument Cicek§, Frédéric Sebagk,Laurent Brunaud¶, Anne Barlier#, Karim Elbayed†,Anderson Loundou**, Philippe Bachellier††,Bernard Goichot‡‡, Constantine A. Stratakis§§,KarelPacakkk, Izzie-JacquesNamer*,† andDavidTaïeb¶¶
*Department of Biophysics and Nuclear Medicine, HautepierreHospital, University Hospitals of Strasbourg, Strasbourg,France; †ICube, UMR 7357, University of Strasbourg/CNRS andFMTS, Faculty of Medicine, Strasbourg, France; ‡IntegrativeStructural and Chemical Biology (iSCB) and INT-3D MolecularModeling Platform, Cancer Research Centre ofMarseille, CNRSUMR7258, INSERM U1068, Institut Paoli Calmettes, Aix-Marseille University UM105,Marseille, France; §Lane Center forComputational Biology, School of Computer Science, CarnegieMellon University, Pittsburgh, PA, USA; kDepartment ofEndocrine Surgery, La Timone University Hospital, Aix-MarseilleUniversity,Marseille, France; ¶DepartmentofDigestive,Hepato-Biliary and Endocrine Surgery, Brabois University Hospital,Nancy, France; #Laboratory of Biochemistry and MolecularBiology, Conception Hospital, Aix-Marseille University,Marseille, France; **Department of Public Health, Aix-MarseilleUniversity, Marseille, France; ††Department of Visceral Surgeryand Transplantation, Hautepierre Hospital, University Hospitalsof Strasbourg, Strasbourg, France; ‡‡Department of InternalMedicine, Diabetes and Metabolic Disorders, HautepierreHospital, University Hospitals of Strasbourg, Strasbourg,France; §§Section on Genetics and Endocrinology (SEGEN),Program on Developmental Endocrinology and Genetics(PDEGEN), Eunice Kennedy Shriver National Institute of ChildHealth and Human Development, National Institutes of Health,Bethesda, MD, USA; kkProgram in Reproductive and AdultEndocrinology, Eunice Kennedy Shriver National Institute ofChild Health and Human Development, National Institutes ofHealth, Bethesda, MD, USA; ¶¶La Timone University Hospital,EuropeanCenter for Research inMedical Imaging, Aix-MarseilleUniversity, Marseille, France
review; F.-M.M.—HRMAS-NMR data acquisition, spectra analysis and metabolitesquantification; P.R.—modeling, data analysis; S.B.—statistical analysis; A.E.C.—networkanalysis; F.S.—patient surgical management; L.B.—patient surgical management; A.B.—molecular biology analysis, data analysis; K.E.—spectra analysis and metabolitesquantification; A.L.—statistical analysis, data analysis; P.B.—patient surgical manage-ment; B.G.—patient clinicalmanagement, data analysis; C.S.—writer, manuscript review;K.P.—writer, data analysis, manuscript review; I.-J.N.—experimental design, dataanalysis, manuscript review. D.T.—writer, study design, data analysis, bibliographicresearch, and manuscript review. All authors have read and approved the final manuscript.Received 3 September 2014; Revised 23 October 2014; Accepted 27 October 2014
© 2014 Neoplasia Press, Inc. Published by Elsevier Inc. This is an open access articleunder the CC BY-NC-ND license (http://creativecommons.org/licenses/by-nc-nd/3.0/).1476-5586/15http://dx.doi.org/10.1016/j.neo.2014.10.010
56 Metabolomics in PHEOs/PGLs Imperiale et al. Neoplasia Vol. 17, No. 1, 2015
AbstractSuccinate dehydrogenase gene (SDHx) mutations increase susceptibility to develop pheochromocytomas/paragangliomas (PHEOs/PGLs). In the present study, we evaluate the performance and clinical applications of 1Hhigh-resolution magic angle spinning (HRMAS) nuclear magnetic resonance (NMR) spectroscopy–based globalmetabolomic profiling in a large series of PHEOs/PGLs of different genetic backgrounds. Eighty-seven PHEOs/PGLs (48 sporadic/23 SDHx/7 von Hippel-Lindau/5 REarranged during Transfection/3 neurofibromatosis type 1/1hypoxia-inducible factor 2α), one SDHD variant of unknown significance, and two Carney triad (CTr)–related tumorswere analyzed by HRMAS-NMR spectroscopy. Compared to sporadic, SDHx-related PHEOs/PGLs exhibit aspecific metabolic signature characterized by increased levels of succinate (P b .0001), methionine (P = .002),glutamine (P = .002), and myoinositol (P b .0007) and decreased levels of glutamate (P b .0007), regardless of theirlocation and catecholamine levels. Uniquely, ATP/ascorbate/glutathione was found to be associated with thesecretory phenotype of PHEOs/PGLs, regardless of their genotype (P b .0007). The use of succinate as a singlescreening test retained excellent accuracy in distinguishing SDHx versus non–SDHx-related tumors (sensitivity/specificity: 100/100%). Moreover, the quantification of succinate could be considered a diagnostic alternative forassessing SDHx-related mutations of unknown pathogenicity. We were also able, for the first time, to uncover anSDH-like pattern in the two CTr-related PGLs. The present study demonstrates that HRMAS-NMR providesimportant information for SDHx-related PHEO/PGL characterization. Besides the high succinate–low glutamatehallmark, SDHx tumors also exhibit high values of methionine, a finding consistent with the hypermethylationpattern of these tumors. We also found important levels of glutamine, suggesting that glutamine metabolismmight be involved in the pathogenesis of SDHx-related PHEOs/PGLs.
Neoplasia (2015) 17, 55–65
IntroductionPheochromocytomas/paragangliomas (PHEOs/PGLs) are characte-rized by high genetic heterogeneity—more than 14 different well-studied genes have been linked to the development of these tumors.Current genetic testing identifies pathogenic mutations in one thirdor more of cases. Of all the known genetic mutations, deleteriousmutations in any of the succinate dehydrogenase (SDH) genes(collectively named SDHx-associated tumors) are currently theleading genetic cause of head and neck PGLs and account for morethan 30% of all hereditary cases. The four SDHx genes encode thefour subunits of the SDH enzyme (also named mitochondrialcomplex II). This membrane complex catalyzes the oxidation ofsuccinate to fumarate in the tricarboxylic acid (TCA) cycle and therespiratory chain. In SDHx mutation carriers, tumorigenesis requiresa second hit process (biallelic inactivation) that invariably results indecreased SDH activity and/or a significant reduction or completeabsence of its protein. For the index cases, genetic testing is oftenneeded to implement personalized medical approaches [1]. A greatbenefit of genetic testing also comes from evaluating family memberssince they are potentially at risk of developing tumors, often multipleand metastatic ones.
Until present, the choice of which genes to be tested has beenguided by clinical presentation and ex vivo biomarkers. Immunohis-tochemistry can be very well used to show the presence or absence ofprotein products [2,3]. Metabolomics, or global metabolite profiling,
which is a new technology of functional genomics, can be used forinvestigating metabolite changes associated with some gene mutations[4]. Currently, well-recognized tools for metabolomics are nuclearmagnetic resonance (NMR) spectroscopy and gas chromatography–mass spectrometry (GC-MS) or liquid chromatography (LC)–MS.GC-MS and LC-MS are more widely represented in the technicalplatforms referred to as metabolomics, mainly due to their highsensitivity [5]. These technologies generate massive amounts of datathat can be interpreted and used for building predictive models. Forthis purpose, machine-learning algorithms represent potent anduseful instruments to reduce the complexity of the data analysis.Among NMR techniques, 1H high-resolution magic angle spinning(HRMAS) NMR spectroscopy technology is especially suited toanalyze a small volume of intact tissue samples while avoiding anychemical extraction procedures or sample manipulation, which arenecessary for both MS and liquid-state NMR or well-establishedimmunohistochemistry. HRMAS NMR enables rapid (3-4 minutesfor tissue sample preparation followed by 10 minutes of spectraacquisition) and reliable identification and quantification of severalmetabolites from spectra with excellent resolution and signal-to-noiseratio. Recently, metabolomics has proven to be a promising tool inthe characterization PHEO/PGL [6–10].
The aim of the present study was to investigate the HRMASNMR-based metabolomic profiling of PHEOs/PGLs to 1) confirmthe accuracy of the previously described metabotype pattern based on
Neoplasia Vol. 17, No. 1, 2015 Metabolomics in PHEOs/PGLs Imperiale et al. 57
four selected metabolites [i.e., succinate, glutamate, glutathione(GSH), and ATP] in the diagnosis of SDH-related PHEO/PGL in alarge cohort of tumors with different genetic backgrounds, 2) definethe global metabolomic profile of the SDH-related PHEOs/PGLs incomparison to sporadic tumors, and 3) identify metabolites that couldbe used as clinical predictors of SDH deficiency even in PHEOs/PGLs without any germline or somatic susceptibility gene mutations.
Materials and Methods
Patients and TumorsEighty-seven specimens of PHEOs and PGLs of sympathetic origin
obtained from 79 unrelated patients were retrospectively selected in thisstudy according to the following criteria:
1. Histologic diagnosis of PGL/PHEO2. Genetic screening for germline mutations in the SDH subunits B/C/D (SDHB/
C/D) (including large gene rearrangements of all the SDH genes), von Hippel-Lindau (VHL) (including large gene rearrangements), neurofibromatosis type 1(NF1) (in the presence of clinical features), REarranged during Transfection(RET) (in the presence of hypercalcitoninemia), transmembrane-encoding geneTMEM127, and MYC-associated factor X genes
3. Absence of systemic anticancer therapy before surgery4. Tissue specimens collected during surgery just after tumor removal and snap-
frozen in liquid nitrogen before storage at −80°C.
The tumors were obtained from three different institutions in France(Strasbourg, Marseille, and Nancy University Hospitals) and weredistributed as follows: 48 sporadic (42 PHEOs, 6 sympathetic PGLs), 23SDHx (5 PHEOs, 18 sympathetic PGLs), 7 VHL (5 PHEOs, 2sympathetic PGLs), 5 RET (PHEOs), 3NF1 (PHEOs), and 1 hypoxia-inducible factor 2α (EPAS1/HIF2A) (sympathetic PGL). The 23 samplesof SDHx tumors were obtained from 23 distinct tumors belonging to 15patients and were distributed as follows: 9 SDHB and 14 SDHD.Data were acquired under regular clinical care conditions, with Ethics
Committee approval obtained for the use of these data for scientificpurposes. Written informed consent was obtained from all patientsincluded in the present study.
HRMAS NMR SpectroscopyHRMAS NMR spectra were recorded on a Bruker Avance III 500
spectrometer operating at a proton frequency of 500.13MHz, installed atthe Pathological Department of Strasbourg University Hospital. Theamount of frozen tissue used for NMR analysis ranged from 15 to 20mg.A one-dimensional (1D) proton spectrum using a Carr-Purcell-Meiboom-Gill (CPMG) pulse sequence with presaturation of the watersignal was acquired for each sample. 1D HRMAS NMR spectra werebucketed into integral regions 0.01 ppm wide (ppm range, 1-8.65) usingAMIX 3.8 software (Bruker GmbH, Rheinstetten, Germany) andexported into SIMCA P (version 11.0; Umetrics AB, Umeå, Sweden).To confirm resonance assignments, two-dimensional (2D) hetero-
nuclear (1H-13C) experiments were also recorded immediately after theend of 1D spectra acquisition. Because the duration of these experimentsis long and tissue degradation occurs duringNMR acquisition, only a fewrepresentative samples were analyzed by 2D experiments. Metaboliteswere assigned using standard metabolite chemical shift tables available inthe literature [11,12].Metabolite quantification has been previously described [6]. Briefly,
quantification was performed using an external reference standard ofsodium lactate, scanned under the same analytical conditions. Spectra
were normalized according to sample weight. Peaks of interest wereautomatically defined by an in-house program using MATLAB 7.0(Mathworks, Natick, MA). Peak integration was then compared to theone obtained with the lactate reference andwas corrected according to thenumber of protons. For our experiments, only peaks that were wellresolved in 1D CPMG spectra were quantified. Quantification resultswere expressed as nmol/mg of tissue.
Statistical AnalysisA combination of principal component analysis (PCA) and
orthogonal partial least square discriminant analysis (OPLS-DA)was herein adopted. The PCA was performed to evaluate the qualityof the data and to identify possible outliers [13]. Then, the OPLS-DAwas employed to optimize the separation between tumor subgroups.The following two-class models of OPLS-DA were built in this study:
1. SDHx (n = 23) versus non-SDHx PHEOs/PGLs (n = 64) including sporadic,VHL, RET, NF1, and HIF2A tumors. This analysis was performed to confirmour previous results achieved in a smaller cohort of patients [7] and obtainedfrom the analysis of spectral intervals corresponding exclusively to four selectedmetabolites with a possible key role in tumoral development. Accordingly,succinate, glutamate, GSH, and ATP were identified and used in the model.Succinate amount was estimated by integrating the area comprised between2.39 and 2.43 ppm, glutamate quantity between 2.32 and 2.38 ppm, GSHamount between 2.93 and 2.98 ppm, and ATP amount within the range of6.07 to 6.11 ppm.
2. SDHx (n = 23) versus sporadic PHEOs/PGLs (n = 48). Seventy-one selectedtumor samples were included in this model to assess the global metabolicfingerprint of SDHx-related PHEOs/PGLs in an exploratory and untargetedmanner. Accordingly, the full spectrum that ranged from 1 to 8.65 ppm wasanalyzed and considered in the statistical model. In this case, the OPLS-DA wasperformed on the whole set of metabolites (variables) to select those with a realdiscriminating power. Metabolites corresponding to variable importance forprojection (VIP) value ≥1 were selected and labeled VIP metabolites. Twomeasurements of model quality were reported for OPLS-DA: R2Y and Q2
representing, respectively, the goodness of fit (i.e., data variation) and thegoodness of prediction, as estimated by cross-validation. Q2 ≥ 0.5 can beconsidered as a good predictor [14].
Cross-validation was used in each OPLS-DA model to determine thenumber of components and to avoid overfitting the data. A cross-validation embedded in a Monte Carlo resampling approach [15,16] wasused during the construction of the model to build a confusion matrixthat allowed a direct visualization of the performances of the model interms of classification power [sensitivity (Se), specificity (Sp), positivepredictive value (PPV), negative predictive value (NPV), and globalaccuracy]. The SIMCA P (version 11.0; Umetrics AB) package was usedfor statistical data analysis.
Continuous variables are expressed as mean ± SD. Statistical analysiswas performed using IBM SPSS Statistics version 20 (IBM SPSS Inc,Chicago, IL). The Spearman non-parametric test was performed todetermine the correlation between metabolites. Comparisons of tumormetabolite concentrations between SDHx-related and sporadic tumorswere performed using a Mann-Whitney U test. The receiver operatingcharacteristic (ROC) curves were used to evaluate the clinical utility ofmetabolite quantification in the diagnosis of SDHx mutation. Areasunder the ROC curve, sensitivity, and specificity were determined usingMedCalc version 13.2.2 (MedCalc Software, Ostend, Belgium).According to the ROC curve, values exhibiting the best accuracies werechosen as the threshold for a screening test. Linear regression model wasused to examine the association between metabolite levels and geneticstatus with adjustment for tumor location and total catecholamine levels

58 Metabolomics in PHEOs/PGLs Imperiale et al. Neoplasia Vol. 17, No. 1, 2015
as explanatory variables. For multiple testings, adjusted P values werecalculated using the false discovery rate (FDR) procedure with the SASPROC MULTTEST statement [17]. PCA was performed to visualizeand analyze correlations between metabolite concentrations and SDHxstatus. PCA was done using the package FactoMiner (MultivariateExploratory Data Analysis and Data Mining with R). Values of P b .05were considered to be statistically significant.
Network AnalysisThe Algorithm to Determine Expected Metabolite Level Alter-
ations Using Mutual Information (ADEMA) has been applied [18].Instead of analyzing metabolites one by one, the algorithm assessesthe changes in groups of metabolites, between the case and thecontrol. It incorporates the metabolic network topology to determinethe groups of metabolites. ADEMA uses mutual information to 1)find out if those metabolites are biomarkers when considered togetherand 2) predict the expected direction of change per metabolite, whenmetabolic network topology is considered.
Figure 2 shows the simplified metabolic subnetwork we have usedto relate metabolites. The network was constructed using KyotoEncyclopedia of Genes and Genomes (KEGG) [19,20] and the workof Selway et al. [21] On the basis of the network, the followingmetabolite groups were obtained:
• aspartate, succinate, glutamate, glutamine, ATP• methionine, myoinositol, ascorbate, noradrenaline, adrenaline, ATP• myoinositol, ascorbate, methionine, taurine, ATP• noradrenaline, adrenaline, total catecholamines, ATP• myoinositol, ascorbate, noradrenaline, adrenaline, total catecholamines, ATP.
For discretization of metabolite observations, we have set number oflevels (M) as 6 and number possible levels an observation assigned to (k) as4. Missing metabolite observations were amputated using the averagemeasurement value for that metabolite. Using the abovementionedmetabolite groups and parameters, an expected metabolite level for caseand for control is obtained per metabolite. The direction of the expectedchange is obtained by comparing expected levels (e.g., SDHx vs sporadicPHEOs/PGLs).
Results
SDHx versus Non-SDHx PHEOs/PGLsAt visual inspection, all the spectra obtained from the 87 analyzed
tumor samples were of good quality without any prominent hallmarksof tissue necrosis or cystic components. The generated multivariateone-component OPLS-DA based on succinate, glutamate, GSH, andATP allowed a clear separation of SDHx from non-SDHx PHEOs/PGLs showing accurate representation of the data and a goodcumulative confidence criterion of fit (R2Y =0.65) and prediction(Q2 = 0.64). These results are graphically represented in Figure 1.
Nineteen of 23 patients with SDHx-related PHEOs/PGLs werecorrectly identified. Moreover, all 64 patients with non–SDHx-related PHEOs/PGLs were accurately classified. To detect patientswith SDHx germline mutations, the Se and Sp of the establishedmodel were 83% and 100%, respectively. PPV, NPV, and globalaccuracy were 100%, 94%, and 95%, respectively.
No significant spectrum overlap that prevented quantification ofsuccinate, glutamate, GSH, and ATP was found. All NMR spectra fromthe SDHx-related PHEOs/PGLs showed significantly high levels ofsuccinate (4.01 ± 2.45 nmol/mg vs 0.06 ± 0.06 nmol/mg, P b .00001)
and lower concentration of glutamate (0.70 ± 0.41 nmol/mg vs 1.60 ±0.76 nmol/mg, P b .00001) compared to those of sporadic tumors andPHEOs/PGLs related toVHL,RET,NF1, andHIF2mutations. NeitherGSH nor ATP amount was significantly different between the SDHx-and non–SDHx-related PHEOs/PGLs (Figure 1). Interestingly, the fourSDHx-related tumor samples, which were incorrectly classified by theprevious OPLS-DA model, showed significantly lower amounts ofsuccinate (P = .003) and higher concentrations of glutamate (P = .003)than the remaining 19 SDHx-related PHEOs/PGLs [7].
SDHx versus Sporadic PHEOs/PGLsTwenty-three SDHx-related PHEOs/PGLs and 48 sporadic tumors
were included in the analysis. A total of 24 metabolites was recognizedfrom the spectra obtained from all 71 tumor samples within the range of 1to 8.65 ppm (Supplementary Table 1). Besides peaks due to small water-soluble molecules, the acquired spectra display consistent broadresonances, which were attributed to three different fatty acid moietiesdefined as a, b, and c [22]. A two-component OPLS-DA showed a veryclear separation of the two sets of samples, a faithful representation of theY data (R2Y =0.82) and a good cumulative confidence criterion ofprediction (Q2 = 0.7). These results are graphically represented inFigure 1.When comparing sporadic to SDHx-related tumors, the OPLS-DA model accurately classified all samples. Examples of 1D HRMASCPMG spectra obtained from sporadic and SDHD-related PGL arerepresented in Supplementary Figure 2.
According to the results of the OPLS-DA model, 12 VIP metaboliteswere identified. A higher level of succinate, myoinositol, methionine,glutamine, taurine, and ATP characterized SDHx-related PHEOs/PGLs,while sporadic tumors contained a larger amount of adrenaline,noradrenaline, glutamate, GSH, ascorbate, and aspartic acid (Figure 1).The quantity of the 12metabolites previously listed was assessed and usedfor tumor comparison according to the genetic background. Whencompared to sporadic phenotypes, the metabolomic profile of SDHx-related tumors exhibits statistical significance in the following areas:
1. Increased levels of succinate (4.01 ± 2.45 nmol/mg vs 0.06 ± 0.06 nmol/mg,P b .0001), taurine (2.59 ± 1.35 nmol/mg vs 1.66 ± 1.43 nmol/mg, P = .002),methionine (0.09 ± 0.04 nmol/mg vs 0.04 ± 0.04 nmol/mg, P b .0001),glutamine (0.37 ± 0.24 nmol/mg vs 0.23 ± 0.16 nmol/mg, P = .12), andmyoinositol (3.18 ± 1.43 nmol/mg vs 1.87 ± 1.49 nmol/mg, P b .0001).
2. Decreased levels of aspartate (0.32 ± 0.50 nmol/mg vs 0.50 ± 0.27 nmol/mg,P b .0001), glutamate (0.71 ± 0.41 nmol/mg vs 1.64 ± 0.78 nmol/mg,P b .0001), and adrenaline (0.10 ± 0.43 nmol/mg vs 1.17 ± 2.18, P b .001)(Supplementary Tables 2 and 3).
In spite ofGSH,ATP, catecholamines, and ascorbate playing a role intumor classification in the OPLS-DA model, their amounts were notstatistically different between SDHx-related PHEOs/PGLs and sporadictumors when compared using a standard non-parametric univariate test.
Interestingly, after adjustment for tumors, total catecholamine content,and tumor location (adrenal and extra-adrenal), succinate (P b .0001),methionine (P = .002), glutamate (P b .0007), glutamine (P = .002), andmyoinositol (P b .0007) remained statistically different between the twogroups (Supplementary Table 3). Correlations between variables arerepresented in Supplementary Table 4. The importance of the differentmetabolites regarding their correlations with the mutation status isillustrated in Supplementary Figures (Supplementary Figure 1).
When the data are analyzed using ADEMA, using the metabolicsubnetwork depicted in Figure 2, the following results were obtained.ADEMA has predicted a higher level of succinate, myoinositol,

Figure 1. Results of three-component OPLS-DAmodels and the corresponding loading plots according to the patient’s genotypes: (A andB) SDHx (n = 23) versus non-SDHx PHEOs/PGLs (n = 64), including sporadic, VHL, RET, NF1, and HIF2 tumors, and based on succinate,glutamate, GSH, and ATP; (C and D) SDHx (n = 23) versus sporadic PHEOs/PGLs (n = 48) and based on the whole tumoral metabolome.For this OPLS-DAmodel, the loading plot represents only the 12metabolites with the higher discriminant power (VIP metabolites). A cleardistinction between the different classes of tumors is shown in both models.
Neoplasia Vol. 17, No. 1, 2015 Metabolomics in PHEOs/PGLs Imperiale et al. 59
methionine, glutamine, and taurine in SDHx-related PHEOs/PGLs,while sporadic tumors contained a higher amount of adrenaline,glutamate, GSH, and total catecholamines (Figure 2). ATP, noradren-aline, ascorbate, GSH, and aspartate are predicted to be equivalent amongcases and controls. Results show that network and mutual information-based analysis is in accordance with the statistical significance of changesshown above (Supplementary Table 3), with the exception of aspartate.Aspartate is predicted to be same in both groups by ADEMA.
Quantification of Succinate Concentration as a ScreeningMethod for SDH MutationThe use of succinate as a single screening test showed higher accuracy
when compared to other metabolites and a combination of metabolitesfor distinguishing SDHx versus non–SDHx-related tumors (includingsporadic, VHL,MEN2, and HIF2A tumors; Figure 3 and Table 1) andSDHx-related tumors versus sporadic ones (Figure 3 and Table 1). Asshown in Figure 4, tumors with high succinate levels had a highprobability of belonging to an SDHx patient. The optimal succinatecutoff was 0.253 nmol/mg for distinguishing SDHx versus any non-SDHx tumors and 0.096 nmol/mg to discriminate between SDHx andsporadic tumors. With these threshold points, Se and Sp were 100% inboth situations. Interestingly, the four SDHx-related PHEOs/PGLs that
were incorrectly classified by the OPLS-DA model built on the wholestudied population showed a succinate value higher than the diagnosticthreshold established by ROC curve analysis, leading to correct tumoridentification. To discriminate SDHx-related from sporadic PHEOs/PGLs, ROC curves were also built using the quantitative values ofglutamate, methionine, myoinositol, and methionine/glutamate ratio.However, the diagnostic accuracy obtained for each single metabolite waslower than the accuracy achieved by succinate as a single tumorbiomarker. The cutoff of 0.742 nmol/mg for glutamate, 0.045 nmol/mgfor methionine, and 2.383 nmol/mg for myoinositol providedsuboptimal values of Se and Sp in both cases (Se = 86.9% and Sp =89.5% for glutamate; Se = 95.6% and Sp = 62.5% for methionine; andSe = 73.9%and Sp= 81.2% formyoinositol). Finally, considering 0.0524nmol/mg as the diagnostic threshold for methionine/glutamate ratio, Seand Sp were 91.3% and 89.6%, respectively (Figure 3 and Table 1).
Quantification of Succinate Concentration as a Functional Test forEvaluating SDHx Mutation of Unknown Pathogenicity
We report the case of a 55-year-old male who was evaluated forbilateral carotid body PGLs (CBPGLs). At the initial examination,there was no family history of any PGL. Plasma/urinary metane-phrines and serum chromogranin A were normal. Both PGLs were
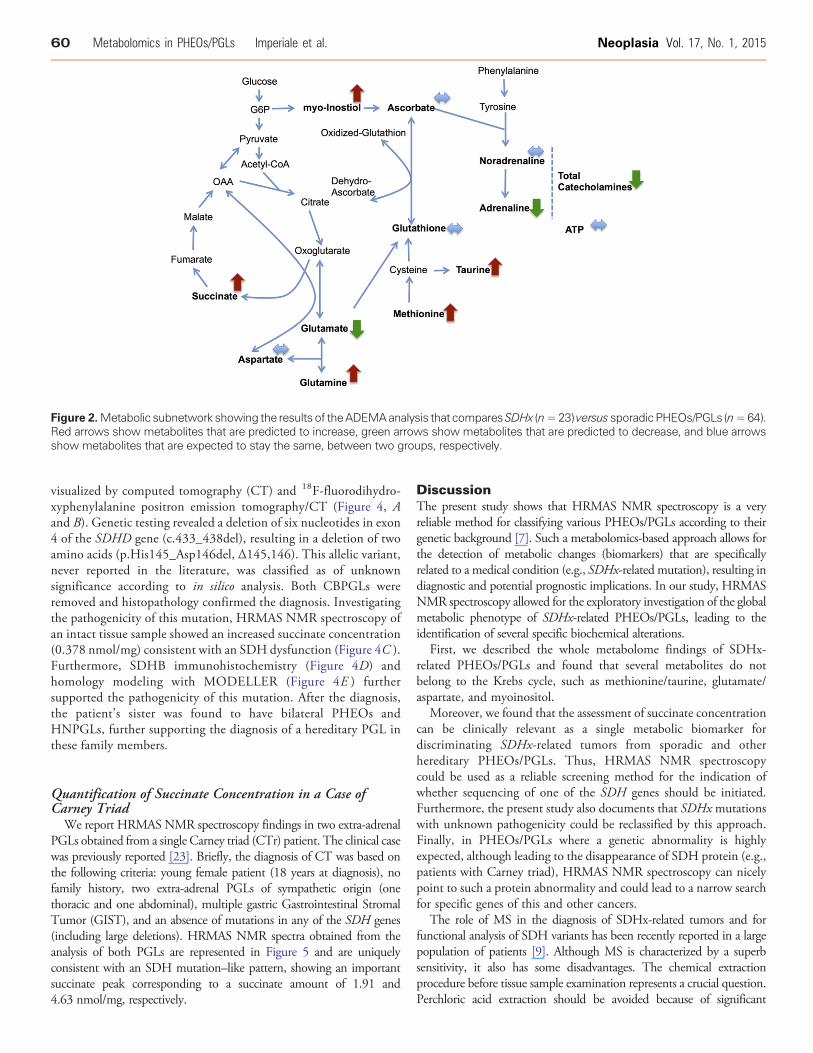
Figure 2.Metabolic subnetwork showing the results of theADEMAanalysis that comparesSDHx (n=23) versus sporadicPHEOs/PGLs (n=64).Red arrows show metabolites that are predicted to increase, green arrows show metabolites that are predicted to decrease, and blue arrowsshow metabolites that are expected to stay the same, between two groups, respectively.
60 Metabolomics in PHEOs/PGLs Imperiale et al. Neoplasia Vol. 17, No. 1, 2015
visualized by computed tomography (CT) and 18F-fluorodihydro-xyphenylalanine positron emission tomography/CT (Figure 4, Aand B). Genetic testing revealed a deletion of six nucleotides in exon4 of the SDHD gene (c.433_438del), resulting in a deletion of twoamino acids (p.His145_Asp146del, Δ145,146). This allelic variant,never reported in the literature, was classified as of unknownsignificance according to in silico analysis. Both CBPGLs wereremoved and histopathology confirmed the diagnosis. Investigatingthe pathogenicity of this mutation, HRMAS NMR spectroscopy ofan intact tissue sample showed an increased succinate concentration(0.378 nmol/mg) consistent with an SDH dysfunction (Figure 4C ).Furthermore, SDHB immunohistochemistry (Figure 4D) andhomology modeling with MODELLER (Figure 4E ) furthersupported the pathogenicity of this mutation. After the diagnosis,the patient’s sister was found to have bilateral PHEOs andHNPGLs, further supporting the diagnosis of a hereditary PGL inthese family members.
Quantification of Succinate Concentration in a Case ofCarney Triad
We report HRMAS NMR spectroscopy findings in two extra-adrenalPGLs obtained from a single Carney triad (CTr) patient. The clinical casewas previously reported [23]. Briefly, the diagnosis of CT was based onthe following criteria: young female patient (18 years at diagnosis), nofamily history, two extra-adrenal PGLs of sympathetic origin (onethoracic and one abdominal), multiple gastric Gastrointestinal StromalTumor (GIST), and an absence of mutations in any of the SDH genes(including large deletions). HRMAS NMR spectra obtained from theanalysis of both PGLs are represented in Figure 5 and are uniquelyconsistent with an SDH mutation–like pattern, showing an importantsuccinate peak corresponding to a succinate amount of 1.91 and4.63 nmol/mg, respectively.
DiscussionThe present study shows that HRMAS NMR spectroscopy is a veryreliable method for classifying various PHEOs/PGLs according to theirgenetic background [7]. Such a metabolomics-based approach allows forthe detection of metabolic changes (biomarkers) that are specificallyrelated to a medical condition (e.g., SDHx-related mutation), resulting indiagnostic and potential prognostic implications. In our study, HRMASNMR spectroscopy allowed for the exploratory investigation of the globalmetabolic phenotype of SDHx-related PHEOs/PGLs, leading to theidentification of several specific biochemical alterations.
First, we described the whole metabolome findings of SDHx-related PHEOs/PGLs and found that several metabolites do notbelong to the Krebs cycle, such as methionine/taurine, glutamate/aspartate, and myoinositol.
Moreover, we found that the assessment of succinate concentrationcan be clinically relevant as a single metabolic biomarker fordiscriminating SDHx-related tumors from sporadic and otherhereditary PHEOs/PGLs. Thus, HRMAS NMR spectroscopycould be used as a reliable screening method for the indication ofwhether sequencing of one of the SDH genes should be initiated.Furthermore, the present study also documents that SDHxmutationswith unknown pathogenicity could be reclassified by this approach.Finally, in PHEOs/PGLs where a genetic abnormality is highlyexpected, although leading to the disappearance of SDH protein (e.g.,patients with Carney triad), HRMAS NMR spectroscopy can nicelypoint to such a protein abnormality and could lead to a narrow searchfor specific genes of this and other cancers.
The role of MS in the diagnosis of SDHx-related tumors and forfunctional analysis of SDH variants has been recently reported in a largepopulation of patients [9]. Although MS is characterized by a superbsensitivity, it also has some disadvantages. The chemical extractionprocedure before tissue sample examination represents a crucial question.Perchloric acid extraction should be avoided because of significant

Figure 3. ROC curves obtained from analysis of the succinate, glutamate, methionine, glutamine, and myoinositol concentrations for thediagnosis of SDHxmutation. Detailed information about the area under the ROC curve, the cutoff values, sensitivity, and specificity are shown.
Neoplasia Vol. 17, No. 1, 2015 Metabolomics in PHEOs/PGLs Imperiale et al. 61
changes in the real metabolic profile. Moreover, LC-MS is neither asreproducible nor resolvable asGCand it is perhaps the slowest (1 to 2 daysper sample) of all three methods, including GC-MS and NMRspectroscopy. Finally, LC-MS is not really quantitative and is oftendesigned to simply detect the presence or absence of a molecule ratherthan to assess its concentration [24]. Furthermore, immunohistochem-istry (IHC) for SDH tumors, although currently very popular andreliable, first requires sample processing and, second, an experiencedtechnician and pathologist to minimize false-positive or false-negative
interpretations. Moreover, this technique provides a limited view of atumor’s biology, usually assessing only one protein at a time and in asemiquantitative manner. In contrast, HRMAS NMR allows for rapidand reproducible quantification of several metabolites (proteins) fromonly 15 mg of intact tissue, requiring only about 1 hour to prepare thetissue sample, collect data, and analyze the results. Nevertheless, similar toother approaches, experienced staff are required to interpret results.However, compared to othermethodsmentioned above,HRMASNMRspectroscopy provides new insights into the understanding of tumor
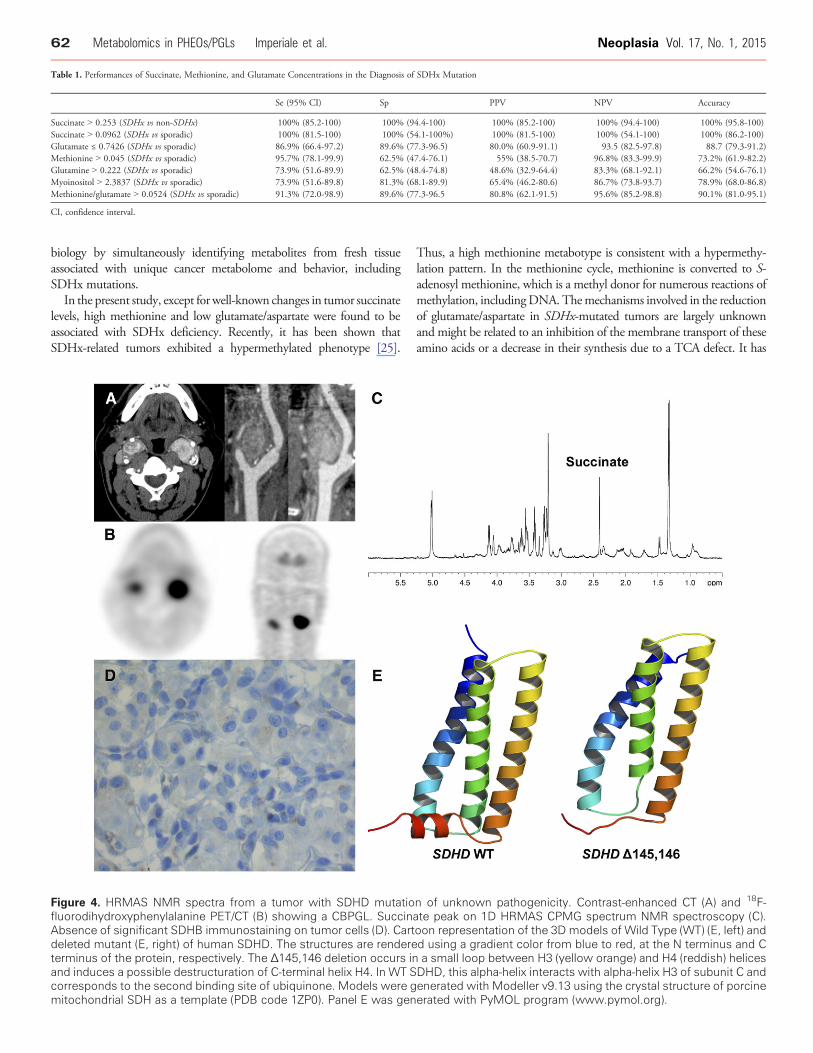
Table 1. Performances of Succinate, Methionine, and Glutamate Concentrations in the Diagnosis of SDHx Mutation
Se (95% CI) Sp PPV NPV Accuracy
Succinate N 0.253 (SDHx vs non-SDHx) 100% (85.2-100) 100% (94.4-100) 100% (85.2-100) 100% (94.4-100) 100% (95.8-100)Succinate N 0.0962 (SDHx vs sporadic) 100% (81.5-100) 100% (54.1-100%) 100% (81.5-100) 100% (54.1-100) 100% (86.2-100)Glutamate ≤ 0.7426 (SDHx vs sporadic) 86.9% (66.4-97.2) 89.6% (77.3-96.5) 80.0% (60.9-91.1) 93.5 (82.5-97.8) 88.7 (79.3-91.2)Methionine N 0.045 (SDHx vs sporadic) 95.7% (78.1-99.9) 62.5% (47.4-76.1) 55% (38.5-70.7) 96.8% (83.3-99.9) 73.2% (61.9-82.2)Glutamine N 0.222 (SDHx vs sporadic) 73.9% (51.6-89.9) 62.5% (48.4-74.8) 48.6% (32.9-64.4) 83.3% (68.1-92.1) 66.2% (54.6-76.1)Myoinositol N 2.3837 (SDHx vs sporadic) 73.9% (51.6-89.8) 81.3% (68.1-89.9) 65.4% (46.2-80.6) 86.7% (73.8-93.7) 78.9% (68.0-86.8)Methionine/glutamate N 0.0524 (SDHx vs sporadic) 91.3% (72.0-98.9) 89.6% (77.3-96.5 80.8% (62.1-91.5) 95.6% (85.2-98.8) 90.1% (81.0-95.1)
CI, confidence interval.
62 Metabolomics in PHEOs/PGLs Imperiale et al. Neoplasia Vol. 17, No. 1, 2015
biology by simultaneously identifying metabolites from fresh tissueassociated with unique cancer metabolome and behavior, includingSDHx mutations.
In the present study, except for well-known changes in tumor succinatelevels, high methionine and low glutamate/aspartate were found to beassociated with SDHx deficiency. Recently, it has been shown thatSDHx-related tumors exhibited a hypermethylated phenotype [25].
Figure 4. HRMAS NMR spectra from a tumor with SDHD mutatiofluorodihydroxyphenylalanine PET/CT (B) showing a CBPGL. SuccinAbsence of significant SDHB immunostaining on tumor cells (D). Cartdeleted mutant (E, right) of human SDHD. The structures are rendereterminus of the protein, respectively. The Δ145,146 deletion occurs inand induces a possible destructuration of C-terminal helix H4. In WT Scorresponds to the second binding site of ubiquinone. Models were gmitochondrial SDH as a template (PDB code 1ZP0). Panel E was gen
Thus, a high methionine metabotype is consistent with a hypermethy-lation pattern. In the methionine cycle, methionine is converted to S-adenosyl methionine, which is a methyl donor for numerous reactions ofmethylation, includingDNA. Themechanisms involved in the reductionof glutamate/aspartate in SDHx-mutated tumors are largely unknownand might be related to an inhibition of the membrane transport of theseamino acids or a decrease in their synthesis due to a TCA defect. It has
n of unknown pathogenicity. Contrast-enhanced CT (A) and 18F-ate peak on 1D HRMAS CPMG spectrum NMR spectroscopy (C).oon representation of the 3D models of Wild Type (WT) (E, left) andd using a gradient color from blue to red, at the N terminus and Ca small loop between H3 (yellow orange) and H4 (reddish) helicesDHD, this alpha-helix interacts with alpha-helix H3 of subunit C andenerated with Modeller v9.13 using the crystal structure of porcineerated with PyMOL program (www.pymol.org).
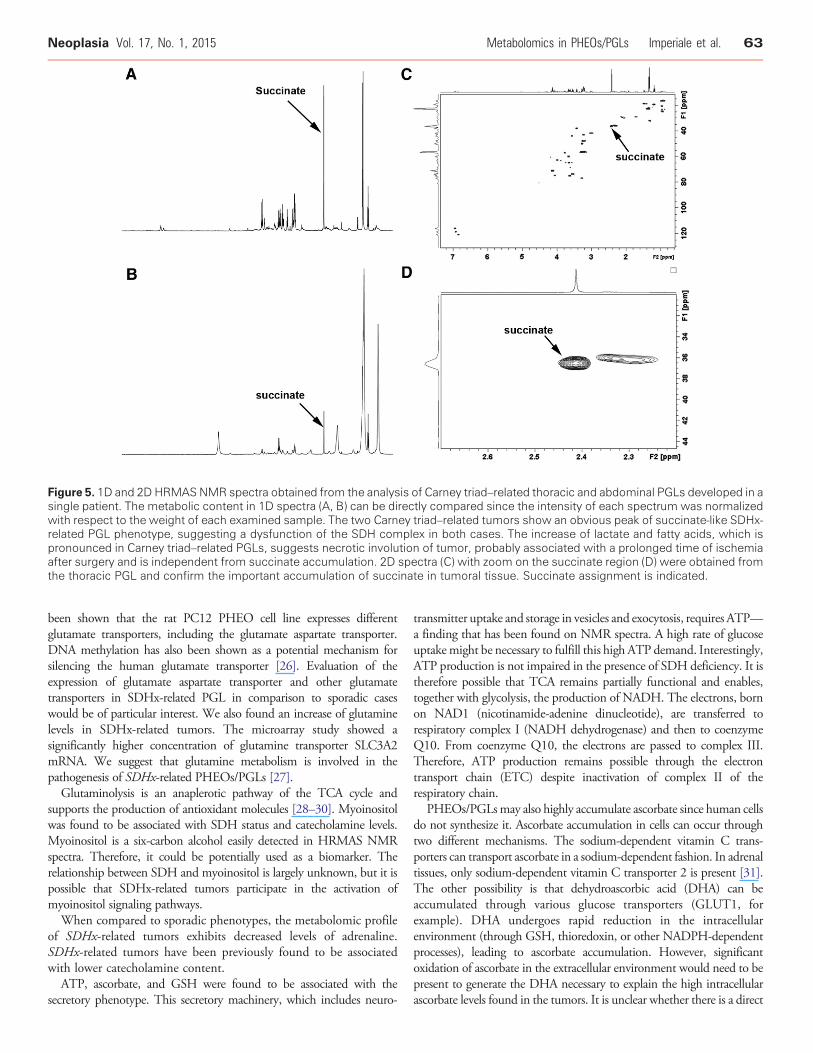
Figure 5. 1D and 2D HRMASNMR spectra obtained from the analysis of Carney triad–related thoracic and abdominal PGLs developed in asingle patient. The metabolic content in 1D spectra (A, B) can be directly compared since the intensity of each spectrum was normalizedwith respect to the weight of each examined sample. The two Carney triad–related tumors show an obvious peak of succinate-like SDHx-related PGL phenotype, suggesting a dysfunction of the SDH complex in both cases. The increase of lactate and fatty acids, which ispronounced in Carney triad–related PGLs, suggests necrotic involution of tumor, probably associated with a prolonged time of ischemiaafter surgery and is independent from succinate accumulation. 2D spectra (C) with zoom on the succinate region (D) were obtained fromthe thoracic PGL and confirm the important accumulation of succinate in tumoral tissue. Succinate assignment is indicated.
Neoplasia Vol. 17, No. 1, 2015 Metabolomics in PHEOs/PGLs Imperiale et al. 63
been shown that the rat PC12 PHEO cell line expresses differentglutamate transporters, including the glutamate aspartate transporter.DNA methylation has also been shown as a potential mechanism forsilencing the human glutamate transporter [26]. Evaluation of theexpression of glutamate aspartate transporter and other glutamatetransporters in SDHx-related PGL in comparison to sporadic caseswould be of particular interest. We also found an increase of glutaminelevels in SDHx-related tumors. The microarray study showed asignificantly higher concentration of glutamine transporter SLC3A2mRNA. We suggest that glutamine metabolism is involved in thepathogenesis of SDHx-related PHEOs/PGLs [27].Glutaminolysis is an anaplerotic pathway of the TCA cycle and
supports the production of antioxidant molecules [28–30]. Myoinositolwas found to be associated with SDH status and catecholamine levels.Myoinositol is a six-carbon alcohol easily detected in HRMAS NMRspectra. Therefore, it could be potentially used as a biomarker. Therelationship between SDH and myoinositol is largely unknown, but it ispossible that SDHx-related tumors participate in the activation ofmyoinositol signaling pathways.When compared to sporadic phenotypes, the metabolomic profile
of SDHx-related tumors exhibits decreased levels of adrenaline.SDHx-related tumors have been previously found to be associatedwith lower catecholamine content.ATP, ascorbate, and GSH were found to be associated with the
secretory phenotype. This secretory machinery, which includes neuro-
transmitter uptake and storage in vesicles and exocytosis, requires ATP—a finding that has been found on NMR spectra. A high rate of glucoseuptakemight be necessary to fulfill this high ATP demand. Interestingly,ATP production is not impaired in the presence of SDH deficiency. It istherefore possible that TCA remains partially functional and enables,together with glycolysis, the production of NADH. The electrons, bornon NAD1 (nicotinamide-adenine dinucleotide), are transferred torespiratory complex I (NADH dehydrogenase) and then to coenzymeQ10. From coenzyme Q10, the electrons are passed to complex III.Therefore, ATP production remains possible through the electrontransport chain (ETC) despite inactivation of complex II of therespiratory chain.
PHEOs/PGLsmay also highly accumulate ascorbate since human cellsdo not synthesize it. Ascorbate accumulation in cells can occur throughtwo different mechanisms. The sodium-dependent vitamin C trans-porters can transport ascorbate in a sodium-dependent fashion. In adrenaltissues, only sodium-dependent vitamin C transporter 2 is present [31].The other possibility is that dehydroascorbic acid (DHA) can beaccumulated through various glucose transporters (GLUT1, forexample). DHA undergoes rapid reduction in the intracellularenvironment (through GSH, thioredoxin, or other NADPH-dependentprocesses), leading to ascorbate accumulation. However, significantoxidation of ascorbate in the extracellular environment would need to bepresent to generate the DHA necessary to explain the high intracellularascorbate levels found in the tumors. It is unclear whether there is a direct
64 Metabolomics in PHEOs/PGLs Imperiale et al. Neoplasia Vol. 17, No. 1, 2015
explanation for the high ascorbate levels in some tumors. In the presentstudy, we found that ascorbate was correlated with total catecholamineconcentrations. This finding could be explained by the role of ascorbate asa cofactor in the conversion of dopamine to norepinephrine. Oxygen isalso a co-factor in that reaction, consistent with the idea that the tumorsare not hypoxic.
GSH is the most abundant endogenous antioxidant protein andtherefore plays a critical role in the regulation of oxidative stress.We have found GSH to be correlated with total catecholamine levels.o-Quinones are physiological oxidation products of catecholaminesthat contribute to redox cycling, toxicity, and apoptosis. Therefore,GSH conjugation of these oxidized metabolites (o-quinones) throughGSH transferases is a detoxification reaction that prevents redoxcycling, thus indicating that GSH and GSH transferases have acytoprotective role involving elimination of reactive chemical speciesoriginating from the oxidative metabolism of catecholamines [32].
When we have analyzed our observations using a mutualinformation and metabolic network–based analysis, called ADEMA,we have seen that the algorithm has predicted changes that are inaccordance with the hypotheses given above. This shows that theresults are also robust with respect to the dependencies within thetopology of the metabolic network.
Metabolomics may also illustrate the SDH dysfunction that mayoccur in the absence of an SDH mutation. This is the case for Carneytriad. Carney triad, originally described by J. Aidan Carney in 1977,associates tumors in at least two of the five following organs in thesame patient: stomach (gastric gastrointestinal stromal tumor), lungs(pulmonary chondroma), paraganglionic system (extra-adrenal PGL),adrenal cortex (adenoma), and esophagus (leiomyoma) [33]. Atpresent, a specific genetic mutation has not been discovered with CT;however, very few patients were found to have SDHx geneticmutations. Recently, DNA methylation at the gene locus of theSDHC has been found in CT-related tumors, leading to loss of theSDHC protein [34]. In the present study, we found that Carney triadwas associated with SDH deficiency. Therefore, in the presence ofhigh succinate/no SDHx mutation, the possible diagnosis of CTshould be raised and patients should undergo screening for other CT-related tumors, especially gastric gastrointestinal stromal tumor thatmay affect long-term survival in CT patients.
ConclusionsThe present study, which includes a large number of PHEOs/PGLs,shows that HRMAS NMR spectroscopy provides unique and accurateinformation in the metabolomic classification of these tumors.Furthermore, this approach also advances our knowledge of thepathogenesis of PHEOs/PGLs. It is also expected that many of thesemetabolomic approaches, along with the latest improvements, willreveal new targets for future therapeutic options. Recent introduction ofcryogenic probes has already improved spectral signal-to-noise ratios byup to a factor of five, reducing the gap betweenHRMASNMR andMS[35]. In comparison to 1D 1H-NMR spectroscopy, 2D techniquesbased on proton scalar coupling are further improving both detectionsensitivity and metabolite identification, especially when specificmetabolite-related picks are overlapped in 1D NMR acquisitions.Moreover, it is nowadays possible to quantifymetabolites on 2D spectra[36]. However, the large centrifugal forces applied to the biologicsample during several hours of 2D NMR acquisition have a directconsequence on tissue integrity, which could potentially influenceresults [37].
The present study well justifies that, in the near future, functionalgenomics will allow for and perfect the identification of tumor-specificmetabolic biomarkers as well as their genetics. It is expected that cancermetabolomes will be quickly implemented in new diagnostic andtreatment options of various cancers as well as their prognosis.
Supplementary data to this article can be found online at http://dx.doi.org/10.1016/j.neo.2014.10.010.
AcknowledgementsThe laboratory personnel of the Tumor Bio-Bank (Centre de RessourcesBiologiques) of the Strasbourg University Hospital are gratefullyacknowledged for their technical assistance.
References
[1] Taïeb D, Kaliski A, Boedeker CC, Martucci V, Fojo T, Adler Jr JR, and Pacak K(2014). Current approaches and recent developments in the management of headand neck paragangliomas. Endocr Rev . http://dx.doi.org/10.1210/er.2014-1026.
[2] vanNederveen FH, Gaal J, Favier J, Korpershoek E, Oldenburg RA, de Bruyn EM,Sleddens HF, Derkx P, Riviere J, and Dannenberg H, et al (2009). Animmunohistochemical procedure to detect patients with paraganglioma andphaeochromocytoma with germline SDHB, SDHC, or SDHD gene mutations: aretrospective and prospective analysis. Lancet Oncol 10, 764–771.
[3] Korpershoek E, Favier J, Gaal J, Burnichon N, van Gessel B, Oudijk L, Badoual C,Gadessaud N, Venisse A, and Bayley JP, et al (2011). SDHA immunohistochemistrydetects germline SDHA gene mutations in apparently sporadic paragangliomas andpheochromocytomas. J Clin Endocrinol Metab 96, E1472-1476.
[4] ReitmanZJ, JinG,Karoly ED, Spasojevic I, Yang J, Kinzler KW,HeY, BignerDD,Vogelstein B, and Yan H (2011). Profiling the effects of isocitrate dehydrogenase 1and 2 mutations on the cellular metabolome. Proc Natl Acad Sci U S A 108,3270–3275.
[5] Griffin JL (2003). Metabonomics: NMR spectroscopy and pattern recognitionanalysis of body fluids and tissues for characterisation of xenobiotic toxicity anddisease diagnosis. Curr Opin Chem Biol 7, 648–654.
[6] Imperiale A, Elbayed K,Moussallieh FM, Reix N, PiottoM, Bellocq JP, Goichot B,Bachellier P, and Namer IJ (2013). Metabolomic profile of the adrenal gland: fromphysiology to pathological conditions. Endocr Relat Cancer 20, 705–716.
[7] Imperiale A, Moussallieh FM, Sebag F, Brunaud L, Barlier A, Elbayed K,Bachellier P, Goichot B, Pacak K, and Namer IJ, et al (2013). A new specificsuccinate-glutamate metabolomic hallmark in SDHx-related paragangliomas.PLoS One 8, e80539.
[8] Rao JU, Engelke UF, Rodenburg RJ, Wevers RA, Pacak K, Eisenhofer G, Qin N,Kusters B, Goudswaard AG, and Lenders JW, et al (2013). Genotype-specificabnormalities in mitochondrial function associate with distinct profiles of energymetabolism and catecholamine content in pheochromocytoma and paragan-glioma. Clin Cancer Res 19, 3787–3795.
[9] Richter S, Peitzsch M, Rapizzi E, Lenders JW, Qin N, de Cubas AA, Schiavi F,Rao JU, Beuschlein F, and Quinkler M, et al (2014). Krebs cycle metaboliteprofiling for identification and stratification of pheochromocytomas/paragan-gliomas due to succinate dehydrogenase deficiency. J Clin Endocrinol Metab .http://dx.doi.org/10.1210/jc.2014-2151.
[10] Canu L, Rapizzi E, Zampetti B, Fucci R, Nesi G, Richter S, Qin N, Giache V,Bergamini C, and Parenti G, et al (2014). Pitfalls in genetic analysis ofpheochromocytomas/paragangliomas—case report. J Clin Endocrinol Metab 99,2321–2326.
[11] Wishart DS, Jewison T, Guo AC, Wilson M, Knox C, Liu Y, Djoumbou Y,Mandal R, Aziat F, and Dong E, et al (2013). HMDB 3.0—the HumanMetabolome Database in 2013. Nucleic Acids Res 41, D801–D807.
[12] Wishart DS, Tzur D, Knox C, Eisner R, Guo AC, Young N, Cheng D, Jewell K,Arndt D, and Sawhney S, et al (2007). HMDB: the Human MetabolomeDatabase. Nucleic Acids Res 35, D521–D526.
[13] Ebbels TMD and Cavill R (2009). Bioinformatic methods in NMR-basedmetabolic profiling. Prog Nucl Magn Reson Spectrosc 55, 361–374.
[14] Wold S, Ruhe A, Wold H, and Dunn WJJ (1984). The collinearity problem inlinear regression. The partial least squares (PLS) approach to generalized inverses.SIAM J Sci Stat Comput 5, 735–743.

Neoplasia Vol. 17, No. 1, 2015 Metabolomics in PHEOs/PGLs Imperiale et al. 65
[15] Picard RR and Cook RD (1984). Cross-validation of regression models. J AmStat Assoc 79, 575–583.
[16] Xu QS and Liang YZ (2001). Monte Carlo cross validation. Chemom Intell LabSyst 56, 1–11.
[17] Benjamini Y andHochberg Y (1995). Controlling the false discovery rate: a practicaland powerful approach to multiple testing. J R Stat Soc Ser B 57, 289–300.
[18] Cicek AE, Bederman I, Henderson L, Drumm ML, and Ozsoyoglu G (2013).ADEMA: an algorithm to determine expected metabolite level alterations usingmutual information. PLoS Comput Biol 9, e1002859.
[19] Kanehisa M and Goto S (2000). KEGG: Kyoto encyclopedia of genes andgenomes. Nucleic Acids Res 28, 27–30.
[20] Kanehisa M, Goto S, Sato Y, Kawashima M, Furumichi M, and Tanabe M(2014). Data, information, knowledge and principle: back to metabolism inKEGG. Nucleic Acids Res 42, D199–D205.
[21] Selway ZZ (2014). Metabolism at a Glance. . 3rd edn.Malden, MI: BlackwellPublishing; 2014.
[22] Martínez-Bisbal MC, Martí-Bonmatí L, Piquer J, Revert A, Ferrer P, Llacer JL,Piotto M, Assemat O, and Celda B (2004). 1H and 13C HR-MAS spectroscopyof intact biopsy samples ex vivo and in vivo 1HMRS study of human high gradegliomas. NMR Biomed 17, 191–205.
[23] Taïeb D, Sebag F, Sarde E, Berdah S, Doddoli C, Palazzo F, Barlier A, Neumann H,andMundlerO (2012). First report of harlequin syndrome as the presenting feature ofCarney Triad: a diagnostic and imaging challenge. J Clin Oncol 30, e168–e171.
[24] Wishart DS (2013). Exploring the human metabolome by nuclear magneticresonance spectroscopy and mass spectroscopy, vol. 627. Cambridge, UnitedKingdom: Cambridge University Press; 2013.
[25] Letouzé E,Martinelli C, Loriot C, Burnichon N, Abermil N, Ottolenghi C, JaninM,Menara M, Nguyen AT, and Benit P, et al (2013). SDH mutations establish ahypermethylator phenotype in paraganglioma. Cancer Cell 23, 739–752.
[26] Zschocke J, Allritz C, Engele J, and Rein T (2007). DNAmethylation dependentsilencing of the human glutamate transporter EAAT2 gene in glial cells. Glia 55,663–674.
[27] Vicha A, Taieb D, and Pacak K (2014). Current views on cell metabolism in SDHx-related pheochromocytoma and paraganglioma. Endocr Relat Cancer 21, R261-277.
[28] Dang CV (2010). Glutaminolysis: supplying carbon or nitrogen or both forcancer cells? Cell Cycle 9, 3884–3886.
[29] Eng CH and Abraham RT (2010). Glutaminolysis yields a metabolic by-productthat stimulates autophagy. Autophagy 6, 968–970.
[30] Yuneva M (2008). Finding an “Achilles' heel” of cancer: the role of glucose andglutamine metabolism in the survival of transformed cells. Cell Cycle 7,2083–2089.
[31] Bornstein SR, Yoshida-HiroiM, Sotiriou S, LevineM,HartwigHG,NussbaumRL,and Eisenhofer G (2003). Impaired adrenal catecholamine system function inmice with deficiency of the ascorbic acid transporter (SVCT2). FASEB J 17,1928–1930.
[32] Baez S, Segura-Aguilar J, Widersten M, Johansson AS, and Mannervik B(1997). Glutathione transferases catalyse the detoxication of oxidizedmetabolites (o-quinones) of catecholamines and may serve as an antioxidantsystem preventing degenerative cellular processes. Biochem J 324(Pt 1),25–28.
[33] Carney JA (2013). Carney triad. Front Horm Res 41, 92–110.[34] Haller F, Moskalev EA, Faucz FR, Barthelmess S, Wiemann S, Bieg M, Assie G,
Bertherat J, Schaefer IM, and Otto C, et al (2014). Aberrant DNAhypermethylation of SDHC: a novel mechanism of tumor development inCarney triad. Endocr Relat Cancer 21(4), 567–577.
[35] Lindon JC and Nicholson JK (2008). Spectroscopic and statistical techniques forinformation recovery in metabonomics and metabolomics. Annu Rev Anal Chem(Palo Alto, Calif) 1, 45–69.
[36] Righi V, Andronesi O, Mintzopoulos D, and Tzika AA (2009). Molecularcharacterization and quantification using state of the art solid-state adiabaticTOBSY NMR in burn trauma. Int J Mol Med 24, 749–757.
[37] Esteve V, Martinez-Granados B, and Martinez-Bisbal MC (2014). Pitfalls to beconsidered on the metabolomic analysis of biological samples by HR-MAS. FrontChem 2, 33.
Copyright © 2022 FDOKUMEN