A framework for learning biped locomotion with dynamical movement primitives

Aquatic Toxicology 47 (1999) 23–41
Metabolic trade-off between locomotion and detoxificationfor maintenance of blood chemistry and growth parameters
by rainbow trout (Oncorhynchus mykiss) during chronicdietary exposure to copper
R.D. Handy a,*, D.W. Sims a,1, A. Giles a, H.A. Campbell a, M.M. Musonda a,b
a Department of Biological Sciences and Plymouth En6ironmental Research Centre, Uni6ersity of Plymouth, Drake Circus,Plymouth PL4 8AA, UK
b School of Veterinary Medicine, Uni6ersity of Zambia, P. O. Box 3237G, Lusaka, Zambia
Received 20 September 1998; received in revised form 19 January 1999; accepted 25 January 1999
Abstract
The aim of this study was to obtain a holistic view of the sublethal toxic responses, and compensations, of fishexposed to Cu in the diet. Rainbow trout were fed to appetite on either a Cu-loaded diet (500 mg Cu kg−1 dw) ora control diet (11.9 mg Cu kg−1 dw) for 3 months. Nutritional performance, blood and muscle chemistry, histology,respiration, and swimming behaviour were measured. Copper concentration in intestine and liver of exposed fish was16 and 2.5 times greater than in controls respectively, confirming oral Cu exposure. [Cu] remained low in the gills offish irrespective of Cu treatment (B0.096 mmol g−1 dw). Hepatic and intestinal metallothionien levels increased 8-and 1.5-fold, respectively, in Cu-treated fish compared to controls. Growth rate, appetite, food conversion ratios,carcass composition, oxygen consumption and ventilation rate in exposed fish were not different from controls. Therewere no treatment related changes in serum chemistry (glucose, triglycerides, protein, Na, K, Hb) or the mineralcomposition of skeletal muscle (Ca, Mg, Zn, Na, or K). However, quantitative histology showed a 9% increase in gillsecondary lamellae length, together with lipid depletion in the livers of copper treated fish compared to controls.Routine swimming activity was affected significantly by oral Cu exposure. Time spent swimming was 35% lower inCu-exposed fish after 3 months, while total distance moved was reduced by only 21% because mean swimming speedwas 12% higher in contaminated fish. Maximum speeds attained by exposed fish were not different compared tocontrols. Exposed fish lowered activity overall by decreasing time spent swimming at low (1–17 cm s−1) and mediumspeeds (17–40 cm s−1), whilst increasing proportionately time spent fast swimming (40–58 cm s−1). These results arediscussed in terms of sub–lethal oral Cu affecting the partitioning of energy utilisation between locomotion and
www.elsevier.com/locate/aquatox
* Corresponding author.E-mail address: [email protected] (R.D. Handy)1 Present address: Department of Zoology, University of Aberdeen, Tillydrone Avenue, Aberdeen, AB24 2TZ, Scotland, UK.
0166-445X/99/$ - see front matter © 1999 Elsevier Science B.V. All rights reserved.
PII: S 0166 -445X(99 )00004 -1

R.D. Handy et al. / Aquatic Toxicology 47 (1999) 23–4124
maintenance metabolism by trout in a physiological drive towards invariant growth rates. © 1999 Elsevier ScienceB.V. All rights reserved.
Keywords: Copper; Diet; Rainbow trout (Oncorhynchus mykiss); Swimming behaviour; Haematology; Growth;Metabolism; Liver morphology
1. Introduction
The sub-lethal toxic effects of copper on fisheshave been described at several levels of biologicalorganisation, mostly in animals exposed to water-borne copper. These include changes in biochem-istry, anatomy, physiology, and behaviour. At thecellular level, Cu inhibits the Na,K-ATPase (Lau-ren and McDonald, 1987a), causes lipid peroxida-tion (Baker et al., 1998), alters the activity ofCu-dependent enzymes (Syed and Coombs, 1982),and induces extracellular and/or cytosolic metalchelating proteins (Overnell and McIntosh, 1988;Pelgrom et al., 1995). Copper can produce mor-phological damage (Baker 1969), which in the gilltissue is associated with disturbances to Na bal-ance (Sola et al., 1995), and in the liver to alteredenergy metabolism (Segner, 1987). These bio-chemical and structural changes underlie majorhaematological disturbances (Pilgaard et al., 1994;Nussey et al., 1995; Pelgrom et al., 1995), whichultimately affect respiratory (Sellers et al., 1975),renal compensation (Grosell et al., 1998), andlocomotor (Scarfe et al., 1982) functions. Thesephysiological dysfunctions might also include su-pression of olfaction and reduced apetite (Hara etal., 1976; Lett et al., 1976), so that major changesin foraging and other behaviours occur (Little andFinger, 1990; Sandheinrich and Atchison, 1990).
The overall biological effect of Cu exposure willbe an integration of toxic effects and compensa-tory responses at the organism level (Hebel et al.,1997). Mobile animals could compensate for thecost of pollutant exposure by changes in dailyactivity (locomotion), growth or reproduction(McCann and Shuter, 1997). The few attempts atintegrated laboratory studies of Cu effects onaquatic animals have been at the biochemical andphysiological levels in fish (Lauren and McDon-ald, 1987a,b; Pelgrom et al., 1995), although a
holistic view of responses including behaviour waspresented for crustaceans (Hebel et al., 1997).These integrated studies have focused on exposurevia the gills, where disturbances to respiration andosmoregulatory processes (Pilgaard et al., 1994)may limit the locomotory capacity (Waiwood andBeamish, 1978), and thus reduce the activity timeand behavioural repertoire of the animal. Alterna-tively, exposure via the diet leaves the gills intact(Handy, 1996), so that presumably, respirationand branchial osmoregulation would not limit therange of behavioural activities. Behavioural mea-surements during oral toxicity studies are rare andhave so far been restricted to feeding behaviour(e.g. Woodward et al., 1995).
The first objective of the present study was toobtain a holistic view of the sublethal toxic re-sponses, and compensations, of fish exposed toCu in the diet by making biochemical, morpho-logical, physiological and behavioural measure-ments on fish within a single, long-termexperiment. A second objective was to establishwhether fish with intact branchial functions ex-ploited possible compensatory changes in dailyactivity to off-set the cost of exposure, a strategynot available to fish with damaged gills. Thesecond objective was achieved by exposing the fishvia the food instead of the water to ensure gillintegrity, and recording the daily activity patternsusing a computer-aided video tracking system. Afinal objective was to add to the sparse literatureon oral exposure to Cu (Handy 1996) by perform-ing an in-depth, chronic exposure study.
2. Materials and methods
2.1. Experimental design
Rainbow trout (Oncorhynchus mykiss) weighing46.5 g92.0 (9S.E., n=324) were obtained from

R.D. Handy et al. / Aquatic Toxicology 47 (1999) 23–41 25
a local fish farm (Hartford Fisheries, SouthMolten, Somerset, UK) and held for 14 days instock aquaria supplied with flowing, aerated, anddechlorinated Plymouth tap water (see below).During this time fish were fed to satiation on acontrol diet supplemented with a precautionaryantibiotic (20 mg of oxolinic acid/kg of diet)during the first week. Fish were then graded intotwo 800 l experimental aquaria (162 tank−1) sup-plied with aerated and dechlorinated Plymouthtap water flowing at a rate of 100 l h−1. Initially,all fish were fed on the control diet, containing noadded copper, for 1 month to acclimate to theexperimental conditions. Thereafter one tank wasfed a Cu-supplemented diet for 3 months whilethe other remained on the control diet (no addedCu). Fish were given a single feed to satiation atabout 13:00 h each day. Care was taken to ensurethat all food pellets added to the tanks wereeaten. Fish were fed in reverse order on alternatedays to minimise tank bias effects on feeding andthe same person fed the fish throughout the exper-iment. The self-cleaning design of the tanks androutine siphoning after feeding removed faecalwaste quickly. Nonetheless, water samples werecollected immediately before, and 1 h after feed-ing to assess potential Cu leaching from expelledfaecal material. Aqueous Cu levels remained lowthroughout the experiment (see below).
Fish were monitored for growth and nutritionalperformance throughout the experiment and somefish were sampled randomly from the experimen-tal holding tanks at monthly intervals for eitherclosed circuit respirometry, swimming behaviourmeasurements followed by haematology and bio-chemistry, or dissected for histological analysis(see below).
2.2. Diet formulation
The control diet was prepared from raw ingre-dients using the following formulation (in g kg−1
dw): fishmeal 600; maize gluten 85; wheatfeed 195;cod liver oil 60; vitamin and mineral premix 40;Finnstim 20. The vitamin and mineral premix wasfrom Trouw Aquaculture (Wincham, Cheshire,UK) and formulated to supply the recommended
requirements for rainbow trout. The expected Cucontent of the control diet was 11.92 mg kg−1 dwof food based on maufacturers data for the ingre-dients. The Cu-supplemented diet was preparedusing the same formulation except that 2 g kg−1
of wheatfeed was omitted to compensate for themass of copper sulphate added to the food. TheCu-supplement of 2 g of CuSO4.5H2O was dis-solved in 300ml of deionised water and graduallyadded to the blended dry ingredients to give anexpected Cu content of 500 mg kg−1 dw. Theresulting paste was extruded through a Hobartfood mixer (model A-120, 3 mm extrusion plate)and air dried at 40°C for 96 h. Pellets were storedin dry air-tight containers until required. Controldiet was treated in the same way except deionizedwater alone was used to form the paste. Coppercontent of the food was confirmed by atomicabsorption spectroscopy (AAS) and was (mean9S. E., n=6) 16.391.0 and 489.891.9 mg kg−1
dw for control and Cu-supplemented diets, re-spectively. The proximate composition of the dietswere determined for duplicate samples (Baker andDavies, 1996). The moisture, protein, lipid, andash content (% dry matter) were: 11, 57, 19, and10% for the control diet, compared to 9, 53, 18,11% for the copper diet.
2.3. Growth and nutritional performance
To establish whether exposure to oral copperinfluenced food intake, or energy utilisation(reflected by carcass composition) the amount offood fed to each tank was recorded daily (byweighing food containers before and after feedingto calculate food dispensed), and fish were indi-vidually weighed at fortnightly intervals (beforethe daily feed). Condition factor (K=100×weight (g)/length3 (cm)) was calculated for eachtreatment at monthly intervals. Specific growthrate (SGR), satiation ration (appetite), and foodconversion ratio (FCR) were calculated frommean fish weights. The serial sacrifice or removalof fish from the main tanks during the experimentprevented these nutritional parameters from beingcalculated using cumulative biomass per tank.SGR was calculated from the mean gain in body
R.D. Handy et al. / Aquatic Toxicology 47 (1999) 23–4126
weight over 3 months. FCR and satiation rationwere calculated fortnightly on the days that ani-mals were weighed. FCR values were calculatedfrom the average food intake per fish divided bythe body weight gain in each 2 week period.The average daily satiation ration (relative%food intake day−1) for each 2 week period wascalculated by multiplying SGR by FCR. Thefortnightly measurements of FCR and the satia-tion ration were pooled to give their respectivemean values for the whole experiment (Table 2).The proximate composition of the carcass (in-cluding the washed gut) was determined (Bakerand Davies, 1996) for ten fish taken at randomfrom the tanks 5 days before the Cu diet wasintroduced (initial fish). Proximate compositionwas also determined for a further five fish pertreatment at the end of the experiment.
2.4. Respirometry
The main purpose of these experiments was toestablish whether altered respiratory functioncould explain any observed changes in swim-ming performance. Ammonia excretion was alsorecorded since Taylor et al. (1996) suggestedthat ammonia retention might reduce swimmingperformance of trout exposed to Cu. Fish werecollected at monthly intervals from the experi-mental tanks for respirometry, and returned tothe appropriate tank after measurements weremade. The volume of the perspex respirometerwas 37 l and during respirometry trials was sup-plied with water of similar quality as the maintanks. The respirometer was located in a quietarea with a partition screen so that the instru-ment could be operated without disturbing thefish. A constant biomass relative to respirometervolume (300 g of fish) was maintained for allmeasurements (Cech, 1990). To achieve this, thenumber of fish in the respirometer was reducedeach month in proportion to growth increases.Initially five fish equalled the 300 g biomass, butthis was reduced to a single animal in the lasttwo months of the experiment.
Fish were placed in the respirometer (operat-ing in flow-through mode, 1–2 l min−1) to ac-
climate overnight. At 13:30 h the following day,the respirometer was then switched to closed cir-cuit operation where water was recirculated witha pump (Eheim model 2213). Dissolved oxygenwas measured continuously using a polaro-graphic oxygen electrode connected to an oxy-gen meter (OXI 96, WTW, Weilheim, Germany)with readings stored on a data logger (Squirrel,Grant Instruments, Cambridge) at 5 min inter-vals during each experiment. The oxygen elec-trode was located in the pump reservoir as thisposition gave representative measurements with-out disturbing laminar flow in the respirometer,and water flow around the electrode could notbe altered by fish movements. A three-way tapclose to the pump inlet allowed 5 ml ofrespirometer water to be collected at 30 min in-tervals for pH, alkalinity and ammonia determi-nation. The first water sample drawn consistedof water from the tap’s dead-space and was dis-carded. Respirometry determinations were termi-nated after 2.5 h, or when oxygen saturation inthe respirometer decreased to 55%. This elimi-nated the possibility of artifactual rises in venti-lation rate associated with low pO2 (Cech, 1990)and minimised build-up of excreted waste prod-ucts. Ventilation rate was measured at 30 minintervals during each respirometry session bycounting fish opercular beats over a 30 s period(three replicates per fish at each time interval).The elevation of total ammonia during experi-ments was typically 58 mmol l−1 while water pHdeclined by 0.2 units. Oxygen consumption ratewas calculated from the decline in oxygen con-centration in the respirometer with respect tochamber volume and relative to fish biomass(Cech, 1990):
MO2=(CO2(A)−CO2(B))V
T
MO2, oxygen consumption rate (mg O2 h−1);CO2(A), oxygen concentration in water (mg O2
l−1) at the start of the trial. CO2(B), oxygenconcentration in water (mg O2 l−1) at the endof the trial. V, volume of respirometer (l). T,duration of measurement period (h).
R.D. Handy et al. / Aquatic Toxicology 47 (1999) 23–41 27
Oxygen consumption and ammonia excretiondata were corrected for growth rate effects using amass exponent of 0.8 (Cech, 1990). Ammoniaexcretion rates were calculated from the change intotal ammonia, accounting for the volume of therespirometer and fish biomass in a similar way tothe oxgen consumption calculations. Ventilationrate was calculated by pooling the 30 min ventila-tion observations, to give a mean value for therespirometry session. Oxygen, pH and ammoniaconcentration measurements conducted withoutfish in the respirometer (blanks) showed negligiblechanges.
2.5. Swimming beha6iour
At monthly intervals eight fish per treatmentwere chosen at random from each of the twoexperimental holding aquaria and their routineswimming behaviour assessed with a computer-aided video monitoring system (Aagaard et al.,1991). At 17:00 h the day before each behaviourassessment (4 h post-prandial), four individualsfrom each treatment were put separately into fourbehavioural arenas (white plastic tanks; 45×70×30 cm) positioned next to each other, andsupplied with filtered water cooled to the acclima-tion temperature of 16°C. The fish were left tosettle down for 17 h in the arenas that weresituated in a room isolated from the rest of thelaboratory.
Between 10:00 and 13:00 h the following daythe routine behaviour of each fish was monitoredsimultaneously from analysed images of the fish inthe arenas captured using a video camera (JVCTK 1070E RGB) and a TARGA+16/32 colourframe grabbing card (Truevision) fitted into astandard PC. The video camera was suspended1.5 m above the four tanks. Computer softwaredefined each fish’s image colour criteria, and fishwere tracked by image recognition of their degreeof colour contrast with the white background ofthe arenas (GIPS and GIPSTRA software, ImageHouse, Denmark). Fish position in each arenawas determined at a rate of 8 locations s−1 withx, y co-ordinates of position together with time,recorded in a datafile. After each trial, positionco-ordinates were used to re-construct each fish’s
track during each 3 h experimental period. Cus-tom written software (Trackana v.6; A. Aagaard,Danish EPA) was used to analyse each fish’sre-constructed track to obtain mean behaviouralparameter values for each 5 min interval over theentire 3 h trial period. Total active time (s), totaldistance moved (cm), maximum swimming speed(cm s−1), mean speed when active (cm s−1) andtime spent at ‘low’, ‘medium’ and ‘high’ speeds(hs) were calculated from the re-contructed fishtracks. Speed bins (speed classes) were definedarbitrarily such that ‘low’ speed ranged from 1–17 cm s−1, ‘medium’ speed from 17–40 cm s−1,and ‘high’ speed from 40–58 cm s−1.
Water was changed in the system after eachtrial and 4 further fish were placed into the be-havioural arenas at 17:00 h the same day. Thisprocedure was repeated for each batch of four fishuntil the routine behaviours of eight fish pertreatment were determined. Hence, the behaviourof 16 fish (eight control, eight Cu-exposed) eachmonth was assessed within 4 days.
2.6. Haematology and biochemistry
At the end of each behaviour trial, fish wereanaesthetised with unbuffered MS222 and wholeblood was collected via cardiac puncture intolithium-heparinised syringes. Haematocrit andhaemoglobin concentration (Sigma Diagnosticskit No. 525-A) were determined immediately. A20 ml aliquot of blood was also mixed with 0.98ml of Dacie’s fluid in preparation for red andwhite cell counts (Houston, 1990). The remainingblood was centrifuged (7000 rpm for 2 min, MicroCentaur MSE), and the serum collected wasfrozen (−20°C) until required for analysis. Fishwere then sacrificed by terminal anaesthesia fol-lowed by pithing, and tissue samples (�1 g) werecollected with clean dissecting instruments for ionanalysis in the following order: gill, liver, spleen,anterior intestine, kidney, skinned muscle fromthe flank. Samples were quickly rinsed indeionised water and blotted dry, placed on ion-clean (triple acid washed, then deionized) glassslides, and dried to constant weight at 120°C. Anadditional muscle sample was dissected from theflank of each fish, rapidly frozen in liquid nitro-
R.D. Handy et al. / Aquatic Toxicology 47 (1999) 23–4128
gen, and stored at −85°C for subsequent ATPaseactivity determinations.
Frozen serum samples, collected from fish afterthe behavioural trials, were rapidly defrosted andanalysed in triplicate for glucose (Sigma Diagnos-tics kit No. glucose 16–20), total triglyceride(Sigma Diagnostics kit No. 334-UV), total protein(Hartree 1972). Serum Na and K were determinedusing a Corning flamephotometer (model 410)calibrated with matrix matched standards. MuscleATPase activity was determined after homogenis-ing approximately 0.1g of tissue in 10 volumes ofice cold hypotonic buffer (20 mmol l−1 Tris–HCl,1 mmol l−1 EDTA at pH 7.0). Homogenates werefrozen at −80°C as 100 ml aliquots until required.ATPase activities were determined using themethod of Jones and Besch (1984) with a minormodification; the alamethicin incubation was re-placed by saponin (0.2 mg mg protein−1) toreveal latent ATPase activity. At the end of theexperiment, some liver tissue, whole gillsfilaments, longitudinal slices of stomach plusoesophagus (anterior gut), and pyloric caecae plusthe hind gut (intestine), were collected from con-trol and Cu-exposed animals; then rapidly frozenin liquid nitrogen and stored at −80°C untilanalysed for metallothionein using the method ofViarengo et al. (1997).
2.7. Histology
Trout were collected at monthly intervals fromthe main experimental tanks for histological ex-aminations. Samples of gill, pseudobranch, liver,spleen, intestine, kidney, and muscle were dis-sected as described above. Tissue samples werefixed in buffered formal saline and processed forboth wax and methacrylate resin sectioning. Waxsections were cut at 7 mm and subsequentlystained with Mallory’s Trichrome. Resin sections(2 mm) were stained with 1% toluidine blue. Someliver samples were rapidly frozen in liquid nitro-gen and stored at −80°C, until required forfrozen sectioning to assess lipid content. Slideswere stained in batches containing sections fromcontrol and treatment animals to eliminate tem-poral artifacts in staining protocols. Slides werethen scored blind using a Quantimet 570 image
analyser. Observations on gill filaments were con-ducted on fish of the same size, and the locationon the secondary lamellae of the primary filamentwas automatically standardised using the imageanalyser. This was achieved by programming theanalyser to select the midpoint of each gillfilament (calculated from coordinates for the tipand base of each gill filament), and then recordingfour frames (viewing eight lamellae in each) later-ally and longitudinally from the midpoint refer-ence position. Thus 32 separate lamellae wereviewed in the middle third of the same filamentfrom each fish. This eliminated weight-specificeffects on gill size, and differences in maturationof the secondary lamellae along each filament,from the analysis. Photomicrographs were takenon an Olympus Vanox microscope using 100ISOKodak colour film.
2.8. Water quality
Routine water samples were collected on aweekly basis immediately before feeding and 1 hafter feeding. In addition, random checks weremade between the weekly samples. There were nostatistical differences between the water quality inthe control or treatment tank (P\0.05, Pairedt-tests). There were no statistical differences in thepre and post feeding water quality within eachtank (P\0.05, paired t-tests or Mann–WhitneyW-test), apart from a small (1.1 mmol l−1) rise inammonia caused by post-prandial ammonia ex-cretion. Water quality data before and after feed-ing were pooled for each tank. Water quality forthe fish on the Cu-contaminated diet was (inmmol l−1, means91 S.E., n=22): Ca, 0.4490.10; Mg, 0.1190.004; Na, 0.3390.007; K,0.0890.003; Cu, B0.0000001; Zn, B0.000001;N as NH3 0.00890.004; total alkalinity, 0.4790.05; pH 7.2190.27; dissolved oxygen, 80%94;temperature, 16.5°C90.67. Trace metals were de-termined using inductively coupled plasma-atomicemission spectrophotometry (ICP-AES) (VarianLiberty 200). Total ammonia and total alkalinitywere determined by the method of Verdouw et al.(1978) and Stirling (1985), respectively. All pHmeasurements were performed using a low con-ductivity combination pH electrode (Russell,
R.D. Handy et al. / Aquatic Toxicology 47 (1999) 23–41 29
Auchtermuchty, Scotland) connected to a Corn-ing 250 ion analyser. Dissolved oxygen was mea-sured using a portable oxygen meter (OXI 96,WTW, Weilheim, Germany).
2.9. Trace metal analysis
All reagents for trace metal analysis of tissuesand water samples were spectrosol grade or equiv-alent. All glassware was triple acid washed andthen deionised before use. Samples (0.1 g) of driedtissue were digested (modified from Handy, 1993)with 1 ml of concentrated nitric and 1 ml ofsulphuric acid for 48 h and diluted to 10 ml withdeionised water. Each digest was analysed simul-taneously for Na, K, Ca, Mg, Cu and Zn byICP-AES. Standards were matrix matched to thesamples, and instrument detection limits for thematrix were determined (in mmol l−1): Na, 14.8;K, 35.5; Ca, 0.5; Mg, 0.5; Cu, 0.96; Zn, 1.2. Fortissue samples of approximately 0.1 g these detec-tion limits are equivalent to (mmol g−1 dw): Na,1.4; K, 3.5; Ca, 0.05; Mg, 0.05; Cu 0.096; Zn 0.12.Water samples were collected in ion-clean tubes(13 ml) and acidified with one drop of 6 molarnitric acid and stored at 4°C until analysed formineral content as above. In addition, water sam-ples were analysed by graphite furnace atomicabsorption spectrophotometry (GF-AAS) to im-prove the detection limit for Cu (0.1 mmol l−1;Varian SpectrAA 600). Water copper concentra-tions were not detected above this limit.
2.10. Statistical analysis
Data on copper accumulation, serum chem-istry, muscle mineral contents, and respirometrywere analysed using Statgraphics Plus for Win-dows version 1.4. Data were given codes to iden-tify month and treatment combinations, andinitially checked by code for variance (Bartlett’stest) and skewedness. Where data were non-para-metric the Kruskal–Wallis test was applied todetermine differences between codes. Where dif-ferences occurred, every combination of code wasindividually tested for significant differences usingthe Mann–Whitney W-test. This analysis wasapplied to Cu accumulation data, serum chem-
istry, and muscle mineral contents, except whenthe parameter could be analysed parametricallyusing a multifactorial analysis of variance(ANOVA) and least squares difference (LSD)multiple range test. Respirometry data were testedusing an unpaired, 2-tailed t-test.
Data on behaviour and haematology wereanalysed using Minitab (v10.2). The effect oftreatment (control or Cu-exposed) on fish weight,behavioural parameters (total active time, totaldistance moved, maximum swimming speed, meanswimming speed) and haematological parameterswas tested by non-parametric, two-factor analysisof variance with unequal replication (Zar, 1996).Data streams of each parameter for both treat-ments were ranked and missing values estimatedby iteration using the General Linear Model(GLM) (Minitab v10.2). Sums of squares valuesdetermined by GLM for each comparative analy-sis were substituted into the Kruskal–Wallis H-test to determine significant effects on eachparameter of both treatment and time (month 1,2, 3 after exposure). Where the null hypothesiswas rejected indicating time as a significant factoraffecting a particular parameter, a non-parametricTukey-type comparison was used to determineposition of significant differences within the treat-ment over time. When a null hypothesis wasrejected indicating significance of treatment as afactor affecting a particular parameter at a giventime, a Mann–Whitney U-test was carried out todetermine the level of significant differences. Thenormal approximation to the Mann–Whitney testwith Z-transformation was applied to the U dis-tribution in each test. The differences in time thefish spent swimming at low, medium and highspeeds within and between treatments and overtime were determined using the Mann–Whitneytest described above.
3. Results
3.1. Copper accumulation and metallothionein
Exposure to copper via the oral route wasconfirmed by large increases in the copper contentof the anterior intestine and liver (PB0.05,
R.D. Handy et al. / Aquatic Toxicology 47 (1999) 23–4130
Mann–Whitney), while contamination in thegills remained low compared to controls (Table1). The Cu concentration in the livers of exposedfish gradually increased to a maximum of 5.090.6 mmol g−1 dw (or 318 mg g−1 dw) (mean91S.E., n=7) by the end of the experiment, com-pared to control livers which remained at about2.090.4 mmol g−1 dw (or 127 mg g−1 dw; n=8) throughout. Intestinal Cu concentrationspeaked at the end of the first month (1.590.8mmol g−1 dw, or 95.3 mg g−1 dw, n=7) andremained higher than the controls (B0.096 mmolg−1 dw, or B6.1 mg g−1 dw) during the experi-ment. Copper concentrations in the gill, skeletalmuscle, and spleen remained low (B0.096 mmolg−1 dw, n=6–11 fish each month) in bothtreatments, while the kidney of exposed fishshowed a small transient rise in months 1 and 2of exposure compared to controls (Table 1).
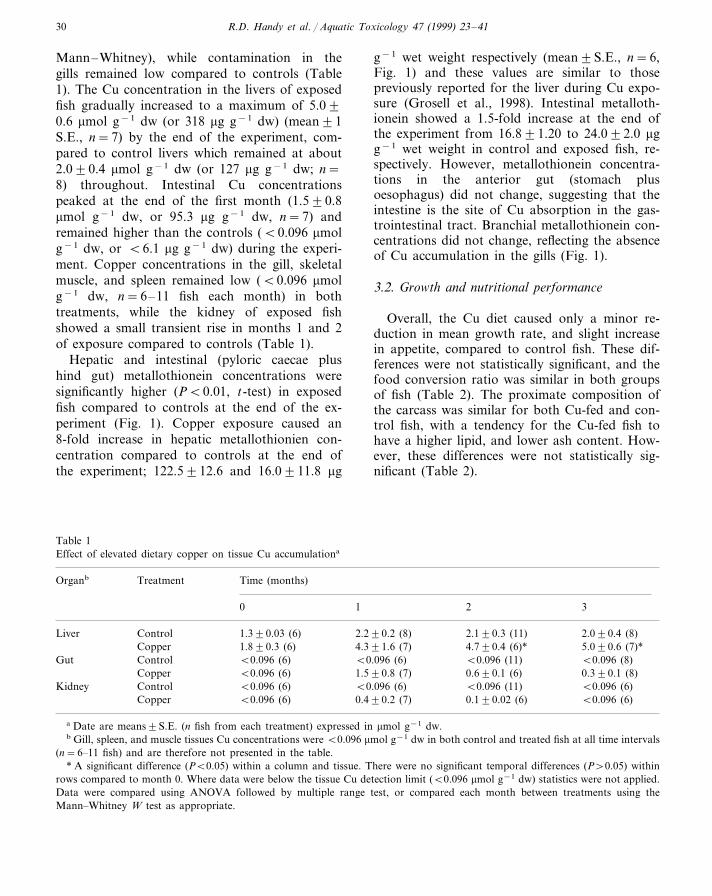
Hepatic and intestinal (pyloric caecae plushind gut) metallothionein concentrations weresignificantly higher (PB0.01, t-test) in exposedfish compared to controls at the end of the ex-periment (Fig. 1). Copper exposure caused an8-fold increase in hepatic metallothionien con-centration compared to controls at the end ofthe experiment; 122.5912.6 and 16.0911.8 mg
g−1 wet weight respectively (mean9S.E., n=6,Fig. 1) and these values are similar to thosepreviously reported for the liver during Cu expo-sure (Grosell et al., 1998). Intestinal metalloth-ionein showed a 1.5-fold increase at the end ofthe experiment from 16.891.20 to 24.092.0 mgg−1 wet weight in control and exposed fish, re-spectively. However, metallothionein concentra-tions in the anterior gut (stomach plusoesophagus) did not change, suggesting that theintestine is the site of Cu absorption in the gas-trointestinal tract. Branchial metallothionein con-centrations did not change, reflecting the absenceof Cu accumulation in the gills (Fig. 1).
3.2. Growth and nutritional performance
Overall, the Cu diet caused only a minor re-duction in mean growth rate, and slight increasein appetite, compared to control fish. These dif-ferences were not statistically significant, and thefood conversion ratio was similar in both groupsof fish (Table 2). The proximate composition ofthe carcass was similar for both Cu-fed and con-trol fish, with a tendency for the Cu-fed fish tohave a higher lipid, and lower ash content. How-ever, these differences were not statistically sig-nificant (Table 2).
Table 1Effect of elevated dietary copper on tissue Cu accumulationa
Organb Treatment Time (months)
0 1 32
2.090.4 (8)ControlLiver 2.190.3 (11)2.290.2 (8)1.390.03 (6)5.090.6 (7)*4.790.4 (6)*4.391.6 (7)1.890.3 (6)Copper
Control B0.096 (6)Gut B0.096 (6) B0.096 (11) B0.096 (8)Copper B0.096 (6) 1.590.8 (7) 0.690.1 (6) 0.390.1 (8)
B0.096 (6)B0.096 (6)Kidney B0.096 (6)Control B0.096 (11)Copper B0.096 (6) 0.490.2 (7) 0.190.02 (6) B0.096 (6)
a Date are means9S.E. (n fish from each treatment) expressed in mmol g−1 dw.b Gill, spleen, and muscle tissues Cu concentrations wereB0.096 mmol g−1 dw in both control and treated fish at all time intervals
(n=6–11 fish) and are therefore not presented in the table.* A significant difference (PB0.05) within a column and tissue. There were no significant temporal differences (P\0.05) within
rows compared to month 0. Where data were below the tissue Cu detection limit (B0.096 mmol g−1 dw) statistics were not applied.Data were compared using ANOVA followed by multiple range test, or compared each month between treatments using theMann–Whitney W test as appropriate.

R.D. Handy et al. / Aquatic Toxicology 47 (1999) 23–41 31
Fig. 1. Metallothionein concentrations (mean9S.E.; n=6 fish per treatment) in gill, anterior gut (stomach plus oesophagus),intestine (pyloric caecae plus hind gut), and liver from control (clear bars) and Cu-exposed fish (dark bars) after 3 months.** Statistically significant from control (PB0.01, t-test).
appeared to be small fragments of empty faecaltubes (�18 h post-prandial). The ammonia con-centrations in these few experiments were nothigher than other experiments. Nonetheless, wecannot completely exclude the possibility of anintestinal contribution to whole body ammoniaexcretion. The change in total alkalinity duringthe experiments was less than 20 mEq l−1, andsince this was close to the detection limit of thetitration method employed, net acid excretion wasnot calculated.
3.4. Swimming beha6iour
Routine swimming activity was affected by di-etary Cu. Overall, exposed animals were muchless active, although this was partially compen-sated for by increases in swimming speed duringperiods of activity, compared to control fish (Figs.2 and 3). The mean total active time of fish fedthe Cu diet did not change over the 3 months ofexposure, whereas activity time of control fish wasincreased by 51% after 3 months exposure (Fig.2a). This increase in active time of control fishindicates the normal change in activity patternwith increased growth. However, despite similargrowth increases, there was a significant decreasein time spent swimming of 53% in Cu-exposed fishcompared to control fish after 3 months of con-
3.3. Respirometry
Exposure to dietary copper had no effect onrespiratory function. There were no overall differ-ences in oxygen consumption between treatments.At the end of the experiments the mean oxygenconsumption rates were 1591 and 1391 mmolO2 kg−1 h−1 (mean91 S.E., n=4) for controland exposed fish respectively (P\0.05). Meanventilation rates were identical at the end of theexperiment (mean91 S.E., n=4); 11794 and11893 beats min−1 for control and exposed fishrespectively. The total ammonia concentration in-creased slightly during the period of closedrespirometry measurements. The changes in totalammonia were similar for both treatments (58mmol l−1), so data were pooled. The maximumtotal ammonia was 7396 mmol l−1 (mean91S.E, n=15) at a final mean pH of 7.03. Thisequates to a free NH3 concentration of 2.7 mmoll−1. The rise in ammonia did not stimulate venti-lation rate, since the typical rise in ventilationduring each respirometry session was only 4% ofthe initial value. There were no differences (P\0.05) in the whole body ammonia excretion rates(mass exponent corrected) of control or Cu-fedfish. Values were 3.390.3 and 2.390.6 mmolkg−1 h−1, respectively (mean91 S.E, n=6 or 7).In a few of the experiments, fish excreted what
R.D. Handy et al. / Aquatic Toxicology 47 (1999) 23–4132
sumption of the Cu diet. The observed changes inactivity time of Cu contaminated fish occurredbetween 1 and 2 months of exposure (Fig. 2a).
The mean total distance covered by exposedfish per 5 min interval increased by 37% over the3 month exposure period compared to a 77%increase observed in the control fish. After 3months the control fish moved 27% further in anobservation period than exposed fish (Fig. 2b).Although the mean maximum swimming speedattained by fish in either treatment was not differ-ent at any time during Cu exposure (Fig. 2c), thelower than expected distances covered by controlfish with respect to the time they spent swimmingwere accounted for by differences in mean swim-ming speed between exposed and control fish (Fig.
2d). After 1 month of exposure, the increase inmean swimming speed of contaminated fish abovethat of controls was 12.3 and 11.8% at 2 and 3months exposure, respectively, indicating that al-though Cu-exposed fish were swimming fasterthey were active for less time and hence coveredless distance than control fish.
The mean time fish spent swimming at low,medium and high speeds were not different be-tween treatments after 1 month of Cu exposure(Fig. 3). However, between 2 and 3 months expo-sure, the time that contaminated fish spent at lowspeeds was significantly reduced by 31%, whereascontrol fish spent 32% longer swimming at lowspeeds after 3 months compared to month 1. Thetime spent swimming at medium speeds did notalter for exposed fish during the experimentalperiod, but controls spent 51% more time in thisspeed bin at month 3 than at month 1 corroborat-ing the increases in activity time observed in thisgroup. In both treatments the amount of timespent fast swimming by exposed and control fishincreased by 130 and 164%, respectively (Fig. 3).Overall, the activity was lowered in exposed fishby large decreases in time spent swimming at lowspeed which were balanced by increased timespent fast swimming. This indicates that relativelymore time spent during activity was spent fastswimming by exposed fish because their totalactive time was not different during the exposureperiod. In contrast, the observed increases in timespent swimming at all three speed groupings bycontrol fish were consistent with the large in-creases in the total time spent in activity over theexperimental period.
3.5. Haematology and biochemistry
There were no treatment related changes inserum chemistry or haematology during the ex-periment which might offer explanations for theobserved changes in swimming performance.There was a significant decline (PB0.05) in serumprotein concentration in month 1, and serum Kconcentration in month 0, in the Cu-treated fishcompared to controls. Serum protein and triglyce-ride concentrations increased gradually during theexperiment in all fish, probably reflecting changes
Table 2The effect of dietary copper on nutrition and growtha
Control dietVariable Copper diet
Initial mean weight (g) 54.892.0 (92) 54.292.0 (92)248.7911.6 (31)Final mean weight (g) 230.699.7 (48)
Specific growth rate 1.641.71(% day)
Condition factorb 1.3990.03 (6)1.3390.06 (6)1.0890.11 (6)0.9990.08 (6)Mean feed conversion
ratioMean ration 1.6290.19 (6) 1.6990.14 (6)
(% biomass day−1)
Proximate carcass composition*Moisture (%) 69.990.4 (5) 68.691.0 (5)
15.590.4 (5) 15.191.6 (5)Protein (%)10.890.7 (5)Lipid (%) 13.391.3 (5)
Ash (%) 2.0590.04 (5) 1.8690.04 (5)
a Means are 9S.E. (n fish from each treatment). Specificgrowth rate (SGR) is calculated for the whole exposure period(4 months). Mean food conversion ratio and mean ration arecalculated from fortnightly measurements.
b Condition factor in month 3, initial values were (mean9S.E., n=6 fish) 1.2790.03 and 1.2290.03 for control andCu-treated fish, no treatment-related effects were identified byANOVA, although condition factor at month 3 was signifi-cantly higher than at time zero within the exposed group.
* Values are for fish at the end of the experiment expressedas a percentage of dry matter. Proximate carcass compositionof initial fish for moisture, protein, lipid, and ash respectivelywere (means9S. E. n=10): 73.090.5; 15.490.3; 8.790.5;2.290.1. No significant differences (P\0.05) were observedbetween treatments.

R.D. Handy et al. / Aquatic Toxicology 47 (1999) 23–41 33
Fig. 2. Mean changes in behaviour (9S.E.) of Cu-exposed (�) and control () rainbow trout for each successive 5 min intervalduring a 3 h experimental period each month over a 3 month exposure period. (a) Total active time; (b) total distance moved; (c)maximum swimming speed attained; (d) swimming speed when active. Means represent multiple determinations for each of six oreight fish per month. Between treatment differences were examined at each month: ** PB0.01, *** PB0.005.
in energy utilisation during growth, since no sig-nificant treatment effects were observed (Table 3).
There were no treatment-dependent changes ineither red or white cell counts in the blood, andneither whole blood haemoglobin concentrationnor haematocrit were affected by Cu. However,there were some temporal changes in haematologywhich probably relate to fish size. All fish showeda gradual increase in red blood cell count andhaematocrit, whist white cell counts were variablewith a tendency to decline during the experiment(Table 4). The normal haematocrits and red cellcounts suggest that there was no osmotic distur-
bances to red cell volume. The normalhaemoglobin content of the whole blood indicatesthat the oxygen carrying capacity was probablymaintained during Cu exposure (Table 4).
Disturbances to ion balance in the skeletal mus-cle might also be expected to influence swimmingperformance. However, no significant changes inCa, Mg, Zn, Na, or K were observed in the lastmonth of the experiment. In addition, Cu levels inthe muscle remained below the protocol’s detec-tion limit (B0.096 mmol g−1 dw). Mineral con-centrations (mean91 S.E., n=6 or 7) in theskeletal muscle of fish at the end of the experi-

R.D. Handy et al. / Aquatic Toxicology 47 (1999) 23–4134
ment were (in mmol g−1 dw for control andexposed, respectively): Ca, 9.993.5, 25.0915.2;Mg, 30.699.1, 22.899.6; Na, 22.997.0, 26.5913.5; K, 95923, 86940; Zn, 0.1390.03, 0.2490.09. These observations reflect normal Na-dependent ATPase and Ca-dependent ATPase ac-tivity in crude homogenates of skeletal muscle atthe end of the experiment, and the followingspecific activities are typical of crude muscle ho-mogenates from fish (e.g. Aho and Vornanen,1998). Na-dependent ATPase values were 5.5690.41 and 5.8490.29 mmol Pi mg−1 protein h−1
(mean9S.E., n=9) for control and exposed re-
spectively after 3 months Cu exposure. Ca-depen-dent ATPase values were 8.6290.31 and8.8290.41 mmol Pi mg−1 protein h−1 (mean9S.E., n=10,8) for control and exposed respec-tively after 3 months Cu exposure. No statisticaldifferences in ATPase activities were observedbetween treatments using an unpaired, 2-tailedt-test (P\0.05).
3.6. Histology
No gross pathological changes were observed inany of the organs examined (sections not shown).However, non-pathological changes in the gillwere observed (Fig. 4). Secondary lamellar length(mm) increased significantly from 0.16590.001 to0.1890.001 (mean9S.E., n=32 lamellae fromeach of six fish from each treatment) in controland Cu-exposed fish respectively (a 9% rise insecondary lamellar length), while lamellar thick-ness remained the same. These changes occurredat month 1 of exposure and persisted until the endof the experiment. The livers of treated fishshowed an extreme reduction in lipid contentcompared to controls after 1 month of exposureto Cu, but showed a partial recovery of the lipidcontent in the remaining two months (Fig. 4). Amarked cell shrinkage, without necrosis, was ob-served in the livers of Cu-treated fish in the lastmonth, and was accompanied by an increase insinusoidal space (Fig. 4).
4. Discussion
Copper exposure via the dietary route is char-acterised by large increases in the Cu content ofthe gut tissue compared to the gills (Handy,1992). In this study there was a 16-fold increase inthe Cu concentration of the anterior intestine ofCu-fed fish, whilst the gills remained uncontami-nated. The low aqueous Cu concentrations (B0.1mmol l−1) before and after feeding, combinedwith the absence of pathology in the gills, alsoindicate that the food route was the only mode ofexposure. This is also supported by the metal-lothein data (Fig. 1) where the gills show noinduction, but increases occur in the intestine and
Fig. 3. Mean changes in time (9S.E.) spent by (a) Cu-exposedand (b) control rainbow trout in each of three swimming speedbins for each successive 5 min interval during a 3 h experimen-tal period each month over a 3-month exposure period. Speedranges: low, 1–17 cm s−1; medium, 17–40 cm s−1; high,40–58 cm s−1. Means represent multiple determinations foreach of six or eight fish per month. Within treatment timedifferences at each speed interval in month 1 was compared tomonth 3: ** PB0.01. Between treatment time changes formonth 1 were not significant.

R.D. Handy et al. / Aquatic Toxicology 47 (1999) 23–41 35
Fig. 4. Sections of the gills (×230 magnification) and livers (×460 magnification) from control (left panels) and exposed (rightpanels) rainbow trout. Gills from control (a) and Cu-fed fish (b) after 1 month of exposure. Livers from control and Cu-fed fish atone month (c and d, respectively), and 3 months (e and f), of exposure. Bar=50 mm. Copper exposure increases the secondarylamellae length by 9% and reduces lipid (L) content of the liver at 1 month. Hepatic glycogen storage (G) becomes more diffuse (butnot reduced overall) after month 1 of exposure. After 3 months the Cu-treated livers show cell shrinkage and increased sinusoidalspace (S) compared to the control, abnormal lipid deposition occurs.
R.D. Handy et al. / Aquatic Toxicology 47 (1999) 23–4136
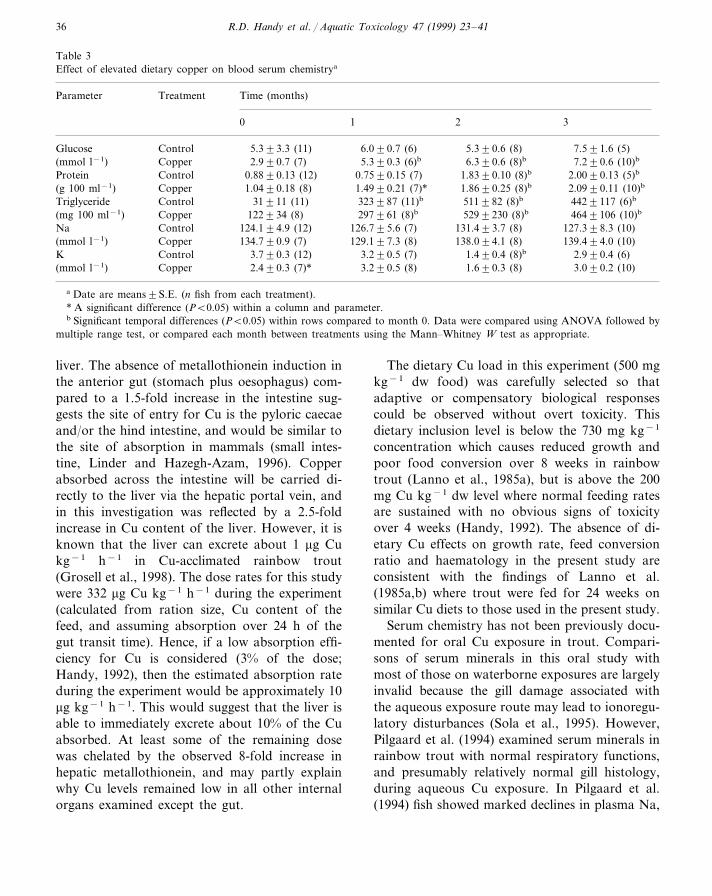
Table 3Effect of elevated dietary copper on blood serum chemistrya
Parameter Time (months)Treatment
0 1 2 3
Glucose Control 5.393.3 (11) 6.090.7 (6) 5.390.6 (8) 7.591.6 (5)2.990.7 (7) 5.390.3 (6)b(mmol l−1) 6.390.6 (8)bCopper 7.290.6 (10)b
0.8890.13 (12) 0.7590.15 (7)Control 1.8390.10 (8)bProtein 2.0090.13 (5)b
Copper(g 100 ml−1) 1.0490.18 (8) 1.4990.21 (7)* 1.8690.25 (8)b 2.0990.11 (10)b
31911 (11) 323987 (11)bTriglyceride 511982 (8)bControl 4429117 (6)b
122934 (8) 297961 (8)bCopper 5299230 (8)b(mg 100 ml−1) 4649106 (10)b
ControlNa 124.194.9 (12) 126.795.6 (7) 131.493.7 (8) 127.398.3 (10)134.790.9 (7) 129.197.3 (8) 138.094.1 (8) 139.494.0 (10)(mmol l−1) Copper
3.790.3 (12) 3.290.5 (7)Control 1.490.4 (8)bK 2.990.4 (6)2.490.3 (7)* 3.290.5 (8)(mmol l−1) 1.690.3 (8)Copper 3.090.2 (10)
a Date are means9S.E. (n fish from each treatment).* A significant difference (PB0.05) within a column and parameter.b Significant temporal differences (PB0.05) within rows compared to month 0. Data were compared using ANOVA followed by
multiple range test, or compared each month between treatments using the Mann–Whitney W test as appropriate.
liver. The absence of metallothionein induction inthe anterior gut (stomach plus oesophagus) com-pared to a 1.5-fold increase in the intestine sug-gests the site of entry for Cu is the pyloric caecaeand/or the hind intestine, and would be similar tothe site of absorption in mammals (small intes-tine, Linder and Hazegh-Azam, 1996). Copperabsorbed across the intestine will be carried di-rectly to the liver via the hepatic portal vein, andin this investigation was reflected by a 2.5-foldincrease in Cu content of the liver. However, it isknown that the liver can excrete about 1 mg Cukg−1 h−1 in Cu-acclimated rainbow trout(Grosell et al., 1998). The dose rates for this studywere 332 mg Cu kg−1 h−1 during the experiment(calculated from ration size, Cu content of thefeed, and assuming absorption over 24 h of thegut transit time). Hence, if a low absorption effi-ciency for Cu is considered (3% of the dose;Handy, 1992), then the estimated absorption rateduring the experiment would be approximately 10mg kg−1 h−1. This would suggest that the liver isable to immediately excrete about 10% of the Cuabsorbed. At least some of the remaining dosewas chelated by the observed 8-fold increase inhepatic metallothionein, and may partly explainwhy Cu levels remained low in all other internalorgans examined except the gut.
The dietary Cu load in this experiment (500 mgkg−1 dw food) was carefully selected so thatadaptive or compensatory biological responsescould be observed without overt toxicity. Thisdietary inclusion level is below the 730 mg kg−1
concentration which causes reduced growth andpoor food conversion over 8 weeks in rainbowtrout (Lanno et al., 1985a), but is above the 200mg Cu kg−1 dw level where normal feeding ratesare sustained with no obvious signs of toxicityover 4 weeks (Handy, 1992). The absence of di-etary Cu effects on growth rate, feed conversionratio and haematology in the present study areconsistent with the findings of Lanno et al.(1985a,b) where trout were fed for 24 weeks onsimilar Cu diets to those used in the present study.
Serum chemistry has not been previously docu-mented for oral Cu exposure in trout. Compari-sons of serum minerals in this oral study withmost of those on waterborne exposures are largelyinvalid because the gill damage associated withthe aqueous exposure route may lead to ionoregu-latory disturbances (Sola et al., 1995). However,Pilgaard et al. (1994) examined serum minerals inrainbow trout with normal respiratory functions,and presumably relatively normal gill histology,during aqueous Cu exposure. In Pilgaard et al.(1994) fish showed marked declines in plasma Na,

R.D. Handy et al. / Aquatic Toxicology 47 (1999) 23–41 37
K, Cl and Ca with exposure, whilst those in thepresent oral study did not (Table 3). These differ-ences might be explained by the level of Cucontamination in the gills; Pilgaard et al. (1994)reports 32 mg g−1 dw Cu in the gills compared toB6.1 mg g−1 dw in this study.
Swimming behaviour of trout in this study wasaffected by oral Cu exposure in the absence ofnutritional or other physiological disturbances.This is not surprising, however, since studies onaqueous Cu exposure show that swimming be-haviour is a much more sensitive indicator of Cuexposure (Drummond et al., 1973) than nutri-tional (Lett et al., 1976) or survivorship parame-ters (Little and Finger, 1990). The Cu-treated fishin the present study spent 35% less time swimming(i.e. 35% more time stationary in the tank) com-pared to controls after 3 months although theCu-fed fish were 12% faster when active swim-ming occurred. Both groups of fish achieved simi-lar maximum swimming speeds duringspontaneous activity, indicating that both groupsof fish had the same swimming capacity, but theCu-treated fish chose to be less active overall.Previous studies on the effects of Cu on swimmingbehaviour of fish have focused on sublethalaqueous exposures lasting a few days (Drummondet al., 1973; Waiwood and Beamish, 1978; Scarfeet al., 1982). These studies, along with those on
other pollutants (Little et al., 1985; Little andFinger, 1990), show that swimming capacity isreduced at pollutant concentrations likely to causedamage to the gill epithelium (e.g. 100–10 mg l−1
for Cu). The latter condition being reflected inelevated coughing frequency (Drummond et al.,1973) and increased oxygen consumption rates ata given swimming speed (Waiwood and Beamish,1978). At less toxic concentrations changes inspeed-frequency distribution occur, with initialperiods of hyperactivity (attributed to avoidancebehaviour), followed by hypoactivity which maybe associated with latent toxic effects (Scarfe etal., 1982; Little and Finger, 1990). The results ofthe latter studies perhaps broadly reflect theevents in this study where a long period of expo-sure occurs without gill damage or Cu-effects onventilation rate.
In ecotoxicology there are usually ‘trade-offs’between the metabolic cost of detoxification andother processes vital to the survival of the organ-ism (e.g. respiration, growth, reproduction;Maltby and Naylor, 1990). In this study, the maintrade-off appears to be that the metabolic effortassociated with detoxification via the gastrointes-tinal-biliary-hepatic system is met by a reductionin locomotor activity. If this hypothesis is correct,then temporal changes in behaviour should matchevents in the liver, and other physiological distur-
Table 4Effect of elevated dietary copper on haematology*
Parameter Treatment Time (months)
0 1 32
0.9990.04d (14)ControlRBC1 0.7990.04c (18)0.7090.03b (14)0.6290.04a (8)(106 mm3) 1.0490.04c (16)0.8690.03b (16)0.7690.05a (8)0.6590.02a (16)Copper
Control 14.991.17a (8)WBC2 17.991.40c (14) 15.591.10a (18) 12.690.93b (14)(g 103 mm3) Copper 13.990.99a (16) 17.192.50b (8) 12.191.90c (16) 10.191.03d (16)Haemoglobin Control 7.2290.29a (8) 7.0690.26a (14) 6.9790.37a (18) 7.1690.22a (14)(g dl−1) Copper 7.0490.26a (16) 7.3390.15a (8) 7.3190.29a (16) 7.5890.37a (16)
40.492.00d (14)36.891.80c (18)31.491.71b (14)Haematocrit 32.490.57a (8)Control38.991.60c (16) 44.691.60d (16)(%) Copper 29.590.69a (16) 34.191.02b (8)
1 RBC, red blood cell count;2 WBC, total white cell count.* Date are means9S.E. (n fish from each treatment). Values with common superscripts within rows are not significantly different
over time (P\0.05, non-parametric Tukey-type multiple comparison). There were no significant treatment effects within months(P\0.05; Mann–Whitney with tied ranks).

R.D. Handy et al. / Aquatic Toxicology 47 (1999) 23–4138
bances should be absent. At the end of month 1of exposure the livers of contaminated fishshowed a marked reduction in lipid content, whileserum glucose and triglyceride levels were normal,and no changes in swimming behaviour were ob-served. This suggests that hepatic lipid stores wereutilised to maintain locomotion during the earlystages of the exposure. The normal nutritionalperformance of all fish (Table 2) excludes malnu-trition effects on the liver. At the same time, thesecondary lamellae of the gills showed an 9%increase in length (Fig. 4). If the formula for areaof a cylinder is applied (2p×radius× length),then summed for each pair of secondary lamellaeand both branchial chambers, an overall increaseof secondary lamellar surface area of about 36%is obtained. These observed branchial modifica-tions would presumably require fuel from the liverstores to complete, but once completed wouldimprove the oxygen uptake efficiency of the gills.The molecular mechanism which initiates thesebranchial modifications remains unclear. By theend of the experiment the contaminated liversshowed signs of large increases in metabolic rate,characterised by cell shrinkage (without necrosis)and a 50% increase in sinusoidal space comparedto controls. These histological observations areconsistent with Cu detoxification (compare Fig.1(a) and (b) in Lanno et al., 1987) and glycogendepletion (Segner, 1987). Hepatic Cu detoxifica-tion in the present study was further supported bythe observed increases in metallothionein concen-tration. The increased long-term metabolic de-mand in the livers of exposed fish was not met byan overall increase in oxygen consumption by thewhole animal (see respirometry results). Instead, itis suggested that the metabolic demand due todetoxification costs was met by (i) reductions inthe overall time spent swimming, and perhaps (ii)improvements in respiratory efficiency related toincreased gill surface area (Fig. 4, Piiper et al.,1986).
The Cu-induced reductions in time spent swim-ming by trout in this study cannot be explainedby Cu pathology in the skeletal muscle, becausemuscle mineral contents and ATPase activitieswere not different between treatments at the endof the experiment. General cardiovascular
pathologies were also excluded as effecting factorsduring autopsy, and in addition, the maximumspontaneous swimming speed of the Cu-exposedfish was the same as controls at around 65 cm s−1
at 16.5°C; a value is similar to that obtained byWaiwood and Beamish (1978) (58 cm s−1 at12°C). The Cu-exposed fish also had a highermean swimming speed during periods of activitycompared to controls, which was caused by agradual shift in the mean speed-frequency distri-bution from low to high speeds. The mechanisticreasons for this are not clear from the physiologi-cal data, probably because growth rate-relatedchanges in blood chemistry (McCarthy et al.,1975; Houston, 1990) may have masked much ofthe temporal resolution in the blood parameters.
4.1. Ecological significance
The results of this integrated study of the sub-lethal effects of dietary Cu on rainbow troutindicate that locomotor activity of contaminatedfish was reduced as a metabolic ‘sparing effect’ toenable detoxification of Cu without concomitantreductions in feeding efficiency and growth rateparameters. The findings may be viewed, there-fore, to document a fish species’ integrated re-sponse to dietary Cu manifesting as a drive tomaintain growth (which can be assumed to be asurrogate for fitness). Natural selection theorysuggests that there is a poor correlation betweenenergetic efficiency and evolutionary success, be-cause energetic efficiency has no necessary linkwith Darwinian fitness since any ratio of efficiencyis acceptable, as long as net positive gains aresufficient to support rates of growth and repro-duction (Priede, 1985). It would appear that thestudy supports this concept as the priority ofrainbow trout exposed to sublethal oral Cu was tomaintain growth rates at the expense of activityfrequency (activity being the major component ofenergy expenditure and thus having the most infl-uence over energy efficiency ratios). This suggeststhat there was not a decrease in fitness of chronicCu-exposed trout as a direct result of themetabolic trade-off observed over the 4-monthexperimental period.
R.D. Handy et al. / Aquatic Toxicology 47 (1999) 23–41 39
It could be argued, however, that if in thenatural environment trout were to consume Cu-contaminated prey and activity was lowered inresponse to this exposure, then the chances ofencountering prey would be reduced, thus lower-ing food intake, growth and presumably fitness.However, simply because Cu-exposed rainbowtrout reduce their level of activity, and hence thetotal distance moved, it should not be assumedthat this is evidence of a maladaptive behaviouralresponse to dietary Cu, leading necessarily toreductions in prey capture or growth, and hencefitness. Rather, the strategy of lowering activity(but when active to swim at a greater mean speed)when exposed to dietary toxicant stress, may rep-resent a compromise between the necessity tocover an appropriately sized area to obtain suffi-cient food and the need to reduce time spentactive to maintain metabolism within the aerobicscope limit. Alterations in activity frequency andspeed of movements when active could form thebasis of a strategy used by fishes to maintainpre-exposure ratios of energy intake over expendi-ture by spending less time active, but to coveronly marginally less foraging area by swimming(searching) at a faster rate. The results suggestthat this change in locomotor strategy induced bydietary Cu was sufficient to maintain growth ratesin addition to meeting detoxification costs, andemphasises that Cu-contaminated trout demon-strate metabolic trade-offs to maintain fitnesswhen posed with chronic, sublethal environmentalstress. Because these metabolic and behaviouralchanges are associated with normal blood chem-istry and nutrition, it may be most useful to selectbehavioural and histological parameters as themore sensitive indicators of chronic oral Cu expo-sure. However, it is clear that more ecologicallyrealistic experiments are required to confirmwhether the metabolic strategies apparent in thestudy are employed by fishes in the wild wherefood may not be available to excess.
More importantly from an ecological perspec-tive was the finding that trout, contaminated withCu via the oral route, selected to spend propor-tionately more time swimming at high speeds thanat lower power outputs. What long-term effectsmight there be for Cu-contaminated trout that
spend proportionately more time at fast swim-ming speeds? It has been theorized that life expec-tancy should decrease if more time is spent athigher levels of activity (Priede, 1977). Integratedexperiments of the type undertaken here but onsuccessive generations of fish to test this concept,however, have yet to be attempted. This is despitethe fact that these studies could make a significantadvance for a quantitative understanding of toxi-cant effects on organismal and population fitnessas they would reconcile measurements of impor-tant ecological effects of long-term contaminationon fishes, such as fecundity and mortality, withknown cellular, physiological and behaviouralbiomarkers.
Acknowledgements
This study was supported by grants from theUniversity of Plymouth (DevR scheme) and theWellcome Trust to R. Handy. Dr M.M. Musondawas supported by a fellowship from the Common-Wealth Scholarship Commission in the UnitedKingdom. The authors thank R. Serwata formaintaining the exposures and preparing diets, J.Soane for serum chemistry, A. Gidlow forrespirometry, P. Russell and M. Hocking for his-tology, Dr S. Davies for diet formulation andequipment for the fish nutrition parameters, DrA. Aagaard for instructions on using video-track-ing systems and allowing us to use his trackinganalysis software, and Professor M. Depledge forthe loan of the computer-aided video trackingunit.
References
Aagaard, A., Andersen, B.B., Depledge, M.H., 1991. Simulta-neous monitoring of physiological and behavioural activityin marine organisms using non-invasive, computer aidedtechniques. Mar. Ecol. Prog. Ser. 73, 277–282.
Aho, E., Vornanen, M., 1998. Ca2+-ATPase activity andCa2+-uptake by sarcoplasmic reticulum in fish heart: ef-fects of thermal acclimation. J. Exp. Biol. 201, 525–532.
Baker, J.T.P., 1969. Histological and electron microscopicalobservations on copper poisoning in the Winter Flounder(Pseudopleuronectes americanus). J. Fish. Res. Bd. Can. 26,2785–2793.

R.D. Handy et al. / Aquatic Toxicology 47 (1999) 23–4140
Baker, R.T.M., Davies, S.J., 1996. Changes in tissue a-toco-pherol status and degree of lipid peroxidation with varyinga-tocopherol acetate inclusion in diets for the Africancatfish. Aquacult. Nutr. 2, 71–79.
Baker, R.T.M., Handy, R.D., Davies, S.J., Snook, J.C., 1998.Chronic dietary exposure to copper affects growth, tissuelipid peroxidation, and metal composition of the greymullet, Chelon labrosus. Mar. Environ. Res. 45, 357–365.
Cech, J.J., 1990. Respirometry. In: Schreck, C.B., Moyle, P.B.(Eds.), Methods for Fish Biology. American Fisheries Soci-ety, Bethesda, MA, pp. 335–362.
Drummond, R.A., Spoor, W.A., Olson, G.F., 1973. Someshort-term indicators of sublethal effects of copper onbrook trout, Sal6elinus fontinalis. J. Fish. Res. Bd. Can. 30,698–701.
Grosell, M.H., Hogstrund, C., Wood, C.M., 1998. Renal Cuand Na excretion and hepatic Cu metabolism in both Cuacclimated and non acclimated rainbow trout(Oncorhynchus mykiss). Aquat. Toxicol. 40, 275–291.
Handy, R.D., 1992. The assessment of episodic metal pollu-tion. II. The effects of cadmium and copper enriched dietson tissue contaminant analysis in rainbow trout(Oncorhynchus mykiss). Arch. Environ. Contam. Toxicol.22, 82–87.
Handy, R.D., 1993. The effect of acute exposure to dietary Cdand Cu on organ toxicant concentrations in rainbow trout,Oncorhynchus mykiss. Aquat. Toxicol. 27, 1–14.
Handy, R.D., 1996. Dietary exposure to toxic metals in fish.In: Taylor, E.W. (Ed.), Toxicology of Aquatic Pollution.University Press, Cambridge, pp. 29–60.
Hara, T.J., Law, Y.M.C., Macdonald, S., 1976. Effects ofmercury and copper on the olfactory response in rainbowtrout, Salmo gairdneri. J. Fish. Res. Bd. Can. 33, 1568–1573.
Hartree, E.F., 1972. Determinaton of protein: a modificationof the Lowry method that gives a linear photometricresponse. Anal. Biochem. 48, 422–427.
Hebel, D.K., Jones, M.B., Depledge, M.H., 1997. Responsesof crustaceans to contaminant exposure: a holistic ap-proach. Estuar. Coast. Shlf. Sci. 44, 177–184.
Houston, A.H., 1990. Blood and circulation. In: Schreck,C.B., Moyle, P.B. (Eds.), Methods for Fish Biology. Amer-ican Fisheries Society, Bethesda, MA, pp. 273–334.
Jones, L.R., Besch, H.R., 1984. Isolation of canine cardiacsarcolemma vesicles. Methods Pharmacol. 5, 1–12.
Lanno, R.P., Slinger, S.J., Hilton, J.W., 1985a. Maximumtolerable and toxicity levels of dietary copper in rainbowtrout (Salmo gairdneri Richardson). Aquaculture 49, 257–268.
Lanno, R.P., Slinger, S.J., Hilton, J.W., 1985b. Effect ofascorbic acid on dietary copper toxicity in rainbow trout(Salmo gairdneri Richardson). Aquaculture 49, 269–287.
Lanno, R.P., Hicks, B., Hilton, J.W., 1987. Histological obser-vations on intrahepatocytic copper-containing granules inrainbow trout reared on diets containing elevated levels ofcopper. Aquat. Toxicol. 10, 251–263.
Lauren, D.J., McDonald, D.G., 1987a. Acclimation to copperby rainbow trout, Salmo gairdneri : biochemistry. Can. J.Fish. Aquat. Sci. 44, 105–111.
Lauren, D.J., McDonald, D.G., 1987b. Acclimation to copperby rainbow trout, Salmo gairdneri : physiology. Can. J.Fish. Aquat. Sci. 44, 99–104.
Lett, P.F., Farmer, G.J., Beamish, F.W.H., 1976. Effect ofcopper on some aspects of bioenergetics of rainbow trout(Salmo gairdneri ). J. Fish. Res. Bd. Can. 33, 1335–1342.
Linder, M.C., Hazegh-Azam, M., 1996. Copper biochemistryand molecular biology. Am. J. Clin. Nutr. 63, 797S–811S.
Little, E.E., Flerov, B.A., Ruzhinskaya, N.N. Jr., 1985. Be-havioural approaches in aquatic toxicology: a review. In:Mehrl, P.M. Jr., Gray, R.H., Kendall, R.L. (Eds.), ToxicSubstances in the Aquatic Environment: An InternationalAspect. American Fisheries Society, Water Quality Section,Bethesda, MD, pp. 72–98.
Little, E.E., Finger, S.E., 1990. Swimming behaviour as anindicator of sublethal toxicity in fish. Environ. Toxicol.Chem. 9, 13–19.
Maltby, L., Naylor, C., 1990. Preliminary observations on theecological relevance of the Gammarus ‘scope for growth’assay: effect of zinc on reproduction. Functional Ecol. 4,393–397.
McCann, K, Shuter, B., 1997. Bioenergetics of life historystrategies and the comparative allometry of reproduction.Can. J. Fish. Aquat. Sci. 54, 1289–1298.
McCarthy, D.H., Stevenson, J.P., Roberts, M.S., 1975. Someblood parameters of the rainbow trout (Salmo gairdneriRichardson) II. The Shasta variety. J. Fish Biol. 7, 215–219.
Nussey, G., van Vuren, J.H.J., du Preez, H.H., 1995. Effect ofcopper on the haematology and osmoregulation of theMozambique tilapia, Oreochromis mossambicus (Cichli-dae). Comp. Biochem. Physiol. 111C, 369–380.
Overnell, J., McIntosh, R., 1988. The effect of supplementarydietary copper on copper and metallothionein levels in thefish, Dab, Limanda limanda. Mar. Environ. Res. 26, 237–247.
Pelgrom, S.M.G.J., Lock, R.A.C., Balm, P.H.M., WendelaarBonga, S.E., 1995. Integrated physiological response oftilapia, Oreochromis mossambicus, to sublethal copper ex-posure. Aquat. Toxicol. 32, 303–320.
Piiper, J., Scheid, P., Perry, S.F., Hughes, G.M., 1986. Effec-tive and morphometric oxygen diffusing capacity of thegills of the elasmobranch Scylorhinus stellaris. J. Exp. Biol.123, 27–41.
Pilgaard, L., Malte, H., Jensen, F.B., 1994. Physiologicaleffects and tissue accumulation of copper in freshwaterrainbow trout (Oncorhynchus mykiss) under normoxic andhypoxic conditions. Aquat. Toxicol. 29, 197–212.
Priede, I.G., 1977. Natural selection for energetic efficiencyand the relationship between activity level and mortality.Nature (Lond.) 267, 610–611.
Priede, I.G., 1985. Metabolic scope in fishes. In: Tytler, P.,Calow, P. (Eds.), Fish Energetics: New Perspectives.Croom Helm, London, pp. 33–63.
R.D. Handy et al. / Aquatic Toxicology 47 (1999) 23–41 41
Sandheinrich, M.B., Atchison, G.J., 1990. Sublethal toxicanteffects on fish foraging behaviour: empirical vs. mechanis-tic approaches. Environ. Toxicol. Chem. 9, 107–119.
Scarfe, A.D., Jones, K.A., Steele, C.W., Keerekoper, H., Cor-bett, M., 1982. Locomotor behaviour of four marineteleosts in response to sublethal copper exposure. Aquat.Toxicol. 2, 335–353.
Segner, H., 1987. Response of fed and starved roach, Rutilusrutilus, to sublethal copper contamination. J. Fish Biol. 30,423–437.
Sellers, C.M., Heath, A.G., Bass, M.L., 1975. The effect ofsublethal concentrations of copper and zinc on ventilatoryactivity, blood oxygen and pH in rainbow trout (Salmogairdneri ). Water Res. 9, 401–408.
Stirling, H.P., 1985. Chemical and Biological Methods ofWater Analysis for Aquaculturists. Institute of Aquacul-ture, University of Stirling, Stirling, p. 58.
Sola, F., Isaia, J., Masoni, A., 1995. Effect of copper on gillstructure and transport function in the rainbow trout,Oncorhynchus mykiss. J. Appl. Toxicol. 15, 391–398.
Syed, M.A., Coombs, T.L., 1982. Copper metabolism in theplaice, Pleuronectes platessa (L.). J. Exp. Mar. Biol. Ecol.63, 281–296.
Taylor, E.W., Beaumont, M.W., Butler, P.J., Mair, J., Mujal-lid, M.S.I., 1996. Lethal and sub-lethal effects of copperupon fish: a role for ammonia toxicity? In: Taylor, E.W.(Ed.), Toxicology of Aquatic Pollution. University Press,Cambridge, pp. 85–114.
Viarengo, A., Ponzano, E., Donodero, F., Fabbri, R., 1997. Asimple spectrophotometric method for metallothioneinevaluation in marine organisms: an application to Mediter-ranean and Antartic molluscs. Mar. Environ. Res. 44,69–84.
Verdouw, H., van Echteld, C.J.A., Dekkers, E.M.J., 1978.Ammonia determination based on indophenol formationwith sodium salicylate. Water Res. 12, 399–402.
Waiwood, K.G., Beamish, F.W.H., 1978. Effects of copper,pH and hardness on the critical swimming performance ofrainbow trout (Salmo gairdneri Richardson). Water Res.12, 611–619.
Woodward, D.F., Farag, A.M., Bergman, H.L., Delonay,A.J., Little, E.E., Smith, C.E., Barrows, F.T., 1995.Metals-contaminated benthic invertebrates in the ClarkFork River, Montana: effects on age-0 brown trout andrainbow trout. Can. J. Fish. Aquat. Sci. 52, 1994–2004.
Zar, J.H., 1996. Biostatistical Analysis. Prentice Hall, London.
.
Copyright © 2022 FDOKUMEN