Oncogene-induced Nrf2 transcription promotes ROS detoxification and tumorigenesis
14
Oncogene-induced Nrf2 transcription promotes ROS detoxification and tumorigenesis Gina M. DeNicola 1,2 , Florian A. Karreth 1,4 , Timothy J. Humpton 1 , Aarthi Gopinathan 1,2 , Cong Wei 3 , Kristopher Frese 1 , Dipti Mangal 3 , Kenneth H. Yu 3 , Charles J. Yeo 5 , Eric S. Calhoun 6 , Francesca Scrimieri 7 , Jordan M. Winter 8 , Ralph H. Hruban 7,9 , Christine Iacobuzio-Donahue 7,9 , Scott E. Kern 7 , Ian A. Blair 3 , and David A. Tuveson 1 1 Li Ka Shing Centre, Cancer Research UK Cambridge Institute, Robinson Way, Cambridge CB2 0RE, United Kingdom 2 Abramson Family Cancer Research Institute, University of Pennsylvania, Philadelphia, PA 19104, USA 3 Center for Cancer Pharmacology, University of Pennsylvania, Philadelphia, PA 19104, USA 4 University of Vienna, Dr. Bohrgasse 9, 1030 Vienna, Austria 5 Department of Surgery, Jefferson Medical College, Philadelphia, PA 19107, USA 6 Department of Biology, Alma College, Alma, MI 48801 7 Department of Oncology, The Sol Goldman Pancreatic Cancer Research Center, the Johns Hopkins Medical Institutions, Baltimore MD 21287, USA 8 Department of Surgery, The Sol Goldman Pancreatic Cancer Research Center, the Johns Hopkins Medical Institutions, Baltimore MD 21287, USA 9 Department of Pathology, The Sol Goldman Pancreatic Cancer Research Center, the Johns Hopkins Medical Institutions, Baltimore MD 21287, USA Abstract Reactive oxygen species (ROS) are mutagenic and may thereby promote cancer 1 . Normally, ROS levels are tightly controlled by an inducible antioxidant program that responds to cellular stressors and is predominantly regulated by the transcription factor Nrf2 and its repressor protein Keap1 2-5 . In contrast to the acute physiological regulation of Nrf2, in neoplasia there is evidence for increased basal activation of Nrf2. Indeed, somatic mutations that disrupt the Nrf2-Keap1 interaction to stabilize Nrf2 and increase the constitutive transcription of Nrf2 target genes were recently identified, suggesting that enhanced ROS detoxification and additional Nrf2 functions may in fact be pro-tumorigenic 6 . Here, we investigated ROS metabolism in primary murine cells following the expression of endogenous oncogenic alleles of K-Ras, B-Raf and Myc, and find that ROS are actively suppressed by these oncogenes. K-Ras G12D , B-Raf V619E and Myc ERT2 each increased the transcription of Nrf2 to stably elevate the basal Nrf2 antioxidant program and thereby lower intracellular ROS and confer a more reduced intracellular environment. Oncogene- directed increased expression of Nrf2 is a novel mechanism for the activation of the Nrf2 antioxidant program, and is evident in primary cells and tissues of mice expressing K-Ras G12D and Correspondence should be addressed to David A Tuveson. Li Ka Shing Centre, Cancer Research UK Cambridge Institute, Robinson Way, Cambridge CB2 0RE, United Kingdom, Tel: +44 (0)1223 404300, Fax: +44 (0)1223 404199, [email protected]. Author Contributions: GMD, FAK, TH, AG and KF performed cell culture and mouse experiments. CW, DM, KHY and IAB performed 8-oxo-dGuo and glutathione assays. CJY, ESC, FS, JMW, RHH, CID and SEK performed Nrf2 and Keap1 sequencing. GMD and DAT designed the study and wrote the manuscript, and all authors commented on it. NIH Public Access Author Manuscript Nature. Author manuscript; available in PMC 2012 July 25. Published in final edited form as: Nature. ; 475(7354): 106–109. doi:10.1038/nature10189. NIH-PA Author Manuscript NIH-PA Author Manuscript NIH-PA Author Manuscript
-
Upload
independent -
Category
Documents
-
view
0 -
download
0
Transcript of Oncogene-induced Nrf2 transcription promotes ROS detoxification and tumorigenesis
Oncogene-induced Nrf2 transcription promotes ROSdetoxification and tumorigenesis
Gina M. DeNicola1,2, Florian A. Karreth1,4, Timothy J. Humpton1, Aarthi Gopinathan1,2,Cong Wei3, Kristopher Frese1, Dipti Mangal3, Kenneth H. Yu3, Charles J. Yeo5, Eric S.Calhoun6, Francesca Scrimieri7, Jordan M. Winter8, Ralph H. Hruban7,9, ChristineIacobuzio-Donahue7,9, Scott E. Kern7, Ian A. Blair3, and David A. Tuveson1
1Li Ka Shing Centre, Cancer Research UK Cambridge Institute, Robinson Way, Cambridge CB20RE, United Kingdom2Abramson Family Cancer Research Institute, University of Pennsylvania, Philadelphia, PA19104, USA3Center for Cancer Pharmacology, University of Pennsylvania, Philadelphia, PA 19104, USA4University of Vienna, Dr. Bohrgasse 9, 1030 Vienna, Austria5Department of Surgery, Jefferson Medical College, Philadelphia, PA 19107, USA6Department of Biology, Alma College, Alma, MI 488017Department of Oncology, The Sol Goldman Pancreatic Cancer Research Center, the JohnsHopkins Medical Institutions, Baltimore MD 21287, USA8Department of Surgery, The Sol Goldman Pancreatic Cancer Research Center, the JohnsHopkins Medical Institutions, Baltimore MD 21287, USA9Department of Pathology, The Sol Goldman Pancreatic Cancer Research Center, the JohnsHopkins Medical Institutions, Baltimore MD 21287, USA
AbstractReactive oxygen species (ROS) are mutagenic and may thereby promote cancer1. Normally, ROSlevels are tightly controlled by an inducible antioxidant program that responds to cellular stressorsand is predominantly regulated by the transcription factor Nrf2 and its repressor protein Keap12-5.In contrast to the acute physiological regulation of Nrf2, in neoplasia there is evidence forincreased basal activation of Nrf2. Indeed, somatic mutations that disrupt the Nrf2-Keap1interaction to stabilize Nrf2 and increase the constitutive transcription of Nrf2 target genes wererecently identified, suggesting that enhanced ROS detoxification and additional Nrf2 functionsmay in fact be pro-tumorigenic6. Here, we investigated ROS metabolism in primary murine cellsfollowing the expression of endogenous oncogenic alleles of K-Ras, B-Raf and Myc, and find thatROS are actively suppressed by these oncogenes. K-RasG12D, B-RafV619E and MycERT2 eachincreased the transcription of Nrf2 to stably elevate the basal Nrf2 antioxidant program andthereby lower intracellular ROS and confer a more reduced intracellular environment. Oncogene-directed increased expression of Nrf2 is a novel mechanism for the activation of the Nrf2antioxidant program, and is evident in primary cells and tissues of mice expressing K-RasG12D and
Correspondence should be addressed to David A Tuveson. Li Ka Shing Centre, Cancer Research UK Cambridge Institute, RobinsonWay, Cambridge CB2 0RE, United Kingdom, Tel: +44 (0)1223 404300, Fax: +44 (0)1223 404199, [email protected].
Author Contributions: GMD, FAK, TH, AG and KF performed cell culture and mouse experiments. CW, DM, KHY and IABperformed 8-oxo-dGuo and glutathione assays. CJY, ESC, FS, JMW, RHH, CID and SEK performed Nrf2 and Keap1 sequencing.GMD and DAT designed the study and wrote the manuscript, and all authors commented on it.
NIH Public AccessAuthor ManuscriptNature. Author manuscript; available in PMC 2012 July 25.
Published in final edited form as:Nature. ; 475(7354): 106–109. doi:10.1038/nature10189.
NIH
-PA Author Manuscript
NIH
-PA Author Manuscript
NIH
-PA Author Manuscript
B-RafV619E, and in human pancreatic cancer. Furthermore, genetic targeting of the Nrf2 pathwayimpairs K-RasG12D-induced proliferation and tumorigenesis in vivo. Thus, the Nrf2 antioxidantand cellular detoxification program represents a previously unappreciated mediator ofoncogenesis.
To examine the role of ROS in cellular transformation and tumorigenesis, we utilized anendogenous and conditional oncogenic LSL-K-RasG12D allele7. K-RasG12D/+ and K-RasLSL/+ MEFs were compared to MEFs and NIH3T3 fibroblasts (NIH3T3s) transducedwith K-Ras4BG12D and H-RasV12 (Fig. 1a), since ectopic Ras introduction was previouslyreported to increase ROS production8. In contrast to ectopic overexpression of oncogenicRas, K-RasG12D/+ MEFs demonstrated lower levels of hydrogen peroxide, superoxide, andmitochondrial ROS compared to K-RasLSL/+ MEFs (Fig. 1a, Supplementary Fig. 2a,b).Accordingly, the level of 7,8-dihydro-8-oxo-2′-deoxyguanosine (8-oxo-dGuo), one of themajor products of DNA oxidation, was decreased in MEFs expressing endogenous K-RasG12D/+, but increased by ectopic oncogenic Ras (Fig. 1b). The levels of ROS and 8-oxo-dGuo were also lower in p53-/-; K-RasG12D/+ MEFs compared to p53-/-; K-RasLSL/+ MEFs(Supplementary Fig. 2c,d), supporting that these differences are not due to differentialactivation of a senescence program and demonstrating that increased ROS production is notrequired for full transformation7,9.
Because alterations of ROS can affect the intracellular redox state10, the ratio of reduced/oxidized glutathione (GSH/GSSG) was examined in cells expressing ectopic andendogenous K-RasG12D. While both elevated the level of total glutathione (Fig. 1d,f and ref.11), only the endogenous expression of K-RasG12D elevated the GSH/GSSG ratio topromote a more reduced intracellular environment (Fig. 1c,e). The production of ROS byectopic oncogenic Ras is chiefly regulated by NADPH-oxidase (Nox)12. Only the ectopicoverexpression of oncogenic Ras increased Nox activity and mRNA, providing amechanistic explanation for these differing results (Supplementary Fig. 3). Similar tooncogenic Ras, ectopic expression of Myc has also been shown to increase the production ofROS in NIH3T3 fibroblasts13 and accordingly we sought to determine whether near-physiological expression of this oncogene had a similar effect. Treatment of R26MER/MER
MEFs, which express a homozygous MycERT2 allele under the control of the Rosa26promoter14, with 4-OHT resulted in a substantial reduction of ROS (Fig. 1g). However, thiswas not a characteristic feature of all oncogenic stimuli as expression of activated Notch1and β-catenin did not lower ROS (Supplementary Fig. 4). Therefore, endogenous expressionof oncogenic K-Ras or MycERT2 lowers the level of cellular ROS, in contrast to the ectopicoverexpression of these oncogenes.
As the intracellular redox state is chiefly regulated by Nrf2, we examined Nrf2 protein levelsand activity in K-RasLSL/+ and K-RasG12D/+ MEFs by western blot, reporter assay andchromatin immunoprecipitation analysis of the Nrf2 target genes Hmox1 and Nqo1.Expression of K-RasG12D resulted in an approximately two-fold increase in Nrf2 protein andbinding activity compared to control MEFs (Fig. 2a,b, Supplementary Fig. 5a), which wasnot attributable to altered regulation by Keap12 (Supplementary Fig. 6). K-RasG12D/+ MEFsdemonstrated increased Nrf2 mRNA and increased expression of Hmox1, Nqo1, Gclc, Gclmand Ggt1 mRNA and protein (Fig. 2c, Supplementary Fig. 5b). Increased expression of Nrf2and its target genes was also observed following K-RasG12D expression in p53-/- MEFs, andfollowing ectopic expression of K-RasG12D and H-RasV12 in primary MEFs, but notfollowing expression of activated Notch1 or β-catenin (Supplementary Figs. 5c-g).However, expression of K-RasG12D in Nrf2-deficient MEFs failed to elevate totalglutathione and resulted in a more oxidized intracellular environment (Fig. 2d,e). Neither thecell culture conditions employed to express K-RasG12D nor the gene dosage of wild-type K-
DeNicola et al. Page 2
Nature. Author manuscript; available in PMC 2012 July 25.
NIH
-PA Author Manuscript
NIH
-PA Author Manuscript
NIH
-PA Author Manuscript
Ras affected the expression of Nrf2 target genes (Supplementary Fig. 7a,b). Additionally,ROS metabolism in wild-type MEFs was sensitive to acute changes in the levels of Keap1and Nrf2, further supporting a causal relationship between Nrf2 and ROS (SupplementaryFig. 7c-e). Furthermore, acute knockdown of Nrf2 attenuated the reduction in ROS by K-RasG12D (Fig. 2f), and the effects of Nrf2 depletion on ROS were dosage-dependent,supporting the importance of the level of Nrf2 mRNA for ROS control (Supplementary Fig.7f,g). Similar to K-RasG12D, activation of c-MycERT2 (with 4-OHT) promoted an increase inthe mRNA and protein levels of Nrf2 and its target genes (Fig. 2g,h, Supplementary Fig.7h). Furthermore, ChIP-seq data from the ENCODE consortium demonstrated direct bindingof Myc to the Nrf2 locus (Supplementary Fig. 8a)15. Therefore, the K-Ras and Myconcogenes can constitutively increase the transcription of Nrf2 to elevate the basal activityof the antioxidant and cellular detoxification program.
To investigate the mechanism of Nrf2 activation by K-RasG12D, the roles of the Raf/MEK/ERK and p38alpha MAPK pathways were investigated. First, cells were treated with apotent and specific inhibitor of MEK, AZD6244 (ARRY-142886) (Supplementary Fig. 9a-c), which restored the ROS level of K-RasG12D/+ cells nearly to the level of K-RasLSL/+ cells(Fig. 3a). Additionally, AZD6244 treatment resulted in decreased induction of Nrf2 and itstarget genes (Fig. 3b). Furthermore, endogenous expression of B-RafV619E (correspondingto human B-RafV600E)16 resulted in increased phospho-ERK levels, a decrease in ROS, andan increase in Nrf2 mRNA and antioxidant gene expression (Supplementary Fig. 9d-f). Aspreviously reported17, we found that p38alpha MAPK kinase did not activate Nrf2(Supplementary Fig. 9g-i). To determine the mechanism of increased Nrf2 expression,transcription factors downstream of MAPK signaling were examined. Accordingly,knockdown of Jun, Fra1, and Myc, but not JunD or Elk1, decreased the Nrf2 mRNA in K-RasG12D/+ cells, with almost complete rescue achieved with Jun (Fig. 3c). siRNA efficiencywas confirmed by real-time PCR and western blot (Supplementary Fig. 10a,b). Importantly,K-RasG12D/+ MEFs and B-RafV619E MEFs demonstrated elevated Jun protein levelscompared to control MEFs, and the elevated Jun level in K-RasG12D/+ MEFs was rescued bytreatment with AZD6244 (Fig. 3d). Furthermore, depletion of Jun with siRNA prevented thedecrease in ROS following expression of K-RasG12D (Fig. 3e, Supplementary Fig. 10c). Ourresults reinforce a prior finding that antioxidant response elements that closely resembleAP-1 sites help regulate the Nrf2 promoter18. Finally, ChIP-seq revealed that thetranscriptional start site of the Nrf2 locus is a direct binding target of Jun (SupplementaryFig. 8b)15. Thus, K-RasG12D and B-RafV619E stimulate transcription of Nrf2 via Jun andMyc.
We next examined whether these oncogenes promote activation of the Nrf2 antioxidant andcellular detoxification program in vivo. Elevated protein expression of the Nrf2 target geneNqo1 and decreased immunoreactivity for 8-oxo-dGuo were evident in K-Ras mutantmurine19 and human preinvasive pancreatic intraepithelial neoplasia (PanIN) and pancreaticductal adenocarcinoma (PDA), and in murine lung adenomas expressing B-RafV619E (Fig.4a, Supplementary Figs. 11a, 12, 13, 14a). PanIN also demonstrated reducedimmunoreactivity for the lipid peroxidation adduct malondialdehyde (MDA)(Supplementary Fig. 11b). Furthermore, K-RasG12D/+ pancreatic epithelial cellsdemonstrated activation of Nrf2 and decreased ROS compared to K-RasLSL/+, whiletreatment of human PDA tumor lines with K-Ras siRNA resulted in decreased Nrf2 andNqo1 mRNA and an increase in ROS (Supplementary Fig. 15). The activation of Nrf2 inhuman pancreatic cancer could not be explained by somatic mutations in NRF2 or KEAP1;we sequenced over 100 samples of human PDA and identified only one case with aconcomitant KEAP1 and K-RAS mutation (Supplemental material and Supplementary Fig.14b). Importantly, Nrf2-deficient murine PanIN were negative for Nqo1 and demonstratedsimilar levels of 8-oxo-dGuo and MDA in PanIN compared to neighboring morphologically
DeNicola et al. Page 3
Nature. Author manuscript; available in PMC 2012 July 25.
NIH
-PA Author Manuscript
NIH
-PA Author Manuscript
NIH
-PA Author Manuscript
normal ductal cells, supporting a role for Nrf2 in ROS detoxification in vivo (Fig. 4b,Supplementary Fig. 11b,c). Nrf2-deficient salivary gland did not demonstrate elevated 8-oxo-dGuo immunoreactivity, suggesting that K-RasG12D-expressing cells are more relianton Nrf2 for ROS detoxification (Supplementary Fig. 16a). Therefore, an antioxidantprogram is operant during tumorigenesis, consistent with our findings that link oncogenic K-Ras and B-Raf expression with the activation of Nrf2.
To investigate whether activation of Nrf2 promotes K-RasG12D–initiated carcinomas, theeffects of Nrf2 ablation were examined in established mouse models of pancreatic and lungcancer. Nrf2-deficient pancreata were noted to contain fewer PanIN (Fig. 4c). While theproliferation of the salivary gland was unchanged (Supplementary Fig. 16b), PanIN fromNrf2-deficient mice were significantly less proliferative and demonstrated an increasedcontent of cells exhibiting senescence-associated β-galactosidase activity (Fig. 4d,Supplementary Fig. 17a). No significant differences were observed in PanIN cell apoptosisor DNA damage (Supplementary Fig. 17b,c). Senescence was also observed in K-RasG12D/+
MEFs following acute depletion of Nrf2 with siRNA and was dependent on expression ofp53 (Supplementary Fig. 17d). The Nrf2 dependent proliferation defect noted in PanIN wasalso observed in MEFs, and both could be rescued by the antioxidant N-acetyl cysteine(Supplementary Fig. 18a,b). Furthermore, treatment of Nrf2+/+ PanIN mice with aglutathione synthesis inhibitor resulted in a significant decrease in the proliferation of PanINbut not adjacent acinar cells (Supplementary Fig. 18c-e). Additionally, the role of Nrf2 inlung cancer development was investigated. Nrf2 deficiency resulted in a significantreduction in disease burden and proliferation, and an increase in median survival(Supplementary Fig. 19). While we cannot exclude the potential involvement of non-cellautonomous effects arising from constitutive Nrf2 deficiency, the major impact appeared tobe restricted to tumor initiation and proliferation of nascent preneoplastic cells. These resultsdemonstrate that Nrf2 promotes K-RasG12D-initiated pancreatic and lung tumorigenesis andproliferation.
ROS can stimulate tumorigenesis through the oxidation of DNA and subsequent mutation ofgenes that promote carcinogenesis. In contrast, we found that activating an ROS-detoxification program contributed to tumorigenesis, although our study does not exclude arole for other Nrf2 targets such as drug-metabolizing enzymes and efflux pumps, heat shockproteins, 26S proteasome subunits, growth factors and receptors6. Future studies will benecessary to determine the role of these Nrf2 functions in tumors with activated Nrf2.Increased expression of Nrf2 target genes and increased stability of Nrf2 caused by somaticmutations in Nrf2 and Keap1 are well documented in human cancer, providing onemechanism for enhanced Nrf2 activity during tumorigenesis. Our work describes oncogenicsignaling as an alternative mechanism to activate Nrf2 transcription during tumorigenesis(Supplementary Fig. 1), and suggests that modulation of the redox state is uniformlyimportant in cancer and may therefore represent a therapeutic opportunity. Thus,constitutively elevated Nrf2 activity in cancer cells occurs through two distinct mechanisms:diminished Nrf2 turnover and augmented Nrf2 mRNA levels.
MethodsChromatin Immunoprecipitation
Chromatin Immunoprecipitation was performed as described25. 5×10⁶ cells were fixed at37°C in DMEM + 1% Formaldehyde for 10 minutes and lysed in 1% SDS, 10mM EDTA,50 mM Tris-HCl pH 8.1 plus protease inhibitors and sonicated for 20 minutes in a coldwater bath until DNA was an average size of 1Kb. Input was saved and lysate was diluted inIP buffer (1% Triton, 2mM EDTA, 150mM NaCl, 20 mM Tris-HCl pH 8.1) and mixed withbeads (Dynal Protein A, Invitrogen) that were pre-bound overnight with Nrf2 antibody
DeNicola et al. Page 4
Nature. Author manuscript; available in PMC 2012 July 25.
NIH
-PA Author Manuscript
NIH
-PA Author Manuscript
NIH
-PA Author Manuscript
(H-300, Santa Cruz). Chromatin was immunoprecipitated overnight, and beads were washed6 times with RIPA buffer (50mM HEPES pH 7.6, 1mM EDTA, 0.7% Na deoxycholate, 1%NP-40, 0.5M LiCl) and twice with TE. Beads were incubated with 1% SDS, 0.1M NaHCO3for 30 minutes at room temperature, and then crosslinks were reversed on both the input andthe IP by heating overnight in a 65°C water bath. DNA was purified with a QIAquick spinkit (Qiagen) and Q-PCR was performed in triplicate with power sybr mastermix (AppliedBiosystems) on an Applied Biosystems 7900HT with the following primers26,27: Nqo1-F 5′-GCAGTTTCTAAGAGCAGAAC-3′, Nqo1-R 5′-GTAGATTAGTCCTCACTCAGCCG-3′, Nqo1 Non-specific-F 5′-AGGAGATGGAAGGCAGGAAG-3′, Nqo1 Non-specific-R 5′-GGGCGCACTATTGTCATCTT-3′, Hmox-1-F 5′-GGGCTAGCATGCGAAGTGAG-3′,Hmox-1-R 5′-AGACTCCGCCCTAAGGGTTC-3′, Hmox-1 Non-specific-F 5′-GGCAGGTATGGACCTTCAAA-3′, Hmox-1 Non-specific-R 5-AAAGGAGTCAGGGAGGGAGA-3′.
ChIP-seq (ENCODE)These data were generated and analyzed by the labs of Michael Snyder, Mark Gerstein andSherman Weissman at Yale University; Peggy Farnham at UC Davis; and Kevin Struhl atHarvard using the K562 cell line. The following antibodies were used: c-Jun (sc-1694, SantaCruz), c-Myc (sc-764, Santa Cruz). The data can be accessed athttp://genome.ucsc.edu/ENCODE/
Human pancreatic cancer cell cultureMiaPaCa2 and Hs766T cells were obtained from CRUK Clare Hall Laboratories. Both lineswere grown in DMEM + 10% FBS. siRNA transfections were performed withDharmaFECT 1.
ImmunohistochemistryHuman tissue was donated for research purposes by patients undergoing pancreatic surgeryat a tertiary hepatopancreaticobiliary referral center (Addenbrookes Teaching HospitalsNHS Trust, Cambridge, UK). Ethical approval was granted by the local research and ethicscommittee (LREC Number: 08/H0306/32). Paraffin embedded mouse and human specimenswere deparaffinized and rehydrated, followed by antigen retrieval in boiling citrate buffer.The following primary antibodies were used: Ki-67 (SP-6, Neomarkers), Nqo1 (Abcam,Sigma Aldrich), 8-oxo-dGuo ([N45.1], Abcam), γ -H2AX (Millipore), Cleaved caspase 3(Cell Signaling), anti-Malondialdehyde (Abcam). HRP-based detection reagents were usedfor all IHC except 8-oxo-dGuo, for which AP-based reagents were used. 8-oxo-dGuospecificity was verified by treating sections for 1 hour with 1U/ml DNase at 37°C. Forquantification of 8-oxo-dGuo, mean signal intensity was calculated using Adobe PhotoshopCS. Immunohistochemistry images were converted to grayscale images, inverted, and meanpixel 8-oxo-dGuo intensity analyzed. For murine Nqo1 IHC, the Sigma Aldrich anti-Nqo1antibody was used, and the staining pattern was confirmed to be reproducible with theAbcam antibody (not shown). The Abcam Nqo1 antibody was used for human tissue.
Luciferase assayLSL-K-RasG12D and Nrf2-/-; K-RasG12D MEFs were plated in 12 well dishes at a density of5 × 104 cells/well and infected with a Cignal Lenti ARE Reporter (Qiagen) at an MOI of 10.After 6 hours the cells were split 1:2 and infected the next day with Ad-mock and Ad-cre.After 4 days the cells were plated at 70% confluence and analyzed for luciferase activityusing the Dual-Luciferase Reporter Assay System (Promega) with a luminometer. Lysateswere analyzed in duplicate and cells lacking the ARE reporter were included as a control.
DeNicola et al. Page 5
Nature. Author manuscript; available in PMC 2012 July 25.
NIH
-PA Author Manuscript
NIH
-PA Author Manuscript
NIH
-PA Author Manuscript
Mitochondrial ROSCells were incubated in serum- and phenol red-free DMEM with 5uM MitoSOX or 100nMMitotracker Green FM (both Invitrogen) for 30 minutes and analyzed by flow cytometry.Mitochondrial ROS was plotted as the mitochondrial ROS signal (MitoSOX) normalized tomitochondrial mass (Mitotracker Green FM).
Nox Activity assayCells were washed twice with ice cold PBS, scraped in PBS, and centrifuged to obtain a cellpellet. The pellet was dounce homogenized in PBS + 1mM MgCl2 + 1mM EGTA +protease inhibitors and 100ul of homogenate was added to 100ul of 2× reaction buffer (PBS+ 1mM MgCl2 + 1mM EGTA + 300mM sucrose + 10uM lucigenin [Sigma Aldrich] +200uM NADPH [Sigma Aldrich]) and relative light units were measured with aluminometer every minute for 10 minutes. Specificity was confirmed by adding the specificNox inhibitor diphenylene iodonium (10uM, Sigma Aldrich). Graphs show onerepresentative measurement in the linear range (2-3 minutes) and are expressed as relativelight units per μg protein.
Nrf2 stabilityMEFs were treated with 25ug/ml cycloheximide (Acros Organics) for indicated time pointsand total cell lysates extracted and separated by SDS-PAGE. Gels were transferred tonitrocellulose (Biorad), and membranes were probed with Anti-Nrf2 antibody, affinitypurified as described.28
Quantification of proliferation and neoplasmsValues for proliferation were obtained by counting at least 5 fields of greater than 50 cells.For PanIN studies, only cells contained in PanIN-1a were included in the analysis(surrounding stromal, acinar or immune cells were all excluded). Proliferation is determinedas a percentage and therefore represents the number of Ki-67 positive PanIN-1a cells /totalPanIN-1a cells. For quantification of lung disease burden, total lung areas and neoplasmareas were calculated using Image J29 and disease burden was represented as a percent oftotal area. For characterization of individual neoplasms, data was represented as neoplasms/lung area. For quantification of PanIN per mouse, paraffin embedded pancreata weresectioned at 100 micron intervals and individual PanIN were counted.
Ras-GTP activity assaysRas-GTP levels were determined according to the manufacturer's instructions (Millipore).Membranes were also blotted with anti-Rac antibody (Millipore) as a loading control.
Reagents4-hydroxy-tamoxifen (4-OHT) was obtained from Sigma Aldrich. AZD6244(ARRY-142886) was obtained from Symansis.
Senescence-associated b-galactosidase stainingCells were fixed in 2% formaldehyde/0.2% glutaraldehyde in PBS for 5 minutes and stainedin staining solution (Citric acid/Phosphate buffer pH 6.0, 150mM NaCl, 2mM MgCl, 5mMPotassium Ferricyanide, 5mM Potassium Ferrocyanide, and 1mg/ml X-gal) overnight at37°C. Fields of at least 50 cells were counted, in triplicate. For tissue, fresh pancreas frommice harboring PanIN was cut into small pieces (approximately 1-3 mm cubes) and fixed for2 hours in 4% PFA in PBS on ice, and incubated in staining solution overnight at 37°C. Thepieces were then fixed in formalin overnight, followed by a quick processing and embedding
DeNicola et al. Page 6
Nature. Author manuscript; available in PMC 2012 July 25.
NIH
-PA Author Manuscript
NIH
-PA Author Manuscript
NIH
-PA Author Manuscript
in paraffin wax. Sections were cut with a thickness of 10 microns, dewaxed with minimalexposure to xylene, and counterstained with nuclear fast red. Five fields of at least 50 cellswere counted per mouse.
Sequencing of KEAP1 and NRF2 in patient samplesXenograft enriched pancreatic cancers were created as described previously30. Cell lineswere obtained from the ATCC (Aspc-1, CAPAN1, CFPAC1, Hs766T, MiaPACA2, Panc-1and Su86.86) or from other sources. PK8 and PK9 were kindly provided by Dr. A. Horii31.PL11, PL19, PL23, (kindly provided by Dr. E. Jaffee), and XPA1 (kindly provided by Dr.A. Maitra) were also used. Genomic DNA from immortalized peripheral blood lymphocytesof 29 patients with familial pancreatic cancer were obtained from the National FamilialPancreatic Tumor Registry (NFPTR). The acquisition of human tissues from resectionspecimens or the NFPTR was approved by the Institutional Review Board at the JohnsHopkins Hospital. The coding sequences of exons 2-6, encompassing the entire codingsequence of KEAP1, and exon 2 of NRF2 (official current gene name, NFE2L2),encompassing the KEAP1 binding domain, were amplified from genomic DNAs usingintronic primers flanking each exon. Primers were designed using Primer3 online software(http://frodo.wi.mit.edu/primer3). PCR-amplified products were sequenced using nestedprimers and an ABI Prism model 3700 Applied Biosystems, Foster City, CA). Sequenceanalysis employed Sequencher™ version 4.8 software (Gene Codes, Ann Arbor, MI).Identified variants were verified by independent PCR amplification and reverse sequencingof the amplified products. The somatic or germline nature of each variant was determined bycomparing their respective sequences to matched normal DNA available from the samepatients. The following primers were used:
Location Forward Reverse
Keap1 Exon 2 ATCAGGTCGGGGAAGTTTG AGCCCAGAACCTCCTTTTTC
Keap1 Exon 3 GTCAGCGGCAGTGATAAGTTAC TGACAGTCCCCTAAGCATTTC
Keap1 Exon 4 TCCACGAAGGTCAGCTATAATG TCCAGGGCTTCTGTGGTTAC
Keap1 Exon 5 TCTCTCCCCGCTTCATTTC GCAAAAGCAGTCCACAAAAG
Keap1 Exon 6 GACCATCCCTTCTGTTCTTC GCTTTGGACTTCTTTTGAGATG
Nrf2 Exon 2 CCACCATCAACAGTGGCATA AAGGCAAAGCTGGAACTCAA
Statistical AnalysesAll data are expressed as the mean ± SEM. Results are representative examples of three ormore individual experiments. Statistical analyses were performed with the Mann-Whitney Utest or Student's T-test (*p < 0.05; **p < 0.01; ***p < 0.001; ns, not significant). Graph PadPrism was used for both analyses.
TransfectionsDNA transfections were performed with Fugene 6 (Roche) or Lipofectamine 2000(Invitrogen). siRNA transfections were performed with ON-TARGETplus SMARTpoolsiRNA using DharmaFECT 1 reagent (both Dharmacon) according to the manufacturer′sinstructions. The following siRNA sequences were used:
DeNicola et al. Page 7
Nature. Author manuscript; available in PMC 2012 July 25.
NIH
-PA Author Manuscript
NIH
-PA Author Manuscript
NIH
-PA Author Manuscript
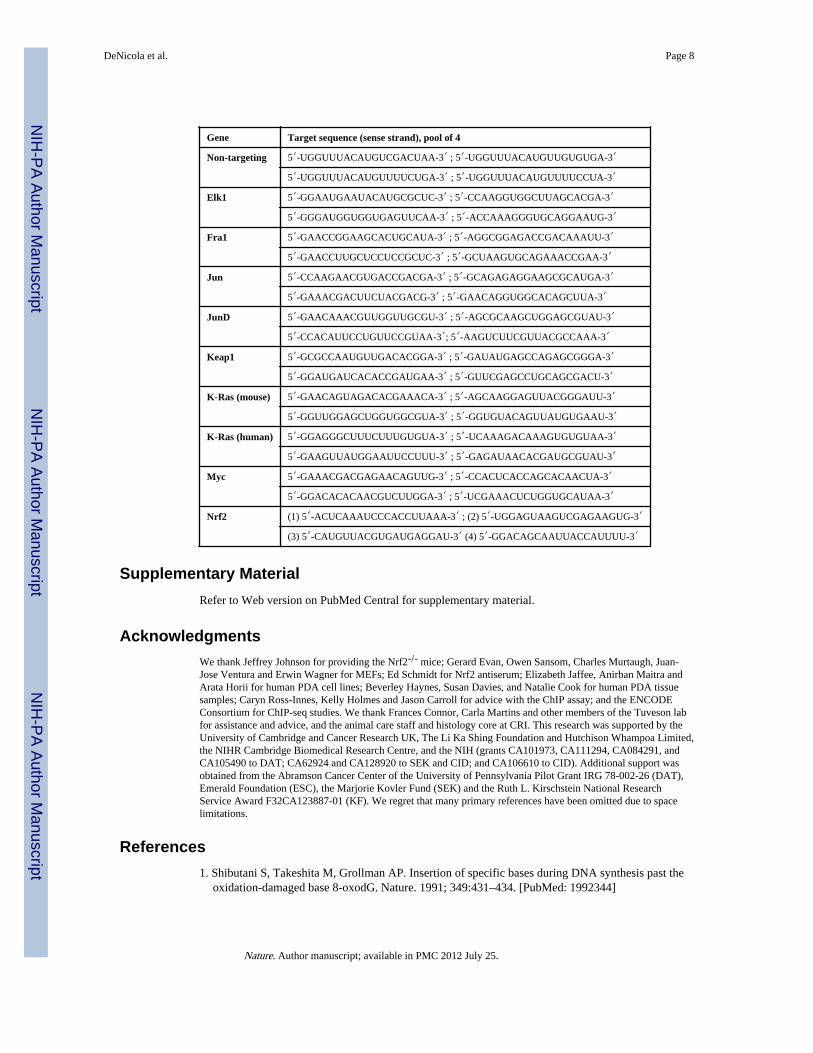
Gene Target sequence (sense strand), pool of 4
Non-targeting 5′-UGGUUUACAUGUCGACUAA-3′ ; 5′-UGGUUUACAUGUUGUGUGA-3′
5′-UGGUUUACAUGUUUUCUGA-3′ ; 5′-UGGUUUACAUGUUUUCCUA-3′
Elk1 5′-GGAAUGAAUACAUGCGCUC-3′ ; 5′-CCAAGGUGGCUUAGCACGA-3′
5′-GGGAUGGUGGUGAGUUCAA-3′ ; 5′-ACCAAAGGGUGCAGGAAUG-3′
Fra1 5′-GAACCGGAAGCACUGCAUA-3′ ; 5′-AGGCGGAGACCGACAAAUU-3′
5′-GAACCUUGCUCCUCCGCUC-3′ ; 5′-GCUAAGUGCAGAAACCGAA-3′
Jun 5′-CCAAGAACGUGACCGACGA-3′ ; 5′-GCAGAGAGGAAGCGCAUGA-3′
5′-GAAACGACUUCUACGACG-3′ ; 5′-GAACAGGUGGCACAGCUUA-3′
JunD 5′-GAACAAACGUUGGUUGCGU-3′ ; 5′-AGCGCAAGCUGGAGCGUAU-3′
5′-CCACAUUCCUGUUCCGUAA-3′; 5′-AAGUCUUCGUUACGCCAAA-3′
Keap1 5′-GCGCCAAUGUUGACACGGA-3′ ; 5′-GAUAUGAGCCAGAGCGGGA-3′
5′-GGAUGAUCACACCGAUGAA-3′ ; 5′-GUUCGAGCCUGCAGCGACU-3′
K-Ras (mouse) 5′-GAACAGUAGACACGAAACA-3′ ; 5′-AGCAAGGAGUUACGGGAUU-3′
5′-GGUUGGAGCUGGUGGCGUA-3′ ; 5′-GGUGUACAGUUAUGUGAAU-3′
K-Ras (human) 5′-GGAGGGCUUUCUUUGUGUA-3′ ; 5′-UCAAAGACAAAGUGUGUAA-3′
5′-GAAGUUAUGGAAUUCCUUU-3′ ; 5′-GAGAUAACACGAUGCGUAU-3′
Myc 5′-GAAACGACGAGAACAGUUG-3′ ; 5′-CCACUCACCAGCACAACUA-3′
5′-GGACACACAACGUCUUGGA-3′ ; 5′-UCGAAACUCUGGUGCAUAA-3′
Nrf2 (1) 5′-ACUCAAAUCCCACCUUAAA-3′ ; (2) 5′-UGGAGUAAGUCGAGAAGUG-3′
(3) 5′-CAUGUUACGUGAUGAGGAU-3′ (4) 5′-GGACAGCAAUUACCAUUUU-3′
Supplementary MaterialRefer to Web version on PubMed Central for supplementary material.
AcknowledgmentsWe thank Jeffrey Johnson for providing the Nrf2-/- mice; Gerard Evan, Owen Sansom, Charles Murtaugh, Juan-Jose Ventura and Erwin Wagner for MEFs; Ed Schmidt for Nrf2 antiserum; Elizabeth Jaffee, Anirban Maitra andArata Horii for human PDA cell lines; Beverley Haynes, Susan Davies, and Natalie Cook for human PDA tissuesamples; Caryn Ross-Innes, Kelly Holmes and Jason Carroll for advice with the ChIP assay; and the ENCODEConsortium for ChIP-seq studies. We thank Frances Connor, Carla Martins and other members of the Tuveson labfor assistance and advice, and the animal care staff and histology core at CRI. This research was supported by theUniversity of Cambridge and Cancer Research UK, The Li Ka Shing Foundation and Hutchison Whampoa Limited,the NIHR Cambridge Biomedical Research Centre, and the NIH (grants CA101973, CA111294, CA084291, andCA105490 to DAT; CA62924 and CA128920 to SEK and CID; and CA106610 to CID). Additional support wasobtained from the Abramson Cancer Center of the University of Pennsylvania Pilot Grant IRG 78-002-26 (DAT),Emerald Foundation (ESC), the Marjorie Kovler Fund (SEK) and the Ruth L. Kirschstein National ResearchService Award F32CA123887-01 (KF). We regret that many primary references have been omitted due to spacelimitations.
References1. Shibutani S, Takeshita M, Grollman AP. Insertion of specific bases during DNA synthesis past the
oxidation-damaged base 8-oxodG. Nature. 1991; 349:431–434. [PubMed: 1992344]
DeNicola et al. Page 8
Nature. Author manuscript; available in PMC 2012 July 25.
NIH
-PA Author Manuscript
NIH
-PA Author Manuscript
NIH
-PA Author Manuscript
2. Itoh K, et al. Keap1 represses nuclear activation of antioxidant responsive elements by Nrf2 throughbinding to the amino-terminal Neh2 domain. Genes Dev. 1999; 13:76–86. [PubMed: 9887101]
3. Wakabayashi N, et al. Keap1-null mutation leads to postnatal lethality due to constitutive Nrf2activation. Nat Genet. 2003; 35:238–245. [PubMed: 14517554]
4. Nguyen T, Nioi P, Pickett CB. The Nrf2-antioxidant response element signaling pathway and itsactivation by oxidative stress. J Biol Chem. 2009; 284:13291–13295. [PubMed: 19182219]
5. Venugopal R, Jaiswal AK. Nrf2 and Nrf1 in association with Jun proteins regulate antioxidantresponse element-mediated expression and coordinated induction of genes encoding detoxifyingenzymes. Oncogene. 1998; 17:3145–3156. [PubMed: 9872330]
6. Hayes JD, McMahon M. NRF2 and KEAP1 mutations: permanent activation of an adaptiveresponse in cancer. Trends Biochem Sci. 2009; 34:176–188. [PubMed: 19321346]
7. Tuveson DA, et al. Endogenous oncogenic K-ras(G12D) stimulates proliferation and widespreadneoplastic and developmental defects. Cancer Cell. 2004; 5:375–387. [PubMed: 15093544]
8. Lee AC, et al. Ras proteins induce senescence by altering the intracellular levels of reactive oxygenspecies. J Biol Chem. 1999; 274:7936–7940. [PubMed: 10075689]
9. Mitsushita J, Lambeth JD, Kamata T. The superoxide-generating oxidase Nox1 is functionallyrequired for Ras oncogene transformation. Cancer Res. 2004; 64:3580–3585. [PubMed: 15150115]
10. Cakir Y, Ballinger SW. Reactive species-mediated regulation of cell signaling and the cell cycle:the role of MAPK. Antioxid Redox Signal. 2005; 7:726–740. [PubMed: 15890019]
11. Recktenwald CV, Kellner R, Lichtenfels R, Seliger B. Altered detoxification status and increasedresistance to oxidative stress by K-ras transformation. Cancer Res. 2008; 68:10086–10093.[PubMed: 19074874]
12. Irani K, et al. Mitogenic signaling mediated by oxidants in Ras-transformed fibroblasts. Science.1997; 275:1649–1652. [PubMed: 9054359]
13. Tanaka H, et al. E2F1 and c-Myc potentiate apoptosis through inhibition of NF-kappaB activitythat facilitates MnSOD-mediated ROS elimination. Mol Cell. 2002; 9:1017–1029. [PubMed:12049738]
14. Murphy DJ, et al. Distinct thresholds govern Myc's biological output in vivo. Cancer Cell. 2008;14:447–457. [PubMed: 19061836]
15. Birney E, et al. Identification and analysis of functional elements in 1% of the human genome bythe ENCODE pilot project. Nature. 2007; 447:799–816. [PubMed: 17571346]
16. Karreth FA, DeNicola GM, Winter SP, Tuveson DA. C-Raf inhibits MAPK activation andtransformation by B-Raf(V600E). Mol Cell. 2009; 36:477–486. [PubMed: 19917255]
17. Keum YS, et al. Mechanism of action of sulforaphane: inhibition of p38 mitogen-activated proteinkinase isoforms contributing to the induction of antioxidant response element-mediated hemeoxygenase-1 in human hepatoma HepG2 cells. Cancer research. 2006; 66:8804–8813. [PubMed:16951197]
18. Kwak MK, Itoh K, Yamamoto M, Kensler TW. Enhanced expression of the transcription factorNrf2 by cancer chemopreventive agents: role of antioxidant response element-like sequences in thenrf2 promoter. Mol Cell Biol. 2002; 22:2883–2892. [PubMed: 11940647]
19. Hingorani SR, et al. Preinvasive and invasive ductal pancreatic cancer and its early detection in themouse. Cancer Cell. 2003; 4:437–450. [PubMed: 14706336]
20. Jackson EL, et al. Analysis of lung tumor initiation and progression using conditional expression ofoncogenic K-ras. Genes Dev. 2001; 15:3243–3248. [PubMed: 11751630]
21. Chan K, Lu R, Chang JC, Kan YW. NRF2, a member of the NFE2 family of transcription factors,is not essential for murine erythropoiesis, growth, and development. Proc Natl Acad Sci U S A.1996; 93:13943–13948. [PubMed: 8943040]
22. Kawaguchi Y, et al. The role of the transcriptional regulator Ptf1a in converting intestinal topancreatic progenitors. Nat Genet. 2002; 32:128–134. [PubMed: 12185368]
23. Park JH, et al. Evidence for the aldo-keto reductase pathway of polycyclic aromatic trans-dihydrodiol activation in human lung A549 cells. Proc Natl Acad Sci U S A. 2008; 105:6846–6851. [PubMed: 18474869]
DeNicola et al. Page 9
Nature. Author manuscript; available in PMC 2012 July 25.
NIH
-PA Author Manuscript
NIH
-PA Author Manuscript
NIH
-PA Author Manuscript
24. Zhu P, Oe T, Blair IA. Determination of cellular redox status by stable isotope dilution liquidchromatography/mass spectrometry analysis of glutathione and glutathione disulfide. RapidCommun Mass Spectrom. 2008; 22:432–440. [PubMed: 18215009]
25. Carroll JS, et al. Chromosome-wide mapping of estrogen receptor binding reveals long-rangeregulation requiring the forkhead protein FoxA1. Cell. 2005; 122:33–43. [PubMed: 16009131]
26. He X, Chen MG, Lin GX, Ma Q. Arsenic induces NAD(P)H-quinone oxidoreductase I bydisrupting the Nrf2 × Keap1 × Cul3 comple × and recruiting Nrf2 × Maf to the antioxidantresponse element enhancer. J Biol Chem. 2006; 281:23620–23631. [PubMed: 16785233]
27. Sun J, et al. Hemoprotein Bach1 regulates enhancer availability of heme oxygenase-1 gene. EMBOJ. 2002; 21:5216–5224. [PubMed: 12356737]
28. Suvorova ES, et al. Cytoprotective Nrf2 pathway is induced in chronically txnrd 1-deficienthepatocytes. PLoS One. 2009; 4:e6158. [PubMed: 19584930]
29. Rasband, WS. ImageJ. U. S. National Institutes of Health; Bethesda, Maryland, USA: 1997-2008.
30. Hahn SA, et al. Allelotype of pancreatic adenocarcinoma using xenograft enrichment. Cancer Res.1995; 55:4670–4675. [PubMed: 7553647]
31. Sun C, et al. Characterization of the mutations of the K-ras, p53, p16, and SMAD4 genes in 15human pancreatic cancer cell lines. Oncol Rep. 2001; 8:89–92. [PubMed: 11115575]
DeNicola et al. Page 10
Nature. Author manuscript; available in PMC 2012 July 25.
NIH
-PA Author Manuscript
NIH
-PA Author Manuscript
NIH
-PA Author Manuscript
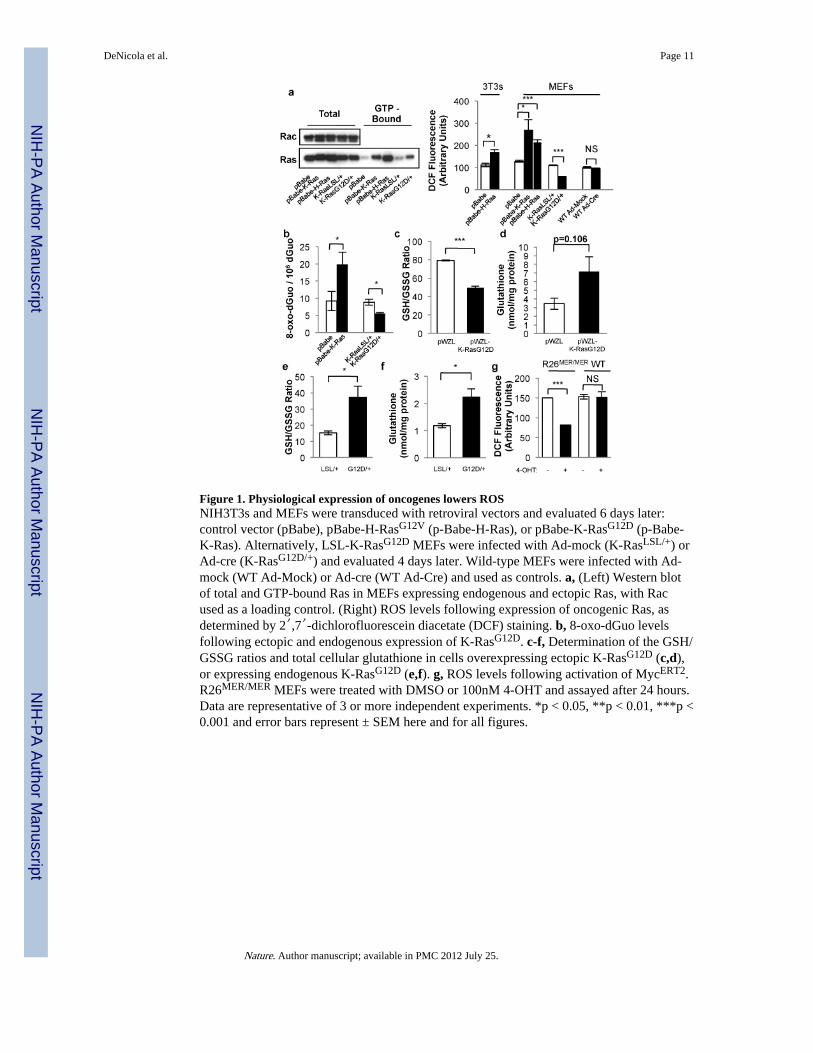
Figure 1. Physiological expression of oncogenes lowers ROSNIH3T3s and MEFs were transduced with retroviral vectors and evaluated 6 days later:control vector (pBabe), pBabe-H-RasG12V (p-Babe-H-Ras), or pBabe-K-RasG12D (p-Babe-K-Ras). Alternatively, LSL-K-RasG12D MEFs were infected with Ad-mock (K-RasLSL/+) orAd-cre (K-RasG12D/+) and evaluated 4 days later. Wild-type MEFs were infected with Ad-mock (WT Ad-Mock) or Ad-cre (WT Ad-Cre) and used as controls. a, (Left) Western blotof total and GTP-bound Ras in MEFs expressing endogenous and ectopic Ras, with Racused as a loading control. (Right) ROS levels following expression of oncogenic Ras, asdetermined by 2′,7′-dichlorofluorescein diacetate (DCF) staining. b, 8-oxo-dGuo levelsfollowing ectopic and endogenous expression of K-RasG12D. c-f, Determination of the GSH/GSSG ratios and total cellular glutathione in cells overexpressing ectopic K-RasG12D (c,d),or expressing endogenous K-RasG12D (e,f). g, ROS levels following activation of MycERT2.R26MER/MER MEFs were treated with DMSO or 100nM 4-OHT and assayed after 24 hours.Data are representative of 3 or more independent experiments. *p < 0.05, **p < 0.01, ***p <0.001 and error bars represent ± SEM here and for all figures.
DeNicola et al. Page 11
Nature. Author manuscript; available in PMC 2012 July 25.
NIH
-PA Author Manuscript
NIH
-PA Author Manuscript
NIH
-PA Author Manuscript
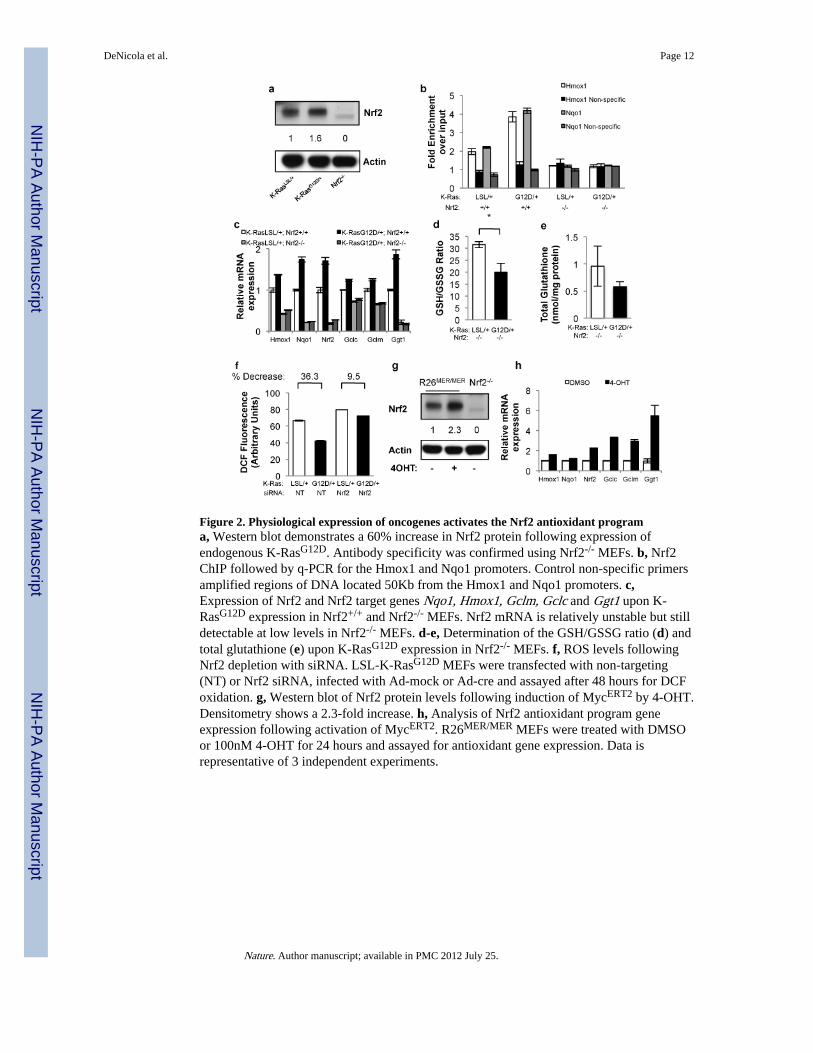
Figure 2. Physiological expression of oncogenes activates the Nrf2 antioxidant programa, Western blot demonstrates a 60% increase in Nrf2 protein following expression ofendogenous K-RasG12D. Antibody specificity was confirmed using Nrf2-/- MEFs. b, Nrf2ChIP followed by q-PCR for the Hmox1 and Nqo1 promoters. Control non-specific primersamplified regions of DNA located 50Kb from the Hmox1 and Nqo1 promoters. c,Expression of Nrf2 and Nrf2 target genes Nqo1, Hmox1, Gclm, Gclc and Ggt1 upon K-RasG12D expression in Nrf2+/+ and Nrf2-/- MEFs. Nrf2 mRNA is relatively unstable but stilldetectable at low levels in Nrf2-/- MEFs. d-e, Determination of the GSH/GSSG ratio (d) andtotal glutathione (e) upon K-RasG12D expression in Nrf2-/- MEFs. f, ROS levels followingNrf2 depletion with siRNA. LSL-K-RasG12D MEFs were transfected with non-targeting(NT) or Nrf2 siRNA, infected with Ad-mock or Ad-cre and assayed after 48 hours for DCFoxidation. g, Western blot of Nrf2 protein levels following induction of MycERT2 by 4-OHT.Densitometry shows a 2.3-fold increase. h, Analysis of Nrf2 antioxidant program geneexpression following activation of MycERT2. R26MER/MER MEFs were treated with DMSOor 100nM 4-OHT for 24 hours and assayed for antioxidant gene expression. Data isrepresentative of 3 independent experiments.
DeNicola et al. Page 12
Nature. Author manuscript; available in PMC 2012 July 25.
NIH
-PA Author Manuscript
NIH
-PA Author Manuscript
NIH
-PA Author Manuscript
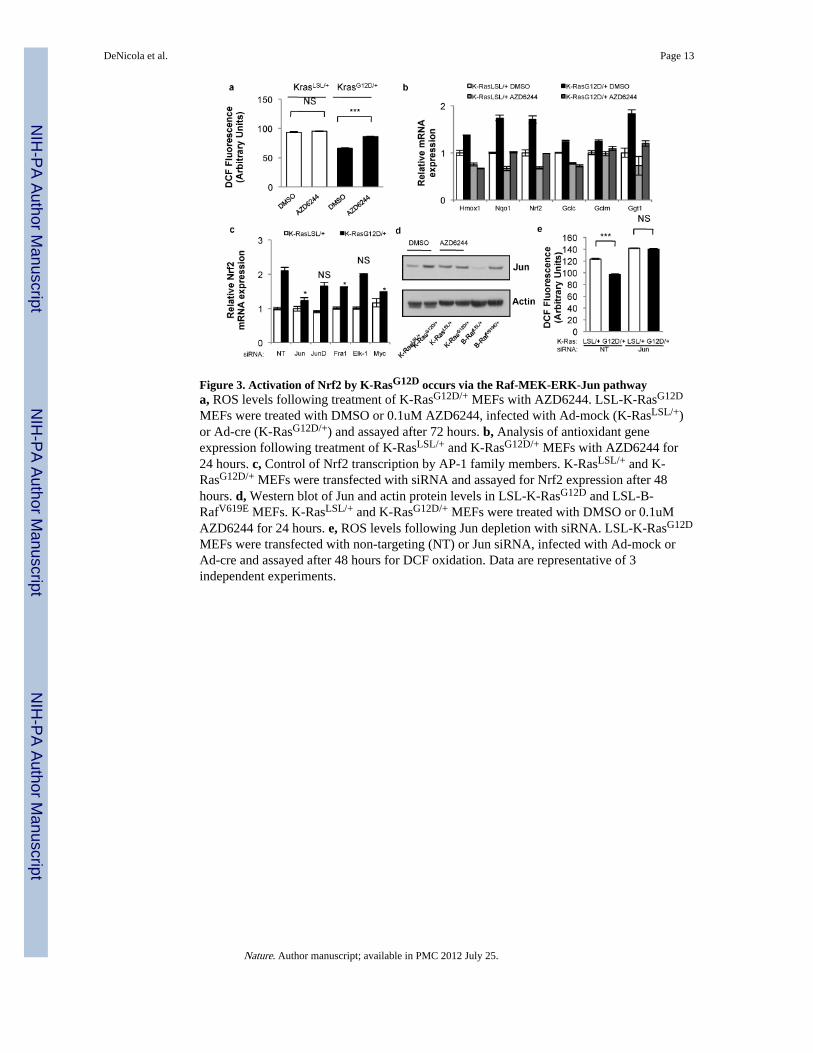
Figure 3. Activation of Nrf2 by K-RasG12D occurs via the Raf-MEK-ERK-Jun pathwaya, ROS levels following treatment of K-RasG12D/+ MEFs with AZD6244. LSL-K-RasG12D
MEFs were treated with DMSO or 0.1uM AZD6244, infected with Ad-mock (K-RasLSL/+)or Ad-cre (K-RasG12D/+) and assayed after 72 hours. b, Analysis of antioxidant geneexpression following treatment of K-RasLSL/+ and K-RasG12D/+ MEFs with AZD6244 for24 hours. c, Control of Nrf2 transcription by AP-1 family members. K-RasLSL/+ and K-RasG12D/+ MEFs were transfected with siRNA and assayed for Nrf2 expression after 48hours. d, Western blot of Jun and actin protein levels in LSL-K-RasG12D and LSL-B-RafV619E MEFs. K-RasLSL/+ and K-RasG12D/+ MEFs were treated with DMSO or 0.1uMAZD6244 for 24 hours. e, ROS levels following Jun depletion with siRNA. LSL-K-RasG12D
MEFs were transfected with non-targeting (NT) or Jun siRNA, infected with Ad-mock orAd-cre and assayed after 48 hours for DCF oxidation. Data are representative of 3independent experiments.
DeNicola et al. Page 13
Nature. Author manuscript; available in PMC 2012 July 25.
NIH
-PA Author Manuscript
NIH
-PA Author Manuscript
NIH
-PA Author Manuscript
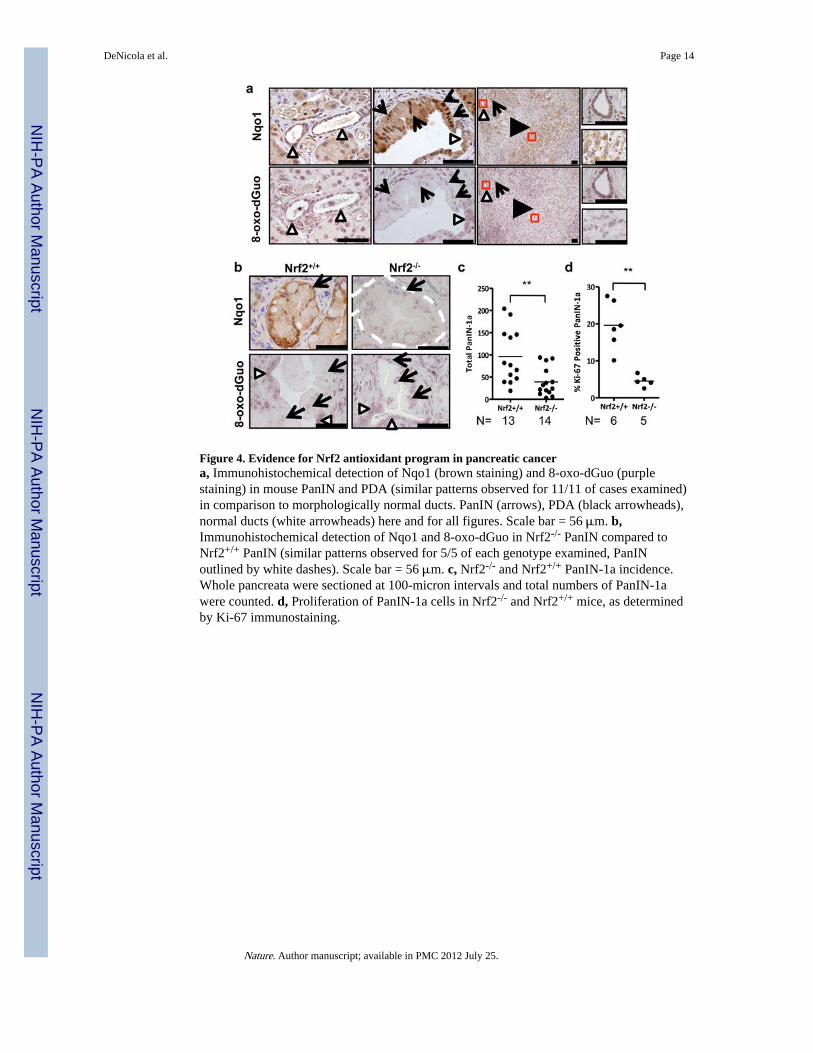
Figure 4. Evidence for Nrf2 antioxidant program in pancreatic cancera, Immunohistochemical detection of Nqo1 (brown staining) and 8-oxo-dGuo (purplestaining) in mouse PanIN and PDA (similar patterns observed for 11/11 of cases examined)in comparison to morphologically normal ducts. PanIN (arrows), PDA (black arrowheads),normal ducts (white arrowheads) here and for all figures. Scale bar = 56 μm. b,Immunohistochemical detection of Nqo1 and 8-oxo-dGuo in Nrf2-/- PanIN compared toNrf2+/+ PanIN (similar patterns observed for 5/5 of each genotype examined, PanINoutlined by white dashes). Scale bar = 56 μm. c, Nrf2-/- and Nrf2+/+ PanIN-1a incidence.Whole pancreata were sectioned at 100-micron intervals and total numbers of PanIN-1awere counted. d, Proliferation of PanIN-1a cells in Nrf2-/- and Nrf2+/+ mice, as determinedby Ki-67 immunostaining.
DeNicola et al. Page 14
Nature. Author manuscript; available in PMC 2012 July 25.
NIH
-PA Author Manuscript
NIH
-PA Author Manuscript
NIH
-PA Author Manuscript