All-Optical Clock Recovery for 20 Gb/s Using an Amplified Feedback DFB Laser
Upload
independentCategory
view
2download
0
Genomic Profiling Identifies GATA6 as a CandidateOncogene Amplified in Pancreatobiliary CancerKevin A. Kwei1., Murali D. Bashyam1,2,3.", Jessica Kao1, Raman Ratheesh2, Edumakanti C. Reddy3,
Young H. Kim1, Kelli Montgomery1, Craig P. Giacomini1, Yoon-La Choi1,4, Sreejata Chatterjee2, Collins A.
Karikari5, Keyan Salari1,6, Pei Wang7, Tina Hernandez-Boussard6, Gowrishankar Swarnalata8, Matt van
de Rijn1, Anirban Maitra5, Jonathan R. Pollack1"*
1 Department of Pathology, Stanford University, Stanford, California, United States of America, 2 Laboratory of Molecular Oncology, Centre for DNA Fingerprinting and
Diagnostics, Nacharam, Hyderabad, India, 3 National Genomics and Transcriptomics Facility, Centre for DNA Fingerprinting and Diagnostics, Nacharam, Hyderabad, India,
4 Department of Pathology, Samsung Medical Center, Sungkyunkwan University School of Medicine, Seoul, South Korea, 5 Department of Pathology, The Johns Hopkins
University, Baltimore, Maryland, United States of America, 6 Department of Genetics, Stanford University, Stanford, California, United States of America, 7 Division of Public
Health Sciences, Fred Hutchinson Cancer Research Center, Seattle, Washington, United States of America, 8 Department of Pathology, Apollo Hospitals, Hyderabad, India
Abstract
Pancreatobiliary cancers have among the highest mortality rates of any cancer type. Discovering the full spectrum ofmolecular genetic alterations may suggest new avenues for therapy. To catalogue genomic alterations, we carried out array-based genomic profiling of 31 exocrine pancreatic cancers and 6 distal bile duct cancers, expanded as xenografts to enrichthe tumor cell fraction. We identified numerous focal DNA amplifications and deletions, including in 19% of pancreatobiliarycases gain at cytoband 18q11.2, a locus uncommonly amplified in other tumor types. The smallest shared amplification at18q11.2 included GATA6, a transcriptional regulator previously linked to normal pancreas development. When amplified,GATA6 was overexpressed at both the mRNA and protein levels, and strong immunostaining was observed in 25 of 54 (46%)primary pancreatic cancers compared to 0 of 33 normal pancreas specimens surveyed. GATA6 expression in xenografts wasassociated with specific microarray gene-expression patterns, enriched for GATA binding sites and mitochondrial oxidativephosphorylation activity. siRNA mediated knockdown of GATA6 in pancreatic cancer cell lines with amplification led toreduced cell proliferation, cell cycle progression, and colony formation. Our findings indicate that GATA6 amplification andoverexpression contribute to the oncogenic phenotypes of pancreatic cancer cells, and identify GATA6 as a candidatelineage-specific oncogene in pancreatobiliary cancer, with implications for novel treatment strategies.
Citation: Kwei KA, Bashyam MD, Kao J, Ratheesh R, Reddy EC, et al. (2008) Genomic Profiling Identifies GATA6 as a Candidate Oncogene Amplified inPancreatobiliary Cancer. PLoS Genet 4(5): e1000081. doi:10.1371/journal.pgen.1000081
Editor: Wayne N. Frankel, The Jackson Laboratory, United States of America
Received August 30, 2007; Accepted April 25, 2008; Published May 23, 2008
Copyright: � 2008 Kwei et al. This is an open-access article distributed under the terms of the Creative Commons Attribution License, which permitsunrestricted use, distribution, and reproduction in any medium, provided the original author and source are credited.
Funding: This work was supported by grants from the NIH, CA112016 (JRP), CA09151 (KAK), GM07365 (KS), GI Cancer SPORE CA62924 (AM), from the LustgartenFoundation (JRP), and by a core grant to the Centre for DNA Fingerprinting and Diagnostics by the Department of Biotechnology, Government of India (MDB). Wealso thank the family of Margaret Lee and the Sol Goldman Pancreatic Cancer Research Center for supporting the xenografting efforts at Johns Hopkins. MDB wassupported in part by a Biotechnology Overseas Associateship from the Department of Biotechnology, Ministry of Science and Technology, Government of India.RR and SC were supported by a Senior Research Fellowship and a Junior Research Fellowship respectively from the Council for Scientific and Industrial Research,Government of India. None of the sponsors or funders had any role in the design and conduct of the study, in the collection, analysis, and interpretation of thedata, or in the preparation, review, or approval of the manuscript.
Competing Interests: The authors have declared that no competing interests exist.
* E-mail: [email protected]
. These authors contributed equally to this work.
" These authors are joint senior authors on this work.
Introduction
Pancreatic cancer has among the highest mortality rates of any
cancer, pointing to a critical need for more effective therapies.
While much progress has been made in understanding pancreatic
cancer pathogenesis, a more comprehensive characterization of
molecular genetic alterations is needed to define new molecular
targets and therapeutic opportunities [1].
Genomic DNA copy number alterations (CNAs) are frequent in
pancreatic cancer, where they alter the dosage and expression of
cancer genes. Amplified oncogenes include KRAS (also commonly
activated by point mutation), AKT2 and MYB. Likewise, deleted
tumor suppressor genes (TSGs) include CDKN2A, TP53 and
SMAD4 (also inactivated by mutation and promoter hypermethy-
lation) [2]. Mapping CNAs has become an important starting
point for discovering new cancer genes, and indeed led to the
original identification of CDKN2A and SMAD4 as TSGs [3,4].
During development, the ventral portion of the pancreas arises
from the primitive bile duct [5]. While less is known of extrahepatic
bile duct cancers, they appear to share many features with pancreatic
cancers, including frequent molecular alterations of KRAS, CDKN2A,
TP53 and SMAD4, as well as global patterns of allelic loss [6,7].
Because of their anatomic proximity and similar histologies,
pancreatic and distal bile duct cancers can at times be difficult to
distinguish, and from a clinical and research standpoint are often
practically combined under the umbrella of pancreatobiliary cancer.
Recently, array-based comparative genomic hybridization
(array CGH) has provided a powerful approach to catalog CNAs
PLoS Genetics | www.plosgenetics.org 1 May 2008 | Volume 4 | Issue 5 | e1000081

in cancer genomes [8,9]. Profiling pancreatobiliary cancers,
however, presents unique technical challenges due to the strong
stromal response, where tumor cells typically account for less than
20% of cells in the specimen. Not surprisingly, to date genomic
profiling of pancreatic cancer has been largely confined to studies
of derived cell lines [10–13]. Strategies to enrich for tumor cells
from primary cancers include physical microdissection, which is
both technically demanding and, with the low yield of genomic
DNA, is subject to biases in subsequent target amplification. An
alternative strategy is expanding tumors as xenografts in nude
mice, which effectively enriches the tumor cell fraction to .95%,
(with the remaining stromal cells being of murine origin), while
preserving genomic alterations of the parental tumor [14]. Here,
we apply genomic profiling to a set of pancreatic and distal bile
duct cancers grown as xenografts in nude mice, where among
other alterations we identify and characterize GATA6 as a novel
candidate lineage-specific oncogene amplified in pancreatobiliary
cancer.
Results
To comprehensively catalog CNAs in pancreatobiliary cancers,
we carried out array CGH-based genomic profiling of a set of 37
cancers (31 exocrine pancreatic cancers and 6 distal bile duct
cancers) expanded as xenografts to enrich for tumor cells, using
cDNA microarrays representing ,22,000 genes with a median
interprobe spacing of ,15 Kb. We identified numerous CNAs,
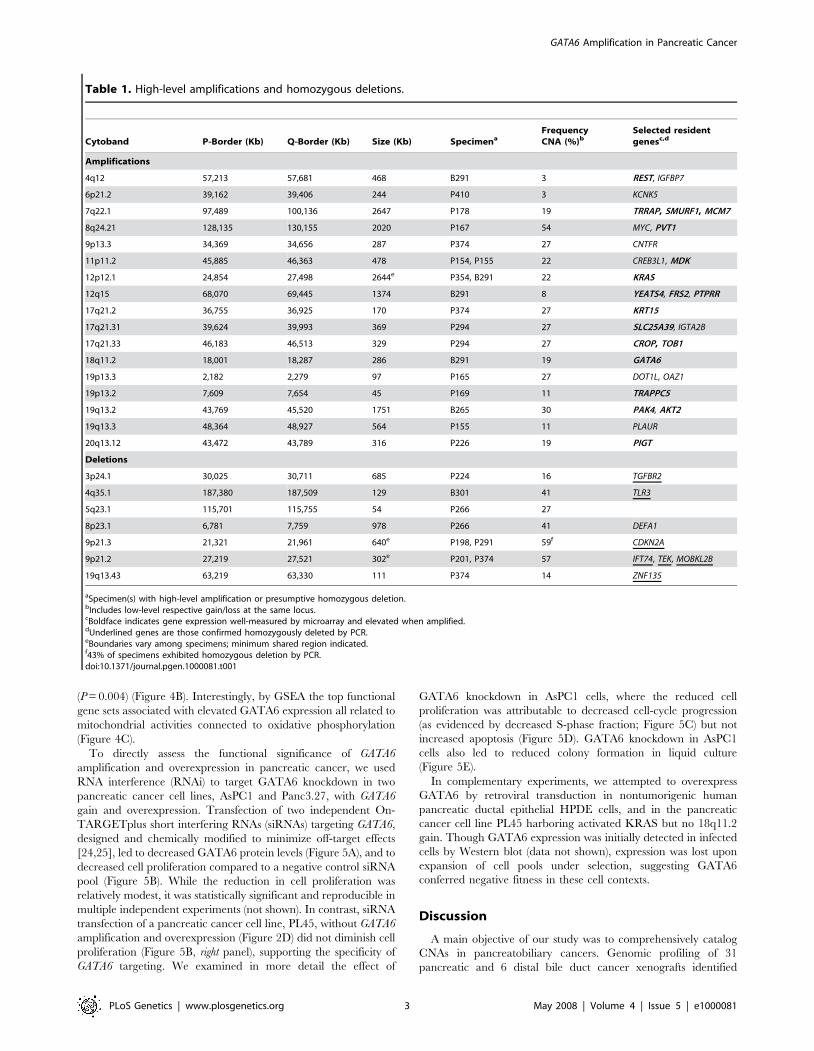
among which 17 focal high-level DNA amplifications (i.e.
fluorescence ratios $3, corresponding to at least 5-fold amplifica-
tion [8]) and 7 presumptive homozygous deletions (i.e. fluorescence
ratios #0.25) were particularly informative in pinpointing known or
novel candidate cancer genes (Table 1). By profiling gene expression
in parallel, we also defined the subset of amplified genes exhibiting
elevated expression (Table 1), a characteristic of oncogenes. For a
subset of presumptive homozygous deletions, we validated homo-
zygous loss by polymerase chain reaction (PCR) using human gene-
specific primers (Table 1 and Figure S1).
Among the focal amplifications, we identified gain at 18q11.2 in
19% of pancreatobiliary cancers (5 of 31 pancreatic, and 2 of 6
bile duct). Notably, we found gains spanning 18q11.2 to be less
common in other tumor types we had profiled on the same array
platform, including cancers of the breast (3 gains in 89 (3%)
tumors, 1 in 49 (2%) cell lines), prostate (0 in 64 (0%) tumors), lung
(4 in 76 (5%) tumors, 4 in 52 (8%) cell lines) and colon (1 in 29
(3%) cell lines) [15–17] (and unpublished data), and in these other
tumor types the gains when present were not focal, suggesting the
putative driver oncogene within this locus may be specific to
pancreatobiliary cancer. Strikingly, the smallest shared region of
amplification among the xenograft specimens spanned just two
annotated genes, GATA6 (GATA binding protein 6) and CTAGE1
(cutaneous T-cell lymphoma (CTCL)-associated antigen 1)
(Figure 1A). GATA6 [18] belongs to the GATA factor family of
transcriptional regulators, whose members are expressed in
distinct developmental and tissue-specific patterns and regulate
cell-restricted programs of gene expression [19]. Because GATA6
was known to regulate normal pancreas development [20,21], we
sought to explore a possible functional connection of GATA6 gene
amplification and pancreatobiliary cancer.
A single bile duct cancer xenograft specimen (B291) with focal
high-level DNA amplification was particularly informative in
defining amplicon boundaries. Using a custom Agilent ultra-high
definition CGH array with probes tiling 18q11.2 with an average
343nt spacing, we first confirmed the amplicon boundaries in
B291, finding the amplicon peak indeed spanned just GATA6 and
CTAGE1 (Figure 1B). We also validated GATA6 amplification in
B291 by quantitative (Q)-PCR (Figure 1C), and by fluorescence in
situ hybridization (FISH) in the parent tumor from which the B291
xenograft was derived (Figure 1D, left panel), the latter excluding
the possibility of amplification arising during xenograft growth.
Focal 18q11.2 gain was also present in 3 of 18 (17%) pancreatic
cancer cell lines (AsPC1, Panc3.27 and Capan1) we had previously
profiled by array CGH ([13]) (Figure 1A, and data not shown), a
finding we confirmed by FISH (Figure 1D).
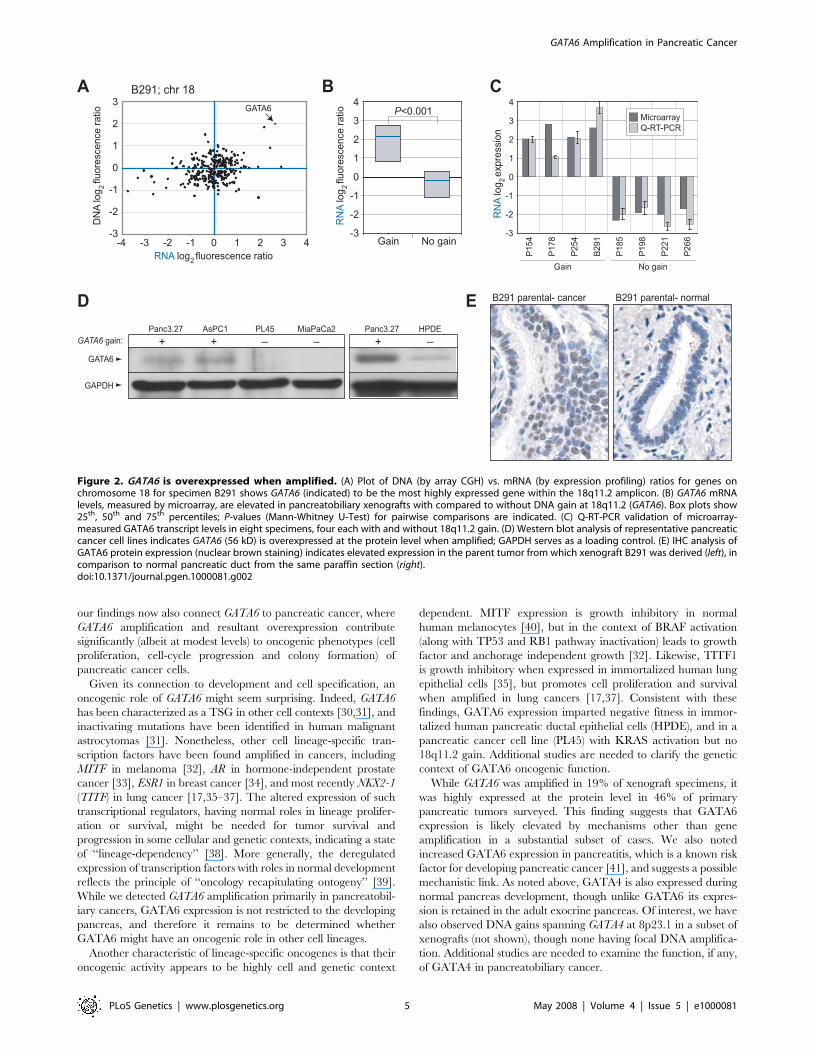
Consistent with an oncogenic role, GATA6 exhibited increased
mRNA expression by microarray in B291 (Figure 2A) and among
the group of xenograft specimens with 18q11.2 gain (Figure 2B;
P = 0.003, Mann-Whitney U-Test), a finding also confirmed by Q-
reverse transcription (RT)-PCR (Figure 2C). In contrast, expres-
sion of the neighboring gene CTAGE1 was not detectable by Q-
RT-PCR (data not shown). We also observed increased GATA6
protein levels by Western blot in pancreatic cancer cell lines with
18q11.2 gain, compared to pancreatic cancer cell lines without
gain or to the nontumorigenic human pancreatic ductal epithelial
line HPDE (Figure 2D), and by immunohistochemistry (IHC) in
the parent tumor from which the B291 xenograft was derived
(Figure 2E). To assess the frequency with which GATA6 exhibited
elevated expression in primary pancreatic cancer, we performed
IHC on a tissue microarray (TMA) that included cases of normal
pancreas, pancreatitis and pancreatic ductal adenocarcinoma. We
observed moderate and strong GATA6 nuclear staining respec-
tively in 15 (28%) and 25 (46%) of 54 primary pancreatic cancers
compared to just 3 (9%) and 0 (0%) of 33 normal pancreas
specimens surveyed (P,0.001, x2 test) (Figure 3). GATA6
expression was also elevated in pancreatitis (Figure 3E). There
was no significant relation between GATA6 staining and tumor
grade (P = 0.18, x2 test).
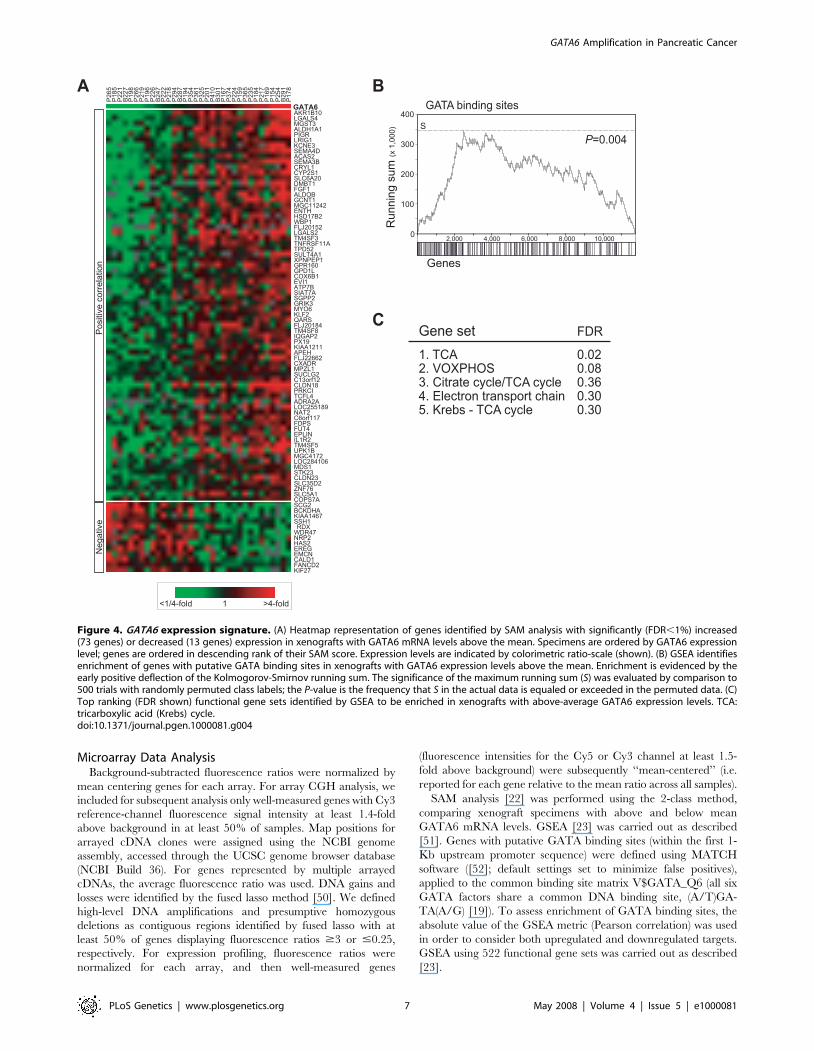
Since GATA6 is a transcriptional regulator, we sought to
identify co-expressed genes, which might include its downstream
transcriptional targets and suggest functional involvements. Using
Significance Analysis of Microarrays (SAM) [22], we identified 86
genes whose expression was significantly (False discovery rate,
FDR, ,1%) increased (73 genes) or decreased (13 genes) in
xenografts with elevated GATA6 expression (Figure 4A). The
SAM-identified gene set spanned diverse biological processes, and
included known cancer genes like FGF1 and EVI1. Gene Set
Enrichment Analysis (GSEA) [23] confirmed an enrichment of
putative upstream GATA factor binding sites among the genes
whose expression correlated with elevated GATA6 levels
Author Summary
Pancreatic cancer is a devastating disease, having amongthe lowest survival rates of any cancer. A betterunderstanding of the molecular basis of pancreatic cancermay lead to improved rationale therapies. We report herethe discovery of amplification (i.e. extra copies) of theGATA6 gene in many human pancreatic cancers. GATA6 isa regulator of gene expression and functions in thedevelopment of the normal pancreas. Our findingsindicate that its amplification and aberrant overexpressioncontribute to pancreatic cancer development. GATA6 joinsa growing list of cancer genes with key roles in normalhuman development but pathogenic roles in cancer whenaberrantly expressed. Our discovery of GATA6 amplifica-tion provides a new foothold into understanding thepathogenic mechanisms underlying pancreatic cancer, andsuggests new strategies for therapy by targeting GATA6 orthe genes it regulates.
GATA6 Amplification in Pancreatic Cancer
PLoS Genetics | www.plosgenetics.org 2 May 2008 | Volume 4 | Issue 5 | e1000081
(P = 0.004) (Figure 4B). Interestingly, by GSEA the top functional
gene sets associated with elevated GATA6 expression all related to
mitochondrial activities connected to oxidative phosphorylation
(Figure 4C).
To directly assess the functional significance of GATA6
amplification and overexpression in pancreatic cancer, we used
RNA interference (RNAi) to target GATA6 knockdown in two
pancreatic cancer cell lines, AsPC1 and Panc3.27, with GATA6
gain and overexpression. Transfection of two independent On-
TARGETplus short interfering RNAs (siRNAs) targeting GATA6,
designed and chemically modified to minimize off-target effects
[24,25], led to decreased GATA6 protein levels (Figure 5A), and to
decreased cell proliferation compared to a negative control siRNA
pool (Figure 5B). While the reduction in cell proliferation was
relatively modest, it was statistically significant and reproducible in
multiple independent experiments (not shown). In contrast, siRNA
transfection of a pancreatic cancer cell line, PL45, without GATA6
amplification and overexpression (Figure 2D) did not diminish cell
proliferation (Figure 5B, right panel), supporting the specificity of
GATA6 targeting. We examined in more detail the effect of
GATA6 knockdown in AsPC1 cells, where the reduced cell
proliferation was attributable to decreased cell-cycle progression
(as evidenced by decreased S-phase fraction; Figure 5C) but not
increased apoptosis (Figure 5D). GATA6 knockdown in AsPC1
cells also led to reduced colony formation in liquid culture
(Figure 5E).
In complementary experiments, we attempted to overexpress
GATA6 by retroviral transduction in nontumorigenic human
pancreatic ductal epithelial HPDE cells, and in the pancreatic
cancer cell line PL45 harboring activated KRAS but no 18q11.2
gain. Though GATA6 expression was initially detected in infected
cells by Western blot (data not shown), expression was lost upon
expansion of cell pools under selection, suggesting GATA6
conferred negative fitness in these cell contexts.
Discussion
A main objective of our study was to comprehensively catalog
CNAs in pancreatobiliary cancers. Genomic profiling of 31
pancreatic and 6 distal bile duct cancer xenografts identified
Table 1. High-level amplifications and homozygous deletions.
Cytoband P-Border (Kb) Q-Border (Kb) Size (Kb) SpecimenaFrequencyCNA (%)b
Selected residentgenesc,d
Amplifications
4q12 57,213 57,681 468 B291 3 REST, IGFBP7
6p21.2 39,162 39,406 244 P410 3 KCNK5
7q22.1 97,489 100,136 2647 P178 19 TRRAP, SMURF1, MCM7
8q24.21 128,135 130,155 2020 P167 54 MYC, PVT1
9p13.3 34,369 34,656 287 P374 27 CNTFR
11p11.2 45,885 46,363 478 P154, P155 22 CREB3L1, MDK
12p12.1 24,854 27,498 2644e P354, B291 22 KRAS
12q15 68,070 69,445 1374 B291 8 YEATS4, FRS2, PTPRR
17q21.2 36,755 36,925 170 P374 27 KRT15
17q21.31 39,624 39,993 369 P294 27 SLC25A39, IGTA2B
17q21.33 46,183 46,513 329 P294 27 CROP, TOB1
18q11.2 18,001 18,287 286 B291 19 GATA6
19p13.3 2,182 2,279 97 P165 27 DOT1L, OAZ1
19p13.2 7,609 7,654 45 P169 11 TRAPPC5
19q13.2 43,769 45,520 1751 B265 30 PAK4, AKT2
19q13.3 48,364 48,927 564 P155 11 PLAUR
20q13.12 43,472 43,789 316 P226 19 PIGT
Deletions
3p24.1 30,025 30,711 685 P224 16 TGFBR2
4q35.1 187,380 187,509 129 B301 41 TLR3
5q23.1 115,701 115,755 54 P266 27
8p23.1 6,781 7,759 978 P266 41 DEFA1
9p21.3 21,321 21,961 640e P198, P291 59f CDKN2A
9p21.2 27,219 27,521 302e P201, P374 57 IFT74, TEK, MOBKL2B
19q13.43 63,219 63,330 111 P374 14 ZNF135
aSpecimen(s) with high-level amplification or presumptive homozygous deletion.bIncludes low-level respective gain/loss at the same locus.cBoldface indicates gene expression well-measured by microarray and elevated when amplified.dUnderlined genes are those confirmed homozygously deleted by PCR.eBoundaries vary among specimens; minimum shared region indicated.f43% of specimens exhibited homozygous deletion by PCR.doi:10.1371/journal.pgen.1000081.t001
GATA6 Amplification in Pancreatic Cancer
PLoS Genetics | www.plosgenetics.org 3 May 2008 | Volume 4 | Issue 5 | e1000081

numerous focal high-level DNA amplifications and homozygous
deletions, thereby pinpointing known and candidate cancer genes.
Known cancer genes included focal amplifications of MYC
(8q24.21), KRAS (12p12.1) and AKT2 (19q13.2), and homozygous
deletions of TGFBR2 (3p24.1) and CDKN2A (9p21.3). Other focal
changes suggest entirely new pathobiology. For example, homo-
zygous deletion of TLR3 (Toll-like receptor 3) (4q35.1), which
functions in the innate immune response and is also highly
expressed in pancreas [26,27], suggests a possible role of infection
in pancreatic carcinogenesis.
Prominent among novel oncogene candidates we identified
GATA6 amplification at 18q11.2. GATA6 is one of six members of
the mammalian GATA family of transcriptional regulators, each
having two zinc finger domains and binding the common DNA
sequence element (A/T)GATA(A/G) [19]. GATA factors 1–3 are
expressed mainly in hematopoietic lineages, while GATA factors
4–6 are expressed in various tissues derived from mesoderm and
endoderm, including the heart, liver, lung, gut, ovary and testis,
where they function in cell lineage specification [19,28]. In relation
to pancreas development in the mouse, GATA4 and GATA6 are
expressed in both endocrine and exocrine cell precursors, while in
the adult pancreas expression of GATA4 and GATA6 is restricted
to the exocrine and endocrine compartment, respectively [20,29].
Recently, GATA4 and GATA6 have both been shown to be
required for normal pancreas specification and development
[20,21]. While GATA6 has been linked to pancreas development,
Figure 1. GATA6 is focally amplified in pancreatobiliary cancer. (A) Genomic profiles by CGH on cDNA microarrays of pancreatic (P) and bileduct (B) cancer xenografts across cytoband 18q11.2. Genes are ordered by genome position. Red indicates positive tumor/normal aCGH ratios (scaleshown), and samples called gained at 18q11.2 are marked below by closed circle (gains highlighted in yellow). Genes and ESTs (IMAGE clone IDshown) on the microarray residing within the amplicon core are indicated. CTAGE1 (asterisked) was not present on the array but resides where shown.(B) Genomic profile of B291 by CGH on an Agilent ultra high-definition custom microarray tiling 18q11.2, mapped onto the UCSC genome browser(http://genome.ucsc.edu) [55]. The amplicon peak spans two genes, GATA6 and CTAGE1. (C) Q-PCR validation of GATA6 amplification in B291. Note,hybridization measurements by CGH tend to underestimate true CNA ratios [8]. (D) FISH validation of GATA6 amplification in the parent tumor(paraffin section) from which xenograft B291 was derived (left), and GATA6 gain in pancreatic cancer cell lines AsPC1 (center) and Panc3.27 (right). Gainis evident by the increased ratio of GATA6(red)/centromere-18(green) signals. DAPI (nuclear) counterstaining is shown in grayscale.doi:10.1371/journal.pgen.1000081.g001
GATA6 Amplification in Pancreatic Cancer
PLoS Genetics | www.plosgenetics.org 4 May 2008 | Volume 4 | Issue 5 | e1000081
our findings now also connect GATA6 to pancreatic cancer, where
GATA6 amplification and resultant overexpression contribute
significantly (albeit at modest levels) to oncogenic phenotypes (cell
proliferation, cell-cycle progression and colony formation) of
pancreatic cancer cells.
Given its connection to development and cell specification, an
oncogenic role of GATA6 might seem surprising. Indeed, GATA6
has been characterized as a TSG in other cell contexts [30,31], and
inactivating mutations have been identified in human malignant
astrocytomas [31]. Nonetheless, other cell lineage-specific tran-
scription factors have been found amplified in cancers, including
MITF in melanoma [32], AR in hormone-independent prostate
cancer [33], ESR1 in breast cancer [34], and most recently NKX2-1
(TITF) in lung cancer [17,35–37]. The altered expression of such
transcriptional regulators, having normal roles in lineage prolifer-
ation or survival, might be needed for tumor survival and
progression in some cellular and genetic contexts, indicating a state
of ‘‘lineage-dependency’’ [38]. More generally, the deregulated
expression of transcription factors with roles in normal development
reflects the principle of ‘‘oncology recapitulating ontogeny’’ [39].
While we detected GATA6 amplification primarily in pancreatobil-
iary cancers, GATA6 expression is not restricted to the developing
pancreas, and therefore it remains to be determined whether
GATA6 might have an oncogenic role in other cell lineages.
Another characteristic of lineage-specific oncogenes is that their
oncogenic activity appears to be highly cell and genetic context
dependent. MITF expression is growth inhibitory in normal
human melanocytes [40], but in the context of BRAF activation
(along with TP53 and RB1 pathway inactivation) leads to growth
factor and anchorage independent growth [32]. Likewise, TITF1
is growth inhibitory when expressed in immortalized human lung
epithelial cells [35], but promotes cell proliferation and survival
when amplified in lung cancers [17,37]. Consistent with these
findings, GATA6 expression imparted negative fitness in immor-
talized human pancreatic ductal epithelial cells (HPDE), and in a
pancreatic cancer cell line (PL45) with KRAS activation but no
18q11.2 gain. Additional studies are needed to clarify the genetic
context of GATA6 oncogenic function.
While GATA6 was amplified in 19% of xenograft specimens, it
was highly expressed at the protein level in 46% of primary
pancreatic tumors surveyed. This finding suggests that GATA6
expression is likely elevated by mechanisms other than gene
amplification in a substantial subset of cases. We also noted
increased GATA6 expression in pancreatitis, which is a known risk
factor for developing pancreatic cancer [41], and suggests a possible
mechanistic link. As noted above, GATA4 is also expressed during
normal pancreas development, though unlike GATA6 its expres-
sion is retained in the adult exocrine pancreas. Of interest, we have
also observed DNA gains spanning GATA4 at 8p23.1 in a subset of
xenografts (not shown), though none having focal DNA amplifica-
tion. Additional studies are needed to examine the function, if any,
of GATA4 in pancreatobiliary cancer.
Figure 2. GATA6 is overexpressed when amplified. (A) Plot of DNA (by array CGH) vs. mRNA (by expression profiling) ratios for genes onchromosome 18 for specimen B291 shows GATA6 (indicated) to be the most highly expressed gene within the 18q11.2 amplicon. (B) GATA6 mRNAlevels, measured by microarray, are elevated in pancreatobiliary xenografts with compared to without DNA gain at 18q11.2 (GATA6). Box plots show25th, 50th and 75th percentiles; P-values (Mann-Whitney U-Test) for pairwise comparisons are indicated. (C) Q-RT-PCR validation of microarray-measured GATA6 transcript levels in eight specimens, four each with and without 18q11.2 gain. (D) Western blot analysis of representative pancreaticcancer cell lines indicates GATA6 (56 kD) is overexpressed at the protein level when amplified; GAPDH serves as a loading control. (E) IHC analysis ofGATA6 protein expression (nuclear brown staining) indicates elevated expression in the parent tumor from which xenograft B291 was derived (left), incomparison to normal pancreatic duct from the same paraffin section (right).doi:10.1371/journal.pgen.1000081.g002
GATA6 Amplification in Pancreatic Cancer
PLoS Genetics | www.plosgenetics.org 5 May 2008 | Volume 4 | Issue 5 | e1000081

Our analysis of gene-expression patterns correlated with
GATA6 transcript levels has revealed an intriguing association
with genes functioning in mitochondrial oxidative phosphoryla-
tion. Such altered mitochondrial activity might contribute to
carcinogenesis through changes in cell metabolism, reactive
oxygen species (ROS) production, or (through altered mitochon-
drial membrane potential) mitochondrial-associated apoptotic
pathways [42,43]. In the latter regard, it is notable in that we
did not observe an effect of GATA6 knockdown on apoptosis, but
rather on cell-cycle progression. While the exact connection to
mitochondrial oxidative phosphorylation remains to be elucidated,
it is of interest that a similar ‘‘OxPhos’’ expression pattern was
recently identified in a subset of diffuse large B-cell lymphomas
[44].
Since GATA6 is expressed in normal adult tissues like the
endocrine pancreas, the lung, liver and heart [18], it is itself
unlikely to become a useful target for therapy. However, future
investigations will more precisely define the transcriptional
effectors and pathways through which GATA6 mediates its
oncogenic function, some of which might become important
molecular targets. In conclusion, our genomic profiling and
functional studies define GATA6 as a candidate lineage-specific
oncogene in pancreatobiliary cancers, a finding which should lead
to new opportunities for therapeutic intervention.
Materials and Methods
SpecimensPancreatic and distal bile duct cancer xenografts were generated
as described [14] at the Johns Hopkins Hospital, with Institutional
Review Board (IRB) and Institutional Animal Care and Use
Committee approval. Briefly, a 1 mm3 piece of the primary tumor
was soaked in Matrigel (Collaborative Biomedical Research), then
implanted subcutaneously in a nu/nu mouse. Engrafted tumors
were harvested when they reached 1–2 cm in diameter. Tumor
cell enrichment was confirmed by H&E-stained frozen section.
From adjacent pieces of the xenograft, DNA was isolated using the
Qiagen DNeasy Tissue kit, and RNA using the Trizol (Invitrogen)
method. Pancreatic cancer cell lines were obtained from the
American Type Culture Collection, and the HPDE cell line [45]
was kindly provided by Dr. Ming Tsao (University of Toronto).
Array CGH and Expression ProfilingcDNA microarrays were obtained from the Stanford Functional
Genomics Facility and included 39,632 human cDNAs, repre-
senting 22,279 mapped human genes (18,049 UniGene clusters
[46], together with 4,230 additional mapped ESTs not assigned
UniGene IDs). Array CGH and expression profiling were
performed according to our published protocols [47,48]. For
array CGH, 4 mg of genomic DNA from each test sample was
random-primer labeled with Cy5 and co-hybridized to the
microarray along with 4 mg of Cy3-labeled sex-matched normal
leukocyte reference DNA from a single donor. For gene-expression
profiling, 50 mg of total RNA from each sample and 50 mg of
‘‘universal’’ reference RNA (derived from 11 different established
human cell lines) were differentially labeled with Cy5 and Cy3,
respectively, and co-hybridized to cDNA microarrays. Following
overnight hybridization and washing, arrays were imaged using a
GenePix 4000B scanner (Molecular Devices). Fluorescence ratios
were extracted using SpotReader software (Niles Scientific), and
the data uploaded into the Stanford Microarray Database (SMD)
[49] for storage, retrieval and analysis. The complete microarray
datasets are available at SMD and at the Gene Expression
Omnibus (GEO) (accession GSE11152).
E
Normal Pancreatitis Benign AdenoCA
Num
ber
of
cases
0
1-3
4-7
Score:
0
5
10
15
20
25
30
35
A B C D
Figure 3. GATA6 is overexpressed in primary pancreatic tumors. Shown are representative IHC stains for GATA6 protein expression in (A)normal pancreas, and in pancreatic ductal adenocarcinoma with (B) absent, (C) moderate, and (D) strong nuclear staining. Filled arrowheads indicatepancreatic ductal epithelial cells (A), or pancreatic adenocarcinoma cells (B–D). Open arrowhead (A) shows non-specific cytoplasmic staining observedin pancreatic acinar cells. (E) Distribution of GATA6 expression among different diagnoses represented on the tissue microarray. The IHC stainingscore considers both staining intensity and fraction of cells with nuclear staining (see Materials and Methods). GATA6 expression is significantlyelevated in pancreatic cancer compared to normal pancreas (P,0.001, x2 test).doi:10.1371/journal.pgen.1000081.g003
GATA6 Amplification in Pancreatic Cancer
PLoS Genetics | www.plosgenetics.org 6 May 2008 | Volume 4 | Issue 5 | e1000081
Microarray Data AnalysisBackground-subtracted fluorescence ratios were normalized by
mean centering genes for each array. For array CGH analysis, we
included for subsequent analysis only well-measured genes with Cy3
reference-channel fluorescence signal intensity at least 1.4-fold
above background in at least 50% of samples. Map positions for
arrayed cDNA clones were assigned using the NCBI genome
assembly, accessed through the UCSC genome browser database
(NCBI Build 36). For genes represented by multiple arrayed
cDNAs, the average fluorescence ratio was used. DNA gains and
losses were identified by the fused lasso method [50]. We defined
high-level DNA amplifications and presumptive homozygous
deletions as contiguous regions identified by fused lasso with at
least 50% of genes displaying fluorescence ratios $3 or #0.25,
respectively. For expression profiling, fluorescence ratios were
normalized for each array, and then well-measured genes
(fluorescence intensities for the Cy5 or Cy3 channel at least 1.5-
fold above background) were subsequently ‘‘mean-centered’’ (i.e.
reported for each gene relative to the mean ratio across all samples).
SAM analysis [22] was performed using the 2-class method,
comparing xenograft specimens with above and below mean
GATA6 mRNA levels. GSEA [23] was carried out as described
[51]. Genes with putative GATA binding sites (within the first 1-
Kb upstream promoter sequence) were defined using MATCH
software ([52]; default settings set to minimize false positives),
applied to the common binding site matrix V$GATA_Q6 (all six
GATA factors share a common DNA binding site, (A/T)GA-
TA(A/G) [19]). To assess enrichment of GATA binding sites, the
absolute value of the GSEA metric (Pearson correlation) was used
in order to consider both upregulated and downregulated targets.
GSEA using 522 functional gene sets was carried out as described
[23].
Figure 4. GATA6 expression signature. (A) Heatmap representation of genes identified by SAM analysis with significantly (FDR,1%) increased(73 genes) or decreased (13 genes) expression in xenografts with GATA6 mRNA levels above the mean. Specimens are ordered by GATA6 expressionlevel; genes are ordered in descending rank of their SAM score. Expression levels are indicated by colorimetric ratio-scale (shown). (B) GSEA identifiesenrichment of genes with putative GATA binding sites in xenografts with GATA6 expression levels above the mean. Enrichment is evidenced by theearly positive deflection of the Kolmogorov-Smirnov running sum. The significance of the maximum running sum (S) was evaluated by comparison to500 trials with randomly permuted class labels; the P-value is the frequency that S in the actual data is equaled or exceeded in the permuted data. (C)Top ranking (FDR shown) functional gene sets identified by GSEA to be enriched in xenografts with above-average GATA6 expression levels. TCA:tricarboxylic acid (Krebs) cycle.doi:10.1371/journal.pgen.1000081.g004
GATA6 Amplification in Pancreatic Cancer
PLoS Genetics | www.plosgenetics.org 7 May 2008 | Volume 4 | Issue 5 | e1000081

High-Definition 18q11.12 CGH MicroarrayA custom ultra high-definition CGH microarray was designed
and obtained from Agilent Technologies [53]. The array included
4,362 probes tiling 1.5 Mb (Mb 17.5–19.0) of 18q11.2 with an
average inter-probe spacing of 344 nt, and an additional 23,652
probes spanning the remaining genome for data normalization.
DNAs were labeled as above, then hybridized to the Agilent array
following the manufacturer’s instructions, except using a 40 hr
hybridization time (rather than the recommended 24 hr). Arrays
were scanned using an Agilent G2505B scanner, and data
extracted and normalized using Agilent Feature Extraction
software (version 9.1) with default settings.
PCR AssaysTo validate homozygous deletions (see Table 1), we used gene-
specific primer-pairs to PCR amplify genomic DNA from
xenograft specimens. Primer-pairs for genes flanking the regions
of homozygous deletion, and designed to have a distinguishable
fragment size, were included in the PCR reactions as internal
controls, and normal DNA was used as positive control for primer
pairs. PCR was performed on an Applied Biosystems GeneAmp
9700, using 40 ng DNA template, 16 PCR buffer (Applied
Biosystems), 200 mM dNTPs, 2.0 mM MgCl2, 10 pmol each
individual primer (Table S1), and 1 U of AmpliTaq Gold DNA
polymerase (Applied Biosystems) in a 10 ml reaction. The reaction
conditions were: 95uC 10 min initial denaturation, followed by 35
cycles (94uC 30 s; annealing temp (see Table S1) 30 s; 72uC 30 s),
and a final extension of 72uC 7 min. PCR products were resolved
by gel electrophoresis on a 1.8% TAE agarose gel, and visualized
using a UVP gel documentation system.
To validate GATA6 amplification in B291, we carried out Q-
PCR using the Quantitect SYBR Green PCR kit (Qiagen) on an
ABI 7500 sequence detection system as per manufacturer’s
instructions. PCR was initiated at 95uC for 15 min (to activate
the modified Taq polymerase), followed by a 40 cycle amplifica-
tion (95uC 15 s, 58uC 30 s, 72uC 30 s). Melting curve analysis was
performed to ensure specific PCR product while excluding primer
dimers. We used the comparative CT method [54] to calculate
relative DNA levels normalized to NPC1 (a gene located outside
the 18q11.2 amplicon and not exhibiting CNA), which we then
expressed as a ratio to the Ct value of GATA6 (also normalized to
NPC1) obtained from normal DNA. PCR primer sequences are
listed in Table S1.
Figure 5. GATA6 amplification/overexpression contributes to cell proliferation. (A) Confirmation of siRNA-mediated knockdown of GATA6in AsPC1 and Panc3.27 cells. Two different siRNAs (GATA6-1 and GATA6-2) were used to target GATA6, along with a non-targeting siRNA pool(control). GATA6 levels assayed by Western blot; GAPDH levels provide a loading control. (B) GATA6 knockdown results in decreased cell proliferationin reduced serum, measured by WST-1 assay, in cells with (AsPC1, Panc3.27) but not without (PL45) GATA6 gain/overexpression. *, P,0.05; **, P,0.01(Student’s t-test; GATA6 compared to control). (C) GATA6 knockdown reduces cell-cycle progression in AsPC1 cells, evidenced by decreased S-phasefraction following BrdU labeling, quantified by flow cytometry. *, P,0.05; (Student’s t-test; GATA6 compared to control). (D) GATA6 knockdown doesnot significantly alter levels of apoptosis, quantified by annexin V staining. (E) GATA6 knockdown reduces colony growth of AsPC1 cells in liquidculture. Box plot illustrates 25th, mean and 75th percentile; P values (Student’s t-test) indicated. Representative fields of Giemsa-stained colonies areshown (right).doi:10.1371/journal.pgen.1000081.g005
GATA6 Amplification in Pancreatic Cancer
PLoS Genetics | www.plosgenetics.org 8 May 2008 | Volume 4 | Issue 5 | e1000081

To validate microarray-measured GATA6 mRNA levels, we
carried out Q-RT-PCR using the QuantiTect SYBR Green RT-
PCR Kit according to the manufacturer’s instructions. The
reaction mixture was first incubated at 50uC for 30 min for
reverse transcription, then Q-PCR was carried out as above. For
each specimen, relative levels of GATA6 transcript were
calculated as the ratio of Ct value of GATA6 to that of GAPDH.
Ratio values were then converted to log2 scale and normalized to
the mean across all specimens. PCR primer sequences are listed in
Table S1.
FISHProbe labeling and FISH were performed using Vysis reagents
according to the manufacturer’s protocols. A locus-specific BAC
mapping to GATA6 at 18q11.2 (RP11-1083G24; BACPAC
Resources Centre) was labeled with SpectrumOrange, and co-
hybridized with SpectrumGreen-labeled chromosome 18 centro-
mere probe (CEP18; Vysis). Chromosomal locations of BACs were
validated using normal metaphase slides (not shown). Slides were
counterstained with DAPI, and imaged using an Olympus BX51
fluorescence microscope with Applied Imaging Cytovision 3.0
software.
ImmunohistochemistryA tissue microarray (TMA) was constructed using a tissue
arrayer (Beecher Instruments) and archived formalin-fixed,
paraffin-embedded pancreatic tissue specimens from Stanford
University, with IRB approval. The TMA contained 1.2 mm
cores representing normal pancreas (33 cases), pancreatitis (16),
other benign diagnoses (9), and pancreatic ductal adenocarcinoma
(54). For immunohistochemistry, a 4 mm section was cut from the
tissue microarray block, de-paraffinized in Citrisolv (Fisher
Scientific), and hydrated in a graded series of alcohol solutions.
Heat-induced antigen retrieval was performed by microwave
pretreatment in citrate (1 mM, pH 6.0) for 15 minutes before
staining. Endogenous peroxidase was blocked by preincubation
with 1% hydrogen peroxide in phosphate-buffered saline. A
GATA6 mouse monoclonal antibody (R&D systems) was used at
1:10 dilution for 30 min. Chromogenic detection was carried out
using a peroxidase-conjugated secondary antibody and DAB
reagents provided with the Envision detection kit (Dako). Nuclear
staining intensity (absent, weak, medium, strong; 0–3 scale) and
fractional epithelium staining (up to 25%, 50%, 75%, 100%; 1–4
scale) were each recorded, then summed for a final staining score.
siRNA TransfectionsOn-TARGETplus siRNAs targeting GATA6, along with a
negative control siRNA pool (ON-TARGETplus siCONTROL
Non-targeting Pool), were obtained from Dharmacon. Sequences
of siRNAs are listed in Table S1. Cell lines were maintained at
37uC in complete media of RPMI-1640 (Invitrogen), 10% FBS,
50 U/ml penicillin, and 50 U/ml streptomycin. For transfection,
100,000–250,000 cells were seeded per 6-well plate well, and
transfected using Lipofectamine 2000 reagent (Invitrogen) accord-
ing to the manufacturer’s protocol. Cells were transfected with a
final concentration of 50 nM siRNA for 6 hrs, subsequently
replaced with reduced serum (2% FBS) growth media, where
siRNA-mediated phenotypic effects were more reproducibly
observed.
Western Blot72 hours post-transfection, cells were lysed in 16 RIPA Lysis
buffer (Upstate/Chemicon) supplemented with 16 Complete
Protease Inhibitor (Roche, Indianapolis, IN), 0.1 mM sodium
orthovanadate, 1 mM sodium fluoride and 1 mM PMSF, and
protein quantified using the DC Protein Assay (Biorad). For
Western blot, 25–40 mg protein lysate was electrophoresed on a
10% Tris/glycine polyacrylamide gradient gel (Biorad) and
transferred to PVDF membrane (Biorad). After blocking in TBS-
T buffer (20 mM Tris-HCl pH 7.4, 0.15 M NaCl, 0.1% Tween
20) with 5% dry milk for 30 min, blots were incubated sequentially
with primary antibody at 4uC overnight, then HRP-conjugated
secondary antibody at room temp for 45 min. Antibodies were
used as follows: anti-GATA6 rabbit polyclonal antibody (1:200;
Santa Cruz Biotechnology); anti-GAPDH rabbit polyclonal
antibody (1:5,000 for loading control; Santa Cruz Biotechnology);
HRP-conjugated anti-rabbit IgG (1:20,000, Pierce). Detection was
carried out using the ECL kit (Amersham Biosciences).
Cell Proliferation Assay24, 72 and 96 hours post-transfection, cell proliferation was
quantified by colorimetry based on the metabolic cleavage of the
tetrazolium salt WST-1 in viable cells, according to the
manufacturer’s protocol (Roche). WST-1 reagent was added at
1/10th the culture volume and incubated at 37uC for 30 min.
Absorbance was then measured at 450 nm with reference to
650 nm using a Spectra Max 190 plate reader (Molecular
Devices). Transfections were performed in triplicate and average
(61 SD) OD reported.
Cell-Cycle Analysis72 hours post-transfection, cell-cycle distribution analysis was
performed by flow cytometry using the BrdU-FITC Flow kit (BD
Biosciences) per the manufacturer’s instructions. Cells were
incubated with 10 mM BrdU at 37uC for 4 hrs, then fixed and
permeabilized with Cytofix/Cytoperm buffer (BD Biosciences).
Cellular DNA was treated with DNase at 37u C for 1hr to expose
incorporated BrdU, then cells were stained with anti-BrdU FITC
antibody (to quantify incorporated BrdU) and 7-aminoactinomy-
cin D (7-AAD; to quantify total DNA content). 10,000 events were
scored by FACSCalibur (BD Biosciences) and analyzed using
CellQuest software (BD Biosciences). Transfections were per-
formed in triplicate and average (61 SD) cell-cycle fractions
reported.
Liquid Colony Formation Assay24 hours post-transfection, 200 cells were plated each onto ten
10 cm dishes in complete media. After 2 weeks, surviving cells
were stained with Giemsa (Sigma-Aldrich) for 15 min, and visible
colonies counted on a light box.
Apoptosis Assay72 hours post transfection, apoptosis was assayed by annexin V
staining, quantified by flow cytometry using the Vybrant Apoptosis
Assay kit (Invitrogen) as per the manufacturer’s instructions.
Floating cells and trypsinized adherent cells were pooled and
resuspended in 200 ml annexin binding buffer. 2.5 ml Alexa Fluor
488 annexin V and 1 ml of 100 mg/ml propidium iodide (PI)
solution were added and cells incubated for 15 min at room temp.
Cells were then resuspended in equal volume of annexin binding
buffer and analyzed immediately by flow cytometry. 10,000 events
were scored by FACSCalibur and analyzed using CellQuest
software. Transfections were performed in triplicate, and average
(61 SD) percent apoptosis reported.
GATA6 Amplification in Pancreatic Cancer
PLoS Genetics | www.plosgenetics.org 9 May 2008 | Volume 4 | Issue 5 | e1000081
Supporting Information
Figure S1 Representative PCR-validations of homozygous
deletion. (A) 3p24.1 deletion. TGFBR2, located within the
presumptive homozygous deletion, is PCR-amplified from normal
genomic DNA, but not from pancreatic cancer xenograft P224. (B)
9p21.2 deletion. MOBKL2B, within the deletion, is PCR-
amplified from normal genomic DNA but not from P201.
Found at: doi:10.1371/journal.pgen.1000081.s001 (0.22 MB PDF)
Table S1 Primer/siRNA sequences.
Found at: doi:10.1371/journal.pgen.1000081.s002 (0.02 MB
XLS)
Acknowledgments
We wish to thank the SFGF for microarray manufacture, the SMD for
database support, Ilana Galperin (Stanford Cytogenetics Laboratory) for
assistance with FISH analysis, and Eon Rios for assistance with FACS
analysis. We also thank the members of the Pollack lab for helpful
discussions.
Author Contributions
Conceived and designed the experiments: KK MB AM JP. Performed the
experiments: KK MB JK RR ER YK SC GS. Analyzed the data: KK MB
JK RR ER YK CG YC SC KS PW GS JP. Contributed reagents/
materials/analysis tools: KM CK PW TH MV AM. Wrote the paper: KK
MB JP.
References
1. Bardeesy N, DePinho RA (2002) Pancreatic cancer biology and genetics. Nat
Rev Cancer 2: 897–909.
2. Maitra A, Kern SE, Hruban RH (2006) Molecular pathogenesis of pancreatic
cancer. Best Pract Res Clin Gastroenterol 20: 211–226.
3. Kamb A, Gruis NA, Weaver-Feldhaus J, Liu Q, Harshman K, et al. (1994) A
cell cycle regulator potentially involved in genesis of many tumor types. Science
264: 436–440.
4. Hahn SA, Schutte M, Hoque AT, Moskaluk CA, da Costa LT, et al. (1996)
DPC4, a candidate tumor suppressor gene at human chromosome 18q21.1.
Science 271: 350–353.
5. Kozu T, Suda K, Toki F (1995) Pancreatic development and anatomical
variation. Gastrointest Endosc Clin N Am 5: 1–30.
6. Rashid A (2002) Cellular and molecular biology of biliary tract cancers. Surg
Oncol Clin N Am 11: 995–1009.
7. Iacobuzio-Donahue CA, van der Heijden MS, Baumgartner MR, Troup WJ,
Romm JM, et al. (2004) Large-scale allelotype of pancreaticobiliary carcinoma
provides quantitative estimates of genome-wide allelic loss. Cancer Res 64:
871–875.
8. Pollack JR, Perou CM, Alizadeh AA, Eisen MB, Pergamenschikov A, et al.
(1999) Genome-wide analysis of DNA copy-number changes using cDNA
microarrays. Nat Genet 23: 41–46.
9. Pinkel D, Albertson DG (2005) Array comparative genomic hybridization and its
applications in cancer. Nat Genet 37 Suppl: S11–17.
10. Heidenblad M, Schoenmakers EF, Jonson T, Gorunova L, Veltman JA, et al.
(2004) Genome-wide array-based comparative genomic hybridization reveals
multiple amplification targets and novel homozygous deletions in pancreatic
carcinoma cell lines. Cancer Res 64: 3052–3059.
11. Aguirre AJ, Brennan C, Bailey G, Sinha R, Feng B, et al. (2004) High-resolution
characterization of the pancreatic adenocarcinoma genome. Proc Natl Acad
Sci U S A 101: 9067–9072.
12. Holzmann K, Kohlhammer H, Schwaenen C, Wessendorf S, Kestler HA, et al.
(2004) Genomic DNA-chip hybridization reveals a higher incidence of genomic
amplifications in pancreatic cancer than conventional comparative genomic
hybridization and leads to the identification of novel candidate genes. Cancer
Res 64: 4428–4433.
13. Bashyam MD, Bair R, Kim YH, Wang P, Hernandez-Boussard T, et al. (2005)
Array-based comparative genomic hybridization identifies localized DNA
amplifications and homozygous deletions in pancreatic cancer. Neoplasia 7:
556–562.
14. Hahn SA, Seymour AB, Hoque AT, Schutte M, da Costa LT, et al. (1995)
Allelotype of pancreatic adenocarcinoma using xenograft enrichment. Cancer
Res 55: 4670–4675.
15. Bergamaschi A, Kim YH, Wang P, Sorlie T, Hernandez-Boussard T, et al.
(2006) Distinct patterns of DNA copy number alteration are associated with
different clinicopathological features and gene-expression subtypes of breast
cancer. Genes Chromosomes Cancer 45: 1033–1040.
16. Lapointe J, Li C, Giacomini CP, Salari K, Huang S, et al. (2007) Genomic
profiling reveals alternative genetic pathways of prostate tumorigenesis. Cancer
Res 67: 8504–8510.
17. Kwei KA, Kim YH, Girard L, Kao J, Pacyna-Gengelbach M, et al. (2008)
Genomic profiling identifies TITF1 as a lineage-specific oncogene amplified in
lung cancer. Oncogene.
18. Suzuki H, Gabrielson E, Chen W, Anbazhagan R, van Engeland M, et al. (2002)
A genomic screen for genes upregulated by demethylation and histone
deacetylase inhibition in human colorectal cancer. Nat Genet 31: 141–149.
19. Molkentin JD (2000) The zinc finger-containing transcription factors GATA-4,
-5, and -6. Ubiquitously expressed regulators of tissue-specific gene expression.
J Biol Chem 275: 38949–38952.
20. Decker K, Goldman DC, Grasch CL, Sussel L (2006) Gata6 is an important
regulator of mouse pancreas development. Dev Biol 298: 415–429.
21. Watt AJ, Zhao R, Li J, Duncan SA (2007) Development of the mammalian liver
and ventral pancreas is dependent on GATA4. BMC Dev Biol 7: 37.
22. Tusher VG, Tibshirani R, Chu G (2001) Significance analysis of microarrays
applied to the ionizing radiation response. Proc Natl Acad Sci U S A 98:
5116–5121.
23. Subramanian A, Tamayo P, Mootha VK, Mukherjee S, Ebert BL, et al. (2005)
Gene set enrichment analysis: a knowledge-based approach for interpreting
genome-wide expression profiles. Proc Natl Acad Sci U S A 102: 15545–
15550.
24. Birmingham A, Anderson EM, Reynolds A, Ilsley-Tyree D, Leake D, et al.
(2006) 39 UTR seed matches, but not overall identity, are associated with RNAi
off-targets. Nat Methods 3: 199–204.
25. Jackson AL, Burchard J, Leake D, Reynolds A, Schelter J, et al. (2006) Position-
specific chemical modification of siRNAs reduces ‘‘off-target’’ transcript
silencing. Rna 12: 1197–1205.
26. Rock FL, Hardiman G, Timans JC, Kastelein RA, Bazan JF (1998) A family of
human receptors structurally related to Drosophila Toll. Proc Natl Acad Sci U S A
95: 588–593.
27. Alexopoulou L, Holt AC, Medzhitov R, Flavell RA (2001) Recognition of
double-stranded RNA and activation of NF-kappaB by Toll-like receptor 3.
Nature 413: 732–738.
28. Patient RK, McGhee JD (2002) The GATA family (vertebrates and
invertebrates). Curr Opin Genet Dev 12: 416–422.
29. Ketola I, Otonkoski T, Pulkkinen MA, Niemi H, Palgi J, et al. (2004)
Transcription factor GATA-6 is expressed in the endocrine and GATA-4 in the
exocrine pancreas. Mol Cell Endocrinol 226: 51–57.
30. Capo-chichi CD, Roland IH, Vanderveer L, Bao R, Yamagata T, et al. (2003)
Anomalous expression of epithelial differentiation-determining GATA factors in
ovarian tumorigenesis. Cancer Res 63: 4967–4977.
31. Kamnasaran D, Qian B, Hawkins C, Stanford WL, Guha A (2007) GATA6 is
an astrocytoma tumor suppressor gene identified by gene trapping of mouse
glioma model. Proc Natl Acad Sci U S A 104: 8053–8058.
32. Garraway LA, Widlund HR, Rubin MA, Getz G, Berger AJ, et al. (2005)
Integrative genomic analyses identify MITF as a lineage survival oncogene
amplified in malignant melanoma. Nature 436: 117–122.
33. Visakorpi T, Hyytinen E, Koivisto P, Tanner M, Keinanen R, et al. (1995) In
vivo amplification of the androgen receptor gene and progression of human
prostate cancer. Nat Genet 9: 401–406.
34. Holst F, Stahl PR, Ruiz C, Hellwinkel O, Jehan Z, et al. (2007) Estrogen
receptor alpha (ESR1) gene amplification is frequent in breast cancer. Nat Genet
39: 655–660.
35. Tanaka H, Yanagisawa K, Shinjo K, Taguchi A, Maeno K, et al. (2007)
Lineage-specific dependency of lung adenocarcinomas on the lung development
regulator TTF-1. Cancer Res 67: 6007–6011.
36. Kendall J, Liu Q, Bakleh A, Krasnitz A, Nguyen KC, et al. (2007) Oncogenic
cooperation and coamplification of developmental transcription factor genes in
lung cancer. Proc Natl Acad Sci U S A 104: 16663–16668.
37. Weir BA, Woo MS, Getz G, Perner S, Ding L, et al. (2007) Characterizing the
cancer genome in lung adenocarcinoma. Nature 450: 893–898.
38. Garraway LA, Sellers WR (2006) Lineage dependency and lineage-survival
oncogenes in human cancer. Nat Rev Cancer 6: 593–602.
39. Lechner JF, Fugaro JM, Wong Y, Pass HI, Harris CC, et al. (2001) Perspective:
cell differentiation theory may advance early detection of and therapy for lung
cancer. Radiat Res 155: 235–238.
40. Loercher AE, Tank EM, Delston RB, Harbour JW (2005) MITF links
differentiation with cell cycle arrest in melanocytes by transcriptional activation
of INK4A. J Cell Biol 168: 35–40.
41. Algul H, Treiber M, Lesina M, Schmid RM (2007) Mechanisms of disease:
chronic inflammation and cancer in the pancreas–a potential role for pancreatic
stellate cells? Nat Clin Pract Gastroenterol Hepatol 4: 454–462.
42. Birch-Machin MA (2006) The role of mitochondria in ageing and carcinogen-
esis. Clin Exp Dermatol 31: 548–552.
43. Galluzzi L, Larochette N, Zamzami N, Kroemer G (2006) Mitochondria as
therapeutic targets for cancer chemotherapy. Oncogene 25: 4812–4830.
GATA6 Amplification in Pancreatic Cancer
PLoS Genetics | www.plosgenetics.org 10 May 2008 | Volume 4 | Issue 5 | e1000081

44. Monti S, Savage KJ, Kutok JL, Feuerhake F, Kurtin P, et al. (2005) Molecular
profiling of diffuse large B-cell lymphoma identifies robust subtypes includingone characterized by host inflammatory response. Blood 105: 1851–1861.
45. Liu N, Furukawa T, Kobari M, Tsao MS (1998) Comparative phenotypic
studies of duct epithelial cell lines derived from normal human pancreas andpancreatic carcinoma. Am J Pathol 153: 263–269.
46. Schuler GD (1997) Pieces of the puzzle: expressed sequence tags and the catalogof human genes. J Mol Med 75: 694–698.
47. Pollack JR, Sorlie T, Perou CM, Rees CA, Jeffrey SS, et al. (2002) Microarray
analysis reveals a major direct role of DNA copy number alteration in thetranscriptional program of human breast tumors. Proc Natl Acad Sci U S A 99:
12963–12968.48. Lapointe J, Li C, Higgins JP, van de Rijn M, Bair E, et al. (2004) Gene
expression profiling identifies clinically relevant subtypes of prostate cancer. ProcNatl Acad Sci U S A 101: 811–816.
49. Demeter J, Beauheim C, Gollub J, Hernandez-Boussard T, Jin H, et al. (2007)
The Stanford Microarray Database: implementation of new analysis tools andopen source release of software. Nucleic Acids Res 35: D766–770.
50. Tibshirani R, Wang P (2008) Spatial smoothing and hot spot detection for CGH
data using the fused lasso. Biostatistics 9: 18–29.
51. Kim YH, Girard L, Giacomini CP, Wang P, Hernandez-Boussard T, et al.
(2006) Combined microarray analysis of small cell lung cancer reveals altered
apoptotic balance and distinct expression signatures of MYC family gene
amplification. Oncogene 25: 130–138.
52. Kel AE, Gossling E, Reuter I, Cheremushkin E, Kel-Margoulis OV, et al. (2003)
MATCH: A tool for searching transcription factor binding sites in DNA
sequences. Nucleic Acids Res 31: 3576–3579.
53. Barrett MT, Scheffer A, Ben-Dor A, Sampas N, Lipson D, et al. (2004)
Comparative genomic hybridization using oligonucleotide microarrays and total
genomic DNA. Proc Natl Acad Sci U S A 101: 17765–17770.
54. Livak KJ, Schmittgen TD (2001) Analysis of relative gene expression data using
real-time quantitative PCR and the 2(2Delta Delta C(T)) Method. Methods 25:
402–408.
55. Kent WJ, Sugnet CW, Furey TS, Roskin KM, Pringle TH, et al. (2002) The
human genome browser at UCSC. Genome Res 12: 996–1006.
GATA6 Amplification in Pancreatic Cancer
PLoS Genetics | www.plosgenetics.org 11 May 2008 | Volume 4 | Issue 5 | e1000081
Copyright © 2022 FDOKUMEN