Non invasive anatomical and functional assessment of coronary artery disease
Comparative MedicineCopyright 2010by the American Association for Laboratory Animal Science
Vol 60, No 4August 2010
Pages 300–315
300
Atherosclerotic coronary artery disease (CAD) is increased at least 2-fold in patients with metabolic syndrome (MetS)27 and is accompanied by marked microvascular dysfunction that fur-ther impairs coronary blood flow.10 MetS generally is diagnosed by the presence of 3 or more of the following conditions: obe-sity, insulin resistance, glucose intolerance, dyslipidemia, and hypertension.17,28 There is strong support for the role of the hy-perinsulinemia component of MetS in increased restenosis after percutaneous coronary interventions.74,75,84,85 Further, our group has shown that severe coronary microvascular dysfunction oc-curs in MetS.5 Because MetS (so-called ‘prediabetes’) affects as much as 27% of the United States population, is increasing dra-matically in prevalence,94 and can progress to type 2 diabetes, there is great need for basic research using animal models that ac-curately mimic MetS and the accompanying CAD. Clearly, there is need for study of MetS-induced CAD and in-stent stenosis and the underlying cellular and molecular mechanisms.
Mice, rats, and swine are known to recapitulate MetS;3,12,36,60,71,72 however, none of these models fully reproduce the combined symptoms of MetS and CAD. Further, transgenic mouse mod-els are simply not adequate for coronary vascular interventions using stents identical to those used in humans,18,23,38,55,57,79,83,86 a step that is essential for translation to the clinic. Yucatan and do-mestic swine are commonly used large animal models for study
of cardiovascular disease due to their ability to mimic the neo-intimal formation and thrombosis observed in humans.86 For example, several laboratories have produced severe CAD in swine,8,24,51,61,62,68,91 but through toxin-induced pancreatic β-cell ab-lation and feeding of an atherogenic diet, rather than as a natural development subsequent to MetS or diabetes. Currently, there is a paucity of large animal models that reproduce MetS and CAD.3
Research on the obesity-prone Ossabaw miniature swine59 clear-ly indicates that these animals develop MetS and cardiovascular disease when fed a high-calorie atherogenic diet,4,5,9,16,19,42,50,52,83,92 Female Ossabaw swine on this type of diet nearly doubled their percentage body fat in only 9 wk, showed insulin resistance, impaired glucose tolerance, dyslipidemia (profound increase in the ratio of low-density to high-density lipoprotein cholesterol, hypertriglyceridemia), hypertension, and early coronary ath-erosclerosis.16 These data contrast with those from male Yucatan miniature pigs, which did not develop MetS even after 20 wk on a comparable excess calorie atherogenic diet.8,68,95 Yucatan swine do not develop MetS through diet manipulation, unlike Ossabaw swine, which consistently recapitulate all MetS characteristics. However, important differences in study design have not allowed direct comparison between Yucatan and Ossabaw swine.
Cytosolic Ca2+ signaling is involved in ‘phenotypic modulation’ of coronary smooth muscle (CSM), as characterized by prolifera-tion and migration in several in vitro cell culture models33,35,89,90 and in vivo rodent models of the peripheral circulation (for ex-ample, reference 51). The Yucatan swine model of diabetic dys-lipidemia shows altered Ca2+ extrusion,96 Ca2+ sequestration by
Metabolic Syndrome and Coronary Artery Disease in Ossabaw Compared with Yucatan Swine
Zachary P Neeb, Jason M Edwards, Mouhamad Alloosh, Xin Long, Eric A Mokelke, and Michael Sturek*
Metabolic syndrome (MetS), a compilation of associated risk factors, increases the risk of type 2 diabetes and coronary artery disease (CAD, atherosclerosis), which can progress to the point of artery occlusion. Stents are the primary interventional treatment for occlusive CAD, and patients with MetS and hyperinsulinemia have increased restenosis. Because of its thrifty genotype, the Ossabaw pig is a model of MetS. We tested the hypothesis that, when fed high-fat diet, Ossabaw swine develop more features of MetS, greater native CAD, and greater stent-induced CAD than do Yucatan swine. Animals of each breed were divided randomly into 2 groups and fed 2 different calorie-matched diets for 40 wk: control diet (C) and high-fat, high-cholesterol atherogenic diet (H). A bare metal stent was placed in the circumflex artery, and pigs were allowed to recover for 3 wk. Characteristics of MetS, macrovascular and microvascular CAD, in-stent stenosis, and Ca2+ signaling in coronary smooth muscle cells were evaluated. MetS characteristics including, obesity, glucose intolerance, hyperinsulinemia, and elevated arterial pressure were elevated in Ossabaw swine compared to Yucatan swine. Ossabaw swine with MetS had more extensive and diffuse native CAD and in-stent stenosis and impaired coronary blood flow regulation compared with Yucatan. In-stent atherosclerotic lesions in Ossabaw coronary arter-ies were less fibrous and more cellular. Coronary smooth muscle cells from Ossabaw had impaired Ca2+ efflux and intracellular sequestration versus cells from Yucatan swine. Therefore, Ossabaw swine are a superior model of MetS, subsequent CAD, and cellular Ca2+ signaling defects, whereas Yucatan swine are leaner and relatively resistant to MetS and CAD.
Abbreviations: CAD, coronary artery disease; CSM, coronary smooth muscle; IVGTT, intravenous glucose tolerance test; MetS, metabolic syndrome; SERCA, sarco–endoplasmic reticulum Ca2+ ATPase; ET1, endothelin 1; SOCE, store-operated Ca2+ entry.
Received: 03 Dec 2009. Revision requested: 03 Jan 2010. Accepted: 20 Apr 2010.Department of Cellular and Integrative Physiology, Indiana University School of Medicine, Indianapolis, Indiana.
*Corresponding author. Email: [email protected]
CAD in metabolic syndrome
301
sessment is used to diagnose insulin resistance under fasting con-ditions.88 We measured insulin×glucose concentration near their peaks (10 min after bolus glucose injection) during the IVGTT to obtain a modified value for homeostasis model assessment.16,52
Plasma lipid assays. Venous blood samples were obtained dur-ing the week preceding stent placement after overnight fasting and were analyzed for triglyceride and total cholesterol (fraction-ated into HDL and LDL components) concentrations. Choles-terol in lipoprotein fractions was determined after precipitation of HDL by using minor modifications of standard methods.16,93 Specifically, apolipoprotein-B–containing lipoproteins were pre-cipitated with heparin–MnCl2, and the supernatant was assayed. LDL content was calculated from the Friedewald equation:22
LDL = total cholesterol – HDL – (triglyceride ÷ 5).
Stent procedure. After 40 wk on the diets, all pigs underwent placement of a bare metal stent in the circumflex coronary artery of all pigs followed by euthanasia 3 wk later, similar to previ-ous reports.18,19,55,83 Swine received 325 mg aspirin as antiplatelet therapy starting the day prior to the stent procedure and continu-ing for the 3 wk after stent deployment. After an overnight fast, swine received 0.05 mg/kg atropine, 2.2 mg/kg xylazine, and 5.5 mg/kg Telazol (Fort Dodge Animal Health, Fort Dodge, IA) IM. Swine were intubated, and anesthesia was maintained with 2% to 4% isoflurane in 100% O2 as a carrier gas. The isoflurane level was adjusted to maintain anesthesia with stable hemodynamics. Heart rate, aortic blood pressure, respiratory rate, and electrocar-diographic data were continuously monitored throughout the procedure. Under sterile conditions, a 7-French vascular intro-ducer sheath was inserted into the right femoral artery and hepa-rin (200 U/kg) administered. A 7-French guiding catheter (sizes 0.75 to 2.0; Amplatz L, Cordis, Bridgewater, NJ) was advanced to engage the left main coronary ostium. A 3.2-French, 30-MHz intravascular ultrasound catheter (Boston Scientific, Natick, MA) was advanced over a guide wire and positioned in the coronary artery. A mechanized device pulled the intravascular ultrasound transducer, located within the lumen of the intravascular ultra-sound catheter, at a constant rate of 0.5 mm/sec back towards the left main coronary ostium, allowing visualization of the entire length of the coronary artery (a technique termed ‘intravascular ultrasound pullback’). Importantly, the intravascular ultrasound catheter remained stationary during the pullback procedure, and the transducer moved within the catheter, thus limiting any me-chanical stress on the coronary artery wall. Video images were analyzed offline (Sonos Intravascular Imaging System; Hewlett Packard, Palo Alto, CA).
The intravascular ultrasound catheter was removed, and a coronary stent (diameter, 2.5 to 4.0 mm; length, 8 mm; Express2, Boston Scientific) catheter was deployed. Stents were chosen to match artery diameter at optimal inflation pressure. One stent (di-ameter, 1.0 × lumen diameter) was placed in the circumflex artery. After stent placement, angiography was repeated followed by reintroduction of the intravascular ultrasound catheter, to confirm correct stent deployment. The intravascular ultrasound catheter, guide catheter, and introducer sheath were removed and the right femoral artery ligated. The incision was closed, and the pig was allowed to recover. Cephalexin (1000 mg) was given twice daily for 6 d after the stent procedure.
Coronary blood flow. The ostium of the left main artery was engaged with the guiding catheter, and a Doppler flow wire (di-
the sarcoplasmic reticulum,32,34,98 and Ca2+ influx through voltage-gated Ca2+ channels.98 Currently, Ca2+ signaling has not been com-pared directly between MetS Ossabaw and Yucatan swine CSM. Therefore, the purpose of the present study was to test the hy-pothesis that compared with Yucatan swine on calorie-matched standard chow (for example, Yucatan maintenance diet8,95) and atherogenic diets, Ossabaw swine have a greater propensity to MetS and CAD with impaired coronary microvascular dysfunc-tion and Ca2+ handling in CSM.
Materials and MethodsAnimal care and use. All protocols involving animals were ap-
proved by an institutional animal care and use committee and complied fully with recommendations outlined by the National Research Council and American Veterinary Medical Associa-tion.2,37 Male Ossabaw and Yucatan swine each were assigned to 1 of 4 groups (n = 9 per group): Ossabaw control, Yucatan control, and Ossabaw and Yucatan on high-fat, high-cholesterol, athero-genic diet. The control groups for both breeds were fed a calorie-matched diet for 43 wk, which contained 22% of calories from protein, 70% of calories from carbohydrates, and 8% of calories from fat. The pigs in the control groups received 3200 kcal daily until euthanasia, which was a standard amount for maintaining lean, normal body growth in Yucatan swine.83 The atherogenic diet was composed of control chow supplemented with (percent-age by weight): cholesterol, 2.0%; coconut oil, 17%; corn oil, 2.5%, and sodium cholate, 0.7%. This mixture yielded 13% of calories from protein, 40% of calories from carbohydrates, and 47% of calories from fat. The animals in the atherogenic groups ate 3200 kcal daily (calorie-matched to the control diet) for 43 wk until they were euthanized. The very-high-fat diet was similar to the high-fat diet in matching of calories and duration of feeding, ex-cept that the very-high-fat mixture yielded 6% of calories from protein, 19% of calories from carbohydrates, and 75% of calories from fat (n = 8). All animals were housed and fed in individual pens and provided a 12:12-h light:dark cycle. Water was provided ad libitum.
Body composition. Backfat was measured by using ultrasonog-raphy and carcass fat was assessed by proximate chemical compo-sition analysis, as previously described.95 Backfat measurements were taken 1 wk before euthanasia; carcass fat was measured af-terward. Body mass index was determined as in humans,26 as body weight in kg divided by the square of the pig’s length from the end of the snout to the base of the tail.
Intravenous glucose tolerance test (IVGTT). Swine were accli-mated to restraint in a specialized sling for 5 to 7 d before IVGTT was conducted within 1 wk before stent placement. Swine then were fasted overnight and anesthetized with isoflurane (main-tained at 2% by mask with supplemental O2). The right jugular vein was catheterized percutaneously.11,16,83 After catheterization, swine were allowed to recover for 3 h before the IVGTT to avoid any effect of isoflurane on insulin signaling.68 Once recovered from anesthesia, swine were restrained in the sling, and tail cuff blood pressure measurements and baseline blood samples were obtained, as previously described.68,95 Glucose (0.5 g/kg IV) was administered, and timed blood samples were collected.68 Blood glucose was measured automatically (YSI 2300 STAT Plus Glu-cose analyzer, YSI Life Sciences, Yellow Springs, OH). Plasma insulin assays were performed by a commercial laboratory (Linco Research Laboratories, St Charles, MO). Homeostasis model as-
Vol 60, No 4Comparative MedicineAugust 2010
302302
tery, flow velocity signals were allowed to stabilize for several minutes. The analog Doppler signals were digitized continuously both as instantaneous peak velocity and averaged peak velocity
ameter, 0.014 in.; JoMed, Rancho Cordova, CA) was advanced down the circumflex artery.61 After angiography-aided placement of the flow wire in a nonbranching section of the circumflex ar-
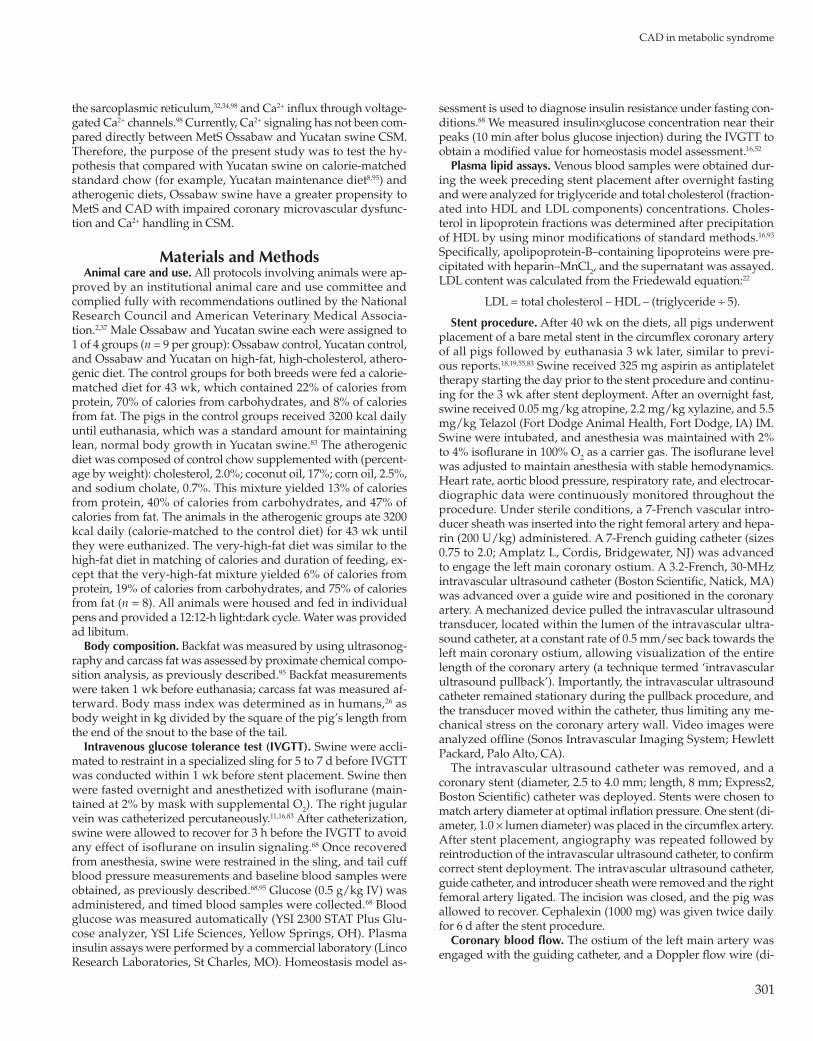
Table 1. Phenotypic characteristics of Yucatan (Y) and Ossabaw (O) swine fed control (C) or high-fat, high-cholesterol atherogenic (H) diet
Yucatan C Yucatan H Ossabaw C Ossabaw H P < 0.05
Starting body weight (kg) 41.3 ± 9.8 37.3 ± 1.6 43 ± 0.8 44.4 ± 0.7 None
End body weight (kg) 59 ± 2 58 ± 3 74 ± 2 76 ± 2 Y < OStarting body mass index (kg/m2) 32 ± 1 34 ± 1 28 ± 1 28 ± 1 Y > OEnd body mass index (kg/m2) 38 ± 1 38 ± 3 47 ± 6 45 ± 1 Y < OTotal cholesterol (mg/dL) 52 ± 4 420 ± 72 62 ± 3 338 ± 28 C < HHDL (mg/dL) 30 ± 3 60 ± 10 34 ± 1 75 ± 9 C < HLDL (mg/dL) 14 ± 3 351 ± 76 20 ± 4 255 ± 29 C < HLDL:HDL 0.5 ± 0.1 6.5 ± 1.6 0.7 ± 0.1 3.9 ± 0.8 C < HTriglycerides (mg/dL) 38 ± 6 41 ± 6 19 ± 3 41 ± 7 None
Systolic blood pressure (mm Hg) 77 ± 4 79 ± 9 88 ± 7 91 ± 3 None
Diastolic blood pressure (mm Hg) 48 ± 3 54 ± 1 59 ± 8 56 ± 3 None
Mean arterial pressure (mm Hg) 57 ± 4 62 ± 1 68 ± 7 67 ± 3 Y < OHeart weight/ body weight 0.0039 ± 0.00012 0.00436 ± 0.00023 0.0031 ± 0.0001 0.003 ± 0.00006 Y > OCoronary artery diameter (mm) 2.7 ± 0.1 2.5 ± 0.1 2.3 ± 0.3 2.3 ± 0.1 Y > O
Two-way ANOVA was performed on each data set. Any significant differences (P < 0.5) were reported between groups of swine or diets (within each breed).
Figure 1. Body fat is greater and leptin increase is blunted in Ossabaw compared with Yucatan swine on calorie-matched diets. (A) Backfat measured by ultrasonography at the fifth rib. *, P < 0.05 Ossabaw C versus all other groups; **, P < 0.05 Ossabaw H versus all other groups. (B) Percentage of carcass as fat measured by direct chemical analysis. *P < 0.05 Ossabaw H versus all other groups. (C) Plasma leptin is increased similarly by H diet in both Ossabaw and Yucatan. *P < 0.05 H versus C. (D) Plasma leptin is increased in a subset of Ossabaw fed a very-high–fat (VH) diet consisting of 75% of caloric content from fat. *, P < 0.05 Ossabaw C compared with VH.

CAD in metabolic syndrome
303
coronary flow reserve, which is the adenosine- or bradykinin-induced flow divided by baseline flow velocity. Briefly, baseline flow was defined as 20 to 30 consecutive average peak velocity values (corresponding to approximately 1 min) with less than
values. Each average peak velocity value was calculated online as an average of instantaneous peak velocity over 2 consecutive cardiac cycles. All flow data were stored on videotape and per-sonal computer for further offline analysis. Data are shown as
Figure 2. Ossabaw (O) swine are glucose-intolerant and insulin-resistant (hyperinsulinemic) compared with Yucatan (Y) pigs. Intravenous glucose tolerance testing (IVGTT) in Yucatan and Ossabaw swine was initiated by infusion of 0.5 g glucose/kg body weight at time 0. (A) Time course of blood glucose responses in Yucatan control (C, filled circles), Yucatan high-fat–fed (H,open circles), Ossabaw C (filled triangles), and Ossabaw H (open triangles) swine. *, Ossabaw H greater (P < 0.05) than all other groups. (B) Data for C and H groups combined by breed to compare glucose levels. (C) Simultaneous measurement of insulin responses during IVGTT. *, all groups greater (P < 0.05) than Yucatan C. (D) Data for C and H groups combined by breed to compare insulin levels. (E) Ossabaw C and H swine have greater insulin×glucose values near peak (10 min) during IVGTT than do Yucatan C and H pigs. (F) Combined C and H diets to compare insulin × glucose at peak (10 min).

Vol 60, No 4Comparative MedicineAugust 2010
304304
by the external elastic lamina and internal elastic lamina (tunica media) or internal elastic lamina and lumen (neointima) by us-ing commercially available software (ImagePro 3.0, PowerQuest, Orem, UT). The percentage stenosis was calculated as
% stenosis = area of neointima ÷ (area of tunica media + area of neointima) × 100%.
Collagen content in the sections of the stented arteries was determined by colorimetric analysis of trichrome histology. The adventitia, which is composed predominantly of collagen, was used as the reference color template against which the rest of the section was compared.15,19
Assessment of native atheroma. Intravascular ultrasound pull-backs (see Stent Procedure in Methods section for details) per-formed during the stenting procedure before stent placement were used to assess native atheroma. Post-stent evaluations of atheroma were not included in any measure of native atheroma because of the possibility that catheter intervention accelerated atheroma formation. Cross-sectional measurements were ob-tained every 2 mm through the length of the artery. Each cross-sectional image was divided into 16 equal segments. Percentage wall coverage (by atheroma) was calculated similar to that in pre-vious reports4,19,51,91 as:
% wall coverage = (no. of segments containing atheroma ÷ 16) × 100%
Statistical analysis. Analyses were performed by using commer-cially available software (Prism 4.0, GraphPad Software, La Jolla, CA). One-way ANOVA or 2×2 ANOVA with Student–Newman–Keuls or Bonferroni post hoc tests, respectively, were used where appropriate. In all tests, a P value of less than 0.05 was the crite-rion for statistical significance.
ResultsTo test the hypothesis that Ossabaw swine were MetS-prone,
metabolic profiles were obtained for Ossabaw and Yucatan swine on control and high-fat, atherogenic diets. Regardless of diet, Ossabaw swine had greater body weight and body mass index at euthanasia than did both groups of Yucatan swine, despite
5% variance that were obtained before bolus infusion of adenos-ine or bradykinin. Adenosine or bradykinin was delivered to the coronary microcirculation by means of bolus infusion through the guiding catheter, as previously described.61 The peak increase in coronary flow typically occurred within 30 s of the infusion. After each drug bolus, coronary flow was allowed to return to baseline. Saline (vehicle) had no effect on coronary blood flow (data not shown).
Cell dispersion. The procedures for isolation of the nonstented right coronary artery and acute enzymatic dispersal of coronary smooth muscle cells have been described.32,33,34, 96,97,98 Artery seg-ments (from unstented artery controls and peri-stent sections) were incubated in collagenase solution for 45 min to disperse endothelial cells, followed by a second incubation of 30 min to obtain the smooth muscle cell fraction.
Intracellular Ca2+ measurements. Whole-cell intracellular Ca2+ levels were measured at room temperature (22 to 25 °C) by us-ing the fluorescent Ca2+ indicator fura 2 (InCa++ Ca2+ Imaging System, Intracellular Imaging, Cincinnati, OH) as previously de-scribed.32-34, 96-98 Briefly, freshly dispersed cells were incubated with 2.5 µM fura-2–AM (Molecular Probes, Eugene, OR) in a shaking water bath at 37 °C for 20 min before being washed 3 times in a solution containing low Ca2+. An aliquot of cells loaded with fura-2 was placed on a coverslip contained within a constant-flow superfusion chamber that was mounted on an inverted epifluorescent microscope (model TMS-F, Nikon, Melville, NY). Solutions, including those containing 80 mM potassium, caffeine, thapsigargin, and endothelin 1, were superfused at a constant rate of 1 to 2 mL/min. Fura-2 was excited by light from a 300-W xenon arc lamp that was passed through a computer-controlled filter changer containing 340 ± 10 and 380 ± 10 nm bandpass fil-ters. The fluorescence emission at 510 nm was collected by using a monochrome charge-coupled device camera (COHU, San Diego, CA) attached to a 100-MHz Pentium data acquisition computer. Whole-cell fura-2 fluorescence was expressed as the 340:380-nm ratio of fura-2 emission.
Histology. Verhoeff–van Gieson and trichrome staining were performed on sections of stented arteries.19,55 Neointima forma-tion was determined by obtaining area measurements bounded
Figure 3. Ossabaw (Oss) swine exhibit coronary microvascular dysfunction compared with Yucatan (Yuc) swine. (A) Coronary schematic illustrates flow wire positioning in circumflex artery (from right anterior oblique view) and downstream microvasculature. (B) Coronary flow reserve is reduced in response to adenosine in Ossabaw swine. C) Ossabaw swine exhibit endothelial dysfunction in response to bradykinin. * P < 0.05 by 2-way ANOVA with Bonferroni posttest.
CAD in metabolic syndrome
305
To determine whether increased adipose tissue was respon-sible for increased body weight and body mass index of Ossabaw swine, back fat was measured by ultrasonography. Ossabaw swine fed the high-fat diet had the most backfat, whereas backfat in Ossabaw swine on the control diet was increased compared to Yucatan swine on either diet (Figure 1 A). Ossabaw swine also demonstrated significantly (P < 0.05) greater whole carcass fat as a percentage of body weight, compared with Yucatan swine (Figure 1 B). Concurrently, plasma leptin levels were similar in Ossabaw and Yucatan swine, whereas plasma leptin due to high-fat diet
comparable ages and body weights at the start of the study and calorie-matched diets for all groups throughout the study (Table 1). Compared with control diet, hyperlipidemic diet increased total cholesterol, LDL, and HDL levels, although no increases in triglyceride levels were observed (Table 1). Although systolic and diastolic blood pressures showed statistical trends (P < 0.10) toward increases in Ossabaw swine, mean arterial pressure was significantly (P < 0.05) greater in anesthetized Ossabaw compared with Yucatan swine.
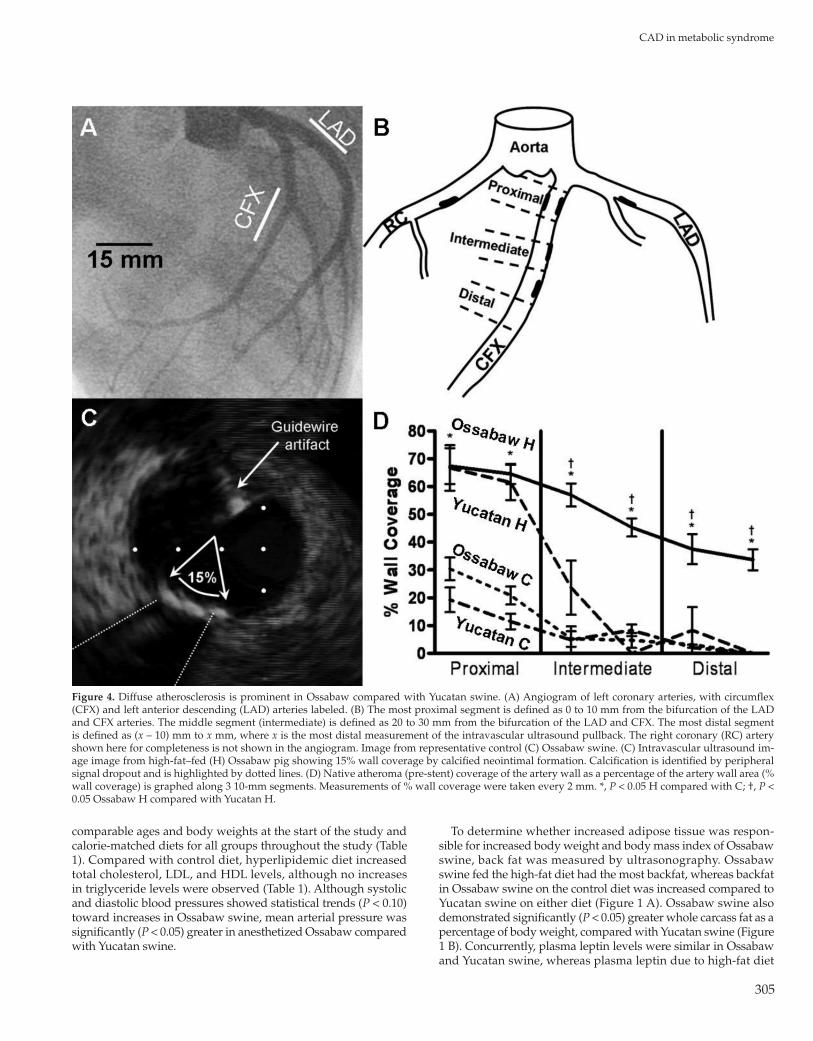
Figure 4. Diffuse atherosclerosis is prominent in Ossabaw compared with Yucatan swine. (A) Angiogram of left coronary arteries, with circumflex (CFX) and left anterior descending (LAD) arteries labeled. (B) The most proximal segment is defined as 0 to 10 mm from the bifurcation of the LAD and CFX arteries. The middle segment (intermediate) is defined as 20 to 30 mm from the bifurcation of the LAD and CFX. The most distal segment is defined as (x – 10) mm to x mm, where x is the most distal measurement of the intravascular ultrasound pullback. The right coronary (RC) artery shown here for completeness is not shown in the angiogram. Image from representative control (C) Ossabaw swine. (C) Intravascular ultrasound im-age image from high-fat–fed (H) Ossabaw pig showing 15% wall coverage by calcified neointimal formation. Calcification is identified by peripheral signal dropout and is highlighted by dotted lines. (D) Native atheroma (pre-stent) coverage of the artery wall as a percentage of the artery wall area (% wall coverage) is graphed along 3 10-mm segments. Measurements of % wall coverage were taken every 2 mm. *, P < 0.05 H compared with C; †, P < 0.05 Ossabaw H compared with Yucatan H.

Vol 60, No 4Comparative MedicineAugust 2010
306306
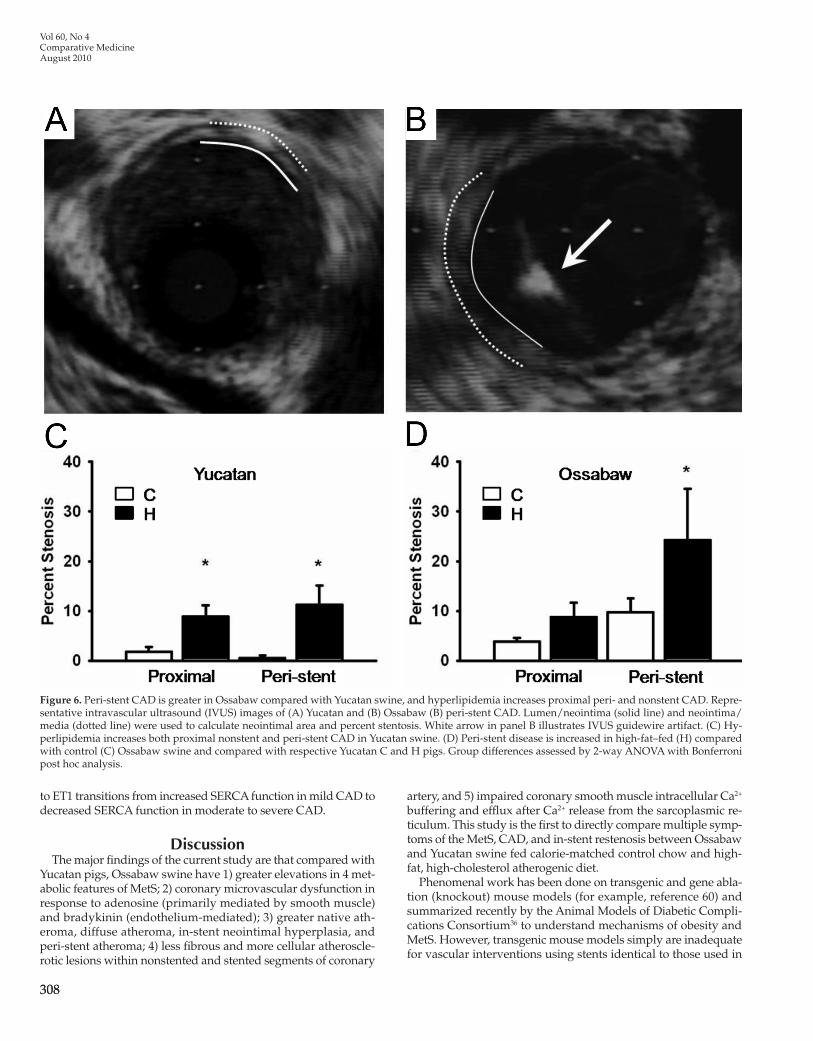
lular than that of Yucatan pigs. Histologic evaluation of the neo-intima of nonstent artery segments, revealed that the percentage collagen was greater in Yucatan than in Ossabaw swine, with diet having no significant effect (Figure 5 J), whereas cellularity was unchanged (data not shown). CAD in nonstent segments proxi-mal and immediately adjacent to the stent (that is, peri-stent) was quantified by using intravascular ultrasound (Figure 6). Peri-stent CAD was approximately 5-fold greater in Ossabaw compared with Yucatan control pigs, and peri-stent CAD was increased af-ter atherogenic diet in both breeds.
We previously reported that intracellular Ca2+ signaling events are altered in coronary arteries with atherosclerotic le-sions.4,9,32,34,61,91,96,98 High extracellular K+ (that is, 80 mM) depolar-ized the cell membrane, activating voltage-gated Ca2+ channels in CSM, leading to Ca2+ influx and a rise in intracellular Ca2+ levels (Figure 7 A). In addition, providing high K+ maximally loaded the Ca2+ store of the sarcoplasmic reticulum. The area-under-the-curve of the high-K+ response did not differ between Yucatan and Ossabaw control animals (Figure 7 B). Subsequent to caffeine-induced Ca2+ release from the sarcoplasmmic reticulum, intracel-lular Ca2+ levels rose transiently then fell over time due to Ca2+ extrusion (efflux) and sequestration mechanisms (Figure 7 A). Baseline-subtracted peak Ca2+ response to caffeine (5 mM) was not different between Yucatan C and Ossabaw control swine (Fig-ure 7 C). Overall buffering of intracellular Ca2+ was measured as time from peak Ca2+ response to caffeine to half the initial base-line (that is, half minimum). CSM from Ossabaw control pigs in Ca2+-containing and Ca2+-free solution displayed increased time to half minimum from peak Ca2+ response to caffeine compared with CSM from Yucatan controls (Figure 7 D), thus providing evidence for decreased Ca2+ efflux in Ossabaw compared with Yucatan control swine.
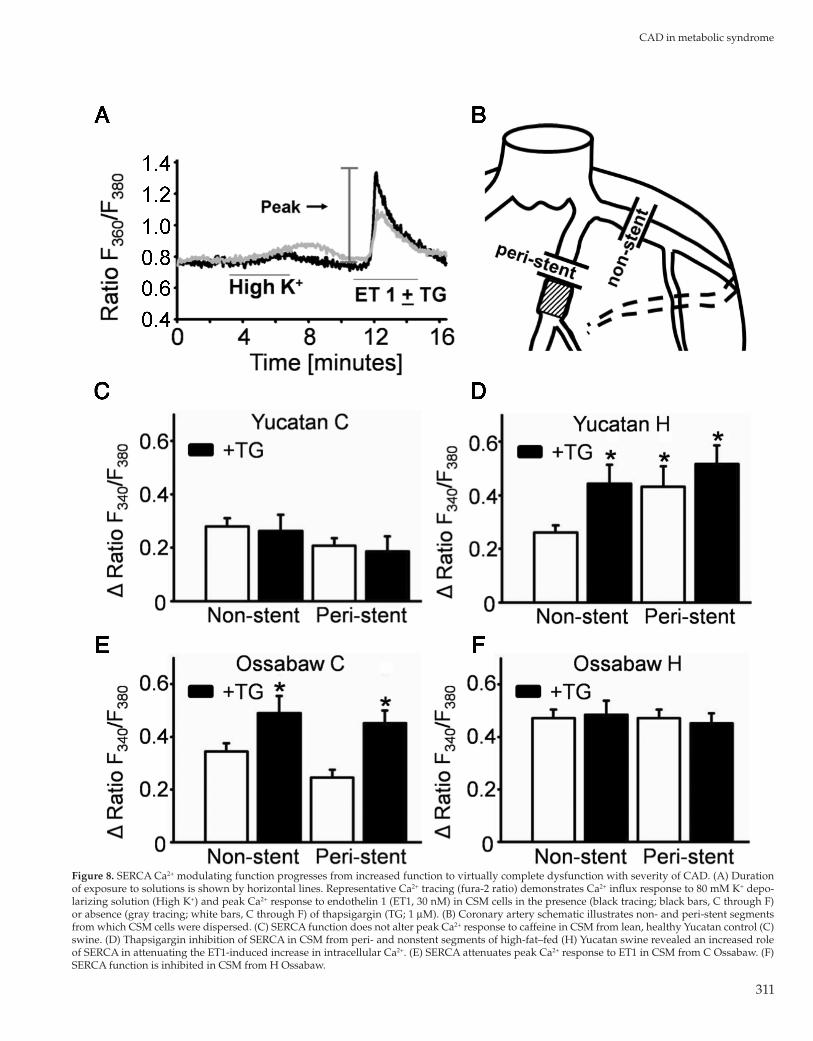
In addition, CSM from peri-stent and nonstent arterial seg-ments of Yucatan and Ossabaw control and high-fat–fed swine were assessed for sarco–endoplasmic reticulum Ca2+ ATPase (SERCA) function. CSM were depolarized with high K+ to load the sarcoplasmic reticulum (Figure 8 A). Endothelin 1 (ET1, 30 nM) elicited release of Ca2+ from the sarcoplasmic reticulum, whereas thapsigargin (1 μM) prevented Ca2+ uptake into the sarcoplasmic reticulum by blocking SERCA. SERCA buffering of Ca2+ was assessed by the effect of full SERCA inhibition by thapsigargin on the peak Ca2+ response to ET1. SERCA buffering of Ca2+ was not involved in the overall Ca2+ response to ET1 in Yucatan C in either peri- or nonstent CSM (Figure 8 B and C). In contrast, SERCA contributed significantly to buffering the ET1-associated Ca2+ response in nonstent CSM from high-fat–fed Yu-catan swine, as evidenced by increased peak Ca2+ response to ET1 after thapsigargin treatment (Figure 8 D). In other words, SERCA function was increased in native atherosclerotic arterial segments. Importantly, peri-stent CSM from high-fat–fed Yucatan swine have SERCA dysfunction, because their peak Ca2+ response to ET1 is similar to that of non- and peri-stent CSM, in which SERCA was inhibited completely by thapsigargin treatment. CSM from both non- and peri-stent segments from Ossabaw control swine had increased SERCA function, as evidenced by increased peak Ca2+ response to ET1 in the presence of thapsigargin (Figure 8 E). SERCA function is virtually nonexistent in CSM from non- and peri-stent segments from high-fat–fed Ossabaw swine, in that peak Ca2+ response to ET1 was elevated in the absence of thapsi-gargin (Figure 8 F). Therefore, buffering of the peak Ca2+ response
was increased compared with control diet (Figure 1 C). In a subset of Ossabaw pigs fed a very-high-fat diet containing 75% of total calories from fat, leptin levels were only 55% greater than those in Ossabaw swine on control diet (Figure 1 D).
Both glucose intolerance and insulin resistance are key com-ponents of MetS and were assessed in the current study by us-ing IVGTT. Compared with all other groups, Ossabaw swine fed the high-fat diet had significantly (P < 0.05) higher blood glucose concentrations at 5 and 10 min after 0.5 mg/kg bolus injection of glucose (Figure 2 A). Further, peak plasma insulin was lower (P < 0.05) in control Yucatan swine compared with all other groups. (Figure 2 C). To evaluate the contribution of breed alone on blood glucose and plasma insulin during IVGTT, we combined both diet groups for each pig breed. Ossabaw swine had significantly (P < 0.05) greater peak glucose at 5 and 10 min and plasma insulin at 10 min after bolus injection of glucose (Figure 2 B and D). The modified value for homeostatsis model assessment yielded simi-lar results to that of area-under-the-curve measures.16,52,88 These modified values were significantly (P < 0.05) greater in Ossabaw compared with Yucatan swine (Figure 2 E and F).
We assessed coronary microvascular function in Ossabaw and Yucatan swine by measuring blood flow velocity and calculating coronary flow reserve in response to bradykinin and adenosine, 2 well-characterized vasodilators.61 Placement of the flow wire in the circumflex artery is show in Figure 3 A. Mobilization of coronary flow reserves in response to adenosine was impaired in Ossabaw compared with Yucatan (Figure 3 B). In addition, endo-thelial cell dysfunction in response to bradykinin was greater in Ossabaw compared with Yucatan pigs (Figure 3 C).
Diffuse atherosclerosis was assessed by measuring neointimal formation in proximal, intermediate, and distal segments of the left anterior descending and circumflex coronary arteries before stent placement, as highlighted in coronary angiograms (Figure 4 A) and diagrams (Figure 4 B). Atheroma was quantified by mea-suring the percentage of the artery wall with neointimal forma-tion (Figure 4 C), in which a calcified lesion covers 15% of the cross-section of the coronary wall. Atherosclerosis in the proximal segment was increased in Yucatan swine on high-fat diet, but was indistinguishable among these animals and both control groups throughout the intermediate segment. Importantly, atheroscle-rosis in Ossabaw swine on high-fat diet remained elevated in all segments measured (Figure 4 D), demonstrating that Ossabaw swine develop MetS with diffuse CAD whereas Yucatan swine do not.
In-stent CAD was investigated in Ossabaw and Yucatan swine by evaluating coronary angiograms obtained immediately before stent expansion (Figure 5 A) and during stent expansion with ra-dio-opaque dye within the inflated balloon (Figure 5 B). Verhoeff–Van Gieson elastin (Figure 5 C and D), hematoxylin and eosin (not shown), and trichrome collagen (Figure 5 E and F) stains were used to characterize in-stent CAD and stenosis in Ossabaw and Yucatan swine at 3 wk after stent placement. In-stent neo-intimal hyperplasia was 2.5-fold greater in Ossabaw compared with Yucatan swine, regardless of diet (Figure 5 G). In addition, Ossabaw swine had more cells per unit area (Figure 5 H) and decreased in-stent collagen content (Figure 5 I) than did Yucatan swine. There was a preponderance of spindle cells (fibroblasts and smooth muscle cells) in the in-stent neointima of Ossabaw compared with Yucatan swine. Therefore, the in-stent neointima of Ossabaw swine was more occlusive, less fibrous, and more cel-

CAD in metabolic syndrome
307
Figure 5. In-stent stenosis is greater in Ossabaw compared with Yucatan swine. Coronary angiogram in right anterior oblique 30° view (A) prior to and (B) during stent deployment in a representative control (C) Yucatan pig. (C) Representative Verhoeff–Van Gieson stain of Yucatan C in-stent CAD. D) Representative Verhoeff–Van Gieson stain of Ossabaw C in-stent CAD illustrating adventitia (A), neointima (Neo), media (M), lumen (L), and pre-stent lumen border (dotted line) and post-stent lumen border (dashed line) of neointimal hyperplasia. (E and F) Histology using Masson trichrome collagen staining (blue). Open spaces to the left and below neointima are from stent struts that were removed in sectioning. (G) Percentage cross-sectional area of stenosis calculated by histology is greater in Ossabaw C and H than Yucatan C and H, with no effect of atherogenic diet (H). (H) Ossabaw C and H swine have greater cell nuclei per unit area than do Yucatan C and H swine. Percentage collagen in neointima area of (I) in-stent and (J) nonstent artery segment. *, P < 0.05 Ossabaw compared with Yucatan; †, P < 0.05 C compared with H diet.
Vol 60, No 4Comparative MedicineAugust 2010
308308
Figure 6. Peri-stent CAD is greater in Ossabaw compared with Yucatan swine, and hyperlipidemia increases proximal peri- and nonstent CAD. Repre-sentative intravascular ultrasound (IVUS) images of (A) Yucatan and (B) Ossabaw (B) peri-stent CAD. Lumen/neointima (solid line) and neointima/media (dotted line) were used to calculate neointimal area and percent stentosis. White arrow in panel B illustrates IVUS guidewire artifact. (C) Hy-perlipidemia increases both proximal nonstent and peri-stent CAD in Yucatan swine. (D) Peri-stent disease is increased in high-fat–fed (H) compared with control (C) Ossabaw swine and compared with respective Yucatan C and H pigs. Group differences assessed by 2-way ANOVA with Bonferroni post hoc analysis.
to ET1 transitions from increased SERCA function in mild CAD to decreased SERCA function in moderate to severe CAD.
DiscussionThe major findings of the current study are that compared with
Yucatan pigs, Ossabaw swine have 1) greater elevations in 4 met-abolic features of MetS; 2) coronary microvascular dysfunction in response to adenosine (primarily mediated by smooth muscle) and bradykinin (endothelium-mediated); 3) greater native ath-eroma, diffuse atheroma, in-stent neointimal hyperplasia, and peri-stent atheroma; 4) less fibrous and more cellular atheroscle-rotic lesions within nonstented and stented segments of coronary
artery, and 5) impaired coronary smooth muscle intracellular Ca2+ buffering and efflux after Ca2+ release from the sarcoplasmic re-ticulum. This study is the first to directly compare multiple symp-toms of the MetS, CAD, and in-stent restenosis between Ossabaw and Yucatan swine fed calorie-matched control chow and high-fat, high-cholesterol atherogenic diet.
Phenomenal work has been done on transgenic and gene abla-tion (knockout) mouse models (for example, reference 60) and summarized recently by the Animal Models of Diabetic Compli-cations Consortium36 to understand mechanisms of obesity and MetS. However, transgenic mouse models simply are inadequate for vascular interventions using stents identical to those used in

CAD in metabolic syndrome
309
Figure 7. Dysfunctional Ca2+ efflux in CSM from Ossabaw compared to CSM from Yucatan. (A) Duration of exposure to solutions is shown by horizon-tal lines. Representative Ca2+ tracing (fura-2 ratio) demonstrates Ca2+ influx response to 80 mM K+ depolarizing solution (High K+), peak Ca2+ response to caffeine (Caff, 5 mM), and time to half minimum from caffeine-induced Ca2+ peaks. (B) Integral of the intracellular Ca2+ response to depolarizing solution is not different between CSM from control (C) Ossabaw and Yucatan swine. (C) Peak Ca2+ response to caffeine is not different between CSM from C Ossabaw and Yucatan swine. (D) Time to half minimum from peak is increased in CSM from C Ossabaw compared with Yucatan.

Vol 60, No 4Comparative MedicineAugust 2010
310310
2.2-fold6 in swine demonstrating MetS. Although similar to hu-mans, glucose homeostasis in swine shows important differences that should be taken into careful consideration when defining diabetes in swine.44 Chief among these concerns are the lower fasting glucose levels (60 to 80 mg/dL47) in healthy swine com-pared with humans. Also of importance is that swine have rela-tively high glucose tolerance to oral glucose load and increased clearance after intravenous glucose load.44 In addition, pancreatic β-cell:body mass ratio in swine is twice that in humans, suggest-ing considerable insulin secretory reserve in swine.49,58 Taken to-gether, these observations suggest that lower thresholds for the diagnosis of prediabetes and diabetes mellitus should be consid-ered for swine.
Despite intensive efforts to induce insulin resistance and glu-cose intolerance in Yucatan swine on high-fat, high-cholesterol, and high-sucrose diets, we have found that currently available Yucatan pigs do not naturally develop obesity-associated insu-lin resistance68,70,72,73 (Table 2). In contrast, Ossabaw swine fed a high-calorie diet display natural pathogenesis of MetS with hy-perinsulinemia and eventual progression to type 2 diabetes as evidenced by a significantly increased fasting blood glucose.5,6,7,9 Other miniature swine breeds currently available for laboratory animal medicine (that is, Yucatan and Gottingen) do not prog-ress to type 2 diabetes,45,68,72 although Gottingen pigs will develop mild MetS.43,45,46,48 Despite outstanding work showing that a line of crossbred domestic pigs with familial hypercholesterolemia develop MetS,3 the use of standard-size domestic swine is imprac-tical because they weigh more than 250 kg and are 2 y old before type 2 diabetes occurs. Furthermore, a 250-kg pig is not amenable to the use of the conventional angiography instrumentation need-ed for stent deployment, compared with the convenient small stature of Ossabaw miniature swine (Table 2).
Dyslipidemia was comparable between Yucatan and Ossabaw swine in the present study (Table 1), but other studies using hy-percaloric diets showed robust increases in LDL:HDL and trig-lycerides in Ossabaw swine (Table 2). The similar dyslipidemia but greater and diffuse CAD in MetS Ossabaw compared with Yucatan pigs clearly indicates that CAD is not driven simply by increased cholesterol levels.36 Instead, the addition of more components of MetS (for example, obesity) likely may exacerbate hyperlipidemia-induced CAD. Genetically leaner Yucatan pigs made mildly obese and hyperlipidemic by consumption of excess calorie atherogenic diet did not become hypertensive8,68,96 (Table 1). In contrast, in all of our chronic studies of hypercaloric feeding of Ossabaw swine, hypertension was a clear finding (Table 2), thus indicating MetS. Convincing evidence of ‘obesity hyperten-sion’30 is the robust, 5-fold increases in plasma renin and aldoster-one in Ossabaw swine.1
In the current study, we show that mild MetS in Ossabaw swine increases CAD. Although high-fat–fed Ossabaw and Yucatan swine have similar levels of CAD in proximal arterial segments, high-fat–fed Ossabaw pigs—the only group to exhibit elevated peak glucose in response to glucose tolerance testing—have dif-fuse atherosclerosis, a hallmark of patients with diabetes64,65,67 (Table 2). This difference in CAD between Yucatan and Ossabaw swine is especially striking considering the modest metabolic dif-ferences.
Patients with MetS have increased incidence of CAD,27 and those presenting with flow-limiting coronary occlusions are treated primarily by stent deployment. Drug-eluting stents have
humans,18,23,38,55,57,79,83,86 a step that is essential for translation to the clinic. Because the Ossabaw miniature swine model of MetS also develops mature, clinically significant atheroma that includes the presence of lipid cores, foam cells, proliferating smooth muscle cells, and small foci of calcification,42,92 it has the potential to yield vastly superior information than that gained through other stent-ing studies that involved injury of healthy arteries.38,57,79,86
A primary advantage of Ossabaw miniature swine use in re-search is their predisposition to obesity, natural occurrence of MetS, and progression to type 2 diabetes, which is unique to Ossabaw swine. Table 2 compares the major features of MetS in Yucatan and Ossabaw miniature swine and their utility as cardio-vascular disease models and for study of Ca2+ signaling. Yucatan pigs are our comparison because of our extensive work with this genetically leaner pig, which is the predominantly used miniature swine for laboratory research. The current study yielded rela-tively mild differences in various metabolic parameters (for ex-ample, body mass index, hyperglycemia, hyperinsulinemia, and hypercholesterolemia) after atherogenic diet feeding, compared with previous reports in Ossabaw and Yucatan swine (summa-rized in Table 2). This outcome was a direct result of our study’s aim to sensitively measure breed differences by calorie-matching control and high-fat diets to that required for maintenance of nor-mal body weight in adult Yucatan swine, rather than by induc-ing maximal MetS by overfeeding the high-fat groups. Rigorous comparison revealed the much greater propensity to obesity (that is, ‘thriftiness’) of Ossabaw compared with Yucatan swine. High-fat–fed Ossabaw swine demonstrated increased back and carcass fat compared with breed controls, but Yucatan swine lacked simi-lar differences between high-fat–fed and control groups (Figure 1 A and B).
Leptin insensitivity leads to ectopic lipid accumulation, in turn contributing to insulin insensitivity.56 Although backfat and car-cass fat were greater in high-fat–fed Ossabaw than Yucatan swine, plasma leptin was similarly and modestly elevated in both high-fat–fed Ossabaw and Yucatan pigs compared with their respec-tive controls. Lending support to this finding are our previously published data,95 which revealed that leptin levels in hypercaloric high-fat–fed Yucatan swine were 84% greater than those of high-fat–fed Yucatan swine in the current study (Figure 1 C). In con-trast, hypercaloric very-high-fat–fed Ossabaw swine displayed only an 11% increase in plasma leptin over that in high-fat–fed Ossabaw (Figure 1 C and D), although the hypercaloric swine were much more obese (data not shown). This result suggests that Ossabaw pigs have a deficient (blunted) leptin response to increased adipose, and this dampening may explain in part the increased weight gain that contributes to MetS in these pigs, a situation strikingly similar to the constellation of leptin deficien-cy, obesity, and MetS in humans.21 In summary, Ossabaw swine clearly show greater propensity to obesity than do Yucatans and direct measures show a greater accumulation of visceral fat on rigorously controlled experimental diets (Figure 1B).
Type 2 diabetes has been defined in humans as a fasting blood glucose exceeding 126 mg/dL. Perhaps less known is that the fasting blood glucose in healthy adults is approximately 90 mg/dL (range, 74 to 110 mg/dL).78 Therefore, an approximate 1.4-fold increase in the fasting blood glucose level in humans renders a diagnosis of diabetes mellitus. Given this information, our labo-ratory has several publications demonstrating increased fasting blood glucose on the order of 1.4-fold,9 1.7-fold,5 1.4-fold,7 and
CAD in metabolic syndrome
311
Figure 8. SERCA Ca2+ modulating function progresses from increased function to virtually complete dysfunction with severity of CAD. (A) Duration of exposure to solutions is shown by horizontal lines. Representative Ca2+ tracing (fura-2 ratio) demonstrates Ca2+ influx response to 80 mM K+ depo-larizing solution (High K+) and peak Ca2+ response to endothelin 1 (ET1, 30 nM) in CSM cells in the presence (black tracing; black bars, C through F) or absence (gray tracing; white bars, C through F) of thapsigargin (TG; 1 μM). (B) Coronary artery schematic illustrates non- and peri-stent segments from which CSM cells were dispersed. (C) SERCA function does not alter peak Ca2+ response to caffeine in CSM from lean, healthy Yucatan control (C) swine. (D) Thapsigargin inhibition of SERCA in CSM from peri- and nonstent segments of high-fat–fed (H) Yucatan swine revealed an increased role of SERCA in attenuating the ET1-induced increase in intracellular Ca2+. (E) SERCA attenuates peak Ca2+ response to ET1 in CSM from C Ossabaw. (F) SERCA function is inhibited in CSM from H Ossabaw.
Vol 60, No 4Comparative MedicineAugust 2010
312312
portantly there was no difference in time to half minimum despite the presence or absence of extracellular Ca2+ for CSM from either breed (Figure 7D), suggesting store-operated Ca2+ entry (SOCE) was not a predominant factor.
The lack of SOCE in Ossabaw CSM may appear to contradict recently published results from our laboratory implicating the SOCE channel transient receptor potential classical 1 (TRPC1) in MetS- and stent-induced CAD in Ossabaw swine.19 However, an important difference between the previous and current studies is the induction of robust MetS and severe CAD of the earlier work compared with the relatively mild MetS and CAD induced here. The current finding that SOCE is not evident in CSM from Yucatan swine confirms previous reports by our laboratory,14,31 although we have observed robust SOCE in endothelial cells.25 Interestingly, SERCA does not influence the peak response to ET1 in CSM from non- and peri-stent segments from Yucatan pigs fed the control diet (Figure 8 C). The Ca2+ response is maintained at normal levels with increased SERCA function in CSM from both non- and peri-stent Ossabaw controls (Figure 8 E), compared with Yucatan controls. SERCA function increases with mainte-nance of peak response in CSM from nonstent segments from high-fat–fed compared with control Yucatan, but high-fat–fed Yucatan peri-stent CSM are unable to maintain peak response de-spite increased SERCA function (Figure 8 D). Incredibly, SERCA is virtually nonfunctional in CSM from non- and peri-stent sections of high-fat–fed Ossabaw swine (Figure 8 F), as assessed by peak response to ET1 with or without thapsigargin.
Complex and unstable plaque formation lead to increased risk of thrombosis,13 resulting in acute myocardial infarction. We have observed more than 500 Yucatan coronary arteries without docu-menting calcified coronary lesions; however, Ossabaw coronary arteries contain calcified lesions (Figure 3 C, Table 2). Previously published data demonstrated collagen-rich atherosclerotic tis-sue in restenotic specimens was greater in humans with diabetes than in nondiabetic patients.63 In contrast, we show an approxi-mate 2-fold increase in percentage collagen of in-stent segments in high-fat–fed Yucatan swine compared to high-fat–fed Ossabaw swine. One possible explanation is that the atherosclerotic tissue in the human study is more mature, whereas that in our study is at an early stage of progression, which is characterized by less stable plaque formation. The complex (highly cellular, calcified,
greatly reduced restenosis rates, but restenosis remains a major concern when treatment is complicated by diffuse and severe atheroma, which progresses much more aggressively in regions adjacent to the stent (so-called ‘peri-stent CAD’).64,65,67 Ossabaw swine, which show at least 6 features of MetS (Table 2), have in-creased peri- and in-stent CAD (Figures 5 and 6), compared with Yucatan swine. Interestingly, pig breed, but not diet, is associ-ated with increased in-stent stenosis. This outcome differs from that of nonstent segments, in which only the combination of the Ossabaw breed and atherogenic diet elicited diffuse atherosclero-sis. These findings suggest that factors key to CAD in Ossabaw swine drive their greater peri- and in-stent CAD compared with that in Yucatan swine; possible factors include: 1) components of MetS not examined in our study, 2) other inflammatory media-tors, and 3) genetic components beyond the thrifty genotype (for example, vascular wall differences) that render coronary arteries more sensitive to stenting. The most likely difference, however, is hyperinsulinemia, which was present in Ossabaw compared with Yucatan swine. Although some reports indicate no greater coronary restenosis in patients with MetS compared to healthy patients,76 considerable evidence supports a role for the hyperin-sulinemia component of MetS in increased restenosis after per-cutaneous coronary interventions.74,75,84,85 Particularly compelling is a study84 showing serial intravascular ultrasound measures of coronary restenosis in humans.
Mechanisms underlying CAD and vascular response to inju-ry are not completely understood, but we and others have re-ported that altered CSM Ca2+ signaling is involved in diabetic CAD.9,19,32,34,41,51,91,96,98 Intracellular free Ca2+ concentration is deter-mined by 3 major mechanisms: Ca2+ influx, Ca2+ extrusion, and intracellular Ca2+ sequestration by the sarcoplasmic reticulum. Important observations in the present study include no differ-ence in Ca2+ influx in response to depolarizing extracellular solu-tion (Figure 7 B; quantifies mainly voltage-gated Ca2+ channel activity in the plasma membrane34,98) or peak Ca2+ in response to caffeine treatment (Figure 7 C; quantifies Ca2+ stores in the sarco-plasmic reticulum81,82,97) between Ossabaw and Yucatan swine. In the presence and absence of extracellular Ca2+, increased time to half minimum in response to caffeine indicates decreased Ca2+ extrusion across the plasma membrane (Ca2+ efflux97,98) in CSM from Ossabaw compared with Yucatan swine (Figure 7 D). Im-
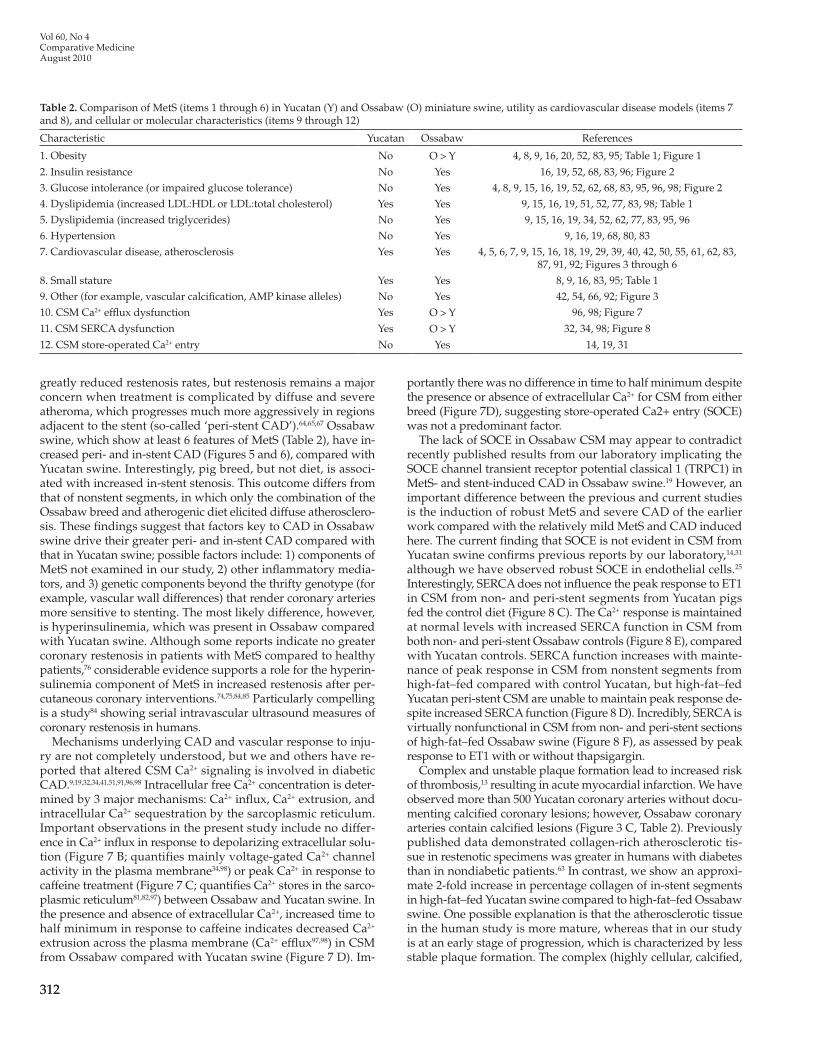
Table 2. Comparison of MetS (items 1 through 6) in Yucatan (Y) and Ossabaw (O) miniature swine, utility as cardiovascular disease models (items 7 and 8), and cellular or molecular characteristics (items 9 through 12)
Characteristic Yucatan Ossabaw References
1. Obesity No O > Y 4, 8, 9, 16, 20, 52, 83, 95; Table 1; Figure 1
2. Insulin resistance No Yes 16, 19, 52, 68, 83, 96; Figure 23. Glucose intolerance (or impaired glucose tolerance) No Yes 4, 8, 9, 15, 16, 19, 52, 62, 68, 83, 95, 96, 98; Figure 24. Dyslipidemia (increased LDL:HDL or LDL:total cholesterol) Yes Yes 9, 15, 16, 19, 51, 52, 77, 83, 98; Table 15. Dyslipidemia (increased triglycerides) No Yes 9, 15, 16, 19, 34, 52, 62, 77, 83, 95, 966. Hypertension No Yes 9, 16, 19, 68, 80, 837. Cardiovascular disease, atherosclerosis Yes Yes 4, 5, 6, 7, 9, 15, 16, 18, 19, 29, 39, 40, 42, 50, 55, 61, 62, 83,
87, 91, 92; Figures 3 through 68. Small stature Yes Yes 8, 9, 16, 83, 95; Table 19. Other (for example, vascular calcification, AMP kinase alleles) No Yes 42, 54, 66, 92; Figure 310. CSM Ca2+ efflux dysfunction Yes O > Y 96, 98; Figure 7
11. CSM SERCA dysfunction Yes O > Y 32, 34, 98; Figure 8
12. CSM store-operated Ca2+ entry No Yes 14, 19, 31

CAD in metabolic syndrome
313
and less fibrous) neointimal composition observed in stented seg-ments of Ossabaw coronary artery suggests a complex, mature, proliferative, or lipid-laden composition, which is thus poten-tially more vulnerable to plaque rupture.
Ossabaw swine were first used as a laboratory animal model almost 40 y ago59 and may be more relevant now than ever due to the increasing incidence of MetS and type 2 diabetes in Western society.94 Ossabaw swine remarkably mimic the MetS and ad-vanced CAD seen in humans and likely will serve as an excellent large animal model for the study of metabolic abnormalities and CAD in the future.
AcknowledgmentsWe thank the many outstanding coworkers who contributed to this
work, especially J Bryd, J Wenzel, R Boullion, and Dr C A Witczak. We thank J M Sturek for initial strategies for segmental analysis of intravascular ultrasound images to characterize diffuse coronary artery disease. This work was supported by the National Institutes of Health grant numbers HL062552 and RR013223 and an Innovation Award from the American Diabetes Association (to MS), the Purdue–Indiana University Comparative Medicine Program, and the Fortune–Fry Ultrasound Research Fund of the Department of Cellular and Integrative Physiology at Indiana University School of Medicine. JME and ZPN are recipients of a Translational Research Fellowship from the Indiana University School of Medicine, ZPN was the recipient of a Translational Fellowship from NIH UL1 RR025761, and XL was the recipient of a Predoctoral Fellowship from the American Heart Association.
References 1. Alloosh M, Pratt JH, Sturek M, Basile DP. 2008. Elevated renin and
enhanced adrenal steroidogenesis in the Ossabaw miniature swine model of the metabolic syndrome. FASEB J 22:736.7.
2. AVMA Panel on Euthanasia. American Veterinary Medical Asso-ciation. 2001. 2000 Report of the AVMA panel on euthanasia. J Am Vet Med Assoc 218:669–696.
3. Bellinger DA, Merricks EP, Nichols TC. 2006. Swine models of type 2 diabetes mellitus: insulin resistance, glucose tolerance, and cardiovascular complications. ILAR J 47:243–258.
4. Bender SB, Tune JD, Borbouse L, Long X, Sturek M, Laughlin MH. 2009. Altered mechanism of adenosine-induced coronary arteriolar dilation in early-stage metabolic syndrome. Exp Biol Med (May-wood) 234:683–692.
5. Borbouse L, Dick GM, Asano S, Bender SB, Dincer UD, Payne GA, Neeb ZP, Bratz IN, Sturek M, Tune JD. 2009. Impaired function of coronary BKCa channels in metabolic syndrome. Am J Physiol Heart Circ Physiol 297:H1629–H1637.
6. Borbouse L, Dick GM, Payne GA, Berwick ZC, Neeb ZP, Alloosh M, Bratz IN, Sturek M, Tune JD. 2010. Metabolic syndrome reduces the contribution of K+ channels to ischemic coronary vasodilation. Am J Physiol Heart Circ Physiol 298:H1182–H1189.
7. Borbouse L, Dick GM, Payne GA, Payne BD, Svendsen MC, Neeb ZP, Alloosh M, Bratz IN, Sturek M, Tune JD. 2010. Contribution of BKCa channels to local metabolic coronary vasodilation: effects of metabolic syndrome. Am J Physiol Heart Circ Physiol 298:H966–H973.
8. Boullion RD, Mokelke EA, Wamhoff BR, Otis CR, Wenzel J, Dixon JL, Sturek M. 2003. Porcine model of diabetic dyslipidemia: insulin and feed algorithms for mimicking diabetes in humans. Comp Med 53:42–52.
9. Bratz IN, Dick GM, Tune JD, Edwards JM, Neeb ZP, Dincer UD, Sturek M. 2008. Impaired capsaicin-induced relaxation of coronary arteries in a porcine model of the metabolic syndrome. Am J Physiol Heart Circ Physiol 294:H2489–H2496.
10. Camici PG, Crea F. 2007. Coronary microvascular dysfunction. N Engl J Med 356:830–840.
11. Carroll JA, Daniel JA, Keisler DH, Matteri RL. 1999. Nonsurgi-cal catheterization of the jugular vein in young pigs. Lab Anim 33:129–134.
12. Christoffersen BO, Grand N, Golozoubova V, Svendsen O, Raun K. 2007. Gender-associated differences in metabolic syndrome-related parameters in Gottingen minipigs. Comp Med 57:493–504.
13. Daemen J, Wenaweser P, Tsuchida K, Abrecht L, Vaina S, Morger C, Kukreja N, Juni P, Sianos G, Hellige G, Van Domburg RT, Hess OM, Boersma E, Meier B, Windecker S, Serruys PW. 2007. Early and late coronary stent thrombosis of sirolimus-eluting and paclitaxel-eluting stents in routine clinical practice: data from a large 2-institutional cohort study. Lancet 369:667–678.
14. Dick GM, Sturek M. 1996. Effects of a physiological insulin con-centration on the endothelin-sensitive Ca2+ store in porcine coronary artery smooth muscle. Diabetes 45:876–880.
15. Dixon JL, Shen S, Vuchetich JP, Wysocka E, Sun G, Sturek M. 2002. Increased atherosclerosis in diabetic dyslipidemic swine: protection by atorvastatin involves decreased VLDL triglycerides but minimal effects on the lipoprotein profile. J Lipid Res 43:1618–1629.
16. Dyson MC, Alloosh M, Vuchetich JP, Mokelke EA, Sturek M. 2006. Components of metabolic syndrome and coronary artery disease in female Ossabaw swine fed excess atherogenic diet. Comp Med 56:35–45.
17. Eckel RH, Kahn R, Robertson RM, Rizza RA. 2006. Preventing car-diovascular disease and diabetes: a call to action from the American Diabetes Association and the American Heart Association. Circula-tion 113:2943–2946.
18. Edwards JM, Alloosh M, Long X, Dick GM, Lloyd PG, Mokelke EA, Sturek M. 2008. Adenosine A1 receptors in neointimal hyperplasia and in-stent stenosis in Ossabaw miniature swine. Coron Artery Dis 19:27–31.
19. Edwards JM, Neeb ZP, Alloosh MA, Long X, Bratz IN, Peller CR, Byrd JP, Kumar S, Obukhov AG, Sturek M. 2010. Exercise training decreases store-operated Ca2+ entry associated with metabolic syn-drome and coronary atherosclerosis. Cardiovasc Res 85:631–640.
20. Flum DR, Devlin A, Wright AS, Figueredo E, Alyea E, Hanley PW, Lucas MK, Cummings DE. 2007. Development of a porcine Roux-en-Y gastric bypass survival model for the study of postsurgical physiology. Obes Surg 17:1332–1339.
21. Friedman JM. 2002. The function of leptin in nutrition, weight, and physiology. Nutr Rev 60:S1–S14.
22. Friedewald WT, Levy RI, Fredrickson DS. 1972. Estimation of the concentration of low-density lipoprotein cholesterol in plasma, with-out use of the preparative ultracentrifuge. Clin Chem 18:499–502.
23. Gal D, Isner JM. 1992. Atherosclerotic Yucatan microswine as a model for novel cardiovascular interventions and imaging, p 118–140. In: Swindle MM, Moody DC, Phillips LD, editors. Swine as models in biomedical research. Ames (IA): Iowa State University Press.
24. Gerrity RG, Natarajan R, Nadler JL, Kimsey T. 2001. Diabetes-in-duced accelerated atherosclerosis in swine. Diabetes 50:1654–1665.
25. Graier WF, Simecek S, Sturek M. 1995. Cytochrome P450 mono-oxygenase-regulated signalling of Ca2+ entry in human and bovine endothelial cells. J Physiol 482:259–274.
26. Greif M, Becker A, von Ziegler F, Lebherz C, Lehrke M, Broedl UC, Tittus J, Parhofer K, Becker C, Reiser M, Knez A, Leber AW. 2009. Pericardial adipose tissue determined by dual-source CT is a risk factor for coronary atherosclerosis. Arterioscler Thromb Vasc Biol 29:781–786.
27. Grundy SM. 2007. Metabolic syndrome: a multiplex cardiovascular risk factor. J Clin Endocrinol Metab 92:399–404.
28. Grundy SM, Brewer HB, Cleeman JI, Smith SC Jr, Lenfant C. 2004. Definition of the metabolic syndrome. Circulation 109:433–438.
29. Hainsworth DP, Katz ML, Sanders DA, Sanders DN, Wright EJ, Sturek M. 2002. Retinal capillary basement membrane thickening in a porcine model of diabetes mellitus. Comp Med 52:523–529.
30. Hall JE. 2003. The kidney, hypertension, and obesity. Hypertension 41:625–633.

Vol 60, No 4Comparative MedicineAugust 2010
314314
31. Heaps CL, Sturek M, Price EM, Laughlin MH, Parker JL. 2001. Sarcoplasmic reticulum Ca2+-ATPase uptake is impaired in coronary smooth muscle distal to chronic occlusion. Am J Physiol Heart Circ Physiol 281:H223–H231.
32. Hill BJF, Dixon JL, Sturek M. 2001. Effect of atorvastatin on intracel-lular calcium uptake in coronary smooth muscle cells from diabetic pigs fed an atherogenic diet. Atherosclerosis 159:117–124.
33. Hill BJF, Katwa LC, Wamhoff BR, Sturek M. 2000. Enhanced en-dothelinA receptor-mediated calcium mobilization and contraction in organ cultured porcine coronary arteries. J Pharmacol Exp Ther 295:484–491.
34. Hill BJF, Price EM, Dixon JL, Sturek M. 2003. Increased calcium buffering in coronary smooth muscle cells from diabetic dyslipidemic pigs. Atherosclerosis 167:15–23.
35. Hill BJF, Wamhoff BR, Sturek M. 2001. Functional nucleotide receptor expression and sarcoplasmic reticulum morphology in dedifferentiated porcine coronary smooth muscle cells. J Vasc Res 38:432–443.
36. Hsueh W, Abel ED, Breslow JL, Maeda N, Davis RC, Fisher EA, Dansky H, McClain DA, McIndoe R, Wassef MK, Rabadan-Diehl C, Goldberg IJ. 2007. Recipes for creating animal models of diabetic cardiovascular disease. Circ Res 100:1415–1427.
37. Institute for Laboratory Animal Research. 1996. Guide for the care and use of laboratory animals. Washington (DC): National Acad-emies Press.
38. Johnson GJ, Griggs TR, Badimon L. 1999. The utility of animal models in the preclinical study of interventions to prevent human coronary artery restenosis: analysis and recommendations. Thromb Haemost 81:835–843.
39. Korte FS, Mokelke EA, Sturek M, McDonald KS. 2005. Exercise improves impaired ventricular function and alterations of cardiac myofibrillar proteins in diabetic dyslipidemic pigs. J Appl Physiol 98:461–467.
40. Kreutz RP, Alloosh M, Neeb ZP, Kreutz Y, Flockhart DA, Sturek M. 2009. Metabolic syndrome in Ossabaw miniature swine is associ-ated with increased sensitivity of platelet aggregation to adenosine diphosphate. [(abstract)] Arterioscler Thromb Vasc Biol. 29:e122.
41. Kumar B, Dreja K, Shah SS, Cheong A, Xu SZ, Sukumar P, Naylor J, Forte A, Cipollaro M, McHugh D, Kingston PA, Heagerty AM, Munsch CM, Bergdahl A, Hultgardh-Nilsson A, Gomez MF, Porter KE, Hellstrand P, Beech DJ. 2006. Upregulated TRPC1 channel in vascular injury in vivo and its role in human neointimal hyperplasia. Circ Res 98:557–563.
42. Langohr IM, HogenEsch H, Stevenson GW, Sturek M. 2008. Vascular-associated lymphoid tissue in swine (Sus scrofa). Comp Med 58:168–173.
43. Larsen MO, Juhl CB, Porksen N, Gotfredsen CF, Carr RD, Ribel U, Wilken M, Rolin B. 2005. β-Cell function and islet morphology in normal, obese, and obese β-cell mass-reduced Gottingen minipigs. Am J Physiol Endocrinol Metab 288:E412–E421.
44. Larsen MO, Rolin B. 2004. Use of the Gottingen minipig as a model of diabetes with special focus on type 1 diabetes research. ILAR J 45:303–313.
45. Larsen MO, Rolin B, Raun K, Bjerre Knudsen L, Gotfredsen CF, Bock T. 2007. Evaluation of β-cell mass and function in the Gottingen minipig. Diabetes Obes Metab 9 Suppl 2:170–179.
46. Larsen MO, Rolin B, Sturis J, Wilken M, Carr RD, Porksen N, Gotfredsen CF. 2006. Measurements of insulin responses as predic-tive markers of pancreatic β-cell mass in normal and β-cell-reduced lean and obese Gottingen minipigs in vivo. Am J Physiol Endocrinol Metab 290:E670–E677.
47. Larsen MO, Rolin B, Wilken M, Carr RD, Gotfredsen CF. 2003. Measurements of insulin secretory capacity and glucose tolerance to predict pancreatic β-cell mass in vivo in the nicotinamide–strep-tozotocin Gottingen minipig, a model of moderate insulin deficiency and diabetes. Diabetes 52:118–123.
48. Larsen MO, Rolin B, Wilken M, Carr RD, Svendsen O. 2002. High-fat high-energy feeding impairs fasting glucose and increases fasting
insulin levels in the Gottingen minipig: results from a pilot study. Ann N Y Acad Sci 967:414–423.
49. Larsen MO, Wilken M, Gotfredsen CF, Carr RD, Svendsen O, Rolin B. 2002. Mild streptozotocin diabetes in the Göttingen minipig: a novel model of moderate insulin deficiency and diabetes. Am J Physiol Endocrinol Metab 282:E1342–E1351.
50. Le TT, Langohr IM, Locker MJ, Sturek M, Cheng JX. 2007. Label-free molecular imaging of atherosclerotic lesions using multimodal nonlinear optical microscopy. J Biomed Opt 12:054007.
51. Lee DL, Wamhoff BR, Katwa LC, Reddy HK, Voelker DJ, Dixon JL, Sturek M. 2003. Increased endothelin-induced Ca2+ signaling, tyrosine phosphorylation, and coronary artery disease in diabetic dyslipidemic swine are prevented by atorvastatin. J Pharmacol Exp Ther 306:132–140.
52. Lee L, Alloosh M, Saxena R, Van Alstine W, Watkins BA, Klaunig JE, Sturek M, Chalasani N. 2009. Nutritional model of steatohepatitis and metabolic syndrome in the Ossabaw miniature swine. Hepatol-ogy 50:56–67.
53. Levy J, Gavin JR, Sowers JR. 1994. Diabetes mellitus: A disease of abnormal cellular calcium metabolism? Am J Med 96:260–273.
54. Lloyd PG, Fang M, Brisbin IL Jr, Andersson L, Sturek M. 2006. AMP kinase gene mutation is consistent with a thrifty phenotype (meta-bolic syndrome) in a population of feral swine. FASEB J 20:A299.
55. Lloyd PG, Sheehy AF, Edwards JM, Mokelke EA, Sturek M. 2008. Leukemia inhibitory factor is upregulated in coronary arteries of Ossabaw miniature swine after stent placement. Coron Artery Dis 19:217–226.
56. Lovejoy JC, Windhauser MM, Rood JC, de la Bretonne JA. 1998. Effect of a controlled high-fat versus low-fat diet on insulin sensitiv-ity and leptin levels in African-American and Caucasian women. Metabolism 47:1520–1524.
57. Lowe HC, Schwartz RS, Mac Neill BD, Jang IK, Hayase M, Rog-ers C, Oesterle SN. 2003. The porcine coronary model of in-stent restenosis: current status in the era of drug-eluting stents. Catheter Cardiovasc Interv 60:515–523.
58. Maclean N, Ogilvie RF. 1955. Quantitative estimation of the pan-creatic islet tissue in diabetic subjects. Diabetes 4:367–376.
59. Martin RJ, Gobble JL, Hartsock TH, Graves HB, Ziegler JH. 1973. Characterization of an obese syndrome in the pig. Proc Soc Exp Biol Med 143:198–203.
60. Masuzaki H, Paterson J, Shinyama H, Morton NM, Mullins JJ, Seckl JR, Flier JS. 2001. A transgenic model of visceral obesity and the metabolic syndrome. Science 294:2166–2170.
61. Mokelke EA, Dietz NJ, Eckman DM, Nelson MT, Sturek M. 2005. Diabetic dyslipidemia and exercise affect coronary tone and differ-ential regulation of conduit and microvessel K+ current. Am J Physiol Heart Circ Physiol 288:H1233–H1241.
62. Mokelke EA, Hu Q, Song M, Toro L, Reddy HK, Sturek M. 2003. Al-tered functional coupling of coronary K+ channels in diabetic dyslipi-demic pigs is prevented by exercise. J Appl Physiol 95:1179–1193.
63. Moreno PR, Fallon JT, Murcia AM, Leon MN, Simosa H, Fuster V, Palacios IF. 1999. Tissue characteristics of restenosis after percuta-neous transluminal coronary angioplasty in diabetic patients. J Am Coll Cardiol 34:1045–1049.
64. Morgan KP, Kapur A, Beatt KJ. 2004. Anatomy of coronary disease in diabetic patients: an explanation for poorer outcomes after percu-taneous coronary intervention and potential target for intervention. Heart 90:732–738.
65. Natali A, Vichi S, Landi P, Severi S, L’Abbate A, Ferrannini E. 2000. Coronary atherosclerosis in type II diabetes: angiographic findings and clinical outcome. Diabetologia 43:632–641.
66. Neeb ZP, Edwards JM, Bratz IN, Alloosh M, Schultz C, Thompson K, Cunha T, and Sturek M. 2008. Occlusive, diffuse coronary artery disease in Ossabaw miniature swine with metabolic syndrome. FASEB J 22:1152.10.
67. Nicholls SJ, Tuzcu EM, Kalidindi S, Wolski K, Moon KW, Sipahi I, Schoenhagen P, Nissen SE. 2008. Effect of diabetes on progression of
CAD in metabolic syndrome
315
coronary atherosclerosis and arterial remodeling: a pooled analysis of 5 intravascular ultrasound trials. J Am Coll Cardiol 52:255–262.
68. Otis CR, Wamhoff BR, Sturek M. 2003. Hyperglycemia-induced insulin resistance in diabetic dyslipidemic Yucatan swine. Comp Med 53:53–64.
69. Owens GK, Kumar MS, Wamhoff BR. 2004. Molecular regulation of vascular smooth muscle cell differentiation in development and disease. Physiol Rev 84:767–801.
70. Panepinto LM, Phillips RW, Westmoreland NW, Cleek JL. 1982. Influence of genetics and diet on the development of diabetes in Yucatan miniature swine. J Nutr 112:2307–2313.
71. Peterson RG. 2001. The Zucker diabetic fatty (ZDF) rat, p 109–128. In: Sima AAF, Shafrir E, editors. Animal models of diabetes: a primer. Amsterdam (Netherlands): Harwood Academic Publishers.
72. Phillips RW, Panepinto LM, Spangler R, Westmoreland N. 1982. Yucatan miniature swine as a model for the study of human diabetes mellitus. Diabetes 31:30–36.
73. Phillips RW, Westmoreland N, Panepinto L, Case GL. 1982. Dietary effects on metabolism of Yucatan miniature swine selected for low and high glucose utilization. J Nutr 112:104–111.
74. Piatti P, Di Mario C, Monti LD, Fragasso G, Sgura F, Caumo A, Setola E, Lucotti P, Galluccio E, Ronchi C, Origgi A, Zavaroni I, Margonato A, Colombo A. 2003. Association of insulin resistance, hyperleptinemia, and impaired nitric oxide release with in-stent restenosis in patients undergoing coronary stenting. Circulation 108:2074–2081.
75. Pons D, Monraats PS, Zwinderman AH, de Maat MPM, Doeven-dans PAFM, de Winter RJ, Tio RA, Waltenberger J, Jukema JW. 2009. Metabolic background determines the importance of NOS3 polymorphisms in restenosis after percutaneous coronary interven-tion: a study in patients with and without the metabolic syndrome. Dis Markers 26:75–83.
76. Rana JS, Monraats PS, Zwinderman AH, de Maat MPM, Kastelein JJP, Doevendans PAF, de Winter RJ, Tio RA, Frants RR, van der Laarse A, van der Wall EE, Jukema JW. 2005. Metabolic syndrome and risk of restenosis in patients undergoing percutaneous coronary intervention. Diabetes Care 28:873–877.
77. Rector RS, Thomas TR, Liu Y, Henderson KK, Holiman DA, Sun GY, Sturek M. 2004. Effect of exercise on postprandial lipemia fol-lowing a higher calorie meal in Yucatan miniature swine. Metabolism 53:1021–1026.
78. Sacks DB, Bruns DE, Goldstein DE, Maclaren NK, McDonald JM, Parrott M. 2002. Guidelines and recommendations for laboratory analysis in the diagnosis and management of diabetes mellitus. Clin Chem 48:436–472.
79. Schwartz RS, Edelman ER. 2002. Drug-eluting stents in preclinical studies. Recommended evaluation from a consensus group. Circula-tion 106:1867–1873.
80. Sheehy A, Mokelke EA, Lloyd PG, Sturek J, Sturek M. 2006. Re-duced expression of leukemia inhibitory factor correlates with coro-nary atherosclerosis in the metabolic syndrome. FASEB J 20:A698.
81. Stehno-Bittel L, Laughlin MH, Sturek M. 1990. Exercise training alters Ca2+ release from coronary smooth muscle sarcoplasmic re-ticulum. Am J Physiol 259:H643–H647.
82. Stehno-Bittel L, Laughlin MH, Sturek M. 1991. Exercise training depletes sarcoplasmic reticulum calcium in coronary smooth muscle. J Appl Physiol 71:1764–1773.
83. Sturek M, Alloosh M, Wenzel J, Byrd JP, Edwards JM, Lloyd PG, Tune JD, March KL, Miller MA, Mokelke EA, Brisbin IL Jr. 2007. Ossabaw Island miniature swine: cardiometabolic syndrome assess-ment, p 397–402. In: Swindle MM, editor. Swine in the laboratory: surgery, anesthesia, imaging, and experimental techniques. Boca Raton (FL): CRC Press.
84. Takagi T, Yoshida K, Akasaka T, Kaji S, Kawamoto T, Honda Y, Yamamuro A, Hozumi T, Morioka S. 2000. Hyperinsulinemia during oral glucose tolerance test is associated with increased neointimal tissue proliferation after coronary stent implantation in nondiabetic patients: a serial intravascular ultrasound study. J Am Coll Cardiol 36:731–738.
85. Tommasino A, Burzotta F, Trani C, Giammarinaro M, Schiavoni G. 2008. Impact of metabolic syndrome on angiographic and clinical outcome after stenting. Am J Cardiol 101:1679.
86. Touchard AG, Schwartz RS. 2006. Preclinical restenosis models: challenges and successes. Toxicol Pathol 34:11–18.
87. Turk JR, Carroll JA, Laughlin MH, Thomas TR, Casati J, Bowles DK, Sturek M. 2003. C-reactive protein correlates with macrophage accumulation in coronary arteries of hypercholesterolemic pigs. J Appl Physiol 95:1301–1304.
88. Wallace TM, Levy JC, Matthews DR. 2004. Use and abuse of HOMA modeling. Diabetes Care 27:1487–1495.
89. Wamhoff BR, Bowles DK, Dietz NJ, Hu Q, Sturek M. 2002. Exercise training attenuates coronary smooth muscle phenotypic modula-tion and nuclear Ca2+ signaling. Am J Physiol Heart Circ Physiol 283:H2397–H2410.
90. Wamhoff BR, Bowles DK, McDonald OG, Sinha S, Somlyo AP, Owens GK. 2004. L-type voltage-gated Ca2+ channels modulate expression of smooth muscle differentiation marker genes via a Rho kinase–myocardin–SRF-dependent mechanism. Circ Res 95:406–414.
91. Wamhoff BR, Dixon JL, Sturek M. 2002. Atorvastatin treatment prevents alterations in coronary smooth muscle nuclear Ca2+ signal-ing associated with diabetic dyslipidemia. J Vasc Res 39:208–220.
92. Wang HW, Langohr IM, Sturek M, Cheng JX. 2009. Imaging and quantitative analysis of atherosclerotic lesions by CARS-based mul-timodal nonlinear optical microscopy. Arterioscler Thromb Vasc Biol 29:1342–1348.
93. Warnick GR, Benderson J, Albers JJ. 1982. Dextran sulfate–Mg2+ precipitation procedure for quantitation of HDL cholesterol. Clin Chem 28:1379–1388.
94. Wilson PW, D’Agostino RB, Parise H, Sullivan L, Meigs JB. 2005. Metabolic syndrome as a precursor of cardiovascular disease and type 2 diabetes mellitus. Circulation 112:3066–3072.
95. Witczak CA, Mokelke EA, Boullion RD, Wenzel J, Keisler DH, Sturek M. 2005. Noninvasive measures of body fat percentage in male Yucatan swine. Comp Med 55:445–451.
96. Witczak CA, Sturek M. 2004. Exercise prevents diabetes-induced impairment in superficial buffer barrier in porcine coronary smooth muscle. J Appl Physiol 96:1069–1079.
97. Witczak CA, Sturek M. 2005. Training-induced sarcoplasmic reticu-lum Ca2+ unloading occurs without Ca2+ influx. Med Sci Sports Exerc 37:1119–1125.
98. Witczak CA, Wamhoff BR, Sturek M. 2006. Exercise training pre-vents Ca2+ dysregulation in coronary smooth muscle from diabetic dyslipidemic Yucatan swine. J Appl Physiol 101:752–762.
Copyright © 2022 FDOKUMEN