Assessment of Advanced Coronary Artery Disease
18
Assessment of Advanced Coronary Artery Disease: Advantages of Quantitative Cardiac Magnetic Resonance Perfusion Analysis Amit R. Patel, MD * , Patrick F. Antkowiak, BS † , Kiran R. Nandalur, MD || , Amy M. West, MD ‡ , Michael Salerno, MD, PhD ‡ , Vishal Arora, MD ¶ , John Christopher, RT § , Frederick H. Epstein, PhD †,§ , and Christopher M. Kramer, MD ‡,§ * Department of Medicine, University of Chicago, Chicago, Illinois † Department of Biomedical Engineering, University of Virginia, Charlottesville, Virginia ‡ Department of Medicine, University of Virginia, Charlottesville, Virginia § Department of Radiology, University of Virginia, Charlottesville, Virginia || Department of Radiology, William Beaumont Hospital, Royal Oak, Michigan ¶ Department of Medicine, Medical College of Georgia, Augusta, Georgia Abstract Objectives—The purpose of this paper was to compare quantitative cardiac magnetic resonance (CMR) first-pass contrast-enhanced perfusion imaging to qualitative interpretation for determining the presence and severity of coronary artery disease (CAD). Background—Adenosine CMR can detect CAD by measuring perfusion reserve (PR) or by qualitative interpretation (QI). Methods—Forty-one patients with an abnormal nuclear stress scheduled for X-ray angiography underwent dual-bolus adenosine CMR. Segmental myocardial perfusion analyzed using both QI and PR by Fermi function deconvolution was compared to quantitative coronary angiography. Results—In the 30 patients with complete quantitative data, PR (mean ± SD) decreased stepwise as coronary artery stenosis (CAS) severity increased: 2.42 ± 0.94 for <50%, 2.14 ± 0.87 for 50% to 70%, and 1.85 ± 0.77 for > 70% (p < 0.001). The PR and QI had similar diagnostic accuracies for detection of CAS > 50% (83% vs. 80%), and CAS > 70% (77% vs. 67%). Agreement between observers was higher for quantitative analysis than for qualitative analysis. Using PR, patients with triple-vessel CAD had a higher burden of detectable ischemia than patients with single-vessel CAD (60% vs. 25%; p = 0.02), whereas no difference was detected by QI (31% vs. 21%; p = 0.26). In segments with myocardial scar (n = 64), PR was 3.10 ± 1.34 for patients with CAS <50% (n = 18) and 1.91 ± 0.96 for CAS >50% (p < 0.0001). Conclusions—Quantitative PR by CMR differentiates moderate from severe stenoses in patients with known or suspected CAD. The PR analysis differentiates triple- from single-vessel CAD, whereas QI does not, and determines the severity of CAS subtending myocardial scar. This has important implications for assessment of prognosis and therapeutic decision making. Keywords myocardial perfusion imaging; MRI; ischemia; coronary artery disease; perfusion reserve; perfusion Reprint requests and correspondence: Dr. Christopher M. Kramer, University of Virginia Health System, Departments of Medicine and Radiology, 1215 Lee Street, Box 800170, Charlottesville, Virginia 22908. [email protected]. Drs. Patel, Antkowiak, Epstein, and Kramer contributed equally to this work. NIH Public Access Author Manuscript J Am Coll Cardiol. Author manuscript; available in PMC 2010 August 31. Published in final edited form as: J Am Coll Cardiol. 2010 August 10; 56(7): 561–569. doi:10.1016/j.jacc.2010.02.061. NIH-PA Author Manuscript NIH-PA Author Manuscript NIH-PA Author Manuscript
-
Upload
independent -
Category
Documents
-
view
4 -
download
0
Transcript of Assessment of Advanced Coronary Artery Disease

Assessment of Advanced Coronary Artery Disease:Advantages of Quantitative Cardiac Magnetic Resonance Perfusion Analysis
Amit R. Patel, MD*, Patrick F. Antkowiak, BS†, Kiran R. Nandalur, MD||, Amy M. West, MD‡,Michael Salerno, MD, PhD‡, Vishal Arora, MD¶, John Christopher, RT§, Frederick H. Epstein,PhD†,§, and Christopher M. Kramer, MD‡,§* Department of Medicine, University of Chicago, Chicago, Illinois† Department of Biomedical Engineering, University of Virginia, Charlottesville, Virginia‡ Department of Medicine, University of Virginia, Charlottesville, Virginia§ Department of Radiology, University of Virginia, Charlottesville, Virginia|| Department of Radiology, William Beaumont Hospital, Royal Oak, Michigan¶ Department of Medicine, Medical College of Georgia, Augusta, Georgia
AbstractObjectives—The purpose of this paper was to compare quantitative cardiac magnetic resonance(CMR) first-pass contrast-enhanced perfusion imaging to qualitative interpretation for determiningthe presence and severity of coronary artery disease (CAD).
Background—Adenosine CMR can detect CAD by measuring perfusion reserve (PR) or byqualitative interpretation (QI).
Methods—Forty-one patients with an abnormal nuclear stress scheduled for X-ray angiographyunderwent dual-bolus adenosine CMR. Segmental myocardial perfusion analyzed using both QI andPR by Fermi function deconvolution was compared to quantitative coronary angiography.
Results—In the 30 patients with complete quantitative data, PR (mean ± SD) decreased stepwiseas coronary artery stenosis (CAS) severity increased: 2.42 ± 0.94 for <50%, 2.14 ± 0.87 for 50% to70%, and 1.85 ± 0.77 for > 70% (p < 0.001). The PR and QI had similar diagnostic accuracies fordetection of CAS > 50% (83% vs. 80%), and CAS > 70% (77% vs. 67%). Agreement betweenobservers was higher for quantitative analysis than for qualitative analysis. Using PR, patients withtriple-vessel CAD had a higher burden of detectable ischemia than patients with single-vessel CAD(60% vs. 25%; p = 0.02), whereas no difference was detected by QI (31% vs. 21%; p = 0.26). Insegments with myocardial scar (n = 64), PR was 3.10 ± 1.34 for patients with CAS <50% (n = 18)and 1.91 ± 0.96 for CAS >50% (p < 0.0001).
Conclusions—Quantitative PR by CMR differentiates moderate from severe stenoses in patientswith known or suspected CAD. The PR analysis differentiates triple- from single-vessel CAD,whereas QI does not, and determines the severity of CAS subtending myocardial scar. This hasimportant implications for assessment of prognosis and therapeutic decision making.
Keywordsmyocardial perfusion imaging; MRI; ischemia; coronary artery disease; perfusion reserve; perfusion
Reprint requests and correspondence: Dr. Christopher M. Kramer, University of Virginia Health System, Departments of Medicine andRadiology, 1215 Lee Street, Box 800170, Charlottesville, Virginia 22908. [email protected]. Patel, Antkowiak, Epstein, and Kramer contributed equally to this work.
NIH Public AccessAuthor ManuscriptJ Am Coll Cardiol. Author manuscript; available in PMC 2010 August 31.
Published in final edited form as:J Am Coll Cardiol. 2010 August 10; 56(7): 561–569. doi:10.1016/j.jacc.2010.02.061.
NIH
-PA Author Manuscript
NIH
-PA Author Manuscript
NIH
-PA Author Manuscript

Cardiac magnetic resonance (CMR) perfusion imaging is an important clinical tool for thedetection of significant coronary artery disease (CAD) (1,2). Image analysis can be performedusing qualitative interpretation (QI), in which a hypointense segment seen during the initialtransit of a contrast agent through the myocardium during hyperemic conditions representsischemia. When combined with myocardial scar imaging, in 1 recent study, first-pass perfusionimaging using QI had a sensitivity and specificity of 89% and 87%, respectively, for thedetection of CAD (3). Also using QI, another study showed that the absence of ischemia on aperfusion CMR study identifies a group of patients who have a <1% likelihood of having acardiac event during the subsequent 3 years (4).
A potential advantage of perfusion CMR is its ability to quantify perfusion reserve (PR) withina myocardial segment. Semiquantitative estimates of PR such as the upslope index have beenvalidated against invasive fractional flow reserve in a highly selective patient population (5),but when compared to positron emission tomography, it is apparent that the upslope index wasnot an adequate surrogate of PR at higher myocardial blood flows (6). Regardless, in a recentstudy, the presence of an abnormal regional semiquantitative perfusion reserve index had asensitivity and specificity of 88% and 90%, respectively, for the detection of significant CAD(7). More quantitative measurements of PR determined by de-convolution of the tissue function(TF) and the arterial input function (AIF) require low doses of contrast, which limits signal-to-noise ratio in the tissue and can weaken qualitative analysis (8). However, in 1 study, whencompared to invasive fractional flow reserve and X-ray angiography, the presence of anabnormal quantitative measurement of PR still had a relatively poor specificity for detectingsignificant CAD (9), possibly due to error introduced by inadequate estimation of the TF.Recently, a newer quantitative technique, in which the AIF and TF are acquired during separateboluses of gadolinium-diethylenetriamine penta-acetic acid (Gd-DTPA), has been shown tocorrelate very precisely with absolute myocardial blood flow over the full range of physiologicflow values (10). The advantage of this technique is that the AIF is accurately measured usingthe low-dose contrast bolus, and the TF is measured, either quantitatively or qualitatively, withhigh signal-to-noise ratio using a high-dose contrast bolus.
Potential benefits of measuring PR include reduced interpreter bias, quantification of treatmentresponse, and improved detection of balanced ischemia. Despite these potential benefits,quantitative PR analysis is time consuming and has not been adopted in clinical practice. Noprospective comparisons of QI and quantitative PR analysis have been performed to date. Wesought to determine whether PR analysis provides additional clinically relevant informationwhen compared to QI. We hypothesized that PR analysis would improve the assessment ofsevere and triple-vessel CAD.
MethodsPopulation
We recruited 41 patients with an abnormal single-positron emission computed tomographystress test who were awaiting or had undergone a diagnostic X-ray angiogram (within 30 dayswithout intervention or clinical events) as part of their clinical care. Patients were excluded ifthey had a recent myocardial infarction, were older than 85 years, or had any contraindicationsto CMR or adenosine. Patients were asked to avoid beta-blockers, nitrates, and caffeine beforetheir stress CMR study. The institutional review board approved the study protocol, and allpatients provided informed consent.
CMR protocolAll CMR studies were performed on either a Sonata or Avanto MRI 1.5-T scanner (SiemensHealthcare, Erlangen, Germany) with a 4-channel phased array radiofrequency coil.
Patel et al. Page 2
J Am Coll Cardiol. Author manuscript; available in PMC 2010 August 31.
NIH
-PA Author Manuscript
NIH
-PA Author Manuscript
NIH
-PA Author Manuscript

DUAL-BOLUS STRESS PERFUSION CMR—Before the infusion of adenosine orcontrast agent, 3 short-axis slices of the left ventricle (base, mid, and apex) were acquired aslocalizers using a hybrid gradient echo and echo-planar imaging pulse sequence (GRE-EPI)(11): nonselective 90° saturation pulse followed by an 80 ms delay, field of view = 340 to 400× 212 to 360 mm, matrix = 128 × 80, slice thickness = 8 mm, flip angle = 25°, repetition time(TR) = 5.6 to 6.2 ms, echo time (TE) = 1.3 ms, echo train length = 4, effective spatial resolutionapproximately 2.8 × 2.8 mm with (n = 23) or without (n = 18) rate 2 parallel imaging (TSENSE)(12). Adenosine (Adenoscan, Astellas, Tokyo, Japan) 140 μg/kg/min was then infused. After2 to 3 min of infusion, a low dose of Gd-DTPA (Magnevist, Bayer Healthcare, Leverkusen,Germany; 0.0075 mmol/kg at 4 ml/s) was injected to measure the AIF and was immediatelyfollowed by a higher dose of Gd-DTPA (0.075 mmol/kg) to measure the TF. Each infusionwas followed by 20 ml normal saline (4 ml/s). The GRE-EPI images were acquired during thefirst pass of both the low-dose and higher-dose Gd-DTPA infusions for 40 to 50 heartbeatseach. An image of each of the 3 short-axis slices was acquired during each heartbeat. Afterperfusion imaging, the adenosine was discontinued.
CINE CMR—Steady-state free precession imaging (TR/TE 3 ms/1.1 to 1.3 ms) was used toobtain cine images of the left ventricle in the short-axis plane (8-mm slice thickness with 20%gap) and in 2-, 3-, and 4-chamber long-axis views.
REST PERFUSION CMR—Ten minutes after stopping adenosine, first-pass perfusionimaging with both low- and higher-dose Gd-DTPA was repeated under resting conditions.
LATE GADOLINIUM ENHANCEMENT—Five minutes after rest perfusion imaging, lategadolinium enhancement imaging was performed in the same slices to detect the presence ofmyocardial scar using either T1-weighted inversion recovery GRE (inversion time [TI] basedon optimal nulling of the myocardium, TR 750 ms, TE 4.3 ms, flip angle = 30°) or phase-sensitive inversion recovery GRE (TR 700 ms, TE 4.2 ms, TI 300 ms, flip angle = 25°).
Qualitative CMR interpretationThe QI was performed separately by 2 highly experienced interpreters (with American Collegeof Cardiology Foundation/American Heart Association [AHA] Level 3 CMR clinicalcompetence and training) blinded to all clinical and X-ray angiography data. The presence orabsence of a perfusion defect was assigned to the appropriate segment of a modified AHA 16-segment model. A perfusion defect was considered to be positive if it was present after peakcontrast enhancement of the LV cavity and persisted for several beats. Figure 1 shows a largeperfusion defect in the basal, mid-ventricular, and apical slices during hyperemia but not duringresting conditions.
Quantitative CMR analysisThe PR quantification was performed using Fermi function deconvolution (8,13). Convolutionof the AIF with a flow-weighted residue function (whose initial amplitude is a measure ofmyocardial perfusion) yields the TF; thus, perfusion can be calculated through deconvolutionof the AIF from the TF. A large region of interest was drawn using Argus software (SiemensMedical Solutions, Munich, Germany) in the basal slice of the left ventricular cavity of thelow-dose Gd-DTPA perfusion images to generate time-intensity curves representing the AIF;similarly, the endocardial and epicardial surfaces were manually delineated on the higher doseGd-DTPA perfusion images, and the 16-segment model was applied. The subendocardial (andalso the subepicardial) halves of these segments were used to generate time intensity curvesrepresenting the TFs. All curves were resampled into 1-s intervals, and the AIF was scaled bya factor of 10 to account for the gadolinium dose and fit to a gamma-variate function.
Patel et al. Page 3
J Am Coll Cardiol. Author manuscript; available in PMC 2010 August 31.
NIH
-PA Author Manuscript
NIH
-PA Author Manuscript
NIH
-PA Author Manuscript

Constrained Fermi function deconvolution was then performed using custom softwaredeveloped in MATLAB (The Mathworks, Inc., Natick, Massachusetts). For the deconvolutionprocedure, approximately 20 s to 25 s of the AIF and TF were selected for analysis, whichincluded both pre-contrast points as well as points several seconds after peak contrastenhancement. The user adjusted a delay parameter to align the AIF and TF, since they werenot acquired simultaneously. A Marquardt-Levenberg nonlinear least squares optimizationalgorithm was used to estimate the 3 parameters describing the Fermi function. The initialamplitude of the Fermi function was recorded as the perfusion measurement. This perfusionmeasurement was made in units of minute−1, and was not scaled to be in units of ml/g/min.Thus, this measurement is not suitable for direct assessment of tissue perfusion, but is perfectlysuitable for calculation of PR.
The PR, defined as the ratio of stress to rest perfusion, was determined for each segment. Inaddition, the transmural gradient (or endocardial to epicardial blood flow ratio [ENDO/EPI])during stress perfusion was determined for each segment. Figure 2 shows a typical AIF andexample TFs for segments supplied by a normal coronary artery and a stenosed coronary artery.A subset of 10 studies was reanalyzed separately by a second blinded person to determine theinterobserver variability of PR quantification.
Angiographic analysisThe X-ray angiography was performed using standard clinical techniques and interpreted byan interventional cardiologist blinded to all clinical and CMR data. Quantitative coronaryangiography was used to categorize stenoses as <50%, 50% to 70%, or >70%. All stenoseswere then assigned to the appropriate segment of a modified AHA 16-segment model.
Statistical analysisAnalysis was performed using Prism (GraphPad Software, San Diego, California). Continuousvariables are expressed as mean ± SD and were compared using unpaired t tests. Receiver-operating characteristic curve analysis was used to determine optimal PR cutoff values (definedas the PR value that resulted in the highest diagnostic accuracy). Sensitivities and specificitieswere determined for both qualitative and quantitative analyses and compared using theMcNemar test. The Kruskal-Wallis 1-way analysis of variance by ranks with a post-test wasused to compare the relationship (and any trends that exist) between PR and severity of coronaryartery stenosis (CAS). A p value <0.05 was considered statistically significant. Interobserveragreement was measured using kappa statistics.
ResultsStudy population
Forty-one patients were enrolled in the study (32% female, mean age 68 ± 12 years). Patientcharacteristics are described in Table 1. The typical patient was obese (body mass index 30.2± 4.8 kg/m2) and hypertensive. The X-ray angiography demonstrated significant CAD in 71%.Thirty-seven percent of the total population had 3-vessel CAD, and 27% had 1-vessel CAD.Left ventricular size and function are shown in Table 1. By late gadolinium enhancement, 44%had a prior myocardial infarction. One patient refused X-ray angiography and another wasexcluded from analysis because his chest pain was a result of acute myocarditis. Of theremaining 39 patients, 30 patients had adequate data for PR analysis. The 23% of quantitativedata sets that were incomplete were due to inadequate clearance of Gd-DTPA beforeacquisition of the resting AIF (n = 3), image acquisition error (n = 3), insufficient contrast doseduring stress AIF (n = 2), or poor image quality (n = 1). Most of these occurred in the earlierstudies and occurred at a lower frequency as we gained experience with the technique.
Patel et al. Page 4
J Am Coll Cardiol. Author manuscript; available in PMC 2010 August 31.
NIH
-PA Author Manuscript
NIH
-PA Author Manuscript
NIH
-PA Author Manuscript

PR analysisA stepwise reduction in PR occurred as the severity of coronary stenosis increased (Fig. 3).Specifically, PR was 2.42 ± 0.94 in myocardial segments perfused by CAS <50% (n = 245),2.14 ± 0.87 for CAS 50% to 70% (n = 92), and 1.85 ± 0.77 for CAS >70% (n = 143; p < 0.001for trend). Segments with late gadolinium enhancement (indicating the presence of myocardialscar) that were subtended by a CAS <50% (n = 18) had a preserved PR of 3.10 ± 1.34; whereasthose subtended by a CAS >50% (n = 46; 33 of 46 with CAS >70%) had a reduced PR of 1.91± 0.96 (p < 0.0001). There was no difference in the frequency of transmural and nontransmuralscars in segments with or without CAS >50% (data not shown). Additionally, there was nodifference in perfusion reserve between segments with a transmural scar (PR = 2.36 ± 1.25)and those with a nontransmural scar (PR = 1.83 ± 0.91, p = 0.14). There was no relationshipdetected between the severity of stenosis and ENDO/EPI under hyperemic or restingconditions. Under hyperemic conditions, ENDO/EPI for CAS <50% was 1.051 ± 0.175; forCAS 50% to 70%, it was 1.053 ± 0.170; and for CAS >70%, it was 1.067 ± 0.373 (p = 0.39).Under resting conditions, ENDO/EPI for CAS <50% was 1.131 ± 0.290; for CAS 50% to 70%,it was 1.130 ± 0.207; and for CAS >70%, it was 1.136 ± 0.265 (p = 0.74).
Diagnostic performanceIn the entire cohort, QI detected patients who had a CAS >50% with a sensitivity of 79%,specificity of 90%, and accuracy of 82%; whereas CAS >70% was detected with a sensitivity,specificity, and accuracy of 77%, 59%, and 69%, respectively. For the 30 patients whosuccessfully completed both QI and PR analysis, QI had a sensitivity, specificity, and accuracyof 79%, 83%, and 80%, respectively, for the detection of CAS >50%. Similar to that seen inthe overall group, when QI was used to detect only CAS >70%, the sensitivity was essentiallyunchanged (78%) while the specificity and accuracy decreased to 50% and 67%.
Because PR is related to the severity of underlying CAS, an optimal PR cutoff value can beselected for the detection of a specific severity of coronary stenosis. Using receiver-operatingcharacteristics, PR analysis had an area under the curve of 0.82 for the detection of CAS >50%and 0.77 for CAS >70%. The optimal PR cutoff value, defined as the PR cutoff value thatmaximized diagnostic accuracy, for detecting patients with CAS >50% was 1.85; whereas thebest cutoff value was 1.55 for detecting those with CAS >70%. The PR analysis detected CAS>50% with a sensitivity, specificity, and diagnostic accuracy of 88%, 67%, and 83%,respectively. The odds ratio that QI and PR analysis were the same for detecting CAS >50%was 2.0 (95% confidence interval: 0.43 to 12.4, p = NS). The accuracy for detecting patientswith CAS >70% was 77% for PR and 67% for QI. The sensitivity was 78% for both, butspecificity was 75% for QI and 50% for PR; however, these differences were not statisticallysignificant. Segments with a PR of <1.55 tended to have lower wall thickening (47 ± 33%)than did segments with a PR >1.55 (54 ± 41%, p = 0.09). The diagnostic performance of PRfor detecting CAS >50% or >70% was not improved by normalizing the PR to resting ratepressure product.
Figure 4 represents a patient with multivessel coronary disease that was not detected using QIbut was readily identified using PR analysis.
ReproducibilityOn a per-patient basis for QI, interobserver agreement was moderate (kappa = 0.54, 95%confidence interval: 0.25 to 0.82) for the detection of CAS >50%. There was better agreementfor quantitative PR analysis for the detection of CAS >50% (kappa = 0.66, 95% confidenceinterval: 0.54 to 0.78).
Patel et al. Page 5
J Am Coll Cardiol. Author manuscript; available in PMC 2010 August 31.
NIH
-PA Author Manuscript
NIH
-PA Author Manuscript
NIH
-PA Author Manuscript

Evaluation of ischemic burdenAs shown in Figure 5, when estimated using QI, the myocardial ischemic burden was similarin patients with triple-vessel CAD (n = 14) and single-vessel (n = 8; 31 ± 20% vs. 21 ± 26%,p = 0.26). When ischemic burden was measured using PR analysis, patients with triple-vesselCAD had more ischemia than patients with single-vessel CAD (60 ± 38% vs. 25 ± 41%, p =0.02). Figure 6 represents a patient with multivessel CAD who had only a small amount ofvisually appreciable ischemia, but the PR was severely reduced in the majority of the leftventricle.
Image contrast-to-noise ratio and dispersion of AIFThe myocardial contrast-to-noise ratio (defined as [SIpeak − SIpre-contrast]/σpre-contrast) wascalculated for each tissue segment at stress and rest. Contrast-to-noise ratio was 42 ± 13 forthe stress studies and 35 ± 14 for the rest studies, with the lower rest value due to the presenceof residual gadolinium initially in the myocardium from the prior stress scan. The AIF bolusunderwent less dispersion in the stress scan compared with the rest scan, as the full width athalf-maximum of the AIF was 7.0 ± 3.0 s for the stress studies compared with 9.3 ± 3.3 s forthe rest studies (p < 0.01).
DiscussionWe used dual-bolus perfusion CMR to determine the relationship between PR and CAS inpatients with known or suspected CAD. We observed stepwise decreases in PR as the severityof CAS increased. We also found that PR analysis was better than QI at discriminating patientswith triple-vessel CAD from those with only single-vessel CAD. The PR analysis accuratelydifferentiated scarred myocardial segments perfused by significantly stenosed coronaryarteries from those that were not. Agreement between observers was higher for quantitativethan qualitative analysis.
PR and severity of CASPrevious studies using positron emission tomography have shown that PR is inversely relatedto the severity of underlying CAS (14). Myocardial blood flow measured using the dual-bolusperfusion CMR technique (10) is highly correlated to measurements made with gold-standardradiolabeled microspheres. The differentiation of varying degrees of CAS requires ameasurement of PR that accurately estimates the full range of clinically relevant myocardialblood flow. The inverse relationship between PR and CAS has been difficult to measure usingCMR in patients because commonly used approaches such as the upslope technique do notadequately correlate with myocardial blood flow >2 ml/g/min (10). Techniques such asdeconvolution (8,13) can accurately measure myocardial blood flow but were previouslyapplied using low doses of Gd-DTPA, which is suboptimal for QI due to poor contrast-to-noiseratio. The dual-bolus technique uses high enough doses of Gd-DTPA to visually assess andmeasure tissue perfusion and very low doses of Gd-DTPA to accurately measure the AIF(10). This combination prevents the underestimation of myocardial blood flow withoutsacrificing the contrast-to-noise ratio needed for optimal QI. Using this CMR technique, wesuccessfully detected the expected stepwise reduction in PR with worsening CAS.
Diagnostic performanceBoth QI (2,3,15) and PR analysis (5,7,9) can be used to detect significant CAD, and overallaccuracy is similar for stenosis detection. The diagnostic performance of both approaches isdependent on technical factors such as the pulse sequence used and selection of the optimalcontrast dose. As demonstrated by the reproducibility analysis performed in our study, thebenefits of PR analysis include better interobserver agreement. However, it is time consuming,
Patel et al. Page 6
J Am Coll Cardiol. Author manuscript; available in PMC 2010 August 31.
NIH
-PA Author Manuscript
NIH
-PA Author Manuscript
NIH
-PA Author Manuscript
and it was previously unknown whether quantification adds substantial clinical benefit for theevaluation of CAD. We show in this prospective, head-to-head comparison of QI and PR thatthe latter improves the evaluation of 3-vessel CAD.
Although PR analysis performed well in our study, it is known that perfusion is a measurementof the hemodynamic consequences of a CAS (16) and that coronary angiography is an imperfectstandard for judging myocardial perfusion imaging. In fact, Pijls et al. (17) have shown usingan invasive technique that not all 50% coronary stenoses are hemodynamically significant(17). When compared to fractional flow reserve rather than coronary angiography, perfusionCMR accurately differentiated physiologically significant stenoses >50% from those that werenot flow limiting (5). The lower specificity seen in our study was likely due to the patientpopulation studied. Although PR is clearly reduced in patients with a severe CAS, there areother causes of abnormal PR such as hypertension, diabetes mellitus, hyperlipidemia, andcardiac syndrome X (18–22). Eighty-three percent of our population had a history ofhypertension, 27% had diabetes mellitus, and 88% had dyslipidemia. In our study, QI had asensitivity of 79% for detecting CAS >50%. In fact, the example shown in Figure 4 shows apatient with significant 3-vessel CAD who has no visually apparent perfusion defect but has areduced PR. One potential mechanism for false negative visual interpretation is the presenceof balanced transmural ischemia where there are no adequately perfused segments that can beused as a normal reference.
Assessment of left ventricular ischemic burdenAlthough QI could be used to diagnose the presence of significant CAD, patients withmultivessel CAD were not reliably differentiated from patients with only single-vessel disease:no difference in ischemic burden was visually apparent in the 2 groups because QIunderestimated the amount of ischemia present in patients with 3-vessel CAD. Conversely,when the ischemic burden was quantified using PR analysis, patients with multivessel CADhad more ischemia than patients with single-vessel CAD. A similar phenomenon has beendescribed using positron emission tomography (23). An accurate assessment of ischemicburden is important because the extent of ischemia is a marker of patient prognosis: patientswith lesser amounts of ischemia have a better prognosis than do patients with extensiveischemia (24). Additionally, the ischemic burden can be used to identify patients who maybenefit from more aggressive treatment strategies such as revascularization (25). In fact, evenasymptomatic patients with extensive ischemia may have better outcomes withrevascularization (26). Thus, quantitative analysis may offer improved assessment of patientprognosis and help to identify the optimal therapeutic approach.
PR in segments with myocardial scarPrevious studies demonstrate that in the presence of a myocardial scar, resting myocardialblood flow is inversely related to the transmural extent of scar (27). Additionally, PR is acutelydiminished in small scars that occur as a complication of percutaneous coronary intervention(28). However, it was previously unknown whether PR analysis could be used to determine ifa scarred segment is subtended by a significantly stenosed coronary artery. Forty-four percentof our study population had evidence of a myocardial scar. In myocardial segments with a scar,the PR was significantly lower if the segment was supplied by a stenosed coronary artery.Therefore, our data suggest that PR can be used to detect the presence or absence ofhemodynamically significant CAD in patients with a history of prior myocardial infarction.
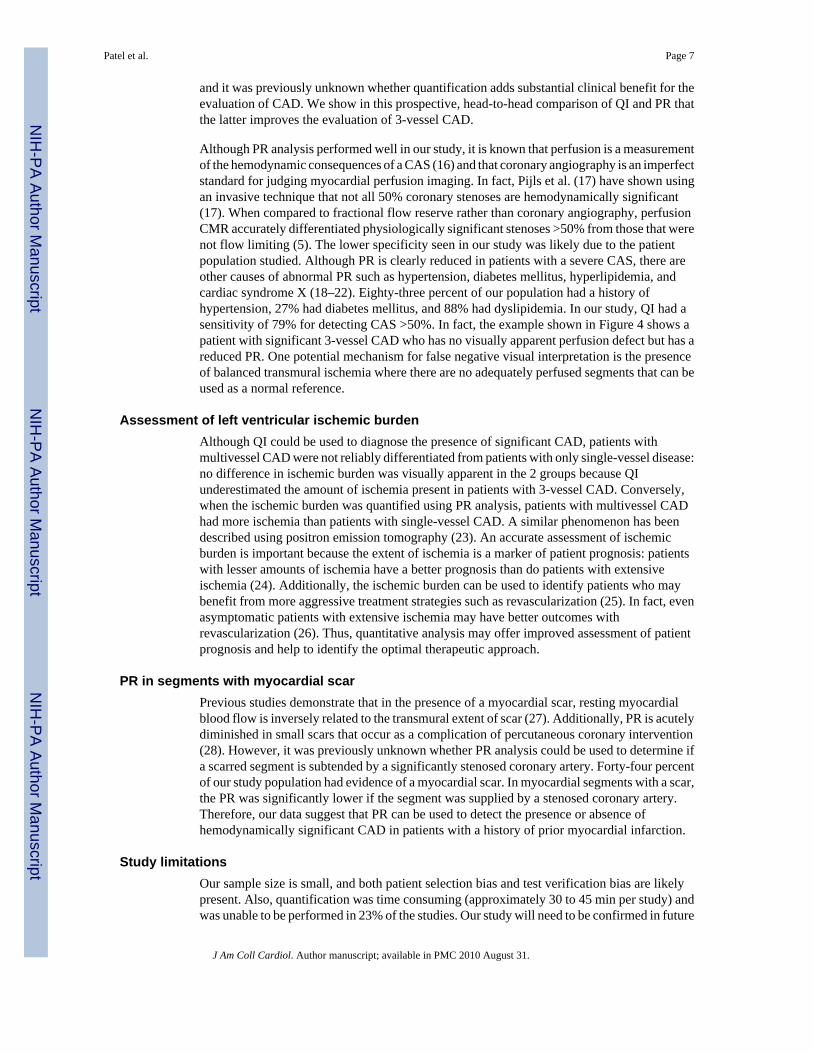
Study limitationsOur sample size is small, and both patient selection bias and test verification bias are likelypresent. Also, quantification was time consuming (approximately 30 to 45 min per study) andwas unable to be performed in 23% of the studies. Our study will need to be confirmed in future
Patel et al. Page 7
J Am Coll Cardiol. Author manuscript; available in PMC 2010 August 31.
NIH
-PA Author Manuscript
NIH
-PA Author Manuscript
NIH
-PA Author Manuscript

larger trials using the dual-bolus PR analysis. Because the dual-bolus technique requires 4separate injections of Gd-DTPA, a technical problem during any 1 of the 4 injections affectsthe composite measurement of PR. This is an important limitation of the dual-bolus approachand may reduce its clinical applicability. However, with a learning curve, very few problemswere encountered during the latter half of the study. Newer dual-contrast pulse sequences thatrequire only 2 injections will simplify the procedure (29). The imaging protocol used in thisstudy included only a 10-min delay between stress and rest perfusion imaging. This resultedin inadequate data quality for perfusion reserve analysis in 3 patients. It may be prudent to waitlonger before rest imaging. For our gadolinium injections, the volumes of the AIF bolus andTF bolus were not identical. Ideally, the low AIF doses should have been diluted into volumesequivalent to that used for the TF. However, the same AIF volumes were used for the stressand rest scans, and any systematic error resulting from the small AIF volumes would mostlycancel out when dividing to calculate the perfusion reserve. Additionally, our study wasperformed using a 1.5-T MRI scanner; it is likely that imaging at 3.0-T could have improvedour results (30).
ConclusionsWe have shown in this prospective, head-to-head comparison that PR analysis of first-passCMR images provides additional clinically relevant information compared with QI.Specifically, compared with QI, quantification of PR can differentiate moderate from severeCAD and can better discriminate patients with triple-vessel CAD from patients with single-vessel CAD. Additionally, PR analysis can be used to differentiate scarred myocardialsegments that are supplied by a severely stenosed coronary artery from those that are not.Agreement between observers is better for quantitative analysis. Thus, continued technicaldevelopment to automate PR analysis is warranted. These findings have important implicationsfor ascertaining prognosis in an individual patient and determining an optimal therapeuticapproach.
AcknowledgmentsThis study was supported in part by research grants from Astellas Pharma US Inc., Siemens Medical Solutions, and5-T32 EB003841. Dr. Patel has received a research grant from Astellas Pharma. Dr. Epstein has received researchsupport from Siemens Medical Solutions. Dr. Kramer has received research equipment support from Siemens MedicalSolutions and a research grant from Astellas Pharma. Mr. Antkowiak and Drs. Nandalur, West, Salerno, Arora, andChristopher have reported that they have no relationships to disclose.
Abbreviations and Acronyms
AIF arterial input function
CAD coronary artery disease
CAS coronary artery stenosis
CMR cardiac magnetic resonance
ENDO/EPI endocardial to epicardial blood flow ratio
Gd-DTPA gadolinium-diethylenetriamine penta-acetic acid
GRE-EPI hybrid gradient echo/echo planar imaging
PR perfusion reserve
QI qualitative interpretation
TE echo time
Patel et al. Page 8
J Am Coll Cardiol. Author manuscript; available in PMC 2010 August 31.
NIH
-PA Author Manuscript
NIH
-PA Author Manuscript
NIH
-PA Author Manuscript

TF tissue function
TI inversion time
TR repetition time
References1. Nandalur KR, Dwamena BA, Choudhri AF, Nandalur MR, Carlos RC. Diagnostic performance of
stress cardiac magnetic resonance imaging in the detection of coronary artery disease: a meta-analysis.J Am Coll Cardiol 2007;50:1343–53. [PubMed: 17903634]
2. Schwitter J, Wacker CM, van Rossum AC, et al. MR-IMPACT: comparison of perfusion-cardiacmagnetic resonance with single-photon emission computed tomography for the detection of coronaryartery disease in a multicentre, multivendor, randomized trial. Eur Heart J 2008;29:480–9. [PubMed:18208849]
3. Klem I, Heitner JF, Shah DJ, et al. Improved detection of coronary artery disease by stress perfusioncardiovascular magnetic resonance with the use of delayed enhancement infarction imaging. J AmColl Cardiol 2006;47:1630–8. [PubMed: 16631001]
4. Jahnke C, Nagel E, Gebker R, et al. Prognostic value of cardiac magnetic resonance stress tests:adenosine stress perfusion and dobut-amine stress wall motion imaging. Circulation 2007;115:1769–76. [PubMed: 17353441]
5. Rieber J, Huber A, Erhard I, et al. Cardiac magnetic resonance perfusion imaging for the functionalassessment of coronary artery disease: a comparison with coronary angiography and fractional flowreserve. Eur Heart J 2006;27:1465–71. [PubMed: 16720685]
6. Ibrahim T, Nekolla SG, Schreiber K, et al. Assessment of coronary flow reserve: comparison betweencontrast-enhanced magnetic resonance imaging and positron emission tomography. J Am Coll Cardiol2002;39:864–70. [PubMed: 11869854]
7. Nagel E, Klein C, Paetsch I, et al. Magnetic resonance perfusion measurements for the noninvasivedetection of coronary artery disease. Circulation 2003;108:432–7. [PubMed: 12860910]
8. Jerosch-Herold M, Wilke N, Stillman AE. Magnetic resonance quantification of the myocardialperfusion reserve with a Fermi function model for constrained deconvolution. Med Phys 1998;25:73–84. [PubMed: 9472829]
9. Costa MA, Shoemaker S, Futamatsu H, et al. Quantitative magnetic resonance perfusion imagingdetects anatomic and physiologic coronary artery disease as measured by coronary angiography andfractional flow reserve. J Am Coll Cardiol 2007;50:514–22. [PubMed: 17678734]
10. Christian TF, Rettmann DW, Aletras AH, et al. Absolute myocardial perfusion in canines measuredby using dual-bolus first-pass MR imaging. Radiology 2004;232:677–84. [PubMed: 15284436]
11. Ding S, Wolff SD, Epstein FH. Improved coverage in dynamic contrast-enhanced cardiac MRI usinginterleaved gradient-echo EPI. Magn Reson Med 1998;39:514–9. [PubMed: 9543412]
12. Kellman P, Epstein FH, McVeigh ER. Adaptive sensitivity encoding incorporating temporal filtering(TSENSE). Magn Reson Med 2001;45:846–52. [PubMed: 11323811]
13. Axel L. Tissue mean transit time from dynamic computed tomography by a simple deconvolutiontechnique. Invest Radiol 1983;18:94–9. [PubMed: 6832937]
14. Uren NG, Melin JA, De Bruyne B, Wijns W, Baudhuin T, Camici PG. Relation between myocardialblood flow and the severity of coronary-artery stenosis. N Engl J Med 1994;330:1782–8. [PubMed:8190154]
15. Wolff SD, Schwitter J, Coulden R, et al. Myocardial first-pass perfusion magnetic resonance imaging:a multicenter dose-ranging study. Circulation 2004;110:732–7. [PubMed: 15289374]
16. Gould KL. Quantification of coronary artery stenosis in vivo. Circ Res 1985;57:341–53. [PubMed:3896552]
17. Pijls NH, De Bruyne B, Peels K, et al. Measurement of fractional flow reserve to assess the functionalseverity of coronary-artery stenoses. N Engl J Med 1996;334:1703–8. [PubMed: 8637515]
Patel et al. Page 9
J Am Coll Cardiol. Author manuscript; available in PMC 2010 August 31.
NIH
-PA Author Manuscript
NIH
-PA Author Manuscript
NIH
-PA Author Manuscript

18. Panting JR, Gatehouse PD, Yang GZ, et al. Abnormal subendocardial perfusion in cardiac syndromeX detected by cardiovascular magnetic resonance imaging. N Engl J Med 2002;346:1948–53.[PubMed: 12075055]
19. Wang L, Jerosch-Herold M, Jacobs DR Jr, Shahar E, Folsom AR. Coronary risk factors andmyocardial perfusion in asymptomatic adults: the Multi-Ethnic Study of Atherosclerosis (MESA). JAm Coll Cardiol 2006;47:565–72. [PubMed: 16458137]
20. Doyle M, Fuisz A, Kortright E, et al. The impact of myocardial flow reserve on the detection ofcoronary artery disease by perfusion imaging methods: an NHLBI WISE study. J Cardiovasc MagnReson 2003;5:475–85. [PubMed: 12882078]
21. Di Carli MF, Janisse J, Grunberger G, Ager J. Role of chronic hyperglycemia in the pathogenesis ofcoronary microvascular dysfunction in diabetes. J Am Coll Cardiol 2003;41:1387–93. [PubMed:12706936]
22. Yokoyama I, Momomura S, Ohtake T, et al. Improvement of impaired myocardial vasodilatation dueto diffuse coronary atherosclerosis in hypercholesterolemics after lipid-lowering therapy. Circulation1999;100:117–22. [PubMed: 10402439]
23. Parkash R, deKemp RA, Ruddy TD, et al. Potential utility of rubidium 82 PET quantification inpatients with 3-vessel coronary artery disease. J Nucl Cardiol 2004;11:440–9. [PubMed: 15295413]
24. Hachamovitch R, Berman DS, Shaw LJ, et al. Incremental prognostic value of myocardial perfusionsingle photon emission computed tomography for the prediction of cardiac death. Differentialstratification for risk of cardiac death and myocardial infarction. Circulation 1998;97:535–43.[PubMed: 9494023]
25. Hachamovitch R, Hayes SW, Friedman JD, Cohen I, Berman DS. Comparison of the short-termsurvival benefit associated with revascularization compared with medical therapy in patients with noprior coronary artery disease undergoing stress myocardial perfusion single photon emissioncomputed tomography. Circulation 2003;107:2900–7. [PubMed: 12771008]
26. Sorajja P, Chareonthaitawee P, Rajagopalan N, et al. Improved survival in asymptomatic diabeticpatients with high-risk SPECT imaging treated with coronary artery bypass grafting. Circulation2005;112:I311–6. [PubMed: 16159837]
27. Selvanayagam JB, Jerosch-Herold M, Porto I, et al. Resting myocardial blood flow is impaired inhibernating myocardium. A magnetic resonance study of quantitative perfusion assessment.Circulation 2005;112:3289–96. [PubMed: 16286587]
28. Selvanayagam JB, Cheng ASH, Jerosch-Herold M, et al. Effect of distal embolization on myocardialperfusion reserve after percutaneous coronary intervention: a quantitative magnetic resonanceperfusion study. Circulation 2007;116:1458–64. [PubMed: 17785626]
29. Gatehouse PD, Elkington AG, Ablitt NA, Yang GZ, Pennell DJ, Firmin DN. Accurate assessment ofthe arterial input function during high-dose myocardial perfusion cardiovascular magnetic resonance.J Magn Reson Imaging 2004;20:39–45. [PubMed: 15221807]
30. Cheng AS, Pegg TJ, Karamitsos TD, et al. Cardiovascular magnetic resonance perfusion imaging at3-tesla for the detection of coronary artery disease: a comparison with 1.5-tesla. J Am Coll Cardiol2007;49:2440–9. [PubMed: 17599608]
Patel et al. Page 10
J Am Coll Cardiol. Author manuscript; available in PMC 2010 August 31.
NIH
-PA Author Manuscript
NIH
-PA Author Manuscript
NIH
-PA Author Manuscript

Figure 1. Qualitative Interpretation of Perfusion CMR ImagingFirst-pass perfusion images obtained during peak contrast enhancement cardiac magneticresonance (CMR) imaging of the basal left ventricular (left column), mid-ventricular (middlecolumn), and apical (right column) slices are shown during hyperemic (top row) and resting(bottom row) conditions. The white arrows point to a large perfusion defect extending fromthe basal to the apical slice.
Patel et al. Page 11
J Am Coll Cardiol. Author manuscript; available in PMC 2010 August 31.
NIH
-PA Author Manuscript
NIH
-PA Author Manuscript
NIH
-PA Author Manuscript

Figure 2. Perfusion Time Intensity CurvesRepresentative time intensity curves used for Fermi function deconvolution are shown. Thered line and circles represent a typical arterial input function (AIF). The top blue line andXs represent the tissue function (TF) in a segment supplied by a coronary artery without astenosis. The bottom blue line and triangles represent the tissue function in a segmentsupplied by a stenosed coronary artery.
Patel et al. Page 12
J Am Coll Cardiol. Author manuscript; available in PMC 2010 August 31.
NIH
-PA Author Manuscript
NIH
-PA Author Manuscript
NIH
-PA Author Manuscript

Figure 3. Relationship Between Perfusion Reserve and Percent StenosisSegmental perfusion reserve (mean ± SE) decreases in a stepwise manner as the severity ofcoronary stenosis increases.
Patel et al. Page 13
J Am Coll Cardiol. Author manuscript; available in PMC 2010 August 31.
NIH
-PA Author Manuscript
NIH
-PA Author Manuscript
NIH
-PA Author Manuscript

Figure 4. Comparison of Qualitative Interpretation and Perfusion Reserve Analysis, Example 1(A) No perfusion defects are visually appreciated on first-pass perfusion images obtainedduring peak contrast enhancement of the basal left ventricular (left column), the mid-ventricular (middle column), and the apical (right column) slices during hyperemic (toprow) or resting (bottom row) conditions. (B) Measured perfusion reserve for each of the 16segments is plotted using a bulls-eye graph with the color scale shown on the right. Fifty-sixpercent of the left ventricle had a perfusion reserve <1.55. (C) Based on quantitative coronaryangiography, each of the 16 segments was determined to be supplied by a stenosis <50%(yellow), >50% (orange), or >70% (red). Despite the absence of a visually appreciableperfusion defect, an abnormal perfusion reserve was present in this patient with multivesselcoronary artery disease.
Patel et al. Page 14
J Am Coll Cardiol. Author manuscript; available in PMC 2010 August 31.
NIH
-PA Author Manuscript
NIH
-PA Author Manuscript
NIH
-PA Author Manuscript

Figure 5. Assessment of LV Ischemic BurdenComparison of qualitative interpretation and perfusion reserve analysis: unlike perfusionreserve analysis, qualitative interpretation cannot detect the difference in ischemic burden(percent left ventricular [LV] ischemia [mean ± SE]) that is present in patients with single-vessel (1V) coronary artery disease (CAD) (blue bars) or triple-vessel (3V) CAD (goldbars).
Patel et al. Page 15
J Am Coll Cardiol. Author manuscript; available in PMC 2010 August 31.
NIH
-PA Author Manuscript
NIH
-PA Author Manuscript
NIH
-PA Author Manuscript

Figure 6. Comparison of Qualitative Interpretation and Perfusion Reserve Analysis, Example 2(A) First-pass perfusion images obtained during peak contrast enhancement of the basal leftventricular slice (left column), the mid-ventricular slice (middle column), and the apical slice(right column) are shown during hyperemic (top row) and resting (bottom row) conditions.The white arrows point to a small perfusion defect in the inferolateral wall. (B) Perfusionreserve for each of the 16 segments is plotted using a bulls-eye graph with the color scale shownon the right. Fifty-six percent of the left ventricle had a perfusion reserve <1.55. (C) Based onquantitative coronary angiography, each of the 16 segments was determined to be supplied bya stenosis <50% (yellow), >50% (orange), or >70% (red). Qualitative interpretationsignificantly underestimated the ischemic burden in this patient with multivessel coronaryartery disease.
Patel et al. Page 16
J Am Coll Cardiol. Author manuscript; available in PMC 2010 August 31.
NIH
-PA Author Manuscript
NIH
-PA Author Manuscript
NIH
-PA Author Manuscript

NIH
-PA Author Manuscript
NIH
-PA Author Manuscript
NIH
-PA Author Manuscript
Patel et al. Page 17
Table 1
Patient Characteristics
Male, n (%) 28 (68)
Age, yrs 68 ± 12
Body mass index, kg/m2 30.2 ± 4.8
Symptoms, n (%) 38 (93)
Chest pain 32 (78)
Shortness of breath 4 (10)
Other symptoms 2 (5)
None 3 (7)
History of myocardial infarction, n (%) 14 (34)
Previous revascularization, n (%) 12 (29)
Diabetes mellitus, n (%) 11 (27)
Prior tobacco use, n (%) 27 (66)
Dyslipidemia, n (%) 36 (88)
Hypertension, n (%) 34 (83)
Medications, n (%)
Aspirin 33 (80)
Beta-blockers 22 (54)
Angiotensin-blockers 20 (49)
Statins 28 (68)
Nitrates 14 (34)
Hemodynamics
Peak systolic blood pressure, mm Hg 137 ± 27
Peak diastolic blood pressure, mm Hg 73 ± 13
Peak heart rate, beats/min 87 ± 16
Cardiac magnetic resonance data
Left ventricular ejection fraction, % 58 ± 11
Left ventricular end-diastolic volume, ml 141 ± 37
Left ventricular end-systolic volume, ml 62 ± 31
Left ventricular mass, g 132 ± 38
Late gadolinium enhancement, n (%) 18 (44)
Coronary angiography, n (%)
Any stenoses >50% 29 (71)
1-vessel disease 11 (27)
2-vessel disease 3 (7)
J Am Coll Cardiol. Author manuscript; available in PMC 2010 August 31.

NIH
-PA Author Manuscript
NIH
-PA Author Manuscript
NIH
-PA Author Manuscript
Patel et al. Page 18
3-vessel disease 15 (37)
J Am Coll Cardiol. Author manuscript; available in PMC 2010 August 31.