Metabolic Actions of Estrogen Receptor Beta (ERβ) are Mediated by a Negative Cross-Talk with PPAR
16
Metabolic Actions of Estrogen Receptor Beta (ERb) are Mediated by a Negative Cross-Talk with PPARc Anna Foryst-Ludwig 1 , Markus Clemenz 1 , Stephan Hohmann 1 , Martin Hartge 1 , Christiane Sprang 1 , Nikolaj Frost 1 , Maxim Krikov 1 , Sanjay Bhanot 2 , Rodrigo Barros 3 , Andrea Morani 3 , Jan-A ˚ ke Gustafsson 3 , Thomas Unger 1 , Ulrich Kintscher 1 * 1 Center for Cardiovascular Research (CCR), Institute of Pharmacology, Charite ´ -Universita ¨ tsmedizin Berlin, Berlin, Germany, 2 ISIS Pharmaceuticals, Carlsbad, California, United States of America, 3 Department of Biosciences and Nutrition, Karolinska Institutet, NOVUM, Huddinge, Sweden Abstract Estrogen receptors (ER) are important regulators of metabolic diseases such as obesity and insulin resistance (IR). While ERa seems to have a protective role in such diseases, the function of ERb is not clear. To characterize the metabolic function of ERb, we investigated its molecular interaction with a master regulator of insulin signaling/glucose metabolism, the PPARc, in vitro and in high-fat diet (HFD)-fed ERb -/- mice (bERKO) mice. Our in vitro experiments showed that ERb inhibits ligand- mediated PPARc-transcriptional activity. That resulted in a blockade of PPARc-induced adipocytic gene expression and in decreased adipogenesis. Overexpression of nuclear coactivators such as SRC1 and TIF2 prevented the ERb-mediated inhibition of PPARc activity. Consistent with the in vitro data, we observed increased PPARc activity in gonadal fat from HFD-fed bERKO mice. In consonance with enhanced PPARc activation, HFD-fed bERKO mice showed increased body weight gain and fat mass in the presence of improved insulin sensitivity. To directly demonstrate the role of PPARc in HFD-fed bERKO mice, PPARc signaling was disrupted by PPARc antisense oligonucleotide (ASO). Blockade of adipose PPARc by ASO reversed the phenotype of bERKO mice with an impairment of insulin sensitization and glucose tolerance. Finally, binding of SRC1 and TIF2 to the PPARc-regulated adiponectin promoter was enhanced in gonadal fat from bERKO mice indicating that the absence of ERb in adipose tissue results in exaggerated coactivator binding to a PPARc target promoter. Collectively, our data provide the first evidence that ERb-deficiency protects against diet-induced IR and glucose intolerance which involves an augmented PPARc signaling in adipose tissue. Moreover, our data suggest that the coactivators SRC1 and TIF2 are involved in this interaction. Impairment of insulin and glucose metabolism by ERb may have significant implications for our understanding of hormone receptor-dependent pathophysiology of metabolic diseases, and may be essential for the development of new ERb-selective agonists. Citation: Foryst-Ludwig A, Clemenz M, Hohmann S, Hartge M, Sprang C, et al. (2008) Metabolic Actions of Estrogen Receptor Beta (ERb) are Mediated by a Negative Cross-Talk with PPARc. PLoS Genet 4(6): e1000108. doi:10.1371/journal.pgen.1000108 Editor: Johan Auwerx, Institut de Ge ´ne ´ tique et de Biologie Mole ´ culaire et Cellulaire, CNRS/INSERM/Universite ´ Louis Pasteur, France Received January 8, 2008; Accepted May 28, 2008; Published June 27, 2008 Copyright: ß 2008 Foryst-Ludwig et al. This is an open-access article distributed under the terms of the Creative Commons Attribution License, which permits unrestricted use, distribution, and reproduction in any medium, provided the original author and source are credited. Funding: AFL is supported by the Deutsche Forschungsgemeinschaft (DFG-GK 754 III). MC is supported by the Deutsche Forschungsgemeinschaft (DFG-KI 712/ 3-1). TU is supported by the Deutsche Forschungsgemeinschaft (DFG-GK 754-III, DFG-GK 865-II). UK is supported by the Deutsche Forschungsgemeinschaft (DFG- GK 754-III, DFG-GK 865-II, DFG-KI 712/ 3-1. Competing Interests: JA ˚ G is shareholder and consultant of KaroBio AB. SB is an employee at ISIS Pharmaceuticals, Carlsbad, California, United States of America. * E-mail: [email protected] Introduction The estrogen receptors (ERs) are members of the nuclear hormone receptor family (NHR) which act as eukaryotic ligand- dependent transcription factors. ERs are involved in the regulation of embryonic development, homeostasis and reproduction. Two major estrogen receptors, alpha and beta (ERa and ERb), convey the physiological signaling of estrogens (17b-estradiol, E2) [1]. Additionally, ERs are activated by specific synthetic ligands such as raloxifene, tamoxifen, the ERb-specific ligand diarylpropioni- trile (DPN), and the ERb-specific agonist propylpyrazole-triol (PPT), which belong to the group of selective estrogen receptor modulators (SERMS) [2–4]. The prevalence of metabolic diseases such as obesity, insulin resistance and type 2 diabetes has increased dramatically during the recent ten years [5]. Gender differences in the pathophysiology of obesity and metabolic disorders are well established [6–8]. However, the molecular mechanisms of sexual dimorphism in metabolic diseases are largely unknown. In addition, lack of ER activation has been implicated in postmenopausal impairment of glucose and lipid metabolism, resulting in visceral fat distribution, insulin resistance and increased cardiovascular risk after meno- pause [9]. In this context the investigation of ER-signaling and its role in metabolic disorders has gained increasing attention [4,8]. To identify the ER subtype involved in the regulation of metabolic disorders, studies have been carried out in ER-deficient mice. ERa-deficient (aERKO) mice have profound insulin resistance and impaired glucose tolerance [10–13]. These studies indicate that ERa has a protective role in metabolic disorders by improving insulin sensitivity and glucose tolerance. The metabolic function of ERb is not clear. ERb knockout mice (bERKO) have a similar body weight and equal fat distribution in comparison to wild type littermates. Additionally, bERKO and wild-type (wt) mice exhibit similar insulin and lipid levels [14]. However, PLoS Genetics | www.plosgenetics.org 1 June 2008 | Volume 4 | Issue 6 | e1000108
-
Upload
unianahnguera -
Category
Documents
-
view
5 -
download
0
Transcript of Metabolic Actions of Estrogen Receptor Beta (ERβ) are Mediated by a Negative Cross-Talk with PPAR

Metabolic Actions of Estrogen Receptor Beta (ERb) areMediated by a Negative Cross-Talk with PPARcAnna Foryst-Ludwig1, Markus Clemenz1, Stephan Hohmann1, Martin Hartge1, Christiane Sprang1,
Nikolaj Frost1, Maxim Krikov1, Sanjay Bhanot2, Rodrigo Barros3, Andrea Morani3, Jan-Ake Gustafsson3,
Thomas Unger1, Ulrich Kintscher1*
1 Center for Cardiovascular Research (CCR), Institute of Pharmacology, Charite-Universitatsmedizin Berlin, Berlin, Germany, 2 ISIS Pharmaceuticals, Carlsbad, California,
United States of America, 3 Department of Biosciences and Nutrition, Karolinska Institutet, NOVUM, Huddinge, Sweden
Abstract
Estrogen receptors (ER) are important regulators of metabolic diseases such as obesity and insulin resistance (IR). While ERaseems to have a protective role in such diseases, the function of ERb is not clear. To characterize the metabolic function ofERb, we investigated its molecular interaction with a master regulator of insulin signaling/glucose metabolism, the PPARc,in vitro and in high-fat diet (HFD)-fed ERb -/- mice (bERKO) mice. Our in vitro experiments showed that ERb inhibits ligand-mediated PPARc-transcriptional activity. That resulted in a blockade of PPARc-induced adipocytic gene expression and indecreased adipogenesis. Overexpression of nuclear coactivators such as SRC1 and TIF2 prevented the ERb-mediatedinhibition of PPARc activity. Consistent with the in vitro data, we observed increased PPARc activity in gonadal fat fromHFD-fed bERKO mice. In consonance with enhanced PPARc activation, HFD-fed bERKO mice showed increased body weightgain and fat mass in the presence of improved insulin sensitivity. To directly demonstrate the role of PPARc in HFD-fedbERKO mice, PPARc signaling was disrupted by PPARc antisense oligonucleotide (ASO). Blockade of adipose PPARc by ASOreversed the phenotype of bERKO mice with an impairment of insulin sensitization and glucose tolerance. Finally, binding ofSRC1 and TIF2 to the PPARc-regulated adiponectin promoter was enhanced in gonadal fat from bERKO mice indicating thatthe absence of ERb in adipose tissue results in exaggerated coactivator binding to a PPARc target promoter. Collectively,our data provide the first evidence that ERb-deficiency protects against diet-induced IR and glucose intolerance whichinvolves an augmented PPARc signaling in adipose tissue. Moreover, our data suggest that the coactivators SRC1 and TIF2are involved in this interaction. Impairment of insulin and glucose metabolism by ERb may have significant implications forour understanding of hormone receptor-dependent pathophysiology of metabolic diseases, and may be essential for thedevelopment of new ERb-selective agonists.
Citation: Foryst-Ludwig A, Clemenz M, Hohmann S, Hartge M, Sprang C, et al. (2008) Metabolic Actions of Estrogen Receptor Beta (ERb) are Mediated by aNegative Cross-Talk with PPARc. PLoS Genet 4(6): e1000108. doi:10.1371/journal.pgen.1000108
Editor: Johan Auwerx, Institut de Genetique et de Biologie Moleculaire et Cellulaire, CNRS/INSERM/Universite Louis Pasteur, France
Received January 8, 2008; Accepted May 28, 2008; Published June 27, 2008
Copyright: � 2008 Foryst-Ludwig et al. This is an open-access article distributed under the terms of the Creative Commons Attribution License, which permitsunrestricted use, distribution, and reproduction in any medium, provided the original author and source are credited.
Funding: AFL is supported by the Deutsche Forschungsgemeinschaft (DFG-GK 754 III). MC is supported by the Deutsche Forschungsgemeinschaft (DFG-KI 712/3-1). TU is supported by the Deutsche Forschungsgemeinschaft (DFG-GK 754-III, DFG-GK 865-II). UK is supported by the Deutsche Forschungsgemeinschaft (DFG-GK 754-III, DFG-GK 865-II, DFG-KI 712/ 3-1.
Competing Interests: JAG is shareholder and consultant of KaroBio AB. SB is an employee at ISIS Pharmaceuticals, Carlsbad, California, United States of America.
* E-mail: [email protected]
Introduction
The estrogen receptors (ERs) are members of the nuclear
hormone receptor family (NHR) which act as eukaryotic ligand-
dependent transcription factors. ERs are involved in the regulation
of embryonic development, homeostasis and reproduction. Two
major estrogen receptors, alpha and beta (ERa and ERb), convey
the physiological signaling of estrogens (17b-estradiol, E2) [1].
Additionally, ERs are activated by specific synthetic ligands such
as raloxifene, tamoxifen, the ERb-specific ligand diarylpropioni-
trile (DPN), and the ERb-specific agonist propylpyrazole-triol
(PPT), which belong to the group of selective estrogen receptor
modulators (SERMS) [2–4].
The prevalence of metabolic diseases such as obesity, insulin
resistance and type 2 diabetes has increased dramatically during
the recent ten years [5]. Gender differences in the pathophysiology
of obesity and metabolic disorders are well established [6–8].
However, the molecular mechanisms of sexual dimorphism in
metabolic diseases are largely unknown. In addition, lack of ER
activation has been implicated in postmenopausal impairment of
glucose and lipid metabolism, resulting in visceral fat distribution,
insulin resistance and increased cardiovascular risk after meno-
pause [9]. In this context the investigation of ER-signaling and its
role in metabolic disorders has gained increasing attention [4,8].
To identify the ER subtype involved in the regulation of
metabolic disorders, studies have been carried out in ER-deficient
mice. ERa-deficient (aERKO) mice have profound insulin
resistance and impaired glucose tolerance [10–13]. These studies
indicate that ERa has a protective role in metabolic disorders by
improving insulin sensitivity and glucose tolerance. The metabolic
function of ERb is not clear. ERb knockout mice (bERKO) have a
similar body weight and equal fat distribution in comparison to
wild type littermates. Additionally, bERKO and wild-type (wt)
mice exhibit similar insulin and lipid levels [14]. However,
PLoS Genetics | www.plosgenetics.org 1 June 2008 | Volume 4 | Issue 6 | e1000108
previous studies in bERKO mice were only carried out under low
fat diet, which may have concealed a phenotype relevant for
human obesity normally induced by high-energy/fat diet.
The peroxisome proliferator-activated receptor gamma
(PPARc) belongs to the NHR family and is a major regulator of
glucose and lipid metabolism by modulating energy homeostasis in
adipose tissue, skeletal muscle and liver [15–17]. Glitazones or
thiazolidinediones (TZDs) are high-affinity PPARc agonists, and
act as insulin sensitizers. TZDs induce adipogenesis and adipose
tissue remodeling followed by an improvement of glucose
tolerance [18]. The role of PPARc in the control of glucose
homeostasis expands beyond its primary action in adipose tissue,
and involves the regulation of adipocytokine production such as
adiponectin, leptin, and resistin [19–21]. Consistently, reduced
PPARc activity has important metabolic and cardiovascular
pathophysiological consequences leading to insulin resistance,
diabetes and end organ damage [15].
The molecular mechanisms underlying PPARc function are
similar to those of ER-signaling. In a basal state, PPARc, similar to
ERs, is bound to corepressor proteins such as nuclear receptor
corepressor (NCoR) or silencing mediator of retinoic acid and
thyroid hormone receptor (SMRT) [22]. After binding within the
ligand binding domain (LBD), PPARc ligands induce its
heterodimerization with retinoid x receptor alpha (RXRa), and
its subsequent interaction with co-activators like steroid receptor
coactivators (SRCs) followed by binding to PPARc response
elements (PPREs) within target gene promoters [23]. Importantly,
PPARc is sharing a similar pool of cofactors with ERb which
provides a platform for mutual interactions between these two
NHRs [23,24].
To study the crosstalk between ERb and PPARc, we
investigated the regulation of PPARc-mediated transcriptional
activity by ERb. Our in-vitro experiments in 3T3-L1 preadipo-
cytes showed that ERb inhibits ligand-mediated PPARc-tran-
scriptional activity. That resulted in the blockade of PPARc-
induced adipocytic gene expression and in decreased adipogenesis.
Overexpression of nuclear coactivators such as steroid receptor
coactivator 1 (SRC1) and transcriptional intermediary factor 2
(TIF2) prevented the ERb-mediated inhibition of PPARc activity,
whereas the presence of vitamin D receptor (VDR)-interacting
protein 205 (DRIP205) or PPARc coactivator-1alpha (PGC1a)
had no effect indicating a role for distinct nuclear coactivators for
ERb-PPARc interaction in-vitro. High fat diet (HFD)-fed bERKO
mice showed increased body weight and fat mass. In contrast,
triglyceride content in liver and muscle was decreased in bERKO
mice, which was associated with a marked improvement of hepatic
and muscular insulin signaling. Compared to wt, bERKO mice
demonstrated improved systemic insulin sensitivity and glucose
tolerance. In consonance with the metabolic phenotype and with
the in-vitro data, bERKO mice exhibited augmented PPARcsignaling in adipose tissue corresponding to increased food
efficiency and significantly elevated RQ (respiratory quotient).
Blockade of adipose PPARc signaling in bERKO mice by PPARcantisense oligonucleotide injection resulted in a reversal of the
bERKO phenotype including body weight reduction and
impairment of insulin sensitivity.
In summary, the present data demonstrate that ERb impairs
insulin and glucose metabolism which may, at least in part, result
from a negative cross-talk with adipose PPARc.
Results
ERb Inhibits PPARc Activity in a Ligand-IndependentManner
In order to demonstrate a molecular interaction between
PPARc and ERb in a metabolically relevant cell system, we first
investigated ligand-dependent PPARc activity in the presence of
ERb in 3T3-L1 preadipocytes. Cells were treated with the
PPARc-agonist pioglitazone (10 mM), with or without additional
E2 stimulation, and PPARc activation was measured using pGal4-
hPPARcDEF/pG5TkGL3 luciferase assay [25]. Upon pioglita-
zone stimulation, 3T3-L1 preadipocytes showed pronounced
PPARc activation (bar 1+2, Figure 1A). This activation was not
affected by co-treatment with ligands for ERb such as E2 (bar 2 vs.
3, Figure 1A) or DPN (data not shown). Overexpression of ERbled to a marked inhibition of ligand-dependent PPARc activity
(bar 2 vs. 4+6+8, Figure 1A) which was also corroborated in a
PPARc response element (PPRE) luciferase assay (Figure S1). This
inhibition was E2 (bar 4+6+8 vs. 5+7+9, Figure 1A) and DPN
independent (data not shown). The inhibitory effect of ERbseemed to be isoform specific, since ERa overexpression resulted
in no inhibition of PPARc activity (bar 11, Figure 1A and Figure
S2). To further explore the regulation of PPARc by ERb, we
performed additional experiments coexpressing an activation
function 1 domain (AF-1) deleted-ERb construct in 3T3-L1 cells.
Overexpression of this truncated form of ERb which still contains
a functional ligand binding domain (LBD) did not reduce PPARcactivity indicating that ERb AF-1 is necessary for regulation of
PPARc by ERb (bar 10, Figure 1A). To assure adequate
overexpression and function of ERb in our system, 3T3-L1
preadipocytes were transiently transfected with ERb followed by
Western blot analysis and transactivation assays using ER response
elements (ERE)-luciferase system (Figure 1B, C). Both assays
confirmed adequate expression and function of ERb.
ERb Inhibits PPARc-Dependent Adipocyte Differentiationand Target Gene Expression
While our data implicated a negative regulation of ligand-
mediated PPARc transcription by ERb, we next investigated the
regulation of PPARc-dependent gene expression during 3T3-L1
preadipocyte differentiation. The preadipocytes were transfected
Author Summary
In the present study, we demonstrate for the first time apro-diabetogenic function of the ERb. Our experimentsindicate that ERb impairs insulin sensitivity and glucosetolerance in mice challenged with a high fat diet (HFD).Loss of ERb, studied in ERb -/- mice (bERKO mice), results inincreased body weight gain and fat deposition under HFD-treatment. Conversely, absence of ERb averted accumula-tion of triglycerides and preserved regular insulin signalingin liver and skeletal muscle. This observation wasassociated with improved whole-body insulin sensitivityand glucose tolerance. Increased adipose tissue mass inthe presence of improved insulin sensitivity and glucosetolerance is usually observed under chronic stimulation ofthe nuclear hormone receptor PPARc. In consonance, weshow that activation of PPARc was markedly induced ingonadal fat from bERKO mice and blockade of adiposePPARc signaling by antisense oligonucleotide injectionreversed the metabolic phenotype. Moreover, our cellculture experiments indicate that ERb is a negativeregulator of ligand-induced PPARc activity in vitro. Finally,we identify SRC1 and TIF2 as key players in the ERb-PPARcinteraction. In summary, the present study demonstratesthat ERb impairs insulin and glucose metabolism, whichmay, at least in part, result from a negative cross-talk withadipose PPARc.
Metabolic Action of ERb
PLoS Genetics | www.plosgenetics.org 2 June 2008 | Volume 4 | Issue 6 | e1000108

with indicated plasmids and differentiated for 3 days using
standard differentiation medium [25]. As the full differentiation
procedure requires 7-10 days of treatment, the observed effect on
fat droplet accumulation and expression pattern are typical for
early phase of adipocyte differentiation. The 3T3-L1 cells
transfected with ERb and differentiated for 3 days showed
reduced adipogenesis visualized by fat droplet accumulation in
comparison to control cells (Figure 2A). Low levels of ERb could
also be detected in untransfected 3T3-L1 cells and its expression
was slightly elevated during differentiation (data not shown)
underlining the physiological importance of our findings. Over-
expression of the ERa isoform in these cells did not show any
inhibitory effect on preadipocyte differentiation (Figure 2A). The
adipocyte protein 2 (aP2) gene belongs to the classical PPARc-
regulated genes involved in the early phase of adipogenesis [26].
The expression level of aP2 measured by real-time PCR was
significantly elevated in the differentiated control cells (bar 2 vs. 1,
Figure 2B). Overexpression of ERb-but not ERa- in these cells led
to a significant reduction of aP2 expression (bar 2 vs. 4 and 6,
Figure 2B) indicating that endogenous PPARc activation in 3T3-
L1 cells was inhibited by ERb.
Furthermore pioglitazone (10 mM) treatment of 3T3-L1 cells
overexpressing PPARc/RXRa showed increased adipogenesis, an
effect that was markedly inhibited by coexpression of ERb(Figure 2C). aP2 expression level was also significantly reduced
in cells co-expressing ERb together with PPARc/RXRa (bar 2 vs.
3, Figure 2D). These data indicate that ERb inhibits PPARc-
transcriptional activity resulting in the blockade of PPARc-
induced adipocytic target gene expression and amelioration of
adipogenesis.
PPARc Target Gene Expression and PPARc Activity AreIncreased in bERKO Mice
To investigate ERb’s action on PPARc in vivo, we studied
PPARc activity and PPARc target genes in HFD-fed bERKO and
wt mice. bERKO mice and their wt littermates were fed HFD
containing 60% calories from fat for 12 weeks followed by the
analysis of PPARc-dependent gene expression in gonadal fat
tissue. Adipose mRNA expression of PPARc target genes involved
in triglycerides (TG) synthesis such as lipoprotein lipase (Lpl),
phosphoenolpyruvate carboxykinase (PEPCK) and CD36 was
significantly upregulated in bERKO mice (Figure 3 A–C). Key
mediators of insulin and glucose metabolism such as the retinol-
binding protein 4 (RBP4) were also regulated in bERKO mice
(Figure 3D). Consistently with these findings, adiponectin mRNA
expression and adiponectin serum levels were elevated in bERKO
mice (Figure 3E, F). No difference of PPARc target gene
regulation between bERKO and wt mice was observed in liver
(data not shown).
Positive regulation of a series of adipose PPARc target genes in
bERKO mice suggested a general induction of PPARc transcrip-
tion in bERKO mice. To prove this, we performed EMSA assays
in gonadal fat from bERKO and wt mice after 12 weeks on HFD.
Nuclear fractions isolated from adipose tissues from bERKO mice
showed an increased binding/activation of endogenous PPARc in
comparison to wt mice (line 4–7 vs. 1–3, Figure 3G) in the
presence of similar PPARc expression levels, as shown by real-time
RT-PCR analysis and Western Blot (Figure 3G). Increased
adipose PPARc target gene expression and PPARc-DNA binding
confirmed an augmented PPARc signaling in adipose tissue from
bERKO mice.
bERKO Mice Exhibit Enhanced PPARc Signaling underPioglitazone Treatment
To exclude the possibility that the augmented expression of
PPARc target genes measured in HFD-fed bERKO is the result of
increased adipose tissue mass, we performed experiments using ex-
vivo fat pads isolated from wt and bERKO mice, treated for 24h
with 10 mM pioglitazone or vehicle-control, followed by analysis of
PPARc target gene expression using real-time RT-PCR. In this
system augmented ligand-induced PPARc target gene expression
mainly results from enhanced PPARc transcriptional activity and
Figure 1. ERb inhibits PPARc activity in a ligand-independentmanner. A) 3T3-L1 preadipocytes were transfected with the indicatedplasmids together with pGal4-hPPARcDEF, pG5TkGL3 and renilla,followed by treatment with 10 mM pioglitazone, 100 nM E2, or incombination as indicated. # p,0.05 vs. pSG5+veh; * p,0.05 vs.pSG5+Pio, ns: not significant vs. pSG5+Pio, nsa: not significant vs.ERb+Pio. B) 3T3-L1 preadipocytes were transfected with ERb (asindicated), and protein level of ERb was analysed by Western blot. C)3T3-L1 preadipocytes were transfected with the indicated plasmidstogether with pERE-TkGL3, and cells were treated with 100 nM E2, asindicated. * p,0.05 vs. pSG5+E2; ns: not significant vs. pSG5+veh.doi:10.1371/journal.pgen.1000108.g001
Metabolic Action of ERb
PLoS Genetics | www.plosgenetics.org 3 June 2008 | Volume 4 | Issue 6 | e1000108
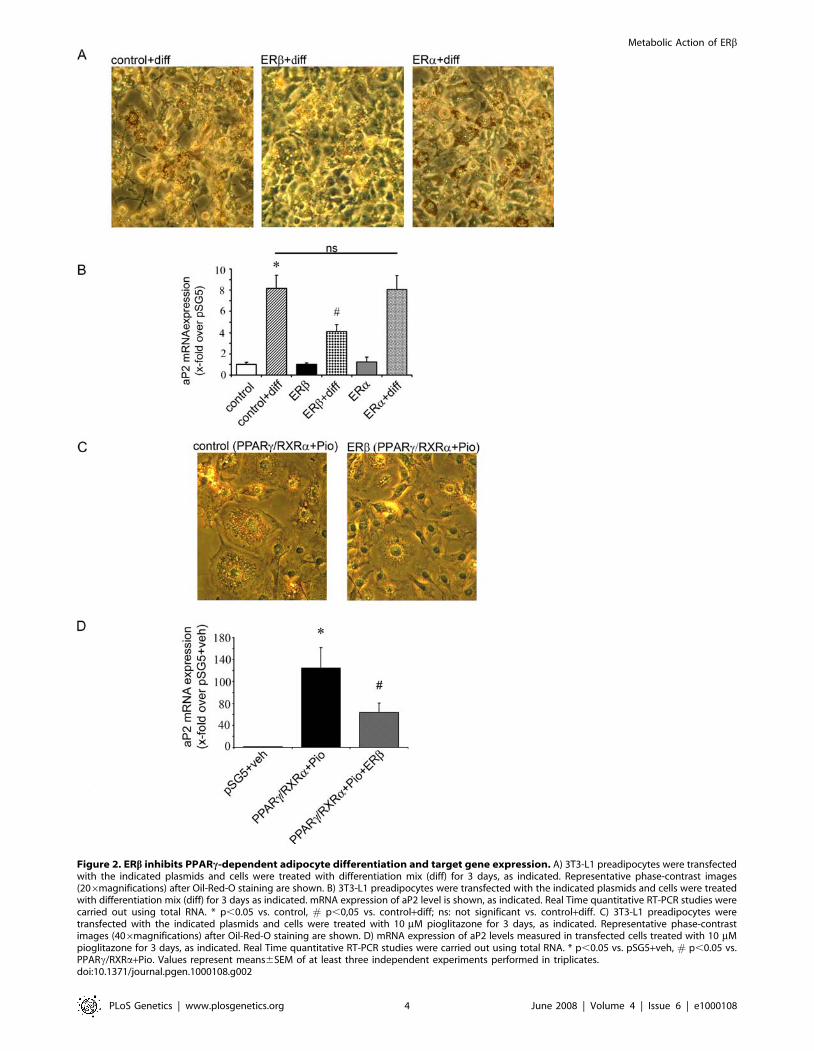
Figure 2. ERb inhibits PPARc-dependent adipocyte differentiation and target gene expression. A) 3T3-L1 preadipocytes were transfectedwith the indicated plasmids and cells were treated with differentiation mix (diff) for 3 days, as indicated. Representative phase-contrast images(206magnifications) after Oil-Red-O staining are shown. B) 3T3-L1 preadipocytes were transfected with the indicated plasmids and cells were treatedwith differentiation mix (diff) for 3 days as indicated. mRNA expression of aP2 level is shown, as indicated. Real Time quantitative RT-PCR studies werecarried out using total RNA. * p,0.05 vs. control, # p,0,05 vs. control+diff; ns: not significant vs. control+diff. C) 3T3-L1 preadipocytes weretransfected with the indicated plasmids and cells were treated with 10 mM pioglitazone for 3 days, as indicated. Representative phase-contrastimages (406magnifications) after Oil-Red-O staining are shown. D) mRNA expression of aP2 levels measured in transfected cells treated with 10 mMpioglitazone for 3 days, as indicated. Real Time quantitative RT-PCR studies were carried out using total RNA. * p,0.05 vs. pSG5+veh, # p,0.05 vs.PPARc/RXRa+Pio. Values represent means6SEM of at least three independent experiments performed in triplicates.doi:10.1371/journal.pgen.1000108.g002
Metabolic Action of ERb
PLoS Genetics | www.plosgenetics.org 4 June 2008 | Volume 4 | Issue 6 | e1000108

Figure 3. PPARc target gene expression and PPARc activity are increased in bERKO mice. A–E) Analysis of Lpl, PEPCK, CD36, RBP4 andadiponectin mRNA expression levels in gonadal fat from HFD-fed wt and bERKO mice. Real-time quantitative RT-PCR studies were carried out usingtotal RNA prepared from gonadal fat isolated from HFD-fed wt and bERKO mice (n = 3 per group). For details, see Materials and Methods andsupplemental data. * p,0.05 vs. wt-control. F) Adiponectin levels measured in serum isolated from fasted wt and bERKO mice (n = 10 per group);* p,0.05 vs. wt-control. Values represent means6SEM. G) Nuclear fractions isolated from gonadal fat from HFD-fed wt and bERKO mice (n = 3 andn = 4, respectively) were incubated with 32P-labeled PPRE and analyzed by EMSA, as described in Materials and Methods. Real-time quantitative RT-PCR studies for PPARc mRNA expression in gonadal fat were performed. Additionally 20 mg of the nuclear fraction used in EMSA assay were analyzedin Western Blot using PPARc-specific antibody.doi:10.1371/journal.pgen.1000108.g003
Metabolic Action of ERb
PLoS Genetics | www.plosgenetics.org 5 June 2008 | Volume 4 | Issue 6 | e1000108
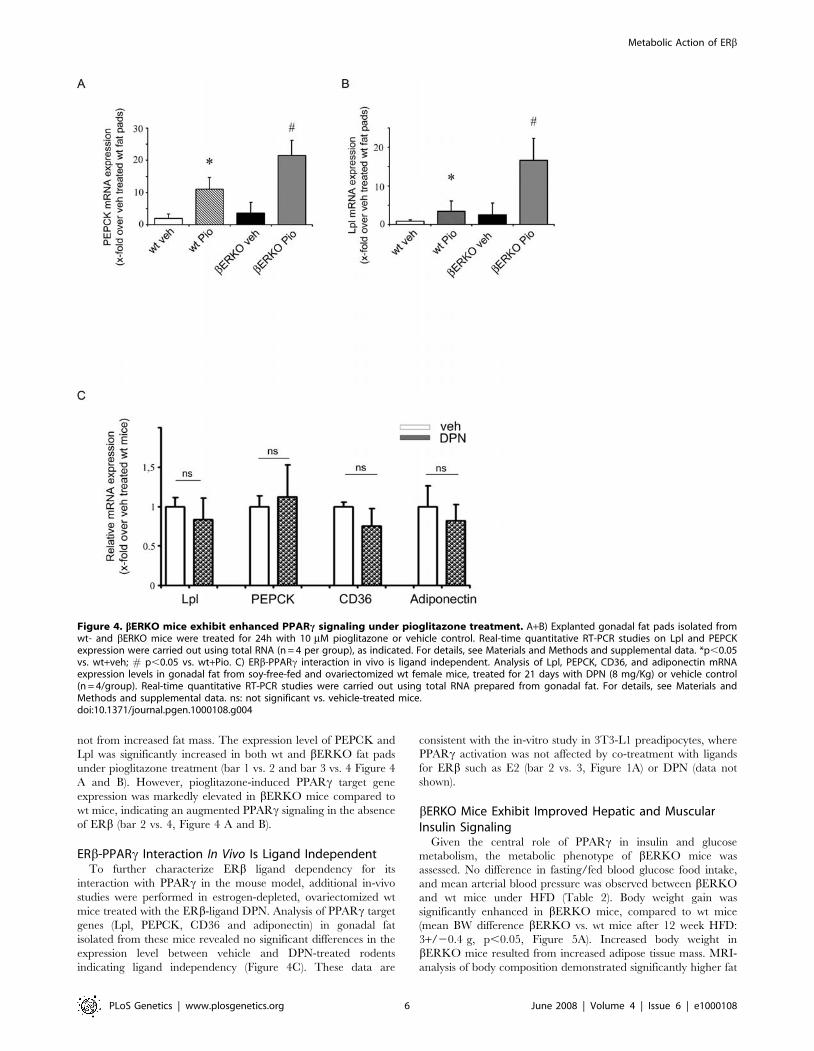
not from increased fat mass. The expression level of PEPCK and
Lpl was significantly increased in both wt and bERKO fat pads
under pioglitazone treatment (bar 1 vs. 2 and bar 3 vs. 4 Figure 4
A and B). However, pioglitazone-induced PPARc target gene
expression was markedly elevated in bERKO mice compared to
wt mice, indicating an augmented PPARc signaling in the absence
of ERb (bar 2 vs. 4, Figure 4 A and B).
ERb-PPARc Interaction In Vivo Is Ligand IndependentTo further characterize ERb ligand dependency for its
interaction with PPARc in the mouse model, additional in-vivo
studies were performed in estrogen-depleted, ovariectomized wt
mice treated with the ERb-ligand DPN. Analysis of PPARc target
genes (Lpl, PEPCK, CD36 and adiponectin) in gonadal fat
isolated from these mice revealed no significant differences in the
expression level between vehicle and DPN-treated rodents
indicating ligand independency (Figure 4C). These data are
consistent with the in-vitro study in 3T3-L1 preadipocytes, where
PPARc activation was not affected by co-treatment with ligands
for ERb such as E2 (bar 2 vs. 3, Figure 1A) or DPN (data not
shown).
bERKO Mice Exhibit Improved Hepatic and MuscularInsulin Signaling
Given the central role of PPARc in insulin and glucose
metabolism, the metabolic phenotype of bERKO mice was
assessed. No difference in fasting/fed blood glucose food intake,
and mean arterial blood pressure was observed between bERKO
and wt mice under HFD (Table 2). Body weight gain was
significantly enhanced in bERKO mice, compared to wt mice
(mean BW difference bERKO vs. wt mice after 12 week HFD:
3+/20.4 g, p,0.05, Figure 5A). Increased body weight in
bERKO mice resulted from increased adipose tissue mass. MRI-
analysis of body composition demonstrated significantly higher fat
Figure 4. bERKO mice exhibit enhanced PPARc signaling under pioglitazone treatment. A+B) Explanted gonadal fat pads isolated fromwt- and bERKO mice were treated for 24h with 10 mM pioglitazone or vehicle control. Real-time quantitative RT-PCR studies on Lpl and PEPCKexpression were carried out using total RNA (n = 4 per group), as indicated. For details, see Materials and Methods and supplemental data. *p,0.05vs. wt+veh; # p,0.05 vs. wt+Pio. C) ERb-PPARc interaction in vivo is ligand independent. Analysis of Lpl, PEPCK, CD36, and adiponectin mRNAexpression levels in gonadal fat from soy-free-fed and ovariectomized wt female mice, treated for 21 days with DPN (8 mg/Kg) or vehicle control(n = 4/group). Real-time quantitative RT-PCR studies were carried out using total RNA prepared from gonadal fat. For details, see Materials andMethods and supplemental data. ns: not significant vs. vehicle-treated mice.doi:10.1371/journal.pgen.1000108.g004
Metabolic Action of ERb
PLoS Genetics | www.plosgenetics.org 6 June 2008 | Volume 4 | Issue 6 | e1000108
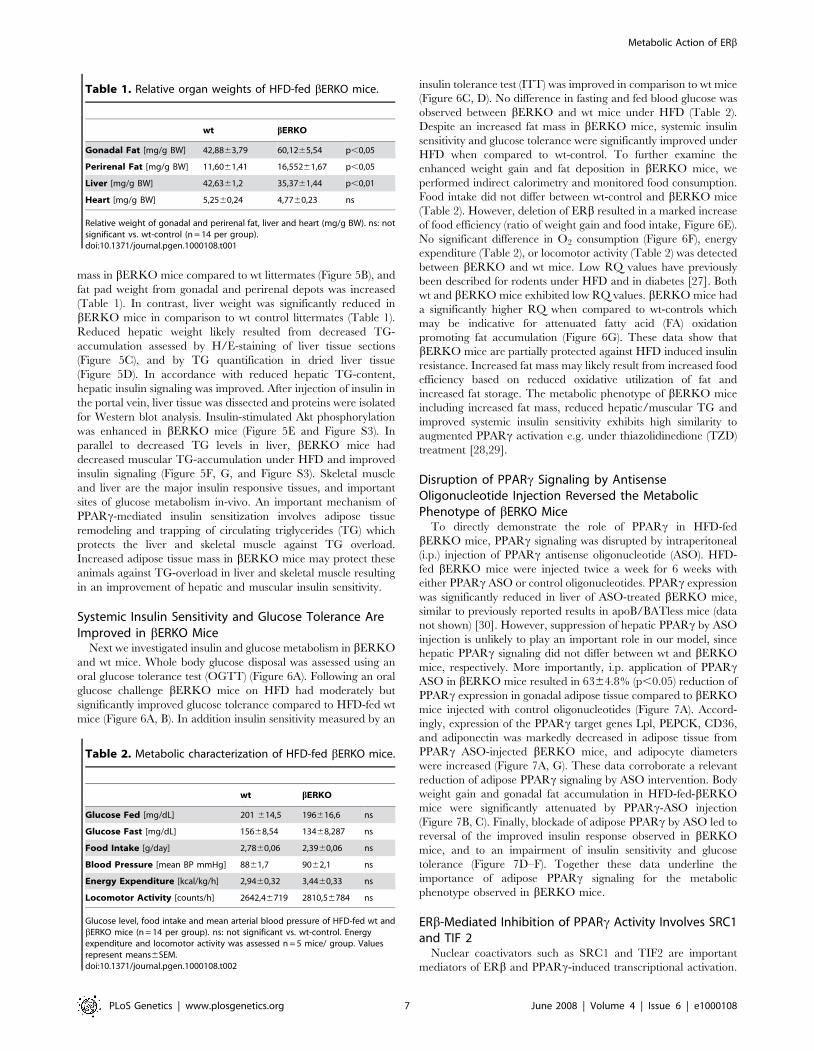
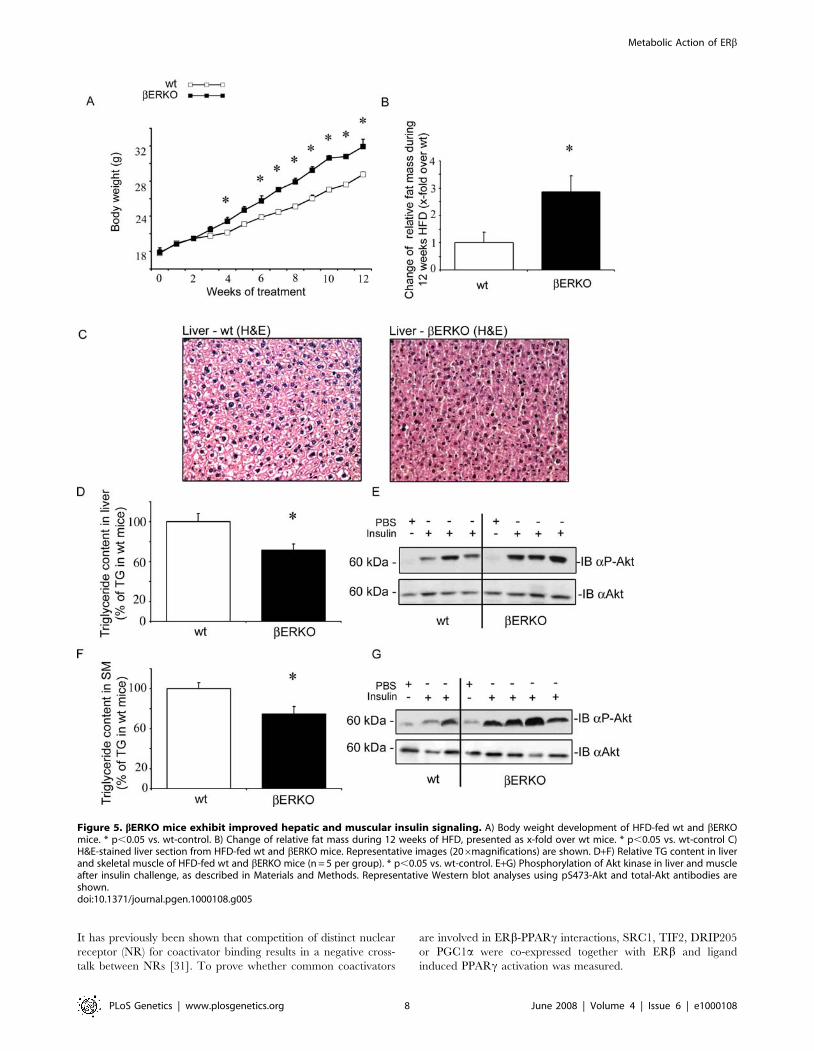
mass in bERKO mice compared to wt littermates (Figure 5B), and
fat pad weight from gonadal and perirenal depots was increased
(Table 1). In contrast, liver weight was significantly reduced in
bERKO mice in comparison to wt control littermates (Table 1).
Reduced hepatic weight likely resulted from decreased TG-
accumulation assessed by H/E-staining of liver tissue sections
(Figure 5C), and by TG quantification in dried liver tissue
(Figure 5D). In accordance with reduced hepatic TG-content,
hepatic insulin signaling was improved. After injection of insulin in
the portal vein, liver tissue was dissected and proteins were isolated
for Western blot analysis. Insulin-stimulated Akt phosphorylation
was enhanced in bERKO mice (Figure 5E and Figure S3). In
parallel to decreased TG levels in liver, bERKO mice had
decreased muscular TG-accumulation under HFD and improved
insulin signaling (Figure 5F, G, and Figure S3). Skeletal muscle
and liver are the major insulin responsive tissues, and important
sites of glucose metabolism in-vivo. An important mechanism of
PPARc-mediated insulin sensitization involves adipose tissue
remodeling and trapping of circulating triglycerides (TG) which
protects the liver and skeletal muscle against TG overload.
Increased adipose tissue mass in bERKO mice may protect these
animals against TG-overload in liver and skeletal muscle resulting
in an improvement of hepatic and muscular insulin sensitivity.
Systemic Insulin Sensitivity and Glucose Tolerance AreImproved in bERKO Mice
Next we investigated insulin and glucose metabolism in bERKO
and wt mice. Whole body glucose disposal was assessed using an
oral glucose tolerance test (OGTT) (Figure 6A). Following an oral
glucose challenge bERKO mice on HFD had moderately but
significantly improved glucose tolerance compared to HFD-fed wt
mice (Figure 6A, B). In addition insulin sensitivity measured by an
insulin tolerance test (ITT) was improved in comparison to wt mice
(Figure 6C, D). No difference in fasting and fed blood glucose was
observed between bERKO and wt mice under HFD (Table 2).
Despite an increased fat mass in bERKO mice, systemic insulin
sensitivity and glucose tolerance were significantly improved under
HFD when compared to wt-control. To further examine the
enhanced weight gain and fat deposition in bERKO mice, we
performed indirect calorimetry and monitored food consumption.
Food intake did not differ between wt-control and bERKO mice
(Table 2). However, deletion of ERb resulted in a marked increase
of food efficiency (ratio of weight gain and food intake, Figure 6E).
No significant difference in O2 consumption (Figure 6F), energy
expenditure (Table 2), or locomotor activity (Table 2) was detected
between bERKO and wt mice. Low RQ values have previously
been described for rodents under HFD and in diabetes [27]. Both
wt and bERKO mice exhibited low RQ values. bERKO mice had
a significantly higher RQ when compared to wt-controls which
may be indicative for attenuated fatty acid (FA) oxidation
promoting fat accumulation (Figure 6G). These data show that
bERKO mice are partially protected against HFD induced insulin
resistance. Increased fat mass may likely result from increased food
efficiency based on reduced oxidative utilization of fat and
increased fat storage. The metabolic phenotype of bERKO mice
including increased fat mass, reduced hepatic/muscular TG and
improved systemic insulin sensitivity exhibits high similarity to
augmented PPARc activation e.g. under thiazolidinedione (TZD)
treatment [28,29].
Disruption of PPARc Signaling by AntisenseOligonucleotide Injection Reversed the MetabolicPhenotype of bERKO Mice
To directly demonstrate the role of PPARc in HFD-fed
bERKO mice, PPARc signaling was disrupted by intraperitoneal
(i.p.) injection of PPARc antisense oligonucleotide (ASO). HFD-
fed bERKO mice were injected twice a week for 6 weeks with
either PPARc ASO or control oligonucleotides. PPARc expression
was significantly reduced in liver of ASO-treated bERKO mice,
similar to previously reported results in apoB/BATless mice (data
not shown) [30]. However, suppression of hepatic PPARc by ASO
injection is unlikely to play an important role in our model, since
hepatic PPARc signaling did not differ between wt and bERKO
mice, respectively. More importantly, i.p. application of PPARcASO in bERKO mice resulted in 6364.8% (p,0.05) reduction of
PPARc expression in gonadal adipose tissue compared to bERKO
mice injected with control oligonucleotides (Figure 7A). Accord-
ingly, expression of the PPARc target genes Lpl, PEPCK, CD36,
and adiponectin was markedly decreased in adipose tissue from
PPARc ASO-injected bERKO mice, and adipocyte diameters
were increased (Figure 7A, G). These data corroborate a relevant
reduction of adipose PPARc signaling by ASO intervention. Body
weight gain and gonadal fat accumulation in HFD-fed-bERKO
mice were significantly attenuated by PPARc-ASO injection
(Figure 7B, C). Finally, blockade of adipose PPARc by ASO led to
reversal of the improved insulin response observed in bERKO
mice, and to an impairment of insulin sensitivity and glucose
tolerance (Figure 7D–F). Together these data underline the
importance of adipose PPARc signaling for the metabolic
phenotype observed in bERKO mice.
ERb-Mediated Inhibition of PPARc Activity Involves SRC1and TIF 2
Nuclear coactivators such as SRC1 and TIF2 are important
mediators of ERb and PPARc-induced transcriptional activation.
Table 1. Relative organ weights of HFD-fed bERKO mice.
wt bERKO
Gonadal Fat [mg/g BW] 42,8863,79 60,1265,54 p,0,05
Perirenal Fat [mg/g BW] 11,6061,41 16,55261,67 p,0,05
Liver [mg/g BW] 42,6361,2 35,3761,44 p,0,01
Heart [mg/g BW] 5,2560,24 4,7760,23 ns
Relative weight of gonadal and perirenal fat, liver and heart (mg/g BW). ns: notsignificant vs. wt-control (n = 14 per group).doi:10.1371/journal.pgen.1000108.t001
Table 2. Metabolic characterization of HFD-fed bERKO mice.
wt bERKO
Glucose Fed [mg/dL] 201 614,5 196616,6 ns
Glucose Fast [mg/dL] 15668,54 13468,287 ns
Food Intake [g/day] 2,7860,06 2,3960,06 ns
Blood Pressure [mean BP mmHg] 8861,7 9062,1 ns
Energy Expenditure [kcal/kg/h] 2,9460,32 3,4460,33 ns
Locomotor Activity [counts/h] 2642,46719 2810,56784 ns
Glucose level, food intake and mean arterial blood pressure of HFD-fed wt andbERKO mice (n = 14 per group). ns: not significant vs. wt-control. Energyexpenditure and locomotor activity was assessed n = 5 mice/ group. Valuesrepresent means6SEM.doi:10.1371/journal.pgen.1000108.t002
Metabolic Action of ERb
PLoS Genetics | www.plosgenetics.org 7 June 2008 | Volume 4 | Issue 6 | e1000108
It has previously been shown that competition of distinct nuclear
receptor (NR) for coactivator binding results in a negative cross-
talk between NRs [31]. To prove whether common coactivators
are involved in ERb-PPARc interactions, SRC1, TIF2, DRIP205
or PGC1a were co-expressed together with ERb and ligand
induced PPARc activation was measured.
Figure 5. bERKO mice exhibit improved hepatic and muscular insulin signaling. A) Body weight development of HFD-fed wt and bERKOmice. * p,0.05 vs. wt-control. B) Change of relative fat mass during 12 weeks of HFD, presented as x-fold over wt mice. * p,0.05 vs. wt-control C)H&E-stained liver section from HFD-fed wt and bERKO mice. Representative images (206magnifications) are shown. D+F) Relative TG content in liverand skeletal muscle of HFD-fed wt and bERKO mice (n = 5 per group). * p,0.05 vs. wt-control. E+G) Phosphorylation of Akt kinase in liver and muscleafter insulin challenge, as described in Materials and Methods. Representative Western blot analyses using pS473-Akt and total-Akt antibodies areshown.doi:10.1371/journal.pgen.1000108.g005
Metabolic Action of ERb
PLoS Genetics | www.plosgenetics.org 8 June 2008 | Volume 4 | Issue 6 | e1000108
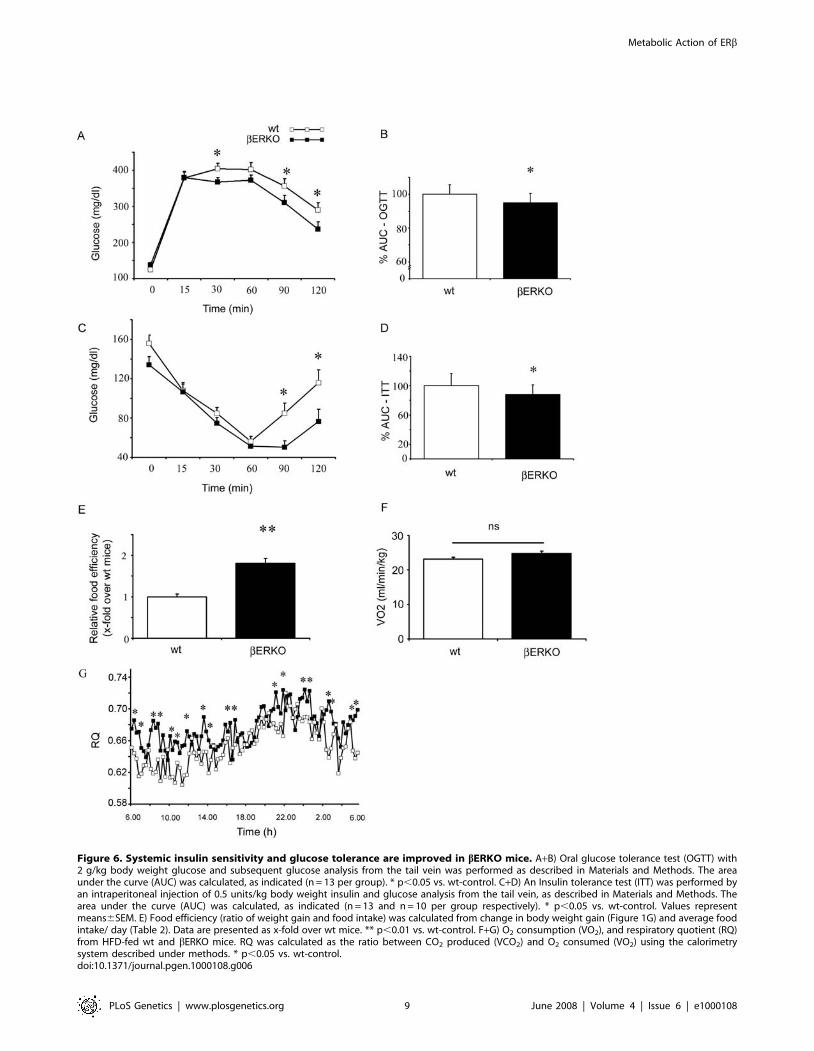
Figure 6. Systemic insulin sensitivity and glucose tolerance are improved in bERKO mice. A+B) Oral glucose tolerance test (OGTT) with2 g/kg body weight glucose and subsequent glucose analysis from the tail vein was performed as described in Materials and Methods. The areaunder the curve (AUC) was calculated, as indicated (n = 13 per group). * p,0.05 vs. wt-control. C+D) An Insulin tolerance test (ITT) was performed byan intraperitoneal injection of 0.5 units/kg body weight insulin and glucose analysis from the tail vein, as described in Materials and Methods. Thearea under the curve (AUC) was calculated, as indicated (n = 13 and n = 10 per group respectively). * p,0.05 vs. wt-control. Values representmeans6SEM. E) Food efficiency (ratio of weight gain and food intake) was calculated from change in body weight gain (Figure 1G) and average foodintake/ day (Table 2). Data are presented as x-fold over wt mice. ** p,0.01 vs. wt-control. F+G) O2 consumption (VO2), and respiratory quotient (RQ)from HFD-fed wt and bERKO mice. RQ was calculated as the ratio between CO2 produced (VCO2) and O2 consumed (VO2) using the calorimetrysystem described under methods. * p,0.05 vs. wt-control.doi:10.1371/journal.pgen.1000108.g006
Metabolic Action of ERb
PLoS Genetics | www.plosgenetics.org 9 June 2008 | Volume 4 | Issue 6 | e1000108
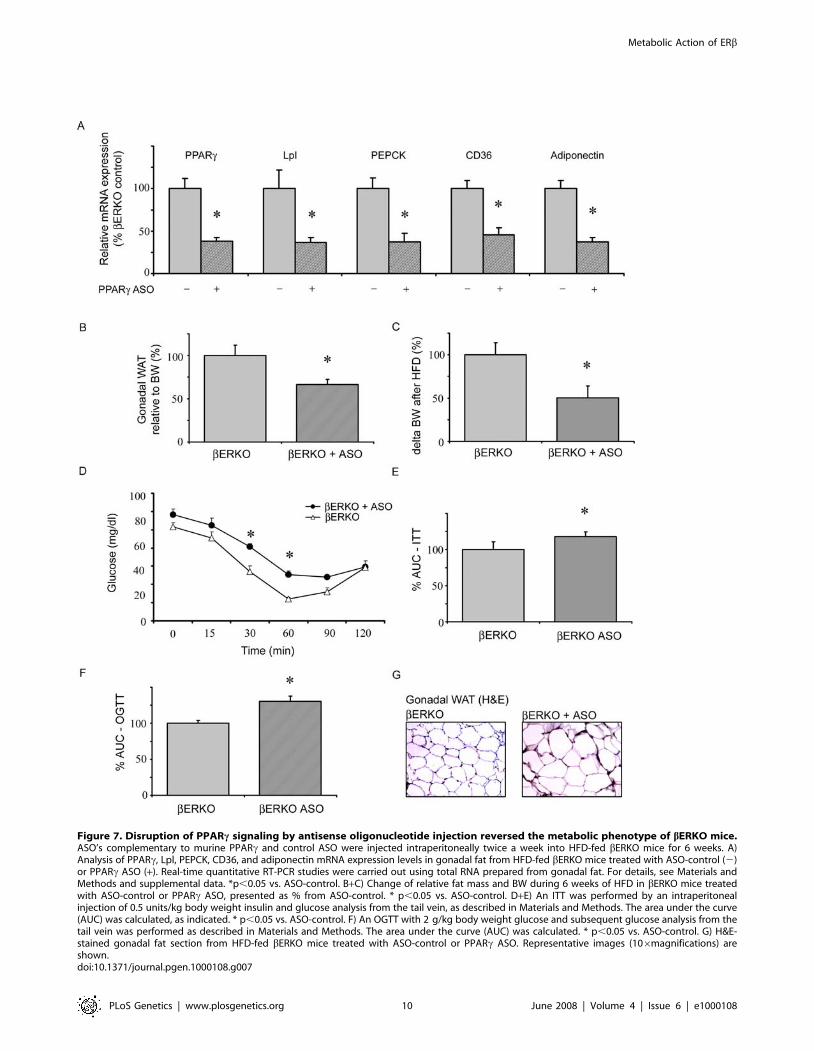
Figure 7. Disruption of PPARc signaling by antisense oligonucleotide injection reversed the metabolic phenotype of bERKO mice.ASO’s complementary to murine PPARc and control ASO were injected intraperitoneally twice a week into HFD-fed bERKO mice for 6 weeks. A)Analysis of PPARc, Lpl, PEPCK, CD36, and adiponectin mRNA expression levels in gonadal fat from HFD-fed bERKO mice treated with ASO-control (2)or PPARc ASO (+). Real-time quantitative RT-PCR studies were carried out using total RNA prepared from gonadal fat. For details, see Materials andMethods and supplemental data. *p,0.05 vs. ASO-control. B+C) Change of relative fat mass and BW during 6 weeks of HFD in bERKO mice treatedwith ASO-control or PPARc ASO, presented as % from ASO-control. * p,0.05 vs. ASO-control. D+E) An ITT was performed by an intraperitonealinjection of 0.5 units/kg body weight insulin and glucose analysis from the tail vein, as described in Materials and Methods. The area under the curve(AUC) was calculated, as indicated. * p,0.05 vs. ASO-control. F) An OGTT with 2 g/kg body weight glucose and subsequent glucose analysis from thetail vein was performed as described in Materials and Methods. The area under the curve (AUC) was calculated. * p,0.05 vs. ASO-control. G) H&E-stained gonadal fat section from HFD-fed bERKO mice treated with ASO-control or PPARc ASO. Representative images (106magnifications) areshown.doi:10.1371/journal.pgen.1000108.g007
Metabolic Action of ERb
PLoS Genetics | www.plosgenetics.org 10 June 2008 | Volume 4 | Issue 6 | e1000108

Overexpression of SRC1 and TIF2 prevented the ERb-
mediated inhibition of PPARc activity (Figure 8A, B) whereas
the presence of DRIP205 (Figure 8C) and PGC1a (Figure S4) had
no effect. To demonstrate that SRC1 and TIF2 are also involved
in ERb-PPARc interaction in-vivo, we performed ChIP experi-
ments with gonadal fat from HFD-fed bERKO and wt mice. The
adiponectin promoter was selected as a PPARc-target promoter.
Binding of SRC1 and TIF2 to the adiponectin promoter was
enhanced in gonadal fat from bERKO mice (Figure 8D),
indicating that the absence of ERb in adipose tissue results in
Figure 8. ERb inhibits PPARc activity in a ligand-independent manner involving SRC1+TIF2. A–C) 3T3-L1 preadipocytes were transfectedwith the indicated plasmids together with pGal4-hPPARcDEF, pG5TkGL3 and renilla followed by treatment with 10 mM pioglitazone as indicated.*p,0.05 vs. pSG5+veh; # p,0,05 vs. pSG5+Pio, ^ p,0.05 vs. ERb+Pio, ns: not significant vs. ERb+Pio. Values represent means6SEM of at least twoindependent experiments performed in triplicates. D) ChIP experiment with gonadal fat from HFD-fed wt mice and bERKO mice. IP was performedusing Flag, RNA Pol II, SRC1 and TIF2 as indicated. (– no template control (NTC), + genomic DNA, input: 1% of the initial probe taken for IP). For detailsplease see Materials and Methods.doi:10.1371/journal.pgen.1000108.g008
Metabolic Action of ERb
PLoS Genetics | www.plosgenetics.org 11 June 2008 | Volume 4 | Issue 6 | e1000108
exaggerated coactivator binding to a PPARc target promoter.
Together these data suggest that the coactivators SRC1 and TIF2
are involved in the negative regulation of PPARc by ERb in vitro
and in vivo.
Discussion
The present study demonstrates that ERb is a negative regulator
of ligand-induced PPARc activity in-vitro. Consequently, data
from bERKO mice suggest that ERb negatively regulates insulin
and glucose metabolism which may, at least in part, result from an
impairment of regular adipose tissue function based on a negative
cross-talk between ERb and PPARc. Loss of ERb resulted in
enhanced body weight gain and fat accumulation in HFD-fed
mice. However, absence of ERb prevented hepatic/ muscular
triglyceride overload, preserved regular insulin signaling in liver/
skeletal muscle, and improved whole-body insulin sensitivity and
glucose tolerance under HFD. This metabolic phenotype strongly
suggested augmented PPARc signaling in mice lacking ERb. And
indeed, PPARc target genes and PPARc-DNA binding were
markedly induced in gonadal fat from bERKO mice. Along this
line, blockade of adipose PPARc signaling by PPARc ASO
injection reversed the metabolic changes in bERKO mice.
A mutual signaling cross-talk between ERs and PPARc has
been described previously. PPARc together with its heterodimeric
partner RXRa has been shown to suppress ER-induced target
gene expression through competitive binding to an ERE site in the
vitellogenin A2 promoter [32]. In accordance with a bidirectional
interaction, Wang and colleagues demonstrated that ERs are
capable of inhibiting ligand-induced PPARc activation in two
different breast cancer cell lines [33]. In contrast to our results,
these authors show that basal and agonist-stimulated PPRE-
activity is also blocked by ERa. Transcriptional activity of PPARcdiffers markedly depending on the cell system and tissues. The
highest level of PPARc-mediated transcription has been described
in adipocytes and adipocytic cell lines, where molecular conditions
such as cofactor availability seemed to be optimized [34].
Compared to adipocytes, breast cancer cells exhibit low PPARcexpression and activity reflected by a less than 2-fold induction of
PPRE-activity after ligand stimulation [33]. The presence of
PPARc suppression by ERa in breast cancer cells might be a result
of weak basal PPARc transcriptional activity in these cells. In
contrast, the pronounced activation of the exogenous PPARc LBD
in 3T3-L1 preadipocytes may require more potent inhibitory
stimuli which could not be achieved by ERa overexpression in our
system.
Suppression of PPARc-LBD activation by ERb did not depend
on ERb ligands which is consistent with previous reports [33]. Also
our in vivo studies in estrogen-depleted, ovariectomized wt mice
treated with the ERb-ligand DPN indicate that PPARc-ERbinteraction is ligand independent. More importantly, overexpres-
sion of a truncated form of ERb containing solely the ERb-LBD/
AF2 domain did not induce any inhibitory effect on PPARcsuggesting an important role of ERb’s NH2-terminal AF1 domain
for ERb-PPARc interactions. Consistently, activity of the ER-AF1
domain is usually not dependent on ligand activation [35].
Furthermore, Tremblay and coworkers demonstrated that ERb-
AF1 activation involves ligand-independent recruitment of SRC-1,
a cofactor involved in ERb-PPARc interactions in our study [36].
These data corroborate our observation that PPARc suppression
by ERb involves the AF1 domain and ligand-independent
interactions with the coactivators SRC1 and TIF2. Repression
of PPARc activity through ERb was reversed by titration of the
p160 coactivators, SRC1 and TIF2, suggesting that the suppres-
sive action of ERb is a result of p160 coactivator interaction with
ERb thereby preventing the binding of PPARc to the same
coactivators. Similar interactions have been described previously
for ER interaction with the thyroid receptor [31].
The present study demonstrates for the first time that ERbimpairs insulin sensitivity and glucose tolerance under HFD
implicating pro-diabetogenic actions of this receptor. In conso-
nance, we could recently demonstrate that ERb has a suppressive
role on glucose transporter 4 (GLUT4) expression in skeletal
muscle [8,37]. GLUT4 has been identified as the major mediator
of insulin-induced glucose uptake in fat and skeletal muscle. In
addition, removal of the E2-ERb signaling by ovariectomy in
ERa-deficient mice improved glucose and insulin metabolism
supporting the diabetogenic effect of ERb [12]. Loss of ERbresulted in a marked augmentation of adipose PPARc activity in
our model indicating that ERb mediates its metabolic actions by a
negative interaction with PPARc in adipose tissue. This concept is
corroborated by a number of observations. HFD-fed bERKO
mice exhibited increased adipose tissue mass in the presence of
improved insulin sensitivity and glucose tolerance. These meta-
bolic changes are usually observed under chronic PPARcstimulation [17]. PPARc has been identified as an essential
regulator of whole-body insulin sensitivity. Two major mecha-
nisms have been described: (1) Adipose PPARc protects non-
adipose tissue against excessive lipid overload and maintains
normal organ function and insulin responses (liver, skeletal muscle)
by preserving regular adipose tissue function, and (2) Adipose
PPARc guarantees a balanced and adequate production of
adipocytokine secretion such as adiponectin from adipose tissue,
factors which are important mediators of insulin action in
peripheral tissues [38–40]. Both processes could be observed in
bERKO mice. Further support of this notion comes from clinical
actions of anti-diabetic PPARc agonists (TZD) [28,29]. Activation
of PPARc by TZDs in diabetic patients resembles the phenotype
of bERKO mice including improved insulin sensitization and
glucose tolerance in the presence of weight gain. We also observed
increased food efficiency and changes in nutrient partitioning
reflected by an increased RQ in bERKO mice. Loss of ERbappears to result in attenuated fatty acid (FA) oxidation which may
favor the storage of TGs in adipose tissue and increased fat
accumulation, and may provide a possible explanation for the
enhanced weight gain. Interestingly, treatment of obese mice with
a synthetic PPARc agonist has been shown to mediate similar
changes including an increase in food efficiency and higher RQ
values [41]. Finally, blockade of PPARc signaling in adipose tissue
of bERKO mice resulted in a reversal of the metabolic phenotype
corroborating the importance of adipose PPARc in the present
model. The observed suppression of hepatic PPARc activity by
ASO injection is unlikely to play a major role since the initial
metabolic characterization of untreated bERKO mice under HFD
did not reveal any dysregulation of hepatic PPARc signaling. In
summary, the metabolic phenotype of bERKO mice is mediated
by an augmented adipose PPARc action, which implies that in the
presence of ERb, PPARc activity might be partially suppressed.
The notion, that ERb-PPARc crosstalk requires receptor-p160
interaction, was underlined by our observations in WAT from
bERKO mice. Binding of SRC1 and TIF2 to the PPARc-
regulated adiponectin promoter in WAT was enhanced in the
absence of ERb. It has recently been demonstrated that p160
coactivators are important regulators of PPARc transcriptional
activity in WAT [42]. In particular, TIF2 has been identified as a
nuclear coactivator involved in the adipogenic actions of PPARc.
Future experiments are required to define the functional relevance
of TIF2 and SRC1 in our model. So far one may conclude that the
Metabolic Action of ERb
PLoS Genetics | www.plosgenetics.org 12 June 2008 | Volume 4 | Issue 6 | e1000108

metabolic phenotype of HFD-fed bERKO mice is, at least in part,
explained by increased adipose PPARc activity as a result of
exaggerated binding of p160 coactivators to PPARc-regulated
target gene promoters. Diabetogenic actions of ERb are of major
significance for the pharmaceutical development of new ERb-
selective agonists intended for use against a multitude of diseases
such as rheumatoid arthritis or postmenopausal osteoporosis
[43,44]. Despite the high tissue selectivity of such compounds,
and despite the fact that the actions observed in our study were
ligand-independent, one has to be aware of the potentially
deleterious actions of ERb on insulin- and glucose metabolism.
As a precautionary measure metabolic profiling of new ERbagonist should be performed.
Collectively, our data provide first evidence that ERb negatively
regulates insulin signaling and glucose metabolism that involves an
impairment of regular adipose PPARc function. Moreover our
data suggest that the coactivators SRC1 and TIF2 are involved in
this inhibition. In consonance, impairment of insulin and glucose
metabolism by ERb has significant implications for our under-
standing of hormone receptor-dependent pathophysiology of
metabolic diseases, and is essential for the development of new
ERb-selective agonists.
Materials and Methods
Animal Care and TreatmentFemale estrogen receptor b -/- mice (bERKO) received from
J.-A. Gustafsson (Karolinska Institutet, Huddinge, Sweden) and
their wt littermates were housed in a temperature controlled
(25uC) facility with a 12-h light/dark cycle and genotyped using
genomic DNA isolation kit (Invitek) and PCR primers described
elsewhere [45]. 4–5 week old mice were fed ad libitum with a
high-fat diet (60% kcal from fat, [25]) for 12 weeks. Body weight
and food intake were determined throughout the experiment. At
start and end of treatment, body composition was determined by
nuclear magnetic resonance imaging (Bruker’s Minispec MQ10).
After 12 weeks’ treatment, blood samples were collected from
overnight-fasted animals by retroorbital venous puncture under
isoflurane anesthesia for analysis of serum adiponectin (mouse-
adiponectin ELISA; Linco Research) and glucose (colorimetric
glucose test; Cypress Diagnostics). An OGTT using a dose of
2 g/kg body weight (BW) glucose and ITT with intraperitoneally
injected 0.5 units/kg BW insulin (Actrapid; Novo Nordisk) were
performed. Tail vein blood was used for glucose quantification
with a glucometer (Precision Xtra; Abbott). Blood pressure was
measured invasively in the abdominal aorta using a solid-state
pressure transducer catheter (Micro-Tip 3F; Millar Instruments)
under isoflurane anesthesia. Afterwards animals were killed and
organs were dissected. For immunohistochemical studies organs
were fixed in 4% formalin, embedded in paraffin and stained
with Haematoxylin/Eosin (H&E); for RNA, Western blot analysis
and measurement of TG content isolated organs were frozen in
liquid nitrogen; for EMSA and Chromatin IP assays abdominal
fat was stored in ice-cold PBS with proteinase inhibitors
(Complete Mini, Roche), and immediately proceeded as de-
scribed below.
For DPN- treatment, 10 week old female C57BL/6J mice were
ovariectomized, and after 1 week recovery set on soy-free diet.
Subsequently mice were treated for 21 days with DPN (8 mg/kg)
or vehicle administered using subcutaneous pellets (Innovative
Research of America). Afterwards animals were killed under
isoflurane anesthesia and organs were dissected.
All animal procedures were in accordance with institutional
guidelines and were approved.
Antisense ExperimentsASO complementary to murine PPARc (Gen-BankTM acces-
sion number U09138.1), ISIS 141941, 59-AGTGGTCTTCCAT-
CACGGAG-39, and ASO control, ISIS 141923, 59-CCTTCC-
TGAAGGTTCCTCC-39 was generously provided by ISIS
Pharmaceuticals (Carlsbad, CA, U.S.A.). Both ASO’s were
injected intraperitoneally twice a week into 6 week-old female
bERKO mice (n = 7 per group). Injections were continued over 6
weeks at a dose of 100 mg/kg/week as described previously [30].
At the end of the experiment animals were metabolically
phenotyped as described above.
Energy Expenditure, Locomotor Activity, and RQAfter HFD feeding, bERKO mice and their wt littermates were
analyzed for energy expenditure, RQ, and locomotor activity
using a custom-made 4-cage calorimetry system (LabMaster; TSE
Systems). The instrument consists of a combination of highly
sensitive feeding and drinking sensors for automated online
measurement. The calorimetry system is an open-circuit system
that determines O2 consumption, CO2 production, and RQ. A
photobeam-based activity monitoring system detects and records
every ambulatory movement, including rearing and climbing
movements, in every cage. All the parameters can be measured
continuously. Mice (n = 7 per group) were placed in the
calorimetry system cages for 24h.
Explanted Gonadal Fat Pads ExperimentsTissue samples from gonadal fat were prepared from female wt
and bERKO mice. Explanted gonadal fat samples were washed 3
times with ice-cold Hanks Balanced Salt Solution (HBSS) and
treated for 24h with 10 mM pioglitazone or vehicle in Dulbecco’s
modified Eagle’s medium F2 (DMEM:F12, Invitrogen). After-
wards tissue samples were washed with ice-cold PBS and RNA
extraction was performed using trizol (Invitrogen).
Cell Culture and Differentiation3T3-L1 preadipocytes were purchased from the American Type
Culture Collection. Preadipocytes were cultured in Dulbecco’s
modified Eagle’s medium with 10% Fetal Bovine Serum (FBS) and
1% Pen-Strep (Invitrogen). For differentiation experiments pre-
adipocytes were grown to confluence and after 12h culture
medium was supplemented with methylisobutylxanthine
(0.5 mM), dexamethasone (0.25 mM), and insulin (1 mg/ml) in
DMEM containing 10% FBS for 72h [25]. Afterwards cells were
washed with ice-cold PBS and RNA extraction was performed
using trizol (Invitrogen) according to the manufacturer’s instruc-
tions. For the staining procedure differentiated cells were washed
twice with ice-cold PBS, fixed with 4% PFA, and stained for 1h at
room temperature with Oil-red-O solution.
Transfection and Luciferase Reporter AssaysTransient transfection and luciferase assays were performed as
previously described [25]. Briefly 3T3-L1 cells were plated in 12-
well plates and transfected using lipofectamine 2000 and OptiMEM
(Invitrogen) with 100 ng pGal4-hPPARcDEF; 400 ng pG5TkGL3,
TIF2-pSG5, DRIP205-pSG5 (kindly provided by B. Staels, Institut
Pasteur de Lille, France), 5 ng pRL-CMV, a renilla luciferase
reporter vector (Promega), hPPARc2-pSG5 and hRXRa-pCDNA,
pSG5 (Stratagene), hSRC1-pSG5 (kindly provided by M. Parker,
Institute of Reproductive and Developmental Biology, Imperial
College London, United Kingdom), pERE-TkGL3 (kindly provided
by P.J. Kushner, Metabolic Research Unit and Diabetes Center,
University of California, San Francisco, USA), hERa-pSG5 and
Metabolic Action of ERb
PLoS Genetics | www.plosgenetics.org 13 June 2008 | Volume 4 | Issue 6 | e1000108
ERb-pSG5 (kindly provided by P. Chambon, Institut Clinique de la
Souris, Illkirch Cedex, France), and PGC1a kindly provided by
Addgene, USA. Delta AF1-ERb-pSG5 was cloned from full length
ERb-pSG5. After 3h of transfection cells were washed, left for 12h
in serum deprived medium (0.5% FCS, 1% Pen-Strep), and
afterwards treated for 24h with 10 mM pioglitazone (Takeda
Pharmaceutical Co. Ltd, Japan) or vehicle (DMSO). When treated
with E2 or specific ERb agonist diarylpropionitrile (DPN), cells were
cultivated in phenol red free DMEM and coal-striped FCS.
Luciferase activity was measured 36 h after transfection using the
dual-luciferase reporter assay system (Promega). Transfection
experiments were performed in triplicate and repeated at least
three times.
RNA and Protein AnalysisTotal RNA from cultured preadipocytes, abdominal fat tissue
and skeletal muscle was isolated using trizol (Invitrogen) according
to the manufacturer’s instructions. For real-time PCR analysis
RNA samples were DNAse digested (Invitrogen), reverse tran-
scribed using Superscript (Promega), RNasin (Promega), dNTPs
(Invitrogen), according to the manufacturer’s instructions, and
used in quantitative PCR reactions in the presence of a fluorescent
dye (Sybrgreen, BioRad). Relative abundance of mRNA was
calculated after normalization to 18S ribosomal RNA. Primer
sequences are provided in Table S1. For Western blot detection of
ERb cells were grown on W10 cm plates and transfected with
increasing amount of ERb plasmid or empty vector control. After
24h cells were harvested and WB analysis was performed as
following: cells (and tissues for Akt analysis) were lysed in RIPA
buffer (50 mM Tris pH 7.5, 150 mM NaCl, 5 mM MgCl2, 1%
Nonidet P-40, 2.5% glycerol, 1 mM EGTA, 50 mM NaF, 1 mM
Na3VO4, 10 mM Na4P2O7, 100 mM phenylmethylsulfonyl fluo-
ride with proteinase inhibitors (Complete Mini, Roche). Lysates
(tissues (30 mg) and cells (20 mg)) were analyzed by immunoblot-
ting using antibody raised against ERb (H-150, Santa Cruz),
antibody raised against pS473- Akt and total-Akt (Cell Signalling),
and secondary horseradish-conjugated antibodies (Amersham).
For PPARc immunoblotting, 20 mg of nuclear fractions used for
EMSA were analyzed using antibody raised against PPARc (E-8,
Santa Cruz). For detection, enhanced chemiluminescent substrate
kit (Amersham) was used.
EMSANuclear extracts were prepared by using a nonionic detergent
method as described previously [46]. The inputs were normalized
for protein contents, as ERb-deficient mice have increased fat
tissue mass. Detection of PPARc was performed with a [32P]
cATP-labeled PPRE oligo (59-CAAAACTAGGTCAAAGGTCA-
39 59- TGACCTTTGACCTAGTTTTG-39). The DNA binding
reactions were performed with 40 ml of binding buffer (20 mg
nuclear extracts, 2 mg of poly(dI-dC), 1 mg of bovine serum
albumin (BSA), 5 mM dithiothreitol (DTT), 20 mM HEPES,
pH 8.4, 60 mM KCl, and 10% glycerol) for 30 min at 37uC. For
competition experiments, a cold oligonucleotide probe was used.
The reaction products were analyzed via 5% polyacrylamide gel
electrophoresis using 12.5 mM Tris, 12.5 mM boric acid, and
0.25 mM EDTA, pH 8.3. Gels were dried and exposed to
Amersham TM film (Amersham Pharmacia Biotech) at 280uCusing an intensifying screen.
Chromatin IPAbdominal fat tissue (gonadal fat) isolated from wt and bERKO
mice was washed in ice-cold PBS with proteinase inhibitors
(Complete Mini, Roche), cut into small pieces, and incubated for
12h in 1% formaldehyde, PBS and proteinase inhibitors
(Complete Mini, Roche) with rotation at 4uC. Formaldehyde
was removed by intensive washing in ice-cold PBS and
centrifugation. Samples were lysed in RIPA (with proteinase
inhibitors, Complete Mini, Roche), sonicated on ice (Sonopuls HD
2070, 4 times 10s, 100%), and centrifuged. Samples from each
group were pooled and protein content of clear phase lysates was
measured using a Bradford assay (Amersham). For each
immunoprecipitation (IP) 1.5 mg of protein was taken. The
volume of the samples was kept constant by using dilution buffer
(prepared according to Upstate protocol). For preclearance 90 ml
of Protein A Sepharose slurry (Amersham) was added, and the
samples were rotated for 1h in 4uC. After centrifugation beads
were discarded, and 1% of supernatant volume per aliquot was
used as an input control. The residual volume was incubated with
6 mg of appropriate antibodies (anti-Pol II (C-18, Santa Cruz),
anti-Flag (Sigma), anti-SRC1 (M-20, Santa Cruz), anti-TIF2 (C-
20, Santa Cruz)). The antibody-bound proteins were then
precipitated using 300 ml Protein A Sepharose slurry (Amersham),
washed and further processed according to the Upstate protocol.
Quantification of Hepatic/Muscular TriglyceridesTriglyceride-content in skeletal muscle and liver was measured
as described previously [47]. Briefly, tissues were homogenized in
liquid nitrogen and treated with ice-cold chloroform/methanol/
water mixture (2:1:0.8) for 2 min. After centrifugation the aqueous
layer was removed and the chloroform layer was decanted. The
mixture was incubated at 70uC for chloroform clearance, and the
residues were dissolved in isopropanol, and assessed for the
triglyceride content using an enzymatic-calorimetric test (Cypress
diagnostics) according to the manufacturer’s instructions.
Statistical AnalysisResults from real-time PCR of cell lines, transfections, and
animal experiments were analyzed by ANOVA followed by
multiple comparison testing or with paired/unpaired t tests, as
appropriate. Data are expressed as mean6SEM or as indicated.
Results were considered to be statistically significant at p,0.05.
Supporting Information
Figure S1 ERb inhibits PPARc activity in vitro. In order to
demonstrate a molecular interaction between PPARc and ERb in
a metabolically relevant cell system, we first investigated ligand-
dependent PPARc activity in the presence of b in 3T3-L1
preadipocytes. Cells were transfected with 100 ng of PPARc,
50 ng of RXRa, 700 ng of PPRE-luc, 5 ng of renilla, and
increasing amount of ERb, as indicated. Afterwards cells were
treated with the PPARc-agonist pioglitazone (10 mM), and PPARcactivation was measured using PPRE-luc luciferase assay. Upon
pioglitazone stimulation, 3T3-L1 preadipocytes showed increased
PPARc activation. Overexpression of ERb led to a marked
inhibition of ligand-dependent PPARc activity (bar 1 vs. 2 and 3).
# p,0.05 vs. control.
Found at: doi:10.1371/journal.pgen.1000108.s001 (0.22 MB TIF)
Figure S2 ERa does not inhibit PPARc activity. 3T3-L1
preadipocytes were transfected with the indicated plasmids
together with pGal4-hPPARcDEF, pG5TkGL3 and renilla,
followed by treatment with 10 mM pioglitazone or vehicle control;
* p,0.05 vs. control+veh; u p,0.05 vs. control+Pio.
Found at: doi:10.1371/journal.pgen.1000108.s002 (0.31 MB TIF)
Figure S3 Densitometrical quantification of the Western blot
analysis. Densitometrical quantification of the Western blot
Metabolic Action of ERb
PLoS Genetics | www.plosgenetics.org 14 June 2008 | Volume 4 | Issue 6 | e1000108
analysis (Figure 5E/G) was performed by calculating the Akt-P/
total Akt ratio. * p,0.05 vs. wt controls.
Found at: doi:10.1371/journal.pgen.1000108.s003 (0.21 MB TIF)
Figure S4 PGC1a overexpression does not affect ERb-mediated
PPARc repression. 3T3-L1 preadipocytes were transfected with
the PGC1a plasmids together with pGal4-hPPARcDEF,
pG5TkGL3 and renilla and 500 ng ERb followed by treatment
with 10 mM pioglitazone as indicated; *p,0.05 vs. pSG5+veh; #p,0,05 vs. pSG5+Pio.
Found at: doi:10.1371/journal.pgen.1000108.s004 (0.26 MB TIF)
Table S1 Primer sequences used for qRT-PCR and ChIP
analysis.
Found at: doi:10.1371/journal.pgen.1000108.s005 (0.05 MB
DOC)
Acknowledgments
The authors thank J. Reinemund and H. Funke-Kaiser for help in
establishing the ChIP experiments, and M. Sommerfeld for help with the
immunohistochemical analysis. The authors thank S. Anker for kindly
providing the MRI equipment.
Author Contributions
Conceived and designed the experiments: AF UK. Performed the
experiments: AF MC SH MH CS NF MK RB AM. Analyzed the data:
AF. Contributed reagents/materials/analysis tools: SB JG. Wrote the
paper: AF JG TU UK.
References
1. Nilsson S, Gustafsson JA (2000) Estrogen receptor transcription and transactiva-
tion: Basic aspects of estrogen action. Breast Cancer Res 2: 360–366.
2. Smith CL, O’Malley BW (2004) Coregulator function: a key to understanding
tissue specificity of selective receptor modulators. Endocr Rev 25: 45–71.
3. Osborne CK, Schiff R (2005) Estrogen-receptor biology: continuing progress
and therapeutic implications. J Clin Oncol 23: 1616–1622.
4. McKenna NJ, O’Malley BW (2005) Teaching resources. An interactive course in
nuclear receptor signaling: concepts and models. Sci STKE 2005: tr22.
5. Haslam DW, James WP (2005) Obesity. Lancet 366: 1197–1209.
6. Regitz-Zagrosek V (2006) Therapeutic implications of the gender-specific
aspects of cardiovascular disease. Nat Rev Drug Discov 5: 425–438.
7. Regitz-Zagrosek V, Lehmkuhl E, Weickert MO (2006) Gender differences in the
metabolic syndrome and their role for cardiovascular disease. Clin Res Cardiol
95: 136–147.
8. Barros RP, Machado UF, Gustafsson JA (2006) Estrogen receptors: new players
in diabetes mellitus. Trends Mol Med.
9. Carr MC (2003) The emergence of the metabolic syndrome with menopause.
J Clin Endocrinol Metab 88: 2404–2411.
10. Cooke PS, Heine PA, Taylor JA, Lubahn DB (2001) The role of estrogen and
estrogen receptor-alpha in male adipose tissue. Mol Cell Endocrinol 178:
147–154.
11. Heine PA, Taylor JA, Iwamoto GA, Lubahn DB, Cooke PS (2000) Increased
adipose tissue in male and female estrogen receptor-alpha knockout mice. Proc
Natl Acad Sci U S A 97: 12729–12734.
12. Naaz A, Zakroczymski M, Heine P, Taylor J, Saunders P, et al. (2002) Effect of
ovariectomy on adipose tissue of mice in the absence of estrogen receptor alpha
(ERalpha): a potential role for estrogen receptor beta (ERbeta). Horm Metab
Res 34: 758–763.
13. Bryzgalova G, Gao H, Ahren B, Zierath JR, Galuska D, et al. (2006) Evidence
that oestrogen receptor-alpha plays an important role in the regulation of
glucose homeostasis in mice: insulin sensitivity in the liver. Diabetologia 49:
588–597.
14. Ohlsson C, Hellberg N, Parini P, Vidal O, Bohlooly M, et al. (2000) Obesity and
disturbed lipoprotein profile in estrogen receptor-alpha-deficient male mice.
Biochem Biophys Res Commun 278: 640–645.
15. Semple RK, Chatterjee VK, O’Rahilly S (2006) PPAR gamma and human
metabolic disease. J Clin Invest 116: 581–589.
16. Kliewer SA, Forman BM, Blumberg B, Ong ES, Borgmeyer U, et al. (1994)
Differential expression and activation of a family of murine peroxisome
proliferator-activated receptors. Proc Natl Acad Sci U S A 91: 7355–7359.
17. Picard F, Auwerx J (2002) PPAR(gamma) and glucose homeostasis. Annu Rev
Nutr 22: 167–197.
18. Yki-Jarvinen H (2004) Thiazolidinediones. N Engl J Med 351: 1106–1118.
19. Matsuzawa Y (2006) The metabolic syndrome and adipocytokines. FEBS Lett
580: 2917–2921.
20. Okamoto Y, Kihara S, Funahashi T, Matsuzawa Y, Libby P (2006) Adiponectin:
a key adipocytokine in metabolic syndrome. Clin Sci (Lond) 110: 267–278.
21. Kadowaki T, Yamauchi T (2005) Adiponectin and adiponectin receptors.
Endocr Rev 26: 439–451.
22. Guan HP, Ishizuka T, Chui PC, Lehrke M, Lazar MA (2005) Corepressors
selectively control the transcriptional activity of PPARgamma in adipocytes.
Genes Dev 19: 453–461.
23. Glass CK (2006) Going nuclear in metabolic and cardiovascular disease. J Clin
Invest 116: 556–560.
24. Gronemeyer H, Gustafsson JA, Laudet V (2004) Principles for modulation of the
nuclear receptor superfamily. Nat Rev Drug Discov 3: 950–964.
25. Schupp M, Clemenz M, Gineste R, Witt H, Janke J, et al. (2005) Molecular
characterization of new selective peroxisome proliferator-activated receptor
gamma modulators with angiotensin receptor blocking activity. Diabetes 54:
3442–3452.
26. Tontonoz P, Hu E, Spiegelman BM (1994) Stimulation of adipogenesis in
fibroblasts by PPAR gamma 2, a lipid-activated transcription factor. Cell 79:
1147–1156.
27. Maxwell GM, Nobbs S, Bates DJ (1987) Diet-induced thermogenesis in
cafeteria-fed rats: a myth? Am J Physiol 253: E264–270.
28. Frias JP, Yu JG, Kruszynska YT, Olefsky JM (2000) Metabolic effects of
troglitazone therapy in type 2 diabetic, obese, and lean normal subjects. Diabetes
Care 23: 64–69.
29. Staels B, Fruchart JC (2005) Therapeutic roles of peroxisome proliferator-
activated receptor agonists. Diabetes 54: 2460–2470.
30. Zhang YL, Hernandez-Ono A, Siri P, Weisberg S, Conlon D, et al. (2006)
Aberrant hepatic expression of PPARgamma2 stimulates hepatic lipogenesis in a
mouse model of obesity, insulin resistance, dyslipidemia, and hepatic steatosis.
J Biol Chem 281: 37603–37615.
31. Lopez GN, Webb P, Shinsako JH, Baxter JD, Greene GL, et al. (1999) Titration
by estrogen receptor activation function-2 of targets that are downstream from
coactivators. Mol Endocrinol 13: 897–909.
32. Keller H, Givel F, Perroud M, Wahli W (1995) Signaling cross-talk between
peroxisome proliferator-activated receptor/retinoid X receptor and estrogen
receptor through estrogen response elements. Mol Endocrinol 9: 794–804.
33. Wang X, Kilgore MW (2002) Signal cross-talk between estrogen receptor alpha
and beta and the peroxisome proliferator-activated receptor gamma1 in MDA-
MB-231 and MCF-7 breast cancer cells. Mol Cell Endocrinol 194: 123–133.
34. Tontonoz P, Hu E, Graves RA, Budavari AI, Spiegelman BM (1994) mPPAR
gamma 2: tissue-specific regulator of an adipocyte enhancer. Genes Dev 8:
1224–1234.
35. Metzger D, Ali S, Bornert JM, Chambon P (1995) Characterization of the
amino-terminal transcriptional activation function of the human estrogen
receptor in animal and yeast cells. J Biol Chem 270: 9535–9542.
36. Tremblay A, Tremblay GB, Labrie F, Giguere V (1999) Ligand-independent
recruitment of SRC-1 to estrogen receptor beta through phosphorylation of
activation function AF-1. Mol Cell 3: 513–519.
37. Barros RP, Machado UF, Warner M, Gustafsson JA (2006) Muscle GLUT4
regulation by estrogen receptors ERbeta and ERalpha. Proc Natl Acad Sci U S A
103: 1605–1608.
38. He W, Barak Y, Hevener A, Olson P, Liao D, et al. (2003) Adipose-specific
peroxisome proliferator-activated receptor gamma knockout causes insulin
resistance in fat and liver but not in muscle. Proc Natl Acad Sci U S A 100:
15712–15717. Epub 12003 Dec 15715.
39. Koutnikova H, Cock TA, Watanabe M, Houten SM, Champy MF, et al. (2003)
Compensation by the muscle limits the metabolic consequences of lipodystrophy
in PPAR gamma hypomorphic mice. Proc Natl Acad Sci U S A 100:
14457–14462. Epub 12003 Nov 14455.
40. Zhang J, Fu M, Cui T, Xiong C, Xu K, et al. (2004) Selective disruption of
PPARgamma 2 impairs the development of adipose tissue and insulin sensitivity.
Proc Natl Acad Sci U S A 101: 10703–10708. Epub 12004 Jul 10712.
41. Sell H, Berger JP, Samson P, Castriota G, Lalonde J, et al. (2004) Peroxisome
proliferator-activated receptor gamma agonism increases the capacity for
sympathetically mediated thermogenesis in lean and ob/ob mice. Endocrinology
145: 3925–3934.
42. Picard F, Gehin M, Annicotte J, Rocchi S, Champy MF, et al. (2002) SRC-1
and TIF2 control energy balance between white and brown adipose tissues. Cell
111: 931–941.
43. Follettie MT, Pinard M, Keith JC Jr, Wang L, Chelsky D, et al. (2006) Organ
messenger ribonucleic acid and plasma proteome changes in the adjuvant-
induced arthritis model: responses to disease induction and therapy with the
estrogen receptor-beta selective agonist ERB-041. Endocrinology 147: 714–723.
44. Komm BS, Kharode YP, Bodine PV, Harris HA, Miller CP, et al. (2005)
Bazedoxifene acetate: a selective estrogen receptor modulator with improved
selectivity. Endocrinology 146: 3999–4008.
Metabolic Action of ERb
PLoS Genetics | www.plosgenetics.org 15 June 2008 | Volume 4 | Issue 6 | e1000108
45. Krege JH, Hodgin JB, Couse JF, Enmark E, Warner M, et al. (1998) Generation
and reproductive phenotypes of mice lacking estrogen receptor beta. Proc Natl
Acad Sci U S A 95: 15677–15682.
46. Foryst-Ludwig A, Naumann M (2000) p21-activated kinase 1 activates the
nuclear factor kappa B (NF-kappa B)-inducing kinase-Ikappa B kinases NF-
kappa B pathway and proinflammatory cytokines in Helicobacter pylori
infection. J Biol Chem 275: 39779–39785.47. Cheng L, Ding G, Qin Q, Huang Y, Lewis W, et al. (2004) Cardiomyocyte-
restricted peroxisome proliferator-activated receptor-delta deletion perturbs
myocardial fatty acid oxidation and leads to cardiomyopathy. Nat Med 10:1245–1250.
Metabolic Action of ERb
PLoS Genetics | www.plosgenetics.org 16 June 2008 | Volume 4 | Issue 6 | e1000108