messenger-no73.pdf - Eso.org
48
No. 73 - September 1993 A Message trom the New Editor It is an honour and a pleasure to take on the responsibility of the Editorship of THE MESSENGER. The former editors, and in particularRichard West who was editor for two terms (1976-1979 and 1986-1993), made the Messenger an informative and friendly publication. It is therefore clear that no large changes should be brought to the Messenger. However, because of the forthcoming deployment of the VLT- VLTI, the ESO observers' community has an increasing need for technical information in all domains: site infrastructure, telescopes, instrumentation and detectors, calibration, data analysis and archiving. More emphasis will be given to these topics concerning both Paranal and La Silla. The Messenger will also carry articles on the use of the VLT-VLTI for specific astronomical topics. These articles are written byastronomers invited by the Editor to present their views. As before, observational results obtained at La Silla will also be presented. In this area, there will be no attempt at presenting a complete panorama of the observations carried out at ESO, and the number of articles in the observations section is likely to fluctuate from issue to issue. The most apparentchange in the look of thejournal is a division into sections: first the telescopes and instrumentation including detectors. This will be followed byarticles on science with the VLT. Then there will be a section on scientific results obtained at La Silla and a section on otherastronomical news. The last section groups all the announcements of ESO conferences and workshops, some announcements for positions (mostly in the Science Division), the tit/es of the accepted programmes and similar matters. The technical editor of the Messenger remains Kurt Kjär and I look forward to our collaboration in producing the Messenger. Marie-Helene Ulrich email Internet: mulrich eso.org TELESCOPES AND INSTRUMENTATION The 8.2-m Primary Mirrors of the VLT R. MUELLER, H. HOENESS, Schott Glaswerke, Mainz, Germany J. ESPIARO, J. PASERI, REOSC, Longjumeau, France P OIERlCKX, ESO 1. Introduction The 8.2-m Zerodur primary mirrors of the VLT telescopes are on their way to the observatory. On June 25, the first of the four mirror blanks (code name Joe Dalton) was delivered by SCHOn, the mirror blank manufacturer, to REOSC, who will polish it and mount its interfaces. Inspections performed be- fore delivery have not only demonstra- ted the compliance of the blank with its specifications, but also the perfor- mance of the blank manufacturer in achieving superb quality. On July 19 at 14:20, Joe was trans- ported to Mainz harbour, a few kilome- tres away from the SCHOn plant (Fig- ure 1). At 9 p. m. it was loaded onto the barge ELDOR. The ELDOR went down the Rhine to Rotterdam, travelled south
-
Upload
khangminh22 -
Category
Documents
-
view
1 -
download
0
Transcript of messenger-no73.pdf - Eso.org
No. 73 - September 1993
A Message trom the New EditorIt is an honour and a pleasure to take on the responsibility of the Editorship of THE MESSENGER. The former editors, and
in particular Richard West who was editor for two terms (1976-1979 and 1986-1993), made the Messenger an informativeand friendly publication. It is therefore clear that no large changes should be brought to the Messenger.
However, because of the forthcoming deployment of the VLT- VLTI, the ESO observers' community has an increasing needfor technical information in all domains: site infrastructure, telescopes, instrumentation and detectors, calibration, dataanalysis and archiving. More emphasis will be given to these topics concerning both Paranal and La Silla. The Messenger willalso carry articles on the use of the VLT-VLTI for specific astronomical topics. These articles are written byastronomersinvited by the Editor to present their views. As before, observational results obtained at La Silla will also be presented. In thisarea, there will be no attempt at presenting a complete panorama of the observations carried out at ESO, and the number ofarticles in the observations section is likely to fluctuate from issue to issue. The mostapparent change in the look of the journalis a division into sections: first the telescopes and instrumentation including detectors. This will be followed byarticles onscience with the VLT. Then there will be a section on scientific results obtained at La Silla and a section on other astronomicalnews. The last section groups all the announcements of ESO conferences and workshops, some announcements forpositions (mostly in the Science Division), the tit/es of the accepted programmes and similar matters.
The technical editor of the Messenger remains Kurt Kjär and I look forward to our collaboration in producing theMessenger. Marie-Helene Ulrich
email Internet: mulrich eso.org
TELESCOPES AND INSTRUMENTATION
The 8.2-m Primary Mirrors of the VLTR. MUELLER, H. HOENESS, Schott Glaswerke, Mainz, Germany
J. ESPIARO, J. PASERI, REOSC, Longjumeau, France
P OIERlCKX, ESO
1. Introduction
The 8.2-m Zerodur primary mirrorsof the VLT telescopes are on their wayto the observatory. On June 25, the firstof the four mirror blanks (code nameJoe Dalton) was delivered by SCHOn,
the mirror blank manufacturer, toREOSC, who will polish it and mount itsinterfaces. Inspections performed before delivery have not only demonstrated the compliance of the blank withits specifications, but also the performance of the blank manufacturer in
achieving superb quality.On July 19 at 14:20, Joe was trans
ported to Mainz harbour, a few kilometres away from the SCHOn plant (Figure 1). At 9 p. m. it was loaded onto thebarge ELDOR. The ELDOR went downthe Rhine to Rotterdam, travelled south

to Galais, then up the Seine to Evry aftercrossing Paris on Friday 23 overnight.On Monday 26 at 10 a. m. it was unloaded and placed onto a trailer. Theroad transport to the REOSG plantstarted at 0:00 on Tuesday 27 and Joearrived at REOSG at 02:30 a. m. Thecontainer was opened the same day at14:00'.
One of the greatest difficulties in thedesign of telescopes larger than about 401' 5 metres is the manufacturing of theprimary mirror blank. The classical design of a thick and solid mirror wouldimply enormous masses. First of a longseries of problems, the homogeneity ofa 200-ton casting is very unlikely tosatisfy the stringent requirements applied to high accuracy optical components. Even under the unrealisticassumption that all manufacturing andassembling issues could be solved, an8-m mirror more than 1 m thick wouldstill deform too much under its ownweight. Remember the basic idea: get asurface the size of a small appartmentdown to sub-micron accuracy, andmaintain it.
There are three possible diets to getthe mass down: reduce its weight, makeit out of segments, 01' get it slim and useits support to control its shape. Thethree names behind these solutions are:Palomar, Keck, ND, respectively. However, in the 8-m range, a Palomar-typeprimary mirror still needs some activecontrol as gravity and thermal loads mayaffect the surface accuracy. The effectiveness (with regard to performanceand safety) of very large honeycombstructures is still to be proven, while thesecond 10-m Keck telescope is on itsway, and the ND has already providedsuperb images. Each of the three solutions has its pros and cons, and thetrade-off is extremely difficult. There areno miracles, just tremendous efforts tobring the concepts into operation.
2. The Actively ControlledMeniscus Concept
The concept selected by ESO for theVLT is an extrapolation of the conceptdemonstrated first with an experimentalmirror 1 m in diameter and subsequentlywith the ND. It consists of a f/1.8, 8.2-mdiameter actively supported Zerodurmeniscus, 175 mm thick. The mirrorswill be supported axially by 150 hydraulic actuators. These actuatorscan be seen as computer-controlledsprings: they do not constrain the spa-
I On ESO side the whole process has been extensively recorded by Messrs. Heyer, Madsen andZodet. They shall be acknowledged for their exceptional dedication and efficiency.
2
Figure 1: Joe on its way to Mainz harbour.
tial position of the mirror at 150 locations but aim at providing a force distribution which results in a fully predictable elastic deformation of the mirror.With an active mirror, flexibility is usedto compensate for manufacturing errorand for on-line, real-time optimization ofthe optical properties of the telescope.
The hydraulic support system is divided into three sectors, each of themproviding a virtual fixed point. Therefore,the axial position and tilt of the mirror isfixed. The actuators interface to themirror through axial pads, the geometryof which is a three-Ieg spider. Each legis connected to an invar pad about50 mm in diameter, which is glued ontothe convex surface. The distribution ofthe supports has been optimized to provide the lowest possible print-throughon the mirror's surface. Additionally, thetripods introduce shear forces which reduce local deformations. The residualerror is in the ,J40 rms range, and will bealmost totally polished off as the mirrorsare figured on their tripods. (See section4.3, Effectiveness of the FLIP method.)
Ouring operation the exact shape ofthe mirror will be monitored by ShackHartmann sensors. These sensors collect the light of an off-axis star to forman image of the pupil of the telescopeonto a grid of lenses. A GGO camerarecords the distribution of the point images provided by the individual microIenses. A phase error of the incomingwavefront would imply a variable inclination of the rays with respect to theaxis of each microlens thus resulting in adeviation from the nominal distribution
of spot images on the GGO. This deviation is measured and the wavefront reconstructed. The necessary correctionis translated into a force distributionwhich is applied to the mirror through itsactive support. With active optics thefrequency of correction is below about1Hz. With its six rings of support the VLTshould be able to compensate errorswith spatial frequencies up to about1 m-" within an accuracy in the range of50 to 100 nm rms, i.e. weil beyond theeffect of atmospheric turbulence.
On the user's side active opticsshould be fully automatic, i.e. the onlynoticeable effect should be the highquality of the data collected under permanent computerized optimization. Ofcourse this situation is quite demandingin terms of tuning and reliability, and theconcept inevitably requires permanentmaintenance, as any large and complextelescope. On the other side the positiveaspects of the active optics conceptextend far beyond the potential excellence of the optical properties. Indeed itprovides far more design and manufacturing perspectives than a passive concept, with positive consequences bothon performance and cost.
The fragility of the thin meniscus requires particular attention. All supportsand auxiliary equipment which will interface to the mirror at one stage 01' theother are designed to keep the probability of damage under about 10-5 undermaximum loads. Nevertheless, giventhe high flexibility of the mirrors and thehighly non-linear relation between damage probability and load parameters

The issue of matching is less criticalas weil, as the active support can handlea fairly large error of the conic constant.Although the option of a pentaprism teston the primary and secondary mirrorscombination can still be ordered, thecurrent strategy for the VLT is to haveseparate cross-checks performed onthe primary and secondary mirrors.These are direct tests, i.e. they do notinvolve relay lenses which could introduce systematic errors, and they aim atensuring that no significant matchingerror is left.
As for any optical component, opticaltesting is essential as it should ensurethat the manufacturing tolerances arefulfilled, and as a proper measurementof the surface data (radius of curvatureand conic constant) is requested for thecalibration of the field aberrations. Indeed, the latter have to be deductedfrom the off-axis measurement by thewavefront sensors, in order that the active system applies the appropriatecorrections.
3. Mirror Blanks
Large-diameter and medium-thickness menisci are economically manufactured by using the spin casting technique. This technique was specificallydevelopped by SCHOn in 1986-1987for the production of mirror blanks of the8-m class. Contrary to the conventionalcasting technique, spin casting is ableto produce a meniscus which approaches the final shape of the mirrorwith only small oversizing, thus reducedmass. The meniscus shape is obtainedby rotating the mold (which has a spherical bottom) while the glass is not yetsolidified.
The spin casting technique hasproven successful in the production ofseveral raw blanks of the 8-m class.
._-.'
.......~..l!<%~///
~
"found another bubble?::J
specified in such a way that after convolution with the atmospheric seeingtheir effect on the long-exposure imagewill be limited to a maximum decreaseof 5 % of the peak intensity in stellarimages, in the visible and with a seeingangle of 0.4 arcseconds full width at halfmaximum. It can be easily shown thatthe specification ensures simultaneousIy seeing-limited angular resolution andhigh signal throughput and signal-tonoise ratio.
A positive consequence of the activeoptics concept is that it allows themanufacturer to concentrate on highspatial frequency errors, which haveusually lower amplitude but much higherslopes and are therefore more detrimental to performance than the low spatialfrequency ones. In other words, an active mirror is likely to be smoother than apassive one, and therefore to providebetter contrast and signal-to-noise ratio.
Table 1.
ParameterSpecifica- Achieve-
tions ment
Outer diameter 8200 ± 2 8201.52 mmInner diameter 1000 ± 0.5 999.81 mmConcentricity 51 0.01 mmThickness 1 176 + 2-0 177.9 mmRadius of curvature (concave surface) 28975 289682 mm
(convex surface) 28977 289793 mmProfile tolerance (concave surface) 2 0.124 mm
(convex surface) 2 0.055 mmResidual stresses (tensile) 50.10 max.0.07 MPa
(compressive) 50.60 max.0.08 MPaCoefficient of thermal expansion (mean value) o ± 0.15 -0.043 10-6o K- 1
(homogeneity) 50.05 0.009 1O-6O K- 1
I Normal to convex suriace, on a diameter of 8160 mm. - 2 Best fitting sphere. - 3 Best fitting sphere. -• Including the eHect of the 7mm error on the radius of curvature of the concave suriace. - 5 Including theeHect of the 2mm error on the radius of curvature of the concex suriace.
--
--'- I?'I'
~-------/"-/./ ~./"
./-----
(e.g. area of stress fields, magnitude ofstress, duration, surface finish), transport, handling and operation of anylarge mirror have to follow strict andrigorous rules.
The mirror itself is made out of ahighly homogeneous Zerodur substrate, with near-zero residual stresses.Table 1 summarizes the main specifications for the mirror blanks, togetherwith the achievement by SCHOn forthe first mirror blank. In many respectsthe mirror blank is of exceptionalquality.
In addition to the geometrical andmaterial properties, the internal qualitywas specified in terms of maximumnumber of bubbles and inclusions.Again, the result is weil within thespecification. The convex surface hastwo holes (to be compared to 10allowed), maximum diameter 34.8 mmand maximum depth 40 mm, which result from the removal of inclusions before ceramization. Local acid etchinghas been applied and the effect of theholes on stress fields is such that theprobability of breakage is still beyond10-5 .
The optical specifications given to theoptical manufacturer are in line with theactive optics concept and follow theformalism developed at ESO to quantifyoptical performance of ground-basedtelescopes.
The mirrors will be polished on anactive support system which interfacesto the tripods. The manufacturer is permitted to physically remove low spatialfrequency errors, provided that he stayswithin the specified budget of ± 120Newton maximum active force. The operational performance of the mirrors isgiven by the residual errors after activecorrection. The latter have been
3

Figura 2: Lifting the overhead heating system.
After the resolution of start-up problems, several castings could be successfully cooled down to room temperature. The subsequent quality inspections showed that the high requirementsset to the inner quality of ZERODUR arecompletely fulfilled.
All subsequent operations like handling, ceramization and machining werecarried out without any problems. Thefirst blank is already delivered, and thesecond blank is currently in the processof being transformed into glass ceramics in the ceramization furnace.
For the spin casting production ofmirror blanks of the 8-m class, allfacilities and the respective buildingswere built between June 1989 andMarch 1991. The facilities are entirelydedicated to the manufacture ofZERODUR blanks (mirror substrates ofthe 8-m class and smaller blanks of0.6 m up to 4.4 m in diameter). Production structures include new buildingswith about 50,000 m3 of enclosedspace, and modified and enlarged buildings.
The main steps of themanufacturing process are:
• Melting of glass in 70-t melting tank(discontinuous)
4
• Pouring of molten glass into the casting mold (which has a curved bottom). and generation of meniscus byspinning
• Coarse annealing of vitreous blank toambient temperature
• Machining (rough grinding of frontside, rear and edge)
• Transformation into glass ceramic(ceramization) by thermal retreatment
• Drilling of centre hole• Final grinding
The handling and quality controlswhich are necessary between the individual production steps are not mentioned. In the following paragraphs theproduction process is described insome more detail.
• Me/tingFor this purpose, the batch is fed into
the tank and melted, refined, and subsequently homogenized by stirring. Amelting cycle lasts 24 days.
• Pouring
The casting mold is preheated forabout 2 days, with the overhead heatingsystem being lowered. Following this,the casting mold is lifted to allow thefeeder (platinum tube for feeding the
molten glass from the tank into the casting mold) to protrude downward fromthe bottom of the mold.
After heating the feeder nose with thehelp of proper devices, the molten glassflows from the melting tank onto a conveyer.
Then the mold is progressively lowered to keep the feeder nose at aspecified distance of the bottom of thecasting mold. The discharged glass flowis cut by an appropriate device whichallows the casting mold to be filled whileit is slowly being lowered. This fillingoperation lasts approximately 4 hours.
After completing the filling operation,the mold is moved from the casting areaonto the spinning area with the help ofthe transfer vehicle.
• Spinning
Once the transfer vehicle has beenfixed to the spinning unit along with thecasting mold, the overhead heating system is fastened to and slightly lifted bysome hoisting equipment from the casting mold (Figure 2). This is followed byspinning the casting mold containingthe molten glass at a specified rotationrate. A cooling cap is placed above themold after the concave upper surface ofthe glass has been produced. The released radiation energy (20 MW immediately after lifting the heating system) is dissipated through the evaporation of water. During the spinning phase,the molten glass cools down in such away that the glass surface retains itscontour. The spinning process lasts approximately 1 hour.
• Annea/ing
After the spinning process, the casting mold with the raw blank is enteredinto the annealing furnace. SubsequentIy, the transfer vehicle is moved out andthe furnace is closed. This is followed byannealing the vitreous-state raw blankto ambient temperature. During this process, the blank is supported by anadaptable support system which followsthe deformation and shrinking of theconvex surface through the annealingprocess. The annealing period iasts approximately 3 months.
• Lifting and turn-over•whem annealing has been completed,
the annealing furnace is opened, afterwhich the raw blank is lifted from thecasting mold with a vacuum lifter andmoved to the turning position by thecrane equipment. There it is turned over(convex surface up) with the help of theturn-over installation (Figure 3).

Figure 3: Turning the mirrar blank.
During all handling operations, deformations of the handling equipmentshould not be transferred to the blank.Therefore the handling equipment musthave a flexible and adaptable couplingto the mirror blank. For this reason hydraulic cylinders are used. All supportsystems are designed in such a way thattensile stresses induced in the blank arekept weil below 1 MPa.
• Rough machining
After turning over the raw blank, it isplaced on the support system of theCNC grinding machine. This supportsystem has a design similar to the design of the handling equipment. Theblank convex surface and edge areroughly machined with diamond grinding wheels. This is followed by turning
over the blank again and machining thefront side.
• Transformation to a semicrystalline state (ceramization)
After completing the rough machiningthe blank is submitted to a thermal aftertreatment in the annealing furnace,which causes the vitreous state to betransformed into a semi-crystallinestate. This procedure causes the material to acquire its outstanding propertiesof thermal zero expansion.
This crystallization process is exothermic. During crystallization, the volume shrinks by approximately 3 %.Hence, all efforts should be made tocause crystallization to proceed veryslowly, in order to prevent stresses fromcoming up and leading to the fracture ofthe disk due to non-controlled crystallization and resultant non-uniform shrinkage. This is why transformation from thevitreous to the semi-crystalline statetakes approximately 8 months.
During the transformation process,the blank is supported by an adaptablesupport system within the annealing furnace.
• Drilling of the centre hole andfinal grinding
After transformation into a glass
Figure 4: The blank during quality inspection.
5

ceramic, the centre hole is drilled withthe CNC grinding machine.
The final grinding is also performed onthe machine, the accuracy of which is asfoliows:Rotating table at 7000 mm diameter:
radial (x) runout < 10 ~lm
axial (z) runout < 15 ~lm
angular positioning < 120 ~lm
Positioning in x and z: < 20 ~lm
Reproducibility in X and Z < 2 /olmTo preserve this accuracy the
machine raom has a temperature contral giving
spatial temperature homogeneity< ± 1.5°C
temporal temperature inertia< ± 1SC/h.
• Qua/ity contro/s
Quality controls and acceptance bycustomers are provided during and between the individual production steps(Figure 4).
Material characteristics are determined by the corporate Service RESEARCH & OEVELOPMENT. The projecHied inspection means consist of:overall geometric testing system(theodolite with pracess contraI computer), local geometric testing system, ultrasonic thickness gauge system, stressmeasuring system, video system fortesting and documenting the inner quality. For stress measurements the blank isput onto a special quality controlsupport system that generates extremeIy low stresses in the blank.
• Transfer to transportation system
After final acceptance, the blank isplaced onto the transportation systemwith the vacuum lifter and the crane. Thetransportation system (REOSC) isassembled beforehand in the production wing.
4. Mirror Figuring and Polishing
On July 25, 1989, REOSC obtainedfrom ESO the contract for the polishingof the four VLT mirrors and the followingtasks:• design and manufacture of the mirrar
handling tool and container,• transportation of each VLT mirror
blank fram SCHOn's plant in Mainz(Germany) to REOSC's plant,
• design, manufacture and assemblyon the mirror of special devices forthe mirror fixation in the cell,
• grinding, polishing and testing of thefour VLT mirrors.One of the governing design drivers in
this project was the very important flexibility of the VLT mirrors as they feature ahuge diameter of 8.2 m associated to avery low thickness of only 17.5 cm.
6
Figure 5: The REOSC optical shop.
4.1 THE OPTICAL SHOP
The new 8-m REOSC shop (Figure 5)was dedicated by the French Minister ofResearch and Space on April 24, 1992.
This plant is located close to theSeine, in order to optimize the mirrortransport. lts total surface is 1100 m2
and its dimensions are: length 70 m,width at the tower base 22 m, width ofthe shop 12.6 m, testing tower height32 m.
4.2 OVERVIEW ON THE TECHNICALPROCESS FOR FIGURING THE VLTMIRRORS
Oue to their huge size and high flexibility, the conventional technique of thefull sized flexible tool previously used forpolishing and figuring has been modified in order to obtain a mirrar surfacefree of high frequency defects and compliant with the requested asphericalshape.
Thus, the VLT mirrors will be groundand polished by using tools of adequatesizes associated with the REOSC Computer Controlled Surfacing (CCS) Pracess, and axially sustained by a supportwhich is accurate enough not to blur themirrar high frequency defects with alarge amount of non-axisymmetric lowfrequency defects.
Grinding machine
The grinding machine is composed ofa ratating table, a removable millingbridge, a couple of two-arm machinesdesigned and manufactured accordingto the REOSC requirements and a simplified axial support composed of 150pneumatic actuators.
All this assembly is computer controlled through a unique console.
Po/ishing machine
The polishing machine (Figure 6) isidentical to the grinding one but it is notpermanently equipped with the millingbridge. Furthermore, this machine, 10cated just under the testing tower, isequipped with an axial support of 150pneumatic actuators, each of them iscomputer controlled through a ShackHartmann CCO camera. The force accuracy delivered by each actuator is betterthan 2N and this support will be able toremove physically a large amount of lowfrequency defects.
The suppport software enables theuser to adjust automatically the mirrorposition and its trim thanks to threelength sensors. This software featuresalso the mirror weighting, forces excerted by each actuator, mirrar position,etc....
4.3 OVERVIEW OF THE TESTINGMETHODS
The testing faci/ities: the tower
As the efficiency of the optical testsdepends on the vibration level, thermalstability and on the easiness to passfrom a polishing run to a testing one,REOSC has given particular care in designing the testing tower which featuresan external sun shield, a main wall madeof boarding with a thick lagging, an internal tower totally independent framthe external one, made of a weldedmetallic structure which bears a doublewalled plastic tent. Thermally contralIedair is inflected between the two walls ofthis tent.

ManufacturingTest
Number Absolute Sensitive- Towerstage of points accuracy ness PIV requested
Rough grinding Spherometry 198 5000 nm 1000nm NoFine grinding IR tnterferometry 2000 500nm 300nm YesPolishing, final figuring FLIP method 250x250 5nm 5nm Yes
Figure 6: The 8.2-m dummy mirror on the polishing machine, as seen trom the test tower.
Furthermore, in the testing tower,REOSC has foreseen the possibility totest the matching of a convex mirrorassociated with a concave mirror by using the Pentaprism method as alreadyperformed for the ESO 3.6-m telescope.
The testing plan
Ouring the whoie surfacing process ofthe VLT mirrors, the progress of thework is checked by the testing methodssummarized in Table 2.
The mirror aspherical shape will begenerated on the mirror at the roughgrinding stage and checked byspherometry. Then the mirror will bemoved to the polishing machine locatedunder the tower. Ouring the fine grinding, the mirror surface is tested by IRinterferometry. When the mirror surfaceis smooth enough and about a few microns from the requested mirror shape,the polishing and the visible interferometric testing will start.
The spherometer
The spherometer body is made of analuminium honeycomb structure. Thereare 8 points of measure and about 200points of the mirror surface can beknown. The estimated time for performing this measure and processing thedata is about half an hour. Thespherometer is carried by the millingbridge and its position and the positionof the rotating table are controlled online by a computerto which are input themirror sag measurements.
Visible interferometry and the FlowInterferogram Processing (FLIP)
The residual vibrations of the tower donot allow the use of the conventionalphase shift method. The phase methodbased on Fourier transforms and theworks of Claude and Franyois Roddierlead to a too long processing time foraveraging a large number of interferograms.
In order to overcome this difficulty,REOSC has developed a new algorithmwhich allows quick computing of thephase from only ONE interferogramwhich must present about 80 fringesinclined at 45° if a CCO camera of250 x 250 pixels is used for an 8-mmirror. Furthermore, as an image can be
Table2
caught in a thousandth of a secondthanks to the use of an electronic shutter, the disturbing effect of the vibrationsare eliminated.
FLIP is a special software which canbe used with any interferometer provided it is equipped with a CCO cameraand an electronic shutter. REOSC thinksthat the FLIP method has the bestmoney value.
The interferograms are taken bybatches of 50 units and processed in1 minute for 250 x 250 points with ourpresent PC 386 equipped with a framegraber card, an accelerator card and acoprocessor. By adding two acceleratorcards, the processing time can be divided by two. The residual vibrations ofthe tower combined with the averagingof the results allow the elimination ofirregularities of illumination.
This software delivers the X and Yslope error map and the values of theRMS and PN errors, the wavefront errormap and the values of the RMS and PN,as weil as the mirror surface profilewhen the non-axisymmetric defectshave been removed.
The programme is user friendly and itis now currently used in REOSC's optical shop.
Effectiveness ofthe FLIP method
In order to test the effectiveness ofthe VLT axial support when it is provided
with special tripods as interface between the actuator shaft head and themirror, REOSC has figured a Zerodurspherical mirror of 1.7 m in diameter,17.5 cm thick and with a radius of curvature of 28.8 m, the same as the VLT one.This mirror is in fact apart of a wholeVLT mirror. For the experiment, this testmirror was resting on seven VLT actuators, each of them was provided witha tripod. Furthermore, some of themwere equipped with a large dish in orderto compare the residual high frequencydefects between two kinds of supportfor polishing: on the tripod and on thedishes.
Since the testing tower of the newplant was not available at the date ofthis experiment, the 1.7-m mirror andits support were installed under theREOSC old testing tower of the 4-mmirror shop. The light beam was foldedtwice. The results obtained with this setup and the FLIP method are thefollowing:
When the mirror is resting on 7 singlepoints, the measured and computedmirror deformations are as shown inTable 3.
There is a perfect correlation betweenthe experiment and the FE computation.
In order to evaluate the FLIP ability todetect minute defects among largerones, we have compared the resultsobtained by finite elements computationand FLIP measurements when themirror is resting on the tripods.
The mirror figure obtained by interferometry is the averaging of a batch of 50interferograms taken by the FLIPmethod to which we have substractedthe 1.7-m mirror figure (see Table 4).
The conclusion is that the finite elements results are very close to the experimental ones. The difference in the
7

Interferometry Computation
PIV RMS PIV RMS
Mirror surface 148nm 24 nm 107nm 25nm
Interferometry Computation
PIV RMS PIV RMS
Mirror surface 59nm 7.3 nm 37nm 8nm
Table3
PN values comes from the presence inthe laser beam of some artefacts whichgenerate a few local sharp defects.
It is worth noting that the RMS valueof the high frequency defects generatedby the axial support is three times lowerwhen the mirror is resting on the tripods.This factor of three is in very goodagreement with the computation.
In order to evaluate the noise of themeasurements. we have computed thedifference between the average of three
batches of fifty interferograms of themirror resting on the tripods. The RMSerror on the mirror surface error is5.6 nm.
Table4.
5. Conclusion
Joe Dalton was delivered in time andweil within specifications. It is now Iyingon the grinding machine at REOSC,where everything is ready for the nextsteps: glueing of the axial interfaces (inAugust 1993). followed by the excitingtasks of grinding it aspherical to a fewmicrons accuracy. and then polishing tooptical accuracy. Looking forward tomeeting Bill, William and Averell!
Ground-Based Astronomy in the 10 and 20 !lmAtmospheric Windows at ESO - Scientific Potential atPresent and in the FutureH. u. KÄUFL, ESO
1. Introduction
This article is especially written forthose who have little or no experiencewith astronomical observations in the infrared, especially longwards of 2.2 ~lm.
In recent issues of the Messenger(Käufl et al. 1992, Käufl 1993) therewere several reports on instrumentationat ESO for observations in the 10 and20 ~m atmospheric windows (N and Qband in Johnson's photometrie system).In this article a description of the perspectives of ground-based astronomyin these windows will be given. A specialfocus is set on the astronomical applications with respect to what is possible(and what not) with the present equipment; which improvements are anticipated at the VLT and how these observations compare to air-borne andspace-based infrared astronomy.
2. Targets tor Ground-basedIntrared Observations atWavelengths longer than 5 f-lm 1
2.1 Atmospheric constraints
The terrestrial atmosphere has a substantial opacity in the infrared due to
1 Some of the argumentation holds also for therange of 3-5flm. This transition region betweenthe near infrared and the thermal infrared, however. is outside the scope of this article.
8
rotational-vibrational transitions of tracemoleeules (e.g. CO2, H20, CH4 , 0 3), Insome spectral regions these moleculartransitions blend creating a practicallyopaque sky. The region between 8 and13 ~m, however, is reasonably free ofinterfering molecular transitions. Remaining absorption lines in the windowitself and at the "red" edge are ratherstable and observations can be easilycorrected for these perturbations. Onthe "blue" edge H20 is a source of variable opacity following the rapid variations of local humidity. Close to thisedge more careful observing procedures are required. Beyond = 13.3 ~lm
the atmosphere becomes opaque dueto the \/2-band of CO2 and opens againaround 16.5 ~m. A forest of lines of H20.however. prevents the sky from gettingclear so that even in the best part of the20 ~m window the average opacity moreor less corresponds to 50 % and is variable. Beyond 20 ~m the water vapourlines become a real problem. The term"Q-window" is misleading and shouldbe replaced by "Q-venetian-blind". Depending on site and local weather, limited astronomical observations are possible up to 30-35 ~m. Beyond =35 ~mthe atmosphere remains opaque untilthe sub-millimetre region (~ 300~lm) isreached.
In conclusion, long wavelength in-
frared astronomical observations areconstrained to:• A=8-13 ~lm with very good condi
tions• A= 16.5-30~m with reasonable to
poor conditions
2.2 Wien's Law, Kirchhoff's Lawand their consequences
Wien's law relates the maximum ofthe Planck curve for black body radiation with its temperature
A = 2898!lmmax T[K]
For a telescope at ambient temperature )'max lies exactly in the centre of the10 ~lm atmospheric window. Translatedinto the words of optical astronomy thisis equivalent to observing stars fromwithin a furnace (Iike the one in whichthe VLT blanks have been casted) ratherthan from a dark astronomical site.
To those readers not familiar with infrared astronomy it is also useful to recall Kirchhoff's law
a(A, T) = e(}., T)
which states that for all wavelengths andtemperatures the emissivity equals exactly the absorptivity. For ground-basedinfrared astronomy this means that e.g. a

change in opacity from 5 % to 20 % hasthe minor effect of reducing the signal by= 16 % but increases the backgroundradiation level by a factor of 4.
Typical background generated signals at 10 ~lm are of the order of 1010
electrons/pixel, equivalent to a magnitude mN = -2.50 (for details of background noise limited operation see e.g.H.U. Käufl et al. 1991). In spite of thehigh background it can be expected(based on experience with today's instrumentation) that a limiting magnitudeat N of the order of 12 will be achievablewith ESO's VLT, i.e. 14.5 magnitl:ldesfainter than the background.
At this point the reader may ask thequestion: why bother to try to observeunder such conditions at all? Part of theanswer is again Wien's law: if one wantsto study radiation from the cold universeone cannot do it at short wavelengths.For objects colder than 500 K the radiation is best (I.e. with the highest signal tonoise ratio) detected at wavelengthsaround 10~lm. Also many objects (moststars, galaxies and aSOs) tend to havemv - mN > O. Usually, however, this isnot quite sufficient to outweigh thebackground induced loss in sensitivitycompared to visible wavelengths. Thereis, however, a substantial number of infrared bright but obscured sources withmv - mN = 15 to 25. In some of thesecases it is not even sure if the light at V isradiation from the object itself or justscattering of interstellar light on thedust-shell.
2.3 On the scientific interest in dust2
By now it is weil known that there is alot of dust in the universe which comesin all grain sizes, basically from macroscopic grains to aggregates of several100 atoms (e.g. the .EolY6romatic ]jydrocarbonates, PAH). Working at A ;=:2.2 ~m allows one to actually penetratedust aggregations. For a nice examplesee e.g. the article by Peletier and Knapen (1992) who compare V and K images of the edge-on galaxy NGC 7814.The strong dust-Iane apparent in the Vimage is fairly transparent at 2.2 ~m. Observation of the dust itself (e.g. to studyits chemical composition) is governedby Wien's law and much of the dust issimply too cold to be observable inthe infrared, even at the longestwavelengths accessible from theground. But there exist interesting exceptions: compact objects and PAHs.
Many objects are sufficiently compactso that the dust is hot enough to beobservable with ground-based IR as-
2 This is not al all complete, just a couple 01 examples.
tronomy. Usually these dust shells provide for a "calorimeter" which allows todetermine bolometric fluxes from the integrated infrared radiation with very littleuncertainties. It is also in many of theseobjects (especially stars on the 6symptotic §iant .!2.ranch, AGB) where the dustis actually being produced. While thephysics of the mass-Ioss of these objects is poorly understood (see e.g. thereview paper by Lafon and Berruyer,1991) it is now clear that they are ofsome importance for galactic evolution,since all stars having main-sequencemasses :5 8 MG will follow the trackfrom a red giant via the AGB to a Planetary Nebula, leaving a white dwarf ascompact remnant and returning the restof the mass to the interstellar medium.The 2nd ESO/CTIO workshop held in LaSerena in 1992 was also entirely devoted to this topic (proceedings editedby H.E. Schwarz, now available fromESO). Dust is of course also of extremeinterest in the context of young starsand star formation, especially of lowmass stars. This ranges from HerbigHaro type objects to circumstellar disksin young stars. Arecent highlight in thiscontext: sub-arcsec spatial resolution10~m images of the disk of ß-Pictorisobtained with TIMMI at ESO's 3.6-mtelescope (P.O. Lagage, private communication).
The PAHs - normally too cold to bedetectable - are small enough that theenergy of single UV photons hittingthem raises their temperature to typicalIy 1000K. The PAHs then cool via theirwell-known molecular vibrations givingrise to several strong features in the10~lm atmospheric window.
The spectroscopic observation of dustin the 10 ~lm atmospheric window is bestdone with a resolution ~\. = 300 becauseonly this resolution allows for an unambiguous discrimination of broad solidstate dust features, narrow PAH-transitions and very narrow emission lines.
2.4 Moleeules
Many molecules of astrophysical importance (e.g. SiO, CO2 , C2 H2 , C2H4 ,
C2H6 , SiH4 or NH3) have rotational-vibrational transitions between 8 and 13~mcreating absorption lines in spectra ofcool stars. These spectra contain practically all information on chemistry andphysical conditions of photospheresand circumstellar envelopes. Dependingon quality (noise, resolution) such spectra allow to retrieve much of this information. Molecular spectra usually formbands which allow to select "strategic"portions containing transitions sensitiveto temperature and/or gradients andwith optical depths close to unity.Isotopic shifts of transitions are easily
resolved. In AGB objects the molecularspectra tend to originate from the regionwhere the dust formation and the acceleration of the outflowing material to itsterminal velocity takes place. Dust andparent molecules can be observedsimultaneously. Radio observations, onthe contrary, are usually restricted torotational transitions in the vibrationalground state and thus to cold material inregions where the dust formation iscompleted and the material has beenaccelerated to its terminal velocity. Typical linewidths are of the order of thesound-speed. The spectral resolutionshould match this, i.e. approach thekm/s realm.
Two of the three lowest energy quadrupole transitions of molecular hydrogenin the vibrational ground state (H2 (0,0)S (2) at 12.38~m and H2 (0,0) S (1) at17.03 ~lm) are observable from groundbased telescopes. Since they are partially overlapping with telluric lines suchobservations require a spectral resolution high enough to discriminate againstthe atmosphere, regardless of their instrinsic line width.
2.5 Ions and atoms
A variety of atomic lines are accessible for ground-based observations inthe 10 and 20 ~m atmospheric windows. Those include normal hydrogenrecombination lines (H 1(7-6) at 12.36~mor HI (9-7) at 11.30~m) and forbiddenlines (e.g. [FV] at 13.4~lm, [Nil] at12.79~m, [NaiV] at 9.04 and 21.3~m,
[PIII] at 17.87~lm, [Sill] at 18.68~lm,
[SIV] at 10.52~m, [CIIV] at 11.76 and20.37~m, [Ar 111] at 8.99 and 21.84~m,
[ArV] at 13.07~lm, [KVI] at 8.84~m and[CaV] at 11.47~m, for more details asweil as a discussion on the formation ofthese lines in H 11 regions see e.g. theoriginal article by Simpson 1975). Manyof these lines have al ready been utilizedto assess physical conditions of ionizedmaterials while others still await theirdiscovery in the interstellar medium. Ofextreme interest for quantitative modelling in this context is that extinctioncorrections are much simpler or evennot required at all, since most objectsare practically optically thin at ), = 10 20 ~lm. For a very recent example seee.g. Jennings et al. (1993) who reportfully resolved spectra of [Co 11] at10.52~m, [Nil] at 11.31 ~lm and [Fell] at17.94~lm in SN 1987A, 612 days afteroutburst.
Since typical intrinsic linewidths are ofthe order of 10-30 km/s they can beobserved with maximum sensitivity ifone uses a spectrograph which just notresolves these lines. At a spectral resolution exceeding = 20 km/s kinematicstudies inside of objects opaque for visi-
9

ble light become possible. Observingsuch lines in external galaxies requireshighest sensitivity and therefore is bestdone with aresolution matching the typical velocity dispersion inside the field ofview of one pixel (i.e. resolutions between 10 and 500 km/s are required).
2.6 Magnetic fields
The ratio of Zeeman-splitting to Doppler-width for atomic lines increaseslinearly with the wavelength of observations, i.e. Zeeman-splitting of lines at10f.lm is 20 times larger than at 0.5f.lm.Brault and Noyes (1983) observed andidentified for the first time such Zeemansplitting of transitions of Mg I at 12 f.lm insolar spectra. Deming at al. (1988) usedthese lines to map with arcsec spatialresolution magnetic fields around sunspots. Applying such techniques onother stars so far is quite difficult because of a lack of suitable instrumentation on large enough telescopes.
3. State ot the Art,Now and in the Near Future
3.1 The IRAS database
With the publication of the IRAS catalogues a great wealth of precise highquality data readily accessible to nonspecialists became available to the astronomical community. Thus the scientific value of infrared astronomy becamerecognized in a much broader community than was reached in the pioneeringdays. Still the IRAS mission had its limitations:• being largely a survey-type mission
the sensitivity is not extremely high:250-1000 mJy at 10-20f.lm (for pointsourees; equiv. mN = 3.9-5.3, ma =
2.5-4.0)• spatial resolution is Iimited ("" 25
arcsec)• spectroscopic data are only available
for the brightest sources while thespectral resolution of \; "" 25 allowsonly for rather restricted investigations/conclusions.
Just for comparison it should be notedthat in the 10 ~lm window a bolometer atthe ESO 1-m telescope would allow fordeeper photometry.
3.2 00 not wait for ISO
"This star is not in the IRAS catalogue,so we have to wait for ISO to settle thisquestion" (quote from a colloquiumspeaker at ESO). This is just one exampie of the widely spread belief thatfollow-up observations in the infrared atlong wavelengths need to wait for ISO(the ESA Infrared Space Observatory).Clearly ultimate sensitivity on point
10
sources and especially on extendedsources at 10 f.lm can only be achievedwith cryogenic telescopes from space;but space-based infrared observingplatforms are like apparitions of brightcomets: they are rare and short transientthings (e.g. 18 months for the case ofISO). Any form of synoptic observations(e.g. bolometric light curve of aMira) arevirtually excluded. Also observations requiring sub-arcsec spatial resolution(and consequently telescopes largerthan 4 m) can only be done from ground.In addition, as a rule of the thumb, thehigher the spectral resolution the less itis advantageous to observe from space.In that sense the working group on infrared aspects for the VLT also recommended to equip the VLT with instrumentation which complements theperformance of space observations (c.f.Moorwood, 1986). At this point I wouldalso like to add the advice: do not waitfor the VLT. In the following chapters Iwill describe what is available at ESOnow or in the near future and what isplanned to be available at the VLT.
3.3 TIMMI, ESO's 10pm Camera/Spectrometer
Recently ESO has complemented itssuite of infrared instrumentation (thephotometers/bolometers at the 1-m,2.2-m and 3.6-m telescopes, IRSPEC,the 1-5~lm medium resolution spectrograph at the ND, and IRAC2, the 12.5f.lm near-infrared camera at the2.2-m telescope) by adding TIMMI (seee.g. Käufl et al. 1992 for a detailed description of the instrument). While thiscamera has been first offered on ashared risk basis in period 52, ESO hasalready received 24 observing proposais asking for a total of 85 nights. TIMMIwill now be mounted for 2 (out of 6available) full moon periods in the coming semester. The proposals cover agreat variety of topics: solar system,stars (young, old, circumstellar disks,outflow), interstellar medium and galaxies. They involve broad- and narrowband imaging and mostly rely on subarcsecond resolution which is only possible from a good 3-4-m-class groundbased telescope. A further increase ofthe demand is expected once the spectroscopic mode ie.\ "" 300, 1-pixelsampling in long slit mode) of the camera is implemented. It should be notedthat there are more than 10 similar camera projects under way or already in useworldwide. Still TIMMI is to the best ofour knowledge the only system availablewithout restrietions to visiting astronomers.
3.4 Potential upgrades of TIMMI
The implementation of the spectros-
copic mode in TIMMI will be done usinggrisms. These grisms need the gratingstructure to be machined directly into thebase prism material (e.g. Germanium).Such devices are not easily availablecommercially. ESO has a contract withthe Institut für Festkörpertechnologie,München, of the Fraunhofer Gesellschaftto produce such prisms. Once they areavailable they can immediately be builtinto TIMMI to provide for the spectroscopic mode. TIMMI works today with a64 x 64-element detector (gallium dopedsilicon) produced by LETI/L1R of Grenoble/France. At this laboratory there is,also with ESO participation, a new device under development which will haveboth a substantially higher quantum-efficiency and format3 . Since this new detector will be basically pin-compatiblewith the one presently in use in TIMMI, anupgrade with this device is feasible.While all modes will benefit substantiallyfrom the increase in quantum-efficiencyand better sampling, the device wouldalso allow to increase the spectral resolution for grism spectroscopy to \. ""500-600 with 2-pixel sampling per spectral element.
4. Present Plans at ESO tor the 10and 20 ~m Atmospheric Window at the VLT
4. 1 VLT specific aspects
Great care is being taken in the VLTdesign to preserve the intrinsic quality ofthe site (Paranal). The design ensuresgood performance in the infrared (pupilon M2 for a field of up to 3 arcmin, nobaffles, in-situ mirror cleaning andwashing, emissivity at Cassegrain ""6 % and provision of a chopping secondary).
Extrapolating the Paranal seeing measurements at 500 nm to A"" 10~lm usingKolmogorov-Taylor theory yields amonthly averaged seeing between 0.3and 0.5 arcsec, i.e. close to the diffraction limit of the VLT (1.22b = 0.3 arcsecat 10f.lm at the VLT). According to measurements done with a 10f.lm interferometer (Bester et al. 1992), this is aconservative extrapolation. Thus thespatial resolution will always be close todiffraction limited. This image qualityalso ensures that unresolved sourcescan be observed "" 25 times faster withthe VLT than with the 3.6-m telescope.With its fairly dry atmosphere (precipitable H20 less than 2 mm for half of thetime in southern winter) Paranal is asubstantial improvement for working at20 f.lm when compared to La Silla.
3 In a lortheoming issue 01 the Messenger there willbe a status report of this projeet.

M5~
Optical Design ofthe 10/20pm Camera/Spectrometer: The instrument is shown in its spectroscopy mode utilizing the anamorphic beam-expansion for highest resolution (\\ = 30 - 45000,diffr. limited). The flat entrance window is omitted. M 1 is a cylindrical and M 2 a toroidal mirror.Whereas the 2-mirror collimator produces a circular beam (diameter = 50 mm) this is changedto an elliptical beam of 50 x 166 mm2 by the Germanium prism operating close to the Brewsterangle. Even if no suitable coating for the grazing incidence into Germanium can be found stillan overall efficiency of collimator plus grating exceeding 40 % can be achieved. In the normalspectroscopy mode the expansion prism will be replaced bya folding mirror which sends thebeam to a standard grating uni!. M 3 is a folding mirror. Behind M 3 the intermediate spectrumis formed which could be diverted by another kinematic folding mirror (not shown) to feed adedicated spectroscopic camera for the 20pm atmospheric window.M 4 (kinematic mirror) allows to select between the camera mode (dotted position) and thelong slit spectroscopy mode. L 1 is the camera collimator lens (Germanium, f =268 mm, f # =13.4) which forms an intermediate pupil of 20 mm diameter behind the folding mirror M 5. Thisis also the location of the filter wheel. L 2 (mounted to a lens wheel) is one of the camera lenses.Shown here is the most critical lens (scale of 6 a't.-'!nec ). To achieve background noise limitedperformance all components before the pupil stop have to be cooled below = 70 K, pupil stop,filter and lens wheel have to be cooled below = SOKo
200mm
ment most of the above-defined observing modes. Only the implementation of high-resolution spectroscopyneeds further studies.The final embodiment will depend on
the result of the study. The ESO-internaldedicated design will be used for thesensitivity/performance estimates in thefollowing chapter.
Ml
M2
T1
a comparatively moderate size andcomplexity. Figure 1 shows this instrument in its high-resolution spectroscopic mode.
• The opto-mechanical concept ofISAAC, the corresponding instrumentfor the near-infrared (for a descriptionsee e.g. Moorwood, 1992), lends itself to an easy modification to imple-
M4
; L2I
Intermediatepupil
In order to define the scope of theabove-mentioned study contract, predesigns were made internally at ESOresulting in two proposals:• A dedicated concept for a 10/20 flm
instrument taking full advantage ofthe relaxed optical requirements inthe infrared (Käufl and Delabre, 1992).All observing modes sketched aboveare feasible with generally close tooptimum performance while retaining
4 A slil lenglh of lhe order of 30-40 arcsec isconsidered sufficient.
5 See also The Messenger. 72. p. 44 for somebackground.
4.4 Possible embodiments
4.2 Anticipated operating modes ofthe 10/20~lm instrument at theVLT
According to ESO's instrumentationplan for the VLT (see e.g. S. D'Odorico,1992) the Cassegrain focus of unit telescope 2 will carry a dedicated 10/20flmmulti-purpose instrument. Installationand commissioning of the instrument ispresently scheduled for the second halfof 1999. The following operating modeshave been identified as the minimum tobe implemented to match most scientific objectives addressed above, bothfor galactic and extragalactic astronomy:• diffraction limited imaging in the
N-band with variable magnificationfor fields as large as 80 x 80 arcsecwith a suite of filters (incl. potentiallyfixed-spacer Fabry-Perot etalons)
• diffraction limited imaging for the partof the Q-band accessible with Ga:Sidetectors (16.5 to 17.8 flm)
• long slit4 spectroscopy at 7.9-14 flmwith- .~i. = 300 - 500 (i.e. covering the
entire band in 'one shot')- u~ = 7000- limited access in spectroscopy to
the 16.5-17.8J.lm region at ~,. ~
3000additional (optional) observing modeswhich would be highly desirable:• high resolution (i.e. 1;;. = 30,000
50,000, potentially as high as100,000) long-slit spectroscopymode for 10 J.lm
• long slit spectroscopy mode for mostof the Q-band (J}. = 3000 at =17-24flm)This instrument shall be manufac
tured by a consortium of institutes in theESO member states. A study contracthas been awarded to a team led by PO.Lagage at the Service d'Astrophysiqueof CEN-Saclay (France)5. After completion of the study the operating modesmay be revised.
11

4.5 Sensitivity ofsuch an instrumentat A = 10urn in an astronornicalcontextS '
Broad Band Imaging: The limitingflux is expected to be 5.4 x 10⁻⁴ Jansky(i.e. 12.1 mag). Operating at the diffraction limit of the VLT (i.e. 0.33" at lO~m)
this instrument will allow to image anycelestial object exceeding a brightnesstemperature of = 90 K, irrespective of itsdistance as long as it is spatially resolved. For point sources this instrument will be = 3 orders of magnitudemore sensitive than the IRAS pointsource catalogue.
Narrow Band Imaging: At a spectralresolution of ~'i = 100 the limiting lineintegrated flux for ionic lines (e.g. [Arlll],[Ne 11], [SIV] will be = 1.3 10-17 ~, per0.3 x 0.3 arcsec pixel. This implies thatgalactic Planetary Nebulae such asNGC 7009 or IC 418 would be detectable up to typically their 150-fold distance, Le. = 75 kpc. If the size ofthe intermediate pupil is chosen to be= 20 mm, monochromatic images for afield of 30" with a spectral resolution ashigh as 300 are feasible for selectedtransitions. Because of the betterbackground rejection the sensitivitylimits would then be a factor 3 fainter.
Low Resolution Long Slit Spectroscopy: In this mode the entire 10~m window could be observed in one integration with .~i = 300-500 to study dust(temperature, composition) and to survey emission lines. The limiting continuum flux for this mode will be 8.7mJansky (9.0 mag). Spectroscopy of typical galactic C stars or OH stars will bepossible even if they were located atdistances of 500 to 1000 kpc. Manyextragalactic sources are exceedingthat limiting flux (e.g. the QSO 3C48 at z= 0.4 is 8 times brighter than the limitingflux given above). While 10~m spectroscopy of QSOs will certainly be restrictedto few bright quasars, these spectra willbe of extreme interest because they willallow to study dust (temperature, composition) in these objects and the redshift will move a variety of interestingatomic emission lines into the observable window.
Medium Resolution Long Slit Spectroscopy: This mode allows for the observation of atomic and ionic emissionlines combining highest sensitivity andspectrophotometric precision. Limitedmolecular spectroscopy will be feasible.The Iimiting flux for sources emitting a
6 Assumptions for sensitivity calculations:Background !:!mited !::erformance, quantum eHiCiency 30 %, emissivity of sky and telescope 20 %at 273K, transmission of filters 80%, grating eff.80 % tor medium resolution and 50 % for highresolution mode. The limiting f1uxes are always tora ~ ot 10 II in 1 hour in the brightest pixel.
12
continuum is of the order of 60 mJansky(7.0 mag) or 2 x 10-18 w, for emissionlines. Galactic PNs (e.g. NCG 7009 or IC418) would be observable at 300 to 400times their distance which will enhancethe research capabilities on PNs in theMagellanic Clouds substantially. Forcompact sources, the instrument whencompared to the IRAS spectroscopicchannel, will have a 200 times higherspectral resolution, will be 100 timesmore sensitive and provide 0.3" spatialresolution along the slit. As e.g. the QSO3C273 exceeds the limiting flux by afactor of 8, extragalactic work at thisspectral resolution even up to cosmological distances will become possible.
High Resolution Long Slit Spectroscopy: The limiting flux averagedover one pixel could be of the order of300 to 500 mJansky. For point sourcesthis implies that most sources in theIRAS point source catalogue are brightenough to be detected with a ~ 2: 10within one hour. This will provide newinsight into the kinematic and physicalstructure of optically thick or obscuredcompact ionized objects. In starsmolecular transitions or Zeeman-sensitive hydrogen-like metal lines can bestudied with this mode. Particularly interesting is also that many AsymptoticGiant Branch objects known in ourGalaxy could be observed at LMC/SMCdistances thus providing for a coherentsampie of AGB stars where physics ofmass loss and dust formation could bestudied in an unprecedented way.
Imaging in the 16.5 to 17.8-~m
passband: It can be expected to reacha limiting flux of 13mJy (mo = 7) for thismode on point sources. This would exceed the sensitivity of the IRAS 25~lm
channel for point sources with a flatspectrum by a factor of 10-20. E.g. theabove-mentioned QSO 3C48 is 50 %brighter than the limiting flux. For manysources this channel can thus provideextremely valuable photometric information to judge the bolometricluminosities.
Performance in other parts of the Qband is difficult to judge since one lacksa precise knowledge or models of theatmospheric spectrum at the VLT site.Furthermore, little is known about detectors which could be available to ESOto be used for this window.
5. Conclusions and OutlookIt has been demonstrated that a dedi
cated 10/20~lm instrument at ESO'sVLT, located on Paranal, certainly anexcellent site for IR astronomy, will allowto investigate a significant amount ofscientific objectives ranging from thesolar system to cosmological distances.In the passbands set by the terrestrialatmosphere, it will in many respects out-
perform space-based or air-borne observing platforms. The sensitivity increase of such an instrument at the VLTas compared to a 4-m class telescopewill be substantial and give astronomersa wide access to objects in theMagellanic Clouds for programmeswhich today are restricted to few brightstars (also due to lack of suitable focalplane instrumentation). A big boost isespecially expected for stars in theirearly and late stages of evolution. Infrared spectroscopy at spectral resolutions approaching photospheric soundspeeds which today are rarely done andrestricted to the few brightest stars willbecome possible for several 10000stars, thus allowing the systematicstudy of sampies selected with coherentcriteria. It is also expected that this instrument will contribute enormously toresearch, where a multi-wavelength approach is required or beneficial, e.g. inthe study of winds in hot stars, PlanetaryNebulae, Herbig-Haro objects or otherforms of low-mass star formation.
ReferencesM. Bester, W.C. Danchi, C.G. Degiacomi, L.J.
Greenhili, C.H. Townes: AstrophysicalJournal, 392, p. 357, 1992.
J.w. Brault, Noyes R.w.: Astrophysical Journal Leiters, 269, L61, 1983.
D. Deming, R.J. Boyle, D.E. Jennings, G.Wiedemann: Astrophysical Journal 333,p. 978 (1988).
S. D'Odorico: 1992, proceedings ot the ESOconterence on Progress in Telescope andInstrumentation Technologies, p. 557, M.H. Ulrich editor.
D.E. Jennings, R.J. Boyle, G.R. Wiedemann,S.H. Moseley: Astrophysical Journal 408p.277, 1993.
H.U. Käutl, P. Bouchet, A. van Dijsseldonk, U.Weilenmann: Experimental Astronomy 2,1991, p. 115.
H. U. Käutl, B. Delabre: 1992, proceedings otthe ESO conterence on Progress in Telescope and Instrumentation Technologies,p. 597, M.-H. Ulrich editor.
H.U. Käutl, R. Jouan, P.O. Lagage, P. Masse,P. Mestreau, A. Tarrius: The Messenger,70, 1992, p. 67.
H.U. Käutl, 1993, The Messenger 72, p. 42.H.U. Käutl, R. Jouan, P.O. Lagage, P. Masse,
P. Mestreau, A. Tarrius: 1993, InfraredPhysics, special issue on CIRP V, in press.
J.-P.J. Laton, N. Berruyer: Astron. Astrophys.Rev. 2, 1991, p. 249.
P.O. Lagage, R. Jouan, P. Masse, P. Mestreau, A. Tarrius, H.U. Käutl, 1993, Proceedings SPIE Cont.: Infrared Detectorsand Instrumentation, Orlando, USA, Apnl1993, Vol 1946 (in press).
A. Moorwood: "Working Group Report onInfrared Aspects" in proc. ot 2nd Workshop on ESO's Very Large Telescope, p.55-82, S. D'Odorico and J.-P. Swingseditors, 1986.
A. Moorwood: 1992, proceedings ot the ESOconterence on Progress in Telescope andInstrumentation Technologies, p. 567, M.H. Ulrich editor.
R.F. Peletier, J.H. Knapen: 1992, TheMessenger 70, p. 57.
J.P. Simpson: Astron. Astrophys. 39, 1975,p.43.

On the Linearity of ESO CCD # 9 at CAT + CESE. GOSSETand P MAGAIN, Institut d'Astrophysique, Universite de Liege, Belgium
Table 1: Additional information on the different sequences selected for our study (LS: La Si/la;RC' Remote Contral fram Garehing)
Central Number ofSequence Date wavelength flat fields Place Selected zone
1 02-03/05/1987 7790A 30 LS X346-X355 Y939-Y995
2 12-13/06/1990 4057 A 18 RC X300-X306 Y200-Y350
3 12-13/06/1990 3835A 21 RC X300-X306 Y650-Y800
4 25-26/05/1991 4057 A 33 RC X418-X423 Y170-Y350
5 01-02/03/1992 4542 A 38 RC X365-X380 Y270-Y330
X365-X380 Y470-Y530
X365-X380 Y670-Y730
6 09-10103/1992 4057 A 33 RC X367-X377 Y040-Y140
X367-X377 Y300-Y400
X367-X377 Y850-Y950
7 21/07/1992 4130A 28 RC X417-X429 Y409-Y754
1. Introduction
The Coude Echelle Spectrograph(CES) is the main facility at ESO fordoing high resolution, high signal-tonoise spectroscopy. The amount andquality of the work done with it clearlyshow its great interest. Reaching suchhigh resolution (AIf:1.).. 50,000100,000) with a conveniently high signal-to-noise ratio would have beennearly unfeasible without the availabilityof efficient silicon detectors such as theCCOs. An RCA SIO 006 EX High Resolution CCO (ESO number 9) is equippingthe short camera (SC) since 1987, andhas equipped the lang one (in alternance with the Reticon) from 1987 to1992. The CCOs have, compared to older detectors (e.g. the photographicplates), several advantages such astheir high quantum efficiency and theirlinearity. The linearity is normally betterthan 1 per cent, sometimes reaching0.1 per cent, in particular for an RCACCO (McLean, 1989). This latter property greatly facilitates the reduction of thedata while making it more precise. Theidea that CCOs are linear is so commonand the manuals are so much dwellingon that, that it became an every dayunquestionable evidence.
In the course of the reduction of theirdata, both authors of the present articlehad sometimes the feeling that something went wrang. A few facts, noticedby several users, hinted towards a problem with that instrument:
• the equivalent widths measured atCAT + CES + SC + CCO#9 are dependent on the exposure level in thecontinuum;
• the equivalent widths measured withthe Reticon are smaller than thosemeasured with the CCO (5 to 15%discrepancy);
• the result of the division of two consecutive columns of the CCO has acomplicated, spectrum dependentshape;
• flat fields at levels differing tao muchfrom the science exposure are notadequate for flat fielding;
• flat fields corresponding to differentexposure times are not always strictlyproportional.
The above-mentioned statements arenot necessarily independent and couldfurthermore represent different aspectsof the same effect. Most of the time,they were attributed, without further
analysis, to complicated, pernlclouseffects related to vignetting or, alternatively, to diffuse light in the spectrograph.
Recently, Magain et al. (1992) reported problems in the reduction of theirdata, including a clear non linearity ofCCO#5. Shortly after, J. Surdej, J.P.Swings and A. Smette took the opportunity of an observing run to performextensive tests on the CCO#8 mountedat the 2.2-m telescape, which led to thediscovery of strang problems. At thesame time, one of us (E.G.) was observing with the CAT. Following a telephoneconversation with J. Surdej and A.Smette, E.G. decided to conduct similartests on CCO#9 in order to further investigate the question. After all, although the idea of the existence of nonlinearities in ESO CCOs could appear asheresy, a mere lack of linearity wouldnaturally explain, at least qualitatively,all the above-mentioned problems. Indeed, quite recently (however not independently), Schwarz and Abbott (1993)reported the actual existence of suchproblems.
2. Test of the Linearity of CCD # 9
At the end of the night 01-02/03/92,we acquired a sequence of triplets andpairs of internal flat fields with the CESin the configuration SC + CCO#9. Thiscorresponds to sequence number 5 inTable 1. The sequence was designed tostudy the linearity of the CCO. In par-
ticular, we waited for the lamp tostabilize and the shortest exposure timewas chosen to be 5 s in order to avoidpossible problems linked to the precision of the shutter at tao short exposures. In addition, the sequence ofexposure times is first decreasing andthen increasing in order to check thestability of the flat-field lamp. Weadopted the following sequence:3x140s, 3x120s, 3x100s, 3x80s,3x60 s, 3x40 s, 3x20 s, 3x5 s,3x10s, 2x30s, 2x50s, 2x70s,2x90s, 2x110s, 1x130s (the sequence had been abruptly interruptedby a switch-off of the remote control linefrom La Silla). These exposures allow toexplore the response curve up to 10,000AOU.
The first method (M1) we used toanalyse the data is based on the hypothesis that the flux rate is constant. IfFis the received flux integrated over theexposure time f:1. t, then the flux rate FI tis independent of the exposure time. If,in addition, the CCO is linear, the observed flux f should share the samepropertyfff:1.t=con~a~.
First, a mean bias was subtractedfrom each flat field exposure. Then, 3areas were defined on the CCO (they aregiven in Table 1) so that the spatiaivariation of the flux inside them wasminimal. The observed flux rate fl t isplotted in Figure 1 as a function of f. Forthe sake of clarity, the points comingfrom the three zones have been normalized to the same incident flux. Fig-
13

F is proportional to t:.. t, so we obtain10000.0 the following proportionality
We are interested in the reciprocalresponse function which is also thelinearizing function
(4)
(2)
(3)
We fitted the function
fP(f) ce t::t.
f= R(F).
of the response curve or to the presenceof an additional, non poissonnian, fluxdependent noise. The discrimination between the two causes is possible bycomparing the functions P(f) and Q(f).
If R is the response curve, we have
+. ++
+ +'t
+
8000.0
++
++
6000.0'1000.02000.0
1. 1
1. 08
.,.,1. 06<1--.......
1. 0'1
1. 02
1.0
0.0
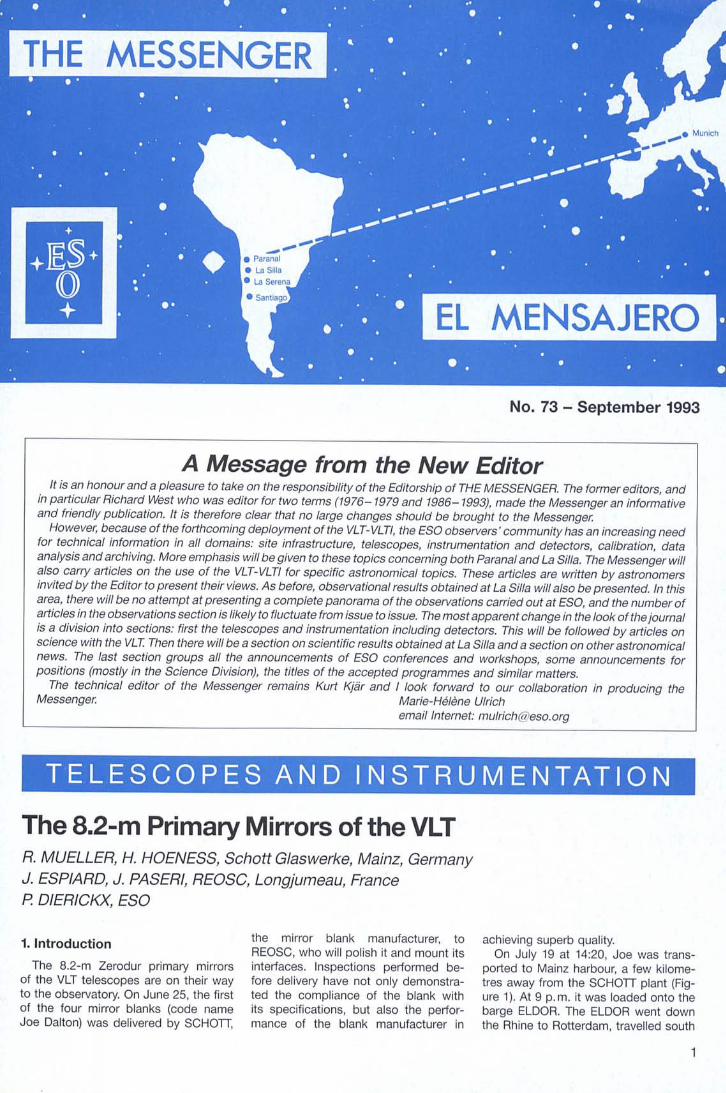
fFigure 1: Plot of the normalized observed flux rate fl. t versus the observed flux f. The units areAOU. The continuous fine is the fitted function P(f).
(5)
++
+
:j:
+
+
+
1+
R-1(f) ce _f_P(f)'
On the other hand, the variance of theobserved flux as a function of the latteris given, in the case of no additionalnoise, by
To check the equivalence of the twoapproaches, we derived the expected arfrom the fitted function P(f) through Eqs.5 and 6. We found that the expectedar - (RON)2 function found in this waycorresponds quite weil to the functionQ(f). Therefore, we conclude that wehave to deal with a clear non-linearitypresent in the response curve and notwith the apparition of an additionalstrange noise.
N1000.0
----..
6e:::..........
N .......b 500.0
0.0
observed flux f. Usually, GGD#9 is operated at - 7 e-/ADU.
We estimated cd by dividing two flatfjelds of the same exposure time (f1 - f2 )
and by computing ar Ir. We approxi-2 2 2 1 2
mate G, by 0.5 f a',II,. In Figure 2, weplotted Gr - (RON)2 as a function of f.Although the first part of the curve iscompatible with linearity, an elbow isagain present at about 3000 ADU and,beyond, the slope is markedly different.The data have been fitted with a function Q(f) of the same form as P(f) butconstrained to go through the origin.
The lack of linearity of the variancecould be due either to a lack of linearity
1500.0
(1 )a~ = (RON)2 + ~
ure 1 shows that f/ t is not constant. Alinear increase (i.e. a second order response curve) is visible up to 3000 ADU;then, an elbow is present and a secondlinear increase, with a different slope,stands up to - 10,000 ADU. This ishighly suggestive of non-Iinearities witha rather complex behaviour.
A function P(f) (fourth order polynomial up to 4500 ADU and a straight linebeyond, the continuity being imposedup to the first derivative) has been fittedand is also shown in Figure 1. Unfortunately, this method (M1) suffers fromseveral weaknesses in the form of implicit hypotheses not necessarily satisfied. For example, it assumes the constancy of the flat field lamp emission. Aslow drift is effectively present (one cansee small oscillations in Figure 1 due toexposures of the increasing branch alternating with exposures of the decreasing branch) but the sequence has beendesigned to minimize the correspondingconsequences. Faster variations couldalso be present and would be morecumbersome. In particular, uncertainties(particularly systematic ones) in thefunctioning of the shutter could annihilate any confidence in the results.
To further ascertain our approach, weused a second method based on theproperties of the variance of a Poissonprocess.
The variance a~ of the flux is given by
Figure 2: Plot of the variance 0 {- (RONl as a function of the observed flux f. The units areAOU. The continuous line is the fit ted function Off).
where RON is the read-out noise (possibly corrected for the effect of the biassubtraction) and gis the gain. If the GGDis linear, the law is also valid for the
0.0 2000.0 '1000.0 6000.0
f8000.0 10000.0
14

1500.0a
+ 1992 (5eq.Sl
o 1991 <5eq.4l
+
++
++ 1500.0
b+ 1992 (5eq.S)
o 1990 '5eq.3)
+
++
++
.... +
f
+C'I 1000.0
%'.:s"'.....b 500.0-
10000.08000.0
f
+
~+
6000.0
0.0
0.0 2000.0 4000.0 6000.0 8000.0 10000.0 0.0 2000.0 4000.0 6000.0 8000.0 10000.0
f f
•+ +.
1500.0 + 1992 '5eq.S) + + - 1500.0 + 1992 '5eq.S) +'\ +
c + + cl +l> 1990 '5eq.2) $ • 1987 (5eq. 1) $
.... + * .... + *+ • +
'"1000.0 ~ '"
1000.0 ~
%' +15
+
.:s .:s"'..... "'.....
b 500.0 b 500.0
"'.....b SQO.O
C'I 1000.0
~
Figure 3: Comparison of the variance plots corresponding to different epochs. The crosses correspond to the 1992 reference data. Panel (a)corresponds to the 1991 data (sequence 4); panel (b) to the 1990 data (sequence 3) and panel (c) to the same year (sequence 2); finally panel (d)corresponds to the 1987 data (sequence 1).
It is rather surprising that we have todeal with the inverse phenomenon of asaturation: the higher the received fluxis, the more strongly is the observed fluxoverestimated. 10.0
3. Persistenceof the Phenomenon 8.0
eu
O. 0 L-1.--,--,--l--'-L-l-L-'---'-..I.-L..1--'--'-..L--'-L-l.......L-'-...l.-L-l--'--'--'--J
0.0 20.0 40.0 60.0 80.0 100.0 120.0 140.0
Figure 4: Relative error on the measured equivalent width, as a function of the equivalent width(expressed in mA), for different levels of the continuum. The continuum varies from 1000 AOU(Iower curve) to 10,000 AOU (upper curve) by steps of 1000 AOU. The line width remains fixed;the line depth varies from 10 % (Ieft) to 100 % (right) of the continuum level.
?======-4.0
2.0
L..
2 6.0L..W
After the existence of a non-Iinearityhad been ascertained, we studied itsevolution with time. Within our own archive, we found a few sequences of flatfields useful for such an investigation;they were however not designed for thatpurpose. We found an interesting sequence on the night 25-26/05/91, andtwo on the night 12-13/06/90. We canalso add an older sequence on 02-03/05/87. Additional information is given inTable 1. The variance diagram (u? (RON)2 as a function of f) is plotted inFigure 3 for all the selected sequencesalong with the 1992 one as a reference.It is seen that sequences 2 and 3 (1990)are in excellent agreement with the reference. Concerning the 1991 sequence(4), we had to increase 1/g by 15 % toget the agreement. Most probably, thegain was different at that time although
15

Simulations have been carried out for atypical case, and show the equivalentwidths to be overestimated typically by5%, but by more than 10% for weaklines on a well-exposed continuum (thebest case for abundance analyses ...).Figure 4 exhibits the results of such asimulation.
6. The Response Curve AfterMarch 2, 1992
We had another run from 06/03/92 to10/03/92. We took this opportunity toacquire another sequence of flat fields inorder to further study the above-mentioned problems, particularly, as weknew that the electronic settings werechanged. The variance diagram corresponding to this sequence (numbered 6in Table 1) is given in Figure 5 along withthe curve Q(f) (introduced in section 2)for comparison. The response curveclearly changed: the non-linearity is anyway still present but to a lesser extentand the elbow is less obvious than inFigure 2. The variance however behavesmore Iike a second-degree polynomialwh ich underlines the persistence of thenon-linearity.
Finally, we could make a last check inJuly 1992. Sequence 7 was acquired on21/07/92; the corresponding variancediagram is also given in the same Figure 5. The curve is again different fromall the others shown above. A nonlinearity is still present but its natureseems more complex.
The conclusion is that, during thecourse of 1992, the non-linearity problem was not solved at all and that, inaddition, variability of the responsecurve prevents to apply a generalcorrection to the data similar to the oneproposed in section 4.
As a last illustration, we decided touse a third method (M3) to investigatethe linearity of CCD#9. The principle isthat the shape of a spectral featureshould remain the same, independentlyof the exposure level. So, the profile of astrong line observed with different exposure times could be used to derive thenon-linearity curve.
Here, we simulated such a broademission line by narrowing the exit slit of
(7)
t:>.t:>.
t:>.t:>. t:>.
t:>.
t:>.
l>. Bt:>.
t:>.
fUN oc F
Table 2' Power expansion of the reeiproea/ response funetion R- 1 m(see equation 9).
5. The Scientific Impact of theProblem
On Figures 1 and 2, deviations fromlinearity of 5 to 10 % are clearly visible.The observed spectrum changes withexposure level and is different from thecorrect one. The line profiles are modified, the equivalent widths overestimated.
The effect on equivalent widths depends on the continuum level, on theshape of the spectrum perpendicular tothe dispersion and on the line profiles.
The coefficients are given in Table 2.The high order of the polynomial is basically due to the elbow. The correctionshould be applied to the debiased exposures (science and flat field ones)prior to flat fielding.
fUN oc W'(f) (8)
= 8\ f+ 82f2 + 83f3 + 84f4 + 8s f S + 87f7. (9)
can be expressed by
Parameter Value 1 :s 4500 Value 1~ 4500
(,(, 1.00475 1.02824
(,(2 - 0.7456.10-5 - 1.4840.10-5
(,(3 - 1.0272.10-9 + 2.142.10- 10
(,(4 + 5.0929.10- 13 - 3.09.10- 15
(,(5 - 8.0300.10- \7 + 4.5.10-20
().7 + 1.9823.10-25 -
1992 (Seq.6)
1992 (Seq.7)
t:>.
o
o. 0 L-..L---L--I....---.l..---'_'--..I..-...L--I....----L---l.----lL-.L..-..L---L--I....----'----'-'--:-..l----:---'-'0.0 2000.0 4000.0 6000.0 8000.0 10000.0
1500.0
C'l 1000.0~
>--00:::
'-..../
C'l......b 500.0
4. Correction of the Non-Linearityas Before March 2, 1992
Strong evidence of the stability of theinadequate response curve, at leastsince 1990, has been given in section 3.Therefore, we used the reference, sequence 5, as analysed in section 2, toderive a response curve and thus aIinearizing function, adequate forcorrecting data obtained during thatperiod.
From the function P(f) fitted on theflux rate (Eq. 4), wh ich is perfectly compatible (through Eqs. 5 and 6) with the fitQ(f) made on the at - (RON)2 corresponding either to sequence 5 alone orto sequences 2, 3, 4, 5 altogether, wecan deduce the reciprocal responsecurve function W'(f) (Eq. 5) within amultiplicative factor. Therefore, thelinearized flux fUN which is directly proportional to F
fFigure 5: Plot of the varianee 0 l- (RONf as a funetion of the observed flux 1 for sequenee 6(triang/es) and sequenee 7 (eire/es). The units are AOU. The eontinuous line is the funetion 0(1)as introdueed in seetion 2; it is given for eomparison.
this was not mentioned in the descriptors (15 % is approximately one e- at 7e-/ADU). The only slight discrepancyconcerns the 1987 data. Clearly, thenon-linearity is already present butthe elbow could be at somewhat lowercounts. In any case, the similarity between the curves is so strong that itindicates that the non-linearity wasprobably there from the beginning.
After our run (March 2, 1992), wecomplained about the problem described here and the electronic settingshave been modified on several occasions, therefore changing the responsecurve. The situation after March 2, 1992is described in section 6.
16

15000.0 a9.5
b
9.0
QJ10000.0
QJ~ ~
'" '":> :>
(ij (ijx xn. n.
5000.0 8.5
0.0 8.0
0.0 200.0 ~oo.o 600.0 800.0 1000.0 0.0 200.0 ~oo.o 600.0 800.0 1000.0Pos I t Ion POSllJon
Figure 6: Ratio of two vignetted flat fields of different exposures. Panel (a) shows the two flat fields (1000 and 120 seconds of exposure)averaged over the slit height. Panel (b) gives the ratio of the two flat fields compared to the ratio of the exposure limes (the straight horizontalline).
the pre-disperser in order to get strongvignetting of the flat fields. As an illustration, two flat fields of different exposurelevels are shown in Figure 6. The ratioof the two is clearly flux dependent,showing that the response curve ofCCO # 9 was still clearly non linear inJuly 1992.
7. Conclusion
We gave evidence that ESO CCO # 9used at CAT + CES has never beenlinear from 1987, shortly after its installation at the CES, to 1992. The responsecurve seems to have been rather stablefrom the beginning up to March 2, 1992;this is certainly true during the years1990 and 1991.
We briefly analysed the impact of theproblem on abundance analysis worksas those customarily done at CAT. We
proposed a first order correction to beapplied on the debiased frames. Thiscorrection is to be considered a firstorder one because we do not know theexact origin of the problem; the dependency of the response curve on the biaslevel, for example, is completely unknown.
RCA CCOs are usually thought to bepretty linear (McLean, 1989). This suggests that the problem of CCO # 9originates in fact in the electronics behind the CCO itself. This is supported bythe strong dependency of the responsecurve on the electronic settings as evidenced after March 2, 1992.
Acknowledgements
Calculations on polynomials havebeen performed thanks to Mathematica:we would like to acknowledge the ex-
pertise of Philippe TombaI. We are alsoindebted to Or. Gang Zhao for a preliminary look at the 1987 data. This research was supported in part by contract ARC 90/94-140 "Action de recherche concertee de la CommunauteFran9aise" (Belgium) and by the BelgianProgramme Service Centres and Research Networks initiated by the BelgianState, Prime Minister's Office, SciencePolicy Programming.
ReferencesMagain, P., Surdej, J., Vanderriest, C., Piren
ne, S., Hutsemekers, D.: 1992, TheMessenge/; 67, 30.
McLean, I.S.: 1989, Electronic and computeraided astronomy: from eyes to electronicsensors, Chichester: Ellis Horwood Ud.
Schwarz, H.E., Abbott, T.M.C.: 1993, TheMessenger, 71, 53.
CCD Linearity at La Silla - a Status ReportIM.C. ABBOTTand P SINCLAIRE, ES0, La Silla
We believe that the non-linearities reported above by Gosset and Magainarise from a combination of two effects.First are the non-linearities reported inSchwarz and Abbott (1993), resultingfrom a failure in some new ND converter chains in the Generation 111 CCO controllers. Secondly, in the process of replacing these converters, we discoveredthat many of our RCA CCOs exhibitedsome intrinsic non-linearities which may
be related to the age of these devices.Unfortunately, we do not have adequatetest data to demonstrate that our RCACCOs were ever linear to better than1 %, but they were certainly non-linearto as much as 8 % over their full dynamic range before March of 1993. Atthis time, we determined that we couldreduce these non-linearities to acceptable levels by careful adjustment of thebias level of the output FET's drain vol-
tage. It was found that a fraction of avolt may have a significant effect on thelinearity. All RCA CCOs required adjustment, except RCA#13.
Below is a list of our CCOs and themost recently measured or most representative degree of non-linearity. Forthe RCA CCOs, data prior to adjustmentof the output drain bias voltage is included. Non-linearities are expressed asthe fractional amplitude of any trends in
17

CCO Telescope & Nonlinearity Range (e-) ofName Instrument Date (%) Measurement Comments
RCA#5 0.9-m 22/2/93 3 180,000 Effect unrepeatableAdapter CCO retired 3/93
GEC#7 0.9-m 3/3/93 1.3 55,000Adapter CCO retired 12/92
RCA#8 2.2-m 19/3/93 6 75,000 Vod = 17.0VAdapter < 0.6 62,000 VOd = 18.5V
RCA#9 CAT 19/3/93 8 100,000 Vod = 16.0VCES Silort < 0.7 73,000 Vod = 18.0V
RCA#13 1.52-m 6/4/93 < 0.5 120,000 VOd = 21.0VECHELEC No adjustment necessary
TH#19 2.2-m 18/4/93 < 0.1 60,000EFOSC 11
FA#24 1.52-m 13/4/93 < 0.5 90,000S&C
TK#25 NTT 19/6/93 - 1 200,000SUSI
TK#26 3.6-m 11/8/93 - 0.5 115,000EFOSC I
TK#28 1.54-m 11/6/93 < 0.5 110,000Adapter
TK#29 0.9-m 4/8/93 -1 260,000Adapter Temporary location
FA#30 CAT 11/8/93 < 0.5 47,000CES Long Non-linear transfer curve'
TK#31 NTT 24/7/93 < 0.2 150,000EMMI Slue
TK#32 3.6-m 20/12/92 < 0.25 140,000CASPEC
TK#33 0.9-m 15/5/93 < 0.5 465,000Adapter Temporarily out of service
LO#34 NTT 6/3/93 < 0.2 42,000EMMI Red
. Although FA#30 has a linear response to incident light, we have discovered a noise source in this system which is proportional to the signal level;work continues to identify its cause.
count rate over the measured range.Most of the linearity tests were performed using a beta light placed in frontof the CCO, a few utilized an LEO preflash light, powered with a stable, lownoise power supply.
Please note that these results are expressed in terms of the maximum ob-
18
served non-linearity. In most cases, thelinearity was measured over the full,useful dynamic range of the CCO. Theextent to which an observer's data willbe affected is dependent on the fractionof the CCO's dynamic range which wasused for the observations; normally, theeffect will be insignificant. In those few
cases where the non-linearity may affectobservations, work continues to correctthe situation.
ReferenceSchwarz, H.E. and Abbott, T.M.C., 1993 The
Messenger 71, 53.

SCIENCE WITH THE VLT
The Magellanic Clouds and the VLTJ. LEQUEUX, Observatoire de Paris-Meudon and Ecole Normale Superieure, France
The Magellanic Clouds do not need tobe presented to the readers of theMessenger! I wish however to remindthem of their interest in general:
(1) they are the closest galaxies of atype different from our own Galaxy;
(2) they are sufficiently close for detailed studies, similar to many of thosewhich can be done in our Galaxy;
(3) they are relatively small systemscompared to their distance, thus all theobjects they contain are more or less atthe same (known) distance; moreover,interstellar extinction is generally smalI;these properties make the MagellanicClouds especially interesting for studying objects whose distance is difficult orimpossible to obtain in our Galaxy (giantstars, AGB and post-AGB objects including planetary nebulae, symbioticand other strange stars, X-ray binaries,novae, etc.);
(4) the abundances of heavy elementsare different from those in our Galaxy; thisallows to study the formation and evolution of stars as a function of abundance;
(5) Iinked to these differences in abundance, the properties of interstellar matter (ISM) in the Clouds are strongly different from those of the Galactic ISM.
It is obvious that the largest telescopes of the future like the VLT will beof much interest for Magellanic Cloudstudies, since they will already be ofinterest for many Galactic studies. Mygoal in this article is to review someareas where the VLT will make possibleconsiderable progress in our understanding of the Magellanic Clouds. Thepresent study bears heavily upon anumber of recent reviews by myself andby others, and upon the following booksentirely devoted to the MagellanicClouds: lAU Symposium No. 108; lAUSymposium No. 148; Recent Developments of Magellanic Cloud Research(1980, K.S. de Boer, F. Spite & G.Stasinska, eds., Observatoire de Paris);New Aspects of Magellanic Cloud Research (1993, B. Baschek, G. Klare & J.Lequeux, eds. Springer-Verlag, Berlin). Iwill make reference to some of the VLTinstrumentation: for a general presentation see D'Odorico et al. 1991, TheMessenger 65, 10. For the presentationof the 4 instruments under constructionsee Lenzen & von der Lühe 1992, The
Messenger 67, 17 (CONICA, the highresolution near-IR camera); Appenzeller& Ruprecht 1992, The Messenger 67, 18(FORS, the focal reducer/low dispersionspectrograph); Moorwood 1992, TheMessenger 70, 10 (ISAAC, the infraredspectrometer and array camera); Dekker& D'Odorico 1992, The Messenger 70,13 (UVES, the UV-visual echelle spectrograph). The multi-fiber spectrographFUEGOS is in Phase A only and nodescription is generally available yet.
Structure and Kinematics of theMagellanic Clouds
In spite of much effort, the structure ofthe Magellanic Clouds is not yet completely understood especially for theSMC which has a very irregular shape.The SMC contains up to 4 differentgaseous components with different radial velocities and associated youngstellar populations, but their relative 10cation in depth and their distances arenot weil known. Interstellar absorptionlines can show which component is infront of the studied star, but there arenot yet enough such measurements dueto the faintness of the suitable stars; theVLT will allow fast observation of interstellar lines (especially the sodium lines)in front of many stars; the most suitedinstrument will be UVES and alsoFUEGOS in its high-resolution mode (R= 30,000, enough for a kinematic study).However this does not give distances.They have to be obtained from cepheidsusing their period-Iuminosity relationpreferably in the infrared. Measurementof the mean radial velocity of eachcepheid will allow to know to whichcomponent it belongs. Present attemptsat using this method have not been fullyconvincing for lack of photometric andradial velocity measurements coveringevenly the period of the cepheid. Whilethe photometry part of this programmedoes not necessarily require a very largetelescope, the radial velocity one does,using correlation methods, if one wishesto observe a large number of cepheids.FUEGOS appears most adapted to thisprogramme which would require anenormous amount of telescope timewith single-object spectrographs. As avery important by-product, this pro-
gramme will supply a data base for ourunderstanding of the cepheid phenomenon. Similar interstellar absorption lineand cepheid studies will also be interesting for the LMC: absorption lines inthe LMC often show multiple velocitycomponents, the origin of which is notweil understood, and the cepheids willallow a direct measurement of the inclination and of the shape of the disk ofthe LMC.
Another topic of great interest is thekinematics of the old populations in theMagellanic Clouds. While the kinematicsof the young population is weil understood, that of the older one is muchmore difficult to study. Objects likeplanetary nebulae and carbon stars willyield the kinematics of intermediate-agepopulations: from what we know, theydo not seem to differ much from that ofthe young populations. However the oldclusters of the LMC seem to have adifferent kinematics from the youngerclusters, but this observation is at thelimit of the present telescopes and deserves confirmation with the VLT. Weknow almost nothing of the kinematicsof the halo stars of both Clouds and thiswill be a new field to open with the VLT.Presumably FORS and FUEGOS aremost suited for such studies.
Finally the VLT is needed for studyingin detail the stellar population and (viaobservation of interstellar absorptionlines on background objects) the interstellar matter in the bridge which connects the two Clouds and in theMagellanic stream. While young starsare known to exist in the Bridge, nobona fide member star has been foundin the Stream. This may point to differentorigins, the Bridge being a tidal featureor at least having experienced a tidalperturbation responsible for star formation, and the Stream being perhaps dueto tidal stripping. Observations with theVLT should allow to settle this longdebated question.
Interstellar Matter
Interstellar matter in the Clouds isvery different from that in our Galaxy:the abundance of heavy elements is 4and 10 times smaller in the LMC and theSMC respectively, the dust-to-gas ratio
19

is smaller in the same proportions andthe properties of dust are qualitativelydifferent (smaller absorption bump at200 nm, higherfar-UVabsorption, smaller far-infrared emission by very smalldust particles). The higher far-UV radiation field together with the lower abundance of dust produce an increasedphotodissociation of molecular hydrogen, of CO and of other molecules whichaffect considerably the properties of themolecular clouds. I do not clearly seeobservations of the ISM which could beunique to the VLT, but it is clear that thevery large sensitivity of this instrumentwill allow improvements with respect towhat is done at present, for example bydensifying the observations by FUEGOSof interstellar absorption lines allowingstudies of the fine structure of the ISM, orby making easier visible and infraredobservations of star-forming regions, interfaces between ionized and neutralgas, supernova remnants, etc. The latterstudies will make use of FORS, ISAACand perhaps CONICA. An interestingpossibility which requires both high sensitivity and excellent image quality is toinvestigate through extinction (starcounts and photometry) the internalstructure of the molecular clouds (notaccessible to the SEST). This will check ifthe properties of the molecular clouds inthe Magellanic Clouds differ from thosein our Galaxy only due to the differencesin photodissociation as explained before, or due to differences in structure.
Stellar Populations andStar Formation
Due to various causes (not alwaysweil understood) the properties of stellarpopulations in the Magellanic Cloudsdiffer from those in our Galaxy. For example, the Clouds like M 33 and a fewirregular galaxies are known to containyoung globular clusters which are lacking in our Galaxy. The youngest of allcould be the dense clusters of 0 starsthat ionize the biggest H 1I regions(30 Dor in the LMC and to a lesserdegree N 66 in the SMC). Of course thedynamical study of those young clustersand also of those of intermediate age isof high interest since in our Galaxy onlyold globular clusters are seen. Suchstudies have started in particular withthe ESO telescopes, but they will bemade considerably easier by the VLTand will reach stars of earlier spectraltype for which accurate radial velocitiesare more difficult to measure. Due tocrowding one will have to use amedium-to-high resolution field spectrograph. Once again one will useFUEGOS in the compact fiber mode forthe centre of the cluster, or in the normalmode for the rest of the cluster.
20
One very important goal of Magellanic Cloud stellar observations is tohelp understanding stellar evolution.While sophisticated models exist forthis evolution, the physics introducedin these models is to a large extent arbitrary and as a result this evolutionis still very poorly known: for examplethe evolutionary status of the progenitor of SN 1987A is still controversial. For low- and intermediate-massstars, high-quality photometric andspectroscopic observations of individual stars in clusters of different ages andmetallicities will help tremendouslyunderstanding their evolution; althoughmuch is presently being done with 4-mclass telescopes, the VLT will allowdoing more and better. For massivestars, the observational problem ismore difficult. The only way to progressseems to locate the observed massivestars in a "theoretical" (L vs. Tell) HRdiagram, to measure their densities inthe different parts of the diagram, tostudy surface abundance anomaliesdue to internal mixing, then to confrontthese observations with the predictionsof models. It is also necessary tomeasure the strength of the stellar windwhich plays an enormous role in theevolution. All this should be done forstars with different metallicities in orderto understand the role of metallicity inthe internal evolution and in the acceleration of the wind. The MagellanicClouds are ideal places for such investigations. They contain a sufficientnumber of massive stars for statisticalstudies, they have very differentmetallicities and a comparison will bepossible between a complete sampie ofstars belonging to Galactic open clusters and associations. One problem isto build the sampie, requiring fine spectral classification of stars first selected by colours, and another one is tosecure the high-resolution spectroscopy necessary for determining theabundance of carbon and nitrogen fromtheir rather faint lines. It is alsodesirable to study the HR diagramdown to 6-8 solar masses where thetransition between the two main regimes of stellar evolution occurs. A 6solar-mass star on the main sequencehas V = 18 in the SMC, and it is clearthat the VLT is necessary for high-resolution, high-quality spectroscopy ofsuch astar. As one wants to performthis kind of analysis for several hundreds of stars in each cloud, a multiobjet spectrograph is required, onceagain FUEGOS.
Apart from this, the VLT will be idealfor detailed observations of all sorts ofmore or less exotic objects whose studyin the Galaxy is hampered by the lack ofdistance information. This fauna is too
varied to be discussed here in any detail. It seems to me that the AGB andpost-AGB stars are the most interestingclass of such objects. Their evolution isstill very poorly known in spite of mucheffort - in part due to the lack of distance information in our Galaxy - andmay depend on metallicity. Once again,a multi-object spectrograph is appropriate as the surface density of mostclasses of such objects (e.g. carbonstars) is relatively large.
Finally, observing star formation in adifferent context than the galactic one isa very exciting perspective. Already ithas been demonstrated that massivestars occur in small compact groups inthe Clouds, but we would like to knowwhy and how, and also to know moreabout the formation of lower-massstars. For this, one will use the VLTmainly in the near- and mid-infrared using ISAAC and the foreseen mid-IR imager/spectrometer. Such studies arestill in their infancy in the MagellanicClouds (only a few images in the K bandhave been published, for instance).While it is hard to predict what theoutcome of future VLT studies willbe in this field, it would be very surprising if the results would not be of9reat interest.
Chemical Abundancesand Evolution of the MagellanicClouds
In spite of being a relatively ancienttopic, this is a very controversial one.Determinations of the abundances ofheavy elements in different classes ofyoung objects in the Magellanic Cloudsoften give discrepant results: while H 11regions exhibit a remarkable degree ofhomogeneity in either Cloud, indicatingefficient mixing of the interstellar matterduring the evolution of the Clouds,young stars like hot or cold supergiantshave been claimed to have rather different abundances between them and withthe H II regions. If real, this result is verydifficult to understand. However thereare some doubts about determinationsof abundances in supergiants, which aremade difficult by the strong non-LTEeffects and by problems in measuringeffective temperature, gravity and interstellar extinction. One would very muchlike to have such determinations madein stars with higher gravities. Unfortunately these stars are faint in theMagellanic Clouds and generally out ofreach of the present telescopes. Thiswill be a very important programme forthe VLT, presumably using UVES orFUEGOS. I will not specifically discussthe evolution of the Clouds, but it isunderlying most of the previous discussion.

Conclusion
I hope to have convinced the readerthat the VLT will allow very significantadvances in our knowledge of theMagellanic Clouds, and perhaps more
importantly of stellar evolution in general: I would like to stress once again howunique the Clouds are for studying thevarious stages of the evolution of massive stars and the late stages of evolution of stars of all masses. The most
useful of all the foreseen foca/-planeinstruments for that purpose appears tobe FUEGOS, and I very much hope thatits construction will not be unduly delayed by budgetary restrictions.
Nuclei of Non-Active Galaxies with the VLTM. STIAVELLI, Scuola Normale Superiore, Pisa, Italy
Figure 1: The apparent centrallight density of galaxies appears to anticorrelate with galacticdistance. This is aresolution effect also present in Hubble Space Telescope data (Crane et al.1993).
1Log D(Mpc)
2
oo
o
o
o
o
equilibrium configurations and theavailability of powerful and flexible modelling techniques, makes it difficult toobtain an irrefutable proof of the existence of a black hole in any given galaxy(see, e.g., Kormendy 1993). Althoughthe central black hole hypothesis isprobably the simplest to explain objectslike M87, it is important to obtain such aproof by improving resolution and accuracy of observations.
Galaxy cores are also important asbenchmarks for theories of galaxy formation. Great progress has been madein this field, often guided by our interpre-
o
o
6".--....,
C':>I
C)
~
~5.....::l
----0........,
Q.(J 4 00
.....::l
3
7 0
hand the red herring of isothermal coreswas brought up and followed by severalinvestigators, who found less and lesstruly isothermal cores as the resolutionincreased. Even in the late 80s it waspossible to find statements concerninga broad subdivision of galaxies intothose with isothermal cores and thosewithout. On the other hand, dynamicistswere able to produce (often contrived)models able to fit the observed kinematic and photometric profiles of galaxieswithout the need of a supermassiveblack hole. Unfortunately, the intrinsicfreedom allowed by stellar dynamics
1. The Physical Properties 01Galactic Cores and Nuclei
Since the very beginning of extragalactic studies it was realized thatgalaxies have very compact centralparts. However, only in the last decadesit has been fully appreciated that atmospheric seeing was the major limitingfactor for the angular resolution thatcould be achieved from the ground andthat, in turn, the observed core properties were often just artifacts of the Iimited resolution available (Hoyle 1965;Schweizer 1979, 1981). Of the twogalaxies known in the late 1970s withtruly resolved cores, one, M31, had anuclear, very dense, spike roughly in thecentre of its broader core, while theother, the radio galaxy M87, presented acentral spike in the light profile, whichwas interpreted as due to an unresolvednon-stellar point source. Despite this,the notion of isothermal cares was introduced, i.e. of cores with a light profilethat flattens to a plateau at small radii.This was partly inspired by theoreticalarguments, in practice it reflected precisely the kind of profile that seeingeffects were producing. On the otherhand, spectacular phenomena like theM87 optical jet opened up the issue ofthe nature of the nuclear energy sourcesin galaxies and of the possible existenceof nuclear supermassive black holes. Itis very intuitive that a supermassiveblack hole would affect the stellar orbitsin the core, producing spikes in velocitydispersion and nuclear rotation curveswith steep gradients. Theoretical arguments showed that a black hole wouldinfluence also the core light profile, bycapturing stars in a very concentratedcusp detectable in the light profile. Indeed, both indicators were used byYoung and collaborators (1978, 1979) toclaim the existence of a central blackhole in M87. Unfortunately, even modelswithout a central black hole can be constructed able to give adequate fit to thedata (Binney and Mamon 1982).
Developments in the following yearswere in a way frustrating. On the one
21

Figure 2: Hubble Space Telescope FOG image at 3420 Aof the core of the Sombrero Galaxy(NGG 4594). Visible are the point-Iike nucleus as weil as the dust lanes and patches (fromGrane et al. 1993).
tation of what the core properties wereand how they originated. For instance,the discovery of counter-rotating anddecoupled cores was seen as a proofthat merging and accretion is occurring,with the remnants of tidally destroyedcompanions settling into the cores oflarger galaxies with their residual angular momentum. Better data and new indicators have shown that this is probably not the case, since (at least someof) these decoupled nuclei turn out to bemuch more metal rich than the maingalactic body (Bender and Surma 1992,Davies et al. 1993), in opposition to thedissipationless merging prediction.Should all decoupled cores have thesame property, what was seen as a successful prediction of late-time mergingwould turn into a fatal blow to this idea.Most likely, further strong constraints onthe formation of galaxies will come fromdeeper studies of their cores.
2. Progress with the CurrentGeneration of Telescopes
Gores are the brightest parts of galaxies. In addition, the desire of having aspatial resolution as high as possibleforces us to consider relatively nearbyobjects. Why then should one use alarge telescope? Shouldn't telescopesof the 3.6-m class or even smaller beadequate? This question has two opposite aspects.
Experience shows that typical integration times with e.g. the SUSI cameraat the 3.5-m ND or the standy-by camera at the 2.5-m NOT are, respectively, 2and 5 minutes. Therefore, the use ofthese cameras often leads to low-efficiency observations, since the integration time is shorter or comparable to theread-out time. From this point of view,and considering that so far the angularresolution which could be obtained wasdictated by atmospheric seeing ratherthan telescope diffraction limit, a largetelescope does not seem to benecessary. In fact, at the GFHT it is aweil established procedure to diaphragm the main mirror reducing its sizeto 1.8 m to improve optical quality andangular resolution.
From what we have seen, one couldtherefore argue that a small telescope inspace would be better than a large telescope on the ground. This is not true.Indeed, it is now becoming apparent thatmany galaxy cores remain unresolvedeven at the HST resolution. Grane et al.(1993) have observed a sampie of 10objects with the FOG camera. They findan anticorrelation between the centraldensity and the distance of the galaxy(see Figure 1), weil described by apowerlaw with power 1.8. Since apower of 2would indicate that the core properties
22
are just the result of a finite resolutioneffect, we have to conclude that even attheir resolution of about 0.05 arcsecFWHM the derived core properties arestrongly affected by resolution. It is unlikely that this will be changed significantly by GOSTAR, since the gain inresolution will only be moderate. In addition, some cores, and perhaps the mostinteresting ones, like those of NGG 4261(Ford et al. 1993), of Sombrero (NGG4594, Grane et al. 1993, see also Figure2), and of NGG 3557 (Zeilinger et al.1993), contain dust. This is a reason toshift the preferred observationalwavelengths to the Near Infrared. Notethat after GOSTAR only the UV (anddust!) sensitive FOG will sampie the Hubble Space Telescope PSF properly.
Not only direct images but also longslit spectra are desired. Indeed, spectraallow one to derive stellar kinematicalinformation, stellar line-strengths, andionized gas kinematics and metal content. These data are essential in understanding dynamics and formation ofcores.
The need of both high spatial andwavelength resolution forces one to usevery narrow slits and high dispersions,at the price of reducing the signal tonoise. As an example, a one-hour spectrum of the core of NGG 1399 withEMMI Red Arm at the ND, with 0.5 Aresolution, only yields a signal to noiseof about 30 in the core, adequate toderive kinematical information but notenough to carry out more sophisticated
analyses involving the study of line profiles. The latter will probably be fundamental in proving the existence of ablack hole in a given galaxy since theyprobe directly the stellar distributionfunction. Another example is the rotating gas disk in the nucleus of NGG 3557identified by Zeilinger et al. (1993). Thedisk was detected in a spectrum takenat the ESO 3.6-m telescope with a resolution of 1 Aper pixel, by resolving the[N 11] (), 6583.4 A) into two wings bothappearing in the core of the galaxy. Eastand west of the nucleus only the approaching and receding wings, respectively, are observed, thus producing atypical-Iooking rotation curve. Thisspectrum already gives strong hints forthe existence of a central black hole inthis galaxy (Zeilinger et. al. 1993). A further attempt to derive more accurateline shapes by using the echelle spectrograph GASPEG at the 3.6-metre telescope failed because even with 4 hoursof integration not enough photonswere collected. For very high resolutionwork, a 3.6-metre-class telescope issimply too small to observe galaxycores with typical B surface brightnessof 17 magnitudes/arcsec2 or more.
3. Developments with the VLT
A number of factors concur to makethe VLT (see Figure 3) a superb telescope for a variety of applications: thesite, the size of the unit telescope, theinstrumental developments. Here we

Figure 3: Schematic drawing of the VLT with the instruments considered in the text.
Layout of the VLT Observatory
CONICA : Coude' Near Infrared Camera
FORS : Focal Reducer/low dispersion Speclrograph
ISAAC : Infrared Speclrometer And Array Camera
UVES : UV-Visual Echelle Speclrograph
VLTI : VLT Inlerferometer
VLTI
VLT unil VLT unil VLT unit VLT unil
- 1 2 3 4CIlv0..
I I I I0CJCIlVV- -' FORS ISAAC UVES FORS UVES:>,~
~'x:Jco
- CONICA
olution achieved, these wavelengths willallow unique opportunities for those objects with cores obscured by dust lanes,like, e.g., NGC 5128.
3.2 FORS
FORS is a focal reducer with parallelbeams (Appenzeller and Rupprecht1992). For imaging application the setupof choice will be the High Resolutionmode with 0.1 arcsec/pixel. Such a pixelsize should allow a suitable sampie ofthe typical seeing conditions at the VLTObservatory. The large collecting areaof the VLT unit however would implyvery short exposure times and thereforeinefficient observations. Apart from theresolution benefits in using very shortexposures, we therefore expect that theuse of FORS in the study of cores willprimarily be spectroscopic. With a grismand narrow slits, it will be possible toobtain spectra with aresolution of about100 Nmm of the core regions of galaxies. In good seeing, with a 004 arcsecslit, spectra with 2.5 Aper pixel and S/N200 in the centre will be obtained in onehour for typical galaxy cores. Such aresolution is adequate for deriving accurate kinematical properties (errors smaller than 20 km/s in radial velocity and
"shift and add" operation. A typical elliptical galaxy core with surface brightnessPJ = 13.8 and PK = 12.7 will be detectedas 20 photons/sec/pixel (0.012 arcsec/pixel) in the J band and as 110 photons/sec/pixel (0.024 arcsec/pixel) in the Kband. These fluxes are too small to usesampling rates larger than 10Hz. However, many galaxies turn out to be brighter by about a factor 10 at milliarcsecscales compared to the aresec scales;in addition, many contain point sourcesbrighter than 20 in V. The latter are usually too faint to serve as reference starsfor adaptive optics but can be used toalign the images. Globular clusters mayalso be suitable for similar purposes,provided some are present in the restricted FOV of 3 arcsec in J and 6arcsec in K.
At lower resolution, the capability ofextending the observing wavelength to5 micron is also very important, especially since no high-resolution data areavailable for galaxies at thesewavelengths. In the Land M bands respectively, a diffraction-limited resolution 0.093 and 0.12 arcsec FWHM willbe obtained for a significant fraction ofthe sky, thanks to the less demandingrequirements of adaptive optics at thesewavelengths. In addition to the high res-
3.1 CON/CA
will consider separately the contributionthat CONICA, FüRS, ISAAC, and UVESwill make to the study of galaxy cores.
CONICA is the Coude Near-InfraredCamera (Lenzen and von der Lühe1992). It is the prime instrument for exploiting the high resolution potentiallyavailable at the single VLT unit. In fact,the diffraction limit of a single VLT mirroris for a given wavelength almost 4 timesas small as for the Hubble Space Telescope. With adaptive optics it is expected that the diffraction limit will bereached in the Near Infrared for A. > 2.2micron and that partial correction will beattempted at 1.25 micron. The PSF forthe case of partial correction is characterized by a diffraction limited core withmost of the power in the PSF wings, i.e.,a situation similar to that of the preCOSTAR HST, so that one will be ableto exploit all techniques developed forHST data. The CONICA Camera will beable to sampie with 0.012 arcsec pixelsthe PSF at 1.25 micron, yielding a resolution of 0.032 arcsec FWHM, and with0.024 arcsec pixels the PSF at 2.2 micron, yielding a (fully corrected) resolution of 0.057 arcsec FWHM. Thus effectively exceeding, with weil sampled images, the spatial resolution provided byHST at optical wavelengths. The gain ofa factor 2 in resolution over HST is certainly welcome, but very important isalso the ability to take such high resolution images in the Near Infrared, wherethe effects of obscuration by dust aremuch less important.
The major problem of adaptive opticsat the VLT, at least until the technique ofartificial reference stars will be introduced, is that only a small fraction ofgalaxies will be suitable for such astudy, since adaptive optics requires thepresence of a reference star (brighterthan about 15) within the isoplanaticpatch, i.e. at, say, less than 10 arcsecfrom the target. Luckily, many galaxiesturn out to have central point sources(Lauer et al. 1991, Crane et al. 1993).For a number of objects including, e.g.M87, the central (non-thermal) pointsource is bright enough to serve as areference star. When this is possible,this is an optimal observing mode sincereference star and target coincide in position. CONICA offers other possibilitiesfor galaxies without a suitable referencestar near the core. These techniquesinclude speckle imaging and variousforms of coaddition. Abasie requirement is that an object in the field of viewis bright enough to get enough photonsin a very short integration time to, e.g.,allow for the measurement of the framereference coordinates and carry out a
23

velocity dispersion), line profiles, andabsorption line strengths. Therefore,with a moderate amount of telescopetime, it will be possible to make a complete two-dimensional mapping withhigh spatial resolution of the cores ofnearby galaxies. Such a mapping willallow us to construct an accurate dynamical model for the core and also toinfer its stellar population properties andpossibly its star formation history.
3.3/SAAC
The Infrared Spectrometer and ArrayCamera (Moorwood 1992) is anotherNear-IR instrument for the VLT. The instrument has a relatively large field (upto 2 arcmin) and medium spectral resolution capabilities. In imaging applications, particularly interesting would bethe inclusion of the tip-tilt option of thesecondary mirror. Such control shouldallow diffraction limited imaging in the Land M bands, where the images wouldhowever be undersampled by the 0.125arcsec pixels. Despite the problems ofundersampling (possibly cured by a reduction in pixel size with the use ofdetectors of a new generation) imagingat these wavelengths, and also in J andK, with ISAAC can be an important complement to CONICA given the largerfield and the higher sensitivity resultingfrom being at the Nasmyth focus ratherthan at the COUdEL The use of a shiftand-add technique should in any caseguarantee very good spatial resolutionat the longer wavelengths. The expected count rates from a typical galaxycore are 4000 and 5600 counts/pixel/second, respectively in the J and Kbands. They should allow integrationtimes shorter than 0.1 second.
Especially interesting is the possibilityof obtaining long-slit spectra at a resolution of 5000 (for a 1 arcsec wide slit).Indeed, Near-IR spectroscopy of galaxies is a relatively new field which willbenefit considerably from the availabilityof ISAAC at the VLT. The observation ofCO lines is perhaps the only way toderive central velocity dispersions forheavily obscured cores like NGC 5128.In addition, important applications willbe possible also in stellar populationstudies.
3.4 UVES
The prime instrument for the study withhigh wavelength resolution of both lineprofiles from stellar absorption lines andionized gas emission lines will be represented by the UV-Visual Echelle Spectrograph (Dekker and D'Odorico 1992).This instrument will profit from the size ofthe VLT and allow for observations whichhave not been possible so far.
24
In good seeing, with a 0.4 arcsec slitexploiting the 0.19 arcsec/pixel of theblue arm, one will be able to obtain highspatial and spectral resolution. Stellarkinematics in the blue arm will be carriedout preferably on the Ca 1I H + K bandand on the G band. The slit length willhave to be limited at 8 arcsec to avoidorder overlapping. The overall efficiencyshould be around 8 per cent. For agalaxy of typical surface brightness Ila =
17.6, a signal-to-noise of 20 will bereached with two hours of integration.Such a signal to noise would be adequate to derive kinematical information.It appears that several galaxy cores mayhave low velocity dispersions in therange of the few tens km/s (see, e.g.,M33), such cores would require the useof UVES to be detected outside the localgroup.
The red arm would allow for a highersensitivity. With a 0.7 arcsec slit and0.31 arcsec/pixel one could obtain highresolution spectra of the Mg I blend andof the Ca + Fe E band, which are thestandard regions used for stellarkinematical measurements. A signal tonoise exceeding 30 should be obtainedwith two hours of integration.
Longer integrations will probably beof interest to improve the accuracy ofthe measurement but also to allow for amore reliable determination of the lineprofiles, wh ich will give a direct observational constraint on the stellar distribution function in the parent galaxy. Sucha measurement will have an impact bothon the problem of galaxy formation andon that of the presence of central blackholes, since the various models makevery clear and specific predictions onthe distribution function properties.
One possible additional applicationfor such an instrument is in the directmeasurement of the gravitational potential in galaxy cores. Such a measurement is made possible by gravitationalredshift, wh ich for a big galaxy is expected to be of the order of 10 km/soThe effect has already been detected inaccurate radial velocity profiles (Stiavelliand Setti 1993) but it would require avery high resolution and signal to noiseto actually measure the potential variation in the core, i.e. reach a velocityresolution below 1 km/so
In addition to stellar kinematics, gasemission lines will also be measuredand used to derive information on thephysical properties of gas in the dustand gas disks often seen in the centresof ellipticals. This is especially importantsince these dust rings appear to be involved in the fuelling of nuclear activityin normal galaxies and could also be theprogenitors of the kinematically decoupled stellar disks observed in somegalaxies.
4. Further Desirable Instruments
The VLT interferometer (Beckers andMerkle 1991) would represent anotherstep further in terms of angular resolution, since it should allow aresolution ofabout 0.004 arcsec, corresponding toabout a factor 10 improvement overHST. It is very hard at this stage topredict the kind of impact that such aninstrument would allow. It is perhapssignificant to note that it would allow forgalaxies in the Virgo Cluster aresolutionin physical distance scales comparableto what can be obtained now with theHubble Space Telescope on M32. IfM32 remains unresolved with HST, it isextremely important to understand if it isan extreme, not too significant, objector, rather, a typical core for low massgalaxies. 00 NGC 7457 (Lauer et al.1991) and NGC 4621 (Crane et al. 1993),both unresolved with HST, have similarIy compact nuclei? The major limitationfor such a study will again be the availability of a suitable reference star. Itshould be noted that the quasi point-likesource in M87, for instance, is partiallyresolved by HST and therefore cannotbe used for this application.
As we have seen, the instruments already foreseen for the VLT guaranteeenormous improvements with respectto what can be done now from theground or from space. Is there any otherimprovement possible? The need of being able to take high spatial and frequency resolution spectra could besatisfied with a Fabry-Perot spectrograph. Such an instrument could allowfor the measurement of the velocity dispersion and rotation velocity fields ofgalaxy cores. This kind of instrumentshas been so far limited by technicalreasons and by their relatively low sensitivity, requiring the use of a very largetelescope.
ReferencesAppenzeller, 1., Rupprecht, G., 1992, The
Messenger, 67, 18.Bender, R., Surma, P., 1992, M 258, 250.Beckers, J.M., Merkle, F., 1991, The
Messenger, 66, 5.Binney, J., Mamon, G., 1982, MNRAS 200,
361.Crane, P., Stiavelli, M., King, I.R., et al., 1993,
A.J. in press.Davies, R., Sadler, E.M., Peletier, R., 1993,
. MNRAS 262, 650.Dekker, H., D'Odorico, S., 1992, The
Messenger, 70, 13.Ford, H., Jaffe, W, Ferrarese, L., van den
Bosch, F., O'Connell, R.W, 1993, STSC/News/etter, 10, 1.
Hoyle, F., 1965, Nature 208, 111.Kormendy, J., 1993, in The Nearest Active
Ga/axies, J.E. Beckman et al. Eds.

Lauer, T.R., Faber, S.M., Lynds, C.R., et al.,1991, ApJ Lett 369, L 41.
Lenzen, R., von der Lühe, 0., 1992, TheMessenger, 67, 17.
Moorwood, A., 1992, The Messenger, 70, 10.Schweizer, F., 1979, ApJ 233, 23.
Schweizer, F., 1981, AJ 86, 662.Stiavelli, M., M011er, P., Zeilinger, WW, 1993,
AA in press.Stiavelli, M., Setti, G.C., 1993, MNRAS 262, L
51.Young, P.J., Westphal, JA, Kristian, J., Wil-
son, C.P., Landauer, F.P., 1978, ApJ 221,721.
Young, P.J., Sargent, WL.W, Kristian, J.,Westphal, JA, 1979, ApJ 234, 76.
Zeilinger, WW, Stiavelli, M., M011er, 1993,submitted.
From Planets to the Big Bang with High-ResolutionSpectroscopy at the VLTR. FERLET, Institut d'Astrophysique de Paris, France
Introduction
Some years ago, M. Harwit showedthat most cosmic discoveries were connected with the occurrence of a significant technical step or the opening of anew window on the Universe. Withoutquestion, high-resolution spectroscopyassociated with very large collectingarea will be such a major tool to attackvital astrophysical problems. Besideserendipitous discoveries, there areseveral areas of research to be investigated with a high-resolution VLTspectrographic capability. The VLTshould not miss the opportunity to venture into an almost virgin universe andmake discoveries.
Here, we are talking about resolvingpower R of at least 1-1.5x10⁵ , simplybecause many important pending problems cannot be tackled with lower resolution. Many of these are reviewed in theproceedings of the ESO Workshop on"High Resolution Spectroscopy with theVLT" held in Garching in 1992. We willbriefly give here only a few exciting examples of potential achievements in various fields through high-resolution absorption spectroscopy at the VLT.
Technical Advances
Measurements of equivalent widths ofinterstellar lines (IS) are indeed quite independent of the resolution. However, itis weil known that they can yield verylarge errors on column densities whenmultiple components are present on theline of sight and when lines are saturated (on the flat part of the curve ofgrowth). The former situation appearsvery general, even for the short lines ofsight of the solar neighbourhood. Thelatter one is less common, at least forpart of the IS lines in the visible spectrum. But both cases will become severe limitations when probing the diffuseIS medium beyond what is currentlyreachable in the galactic plane with theavailable telescopes.
Sufficient resolution is required to resolve the velocity structure of the linesof sight. This is the only way to gaininformation on individual clouds, on average separated by a few km/s, that isnow badly needed instead of integratedproperties. Amongst physical parameters, temperature is directly accessibleonly through the intrinsic width of thelines. For purely thermal broadening, thewidth increases with decreasing massof the studied ions, and the lightest element having an observable resonanceline in the visible is lithium (the lighterelements hydrogen, deuterium andhelium show up in the currently unaccessible far UV, except Lya observablewith the Hubble Space Telescope butwhich is always heavily saturated andblended). Nevertheless, even throughthe Li I doublet, IS gas at 1000 K gives afull width at half maximum of 2.57 km/s,requiring already R > 1.2-105 . Higherresolution is mandatory in order to derive true b-values from cooler IS gas,even though careful profile fitting analysis of several lines may help to artificiallyincrease the resolution by a factor ofperhaps 2 or so depending on the signal-to-noise ratio. Moreover, using linesof different ions in the same velocitycomponents will allow to also determineany turbulent velocity, another important and poorly known parameter for thedynamics of the interstellar medium.
Astrophysical Considerations:Interstellar Medium
The Li7 equivalent width for IS diffuseclouds such as those in front of ~Oph orQ Oph in which typical temperature isvery likely below 100 K, is of the order ofthe mÄ, claiming thus for S/N ratios weilabove 100. Because both stars arebright enough, these two lines of sightare weil studied with the ESO CES at LaSilla, which has provided R= 105 formore than ten years. The CES is usuallyfed by a 1.4-m telescope. The jump to
an 8-m-c1ass one will so much increasethe number of potential targets thatmany stars more deeply embedded incloud cores will become accessible,allowing thus to link the properties of thediffuse clouds currently studied in absorption to those of the denser andcolder regions detected in the IR ormm radio range.
A more specific programme would bethe measurements of the IS abundancesof light elements, in particular berylliumand lithium which are only observable inthe visible range around 3130 A and6707 Arespectively. The knowledge oftheir present-day abundances, and evenmore uniquely of the ratios Be/Li and Li7
/
Li6 , is a key-milestone to severely constrain cosmological scenarios andgalactic chemical evolution models. Thiskind of observations needs extremelyhigh S/N ratios. For instance, IS Li6 hasbeen recently detected for the first timetowards Q Oph (Lemoine et al., 1993),thanks to a S/N ratio 2:: 2700 per pixel,implying a limiting detectable equivalentwidth of 0.043 mA (3 a). The resulting Li7
/
Li6 ratio - 12.5 is in strikingly goodagreement with the meteoritic valuewhich is thought to be representative ofthe early solar system, and cannot as yetbe explained by the most recent andelaborated evolutionary models. Thishas been achieved after 13 hours ofintegration time with the CES linked tothe ESO 3.6-m telescope via fiber optics,on a mv - 5.0 star. The same measurement is going to be published for ~ Oph(mv =2.7) with a S/N ratio above - 7000!(see Figures 1 and 2). However, this isrestricted to the 4-5 stars on the wholesky which are bright enough but stillshining through a dense cloud to enhance the expected column density. Itshould be done in many individual cloudsin order to statistically establish the significance of the first results and to directIy test the cosmic ray production of Li;the gain from one VLT unit should evenallow to see possible variations in the
25

supernova rate through IS clouds inother galactic spiral arms.
Measurements in the visible range ofmolecules Iike CH, CH+, co+ or C2 arealso of prime importance for interstellarchemistry; they can also yield the carbon isotopic ratio C 12/C13 and the darkc10uds temperature (see e.g. Black andVan Dishoek, 1988; Crane et al., 1991;Hobbs, 1973, Vladilo et al. , 1993). Infact, requiring very high spectral resolution and S/N ratios, all these abundancestudies need to be performed towardsmore and more distant targets, in verydifferent environments or where galacticgradients become sensitive, or in otherspiral arms. In several hours of integration time with the VLT, the most abundant of these species might be detectable in the Magellanic Clouds, whichwould give access to less processedextragalactic material, to be comparedto the more extreme metaliicity towardsthe galactic centre. Equivalent widths ofseveral tens of mA in neutral IS sodiumat 5890 A, good tracer of H I, are alreadygathered at R= 105 towards the verybrightest Magellanic supergiants withthe 3.6-m telescope, but Call at 3930 A,providing information on ionization, isjust barely feasible at that resolution(Molaro et al. and Vladilo et al., 1993).The use of an 8-m telescope would
7+6Lil (" Oph
allow a much more complete mappingof the Clouds, yielding in particular thestill poorly known depth structure of theClouds.
Astrophysical Considerations:Extragalactic
Another example of the need for resolution in the 105 range at the VLT is thestudy of the narrow absorption lines inquasar spectra. Just to give two excitingcases, one can first mention the measurement of the cosmic backgroundradiation temperature, TCBR, at high redshifts. Besides black body microwaveobservations, IS lines from the lowestrotational levels of the CN moleculearound 3875 A have been used for manyyears to derive the precise CBR temperature at the present epoch (e.g. Palazziet al. , 1992). However, this is the onlypoint determined up to now. Accordingto the Big Bang theory, TCBR depends ina simple way upon the redshift, and itsdetermination at different z would reallybe a new extremely strong observational argument in favour of the Big Bang. Aconvenient radiometer for directlymeasuring the background radiation atearlier epochs would be neutral carbon.The ground state of CI splits into threelevels separated by energies of the
same order as kTCBR at z > 0.5, when CIIines show up in the visible range. Atsuch epochs, contrary to the galacticISM where collisions are much moreefficient, CI should be appreciably excited by the CBR. Up to now, becauseof the lack of resolution available evenfor the brightest asos to resolve the CIline splitting, only an upper limit of 16 Kat z=1.776 has been assigned by Meyeret al. (1986). Such measurements inseveral asos' absorption systems atdifferent z are waiting for the VLT.
The second case is the measurementof the deuterium abundance in adequate absorption components of the socalled Lya forest in quasar spectra. Onlydirectly observable in the far UV, thepresent-day IS value of the D/H ratio isstill controversial since variations mightexist in the very local ISM (see e.g. Ferlet, 1992). New determinations areunder way with HST, but restricted tovery short lines of sight. Furthermore, togo from the IS value to the primordialone - which is of major cosmologicalsignificance since it is highly sensitive tothe universal baryon density and thuscan constrain the density parameter requires very uncertain evolutionarymodels. While early models suggested arelatively low astration of deuterium (afactor 2-3), the accumulation of obser-
6Lil (" Oph
.998
.996
.994
.992
1.0005
.9995
.999
f- I I 1-f-
IlII..... ·r············· ................ ...........
/
I1{II
I-- .\ -
I -I-- -
I I I I6708.5 6708.56707.5 6708
Wavelength (Ä)Figure 1: Interstellar 6. 7U I absorption doublets toward S Oph. Thedata were gathered in June 1990 and June 1992 at ESO using theCES linked to the 3.6-m telescope via a fiber link. The total integration time is 15h., the resolution is Al6-).. =100,000, and the signal-tonoise ratio 7500 per pixel, 01' 11 per resolution element, giving a 30limiting detectable equivalent width of 18 W~!
The solid line represents the fit to the data with two interstellarabsorbing clouds on the line of sight, and taking 6U and 7U absorptions into account. Ordinates are arbitrary units; error bars are 1 o.
26
6707.5 6708
Wavelength (Ä)Figure 2: Same as Figure 1, but the calculated 7U absorption wassubtracted from the data points. These residuals thus reveal clearlythe 6U absorption doublet. The depth of this doublet is less than0.1 % of the continuum (see ordinates). The solid line represents thepreviously calculated 6U fit to this profile. Error bars are 1 o.

vational data made apparent that factors of 10-50 are needed if the standardBig Bang nucleosynthesis predictionsare to remain consistent with the observations (see e.g. Audouze, 1987). Theidea is therefore to evaluate D/H inmedia as primordial as possible, and inabsorption systems having a wide rangein abundances to be able to discriminate between theoretical models ofgalactic chemical evolution.
The feasibility of such measurementshas been last explored by Webb et al.(1991), assuming existing possibilities:10 km/s resolution, 10 hours integrationtime with a 4-m telescope on a mv
-17.5 aso (i.e. S/N=15), and the first 5Lyman lines are observed, implying zabs~ 2.6. Deuterium appears detectableonly as an extension in some of theLyman line wings, but the DI line is notresolved and D/H very difficult to measure, although some particular ranges ofvalues for the crucial velocity dispersionband for the H I column density mayincrease the chances of making cosmologically significant measurements.Obviously, the VLT will make these D/Hanalysis not only easier but also, as forthe TCBR determination, more numerous:Webb et al. (1991) identify about 35suitable absorption systems with highenough NH I in the around 30 knownasos with z ~ 2.6 and mv ::5 17.5; about10 times more potential asos as yetundiscovered are expected with thesecharacteristics. It will thus be possible toperform a more extensive statistical investigation in order to place tight constraints on chemical evolution modelsand the Big Bang itself.
Astrophysical Considerations:Planetary Systems
The study of protoplanetary systemsis another field of research we would liketo mention here. The ß Pictoris disk isthe prototype of this new area which willsurely become more and more important in the near future with the discoveryof other systems. As for the previousfields, this asks for high spectral resolution at high S/N ratios, but also for hightemporal resolution. In the case of ßPie,the very large UV and visual circumstellar absorption data base is presentlyinterpreted as the signature of cometary-like bodies evaporating when grazing and falling onto the star, perhapsthrough perturbations of a huge smallbodies reservoir by an already formedplanet orbiting ß Pie. Such events lastfew hours and have to be spectroscopically followed in velocity and equivalentwidth simultaneously in different lines(Iike the Call doublet), or as close aspossible in time (see e.g. LagrangeHenri et al., 1992).
The search for extra-solar giantplanets through extremely precise radialvelocity measurements is also now entering the discovery phase, since a ± 5m/s sensitivity has been reached forvery bright stars by two techniques:Fabry-Perot and gas absorption cell. Ithas been vigorously put forward as partof the first stage of the recentlyannounced TOPS Program of NASA:Toward Other Planetary Systems. Forinstance, Jupiter induces an amplitudevariation of 13 m/s in the radial velocityof the Sun over aperiod of 11.9 years.The limits for such long-term follow-upof very many stars are more imposed bythe apparent brightness of the observedstars. This is why TOPS is intended tobe performed in partnership with theKeck Observatory.
Astrophysical Considerations:Stars
Last, in the field of stellar research,one can briefly mention the study of nonradial pulsation in early-type stars. Forcooler stars, again the determination ofthe Li isotopic ratio, the measurementsof surface magnetic fields from the Zeeman broadening, the separation of different broadening mechanisms such asrotation and macroturbulence in G andK stars, time-resolved spectroscopy (ontime scales as low as -1 sec) of flares,the mapping of stellar surface features(spots) through Doppler imaging techniques, and an approach to astroseismology, etc. This kind of problems, thatwe have limited to those really needingspectral resolution in the 105 range and/or time resolution, are currently tackledat ESO; but the small aperture of theavailable telescopes simply preventsmost interesting targets to be reached,e.g. M dwarfs, T-Tauri stars, stars inclusters, Pop II stars, etc. A new potentially also very interesting case is thestudy of the remnants of the AGB windsduring the post-AGB stellar evolutionaryphase towards planetary nebulae. Hereagain, all the targets are very obscuredand optically very faint.
Condusion
It is obvious that the jump from 4-m to8-m (and a fortiori from 2-m) class telescopes will very much increase thenumber of observable targets so thatentirely new results will undoubtedlycome up. The type of scientific questions we have discussed here are onlytractable with a spectral resolution VLTmode in the 1-2 x 10⁵ range. It does notat all mean that an ultra-high resolutionmode (R ~ 3 x 10⁵) would be useless; anenormous amount of information onphysical processes is waiting for that
mode, some examples having beenpointed out in e.g. Ferlet (1993) andDravins (1993). It has to be noted alsothat for both modes, a small spectralrange, say few tens of Ato record simultaneously both lines of the Call doublet,is often sufficient. It would be advisableto implement these modes at the VLTcoude focus, in order to provide enoughroom and stability, and avoid the fieldrotation of the Nasmyth focus. This willmoreover leave open the future possibility to dedicate a 4-m class "Auxiliary"telescope for high-resolution spectroscopy.
ReferencesAudouze, J., 1987, in Observational Cosmol
ogy, lAU Symp. 124, Dordrecht: Reidel,p.89.
Black, J., van Dishoek, E., 1988, Astrophys.J, 331, 986.
Grane, P., Hegyi, D., Lambert, D., 1991, Astrophys. J, 378, 181.
Dravins, D., 1993, in High Resolution Spectroscopy with the VLT, ESO Workshop,Garehing, p. 55.
Ferlet, R., 1992, in Astrochemistry of CosmicPhenomena, lAU Symp. 150, Dordrecht:Reidel, p. 85.
Ferlet, R., 1993, in High Resolution Spectroscopy with the VLT, ESO Workshop, Garehing, p. 97.
Hobbs, L, 1973, Astrophys. J., 181, 795.Lagrange-Henri, A.M., Gosset, E., Beust, H.,
Ferlet, R., Vidal-Madjar, A., 1992, Astron.Astrophys., 264, 637.
Lemoine, M., Ferlet, R., Vidal-Madjar, A.,Emerich, G., Bertin, P., 1993, Astron. Astrophys., 269, 469.
Meyer, D., Black, J., Ghaffee, F., Foltz, G.,York, D., 1986, Astrophys. J Lett., 308,L37.
Molaro, P., Vladilo, G., Monai, S., D'Odorico,S., Ferlet, R., Vidal-Madjar, A., Dennefeld,M., 1993, Astron. Astrophys., in press;ESO Preprint 907.
Palazzi, E., Mandolesi, N., Grane, P., 1992,Astrophys. J., 398, 53.
TOPS, AReport by the Solar System Exploration Division, Ed. B. Burke, NASA.
Vladilo, G., Centurion, M., Cassola, G., 1993,Astron. Astrophys., 273, 239.
Vladilo, G., Molaro, P., Monai, S., D'Odorico,S., Ferlet, R., Vidal-Madjar, A., Dennefeld,M., 1993, Astron. Astrophys., in press;ESO Preprint 907.
Webb, J., Carswell, R., Irwin, M., Penston,M., 1991, MNRAS, 250, 657.
27

REPORTS FROM OBSERVERS
Probing the Properties of Elliptical Galaxy Cores:Analysis of High Angular Resolution DataW W ZEIUNGER 1
, P M0LLER2 and M. STIAVELU3
1ST-ECF, Garching, Germany: 2ESA STScl Baltimore, Md, U.SA, 3Scuola Normale Superiore, Pisa, Italy
Figure 1: Distribution of best seeing values of a sampie of 69 galaxies. The shaded areaindicates objects observed at the NOT. The remaining data are from the NTT using SUSI.
Introduction
The cores of elliptical galaxies provideimportant clues to the formation anddynamical evolution of the parent galaxies, e.g. recent episodes of star formation, merging and cannibalism and possible presence of black holes. Many"features" are observed in the centralregion of ellipticals: Gores kinematically
The Survey
On the basis of the morphologicalclassifications in the "Gatalogue of Principal Galaxies" (Paturel et al. 1989) andthe "Third Reference Gatalogue ofBright Galaxies" (de Vaucouleurs et al.1991) all elliptical galaxies within a redshift of 3000 km/s were selected for thepresent survey, in total about 230 galaxies. The aim of the survey is to obtain ahomogeneous set of high-resolutionmulti-colour surface photometry dataand major-axis long-slit spectra for thewhole sampie. As a first step VRI imageswere obtained at the 2.5-m Nordic Telescope (NOT) for the northern hemisphere and at the ESO 3.5-m ND usingthe direct imaging facility SUSI forsouthern hemisphere objects. In addi-
alignment of the angular momentumvectors of the stellar component in thecentral region with respect to the maingalaxy body, and finally core radio sources and X-ray emission found in ellipticals may indicate the presence of a(super) massive central object. More recently, unresolved nuclei have been discovered in many ellipticals and seem tobe a much more common phenomenonthan previously thought as also pointedout by the HST observations of the coreof the early-type galaxy NGG 7457(Lauer et al. 1991). Grane et al. (1993)reported central mass densities in excess of 103 MQ /pc3 for several galaxies.
Despite the fact that a wide range ofcore properties has been found in elliptical galaxies, no homogeneous surveyhas been carried out so far with thenecessary high resolution. Therefore,nature and physical interpretation ofgalaxy cores are still subjects of discussion. The largest sampie published sofar is the compilation by Lauer (1985) ofsurface photometry for the cores of 42early-type galaxies. Lauer's sampie,however, is not complete and based onsingle waveband observations carriedout at a 1-m telescope with a mediumseeing of about 1.7 arcsec FWHM andno comparable kinematic survey existsin the literature.
1.2
decoupled fram the main body of thegalaxy are known to exist in many ellipticals and are widely interpreted as evidence for galactic cannibalism. However, different signatures of the decoupling have been found which maynot necessarily be related to each other:central light excess (Kormendy 1985),kinematically decoupled cores, i.e. mis-
0.6 0.9
Seeing FWHM [arcsec]
0.3
5
10
15
20
CIl.;.JC)(l)'''-'..0o
28

Figure 2: Gore resolution diagram for a sampie of 21 galaxies observed at the NOT. The galaxydata are plotted with 10 error bars. The uppermost dotted line indicates the location ofisothermal cores. The other dotted curves represent non-isothermal cores with their respectivespikyness lTe . The units of lTe are parts per thousand of the underlying core flux. Resolved coreswill lie in the left part of the diagram, unresolved ones in the right part.
0.6 I- '
,'2
-
-
-
-
-
I
1
I
I
,,,
,
,,
,,,
I
I
0.5
, 100
,'70, ,, ,
, 50
, " H1i'35
,I ,, ,, ,,
, ,, ,, ,, ,, ", ',20
-,: I
" '10, ,: I 5
,,
,I- ' ,
0.8 -
0.2
0.4
(.J
(~
tion, using the ESO Archive Databasefacility within STARCAT, the ND dataarchive was systematically searched foradequate galaxy images. Long-slitspectra for southern hemisphere objects were obtained using the ESO1.5-m telescope during several observing runs. For a sub-sampie of objects,images and spectra were obtained atthe ESO/MPI 2.2-m equipped withEFOSC2 and IRAC2 and also at the NDwith EMMI. The long-slit spectra shouldprovide information on global kinematicproperties on the (ionized) gas and starsand identify candidates for high-resolution studies.
Most of the effort so far has been putin performing surface photometry andfurther analysis of the images. The resolution of the NOT and ND-SUSI dataare of comparable order. The respectivescales on the detector are 0.20 and 0.13arcsec/pixel. In Figure 1 the best-seeing values for 69 galaxies are presentedwhich have been analysed so far fromthe VRI data sampie. The seeing wasmeasured on stellar-like images in therespective frames. A data base of images obtained at very good (exceptional) seeing conditions is an essential ingredient for this project. However, inorder to take full advantage of the highresolution data one needs also take intoaccount effects of seeing, telescopeguiding, etc. which affect the imagequality. Some experiences on handlingand analysing such images are presented in the following sections.
Parametrization of the(Photometrie) Core Properties
The "classical" galaxy core parameters are the central surface brightnessand the core radius (i.e. radius of theisophote at wh ich the surface brightness has decreased by a factor of twowith respect to the central surfacebrightness). It is immediately evidentthat these parameters depend cruciallyon the seeing conditions during the observations, and several studies have addressed the problem of how to consistently correct the parameters for theseseeing effects. The most commonlyused methods of seeing correction havebeen to firstly extract the luminosity profile of the galaxy, and then either (i)deconvolve the profile directly with anappropriate PSF (Lauer 1985, (ii) measure the core parameters of the extracted luminosity profile and apply seeing corrections found by convolution ofcore models with a PSF (Kormendy1985), or (iii) use directly the core parameters derived from galaxy models fitted to the luminosity profile (Kormendy& Richstone 1992). It is evident thatthese methods all have their limitations:
As shown by Meiler, Stiavelli & Zeilinger(1992 a, 1992 b), deconvolution ofluminosity profiles cannot in generalcompensate for lack of resolution (Iikebad seeing) and seeing corrections using light profiles derived from galaxymodels are necessarily model-dependent (i.e. one has to know in advanceproperties and structure of the core andthe underlying galaxy, to be able to determine them).
In order to reduce the seeing dependence of the classical core parameterswe have introduced a new type of coreradius, wh ich for an isothermal (Hubblelaw) core is identical to the classicalcore radius but which does not dependstrongly on the core structure (e.g. presence of a central point source). The Petrosian core radius (Petrosian 1976),wh ich is defined as the distance fromthe centre at wh ich the local surfacebrightness has fallen to some fraction ofthe mean surface brightness inside thatradius, will reduce the influence of theseeing since it depends only on the totalflux inside the radius irrespective of itsdistribution. Two core resolution parameters were introduced in order toquantify the observed core properties,
namely 2,w = seeing FWHMI Rn andRe = Re/Rn with Re being the observedcore radius and Rn the Petrosian radiusas previously defined. Re is an isothermality measure, i.e. for an isothermalGare Re = 1, while ±,w represents an inverse resolution measure, 2,w = 0 indicates a fully resolved core and becomeslarger when the same core is observedwith worse seeing. The i:,w versus Replane {core resolution diagram is therefore a useful tool for the first direct analysis of the observed data and their quality. As a first step of analysing the singlegalaxy data and their location in the coreresolution diagram, one may quantifythe non-isothermality of the core interms of "equivalent point-source fluxfraction" (spikyness parameter .iTe). Suchan example is shown in Figure 2 using asub-sampie of 21 galaxies observed atthe NOT. As a next step one may applyanalytical models using parametrizedcentral point sources, power laws orcentral cusps introduced by a black holeto interpret the data. Such a study hasbeen carried out for the elliptical NGC1399 (Stiavelli, M011er & Zeilinger 1993).
A more detailed introduction to thecore resolution technique together with
29

Figure 3: (a) R band image of NGC 4261 obtained with NTT-SUSI (exposure time 120 seconds). The frame has been aligned with the HST-PCimage and rebinned to the PC detector scale. The seeing FWHM is 0.63 arcsec.(b) F555W band HST-PC image of NGC 4261 (exposure time 1700 seconds). The image is rotated 68° counter-clockwise with respect to theastronomical convention.(c) Combined SUSI and PC image using the co-addition technique after applying 150 iterations of the Richardson-Lucy restauration algorithm.(See also the at1icle on page 37 of this issue.)
a presentation of the first scientific results and implications is given by M011er,Stiavelli & Zeilinger (1992a, 1992b).
The Search tor Sub-Componentsin the Nuclear Region
The use of image restoration techniques becomes more and more popular not only in relation with HST data.One of the most versatile tools is theRichardson-Lucy technique whose algorithm is now part of major image processing packages like IRAF and MIDAS.The straightforward application of thisalgorithm enables the correction of earlier mentioned impairments of the imagequality by means of an appropriate PSFand allows enhancements of faint structures. The study of the nuclear gas anddust disk in NGC 3557 is such an exampie (Zeilinger, Stiavelli & M011er 1993).
An interesting option of the method isthe possibility to combine images having different PSFs (resolutions). The coadding technique, using the Richardson-Lucy algorithm, consolidates thesignal of different images but conservesthe resolution of the sharpest one. Amore detailed description of the methodis given by Lucy (1991) and Hook & Lucy(1992). One is now in the position to takefull advantage of the high-resolution images in the HST Data Archive, by coadding them with (high signal-to-noise)ground-based data. In order to illustratethe capabilities of this method the wellknown elliptical NGC 4261 (Ford et al.1993) has been chosen. The core regionof this galaxy is characterized by a dustlane (radial extent less than 2 arcsec)and a point source. Figure 3a shows anND image of NGC 4261 obtained withSUSI (detector scale 0.13 arcsec/pixel).
30
From star-like images a seeing FWHMof 0.63 arcsec was determined. An HSTPlanetary Camera (PC) image of NGC4261 (detector scale 0.0439 arcsec/pixel) is shown in Figure 3 b as comparison.The frame was extracted from the HSTData Archive. The SUSI image was rebinned to the scale and then alignedwith the PC frame. Because of missingfield stars, the alignment of the two images was done using the (bright) galaxynucleus as reference point. Thereforethe accuracy of the alignment of the twoimages is only at the level of 1 (PC) pixel.The selection of the "right" PSF is acrucial part for the image restaurationand subsequent co-addition. A well-exposed star within the frame was used forthe SUSI image of NGC 4261. In thecase of the PC image the situation ismuch more difficult. Given the fact, thatthe shape of the PSF varies as a function of the location in the frame, oneneeds to know the PSF in position of theobserved object. Useful stellar images,repeating the exact instrument configuration, are therefore almost never available. A solution to this problem gives thesoftware tool TINYTIM (Kirst 1992)which can calculate an "artificial" PSFfor a given observation date and instrument configuration. The usage of thepackage is straightforward, however,one has to be aware that TINYTIM isonly a tool based on current best fits ofaberration values for the various mirrorpositions and current best estimates ofthe obscuration positions and sizeswhich may still not describe the HSTPSF exactly. After applying 150 iterations the deconvolved image was convolved again with the appropriate PSF.The result is shown in Figure 3c. Theresolution of the PC image has beenretained, shape and structure of the
central dust lane profit however from thebetter signal-to-noise ratio of theground-based image.
In the context of studying core regions of elliptical galaxies at high spatialresolution, one of the main open issuesis the question of the (non) presence ofcentral black holes. There have beenextensive studies in this field (e.g. Kormendy 1993, Nieto 1992) pointing out,however, mostly circumstantial evidence like (radio) jets, compact (unresolved) radio sources or core fluxes inexcess of an isothermal galaxy core.The nearby elliptical NGC 4486 (M87)illustrates very weil the problem (Zeilinger, M011er & Stiavelli 1993). Despite itsobvious signatures of nuclear activityand non-isothermal core, it was up tonow not possible to pinpoint the natureof the central source. The kinematics inthe nucleus is a key element in thisstudy. It is by now a well-establishedfact that, in general, giant (high-Iuminosity) ellipticals are not rotationallyflattened systems. Therefore, in order toaccount for their triaxial shape, theymust have an anisotropic velocity distribution. It has been shown that most ofthe light contribution in excess of anisothermal model can be explained byan even modest anisotropy in the velocity field (Binney & Mamon 1982). Thekinematic signature of a central darkmass concentration, however, is verydifficult to detect since it requires spectroscopic data with aresolution at thesubarcsecond level. NGC 1399 is such acase where the combination of radio,photometric and (stellar) kinematic signatures (each of them alone would nothave been conclusive) has led to theconfirmation of a central black hole ofabout 6 x 10⁹ MG (Stiavelli, M011er &Zeilinger 1993).

References
Binney, J. &Mamon, GA, 1982, Mon. Not.R. Astr. Soc., 200, 361.
Crane, P., et al. 1993, Astr. J., in press.de Vaueouleurs, G., et al., 1991, "Third Refer
ence Catalogue of Bright Galaxies"(Springer).
Ford, H., Jaffe, W, Ferrarese, L., van denBoseh, F. &O'Connell, R.w., 1993, STSclNewsletter, 10, 1.
Hook, R. & Luey, L., 1992, ST-ECF Newsletter, 17, 10.
Kirst, J., 1992, "The TinyTim User's Manual"(STSel).
Kormendy, J., 1985, Astrophys. J. (Lett.),292, L9.
Kormendy, J., 1993, in High Energy NeutrinoAstrophysics, ed. V.J. Stenger et al. (WorldSeientifie).
Kormendy, J. &Riehstone, D., 1992, Astrophys. J., 393, 559.
Lauer, T.R., 1985, Astrophys. J., 292, 104.Lauer, T.A., et al, 1991, Astrophys. J. (Lett),
369, L41.Luey, L.B., 1991, ST-ECF Newsletter, 16, 6.M0l1er, P., Stiavelli, M. &Zeilinger, WW,
1992a, in Structure, Dynamics and Chemical Evolution of Ellipticaf Galaxies, ed. I. J.Danziger et al. (ESO).
M011er, P., Stiavelli, M. &Zeilinger, WW,
1992b, Mon. Not. R. Astr. Soc., submitted.Nieto, J.-L., 1992, in Morphological and
Physical Classification of Galaxies, ed. G.Longo et al. (Kluwer).
Paturel, G., Fouque, P., Bottinelli, L. &Gouguenheim, L., 1989, "Catalogue of Principal Galaxies" (Lyon).
Petrosian, v., 1976, Astrophys. J. (Lett.), 209,L1.
Stiavelli, M., Moller, P. &Zeilinger, WW,1993, Astr. Astrophys., in press.
Zeilinger, WW, M0l1er, P. & Stiavelli, M.,1993, Mon. Not. R. Astr. Soc., 261,175.
Zeilinger, WW, Stiavelli, M. & Moller, j'.,1993, Nature, submitted.
Light Curves of Miras Towards the Galactic Centrec. ALARO 1, A. TERZAN2
, J. GUIBERT1
lCentre d'Analyse des Images, Observatoire de Paris, France; 20bservatoire de Lyon, France
Introduction
Long Period Variables represent a latestage in the evolution of stars of intermediate masses. Mass loss, whichleads them to planetary nebulae in a few
105 years, is a complex process and theobject of many investigations. For instance, Vassiliadis and Woods (1993)suggest that mass loss could occur inbrief superwind phases separated bylong quiescent periods.
A First Step in the Inventory
Here we present the first results of asystematic study of variable objects in afield of about 10 x 10 degrees towardsthe Gaiactic Centre. The first step of our
* 422.654I ** * ~ * ~
* (a) • N -N
(b)
* * *~ '<T
* * ** * * ** * * * ** , ,.. ,..
<D " * * t, • t,* • tD f- -
* * ** * * * * .** .*I I
1980 1985 1990 0 0.5 1 1.5 2
8xl06xl04xl02xl0
424.1 62 •0.018
0.047
0.12
0.285
IM I~ IM~ IA
- - n-Joo
Cl
Cl
(d) ~
8xl06xl04xl02xl0
1II (C)
-, -, ,->o
o
8
Figure 1: Example of light curve derived from ESO Schmidt plate measurements. (a) time sampling of R magnitudes; (b) derived light curve;(c) Renson's method; (d) periodogram with Scargle's false alarm probability
31

investigation deals with the thousandsof variable stars discovered by Terzan(Terzan, 1982, Terzan, 1990 and ref.therein) on ESO Schmidt plates. Wehave scanned 22 ESO Red Schmidtplates centred on the star 45 Oph., withthe MAMA measuring machine (e.g.Guibert and Moreau, 1991). In this field,we have selected 150 variables with6.mR > 2. The plates were calibratedwith 55 photometrie standards.
Light Curves
Two methods have been implemented to derive the light curves fromthe time sampling series. The first one(Renson, 1978), presents the advantage
of not being too sensitive to gaps in thedata. The periodogramme yields an estimate of the probability of false periodicity detection. Both methods lead to similar results in most cases, as exemplifiedby Figure 1. As a result, we have obtained light curves for 118 variables(80 % of the stars under investigation).
Developments in Progress
This programme is being continuedby a systematic search for variables inthe whole 100-square-degree field. Itwill require additional plates to cover thewhole range of periods, as weil as nearinfrared and radio measurements. Interpretation of these data will lead to a
better knowledge of the period-Iuminosity relations for various kinds of objects,and understanding of the relations between the shape of the light curves,mass loss and other properties of variable objects.
ReferencesA. Vassiliadis, P.R. Wood, 1993, Astrophys.
J. in press.A. Terzan, 1982, Astron. Astrophys. Suppt.
49,715.A. Terzan, 1990, The Messenger, 59, 41.J. Guibert, O. Moreau, 1991, The Messen
ger, 64, 69.P. Renson, 1978, Astron. Astrophys. 63, 125.
NGC4636 - a Rich Globular Cluster System in aNormalElliptical GalaxyM. KISSLER 1, T RICHTLER 1
, E. V HEL02, E.K. GREBEL 3, S. WAGNER4
, M. CAPACCIOL/5
lSternwat1e der Universität Bonn, Germany; 20sservatorio Astronomico di Bologna, Italy; 3ESO, La Silla, Chile;4Landessternwat1e Heidelberg, Germany; 50ipat1imento di Astronomia, Universita di Padova, Italy
1. What Drives the Investigationsof Globular Cluster Systems ofElliptical Galaxies?
In 1918 Shapley started to use thegalactic globular clusters to explore thespatial dimensions of our Milky Way.Three quarters of a century later, we stillcannot claim to have understood theproperties of our globular cluster system(GCS) in the context of the early evolution of the Galaxy. This is mainlydue to the fact that there are severeproblems in disentangling age andmetallicity, which are the most significant parameters in theories of galaxyevolution.
Given these problems with weil observable clusters, what can we hope tolearn from the study of faint images ofglobular clusters around distant galaxies, where individual clusters appearstar-like and only integrated magnitudescan be determined?
Research on GCSs over the past 20years showed that there is an amazingvariety in the morphologies of GCSs(see Harris 1991 for a review). Moststudies refer to elliptical galaxies, because globular clusters in spirals arenormally much less numerous and theyare difficult to identify due to the inhomogeneous background of brightstars or H I1 regions. Relating the properties of GCSs (such as total number of
32
clusters, colour, and spatial distribution)to those of their host galaxies, the studyof extragalactic GCSs leads to a newlevel of problems, which could not beforeseen by the study of the galacticGCS alone. One of the systematicpatterns emerging from all previousstudies is that the richness of a GCSdepends somehow on the environmentof the host galaxy. M87 became the firstexample of a giant elliptical galaxy, 10cated in the dynamical centre of a richgalaxy cluster, found to be surroundedby a huge number of globular clusters(Baum 1955, Sandage 1961). Later on,very rich GCSs have been also discovered in the central giant ellipticals NGC1399 in the Fornax cluster (e.g. Wagneret al. 1991), NGC 3311 in the Hydracluster (Harris et al. 1983), and NGC4874 in the Centaurus cluster (Harris1987). Harris and van den Bergh (1981)introduced the "specific frequency" Sas a quantitative measure: S = N .1Q0.4(Mv+15), where N is the total numberof globular clusters and Mv the absolutevisual brightness of the host galaxy. Theabove mentioned galaxies have S values between 12 and 18.
All galaxies that do not occupy centralpositions in galaxy clusters possesspoorer GCSs, but a relation with theenvironment persists: e.g., the normalelliptical galaxies in the sparse Fornaxcluster have a mean S value of 3, while
for ellipticals in the rich Virgo cluster it isabout 6. The interpretation of this tendency is far from being unambiguous,but the dependence on the environmentsuggests that interaction betweengalaxies may playa role.
Other morphological properties, forexample the relation between the spatialdistribution of clusters and the light profile of the host galaxy, or the luminosityfunction of globular clusters, also bearpotential information which may finallylead us to an understanding of the formation history of GCSs and thus to gaindeeper insight in the formation andstructure of the host galaxies themselves. This field is still in the phasewhere the investigation of individual galaxies provides interesting and usefulcontributions to the general knowledge.The elliptical galaxy NGC 4636 appearsto violate these general properties. NGC4636 is supposed to be a member of theVirgo cluster of galaxies though it isIying weil outside the main body of thecluster, in a region where the density ofgalaxies is quite low. Using photographie plates, Hanes (1977) determined a specific frequency of 9.9 ± 3for the GCS of this galaxy, which is asurprisingly high value considering location and environment of NGC4636. Wereobserved NGC4636 using CCO imaging to investigate the properties of itsGCS with higher accuracy.

Figure 1: Six N7T frames combined to a single image of one houreffective exposure time. The frame shows a 7.5' x 7.5' field northeast of NGC 4636.
Figure 2: The image shown above results from subtracting a model ofthe galaxy light, which has been obtained by a median filteringtechnique. This is the frame on which we performed our search andphotometry of globular cluster candidates. The crowding of stellarlike images near the galaxy centre is striking.
2. Our NTT ObservationsofNGC4636
NGC 4636 was observed at the NDusing EMMI and a 1k Thomson chip inJuly 1992, in the context of a collaboration between German and Italian groupsinterested in the GCS problem. The seeing during our run was only moderate(1.5") and this prevented an investigation of the luminosity function beyond itsturnover (see section 4). but the dataquality turned out to suffice for a studyof the main properties of the GCS ofNGC 4636. We combined six frames inthe V filter of 10 minutes each to a frameof an effective exposure time of onehour (Figure 1). We modelIed the galaxylight by a median filtering technique andsubtracted it from the original frame toobtain a homogeneous background. Wethen ran DAOPHOT on the resulting image (Figure 2). About 1500 point sources down to a magnitude of 24.5 wereidentified. At the faint magnitude limitwe reached a completeness in findingpoint sources of 60%.
We calibrated our data by simulatingaperture photometry on a frame centredon NGC 4636. The zeropoint has beenobtained from the photometry publishedby Poulain (1988). and we estimate azeropoint error of 0.05 mag.
To account for contamination withbackground objects we statistically subtracted the objects found on a frame 7'away from the galaxy centre, and considered the remaining objects as globular clusters belonging to NGC4636.
3. The Specific FrequencyofNGC4636
To calculate the total number ofglobular clusters, we had to correct forthe incomplete spatial coverage of thegalaxy and for the fact that we only seethe brightest part of the luminosity function (see below). After all corrections, weobtained a total number of 3500 ± 200globular clusters around NGC 4636,which corresponds to a specific frequency of $ = 7.3 ± 2.0, if (m - M)= 31.2 and Mv = -21.7 ± 0.3 areadopted. As can be noticed, the error in$ is quite substantial. This is the consequence of the fact that $ is very sensitive to the absolute brightness of thegalaxy, and an error of 0.1 in (m - M)implies an error of 10% in $.
This $ value of 7.3 ± 2.0 for NGC4636 is marginally below the one foundby Hanes (1977), and slightly higherthan the mean value for elliptical galaxies in the Virgo cluster. It is thus at theupper limit of what can be considered a"normal" specific frequency. However,the question remains what distinguishesNGC 4636 for example from NGC 4697,another Virgo elliptical with $ = 3.5, butalmost twice as bright. There is muchroom for speculation. NGC 4636 has anX-ray luminosity ten times as high asNGC 4697 (Roberts et al. 1991) andpresumably a high dark matter content(Saglia et al. 1992). While the X-ray fluxis not generally correlated with $, as thepair NGC 1399 and NGC 1404 in theFornax cluster shows (Richtler et al.
1992), it may indicate a large total masswhich in combination with a rich environment causes effective accretion ofmatter. This matter could be for exampie in the form of dwarf galaxies. Werecall in this respect that the dwarfspheroidal in the constellation Fornaxpossesses 5 globular clusters. Adding500 dwarf spheroidals of the Fornaxtype to NGC4636 could account for2500 clusters, but would increase itstotalluminosity by only 0.1 mag.
4. The Luminosity Function of theGCS: Gaussian or Power Law?
Apparently, globular cluster luminosity functions (GCLFs) exhibit a nearly universal shape, which in the past has beenrepresented by Gaussians with dispersions of 1.3 mag and a peak or "turnover" of Mv = -7.1 ± 0.3 mag, as derived for several ellipticals in the Virgocluster (Secker & Harris 1993). ForNGC 4636, we find the turnover to be atMv = 24.1. This corresponds to a distance modulus of (m - M) = 31.2 ± 0.3,which is in good agreement with previously determined distances of NGC4636 (31.1 ± 0.4 using the supernova1993a, Capaccioli et al. 1990;30.96 ± 0.08 by surface brightness fluctuation, Tonry et al. 1990).
We believe that the choice of a Gaussian for a GCLF does not bear any physical significance. In particular, the possible existence of a universal turnovermagnitude does not mean that there is a
33

"
"
6. Concluding Remarks
This investigation of GCS ofNGC 4636 demonstrates that morequestions are open than answered. Thefundamental problem of what determines the total number of globular clusters in a galaxy is still open, but the firststeps to an answer point in directionsthat are closely connected with generalproblems of galaxy structure and evolution. Moreover, the use of globular cluster luminosity functions as distance indicators will perhaps play an importantrole in the forthcoming VLT era. A hugepotential of information about the physics of galaxies and their stellar populations awaits its exploitation.
NGC 4365 and 4649, Harris et al. 1991).while in poorer systems the GCSs seemto follow the light of the host galaxy(NGC 3379, Pritchet & van den Bergh,1985; NGC 1404, Richtler et al. 1992).Again, this can be understood as anindication that rich cluster systemsmight be partially formed throughmerger er accretion processes.
2.5
.... '
...
2,252
-."
1. 751.5
1
. 5
1og
",
1.5
cD.,
2
log(rad1us["])
Figure 3: This plot compares the profile of the sur1ace density of globular clusters with the lightof NGC 4636. The abscissa is the logarithm of the galactocentric radius (arcsec) along themajor axis. The ordinate is the logarithm of the number of globular clusters per square arcmin.Open circles represent the globular cluster profile. The small dots are measurements of thegalaxy light. The density profile ofglobular clusters is flatter than the galaxy light. This suggeststhat the globular clusters do not share the dynamical history of the field population.
characteristic mass among globularclusters connected with this characteristic magnitude. Richtler (1993) andHarris & Pudritz (1993) show that themass distribution of globular clusters inthe Milky Way, M31, and some Virgogalaxies is weil described by apowerlaw ~~ - m-ü where a is about -1.7. Inthe Milky Way and M31, i.e. in thosegalaxies where the luminosity functioncan be followed weil beyond the turnover magnitude, this power law continues beyond the turnover magnitudeand has a cut-off at very low masses, probably due to the dissolution ofless massive clusters. Concerning NGC4636, we transformed the luminositiesof globular cluster candidates tomasses using the relation given byMandushev et al. (1991), and calculatedthe mass distribution of the globularcluster in NGC 4636. We found b = -1.9which fits weil to the Milky Way system.The existence of a power-Iaw (which isequivalent to the absence of a characteristic mass scale) and its apparentlyuniversal shape are remarkable features. A satisfactory explanation has yetto be found.
5. The Density Profile
A further interesting question iswhether the surface density of globular
clusters decreases with increasinggalactocentric distance in the same wayas the galaxy light itself. If it does, thiswould indicate that globular clustersand field population behave dynamicallyin the same way and probably date fromthe same epoch of formation. For manygalaxies this is not easy to investigatedue to the large scatter in the globularcluster counts in small number statistics. In case of rich systems like the onediscussed, the statistics are more trustworthy. We find the density profile of theGCS of NGC 4636 to be flatter than thegalaxy halo light itself. If we representboth pofiles by apower law Q - r-(t.,where Q is the surface density of globular clusters and r the projected ga-lactocentric distance, we geta=-1.0±0.1 for the GCS anda = -1.5 ± 0.1 for the galaxy light. Thedensity profile is plotted in Figure 3,where the ordinate is the logarithm ofthe number of globular clusters persquare arcminute. The abscissa is thelogarithm of the galactocentric radius inarcseconds along the major axis. Thesmall dots are measurements of thegalaxy light with an arbitrary offset. Thefour open circles represent the globularcluster density profile. Interestingly, thishas also been found in other rich globular cluster systems (NGC 1399, Wagneret al. 1991; NGC 4472, Cohen 1988;
ReferencesBaum, WA., 1955, PASp, 67, 328.Capaccioli, M., Cappellaro, E., Della Valle,
M., D'Onofrio, M., Rosino, L. and Turatto,M., 1990, ApJ 350, 110.
Cohen, J., 1988, AJ 95, 682.Fischer, P., Hesser, J.E., Harris, H.C.,
Bothun, G.D., 1990, PASP 102, 5.Hanes, DA, 1977, MemRAS 84,45.Harris, WE., van den Bergh, S., 1981, AJ 86,
1627.Harris, WE., Smith, M.G., Myra, E.S., 1983,
ApJ 272, 456.Harris, WE., 1986, AJ 91, 822.Harris, WE., 1987, ApJ Lett. 315, L29.Harris, WE., 1991, ARM 29,543.Harris, WE., Allwright, J.WB., Pritchet, C.J.,
van den Bergh, S., 1991, ApJS 76, 115.Harris, WE., Pudritz, A.E., 1993, AJ, in press.Mandushev, G., Spassova, N., Staneva, A.,
1991, A & A 252, 94.Poulain, P., 1988, A & AS 72, 215.Pritchet, C.J., van den Bergh, S., 1985, AJ
90, 2027.Richtler, 1., Grebel, E.K., Domgörgen, H.,
Hilker, M., Kissler, M., 1992, A & A 264,25.Richtler, 1., 1993, 11 '11 Santa Cruz Sommer
Workshop proceedings, The globular cluster-galaxy connection, in press.
Sandage, A., 1961 The Hubble Atlas ofGalaxies, Carnegie Inst. Washington Publ.N.618.
Saglia, R.P., Bertini, G., Stiavelli, M. 1992,ApJ, 384, 433.
Shapley, H., 1918, ApJ 48,89.Secker, J., Harris, WE., 1993, AJ 105, 1358.Tonry, J.L., Ajhar, E.A., Luppino, GA, 1990,
AJ 100, 1416.Tu 11 y, R.B., Shaya, E.J., 1984, ApJ 281, 31.Wagner, S., Richtler, T., Hoop, U., 1991,
A&A241,399.
34

Imaging the Globules in the Core of the Helix Nebula(NGC 7293)J. R. WALSH, ST-ECF, ESO
J. MEABURN, Oept. ofAstronomy, University of Manchester, England
Introduction
NGC 7293 is one of the closestplanetary nebulae and the only one inwhich small scale structures can beeasily resolved on ground-based images. The distance is about 130 pc [1]and the central star has an effectivetemperature of - 120,000 K [2] makingit a typical high ionization planetarynebula with emission lines of He 11 andhigher ionization species. On account ofits proximity the projected size of thenebula is very large - the bright innerrings are 13' in diameter but there is aprominent ring structure of radius 10'and faint extensions, clearly belongingto the nebula, out to at least 15'; theprojected size is thus at least half adegree (eg. [3)). On the large scale, thenebula shows some resemblances to ahelix (hence its name) in the low ionization emission (eg [N 11)) but in high ionization emission a central, nearly spherical,volume [4] is seen. Some attempts havebeen made to understand the velocitystructure in terms of a radially expanding helix but the real 3-D structure isprobably more barrel-shaped with anexpansion velocity of - 25 km/s, al-
though higher velocity structures havebeen found ([5], [3)).
Knots and Tails
Around the periphery of the inner lowionization shell there are numeroussmall (- 1") emission knots, some withtails pointing radially away from the star[6J. With the ND and EFOSC2 in 1990(before the commissioning of EMMI) weobtained CCO images in low (Ha + [N 11))and high ([0111)) ionization emission ingood seeing of some of these knots.The result was unexpected: whilst in lowionization emission the knots show upas bow-shaped structures with a brighttip on the side of the globule nearer tothe central star and a tail extending radially outwards, at [0111] no emissionwas seen, only a depression in the localsmooth [0111]; the knots were thus seenin absorption. On consideration, this isnot so surprising if the knots are dustyand are seen against background [0111]emission [7]. If a dense dusty knot lieson the near side of the central emitting[0111] volume then it will absorb thebackground [0111] radiation and appear
dark. Of the knots observed by Meaburnet al. [7] the one with the highest absorption had a central extinction of 0.5mag. and a projected diameter of 1.4"(3 x 1015 cm). If such a globule werespherical and had a dust content typicalof interstellar gas and with interstellargas-to-dust mass ratio then the densityis - 5 x 105 cm-3 and its total mass:::: 10-5 MG).
New Observations
With the new large CCO chips and thebig field available for imaging at theCassegrain focus of the ND with EMMIwe can obtain in one image the whole ofthe central region of the Helix nebulaand examine in detail all the knots andtails. This was done in August 1992 andsome of the spectacular images areshown here. Figure 1 shows the wholeof an Ha + [Nil] Thomson 10242 CCOimage covering the central 7.5' ofNGC 7293. The star at the centre is theionizing star of the nebula. In Figure 2 isshown the corresponding [0111] image.Comparison of Figure 1 and 2 showsthat not all the globules seen in emission
Figura 1: A photographic representation of the NTT + EMMI GGOimage of the core of NGG 7293 taken with an Ha + [N 11] filter. Alogarithmic intensity scale was used and the size of the field is450 x 450" (10" = 1.9 x 10/6 cm); north is at the top and east to theleft.
Figure 2: A photographic print of the NTT + EMMI GGO image of theHelix nebula taken with an [OIl1j5007A. filter is shown at the samescale and orientation as Figure 1.
35

Figure 3: An enlarged view of both the Ha + [NI/] (upper) and [01/1](Iower) images of the globules and tails in the north-east corner ofFigure 1 is shown. The bright globule which shows both Ha + [N 1/]and [01/1] emission is arrowed.
Figure 4: An enlarged view of both the Ha + [NI/] (upper) and [01/1](Iower) images of the region of extended dust absorption to thesouth-east of the core of the Helix nebula. The largest globule withthe deepest absorption is indicated.
on Figure 1 are found on Figure 2. Thiscan be simply understood in terms ofthe globules being distributed along theline of sight through the nebula, somebeing on the near side of the [0111] zone,some on the far side; only those on thenear side give rise to observed absorbing globules. Of the - 600 globulescounted in emission on Figure 1, some40 % are found in absorption in Figure 2,consistent with this hypothesis. Onlythree globules were seen with [0111]emission from the bow-shaped heads,and one of these is seen in the lower leftof Figure 3 (arrowed), which is an enlargement of a region to the north-eastof the central star. The three globuleswith [0111] emission are also those Glosest in projected distance to the centralstar; presumably they must be embedded in the [0111] zone whilst the otherglobules are in lower ionization
36
surroundings. Figure 4 shows an enlargement of the large scale dust featureto the south-east. The globule in thecentre of this field (arrowed), wh ichappears to have no low ionization emission, is the largest found with a maximum diameter of 4" and also has thedeepest absorption.
Nature of the Globules
The low ionization crescent-shapedheads to the globules are presumablyattributable to radiative ionization by thephotons from the central star, with mostglobules being beyond the 0++ ionizingzone where the photons have lowerenergy. However, central stars ofplanetary nebulae are known to havehigh velocity winds (typically 2000 km/sand mass loss rates -10-8 MG) yr-1
) sothat there may be wind impacting the
neutral globules and producing a bowshock around the globule. In addition, ifthe globules are stationary then therewill be ionized gas streaming past at- 20 km/s from the expanding nebula.All these effects may contrive to dragmaterial off the globule and entrain it in aradial tail as observed. Meaburn et al. [7]showed that the size and density of theglobules are such that they could survive long enough for such ablation processes to be important.
One of the abiding puzzles is the ionization mechanisms for the tails. Earlywork ([8], [9]) suggested they could beionized by the diffuse radiation fieldsince they are shadowed by the opticalIy thick globule from the direct ionizingradiation of the central star. Hartquist &Dyson [10] and Dyson, Hartquist & Biro[11] suggest that the material in the tailcould be a low Mach number shock

ionized flow caused by interaction with alow velocity wind, perhaps arising in theexpanding ionized gas rather than in thestellar wind itself. Clearly the ionizationmechanism in the vicinity of theseglobules and their tails need to be explored more closely and NGC 7293 provides an excellent site.
Where do the globules come from?Perhaps they represent clumpy ejectafrom the progenitor asymptotic giantbranch (AGB) star ejecta during a phaseof mass loss or are formed through instabilities when the hot fast wind fromthe central star collides with the slowhigher density red giant wind. Dyson etal. [12] have suggested that the knotscould be remnants of SiO maser spotswhich were formed in the atmosphere ofthe AGB star and have survived ejectionand photoionization. CO emission hasbeen detected from some of the globules even though the beam is larger than
the globules themselves [13]. The COlinewidths are small suggesting molecular gas at - 25 K. Further observations athigh spatial resolution in the optical andmillimetre will enable the parameters ofthe globules, such as the gas and dustcontent, to be determined and their formation and evolution to be morethoroughly investigated. So far no otherplanetary nebulae with similar smallscale structures have been observedbut there is no reason to think that theHelix is atypical and such structuresprobably exist in all planetary nebulae.Until more are found the Helix will continue to be an ideal laboratory for thestudy of these ionized-neutral/dusty interfaces.
References1 Daub, G.T., 1982, ApJ, 260, 612.2 Bohlin, R., Harrington, J.P. & Stecher,
T.P., 1982, ApJ, 255, 87.
3 Walsh, J.R. & Meaburn, J., 1987,MNRAS, 224, 885.
4 Meaburn, J. &White, N.J., 1986, ASS, 82,423.
5 Meaburn, J. & Walsh, J.R., 1980, Astrophys. Letl., 21, 53.
6 Vorontsov-Velyaminov, BA, 1968. InPlanetary Nebulae. lAU Symp. No. 34eds. Osterbrock, D.E. & O'Dell, G.R.,Reidel, p.256.
7 Meaburn, J., Walsh, J.R., Glegg, R.E.S.,Walton, NA, Taylor, D. & Berry, D.S.,1992, MNRAS, 255, 177.
8 Kirkpatrick, J.P., 1972, MNRAS, 176,381.
9 Van BIerkom, D. & Arny, 1., 1972,MNRAS, 156, 91.
10 Hartquist, T.W. & Dyson, J.E., 1993,QJRAS, 34, 57.
11 Dyson, J.E., Hartquist, T.w. & Biro, S.,1993, MNRAS, 261, 430.
12 Dyson, J.E., Hartquist, T.w., Pettini, M. &Smit'" L.J., 1989, MNRAS, 241, 625.
13 Huggins, P.J., Bachiller, R., Gox, P. &Forveille, T., 1992, ApJ, 300, L17.
OTHER ASTRONOMICAL NEWS
Detection of Faint Extended Structures byMultiresolution Wavelet AnalysisF MURTAGH 1
, WW ZEILINGER 1, J.-L. STARCK2 and H. BÖHNHARDT3
1ST-ECF; 2ESO, OCA Nice, Cisi-/ngfmierie Va/bonne; 3University of Munich
1. Introduction
The wavelet transform, in commonwith other image transforms such as theFourier or the Haar transforms, can beused to produce insightful perspectiveson image data. Some particular attributes of the wavelet transform will bediscussed in the next section, whichseem to make it very appropriate forastronomical image data. Two illustrative examples will be used, where theoriginal images do not provide muchindication of underlying faint extendedstructure. The wavelet transform caneffectively uncover such faint structure.It is a new mathematical tool whichought to be kept in mind when exploringand analysing image data.
2. Multiresolution Analysis withthe Wavelet Transform
We will briefly motivate the use ofwavelets by making reference to (i) theproperty of multiresolution usuallyassociated with the wavelet transform;and (ii) the perspective of the wavelettransform as a discrete convolutionfilter.
It has been known for a long time thatmulti resolution approaches to imagesallow an image to be interpreted as asum of details which appear at differentresolutions. Furthermore, each scale ofresolution may pick up different types ofstructure in the image. For example, acoarse resolution may pick up grossstructure, and finer resolutions allowprogressive insights into faint and textured structures.
Consider the convolution of an imagewith a Gaussian. The effect is to smooththe image. Now consider that Gaussianto have a scale parameter, a function ofthe standard deviation (e.g. 1s, 2s, 3s,..., where s is the standard deviation).By varying the scale parameter, a sequence of Gaussian-filtered images isarrived at. These provide a sequence ofresolution scales. The Gaussian function is not a wavelet; for the latter certainproperties are required, such as translation invariance, and a "scaling property"- a dilation invariance property - whichrelates the filtered images at twosuccessive scales. The wavelet used inthis article is isotropic, which is unlikesome other wavelets used to enhance
alignments or to develop usefulstrategies for image compression. Anisotropic wavelet appears to be a goodchoice for the investigation of astronomical objects.
The natural incorporation of a suite ofresolution scales in the wavelet transform has been beneficially used in different application fields. Such multiresolution analysis is particularly appropriatefor astronomical data since the structures we want to recognize have verydifferent scales. Apriori we cannotknow the size of a local neighbourhoodwhere contrast should be enhanced, i.e.we cannot define in advance an optimalresolution level for analysing an image.The wavelet transform implicitly catersfor a more sophisticated astronomicalimage model than the simple"background plus objects" image model. The latter, implicitly, is very widelyused: object detection packages estimate the local background, and thendefine protrusions from this as objects;or in image restoration, a two-channelalgorithm regularizes the backgrounddifferently from non-background objects. In practice, astronomical images
37

often encapsulate more complex,superimposed objects and/or structuresthan is allowed for by the traditionalimage model.
Let us take image restoration as anexample. There are different ways ofenforcing, e.g., the smoothness of thebackground, or of planetary objects, byadapting the widely-used RichardsonLucy (RL) method. A good alternative isde-noising through shrinking noisywavelet coefficients. The latter definethe wavelet-transformed image. Furthermore wavelet coefficients are obtained which define the transformed image at varying levels of resolution. Theoriginal image may be reconstructedfrom the series of wavelet-transformedimages. A noise-removal strategy isbased on the wavelet coefficients beingclipped in value if they are considered tobe associated with noise. Such an approach has been pursued by variousauthors. This strategy was investigatedby Starck and Murtagh (1993) with theconclusion that such de-noising, in theframework of RL restoration, leads tosignificantly improved detection of faintobjects. This de-noised RL image restoration method, used in the preparationof some of the images discussed below,is available in the MIDAS image processing system (version N093).
In this article we wish to see whatinsights the wavelet transform, at someappropriate resolution level, can offer interms of uncovering faint extendedstructures and physical processes.Differing structures, which are not at allapparent in the given image, may become salient at other resolution scales.We select a range of differences of reso-
lution levels of the image, - which aresensitive to faint structures, and whichare produced and output in the newMIDAS wavelet package. Thus, whatmay be referred to as a "level 1" imageis the difference between the originalimage and the first wavelet-transformedimage; the "level 2" image is the difference between the first and the secondwavelet-transformed images; etc. Similar objectives have also been pursuedusing another wavelet-based approach,the H-transform. The latter is available inMIDAS as a command FILTER/ADAPTIV.
3. Cometary Coma Analysis
The abilities of the wavelet transformto provide insight on cometary comaswas tested with images of the periodiccomet P/Swift-Tuttle. The data werecollected with the 1.2-m telescope atthe Calar Alto Observatory in Spain inOctober and November 1992 and werekindly provided by Dr. K. Birkle of theMax-Planck-Institut für Astronomie,Heidelberg.
Figure 1 shows the cometary coma ofP/Swift-Tuttle observed through the CNmolecule filter of the IHW filter set. Theisophote pattern is asymmetric with respect to the nucleus (= central brightness peak) and highly irregular whichusually indicates the presence of jets inthe coma. Figure 2 gives the level 4wavelet transform result for the CN image. Three jets can clearly be identified.It is also easily possible to determine thegeometry, the curvature and the approximate position angles of the jets atthe nucleus from the wavelet image.
Compared to other methods for thecoma structure enhancement (see Larson and Sekanina, 1984; A'Hearn et al.,1986; Schulz, 1990; Boehnhardt andKohoutek, 1992) the wavelet analysiscan be applied in a very convenient andstraightforward way to cometary comaimages. Most importantly, it does notdepend on the accurate determinationof the nucleus position as a referencepoint for angular or radial shifts (methodof Larson and Sekanina, and of Schulz)or for the alignment of the images anaIysed (allother methods). Therefore, theinterpretation of the wavelet analysedcoma structures should not suffer fromthe presence of image processing artifacts or "diseases" (artificial structures,modified geometry, "blindness" as regards ring structures) as do each of theprevious methods.
In summary, the wavelet analysis ofcometary images promises to become avery useful tool for the enhancement offaint coma and tail structures. The identification of jets, fans, shells and brightness excess areas, and the derivation oftheir characteristics from such imagescan be used for the determination ofimportant properties of cometary nuclei(rotation motion and axis, nucleographyof activity centres) from ground-basedobservations.
4. Physical Processes aroundElliptical Galaxies
The HST PC (Planetary Camera) image of elliptical galaxy NGC 4261, andthe NTT SUSI image of the same object,as described in Zeilinger et al. (1993),were used. The objective was to uncov-
Figure 1: Gomet P/Swift-Tuttle, October-November 1992.
38
Figure 2: Wavelet transform of Figure 1 image, enhancing coma.

Figure 3: Wavelet transform of the SUSI image of NGC 4261.
Figure 5: Wavelet transform of the PC imageof NGC 4261 (level 3).
Figure 4: Wavelet transform of the PC imageof NGC 4261 (level 4).
•• ••
er the morphological characteristics ofinfalling matter in the central region ofthe galaxy. The original images providedno direct clues. Availability of a pair ofimages from different instruments withvery different resolutions and signallevels affords a very good framework forvalidating the faint structures uncoveredby the wavelet transform, as will beseen. (See also p. 28 of this issue.)
To lessen the impact of differenteffects due to image borders and imageresolution, the SUSI image was rebinned to the scale of, and rotated to bealigned with, the PC image. Both images are shown in Zeilinger et al. (1993).The SUSI image was sharpened, andthe PC image was restored, using 40iterations of the de-noising RL methodreferenced in Section 1 above.
Figure 3 shows a wavelet transformimage (level 4) of the de-noised andsharpened SUSI image. Figures 4 and 5show two wavelet transform images(levels 3 and 4) of the de-noised and
restored PC image. A rather severe intensity transfer function has been usedto emphasize the faint features externalto, and closely adjacent to, the centraldust lane of the galaxy. In the groundbased and level 3 space-born imagesone notices a clear protrusion to theright-hand side (which is far less pronounced in the level 4 PC image). Similarly, much of the detail in the upper lefthand side is common to these images.These features may be interpreted interms of a warp related to the centraldisko Emphasized features in thebackground, and towards the imageborders, are artifacts which are ofcourse uninteresting.
5. Conclusion
The wavelet transform provides apowerful exploratory tool for the analysis of faint features associated with processes which are superimposed and/ornot easily distinguished. It is undemand-
ing in terms of image pre-preparation ormodelling. If faint and complex featuresare present, then it offers an excellentway of heuristically demarcating them.
ReferencesA'Hearn, M.F.S., Hoban, S., Birch, P.V., Bow
ers, C., Martin, R. and Klinglesmith 111, DA,1990, Nature, 324, 649.
Boehnhardt, H. and Kohoutek, L., 1992,Icarus, 99, 106.
Larson, S.M. and Sekanina, Z., 1984 Astron.J., 89, 571.
Schulz, R., 1990, PhD thesis, University ofBochum.
Starck, J.-L., 1993, "The wavelet transfarm",MIDAS Manual, Version N093.
Starck, J.-L. and Murtagh, F., 1993, "Imagerestaration or sharpening with noise suppression using the wavelet transfarm" ,submitted.
Zeilinger, w.w., M011er, P. and Stiavelli, M.,1993, The Messenger, this issue.
StarGates and StarWordsAN ON-UNE YELLOW PAGES DIRECTORY FOR ASTRONOMY
M. A. ALBRECHT, ESO, and A. HECK, Observatoire Astronomique, Strasbourg, France
1. General
Two new databases have been madeavailable at ESO under Starcat (Pirenneet al. , 1993). They are products of theStar's Family encompassing databases,data sets, dictionaries, directories, mailing labels, and so on, compiled by thesecond author (see Heck, 1991 cl. Theyoffer a comprehensive yellow pagesservice of astronomical institutionsworld-wide as weil as a lookup data-
base of acronyms and abbreviationsused in astronomy and related sciences.
2. StarGates
StarGates is an on-line database ofastronomy, space sciences, and relatedorganizations in the world. It offersessentially the information listed in directories on paper published previouslyunder the acronyms IDAAS (Heck,
1989a), IDPAI (Heck, 1989b) andASpScROW (Heck, 1991 a&b), and currently available under the homogenizedname of StarGuides (Heck, 1993 a&b).StarGates has however the advantageof being permanently updated. To date,more than 6,000 entries from about 100countries are accessible.
Besides astronomy and space sciences, related fields, such as aeronautics, aeronomy, astronautics, atmo-
39

spheric sciences, chemistry, communications, computer sciences, data processing, education, electronics, energetics, engineering, environment, geodesy, geophysics, information handling,management, mathematics, meteorology, optics, physics, remote sensing, andso son, are also covered when appropriate.
StarGates gathers all practical dataavailable on associations, societies, scientific committees, agencies, companies, institutions, universities, etc.,and more generally organizations involved in astronomy and space sciences.
Many other related types of entrieshave also been included, such asacademies, bibliographical services,data centres, and also distributors,funding organizations, IAU-adhering organizations, journals, manufacturers,meteorological services, national normsand standards institutes, parent associations and societies, publishers, software producers, and so on.
The information is given in an uncodedway for easy and direct use. For eachentry, all practical data returned by theorganizations are available: city, postaland electronic-mail addresses; telephone, telex and telefax numbers;foundation years; numbers of membersor staff; main activities; titles, frequencies, ISS-Numbers and circulations ofperiodicals produced; names and geographical coordinates of observing sites;names of planetariums; awards, prizesor distinctions granted; and so on.
StarGates points to the various entries not only by their different designations and acronyms, but also by locations and major terms in names. Setection criteria are also available, such asthe geographical coordinates of a location around which one would like to listthe entries (with available coordinates)
within a given radius. Any string ofcharacters can also be searched in anyfield. It is also possible to search bykeywords such as places, etc.
3. StarWords
StarWords is an on-line database ofabbreviations, acronyms, contractions,and symbols in astronomy, space sciences, and related fields. It offers essentially the updated information listed inthe dictionary StarBriefs (Heck, 1993c&d). To date, about 60,000 entries areaccessible.
The field coverage is 1he same as forStarGates. Abbreviations, acronyms,contractions and symbols in commonuse and/or of general interest have alsobeen included when appropriate. Thetravelling scientist has not been forgotten either (codes of airlines, locations, currencies, and so on).
4. How to Access It?
Access to StarGates and StarWordsis included in Starcat which can be runfrom any computer within ESO orthrough the standard Starcat accountreachable•• through Internet: $ telnet
stesis.hq.eso.org (134.171.8.100),•• through SPAN: $ set host stesis
From the top level menu, select theESO option. The successive menus arethen setf-explanatory. On-line help anddocumentation is also available, as weilas a dedicated user report system.
More details on Starcat can be obtained by contacting S. Hili at ESO orarcheso a eso.org (Internet) orESO::ARCHESO (SPAN).
Acknowledgements
It is a very pleasant duty to expresshere our gratitude to the organizationsand individuals who have helped in vari-
ous ways to compile and update theinformation presented in StarGates andStarWords.
Part of the processing involved in thiswork has been carried out on the IBM3090 of the CNRS Strasbourg-Cronenbourg Computer Centre (France).
Feedback from users on possiblemodifications and/or additions to thedata provided in StarGates and StarWords would be highly appreciated inorder to ensure endured accuracy of themaster files.
References1. Heck, A. 1989a, International Oirectory of
Astronomical Associations and Societies together with related items of interest. IOAAS1990, CDS Special Publ. 13, vi+716 pp.(ISSN 0764-9614 - ISBN 2-908064-11-1).
2. Heck, A. 1989b, International Oirectory ofProfessional Astronomical Institutions together with related items of interest. IOPAI1990, CDS Special Publ. 14, vi+658 pp.(ISSN 0764-9614 - ISBN 2-908064-12-X).
3. Heck, A. 1991 a, Astronomy, space sciences and related organizations of the world- ASpScROW 1991, CDS Special Publ. 16, x+ 1182 pp. (ISSN 0764-9614 - ISBN 2908064-14-6) (two volumes).
4. Heck, A. 1991 b, Astron. Astrophys.Suppl. 90,103-104.
5. Heck, A. 1991c, CDS Inform. Bull. 40,139-141.
6. Heck, A. 1993a, StarGuides, a directoryof astronomy, space seiences, and relatedorganizations of the world, CDS Special Publ.20, x + 1174 pp. (ISSN 0764-9614 - ISBN 2908064-18-9) (two volumes).
7. Heck, A. 1993b, CDS Inform. Bull. 42,71-72.
8. Heck, A. 1993c, StarBriefs, a dictionary ofabbreviations, acronyms, and symbols in astronomy, space sciences, and related fieldsCDS Special Publ. 21, xxxiv + 778 pp. (ISSN0764-9614 - ISBN 2-908064-19-7).
9. Heck, A. 1993 d, CDS Inform. Bull. 42,73-74.10. Pirenne, B. and Albrecht, M.A. 1993, ECFNewsletter19,16-17.
• ~ .... III ,*
Summary of StarGates Oatabase Entries
Org Title: Max-Planck-Institut fuer Astronomie (MP1AL Heidelberg
Address: Koenigstuhl 17
City: 0-69117 Heidelberg Country: Gerlllany
<user~d)@mpia-hd.mpg.de (internet) <userid)@dhdmpi5v (bitnet)
Tel: 6221-5280Fax: 6221-528246
[-Mall :
Activities: star forming regions .. circumstellar matter * 15M * AGNs *ion of alaxies. clusters of alaxies * IR observin from
Remarks:
40

ANNOUNCEMENTS
Programmes Approved tor Period 52KEY PROGRAMMES
ESO No.
1-003-43K1-005-43K1-012-43K1-014-43K1-019-47K1-022-47K
1-023-49K2-001-43K2-007-43K2-009-45K2-013-49K3-001-43K4-004-45/51 K5-001-43K5-004-43K
5-005-45K
6-003-45K
7-008-51 K7-009-49K9-002-49K9-004-51 K
Principal Investigator
de Lapparent et al.Rhee/Katgert et al.Bergeron et al.Mazure et al.Vettolani et al.Tammann et al.
Böhringer et al.Mileyet al.Cristiani et al.Reimers et al.D'Odorico et al.Israel et al.Turatto et al.Mayor et al.Gerbaldi et al.
Hensberge et al.
Danziger et al.
Habing et al.Oblak et al.Epchtein et al.Ferletet al.
Title of submitted programme
A redshift survey of galaxies with z S 0.6 using multi-slil spectroscopyPeculiar motions of rich clusters of galaxiesIdentification of high redshift galaxies with very large gaseous halosStructure and dynamical state of nearby clusters of galaxiesA galaxy redshift survey over a fair sampie of the UniverseThe distance of the Centaurus Group: A test for various distance
indicatorsRedshift survey of ROSAT clusters of galaxiesA study of the most distant radio galaxiesA homogeneous bright quasar surveyA wide angle objective prism survey for bright asosA statistical study of the intergalactic medium at high redshiftsCO as a tracer for the molecular content of the Magellanic CloudsA photometric and spectroscopic study of supernovae of all typesRadial velocity survey of southern late-type Hipparcos starsAstrophysical fundamental parameters of early-type stars of the Hipparcos SurveyHigh-precision radial velocity determinations for the study of the internal kinematical and dynamical structure and evolution of youngstellar groupsOptical identification content in selected regions of ROSAT All SkyX-Ray SurveyInfrared standards for ISOCCD and conventional photometry of components of visual binariesDeep near infrared survey of the southern sky (DEN IS)Is our halo dark matter made of compact objects?
Telescope
NTT3.6mNTT3.6m3.6mNTT
3.6m, 202m, 1.5m3.6m, NTT2.2m,1.5m,lm3.6m, 1.5m, 0.9mDuNTTSEST3.6m, NTT, 2.2m, 0.9Du1.5m Danish1.5m
3.6m
3.6m, 2.2m, 1.5m
NTT, 2.2m, 1m1m, 50cm, 0.9mDu1mGPO, 1.5m Danish
Name(s)
Abbott/Pasquini/Fleming
AbbottiShafterAcker/Cuisinier/Gesicki/GornylTylendaAcker/Cuisinier/Gesicki/GornylTylendaAlcalWCovino/KrautterlTerranegraIWichmann
Alloin/Blietz/Cameron/Rouan
Andreani/La FrancaiMilier/Cristiani/Goldschmidl/ReadAntonello/MantegazzaiPorettiAppenzeller/Beckmann/Nussbaum/Schoeller/Van Elst/WagnerlWeigeltAzzopardi/Breysacher/LequeuxiMuratorioBaessgen/Bremer/Diesch/GrewingBarthellHes
Bergeron/Le Brun
BertauxiLallementiBeustBertolaiPersic/PizzellaiSalucciBeuermann/GrupelThomas H.lReinsch/FinkBeuzitiLagrangelTessierNidal-Madjar/FerletBlaauw/Srinivasan-SahuBockelee-Morvan/Gautier/OwenBouvier/BeuzitiPerrier/SamsBower/Böhringer/Ellis/Castander/CouchBrandner/Zinnecker
ESO No.
07127
07125040350403407121
01002
02026
0301202036
010780404302050
01082
071150102002006070980405207131071140107407058
Title of submitted programme and telescope(s)
Time-series CCD photometry of cataclysmic variables discovered by ROSAT(0.9m Dutch).Time series CCD photometry of old novae (0.9m Dutch).WR nuclei of planetary nebulae: physical and chemical properties (1.5m).Wolf-Rayet nuclei of planetary nebulae: distances and expansion (104m CAll.Spectroscopic and photometric monitoring of strongly variable weak-Iine T Tauristars (0.5m, 3.6m).Diffraction limited broad-band studies of the Seyfert galaxies NGC 7469 and NGC1068 (3.6m).The cosmological evolution of the clustering of quasars (3.6m).
First overtone mode Cepheids in Magellanic Clouds (0.9m Dutch).Speckle imaging and speckle spectroscopy of nearby Seyfert galaxies (2.2m).
Final search and spectroscopic study of Wolf-Rayet stars in NGC 300 (3.5m NTl").Detailed studies of old, extended planetary nebulae (1.5m).The high-redshift nature of GPS radio sources: searching for the most distantquasars (2.2m)Identification of the gaseous systems detected by their CIV and Ly 0. in the quasarspectra of the HST KP (3.5m NTl").Search for cometary water vapour towards ß Pictoris (104m CAll.Modelling the dark matter component in Sa galaxies (1.5m).Spectroscopic indicators for the soft X-ray excess in AGN (2.2m).IR Observations of the ß-Pictoris disk with adaptive optics (3.6m).The Distance of the Vela molecular ridge (104m CAll.Search for cometary gas around ß Pic and Fomalhaut (SESll.High angular resolution imaging of close pre-main sequence binaries (3.6m)The dynamical structure of galaxy clusters at z=0.5 (3.6m).Component colours and spectroscopy of low-main-sequence (PMS) binaries(0.9m Dutch, 1.5m, 3.5m NTl").
41

Name(s)
BroadhurstlMoeller/SzalayBues/KarlBuonannoNietrilMarconiCabritlCesarsky/Lagage/Olofsson/PantinCacciari/BragagliaiFusi Pecci/CarrettaCalvanilSulentic/MarzianiCapacciolilFreeman/Ford/HuilArnaboldiCaraveo/Bignami/Mereghetti/MignanilGoldoni/Pacini/SalvatiCarollo/Danziger/De ZeeuwnCarrasco G.lLoyolaCasoli/Boselli/Braine/Combes/FouqueiGavazzi/KarachetsevaiKazes/LequeuxCastellani/Brocato/PiottoCauletlHasinger/Pietsch/SmithCayrel/Nissen/Beers/Spite F./Spite M.lAndersen J.lNordstroem/BarbuyChar/LabraiBerrios/MaldinilJankov/FoinglNeff/Di-ShengChiosi/Ortolani/BertelliNallenariCimatti/FreudlingClausen/StormlTobin/Hilditch/Hill/Gimenez
Collins/Nichol/GuzzoCombes/Saint-PelTomasko/DemaillylFaucherre/EncrenazCorradi/Schwarz H.CostaiGrebel/Macconnell/RobertslWingCourvoisier/BouchetlBlechaiPaltaniCox/Bronfman/RoelfsemaCunow/Naumann/Ungruhe/SommerDanks/Sembach/Caulet
Danziger/Baade/Della Valle
Danziger/Baade/Gouiffes/Della ValleDanziger/BouchetlGouiffes/Lucy/FranssonlMazzali/Della ValleDanziger/CarolloDanziger/Liu
Danziger/MendeziKudritzki/Mazzali/Lucy/Ciardullo/Jacoby/Roth/SoffnerOe AngelisOe BoerlWill/Bomans/SeggewissOe Medeiros/Lebre/CharbonnelOe Ruiter/Lub
Oe WinterlThe
Oe WinterNan den Ancker
Della Valle/Bianchini/Duerbeck/Oegelman/OrioDennefeld/Bertin/Boulanger/MoshirDietersNan der KlisDoyle/Houdebine/Gunn
DrossartiForni/BenitlBibring/Lellouch/RosenqvistDürbeck/SeitterDuquennoy/Mariolti/Mayor/PerrierDuquennoy/MayorEistFalomo/PescelTrevesFavataiBarberaiMicelaiSciortino
FavataiBarberaiMicelaiSciortino/Schachter
FavataiMicelaiSciortino
Felenbok/JablonkalAlloi nlArimoto/BicaiBalkowski/Cayatte/Kraan-Korteweg
42
ESO No.
0103107081050080709605010020520108606018
011160706001003
050270303307029
07132
030370201603025
0104508014
040460705202046040470104004048
07023
0702203005
0111704049
01053
08023030060710702075
07137
07135
07025010500713807033
08013
070460710407103080100200507042
06004
07041
01062
Title of submitted programme and telescope(s)
Cluster mass profiles via amplification of background galaxy fluxes (305m NTT).Spectral variability of single magnetic white dwarfs (1.5m).Young globular clusters in the Milky Way (2.2m).10 micron spectro-imaging of young outflow sources (3.6m).Spectroscopic study of blue horizontal branch stars in globular clusters (1.5m).Orientation effects in radio loud AGN (1.5).Dynamics of the outer halos of elliptical galaxies (3.5m NTT)Optical studies of isolated neutron stars detected as X1gamma-ray sources(3.5m NTT).Linking stellar population and orbital structure in elliptical galaxies (2.2m).UBVRI photometry of FK5 faint stars (0.5m).The CO emission of isolated spirals (SEST).
White dwarfs in old open clusters (3.5m NTT).Probing the IS gas of the superbubble LMC2 (3.6m).Survey of very metal-poor stars and nucleosynthesis in the galaxy (1.5m).
Survey de la variabilite chromospherique d'etoiles ci. rotation rapide (0.5m,1.4m CAT).Star formation I,istory of the Magellanic Clouds (2.2m).A millimetric view of distant radio galaxies (z> 1) (SEST).Eclipsing binaries in the Magellanic Clouds - distances and absolute dimensions(3.5m NTT).Multiobject spectroscopy of distant clusters of galaxies (3.6m).Very high spatial resolution study of Titan in the near IR (3.6m).
00 bipolar nebulae have the hottest central stars of PNe? (1.5m).Red supergiants as tracers of Galactic spiral arms (1.5m).Coordinated observations of 3C 273 (1.5m, SEST).A study of the photon dominated region facing Trumpier 14 (SEST).Magnitude calibration for homogeneity studies of the Universe (0.9m Dutch).Gas kinematics and physical conditions in the Vela supernova remnant(1.4m CAT).Optical spectroscopy of the visible counterpart of the bright radio millisecondpulsar J0437-4715 (3.6m).Fast photometry of the millisecond pulsar candidate (3.6m).SN 1987A (SEST, 1.5m Danish 2.2m, 3.6m).
Optical and infrared colour gradients in early-type galaxies (2.2m, 1.5m Danish).Observations of molecular hydrogen emission from planetary nebulae (305m ND,1.5m).Determining distances to galaxies with well-studied SN la's using the PNLFmethod (3.5m NTT).Asteroid photometry for pole and shape determination (0.9m Dutch).Spectroscopic improvement of the age determination of NGC 1948 (105m).Lithium and rotation in subgiant stars (1.4m CAT).Variations of emission line and continuum intensities in Seyfert nuclei (0.9mDutch,105m).Detection of mass-outflow indicators of newly discovered young stellar objects ofintermediate mass (0.9m Dutch).Astrophysical properties of newly found early-type young stars associated withstrong IRAS-sources (0.5m Danish, 1.5m, 0.5m).Novae as standard candles: calibrations of nova shells (3.6m).The nature of the faintestlRAS galaxies and galaxy evolution (3.6m).Spectrophotometry of CP Pub: Weighing the white dwarf (1.5m).Eclipse imaging of active binaries: coronal mass ejections & related phenomena(1.4m CAT).Observations of the Jovian system at4 microns with COME-ON PLUS (3.6 m).
Accretion disk properties and masses of bright exnovae (1.5 m).Infrared imaging of very low mass companions to nearby stars (3.6 m).Stellar duplicity of very low mass stars (1.5 m Danish).L5 Trojan search (Schmidt).The environment of BL Lacertae objects (3.5 m NTT).Lithium abundance determination in a sampie of volume-limited main-sequence Kstars (1.4 m CAT).Identification and classification of candidate stellar Einstein Siew Survey sources(1.4m CAT, 1.5 m).Lithium abundance in a sampie of active binaries with known levels of X-rayemission (1.4 m CAT).1. Spectropl,otometric properties of spiral galaxies; 2. Search in the Galacticplane toward the Great Attractor (3.6 m).

Name(s)
FerletJHobbs/WallersteinFerrari/Bucciarelli/Massone/Pizzuti/Koornneef/Lattanzi/Lasker/Postman/Siciliano/Le PooleForni/Bibring/BenitFreudling/Alonso/Da CostaIWegnerFusi Pecci/Cacciari/Bragaglia/Ferraro/CarrettaGahm/CarlqvistJMattila/KaasGalletta/PiccolilTomadiniGehren/Baumüller/Fuhrmann/ReetzGemmoGenzel/Beckers/LEma/Sams/Brandl
GochermannlTappert
GochermannlTappertGochermann/ZaumlTappertGossetJManlroidNreux/SmetteGossetJMoreauGossetJMoreauGouiffes/Oegelmann/Augusteijn/BouchetGredelGredelGredel/Kopp
Grenier/Gouiffes/OegelmanGriffin R.E.lGriffin R.E.M.lMayor/ClubeGustalsson/Andersen J.lEdvardsson/NissenHenning/LaunhardtHensberge/DavidNerschueren
HES/Barthel/PeletierHeydari-Malayeri/Rigaut
Hillier/Kudritzki/Lennon/Butler/Hamann/WessolowskiHoffmannHutsemekersNan Drom/RemyInfante/Fouque/Richller/Quintanalovino/Chincarini/Garilli/Maccagni/SaraccoIsrael/Oe GraauwNan der HulstJLacy/KellyIvison/SeaquistJHughes/Schwarz H.
Jerjen/Binggeli
Jorissen/Mayor/NorthJüttner/Baschek/Stahl/Wolf
Kaper/Hammerschlag/Blondin
Kneer/Bender/KrautterKnude/BowyerKopp/SmetteKostiuk/Käull/LivengoodKrautter/AlcalaiSchmittlMundtIWichmann/ZinneckerKudritzki/MendeziGabler/Puls/RothKürster/Hatzes/Cochran/Dennerl/DöbereinerKürster/SchmittLagage/PantinLagerkvistJMagnusson/EriksonLagrangeNidal-Madjar/FerletJCorporon/Deleuil/GrylTobinLamers/De Graauw/Waters/LoupNan HoolLennon/Kudritzki/Dufton
Lennon/Kudritzki/Husleld/Herrero/Gabler
Liller/Alcaino/Alvarado/WenderothLin YunLin YunLin Yun/Clemens
ESO No.
0402305030
0801201090050090402509001070260703901066
03018
030170301907013020310203003030040170401604018
0713905017050310500105032
0202803008
07141
080010202101017010930109507001
01096
0705003011
06010
0101504053020480802107071
070900700207143070950800507116
0714403041
07016
03002070910701907047
Tille 01 submitted programme and telescope(s)
Variable interstellar absorption within the Vela supernova remnant (1.4 m CAT).Photometrie calibrations lor the southern sky surveys (0.9 m Outeh).
Observations of the Jovian system at 2 microns with COME-ON-PLUS (3.6 m).The peculiar motion 01 galaxies and the density 01 the Universe (1.5m Danish, 1.5m).UV survey 01 Galactic globular clusters (1.5 m Danish).Serpentine structures in the Chamaeleon Dark Clouds (Schmidt).A search for Sun companions (1.4 m CAT).CNO abundances in metal-poor stars (3.6 m).An inlrared search lor companions to white dwarfs (2.2 m).Diffraction Iimited K-band studies 01 high-z galaxy evolution and morphology(3.6m).Physical and chemical parameters 01 LMC supergiants Irom medium-resolutionspectroscopy (1.5 m).Physical parameters 01 LMC supergiants Irom UBVRI-JHKL photometry (1 m).UBV photometry 01 LMC galactic loreground and member stars (0.5 m).Study 01 eclipses of the SB1 system WR22 (0.5 m Danish).A multi-technique quasar survey: the variability criterion (Schmidt).An objective-prism survey for high redshift quasars: a feasibility test (Schmidt).Optical search for the pulsar in SN1987A. (3.6 m).Narrow band imaging 01 Herbig-Haro objects and jets in Hand K (2.2 m).Near-inlrared spectroscopy of Herbig-Haro objects and jets (3.5 m NTT).Interstellar molecular absorption lines towards southern OB associations(1.4 m CAT).Fast photometry 01 the Vela gamma-ray pulsar (3.6 m).Radial velocities 01 stars in the Clube selected areas (1.5 m Danish).The transition Irom the thick to the thin galactic disk (1.4 m CAT).A 1.3mm continuum and CO outflow search lor extreme class I sources (SEST).Study 01 the double-Iined eclipsing binary NGC 2244-200 =V578 Mon(0.5 m Danish)Inlrared imaging 01 hotspots in radio sources (2.2 m).High resolution investigation 01 the most massive stars in the Magellanic Clouds(3.6 m).Constraints on massive star evolution from abundances in LMC WC stars(3.5 m NTT).Structure 01 suspected composite asteroids (1.5 m Danish).Polarization properties 01 BAL QSOs (3.6 m).The distribution 01 dwarf galaxies in the Fornax Cluster (3.6 m).K-band galaxy counts: the way to QO? (2.2 m).Low resolution spectroscopy of galactic nuclei in the near-IR (3.5 m NTT)A simultaneous multi-Irequency study 01 symbiotic stars: The cm-mm continuum(SEST).Exploring the spatial structure 01 the Centaurus Cluster by surface photometry 01its dwarf galaxies (1.5 m Danish).The evolutionary status of S stars and dwarf Barium stars (1.5 m Danish).Abundances from early B-type giants in selected regions 01 the Magellanic Clouds(3.6m).Simultaneous optical, UV, and X-ray observations of HMXRB Vela X-1 (1.4 mCAT).Spectroscopy 01 distant, laint clusters 01 galaxies (3.6 m).Distances 01 local EUV shadowing clouds (0.5 m Danish).Search lor CO in quasar absorption lines (SEST).Morphology 01 Jupiter's thermal inlrared aurorae (3.6 m).Search lor weak-line T Tauri stars in Chamaeleon and Lupus (1.5 m).
Mass loss rates 01 central stars 01 planetary nebulae (3.5 m NTT).High precision stellar radial velocities, part 111 (1.4 m CAT).Towards a butterfly diagram for AB Dor (1.4 m CAT).Prolile and composition 01 the inner dust disk of tl1e ß-Pictoris star (3.6 m).Pole orientations and shapes 01 asteroids (1 m).High resolution survey 01 ß Pictoris with the CES (1.4 m CAT).
Inlrared spectroscopy and imaging of LBV's (3.5 m NTT).An intermediate dispersion spectroscopic survey 01 B-supergiants in the SMC(3.5 m NTT).Spectroscopy of luminous blue stars in the Local Group galaxies NGC 6822, IC1613 and WLM (3.5 m NTT).UBVRI photometry of Magellanic Clouds cluster standards (1 m).Near-inlrared imaging 01 young stellar objects in Bok globules (2.2m).Narrow-Band imaging ofT Tauri stars associated with Bok globules (0.9m OuteIl).Spectral energy distributions of young stellar objects in Bok globules: millimeterIluxes (SEST).
43

Name(s)
Lin Yun/ClemensLindblad PAB.lLindblad/JoersaeterLindblad/JoersaeterNaesterberg/LindbladPAB.Loiseau/CombesLorenzetti/Moneti/Spinoglio/LiseauLoup/Hron/Kerschbaum/ZijlstraiWatersMacchetto/Giavalisco/SteidellSparks
Magnan/De Laverny/Mennessier
Mandolesi/CranelAttoli nilPalazziMaranolZamorani/Zitelli/Cimatti/GiacconilHasingerMariotti/BeuzitlDuquennoy/EckartiPerrierMathys/LandstreetiLanziManfroid/HubrigMegeathlWilsonMenard/LEmaiMalbetiCatalatMonin/Schuster
Mermilliod/Mayor
MermilliodlTuron/GomeziSellier/GuibertlRobichonMeylanlAzzopardi/Dubath/LequeuxMeylan/DjorgovskilThompsonMoellerlWarrenMolaro/Rebolo/Martin E.lCharles/CasaresMoneti/ZinneckerlWilkingMontmerlelAndre/CasanovaiCesarsky/LagageMoorwood/KotilainenNan der Werf/OlivaMotch/Hasinger/Pietsch
MottolaiLagerkvistiDi Martino/NeukumNußbaumer/MürsetiSchild/Schmid/SchmutzOlivaiMoorwood/OrigliaOlivaiReconditi/OrigliaiMoorwoodOmontIWalmsley/ChinilLebre/MennessierlNyman/ForveilleOrio/Bianchini/Della Valle/MassonelOegelmanPagani/Castets/LangerPalazzi/Penprase/CaseyPallavicini/Gratton/RandichPallavicini/Haisch/SchmilVPasquiniPanagilAndrews/BouchetPaquetlArimoto/MoellenhoffPaquetiDavies/BenderParesce/Clampin/Robberto/Ferrari/AbbottPasquini/BelloniPasquini/Randich/Andersen J.PatatiBarbon/Benetti/CappellarolTurattoPeterson/D'Odorico/MoorwoodlTarenghilYoshii/SilkPetterssonPiottolAparicio/DjorgovskiPogodin
Pottasch/Manchado/Garcia-Lario/Sallu K.C.
Pottasch/Manchado/Garcia-Lario/Sallu K.C.
Pottasch/Manchado/Garcia-LarioPrustilAbraham/PallaRamellaiFalco/FabricantiDresslerlTuckerRasmussen/JoergensenReimers/KösterReinsch/BeuermannlThomas H.IBeckerlTrümper/Motch/Pakul1Reinsch/BeuermannlThomas H.ReipurthReipurth/Lago/PedrosaRichtler/Hilker/GierenRigautiLenaiGehring/Cuby
44
ESO No.
070280103602029
01097070660714501098
07021
0405402038
07049070630400307100
05003
05014
0111802060010330600707118070970200806021
0802407068050050400707087
07150040270402407056060080705501046010380715106003070590715201073
071550503607005
04058
04057
040560715101025010340708006016
0601104020070610300907099
Tille of submitted programme and telescope(s)
HCN survey of physical conditions in cores of star-forming Bok globules (SEST).Photometry of nearby barred spiral galaxies (1.5m Danish).Active nuclei of NGC 613 and NGC 1365 (1.5m).
CO observations of active interacting galaxies -111 (SEST).The initialluminosity function in the Vela star forming region (2.2m).Oxygen-rich AGB-stars willl 60 micron excess (1 m, 1.5m).Optical and near-infrared spectroscopy of radio-quiet galaxy candidates at z>3(3.5m NTT).UBVRI photometry of Mira variables during a whole cycle and study of the lightcurve in different cycles (0.5m).Small scale structure of diffuse interstellar clouds (104m CAT).Deep multi-colour imaging for faint X-ray sources and a search for faint quasarcandidates (22.0<MB<24.5) (3.5m NTT).Diffraction-limited imaging of the brown dwarf candidate G29-38B (3.6m).Ap stars with resolved magnetically split lines (104m CAT).A survey for dense gas in a young GMC (SEST).Deep high angular resolution imaging of selected young stellar objects withCOME-ON PLUS (3.6m).Constraints on stellar formation from orbital elements of cluster binaries(1.5m Danish).Photometric calibration for open clusters observed with Hipparcos (1.5m Danish).
Search for dark matter in the Fornax dwarf spheroidal galaxy (305m NTT).A search for quasar protoclusters at high redshifts (3.5m NTT).The size and morphology of normal galaxies at z=3 (3.5m NTT).Search for lithium in black-hole systems (3.5m NTT).Infrared imaging and photometry of southern T Tauri binary systems (2.2m).Protostars and star formation activity in the Chamaeleon I cloud (3.6m).Near-infrared spectroscopy of starburst and Seyfert galaxies (3.5m ND, 2.2m).Spectroscopic study of a new luminous supersoft X-ray binary in the Galaxy(1.5m).Physical studies of Trojans and Outer Belt asteroids (1 m).Wind structure of red giants in symbiotic systems (104m CAT).Near infrared spectroscopy of Magellanic Cloud clusters (3.5m NTT).Infrared line imaging of SMC/LMC supernova remnants (2.2m).Bolometer monitoring of Mira variables (SEST).
Optical identification of supersoft X-ray sources (1.5m Danish).Search for 160 180 towards cold dark clouds at 234 GHz (SEST).High resolution spectroscopy of central stars in reflection nebulae (1.4m CAT).Lithium abundance and post-main sequence evolution (104m CAT).Chromospheres, coronae and winds of cool giants (104m CAT).Transient and short period phenomena in late-type stars (0.5m, 1m).Line-strength gradients in disks of SO galaxies (1.5m).Low mass E/SO's: the building blocks of giant ellipticals? (3.5m NTT).Deep imaging of circumstellar disks with the ND coronograph (3.5m NTT).X-ray sources and binaries in M67 (3.6m).Hunting young, nearby G stars (104m CAT).The intrinsic colours of supernovae of type 1a (0.9m Dutch).Galaxy counts to faint K-prime magnitudes (2.2m).
Young stellar objects in the direction of the Gum Nebula (0.9m Dutch, Schmidt).Stellar luminosity functions of the outer halo globular clusters (3.5m NTT).Circumstellar envelopes of AE Herbig stars of the PCyg-subgroup withinhomogeneous structure (104m CAT).Direct imaging and photometry of proto-planetary nebulae candidates(0.9m Dutch).Infrared spectroscopy of newly discovered IRAS proto-planetary nebulae(3.5m NTT).Optical spectroscopy of BO[ 1stars and related objects (1.5m).Luminosity function of pre-main-sequence stars in Lupus (2.2m).Spectroscopy of the giant gravitational arc in C10657-56 (3.5m NTT).The fundamental plane for E and SO galaxies in the Fornax (1.5m Danish).An empirical test of the mass-radius relation for white dwarfs (3.6m).Optical counterparts of binary millisecond pulsars and supersoft X-ray sources(2.2m).The nature of the peculiar cataclysmic variable KO Velorum (0.9m Dutch).Herbig-Haro jets from newborn stars (3.5m NTT).Ha emission Iines in TTauri stars: profiles and variability (104m CAT).CCD Strömgren photometry of LMC cluster and field stars (1.5m Danish).High angular resolution imaging of 11 Car (3.6m).

Name(s)
Röttgering/BremerRoueff/Kopp/Le BourloVGerinRutten/Harlaftis/OhilionNan ParadijsSaglialOavies/Baggley/Colless/Burstein/Bertschinger/McMahan/WegnerSchildlTennyson/MillerSchildNogel/Nußbaumer/MürseVSchmidSchoberSchutteNan Oishoeck/HelmichlTielens/GredelSeaquistllvison/Evans/Schwarz H.Shaver/Wall/KellermannSiebenmorgen/ZijlstraiGredelSimon/Saleck/Stutzki/WinnewisserSivan/PerrinSommer-Larsen/Christensen/Beers/FlynnSoucall/Kneib/FortlMellier
Spite F./Spite M.lFran«ois/HillStark/GredelStecklum/EckartlHenning/FischerStecklum/Henning/PfauSterkenSterkenStirpe/GianuzzoSurdej etal.Telles/KotilainenlTerlevichThe/Grady/Perez
TM/Moister
Theuns/Warren
Thomas H.lTrümper/Beuermann/Reinsch/SimonTinneyTinneyTinney/Mould/ReidToussaintlReimers/HünschTuron/Mermilliod/Gomez/Sellier/GuibertlRobicllonVan de Steene/Sahai/PottaschVan der Bliek/GustafssonVan der HülsWan der Werf/Oe Graauw/Israel/Joubert/BaluteauVan der KruitlOe Grijs/PeletierVan der WerfNan der HülstVan Oishoeck/Helmich/HogerheijdeVan Oishoeck/Langevelde/HogerheijdeVan Winckel/Balm/WaelkensVidal-Madjar et al.WaelkensWaelkens/MayorWagnerWalsh/Walton/PottaschWampler/HazardlTurnshek
Wampler/WangWanders/Bergvali/OestiinNan Groningen/Roennback/Olofsson/OerndahlWarren/lovino/ShaverWarren/Pownall/HewettWaters/ZijlstralKäuflNan Winckel/MeixnerWay/QuintanallnfanteWeigeIVBeckmann/Oavidson/Kohl/Nußbaum/Schöller/SeggewissNan EistWest M.J.lBothumWest R.lHainautlMarsden/Meech/SmetteWesterlund/Azzopardi/BreysacherWild/Cameron/EckartlRothermelWild/EckartWolflKaufer/Mandel/Stahl/Gaeng/Gummersbach/Sterken
ESO No.
02065040590600201007
0400607040080190400407034020010403204038040020500701027
05026040110710207086070150701402037020470107507051
07010
01056
06013
0707007069050160710605006
071110705303026
0102103027040050400907048090020703007031020350401502044
0303502071
0105501113070930207307101
010570801703004020250102807017
Title of submitted programme and telescope(s)
Compact radio galaxies and the continuum alignment effect (2.2m).Search for CS and CN in the diffuse clouds close to ~ Oph (SEST).Spatially-resolved spectra of accretion disks in cataclysmic variables (2.2m)Peculiar velocities of galaxy clusters in the Pisces-Cetus supercluster (3.6m)
Search for the moieculaI' ion H3+ in Orion (2.2m).Symbiotic stars in the Magellanic Clouds (2.2m, 3.6m).Variable lightcurves of asteroids 258, 369 and 582 (0.5m).Interstellar ice composition toward southern infrared sources (305m NTT).A maser survey of symbiotic Miras (SEST).A search for radio-Ioud quasars at z>5 (3.6m).The dust composition in Herbig-Haro objects (305m NTT).Abundance and excitation of CN, 13CN and CiS N in OMC1 (SEST).Spectrophotometry of reflection nebulae illuminated by late type stars (1.5m).Bright blue horizontal branch field stars in the inner galactic halo (1.5m).Spectroscopic survey of the galaxies in S295, and redshift determination of thearcs in MS2137-23 (3.5m NTT).Abundances of Lithium and heavy elements in NGC 2004 (3.5m NTT).MoieculaI' absorption lines toward cometary interstellar cirrus clouds (104m CAT).High angular resolution observations of Herbig Ae/Be and Vega-like stars (3.6m)NIR photometry of candidate pre-main sequence stars (1 m).Long-term photometry of variables (O.5m Oanish)Pulsating B stars in NGC 3293 (O.5m Oanish).Are narrow line Seyfert 1 nuclei variable? (1.5m)Spectroscopic identification of gravitationallens candidates (3.5m NTT).High resolution near-infrared imaging of H 11 galaxies (2.2m).High resolution and S/N spectroscopy of edge-on proto-planetary disk systems(104m CAT).Planet formation in proto-planetary dust clouds of Herbig Ae/Be stellar systems(O.5m).Search and identification of intergalactic planetary nebulae in galaxy clusters(3.5m NTT).Spectroscopic identification of ROSAT X-ray sources near the South Ecliptic Pole(SEP) (1.5m)A spectral atlas for the latest M-dwarfs (3.5m NTT).Parallaxes of VLM stars (202m).The kinematics of stars at the bottom of the main sequence (3.6m).A high resolution study of short-lived absorption in three M giants (104m CAT).The core-halo structure of open clusters observed with Hipparcos (Schmidt).
A search for moieculaI' envelopes in newly discovered planetary nebulae (SEST).Chemical abundances analysis of the royal standard stars for ISO (104m CAT).Excitation of H 11 regions in the Magellanic Clouds (3.6m).
Optical surface photometry of edge-on spiral galaxies (1.5m Oanish).Excitation of moieculaI' and ionized gas in the Magellanic Clouds (202m).The chemical state of southern star-forming regions (SEST).The nature and dust content of young stellar objects in Chamaeleon (SEST).CW of the Red Rectangle Nebula (104m CAT).is our halo dark matter made of compact objects? (Schmidt).110rionis (104m CAT).Radial-Velocity variations in post-AGB stars (1.5m Oanish).High resolution spectroscopy of the NLRS of NGC 1068 and NGC 1386 (3.6m).Spectral classification and distances for binary star planetary nebulae (2.2m).An absorption-line study of chemical abundances in quasar nuclei (3.5m ND,3.6m).The SN 1987A environment (3.5m NTT).Host galaxies of intermediate-redshift quasars (3.5m NTT).
The evolution of the galaxy correlation function (3.6m).Ha emission from galaxies at z>2 (2.2m).10 micron direct imaging of detached envelopes around post-AGB stars (3.6m).A spectrophotometric survey of AGN in rich clusters of galaxies (2.2m).Speckle masking and speckle spectroscopy observations of stellar objects(2.2m).Globular cluster populations in Hickson compact groups (3.5m NTT).Activity in very distant comets (3.5m NTT).Low-Iuminosity carbon stars in the Large Magellanic Cloud (2.2m).12CO/C180 ratio in the nucleus of Centaurus A (SEST).The moieculaI' ISM ofthe starburst galaxy NGC 5188 (SEST).Structure and variability of the winds of A-type supergiants (O.5m).
45

Name(s)
Wolter/Maccacaro/Ciliegi
Zamorani/Giacconi/Hasinger/Marano/Mignoli/ZitelliZijlstraiLoup/WaterslTinney/Groenewegen
Zinnecker/McCaughrean/Meylan
ESO No. Title of submitted programme and telescope(s)
06014 Search for distant clusters of unusual objects among unidentified EMSS sources(2.2m).
06015 Spectroscopic follow-up of ROSAT discovered X-ray sources in the "MaranoField" (3.6m).
03028 TIMMI observations and infrared photometry of obscured AGB stars in the LMC(3.6m).
03031 Testing the starburst paradigm in 30 Ooradus (2.2m).
ANNOUNCEMENT
ESOIEIpe Workshop onThe Light Element Abundances
Marciana Marina, Isola d'Elba22-28 May 1994
A joint ESO/EIPC workshop on the Light Element Abundances will be held from 22 to 28 May 1994, at the ElbaInternational Physics Center, Marciana Marina, Isola d'Elba,Italy.
The workshop is intended to discuss the theory and observations of the light elements (z<5) in relation to the followingtopics:
• Primordial Abundances• Elements at High Redshift• Stellar Processes• Interstellar Processes• Galactic Evolution• Isotopic effects
Organizing Committee:P. Crane (ESO), R. Ferlet (Paris), F. Ferrini (Pisa), O.L. Lambert(Austin), P. Molaro (Trieste), P. Nissen (Aarhus), B. Pagel (NOROITA), L. Pasquini (La Silla), G. Steigman (Columbus).
Contact Address:Phil Crane, European Southern ObservatoryKarl-Schwarzschild-Str.2, 0-85748 Garching bei München,Germanye-mail: crane CI eso.org fax: +4989320-06-480/320-23-62
ANNOUNCEMENT
ESO Workshop onaso Absorption Lines
ESO, Garehing21-24 November 1994
An ESO workshop on aso absorption lines will be held from21 to 24 November 1994, at the Headquarters of the EuropeanSouthern Observatory, Garching bei München, Germany.
The workshop is intended to discuss the theory and observa-tions of aso absorption lines in relation to the following topics:
• Galactic halo and interstellar medium• Low-redshift systems• Intrinsic absorption Iines and BAL systems• Ly-alpha clouds• Oamped systems• Metal systems• Probing the large scale structure• Probing the Universe at high redshifts
Organizing Committee:S. O'Odorico, G. Meylan, P. Petitjean, P. Shaver, J. Wampler,ESO.
Contact Address:Georges Meylan, European Southern ObservatoryKarl-Schwarzschild-Str.2, 0-85748 Garching bei Müncllen,Germanye-mail: gmeylan aeso.org fax: +4989320-06-480/320-23-62
The European Southern Observatory (ESO) is an intergovernmental organization responsible for astronomical research in the southernhemisphere. The eight member States of ESO are Belgium, Denmark, France, Germany, Italy, the Netherlands, Sweden and Switzerland.As the prime European astronomical centre, ESO occupies a leading position in the world's scientific community. Its research work is ofgreat value to many areas of science and industry.
Applications are invited for the position of (m/~:
Associate Director tor Science (ref. ESD205)
within the Science Division at the ESO Headquarters, in Garching near Munich, Germany.Assignment: a strong research-orientated scientific staff with diverse expertise is essential if ESO is to fulfil its mandate of providing and
maintaining an international competitive multi-telescope observatory for its community of users. Within this framework, the AssociateOirector for Science will be responsible to the Oirector General for the overall quality of scientific research at ESO, for guiding the rebuildingand expansion of the scientific staff in anticipation of the Very Large Telescope era, for coordinating the participation of the scientific staffin the VLT project and for revitalizing the ESO Fellowship and Studentship programmes. A further responsibility will be to ensure the broadparticipation of the European astronomical community in all ESO activities and in particular in the VLTNLT Interferometer programme.
Experience: the chosen candidate will have an outstanding record of achievement in one or more areas of modern astrophysics and willbe widely experienced in the use of large ground-based optical telescopes. This will be combined with excellent management andleadership skills.
Contractual conditions: the Associate Oirectorship is intended as a tenured staff appointment. Nevertheless, serious consideration willbe given to outstanding candidates willing to be seconded to ESO on extended leaves from their home institutions.
ESO remuneration and conditions: remuneration will be commensurate with background, experience and family status of theincumbent. The basic tax-free monthly salary will not be less than DM 12,402.-. To this may be added an expatriation allowance and otherallowances depending on family status.
ESO staff enjoy highly-favourable working conditions and have every opportunity to demonstrate their skills in an international andcreative environment equipped with advanced technologies.
Applications should specify the job reference and be submilted before October 31, 1993 to: The Oirector General, Prof. R. Giacconi,European Southern Observatory, Karl-Schwarzschild-Straße 2, 0-85748 Garching near Munich, Germany. Tel. (089) 32006250.
46

All meetings will take plaee in Garching.
The Proceedings of the Second ESO/CTIO Workshop on
Mass Loss on the AGB and Beyond
Tentative Time-Tableof Council Sessions and
Committee MeetingsSeientifie Technieal CommitteeFinanee CommitteeObserving Programmes CommitteeCouncil
November 4-5November 8-9November 25-26Oecember 1-2
The European Southern Observatory has positions availablefor 12 research students. Six of these positions are at the ESOHQ in Garching, the other six at the Observatory, La Silla, Chile.Since students normally stay approximately 2 years, this meansthat each year a total of 6 students (3 at each location) may beaccepted. These are applicable to any student enrolled in aPh.O. (or equivalent) programme in institutions in the memberstates.
Potential candidates or their supervisors may obtain detailedinformation about the programme by requesting the updatedbrochure and application forms from the Personnel Administration and General Services at ESO HQ, Karl-SchwarzschildStr. 2, 0-85748 Garching bei München, Germany.
There is now an annual closing date of 15 October for applications.
ESO Studentship Programme
ESO Users Manual 1993The new (1993) edition of the ESO Users Manual has justbecome available and been distributed to Institutes in the ESOmember States. Institutes which have not received a copymany obtain one on request addressed to the
ESO Visiting Astronomers ServiceKarl-Schwarzschild-Str. 20-85748 Garching b. München, Germany
(ESO Conference and Workshop Proceedings No. 46)
have now been published. The 479-p. volume, edited by H.E.Schwarz, is available at a price of DM 70,- (prepayment required).Payments have to be made to the ESO bank aceount 2102002with Commerzbank München or by cheque, addressed to theattention of
ESO, Financial ServicesKarl-Sehwarzschild-Str. 20-85748 Garching b. München, Germany
Please do not forget to indicate your eomplete address and thetitle of the Proceedings.
New ESO Preprints STAFF MOVEMENTSJune-August 1993
Scientific Preprints
920. T.R. Bedding: The Orbit of the Binary Star Delta Scorpii.Astronomical Journal.
921. F. Matteucci: lron and Magnesium Evolution in Giant EllipticalGalaxies. A Cimatti and S. di Serego Alighieri: Stellar andScattered Light in a Radio Galaxy at z=2.63.G. Marconi et al.: Chemical Evolution of Blue Compact Galaxies.Papers presented at the Kiel Conferenee "Panchromatic View ofGalaxies: their evolutionary puzzle".
922. C.M. Carollo et al.: Metallicity Gradients in Early-Type Galaxies.Monthly Notices of the Royal Astronomical Society.
923. P. Crane et al.: High Resolution Imaging of Galaxy Cores.Astronomical Journal.
924. N. Meyssonnier and M. Azzopardi: A New Catalogue of HaEmission-Line Stars and Small Nebulae in the Small MagellanieCloud. Astronomy and Astrophysics Suppl.
925. H. van Winckel et al.: An Atlas of High Resolution Line Profiles ofSymbiotie Stars. Part I: Coude Echelle Spectrometry of Southern Objects and a Classification System of Ha Line Profiles.Astronomy and Astrophysics.
926. Bo Reipurth and H. Zinnecker: Visual Binaries Among Pre-MainSequenee Stars. Astronomy and Astrophysics.
927. M. Heydari-Malayeri et al.: HOE 269828: A Reddened MassiveStar Cluster. Astronomy and Astrophysics.
928. M. Stiavelli et al.: Core Sub-Structure of Elliptical Galaxies: theCore Resolution Technique Applied to NGC 1399. Astronomyand Astrophysics.
929. J.K. Kotilainen and M.J. Ward: The Host Galaxies of SeyfertType 1 Nuclei. Monthly Notices of the Royal AstronomicalSociety.
930. A.F.M. Moorwood and E. Oliva: Infrared Spectroscopy of Starburst and Seyfert Galaxies. Invited paper to appear in CIRP5:Topical Conference on Infrared Astrophysics. Infrared Physics(ed. F.K. Kneubühl).
931. M.A. Prieto and W. Freudling: New Evidenee for an Anisotropie:Radiation Field in NGC 5252. The Astrophysical Journal.
932. S.G. Ojorgovski and G. Meylan: Appendices and Tables toappear in Structure and Dynamics of Globular Clusters - Proceedings of a Workshop held in Berkeley, California, July 15th to17th, 1992, to honour the 65th birthday of Ivan King.
Arrivals
Europe
SIML, Erieh (0), Clerk (General Services)TEUPKE, Svea (0). SecretaryZELLER; Kurt (CH), Head of PersonnelHUBERT, Georgette (0), SecretaryCUMANI, Claudio (I), AssoeiateHUIZINGA, Edwin (NL), FellowAUSSEM, Alexandre (F), CooperantPETERSON, Bruce (Aus), Guest ProfessorPETITJEAN, Patrick (F), Associate
Chile
KNEE, Lewis B.G. (Can.), Fellow (SEST)MANFROIO, Jean (B), Associate (Senior Visitor Progr.)CLAESKENS, Jean-Franyois (B), CooperantBRANONER, Wolfgang (0), Student
Departures
Europe
BEELEN, Marion (NL), SecretaryPLÖTZ, Franz (0), Electro-Mechanieal EngineerBECKERS, Jacques (USA), VLT Programme ScientistZAGO, Lorenzo (I), Engineer/PhysieistSIEBENMORGEN, Ralf (0), Fellow
Chile
WILD, Wolfgang (0), FellowSMETIE, Alain (B), CooperantiAssociate
933. M.H.O. Ulrich: The Energy Budget on the Irradiation Model ofQuasars. 2nd Workshop on Theory of Aecretion Oisks, MPIGarehing, March 1993.
934. F. Murtagh and M. Sarazin: Nowcasting Astronomical Seeing: aStudy of ESO La Silla and Paranal. Publications of theAstronomical Society of the Pacific.
47

48
935. C. Aspin et al.: Near-IR Spectroscopy and Imaging Photometry of M1-16: Bipolar H2 Jetsin a Post-AGB Transition Object. Astronomy and Astrophysics.
936. G. Meylan: Some Clues About the Dynamics of Globular Clusters from High-ResolutionObservations. Invited review in Ergodie Concepts in Stellar Dynamies, eds. D. Pfennigerand v.G. Gurzadyan (Berlin: Springer), in press.
937. L. Origlia et al.: The 1.5-1.7 Microns spectrum of Cool Stars: Une Identifications, Indicesfor Spectral Classification and the Stellar Content of the Seyfert Galaxy NGC 1068.Astronomy and Astrophysics.
938. L.F. Rodriguez and Bo Reipurth: the Exciting Source of the Herbig-Haro 111 Jet Complex:VLA Detection of a One-Sided Radio Jet. Astronomy and Astrophysics.
Technical Preprints
52. A.F.M. Moorwood: IR Instrumentation for the VLT. To appear in Proceedings of SPIEConference No. 1946 on Infrared Detectors and Instrumentation (ed. A. Fowler), Orlando,April 1993.
53. G. Finger et al.: Image Sharpening by On-Chip Tracking in IRAC2. To appear in Proc. ofSPIE Conference No. 1946 in Infrared Detectors and Instrumentation (ed. A. Fowler),Orlando, April 1993.
54. J.M. Beckers: Progress in High Resolution Astronomical Imaging Including Active andAdaptive Optics. Invited lecture at the 16th meeting of the International Commission forOptics, August 9-13,1993, Budapest.
55. N. Hubin et al.: Results of a System Study for the ESO Very Large Telescope AdaptiveOptics. To be published in the Proc. ICO-16 Satellite Conf. on "Active and AdaptiveOptics", Garching, August 2-5, 1993.
ContentsM.-H. Ulrich: A Message from the New Editor .
TELESCOPES AND INSTRUMENTATIONR. Mueller, H. Hoeness, J. Espiard, J. Paseri, P. Dierickx: The 8.2-m Primary
Mirrors of the VLT .H.U. Käufl: Ground-Based Astronomy in the 10 and 20 ~lm Atmospheric
Windows at ESO - Scientific Potential at Present and in the Future 8E. Gosset, P. Magain: On the Linearity of ESO CCD # 9 at CAT + CES 131. M. C. Abbott, P. Sinclaire: CCD Linearity at La Silla - a Status Report . . . . . . .. 17
SCIENCE WITH THE VLTJ. Lequeux: The Magellanic Clouds and the VLT 19M. Stiavelli: Nuclei of Non-Active Galaxies with the VLT . . . . . . . . . . . . . . . . . . .. 21R. Ferlet: From Planets to the Big Bang with High-Resolution Spectroscopy at
the VLT .. . . . . . . . . . . . . . . . . . . . . . . . . . . . . . . . . . . . . . . . . . . . . . . . . . . .. 25
REPORTS FROM OBSERVERSW. W. Zeilinger, P. M0l1er, M. Stiavelli: Probing the Properties of Elliptical
Galaxy Cores: Analysis of High Angular Resolution Observational Data . . .. 28C. Alard, A. Terzan, ,I. Guibert: Light Curves of Miras Towards the Galactic
Centre. . . . . . . . . . . . . . . . . . . . . . . . . . . . . . . . . . . . . . . . . . . . . . . . . . . . . .. 31M. Kissler, 1. Richtler: E. V. Held, E. K. Grebel, S. Wagner, M. Capaccioli: NGC
4636 - a Rich Globular Cluster System in aNormal Elliptical Galaxy . . . . . .. 32J. R. Walsh, J. Meaburn: Imaging the Globules in the Core of the Helix Nebula
(NGC 7293) . . . . . . . . . . . . . . . . . . . . . . . . . . . . . . . . . . . . . . . . . . . . . . . . . .. 35
OTHER ASTRONOMICAL NEWSF. Murtagh, W. W. Zeilinger, J.-L. Starck, H. Böhnhardt: Detection of Faint
Extended Structures by Multiresolution Wavelet Analysis . . . . . . . . . . . . . .. 37M.A. Albrecht, A. Heck: StarGates and StarWords - an On-Line Yellow Pages
Directory for Astronomy . . . . . . . . . . . . . . . . . . . . . . . . . . . . . . . . . . . . . . . .. 39
ANNOUNCEMENTSProgrammes Approved for Period 52 . . . . . . . . . . . . . . . . . . . . . . . . . . . . . . . . .. 41Announcement of ESO/EIPC Workshop on "The Light Element Abundances" .. 46Announcement of ESO Workshop on "OSO Absorption Lines" . . . . . . . . . . . . .. 46Associate Director for Science . . . . . . . . . . . . . . . . . . . . . . . . . . . . . . . . . . . . . .. 46ESO Studentship Programme. . . . . . . . . . . . . . . . . . . . . . . . . . . . . . . . . . . . . . .. 46ESO Users Manual 1993 . . . . . . . . . . . . . . . . . . . . . . . . . . . . . . . . . . . . . . . . . . .. 46Tentative Time-Table of Council Sessions and Committee Meetings. . . . . . . . .. 46Proceedings of Second ESO/CTIO Workshop on "Mass Loss on the AGB and
Beyond" . . . . . . . . . . . . . . . . . . . . . . . . . . . . . . . . . . . . . . . . . . . . . . . . . . . .. 46New ESO Preprints (June-August 1993) 47Staff Movements . . . . . . . . . . . . . . . . . . . . . . . . . . . . . . . . . . . . . . . . . . . . . . . . .. 47