MERIAN GLOBAL INVESTORS SERIES PLC (previously Old ...
907
MERIAN GLOBAL INVESTORS SERIES PLC (previously Old Mutual Global Investors Series Plc) An investment company with variable capital incorporated with limited liability in Ireland, established as an umbrella fund with segregated liability between Sub-Funds and authorised pursuant to the European Communities (Undertakings for Collective Investment in Transferable Securities) Regulations, 2011, as amended, and the Central Bank (Supervision and Enforcement) Act 2013 (Section 48(1)) (Undertakings for Collective Investment in Transferable Securities) Regulations 2015 (Registered Number 271517) Annual Report and Audited Financial Statements for the financial year ended 31 December 2018 This annual report may be translated into other languages. Any such translation shall be a direct translation of the English text. In the event of any inconsistency or ambiguity in relation to the meaning of any word or phrase in the translation, the English text will prevail. Any disputes as to the terms thereof shall be governed by, and construed in accordance with, the law of Ireland.
-
Upload
khangminh22 -
Category
Documents
-
view
1 -
download
0
Transcript of MERIAN GLOBAL INVESTORS SERIES PLC (previously Old ...
MERIAN GLOBAL INVESTORS SERIES PLC
(previously Old Mutual Global Investors Series Plc)
An investment company with variable capital incorporated with limited liability in
Ireland, established as an umbrella fund with segregated liability between Sub-Funds
and authorised pursuant to the European Communities (Undertakings for Collective
Investment in Transferable Securities) Regulations, 2011, as amended, and the Central
Bank (Supervision and Enforcement) Act 2013 (Section 48(1)) (Undertakings for
Collective Investment in Transferable Securities) Regulations 2015
(Registered Number 271517)
Annual Report and Audited Financial Statements
for the financial year ended 31 December 2018
This annual report may be translated into other languages. Any such translation shall be a
direct translation of the English text. In the event of any inconsistency or ambiguity in
relation to the meaning of any word or phrase in the translation, the English text will
prevail. Any disputes as to the terms thereof shall be governed by, and construed in
accordance with, the law of Ireland.
Merian Global Investors Series Plc Annual Report and Audited Financial Statements for the financial year ended 31 December 2018
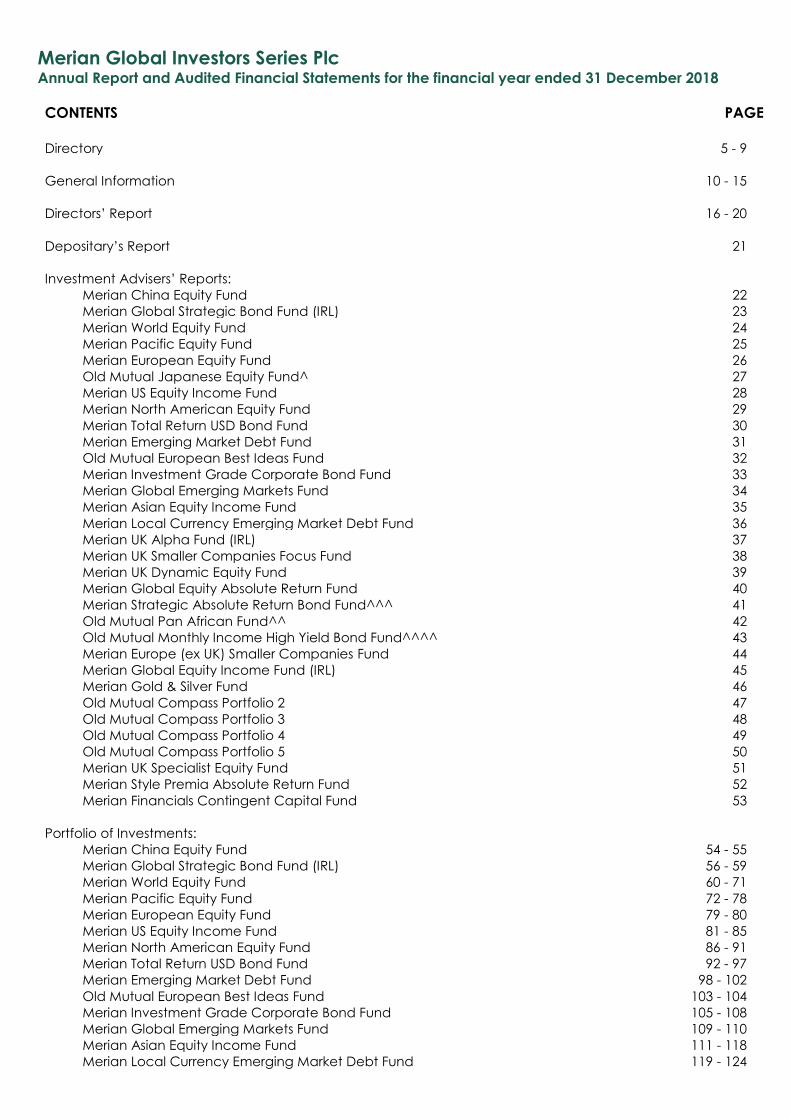
CONTENTS PAGE
Directory 5 - 9
General Information 10 - 15
Directors’ Report 16 - 20
Depositary’s Report 21
Investment Advisers’ Reports:
Merian China Equity Fund 22
Merian Global Strategic Bond Fund (IRL) 23
Merian World Equity Fund 24
Merian Pacific Equity Fund 25
Merian European Equity Fund 26
Old Mutual Japanese Equity Fund^ 27
Merian US Equity Income Fund 28
Merian North American Equity Fund 29
Merian Total Return USD Bond Fund 30
Merian Emerging Market Debt Fund 31
Old Mutual European Best Ideas Fund 32
Merian Investment Grade Corporate Bond Fund 33
Merian Global Emerging Markets Fund 34
Merian Asian Equity Income Fund 35
Merian Local Currency Emerging Market Debt Fund 36
Merian UK Alpha Fund (IRL) 37
Merian UK Smaller Companies Focus Fund 38
Merian UK Dynamic Equity Fund 39
Merian Global Equity Absolute Return Fund 40
Merian Strategic Absolute Return Bond Fund^^^ 41
Old Mutual Pan African Fund^^ 42
Old Mutual Monthly Income High Yield Bond Fund^^^^ 43
Merian Europe (ex UK) Smaller Companies Fund 44
Merian Global Equity Income Fund (IRL) 45
Merian Gold & Silver Fund 46
Old Mutual Compass Portfolio 2 47
Old Mutual Compass Portfolio 3 48
Old Mutual Compass Portfolio 4 49
Old Mutual Compass Portfolio 5 50
Merian UK Specialist Equity Fund 51
Merian Style Premia Absolute Return Fund 52
Merian Financials Contingent Capital Fund 53
Portfolio of Investments:
Merian China Equity Fund 54 - 55
Merian Global Strategic Bond Fund (IRL) 56 - 59
Merian World Equity Fund 60 - 71
Merian Pacific Equity Fund 72 - 78
Merian European Equity Fund 79 - 80
Merian US Equity Income Fund 81 - 85
Merian North American Equity Fund 86 - 91
Merian Total Return USD Bond Fund 92 - 97
Merian Emerging Market Debt Fund 98 - 102
Old Mutual European Best Ideas Fund 103 - 104
Merian Investment Grade Corporate Bond Fund 105 - 108
Merian Global Emerging Markets Fund 109 - 110
Merian Asian Equity Income Fund 111 - 118
Merian Local Currency Emerging Market Debt Fund 119 - 124
Merian Global Investors Series Plc Annual Report and Audited Financial Statements for the financial year ended 31 December 2018
CONTENTS (continued) PAGE
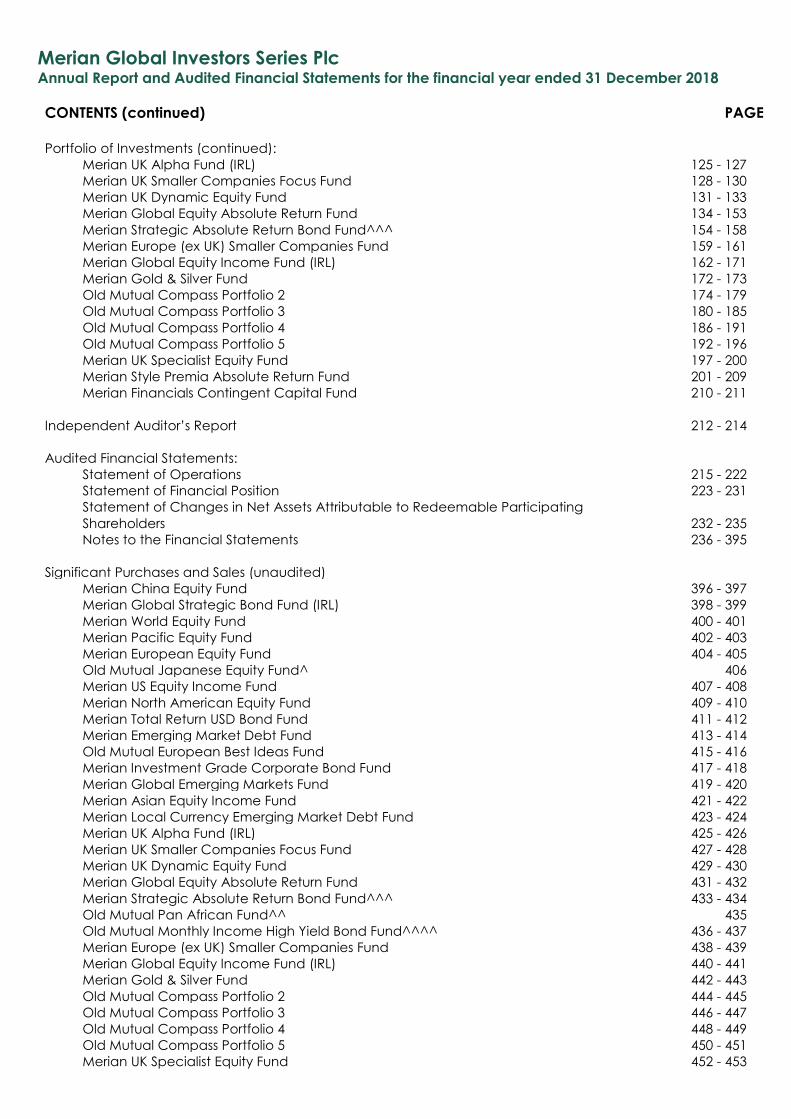
Portfolio of Investments (continued):
Merian UK Alpha Fund (IRL) 125 - 127
Merian UK Smaller Companies Focus Fund 128 - 130
Merian UK Dynamic Equity Fund 131 - 133
Merian Global Equity Absolute Return Fund 134 - 153
Merian Strategic Absolute Return Bond Fund^^^ 154 - 158
Merian Europe (ex UK) Smaller Companies Fund 159 - 161
Merian Global Equity Income Fund (IRL) 162 - 171
Merian Gold & Silver Fund 172 - 173 Old Mutual Compass Portfolio 2 174 - 179 Old Mutual Compass Portfolio 3 180 - 185 Old Mutual Compass Portfolio 4 186 - 191 Old Mutual Compass Portfolio 5 192 - 196 Merian UK Specialist Equity Fund 197 - 200 Merian Style Premia Absolute Return Fund 201 - 209 Merian Financials Contingent Capital Fund 210 - 211
Independent Auditor’s Report 212 - 214
Audited Financial Statements:
Statement of Operations 215 - 222
Statement of Financial Position 223 - 231
Statement of Changes in Net Assets Attributable to Redeemable Participating
Shareholders 232 - 235
Notes to the Financial Statements 236 - 395
Significant Purchases and Sales (unaudited)
Merian China Equity Fund 396 - 397
Merian Global Strategic Bond Fund (IRL) 398 - 399
Merian World Equity Fund 400 - 401
Merian Pacific Equity Fund 402 - 403
Merian European Equity Fund 404 - 405
Old Mutual Japanese Equity Fund^ 406
Merian US Equity Income Fund 407 - 408
Merian North American Equity Fund 409 - 410
Merian Total Return USD Bond Fund 411 - 412
Merian Emerging Market Debt Fund 413 - 414
Old Mutual European Best Ideas Fund 415 - 416
Merian Investment Grade Corporate Bond Fund 417 - 418
Merian Global Emerging Markets Fund 419 - 420
Merian Asian Equity Income Fund 421 - 422
Merian Local Currency Emerging Market Debt Fund 423 - 424
Merian UK Alpha Fund (IRL) 425 - 426
Merian UK Smaller Companies Focus Fund 427 - 428
Merian UK Dynamic Equity Fund 429 - 430
Merian Global Equity Absolute Return Fund 431 - 432
Merian Strategic Absolute Return Bond Fund^^^ 433 - 434
Old Mutual Pan African Fund^^ 435
Old Mutual Monthly Income High Yield Bond Fund^^^^ 436 - 437
Merian Europe (ex UK) Smaller Companies Fund 438 - 439
Merian Global Equity Income Fund (IRL) 440 - 441
Merian Gold & Silver Fund 442 - 443
Old Mutual Compass Portfolio 2 444 - 445
Old Mutual Compass Portfolio 3 446 - 447
Old Mutual Compass Portfolio 4 448 - 449
Old Mutual Compass Portfolio 5 450 - 451
Merian UK Specialist Equity Fund 452 - 453
Merian Global Investors Series Plc Annual Report and Audited Financial Statements for the financial year ended 31 December 2018
CONTENTS (continued) PAGE
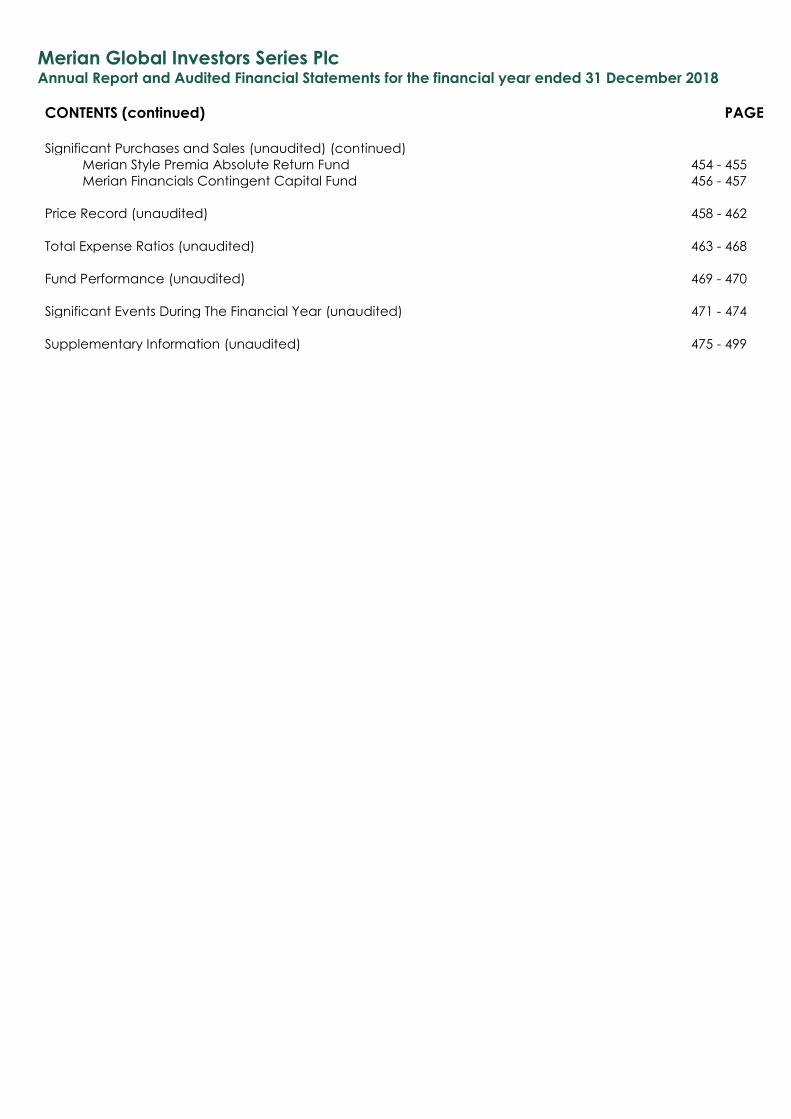
Significant Purchases and Sales (unaudited) (continued)
Merian Style Premia Absolute Return Fund 454 - 455
Merian Financials Contingent Capital Fund 456 - 457
Price Record (unaudited) 458 - 462
Total Expense Ratios (unaudited) 463 - 468
Fund Performance (unaudited) 469 - 470
Significant Events During The Financial Year (unaudited) 471 - 474
Supplementary Information (unaudited) 475 - 499
Merian Global Investors Series Plc Annual Report and Audited Financial Statements for the financial year ended 31 December 2018
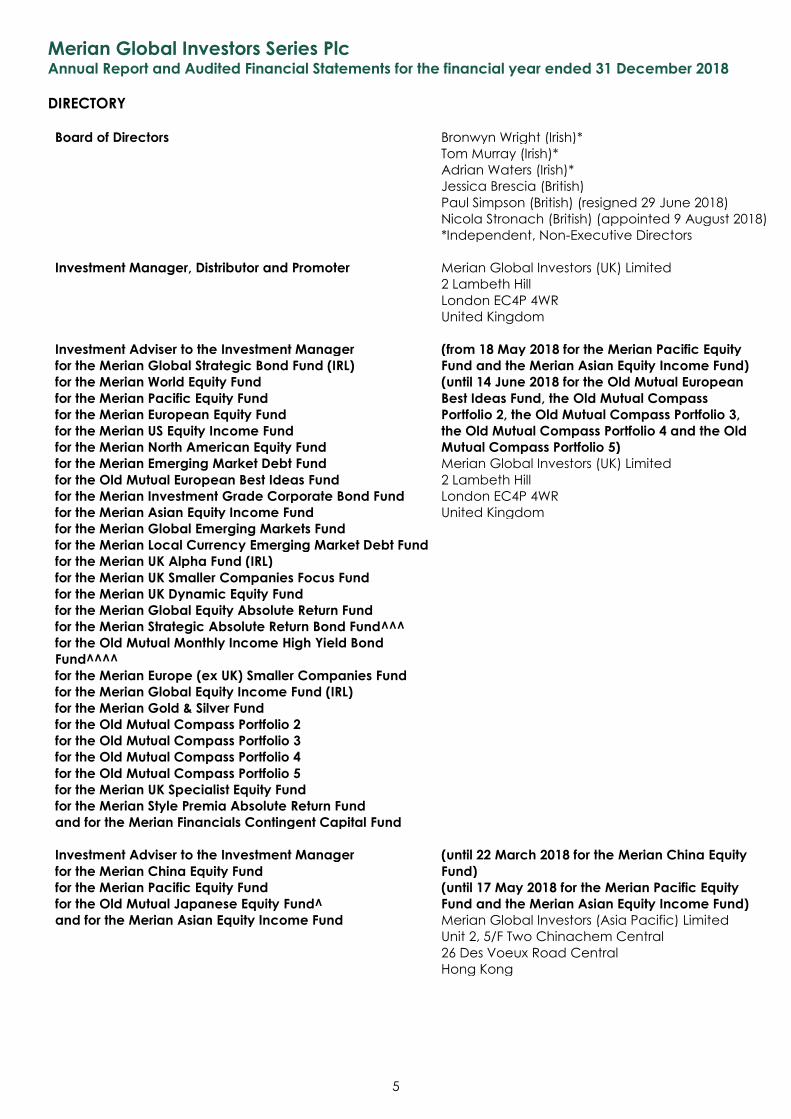
DIRECTORY
5
Board of Directors Bronwyn Wright (Irish)*
Tom Murray (Irish)*
Adrian Waters (Irish)*
Jessica Brescia (British)
Paul Simpson (British) (resigned 29 June 2018)
Nicola Stronach (British) (appointed 9 August 2018)
*Independent, Non-Executive Directors
Investment Manager, Distributor and Promoter Merian Global Investors (UK) Limited
2 Lambeth Hill
London EC4P 4WR
United Kingdom
Investment Adviser to the Investment Manager (from 18 May 2018 for the Merian Pacific Equity
for the Merian Global Strategic Bond Fund (IRL) Fund and the Merian Asian Equity Income Fund)
for the Merian World Equity Fund (until 14 June 2018 for the Old Mutual European
for the Merian Pacific Equity Fund Best Ideas Fund, the Old Mutual Compass
for the Merian European Equity Fund Portfolio 2, the Old Mutual Compass Portfolio 3,
for the Merian US Equity Income Fund the Old Mutual Compass Portfolio 4 and the Old
for the Merian North American Equity Fund Mutual Compass Portfolio 5)
for the Merian Emerging Market Debt Fund Merian Global Investors (UK) Limited
for the Old Mutual European Best Ideas Fund 2 Lambeth Hill
for the Merian Investment Grade Corporate Bond Fund London EC4P 4WR
for the Merian Asian Equity Income Fund United Kingdom
for the Merian Global Emerging Markets Fund
for the Merian Local Currency Emerging Market Debt Fund
for the Merian UK Alpha Fund (IRL)
for the Merian UK Smaller Companies Focus Fund
for the Merian UK Dynamic Equity Fund
for the Merian Global Equity Absolute Return Fund
for the Merian Strategic Absolute Return Bond Fund^^^
for the Old Mutual Monthly Income High Yield Bond
Fund^^^^
for the Merian Europe (ex UK) Smaller Companies Fund
for the Merian Global Equity Income Fund (IRL)
for the Merian Gold & Silver Fund
for the Old Mutual Compass Portfolio 2
for the Old Mutual Compass Portfolio 3
for the Old Mutual Compass Portfolio 4
for the Old Mutual Compass Portfolio 5
for the Merian UK Specialist Equity Fund
for the Merian Style Premia Absolute Return Fund
and for the Merian Financials Contingent Capital Fund
Investment Adviser to the Investment Manager (until 22 March 2018 for the Merian China Equity
for the Merian China Equity Fund Fund)
for the Merian Pacific Equity Fund (until 17 May 2018 for the Merian Pacific Equity
for the Old Mutual Japanese Equity Fund^ Fund and the Merian Asian Equity Income Fund)
and for the Merian Asian Equity Income Fund Merian Global Investors (Asia Pacific) Limited
Unit 2, 5/F Two Chinachem Central
26 Des Voeux Road Central
Hong Kong
Merian Global Investors Series Plc Annual Report and Audited Financial Statements for the financial year ended 31 December 2018
DIRECTORY (continued)
6
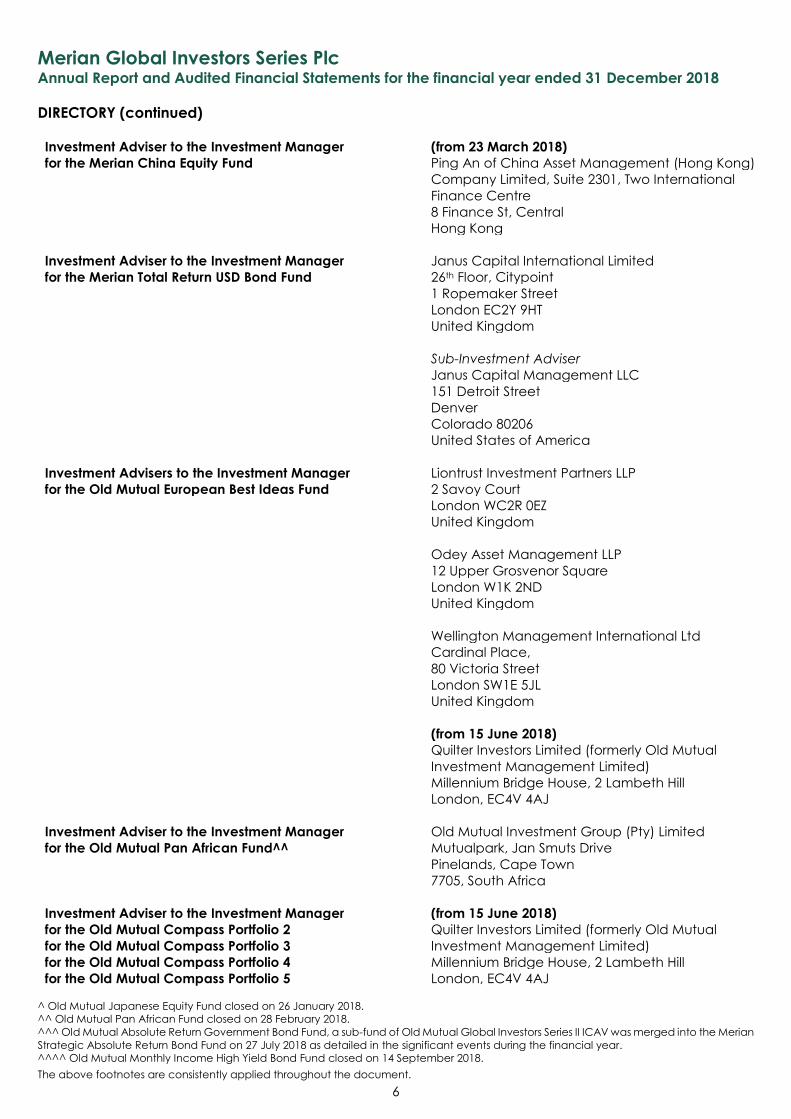
Investment Adviser to the Investment Manager (from 23 March 2018)
for the Merian China Equity Fund Ping An of China Asset Management (Hong Kong)
Company Limited, Suite 2301, Two International
Finance Centre
8 Finance St, Central
Hong Kong
Investment Adviser to the Investment Manager Janus Capital International Limited
for the Merian Total Return USD Bond Fund 26th Floor, Citypoint
1 Ropemaker Street
London EC2Y 9HT
United Kingdom
Sub-Investment Adviser
Janus Capital Management LLC
151 Detroit Street
Denver
Colorado 80206
United States of America
Investment Advisers to the Investment Manager Liontrust Investment Partners LLP
for the Old Mutual European Best Ideas Fund 2 Savoy Court
London WC2R 0EZ
United Kingdom
Odey Asset Management LLP
12 Upper Grosvenor Square
London W1K 2ND
United Kingdom
Wellington Management International Ltd
Cardinal Place,
80 Victoria Street
London SW1E 5JL
United Kingdom
(from 15 June 2018)
Quilter Investors Limited (formerly Old Mutual
Investment Management Limited)
Millennium Bridge House, 2 Lambeth Hill
London, EC4V 4AJ
Investment Adviser to the Investment Manager Old Mutual Investment Group (Pty) Limited
for the Old Mutual Pan African Fund^^ Mutualpark, Jan Smuts Drive
Pinelands, Cape Town
7705, South Africa
Investment Adviser to the Investment Manager (from 15 June 2018)
for the Old Mutual Compass Portfolio 2 Quilter Investors Limited (formerly Old Mutual
for the Old Mutual Compass Portfolio 3 Investment Management Limited)
for the Old Mutual Compass Portfolio 4 Millennium Bridge House, 2 Lambeth Hill
for the Old Mutual Compass Portfolio 5 London, EC4V 4AJ
^ Old Mutual Japanese Equity Fund closed on 26 January 2018.
^^ Old Mutual Pan African Fund closed on 28 February 2018.
^^^ Old Mutual Absolute Return Government Bond Fund, a sub-fund of Old Mutual Global Investors Series II ICAV was merged into the Merian
Strategic Absolute Return Bond Fund on 27 July 2018 as detailed in the significant events during the financial year.
^^^^ Old Mutual Monthly Income High Yield Bond Fund closed on 14 September 2018.
The above footnotes are consistently applied throughout the document.
Merian Global Investors Series Plc Annual Report and Audited Financial Statements for the financial year ended 31 December 2018
DIRECTORY (continued)
7
Depositary Citi Depositary Services Ireland Designated
Activity Company (formerly Citi Depositary
Services Ireland DAC)
1 North Wall Quay
Dublin 1
Ireland
Administrator, Registrar and Transfer Agent Citibank Europe plc
1 North Wall Quay
Dublin 1
D01 T8Y1
Ireland
Company Secretary Tudor Trust Limited
33 Sir John Rogerson’s Quay
Dublin 2
D02 XK09
Ireland
Registered Office 33 Sir John Rogerson’s Quay
Dublin 2
D02 XK09
Ireland
Auditor KPMG
1 Harbourmaster Place
International Financial Services Centre
Dublin 1
D01 F6F5
Ireland
Legal Advisers Dillon Eustace
33 Sir John Rogerson’s Quay
Dublin 2
D02 XK09
Ireland
Hong Kong Representative Merian Global Investors (Asia Pacific) Limited
24th Floor
Henley Building
5 Queen’s Road
Hong Kong
Paying Agent in Luxembourg BNP Paribas Securities Services
Luxembourg Branch
60 Avenue John F. Kennedy
1855 Luxembourg
Grand Duchy of Luxembourg
Paying Agent in Switzerland BNP Paribas Securities Services, Paris
Succursale de Zurich, Selnaustrasse 16
8001 Zurich
Switzerland
Merian Global Investors Series Plc Annual Report and Audited Financial Statements for the financial year ended 31 December 2018
DIRECTORY (continued)
8
Representative in Switzerland First Independent Fund Services Limited
Klausstrasse 33
8008 Zurich
Switzerland
Facilities Agent in the United Kingdom Merian Global Investors (UK) Limited
Millennium Bridge House, 2 Lambeth Hill
London EC4P 4WR
United Kingdom
French Centralising and Financial Agent BNP Paribas Securities Services
3 Rue d’Antin
75002, Paris
France
Paying Agent in Austria
Erste Bank der Oesterreichischen Sparkassen AG,
France
Graben 21
1010 Wien
Austria
Paying Agents in Chile Cruz del Sur, Corredora de Bolsa S.A.
Augusto Leguía 70
Piso 5
Las Condes
Santiago,
Chile
Larraín Vial S.A., Corredora de Bolsa
Avenida El Bosque Norte N0 0177, piso 3
Las Condes
Santiago,
Chile
Paying Agents in Italy Allfunds Bank, S.A.U.
Via Santa Margherita
720121 Milan
Italy
BNP Paribas Securities Services
Ansperto 5
20123 Milano
Italy
SGSS. S.p.A, Milan
Via Benigno Crespi n19A
MAC2,l
Italy
Paying Agent in Sweden Skandinaviska Enskilda Banken AB (publ)
Kungsträdgårdsgatan 8
SE-106 40
Stockholm
Sweden
Merian Global Investors Series Plc Annual Report and Audited Financial Statements for the financial year ended 31 December 2018
DIRECTORY (continued)
9
Private placement and Master Agent in Taiwan Capital Gateway Securities Investment Consulting
Enterprise
No. 171 Sung-De Road
Taipei 110
Taiwan
German Information Agent GerFIS – German Fund Information Service UG
Zum Eichhagen 4
21382 Brietlingen
Deutschland
Belgian Financial Agent Caceis Belgium SA
B – 1000 Brussels, Avenue du Port 86 C b320
Belgium
Copies of the Memorandum and Articles of Association, the Prospectus, the Key Investor Information documents,
the annual and semi-annual reports of the Company are available free of charge at the office of the
representative or agent of each jurisdiction.
Additionally, a list of the purchases and sales of each Sub-Fund made during the financial year of this report may
be obtained free of charge from the Representative in Switzerland.
The following Sub-Funds are not authorised in Hong Kong and not available to Hong Kong residents:
Merian China Equity Fund
Merian US Equity Income Fund
Old Mutual European Best Ideas Fund
Merian Investment Grade Corporate Bond Fund
Merian Global Emerging Markets Fund
Merian Local Currency Emerging Market Debt Fund
Merian UK Smaller Companies Focus Fund
Merian UK Dynamic Equity Fund
Merian Global Equity Absolute Return Fund
Merian Strategic Absolute Return Bond Fund^^^
Old Mutual Compass Portfolio 2
Old Mutual Compass Portfolio 3
Old Mutual Compass Portfolio 4
Old Mutual Compass Portfolio 5
Merian UK Specialist Equity Fund
Merian Style Premia Absolute Return Fund
Merian Financials Contingent Capital Fund
The following Sub-Funds are not authorised in Sweden and not available to Swedish residents:
Merian Europe (ex UK) Smaller Companies Fund
Old Mutual Compass Portfolio 2
Old Mutual Compass Portfolio 3
Old Mutual Compass Portfolio 4
Old Mutual Compass Portfolio 5
Merian Global Investors Series Plc Annual Report and Audited Financial Statements for the financial year ended 31 December 2018
GENERAL INFORMATION
10
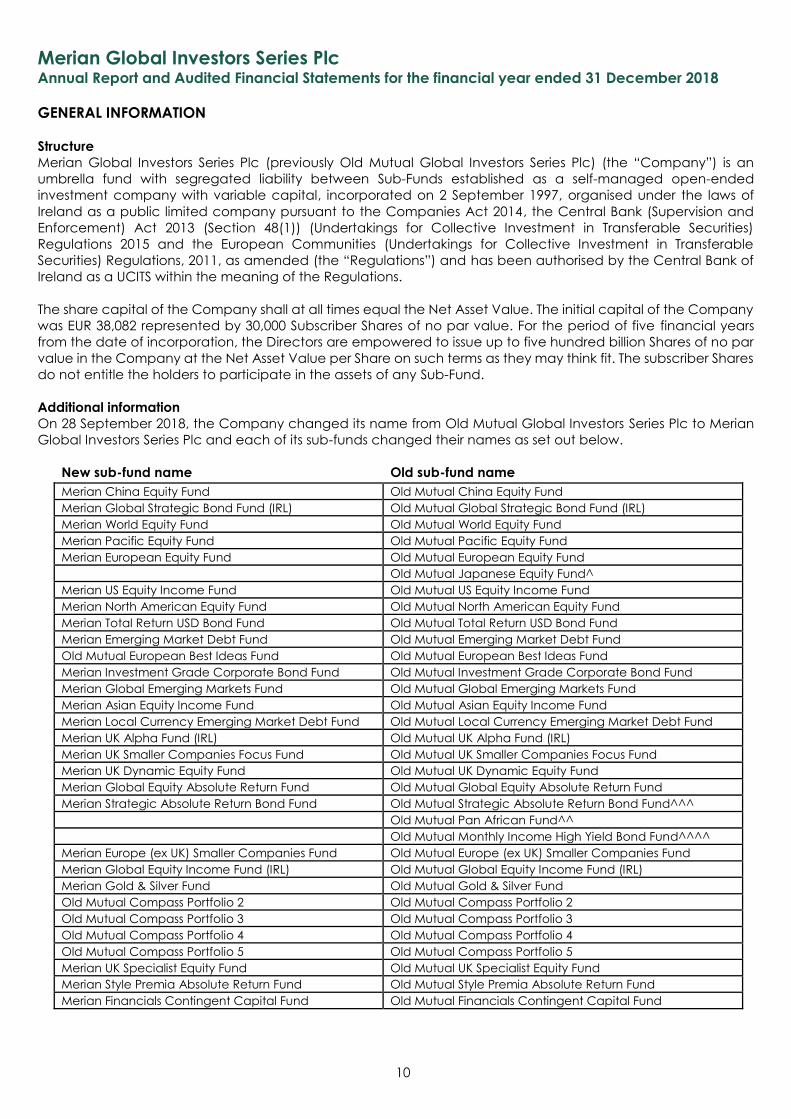
Structure
Merian Global Investors Series Plc (previously Old Mutual Global Investors Series Plc) (the “Company”) is an
umbrella fund with segregated liability between Sub-Funds established as a self-managed open-ended
investment company with variable capital, incorporated on 2 September 1997, organised under the laws of
Ireland as a public limited company pursuant to the Companies Act 2014, the Central Bank (Supervision and
Enforcement) Act 2013 (Section 48(1)) (Undertakings for Collective Investment in Transferable Securities)
Regulations 2015 and the European Communities (Undertakings for Collective Investment in Transferable
Securities) Regulations, 2011, as amended (the “Regulations”) and has been authorised by the Central Bank of
Ireland as a UCITS within the meaning of the Regulations.
The share capital of the Company shall at all times equal the Net Asset Value. The initial capital of the Company
was EUR 38,082 represented by 30,000 Subscriber Shares of no par value. For the period of five financial years
from the date of incorporation, the Directors are empowered to issue up to five hundred billion Shares of no par
value in the Company at the Net Asset Value per Share on such terms as they may think fit. The subscriber Shares
do not entitle the holders to participate in the assets of any Sub-Fund.
Additional information
On 28 September 2018, the Company changed its name from Old Mutual Global Investors Series Plc to Merian
Global Investors Series Plc and each of its sub-funds changed their names as set out below.
New sub-fund name Old sub-fund name
Merian China Equity Fund Old Mutual China Equity Fund
Merian Global Strategic Bond Fund (IRL) Old Mutual Global Strategic Bond Fund (IRL)
Merian World Equity Fund Old Mutual World Equity Fund
Merian Pacific Equity Fund Old Mutual Pacific Equity Fund
Merian European Equity Fund Old Mutual European Equity Fund
Old Mutual Japanese Equity Fund^
Merian US Equity Income Fund Old Mutual US Equity Income Fund
Merian North American Equity Fund Old Mutual North American Equity Fund
Merian Total Return USD Bond Fund Old Mutual Total Return USD Bond Fund
Merian Emerging Market Debt Fund Old Mutual Emerging Market Debt Fund
Old Mutual European Best Ideas Fund Old Mutual European Best Ideas Fund
Merian Investment Grade Corporate Bond Fund Old Mutual Investment Grade Corporate Bond Fund
Merian Global Emerging Markets Fund Old Mutual Global Emerging Markets Fund
Merian Asian Equity Income Fund Old Mutual Asian Equity Income Fund
Merian Local Currency Emerging Market Debt Fund Old Mutual Local Currency Emerging Market Debt Fund
Merian UK Alpha Fund (IRL) Old Mutual UK Alpha Fund (IRL)
Merian UK Smaller Companies Focus Fund Old Mutual UK Smaller Companies Focus Fund
Merian UK Dynamic Equity Fund Old Mutual UK Dynamic Equity Fund
Merian Global Equity Absolute Return Fund Old Mutual Global Equity Absolute Return Fund
Merian Strategic Absolute Return Bond Fund Old Mutual Strategic Absolute Return Bond Fund^^^
Old Mutual Pan African Fund^^
Old Mutual Monthly Income High Yield Bond Fund^^^^
Merian Europe (ex UK) Smaller Companies Fund Old Mutual Europe (ex UK) Smaller Companies Fund
Merian Global Equity Income Fund (IRL) Old Mutual Global Equity Income Fund (IRL)
Merian Gold & Silver Fund Old Mutual Gold & Silver Fund
Old Mutual Compass Portfolio 2 Old Mutual Compass Portfolio 2
Old Mutual Compass Portfolio 3 Old Mutual Compass Portfolio 3
Old Mutual Compass Portfolio 4 Old Mutual Compass Portfolio 4
Old Mutual Compass Portfolio 5 Old Mutual Compass Portfolio 5
Merian UK Specialist Equity Fund Old Mutual UK Specialist Equity Fund
Merian Style Premia Absolute Return Fund Old Mutual Style Premia Absolute Return Fund
Merian Financials Contingent Capital Fund Old Mutual Financials Contingent Capital Fund
Merian Global Investors Series Plc Annual Report and Audited Financial Statements for the financial year ended 31 December 2018
GENERAL INFORMATION (continued)
11
Investment Objectives of the Sub-Funds
Merian China Equity Fund
The objective of the Merian China Equity Fund is to seek to achieve long-term capital appreciation by investing
in a well-diversified portfolio of equity securities issued by companies with either the predominant part of their
assets in, or the predominant part of their revenues derived from, the People’s Republic of China, Hong Kong
and/or Taiwan that are listed, traded or dealt in on Regulated Markets in the People’s Republic of China, Hong
Kong, Taiwan, the United States of America (“US”), Singapore, Korea, Thailand and Malaysia or in a member
state of the Organisation for Economic Co-Operation and Development (“OECD”).
Merian Global Strategic Bond Fund (IRL)
The objective of the Merian Global Strategic Bond Fund (IRL) is to seek to achieve total return through worldwide
investment primarily in a diversified portfolio of fixed and variable rate debt securities.
Merian World Equity Fund
The objective of the Merian World Equity Fund is to seek to achieve asset growth through investment in a well-
diversified portfolio of securities of issuers worldwide. It is not proposed to concentrate investments in any one
geographical region, industry or sector.
Merian Pacific Equity Fund
The objective of the Merian Pacific Equity Fund is to seek to achieve asset growth through investment in a well-
diversified portfolio of securities of Pacific region issuers or of issuers established outside the Pacific region which
have a predominant proportion of their assets or business operations in the Pacific region. It is not proposed to
concentrate investments in any one industry or sector.
Merian European Equity Fund
The objective of the Merian European Equity Fund is to seek to achieve asset growth through investment in a
well-diversified portfolio of securities of European issuers, of issuers established outside Europe which have a
predominant proportion of their assets or business operations in Europe, or of securities listed or having a listing
on a European exchange. It is not proposed to concentrate investments in any one industry or sector.
Old Mutual Japanese Equity Fund^
The objective of the Old Mutual Japanese Equity Fund^ was to seek to achieve asset growth through investment
in a well-diversified portfolio of securities of Japanese issuers or of issuers established outside Japan which had a
predominant proportion of their assets or business operations in Japan. It was not proposed to concentrate
investments in any one industry or sector.
Merian US Equity Income Fund
The objective of the Merian US Equity Income Fund is to seek to achieve asset growth through investment in a
diversified portfolio of equity and equity-related securities.
Merian North American Equity Fund
The objective of the Merian North American Equity Fund is to seek to achieve long term capital growth through
the active management of a diversified portfolio invested primarily in North American stock markets. It is not
proposed to concentrate investments in any one industry or sector.
Merian Total Return USD Bond Fund
The objective of the Merian Total Return USD Bond Fund is to seek to maximise total return consistent with
preservation of capital and prudent investment management.
Merian Emerging Market Debt Fund
The objective of the Merian Emerging Market Debt Fund is to seek to achieve asset growth through investment
in a well-diversified portfolio of fixed and variable rate debt securities issued in Emerging Markets.
Merian Global Investors Series Plc Annual Report and Audited Financial Statements for the financial year ended 31 December 2018
GENERAL INFORMATION (continued)
12
Investment Objectives of the Sub-Funds (continued)
Old Mutual European Best Ideas Fund
The objective of the Old Mutual European Best Ideas Fund is to seek to achieve asset growth through investment
in a well-diversified portfolio of equities or equity-related securities of European issuers or of issuers established
outside Europe which have a predominant proportion of their assets and/or business operations in Europe.
Merian Investment Grade Corporate Bond Fund
The objective of the Merian Investment Grade Corporate Bond Fund is to seek to achieve income and capital
growth predominantly through investment in a well-diversified portfolio of credit securities rated Investment
Grade.
Merian Global Emerging Markets Fund
The objective of the Merian Global Emerging Markets Fund is to seek to achieve asset growth through investment
in a well-diversified portfolio of equity securities of issuers in the Emerging Markets or of issuers established outside
of the Emerging Markets, which have a predominant proportion of their assets or business operations in the
Emerging Markets and which are listed, traded or dealt in on a Regulated Market worldwide. It is not proposed
to concentrate investments in any one industry or sector.
Merian Asian Equity Income Fund
The objective of the Merian Asian Equity Income Fund is to seek to achieve a total return through a combination
of income and capital growth.
Merian Local Currency Emerging Market Debt Fund
The objective of the Merian Local Currency Emerging Market Debt Fund is to seek to achieve total return through
investment in a well-diversified portfolio of fixed and variable rate debt securities issued in the Emerging Markets
worldwide and which are primarily denominated in the local currency of the issuer.
Merian UK Alpha Fund (IRL)
The objective of the Merian UK Alpha Fund (IRL) is to seek to achieve capital appreciation.
Merian UK Smaller Companies Focus Fund
The objective of the Merian UK Smaller Companies Focus Fund aims to provide capital growth from investing
primarily in an equity portfolio of UK smaller companies. Smaller companies are defined for this purpose as those
companies which are quoted on a Regulated Market and which have a market capitalisation no greater than
the largest company in the Numis Smaller Companies Index at the time of initial investment. The Numis Smaller
Companies Index is designed to monitor the performance of the smaller companies sector.
Merian UK Dynamic Equity Fund
The investment objective of the Merian UK Dynamic Equity Fund is to achieve capital appreciation by taking
long and short positions principally in UK equities outside of the FTSE 100 Index.
Merian Global Equity Absolute Return Fund
The investment objective of the Merian Global Equity Absolute Return Fund is capital appreciation while closely
controlling risk. In addition, the Sub-Fund intends to deliver absolute returns that have a low correlation with equity
and bond markets.
Merian Strategic Absolute Return Bond Fund^^^ The investment objective of the Merian Strategic Absolute Return Bond Fund^^^ is to seek to deliver positive total
returns on a rolling twelve month basis with stable levels of volatility uncorrelated to bond and equity market
conditions.
Merian Global Investors Series Plc Annual Report and Audited Financial Statements for the financial year ended 31 December 2018
GENERAL INFORMATION (continued)
13
Investment Objectives of the Sub-Funds (continued)
Old Mutual Pan African Fund^^
The investment objective of the Old Mutual Pan African Fund^^ was to seek to achieve long term capital growth
by investing in companies that directly benefitted from long term economic growth opportunities in the African
continent.
Old Mutual Monthly Income High Yield Bond Fund^^^^
The objective of the Old Mutual Monthly Income High Yield Bond Fund^^^^ was to seek to achieve a total return
through a combination of income and capital growth from a well-diversified portfolio predominantly comprising
of fixed and variable rate debt securities located worldwide.
Merian Europe (ex UK) Smaller Companies Fund
The investment objective of the Merian Europe (ex UK) Smaller Companies Fund is to achieve long term capital
growth through investing primarily in an equity portfolio of smaller companies incorporated in Europe (excluding
the United Kingdom) or of companies incorporated outside of Europe (excluding the UK) which have a
predominant proportion of their assets and/or business operations in Europe (excluding the UK).
Merian Global Equity Income Fund (IRL)
The investment objective of the Merian Global Equity Income Fund (IRL) is to seek to achieve a total return
through a combination of income and capital growth.
Merian Gold & Silver Fund
The investment objective of the Merian Gold & Silver Fund is to seek to achieve a total return by investing
predominantly in listed equities.
Old Mutual Compass Portfolio 2
The investment objective of the Old Mutual Compass Portfolio 2 is to generate a long-term total return.
Old Mutual Compass Portfolio 3
The investment objective of the Old Mutual Compass Portfolio 3 is to generate a long-term total return.
Old Mutual Compass Portfolio 4
The investment objective of the Old Mutual Compass Portfolio 4 is to generate a long-term total return.
Old Mutual Compass Portfolio 5
The investment objective of the Old Mutual Compass Portfolio 5 is to generate a long-term total return.
Merian UK Specialist Equity Fund
The investment objective of the Merian UK Specialist Equity Fund is to seek to achieve capital appreciation by
taking long and short positions mainly in UK equities outside the FTSE 100 Index, whilst seeking to deliver absolute
returns in all market conditions.
Merian Style Premia Absolute Return Fund
The investment objective of the Merian Style Premia Absolute Return Fund is to seek to deliver positive total returns
on a rolling twelve month basis with stable levels of volatility uncorrelated to bond and equity market conditions.
Merian Financials Contingent Capital Fund
The investment objective of the Merian Financials Contingent Capital Fund is to seek to achieve a total return
through a combination of income and capital growth from a portfolio of primarily fixed and variable rate debt
securities issued by financial institutions with minimum capital requirements, such as insurers and banks.
Merian Global Investors Series Plc Annual Report and Audited Financial Statements for the financial year ended 31 December 2018
GENERAL INFORMATION (continued)
14
Distribution Policy
Distributions to holders of Redeemable Participating Shares are recorded in the Statement of Operations as
finance costs. Distributions paid and proposed during the financial years ended 31 December 2018, and 31
December 2017 with respect to certain share classes are outlined in Note 10. All of the other Sub-Funds’ income
and capital gains were reinvested in accordance with the investment objective and policy of the Sub-Funds.
The Company will declare a dividend in respect of the Classes of Shares of the Sub-Funds as set out in the
Prospectus of the Company. For all Classes of Shares that are not distributing, the Sub-Fund’s income and capital
gains will be reinvested in accordance with the investment objectives and investment policies of the Sub-Fund.
Dilution Adjustment
On any Dealing Day the Directors may determine when there are net inflows into a Sub-Fund or net outflows
from a Sub-Fund to apply a dilution adjustment to the dealing Net Asset Value per Share so that the price of a
Share in the Sub-Fund is above or below that which would have resulted from a latest available market valuation.
This adjustment is intended to pass the estimated costs of underlying investment activity of the Sub-Fund to the
active Shareholders by adjusting the Net Asset Value of the relevant classes of Shares and thus to protect the
Sub-Fund’s long-term Shareholders from costs associated with ongoing subscription and redemption activity.
These costs may include dealing charges, commissions and the effects of dealing at prices other than the middle
market price. The price of each Class of Share in a Sub-Fund will be calculated separately but any dilution
adjustment will affect the price of Shares of each Class in a Sub-Fund in an identical manner.
Investment Risks
An investment in any Sub-Fund involves investment risks, including possible loss of the amount invested. Moreover,
there can be no assurance that a Sub-Fund will achieve its investment objective.
Taxation
As an investment undertaking within the meaning of Section 739(B) of the Taxes Consolidation Act 1997, as
amended, the Company is generally exempt from Irish tax on its income and gains and the Company will not
be required to account for any tax in respect of Shareholders who are not Irish residents or exempt Irish residents
provided that the signed necessary declarations are in place. The Company may be required to account for
tax in respect of Shareholders who are Irish residents. Shareholders who are not Irish residents and have made
the required declaration of non-residence will not be liable to Irish tax on income from their Shares or gains made
on the disposal of their Shares, provided the Shares are not attributable to an Irish branch or agency of such
shareholder. No stamp duty or other tax is generally payable in Ireland on the subscription, issue, holding,
redemption, conversion or transfer of Shares.
Selling Restrictions
The Shares may not be purchased or held by US persons unless pursuant to an exemption under applicable US
law and may not be offered or sold in any jurisdiction in which such offer or sale is not lawful or in which the
person making such offer or sale is not qualified to do so or to anyone to whom it is unlawful to make such an
offer or sale.
Dealing Days
A Dealing Day in respect of all of the Sub-Funds means every Business Day (as defined for each Sub-Fund in the
Prospectus) or such other days as the Directors may determine provided that there shall be at least one Dealing
Day each fortnight.
Merian Global Investors Series Plc Annual Report and Audited Financial Statements for the financial year ended 31 December 2018
GENERAL INFORMATION (continued)
15
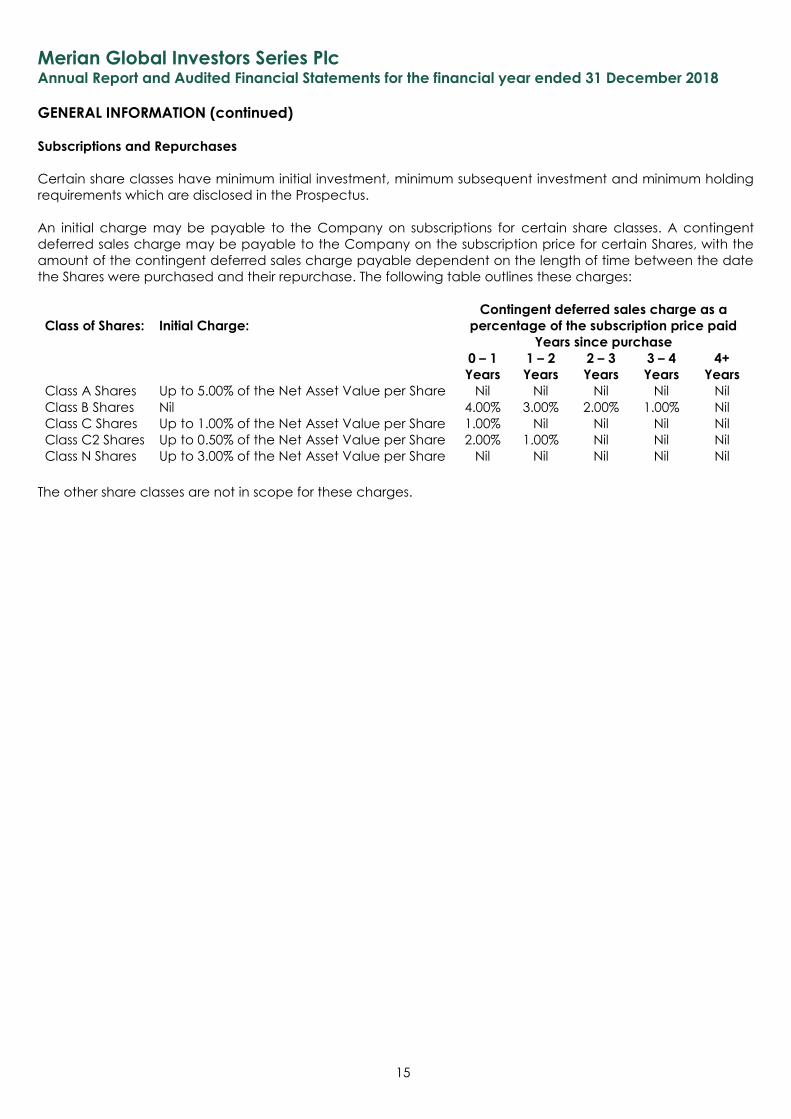
Subscriptions and Repurchases
Certain share classes have minimum initial investment, minimum subsequent investment and minimum holding
requirements which are disclosed in the Prospectus.
An initial charge may be payable to the Company on subscriptions for certain share classes. A contingent
deferred sales charge may be payable to the Company on the subscription price for certain Shares, with the
amount of the contingent deferred sales charge payable dependent on the length of time between the date
the Shares were purchased and their repurchase. The following table outlines these charges:
Class of Shares: Initial Charge:
Contingent deferred sales charge as a
percentage of the subscription price paid
Years since purchase
0 – 1
Years
1 – 2
Years
2 – 3
Years
3 – 4
Years
4+
Years
Class A Shares Up to 5.00% of the Net Asset Value per Share Nil Nil Nil Nil Nil
Class B Shares Nil 4.00% 3.00% 2.00% 1.00% Nil
Class C Shares Up to 1.00% of the Net Asset Value per Share 1.00% Nil Nil Nil Nil
Class C2 Shares Up to 0.50% of the Net Asset Value per Share 2.00% 1.00% Nil Nil Nil
Class N Shares Up to 3.00% of the Net Asset Value per Share Nil Nil Nil Nil Nil
The other share classes are not in scope for these charges.
Merian Global Investors Series Plc Annual Report and Audited Financial Statements for the financial year ended 31 December 2018
DIRECTORS’ REPORT
16
The Directors submit their annual report together with the audited financial statements for the financial year
ended 31 December 2018.
Principal Activities
As at 31 December 2018, the Company consisted of 32 Sub-Funds (the “Sub-Funds”) of which 29 are in operation
at financial year end (2017: 32).
Business Review, Results and Future Development
A more comprehensive overview of the Company’s investment activities and the analysis of the Company’s key
performance indicator (‘KPIs’), such as the performance of the relevant Sub-Funds is detailed in the Investment
Advisers’ Reports.
The results for the financial year are set out in the Statement of Operations and the assets and liabilities are set
out in the Statement of Financial Position. Details of the Company’s share capital and changes during the
financial year under review are disclosed in the Statement of Changes in Net Assets Attributable to Redeemable
Participating Shareholders. Significant shareholders are disclosed in Note 5.
The Company intends to continue promoting and generating interest in its business in the future.
The impact of the Brexit vote has resulted in some uncertainty for the financial industry. While it is still too soon to
judge the full impact of the UK’s decision to leave the EU, as Directors of the Company, we maintain that Europe
is a core market for distribution of the Sub-Funds and will remain so. To this end, Shareholders were notified by
way of a Shareholder Notice issued on 22nd February, of a proposal to appoint a UCITS management company,
Merian Global Investors (Europe) Limited (“MGIEL”), to act as Manager of the Company. MGIEL is authorized by
the Central Bank to act as a UCITS management company pursuant to the Regulations and an Alternative
Investment Fund Manager (AIFM) pursuant to the European Communities (Alternative Investment Fund
Managers) Regulations, 2013, as amended. The rationale for the proposed appointment is primarily to ensure
that the Company has an EU domiciled fund management company, post Brexit, so the Funds of the Company
can continue to be marketed within the EEA. It is expected that once the proposed appointment has taken
effect the Funds of the Company can continue to be marketed within the EEA on a cross-border basis by the
Manager. The proposed appointment will also have the effect of enhancing the Company’s corporate
governance structure in an evolving regulatory environment. The emergence of the management company as
the preferred organisational and corporate governance structure for UCITS funds is a reflection of the additional
regulatory obligations and requirements imposed by the Central Bank and the increasing administrative
complexity associated with the operation of UCITS funds.
There is a risk that Brexit, other political developments or developments otherwise affecting market confidence
may result in outflows of assets from investment portfolios with exposure to the UK, which could include asset
portfolios held by the company. Due to the size and importance of the UK economy in the global economy,
particularly with respect to the UK financial services market, as well as the uncertainty and unpredictability
concerning the UK’s legal, political, financial and economic relationship with the EU after Brexit, there may
continue to be instability in the national and international financial markets, significant currency fluctuations and
otherwise adverse effects on consumer confidence for the foreseeable future, including beyond the date of the
UK’s withdrawal from the EU.
Dividends
Distributions paid and proposed during the financial years ended 31 December 2018 and 31 December 2017 are
detailed in Note 10.
Principal Risks, Risk Management Objectives and Policies
The main risks arising from the Company’s financial instruments are market risk (including market price risk, interest
rate risk and currency risk), liquidity risk and credit risk. In order to manage such risks the Company shall comply
with the investment restrictions and diversification limits provided for in the Prospectus and the UCITS Regulations.
Details of the principal risks, risk management objectives and policies associated with investment in the Company
are listed in Note 11.
Merian Global Investors Series Plc Annual Report and Audited Financial Statements for the financial year ended 31 December 2018
DIRECTORS’ REPORT (continued)
17
Significant Events During the Financial Year
The significant events during the financial year are detailed on pages 471 to 474.
Securities Financing Transactions Regulation
Securities Financing Transactions Regulation (Regulation (EU) 2015/2365) (“SFTR”) came into force on 12 January
2016 and, amongst other requirements, introduces new disclosure requirements in the Company's annual and
semi-annual reports published after 13 January 2017 detailing the Companies use of securities financing
transactions. As a result, additional disclosures have been included in the Supplemental Information (unaudited)
to the annual financial statements.
Subsequent Events
Events subsequent to the Statement of Financial Position date are detailed in Note 13.
Employees
There were no employees of the Company during the financial year under review or during the prior financial
year.
Segregated Liability of Sub-Funds
The Company is an umbrella fund with segregated liability between Sub-Funds.
Directors
The Directors of the Company during the year ended 31 December 2018 were:
Nationality
Bronwyn Wright Irish
Tom Murray Irish
Adrian Waters Irish
Jessica Brescia British
Nicola Stronach (appointed 9 August 2018) British
Paul Simpson (resigned 29 June 2018) British
The Articles of Association do not stipulate a retirement age for Directors and do not provide for retirement of
Directors by rotation.
All of the Directors have served for the entire financial year, with the exception of Nicola Stronach, who was
appointed as a director of the Company on 9 August 2018, and Paul Simpson, who resigned as a director of
the Company on 29 June 2018. Directors’ remuneration paid and payable during the financial years ended 31
December 2018 and 31 December 2017 are detailed in Note 5. All expenses paid to Directors were non-taxable
in line with Section 305 of the Companies Act 2014.
Directors' and Company Secretary's Interests in Shares and Contracts
All Directors and the Company Secretary who held office at 31 December 2018 and at 31 December 2017 had
no interest in the share capital of the Company or group undertakings of the Company.
Transactions Involving Directors
The Board of Directors are not aware of any contracts or arrangements of any significance in relation to the
business of the Company in which the Directors had any interest as defined in Section 329 of the Companies Act
2014 at any time during the financial year ended 31 December 2018 (2017: Nil).
As at 31 December 2018, Jessica Brescia and Nicola Stronach are employees of the Investment Manager,
Merian Global Investors (UK) Limited (2017: Jessica Brescia and Paul Simpson).
Merian Global Investors Series Plc Annual Report and Audited Financial Statements for the financial year ended 31 December 2018
DIRECTORS’ REPORT (continued)
18
Corporate Governance Code
The Company has adopted in full the voluntary Code of Corporate Governance ("the Corporate Governance
Code") for Collective Investment Schemes and Management Companies issued by the Irish Funds (“IF”), the text
of which is available from the IF website, www.irishfunds.ie. The Company has been in compliance with the
Corporate Governance Code during the financial year ended 31 December 2018.
Connected Person Transactions
In accordance with the requirements of the Central Bank UCITS Regulations, any transaction carried out with the
Company by its Manager, Depositary, Investment Adviser and/or associated or group companies of these
entities (“connected person”) must be carried out as if negotiated at arm’s length. Such transactions must be in
the best interests of the shareholders. In addition to those transactions, there are also transactions carried out by
connected persons on behalf of the Company to which the Directors have no direct access and in respect of
which the Directors must rely upon assurances from its delegates that the connected persons carrying out these
transactions do carry them out on a similar basis.
The Board of Directors are satisfied that: (i) there are arrangements (evidenced by written procedures) in place
to ensure that the obligations set out in Central Bank of Ireland’s UCITS Regulations are applied to all transactions
with connected parties; and (ii) transactions with connected parties entered into during the financial year
complied with the obligations set out in the UCITS Regulations.
Although not deemed to be related parties under FRS 102 as they do not exercise significant influence over the
activities of the Company, UCITS Regulations also deems a “Depositary” and its “associated or group
companies” to be related parties to the Company. As such, Citi Depositary Services Ireland DAC, the Depositary,
and Citibank Europe plc, the Administrator, are related parties to the Company. During the financial year, Citi
Depositary Services Ireland DAC and Citibank Europe plc earned fees for provision of depositary and
administration services to the Company as disclosed in Note 9. Citi Depositary Services Ireland DAC were
selected by the Company to execute certain transactions on behalf of the Sub-Funds, the terms of such
transactions were negotiated by the Company and were at normal commercial terms.
Statement of Directors' Responsibilities
The Directors are responsible for preparing the Directors’ Report and the financial statements, in accordance
with applicable law and regulations.
Company law requires the Directors to prepare financial statements for each financial year. Under that law they
have elected to prepare the financial statements in accordance with Irish law and FRS 102 The Financial
Reporting Standard applicable in the UK and in the Republic of Ireland.
Under company law the Directors must not approve the financial statements unless they are satisfied that they
give a true and fair view of the assets, liabilities and financial position of the Company and of its decrease in net
assets attributable to redeemable participating shareholders for that year. In preparing the financial statements,
the Directors are required to:
• select suitable accounting policies and then apply them consistently;
• make judgements and estimates that are reasonable and prudent;
• state whether applicable Accounting Standards have been followed, subject to any material departures
disclosed and explained in the financial statements;
• assess the Company’s ability to continue as a going concern, disclosing, as applicable, matters related
to going concern; and
• use the going concern basis of accounting unless they either intend to liquidate the Company or to
cease operations, or have no realistic alternative but to do so.
Merian Global Investors Series Plc Annual Report and Audited Financial Statements for the financial year ended 31 December 2018
DIRECTORS’ REPORT (continued)
19
Statement of Directors' Responsibilities (continued)
The Directors are responsible for keeping adequate accounting records which disclose with reasonable
accuracy at any time the assets, liabilities, financial position and profit or loss of the Company and enable them
to ensure that the financial statements comply with the Companies Act 2014, the European Communities
(Undertakings for Collective Investment in Transferable Securities) Regulations 2011 and the Central Bank
(Supervision and Enforcement) Act 2013 (Section 48(1)) (Undertakings for Collective Investment in Transferable
Securities) Regulations 2015. They have general responsibility for taking such steps as are reasonably open to
them to safeguard the assets of the Company. In this regard they have entrusted the assets of the Company to
a trustee for safe-keeping. They are responsible for such internal controls as they determine is necessary to enable
the preparation of financial statements that are free from material misstatement, whether due to fraud or error,
and to prevent and detect fraud and other irregularities. The Directors are also responsible for preparing a
Directors’ Report that complies with the requirements of the Companies Act 2014.
The Directors are responsible for the maintenance and integrity of the corporate and financial information
included on the Company’s website. Legislation in the Republic of Ireland governing the preparation and
dissemination of financial statements may differ from legislation in other jurisdictions.
Directors’ Compliance Statement
The Directors are responsible for securing the company’s compliance with its “relevant obligations” under section
225 of the Companies Act 2014 (as defined in section 225(1) thereof).
As required under section 225(3), the Directors confirm that:
a) a compliance policy statement has been drawn up setting out the Company’s compliance policies
(that, in the Directors’ opinion, are appropriate to the Company) with respect to compliance by the
Company with its relevant obligations;
b) appropriate arrangements or structures are in place that, in Directors’ opinion, are designed to secure
material compliance with the Company’s relevant obligations; and
c) a review has been conducted during the financial year ending 31 December 2018 of the arrangements
or structures referred to in paragraph b) above.
Accounting Records
The Directors are responsible for ensuring that adequate accounting records, as outlined in Sections 281 to 285
of the Companies Act 2014, are kept by the Company. To achieve this, the Directors have appointed Citibank
Europe plc, (the “Administrator”), which reports to the Board of Directors (the “Board”) to ensure that the
requirements of Sections 281 to 285 of the Companies Act 2014 are complied with. The adequate accounting
records are located at 1 North Wall Quay, Dublin 1.
Audit Information Statement
In accordance with Section 330 of the Companies Act 2014, the Directors hereby confirm that:
a) so far as the Directors are aware, there is no relevant audit information of which the Company’s statutory
auditor is unaware; and
b) the Directors have taken all the steps that ought to have taken as a Director in order to make aware of
any relevant audit information and to establish that the Company’s statutory auditor is aware of that
information.
Audit Committee
The Company has established an audit committee.
Auditor
KPMG, Chartered Accountants, have indicated their willingness to continue in office in accordance with Section
383(2) of the Companies Act 2014.
Merian Global Investors Series PicAnnual Report and Audited Financial Statements for the financial year ended 31 December 2018
DIRECTORS' REPORT (continued)
On behalf of the Board of Directors of Merian Global Investors Series Pic
^<Tom Mui
Director
AjduarfWaters
Director
Date: 25 April 2019
20
Merian Global Investors Series Plc Annual Report and Audited Financial Statements for the financial year ended 31 December 2018
MERIAN CHINA EQUITY FUND
INVESTMENT ADVISER’S REPORT FOR THE FINANCIAL YEAR ENDED 31 DECEMBER 2018
Investment Advisers – Merian Global Investors (Asia Pacific) Limited (until 22 March 2018)
– Ping An of China Asset Management (Hong Kong) Company Limited (from 23 March 2018)
22
The Chinese equity market was volatile during 2018. At the beginning of the year, its growth was buoyed by an
upbeat consensus, but it subsequently fell on worries about the US-China trade war and economic slowdown.
China’s deleveraging drive, which aims to improve the quality of economic growth, has led to tightening liquidity
and higher financial costs for Chinese companies. China’s economic data showed growth slowing, partly
attributable to deleveraging efforts and the weakness of global trade and of domestic demand. In response to
this, China’s policymakers changed to a more accommodative approach and announced a series of monetary
and fiscal measures aiming to stimulate the economy: their effects are yet to be observed. Trade frictions between
US and China escalated during the year and the market even feared the possibility of a full-blown trade war. This
weighed on investor sentiment and was a drag on China’s equity market. In December, US president Trump and
China’s president Xi agreed to halt new trade tariffs for 90 days to allow for talks, an early sign of trade tensions
easing. However, the Huawei arrest issue may indicate that global tension is expanding beyond just trade.
We narrowed the underweight position to the real estate sector on bottom fishing and policy easing. The sector
had suffered a severe panic sell off on deleveraging policy and a weakening economy, and its valuation has
become reasonable and attractive, in our view. We increased exposure to industrials, as we saw stimulus policies
for infrastructure construction, and stabilising fixed asset investment (FAI) figures.
We trimmed exposure to the energy sector on a declining oil price and a weakening economic forecast. We
trimmed exposure to the consumer sector since channel checks showed slowing demand and increasing
inventory.
In our view, the Chinese government understands the urgency and necessity of launching reforms to improve
efficiency and unleash growth potential. In addition to stimulus policies for infrastructure construction, China has
introduced other favourable policies, such as the suspension of changes to social security contributions, allowing
a transition period for collecting tax on annual bonuses, allocation of an early quota to local governments’ bond
issuance, state-owned banks' issuance of perpetual bonds to supplement capital, and the relaxation of
regulations on the culture-related industries, for example the resumption of computer game licence approvals.
Overall, we are cautiously optimistic for 2019. Although the Chinese economy may continue to slow, market
valuations are becoming very attractive, especially for the last year’s hardest hit sectors, like consumer and
healthcare. In addition, pressure on economic growth and employment may serve as catalysts for a new round
of positive fiscal and monetary policies that could provide a favourable environment for mid to long term growth.
We will focus on high quality names with strong fundamentals in the consumer, healthcare, utility and financials
sectors, as well as trading opportunities in the energy and industrial sectors.
Merian Global Investors Series Plc Annual Report and Audited Financial Statements for the financial year ended 31 December 2018
MERIAN GLOBAL STRATEGIC BOND FUND (IRL)
INVESTMENT ADVISER’S REPORT FOR THE FINANCIAL YEAR ENDED 31 DECEMBER 2018
Investment Adviser – Merian Global Investors (UK) Limited
23
The fund underperformed its benchmark in 2018. The view at the beginning of the year was that there would be
a continuation of the global reconvergence trade, with strength in the US economy permeating into the rest of
the global economy, with the output gap closing, and with other major central banks starting to follow the US
Federal Reserve in moving interest rates higher, reducing the divergence with the hiking cycle in the US. However,
emerging weakness in the Chinese economy, and an increasingly bitter trade dispute between the Trump
administration and the Chinese authorities, introduced a negative effect to the global growth picture not
anticipated in the first half of the year.
The view on the Chinese economy was that mutually recognised benefits between the US and China would
bring trade talks to a more conciliatory outcome, and in the meantime the Chinese authorities would ease the
pain in their domestic economy by pausing the deleveraging trend and introducing some fiscal stimulus. This did
occur, but not to an extent sufficient to override the negative effect of souring relations on trade.
We had expected that this global backdrop would temper the US Federal Reserve’s language around the hiking
cycle, and that some concern around US credit and the health of the economy would not only lead to
something of a pause by the Fed but also to some weakness in the US dollar. We were positioned for this but too
early in the process. This picture did eventually emerge but only very close to the end of the year.
A weaker US dollar earlier in the year would have eased stresses it caused in emerging markets. The fund had
anticipated the eventual bounce in emerging market debt valuations, but entered the trade too early. Inflows
into the dollar kept going until the year end and it has only been at the turn of the year that we have seen our
anticipated scenario play out.
Overall the fund lost out from expecting European rates to tighten to US rates, European FX to appreciate versus
the US dollar, and emerging market debt and FX to rally into the second half of the year. The fund did well from
being short US and European credit and from our US rates position.
Our view going forward is that the US Fed’s hiking cycle has come to a close, or at least is very near its peak. The
front end of the US curve therefore looks attractive in our eyes, and the US yield curve is likely to steepen. In this
environment, the US dollar would seemed to have run its course, and we are now looking for it to weaken over
the next few months, meaning that emerging markets can continue to recover from their poor performance of
2018, and generally the stresses that the strong dollar has recently caused can be corrected. US credit looks
vulnerable to us, because the US economy is late cycle, and we continue to believe that inflation in the US and
elsewhere will increase as wage inflation ticks higher.
Merian Global Investors Series Plc Annual Report and Audited Financial Statements for the financial year ended 31 December 2018
MERIAN WORLD EQUITY FUND
INVESTMENT ADVISER’S REPORT FOR THE FINANCIAL YEAR ENDED 31 DECEMBER 2018
Investment Adviser – Merian Global Investors (UK) Limited
24
For the first three quarters, US equities powered ahead of the rest of the world, achieving dispersion of
performance not replicated since the early 1970s. The initial momentum-driven moves to the upside were
supported by investor optimism and additional liquidity courtesy of the recent US tax cuts. Following an initial
pullback in February, the next market phase saw US equities attain new highs, sustained by record levels of
buybacks that were accentuated by waning volumes and market participants. Concurrently, an ascendant US
dollar led to money being drawn out of riskier emerging markets as investors sought to book profits following a
strong run in 2017. These factors contributed to a broad sell-off in Asia equities generally. An ongoing trade
dispute with the US and a crackdown on shadow banking contributed to Chinese equities posting the worst
performance of major stock markets in 2018, shedding some US$2.3 trillion in value. Yet 2018 marks the first time
since 1948 that the S&P 500 index finished the year in negative territory after posting positive returns in each of
the first three quarters. The equity market retreat in Q4 was stoked by growing alarm about a slowing global
economy and tightening monetary policy framework.
Over the course of the year, the sub-fund’s dynamic valuation stock selection criterion contributed negatively
to performance. In terms of asset allocation, the portfolio was largely correctly positioned away from risk on
throughout the year. This was demonstrated by those occasions when it avoided the sizeable drawdowns to
value; however, for most of this time it was bereft the ‘kicker’ of quality returns. Investors demonstrated a
preference for low volatility and dividend yield to traditional balance sheet strength as their source of safe haven
assets during episodes of heightened market volatility.
Reassuringly, the recent asset allocation reduction to the sustainable growth component reaffirmed the
prevailing pessimism inherent in investor sentiment, recognising how the opportunity to avail of structural
mispricing in growth companies weakened over the course of the year, and the near-term impact on
performance in the latter stages of Q4 proved a positive contributor.
The same headwinds which weighed on the asset classes through 2018, specifically geopolitical instability and
the repercussion from tighter financial conditions, continue to pose risks, at least in the near term. While
navigating regime changes of this kind, we cannot exclude the occurrence of future left tail events or discount
the possibility of whipsawing at the portfolio level. However, as long-term investors in these markets, we maintain
confidence and conviction in the persistence and consistency of mispricing, together with our unique stock
selection process which aims to mitigate downside risk, cyclicality of returns and the effects of correlating with
market state. Our expectation is that the sub-fund should continue to provide diversification over the medium
term against equity market moves, as it has done both historically as well as in the latter stages of this month
following the implementation of these changes at the portfolio level.
Merian Global Investors Series Plc Annual Report and Audited Financial Statements for the financial year ended 31 December 2018
MERIAN PACIFIC EQUITY FUND
INVESTMENT ADVISER’S REPORT FOR THE FINANCIAL YEAR ENDED 31 DECEMBER 2018
Investment Advisers – Merian Global Investors (Asia Pacific) Limited (until 17 May 2018)
– Merian Global Investors (UK) Limited (from 18 May 2018)
25
For the first three quarters, US equities powered ahead of the rest of the world, achieving dispersion of
performance not replicated since the early 1970s. Concurrently, an ascendant US dollar led to money being
drawn out of riskier emerging markets as investors sought to book profits following a strong run in 2017. These
factors contributed to a broad sell-off in Asia equities generally.
Liquidity in the Chinese market tightened this year following a regulatory crackdown aimed at combating a
build-up of leverage in the financial system. The reforms have focused largely on so-called shadow banking,
which before the clampdown saw lenders channel significant sums to fund managers who then invested the
money in Chinese stocks. As the year played out, investors became more concerned about the impact that a
protracted trade war with the US might have on the prospects of Chinese corporates.
Over the course of the year, dynamic valuation contributed negatively to performance. In terms of asset
allocation, the portfolio was largely correctly positioned away from risk on throughout the year. This was
demonstrated by those occasions when it avoided the sizeable drawdowns to value; however, for most of this
time it was bereft the ‘kicker’ of quality returns. Investors demonstrated a preference for low volatility and
dividend yield to traditional balance sheet strength as their source of safe haven assets during episodes of
heightened market volatility.
Reassuringly, the recent asset allocation reduction to the sustainable growth component reaffirmed the
prevailing pessimism inherent in investor sentiment, recognising how the opportunity to avail of structural
mispricing in growth companies weakened over the course of the year, and the near-term impact on
performance in the latter stages of Q4 proved a positive contributor.
The same headwinds which weighed on the asset classes through 2018, specifically geopolitical instability and
the repercussion from tighter financial conditions, continue to pose risks, at least in the near term. While
navigating regime changes of this kind we cannot exclude the occurrence of future left tail events, or discount
the possibility of whipsawing at the portfolio level. However, as long-term investors in these markets, we maintain
confidence and conviction in the persistence and consistency of mispricing, together with our unique stock
selection process which aims to mitigate downside risk, cyclicality of returns and the effects of correlating with
market state. Our expectation is that the sub-fund should continue to provide diversification over the medium
term against equity market moves, as it has done both historically as well as following the implementation of
these changes at the portfolio level.
Merian Global Investors Series Plc Annual Report and Audited Financial Statements for the financial year ended 31 December 2018
MERIAN EUROPEAN EQUITY FUND
INVESTMENT ADVISER’S REPORT FOR THE FINANCIAL YEAR ENDED 31 DECEMBER 2018
Investment Adviser – Merian Global Investors (UK) Limited
26
Performance of European equities for 2018 has been dominated by weak markets in the second half, and
particularly in the final quarter.
A sell-off which started in the US with a sustained push above 3% for US 10-year Treasuries, predominantly hitting
growth stocks, broadened out into a bigger market event. Among European companies, the market appears to
be moving towards a recessionary scenario, with only defensive companies spared the selling. Macroeconomic
data continues to disappoint modestly. The data has been mostly affected by uncertainty in the external
environment with regard to tariffs and the potential for a global slowdown. The worst performing sectors were
financials, consumer discretionary, real estate and industrials. Reflecting its pro-cyclical positioning, the sub-fund
performed poorly in 2018, suffering at the stock level in the consumer, financial and industrial areas. At a country
level, exposure to Germany and Sweden because of their international industrial names and the UK because of
Brexit hurt performance. The portfolio also suffered as a result of its exposure to some mid-cap names which
suffered disproportionately as the market declined. Portfolio activity has sought to lessen the cyclicality of the
portfolio while still remaining underweight in some of the more expensive defensive areas of the market.
In early 2019 there are some grounds for optimism; the headwinds to European GDP are easing, not least the
reversal of the oil price in Q4; China and the US seem to be making more concerted efforts to end their trade
dispute and the signalling from the Fed indicates that we are closer to the top of the tightening cycle than
previously thought. The asset class is moving from mid-cycle valuation to cheap very quickly. In terms of style,
sector and country positioning, the sub-fund remains tilted towards value, and is modestly pro-cyclical expressed
mostly through financial and industrial exposure. We are overweight communication services representing value
in the defensive telco sector and underweight consumer discretionary, staples, energy, utilities and real estate.
The sub-fund remains heavily exposed to the European core markets with substantial weights in France, UK,
Netherlands, Germany and Switzerland.

Merian Global Investors Series Plc Annual Report and Audited Financial Statements for the financial year ended 31 December 2018
OLD MUTUAL JAPANESE EQUITY FUND^
INVESTMENT ADVISER’S REPORT FOR THE FINANCIAL YEAR ENDED 31 DECEMBER 2018
Investment Adviser – Merian Global Investors (Asia Pacific) Limited
27
On 22 December 2017, a notification was sent to shareholders informing them of the intention to close the Old
Mutual Japanese Equity Fund^. This became effective on 26 January 2018.
Merian Global Investors Series Plc Annual Report and Audited Financial Statements for the financial year ended 31 December 2018
MERIAN US EQUITY INCOME FUND
INVESTMENT ADVISER’S REPORT FOR THE FINANCIAL YEAR ENDED 31 DECEMBER 2018
Investment Adviser – Merian Global Investors (UK) Limited
28
For the first three quarters, US equities powered ahead of the rest of the world, achieving dispersion of
performance not replicated since the early 1970s. The initial momentum-driven moves to the upside were
supported by investor optimism and additional liquidity courtesy of the recent US tax cuts. Following an initial
pullback in February, the next market phase saw US equities attain new highs, sustained by record levels of
buybacks that were accentuated by waning volumes and market participants. Yet 2018 marks the first time since
1948 that the S&P 500 index finished the year in negative territory after posting positive returns in each of the first
three quarters. The equity market retreat in Q4 was stoked by growing alarm about a slowing global economy
and tightening monetary policy framework.
Over the course of the year, dynamic valuation contributed negatively to performance. In terms of asset
allocation, the portfolio was largely correctly positioned away from risk on throughout the year. This was
demonstrated by those occasions when it avoided the sizeable drawdowns to value; however, for most of this
time it was bereft the ‘kicker’ of quality returns. Investors demonstrated a preference for low volatility and
dividend yield to traditional balance sheet strength as their source of safe haven assets during episodes of
heightened market volatility.
Reassuringly, the recent asset allocation reduction to the sustainable growth component reaffirmed the
prevailing pessimism inherent in investor sentiment, recognising how the opportunity to avail of structural
mispricing in growth companies weakened over the course of the year, and the near-term impact on
performance in the latter stages of Q4 proved a positive contributor.
The same headwinds which weighed on the asset classes through 2018, specifically geopolitical instability and
the repercussion from tighter financial conditions, continue to pose risks, at least in the near term. While
navigating regime changes of this kind we cannot exclude the occurrence of future left tail events, or discount
the possibility of whipsawing at the portfolio level. However, as long-term investors in these markets, we maintain
confidence and conviction in the persistence and consistency of mispricing, together with our unique stock
selection process which aims to mitigate downside risk, cyclicality of returns and the effects of correlating with
market state. Our expectation is that the sub-fund should continue to provide diversification over the medium
term against equity market moves, as it has done both historically as well as in the latter stages of this month post
the implementation of these changes at the portfolio level.
Merian Global Investors Series Plc Annual Report and Audited Financial Statements for the financial year ended 31 December 2018
MERIAN NORTH AMERICAN EQUITY FUND
INVESTMENT ADVISER’S REPORT FOR THE FINANCIAL YEAR ENDED 31 DECEMBER 2018
Investment Adviser – Merian Global Investors (UK) Limited
29
For the first three quarters, US equities powered ahead of the rest of the world, achieving dispersion of
performance not replicated since the early 1970s. The initial momentum-driven moves to the upside were
supported by investor optimism and additional liquidity courtesy of the recent US tax cuts. Following an initial
pullback in February, the next market phase saw US equities attain new highs, sustained by record levels of
buybacks that were accentuated by waning volumes and market participants. Yet 2018 marks the first time since
1948 that the S&P 500 index finished the year in negative territory after posting positive returns in each of the first
three quarters. The equity market retreat in Q4 was stoked by growing alarm about a slowing global economy
and tightening monetary policy framework.
Over the course of the year, the sub-fund’s dynamic valuation stock selection criterion contributed negatively
to performance. In terms of asset allocation, the portfolio was largely correctly positioned away from risk on
throughout the year. This was demonstrated by those occasions when it avoided the sizeable drawdowns to
value; however, for most of this time it was bereft the ‘kicker’ of quality returns. Investors demonstrated a
preference for low volatility and dividend yield to traditional balance sheet strength as their source of safe haven
assets during episodes of heightened market volatility.
Reassuringly, the recent asset allocation reduction to the sustainable growth component reaffirmed the
prevailing pessimism inherent in investor sentiment, recognising how the opportunity to avail of structural
mispricing in growth companies weakened over the course of the year, and the near-term impact on
performance in the latter stages of Q4 proved a positive contributor.
The same headwinds which weighed on the asset classes through 2018, specifically geopolitical instability and
the repercussion from tighter financial conditions, continue to pose risks, at least in the near term. While
navigating regime changes of this kind, we cannot exclude the occurrence of future left tail events or discount
the possibility of whipsawing at the portfolio level. However, as long-term investors in these markets, we maintain
confidence and conviction in the persistence and consistency of mispricing, together with our unique stock
selection process which aims to mitigate downside risk, cyclicality of returns and the effects of correlating with
market state. Our expectation is that the sub-fund should continue to provide diversification over the medium
term against equity market moves, as it has done both historically as well as in the latter stages of this month
following the implementation of these changes at the portfolio level.
Merian Global Investors Series Plc Annual Report and Audited Financial Statements for the financial year ended 31 December 2018
MERIAN TOTAL RETURN USD BOND FUND
INVESTMENT ADVISER’S REPORT FOR THE FINANCIAL YEAR ENDED 31 DECEMBER 2018
Investment Advisers – Janus Capital International Limited
– Sub-Investment Adviser: Janus Capital Management LLC
30
US and global bond benchmarks were flat to negative in 2018 as the expectation of higher interest rates pushed
yields on US Treasuries higher for much of the year and investors priced in perhaps better-than-expected
economic growth. That concern, magnified by rising wages in the US, caused many to fear inflation may run
ahead of US Federal Reserve (Fed) expectations. That scenario shifted during the autumn as emerging worries
about slowing growth came to the fore. This sent government bonds rallying, but overall market returns remained
under pressure as spreads on corporate credit widened – and in the case of high-yield issuers, significantly.
The sub-fund underperformed its index, the Bloomberg Barclays US Aggregate Bond Index.
Much of the period’s underperformance was concentrated in the sub-fund’s interest rate positioning. For much
of the early part of the year, we believed that wide spreads between German Bunds and US Treasuries were not
supported by economic fundamentals. Consequently, we structured a position aimed at benefiting from
narrowing spreads between these two securities. Rising political uncertainty, however, pushed Bund yields
significantly lower, resulting in these positions generating negative returns.
Also detracting were volatility sales on high-yield corporate credits. Throughout much of the period, we believed
that high-yield credits were richly priced, especially in light of an extended business cycle. With spreads
remaining persistently tight during much of the year. Losses, however, were narrowed late in the period and these
same bearish positions generated positive returns. Volatility in sales on stocks contributed to performance.
The sub-fund’s cash-based core generated positive returns, especially later in the period, when our focus on
shorter-duration credits performed well in the broader market sell-off. Also contributing was our allocation to
securitized credit and government debt.
Over the short run, we expect market stresses to remain elevated due to a range of concerns, including Brexit, a
slowing European – and global – economy, the ongoing US-China trade war and potential repercussions from
political upheaval in the US, including the government shutdown.
While we foresee eventual increases in service-sector inflation, goods inflation, in our view, should remain well
contained, being less linked to decreasing US unemployment. Global spare capacity should continue to make
cheap imports a viable alternative to domestic products, although the continuing trade war acting as a de
facto tax on consumers may limit otherwise cheaper imports’ effects. Payroll gains corroborate the last eight
years of stable and steady jobs growth, but inflation risks are limited.
Merian Global Investors Series Plc Annual Report and Audited Financial Statements for the financial year ended 31 December 2018
MERIAN EMERGING MARKET DEBT FUND
INVESTMENT ADVISER’S REPORT FOR THE FINANCIAL YEAR ENDED 31 DECEMBER 2018
Investment Adviser – Merian Global Investors (UK) Limited
31
After two years of double-digit returns and steady inflows, emerging markets (EM) had a challenging 2018. Full-
year returns were negative across hard currency sovereigns. Investors took their cues from the strong fiscal
impulse and data releases from the United States, and revised their expectations to more aggressive US Federal
Reserve (Fed) rate hikes and a stronger US dollar. Consequently, tighter global financial conditions seriously
dented investors’ confidence in EM. Fears of a protracted trade war between the US and China added to the
negative backdrop for the sector. In response, flows into EM funds reversed after April, resulting in a small outflow
of US$300m for the full year, compared to a US$63bn inflow in 2017. As investors pulled out of EM, countries with
large external funding needs saw their currencies particularly tested: the Turkish lira depreciated 29% while the
Argentine peso lost 51% of its value in 2018. Going into the fourth quarter, a sharp drop in the oil price and the
prospect of slower US and global growth caused broad-based negative sentiment across all asset classes.
High yield countries underperformed defensive investment grade countries. Off-benchmark allocations to
frontier local markets in Egypt and Nigeria added to the performance of the sub-fund. Overweight positions in
Angola, whose fiscal trajectory is improving, also contributed positively. However, overweight positions in
Argentine assets detracted, while a zero-weight position in China also detracted from the sub-fund’s
performance.
Looking ahead, EM valuations look attractive and should benefit from a more favourable external environment.
The Fed is likely to pause rate hikes, while expectations of a US-China trade deal have strengthened. Renewed
easing efforts from China would also provide support for a return of investor confidence in EM.
Merian Global Investors Series Plc Annual Report and Audited Financial Statements for the financial year ended 31 December 2018
OLD MUTUAL EUROPEAN BEST IDEAS FUND
INVESTMENT ADVISER’S REPORT FOR THE FINANCIAL YEAR ENDED 31 DECEMBER 2018
Investment Advisers – Liontrust Investment Partners LLP
– Odey Asset Management LLP
– Merian Global Investors (UK) Limited (until 14 June 2018)
– Quilter Investors Limited (formerly Old Mutual Investment Management Limited) (from
15 June 2018)
– Wellington Management International Limited
32
Market review
After outperforming developed markets in the first quarter of the year, emerging markets significantly
underperformed them in the second with strong US and UK equity market performance being especially notable.
By the third quarter, the US equity market was pulling away from its peers – especially those in developing markets
which by now had fallen into bear market territory. Meanwhile, European markets were tossed to and fro by
worries as to the mounting trade war, Brexit and the emergence of a new anti-European coalition after yet
another divisive Italian election.
However, all it took was some ‘hawkish’ rhetoric from the US Federal Reserve in the fourth quarter to trigger a
major reversal in investor sentiment. A chain of violent equity market sell-offs resulted culminating in the worst
December for US equities since the Great Depression in 1931. All at once investors were contending with fears of
rising US interest rates, a sudden slowdown in eurozone business confidence, weaker Chinese growth and a host
of geopolitical concerns from Brexit to political unrest in Italy and France and, of course, Mr Trump’s escalating
trade conflict with China and his decision to partially close down the US government.
Performance of the fund
Despite a promising second quarter, when the portfolio outperformed its benchmark, poor performance in the
second half of the year saw the fund significantly underperform its benchmark while delivering a negative return
to investors.
Although the mandate managed by ‘perma-bear’ Crispin Odey was a positive contributor to relative
performance due to consistent stock picking throughout the year and strong gains in the final quarter thanks to
a merger in the gold market and exposure to Argentina’s private banking sector, relative gains here were
outweighed by losses elsewhere in the portfolio.
Among the detractors over the period was the Wellington equity mandate run by Dirk Enderlein which suffered
late in the period as a number of core portfolio constituents in the UK and France racked up significant losses.
However, the biggest detractor from relative returns over the period was the UK equity mandate managed by
Dan Nickols at Merian Global Investors. After struggling with underperformance all year, the portfolio incurred
substantial further losses in November due to poor stock selection.
Merian Global Investors Series Plc Annual Report and Audited Financial Statements for the financial year ended 31 December 2018
MERIAN INVESTMENT GRADE CORPORATE BOND FUND
INVESTMENT ADVISER’S REPORT FOR THE FINANCIAL YEAR ENDED 31 DECEMBER 2018
Investment Adviser – Merian Global Investors (UK) Limited
33
2018 proved to be a disappointing year for risk, global corporate credit included. Global equities, however, fell
by a greater amount, highlighting the attractively low volatility of corporate credit as an asset class.
The weakness was initially due to fading hopes for stronger economic growth worldwide and particularly in
Europe, which was also beset by concerns about political fragmentation - with previously fringe parties attaining
electoral success in Italy. As the year progressed, the threat of a US-China trade war depressed the global
economic outlook. Worries over contagion led to weakness in several emerging market economies such as Brazil
and Turkey. In the second half of the year central bank balance sheets shrunk as a result of quantitative
tightening; and an increasingly strong US dollar, caused by fears that the US Federal Reserve might press ahead
with further interest rate hikes, led to a fall in risk assets around the world, including in corporate credit.
The fund continued to reduce its exposure to higher beta credit throughout the year, and the managers looked
to continue to improve the credit quality of the fund as the economic cycle grew progressively longer in the
tooth. The fund retained its exposure to subordinated financial bonds where the managers see the greatest
value, accepting that subordinated bonds will lead to slightly higher levels of volatility in the fund relative to the
benchmark. The fund also retains its overweight exposure to sterling denominated bonds, again where the
managers see opportunity to exploit the unique characteristics of the sterling corporate credit market.
During the year the managers reduced exposure to those corporates or financial companies that had exposures
either to Turkey or Brazil, as well as reducing names associated with the European periphery on the back of the
noise emanating from Italy.
While the outlook is still shrouded in uncertainty, with doubts over trade wars, central bank tightening and Brexit,
we believe that after the sell-off in risk markets, which was pronounced in the last quarter, the asset class again
offers pockets of value and return potential. The fund views the outlook for developed economies cautiously, as
headwinds remain given the difficult political backdrop on both sides of the Atlantic and a slowing Chinese
economy.
In short, given the recent tightening from the US Federal Reserve, the breakevens on bonds have materially
improved, and as a result we expect the fund to offer the relative safety of the asset class whilst benefitting from
the higher yields on offer compared to recent years.
Merian Global Investors Series Plc Annual Report and Audited Financial Statements for the financial year ended 31 December 2018
MERIAN GLOBAL EMERGING MARKETS FUND
INVESTMENT ADVISER’S REPORT FOR THE FINANCIAL YEAR ENDED 31 DECEMBER 2018
Investment Adviser – Merian Global Investors (UK) Limited
34
In contrast to the smooth sailing of markets in 2017, the calendar year 2018 proved to be an altogether more
challenging period for emerging market equities, and the MSCI emerging markets index fell 15% in US dollar
terms. Stocks came under pressure from unexpected strength in the value of the US dollar, fears of a trade war
between the US and China, which boiled over into each nation imposing tariffs on the other’s imports, and an
economic slowdown in China. As a result, well owned technology darlings such as Tencent and Alibaba sold off
heavily, as did other growth orientated companies. Brazil was a rare highlight and was the best performing
emerging market in the fourth quarter, with investors cheering the election of President Jair Bolsonaro.
Volatility brings opportunity and 2018 gave us the chance to buy strong businesses at knockdown prices. We
used the selloff in the second quarter to switch our position in Banks Mandiri and Rakyat into Bank Central Asia,
the best privately owned bank franchise in Indonesia. In the third quarter we bought a new stake in Banco do
Brasil, the largest bank in Brazil and majority owned by the government, where the company now has scope to
substantially improve operations and returns on equity if it is left alone from government interference and is
allowed to price lending risk appropriately. We reduced exposure to technology names such as Sunny Optical
and Win Semi on the slowdown in the smartphone market.
Emerging markets faced three principal headwinds in 2018 and we are beginning to see them ease. Firstly, there
has been a more dovish tone from the US Federal Reserve, given evidence of slowing in the US economy;
secondly, the Sino-US trade “war” tension has eased slightly following the G7 summit in Buenos Aires and renewed
talks in the first days of 2019; and thirdly, the Chinese authorities have noted the deceleration in their economy
and have initiated targeted monetary and fiscal easing to help reflate the economy and stabilise sentiment.
Current valuation ratios for emerging market equities sit at multiyear lows, whilst sentiment indicators are so weak
that only those witnessed in the crisis of 2008 are worse. We continue to see a good opportunity set of high quality
emerging market companies, across diverse countries and sectors, which are selling at less than our team’s
assessment of their intrinsic value.
Merian Global Investors Series Plc Annual Report and Audited Financial Statements for the financial year ended 31 December 2018
MERIAN ASIAN EQUITY INCOME FUND
INVESTMENT ADVISER’S REPORT FOR THE FINANCIAL YEAR ENDED 31 DECEMBER 2018
Investment Advisers – Merian Global Investors (Asia Pacific) Limited (until 17 May 2018)
– Merian Global Investors (UK) Limited (from 18 May 2018)
35
For the first three quarters, US equities powered ahead of the rest of the world, achieving dispersion of
performance not replicated since the early 1970s. Concurrently, an ascendant US dollar led to money being
drawn out of riskier emerging markets as investors sought to book profits following a strong run in 2017. These
factors contributed to a broad sell-off in Asia equities generally.
Liquidity in the Chinese market tightened this year following a regulatory crackdown aimed at combating a
build-up of leverage in the financial system. The reforms have focused largely on so-called shadow banking,
which before the clampdown saw lenders channel significant sums to fund managers who then invested the
money in Chinese stocks. As the year played out, investors became more concerned about the impact that a
protracted trade war with the US might have on the prospects of Chinese corporates.
Over the course of the year, dynamic valuation contributed negatively to performance. In terms of asset
allocation, the portfolio was largely correctly positioned away from risk on throughout the year. This was
demonstrated by those occasions when it avoided the sizeable drawdowns to value; however, for most of this
time it was bereft the ‘kicker’ of quality returns. Investors demonstrated a preference for low volatility and
dividend yield to traditional balance sheet strength as their source of safe haven assets during episodes of
heightened market volatility.
Reassuringly, the recent asset allocation reduction to the sustainable growth component reaffirmed the
prevailing pessimism inherent in investor sentiment, recognising how the opportunity to avail of structural
mispricing in growth companies weakened over the course of the year, and the near-term impact on
performance in the latter stages of Q4 proved a positive contributor.
The same headwinds which weighed on the asset classes through 2018, specifically geopolitical instability and
the repercussion from tighter financial conditions, continue to pose risks, at least in the near term. While
navigating regime changes of this kind we cannot exclude the occurrence of future left tail events, or discount
the possibility of whipsawing at the portfolio level. However, as long-term investors in these markets, we maintain
confidence and conviction in the persistence and consistency of mispricing, together with our unique stock
selection process which aims to mitigate downside risk, cyclicality of returns and the effects of correlating with
market state. Our expectation is that the sub-fund should continue to provide diversification over the medium
term against equity market moves, as it has done both historically as well as following the implementation of
these changes at the portfolio level.
Merian Global Investors Series Plc Annual Report and Audited Financial Statements for the financial year ended 31 December 2018
MERIAN LOCAL CURRENCY EMERGING MARKET DEBT FUND
INVESTMENT ADVISER’S REPORT FOR THE FINANCIAL YEAR ENDED 31 DECEMBER 2018
Investment Adviser – Merian Global Investors (UK) Limited
36
After two years of double-digit returns and steady inflows, emerging markets (EM) had a challenging 2018. Full-
year returns were negative across local currency EM debt. Investors took their cues from the strong fiscal impulse
and data releases from the United States, and revised their expectations to more aggressive US Federal Reserve
(Fed) rate hikes and a stronger US dollar. Consequently, tighter global financial conditions seriously dented
investors’ confidence in EM. Fears of a protracted trade war between the US and China also added to the
negative backdrop for the sector. In response, EM fund flows reversed after April, resulting in a small outflow of
US$300m for the full year, compared to a US$63bn inflow in 2017. As investors pulled out of EM, countries with
large external funding needs saw their currencies particularly tested – the Turkish lira depreciated 29% while the
Argentine peso lost 51% of its value in 2018. Going into the fourth quarter, a sharp drop in the oil price and the
prospect of slower US and global growth brought about broad-based negative sentiment across all asset classes.
High yield countries underperformed defensive investment grade countries. Our long duration positions in South
Africa and Colombia added to the sub-fund’s performance. We took a short position in Indian rupee in 1H and
subsequently reversed to a long position when oil price declined. Both trades contributed positively. Overweight
positions in Argentine local bonds and Indonesian rates detracted from performance. Despite the high volatility,
the sub-fund benefited from actively adding to Turkey after the sharp sell-off. In addition, the sub-fund’s
overweight in Brazilian rates added to performance as we anticipated Bolsonaro winning the election.
Looking ahead, EM valuations look attractive and should benefit from a more favourable external environment.
The Fed is likely to pause rate hikes, while expectations of a US-China trade deal have strengthened. Renewed
easing efforts from China would also provide support for a return of investor confidence in EM.
Merian Global Investors Series Plc Annual Report and Audited Financial Statements for the financial year ended 31 December 2018
MERIAN UK ALPHA FUND (IRL)
INVESTMENT ADVISER’S REPORT FOR THE FINANCIAL YEAR ENDED 31 DECEMBER 2018
Investment Adviser – Merian Global Investors (UK) Limited
37
The FTSE All Share index lost ground over the year. Slowing economic growth against a background of tightening
monetary policy pushed equity market sharply lower in the second half. The US/China trade war and the Brexit
process contributed to the market weakness.
Trade tensions between the US and China escalated over the year as the Trump administration progressively
expanded tariffs on Chinese imports. Though the US agreed trade deals with Canada and Mexico, the trade
war impacted on global growth in the second half of the year. Europe also suffered from stricter emissions testing
procedures, slowing production in the important automotive sector. The US Federal Reserve, while recognising
the slowdown, raised interest rates while the European Central Bank ended asset purchases.
In the UK, the prime minster agreed a draft withdrawal agreement from the European Union which failed to
satisfy Leavers or Remainers and led to resignations from the government. The uncertainty over how the UK will
leave the EU pushed Sterling sharply lower at the year end.
The sub-fund posted a negative performance for the year. Positive contributions to performance came from
power generator Drax on strong operational performance and rising commodity prices. Whitbread moved
higher on the sale of its Costa Coffee division at an attractive price while Smith & Nephew, Experian and
Worldpay gained on strong business performances. Gaming group GVC fell on regulatory concerns in spite of
generating excellent growth from its online business. TP ICAP, Sage and Micro Focus moved fell following profit
warnings while the economic slowdown took its toll on paper group DS Smith.
We sold out of Shire following the Takeda takeover and took profits in Experian, International Consolidated
Airlines, Royal Dutch Shell and Worldpay. We started a position in luxury car group Aston Martin Lagonda which
plans to expand volumes significantly over the next few years through the introduction of new models giving a
strong profit growth profile. We topped up positions in DS Smith, GVC, Next, Tesco and Whitbread.
The economic slowdown is likely to see central banks slow the pace of monetary tightening which will provide
support to equity markets. The UK stock market is trading at below long-term average valuations following last
year’s fall and appears to have discounted the impact on profits of slower growth. We believe the UK stock
market can make progress in 2019.
Merian Global Investors Series Plc Annual Report and Audited Financial Statements for the financial year ended 31 December 2018
MERIAN UK SMALLER COMPANIES FOCUS FUND
INVESTMENT ADVISER’S REPORT FOR THE FINANCIAL YEAR ENDED 31 DECEMBER 2018
Investment Adviser – Merian Global Investors (UK) Limited
38
After strong performances over 2016 and 2017, 2018 was a disappointing year, with the fund posting a negative
return and underperforming its reference index, despite having comfortably outperformed the benchmark in the
nine months to the end of September.
This loss of performance over the fourth quarter coincided with weak stock markets, driven by fears over rising US
yields and President Donald Trump’s trade war with China. These factors triggered a significant rotation away
from structural growth stocks – where the fund was overweight – and internationally-focused cyclical names. This
led to severe share price falls for some of the fund’s best performers over the first nine months of the year, such
as Blue Prism and Fevertree.
The fund also suffered from a number of profit warnings over the year. The worst of these was Conviviality, the
drinks distributor, where accounting irregularities were uncovered in March; while value was destroyed via this
holding, the fund did successfully exit this position before the shares were suspended. Both GYG, a yacht painter,
and Ten Group, a concierge service, also warned on trading, and Purplebricks struggled against a poor UK
housing market backdrop.
On the positive side, Burford Capital and Zoo Digital made meaningful contributions, supported by a range of
other ideas.
We began to decrease the degree of thematic tilts in the fund over the back end of 2018. The most pertinent
driver of this was voting on Teresa May’s long-awaited Brexit deal being deferred, due to its unpalatability to
both sides of the debate. In our minds, this increased the possibility of a softer Brexit, and we began to rotate the
fund to close our domestic cyclical underweight. Events in early 2019 have reinforced this view, and, while the
fund still has a structural growth bias, the extent of this overweight has been reduced, with more domestic
cyclicality being added.
Brexit machinations remain a risk, albeit arguably reflected in UK stock market valuations, and we would expect
any “soft” resolution of this issue would be taken well by investors. With a more neutral positioning into 2019, the
fund’s focus is to try to identify the best stock ideas available.
Merian Global Investors Series Plc Annual Report and Audited Financial Statements for the financial year ended 31 December 2018
MERIAN UK DYNAMIC EQUITY FUND
INVESTMENT ADVISER’S REPORT FOR THE FINANCIAL YEAR ENDED 31 DECEMBER 2018
Investment Adviser – Merian Global Investors (UK) Limited
39
Economic growth slowed through 2018 as trade tensions between the US and China escalated, stricter emissions
testing procedures in Europe severely impacted production in the important automotive sector and the UK
continued to suffer from Brexit-related uncertainty. The US Federal Reserve (Fed), while recognising the slowdown,
raised interest rates while the European Central Bank ended asset purchases. This combination of tightening
monetary policy against a backdrop of slowing economic growth pushed equity markets sharply lower in the
final quarter.
The fund lost ground over the year and underperformed its reference index, the FTSE 250 Index. This
underperformance was the result of poor stock selection partially offset by good sector allocation and a positive
contribution from the fund’s short positions. Strong performances came from Burford, Transferwise, Homeserve,
Ascential and Fevertree amongst others. However the fund suffered from an unusually high number of profit
warnings, such as in Microfocus, Indivior, Footasylum, Victoria, Medica and TP ICAP. Not owning Ocado was
highly detrimental to relative performance.
The fund held relatively neutral sectoral positions over the year albeit with a bias towards growth stocks and an
underweight in UK domestic stocks. Both these skews were reduced in the final quarter.
New long positions, were added in JTC, Integrafin AJ Bell, S4 Capital and Gym Group via IPOs/placings and our
second unlisted equity, The Hut Group, was added. Against this we sold a range of highly rated smaller
companies such as Joules, Keywords, Globaldata, Sanne, XP Power and Purplebricks, cyclicals such as Weir,
Vesuvius and Ashtead and exited Microfocus, Victoria, TP ICAP and Indivior after poor trading updates. Sales
outweighed purchases through the final quarter and the short book was modestly increased.
We expect global growth to moderate in 2019 and this is likely to force central banks to slow, or even stop,
monetary tightening for the time being. If the Fed remains on hold and trade talks between the US and China
do not deteriorate then equity markets should perform well from what have now become quite attractive
valuation levels.
In response to moderating economic prospects, we have reduced the funds’ exposure to both internationally-
focused cyclicals and growth and increased the cash balance. We now believe that the backdrop is likely to
be supportive for the UK pound and UK domestic stocks. We have therefore reduced our longstanding
underweight in this area.
Merian Global Investors Series Plc Annual Report and Audited Financial Statements for the financial year ended 31 December 2018
MERIAN GLOBAL EQUITY ABSOLUTE RETURN FUND
INVESTMENT ADVISER’S REPORT FOR THE FINANCIAL YEAR ENDED 31 DECEMBER 2018
Investment Adviser – Merian Global Investors (UK) Limited
40
The elevated volatility that characterised all regions, relative to the beginning of the year, showed no sign of
dissipating through the remaining three calendar quarters. All regions graduated, in an almost linear trajectory,
through worsening phases of sentiment and volatility profiles, until by year end North America and Europe were
anchored in high volatility, pessimistic sentiment states. The continuous deterioration in sentiment brought Japan
and Asia Pacific into line with the other regions, such that they were differentiated only by their slightly more
moderate volatility profiles.
These changes in market sentiment belie the sudden, sharp moves in risk appetite which took place throughout
the period. Risk appetite globally by year end was positioned just above one third risk on, following a further
deterioration in North America, which ended at under one-tenth risk on, its lowest level all year. Risk in Europe
similarly moderated to below one-third risk on; whereas Japan and Asia Pacific sat respectively above and below
the threshold of 50/50 risk on/off; having swung between risk on and risk off states throughout the period.
Over the course of the year, dynamic valuation, company management and market dynamics contributed
negatively to performance. In the context of dynamic valuation it is worth highlighting how in terms of asset
allocation, the portfolio was largely correctly positioned away from risk on throughout the year. This was
demonstrated by those occasions when it avoided the sizeable drawdowns to value; however for most of this
time it was bereft the ‘kicker’ of quality returns. Investors demonstrated a preference for low volatility and
dividend yield to traditional balance sheet strength as their source of safe haven assets during episodes of
heightened market volatility.
Reassuringly, the recent asset allocation reduction to the sustainable growth component reaffirmed the
prevailing pessimism inherent in investor sentiment, recognising how the opportunity to avail of structural
mispricing in growth companies weakened over the course of the year, and the near term impact on
performance in the latter stages of Q4 proved a positive contributor.
The same headwinds which weighed on the asset classes through 2018, specifically geopolitical instability and
the repercussion from tighter financial conditions, continue to pose risks, at least in the near term. While
navigating regime changes of this kind we cannot exclude the occurrence of future left tail events, or discount
the possibility of whipsawing at the portfolio level. However as long term investors in these markets we maintain
confidence and conviction in the persistence and consistency of mispricing, together with our unique stock
selection process which aims to mitigate downside risk, cyclicality of returns and the effects of correlating with
market state. Our expectation is that the sub-fund should continue to provide diversification over the medium
term against equity market moves, as it has done both historically as well as post the implementation of these
most recent changes at the portfolio level.
Merian Global Investors Series Plc Annual Report and Audited Financial Statements for the financial year ended 31 December 2018
MERIAN STRATEGIC ABSOLUTE RETURN BOND FUND^^^
INVESTMENT ADVISER’S REPORT FOR THE FINANCIAL YEAR ENDED 31 DECEMBER 2018
Investment Adviser – Merian Global Investors (UK) Limited
41
The fund underperformed its benchmark in 2018. The view at the beginning of the year was that there would be
a continuation of the global reconvergence trade, with strength in the US economy permeating into the rest of
the global economy, with the output gap closing, and with other major central banks starting to follow the US
Federal Reserve in moving interest rates higher, reducing the divergence with the hiking cycle in the US. However,
emerging weakness in the Chinese economy, and an increasingly bitter trade dispute between the Trump
administration and the Chinese authorities, introduced a negative effect to the global growth picture not
anticipated in the first half of the year.
The view on the Chinese economy was that mutually recognised benefits between the US and China would
bring trade talks to a more conciliatory outcome, and in the meantime the Chinese authorities would ease the
pain in their domestic economy by pausing the deleveraging trend and introducing some fiscal stimulus. This did
occur, but not to an extent sufficient to override the negative effect of souring relations on trade.
We had expected that this global backdrop would temper the US Federal Reserve’s language around the hiking
cycle, and that some concern around US credit and the health of the economy would not only lead to
something of a pause by the Fed but also to some weakness in the US dollar. We were positioned for this but too
early in the process. This picture did eventually emerge but only very close to the end of the year.
A weaker US dollar earlier in the year would have eased stresses it caused in emerging markets. The fund had
anticipated the eventual bounce in emerging market debt valuations, but entered the trade too early. Inflows
into the dollar kept going until the year end and it has only been at the turn of the year that we have seen our
anticipated scenario play out.
Overall the fund lost out from expecting European rates to tighten to US rates, European FX to appreciate versus
the US dollar, and emerging market debt and FX to rally into the second half of the year. The fund did well from
being short US and European credit and from our US rates position.
Our view going forward is that the US Fed’s hiking cycle has come to a close, or at least is very near its peak. The
front end of the US curve therefore looks attractive in our eyes, and the US yield curve is likely to steepen. In this
environment, the US dollar would seemed to have run its course, and we are now looking for it to weaken over
the next few months, meaning that emerging markets can continue to recover from their poor performance of
2018, and generally the stresses that the strong dollar has recently caused can be corrected. US credit looks
vulnerable to us, because the US economy is late cycle, and we continue to believe that inflation in the US and
elsewhere will increase as wage inflation ticks higher.
Merian Global Investors Series Plc Annual Report and Audited Financial Statements for the financial year ended 31 December 2018
OLD MUTUAL PAN AFRICAN FUND^^
INVESTMENT ADVISER’S REPORT FOR THE FINANCIAL YEAR ENDED 31 DECEMBER 2018
Investment Adviser – Old Mutual Investment Group (Pty) Limited
42
Market
After a strong start to equity markets at the start of 2018, stocks in both the developed and the emerging markets
tumbled in late January and February, amid concern US interest rates would rise at a faster pace than expected.
The selloff in equities, however, was less pronounced in frontier markets in Africa.
Performance
The Old Mutual Pan African Fund^^ was officially closed on 28 February, 2018. The sub-fund invested in
companies that directly benefited from economic growth on the African continent.
Merian Global Investors Series Plc Annual Report and Audited Financial Statements for the financial year ended 31 December 2018
OLD MUTUAL MONTHLY INCOME HIGH YIELD BOND FUND^^^^
INVESTMENT ADVISER’S REPORT FOR THE FINANCIAL YEAR ENDED 31 DECEMBER 2018
Investment Adviser – Merian Global Investors (UK) Limited
43
Please note that the sub-fund closed on 14 September 2018.
A divergence between economic data and monetary policy was the driving force behind a poor environment
for risk assets in 2018.
Excluding the US economy, the momentum in global growth came to a halt. The pace set in the second quarter
of 2017 and first quarter of 2018 proved too quick to be maintained. A number of headwinds hit sentiment,
including Chinese deleveraging, Italian political uncertainty, truckers’ strikes in Brazil, lingering Brexit uncertainty
and the ongoing threat of a trade war. Against this, the US economy was firing on all cylinders thanks to fiscal
stimulus and deregulation which boosted pay-packets and consumer confidence.
Relative US economic strength affects the rest of the world in two ways, where one is more positive than the
other. It can boost trade as the US imports more goods from the rest of the world, though recent academic
studies suggest this effect is far less powerful than it once was. On the negative side, a relatively strong US
economy strengthens the dollar which can have global ramifications. After years of loose US monetary policy,
the rest of the world holds a lot of US dollar-denominated debt, which means that those debtholders have seen
their liabilities rise which has limited their ability to invest and forced some to deleverage. In emerging markets,
some countries were forced to hike interest rates to protect their currencies too, tightening domestic credit
conditions further. The financial channel impact dominated the price action.
The sub-fund went into 2018 positioned with greater credit beta than the benchmark because of the relatively
benign economic backdrop and fair valuations. This played out well in January, as credit markets rallied
aggressively which gave rise to profit taking opportunities. It led the managers to reduce credit exposure by
increasing both the quality of the companies and reducing credit duration. The sub-fund remained neutrally
positioned throughout the rest of the period.
Merian Global Investors Series Plc Annual Report and Audited Financial Statements for the financial year ended 31 December 2018
MERIAN EUROPE (ex UK) SMALLER COMPANIES FUND
INVESTMENT ADVISER’S REPORT FOR THE FINANCIAL YEAR ENDED 31 DECEMBER 2018
Investment Adviser – Merian Global Investors (UK) Limited
44
Performance of European small and mid-cap equities for 2018 has been dominated by weak markets in the
second half, and particularly in the final quarter.
A sell-off which started in the US with a sustained push above 3% for US 10-year Treasuries, predominantly hitting
growth stocks, broadened out into a bigger market event. Among European smaller companies, the market
appears to be moving towards a recessionary scenario, with only defensive companies spared the selling.
Macroeconomic data continues to disappoint modestly. The data has been mostly affected by uncertainty in
the external environment with regard to tariffs and the potential for a global slowdown. The oil price fell sharply
late in the year, and unsurprisingly, the market was dragged down by energy stocks, followed by the materials,
IT, industrial, and consumer discretionary sectors. The relative winners were utilities and real estate. Reflecting its
pro-cyclical positioning, the sub-fund performed poorly in 2018, particularly in consumer stocks such as Vapiano
and Home24 and also suffered from its skew towards smaller names as liquidity has diminished. Over the year the
sub-fund has seen reduced exposure to cyclicals and an improvement in business and financial quality.
2019 starts with many of the same issues as last year, such as slowing European growth, ongoing trade war
rhetoric and falling liquidity from central banks. These factors have clearly influenced the very weak European
small cap market and leadership within it with growth giving way to defensives in Q4. There are some grounds
for optimism on all of these fronts; the headwinds to European GDP are easing, not least the reversal of the oil
price in Q4; China and the US seem to be making more concerted efforts to end their trade dispute and the
signalling from the Fed indicates that we are closer to the top of the tightening cycle than previously thought.
The asset class is moving from mid-cycle valuation to cheap very quickly and we will look to take advantage
and add more quality names to the portfolio.
Merian Global Investors Series Plc Annual Report and Audited Financial Statements for the financial year ended 31 December 2018
MERIAN GLOBAL EQUITY INCOME FUND (IRL)
INVESTMENT ADVISER’S REPORT FOR THE FINANCIAL YEAR ENDED 31 DECEMBER 2018
Investment Adviser – Merian Global Investors (UK) Limited
45
For the first three quarters, US equities powered ahead of the rest of the world, achieving dispersion of
performance not replicated since the early 1970s. The initial momentum-driven moves to the upside were
supported by investor optimism and additional liquidity courtesy of the recent US tax cuts. Following an initial
pullback in February, the next market phase saw US equities attain new highs, sustained by record levels of
buybacks that were accentuated by waning volumes and market participants. Concurrently, an ascendant US
dollar led to money being drawn out of riskier emerging markets as investors sought to book profits following a
strong run in 2017. These factors contributed to a broad sell-off in Asia equities generally. An ongoing trade
dispute with the US and a crackdown on shadow banking contributed to Chinese equities posting the worst
performance of major stock market in 2018, shedding some US$2.3 trillion in value. Yet 2018 marks the first time
since 1948 that the S&P 500 index finished the year in negative territory, after posting positive returns in each of
the first three quarters. The equity market retreat of Q4 was stoked by growing alarm about a slowing global
economy and tightening monetary policy framework.
Over the course of the year, dynamic valuation contributed negatively to performance. In terms of asset
allocation, the portfolio was largely correctly positioned away from risk on throughout the year. This was
demonstrated by those occasions when it avoided the sizeable drawdowns to value; however, for most of this
time it was bereft the ‘kicker’ of quality returns. Investors demonstrated a preference for low volatility and
dividend yield to traditional balance sheet strength as their source of safe haven assets during episodes of
heightened market volatility.
Reassuringly, the recent asset allocation reduction to the sustainable growth component reaffirmed the
prevailing pessimism inherent in investor sentiment, recognising how the opportunity to avail of structural
mispricing in growth companies weakened over the course of the year, and the near-term impact on
performance in the latter stages of Q4 proved a positive contributor.
The same headwinds which weighed on the asset classes through 2018, specifically geopolitical instability and
the repercussion from tighter financial conditions, continue to pose risks, at least in the near term. While
navigating regime changes of this kind we cannot exclude the occurrence of future left tail events, or discount
the possibility of whipsawing at the portfolio level. However, as long-term investors in these markets, we maintain
confidence and conviction in the persistence and consistency of mispricing, together with our unique stock
selection process which aims to mitigate downside risk, cyclicality of returns and the effects of correlating with
market state. Our expectation is that the sub-fund should continue to provide diversification over the medium
term against equity market moves.
Merian Global Investors Series Plc Annual Report and Audited Financial Statements for the financial year ended 31 December 2018
MERIAN GOLD & SILVER FUND
INVESTMENT ADVISER’S REPORT FOR THE FINANCIAL YEAR ENDED 31 DECEMBER 2018
Investment Adviser – Merian Global Investors (UK) Limited
46
Exactly like the previous year, 2018 started and ended with a rally in gold and silver prices. Subsequently the first
half of the year was broadly sideways, until mid-summer, when we hit a deep sell off in both monetary metals.
After that, and until the Fed backed off its normalisation and rate-hiking narrative, we moved back into sideways
tracking mode. It was overall yet another tough year for gold and silver and the underlying equities because
until December the market continued to believe that monetary policy normalisation and endless rate hikes were
a real and viable central bank policy.
Digging into it, the real interest rate versus gold and silver story for 2018 was one attached to this continued
promises of rate hikes, indeed delivery of rate hikes, and relatively benign headline inflation. Right up until the
stresses caused by these hikes created an environment for a genuine change in guidance, investors slavishly
followed the narrative of goldilocks – not too hot and not too cold – and trusted that central bankers were in
tight control of all levers. The policy of central bank balance sheet unwinding and lifting of base rates, however,
created real stress in lower quality credit markets in the second half of the year. Equity markets fell hard in Q4,
compounding this souring of the punchbowl and led to what looks like the end of six years of hawkish promises
by the Fed. This shift from hawkishness to a neutral stance has improved sentiment if not yet capital flows towards
monetary metals and the sub-fund. This direction of central bank policymaking and underlying macro conditions
are vital to the return profile of the sub-fund.
Mining companies, meanwhile, continued to struggle against a difficult environment of higher costs and
sideways trending lower gold and silver prices. Silver had a particularly tough year and the sub-fund was also hit
by some investors actively shorting Mexican silver mining equities as a way of playing geopolitical risk surrounding
the election of a new president who was perceived as business and mining unfriendly. Mexico accounts for
around 40% of global silver production so we had little choice but to ride this out and indeed add to holdings
such as Fresnillo in the face of this headwind. This short-term political risk has dissipated since, as we felt was likely,
but helped create a bit of a storm for silver investors in the middle of Q4.
On the positive side of the ledger, alongside the change in forward guidance at the end of 2018, we saw two
big M&A transactions. Additionally there were a handful of other mid-cap transactions during the year which
indicate that industry consolidation is now underway in meaningful fashion. This consolidation was something we
have been watching for and chimes with the improved sentiment and commentary towards gold overall.
Merian Global Investors Series Plc Annual Report and Audited Financial Statements for the financial year ended 31 December 2018
OLD MUTUAL COMPASS PORTFOLIO 2
INVESTMENT ADVISER’S REPORT FOR THE FINANCIAL YEAR ENDED 31 DECEMBER 2018
Investment Advisers – Merian Global Investors (UK) Limited (until 14 June 2018)
– Quilter Investors Limited (formerly Old Mutual Investment Management Limited) (from 15
June 2018)
47
Market Review
Equity markets suffered a torrid start to the year and ended the period in the same way. After UK and US stock
markets both hit record highs in January, global equities suffered two major setbacks in the first three months of
2018. Thanks to a sudden hike in US inflation and fears of a more aggressive interest-rate posture in the US, markets
sold off sharply on concerns of the global economy overheating, while the second stumble occurred on the
back of President Trump’s increased trade-war rhetoric and issues at Facebook that spread contagion fears
across the technology sector.
In the second half of the period, markets recovered strongly, driven by the US as technology stocks recovered
and overall strong corporate earnings helped push markets higher, with the S&P 500 index reaching a record bull
run in August. However, by October markets became choppy once again and the final months of the year,
particularly December, saw most markets end the period on a downwards note, with only emerging markets
managing to rally somewhat.
Fixed income had a somewhat steadier, yet uninspiring year, although the asset class was not immune from the
sell-offs in the equity space and faced disappointing periods as a result. Towards the end of the year government
bonds performed better than their credit counterparts, reversing the trend seen earlier in the period, although
emerging market debt and certain high yield bonds offered some bright spots.
In our view, the market moves we’ve witnessed this year have been outsized relative to the fundamentals, and
have been somewhat inconsistent in its reactions to things such as economic data points and central bank policy
actions. While it has affected the portfolio, these market dislocations also provide us with new and interesting
opportunities to strengthen our diversification.
Performance
The portfolio declined in the 12 month period but did a respectable job in protecting the value of our clients’
wealth during periods of market uncertainty. The equity allocation had a mixed year, starting off with some
disappointments before recovering strongly helped by the exposure to US equities. However, the indiscriminate
sell-off towards the end of the year retraced many of the earlier gains, but we used this opportunity to add to
the equity risk in the portfolio, including increasing our overweight position in Japanese equities.
Fixed income overall delivered a relatively flat performance, as the gains earlier in the year from high yield debt
were offset by the poor performance of emerging market debt, which later in the year effectively reversed.
Government bonds added some value in the period, especially towards the end of the 12 months, but not
enough to offset the disappointing end experienced by the investment grade credit managers.
The alternatives allocation has seen mixed performance, with the alternative beta strategies struggling
throughout the period as few style factors seemed to work consistently. Other alternatives exposure performed
relatively better as a whole, with macro, event driven and long/short strategies all delivering reasonable
performance.

Merian Global Investors Series Plc Annual Report and Audited Financial Statements for the financial year ended 31 December 2018
OLD MUTUAL COMPASS PORTFOLIO 3
INVESTMENT ADVISER’S REPORT FOR THE FINANCIAL YEAR ENDED 31 DECEMBER 2018
Investment Advisers – Merian Global Investors (UK) Limited (until 14 June 2018)
– Quilter Investors Limited (formerly Old Mutual Investment Management Limited) (from 15
June 2018)
48
Market Review
Equity markets suffered a torrid start to the year and ended the period in the same way. After UK and US stock
markets both hit record highs in January, global equities suffered two major setbacks in the first three months of
2018. Thanks to a sudden hike in US inflation and fears of a more aggressive interest-rate posture in the US, markets
sold off sharply on concerns of the global economy overheating, while the second stumble occurred on the
back of President Trump’s increased trade-war rhetoric and issues at Facebook that spread contagion fears
across the technology sector.
In the second half of the period, markets recovered strongly, driven by the US as technology stocks recovered
and overall strong corporate earnings helped push markets higher, with the S&P 500 index reaching a record bull
run in August. However, by October markets became choppy once again and the final months of the year,
particularly December, saw most markets end the period on a downwards note, with only emerging markets
managing to rally somewhat.
Fixed income had a somewhat steadier, yet uninspiring year, although the asset class was not immune from the
sell-offs in the equity space and faced disappointing periods as a result. Towards the end of the year government
bonds performed better than their credit counterparts, reversing the trend seen earlier in the period, although
emerging market debt and certain high yield bonds offered some bright spots.
In our view, the market moves we’ve witnessed this year have been outsized relative to the fundamentals, and
have been somewhat inconsistent in its reactions to things such as economic data points and central bank policy
actions. While it has affected the portfolio, these market dislocations also provide us with new and interesting
opportunities to strengthen our diversification.
Performance
The portfolio declined in the 12 month period but did a respectable job in protecting the value of our clients’
wealth during periods of market uncertainty. The equity allocation had a mixed year, starting off with some
disappointments before recovering strongly helped by the exposure to US equities. However, the indiscriminate
sell-off towards the end of the year retraced many of the earlier gains, but we used this opportunity to add to
the equity risk in the portfolio, including increasing our overweight position in Japanese equities.
Fixed income overall delivered a relatively flat performance, as the gains earlier in the year from high yield debt
were offset by the poor performance of emerging market debt, which later in the year effectively reversed.
Government bonds added some value in the period, especially towards the end of the 12 months, but not
enough to offset the disappointing end experienced by the investment grade credit managers.
The alternatives allocation has seen mixed performance, with the alternative beta strategies struggling
throughout the period as few style factors seemed to work consistently. Other alternatives exposure performed
relatively better as a whole, with macro, event driven and long/short strategies all delivering reasonable
performance.

Merian Global Investors Series Plc Annual Report and Audited Financial Statements for the financial year ended 31 December 2018
OLD MUTUAL COMPASS PORTFOLIO 4
INVESTMENT ADVISER’S REPORT FOR THE FINANCIAL YEAR ENDED 31 DECEMBER 2018
Investment Advisers – Merian Global Investors (UK) Limited (until 14 June 2018)
– Quilter Investors Limited (formerly Old Mutual Investment Management Limited) (from 15
June 2018)
49
Market Review
Equity markets suffered a torrid start to the year and ended the period in the same way. After UK and US stock
markets both hit record highs in January, global equities suffered two major setbacks in the first three months of
2018. Thanks to a sudden hike in US inflation and fears of a more aggressive interest-rate posture in the US, markets
sold off sharply on concerns of the global economy overheating, while the second stumble occurred on the
back of President Trump’s increased trade-war rhetoric and issues at Facebook that spread contagion fears
across the technology sector.
In the second half of the period, markets recovered strongly, driven by the US as technology stocks recovered
and overall strong corporate earnings helped push markets higher, with the S&P 500 index reaching a record bull
run in August. However, by October markets became choppy once again and the final months of the year,
particularly December, saw most markets end the period on a downwards note, with only emerging markets
managing to rally somewhat.
Fixed income had a somewhat steadier, yet uninspiring year, although the asset class was not immune from the
sell-offs in the equity space and faced disappointing periods as a result. Towards the end of the year government
bonds performed better than their credit counterparts, reversing the trend seen earlier in the period, although
emerging market debt and certain high yield bonds offered some bright spots.
In our view, the market moves we’ve witnessed this year have been outsized relative to the fundamentals, and
have been somewhat inconsistent in its reactions to things such as economic data points and central bank policy
actions. While it has affected the portfolio, these market dislocations also provide us with new and interesting
opportunities to strengthen our diversification.
Performance
The portfolio declined in the 12 month period but did a respectable job in protecting the value of our clients’
wealth during periods of market uncertainty. The equity allocation had a mixed year, starting off with some
disappointments before recovering strongly helped by the exposure to US equities. However, the indiscriminate
sell-off towards the end of the year retraced many of the earlier gains, but we used this opportunity to add to
the equity risk in the portfolio, including increasing our overweight position in Japanese equities.
Fixed income overall delivered a relatively flat performance, as the gains earlier in the year from high yield debt
were offset by the poor performance of emerging market debt, which later in the year effectively reversed.
Government bonds added some value in the period, especially towards the end of the 12 months, but not
enough to offset the disappointing end experienced by the investment grade credit managers.
The alternatives allocation has seen mixed performance, with the alternative beta strategies struggling
throughout the period as few style factors seemed to work consistently. Other alternatives exposure performed
relatively better as a whole, with macro, event driven and long/short strategies all delivering reasonable
performance.
Merian Global Investors Series Plc Annual Report and Audited Financial Statements for the financial year ended 31 December 2018
OLD MUTUAL COMPASS PORTFOLIO 5
INVESTMENT ADVISER’S REPORT FOR THE FINANCIAL YEAR ENDED 31 DECEMBER 2018
Investment Advisers – Merian Global Investors (UK) Limited (until 14 June 2018)
– Quilter Investors Limited (formerly Old Mutual Investment Management Limited) (from 15
June 2018)
50
Market Review
Equity markets suffered a torrid start to the year and ended the period in the same way. After UK and US stock
markets both hit record highs in January, global equities suffered two major setbacks in the first three months of
2018. Thanks to a sudden hike in US inflation and fears of a more aggressive interest-rate posture in the US, markets
sold off sharply on concerns of the global economy overheating, while the second stumble occurred on the
back of President Trump’s increasesd trade-war rhetoric and issues at Facebook that spread contagion fears
across the technology sector.
In the second half of the period, markets recovered strongly, driven by the US as technology stocks recovered
and overall strong corporate earnings helped push markets higher, with the S&P 500 index reaching a record bull
run in August. However, by October markets became choppy once again and the final months of the year,
particularly December, saw most markets end the period on a downwards note, with only emerging markets
managing to rally somewhat.
Fixed income had a somewhat steadier, yet uninspiring year, although the asset class was not immune from the
sell-offs in the equity space and faced disappointing periods as a result. Towards the end of the year government
bonds performed better than their credit counterparts, reversing the trend seen earlier in the period, although
emerging market debt and certain high yield bonds offered some bright spots.
In our view, the market moves we’ve witnessed this year have been outsized relative to the fundamentals, and
have been somewhat inconsistent in its reactions to things such as economic data points and central bank policy
actions. While it has affected the portfolio, these market dislocations also provide us with new and interesting
opportunities to strengthen our diversification.
Performance
The portfolio declined in the 12 month period but did a respectable job in protecting the value of our clients’
wealth during periods of market uncertainty. The equity allocation had a mixed year, starting off with some
disappointments before recovering strongly helped by the exposure to US equities. However, the indiscriminate
sell-off towards the end of the year retraced many of the earlier gains, but we used this opportunity to add to
the equity risk in the portfolio, including increasing our overweight position in Japanese equities.
Merian Global Investors Series Plc Annual Report and Audited Financial Statements for the financial year ended 31 December 2018
MERIAN UK SPECIALIST EQUITY FUND
INVESTMENT ADVISER’S REPORT FOR THE FINANCIAL YEAR ENDED 31 DECEMBER 2018
Investment Adviser – Merian Global Investors (UK) Limited
51
Following a strong performance in 2017, 2018 proved a disappointing year for the sub-fund. There were two
principal factors behind this. First, the sub-fund’s long book was hit by a number of stock specific disappointments,
mainly in the first half of the year. Foremost was Conviviality Retail, a distributor of alcoholic drinks, where
accounting irregularities were discovered in March, leading to a very substantial fall in the company’s share
price. Unexpected profit warnings hit the sub-fund’s holdings in Micro Focus, a software company, Superdry, a
clothing brand, and Ten Lifestyle, a provider of concierge services. The holding in Indivior, a pharmaceutical
company, disappointed on early take-up of the company’s new delivery mechanism for opioid painkiller
addiction treatment.
On the positive side, long-standing holdings in Burford Capital, Fevertree Drinks, Homeserve and Auto Trader were
the most significant. The short book contributed positive alpha, falling by more than the FTSE 250 over the year.
The standout contribution came from a position in a provider of funeral services: the company’s strategy to raise
prices sharply every year came under pressure from emerging competition and regulator scrutiny. Warnings from
two retailers, an estate agent, a shopping centre owner, an ad-tech company, a photo booth operator, a
manufacturer of industrial tape, a logistics business and newspaper publisher were also notably helpful.
As we look into 2019, thematic tilts and gross exposure are somewhat lower than recent years. Net exposure
remains approximately at zero, both in reported terms and adjusted for beta. The sub-fund has reduced its net
short exposure to economically sensitive UK businesses, given the increasingly binary nature of the risks around
Brexit. Exposure to international cyclicality has reduced to slightly net short, given slowing economic lead
indicators. Structural growth remains a tilt on the long book, though has been reduced somewhat through sales
of lower conviction holdings, and some new shorts in this area. As ever, the focus remains on delivering returns
through stock picking on the long and short books.
Merian Global Investors Series Plc Annual Report and Audited Financial Statements for the financial year ended 31 December 2018
MERIAN STYLE PREMIA ABSOLUTE RETURN FUND
INVESTMENT ADVISER’S REPORT FOR THE FINANCIAL YEAR ENDED 31 DECEMBER 2018
Investment Adviser – Merian Global Investors (UK) Limited
52
2018 was a challenging year for investors, after recent year’s strong performance. As concerns over the US-China
trade relationship, the tapering of monetary stimulus and worries over global growth grew into the last quarter
with global stock markets struggling into year end. Volatility picked up after the very benign market conditions
witnessed over the previous two years. Against this backdrop the fund delivered a negative return in 2018.
The year was characterised by negative return to most strategies with the exception of equity quality, which
delivered strongly positive returns. Equity value was the most significant negative contributor, with all asset classes
negative.
From an asset class perspective, equities, fixed income and FX were negative. At an aggregate asset level, with
the exception of strong returns to quality, all styles were negative. Leverage was in line with expectations
throughout the year. While volatility was below target over the year, the last quarter saw an increase in realised
volatility.
Despite the recent market environment, the risk of greater volatility remains. Given the unpredictability of
markets, we continue to believe there is value in a strategy that can source returns from persistent styles across
multiple asset class, and the positive skew aspects of statistical arbitrage could help investors in the event markets
become especially turbulent.
Merian Global Investors Series Plc Annual Report and Audited Financial Statements for the financial year ended 31 December 2018
MERIAN FINANCIALS CONTINGENT CAPITAL FUND
INVESTMENT ADVISER’S REPORT FOR THE FINANCIAL YEAR ENDED 31 DECEMBER 2018
Investment Adviser – Merian Global Investors (UK) Limited
53
2018 proved to be a disappointing year for the contingent capital (CoCo) asset class. Bank equities, however,
as measured by the Stoxx 600 Bank Index fell further, once again demonstrating the very low level of volatility
exhibited by the CoCo asset class. This weakness was the result initially of the fading in hopes for stronger growth
and hence steeper yield curves around the world, which would have been very helpful for bank profitability. As
the year progressed further the threat of a US-China trade war depressed the economic outlook further. Worries
over contagion to other areas led to weakness in several emerging market economies such as Brazil and Turkey.
With the UK being almost 1/3 of the total CoCo benchmark index, the deadlock over Brexit negotiations also
had a dampening effect on the sector. In the second half of the year central bank balance sheets shrunk as a
result of quantitative tightening and an increasingly strong US dollar due to fears that the Federal Reserve might
press ahead with further rate rises led to a fall in risk assets around the world, including contingent capital.
The sub-fund retained its exposure to bonds with slightly longer call dates than the index as a whole, typically in
the 4-6 year part of the curve. The managers see the greatest value at this part of the curve, and accept that
the longer duration will lead to slightly higher levels of volatility in the sub-fund relative to the benchmark,
although still very low in absolute terms, even when compared to senior debt. The sub-fund also retains its
overweight exposure to sterling denominated bonds, again where the managers see greatest value relative to
bonds in US dollars in particular.
The early part of the year saw some heavy issuance as spreads tightened quite meaningfully. The sub-fund
participated in some of these issues, but in some the coupon reset level was unattractive and no position was
taken. The sub-fund prefers bonds will greater reset spreads, giving much more certainty over the likelihood of
call and hence more aggressive credit spread roll-down, thus increasing returns.
During the year the managers reduced exposure to banks exposed to Turkey and Brazil, such as BBVA, Unicredit
and Santander, while increasing exposure to the Spanish domestic sector where balance sheet improvement in
rapid amidst a strong housing market recovery. Holdings were also bought in bonds issued at very attractive
levels in the summer from Barclays, Credit Suisse, Bankia, Lloyds and Danske Bank.
While the outlook is still shrouded in uncertainty over trade wars and Brexit, we believe the asset class offers
excellent value and total return potential, primarily because of the underlying yield offered against continuing
improvement in bank balance sheets. In short, we expect 2019 to remain volatile as liquidity is withdrawn by
central banks; however, the yield on the asset class is sufficient to insulate investors from this volatility and provide
a healthy and positive total return.
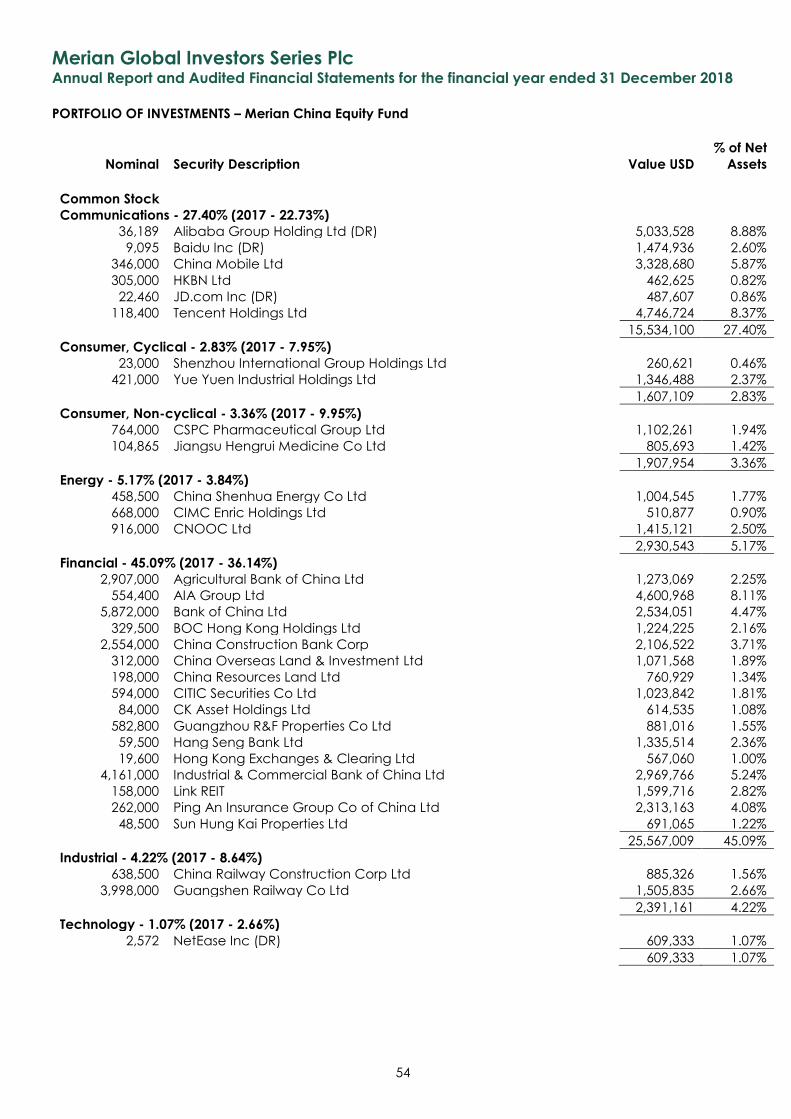
Merian Global Investors Series Plc Annual Report and Audited Financial Statements for the financial year ended 31 December 2018
PORTFOLIO OF INVESTMENTS – Merian China Equity Fund
Nominal Security Description Value USD
% of Net
Assets
54
Common Stock Communications - 27.40% (2017 - 22.73%)
36,189 Alibaba Group Holding Ltd (DR) 5,033,528 8.88%
9,095 Baidu Inc (DR) 1,474,936 2.60%
346,000 China Mobile Ltd 3,328,680 5.87%
305,000 HKBN Ltd 462,625 0.82%
22,460 JD.com Inc (DR) 487,607 0.86%
118,400 Tencent Holdings Ltd 4,746,724 8.37%
15,534,100 27.40%
Consumer, Cyclical - 2.83% (2017 - 7.95%) 23,000 Shenzhou International Group Holdings Ltd 260,621 0.46%
421,000 Yue Yuen Industrial Holdings Ltd 1,346,488 2.37%
1,607,109 2.83%
Consumer, Non-cyclical - 3.36% (2017 - 9.95%) 764,000 CSPC Pharmaceutical Group Ltd 1,102,261 1.94%
104,865 Jiangsu Hengrui Medicine Co Ltd 805,693 1.42%
1,907,954 3.36%
Energy - 5.17% (2017 - 3.84%) 458,500 China Shenhua Energy Co Ltd 1,004,545 1.77%
668,000 CIMC Enric Holdings Ltd 510,877 0.90%
916,000 CNOOC Ltd 1,415,121 2.50%
2,930,543 5.17%
Financial - 45.09% (2017 - 36.14%) 2,907,000 Agricultural Bank of China Ltd 1,273,069 2.25%
554,400 AIA Group Ltd 4,600,968 8.11%
5,872,000 Bank of China Ltd 2,534,051 4.47%
329,500 BOC Hong Kong Holdings Ltd 1,224,225 2.16%
2,554,000 China Construction Bank Corp 2,106,522 3.71%
312,000 China Overseas Land & Investment Ltd 1,071,568 1.89%
198,000 China Resources Land Ltd 760,929 1.34%
594,000 CITIC Securities Co Ltd 1,023,842 1.81%
84,000 CK Asset Holdings Ltd 614,535 1.08%
582,800 Guangzhou R&F Properties Co Ltd 881,016 1.55%
59,500 Hang Seng Bank Ltd 1,335,514 2.36%
19,600 Hong Kong Exchanges & Clearing Ltd 567,060 1.00%
4,161,000 Industrial & Commercial Bank of China Ltd 2,969,766 5.24%
158,000 Link REIT 1,599,716 2.82%
262,000 Ping An Insurance Group Co of China Ltd 2,313,163 4.08%
48,500 Sun Hung Kai Properties Ltd 691,065 1.22%
25,567,009 45.09%
Industrial - 4.22% (2017 - 8.64%) 638,500 China Railway Construction Corp Ltd 885,326 1.56%
3,998,000 Guangshen Railway Co Ltd 1,505,835 2.66%
2,391,161 4.22%
Technology - 1.07% (2017 - 2.66%) 2,572 NetEase Inc (DR) 609,333 1.07%
609,333 1.07%
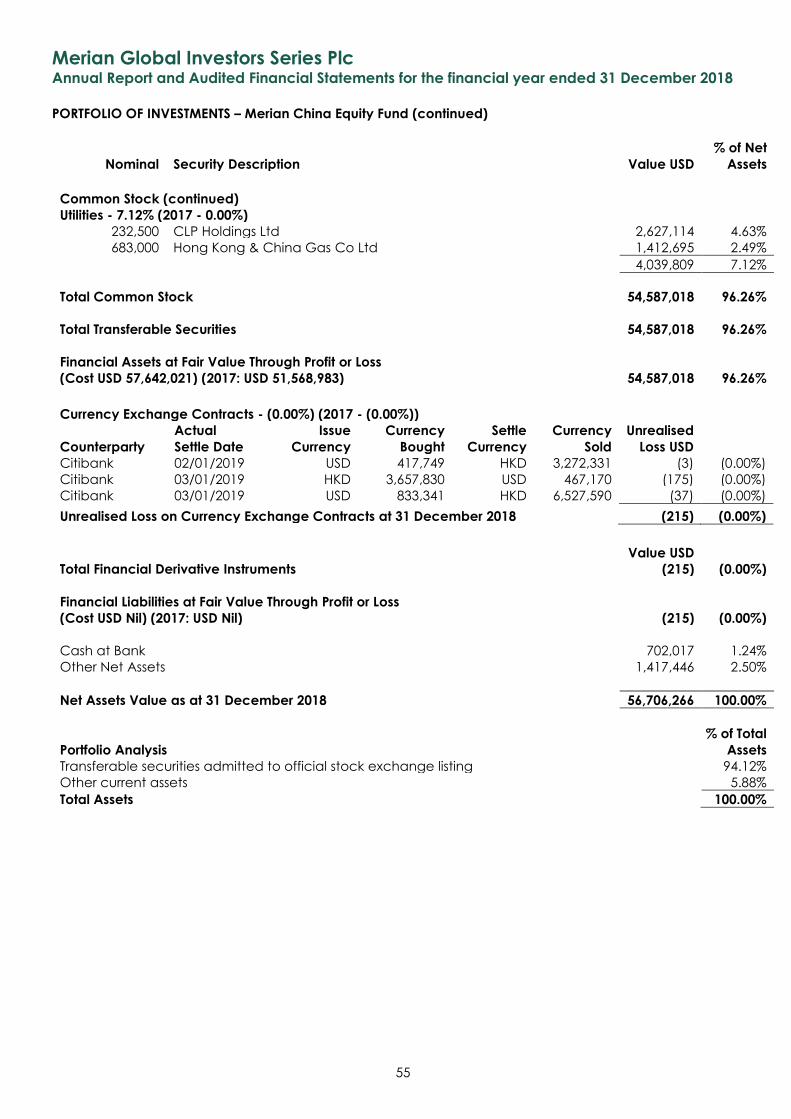
Merian Global Investors Series Plc Annual Report and Audited Financial Statements for the financial year ended 31 December 2018
PORTFOLIO OF INVESTMENTS – Merian China Equity Fund (continued)
Nominal Security Description Value USD
% of Net
Assets
55
Common Stock (continued) Utilities - 7.12% (2017 - 0.00%)
232,500 CLP Holdings Ltd 2,627,114 4.63%
683,000 Hong Kong & China Gas Co Ltd 1,412,695 2.49%
4,039,809 7.12%
Total Common Stock 54,587,018 96.26%
Total Transferable Securities 54,587,018 96.26%
Financial Assets at Fair Value Through Profit or Loss
(Cost USD 57,642,021) (2017: USD 51,568,983) 54,587,018 96.26%
Currency Exchange Contracts - (0.00%) (2017 - (0.00%))
Counterparty
Actual
Settle Date
Issue
Currency
Currency
Bought
Settle
Currency
Currency
Sold
Unrealised
Loss USD
Citibank 02/01/2019 USD 417,749 HKD 3,272,331 (3) (0.00%)
Citibank 03/01/2019 HKD 3,657,830 USD 467,170 (175) (0.00%)
Citibank 03/01/2019 USD 833,341 HKD 6,527,590 (37) (0.00%)
Unrealised Loss on Currency Exchange Contracts at 31 December 2018 (215) (0.00%)
Value USD
Total Financial Derivative Instruments (215) (0.00%)
Financial Liabilities at Fair Value Through Profit or Loss
(Cost USD Nil) (2017: USD Nil) (215) (0.00%)
Cash at Bank 702,017 1.24%
Other Net Assets 1,417,446 2.50%
Net Assets Value as at 31 December 2018 56,706,266 100.00%
Portfolio Analysis
% of Total
Assets
Transferable securities admitted to official stock exchange listing 94.12%
Other current assets 5.88%
Total Assets 100.00%
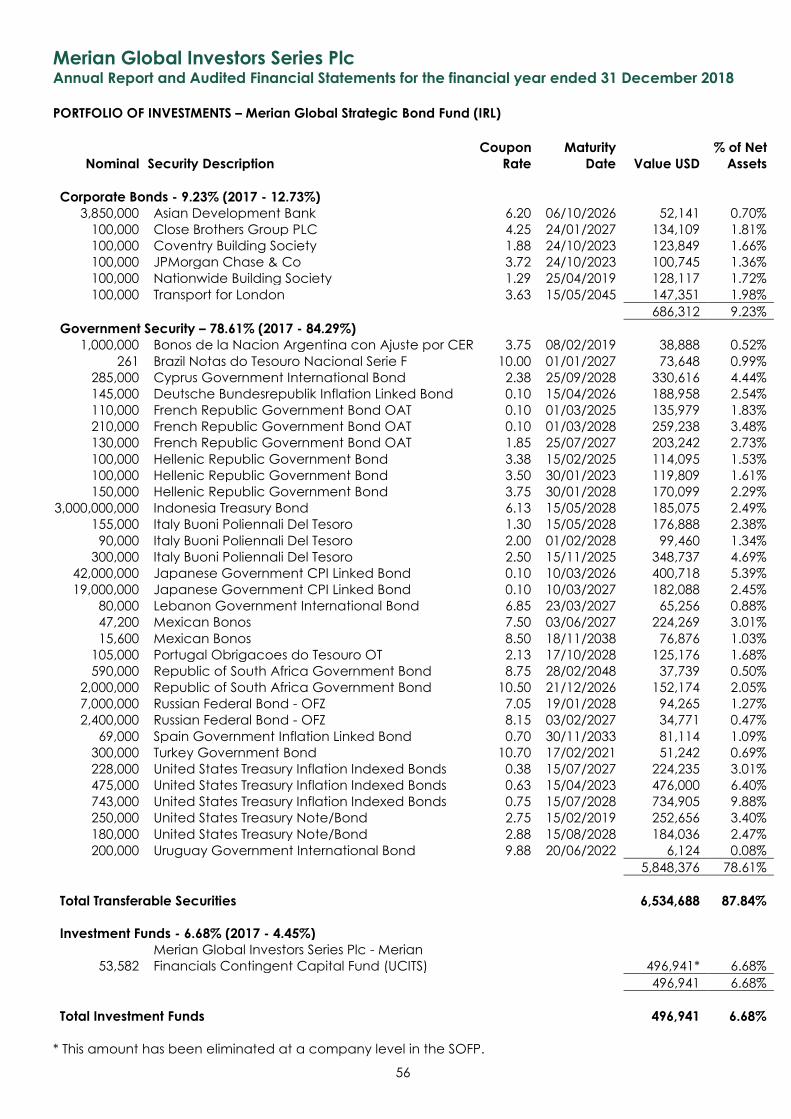
Merian Global Investors Series Plc Annual Report and Audited Financial Statements for the financial year ended 31 December 2018
PORTFOLIO OF INVESTMENTS – Merian Global Strategic Bond Fund (IRL)
Nominal Security Description
Coupon
Rate
Maturity
Date Value USD
% of Net
Assets
56
Corporate Bonds - 9.23% (2017 - 12.73%) 3,850,000 Asian Development Bank 6.20 06/10/2026 52,141 0.70%
100,000 Close Brothers Group PLC 4.25 24/01/2027 134,109 1.81%
100,000 Coventry Building Society 1.88 24/10/2023 123,849 1.66%
100,000 JPMorgan Chase & Co 3.72 24/10/2023 100,745 1.36%
100,000 Nationwide Building Society 1.29 25/04/2019 128,117 1.72%
100,000 Transport for London 3.63 15/05/2045 147,351 1.98%
686,312 9.23%
Government Security – 78.61% (2017 - 84.29%) 1,000,000 Bonos de la Nacion Argentina con Ajuste por CER 3.75 08/02/2019 38,888 0.52%
261 Brazil Notas do Tesouro Nacional Serie F 10.00 01/01/2027 73,648 0.99%
285,000 Cyprus Government International Bond 2.38 25/09/2028 330,616 4.44%
145,000 Deutsche Bundesrepublik Inflation Linked Bond 0.10 15/04/2026 188,958 2.54%
110,000 French Republic Government Bond OAT 0.10 01/03/2025 135,979 1.83%
210,000 French Republic Government Bond OAT 0.10 01/03/2028 259,238 3.48%
130,000 French Republic Government Bond OAT 1.85 25/07/2027 203,242 2.73%
100,000 Hellenic Republic Government Bond 3.38 15/02/2025 114,095 1.53%
100,000 Hellenic Republic Government Bond 3.50 30/01/2023 119,809 1.61%
150,000 Hellenic Republic Government Bond 3.75 30/01/2028 170,099 2.29%
3,000,000,000 Indonesia Treasury Bond 6.13 15/05/2028 185,075 2.49%
155,000 Italy Buoni Poliennali Del Tesoro 1.30 15/05/2028 176,888 2.38%
90,000 Italy Buoni Poliennali Del Tesoro 2.00 01/02/2028 99,460 1.34%
300,000 Italy Buoni Poliennali Del Tesoro 2.50 15/11/2025 348,737 4.69%
42,000,000 Japanese Government CPI Linked Bond 0.10 10/03/2026 400,718 5.39%
19,000,000 Japanese Government CPI Linked Bond 0.10 10/03/2027 182,088 2.45%
80,000 Lebanon Government International Bond 6.85 23/03/2027 65,256 0.88%
47,200 Mexican Bonos 7.50 03/06/2027 224,269 3.01%
15,600 Mexican Bonos 8.50 18/11/2038 76,876 1.03%
105,000 Portugal Obrigacoes do Tesouro OT 2.13 17/10/2028 125,176 1.68%
590,000 Republic of South Africa Government Bond 8.75 28/02/2048 37,739 0.50%
2,000,000 Republic of South Africa Government Bond 10.50 21/12/2026 152,174 2.05%
7,000,000 Russian Federal Bond - OFZ 7.05 19/01/2028 94,265 1.27%
2,400,000 Russian Federal Bond - OFZ 8.15 03/02/2027 34,771 0.47%
69,000 Spain Government Inflation Linked Bond 0.70 30/11/2033 81,114 1.09%
300,000 Turkey Government Bond 10.70 17/02/2021 51,242 0.69%
228,000 United States Treasury Inflation Indexed Bonds 0.38 15/07/2027 224,235 3.01%
475,000 United States Treasury Inflation Indexed Bonds 0.63 15/04/2023 476,000 6.40%
743,000 United States Treasury Inflation Indexed Bonds 0.75 15/07/2028 734,905 9.88%
250,000 United States Treasury Note/Bond 2.75 15/02/2019 252,656 3.40%
180,000 United States Treasury Note/Bond 2.88 15/08/2028 184,036 2.47%
200,000 Uruguay Government International Bond 9.88 20/06/2022 6,124 0.08%
5,848,376 78.61%
Total Transferable Securities 6,534,688 87.84%
Investment Funds - 6.68% (2017 - 4.45%)
53,582
Merian Global Investors Series Plc - Merian
Financials Contingent Capital Fund (UCITS) 496,941* 6.68%
496,941 6.68%
Total Investment Funds 496,941 6.68%
* This amount has been eliminated at a company level in the SOFP.
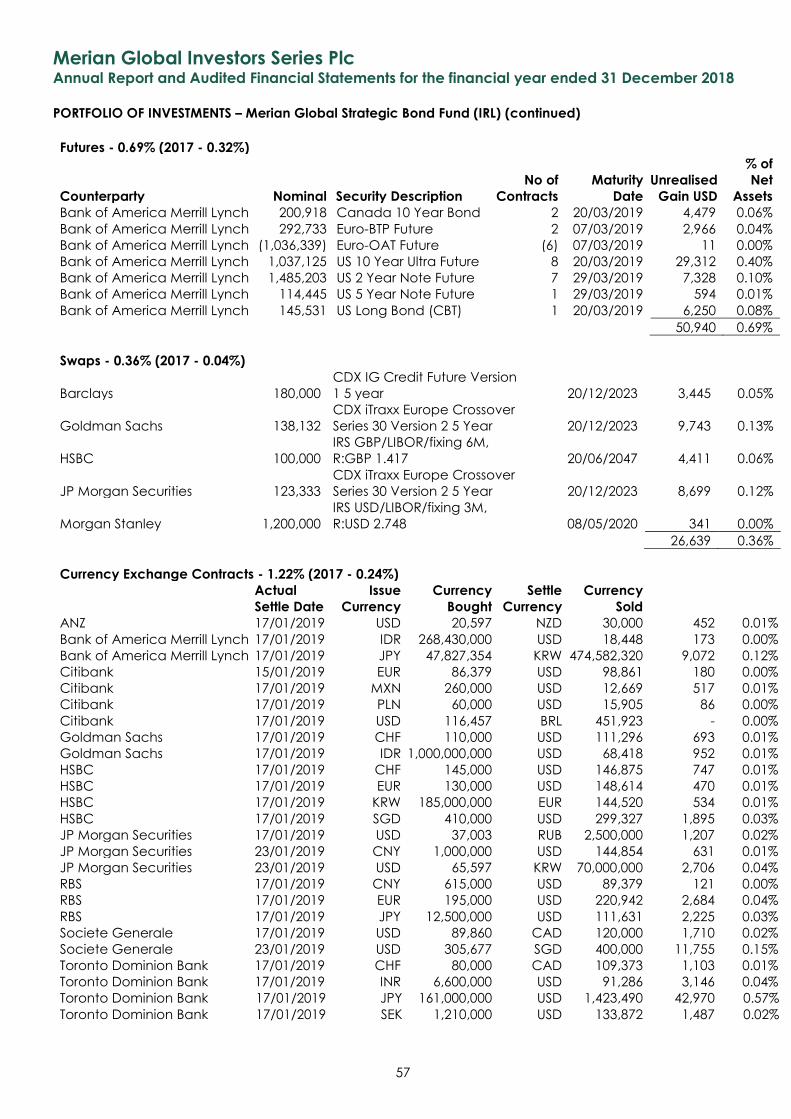
Merian Global Investors Series Plc Annual Report and Audited Financial Statements for the financial year ended 31 December 2018
PORTFOLIO OF INVESTMENTS – Merian Global Strategic Bond Fund (IRL) (continued)
57
Futures - 0.69% (2017 - 0.32%)
Counterparty Nominal Security Description
No of
Contracts
Maturity
Date
Unrealised
Gain USD
% of
Net
Assets
Bank of America Merrill Lynch 200,918 Canada 10 Year Bond 2 20/03/2019 4,479 0.06%
Bank of America Merrill Lynch 292,733 Euro-BTP Future 2 07/03/2019 2,966 0.04%
Bank of America Merrill Lynch (1,036,339) Euro-OAT Future (6) 07/03/2019 11 0.00%
Bank of America Merrill Lynch 1,037,125 US 10 Year Ultra Future 8 20/03/2019 29,312 0.40%
Bank of America Merrill Lynch 1,485,203 US 2 Year Note Future 7 29/03/2019 7,328 0.10%
Bank of America Merrill Lynch 114,445 US 5 Year Note Future 1 29/03/2019 594 0.01%
Bank of America Merrill Lynch 145,531 US Long Bond (CBT) 1 20/03/2019 6,250 0.08%
50,940 0.69%
Swaps - 0.36% (2017 - 0.04%)
Barclays 180,000
CDX IG Credit Future Version
1 5 year 20/12/2023 3,445 0.05%
Goldman Sachs 138,132
CDX iTraxx Europe Crossover
Series 30 Version 2 5 Year 20/12/2023 9,743 0.13%
HSBC 100,000
IRS GBP/LIBOR/fixing 6M,
R:GBP 1.417 20/06/2047 4,411 0.06%
JP Morgan Securities 123,333
CDX iTraxx Europe Crossover
Series 30 Version 2 5 Year 20/12/2023 8,699 0.12%
Morgan Stanley 1,200,000
IRS USD/LIBOR/fixing 3M,
R:USD 2.748 08/05/2020 341 0.00%
26,639 0.36%
Currency Exchange Contracts - 1.22% (2017 - 0.24%)
Actual
Settle Date
Issue
Currency
Currency
Bought
Settle
Currency
Currency
Sold ANZ 17/01/2019 USD 20,597 NZD 30,000 452 0.01%
Bank of America Merrill Lynch 17/01/2019 IDR 268,430,000 USD 18,448 173 0.00%
Bank of America Merrill Lynch 17/01/2019 JPY 47,827,354 KRW 474,582,320 9,072 0.12%
Citibank 15/01/2019 EUR 86,379 USD 98,861 180 0.00%
Citibank 17/01/2019 MXN 260,000 USD 12,669 517 0.01%
Citibank 17/01/2019 PLN 60,000 USD 15,905 86 0.00%
Citibank 17/01/2019 USD 116,457 BRL 451,923 - 0.00%
Goldman Sachs 17/01/2019 CHF 110,000 USD 111,296 693 0.01%
Goldman Sachs 17/01/2019 IDR 1,000,000,000 USD 68,418 952 0.01%
HSBC 17/01/2019 CHF 145,000 USD 146,875 747 0.01%
HSBC 17/01/2019 EUR 130,000 USD 148,614 470 0.01%
HSBC 17/01/2019 KRW 185,000,000 EUR 144,520 534 0.01%
HSBC 17/01/2019 SGD 410,000 USD 299,327 1,895 0.03%
JP Morgan Securities 17/01/2019 USD 37,003 RUB 2,500,000 1,207 0.02%
JP Morgan Securities 23/01/2019 CNY 1,000,000 USD 144,854 631 0.01%
JP Morgan Securities 23/01/2019 USD 65,597 KRW 70,000,000 2,706 0.04%
RBS 17/01/2019 CNY 615,000 USD 89,379 121 0.00%
RBS 17/01/2019 EUR 195,000 USD 220,942 2,684 0.04%
RBS 17/01/2019 JPY 12,500,000 USD 111,631 2,225 0.03%
Societe Generale 17/01/2019 USD 89,860 CAD 120,000 1,710 0.02%
Societe Generale 23/01/2019 USD 305,677 SGD 400,000 11,755 0.15%
Toronto Dominion Bank 17/01/2019 CHF 80,000 CAD 109,373 1,103 0.01%
Toronto Dominion Bank 17/01/2019 INR 6,600,000 USD 91,286 3,146 0.04%
Toronto Dominion Bank 17/01/2019 JPY 161,000,000 USD 1,423,490 42,970 0.57%
Toronto Dominion Bank 17/01/2019 SEK 1,210,000 USD 133,872 1,487 0.02%
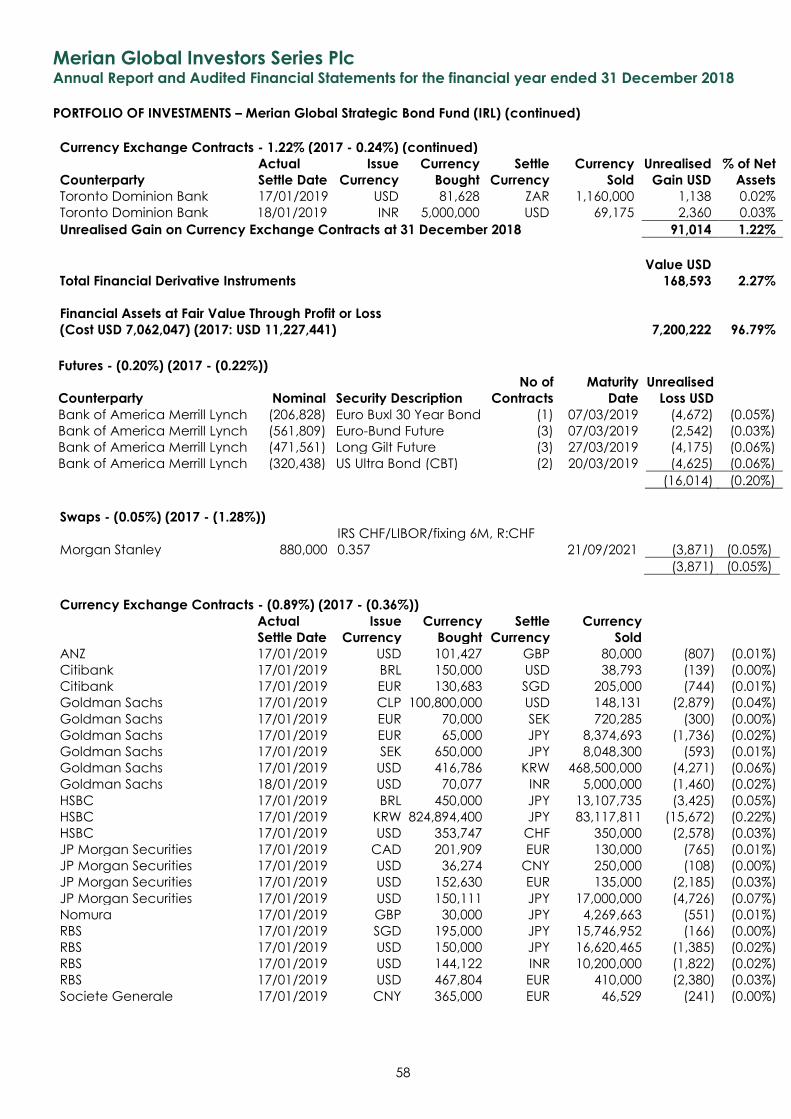
Merian Global Investors Series Plc Annual Report and Audited Financial Statements for the financial year ended 31 December 2018
PORTFOLIO OF INVESTMENTS – Merian Global Strategic Bond Fund (IRL) (continued)
58
Currency Exchange Contracts - 1.22% (2017 - 0.24%) (continued)
Counterparty
Actual
Settle Date
Issue
Currency
Currency
Bought
Settle
Currency
Currency
Sold
Unrealised
Gain USD
% of Net
Assets
Toronto Dominion Bank 17/01/2019 USD 81,628 ZAR 1,160,000 1,138 0.02%
Toronto Dominion Bank 18/01/2019 INR 5,000,000 USD 69,175 2,360 0.03%
Unrealised Gain on Currency Exchange Contracts at 31 December 2018 91,014 1.22%
Value USD
Total Financial Derivative Instruments 168,593 2.27%
Financial Assets at Fair Value Through Profit or Loss
(Cost USD 7,062,047) (2017: USD 11,227,441) 7,200,222 96.79%
Futures - (0.20%) (2017 - (0.22%))
Counterparty Nominal Security Description
No of
Contracts
Maturity
Date
Unrealised
Loss USD
Bank of America Merrill Lynch (206,828) Euro Buxl 30 Year Bond (1) 07/03/2019 (4,672) (0.05%)
Bank of America Merrill Lynch (561,809) Euro-Bund Future (3) 07/03/2019 (2,542) (0.03%)
Bank of America Merrill Lynch (471,561) Long Gilt Future (3) 27/03/2019 (4,175) (0.06%)
Bank of America Merrill Lynch (320,438) US Ultra Bond (CBT) (2) 20/03/2019 (4,625) (0.06%)
(16,014) (0.20%)
Swaps - (0.05%) (2017 - (1.28%))
Morgan Stanley 880,000
IRS CHF/LIBOR/fixing 6M, R:CHF
0.357 21/09/2021 (3,871) (0.05%)
(3,871) (0.05%)
Currency Exchange Contracts - (0.89%) (2017 - (0.36%))
Actual
Settle Date
Issue
Currency
Currency
Bought
Settle
Currency
Currency
Sold ANZ 17/01/2019 USD 101,427 GBP 80,000 (807) (0.01%)
Citibank 17/01/2019 BRL 150,000 USD 38,793 (139) (0.00%)
Citibank 17/01/2019 EUR 130,683 SGD 205,000 (744) (0.01%)
Goldman Sachs 17/01/2019 CLP 100,800,000 USD 148,131 (2,879) (0.04%)
Goldman Sachs 17/01/2019 EUR 70,000 SEK 720,285 (300) (0.00%)
Goldman Sachs 17/01/2019 EUR 65,000 JPY 8,374,693 (1,736) (0.02%)
Goldman Sachs 17/01/2019 SEK 650,000 JPY 8,048,300 (593) (0.01%)
Goldman Sachs 17/01/2019 USD 416,786 KRW 468,500,000 (4,271) (0.06%)
Goldman Sachs 18/01/2019 USD 70,077 INR 5,000,000 (1,460) (0.02%)
HSBC 17/01/2019 BRL 450,000 JPY 13,107,735 (3,425) (0.05%)
HSBC 17/01/2019 KRW 824,894,400 JPY 83,117,811 (15,672) (0.22%)
HSBC 17/01/2019 USD 353,747 CHF 350,000 (2,578) (0.03%)
JP Morgan Securities 17/01/2019 CAD 201,909 EUR 130,000 (765) (0.01%)
JP Morgan Securities 17/01/2019 USD 36,274 CNY 250,000 (108) (0.00%)
JP Morgan Securities 17/01/2019 USD 152,630 EUR 135,000 (2,185) (0.03%)
JP Morgan Securities 17/01/2019 USD 150,111 JPY 17,000,000 (4,726) (0.07%)
Nomura 17/01/2019 GBP 30,000 JPY 4,269,663 (551) (0.01%)
RBS 17/01/2019 SGD 195,000 JPY 15,746,952 (166) (0.00%)
RBS 17/01/2019 USD 150,000 JPY 16,620,465 (1,385) (0.02%)
RBS 17/01/2019 USD 144,122 INR 10,200,000 (1,822) (0.02%)
RBS 17/01/2019 USD 467,804 EUR 410,000 (2,380) (0.03%)
Societe Generale 17/01/2019 CNY 365,000 EUR 46,529 (241) (0.00%)
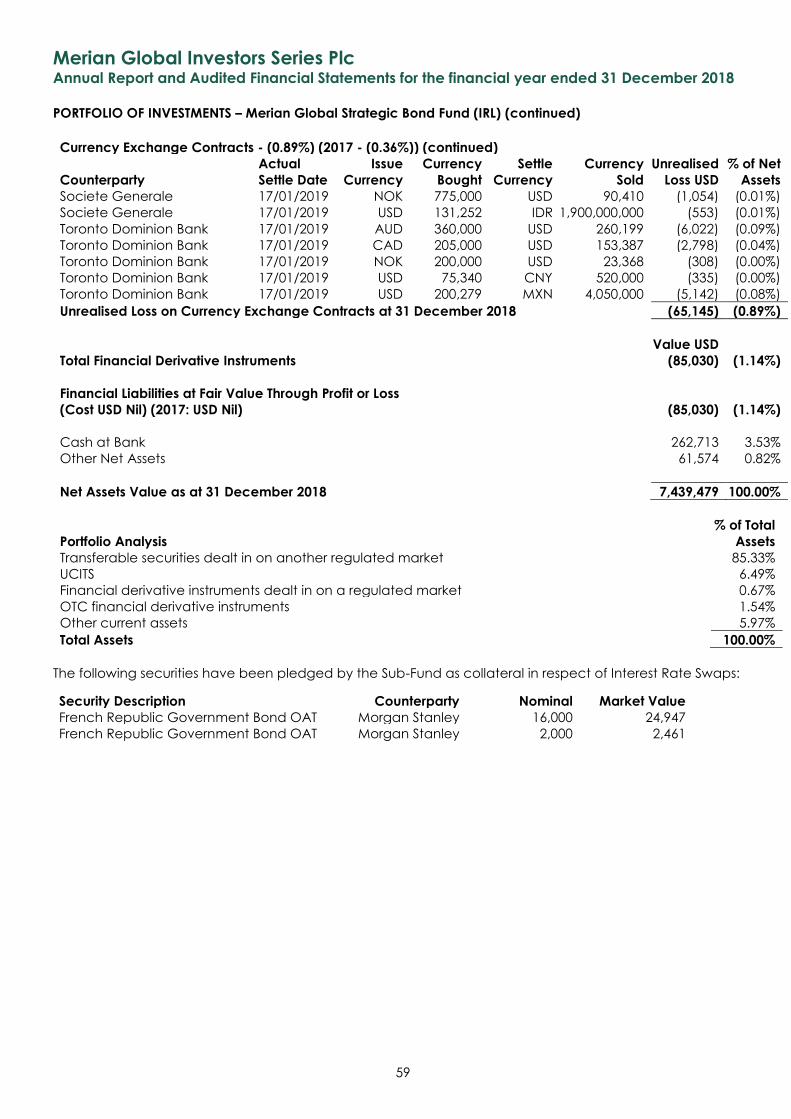
Merian Global Investors Series Plc Annual Report and Audited Financial Statements for the financial year ended 31 December 2018
PORTFOLIO OF INVESTMENTS – Merian Global Strategic Bond Fund (IRL) (continued)
59
Currency Exchange Contracts - (0.89%) (2017 - (0.36%)) (continued)
Counterparty
Actual
Settle Date
Issue
Currency
Currency
Bought
Settle
Currency
Currency
Sold
Unrealised
Loss USD
% of Net
Assets
Societe Generale 17/01/2019 NOK 775,000 USD 90,410 (1,054) (0.01%)
Societe Generale 17/01/2019 USD 131,252 IDR 1,900,000,000 (553) (0.01%)
Toronto Dominion Bank 17/01/2019 AUD 360,000 USD 260,199 (6,022) (0.09%)
Toronto Dominion Bank 17/01/2019 CAD 205,000 USD 153,387 (2,798) (0.04%)
Toronto Dominion Bank 17/01/2019 NOK 200,000 USD 23,368 (308) (0.00%)
Toronto Dominion Bank 17/01/2019 USD 75,340 CNY 520,000 (335) (0.00%)
Toronto Dominion Bank 17/01/2019 USD 200,279 MXN 4,050,000 (5,142) (0.08%)
Unrealised Loss on Currency Exchange Contracts at 31 December 2018 (65,145) (0.89%)
Value USD
Total Financial Derivative Instruments (85,030) (1.14%)
Financial Liabilities at Fair Value Through Profit or Loss
(Cost USD Nil) (2017: USD Nil) (85,030) (1.14%)
Cash at Bank 262,713 3.53%
Other Net Assets 61,574 0.82%
Net Assets Value as at 31 December 2018 7,439,479 100.00%
Portfolio Analysis
% of Total
Assets
Transferable securities dealt in on another regulated market 85.33%
UCITS 6.49%
Financial derivative instruments dealt in on a regulated market 0.67%
OTC financial derivative instruments 1.54%
Other current assets 5.97%
Total Assets 100.00%
The following securities have been pledged by the Sub-Fund as collateral in respect of Interest Rate Swaps:
Security Description Counterparty Nominal Market Value
French Republic Government Bond OAT Morgan Stanley 16,000 24,947
French Republic Government Bond OAT Morgan Stanley 2,000 2,461
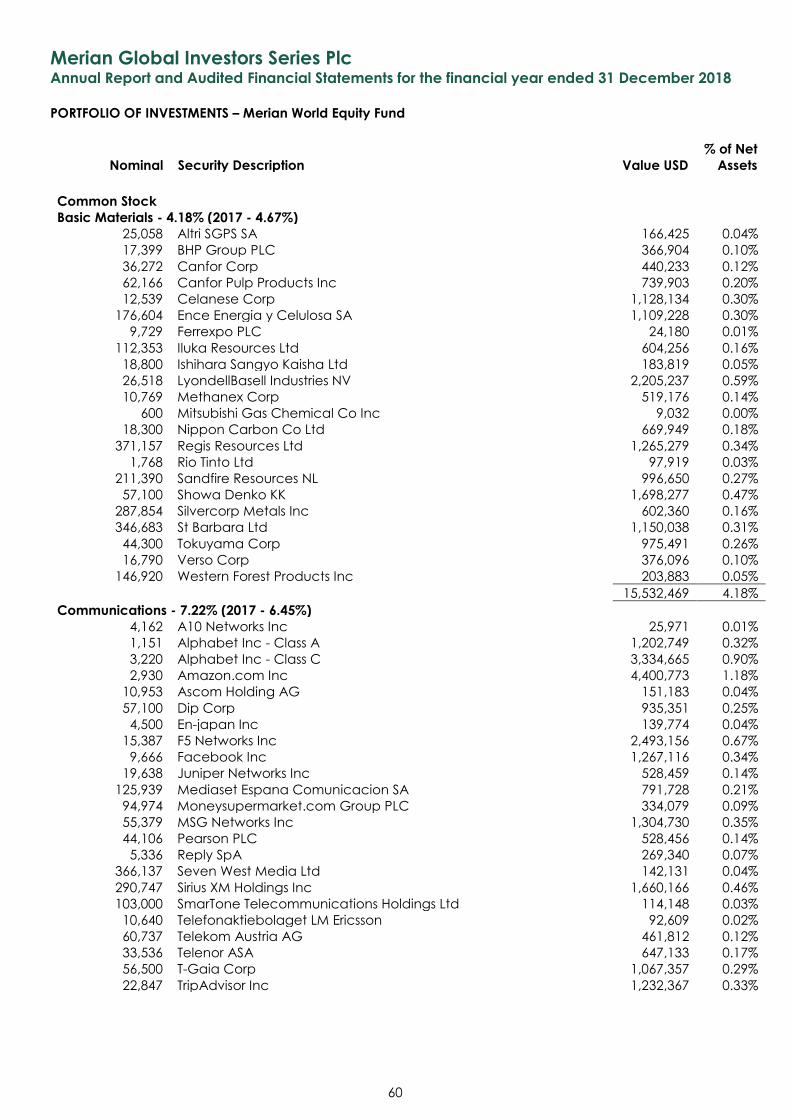
Merian Global Investors Series Plc Annual Report and Audited Financial Statements for the financial year ended 31 December 2018
PORTFOLIO OF INVESTMENTS – Merian World Equity Fund
Nominal Security Description Value USD
% of Net
Assets
60
Common Stock Basic Materials - 4.18% (2017 - 4.67%)
25,058 Altri SGPS SA 166,425 0.04%
17,399 BHP Group PLC 366,904 0.10%
36,272 Canfor Corp 440,233 0.12%
62,166 Canfor Pulp Products Inc 739,903 0.20%
12,539 Celanese Corp 1,128,134 0.30%
176,604 Ence Energia y Celulosa SA 1,109,228 0.30%
9,729 Ferrexpo PLC 24,180 0.01%
112,353 Iluka Resources Ltd 604,256 0.16%
18,800 Ishihara Sangyo Kaisha Ltd 183,819 0.05%
26,518 LyondellBasell Industries NV 2,205,237 0.59%
10,769 Methanex Corp 519,176 0.14%
600 Mitsubishi Gas Chemical Co Inc 9,032 0.00%
18,300 Nippon Carbon Co Ltd 669,949 0.18%
371,157 Regis Resources Ltd 1,265,279 0.34%
1,768 Rio Tinto Ltd 97,919 0.03%
211,390 Sandfire Resources NL 996,650 0.27%
57,100 Showa Denko KK 1,698,277 0.47%
287,854 Silvercorp Metals Inc 602,360 0.16%
346,683 St Barbara Ltd 1,150,038 0.31%
44,300 Tokuyama Corp 975,491 0.26%
16,790 Verso Corp 376,096 0.10%
146,920 Western Forest Products Inc 203,883 0.05%
15,532,469 4.18%
Communications - 7.22% (2017 - 6.45%) 4,162 A10 Networks Inc 25,971 0.01%
1,151 Alphabet Inc - Class A 1,202,749 0.32%
3,220 Alphabet Inc - Class C 3,334,665 0.90%
2,930 Amazon.com Inc 4,400,773 1.18%
10,953 Ascom Holding AG 151,183 0.04%
57,100 Dip Corp 935,351 0.25%
4,500 En-japan Inc 139,774 0.04%
15,387 F5 Networks Inc 2,493,156 0.67%
9,666 Facebook Inc 1,267,116 0.34%
19,638 Juniper Networks Inc 528,459 0.14%
125,939 Mediaset Espana Comunicacion SA 791,728 0.21%
94,974 Moneysupermarket.com Group PLC 334,079 0.09%
55,379 MSG Networks Inc 1,304,730 0.35%
44,106 Pearson PLC 528,456 0.14%
5,336 Reply SpA 269,340 0.07%
366,137 Seven West Media Ltd 142,131 0.04%
290,747 Sirius XM Holdings Inc 1,660,166 0.46%
103,000 SmarTone Telecommunications Holdings Ltd 114,148 0.03%
10,640 Telefonaktiebolaget LM Ericsson 92,609 0.02%
60,737 Telekom Austria AG 461,812 0.12%
33,536 Telenor ASA 647,133 0.17%
56,500 T-Gaia Corp 1,067,357 0.29%
22,847 TripAdvisor Inc 1,232,367 0.33%
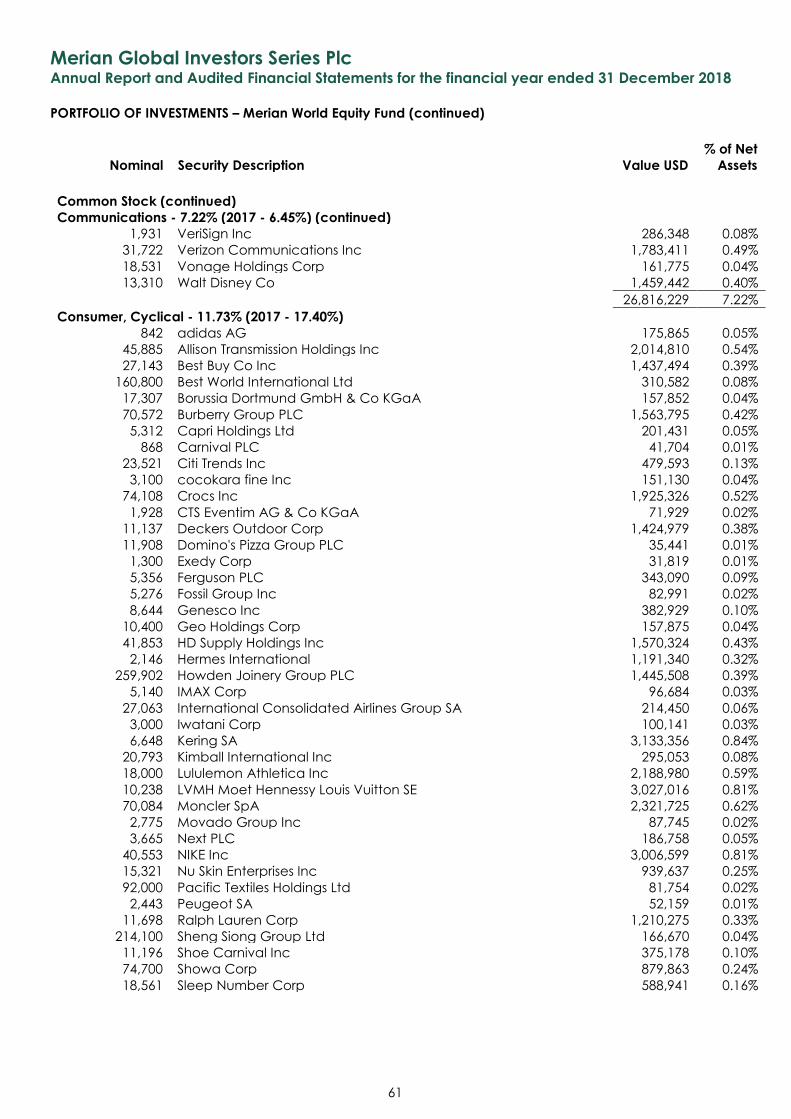
Merian Global Investors Series Plc Annual Report and Audited Financial Statements for the financial year ended 31 December 2018
PORTFOLIO OF INVESTMENTS – Merian World Equity Fund (continued)
Nominal Security Description Value USD
% of Net
Assets
61
Common Stock (continued)
Communications - 7.22% (2017 - 6.45%) (continued)
1,931 VeriSign Inc 286,348 0.08%
31,722 Verizon Communications Inc 1,783,411 0.49%
18,531 Vonage Holdings Corp 161,775 0.04%
13,310 Walt Disney Co 1,459,442 0.40%
26,816,229 7.22%
Consumer, Cyclical - 11.73% (2017 - 17.40%) 842 adidas AG 175,865 0.05%
45,885 Allison Transmission Holdings Inc 2,014,810 0.54%
27,143 Best Buy Co Inc 1,437,494 0.39%
160,800 Best World International Ltd 310,582 0.08%
17,307 Borussia Dortmund GmbH & Co KGaA 157,852 0.04%
70,572 Burberry Group PLC 1,563,795 0.42%
5,312 Capri Holdings Ltd 201,431 0.05%
868 Carnival PLC 41,704 0.01%
23,521 Citi Trends Inc 479,593 0.13%
3,100 cocokara fine Inc 151,130 0.04%
74,108 Crocs Inc 1,925,326 0.52%
1,928 CTS Eventim AG & Co KGaA 71,929 0.02%
11,137 Deckers Outdoor Corp 1,424,979 0.38%
11,908 Domino's Pizza Group PLC 35,441 0.01%
1,300 Exedy Corp 31,819 0.01%
5,356 Ferguson PLC 343,090 0.09%
5,276 Fossil Group Inc 82,991 0.02%
8,644 Genesco Inc 382,929 0.10%
10,400 Geo Holdings Corp 157,875 0.04%
41,853 HD Supply Holdings Inc 1,570,324 0.43%
2,146 Hermes International 1,191,340 0.32%
259,902 Howden Joinery Group PLC 1,445,508 0.39%
5,140 IMAX Corp 96,684 0.03%
27,063 International Consolidated Airlines Group SA 214,450 0.06%
3,000 Iwatani Corp 100,141 0.03%
6,648 Kering SA 3,133,356 0.84%
20,793 Kimball International Inc 295,053 0.08%
18,000 Lululemon Athletica Inc 2,188,980 0.59%
10,238 LVMH Moet Hennessy Louis Vuitton SE 3,027,016 0.81%
70,084 Moncler SpA 2,321,725 0.62%
2,775 Movado Group Inc 87,745 0.02%
3,665 Next PLC 186,758 0.05%
40,553 NIKE Inc 3,006,599 0.81%
15,321 Nu Skin Enterprises Inc 939,637 0.25%
92,000 Pacific Textiles Holdings Ltd 81,754 0.02%
2,443 Peugeot SA 52,159 0.01%
11,698 Ralph Lauren Corp 1,210,275 0.33%
214,100 Sheng Siong Group Ltd 166,670 0.04%
11,196 Shoe Carnival Inc 375,178 0.10%
74,700 Showa Corp 879,863 0.24%
18,561 Sleep Number Corp 588,941 0.16%
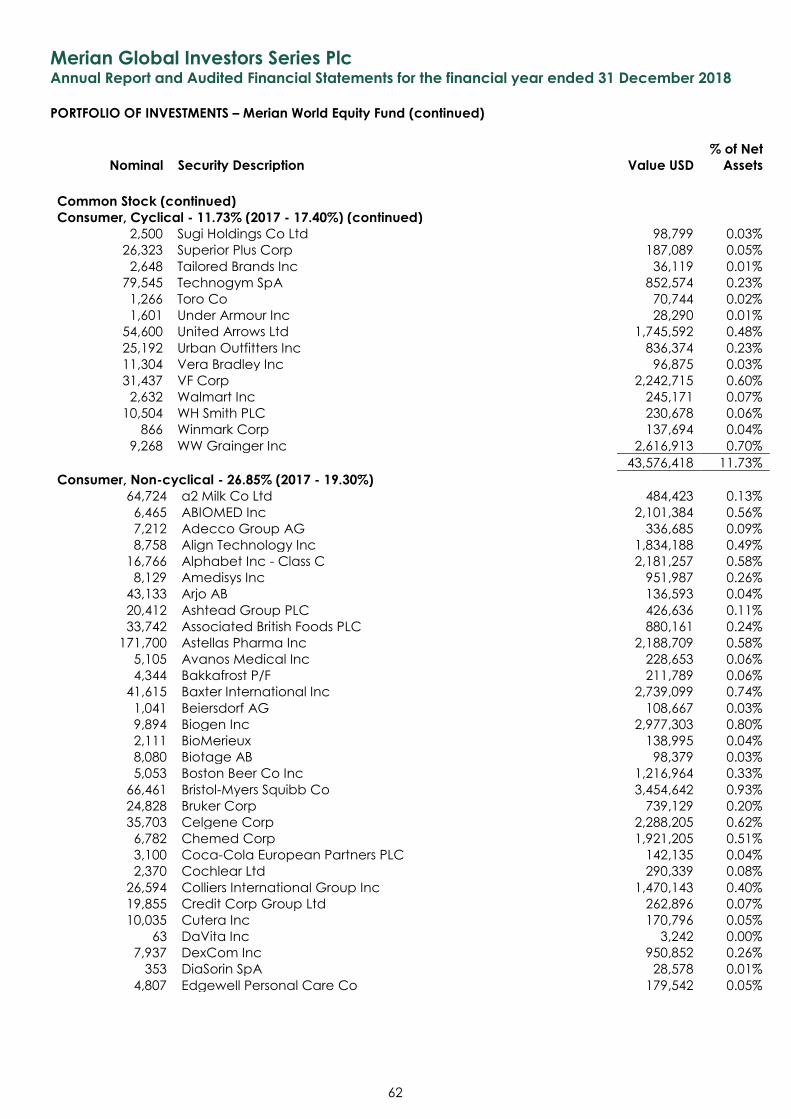
Merian Global Investors Series Plc Annual Report and Audited Financial Statements for the financial year ended 31 December 2018
PORTFOLIO OF INVESTMENTS – Merian World Equity Fund (continued)
Nominal Security Description Value USD
% of Net
Assets
62
Common Stock (continued)
Consumer, Cyclical - 11.73% (2017 - 17.40%) (continued)
2,500 Sugi Holdings Co Ltd 98,799 0.03%
26,323 Superior Plus Corp 187,089 0.05%
2,648 Tailored Brands Inc 36,119 0.01%
79,545 Technogym SpA 852,574 0.23%
1,266 Toro Co 70,744 0.02%
1,601 Under Armour Inc 28,290 0.01%
54,600 United Arrows Ltd 1,745,592 0.48%
25,192 Urban Outfitters Inc 836,374 0.23%
11,304 Vera Bradley Inc 96,875 0.03%
31,437 VF Corp 2,242,715 0.60%
2,632 Walmart Inc 245,171 0.07%
10,504 WH Smith PLC 230,678 0.06%
866 Winmark Corp 137,694 0.04%
9,268 WW Grainger Inc 2,616,913 0.70%
43,576,418 11.73%
Consumer, Non-cyclical - 26.85% (2017 - 19.30%) 64,724 a2 Milk Co Ltd 484,423 0.13%
6,465 ABIOMED Inc 2,101,384 0.56%
7,212 Adecco Group AG 336,685 0.09%
8,758 Align Technology Inc 1,834,188 0.49%
16,766 Alphabet Inc - Class C 2,181,257 0.58%
8,129 Amedisys Inc 951,987 0.26%
43,133 Arjo AB 136,593 0.04%
20,412 Ashtead Group PLC 426,636 0.11%
33,742 Associated British Foods PLC 880,161 0.24%
171,700 Astellas Pharma Inc 2,188,709 0.58%
5,105 Avanos Medical Inc 228,653 0.06%
4,344 Bakkafrost P/F 211,789 0.06%
41,615 Baxter International Inc 2,739,099 0.74%
1,041 Beiersdorf AG 108,667 0.03%
9,894 Biogen Inc 2,977,303 0.80%
2,111 BioMerieux 138,995 0.04%
8,080 Biotage AB 98,379 0.03%
5,053 Boston Beer Co Inc 1,216,964 0.33%
66,461 Bristol-Myers Squibb Co 3,454,642 0.93%
24,828 Bruker Corp 739,129 0.20%
35,703 Celgene Corp 2,288,205 0.62%
6,782 Chemed Corp 1,921,205 0.51%
3,100 Coca-Cola European Partners PLC 142,135 0.04%
2,370 Cochlear Ltd 290,339 0.08%
26,594 Colliers International Group Inc 1,470,143 0.40%
19,855 Credit Corp Group Ltd 262,896 0.07%
10,035 Cutera Inc 170,796 0.05%
63 DaVita Inc 3,242 0.00%
7,937 DexCom Inc 950,852 0.26%
353 DiaSorin SpA 28,578 0.01%
4,807 Edgewell Personal Care Co 179,542 0.05%
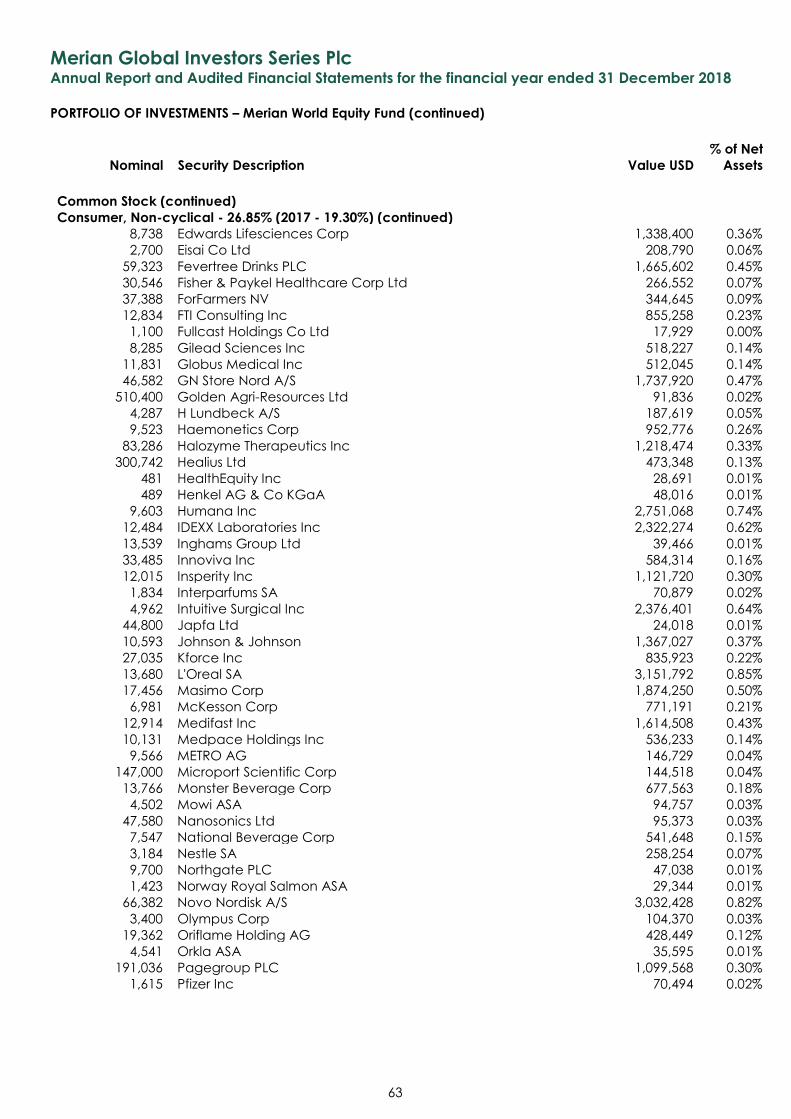
Merian Global Investors Series Plc Annual Report and Audited Financial Statements for the financial year ended 31 December 2018
PORTFOLIO OF INVESTMENTS – Merian World Equity Fund (continued)
Nominal Security Description Value USD
% of Net
Assets
63
Common Stock (continued)
Consumer, Non-cyclical - 26.85% (2017 - 19.30%) (continued)
8,738 Edwards Lifesciences Corp 1,338,400 0.36%
2,700 Eisai Co Ltd 208,790 0.06%
59,323 Fevertree Drinks PLC 1,665,602 0.45%
30,546 Fisher & Paykel Healthcare Corp Ltd 266,552 0.07%
37,388 ForFarmers NV 344,645 0.09%
12,834 FTI Consulting Inc 855,258 0.23%
1,100 Fullcast Holdings Co Ltd 17,929 0.00%
8,285 Gilead Sciences Inc 518,227 0.14%
11,831 Globus Medical Inc 512,045 0.14%
46,582 GN Store Nord A/S 1,737,920 0.47%
510,400 Golden Agri-Resources Ltd 91,836 0.02%
4,287 H Lundbeck A/S 187,619 0.05%
9,523 Haemonetics Corp 952,776 0.26%
83,286 Halozyme Therapeutics Inc 1,218,474 0.33%
300,742 Healius Ltd 473,348 0.13%
481 HealthEquity Inc 28,691 0.01%
489 Henkel AG & Co KGaA 48,016 0.01%
9,603 Humana Inc 2,751,068 0.74%
12,484 IDEXX Laboratories Inc 2,322,274 0.62%
13,539 Inghams Group Ltd 39,466 0.01%
33,485 Innoviva Inc 584,314 0.16%
12,015 Insperity Inc 1,121,720 0.30%
1,834 Interparfums SA 70,879 0.02%
4,962 Intuitive Surgical Inc 2,376,401 0.64%
44,800 Japfa Ltd 24,018 0.01%
10,593 Johnson & Johnson 1,367,027 0.37%
27,035 Kforce Inc 835,923 0.22%
13,680 L'Oreal SA 3,151,792 0.85%
17,456 Masimo Corp 1,874,250 0.50%
6,981 McKesson Corp 771,191 0.21%
12,914 Medifast Inc 1,614,508 0.43%
10,131 Medpace Holdings Inc 536,233 0.14%
9,566 METRO AG 146,729 0.04%
147,000 Microport Scientific Corp 144,518 0.04%
13,766 Monster Beverage Corp 677,563 0.18%
4,502 Mowi ASA 94,757 0.03%
47,580 Nanosonics Ltd 95,373 0.03%
7,547 National Beverage Corp 541,648 0.15%
3,184 Nestle SA 258,254 0.07%
9,700 Northgate PLC 47,038 0.01%
1,423 Norway Royal Salmon ASA 29,344 0.01%
66,382 Novo Nordisk A/S 3,032,428 0.82%
3,400 Olympus Corp 104,370 0.03%
19,362 Oriflame Holding AG 428,449 0.12%
4,541 Orkla ASA 35,595 0.01%
191,036 Pagegroup PLC 1,099,568 0.30%
1,615 Pfizer Inc 70,494 0.02%
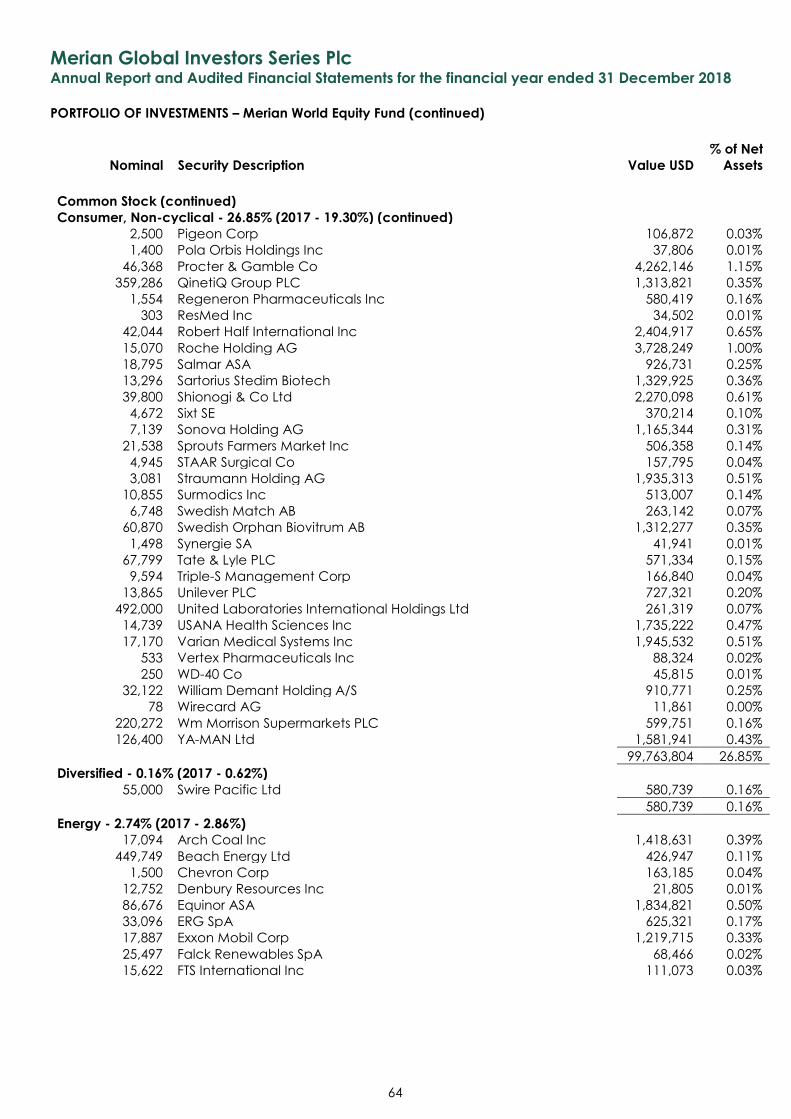
Merian Global Investors Series Plc Annual Report and Audited Financial Statements for the financial year ended 31 December 2018
PORTFOLIO OF INVESTMENTS – Merian World Equity Fund (continued)
Nominal Security Description Value USD
% of Net
Assets
64
Common Stock (continued)
Consumer, Non-cyclical - 26.85% (2017 - 19.30%) (continued)
2,500 Pigeon Corp 106,872 0.03%
1,400 Pola Orbis Holdings Inc 37,806 0.01%
46,368 Procter & Gamble Co 4,262,146 1.15%
359,286 QinetiQ Group PLC 1,313,821 0.35%
1,554 Regeneron Pharmaceuticals Inc 580,419 0.16%
303 ResMed Inc 34,502 0.01%
42,044 Robert Half International Inc 2,404,917 0.65%
15,070 Roche Holding AG 3,728,249 1.00%
18,795 Salmar ASA 926,731 0.25%
13,296 Sartorius Stedim Biotech 1,329,925 0.36%
39,800 Shionogi & Co Ltd 2,270,098 0.61%
4,672 Sixt SE 370,214 0.10%
7,139 Sonova Holding AG 1,165,344 0.31%
21,538 Sprouts Farmers Market Inc 506,358 0.14%
4,945 STAAR Surgical Co 157,795 0.04%
3,081 Straumann Holding AG 1,935,313 0.51%
10,855 Surmodics Inc 513,007 0.14%
6,748 Swedish Match AB 263,142 0.07%
60,870 Swedish Orphan Biovitrum AB 1,312,277 0.35%
1,498 Synergie SA 41,941 0.01%
67,799 Tate & Lyle PLC 571,334 0.15%
9,594 Triple-S Management Corp 166,840 0.04%
13,865 Unilever PLC 727,321 0.20%
492,000 United Laboratories International Holdings Ltd 261,319 0.07%
14,739 USANA Health Sciences Inc 1,735,222 0.47%
17,170 Varian Medical Systems Inc 1,945,532 0.51%
533 Vertex Pharmaceuticals Inc 88,324 0.02%
250 WD-40 Co 45,815 0.01%
32,122 William Demant Holding A/S 910,771 0.25%
78 Wirecard AG 11,861 0.00%
220,272 Wm Morrison Supermarkets PLC 599,751 0.16%
126,400 YA-MAN Ltd 1,581,941 0.43%
99,763,804 26.85%
Diversified - 0.16% (2017 - 0.62%) 55,000 Swire Pacific Ltd 580,739 0.16%
580,739 0.16%
Energy - 2.74% (2017 - 2.86%) 17,094 Arch Coal Inc 1,418,631 0.39%
449,749 Beach Energy Ltd 426,947 0.11%
1,500 Chevron Corp 163,185 0.04%
12,752 Denbury Resources Inc 21,805 0.01%
86,676 Equinor ASA 1,834,821 0.50%
33,096 ERG SpA 625,321 0.17%
17,887 Exxon Mobil Corp 1,219,715 0.33%
25,497 Falck Renewables SpA 68,466 0.02%
15,622 FTS International Inc 111,073 0.03%
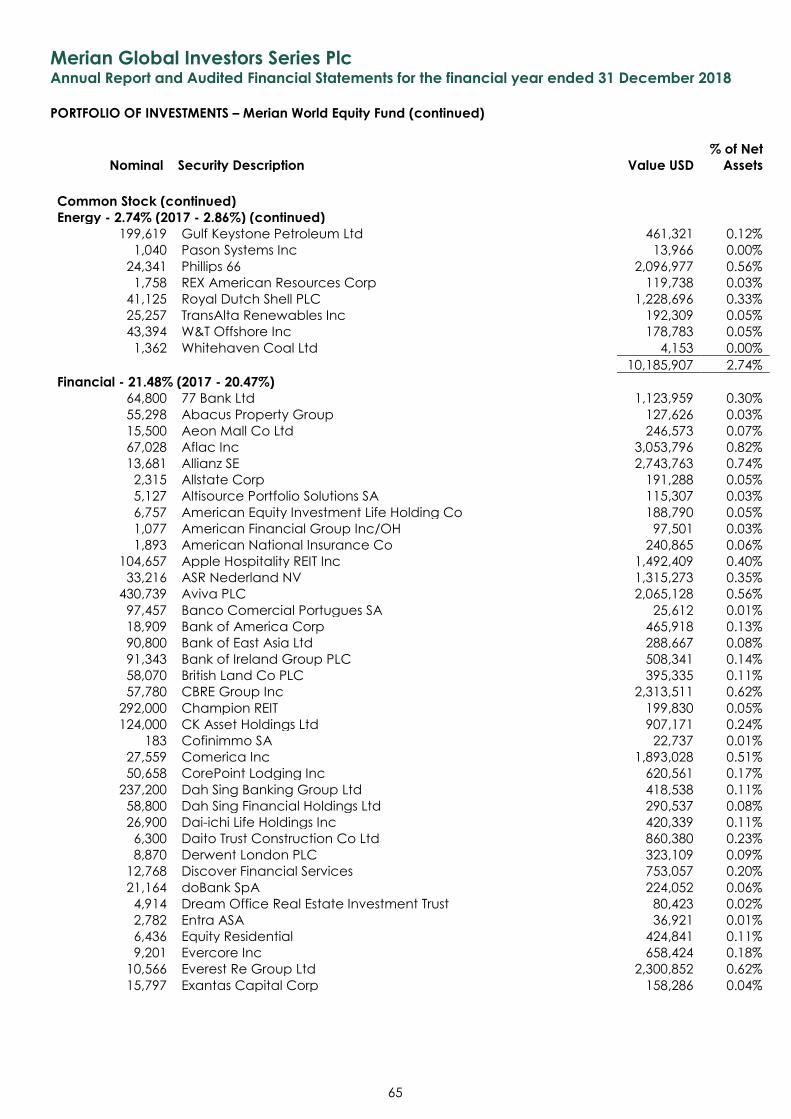
Merian Global Investors Series Plc Annual Report and Audited Financial Statements for the financial year ended 31 December 2018
PORTFOLIO OF INVESTMENTS – Merian World Equity Fund (continued)
Nominal Security Description Value USD
% of Net
Assets
65
Common Stock (continued)
Energy - 2.74% (2017 - 2.86%) (continued)
199,619 Gulf Keystone Petroleum Ltd 461,321 0.12%
1,040 Pason Systems Inc 13,966 0.00%
24,341 Phillips 66 2,096,977 0.56%
1,758 REX American Resources Corp 119,738 0.03%
41,125 Royal Dutch Shell PLC 1,228,696 0.33%
25,257 TransAlta Renewables Inc 192,309 0.05%
43,394 W&T Offshore Inc 178,783 0.05%
1,362 Whitehaven Coal Ltd 4,153 0.00%
10,185,907 2.74%
Financial - 21.48% (2017 - 20.47%) 64,800 77 Bank Ltd 1,123,959 0.30%
55,298 Abacus Property Group 127,626 0.03%
15,500 Aeon Mall Co Ltd 246,573 0.07%
67,028 Aflac Inc 3,053,796 0.82%
13,681 Allianz SE 2,743,763 0.74%
2,315 Allstate Corp 191,288 0.05%
5,127 Altisource Portfolio Solutions SA 115,307 0.03%
6,757 American Equity Investment Life Holding Co 188,790 0.05%
1,077 American Financial Group Inc/OH 97,501 0.03%
1,893 American National Insurance Co 240,865 0.06%
104,657 Apple Hospitality REIT Inc 1,492,409 0.40%
33,216 ASR Nederland NV 1,315,273 0.35%
430,739 Aviva PLC 2,065,128 0.56%
97,457 Banco Comercial Portugues SA 25,612 0.01%
18,909 Bank of America Corp 465,918 0.13%
90,800 Bank of East Asia Ltd 288,667 0.08%
91,343 Bank of Ireland Group PLC 508,341 0.14%
58,070 British Land Co PLC 395,335 0.11%
57,780 CBRE Group Inc 2,313,511 0.62%
292,000 Champion REIT 199,830 0.05%
124,000 CK Asset Holdings Ltd 907,171 0.24%
183 Cofinimmo SA 22,737 0.01%
27,559 Comerica Inc 1,893,028 0.51%
50,658 CorePoint Lodging Inc 620,561 0.17%
237,200 Dah Sing Banking Group Ltd 418,538 0.11%
58,800 Dah Sing Financial Holdings Ltd 290,537 0.08%
26,900 Dai-ichi Life Holdings Inc 420,339 0.11%
6,300 Daito Trust Construction Co Ltd 860,380 0.23%
8,870 Derwent London PLC 323,109 0.09%
12,768 Discover Financial Services 753,057 0.20%
21,164 doBank SpA 224,052 0.06%
4,914 Dream Office Real Estate Investment Trust 80,423 0.02%
2,782 Entra ASA 36,921 0.01%
6,436 Equity Residential 424,841 0.11%
9,201 Evercore Inc 658,424 0.18%
10,566 Everest Re Group Ltd 2,300,852 0.62%
15,797 Exantas Capital Corp 158,286 0.04%
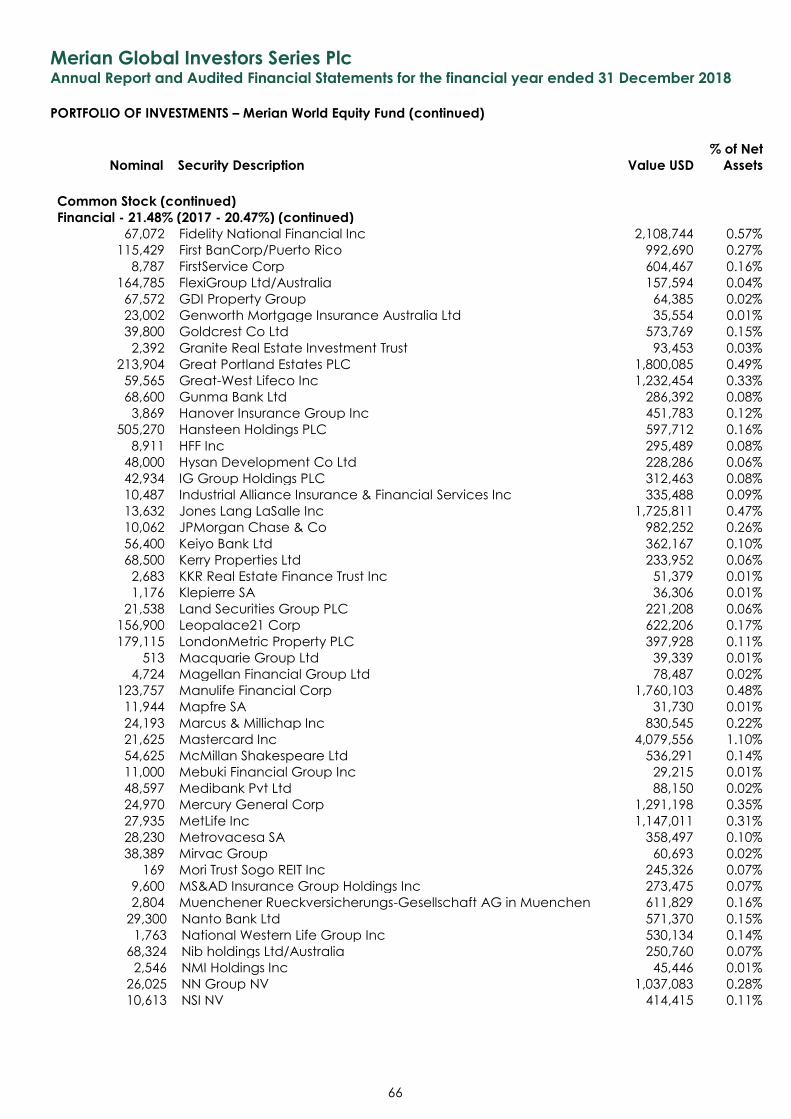
Merian Global Investors Series Plc Annual Report and Audited Financial Statements for the financial year ended 31 December 2018
PORTFOLIO OF INVESTMENTS – Merian World Equity Fund (continued)
Nominal Security Description Value USD
% of Net
Assets
66
Common Stock (continued)
Financial - 21.48% (2017 - 20.47%) (continued)
67,072 Fidelity National Financial Inc 2,108,744 0.57%
115,429 First BanCorp/Puerto Rico 992,690 0.27%
8,787 FirstService Corp 604,467 0.16%
164,785 FlexiGroup Ltd/Australia 157,594 0.04%
67,572 GDI Property Group 64,385 0.02%
23,002 Genworth Mortgage Insurance Australia Ltd 35,554 0.01%
39,800 Goldcrest Co Ltd 573,769 0.15%
2,392 Granite Real Estate Investment Trust 93,453 0.03%
213,904 Great Portland Estates PLC 1,800,085 0.49%
59,565 Great-West Lifeco Inc 1,232,454 0.33%
68,600 Gunma Bank Ltd 286,392 0.08%
3,869 Hanover Insurance Group Inc 451,783 0.12%
505,270 Hansteen Holdings PLC 597,712 0.16%
8,911 HFF Inc 295,489 0.08%
48,000 Hysan Development Co Ltd 228,286 0.06%
42,934 IG Group Holdings PLC 312,463 0.08%
10,487 Industrial Alliance Insurance & Financial Services Inc 335,488 0.09%
13,632 Jones Lang LaSalle Inc 1,725,811 0.47%
10,062 JPMorgan Chase & Co 982,252 0.26%
56,400 Keiyo Bank Ltd 362,167 0.10%
68,500 Kerry Properties Ltd 233,952 0.06%
2,683 KKR Real Estate Finance Trust Inc 51,379 0.01%
1,176 Klepierre SA 36,306 0.01%
21,538 Land Securities Group PLC 221,208 0.06%
156,900 Leopalace21 Corp 622,206 0.17%
179,115 LondonMetric Property PLC 397,928 0.11%
513 Macquarie Group Ltd 39,339 0.01%
4,724 Magellan Financial Group Ltd 78,487 0.02%
123,757 Manulife Financial Corp 1,760,103 0.48%
11,944 Mapfre SA 31,730 0.01%
24,193 Marcus & Millichap Inc 830,545 0.22%
21,625 Mastercard Inc 4,079,556 1.10%
54,625 McMillan Shakespeare Ltd 536,291 0.14%
11,000 Mebuki Financial Group Inc 29,215 0.01%
48,597 Medibank Pvt Ltd 88,150 0.02%
24,970 Mercury General Corp 1,291,198 0.35%
27,935 MetLife Inc 1,147,011 0.31%
28,230 Metrovacesa SA 358,497 0.10%
38,389 Mirvac Group 60,693 0.02%
169 Mori Trust Sogo REIT Inc 245,326 0.07%
9,600 MS&AD Insurance Group Holdings Inc 273,475 0.07%
2,804 Muenchener Rueckversicherungs-Gesellschaft AG in Muenchen 611,829 0.16%
29,300 Nanto Bank Ltd 571,370 0.15%
1,763 National Western Life Group Inc 530,134 0.14%
68,324 Nib holdings Ltd/Australia 250,760 0.07%
2,546 NMI Holdings Inc 45,446 0.01%
26,025 NN Group NV 1,037,083 0.28%
10,613 NSI NV 414,415 0.11%
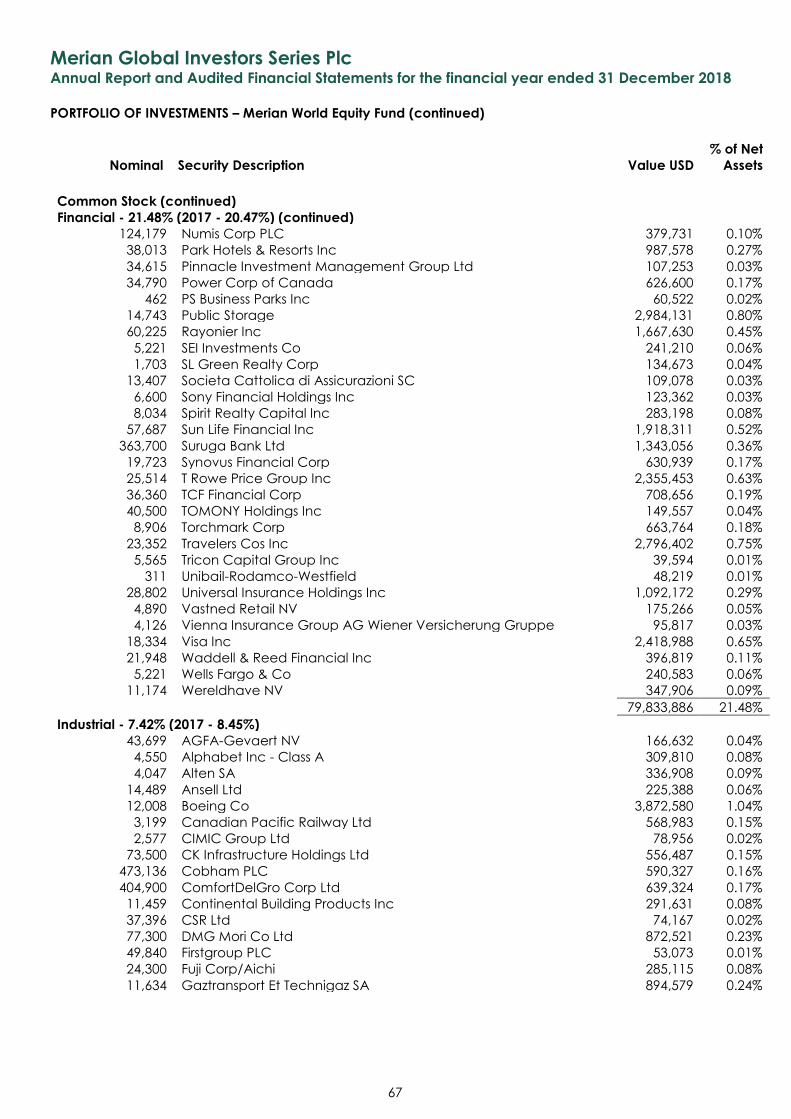
Merian Global Investors Series Plc Annual Report and Audited Financial Statements for the financial year ended 31 December 2018
PORTFOLIO OF INVESTMENTS – Merian World Equity Fund (continued)
Nominal Security Description Value USD
% of Net
Assets
67
Common Stock (continued)
Financial - 21.48% (2017 - 20.47%) (continued)
124,179 Numis Corp PLC 379,731 0.10%
38,013 Park Hotels & Resorts Inc 987,578 0.27%
34,615 Pinnacle Investment Management Group Ltd 107,253 0.03%
34,790 Power Corp of Canada 626,600 0.17%
462 PS Business Parks Inc 60,522 0.02%
14,743 Public Storage 2,984,131 0.80%
60,225 Rayonier Inc 1,667,630 0.45%
5,221 SEI Investments Co 241,210 0.06%
1,703 SL Green Realty Corp 134,673 0.04%
13,407 Societa Cattolica di Assicurazioni SC 109,078 0.03%
6,600 Sony Financial Holdings Inc 123,362 0.03%
8,034 Spirit Realty Capital Inc 283,198 0.08%
57,687 Sun Life Financial Inc 1,918,311 0.52%
363,700 Suruga Bank Ltd 1,343,056 0.36%
19,723 Synovus Financial Corp 630,939 0.17%
25,514 T Rowe Price Group Inc 2,355,453 0.63%
36,360 TCF Financial Corp 708,656 0.19%
40,500 TOMONY Holdings Inc 149,557 0.04%
8,906 Torchmark Corp 663,764 0.18%
23,352 Travelers Cos Inc 2,796,402 0.75%
5,565 Tricon Capital Group Inc 39,594 0.01%
311 Unibail-Rodamco-Westfield 48,219 0.01%
28,802 Universal Insurance Holdings Inc 1,092,172 0.29%
4,890 Vastned Retail NV 175,266 0.05%
4,126 Vienna Insurance Group AG Wiener Versicherung Gruppe 95,817 0.03%
18,334 Visa Inc 2,418,988 0.65%
21,948 Waddell & Reed Financial Inc 396,819 0.11%
5,221 Wells Fargo & Co 240,583 0.06%
11,174 Wereldhave NV 347,906 0.09%
79,833,886 21.48%
Industrial - 7.42% (2017 - 8.45%) 43,699 AGFA-Gevaert NV 166,632 0.04%
4,550 Alphabet Inc - Class A 309,810 0.08%
4,047 Alten SA 336,908 0.09%
14,489 Ansell Ltd 225,388 0.06%
12,008 Boeing Co 3,872,580 1.04%
3,199 Canadian Pacific Railway Ltd 568,983 0.15%
2,577 CIMIC Group Ltd 78,956 0.02%
73,500 CK Infrastructure Holdings Ltd 556,487 0.15%
473,136 Cobham PLC 590,327 0.16%
404,900 ComfortDelGro Corp Ltd 639,324 0.17%
11,459 Continental Building Products Inc 291,631 0.08%
37,396 CSR Ltd 74,167 0.02%
77,300 DMG Mori Co Ltd 872,521 0.23%
49,840 Firstgroup PLC 53,073 0.01%
24,300 Fuji Corp/Aichi 285,115 0.08%
11,634 Gaztransport Et Technigaz SA 894,579 0.24%
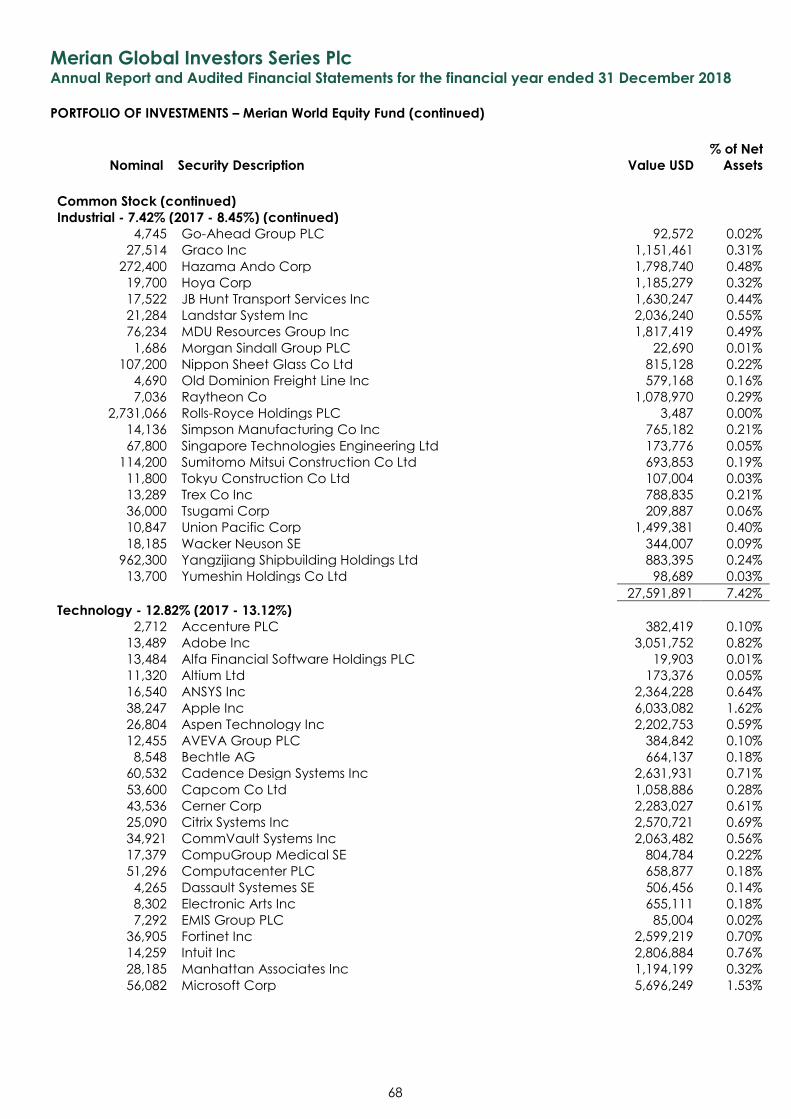
Merian Global Investors Series Plc Annual Report and Audited Financial Statements for the financial year ended 31 December 2018
PORTFOLIO OF INVESTMENTS – Merian World Equity Fund (continued)
Nominal Security Description Value USD
% of Net
Assets
68
Common Stock (continued)
Industrial - 7.42% (2017 - 8.45%) (continued)
4,745 Go-Ahead Group PLC 92,572 0.02%
27,514 Graco Inc 1,151,461 0.31%
272,400 Hazama Ando Corp 1,798,740 0.48%
19,700 Hoya Corp 1,185,279 0.32%
17,522 JB Hunt Transport Services Inc 1,630,247 0.44%
21,284 Landstar System Inc 2,036,240 0.55%
76,234 MDU Resources Group Inc 1,817,419 0.49%
1,686 Morgan Sindall Group PLC 22,690 0.01%
107,200 Nippon Sheet Glass Co Ltd 815,128 0.22%
4,690 Old Dominion Freight Line Inc 579,168 0.16%
7,036 Raytheon Co 1,078,970 0.29%
2,731,066 Rolls-Royce Holdings PLC 3,487 0.00%
14,136 Simpson Manufacturing Co Inc 765,182 0.21%
67,800 Singapore Technologies Engineering Ltd 173,776 0.05%
114,200 Sumitomo Mitsui Construction Co Ltd 693,853 0.19%
11,800 Tokyu Construction Co Ltd 107,004 0.03%
13,289 Trex Co Inc 788,835 0.21%
36,000 Tsugami Corp 209,887 0.06%
10,847 Union Pacific Corp 1,499,381 0.40%
18,185 Wacker Neuson SE 344,007 0.09%
962,300 Yangzijiang Shipbuilding Holdings Ltd 883,395 0.24%
13,700 Yumeshin Holdings Co Ltd 98,689 0.03%
27,591,891 7.42%
Technology - 12.82% (2017 - 13.12%) 2,712 Accenture PLC 382,419 0.10%
13,489 Adobe Inc 3,051,752 0.82%
13,484 Alfa Financial Software Holdings PLC 19,903 0.01%
11,320 Altium Ltd 173,376 0.05%
16,540 ANSYS Inc 2,364,228 0.64%
38,247 Apple Inc 6,033,082 1.62%
26,804 Aspen Technology Inc 2,202,753 0.59%
12,455 AVEVA Group PLC 384,842 0.10%
8,548 Bechtle AG 664,137 0.18%
60,532 Cadence Design Systems Inc 2,631,931 0.71%
53,600 Capcom Co Ltd 1,058,886 0.28%
43,536 Cerner Corp 2,283,027 0.61%
25,090 Citrix Systems Inc 2,570,721 0.69%
34,921 CommVault Systems Inc 2,063,482 0.56%
17,379 CompuGroup Medical SE 804,784 0.22%
51,296 Computacenter PLC 658,877 0.18%
4,265 Dassault Systemes SE 506,456 0.14%
8,302 Electronic Arts Inc 655,111 0.18%
7,292 EMIS Group PLC 85,004 0.02%
36,905 Fortinet Inc 2,599,219 0.70%
14,259 Intuit Inc 2,806,884 0.76%
28,185 Manhattan Associates Inc 1,194,199 0.32%
56,082 Microsoft Corp 5,696,249 1.53%
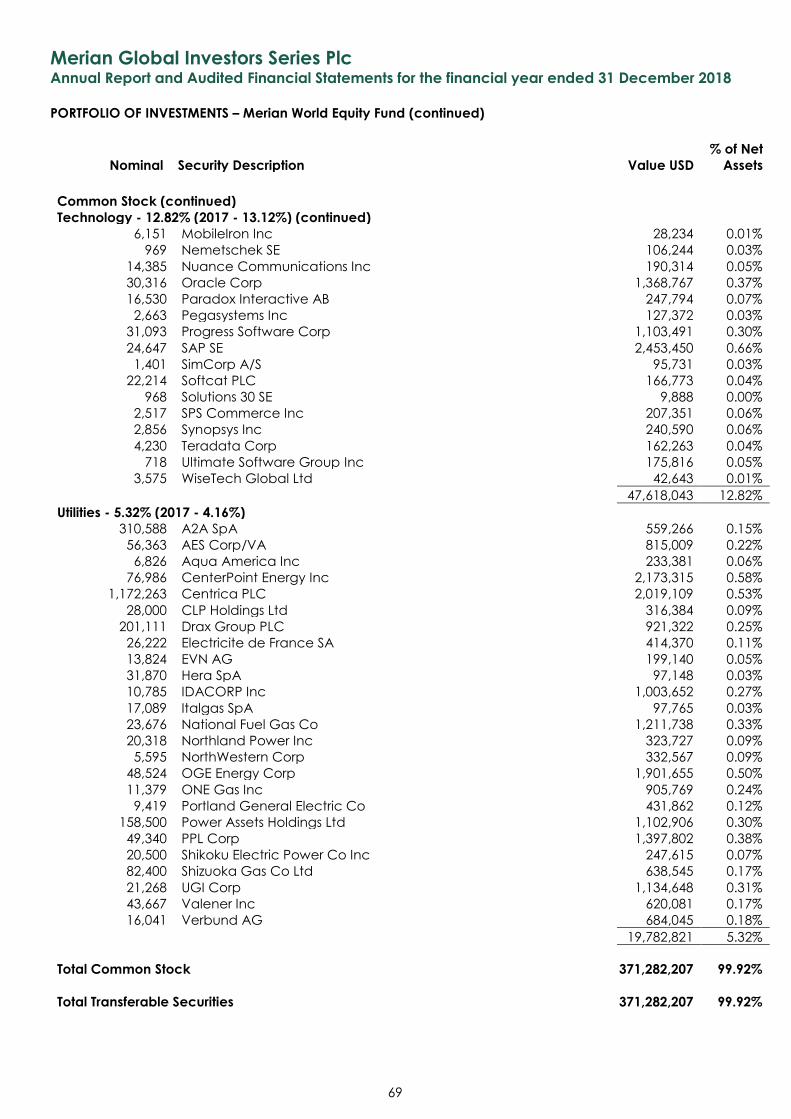
Merian Global Investors Series Plc Annual Report and Audited Financial Statements for the financial year ended 31 December 2018
PORTFOLIO OF INVESTMENTS – Merian World Equity Fund (continued)
Nominal Security Description Value USD
% of Net
Assets
69
Common Stock (continued)
Technology - 12.82% (2017 - 13.12%) (continued)
6,151 MobileIron Inc 28,234 0.01%
969 Nemetschek SE 106,244 0.03%
14,385 Nuance Communications Inc 190,314 0.05%
30,316 Oracle Corp 1,368,767 0.37%
16,530 Paradox Interactive AB 247,794 0.07%
2,663 Pegasystems Inc 127,372 0.03%
31,093 Progress Software Corp 1,103,491 0.30%
24,647 SAP SE 2,453,450 0.66%
1,401 SimCorp A/S 95,731 0.03%
22,214 Softcat PLC 166,773 0.04%
968 Solutions 30 SE 9,888 0.00%
2,517 SPS Commerce Inc 207,351 0.06%
2,856 Synopsys Inc 240,590 0.06%
4,230 Teradata Corp 162,263 0.04%
718 Ultimate Software Group Inc 175,816 0.05%
3,575 WiseTech Global Ltd 42,643 0.01%
47,618,043 12.82%
Utilities - 5.32% (2017 - 4.16%) 310,588 A2A SpA 559,266 0.15%
56,363 AES Corp/VA 815,009 0.22%
6,826 Aqua America Inc 233,381 0.06%
76,986 CenterPoint Energy Inc 2,173,315 0.58%
1,172,263 Centrica PLC 2,019,109 0.53%
28,000 CLP Holdings Ltd 316,384 0.09%
201,111 Drax Group PLC 921,322 0.25%
26,222 Electricite de France SA 414,370 0.11%
13,824 EVN AG 199,140 0.05%
31,870 Hera SpA 97,148 0.03%
10,785 IDACORP Inc 1,003,652 0.27%
17,089 Italgas SpA 97,765 0.03%
23,676 National Fuel Gas Co 1,211,738 0.33%
20,318 Northland Power Inc 323,727 0.09%
5,595 NorthWestern Corp 332,567 0.09%
48,524 OGE Energy Corp 1,901,655 0.50%
11,379 ONE Gas Inc 905,769 0.24%
9,419 Portland General Electric Co 431,862 0.12%
158,500 Power Assets Holdings Ltd 1,102,906 0.30%
49,340 PPL Corp 1,397,802 0.38%
20,500 Shikoku Electric Power Co Inc 247,615 0.07%
82,400 Shizuoka Gas Co Ltd 638,545 0.17%
21,268 UGI Corp 1,134,648 0.31%
43,667 Valener Inc 620,081 0.17%
16,041 Verbund AG 684,045 0.18%
19,782,821 5.32%
Total Common Stock 371,282,207 99.92%
Total Transferable Securities 371,282,207 99.92%
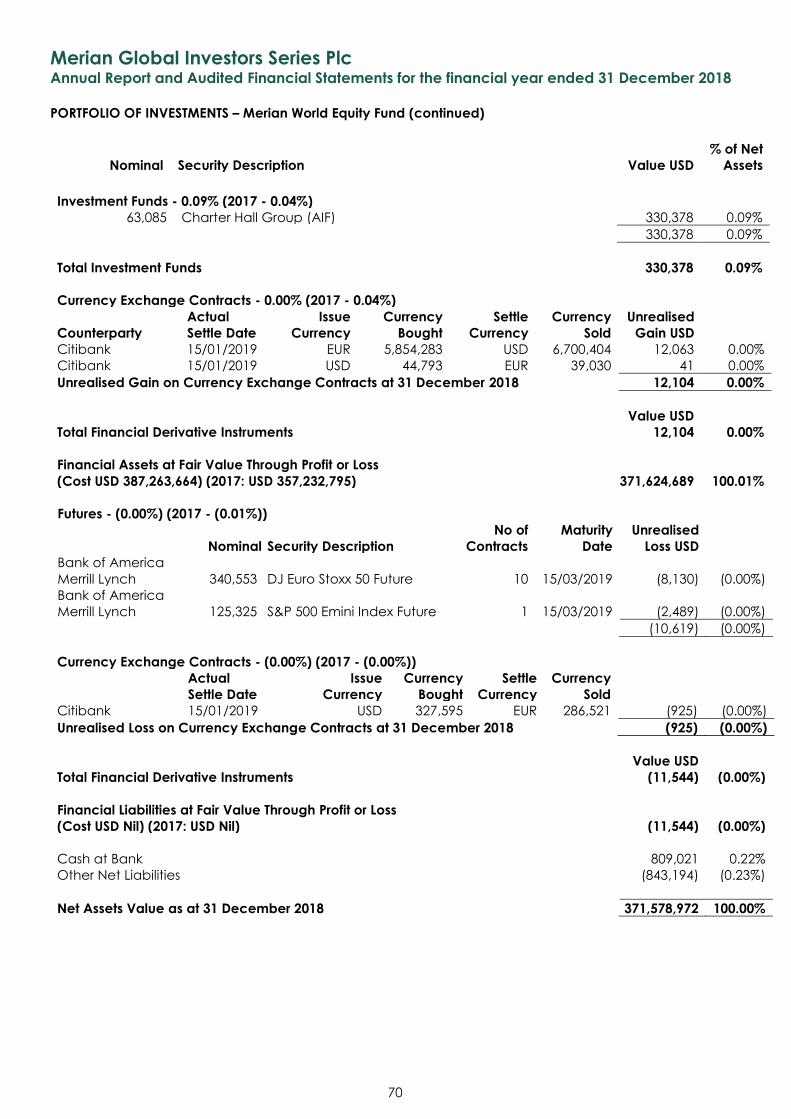
Merian Global Investors Series Plc Annual Report and Audited Financial Statements for the financial year ended 31 December 2018
PORTFOLIO OF INVESTMENTS – Merian World Equity Fund (continued)
Nominal Security Description Value USD
% of Net
Assets
70
Investment Funds - 0.09% (2017 - 0.04%) 63,085 Charter Hall Group (AIF) 330,378 0.09%
330,378 0.09%
Total Investment Funds 330,378 0.09%
Currency Exchange Contracts - 0.00% (2017 - 0.04%)
Counterparty
Actual
Settle Date
Issue
Currency
Currency
Bought
Settle
Currency
Currency
Sold
Unrealised
Gain USD Citibank 15/01/2019 EUR 5,854,283 USD 6,700,404 12,063 0.00%
Citibank 15/01/2019 USD 44,793 EUR 39,030 41 0.00%
Unrealised Gain on Currency Exchange Contracts at 31 December 2018 12,104 0.00%
Value USD
Total Financial Derivative Instruments 12,104 0.00%
Financial Assets at Fair Value Through Profit or Loss
(Cost USD 387,263,664) (2017: USD 357,232,795) 371,624,689 100.01%
Futures - (0.00%) (2017 - (0.01%))
Nominal Security Description
No of
Contracts
Maturity
Date
Unrealised
Loss USD
Bank of America
Merrill Lynch 340,553 DJ Euro Stoxx 50 Future 10 15/03/2019 (8,130) (0.00%)
Bank of America
Merrill Lynch 125,325 S&P 500 Emini Index Future 1 15/03/2019 (2,489) (0.00%)
(10,619) (0.00%)
Currency Exchange Contracts - (0.00%) (2017 - (0.00%))
Actual
Settle Date
Issue
Currency
Currency
Bought
Settle
Currency
Currency
Sold Citibank 15/01/2019 USD 327,595 EUR 286,521 (925) (0.00%)
Unrealised Loss on Currency Exchange Contracts at 31 December 2018 (925) (0.00%)
Value USD
Total Financial Derivative Instruments (11,544) (0.00%)
Financial Liabilities at Fair Value Through Profit or Loss
(Cost USD Nil) (2017: USD Nil) (11,544) (0.00%)
Cash at Bank 809,021 0.22%
Other Net Liabilities (843,194) (0.23%)
Net Assets Value as at 31 December 2018 371,578,972 100.00%
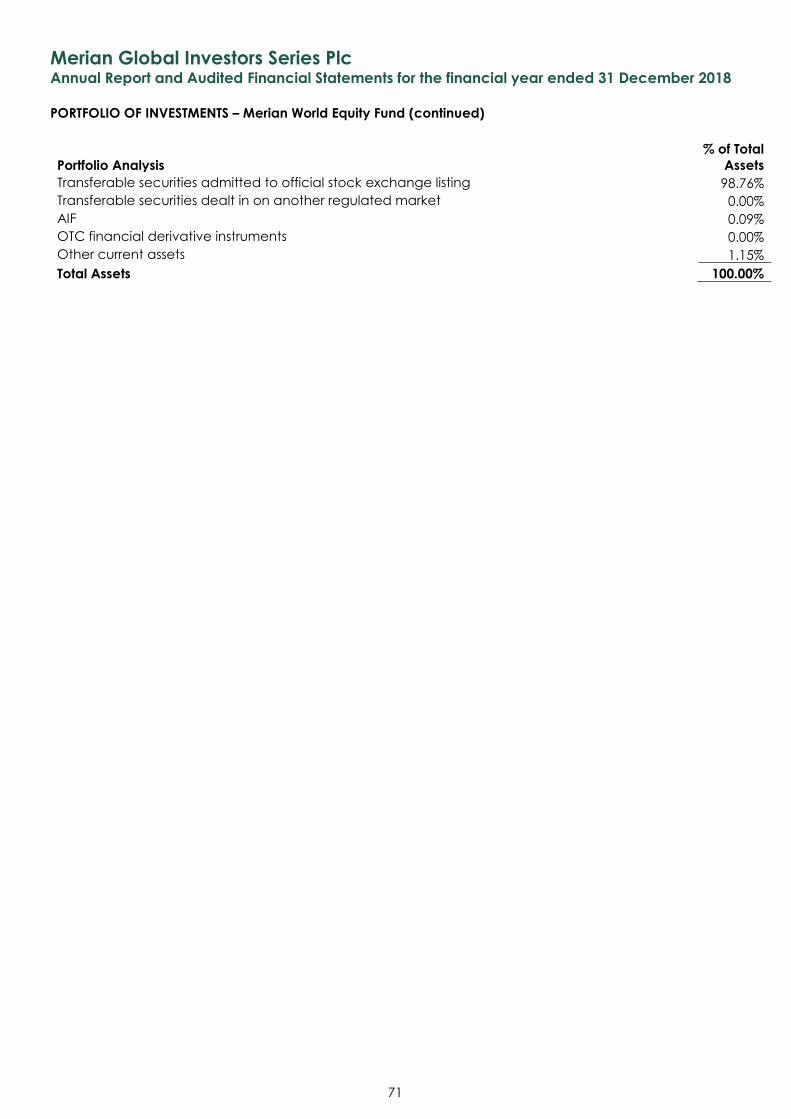
Merian Global Investors Series Plc Annual Report and Audited Financial Statements for the financial year ended 31 December 2018
PORTFOLIO OF INVESTMENTS – Merian World Equity Fund (continued)
71
Portfolio Analysis
% of Total
Assets
Transferable securities admitted to official stock exchange listing 98.76%
Transferable securities dealt in on another regulated market 0.00%
AIF 0.09%
OTC financial derivative instruments 0.00%
Other current assets 1.15%
Total Assets 100.00%
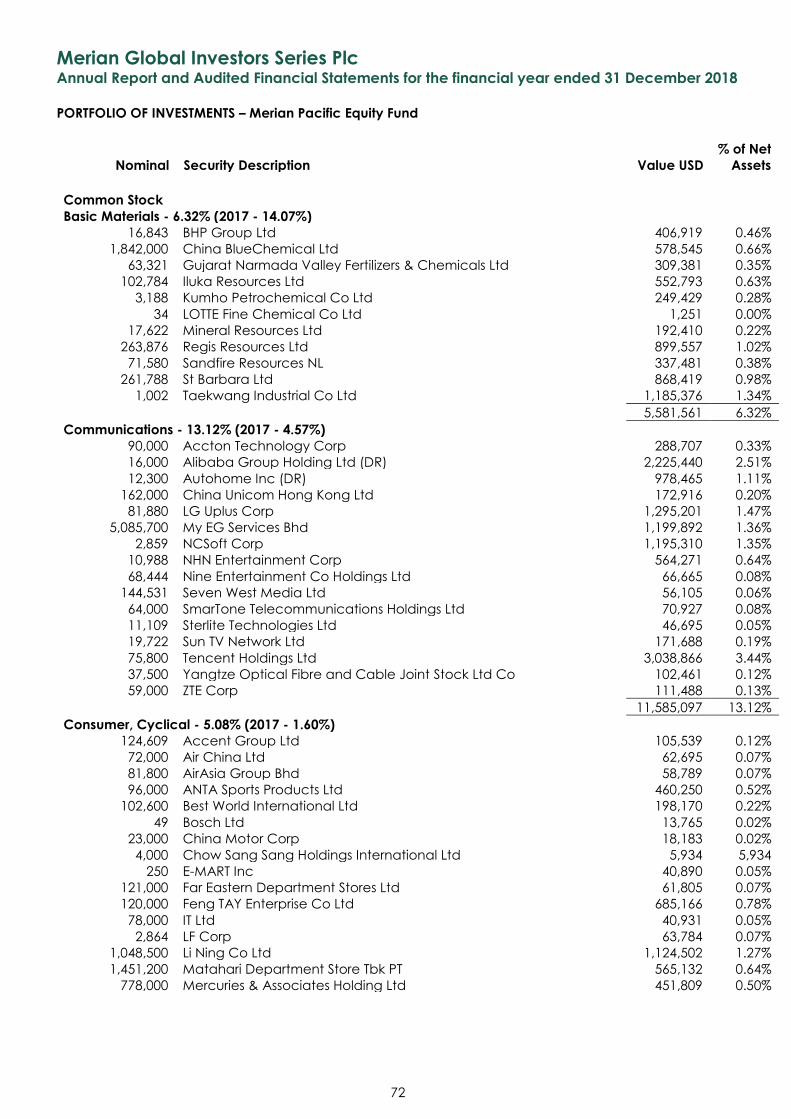
Merian Global Investors Series Plc Annual Report and Audited Financial Statements for the financial year ended 31 December 2018
PORTFOLIO OF INVESTMENTS – Merian Pacific Equity Fund
Nominal Security Description Value USD
% of Net
Assets
72
Common Stock Basic Materials - 6.32% (2017 - 14.07%)
16,843 BHP Group Ltd 406,919 0.46%
1,842,000 China BlueChemical Ltd 578,545 0.66%
63,321 Gujarat Narmada Valley Fertilizers & Chemicals Ltd 309,381 0.35%
102,784 Iluka Resources Ltd 552,793 0.63%
3,188 Kumho Petrochemical Co Ltd 249,429 0.28%
34 LOTTE Fine Chemical Co Ltd 1,251 0.00%
17,622 Mineral Resources Ltd 192,410 0.22%
263,876 Regis Resources Ltd 899,557 1.02%
71,580 Sandfire Resources NL 337,481 0.38%
261,788 St Barbara Ltd 868,419 0.98%
1,002 Taekwang Industrial Co Ltd 1,185,376 1.34%
5,581,561 6.32%
Communications - 13.12% (2017 - 4.57%) 90,000 Accton Technology Corp 288,707 0.33%
16,000 Alibaba Group Holding Ltd (DR) 2,225,440 2.51%
12,300 Autohome Inc (DR) 978,465 1.11%
162,000 China Unicom Hong Kong Ltd 172,916 0.20%
81,880 LG Uplus Corp 1,295,201 1.47%
5,085,700 My EG Services Bhd 1,199,892 1.36%
2,859 NCSoft Corp 1,195,310 1.35%
10,988 NHN Entertainment Corp 564,271 0.64%
68,444 Nine Entertainment Co Holdings Ltd 66,665 0.08%
144,531 Seven West Media Ltd 56,105 0.06%
64,000 SmarTone Telecommunications Holdings Ltd 70,927 0.08%
11,109 Sterlite Technologies Ltd 46,695 0.05%
19,722 Sun TV Network Ltd 171,688 0.19%
75,800 Tencent Holdings Ltd 3,038,866 3.44%
37,500 Yangtze Optical Fibre and Cable Joint Stock Ltd Co 102,461 0.12%
59,000 ZTE Corp 111,488 0.13%
11,585,097 13.12%
Consumer, Cyclical - 5.08% (2017 - 1.60%) 124,609 Accent Group Ltd 105,539 0.12%
72,000 Air China Ltd 62,695 0.07%
81,800 AirAsia Group Bhd 58,789 0.07%
96,000 ANTA Sports Products Ltd 460,250 0.52%
102,600 Best World International Ltd 198,170 0.22%
49 Bosch Ltd 13,765 0.02%
23,000 China Motor Corp 18,183 0.02%
4,000 Chow Sang Sang Holdings International Ltd 5,934 5,934
250 E-MART Inc 40,890 0.05%
121,000 Far Eastern Department Stores Ltd 61,805 0.07%
120,000 Feng TAY Enterprise Co Ltd 685,166 0.78%
78,000 IT Ltd 40,931 0.05%
2,864 LF Corp 63,784 0.07%
1,048,500 Li Ning Co Ltd 1,124,502 1.27%
1,451,200 Matahari Department Store Tbk PT 565,132 0.64%
778,000 Mercuries & Associates Holding Ltd 451,809 0.50%
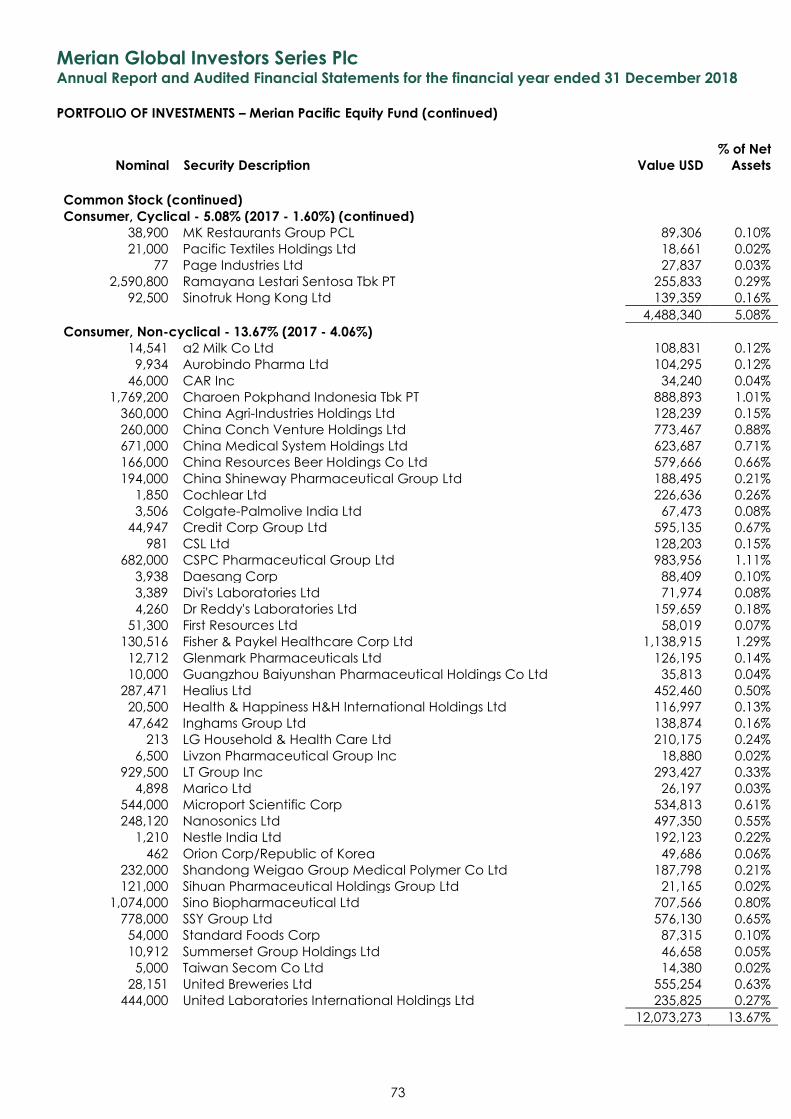
Merian Global Investors Series Plc Annual Report and Audited Financial Statements for the financial year ended 31 December 2018
PORTFOLIO OF INVESTMENTS – Merian Pacific Equity Fund (continued)
Nominal Security Description Value USD
% of Net
Assets
73
Common Stock (continued) Consumer, Cyclical - 5.08% (2017 - 1.60%) (continued)
38,900 MK Restaurants Group PCL 89,306 0.10%
21,000 Pacific Textiles Holdings Ltd 18,661 0.02%
77 Page Industries Ltd 27,837 0.03%
2,590,800 Ramayana Lestari Sentosa Tbk PT 255,833 0.29%
92,500 Sinotruk Hong Kong Ltd 139,359 0.16%
4,488,340 5.08%
Consumer, Non-cyclical - 13.67% (2017 - 4.06%) 14,541 a2 Milk Co Ltd 108,831 0.12%
9,934 Aurobindo Pharma Ltd 104,295 0.12%
46,000 CAR Inc 34,240 0.04%
1,769,200 Charoen Pokphand Indonesia Tbk PT 888,893 1.01%
360,000 China Agri-Industries Holdings Ltd 128,239 0.15%
260,000 China Conch Venture Holdings Ltd 773,467 0.88%
671,000 China Medical System Holdings Ltd 623,687 0.71%
166,000 China Resources Beer Holdings Co Ltd 579,666 0.66%
194,000 China Shineway Pharmaceutical Group Ltd 188,495 0.21%
1,850 Cochlear Ltd 226,636 0.26%
3,506 Colgate-Palmolive India Ltd 67,473 0.08%
44,947 Credit Corp Group Ltd 595,135 0.67%
981 CSL Ltd 128,203 0.15%
682,000 CSPC Pharmaceutical Group Ltd 983,956 1.11%
3,938 Daesang Corp 88,409 0.10%
3,389 Divi's Laboratories Ltd 71,974 0.08%
4,260 Dr Reddy's Laboratories Ltd 159,659 0.18%
51,300 First Resources Ltd 58,019 0.07%
130,516 Fisher & Paykel Healthcare Corp Ltd 1,138,915 1.29%
12,712 Glenmark Pharmaceuticals Ltd 126,195 0.14%
10,000 Guangzhou Baiyunshan Pharmaceutical Holdings Co Ltd 35,813 0.04%
287,471 Healius Ltd 452,460 0.50%
20,500 Health & Happiness H&H International Holdings Ltd 116,997 0.13%
47,642 Inghams Group Ltd 138,874 0.16%
213 LG Household & Health Care Ltd 210,175 0.24%
6,500 Livzon Pharmaceutical Group Inc 18,880 0.02%
929,500 LT Group Inc 293,427 0.33%
4,898 Marico Ltd 26,197 0.03%
544,000 Microport Scientific Corp 534,813 0.61%
248,120 Nanosonics Ltd 497,350 0.55%
1,210 Nestle India Ltd 192,123 0.22%
462 Orion Corp/Republic of Korea 49,686 0.06%
232,000 Shandong Weigao Group Medical Polymer Co Ltd 187,798 0.21%
121,000 Sihuan Pharmaceutical Holdings Group Ltd 21,165 0.02%
1,074,000 Sino Biopharmaceutical Ltd 707,566 0.80%
778,000 SSY Group Ltd 576,130 0.65%
54,000 Standard Foods Corp 87,315 0.10%
10,912 Summerset Group Holdings Ltd 46,658 0.05%
5,000 Taiwan Secom Co Ltd 14,380 0.02%
28,151 United Breweries Ltd 555,254 0.63%
444,000 United Laboratories International Holdings Ltd 235,825 0.27%
12,073,273 13.67%
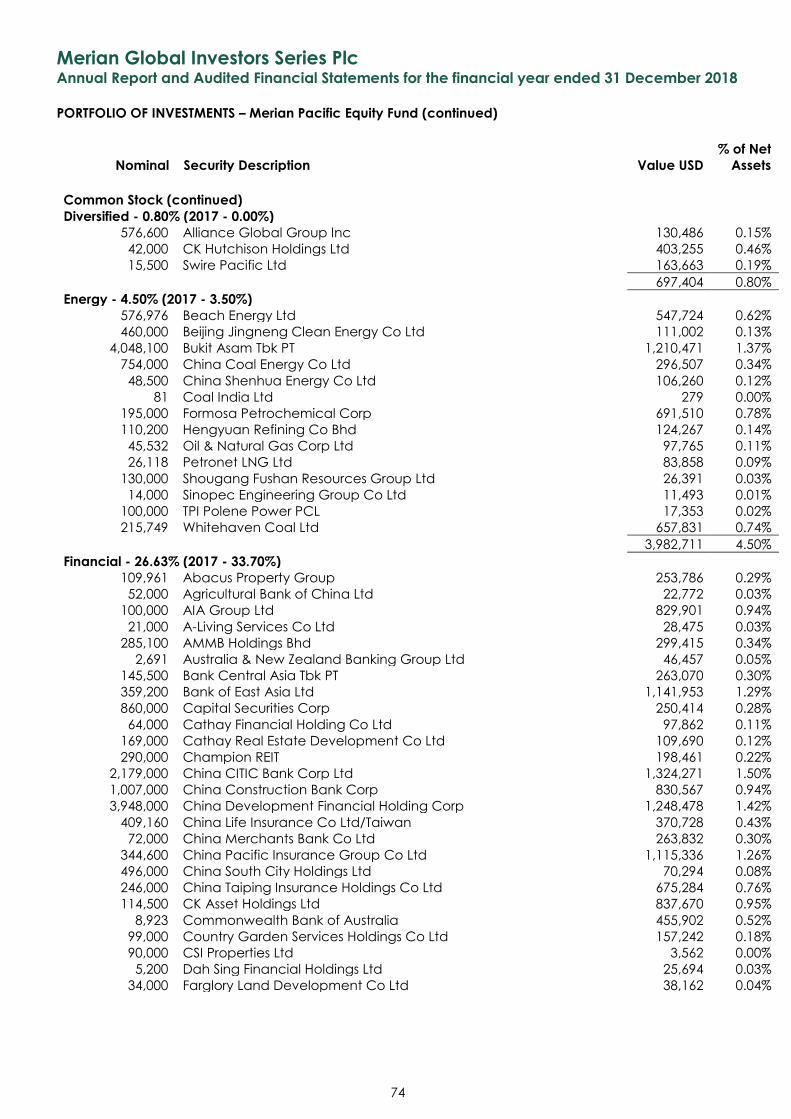
Merian Global Investors Series Plc Annual Report and Audited Financial Statements for the financial year ended 31 December 2018
PORTFOLIO OF INVESTMENTS – Merian Pacific Equity Fund (continued)
Nominal Security Description Value USD
% of Net
Assets
74
Common Stock (continued) Diversified - 0.80% (2017 - 0.00%)
576,600 Alliance Global Group Inc 130,486 0.15%
42,000 CK Hutchison Holdings Ltd 403,255 0.46%
15,500 Swire Pacific Ltd 163,663 0.19%
697,404 0.80%
Energy - 4.50% (2017 - 3.50%) 576,976 Beach Energy Ltd 547,724 0.62%
460,000 Beijing Jingneng Clean Energy Co Ltd 111,002 0.13%
4,048,100 Bukit Asam Tbk PT 1,210,471 1.37%
754,000 China Coal Energy Co Ltd 296,507 0.34%
48,500 China Shenhua Energy Co Ltd 106,260 0.12%
81 Coal India Ltd 279 0.00%
195,000 Formosa Petrochemical Corp 691,510 0.78%
110,200 Hengyuan Refining Co Bhd 124,267 0.14%
45,532 Oil & Natural Gas Corp Ltd 97,765 0.11%
26,118 Petronet LNG Ltd 83,858 0.09%
130,000 Shougang Fushan Resources Group Ltd 26,391 0.03%
14,000 Sinopec Engineering Group Co Ltd 11,493 0.01%
100,000 TPI Polene Power PCL 17,353 0.02%
215,749 Whitehaven Coal Ltd 657,831 0.74%
3,982,711 4.50%
Financial - 26.63% (2017 - 33.70%) 109,961 Abacus Property Group 253,786 0.29%
52,000 Agricultural Bank of China Ltd 22,772 0.03%
100,000 AIA Group Ltd 829,901 0.94%
21,000 A-Living Services Co Ltd 28,475 0.03%
285,100 AMMB Holdings Bhd 299,415 0.34%
2,691 Australia & New Zealand Banking Group Ltd 46,457 0.05%
145,500 Bank Central Asia Tbk PT 263,070 0.30%
359,200 Bank of East Asia Ltd 1,141,953 1.29%
860,000 Capital Securities Corp 250,414 0.28%
64,000 Cathay Financial Holding Co Ltd 97,862 0.11%
169,000 Cathay Real Estate Development Co Ltd 109,690 0.12%
290,000 Champion REIT 198,461 0.22%
2,179,000 China CITIC Bank Corp Ltd 1,324,271 1.50%
1,007,000 China Construction Bank Corp 830,567 0.94%
3,948,000 China Development Financial Holding Corp 1,248,478 1.42%
409,160 China Life Insurance Co Ltd/Taiwan 370,728 0.43%
72,000 China Merchants Bank Co Ltd 263,832 0.30%
344,600 China Pacific Insurance Group Co Ltd 1,115,336 1.26%
496,000 China South City Holdings Ltd 70,294 0.08%
246,000 China Taiping Insurance Holdings Co Ltd 675,284 0.76%
114,500 CK Asset Holdings Ltd 837,670 0.95%
8,923 Commonwealth Bank of Australia 455,902 0.52%
99,000 Country Garden Services Holdings Co Ltd 157,242 0.18%
90,000 CSI Properties Ltd 3,562 0.00%
5,200 Dah Sing Financial Holdings Ltd 25,694 0.03%
34,000 Farglory Land Development Co Ltd 38,162 0.04%
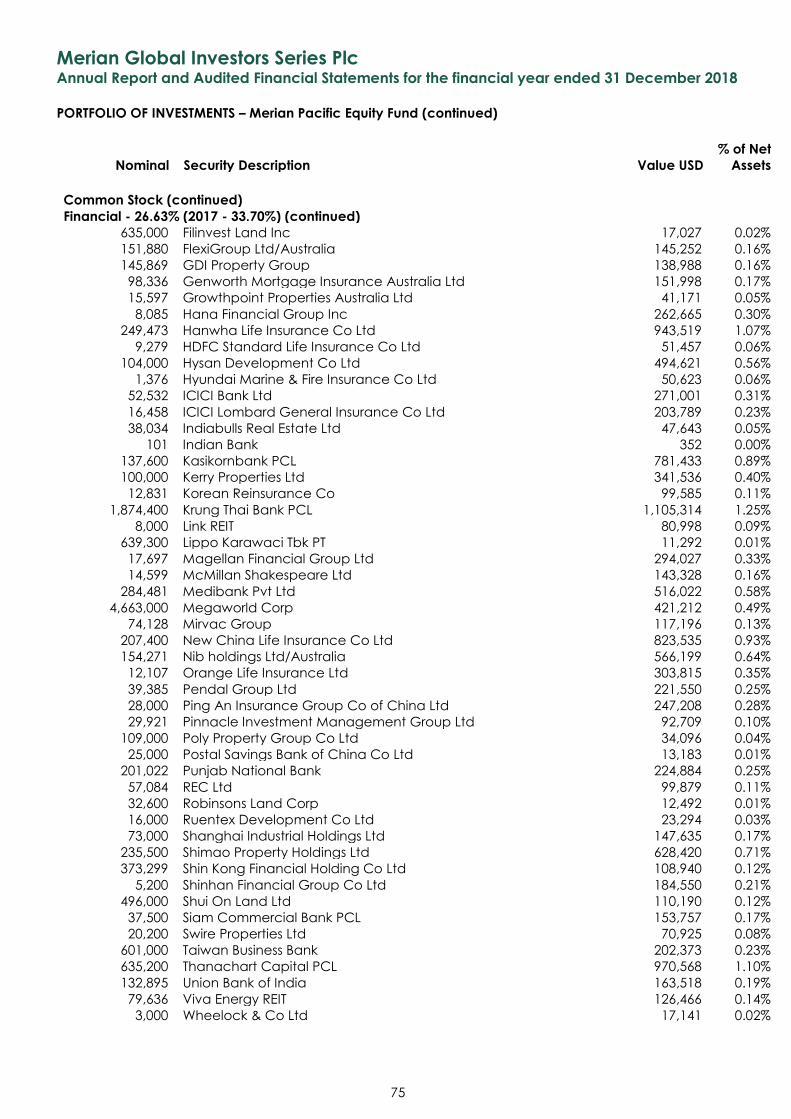
Merian Global Investors Series Plc Annual Report and Audited Financial Statements for the financial year ended 31 December 2018
PORTFOLIO OF INVESTMENTS – Merian Pacific Equity Fund (continued)
Nominal Security Description Value USD
% of Net
Assets
75
Common Stock (continued) Financial - 26.63% (2017 - 33.70%) (continued)
635,000 Filinvest Land Inc 17,027 0.02%
151,880 FlexiGroup Ltd/Australia 145,252 0.16%
145,869 GDI Property Group 138,988 0.16%
98,336 Genworth Mortgage Insurance Australia Ltd 151,998 0.17%
15,597 Growthpoint Properties Australia Ltd 41,171 0.05%
8,085 Hana Financial Group Inc 262,665 0.30%
249,473 Hanwha Life Insurance Co Ltd 943,519 1.07%
9,279 HDFC Standard Life Insurance Co Ltd 51,457 0.06%
104,000 Hysan Development Co Ltd 494,621 0.56%
1,376 Hyundai Marine & Fire Insurance Co Ltd 50,623 0.06%
52,532 ICICI Bank Ltd 271,001 0.31%
16,458 ICICI Lombard General Insurance Co Ltd 203,789 0.23%
38,034 Indiabulls Real Estate Ltd 47,643 0.05%
101 Indian Bank 352 0.00%
137,600 Kasikornbank PCL 781,433 0.89%
100,000 Kerry Properties Ltd 341,536 0.40%
12,831 Korean Reinsurance Co 99,585 0.11%
1,874,400 Krung Thai Bank PCL 1,105,314 1.25%
8,000 Link REIT 80,998 0.09%
639,300 Lippo Karawaci Tbk PT 11,292 0.01%
17,697 Magellan Financial Group Ltd 294,027 0.33%
14,599 McMillan Shakespeare Ltd 143,328 0.16%
284,481 Medibank Pvt Ltd 516,022 0.58%
4,663,000 Megaworld Corp 421,212 0.49%
74,128 Mirvac Group 117,196 0.13%
207,400 New China Life Insurance Co Ltd 823,535 0.93%
154,271 Nib holdings Ltd/Australia 566,199 0.64%
12,107 Orange Life Insurance Ltd 303,815 0.35%
39,385 Pendal Group Ltd 221,550 0.25%
28,000 Ping An Insurance Group Co of China Ltd 247,208 0.28%
29,921 Pinnacle Investment Management Group Ltd 92,709 0.10%
109,000 Poly Property Group Co Ltd 34,096 0.04%
25,000 Postal Savings Bank of China Co Ltd 13,183 0.01%
201,022 Punjab National Bank 224,884 0.25%
57,084 REC Ltd 99,879 0.11%
32,600 Robinsons Land Corp 12,492 0.01%
16,000 Ruentex Development Co Ltd 23,294 0.03%
73,000 Shanghai Industrial Holdings Ltd 147,635 0.17%
235,500 Shimao Property Holdings Ltd 628,420 0.71%
373,299 Shin Kong Financial Holding Co Ltd 108,940 0.12%
5,200 Shinhan Financial Group Co Ltd 184,550 0.21%
496,000 Shui On Land Ltd 110,190 0.12%
37,500 Siam Commercial Bank PCL 153,757 0.17%
20,200 Swire Properties Ltd 70,925 0.08%
601,000 Taiwan Business Bank 202,373 0.23%
635,200 Thanachart Capital PCL 970,568 1.10%
132,895 Union Bank of India 163,518 0.19%
79,636 Viva Energy REIT 126,466 0.14%
3,000 Wheelock & Co Ltd 17,141 0.02%
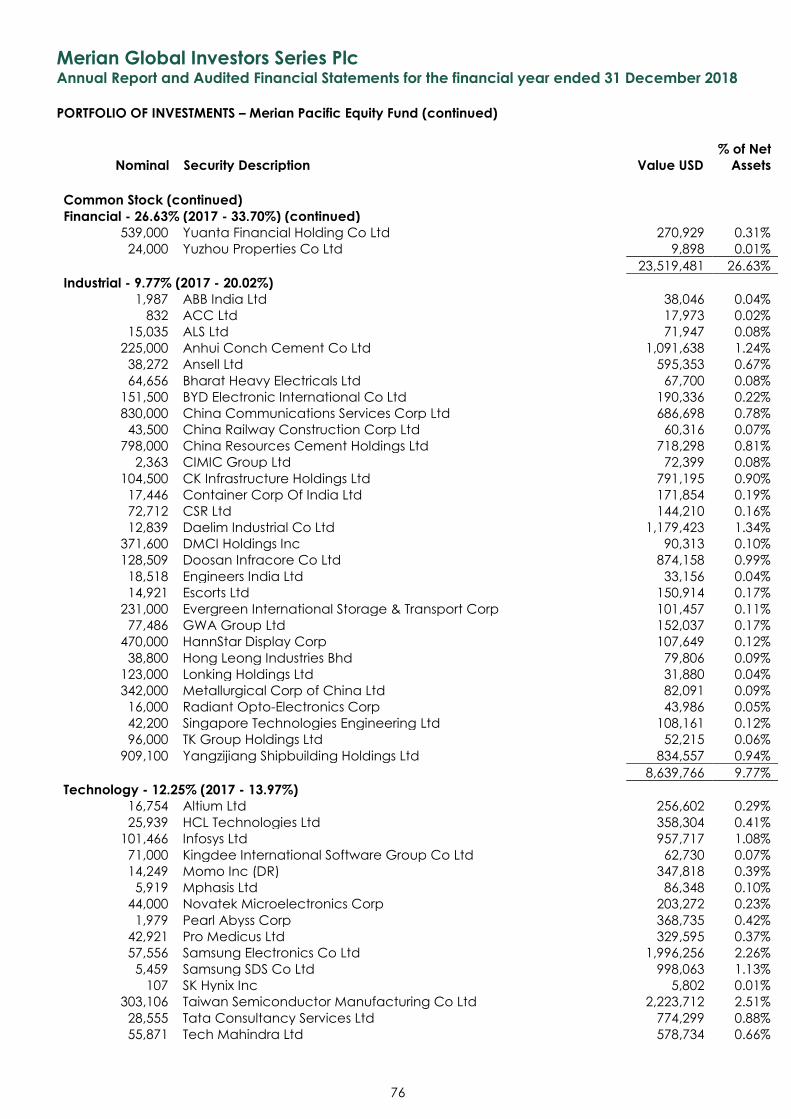
Merian Global Investors Series Plc Annual Report and Audited Financial Statements for the financial year ended 31 December 2018
PORTFOLIO OF INVESTMENTS – Merian Pacific Equity Fund (continued)
Nominal Security Description Value USD
% of Net
Assets
76
Common Stock (continued) Financial - 26.63% (2017 - 33.70%) (continued)
539,000 Yuanta Financial Holding Co Ltd 270,929 0.31%
24,000 Yuzhou Properties Co Ltd 9,898 0.01%
23,519,481 26.63%
Industrial - 9.77% (2017 - 20.02%) 1,987 ABB India Ltd 38,046 0.04%
832 ACC Ltd 17,973 0.02%
15,035 ALS Ltd 71,947 0.08%
225,000 Anhui Conch Cement Co Ltd 1,091,638 1.24%
38,272 Ansell Ltd 595,353 0.67%
64,656 Bharat Heavy Electricals Ltd 67,700 0.08%
151,500 BYD Electronic International Co Ltd 190,336 0.22%
830,000 China Communications Services Corp Ltd 686,698 0.78%
43,500 China Railway Construction Corp Ltd 60,316 0.07%
798,000 China Resources Cement Holdings Ltd 718,298 0.81%
2,363 CIMIC Group Ltd 72,399 0.08%
104,500 CK Infrastructure Holdings Ltd 791,195 0.90%
17,446 Container Corp Of India Ltd 171,854 0.19%
72,712 CSR Ltd 144,210 0.16%
12,839 Daelim Industrial Co Ltd 1,179,423 1.34%
371,600 DMCI Holdings Inc 90,313 0.10%
128,509 Doosan Infracore Co Ltd 874,158 0.99%
18,518 Engineers India Ltd 33,156 0.04%
14,921 Escorts Ltd 150,914 0.17%
231,000 Evergreen International Storage & Transport Corp 101,457 0.11%
77,486 GWA Group Ltd 152,037 0.17%
470,000 HannStar Display Corp 107,649 0.12%
38,800 Hong Leong Industries Bhd 79,806 0.09%
123,000 Lonking Holdings Ltd 31,880 0.04%
342,000 Metallurgical Corp of China Ltd 82,091 0.09%
16,000 Radiant Opto-Electronics Corp 43,986 0.05%
42,200 Singapore Technologies Engineering Ltd 108,161 0.12%
96,000 TK Group Holdings Ltd 52,215 0.06%
909,100 Yangzijiang Shipbuilding Holdings Ltd 834,557 0.94%
8,639,766 9.77%
Technology - 12.25% (2017 - 13.97%) 16,754 Altium Ltd 256,602 0.29%
25,939 HCL Technologies Ltd 358,304 0.41%
101,466 Infosys Ltd 957,717 1.08%
71,000 Kingdee International Software Group Co Ltd 62,730 0.07%
14,249 Momo Inc (DR) 347,818 0.39%
5,919 Mphasis Ltd 86,348 0.10%
44,000 Novatek Microelectronics Corp 203,272 0.23%
1,979 Pearl Abyss Corp 368,735 0.42%
42,921 Pro Medicus Ltd 329,595 0.37%
57,556 Samsung Electronics Co Ltd 1,996,256 2.26%
5,459 Samsung SDS Co Ltd 998,063 1.13%
107 SK Hynix Inc 5,802 0.01%
303,106 Taiwan Semiconductor Manufacturing Co Ltd 2,223,712 2.51%
28,555 Tata Consultancy Services Ltd 774,299 0.88%
55,871 Tech Mahindra Ltd 578,734 0.66%
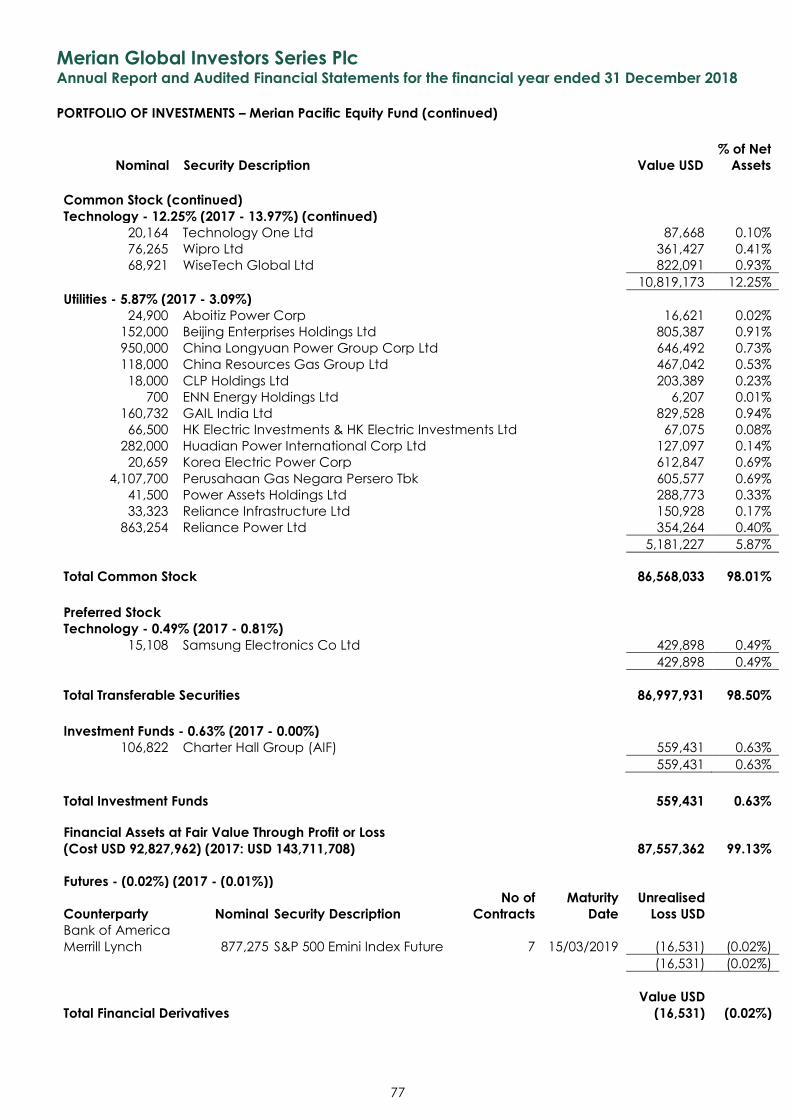
Merian Global Investors Series Plc Annual Report and Audited Financial Statements for the financial year ended 31 December 2018
PORTFOLIO OF INVESTMENTS – Merian Pacific Equity Fund (continued)
Nominal Security Description Value USD
% of Net
Assets
77
Common Stock (continued) Technology - 12.25% (2017 - 13.97%) (continued)
20,164 Technology One Ltd 87,668 0.10%
76,265 Wipro Ltd 361,427 0.41%
68,921 WiseTech Global Ltd 822,091 0.93%
10,819,173 12.25%
Utilities - 5.87% (2017 - 3.09%) 24,900 Aboitiz Power Corp 16,621 0.02%
152,000 Beijing Enterprises Holdings Ltd 805,387 0.91%
950,000 China Longyuan Power Group Corp Ltd 646,492 0.73%
118,000 China Resources Gas Group Ltd 467,042 0.53%
18,000 CLP Holdings Ltd 203,389 0.23%
700 ENN Energy Holdings Ltd 6,207 0.01%
160,732 GAIL India Ltd 829,528 0.94%
66,500 HK Electric Investments & HK Electric Investments Ltd 67,075 0.08%
282,000 Huadian Power International Corp Ltd 127,097 0.14%
20,659 Korea Electric Power Corp 612,847 0.69%
4,107,700 Perusahaan Gas Negara Persero Tbk 605,577 0.69%
41,500 Power Assets Holdings Ltd 288,773 0.33%
33,323 Reliance Infrastructure Ltd 150,928 0.17%
863,254 Reliance Power Ltd 354,264 0.40%
5,181,227 5.87%
Total Common Stock 86,568,033 98.01%
Preferred Stock Technology - 0.49% (2017 - 0.81%)
15,108 Samsung Electronics Co Ltd 429,898 0.49%
429,898 0.49%
Total Transferable Securities 86,997,931 98.50%
Investment Funds - 0.63% (2017 - 0.00%)
106,822 Charter Hall Group (AIF) 559,431 0.63%
559,431 0.63%
Total Investment Funds 559,431 0.63%
Financial Assets at Fair Value Through Profit or Loss
(Cost USD 92,827,962) (2017: USD 143,711,708) 87,557,362 99.13%
Futures - (0.02%) (2017 - (0.01%))
Counterparty Nominal Security Description
No of
Contracts
Maturity
Date
Unrealised
Loss USD
Bank of America
Merrill Lynch 877,275 S&P 500 Emini Index Future 7 15/03/2019 (16,531) (0.02%)
(16,531) (0.02%)
Value USD
Total Financial Derivatives (16,531) (0.02%)
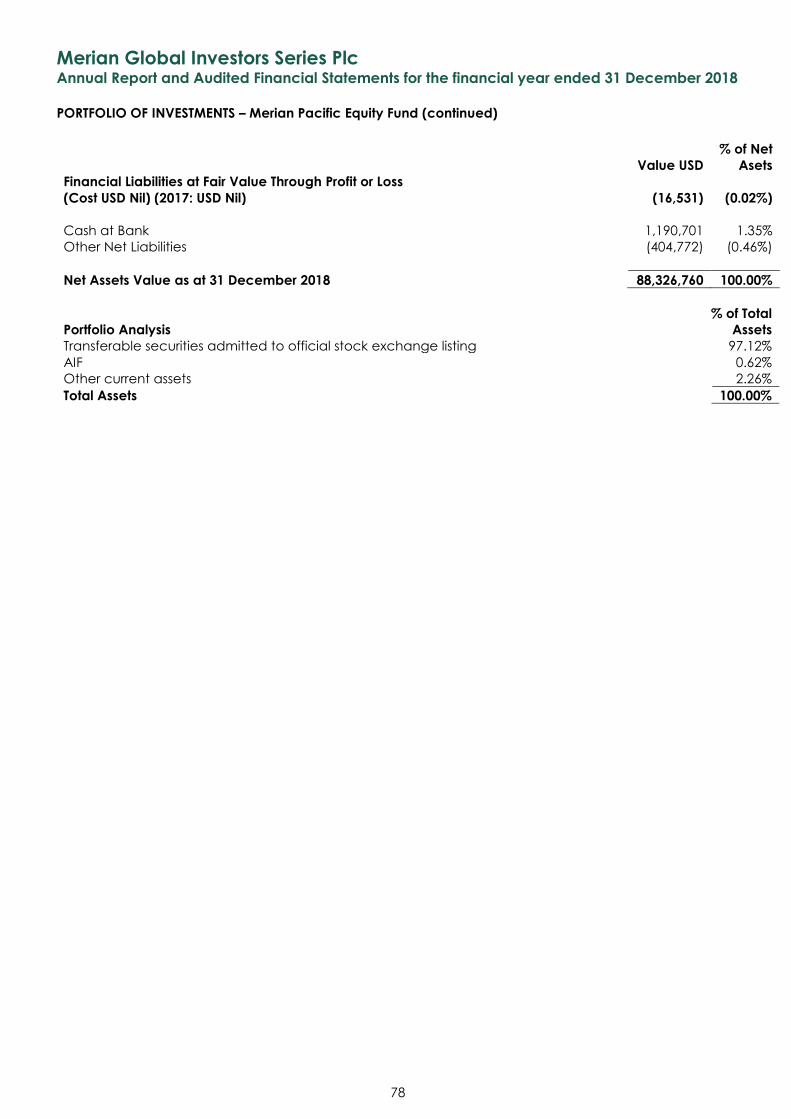
Merian Global Investors Series Plc Annual Report and Audited Financial Statements for the financial year ended 31 December 2018
PORTFOLIO OF INVESTMENTS – Merian Pacific Equity Fund (continued)
78
Value USD
% of Net
Asets
Financial Liabilities at Fair Value Through Profit or Loss
(Cost USD Nil) (2017: USD Nil) (16,531) (0.02%)
Cash at Bank 1,190,701 1.35%
Other Net Liabilities (404,772) (0.46%)
Net Assets Value as at 31 December 2018 88,326,760 100.00%
Portfolio Analysis
% of Total
Assets
Transferable securities admitted to official stock exchange listing 97.12%
AIF 0.62%
Other current assets 2.26%
Total Assets 100.00%
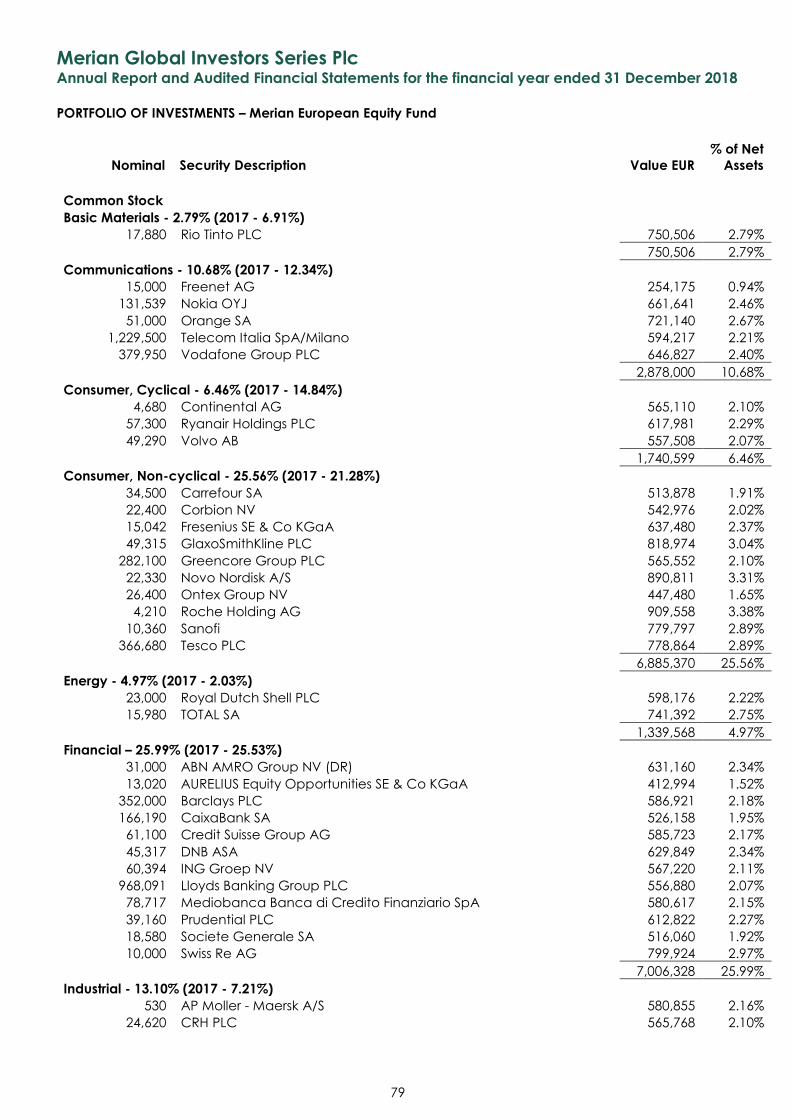
Merian Global Investors Series Plc Annual Report and Audited Financial Statements for the financial year ended 31 December 2018
PORTFOLIO OF INVESTMENTS – Merian European Equity Fund
Nominal Security Description Value EUR
% of Net
Assets
79
Common Stock Basic Materials - 2.79% (2017 - 6.91%)
17,880 Rio Tinto PLC 750,506 2.79%
750,506 2.79%
Communications - 10.68% (2017 - 12.34%) 15,000 Freenet AG 254,175 0.94%
131,539 Nokia OYJ 661,641 2.46%
51,000 Orange SA 721,140 2.67%
1,229,500 Telecom Italia SpA/Milano 594,217 2.21%
379,950 Vodafone Group PLC 646,827 2.40%
2,878,000 10.68%
Consumer, Cyclical - 6.46% (2017 - 14.84%) 4,680 Continental AG 565,110 2.10%
57,300 Ryanair Holdings PLC 617,981 2.29%
49,290 Volvo AB 557,508 2.07%
1,740,599 6.46%
Consumer, Non-cyclical - 25.56% (2017 - 21.28%) 34,500 Carrefour SA 513,878 1.91%
22,400 Corbion NV 542,976 2.02%
15,042 Fresenius SE & Co KGaA 637,480 2.37%
49,315 GlaxoSmithKline PLC 818,974 3.04%
282,100 Greencore Group PLC 565,552 2.10%
22,330 Novo Nordisk A/S 890,811 3.31%
26,400 Ontex Group NV 447,480 1.65%
4,210 Roche Holding AG 909,558 3.38%
10,360 Sanofi 779,797 2.89%
366,680 Tesco PLC 778,864 2.89%
6,885,370 25.56%
Energy - 4.97% (2017 - 2.03%) 23,000 Royal Dutch Shell PLC 598,176 2.22%
15,980 TOTAL SA 741,392 2.75%
1,339,568 4.97%
Financial – 25.99% (2017 - 25.53%) 31,000 ABN AMRO Group NV (DR) 631,160 2.34%
13,020 AURELIUS Equity Opportunities SE & Co KGaA 412,994 1.52%
352,000 Barclays PLC 586,921 2.18%
166,190 CaixaBank SA 526,158 1.95%
61,100 Credit Suisse Group AG 585,723 2.17%
45,317 DNB ASA 629,849 2.34%
60,394 ING Groep NV 567,220 2.11%
968,091 Lloyds Banking Group PLC 556,880 2.07%
78,717 Mediobanca Banca di Credito Finanziario SpA 580,617 2.15%
39,160 Prudential PLC 612,822 2.27%
18,580 Societe Generale SA 516,060 1.92%
10,000 Swiss Re AG 799,924 2.97%
7,006,328 25.99%
Industrial - 13.10% (2017 - 7.21%) 530 AP Moller - Maersk A/S 580,855 2.16%
24,620 CRH PLC 565,768 2.10%
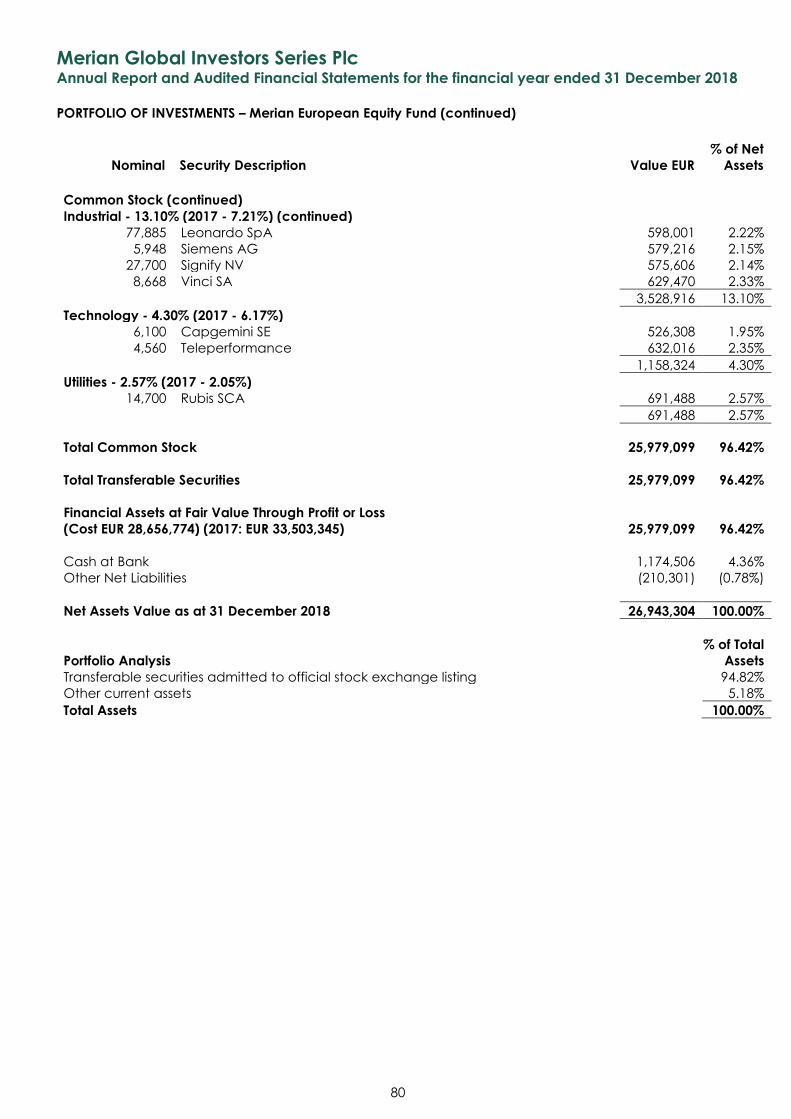
Merian Global Investors Series Plc Annual Report and Audited Financial Statements for the financial year ended 31 December 2018
PORTFOLIO OF INVESTMENTS – Merian European Equity Fund (continued)
Nominal Security Description Value EUR
% of Net
Assets
80
Common Stock (continued) Industrial - 13.10% (2017 - 7.21%) (continued)
77,885 Leonardo SpA 598,001 2.22%
5,948 Siemens AG 579,216 2.15%
27,700 Signify NV 575,606 2.14%
8,668 Vinci SA 629,470 2.33%
3,528,916 13.10%
Technology - 4.30% (2017 - 6.17%) 6,100 Capgemini SE 526,308 1.95%
4,560 Teleperformance 632,016 2.35%
1,158,324 4.30%
Utilities - 2.57% (2017 - 2.05%) 14,700 Rubis SCA 691,488 2.57%
691,488 2.57%
Total Common Stock 25,979,099 96.42%
Total Transferable Securities 25,979,099 96.42%
Financial Assets at Fair Value Through Profit or Loss
(Cost EUR 28,656,774) (2017: EUR 33,503,345) 25,979,099 96.42%
Cash at Bank 1,174,506 4.36%
Other Net Liabilities (210,301) (0.78%)
Net Assets Value as at 31 December 2018 26,943,304 100.00%
% of Total
Portfolio Analysis Assets
Transferable securities admitted to official stock exchange listing 94.82%
Other current assets 5.18%
Total Assets 100.00%
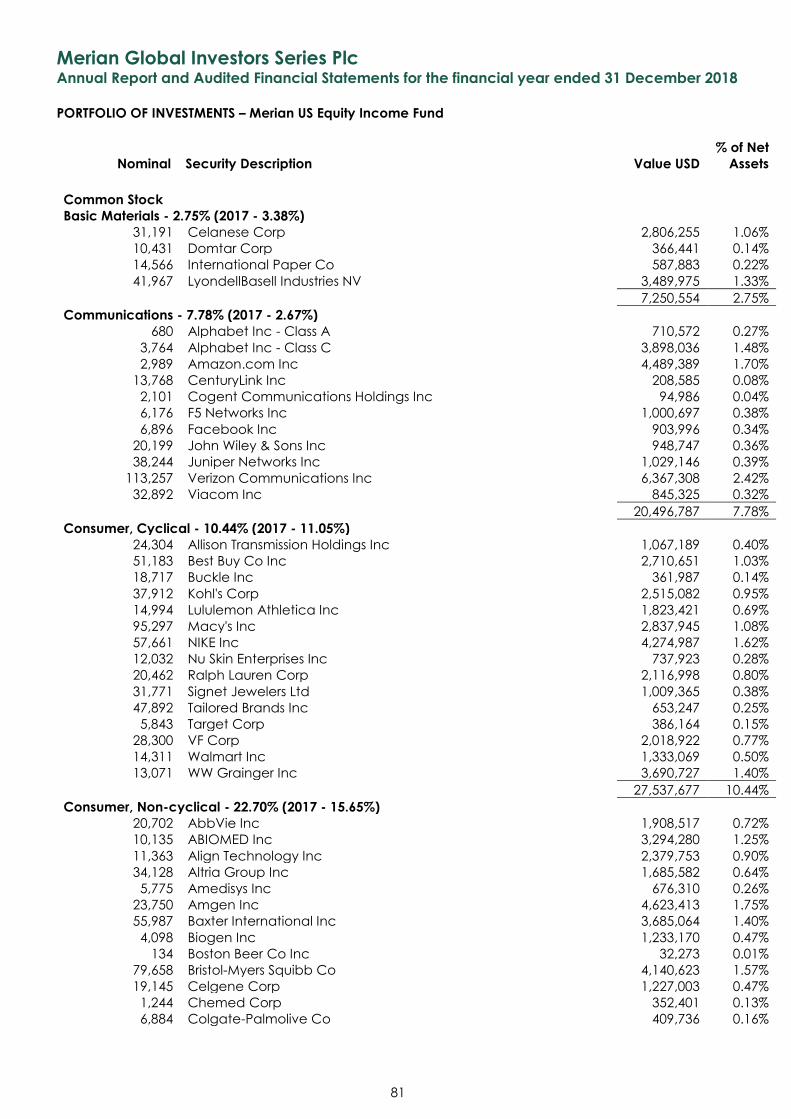
Merian Global Investors Series Plc Annual Report and Audited Financial Statements for the financial year ended 31 December 2018
PORTFOLIO OF INVESTMENTS – Merian US Equity Income Fund
Nominal Security Description Value USD
% of Net
Assets
81
Common Stock Basic Materials - 2.75% (2017 - 3.38%)
31,191 Celanese Corp 2,806,255 1.06%
10,431 Domtar Corp 366,441 0.14%
14,566 International Paper Co 587,883 0.22%
41,967 LyondellBasell Industries NV 3,489,975 1.33%
7,250,554 2.75%
Communications - 7.78% (2017 - 2.67%) 680 Alphabet Inc - Class A 710,572 0.27%
3,764 Alphabet Inc - Class C 3,898,036 1.48%
2,989 Amazon.com Inc 4,489,389 1.70%
13,768 CenturyLink Inc 208,585 0.08%
2,101 Cogent Communications Holdings Inc 94,986 0.04%
6,176 F5 Networks Inc 1,000,697 0.38%
6,896 Facebook Inc 903,996 0.34%
20,199 John Wiley & Sons Inc 948,747 0.36%
38,244 Juniper Networks Inc 1,029,146 0.39%
113,257 Verizon Communications Inc 6,367,308 2.42%
32,892 Viacom Inc 845,325 0.32%
20,496,787 7.78%
Consumer, Cyclical - 10.44% (2017 - 11.05%) 24,304 Allison Transmission Holdings Inc 1,067,189 0.40%
51,183 Best Buy Co Inc 2,710,651 1.03%
18,717 Buckle Inc 361,987 0.14%
37,912 Kohl's Corp 2,515,082 0.95%
14,994 Lululemon Athletica Inc 1,823,421 0.69%
95,297 Macy's Inc 2,837,945 1.08%
57,661 NIKE Inc 4,274,987 1.62%
12,032 Nu Skin Enterprises Inc 737,923 0.28%
20,462 Ralph Lauren Corp 2,116,998 0.80%
31,771 Signet Jewelers Ltd 1,009,365 0.38%
47,892 Tailored Brands Inc 653,247 0.25%
5,843 Target Corp 386,164 0.15%
28,300 VF Corp 2,018,922 0.77%
14,311 Walmart Inc 1,333,069 0.50%
13,071 WW Grainger Inc 3,690,727 1.40%
27,537,677 10.44%
Consumer, Non-cyclical - 22.70% (2017 - 15.65%) 20,702 AbbVie Inc 1,908,517 0.72%
10,135 ABIOMED Inc 3,294,280 1.25%
11,363 Align Technology Inc 2,379,753 0.90%
34,128 Altria Group Inc 1,685,582 0.64%
5,775 Amedisys Inc 676,310 0.26%
23,750 Amgen Inc 4,623,413 1.75%
55,987 Baxter International Inc 3,685,064 1.40%
4,098 Biogen Inc 1,233,170 0.47%
134 Boston Beer Co Inc 32,273 0.01%
79,658 Bristol-Myers Squibb Co 4,140,623 1.57%
19,145 Celgene Corp 1,227,003 0.47%
1,244 Chemed Corp 352,401 0.13%
6,884 Colgate-Palmolive Co 409,736 0.16%
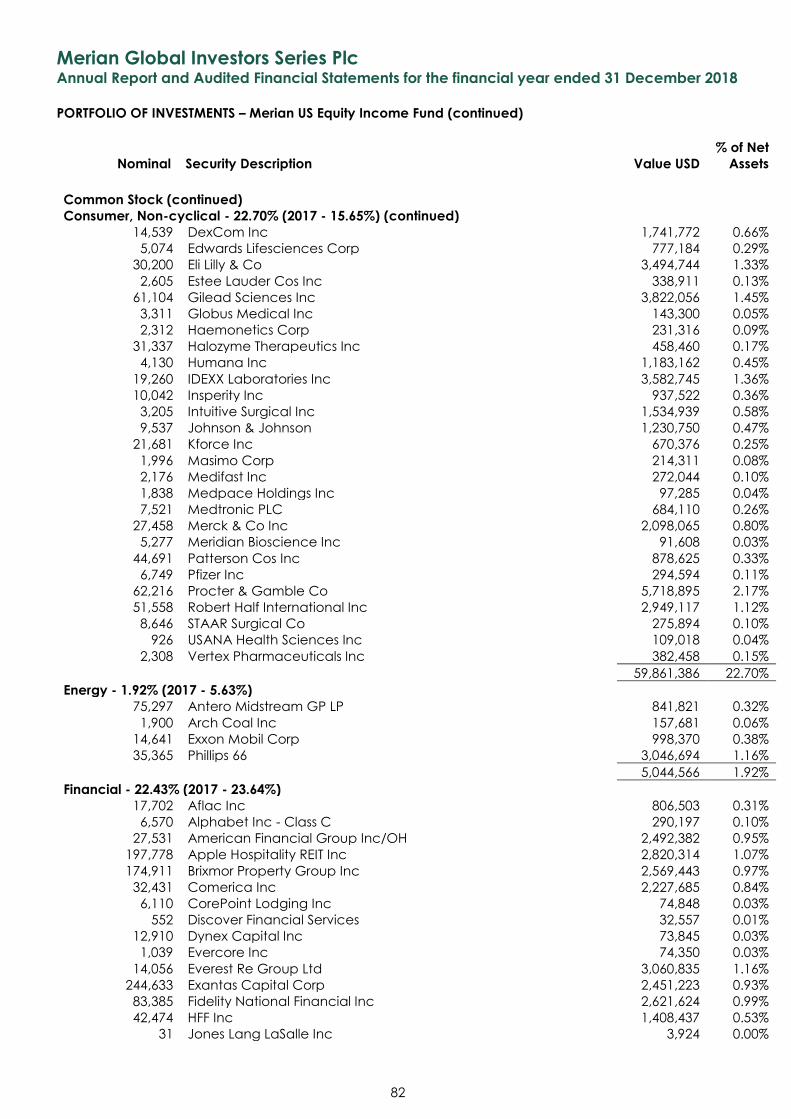
Merian Global Investors Series Plc Annual Report and Audited Financial Statements for the financial year ended 31 December 2018
PORTFOLIO OF INVESTMENTS – Merian US Equity Income Fund (continued)
Nominal Security Description Value USD
% of Net
Assets
82
Common Stock (continued) Consumer, Non-cyclical - 22.70% (2017 - 15.65%) (continued)
14,539 DexCom Inc 1,741,772 0.66%
5,074 Edwards Lifesciences Corp 777,184 0.29%
30,200 Eli Lilly & Co 3,494,744 1.33%
2,605 Estee Lauder Cos Inc 338,911 0.13%
61,104 Gilead Sciences Inc 3,822,056 1.45%
3,311 Globus Medical Inc 143,300 0.05%
2,312 Haemonetics Corp 231,316 0.09%
31,337 Halozyme Therapeutics Inc 458,460 0.17%
4,130 Humana Inc 1,183,162 0.45%
19,260 IDEXX Laboratories Inc 3,582,745 1.36%
10,042 Insperity Inc 937,522 0.36%
3,205 Intuitive Surgical Inc 1,534,939 0.58%
9,537 Johnson & Johnson 1,230,750 0.47%
21,681 Kforce Inc 670,376 0.25%
1,996 Masimo Corp 214,311 0.08%
2,176 Medifast Inc 272,044 0.10%
1,838 Medpace Holdings Inc 97,285 0.04%
7,521 Medtronic PLC 684,110 0.26%
27,458 Merck & Co Inc 2,098,065 0.80%
5,277 Meridian Bioscience Inc 91,608 0.03%
44,691 Patterson Cos Inc 878,625 0.33%
6,749 Pfizer Inc 294,594 0.11%
62,216 Procter & Gamble Co 5,718,895 2.17%
51,558 Robert Half International Inc 2,949,117 1.12%
8,646 STAAR Surgical Co 275,894 0.10%
926 USANA Health Sciences Inc 109,018 0.04%
2,308 Vertex Pharmaceuticals Inc 382,458 0.15%
59,861,386 22.70%
Energy - 1.92% (2017 - 5.63%) 75,297 Antero Midstream GP LP 841,821 0.32%
1,900 Arch Coal Inc 157,681 0.06%
14,641 Exxon Mobil Corp 998,370 0.38%
35,365 Phillips 66 3,046,694 1.16%
5,044,566 1.92%
Financial - 22.43% (2017 - 23.64%) 17,702 Aflac Inc 806,503 0.31%
6,570 Alphabet Inc - Class C 290,197 0.10%
27,531 American Financial Group Inc/OH 2,492,382 0.95%
197,778 Apple Hospitality REIT Inc 2,820,314 1.07%
174,911 Brixmor Property Group Inc 2,569,443 0.97%
32,431 Comerica Inc 2,227,685 0.84%
6,110 CorePoint Lodging Inc 74,848 0.03%
552 Discover Financial Services 32,557 0.01%
12,910 Dynex Capital Inc 73,845 0.03%
1,039 Evercore Inc 74,350 0.03%
14,056 Everest Re Group Ltd 3,060,835 1.16%
244,633 Exantas Capital Corp 2,451,223 0.93%
83,385 Fidelity National Financial Inc 2,621,624 0.99%
42,474 HFF Inc 1,408,437 0.53%
31 Jones Lang LaSalle Inc 3,924 0.00%
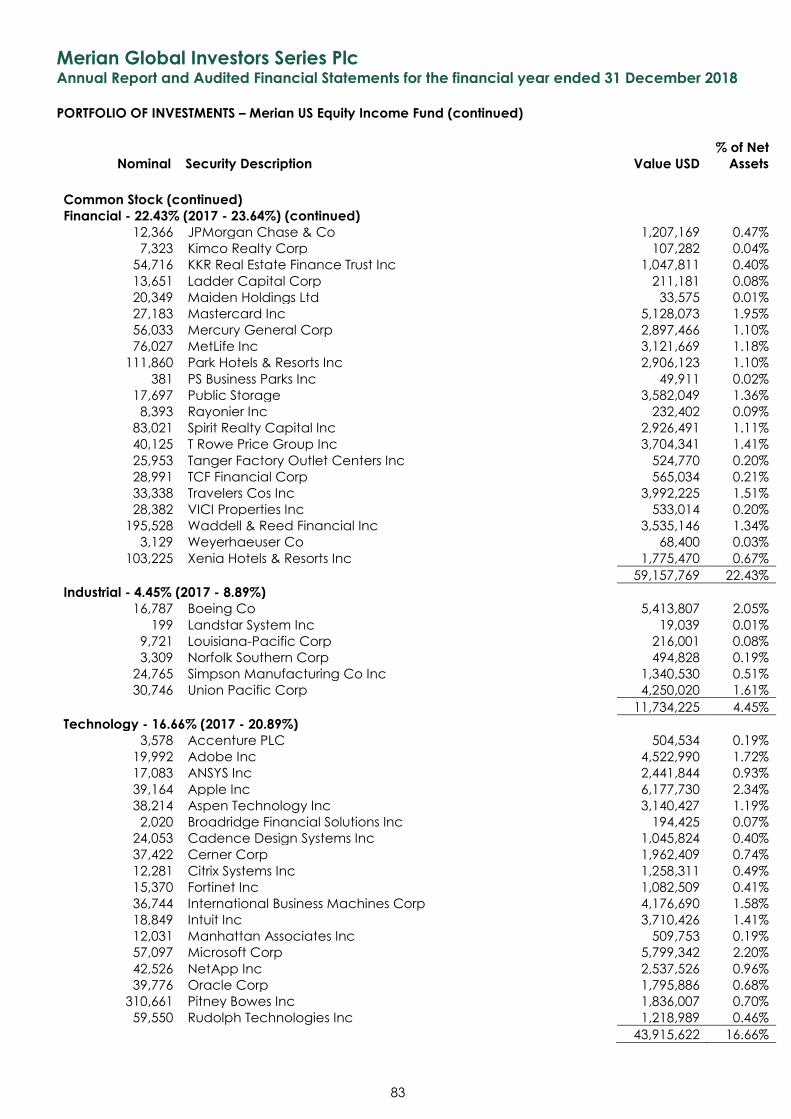
Merian Global Investors Series Plc Annual Report and Audited Financial Statements for the financial year ended 31 December 2018
PORTFOLIO OF INVESTMENTS – Merian US Equity Income Fund (continued)
Nominal Security Description Value USD
% of Net
Assets
83
Common Stock (continued) Financial - 22.43% (2017 - 23.64%) (continued)
12,366 JPMorgan Chase & Co 1,207,169 0.47%
7,323 Kimco Realty Corp 107,282 0.04%
54,716 KKR Real Estate Finance Trust Inc 1,047,811 0.40%
13,651 Ladder Capital Corp 211,181 0.08%
20,349 Maiden Holdings Ltd 33,575 0.01%
27,183 Mastercard Inc 5,128,073 1.95%
56,033 Mercury General Corp 2,897,466 1.10%
76,027 MetLife Inc 3,121,669 1.18%
111,860 Park Hotels & Resorts Inc 2,906,123 1.10%
381 PS Business Parks Inc 49,911 0.02%
17,697 Public Storage 3,582,049 1.36%
8,393 Rayonier Inc 232,402 0.09%
83,021 Spirit Realty Capital Inc 2,926,491 1.11%
40,125 T Rowe Price Group Inc 3,704,341 1.41%
25,953 Tanger Factory Outlet Centers Inc 524,770 0.20%
28,991 TCF Financial Corp 565,034 0.21%
33,338 Travelers Cos Inc 3,992,225 1.51%
28,382 VICI Properties Inc 533,014 0.20%
195,528 Waddell & Reed Financial Inc 3,535,146 1.34%
3,129 Weyerhaeuser Co 68,400 0.03%
103,225 Xenia Hotels & Resorts Inc 1,775,470 0.67%
59,157,769 22.43%
Industrial - 4.45% (2017 - 8.89%) 16,787 Boeing Co 5,413,807 2.05%
199 Landstar System Inc 19,039 0.01%
9,721 Louisiana-Pacific Corp 216,001 0.08%
3,309 Norfolk Southern Corp 494,828 0.19%
24,765 Simpson Manufacturing Co Inc 1,340,530 0.51%
30,746 Union Pacific Corp 4,250,020 1.61%
11,734,225 4.45%
Technology - 16.66% (2017 - 20.89%) 3,578 Accenture PLC 504,534 0.19%
19,992 Adobe Inc 4,522,990 1.72%
17,083 ANSYS Inc 2,441,844 0.93%
39,164 Apple Inc 6,177,730 2.34%
38,214 Aspen Technology Inc 3,140,427 1.19%
2,020 Broadridge Financial Solutions Inc 194,425 0.07%
24,053 Cadence Design Systems Inc 1,045,824 0.40%
37,422 Cerner Corp 1,962,409 0.74%
12,281 Citrix Systems Inc 1,258,311 0.49%
15,370 Fortinet Inc 1,082,509 0.41%
36,744 International Business Machines Corp 4,176,690 1.58%
18,849 Intuit Inc 3,710,426 1.41%
12,031 Manhattan Associates Inc 509,753 0.19%
57,097 Microsoft Corp 5,799,342 2.20%
42,526 NetApp Inc 2,537,526 0.96%
39,776 Oracle Corp 1,795,886 0.68%
310,661 Pitney Bowes Inc 1,836,007 0.70%
59,550 Rudolph Technologies Inc 1,218,989 0.46%
43,915,622 16.66%
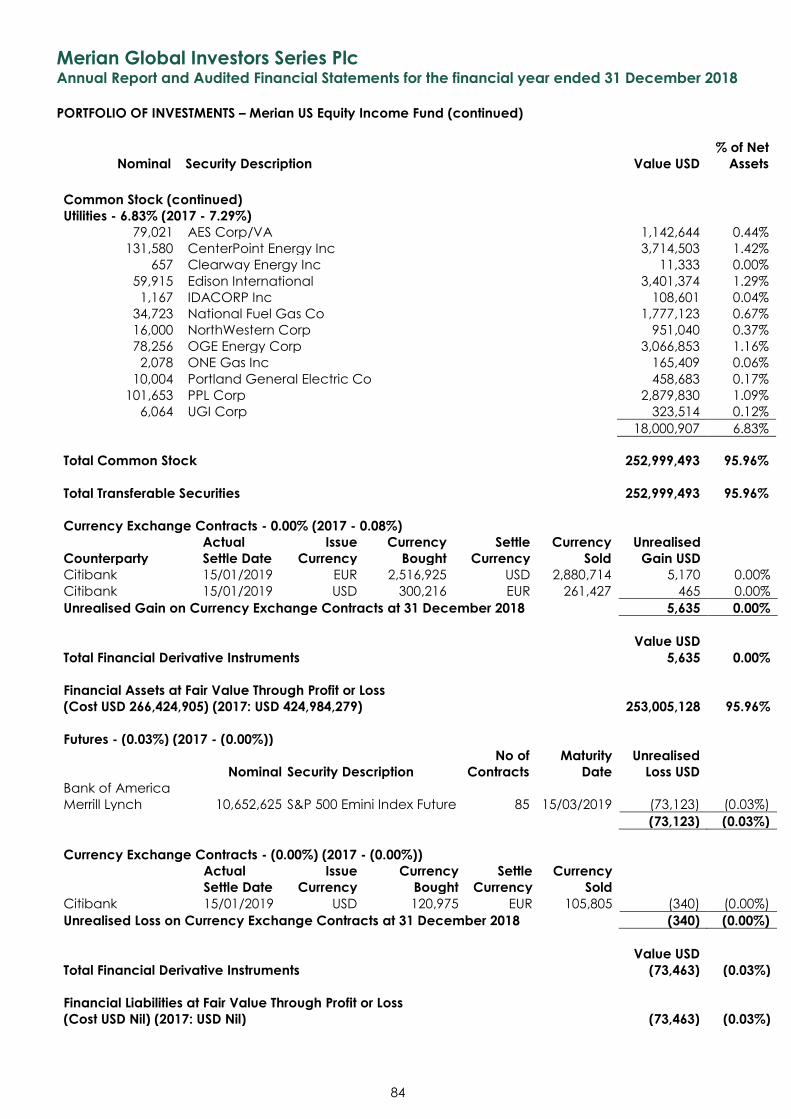
Merian Global Investors Series Plc Annual Report and Audited Financial Statements for the financial year ended 31 December 2018
PORTFOLIO OF INVESTMENTS – Merian US Equity Income Fund (continued)
Nominal Security Description Value USD
% of Net
Assets
84
Common Stock (continued)
Utilities - 6.83% (2017 - 7.29%) 79,021 AES Corp/VA 1,142,644 0.44%
131,580 CenterPoint Energy Inc 3,714,503 1.42%
657 Clearway Energy Inc 11,333 0.00%
59,915 Edison International 3,401,374 1.29%
1,167 IDACORP Inc 108,601 0.04%
34,723 National Fuel Gas Co 1,777,123 0.67%
16,000 NorthWestern Corp 951,040 0.37%
78,256 OGE Energy Corp 3,066,853 1.16%
2,078 ONE Gas Inc 165,409 0.06%
10,004 Portland General Electric Co 458,683 0.17%
101,653 PPL Corp 2,879,830 1.09%
6,064 UGI Corp 323,514 0.12%
18,000,907 6.83%
Total Common Stock 252,999,493 95.96%
Total Transferable Securities 252,999,493 95.96%
Currency Exchange Contracts - 0.00% (2017 - 0.08%)
Counterparty
Actual
Settle Date
Issue
Currency
Currency
Bought
Settle
Currency
Currency
Sold
Unrealised
Gain USD Citibank 15/01/2019 EUR 2,516,925 USD 2,880,714 5,170 0.00%
Citibank 15/01/2019 USD 300,216 EUR 261,427 465 0.00%
Unrealised Gain on Currency Exchange Contracts at 31 December 2018 5,635 0.00%
Value USD
Total Financial Derivative Instruments 5,635 0.00%
Financial Assets at Fair Value Through Profit or Loss
(Cost USD 266,424,905) (2017: USD 424,984,279) 253,005,128 95.96%
Futures - (0.03%) (2017 - (0.00%))
Nominal Security Description
No of
Contracts
Maturity
Date
Unrealised
Loss USD
Bank of America
Merrill Lynch 10,652,625 S&P 500 Emini Index Future 85 15/03/2019 (73,123) (0.03%)
(73,123) (0.03%)
Currency Exchange Contracts - (0.00%) (2017 - (0.00%))
Actual
Settle Date
Issue
Currency
Currency
Bought
Settle
Currency
Currency
Sold Citibank 15/01/2019 USD 120,975 EUR 105,805 (340) (0.00%)
Unrealised Loss on Currency Exchange Contracts at 31 December 2018 (340) (0.00%)
Value USD
Total Financial Derivative Instruments (73,463) (0.03%)
Financial Liabilities at Fair Value Through Profit or Loss
(Cost USD Nil) (2017: USD Nil) (73,463) (0.03%)
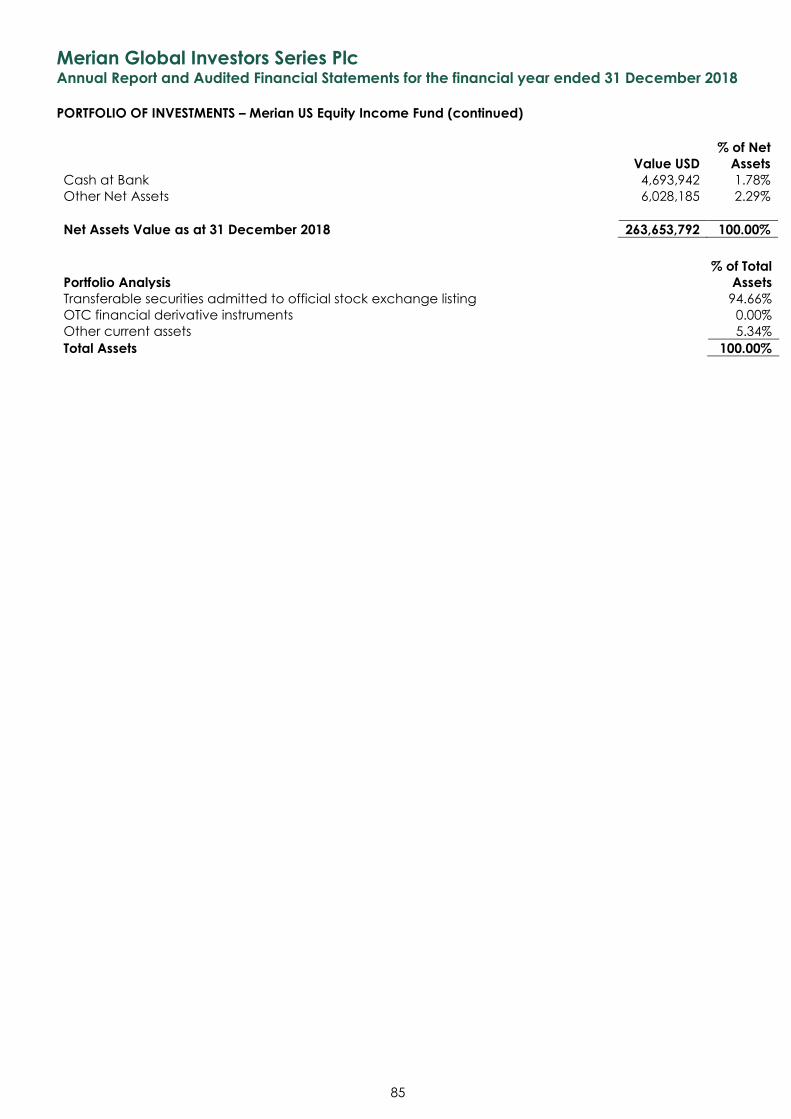
Merian Global Investors Series Plc Annual Report and Audited Financial Statements for the financial year ended 31 December 2018
PORTFOLIO OF INVESTMENTS – Merian US Equity Income Fund (continued)
85
Value USD
% of Net
Assets
Cash at Bank 4,693,942 1.78%
Other Net Assets 6,028,185 2.29%
Net Assets Value as at 31 December 2018 263,653,792 100.00%
Portfolio Analysis
% of Total
Assets
Transferable securities admitted to official stock exchange listing 94.66%
OTC financial derivative instruments 0.00%
Other current assets 5.34%
Total Assets 100.00%
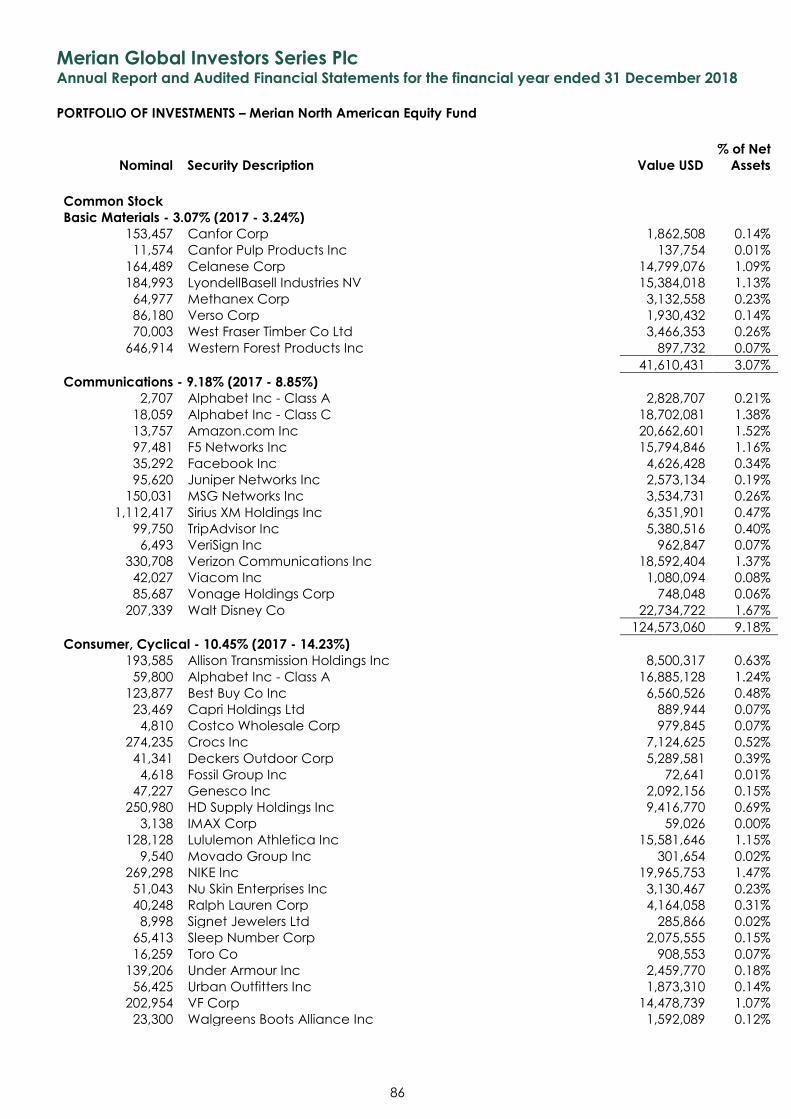
Merian Global Investors Series Plc Annual Report and Audited Financial Statements for the financial year ended 31 December 2018
PORTFOLIO OF INVESTMENTS – Merian North American Equity Fund
Nominal Security Description Value USD
% of Net
Assets
86
Common Stock Basic Materials - 3.07% (2017 - 3.24%)
153,457 Canfor Corp 1,862,508 0.14%
11,574 Canfor Pulp Products Inc 137,754 0.01%
164,489 Celanese Corp 14,799,076 1.09%
184,993 LyondellBasell Industries NV 15,384,018 1.13%
64,977 Methanex Corp 3,132,558 0.23%
86,180 Verso Corp 1,930,432 0.14%
70,003 West Fraser Timber Co Ltd 3,466,353 0.26%
646,914 Western Forest Products Inc 897,732 0.07%
41,610,431 3.07%
Communications - 9.18% (2017 - 8.85%) 2,707 Alphabet Inc - Class A 2,828,707 0.21%
18,059 Alphabet Inc - Class C 18,702,081 1.38%
13,757 Amazon.com Inc 20,662,601 1.52%
97,481 F5 Networks Inc 15,794,846 1.16%
35,292 Facebook Inc 4,626,428 0.34%
95,620 Juniper Networks Inc 2,573,134 0.19%
150,031 MSG Networks Inc 3,534,731 0.26%
1,112,417 Sirius XM Holdings Inc 6,351,901 0.47%
99,750 TripAdvisor Inc 5,380,516 0.40%
6,493 VeriSign Inc 962,847 0.07%
330,708 Verizon Communications Inc 18,592,404 1.37%
42,027 Viacom Inc 1,080,094 0.08%
85,687 Vonage Holdings Corp 748,048 0.06%
207,339 Walt Disney Co 22,734,722 1.67%
124,573,060 9.18%
Consumer, Cyclical - 10.45% (2017 - 14.23%) 193,585 Allison Transmission Holdings Inc 8,500,317 0.63%
59,800 Alphabet Inc - Class A 16,885,128 1.24%
123,877 Best Buy Co Inc 6,560,526 0.48%
23,469 Capri Holdings Ltd 889,944 0.07%
4,810 Costco Wholesale Corp 979,845 0.07%
274,235 Crocs Inc 7,124,625 0.52%
41,341 Deckers Outdoor Corp 5,289,581 0.39%
4,618 Fossil Group Inc 72,641 0.01%
47,227 Genesco Inc 2,092,156 0.15%
250,980 HD Supply Holdings Inc 9,416,770 0.69%
3,138 IMAX Corp 59,026 0.00%
128,128 Lululemon Athletica Inc 15,581,646 1.15%
9,540 Movado Group Inc 301,654 0.02%
269,298 NIKE Inc 19,965,753 1.47%
51,043 Nu Skin Enterprises Inc 3,130,467 0.23%
40,248 Ralph Lauren Corp 4,164,058 0.31%
8,998 Signet Jewelers Ltd 285,866 0.02%
65,413 Sleep Number Corp 2,075,555 0.15%
16,259 Toro Co 908,553 0.07%
139,206 Under Armour Inc 2,459,770 0.18%
56,425 Urban Outfitters Inc 1,873,310 0.14%
202,954 VF Corp 14,478,739 1.07%
23,300 Walgreens Boots Alliance Inc 1,592,089 0.12%
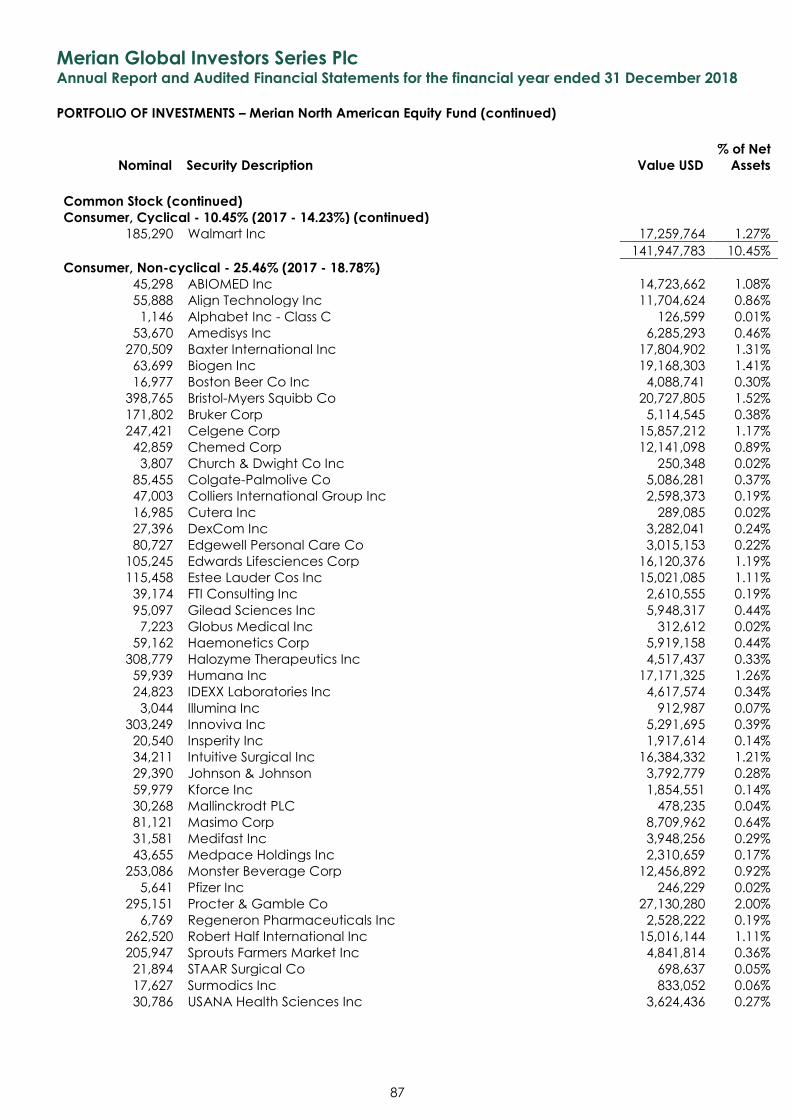
Merian Global Investors Series Plc Annual Report and Audited Financial Statements for the financial year ended 31 December 2018
PORTFOLIO OF INVESTMENTS – Merian North American Equity Fund (continued)
Nominal Security Description Value USD
% of Net
Assets
87
Common Stock (continued) Consumer, Cyclical - 10.45% (2017 - 14.23%) (continued)
185,290 Walmart Inc 17,259,764 1.27%
141,947,783 10.45%
Consumer, Non-cyclical - 25.46% (2017 - 18.78%) 45,298 ABIOMED Inc 14,723,662 1.08%
55,888 Align Technology Inc 11,704,624 0.86%
1,146 Alphabet Inc - Class C 126,599 0.01%
53,670 Amedisys Inc 6,285,293 0.46%
270,509 Baxter International Inc 17,804,902 1.31%
63,699 Biogen Inc 19,168,303 1.41%
16,977 Boston Beer Co Inc 4,088,741 0.30%
398,765 Bristol-Myers Squibb Co 20,727,805 1.52%
171,802 Bruker Corp 5,114,545 0.38%
247,421 Celgene Corp 15,857,212 1.17%
42,859 Chemed Corp 12,141,098 0.89%
3,807 Church & Dwight Co Inc 250,348 0.02%
85,455 Colgate-Palmolive Co 5,086,281 0.37%
47,003 Colliers International Group Inc 2,598,373 0.19%
16,985 Cutera Inc 289,085 0.02%
27,396 DexCom Inc 3,282,041 0.24%
80,727 Edgewell Personal Care Co 3,015,153 0.22%
105,245 Edwards Lifesciences Corp 16,120,376 1.19%
115,458 Estee Lauder Cos Inc 15,021,085 1.11%
39,174 FTI Consulting Inc 2,610,555 0.19%
95,097 Gilead Sciences Inc 5,948,317 0.44%
7,223 Globus Medical Inc 312,612 0.02%
59,162 Haemonetics Corp 5,919,158 0.44%
308,779 Halozyme Therapeutics Inc 4,517,437 0.33%
59,939 Humana Inc 17,171,325 1.26%
24,823 IDEXX Laboratories Inc 4,617,574 0.34%
3,044 Illumina Inc 912,987 0.07%
303,249 Innoviva Inc 5,291,695 0.39%
20,540 Insperity Inc 1,917,614 0.14%
34,211 Intuitive Surgical Inc 16,384,332 1.21%
29,390 Johnson & Johnson 3,792,779 0.28%
59,979 Kforce Inc 1,854,551 0.14%
30,268 Mallinckrodt PLC 478,235 0.04%
81,121 Masimo Corp 8,709,962 0.64%
31,581 Medifast Inc 3,948,256 0.29%
43,655 Medpace Holdings Inc 2,310,659 0.17%
253,086 Monster Beverage Corp 12,456,892 0.92%
5,641 Pfizer Inc 246,229 0.02%
295,151 Procter & Gamble Co 27,130,280 2.00%
6,769 Regeneron Pharmaceuticals Inc 2,528,222 0.19%
262,520 Robert Half International Inc 15,016,144 1.11%
205,947 Sprouts Farmers Market Inc 4,841,814 0.36%
21,894 STAAR Surgical Co 698,637 0.05%
17,627 Surmodics Inc 833,052 0.06%
30,786 USANA Health Sciences Inc 3,624,436 0.27%
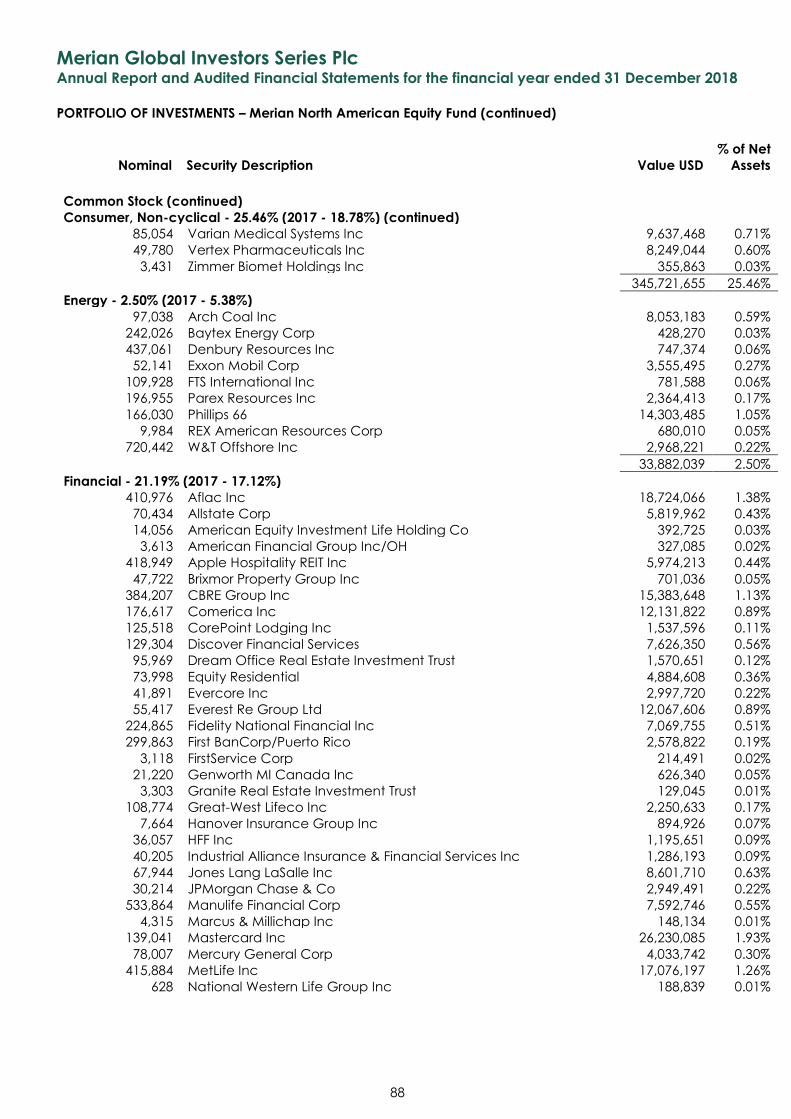
Merian Global Investors Series Plc Annual Report and Audited Financial Statements for the financial year ended 31 December 2018
PORTFOLIO OF INVESTMENTS – Merian North American Equity Fund (continued)
Nominal Security Description Value USD
% of Net
Assets
88
Common Stock (continued) Consumer, Non-cyclical - 25.46% (2017 - 18.78%) (continued)
85,054 Varian Medical Systems Inc 9,637,468 0.71%
49,780 Vertex Pharmaceuticals Inc 8,249,044 0.60%
3,431 Zimmer Biomet Holdings Inc 355,863 0.03%
345,721,655 25.46%
Energy - 2.50% (2017 - 5.38%) 97,038 Arch Coal Inc 8,053,183 0.59%
242,026 Baytex Energy Corp 428,270 0.03%
437,061 Denbury Resources Inc 747,374 0.06%
52,141 Exxon Mobil Corp 3,555,495 0.27%
109,928 FTS International Inc 781,588 0.06%
196,955 Parex Resources Inc 2,364,413 0.17%
166,030 Phillips 66 14,303,485 1.05%
9,984 REX American Resources Corp 680,010 0.05%
720,442 W&T Offshore Inc 2,968,221 0.22%
33,882,039 2.50%
Financial - 21.19% (2017 - 17.12%) 410,976 Aflac Inc 18,724,066 1.38%
70,434 Allstate Corp 5,819,962 0.43%
14,056 American Equity Investment Life Holding Co 392,725 0.03%
3,613 American Financial Group Inc/OH 327,085 0.02%
418,949 Apple Hospitality REIT Inc 5,974,213 0.44%
47,722 Brixmor Property Group Inc 701,036 0.05%
384,207 CBRE Group Inc 15,383,648 1.13%
176,617 Comerica Inc 12,131,822 0.89%
125,518 CorePoint Lodging Inc 1,537,596 0.11%
129,304 Discover Financial Services 7,626,350 0.56%
95,969 Dream Office Real Estate Investment Trust 1,570,651 0.12%
73,998 Equity Residential 4,884,608 0.36%
41,891 Evercore Inc 2,997,720 0.22%
55,417 Everest Re Group Ltd 12,067,606 0.89%
224,865 Fidelity National Financial Inc 7,069,755 0.51%
299,863 First BanCorp/Puerto Rico 2,578,822 0.19%
3,118 FirstService Corp 214,491 0.02%
21,220 Genworth MI Canada Inc 626,340 0.05%
3,303 Granite Real Estate Investment Trust 129,045 0.01%
108,774 Great-West Lifeco Inc 2,250,633 0.17%
7,664 Hanover Insurance Group Inc 894,926 0.07%
36,057 HFF Inc 1,195,651 0.09%
40,205 Industrial Alliance Insurance & Financial Services Inc 1,286,193 0.09%
67,944 Jones Lang LaSalle Inc 8,601,710 0.63%
30,214 JPMorgan Chase & Co 2,949,491 0.22%
533,864 Manulife Financial Corp 7,592,746 0.55%
4,315 Marcus & Millichap Inc 148,134 0.01%
139,041 Mastercard Inc 26,230,085 1.93%
78,007 Mercury General Corp 4,033,742 0.30%
415,884 MetLife Inc 17,076,197 1.26%
628 National Western Life Group Inc 188,839 0.01%
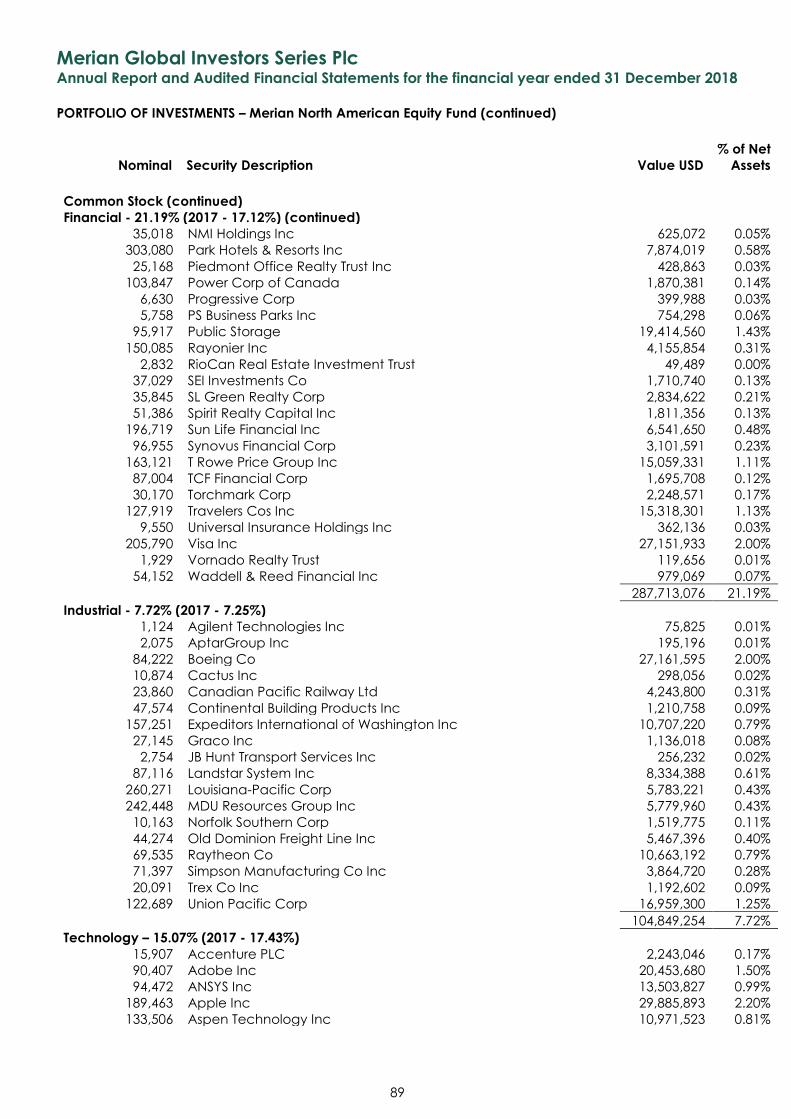
Merian Global Investors Series Plc Annual Report and Audited Financial Statements for the financial year ended 31 December 2018
PORTFOLIO OF INVESTMENTS – Merian North American Equity Fund (continued)
Nominal Security Description Value USD
% of Net
Assets
89
Common Stock (continued) Financial - 21.19% (2017 - 17.12%) (continued)
35,018 NMI Holdings Inc 625,072 0.05%
303,080 Park Hotels & Resorts Inc 7,874,019 0.58%
25,168 Piedmont Office Realty Trust Inc 428,863 0.03%
103,847 Power Corp of Canada 1,870,381 0.14%
6,630 Progressive Corp 399,988 0.03%
5,758 PS Business Parks Inc 754,298 0.06%
95,917 Public Storage 19,414,560 1.43%
150,085 Rayonier Inc 4,155,854 0.31%
2,832 RioCan Real Estate Investment Trust 49,489 0.00%
37,029 SEI Investments Co 1,710,740 0.13%
35,845 SL Green Realty Corp 2,834,622 0.21%
51,386 Spirit Realty Capital Inc 1,811,356 0.13%
196,719 Sun Life Financial Inc 6,541,650 0.48%
96,955 Synovus Financial Corp 3,101,591 0.23%
163,121 T Rowe Price Group Inc 15,059,331 1.11%
87,004 TCF Financial Corp 1,695,708 0.12%
30,170 Torchmark Corp 2,248,571 0.17%
127,919 Travelers Cos Inc 15,318,301 1.13%
9,550 Universal Insurance Holdings Inc 362,136 0.03%
205,790 Visa Inc 27,151,933 2.00%
1,929 Vornado Realty Trust 119,656 0.01%
54,152 Waddell & Reed Financial Inc 979,069 0.07%
287,713,076 21.19%
Industrial - 7.72% (2017 - 7.25%) 1,124 Agilent Technologies Inc 75,825 0.01%
2,075 AptarGroup Inc 195,196 0.01%
84,222 Boeing Co 27,161,595 2.00%
10,874 Cactus Inc 298,056 0.02%
23,860 Canadian Pacific Railway Ltd 4,243,800 0.31%
47,574 Continental Building Products Inc 1,210,758 0.09%
157,251 Expeditors International of Washington Inc 10,707,220 0.79%
27,145 Graco Inc 1,136,018 0.08%
2,754 JB Hunt Transport Services Inc 256,232 0.02%
87,116 Landstar System Inc 8,334,388 0.61%
260,271 Louisiana-Pacific Corp 5,783,221 0.43%
242,448 MDU Resources Group Inc 5,779,960 0.43%
10,163 Norfolk Southern Corp 1,519,775 0.11%
44,274 Old Dominion Freight Line Inc 5,467,396 0.40%
69,535 Raytheon Co 10,663,192 0.79%
71,397 Simpson Manufacturing Co Inc 3,864,720 0.28%
20,091 Trex Co Inc 1,192,602 0.09%
122,689 Union Pacific Corp 16,959,300 1.25%
104,849,254 7.72%
Technology – 15.07% (2017 - 17.43%) 15,907 Accenture PLC 2,243,046 0.17%
90,407 Adobe Inc 20,453,680 1.50%
94,472 ANSYS Inc 13,503,827 0.99%
189,463 Apple Inc 29,885,893 2.20%
133,506 Aspen Technology Inc 10,971,523 0.81%
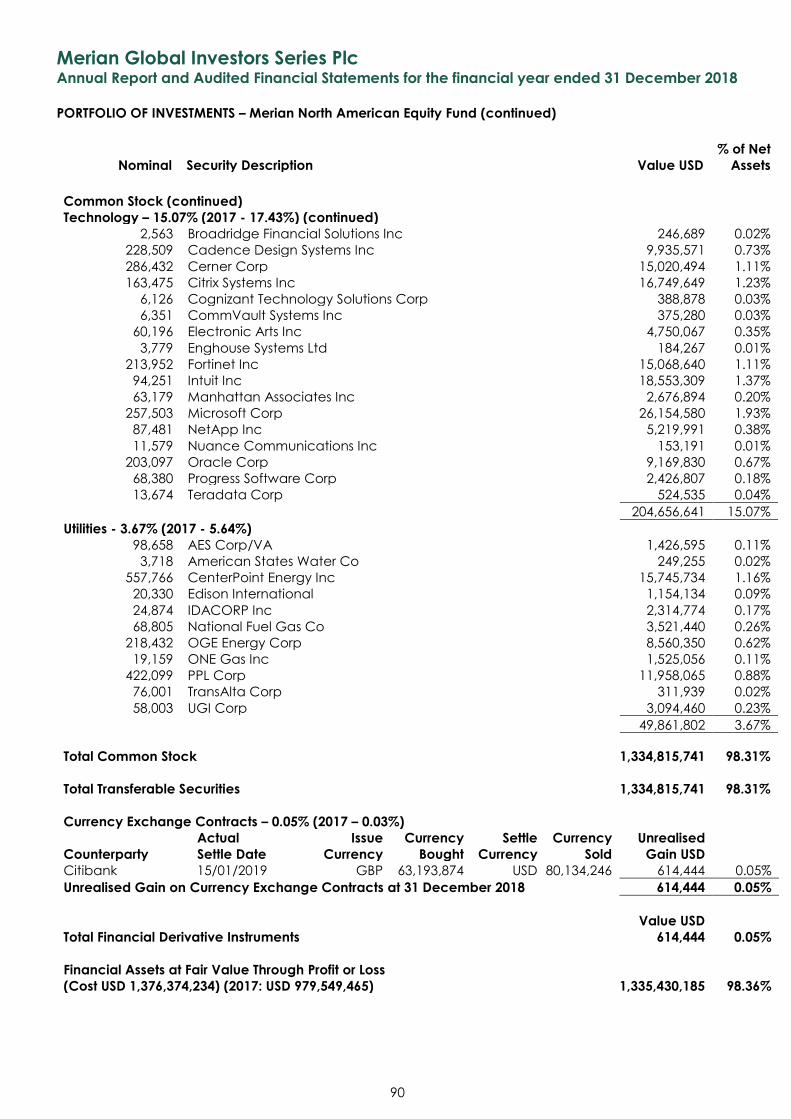
Merian Global Investors Series Plc Annual Report and Audited Financial Statements for the financial year ended 31 December 2018
PORTFOLIO OF INVESTMENTS – Merian North American Equity Fund (continued)
Nominal Security Description Value USD
% of Net
Assets
90
Common Stock (continued) Technology – 15.07% (2017 - 17.43%) (continued)
2,563 Broadridge Financial Solutions Inc 246,689 0.02%
228,509 Cadence Design Systems Inc 9,935,571 0.73%
286,432 Cerner Corp 15,020,494 1.11%
163,475 Citrix Systems Inc 16,749,649 1.23%
6,126 Cognizant Technology Solutions Corp 388,878 0.03%
6,351 CommVault Systems Inc 375,280 0.03%
60,196 Electronic Arts Inc 4,750,067 0.35%
3,779 Enghouse Systems Ltd 184,267 0.01%
213,952 Fortinet Inc 15,068,640 1.11%
94,251 Intuit Inc 18,553,309 1.37%
63,179 Manhattan Associates Inc 2,676,894 0.20%
257,503 Microsoft Corp 26,154,580 1.93%
87,481 NetApp Inc 5,219,991 0.38%
11,579 Nuance Communications Inc 153,191 0.01%
203,097 Oracle Corp 9,169,830 0.67%
68,380 Progress Software Corp 2,426,807 0.18%
13,674 Teradata Corp 524,535 0.04%
204,656,641 15.07%
Utilities - 3.67% (2017 - 5.64%) 98,658 AES Corp/VA 1,426,595 0.11%
3,718 American States Water Co 249,255 0.02%
557,766 CenterPoint Energy Inc 15,745,734 1.16%
20,330 Edison International 1,154,134 0.09%
24,874 IDACORP Inc 2,314,774 0.17%
68,805 National Fuel Gas Co 3,521,440 0.26%
218,432 OGE Energy Corp 8,560,350 0.62%
19,159 ONE Gas Inc 1,525,056 0.11%
422,099 PPL Corp 11,958,065 0.88%
76,001 TransAlta Corp 311,939 0.02%
58,003 UGI Corp 3,094,460 0.23%
49,861,802 3.67%
Total Common Stock 1,334,815,741 98.31%
Total Transferable Securities 1,334,815,741 98.31%
Currency Exchange Contracts – 0.05% (2017 – 0.03%)
Counterparty
Actual
Settle Date
Issue
Currency
Currency
Bought
Settle
Currency
Currency
Sold
Unrealised
Gain USD Citibank 15/01/2019 GBP 63,193,874 USD 80,134,246 614,444 0.05%
Unrealised Gain on Currency Exchange Contracts at 31 December 2018 614,444 0.05%
Value USD
Total Financial Derivative Instruments 614,444 0.05%
Financial Assets at Fair Value Through Profit or Loss
(Cost USD 1,376,374,234) (2017: USD 979,549,465) 1,335,430,185 98.36%
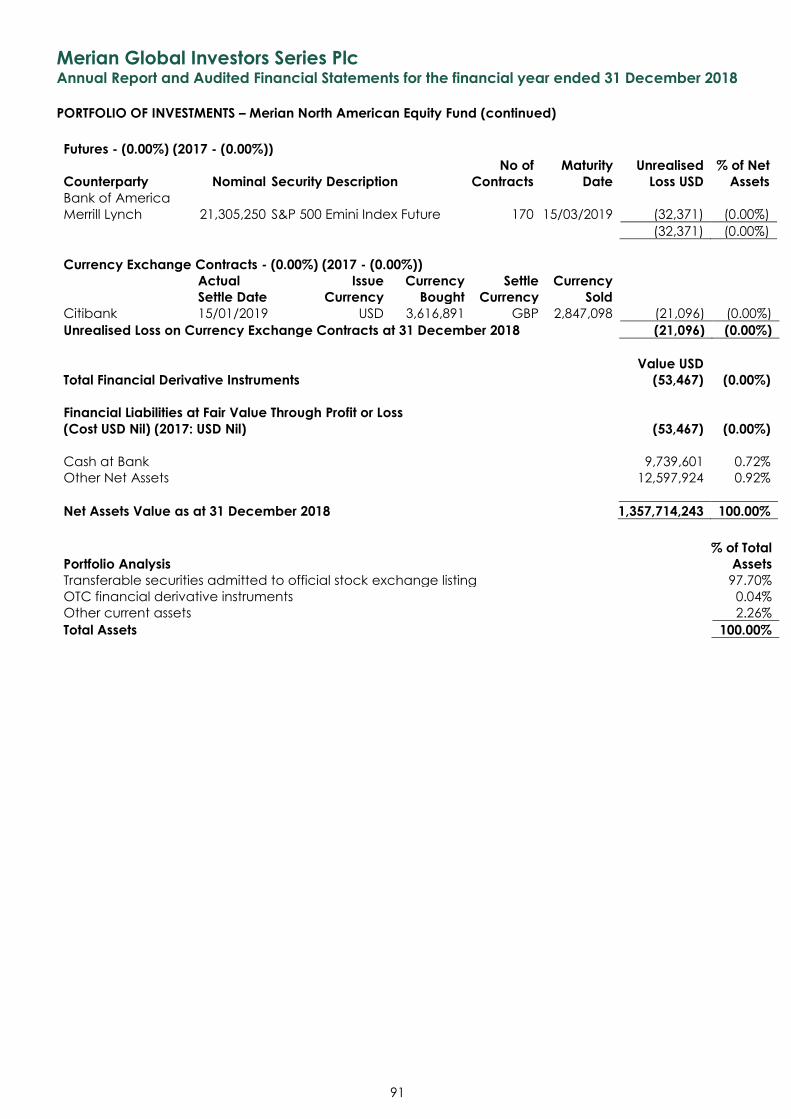
Merian Global Investors Series Plc Annual Report and Audited Financial Statements for the financial year ended 31 December 2018
PORTFOLIO OF INVESTMENTS – Merian North American Equity Fund (continued)
91
Futures - (0.00%) (2017 - (0.00%))
Counterparty Nominal Security Description
No of
Contracts
Maturity
Date
Unrealised
Loss USD
% of Net
Assets
Bank of America
Merrill Lynch 21,305,250 S&P 500 Emini Index Future 170 15/03/2019 (32,371) (0.00%)
(32,371) (0.00%)
Currency Exchange Contracts - (0.00%) (2017 - (0.00%))
Actual
Settle Date
Issue
Currency
Currency
Bought
Settle
Currency
Currency
Sold
Citibank 15/01/2019 USD 3,616,891 GBP 2,847,098 (21,096) (0.00%)
Unrealised Loss on Currency Exchange Contracts at 31 December 2018 (21,096) (0.00%)
Value USD
Total Financial Derivative Instruments (53,467) (0.00%)
Financial Liabilities at Fair Value Through Profit or Loss
(Cost USD Nil) (2017: USD Nil) (53,467) (0.00%)
Cash at Bank 9,739,601 0.72%
Other Net Assets 12,597,924 0.92%
Net Assets Value as at 31 December 2018 1,357,714,243 100.00%
Portfolio Analysis
% of Total
Assets
Transferable securities admitted to official stock exchange listing 97.70%
OTC financial derivative instruments 0.04%
Other current assets 2.26%
Total Assets 100.00%
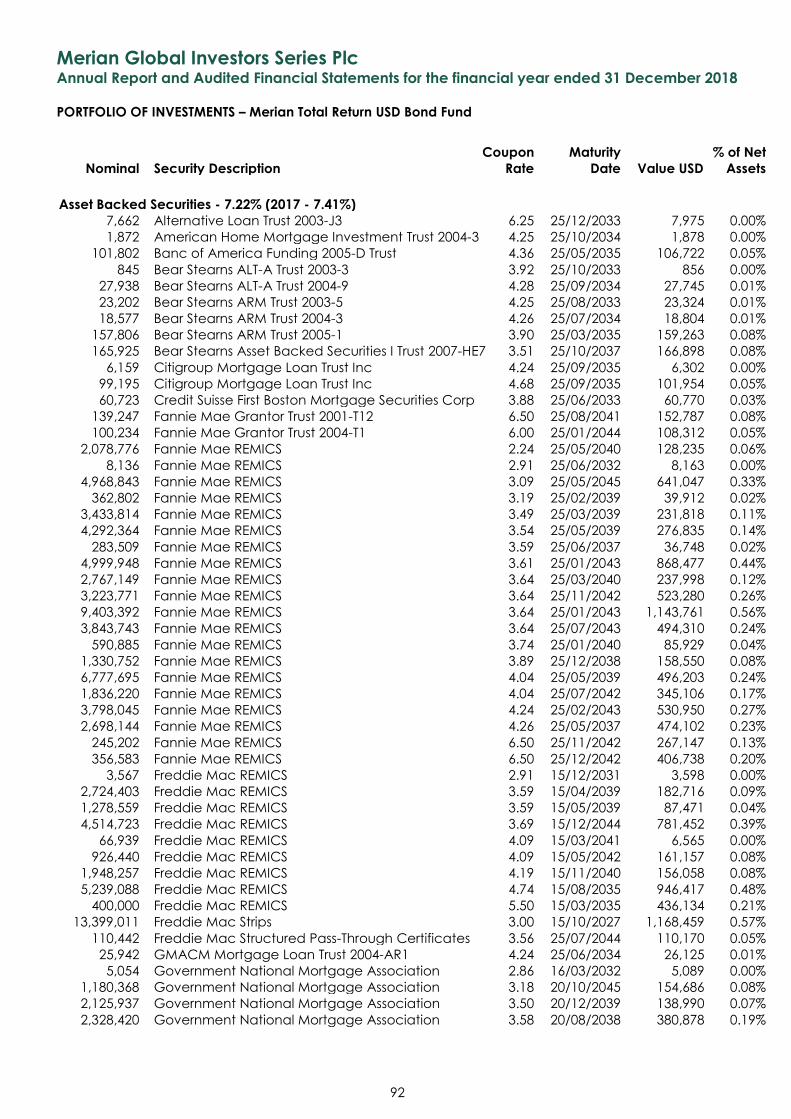
Merian Global Investors Series Plc Annual Report and Audited Financial Statements for the financial year ended 31 December 2018
PORTFOLIO OF INVESTMENTS – Merian Total Return USD Bond Fund
Nominal Security Description
Coupon
Rate
Maturity
Date Value USD
% of Net
Assets
92
Asset Backed Securities - 7.22% (2017 - 7.41%) 7,662 Alternative Loan Trust 2003-J3 6.25 25/12/2033 7,975 0.00%
1,872 American Home Mortgage Investment Trust 2004-3 4.25 25/10/2034 1,878 0.00%
101,802 Banc of America Funding 2005-D Trust 4.36 25/05/2035 106,722 0.05%
845 Bear Stearns ALT-A Trust 2003-3 3.92 25/10/2033 856 0.00%
27,938 Bear Stearns ALT-A Trust 2004-9 4.28 25/09/2034 27,745 0.01%
23,202 Bear Stearns ARM Trust 2003-5 4.25 25/08/2033 23,324 0.01%
18,577 Bear Stearns ARM Trust 2004-3 4.26 25/07/2034 18,804 0.01%
157,806 Bear Stearns ARM Trust 2005-1 3.90 25/03/2035 159,263 0.08%
165,925 Bear Stearns Asset Backed Securities I Trust 2007-HE7 3.51 25/10/2037 166,898 0.08%
6,159 Citigroup Mortgage Loan Trust Inc 4.24 25/09/2035 6,302 0.00%
99,195 Citigroup Mortgage Loan Trust Inc 4.68 25/09/2035 101,954 0.05%
60,723 Credit Suisse First Boston Mortgage Securities Corp 3.88 25/06/2033 60,770 0.03%
139,247 Fannie Mae Grantor Trust 2001-T12 6.50 25/08/2041 152,787 0.08%
100,234 Fannie Mae Grantor Trust 2004-T1 6.00 25/01/2044 108,312 0.05%
2,078,776 Fannie Mae REMICS 2.24 25/05/2040 128,235 0.06%
8,136 Fannie Mae REMICS 2.91 25/06/2032 8,163 0.00%
4,968,843 Fannie Mae REMICS 3.09 25/05/2045 641,047 0.33%
362,802 Fannie Mae REMICS 3.19 25/02/2039 39,912 0.02%
3,433,814 Fannie Mae REMICS 3.49 25/03/2039 231,818 0.11%
4,292,364 Fannie Mae REMICS 3.54 25/05/2039 276,835 0.14%
283,509 Fannie Mae REMICS 3.59 25/06/2037 36,748 0.02%
4,999,948 Fannie Mae REMICS 3.61 25/01/2043 868,477 0.44%
2,767,149 Fannie Mae REMICS 3.64 25/03/2040 237,998 0.12%
3,223,771 Fannie Mae REMICS 3.64 25/11/2042 523,280 0.26%
9,403,392 Fannie Mae REMICS 3.64 25/01/2043 1,143,761 0.56%
3,843,743 Fannie Mae REMICS 3.64 25/07/2043 494,310 0.24%
590,885 Fannie Mae REMICS 3.74 25/01/2040 85,929 0.04%
1,330,752 Fannie Mae REMICS 3.89 25/12/2038 158,550 0.08%
6,777,695 Fannie Mae REMICS 4.04 25/05/2039 496,203 0.24%
1,836,220 Fannie Mae REMICS 4.04 25/07/2042 345,106 0.17%
3,798,045 Fannie Mae REMICS 4.24 25/02/2043 530,950 0.27%
2,698,144 Fannie Mae REMICS 4.26 25/05/2037 474,102 0.23%
245,202 Fannie Mae REMICS 6.50 25/11/2042 267,147 0.13%
356,583 Fannie Mae REMICS 6.50 25/12/2042 406,738 0.20%
3,567 Freddie Mac REMICS 2.91 15/12/2031 3,598 0.00%
2,724,403 Freddie Mac REMICS 3.59 15/04/2039 182,716 0.09%
1,278,559 Freddie Mac REMICS 3.59 15/05/2039 87,471 0.04%
4,514,723 Freddie Mac REMICS 3.69 15/12/2044 781,452 0.39%
66,939 Freddie Mac REMICS 4.09 15/03/2041 6,565 0.00%
926,440 Freddie Mac REMICS 4.09 15/05/2042 161,157 0.08%
1,948,257 Freddie Mac REMICS 4.19 15/11/2040 156,058 0.08%
5,239,088 Freddie Mac REMICS 4.74 15/08/2035 946,417 0.48%
400,000 Freddie Mac REMICS 5.50 15/03/2035 436,134 0.21%
13,399,011 Freddie Mac Strips 3.00 15/10/2027 1,168,459 0.57%
110,442 Freddie Mac Structured Pass-Through Certificates 3.56 25/07/2044 110,170 0.05%
25,942 GMACM Mortgage Loan Trust 2004-AR1 4.24 25/06/2034 26,125 0.01%
5,054 Government National Mortgage Association 2.86 16/03/2032 5,089 0.00%
1,180,368 Government National Mortgage Association 3.18 20/10/2045 154,686 0.08%
2,125,937 Government National Mortgage Association 3.50 20/12/2039 138,990 0.07%
2,328,420 Government National Mortgage Association 3.58 20/08/2038 380,878 0.19%
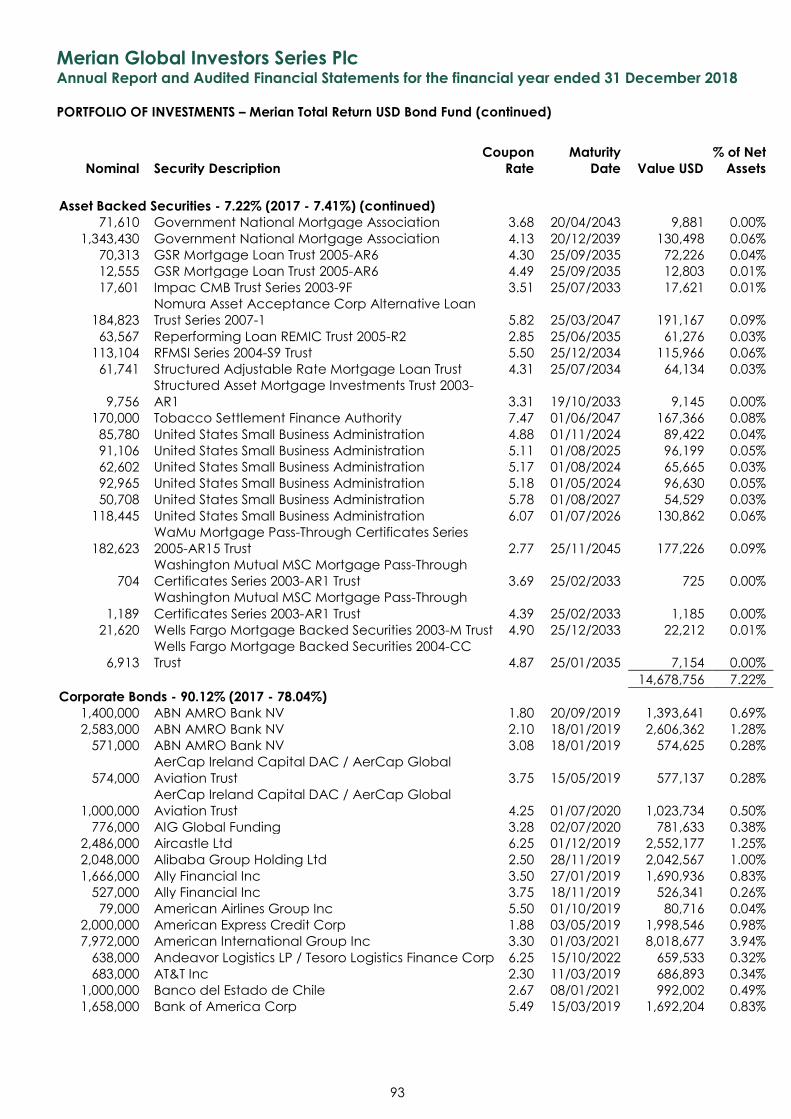
Merian Global Investors Series Plc Annual Report and Audited Financial Statements for the financial year ended 31 December 2018
PORTFOLIO OF INVESTMENTS – Merian Total Return USD Bond Fund (continued)
Nominal Security Description
Coupon
Rate
Maturity
Date Value USD
% of Net
Assets
93
Asset Backed Securities - 7.22% (2017 - 7.41%) (continued) 71,610 Government National Mortgage Association 3.68 20/04/2043 9,881 0.00%
1,343,430 Government National Mortgage Association 4.13 20/12/2039 130,498 0.06%
70,313 GSR Mortgage Loan Trust 2005-AR6 4.30 25/09/2035 72,226 0.04%
12,555 GSR Mortgage Loan Trust 2005-AR6 4.49 25/09/2035 12,803 0.01%
17,601 Impac CMB Trust Series 2003-9F 3.51 25/07/2033 17,621 0.01%
184,823
Nomura Asset Acceptance Corp Alternative Loan
Trust Series 2007-1 5.82 25/03/2047 191,167 0.09%
63,567 Reperforming Loan REMIC Trust 2005-R2 2.85 25/06/2035 61,276 0.03%
113,104 RFMSI Series 2004-S9 Trust 5.50 25/12/2034 115,966 0.06%
61,741 Structured Adjustable Rate Mortgage Loan Trust 4.31 25/07/2034 64,134 0.03%
9,756
Structured Asset Mortgage Investments Trust 2003-
AR1 3.31 19/10/2033 9,145 0.00%
170,000 Tobacco Settlement Finance Authority 7.47 01/06/2047 167,366 0.08%
85,780 United States Small Business Administration 4.88 01/11/2024 89,422 0.04%
91,106 United States Small Business Administration 5.11 01/08/2025 96,199 0.05%
62,602 United States Small Business Administration 5.17 01/08/2024 65,665 0.03%
92,965 United States Small Business Administration 5.18 01/05/2024 96,630 0.05%
50,708 United States Small Business Administration 5.78 01/08/2027 54,529 0.03%
118,445 United States Small Business Administration 6.07 01/07/2026 130,862 0.06%
182,623
WaMu Mortgage Pass-Through Certificates Series
2005-AR15 Trust 2.77 25/11/2045 177,226 0.09%
704
Washington Mutual MSC Mortgage Pass-Through
Certificates Series 2003-AR1 Trust 3.69 25/02/2033 725 0.00%
1,189
Washington Mutual MSC Mortgage Pass-Through
Certificates Series 2003-AR1 Trust 4.39 25/02/2033 1,185 0.00%
21,620 Wells Fargo Mortgage Backed Securities 2003-M Trust 4.90 25/12/2033 22,212 0.01%
6,913
Wells Fargo Mortgage Backed Securities 2004-CC
Trust 4.87 25/01/2035 7,154 0.00%
14,678,756 7.22%
Corporate Bonds - 90.12% (2017 - 78.04%) 1,400,000 ABN AMRO Bank NV 1.80 20/09/2019 1,393,641 0.69%
2,583,000 ABN AMRO Bank NV 2.10 18/01/2019 2,606,362 1.28%
571,000 ABN AMRO Bank NV 3.08 18/01/2019 574,625 0.28%
574,000
AerCap Ireland Capital DAC / AerCap Global
Aviation Trust 3.75 15/05/2019 577,137 0.28%
1,000,000
AerCap Ireland Capital DAC / AerCap Global
Aviation Trust 4.25 01/07/2020 1,023,734 0.50%
776,000 AIG Global Funding 3.28 02/07/2020 781,633 0.38%
2,486,000 Aircastle Ltd 6.25 01/12/2019 2,552,177 1.25%
2,048,000 Alibaba Group Holding Ltd 2.50 28/11/2019 2,042,567 1.00%
1,666,000 Ally Financial Inc 3.50 27/01/2019 1,690,936 0.83%
527,000 Ally Financial Inc 3.75 18/11/2019 526,341 0.26%
79,000 American Airlines Group Inc 5.50 01/10/2019 80,716 0.04%
2,000,000 American Express Credit Corp 1.88 03/05/2019 1,998,546 0.98%
7,972,000 American International Group Inc 3.30 01/03/2021 8,018,677 3.94%
638,000 Andeavor Logistics LP / Tesoro Logistics Finance Corp 6.25 15/10/2022 659,533 0.32%
683,000 AT&T Inc 2.30 11/03/2019 686,893 0.34%
1,000,000 Banco del Estado de Chile 2.67 08/01/2021 992,002 0.49%
1,658,000 Bank of America Corp 5.49 15/03/2019 1,692,204 0.83%
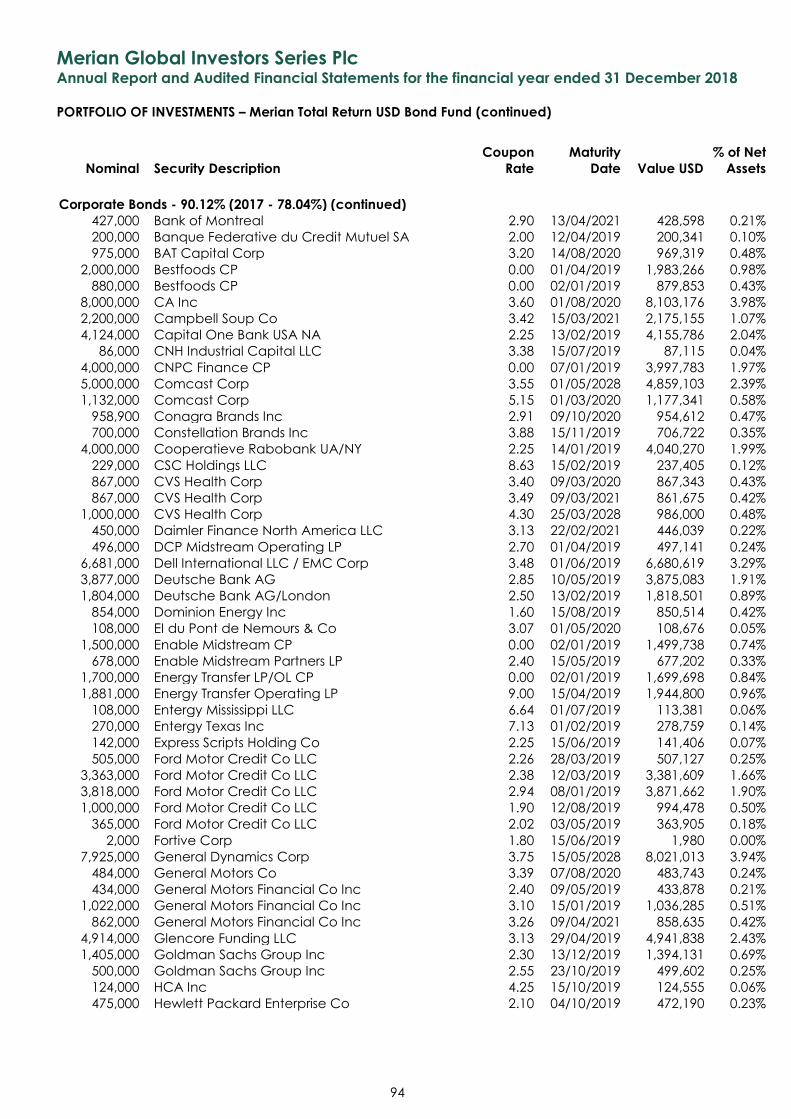
Merian Global Investors Series Plc Annual Report and Audited Financial Statements for the financial year ended 31 December 2018
PORTFOLIO OF INVESTMENTS – Merian Total Return USD Bond Fund (continued)
Nominal Security Description
Coupon
Rate
Maturity
Date Value USD
% of Net
Assets
94
Corporate Bonds - 90.12% (2017 - 78.04%) (continued) 427,000 Bank of Montreal 2.90 13/04/2021 428,598 0.21%
200,000 Banque Federative du Credit Mutuel SA 2.00 12/04/2019 200,341 0.10%
975,000 BAT Capital Corp 3.20 14/08/2020 969,319 0.48%
2,000,000 Bestfoods CP 0.00 01/04/2019 1,983,266 0.98%
880,000 Bestfoods CP 0.00 02/01/2019 879,853 0.43%
8,000,000 CA Inc 3.60 01/08/2020 8,103,176 3.98%
2,200,000 Campbell Soup Co 3.42 15/03/2021 2,175,155 1.07%
4,124,000 Capital One Bank USA NA 2.25 13/02/2019 4,155,786 2.04%
86,000 CNH Industrial Capital LLC 3.38 15/07/2019 87,115 0.04%
4,000,000 CNPC Finance CP 0.00 07/01/2019 3,997,783 1.97%
5,000,000 Comcast Corp 3.55 01/05/2028 4,859,103 2.39%
1,132,000 Comcast Corp 5.15 01/03/2020 1,177,341 0.58%
958,900 Conagra Brands Inc 2.91 09/10/2020 954,612 0.47%
700,000 Constellation Brands Inc 3.88 15/11/2019 706,722 0.35%
4,000,000 Cooperatieve Rabobank UA/NY 2.25 14/01/2019 4,040,270 1.99%
229,000 CSC Holdings LLC 8.63 15/02/2019 237,405 0.12%
867,000 CVS Health Corp 3.40 09/03/2020 867,343 0.43%
867,000 CVS Health Corp 3.49 09/03/2021 861,675 0.42%
1,000,000 CVS Health Corp 4.30 25/03/2028 986,000 0.48%
450,000 Daimler Finance North America LLC 3.13 22/02/2021 446,039 0.22%
496,000 DCP Midstream Operating LP 2.70 01/04/2019 497,141 0.24%
6,681,000 Dell International LLC / EMC Corp 3.48 01/06/2019 6,680,619 3.29%
3,877,000 Deutsche Bank AG 2.85 10/05/2019 3,875,083 1.91%
1,804,000 Deutsche Bank AG/London 2.50 13/02/2019 1,818,501 0.89%
854,000 Dominion Energy Inc 1.60 15/08/2019 850,514 0.42%
108,000 EI du Pont de Nemours & Co 3.07 01/05/2020 108,676 0.05%
1,500,000 Enable Midstream CP 0.00 02/01/2019 1,499,738 0.74%
678,000 Enable Midstream Partners LP 2.40 15/05/2019 677,202 0.33%
1,700,000 Energy Transfer LP/OL CP 0.00 02/01/2019 1,699,698 0.84%
1,881,000 Energy Transfer Operating LP 9.00 15/04/2019 1,944,800 0.96%
108,000 Entergy Mississippi LLC 6.64 01/07/2019 113,381 0.06%
270,000 Entergy Texas Inc 7.13 01/02/2019 278,759 0.14%
142,000 Express Scripts Holding Co 2.25 15/06/2019 141,406 0.07%
505,000 Ford Motor Credit Co LLC 2.26 28/03/2019 507,127 0.25%
3,363,000 Ford Motor Credit Co LLC 2.38 12/03/2019 3,381,609 1.66%
3,818,000 Ford Motor Credit Co LLC 2.94 08/01/2019 3,871,662 1.90%
1,000,000 Ford Motor Credit Co LLC 1.90 12/08/2019 994,478 0.50%
365,000 Ford Motor Credit Co LLC 2.02 03/05/2019 363,905 0.18%
2,000 Fortive Corp 1.80 15/06/2019 1,980 0.00%
7,925,000 General Dynamics Corp 3.75 15/05/2028 8,021,013 3.94%
484,000 General Motors Co 3.39 07/08/2020 483,743 0.24%
434,000 General Motors Financial Co Inc 2.40 09/05/2019 433,878 0.21%
1,022,000 General Motors Financial Co Inc 3.10 15/01/2019 1,036,285 0.51%
862,000 General Motors Financial Co Inc 3.26 09/04/2021 858,635 0.42%
4,914,000 Glencore Funding LLC 3.13 29/04/2019 4,941,838 2.43%
1,405,000 Goldman Sachs Group Inc 2.30 13/12/2019 1,394,131 0.69%
500,000 Goldman Sachs Group Inc 2.55 23/10/2019 499,602 0.25%
124,000 HCA Inc 4.25 15/10/2019 124,555 0.06%
475,000 Hewlett Packard Enterprise Co 2.10 04/10/2019 472,190 0.23%
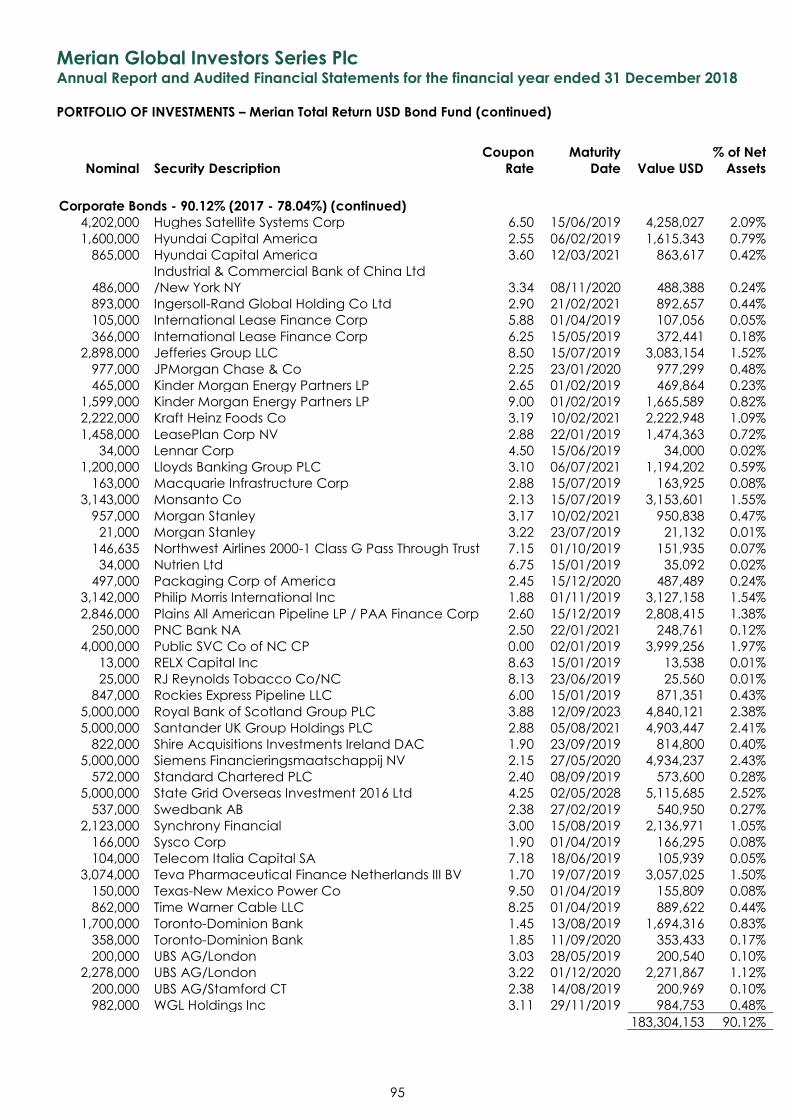
Merian Global Investors Series Plc Annual Report and Audited Financial Statements for the financial year ended 31 December 2018
PORTFOLIO OF INVESTMENTS – Merian Total Return USD Bond Fund (continued)
Nominal Security Description
Coupon
Rate
Maturity
Date Value USD
% of Net
Assets
95
Corporate Bonds - 90.12% (2017 - 78.04%) (continued) 4,202,000 Hughes Satellite Systems Corp 6.50 15/06/2019 4,258,027 2.09%
1,600,000 Hyundai Capital America 2.55 06/02/2019 1,615,343 0.79%
865,000 Hyundai Capital America 3.60 12/03/2021 863,617 0.42%
486,000
Industrial & Commercial Bank of China Ltd
/New York NY 3.34 08/11/2020 488,388 0.24%
893,000 Ingersoll-Rand Global Holding Co Ltd 2.90 21/02/2021 892,657 0.44%
105,000 International Lease Finance Corp 5.88 01/04/2019 107,056 0.05%
366,000 International Lease Finance Corp 6.25 15/05/2019 372,441 0.18%
2,898,000 Jefferies Group LLC 8.50 15/07/2019 3,083,154 1.52%
977,000 JPMorgan Chase & Co 2.25 23/01/2020 977,299 0.48%
465,000 Kinder Morgan Energy Partners LP 2.65 01/02/2019 469,864 0.23%
1,599,000 Kinder Morgan Energy Partners LP 9.00 01/02/2019 1,665,589 0.82%
2,222,000 Kraft Heinz Foods Co 3.19 10/02/2021 2,222,948 1.09%
1,458,000 LeasePlan Corp NV 2.88 22/01/2019 1,474,363 0.72%
34,000 Lennar Corp 4.50 15/06/2019 34,000 0.02%
1,200,000 Lloyds Banking Group PLC 3.10 06/07/2021 1,194,202 0.59%
163,000 Macquarie Infrastructure Corp 2.88 15/07/2019 163,925 0.08%
3,143,000 Monsanto Co 2.13 15/07/2019 3,153,601 1.55%
957,000 Morgan Stanley 3.17 10/02/2021 950,838 0.47%
21,000 Morgan Stanley 3.22 23/07/2019 21,132 0.01%
146,635 Northwest Airlines 2000-1 Class G Pass Through Trust 7.15 01/10/2019 151,935 0.07%
34,000 Nutrien Ltd 6.75 15/01/2019 35,092 0.02%
497,000 Packaging Corp of America 2.45 15/12/2020 487,489 0.24%
3,142,000 Philip Morris International Inc 1.88 01/11/2019 3,127,158 1.54%
2,846,000 Plains All American Pipeline LP / PAA Finance Corp 2.60 15/12/2019 2,808,415 1.38%
250,000 PNC Bank NA 2.50 22/01/2021 248,761 0.12%
4,000,000 Public SVC Co of NC CP 0.00 02/01/2019 3,999,256 1.97%
13,000 RELX Capital Inc 8.63 15/01/2019 13,538 0.01%
25,000 RJ Reynolds Tobacco Co/NC 8.13 23/06/2019 25,560 0.01%
847,000 Rockies Express Pipeline LLC 6.00 15/01/2019 871,351 0.43%
5,000,000 Royal Bank of Scotland Group PLC 3.88 12/09/2023 4,840,121 2.38%
5,000,000 Santander UK Group Holdings PLC 2.88 05/08/2021 4,903,447 2.41%
822,000 Shire Acquisitions Investments Ireland DAC 1.90 23/09/2019 814,800 0.40%
5,000,000 Siemens Financieringsmaatschappij NV 2.15 27/05/2020 4,934,237 2.43%
572,000 Standard Chartered PLC 2.40 08/09/2019 573,600 0.28%
5,000,000 State Grid Overseas Investment 2016 Ltd 4.25 02/05/2028 5,115,685 2.52%
537,000 Swedbank AB 2.38 27/02/2019 540,950 0.27%
2,123,000 Synchrony Financial 3.00 15/08/2019 2,136,971 1.05%
166,000 Sysco Corp 1.90 01/04/2019 166,295 0.08%
104,000 Telecom Italia Capital SA 7.18 18/06/2019 105,939 0.05%
3,074,000 Teva Pharmaceutical Finance Netherlands III BV 1.70 19/07/2019 3,057,025 1.50%
150,000 Texas-New Mexico Power Co 9.50 01/04/2019 155,809 0.08%
862,000 Time Warner Cable LLC 8.25 01/04/2019 889,622 0.44%
1,700,000 Toronto-Dominion Bank 1.45 13/08/2019 1,694,316 0.83%
358,000 Toronto-Dominion Bank 1.85 11/09/2020 353,433 0.17%
200,000 UBS AG/London 3.03 28/05/2019 200,540 0.10%
2,278,000 UBS AG/London 3.22 01/12/2020 2,271,867 1.12%
200,000 UBS AG/Stamford CT 2.38 14/08/2019 200,969 0.10%
982,000 WGL Holdings Inc 3.11 29/11/2019 984,753 0.48%
183,304,153 90.12%
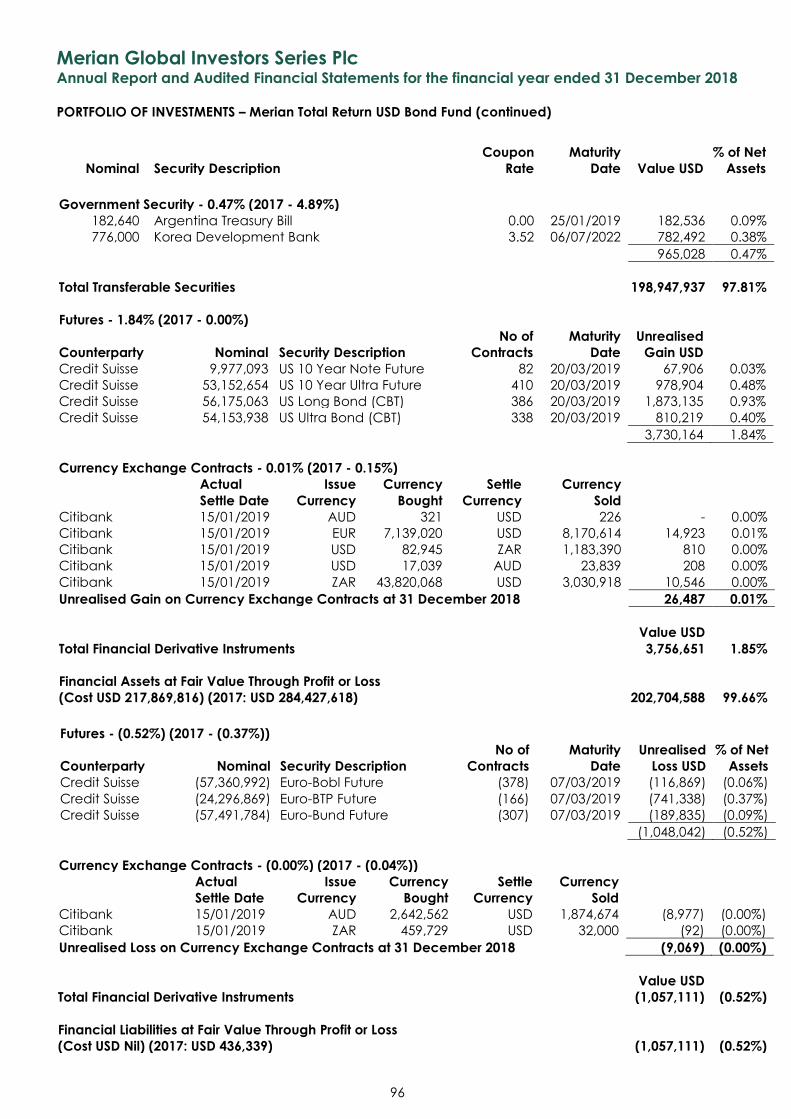
Merian Global Investors Series Plc Annual Report and Audited Financial Statements for the financial year ended 31 December 2018
PORTFOLIO OF INVESTMENTS – Merian Total Return USD Bond Fund (continued)
Nominal Security Description
Coupon
Rate
Maturity
Date Value USD
% of Net
Assets
96
Government Security - 0.47% (2017 - 4.89%) 182,640 Argentina Treasury Bill 0.00 25/01/2019 182,536 0.09%
776,000 Korea Development Bank 3.52 06/07/2022 782,492 0.38%
965,028 0.47%
Total Transferable Securities 198,947,937 97.81%
Futures - 1.84% (2017 - 0.00%)
Counterparty Nominal Security Description
No of
Contracts
Maturity
Date
Unrealised
Gain USD
Credit Suisse 9,977,093 US 10 Year Note Future 82 20/03/2019 67,906 0.03%
Credit Suisse 53,152,654 US 10 Year Ultra Future 410 20/03/2019 978,904 0.48%
Credit Suisse 56,175,063 US Long Bond (CBT) 386 20/03/2019 1,873,135 0.93%
Credit Suisse 54,153,938 US Ultra Bond (CBT) 338 20/03/2019 810,219 0.40%
3,730,164 1.84%
Currency Exchange Contracts - 0.01% (2017 - 0.15%)
Actual
Settle Date
Issue
Currency
Currency
Bought
Settle
Currency
Currency
Sold Citibank 15/01/2019 AUD 321 USD 226 - 0.00%
Citibank 15/01/2019 EUR 7,139,020 USD 8,170,614 14,923 0.01%
Citibank 15/01/2019 USD 82,945 ZAR 1,183,390 810 0.00%
Citibank 15/01/2019 USD 17,039 AUD 23,839 208 0.00%
Citibank 15/01/2019 ZAR 43,820,068 USD 3,030,918 10,546 0.00%
Unrealised Gain on Currency Exchange Contracts at 31 December 2018 26,487 0.01%
Value USD
Total Financial Derivative Instruments 3,756,651 1.85%
Financial Assets at Fair Value Through Profit or Loss
(Cost USD 217,869,816) (2017: USD 284,427,618) 202,704,588 99.66%
Futures - (0.52%) (2017 - (0.37%))
Counterparty Nominal Security Description
No of
Contracts
Maturity
Date
Unrealised
Loss USD
% of Net
Assets
Credit Suisse (57,360,992) Euro-Bobl Future (378) 07/03/2019 (116,869) (0.06%)
Credit Suisse (24,296,869) Euro-BTP Future (166) 07/03/2019 (741,338) (0.37%)
Credit Suisse (57,491,784) Euro-Bund Future (307) 07/03/2019 (189,835) (0.09%)
(1,048,042) (0.52%)
Currency Exchange Contracts - (0.00%) (2017 - (0.04%))
Actual
Settle Date
Issue
Currency
Currency
Bought
Settle
Currency
Currency
Sold
Citibank 15/01/2019 AUD 2,642,562 USD 1,874,674 (8,977) (0.00%)
Citibank 15/01/2019 ZAR 459,729 USD 32,000 (92) (0.00%)
Unrealised Loss on Currency Exchange Contracts at 31 December 2018 (9,069) (0.00%)
Value USD
Total Financial Derivative Instruments (1,057,111) (0.52%)
Financial Liabilities at Fair Value Through Profit or Loss
(Cost USD Nil) (2017: USD 436,339) (1,057,111) (0.52%)
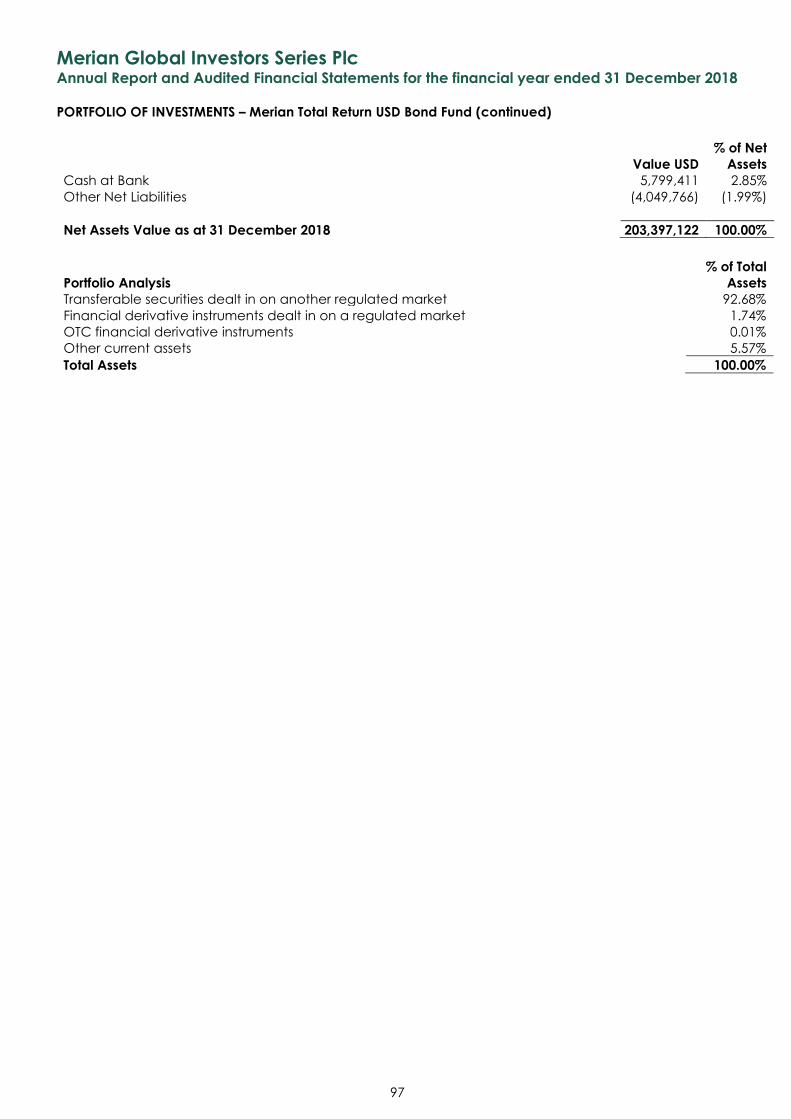
Merian Global Investors Series Plc Annual Report and Audited Financial Statements for the financial year ended 31 December 2018
PORTFOLIO OF INVESTMENTS – Merian Total Return USD Bond Fund (continued)
97
Value USD
% of Net
Assets
Cash at Bank 5,799,411 2.85%
Other Net Liabilities (4,049,766) (1.99%)
Net Assets Value as at 31 December 2018 203,397,122 100.00%
Portfolio Analysis
% of Total
Assets
Transferable securities dealt in on another regulated market 92.68%
Financial derivative instruments dealt in on a regulated market 1.74%
OTC financial derivative instruments 0.01%
Other current assets 5.57%
Total Assets 100.00%
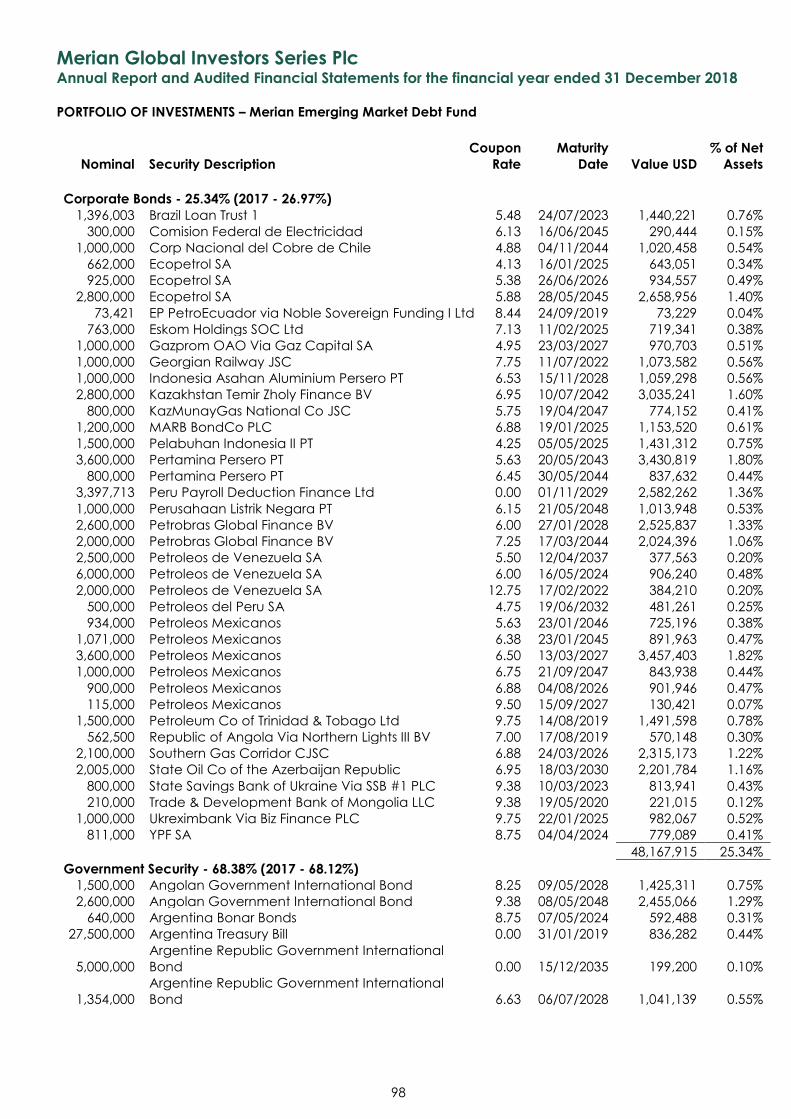
Merian Global Investors Series Plc Annual Report and Audited Financial Statements for the financial year ended 31 December 2018
PORTFOLIO OF INVESTMENTS – Merian Emerging Market Debt Fund
Nominal Security Description
Coupon
Rate
Maturity
Date Value USD
% of Net
Assets
98
Corporate Bonds - 25.34% (2017 - 26.97%) 1,396,003 Brazil Loan Trust 1 5.48 24/07/2023 1,440,221 0.76%
300,000 Comision Federal de Electricidad 6.13 16/06/2045 290,444 0.15%
1,000,000 Corp Nacional del Cobre de Chile 4.88 04/11/2044 1,020,458 0.54%
662,000 Ecopetrol SA 4.13 16/01/2025 643,051 0.34%
925,000 Ecopetrol SA 5.38 26/06/2026 934,557 0.49%
2,800,000 Ecopetrol SA 5.88 28/05/2045 2,658,956 1.40%
73,421 EP PetroEcuador via Noble Sovereign Funding I Ltd 8.44 24/09/2019 73,229 0.04%
763,000 Eskom Holdings SOC Ltd 7.13 11/02/2025 719,341 0.38%
1,000,000 Gazprom OAO Via Gaz Capital SA 4.95 23/03/2027 970,703 0.51%
1,000,000 Georgian Railway JSC 7.75 11/07/2022 1,073,582 0.56%
1,000,000 Indonesia Asahan Aluminium Persero PT 6.53 15/11/2028 1,059,298 0.56%
2,800,000 Kazakhstan Temir Zholy Finance BV 6.95 10/07/2042 3,035,241 1.60%
800,000 KazMunayGas National Co JSC 5.75 19/04/2047 774,152 0.41%
1,200,000 MARB BondCo PLC 6.88 19/01/2025 1,153,520 0.61%
1,500,000 Pelabuhan Indonesia II PT 4.25 05/05/2025 1,431,312 0.75%
3,600,000 Pertamina Persero PT 5.63 20/05/2043 3,430,819 1.80%
800,000 Pertamina Persero PT 6.45 30/05/2044 837,632 0.44%
3,397,713 Peru Payroll Deduction Finance Ltd 0.00 01/11/2029 2,582,262 1.36%
1,000,000 Perusahaan Listrik Negara PT 6.15 21/05/2048 1,013,948 0.53%
2,600,000 Petrobras Global Finance BV 6.00 27/01/2028 2,525,837 1.33%
2,000,000 Petrobras Global Finance BV 7.25 17/03/2044 2,024,396 1.06%
2,500,000 Petroleos de Venezuela SA 5.50 12/04/2037 377,563 0.20%
6,000,000 Petroleos de Venezuela SA 6.00 16/05/2024 906,240 0.48%
2,000,000 Petroleos de Venezuela SA 12.75 17/02/2022 384,210 0.20%
500,000 Petroleos del Peru SA 4.75 19/06/2032 481,261 0.25%
934,000 Petroleos Mexicanos 5.63 23/01/2046 725,196 0.38%
1,071,000 Petroleos Mexicanos 6.38 23/01/2045 891,963 0.47%
3,600,000 Petroleos Mexicanos 6.50 13/03/2027 3,457,403 1.82%
1,000,000 Petroleos Mexicanos 6.75 21/09/2047 843,938 0.44%
900,000 Petroleos Mexicanos 6.88 04/08/2026 901,946 0.47%
115,000 Petroleos Mexicanos 9.50 15/09/2027 130,421 0.07%
1,500,000 Petroleum Co of Trinidad & Tobago Ltd 9.75 14/08/2019 1,491,598 0.78%
562,500 Republic of Angola Via Northern Lights III BV 7.00 17/08/2019 570,148 0.30%
2,100,000 Southern Gas Corridor CJSC 6.88 24/03/2026 2,315,173 1.22%
2,005,000 State Oil Co of the Azerbaijan Republic 6.95 18/03/2030 2,201,784 1.16%
800,000 State Savings Bank of Ukraine Via SSB #1 PLC 9.38 10/03/2023 813,941 0.43%
210,000 Trade & Development Bank of Mongolia LLC 9.38 19/05/2020 221,015 0.12%
1,000,000 Ukreximbank Via Biz Finance PLC 9.75 22/01/2025 982,067 0.52%
811,000 YPF SA 8.75 04/04/2024 779,089 0.41%
48,167,915 25.34%
Government Security - 68.38% (2017 - 68.12%) 1,500,000 Angolan Government International Bond 8.25 09/05/2028 1,425,311 0.75%
2,600,000 Angolan Government International Bond 9.38 08/05/2048 2,455,066 1.29%
640,000 Argentina Bonar Bonds 8.75 07/05/2024 592,488 0.31%
27,500,000 Argentina Treasury Bill 0.00 31/01/2019 836,282 0.44%
5,000,000
Argentine Republic Government International
Bond 0.00 15/12/2035 199,200 0.10%
1,354,000
Argentine Republic Government International
Bond 6.63 06/07/2028 1,041,139 0.55%
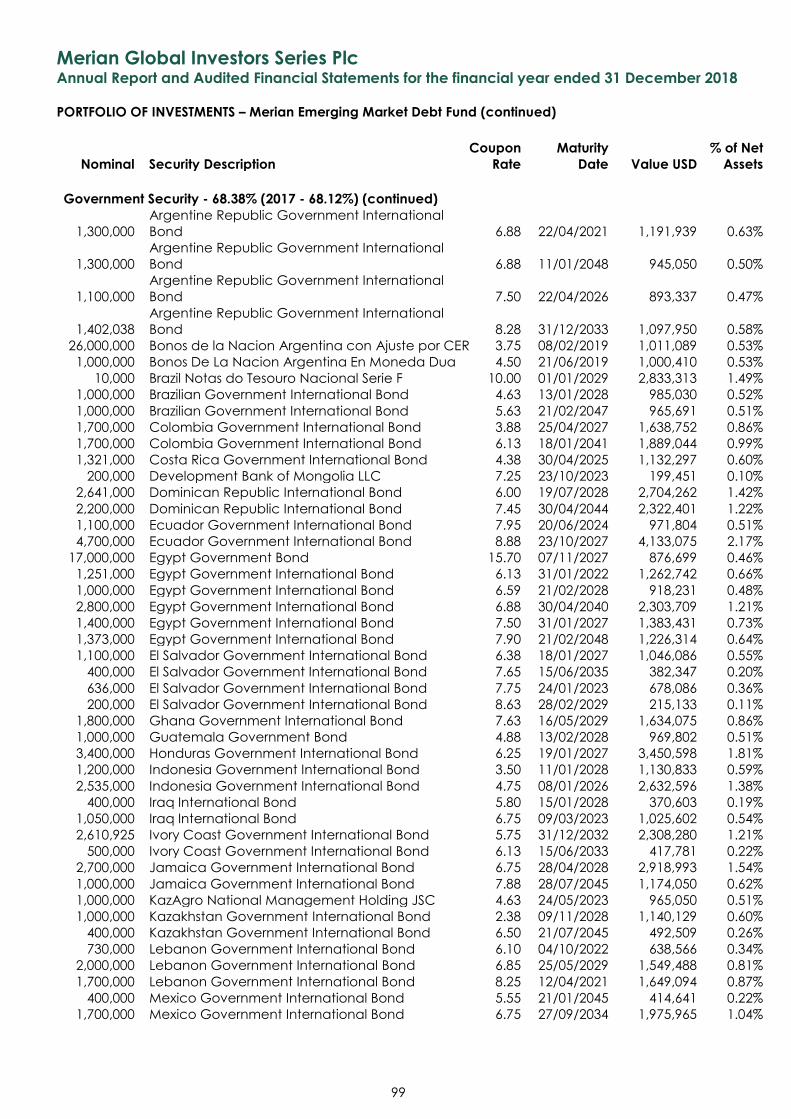
Merian Global Investors Series Plc Annual Report and Audited Financial Statements for the financial year ended 31 December 2018
PORTFOLIO OF INVESTMENTS – Merian Emerging Market Debt Fund (continued)
Nominal Security Description
Coupon
Rate
Maturity
Date Value USD
% of Net
Assets
99
Government Security - 68.38% (2017 - 68.12%) (continued)
1,300,000
Argentine Republic Government International
Bond 6.88 22/04/2021 1,191,939 0.63%
1,300,000
Argentine Republic Government International
Bond 6.88 11/01/2048 945,050 0.50%
1,100,000
Argentine Republic Government International
Bond 7.50 22/04/2026 893,337 0.47%
1,402,038
Argentine Republic Government International
Bond 8.28 31/12/2033 1,097,950 0.58%
26,000,000 Bonos de la Nacion Argentina con Ajuste por CER 3.75 08/02/2019 1,011,089 0.53%
1,000,000 Bonos De La Nacion Argentina En Moneda Dua 4.50 21/06/2019 1,000,410 0.53%
10,000 Brazil Notas do Tesouro Nacional Serie F 10.00 01/01/2029 2,833,313 1.49%
1,000,000 Brazilian Government International Bond 4.63 13/01/2028 985,030 0.52%
1,000,000 Brazilian Government International Bond 5.63 21/02/2047 965,691 0.51%
1,700,000 Colombia Government International Bond 3.88 25/04/2027 1,638,752 0.86%
1,700,000 Colombia Government International Bond 6.13 18/01/2041 1,889,044 0.99%
1,321,000 Costa Rica Government International Bond 4.38 30/04/2025 1,132,297 0.60%
200,000 Development Bank of Mongolia LLC 7.25 23/10/2023 199,451 0.10%
2,641,000 Dominican Republic International Bond 6.00 19/07/2028 2,704,262 1.42%
2,200,000 Dominican Republic International Bond 7.45 30/04/2044 2,322,401 1.22%
1,100,000 Ecuador Government International Bond 7.95 20/06/2024 971,804 0.51%
4,700,000 Ecuador Government International Bond 8.88 23/10/2027 4,133,075 2.17%
17,000,000 Egypt Government Bond 15.70 07/11/2027 876,699 0.46%
1,251,000 Egypt Government International Bond 6.13 31/01/2022 1,262,742 0.66%
1,000,000 Egypt Government International Bond 6.59 21/02/2028 918,231 0.48%
2,800,000 Egypt Government International Bond 6.88 30/04/2040 2,303,709 1.21%
1,400,000 Egypt Government International Bond 7.50 31/01/2027 1,383,431 0.73%
1,373,000 Egypt Government International Bond 7.90 21/02/2048 1,226,314 0.64%
1,100,000 El Salvador Government International Bond 6.38 18/01/2027 1,046,086 0.55%
400,000 El Salvador Government International Bond 7.65 15/06/2035 382,347 0.20%
636,000 El Salvador Government International Bond 7.75 24/01/2023 678,086 0.36%
200,000 El Salvador Government International Bond 8.63 28/02/2029 215,133 0.11%
1,800,000 Ghana Government International Bond 7.63 16/05/2029 1,634,075 0.86%
1,000,000 Guatemala Government Bond 4.88 13/02/2028 969,802 0.51%
3,400,000 Honduras Government International Bond 6.25 19/01/2027 3,450,598 1.81%
1,200,000 Indonesia Government International Bond 3.50 11/01/2028 1,130,833 0.59%
2,535,000 Indonesia Government International Bond 4.75 08/01/2026 2,632,596 1.38%
400,000 Iraq International Bond 5.80 15/01/2028 370,603 0.19%
1,050,000 Iraq International Bond 6.75 09/03/2023 1,025,602 0.54%
2,610,925 Ivory Coast Government International Bond 5.75 31/12/2032 2,308,280 1.21%
500,000 Ivory Coast Government International Bond 6.13 15/06/2033 417,781 0.22%
2,700,000 Jamaica Government International Bond 6.75 28/04/2028 2,918,993 1.54%
1,000,000 Jamaica Government International Bond 7.88 28/07/2045 1,174,050 0.62%
1,000,000 KazAgro National Management Holding JSC 4.63 24/05/2023 965,050 0.51%
1,000,000 Kazakhstan Government International Bond 2.38 09/11/2028 1,140,129 0.60%
400,000 Kazakhstan Government International Bond 6.50 21/07/2045 492,509 0.26%
730,000 Lebanon Government International Bond 6.10 04/10/2022 638,566 0.34%
2,000,000 Lebanon Government International Bond 6.85 25/05/2029 1,549,488 0.81%
1,700,000 Lebanon Government International Bond 8.25 12/04/2021 1,649,094 0.87%
400,000 Mexico Government International Bond 5.55 21/01/2045 414,641 0.22%
1,700,000 Mexico Government International Bond 6.75 27/09/2034 1,975,965 1.04%
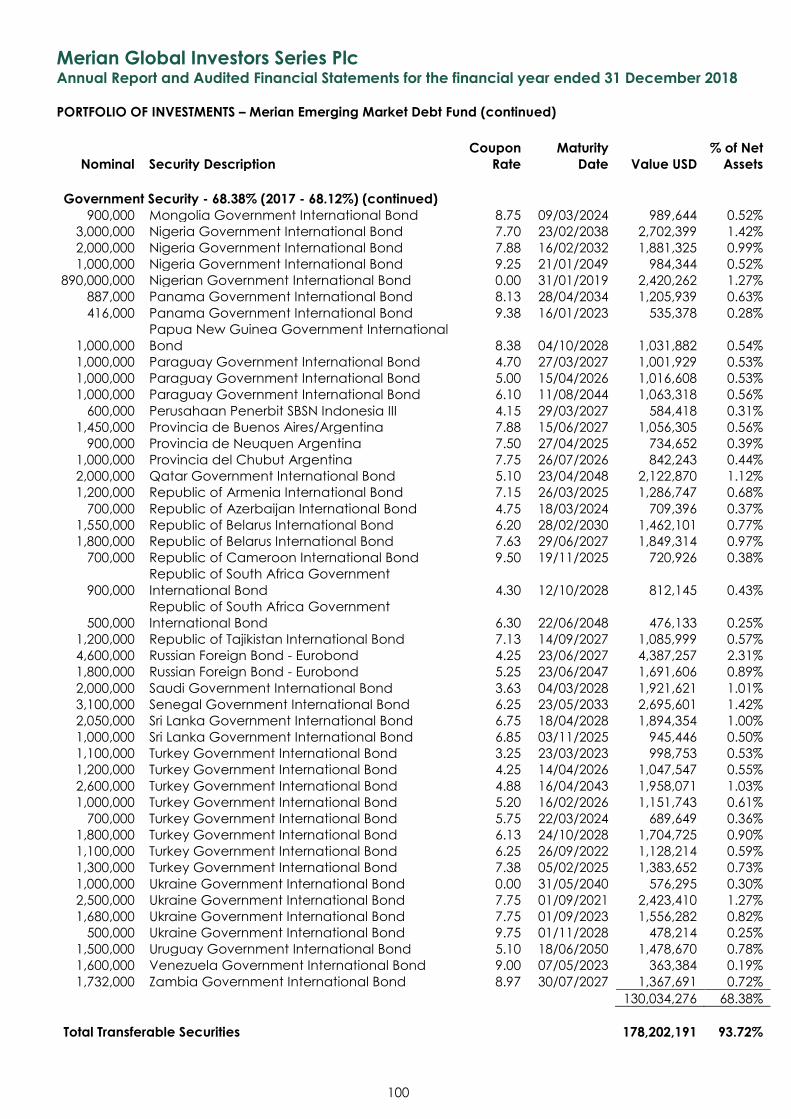
Merian Global Investors Series Plc Annual Report and Audited Financial Statements for the financial year ended 31 December 2018
PORTFOLIO OF INVESTMENTS – Merian Emerging Market Debt Fund (continued)
Nominal Security Description
Coupon
Rate
Maturity
Date Value USD
% of Net
Assets
100
Government Security - 68.38% (2017 - 68.12%) (continued) 900,000 Mongolia Government International Bond 8.75 09/03/2024 989,644 0.52%
3,000,000 Nigeria Government International Bond 7.70 23/02/2038 2,702,399 1.42%
2,000,000 Nigeria Government International Bond 7.88 16/02/2032 1,881,325 0.99%
1,000,000 Nigeria Government International Bond 9.25 21/01/2049 984,344 0.52%
890,000,000 Nigerian Government International Bond 0.00 31/01/2019 2,420,262 1.27%
887,000 Panama Government International Bond 8.13 28/04/2034 1,205,939 0.63%
416,000 Panama Government International Bond 9.38 16/01/2023 535,378 0.28%
1,000,000
Papua New Guinea Government International
Bond 8.38 04/10/2028 1,031,882 0.54%
1,000,000 Paraguay Government International Bond 4.70 27/03/2027 1,001,929 0.53%
1,000,000 Paraguay Government International Bond 5.00 15/04/2026 1,016,608 0.53%
1,000,000 Paraguay Government International Bond 6.10 11/08/2044 1,063,318 0.56%
600,000 Perusahaan Penerbit SBSN Indonesia III 4.15 29/03/2027 584,418 0.31%
1,450,000 Provincia de Buenos Aires/Argentina 7.88 15/06/2027 1,056,305 0.56%
900,000 Provincia de Neuquen Argentina 7.50 27/04/2025 734,652 0.39%
1,000,000 Provincia del Chubut Argentina 7.75 26/07/2026 842,243 0.44%
2,000,000 Qatar Government International Bond 5.10 23/04/2048 2,122,870 1.12%
1,200,000 Republic of Armenia International Bond 7.15 26/03/2025 1,286,747 0.68%
700,000 Republic of Azerbaijan International Bond 4.75 18/03/2024 709,396 0.37%
1,550,000 Republic of Belarus International Bond 6.20 28/02/2030 1,462,101 0.77%
1,800,000 Republic of Belarus International Bond 7.63 29/06/2027 1,849,314 0.97%
700,000 Republic of Cameroon International Bond 9.50 19/11/2025 720,926 0.38%
900,000
Republic of South Africa Government
International Bond 4.30 12/10/2028 812,145 0.43%
500,000
Republic of South Africa Government
International Bond 6.30 22/06/2048 476,133 0.25%
1,200,000 Republic of Tajikistan International Bond 7.13 14/09/2027 1,085,999 0.57%
4,600,000 Russian Foreign Bond - Eurobond 4.25 23/06/2027 4,387,257 2.31%
1,800,000 Russian Foreign Bond - Eurobond 5.25 23/06/2047 1,691,606 0.89%
2,000,000 Saudi Government International Bond 3.63 04/03/2028 1,921,621 1.01%
3,100,000 Senegal Government International Bond 6.25 23/05/2033 2,695,601 1.42%
2,050,000 Sri Lanka Government International Bond 6.75 18/04/2028 1,894,354 1.00%
1,000,000 Sri Lanka Government International Bond 6.85 03/11/2025 945,446 0.50%
1,100,000 Turkey Government International Bond 3.25 23/03/2023 998,753 0.53%
1,200,000 Turkey Government International Bond 4.25 14/04/2026 1,047,547 0.55%
2,600,000 Turkey Government International Bond 4.88 16/04/2043 1,958,071 1.03%
1,000,000 Turkey Government International Bond 5.20 16/02/2026 1,151,743 0.61%
700,000 Turkey Government International Bond 5.75 22/03/2024 689,649 0.36%
1,800,000 Turkey Government International Bond 6.13 24/10/2028 1,704,725 0.90%
1,100,000 Turkey Government International Bond 6.25 26/09/2022 1,128,214 0.59%
1,300,000 Turkey Government International Bond 7.38 05/02/2025 1,383,652 0.73%
1,000,000 Ukraine Government International Bond 0.00 31/05/2040 576,295 0.30%
2,500,000 Ukraine Government International Bond 7.75 01/09/2021 2,423,410 1.27%
1,680,000 Ukraine Government International Bond 7.75 01/09/2023 1,556,282 0.82%
500,000 Ukraine Government International Bond 9.75 01/11/2028 478,214 0.25%
1,500,000 Uruguay Government International Bond 5.10 18/06/2050 1,478,670 0.78%
1,600,000 Venezuela Government International Bond 9.00 07/05/2023 363,384 0.19%
1,732,000 Zambia Government International Bond 8.97 30/07/2027 1,367,691 0.72%
130,034,276 68.38%
Total Transferable Securities 178,202,191 93.72%
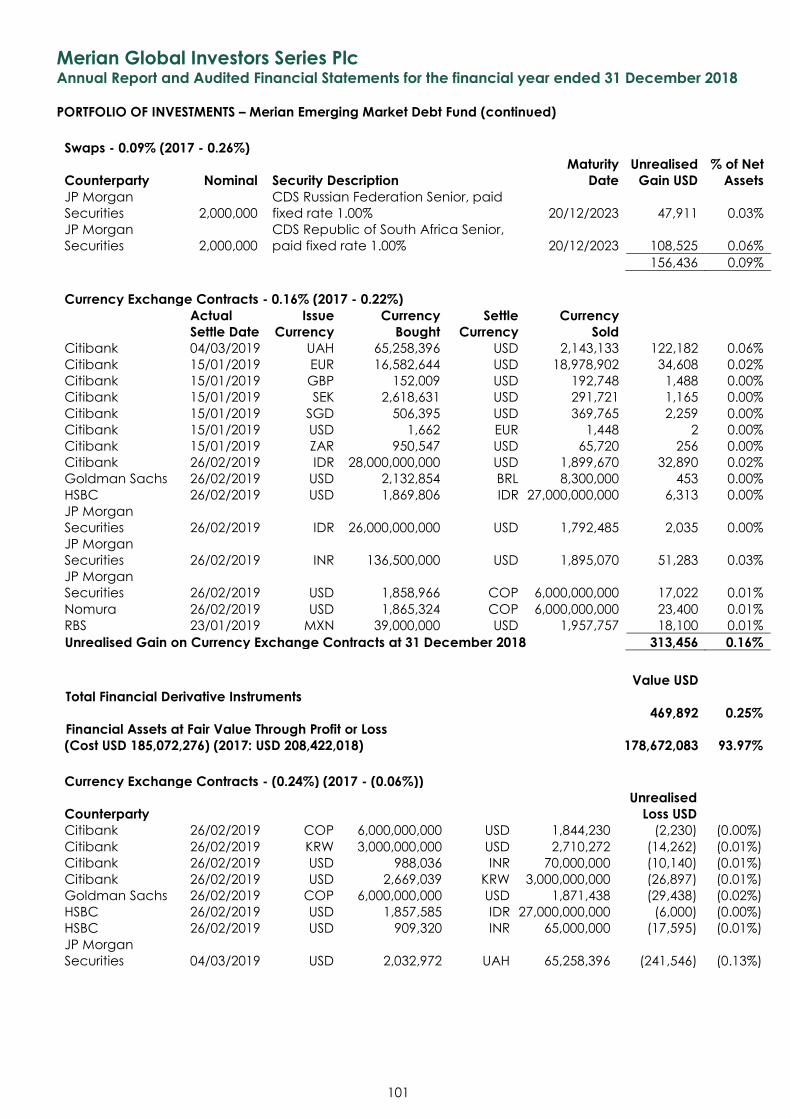
Merian Global Investors Series Plc Annual Report and Audited Financial Statements for the financial year ended 31 December 2018
PORTFOLIO OF INVESTMENTS – Merian Emerging Market Debt Fund (continued)
101
Swaps - 0.09% (2017 - 0.26%)
Counterparty Nominal Security Description
Maturity
Date
Unrealised
Gain USD
% of Net
Assets
JP Morgan
Securities 2,000,000
CDS Russian Federation Senior, paid
fixed rate 1.00% 20/12/2023 47,911 0.03%
JP Morgan
Securities 2,000,000
CDS Republic of South Africa Senior,
paid fixed rate 1.00% 20/12/2023 108,525 0.06%
156,436 0.09%
Currency Exchange Contracts - 0.16% (2017 - 0.22%)
Actual
Settle Date
Issue
Currency
Currency
Bought
Settle
Currency
Currency
Sold
Citibank 04/03/2019 UAH 65,258,396 USD 2,143,133 122,182 0.06%
Citibank 15/01/2019 EUR 16,582,644 USD 18,978,902 34,608 0.02%
Citibank 15/01/2019 GBP 152,009 USD 192,748 1,488 0.00%
Citibank 15/01/2019 SEK 2,618,631 USD 291,721 1,165 0.00%
Citibank 15/01/2019 SGD 506,395 USD 369,765 2,259 0.00%
Citibank 15/01/2019 USD 1,662 EUR 1,448 2 0.00%
Citibank 15/01/2019 ZAR 950,547 USD 65,720 256 0.00%
Citibank 26/02/2019 IDR 28,000,000,000 USD 1,899,670 32,890 0.02%
Goldman Sachs 26/02/2019 USD 2,132,854 BRL 8,300,000 453 0.00%
HSBC 26/02/2019 USD 1,869,806 IDR 27,000,000,000 6,313 0.00%
JP Morgan
Securities 26/02/2019 IDR 26,000,000,000 USD 1,792,485 2,035 0.00%
JP Morgan
Securities 26/02/2019 INR 136,500,000 USD 1,895,070 51,283 0.03%
JP Morgan
Securities 26/02/2019 USD 1,858,966 COP 6,000,000,000 17,022 0.01%
Nomura 26/02/2019 USD 1,865,324 COP 6,000,000,000 23,400 0.01%
RBS 23/01/2019 MXN 39,000,000 USD 1,957,757 18,100 0.01%
Unrealised Gain on Currency Exchange Contracts at 31 December 2018 313,456 0.16%
Value USD
Total Financial Derivative Instruments
469,892 0.25%
Financial Assets at Fair Value Through Profit or Loss
(Cost USD 185,072,276) (2017: USD 208,422,018) 178,672,083 93.97%
Currency Exchange Contracts - (0.24%) (2017 - (0.06%))
Counterparty
Unrealised
Loss USD
Citibank 26/02/2019 COP 6,000,000,000 USD 1,844,230 (2,230) (0.00%)
Citibank 26/02/2019 KRW 3,000,000,000 USD 2,710,272 (14,262) (0.01%)
Citibank 26/02/2019 USD 988,036 INR 70,000,000 (10,140) (0.01%)
Citibank 26/02/2019 USD 2,669,039 KRW 3,000,000,000 (26,897) (0.01%)
Goldman Sachs 26/02/2019 COP 6,000,000,000 USD 1,871,438 (29,438) (0.02%)
HSBC 26/02/2019 USD 1,857,585 IDR 27,000,000,000 (6,000) (0.00%)
HSBC 26/02/2019 USD 909,320 INR 65,000,000 (17,595) (0.01%)
JP Morgan
Securities 04/03/2019 USD 2,032,972 UAH 65,258,396 (241,546) (0.13%)
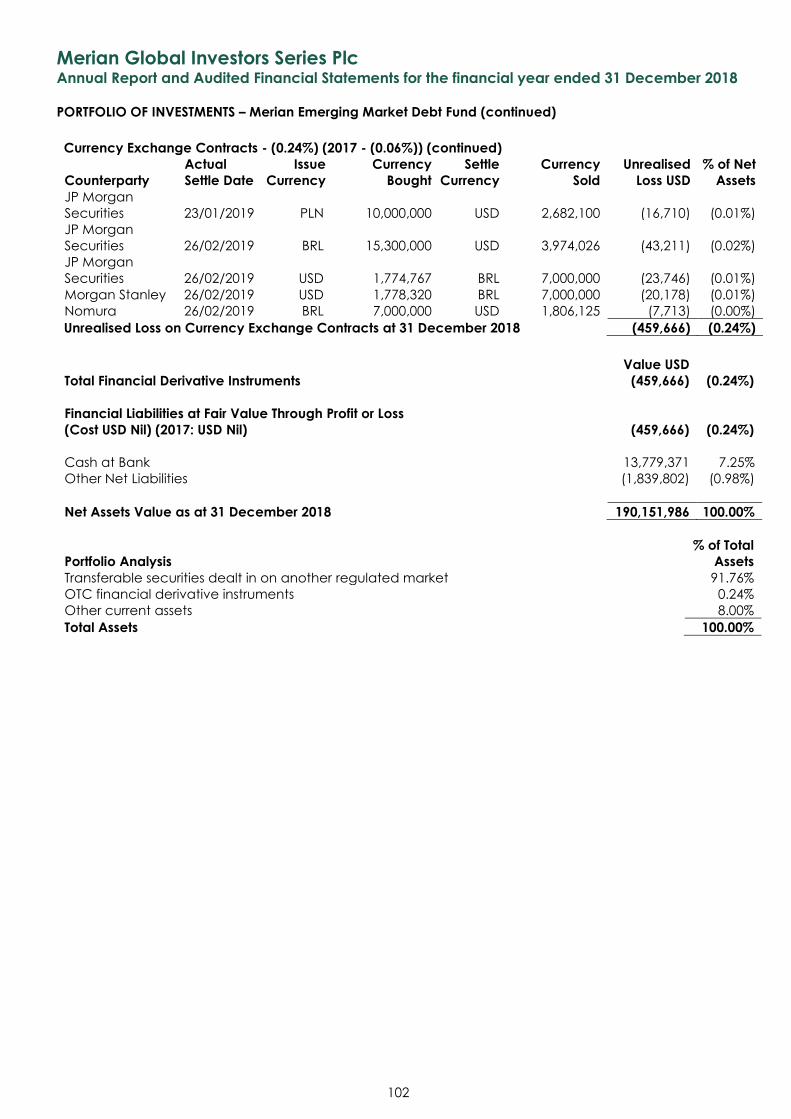
Merian Global Investors Series Plc Annual Report and Audited Financial Statements for the financial year ended 31 December 2018
PORTFOLIO OF INVESTMENTS – Merian Emerging Market Debt Fund (continued)
102
Currency Exchange Contracts - (0.24%) (2017 - (0.06%)) (continued)
Counterparty
Actual
Settle Date
Issue
Currency
Currency
Bought
Settle
Currency
Currency
Sold
Unrealised
Loss USD
% of Net
Assets
JP Morgan
Securities 23/01/2019 PLN 10,000,000 USD 2,682,100 (16,710) (0.01%)
JP Morgan
Securities 26/02/2019 BRL 15,300,000 USD 3,974,026 (43,211) (0.02%)
JP Morgan
Securities 26/02/2019 USD 1,774,767 BRL 7,000,000 (23,746) (0.01%)
Morgan Stanley 26/02/2019 USD 1,778,320 BRL 7,000,000 (20,178) (0.01%)
Nomura 26/02/2019 BRL 7,000,000 USD 1,806,125 (7,713) (0.00%)
Unrealised Loss on Currency Exchange Contracts at 31 December 2018 (459,666) (0.24%)
Value USD
Total Financial Derivative Instruments (459,666) (0.24%)
Financial Liabilities at Fair Value Through Profit or Loss
(Cost USD Nil) (2017: USD Nil) (459,666) (0.24%)
Cash at Bank 13,779,371 7.25%
Other Net Liabilities (1,839,802) (0.98%)
Net Assets Value as at 31 December 2018 190,151,986 100.00%
% of Total
Portfolio Analysis Assets
Transferable securities dealt in on another regulated market 91.76%
OTC financial derivative instruments 0.24%
Other current assets 8.00%
Total Assets 100.00%
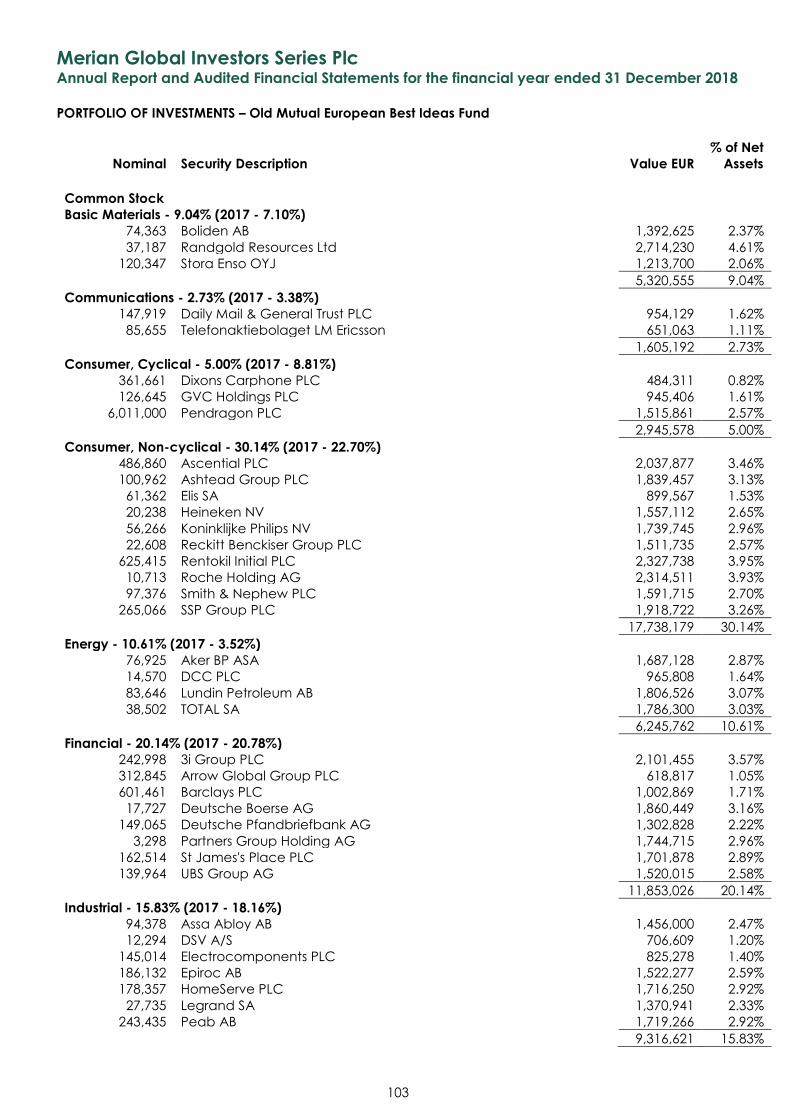
Merian Global Investors Series Plc Annual Report and Audited Financial Statements for the financial year ended 31 December 2018
PORTFOLIO OF INVESTMENTS – Old Mutual European Best Ideas Fund
Nominal Security Description Value EUR
% of Net
Assets
103
Common Stock Basic Materials - 9.04% (2017 - 7.10%)
74,363 Boliden AB 1,392,625 2.37%
37,187 Randgold Resources Ltd 2,714,230 4.61%
120,347 Stora Enso OYJ 1,213,700 2.06%
5,320,555 9.04%
Communications - 2.73% (2017 - 3.38%) 147,919 Daily Mail & General Trust PLC 954,129 1.62%
85,655 Telefonaktiebolaget LM Ericsson 651,063 1.11%
1,605,192 2.73%
Consumer, Cyclical - 5.00% (2017 - 8.81%) 361,661 Dixons Carphone PLC 484,311 0.82%
126,645 GVC Holdings PLC 945,406 1.61%
6,011,000 Pendragon PLC 1,515,861 2.57%
2,945,578 5.00%
Consumer, Non-cyclical - 30.14% (2017 - 22.70%) 486,860 Ascential PLC 2,037,877 3.46%
100,962 Ashtead Group PLC 1,839,457 3.13%
61,362 Elis SA 899,567 1.53%
20,238 Heineken NV 1,557,112 2.65%
56,266 Koninklijke Philips NV 1,739,745 2.96%
22,608 Reckitt Benckiser Group PLC 1,511,735 2.57%
625,415 Rentokil Initial PLC 2,327,738 3.95%
10,713 Roche Holding AG 2,314,511 3.93%
97,376 Smith & Nephew PLC 1,591,715 2.70%
265,066 SSP Group PLC 1,918,722 3.26%
17,738,179 30.14%
Energy - 10.61% (2017 - 3.52%) 76,925 Aker BP ASA 1,687,128 2.87%
14,570 DCC PLC 965,808 1.64%
83,646 Lundin Petroleum AB 1,806,526 3.07%
38,502 TOTAL SA 1,786,300 3.03%
6,245,762 10.61%
Financial - 20.14% (2017 - 20.78%) 242,998 3i Group PLC 2,101,455 3.57%
312,845 Arrow Global Group PLC 618,817 1.05%
601,461 Barclays PLC 1,002,869 1.71%
17,727 Deutsche Boerse AG 1,860,449 3.16%
149,065 Deutsche Pfandbriefbank AG 1,302,828 2.22%
3,298 Partners Group Holding AG 1,744,715 2.96%
162,514 St James's Place PLC 1,701,878 2.89%
139,964 UBS Group AG 1,520,015 2.58%
11,853,026 20.14%
Industrial - 15.83% (2017 - 18.16%) 94,378 Assa Abloy AB 1,456,000 2.47%
12,294 DSV A/S 706,609 1.20%
145,014 Electrocomponents PLC 825,278 1.40%
186,132 Epiroc AB 1,522,277 2.59%
178,357 HomeServe PLC 1,716,250 2.92%
27,735 Legrand SA 1,370,941 2.33%
243,435 Peab AB 1,719,266 2.92%
9,316,621 15.83%
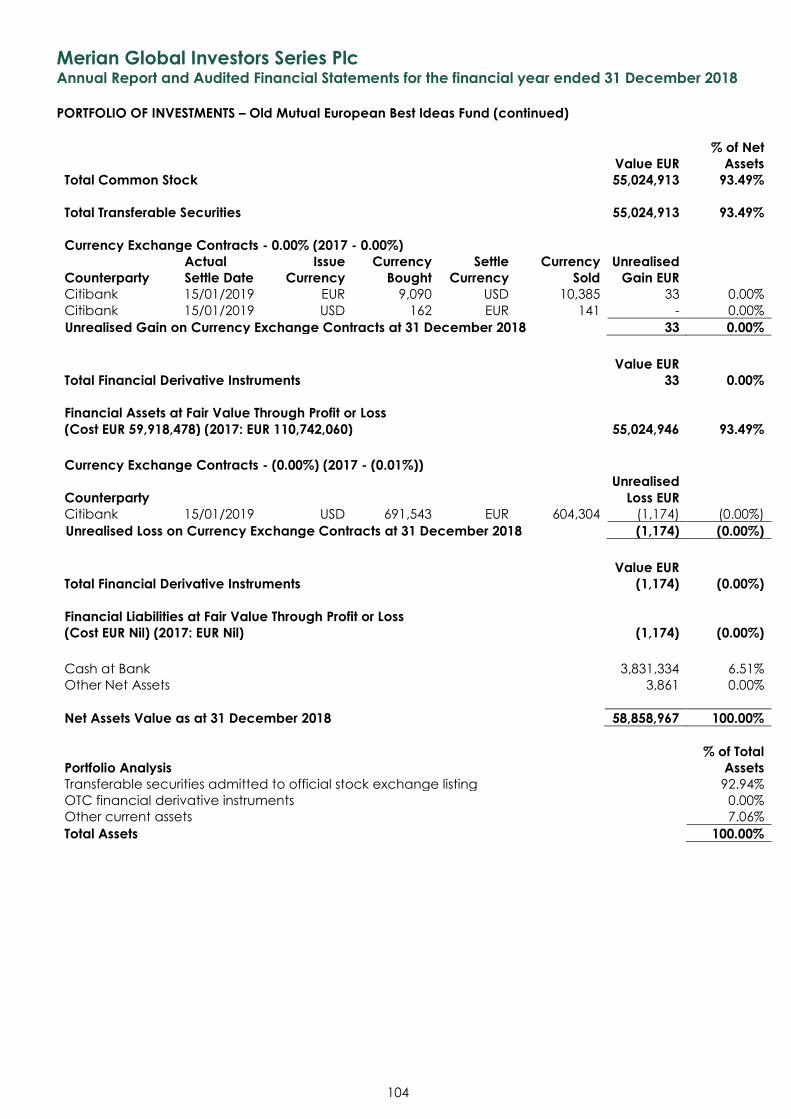
Merian Global Investors Series Plc Annual Report and Audited Financial Statements for the financial year ended 31 December 2018
PORTFOLIO OF INVESTMENTS – Old Mutual European Best Ideas Fund (continued)
104
Value EUR
% of Net
Assets
Total Common Stock 55,024,913 93.49%
Total Transferable Securities 55,024,913 93.49%
Currency Exchange Contracts - 0.00% (2017 - 0.00%)
Counterparty
Actual
Settle Date
Issue
Currency
Currency
Bought
Settle
Currency
Currency
Sold
Unrealised
Gain EUR
Citibank 15/01/2019 EUR 9,090 USD 10,385 33 0.00%
Citibank 15/01/2019 USD 162 EUR 141 - 0.00%
Unrealised Gain on Currency Exchange Contracts at 31 December 2018 33 0.00%
Value EUR
Total Financial Derivative Instruments 33 0.00%
Financial Assets at Fair Value Through Profit or Loss
(Cost EUR 59,918,478) (2017: EUR 110,742,060) 55,024,946 93.49%
Currency Exchange Contracts - (0.00%) (2017 - (0.01%))
Counterparty
Unrealised
Loss EUR
Citibank 15/01/2019 USD 691,543 EUR 604,304 (1,174) (0.00%)
Unrealised Loss on Currency Exchange Contracts at 31 December 2018 (1,174) (0.00%)
Value EUR
Total Financial Derivative Instruments (1,174) (0.00%)
Financial Liabilities at Fair Value Through Profit or Loss
(Cost EUR Nil) (2017: EUR Nil) (1,174) (0.00%)
Cash at Bank 3,831,334 6.51%
Other Net Assets 3,861 0.00%
Net Assets Value as at 31 December 2018 58,858,967 100.00%
% of Total
Portfolio Analysis Assets
Transferable securities admitted to official stock exchange listing 92.94%
OTC financial derivative instruments 0.00%
Other current assets 7.06%
Total Assets 100.00%
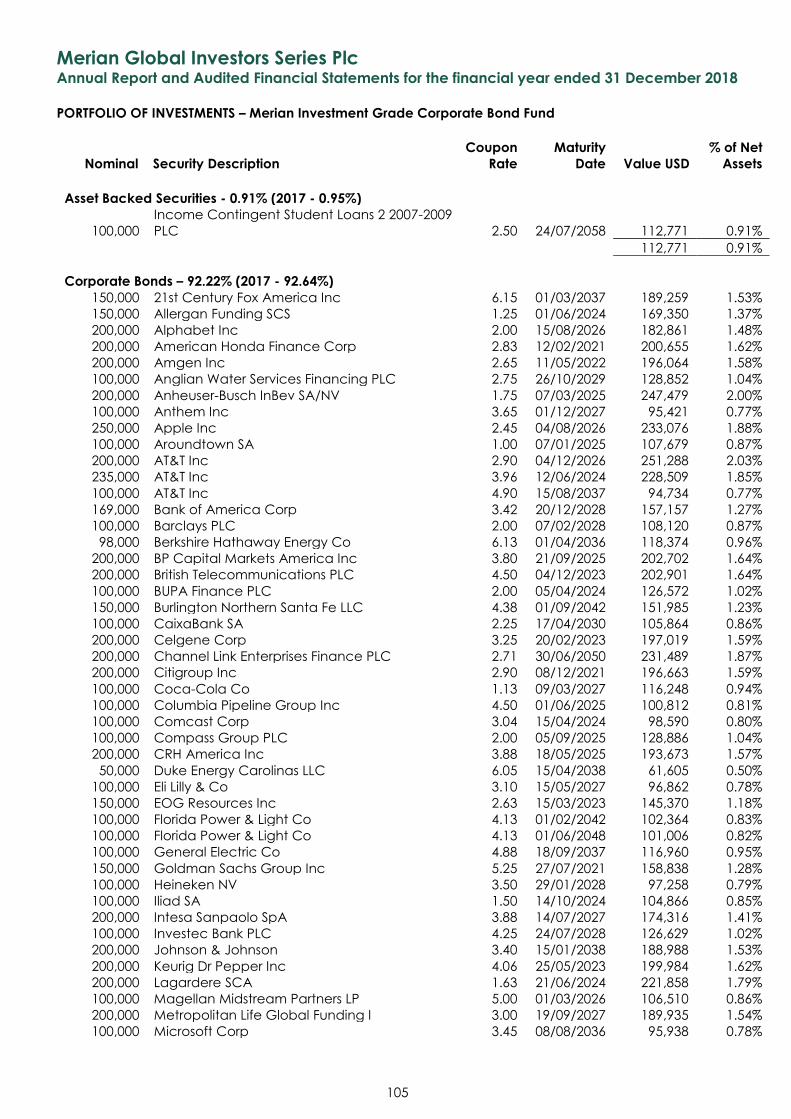
Merian Global Investors Series Plc Annual Report and Audited Financial Statements for the financial year ended 31 December 2018
PORTFOLIO OF INVESTMENTS – Merian Investment Grade Corporate Bond Fund
Nominal Security Description
Coupon
Rate
Maturity
Date Value USD
% of Net
Assets
105
Asset Backed Securities - 0.91% (2017 - 0.95%)
100,000
Income Contingent Student Loans 2 2007-2009
PLC 2.50 24/07/2058 112,771 0.91%
112,771 0.91%
Corporate Bonds – 92.22% (2017 - 92.64%)
150,000 21st Century Fox America Inc 6.15 01/03/2037 189,259 1.53%
150,000 Allergan Funding SCS 1.25 01/06/2024 169,350 1.37%
200,000 Alphabet Inc 2.00 15/08/2026 182,861 1.48%
200,000 American Honda Finance Corp 2.83 12/02/2021 200,655 1.62%
200,000 Amgen Inc 2.65 11/05/2022 196,064 1.58%
100,000 Anglian Water Services Financing PLC 2.75 26/10/2029 128,852 1.04%
200,000 Anheuser-Busch InBev SA/NV 1.75 07/03/2025 247,479 2.00%
100,000 Anthem Inc 3.65 01/12/2027 95,421 0.77%
250,000 Apple Inc 2.45 04/08/2026 233,076 1.88%
100,000 Aroundtown SA 1.00 07/01/2025 107,679 0.87%
200,000 AT&T Inc 2.90 04/12/2026 251,288 2.03%
235,000 AT&T Inc 3.96 12/06/2024 228,509 1.85%
100,000 AT&T Inc 4.90 15/08/2037 94,734 0.77%
169,000 Bank of America Corp 3.42 20/12/2028 157,157 1.27%
100,000 Barclays PLC 2.00 07/02/2028 108,120 0.87%
98,000 Berkshire Hathaway Energy Co 6.13 01/04/2036 118,374 0.96%
200,000 BP Capital Markets America Inc 3.80 21/09/2025 202,702 1.64%
200,000 British Telecommunications PLC 4.50 04/12/2023 202,901 1.64%
100,000 BUPA Finance PLC 2.00 05/04/2024 126,572 1.02%
150,000 Burlington Northern Santa Fe LLC 4.38 01/09/2042 151,985 1.23%
100,000 CaixaBank SA 2.25 17/04/2030 105,864 0.86%
200,000 Celgene Corp 3.25 20/02/2023 197,019 1.59%
200,000 Channel Link Enterprises Finance PLC 2.71 30/06/2050 231,489 1.87%
200,000 Citigroup Inc 2.90 08/12/2021 196,663 1.59%
100,000 Coca-Cola Co 1.13 09/03/2027 116,248 0.94%
100,000 Columbia Pipeline Group Inc 4.50 01/06/2025 100,812 0.81%
100,000 Comcast Corp 3.04 15/04/2024 98,590 0.80%
100,000 Compass Group PLC 2.00 05/09/2025 128,886 1.04%
200,000 CRH America Inc 3.88 18/05/2025 193,673 1.57%
50,000 Duke Energy Carolinas LLC 6.05 15/04/2038 61,605 0.50%
100,000 Eli Lilly & Co 3.10 15/05/2027 96,862 0.78%
150,000 EOG Resources Inc 2.63 15/03/2023 145,370 1.18%
100,000 Florida Power & Light Co 4.13 01/02/2042 102,364 0.83%
100,000 Florida Power & Light Co 4.13 01/06/2048 101,006 0.82%
100,000 General Electric Co 4.88 18/09/2037 116,960 0.95%
150,000 Goldman Sachs Group Inc 5.25 27/07/2021 158,838 1.28%
100,000 Heineken NV 3.50 29/01/2028 97,258 0.79%
100,000 Iliad SA 1.50 14/10/2024 104,866 0.85%
200,000 Intesa Sanpaolo SpA 3.88 14/07/2027 174,316 1.41%
100,000 Investec Bank PLC 4.25 24/07/2028 126,629 1.02%
200,000 Johnson & Johnson 3.40 15/01/2038 188,988 1.53%
200,000 Keurig Dr Pepper Inc 4.06 25/05/2023 199,984 1.62%
200,000 Lagardere SCA 1.63 21/06/2024 221,858 1.79%
100,000 Magellan Midstream Partners LP 5.00 01/03/2026 106,510 0.86%
200,000 Metropolitan Life Global Funding I 3.00 19/09/2027 189,935 1.54%
100,000 Microsoft Corp 3.45 08/08/2036 95,938 0.78%
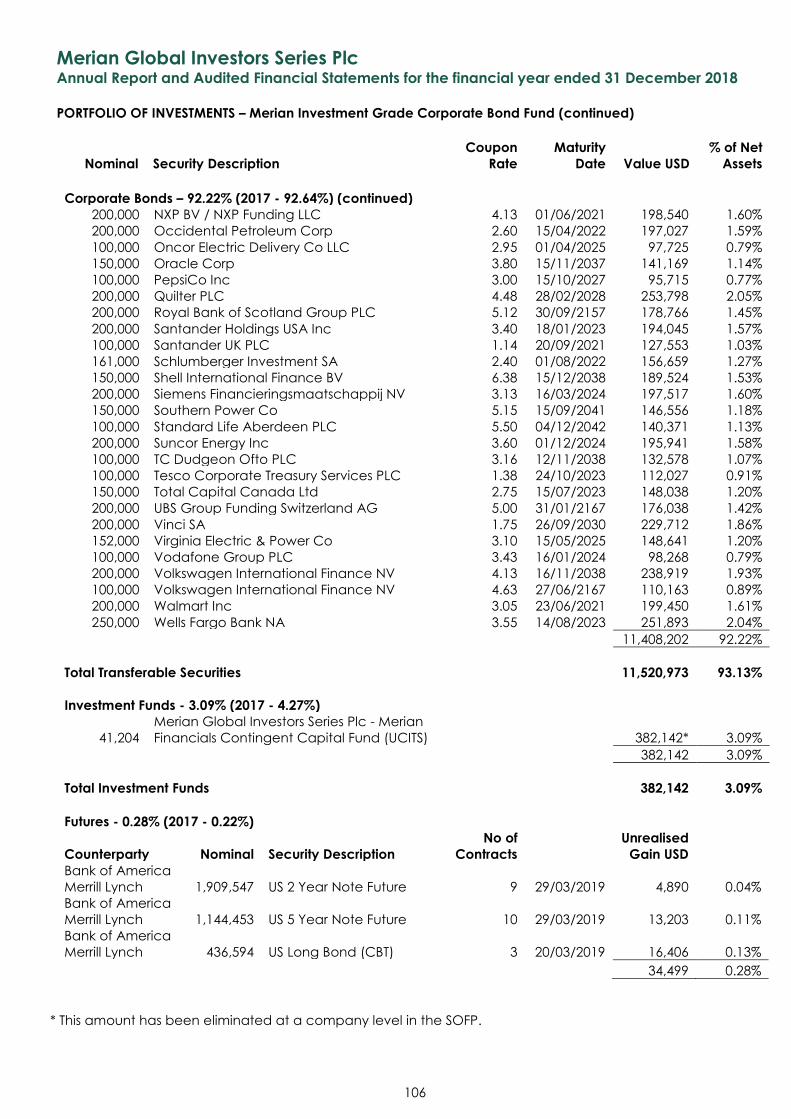
Merian Global Investors Series Plc Annual Report and Audited Financial Statements for the financial year ended 31 December 2018
PORTFOLIO OF INVESTMENTS – Merian Investment Grade Corporate Bond Fund (continued)
Nominal Security Description
Coupon
Rate
Maturity
Date Value USD
% of Net
Assets
106
Corporate Bonds – 92.22% (2017 - 92.64%) (continued) 200,000 NXP BV / NXP Funding LLC 4.13 01/06/2021 198,540 1.60%
200,000 Occidental Petroleum Corp 2.60 15/04/2022 197,027 1.59%
100,000 Oncor Electric Delivery Co LLC 2.95 01/04/2025 97,725 0.79%
150,000 Oracle Corp 3.80 15/11/2037 141,169 1.14%
100,000 PepsiCo Inc 3.00 15/10/2027 95,715 0.77%
200,000 Quilter PLC 4.48 28/02/2028 253,798 2.05%
200,000 Royal Bank of Scotland Group PLC 5.12 30/09/2157 178,766 1.45%
200,000 Santander Holdings USA Inc 3.40 18/01/2023 194,045 1.57%
100,000 Santander UK PLC 1.14 20/09/2021 127,553 1.03%
161,000 Schlumberger Investment SA 2.40 01/08/2022 156,659 1.27%
150,000 Shell International Finance BV 6.38 15/12/2038 189,524 1.53%
200,000 Siemens Financieringsmaatschappij NV 3.13 16/03/2024 197,517 1.60%
150,000 Southern Power Co 5.15 15/09/2041 146,556 1.18%
100,000 Standard Life Aberdeen PLC 5.50 04/12/2042 140,371 1.13%
200,000 Suncor Energy Inc 3.60 01/12/2024 195,941 1.58%
100,000 TC Dudgeon Ofto PLC 3.16 12/11/2038 132,578 1.07%
100,000 Tesco Corporate Treasury Services PLC 1.38 24/10/2023 112,027 0.91%
150,000 Total Capital Canada Ltd 2.75 15/07/2023 148,038 1.20%
200,000 UBS Group Funding Switzerland AG 5.00 31/01/2167 176,038 1.42%
200,000 Vinci SA 1.75 26/09/2030 229,712 1.86%
152,000 Virginia Electric & Power Co 3.10 15/05/2025 148,641 1.20%
100,000 Vodafone Group PLC 3.43 16/01/2024 98,268 0.79%
200,000 Volkswagen International Finance NV 4.13 16/11/2038 238,919 1.93%
100,000 Volkswagen International Finance NV 4.63 27/06/2167 110,163 0.89%
200,000 Walmart Inc 3.05 23/06/2021 199,450 1.61%
250,000 Wells Fargo Bank NA 3.55 14/08/2023 251,893 2.04%
11,408,202 92.22%
Total Transferable Securities 11,520,973 93.13%
Investment Funds - 3.09% (2017 - 4.27%)
41,204
Merian Global Investors Series Plc - Merian
Financials Contingent Capital Fund (UCITS) 382,142* 3.09%
382,142 3.09%
Total Investment Funds 382,142 3.09%
Futures - 0.28% (2017 - 0.22%)
Counterparty Nominal Security Description
No of
Contracts
Unrealised
Gain USD
Bank of America
Merrill Lynch 1,909,547 US 2 Year Note Future 9 29/03/2019 4,890 0.04%
Bank of America
Merrill Lynch 1,144,453 US 5 Year Note Future 10 29/03/2019 13,203 0.11%
Bank of America
Merrill Lynch 436,594 US Long Bond (CBT) 3 20/03/2019 16,406 0.13%
34,499 0.28%
* This amount has been eliminated at a company level in the SOFP.
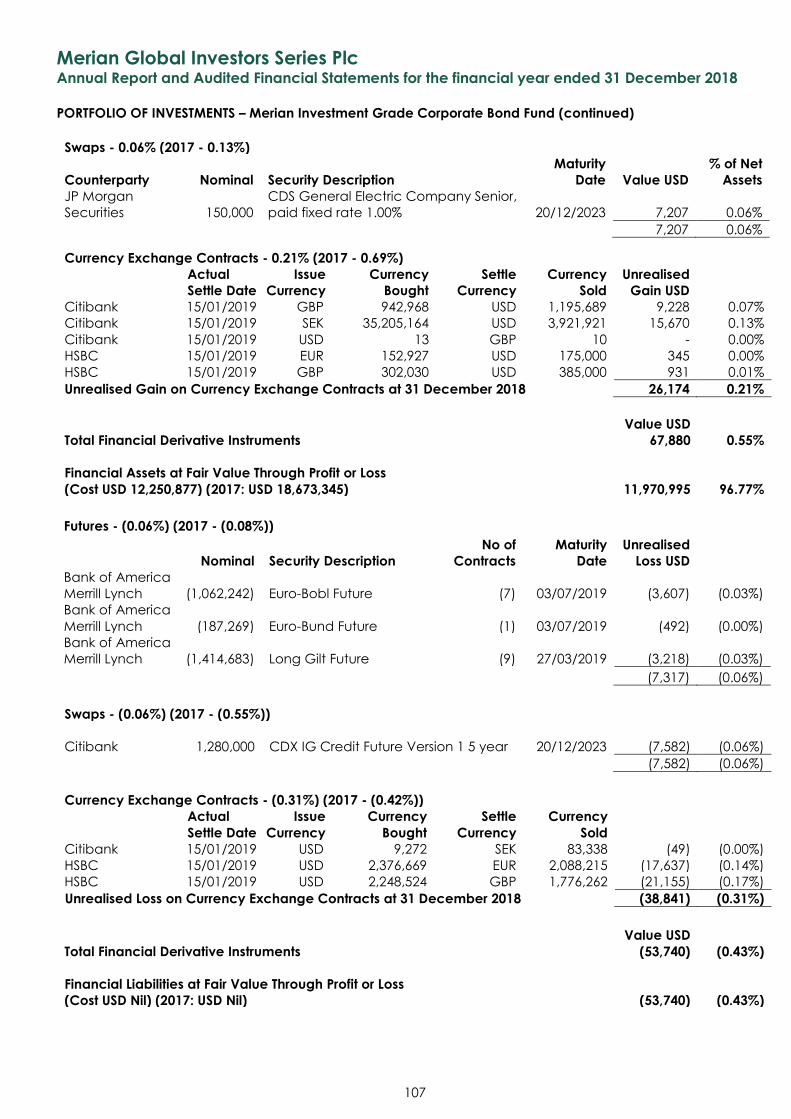
Merian Global Investors Series Plc Annual Report and Audited Financial Statements for the financial year ended 31 December 2018
PORTFOLIO OF INVESTMENTS – Merian Investment Grade Corporate Bond Fund (continued)
107
Swaps - 0.06% (2017 - 0.13%)
Counterparty Nominal Security Description
Maturity
Date Value USD
% of Net
Assets
JP Morgan
Securities 150,000
CDS General Electric Company Senior,
paid fixed rate 1.00% 20/12/2023 7,207 0.06%
7,207 0.06%
Currency Exchange Contracts - 0.21% (2017 - 0.69%)
Actual
Settle Date
Issue
Currency
Currency
Bought
Settle
Currency
Currency
Sold
Unrealised
Gain USD
Citibank 15/01/2019 GBP 942,968 USD 1,195,689 9,228 0.07%
Citibank 15/01/2019 SEK 35,205,164 USD 3,921,921 15,670 0.13%
Citibank 15/01/2019 USD 13 GBP 10 - 0.00%
HSBC 15/01/2019 EUR 152,927 USD 175,000 345 0.00%
HSBC 15/01/2019 GBP 302,030 USD 385,000 931 0.01%
Unrealised Gain on Currency Exchange Contracts at 31 December 2018 26,174 0.21%
Value USD
Total Financial Derivative Instruments 67,880 0.55%
Financial Assets at Fair Value Through Profit or Loss
(Cost USD 12,250,877) (2017: USD 18,673,345) 11,970,995 96.77%
Futures - (0.06%) (2017 - (0.08%))
Nominal Security Description
No of
Contracts
Maturity
Date
Unrealised
Loss USD
Bank of America
Merrill Lynch (1,062,242) Euro-Bobl Future (7) 03/07/2019 (3,607) (0.03%)
Bank of America
Merrill Lynch (187,269) Euro-Bund Future (1) 03/07/2019 (492) (0.00%)
Bank of America
Merrill Lynch (1,414,683) Long Gilt Future (9) 27/03/2019 (3,218) (0.03%)
(7,317) (0.06%)
Swaps - (0.06%) (2017 - (0.55%)) Citibank 1,280,000 CDX IG Credit Future Version 1 5 year 20/12/2023 (7,582) (0.06%)
(7,582) (0.06%)
Currency Exchange Contracts - (0.31%) (2017 - (0.42%))
Actual
Settle Date
Issue
Currency
Currency
Bought
Settle
Currency
Currency
Sold
Citibank 15/01/2019 USD 9,272 SEK 83,338 (49) (0.00%)
HSBC 15/01/2019 USD 2,376,669 EUR 2,088,215 (17,637) (0.14%)
HSBC 15/01/2019 USD 2,248,524 GBP 1,776,262 (21,155) (0.17%)
Unrealised Loss on Currency Exchange Contracts at 31 December 2018 (38,841) (0.31%)
Value USD
Total Financial Derivative Instruments (53,740) (0.43%)
Financial Liabilities at Fair Value Through Profit or Loss
(Cost USD Nil) (2017: USD Nil) (53,740) (0.43%)
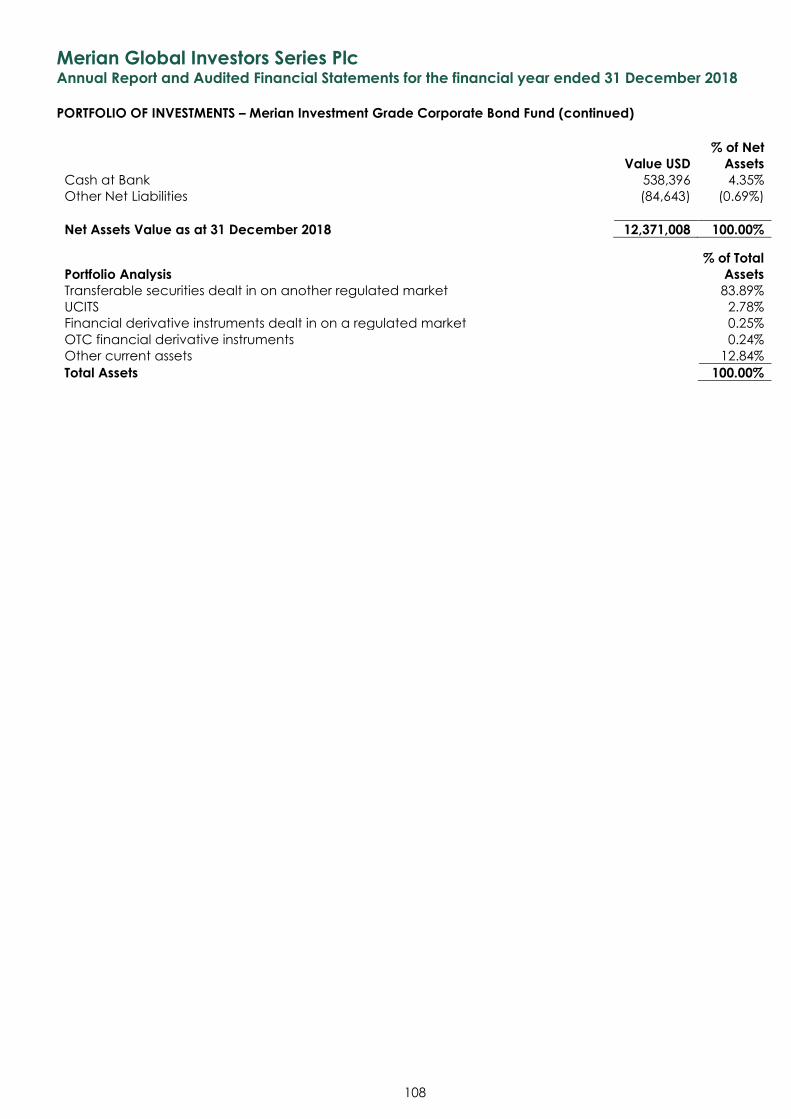
Merian Global Investors Series Plc Annual Report and Audited Financial Statements for the financial year ended 31 December 2018
PORTFOLIO OF INVESTMENTS – Merian Investment Grade Corporate Bond Fund (continued)
108
Value USD
% of Net
Assets
Cash at Bank 538,396 4.35%
Other Net Liabilities (84,643) (0.69%)
Net Assets Value as at 31 December 2018 12,371,008 100.00%
% of Total
Portfolio Analysis Assets
Transferable securities dealt in on another regulated market 83.89%
UCITS 2.78%
Financial derivative instruments dealt in on a regulated market 0.25%
OTC financial derivative instruments 0.24%
Other current assets 12.84%
Total Assets 100.00%
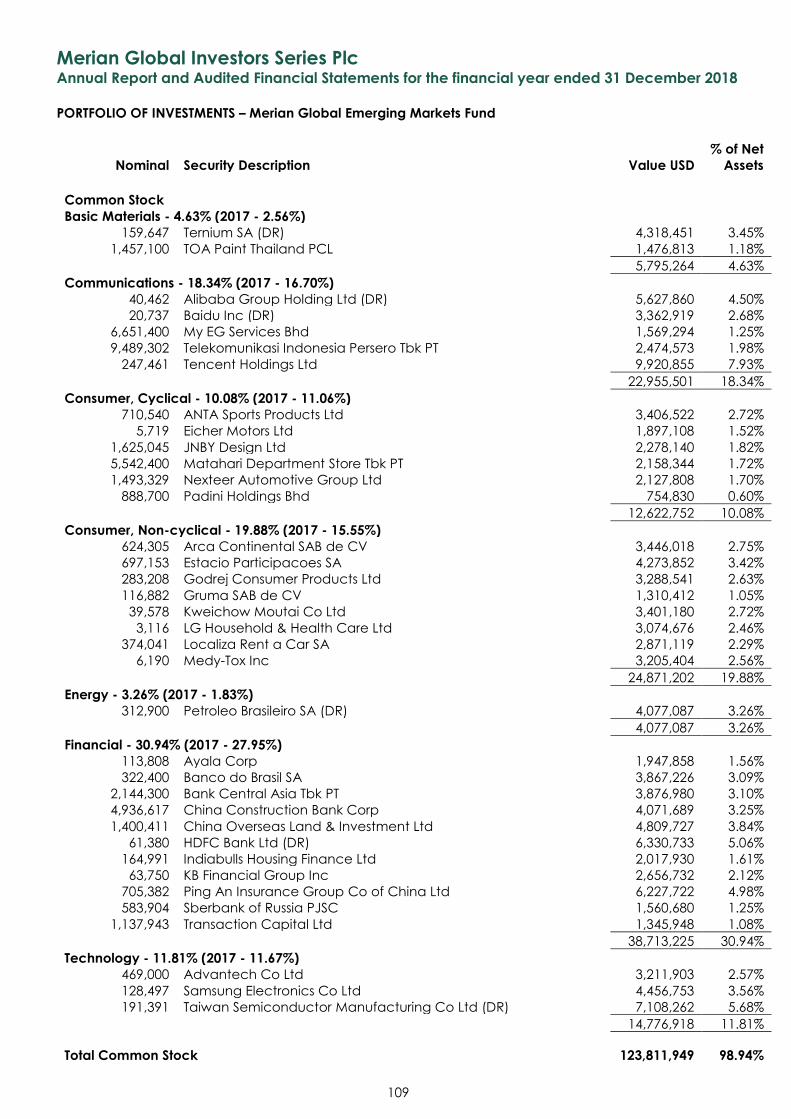
Merian Global Investors Series Plc Annual Report and Audited Financial Statements for the financial year ended 31 December 2018
PORTFOLIO OF INVESTMENTS – Merian Global Emerging Markets Fund
Nominal Security Description Value USD
% of Net
Assets
109
Common Stock Basic Materials - 4.63% (2017 - 2.56%)
159,647 Ternium SA (DR) 4,318,451 3.45%
1,457,100 TOA Paint Thailand PCL 1,476,813 1.18%
5,795,264 4.63%
Communications - 18.34% (2017 - 16.70%) 40,462 Alibaba Group Holding Ltd (DR) 5,627,860 4.50%
20,737 Baidu Inc (DR) 3,362,919 2.68%
6,651,400 My EG Services Bhd 1,569,294 1.25%
9,489,302 Telekomunikasi Indonesia Persero Tbk PT 2,474,573 1.98%
247,461 Tencent Holdings Ltd 9,920,855 7.93%
22,955,501 18.34%
Consumer, Cyclical - 10.08% (2017 - 11.06%) 710,540 ANTA Sports Products Ltd 3,406,522 2.72%
5,719 Eicher Motors Ltd 1,897,108 1.52%
1,625,045 JNBY Design Ltd 2,278,140 1.82%
5,542,400 Matahari Department Store Tbk PT 2,158,344 1.72%
1,493,329 Nexteer Automotive Group Ltd 2,127,808 1.70%
888,700 Padini Holdings Bhd 754,830 0.60%
12,622,752 10.08%
Consumer, Non-cyclical - 19.88% (2017 - 15.55%) 624,305 Arca Continental SAB de CV 3,446,018 2.75%
697,153 Estacio Participacoes SA 4,273,852 3.42%
283,208 Godrej Consumer Products Ltd 3,288,541 2.63%
116,882 Gruma SAB de CV 1,310,412 1.05%
39,578 Kweichow Moutai Co Ltd 3,401,180 2.72%
3,116 LG Household & Health Care Ltd 3,074,676 2.46%
374,041 Localiza Rent a Car SA 2,871,119 2.29%
6,190 Medy-Tox Inc 3,205,404 2.56%
24,871,202 19.88%
Energy - 3.26% (2017 - 1.83%) 312,900 Petroleo Brasileiro SA (DR) 4,077,087 3.26%
4,077,087 3.26%
Financial - 30.94% (2017 - 27.95%) 113,808 Ayala Corp 1,947,858 1.56%
322,400 Banco do Brasil SA 3,867,226 3.09%
2,144,300 Bank Central Asia Tbk PT 3,876,980 3.10%
4,936,617 China Construction Bank Corp 4,071,689 3.25%
1,400,411 China Overseas Land & Investment Ltd 4,809,727 3.84%
61,380 HDFC Bank Ltd (DR) 6,330,733 5.06%
164,991 Indiabulls Housing Finance Ltd 2,017,930 1.61%
63,750 KB Financial Group Inc 2,656,732 2.12%
705,382 Ping An Insurance Group Co of China Ltd 6,227,722 4.98%
583,904 Sberbank of Russia PJSC 1,560,680 1.25%
1,137,943 Transaction Capital Ltd 1,345,948 1.08%
38,713,225 30.94%
Technology - 11.81% (2017 - 11.67%) 469,000 Advantech Co Ltd 3,211,903 2.57%
128,497 Samsung Electronics Co Ltd 4,456,753 3.56%
191,391 Taiwan Semiconductor Manufacturing Co Ltd (DR) 7,108,262 5.68%
14,776,918 11.81%
Total Common Stock 123,811,949 98.94%
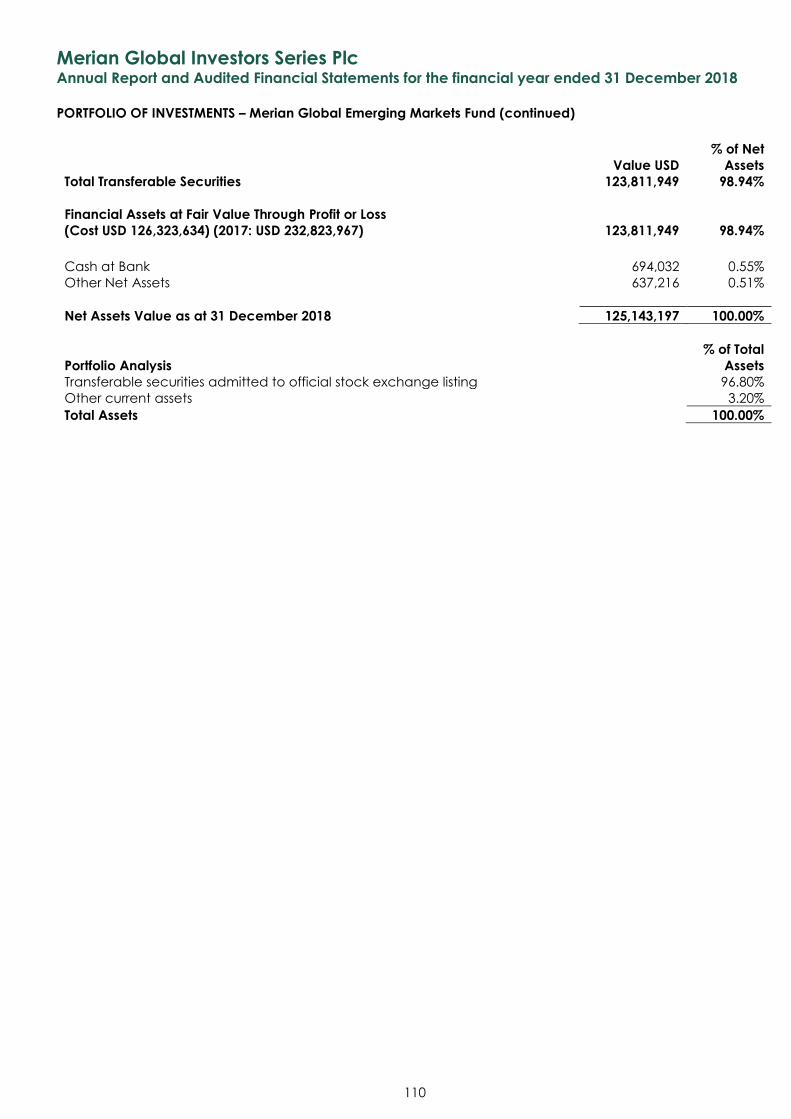
Merian Global Investors Series Plc Annual Report and Audited Financial Statements for the financial year ended 31 December 2018
PORTFOLIO OF INVESTMENTS – Merian Global Emerging Markets Fund (continued)
110
Value USD
% of Net
Assets
Total Transferable Securities 123,811,949 98.94%
Financial Assets at Fair Value Through Profit or Loss
(Cost USD 126,323,634) (2017: USD 232,823,967) 123,811,949 98.94%
Cash at Bank 694,032 0.55%
Other Net Assets 637,216 0.51%
Net Assets Value as at 31 December 2018 125,143,197 100.00%
% of Total
Portfolio Analysis Assets
Transferable securities admitted to official stock exchange listing 96.80%
Other current assets 3.20%
Total Assets 100.00%
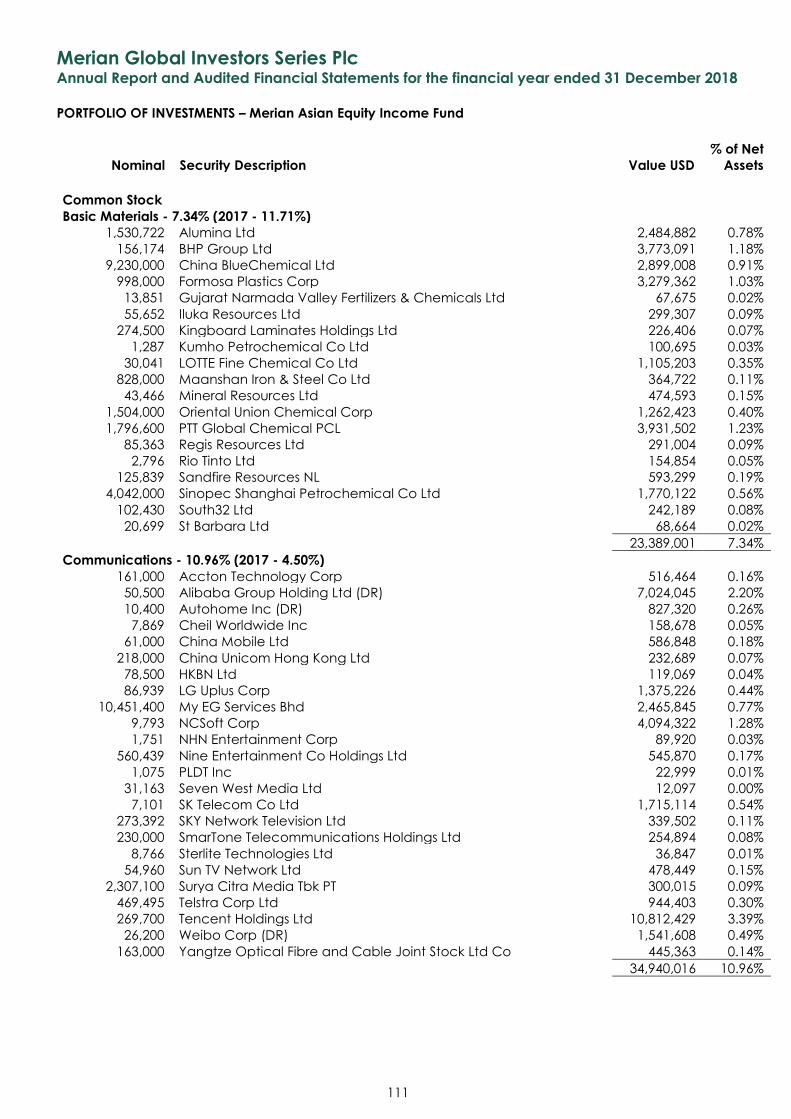
Merian Global Investors Series Plc Annual Report and Audited Financial Statements for the financial year ended 31 December 2018
PORTFOLIO OF INVESTMENTS – Merian Asian Equity Income Fund
Nominal Security Description Value USD
% of Net
Assets
111
Common Stock Basic Materials - 7.34% (2017 - 11.71%)
1,530,722 Alumina Ltd 2,484,882 0.78%
156,174 BHP Group Ltd 3,773,091 1.18%
9,230,000 China BlueChemical Ltd 2,899,008 0.91%
998,000 Formosa Plastics Corp 3,279,362 1.03%
13,851 Gujarat Narmada Valley Fertilizers & Chemicals Ltd 67,675 0.02%
55,652 Iluka Resources Ltd 299,307 0.09%
274,500 Kingboard Laminates Holdings Ltd 226,406 0.07%
1,287 Kumho Petrochemical Co Ltd 100,695 0.03%
30,041 LOTTE Fine Chemical Co Ltd 1,105,203 0.35%
828,000 Maanshan Iron & Steel Co Ltd 364,722 0.11%
43,466 Mineral Resources Ltd 474,593 0.15%
1,504,000 Oriental Union Chemical Corp 1,262,423 0.40%
1,796,600 PTT Global Chemical PCL 3,931,502 1.23%
85,363 Regis Resources Ltd 291,004 0.09%
2,796 Rio Tinto Ltd 154,854 0.05%
125,839 Sandfire Resources NL 593,299 0.19%
4,042,000 Sinopec Shanghai Petrochemical Co Ltd 1,770,122 0.56%
102,430 South32 Ltd 242,189 0.08%
20,699 St Barbara Ltd 68,664 0.02%
23,389,001 7.34%
Communications - 10.96% (2017 - 4.50%) 161,000 Accton Technology Corp 516,464 0.16%
50,500 Alibaba Group Holding Ltd (DR) 7,024,045 2.20%
10,400 Autohome Inc (DR) 827,320 0.26%
7,869 Cheil Worldwide Inc 158,678 0.05%
61,000 China Mobile Ltd 586,848 0.18%
218,000 China Unicom Hong Kong Ltd 232,689 0.07%
78,500 HKBN Ltd 119,069 0.04%
86,939 LG Uplus Corp 1,375,226 0.44%
10,451,400 My EG Services Bhd 2,465,845 0.77%
9,793 NCSoft Corp 4,094,322 1.28%
1,751 NHN Entertainment Corp 89,920 0.03%
560,439 Nine Entertainment Co Holdings Ltd 545,870 0.17%
1,075 PLDT Inc 22,999 0.01%
31,163 Seven West Media Ltd 12,097 0.00%
7,101 SK Telecom Co Ltd 1,715,114 0.54%
273,392 SKY Network Television Ltd 339,502 0.11%
230,000 SmarTone Telecommunications Holdings Ltd 254,894 0.08%
8,766 Sterlite Technologies Ltd 36,847 0.01%
54,960 Sun TV Network Ltd 478,449 0.15%
2,307,100 Surya Citra Media Tbk PT 300,015 0.09%
469,495 Telstra Corp Ltd 944,403 0.30%
269,700 Tencent Holdings Ltd 10,812,429 3.39%
26,200 Weibo Corp (DR) 1,541,608 0.49%
163,000 Yangtze Optical Fibre and Cable Joint Stock Ltd Co 445,363 0.14%
34,940,016 10.96%

Merian Global Investors Series Plc Annual Report and Audited Financial Statements for the financial year ended 31 December 2018
PORTFOLIO OF INVESTMENTS – Merian Asian Equity Income Fund (continued)
Nominal Security Description Value USD
% of Net
Assets
112
Common Stock (continued) Consumer, Cyclical - 5.30% (2017 - 2.68%)
231,698 Accent Group Ltd 196,239 0.06%
43,700 Air New Zealand Ltd 90,934 0.03%
264,900 AirAsia Group Bhd 190,382 0.06%
622,000 ANTA Sports Products Ltd 2,982,037 0.94%
4,117 Asiana Airlines Inc 15,257 0.00%
16,076 Bata India Ltd 261,198 0.08%
64,200 Best World International Ltd 124,001 0.04%
19,000 Cathay Pacific Airways Ltd 27,024 0.01%
660,000 China Dongxiang Group Co Ltd 101,120 0.03%
33,000 Chow Sang Sang Holdings International Ltd 48,959 0.02%
107,000 Feng TAY Enterprise Co Ltd 610,940 0.19%
1,047,700 Genting Singapore Ltd 750,198 0.24%
1,504,000 Giordano International Ltd 710,497 0.22%
148,349 Harvey Norman Holdings Ltd 330,867 0.10%
4,773 Hero MotoCorp Ltd 212,233 0.07%
244,000 IT Ltd 128,040 0.04%
21,708 JB Hi-Fi Ltd 339,218 0.11%
5,960,700 Matahari Department Store Tbk PT 2,321,240 0.73%
187,400 MK Restaurants Group PCL 430,232 0.13%
1,593,000 Pacific Textiles Holdings Ltd 1,415,591 0.44%
501 Page Industries Ltd 181,122 0.06%
174,400 Ramayana Lestari Sentosa Tbk PT 17,221 0.01%
3,480,000 Sa Sa International Holdings Ltd 1,315,175 0.41%
334,100 Shanghai Pharmaceuticals Holding Co Ltd 679,098 0.21%
30,000 Sheng Siong Group Ltd 23,354 0.01%
733,500 Sinotruk Hong Kong Ltd 1,105,083 0.35%
270,232 Super Retail Group Ltd 1,340,830 0.42%
598,000 Texwinca Holdings Ltd 195,458 0.06%
51,400 VTech Holdings Ltd 425,256 0.13%
288,000 Weichai Power Co Ltd 329,100 0.10%
16,897,904 5.30%
Consumer, Non-cyclical - 6.16% (2017 - 2.87%) 46,200 a2 Milk Co Ltd 345,781 0.11%
35,417 Adani Ports & Special Economic Zone Ltd 196,685 0.06%
20,850 Aurobindo Pharma Ltd 218,899 0.07%
526,592 Australian Pharmaceutical Industries Ltd 512,903 0.16%
8,400 Carlsberg Brewery Malaysia Bhd 40,003 0.01%
1,423,500 Charoen Pokphand Indonesia Tbk PT 715,204 0.22%
36,000 China Agri-Industries Holdings Ltd 12,824 0.00%
1,220,410 China Conch Venture Holdings Ltd 3,630,566 1.14%
1,600,000 China Medical System Holdings Ltd 1,487,182 0.48%
661,000 China Shineway Pharmaceutical Group Ltd 642,242 0.20%
4,854 Cochlear Ltd 594,643 0.19%
1,470 Coles Group Ltd 12,181 0.00%
13,301 Credit Corp Group Ltd 176,116 0.06%
5,905 CSL Ltd 771,700 0.24%
636,000 CSPC Pharmaceutical Group Ltd 917,589 0.29%
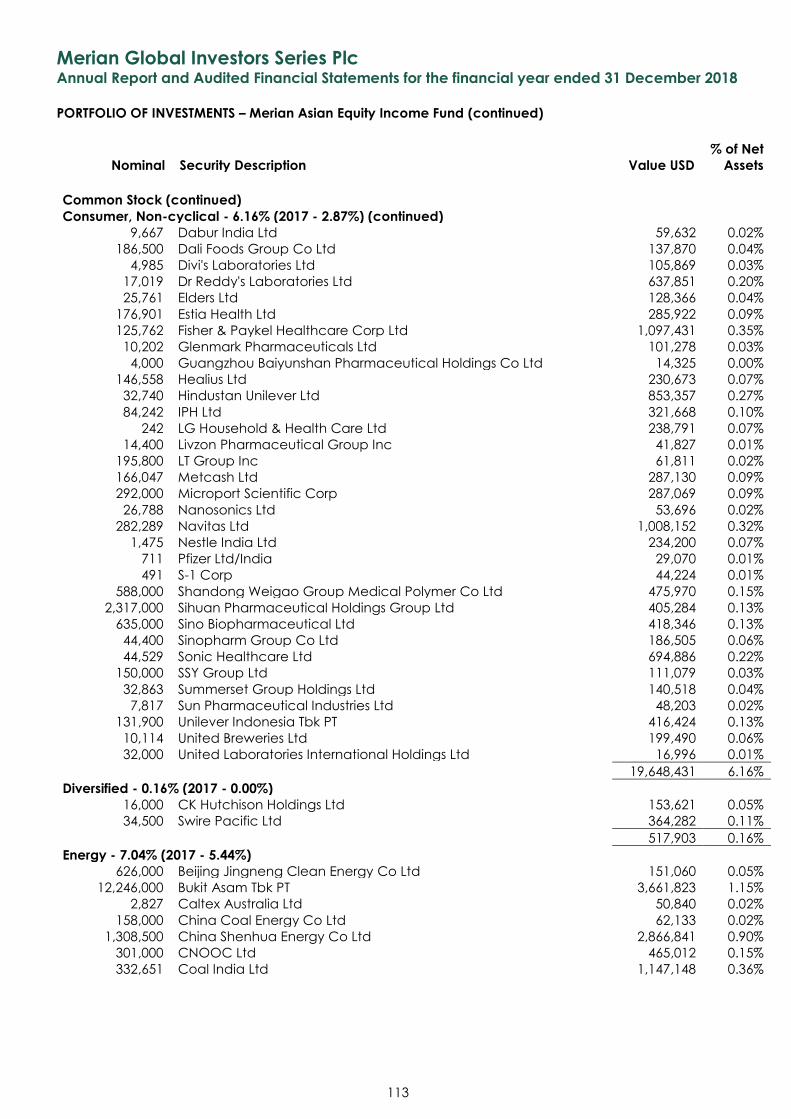
Merian Global Investors Series Plc Annual Report and Audited Financial Statements for the financial year ended 31 December 2018
PORTFOLIO OF INVESTMENTS – Merian Asian Equity Income Fund (continued)
Nominal Security Description Value USD
% of Net
Assets
113
Common Stock (continued) Consumer, Non-cyclical - 6.16% (2017 - 2.87%) (continued)
9,667 Dabur India Ltd 59,632 0.02%
186,500 Dali Foods Group Co Ltd 137,870 0.04%
4,985 Divi's Laboratories Ltd 105,869 0.03%
17,019 Dr Reddy's Laboratories Ltd 637,851 0.20%
25,761 Elders Ltd 128,366 0.04%
176,901 Estia Health Ltd 285,922 0.09%
125,762 Fisher & Paykel Healthcare Corp Ltd 1,097,431 0.35%
10,202 Glenmark Pharmaceuticals Ltd 101,278 0.03%
4,000 Guangzhou Baiyunshan Pharmaceutical Holdings Co Ltd 14,325 0.00%
146,558 Healius Ltd 230,673 0.07%
32,740 Hindustan Unilever Ltd 853,357 0.27%
84,242 IPH Ltd 321,668 0.10%
242 LG Household & Health Care Ltd 238,791 0.07%
14,400 Livzon Pharmaceutical Group Inc 41,827 0.01%
195,800 LT Group Inc 61,811 0.02%
166,047 Metcash Ltd 287,130 0.09%
292,000 Microport Scientific Corp 287,069 0.09%
26,788 Nanosonics Ltd 53,696 0.02%
282,289 Navitas Ltd 1,008,152 0.32%
1,475 Nestle India Ltd 234,200 0.07%
711 Pfizer Ltd/India 29,070 0.01%
491 S-1 Corp 44,224 0.01%
588,000 Shandong Weigao Group Medical Polymer Co Ltd 475,970 0.15%
2,317,000 Sihuan Pharmaceutical Holdings Group Ltd 405,284 0.13%
635,000 Sino Biopharmaceutical Ltd 418,346 0.13%
44,400 Sinopharm Group Co Ltd 186,505 0.06%
44,529 Sonic Healthcare Ltd 694,886 0.22%
150,000 SSY Group Ltd 111,079 0.03%
32,863 Summerset Group Holdings Ltd 140,518 0.04%
7,817 Sun Pharmaceutical Industries Ltd 48,203 0.02%
131,900 Unilever Indonesia Tbk PT 416,424 0.13%
10,114 United Breweries Ltd 199,490 0.06%
32,000 United Laboratories International Holdings Ltd 16,996 0.01%
19,648,431 6.16%
Diversified - 0.16% (2017 - 0.00%) 16,000 CK Hutchison Holdings Ltd 153,621 0.05%
34,500 Swire Pacific Ltd 364,282 0.11%
517,903 0.16%
Energy - 7.04% (2017 - 5.44%) 626,000 Beijing Jingneng Clean Energy Co Ltd 151,060 0.05%
12,246,000 Bukit Asam Tbk PT 3,661,823 1.15%
2,827 Caltex Australia Ltd 50,840 0.02%
158,000 China Coal Energy Co Ltd 62,133 0.02%
1,308,500 China Shenhua Energy Co Ltd 2,866,841 0.90%
301,000 CNOOC Ltd 465,012 0.15%
332,651 Coal India Ltd 1,147,148 0.36%
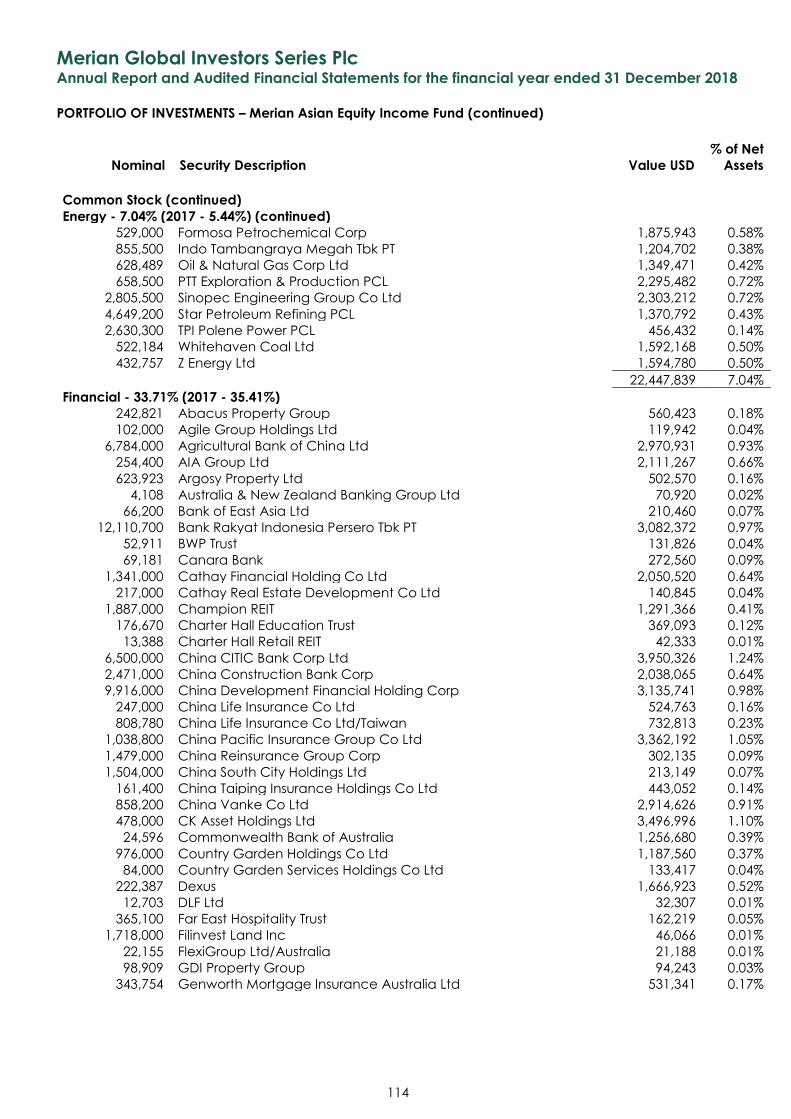
Merian Global Investors Series Plc Annual Report and Audited Financial Statements for the financial year ended 31 December 2018
PORTFOLIO OF INVESTMENTS – Merian Asian Equity Income Fund (continued)
Nominal Security Description Value USD
% of Net
Assets
114
Common Stock (continued) Energy - 7.04% (2017 - 5.44%) (continued)
529,000 Formosa Petrochemical Corp 1,875,943 0.58%
855,500 Indo Tambangraya Megah Tbk PT 1,204,702 0.38%
628,489 Oil & Natural Gas Corp Ltd 1,349,471 0.42%
658,500 PTT Exploration & Production PCL 2,295,482 0.72%
2,805,500 Sinopec Engineering Group Co Ltd 2,303,212 0.72%
4,649,200 Star Petroleum Refining PCL 1,370,792 0.43%
2,630,300 TPI Polene Power PCL 456,432 0.14%
522,184 Whitehaven Coal Ltd 1,592,168 0.50%
432,757 Z Energy Ltd 1,594,780 0.50%
22,447,839 7.04%
Financial - 33.71% (2017 - 35.41%) 242,821 Abacus Property Group 560,423 0.18%
102,000 Agile Group Holdings Ltd 119,942 0.04%
6,784,000 Agricultural Bank of China Ltd 2,970,931 0.93%
254,400 AIA Group Ltd 2,111,267 0.66%
623,923 Argosy Property Ltd 502,570 0.16%
4,108 Australia & New Zealand Banking Group Ltd 70,920 0.02%
66,200 Bank of East Asia Ltd 210,460 0.07%
12,110,700 Bank Rakyat Indonesia Persero Tbk PT 3,082,372 0.97%
52,911 BWP Trust 131,826 0.04%
69,181 Canara Bank 272,560 0.09%
1,341,000 Cathay Financial Holding Co Ltd 2,050,520 0.64%
217,000 Cathay Real Estate Development Co Ltd 140,845 0.04%
1,887,000 Champion REIT 1,291,366 0.41%
176,670 Charter Hall Education Trust 369,093 0.12%
13,388 Charter Hall Retail REIT 42,333 0.01%
6,500,000 China CITIC Bank Corp Ltd 3,950,326 1.24%
2,471,000 China Construction Bank Corp 2,038,065 0.64%
9,916,000 China Development Financial Holding Corp 3,135,741 0.98%
247,000 China Life Insurance Co Ltd 524,763 0.16%
808,780 China Life Insurance Co Ltd/Taiwan 732,813 0.23%
1,038,800 China Pacific Insurance Group Co Ltd 3,362,192 1.05%
1,479,000 China Reinsurance Group Corp 302,135 0.09%
1,504,000 China South City Holdings Ltd 213,149 0.07%
161,400 China Taiping Insurance Holdings Co Ltd 443,052 0.14%
858,200 China Vanke Co Ltd 2,914,626 0.91%
478,000 CK Asset Holdings Ltd 3,496,996 1.10%
24,596 Commonwealth Bank of Australia 1,256,680 0.39%
976,000 Country Garden Holdings Co Ltd 1,187,560 0.37%
84,000 Country Garden Services Holdings Co Ltd 133,417 0.04%
222,387 Dexus 1,666,923 0.52%
12,703 DLF Ltd 32,307 0.01%
365,100 Far East Hospitality Trust 162,219 0.05%
1,718,000 Filinvest Land Inc 46,066 0.01%
22,155 FlexiGroup Ltd/Australia 21,188 0.01%
98,909 GDI Property Group 94,243 0.03%
343,754 Genworth Mortgage Insurance Australia Ltd 531,341 0.17%
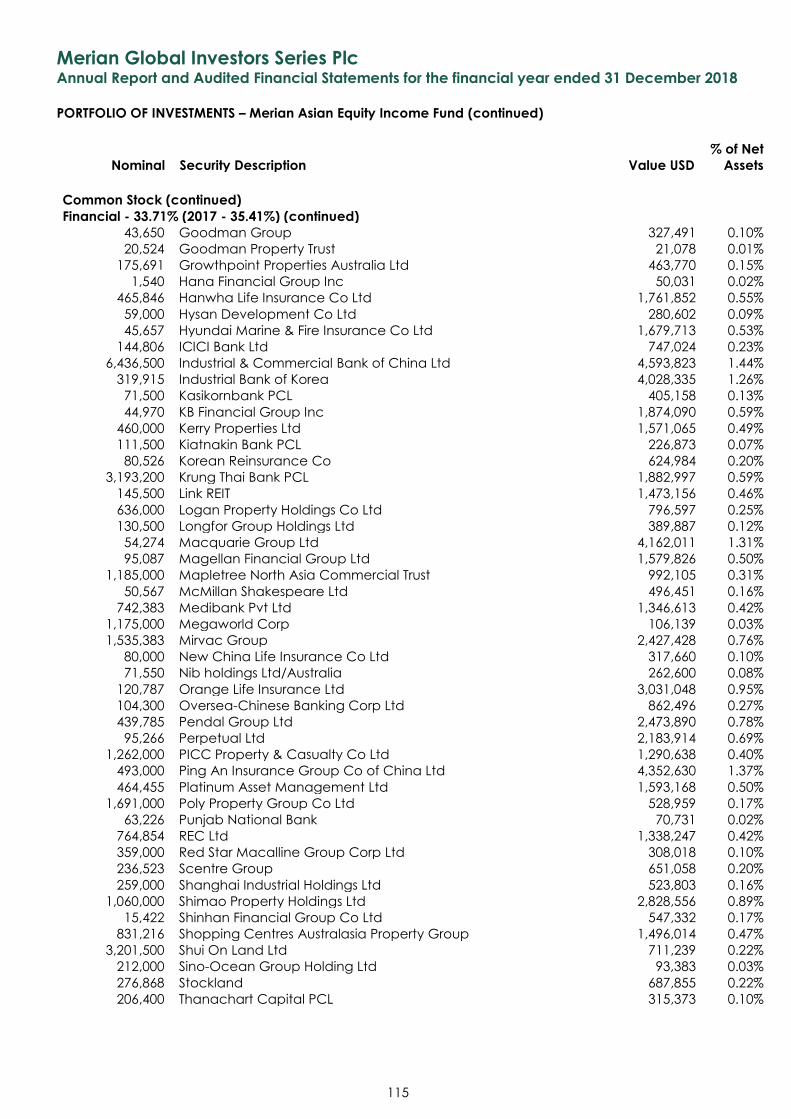
Merian Global Investors Series Plc Annual Report and Audited Financial Statements for the financial year ended 31 December 2018
PORTFOLIO OF INVESTMENTS – Merian Asian Equity Income Fund (continued)
Nominal Security Description Value USD
% of Net
Assets
115
Common Stock (continued) Financial - 33.71% (2017 - 35.41%) (continued)
43,650 Goodman Group 327,491 0.10%
20,524 Goodman Property Trust 21,078 0.01%
175,691 Growthpoint Properties Australia Ltd 463,770 0.15%
1,540 Hana Financial Group Inc 50,031 0.02%
465,846 Hanwha Life Insurance Co Ltd 1,761,852 0.55%
59,000 Hysan Development Co Ltd 280,602 0.09%
45,657 Hyundai Marine & Fire Insurance Co Ltd 1,679,713 0.53%
144,806 ICICI Bank Ltd 747,024 0.23%
6,436,500 Industrial & Commercial Bank of China Ltd 4,593,823 1.44%
319,915 Industrial Bank of Korea 4,028,335 1.26%
71,500 Kasikornbank PCL 405,158 0.13%
44,970 KB Financial Group Inc 1,874,090 0.59%
460,000 Kerry Properties Ltd 1,571,065 0.49%
111,500 Kiatnakin Bank PCL 226,873 0.07%
80,526 Korean Reinsurance Co 624,984 0.20%
3,193,200 Krung Thai Bank PCL 1,882,997 0.59%
145,500 Link REIT 1,473,156 0.46%
636,000 Logan Property Holdings Co Ltd 796,597 0.25%
130,500 Longfor Group Holdings Ltd 389,887 0.12%
54,274 Macquarie Group Ltd 4,162,011 1.31%
95,087 Magellan Financial Group Ltd 1,579,826 0.50%
1,185,000 Mapletree North Asia Commercial Trust 992,105 0.31%
50,567 McMillan Shakespeare Ltd 496,451 0.16%
742,383 Medibank Pvt Ltd 1,346,613 0.42%
1,175,000 Megaworld Corp 106,139 0.03%
1,535,383 Mirvac Group 2,427,428 0.76%
80,000 New China Life Insurance Co Ltd 317,660 0.10%
71,550 Nib holdings Ltd/Australia 262,600 0.08%
120,787 Orange Life Insurance Ltd 3,031,048 0.95%
104,300 Oversea-Chinese Banking Corp Ltd 862,496 0.27%
439,785 Pendal Group Ltd 2,473,890 0.78%
95,266 Perpetual Ltd 2,183,914 0.69%
1,262,000 PICC Property & Casualty Co Ltd 1,290,638 0.40%
493,000 Ping An Insurance Group Co of China Ltd 4,352,630 1.37%
464,455 Platinum Asset Management Ltd 1,593,168 0.50%
1,691,000 Poly Property Group Co Ltd 528,959 0.17%
63,226 Punjab National Bank 70,731 0.02%
764,854 REC Ltd 1,338,247 0.42%
359,000 Red Star Macalline Group Corp Ltd 308,018 0.10%
236,523 Scentre Group 651,058 0.20%
259,000 Shanghai Industrial Holdings Ltd 523,803 0.16%
1,060,000 Shimao Property Holdings Ltd 2,828,556 0.89%
15,422 Shinhan Financial Group Co Ltd 547,332 0.17%
831,216 Shopping Centres Australasia Property Group 1,496,014 0.47%
3,201,500 Shui On Land Ltd 711,239 0.22%
212,000 Sino-Ocean Group Holding Ltd 93,383 0.03%
276,868 Stockland 687,855 0.22%
206,400 Thanachart Capital PCL 315,373 0.10%
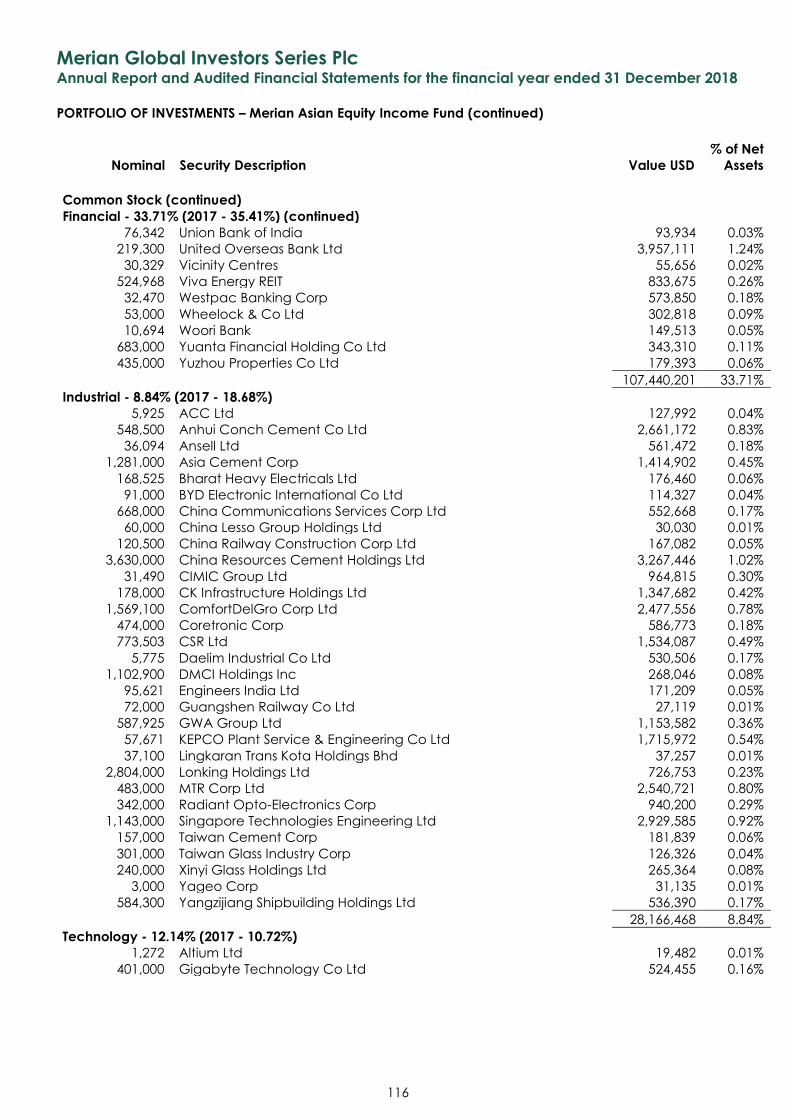
Merian Global Investors Series Plc Annual Report and Audited Financial Statements for the financial year ended 31 December 2018
PORTFOLIO OF INVESTMENTS – Merian Asian Equity Income Fund (continued)
Nominal Security Description Value USD
% of Net
Assets
116
Common Stock (continued) Financial - 33.71% (2017 - 35.41%) (continued)
76,342 Union Bank of India 93,934 0.03%
219,300 United Overseas Bank Ltd 3,957,111 1.24%
30,329 Vicinity Centres 55,656 0.02%
524,968 Viva Energy REIT 833,675 0.26%
32,470 Westpac Banking Corp 573,850 0.18%
53,000 Wheelock & Co Ltd 302,818 0.09%
10,694 Woori Bank 149,513 0.05%
683,000 Yuanta Financial Holding Co Ltd 343,310 0.11%
435,000 Yuzhou Properties Co Ltd 179,393 0.06%
107,440,201 33.71%
Industrial - 8.84% (2017 - 18.68%) 5,925 ACC Ltd 127,992 0.04%
548,500 Anhui Conch Cement Co Ltd 2,661,172 0.83%
36,094 Ansell Ltd 561,472 0.18%
1,281,000 Asia Cement Corp 1,414,902 0.45%
168,525 Bharat Heavy Electricals Ltd 176,460 0.06%
91,000 BYD Electronic International Co Ltd 114,327 0.04%
668,000 China Communications Services Corp Ltd 552,668 0.17%
60,000 China Lesso Group Holdings Ltd 30,030 0.01%
120,500 China Railway Construction Corp Ltd 167,082 0.05%
3,630,000 China Resources Cement Holdings Ltd 3,267,446 1.02%
31,490 CIMIC Group Ltd 964,815 0.30%
178,000 CK Infrastructure Holdings Ltd 1,347,682 0.42%
1,569,100 ComfortDelGro Corp Ltd 2,477,556 0.78%
474,000 Coretronic Corp 586,773 0.18%
773,503 CSR Ltd 1,534,087 0.49%
5,775 Daelim Industrial Co Ltd 530,506 0.17%
1,102,900 DMCI Holdings Inc 268,046 0.08%
95,621 Engineers India Ltd 171,209 0.05%
72,000 Guangshen Railway Co Ltd 27,119 0.01%
587,925 GWA Group Ltd 1,153,582 0.36%
57,671 KEPCO Plant Service & Engineering Co Ltd 1,715,972 0.54%
37,100 Lingkaran Trans Kota Holdings Bhd 37,257 0.01%
2,804,000 Lonking Holdings Ltd 726,753 0.23%
483,000 MTR Corp Ltd 2,540,721 0.80%
342,000 Radiant Opto-Electronics Corp 940,200 0.29%
1,143,000 Singapore Technologies Engineering Ltd 2,929,585 0.92%
157,000 Taiwan Cement Corp 181,839 0.06%
301,000 Taiwan Glass Industry Corp 126,326 0.04%
240,000 Xinyi Glass Holdings Ltd 265,364 0.08%
3,000 Yageo Corp 31,135 0.01%
584,300 Yangzijiang Shipbuilding Holdings Ltd 536,390 0.17%
28,166,468 8.84%
Technology - 12.14% (2017 - 10.72%) 1,272 Altium Ltd 19,482 0.01%
401,000 Gigabyte Technology Co Ltd 524,455 0.16%
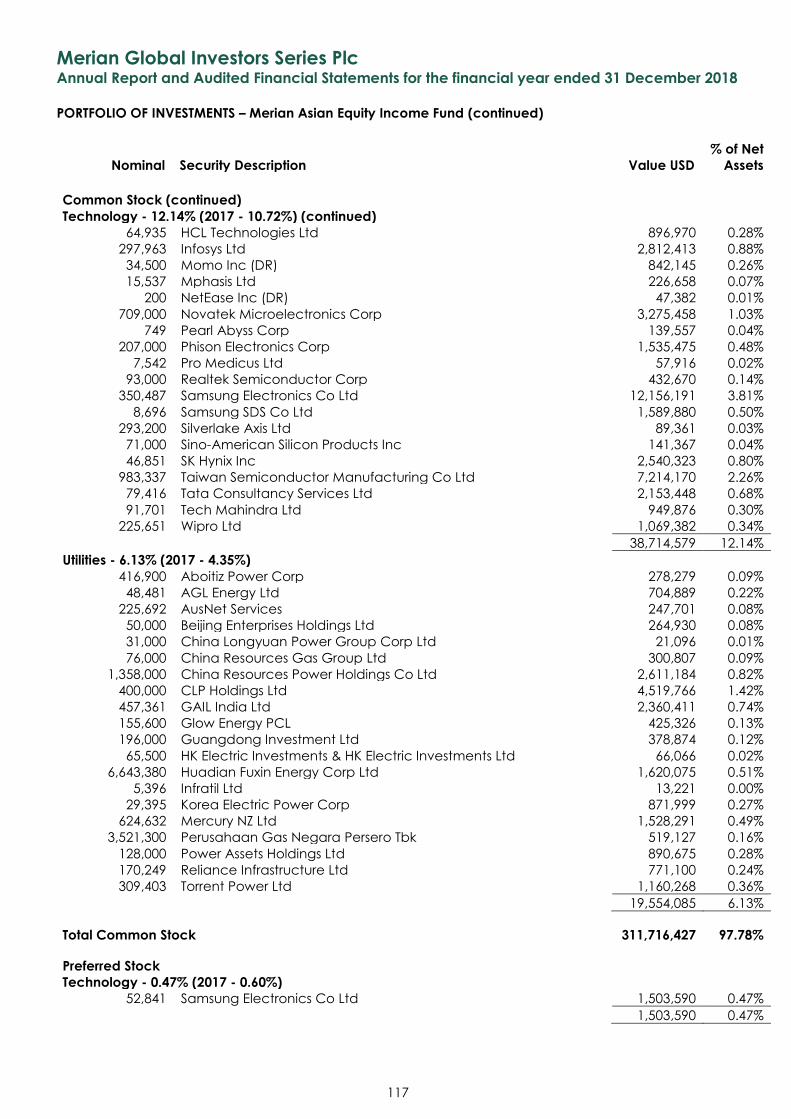
Merian Global Investors Series Plc Annual Report and Audited Financial Statements for the financial year ended 31 December 2018
PORTFOLIO OF INVESTMENTS – Merian Asian Equity Income Fund (continued)
Nominal Security Description Value USD
% of Net
Assets
117
Common Stock (continued) Technology - 12.14% (2017 - 10.72%) (continued)
64,935 HCL Technologies Ltd 896,970 0.28%
297,963 Infosys Ltd 2,812,413 0.88%
34,500 Momo Inc (DR) 842,145 0.26%
15,537 Mphasis Ltd 226,658 0.07%
200 NetEase Inc (DR) 47,382 0.01%
709,000 Novatek Microelectronics Corp 3,275,458 1.03%
749 Pearl Abyss Corp 139,557 0.04%
207,000 Phison Electronics Corp 1,535,475 0.48%
7,542 Pro Medicus Ltd 57,916 0.02%
93,000 Realtek Semiconductor Corp 432,670 0.14%
350,487 Samsung Electronics Co Ltd 12,156,191 3.81%
8,696 Samsung SDS Co Ltd 1,589,880 0.50%
293,200 Silverlake Axis Ltd 89,361 0.03%
71,000 Sino-American Silicon Products Inc 141,367 0.04%
46,851 SK Hynix Inc 2,540,323 0.80%
983,337 Taiwan Semiconductor Manufacturing Co Ltd 7,214,170 2.26%
79,416 Tata Consultancy Services Ltd 2,153,448 0.68%
91,701 Tech Mahindra Ltd 949,876 0.30%
225,651 Wipro Ltd 1,069,382 0.34%
38,714,579 12.14%
Utilities - 6.13% (2017 - 4.35%) 416,900 Aboitiz Power Corp 278,279 0.09%
48,481 AGL Energy Ltd 704,889 0.22%
225,692 AusNet Services 247,701 0.08%
50,000 Beijing Enterprises Holdings Ltd 264,930 0.08%
31,000 China Longyuan Power Group Corp Ltd 21,096 0.01%
76,000 China Resources Gas Group Ltd 300,807 0.09%
1,358,000 China Resources Power Holdings Co Ltd 2,611,184 0.82%
400,000 CLP Holdings Ltd 4,519,766 1.42%
457,361 GAIL India Ltd 2,360,411 0.74%
155,600 Glow Energy PCL 425,326 0.13%
196,000 Guangdong Investment Ltd 378,874 0.12%
65,500 HK Electric Investments & HK Electric Investments Ltd 66,066 0.02%
6,643,380 Huadian Fuxin Energy Corp Ltd 1,620,075 0.51%
5,396 Infratil Ltd 13,221 0.00%
29,395 Korea Electric Power Corp 871,999 0.27%
624,632 Mercury NZ Ltd 1,528,291 0.49%
3,521,300 Perusahaan Gas Negara Persero Tbk 519,127 0.16%
128,000 Power Assets Holdings Ltd 890,675 0.28%
170,249 Reliance Infrastructure Ltd 771,100 0.24%
309,403 Torrent Power Ltd 1,160,268 0.36%
19,554,085 6.13%
Total Common Stock 311,716,427 97.78%
Preferred Stock Technology - 0.47% (2017 - 0.60%)
52,841 Samsung Electronics Co Ltd 1,503,590 0.47%
1,503,590 0.47%
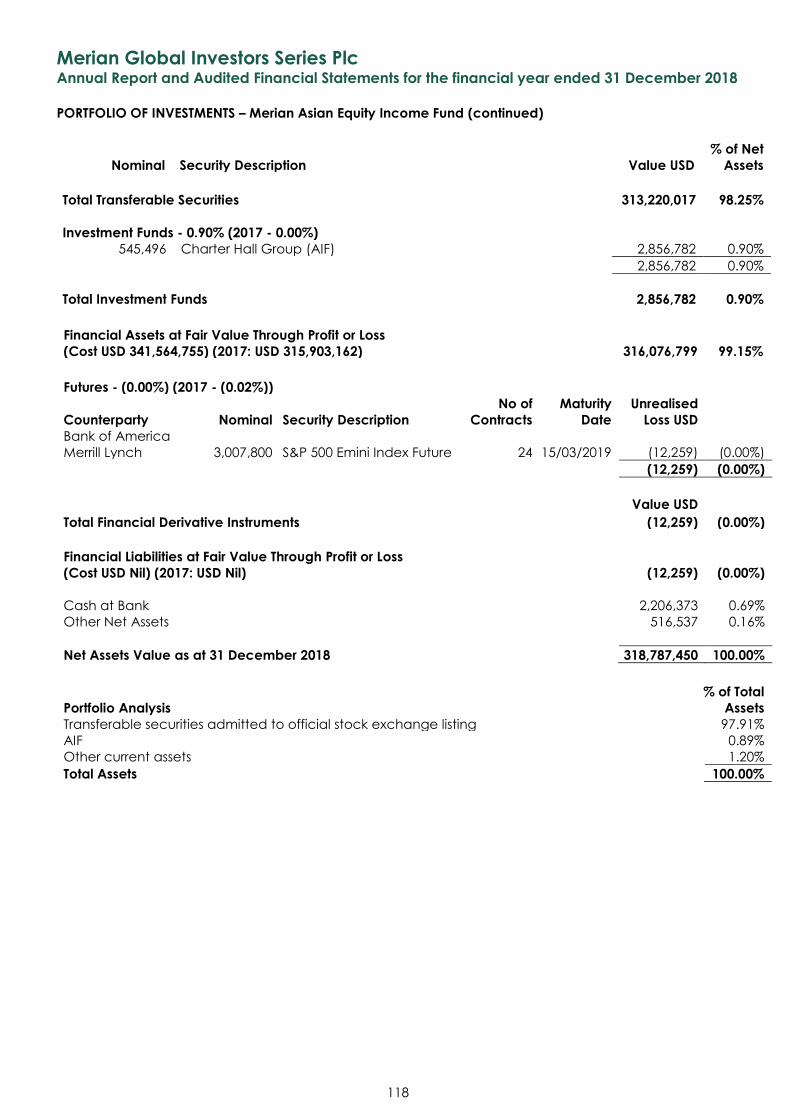
Merian Global Investors Series Plc Annual Report and Audited Financial Statements for the financial year ended 31 December 2018
PORTFOLIO OF INVESTMENTS – Merian Asian Equity Income Fund (continued)
Nominal Security Description Value USD
% of Net
Assets
118
Total Transferable Securities 313,220,017 98.25%
Investment Funds - 0.90% (2017 - 0.00%) 545,496 Charter Hall Group (AIF) 2,856,782 0.90%
2,856,782 0.90%
Total Investment Funds 2,856,782 0.90%
Financial Assets at Fair Value Through Profit or Loss
(Cost USD 341,564,755) (2017: USD 315,903,162) 316,076,799 99.15%
Futures - (0.00%) (2017 - (0.02%))
Counterparty Nominal Security Description
No of
Contracts
Maturity
Date
Unrealised
Loss USD
Bank of America
Merrill Lynch 3,007,800 S&P 500 Emini Index Future 24 15/03/2019 (12,259) (0.00%)
(12,259) (0.00%)
Value USD
Total Financial Derivative Instruments (12,259) (0.00%)
Financial Liabilities at Fair Value Through Profit or Loss
(Cost USD Nil) (2017: USD Nil) (12,259) (0.00%)
Cash at Bank 2,206,373 0.69%
Other Net Assets 516,537 0.16%
Net Assets Value as at 31 December 2018 318,787,450 100.00%
Portfolio Analysis
% of Total
Assets
Transferable securities admitted to official stock exchange listing 97.91%
AIF 0.89%
Other current assets 1.20%
Total Assets 100.00%
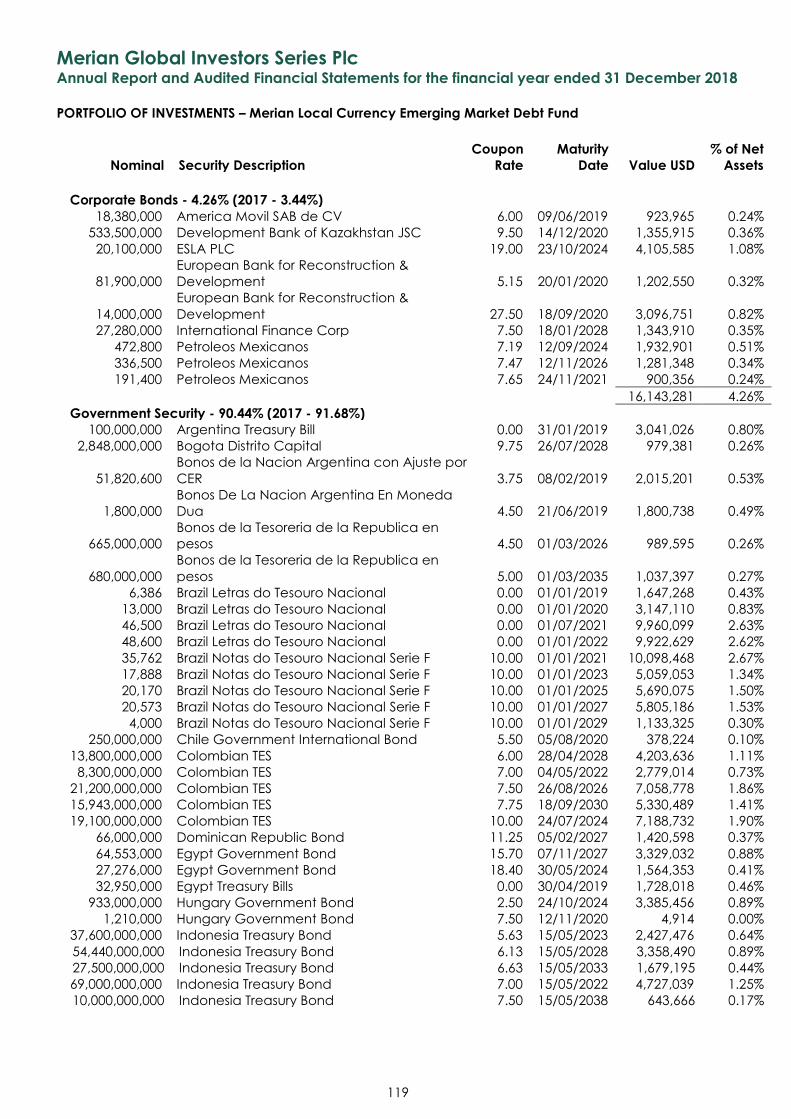
Merian Global Investors Series Plc Annual Report and Audited Financial Statements for the financial year ended 31 December 2018
PORTFOLIO OF INVESTMENTS – Merian Local Currency Emerging Market Debt Fund
Nominal Security Description
Coupon
Rate
Maturity
Date Value USD
% of Net
Assets
119
Corporate Bonds - 4.26% (2017 - 3.44%) 18,380,000 America Movil SAB de CV 6.00 09/06/2019 923,965 0.24%
533,500,000 Development Bank of Kazakhstan JSC 9.50 14/12/2020 1,355,915 0.36%
20,100,000 ESLA PLC 19.00 23/10/2024 4,105,585 1.08%
81,900,000
European Bank for Reconstruction &
Development 5.15 20/01/2020 1,202,550 0.32%
14,000,000
European Bank for Reconstruction &
Development 27.50 18/09/2020 3,096,751 0.82%
27,280,000 International Finance Corp 7.50 18/01/2028 1,343,910 0.35%
472,800 Petroleos Mexicanos 7.19 12/09/2024 1,932,901 0.51%
336,500 Petroleos Mexicanos 7.47 12/11/2026 1,281,348 0.34%
191,400 Petroleos Mexicanos 7.65 24/11/2021 900,356 0.24%
16,143,281 4.26%
Government Security - 90.44% (2017 - 91.68%) 100,000,000 Argentina Treasury Bill 0.00 31/01/2019 3,041,026 0.80%
2,848,000,000 Bogota Distrito Capital 9.75 26/07/2028 979,381 0.26%
51,820,600
Bonos de la Nacion Argentina con Ajuste por
CER 3.75 08/02/2019 2,015,201 0.53%
1,800,000
Bonos De La Nacion Argentina En Moneda
Dua 4.50 21/06/2019 1,800,738 0.49%
665,000,000
Bonos de la Tesoreria de la Republica en
pesos 4.50 01/03/2026 989,595 0.26%
680,000,000
Bonos de la Tesoreria de la Republica en
pesos 5.00 01/03/2035 1,037,397 0.27%
6,386 Brazil Letras do Tesouro Nacional 0.00 01/01/2019 1,647,268 0.43%
13,000 Brazil Letras do Tesouro Nacional 0.00 01/01/2020 3,147,110 0.83%
46,500 Brazil Letras do Tesouro Nacional 0.00 01/07/2021 9,960,099 2.63%
48,600 Brazil Letras do Tesouro Nacional 0.00 01/01/2022 9,922,629 2.62%
35,762 Brazil Notas do Tesouro Nacional Serie F 10.00 01/01/2021 10,098,468 2.67%
17,888 Brazil Notas do Tesouro Nacional Serie F 10.00 01/01/2023 5,059,053 1.34%
20,170 Brazil Notas do Tesouro Nacional Serie F 10.00 01/01/2025 5,690,075 1.50%
20,573 Brazil Notas do Tesouro Nacional Serie F 10.00 01/01/2027 5,805,186 1.53%
4,000 Brazil Notas do Tesouro Nacional Serie F 10.00 01/01/2029 1,133,325 0.30%
250,000,000 Chile Government International Bond 5.50 05/08/2020 378,224 0.10%
13,800,000,000 Colombian TES 6.00 28/04/2028 4,203,636 1.11%
8,300,000,000 Colombian TES 7.00 04/05/2022 2,779,014 0.73%
21,200,000,000 Colombian TES 7.50 26/08/2026 7,058,778 1.86%
15,943,000,000 Colombian TES 7.75 18/09/2030 5,330,489 1.41%
19,100,000,000 Colombian TES 10.00 24/07/2024 7,188,732 1.90%
66,000,000 Dominican Republic Bond 11.25 05/02/2027 1,420,598 0.37%
64,553,000 Egypt Government Bond 15.70 07/11/2027 3,329,032 0.88%
27,276,000 Egypt Government Bond 18.40 30/05/2024 1,564,353 0.41%
32,950,000 Egypt Treasury Bills 0.00 30/04/2019 1,728,018 0.46%
933,000,000 Hungary Government Bond 2.50 24/10/2024 3,385,456 0.89%
1,210,000 Hungary Government Bond 7.50 12/11/2020 4,914 0.00%
37,600,000,000 Indonesia Treasury Bond 5.63 15/05/2023 2,427,476 0.64%
54,440,000,000 Indonesia Treasury Bond 6.13 15/05/2028 3,358,490 0.89%
27,500,000,000 Indonesia Treasury Bond 6.63 15/05/2033 1,679,195 0.44%
69,000,000,000 Indonesia Treasury Bond 7.00 15/05/2022 4,727,039 1.25%
10,000,000,000 Indonesia Treasury Bond 7.50 15/05/2038 643,666 0.17%
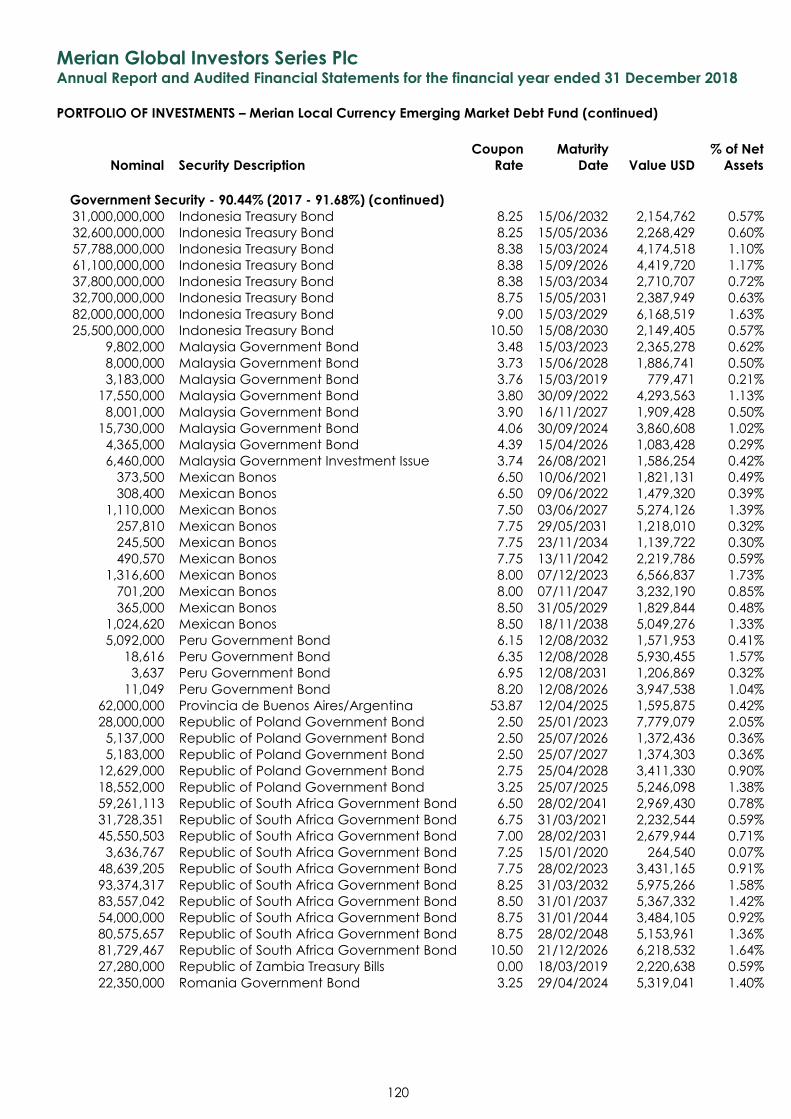
Merian Global Investors Series Plc Annual Report and Audited Financial Statements for the financial year ended 31 December 2018
PORTFOLIO OF INVESTMENTS – Merian Local Currency Emerging Market Debt Fund (continued)
Nominal Security Description
Coupon
Rate
Maturity
Date Value USD
% of Net
Assets
120
Government Security - 90.44% (2017 - 91.68%) (continued) 31,000,000,000 Indonesia Treasury Bond 8.25 15/06/2032 2,154,762 0.57%
32,600,000,000 Indonesia Treasury Bond 8.25 15/05/2036 2,268,429 0.60%
57,788,000,000 Indonesia Treasury Bond 8.38 15/03/2024 4,174,518 1.10%
61,100,000,000 Indonesia Treasury Bond 8.38 15/09/2026 4,419,720 1.17%
37,800,000,000 Indonesia Treasury Bond 8.38 15/03/2034 2,710,707 0.72%
32,700,000,000 Indonesia Treasury Bond 8.75 15/05/2031 2,387,949 0.63%
82,000,000,000 Indonesia Treasury Bond 9.00 15/03/2029 6,168,519 1.63%
25,500,000,000 Indonesia Treasury Bond 10.50 15/08/2030 2,149,405 0.57%
9,802,000 Malaysia Government Bond 3.48 15/03/2023 2,365,278 0.62%
8,000,000 Malaysia Government Bond 3.73 15/06/2028 1,886,741 0.50%
3,183,000 Malaysia Government Bond 3.76 15/03/2019 779,471 0.21%
17,550,000 Malaysia Government Bond 3.80 30/09/2022 4,293,563 1.13%
8,001,000 Malaysia Government Bond 3.90 16/11/2027 1,909,428 0.50%
15,730,000 Malaysia Government Bond 4.06 30/09/2024 3,860,608 1.02%
4,365,000 Malaysia Government Bond 4.39 15/04/2026 1,083,428 0.29%
6,460,000 Malaysia Government Investment Issue 3.74 26/08/2021 1,586,254 0.42%
373,500 Mexican Bonos 6.50 10/06/2021 1,821,131 0.49%
308,400 Mexican Bonos 6.50 09/06/2022 1,479,320 0.39%
1,110,000 Mexican Bonos 7.50 03/06/2027 5,274,126 1.39%
257,810 Mexican Bonos 7.75 29/05/2031 1,218,010 0.32%
245,500 Mexican Bonos 7.75 23/11/2034 1,139,722 0.30%
490,570 Mexican Bonos 7.75 13/11/2042 2,219,786 0.59%
1,316,600 Mexican Bonos 8.00 07/12/2023 6,566,837 1.73%
701,200 Mexican Bonos 8.00 07/11/2047 3,232,190 0.85%
365,000 Mexican Bonos 8.50 31/05/2029 1,829,844 0.48%
1,024,620 Mexican Bonos 8.50 18/11/2038 5,049,276 1.33%
5,092,000 Peru Government Bond 6.15 12/08/2032 1,571,953 0.41%
18,616 Peru Government Bond 6.35 12/08/2028 5,930,455 1.57%
3,637 Peru Government Bond 6.95 12/08/2031 1,206,869 0.32%
11,049 Peru Government Bond 8.20 12/08/2026 3,947,538 1.04%
62,000,000 Provincia de Buenos Aires/Argentina 53.87 12/04/2025 1,595,875 0.42%
28,000,000 Republic of Poland Government Bond 2.50 25/01/2023 7,779,079 2.05%
5,137,000 Republic of Poland Government Bond 2.50 25/07/2026 1,372,436 0.36%
5,183,000 Republic of Poland Government Bond 2.50 25/07/2027 1,374,303 0.36%
12,629,000 Republic of Poland Government Bond 2.75 25/04/2028 3,411,330 0.90%
18,552,000 Republic of Poland Government Bond 3.25 25/07/2025 5,246,098 1.38%
59,261,113 Republic of South Africa Government Bond 6.50 28/02/2041 2,969,430 0.78%
31,728,351 Republic of South Africa Government Bond 6.75 31/03/2021 2,232,544 0.59%
45,550,503 Republic of South Africa Government Bond 7.00 28/02/2031 2,679,944 0.71%
3,636,767 Republic of South Africa Government Bond 7.25 15/01/2020 264,540 0.07%
48,639,205 Republic of South Africa Government Bond 7.75 28/02/2023 3,431,165 0.91%
93,374,317 Republic of South Africa Government Bond 8.25 31/03/2032 5,975,266 1.58%
83,557,042 Republic of South Africa Government Bond 8.50 31/01/2037 5,367,332 1.42%
54,000,000 Republic of South Africa Government Bond 8.75 31/01/2044 3,484,105 0.92%
80,575,657 Republic of South Africa Government Bond 8.75 28/02/2048 5,153,961 1.36%
81,729,467 Republic of South Africa Government Bond 10.50 21/12/2026 6,218,532 1.64%
27,280,000 Republic of Zambia Treasury Bills 0.00 18/03/2019 2,220,638 0.59%
22,350,000 Romania Government Bond 3.25 29/04/2024 5,319,041 1.40%
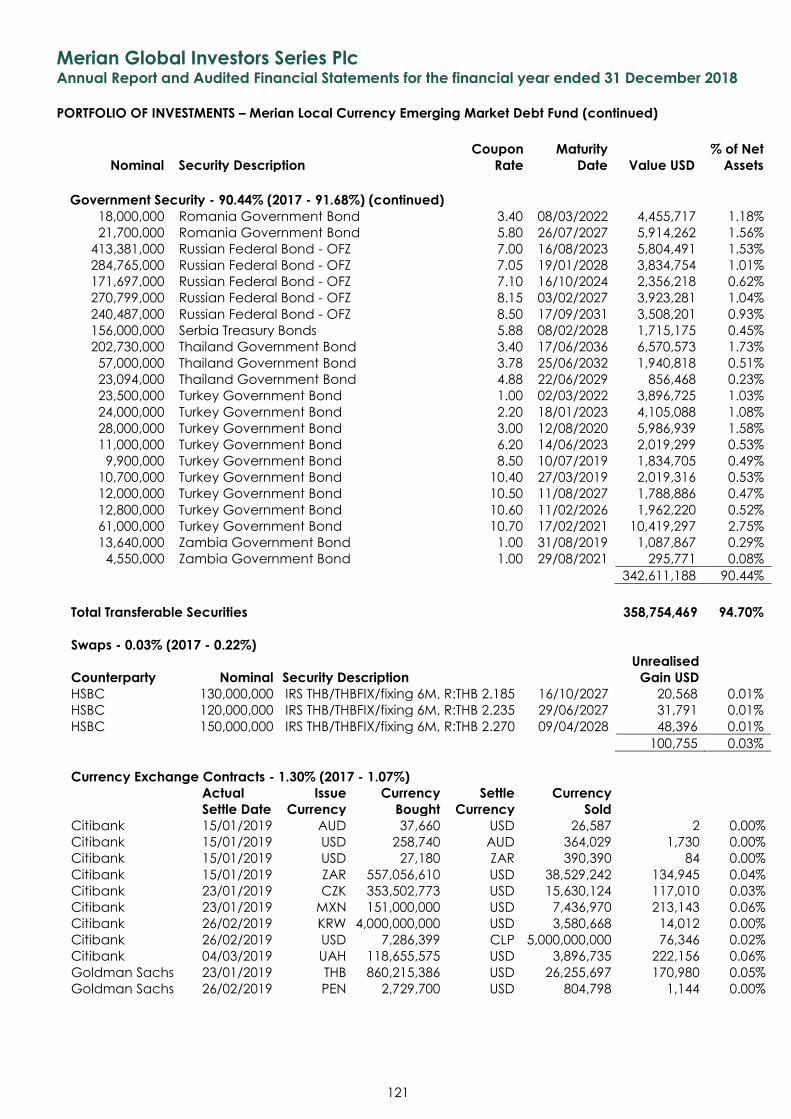
Merian Global Investors Series Plc Annual Report and Audited Financial Statements for the financial year ended 31 December 2018
PORTFOLIO OF INVESTMENTS – Merian Local Currency Emerging Market Debt Fund (continued)
Nominal Security Description
Coupon
Rate
Maturity
Date Value USD
% of Net
Assets
121
Government Security - 90.44% (2017 - 91.68%) (continued) 18,000,000 Romania Government Bond 3.40 08/03/2022 4,455,717 1.18%
21,700,000 Romania Government Bond 5.80 26/07/2027 5,914,262 1.56%
413,381,000 Russian Federal Bond - OFZ 7.00 16/08/2023 5,804,491 1.53%
284,765,000 Russian Federal Bond - OFZ 7.05 19/01/2028 3,834,754 1.01%
171,697,000 Russian Federal Bond - OFZ 7.10 16/10/2024 2,356,218 0.62%
270,799,000 Russian Federal Bond - OFZ 8.15 03/02/2027 3,923,281 1.04%
240,487,000 Russian Federal Bond - OFZ 8.50 17/09/2031 3,508,201 0.93%
156,000,000 Serbia Treasury Bonds 5.88 08/02/2028 1,715,175 0.45%
202,730,000 Thailand Government Bond 3.40 17/06/2036 6,570,573 1.73%
57,000,000 Thailand Government Bond 3.78 25/06/2032 1,940,818 0.51%
23,094,000 Thailand Government Bond 4.88 22/06/2029 856,468 0.23%
23,500,000 Turkey Government Bond 1.00 02/03/2022 3,896,725 1.03%
24,000,000 Turkey Government Bond 2.20 18/01/2023 4,105,088 1.08%
28,000,000 Turkey Government Bond 3.00 12/08/2020 5,986,939 1.58%
11,000,000 Turkey Government Bond 6.20 14/06/2023 2,019,299 0.53%
9,900,000 Turkey Government Bond 8.50 10/07/2019 1,834,705 0.49%
10,700,000 Turkey Government Bond 10.40 27/03/2019 2,019,316 0.53%
12,000,000 Turkey Government Bond 10.50 11/08/2027 1,788,886 0.47%
12,800,000 Turkey Government Bond 10.60 11/02/2026 1,962,220 0.52%
61,000,000 Turkey Government Bond 10.70 17/02/2021 10,419,297 2.75%
13,640,000 Zambia Government Bond 1.00 31/08/2019 1,087,867 0.29%
4,550,000 Zambia Government Bond 1.00 29/08/2021 295,771 0.08%
342,611,188 90.44%
Total Transferable Securities 358,754,469 94.70%
Swaps - 0.03% (2017 - 0.22%)
Counterparty Nominal Security Description
Unrealised
Gain USD
HSBC 130,000,000 IRS THB/THBFIX/fixing 6M, R:THB 2.185 16/10/2027 20,568 0.01%
HSBC 120,000,000 IRS THB/THBFIX/fixing 6M, R:THB 2.235 29/06/2027 31,791 0.01%
HSBC 150,000,000 IRS THB/THBFIX/fixing 6M, R:THB 2.270 09/04/2028 48,396 0.01%
100,755 0.03%
Currency Exchange Contracts - 1.30% (2017 - 1.07%)
Actual
Settle Date
Issue
Currency
Currency
Bought
Settle
Currency
Currency
Sold Citibank 15/01/2019 AUD 37,660 USD 26,587 2 0.00%
Citibank 15/01/2019 USD 258,740 AUD 364,029 1,730 0.00%
Citibank 15/01/2019 USD 27,180 ZAR 390,390 84 0.00%
Citibank 15/01/2019 ZAR 557,056,610 USD 38,529,242 134,945 0.04%
Citibank 23/01/2019 CZK 353,502,773 USD 15,630,124 117,010 0.03%
Citibank 23/01/2019 MXN 151,000,000 USD 7,436,970 213,143 0.06%
Citibank 26/02/2019 KRW 4,000,000,000 USD 3,580,668 14,012 0.00%
Citibank 26/02/2019 USD 7,286,399 CLP 5,000,000,000 76,346 0.02%
Citibank 04/03/2019 UAH 118,655,575 USD 3,896,735 222,156 0.06%
Goldman Sachs 23/01/2019 THB 860,215,386 USD 26,255,697 170,980 0.05%
Goldman Sachs 26/02/2019 PEN 2,729,700 USD 804,798 1,144 0.00%
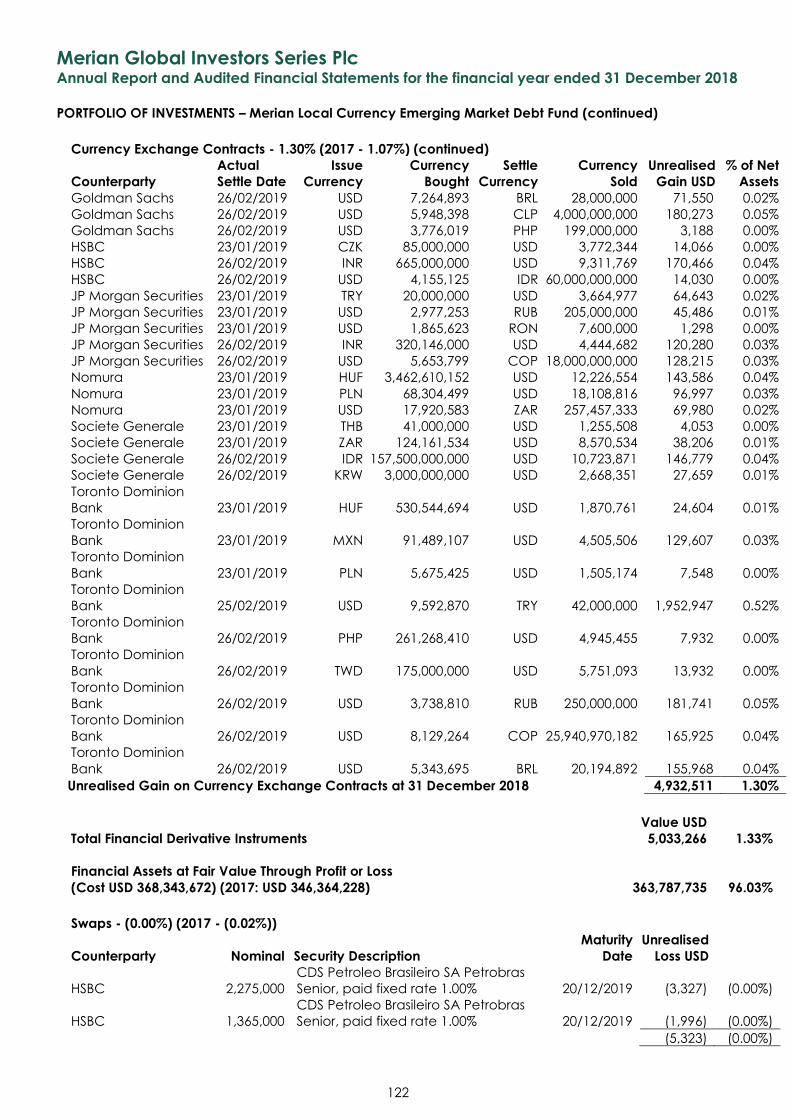
Merian Global Investors Series Plc Annual Report and Audited Financial Statements for the financial year ended 31 December 2018
PORTFOLIO OF INVESTMENTS – Merian Local Currency Emerging Market Debt Fund (continued)
122
Currency Exchange Contracts - 1.30% (2017 - 1.07%) (continued)
Counterparty
Actual
Settle Date
Issue
Currency
Currency
Bought
Settle
Currency
Currency
Sold
Unrealised
Gain USD
% of Net
Assets
Goldman Sachs 26/02/2019 USD 7,264,893 BRL 28,000,000 71,550 0.02%
Goldman Sachs 26/02/2019 USD 5,948,398 CLP 4,000,000,000 180,273 0.05%
Goldman Sachs 26/02/2019 USD 3,776,019 PHP 199,000,000 3,188 0.00%
HSBC 23/01/2019 CZK 85,000,000 USD 3,772,344 14,066 0.00%
HSBC 26/02/2019 INR 665,000,000 USD 9,311,769 170,466 0.04%
HSBC 26/02/2019 USD 4,155,125 IDR 60,000,000,000 14,030 0.00%
JP Morgan Securities 23/01/2019 TRY 20,000,000 USD 3,664,977 64,643 0.02%
JP Morgan Securities 23/01/2019 USD 2,977,253 RUB 205,000,000 45,486 0.01%
JP Morgan Securities 23/01/2019 USD 1,865,623 RON 7,600,000 1,298 0.00%
JP Morgan Securities 26/02/2019 INR 320,146,000 USD 4,444,682 120,280 0.03%
JP Morgan Securities 26/02/2019 USD 5,653,799 COP 18,000,000,000 128,215 0.03%
Nomura 23/01/2019 HUF 3,462,610,152 USD 12,226,554 143,586 0.04%
Nomura 23/01/2019 PLN 68,304,499 USD 18,108,816 96,997 0.03%
Nomura 23/01/2019 USD 17,920,583 ZAR 257,457,333 69,980 0.02%
Societe Generale 23/01/2019 THB 41,000,000 USD 1,255,508 4,053 0.00%
Societe Generale 23/01/2019 ZAR 124,161,534 USD 8,570,534 38,206 0.01%
Societe Generale 26/02/2019 IDR 157,500,000,000 USD 10,723,871 146,779 0.04%
Societe Generale 26/02/2019 KRW 3,000,000,000 USD 2,668,351 27,659 0.01%
Toronto Dominion
Bank 23/01/2019 HUF 530,544,694 USD 1,870,761 24,604 0.01%
Toronto Dominion
Bank 23/01/2019 MXN 91,489,107 USD 4,505,506 129,607 0.03%
Toronto Dominion
Bank 23/01/2019 PLN 5,675,425 USD 1,505,174 7,548 0.00%
Toronto Dominion
Bank 25/02/2019 USD 9,592,870 TRY 42,000,000 1,952,947 0.52%
Toronto Dominion
Bank 26/02/2019 PHP 261,268,410 USD 4,945,455 7,932 0.00%
Toronto Dominion
Bank 26/02/2019 TWD 175,000,000 USD 5,751,093 13,932 0.00%
Toronto Dominion
Bank 26/02/2019 USD 3,738,810 RUB 250,000,000 181,741 0.05%
Toronto Dominion
Bank 26/02/2019 USD 8,129,264 COP 25,940,970,182 165,925 0.04%
Toronto Dominion
Bank 26/02/2019 USD 5,343,695 BRL 20,194,892 155,968 0.04%
Unrealised Gain on Currency Exchange Contracts at 31 December 2018 4,932,511 1.30%
Value USD
Total Financial Derivative Instruments 5,033,266 1.33%
Financial Assets at Fair Value Through Profit or Loss
(Cost USD 368,343,672) (2017: USD 346,364,228) 363,787,735 96.03%
Swaps - (0.00%) (2017 - (0.02%))
Counterparty Nominal Security Description
Maturity
Date
Unrealised
Loss USD
HSBC 2,275,000
CDS Petroleo Brasileiro SA Petrobras
Senior, paid fixed rate 1.00% 20/12/2019 (3,327) (0.00%)
HSBC 1,365,000
CDS Petroleo Brasileiro SA Petrobras
Senior, paid fixed rate 1.00% 20/12/2019 (1,996) (0.00%)
(5,323) (0.00%)
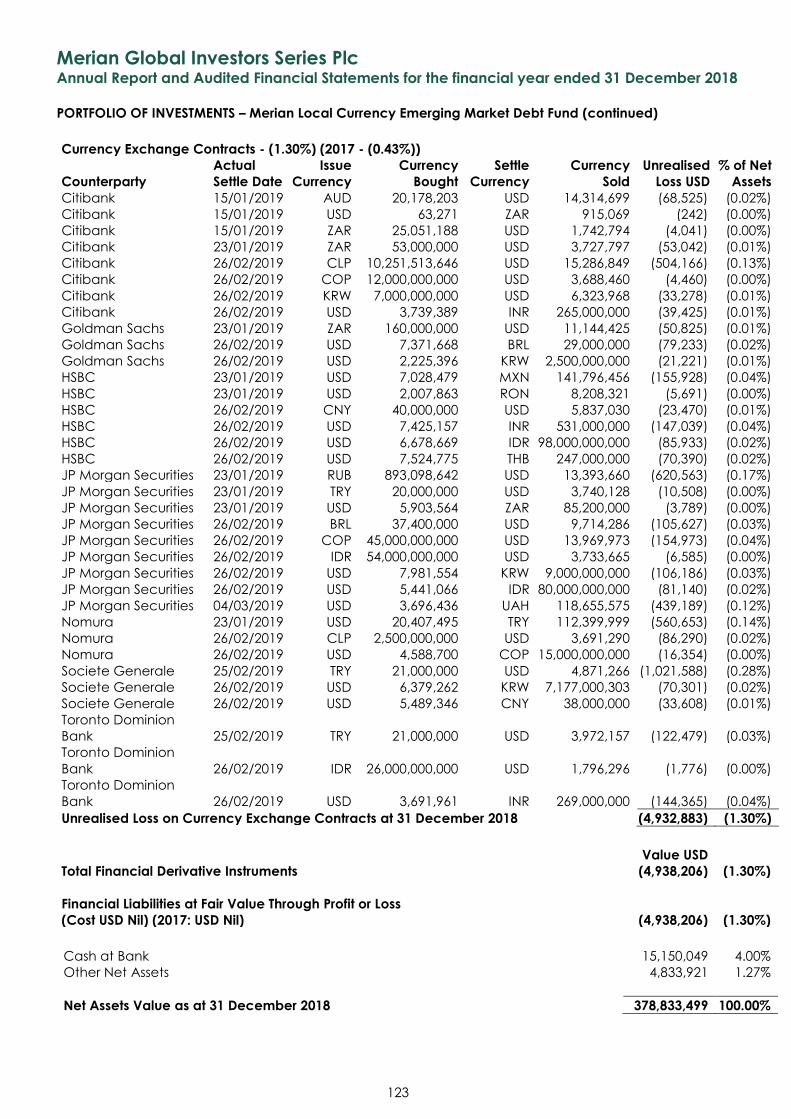
Merian Global Investors Series Plc Annual Report and Audited Financial Statements for the financial year ended 31 December 2018
PORTFOLIO OF INVESTMENTS – Merian Local Currency Emerging Market Debt Fund (continued)
123
Currency Exchange Contracts - (1.30%) (2017 - (0.43%))
Counterparty
Actual
Settle Date
Issue
Currency
Currency
Bought
Settle
Currency
Currency
Sold
Unrealised
Loss USD
% of Net
Assets
Citibank 15/01/2019 AUD 20,178,203 USD 14,314,699 (68,525) (0.02%)
Citibank 15/01/2019 USD 63,271 ZAR 915,069 (242) (0.00%)
Citibank 15/01/2019 ZAR 25,051,188 USD 1,742,794 (4,041) (0.00%)
Citibank 23/01/2019 ZAR 53,000,000 USD 3,727,797 (53,042) (0.01%)
Citibank 26/02/2019 CLP 10,251,513,646 USD 15,286,849 (504,166) (0.13%)
Citibank 26/02/2019 COP 12,000,000,000 USD 3,688,460 (4,460) (0.00%)
Citibank 26/02/2019 KRW 7,000,000,000 USD 6,323,968 (33,278) (0.01%)
Citibank 26/02/2019 USD 3,739,389 INR 265,000,000 (39,425) (0.01%)
Goldman Sachs 23/01/2019 ZAR 160,000,000 USD 11,144,425 (50,825) (0.01%)
Goldman Sachs 26/02/2019 USD 7,371,668 BRL 29,000,000 (79,233) (0.02%)
Goldman Sachs 26/02/2019 USD 2,225,396 KRW 2,500,000,000 (21,221) (0.01%)
HSBC 23/01/2019 USD 7,028,479 MXN 141,796,456 (155,928) (0.04%)
HSBC 23/01/2019 USD 2,007,863 RON 8,208,321 (5,691) (0.00%)
HSBC 26/02/2019 CNY 40,000,000 USD 5,837,030 (23,470) (0.01%)
HSBC 26/02/2019 USD 7,425,157 INR 531,000,000 (147,039) (0.04%)
HSBC 26/02/2019 USD 6,678,669 IDR 98,000,000,000 (85,933) (0.02%)
HSBC 26/02/2019 USD 7,524,775 THB 247,000,000 (70,390) (0.02%)
JP Morgan Securities 23/01/2019 RUB 893,098,642 USD 13,393,660 (620,563) (0.17%)
JP Morgan Securities 23/01/2019 TRY 20,000,000 USD 3,740,128 (10,508) (0.00%)
JP Morgan Securities 23/01/2019 USD 5,903,564 ZAR 85,200,000 (3,789) (0.00%)
JP Morgan Securities 26/02/2019 BRL 37,400,000 USD 9,714,286 (105,627) (0.03%)
JP Morgan Securities 26/02/2019 COP 45,000,000,000 USD 13,969,973 (154,973) (0.04%)
JP Morgan Securities 26/02/2019 IDR 54,000,000,000 USD 3,733,665 (6,585) (0.00%)
JP Morgan Securities 26/02/2019 USD 7,981,554 KRW 9,000,000,000 (106,186) (0.03%)
JP Morgan Securities 26/02/2019 USD 5,441,066 IDR 80,000,000,000 (81,140) (0.02%)
JP Morgan Securities 04/03/2019 USD 3,696,436 UAH 118,655,575 (439,189) (0.12%)
Nomura 23/01/2019 USD 20,407,495 TRY 112,399,999 (560,653) (0.14%)
Nomura 26/02/2019 CLP 2,500,000,000 USD 3,691,290 (86,290) (0.02%)
Nomura 26/02/2019 USD 4,588,700 COP 15,000,000,000 (16,354) (0.00%)
Societe Generale 25/02/2019 TRY 21,000,000 USD 4,871,266 (1,021,588) (0.28%)
Societe Generale 26/02/2019 USD 6,379,262 KRW 7,177,000,303 (70,301) (0.02%)
Societe Generale 26/02/2019 USD 5,489,346 CNY 38,000,000 (33,608) (0.01%)
Toronto Dominion
Bank 25/02/2019 TRY 21,000,000 USD 3,972,157 (122,479) (0.03%)
Toronto Dominion
Bank 26/02/2019 IDR 26,000,000,000 USD 1,796,296 (1,776) (0.00%)
Toronto Dominion
Bank 26/02/2019 USD 3,691,961 INR 269,000,000 (144,365) (0.04%)
Unrealised Loss on Currency Exchange Contracts at 31 December 2018 (4,932,883) (1.30%)
Value USD
Total Financial Derivative Instruments (4,938,206) (1.30%)
Financial Liabilities at Fair Value Through Profit or Loss
(Cost USD Nil) (2017: USD Nil) (4,938,206) (1.30%)
Cash at Bank 15,150,049 4.00%
Other Net Assets 4,833,921 1.27%
Net Assets Value as at 31 December 2018 378,833,499 100.00%
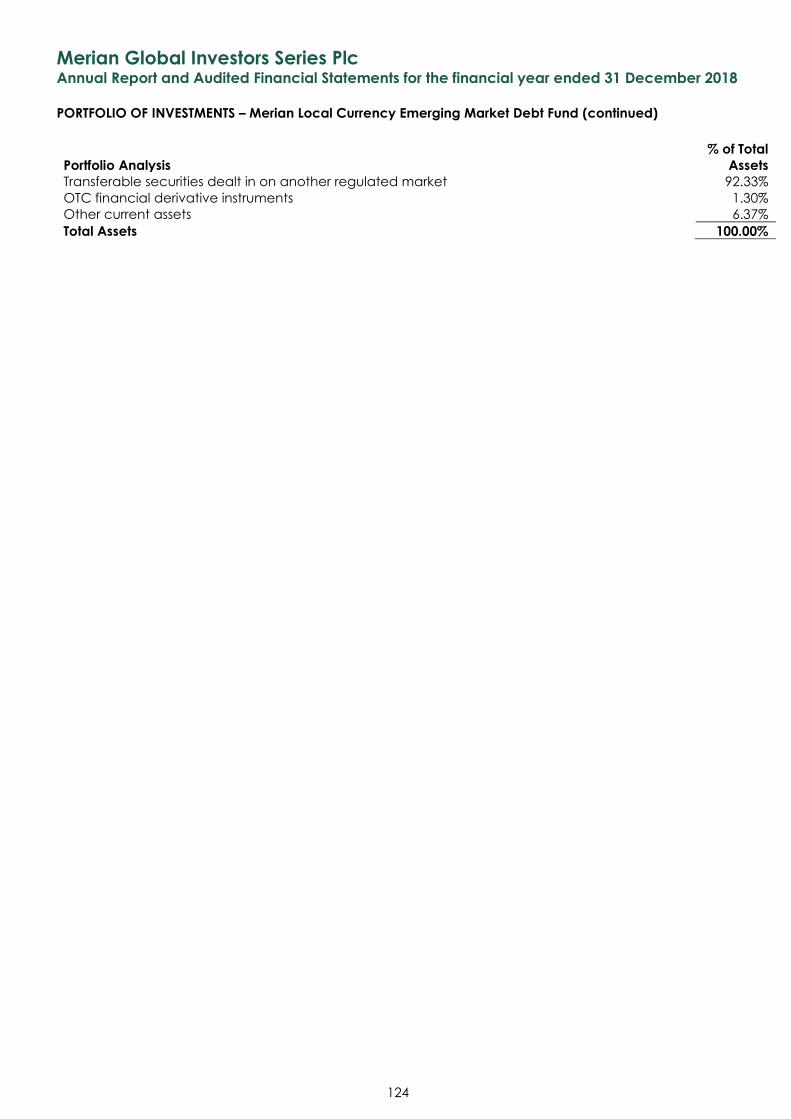
Merian Global Investors Series Plc Annual Report and Audited Financial Statements for the financial year ended 31 December 2018
PORTFOLIO OF INVESTMENTS – Merian Local Currency Emerging Market Debt Fund (continued)
124
Portfolio Analysis
% of Total
Assets
Transferable securities dealt in on another regulated market 92.33%
OTC financial derivative instruments 1.30%
Other current assets 6.37%
Total Assets 100.00%
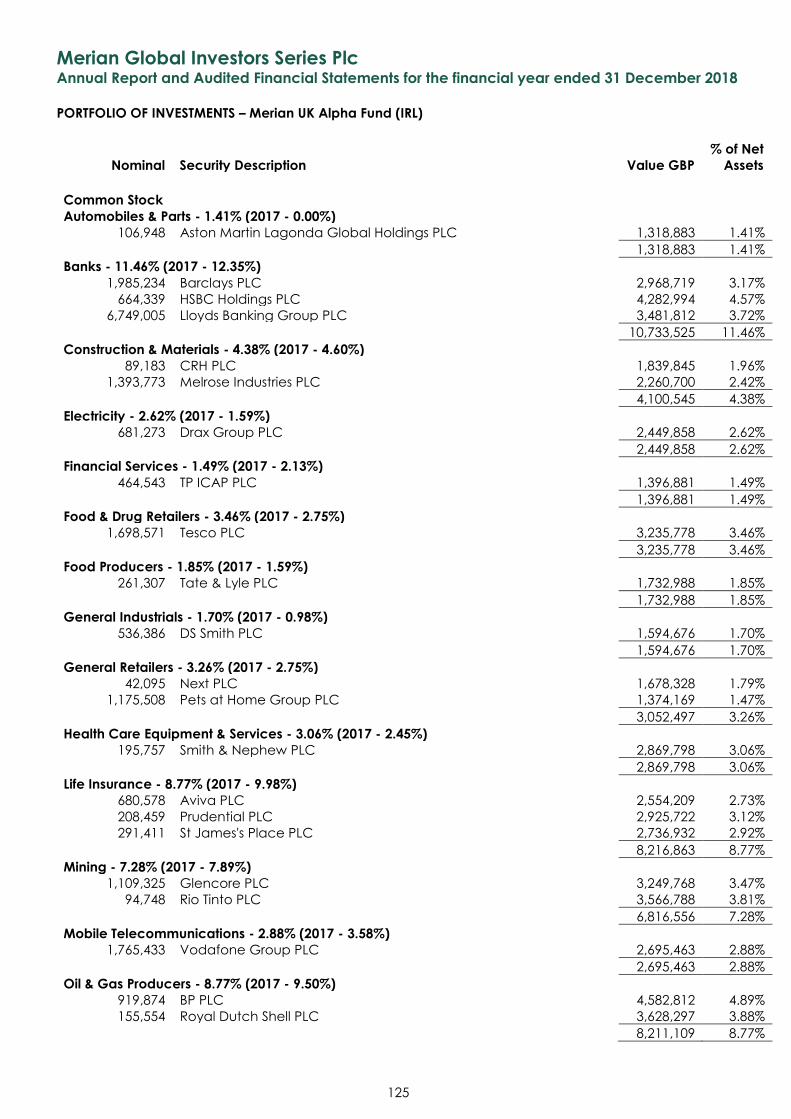
Merian Global Investors Series Plc Annual Report and Audited Financial Statements for the financial year ended 31 December 2018
PORTFOLIO OF INVESTMENTS – Merian UK Alpha Fund (IRL)
Nominal Security Description Value GBP
% of Net
Assets
125
Common Stock Automobiles & Parts - 1.41% (2017 - 0.00%)
106,948 Aston Martin Lagonda Global Holdings PLC 1,318,883 1.41%
1,318,883 1.41%
Banks - 11.46% (2017 - 12.35%) 1,985,234 Barclays PLC 2,968,719 3.17%
664,339 HSBC Holdings PLC 4,282,994 4.57%
6,749,005 Lloyds Banking Group PLC 3,481,812 3.72%
10,733,525 11.46%
Construction & Materials - 4.38% (2017 - 4.60%) 89,183 CRH PLC 1,839,845 1.96%
1,393,773 Melrose Industries PLC 2,260,700 2.42%
4,100,545 4.38%
Electricity - 2.62% (2017 - 1.59%) 681,273 Drax Group PLC 2,449,858 2.62%
2,449,858 2.62%
Financial Services - 1.49% (2017 - 2.13%) 464,543 TP ICAP PLC 1,396,881 1.49%
1,396,881 1.49%
Food & Drug Retailers - 3.46% (2017 - 2.75%) 1,698,571 Tesco PLC 3,235,778 3.46%
3,235,778 3.46%
Food Producers - 1.85% (2017 - 1.59%) 261,307 Tate & Lyle PLC 1,732,988 1.85%
1,732,988 1.85%
General Industrials - 1.70% (2017 - 0.98%) 536,386 DS Smith PLC 1,594,676 1.70%
1,594,676 1.70%
General Retailers - 3.26% (2017 - 2.75%) 42,095 Next PLC 1,678,328 1.79%
1,175,508 Pets at Home Group PLC 1,374,169 1.47%
3,052,497 3.26%
Health Care Equipment & Services - 3.06% (2017 - 2.45%) 195,757 Smith & Nephew PLC 2,869,798 3.06%
2,869,798 3.06%
Life Insurance - 8.77% (2017 - 9.98%) 680,578 Aviva PLC 2,554,209 2.73%
208,459 Prudential PLC 2,925,722 3.12%
291,411 St James's Place PLC 2,736,932 2.92%
8,216,863 8.77%
Mining - 7.28% (2017 - 7.89%) 1,109,325 Glencore PLC 3,249,768 3.47%
94,748 Rio Tinto PLC 3,566,788 3.81%
6,816,556 7.28%
Mobile Telecommunications - 2.88% (2017 - 3.58%) 1,765,433 Vodafone Group PLC 2,695,463 2.88%
2,695,463 2.88%
Oil & Gas Producers - 8.77% (2017 - 9.50%) 919,874 BP PLC 4,582,812 4.89%
155,554 Royal Dutch Shell PLC 3,628,297 3.88%
8,211,109 8.77%
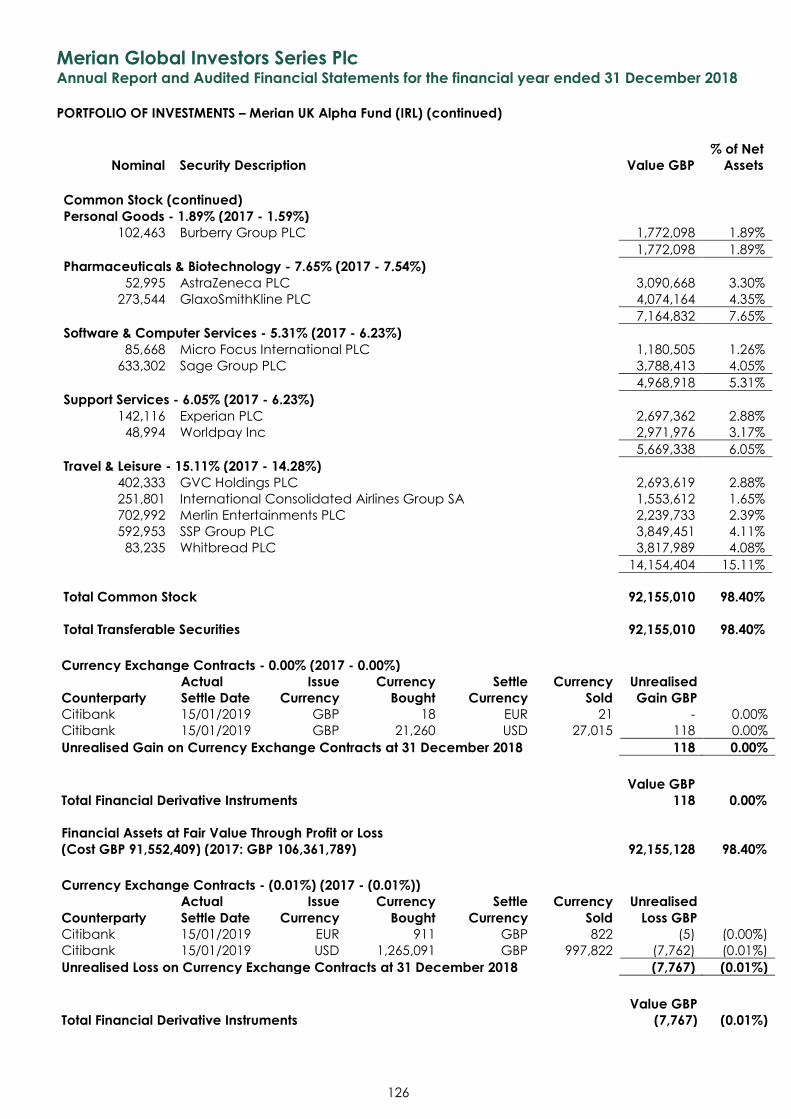
Merian Global Investors Series Plc Annual Report and Audited Financial Statements for the financial year ended 31 December 2018
PORTFOLIO OF INVESTMENTS – Merian UK Alpha Fund (IRL) (continued)
Nominal Security Description Value GBP
% of Net
Assets
126
Common Stock (continued) Personal Goods - 1.89% (2017 - 1.59%)
102,463 Burberry Group PLC 1,772,098 1.89%
1,772,098 1.89%
Pharmaceuticals & Biotechnology - 7.65% (2017 - 7.54%) 52,995 AstraZeneca PLC 3,090,668 3.30%
273,544 GlaxoSmithKline PLC 4,074,164 4.35%
7,164,832 7.65%
Software & Computer Services - 5.31% (2017 - 6.23%) 85,668 Micro Focus International PLC 1,180,505 1.26%
633,302 Sage Group PLC 3,788,413 4.05%
4,968,918 5.31%
Support Services - 6.05% (2017 - 6.23%) 142,116 Experian PLC 2,697,362 2.88%
48,994 Worldpay Inc 2,971,976 3.17%
5,669,338 6.05%
Travel & Leisure - 15.11% (2017 - 14.28%) 402,333 GVC Holdings PLC 2,693,619 2.88%
251,801 International Consolidated Airlines Group SA 1,553,612 1.65%
702,992 Merlin Entertainments PLC 2,239,733 2.39%
592,953 SSP Group PLC 3,849,451 4.11%
83,235 Whitbread PLC 3,817,989 4.08%
14,154,404 15.11%
Total Common Stock 92,155,010 98.40%
Total Transferable Securities 92,155,010 98.40%
Currency Exchange Contracts - 0.00% (2017 - 0.00%)
Counterparty
Actual
Settle Date
Issue
Currency
Currency
Bought
Settle
Currency
Currency
Sold
Unrealised
Gain GBP Citibank 15/01/2019 GBP 18 EUR 21 - 0.00%
Citibank 15/01/2019 GBP 21,260 USD 27,015 118 0.00%
Unrealised Gain on Currency Exchange Contracts at 31 December 2018 118 0.00%
Value GBP
Total Financial Derivative Instruments 118 0.00%
Financial Assets at Fair Value Through Profit or Loss
(Cost GBP 91,552,409) (2017: GBP 106,361,789) 92,155,128 98.40%
Currency Exchange Contracts - (0.01%) (2017 - (0.01%))
Counterparty
Actual
Settle Date
Issue
Currency
Currency
Bought
Settle
Currency
Currency
Sold
Unrealised
Loss GBP Citibank 15/01/2019 EUR 911 GBP 822 (5) (0.00%)
Citibank 15/01/2019 USD 1,265,091 GBP 997,822 (7,762) (0.01%)
Unrealised Loss on Currency Exchange Contracts at 31 December 2018 (7,767) (0.01%)
Value GBP
Total Financial Derivative Instruments (7,767) (0.01%)
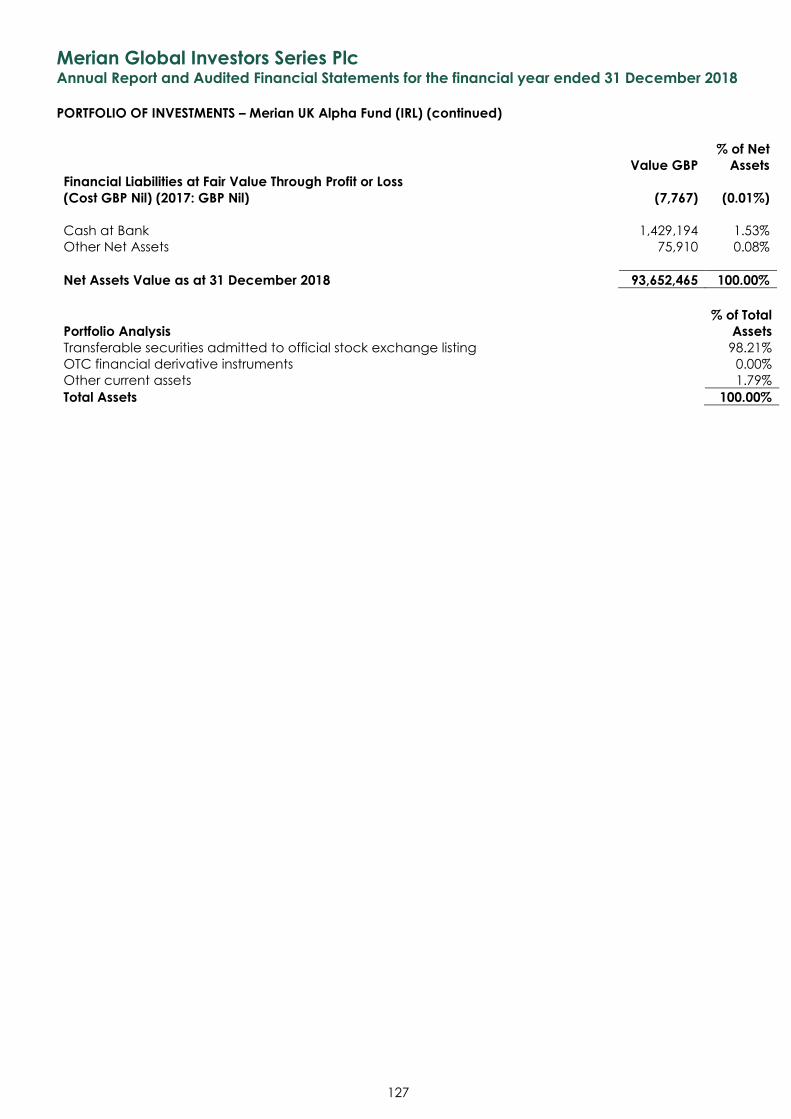
Merian Global Investors Series Plc Annual Report and Audited Financial Statements for the financial year ended 31 December 2018
PORTFOLIO OF INVESTMENTS – Merian UK Alpha Fund (IRL) (continued)
127
Value GBP
% of Net
Assets
Financial Liabilities at Fair Value Through Profit or Loss
(Cost GBP Nil) (2017: GBP Nil) (7,767) (0.01%)
Cash at Bank 1,429,194 1.53%
Other Net Assets 75,910 0.08%
Net Assets Value as at 31 December 2018 93,652,465 100.00%
Portfolio Analysis
% of Total
Assets
Transferable securities admitted to official stock exchange listing 98.21%
OTC financial derivative instruments 0.00%
Other current assets 1.79%
Total Assets 100.00%
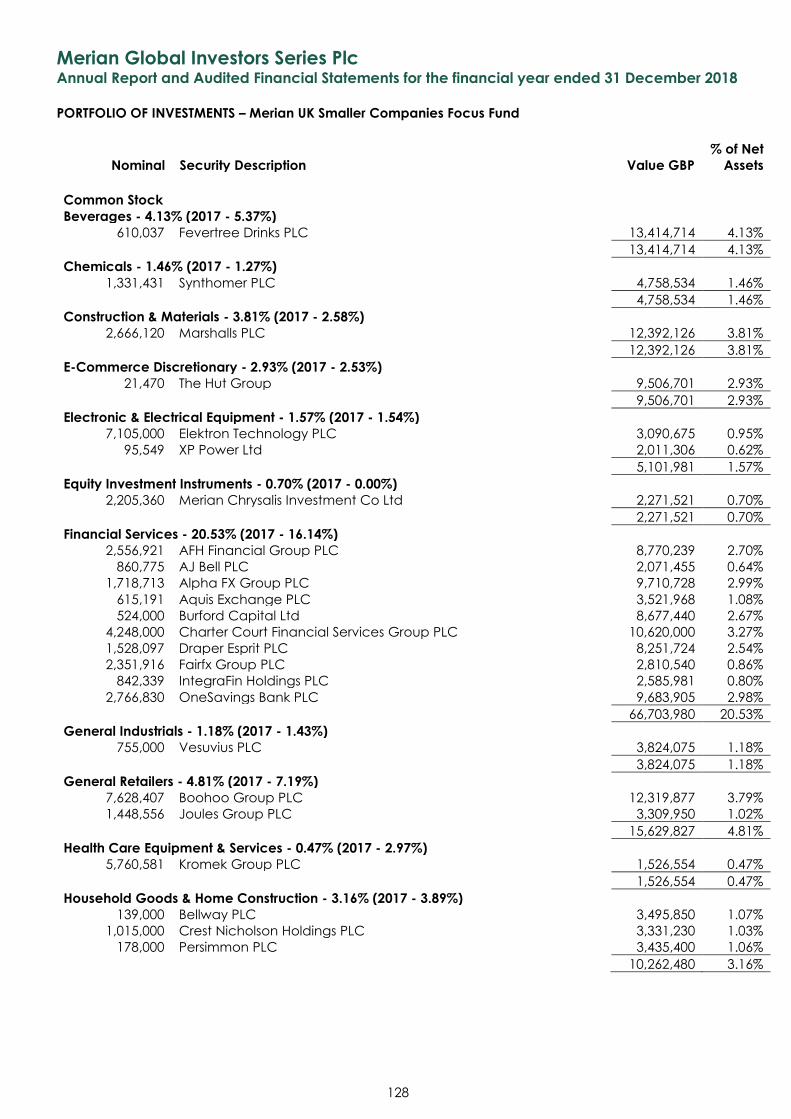
Merian Global Investors Series Plc Annual Report and Audited Financial Statements for the financial year ended 31 December 2018
PORTFOLIO OF INVESTMENTS – Merian UK Smaller Companies Focus Fund
Nominal Security Description Value GBP
% of Net
Assets
128
Common Stock Beverages - 4.13% (2017 - 5.37%)
610,037 Fevertree Drinks PLC 13,414,714 4.13%
13,414,714 4.13%
Chemicals - 1.46% (2017 - 1.27%) 1,331,431 Synthomer PLC 4,758,534 1.46%
4,758,534 1.46%
Construction & Materials - 3.81% (2017 - 2.58%) 2,666,120 Marshalls PLC 12,392,126 3.81%
12,392,126 3.81%
E-Commerce Discretionary - 2.93% (2017 - 2.53%) 21,470 The Hut Group 9,506,701 2.93%
9,506,701 2.93%
Electronic & Electrical Equipment - 1.57% (2017 - 1.54%) 7,105,000 Elektron Technology PLC 3,090,675 0.95%
95,549 XP Power Ltd 2,011,306 0.62%
5,101,981 1.57%
Equity Investment Instruments - 0.70% (2017 - 0.00%) 2,205,360 Merian Chrysalis Investment Co Ltd 2,271,521 0.70%
2,271,521 0.70%
Financial Services - 20.53% (2017 - 16.14%) 2,556,921 AFH Financial Group PLC 8,770,239 2.70%
860,775 AJ Bell PLC 2,071,455 0.64%
1,718,713 Alpha FX Group PLC 9,710,728 2.99%
615,191 Aquis Exchange PLC 3,521,968 1.08%
524,000 Burford Capital Ltd 8,677,440 2.67%
4,248,000 Charter Court Financial Services Group PLC 10,620,000 3.27%
1,528,097 Draper Esprit PLC 8,251,724 2.54%
2,351,916 Fairfx Group PLC 2,810,540 0.86%
842,339 IntegraFin Holdings PLC 2,585,981 0.80%
2,766,830 OneSavings Bank PLC 9,683,905 2.98%
66,703,980 20.53%
General Industrials - 1.18% (2017 - 1.43%) 755,000 Vesuvius PLC 3,824,075 1.18%
3,824,075 1.18%
General Retailers - 4.81% (2017 - 7.19%) 7,628,407 Boohoo Group PLC 12,319,877 3.79%
1,448,556 Joules Group PLC 3,309,950 1.02%
15,629,827 4.81%
Health Care Equipment & Services - 0.47% (2017 - 2.97%) 5,760,581 Kromek Group PLC 1,526,554 0.47%
1,526,554 0.47%
Household Goods & Home Construction - 3.16% (2017 - 3.89%) 139,000 Bellway PLC 3,495,850 1.07%
1,015,000 Crest Nicholson Holdings PLC 3,331,230 1.03%
178,000 Persimmon PLC 3,435,400 1.06%
10,262,480 3.16%
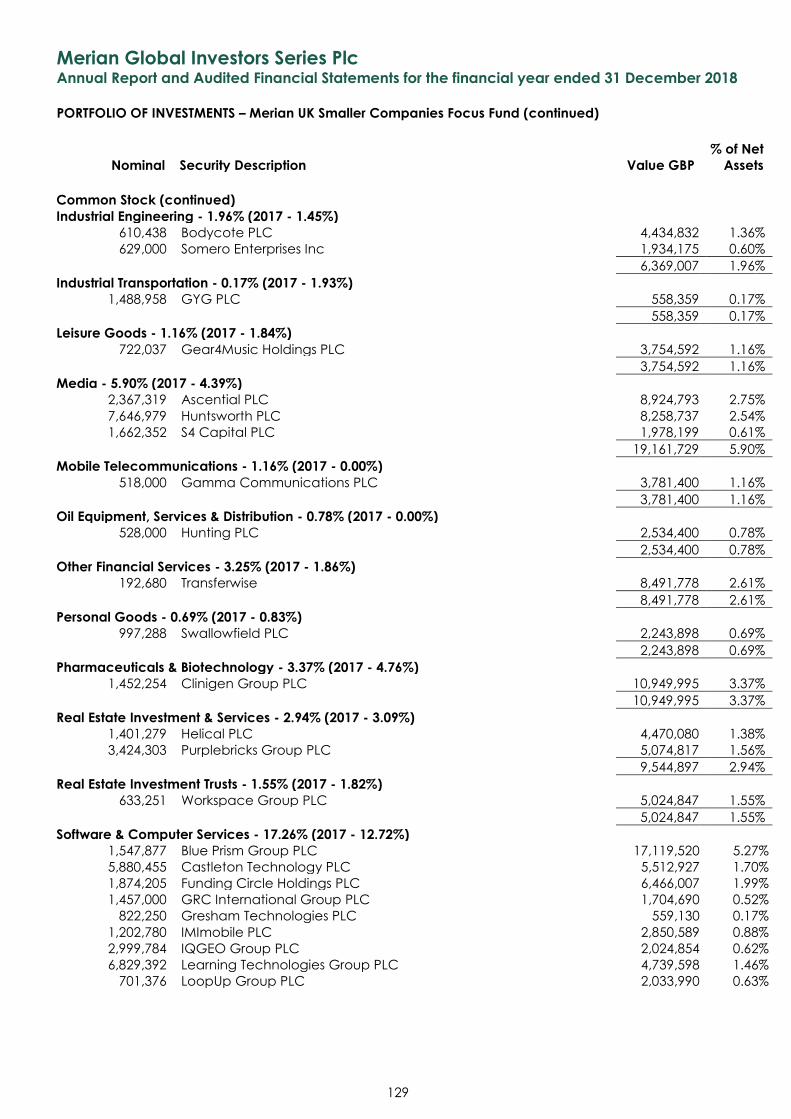
Merian Global Investors Series Plc Annual Report and Audited Financial Statements for the financial year ended 31 December 2018
PORTFOLIO OF INVESTMENTS – Merian UK Smaller Companies Focus Fund (continued)
Nominal Security Description Value GBP
% of Net
Assets
129
Common Stock (continued) Industrial Engineering - 1.96% (2017 - 1.45%)
610,438 Bodycote PLC 4,434,832 1.36%
629,000 Somero Enterprises Inc 1,934,175 0.60%
6,369,007 1.96%
Industrial Transportation - 0.17% (2017 - 1.93%) 1,488,958 GYG PLC 558,359 0.17%
558,359 0.17%
Leisure Goods - 1.16% (2017 - 1.84%) 722,037 Gear4Music Holdings PLC 3,754,592 1.16%
3,754,592 1.16%
Media - 5.90% (2017 - 4.39%) 2,367,319 Ascential PLC 8,924,793 2.75%
7,646,979 Huntsworth PLC 8,258,737 2.54%
1,662,352 S4 Capital PLC 1,978,199 0.61%
19,161,729 5.90%
Mobile Telecommunications - 1.16% (2017 - 0.00%) 518,000 Gamma Communications PLC 3,781,400 1.16%
3,781,400 1.16%
Oil Equipment, Services & Distribution - 0.78% (2017 - 0.00%) 528,000 Hunting PLC 2,534,400 0.78%
2,534,400 0.78%
Other Financial Services - 3.25% (2017 - 1.86%) 192,680 Transferwise 8,491,778 2.61%
8,491,778 2.61%
Personal Goods - 0.69% (2017 - 0.83%) 997,288 Swallowfield PLC 2,243,898 0.69%
2,243,898 0.69%
Pharmaceuticals & Biotechnology - 3.37% (2017 - 4.76%) 1,452,254 Clinigen Group PLC 10,949,995 3.37%
10,949,995 3.37%
Real Estate Investment & Services - 2.94% (2017 - 3.09%) 1,401,279 Helical PLC 4,470,080 1.38%
3,424,303 Purplebricks Group PLC 5,074,817 1.56%
9,544,897 2.94%
Real Estate Investment Trusts - 1.55% (2017 - 1.82%) 633,251 Workspace Group PLC 5,024,847 1.55%
5,024,847 1.55%
Software & Computer Services - 17.26% (2017 - 12.72%) 1,547,877 Blue Prism Group PLC 17,119,520 5.27%
5,880,455 Castleton Technology PLC 5,512,927 1.70%
1,874,205 Funding Circle Holdings PLC 6,466,007 1.99%
1,457,000 GRC International Group PLC 1,704,690 0.52%
822,250 Gresham Technologies PLC 559,130 0.17%
1,202,780 IMImobile PLC 2,850,589 0.88%
2,999,784 IQGEO Group PLC 2,024,854 0.62%
6,829,392 Learning Technologies Group PLC 4,739,598 1.46%
701,376 LoopUp Group PLC 2,033,990 0.63%
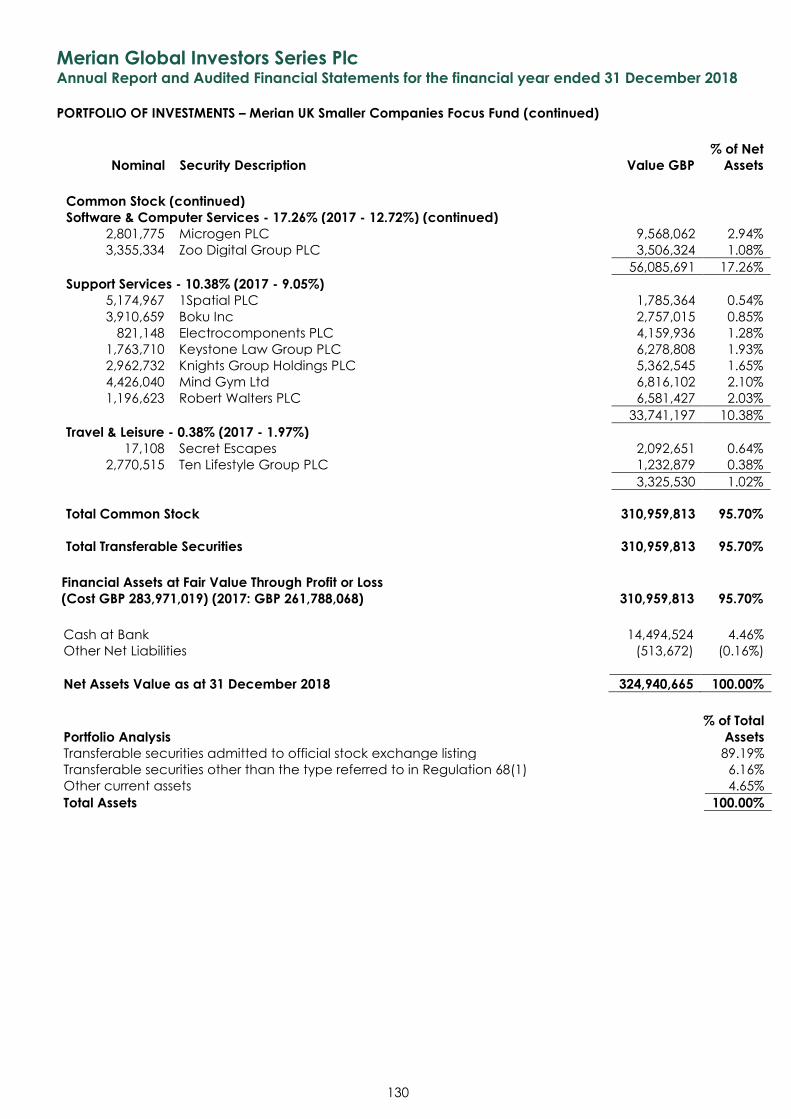
Merian Global Investors Series Plc Annual Report and Audited Financial Statements for the financial year ended 31 December 2018
PORTFOLIO OF INVESTMENTS – Merian UK Smaller Companies Focus Fund (continued)
Nominal Security Description Value GBP
% of Net
Assets
130
Common Stock (continued)
Software & Computer Services - 17.26% (2017 - 12.72%) (continued)
2,801,775 Microgen PLC 9,568,062 2.94%
3,355,334 Zoo Digital Group PLC 3,506,324 1.08%
56,085,691 17.26%
Support Services - 10.38% (2017 - 9.05%) 5,174,967 1Spatial PLC 1,785,364 0.54%
3,910,659 Boku Inc 2,757,015 0.85%
821,148 Electrocomponents PLC 4,159,936 1.28%
1,763,710 Keystone Law Group PLC 6,278,808 1.93%
2,962,732 Knights Group Holdings PLC 5,362,545 1.65%
4,426,040 Mind Gym Ltd 6,816,102 2.10%
1,196,623 Robert Walters PLC 6,581,427 2.03%
33,741,197 10.38%
Travel & Leisure - 0.38% (2017 - 1.97%) 17,108 Secret Escapes 2,092,651 0.64%
2,770,515 Ten Lifestyle Group PLC 1,232,879 0.38%
3,325,530 1.02%
Total Common Stock 310,959,813 95.70%
Total Transferable Securities 310,959,813 95.70%
Financial Assets at Fair Value Through Profit or Loss
(Cost GBP 283,971,019) (2017: GBP 261,788,068) 310,959,813 95.70%
Cash at Bank 14,494,524 4.46%
Other Net Liabilities (513,672) (0.16%)
Net Assets Value as at 31 December 2018 324,940,665 100.00%
Portfolio Analysis
% of Total
Assets
Transferable securities admitted to official stock exchange listing 89.19%
Transferable securities other than the type referred to in Regulation 68(1) 6.16%
Other current assets 4.65%
Total Assets 100.00%
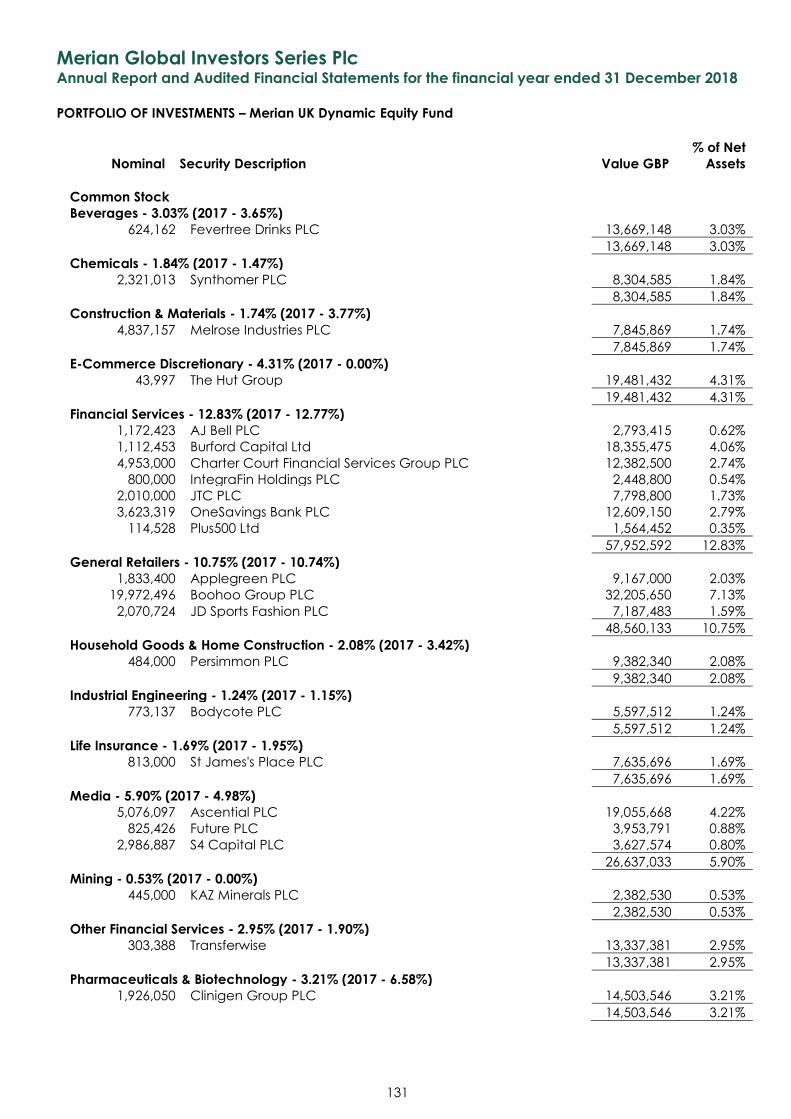
Merian Global Investors Series Plc Annual Report and Audited Financial Statements for the financial year ended 31 December 2018
PORTFOLIO OF INVESTMENTS – Merian UK Dynamic Equity Fund
Nominal Security Description Value GBP
% of Net
Assets
131
Common Stock Beverages - 3.03% (2017 - 3.65%)
624,162 Fevertree Drinks PLC 13,669,148 3.03%
13,669,148 3.03%
Chemicals - 1.84% (2017 - 1.47%) 2,321,013 Synthomer PLC 8,304,585 1.84%
8,304,585 1.84%
Construction & Materials - 1.74% (2017 - 3.77%) 4,837,157 Melrose Industries PLC 7,845,869 1.74%
7,845,869 1.74%
E-Commerce Discretionary - 4.31% (2017 - 0.00%) 43,997 The Hut Group 19,481,432 4.31%
19,481,432 4.31%
Financial Services - 12.83% (2017 - 12.77%) 1,172,423 AJ Bell PLC 2,793,415 0.62%
1,112,453 Burford Capital Ltd 18,355,475 4.06%
4,953,000 Charter Court Financial Services Group PLC 12,382,500 2.74%
800,000 IntegraFin Holdings PLC 2,448,800 0.54%
2,010,000 JTC PLC 7,798,800 1.73%
3,623,319 OneSavings Bank PLC 12,609,150 2.79%
114,528 Plus500 Ltd 1,564,452 0.35%
57,952,592 12.83%
General Retailers - 10.75% (2017 - 10.74%) 1,833,400 Applegreen PLC 9,167,000 2.03%
19,972,496 Boohoo Group PLC 32,205,650 7.13%
2,070,724 JD Sports Fashion PLC 7,187,483 1.59%
48,560,133 10.75%
Household Goods & Home Construction - 2.08% (2017 - 3.42%) 484,000 Persimmon PLC 9,382,340 2.08%
9,382,340 2.08%
Industrial Engineering - 1.24% (2017 - 1.15%) 773,137 Bodycote PLC 5,597,512 1.24%
5,597,512 1.24%
Life Insurance - 1.69% (2017 - 1.95%) 813,000 St James's Place PLC 7,635,696 1.69%
7,635,696 1.69%
Media - 5.90% (2017 - 4.98%) 5,076,097 Ascential PLC 19,055,668 4.22%
825,426 Future PLC 3,953,791 0.88%
2,986,887 S4 Capital PLC 3,627,574 0.80%
26,637,033 5.90%
Mining - 0.53% (2017 - 0.00%) 445,000 KAZ Minerals PLC 2,382,530 0.53%
2,382,530 0.53%
Other Financial Services - 2.95% (2017 - 1.90%) 303,388 Transferwise 13,337,381 2.95%
13,337,381 2.95%
Pharmaceuticals & Biotechnology - 3.21% (2017 - 6.58%)
1,926,050 Clinigen Group PLC 14,503,546 3.21%
14,503,546 3.21%
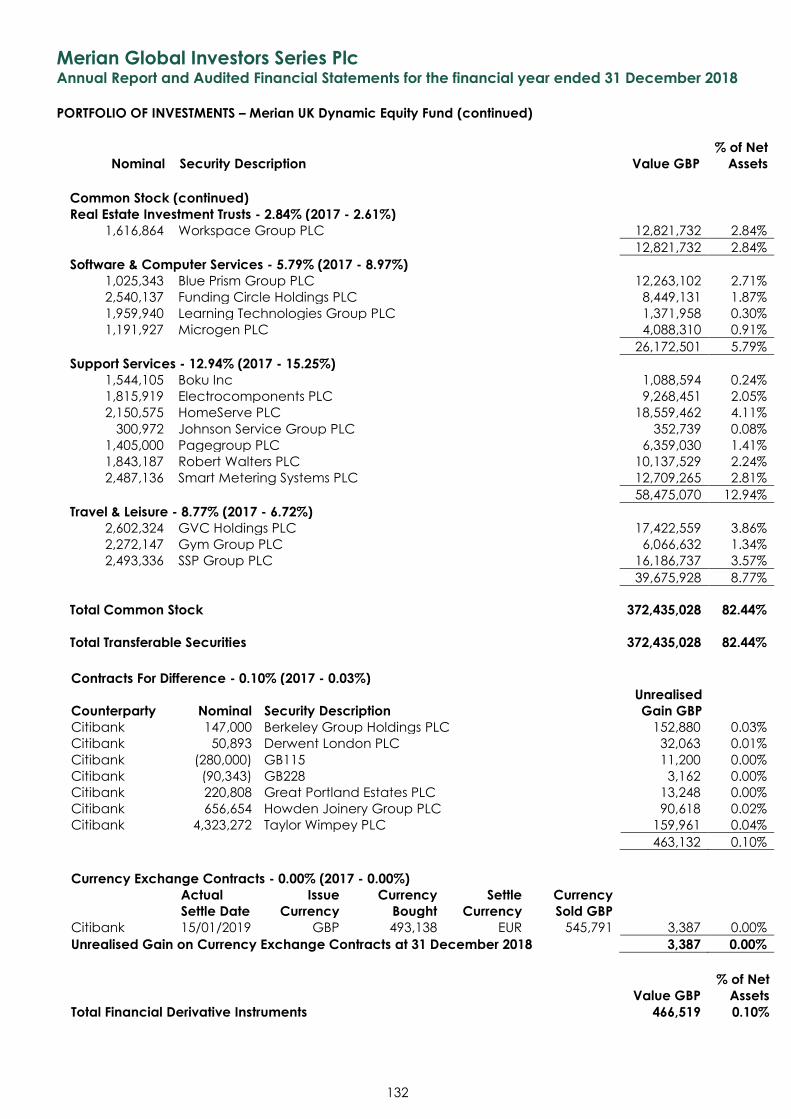
Merian Global Investors Series Plc Annual Report and Audited Financial Statements for the financial year ended 31 December 2018
PORTFOLIO OF INVESTMENTS – Merian UK Dynamic Equity Fund (continued)
Nominal Security Description Value GBP
% of Net
Assets
132
Common Stock (continued) Real Estate Investment Trusts - 2.84% (2017 - 2.61%)
1,616,864 Workspace Group PLC 12,821,732 2.84%
12,821,732 2.84%
Software & Computer Services - 5.79% (2017 - 8.97%) 1,025,343 Blue Prism Group PLC 12,263,102 2.71%
2,540,137 Funding Circle Holdings PLC 8,449,131 1.87%
1,959,940 Learning Technologies Group PLC 1,371,958 0.30%
1,191,927 Microgen PLC 4,088,310 0.91%
26,172,501 5.79%
Support Services - 12.94% (2017 - 15.25%) 1,544,105 Boku Inc 1,088,594 0.24%
1,815,919 Electrocomponents PLC 9,268,451 2.05%
2,150,575 HomeServe PLC 18,559,462 4.11%
300,972 Johnson Service Group PLC 352,739 0.08%
1,405,000 Pagegroup PLC 6,359,030 1.41%
1,843,187 Robert Walters PLC 10,137,529 2.24%
2,487,136 Smart Metering Systems PLC 12,709,265 2.81%
58,475,070 12.94%
Travel & Leisure - 8.77% (2017 - 6.72%) 2,602,324 GVC Holdings PLC 17,422,559 3.86%
2,272,147 Gym Group PLC 6,066,632 1.34%
2,493,336 SSP Group PLC 16,186,737 3.57%
39,675,928 8.77%
Total Common Stock 372,435,028 82.44%
Total Transferable Securities 372,435,028 82.44%
Contracts For Difference - 0.10% (2017 - 0.03%)
Counterparty Nominal Security Description
Unrealised
Gain GBP
Citibank 147,000 Berkeley Group Holdings PLC 152,880 0.03%
Citibank 50,893 Derwent London PLC 32,063 0.01%
Citibank (280,000) GB115 11,200 0.00%
Citibank (90,343) GB228 3,162 0.00%
Citibank 220,808 Great Portland Estates PLC 13,248 0.00%
Citibank 656,654 Howden Joinery Group PLC 90,618 0.02%
Citibank 4,323,272 Taylor Wimpey PLC 159,961 0.04%
463,132 0.10%
Currency Exchange Contracts - 0.00% (2017 - 0.00%)
Actual
Settle Date
Issue
Currency
Currency
Bought
Settle
Currency
Currency
Sold GBP
Citibank 15/01/2019 GBP 493,138 EUR 545,791 3,387 0.00%
Unrealised Gain on Currency Exchange Contracts at 31 December 2018 3,387 0.00%
Value GBP
% of Net
Assets
Total Financial Derivative Instruments 466,519 0.10%
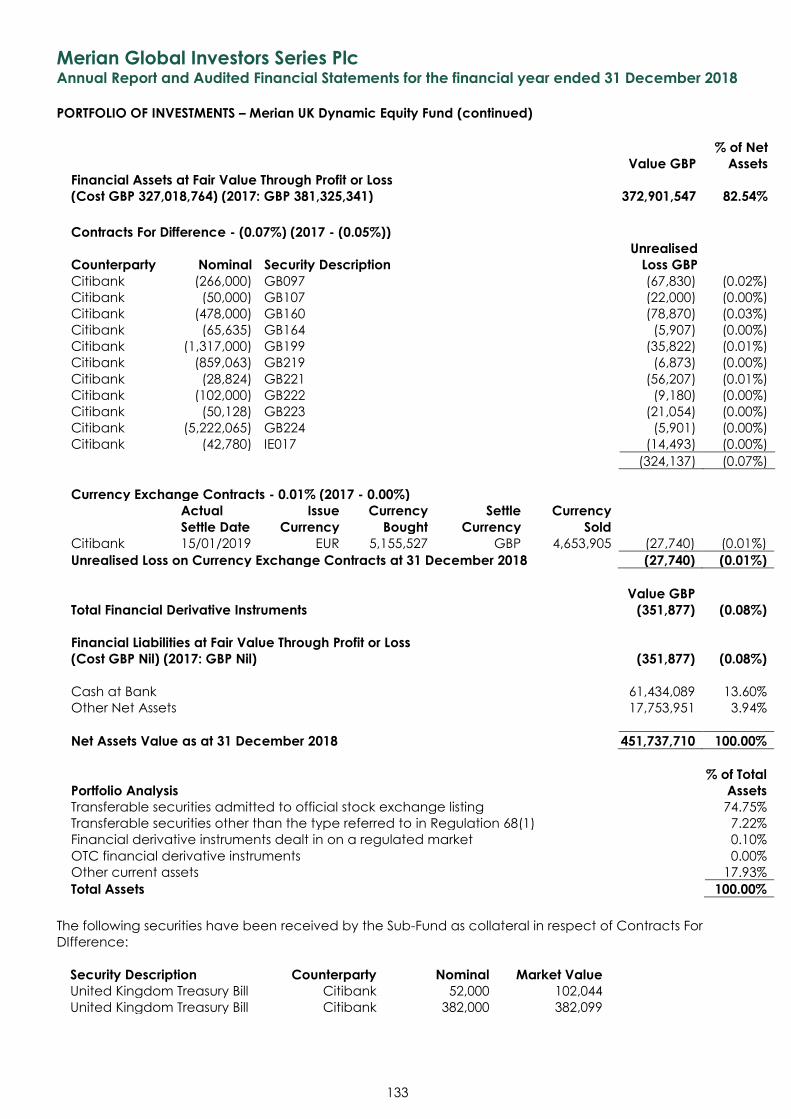
Merian Global Investors Series Plc Annual Report and Audited Financial Statements for the financial year ended 31 December 2018
PORTFOLIO OF INVESTMENTS – Merian UK Dynamic Equity Fund (continued)
133
Value GBP
% of Net
Assets
Financial Assets at Fair Value Through Profit or Loss
(Cost GBP 327,018,764) (2017: GBP 381,325,341) 372,901,547 82.54%
Contracts For Difference - (0.07%) (2017 - (0.05%))
Counterparty Nominal Security Description
Unrealised
Loss GBP
Citibank (266,000) GB097 (67,830) (0.02%)
Citibank (50,000) GB107 (22,000) (0.00%)
Citibank (478,000) GB160 (78,870) (0.03%)
Citibank (65,635) GB164 (5,907) (0.00%)
Citibank (1,317,000) GB199 (35,822) (0.01%)
Citibank (859,063) GB219 (6,873) (0.00%)
Citibank (28,824) GB221 (56,207) (0.01%)
Citibank (102,000) GB222 (9,180) (0.00%)
Citibank (50,128) GB223 (21,054) (0.00%)
Citibank (5,222,065) GB224 (5,901) (0.00%)
Citibank (42,780) IE017 (14,493) (0.00%)
(324,137) (0.07%)
Currency Exchange Contracts - 0.01% (2017 - 0.00%)
Actual
Settle Date
Issue
Currency
Currency
Bought
Settle
Currency
Currency
Sold
Citibank 15/01/2019 EUR 5,155,527 GBP 4,653,905 (27,740) (0.01%)
Unrealised Loss on Currency Exchange Contracts at 31 December 2018 (27,740) (0.01%)
Value GBP
Total Financial Derivative Instruments (351,877) (0.08%)
Financial Liabilities at Fair Value Through Profit or Loss
(Cost GBP Nil) (2017: GBP Nil) (351,877) (0.08%)
Cash at Bank 61,434,089 13.60%
Other Net Assets 17,753,951 3.94%
Net Assets Value as at 31 December 2018 451,737,710 100.00%
Portfolio Analysis
% of Total
Assets
Transferable securities admitted to official stock exchange listing 74.75%
Transferable securities other than the type referred to in Regulation 68(1) 7.22%
Financial derivative instruments dealt in on a regulated market 0.10%
OTC financial derivative instruments 0.00%
Other current assets 17.93%
Total Assets 100.00%
The following securities have been received by the Sub-Fund as collateral in respect of Contracts For
DIfference:
Security Description Counterparty Nominal Market Value
United Kingdom Treasury Bill Citibank 52,000 102,044
United Kingdom Treasury Bill Citibank 382,000 382,099
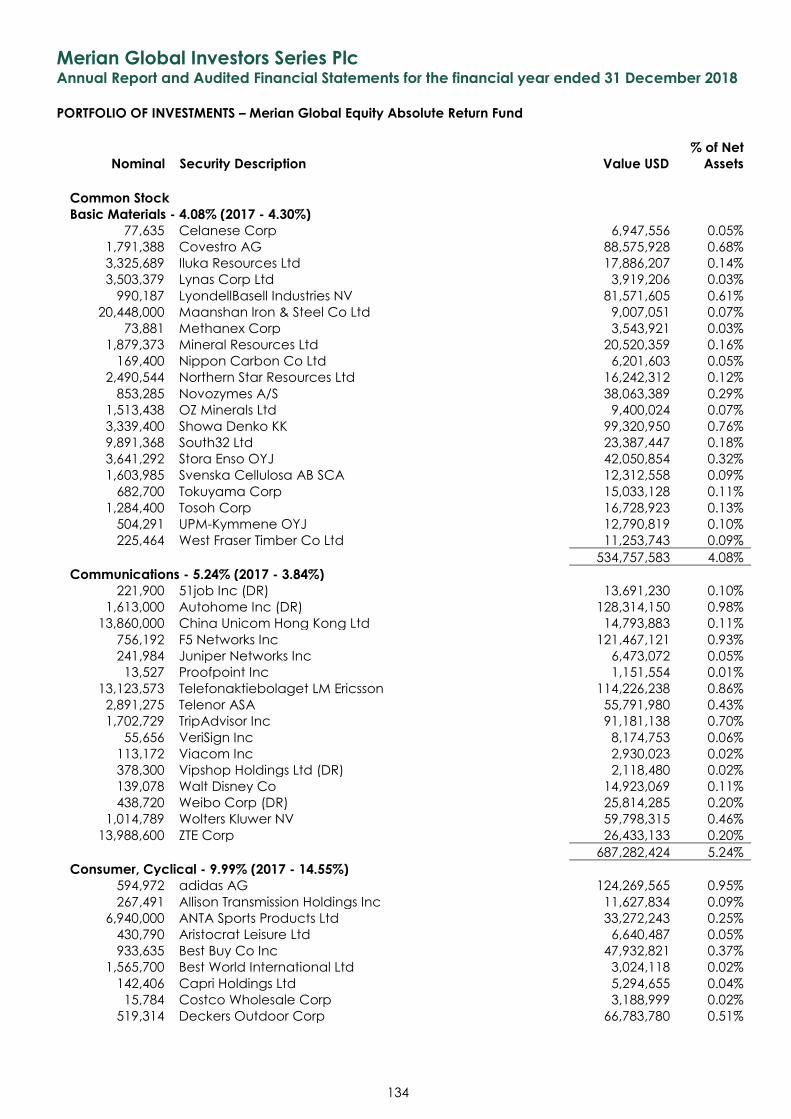
Merian Global Investors Series Plc Annual Report and Audited Financial Statements for the financial year ended 31 December 2018
PORTFOLIO OF INVESTMENTS – Merian Global Equity Absolute Return Fund
Nominal Security Description Value USD
% of Net
Assets
134
Common Stock Basic Materials - 4.08% (2017 - 4.30%)
77,635 Celanese Corp 6,947,556 0.05%
1,791,388 Covestro AG 88,575,928 0.68%
3,325,689 Iluka Resources Ltd 17,886,207 0.14%
3,503,379 Lynas Corp Ltd 3,919,206 0.03%
990,187 LyondellBasell Industries NV 81,571,605 0.61%
20,448,000 Maanshan Iron & Steel Co Ltd 9,007,051 0.07%
73,881 Methanex Corp 3,543,921 0.03%
1,879,373 Mineral Resources Ltd 20,520,359 0.16%
169,400 Nippon Carbon Co Ltd 6,201,603 0.05%
2,490,544 Northern Star Resources Ltd 16,242,312 0.12%
853,285 Novozymes A/S 38,063,389 0.29%
1,513,438 OZ Minerals Ltd 9,400,024 0.07%
3,339,400 Showa Denko KK 99,320,950 0.76%
9,891,368 South32 Ltd 23,387,447 0.18%
3,641,292 Stora Enso OYJ 42,050,854 0.32%
1,603,985 Svenska Cellulosa AB SCA 12,312,558 0.09%
682,700 Tokuyama Corp 15,033,128 0.11%
1,284,400 Tosoh Corp 16,728,923 0.13%
504,291 UPM-Kymmene OYJ 12,790,819 0.10%
225,464 West Fraser Timber Co Ltd 11,253,743 0.09%
534,757,583 4.08%
Communications - 5.24% (2017 - 3.84%) 221,900 51job Inc (DR) 13,691,230 0.10%
1,613,000 Autohome Inc (DR) 128,314,150 0.98%
13,860,000 China Unicom Hong Kong Ltd 14,793,883 0.11%
756,192 F5 Networks Inc 121,467,121 0.93%
241,984 Juniper Networks Inc 6,473,072 0.05%
13,527 Proofpoint Inc 1,151,554 0.01%
13,123,573 Telefonaktiebolaget LM Ericsson 114,226,238 0.86%
2,891,275 Telenor ASA 55,791,980 0.43%
1,702,729 TripAdvisor Inc 91,181,138 0.70%
55,656 VeriSign Inc 8,174,753 0.06%
113,172 Viacom Inc 2,930,023 0.02%
378,300 Vipshop Holdings Ltd (DR) 2,118,480 0.02%
139,078 Walt Disney Co 14,923,069 0.11%
438,720 Weibo Corp (DR) 25,814,285 0.20%
1,014,789 Wolters Kluwer NV 59,798,315 0.46%
13,988,600 ZTE Corp 26,433,133 0.20%
687,282,424 5.24%
Consumer, Cyclical - 9.99% (2017 - 14.55%)
594,972 adidas AG 124,269,565 0.95%
267,491 Allison Transmission Holdings Inc 11,627,834 0.09%
6,940,000 ANTA Sports Products Ltd 33,272,243 0.25%
430,790 Aristocrat Leisure Ltd 6,640,487 0.05%
933,635 Best Buy Co Inc 47,932,821 0.37%
1,565,700 Best World International Ltd 3,024,118 0.02%
142,406 Capri Holdings Ltd 5,294,655 0.04%
15,784 Costco Wholesale Corp 3,188,999 0.02%
519,314 Deckers Outdoor Corp 66,783,780 0.51%
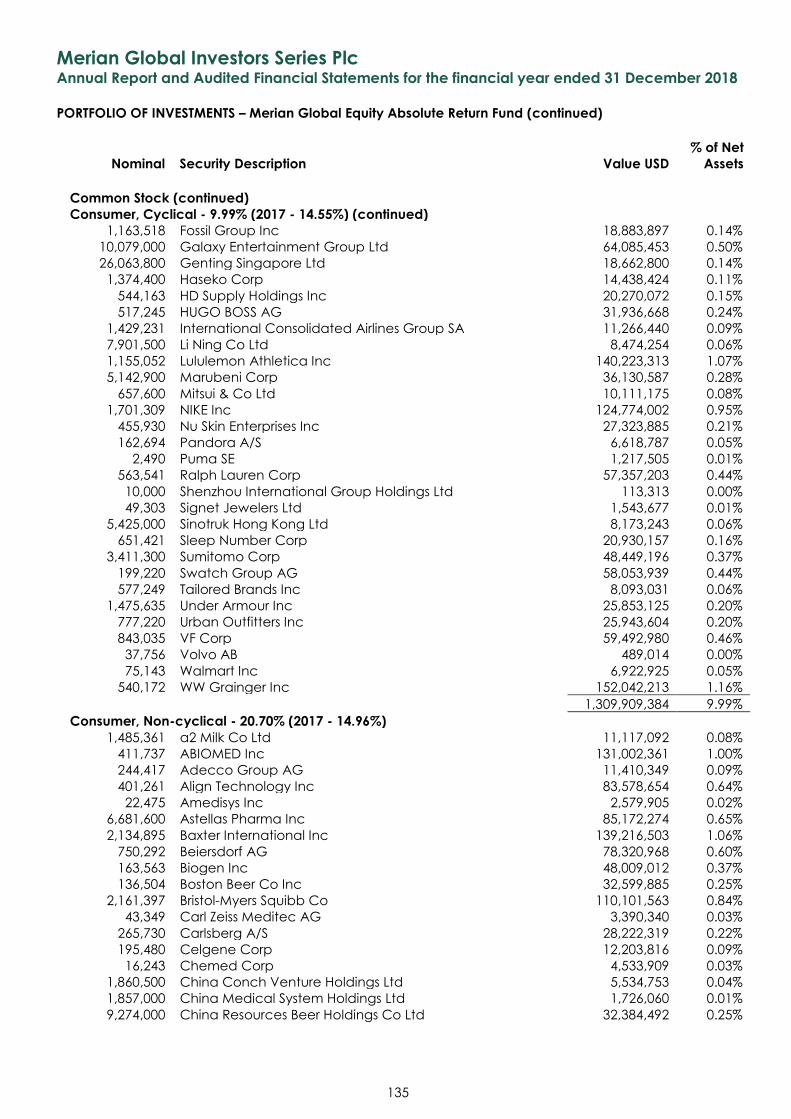
Merian Global Investors Series Plc Annual Report and Audited Financial Statements for the financial year ended 31 December 2018
PORTFOLIO OF INVESTMENTS – Merian Global Equity Absolute Return Fund (continued)
Nominal Security Description Value USD
% of Net
Assets
135
Common Stock (continued)
Consumer, Cyclical - 9.99% (2017 - 14.55%) (continued) 1,163,518 Fossil Group Inc 18,883,897 0.14%
10,079,000 Galaxy Entertainment Group Ltd 64,085,453 0.50%
26,063,800 Genting Singapore Ltd 18,662,800 0.14%
1,374,400 Haseko Corp 14,438,424 0.11%
544,163 HD Supply Holdings Inc 20,270,072 0.15%
517,245 HUGO BOSS AG 31,936,668 0.24%
1,429,231 International Consolidated Airlines Group SA 11,266,440 0.09%
7,901,500 Li Ning Co Ltd 8,474,254 0.06%
1,155,052 Lululemon Athletica Inc 140,223,313 1.07%
5,142,900 Marubeni Corp 36,130,587 0.28%
657,600 Mitsui & Co Ltd 10,111,175 0.08%
1,701,309 NIKE Inc 124,774,002 0.95%
455,930 Nu Skin Enterprises Inc 27,323,885 0.21%
162,694 Pandora A/S 6,618,787 0.05%
2,490 Puma SE 1,217,505 0.01%
563,541 Ralph Lauren Corp 57,357,203 0.44%
10,000 Shenzhou International Group Holdings Ltd 113,313 0.00%
49,303 Signet Jewelers Ltd 1,543,677 0.01%
5,425,000 Sinotruk Hong Kong Ltd 8,173,243 0.06%
651,421 Sleep Number Corp 20,930,157 0.16%
3,411,300 Sumitomo Corp 48,449,196 0.37%
199,220 Swatch Group AG 58,053,939 0.44%
577,249 Tailored Brands Inc 8,093,031 0.06%
1,475,635 Under Armour Inc 25,853,125 0.20%
777,220 Urban Outfitters Inc 25,943,604 0.20%
843,035 VF Corp 59,492,980 0.46%
37,756 Volvo AB 489,014 0.00%
75,143 Walmart Inc 6,922,925 0.05%
540,172 WW Grainger Inc 152,042,213 1.16%
1,309,909,384 9.99%
Consumer, Non-cyclical - 20.70% (2017 - 14.96%)
1,485,361 a2 Milk Co Ltd 11,117,092 0.08%
411,737 ABIOMED Inc 131,002,361 1.00%
244,417 Adecco Group AG 11,410,349 0.09%
401,261 Align Technology Inc 83,578,654 0.64%
22,475 Amedisys Inc 2,579,905 0.02%
6,681,600 Astellas Pharma Inc 85,172,274 0.65%
2,134,895 Baxter International Inc 139,216,503 1.06%
750,292 Beiersdorf AG 78,320,968 0.60%
163,563 Biogen Inc 48,009,012 0.37%
136,504 Boston Beer Co Inc 32,599,885 0.25%
2,161,397 Bristol-Myers Squibb Co 110,101,563 0.84%
43,349 Carl Zeiss Meditec AG 3,390,340 0.03%
265,730 Carlsberg A/S 28,222,319 0.22%
195,480 Celgene Corp 12,203,816 0.09%
16,243 Chemed Corp 4,533,909 0.03%
1,860,500 China Conch Venture Holdings Ltd 5,534,753 0.04%
1,857,000 China Medical System Holdings Ltd 1,726,060 0.01%
9,274,000 China Resources Beer Holdings Co Ltd 32,384,492 0.25%
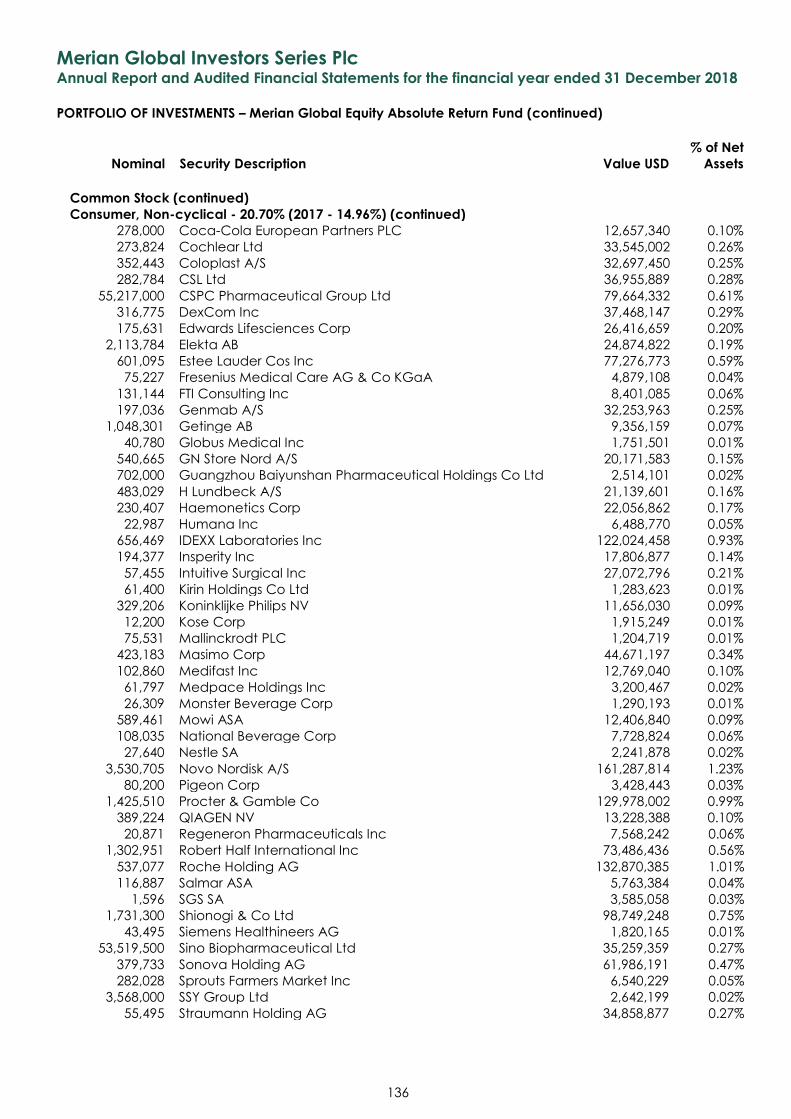
Merian Global Investors Series Plc Annual Report and Audited Financial Statements for the financial year ended 31 December 2018
PORTFOLIO OF INVESTMENTS – Merian Global Equity Absolute Return Fund (continued)
Nominal Security Description Value USD
% of Net
Assets
136
Common Stock (continued)
Consumer, Non-cyclical - 20.70% (2017 - 14.96%) (continued) 278,000 Coca-Cola European Partners PLC 12,657,340 0.10%
273,824 Cochlear Ltd 33,545,002 0.26%
352,443 Coloplast A/S 32,697,450 0.25%
282,784 CSL Ltd 36,955,889 0.28%
55,217,000 CSPC Pharmaceutical Group Ltd 79,664,332 0.61%
316,775 DexCom Inc 37,468,147 0.29%
175,631 Edwards Lifesciences Corp 26,416,659 0.20%
2,113,784 Elekta AB 24,874,822 0.19%
601,095 Estee Lauder Cos Inc 77,276,773 0.59%
75,227 Fresenius Medical Care AG & Co KGaA 4,879,108 0.04%
131,144 FTI Consulting Inc 8,401,085 0.06%
197,036 Genmab A/S 32,253,963 0.25%
1,048,301 Getinge AB 9,356,159 0.07%
40,780 Globus Medical Inc 1,751,501 0.01%
540,665 GN Store Nord A/S 20,171,583 0.15%
702,000 Guangzhou Baiyunshan Pharmaceutical Holdings Co Ltd 2,514,101 0.02%
483,029 H Lundbeck A/S 21,139,601 0.16%
230,407 Haemonetics Corp 22,056,862 0.17%
22,987 Humana Inc 6,488,770 0.05%
656,469 IDEXX Laboratories Inc 122,024,458 0.93%
194,377 Insperity Inc 17,806,877 0.14%
57,455 Intuitive Surgical Inc 27,072,796 0.21%
61,400 Kirin Holdings Co Ltd 1,283,623 0.01%
329,206 Koninklijke Philips NV 11,656,030 0.09%
12,200 Kose Corp 1,915,249 0.01%
75,531 Mallinckrodt PLC 1,204,719 0.01%
423,183 Masimo Corp 44,671,197 0.34%
102,860 Medifast Inc 12,769,040 0.10%
61,797 Medpace Holdings Inc 3,200,467 0.02%
26,309 Monster Beverage Corp 1,290,193 0.01%
589,461 Mowi ASA 12,406,840 0.09%
108,035 National Beverage Corp 7,728,824 0.06%
27,640 Nestle SA 2,241,878 0.02%
3,530,705 Novo Nordisk A/S 161,287,814 1.23%
80,200 Pigeon Corp 3,428,443 0.03%
1,425,510 Procter & Gamble Co 129,978,002 0.99%
389,224 QIAGEN NV 13,228,388 0.10%
20,871 Regeneron Pharmaceuticals Inc 7,568,242 0.06%
1,302,951 Robert Half International Inc 73,486,436 0.56%
537,077 Roche Holding AG 132,870,385 1.01%
116,887 Salmar ASA 5,763,384 0.04%
1,596 SGS SA 3,585,058 0.03%
1,731,300 Shionogi & Co Ltd 98,749,248 0.75%
43,495 Siemens Healthineers AG 1,820,165 0.01%
53,519,500 Sino Biopharmaceutical Ltd 35,259,359 0.27%
379,733 Sonova Holding AG 61,986,191 0.47%
282,028 Sprouts Farmers Market Inc 6,540,229 0.05%
3,568,000 SSY Group Ltd 2,642,199 0.02%
55,495 Straumann Holding AG 34,858,877 0.27%
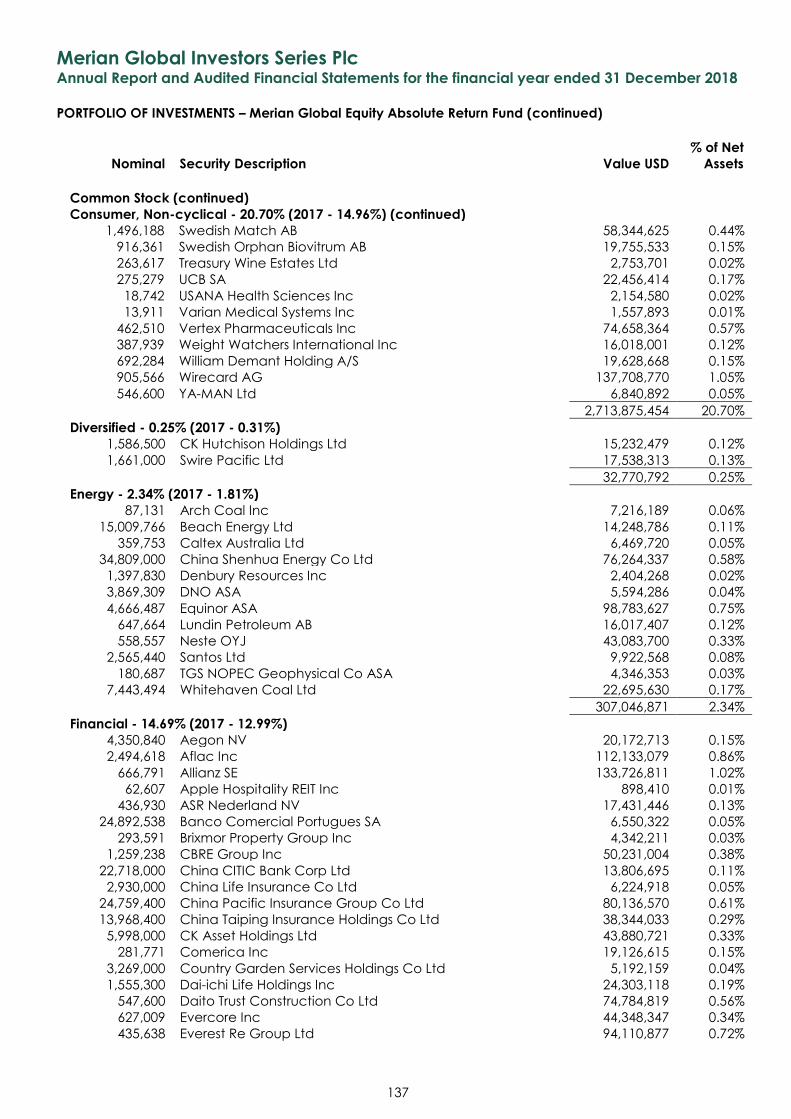
Merian Global Investors Series Plc Annual Report and Audited Financial Statements for the financial year ended 31 December 2018
PORTFOLIO OF INVESTMENTS – Merian Global Equity Absolute Return Fund (continued)
Nominal Security Description Value USD
% of Net
Assets
137
Common Stock (continued)
Consumer, Non-cyclical - 20.70% (2017 - 14.96%) (continued)
1,496,188 Swedish Match AB 58,344,625 0.44%
916,361 Swedish Orphan Biovitrum AB 19,755,533 0.15%
263,617 Treasury Wine Estates Ltd 2,753,701 0.02%
275,279 UCB SA 22,456,414 0.17%
18,742 USANA Health Sciences Inc 2,154,580 0.02%
13,911 Varian Medical Systems Inc 1,557,893 0.01%
462,510 Vertex Pharmaceuticals Inc 74,658,364 0.57%
387,939 Weight Watchers International Inc 16,018,001 0.12%
692,284 William Demant Holding A/S 19,628,668 0.15%
905,566 Wirecard AG 137,708,770 1.05%
546,600 YA-MAN Ltd 6,840,892 0.05%
2,713,875,454 20.70%
Diversified - 0.25% (2017 - 0.31%) 1,586,500 CK Hutchison Holdings Ltd 15,232,479 0.12%
1,661,000 Swire Pacific Ltd 17,538,313 0.13%
32,770,792 0.25%
Energy - 2.34% (2017 - 1.81%) 87,131 Arch Coal Inc 7,216,189 0.06%
15,009,766 Beach Energy Ltd 14,248,786 0.11%
359,753 Caltex Australia Ltd 6,469,720 0.05%
34,809,000 China Shenhua Energy Co Ltd 76,264,337 0.58%
1,397,830 Denbury Resources Inc 2,404,268 0.02%
3,869,309 DNO ASA 5,594,286 0.04%
4,666,487 Equinor ASA 98,783,627 0.75%
647,664 Lundin Petroleum AB 16,017,407 0.12%
558,557 Neste OYJ 43,083,700 0.33%
2,565,440 Santos Ltd 9,922,568 0.08%
180,687 TGS NOPEC Geophysical Co ASA 4,346,353 0.03%
7,443,494 Whitehaven Coal Ltd 22,695,630 0.17%
307,046,871 2.34%
Financial - 14.69% (2017 - 12.99%) 4,350,840 Aegon NV 20,172,713 0.15%
2,494,618 Aflac Inc 112,133,079 0.86%
666,791 Allianz SE 133,726,811 1.02%
62,607 Apple Hospitality REIT Inc 898,410 0.01%
436,930 ASR Nederland NV 17,431,446 0.13%
24,892,538 Banco Comercial Portugues SA 6,550,322 0.05%
293,591 Brixmor Property Group Inc 4,342,211 0.03%
1,259,238 CBRE Group Inc 50,231,004 0.38%
22,718,000 China CITIC Bank Corp Ltd 13,806,695 0.11%
2,930,000 China Life Insurance Co Ltd 6,224,918 0.05%
24,759,400 China Pacific Insurance Group Co Ltd 80,136,570 0.61%
13,968,400 China Taiping Insurance Holdings Co Ltd 38,344,033 0.29%
5,998,000 CK Asset Holdings Ltd 43,880,721 0.33%
281,771 Comerica Inc 19,126,615 0.15%
3,269,000 Country Garden Services Holdings Co Ltd 5,192,159 0.04%
1,555,300 Dai-ichi Life Holdings Inc 24,303,118 0.19%
547,600 Daito Trust Construction Co Ltd 74,784,819 0.56%
627,009 Evercore Inc 44,348,347 0.34%
435,638 Everest Re Group Ltd 94,110,877 0.72%
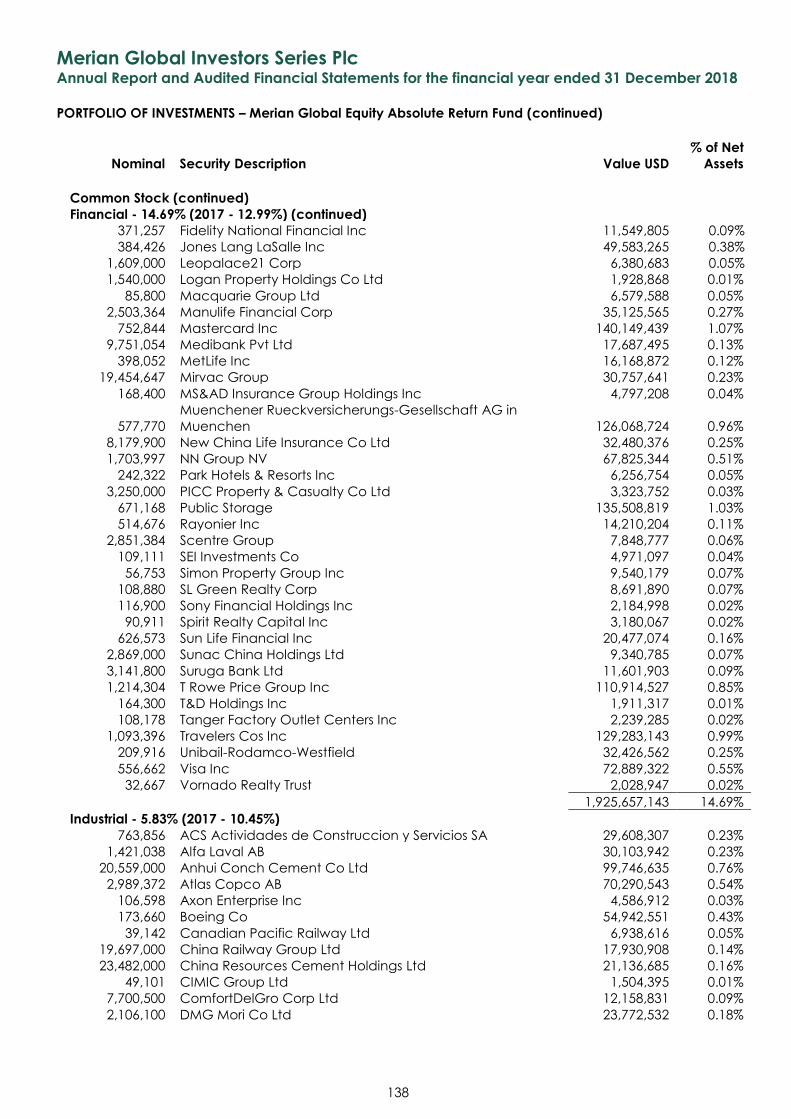
Merian Global Investors Series Plc Annual Report and Audited Financial Statements for the financial year ended 31 December 2018
PORTFOLIO OF INVESTMENTS – Merian Global Equity Absolute Return Fund (continued)
Nominal Security Description Value USD
% of Net
Assets
138
Common Stock (continued)
Financial - 14.69% (2017 - 12.99%) (continued) 371,257 Fidelity National Financial Inc 11,549,805 0.09%
384,426 Jones Lang LaSalle Inc 49,583,265 0.38%
1,609,000 Leopalace21 Corp 6,380,683 0.05%
1,540,000 Logan Property Holdings Co Ltd 1,928,868 0.01%
85,800 Macquarie Group Ltd 6,579,588 0.05%
2,503,364 Manulife Financial Corp 35,125,565 0.27%
752,844 Mastercard Inc 140,149,439 1.07%
9,751,054 Medibank Pvt Ltd 17,687,495 0.13%
398,052 MetLife Inc 16,168,872 0.12%
19,454,647 Mirvac Group 30,757,641 0.23%
168,400 MS&AD Insurance Group Holdings Inc 4,797,208 0.04%
577,770
Muenchener Rueckversicherungs-Gesellschaft AG in
Muenchen 126,068,724 0.96%
8,179,900 New China Life Insurance Co Ltd 32,480,376 0.25%
1,703,997 NN Group NV 67,825,344 0.51%
242,322 Park Hotels & Resorts Inc 6,256,754 0.05%
3,250,000 PICC Property & Casualty Co Ltd 3,323,752 0.03%
671,168 Public Storage 135,508,819 1.03%
514,676 Rayonier Inc 14,210,204 0.11%
2,851,384 Scentre Group 7,848,777 0.06%
109,111 SEI Investments Co 4,971,097 0.04%
56,753 Simon Property Group Inc 9,540,179 0.07%
108,880 SL Green Realty Corp 8,691,890 0.07%
116,900 Sony Financial Holdings Inc 2,184,998 0.02%
90,911 Spirit Realty Capital Inc 3,180,067 0.02%
626,573 Sun Life Financial Inc 20,477,074 0.16%
2,869,000 Sunac China Holdings Ltd 9,340,785 0.07%
3,141,800 Suruga Bank Ltd 11,601,903 0.09%
1,214,304 T Rowe Price Group Inc 110,914,527 0.85%
164,300 T&D Holdings Inc 1,911,317 0.01%
108,178 Tanger Factory Outlet Centers Inc 2,239,285 0.02%
1,093,396 Travelers Cos Inc 129,283,143 0.99%
209,916 Unibail-Rodamco-Westfield 32,426,562 0.25%
556,662 Visa Inc 72,889,322 0.55%
32,667 Vornado Realty Trust 2,028,947 0.02%
1,925,657,143 14.69%
Industrial - 5.83% (2017 - 10.45%) 763,856 ACS Actividades de Construccion y Servicios SA 29,608,307 0.23%
1,421,038 Alfa Laval AB 30,103,942 0.23%
20,559,000 Anhui Conch Cement Co Ltd 99,746,635 0.76%
2,989,372 Atlas Copco AB 70,290,543 0.54%
106,598 Axon Enterprise Inc 4,586,912 0.03%
173,660 Boeing Co 54,942,551 0.43%
39,142 Canadian Pacific Railway Ltd 6,938,616 0.05%
19,697,000 China Railway Group Ltd 17,930,908 0.14%
23,482,000 China Resources Cement Holdings Ltd 21,136,685 0.16%
49,101 CIMIC Group Ltd 1,504,395 0.01%
7,700,500 ComfortDelGro Corp Ltd 12,158,831 0.09%
2,106,100 DMG Mori Co Ltd 23,772,532 0.18%
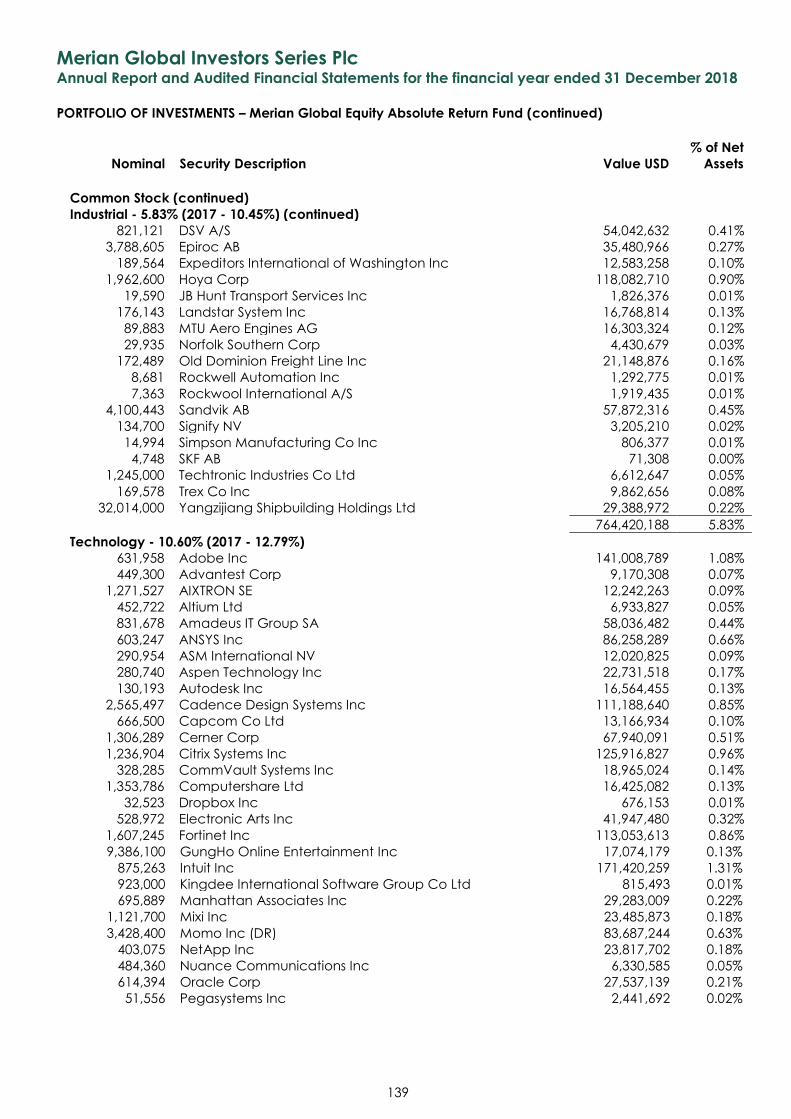
Merian Global Investors Series Plc Annual Report and Audited Financial Statements for the financial year ended 31 December 2018
PORTFOLIO OF INVESTMENTS – Merian Global Equity Absolute Return Fund (continued)
Nominal Security Description Value USD
% of Net
Assets
139
Common Stock (continued)
Industrial - 5.83% (2017 - 10.45%) (continued)
821,121 DSV A/S 54,042,632 0.41%
3,788,605 Epiroc AB 35,480,966 0.27%
189,564 Expeditors International of Washington Inc 12,583,258 0.10%
1,962,600 Hoya Corp 118,082,710 0.90%
19,590 JB Hunt Transport Services Inc 1,826,376 0.01%
176,143 Landstar System Inc 16,768,814 0.13%
89,883 MTU Aero Engines AG 16,303,324 0.12%
29,935 Norfolk Southern Corp 4,430,679 0.03%
172,489 Old Dominion Freight Line Inc 21,148,876 0.16%
8,681 Rockwell Automation Inc 1,292,775 0.01%
7,363 Rockwool International A/S 1,919,435 0.01%
4,100,443 Sandvik AB 57,872,316 0.45%
134,700 Signify NV 3,205,210 0.02%
14,994 Simpson Manufacturing Co Inc 806,377 0.01%
4,748 SKF AB 71,308 0.00%
1,245,000 Techtronic Industries Co Ltd 6,612,647 0.05%
169,578 Trex Co Inc 9,862,656 0.08%
32,014,000 Yangzijiang Shipbuilding Holdings Ltd 29,388,972 0.22%
764,420,188 5.83%
Technology - 10.60% (2017 - 12.79%) 631,958 Adobe Inc 141,008,789 1.08%
449,300 Advantest Corp 9,170,308 0.07%
1,271,527 AIXTRON SE 12,242,263 0.09%
452,722 Altium Ltd 6,933,827 0.05%
831,678 Amadeus IT Group SA 58,036,482 0.44%
603,247 ANSYS Inc 86,258,289 0.66%
290,954 ASM International NV 12,020,825 0.09%
280,740 Aspen Technology Inc 22,731,518 0.17%
130,193 Autodesk Inc 16,564,455 0.13%
2,565,497 Cadence Design Systems Inc 111,188,640 0.85%
666,500 Capcom Co Ltd 13,166,934 0.10%
1,306,289 Cerner Corp 67,940,091 0.51%
1,236,904 Citrix Systems Inc 125,916,827 0.96%
328,285 CommVault Systems Inc 18,965,024 0.14%
1,353,786 Computershare Ltd 16,425,082 0.13%
32,523 Dropbox Inc 676,153 0.01%
528,972 Electronic Arts Inc 41,947,480 0.32%
1,607,245 Fortinet Inc 113,053,613 0.86%
9,386,100 GungHo Online Entertainment Inc 17,074,179 0.13%
875,263 Intuit Inc 171,420,259 1.31%
923,000 Kingdee International Software Group Co Ltd 815,493 0.01%
695,889 Manhattan Associates Inc 29,283,009 0.22%
1,121,700 Mixi Inc 23,485,873 0.18%
3,428,400 Momo Inc (DR) 83,687,244 0.63%
403,075 NetApp Inc 23,817,702 0.18%
484,360 Nuance Communications Inc 6,330,585 0.05%
614,394 Oracle Corp 27,537,139 0.21%
51,556 Pegasystems Inc 2,441,692 0.02%
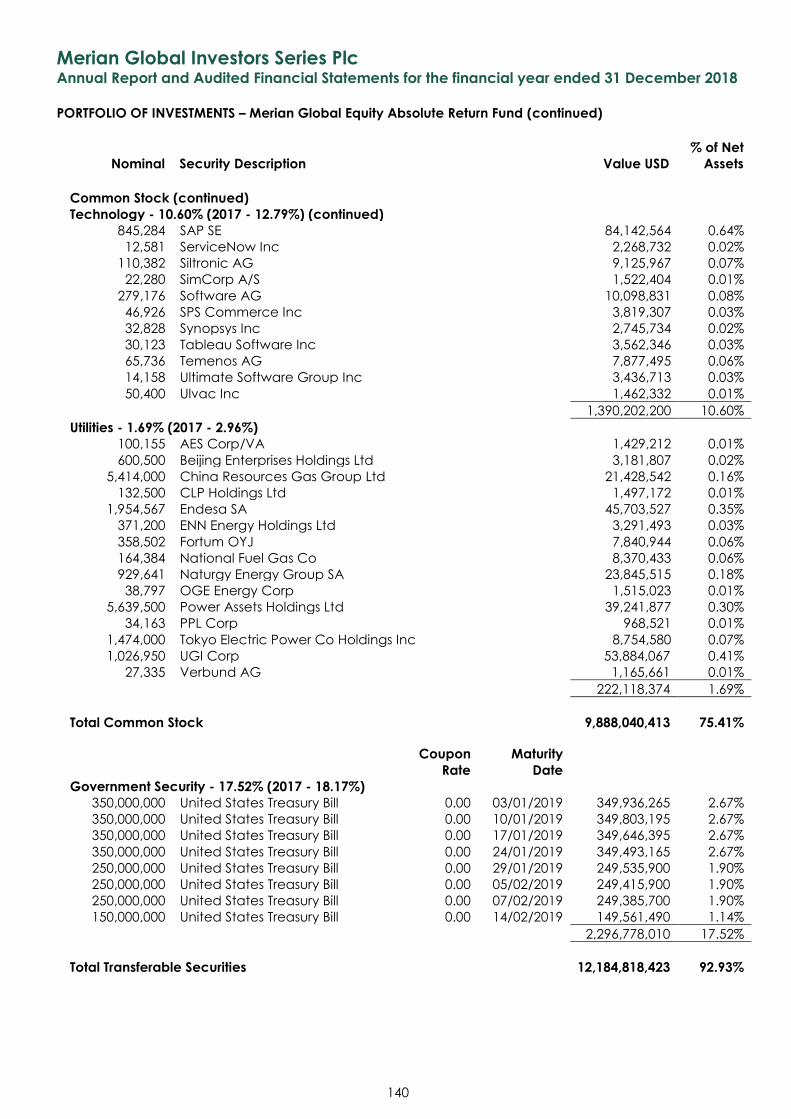
Merian Global Investors Series Plc Annual Report and Audited Financial Statements for the financial year ended 31 December 2018
PORTFOLIO OF INVESTMENTS – Merian Global Equity Absolute Return Fund (continued)
Nominal Security Description Value USD
% of Net
Assets
140
Common Stock (continued)
Technology - 10.60% (2017 - 12.79%) (continued)
845,284 SAP SE 84,142,564 0.64%
12,581 ServiceNow Inc 2,268,732 0.02%
110,382 Siltronic AG 9,125,967 0.07%
22,280 SimCorp A/S 1,522,404 0.01%
279,176 Software AG 10,098,831 0.08%
46,926 SPS Commerce Inc 3,819,307 0.03%
32,828 Synopsys Inc 2,745,734 0.02%
30,123 Tableau Software Inc 3,562,346 0.03%
65,736 Temenos AG 7,877,495 0.06%
14,158 Ultimate Software Group Inc 3,436,713 0.03%
50,400 Ulvac Inc 1,462,332 0.01%
1,390,202,200 10.60%
Utilities - 1.69% (2017 - 2.96%) 100,155 AES Corp/VA 1,429,212 0.01%
600,500 Beijing Enterprises Holdings Ltd 3,181,807 0.02%
5,414,000 China Resources Gas Group Ltd 21,428,542 0.16%
132,500 CLP Holdings Ltd 1,497,172 0.01%
1,954,567 Endesa SA 45,703,527 0.35%
371,200 ENN Energy Holdings Ltd 3,291,493 0.03%
358,502 Fortum OYJ 7,840,944 0.06%
164,384 National Fuel Gas Co 8,370,433 0.06%
929,641 Naturgy Energy Group SA 23,845,515 0.18%
38,797 OGE Energy Corp 1,515,023 0.01%
5,639,500 Power Assets Holdings Ltd 39,241,877 0.30%
34,163 PPL Corp 968,521 0.01%
1,474,000 Tokyo Electric Power Co Holdings Inc 8,754,580 0.07%
1,026,950 UGI Corp 53,884,067 0.41%
27,335 Verbund AG 1,165,661 0.01%
222,118,374 1.69%
Total Common Stock 9,888,040,413 75.41%
Coupon
Rate
Maturity
Date
Government Security - 17.52% (2017 - 18.17%) 350,000,000 United States Treasury Bill 0.00 03/01/2019 349,936,265 2.67%
350,000,000 United States Treasury Bill 0.00 10/01/2019 349,803,195 2.67%
350,000,000 United States Treasury Bill 0.00 17/01/2019 349,646,395 2.67%
350,000,000 United States Treasury Bill 0.00 24/01/2019 349,493,165 2.67%
250,000,000 United States Treasury Bill 0.00 29/01/2019 249,535,900 1.90%
250,000,000 United States Treasury Bill 0.00 05/02/2019 249,415,900 1.90%
250,000,000 United States Treasury Bill 0.00 07/02/2019 249,385,700 1.90%
150,000,000 United States Treasury Bill 0.00 14/02/2019 149,561,490 1.14%
2,296,778,010 17.52%
Total Transferable Securities 12,184,818,423 92.93%
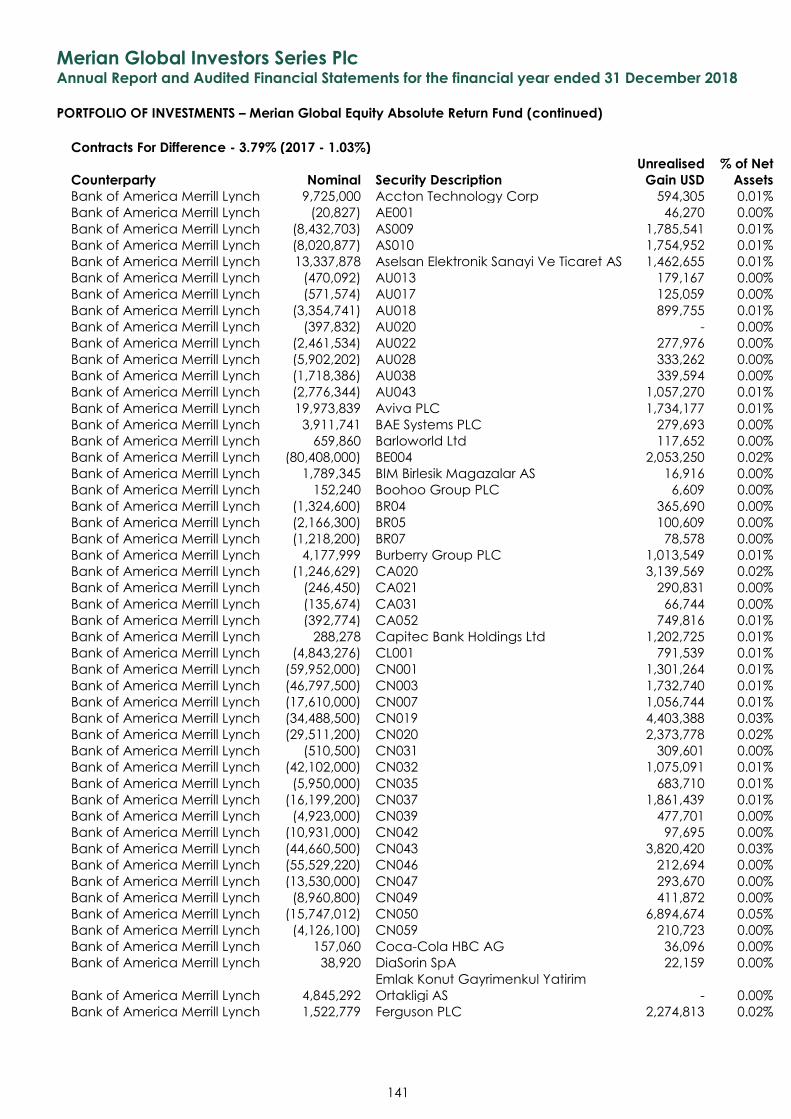
Merian Global Investors Series Plc Annual Report and Audited Financial Statements for the financial year ended 31 December 2018
PORTFOLIO OF INVESTMENTS – Merian Global Equity Absolute Return Fund (continued)
141
Contracts For Difference - 3.79% (2017 - 1.03%)
Counterparty Nominal Security Description
Unrealised
Gain USD
% of Net
Assets
Bank of America Merrill Lynch 9,725,000 Accton Technology Corp 594,305 0.01%
Bank of America Merrill Lynch (20,827) AE001 46,270 0.00%
Bank of America Merrill Lynch (8,432,703) AS009 1,785,541 0.01%
Bank of America Merrill Lynch (8,020,877) AS010 1,754,952 0.01%
Bank of America Merrill Lynch 13,337,878 Aselsan Elektronik Sanayi Ve Ticaret AS 1,462,655 0.01%
Bank of America Merrill Lynch (470,092) AU013 179,167 0.00%
Bank of America Merrill Lynch (571,574) AU017 125,059 0.00%
Bank of America Merrill Lynch (3,354,741) AU018 899,755 0.01%
Bank of America Merrill Lynch (397,832) AU020 - 0.00%
Bank of America Merrill Lynch (2,461,534) AU022 277,976 0.00%
Bank of America Merrill Lynch (5,902,202) AU028 333,262 0.00%
Bank of America Merrill Lynch (1,718,386) AU038 339,594 0.00%
Bank of America Merrill Lynch (2,776,344) AU043 1,057,270 0.01%
Bank of America Merrill Lynch 19,973,839 Aviva PLC 1,734,177 0.01%
Bank of America Merrill Lynch 3,911,741 BAE Systems PLC 279,693 0.00%
Bank of America Merrill Lynch 659,860 Barloworld Ltd 117,652 0.00%
Bank of America Merrill Lynch (80,408,000) BE004 2,053,250 0.02%
Bank of America Merrill Lynch 1,789,345 BIM Birlesik Magazalar AS 16,916 0.00%
Bank of America Merrill Lynch 152,240 Boohoo Group PLC 6,609 0.00%
Bank of America Merrill Lynch (1,324,600) BR04 365,690 0.00%
Bank of America Merrill Lynch (2,166,300) BR05 100,609 0.00%
Bank of America Merrill Lynch (1,218,200) BR07 78,578 0.00%
Bank of America Merrill Lynch 4,177,999 Burberry Group PLC 1,013,549 0.01%
Bank of America Merrill Lynch (1,246,629) CA020 3,139,569 0.02%
Bank of America Merrill Lynch (246,450) CA021 290,831 0.00%
Bank of America Merrill Lynch (135,674) CA031 66,744 0.00%
Bank of America Merrill Lynch (392,774) CA052 749,816 0.01%
Bank of America Merrill Lynch 288,278 Capitec Bank Holdings Ltd 1,202,725 0.01%
Bank of America Merrill Lynch (4,843,276) CL001 791,539 0.01%
Bank of America Merrill Lynch (59,952,000) CN001 1,301,264 0.01%
Bank of America Merrill Lynch (46,797,500) CN003 1,732,740 0.01%
Bank of America Merrill Lynch (17,610,000) CN007 1,056,744 0.01%
Bank of America Merrill Lynch (34,488,500) CN019 4,403,388 0.03%
Bank of America Merrill Lynch (29,511,200) CN020 2,373,778 0.02%
Bank of America Merrill Lynch (510,500) CN031 309,601 0.00%
Bank of America Merrill Lynch (42,102,000) CN032 1,075,091 0.01%
Bank of America Merrill Lynch (5,950,000) CN035 683,710 0.01%
Bank of America Merrill Lynch (16,199,200) CN037 1,861,439 0.01%
Bank of America Merrill Lynch (4,923,000) CN039 477,701 0.00%
Bank of America Merrill Lynch (10,931,000) CN042 97,695 0.00%
Bank of America Merrill Lynch (44,660,500) CN043 3,820,420 0.03%
Bank of America Merrill Lynch (55,529,220) CN046 212,694 0.00%
Bank of America Merrill Lynch (13,530,000) CN047 293,670 0.00%
Bank of America Merrill Lynch (8,960,800) CN049 411,872 0.00%
Bank of America Merrill Lynch (15,747,012) CN050 6,894,674 0.05%
Bank of America Merrill Lynch (4,126,100) CN059 210,723 0.00%
Bank of America Merrill Lynch 157,060 Coca-Cola HBC AG 36,096 0.00%
Bank of America Merrill Lynch 38,920 DiaSorin SpA 22,159 0.00%
Bank of America Merrill Lynch 4,845,292
Emlak Konut Gayrimenkul Yatirim
Ortakligi AS - 0.00%
Bank of America Merrill Lynch 1,522,779 Ferguson PLC 2,274,813 0.02%
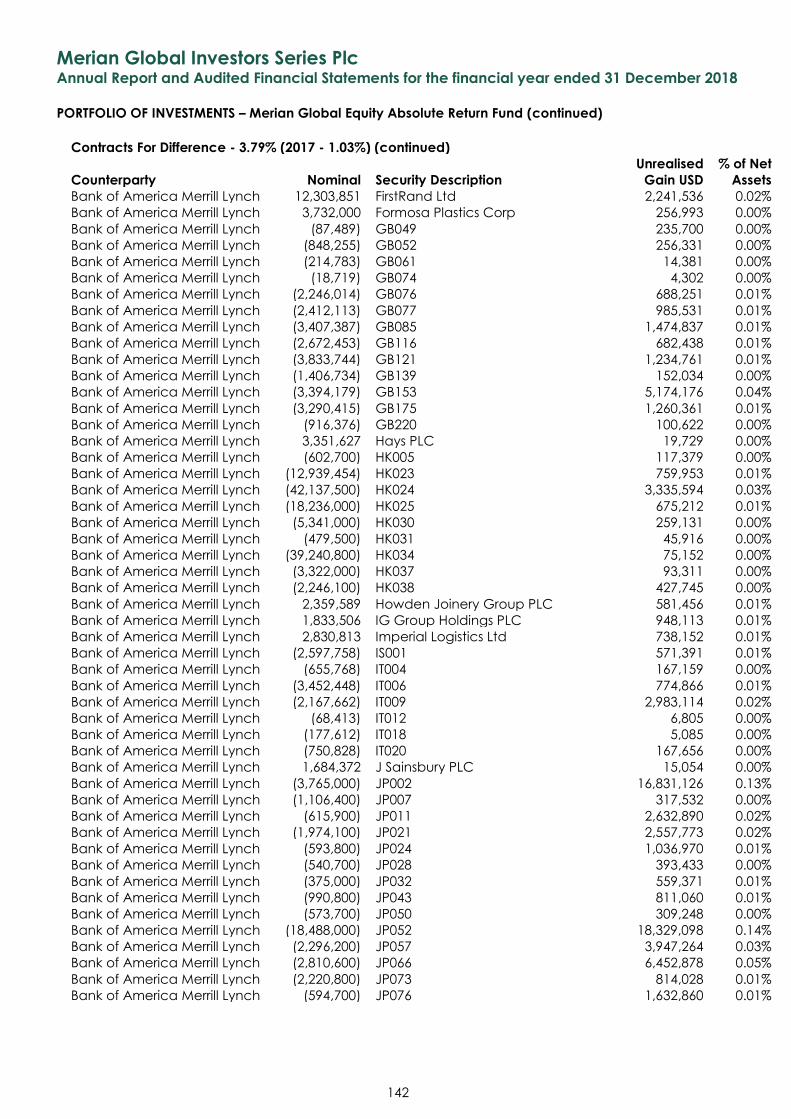
Merian Global Investors Series Plc Annual Report and Audited Financial Statements for the financial year ended 31 December 2018
PORTFOLIO OF INVESTMENTS – Merian Global Equity Absolute Return Fund (continued)
142
Contracts For Difference - 3.79% (2017 - 1.03%) (continued)
Counterparty Nominal Security Description
Unrealised
Gain USD
% of Net
Assets
Bank of America Merrill Lynch 12,303,851 FirstRand Ltd 2,241,536 0.02%
Bank of America Merrill Lynch 3,732,000 Formosa Plastics Corp 256,993 0.00%
Bank of America Merrill Lynch (87,489) GB049 235,700 0.00%
Bank of America Merrill Lynch (848,255) GB052 256,331 0.00%
Bank of America Merrill Lynch (214,783) GB061 14,381 0.00%
Bank of America Merrill Lynch (18,719) GB074 4,302 0.00%
Bank of America Merrill Lynch (2,246,014) GB076 688,251 0.01%
Bank of America Merrill Lynch (2,412,113) GB077 985,531 0.01%
Bank of America Merrill Lynch (3,407,387) GB085 1,474,837 0.01%
Bank of America Merrill Lynch (2,672,453) GB116 682,438 0.01%
Bank of America Merrill Lynch (3,833,744) GB121 1,234,761 0.01%
Bank of America Merrill Lynch (1,406,734) GB139 152,034 0.00%
Bank of America Merrill Lynch (3,394,179) GB153 5,174,176 0.04%
Bank of America Merrill Lynch (3,290,415) GB175 1,260,361 0.01%
Bank of America Merrill Lynch (916,376) GB220 100,622 0.00%
Bank of America Merrill Lynch 3,351,627 Hays PLC 19,729 0.00%
Bank of America Merrill Lynch (602,700) HK005 117,379 0.00%
Bank of America Merrill Lynch (12,939,454) HK023 759,953 0.01%
Bank of America Merrill Lynch (42,137,500) HK024 3,335,594 0.03%
Bank of America Merrill Lynch (18,236,000) HK025 675,212 0.01%
Bank of America Merrill Lynch (5,341,000) HK030 259,131 0.00%
Bank of America Merrill Lynch (479,500) HK031 45,916 0.00%
Bank of America Merrill Lynch (39,240,800) HK034 75,152 0.00%
Bank of America Merrill Lynch (3,322,000) HK037 93,311 0.00%
Bank of America Merrill Lynch (2,246,100) HK038 427,745 0.00%
Bank of America Merrill Lynch 2,359,589 Howden Joinery Group PLC 581,456 0.01%
Bank of America Merrill Lynch 1,833,506 IG Group Holdings PLC 948,113 0.01%
Bank of America Merrill Lynch 2,830,813 Imperial Logistics Ltd 738,152 0.01%
Bank of America Merrill Lynch (2,597,758) IS001 571,391 0.01%
Bank of America Merrill Lynch (655,768) IT004 167,159 0.00%
Bank of America Merrill Lynch (3,452,448) IT006 774,866 0.01%
Bank of America Merrill Lynch (2,167,662) IT009 2,983,114 0.02%
Bank of America Merrill Lynch (68,413) IT012 6,805 0.00%
Bank of America Merrill Lynch (177,612) IT018 5,085 0.00%
Bank of America Merrill Lynch (750,828) IT020 167,656 0.00%
Bank of America Merrill Lynch 1,684,372 J Sainsbury PLC 15,054 0.00%
Bank of America Merrill Lynch (3,765,000) JP002 16,831,126 0.13%
Bank of America Merrill Lynch (1,106,400) JP007 317,532 0.00%
Bank of America Merrill Lynch (615,900) JP011 2,632,890 0.02%
Bank of America Merrill Lynch (1,974,100) JP021 2,557,773 0.02%
Bank of America Merrill Lynch (593,800) JP024 1,036,970 0.01%
Bank of America Merrill Lynch (540,700) JP028 393,433 0.00%
Bank of America Merrill Lynch (375,000) JP032 559,371 0.01%
Bank of America Merrill Lynch (990,800) JP043 811,060 0.01%
Bank of America Merrill Lynch (573,700) JP050 309,248 0.00%
Bank of America Merrill Lynch (18,488,000) JP052 18,329,098 0.14%
Bank of America Merrill Lynch (2,296,200) JP057 3,947,264 0.03%
Bank of America Merrill Lynch (2,810,600) JP066 6,452,878 0.05%
Bank of America Merrill Lynch (2,220,800) JP073 814,028 0.01%
Bank of America Merrill Lynch (594,700) JP076 1,632,860 0.01%
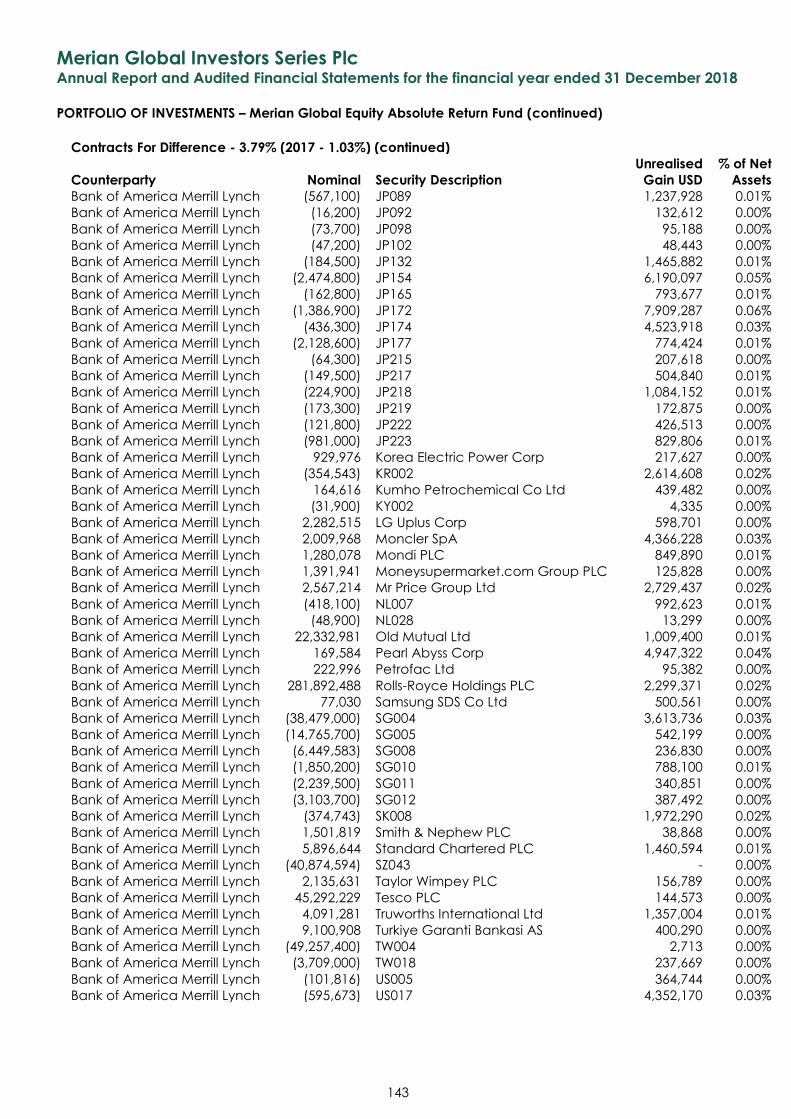
Merian Global Investors Series Plc Annual Report and Audited Financial Statements for the financial year ended 31 December 2018
PORTFOLIO OF INVESTMENTS – Merian Global Equity Absolute Return Fund (continued)
143
Contracts For Difference - 3.79% (2017 - 1.03%) (continued)
Counterparty Nominal Security Description
Unrealised
Gain USD
% of Net
Assets
Bank of America Merrill Lynch (567,100) JP089 1,237,928 0.01%
Bank of America Merrill Lynch (16,200) JP092 132,612 0.00%
Bank of America Merrill Lynch (73,700) JP098 95,188 0.00%
Bank of America Merrill Lynch (47,200) JP102 48,443 0.00%
Bank of America Merrill Lynch (184,500) JP132 1,465,882 0.01%
Bank of America Merrill Lynch (2,474,800) JP154 6,190,097 0.05%
Bank of America Merrill Lynch (162,800) JP165 793,677 0.01%
Bank of America Merrill Lynch (1,386,900) JP172 7,909,287 0.06%
Bank of America Merrill Lynch (436,300) JP174 4,523,918 0.03%
Bank of America Merrill Lynch (2,128,600) JP177 774,424 0.01%
Bank of America Merrill Lynch (64,300) JP215 207,618 0.00%
Bank of America Merrill Lynch (149,500) JP217 504,840 0.01%
Bank of America Merrill Lynch (224,900) JP218 1,084,152 0.01%
Bank of America Merrill Lynch (173,300) JP219 172,875 0.00%
Bank of America Merrill Lynch (121,800) JP222 426,513 0.00%
Bank of America Merrill Lynch (981,000) JP223 829,806 0.01%
Bank of America Merrill Lynch 929,976 Korea Electric Power Corp 217,627 0.00%
Bank of America Merrill Lynch (354,543) KR002 2,614,608 0.02%
Bank of America Merrill Lynch 164,616 Kumho Petrochemical Co Ltd 439,482 0.00%
Bank of America Merrill Lynch (31,900) KY002 4,335 0.00%
Bank of America Merrill Lynch 2,282,515 LG Uplus Corp 598,701 0.00%
Bank of America Merrill Lynch 2,009,968 Moncler SpA 4,366,228 0.03%
Bank of America Merrill Lynch 1,280,078 Mondi PLC 849,890 0.01%
Bank of America Merrill Lynch 1,391,941 Moneysupermarket.com Group PLC 125,828 0.00%
Bank of America Merrill Lynch 2,567,214 Mr Price Group Ltd 2,729,437 0.02%
Bank of America Merrill Lynch (418,100) NL007 992,623 0.01%
Bank of America Merrill Lynch (48,900) NL028 13,299 0.00%
Bank of America Merrill Lynch 22,332,981 Old Mutual Ltd 1,009,400 0.01%
Bank of America Merrill Lynch 169,584 Pearl Abyss Corp 4,947,322 0.04%
Bank of America Merrill Lynch 222,996 Petrofac Ltd 95,382 0.00%
Bank of America Merrill Lynch 281,892,488 Rolls-Royce Holdings PLC 2,299,371 0.02%
Bank of America Merrill Lynch 77,030 Samsung SDS Co Ltd 500,561 0.00%
Bank of America Merrill Lynch (38,479,000) SG004 3,613,736 0.03%
Bank of America Merrill Lynch (14,765,700) SG005 542,199 0.00%
Bank of America Merrill Lynch (6,449,583) SG008 236,830 0.00%
Bank of America Merrill Lynch (1,850,200) SG010 788,100 0.01%
Bank of America Merrill Lynch (2,239,500) SG011 340,851 0.00%
Bank of America Merrill Lynch (3,103,700) SG012 387,492 0.00%
Bank of America Merrill Lynch (374,743) SK008 1,972,290 0.02%
Bank of America Merrill Lynch 1,501,819 Smith & Nephew PLC 38,868 0.00%
Bank of America Merrill Lynch 5,896,644 Standard Chartered PLC 1,460,594 0.01%
Bank of America Merrill Lynch (40,874,594) SZ043 - 0.00%
Bank of America Merrill Lynch 2,135,631 Taylor Wimpey PLC 156,789 0.00%
Bank of America Merrill Lynch 45,292,229 Tesco PLC 144,573 0.00%
Bank of America Merrill Lynch 4,091,281 Truworths International Ltd 1,357,004 0.01%
Bank of America Merrill Lynch 9,100,908 Turkiye Garanti Bankasi AS 400,290 0.00%
Bank of America Merrill Lynch (49,257,400) TW004 2,713 0.00%
Bank of America Merrill Lynch (3,709,000) TW018 237,669 0.00%
Bank of America Merrill Lynch (101,816) US005 364,744 0.00%
Bank of America Merrill Lynch (595,673) US017 4,352,170 0.03%
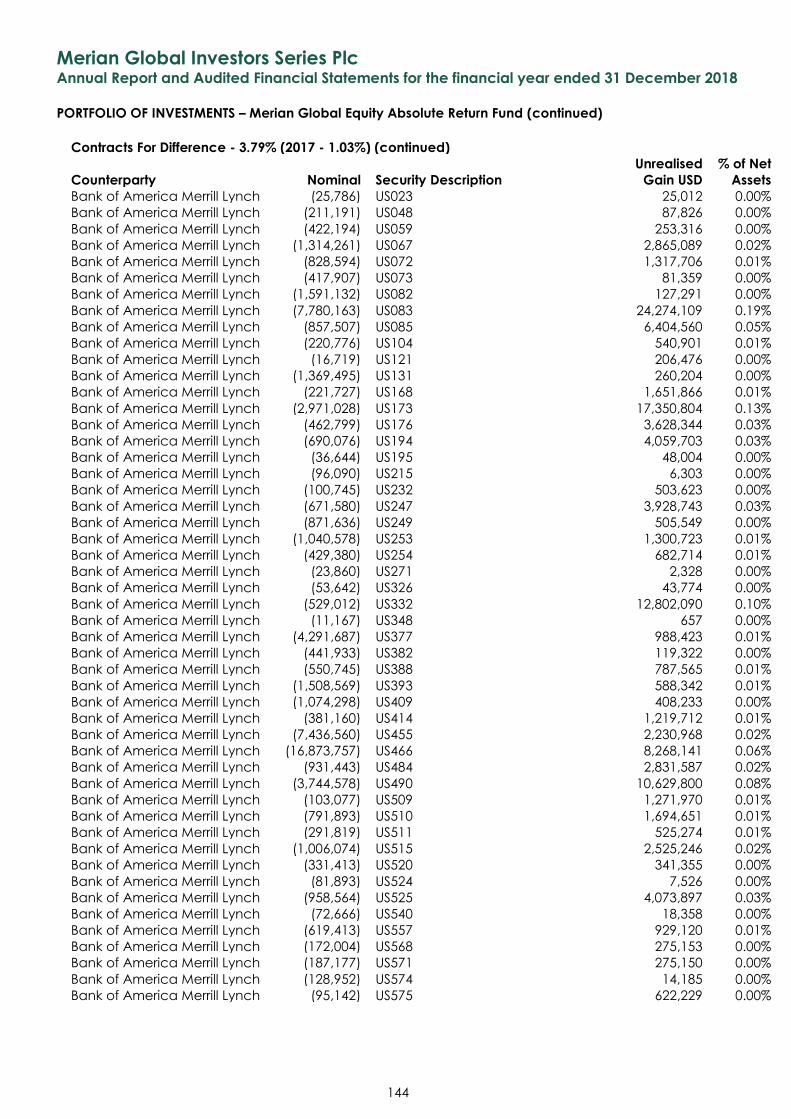
Merian Global Investors Series Plc Annual Report and Audited Financial Statements for the financial year ended 31 December 2018
PORTFOLIO OF INVESTMENTS – Merian Global Equity Absolute Return Fund (continued)
144
Contracts For Difference - 3.79% (2017 - 1.03%) (continued)
Counterparty Nominal Security Description
Unrealised
Gain USD
% of Net
Assets
Bank of America Merrill Lynch (25,786) US023 25,012 0.00%
Bank of America Merrill Lynch (211,191) US048 87,826 0.00%
Bank of America Merrill Lynch (422,194) US059 253,316 0.00%
Bank of America Merrill Lynch (1,314,261) US067 2,865,089 0.02%
Bank of America Merrill Lynch (828,594) US072 1,317,706 0.01%
Bank of America Merrill Lynch (417,907) US073 81,359 0.00%
Bank of America Merrill Lynch (1,591,132) US082 127,291 0.00%
Bank of America Merrill Lynch (7,780,163) US083 24,274,109 0.19%
Bank of America Merrill Lynch (857,507) US085 6,404,560 0.05%
Bank of America Merrill Lynch (220,776) US104 540,901 0.01%
Bank of America Merrill Lynch (16,719) US121 206,476 0.00%
Bank of America Merrill Lynch (1,369,495) US131 260,204 0.00%
Bank of America Merrill Lynch (221,727) US168 1,651,866 0.01%
Bank of America Merrill Lynch (2,971,028) US173 17,350,804 0.13%
Bank of America Merrill Lynch (462,799) US176 3,628,344 0.03%
Bank of America Merrill Lynch (690,076) US194 4,059,703 0.03%
Bank of America Merrill Lynch (36,644) US195 48,004 0.00%
Bank of America Merrill Lynch (96,090) US215 6,303 0.00%
Bank of America Merrill Lynch (100,745) US232 503,623 0.00%
Bank of America Merrill Lynch (671,580) US247 3,928,743 0.03%
Bank of America Merrill Lynch (871,636) US249 505,549 0.00%
Bank of America Merrill Lynch (1,040,578) US253 1,300,723 0.01%
Bank of America Merrill Lynch (429,380) US254 682,714 0.01%
Bank of America Merrill Lynch (23,860) US271 2,328 0.00%
Bank of America Merrill Lynch (53,642) US326 43,774 0.00%
Bank of America Merrill Lynch (529,012) US332 12,802,090 0.10%
Bank of America Merrill Lynch (11,167) US348 657 0.00%
Bank of America Merrill Lynch (4,291,687) US377 988,423 0.01%
Bank of America Merrill Lynch (441,933) US382 119,322 0.00%
Bank of America Merrill Lynch (550,745) US388 787,565 0.01%
Bank of America Merrill Lynch (1,508,569) US393 588,342 0.01%
Bank of America Merrill Lynch (1,074,298) US409 408,233 0.00%
Bank of America Merrill Lynch (381,160) US414 1,219,712 0.01%
Bank of America Merrill Lynch (7,436,560) US455 2,230,968 0.02%
Bank of America Merrill Lynch (16,873,757) US466 8,268,141 0.06%
Bank of America Merrill Lynch (931,443) US484 2,831,587 0.02%
Bank of America Merrill Lynch (3,744,578) US490 10,629,800 0.08%
Bank of America Merrill Lynch (103,077) US509 1,271,970 0.01%
Bank of America Merrill Lynch (791,893) US510 1,694,651 0.01%
Bank of America Merrill Lynch (291,819) US511 525,274 0.01%
Bank of America Merrill Lynch (1,006,074) US515 2,525,246 0.02%
Bank of America Merrill Lynch (331,413) US520 341,355 0.00%
Bank of America Merrill Lynch (81,893) US524 7,526 0.00%
Bank of America Merrill Lynch (958,564) US525 4,073,897 0.03%
Bank of America Merrill Lynch (72,666) US540 18,358 0.00%
Bank of America Merrill Lynch (619,413) US557 929,120 0.01%
Bank of America Merrill Lynch (172,004) US568 275,153 0.00%
Bank of America Merrill Lynch (187,177) US571 275,150 0.00%
Bank of America Merrill Lynch (128,952) US574 14,185 0.00%
Bank of America Merrill Lynch (95,142) US575 622,229 0.00%
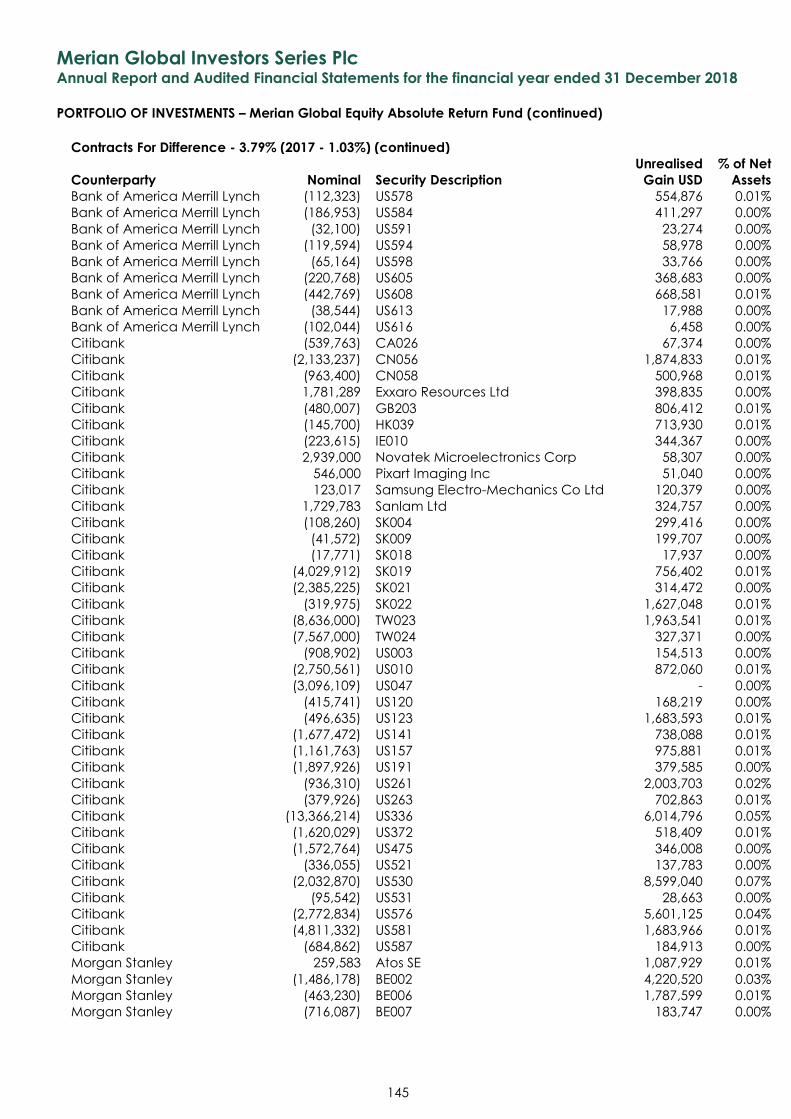
Merian Global Investors Series Plc Annual Report and Audited Financial Statements for the financial year ended 31 December 2018
PORTFOLIO OF INVESTMENTS – Merian Global Equity Absolute Return Fund (continued)
145
Contracts For Difference - 3.79% (2017 - 1.03%) (continued)
Counterparty Nominal Security Description
Unrealised
Gain USD
% of Net
Assets
Bank of America Merrill Lynch (112,323) US578 554,876 0.01%
Bank of America Merrill Lynch (186,953) US584 411,297 0.00%
Bank of America Merrill Lynch (32,100) US591 23,274 0.00%
Bank of America Merrill Lynch (119,594) US594 58,978 0.00%
Bank of America Merrill Lynch (65,164) US598 33,766 0.00%
Bank of America Merrill Lynch (220,768) US605 368,683 0.00%
Bank of America Merrill Lynch (442,769) US608 668,581 0.01%
Bank of America Merrill Lynch (38,544) US613 17,988 0.00%
Bank of America Merrill Lynch (102,044) US616 6,458 0.00%
Citibank (539,763) CA026 67,374 0.00%
Citibank (2,133,237) CN056 1,874,833 0.01%
Citibank (963,400) CN058 500,968 0.01%
Citibank 1,781,289 Exxaro Resources Ltd 398,835 0.00%
Citibank (480,007) GB203 806,412 0.01%
Citibank (145,700) HK039 713,930 0.01%
Citibank (223,615) IE010 344,367 0.00%
Citibank 2,939,000 Novatek Microelectronics Corp 58,307 0.00%
Citibank 546,000 Pixart Imaging Inc 51,040 0.00%
Citibank 123,017 Samsung Electro-Mechanics Co Ltd 120,379 0.00%
Citibank 1,729,783 Sanlam Ltd 324,757 0.00%
Citibank (108,260) SK004 299,416 0.00%
Citibank (41,572) SK009 199,707 0.00%
Citibank (17,771) SK018 17,937 0.00%
Citibank (4,029,912) SK019 756,402 0.01%
Citibank (2,385,225) SK021 314,472 0.00%
Citibank (319,975) SK022 1,627,048 0.01%
Citibank (8,636,000) TW023 1,963,541 0.01%
Citibank (7,567,000) TW024 327,371 0.00%
Citibank (908,902) US003 154,513 0.00%
Citibank (2,750,561) US010 872,060 0.01%
Citibank (3,096,109) US047 - 0.00%
Citibank (415,741) US120 168,219 0.00%
Citibank (496,635) US123 1,683,593 0.01%
Citibank (1,677,472) US141 738,088 0.01%
Citibank (1,161,763) US157 975,881 0.01%
Citibank (1,897,926) US191 379,585 0.00%
Citibank (936,310) US261 2,003,703 0.02%
Citibank (379,926) US263 702,863 0.01%
Citibank (13,366,214) US336 6,014,796 0.05%
Citibank (1,620,029) US372 518,409 0.01%
Citibank (1,572,764) US475 346,008 0.00%
Citibank (336,055) US521 137,783 0.00%
Citibank (2,032,870) US530 8,599,040 0.07%
Citibank (95,542) US531 28,663 0.00%
Citibank (2,772,834) US576 5,601,125 0.04%
Citibank (4,811,332) US581 1,683,966 0.01%
Citibank (684,862) US587 184,913 0.00%
Morgan Stanley 259,583 Atos SE 1,087,929 0.01%
Morgan Stanley (1,486,178) BE002 4,220,520 0.03%
Morgan Stanley (463,230) BE006 1,787,599 0.01%
Morgan Stanley (716,087) BE007 183,747 0.00%
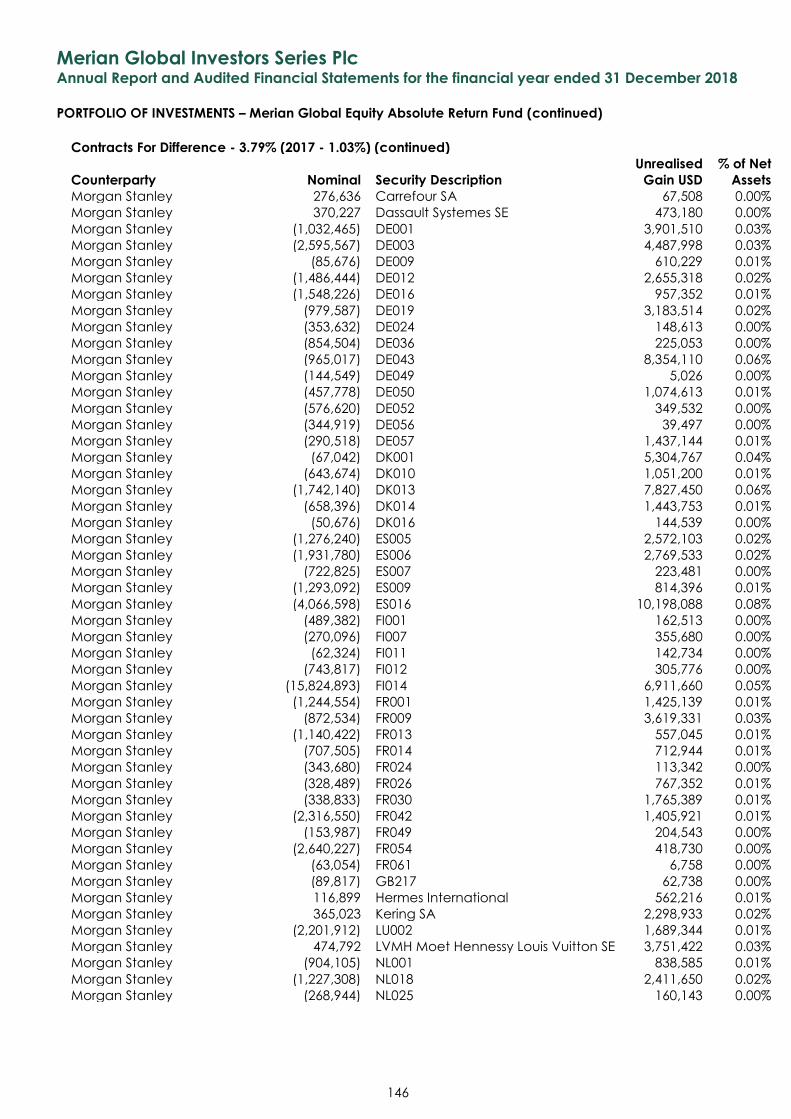
Merian Global Investors Series Plc Annual Report and Audited Financial Statements for the financial year ended 31 December 2018
PORTFOLIO OF INVESTMENTS – Merian Global Equity Absolute Return Fund (continued)
146
Contracts For Difference - 3.79% (2017 - 1.03%) (continued)
Counterparty Nominal Security Description
Unrealised
Gain USD
% of Net
Assets
Morgan Stanley 276,636 Carrefour SA 67,508 0.00%
Morgan Stanley 370,227 Dassault Systemes SE 473,180 0.00%
Morgan Stanley (1,032,465) DE001 3,901,510 0.03%
Morgan Stanley (2,595,567) DE003 4,487,998 0.03%
Morgan Stanley (85,676) DE009 610,229 0.01%
Morgan Stanley (1,486,444) DE012 2,655,318 0.02%
Morgan Stanley (1,548,226) DE016 957,352 0.01%
Morgan Stanley (979,587) DE019 3,183,514 0.02%
Morgan Stanley (353,632) DE024 148,613 0.00%
Morgan Stanley (854,504) DE036 225,053 0.00%
Morgan Stanley (965,017) DE043 8,354,110 0.06%
Morgan Stanley (144,549) DE049 5,026 0.00%
Morgan Stanley (457,778) DE050 1,074,613 0.01%
Morgan Stanley (576,620) DE052 349,532 0.00%
Morgan Stanley (344,919) DE056 39,497 0.00%
Morgan Stanley (290,518) DE057 1,437,144 0.01%
Morgan Stanley (67,042) DK001 5,304,767 0.04%
Morgan Stanley (643,674) DK010 1,051,200 0.01%
Morgan Stanley (1,742,140) DK013 7,827,450 0.06%
Morgan Stanley (658,396) DK014 1,443,753 0.01%
Morgan Stanley (50,676) DK016 144,539 0.00%
Morgan Stanley (1,276,240) ES005 2,572,103 0.02%
Morgan Stanley (1,931,780) ES006 2,769,533 0.02%
Morgan Stanley (722,825) ES007 223,481 0.00%
Morgan Stanley (1,293,092) ES009 814,396 0.01%
Morgan Stanley (4,066,598) ES016 10,198,088 0.08%
Morgan Stanley (489,382) FI001 162,513 0.00%
Morgan Stanley (270,096) FI007 355,680 0.00%
Morgan Stanley (62,324) FI011 142,734 0.00%
Morgan Stanley (743,817) FI012 305,776 0.00%
Morgan Stanley (15,824,893) FI014 6,911,660 0.05%
Morgan Stanley (1,244,554) FR001 1,425,139 0.01%
Morgan Stanley (872,534) FR009 3,619,331 0.03%
Morgan Stanley (1,140,422) FR013 557,045 0.01%
Morgan Stanley (707,505) FR014 712,944 0.01%
Morgan Stanley (343,680) FR024 113,342 0.00%
Morgan Stanley (328,489) FR026 767,352 0.01%
Morgan Stanley (338,833) FR030 1,765,389 0.01%
Morgan Stanley (2,316,550) FR042 1,405,921 0.01%
Morgan Stanley (153,987) FR049 204,543 0.00%
Morgan Stanley (2,640,227) FR054 418,730 0.00%
Morgan Stanley (63,054) FR061 6,758 0.00%
Morgan Stanley (89,817) GB217 62,738 0.00%
Morgan Stanley 116,899 Hermes International 562,216 0.01%
Morgan Stanley 365,023 Kering SA 2,298,933 0.02%
Morgan Stanley (2,201,912) LU002 1,689,344 0.01%
Morgan Stanley 474,792 LVMH Moet Hennessy Louis Vuitton SE 3,751,422 0.03%
Morgan Stanley (904,105) NL001 838,585 0.01%
Morgan Stanley (1,227,308) NL018 2,411,650 0.02%
Morgan Stanley (268,944) NL025 160,143 0.00%
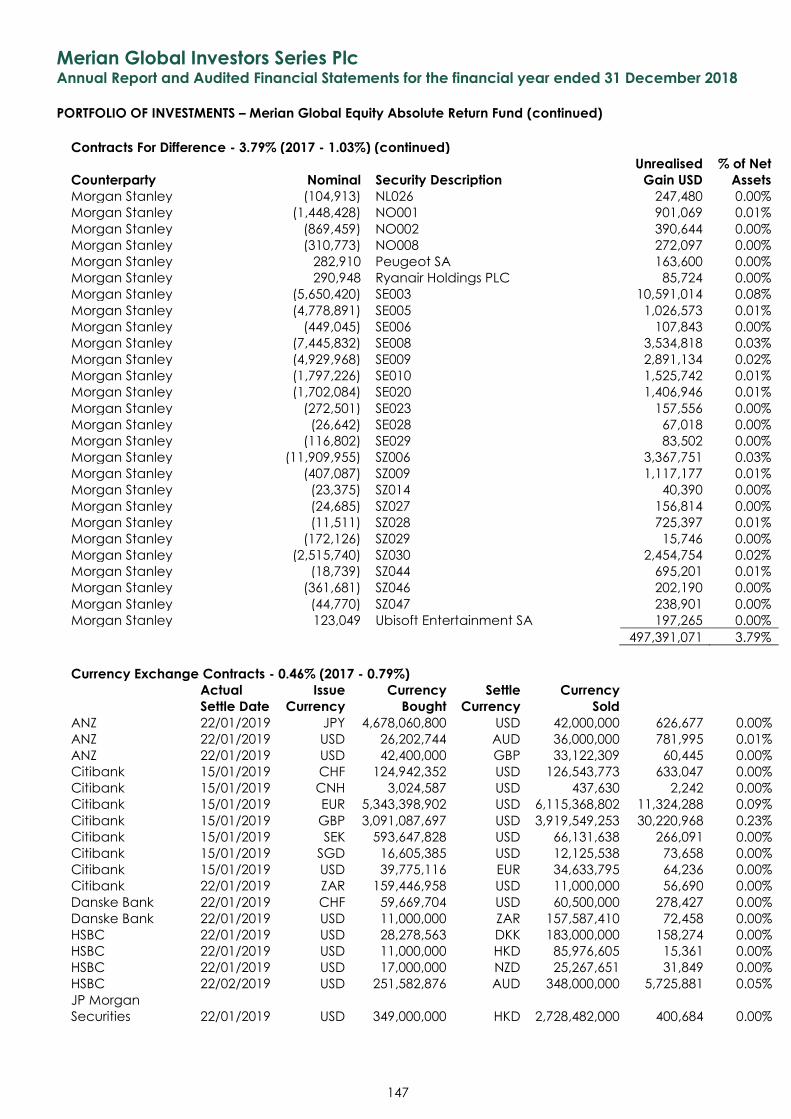
Merian Global Investors Series Plc Annual Report and Audited Financial Statements for the financial year ended 31 December 2018
PORTFOLIO OF INVESTMENTS – Merian Global Equity Absolute Return Fund (continued)
147
Contracts For Difference - 3.79% (2017 - 1.03%) (continued)
Counterparty Nominal Security Description
Unrealised
Gain USD
% of Net
Assets
Morgan Stanley (104,913) NL026 247,480 0.00%
Morgan Stanley (1,448,428) NO001 901,069 0.01%
Morgan Stanley (869,459) NO002 390,644 0.00%
Morgan Stanley (310,773) NO008 272,097 0.00%
Morgan Stanley 282,910 Peugeot SA 163,600 0.00%
Morgan Stanley 290,948 Ryanair Holdings PLC 85,724 0.00%
Morgan Stanley (5,650,420) SE003 10,591,014 0.08%
Morgan Stanley (4,778,891) SE005 1,026,573 0.01%
Morgan Stanley (449,045) SE006 107,843 0.00%
Morgan Stanley (7,445,832) SE008 3,534,818 0.03%
Morgan Stanley (4,929,968) SE009 2,891,134 0.02%
Morgan Stanley (1,797,226) SE010 1,525,742 0.01%
Morgan Stanley (1,702,084) SE020 1,406,946 0.01%
Morgan Stanley (272,501) SE023 157,556 0.00%
Morgan Stanley (26,642) SE028 67,018 0.00%
Morgan Stanley (116,802) SE029 83,502 0.00%
Morgan Stanley (11,909,955) SZ006 3,367,751 0.03%
Morgan Stanley (407,087) SZ009 1,117,177 0.01%
Morgan Stanley (23,375) SZ014 40,390 0.00%
Morgan Stanley (24,685) SZ027 156,814 0.00%
Morgan Stanley (11,511) SZ028 725,397 0.01%
Morgan Stanley (172,126) SZ029 15,746 0.00%
Morgan Stanley (2,515,740) SZ030 2,454,754 0.02%
Morgan Stanley (18,739) SZ044 695,201 0.01%
Morgan Stanley (361,681) SZ046 202,190 0.00%
Morgan Stanley (44,770) SZ047 238,901 0.00%
Morgan Stanley 123,049 Ubisoft Entertainment SA 197,265 0.00%
497,391,071 3.79%
Currency Exchange Contracts - 0.46% (2017 - 0.79%)
Actual
Settle Date
Issue
Currency
Currency
Bought
Settle
Currency
Currency
Sold
ANZ 22/01/2019 JPY 4,678,060,800 USD 42,000,000 626,677 0.00%
ANZ 22/01/2019 USD 26,202,744 AUD 36,000,000 781,995 0.01%
ANZ 22/01/2019 USD 42,400,000 GBP 33,122,309 60,445 0.00%
Citibank 15/01/2019 CHF 124,942,352 USD 126,543,773 633,047 0.00%
Citibank 15/01/2019 CNH 3,024,587 USD 437,630 2,242 0.00%
Citibank 15/01/2019 EUR 5,343,398,902 USD 6,115,368,802 11,324,288 0.09%
Citibank 15/01/2019 GBP 3,091,087,697 USD 3,919,549,253 30,220,968 0.23%
Citibank 15/01/2019 SEK 593,647,828 USD 66,131,638 266,091 0.00%
Citibank 15/01/2019 SGD 16,605,385 USD 12,125,538 73,658 0.00%
Citibank 15/01/2019 USD 39,775,116 EUR 34,633,795 64,236 0.00%
Citibank 22/01/2019 ZAR 159,446,958 USD 11,000,000 56,690 0.00%
Danske Bank 22/01/2019 CHF 59,669,704 USD 60,500,000 278,427 0.00%
Danske Bank 22/01/2019 USD 11,000,000 ZAR 157,587,410 72,458 0.00%
HSBC 22/01/2019 USD 28,278,563 DKK 183,000,000 158,274 0.00%
HSBC 22/01/2019 USD 11,000,000 HKD 85,976,605 15,361 0.00%
HSBC 22/01/2019 USD 17,000,000 NZD 25,267,651 31,849 0.00%
HSBC 22/02/2019 USD 251,582,876 AUD 348,000,000 5,725,881 0.05%
JP Morgan
Securities 22/01/2019 USD 349,000,000 HKD 2,728,482,000 400,684 0.00%
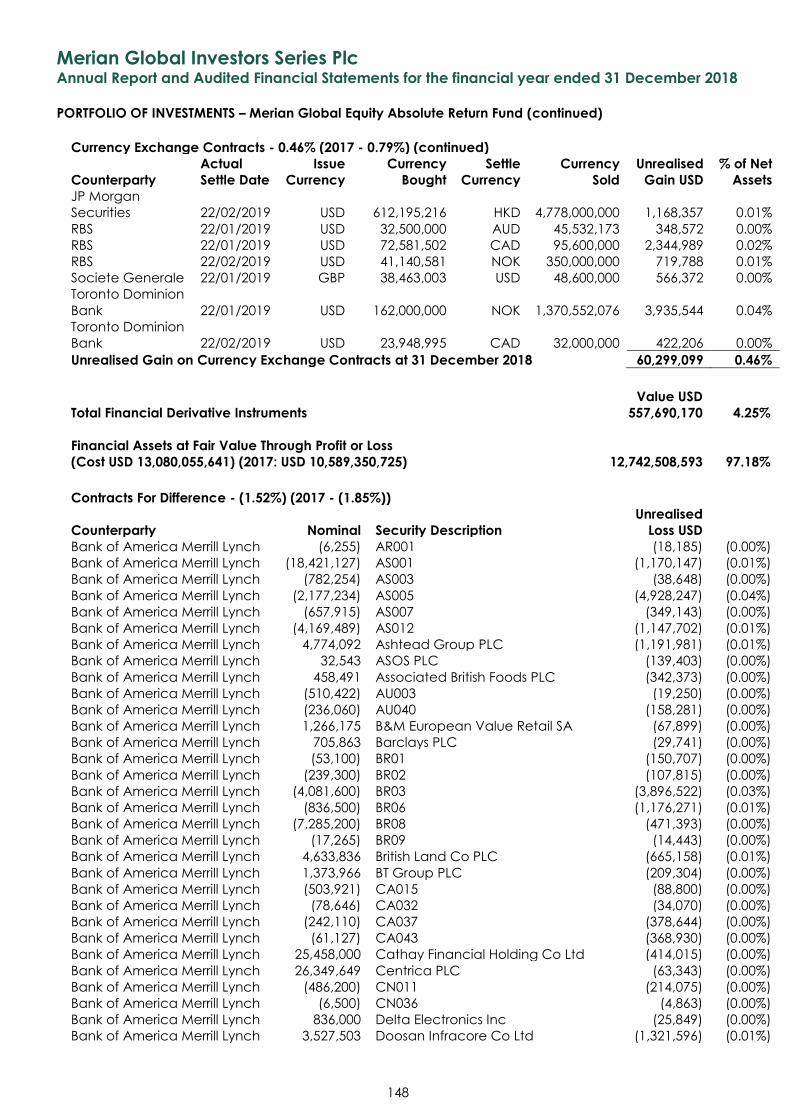
Merian Global Investors Series Plc Annual Report and Audited Financial Statements for the financial year ended 31 December 2018
PORTFOLIO OF INVESTMENTS – Merian Global Equity Absolute Return Fund (continued)
148
Currency Exchange Contracts - 0.46% (2017 - 0.79%) (continued)
Counterparty
Actual
Settle Date
Issue
Currency
Currency
Bought
Settle
Currency
Currency
Sold
Unrealised
Gain USD
% of Net
Assets
JP Morgan
Securities 22/02/2019 USD 612,195,216 HKD 4,778,000,000 1,168,357 0.01%
RBS 22/01/2019 USD 32,500,000 AUD 45,532,173 348,572 0.00%
RBS 22/01/2019 USD 72,581,502 CAD 95,600,000 2,344,989 0.02%
RBS 22/02/2019 USD 41,140,581 NOK 350,000,000 719,788 0.01%
Societe Generale 22/01/2019 GBP 38,463,003 USD 48,600,000 566,372 0.00%
Toronto Dominion
Bank 22/01/2019 USD 162,000,000 NOK 1,370,552,076 3,935,544 0.04%
Toronto Dominion
Bank 22/02/2019 USD 23,948,995 CAD 32,000,000 422,206 0.00%
Unrealised Gain on Currency Exchange Contracts at 31 December 2018 60,299,099 0.46%
Value USD
Total Financial Derivative Instruments 557,690,170 4.25%
Financial Assets at Fair Value Through Profit or Loss
(Cost USD 13,080,055,641) (2017: USD 10,589,350,725) 12,742,508,593 97.18%
Contracts For Difference - (1.52%) (2017 - (1.85%))
Counterparty Nominal Security Description
Unrealised
Loss USD Bank of America Merrill Lynch (6,255) AR001 (18,185) (0.00%)
Bank of America Merrill Lynch (18,421,127) AS001 (1,170,147) (0.01%)
Bank of America Merrill Lynch (782,254) AS003 (38,648) (0.00%)
Bank of America Merrill Lynch (2,177,234) AS005 (4,928,247) (0.04%)
Bank of America Merrill Lynch (657,915) AS007 (349,143) (0.00%)
Bank of America Merrill Lynch (4,169,489) AS012 (1,147,702) (0.01%)
Bank of America Merrill Lynch 4,774,092 Ashtead Group PLC (1,191,981) (0.01%)
Bank of America Merrill Lynch 32,543 ASOS PLC (139,403) (0.00%)
Bank of America Merrill Lynch 458,491 Associated British Foods PLC (342,373) (0.00%)
Bank of America Merrill Lynch (510,422) AU003 (19,250) (0.00%)
Bank of America Merrill Lynch (236,060) AU040 (158,281) (0.00%)
Bank of America Merrill Lynch 1,266,175 B&M European Value Retail SA (67,899) (0.00%)
Bank of America Merrill Lynch 705,863 Barclays PLC (29,741) (0.00%)
Bank of America Merrill Lynch (53,100) BR01 (150,707) (0.00%)
Bank of America Merrill Lynch (239,300) BR02 (107,815) (0.00%)
Bank of America Merrill Lynch (4,081,600) BR03 (3,896,522) (0.03%)
Bank of America Merrill Lynch (836,500) BR06 (1,176,271) (0.01%)
Bank of America Merrill Lynch (7,285,200) BR08 (471,393) (0.00%)
Bank of America Merrill Lynch (17,265) BR09 (14,443) (0.00%)
Bank of America Merrill Lynch 4,633,836 British Land Co PLC (665,158) (0.01%)
Bank of America Merrill Lynch 1,373,966 BT Group PLC (209,304) (0.00%)
Bank of America Merrill Lynch (503,921) CA015 (88,800) (0.00%)
Bank of America Merrill Lynch (78,646) CA032 (34,070) (0.00%)
Bank of America Merrill Lynch (242,110) CA037 (378,644) (0.00%)
Bank of America Merrill Lynch (61,127) CA043 (368,930) (0.00%)
Bank of America Merrill Lynch 25,458,000 Cathay Financial Holding Co Ltd (414,015) (0.00%)
Bank of America Merrill Lynch 26,349,649 Centrica PLC (63,343) (0.00%)
Bank of America Merrill Lynch (486,200) CN011 (214,075) (0.00%)
Bank of America Merrill Lynch (6,500) CN036 (4,863) (0.00%)
Bank of America Merrill Lynch 836,000 Delta Electronics Inc (25,849) (0.00%)
Bank of America Merrill Lynch 3,527,503 Doosan Infracore Co Ltd (1,321,596) (0.01%)
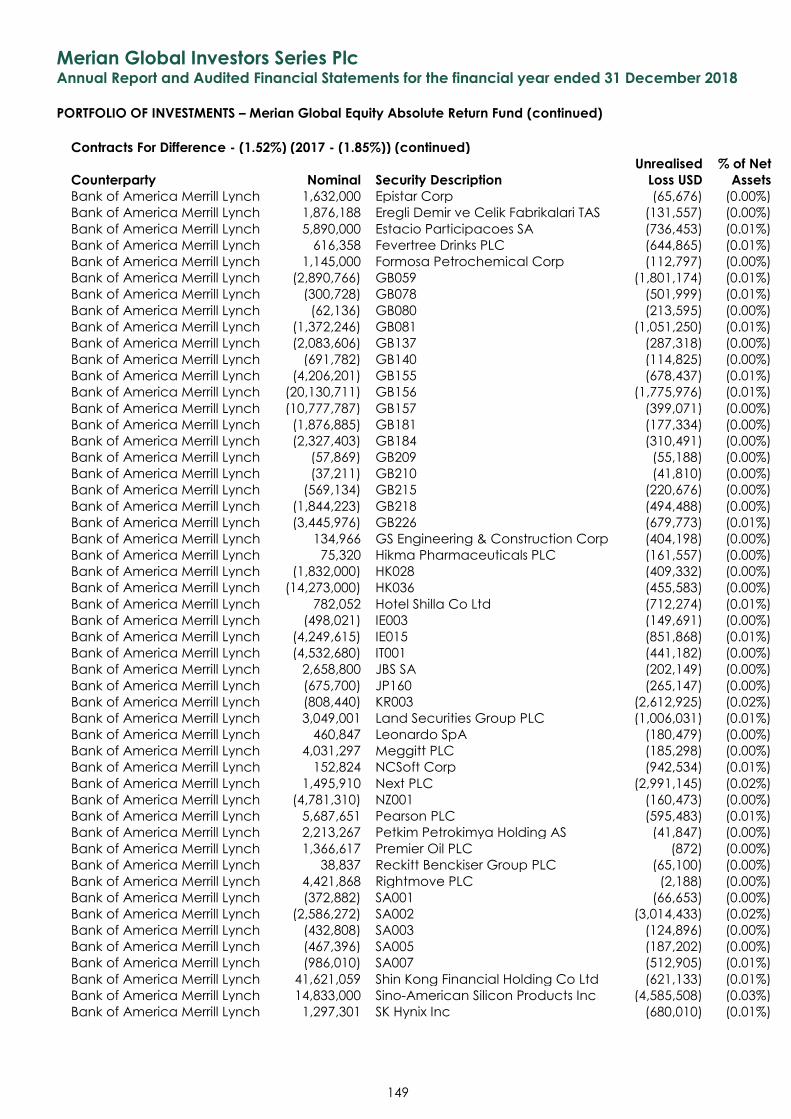
Merian Global Investors Series Plc Annual Report and Audited Financial Statements for the financial year ended 31 December 2018
PORTFOLIO OF INVESTMENTS – Merian Global Equity Absolute Return Fund (continued)
149
Contracts For Difference - (1.52%) (2017 - (1.85%)) (continued)
Counterparty Nominal Security Description
Unrealised
Loss USD
% of Net
Assets
Bank of America Merrill Lynch 1,632,000 Epistar Corp (65,676) (0.00%)
Bank of America Merrill Lynch 1,876,188 Eregli Demir ve Celik Fabrikalari TAS (131,557) (0.00%)
Bank of America Merrill Lynch 5,890,000 Estacio Participacoes SA (736,453) (0.01%)
Bank of America Merrill Lynch 616,358 Fevertree Drinks PLC (644,865) (0.01%)
Bank of America Merrill Lynch 1,145,000 Formosa Petrochemical Corp (112,797) (0.00%)
Bank of America Merrill Lynch (2,890,766) GB059 (1,801,174) (0.01%)
Bank of America Merrill Lynch (300,728) GB078 (501,999) (0.01%)
Bank of America Merrill Lynch (62,136) GB080 (213,595) (0.00%)
Bank of America Merrill Lynch (1,372,246) GB081 (1,051,250) (0.01%)
Bank of America Merrill Lynch (2,083,606) GB137 (287,318) (0.00%)
Bank of America Merrill Lynch (691,782) GB140 (114,825) (0.00%)
Bank of America Merrill Lynch (4,206,201) GB155 (678,437) (0.01%)
Bank of America Merrill Lynch (20,130,711) GB156 (1,775,976) (0.01%)
Bank of America Merrill Lynch (10,777,787) GB157 (399,071) (0.00%)
Bank of America Merrill Lynch (1,876,885) GB181 (177,334) (0.00%)
Bank of America Merrill Lynch (2,327,403) GB184 (310,491) (0.00%)
Bank of America Merrill Lynch (57,869) GB209 (55,188) (0.00%)
Bank of America Merrill Lynch (37,211) GB210 (41,810) (0.00%)
Bank of America Merrill Lynch (569,134) GB215 (220,676) (0.00%)
Bank of America Merrill Lynch (1,844,223) GB218 (494,488) (0.00%)
Bank of America Merrill Lynch (3,445,976) GB226 (679,773) (0.01%)
Bank of America Merrill Lynch 134,966 GS Engineering & Construction Corp (404,198) (0.00%)
Bank of America Merrill Lynch 75,320 Hikma Pharmaceuticals PLC (161,557) (0.00%)
Bank of America Merrill Lynch (1,832,000) HK028 (409,332) (0.00%)
Bank of America Merrill Lynch (14,273,000) HK036 (455,583) (0.00%)
Bank of America Merrill Lynch 782,052 Hotel Shilla Co Ltd (712,274) (0.01%)
Bank of America Merrill Lynch (498,021) IE003 (149,691) (0.00%)
Bank of America Merrill Lynch (4,249,615) IE015 (851,868) (0.01%)
Bank of America Merrill Lynch (4,532,680) IT001 (441,182) (0.00%)
Bank of America Merrill Lynch 2,658,800 JBS SA (202,149) (0.00%)
Bank of America Merrill Lynch (675,700) JP160 (265,147) (0.00%)
Bank of America Merrill Lynch (808,440) KR003 (2,612,925) (0.02%)
Bank of America Merrill Lynch 3,049,001 Land Securities Group PLC (1,006,031) (0.01%)
Bank of America Merrill Lynch 460,847 Leonardo SpA (180,479) (0.00%)
Bank of America Merrill Lynch 4,031,297 Meggitt PLC (185,298) (0.00%)
Bank of America Merrill Lynch 152,824 NCSoft Corp (942,534) (0.01%)
Bank of America Merrill Lynch 1,495,910 Next PLC (2,991,145) (0.02%)
Bank of America Merrill Lynch (4,781,310) NZ001 (160,473) (0.00%)
Bank of America Merrill Lynch 5,687,651 Pearson PLC (595,483) (0.01%)
Bank of America Merrill Lynch 2,213,267 Petkim Petrokimya Holding AS (41,847) (0.00%)
Bank of America Merrill Lynch 1,366,617 Premier Oil PLC (872) (0.00%)
Bank of America Merrill Lynch 38,837 Reckitt Benckiser Group PLC (65,100) (0.00%)
Bank of America Merrill Lynch 4,421,868 Rightmove PLC (2,188) (0.00%)
Bank of America Merrill Lynch (372,882) SA001 (66,653) (0.00%)
Bank of America Merrill Lynch (2,586,272) SA002 (3,014,433) (0.02%)
Bank of America Merrill Lynch (432,808) SA003 (124,896) (0.00%)
Bank of America Merrill Lynch (467,396) SA005 (187,202) (0.00%)
Bank of America Merrill Lynch (986,010) SA007 (512,905) (0.01%)
Bank of America Merrill Lynch 41,621,059 Shin Kong Financial Holding Co Ltd (621,133) (0.01%)
Bank of America Merrill Lynch 14,833,000 Sino-American Silicon Products Inc (4,585,508) (0.03%)
Bank of America Merrill Lynch 1,297,301 SK Hynix Inc (680,010) (0.01%)
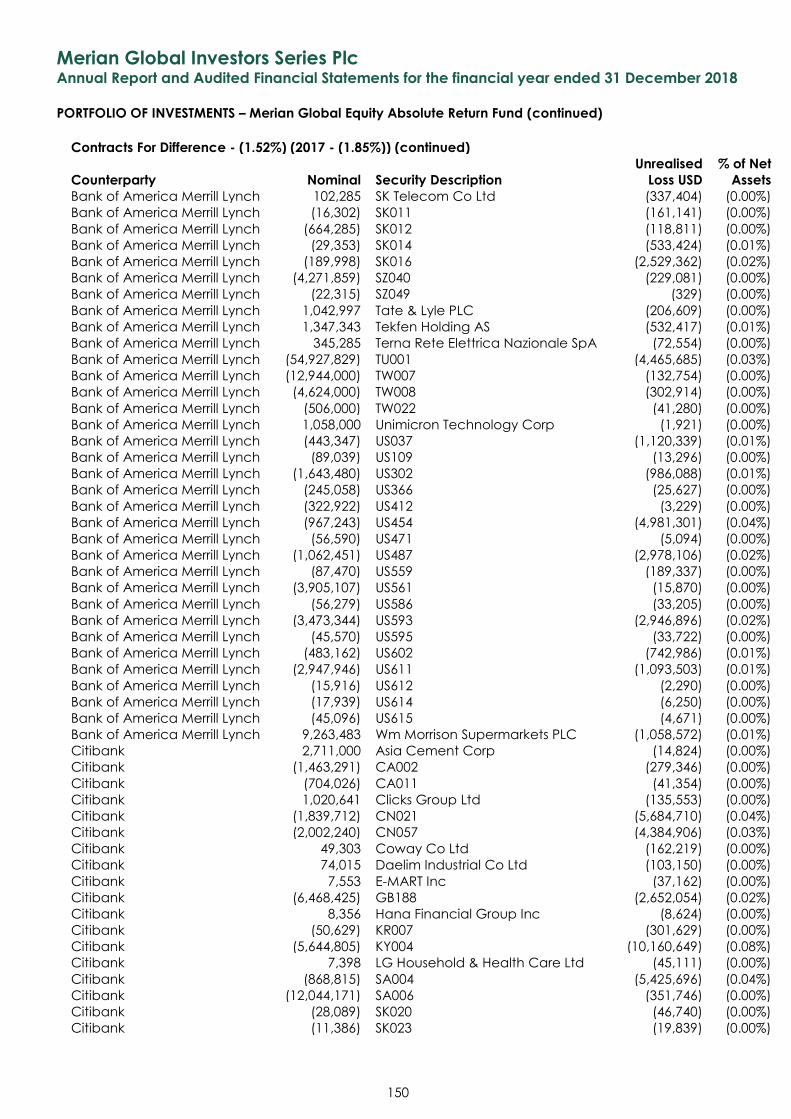
Merian Global Investors Series Plc Annual Report and Audited Financial Statements for the financial year ended 31 December 2018
PORTFOLIO OF INVESTMENTS – Merian Global Equity Absolute Return Fund (continued)
150
Contracts For Difference - (1.52%) (2017 - (1.85%)) (continued)
Counterparty Nominal Security Description
Unrealised
Loss USD
% of Net
Assets
Bank of America Merrill Lynch 102,285 SK Telecom Co Ltd (337,404) (0.00%)
Bank of America Merrill Lynch (16,302) SK011 (161,141) (0.00%)
Bank of America Merrill Lynch (664,285) SK012 (118,811) (0.00%)
Bank of America Merrill Lynch (29,353) SK014 (533,424) (0.01%)
Bank of America Merrill Lynch (189,998) SK016 (2,529,362) (0.02%)
Bank of America Merrill Lynch (4,271,859) SZ040 (229,081) (0.00%)
Bank of America Merrill Lynch (22,315) SZ049 (329) (0.00%)
Bank of America Merrill Lynch 1,042,997 Tate & Lyle PLC (206,609) (0.00%)
Bank of America Merrill Lynch 1,347,343 Tekfen Holding AS (532,417) (0.01%)
Bank of America Merrill Lynch 345,285 Terna Rete Elettrica Nazionale SpA (72,554) (0.00%)
Bank of America Merrill Lynch (54,927,829) TU001 (4,465,685) (0.03%)
Bank of America Merrill Lynch (12,944,000) TW007 (132,754) (0.00%)
Bank of America Merrill Lynch (4,624,000) TW008 (302,914) (0.00%)
Bank of America Merrill Lynch (506,000) TW022 (41,280) (0.00%)
Bank of America Merrill Lynch 1,058,000 Unimicron Technology Corp (1,921) (0.00%)
Bank of America Merrill Lynch (443,347) US037 (1,120,339) (0.01%)
Bank of America Merrill Lynch (89,039) US109 (13,296) (0.00%)
Bank of America Merrill Lynch (1,643,480) US302 (986,088) (0.01%)
Bank of America Merrill Lynch (245,058) US366 (25,627) (0.00%)
Bank of America Merrill Lynch (322,922) US412 (3,229) (0.00%)
Bank of America Merrill Lynch (967,243) US454 (4,981,301) (0.04%)
Bank of America Merrill Lynch (56,590) US471 (5,094) (0.00%)
Bank of America Merrill Lynch (1,062,451) US487 (2,978,106) (0.02%)
Bank of America Merrill Lynch (87,470) US559 (189,337) (0.00%)
Bank of America Merrill Lynch (3,905,107) US561 (15,870) (0.00%)
Bank of America Merrill Lynch (56,279) US586 (33,205) (0.00%)
Bank of America Merrill Lynch (3,473,344) US593 (2,946,896) (0.02%)
Bank of America Merrill Lynch (45,570) US595 (33,722) (0.00%)
Bank of America Merrill Lynch (483,162) US602 (742,986) (0.01%)
Bank of America Merrill Lynch (2,947,946) US611 (1,093,503) (0.01%)
Bank of America Merrill Lynch (15,916) US612 (2,290) (0.00%)
Bank of America Merrill Lynch (17,939) US614 (6,250) (0.00%)
Bank of America Merrill Lynch (45,096) US615 (4,671) (0.00%)
Bank of America Merrill Lynch 9,263,483 Wm Morrison Supermarkets PLC (1,058,572) (0.01%)
Citibank 2,711,000 Asia Cement Corp (14,824) (0.00%)
Citibank (1,463,291) CA002 (279,346) (0.00%)
Citibank (704,026) CA011 (41,354) (0.00%)
Citibank 1,020,641 Clicks Group Ltd (135,553) (0.00%)
Citibank (1,839,712) CN021 (5,684,710) (0.04%)
Citibank (2,002,240) CN057 (4,384,906) (0.03%)
Citibank 49,303 Coway Co Ltd (162,219) (0.00%)
Citibank 74,015 Daelim Industrial Co Ltd (103,150) (0.00%)
Citibank 7,553 E-MART Inc (37,162) (0.00%)
Citibank (6,468,425) GB188 (2,652,054) (0.02%)
Citibank 8,356 Hana Financial Group Inc (8,624) (0.00%)
Citibank (50,629) KR007 (301,629) (0.00%)
Citibank (5,644,805) KY004 (10,160,649) (0.08%)
Citibank 7,398 LG Household & Health Care Ltd (45,111) (0.00%)
Citibank (868,815) SA004 (5,425,696) (0.04%)
Citibank (12,044,171) SA006 (351,746) (0.00%)
Citibank (28,089) SK020 (46,740) (0.00%)
Citibank (11,386) SK023 (19,839) (0.00%)
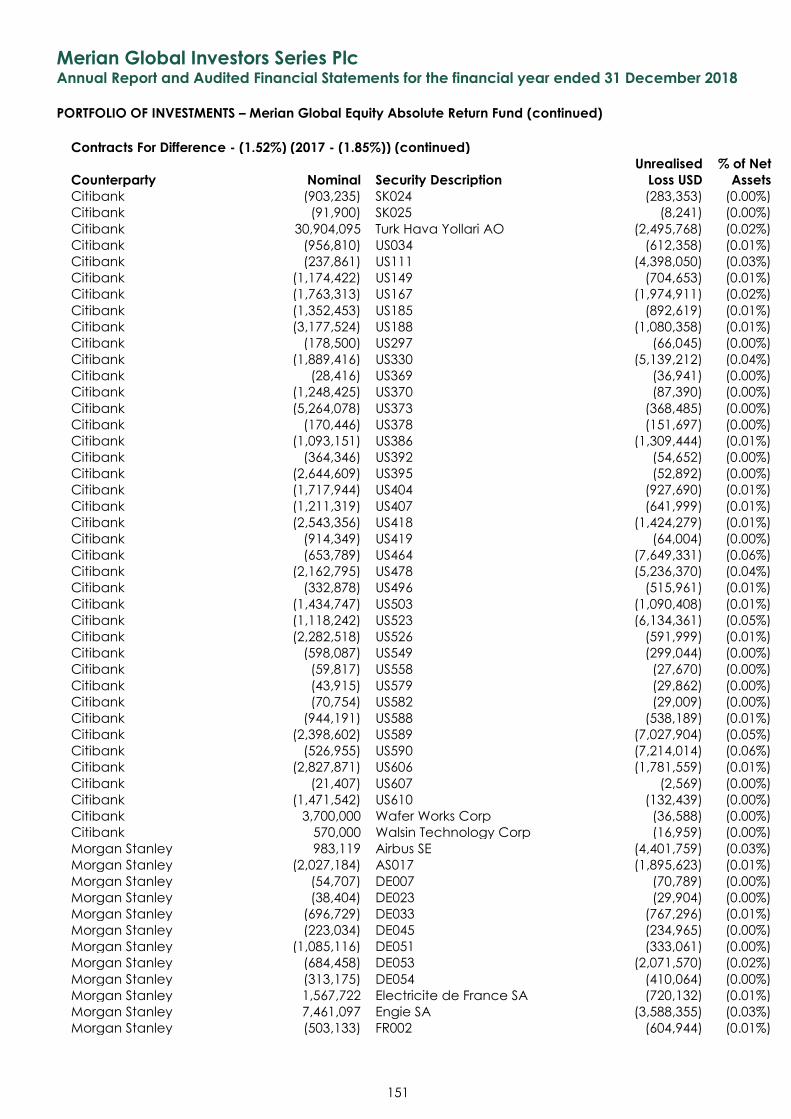
Merian Global Investors Series Plc Annual Report and Audited Financial Statements for the financial year ended 31 December 2018
PORTFOLIO OF INVESTMENTS – Merian Global Equity Absolute Return Fund (continued)
151
Contracts For Difference - (1.52%) (2017 - (1.85%)) (continued)
Counterparty Nominal Security Description
Unrealised
Loss USD
% of Net
Assets
Citibank (903,235) SK024 (283,353) (0.00%)
Citibank (91,900) SK025 (8,241) (0.00%)
Citibank 30,904,095 Turk Hava Yollari AO (2,495,768) (0.02%)
Citibank (956,810) US034 (612,358) (0.01%)
Citibank (237,861) US111 (4,398,050) (0.03%)
Citibank (1,174,422) US149 (704,653) (0.01%)
Citibank (1,763,313) US167 (1,974,911) (0.02%)
Citibank (1,352,453) US185 (892,619) (0.01%)
Citibank (3,177,524) US188 (1,080,358) (0.01%)
Citibank (178,500) US297 (66,045) (0.00%)
Citibank (1,889,416) US330 (5,139,212) (0.04%)
Citibank (28,416) US369 (36,941) (0.00%)
Citibank (1,248,425) US370 (87,390) (0.00%)
Citibank (5,264,078) US373 (368,485) (0.00%)
Citibank (170,446) US378 (151,697) (0.00%)
Citibank (1,093,151) US386 (1,309,444) (0.01%)
Citibank (364,346) US392 (54,652) (0.00%)
Citibank (2,644,609) US395 (52,892) (0.00%)
Citibank (1,717,944) US404 (927,690) (0.01%)
Citibank (1,211,319) US407 (641,999) (0.01%)
Citibank (2,543,356) US418 (1,424,279) (0.01%)
Citibank (914,349) US419 (64,004) (0.00%)
Citibank (653,789) US464 (7,649,331) (0.06%)
Citibank (2,162,795) US478 (5,236,370) (0.04%)
Citibank (332,878) US496 (515,961) (0.01%)
Citibank (1,434,747) US503 (1,090,408) (0.01%)
Citibank (1,118,242) US523 (6,134,361) (0.05%)
Citibank (2,282,518) US526 (591,999) (0.01%)
Citibank (598,087) US549 (299,044) (0.00%)
Citibank (59,817) US558 (27,670) (0.00%)
Citibank (43,915) US579 (29,862) (0.00%)
Citibank (70,754) US582 (29,009) (0.00%)
Citibank (944,191) US588 (538,189) (0.01%)
Citibank (2,398,602) US589 (7,027,904) (0.05%)
Citibank (526,955) US590 (7,214,014) (0.06%)
Citibank (2,827,871) US606 (1,781,559) (0.01%)
Citibank (21,407) US607 (2,569) (0.00%)
Citibank (1,471,542) US610 (132,439) (0.00%)
Citibank 3,700,000 Wafer Works Corp (36,588) (0.00%)
Citibank 570,000 Walsin Technology Corp (16,959) (0.00%)
Morgan Stanley 983,119 Airbus SE (4,401,759) (0.03%)
Morgan Stanley (2,027,184) AS017 (1,895,623) (0.01%)
Morgan Stanley (54,707) DE007 (70,789) (0.00%)
Morgan Stanley (38,404) DE023 (29,904) (0.00%)
Morgan Stanley (696,729) DE033 (767,296) (0.01%)
Morgan Stanley (223,034) DE045 (234,965) (0.00%)
Morgan Stanley (1,085,116) DE051 (333,061) (0.00%)
Morgan Stanley (684,458) DE053 (2,071,570) (0.02%)
Morgan Stanley (313,175) DE054 (410,064) (0.00%)
Morgan Stanley 1,567,722 Electricite de France SA (720,132) (0.01%)
Morgan Stanley 7,461,097 Engie SA (3,588,355) (0.03%)
Morgan Stanley (503,133) FR002 (604,944) (0.01%)
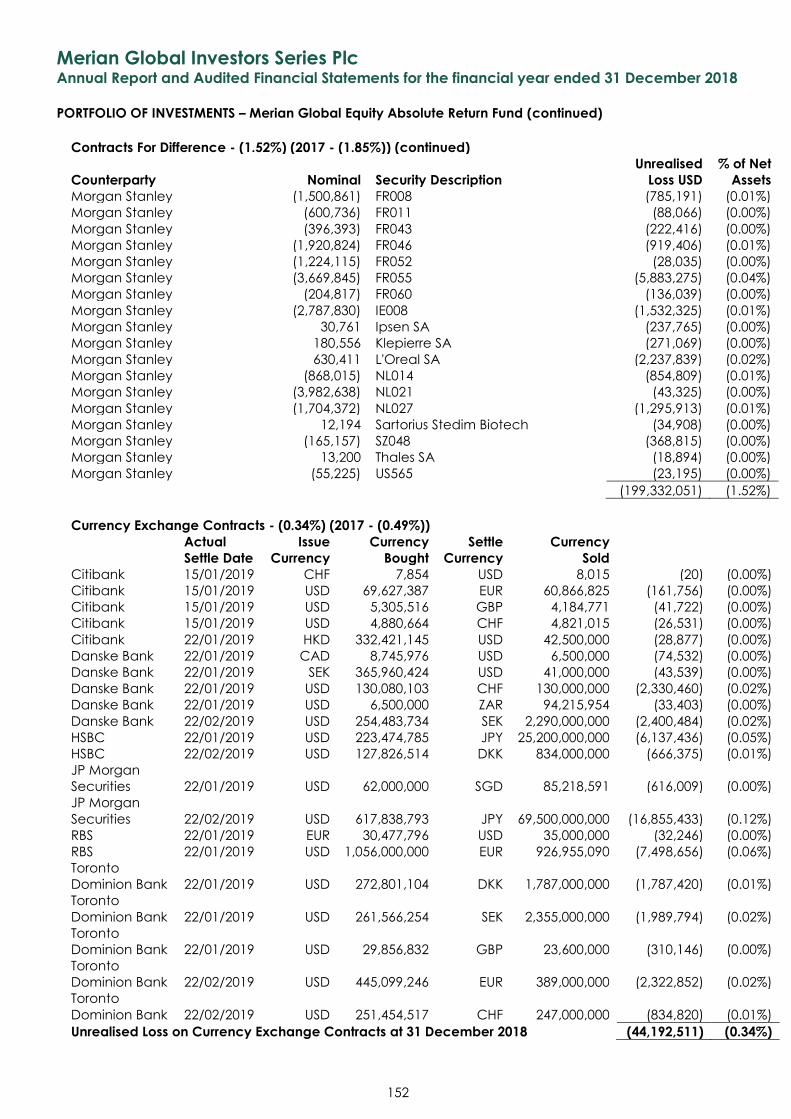
Merian Global Investors Series Plc Annual Report and Audited Financial Statements for the financial year ended 31 December 2018
PORTFOLIO OF INVESTMENTS – Merian Global Equity Absolute Return Fund (continued)
152
Contracts For Difference - (1.52%) (2017 - (1.85%)) (continued)
Counterparty Nominal Security Description
Unrealised
Loss USD
% of Net
Assets
Morgan Stanley (1,500,861) FR008 (785,191) (0.01%)
Morgan Stanley (600,736) FR011 (88,066) (0.00%)
Morgan Stanley (396,393) FR043 (222,416) (0.00%)
Morgan Stanley (1,920,824) FR046 (919,406) (0.01%)
Morgan Stanley (1,224,115) FR052 (28,035) (0.00%)
Morgan Stanley (3,669,845) FR055 (5,883,275) (0.04%)
Morgan Stanley (204,817) FR060 (136,039) (0.00%)
Morgan Stanley (2,787,830) IE008 (1,532,325) (0.01%)
Morgan Stanley 30,761 Ipsen SA (237,765) (0.00%)
Morgan Stanley 180,556 Klepierre SA (271,069) (0.00%)
Morgan Stanley 630,411 L'Oreal SA (2,237,839) (0.02%)
Morgan Stanley (868,015) NL014 (854,809) (0.01%)
Morgan Stanley (3,982,638) NL021 (43,325) (0.00%)
Morgan Stanley (1,704,372) NL027 (1,295,913) (0.01%)
Morgan Stanley 12,194 Sartorius Stedim Biotech (34,908) (0.00%)
Morgan Stanley (165,157) SZ048 (368,815) (0.00%)
Morgan Stanley 13,200 Thales SA (18,894) (0.00%)
Morgan Stanley (55,225) US565 (23,195) (0.00%)
(199,332,051) (1.52%)
Currency Exchange Contracts - (0.34%) (2017 - (0.49%))
Actual
Settle Date
Issue
Currency
Currency
Bought
Settle
Currency
Currency
Sold
Citibank 15/01/2019 CHF 7,854 USD 8,015 (20) (0.00%)
Citibank 15/01/2019 USD 69,627,387 EUR 60,866,825 (161,756) (0.00%)
Citibank 15/01/2019 USD 5,305,516 GBP 4,184,771 (41,722) (0.00%)
Citibank 15/01/2019 USD 4,880,664 CHF 4,821,015 (26,531) (0.00%)
Citibank 22/01/2019 HKD 332,421,145 USD 42,500,000 (28,877) (0.00%)
Danske Bank 22/01/2019 CAD 8,745,976 USD 6,500,000 (74,532) (0.00%)
Danske Bank 22/01/2019 SEK 365,960,424 USD 41,000,000 (43,539) (0.00%)
Danske Bank 22/01/2019 USD 130,080,103 CHF 130,000,000 (2,330,460) (0.02%)
Danske Bank 22/01/2019 USD 6,500,000 ZAR 94,215,954 (33,403) (0.00%)
Danske Bank 22/02/2019 USD 254,483,734 SEK 2,290,000,000 (2,400,484) (0.02%)
HSBC 22/01/2019 USD 223,474,785 JPY 25,200,000,000 (6,137,436) (0.05%)
HSBC 22/02/2019 USD 127,826,514 DKK 834,000,000 (666,375) (0.01%)
JP Morgan
Securities 22/01/2019 USD 62,000,000 SGD 85,218,591 (616,009) (0.00%)
JP Morgan
Securities 22/02/2019 USD 617,838,793 JPY 69,500,000,000 (16,855,433) (0.12%)
RBS 22/01/2019 EUR 30,477,796 USD 35,000,000 (32,246) (0.00%)
RBS 22/01/2019 USD 1,056,000,000 EUR 926,955,090 (7,498,656) (0.06%)
Toronto
Dominion Bank 22/01/2019 USD 272,801,104 DKK 1,787,000,000 (1,787,420) (0.01%)
Toronto
Dominion Bank 22/01/2019 USD 261,566,254 SEK 2,355,000,000 (1,989,794) (0.02%)
Toronto
Dominion Bank 22/01/2019 USD 29,856,832 GBP 23,600,000 (310,146) (0.00%)
Toronto
Dominion Bank 22/02/2019 USD 445,099,246 EUR 389,000,000 (2,322,852) (0.02%)
Toronto
Dominion Bank 22/02/2019 USD 251,454,517 CHF 247,000,000 (834,820) (0.01%)
Unrealised Loss on Currency Exchange Contracts at 31 December 2018 (44,192,511) (0.34%)
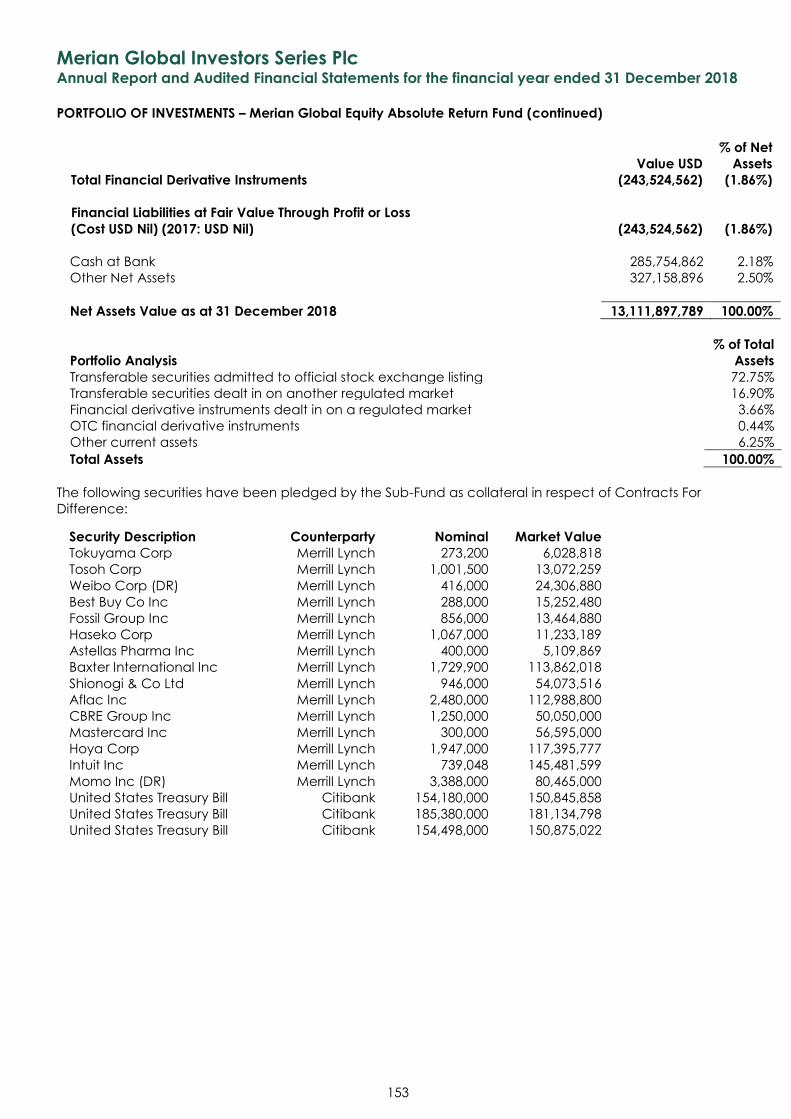
Merian Global Investors Series Plc Annual Report and Audited Financial Statements for the financial year ended 31 December 2018
PORTFOLIO OF INVESTMENTS – Merian Global Equity Absolute Return Fund (continued)
153
Value USD
% of Net
Assets
Total Financial Derivative Instruments (243,524,562) (1.86%)
Financial Liabilities at Fair Value Through Profit or Loss
(Cost USD Nil) (2017: USD Nil) (243,524,562) (1.86%)
Cash at Bank 285,754,862 2.18%
Other Net Assets 327,158,896 2.50%
Net Assets Value as at 31 December 2018 13,111,897,789 100.00%
% of Total
Portfolio Analysis Assets
Transferable securities admitted to official stock exchange listing 72.75%
Transferable securities dealt in on another regulated market 16.90%
Financial derivative instruments dealt in on a regulated market 3.66%
OTC financial derivative instruments 0.44%
Other current assets 6.25%
Total Assets 100.00%
The following securities have been pledged by the Sub-Fund as collateral in respect of Contracts For
Difference:
Security Description Counterparty Nominal Market Value
Tokuyama Corp Merrill Lynch 273,200 6,028,818
Tosoh Corp Merrill Lynch 1,001,500 13,072,259
Weibo Corp (DR) Merrill Lynch 416,000 24,306,880
Best Buy Co Inc Merrill Lynch 288,000 15,252,480
Fossil Group Inc Merrill Lynch 856,000 13,464,880
Haseko Corp Merrill Lynch 1,067,000 11,233,189
Astellas Pharma Inc Merrill Lynch 400,000 5,109,869
Baxter International Inc Merrill Lynch 1,729,900 113,862,018
Shionogi & Co Ltd Merrill Lynch 946,000 54,073,516
Aflac Inc Merrill Lynch 2,480,000 112,988,800
CBRE Group Inc Merrill Lynch 1,250,000 50,050,000
Mastercard Inc Merrill Lynch 300,000 56,595,000
Hoya Corp Merrill Lynch 1,947,000 117,395,777
Intuit Inc Merrill Lynch 739,048 145,481,599
Momo Inc (DR) Merrill Lynch 3,388,000 80,465,000
United States Treasury Bill Citibank 154,180,000 150,845,858
United States Treasury Bill Citibank 185,380,000 181,134,798
United States Treasury Bill Citibank 154,498,000 150,875,022
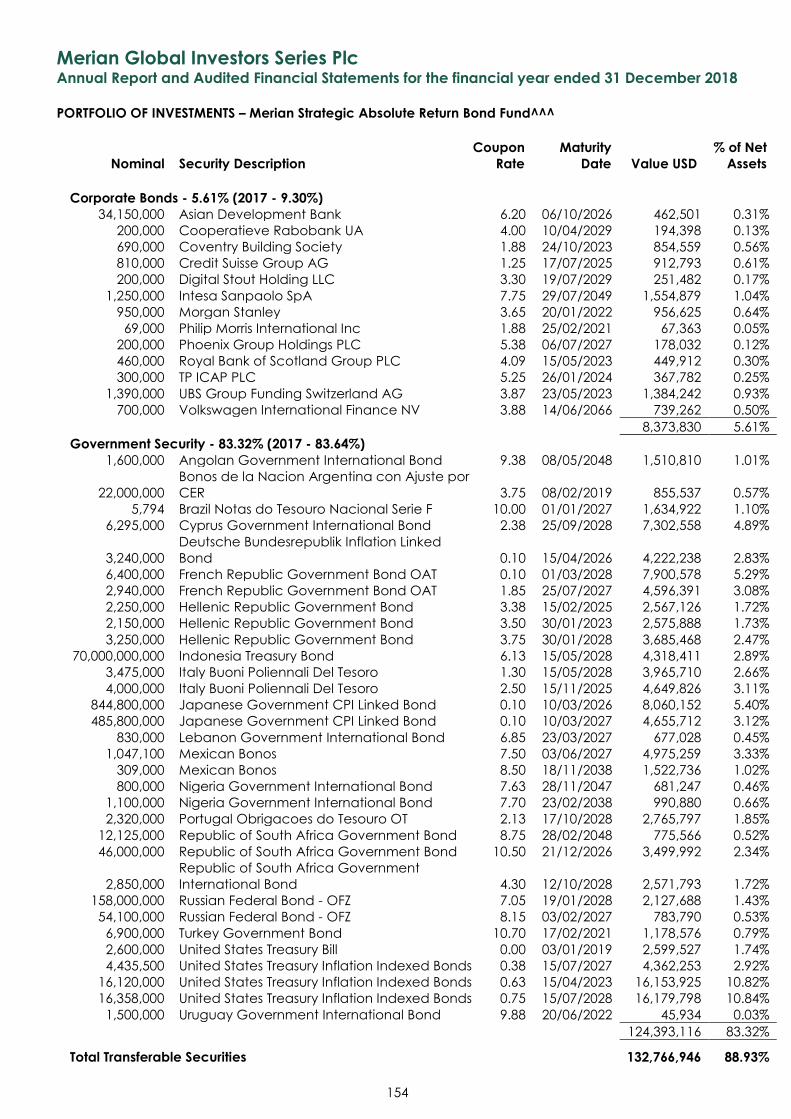
Merian Global Investors Series Plc Annual Report and Audited Financial Statements for the financial year ended 31 December 2018
PORTFOLIO OF INVESTMENTS – Merian Strategic Absolute Return Bond Fund^^^
Nominal Security Description
Coupon
Rate
Maturity
Date Value USD
% of Net
Assets
154
Corporate Bonds - 5.61% (2017 - 9.30%) 34,150,000 Asian Development Bank 6.20 06/10/2026 462,501 0.31%
200,000 Cooperatieve Rabobank UA 4.00 10/04/2029 194,398 0.13%
690,000 Coventry Building Society 1.88 24/10/2023 854,559 0.56%
810,000 Credit Suisse Group AG 1.25 17/07/2025 912,793 0.61%
200,000 Digital Stout Holding LLC 3.30 19/07/2029 251,482 0.17%
1,250,000 Intesa Sanpaolo SpA 7.75 29/07/2049 1,554,879 1.04%
950,000 Morgan Stanley 3.65 20/01/2022 956,625 0.64%
69,000 Philip Morris International Inc 1.88 25/02/2021 67,363 0.05%
200,000 Phoenix Group Holdings PLC 5.38 06/07/2027 178,032 0.12%
460,000 Royal Bank of Scotland Group PLC 4.09 15/05/2023 449,912 0.30%
300,000 TP ICAP PLC 5.25 26/01/2024 367,782 0.25%
1,390,000 UBS Group Funding Switzerland AG 3.87 23/05/2023 1,384,242 0.93%
700,000 Volkswagen International Finance NV 3.88 14/06/2066 739,262 0.50%
8,373,830 5.61%
Government Security - 83.32% (2017 - 83.64%) 1,600,000 Angolan Government International Bond 9.38 08/05/2048 1,510,810 1.01%
22,000,000
Bonos de la Nacion Argentina con Ajuste por
CER 3.75 08/02/2019 855,537 0.57%
5,794 Brazil Notas do Tesouro Nacional Serie F 10.00 01/01/2027 1,634,922 1.10%
6,295,000 Cyprus Government International Bond 2.38 25/09/2028 7,302,558 4.89%
3,240,000
Deutsche Bundesrepublik Inflation Linked
Bond 0.10 15/04/2026 4,222,238 2.83%
6,400,000 French Republic Government Bond OAT 0.10 01/03/2028 7,900,578 5.29%
2,940,000 French Republic Government Bond OAT 1.85 25/07/2027 4,596,391 3.08%
2,250,000 Hellenic Republic Government Bond 3.38 15/02/2025 2,567,126 1.72%
2,150,000 Hellenic Republic Government Bond 3.50 30/01/2023 2,575,888 1.73%
3,250,000 Hellenic Republic Government Bond 3.75 30/01/2028 3,685,468 2.47%
70,000,000,000 Indonesia Treasury Bond 6.13 15/05/2028 4,318,411 2.89%
3,475,000 Italy Buoni Poliennali Del Tesoro 1.30 15/05/2028 3,965,710 2.66%
4,000,000 Italy Buoni Poliennali Del Tesoro 2.50 15/11/2025 4,649,826 3.11%
844,800,000 Japanese Government CPI Linked Bond 0.10 10/03/2026 8,060,152 5.40%
485,800,000 Japanese Government CPI Linked Bond 0.10 10/03/2027 4,655,712 3.12%
830,000 Lebanon Government International Bond 6.85 23/03/2027 677,028 0.45%
1,047,100 Mexican Bonos 7.50 03/06/2027 4,975,259 3.33%
309,000 Mexican Bonos 8.50 18/11/2038 1,522,736 1.02%
800,000 Nigeria Government International Bond 7.63 28/11/2047 681,247 0.46%
1,100,000 Nigeria Government International Bond 7.70 23/02/2038 990,880 0.66%
2,320,000 Portugal Obrigacoes do Tesouro OT 2.13 17/10/2028 2,765,797 1.85%
12,125,000 Republic of South Africa Government Bond 8.75 28/02/2048 775,566 0.52%
46,000,000 Republic of South Africa Government Bond 10.50 21/12/2026 3,499,992 2.34%
2,850,000
Republic of South Africa Government
International Bond 4.30 12/10/2028 2,571,793 1.72%
158,000,000 Russian Federal Bond - OFZ 7.05 19/01/2028 2,127,688 1.43%
54,100,000 Russian Federal Bond - OFZ 8.15 03/02/2027 783,790 0.53%
6,900,000 Turkey Government Bond 10.70 17/02/2021 1,178,576 0.79%
2,600,000 United States Treasury Bill 0.00 03/01/2019 2,599,527 1.74%
4,435,500 United States Treasury Inflation Indexed Bonds 0.38 15/07/2027 4,362,253 2.92%
16,120,000 United States Treasury Inflation Indexed Bonds 0.63 15/04/2023 16,153,925 10.82%
16,358,000 United States Treasury Inflation Indexed Bonds 0.75 15/07/2028 16,179,798 10.84%
1,500,000 Uruguay Government International Bond 9.88 20/06/2022 45,934 0.03%
124,393,116 83.32%
Total Transferable Securities 132,766,946 88.93%
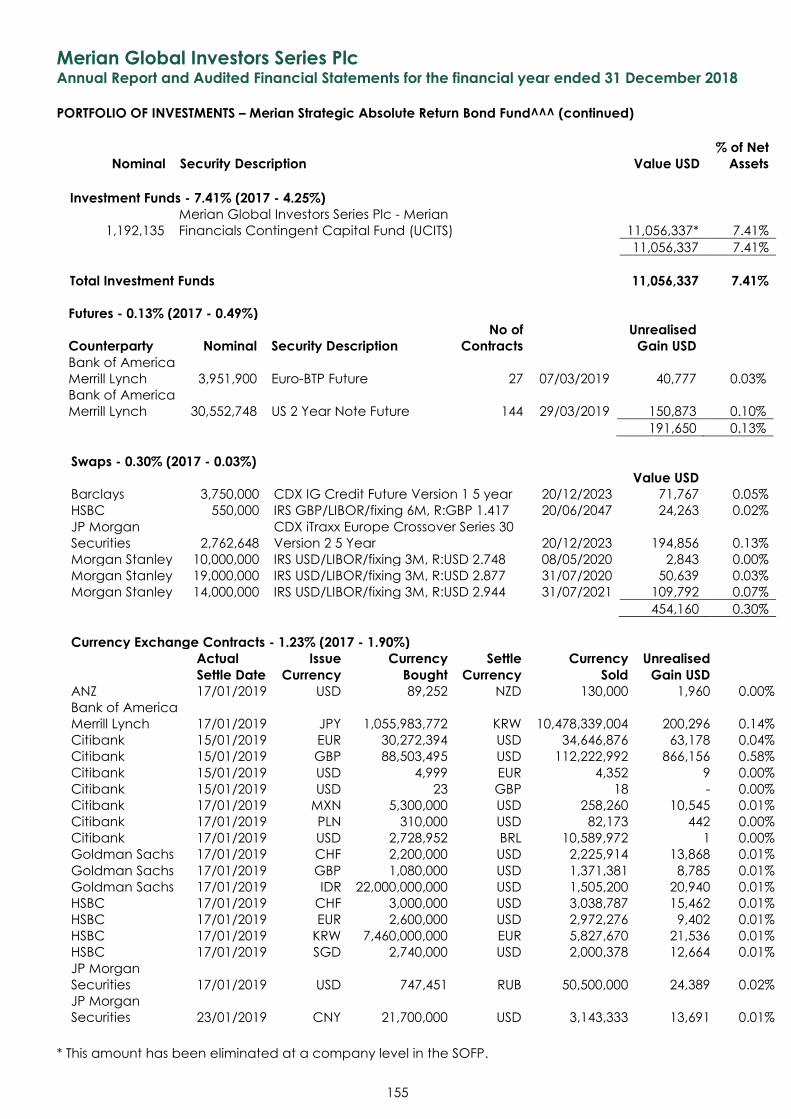
Merian Global Investors Series Plc Annual Report and Audited Financial Statements for the financial year ended 31 December 2018
PORTFOLIO OF INVESTMENTS – Merian Strategic Absolute Return Bond Fund^^^ (continued)
Nominal Security Description Value USD
% of Net
Assets
155
Investment Funds - 7.41% (2017 - 4.25%)
1,192,135
Merian Global Investors Series Plc - Merian
Financials Contingent Capital Fund (UCITS) 11,056,337* 7.41%
11,056,337 7.41%
Total Investment Funds 11,056,337 7.41%
Futures - 0.13% (2017 - 0.49%)
Counterparty Nominal Security Description
No of
Contracts
Unrealised
Gain USD
Bank of America
Merrill Lynch 3,951,900 Euro-BTP Future 27 07/03/2019 40,777 0.03%
Bank of America
Merrill Lynch 30,552,748 US 2 Year Note Future 144 29/03/2019 150,873 0.10%
191,650 0.13%
Swaps - 0.30% (2017 - 0.03%) Value USD
Barclays 3,750,000 CDX IG Credit Future Version 1 5 year 20/12/2023 71,767 0.05%
HSBC 550,000 IRS GBP/LIBOR/fixing 6M, R:GBP 1.417 20/06/2047 24,263 0.02%
JP Morgan
Securities 2,762,648
CDX iTraxx Europe Crossover Series 30
Version 2 5 Year 20/12/2023 194,856 0.13%
Morgan Stanley 10,000,000 IRS USD/LIBOR/fixing 3M, R:USD 2.748 08/05/2020 2,843 0.00%
Morgan Stanley 19,000,000 IRS USD/LIBOR/fixing 3M, R:USD 2.877 31/07/2020 50,639 0.03%
Morgan Stanley 14,000,000 IRS USD/LIBOR/fixing 3M, R:USD 2.944 31/07/2021 109,792 0.07%
454,160 0.30%
Currency Exchange Contracts - 1.23% (2017 - 1.90%)
Actual
Settle Date
Issue
Currency
Currency
Bought
Settle
Currency
Currency
Sold
Unrealised
Gain USD ANZ 17/01/2019 USD 89,252 NZD 130,000 1,960 0.00%
Bank of America
Merrill Lynch 17/01/2019 JPY 1,055,983,772 KRW 10,478,339,004 200,296 0.14%
Citibank 15/01/2019 EUR 30,272,394 USD 34,646,876 63,178 0.04%
Citibank 15/01/2019 GBP 88,503,495 USD 112,222,992 866,156 0.58%
Citibank 15/01/2019 USD 4,999 EUR 4,352 9 0.00%
Citibank 15/01/2019 USD 23 GBP 18 - 0.00%
Citibank 17/01/2019 MXN 5,300,000 USD 258,260 10,545 0.01%
Citibank 17/01/2019 PLN 310,000 USD 82,173 442 0.00%
Citibank 17/01/2019 USD 2,728,952 BRL 10,589,972 1 0.00%
Goldman Sachs 17/01/2019 CHF 2,200,000 USD 2,225,914 13,868 0.01%
Goldman Sachs 17/01/2019 GBP 1,080,000 USD 1,371,381 8,785 0.01%
Goldman Sachs 17/01/2019 IDR 22,000,000,000 USD 1,505,200 20,940 0.01%
HSBC 17/01/2019 CHF 3,000,000 USD 3,038,787 15,462 0.01%
HSBC 17/01/2019 EUR 2,600,000 USD 2,972,276 9,402 0.01%
HSBC 17/01/2019 KRW 7,460,000,000 EUR 5,827,670 21,536 0.01%
HSBC 17/01/2019 SGD 2,740,000 USD 2,000,378 12,664 0.01%
JP Morgan
Securities 17/01/2019 USD 747,451 RUB 50,500,000 24,389 0.02%
JP Morgan
Securities 23/01/2019 CNY 21,700,000 USD 3,143,333 13,691 0.01%
* This amount has been eliminated at a company level in the SOFP.
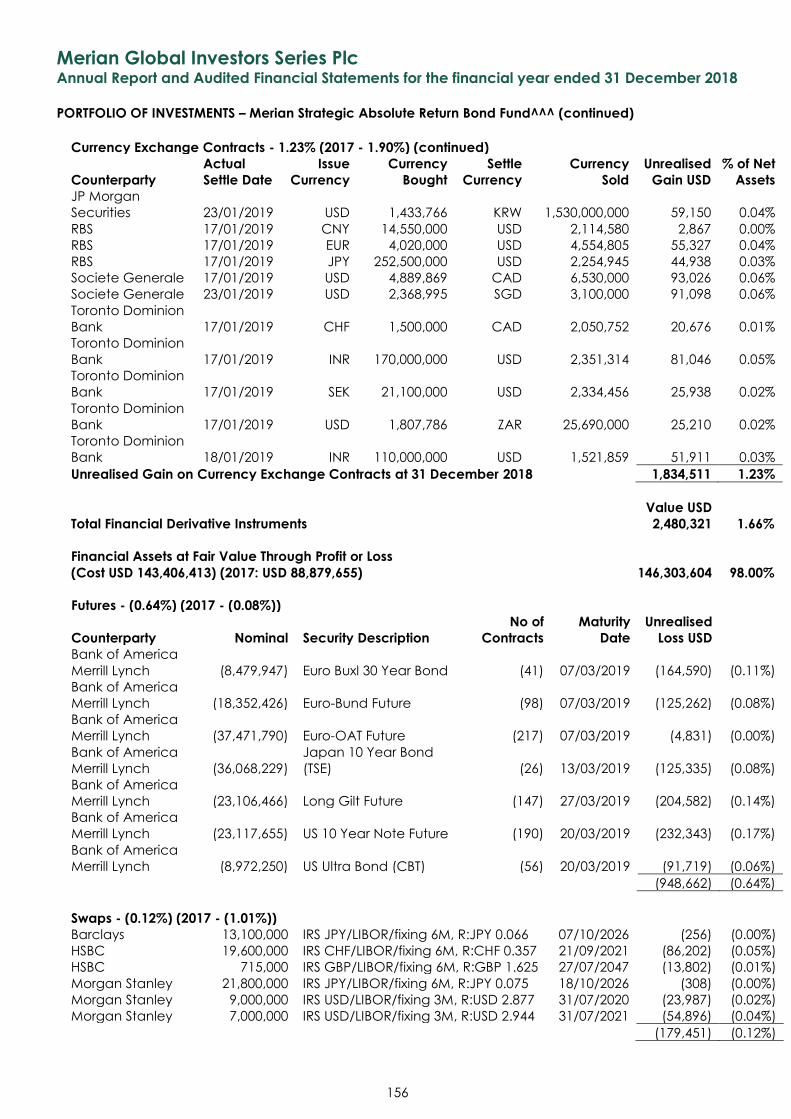
Merian Global Investors Series Plc Annual Report and Audited Financial Statements for the financial year ended 31 December 2018
PORTFOLIO OF INVESTMENTS – Merian Strategic Absolute Return Bond Fund^^^ (continued)
156
Currency Exchange Contracts - 1.23% (2017 - 1.90%) (continued)
Counterparty
Actual
Settle Date
Issue
Currency
Currency
Bought
Settle
Currency
Currency
Sold
Unrealised
Gain USD
% of Net
Assets
JP Morgan
Securities 23/01/2019 USD 1,433,766 KRW 1,530,000,000 59,150 0.04%
RBS 17/01/2019 CNY 14,550,000 USD 2,114,580 2,867 0.00%
RBS 17/01/2019 EUR 4,020,000 USD 4,554,805 55,327 0.04%
RBS 17/01/2019 JPY 252,500,000 USD 2,254,945 44,938 0.03%
Societe Generale 17/01/2019 USD 4,889,869 CAD 6,530,000 93,026 0.06%
Societe Generale 23/01/2019 USD 2,368,995 SGD 3,100,000 91,098 0.06%
Toronto Dominion
Bank 17/01/2019 CHF 1,500,000 CAD 2,050,752 20,676 0.01%
Toronto Dominion
Bank 17/01/2019 INR 170,000,000 USD 2,351,314 81,046 0.05%
Toronto Dominion
Bank 17/01/2019 SEK 21,100,000 USD 2,334,456 25,938 0.02%
Toronto Dominion
Bank 17/01/2019 USD 1,807,786 ZAR 25,690,000 25,210 0.02%
Toronto Dominion
Bank 18/01/2019 INR 110,000,000 USD 1,521,859 51,911 0.03%
Unrealised Gain on Currency Exchange Contracts at 31 December 2018 1,834,511 1.23%
Value USD
Total Financial Derivative Instruments 2,480,321 1.66%
Financial Assets at Fair Value Through Profit or Loss
(Cost USD 143,406,413) (2017: USD 88,879,655) 146,303,604 98.00%
Futures - (0.64%) (2017 - (0.08%))
Counterparty Nominal Security Description
No of
Contracts
Maturity
Date
Unrealised
Loss USD
Bank of America
Merrill Lynch (8,479,947) Euro Buxl 30 Year Bond (41) 07/03/2019 (164,590) (0.11%)
Bank of America
Merrill Lynch (18,352,426) Euro-Bund Future (98) 07/03/2019 (125,262) (0.08%)
Bank of America
Merrill Lynch (37,471,790) Euro-OAT Future (217) 07/03/2019 (4,831) (0.00%)
Bank of America
Merrill Lynch (36,068,229)
Japan 10 Year Bond
(TSE) (26) 13/03/2019 (125,335) (0.08%)
Bank of America
Merrill Lynch (23,106,466) Long Gilt Future (147) 27/03/2019 (204,582) (0.14%)
Bank of America
Merrill Lynch (23,117,655) US 10 Year Note Future (190) 20/03/2019 (232,343) (0.17%)
Bank of America
Merrill Lynch (8,972,250) US Ultra Bond (CBT) (56) 20/03/2019 (91,719) (0.06%)
(948,662) (0.64%)
Swaps - (0.12%) (2017 - (1.01%))
Barclays 13,100,000 IRS JPY/LIBOR/fixing 6M, R:JPY 0.066 07/10/2026 (256) (0.00%)
HSBC 19,600,000 IRS CHF/LIBOR/fixing 6M, R:CHF 0.357 21/09/2021 (86,202) (0.05%)
HSBC 715,000 IRS GBP/LIBOR/fixing 6M, R:GBP 1.625 27/07/2047 (13,802) (0.01%)
Morgan Stanley 21,800,000 IRS JPY/LIBOR/fixing 6M, R:JPY 0.075 18/10/2026 (308) (0.00%)
Morgan Stanley 9,000,000 IRS USD/LIBOR/fixing 3M, R:USD 2.877 31/07/2020 (23,987) (0.02%)
Morgan Stanley 7,000,000 IRS USD/LIBOR/fixing 3M, R:USD 2.944 31/07/2021 (54,896) (0.04%)
(179,451) (0.12%)
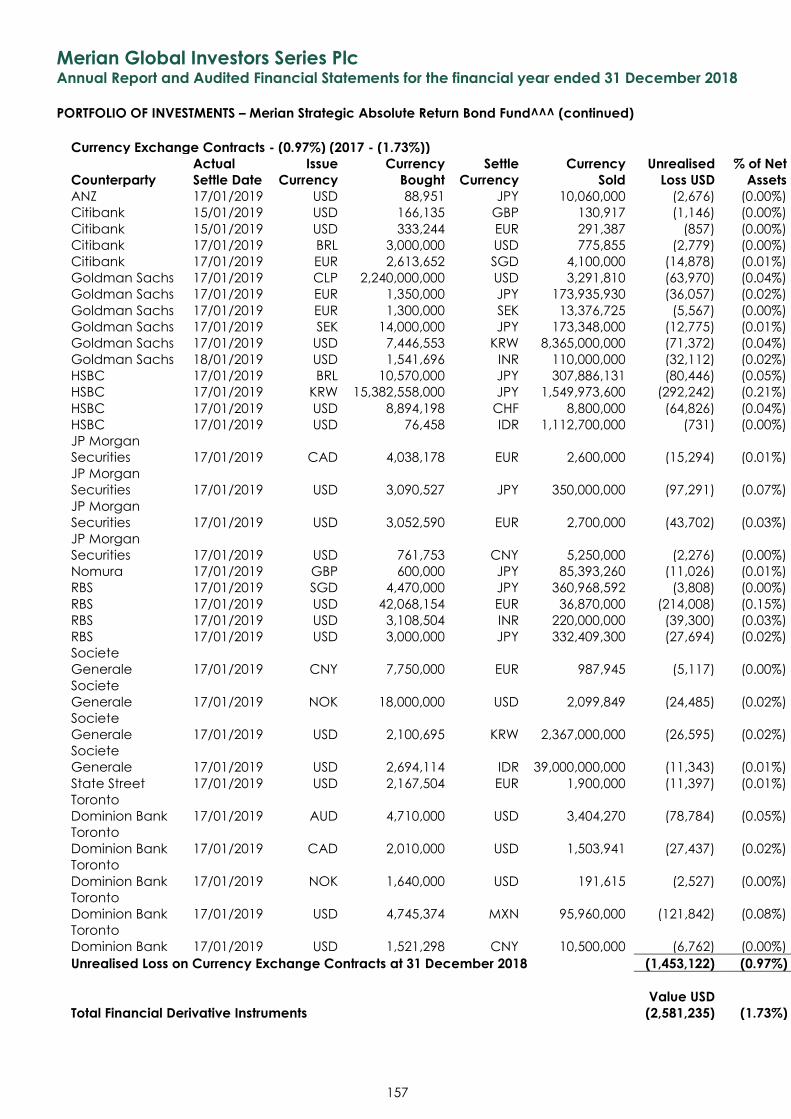
Merian Global Investors Series Plc Annual Report and Audited Financial Statements for the financial year ended 31 December 2018
PORTFOLIO OF INVESTMENTS – Merian Strategic Absolute Return Bond Fund^^^ (continued)
157
Currency Exchange Contracts - (0.97%) (2017 - (1.73%))
Counterparty
Actual
Settle Date
Issue
Currency
Currency
Bought
Settle
Currency
Currency
Sold
Unrealised
Loss USD
% of Net
Assets
ANZ 17/01/2019 USD 88,951 JPY 10,060,000 (2,676) (0.00%)
Citibank 15/01/2019 USD 166,135 GBP 130,917 (1,146) (0.00%)
Citibank 15/01/2019 USD 333,244 EUR 291,387 (857) (0.00%)
Citibank 17/01/2019 BRL 3,000,000 USD 775,855 (2,779) (0.00%)
Citibank 17/01/2019 EUR 2,613,652 SGD 4,100,000 (14,878) (0.01%)
Goldman Sachs 17/01/2019 CLP 2,240,000,000 USD 3,291,810 (63,970) (0.04%)
Goldman Sachs 17/01/2019 EUR 1,350,000 JPY 173,935,930 (36,057) (0.02%)
Goldman Sachs 17/01/2019 EUR 1,300,000 SEK 13,376,725 (5,567) (0.00%)
Goldman Sachs 17/01/2019 SEK 14,000,000 JPY 173,348,000 (12,775) (0.01%)
Goldman Sachs 17/01/2019 USD 7,446,553 KRW 8,365,000,000 (71,372) (0.04%)
Goldman Sachs 18/01/2019 USD 1,541,696 INR 110,000,000 (32,112) (0.02%)
HSBC 17/01/2019 BRL 10,570,000 JPY 307,886,131 (80,446) (0.05%)
HSBC 17/01/2019 KRW 15,382,558,000 JPY 1,549,973,600 (292,242) (0.21%)
HSBC 17/01/2019 USD 8,894,198 CHF 8,800,000 (64,826) (0.04%)
HSBC 17/01/2019 USD 76,458 IDR 1,112,700,000 (731) (0.00%)
JP Morgan
Securities 17/01/2019 CAD 4,038,178 EUR 2,600,000 (15,294) (0.01%)
JP Morgan
Securities 17/01/2019 USD 3,090,527 JPY 350,000,000 (97,291) (0.07%)
JP Morgan
Securities 17/01/2019 USD 3,052,590 EUR 2,700,000 (43,702) (0.03%)
JP Morgan
Securities 17/01/2019 USD 761,753 CNY 5,250,000 (2,276) (0.00%)
Nomura 17/01/2019 GBP 600,000 JPY 85,393,260 (11,026) (0.01%)
RBS 17/01/2019 SGD 4,470,000 JPY 360,968,592 (3,808) (0.00%)
RBS 17/01/2019 USD 42,068,154 EUR 36,870,000 (214,008) (0.15%)
RBS 17/01/2019 USD 3,108,504 INR 220,000,000 (39,300) (0.03%)
RBS 17/01/2019 USD 3,000,000 JPY 332,409,300 (27,694) (0.02%)
Societe
Generale 17/01/2019 CNY 7,750,000 EUR 987,945 (5,117) (0.00%)
Societe
Generale 17/01/2019 NOK 18,000,000 USD 2,099,849 (24,485) (0.02%)
Societe
Generale 17/01/2019 USD 2,100,695 KRW 2,367,000,000 (26,595) (0.02%)
Societe
Generale 17/01/2019 USD 2,694,114 IDR 39,000,000,000 (11,343) (0.01%)
State Street 17/01/2019 USD 2,167,504 EUR 1,900,000 (11,397) (0.01%)
Toronto
Dominion Bank 17/01/2019 AUD 4,710,000 USD 3,404,270 (78,784) (0.05%)
Toronto
Dominion Bank 17/01/2019 CAD 2,010,000 USD 1,503,941 (27,437) (0.02%)
Toronto
Dominion Bank 17/01/2019 NOK 1,640,000 USD 191,615 (2,527) (0.00%)
Toronto
Dominion Bank 17/01/2019 USD 4,745,374 MXN 95,960,000 (121,842) (0.08%)
Toronto
Dominion Bank 17/01/2019 USD 1,521,298 CNY 10,500,000 (6,762) (0.00%)
Unrealised Loss on Currency Exchange Contracts at 31 December 2018 (1,453,122) (0.97%)
Value USD
Total Financial Derivative Instruments (2,581,235) (1.73%)
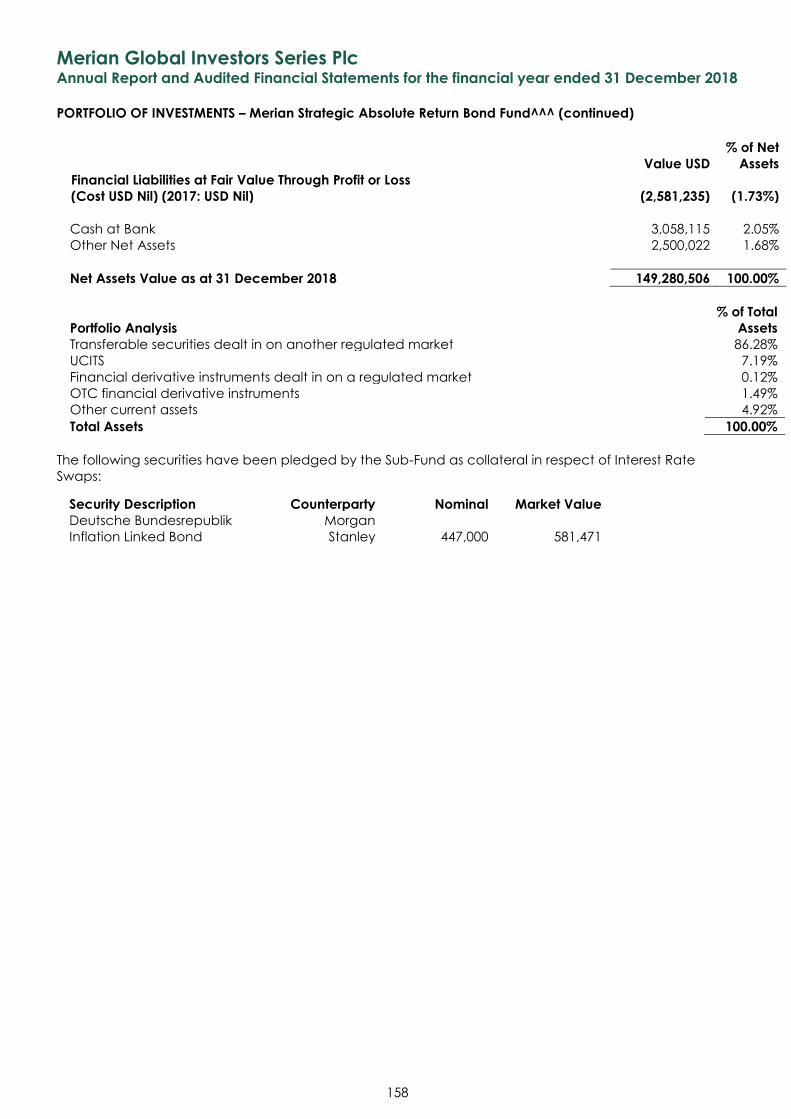
Merian Global Investors Series Plc Annual Report and Audited Financial Statements for the financial year ended 31 December 2018
PORTFOLIO OF INVESTMENTS – Merian Strategic Absolute Return Bond Fund^^^ (continued)
158
Value USD
% of Net
Assets
Financial Liabilities at Fair Value Through Profit or Loss
(Cost USD Nil) (2017: USD Nil) (2,581,235) (1.73%)
Cash at Bank 3,058,115 2.05%
Other Net Assets 2,500,022 1.68%
Net Assets Value as at 31 December 2018 149,280,506 100.00%
% of Total
Portfolio Analysis Assets
Transferable securities dealt in on another regulated market 86.28%
UCITS 7.19%
Financial derivative instruments dealt in on a regulated market 0.12%
OTC financial derivative instruments 1.49%
Other current assets 4.92%
Total Assets 100.00%
The following securities have been pledged by the Sub-Fund as collateral in respect of Interest Rate
Swaps:
Security Description Counterparty Nominal Market Value
Deutsche Bundesrepublik
Inflation Linked Bond
Morgan
Stanley 447,000
581,471
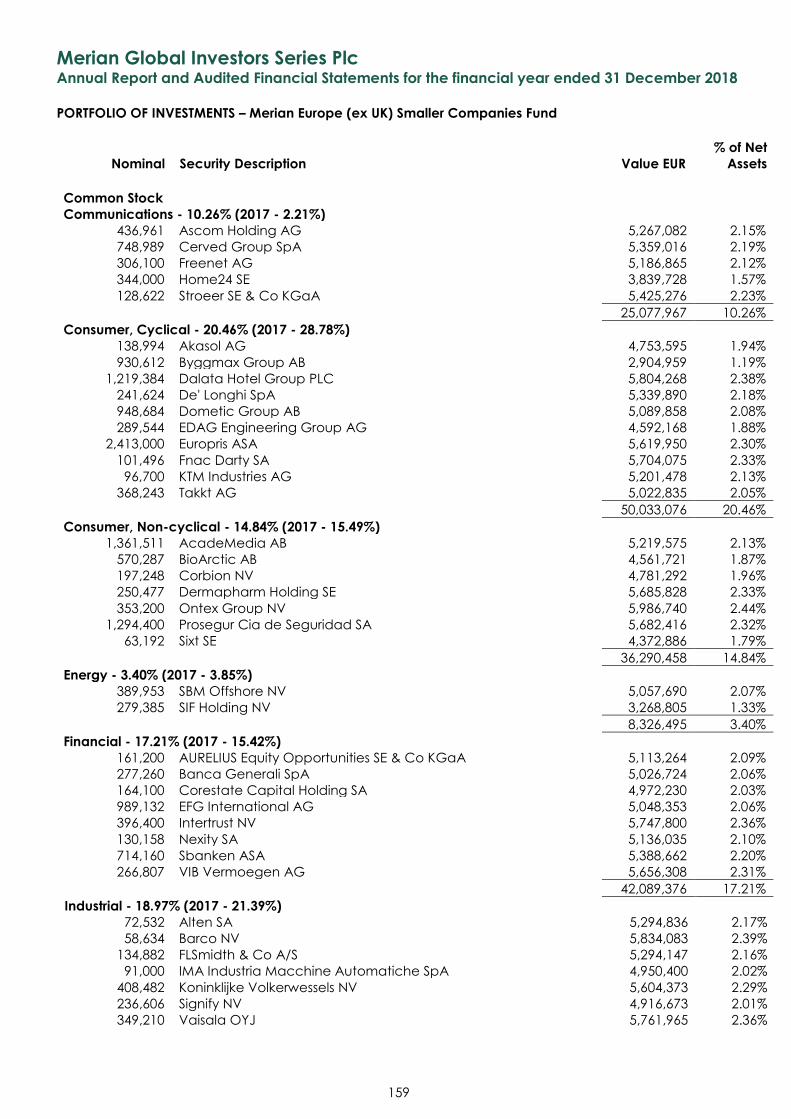
Merian Global Investors Series Plc Annual Report and Audited Financial Statements for the financial year ended 31 December 2018
PORTFOLIO OF INVESTMENTS – Merian Europe (ex UK) Smaller Companies Fund
Nominal Security Description Value EUR
% of Net
Assets
159
Common Stock Communications - 10.26% (2017 - 2.21%)
436,961 Ascom Holding AG 5,267,082 2.15%
748,989 Cerved Group SpA 5,359,016 2.19%
306,100 Freenet AG 5,186,865 2.12%
344,000 Home24 SE 3,839,728 1.57%
128,622 Stroeer SE & Co KGaA 5,425,276 2.23%
25,077,967 10.26%
Consumer, Cyclical - 20.46% (2017 - 28.78%) 138,994 Akasol AG 4,753,595 1.94%
930,612 Byggmax Group AB 2,904,959 1.19%
1,219,384 Dalata Hotel Group PLC 5,804,268 2.38%
241,624 De' Longhi SpA 5,339,890 2.18%
948,684 Dometic Group AB 5,089,858 2.08%
289,544 EDAG Engineering Group AG 4,592,168 1.88%
2,413,000 Europris ASA 5,619,950 2.30%
101,496 Fnac Darty SA 5,704,075 2.33%
96,700 KTM Industries AG 5,201,478 2.13%
368,243 Takkt AG 5,022,835 2.05%
50,033,076 20.46%
Consumer, Non-cyclical - 14.84% (2017 - 15.49%) 1,361,511 AcadeMedia AB 5,219,575 2.13%
570,287 BioArctic AB 4,561,721 1.87%
197,248 Corbion NV 4,781,292 1.96%
250,477 Dermapharm Holding SE 5,685,828 2.33%
353,200 Ontex Group NV 5,986,740 2.44%
1,294,400 Prosegur Cia de Seguridad SA 5,682,416 2.32%
63,192 Sixt SE 4,372,886 1.79%
36,290,458 14.84%
Energy - 3.40% (2017 - 3.85%) 389,953 SBM Offshore NV 5,057,690 2.07%
279,385 SIF Holding NV 3,268,805 1.33%
8,326,495 3.40%
Financial - 17.21% (2017 - 15.42%) 161,200 AURELIUS Equity Opportunities SE & Co KGaA 5,113,264 2.09%
277,260 Banca Generali SpA 5,026,724 2.06%
164,100 Corestate Capital Holding SA 4,972,230 2.03%
989,132 EFG International AG 5,048,353 2.06%
396,400 Intertrust NV 5,747,800 2.36%
130,158 Nexity SA 5,136,035 2.10%
714,160 Sbanken ASA 5,388,662 2.20%
266,807 VIB Vermoegen AG 5,656,308 2.31%
42,089,376 17.21%
Industrial - 18.97% (2017 - 21.39%) 72,532 Alten SA 5,294,836 2.17%
58,634 Barco NV 5,834,083 2.39%
134,882 FLSmidth & Co A/S 5,294,147 2.16%
91,000 IMA Industria Macchine Automatiche SpA 4,950,400 2.02%
408,482 Koninklijke Volkerwessels NV 5,604,373 2.29%
236,606 Signify NV 4,916,673 2.01%
349,210 Vaisala OYJ 5,761,965 2.36%
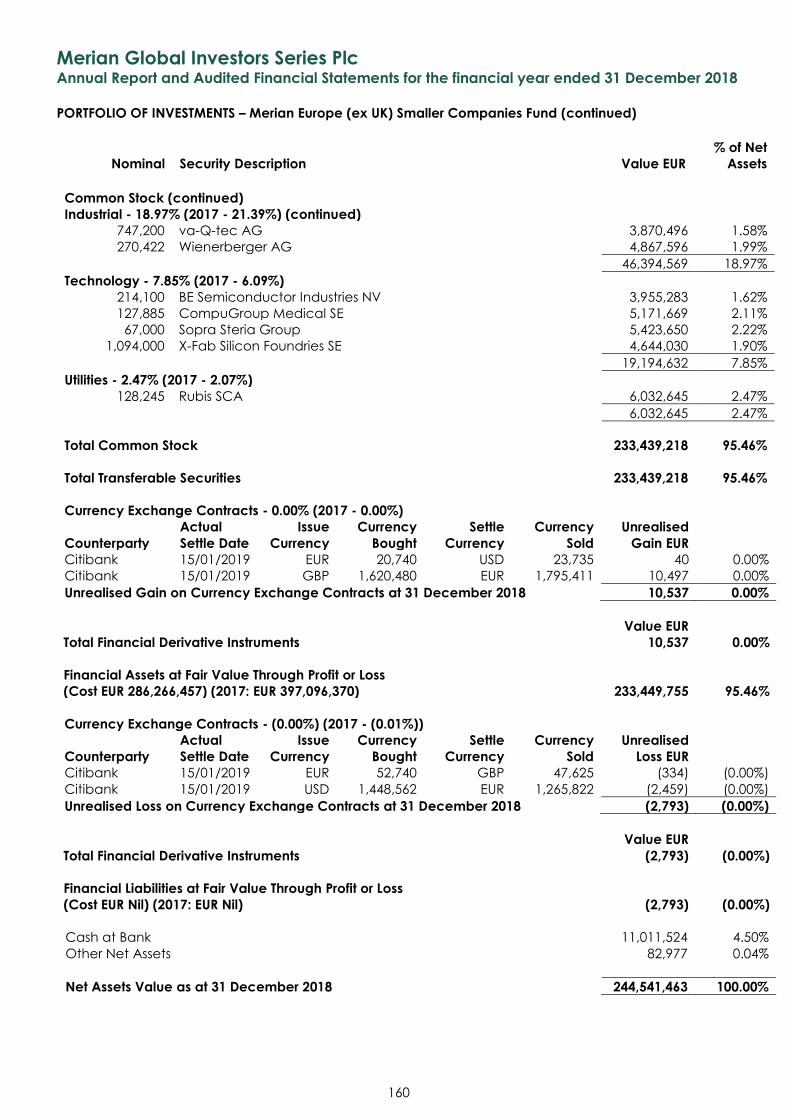
Merian Global Investors Series Plc Annual Report and Audited Financial Statements for the financial year ended 31 December 2018
PORTFOLIO OF INVESTMENTS – Merian Europe (ex UK) Smaller Companies Fund (continued)
Nominal Security Description Value EUR
% of Net
Assets
160
Common Stock (continued)
Industrial - 18.97% (2017 - 21.39%) (continued) 747,200 va-Q-tec AG 3,870,496 1.58%
270,422 Wienerberger AG 4,867,596 1.99%
46,394,569 18.97%
Technology - 7.85% (2017 - 6.09%) 214,100 BE Semiconductor Industries NV 3,955,283 1.62%
127,885 CompuGroup Medical SE 5,171,669 2.11%
67,000 Sopra Steria Group 5,423,650 2.22%
1,094,000 X-Fab Silicon Foundries SE 4,644,030 1.90%
19,194,632 7.85%
Utilities - 2.47% (2017 - 2.07%) 128,245 Rubis SCA 6,032,645 2.47%
6,032,645 2.47%
Total Common Stock 233,439,218 95.46%
Total Transferable Securities 233,439,218 95.46%
Currency Exchange Contracts - 0.00% (2017 - 0.00%)
Counterparty
Actual
Settle Date
Issue
Currency
Currency
Bought
Settle
Currency
Currency
Sold
Unrealised
Gain EUR Citibank 15/01/2019 EUR 20,740 USD 23,735 40 0.00%
Citibank 15/01/2019 GBP 1,620,480 EUR 1,795,411 10,497 0.00%
Unrealised Gain on Currency Exchange Contracts at 31 December 2018 10,537 0.00%
Value EUR
Total Financial Derivative Instruments 10,537 0.00%
Financial Assets at Fair Value Through Profit or Loss
(Cost EUR 286,266,457) (2017: EUR 397,096,370) 233,449,755 95.46%
Currency Exchange Contracts - (0.00%) (2017 - (0.01%))
Counterparty
Actual
Settle Date
Issue
Currency
Currency
Bought
Settle
Currency
Currency
Sold
Unrealised
Loss EUR Citibank 15/01/2019 EUR 52,740 GBP 47,625 (334) (0.00%)
Citibank 15/01/2019 USD 1,448,562 EUR 1,265,822 (2,459) (0.00%)
Unrealised Loss on Currency Exchange Contracts at 31 December 2018 (2,793) (0.00%)
Value EUR
Total Financial Derivative Instruments (2,793) (0.00%)
Financial Liabilities at Fair Value Through Profit or Loss
(Cost EUR Nil) (2017: EUR Nil) (2,793) (0.00%)
Cash at Bank 11,011,524 4.50%
Other Net Assets 82,977 0.04%
Net Assets Value as at 31 December 2018 244,541,463 100.00%
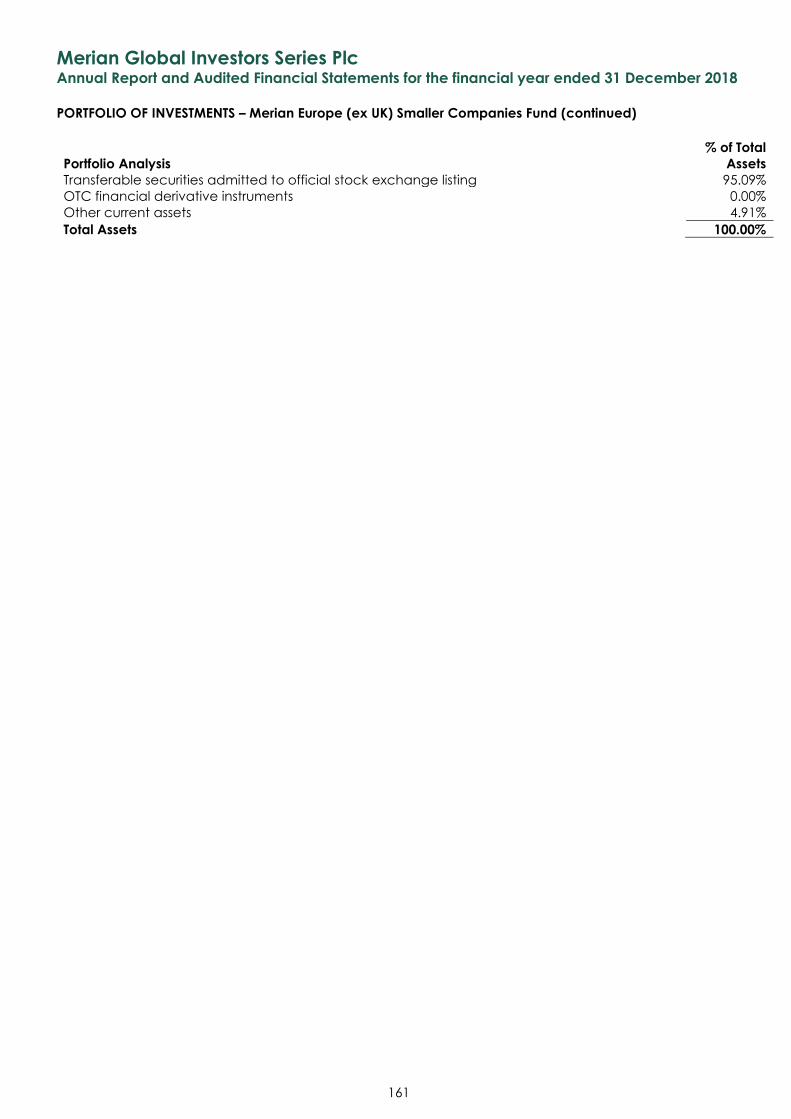
Merian Global Investors Series Plc Annual Report and Audited Financial Statements for the financial year ended 31 December 2018
PORTFOLIO OF INVESTMENTS – Merian Europe (ex UK) Smaller Companies Fund (continued)
161
% of Total
Portfolio Analysis Assets
Transferable securities admitted to official stock exchange listing 95.09%
OTC financial derivative instruments 0.00%
Other current assets 4.91%
Total Assets 100.00%
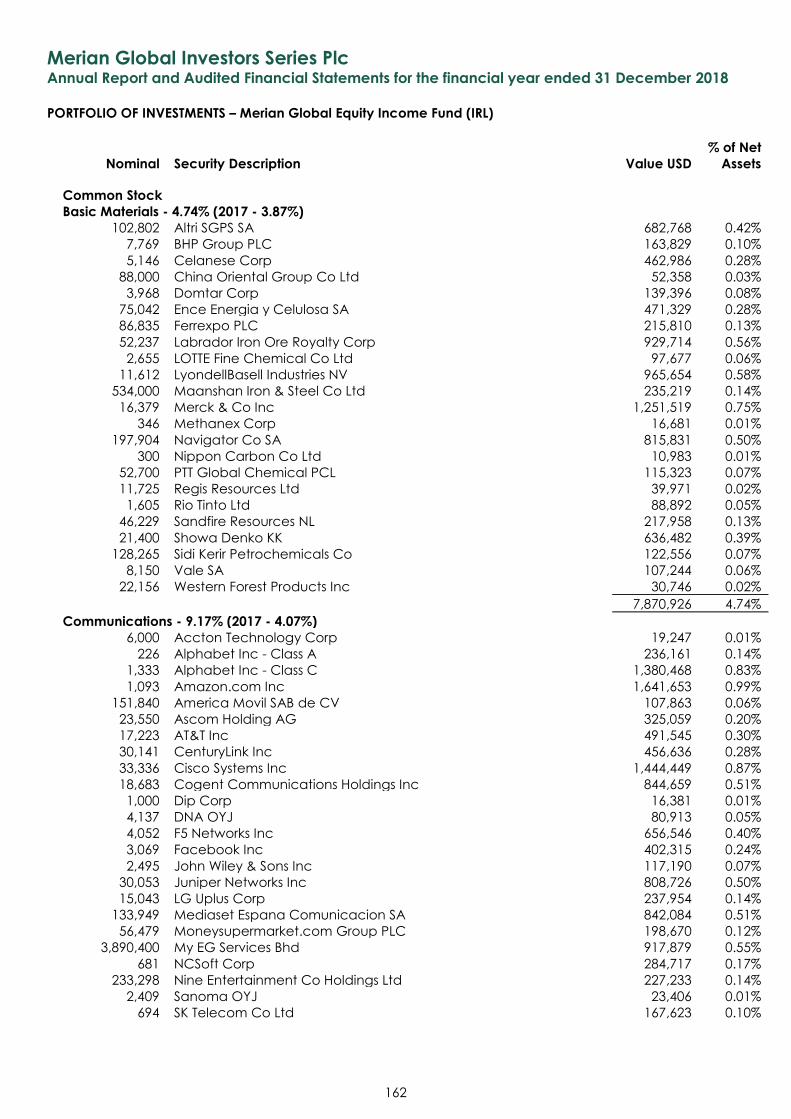
Merian Global Investors Series Plc Annual Report and Audited Financial Statements for the financial year ended 31 December 2018
PORTFOLIO OF INVESTMENTS – Merian Global Equity Income Fund (IRL)
Nominal Security Description Value USD
% of Net
Assets
162
Common Stock
Basic Materials - 4.74% (2017 - 3.87%)
102,802 Altri SGPS SA 682,768 0.42%
7,769 BHP Group PLC 163,829 0.10%
5,146 Celanese Corp 462,986 0.28%
88,000 China Oriental Group Co Ltd 52,358 0.03%
3,968 Domtar Corp 139,396 0.08%
75,042 Ence Energia y Celulosa SA 471,329 0.28%
86,835 Ferrexpo PLC 215,810 0.13%
52,237 Labrador Iron Ore Royalty Corp 929,714 0.56%
2,655 LOTTE Fine Chemical Co Ltd 97,677 0.06%
11,612 LyondellBasell Industries NV 965,654 0.58%
534,000 Maanshan Iron & Steel Co Ltd 235,219 0.14%
16,379 Merck & Co Inc 1,251,519 0.75%
346 Methanex Corp 16,681 0.01%
197,904 Navigator Co SA 815,831 0.50%
300 Nippon Carbon Co Ltd 10,983 0.01%
52,700 PTT Global Chemical PCL 115,323 0.07%
11,725 Regis Resources Ltd 39,971 0.02%
1,605 Rio Tinto Ltd 88,892 0.05%
46,229 Sandfire Resources NL 217,958 0.13%
21,400 Showa Denko KK 636,482 0.39%
128,265 Sidi Kerir Petrochemicals Co 122,556 0.07%
8,150 Vale SA 107,244 0.06%
22,156 Western Forest Products Inc 30,746 0.02%
7,870,926 4.74%
Communications - 9.17% (2017 - 4.07%)
6,000 Accton Technology Corp 19,247 0.01%
226 Alphabet Inc - Class A 236,161 0.14%
1,333 Alphabet Inc - Class C 1,380,468 0.83%
1,093 Amazon.com Inc 1,641,653 0.99%
151,840 America Movil SAB de CV 107,863 0.06%
23,550 Ascom Holding AG 325,059 0.20%
17,223 AT&T Inc 491,545 0.30%
30,141 CenturyLink Inc 456,636 0.28%
33,336 Cisco Systems Inc 1,444,449 0.87%
18,683 Cogent Communications Holdings Inc 844,659 0.51%
1,000 Dip Corp 16,381 0.01%
4,137 DNA OYJ 80,913 0.05%
4,052 F5 Networks Inc 656,546 0.40%
3,069 Facebook Inc 402,315 0.24%
2,495 John Wiley & Sons Inc 117,190 0.07%
30,053 Juniper Networks Inc 808,726 0.50%
15,043 LG Uplus Corp 237,954 0.14%
133,949 Mediaset Espana Comunicacion SA 842,084 0.51%
56,479 Moneysupermarket.com Group PLC 198,670 0.12%
3,890,400 My EG Services Bhd 917,879 0.55%
681 NCSoft Corp 284,717 0.17%
233,298 Nine Entertainment Co Holdings Ltd 227,233 0.14%
2,409 Sanoma OYJ 23,406 0.01%
694 SK Telecom Co Ltd 167,623 0.10%
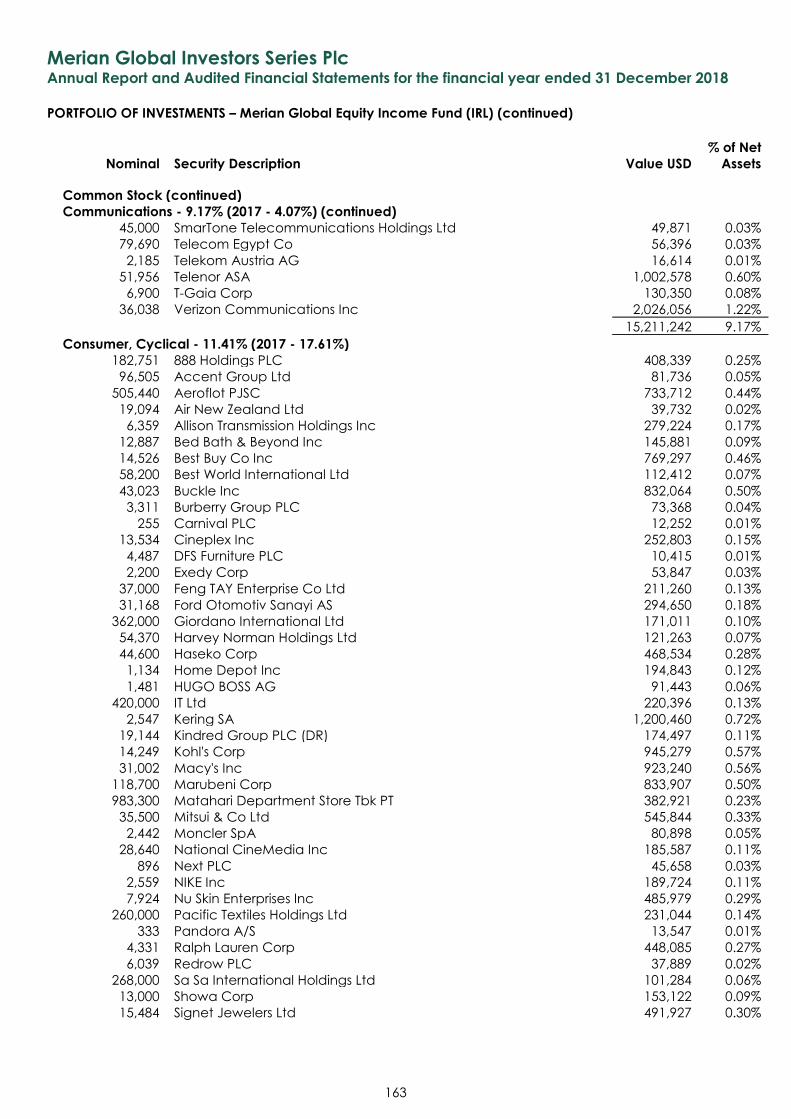
Merian Global Investors Series Plc Annual Report and Audited Financial Statements for the financial year ended 31 December 2018
PORTFOLIO OF INVESTMENTS – Merian Global Equity Income Fund (IRL) (continued)
Nominal Security Description Value USD
% of Net
Assets
163
Common Stock (continued)
Communications - 9.17% (2017 - 4.07%) (continued)
45,000 SmarTone Telecommunications Holdings Ltd 49,871 0.03%
79,690 Telecom Egypt Co 56,396 0.03%
2,185 Telekom Austria AG 16,614 0.01%
51,956 Telenor ASA 1,002,578 0.60%
6,900 T-Gaia Corp 130,350 0.08%
36,038 Verizon Communications Inc 2,026,056 1.22%
15,211,242 9.17%
Consumer, Cyclical - 11.41% (2017 - 17.61%)
182,751 888 Holdings PLC 408,339 0.25%
96,505 Accent Group Ltd 81,736 0.05%
505,440 Aeroflot PJSC 733,712 0.44%
19,094 Air New Zealand Ltd 39,732 0.02%
6,359 Allison Transmission Holdings Inc 279,224 0.17%
12,887 Bed Bath & Beyond Inc 145,881 0.09%
14,526 Best Buy Co Inc 769,297 0.46%
58,200 Best World International Ltd 112,412 0.07%
43,023 Buckle Inc 832,064 0.50%
3,311 Burberry Group PLC 73,368 0.04%
255 Carnival PLC 12,252 0.01%
13,534 Cineplex Inc 252,803 0.15%
4,487 DFS Furniture PLC 10,415 0.01%
2,200 Exedy Corp 53,847 0.03%
37,000 Feng TAY Enterprise Co Ltd 211,260 0.13%
31,168 Ford Otomotiv Sanayi AS 294,650 0.18%
362,000 Giordano International Ltd 171,011 0.10%
54,370 Harvey Norman Holdings Ltd 121,263 0.07%
44,600 Haseko Corp 468,534 0.28%
1,134 Home Depot Inc 194,843 0.12%
1,481 HUGO BOSS AG 91,443 0.06%
420,000 IT Ltd 220,396 0.13%
2,547 Kering SA 1,200,460 0.72%
19,144 Kindred Group PLC (DR) 174,497 0.11%
14,249 Kohl's Corp 945,279 0.57%
31,002 Macy's Inc 923,240 0.56%
118,700 Marubeni Corp 833,907 0.50%
983,300 Matahari Department Store Tbk PT 382,921 0.23%
35,500 Mitsui & Co Ltd 545,844 0.33%
2,442 Moncler SpA 80,898 0.05%
28,640 National CineMedia Inc 185,587 0.11%
896 Next PLC 45,658 0.03%
2,559 NIKE Inc 189,724 0.11%
7,924 Nu Skin Enterprises Inc 485,979 0.29%
260,000 Pacific Textiles Holdings Ltd 231,044 0.14%
333 Pandora A/S 13,547 0.01%
4,331 Ralph Lauren Corp 448,085 0.27%
6,039 Redrow PLC 37,889 0.02%
268,000 Sa Sa International Holdings Ltd 101,284 0.06%
13,000 Showa Corp 153,122 0.09%
15,484 Signet Jewelers Ltd 491,927 0.30%
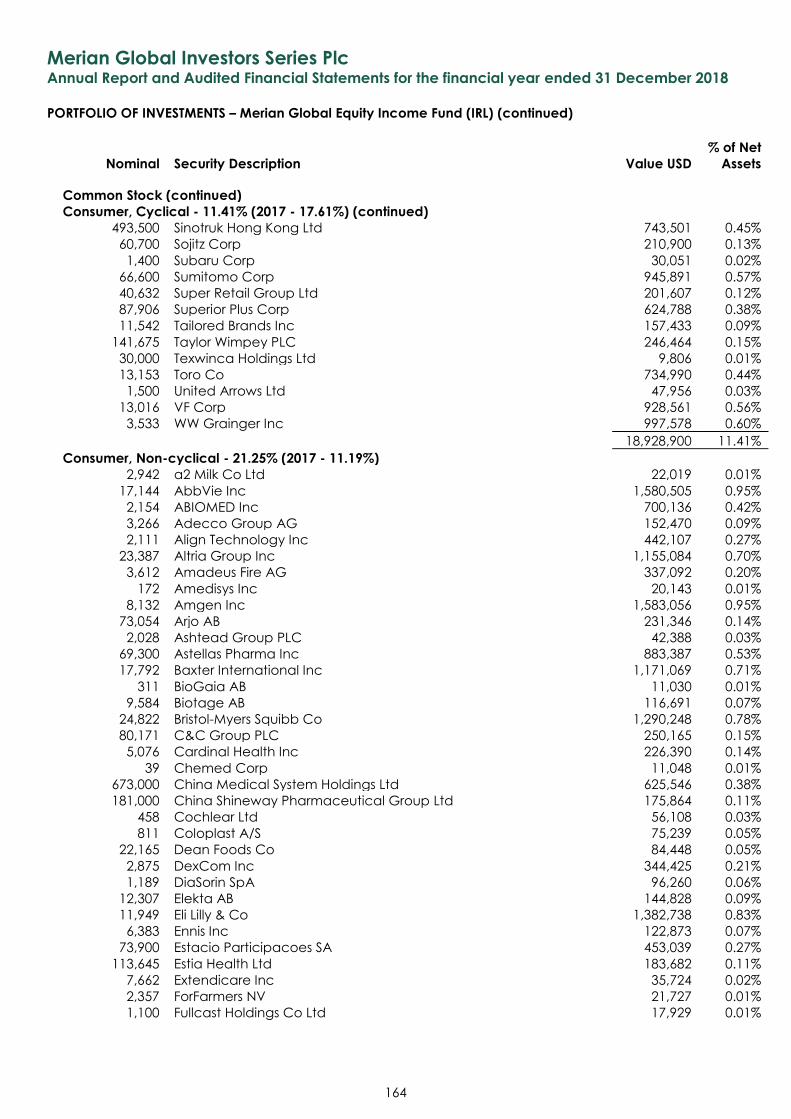
Merian Global Investors Series Plc Annual Report and Audited Financial Statements for the financial year ended 31 December 2018
PORTFOLIO OF INVESTMENTS – Merian Global Equity Income Fund (IRL) (continued)
Nominal Security Description Value USD
% of Net
Assets
164
Common Stock (continued)
Consumer, Cyclical - 11.41% (2017 - 17.61%) (continued)
493,500 Sinotruk Hong Kong Ltd 743,501 0.45%
60,700 Sojitz Corp 210,900 0.13%
1,400 Subaru Corp 30,051 0.02%
66,600 Sumitomo Corp 945,891 0.57%
40,632 Super Retail Group Ltd 201,607 0.12%
87,906 Superior Plus Corp 624,788 0.38%
11,542 Tailored Brands Inc 157,433 0.09%
141,675 Taylor Wimpey PLC 246,464 0.15%
30,000 Texwinca Holdings Ltd 9,806 0.01%
13,153 Toro Co 734,990 0.44%
1,500 United Arrows Ltd 47,956 0.03%
13,016 VF Corp 928,561 0.56%
3,533 WW Grainger Inc 997,578 0.60%
18,928,900 11.41%
Consumer, Non-cyclical - 21.25% (2017 - 11.19%)
2,942 a2 Milk Co Ltd 22,019 0.01%
17,144 AbbVie Inc 1,580,505 0.95%
2,154 ABIOMED Inc 700,136 0.42%
3,266 Adecco Group AG 152,470 0.09%
2,111 Align Technology Inc 442,107 0.27%
23,387 Altria Group Inc 1,155,084 0.70%
3,612 Amadeus Fire AG 337,092 0.20%
172 Amedisys Inc 20,143 0.01%
8,132 Amgen Inc 1,583,056 0.95%
73,054 Arjo AB 231,346 0.14%
2,028 Ashtead Group PLC 42,388 0.03%
69,300 Astellas Pharma Inc 883,387 0.53%
17,792 Baxter International Inc 1,171,069 0.71%
311 BioGaia AB 11,030 0.01%
9,584 Biotage AB 116,691 0.07%
24,822 Bristol-Myers Squibb Co 1,290,248 0.78%
80,171 C&C Group PLC 250,165 0.15%
5,076 Cardinal Health Inc 226,390 0.14%
39 Chemed Corp 11,048 0.01%
673,000 China Medical System Holdings Ltd 625,546 0.38%
181,000 China Shineway Pharmaceutical Group Ltd 175,864 0.11%
458 Cochlear Ltd 56,108 0.03%
811 Coloplast A/S 75,239 0.05%
22,165 Dean Foods Co 84,448 0.05%
2,875 DexCom Inc 344,425 0.21%
1,189 DiaSorin SpA 96,260 0.06%
12,307 Elekta AB 144,828 0.09%
11,949 Eli Lilly & Co 1,382,738 0.83%
6,383 Ennis Inc 122,873 0.07%
73,900 Estacio Participacoes SA 453,039 0.27%
113,645 Estia Health Ltd 183,682 0.11%
7,662 Extendicare Inc 35,724 0.02%
2,357 ForFarmers NV 21,727 0.01%
1,100 Fullcast Holdings Co Ltd 17,929 0.01%
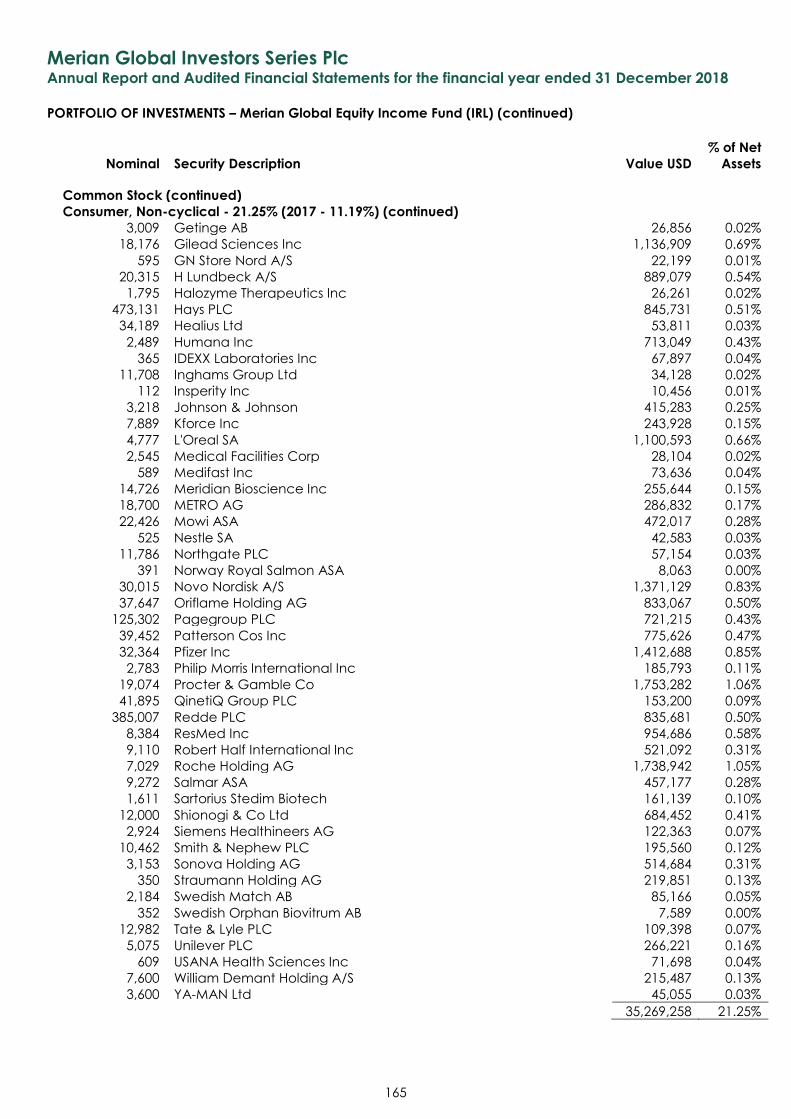
Merian Global Investors Series Plc Annual Report and Audited Financial Statements for the financial year ended 31 December 2018
PORTFOLIO OF INVESTMENTS – Merian Global Equity Income Fund (IRL) (continued)
Nominal Security Description Value USD
% of Net
Assets
165
Common Stock (continued)
Consumer, Non-cyclical - 21.25% (2017 - 11.19%) (continued)
3,009 Getinge AB 26,856 0.02%
18,176 Gilead Sciences Inc 1,136,909 0.69%
595 GN Store Nord A/S 22,199 0.01%
20,315 H Lundbeck A/S 889,079 0.54%
1,795 Halozyme Therapeutics Inc 26,261 0.02%
473,131 Hays PLC 845,731 0.51%
34,189 Healius Ltd 53,811 0.03%
2,489 Humana Inc 713,049 0.43%
365 IDEXX Laboratories Inc 67,897 0.04%
11,708 Inghams Group Ltd 34,128 0.02%
112 Insperity Inc 10,456 0.01%
3,218 Johnson & Johnson 415,283 0.25%
7,889 Kforce Inc 243,928 0.15%
4,777 L'Oreal SA 1,100,593 0.66%
2,545 Medical Facilities Corp 28,104 0.02%
589 Medifast Inc 73,636 0.04%
14,726 Meridian Bioscience Inc 255,644 0.15%
18,700 METRO AG 286,832 0.17%
22,426 Mowi ASA 472,017 0.28%
525 Nestle SA 42,583 0.03%
11,786 Northgate PLC 57,154 0.03%
391 Norway Royal Salmon ASA 8,063 0.00%
30,015 Novo Nordisk A/S 1,371,129 0.83%
37,647 Oriflame Holding AG 833,067 0.50%
125,302 Pagegroup PLC 721,215 0.43%
39,452 Patterson Cos Inc 775,626 0.47%
32,364 Pfizer Inc 1,412,688 0.85%
2,783 Philip Morris International Inc 185,793 0.11%
19,074 Procter & Gamble Co 1,753,282 1.06%
41,895 QinetiQ Group PLC 153,200 0.09%
385,007 Redde PLC 835,681 0.50%
8,384 ResMed Inc 954,686 0.58%
9,110 Robert Half International Inc 521,092 0.31%
7,029 Roche Holding AG 1,738,942 1.05%
9,272 Salmar ASA 457,177 0.28%
1,611 Sartorius Stedim Biotech 161,139 0.10%
12,000 Shionogi & Co Ltd 684,452 0.41%
2,924 Siemens Healthineers AG 122,363 0.07%
10,462 Smith & Nephew PLC 195,560 0.12%
3,153 Sonova Holding AG 514,684 0.31%
350 Straumann Holding AG 219,851 0.13%
2,184 Swedish Match AB 85,166 0.05%
352 Swedish Orphan Biovitrum AB 7,589 0.00%
12,982 Tate & Lyle PLC 109,398 0.07%
5,075 Unilever PLC 266,221 0.16%
609 USANA Health Sciences Inc 71,698 0.04%
7,600 William Demant Holding A/S 215,487 0.13%
3,600 YA-MAN Ltd 45,055 0.03%
35,269,258 21.25%
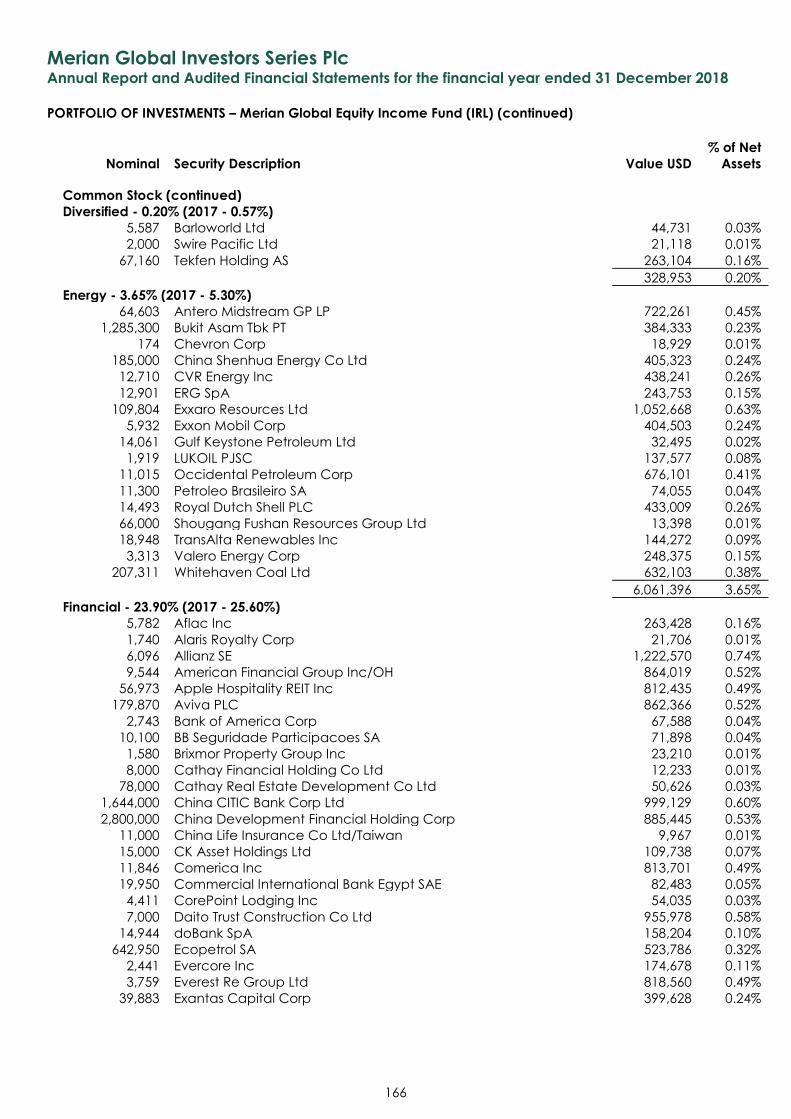
Merian Global Investors Series Plc Annual Report and Audited Financial Statements for the financial year ended 31 December 2018
PORTFOLIO OF INVESTMENTS – Merian Global Equity Income Fund (IRL) (continued)
Nominal Security Description Value USD
% of Net
Assets
166
Common Stock (continued)
Diversified - 0.20% (2017 - 0.57%)
5,587 Barloworld Ltd 44,731 0.03%
2,000 Swire Pacific Ltd 21,118 0.01%
67,160 Tekfen Holding AS 263,104 0.16%
328,953 0.20%
Energy - 3.65% (2017 - 5.30%)
64,603 Antero Midstream GP LP 722,261 0.45%
1,285,300 Bukit Asam Tbk PT 384,333 0.23%
174 Chevron Corp 18,929 0.01%
185,000 China Shenhua Energy Co Ltd 405,323 0.24%
12,710 CVR Energy Inc 438,241 0.26%
12,901 ERG SpA 243,753 0.15%
109,804 Exxaro Resources Ltd 1,052,668 0.63%
5,932 Exxon Mobil Corp 404,503 0.24%
14,061 Gulf Keystone Petroleum Ltd 32,495 0.02%
1,919 LUKOIL PJSC 137,577 0.08%
11,015 Occidental Petroleum Corp 676,101 0.41%
11,300 Petroleo Brasileiro SA 74,055 0.04%
14,493 Royal Dutch Shell PLC 433,009 0.26%
66,000 Shougang Fushan Resources Group Ltd 13,398 0.01%
18,948 TransAlta Renewables Inc 144,272 0.09%
3,313 Valero Energy Corp 248,375 0.15%
207,311 Whitehaven Coal Ltd 632,103 0.38%
6,061,396 3.65%
Financial - 23.90% (2017 - 25.60%)
5,782 Aflac Inc 263,428 0.16%
1,740 Alaris Royalty Corp 21,706 0.01%
6,096 Allianz SE 1,222,570 0.74%
9,544 American Financial Group Inc/OH 864,019 0.52%
56,973 Apple Hospitality REIT Inc 812,435 0.49%
179,870 Aviva PLC 862,366 0.52%
2,743 Bank of America Corp 67,588 0.04%
10,100 BB Seguridade Participacoes SA 71,898 0.04%
1,580 Brixmor Property Group Inc 23,210 0.01%
8,000 Cathay Financial Holding Co Ltd 12,233 0.01%
78,000 Cathay Real Estate Development Co Ltd 50,626 0.03%
1,644,000 China CITIC Bank Corp Ltd 999,129 0.60%
2,800,000 China Development Financial Holding Corp 885,445 0.53%
11,000 China Life Insurance Co Ltd/Taiwan 9,967 0.01%
15,000 CK Asset Holdings Ltd 109,738 0.07%
11,846 Comerica Inc 813,701 0.49%
19,950 Commercial International Bank Egypt SAE 82,483 0.05%
4,411 CorePoint Lodging Inc 54,035 0.03%
7,000 Daito Trust Construction Co Ltd 955,978 0.58%
14,944 doBank SpA 158,204 0.10%
642,950 Ecopetrol SA 523,786 0.32%
2,441 Evercore Inc 174,678 0.11%
3,759 Everest Re Group Ltd 818,560 0.49%
39,883 Exantas Capital Corp 399,628 0.24%
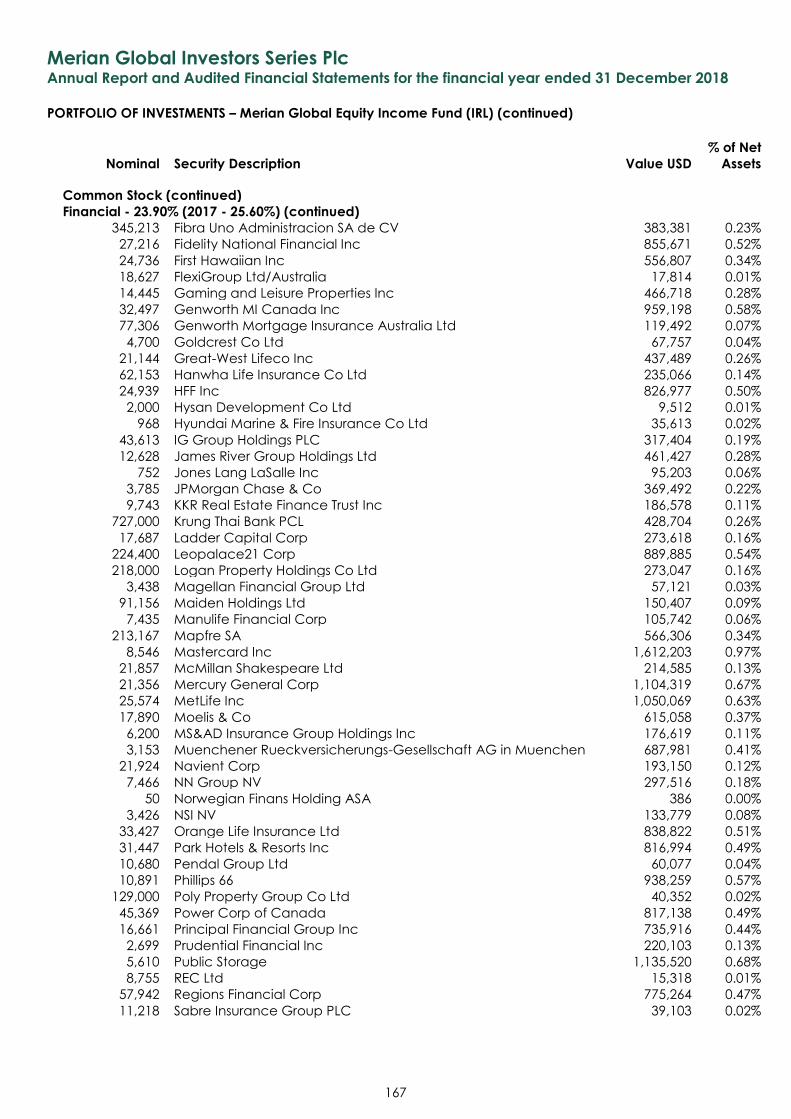
Merian Global Investors Series Plc Annual Report and Audited Financial Statements for the financial year ended 31 December 2018
PORTFOLIO OF INVESTMENTS – Merian Global Equity Income Fund (IRL) (continued)
Nominal Security Description Value USD
% of Net
Assets
167
Common Stock (continued)
Financial - 23.90% (2017 - 25.60%) (continued)
345,213 Fibra Uno Administracion SA de CV 383,381 0.23%
27,216 Fidelity National Financial Inc 855,671 0.52%
24,736 First Hawaiian Inc 556,807 0.34%
18,627 FlexiGroup Ltd/Australia 17,814 0.01%
14,445 Gaming and Leisure Properties Inc 466,718 0.28%
32,497 Genworth MI Canada Inc 959,198 0.58%
77,306 Genworth Mortgage Insurance Australia Ltd 119,492 0.07%
4,700 Goldcrest Co Ltd 67,757 0.04%
21,144 Great-West Lifeco Inc 437,489 0.26%
62,153 Hanwha Life Insurance Co Ltd 235,066 0.14%
24,939 HFF Inc 826,977 0.50%
2,000 Hysan Development Co Ltd 9,512 0.01%
968 Hyundai Marine & Fire Insurance Co Ltd 35,613 0.02%
43,613 IG Group Holdings PLC 317,404 0.19%
12,628 James River Group Holdings Ltd 461,427 0.28%
752 Jones Lang LaSalle Inc 95,203 0.06%
3,785 JPMorgan Chase & Co 369,492 0.22%
9,743 KKR Real Estate Finance Trust Inc 186,578 0.11%
727,000 Krung Thai Bank PCL 428,704 0.26%
17,687 Ladder Capital Corp 273,618 0.16%
224,400 Leopalace21 Corp 889,885 0.54%
218,000 Logan Property Holdings Co Ltd 273,047 0.16%
3,438 Magellan Financial Group Ltd 57,121 0.03%
91,156 Maiden Holdings Ltd 150,407 0.09%
7,435 Manulife Financial Corp 105,742 0.06%
213,167 Mapfre SA 566,306 0.34%
8,546 Mastercard Inc 1,612,203 0.97%
21,857 McMillan Shakespeare Ltd 214,585 0.13%
21,356 Mercury General Corp 1,104,319 0.67%
25,574 MetLife Inc 1,050,069 0.63%
17,890 Moelis & Co 615,058 0.37%
6,200 MS&AD Insurance Group Holdings Inc 176,619 0.11%
3,153 Muenchener Rueckversicherungs-Gesellschaft AG in Muenchen 687,981 0.41%
21,924 Navient Corp 193,150 0.12%
7,466 NN Group NV 297,516 0.18%
50 Norwegian Finans Holding ASA 386 0.00%
3,426 NSI NV 133,779 0.08%
33,427 Orange Life Insurance Ltd 838,822 0.51%
31,447 Park Hotels & Resorts Inc 816,994 0.49%
10,680 Pendal Group Ltd 60,077 0.04%
10,891 Phillips 66 938,259 0.57%
129,000 Poly Property Group Co Ltd 40,352 0.02%
45,369 Power Corp of Canada 817,138 0.49%
16,661 Principal Financial Group Inc 735,916 0.44%
2,699 Prudential Financial Inc 220,103 0.13%
5,610 Public Storage 1,135,520 0.68%
8,755 REC Ltd 15,318 0.01%
57,942 Regions Financial Corp 775,264 0.47%
11,218 Sabre Insurance Group PLC 39,103 0.02%
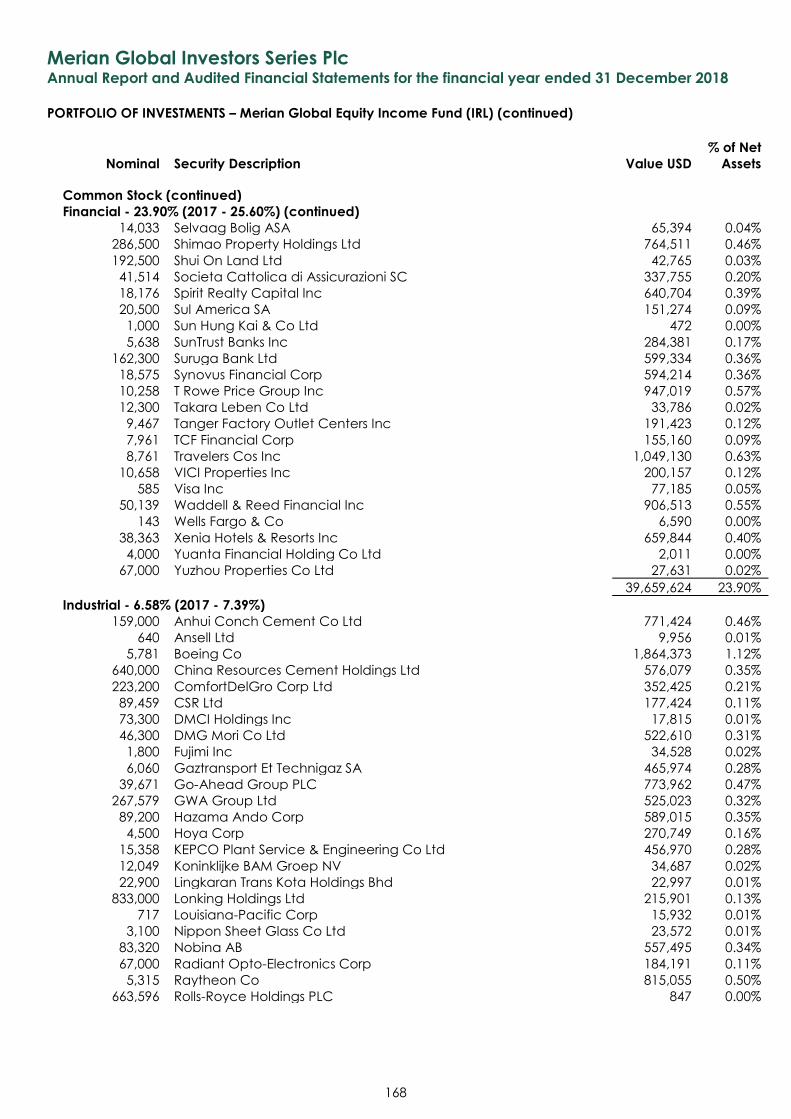
Merian Global Investors Series Plc Annual Report and Audited Financial Statements for the financial year ended 31 December 2018
PORTFOLIO OF INVESTMENTS – Merian Global Equity Income Fund (IRL) (continued)
Nominal Security Description Value USD
% of Net
Assets
168
Common Stock (continued)
Financial - 23.90% (2017 - 25.60%) (continued)
14,033 Selvaag Bolig ASA 65,394 0.04%
286,500 Shimao Property Holdings Ltd 764,511 0.46%
192,500 Shui On Land Ltd 42,765 0.03%
41,514 Societa Cattolica di Assicurazioni SC 337,755 0.20%
18,176 Spirit Realty Capital Inc 640,704 0.39%
20,500 Sul America SA 151,274 0.09%
1,000 Sun Hung Kai & Co Ltd 472 0.00%
5,638 SunTrust Banks Inc 284,381 0.17%
162,300 Suruga Bank Ltd 599,334 0.36%
18,575 Synovus Financial Corp 594,214 0.36%
10,258 T Rowe Price Group Inc 947,019 0.57%
12,300 Takara Leben Co Ltd 33,786 0.02%
9,467 Tanger Factory Outlet Centers Inc 191,423 0.12%
7,961 TCF Financial Corp 155,160 0.09%
8,761 Travelers Cos Inc 1,049,130 0.63%
10,658 VICI Properties Inc 200,157 0.12%
585 Visa Inc 77,185 0.05%
50,139 Waddell & Reed Financial Inc 906,513 0.55%
143 Wells Fargo & Co 6,590 0.00%
38,363 Xenia Hotels & Resorts Inc 659,844 0.40%
4,000 Yuanta Financial Holding Co Ltd 2,011 0.00%
67,000 Yuzhou Properties Co Ltd 27,631 0.02%
39,659,624 23.90%
Industrial - 6.58% (2017 - 7.39%)
159,000 Anhui Conch Cement Co Ltd 771,424 0.46%
640 Ansell Ltd 9,956 0.01%
5,781 Boeing Co 1,864,373 1.12%
640,000 China Resources Cement Holdings Ltd 576,079 0.35%
223,200 ComfortDelGro Corp Ltd 352,425 0.21%
89,459 CSR Ltd 177,424 0.11%
73,300 DMCI Holdings Inc 17,815 0.01%
46,300 DMG Mori Co Ltd 522,610 0.31%
1,800 Fujimi Inc 34,528 0.02%
6,060 Gaztransport Et Technigaz SA 465,974 0.28%
39,671 Go-Ahead Group PLC 773,962 0.47%
267,579 GWA Group Ltd 525,023 0.32%
89,200 Hazama Ando Corp 589,015 0.35%
4,500 Hoya Corp 270,749 0.16%
15,358 KEPCO Plant Service & Engineering Co Ltd 456,970 0.28%
12,049 Koninklijke BAM Groep NV 34,687 0.02%
22,900 Lingkaran Trans Kota Holdings Bhd 22,997 0.01%
833,000 Lonking Holdings Ltd 215,901 0.13%
717 Louisiana-Pacific Corp 15,932 0.01%
3,100 Nippon Sheet Glass Co Ltd 23,572 0.01%
83,320 Nobina AB 557,495 0.34%
67,000 Radiant Opto-Electronics Corp 184,191 0.11%
5,315 Raytheon Co 815,055 0.50%
663,596 Rolls-Royce Holdings PLC 847 0.00%
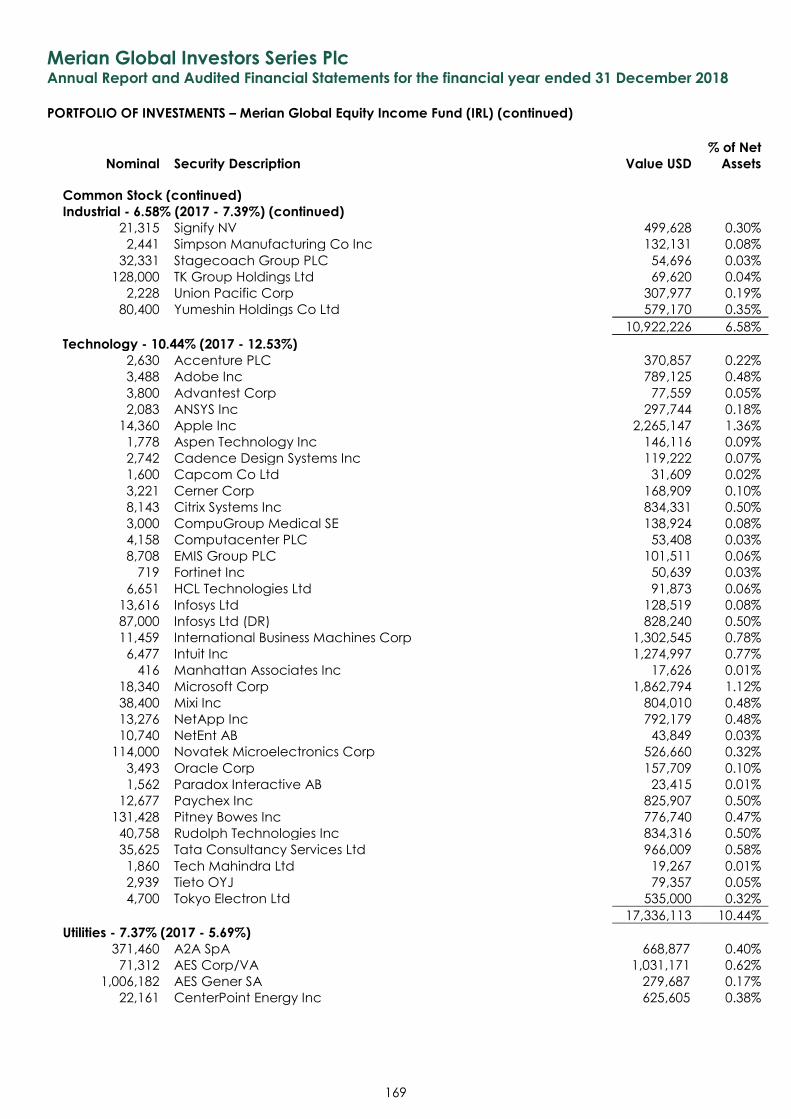
Merian Global Investors Series Plc Annual Report and Audited Financial Statements for the financial year ended 31 December 2018
PORTFOLIO OF INVESTMENTS – Merian Global Equity Income Fund (IRL) (continued)
Nominal Security Description Value USD
% of Net
Assets
169
Common Stock (continued)
Industrial - 6.58% (2017 - 7.39%) (continued)
21,315 Signify NV 499,628 0.30%
2,441 Simpson Manufacturing Co Inc 132,131 0.08%
32,331 Stagecoach Group PLC 54,696 0.03%
128,000 TK Group Holdings Ltd 69,620 0.04%
2,228 Union Pacific Corp 307,977 0.19%
80,400 Yumeshin Holdings Co Ltd 579,170 0.35%
10,922,226 6.58%
Technology - 10.44% (2017 - 12.53%)
2,630 Accenture PLC 370,857 0.22%
3,488 Adobe Inc 789,125 0.48%
3,800 Advantest Corp 77,559 0.05%
2,083 ANSYS Inc 297,744 0.18%
14,360 Apple Inc 2,265,147 1.36%
1,778 Aspen Technology Inc 146,116 0.09%
2,742 Cadence Design Systems Inc 119,222 0.07%
1,600 Capcom Co Ltd 31,609 0.02%
3,221 Cerner Corp 168,909 0.10%
8,143 Citrix Systems Inc 834,331 0.50%
3,000 CompuGroup Medical SE 138,924 0.08%
4,158 Computacenter PLC 53,408 0.03%
8,708 EMIS Group PLC 101,511 0.06%
719 Fortinet Inc 50,639 0.03%
6,651 HCL Technologies Ltd 91,873 0.06%
13,616 Infosys Ltd 128,519 0.08%
87,000 Infosys Ltd (DR) 828,240 0.50%
11,459 International Business Machines Corp 1,302,545 0.78%
6,477 Intuit Inc 1,274,997 0.77%
416 Manhattan Associates Inc 17,626 0.01%
18,340 Microsoft Corp 1,862,794 1.12%
38,400 Mixi Inc 804,010 0.48%
13,276 NetApp Inc 792,179 0.48%
10,740 NetEnt AB 43,849 0.03%
114,000 Novatek Microelectronics Corp 526,660 0.32%
3,493 Oracle Corp 157,709 0.10%
1,562 Paradox Interactive AB 23,415 0.01%
12,677 Paychex Inc 825,907 0.50%
131,428 Pitney Bowes Inc 776,740 0.47%
40,758 Rudolph Technologies Inc 834,316 0.50%
35,625 Tata Consultancy Services Ltd 966,009 0.58%
1,860 Tech Mahindra Ltd 19,267 0.01%
2,939 Tieto OYJ 79,357 0.05%
4,700 Tokyo Electron Ltd 535,000 0.32%
17,336,113 10.44%
Utilities - 7.37% (2017 - 5.69%)
371,460 A2A SpA 668,877 0.40%
71,312 AES Corp/VA 1,031,171 0.62%
1,006,182 AES Gener SA 279,687 0.17%
22,161 CenterPoint Energy Inc 625,605 0.38%
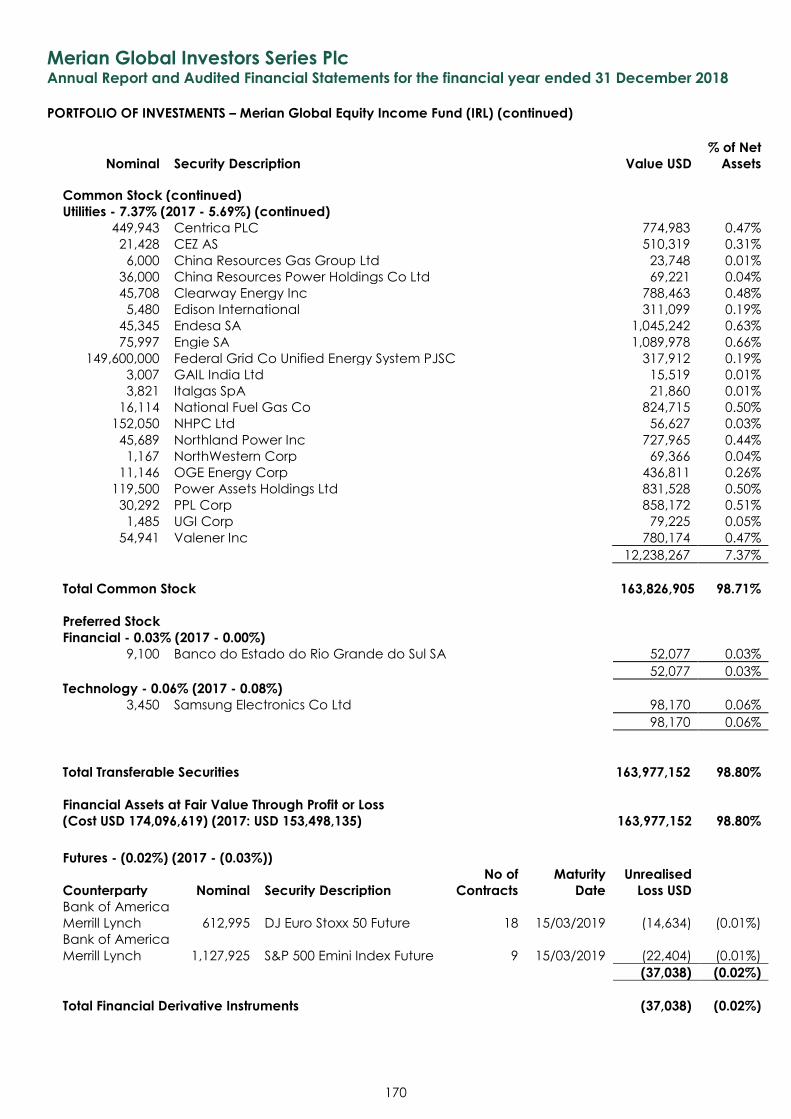
Merian Global Investors Series Plc Annual Report and Audited Financial Statements for the financial year ended 31 December 2018
PORTFOLIO OF INVESTMENTS – Merian Global Equity Income Fund (IRL) (continued)
Nominal Security Description Value USD
% of Net
Assets
170
Common Stock (continued)
Utilities - 7.37% (2017 - 5.69%) (continued)
449,943 Centrica PLC 774,983 0.47%
21,428 CEZ AS 510,319 0.31%
6,000 China Resources Gas Group Ltd 23,748 0.01%
36,000 China Resources Power Holdings Co Ltd 69,221 0.04%
45,708 Clearway Energy Inc 788,463 0.48%
5,480 Edison International 311,099 0.19%
45,345 Endesa SA 1,045,242 0.63%
75,997 Engie SA 1,089,978 0.66%
149,600,000 Federal Grid Co Unified Energy System PJSC 317,912 0.19%
3,007 GAIL India Ltd 15,519 0.01%
3,821 Italgas SpA 21,860 0.01%
16,114 National Fuel Gas Co 824,715 0.50%
152,050 NHPC Ltd 56,627 0.03%
45,689 Northland Power Inc 727,965 0.44%
1,167 NorthWestern Corp 69,366 0.04%
11,146 OGE Energy Corp 436,811 0.26%
119,500 Power Assets Holdings Ltd 831,528 0.50%
30,292 PPL Corp 858,172 0.51%
1,485 UGI Corp 79,225 0.05%
54,941 Valener Inc 780,174 0.47%
12,238,267 7.37%
Total Common Stock 163,826,905 98.71%
Preferred Stock
Financial - 0.03% (2017 - 0.00%)
9,100 Banco do Estado do Rio Grande do Sul SA 52,077 0.03%
52,077 0.03%
Technology - 0.06% (2017 - 0.08%)
3,450 Samsung Electronics Co Ltd 98,170 0.06%
98,170 0.06%
Total Transferable Securities 163,977,152 98.80%
Financial Assets at Fair Value Through Profit or Loss
(Cost USD 174,096,619) (2017: USD 153,498,135) 163,977,152 98.80%
Futures - (0.02%) (2017 - (0.03%))
Counterparty Nominal Security Description
No of
Contracts
Maturity
Date
Unrealised
Loss USD Bank of America
Merrill Lynch 612,995 DJ Euro Stoxx 50 Future 18 15/03/2019 (14,634) (0.01%)
Bank of America
Merrill Lynch 1,127,925 S&P 500 Emini Index Future 9 15/03/2019 (22,404) (0.01%)
(37,038) (0.02%)
Total Financial Derivative Instruments (37,038) (0.02%)
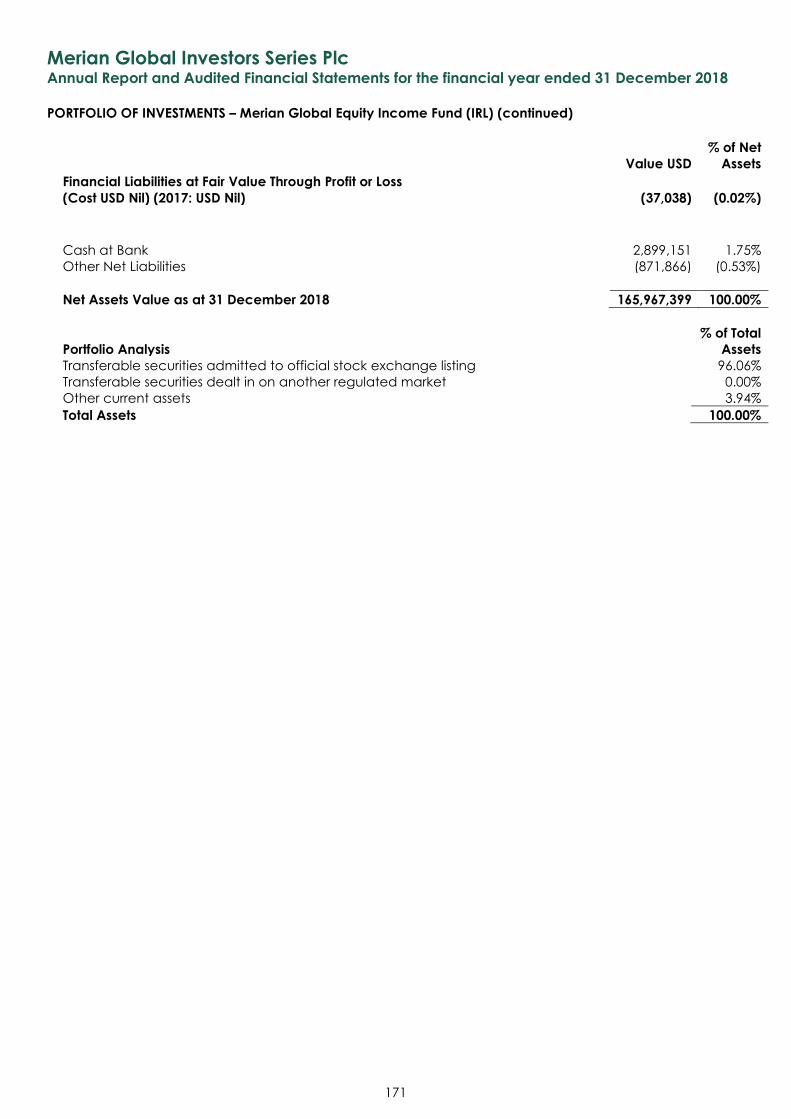
Merian Global Investors Series Plc Annual Report and Audited Financial Statements for the financial year ended 31 December 2018
PORTFOLIO OF INVESTMENTS – Merian Global Equity Income Fund (IRL) (continued)
171
Value USD
% of Net
Assets
Financial Liabilities at Fair Value Through Profit or Loss
(Cost USD Nil) (2017: USD Nil) (37,038) (0.02%)
Cash at Bank 2,899,151 1.75%
Other Net Liabilities (871,866) (0.53%)
Net Assets Value as at 31 December 2018 165,967,399 100.00%
Portfolio Analysis
% of Total
Assets
Transferable securities admitted to official stock exchange listing 96.06%
Transferable securities dealt in on another regulated market 0.00%
Other current assets 3.94%
Total Assets 100.00%
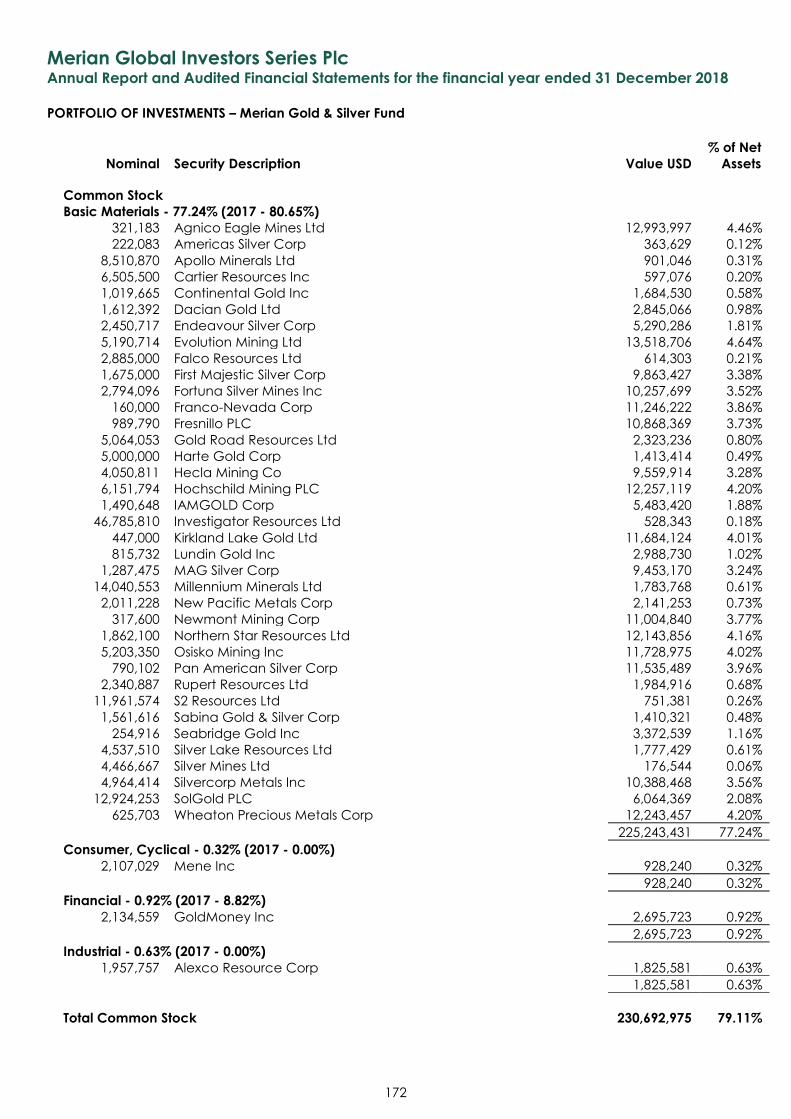
Merian Global Investors Series Plc Annual Report and Audited Financial Statements for the financial year ended 31 December 2018
PORTFOLIO OF INVESTMENTS – Merian Gold & Silver Fund
Nominal Security Description Value USD
% of Net
Assets
172
Common Stock
Basic Materials - 77.24% (2017 - 80.65%)
321,183 Agnico Eagle Mines Ltd 12,993,997 4.46%
222,083 Americas Silver Corp 363,629 0.12%
8,510,870 Apollo Minerals Ltd 901,046 0.31%
6,505,500 Cartier Resources Inc 597,076 0.20%
1,019,665 Continental Gold Inc 1,684,530 0.58%
1,612,392 Dacian Gold Ltd 2,845,066 0.98%
2,450,717 Endeavour Silver Corp 5,290,286 1.81%
5,190,714 Evolution Mining Ltd 13,518,706 4.64%
2,885,000 Falco Resources Ltd 614,303 0.21%
1,675,000 First Majestic Silver Corp 9,863,427 3.38%
2,794,096 Fortuna Silver Mines Inc 10,257,699 3.52%
160,000 Franco-Nevada Corp 11,246,222 3.86%
989,790 Fresnillo PLC 10,868,369 3.73%
5,064,053 Gold Road Resources Ltd 2,323,236 0.80%
5,000,000 Harte Gold Corp 1,413,414 0.49%
4,050,811 Hecla Mining Co 9,559,914 3.28%
6,151,794 Hochschild Mining PLC 12,257,119 4.20%
1,490,648 IAMGOLD Corp 5,483,420 1.88%
46,785,810 Investigator Resources Ltd 528,343 0.18%
447,000 Kirkland Lake Gold Ltd 11,684,124 4.01%
815,732 Lundin Gold Inc 2,988,730 1.02%
1,287,475 MAG Silver Corp 9,453,170 3.24%
14,040,553 Millennium Minerals Ltd 1,783,768 0.61%
2,011,228 New Pacific Metals Corp 2,141,253 0.73%
317,600 Newmont Mining Corp 11,004,840 3.77%
1,862,100 Northern Star Resources Ltd 12,143,856 4.16%
5,203,350 Osisko Mining Inc 11,728,975 4.02%
790,102 Pan American Silver Corp 11,535,489 3.96%
2,340,887 Rupert Resources Ltd 1,984,916 0.68%
11,961,574 S2 Resources Ltd 751,381 0.26%
1,561,616 Sabina Gold & Silver Corp 1,410,321 0.48%
254,916 Seabridge Gold Inc 3,372,539 1.16%
4,537,510 Silver Lake Resources Ltd 1,777,429 0.61%
4,466,667 Silver Mines Ltd 176,544 0.06%
4,964,414 Silvercorp Metals Inc 10,388,468 3.56%
12,924,253 SolGold PLC 6,064,369 2.08%
625,703 Wheaton Precious Metals Corp 12,243,457 4.20%
225,243,431 77.24%
Consumer, Cyclical - 0.32% (2017 - 0.00%)
2,107,029 Mene Inc 928,240 0.32%
928,240 0.32%
Financial - 0.92% (2017 - 8.82%)
2,134,559 GoldMoney Inc 2,695,723 0.92%
2,695,723 0.92%
Industrial - 0.63% (2017 - 0.00%)
1,957,757 Alexco Resource Corp 1,825,581 0.63%
1,825,581 0.63%
Total Common Stock 230,692,975 79.11%
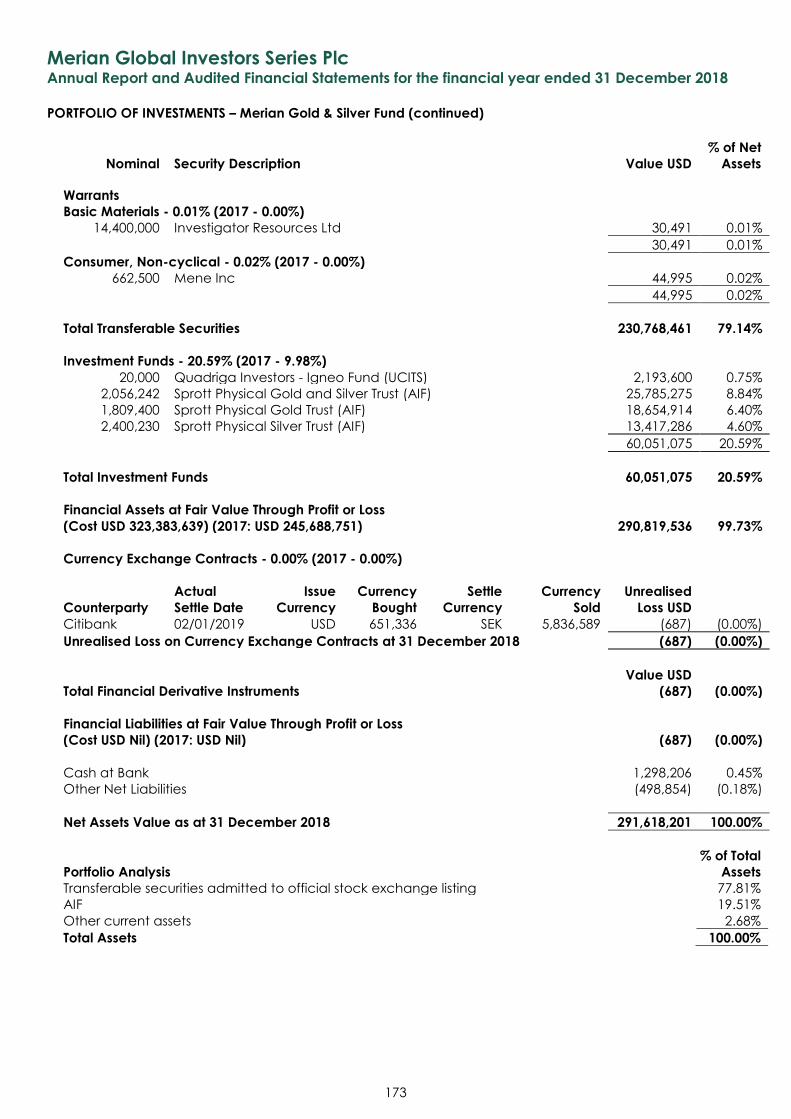
Merian Global Investors Series Plc Annual Report and Audited Financial Statements for the financial year ended 31 December 2018
PORTFOLIO OF INVESTMENTS – Merian Gold & Silver Fund (continued)
Nominal Security Description Value USD
% of Net
Assets
173
Warrants
Basic Materials - 0.01% (2017 - 0.00%)
14,400,000 Investigator Resources Ltd 30,491 0.01%
30,491 0.01%
Consumer, Non-cyclical - 0.02% (2017 - 0.00%)
662,500 Mene Inc 44,995 0.02%
44,995 0.02%
Total Transferable Securities 230,768,461 79.14%
Investment Funds - 20.59% (2017 - 9.98%)
20,000 Quadriga Investors - Igneo Fund (UCITS) 2,193,600 0.75%
2,056,242 Sprott Physical Gold and Silver Trust (AIF) 25,785,275 8.84%
1,809,400 Sprott Physical Gold Trust (AIF) 18,654,914 6.40%
2,400,230 Sprott Physical Silver Trust (AIF) 13,417,286 4.60%
60,051,075 20.59%
Total Investment Funds 60,051,075 20.59%
Financial Assets at Fair Value Through Profit or Loss
(Cost USD 323,383,639) (2017: USD 245,688,751) 290,819,536 99.73%
Currency Exchange Contracts - 0.00% (2017 - 0.00%)
Counterparty
Actual
Settle Date
Issue
Currency
Currency
Bought
Settle
Currency
Currency
Sold
Unrealised
Loss USD
Citibank 02/01/2019 USD 651,336 SEK 5,836,589 (687) (0.00%)
Unrealised Loss on Currency Exchange Contracts at 31 December 2018 (687) (0.00%)
Value USD
Total Financial Derivative Instruments (687) (0.00%)
Financial Liabilities at Fair Value Through Profit or Loss
(Cost USD Nil) (2017: USD Nil) (687) (0.00%)
Cash at Bank 1,298,206 0.45%
Other Net Liabilities (498,854) (0.18%)
Net Assets Value as at 31 December 2018 291,618,201 100.00%
Portfolio Analysis
% of Total
Assets
Transferable securities admitted to official stock exchange listing 77.81%
AIF 19.51%
Other current assets 2.68%
Total Assets 100.00%
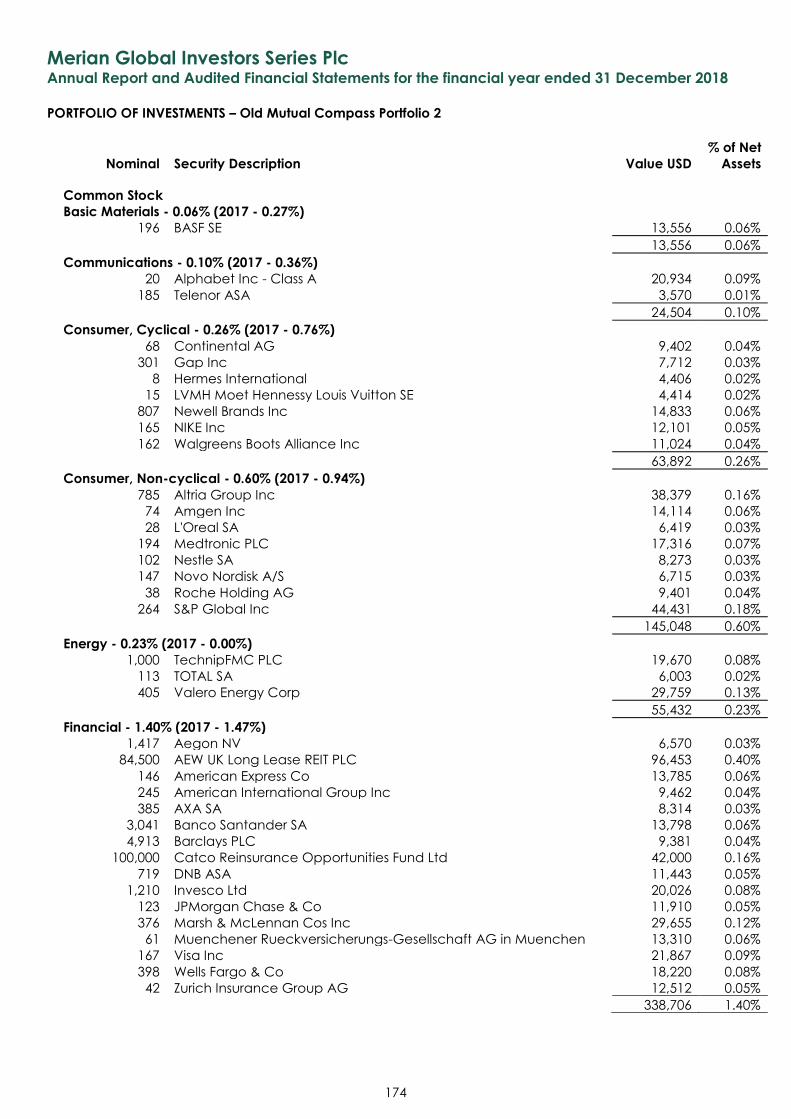
Merian Global Investors Series Plc Annual Report and Audited Financial Statements for the financial year ended 31 December 2018
PORTFOLIO OF INVESTMENTS – Old Mutual Compass Portfolio 2
Nominal Security Description Value USD
% of Net
Assets
174
Common Stock
Basic Materials - 0.06% (2017 - 0.27%)
196 BASF SE 13,556 0.06%
13,556 0.06%
Communications - 0.10% (2017 - 0.36%)
20 Alphabet Inc - Class A 20,934 0.09%
185 Telenor ASA 3,570 0.01%
24,504 0.10%
Consumer, Cyclical - 0.26% (2017 - 0.76%)
68 Continental AG 9,402 0.04%
301 Gap Inc 7,712 0.03%
8 Hermes International 4,406 0.02%
15 LVMH Moet Hennessy Louis Vuitton SE 4,414 0.02%
807 Newell Brands Inc 14,833 0.06%
165 NIKE Inc 12,101 0.05%
162 Walgreens Boots Alliance Inc 11,024 0.04%
63,892 0.26%
Consumer, Non-cyclical - 0.60% (2017 - 0.94%)
785 Altria Group Inc 38,379 0.16%
74 Amgen Inc 14,114 0.06%
28 L'Oreal SA 6,419 0.03%
194 Medtronic PLC 17,316 0.07%
102 Nestle SA 8,273 0.03%
147 Novo Nordisk A/S 6,715 0.03%
38 Roche Holding AG 9,401 0.04%
264 S&P Global Inc 44,431 0.18%
145,048 0.60%
Energy - 0.23% (2017 - 0.00%)
1,000 TechnipFMC PLC 19,670 0.08%
113 TOTAL SA 6,003 0.02%
405 Valero Energy Corp 29,759 0.13%
55,432 0.23%
Financial - 1.40% (2017 - 1.47%)
1,417 Aegon NV 6,570 0.03%
84,500 AEW UK Long Lease REIT PLC 96,453 0.40%
146 American Express Co 13,785 0.06%
245 American International Group Inc 9,462 0.04%
385 AXA SA 8,314 0.03%
3,041 Banco Santander SA 13,798 0.06%
4,913 Barclays PLC 9,381 0.04%
100,000 Catco Reinsurance Opportunities Fund Ltd 42,000 0.16%
719 DNB ASA 11,443 0.05%
1,210 Invesco Ltd 20,026 0.08%
123 JPMorgan Chase & Co 11,910 0.05%
376 Marsh & McLennan Cos Inc 29,655 0.12%
61 Muenchener Rueckversicherungs-Gesellschaft AG in Muenchen 13,310 0.06%
167 Visa Inc 21,867 0.09%
398 Wells Fargo & Co 18,220 0.08%
42 Zurich Insurance Group AG 12,512 0.05%
338,706 1.40%
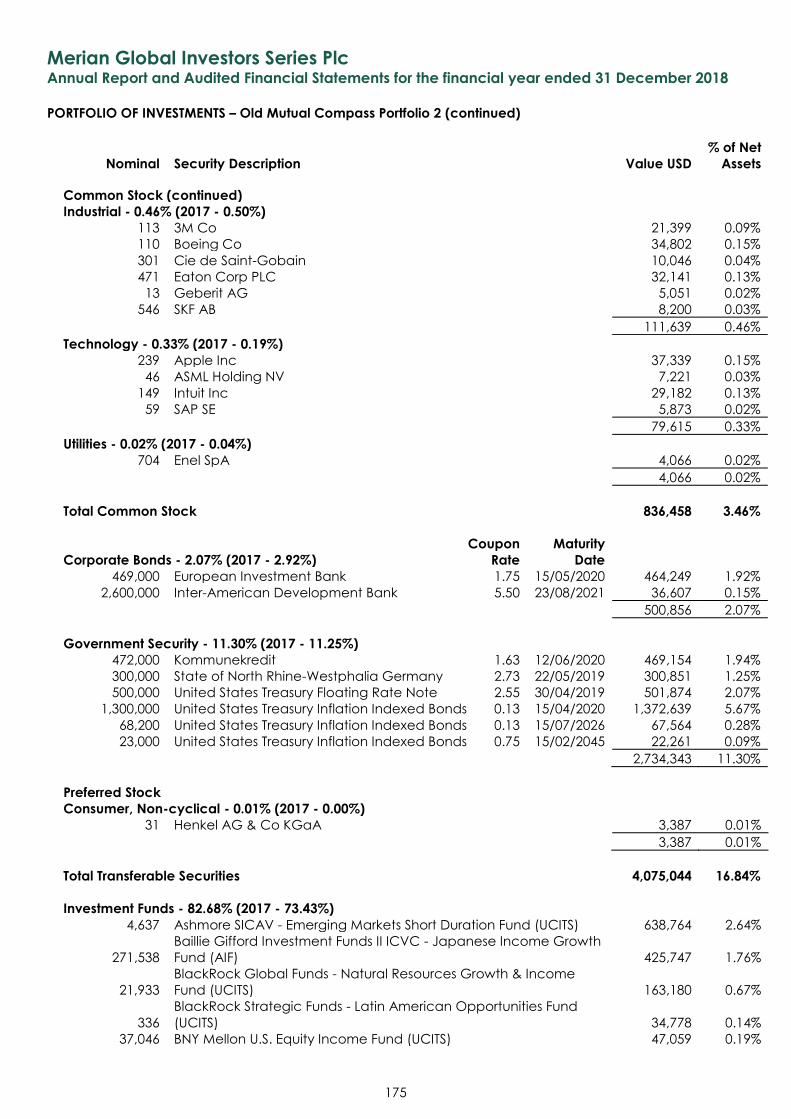
Merian Global Investors Series Plc Annual Report and Audited Financial Statements for the financial year ended 31 December 2018
PORTFOLIO OF INVESTMENTS – Old Mutual Compass Portfolio 2 (continued)
Nominal Security Description Value USD
% of Net
Assets
175
Common Stock (continued)
Industrial - 0.46% (2017 - 0.50%)
113 3M Co 21,399 0.09%
110 Boeing Co 34,802 0.15%
301 Cie de Saint-Gobain 10,046 0.04%
471 Eaton Corp PLC 32,141 0.13%
13 Geberit AG 5,051 0.02%
546 SKF AB 8,200 0.03%
111,639 0.46%
Technology - 0.33% (2017 - 0.19%)
239 Apple Inc 37,339 0.15%
46 ASML Holding NV 7,221 0.03%
149 Intuit Inc 29,182 0.13%
59 SAP SE 5,873 0.02%
79,615 0.33%
Utilities - 0.02% (2017 - 0.04%)
704 Enel SpA 4,066 0.02%
4,066 0.02%
Total Common Stock 836,458 3.46%
Coupon Maturity
Corporate Bonds - 2.07% (2017 - 2.92%) Rate Date
469,000 European Investment Bank 1.75 15/05/2020 464,249 1.92%
2,600,000 Inter-American Development Bank 5.50 23/08/2021 36,607 0.15%
500,856 2.07%
Government Security - 11.30% (2017 - 11.25%)
472,000 Kommunekredit 1.63 12/06/2020 469,154 1.94%
300,000 State of North Rhine-Westphalia Germany 2.73 22/05/2019 300,851 1.25%
500,000 United States Treasury Floating Rate Note 2.55 30/04/2019 501,874 2.07%
1,300,000 United States Treasury Inflation Indexed Bonds 0.13 15/04/2020 1,372,639 5.67%
68,200 United States Treasury Inflation Indexed Bonds 0.13 15/07/2026 67,564 0.28%
23,000 United States Treasury Inflation Indexed Bonds 0.75 15/02/2045 22,261 0.09%
2,734,343 11.30%
Preferred Stock
Consumer, Non-cyclical - 0.01% (2017 - 0.00%)
31 Henkel AG & Co KGaA 3,387 0.01%
3,387 0.01%
Total Transferable Securities 4,075,044 16.84%
Investment Funds - 82.68% (2017 - 73.43%)
4,637 Ashmore SICAV - Emerging Markets Short Duration Fund (UCITS) 638,764 2.64%
271,538
Baillie Gifford Investment Funds II ICVC - Japanese Income Growth
Fund (AIF) 425,747 1.76%
21,933
BlackRock Global Funds - Natural Resources Growth & Income
Fund (UCITS) 163,180 0.67%
336
BlackRock Strategic Funds - Latin American Opportunities Fund
(UCITS) 34,778 0.14%
37,046 BNY Mellon U.S. Equity Income Fund (UCITS) 47,059 0.19%
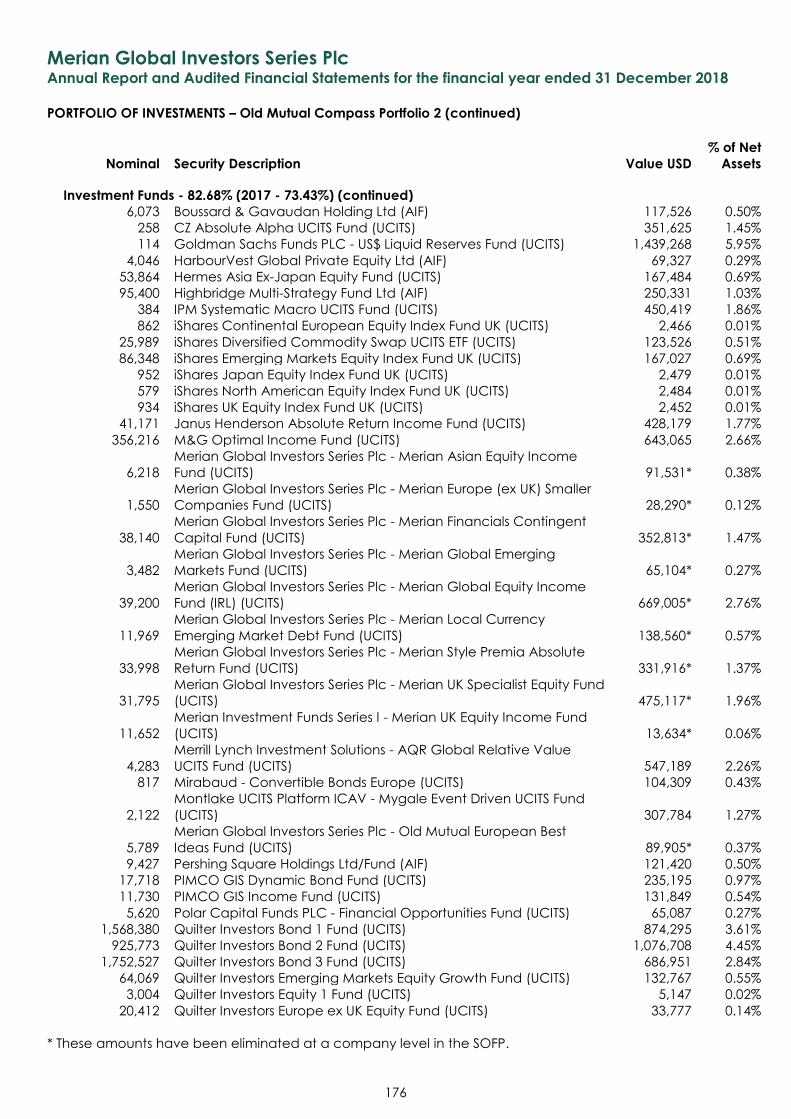
Merian Global Investors Series Plc Annual Report and Audited Financial Statements for the financial year ended 31 December 2018
PORTFOLIO OF INVESTMENTS – Old Mutual Compass Portfolio 2 (continued)
Nominal Security Description Value USD
% of Net
Assets
176
Investment Funds - 82.68% (2017 - 73.43%) (continued)
6,073 Boussard & Gavaudan Holding Ltd (AIF) 117,526 0.50%
258 CZ Absolute Alpha UCITS Fund (UCITS) 351,625 1.45%
114 Goldman Sachs Funds PLC - US$ Liquid Reserves Fund (UCITS) 1,439,268 5.95%
4,046 HarbourVest Global Private Equity Ltd (AIF) 69,327 0.29%
53,864 Hermes Asia Ex-Japan Equity Fund (UCITS) 167,484 0.69%
95,400 Highbridge Multi-Strategy Fund Ltd (AIF) 250,331 1.03%
384 IPM Systematic Macro UCITS Fund (UCITS) 450,419 1.86%
862 iShares Continental European Equity Index Fund UK (UCITS) 2,466 0.01%
25,989 iShares Diversified Commodity Swap UCITS ETF (UCITS) 123,526 0.51%
86,348 iShares Emerging Markets Equity Index Fund UK (UCITS) 167,027 0.69%
952 iShares Japan Equity Index Fund UK (UCITS) 2,479 0.01%
579 iShares North American Equity Index Fund UK (UCITS) 2,484 0.01%
934 iShares UK Equity Index Fund UK (UCITS) 2,452 0.01%
41,171 Janus Henderson Absolute Return Income Fund (UCITS) 428,179 1.77%
356,216 M&G Optimal Income Fund (UCITS) 643,065 2.66%
6,218
Merian Global Investors Series Plc - Merian Asian Equity Income
Fund (UCITS) 91,531* 0.38%
1,550
Merian Global Investors Series Plc - Merian Europe (ex UK) Smaller
Companies Fund (UCITS) 28,290* 0.12%
38,140
Merian Global Investors Series Plc - Merian Financials Contingent
Capital Fund (UCITS) 352,813* 1.47%
3,482
Merian Global Investors Series Plc - Merian Global Emerging
Markets Fund (UCITS) 65,104* 0.27%
39,200
Merian Global Investors Series Plc - Merian Global Equity Income
Fund (IRL) (UCITS) 669,005* 2.76%
11,969
Merian Global Investors Series Plc - Merian Local Currency
Emerging Market Debt Fund (UCITS) 138,560* 0.57%
33,998
Merian Global Investors Series Plc - Merian Style Premia Absolute
Return Fund (UCITS) 331,916* 1.37%
31,795
Merian Global Investors Series Plc - Merian UK Specialist Equity Fund
(UCITS) 475,117* 1.96%
11,652
Merian Investment Funds Series I - Merian UK Equity Income Fund
(UCITS) 13,634* 0.06%
4,283
Merrill Lynch Investment Solutions - AQR Global Relative Value
UCITS Fund (UCITS) 547,189 2.26%
817 Mirabaud - Convertible Bonds Europe (UCITS) 104,309 0.43%
2,122
Montlake UCITS Platform ICAV - Mygale Event Driven UCITS Fund
(UCITS) 307,784 1.27%
5,789
Merian Global Investors Series Plc - Old Mutual European Best
Ideas Fund (UCITS) 89,905* 0.37%
9,427 Pershing Square Holdings Ltd/Fund (AIF) 121,420 0.50%
17,718 PIMCO GIS Dynamic Bond Fund (UCITS) 235,195 0.97%
11,730 PIMCO GIS Income Fund (UCITS) 131,849 0.54%
5,620 Polar Capital Funds PLC - Financial Opportunities Fund (UCITS) 65,087 0.27%
1,568,380 Quilter Investors Bond 1 Fund (UCITS) 874,295 3.61%
925,773 Quilter Investors Bond 2 Fund (UCITS) 1,076,708 4.45%
1,752,527 Quilter Investors Bond 3 Fund (UCITS) 686,951 2.84%
64,069 Quilter Investors Emerging Markets Equity Growth Fund (UCITS) 132,767 0.55%
3,004 Quilter Investors Equity 1 Fund (UCITS) 5,147 0.02%
20,412 Quilter Investors Europe ex UK Equity Fund (UCITS) 33,777 0.14%
* These amounts have been eliminated at a company level in the SOFP.
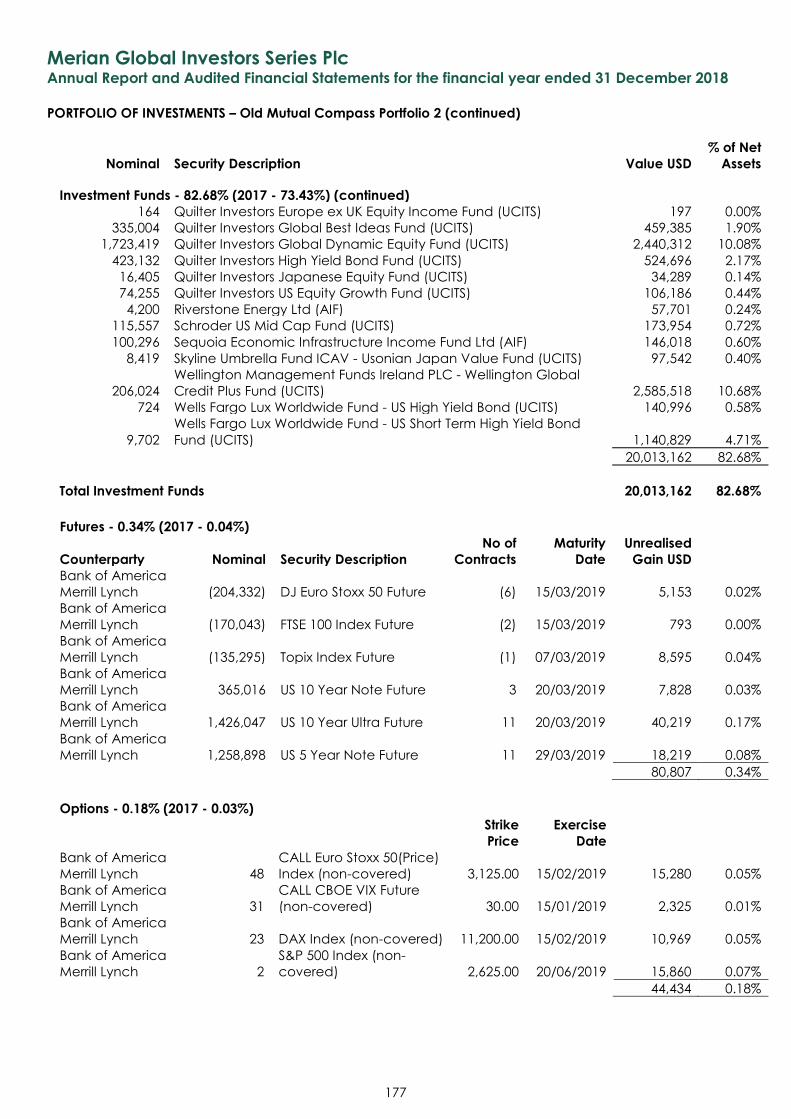
Merian Global Investors Series Plc Annual Report and Audited Financial Statements for the financial year ended 31 December 2018
PORTFOLIO OF INVESTMENTS – Old Mutual Compass Portfolio 2 (continued)
Nominal Security Description Value USD
% of Net
Assets
177
Investment Funds - 82.68% (2017 - 73.43%) (continued)
164 Quilter Investors Europe ex UK Equity Income Fund (UCITS) 197 0.00%
335,004 Quilter Investors Global Best Ideas Fund (UCITS) 459,385 1.90%
1,723,419 Quilter Investors Global Dynamic Equity Fund (UCITS) 2,440,312 10.08%
423,132 Quilter Investors High Yield Bond Fund (UCITS) 524,696 2.17%
16,405 Quilter Investors Japanese Equity Fund (UCITS) 34,289 0.14%
74,255 Quilter Investors US Equity Growth Fund (UCITS) 106,186 0.44%
4,200 Riverstone Energy Ltd (AIF) 57,701 0.24%
115,557 Schroder US Mid Cap Fund (UCITS) 173,954 0.72%
100,296 Sequoia Economic Infrastructure Income Fund Ltd (AIF) 146,018 0.60%
8,419 Skyline Umbrella Fund ICAV - Usonian Japan Value Fund (UCITS) 97,542 0.40%
206,024
Wellington Management Funds Ireland PLC - Wellington Global
Credit Plus Fund (UCITS) 2,585,518 10.68%
724 Wells Fargo Lux Worldwide Fund - US High Yield Bond (UCITS) 140,996 0.58%
9,702
Wells Fargo Lux Worldwide Fund - US Short Term High Yield Bond
Fund (UCITS) 1,140,829 4.71%
20,013,162 82.68%
Total Investment Funds 20,013,162 82.68%
Futures - 0.34% (2017 - 0.04%)
Counterparty Nominal Security Description
No of
Contracts
Maturity
Date
Unrealised
Gain USD Bank of America
Merrill Lynch (204,332) DJ Euro Stoxx 50 Future (6) 15/03/2019 5,153 0.02%
Bank of America
Merrill Lynch (170,043) FTSE 100 Index Future (2) 15/03/2019 793 0.00%
Bank of America
Merrill Lynch (135,295) Topix Index Future (1) 07/03/2019 8,595 0.04%
Bank of America
Merrill Lynch 365,016 US 10 Year Note Future 3 20/03/2019 7,828 0.03%
Bank of America
Merrill Lynch 1,426,047 US 10 Year Ultra Future 11 20/03/2019 40,219 0.17%
Bank of America
Merrill Lynch 1,258,898 US 5 Year Note Future 11 29/03/2019 18,219 0.08%
80,807 0.34%
Options - 0.18% (2017 - 0.03%) Strike Exercise
Price Date
Bank of America
Merrill Lynch 48
CALL Euro Stoxx 50(Price)
Index (non-covered) 3,125.00 15/02/2019 15,280 0.05%
Bank of America
Merrill Lynch 31
CALL CBOE VIX Future
(non-covered) 30.00 15/01/2019 2,325 0.01%
Bank of America
Merrill Lynch 23 DAX Index (non-covered) 11,200.00 15/02/2019 10,969 0.05%
Bank of America
Merrill Lynch 2
S&P 500 Index (non-
covered) 2,625.00 20/06/2019 15,860 0.07%
44,434 0.18%
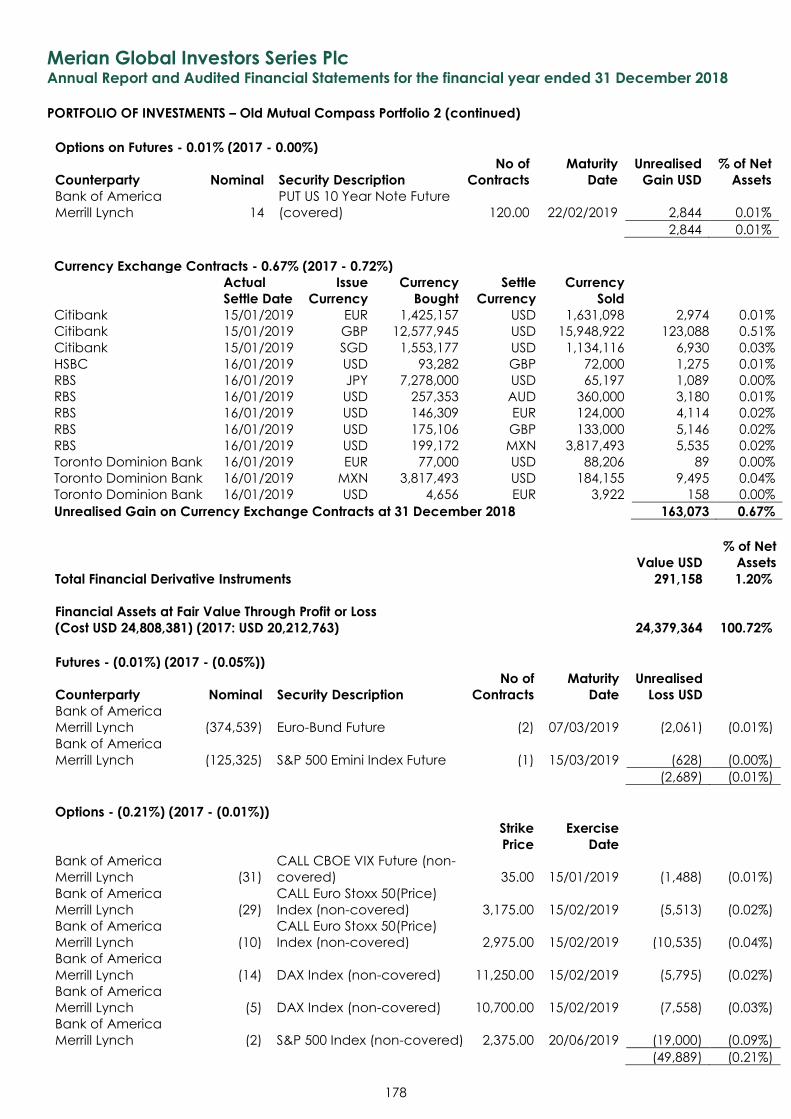
Merian Global Investors Series Plc Annual Report and Audited Financial Statements for the financial year ended 31 December 2018
PORTFOLIO OF INVESTMENTS – Old Mutual Compass Portfolio 2 (continued)
178
Options on Futures - 0.01% (2017 - 0.00%)
Counterparty Nominal Security Description
No of
Contracts
Maturity
Date
Unrealised
Gain USD
% of Net
Assets
Bank of America
Merrill Lynch 14
PUT US 10 Year Note Future
(covered) 120.00 22/02/2019 2,844 0.01%
2,844 0.01%
Currency Exchange Contracts - 0.67% (2017 - 0.72%)
Actual
Settle Date
Issue
Currency
Currency
Bought
Settle
Currency
Currency
Sold
Citibank 15/01/2019 EUR 1,425,157 USD 1,631,098 2,974 0.01%
Citibank 15/01/2019 GBP 12,577,945 USD 15,948,922 123,088 0.51%
Citibank 15/01/2019 SGD 1,553,177 USD 1,134,116 6,930 0.03%
HSBC 16/01/2019 USD 93,282 GBP 72,000 1,275 0.01%
RBS 16/01/2019 JPY 7,278,000 USD 65,197 1,089 0.00%
RBS 16/01/2019 USD 257,353 AUD 360,000 3,180 0.01%
RBS 16/01/2019 USD 146,309 EUR 124,000 4,114 0.02%
RBS 16/01/2019 USD 175,106 GBP 133,000 5,146 0.02%
RBS 16/01/2019 USD 199,172 MXN 3,817,493 5,535 0.02%
Toronto Dominion Bank 16/01/2019 EUR 77,000 USD 88,206 89 0.00%
Toronto Dominion Bank 16/01/2019 MXN 3,817,493 USD 184,155 9,495 0.04%
Toronto Dominion Bank 16/01/2019 USD 4,656 EUR 3,922 158 0.00%
Unrealised Gain on Currency Exchange Contracts at 31 December 2018 163,073 0.67%
Value USD
% of Net
Assets
Total Financial Derivative Instruments 291,158 1.20%
Financial Assets at Fair Value Through Profit or Loss
(Cost USD 24,808,381) (2017: USD 20,212,763) 24,379,364 100.72%
Futures - (0.01%) (2017 - (0.05%))
Counterparty Nominal Security Description
No of
Contracts
Maturity
Date
Unrealised
Loss USD Bank of America
Merrill Lynch (374,539) Euro-Bund Future (2) 07/03/2019 (2,061) (0.01%)
Bank of America
Merrill Lynch (125,325) S&P 500 Emini Index Future (1) 15/03/2019 (628) (0.00%) (2,689) (0.01%)
Options - (0.21%) (2017 - (0.01%)) Strike Exercise
Price Date
Bank of America
Merrill Lynch (31)
CALL CBOE VIX Future (non-
covered) 35.00 15/01/2019 (1,488) (0.01%)
Bank of America
Merrill Lynch (29)
CALL Euro Stoxx 50(Price)
Index (non-covered) 3,175.00 15/02/2019 (5,513) (0.02%)
Bank of America
Merrill Lynch (10)
CALL Euro Stoxx 50(Price)
Index (non-covered) 2,975.00 15/02/2019 (10,535) (0.04%)
Bank of America
Merrill Lynch (14) DAX Index (non-covered) 11,250.00 15/02/2019 (5,795) (0.02%)
Bank of America
Merrill Lynch (5) DAX Index (non-covered) 10,700.00 15/02/2019 (7,558) (0.03%)
Bank of America
Merrill Lynch (2) S&P 500 Index (non-covered) 2,375.00 20/06/2019 (19,000) (0.09%)
(49,889) (0.21%)
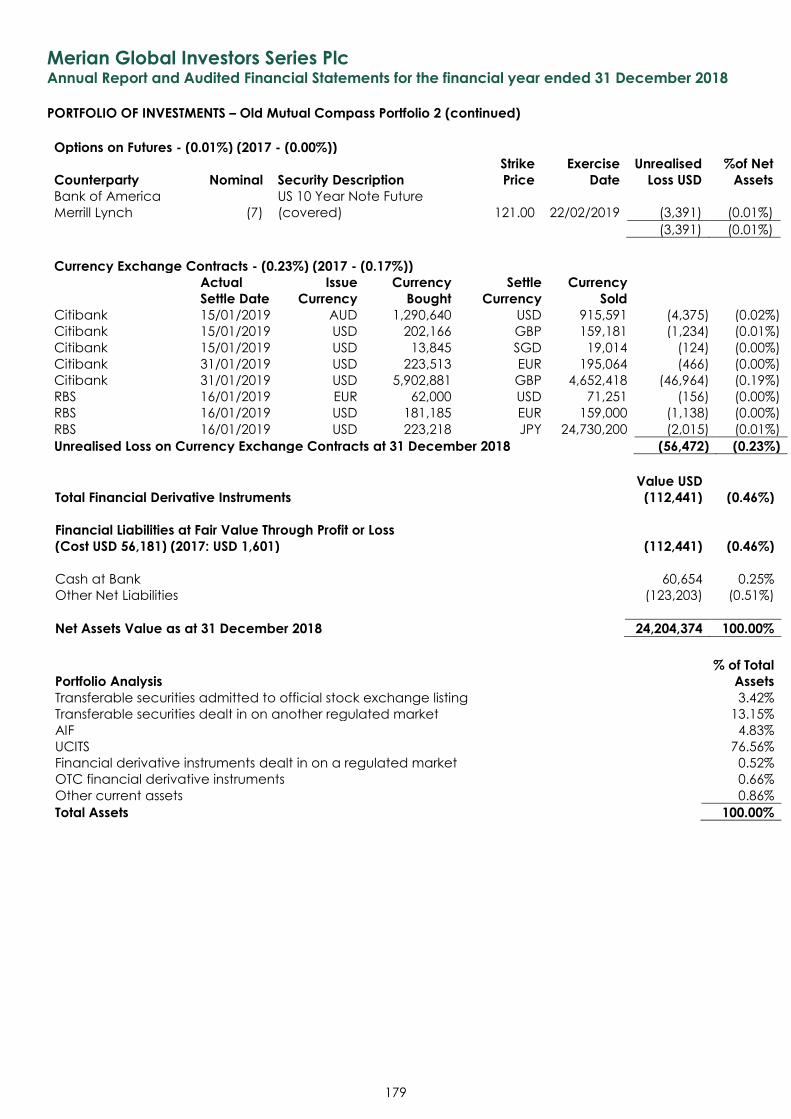
Merian Global Investors Series Plc Annual Report and Audited Financial Statements for the financial year ended 31 December 2018
PORTFOLIO OF INVESTMENTS – Old Mutual Compass Portfolio 2 (continued)
179
Options on Futures - (0.01%) (2017 - (0.00%))
Counterparty Nominal Security Description
Strike
Price
Exercise
Date
Unrealised
Loss USD
%of Net
Assets
Bank of America
Merrill Lynch (7)
US 10 Year Note Future
(covered) 121.00 22/02/2019 (3,391) (0.01%) (3,391) (0.01%)
Currency Exchange Contracts - (0.23%) (2017 - (0.17%))
Actual
Settle Date
Issue
Currency
Currency
Bought
Settle
Currency
Currency
Sold
Citibank 15/01/2019 AUD 1,290,640 USD 915,591 (4,375) (0.02%)
Citibank 15/01/2019 USD 202,166 GBP 159,181 (1,234) (0.01%)
Citibank 15/01/2019 USD 13,845 SGD 19,014 (124) (0.00%)
Citibank 31/01/2019 USD 223,513 EUR 195,064 (466) (0.00%)
Citibank 31/01/2019 USD 5,902,881 GBP 4,652,418 (46,964) (0.19%)
RBS 16/01/2019 EUR 62,000 USD 71,251 (156) (0.00%)
RBS 16/01/2019 USD 181,185 EUR 159,000 (1,138) (0.00%)
RBS 16/01/2019 USD 223,218 JPY 24,730,200 (2,015) (0.01%)
Unrealised Loss on Currency Exchange Contracts at 31 December 2018 (56,472) (0.23%)
Value USD
Total Financial Derivative Instruments (112,441) (0.46%)
Financial Liabilities at Fair Value Through Profit or Loss
(Cost USD 56,181) (2017: USD 1,601) (112,441) (0.46%)
Cash at Bank 60,654 0.25%
Other Net Liabilities (123,203) (0.51%)
Net Assets Value as at 31 December 2018 24,204,374 100.00%
% of Total
Portfolio Analysis Assets
Transferable securities admitted to official stock exchange listing 3.42%
Transferable securities dealt in on another regulated market 13.15%
AIF 4.83%
UCITS 76.56%
Financial derivative instruments dealt in on a regulated market 0.52%
OTC financial derivative instruments 0.66%
Other current assets 0.86%
Total Assets 100.00%
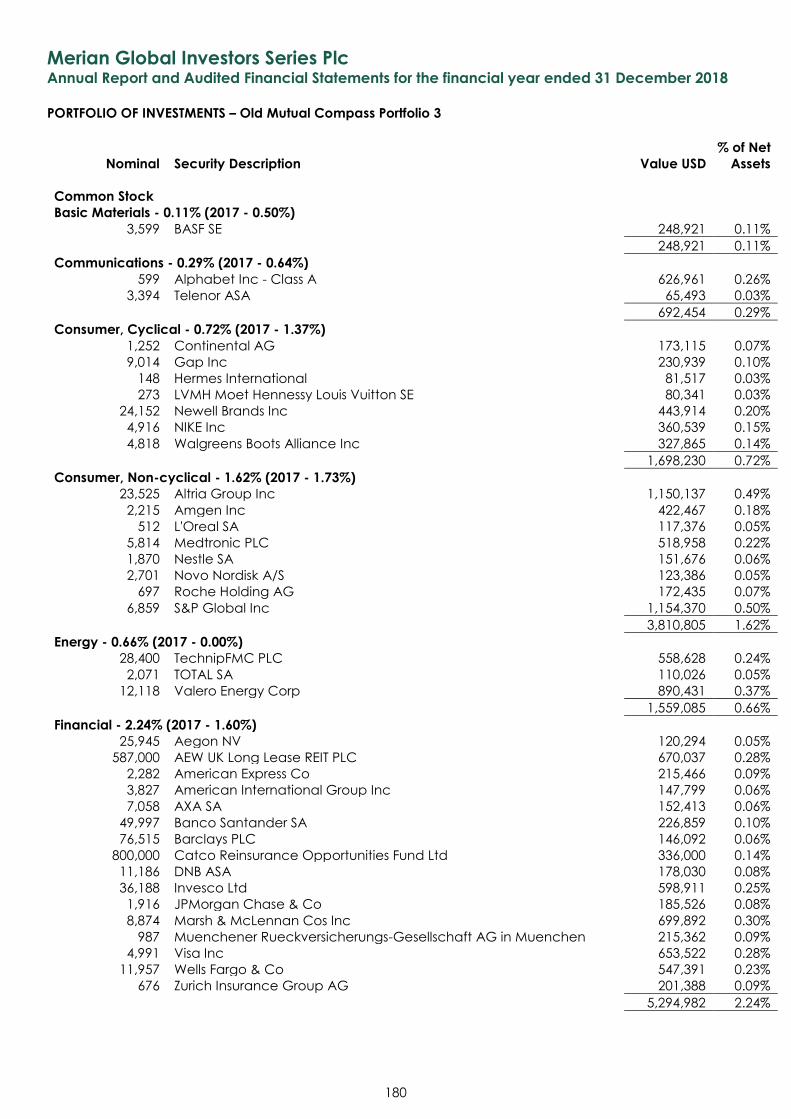
Merian Global Investors Series Plc Annual Report and Audited Financial Statements for the financial year ended 31 December 2018
PORTFOLIO OF INVESTMENTS – Old Mutual Compass Portfolio 3
Nominal Security Description Value USD
% of Net
Assets
180
Common Stock Basic Materials - 0.11% (2017 - 0.50%)
3,599 BASF SE 248,921 0.11%
248,921 0.11%
Communications - 0.29% (2017 - 0.64%) 599 Alphabet Inc - Class A 626,961 0.26%
3,394 Telenor ASA 65,493 0.03%
692,454 0.29%
Consumer, Cyclical - 0.72% (2017 - 1.37%) 1,252 Continental AG 173,115 0.07%
9,014 Gap Inc 230,939 0.10%
148 Hermes International 81,517 0.03%
273 LVMH Moet Hennessy Louis Vuitton SE 80,341 0.03%
24,152 Newell Brands Inc 443,914 0.20%
4,916 NIKE Inc 360,539 0.15%
4,818 Walgreens Boots Alliance Inc 327,865 0.14%
1,698,230 0.72%
Consumer, Non-cyclical - 1.62% (2017 - 1.73%) 23,525 Altria Group Inc 1,150,137 0.49%
2,215 Amgen Inc 422,467 0.18%
512 L'Oreal SA 117,376 0.05%
5,814 Medtronic PLC 518,958 0.22%
1,870 Nestle SA 151,676 0.06%
2,701 Novo Nordisk A/S 123,386 0.05%
697 Roche Holding AG 172,435 0.07%
6,859 S&P Global Inc 1,154,370 0.50%
3,810,805 1.62%
Energy - 0.66% (2017 - 0.00%) 28,400 TechnipFMC PLC 558,628 0.24%
2,071 TOTAL SA 110,026 0.05%
12,118 Valero Energy Corp 890,431 0.37%
1,559,085 0.66%
Financial - 2.24% (2017 - 1.60%) 25,945 Aegon NV 120,294 0.05%
587,000 AEW UK Long Lease REIT PLC 670,037 0.28%
2,282 American Express Co 215,466 0.09%
3,827 American International Group Inc 147,799 0.06%
7,058 AXA SA 152,413 0.06%
49,997 Banco Santander SA 226,859 0.10%
76,515 Barclays PLC 146,092 0.06%
800,000 Catco Reinsurance Opportunities Fund Ltd 336,000 0.14%
11,186 DNB ASA 178,030 0.08%
36,188 Invesco Ltd 598,911 0.25%
1,916 JPMorgan Chase & Co 185,526 0.08%
8,874 Marsh & McLennan Cos Inc 699,892 0.30%
987 Muenchener Rueckversicherungs-Gesellschaft AG in Muenchen 215,362 0.09%
4,991 Visa Inc 653,522 0.28%
11,957 Wells Fargo & Co 547,391 0.23%
676 Zurich Insurance Group AG 201,388 0.09%
5,294,982 2.24%
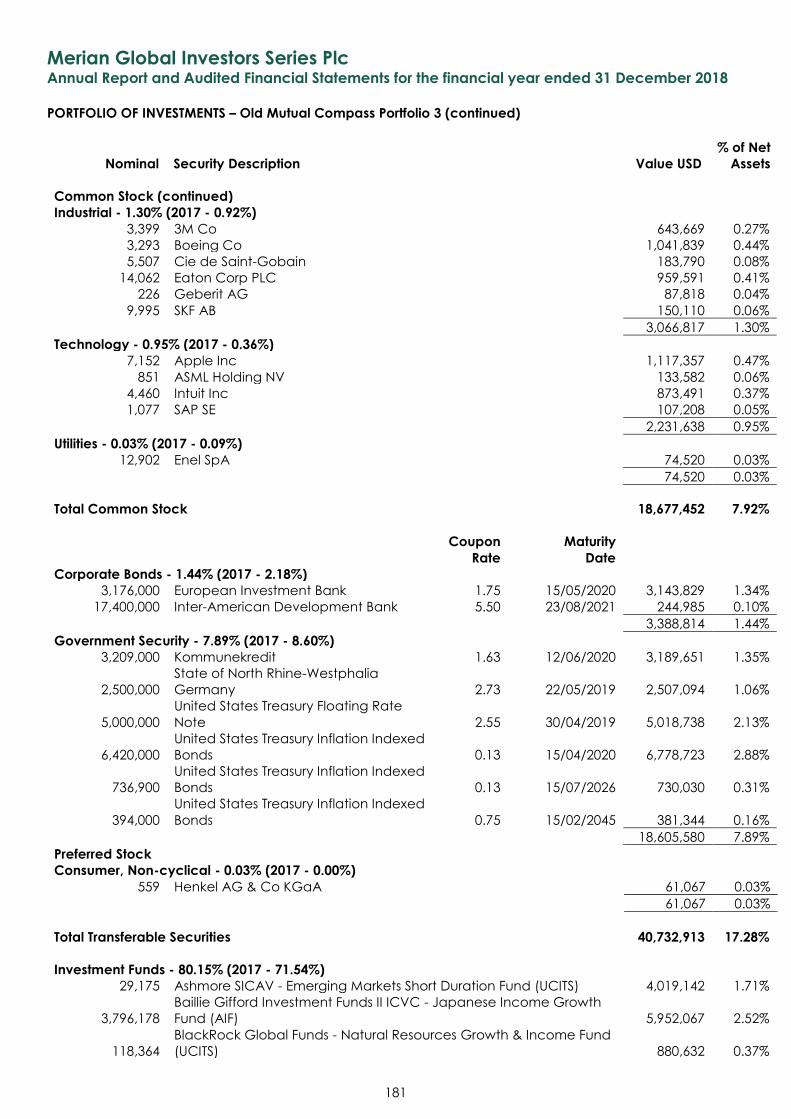
Merian Global Investors Series Plc Annual Report and Audited Financial Statements for the financial year ended 31 December 2018
PORTFOLIO OF INVESTMENTS – Old Mutual Compass Portfolio 3 (continued)
Nominal Security Description Value USD
% of Net
Assets
181
Common Stock (continued)
Industrial - 1.30% (2017 - 0.92%) 3,399 3M Co 643,669 0.27%
3,293 Boeing Co 1,041,839 0.44%
5,507 Cie de Saint-Gobain 183,790 0.08%
14,062 Eaton Corp PLC 959,591 0.41%
226 Geberit AG 87,818 0.04%
9,995 SKF AB 150,110 0.06%
3,066,817 1.30%
Technology - 0.95% (2017 - 0.36%) 7,152 Apple Inc 1,117,357 0.47%
851 ASML Holding NV 133,582 0.06%
4,460 Intuit Inc 873,491 0.37%
1,077 SAP SE 107,208 0.05%
2,231,638 0.95%
Utilities - 0.03% (2017 - 0.09%) 12,902 Enel SpA 74,520 0.03%
74,520 0.03%
Total Common Stock 18,677,452 7.92%
Coupon Maturity
Rate Date Corporate Bonds - 1.44% (2017 - 2.18%)
3,176,000 European Investment Bank 1.75 15/05/2020 3,143,829 1.34%
17,400,000 Inter-American Development Bank 5.50 23/08/2021 244,985 0.10%
3,388,814 1.44%
Government Security - 7.89% (2017 - 8.60%) 3,209,000 Kommunekredit 1.63 12/06/2020 3,189,651 1.35%
2,500,000
State of North Rhine-Westphalia
Germany 2.73 22/05/2019 2,507,094 1.06%
5,000,000
United States Treasury Floating Rate
Note 2.55 30/04/2019 5,018,738 2.13%
6,420,000
United States Treasury Inflation Indexed
Bonds 0.13 15/04/2020 6,778,723 2.88%
736,900
United States Treasury Inflation Indexed
Bonds 0.13 15/07/2026 730,030 0.31%
394,000
United States Treasury Inflation Indexed
Bonds 0.75 15/02/2045 381,344 0.16%
18,605,580 7.89%
Preferred Stock Consumer, Non-cyclical - 0.03% (2017 - 0.00%)
559 Henkel AG & Co KGaA 61,067 0.03%
61,067 0.03%
Total Transferable Securities 40,732,913 17.28%
Investment Funds - 80.15% (2017 - 71.54%) 29,175 Ashmore SICAV - Emerging Markets Short Duration Fund (UCITS) 4,019,142 1.71%
3,796,178
Baillie Gifford Investment Funds II ICVC - Japanese Income Growth
Fund (AIF) 5,952,067 2.52%
118,364
BlackRock Global Funds - Natural Resources Growth & Income Fund
(UCITS) 880,632 0.37%
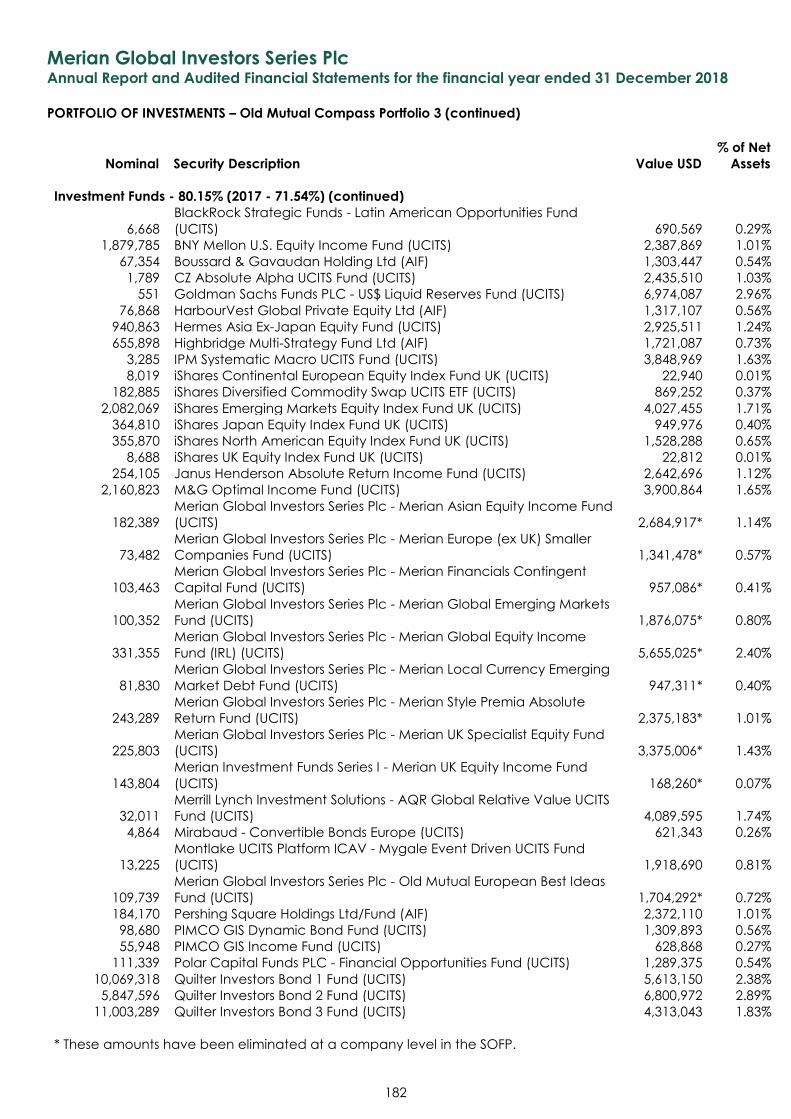
Merian Global Investors Series Plc Annual Report and Audited Financial Statements for the financial year ended 31 December 2018
PORTFOLIO OF INVESTMENTS – Old Mutual Compass Portfolio 3 (continued)
Nominal Security Description Value USD
% of Net
Assets
182
Investment Funds - 80.15% (2017 - 71.54%) (continued)
6,668
BlackRock Strategic Funds - Latin American Opportunities Fund
(UCITS) 690,569 0.29%
1,879,785 BNY Mellon U.S. Equity Income Fund (UCITS) 2,387,869 1.01%
67,354 Boussard & Gavaudan Holding Ltd (AIF) 1,303,447 0.54%
1,789 CZ Absolute Alpha UCITS Fund (UCITS) 2,435,510 1.03%
551 Goldman Sachs Funds PLC - US$ Liquid Reserves Fund (UCITS) 6,974,087 2.96%
76,868 HarbourVest Global Private Equity Ltd (AIF) 1,317,107 0.56%
940,863 Hermes Asia Ex-Japan Equity Fund (UCITS) 2,925,511 1.24%
655,898 Highbridge Multi-Strategy Fund Ltd (AIF) 1,721,087 0.73%
3,285 IPM Systematic Macro UCITS Fund (UCITS) 3,848,969 1.63%
8,019 iShares Continental European Equity Index Fund UK (UCITS) 22,940 0.01%
182,885 iShares Diversified Commodity Swap UCITS ETF (UCITS) 869,252 0.37%
2,082,069 iShares Emerging Markets Equity Index Fund UK (UCITS) 4,027,455 1.71%
364,810 iShares Japan Equity Index Fund UK (UCITS) 949,976 0.40%
355,870 iShares North American Equity Index Fund UK (UCITS) 1,528,288 0.65%
8,688 iShares UK Equity Index Fund UK (UCITS) 22,812 0.01%
254,105 Janus Henderson Absolute Return Income Fund (UCITS) 2,642,696 1.12%
2,160,823 M&G Optimal Income Fund (UCITS) 3,900,864 1.65%
182,389
Merian Global Investors Series Plc - Merian Asian Equity Income Fund
(UCITS) 2,684,917* 1.14%
73,482
Merian Global Investors Series Plc - Merian Europe (ex UK) Smaller
Companies Fund (UCITS) 1,341,478* 0.57%
103,463
Merian Global Investors Series Plc - Merian Financials Contingent
Capital Fund (UCITS) 957,086* 0.41%
100,352
Merian Global Investors Series Plc - Merian Global Emerging Markets
Fund (UCITS) 1,876,075* 0.80%
331,355
Merian Global Investors Series Plc - Merian Global Equity Income
Fund (IRL) (UCITS) 5,655,025* 2.40%
81,830
Merian Global Investors Series Plc - Merian Local Currency Emerging
Market Debt Fund (UCITS) 947,311* 0.40%
243,289
Merian Global Investors Series Plc - Merian Style Premia Absolute
Return Fund (UCITS) 2,375,183* 1.01%
225,803
Merian Global Investors Series Plc - Merian UK Specialist Equity Fund
(UCITS) 3,375,006* 1.43%
143,804
Merian Investment Funds Series I - Merian UK Equity Income Fund
(UCITS) 168,260* 0.07%
32,011
Merrill Lynch Investment Solutions - AQR Global Relative Value UCITS
Fund (UCITS) 4,089,595 1.74%
4,864 Mirabaud - Convertible Bonds Europe (UCITS) 621,343 0.26%
13,225
Montlake UCITS Platform ICAV - Mygale Event Driven UCITS Fund
(UCITS) 1,918,690 0.81%
109,739
Merian Global Investors Series Plc - Old Mutual European Best Ideas
Fund (UCITS) 1,704,292* 0.72%
184,170 Pershing Square Holdings Ltd/Fund (AIF) 2,372,110 1.01%
98,680 PIMCO GIS Dynamic Bond Fund (UCITS) 1,309,893 0.56%
55,948 PIMCO GIS Income Fund (UCITS) 628,868 0.27%
111,339 Polar Capital Funds PLC - Financial Opportunities Fund (UCITS) 1,289,375 0.54%
10,069,318 Quilter Investors Bond 1 Fund (UCITS) 5,613,150 2.38%
5,847,596 Quilter Investors Bond 2 Fund (UCITS) 6,800,972 2.89%
11,003,289 Quilter Investors Bond 3 Fund (UCITS) 4,313,043 1.83%
* These amounts have been eliminated at a company level in the SOFP.
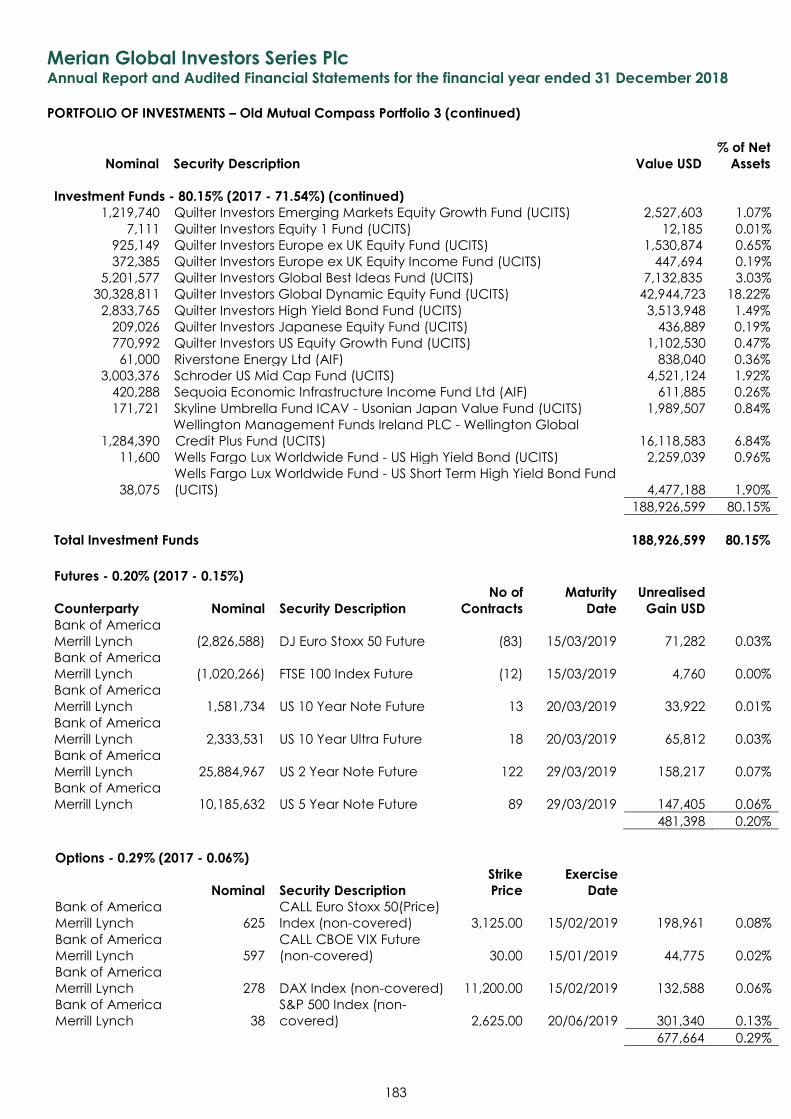
Merian Global Investors Series Plc Annual Report and Audited Financial Statements for the financial year ended 31 December 2018
PORTFOLIO OF INVESTMENTS – Old Mutual Compass Portfolio 3 (continued)
Nominal Security Description Value USD
% of Net
Assets
183
Investment Funds - 80.15% (2017 - 71.54%) (continued)
1,219,740 Quilter Investors Emerging Markets Equity Growth Fund (UCITS) 2,527,603 1.07%
7,111 Quilter Investors Equity 1 Fund (UCITS) 12,185 0.01%
925,149 Quilter Investors Europe ex UK Equity Fund (UCITS) 1,530,874 0.65%
372,385 Quilter Investors Europe ex UK Equity Income Fund (UCITS) 447,694 0.19%
5,201,577 Quilter Investors Global Best Ideas Fund (UCITS) 7,132,835 3.03%
30,328,811 Quilter Investors Global Dynamic Equity Fund (UCITS) 42,944,723 18.22%
2,833,765 Quilter Investors High Yield Bond Fund (UCITS) 3,513,948 1.49%
209,026 Quilter Investors Japanese Equity Fund (UCITS) 436,889 0.19%
770,992 Quilter Investors US Equity Growth Fund (UCITS) 1,102,530 0.47%
61,000 Riverstone Energy Ltd (AIF) 838,040 0.36%
3,003,376 Schroder US Mid Cap Fund (UCITS) 4,521,124 1.92%
420,288 Sequoia Economic Infrastructure Income Fund Ltd (AIF) 611,885 0.26%
171,721 Skyline Umbrella Fund ICAV - Usonian Japan Value Fund (UCITS) 1,989,507 0.84%
1,284,390
Wellington Management Funds Ireland PLC - Wellington Global
Credit Plus Fund (UCITS) 16,118,583 6.84%
11,600 Wells Fargo Lux Worldwide Fund - US High Yield Bond (UCITS) 2,259,039 0.96%
38,075
Wells Fargo Lux Worldwide Fund - US Short Term High Yield Bond Fund
(UCITS) 4,477,188 1.90%
188,926,599 80.15%
Total Investment Funds 188,926,599 80.15%
Futures - 0.20% (2017 - 0.15%)
Counterparty Nominal Security Description
No of
Contracts
Maturity
Date
Unrealised
Gain USD Bank of America
Merrill Lynch (2,826,588) DJ Euro Stoxx 50 Future (83) 15/03/2019 71,282 0.03%
Bank of America
Merrill Lynch (1,020,266) FTSE 100 Index Future (12) 15/03/2019 4,760 0.00%
Bank of America
Merrill Lynch 1,581,734 US 10 Year Note Future 13 20/03/2019 33,922 0.01%
Bank of America
Merrill Lynch 2,333,531 US 10 Year Ultra Future 18 20/03/2019 65,812 0.03%
Bank of America
Merrill Lynch 25,884,967 US 2 Year Note Future 122 29/03/2019 158,217 0.07%
Bank of America
Merrill Lynch 10,185,632 US 5 Year Note Future 89 29/03/2019 147,405 0.06%
481,398 0.20%
Options - 0.29% (2017 - 0.06%)
Nominal Security Description
Strike
Price
Exercise
Date
Bank of America
Merrill Lynch 625
CALL Euro Stoxx 50(Price)
Index (non-covered) 3,125.00 15/02/2019 198,961 0.08%
Bank of America
Merrill Lynch 597
CALL CBOE VIX Future
(non-covered) 30.00 15/01/2019 44,775 0.02%
Bank of America
Merrill Lynch 278 DAX Index (non-covered) 11,200.00 15/02/2019 132,588 0.06%
Bank of America
Merrill Lynch 38
S&P 500 Index (non-
covered) 2,625.00 20/06/2019 301,340 0.13%
677,664 0.29%
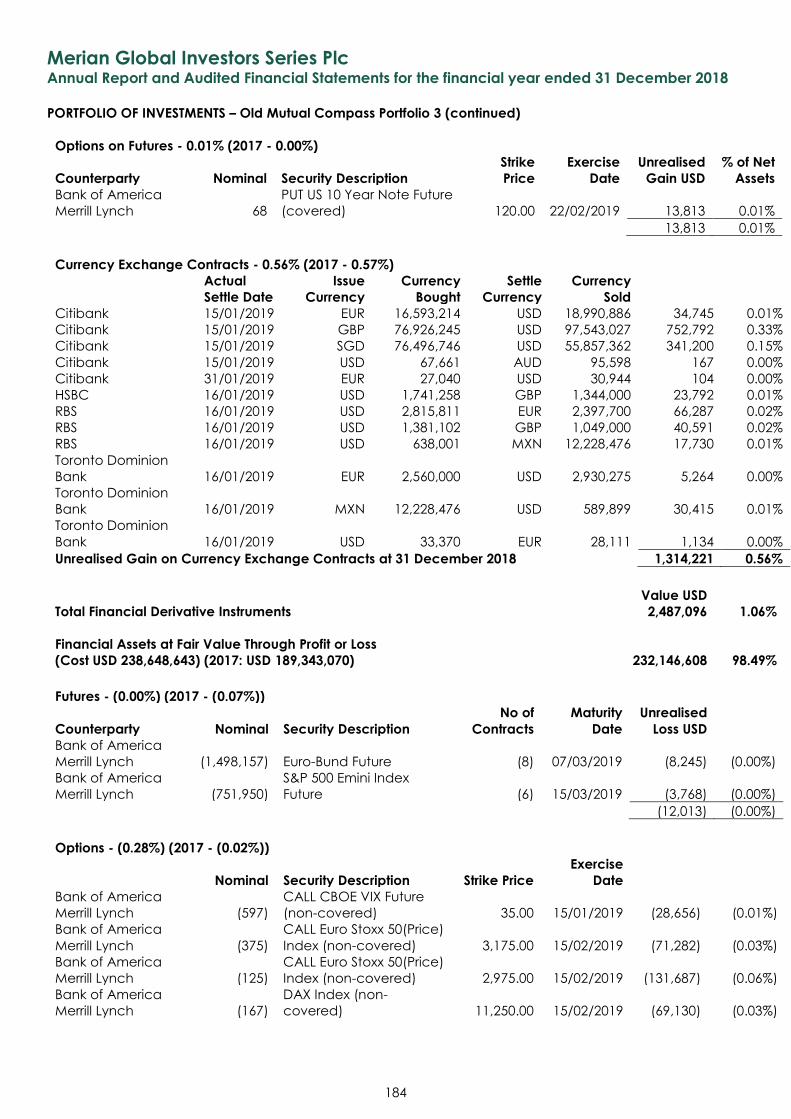
Merian Global Investors Series Plc Annual Report and Audited Financial Statements for the financial year ended 31 December 2018
PORTFOLIO OF INVESTMENTS – Old Mutual Compass Portfolio 3 (continued)
184
Options on Futures - 0.01% (2017 - 0.00%)
Counterparty Nominal Security Description
Strike
Price
Exercise
Date
Unrealised
Gain USD
% of Net
Assets
Bank of America
Merrill Lynch 68
PUT US 10 Year Note Future
(covered) 120.00 22/02/2019 13,813 0.01%
13,813 0.01%
Currency Exchange Contracts - 0.56% (2017 - 0.57%)
Actual
Settle Date
Issue
Currency
Currency
Bought
Settle
Currency
Currency
Sold
Citibank 15/01/2019 EUR 16,593,214 USD 18,990,886 34,745 0.01%
Citibank 15/01/2019 GBP 76,926,245 USD 97,543,027 752,792 0.33%
Citibank 15/01/2019 SGD 76,496,746 USD 55,857,362 341,200 0.15%
Citibank 15/01/2019 USD 67,661 AUD 95,598 167 0.00%
Citibank 31/01/2019 EUR 27,040 USD 30,944 104 0.00%
HSBC 16/01/2019 USD 1,741,258 GBP 1,344,000 23,792 0.01%
RBS 16/01/2019 USD 2,815,811 EUR 2,397,700 66,287 0.02%
RBS 16/01/2019 USD 1,381,102 GBP 1,049,000 40,591 0.02%
RBS 16/01/2019 USD 638,001 MXN 12,228,476 17,730 0.01%
Toronto Dominion
Bank 16/01/2019 EUR 2,560,000 USD 2,930,275 5,264 0.00%
Toronto Dominion
Bank 16/01/2019 MXN 12,228,476 USD 589,899 30,415 0.01%
Toronto Dominion
Bank 16/01/2019 USD 33,370 EUR 28,111 1,134 0.00%
Unrealised Gain on Currency Exchange Contracts at 31 December 2018 1,314,221 0.56%
Value USD
Total Financial Derivative Instruments 2,487,096 1.06%
Financial Assets at Fair Value Through Profit or Loss
(Cost USD 238,648,643) (2017: USD 189,343,070) 232,146,608 98.49%
Futures - (0.00%) (2017 - (0.07%))
Counterparty Nominal Security Description
No of
Contracts
Maturity
Date
Unrealised
Loss USD
Bank of America
Merrill Lynch (1,498,157) Euro-Bund Future (8) 07/03/2019 (8,245) (0.00%)
Bank of America
Merrill Lynch (751,950)
S&P 500 Emini Index
Future (6) 15/03/2019 (3,768) (0.00%)
(12,013) (0.00%)
Options - (0.28%) (2017 - (0.02%))
Nominal Security Description Strike Price
Exercise
Date
Bank of America
Merrill Lynch (597)
CALL CBOE VIX Future
(non-covered) 35.00 15/01/2019 (28,656) (0.01%)
Bank of America
Merrill Lynch (375)
CALL Euro Stoxx 50(Price)
Index (non-covered) 3,175.00 15/02/2019 (71,282) (0.03%)
Bank of America
Merrill Lynch (125)
CALL Euro Stoxx 50(Price)
Index (non-covered) 2,975.00 15/02/2019 (131,687) (0.06%)
Bank of America
Merrill Lynch (167)
DAX Index (non-
covered) 11,250.00 15/02/2019 (69,130) (0.03%)
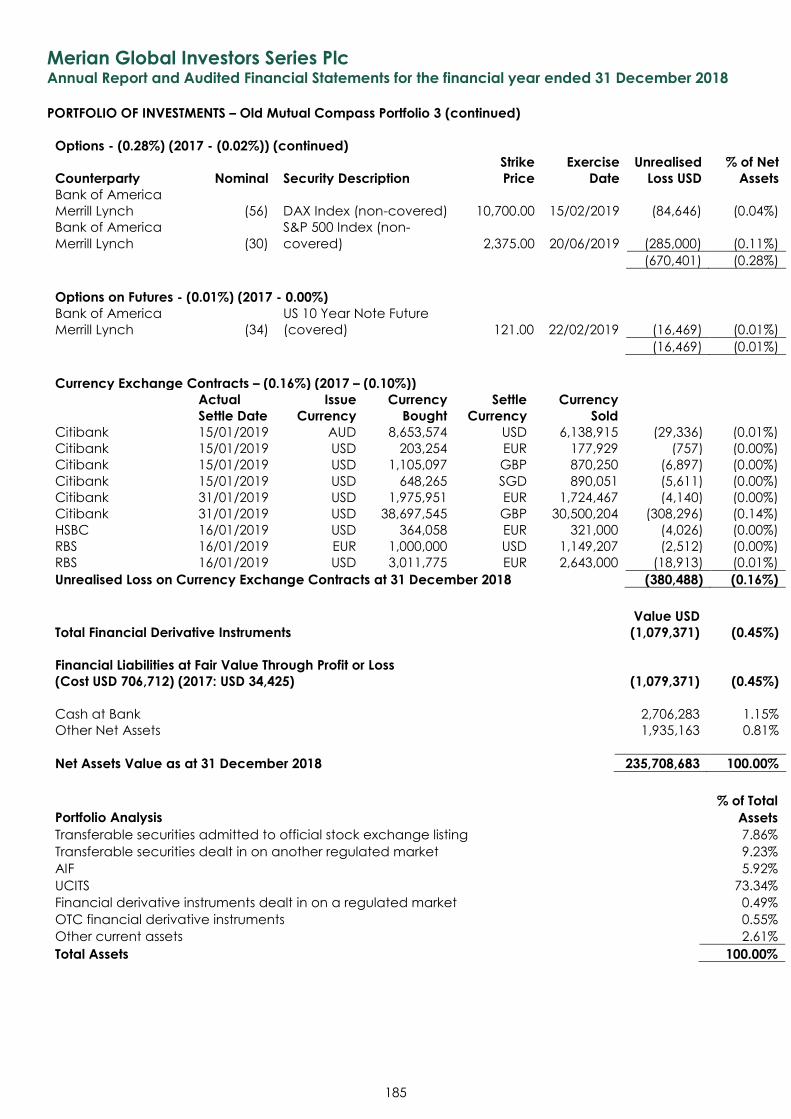
Merian Global Investors Series Plc Annual Report and Audited Financial Statements for the financial year ended 31 December 2018
PORTFOLIO OF INVESTMENTS – Old Mutual Compass Portfolio 3 (continued)
185
Options - (0.28%) (2017 - (0.02%)) (continued)
Counterparty Nominal Security Description
Strike
Price
Exercise
Date
Unrealised
Loss USD
% of Net
Assets
Bank of America
Merrill Lynch (56) DAX Index (non-covered) 10,700.00 15/02/2019 (84,646) (0.04%)
Bank of America
Merrill Lynch (30)
S&P 500 Index (non-
covered) 2,375.00 20/06/2019 (285,000) (0.11%)
(670,401) (0.28%)
Options on Futures - (0.01%) (2017 - 0.00%) Bank of America
Merrill Lynch (34)
US 10 Year Note Future
(covered) 121.00 22/02/2019 (16,469) (0.01%)
(16,469) (0.01%)
Currency Exchange Contracts – (0.16%) (2017 – (0.10%))
Actual
Settle Date
Issue
Currency
Currency
Bought
Settle
Currency
Currency
Sold
Citibank 15/01/2019 AUD 8,653,574 USD 6,138,915 (29,336) (0.01%)
Citibank 15/01/2019 USD 203,254 EUR 177,929 (757) (0.00%)
Citibank 15/01/2019 USD 1,105,097 GBP 870,250 (6,897) (0.00%)
Citibank 15/01/2019 USD 648,265 SGD 890,051 (5,611) (0.00%)
Citibank 31/01/2019 USD 1,975,951 EUR 1,724,467 (4,140) (0.00%)
Citibank 31/01/2019 USD 38,697,545 GBP 30,500,204 (308,296) (0.14%)
HSBC 16/01/2019 USD 364,058 EUR 321,000 (4,026) (0.00%)
RBS 16/01/2019 EUR 1,000,000 USD 1,149,207 (2,512) (0.00%)
RBS 16/01/2019 USD 3,011,775 EUR 2,643,000 (18,913) (0.01%)
Unrealised Loss on Currency Exchange Contracts at 31 December 2018 (380,488) (0.16%)
Value USD
Total Financial Derivative Instruments (1,079,371) (0.45%)
Financial Liabilities at Fair Value Through Profit or Loss
(Cost USD 706,712) (2017: USD 34,425) (1,079,371) (0.45%)
Cash at Bank 2,706,283 1.15%
Other Net Assets 1,935,163 0.81%
Net Assets Value as at 31 December 2018 235,708,683 100.00%
% of Total
Portfolio Analysis Assets
Transferable securities admitted to official stock exchange listing 7.86%
Transferable securities dealt in on another regulated market 9.23%
AIF 5.92%
UCITS 73.34%
Financial derivative instruments dealt in on a regulated market 0.49%
OTC financial derivative instruments 0.55%
Other current assets 2.61%
Total Assets 100.00%
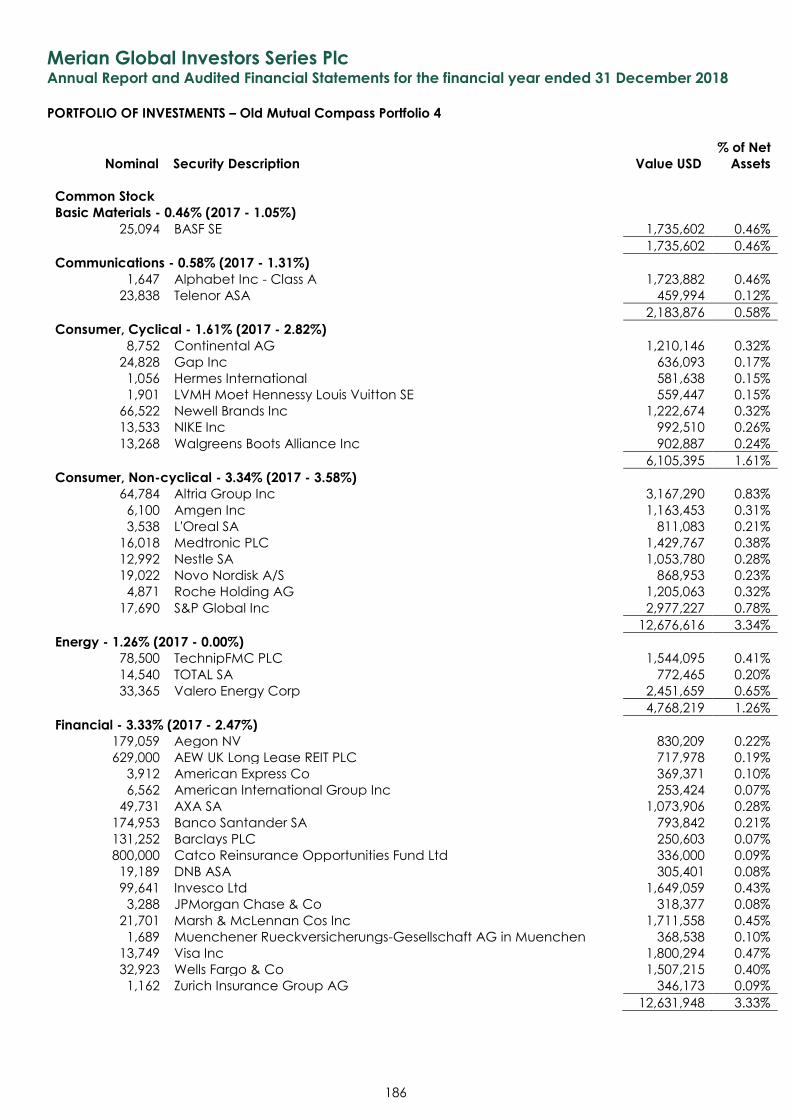
Merian Global Investors Series Plc Annual Report and Audited Financial Statements for the financial year ended 31 December 2018
PORTFOLIO OF INVESTMENTS – Old Mutual Compass Portfolio 4
Nominal Security Description Value USD
% of Net
Assets
186
Common Stock Basic Materials - 0.46% (2017 - 1.05%)
25,094 BASF SE 1,735,602 0.46%
1,735,602 0.46%
Communications - 0.58% (2017 - 1.31%) 1,647 Alphabet Inc - Class A 1,723,882 0.46%
23,838 Telenor ASA 459,994 0.12%
2,183,876 0.58%
Consumer, Cyclical - 1.61% (2017 - 2.82%) 8,752 Continental AG 1,210,146 0.32%
24,828 Gap Inc 636,093 0.17%
1,056 Hermes International 581,638 0.15%
1,901 LVMH Moet Hennessy Louis Vuitton SE 559,447 0.15%
66,522 Newell Brands Inc 1,222,674 0.32%
13,533 NIKE Inc 992,510 0.26%
13,268 Walgreens Boots Alliance Inc 902,887 0.24%
6,105,395 1.61%
Consumer, Non-cyclical - 3.34% (2017 - 3.58%) 64,784 Altria Group Inc 3,167,290 0.83%
6,100 Amgen Inc 1,163,453 0.31%
3,538 L'Oreal SA 811,083 0.21%
16,018 Medtronic PLC 1,429,767 0.38%
12,992 Nestle SA 1,053,780 0.28%
19,022 Novo Nordisk A/S 868,953 0.23%
4,871 Roche Holding AG 1,205,063 0.32%
17,690 S&P Global Inc 2,977,227 0.78%
12,676,616 3.34%
Energy - 1.26% (2017 - 0.00%) 78,500 TechnipFMC PLC 1,544,095 0.41%
14,540 TOTAL SA 772,465 0.20%
33,365 Valero Energy Corp 2,451,659 0.65%
4,768,219 1.26%
Financial - 3.33% (2017 - 2.47%) 179,059 Aegon NV 830,209 0.22%
629,000 AEW UK Long Lease REIT PLC 717,978 0.19%
3,912 American Express Co 369,371 0.10%
6,562 American International Group Inc 253,424 0.07%
49,731 AXA SA 1,073,906 0.28%
174,953 Banco Santander SA 793,842 0.21%
131,252 Barclays PLC 250,603 0.07%
800,000 Catco Reinsurance Opportunities Fund Ltd 336,000 0.09%
19,189 DNB ASA 305,401 0.08%
99,641 Invesco Ltd 1,649,059 0.43%
3,288 JPMorgan Chase & Co 318,377 0.08%
21,701 Marsh & McLennan Cos Inc 1,711,558 0.45%
1,689 Muenchener Rueckversicherungs-Gesellschaft AG in Muenchen 368,538 0.10%
13,749 Visa Inc 1,800,294 0.47%
32,923 Wells Fargo & Co 1,507,215 0.40%
1,162 Zurich Insurance Group AG 346,173 0.09%
12,631,948 3.33%
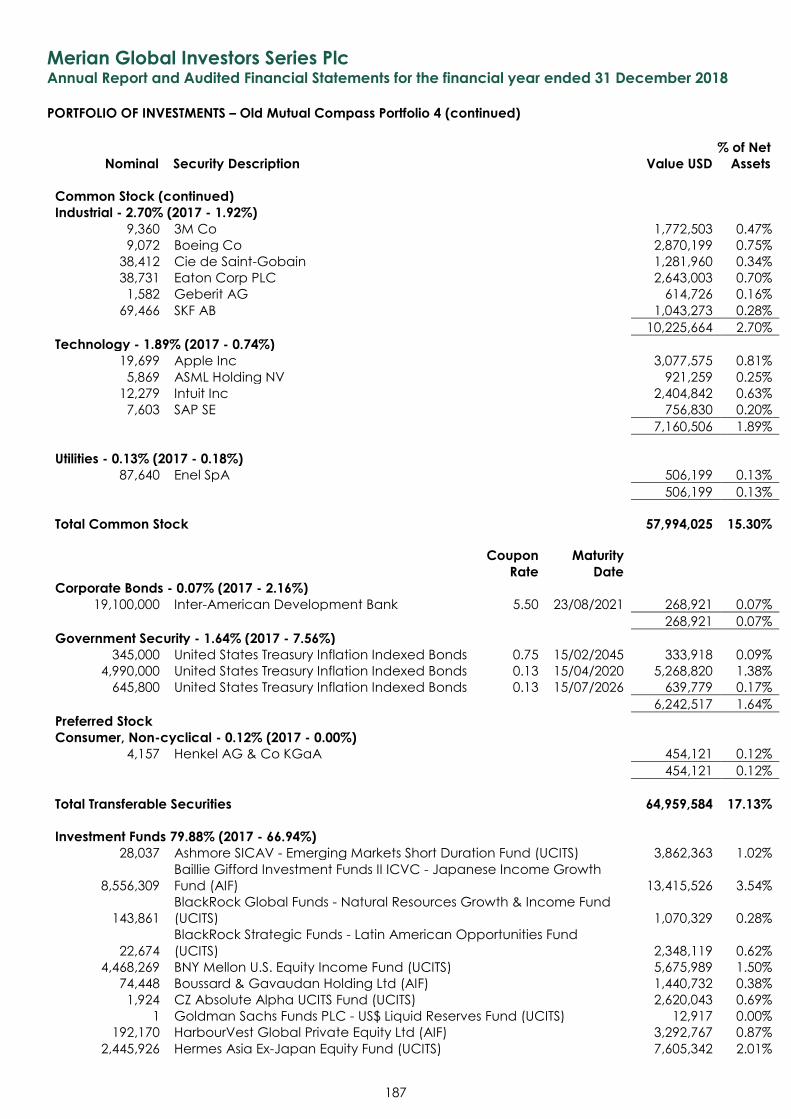
Merian Global Investors Series Plc Annual Report and Audited Financial Statements for the financial year ended 31 December 2018
PORTFOLIO OF INVESTMENTS – Old Mutual Compass Portfolio 4 (continued)
Nominal Security Description Value USD
% of Net
Assets
187
Common Stock (continued)
Industrial - 2.70% (2017 - 1.92%) 9,360 3M Co 1,772,503 0.47%
9,072 Boeing Co 2,870,199 0.75%
38,412 Cie de Saint-Gobain 1,281,960 0.34%
38,731 Eaton Corp PLC 2,643,003 0.70%
1,582 Geberit AG 614,726 0.16%
69,466 SKF AB 1,043,273 0.28%
10,225,664 2.70%
Technology - 1.89% (2017 - 0.74%) 19,699 Apple Inc 3,077,575 0.81%
5,869 ASML Holding NV 921,259 0.25%
12,279 Intuit Inc 2,404,842 0.63%
7,603 SAP SE 756,830 0.20%
7,160,506 1.89%
Utilities - 0.13% (2017 - 0.18%)
87,640 Enel SpA 506,199 0.13%
506,199 0.13%
Total Common Stock 57,994,025 15.30%
Coupon Maturity
Rate Date
Corporate Bonds - 0.07% (2017 - 2.16%) 19,100,000 Inter-American Development Bank 5.50 23/08/2021 268,921 0.07%
268,921 0.07%
Government Security - 1.64% (2017 - 7.56%) 345,000 United States Treasury Inflation Indexed Bonds 0.75 15/02/2045 333,918 0.09%
4,990,000 United States Treasury Inflation Indexed Bonds 0.13 15/04/2020 5,268,820 1.38%
645,800 United States Treasury Inflation Indexed Bonds 0.13 15/07/2026 639,779 0.17%
6,242,517 1.64%
Preferred Stock Consumer, Non-cyclical - 0.12% (2017 - 0.00%)
4,157 Henkel AG & Co KGaA 454,121 0.12%
454,121 0.12%
Total Transferable Securities 64,959,584 17.13%
Investment Funds 79.88% (2017 - 66.94%) 28,037 Ashmore SICAV - Emerging Markets Short Duration Fund (UCITS) 3,862,363 1.02%
8,556,309
Baillie Gifford Investment Funds II ICVC - Japanese Income Growth
Fund (AIF) 13,415,526 3.54%
143,861
BlackRock Global Funds - Natural Resources Growth & Income Fund
(UCITS) 1,070,329 0.28%
22,674
BlackRock Strategic Funds - Latin American Opportunities Fund
(UCITS) 2,348,119 0.62%
4,468,269 BNY Mellon U.S. Equity Income Fund (UCITS) 5,675,989 1.50%
74,448 Boussard & Gavaudan Holding Ltd (AIF) 1,440,732 0.38%
1,924 CZ Absolute Alpha UCITS Fund (UCITS) 2,620,043 0.69%
1 Goldman Sachs Funds PLC - US$ Liquid Reserves Fund (UCITS) 12,917 0.00%
192,170 HarbourVest Global Private Equity Ltd (AIF) 3,292,767 0.87%
2,445,926 Hermes Asia Ex-Japan Equity Fund (UCITS) 7,605,342 2.01%
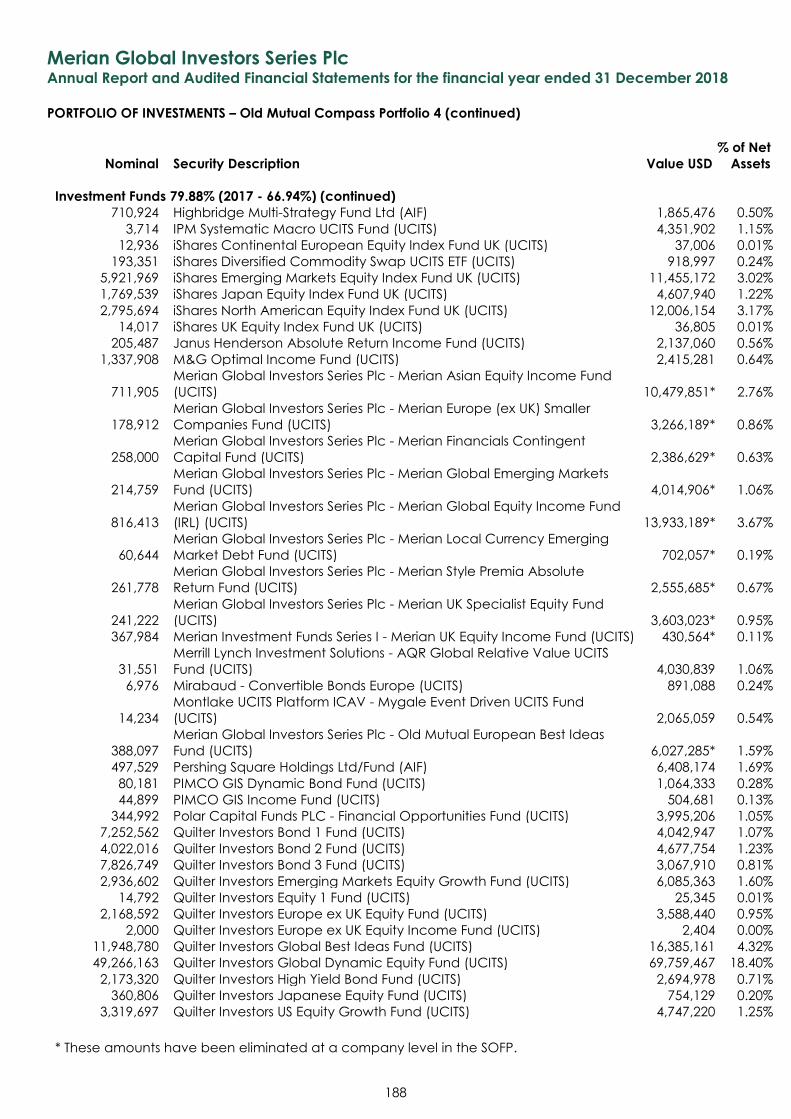
Merian Global Investors Series Plc Annual Report and Audited Financial Statements for the financial year ended 31 December 2018
PORTFOLIO OF INVESTMENTS – Old Mutual Compass Portfolio 4 (continued)
Nominal Security Description Value USD
% of Net
Assets
188
Investment Funds 79.88% (2017 - 66.94%) (continued)
710,924 Highbridge Multi-Strategy Fund Ltd (AIF) 1,865,476 0.50%
3,714 IPM Systematic Macro UCITS Fund (UCITS) 4,351,902 1.15%
12,936 iShares Continental European Equity Index Fund UK (UCITS) 37,006 0.01%
193,351 iShares Diversified Commodity Swap UCITS ETF (UCITS) 918,997 0.24%
5,921,969 iShares Emerging Markets Equity Index Fund UK (UCITS) 11,455,172 3.02%
1,769,539 iShares Japan Equity Index Fund UK (UCITS) 4,607,940 1.22%
2,795,694 iShares North American Equity Index Fund UK (UCITS) 12,006,154 3.17%
14,017 iShares UK Equity Index Fund UK (UCITS) 36,805 0.01%
205,487 Janus Henderson Absolute Return Income Fund (UCITS) 2,137,060 0.56%
1,337,908 M&G Optimal Income Fund (UCITS) 2,415,281 0.64%
711,905
Merian Global Investors Series Plc - Merian Asian Equity Income Fund
(UCITS) 10,479,851* 2.76%
178,912
Merian Global Investors Series Plc - Merian Europe (ex UK) Smaller
Companies Fund (UCITS) 3,266,189* 0.86%
258,000
Merian Global Investors Series Plc - Merian Financials Contingent
Capital Fund (UCITS) 2,386,629* 0.63%
214,759
Merian Global Investors Series Plc - Merian Global Emerging Markets
Fund (UCITS) 4,014,906* 1.06%
816,413
Merian Global Investors Series Plc - Merian Global Equity Income Fund
(IRL) (UCITS) 13,933,189* 3.67%
60,644
Merian Global Investors Series Plc - Merian Local Currency Emerging
Market Debt Fund (UCITS) 702,057* 0.19%
261,778
Merian Global Investors Series Plc - Merian Style Premia Absolute
Return Fund (UCITS) 2,555,685* 0.67%
241,222
Merian Global Investors Series Plc - Merian UK Specialist Equity Fund
(UCITS) 3,603,023* 0.95%
367,984 Merian Investment Funds Series I - Merian UK Equity Income Fund (UCITS) 430,564* 0.11%
31,551
Merrill Lynch Investment Solutions - AQR Global Relative Value UCITS
Fund (UCITS) 4,030,839 1.06%
6,976 Mirabaud - Convertible Bonds Europe (UCITS) 891,088 0.24%
14,234
Montlake UCITS Platform ICAV - Mygale Event Driven UCITS Fund
(UCITS) 2,065,059 0.54%
388,097
Merian Global Investors Series Plc - Old Mutual European Best Ideas
Fund (UCITS) 6,027,285* 1.59%
497,529 Pershing Square Holdings Ltd/Fund (AIF) 6,408,174 1.69%
80,181 PIMCO GIS Dynamic Bond Fund (UCITS) 1,064,333 0.28%
44,899 PIMCO GIS Income Fund (UCITS) 504,681 0.13%
344,992 Polar Capital Funds PLC - Financial Opportunities Fund (UCITS) 3,995,206 1.05%
7,252,562 Quilter Investors Bond 1 Fund (UCITS) 4,042,947 1.07%
4,022,016 Quilter Investors Bond 2 Fund (UCITS) 4,677,754 1.23%
7,826,749 Quilter Investors Bond 3 Fund (UCITS) 3,067,910 0.81%
2,936,602 Quilter Investors Emerging Markets Equity Growth Fund (UCITS) 6,085,363 1.60%
14,792 Quilter Investors Equity 1 Fund (UCITS) 25,345 0.01%
2,168,592 Quilter Investors Europe ex UK Equity Fund (UCITS) 3,588,440 0.95%
2,000 Quilter Investors Europe ex UK Equity Income Fund (UCITS) 2,404 0.00%
11,948,780 Quilter Investors Global Best Ideas Fund (UCITS) 16,385,161 4.32%
49,266,163 Quilter Investors Global Dynamic Equity Fund (UCITS) 69,759,467 18.40%
2,173,320 Quilter Investors High Yield Bond Fund (UCITS) 2,694,978 0.71%
360,806 Quilter Investors Japanese Equity Fund (UCITS) 754,129 0.20%
3,319,697 Quilter Investors US Equity Growth Fund (UCITS) 4,747,220 1.25%
* These amounts have been eliminated at a company level in the SOFP.
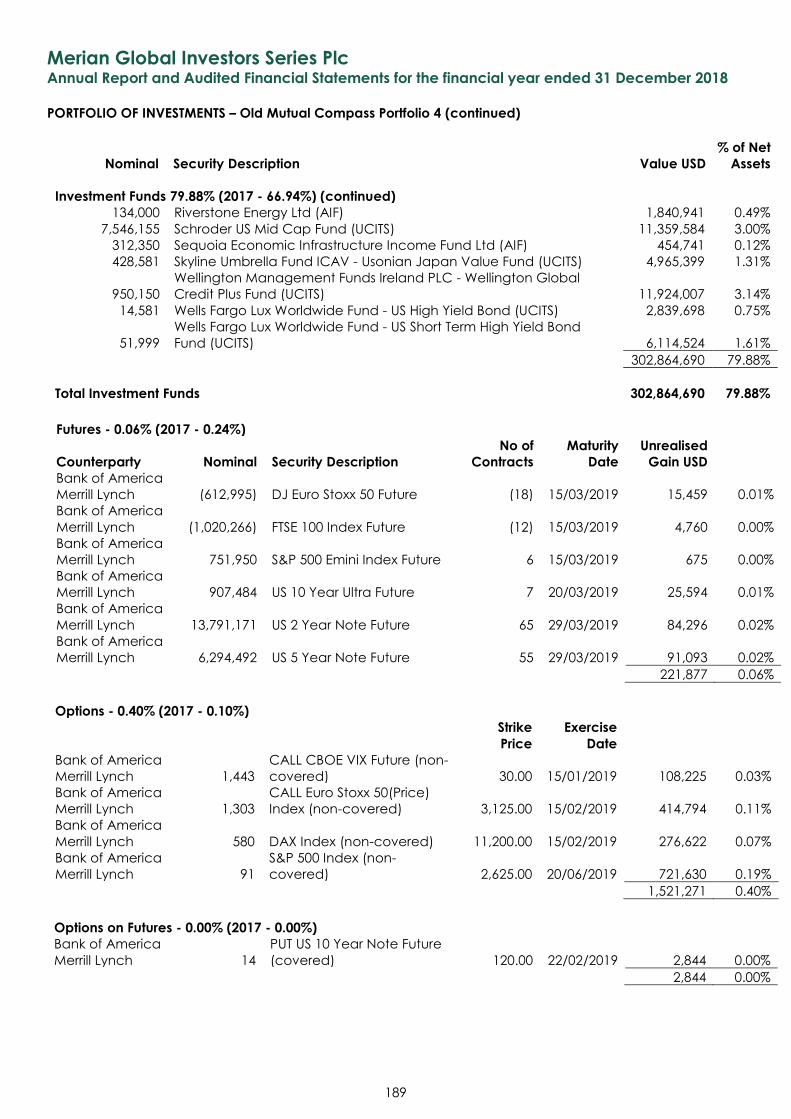
Merian Global Investors Series Plc Annual Report and Audited Financial Statements for the financial year ended 31 December 2018
PORTFOLIO OF INVESTMENTS – Old Mutual Compass Portfolio 4 (continued)
Nominal Security Description Value USD
% of Net
Assets
189
Investment Funds 79.88% (2017 - 66.94%) (continued)
134,000 Riverstone Energy Ltd (AIF) 1,840,941 0.49%
7,546,155 Schroder US Mid Cap Fund (UCITS) 11,359,584 3.00%
312,350 Sequoia Economic Infrastructure Income Fund Ltd (AIF) 454,741 0.12%
428,581 Skyline Umbrella Fund ICAV - Usonian Japan Value Fund (UCITS) 4,965,399 1.31%
950,150
Wellington Management Funds Ireland PLC - Wellington Global
Credit Plus Fund (UCITS) 11,924,007 3.14%
14,581 Wells Fargo Lux Worldwide Fund - US High Yield Bond (UCITS) 2,839,698 0.75%
51,999
Wells Fargo Lux Worldwide Fund - US Short Term High Yield Bond
Fund (UCITS) 6,114,524 1.61%
302,864,690 79.88%
Total Investment Funds 302,864,690 79.88%
Futures - 0.06% (2017 - 0.24%)
Counterparty Nominal Security Description
No of
Contracts
Maturity
Date
Unrealised
Gain USD Bank of America
Merrill Lynch (612,995) DJ Euro Stoxx 50 Future (18) 15/03/2019 15,459 0.01%
Bank of America
Merrill Lynch (1,020,266) FTSE 100 Index Future (12) 15/03/2019 4,760 0.00%
Bank of America
Merrill Lynch 751,950 S&P 500 Emini Index Future 6 15/03/2019 675 0.00%
Bank of America
Merrill Lynch 907,484 US 10 Year Ultra Future 7 20/03/2019 25,594 0.01%
Bank of America
Merrill Lynch 13,791,171 US 2 Year Note Future 65 29/03/2019 84,296 0.02%
Bank of America
Merrill Lynch 6,294,492 US 5 Year Note Future 55 29/03/2019 91,093 0.02%
221,877 0.06%
Options - 0.40% (2017 - 0.10%) Strike Exercise
Price Date
Bank of America
Merrill Lynch 1,443
CALL CBOE VIX Future (non-
covered) 30.00 15/01/2019 108,225 0.03%
Bank of America
Merrill Lynch 1,303
CALL Euro Stoxx 50(Price)
Index (non-covered) 3,125.00 15/02/2019 414,794 0.11%
Bank of America
Merrill Lynch 580 DAX Index (non-covered) 11,200.00 15/02/2019 276,622 0.07%
Bank of America
Merrill Lynch 91
S&P 500 Index (non-
covered) 2,625.00 20/06/2019 721,630 0.19%
1,521,271 0.40%
Options on Futures - 0.00% (2017 - 0.00%)
Bank of America
Merrill Lynch 14
PUT US 10 Year Note Future
(covered) 120.00 22/02/2019 2,844 0.00%
2,844 0.00%
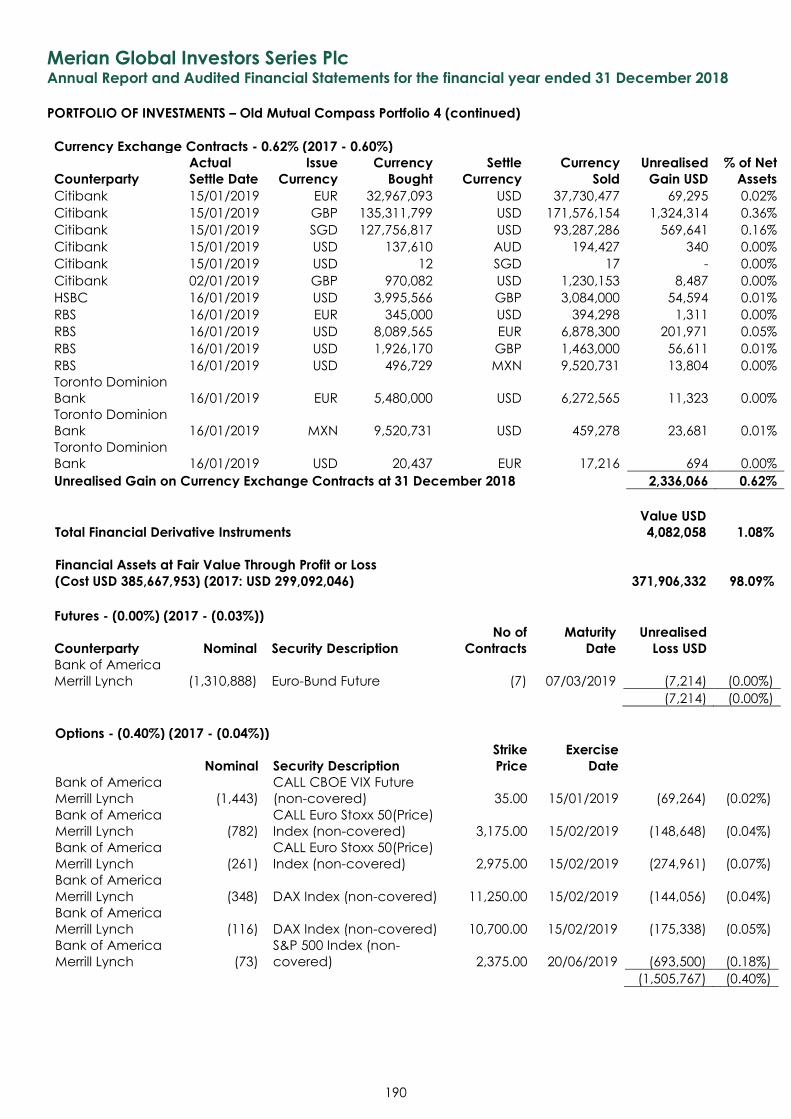
Merian Global Investors Series Plc Annual Report and Audited Financial Statements for the financial year ended 31 December 2018
PORTFOLIO OF INVESTMENTS – Old Mutual Compass Portfolio 4 (continued)
190
Currency Exchange Contracts - 0.62% (2017 - 0.60%)
Counterparty
Actual
Settle Date
Issue
Currency
Currency
Bought
Settle
Currency
Currency
Sold
Unrealised
Gain USD
% of Net
Assets
Citibank 15/01/2019 EUR 32,967,093 USD 37,730,477 69,295 0.02%
Citibank 15/01/2019 GBP 135,311,799 USD 171,576,154 1,324,314 0.36%
Citibank 15/01/2019 SGD 127,756,817 USD 93,287,286 569,641 0.16%
Citibank 15/01/2019 USD 137,610 AUD 194,427 340 0.00%
Citibank 15/01/2019 USD 12 SGD 17 - 0.00%
Citibank 02/01/2019 GBP 970,082 USD 1,230,153 8,487 0.00%
HSBC 16/01/2019 USD 3,995,566 GBP 3,084,000 54,594 0.01%
RBS 16/01/2019 EUR 345,000 USD 394,298 1,311 0.00%
RBS 16/01/2019 USD 8,089,565 EUR 6,878,300 201,971 0.05%
RBS 16/01/2019 USD 1,926,170 GBP 1,463,000 56,611 0.01%
RBS 16/01/2019 USD 496,729 MXN 9,520,731 13,804 0.00%
Toronto Dominion
Bank 16/01/2019 EUR 5,480,000 USD 6,272,565 11,323 0.00%
Toronto Dominion
Bank 16/01/2019 MXN 9,520,731 USD 459,278 23,681 0.01%
Toronto Dominion
Bank 16/01/2019 USD 20,437 EUR 17,216 694 0.00%
Unrealised Gain on Currency Exchange Contracts at 31 December 2018 2,336,066 0.62%
Value USD
Total Financial Derivative Instruments 4,082,058 1.08%
Financial Assets at Fair Value Through Profit or Loss
(Cost USD 385,667,953) (2017: USD 299,092,046) 371,906,332 98.09%
Futures - (0.00%) (2017 - (0.03%))
Counterparty Nominal Security Description
No of
Contracts
Maturity
Date
Unrealised
Loss USD Bank of America
Merrill Lynch (1,310,888) Euro-Bund Future (7) 07/03/2019 (7,214) (0.00%)
(7,214) (0.00%)
Options - (0.40%) (2017 - (0.04%)) Strike Exercise
Nominal Security Description Price Date
Bank of America
Merrill Lynch (1,443)
CALL CBOE VIX Future
(non-covered) 35.00 15/01/2019 (69,264) (0.02%)
Bank of America
Merrill Lynch (782)
CALL Euro Stoxx 50(Price)
Index (non-covered) 3,175.00 15/02/2019 (148,648) (0.04%)
Bank of America
Merrill Lynch (261)
CALL Euro Stoxx 50(Price)
Index (non-covered) 2,975.00 15/02/2019 (274,961) (0.07%)
Bank of America
Merrill Lynch (348) DAX Index (non-covered) 11,250.00 15/02/2019 (144,056) (0.04%)
Bank of America
Merrill Lynch (116) DAX Index (non-covered) 10,700.00 15/02/2019 (175,338) (0.05%)
Bank of America
Merrill Lynch (73)
S&P 500 Index (non-
covered) 2,375.00 20/06/2019 (693,500) (0.18%)
(1,505,767) (0.40%)
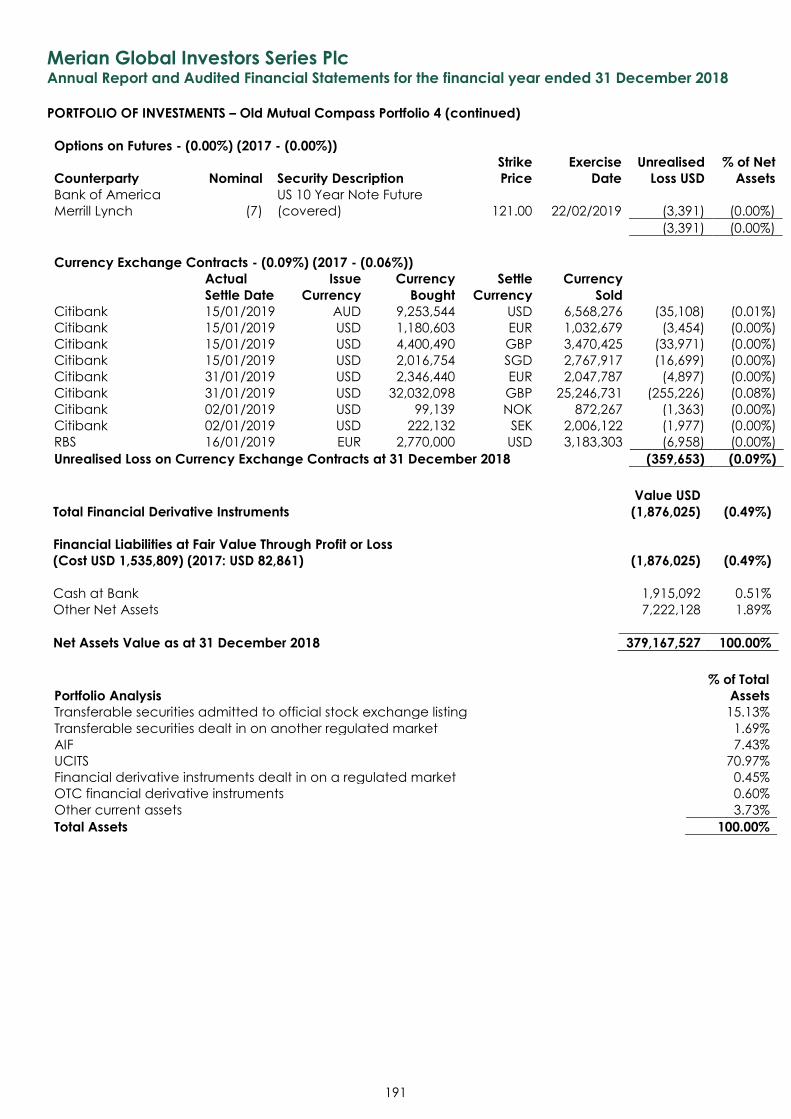
Merian Global Investors Series Plc Annual Report and Audited Financial Statements for the financial year ended 31 December 2018
PORTFOLIO OF INVESTMENTS – Old Mutual Compass Portfolio 4 (continued)
191
Options on Futures - (0.00%) (2017 - (0.00%))
Counterparty Nominal Security Description
Strike
Price
Exercise
Date
Unrealised
Loss USD
% of Net
Assets
Bank of America
Merrill Lynch (7)
US 10 Year Note Future
(covered) 121.00 22/02/2019 (3,391) (0.00%)
(3,391) (0.00%)
Currency Exchange Contracts - (0.09%) (2017 - (0.06%))
Actual
Settle Date
Issue
Currency
Currency
Bought
Settle
Currency
Currency
Sold
Citibank 15/01/2019 AUD 9,253,544 USD 6,568,276 (35,108) (0.01%)
Citibank 15/01/2019 USD 1,180,603 EUR 1,032,679 (3,454) (0.00%)
Citibank 15/01/2019 USD 4,400,490 GBP 3,470,425 (33,971) (0.00%)
Citibank 15/01/2019 USD 2,016,754 SGD 2,767,917 (16,699) (0.00%)
Citibank 31/01/2019 USD 2,346,440 EUR 2,047,787 (4,897) (0.00%)
Citibank 31/01/2019 USD 32,032,098 GBP 25,246,731 (255,226) (0.08%)
Citibank 02/01/2019 USD 99,139 NOK 872,267 (1,363) (0.00%)
Citibank 02/01/2019 USD 222,132 SEK 2,006,122 (1,977) (0.00%)
RBS 16/01/2019 EUR 2,770,000 USD 3,183,303 (6,958) (0.00%)
Unrealised Loss on Currency Exchange Contracts at 31 December 2018 (359,653) (0.09%)
Value USD
Total Financial Derivative Instruments (1,876,025) (0.49%)
Financial Liabilities at Fair Value Through Profit or Loss
(Cost USD 1,535,809) (2017: USD 82,861) (1,876,025) (0.49%)
Cash at Bank 1,915,092 0.51%
Other Net Assets 7,222,128 1.89%
Net Assets Value as at 31 December 2018 379,167,527 100.00%
% of Total
Portfolio Analysis Assets
Transferable securities admitted to official stock exchange listing 15.13%
Transferable securities dealt in on another regulated market 1.69%
AIF 7.43%
UCITS 70.97%
Financial derivative instruments dealt in on a regulated market 0.45%
OTC financial derivative instruments 0.60%
Other current assets 3.73%
Total Assets 100.00%
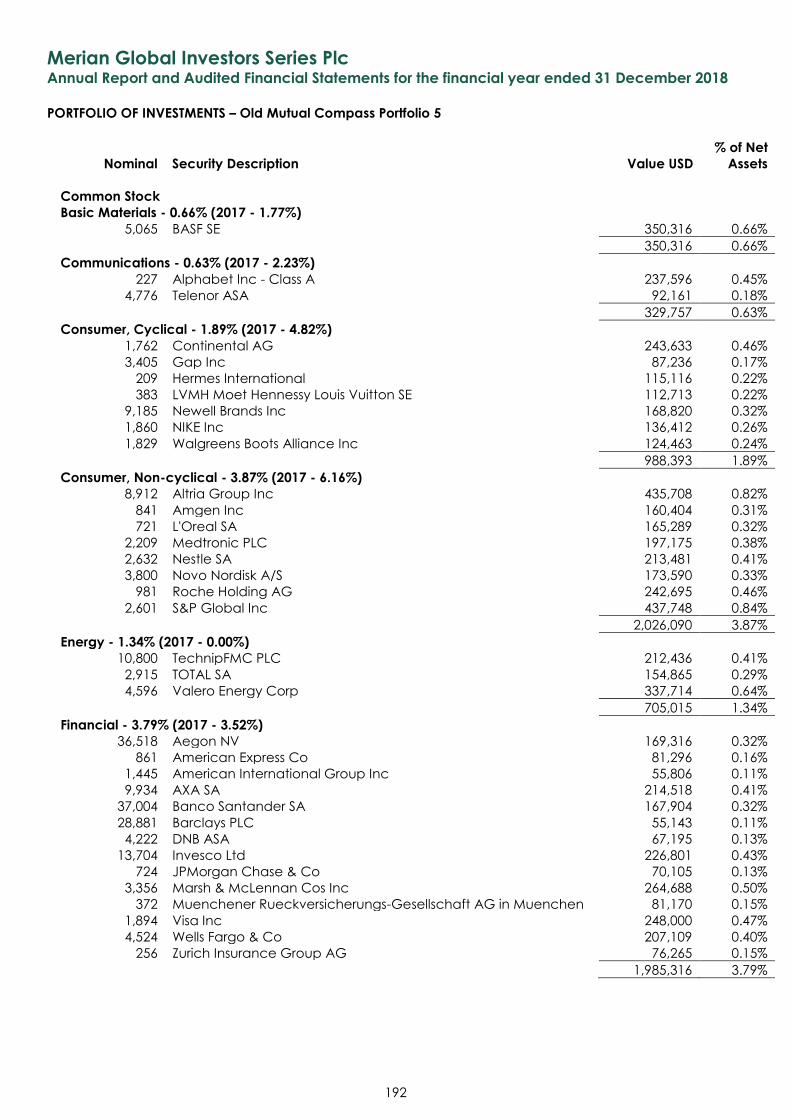
Merian Global Investors Series Plc Annual Report and Audited Financial Statements for the financial year ended 31 December 2018
PORTFOLIO OF INVESTMENTS – Old Mutual Compass Portfolio 5
Nominal Security Description Value USD
% of Net
Assets
192
Common Stock Basic Materials - 0.66% (2017 - 1.77%)
5,065 BASF SE 350,316 0.66%
350,316 0.66%
Communications - 0.63% (2017 - 2.23%) 227 Alphabet Inc - Class A 237,596 0.45%
4,776 Telenor ASA 92,161 0.18%
329,757 0.63%
Consumer, Cyclical - 1.89% (2017 - 4.82%) 1,762 Continental AG 243,633 0.46%
3,405 Gap Inc 87,236 0.17%
209 Hermes International 115,116 0.22%
383 LVMH Moet Hennessy Louis Vuitton SE 112,713 0.22%
9,185 Newell Brands Inc 168,820 0.32%
1,860 NIKE Inc 136,412 0.26%
1,829 Walgreens Boots Alliance Inc 124,463 0.24%
988,393 1.89%
Consumer, Non-cyclical - 3.87% (2017 - 6.16%) 8,912 Altria Group Inc 435,708 0.82%
841 Amgen Inc 160,404 0.31%
721 L'Oreal SA 165,289 0.32%
2,209 Medtronic PLC 197,175 0.38%
2,632 Nestle SA 213,481 0.41%
3,800 Novo Nordisk A/S 173,590 0.33%
981 Roche Holding AG 242,695 0.46%
2,601 S&P Global Inc 437,748 0.84%
2,026,090 3.87%
Energy - 1.34% (2017 - 0.00%) 10,800 TechnipFMC PLC 212,436 0.41%
2,915 TOTAL SA 154,865 0.29%
4,596 Valero Energy Corp 337,714 0.64%
705,015 1.34%
Financial - 3.79% (2017 - 3.52%) 36,518 Aegon NV 169,316 0.32%
861 American Express Co 81,296 0.16%
1,445 American International Group Inc 55,806 0.11%
9,934 AXA SA 214,518 0.41%
37,004 Banco Santander SA 167,904 0.32%
28,881 Barclays PLC 55,143 0.11%
4,222 DNB ASA 67,195 0.13%
13,704 Invesco Ltd 226,801 0.43%
724 JPMorgan Chase & Co 70,105 0.13%
3,356 Marsh & McLennan Cos Inc 264,688 0.50%
372 Muenchener Rueckversicherungs-Gesellschaft AG in Muenchen 81,170 0.15%
1,894 Visa Inc 248,000 0.47%
4,524 Wells Fargo & Co 207,109 0.40%
256 Zurich Insurance Group AG 76,265 0.15%
1,985,316 3.79%
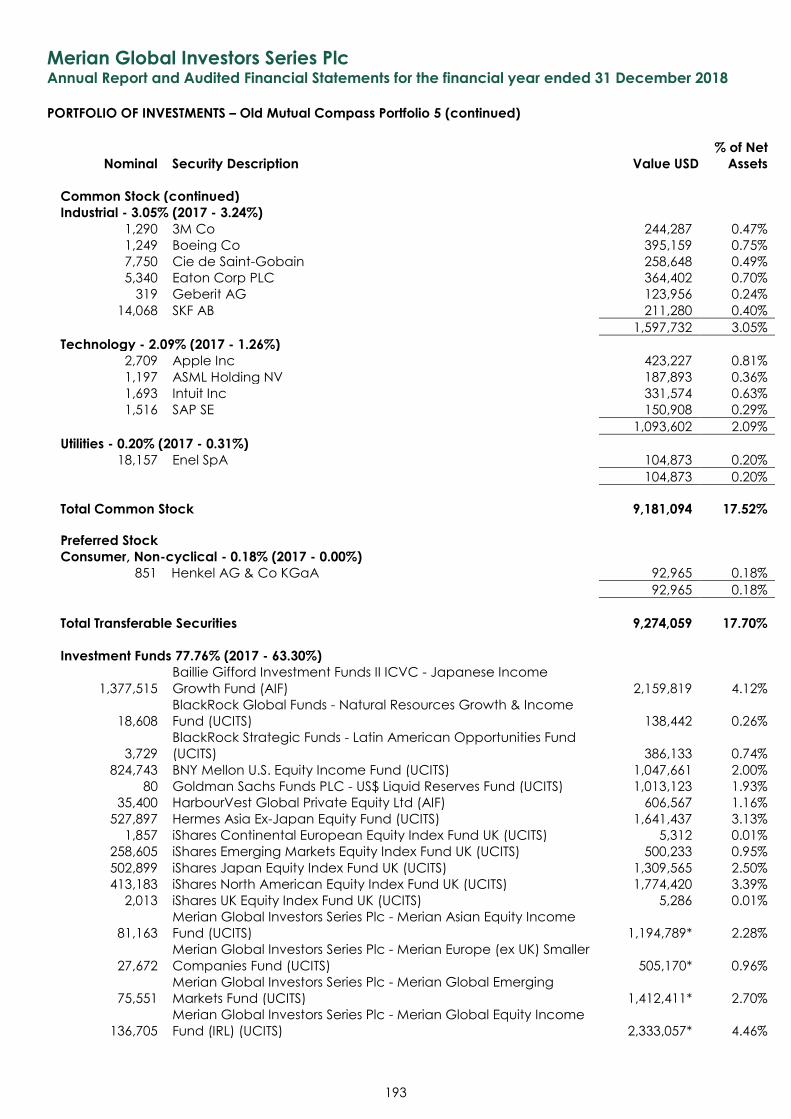
Merian Global Investors Series Plc Annual Report and Audited Financial Statements for the financial year ended 31 December 2018
PORTFOLIO OF INVESTMENTS – Old Mutual Compass Portfolio 5 (continued)
Nominal Security Description Value USD
% of Net
Assets
193
Common Stock (continued)
Industrial - 3.05% (2017 - 3.24%) 1,290 3M Co 244,287 0.47%
1,249 Boeing Co 395,159 0.75%
7,750 Cie de Saint-Gobain 258,648 0.49%
5,340 Eaton Corp PLC 364,402 0.70%
319 Geberit AG 123,956 0.24%
14,068 SKF AB 211,280 0.40%
1,597,732 3.05%
Technology - 2.09% (2017 - 1.26%) 2,709 Apple Inc 423,227 0.81%
1,197 ASML Holding NV 187,893 0.36%
1,693 Intuit Inc 331,574 0.63%
1,516 SAP SE 150,908 0.29%
1,093,602 2.09%
Utilities - 0.20% (2017 - 0.31%) 18,157 Enel SpA 104,873 0.20%
104,873 0.20%
Total Common Stock 9,181,094 17.52%
Preferred Stock Consumer, Non-cyclical - 0.18% (2017 - 0.00%)
851 Henkel AG & Co KGaA 92,965 0.18%
92,965 0.18%
Total Transferable Securities 9,274,059 17.70%
Investment Funds 77.76% (2017 - 63.30%)
1,377,515
Baillie Gifford Investment Funds II ICVC - Japanese Income
Growth Fund (AIF) 2,159,819 4.12%
18,608
BlackRock Global Funds - Natural Resources Growth & Income
Fund (UCITS) 138,442 0.26%
3,729
BlackRock Strategic Funds - Latin American Opportunities Fund
(UCITS) 386,133 0.74%
824,743 BNY Mellon U.S. Equity Income Fund (UCITS) 1,047,661 2.00%
80 Goldman Sachs Funds PLC - US$ Liquid Reserves Fund (UCITS) 1,013,123 1.93%
35,400 HarbourVest Global Private Equity Ltd (AIF) 606,567 1.16%
527,897 Hermes Asia Ex-Japan Equity Fund (UCITS) 1,641,437 3.13%
1,857 iShares Continental European Equity Index Fund UK (UCITS) 5,312 0.01%
258,605 iShares Emerging Markets Equity Index Fund UK (UCITS) 500,233 0.95%
502,899 iShares Japan Equity Index Fund UK (UCITS) 1,309,565 2.50%
413,183 iShares North American Equity Index Fund UK (UCITS) 1,774,420 3.39%
2,013 iShares UK Equity Index Fund UK (UCITS) 5,286 0.01%
81,163
Merian Global Investors Series Plc - Merian Asian Equity Income
Fund (UCITS) 1,194,789* 2.28%
27,672
Merian Global Investors Series Plc - Merian Europe (ex UK) Smaller
Companies Fund (UCITS) 505,170* 0.96%
75,551
Merian Global Investors Series Plc - Merian Global Emerging
Markets Fund (UCITS) 1,412,411* 2.70%
136,705
Merian Global Investors Series Plc - Merian Global Equity Income
Fund (IRL) (UCITS) 2,333,057* 4.46%
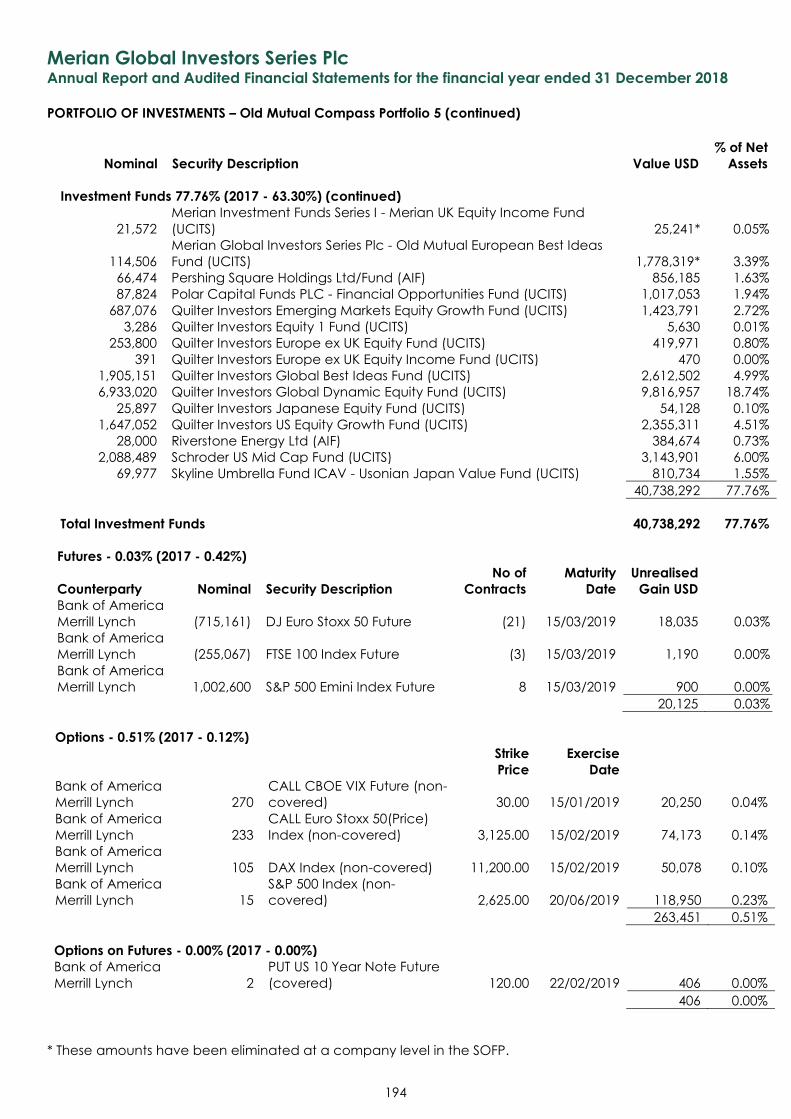
Merian Global Investors Series Plc Annual Report and Audited Financial Statements for the financial year ended 31 December 2018
PORTFOLIO OF INVESTMENTS – Old Mutual Compass Portfolio 5 (continued)
Nominal Security Description Value USD
% of Net
Assets
194
Investment Funds 77.76% (2017 - 63.30%) (continued)
21,572
Merian Investment Funds Series I - Merian UK Equity Income Fund
(UCITS) 25,241* 0.05%
114,506
Merian Global Investors Series Plc - Old Mutual European Best Ideas
Fund (UCITS) 1,778,319* 3.39%
66,474 Pershing Square Holdings Ltd/Fund (AIF) 856,185 1.63%
87,824 Polar Capital Funds PLC - Financial Opportunities Fund (UCITS) 1,017,053 1.94%
687,076 Quilter Investors Emerging Markets Equity Growth Fund (UCITS) 1,423,791 2.72%
3,286 Quilter Investors Equity 1 Fund (UCITS) 5,630 0.01%
253,800 Quilter Investors Europe ex UK Equity Fund (UCITS) 419,971 0.80%
391 Quilter Investors Europe ex UK Equity Income Fund (UCITS) 470 0.00%
1,905,151 Quilter Investors Global Best Ideas Fund (UCITS) 2,612,502 4.99%
6,933,020 Quilter Investors Global Dynamic Equity Fund (UCITS) 9,816,957 18.74%
25,897 Quilter Investors Japanese Equity Fund (UCITS) 54,128 0.10%
1,647,052 Quilter Investors US Equity Growth Fund (UCITS) 2,355,311 4.51%
28,000 Riverstone Energy Ltd (AIF) 384,674 0.73%
2,088,489 Schroder US Mid Cap Fund (UCITS) 3,143,901 6.00%
69,977 Skyline Umbrella Fund ICAV - Usonian Japan Value Fund (UCITS) 810,734 1.55%
40,738,292 77.76%
Total Investment Funds 40,738,292 77.76%
Futures - 0.03% (2017 - 0.42%)
Counterparty Nominal Security Description
No of
Contracts
Maturity
Date
Unrealised
Gain USD
Bank of America
Merrill Lynch (715,161) DJ Euro Stoxx 50 Future (21) 15/03/2019 18,035 0.03%
Bank of America
Merrill Lynch (255,067) FTSE 100 Index Future (3) 15/03/2019 1,190 0.00%
Bank of America
Merrill Lynch 1,002,600 S&P 500 Emini Index Future 8 15/03/2019 900 0.00%
20,125 0.03%
Options - 0.51% (2017 - 0.12%) Strike Exercise
Price Date
Bank of America
Merrill Lynch 270
CALL CBOE VIX Future (non-
covered) 30.00 15/01/2019 20,250 0.04%
Bank of America
Merrill Lynch 233
CALL Euro Stoxx 50(Price)
Index (non-covered) 3,125.00 15/02/2019 74,173 0.14%
Bank of America
Merrill Lynch 105 DAX Index (non-covered) 11,200.00 15/02/2019 50,078 0.10%
Bank of America
Merrill Lynch 15
S&P 500 Index (non-
covered) 2,625.00 20/06/2019 118,950 0.23%
263,451 0.51%
Options on Futures - 0.00% (2017 - 0.00%) Bank of America
Merrill Lynch 2
PUT US 10 Year Note Future
(covered) 120.00 22/02/2019 406 0.00%
406 0.00%
* These amounts have been eliminated at a company level in the SOFP.
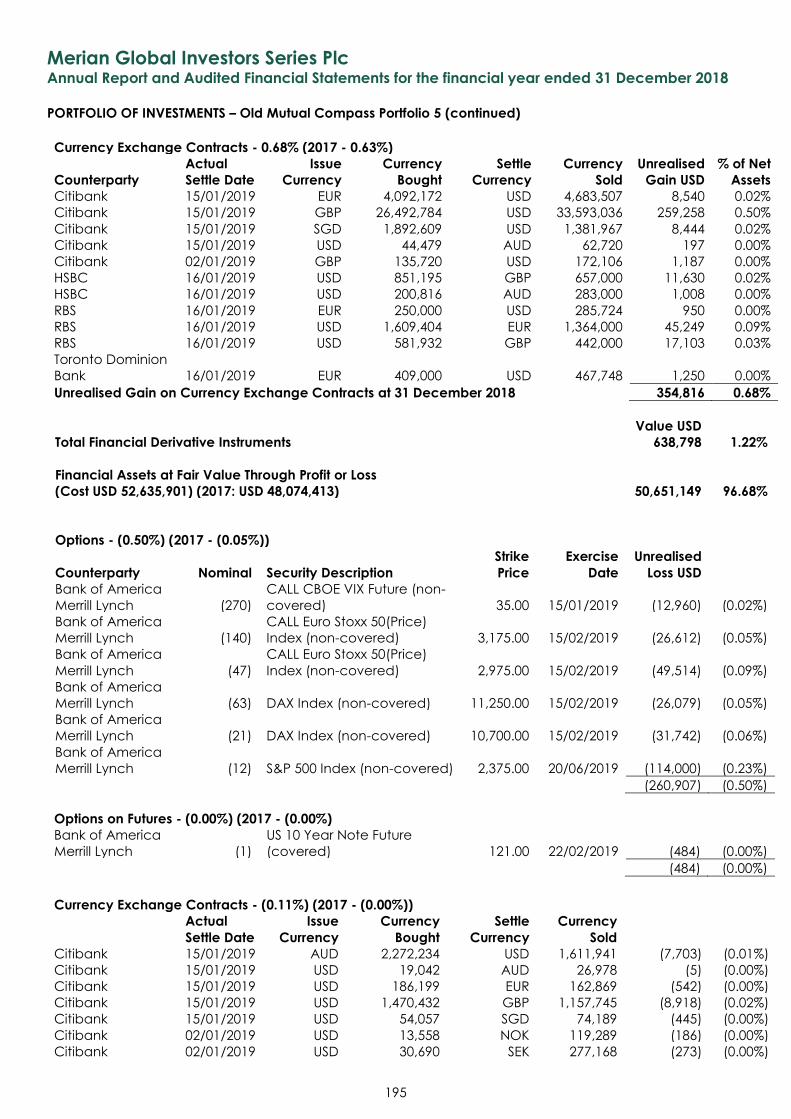
Merian Global Investors Series Plc Annual Report and Audited Financial Statements for the financial year ended 31 December 2018
PORTFOLIO OF INVESTMENTS – Old Mutual Compass Portfolio 5 (continued)
195
Currency Exchange Contracts - 0.68% (2017 - 0.63%)
Counterparty
Actual
Settle Date
Issue
Currency
Currency
Bought
Settle
Currency
Currency
Sold
Unrealised
Gain USD
% of Net
Assets
Citibank 15/01/2019 EUR 4,092,172 USD 4,683,507 8,540 0.02%
Citibank 15/01/2019 GBP 26,492,784 USD 33,593,036 259,258 0.50%
Citibank 15/01/2019 SGD 1,892,609 USD 1,381,967 8,444 0.02%
Citibank 15/01/2019 USD 44,479 AUD 62,720 197 0.00%
Citibank 02/01/2019 GBP 135,720 USD 172,106 1,187 0.00%
HSBC 16/01/2019 USD 851,195 GBP 657,000 11,630 0.02%
HSBC 16/01/2019 USD 200,816 AUD 283,000 1,008 0.00%
RBS 16/01/2019 EUR 250,000 USD 285,724 950 0.00%
RBS 16/01/2019 USD 1,609,404 EUR 1,364,000 45,249 0.09%
RBS 16/01/2019 USD 581,932 GBP 442,000 17,103 0.03%
Toronto Dominion
Bank 16/01/2019 EUR 409,000 USD 467,748 1,250 0.00%
Unrealised Gain on Currency Exchange Contracts at 31 December 2018 354,816 0.68%
Value USD
Total Financial Derivative Instruments 638,798 1.22%
Financial Assets at Fair Value Through Profit or Loss
(Cost USD 52,635,901) (2017: USD 48,074,413) 50,651,149 96.68%
Options - (0.50%) (2017 - (0.05%)) Strike Exercise Unrealised
Counterparty Nominal Security Description Price Date Loss USD
Bank of America
Merrill Lynch (270)
CALL CBOE VIX Future (non-
covered) 35.00 15/01/2019 (12,960) (0.02%)
Bank of America
Merrill Lynch (140)
CALL Euro Stoxx 50(Price)
Index (non-covered) 3,175.00 15/02/2019 (26,612) (0.05%)
Bank of America
Merrill Lynch (47)
CALL Euro Stoxx 50(Price)
Index (non-covered) 2,975.00 15/02/2019 (49,514) (0.09%)
Bank of America
Merrill Lynch (63) DAX Index (non-covered) 11,250.00 15/02/2019 (26,079) (0.05%)
Bank of America
Merrill Lynch (21) DAX Index (non-covered) 10,700.00 15/02/2019 (31,742) (0.06%)
Bank of America
Merrill Lynch (12) S&P 500 Index (non-covered) 2,375.00 20/06/2019 (114,000) (0.23%)
(260,907) (0.50%)
Options on Futures - (0.00%) (2017 - (0.00%) Bank of America
Merrill Lynch (1)
US 10 Year Note Future
(covered) 121.00 22/02/2019 (484) (0.00%)
(484) (0.00%)
Currency Exchange Contracts - (0.11%) (2017 - (0.00%))
Actual
Settle Date
Issue
Currency
Currency
Bought
Settle
Currency
Currency
Sold
Citibank 15/01/2019 AUD 2,272,234 USD 1,611,941 (7,703) (0.01%)
Citibank 15/01/2019 USD 19,042 AUD 26,978 (5) (0.00%)
Citibank 15/01/2019 USD 186,199 EUR 162,869 (542) (0.00%)
Citibank 15/01/2019 USD 1,470,432 GBP 1,157,745 (8,918) (0.02%)
Citibank 15/01/2019 USD 54,057 SGD 74,189 (445) (0.00%)
Citibank 02/01/2019 USD 13,558 NOK 119,289 (186) (0.00%)
Citibank 02/01/2019 USD 30,690 SEK 277,168 (273) (0.00%)
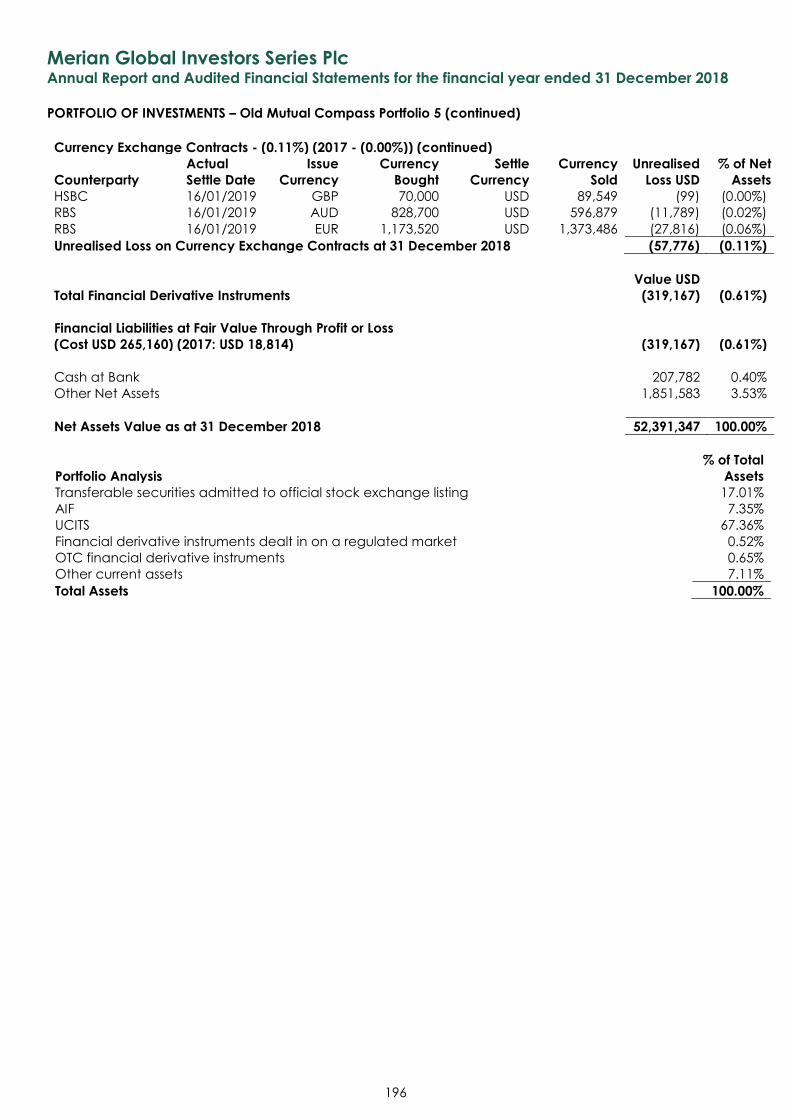
Merian Global Investors Series Plc Annual Report and Audited Financial Statements for the financial year ended 31 December 2018
PORTFOLIO OF INVESTMENTS – Old Mutual Compass Portfolio 5 (continued)
196
Currency Exchange Contracts - (0.11%) (2017 - (0.00%)) (continued)
Counterparty
Actual
Settle Date
Issue
Currency
Currency
Bought
Settle
Currency
Currency
Sold
Unrealised
Loss USD
% of Net
Assets
HSBC 16/01/2019 GBP 70,000 USD 89,549 (99) (0.00%)
RBS 16/01/2019 AUD 828,700 USD 596,879 (11,789) (0.02%)
RBS 16/01/2019 EUR 1,173,520 USD 1,373,486 (27,816) (0.06%)
Unrealised Loss on Currency Exchange Contracts at 31 December 2018 (57,776) (0.11%)
Value USD
Total Financial Derivative Instruments (319,167) (0.61%)
Financial Liabilities at Fair Value Through Profit or Loss
(Cost USD 265,160) (2017: USD 18,814) (319,167) (0.61%)
Cash at Bank 207,782 0.40%
Other Net Assets 1,851,583 3.53%
Net Assets Value as at 31 December 2018 52,391,347 100.00%
% of Total
Portfolio Analysis Assets
Transferable securities admitted to official stock exchange listing 17.01%
AIF 7.35%
UCITS 67.36%
Financial derivative instruments dealt in on a regulated market 0.52%
OTC financial derivative instruments 0.65%
Other current assets 7.11%
Total Assets 100.00%
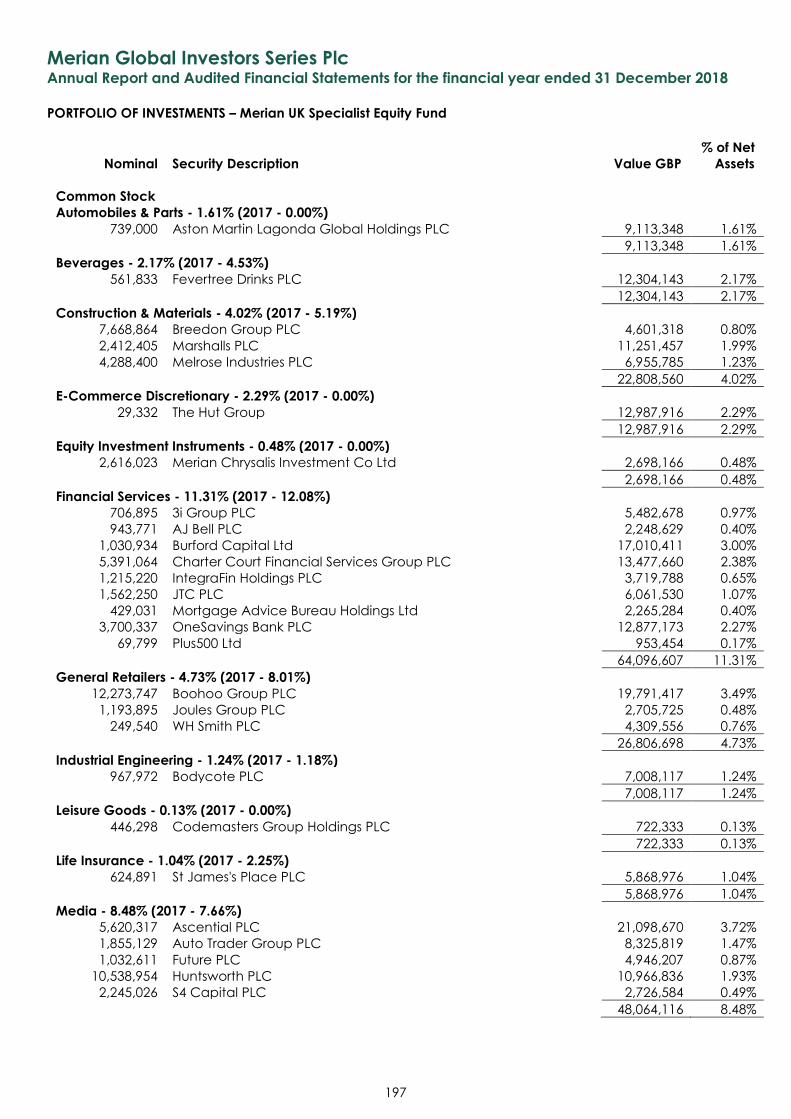
Merian Global Investors Series Plc Annual Report and Audited Financial Statements for the financial year ended 31 December 2018
PORTFOLIO OF INVESTMENTS – Merian UK Specialist Equity Fund
Nominal Security Description Value GBP
% of Net
Assets
197
Common Stock Automobiles & Parts - 1.61% (2017 - 0.00%)
739,000 Aston Martin Lagonda Global Holdings PLC 9,113,348 1.61%
9,113,348 1.61%
Beverages - 2.17% (2017 - 4.53%) 561,833 Fevertree Drinks PLC 12,304,143 2.17%
12,304,143 2.17%
Construction & Materials - 4.02% (2017 - 5.19%) 7,668,864 Breedon Group PLC 4,601,318 0.80%
2,412,405 Marshalls PLC 11,251,457 1.99%
4,288,400 Melrose Industries PLC 6,955,785 1.23%
22,808,560 4.02%
E-Commerce Discretionary - 2.29% (2017 - 0.00%) 29,332 The Hut Group 12,987,916 2.29%
12,987,916 2.29%
Equity Investment Instruments - 0.48% (2017 - 0.00%) 2,616,023 Merian Chrysalis Investment Co Ltd 2,698,166 0.48%
2,698,166 0.48%
Financial Services - 11.31% (2017 - 12.08%) 706,895 3i Group PLC 5,482,678 0.97%
943,771 AJ Bell PLC 2,248,629 0.40%
1,030,934 Burford Capital Ltd 17,010,411 3.00%
5,391,064 Charter Court Financial Services Group PLC 13,477,660 2.38%
1,215,220 IntegraFin Holdings PLC 3,719,788 0.65%
1,562,250 JTC PLC 6,061,530 1.07%
429,031 Mortgage Advice Bureau Holdings Ltd 2,265,284 0.40%
3,700,337 OneSavings Bank PLC 12,877,173 2.27%
69,799 Plus500 Ltd 953,454 0.17%
64,096,607 11.31%
General Retailers - 4.73% (2017 - 8.01%) 12,273,747 Boohoo Group PLC 19,791,417 3.49%
1,193,895 Joules Group PLC 2,705,725 0.48%
249,540 WH Smith PLC 4,309,556 0.76%
26,806,698 4.73%
Industrial Engineering - 1.24% (2017 - 1.18%) 967,972 Bodycote PLC 7,008,117 1.24%
7,008,117 1.24%
Leisure Goods - 0.13% (2017 - 0.00%) 446,298 Codemasters Group Holdings PLC 722,333 0.13%
722,333 0.13%
Life Insurance - 1.04% (2017 - 2.25%) 624,891 St James's Place PLC 5,868,976 1.04%
5,868,976 1.04%
Media - 8.48% (2017 - 7.66%) 5,620,317 Ascential PLC 21,098,670 3.72%
1,855,129 Auto Trader Group PLC 8,325,819 1.47%
1,032,611 Future PLC 4,946,207 0.87%
10,538,954 Huntsworth PLC 10,966,836 1.93%
2,245,026 S4 Capital PLC 2,726,584 0.49%
48,064,116 8.48%
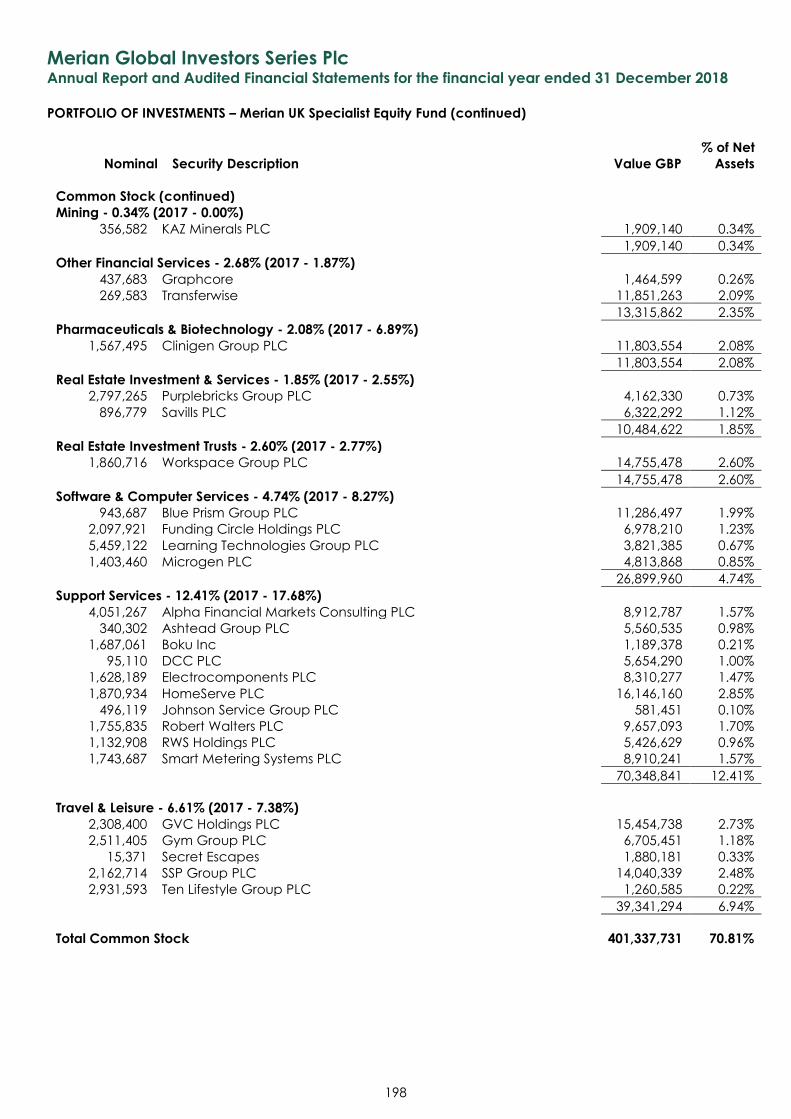
Merian Global Investors Series Plc Annual Report and Audited Financial Statements for the financial year ended 31 December 2018
PORTFOLIO OF INVESTMENTS – Merian UK Specialist Equity Fund (continued)
Nominal Security Description Value GBP
% of Net
Assets
198
Common Stock (continued) Mining - 0.34% (2017 - 0.00%)
356,582 KAZ Minerals PLC 1,909,140 0.34%
1,909,140 0.34%
Other Financial Services - 2.68% (2017 - 1.87%) 437,683 Graphcore 1,464,599 0.26%
269,583 Transferwise 11,851,263 2.09%
13,315,862 2.35%
Pharmaceuticals & Biotechnology - 2.08% (2017 - 6.89%) 1,567,495 Clinigen Group PLC 11,803,554 2.08%
11,803,554 2.08%
Real Estate Investment & Services - 1.85% (2017 - 2.55%) 2,797,265 Purplebricks Group PLC 4,162,330 0.73%
896,779 Savills PLC 6,322,292 1.12%
10,484,622 1.85%
Real Estate Investment Trusts - 2.60% (2017 - 2.77%) 1,860,716 Workspace Group PLC 14,755,478 2.60%
14,755,478 2.60%
Software & Computer Services - 4.74% (2017 - 8.27%) 943,687 Blue Prism Group PLC 11,286,497 1.99%
2,097,921 Funding Circle Holdings PLC 6,978,210 1.23%
5,459,122 Learning Technologies Group PLC 3,821,385 0.67%
1,403,460 Microgen PLC 4,813,868 0.85%
26,899,960 4.74%
Support Services - 12.41% (2017 - 17.68%) 4,051,267 Alpha Financial Markets Consulting PLC 8,912,787 1.57%
340,302 Ashtead Group PLC 5,560,535 0.98%
1,687,061 Boku Inc 1,189,378 0.21%
95,110 DCC PLC 5,654,290 1.00%
1,628,189 Electrocomponents PLC 8,310,277 1.47%
1,870,934 HomeServe PLC 16,146,160 2.85%
496,119 Johnson Service Group PLC 581,451 0.10%
1,755,835 Robert Walters PLC 9,657,093 1.70%
1,132,908 RWS Holdings PLC 5,426,629 0.96%
1,743,687 Smart Metering Systems PLC 8,910,241 1.57%
70,348,841 12.41%
Travel & Leisure - 6.61% (2017 - 7.38%)
2,308,400 GVC Holdings PLC 15,454,738 2.73%
2,511,405 Gym Group PLC 6,705,451 1.18%
15,371 Secret Escapes 1,880,181 0.33%
2,162,714 SSP Group PLC 14,040,339 2.48%
2,931,593 Ten Lifestyle Group PLC 1,260,585 0.22%
39,341,294 6.94%
Total Common Stock 401,337,731 70.81%
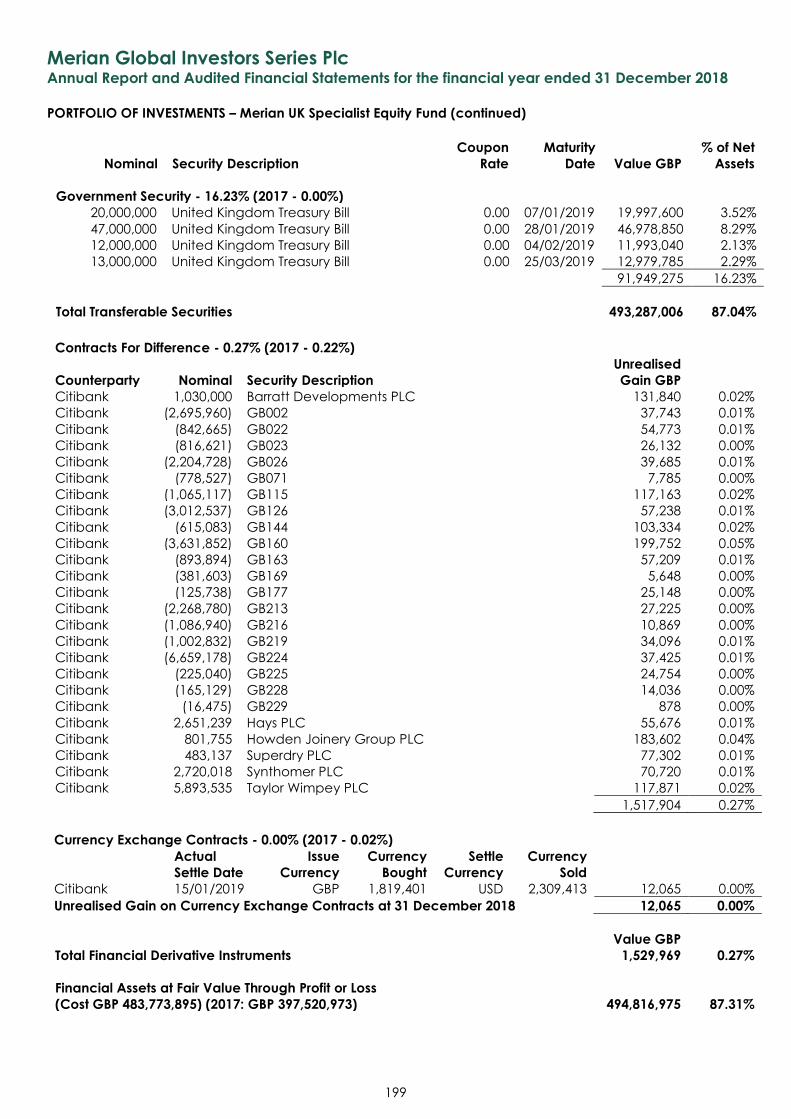
Merian Global Investors Series Plc Annual Report and Audited Financial Statements for the financial year ended 31 December 2018
PORTFOLIO OF INVESTMENTS – Merian UK Specialist Equity Fund (continued)
Nominal Security Description
Coupon
Rate
Maturity
Date Value GBP
% of Net
Assets
199
Government Security - 16.23% (2017 - 0.00%) 20,000,000 United Kingdom Treasury Bill 0.00 07/01/2019 19,997,600 3.52%
47,000,000 United Kingdom Treasury Bill 0.00 28/01/2019 46,978,850 8.29%
12,000,000 United Kingdom Treasury Bill 0.00 04/02/2019 11,993,040 2.13%
13,000,000 United Kingdom Treasury Bill 0.00 25/03/2019 12,979,785 2.29%
91,949,275 16.23%
Total Transferable Securities 493,287,006 87.04%
Contracts For Difference - 0.27% (2017 - 0.22%)
Counterparty Nominal Security Description
Unrealised
Gain GBP Citibank 1,030,000 Barratt Developments PLC 131,840 0.02%
Citibank (2,695,960) GB002 37,743 0.01%
Citibank (842,665) GB022 54,773 0.01%
Citibank (816,621) GB023 26,132 0.00%
Citibank (2,204,728) GB026 39,685 0.01%
Citibank (778,527) GB071 7,785 0.00%
Citibank (1,065,117) GB115 117,163 0.02%
Citibank (3,012,537) GB126 57,238 0.01%
Citibank (615,083) GB144 103,334 0.02%
Citibank (3,631,852) GB160 199,752 0.05%
Citibank (893,894) GB163 57,209 0.01%
Citibank (381,603) GB169 5,648 0.00%
Citibank (125,738) GB177 25,148 0.00%
Citibank (2,268,780) GB213 27,225 0.00%
Citibank (1,086,940) GB216 10,869 0.00%
Citibank (1,002,832) GB219 34,096 0.01%
Citibank (6,659,178) GB224 37,425 0.01%
Citibank (225,040) GB225 24,754 0.00%
Citibank (165,129) GB228 14,036 0.00%
Citibank (16,475) GB229 878 0.00%
Citibank 2,651,239 Hays PLC 55,676 0.01%
Citibank 801,755 Howden Joinery Group PLC 183,602 0.04%
Citibank 483,137 Superdry PLC 77,302 0.01%
Citibank 2,720,018 Synthomer PLC 70,720 0.01%
Citibank 5,893,535 Taylor Wimpey PLC 117,871 0.02%
1,517,904 0.27%
Currency Exchange Contracts - 0.00% (2017 - 0.02%)
Actual
Settle Date
Issue
Currency
Currency
Bought
Settle
Currency
Currency
Sold Citibank 15/01/2019 GBP 1,819,401 USD 2,309,413 12,065 0.00%
Unrealised Gain on Currency Exchange Contracts at 31 December 2018 12,065 0.00%
Value GBP
Total Financial Derivative Instruments 1,529,969 0.27%
Financial Assets at Fair Value Through Profit or Loss
(Cost GBP 483,773,895) (2017: GBP 397,520,973) 494,816,975 87.31%
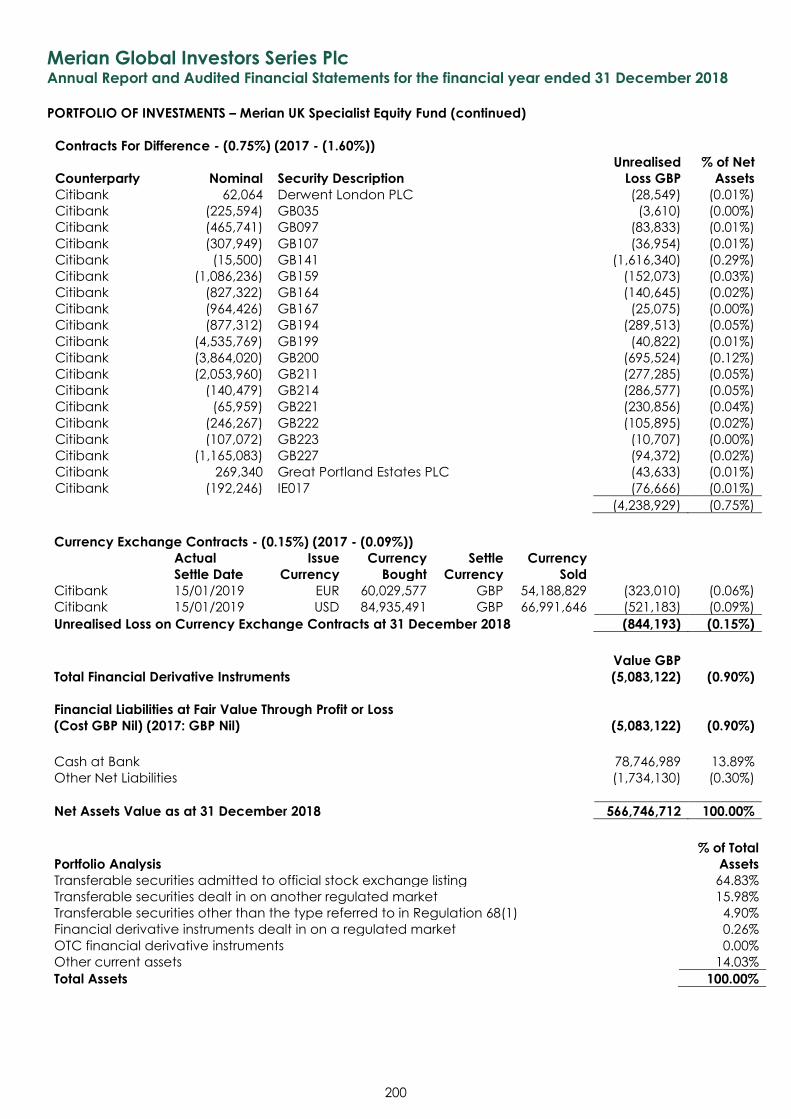
Merian Global Investors Series Plc Annual Report and Audited Financial Statements for the financial year ended 31 December 2018
PORTFOLIO OF INVESTMENTS – Merian UK Specialist Equity Fund (continued)
200
Contracts For Difference - (0.75%) (2017 - (1.60%))
Counterparty Nominal Security Description
Unrealised
Loss GBP
% of Net
Assets
Citibank 62,064 Derwent London PLC (28,549) (0.01%)
Citibank (225,594) GB035 (3,610) (0.00%)
Citibank (465,741) GB097 (83,833) (0.01%)
Citibank (307,949) GB107 (36,954) (0.01%)
Citibank (15,500) GB141 (1,616,340) (0.29%)
Citibank (1,086,236) GB159 (152,073) (0.03%)
Citibank (827,322) GB164 (140,645) (0.02%)
Citibank (964,426) GB167 (25,075) (0.00%)
Citibank (877,312) GB194 (289,513) (0.05%)
Citibank (4,535,769) GB199 (40,822) (0.01%)
Citibank (3,864,020) GB200 (695,524) (0.12%)
Citibank (2,053,960) GB211 (277,285) (0.05%)
Citibank (140,479) GB214 (286,577) (0.05%)
Citibank (65,959) GB221 (230,856) (0.04%)
Citibank (246,267) GB222 (105,895) (0.02%)
Citibank (107,072) GB223 (10,707) (0.00%)
Citibank (1,165,083) GB227 (94,372) (0.02%)
Citibank 269,340 Great Portland Estates PLC (43,633) (0.01%)
Citibank (192,246) IE017 (76,666) (0.01%)
(4,238,929) (0.75%)
Currency Exchange Contracts - (0.15%) (2017 - (0.09%))
Actual
Settle Date
Issue
Currency
Currency
Bought
Settle
Currency
Currency
Sold
Citibank 15/01/2019 EUR 60,029,577 GBP 54,188,829 (323,010) (0.06%)
Citibank 15/01/2019 USD 84,935,491 GBP 66,991,646 (521,183) (0.09%)
Unrealised Loss on Currency Exchange Contracts at 31 December 2018 (844,193) (0.15%)
Value GBP
Total Financial Derivative Instruments (5,083,122) (0.90%)
Financial Liabilities at Fair Value Through Profit or Loss
(Cost GBP Nil) (2017: GBP Nil) (5,083,122) (0.90%)
Cash at Bank 78,746,989 13.89%
Other Net Liabilities (1,734,130) (0.30%)
Net Assets Value as at 31 December 2018 566,746,712 100.00%
% of Total
Portfolio Analysis Assets
Transferable securities admitted to official stock exchange listing 64.83%
Transferable securities dealt in on another regulated market 15.98%
Transferable securities other than the type referred to in Regulation 68(1) 4.90%
Financial derivative instruments dealt in on a regulated market 0.26%
OTC financial derivative instruments 0.00%
Other current assets 14.03%
Total Assets 100.00%
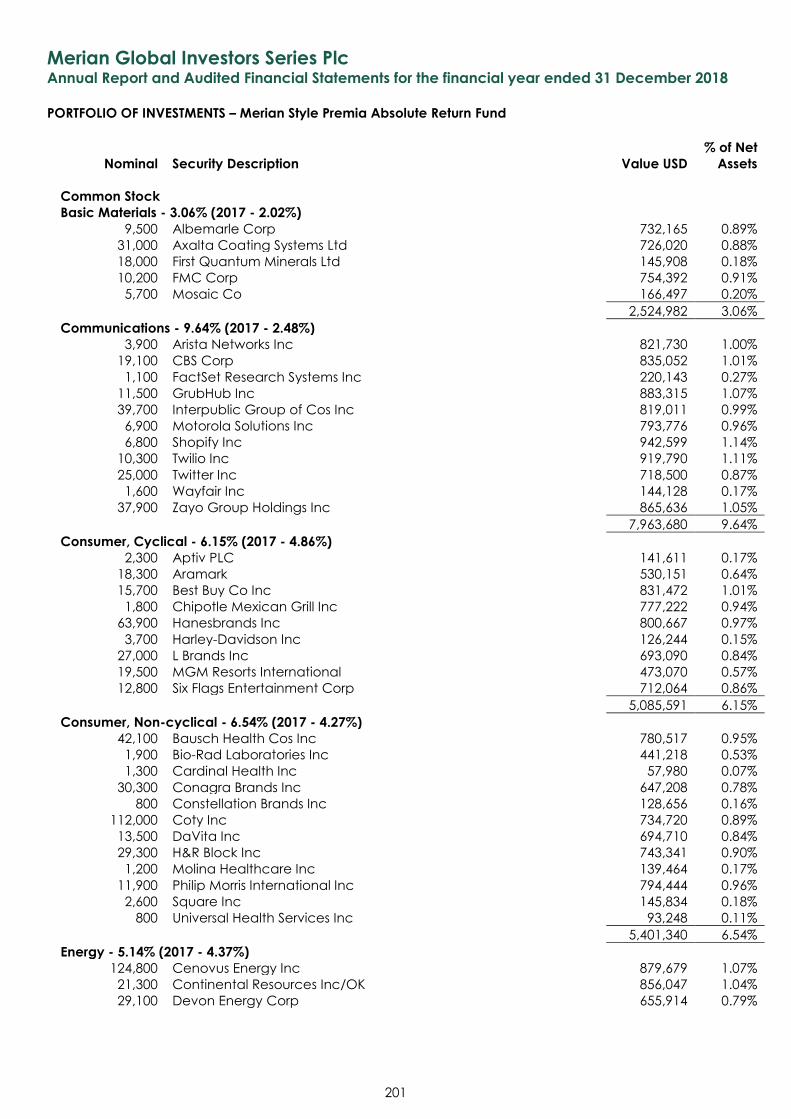
Merian Global Investors Series Plc Annual Report and Audited Financial Statements for the financial year ended 31 December 2018
PORTFOLIO OF INVESTMENTS – Merian Style Premia Absolute Return Fund
Nominal Security Description Value USD
% of Net
Assets
201
Common Stock Basic Materials - 3.06% (2017 - 2.02%)
9,500 Albemarle Corp 732,165 0.89%
31,000 Axalta Coating Systems Ltd 726,020 0.88%
18,000 First Quantum Minerals Ltd 145,908 0.18%
10,200 FMC Corp 754,392 0.91%
5,700 Mosaic Co 166,497 0.20%
2,524,982 3.06%
Communications - 9.64% (2017 - 2.48%) 3,900 Arista Networks Inc 821,730 1.00%
19,100 CBS Corp 835,052 1.01%
1,100 FactSet Research Systems Inc 220,143 0.27%
11,500 GrubHub Inc 883,315 1.07%
39,700 Interpublic Group of Cos Inc 819,011 0.99%
6,900 Motorola Solutions Inc 793,776 0.96%
6,800 Shopify Inc 942,599 1.14%
10,300 Twilio Inc 919,790 1.11%
25,000 Twitter Inc 718,500 0.87%
1,600 Wayfair Inc 144,128 0.17%
37,900 Zayo Group Holdings Inc 865,636 1.05%
7,963,680 9.64%
Consumer, Cyclical - 6.15% (2017 - 4.86%) 2,300 Aptiv PLC 141,611 0.17%
18,300 Aramark 530,151 0.64%
15,700 Best Buy Co Inc 831,472 1.01%
1,800 Chipotle Mexican Grill Inc 777,222 0.94%
63,900 Hanesbrands Inc 800,667 0.97%
3,700 Harley-Davidson Inc 126,244 0.15%
27,000 L Brands Inc 693,090 0.84%
19,500 MGM Resorts International 473,070 0.57%
12,800 Six Flags Entertainment Corp 712,064 0.86%
5,085,591 6.15%
Consumer, Non-cyclical - 6.54% (2017 - 4.27%) 42,100 Bausch Health Cos Inc 780,517 0.95%
1,900 Bio-Rad Laboratories Inc 441,218 0.53%
1,300 Cardinal Health Inc 57,980 0.07%
30,300 Conagra Brands Inc 647,208 0.78%
800 Constellation Brands Inc 128,656 0.16%
112,000 Coty Inc 734,720 0.89%
13,500 DaVita Inc 694,710 0.84%
29,300 H&R Block Inc 743,341 0.90%
1,200 Molina Healthcare Inc 139,464 0.17%
11,900 Philip Morris International Inc 794,444 0.96%
2,600 Square Inc 145,834 0.18%
800 Universal Health Services Inc 93,248 0.11%
5,401,340 6.54%
Energy - 5.14% (2017 - 4.37%) 124,800 Cenovus Energy Inc 879,679 1.07%
21,300 Continental Resources Inc/OK 856,047 1.04%
29,100 Devon Energy Corp 655,914 0.79%
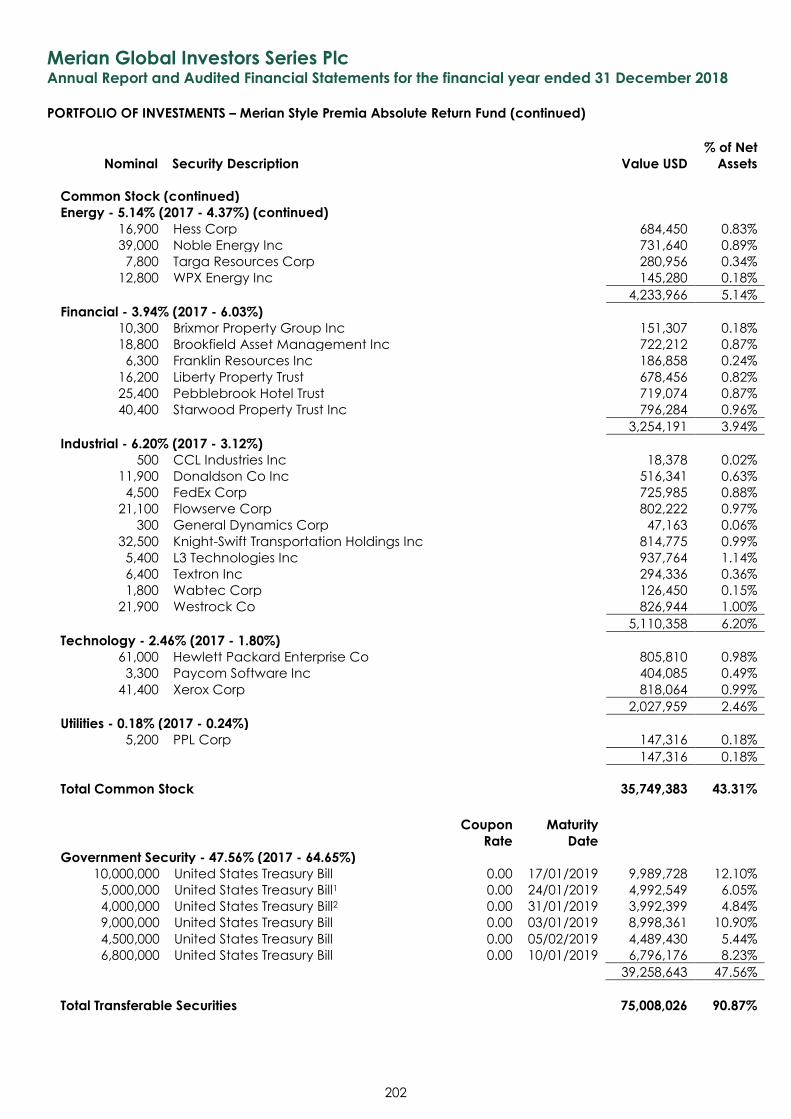
Merian Global Investors Series Plc Annual Report and Audited Financial Statements for the financial year ended 31 December 2018
PORTFOLIO OF INVESTMENTS – Merian Style Premia Absolute Return Fund (continued)
Nominal Security Description Value USD
% of Net
Assets
202
Common Stock (continued) Energy - 5.14% (2017 - 4.37%) (continued)
16,900 Hess Corp 684,450 0.83%
39,000 Noble Energy Inc 731,640 0.89%
7,800 Targa Resources Corp 280,956 0.34%
12,800 WPX Energy Inc 145,280 0.18%
4,233,966 5.14%
Financial - 3.94% (2017 - 6.03%) 10,300 Brixmor Property Group Inc 151,307 0.18%
18,800 Brookfield Asset Management Inc 722,212 0.87%
6,300 Franklin Resources Inc 186,858 0.24%
16,200 Liberty Property Trust 678,456 0.82%
25,400 Pebblebrook Hotel Trust 719,074 0.87%
40,400 Starwood Property Trust Inc 796,284 0.96%
3,254,191 3.94%
Industrial - 6.20% (2017 - 3.12%) 500 CCL Industries Inc 18,378 0.02%
11,900 Donaldson Co Inc 516,341 0.63%
4,500 FedEx Corp 725,985 0.88%
21,100 Flowserve Corp 802,222 0.97%
300 General Dynamics Corp 47,163 0.06%
32,500 Knight-Swift Transportation Holdings Inc 814,775 0.99%
5,400 L3 Technologies Inc 937,764 1.14%
6,400 Textron Inc 294,336 0.36%
1,800 Wabtec Corp 126,450 0.15%
21,900 Westrock Co 826,944 1.00%
5,110,358 6.20%
Technology - 2.46% (2017 - 1.80%) 61,000 Hewlett Packard Enterprise Co 805,810 0.98%
3,300 Paycom Software Inc 404,085 0.49%
41,400 Xerox Corp 818,064 0.99%
2,027,959 2.46%
Utilities - 0.18% (2017 - 0.24%) 5,200 PPL Corp 147,316 0.18%
147,316 0.18%
Total Common Stock 35,749,383 43.31%
Coupon
Rate
Maturity
Date Government Security - 47.56% (2017 - 64.65%)
10,000,000 United States Treasury Bill 0.00 17/01/2019 9,989,728 12.10%
5,000,000 United States Treasury Bill1 0.00 24/01/2019 4,992,549 6.05%
4,000,000 United States Treasury Bill2 0.00 31/01/2019 3,992,399 4.84%
9,000,000 United States Treasury Bill 0.00 03/01/2019 8,998,361 10.90%
4,500,000 United States Treasury Bill 0.00 05/02/2019 4,489,430 5.44%
6,800,000 United States Treasury Bill 0.00 10/01/2019 6,796,176 8.23%
39,258,643 47.56%
Total Transferable Securities 75,008,026 90.87%
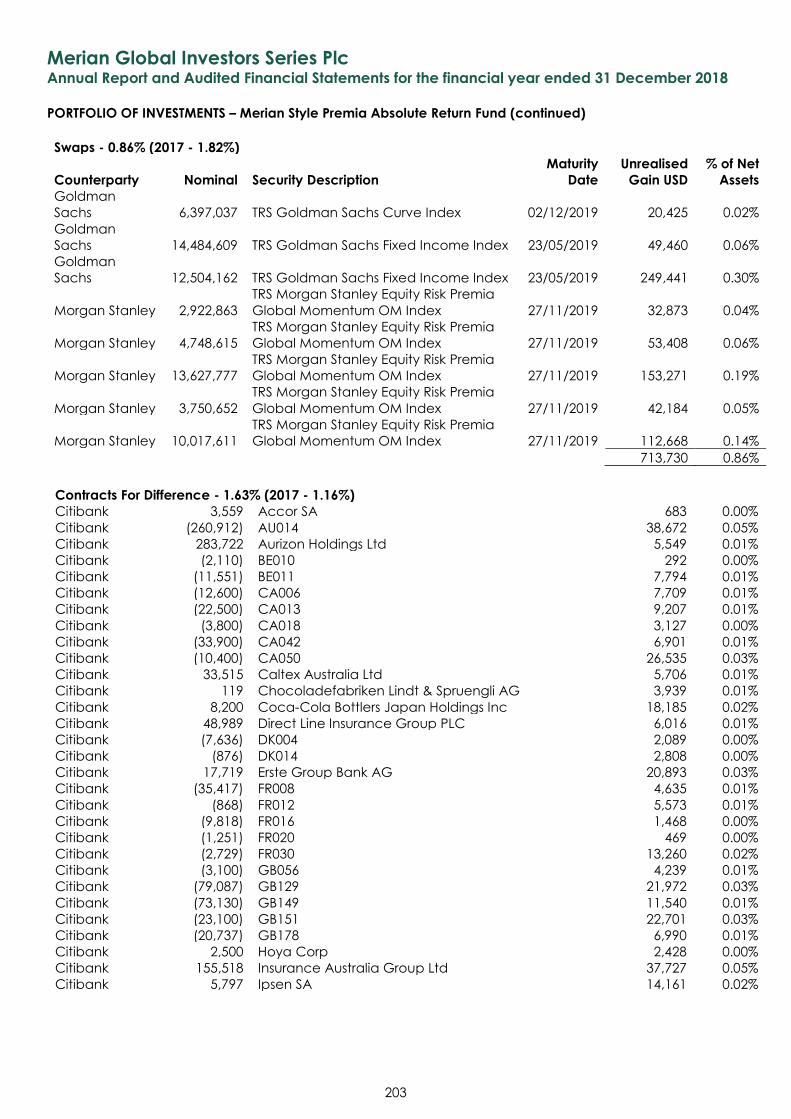
Merian Global Investors Series Plc Annual Report and Audited Financial Statements for the financial year ended 31 December 2018
PORTFOLIO OF INVESTMENTS – Merian Style Premia Absolute Return Fund (continued)
203
Swaps - 0.86% (2017 - 1.82%)
Counterparty Nominal Security Description
Maturity
Date
Unrealised
Gain USD
% of Net
Assets
Goldman
Sachs 6,397,037 TRS Goldman Sachs Curve Index 02/12/2019 20,425 0.02%
Goldman
Sachs 14,484,609 TRS Goldman Sachs Fixed Income Index 23/05/2019 49,460 0.06%
Goldman
Sachs 12,504,162 TRS Goldman Sachs Fixed Income Index 23/05/2019 249,441 0.30%
Morgan Stanley 2,922,863
TRS Morgan Stanley Equity Risk Premia
Global Momentum OM Index 27/11/2019 32,873 0.04%
Morgan Stanley 4,748,615
TRS Morgan Stanley Equity Risk Premia
Global Momentum OM Index 27/11/2019 53,408 0.06%
Morgan Stanley 13,627,777
TRS Morgan Stanley Equity Risk Premia
Global Momentum OM Index 27/11/2019 153,271 0.19%
Morgan Stanley 3,750,652
TRS Morgan Stanley Equity Risk Premia
Global Momentum OM Index 27/11/2019 42,184 0.05%
Morgan Stanley 10,017,611
TRS Morgan Stanley Equity Risk Premia
Global Momentum OM Index 27/11/2019 112,668 0.14%
713,730 0.86%
Contracts For Difference - 1.63% (2017 - 1.16%) Citibank 3,559 Accor SA 683 0.00%
Citibank (260,912) AU014 38,672 0.05%
Citibank 283,722 Aurizon Holdings Ltd 5,549 0.01%
Citibank (2,110) BE010 292 0.00%
Citibank (11,551) BE011 7,794 0.01%
Citibank (12,600) CA006 7,709 0.01%
Citibank (22,500) CA013 9,207 0.01%
Citibank (3,800) CA018 3,127 0.00%
Citibank (33,900) CA042 6,901 0.01%
Citibank (10,400) CA050 26,535 0.03%
Citibank 33,515 Caltex Australia Ltd 5,706 0.01%
Citibank 119 Chocoladefabriken Lindt & Spruengli AG 3,939 0.01%
Citibank 8,200 Coca-Cola Bottlers Japan Holdings Inc 18,185 0.02%
Citibank 48,989 Direct Line Insurance Group PLC 6,016 0.01%
Citibank (7,636) DK004 2,089 0.00%
Citibank (876) DK014 2,808 0.00%
Citibank 17,719 Erste Group Bank AG 20,893 0.03%
Citibank (35,417) FR008 4,635 0.01%
Citibank (868) FR012 5,573 0.01%
Citibank (9,818) FR016 1,468 0.00%
Citibank (1,251) FR020 469 0.00%
Citibank (2,729) FR030 13,260 0.02%
Citibank (3,100) GB056 4,239 0.01%
Citibank (79,087) GB129 21,972 0.03%
Citibank (73,130) GB149 11,540 0.01%
Citibank (23,100) GB151 22,701 0.03%
Citibank (20,737) GB178 6,990 0.01%
Citibank 2,500 Hoya Corp 2,428 0.00%
Citibank 155,518 Insurance Australia Group Ltd 37,727 0.05%
Citibank 5,797 Ipsen SA 14,161 0.02%
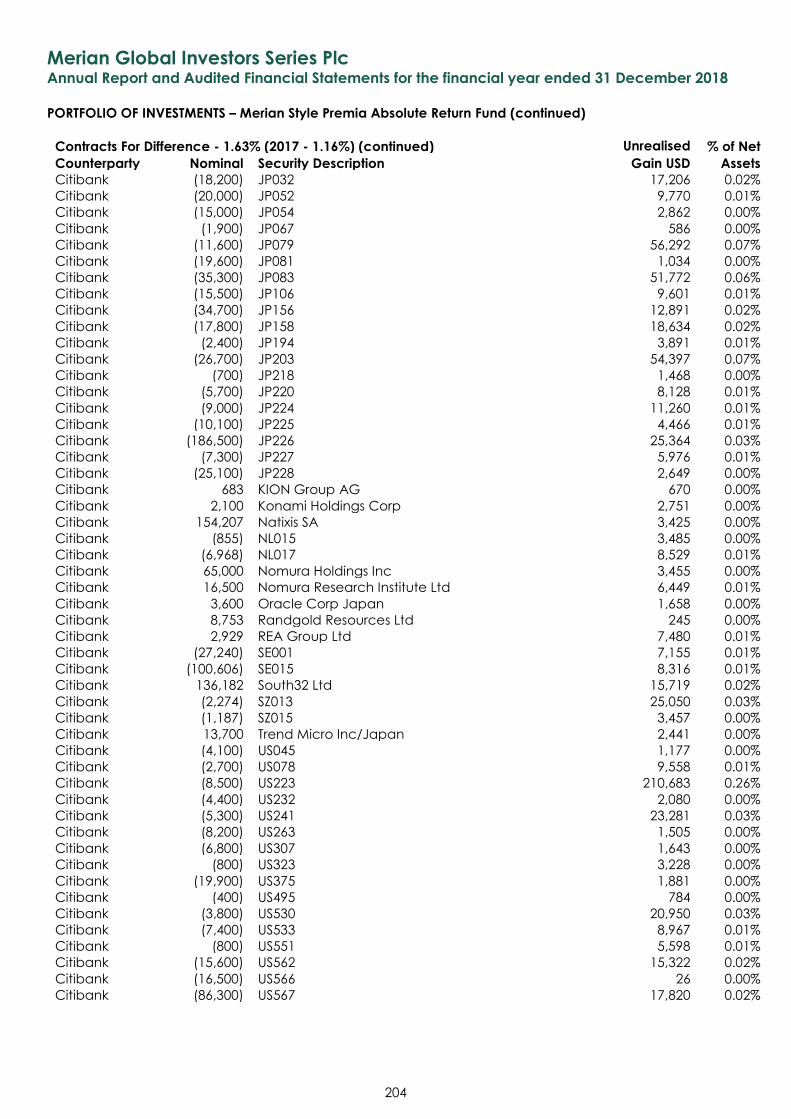
Merian Global Investors Series Plc Annual Report and Audited Financial Statements for the financial year ended 31 December 2018
PORTFOLIO OF INVESTMENTS – Merian Style Premia Absolute Return Fund (continued)
204
Contracts For Difference - 1.63% (2017 - 1.16%) (continued) Unrealised % of Net
Counterparty Nominal Security Description Gain USD Assets
Citibank (18,200) JP032 17,206 0.02%
Citibank (20,000) JP052 9,770 0.01%
Citibank (15,000) JP054 2,862 0.00%
Citibank (1,900) JP067 586 0.00%
Citibank (11,600) JP079 56,292 0.07%
Citibank (19,600) JP081 1,034 0.00%
Citibank (35,300) JP083 51,772 0.06%
Citibank (15,500) JP106 9,601 0.01%
Citibank (34,700) JP156 12,891 0.02%
Citibank (17,800) JP158 18,634 0.02%
Citibank (2,400) JP194 3,891 0.01%
Citibank (26,700) JP203 54,397 0.07%
Citibank (700) JP218 1,468 0.00%
Citibank (5,700) JP220 8,128 0.01%
Citibank (9,000) JP224 11,260 0.01%
Citibank (10,100) JP225 4,466 0.01%
Citibank (186,500) JP226 25,364 0.03%
Citibank (7,300) JP227 5,976 0.01%
Citibank (25,100) JP228 2,649 0.00%
Citibank 683 KION Group AG 670 0.00%
Citibank 2,100 Konami Holdings Corp 2,751 0.00%
Citibank 154,207 Natixis SA 3,425 0.00%
Citibank (855) NL015 3,485 0.00%
Citibank (6,968) NL017 8,529 0.01%
Citibank 65,000 Nomura Holdings Inc 3,455 0.00%
Citibank 16,500 Nomura Research Institute Ltd 6,449 0.01%
Citibank 3,600 Oracle Corp Japan 1,658 0.00%
Citibank 8,753 Randgold Resources Ltd 245 0.00%
Citibank 2,929 REA Group Ltd 7,480 0.01%
Citibank (27,240) SE001 7,155 0.01%
Citibank (100,606) SE015 8,316 0.01%
Citibank 136,182 South32 Ltd 15,719 0.02%
Citibank (2,274) SZ013 25,050 0.03%
Citibank (1,187) SZ015 3,457 0.00%
Citibank 13,700 Trend Micro Inc/Japan 2,441 0.00%
Citibank (4,100) US045 1,177 0.00%
Citibank (2,700) US078 9,558 0.01%
Citibank (8,500) US223 210,683 0.26%
Citibank (4,400) US232 2,080 0.00%
Citibank (5,300) US241 23,281 0.03%
Citibank (8,200) US263 1,505 0.00%
Citibank (6,800) US307 1,643 0.00%
Citibank (800) US323 3,228 0.00%
Citibank (19,900) US375 1,881 0.00%
Citibank (400) US495 784 0.00%
Citibank (3,800) US530 20,950 0.03%
Citibank (7,400) US533 8,967 0.01%
Citibank (800) US551 5,598 0.01%
Citibank (15,600) US562 15,322 0.02%
Citibank (16,500) US566 26 0.00%
Citibank (86,300) US567 17,820 0.02%
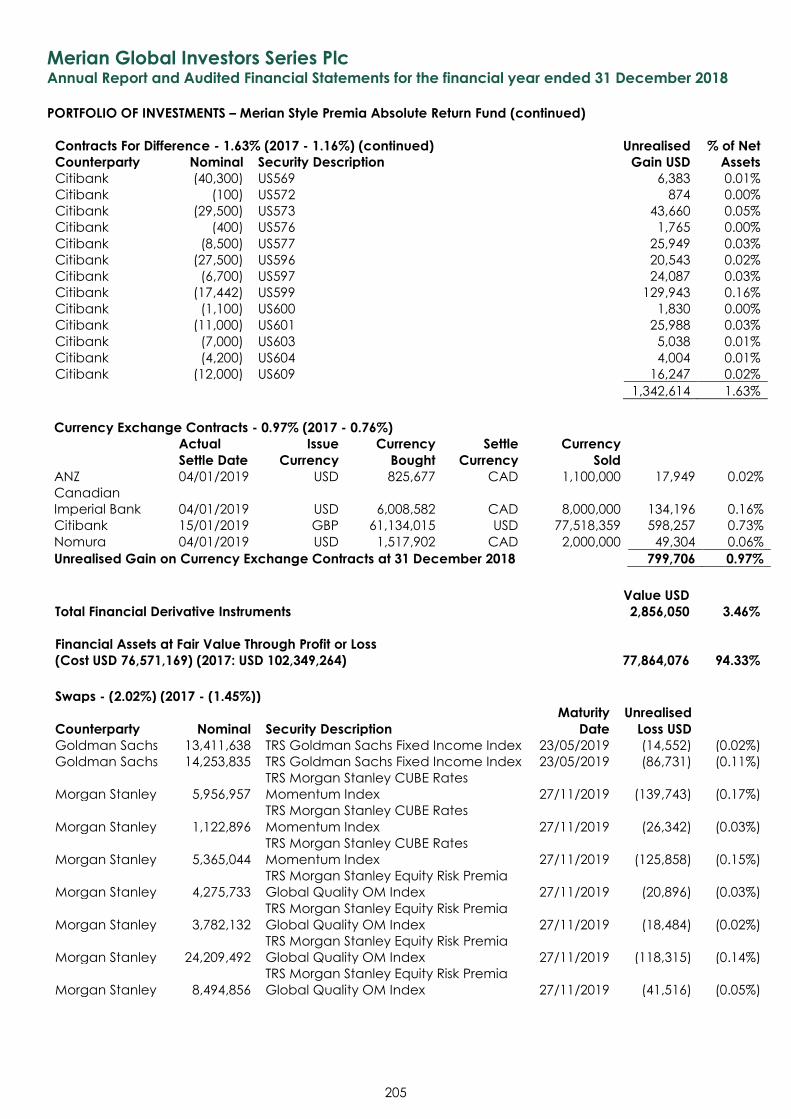
Merian Global Investors Series Plc Annual Report and Audited Financial Statements for the financial year ended 31 December 2018
PORTFOLIO OF INVESTMENTS – Merian Style Premia Absolute Return Fund (continued)
205
Contracts For Difference - 1.63% (2017 - 1.16%) (continued) Unrealised % of Net
Counterparty Nominal Security Description Gain USD Assets
Citibank (40,300) US569 6,383 0.01%
Citibank (100) US572 874 0.00%
Citibank (29,500) US573 43,660 0.05%
Citibank (400) US576 1,765 0.00%
Citibank (8,500) US577 25,949 0.03%
Citibank (27,500) US596 20,543 0.02%
Citibank (6,700) US597 24,087 0.03%
Citibank (17,442) US599 129,943 0.16%
Citibank (1,100) US600 1,830 0.00%
Citibank (11,000) US601 25,988 0.03%
Citibank (7,000) US603 5,038 0.01%
Citibank (4,200) US604 4,004 0.01%
Citibank (12,000) US609 16,247 0.02%
1,342,614 1.63%
Currency Exchange Contracts - 0.97% (2017 - 0.76%)
Actual
Settle Date
Issue
Currency
Currency
Bought
Settle
Currency
Currency
Sold ANZ 04/01/2019 USD 825,677 CAD 1,100,000 17,949 0.02%
Canadian
Imperial Bank 04/01/2019 USD 6,008,582 CAD 8,000,000 134,196 0.16%
Citibank 15/01/2019 GBP 61,134,015 USD 77,518,359 598,257 0.73%
Nomura 04/01/2019 USD 1,517,902 CAD 2,000,000 49,304 0.06%
Unrealised Gain on Currency Exchange Contracts at 31 December 2018 799,706 0.97%
Value USD
Total Financial Derivative Instruments 2,856,050 3.46%
Financial Assets at Fair Value Through Profit or Loss
(Cost USD 76,571,169) (2017: USD 102,349,264) 77,864,076 94.33%
Swaps - (2.02%) (2017 - (1.45%))
Counterparty Nominal Security Description
Maturity
Date
Unrealised
Loss USD
Goldman Sachs 13,411,638 TRS Goldman Sachs Fixed Income Index 23/05/2019 (14,552) (0.02%)
Goldman Sachs 14,253,835 TRS Goldman Sachs Fixed Income Index 23/05/2019 (86,731) (0.11%)
Morgan Stanley 5,956,957
TRS Morgan Stanley CUBE Rates
Momentum Index 27/11/2019 (139,743) (0.17%)
Morgan Stanley 1,122,896
TRS Morgan Stanley CUBE Rates
Momentum Index 27/11/2019 (26,342) (0.03%)
Morgan Stanley 5,365,044
TRS Morgan Stanley CUBE Rates
Momentum Index 27/11/2019 (125,858) (0.15%)
Morgan Stanley 4,275,733
TRS Morgan Stanley Equity Risk Premia
Global Quality OM Index 27/11/2019 (20,896) (0.03%)
Morgan Stanley 3,782,132
TRS Morgan Stanley Equity Risk Premia
Global Quality OM Index 27/11/2019 (18,484) (0.02%)
Morgan Stanley 24,209,492
TRS Morgan Stanley Equity Risk Premia
Global Quality OM Index 27/11/2019 (118,315) (0.14%)
Morgan Stanley 8,494,856
TRS Morgan Stanley Equity Risk Premia
Global Quality OM Index 27/11/2019 (41,516) (0.05%)
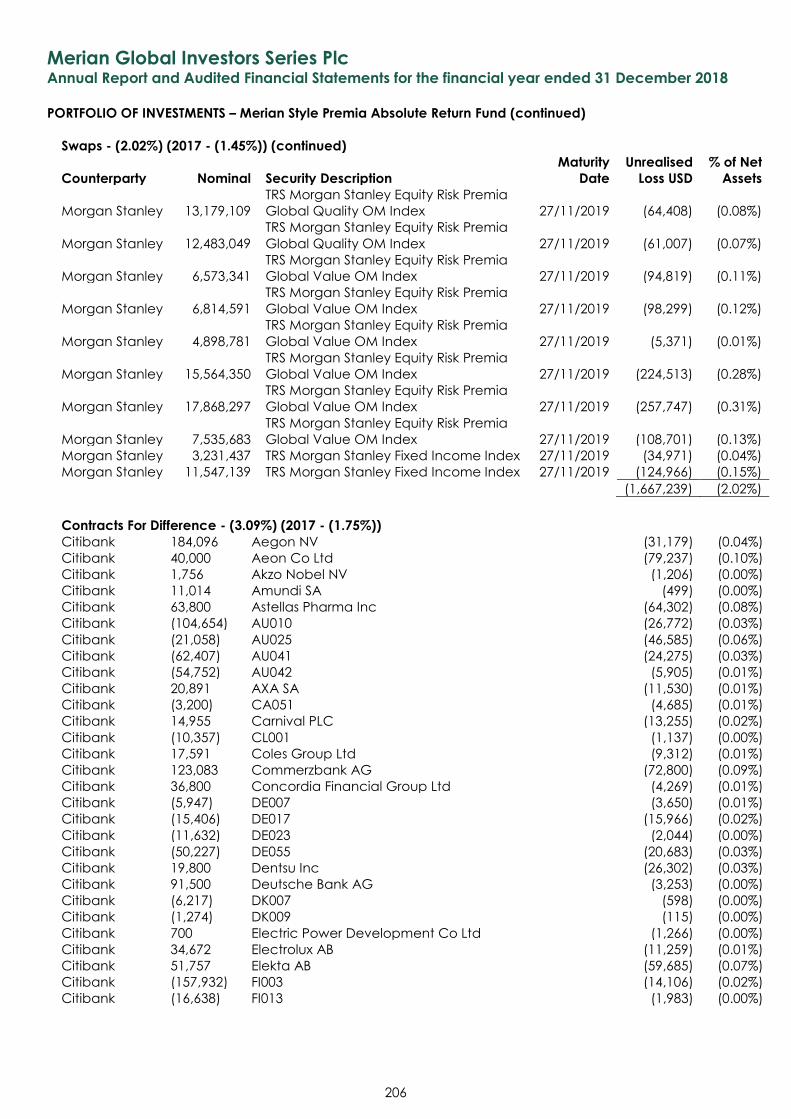
Merian Global Investors Series Plc Annual Report and Audited Financial Statements for the financial year ended 31 December 2018
PORTFOLIO OF INVESTMENTS – Merian Style Premia Absolute Return Fund (continued)
206
Swaps - (2.02%) (2017 - (1.45%)) (continued)
Counterparty Nominal Security Description
Maturity
Date
Unrealised
Loss USD
% of Net
Assets
Morgan Stanley 13,179,109
TRS Morgan Stanley Equity Risk Premia
Global Quality OM Index 27/11/2019 (64,408) (0.08%)
Morgan Stanley 12,483,049
TRS Morgan Stanley Equity Risk Premia
Global Quality OM Index 27/11/2019 (61,007) (0.07%)
Morgan Stanley 6,573,341
TRS Morgan Stanley Equity Risk Premia
Global Value OM Index 27/11/2019 (94,819) (0.11%)
Morgan Stanley 6,814,591
TRS Morgan Stanley Equity Risk Premia
Global Value OM Index 27/11/2019 (98,299) (0.12%)
Morgan Stanley 4,898,781
TRS Morgan Stanley Equity Risk Premia
Global Value OM Index 27/11/2019 (5,371) (0.01%)
Morgan Stanley 15,564,350
TRS Morgan Stanley Equity Risk Premia
Global Value OM Index 27/11/2019 (224,513) (0.28%)
Morgan Stanley 17,868,297
TRS Morgan Stanley Equity Risk Premia
Global Value OM Index 27/11/2019 (257,747) (0.31%)
Morgan Stanley 7,535,683
TRS Morgan Stanley Equity Risk Premia
Global Value OM Index 27/11/2019 (108,701) (0.13%)
Morgan Stanley 3,231,437 TRS Morgan Stanley Fixed Income Index 27/11/2019 (34,971) (0.04%)
Morgan Stanley 11,547,139 TRS Morgan Stanley Fixed Income Index 27/11/2019 (124,966) (0.15%)
(1,667,239) (2.02%)
Contracts For Difference - (3.09%) (2017 - (1.75%)) Citibank 184,096 Aegon NV (31,179) (0.04%)
Citibank 40,000 Aeon Co Ltd (79,237) (0.10%)
Citibank 1,756 Akzo Nobel NV (1,206) (0.00%)
Citibank 11,014 Amundi SA (499) (0.00%)
Citibank 63,800 Astellas Pharma Inc (64,302) (0.08%)
Citibank (104,654) AU010 (26,772) (0.03%)
Citibank (21,058) AU025 (46,585) (0.06%)
Citibank (62,407) AU041 (24,275) (0.03%)
Citibank (54,752) AU042 (5,905) (0.01%)
Citibank 20,891 AXA SA (11,530) (0.01%)
Citibank (3,200) CA051 (4,685) (0.01%)
Citibank 14,955 Carnival PLC (13,255) (0.02%)
Citibank (10,357) CL001 (1,137) (0.00%)
Citibank 17,591 Coles Group Ltd (9,312) (0.01%)
Citibank 123,083 Commerzbank AG (72,800) (0.09%)
Citibank 36,800 Concordia Financial Group Ltd (4,269) (0.01%)
Citibank (5,947) DE007 (3,650) (0.01%)
Citibank (15,406) DE017 (15,966) (0.02%)
Citibank (11,632) DE023 (2,044) (0.00%)
Citibank (50,227) DE055 (20,683) (0.03%)
Citibank 19,800 Dentsu Inc (26,302) (0.03%)
Citibank 91,500 Deutsche Bank AG (3,253) (0.00%)
Citibank (6,217) DK007 (598) (0.00%)
Citibank (1,274) DK009 (115) (0.00%)
Citibank 700 Electric Power Development Co Ltd (1,266) (0.00%)
Citibank 34,672 Electrolux AB (11,259) (0.01%)
Citibank 51,757 Elekta AB (59,685) (0.07%)
Citibank (157,932) FI003 (14,106) (0.02%)
Citibank (16,638) FI013 (1,983) (0.00%)
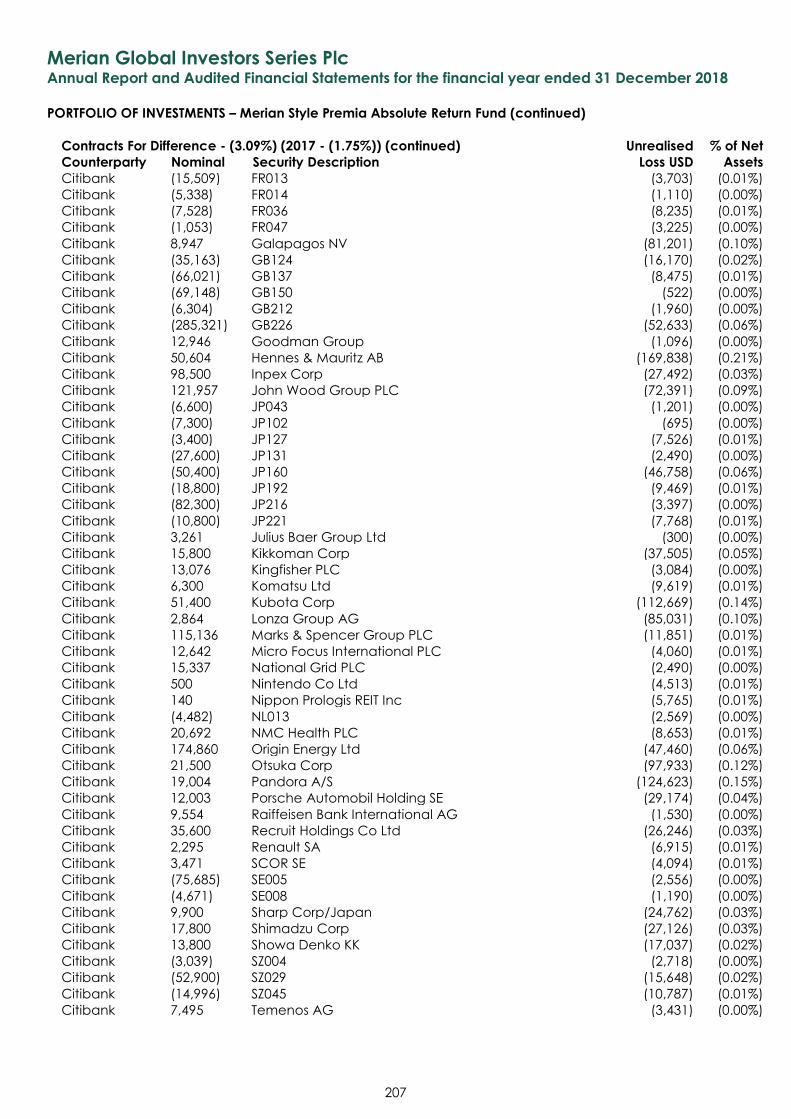
Merian Global Investors Series Plc Annual Report and Audited Financial Statements for the financial year ended 31 December 2018
PORTFOLIO OF INVESTMENTS – Merian Style Premia Absolute Return Fund (continued)
207
Contracts For Difference - (3.09%) (2017 - (1.75%)) (continued) Unrealised % of Net
Counterparty Nominal Security Description Loss USD Assets
Citibank (15,509) FR013 (3,703) (0.01%)
Citibank (5,338) FR014 (1,110) (0.00%)
Citibank (7,528) FR036 (8,235) (0.01%)
Citibank (1,053) FR047 (3,225) (0.00%)
Citibank 8,947 Galapagos NV (81,201) (0.10%)
Citibank (35,163) GB124 (16,170) (0.02%)
Citibank (66,021) GB137 (8,475) (0.01%)
Citibank (69,148) GB150 (522) (0.00%)
Citibank (6,304) GB212 (1,960) (0.00%)
Citibank (285,321) GB226 (52,633) (0.06%)
Citibank 12,946 Goodman Group (1,096) (0.00%)
Citibank 50,604 Hennes & Mauritz AB (169,838) (0.21%)
Citibank 98,500 Inpex Corp (27,492) (0.03%)
Citibank 121,957 John Wood Group PLC (72,391) (0.09%)
Citibank (6,600) JP043 (1,201) (0.00%)
Citibank (7,300) JP102 (695) (0.00%)
Citibank (3,400) JP127 (7,526) (0.01%)
Citibank (27,600) JP131 (2,490) (0.00%)
Citibank (50,400) JP160 (46,758) (0.06%)
Citibank (18,800) JP192 (9,469) (0.01%)
Citibank (82,300) JP216 (3,397) (0.00%)
Citibank (10,800) JP221 (7,768) (0.01%)
Citibank 3,261 Julius Baer Group Ltd (300) (0.00%)
Citibank 15,800 Kikkoman Corp (37,505) (0.05%)
Citibank 13,076 Kingfisher PLC (3,084) (0.00%)
Citibank 6,300 Komatsu Ltd (9,619) (0.01%)
Citibank 51,400 Kubota Corp (112,669) (0.14%)
Citibank 2,864 Lonza Group AG (85,031) (0.10%)
Citibank 115,136 Marks & Spencer Group PLC (11,851) (0.01%)
Citibank 12,642 Micro Focus International PLC (4,060) (0.01%)
Citibank 15,337 National Grid PLC (2,490) (0.00%)
Citibank 500 Nintendo Co Ltd (4,513) (0.01%)
Citibank 140 Nippon Prologis REIT Inc (5,765) (0.01%)
Citibank (4,482) NL013 (2,569) (0.00%)
Citibank 20,692 NMC Health PLC (8,653) (0.01%)
Citibank 174,860 Origin Energy Ltd (47,460) (0.06%)
Citibank 21,500 Otsuka Corp (97,933) (0.12%)
Citibank 19,004 Pandora A/S (124,623) (0.15%)
Citibank 12,003 Porsche Automobil Holding SE (29,174) (0.04%)
Citibank 9,554 Raiffeisen Bank International AG (1,530) (0.00%)
Citibank 35,600 Recruit Holdings Co Ltd (26,246) (0.03%)
Citibank 2,295 Renault SA (6,915) (0.01%)
Citibank 3,471 SCOR SE (4,094) (0.01%)
Citibank (75,685) SE005 (2,556) (0.00%)
Citibank (4,671) SE008 (1,190) (0.00%)
Citibank 9,900 Sharp Corp/Japan (24,762) (0.03%)
Citibank 17,800 Shimadzu Corp (27,126) (0.03%)
Citibank 13,800 Showa Denko KK (17,037) (0.02%)
Citibank (3,039) SZ004 (2,718) (0.00%)
Citibank (52,900) SZ029 (15,648) (0.02%)
Citibank (14,996) SZ045 (10,787) (0.01%)
Citibank 7,495 Temenos AG (3,431) (0.00%)
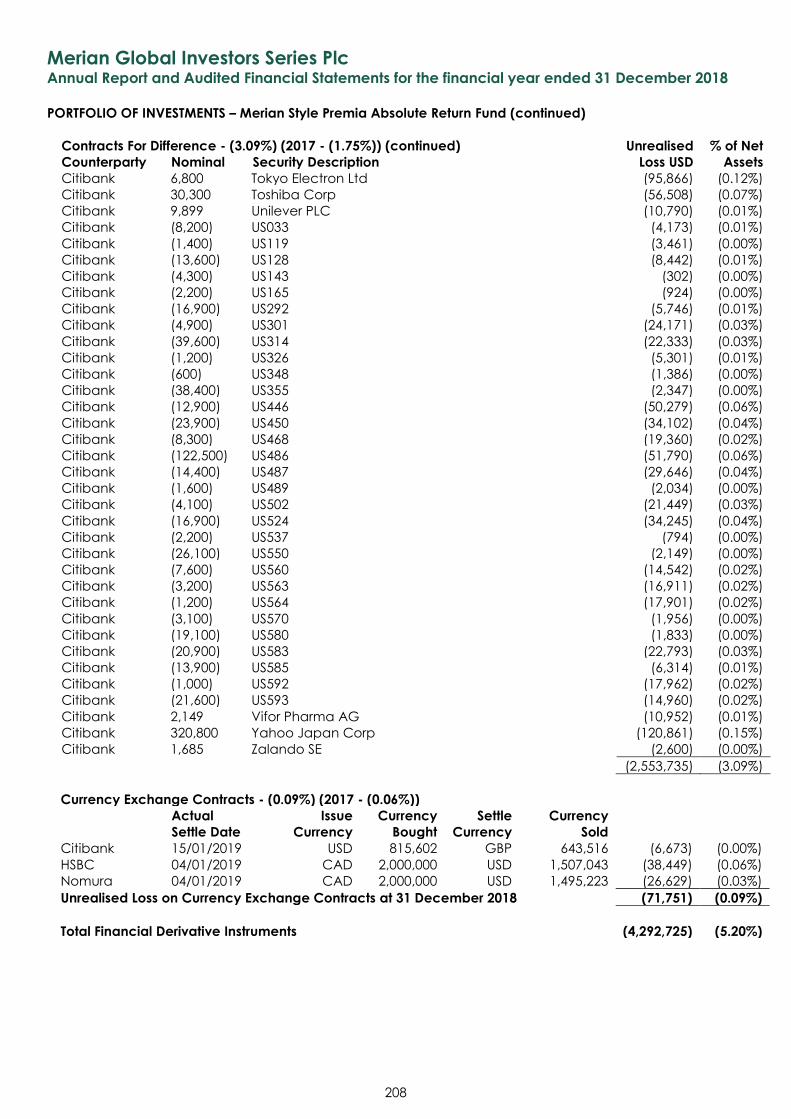
Merian Global Investors Series Plc Annual Report and Audited Financial Statements for the financial year ended 31 December 2018
PORTFOLIO OF INVESTMENTS – Merian Style Premia Absolute Return Fund (continued)
208
Contracts For Difference - (3.09%) (2017 - (1.75%)) (continued) Unrealised % of Net
Counterparty Nominal Security Description Loss USD Assets
Citibank 6,800 Tokyo Electron Ltd
(95,866) (0.12%)
Citibank 30,300 Toshiba Corp
(56,508) (0.07%)
Citibank 9,899 Unilever PLC
(10,790) (0.01%)
Citibank (8,200) US033
(4,173) (0.01%)
Citibank (1,400) US119
(3,461) (0.00%)
Citibank (13,600) US128
(8,442) (0.01%)
Citibank (4,300) US143
(302) (0.00%)
Citibank (2,200) US165
(924) (0.00%)
Citibank (16,900) US292
(5,746) (0.01%)
Citibank (4,900) US301
(24,171) (0.03%)
Citibank (39,600) US314
(22,333) (0.03%)
Citibank (1,200) US326
(5,301) (0.01%)
Citibank (600) US348
(1,386) (0.00%)
Citibank (38,400) US355
(2,347) (0.00%)
Citibank (12,900) US446
(50,279) (0.06%)
Citibank (23,900) US450
(34,102) (0.04%)
Citibank (8,300) US468
(19,360) (0.02%)
Citibank (122,500) US486
(51,790) (0.06%)
Citibank (14,400) US487
(29,646) (0.04%)
Citibank (1,600) US489
(2,034) (0.00%)
Citibank (4,100) US502
(21,449) (0.03%)
Citibank (16,900) US524
(34,245) (0.04%)
Citibank (2,200) US537
(794) (0.00%)
Citibank (26,100) US550
(2,149) (0.00%)
Citibank (7,600) US560
(14,542) (0.02%)
Citibank (3,200) US563
(16,911) (0.02%)
Citibank (1,200) US564
(17,901) (0.02%)
Citibank (3,100) US570
(1,956) (0.00%)
Citibank (19,100) US580
(1,833) (0.00%)
Citibank (20,900) US583
(22,793) (0.03%)
Citibank (13,900) US585
(6,314) (0.01%)
Citibank (1,000) US592
(17,962) (0.02%)
Citibank (21,600) US593
(14,960) (0.02%)
Citibank 2,149 Vifor Pharma AG
(10,952) (0.01%)
Citibank 320,800 Yahoo Japan Corp
(120,861) (0.15%)
Citibank 1,685 Zalando SE
(2,600) (0.00%)
(2,553,735) (3.09%)
Currency Exchange Contracts - (0.09%) (2017 - (0.06%))
Actual
Settle Date
Issue
Currency
Currency
Bought
Settle
Currency
Currency
Sold Citibank 15/01/2019 USD 815,602 GBP 643,516 (6,673) (0.00%)
HSBC 04/01/2019 CAD 2,000,000 USD 1,507,043 (38,449) (0.06%)
Nomura 04/01/2019 CAD 2,000,000 USD 1,495,223 (26,629) (0.03%)
Unrealised Loss on Currency Exchange Contracts at 31 December 2018 (71,751) (0.09%)
Total Financial Derivative Instruments (4,292,725) (5.20%)
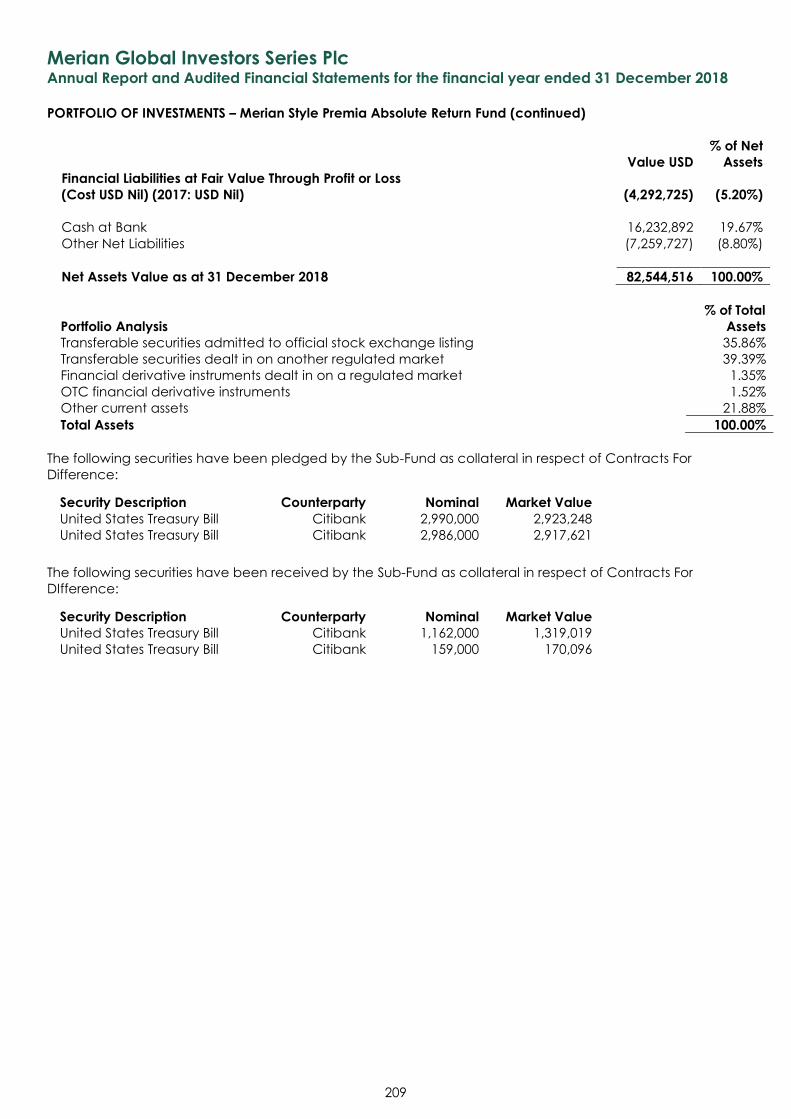
Merian Global Investors Series Plc Annual Report and Audited Financial Statements for the financial year ended 31 December 2018
PORTFOLIO OF INVESTMENTS – Merian Style Premia Absolute Return Fund (continued)
209
Value USD
% of Net
Assets
Financial Liabilities at Fair Value Through Profit or Loss
(Cost USD Nil) (2017: USD Nil) (4,292,725) (5.20%)
Cash at Bank 16,232,892 19.67%
Other Net Liabilities (7,259,727) (8.80%)
Net Assets Value as at 31 December 2018 82,544,516 100.00%
% of Total
Portfolio Analysis Assets
Transferable securities admitted to official stock exchange listing 35.86%
Transferable securities dealt in on another regulated market 39.39%
Financial derivative instruments dealt in on a regulated market 1.35%
OTC financial derivative instruments 1.52%
Other current assets 21.88%
Total Assets 100.00%
The following securities have been pledged by the Sub-Fund as collateral in respect of Contracts For
Difference:
The following securities have been received by the Sub-Fund as collateral in respect of Contracts For
DIfference:
Security Description Counterparty Nominal Market Value
United States Treasury Bill Citibank 2,990,000 2,923,248
United States Treasury Bill Citibank 2,986,000 2,917,621
Security Description Counterparty Nominal Market Value
United States Treasury Bill Citibank 1,162,000 1,319,019
United States Treasury Bill Citibank 159,000 170,096
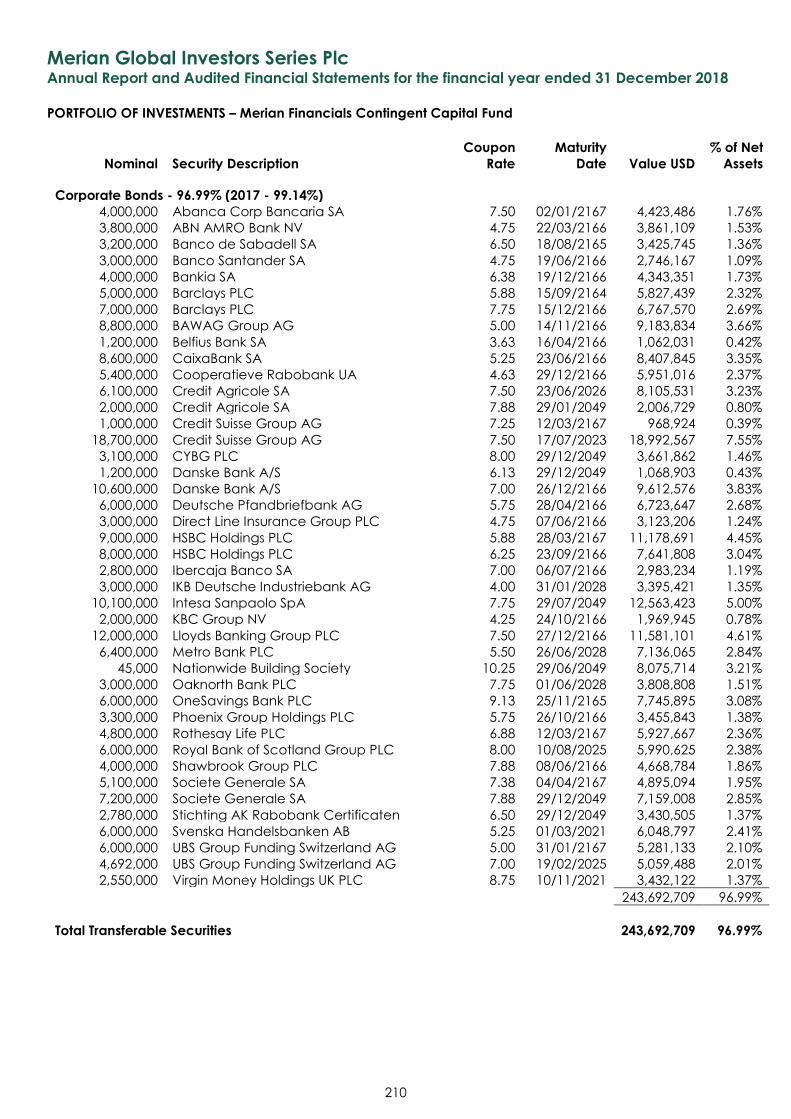
Merian Global Investors Series Plc Annual Report and Audited Financial Statements for the financial year ended 31 December 2018
PORTFOLIO OF INVESTMENTS – Merian Financials Contingent Capital Fund
Nominal Security Description
Coupon
Rate
Maturity
Date Value USD
% of Net
Assets
210
Corporate Bonds - 96.99% (2017 - 99.14%) 4,000,000 Abanca Corp Bancaria SA 7.50 02/01/2167 4,423,486 1.76%
3,800,000 ABN AMRO Bank NV 4.75 22/03/2166 3,861,109 1.53%
3,200,000 Banco de Sabadell SA 6.50 18/08/2165 3,425,745 1.36%
3,000,000 Banco Santander SA 4.75 19/06/2166 2,746,167 1.09%
4,000,000 Bankia SA 6.38 19/12/2166 4,343,351 1.73%
5,000,000 Barclays PLC 5.88 15/09/2164 5,827,439 2.32%
7,000,000 Barclays PLC 7.75 15/12/2166 6,767,570 2.69%
8,800,000 BAWAG Group AG 5.00 14/11/2166 9,183,834 3.66%
1,200,000 Belfius Bank SA 3.63 16/04/2166 1,062,031 0.42%
8,600,000 CaixaBank SA 5.25 23/06/2166 8,407,845 3.35%
5,400,000 Cooperatieve Rabobank UA 4.63 29/12/2166 5,951,016 2.37%
6,100,000 Credit Agricole SA 7.50 23/06/2026 8,105,531 3.23%
2,000,000 Credit Agricole SA 7.88 29/01/2049 2,006,729 0.80%
1,000,000 Credit Suisse Group AG 7.25 12/03/2167 968,924 0.39%
18,700,000 Credit Suisse Group AG 7.50 17/07/2023 18,992,567 7.55%
3,100,000 CYBG PLC 8.00 29/12/2049 3,661,862 1.46%
1,200,000 Danske Bank A/S 6.13 29/12/2049 1,068,903 0.43%
10,600,000 Danske Bank A/S 7.00 26/12/2166 9,612,576 3.83%
6,000,000 Deutsche Pfandbriefbank AG 5.75 28/04/2166 6,723,647 2.68%
3,000,000 Direct Line Insurance Group PLC 4.75 07/06/2166 3,123,206 1.24%
9,000,000 HSBC Holdings PLC 5.88 28/03/2167 11,178,691 4.45%
8,000,000 HSBC Holdings PLC 6.25 23/09/2166 7,641,808 3.04%
2,800,000 Ibercaja Banco SA 7.00 06/07/2166 2,983,234 1.19%
3,000,000 IKB Deutsche Industriebank AG 4.00 31/01/2028 3,395,421 1.35%
10,100,000 Intesa Sanpaolo SpA 7.75 29/07/2049 12,563,423 5.00%
2,000,000 KBC Group NV 4.25 24/10/2166 1,969,945 0.78%
12,000,000 Lloyds Banking Group PLC 7.50 27/12/2166 11,581,101 4.61%
6,400,000 Metro Bank PLC 5.50 26/06/2028 7,136,065 2.84%
45,000 Nationwide Building Society 10.25 29/06/2049 8,075,714 3.21%
3,000,000 Oaknorth Bank PLC 7.75 01/06/2028 3,808,808 1.51%
6,000,000 OneSavings Bank PLC 9.13 25/11/2165 7,745,895 3.08%
3,300,000 Phoenix Group Holdings PLC 5.75 26/10/2166 3,455,843 1.38%
4,800,000 Rothesay Life PLC 6.88 12/03/2167 5,927,667 2.36%
6,000,000 Royal Bank of Scotland Group PLC 8.00 10/08/2025 5,990,625 2.38%
4,000,000 Shawbrook Group PLC 7.88 08/06/2166 4,668,784 1.86%
5,100,000 Societe Generale SA 7.38 04/04/2167 4,895,094 1.95%
7,200,000 Societe Generale SA 7.88 29/12/2049 7,159,008 2.85%
2,780,000 Stichting AK Rabobank Certificaten 6.50 29/12/2049 3,430,505 1.37%
6,000,000 Svenska Handelsbanken AB 5.25 01/03/2021 6,048,797 2.41%
6,000,000 UBS Group Funding Switzerland AG 5.00 31/01/2167 5,281,133 2.10%
4,692,000 UBS Group Funding Switzerland AG 7.00 19/02/2025 5,059,488 2.01%
2,550,000 Virgin Money Holdings UK PLC 8.75 10/11/2021 3,432,122 1.37%
243,692,709 96.99%
Total Transferable Securities 243,692,709 96.99%
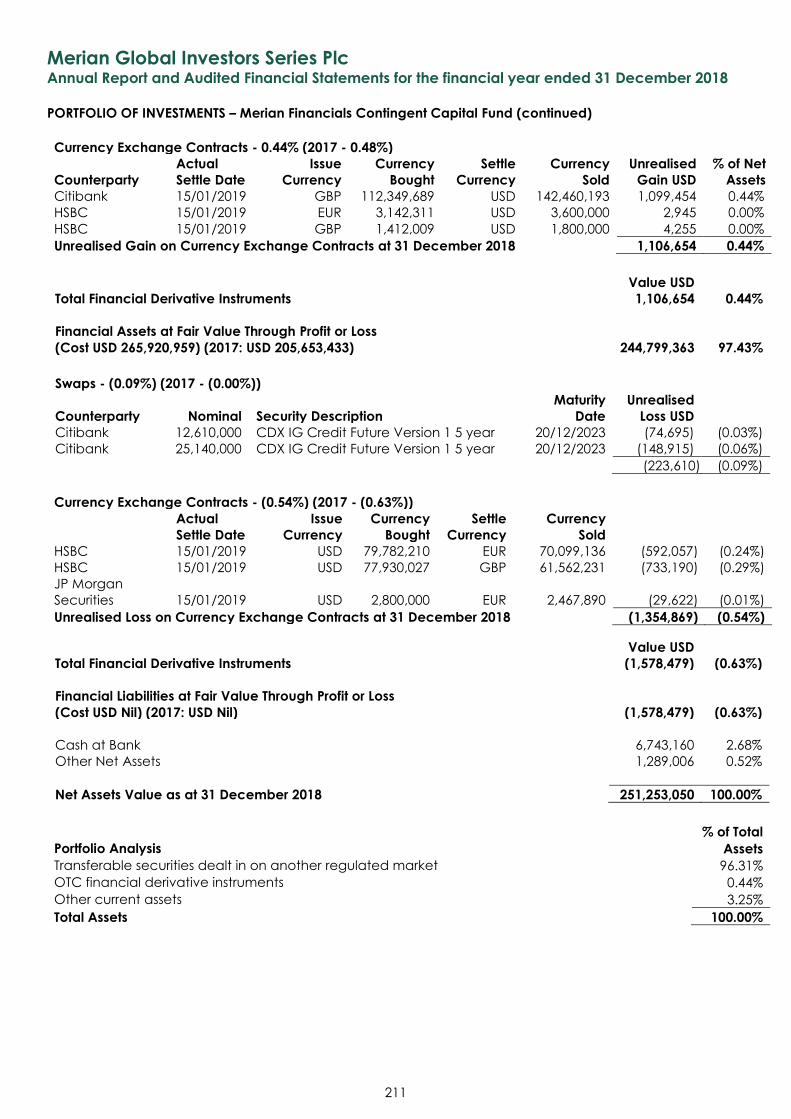
Merian Global Investors Series Plc Annual Report and Audited Financial Statements for the financial year ended 31 December 2018
PORTFOLIO OF INVESTMENTS – Merian Financials Contingent Capital Fund (continued)
211
Currency Exchange Contracts - 0.44% (2017 - 0.48%)
Counterparty
Actual
Settle Date
Issue
Currency
Currency
Bought
Settle
Currency
Currency
Sold
Unrealised
Gain USD
% of Net
Assets
Citibank 15/01/2019 GBP 112,349,689 USD 142,460,193 1,099,454 0.44%
HSBC 15/01/2019 EUR 3,142,311 USD 3,600,000 2,945 0.00%
HSBC 15/01/2019 GBP 1,412,009 USD 1,800,000 4,255 0.00%
Unrealised Gain on Currency Exchange Contracts at 31 December 2018 1,106,654 0.44%
Value USD
Total Financial Derivative Instruments 1,106,654 0.44%
Financial Assets at Fair Value Through Profit or Loss
(Cost USD 265,920,959) (2017: USD 205,653,433) 244,799,363 97.43%
Swaps - (0.09%) (2017 - (0.00%))
Counterparty Nominal Security Description
Maturity
Date
Unrealised
Loss USD
Citibank 12,610,000 CDX IG Credit Future Version 1 5 year 20/12/2023 (74,695) (0.03%)
Citibank 25,140,000 CDX IG Credit Future Version 1 5 year 20/12/2023 (148,915) (0.06%)
(223,610) (0.09%)
Currency Exchange Contracts - (0.54%) (2017 - (0.63%))
Actual
Settle Date
Issue
Currency
Currency
Bought
Settle
Currency
Currency
Sold HSBC 15/01/2019 USD 79,782,210 EUR 70,099,136 (592,057) (0.24%)
HSBC 15/01/2019 USD 77,930,027 GBP 61,562,231 (733,190) (0.29%)
JP Morgan
Securities 15/01/2019 USD 2,800,000 EUR 2,467,890 (29,622) (0.01%)
Unrealised Loss on Currency Exchange Contracts at 31 December 2018 (1,354,869) (0.54%)
Value USD
Total Financial Derivative Instruments (1,578,479) (0.63%)
Financial Liabilities at Fair Value Through Profit or Loss
(Cost USD Nil) (2017: USD Nil) (1,578,479) (0.63%)
Cash at Bank 6,743,160 2.68%
Other Net Assets 1,289,006 0.52%
Net Assets Value as at 31 December 2018 251,253,050 100.00%
% of Total
Portfolio Analysis Assets
Transferable securities dealt in on another regulated market 96.31%
OTC financial derivative instruments 0.44%
Other current assets 3.25%
Total Assets 100.00%
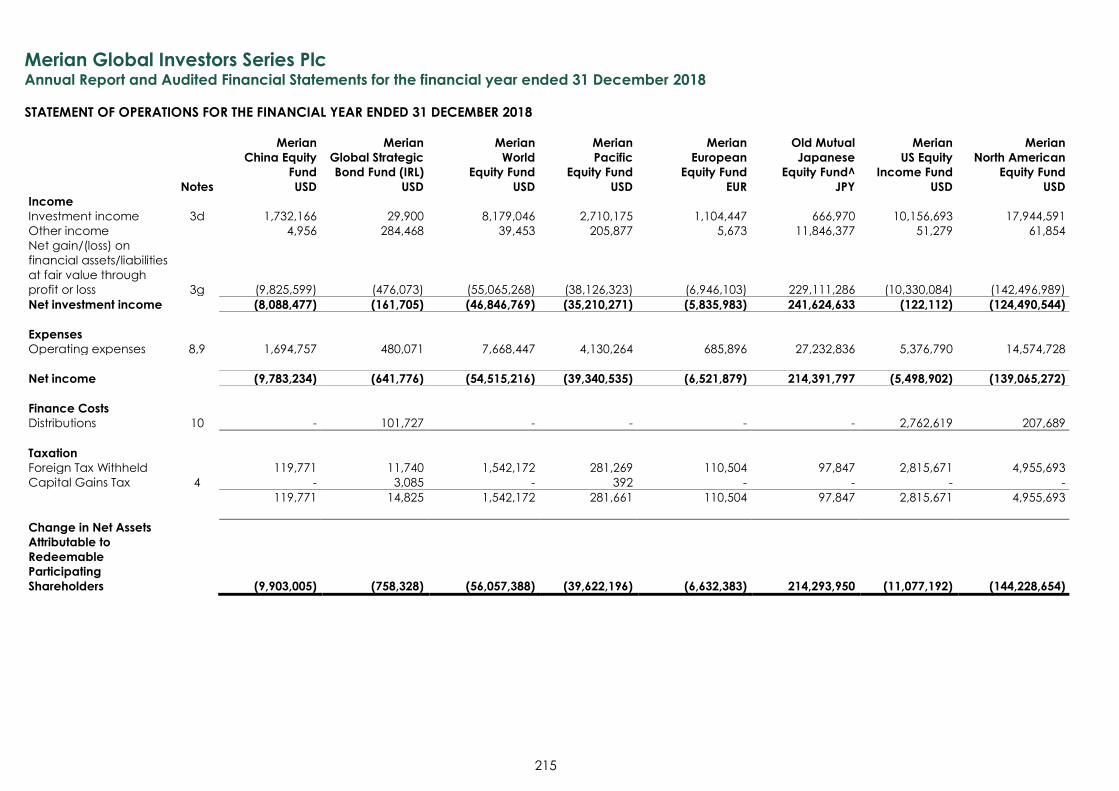
Merian Global Investors Series Plc Annual Report and Audited Financial Statements for the financial year ended 31 December 2018
STATEMENT OF OPERATIONS FOR THE FINANCIAL YEAR ENDED 31 DECEMBER 2018
215
Merian
China Equity
Fund
Merian
Global Strategic
Bond Fund (IRL)
Merian
World
Equity Fund
Merian
Pacific
Equity Fund
Merian
European
Equity Fund
Old Mutual
Japanese
Equity Fund^
Merian
US Equity
Income Fund
Merian
North American
Equity Fund
Notes USD USD USD USD EUR JPY USD USD
Income
Investment income 3d 1,732,166 29,900 8,179,046 2,710,175 1,104,447 666,970 10,156,693 17,944,591
Other income 4,956 284,468 39,453 205,877 5,673 11,846,377 51,279 61,854
Net gain/(loss) on
financial assets/liabilities
at fair value through
profit or loss 3g (9,825,599) (476,073) (55,065,268) (38,126,323) (6,946,103) 229,111,286 (10,330,084) (142,496,989)
Net investment income (8,088,477) (161,705) (46,846,769) (35,210,271) (5,835,983) 241,624,633 (122,112) (124,490,544)
Expenses
Operating expenses 8,9 1,694,757 480,071 7,668,447 4,130,264 685,896 27,232,836 5,376,790 14,574,728
Net income (9,783,234) (641,776) (54,515,216) (39,340,535) (6,521,879) 214,391,797 (5,498,902) (139,065,272)
Finance Costs
Distributions 10 - 101,727 - - - - 2,762,619 207,689
Taxation
Foreign Tax Withheld 119,771 11,740 1,542,172 281,269 110,504 97,847 2,815,671 4,955,693
Capital Gains Tax 4 - 3,085 - 392 - - - -
119,771 14,825 1,542,172 281,661 110,504 97,847 2,815,671 4,955,693
Change in Net Assets
Attributable to
Redeemable
Participating
Shareholders (9,903,005) (758,328) (56,057,388) (39,622,196) (6,632,383) 214,293,950 (11,077,192) (144,228,654)
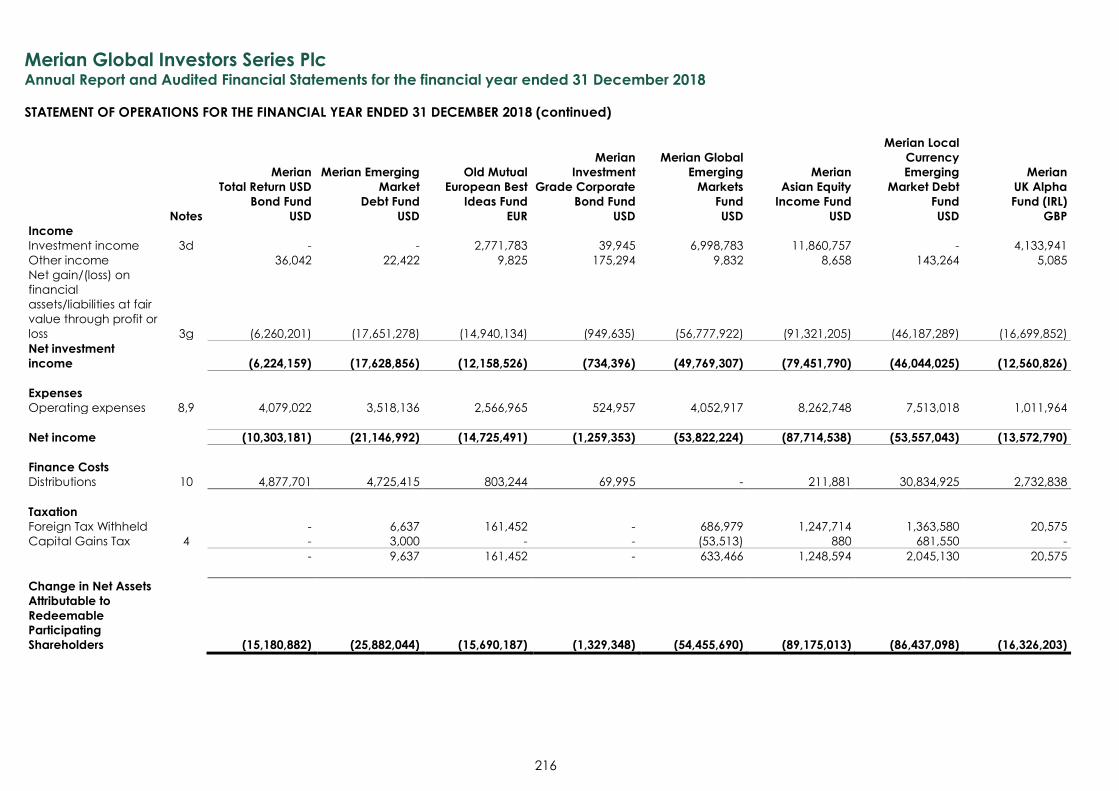
Merian Global Investors Series Plc Annual Report and Audited Financial Statements for the financial year ended 31 December 2018
STATEMENT OF OPERATIONS FOR THE FINANCIAL YEAR ENDED 31 DECEMBER 2018 (continued)
216
Merian
Total Return USD
Bond Fund
Merian Emerging
Market
Debt Fund
Old Mutual
European Best
Ideas Fund
Merian
Investment
Grade Corporate
Bond Fund
Merian Global
Emerging
Markets
Fund
Merian
Asian Equity
Income Fund
Merian Local
Currency
Emerging
Market Debt
Fund
Merian
UK Alpha
Fund (IRL)
Notes USD USD EUR USD USD USD USD GBP
Income
Investment income 3d - - 2,771,783 39,945 6,998,783 11,860,757 - 4,133,941
Other income 36,042 22,422 9,825 175,294 9,832 8,658 143,264 5,085
Net gain/(loss) on
financial
assets/liabilities at fair
value through profit or
loss 3g (6,260,201) (17,651,278) (14,940,134) (949,635) (56,777,922) (91,321,205) (46,187,289) (16,699,852)
Net investment
income (6,224,159) (17,628,856) (12,158,526) (734,396) (49,769,307) (79,451,790) (46,044,025) (12,560,826)
Expenses
Operating expenses 8,9 4,079,022 3,518,136 2,566,965 524,957 4,052,917 8,262,748 7,513,018 1,011,964
Net income (10,303,181) (21,146,992) (14,725,491) (1,259,353) (53,822,224) (87,714,538) (53,557,043) (13,572,790)
Finance Costs
Distributions 10 4,877,701 4,725,415 803,244 69,995 - 211,881 30,834,925 2,732,838
Taxation
Foreign Tax Withheld - 6,637 161,452 - 686,979 1,247,714 1,363,580 20,575
Capital Gains Tax 4 - 3,000 - - (53,513) 880 681,550 -
- 9,637 161,452 - 633,466 1,248,594 2,045,130 20,575
Change in Net Assets
Attributable to
Redeemable
Participating
Shareholders (15,180,882) (25,882,044) (15,690,187) (1,329,348) (54,455,690) (89,175,013) (86,437,098) (16,326,203)
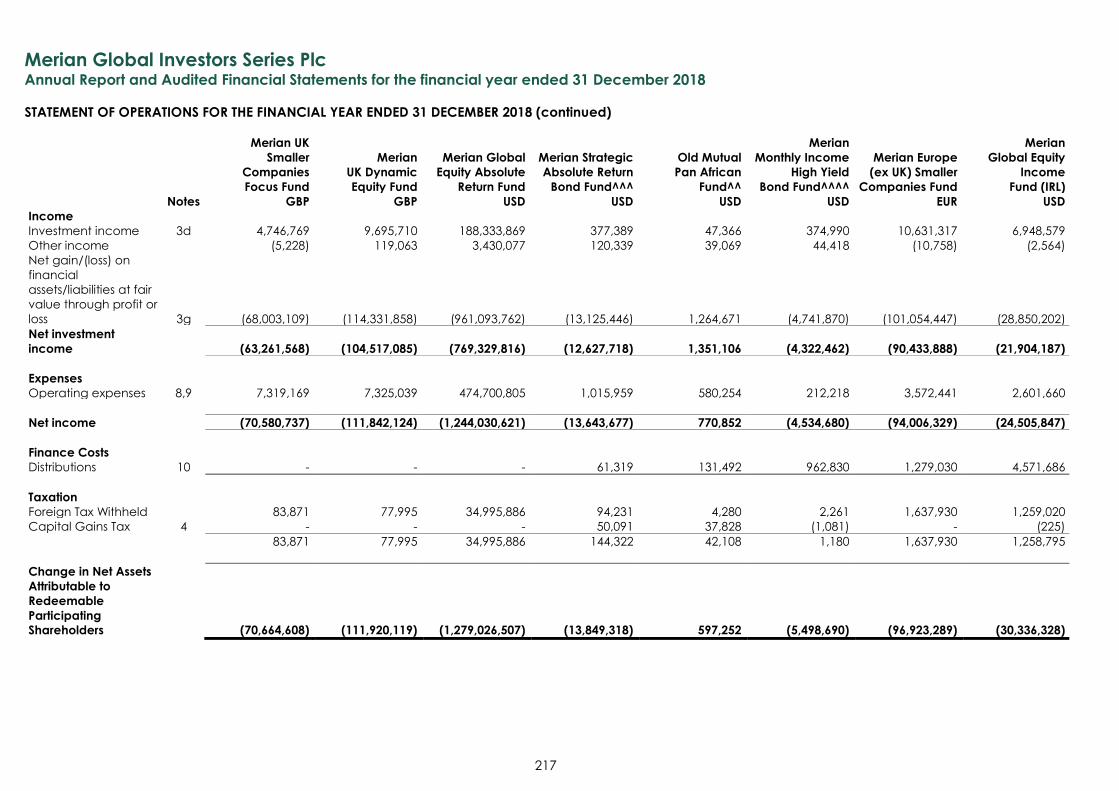
Merian Global Investors Series Plc Annual Report and Audited Financial Statements for the financial year ended 31 December 2018
STATEMENT OF OPERATIONS FOR THE FINANCIAL YEAR ENDED 31 DECEMBER 2018 (continued)
217
Merian UK
Smaller
Companies
Focus Fund
Merian
UK Dynamic
Equity Fund
Merian Global
Equity Absolute
Return Fund
Merian Strategic
Absolute Return
Bond Fund^^^
Old Mutual
Pan African
Fund^^
Merian
Monthly Income
High Yield
Bond Fund^^^^
Merian Europe
(ex UK) Smaller
Companies Fund
Merian
Global Equity
Income
Fund (IRL)
Notes GBP GBP USD USD USD USD EUR USD
Income
Investment income 3d 4,746,769 9,695,710 188,333,869 377,389 47,366 374,990 10,631,317 6,948,579
Other income (5,228) 119,063 3,430,077 120,339 39,069 44,418 (10,758) (2,564)
Net gain/(loss) on
financial
assets/liabilities at fair
value through profit or
loss 3g (68,003,109) (114,331,858) (961,093,762) (13,125,446) 1,264,671 (4,741,870) (101,054,447) (28,850,202)
Net investment
income (63,261,568) (104,517,085) (769,329,816) (12,627,718) 1,351,106 (4,322,462) (90,433,888) (21,904,187)
Expenses
Operating expenses 8,9 7,319,169 7,325,039 474,700,805 1,015,959 580,254 212,218 3,572,441 2,601,660
Net income (70,580,737) (111,842,124) (1,244,030,621) (13,643,677) 770,852 (4,534,680) (94,006,329) (24,505,847)
Finance Costs
Distributions 10 - - - 61,319 131,492 962,830 1,279,030 4,571,686
Taxation
Foreign Tax Withheld 83,871 77,995 34,995,886 94,231 4,280 2,261 1,637,930 1,259,020
Capital Gains Tax 4 - - - 50,091 37,828 (1,081) - (225)
83,871 77,995 34,995,886 144,322 42,108 1,180 1,637,930 1,258,795
Change in Net Assets
Attributable to
Redeemable
Participating
Shareholders (70,664,608) (111,920,119) (1,279,026,507) (13,849,318) 597,252 (5,498,690) (96,923,289) (30,336,328)
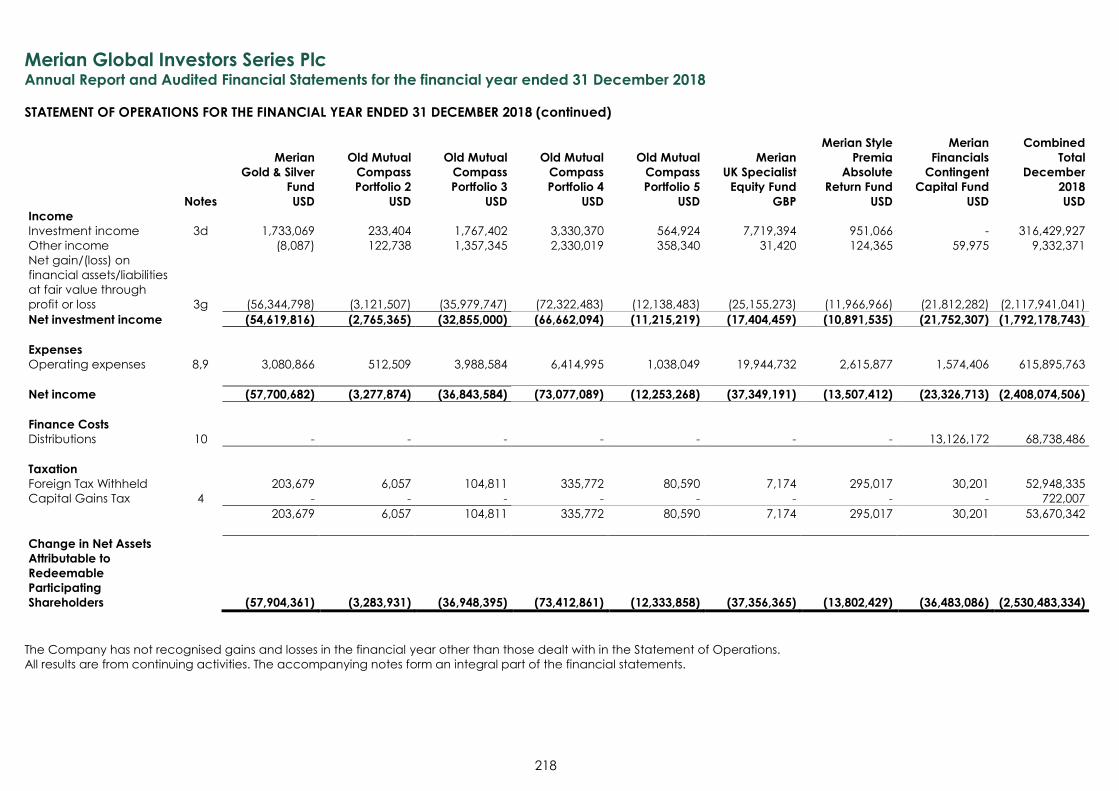
Merian Global Investors Series Plc Annual Report and Audited Financial Statements for the financial year ended 31 December 2018
STATEMENT OF OPERATIONS FOR THE FINANCIAL YEAR ENDED 31 DECEMBER 2018 (continued)
218
Merian
Gold & Silver
Fund
Old Mutual
Compass
Portfolio 2
Old Mutual
Compass
Portfolio 3
Old Mutual
Compass
Portfolio 4
Old Mutual
Compass
Portfolio 5
Merian
UK Specialist
Equity Fund
Merian Style
Premia
Absolute
Return Fund
Merian
Financials
Contingent
Capital Fund
Combined
Total
December
2018
Notes USD USD USD USD USD GBP USD USD USD
Income
Investment income 3d 1,733,069 233,404 1,767,402 3,330,370 564,924 7,719,394 951,066 - 316,429,927
Other income (8,087) 122,738 1,357,345 2,330,019 358,340 31,420 124,365 59,975 9,332,371
Net gain/(loss) on
financial assets/liabilities
at fair value through
profit or loss 3g (56,344,798) (3,121,507) (35,979,747) (72,322,483) (12,138,483) (25,155,273) (11,966,966) (21,812,282) (2,117,941,041)
Net investment income (54,619,816) (2,765,365) (32,855,000) (66,662,094) (11,215,219) (17,404,459) (10,891,535) (21,752,307) (1,792,178,743)
Expenses
Operating expenses 8,9 3,080,866 512,509 3,988,584 6,414,995 1,038,049 19,944,732 2,615,877 1,574,406 615,895,763
Net income (57,700,682) (3,277,874) (36,843,584) (73,077,089) (12,253,268) (37,349,191) (13,507,412) (23,326,713) (2,408,074,506)
Finance Costs
Distributions 10 - - - - - - - 13,126,172 68,738,486
Taxation
Foreign Tax Withheld 203,679 6,057 104,811 335,772 80,590 7,174 295,017 30,201 52,948,335
Capital Gains Tax 4 - - - - - - - - 722,007
203,679 6,057 104,811 335,772 80,590 7,174 295,017 30,201 53,670,342
Change in Net Assets
Attributable to
Redeemable
Participating
Shareholders (57,904,361) (3,283,931) (36,948,395) (73,412,861) (12,333,858) (37,356,365) (13,802,429) (36,483,086) (2,530,483,334)
The Company has not recognised gains and losses in the financial year other than those dealt with in the Statement of Operations.
All results are from continuing activities. The accompanying notes form an integral part of the financial statements.

Merian Global Investors Series Plc Annual Report and Audited Financial Statements for the financial year ended 31 December 2018
STATEMENT OF OPERATIONS FOR THE FINANCIAL YEAR ENDED 31 DECEMBER 2017
219
Old Mutual
China
Equity Fund
Old Mutual
Global Strategic
Bond Fund (IRL)
Old Mutual
World
Equity Fund
Old Mutual
Pacific
Equity Fund
Old Mutual
European
Equity Fund
Old Mutual
Japanese
Equity Fund
Old Mutual
US Equity
Income Fund
Old Mutual
North American
Equity Fund
Notes USD USD USD USD EUR JPY USD USD
Income
Investment Income 3d 1,670,036 8,029 4,182,984 4,213,083 1,199,279 86,391,551 12,062,272 8,662,429
Other Income 89,316 105,338 8,349 152,263 17,718 4,242,073 20,928 11,853
Net gain/(loss) on
financial assets/liabilities
at fair value through
profit or loss 3g 21,499,976 873,474 60,232,800 54,474,135 2,778,379 857,106,578 39,924,868 131,179,671
Net investment income 23,259,328 986,841 64,424,133 58,839,481 3,995,376 947,740,202 52,008,068 139,853,953
Expenses
Operating expenses 8,9 1,579,808 348,527 4,979,805 4,471,859 903,897 112,275,000 6,054,245 8,986,831
Net income 21,679,520 638,314 59,444,328 54,367,622 3,091,479 835,465,202 45,953,823 130,867,122
Finance Costs
Distributions 10 - 67,277 - - - - 2,374,403 -
Taxation
Foreign Tax Withheld 142,655 1,463 799,335 368,934 139,032 12,323,343 3,006,589 2,399,440
Capital Gains Tax 4 - 1,480 41 192,034 - - - -
142,655 2,943 799,376 560,968 139,032 12,323,343 3,006,589 2,399,440
Change in Net Assets
Attributable to
Redeemable
Participating
Shareholders 21,536,865 568,094 58,644,952 53,806,654 2,952,447 823,141,859 40,572,831 128,467,682
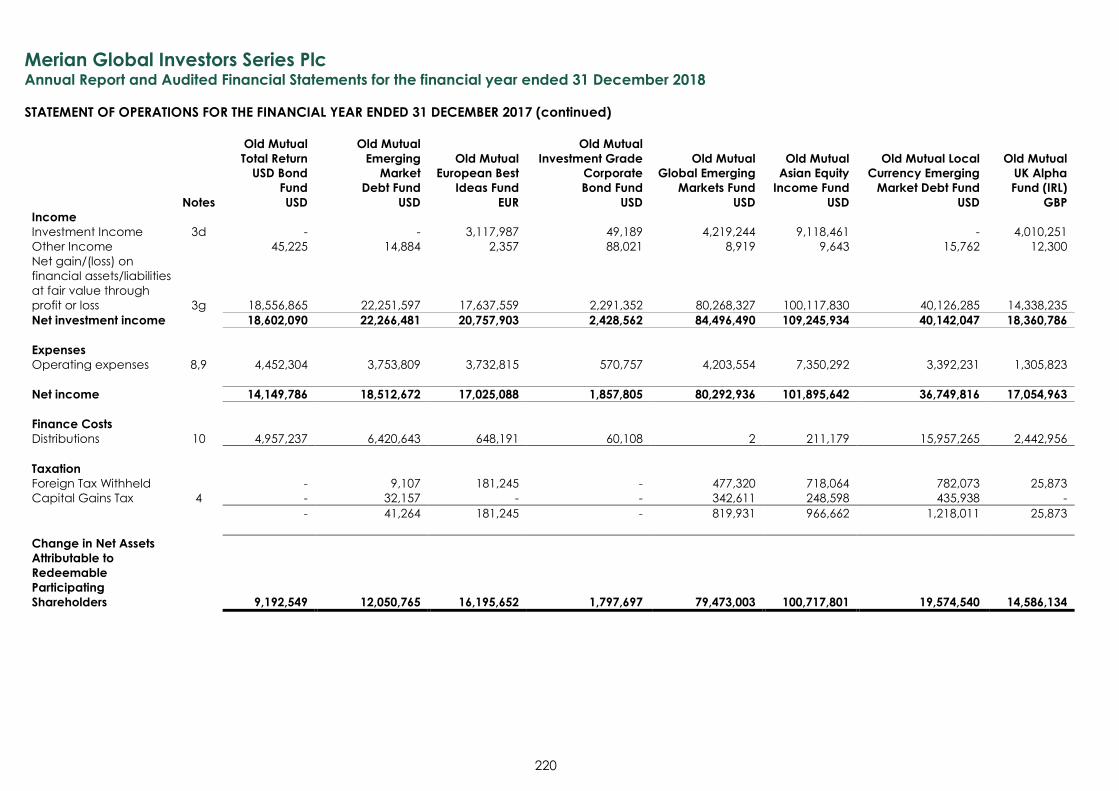
Merian Global Investors Series Plc Annual Report and Audited Financial Statements for the financial year ended 31 December 2018
STATEMENT OF OPERATIONS FOR THE FINANCIAL YEAR ENDED 31 DECEMBER 2017 (continued)
220
Old Mutual
Total Return
USD Bond
Fund
Old Mutual
Emerging
Market
Debt Fund
Old Mutual
European Best
Ideas Fund
Old Mutual
Investment Grade
Corporate
Bond Fund
Old Mutual
Global Emerging
Markets Fund
Old Mutual
Asian Equity
Income Fund
Old Mutual Local
Currency Emerging
Market Debt Fund
Old Mutual
UK Alpha
Fund (IRL)
Notes USD USD EUR USD USD USD USD GBP
Income
Investment Income 3d - - 3,117,987 49,189 4,219,244 9,118,461 - 4,010,251
Other Income 45,225 14,884 2,357 88,021 8,919 9,643 15,762 12,300
Net gain/(loss) on
financial assets/liabilities
at fair value through
profit or loss 3g 18,556,865 22,251,597 17,637,559 2,291,352 80,268,327 100,117,830 40,126,285 14,338,235
Net investment income 18,602,090 22,266,481 20,757,903 2,428,562 84,496,490 109,245,934 40,142,047 18,360,786
Expenses
Operating expenses 8,9 4,452,304 3,753,809 3,732,815 570,757 4,203,554 7,350,292 3,392,231 1,305,823
Net income 14,149,786 18,512,672 17,025,088 1,857,805 80,292,936 101,895,642 36,749,816 17,054,963
Finance Costs
Distributions 10 4,957,237 6,420,643 648,191 60,108 2 211,179 15,957,265 2,442,956
Taxation
Foreign Tax Withheld - 9,107 181,245 - 477,320 718,064 782,073 25,873
Capital Gains Tax 4 - 32,157 - - 342,611 248,598 435,938 -
- 41,264 181,245 - 819,931 966,662 1,218,011 25,873
Change in Net Assets
Attributable to
Redeemable
Participating
Shareholders 9,192,549 12,050,765 16,195,652 1,797,697 79,473,003 100,717,801 19,574,540 14,586,134
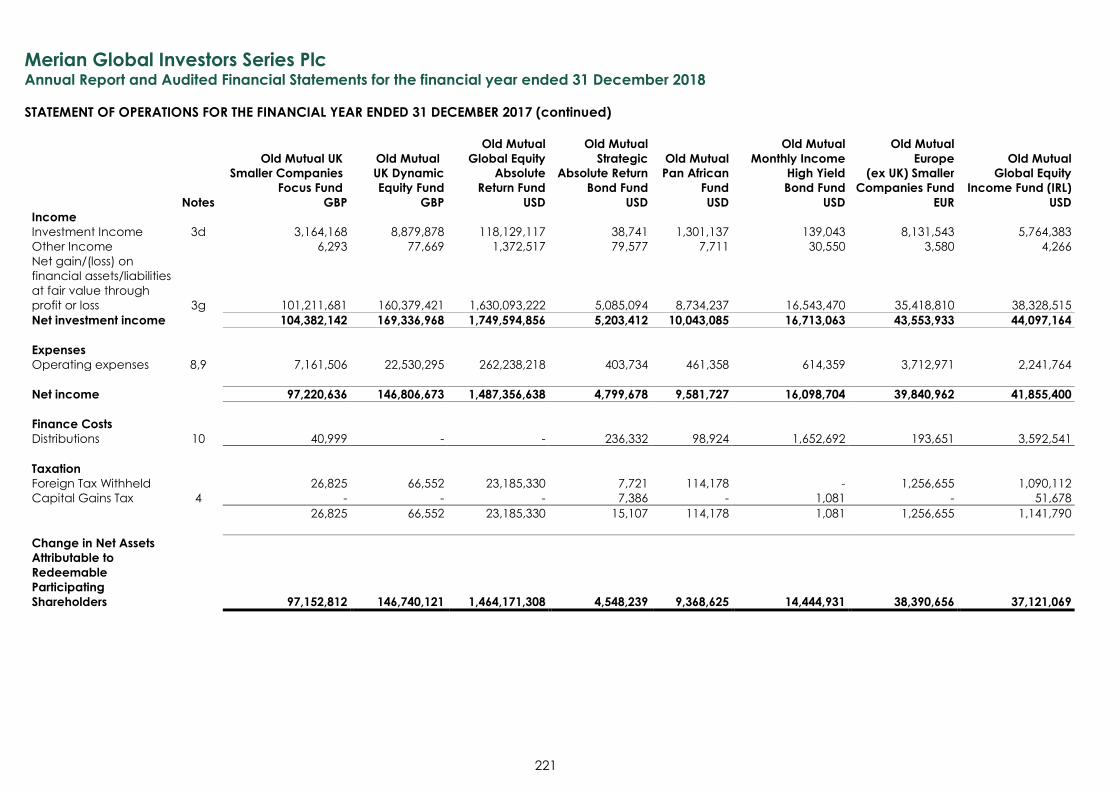
Merian Global Investors Series Plc Annual Report and Audited Financial Statements for the financial year ended 31 December 2018
STATEMENT OF OPERATIONS FOR THE FINANCIAL YEAR ENDED 31 DECEMBER 2017 (continued)
221
Old Mutual UK
Smaller Companies
Focus Fund
Old Mutual
UK Dynamic
Equity Fund
Old Mutual
Global Equity
Absolute
Return Fund
Old Mutual
Strategic
Absolute Return
Bond Fund
Old Mutual
Pan African
Fund
Old Mutual
Monthly Income
High Yield
Bond Fund
Old Mutual
Europe
(ex UK) Smaller
Companies Fund
Old Mutual
Global Equity
Income Fund (IRL)
Notes GBP GBP USD USD USD USD EUR USD
Income
Investment Income 3d 3,164,168 8,879,878 118,129,117 38,741 1,301,137 139,043 8,131,543 5,764,383
Other Income 6,293 77,669 1,372,517 79,577 7,711 30,550 3,580 4,266
Net gain/(loss) on
financial assets/liabilities
at fair value through
profit or loss 3g 101,211,681 160,379,421 1,630,093,222 5,085,094 8,734,237 16,543,470 35,418,810 38,328,515
Net investment income 104,382,142 169,336,968 1,749,594,856 5,203,412 10,043,085 16,713,063 43,553,933 44,097,164
Expenses
Operating expenses 8,9 7,161,506 22,530,295 262,238,218 403,734 461,358 614,359 3,712,971 2,241,764
Net income 97,220,636 146,806,673 1,487,356,638 4,799,678 9,581,727 16,098,704 39,840,962 41,855,400
Finance Costs
Distributions 10 40,999 - - 236,332 98,924 1,652,692 193,651 3,592,541
Taxation
Foreign Tax Withheld 26,825 66,552 23,185,330 7,721 114,178 - 1,256,655 1,090,112
Capital Gains Tax 4 - - - 7,386 - 1,081 - 51,678
26,825 66,552 23,185,330 15,107 114,178 1,081 1,256,655 1,141,790
Change in Net Assets
Attributable to
Redeemable
Participating
Shareholders 97,152,812 146,740,121 1,464,171,308 4,548,239 9,368,625 14,444,931 38,390,656 37,121,069
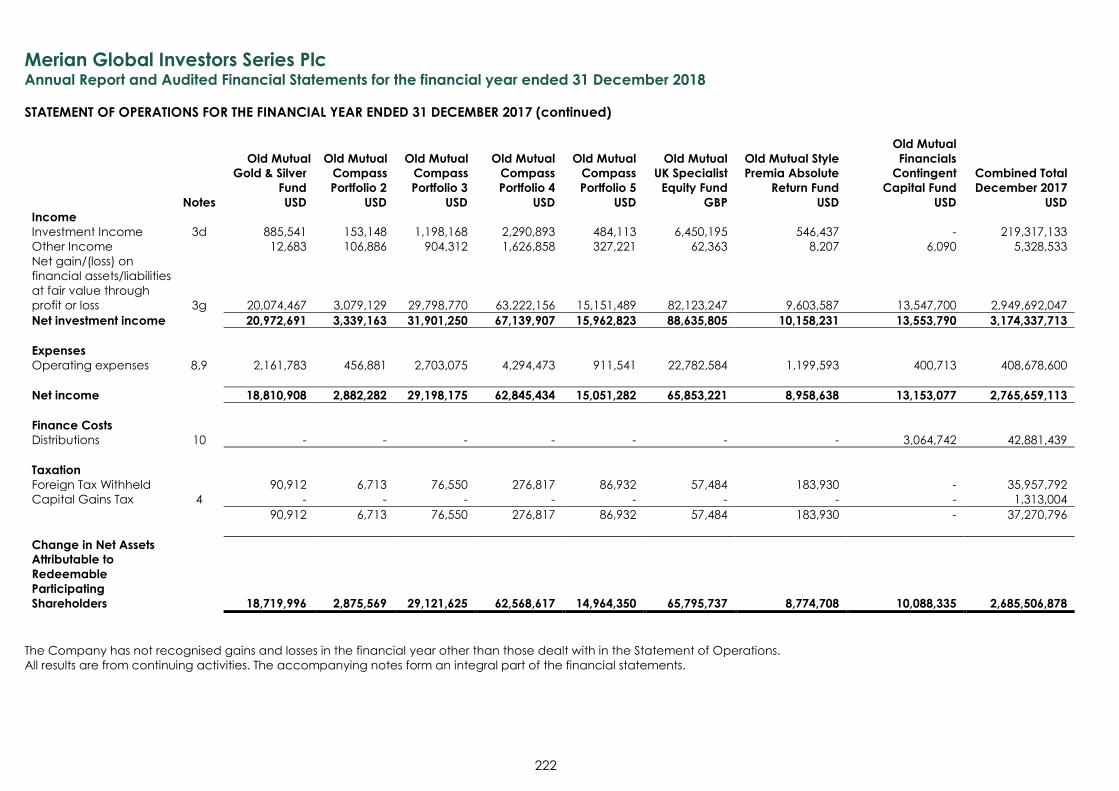
Merian Global Investors Series Plc Annual Report and Audited Financial Statements for the financial year ended 31 December 2018
STATEMENT OF OPERATIONS FOR THE FINANCIAL YEAR ENDED 31 DECEMBER 2017 (continued)
222
Old Mutual
Gold & Silver
Fund
Old Mutual
Compass
Portfolio 2
Old Mutual
Compass
Portfolio 3
Old Mutual
Compass
Portfolio 4
Old Mutual
Compass
Portfolio 5
Old Mutual
UK Specialist
Equity Fund
Old Mutual Style
Premia Absolute
Return Fund
Old Mutual
Financials
Contingent
Capital Fund
Combined Total
December 2017
Notes USD USD USD USD USD GBP USD USD USD
Income
Investment Income 3d 885,541 153,148 1,198,168 2,290,893 484,113 6,450,195 546,437 - 219,317,133
Other Income 12,683 106,886 904,312 1,626,858 327,221 62,363 8,207 6,090 5,328,533
Net gain/(loss) on
financial assets/liabilities
at fair value through
profit or loss 3g 20,074,467 3,079,129 29,798,770 63,222,156 15,151,489 82,123,247 9,603,587 13,547,700 2,949,692,047
Net investment income 20,972,691 3,339,163 31,901,250 67,139,907 15,962,823 88,635,805 10,158,231 13,553,790 3,174,337,713
Expenses
Operating expenses 8,9 2,161,783 456,881 2,703,075 4,294,473 911,541 22,782,584 1,199,593 400,713 408,678,600
Net income 18,810,908 2,882,282 29,198,175 62,845,434 15,051,282 65,853,221 8,958,638 13,153,077 2,765,659,113
Finance Costs
Distributions 10 - - - - - - - 3,064,742 42,881,439
Taxation
Foreign Tax Withheld 90,912 6,713 76,550 276,817 86,932 57,484 183,930 - 35,957,792
Capital Gains Tax 4 - - - - - - - - 1,313,004
90,912 6,713 76,550 276,817 86,932 57,484 183,930 - 37,270,796
Change in Net Assets
Attributable to
Redeemable
Participating
Shareholders 18,719,996 2,875,569 29,121,625 62,568,617 14,964,350 65,795,737 8,774,708 10,088,335 2,685,506,878
The Company has not recognised gains and losses in the financial year other than those dealt with in the Statement of Operations.
All results are from continuing activities. The accompanying notes form an integral part of the financial statements.
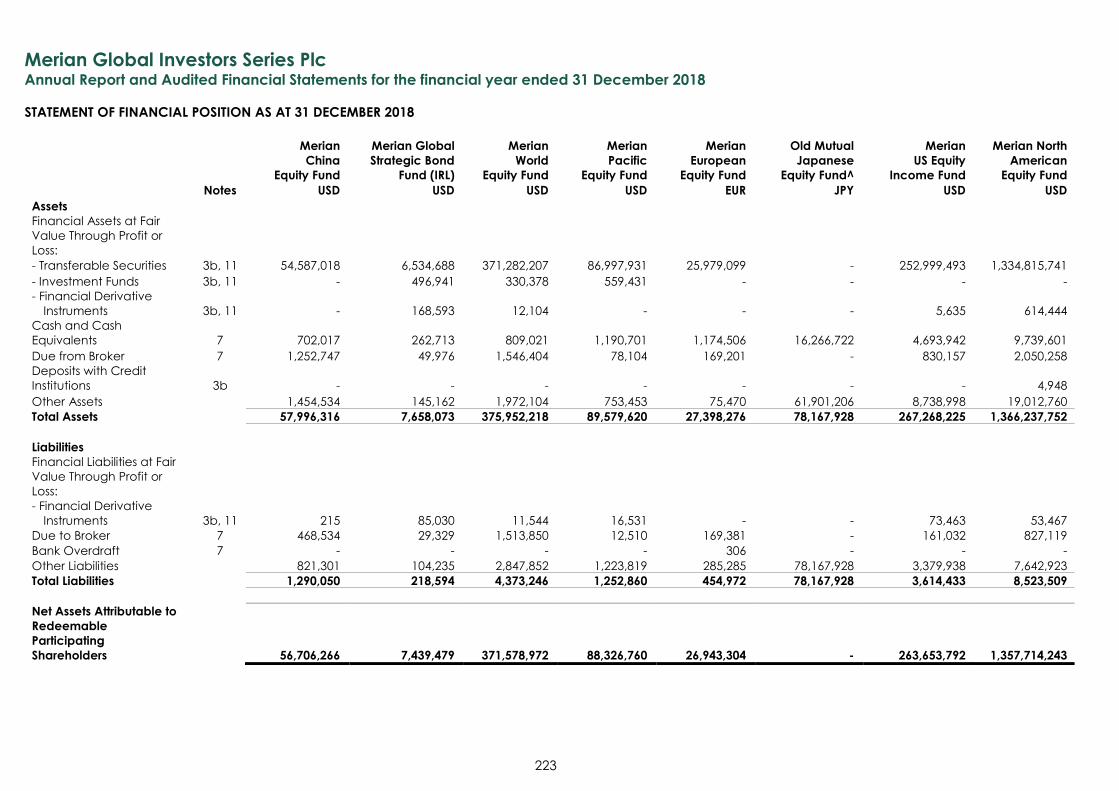
Merian Global Investors Series Plc Annual Report and Audited Financial Statements for the financial year ended 31 December 2018
STATEMENT OF FINANCIAL POSITION AS AT 31 DECEMBER 2018
223
Merian
China
Equity Fund
Merian Global
Strategic Bond
Fund (IRL)
Merian
World
Equity Fund
Merian
Pacific
Equity Fund
Merian
European
Equity Fund
Old Mutual
Japanese
Equity Fund^
Merian
US Equity
Income Fund
Merian North
American
Equity Fund
Notes USD USD USD USD EUR JPY USD USD
Assets
Financial Assets at Fair
Value Through Profit or
Loss:
- Transferable Securities 3b, 11 54,587,018 6,534,688 371,282,207 86,997,931 25,979,099 - 252,999,493 1,334,815,741
- Investment Funds 3b, 11 - 496,941 330,378 559,431 - - - -
- Financial Derivative
Instruments 3b, 11 - 168,593 12,104 - - - 5,635 614,444
Cash and Cash
Equivalents 7 702,017 262,713 809,021 1,190,701 1,174,506 16,266,722 4,693,942 9,739,601
Due from Broker 7 1,252,747 49,976 1,546,404 78,104 169,201 - 830,157 2,050,258
Deposits with Credit
Institutions 3b - - - - - - - 4,948
Other Assets 1,454,534 145,162 1,972,104 753,453 75,470 61,901,206 8,738,998 19,012,760
Total Assets 57,996,316 7,658,073 375,952,218 89,579,620 27,398,276 78,167,928 267,268,225 1,366,237,752
Liabilities
Financial Liabilities at Fair
Value Through Profit or
Loss:
- Financial Derivative
Instruments 3b, 11 215 85,030 11,544 16,531 - - 73,463 53,467
Due to Broker 7 468,534 29,329 1,513,850 12,510 169,381 - 161,032 827,119
Bank Overdraft 7 - - - - 306 - - -
Other Liabilities 821,301 104,235 2,847,852 1,223,819 285,285 78,167,928 3,379,938 7,642,923
Total Liabilities 1,290,050 218,594 4,373,246 1,252,860 454,972 78,167,928 3,614,433 8,523,509
Net Assets Attributable to
Redeemable
Participating
Shareholders 56,706,266 7,439,479 371,578,972 88,326,760 26,943,304 - 263,653,792 1,357,714,243
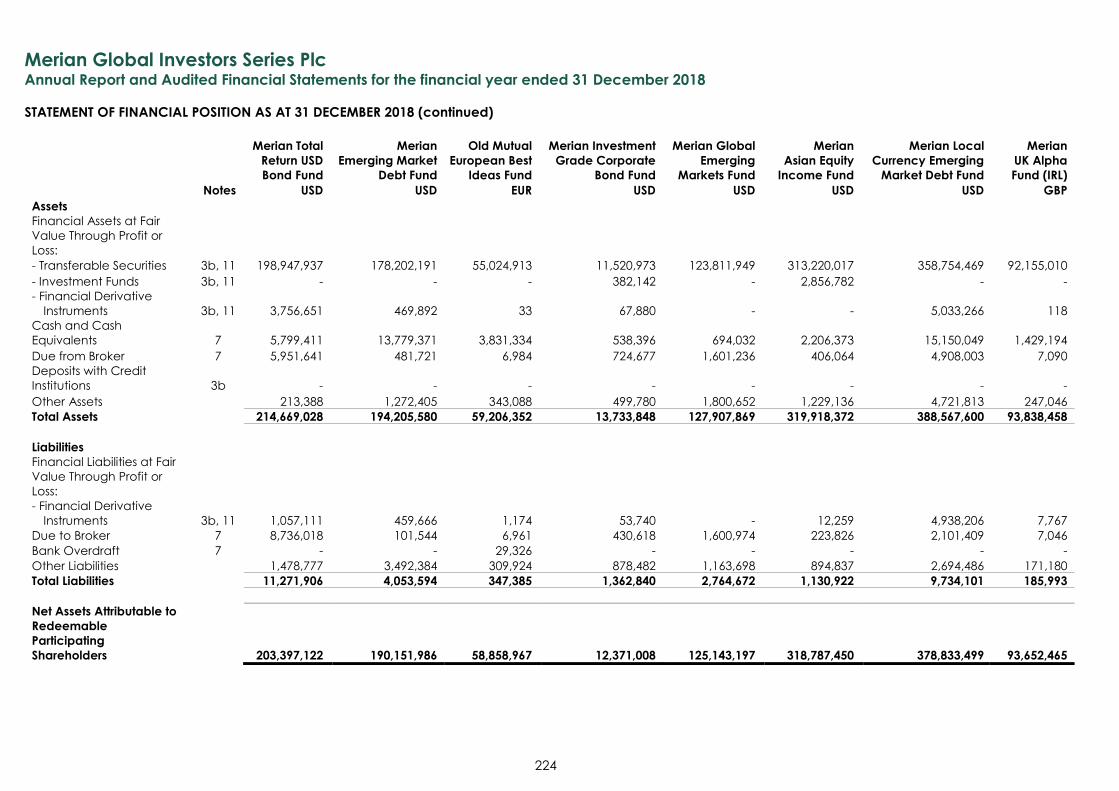
Merian Global Investors Series Plc Annual Report and Audited Financial Statements for the financial year ended 31 December 2018
STATEMENT OF FINANCIAL POSITION AS AT 31 DECEMBER 2018 (continued)
224
Merian Total
Return USD
Bond Fund
Merian
Emerging Market
Debt Fund
Old Mutual
European Best
Ideas Fund
Merian Investment
Grade Corporate
Bond Fund
Merian Global
Emerging
Markets Fund
Merian
Asian Equity
Income Fund
Merian Local
Currency Emerging
Market Debt Fund
Merian
UK Alpha
Fund (IRL)
Notes USD USD EUR USD USD USD USD GBP
Assets
Financial Assets at Fair
Value Through Profit or
Loss:
- Transferable Securities 3b, 11 198,947,937 178,202,191 55,024,913 11,520,973 123,811,949 313,220,017 358,754,469 92,155,010
- Investment Funds 3b, 11 - - - 382,142 - 2,856,782 - -
- Financial Derivative
Instruments 3b, 11 3,756,651 469,892 33 67,880 - - 5,033,266 118
Cash and Cash
Equivalents 7 5,799,411 13,779,371 3,831,334 538,396 694,032 2,206,373 15,150,049 1,429,194
Due from Broker 7 5,951,641 481,721 6,984 724,677 1,601,236 406,064 4,908,003 7,090
Deposits with Credit
Institutions 3b - - - - - - - -
Other Assets 213,388 1,272,405 343,088 499,780 1,800,652 1,229,136 4,721,813 247,046
Total Assets 214,669,028 194,205,580 59,206,352 13,733,848 127,907,869 319,918,372 388,567,600 93,838,458
Liabilities
Financial Liabilities at Fair
Value Through Profit or
Loss:
- Financial Derivative
Instruments 3b, 11 1,057,111 459,666 1,174 53,740 - 12,259 4,938,206 7,767
Due to Broker 7 8,736,018 101,544 6,961 430,618 1,600,974 223,826 2,101,409 7,046
Bank Overdraft 7 - - 29,326 - - - - -
Other Liabilities 1,478,777 3,492,384 309,924 878,482 1,163,698 894,837 2,694,486 171,180
Total Liabilities 11,271,906 4,053,594 347,385 1,362,840 2,764,672 1,130,922 9,734,101 185,993
Net Assets Attributable to
Redeemable
Participating
Shareholders 203,397,122 190,151,986 58,858,967 12,371,008 125,143,197 318,787,450 378,833,499 93,652,465
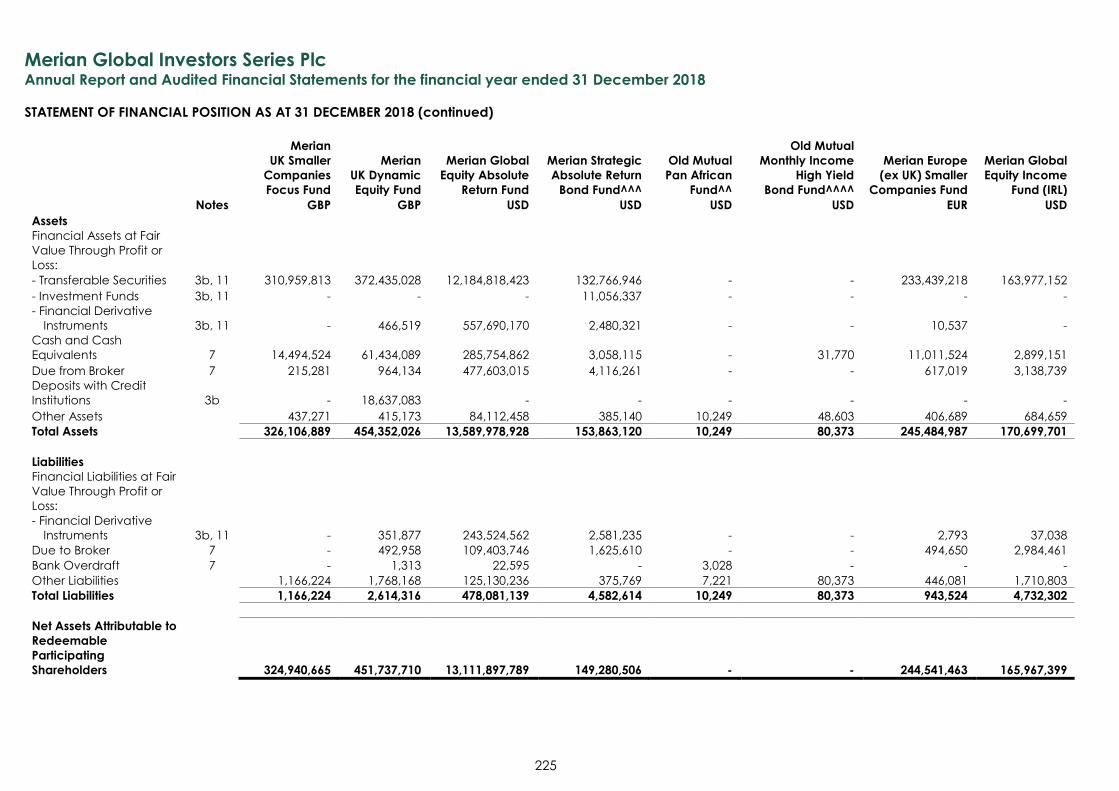
Merian Global Investors Series Plc Annual Report and Audited Financial Statements for the financial year ended 31 December 2018
STATEMENT OF FINANCIAL POSITION AS AT 31 DECEMBER 2018 (continued)
225
Merian
UK Smaller
Companies
Focus Fund
Merian
UK Dynamic
Equity Fund
Merian Global
Equity Absolute
Return Fund
Merian Strategic
Absolute Return
Bond Fund^^^
Old Mutual
Pan African
Fund^^
Old Mutual
Monthly Income
High Yield
Bond Fund^^^^
Merian Europe
(ex UK) Smaller
Companies Fund
Merian Global
Equity Income
Fund (IRL)
Notes GBP GBP USD USD USD USD EUR USD
Assets
Financial Assets at Fair
Value Through Profit or
Loss:
- Transferable Securities 3b, 11 310,959,813 372,435,028 12,184,818,423 132,766,946 - - 233,439,218 163,977,152
- Investment Funds 3b, 11 - - - 11,056,337 - - - -
- Financial Derivative
Instruments 3b, 11 - 466,519 557,690,170 2,480,321 - - 10,537 -
Cash and Cash
Equivalents 7 14,494,524 61,434,089 285,754,862 3,058,115 - 31,770 11,011,524 2,899,151
Due from Broker 7 215,281 964,134 477,603,015 4,116,261 - - 617,019 3,138,739
Deposits with Credit
Institutions 3b - 18,637,083 - - - - - -
Other Assets 437,271 415,173 84,112,458 385,140 10,249 48,603 406,689 684,659
Total Assets 326,106,889 454,352,026 13,589,978,928 153,863,120 10,249 80,373 245,484,987 170,699,701
Liabilities
Financial Liabilities at Fair
Value Through Profit or
Loss:
- Financial Derivative
Instruments 3b, 11 - 351,877 243,524,562 2,581,235 - - 2,793 37,038
Due to Broker 7 - 492,958 109,403,746 1,625,610 - - 494,650 2,984,461
Bank Overdraft 7 - 1,313 22,595 - 3,028 - - -
Other Liabilities 1,166,224 1,768,168 125,130,236 375,769 7,221 80,373 446,081 1,710,803
Total Liabilities 1,166,224 2,614,316 478,081,139 4,582,614 10,249 80,373 943,524 4,732,302
Net Assets Attributable to
Redeemable
Participating
Shareholders 324,940,665 451,737,710 13,111,897,789 149,280,506 - - 244,541,463 165,967,399
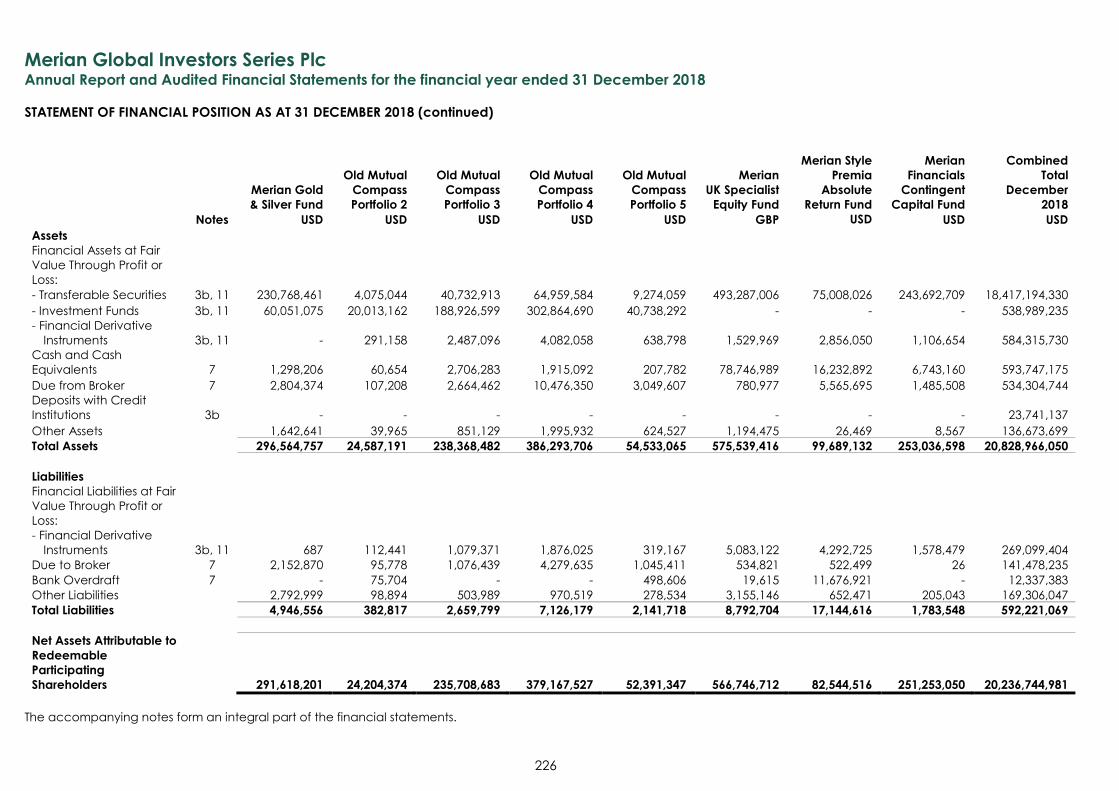
Merian Global Investors Series Plc Annual Report and Audited Financial Statements for the financial year ended 31 December 2018
STATEMENT OF FINANCIAL POSITION AS AT 31 DECEMBER 2018 (continued)
226
Merian Gold
& Silver Fund
Old Mutual
Compass
Portfolio 2
Old Mutual
Compass
Portfolio 3
Old Mutual
Compass
Portfolio 4
Old Mutual
Compass
Portfolio 5
Merian
UK Specialist
Equity Fund
Merian Style
Premia
Absolute
Return Fund
Merian
Financials
Contingent
Capital Fund
Combined
Total
December
2018
Notes USD USD USD USD USD GBP USD USD USD
Assets
Financial Assets at Fair
Value Through Profit or
Loss:
- Transferable Securities 3b, 11 230,768,461 4,075,044 40,732,913 64,959,584 9,274,059 493,287,006 75,008,026 243,692,709 18,417,194,330
- Investment Funds 3b, 11 60,051,075 20,013,162 188,926,599 302,864,690 40,738,292 - - - 538,989,235
- Financial Derivative
Instruments 3b, 11 - 291,158 2,487,096 4,082,058 638,798 1,529,969 2,856,050 1,106,654 584,315,730
Cash and Cash
Equivalents 7 1,298,206 60,654 2,706,283 1,915,092 207,782 78,746,989 16,232,892 6,743,160 593,747,175
Due from Broker 7 2,804,374 107,208 2,664,462 10,476,350 3,049,607 780,977 5,565,695 1,485,508 534,304,744
Deposits with Credit
Institutions 3b - - - - - - - - 23,741,137
Other Assets 1,642,641 39,965 851,129 1,995,932 624,527 1,194,475 26,469 8,567 136,673,699
Total Assets 296,564,757 24,587,191 238,368,482 386,293,706 54,533,065 575,539,416 99,689,132 253,036,598 20,828,966,050
Liabilities
Financial Liabilities at Fair
Value Through Profit or
Loss:
- Financial Derivative
Instruments 3b, 11 687 112,441 1,079,371 1,876,025 319,167 5,083,122 4,292,725 1,578,479 269,099,404
Due to Broker 7 2,152,870 95,778 1,076,439 4,279,635 1,045,411 534,821 522,499 26 141,478,235
Bank Overdraft 7 - 75,704 - - 498,606 19,615 11,676,921 - 12,337,383
Other Liabilities 2,792,999 98,894 503,989 970,519 278,534 3,155,146 652,471 205,043 169,306,047
Total Liabilities 4,946,556 382,817 2,659,799 7,126,179 2,141,718 8,792,704 17,144,616 1,783,548 592,221,069
Net Assets Attributable to
Redeemable
Participating
Shareholders 291,618,201 24,204,374 235,708,683 379,167,527 52,391,347 566,746,712 82,544,516 251,253,050 20,236,744,981
The accompanying notes form an integral part of the financial statements.
Merian Global Investors Series PicAnnual Report and Audited Financial Statements for the financial year ended 31 December 2018
STATEMENT OF FINANCIAL POSITION AS AT 31 DECEMBER 2018 (continued)
On behalf of the Board of Directors of Merian Global Investors Series Pic
Tom Murr&T"^ —" A<^Jan ^afersL^'
Director Director
Date: 25 April 2019
227
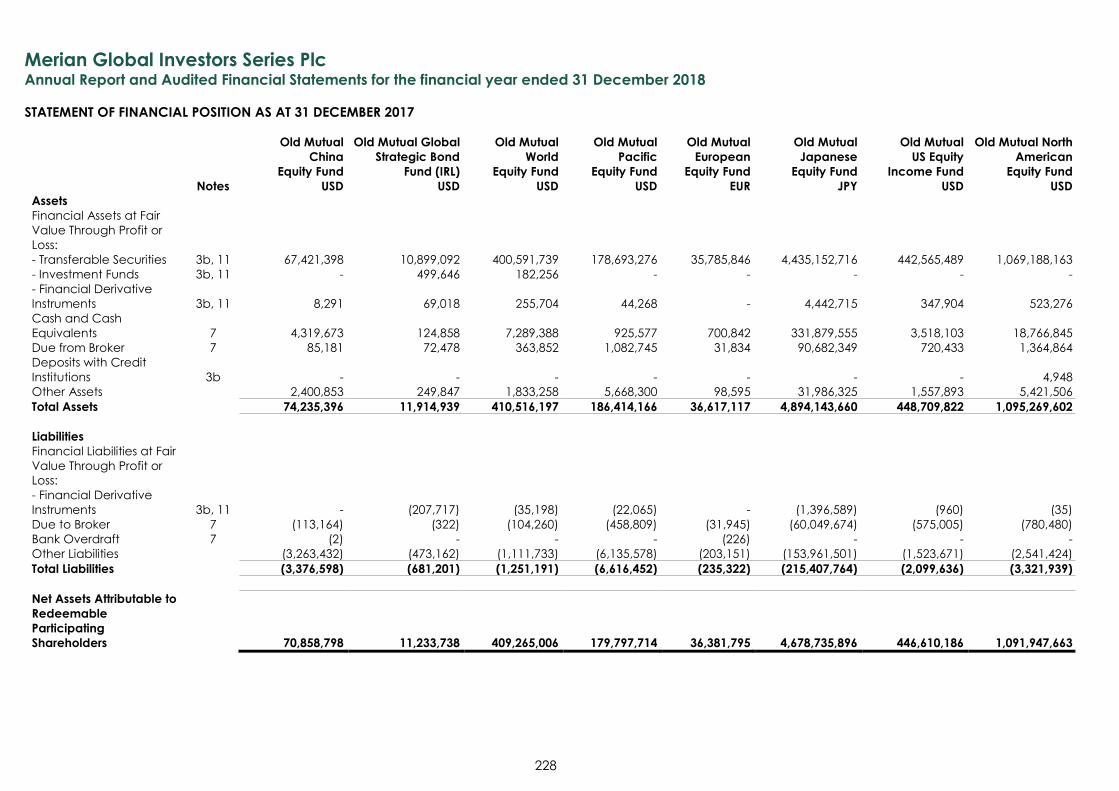
Merian Global Investors Series Plc Annual Report and Audited Financial Statements for the financial year ended 31 December 2018
STATEMENT OF FINANCIAL POSITION AS AT 31 DECEMBER 2017
228
Old Mutual
China
Equity Fund
Old Mutual Global
Strategic Bond
Fund (IRL)
Old Mutual
World
Equity Fund
Old Mutual
Pacific
Equity Fund
Old Mutual
European
Equity Fund
Old Mutual
Japanese
Equity Fund
Old Mutual
US Equity
Income Fund
Old Mutual North
American
Equity Fund Notes USD USD USD USD EUR JPY USD USD
Assets
Financial Assets at Fair
Value Through Profit or
Loss:
- Transferable Securities 3b, 11 67,421,398 10,899,092 400,591,739 178,693,276 35,785,846 4,435,152,716 442,565,489 1,069,188,163
- Investment Funds 3b, 11 - 499,646 182,256 - - - - -
- Financial Derivative
Instruments 3b, 11 8,291 69,018 255,704 44,268 - 4,442,715 347,904 523,276
Cash and Cash
Equivalents 7 4,319,673 124,858 7,289,388 925,577 700,842 331,879,555 3,518,103 18,766,845
Due from Broker 7 85,181 72,478 363,852 1,082,745 31,834 90,682,349 720,433 1,364,864
Deposits with Credit
Institutions 3b - - - - - - - 4,948
Other Assets 2,400,853 249,847 1,833,258 5,668,300 98,595 31,986,325 1,557,893 5,421,506
Total Assets 74,235,396 11,914,939 410,516,197 186,414,166 36,617,117 4,894,143,660 448,709,822 1,095,269,602
Liabilities
Financial Liabilities at Fair
Value Through Profit or
Loss:
- Financial Derivative
Instruments 3b, 11 - (207,717) (35,198) (22,065) - (1,396,589) (960) (35)
Due to Broker 7 (113,164) (322) (104,260) (458,809) (31,945) (60,049,674) (575,005) (780,480)
Bank Overdraft 7 (2) - - - (226) - - -
Other Liabilities (3,263,432) (473,162) (1,111,733) (6,135,578) (203,151) (153,961,501) (1,523,671) (2,541,424)
Total Liabilities (3,376,598) (681,201) (1,251,191) (6,616,452) (235,322) (215,407,764) (2,099,636) (3,321,939)
Net Assets Attributable to
Redeemable
Participating
Shareholders 70,858,798 11,233,738 409,265,006 179,797,714 36,381,795 4,678,735,896 446,610,186 1,091,947,663
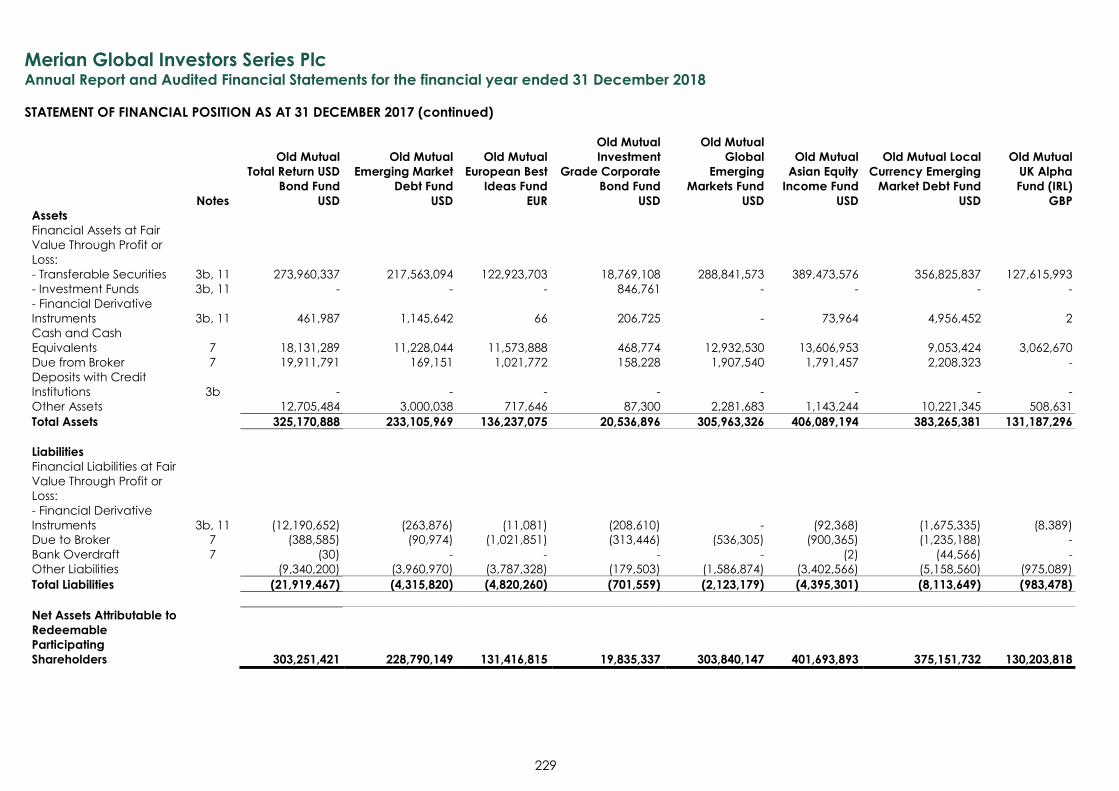
Merian Global Investors Series Plc Annual Report and Audited Financial Statements for the financial year ended 31 December 2018
STATEMENT OF FINANCIAL POSITION AS AT 31 DECEMBER 2017 (continued)
229
Old Mutual
Total Return USD
Bond Fund
Old Mutual
Emerging Market
Debt Fund
Old Mutual
European Best
Ideas Fund
Old Mutual
Investment
Grade Corporate
Bond Fund
Old Mutual
Global
Emerging
Markets Fund
Old Mutual
Asian Equity
Income Fund
Old Mutual Local
Currency Emerging
Market Debt Fund
Old Mutual
UK Alpha
Fund (IRL)
Notes USD USD EUR USD USD USD USD GBP
Assets
Financial Assets at Fair
Value Through Profit or
Loss:
- Transferable Securities 3b, 11 273,960,337 217,563,094 122,923,703 18,769,108 288,841,573 389,473,576 356,825,837 127,615,993
- Investment Funds 3b, 11 - - - 846,761 - - - -
- Financial Derivative
Instruments 3b, 11 461,987 1,145,642 66 206,725 - 73,964 4,956,452 2
Cash and Cash
Equivalents 7 18,131,289 11,228,044 11,573,888 468,774 12,932,530 13,606,953 9,053,424 3,062,670
Due from Broker 7 19,911,791 169,151 1,021,772 158,228 1,907,540 1,791,457 2,208,323 -
Deposits with Credit
Institutions 3b - - - - - - - -
Other Assets 12,705,484 3,000,038 717,646 87,300 2,281,683 1,143,244 10,221,345 508,631
Total Assets 325,170,888 233,105,969 136,237,075 20,536,896 305,963,326 406,089,194 383,265,381 131,187,296
Liabilities
Financial Liabilities at Fair
Value Through Profit or
Loss:
- Financial Derivative
Instruments 3b, 11 (12,190,652) (263,876) (11,081) (208,610) - (92,368) (1,675,335) (8,389)
Due to Broker 7 (388,585) (90,974) (1,021,851) (313,446) (536,305) (900,365) (1,235,188) -
Bank Overdraft 7 (30) - - - - (2) (44,566) -
Other Liabilities (9,340,200) (3,960,970) (3,787,328) (179,503) (1,586,874) (3,402,566) (5,158,560) (975,089)
Total Liabilities (21,919,467) (4,315,820) (4,820,260) (701,559) (2,123,179) (4,395,301) (8,113,649) (983,478)
Net Assets Attributable to
Redeemable
Participating
Shareholders 303,251,421 228,790,149 131,416,815 19,835,337 303,840,147 401,693,893 375,151,732 130,203,818
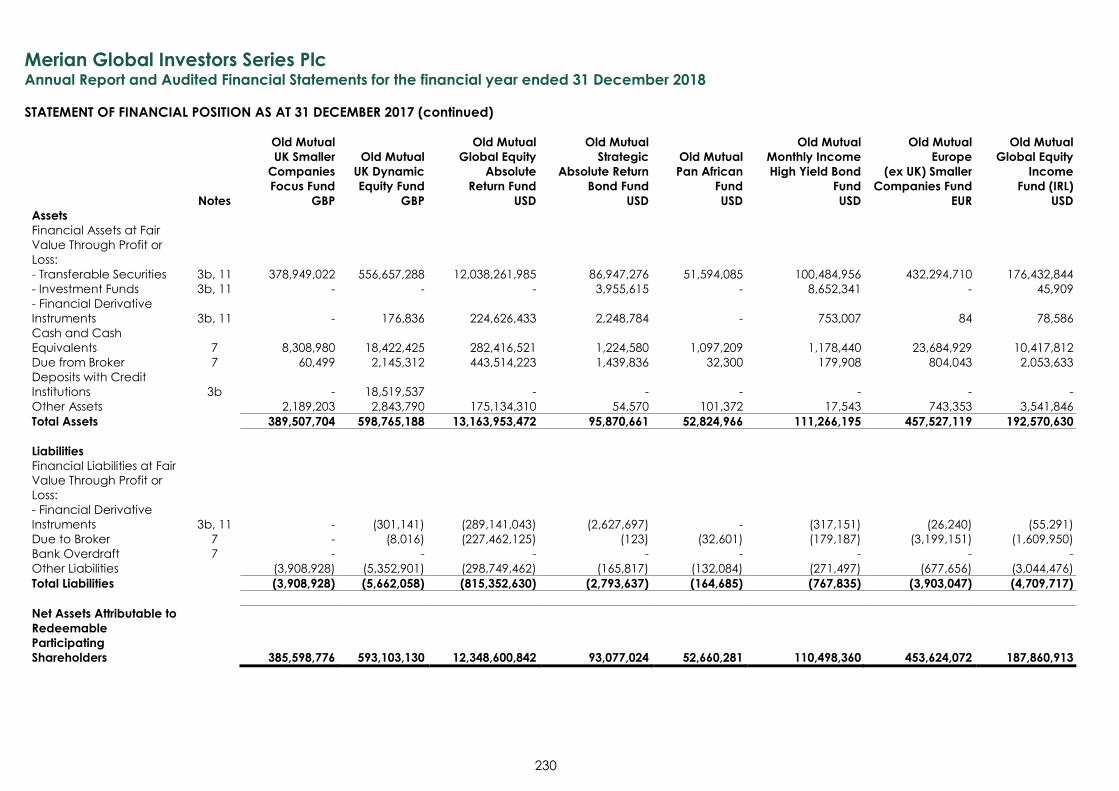
Merian Global Investors Series Plc Annual Report and Audited Financial Statements for the financial year ended 31 December 2018
STATEMENT OF FINANCIAL POSITION AS AT 31 DECEMBER 2017 (continued)
230
Old Mutual
UK Smaller
Companies
Focus Fund
Old Mutual
UK Dynamic
Equity Fund
Old Mutual
Global Equity
Absolute
Return Fund
Old Mutual
Strategic
Absolute Return
Bond Fund
Old Mutual
Pan African
Fund
Old Mutual
Monthly Income
High Yield Bond
Fund
Old Mutual
Europe
(ex UK) Smaller
Companies Fund
Old Mutual
Global Equity
Income
Fund (IRL)
Notes GBP GBP USD USD USD USD EUR USD
Assets
Financial Assets at Fair
Value Through Profit or
Loss:
- Transferable Securities 3b, 11 378,949,022 556,657,288 12,038,261,985 86,947,276 51,594,085 100,484,956 432,294,710 176,432,844
- Investment Funds 3b, 11 - - - 3,955,615 - 8,652,341 - 45,909
- Financial Derivative
Instruments 3b, 11 - 176,836 224,626,433 2,248,784 - 753,007 84 78,586
Cash and Cash
Equivalents 7 8,308,980 18,422,425 282,416,521 1,224,580 1,097,209 1,178,440 23,684,929 10,417,812
Due from Broker 7 60,499 2,145,312 443,514,223 1,439,836 32,300 179,908 804,043 2,053,633
Deposits with Credit
Institutions 3b - 18,519,537 - - - - - -
Other Assets 2,189,203 2,843,790 175,134,310 54,570 101,372 17,543 743,353 3,541,846
Total Assets 389,507,704 598,765,188 13,163,953,472 95,870,661 52,824,966 111,266,195 457,527,119 192,570,630
Liabilities
Financial Liabilities at Fair
Value Through Profit or
Loss:
- Financial Derivative
Instruments 3b, 11 - (301,141) (289,141,043) (2,627,697) - (317,151) (26,240) (55,291)
Due to Broker 7 - (8,016) (227,462,125) (123) (32,601) (179,187) (3,199,151) (1,609,950)
Bank Overdraft 7 - - - - - - - -
Other Liabilities (3,908,928) (5,352,901) (298,749,462) (165,817) (132,084) (271,497) (677,656) (3,044,476)
Total Liabilities (3,908,928) (5,662,058) (815,352,630) (2,793,637) (164,685) (767,835) (3,903,047) (4,709,717)
Net Assets Attributable to
Redeemable
Participating
Shareholders 385,598,776 593,103,130 12,348,600,842 93,077,024 52,660,281 110,498,360 453,624,072 187,860,913
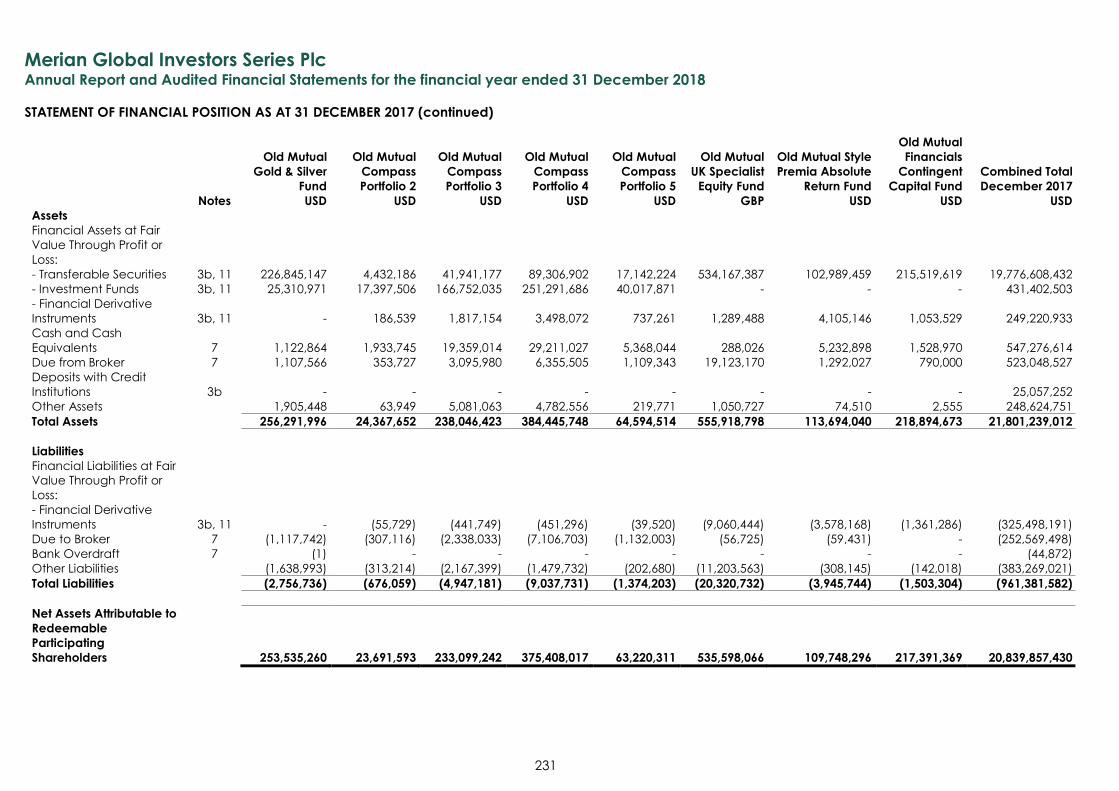
Merian Global Investors Series Plc Annual Report and Audited Financial Statements for the financial year ended 31 December 2018
STATEMENT OF FINANCIAL POSITION AS AT 31 DECEMBER 2017 (continued)
231
Old Mutual
Gold & Silver
Fund
Old Mutual
Compass
Portfolio 2
Old Mutual
Compass
Portfolio 3
Old Mutual
Compass
Portfolio 4
Old Mutual
Compass
Portfolio 5
Old Mutual
UK Specialist
Equity Fund
Old Mutual Style
Premia Absolute
Return Fund
Old Mutual
Financials
Contingent
Capital Fund
Combined Total
December 2017
Notes USD USD USD USD USD GBP USD USD USD
Assets
Financial Assets at Fair
Value Through Profit or
Loss:
- Transferable Securities 3b, 11 226,845,147 4,432,186 41,941,177 89,306,902 17,142,224 534,167,387 102,989,459 215,519,619 19,776,608,432
- Investment Funds 3b, 11 25,310,971 17,397,506 166,752,035 251,291,686 40,017,871 - - - 431,402,503
- Financial Derivative
Instruments 3b, 11 - 186,539 1,817,154 3,498,072 737,261 1,289,488 4,105,146 1,053,529 249,220,933
Cash and Cash
Equivalents 7 1,122,864 1,933,745 19,359,014 29,211,027 5,368,044 288,026 5,232,898 1,528,970 547,276,614
Due from Broker 7 1,107,566 353,727 3,095,980 6,355,505 1,109,343 19,123,170 1,292,027 790,000 523,048,527
Deposits with Credit
Institutions 3b - - - - - - - - 25,057,252
Other Assets 1,905,448 63,949 5,081,063 4,782,556 219,771 1,050,727 74,510 2,555 248,624,751
Total Assets 256,291,996 24,367,652 238,046,423 384,445,748 64,594,514 555,918,798 113,694,040 218,894,673 21,801,239,012
Liabilities
Financial Liabilities at Fair
Value Through Profit or
Loss:
- Financial Derivative
Instruments 3b, 11 - (55,729) (441,749) (451,296) (39,520) (9,060,444) (3,578,168) (1,361,286) (325,498,191)
Due to Broker 7 (1,117,742) (307,116) (2,338,033) (7,106,703) (1,132,003) (56,725) (59,431) - (252,569,498)
Bank Overdraft 7 (1) - - - - - - - (44,872)
Other Liabilities (1,638,993) (313,214) (2,167,399) (1,479,732) (202,680) (11,203,563) (308,145) (142,018) (383,269,021)
Total Liabilities (2,756,736) (676,059) (4,947,181) (9,037,731) (1,374,203) (20,320,732) (3,945,744) (1,503,304) (961,381,582)
Net Assets Attributable to
Redeemable
Participating
Shareholders 253,535,260 23,691,593 233,099,242 375,408,017 63,220,311 535,598,066 109,748,296 217,391,369 20,839,857,430
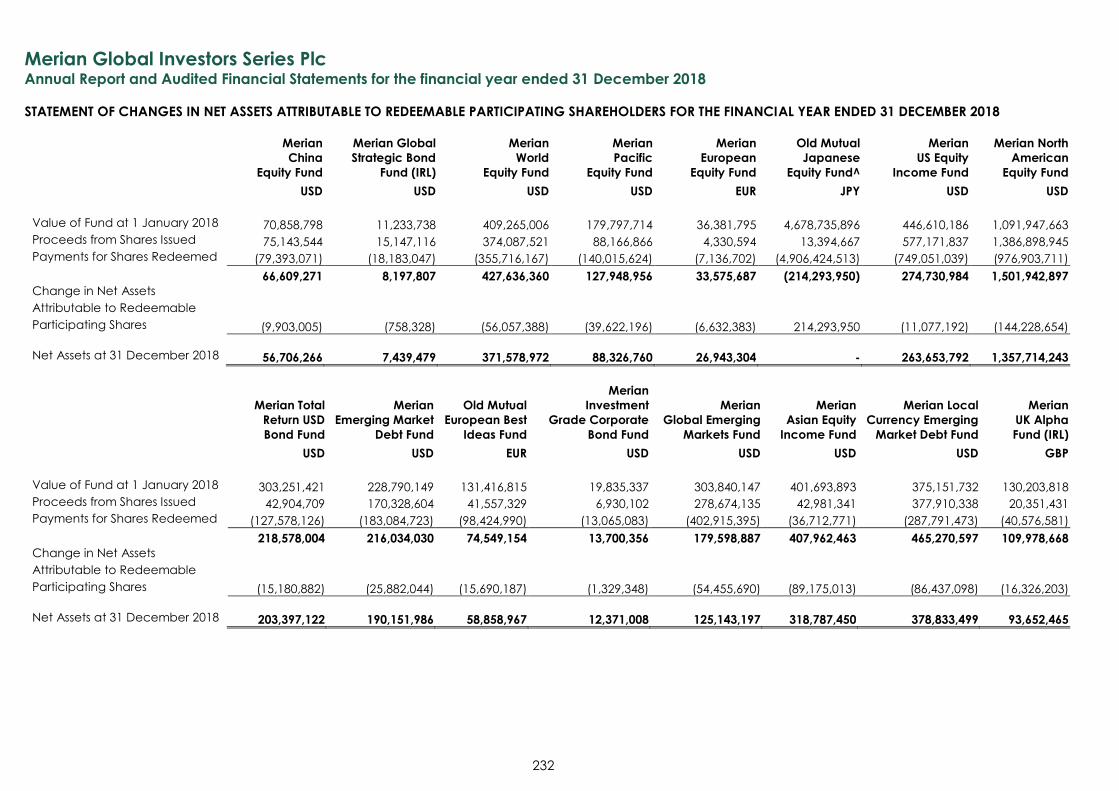
Merian Global Investors Series Plc Annual Report and Audited Financial Statements for the financial year ended 31 December 2018
STATEMENT OF CHANGES IN NET ASSETS ATTRIBUTABLE TO REDEEMABLE PARTICIPATING SHAREHOLDERS FOR THE FINANCIAL YEAR ENDED 31 DECEMBER 2018
232
Merian
China
Equity Fund
Merian Global
Strategic Bond
Fund (IRL)
Merian
World
Equity Fund
Merian
Pacific
Equity Fund
Merian
European
Equity Fund
Old Mutual
Japanese
Equity Fund^
Merian
US Equity
Income Fund
Merian North
American
Equity Fund
USD USD USD USD EUR JPY USD USD
Value of Fund at 1 January 2018 70,858,798 11,233,738 409,265,006 179,797,714 36,381,795 4,678,735,896 446,610,186 1,091,947,663
Proceeds from Shares Issued 75,143,544 15,147,116 374,087,521 88,166,866 4,330,594 13,394,667 577,171,837 1,386,898,945
Payments for Shares Redeemed (79,393,071) (18,183,047) (355,716,167) (140,015,624) (7,136,702) (4,906,424,513) (749,051,039) (976,903,711)
66,609,271 8,197,807 427,636,360 127,948,956 33,575,687 (214,293,950) 274,730,984 1,501,942,897
Change in Net Assets
Attributable to Redeemable
Participating Shares (9,903,005) (758,328) (56,057,388) (39,622,196) (6,632,383) 214,293,950 (11,077,192) (144,228,654)
Net Assets at 31 December 2018 56,706,266 7,439,479 371,578,972 88,326,760 26,943,304 - 263,653,792 1,357,714,243
Merian Total
Return USD
Bond Fund
Merian
Emerging Market
Debt Fund
Old Mutual
European Best
Ideas Fund
Merian
Investment
Grade Corporate
Bond Fund
Merian
Global Emerging
Markets Fund
Merian
Asian Equity
Income Fund
Merian Local
Currency Emerging
Market Debt Fund
Merian
UK Alpha
Fund (IRL)
USD USD EUR USD USD USD USD GBP
Value of Fund at 1 January 2018 303,251,421 228,790,149 131,416,815 19,835,337 303,840,147 401,693,893 375,151,732 130,203,818
Proceeds from Shares Issued 42,904,709 170,328,604 41,557,329 6,930,102 278,674,135 42,981,341 377,910,338 20,351,431
Payments for Shares Redeemed (127,578,126) (183,084,723) (98,424,990) (13,065,083) (402,915,395) (36,712,771) (287,791,473) (40,576,581)
218,578,004 216,034,030 74,549,154 13,700,356 179,598,887 407,962,463 465,270,597 109,978,668
Change in Net Assets
Attributable to Redeemable
Participating Shares (15,180,882) (25,882,044) (15,690,187) (1,329,348) (54,455,690) (89,175,013) (86,437,098) (16,326,203)
Net Assets at 31 December 2018 203,397,122 190,151,986 58,858,967 12,371,008 125,143,197 318,787,450 378,833,499 93,652,465
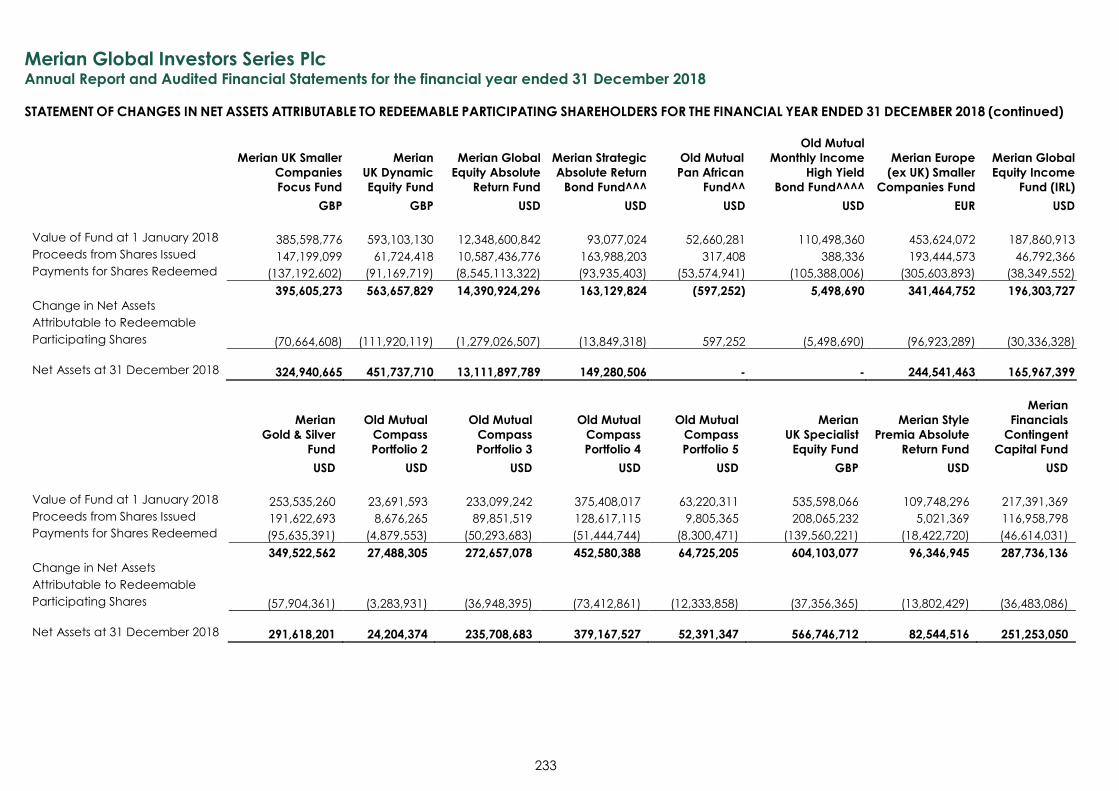
Merian Global Investors Series Plc Annual Report and Audited Financial Statements for the financial year ended 31 December 2018
STATEMENT OF CHANGES IN NET ASSETS ATTRIBUTABLE TO REDEEMABLE PARTICIPATING SHAREHOLDERS FOR THE FINANCIAL YEAR ENDED 31 DECEMBER 2018 (continued)
233
Merian UK Smaller
Companies
Focus Fund
Merian
UK Dynamic
Equity Fund
Merian Global
Equity Absolute
Return Fund
Merian Strategic
Absolute Return
Bond Fund^^^
Old Mutual
Pan African
Fund^^
Old Mutual
Monthly Income
High Yield
Bond Fund^^^^
Merian Europe
(ex UK) Smaller
Companies Fund
Merian Global
Equity Income
Fund (IRL)
GBP GBP USD USD USD USD EUR USD
Value of Fund at 1 January 2018 385,598,776 593,103,130 12,348,600,842 93,077,024 52,660,281 110,498,360 453,624,072 187,860,913
Proceeds from Shares Issued 147,199,099 61,724,418 10,587,436,776 163,988,203 317,408 388,336 193,444,573 46,792,366
Payments for Shares Redeemed (137,192,602) (91,169,719) (8,545,113,322) (93,935,403) (53,574,941) (105,388,006) (305,603,893) (38,349,552)
395,605,273 563,657,829 14,390,924,296 163,129,824 (597,252) 5,498,690 341,464,752 196,303,727
Change in Net Assets
Attributable to Redeemable
Participating Shares (70,664,608) (111,920,119) (1,279,026,507) (13,849,318) 597,252 (5,498,690) (96,923,289) (30,336,328)
Net Assets at 31 December 2018 324,940,665 451,737,710 13,111,897,789 149,280,506 - - 244,541,463 165,967,399
Merian
Gold & Silver
Fund
Old Mutual
Compass
Portfolio 2
Old Mutual
Compass
Portfolio 3
Old Mutual
Compass
Portfolio 4
Old Mutual
Compass
Portfolio 5
Merian
UK Specialist
Equity Fund
Merian Style
Premia Absolute
Return Fund
Merian
Financials
Contingent
Capital Fund
USD USD USD USD USD GBP USD USD
Value of Fund at 1 January 2018 253,535,260 23,691,593 233,099,242 375,408,017 63,220,311 535,598,066 109,748,296 217,391,369
Proceeds from Shares Issued 191,622,693 8,676,265 89,851,519 128,617,115 9,805,365 208,065,232 5,021,369 116,958,798
Payments for Shares Redeemed (95,635,391) (4,879,553) (50,293,683) (51,444,744) (8,300,471) (139,560,221) (18,422,720) (46,614,031)
349,522,562 27,488,305 272,657,078 452,580,388 64,725,205 604,103,077 96,346,945 287,736,136
Change in Net Assets
Attributable to Redeemable
Participating Shares (57,904,361) (3,283,931) (36,948,395) (73,412,861) (12,333,858) (37,356,365) (13,802,429) (36,483,086)
Net Assets at 31 December 2018 291,618,201 24,204,374 235,708,683 379,167,527 52,391,347 566,746,712 82,544,516 251,253,050
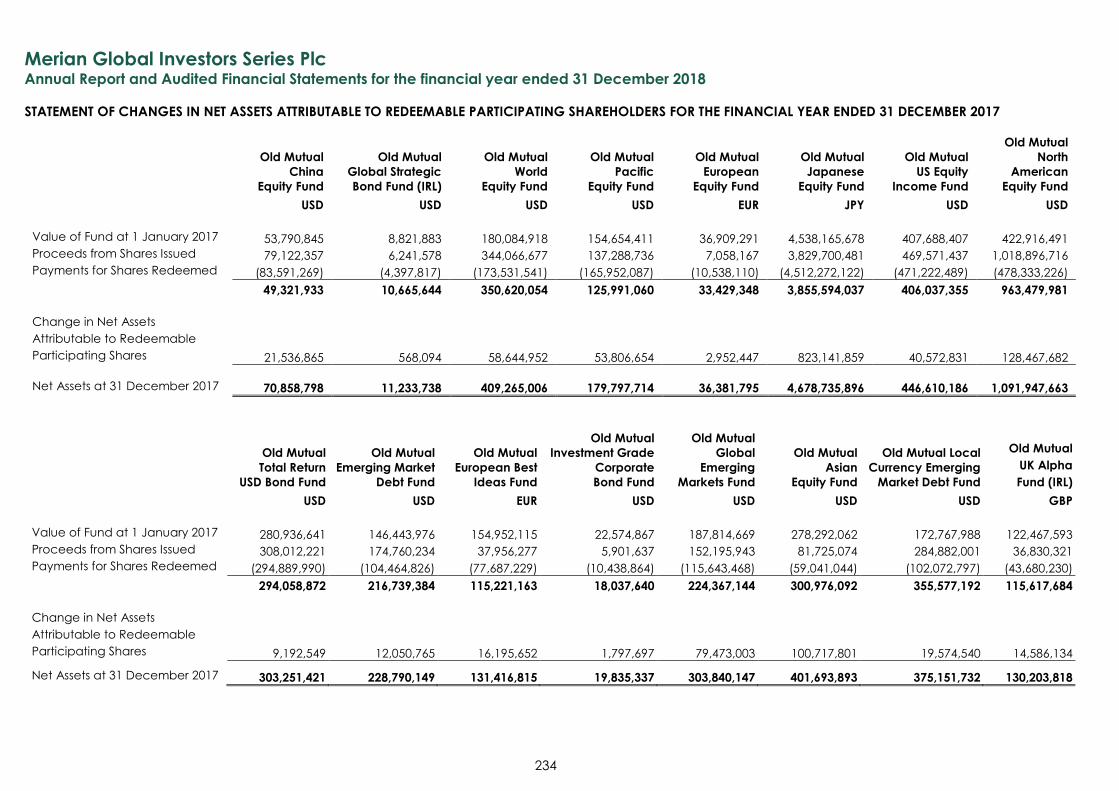
Merian Global Investors Series Plc Annual Report and Audited Financial Statements for the financial year ended 31 December 2018
STATEMENT OF CHANGES IN NET ASSETS ATTRIBUTABLE TO REDEEMABLE PARTICIPATING SHAREHOLDERS FOR THE FINANCIAL YEAR ENDED 31 DECEMBER 2017
234
Old Mutual
China
Equity Fund
Old Mutual
Global Strategic
Bond Fund (IRL)
Old Mutual
World
Equity Fund
Old Mutual
Pacific
Equity Fund
Old Mutual
European
Equity Fund
Old Mutual
Japanese
Equity Fund
Old Mutual
US Equity
Income Fund
Old Mutual
North
American
Equity Fund
USD USD USD USD EUR JPY USD USD
Value of Fund at 1 January 2017 53,790,845 8,821,883 180,084,918 154,654,411 36,909,291 4,538,165,678 407,688,407 422,916,491
Proceeds from Shares Issued 79,122,357 6,241,578 344,066,677 137,288,736 7,058,167 3,829,700,481 469,571,437 1,018,896,716
Payments for Shares Redeemed (83,591,269) (4,397,817) (173,531,541) (165,952,087) (10,538,110) (4,512,272,122) (471,222,489) (478,333,226)
49,321,933 10,665,644 350,620,054 125,991,060 33,429,348 3,855,594,037 406,037,355 963,479,981
Change in Net Assets
Attributable to Redeemable
Participating Shares 21,536,865 568,094 58,644,952 53,806,654 2,952,447 823,141,859 40,572,831 128,467,682
Net Assets at 31 December 2017 70,858,798 11,233,738 409,265,006 179,797,714 36,381,795 4,678,735,896 446,610,186 1,091,947,663
Old Mutual
Total Return
USD Bond Fund
Old Mutual
Emerging Market
Debt Fund
Old Mutual
European Best
Ideas Fund
Old Mutual
Investment Grade
Corporate
Bond Fund
Old Mutual
Global
Emerging
Markets Fund
Old Mutual
Asian
Equity Fund
Old Mutual Local
Currency Emerging
Market Debt Fund
Old Mutual
UK Alpha
Fund (IRL)
USD USD EUR USD USD USD USD GBP
Value of Fund at 1 January 2017 280,936,641 146,443,976 154,952,115 22,574,867 187,814,669 278,292,062 172,767,988 122,467,593
Proceeds from Shares Issued 308,012,221 174,760,234 37,956,277 5,901,637 152,195,943 81,725,074 284,882,001 36,830,321
Payments for Shares Redeemed (294,889,990) (104,464,826) (77,687,229) (10,438,864) (115,643,468) (59,041,044) (102,072,797) (43,680,230)
294,058,872 216,739,384 115,221,163 18,037,640 224,367,144 300,976,092 355,577,192 115,617,684
Change in Net Assets
Attributable to Redeemable
Participating Shares 9,192,549 12,050,765 16,195,652 1,797,697 79,473,003 100,717,801 19,574,540 14,586,134
Net Assets at 31 December 2017 303,251,421 228,790,149 131,416,815 19,835,337 303,840,147 401,693,893 375,151,732 130,203,818
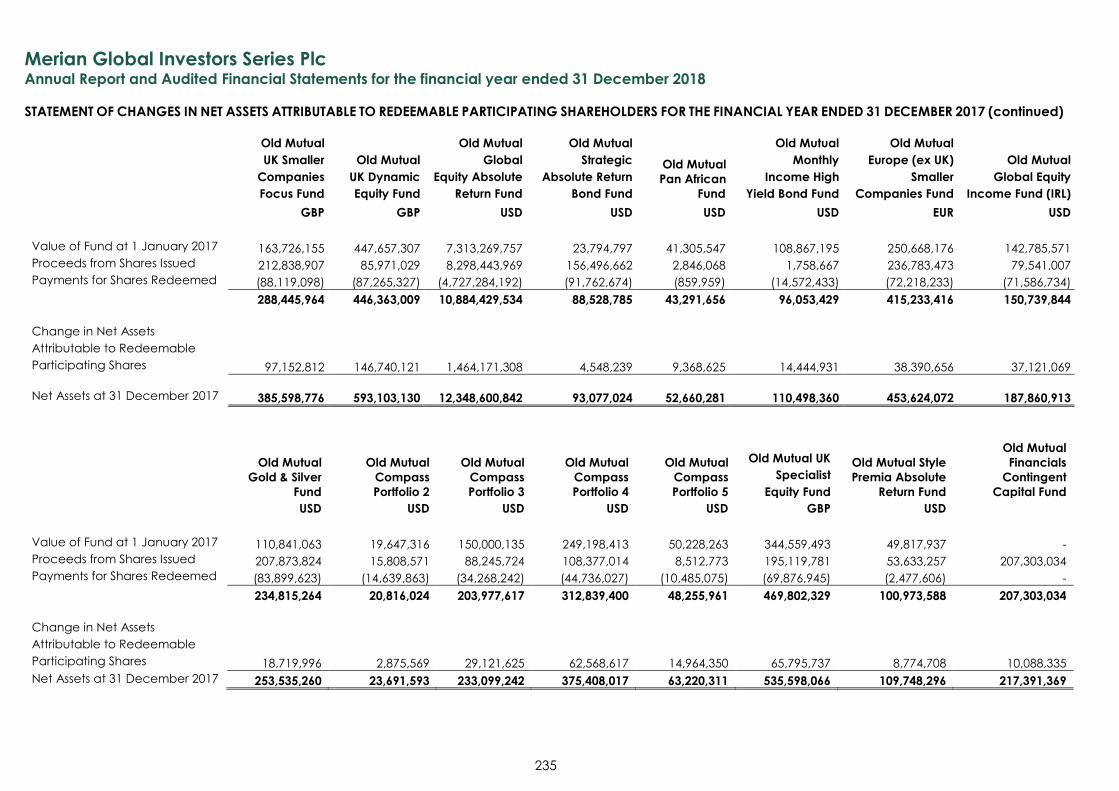
Merian Global Investors Series Plc Annual Report and Audited Financial Statements for the financial year ended 31 December 2018
STATEMENT OF CHANGES IN NET ASSETS ATTRIBUTABLE TO REDEEMABLE PARTICIPATING SHAREHOLDERS FOR THE FINANCIAL YEAR ENDED 31 DECEMBER 2017 (continued)
235
Old Mutual
UK Smaller
Companies
Focus Fund
Old Mutual
UK Dynamic
Equity Fund
Old Mutual
Global
Equity Absolute
Return Fund
Old Mutual
Strategic
Absolute Return
Bond Fund
Old Mutual
Pan African
Fund
Old Mutual
Monthly
Income High
Yield Bond Fund
Old Mutual
Europe (ex UK)
Smaller
Companies Fund
Old Mutual
Global Equity
Income Fund (IRL)
GBP GBP USD USD USD USD EUR USD
Value of Fund at 1 January 2017 163,726,155 447,657,307 7,313,269,757 23,794,797 41,305,547 108,867,195 250,668,176 142,785,571
Proceeds from Shares Issued 212,838,907 85,971,029 8,298,443,969 156,496,662 2,846,068 1,758,667 236,783,473 79,541,007
Payments for Shares Redeemed (88,119,098) (87,265,327) (4,727,284,192) (91,762,674) (859,959) (14,572,433) (72,218,233) (71,586,734)
288,445,964 446,363,009 10,884,429,534 88,528,785 43,291,656 96,053,429 415,233,416 150,739,844
Change in Net Assets
Attributable to Redeemable
Participating Shares 97,152,812 146,740,121 1,464,171,308 4,548,239 9,368,625 14,444,931 38,390,656 37,121,069
Net Assets at 31 December 2017 385,598,776 593,103,130 12,348,600,842 93,077,024 52,660,281 110,498,360 453,624,072 187,860,913
Old Mutual
Gold & Silver
Fund
Old Mutual
Compass
Portfolio 2
Old Mutual
Compass
Portfolio 3
Old Mutual
Compass
Portfolio 4
Old Mutual
Compass
Portfolio 5
Old Mutual UK
Specialist
Equity Fund
Old Mutual Style
Premia Absolute
Return Fund
Old Mutual
Financials
Contingent
Capital Fund
USD USD USD USD USD GBP USD
Value of Fund at 1 January 2017 110,841,063 19,647,316 150,000,135 249,198,413 50,228,263 344,559,493 49,817,937 -
Proceeds from Shares Issued 207,873,824 15,808,571 88,245,724 108,377,014 8,512,773 195,119,781 53,633,257 207,303,034
Payments for Shares Redeemed (83,899,623) (14,639,863) (34,268,242) (44,736,027) (10,485,075) (69,876,945) (2,477,606) -
234,815,264 20,816,024 203,977,617 312,839,400 48,255,961 469,802,329 100,973,588 207,303,034
Change in Net Assets
Attributable to Redeemable
Participating Shares 18,719,996 2,875,569 29,121,625 62,568,617 14,964,350 65,795,737 8,774,708 10,088,335
Net Assets at 31 December 2017 253,535,260 23,691,593 233,099,242 375,408,017 63,220,311 535,598,066 109,748,296 217,391,369
Merian Global Investors Series Plc Annual Report and Audited Financial Statements for the financial year ended 31 December 2018
NOTES TO THE FINANCIAL STATEMENTS FOR THE FINANCIAL YEAR ENDED 31 DECEMBER 2018
236
1. Reporting Entity
Merian Global Investors Series Plc (the “Company”) is an open-ended investment company with variable
capital organised under the laws of Ireland. The Company is organised in the form of an umbrella fund
insofar as the share capital of the Company will be divided into different series of shares with each series
of shares representing a portfolio of assets which will comprise a separate fund (each a “Sub-Fund”). As at
31 December 2018, the Company has 29 Sub-Funds in operation (2017: 32 Sub-Funds). Old Mutual
Japanese Equity Fund, Old Mutual Pan African Fund and Old Mutual Monthly Income High Yield Bond Fund
closed during the financial year.
2. Basis of Preparation
The Company is incorporated in Ireland and authorised by the Central Bank. The financial statements are
prepared in accordance with Financial Reporting Standard 102 (“FRS 102”) applicable in the UK and
Republic of Ireland issued by the Financial Reporting Council (FRC) in September 2015 and promulgated
by the Institute of Chartered Accountants in Ireland (“ICAI”), Irish statute comprising the Companies Act
2014 (as amended) and the European Communities (Undertakings for Collective Investment in Transferable
Securities) Regulations 2011 (as amended) (“the UCITS Regulations”) and the Central Bank (Supervision and
Enforcement) Act 2013 (Section 48(1)) (Undertakings for Collective Investment in Transferable Securities)
Regulations 2015 (the "Central Bank UCITS Regulations").
The format and certain wordings of the financial statements have been adapted from those contained in
the FRS 102 and the Companies Act 2014 so that, in the opinion of the Directors, they more appropriately
reflect the nature of the Company’s business as an investment fund.
The Company has availed of the exemption available to open-ended investment funds under FRS 102 and
are not presenting a cash flow statement.
Measurement Convention
The financial statements are prepared under the historical cost convention as modified by the revaluation
of financial assets and financial liabilities at fair value through profit or loss. The debt instruments are held in
the financial statements at an amount that includes accrued interest.
Going Concern
The financial statements have been prepared on the going concern basis.
3. Significant Accounting Policies
The principal accounting policies and estimates applied in the preparation of these financial statements
are set out below. These policies have been consistently applied to all the periods presented, unless
otherwise stated.
Estimates and Judgments
The preparation of financial statements in conformity with FRS 102 requires management to make
judgements, estimates and assumptions that may affect the reported amounts of assets, liabilities, income
and expenses.
The estimates and associated assumptions are based on historical experience and various other factors
which are believed to be reasonable under the circumstances, the results of which form the basis of making
the judgements about carrying values of assets and liabilities which are not readily apparent from others.
Estimates and underlying assumptions are reviewed on an ongoing basis. Revisions to accounting estimates
are recognised in the period in which the estimates are revised and in any future accounting periods
affected. Information about assumptions and estimation uncertainties that have a significant risk of
resulting in a material adjustment within the next financial year, as well as critical judgement in applying
accounting policies that have the most significant effect on the amounts recognised in the financial
statements are included in Note 11.
Merian Global Investors Series Plc Annual Report and Audited Financial Statements for the financial year ended 31 December 2018
NOTES TO THE FINANCIAL STATEMENTS FOR THE FINANCIAL YEAR ENDED 31 DECEMBER 2018 (continued)
237
3. Significant Accounting Policies (continued)
a. Foreign Currency Translation
Functional and Presentation Currency of the Company
The Company has adopted United States Dollar (“USD”) as a substantial part of the Company’s assets and
liabilities are denominated in USD.
Functional and Presentation Currency of the Sub-Funds
Items included in the Company’s financial statements are measured using the currency of the primary
economic environment in which the respective Sub-Funds operate (the “functional currency”). The
functional currency, which is either Euro (“EUR”), Japanese Yen (“JPY”), United States Dollar (“USD”) or
Pound Sterling (“GBP”), is shown in the Statement of Financial Position for each Sub-Fund. The Sub-Funds
also adopted these functional currencies as their presentation currency.
Transactions and Balances
Transactions in foreign currencies are translated to the Sub-Fund's functional currency at the foreign
exchange rate at the date of the transaction. Assets and liabilities in foreign currencies are translated into
the functional currency at the rates prevailing at the financial year end date.
Translation of Sub-Funds for the purposes of calculating the Company Values
For the purposes of calculating the overall value of the Company, for all Sub-Funds where USD is not the
functional currency, all assets and liabilities in the Statement of Financial Position are translated to USD at
financial year end exchange rates and all income and expenses are translated to USD using an average
rate of exchange for the entire financial year.
b. Financial Instruments
The Company has chosen to implement the recognition and measurement provisions of IAS 39 and only
the disclosure requirements of Sections 11 and 12 of FRS 102.
The majority of the Company’s financial instruments are classified in categories that require measurement
at fair value through profit or loss, with the basis for arriving at this position being set out below.
Classification The Company classifies financial assets and financial liabilities into the following categories: Financial assets at fair value through profit or loss:
- Held for trading: transferable securities, investment funds and financial derivative instruments.
Financial assets at amortised cost:
- Loans and receivables: cash and cash equivalents, due from broker, collateral cash, deposits with credit institutions and other assets. Financial liabilities at fair value through profit or loss:
- Held for trading: financial derivative instruments. Financial liabilities at amortised cost:
- Other liabilities: due to broker, bank overdraft and other liabilities and Net Assets Attributable to Redeemable Participating Shareholders
A financial instrument is classified as held for trading if:
- it is acquired or incurred principally for the purpose of selling or repurchasing it in the near term; - on initial recognition, it is part of a portfolio that is managed together and for which there is evidence
of a recent pattern of short-term profit taking; or - is a derivative, other than a designated and effective hedging instrument.
Merian Global Investors Series Plc Annual Report and Audited Financial Statements for the financial year ended 31 December 2018
NOTES TO THE FINANCIAL STATEMENTS FOR THE FINANCIAL YEAR ENDED 31 DECEMBER 2018 (continued)
238
3. Significant Accounting Policies (continued)
b. Financial Instruments (continued)
Recognition and Measurement Financial assets and financial liabilities at fair value through profit or loss are recognised as of the day the transaction takes place (trade date), the date on which the Sub-Fund commits to purchase or sell the asset. Other financial assets and financial liabilities are recognised on the date in which they originated. Investments are initially recognised at fair value, and costs for all financial assets and financial liabilities carried at fair value through profit or loss are expensed as incurred. Financial assets and financial liabilities not at fair value through profit or loss are initially recognised at fair value plus transaction costs that are directly attributable to their acquisition or issue.
Subsequent to initial recognition, all instruments classified at fair value through profit or loss are measured
at fair value with changes in their fair value recognised in the Statement of Operations. Financial assets
and liabilities, other than those at fair value through profit or loss, are measured at amortised cost using the
effective interest rate, with other assets being measured using effective interest rate and less impairment
losses, if any. Financial liabilities arising from the redeemable shares issued by the Company are carried at
the redemption amount representing the investors’ right to a residual interest in the Company’s assets.
Fair Value Measurement ‘Fair value’ is the price that would be received to sell an asset or paid to transfer a liability in an orderly transaction between market participants at the measurement date in the principal or, in its absence, the most advantageous market to which the Sub-Fund has access at that date. The fair value of a liability reflects its non-performance risk.
i) Transferable Securities When available, the Sub-Funds measure the fair value of an investment using the quoted price in an active market for that instrument. A market is regarded as ‘active’ if transactions for the asset or liability take place with sufficient frequency and volume to provide pricing information on an ongoing basis. Sub-Funds measure instruments quoted in an active market at a last traded price, without any deduction for estimated future selling cost, the last traded price provides a reasonable approximation of exit price. If there is no quoted price in an active market, then the Sub-Fund uses valuation techniques that maximise the use of relevant observable inputs and minimise the use of unobservable inputs. The chosen valuation technique incorporates all of the factors that market participants would take into account in pricing a transaction.
ii) Investment Funds The fair value of investment funds is based on the underlying fund administrator’s calculation of the net asset value per share (market value of the Sub-Fund’s assets less liabilities divided by the number of shares) which will be the latest bid price published by the investment funds taking into account any adjustments that may be required to account for illiquidity, low trading volumes or any such factors that may indicate that the bid price may not be fair value. The fair value of any investments in closed-ended investment funds is based on the bid prices available on the principal market for such security at the valuation date taking into account any adjustments that may be required to account for illiquidity, low trading volumes or any such factors that may indicate that the bid price may not be fair value.
iii) Financial Derivative Instruments
Currency Exchange Contracts The Sub-Funds may employ currency exchange contracts to purchase or sell a specific currency at a future date at a price set at the time of the contract. The Base Currency of each Sub-Fund is either GBP, EUR, JPY or USD but securities in a Sub-Fund may be denominated in large range of currencies. Consequently, a Sub-Fund may enter into currency exchange contracts to hedge against exchange rate risk. Performance may be significantly influenced by movements in foreign exchange rates because currency positions held by a Sub-Fund may not correspond with the currency of the securities invested in. The unrealized gain or loss on open currency exchange contracts is calculated as the difference between the contract price and the spot price as at year end. Any changes in fair value are recognised in the Statement of Operations.
Merian Global Investors Series Plc Annual Report and Audited Financial Statements for the financial year ended 31 December 2018
NOTES TO THE FINANCIAL STATEMENTS FOR THE FINANCIAL YEAR ENDED 31 DECEMBER 2018 (continued)
239
3. Significant Accounting Policies (continued)
b. Financial Instruments (continued)
Fair Value Measurement (continued)
iii) Financial Derivative Instruments (continued)
Futures contracts Futures contracts are commitments either to purchase or sell a designated financial instrument, currency, commodity or an index at a specified future date for a specified price and may be settled in cash or another financial asset. Futures are standardised exchange-traded contracts. Initial margin requirements for futures are met in cash or other instruments, and changes in the futures contract values are settled daily. Daily fluctuations in the value of a futures contract are recorded for financial reporting purposes as unrealised gains or losses by the Sub-Funds and are recorded as a realised gain or loss when the position is closed.
Options A Sub-Fund may purchase and sell (write) call and put options on securities, securities indices and foreign currencies traded on a national securities exchange or in an over-the-counter market. When a Sub-Fund purchases a call or a put option, a premium is paid by the Sub-Fund. The premium on purchased put options exercised is subtracted from the proceeds of the sale of the underlying security or foreign currency in determining the realised gain or loss. The premium on purchased call options exercised is included in determining initial fair value of the securities or foreign currency purchased. Premiums paid on the purchase of options which expire unexercised are treated as realised losses. The option is subsequently marked-to-market to reflect the fair value of the option purchased, which is reported within financial assets at fair value through profit or loss on the Statement of Financial Position for each relevant Sub-Fund.
The over-the-counter options are valued at close of business on the dealing day at the settlement price as
provided by the counterparty/broker and the values are independently valued, at a minimum, weekly.
The fair value of exchange traded options are based upon their quoted daily settlement prices on the
relevant exchange. In the event of it being impossible or incorrect to carry out a valuation of a specific
investment in accordance with the valuation rules, or if such valuation is not representative of a security’s
fair market value, the Directors are entitled to use other generally recognised valuation methods in order
to reach a proper valuation of that specific instrument, provided that such method of valuation has been
approved by the Depositary.
Swap contracts
Swap contracts are carried at fair value based upon the fair value of the underlying assets, the risk
associated with the underlying assets, and any additional provisions of the derivative contract.
Interest rate swaps (“IRSs”) are measured initially at fair value on the date on which the derivative contract
is entered into and subsequently remeasured at fair value. Fair values are obtained from counterparties or
from quoted market prices in active markets, including recent market transactions, and from valuation
techniques using discounted cash flow models and option pricing models as appropriate. IRSs are included
in assets when the fair value is positive, and in liabilities when the fair value is negative, unless there is the
legal ability and intention to settle the asset and liability on a net basis. Revenues/payments arising on IRSs
are included in the net gain on investment activities in the Statement of Operations.
Credit default swap (“CDS”) and credit default index swap (“CDX”) contracts are valued at fair value
based on a pricing methodology utilising certain factors which include the credit risk of the reference
obligations of the underlying issuers, as well as the specific terms of the contract. Certain contracts entered
into may include upfront fees that are paid by the buyer to the seller of the contracts at the date of
transaction.
Merian Global Investors Series Plc Annual Report and Audited Financial Statements for the financial year ended 31 December 2018
NOTES TO THE FINANCIAL STATEMENTS FOR THE FINANCIAL YEAR ENDED 31 DECEMBER 2018 (continued)
240
3. Significant Accounting Policies (continued)
b. Financial Instruments (continued)
Fair Value Measurement (continued)
iii) Financial Derivative Instruments (continued)
Swap contracts (continued)
Such fees are reported as unrealised gains or losses in the Statement of Financial Position and as net gains
and losses in the Statement of Operations. These upfront payments represent the amounts paid or received
when initially entering into the swap agreement to compensate for differences between the stated terms
of the swap agreement and the prevailing market conditions and are included as realised gains or losses
on the Statement of Operations upon termination or maturity of the swap.
Total return swaps (“TRS’s”) involve a commitment by one party to pay interest to the other party in
exchange for a payment to it from the other party based on the return of a reference asset (e.g., a security,
basket of securities or futures contract), both based on notional amounts. To the extent the return of the
reference asset exceeds or falls short of the interest payments, one party is entitled to receive a payment
from or obligated to make a payment to the other party.
Contracts for difference
Contracts for difference may be used either as a substitute for direct investment in the underlying equity
or fixed income security or as an alternative to and for the same purposes as futures and options. Changes
in the value of open contracts for difference are recognised as unrealised gains or losses on contracts for
difference and are included in net gain/loss on financial assets and financial liabilities at fair value through
profit and loss in the Statement of Operations, until the contracts are terminated, at which time realised
gains and losses are recognised as a realised gain or loss and included in net gain/loss on financial assets
and financial liabilities at fair value through profit and loss in the Statement of Operations. Unrealised gains
or losses on contracts for difference are shown in the Statement of Financial Position.
Amortised cost measurement Financial asset and liabilities other than those classified at fair value through profit or loss are held at amortised cost. The amortised cost of the financial asset or financial liability is the amount at which the financial asset or financial liability is measured at initial recognition, minus principal repayments, plus or minus the accumulative amortisation using the effective interest method of any difference between the initial amount recognised and the maturity amount, minus any reduction for impairment.
i) Cash and Cash Equivalents/ Due to/from Broker/Deposits with Credit Institutions/Fund Assets Cash Cash amounts held comprise of current deposits in banks which are readily available. Cash equivalents are short-term highly liquid investments that are readily convertible to known amounts of cash, are subject to an insignificant risk of changes in value and are held for the purpose of meeting short-term cash commitments rather than for investment or other purposes. Due to/from Broker is an amount which is made up of margin cash, spot contracts, pending trades and collateral pledged. The margin cash and cash collateral is held by or due to brokers for open futures contracts and represents the exchange traded futures contracts margin deposits. This amount is the minimum deemed by the brokers and counterparties for collateral requirements and is as such restricted and therefore reported separately to the unrestricted cash on the Sub-Fund’s Statements of Financial Position. Sub-Fund’s assets may be deposited by or received by the Sub-Fund for collateral purposes with counterparties in respect of OTC financial derivative instruments held by the Sub-Fund. Such assets remain in the ownership of the relevant Sub-Fund and are recorded as an asset on the Statement of Financial Position. Investments pledged by the Sub-Funds as collateral are recognised at fair value in the relevant Sub-Fund’s Portfolio of Investments and are referenced accordingly at the base of the Portfolio of Investments. Securities received by the Sub-Funds as collateral from counterparties do not form part of the Net Asset Value of the Sub-Funds and are disclosed at the end of the relevant Portfolio of Investments.
Merian Global Investors Series Plc Annual Report and Audited Financial Statements for the financial year ended 31 December 2018
NOTES TO THE FINANCIAL STATEMENTS FOR THE FINANCIAL YEAR ENDED 31 DECEMBER 2018 (continued)
241
3. Significant Accounting Policies (continued)
b. Financial Instruments (continued)
ii) Other Assets and Other Liabilities
Other assets and liabilities represent amounts receivable and payable respectively, for transactions
contracted for but not yet paid for by the end of the period. These amounts are held relate to subscription
and redemption monies and dividend transactions. Other assets and liabilities are primarily non-interest
bearing and short term in nature.
Fund asset cash balances, including an appropriate equal and opposing liability, are reflected at a Sub-
Fund level on the Statement of Financial Position. The Fund asset cash receivables are included in the Other
Assets and Fund asset cash payables are included in the Other Liabilities on the Statement of Financial
Position respectively. They represent umbrella cash collection account balances attributable to the
individual Sub-Funds of the Company. These amounts relate to subscription and redemption monies,
including dividend money, that are due to an individual Sub-Fund, as Sub-Fund assets, and which are held
in an umbrella cash collection account in the name of the Company.
Offsetting
Financial assets and financial liabilities are offset and the net amount presented in the Statement of
Financial Position when, and only when, the Sub-Fund has a legally enforceable right to offset the
recognised amounts and it intends either to settle on a net basis or to realise the asset and settle the liability
simultaneously. Income and expenses are presented on a net basis for gains and losses from financial
instruments at fair value through profit or loss and foreign exchange gains and losses. The Company’s
financial assets and financial liabilities are not subject to offsetting, enforceable master netting
arrangements and similar agreements.
Derecognition
Each Sub-Fund derecognises a financial asset when the contractual rights to the cash flows from the asset
expire, or it transfers the rights to receive the contractual cash flows in a transaction in which substantially
all of the risks and rewards of ownership of the financial asset are transferred or in which the Sub-Fund
neither transfers nor retains substantially all of the risks and rewards of ownership and does not retain control
of the financial asset.
On derecognition of a financial asset, the difference between the carrying amount of the asset (or the
carrying amount allocated to the portion of the asset that is derecognised) and the consideration received
(including any new asset obtained less any new liability assumed) is recognised in the Statement of
Operations. Any interest in such transferred financial assets that is created or retained by the Company is
recognised as a separate asset or liability.
The Company derecognises a financial liability when its contractual obligations are discharged or
cancelled, or expire.
c. Cross Investments
During the financial year ended 31 December 2018 a number of the Sub-Funds invested in other Sub-Funds
in the Company (the “Cross Investments”). The fair value of these investments as of 31 December 2018 is
disclosed within each relevant Sub-Fund’s Portfolio of Investments. For details on how these are eliminated
at a company level, please see the Related Parties note.
For the purposes of producing the combined Company total financial statements, investments by Sub-
Funds within the Company in the units of other Sub-Funds within the Company, also known as “Cross
Investments” must be eliminated in order to prevent double counting.
Merian Global Investors Series Plc Annual Report and Audited Financial Statements for the financial year ended 31 December 2018
NOTES TO THE FINANCIAL STATEMENTS FOR THE FINANCIAL YEAR ENDED 31 DECEMBER 2018 (continued)
242
3. Significant Accounting Policies (continued)
d. Dividend income/expense
Dividend income arising on the underlying equity investments of the Company is recognised as income of
the relevant Sub-Fund on the ex-dividend date. Income is shown gross of any non-recoverable withholding
taxes, which is disclosed separately in the Statement of Operations, and net of any tax credits.
The Sub-Funds incur expenses on contract for differences equal to the dividends due on these securities.
Such dividend expense is recognised in the Statement of Operations as dividend expense on contract for
differences when the shareholders’ right to receive payment is established. Dividend expenses are
included in operating expenses in the Statement of Operations.
e. Interest income/expense
Interest income from bonds and swap contracts is recognised in the Statement of Operations as part of
net gain/loss on financial assets/liabilities at fair value through profit or loss.
All other interest income and interest expense, are recognised in the Statement of Operations using the
effective interest rate method. When calculating the effective interest rate, the Sub-Funds estimate future
cash flows considering all contractual terms but not future credit losses. Interest received or receivable and
interest paid or payable are recognised in the Statement of Operations and included in other income and
operating expenses, respectively.
f. Expenses
All expenses are recognised in the Statement of Operations on an accruals basis. Expenses arising on the
disposal of investments are deducted from the disposal proceeds.
g. Realised Gains and Losses
Net realised gains and losses from financial instruments at fair value through profit or loss include all realised
gains and losses and coupon interest earned from debt securities held by the Sub-Funds. Realised gains
and losses on sales of investments are calculated based on the average cost of the investment in local
currency and are included in net gain/loss on financial assets/liabilities at fair value through profit or loss in
the Statement of Operations.
h. Unrealised Gains and Losses
Unrealised gains and losses on investments are the difference between the average cost of the investment
and its value at the reporting period end and are included in net gain/loss on financial assets/liabilities at
fair value through profit or loss in the Statement of Operations.
i. Redeemable Participating Shares
In accordance with the Prospectus, the Company issues redeemable participating shares, which are
redeemable at the holder's option and are classified as financial liabilities. Redeemable participating
Shares can be put back into the Sub-Fund at any time for cash equal to a proportionate share of the Sub-
Fund's NAV. The redeemable participating Share is carried at the redemption amount that is payable at
the year end date if the holder exercises the right to put the Share back into the Sub-Fund.
Save as may be otherwise described in the Supplement for the relevant Fund the Net Asset Value per
redeemable participating Share is determined as at 12 noon GMT on each valuation day in accordance
with the provisions set out in the Prospectus.
An anti-dilution levy ("ADL") is applied daily where the pending deals are over a fixed percentage of the
NAV. The ADL is included within Other Income in the Statement of Operations.
Merian Global Investors Series Plc Annual Report and Audited Financial Statements for the financial year ended 31 December 2018
NOTES TO THE FINANCIAL STATEMENTS FOR THE FINANCIAL YEAR ENDED 31 DECEMBER 2018 (continued)
243
3. Significant Accounting Policies (continued)
j. Taxation
The Sub-Funds currently incur withholding taxes imposed by certain countries on investment income and
capital gains. Such income or gains are recorded gross of withholding taxes in the Statement of Operations.
Withholding taxes are shown as a separate item in the Statement of Operations.
k. Borrowing Costs
Borrowing costs are recognised as an expense in the year in which they are incurred.
4. Taxation
The Company qualifies as investment undertaking as defined in Section 739B of the Taxes Consolidated
Act 1997.
On that basis, Irish tax is not chargeable to the Company on its income or capital gains.
Irish tax can arise on the happening of a “chargeable event” in the Company. A chargeable event
includes any payments of distributions to Shareholders, any encashment, repurchase, redemption,
cancellation or transfer of Shares and any deemed disposal of Shares for Irish tax purposes arising as a result
of holding Shares in the Company for a period of eight years or more. Where a chargeable event occurs,
the Company is required to account for the Irish tax thereon.
A gain on a chargeable event may not arise in respect of:
(i) any transactions (which might otherwise be a chargeable event) in relation to Shares held in a
recognised clearing system as designated by order of the Revenue Commissioners of Ireland; or;
(ii) a transfer of Shares between spouses and any transfer of Shares between spouses or former spouses
on the occasion of judicial separation and/or divorce; or;
(iii) an exchange by a shareholder, effected by way of arm’s length bargain where no payment is made
to the shareholder, of Shares in the Company for other Shares in the Company; or;
(iv) an exchange of Shares arising on a qualifying amalgamation or reconstruction of the Company with
another Irish investment fund.
(v) a shareholder who is not an Irish resident and not ordinarily resident in Ireland at the time of the
chargeable event, provided the necessary signed statutory declarations are held by the Company;
or;
(vi) a shareholder who is an exempt Irish resident and it (or an intermediary acting on its behalf) has made
the necessary declaration to that effect.
In the absence of an appropriate declaration, the Company will be liable to Irish tax on the occurrence of
a chargeable event.
Dividends, interest and capital gains (if any) received on investments made by the Company may be
subject to withholding taxes or capital gains taxes imposed by the country from which the investment
income/gains are received and such taxes may not be recoverable by the Company or its Shareholders.
The Company may be subject to taxes imposed on realised and unrealised gains on securities of certain
foreign countries in which the Company invests. The foreign tax expense, if any, is recorded on an accrual
basis and is included in capital gains taxes in the Statement of Operations. The amount of foreign tax owed,
if any, is included in other liabilities in the Statement of Financial Position.
Under Brazilian, Indian and Pakistani income tax laws, capital gains tax is payable on the sale of assets,
investments and capital accumulation. Included in the capital gains tax expense in the Statement of
Operations is USD 722,007 (2017: USD 1,313,004), included in other liabilities in the Statement of Financial
Position is a payable of USD 670,875 (2017: USD 766,216).
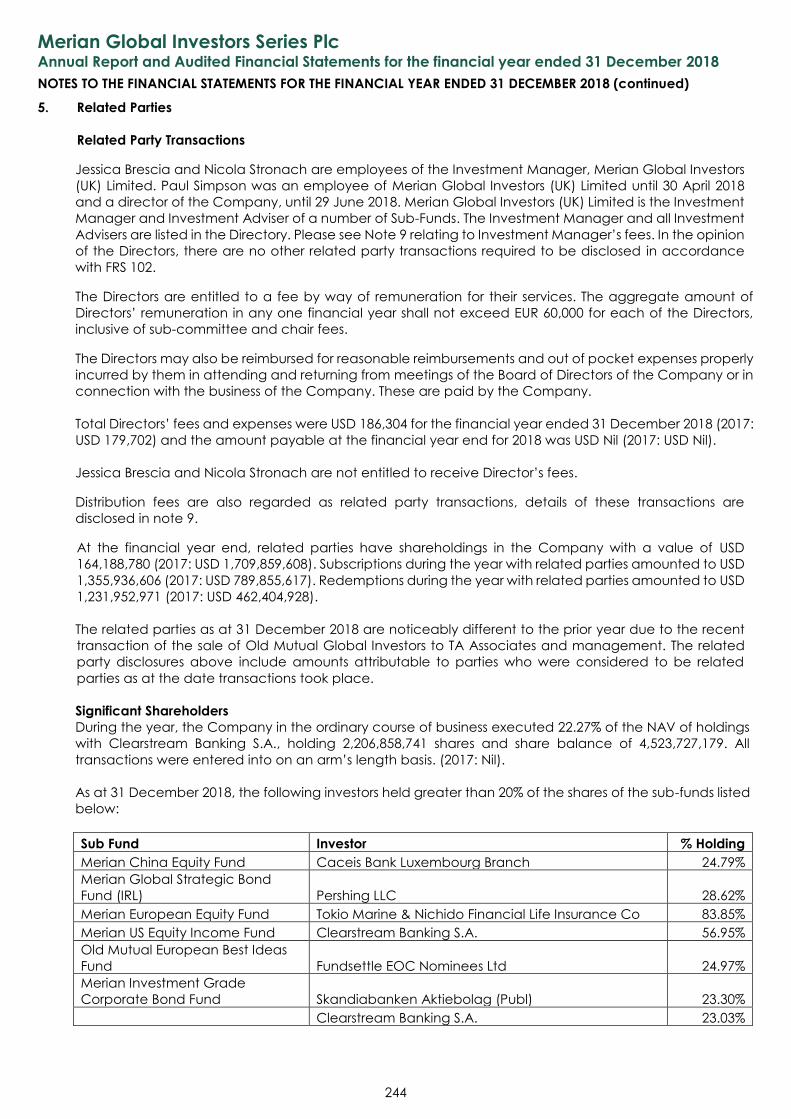
Merian Global Investors Series Plc
Annual Report and Audited Financial Statements for the financial year ended 31 December 2018
NOTES TO THE FINANCIAL STATEMENTS FOR THE FINANCIAL YEAR ENDED 31 DECEMBER 2018 (continued)
244
5. Related Parties
Related Party Transactions
Jessica Brescia and Nicola Stronach are employees of the Investment Manager, Merian Global Investors
(UK) Limited. Paul Simpson was an employee of Merian Global Investors (UK) Limited until 30 April 2018
and a director of the Company, until 29 June 2018. Merian Global Investors (UK) Limited is the Investment
Manager and Investment Adviser of a number of Sub-Funds. The Investment Manager and all Investment
Advisers are listed in the Directory. Please see Note 9 relating to Investment Manager’s fees. In the opinion
of the Directors, there are no other related party transactions required to be disclosed in accordance
with FRS 102.
The Directors are entitled to a fee by way of remuneration for their services. The aggregate amount of
Directors’ remuneration in any one financial year shall not exceed EUR 60,000 for each of the Directors,
inclusive of sub-committee and chair fees.
The Directors may also be reimbursed for reasonable reimbursements and out of pocket expenses properly
incurred by them in attending and returning from meetings of the Board of Directors of the Company or in
connection with the business of the Company. These are paid by the Company.
Total Directors’ fees and expenses were USD 186,304 for the financial year ended 31 December 2018 (2017:
USD 179,702) and the amount payable at the financial year end for 2018 was USD Nil (2017: USD Nil).
Jessica Brescia and Nicola Stronach are not entitled to receive Director’s fees.
Distribution fees are also regarded as related party transactions, details of these transactions are
disclosed in note 9.
At the financial year end, related parties have shareholdings in the Company with a value of USD
164,188,780 (2017: USD 1,709,859,608). Subscriptions during the year with related parties amounted to USD
1,355,936,606 (2017: USD 789,855,617). Redemptions during the year with related parties amounted to USD
1,231,952,971 (2017: USD 462,404,928).
The related parties as at 31 December 2018 are noticeably different to the prior year due to the recent
transaction of the sale of Old Mutual Global Investors to TA Associates and management. The related
party disclosures above include amounts attributable to parties who were considered to be related
parties as at the date transactions took place.
Significant Shareholders
During the year, the Company in the ordinary course of business executed 22.27% of the NAV of holdings
with Clearstream Banking S.A., holding 2,206,858,741 shares and share balance of 4,523,727,179. All
transactions were entered into on an arm’s length basis. (2017: Nil).
As at 31 December 2018, the following investors held greater than 20% of the shares of the sub-funds listed
below:
Sub Fund Investor % Holding
Merian China Equity Fund Caceis Bank Luxembourg Branch 24.79%
Merian Global Strategic Bond
Fund (IRL) Pershing LLC 28.62%
Merian European Equity Fund Tokio Marine & Nichido Financial Life Insurance Co 83.85%
Merian US Equity Income Fund Clearstream Banking S.A. 56.95%
Old Mutual European Best Ideas
Fund Fundsettle EOC Nominees Ltd 24.97%
Merian Investment Grade
Corporate Bond Fund Skandiabanken Aktiebolag (Publ) 23.30%
Clearstream Banking S.A. 23.03%
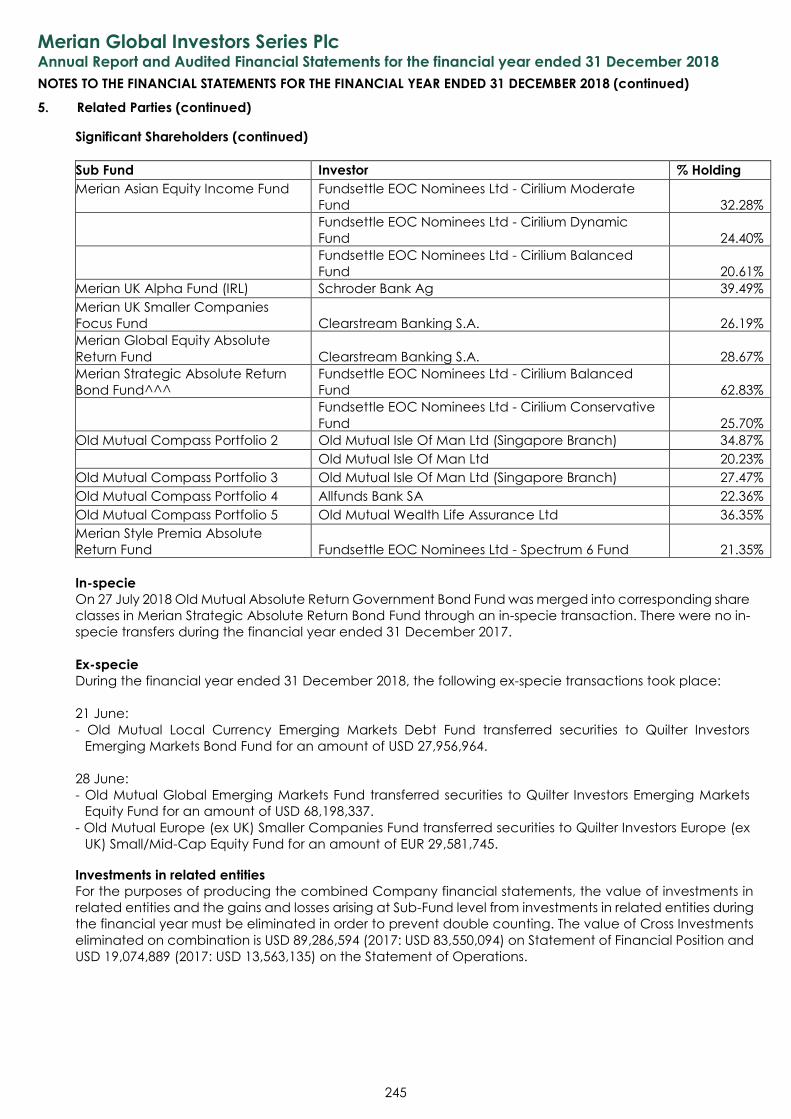
Merian Global Investors Series Plc
Annual Report and Audited Financial Statements for the financial year ended 31 December 2018
NOTES TO THE FINANCIAL STATEMENTS FOR THE FINANCIAL YEAR ENDED 31 DECEMBER 2018 (continued)
245
5. Related Parties (continued)
Significant Shareholders (continued)
Sub Fund Investor % Holding
Merian Asian Equity Income Fund Fundsettle EOC Nominees Ltd - Cirilium Moderate
Fund
32.28%
Fundsettle EOC Nominees Ltd - Cirilium Dynamic
Fund
24.40% Fundsettle EOC Nominees Ltd - Cirilium Balanced
Fund
20.61%
Merian UK Alpha Fund (IRL) Schroder Bank Ag 39.49%
Merian UK Smaller Companies
Focus Fund
Clearstream Banking S.A.
26.19%
Merian Global Equity Absolute
Return Fund
Clearstream Banking S.A.
28.67%
Merian Strategic Absolute Return
Bond Fund^^^
Fundsettle EOC Nominees Ltd - Cirilium Balanced
Fund
62.83% Fundsettle EOC Nominees Ltd - Cirilium Conservative
Fund
25.70%
Old Mutual Compass Portfolio 2 Old Mutual Isle Of Man Ltd (Singapore Branch) 34.87% Old Mutual Isle Of Man Ltd 20.23%
Old Mutual Compass Portfolio 3 Old Mutual Isle Of Man Ltd (Singapore Branch) 27.47%
Old Mutual Compass Portfolio 4 Allfunds Bank SA 22.36%
Old Mutual Compass Portfolio 5 Old Mutual Wealth Life Assurance Ltd 36.35%
Merian Style Premia Absolute
Return Fund
Fundsettle EOC Nominees Ltd - Spectrum 6 Fund
21.35%
In-specie
On 27 July 2018 Old Mutual Absolute Return Government Bond Fund was merged into corresponding share
classes in Merian Strategic Absolute Return Bond Fund through an in-specie transaction. There were no in-
specie transfers during the financial year ended 31 December 2017.
Ex-specie
During the financial year ended 31 December 2018, the following ex-specie transactions took place:
21 June:
- Old Mutual Local Currency Emerging Markets Debt Fund transferred securities to Quilter Investors
Emerging Markets Bond Fund for an amount of USD 27,956,964.
28 June:
- Old Mutual Global Emerging Markets Fund transferred securities to Quilter Investors Emerging Markets
Equity Fund for an amount of USD 68,198,337.
- Old Mutual Europe (ex UK) Smaller Companies Fund transferred securities to Quilter Investors Europe (ex
UK) Small/Mid-Cap Equity Fund for an amount of EUR 29,581,745.
Investments in related entities
For the purposes of producing the combined Company financial statements, the value of investments in
related entities and the gains and losses arising at Sub-Fund level from investments in related entities during
the financial year must be eliminated in order to prevent double counting. The value of Cross Investments
eliminated on combination is USD 89,286,594 (2017: USD 83,550,094) on Statement of Financial Position and
USD 19,074,889 (2017: USD 13,563,135) on the Statement of Operations.
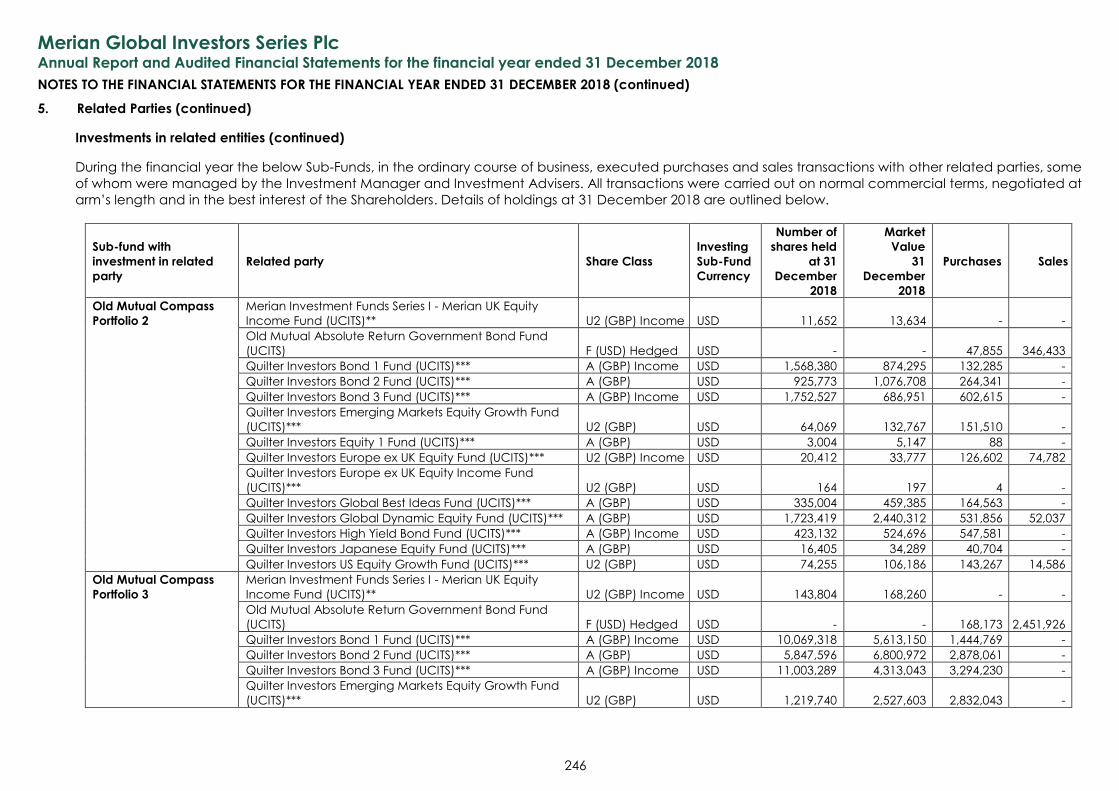
Merian Global Investors Series Plc
Annual Report and Audited Financial Statements for the financial year ended 31 December 2018
NOTES TO THE FINANCIAL STATEMENTS FOR THE FINANCIAL YEAR ENDED 31 DECEMBER 2018 (continued)
246
5. Related Parties (continued)
Investments in related entities (continued)
During the financial year the below Sub-Funds, in the ordinary course of business, executed purchases and sales transactions with other related parties, some
of whom were managed by the Investment Manager and Investment Advisers. All transactions were carried out on normal commercial terms, negotiated at
arm’s length and in the best interest of the Shareholders. Details of holdings at 31 December 2018 are outlined below.
Sub-fund with
investment in related
party
Related party Share Class
Investing
Sub-Fund
Currency
Number of
shares held
at 31
December
2018
Market
Value
31
December
2018
Purchases Sales
Old Mutual Compass
Portfolio 2
Merian Investment Funds Series I - Merian UK Equity
Income Fund (UCITS)** U2 (GBP) Income USD 11,652 13,634 - -
Old Mutual Absolute Return Government Bond Fund
(UCITS) F (USD) Hedged USD - - 47,855 346,433
Quilter Investors Bond 1 Fund (UCITS)*** A (GBP) Income USD 1,568,380 874,295 132,285 -
Quilter Investors Bond 2 Fund (UCITS)*** A (GBP) USD 925,773 1,076,708 264,341 -
Quilter Investors Bond 3 Fund (UCITS)*** A (GBP) Income USD 1,752,527 686,951 602,615 -
Quilter Investors Emerging Markets Equity Growth Fund
(UCITS)*** U2 (GBP) USD 64,069 132,767 151,510 -
Quilter Investors Equity 1 Fund (UCITS)*** A (GBP) USD 3,004 5,147 88 -
Quilter Investors Europe ex UK Equity Fund (UCITS)*** U2 (GBP) Income USD 20,412 33,777 126,602 74,782
Quilter Investors Europe ex UK Equity Income Fund
(UCITS)*** U2 (GBP) USD 164 197 4 -
Quilter Investors Global Best Ideas Fund (UCITS)*** A (GBP) USD 335,004 459,385 164,563 -
Quilter Investors Global Dynamic Equity Fund (UCITS)*** A (GBP) USD 1,723,419 2,440,312 531,856 52,037
Quilter Investors High Yield Bond Fund (UCITS)*** A (GBP) Income USD 423,132 524,696 547,581 -
Quilter Investors Japanese Equity Fund (UCITS)*** A (GBP) USD 16,405 34,289 40,704 -
Quilter Investors US Equity Growth Fund (UCITS)*** U2 (GBP) USD 74,255 106,186 143,267 14,586
Old Mutual Compass
Portfolio 3
Merian Investment Funds Series I - Merian UK Equity
Income Fund (UCITS)** U2 (GBP) Income USD 143,804 168,260 - -
Old Mutual Absolute Return Government Bond Fund
(UCITS) F (USD) Hedged USD - - 168,173 2,451,926
Quilter Investors Bond 1 Fund (UCITS)*** A (GBP) Income USD 10,069,318 5,613,150 1,444,769 -
Quilter Investors Bond 2 Fund (UCITS)*** A (GBP) USD 5,847,596 6,800,972 2,878,061 -
Quilter Investors Bond 3 Fund (UCITS)*** A (GBP) Income USD 11,003,289 4,313,043 3,294,230 -
Quilter Investors Emerging Markets Equity Growth Fund
(UCITS)*** U2 (GBP) USD 1,219,740 2,527,603 2,832,043 -
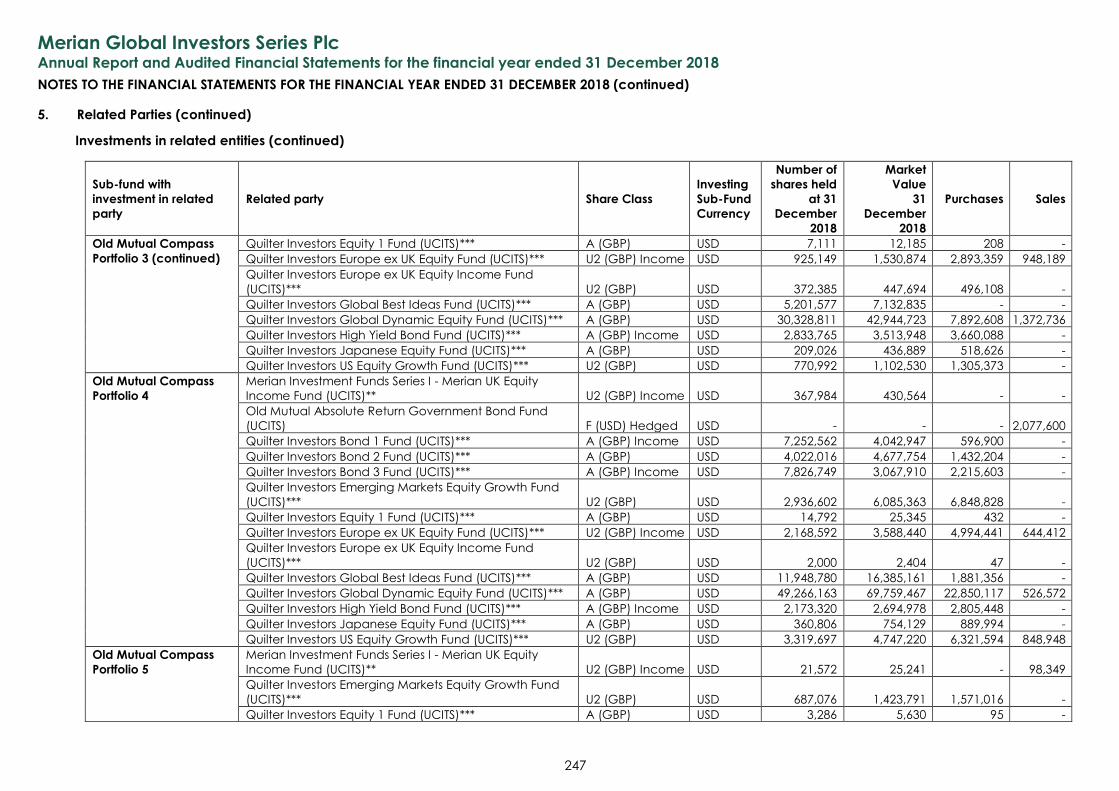
Merian Global Investors Series Plc
Annual Report and Audited Financial Statements for the financial year ended 31 December 2018
NOTES TO THE FINANCIAL STATEMENTS FOR THE FINANCIAL YEAR ENDED 31 DECEMBER 2018 (continued)
247
5. Related Parties (continued)
Investments in related entities (continued)
Sub-fund with
investment in related
party
Related party Share Class
Investing
Sub-Fund
Currency
Number of
shares held
at 31
December
2018
Market
Value
31
December
2018
Purchases Sales
Old Mutual Compass
Portfolio 3 (continued)
Quilter Investors Equity 1 Fund (UCITS)*** A (GBP) USD 7,111 12,185 208 -
Quilter Investors Europe ex UK Equity Fund (UCITS)*** U2 (GBP) Income USD 925,149 1,530,874 2,893,359 948,189
Quilter Investors Europe ex UK Equity Income Fund
(UCITS)*** U2 (GBP) USD 372,385 447,694 496,108 -
Quilter Investors Global Best Ideas Fund (UCITS)*** A (GBP) USD 5,201,577 7,132,835 - -
Quilter Investors Global Dynamic Equity Fund (UCITS)*** A (GBP) USD 30,328,811 42,944,723 7,892,608 1,372,736
Quilter Investors High Yield Bond Fund (UCITS)*** A (GBP) Income USD 2,833,765 3,513,948 3,660,088 -
Quilter Investors Japanese Equity Fund (UCITS)*** A (GBP) USD 209,026 436,889 518,626 -
Quilter Investors US Equity Growth Fund (UCITS)*** U2 (GBP) USD 770,992 1,102,530 1,305,373 -
Old Mutual Compass
Portfolio 4
Merian Investment Funds Series I - Merian UK Equity
Income Fund (UCITS)** U2 (GBP) Income USD 367,984 430,564 - -
Old Mutual Absolute Return Government Bond Fund
(UCITS) F (USD) Hedged USD - - - 2,077,600
Quilter Investors Bond 1 Fund (UCITS)*** A (GBP) Income USD 7,252,562 4,042,947 596,900 -
Quilter Investors Bond 2 Fund (UCITS)*** A (GBP) USD 4,022,016 4,677,754 1,432,204 -
Quilter Investors Bond 3 Fund (UCITS)*** A (GBP) Income USD 7,826,749 3,067,910 2,215,603 -
Quilter Investors Emerging Markets Equity Growth Fund
(UCITS)*** U2 (GBP) USD 2,936,602 6,085,363 6,848,828 -
Quilter Investors Equity 1 Fund (UCITS)*** A (GBP) USD 14,792 25,345 432 -
Quilter Investors Europe ex UK Equity Fund (UCITS)*** U2 (GBP) Income USD 2,168,592 3,588,440 4,994,441 644,412
Quilter Investors Europe ex UK Equity Income Fund
(UCITS)*** U2 (GBP) USD 2,000 2,404 47 -
Quilter Investors Global Best Ideas Fund (UCITS)*** A (GBP) USD 11,948,780 16,385,161 1,881,356 -
Quilter Investors Global Dynamic Equity Fund (UCITS)*** A (GBP) USD 49,266,163 69,759,467 22,850,117 526,572
Quilter Investors High Yield Bond Fund (UCITS)*** A (GBP) Income USD 2,173,320 2,694,978 2,805,448 -
Quilter Investors Japanese Equity Fund (UCITS)*** A (GBP) USD 360,806 754,129 889,994 -
Quilter Investors US Equity Growth Fund (UCITS)*** U2 (GBP) USD 3,319,697 4,747,220 6,321,594 848,948
Old Mutual Compass
Portfolio 5
Merian Investment Funds Series I - Merian UK Equity
Income Fund (UCITS)** U2 (GBP) Income USD 21,572 25,241 - 98,349
Quilter Investors Emerging Markets Equity Growth Fund
(UCITS)*** U2 (GBP) USD 687,076 1,423,791 1,571,016 -
Quilter Investors Equity 1 Fund (UCITS)*** A (GBP) USD 3,286 5,630 95 -
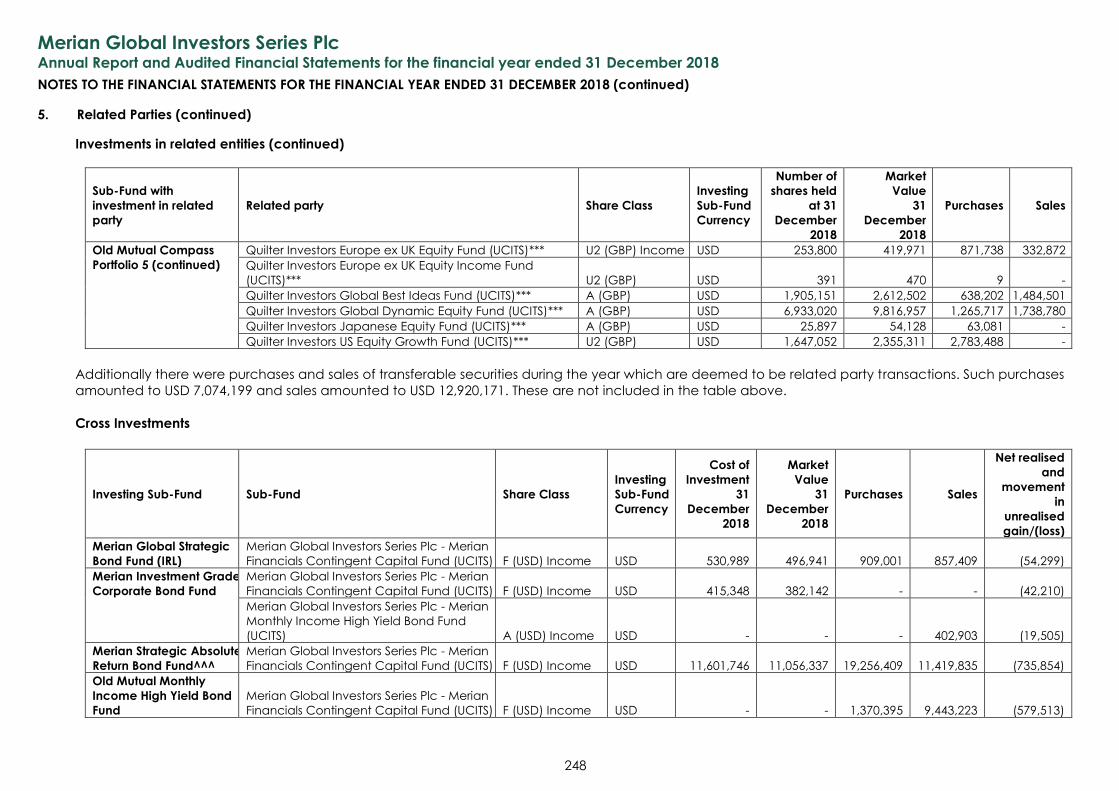
Merian Global Investors Series Plc
Annual Report and Audited Financial Statements for the financial year ended 31 December 2018
NOTES TO THE FINANCIAL STATEMENTS FOR THE FINANCIAL YEAR ENDED 31 DECEMBER 2018 (continued)
248
5. Related Parties (continued)
Investments in related entities (continued)
Sub-Fund with
investment in related
party
Related party Share Class
Investing
Sub-Fund
Currency
Number of
shares held
at 31
December
2018
Market
Value
31
December
2018
Purchases Sales
Old Mutual Compass
Portfolio 5 (continued)
Quilter Investors Europe ex UK Equity Fund (UCITS)*** U2 (GBP) Income USD 253,800 419,971 871,738 332,872
Quilter Investors Europe ex UK Equity Income Fund
(UCITS)*** U2 (GBP) USD 391 470 9 -
Quilter Investors Global Best Ideas Fund (UCITS)*** A (GBP) USD 1,905,151 2,612,502 638,202 1,484,501
Quilter Investors Global Dynamic Equity Fund (UCITS)*** A (GBP) USD 6,933,020 9,816,957 1,265,717 1,738,780
Quilter Investors Japanese Equity Fund (UCITS)*** A (GBP) USD 25,897 54,128 63,081 -
Quilter Investors US Equity Growth Fund (UCITS)*** U2 (GBP) USD 1,647,052 2,355,311 2,783,488 -
Additionally there were purchases and sales of transferable securities during the year which are deemed to be related party transactions. Such purchases
amounted to USD 7,074,199 and sales amounted to USD 12,920,171. These are not included in the table above.
Cross Investments
Investing Sub-Fund Sub-Fund Share Class
Investing
Sub-Fund
Currency
Cost of
Investment
31
December
2018
Market
Value
31
December
2018
Purchases Sales
Net realised
and
movement
in
unrealised
gain/(loss)
Merian Global Strategic
Bond Fund (IRL)
Merian Global Investors Series Plc - Merian
Financials Contingent Capital Fund (UCITS) F (USD) Income USD 530,989 496,941 909,001 857,409 (54,299)
Merian Investment Grade
Corporate Bond Fund
Merian Global Investors Series Plc - Merian
Financials Contingent Capital Fund (UCITS) F (USD) Income USD 415,348 382,142 - - (42,210)
Merian Global Investors Series Plc - Merian
Monthly Income High Yield Bond Fund
(UCITS) A (USD) Income USD - - - 402,903 (19,505)
Merian Strategic Absolute
Return Bond Fund^^^
Merian Global Investors Series Plc - Merian
Financials Contingent Capital Fund (UCITS) F (USD) Income USD 11,601,746 11,056,337 19,256,409 11,419,835 (735,854)
Old Mutual Monthly
Income High Yield Bond
Fund
Merian Global Investors Series Plc - Merian
Financials Contingent Capital Fund (UCITS) F (USD) Income USD - - 1,370,395 9,443,223 (579,513)
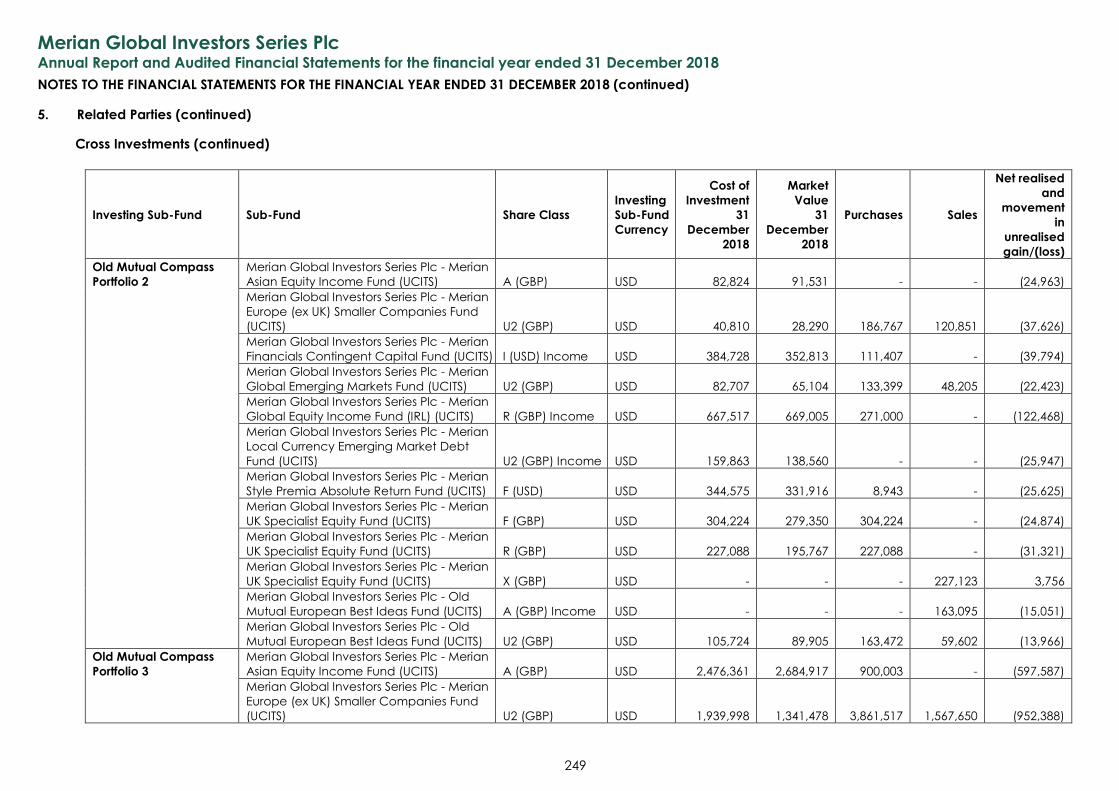
Merian Global Investors Series Plc
Annual Report and Audited Financial Statements for the financial year ended 31 December 2018
NOTES TO THE FINANCIAL STATEMENTS FOR THE FINANCIAL YEAR ENDED 31 DECEMBER 2018 (continued)
249
5. Related Parties (continued)
Cross Investments (continued)
Investing Sub-Fund Sub-Fund Share Class
Investing
Sub-Fund
Currency
Cost of
Investment
31
December
2018
Market
Value
31
December
2018
Purchases Sales
Net realised
and
movement
in
unrealised
gain/(loss)
Old Mutual Compass
Portfolio 2
Merian Global Investors Series Plc - Merian
Asian Equity Income Fund (UCITS) A (GBP) USD 82,824 91,531 - - (24,963)
Merian Global Investors Series Plc - Merian
Europe (ex UK) Smaller Companies Fund
(UCITS) U2 (GBP) USD 40,810 28,290 186,767 120,851 (37,626)
Merian Global Investors Series Plc - Merian
Financials Contingent Capital Fund (UCITS) I (USD) Income USD 384,728 352,813 111,407 - (39,794)
Merian Global Investors Series Plc - Merian
Global Emerging Markets Fund (UCITS) U2 (GBP) USD 82,707 65,104 133,399 48,205 (22,423)
Merian Global Investors Series Plc - Merian
Global Equity Income Fund (IRL) (UCITS) R (GBP) Income USD 667,517 669,005 271,000 - (122,468)
Merian Global Investors Series Plc - Merian
Local Currency Emerging Market Debt
Fund (UCITS) U2 (GBP) Income USD 159,863 138,560 - - (25,947)
Merian Global Investors Series Plc - Merian
Style Premia Absolute Return Fund (UCITS) F (USD) USD 344,575 331,916 8,943 - (25,625)
Merian Global Investors Series Plc - Merian
UK Specialist Equity Fund (UCITS) F (GBP) USD 304,224 279,350 304,224 - (24,874)
Merian Global Investors Series Plc - Merian
UK Specialist Equity Fund (UCITS) R (GBP) USD 227,088 195,767 227,088 - (31,321)
Merian Global Investors Series Plc - Merian
UK Specialist Equity Fund (UCITS) X (GBP) USD - - - 227,123 3,756
Merian Global Investors Series Plc - Old
Mutual European Best Ideas Fund (UCITS) A (GBP) Income USD - - - 163,095 (15,051)
Merian Global Investors Series Plc - Old
Mutual European Best Ideas Fund (UCITS) U2 (GBP) USD 105,724 89,905 163,472 59,602 (13,966)
Old Mutual Compass
Portfolio 3
Merian Global Investors Series Plc - Merian
Asian Equity Income Fund (UCITS) A (GBP) USD 2,476,361 2,684,917 900,003 - (597,587)
Merian Global Investors Series Plc - Merian
Europe (ex UK) Smaller Companies Fund
(UCITS) U2 (GBP) USD 1,939,998 1,341,478 3,861,517 1,567,650 (952,388)
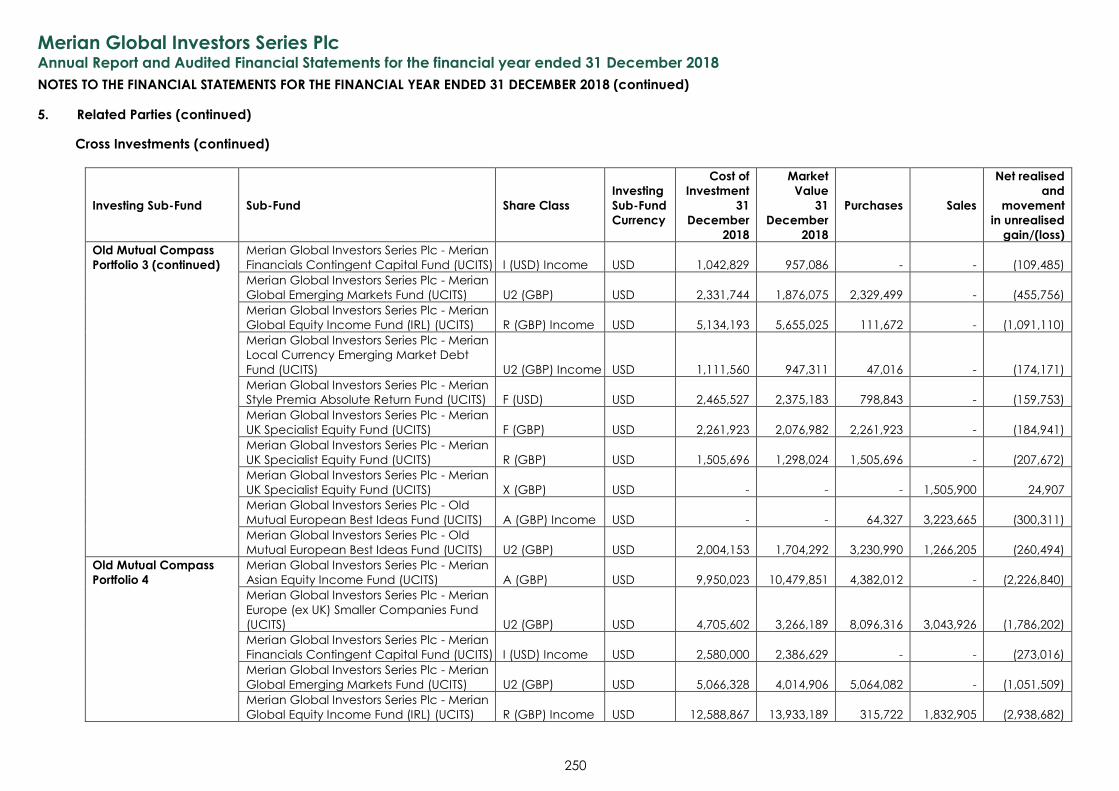
Merian Global Investors Series Plc
Annual Report and Audited Financial Statements for the financial year ended 31 December 2018
NOTES TO THE FINANCIAL STATEMENTS FOR THE FINANCIAL YEAR ENDED 31 DECEMBER 2018 (continued)
250
5. Related Parties (continued)
Cross Investments (continued)
Investing Sub-Fund Sub-Fund Share Class
Investing
Sub-Fund
Currency
Cost of
Investment
31
December
2018
Market
Value
31
December
2018
Purchases Sales
Net realised
and
movement
in unrealised
gain/(loss)
Old Mutual Compass
Portfolio 3 (continued)
Merian Global Investors Series Plc - Merian
Financials Contingent Capital Fund (UCITS) I (USD) Income USD 1,042,829 957,086 - - (109,485)
Merian Global Investors Series Plc - Merian
Global Emerging Markets Fund (UCITS) U2 (GBP) USD 2,331,744 1,876,075 2,329,499 - (455,756)
Merian Global Investors Series Plc - Merian
Global Equity Income Fund (IRL) (UCITS) R (GBP) Income USD 5,134,193 5,655,025 111,672 - (1,091,110)
Merian Global Investors Series Plc - Merian
Local Currency Emerging Market Debt
Fund (UCITS) U2 (GBP) Income USD 1,111,560 947,311 47,016 - (174,171)
Merian Global Investors Series Plc - Merian
Style Premia Absolute Return Fund (UCITS) F (USD) USD 2,465,527 2,375,183 798,843 - (159,753)
Merian Global Investors Series Plc - Merian
UK Specialist Equity Fund (UCITS) F (GBP) USD 2,261,923 2,076,982 2,261,923 - (184,941)
Merian Global Investors Series Plc - Merian
UK Specialist Equity Fund (UCITS) R (GBP) USD 1,505,696 1,298,024 1,505,696 - (207,672)
Merian Global Investors Series Plc - Merian
UK Specialist Equity Fund (UCITS) X (GBP) USD - - - 1,505,900 24,907
Merian Global Investors Series Plc - Old
Mutual European Best Ideas Fund (UCITS) A (GBP) Income USD - - 64,327 3,223,665 (300,311)
Merian Global Investors Series Plc - Old
Mutual European Best Ideas Fund (UCITS) U2 (GBP) USD 2,004,153 1,704,292 3,230,990 1,266,205 (260,494)
Old Mutual Compass
Portfolio 4
Merian Global Investors Series Plc - Merian
Asian Equity Income Fund (UCITS) A (GBP) USD 9,950,023 10,479,851 4,382,012 - (2,226,840)
Merian Global Investors Series Plc - Merian
Europe (ex UK) Smaller Companies Fund
(UCITS) U2 (GBP) USD 4,705,602 3,266,189 8,096,316 3,043,926 (1,786,202)
Merian Global Investors Series Plc - Merian
Financials Contingent Capital Fund (UCITS) I (USD) Income USD 2,580,000 2,386,629 - - (273,016)
Merian Global Investors Series Plc - Merian
Global Emerging Markets Fund (UCITS) U2 (GBP) USD 5,066,328 4,014,906 5,064,082 - (1,051,509)
Merian Global Investors Series Plc - Merian
Global Equity Income Fund (IRL) (UCITS) R (GBP) Income USD 12,588,867 13,933,189 315,722 1,832,905 (2,938,682)
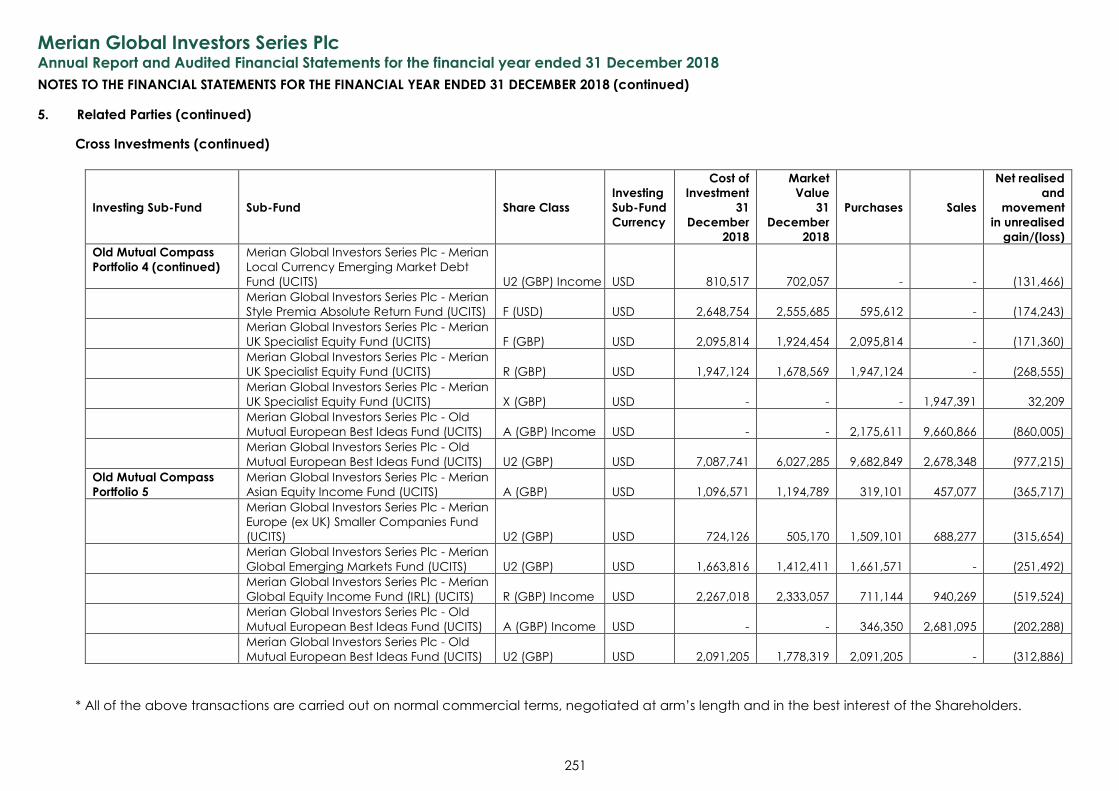
Merian Global Investors Series Plc
Annual Report and Audited Financial Statements for the financial year ended 31 December 2018
NOTES TO THE FINANCIAL STATEMENTS FOR THE FINANCIAL YEAR ENDED 31 DECEMBER 2018 (continued)
251
5. Related Parties (continued)
Cross Investments (continued)
Investing Sub-Fund Sub-Fund Share Class
Investing
Sub-Fund
Currency
Cost of
Investment
31
December
2018
Market
Value
31
December
2018
Purchases Sales
Net realised
and
movement
in unrealised
gain/(loss)
Old Mutual Compass
Portfolio 4 (continued)
Merian Global Investors Series Plc - Merian
Local Currency Emerging Market Debt
Fund (UCITS) U2 (GBP) Income USD 810,517 702,057 - - (131,466)
Merian Global Investors Series Plc - Merian
Style Premia Absolute Return Fund (UCITS) F (USD) USD 2,648,754 2,555,685 595,612 - (174,243)
Merian Global Investors Series Plc - Merian
UK Specialist Equity Fund (UCITS) F (GBP) USD 2,095,814 1,924,454 2,095,814 - (171,360)
Merian Global Investors Series Plc - Merian
UK Specialist Equity Fund (UCITS) R (GBP) USD 1,947,124 1,678,569 1,947,124 - (268,555)
Merian Global Investors Series Plc - Merian
UK Specialist Equity Fund (UCITS) X (GBP) USD - - - 1,947,391 32,209
Merian Global Investors Series Plc - Old
Mutual European Best Ideas Fund (UCITS) A (GBP) Income USD - - 2,175,611 9,660,866 (860,005)
Merian Global Investors Series Plc - Old
Mutual European Best Ideas Fund (UCITS) U2 (GBP) USD 7,087,741 6,027,285 9,682,849 2,678,348 (977,215)
Old Mutual Compass
Portfolio 5
Merian Global Investors Series Plc - Merian
Asian Equity Income Fund (UCITS) A (GBP) USD 1,096,571 1,194,789 319,101 457,077 (365,717)
Merian Global Investors Series Plc - Merian
Europe (ex UK) Smaller Companies Fund
(UCITS) U2 (GBP) USD 724,126 505,170 1,509,101 688,277 (315,654)
Merian Global Investors Series Plc - Merian
Global Emerging Markets Fund (UCITS) U2 (GBP) USD 1,663,816 1,412,411 1,661,571 - (251,492)
Merian Global Investors Series Plc - Merian
Global Equity Income Fund (IRL) (UCITS) R (GBP) Income USD 2,267,018 2,333,057 711,144 940,269 (519,524)
Merian Global Investors Series Plc - Old
Mutual European Best Ideas Fund (UCITS) A (GBP) Income USD - - 346,350 2,681,095 (202,288)
Merian Global Investors Series Plc - Old
Mutual European Best Ideas Fund (UCITS) U2 (GBP) USD 2,091,205 1,778,319 2,091,205 - (312,886)
* All of the above transactions are carried out on normal commercial terms, negotiated at arm’s length and in the best interest of the Shareholders.
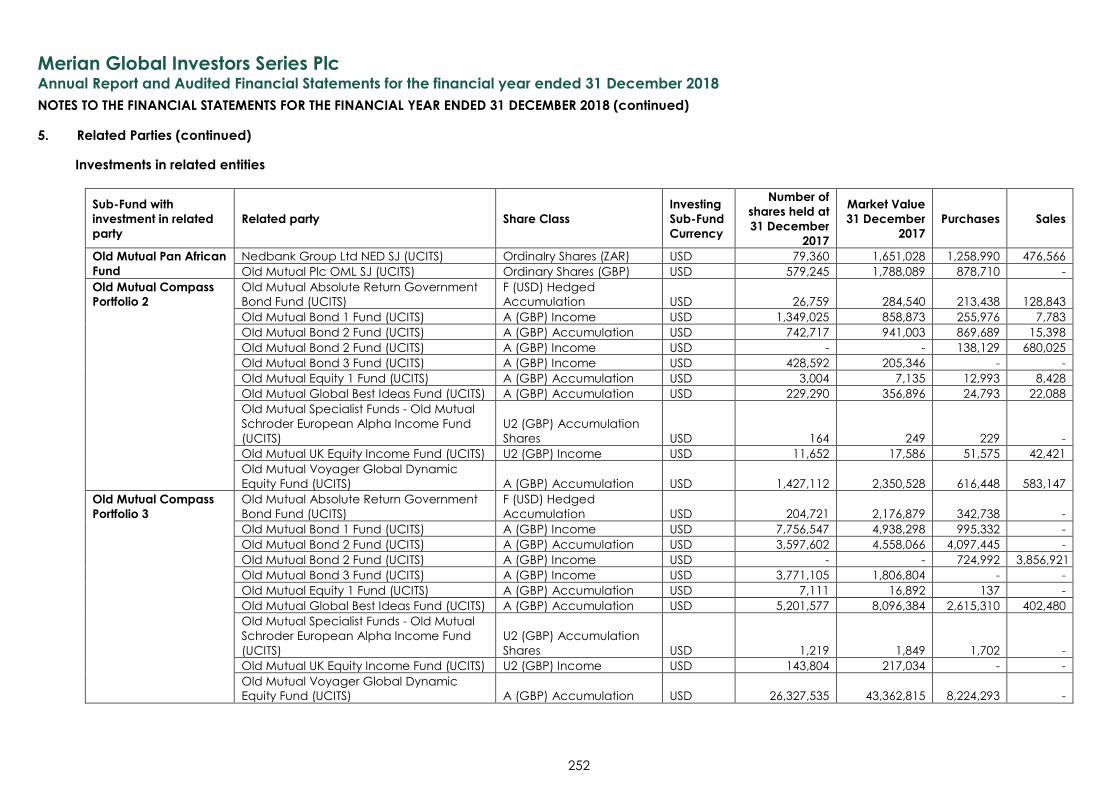
Merian Global Investors Series Plc
Annual Report and Audited Financial Statements for the financial year ended 31 December 2018
NOTES TO THE FINANCIAL STATEMENTS FOR THE FINANCIAL YEAR ENDED 31 DECEMBER 2018 (continued)
252
5. Related Parties (continued)
Investments in related entities
Sub-Fund with
investment in related
party
Related party Share Class
Investing
Sub-Fund
Currency
Number of
shares held at
31 December
2017
Market Value
31 December
2017
Purchases Sales
Old Mutual Pan African
Fund
Nedbank Group Ltd NED SJ (UCITS) Ordinalry Shares (ZAR) USD 79,360 1,651,028 1,258,990 476,566
Old Mutual Plc OML SJ (UCITS) Ordinary Shares (GBP) USD 579,245 1,788,089 878,710 -
Old Mutual Compass
Portfolio 2
Old Mutual Absolute Return Government
Bond Fund (UCITS)
F (USD) Hedged
Accumulation USD 26,759 284,540 213,438 128,843
Old Mutual Bond 1 Fund (UCITS) A (GBP) Income USD 1,349,025 858,873 255,976 7,783
Old Mutual Bond 2 Fund (UCITS) A (GBP) Accumulation USD 742,717 941,003 869,689 15,398
Old Mutual Bond 2 Fund (UCITS) A (GBP) Income USD - - 138,129 680,025
Old Mutual Bond 3 Fund (UCITS) A (GBP) Income USD 428,592 205,346 - -
Old Mutual Equity 1 Fund (UCITS) A (GBP) Accumulation USD 3,004 7,135 12,993 8,428
Old Mutual Global Best Ideas Fund (UCITS) A (GBP) Accumulation USD 229,290 356,896 24,793 22,088
Old Mutual Specialist Funds - Old Mutual
Schroder European Alpha Income Fund
(UCITS)
U2 (GBP) Accumulation
Shares USD 164 249 229 -
Old Mutual UK Equity Income Fund (UCITS) U2 (GBP) Income USD 11,652 17,586 51,575 42,421
Old Mutual Voyager Global Dynamic
Equity Fund (UCITS) A (GBP) Accumulation USD 1,427,112 2,350,528 616,448 583,147
Old Mutual Compass
Portfolio 3 Old Mutual Absolute Return Government
Bond Fund (UCITS)
F (USD) Hedged
Accumulation USD 204,721 2,176,879 342,738 -
Old Mutual Bond 1 Fund (UCITS) A (GBP) Income USD 7,756,547 4,938,298 995,332 -
Old Mutual Bond 2 Fund (UCITS) A (GBP) Accumulation USD 3,597,602 4,558,066 4,097,445 -
Old Mutual Bond 2 Fund (UCITS) A (GBP) Income USD - - 724,992 3,856,921
Old Mutual Bond 3 Fund (UCITS) A (GBP) Income USD 3,771,105 1,806,804 - -
Old Mutual Equity 1 Fund (UCITS) A (GBP) Accumulation USD 7,111 16,892 137 -
Old Mutual Global Best Ideas Fund (UCITS) A (GBP) Accumulation USD 5,201,577 8,096,384 2,615,310 402,480
Old Mutual Specialist Funds - Old Mutual
Schroder European Alpha Income Fund
(UCITS)
U2 (GBP) Accumulation
Shares USD 1,219 1,849 1,702 -
Old Mutual UK Equity Income Fund (UCITS) U2 (GBP) Income USD 143,804 217,034 - -
Old Mutual Voyager Global Dynamic
Equity Fund (UCITS) A (GBP) Accumulation USD 26,327,535 43,362,815 8,224,293 -
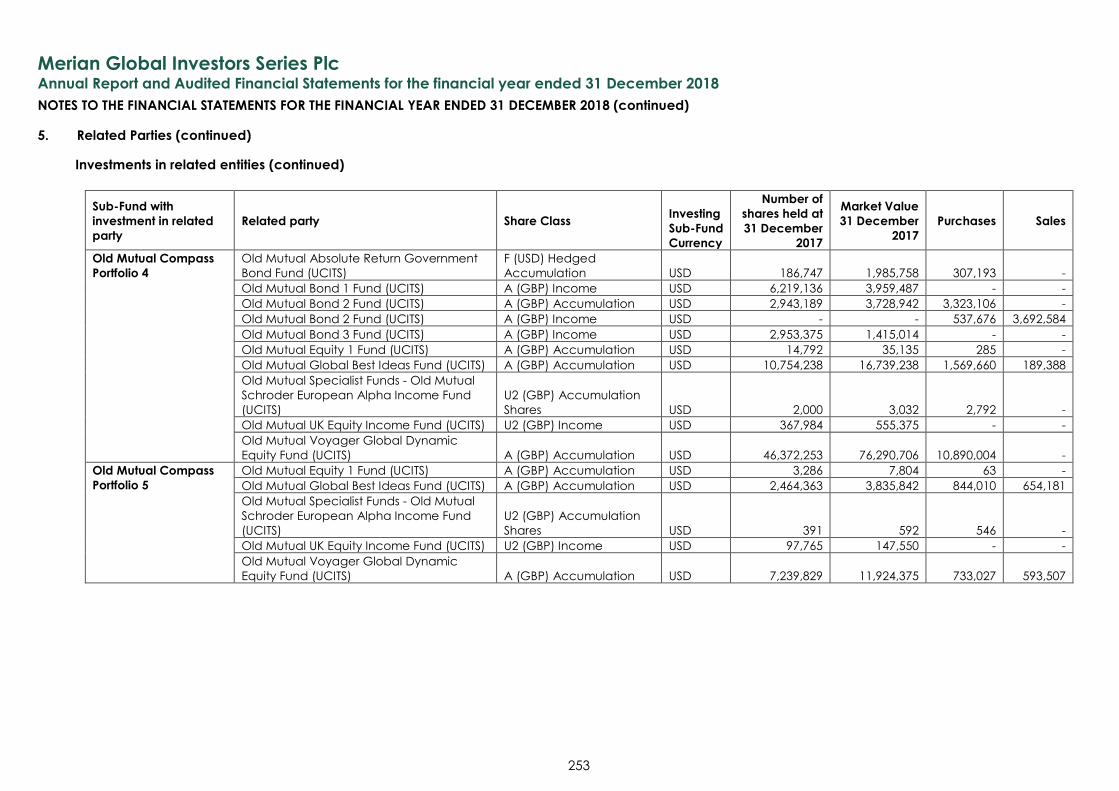
Merian Global Investors Series Plc
Annual Report and Audited Financial Statements for the financial year ended 31 December 2018
NOTES TO THE FINANCIAL STATEMENTS FOR THE FINANCIAL YEAR ENDED 31 DECEMBER 2018 (continued)
253
5. Related Parties (continued)
Investments in related entities (continued)
Sub-Fund with
investment in related
party
Related party Share Class Investing
Sub-Fund
Currency
Number of
shares held at
31 December
2017
Market Value
31 December
2017
Purchases Sales
Old Mutual Compass
Portfolio 4
Old Mutual Absolute Return Government
Bond Fund (UCITS)
F (USD) Hedged
Accumulation USD 186,747 1,985,758 307,193 -
Old Mutual Bond 1 Fund (UCITS) A (GBP) Income USD 6,219,136 3,959,487 - -
Old Mutual Bond 2 Fund (UCITS) A (GBP) Accumulation USD 2,943,189 3,728,942 3,323,106 -
Old Mutual Bond 2 Fund (UCITS) A (GBP) Income USD - - 537,676 3,692,584
Old Mutual Bond 3 Fund (UCITS) A (GBP) Income USD 2,953,375 1,415,014 - -
Old Mutual Equity 1 Fund (UCITS) A (GBP) Accumulation USD 14,792 35,135 285 -
Old Mutual Global Best Ideas Fund (UCITS) A (GBP) Accumulation USD 10,754,238 16,739,238 1,569,660 189,388
Old Mutual Specialist Funds - Old Mutual
Schroder European Alpha Income Fund
(UCITS)
U2 (GBP) Accumulation
Shares USD 2,000 3,032 2,792 -
Old Mutual UK Equity Income Fund (UCITS) U2 (GBP) Income USD 367,984 555,375 - -
Old Mutual Voyager Global Dynamic
Equity Fund (UCITS) A (GBP) Accumulation USD 46,372,253 76,290,706 10,890,004 -
Old Mutual Compass
Portfolio 5 Old Mutual Equity 1 Fund (UCITS) A (GBP) Accumulation USD 3,286 7,804 63 -
Old Mutual Global Best Ideas Fund (UCITS) A (GBP) Accumulation USD 2,464,363 3,835,842 844,010 654,181
Old Mutual Specialist Funds - Old Mutual
Schroder European Alpha Income Fund
(UCITS)
U2 (GBP) Accumulation
Shares USD 391 592 546 -
Old Mutual UK Equity Income Fund (UCITS) U2 (GBP) Income USD 97,765 147,550 - -
Old Mutual Voyager Global Dynamic
Equity Fund (UCITS) A (GBP) Accumulation USD 7,239,829 11,924,375 733,027 593,507
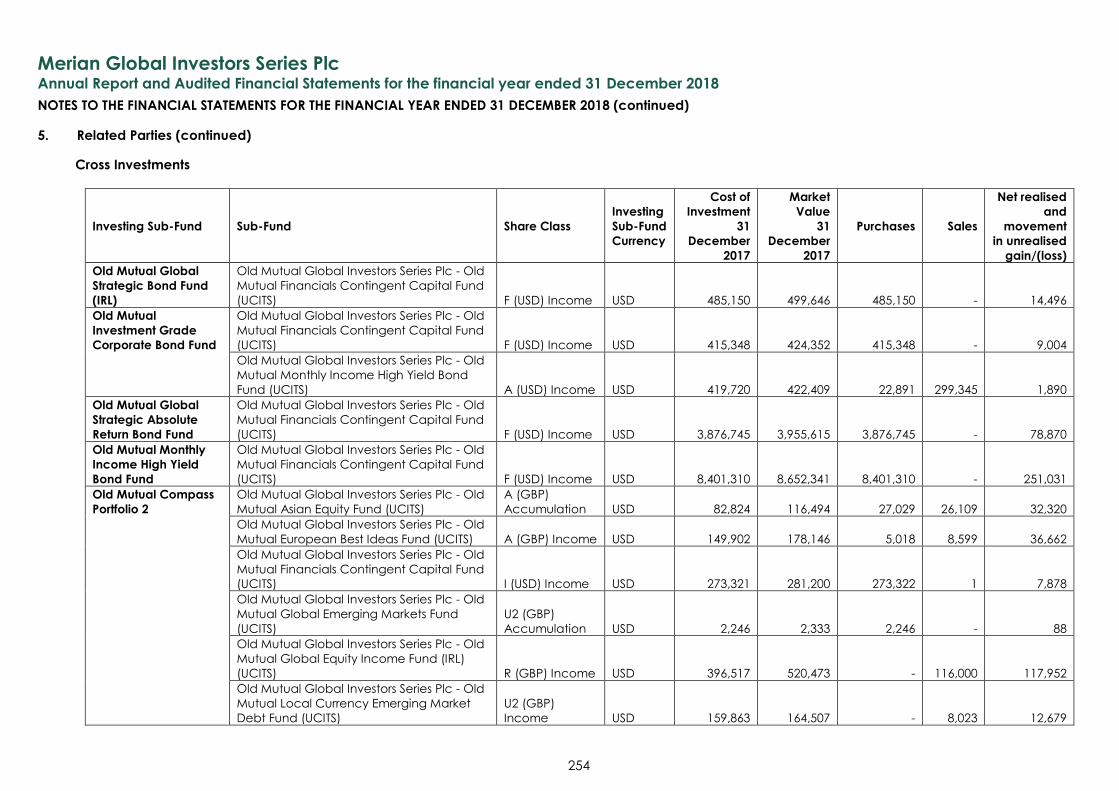
Merian Global Investors Series Plc
Annual Report and Audited Financial Statements for the financial year ended 31 December 2018
NOTES TO THE FINANCIAL STATEMENTS FOR THE FINANCIAL YEAR ENDED 31 DECEMBER 2018 (continued)
254
5. Related Parties (continued)
Cross Investments
Investing Sub-Fund Sub-Fund Share Class
Investing
Sub-Fund
Currency
Cost of
Investment
31
December
2017
Market
Value
31
December
2017
Purchases Sales
Net realised
and
movement
in unrealised
gain/(loss)
Old Mutual Global
Strategic Bond Fund
(IRL)
Old Mutual Global Investors Series Plc - Old
Mutual Financials Contingent Capital Fund
(UCITS) F (USD) Income USD 485,150 499,646 485,150 - 14,496
Old Mutual
Investment Grade
Corporate Bond Fund
Old Mutual Global Investors Series Plc - Old
Mutual Financials Contingent Capital Fund
(UCITS) F (USD) Income USD 415,348 424,352 415,348 - 9,004
Old Mutual Global Investors Series Plc - Old
Mutual Monthly Income High Yield Bond
Fund (UCITS) A (USD) Income USD 419,720 422,409 22,891 299,345 1,890
Old Mutual Global
Strategic Absolute
Return Bond Fund
Old Mutual Global Investors Series Plc - Old
Mutual Financials Contingent Capital Fund
(UCITS) F (USD) Income USD 3,876,745 3,955,615 3,876,745 - 78,870
Old Mutual Monthly
Income High Yield
Bond Fund
Old Mutual Global Investors Series Plc - Old
Mutual Financials Contingent Capital Fund
(UCITS) F (USD) Income USD 8,401,310 8,652,341 8,401,310 - 251,031
Old Mutual Compass
Portfolio 2 Old Mutual Global Investors Series Plc - Old
Mutual Asian Equity Fund (UCITS)
A (GBP)
Accumulation USD 82,824 116,494 27,029 26,109 32,320
Old Mutual Global Investors Series Plc - Old
Mutual European Best Ideas Fund (UCITS) A (GBP) Income USD 149,902 178,146 5,018 8,599 36,662
Old Mutual Global Investors Series Plc - Old
Mutual Financials Contingent Capital Fund
(UCITS) I (USD) Income USD 273,321 281,200 273,322 1 7,878
Old Mutual Global Investors Series Plc - Old
Mutual Global Emerging Markets Fund
(UCITS)
U2 (GBP)
Accumulation USD 2,246 2,333 2,246 - 88
Old Mutual Global Investors Series Plc - Old
Mutual Global Equity Income Fund (IRL)
(UCITS) R (GBP) Income USD 396,517 520,473 - 116,000 117,952
Old Mutual Global Investors Series Plc - Old
Mutual Local Currency Emerging Market
Debt Fund (UCITS)
U2 (GBP)
Income USD 159,863 164,507 - 8,023 12,679
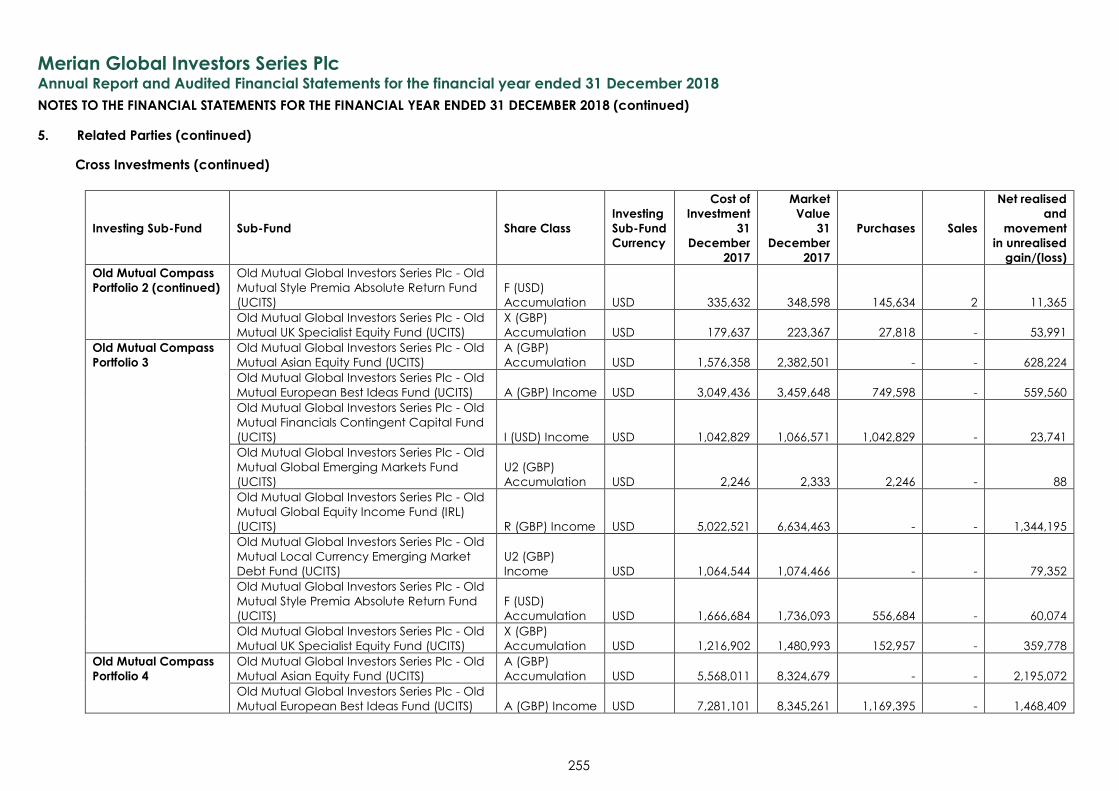
Merian Global Investors Series Plc
Annual Report and Audited Financial Statements for the financial year ended 31 December 2018
NOTES TO THE FINANCIAL STATEMENTS FOR THE FINANCIAL YEAR ENDED 31 DECEMBER 2018 (continued)
255
5. Related Parties (continued)
Cross Investments (continued)
Investing Sub-Fund Sub-Fund Share Class
Investing
Sub-Fund
Currency
Cost of
Investment
31
December
2017
Market
Value
31
December
2017
Purchases Sales
Net realised
and
movement
in unrealised
gain/(loss)
Old Mutual Compass
Portfolio 2 (continued) Old Mutual Global Investors Series Plc - Old
Mutual Style Premia Absolute Return Fund
(UCITS)
F (USD)
Accumulation USD 335,632 348,598 145,634 2 11,365
Old Mutual Global Investors Series Plc - Old
Mutual UK Specialist Equity Fund (UCITS)
X (GBP)
Accumulation USD 179,637 223,367 27,818 - 53,991
Old Mutual Compass
Portfolio 3 Old Mutual Global Investors Series Plc - Old
Mutual Asian Equity Fund (UCITS)
A (GBP)
Accumulation USD 1,576,358 2,382,501 - - 628,224
Old Mutual Global Investors Series Plc - Old
Mutual European Best Ideas Fund (UCITS) A (GBP) Income USD 3,049,436 3,459,648 749,598 - 559,560
Old Mutual Global Investors Series Plc - Old
Mutual Financials Contingent Capital Fund
(UCITS) I (USD) Income USD 1,042,829 1,066,571 1,042,829 - 23,741
Old Mutual Global Investors Series Plc - Old
Mutual Global Emerging Markets Fund
(UCITS)
U2 (GBP)
Accumulation USD 2,246 2,333 2,246 - 88
Old Mutual Global Investors Series Plc - Old
Mutual Global Equity Income Fund (IRL)
(UCITS) R (GBP) Income USD 5,022,521 6,634,463 - - 1,344,195
Old Mutual Global Investors Series Plc - Old
Mutual Local Currency Emerging Market
Debt Fund (UCITS)
U2 (GBP)
Income USD 1,064,544 1,074,466 - - 79,352
Old Mutual Global Investors Series Plc - Old
Mutual Style Premia Absolute Return Fund
(UCITS)
F (USD)
Accumulation USD 1,666,684 1,736,093 556,684 - 60,074
Old Mutual Global Investors Series Plc - Old
Mutual UK Specialist Equity Fund (UCITS)
X (GBP)
Accumulation USD 1,216,902 1,480,993 152,957 - 359,778
Old Mutual Compass
Portfolio 4
Old Mutual Global Investors Series Plc - Old
Mutual Asian Equity Fund (UCITS)
A (GBP)
Accumulation USD 5,568,011 8,324,679 - - 2,195,072
Old Mutual Global Investors Series Plc - Old
Mutual European Best Ideas Fund (UCITS) A (GBP) Income USD 7,281,101 8,345,261 1,169,395 - 1,468,409
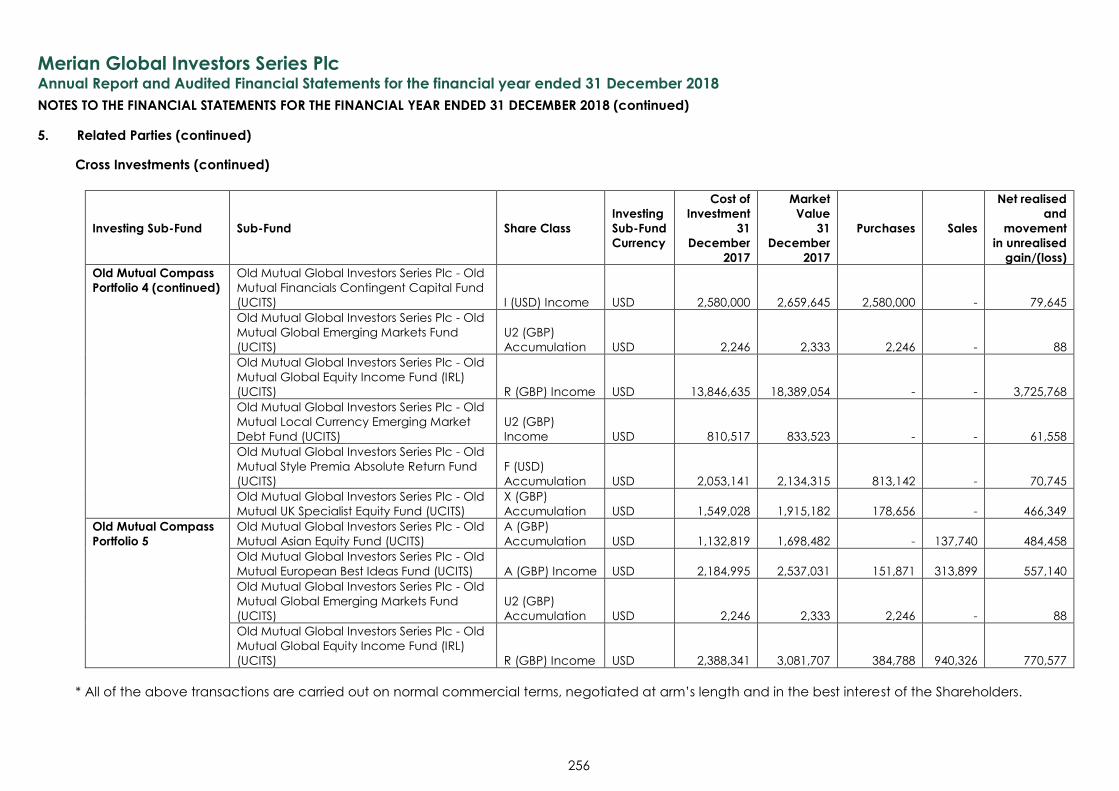
Merian Global Investors Series Plc
Annual Report and Audited Financial Statements for the financial year ended 31 December 2018
NOTES TO THE FINANCIAL STATEMENTS FOR THE FINANCIAL YEAR ENDED 31 DECEMBER 2018 (continued)
256
5. Related Parties (continued)
Cross Investments (continued)
Investing Sub-Fund Sub-Fund Share Class
Investing
Sub-Fund
Currency
Cost of
Investment
31
December
2017
Market
Value
31
December
2017
Purchases Sales
Net realised
and
movement
in unrealised
gain/(loss)
Old Mutual Compass
Portfolio 4 (continued)
Old Mutual Global Investors Series Plc - Old
Mutual Financials Contingent Capital Fund
(UCITS) I (USD) Income USD 2,580,000 2,659,645 2,580,000 - 79,645
Old Mutual Global Investors Series Plc - Old
Mutual Global Emerging Markets Fund
(UCITS)
U2 (GBP)
Accumulation USD 2,246 2,333 2,246 - 88
Old Mutual Global Investors Series Plc - Old
Mutual Global Equity Income Fund (IRL)
(UCITS) R (GBP) Income USD 13,846,635 18,389,054 - - 3,725,768
Old Mutual Global Investors Series Plc - Old
Mutual Local Currency Emerging Market
Debt Fund (UCITS)
U2 (GBP)
Income USD 810,517 833,523 - - 61,558
Old Mutual Global Investors Series Plc - Old
Mutual Style Premia Absolute Return Fund
(UCITS)
F (USD)
Accumulation USD 2,053,141 2,134,315 813,142 - 70,745
Old Mutual Global Investors Series Plc - Old
Mutual UK Specialist Equity Fund (UCITS)
X (GBP)
Accumulation USD 1,549,028 1,915,182 178,656 - 466,349
Old Mutual Compass
Portfolio 5
Old Mutual Global Investors Series Plc - Old
Mutual Asian Equity Fund (UCITS)
A (GBP)
Accumulation USD 1,132,819 1,698,482 - 137,740 484,458
Old Mutual Global Investors Series Plc - Old
Mutual European Best Ideas Fund (UCITS) A (GBP) Income USD 2,184,995 2,537,031 151,871 313,899 557,140
Old Mutual Global Investors Series Plc - Old
Mutual Global Emerging Markets Fund
(UCITS)
U2 (GBP)
Accumulation USD 2,246 2,333 2,246 - 88
Old Mutual Global Investors Series Plc - Old
Mutual Global Equity Income Fund (IRL)
(UCITS) R (GBP) Income USD 2,388,341 3,081,707 384,788 940,326 770,577
* All of the above transactions are carried out on normal commercial terms, negotiated at arm’s length and in the best interest of the Shareholders.
Merian Global Investors Series Plc
Annual Report and Audited Financial Statements for the financial year ended 31 December 2018
NOTES TO THE FINANCIAL STATEMENTS FOR THE FINANCIAL YEAR ENDED 31 DECEMBER 2018 (continued)
257
6. Share Capital
Subscriber Shares
The authorised share capital of the Company is EUR 38,082 represented by 30,000 subscriber Shares of no
par value and 500,000,000,000 Shares of no par value. The Company has repurchased all but seven of the
subscriber Shares. The subscriber Shares entitle the Shareholders holding them to attend and vote at all
meetings of the Company. The subscriber Shares entitles the Shareholder to participate equally on a pro
rata basis in the dividends and net assets of the Company, this entitlement shall be limited to the amount
subscribed and any accrued income thereon.
Redeemable Participating Shares
The creation of the various share classes is intended to offer greater flexibility to both retail and institutional
clients. Each Share Class may also be distinguished by the Investment Management Fee, initial charge,
contingent deferred sales charge and redemption charges applicable and the minimum subscription
requirements. Each Share Class in each Sub-Fund has equal voting, distribution and liquidation rights in
proportion to the number of the Shares held in that Sub-Fund.
The net assets attributable to holders of Redeemable Participating Shares are at all times equal to the Net
Asset Value of the Company. The participating shares can be redeemed at the option of the shareholder.
Participating shares may be redeemed on each dealing date or such other date or dates as the Board of
Directors shall from time to time determine (Valuation Day) at the Net Asset Value per share.
Capital Management
The Company is a self-managed UCITS Company and by taking into consideration of Subscriber Shares,
has met the minimum capital requirements whereby the Company must, at all times, maintain a minimum
capital requirement equivalent to €300,000. The Company endeavours to manage itself in such a way as
to meet the Company’s investment objectives while maintaining sufficient liquidity to meet shareholders
redemptions.
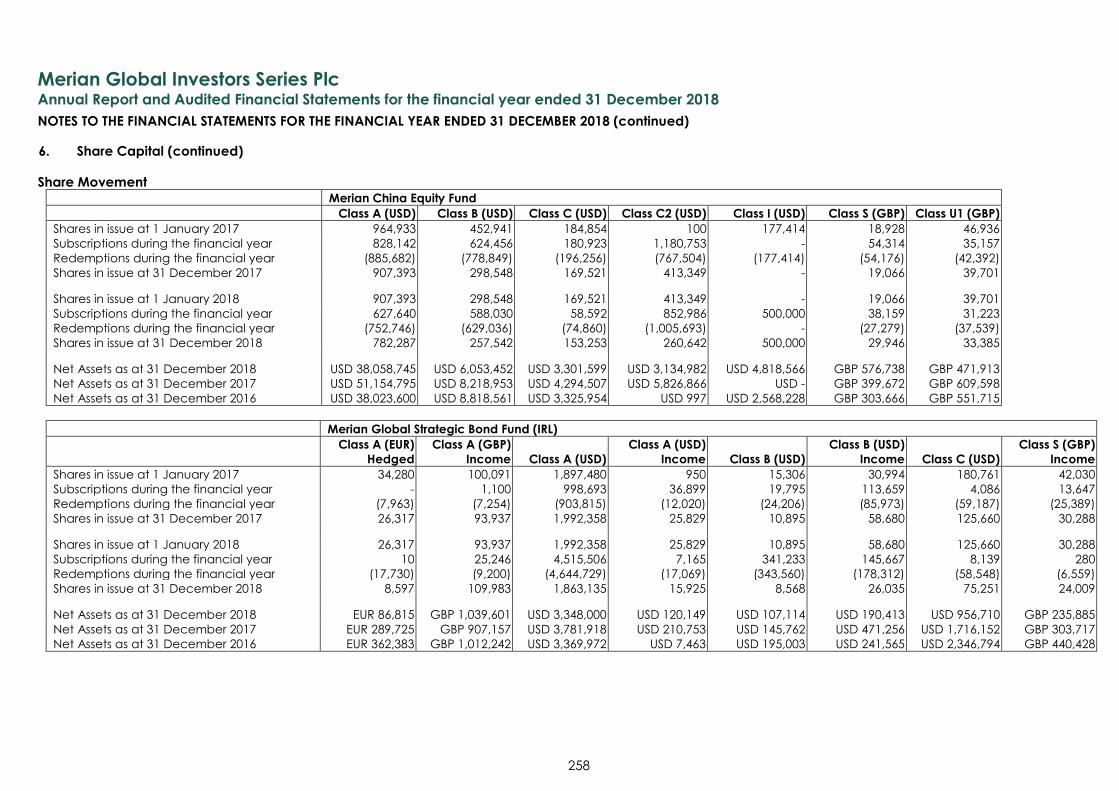
Merian Global Investors Series Plc
Annual Report and Audited Financial Statements for the financial year ended 31 December 2018
NOTES TO THE FINANCIAL STATEMENTS FOR THE FINANCIAL YEAR ENDED 31 DECEMBER 2018 (continued)
258
6. Share Capital (continued)
Share Movement Merian China Equity Fund
Class A (USD) Class B (USD) Class C (USD) Class C2 (USD) Class I (USD) Class S (GBP) Class U1 (GBP)
Shares in issue at 1 January 2017 964,933 452,941 184,854 100 177,414 18,928 46,936
Subscriptions during the financial year 828,142 624,456 180,923 1,180,753 - 54,314 35,157
Redemptions during the financial year (885,682) (778,849) (196,256) (767,504) (177,414) (54,176) (42,392)
Shares in issue at 31 December 2017 907,393 298,548 169,521 413,349 - 19,066 39,701
Shares in issue at 1 January 2018 907,393 298,548 169,521 413,349 - 19,066 39,701
Subscriptions during the financial year 627,640 588,030 58,592 852,986 500,000 38,159 31,223
Redemptions during the financial year (752,746) (629,036) (74,860) (1,005,693) - (27,279) (37,539)
Shares in issue at 31 December 2018 782,287 257,542 153,253 260,642 500,000 29,946 33,385
Net Assets as at 31 December 2018 USD 38,058,745 USD 6,053,452 USD 3,301,599 USD 3,134,982 USD 4,818,566 GBP 576,738 GBP 471,913
Net Assets as at 31 December 2017 USD 51,154,795 USD 8,218,953 USD 4,294,507 USD 5,826,866 USD - GBP 399,672 GBP 609,598
Net Assets as at 31 December 2016 USD 38,023,600 USD 8,818,561 USD 3,325,954 USD 997 USD 2,568,228 GBP 303,666 GBP 551,715
Merian Global Strategic Bond Fund (IRL)
Class A (EUR)
Hedged
Class A (GBP)
Income Class A (USD)
Class A (USD)
Income Class B (USD)
Class B (USD)
Income Class C (USD)
Class S (GBP)
Income
Shares in issue at 1 January 2017 34,280 100,091 1,897,480 950 15,306 30,994 180,761 42,030
Subscriptions during the financial year - 1,100 998,693 36,899 19,795 113,659 4,086 13,647
Redemptions during the financial year (7,963) (7,254) (903,815) (12,020) (24,206) (85,973) (59,187) (25,389)
Shares in issue at 31 December 2017 26,317 93,937 1,992,358 25,829 10,895 58,680 125,660 30,288
Shares in issue at 1 January 2018 26,317 93,937 1,992,358 25,829 10,895 58,680 125,660 30,288
Subscriptions during the financial year 10 25,246 4,515,506 7,165 341,233 145,667 8,139 280
Redemptions during the financial year (17,730) (9,200) (4,644,729) (17,069) (343,560) (178,312) (58,548) (6,559)
Shares in issue at 31 December 2018 8,597 109,983 1,863,135 15,925 8,568 26,035 75,251 24,009
Net Assets as at 31 December 2018 EUR 86,815 GBP 1,039,601 USD 3,348,000 USD 120,149 USD 107,114 USD 190,413 USD 956,710 GBP 235,885
Net Assets as at 31 December 2017 EUR 289,725 GBP 907,157 USD 3,781,918 USD 210,753 USD 145,762 USD 471,256 USD 1,716,152 GBP 303,717
Net Assets as at 31 December 2016 EUR 362,383 GBP 1,012,242 USD 3,369,972 USD 7,463 USD 195,003 USD 241,565 USD 2,346,794 GBP 440,428
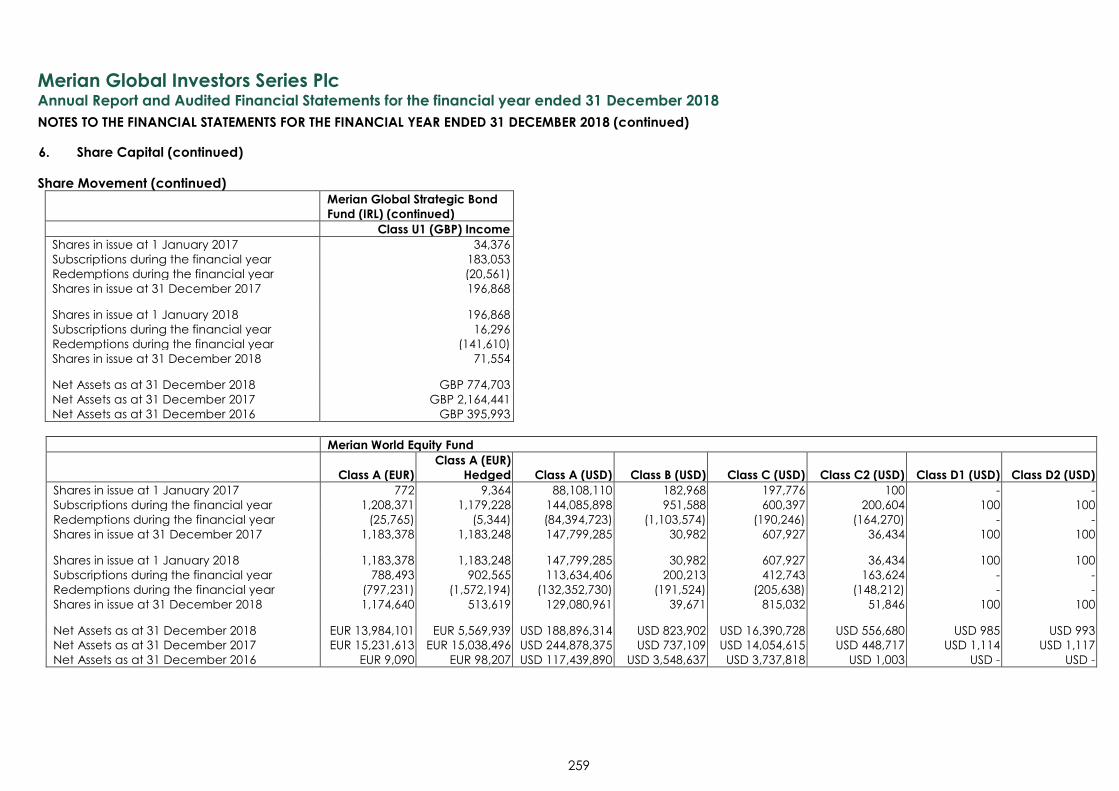
Merian Global Investors Series Plc
Annual Report and Audited Financial Statements for the financial year ended 31 December 2018
NOTES TO THE FINANCIAL STATEMENTS FOR THE FINANCIAL YEAR ENDED 31 DECEMBER 2018 (continued)
259
6. Share Capital (continued)
Share Movement (continued)
Merian Global Strategic Bond
Fund (IRL) (continued)
Class U1 (GBP) Income
Shares in issue at 1 January 2017 34,376
Subscriptions during the financial year 183,053
Redemptions during the financial year (20,561)
Shares in issue at 31 December 2017 196,868
Shares in issue at 1 January 2018 196,868
Subscriptions during the financial year 16,296
Redemptions during the financial year (141,610)
Shares in issue at 31 December 2018 71,554
Net Assets as at 31 December 2018 GBP 774,703
Net Assets as at 31 December 2017 GBP 2,164,441
Net Assets as at 31 December 2016 GBP 395,993
Merian World Equity Fund
Class A (EUR)
Class A (EUR)
Hedged Class A (USD) Class B (USD) Class C (USD) Class C2 (USD) Class D1 (USD) Class D2 (USD)
Shares in issue at 1 January 2017 772 9,364 88,108,110 182,968 197,776 100 - -
Subscriptions during the financial year 1,208,371 1,179,228 144,085,898 951,588 600,397 200,604 100 100
Redemptions during the financial year (25,765) (5,344) (84,394,723) (1,103,574) (190,246) (164,270) - -
Shares in issue at 31 December 2017 1,183,378 1,183,248 147,799,285 30,982 607,927 36,434 100 100
Shares in issue at 1 January 2018 1,183,378 1,183,248 147,799,285 30,982 607,927 36,434 100 100
Subscriptions during the financial year 788,493 902,565 113,634,406 200,213 412,743 163,624 - -
Redemptions during the financial year (797,231) (1,572,194) (132,352,730) (191,524) (205,638) (148,212) - -
Shares in issue at 31 December 2018 1,174,640 513,619 129,080,961 39,671 815,032 51,846 100 100
Net Assets as at 31 December 2018 EUR 13,984,101 EUR 5,569,939 USD 188,896,314 USD 823,902 USD 16,390,728 USD 556,680 USD 985 USD 993
Net Assets as at 31 December 2017 EUR 15,231,613 EUR 15,038,496 USD 244,878,375 USD 737,109 USD 14,054,615 USD 448,717 USD 1,114 USD 1,117
Net Assets as at 31 December 2016 EUR 9,090 EUR 98,207 USD 117,439,890 USD 3,548,637 USD 3,737,818 USD 1,003 USD - USD -
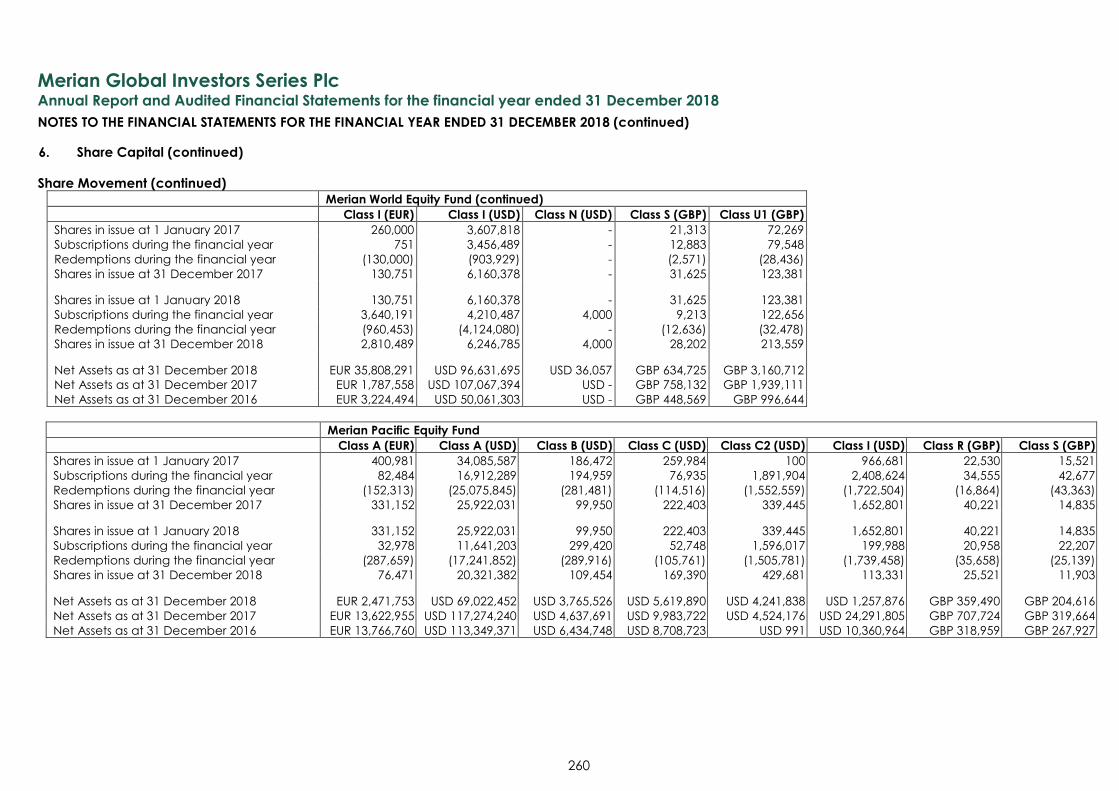
Merian Global Investors Series Plc
Annual Report and Audited Financial Statements for the financial year ended 31 December 2018
NOTES TO THE FINANCIAL STATEMENTS FOR THE FINANCIAL YEAR ENDED 31 DECEMBER 2018 (continued)
260
6. Share Capital (continued)
Share Movement (continued) Merian World Equity Fund (continued)
Class I (EUR) Class I (USD) Class N (USD) Class S (GBP) Class U1 (GBP)
Shares in issue at 1 January 2017 260,000 3,607,818 - 21,313 72,269
Subscriptions during the financial year 751 3,456,489 - 12,883 79,548
Redemptions during the financial year (130,000) (903,929) - (2,571) (28,436)
Shares in issue at 31 December 2017 130,751 6,160,378 - 31,625 123,381
Shares in issue at 1 January 2018 130,751 6,160,378 - 31,625 123,381
Subscriptions during the financial year 3,640,191 4,210,487 4,000 9,213 122,656
Redemptions during the financial year (960,453) (4,124,080) - (12,636) (32,478)
Shares in issue at 31 December 2018 2,810,489 6,246,785 4,000 28,202 213,559
Net Assets as at 31 December 2018 EUR 35,808,291 USD 96,631,695 USD 36,057 GBP 634,725 GBP 3,160,712
Net Assets as at 31 December 2017 EUR 1,787,558 USD 107,067,394 USD - GBP 758,132 GBP 1,939,111
Net Assets as at 31 December 2016 EUR 3,224,494 USD 50,061,303 USD - GBP 448,569 GBP 996,644
Merian Pacific Equity Fund
Class A (EUR) Class A (USD) Class B (USD) Class C (USD) Class C2 (USD) Class I (USD) Class R (GBP) Class S (GBP)
Shares in issue at 1 January 2017 400,981 34,085,587 186,472 259,984 100 966,681 22,530 15,521
Subscriptions during the financial year 82,484 16,912,289 194,959 76,935 1,891,904 2,408,624 34,555 42,677
Redemptions during the financial year (152,313) (25,075,845) (281,481) (114,516) (1,552,559) (1,722,504) (16,864) (43,363)
Shares in issue at 31 December 2017 331,152 25,922,031 99,950 222,403 339,445 1,652,801 40,221 14,835
Shares in issue at 1 January 2018 331,152 25,922,031 99,950 222,403 339,445 1,652,801 40,221 14,835
Subscriptions during the financial year 32,978 11,641,203 299,420 52,748 1,596,017 199,988 20,958 22,207
Redemptions during the financial year (287,659) (17,241,852) (289,916) (105,761) (1,505,781) (1,739,458) (35,658) (25,139)
Shares in issue at 31 December 2018 76,471 20,321,382 109,454 169,390 429,681 113,331 25,521 11,903
Net Assets as at 31 December 2018 EUR 2,471,753 USD 69,022,452 USD 3,765,526 USD 5,619,890 USD 4,241,838 USD 1,257,876 GBP 359,490 GBP 204,616
Net Assets as at 31 December 2017 EUR 13,622,955 USD 117,274,240 USD 4,637,691 USD 9,983,722 USD 4,524,176 USD 24,291,805 GBP 707,724 GBP 319,664
Net Assets as at 31 December 2016 EUR 13,766,760 USD 113,349,371 USD 6,434,748 USD 8,708,723 USD 991 USD 10,360,964 GBP 318,959 GBP 267,927
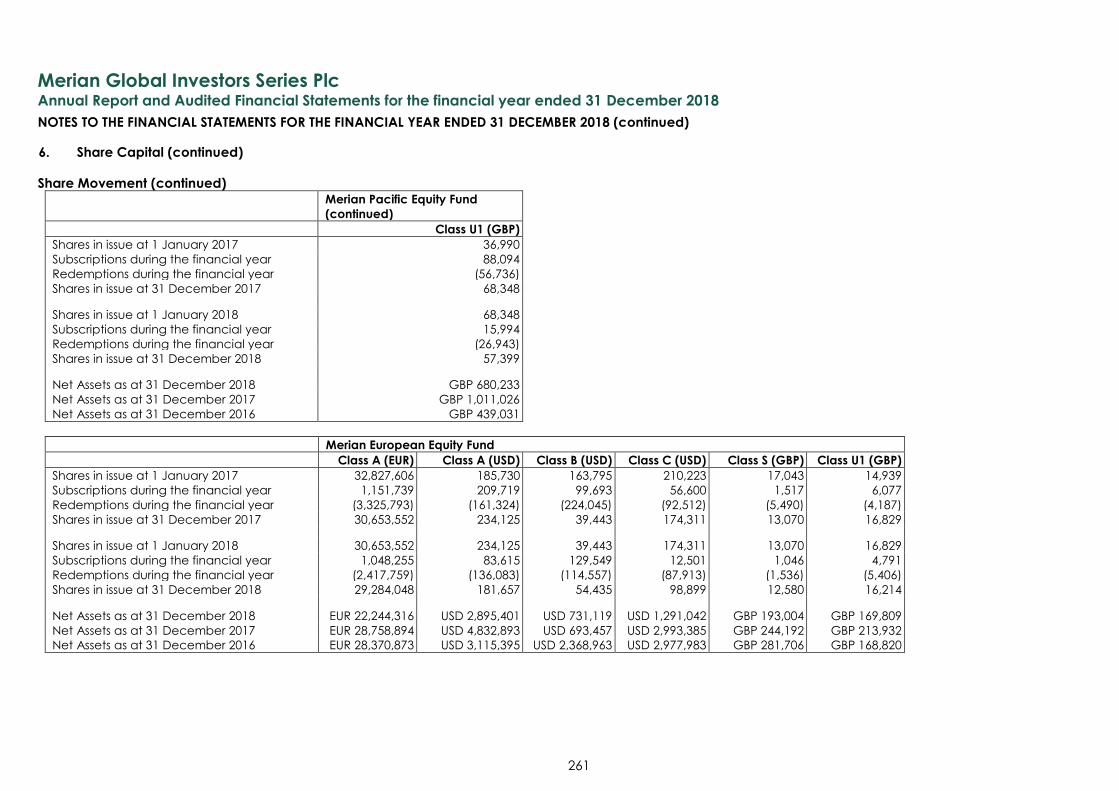
Merian Global Investors Series Plc
Annual Report and Audited Financial Statements for the financial year ended 31 December 2018
NOTES TO THE FINANCIAL STATEMENTS FOR THE FINANCIAL YEAR ENDED 31 DECEMBER 2018 (continued)
261
6. Share Capital (continued)
Share Movement (continued) Merian Pacific Equity Fund
(continued)
Class U1 (GBP)
Shares in issue at 1 January 2017 36,990
Subscriptions during the financial year 88,094
Redemptions during the financial year (56,736)
Shares in issue at 31 December 2017 68,348
Shares in issue at 1 January 2018 68,348
Subscriptions during the financial year 15,994
Redemptions during the financial year (26,943)
Shares in issue at 31 December 2018 57,399
Net Assets as at 31 December 2018 GBP 680,233
Net Assets as at 31 December 2017 GBP 1,011,026
Net Assets as at 31 December 2016 GBP 439,031
Merian European Equity Fund
Class A (EUR) Class A (USD) Class B (USD) Class C (USD) Class S (GBP) Class U1 (GBP)
Shares in issue at 1 January 2017 32,827,606 185,730 163,795 210,223 17,043 14,939
Subscriptions during the financial year 1,151,739 209,719 99,693 56,600 1,517 6,077
Redemptions during the financial year (3,325,793) (161,324) (224,045) (92,512) (5,490) (4,187)
Shares in issue at 31 December 2017 30,653,552 234,125 39,443 174,311 13,070 16,829
Shares in issue at 1 January 2018 30,653,552 234,125 39,443 174,311 13,070 16,829
Subscriptions during the financial year 1,048,255 83,615 129,549 12,501 1,046 4,791
Redemptions during the financial year (2,417,759) (136,083) (114,557) (87,913) (1,536) (5,406)
Shares in issue at 31 December 2018 29,284,048 181,657 54,435 98,899 12,580 16,214
Net Assets as at 31 December 2018 EUR 22,244,316 USD 2,895,401 USD 731,119 USD 1,291,042 GBP 193,004 GBP 169,809
Net Assets as at 31 December 2017 EUR 28,758,894 USD 4,832,893 USD 693,457 USD 2,993,385 GBP 244,192 GBP 213,932
Net Assets as at 31 December 2016 EUR 28,370,873 USD 3,115,395 USD 2,368,963 USD 2,977,983 GBP 281,706 GBP 168,820
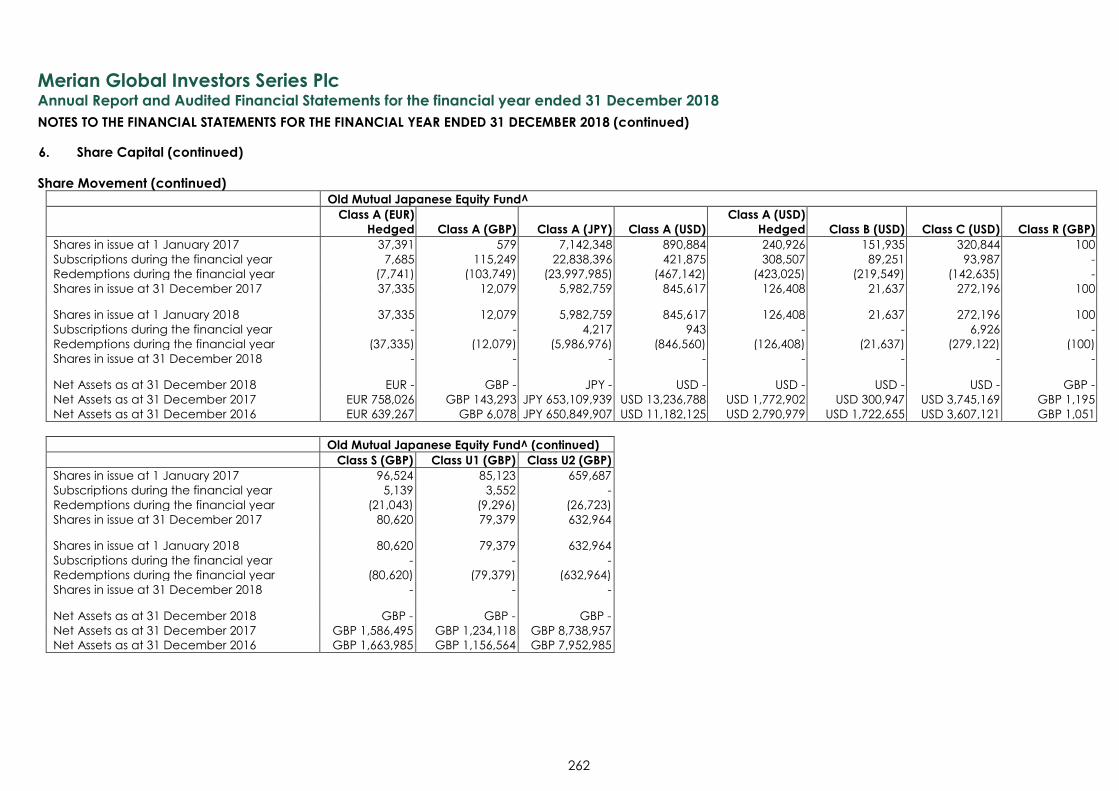
Merian Global Investors Series Plc
Annual Report and Audited Financial Statements for the financial year ended 31 December 2018
NOTES TO THE FINANCIAL STATEMENTS FOR THE FINANCIAL YEAR ENDED 31 DECEMBER 2018 (continued)
262
6. Share Capital (continued)
Share Movement (continued) Old Mutual Japanese Equity Fund^
Class A (EUR)
Hedged Class A (GBP) Class A (JPY) Class A (USD)
Class A (USD)
Hedged Class B (USD) Class C (USD) Class R (GBP)
Shares in issue at 1 January 2017 37,391 579 7,142,348 890,884 240,926 151,935 320,844 100
Subscriptions during the financial year 7,685 115,249 22,838,396 421,875 308,507 89,251 93,987 -
Redemptions during the financial year (7,741) (103,749) (23,997,985) (467,142) (423,025) (219,549) (142,635) -
Shares in issue at 31 December 2017 37,335 12,079 5,982,759 845,617 126,408 21,637 272,196 100
Shares in issue at 1 January 2018 37,335 12,079 5,982,759 845,617 126,408 21,637 272,196 100
Subscriptions during the financial year - - 4,217 943 - - 6,926 -
Redemptions during the financial year (37,335) (12,079) (5,986,976) (846,560) (126,408) (21,637) (279,122) (100)
Shares in issue at 31 December 2018 - - - - - - - -
Net Assets as at 31 December 2018 EUR - GBP - JPY - USD - USD - USD - USD - GBP -
Net Assets as at 31 December 2017 EUR 758,026 GBP 143,293 JPY 653,109,939 USD 13,236,788 USD 1,772,902 USD 300,947 USD 3,745,169 GBP 1,195
Net Assets as at 31 December 2016 EUR 639,267 GBP 6,078 JPY 650,849,907 USD 11,182,125 USD 2,790,979 USD 1,722,655 USD 3,607,121 GBP 1,051
Old Mutual Japanese Equity Fund^ (continued)
Class S (GBP) Class U1 (GBP) Class U2 (GBP)
Shares in issue at 1 January 2017 96,524 85,123 659,687
Subscriptions during the financial year 5,139 3,552 -
Redemptions during the financial year (21,043) (9,296) (26,723)
Shares in issue at 31 December 2017 80,620 79,379 632,964
Shares in issue at 1 January 2018 80,620 79,379 632,964
Subscriptions during the financial year - - -
Redemptions during the financial year (80,620) (79,379) (632,964)
Shares in issue at 31 December 2018 - - -
Net Assets as at 31 December 2018 GBP - GBP - GBP -
Net Assets as at 31 December 2017 GBP 1,586,495 GBP 1,234,118 GBP 8,738,957
Net Assets as at 31 December 2016 GBP 1,663,985 GBP 1,156,564 GBP 7,952,985
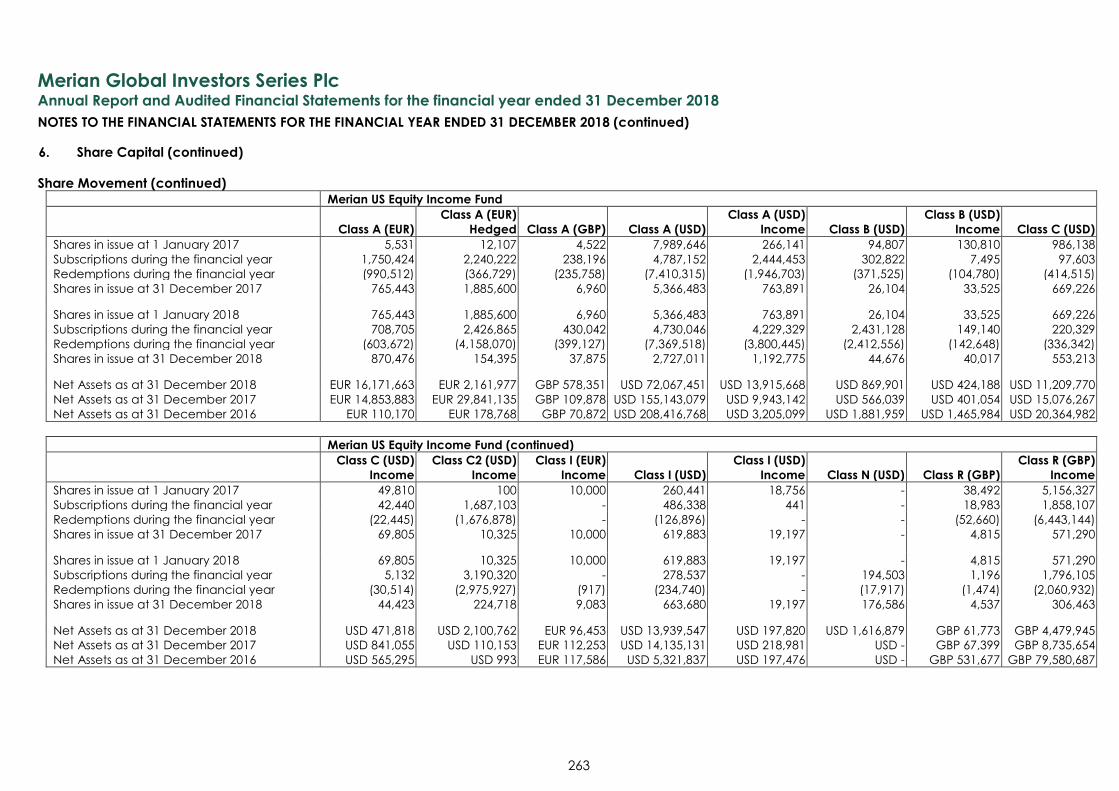
Merian Global Investors Series Plc
Annual Report and Audited Financial Statements for the financial year ended 31 December 2018
NOTES TO THE FINANCIAL STATEMENTS FOR THE FINANCIAL YEAR ENDED 31 DECEMBER 2018 (continued)
263
6. Share Capital (continued)
Share Movement (continued)
Merian US Equity Income Fund
Class A (EUR)
Class A (EUR)
Hedged Class A (GBP) Class A (USD)
Class A (USD)
Income Class B (USD)
Class B (USD)
Income Class C (USD)
Shares in issue at 1 January 2017 5,531 12,107 4,522 7,989,646 266,141 94,807 130,810 986,138
Subscriptions during the financial year 1,750,424 2,240,222 238,196 4,787,152 2,444,453 302,822 7,495 97,603
Redemptions during the financial year (990,512) (366,729) (235,758) (7,410,315) (1,946,703) (371,525) (104,780) (414,515)
Shares in issue at 31 December 2017 765,443 1,885,600 6,960 5,366,483 763,891 26,104 33,525 669,226
Shares in issue at 1 January 2018 765,443 1,885,600 6,960 5,366,483 763,891 26,104 33,525 669,226
Subscriptions during the financial year 708,705 2,426,865 430,042 4,730,046 4,229,329 2,431,128 149,140 220,329
Redemptions during the financial year (603,672) (4,158,070) (399,127) (7,369,518) (3,800,445) (2,412,556) (142,648) (336,342)
Shares in issue at 31 December 2018 870,476 154,395 37,875 2,727,011 1,192,775 44,676 40,017 553,213
Net Assets as at 31 December 2018 EUR 16,171,663 EUR 2,161,977 GBP 578,351 USD 72,067,451 USD 13,915,668 USD 869,901 USD 424,188 USD 11,209,770
Net Assets as at 31 December 2017 EUR 14,853,883 EUR 29,841,135 GBP 109,878 USD 155,143,079 USD 9,943,142 USD 566,039 USD 401,054 USD 15,076,267
Net Assets as at 31 December 2016 EUR 110,170 EUR 178,768 GBP 70,872 USD 208,416,768 USD 3,205,099 USD 1,881,959 USD 1,465,984 USD 20,364,982
Merian US Equity Income Fund (continued)
Class C (USD)
Income
Class C2 (USD)
Income
Class I (EUR)
Income Class I (USD)
Class I (USD)
Income Class N (USD) Class R (GBP)
Class R (GBP)
Income
Shares in issue at 1 January 2017 49,810 100 10,000 260,441 18,756 - 38,492 5,156,327
Subscriptions during the financial year 42,440 1,687,103 - 486,338 441 - 18,983 1,858,107
Redemptions during the financial year (22,445) (1,676,878) - (126,896) - - (52,660) (6,443,144)
Shares in issue at 31 December 2017 69,805 10,325 10,000 619,883 19,197 - 4,815 571,290
Shares in issue at 1 January 2018 69,805 10,325 10,000 619,883 19,197 - 4,815 571,290
Subscriptions during the financial year 5,132 3,190,320 - 278,537 - 194,503 1,196 1,796,105
Redemptions during the financial year (30,514) (2,975,927) (917) (234,740) - (17,917) (1,474) (2,060,932)
Shares in issue at 31 December 2018 44,423 224,718 9,083 663,680 19,197 176,586 4,537 306,463
Net Assets as at 31 December 2018 USD 471,818 USD 2,100,762 EUR 96,453 USD 13,939,547 USD 197,820 USD 1,616,879 GBP 61,773 GBP 4,479,945
Net Assets as at 31 December 2017 USD 841,055 USD 110,153 EUR 112,253 USD 14,135,131 USD 218,981 USD - GBP 67,399 GBP 8,735,654
Net Assets as at 31 December 2016 USD 565,295 USD 993 EUR 117,586 USD 5,321,837 USD 197,476 USD - GBP 531,677 GBP 79,580,687
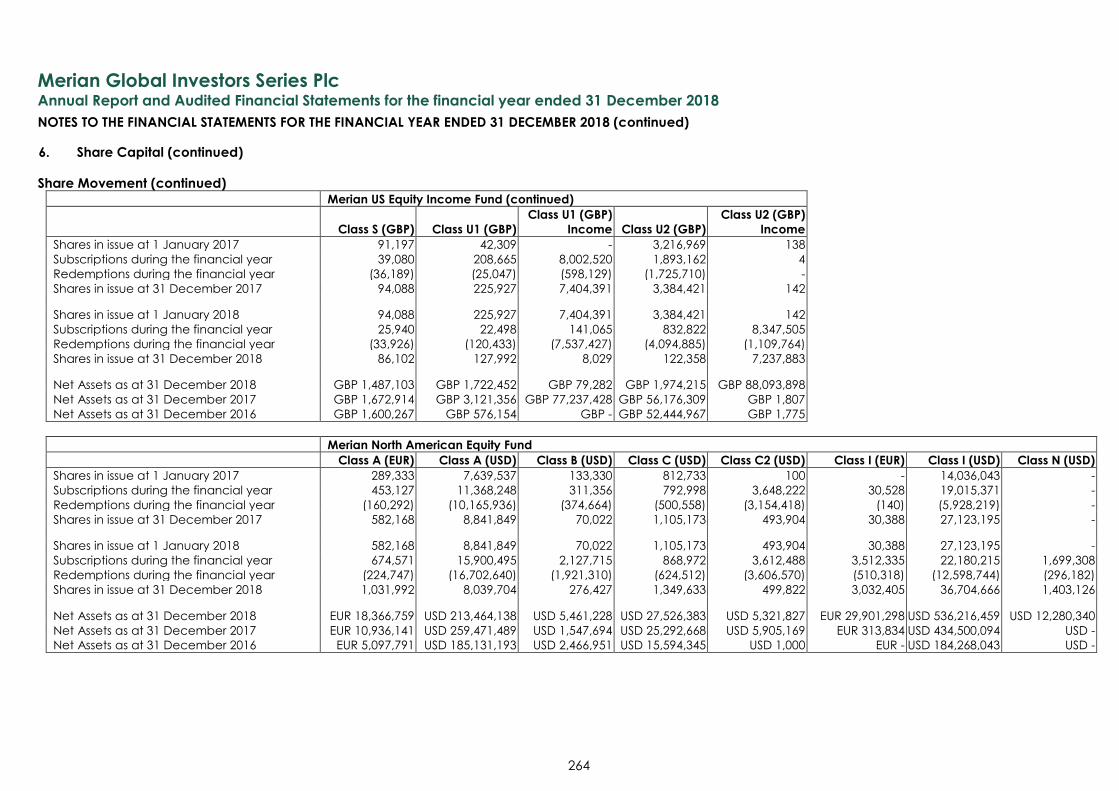
Merian Global Investors Series Plc
Annual Report and Audited Financial Statements for the financial year ended 31 December 2018
NOTES TO THE FINANCIAL STATEMENTS FOR THE FINANCIAL YEAR ENDED 31 DECEMBER 2018 (continued)
264
6. Share Capital (continued)
Share Movement (continued)
Merian US Equity Income Fund (continued)
Class S (GBP) Class U1 (GBP)
Class U1 (GBP)
Income Class U2 (GBP)
Class U2 (GBP)
Income
Shares in issue at 1 January 2017 91,197 42,309 - 3,216,969 138
Subscriptions during the financial year 39,080 208,665 8,002,520 1,893,162 4
Redemptions during the financial year (36,189) (25,047) (598,129) (1,725,710) -
Shares in issue at 31 December 2017 94,088 225,927 7,404,391 3,384,421 142
Shares in issue at 1 January 2018 94,088 225,927 7,404,391 3,384,421 142
Subscriptions during the financial year 25,940 22,498 141,065 832,822 8,347,505
Redemptions during the financial year (33,926) (120,433) (7,537,427) (4,094,885) (1,109,764)
Shares in issue at 31 December 2018 86,102 127,992 8,029 122,358 7,237,883
Net Assets as at 31 December 2018 GBP 1,487,103 GBP 1,722,452 GBP 79,282 GBP 1,974,215 GBP 88,093,898
Net Assets as at 31 December 2017 GBP 1,672,914 GBP 3,121,356 GBP 77,237,428 GBP 56,176,309 GBP 1,807
Net Assets as at 31 December 2016 GBP 1,600,267 GBP 576,154 GBP - GBP 52,444,967 GBP 1,775
Merian North American Equity Fund
Class A (EUR) Class A (USD) Class B (USD) Class C (USD) Class C2 (USD) Class I (EUR) Class I (USD) Class N (USD)
Shares in issue at 1 January 2017 289,333 7,639,537 133,330 812,733 100 - 14,036,043 -
Subscriptions during the financial year 453,127 11,368,248 311,356 792,998 3,648,222 30,528 19,015,371 -
Redemptions during the financial year (160,292) (10,165,936) (374,664) (500,558) (3,154,418) (140) (5,928,219) -
Shares in issue at 31 December 2017 582,168 8,841,849 70,022 1,105,173 493,904 30,388 27,123,195 -
Shares in issue at 1 January 2018 582,168 8,841,849 70,022 1,105,173 493,904 30,388 27,123,195 -
Subscriptions during the financial year 674,571 15,900,495 2,127,715 868,972 3,612,488 3,512,335 22,180,215 1,699,308
Redemptions during the financial year (224,747) (16,702,640) (1,921,310) (624,512) (3,606,570) (510,318) (12,598,744) (296,182)
Shares in issue at 31 December 2018 1,031,992 8,039,704 276,427 1,349,633 499,822 3,032,405 36,704,666 1,403,126
Net Assets as at 31 December 2018 EUR 18,366,759 USD 213,464,138 USD 5,461,228 USD 27,526,383 USD 5,321,827 EUR 29,901,298 USD 536,216,459 USD 12,280,340
Net Assets as at 31 December 2017 EUR 10,936,141 USD 259,471,489 USD 1,547,694 USD 25,292,668 USD 5,905,169 EUR 313,834 USD 434,500,094 USD -
Net Assets as at 31 December 2016 EUR 5,097,791 USD 185,131,193 USD 2,466,951 USD 15,594,345 USD 1,000 EUR - USD 184,268,043 USD -
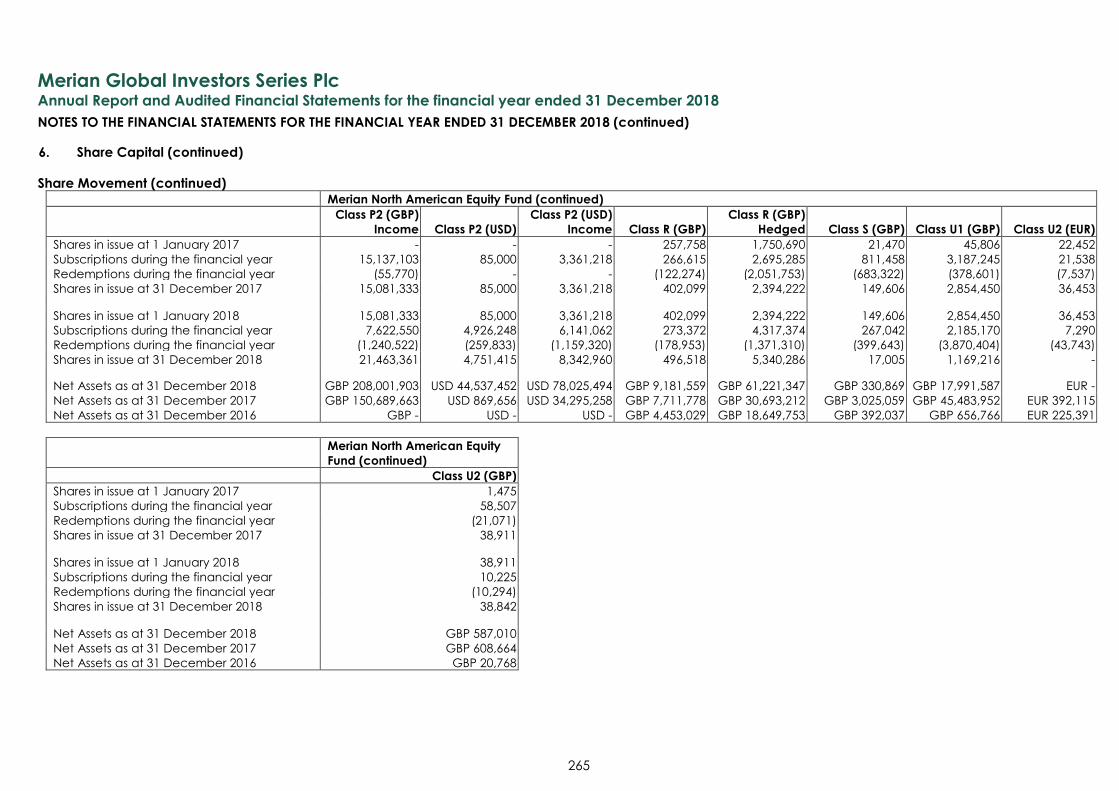
Merian Global Investors Series Plc
Annual Report and Audited Financial Statements for the financial year ended 31 December 2018
NOTES TO THE FINANCIAL STATEMENTS FOR THE FINANCIAL YEAR ENDED 31 DECEMBER 2018 (continued)
265
6. Share Capital (continued)
Share Movement (continued) Merian North American Equity Fund (continued)
Class P2 (GBP)
Income Class P2 (USD)
Class P2 (USD)
Income Class R (GBP)
Class R (GBP)
Hedged Class S (GBP) Class U1 (GBP) Class U2 (EUR)
Shares in issue at 1 January 2017 - - - 257,758 1,750,690 21,470 45,806 22,452
Subscriptions during the financial year 15,137,103 85,000 3,361,218 266,615 2,695,285 811,458 3,187,245 21,538
Redemptions during the financial year (55,770) - - (122,274) (2,051,753) (683,322) (378,601) (7,537)
Shares in issue at 31 December 2017 15,081,333 85,000 3,361,218 402,099 2,394,222 149,606 2,854,450 36,453
Shares in issue at 1 January 2018 15,081,333 85,000 3,361,218 402,099 2,394,222 149,606 2,854,450 36,453
Subscriptions during the financial year 7,622,550 4,926,248 6,141,062 273,372 4,317,374 267,042 2,185,170 7,290
Redemptions during the financial year (1,240,522) (259,833) (1,159,320) (178,953) (1,371,310) (399,643) (3,870,404) (43,743)
Shares in issue at 31 December 2018 21,463,361 4,751,415 8,342,960 496,518 5,340,286 17,005 1,169,216 -
Net Assets as at 31 December 2018 GBP 208,001,903 USD 44,537,452 USD 78,025,494 GBP 9,181,559 GBP 61,221,347 GBP 330,869 GBP 17,991,587 EUR -
Net Assets as at 31 December 2017 GBP 150,689,663 USD 869,656 USD 34,295,258 GBP 7,711,778 GBP 30,693,212 GBP 3,025,059 GBP 45,483,952 EUR 392,115
Net Assets as at 31 December 2016 GBP - USD - USD - GBP 4,453,029 GBP 18,649,753 GBP 392,037 GBP 656,766 EUR 225,391
Merian North American Equity
Fund (continued)
Class U2 (GBP)
Shares in issue at 1 January 2017 1,475
Subscriptions during the financial year 58,507
Redemptions during the financial year (21,071)
Shares in issue at 31 December 2017 38,911
Shares in issue at 1 January 2018 38,911
Subscriptions during the financial year 10,225
Redemptions during the financial year (10,294)
Shares in issue at 31 December 2018 38,842
Net Assets as at 31 December 2018 GBP 587,010
Net Assets as at 31 December 2017 GBP 608,664
Net Assets as at 31 December 2016 GBP 20,768
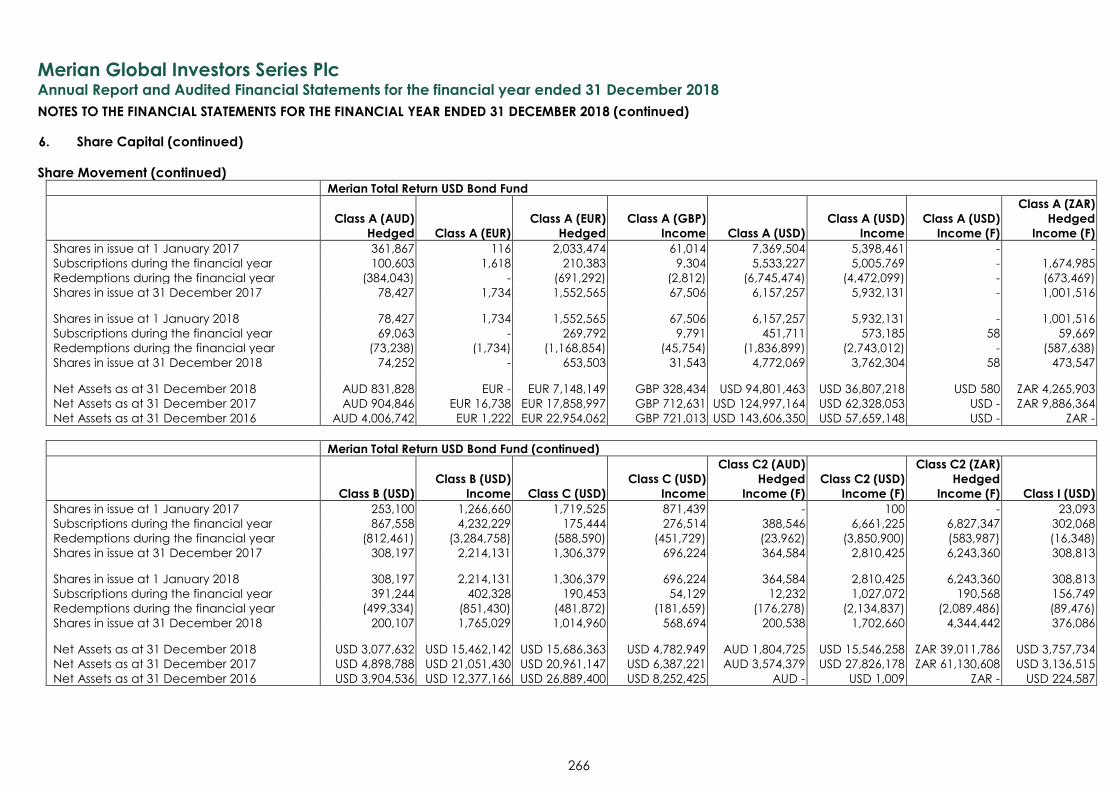
Merian Global Investors Series Plc
Annual Report and Audited Financial Statements for the financial year ended 31 December 2018
NOTES TO THE FINANCIAL STATEMENTS FOR THE FINANCIAL YEAR ENDED 31 DECEMBER 2018 (continued)
266
6. Share Capital (continued)
Share Movement (continued) Merian Total Return USD Bond Fund
Class A (AUD)
Hedged Class A (EUR)
Class A (EUR)
Hedged
Class A (GBP)
Income Class A (USD)
Class A (USD)
Income
Class A (USD)
Income (F)
Class A (ZAR)
Hedged
Income (F)
Shares in issue at 1 January 2017 361,867 116 2,033,474 61,014 7,369,504 5,398,461 - -
Subscriptions during the financial year 100,603 1,618 210,383 9,304 5,533,227 5,005,769 - 1,674,985
Redemptions during the financial year (384,043) - (691,292) (2,812) (6,745,474) (4,472,099) - (673,469)
Shares in issue at 31 December 2017 78,427 1,734 1,552,565 67,506 6,157,257 5,932,131 - 1,001,516
Shares in issue at 1 January 2018 78,427 1,734 1,552,565 67,506 6,157,257 5,932,131 - 1,001,516
Subscriptions during the financial year 69,063 - 269,792 9,791 451,711 573,185 58 59,669
Redemptions during the financial year (73,238) (1,734) (1,168,854) (45,754) (1,836,899) (2,743,012) - (587,638)
Shares in issue at 31 December 2018 74,252 - 653,503 31,543 4,772,069 3,762,304 58 473,547
Net Assets as at 31 December 2018 AUD 831,828 EUR - EUR 7,148,149 GBP 328,434 USD 94,801,463 USD 36,807,218 USD 580 ZAR 4,265,903
Net Assets as at 31 December 2017 AUD 904,846 EUR 16,738 EUR 17,858,997 GBP 712,631 USD 124,997,164 USD 62,328,053 USD - ZAR 9,886,364
Net Assets as at 31 December 2016 AUD 4,006,742 EUR 1,222 EUR 22,954,062 GBP 721,013 USD 143,606,350 USD 57,659,148 USD - ZAR -
Merian Total Return USD Bond Fund (continued)
Class B (USD)
Class B (USD)
Income Class C (USD)
Class C (USD)
Income
Class C2 (AUD)
Hedged
Income (F)
Class C2 (USD)
Income (F)
Class C2 (ZAR)
Hedged
Income (F) Class I (USD)
Shares in issue at 1 January 2017 253,100 1,266,660 1,719,525 871,439 - 100 - 23,093
Subscriptions during the financial year 867,558 4,232,229 175,444 276,514 388,546 6,661,225 6,827,347 302,068
Redemptions during the financial year (812,461) (3,284,758) (588,590) (451,729) (23,962) (3,850,900) (583,987) (16,348)
Shares in issue at 31 December 2017 308,197 2,214,131 1,306,379 696,224 364,584 2,810,425 6,243,360 308,813
Shares in issue at 1 January 2018 308,197 2,214,131 1,306,379 696,224 364,584 2,810,425 6,243,360 308,813
Subscriptions during the financial year 391,244 402,328 190,453 54,129 12,232 1,027,072 190,568 156,749
Redemptions during the financial year (499,334) (851,430) (481,872) (181,659) (176,278) (2,134,837) (2,089,486) (89,476)
Shares in issue at 31 December 2018 200,107 1,765,029 1,014,960 568,694 200,538 1,702,660 4,344,442 376,086
Net Assets as at 31 December 2018 USD 3,077,632 USD 15,462,142 USD 15,686,363 USD 4,782,949 AUD 1,804,725 USD 15,546,258 ZAR 39,011,786 USD 3,757,734
Net Assets as at 31 December 2017 USD 4,898,788 USD 21,051,430 USD 20,961,147 USD 6,387,221 AUD 3,574,379 USD 27,826,178 ZAR 61,130,608 USD 3,136,515
Net Assets as at 31 December 2016 USD 3,904,536 USD 12,377,166 USD 26,889,400 USD 8,252,425 AUD - USD 1,009 ZAR - USD 224,587
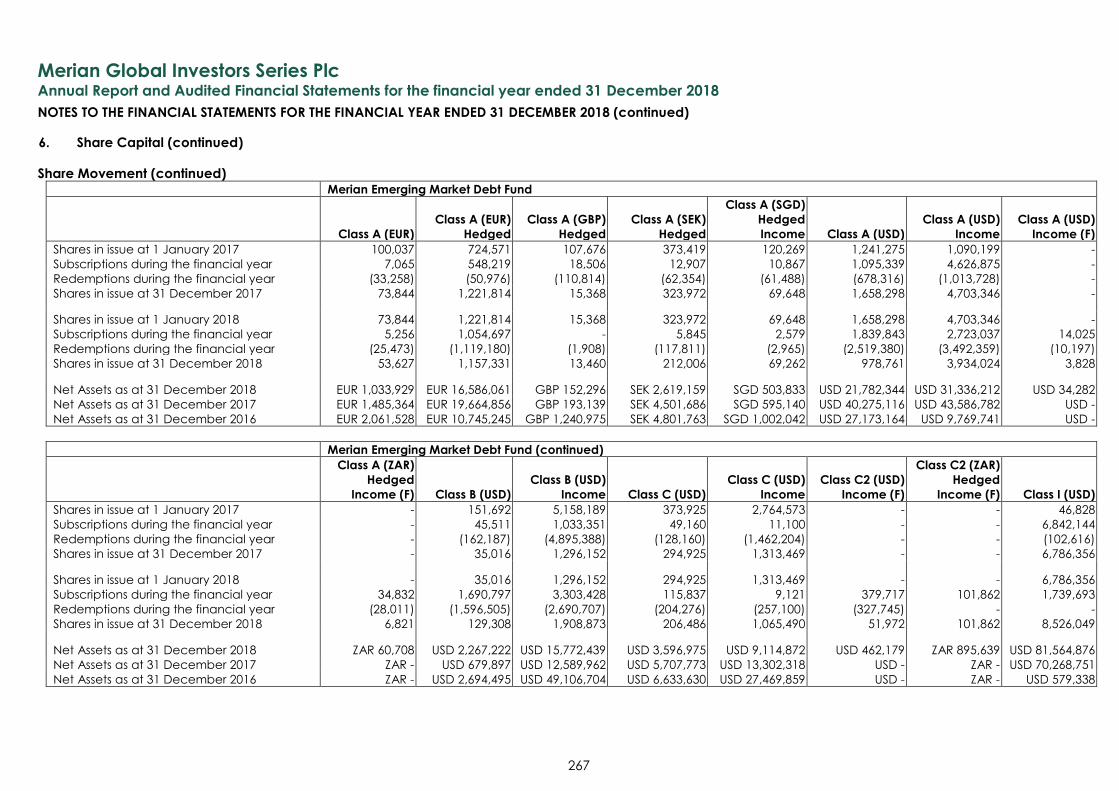
Merian Global Investors Series Plc
Annual Report and Audited Financial Statements for the financial year ended 31 December 2018
NOTES TO THE FINANCIAL STATEMENTS FOR THE FINANCIAL YEAR ENDED 31 DECEMBER 2018 (continued)
267
6. Share Capital (continued)
Share Movement (continued) Merian Emerging Market Debt Fund
Class A (EUR)
Class A (EUR)
Hedged
Class A (GBP)
Hedged
Class A (SEK)
Hedged
Class A (SGD)
Hedged
Income Class A (USD)
Class A (USD)
Income
Class A (USD)
Income (F)
Shares in issue at 1 January 2017 100,037 724,571 107,676 373,419 120,269 1,241,275 1,090,199 -
Subscriptions during the financial year 7,065 548,219 18,506 12,907 10,867 1,095,339 4,626,875 -
Redemptions during the financial year (33,258) (50,976) (110,814) (62,354) (61,488) (678,316) (1,013,728) -
Shares in issue at 31 December 2017 73,844 1,221,814 15,368 323,972 69,648 1,658,298 4,703,346 -
Shares in issue at 1 January 2018 73,844 1,221,814 15,368 323,972 69,648 1,658,298 4,703,346 -
Subscriptions during the financial year 5,256 1,054,697 - 5,845 2,579 1,839,843 2,723,037 14,025
Redemptions during the financial year (25,473) (1,119,180) (1,908) (117,811) (2,965) (2,519,380) (3,492,359) (10,197)
Shares in issue at 31 December 2018 53,627 1,157,331 13,460 212,006 69,262 978,761 3,934,024 3,828
Net Assets as at 31 December 2018 EUR 1,033,929 EUR 16,586,061 GBP 152,296 SEK 2,619,159 SGD 503,833 USD 21,782,344 USD 31,336,212 USD 34,282
Net Assets as at 31 December 2017 EUR 1,485,364 EUR 19,664,856 GBP 193,139 SEK 4,501,686 SGD 595,140 USD 40,275,116 USD 43,586,782 USD -
Net Assets as at 31 December 2016 EUR 2,061,528 EUR 10,745,245 GBP 1,240,975 SEK 4,801,763 SGD 1,002,042 USD 27,173,164 USD 9,769,741 USD -
Merian Emerging Market Debt Fund (continued)
Class A (ZAR)
Hedged
Income (F) Class B (USD)
Class B (USD)
Income Class C (USD)
Class C (USD)
Income
Class C2 (USD)
Income (F)
Class C2 (ZAR)
Hedged
Income (F) Class I (USD)
Shares in issue at 1 January 2017 - 151,692 5,158,189 373,925 2,764,573 - - 46,828
Subscriptions during the financial year - 45,511 1,033,351 49,160 11,100 - - 6,842,144
Redemptions during the financial year - (162,187) (4,895,388) (128,160) (1,462,204) - - (102,616)
Shares in issue at 31 December 2017 - 35,016 1,296,152 294,925 1,313,469 - - 6,786,356
Shares in issue at 1 January 2018 - 35,016 1,296,152 294,925 1,313,469 - - 6,786,356
Subscriptions during the financial year 34,832 1,690,797 3,303,428 115,837 9,121 379,717 101,862 1,739,693
Redemptions during the financial year (28,011) (1,596,505) (2,690,707) (204,276) (257,100) (327,745) - -
Shares in issue at 31 December 2018 6,821 129,308 1,908,873 206,486 1,065,490 51,972 101,862 8,526,049
Net Assets as at 31 December 2018 ZAR 60,708 USD 2,267,222 USD 15,772,439 USD 3,596,975 USD 9,114,872 USD 462,179 ZAR 895,639 USD 81,564,876
Net Assets as at 31 December 2017 ZAR - USD 679,897 USD 12,589,962 USD 5,707,773 USD 13,302,318 USD - ZAR - USD 70,268,751
Net Assets as at 31 December 2016 ZAR - USD 2,694,495 USD 49,106,704 USD 6,633,630 USD 27,469,859 USD - ZAR - USD 579,338
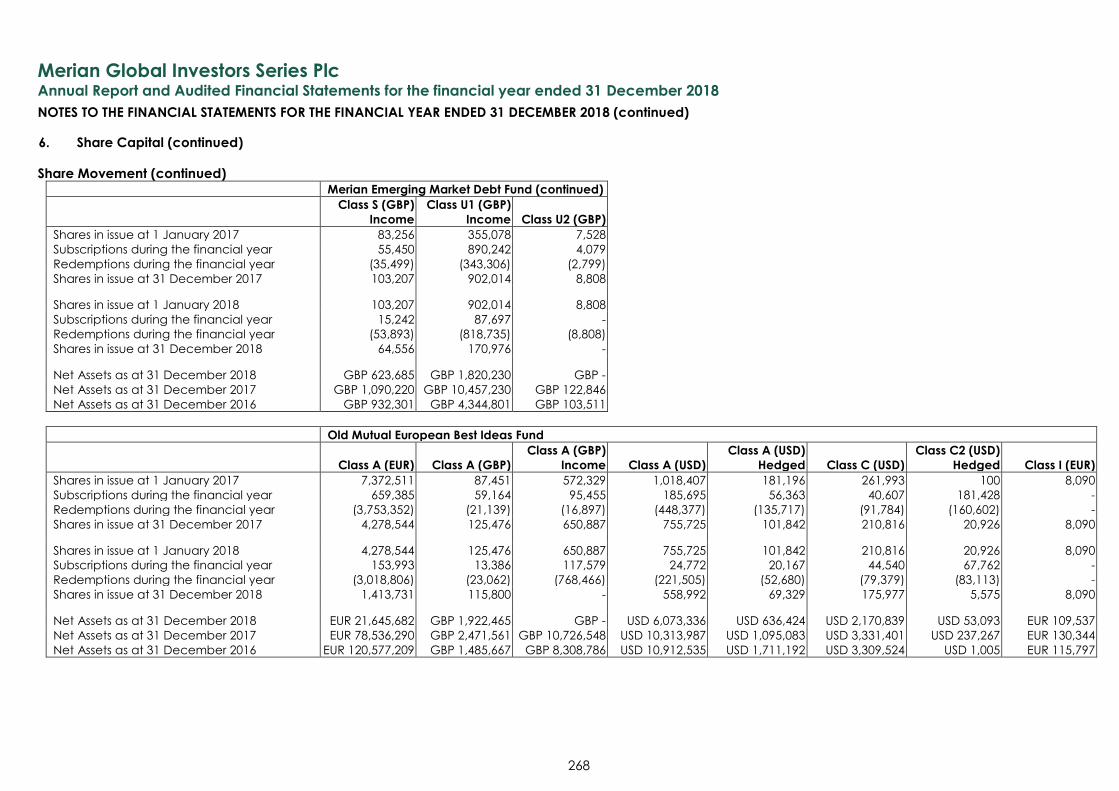
Merian Global Investors Series Plc
Annual Report and Audited Financial Statements for the financial year ended 31 December 2018
NOTES TO THE FINANCIAL STATEMENTS FOR THE FINANCIAL YEAR ENDED 31 DECEMBER 2018 (continued)
268
6. Share Capital (continued)
Share Movement (continued)
Merian Emerging Market Debt Fund (continued)
Class S (GBP)
Income
Class U1 (GBP)
Income Class U2 (GBP)
Shares in issue at 1 January 2017 83,256 355,078 7,528
Subscriptions during the financial year 55,450 890,242 4,079
Redemptions during the financial year (35,499) (343,306) (2,799)
Shares in issue at 31 December 2017 103,207 902,014 8,808
Shares in issue at 1 January 2018 103,207 902,014 8,808
Subscriptions during the financial year 15,242 87,697 -
Redemptions during the financial year (53,893) (818,735) (8,808)
Shares in issue at 31 December 2018 64,556 170,976 -
Net Assets as at 31 December 2018 GBP 623,685 GBP 1,820,230 GBP -
Net Assets as at 31 December 2017 GBP 1,090,220 GBP 10,457,230 GBP 122,846
Net Assets as at 31 December 2016 GBP 932,301 GBP 4,344,801 GBP 103,511
Old Mutual European Best Ideas Fund
Class A (EUR) Class A (GBP)
Class A (GBP)
Income Class A (USD)
Class A (USD)
Hedged Class C (USD)
Class C2 (USD)
Hedged Class I (EUR)
Shares in issue at 1 January 2017 7,372,511 87,451 572,329 1,018,407 181,196 261,993 100 8,090
Subscriptions during the financial year 659,385 59,164 95,455 185,695 56,363 40,607 181,428 -
Redemptions during the financial year (3,753,352) (21,139) (16,897) (448,377) (135,717) (91,784) (160,602) -
Shares in issue at 31 December 2017 4,278,544 125,476 650,887 755,725 101,842 210,816 20,926 8,090
Shares in issue at 1 January 2018 4,278,544 125,476 650,887 755,725 101,842 210,816 20,926 8,090
Subscriptions during the financial year 153,993 13,386 117,579 24,772 20,167 44,540 67,762 -
Redemptions during the financial year (3,018,806) (23,062) (768,466) (221,505) (52,680) (79,379) (83,113) -
Shares in issue at 31 December 2018 1,413,731 115,800 - 558,992 69,329 175,977 5,575 8,090
Net Assets as at 31 December 2018 EUR 21,645,682 GBP 1,922,465 GBP - USD 6,073,336 USD 636,424 USD 2,170,839 USD 53,093 EUR 109,537
Net Assets as at 31 December 2017 EUR 78,536,290 GBP 2,471,561 GBP 10,726,548 USD 10,313,987 USD 1,095,083 USD 3,331,401 USD 237,267 EUR 130,344
Net Assets as at 31 December 2016 EUR 120,577,209 GBP 1,485,667 GBP 8,308,786 USD 10,912,535 USD 1,711,192 USD 3,309,524 USD 1,005 EUR 115,797
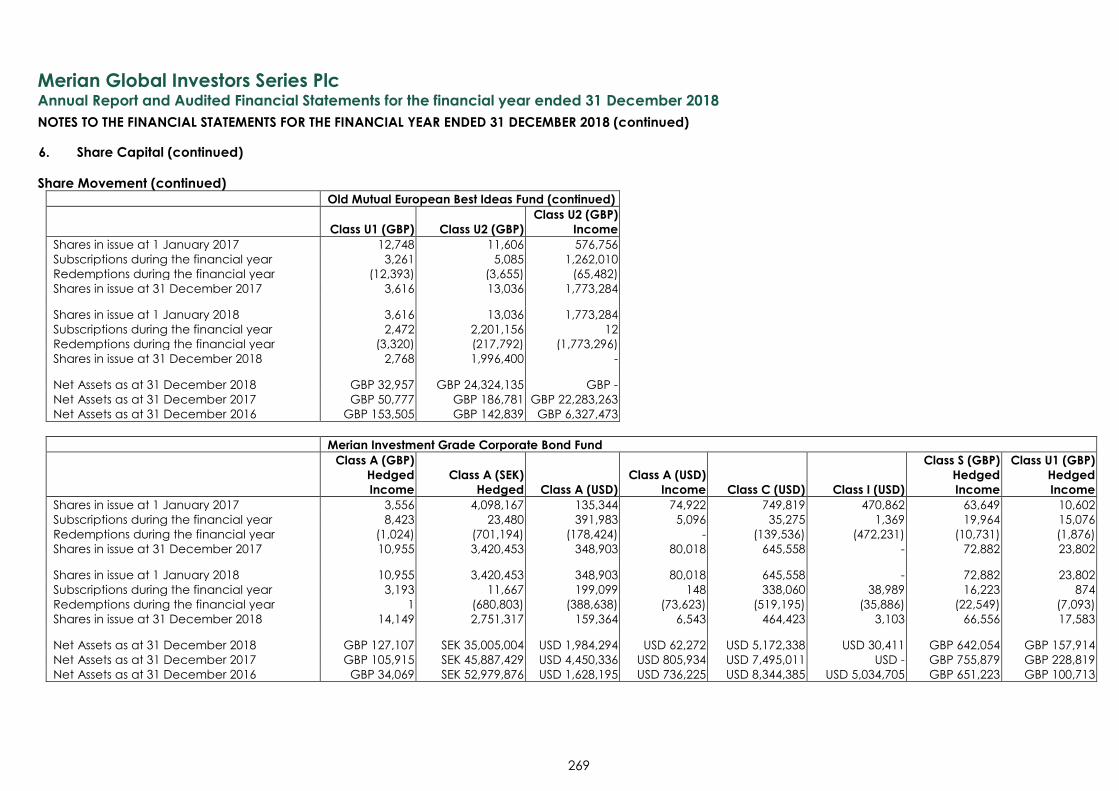
Merian Global Investors Series Plc
Annual Report and Audited Financial Statements for the financial year ended 31 December 2018
NOTES TO THE FINANCIAL STATEMENTS FOR THE FINANCIAL YEAR ENDED 31 DECEMBER 2018 (continued)
269
6. Share Capital (continued)
Share Movement (continued)
Old Mutual European Best Ideas Fund (continued)
Class U1 (GBP) Class U2 (GBP)
Class U2 (GBP)
Income
Shares in issue at 1 January 2017 12,748 11,606 576,756
Subscriptions during the financial year 3,261 5,085 1,262,010
Redemptions during the financial year (12,393) (3,655) (65,482)
Shares in issue at 31 December 2017 3,616 13,036 1,773,284
Shares in issue at 1 January 2018 3,616 13,036 1,773,284
Subscriptions during the financial year 2,472 2,201,156 12
Redemptions during the financial year (3,320) (217,792) (1,773,296)
Shares in issue at 31 December 2018 2,768 1,996,400 -
Net Assets as at 31 December 2018 GBP 32,957 GBP 24,324,135 GBP -
Net Assets as at 31 December 2017 GBP 50,777 GBP 186,781 GBP 22,283,263
Net Assets as at 31 December 2016 GBP 153,505 GBP 142,839 GBP 6,327,473
Merian Investment Grade Corporate Bond Fund
Class A (GBP)
Hedged
Income
Class A (SEK)
Hedged Class A (USD)
Class A (USD)
Income Class C (USD) Class I (USD)
Class S (GBP)
Hedged
Income
Class U1 (GBP)
Hedged
Income
Shares in issue at 1 January 2017 3,556 4,098,167 135,344 74,922 749,819 470,862 63,649 10,602
Subscriptions during the financial year 8,423 23,480 391,983 5,096 35,275 1,369 19,964 15,076
Redemptions during the financial year (1,024) (701,194) (178,424) - (139,536) (472,231) (10,731) (1,876)
Shares in issue at 31 December 2017 10,955 3,420,453 348,903 80,018 645,558 - 72,882 23,802
Shares in issue at 1 January 2018 10,955 3,420,453 348,903 80,018 645,558 - 72,882 23,802
Subscriptions during the financial year 3,193 11,667 199,099 148 338,060 38,989 16,223 874
Redemptions during the financial year 1 (680,803) (388,638) (73,623) (519,195) (35,886) (22,549) (7,093)
Shares in issue at 31 December 2018 14,149 2,751,317 159,364 6,543 464,423 3,103 66,556 17,583
Net Assets as at 31 December 2018 GBP 127,107 SEK 35,005,004 USD 1,984,294 USD 62,272 USD 5,172,338 USD 30,411 GBP 642,054 GBP 157,914
Net Assets as at 31 December 2017 GBP 105,915 SEK 45,887,429 USD 4,450,336 USD 805,934 USD 7,495,011 USD - GBP 755,879 GBP 228,819
Net Assets as at 31 December 2016 GBP 34,069 SEK 52,979,876 USD 1,628,195 USD 736,225 USD 8,344,385 USD 5,034,705 GBP 651,223 GBP 100,713
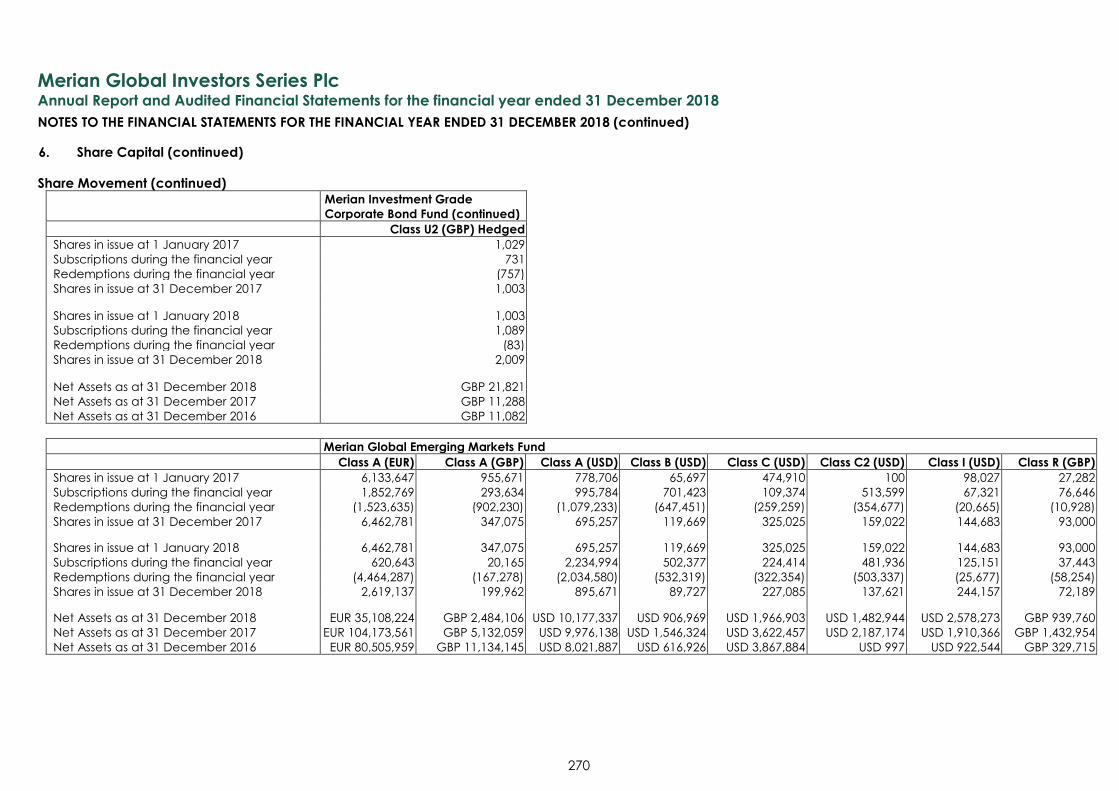
Merian Global Investors Series Plc
Annual Report and Audited Financial Statements for the financial year ended 31 December 2018
NOTES TO THE FINANCIAL STATEMENTS FOR THE FINANCIAL YEAR ENDED 31 DECEMBER 2018 (continued)
270
6. Share Capital (continued)
Share Movement (continued) Merian Investment Grade
Corporate Bond Fund (continued)
Class U2 (GBP) Hedged
Shares in issue at 1 January 2017 1,029
Subscriptions during the financial year 731
Redemptions during the financial year (757)
Shares in issue at 31 December 2017 1,003
Shares in issue at 1 January 2018 1,003
Subscriptions during the financial year 1,089
Redemptions during the financial year (83)
Shares in issue at 31 December 2018 2,009
Net Assets as at 31 December 2018 GBP 21,821
Net Assets as at 31 December 2017 GBP 11,288
Net Assets as at 31 December 2016 GBP 11,082
Merian Global Emerging Markets Fund
Class A (EUR) Class A (GBP) Class A (USD) Class B (USD) Class C (USD) Class C2 (USD) Class I (USD) Class R (GBP)
Shares in issue at 1 January 2017 6,133,647 955,671 778,706 65,697 474,910 100 98,027 27,282
Subscriptions during the financial year 1,852,769 293,634 995,784 701,423 109,374 513,599 67,321 76,646
Redemptions during the financial year (1,523,635) (902,230) (1,079,233) (647,451) (259,259) (354,677) (20,665) (10,928)
Shares in issue at 31 December 2017 6,462,781 347,075 695,257 119,669 325,025 159,022 144,683 93,000
Shares in issue at 1 January 2018 6,462,781 347,075 695,257 119,669 325,025 159,022 144,683 93,000
Subscriptions during the financial year 620,643 20,165 2,234,994 502,377 224,414 481,936 125,151 37,443
Redemptions during the financial year (4,464,287) (167,278) (2,034,580) (532,319) (322,354) (503,337) (25,677) (58,254)
Shares in issue at 31 December 2018 2,619,137 199,962 895,671 89,727 227,085 137,621 244,157 72,189
Net Assets as at 31 December 2018 EUR 35,108,224 GBP 2,484,106 USD 10,177,337 USD 906,969 USD 1,966,903 USD 1,482,944 USD 2,578,273 GBP 939,760
Net Assets as at 31 December 2017 EUR 104,173,561 GBP 5,132,059 USD 9,976,138 USD 1,546,324 USD 3,622,457 USD 2,187,174 USD 1,910,366 GBP 1,432,954
Net Assets as at 31 December 2016 EUR 80,505,959 GBP 11,134,145 USD 8,021,887 USD 616,926 USD 3,867,884 USD 997 USD 922,544 GBP 329,715
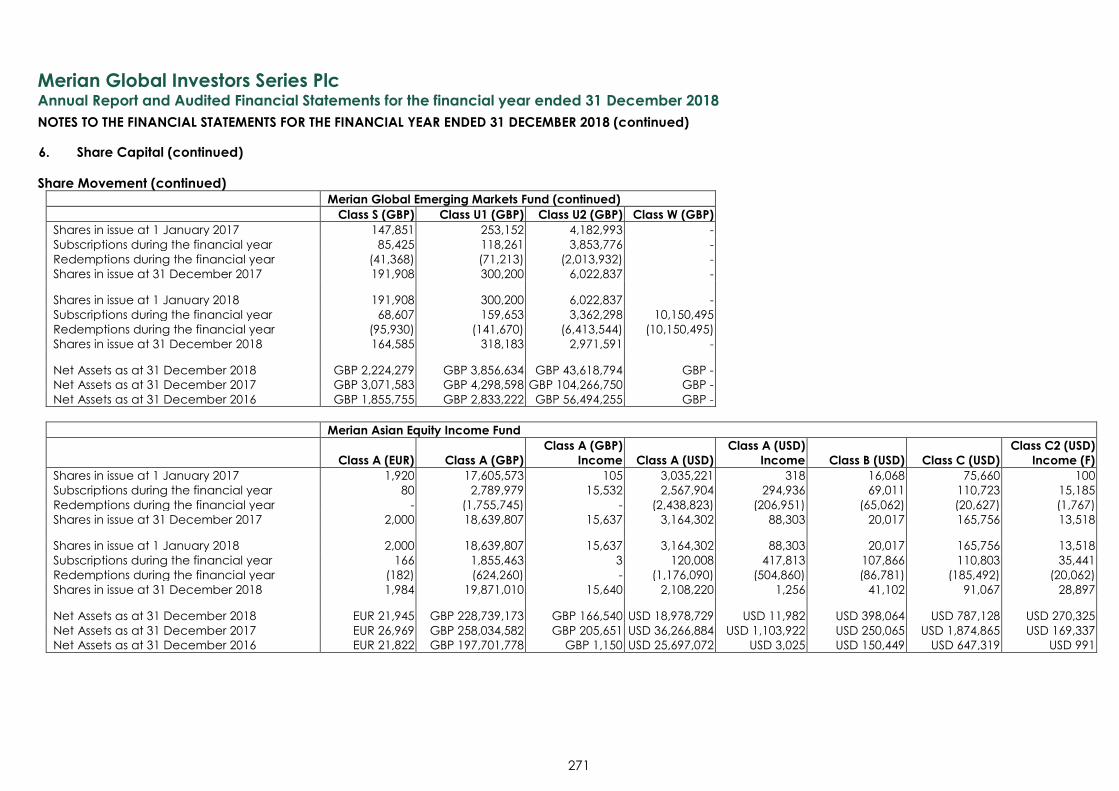
Merian Global Investors Series Plc
Annual Report and Audited Financial Statements for the financial year ended 31 December 2018
NOTES TO THE FINANCIAL STATEMENTS FOR THE FINANCIAL YEAR ENDED 31 DECEMBER 2018 (continued)
271
6. Share Capital (continued)
Share Movement (continued) Merian Global Emerging Markets Fund (continued)
Class S (GBP) Class U1 (GBP) Class U2 (GBP) Class W (GBP)
Shares in issue at 1 January 2017 147,851 253,152 4,182,993 -
Subscriptions during the financial year 85,425 118,261 3,853,776 -
Redemptions during the financial year (41,368) (71,213) (2,013,932) -
Shares in issue at 31 December 2017 191,908 300,200 6,022,837 -
Shares in issue at 1 January 2018 191,908 300,200 6,022,837 -
Subscriptions during the financial year 68,607 159,653 3,362,298 10,150,495
Redemptions during the financial year (95,930) (141,670) (6,413,544) (10,150,495)
Shares in issue at 31 December 2018 164,585 318,183 2,971,591 -
Net Assets as at 31 December 2018 GBP 2,224,279 GBP 3,856,634 GBP 43,618,794 GBP -
Net Assets as at 31 December 2017 GBP 3,071,583 GBP 4,298,598 GBP 104,266,750 GBP -
Net Assets as at 31 December 2016 GBP 1,855,755 GBP 2,833,222 GBP 56,494,255 GBP -
Merian Asian Equity Income Fund
Class A (EUR) Class A (GBP)
Class A (GBP)
Income Class A (USD)
Class A (USD)
Income Class B (USD) Class C (USD)
Class C2 (USD)
Income (F)
Shares in issue at 1 January 2017 1,920 17,605,573 105 3,035,221 318 16,068 75,660 100
Subscriptions during the financial year 80 2,789,979 15,532 2,567,904 294,936 69,011 110,723 15,185
Redemptions during the financial year - (1,755,745) - (2,438,823) (206,951) (65,062) (20,627) (1,767)
Shares in issue at 31 December 2017 2,000 18,639,807 15,637 3,164,302 88,303 20,017 165,756 13,518
Shares in issue at 1 January 2018 2,000 18,639,807 15,637 3,164,302 88,303 20,017 165,756 13,518
Subscriptions during the financial year 166 1,855,463 3 120,008 417,813 107,866 110,803 35,441
Redemptions during the financial year (182) (624,260) - (1,176,090) (504,860) (86,781) (185,492) (20,062)
Shares in issue at 31 December 2018 1,984 19,871,010 15,640 2,108,220 1,256 41,102 91,067 28,897
Net Assets as at 31 December 2018 EUR 21,945 GBP 228,739,173 GBP 166,540 USD 18,978,729 USD 11,982 USD 398,064 USD 787,128 USD 270,325
Net Assets as at 31 December 2017 EUR 26,969 GBP 258,034,582 GBP 205,651 USD 36,266,884 USD 1,103,922 USD 250,065 USD 1,874,865 USD 169,337
Net Assets as at 31 December 2016 EUR 21,822 GBP 197,701,778 GBP 1,150 USD 25,697,072 USD 3,025 USD 150,449 USD 647,319 USD 991
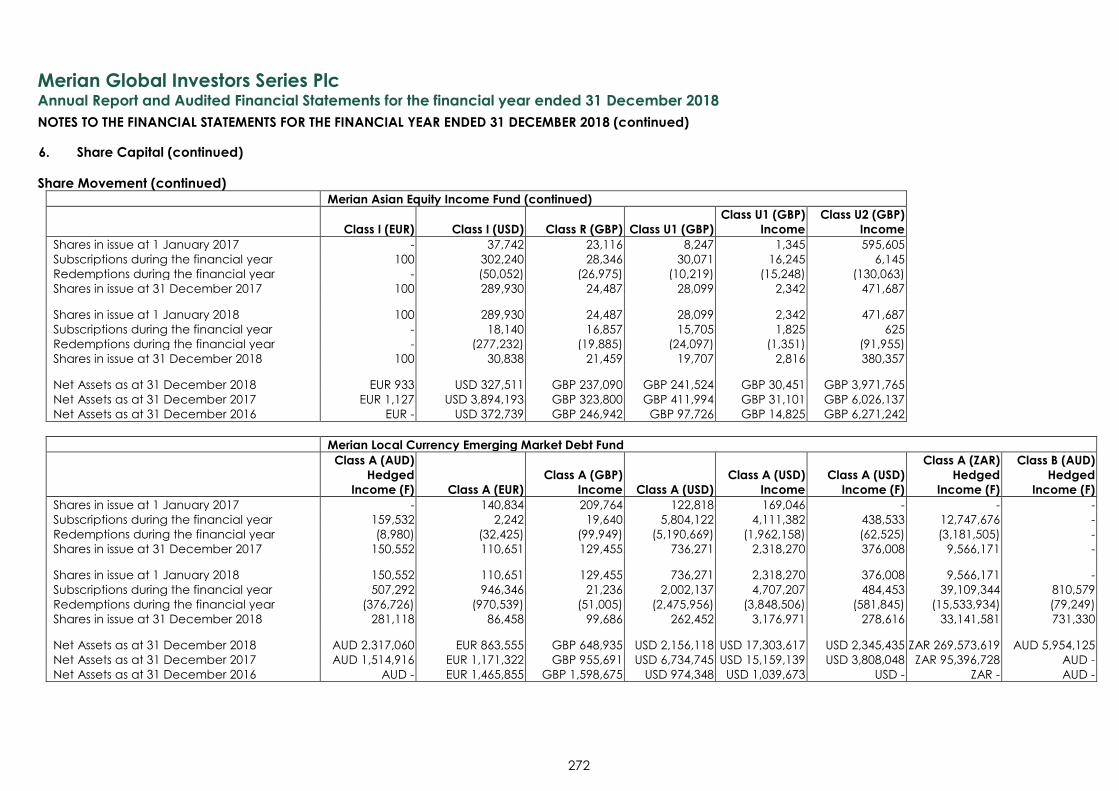
Merian Global Investors Series Plc
Annual Report and Audited Financial Statements for the financial year ended 31 December 2018
NOTES TO THE FINANCIAL STATEMENTS FOR THE FINANCIAL YEAR ENDED 31 DECEMBER 2018 (continued)
272
6. Share Capital (continued)
Share Movement (continued) Merian Asian Equity Income Fund (continued)
Class I (EUR) Class I (USD) Class R (GBP) Class U1 (GBP)
Class U1 (GBP)
Income
Class U2 (GBP)
Income
Shares in issue at 1 January 2017 - 37,742 23,116 8,247 1,345 595,605
Subscriptions during the financial year 100 302,240 28,346 30,071 16,245 6,145
Redemptions during the financial year - (50,052) (26,975) (10,219) (15,248) (130,063)
Shares in issue at 31 December 2017 100 289,930 24,487 28,099 2,342 471,687
Shares in issue at 1 January 2018 100 289,930 24,487 28,099 2,342 471,687
Subscriptions during the financial year - 18,140 16,857 15,705 1,825 625
Redemptions during the financial year - (277,232) (19,885) (24,097) (1,351) (91,955)
Shares in issue at 31 December 2018 100 30,838 21,459 19,707 2,816 380,357
Net Assets as at 31 December 2018 EUR 933 USD 327,511 GBP 237,090 GBP 241,524 GBP 30,451 GBP 3,971,765
Net Assets as at 31 December 2017 EUR 1,127 USD 3,894,193 GBP 323,800 GBP 411,994 GBP 31,101 GBP 6,026,137
Net Assets as at 31 December 2016 EUR - USD 372,739 GBP 246,942 GBP 97,726 GBP 14,825 GBP 6,271,242
Merian Local Currency Emerging Market Debt Fund
Class A (AUD)
Hedged
Income (F) Class A (EUR)
Class A (GBP)
Income Class A (USD)
Class A (USD)
Income
Class A (USD)
Income (F)
Class A (ZAR)
Hedged
Income (F)
Class B (AUD)
Hedged
Income (F)
Shares in issue at 1 January 2017 - 140,834 209,764 122,818 169,046 - - -
Subscriptions during the financial year 159,532 2,242 19,640 5,804,122 4,111,382 438,533 12,747,676 -
Redemptions during the financial year (8,980) (32,425) (99,949) (5,190,669) (1,962,158) (62,525) (3,181,505) -
Shares in issue at 31 December 2017 150,552 110,651 129,455 736,271 2,318,270 376,008 9,566,171 -
Shares in issue at 1 January 2018 150,552 110,651 129,455 736,271 2,318,270 376,008 9,566,171 -
Subscriptions during the financial year 507,292 946,346 21,236 2,002,137 4,707,207 484,453 39,109,344 810,579
Redemptions during the financial year (376,726) (970,539) (51,005) (2,475,956) (3,848,506) (581,845) (15,533,934) (79,249)
Shares in issue at 31 December 2018 281,118 86,458 99,686 262,452 3,176,971 278,616 33,141,581 731,330
Net Assets as at 31 December 2018 AUD 2,317,060 EUR 863,555 GBP 648,935 USD 2,156,118 USD 17,303,617 USD 2,345,435 ZAR 269,573,619 AUD 5,954,125
Net Assets as at 31 December 2017 AUD 1,514,916 EUR 1,171,322 GBP 955,691 USD 6,734,745 USD 15,159,139 USD 3,808,048 ZAR 95,396,728 AUD -
Net Assets as at 31 December 2016 AUD - EUR 1,465,855 GBP 1,598,675 USD 974,348 USD 1,039,673 USD - ZAR - AUD -
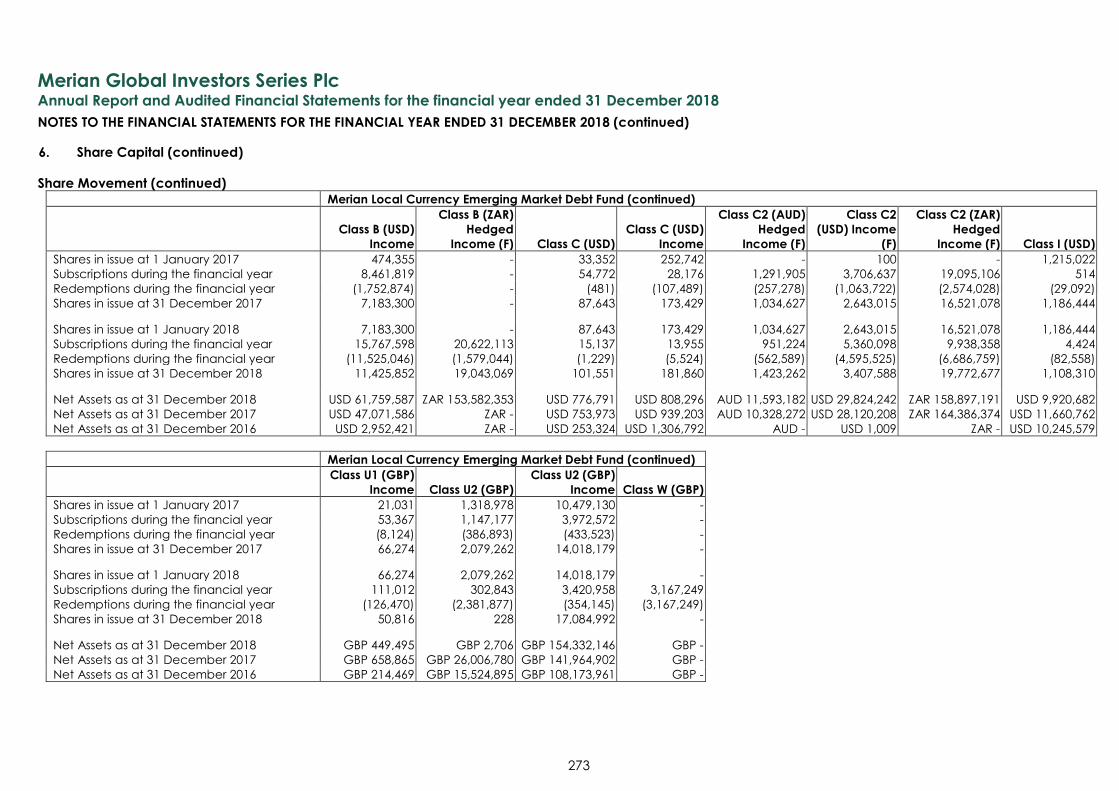
Merian Global Investors Series Plc
Annual Report and Audited Financial Statements for the financial year ended 31 December 2018
NOTES TO THE FINANCIAL STATEMENTS FOR THE FINANCIAL YEAR ENDED 31 DECEMBER 2018 (continued)
273
6. Share Capital (continued)
Share Movement (continued) Merian Local Currency Emerging Market Debt Fund (continued)
Class B (USD)
Income
Class B (ZAR)
Hedged
Income (F) Class C (USD)
Class C (USD)
Income
Class C2 (AUD)
Hedged
Income (F)
Class C2
(USD) Income
(F)
Class C2 (ZAR)
Hedged
Income (F) Class I (USD)
Shares in issue at 1 January 2017 474,355 - 33,352 252,742 - 100 - 1,215,022
Subscriptions during the financial year 8,461,819 - 54,772 28,176 1,291,905 3,706,637 19,095,106 514
Redemptions during the financial year (1,752,874) - (481) (107,489) (257,278) (1,063,722) (2,574,028) (29,092)
Shares in issue at 31 December 2017 7,183,300 - 87,643 173,429 1,034,627 2,643,015 16,521,078 1,186,444
Shares in issue at 1 January 2018 7,183,300 - 87,643 173,429 1,034,627 2,643,015 16,521,078 1,186,444
Subscriptions during the financial year 15,767,598 20,622,113 15,137 13,955 951,224 5,360,098 9,938,358 4,424
Redemptions during the financial year (11,525,046) (1,579,044) (1,229) (5,524) (562,589) (4,595,525) (6,686,759) (82,558)
Shares in issue at 31 December 2018 11,425,852 19,043,069 101,551 181,860 1,423,262 3,407,588 19,772,677 1,108,310
Net Assets as at 31 December 2018 USD 61,759,587 ZAR 153,582,353 USD 776,791 USD 808,296 AUD 11,593,182 USD 29,824,242 ZAR 158,897,191 USD 9,920,682
Net Assets as at 31 December 2017 USD 47,071,586 ZAR - USD 753,973 USD 939,203 AUD 10,328,272 USD 28,120,208 ZAR 164,386,374 USD 11,660,762
Net Assets as at 31 December 2016 USD 2,952,421 ZAR - USD 253,324 USD 1,306,792 AUD - USD 1,009 ZAR - USD 10,245,579
Merian Local Currency Emerging Market Debt Fund (continued)
Class U1 (GBP)
Income Class U2 (GBP)
Class U2 (GBP)
Income Class W (GBP)
Shares in issue at 1 January 2017 21,031 1,318,978 10,479,130 -
Subscriptions during the financial year 53,367 1,147,177 3,972,572 -
Redemptions during the financial year (8,124) (386,893) (433,523) -
Shares in issue at 31 December 2017 66,274 2,079,262 14,018,179 -
Shares in issue at 1 January 2018 66,274 2,079,262 14,018,179 -
Subscriptions during the financial year 111,012 302,843 3,420,958 3,167,249
Redemptions during the financial year (126,470) (2,381,877) (354,145) (3,167,249)
Shares in issue at 31 December 2018 50,816 228 17,084,992 -
Net Assets as at 31 December 2018 GBP 449,495 GBP 2,706 GBP 154,332,146 GBP -
Net Assets as at 31 December 2017 GBP 658,865 GBP 26,006,780 GBP 141,964,902 GBP -
Net Assets as at 31 December 2016 GBP 214,469 GBP 15,524,895 GBP 108,173,961 GBP -
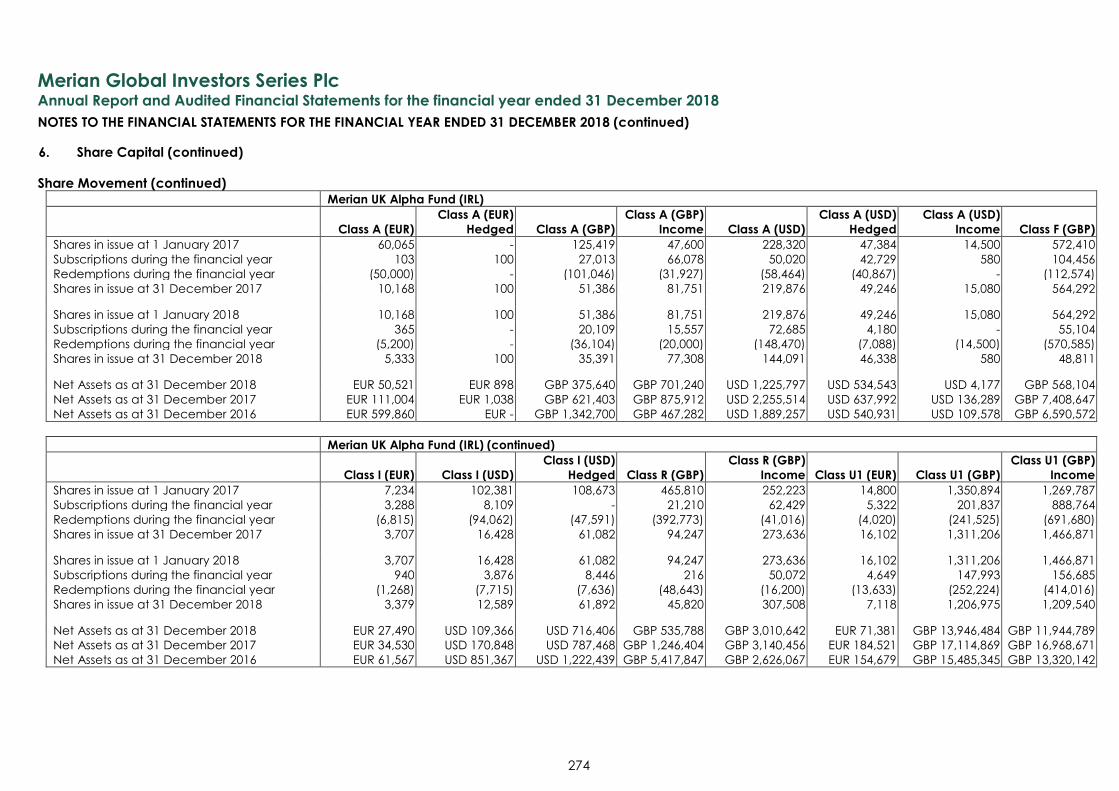
Merian Global Investors Series Plc
Annual Report and Audited Financial Statements for the financial year ended 31 December 2018
NOTES TO THE FINANCIAL STATEMENTS FOR THE FINANCIAL YEAR ENDED 31 DECEMBER 2018 (continued)
274
6. Share Capital (continued)
Share Movement (continued)
Merian UK Alpha Fund (IRL)
Class A (EUR)
Class A (EUR)
Hedged Class A (GBP)
Class A (GBP)
Income Class A (USD)
Class A (USD)
Hedged
Class A (USD)
Income Class F (GBP)
Shares in issue at 1 January 2017 60,065 - 125,419 47,600 228,320 47,384 14,500 572,410
Subscriptions during the financial year 103 100 27,013 66,078 50,020 42,729 580 104,456
Redemptions during the financial year (50,000) - (101,046) (31,927) (58,464) (40,867) - (112,574)
Shares in issue at 31 December 2017 10,168 100 51,386 81,751 219,876 49,246 15,080 564,292
Shares in issue at 1 January 2018 10,168 100 51,386 81,751 219,876 49,246 15,080 564,292
Subscriptions during the financial year 365 - 20,109 15,557 72,685 4,180 - 55,104
Redemptions during the financial year (5,200) - (36,104) (20,000) (148,470) (7,088) (14,500) (570,585)
Shares in issue at 31 December 2018 5,333 100 35,391 77,308 144,091 46,338 580 48,811
Net Assets as at 31 December 2018 EUR 50,521 EUR 898 GBP 375,640 GBP 701,240 USD 1,225,797 USD 534,543 USD 4,177 GBP 568,104
Net Assets as at 31 December 2017 EUR 111,004 EUR 1,038 GBP 621,403 GBP 875,912 USD 2,255,514 USD 637,992 USD 136,289 GBP 7,408,647
Net Assets as at 31 December 2016 EUR 599,860 EUR - GBP 1,342,700 GBP 467,282 USD 1,889,257 USD 540,931 USD 109,578 GBP 6,590,572
Merian UK Alpha Fund (IRL) (continued)
Class I (EUR) Class I (USD)
Class I (USD)
Hedged Class R (GBP)
Class R (GBP)
Income Class U1 (EUR) Class U1 (GBP)
Class U1 (GBP)
Income
Shares in issue at 1 January 2017 7,234 102,381 108,673 465,810 252,223 14,800 1,350,894 1,269,787
Subscriptions during the financial year 3,288 8,109 - 21,210 62,429 5,322 201,837 888,764
Redemptions during the financial year (6,815) (94,062) (47,591) (392,773) (41,016) (4,020) (241,525) (691,680)
Shares in issue at 31 December 2017 3,707 16,428 61,082 94,247 273,636 16,102 1,311,206 1,466,871
Shares in issue at 1 January 2018 3,707 16,428 61,082 94,247 273,636 16,102 1,311,206 1,466,871
Subscriptions during the financial year 940 3,876 8,446 216 50,072 4,649 147,993 156,685
Redemptions during the financial year (1,268) (7,715) (7,636) (48,643) (16,200) (13,633) (252,224) (414,016)
Shares in issue at 31 December 2018 3,379 12,589 61,892 45,820 307,508 7,118 1,206,975 1,209,540
Net Assets as at 31 December 2018 EUR 27,490 USD 109,366 USD 716,406 GBP 535,788 GBP 3,010,642 EUR 71,381 GBP 13,946,484 GBP 11,944,789
Net Assets as at 31 December 2017 EUR 34,530 USD 170,848 USD 787,468 GBP 1,246,404 GBP 3,140,456 EUR 184,521 GBP 17,114,869 GBP 16,968,671
Net Assets as at 31 December 2016 EUR 61,567 USD 851,367 USD 1,222,439 GBP 5,417,847 GBP 2,626,067 EUR 154,679 GBP 15,485,345 GBP 13,320,142
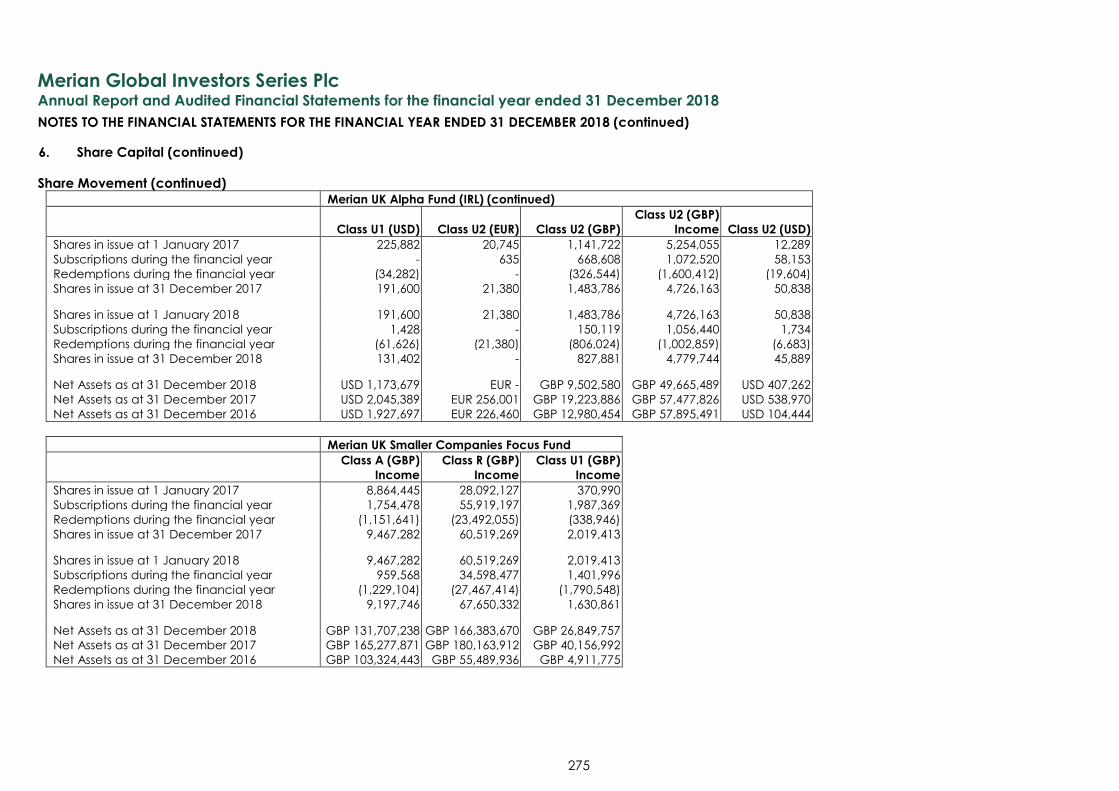
Merian Global Investors Series Plc
Annual Report and Audited Financial Statements for the financial year ended 31 December 2018
NOTES TO THE FINANCIAL STATEMENTS FOR THE FINANCIAL YEAR ENDED 31 DECEMBER 2018 (continued)
275
6. Share Capital (continued)
Share Movement (continued)
Merian UK Alpha Fund (IRL) (continued)
Class U1 (USD) Class U2 (EUR) Class U2 (GBP)
Class U2 (GBP)
Income Class U2 (USD)
Shares in issue at 1 January 2017 225,882 20,745 1,141,722 5,254,055 12,289
Subscriptions during the financial year - 635 668,608 1,072,520 58,153
Redemptions during the financial year (34,282) - (326,544) (1,600,412) (19,604)
Shares in issue at 31 December 2017 191,600 21,380 1,483,786 4,726,163 50,838
Shares in issue at 1 January 2018 191,600 21,380 1,483,786 4,726,163 50,838
Subscriptions during the financial year 1,428 - 150,119 1,056,440 1,734
Redemptions during the financial year (61,626) (21,380) (806,024) (1,002,859) (6,683)
Shares in issue at 31 December 2018 131,402 - 827,881 4,779,744 45,889
Net Assets as at 31 December 2018 USD 1,173,679 EUR - GBP 9,502,580 GBP 49,665,489 USD 407,262
Net Assets as at 31 December 2017 USD 2,045,389 EUR 256,001 GBP 19,223,886 GBP 57,477,826 USD 538,970
Net Assets as at 31 December 2016 USD 1,927,697 EUR 226,460 GBP 12,980,454 GBP 57,895,491 USD 104,444
Merian UK Smaller Companies Focus Fund
Class A (GBP)
Income
Class R (GBP)
Income
Class U1 (GBP)
Income
Shares in issue at 1 January 2017 8,864,445 28,092,127 370,990
Subscriptions during the financial year 1,754,478 55,919,197 1,987,369
Redemptions during the financial year (1,151,641) (23,492,055) (338,946)
Shares in issue at 31 December 2017 9,467,282 60,519,269 2,019,413
Shares in issue at 1 January 2018 9,467,282 60,519,269 2,019,413
Subscriptions during the financial year 959,568 34,598,477 1,401,996
Redemptions during the financial year (1,229,104) (27,467,414) (1,790,548)
Shares in issue at 31 December 2018 9,197,746 67,650,332 1,630,861
Net Assets as at 31 December 2018 GBP 131,707,238 GBP 166,383,670 GBP 26,849,757
Net Assets as at 31 December 2017 GBP 165,277,871 GBP 180,163,912 GBP 40,156,992
Net Assets as at 31 December 2016 GBP 103,324,443 GBP 55,489,936 GBP 4,911,775
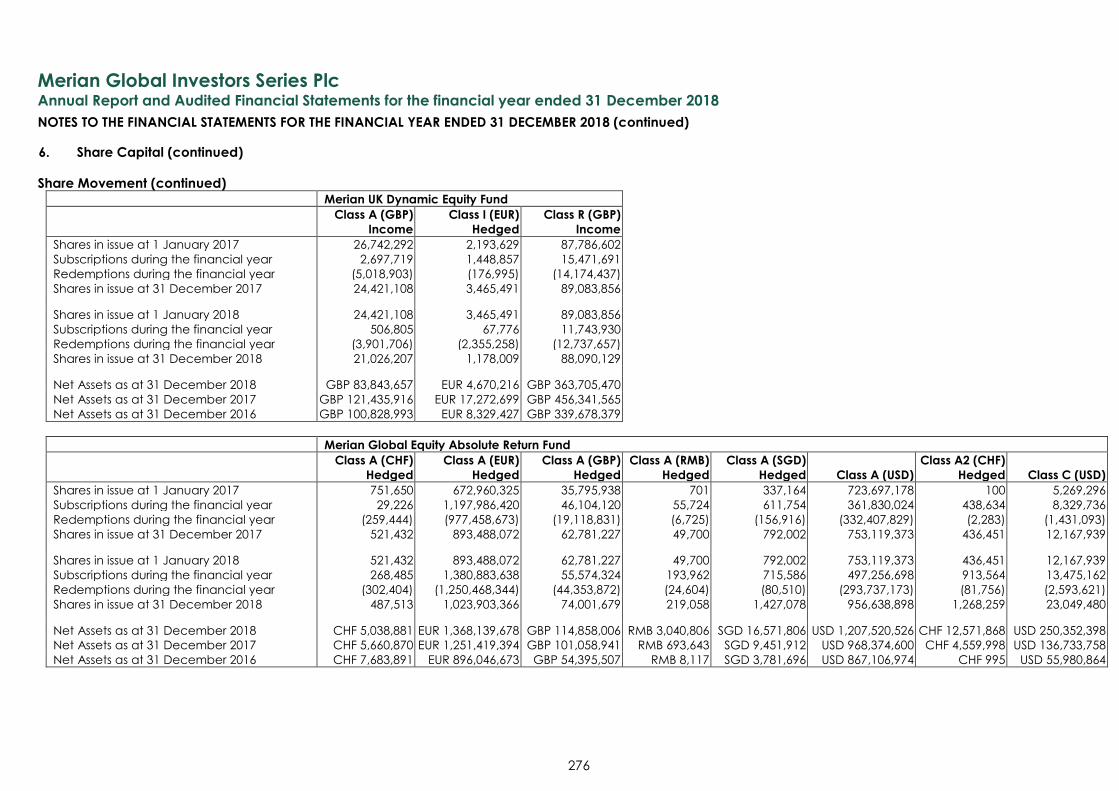
Merian Global Investors Series Plc
Annual Report and Audited Financial Statements for the financial year ended 31 December 2018
NOTES TO THE FINANCIAL STATEMENTS FOR THE FINANCIAL YEAR ENDED 31 DECEMBER 2018 (continued)
276
6. Share Capital (continued)
Share Movement (continued) Merian UK Dynamic Equity Fund
Class A (GBP)
Income
Class I (EUR)
Hedged
Class R (GBP)
Income
Shares in issue at 1 January 2017 26,742,292 2,193,629 87,786,602
Subscriptions during the financial year 2,697,719 1,448,857 15,471,691
Redemptions during the financial year (5,018,903) (176,995) (14,174,437)
Shares in issue at 31 December 2017 24,421,108 3,465,491 89,083,856
Shares in issue at 1 January 2018 24,421,108 3,465,491 89,083,856
Subscriptions during the financial year 506,805 67,776 11,743,930
Redemptions during the financial year (3,901,706) (2,355,258) (12,737,657)
Shares in issue at 31 December 2018 21,026,207 1,178,009 88,090,129
Net Assets as at 31 December 2018 GBP 83,843,657 EUR 4,670,216 GBP 363,705,470
Net Assets as at 31 December 2017 GBP 121,435,916 EUR 17,272,699 GBP 456,341,565
Net Assets as at 31 December 2016 GBP 100,828,993 EUR 8,329,427 GBP 339,678,379
Merian Global Equity Absolute Return Fund
Class A (CHF)
Hedged
Class A (EUR)
Hedged
Class A (GBP)
Hedged
Class A (RMB)
Hedged
Class A (SGD)
Hedged Class A (USD)
Class A2 (CHF)
Hedged Class C (USD)
Shares in issue at 1 January 2017 751,650 672,960,325 35,795,938 701 337,164 723,697,178 100 5,269,296
Subscriptions during the financial year 29,226 1,197,986,420 46,104,120 55,724 611,754 361,830,024 438,634 8,329,736
Redemptions during the financial year (259,444) (977,458,673) (19,118,831) (6,725) (156,916) (332,407,829) (2,283) (1,431,093)
Shares in issue at 31 December 2017 521,432 893,488,072 62,781,227 49,700 792,002 753,119,373 436,451 12,167,939
Shares in issue at 1 January 2018 521,432 893,488,072 62,781,227 49,700 792,002 753,119,373 436,451 12,167,939
Subscriptions during the financial year 268,485 1,380,883,638 55,574,324 193,962 715,586 497,256,698 913,564 13,475,162
Redemptions during the financial year (302,404) (1,250,468,344) (44,353,872) (24,604) (80,510) (293,737,173) (81,756) (2,593,621)
Shares in issue at 31 December 2018 487,513 1,023,903,366 74,001,679 219,058 1,427,078 956,638,898 1,268,259 23,049,480
Net Assets as at 31 December 2018 CHF 5,038,881 EUR 1,368,139,678 GBP 114,858,006 RMB 3,040,806 SGD 16,571,806 USD 1,207,520,526 CHF 12,571,868 USD 250,352,398
Net Assets as at 31 December 2017 CHF 5,660,870 EUR 1,251,419,394 GBP 101,058,941 RMB 693,643 SGD 9,451,912 USD 968,374,600 CHF 4,559,998 USD 136,733,758
Net Assets as at 31 December 2016 CHF 7,683,891 EUR 896,046,673 GBP 54,395,507 RMB 8,117 SGD 3,781,696 USD 867,106,974 CHF 995 USD 55,980,864
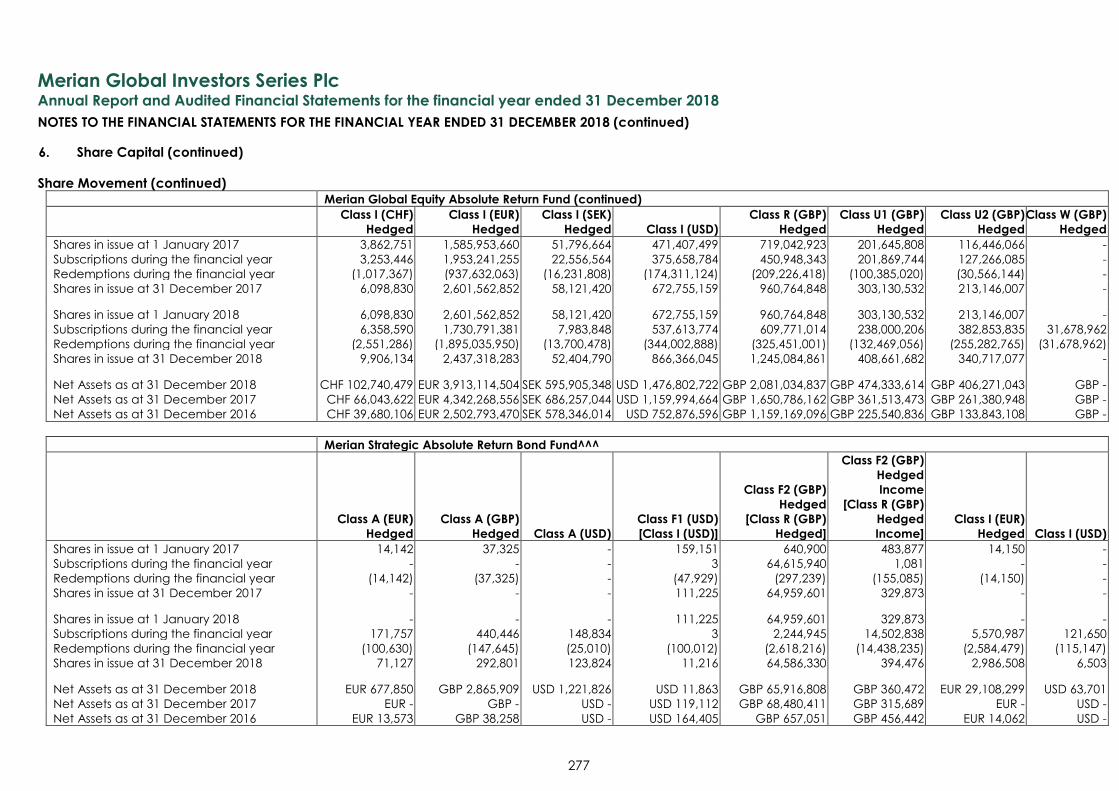
Merian Global Investors Series Plc
Annual Report and Audited Financial Statements for the financial year ended 31 December 2018
NOTES TO THE FINANCIAL STATEMENTS FOR THE FINANCIAL YEAR ENDED 31 DECEMBER 2018 (continued)
277
6. Share Capital (continued)
Share Movement (continued) Merian Global Equity Absolute Return Fund (continued)
Class I (CHF)
Hedged
Class I (EUR)
Hedged
Class I (SEK)
Hedged Class I (USD)
Class R (GBP)
Hedged
Class U1 (GBP)
Hedged
Class U2 (GBP)
Hedged
Class W (GBP)
Hedged
Shares in issue at 1 January 2017 3,862,751 1,585,953,660 51,796,664 471,407,499 719,042,923 201,645,808 116,446,066 -
Subscriptions during the financial year 3,253,446 1,953,241,255 22,556,564 375,658,784 450,948,343 201,869,744 127,266,085 -
Redemptions during the financial year (1,017,367) (937,632,063) (16,231,808) (174,311,124) (209,226,418) (100,385,020) (30,566,144) -
Shares in issue at 31 December 2017 6,098,830 2,601,562,852 58,121,420 672,755,159 960,764,848 303,130,532 213,146,007 -
Shares in issue at 1 January 2018 6,098,830 2,601,562,852 58,121,420 672,755,159 960,764,848 303,130,532 213,146,007 -
Subscriptions during the financial year 6,358,590 1,730,791,381 7,983,848 537,613,774 609,771,014 238,000,206 382,853,835 31,678,962
Redemptions during the financial year (2,551,286) (1,895,035,950) (13,700,478) (344,002,888) (325,451,001) (132,469,056) (255,282,765) (31,678,962)
Shares in issue at 31 December 2018 9,906,134 2,437,318,283 52,404,790 866,366,045 1,245,084,861 408,661,682 340,717,077 -
Net Assets as at 31 December 2018 CHF 102,740,479 EUR 3,913,114,504 SEK 595,905,348 USD 1,476,802,722 GBP 2,081,034,837 GBP 474,333,614 GBP 406,271,043 GBP -
Net Assets as at 31 December 2017 CHF 66,043,622 EUR 4,342,268,556 SEK 686,257,044 USD 1,159,994,664 GBP 1,650,786,162 GBP 361,513,473 GBP 261,380,948 GBP -
Net Assets as at 31 December 2016 CHF 39,680,106 EUR 2,502,793,470 SEK 578,346,014 USD 752,876,596 GBP 1,159,169,096 GBP 225,540,836 GBP 133,843,108 GBP -
Merian Strategic Absolute Return Bond Fund^^^
Class A (EUR)
Hedged
Class A (GBP)
Hedged Class A (USD)
Class F1 (USD)
[Class I (USD)]
Class F2 (GBP)
Hedged
[Class R (GBP)
Hedged]
Class F2 (GBP)
Hedged
Income
[Class R (GBP)
Hedged
Income]
Class I (EUR)
Hedged Class I (USD)
Shares in issue at 1 January 2017 14,142 37,325 - 159,151 640,900 483,877 14,150 -
Subscriptions during the financial year - - - 3 64,615,940 1,081 - -
Redemptions during the financial year (14,142) (37,325) - (47,929) (297,239) (155,085) (14,150) -
Shares in issue at 31 December 2017 - - - 111,225 64,959,601 329,873 - -
Shares in issue at 1 January 2018 - - - 111,225 64,959,601 329,873 - -
Subscriptions during the financial year 171,757 440,446 148,834 3 2,244,945 14,502,838 5,570,987 121,650
Redemptions during the financial year (100,630) (147,645) (25,010) (100,012) (2,618,216) (14,438,235) (2,584,479) (115,147)
Shares in issue at 31 December 2018 71,127 292,801 123,824 11,216 64,586,330 394,476 2,986,508 6,503
Net Assets as at 31 December 2018 EUR 677,850 GBP 2,865,909 USD 1,221,826 USD 11,863 GBP 65,916,808 GBP 360,472 EUR 29,108,299 USD 63,701
Net Assets as at 31 December 2017 EUR - GBP - USD - USD 119,112 GBP 68,480,411 GBP 315,689 EUR - USD -
Net Assets as at 31 December 2016 EUR 13,573 GBP 38,258 USD - USD 164,405 GBP 657,051 GBP 456,442 EUR 14,062 USD -
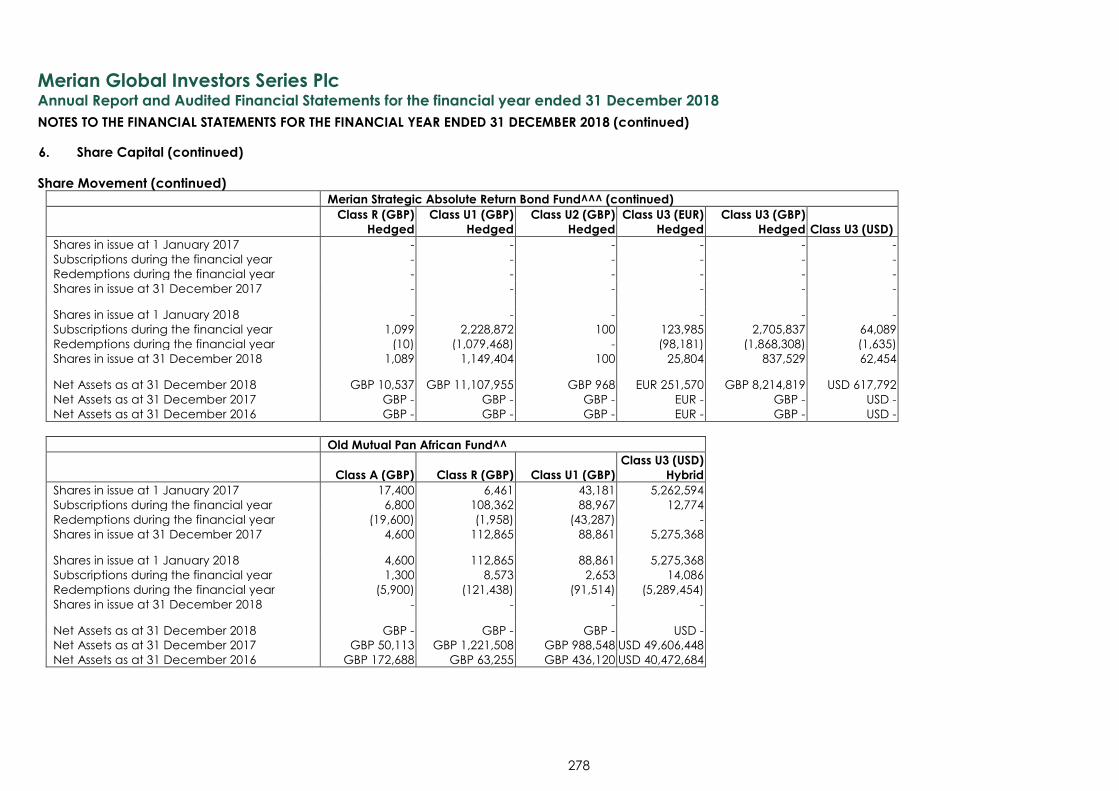
Merian Global Investors Series Plc
Annual Report and Audited Financial Statements for the financial year ended 31 December 2018
NOTES TO THE FINANCIAL STATEMENTS FOR THE FINANCIAL YEAR ENDED 31 DECEMBER 2018 (continued)
278
6. Share Capital (continued)
Share Movement (continued) Merian Strategic Absolute Return Bond Fund^^^ (continued)
Class R (GBP)
Hedged
Class U1 (GBP)
Hedged
Class U2 (GBP)
Hedged
Class U3 (EUR)
Hedged
Class U3 (GBP)
Hedged Class U3 (USD)
Shares in issue at 1 January 2017 - - - - - -
Subscriptions during the financial year - - - - - -
Redemptions during the financial year - - - - - -
Shares in issue at 31 December 2017 - - - - - -
Shares in issue at 1 January 2018 - - - - - -
Subscriptions during the financial year 1,099 2,228,872 100 123,985 2,705,837 64,089
Redemptions during the financial year (10) (1,079,468) - (98,181) (1,868,308) (1,635)
Shares in issue at 31 December 2018 1,089 1,149,404 100 25,804 837,529 62,454
Net Assets as at 31 December 2018 GBP 10,537 GBP 11,107,955 GBP 968 EUR 251,570 GBP 8,214,819 USD 617,792
Net Assets as at 31 December 2017 GBP - GBP - GBP - EUR - GBP - USD -
Net Assets as at 31 December 2016 GBP - GBP - GBP - EUR - GBP - USD -
Old Mutual Pan African Fund^^
Class A (GBP) Class R (GBP) Class U1 (GBP)
Class U3 (USD)
Hybrid
Shares in issue at 1 January 2017 17,400 6,461 43,181 5,262,594
Subscriptions during the financial year 6,800 108,362 88,967 12,774
Redemptions during the financial year (19,600) (1,958) (43,287) -
Shares in issue at 31 December 2017 4,600 112,865 88,861 5,275,368
Shares in issue at 1 January 2018 4,600 112,865 88,861 5,275,368
Subscriptions during the financial year 1,300 8,573 2,653 14,086
Redemptions during the financial year (5,900) (121,438) (91,514) (5,289,454)
Shares in issue at 31 December 2018 - - - -
Net Assets as at 31 December 2018 GBP - GBP - GBP - USD -
Net Assets as at 31 December 2017 GBP 50,113 GBP 1,221,508 GBP 988,548 USD 49,606,448
Net Assets as at 31 December 2016 GBP 172,688 GBP 63,255 GBP 436,120 USD 40,472,684
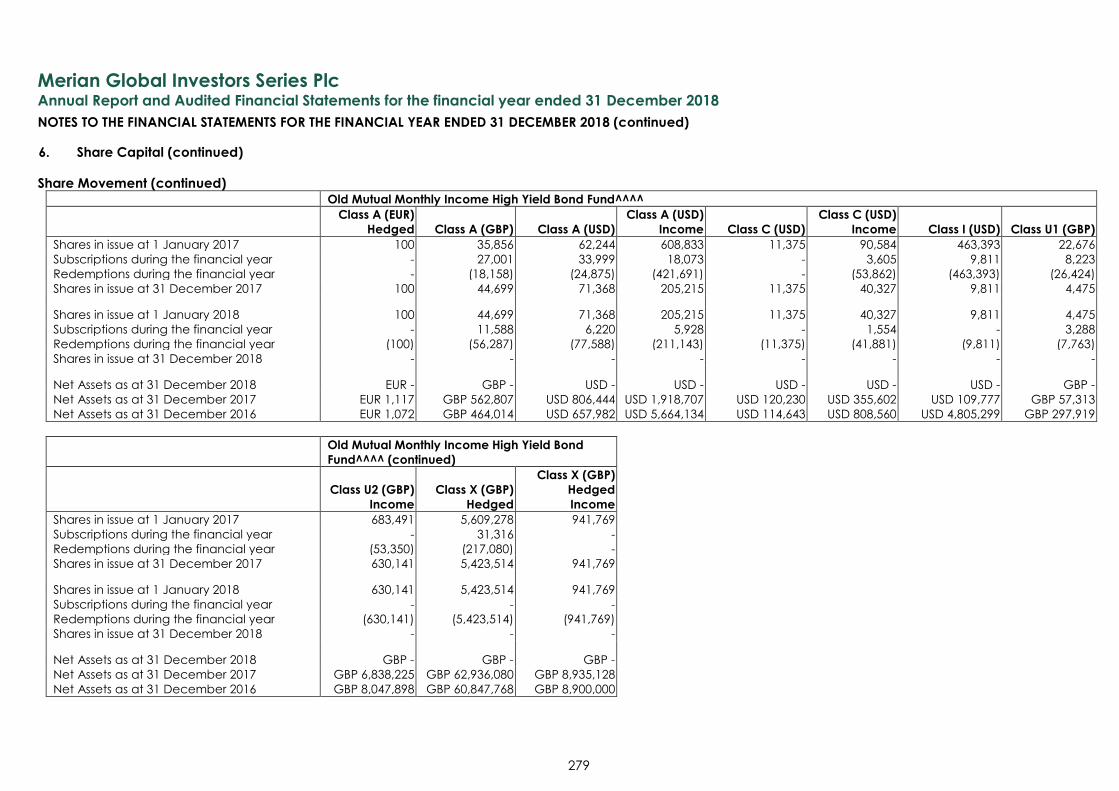
Merian Global Investors Series Plc
Annual Report and Audited Financial Statements for the financial year ended 31 December 2018
NOTES TO THE FINANCIAL STATEMENTS FOR THE FINANCIAL YEAR ENDED 31 DECEMBER 2018 (continued)
279
6. Share Capital (continued)
Share Movement (continued) Old Mutual Monthly Income High Yield Bond Fund^^^^
Class A (EUR)
Hedged Class A (GBP) Class A (USD)
Class A (USD)
Income Class C (USD)
Class C (USD)
Income Class I (USD) Class U1 (GBP)
Shares in issue at 1 January 2017 100 35,856 62,244 608,833 11,375 90,584 463,393 22,676
Subscriptions during the financial year - 27,001 33,999 18,073 - 3,605 9,811 8,223
Redemptions during the financial year - (18,158) (24,875) (421,691) - (53,862) (463,393) (26,424)
Shares in issue at 31 December 2017 100 44,699 71,368 205,215 11,375 40,327 9,811 4,475
Shares in issue at 1 January 2018 100 44,699 71,368 205,215 11,375 40,327 9,811 4,475
Subscriptions during the financial year - 11,588 6,220 5,928 - 1,554 - 3,288
Redemptions during the financial year (100) (56,287) (77,588) (211,143) (11,375) (41,881) (9,811) (7,763)
Shares in issue at 31 December 2018 - - - - - - - -
Net Assets as at 31 December 2018 EUR - GBP - USD - USD - USD - USD - USD - GBP -
Net Assets as at 31 December 2017 EUR 1,117 GBP 562,807 USD 806,444 USD 1,918,707 USD 120,230 USD 355,602 USD 109,777 GBP 57,313
Net Assets as at 31 December 2016 EUR 1,072 GBP 464,014 USD 657,982 USD 5,664,134 USD 114,643 USD 808,560 USD 4,805,299 GBP 297,919
Old Mutual Monthly Income High Yield Bond
Fund^^^^ (continued)
Class U2 (GBP)
Income
Class X (GBP)
Hedged
Class X (GBP)
Hedged
Income
Shares in issue at 1 January 2017 683,491 5,609,278 941,769
Subscriptions during the financial year - 31,316 -
Redemptions during the financial year (53,350) (217,080) -
Shares in issue at 31 December 2017 630,141 5,423,514 941,769
Shares in issue at 1 January 2018 630,141 5,423,514 941,769
Subscriptions during the financial year - - -
Redemptions during the financial year (630,141) (5,423,514) (941,769)
Shares in issue at 31 December 2018 - - -
Net Assets as at 31 December 2018 GBP - GBP - GBP -
Net Assets as at 31 December 2017 GBP 6,838,225 GBP 62,936,080 GBP 8,935,128
Net Assets as at 31 December 2016 GBP 8,047,898 GBP 60,847,768 GBP 8,900,000
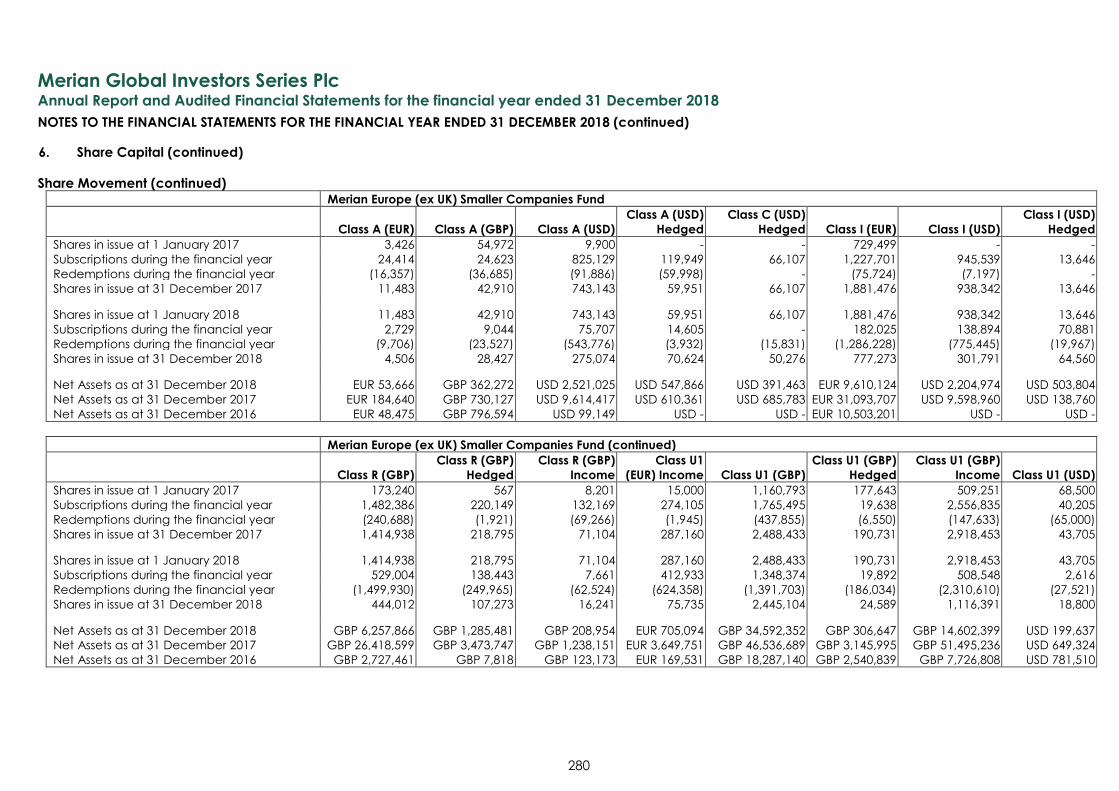
Merian Global Investors Series Plc
Annual Report and Audited Financial Statements for the financial year ended 31 December 2018
NOTES TO THE FINANCIAL STATEMENTS FOR THE FINANCIAL YEAR ENDED 31 DECEMBER 2018 (continued)
280
6. Share Capital (continued)
Share Movement (continued)
Merian Europe (ex UK) Smaller Companies Fund
Class A (EUR) Class A (GBP) Class A (USD)
Class A (USD)
Hedged
Class C (USD)
Hedged Class I (EUR) Class I (USD)
Class I (USD)
Hedged
Shares in issue at 1 January 2017 3,426 54,972 9,900 - - 729,499 - -
Subscriptions during the financial year 24,414 24,623 825,129 119,949 66,107 1,227,701 945,539 13,646
Redemptions during the financial year (16,357) (36,685) (91,886) (59,998) - (75,724) (7,197) -
Shares in issue at 31 December 2017 11,483 42,910 743,143 59,951 66,107 1,881,476 938,342 13,646
Shares in issue at 1 January 2018 11,483 42,910 743,143 59,951 66,107 1,881,476 938,342 13,646
Subscriptions during the financial year 2,729 9,044 75,707 14,605 - 182,025 138,894 70,881
Redemptions during the financial year (9,706) (23,527) (543,776) (3,932) (15,831) (1,286,228) (775,445) (19,967)
Shares in issue at 31 December 2018 4,506 28,427 275,074 70,624 50,276 777,273 301,791 64,560
Net Assets as at 31 December 2018 EUR 53,666 GBP 362,272 USD 2,521,025 USD 547,866 USD 391,463 EUR 9,610,124 USD 2,204,974 USD 503,804
Net Assets as at 31 December 2017 EUR 184,640 GBP 730,127 USD 9,614,417 USD 610,361 USD 685,783 EUR 31,093,707 USD 9,598,960 USD 138,760
Net Assets as at 31 December 2016 EUR 48,475 GBP 796,594 USD 99,149 USD - USD - EUR 10,503,201 USD - USD -
Merian Europe (ex UK) Smaller Companies Fund (continued)
Class R (GBP)
Class R (GBP)
Hedged
Class R (GBP)
Income
Class U1
(EUR) Income Class U1 (GBP)
Class U1 (GBP)
Hedged
Class U1 (GBP)
Income Class U1 (USD)
Shares in issue at 1 January 2017 173,240 567 8,201 15,000 1,160,793 177,643 509,251 68,500
Subscriptions during the financial year 1,482,386 220,149 132,169 274,105 1,765,495 19,638 2,556,835 40,205
Redemptions during the financial year (240,688) (1,921) (69,266) (1,945) (437,855) (6,550) (147,633) (65,000)
Shares in issue at 31 December 2017 1,414,938 218,795 71,104 287,160 2,488,433 190,731 2,918,453 43,705
Shares in issue at 1 January 2018 1,414,938 218,795 71,104 287,160 2,488,433 190,731 2,918,453 43,705
Subscriptions during the financial year 529,004 138,443 7,661 412,933 1,348,374 19,892 508,548 2,616
Redemptions during the financial year (1,499,930) (249,965) (62,524) (624,358) (1,391,703) (186,034) (2,310,610) (27,521)
Shares in issue at 31 December 2018 444,012 107,273 16,241 75,735 2,445,104 24,589 1,116,391 18,800
Net Assets as at 31 December 2018 GBP 6,257,866 GBP 1,285,481 GBP 208,954 EUR 705,094 GBP 34,592,352 GBP 306,647 GBP 14,602,399 USD 199,637
Net Assets as at 31 December 2017 GBP 26,418,599 GBP 3,473,747 GBP 1,238,151 EUR 3,649,751 GBP 46,536,689 GBP 3,145,995 GBP 51,495,236 USD 649,324
Net Assets as at 31 December 2016 GBP 2,727,461 GBP 7,818 GBP 123,173 EUR 169,531 GBP 18,287,140 GBP 2,540,839 GBP 7,726,808 USD 781,510
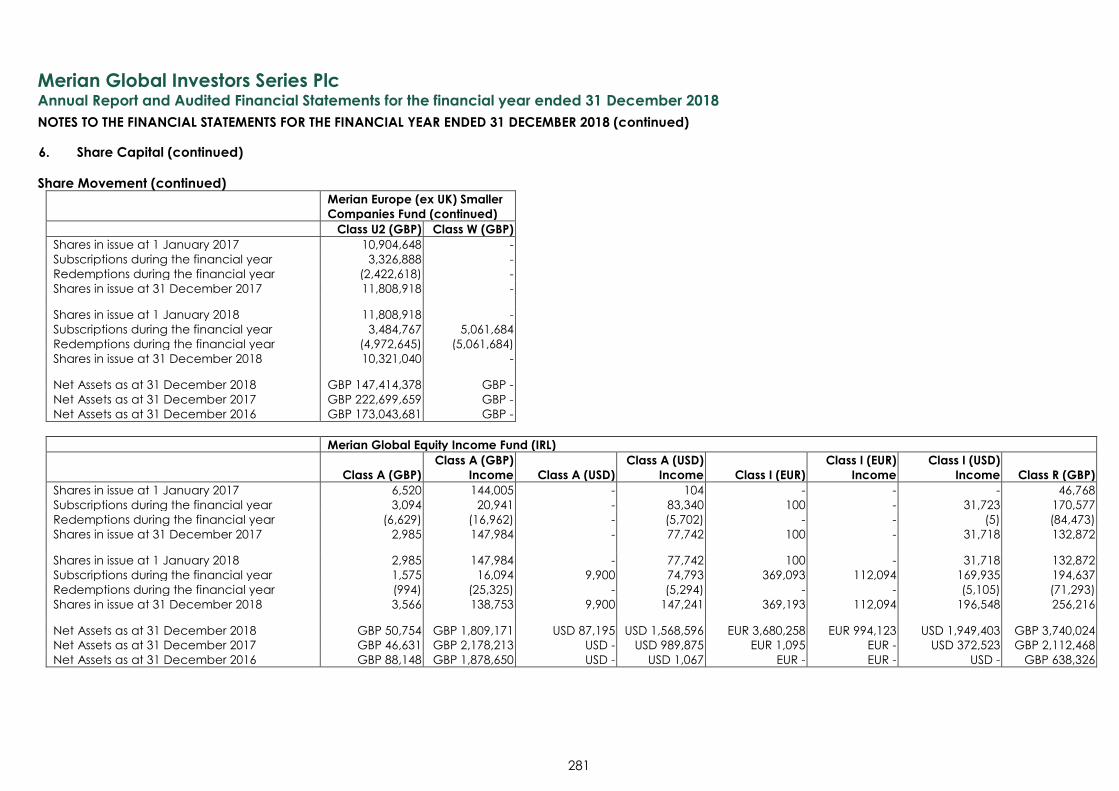
Merian Global Investors Series Plc
Annual Report and Audited Financial Statements for the financial year ended 31 December 2018
NOTES TO THE FINANCIAL STATEMENTS FOR THE FINANCIAL YEAR ENDED 31 DECEMBER 2018 (continued)
281
6. Share Capital (continued)
Share Movement (continued)
Merian Europe (ex UK) Smaller
Companies Fund (continued)
Class U2 (GBP) Class W (GBP)
Shares in issue at 1 January 2017 10,904,648 -
Subscriptions during the financial year 3,326,888 -
Redemptions during the financial year (2,422,618) -
Shares in issue at 31 December 2017 11,808,918 -
Shares in issue at 1 January 2018 11,808,918 -
Subscriptions during the financial year 3,484,767 5,061,684
Redemptions during the financial year (4,972,645) (5,061,684)
Shares in issue at 31 December 2018 10,321,040 -
Net Assets as at 31 December 2018 GBP 147,414,378 GBP -
Net Assets as at 31 December 2017 GBP 222,699,659 GBP -
Net Assets as at 31 December 2016 GBP 173,043,681 GBP -
Merian Global Equity Income Fund (IRL)
Class A (GBP)
Class A (GBP)
Income Class A (USD)
Class A (USD)
Income Class I (EUR)
Class I (EUR)
Income
Class I (USD)
Income Class R (GBP)
Shares in issue at 1 January 2017 6,520 144,005 - 104 - - - 46,768
Subscriptions during the financial year 3,094 20,941 - 83,340 100 - 31,723 170,577
Redemptions during the financial year (6,629) (16,962) - (5,702) - - (5) (84,473)
Shares in issue at 31 December 2017 2,985 147,984 - 77,742 100 - 31,718 132,872
Shares in issue at 1 January 2018 2,985 147,984 - 77,742 100 - 31,718 132,872
Subscriptions during the financial year 1,575 16,094 9,900 74,793 369,093 112,094 169,935 194,637
Redemptions during the financial year (994) (25,325) - (5,294) - - (5,105) (71,293)
Shares in issue at 31 December 2018 3,566 138,753 9,900 147,241 369,193 112,094 196,548 256,216
Net Assets as at 31 December 2018 GBP 50,754 GBP 1,809,171 USD 87,195 USD 1,568,596 EUR 3,680,258 EUR 994,123 USD 1,949,403 GBP 3,740,024
Net Assets as at 31 December 2017 GBP 46,631 GBP 2,178,213 USD - USD 989,875 EUR 1,095 EUR - USD 372,523 GBP 2,112,468
Net Assets as at 31 December 2016 GBP 88,148 GBP 1,878,650 USD - USD 1,067 EUR - EUR - USD - GBP 638,326
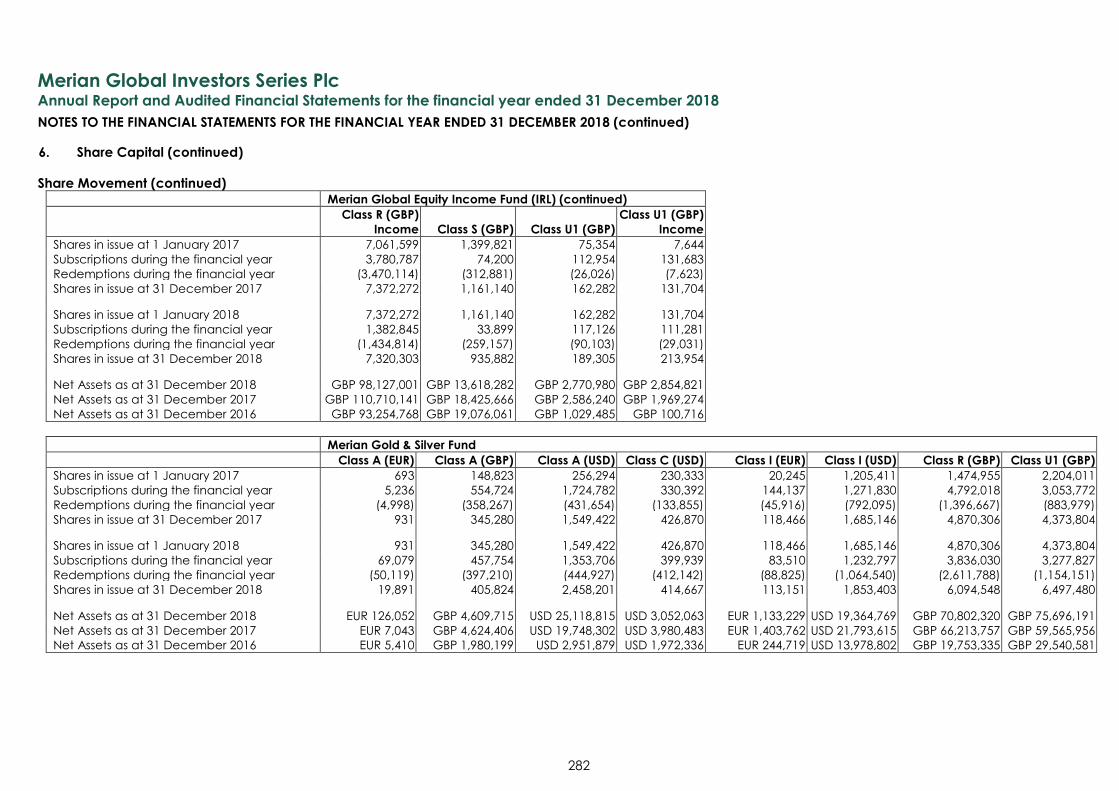
Merian Global Investors Series Plc
Annual Report and Audited Financial Statements for the financial year ended 31 December 2018
NOTES TO THE FINANCIAL STATEMENTS FOR THE FINANCIAL YEAR ENDED 31 DECEMBER 2018 (continued)
282
6. Share Capital (continued)
Share Movement (continued)
Merian Global Equity Income Fund (IRL) (continued)
Class R (GBP)
Income Class S (GBP) Class U1 (GBP)
Class U1 (GBP)
Income
Shares in issue at 1 January 2017 7,061,599 1,399,821 75,354 7,644
Subscriptions during the financial year 3,780,787 74,200 112,954 131,683
Redemptions during the financial year (3,470,114) (312,881) (26,026) (7,623)
Shares in issue at 31 December 2017 7,372,272 1,161,140 162,282 131,704
Shares in issue at 1 January 2018 7,372,272 1,161,140 162,282 131,704
Subscriptions during the financial year 1,382,845 33,899 117,126 111,281
Redemptions during the financial year (1,434,814) (259,157) (90,103) (29,031)
Shares in issue at 31 December 2018 7,320,303 935,882 189,305 213,954
Net Assets as at 31 December 2018 GBP 98,127,001 GBP 13,618,282 GBP 2,770,980 GBP 2,854,821
Net Assets as at 31 December 2017 GBP 110,710,141 GBP 18,425,666 GBP 2,586,240 GBP 1,969,274
Net Assets as at 31 December 2016 GBP 93,254,768 GBP 19,076,061 GBP 1,029,485 GBP 100,716
Merian Gold & Silver Fund
Class A (EUR) Class A (GBP) Class A (USD) Class C (USD) Class I (EUR) Class I (USD) Class R (GBP) Class U1 (GBP)
Shares in issue at 1 January 2017 693 148,823 256,294 230,333 20,245 1,205,411 1,474,955 2,204,011
Subscriptions during the financial year 5,236 554,724 1,724,782 330,392 144,137 1,271,830 4,792,018 3,053,772
Redemptions during the financial year (4,998) (358,267) (431,654) (133,855) (45,916) (792,095) (1,396,667) (883,979)
Shares in issue at 31 December 2017 931 345,280 1,549,422 426,870 118,466 1,685,146 4,870,306 4,373,804
Shares in issue at 1 January 2018 931 345,280 1,549,422 426,870 118,466 1,685,146 4,870,306 4,373,804
Subscriptions during the financial year 69,079 457,754 1,353,706 399,939 83,510 1,232,797 3,836,030 3,277,827
Redemptions during the financial year (50,119) (397,210) (444,927) (412,142) (88,825) (1,064,540) (2,611,788) (1,154,151)
Shares in issue at 31 December 2018 19,891 405,824 2,458,201 414,667 113,151 1,853,403 6,094,548 6,497,480
Net Assets as at 31 December 2018 EUR 126,052 GBP 4,609,715 USD 25,118,815 USD 3,052,063 EUR 1,133,229 USD 19,364,769 GBP 70,802,320 GBP 75,696,191
Net Assets as at 31 December 2017 EUR 7,043 GBP 4,624,406 USD 19,748,302 USD 3,980,483 EUR 1,403,762 USD 21,793,615 GBP 66,213,757 GBP 59,565,956
Net Assets as at 31 December 2016 EUR 5,410 GBP 1,980,199 USD 2,951,879 USD 1,972,336 EUR 244,719 USD 13,978,802 GBP 19,753,335 GBP 29,540,581
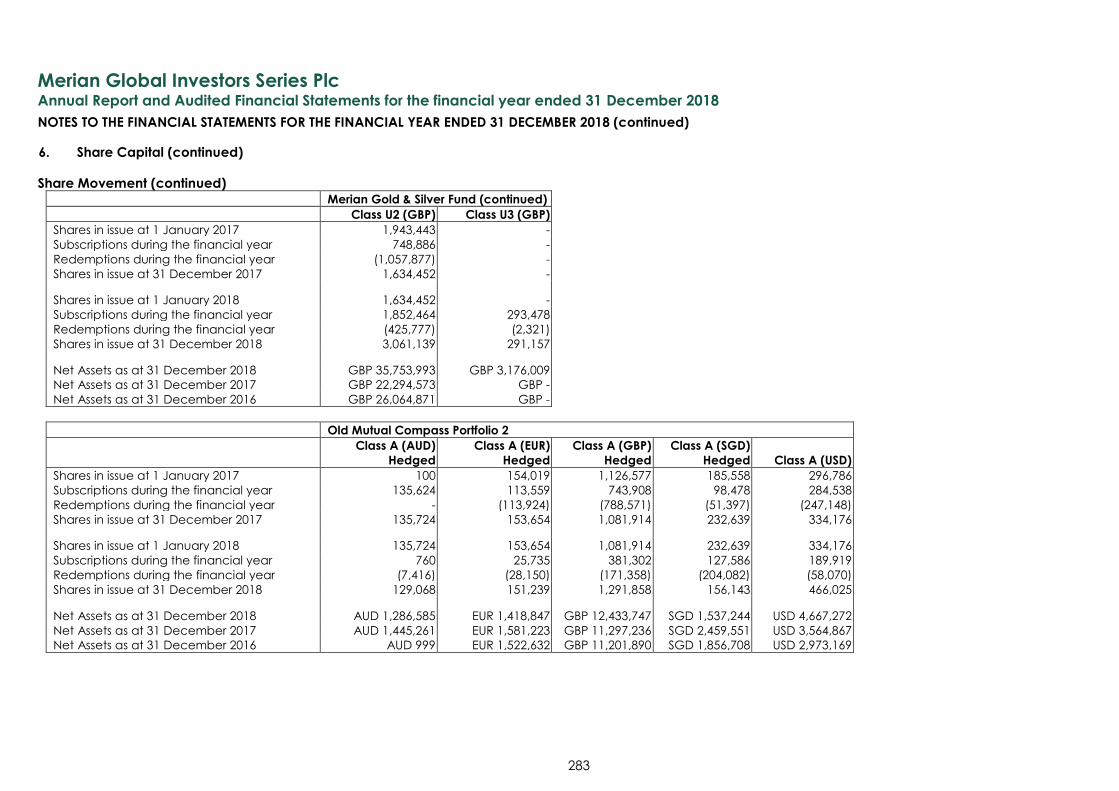
Merian Global Investors Series Plc
Annual Report and Audited Financial Statements for the financial year ended 31 December 2018
NOTES TO THE FINANCIAL STATEMENTS FOR THE FINANCIAL YEAR ENDED 31 DECEMBER 2018 (continued)
283
6. Share Capital (continued)
Share Movement (continued)
Merian Gold & Silver Fund (continued)
Class U2 (GBP) Class U3 (GBP)
Shares in issue at 1 January 2017 1,943,443 -
Subscriptions during the financial year 748,886 -
Redemptions during the financial year (1,057,877) -
Shares in issue at 31 December 2017 1,634,452 -
Shares in issue at 1 January 2018 1,634,452 -
Subscriptions during the financial year 1,852,464 293,478
Redemptions during the financial year (425,777) (2,321)
Shares in issue at 31 December 2018 3,061,139 291,157
Net Assets as at 31 December 2018 GBP 35,753,993 GBP 3,176,009
Net Assets as at 31 December 2017 GBP 22,294,573 GBP -
Net Assets as at 31 December 2016 GBP 26,064,871 GBP -
Old Mutual Compass Portfolio 2
Class A (AUD)
Hedged
Class A (EUR)
Hedged
Class A (GBP)
Hedged
Class A (SGD)
Hedged Class A (USD)
Shares in issue at 1 January 2017 100 154,019 1,126,577 185,558 296,786
Subscriptions during the financial year 135,624 113,559 743,908 98,478 284,538
Redemptions during the financial year - (113,924) (788,571) (51,397) (247,148)
Shares in issue at 31 December 2017 135,724 153,654 1,081,914 232,639 334,176
Shares in issue at 1 January 2018 135,724 153,654 1,081,914 232,639 334,176
Subscriptions during the financial year 760 25,735 381,302 127,586 189,919
Redemptions during the financial year (7,416) (28,150) (171,358) (204,082) (58,070)
Shares in issue at 31 December 2018 129,068 151,239 1,291,858 156,143 466,025
Net Assets as at 31 December 2018 AUD 1,286,585 EUR 1,418,847 GBP 12,433,747 SGD 1,537,244 USD 4,667,272
Net Assets as at 31 December 2017 AUD 1,445,261 EUR 1,581,223 GBP 11,297,236 SGD 2,459,551 USD 3,564,867
Net Assets as at 31 December 2016 AUD 999 EUR 1,522,632 GBP 11,201,890 SGD 1,856,708 USD 2,973,169
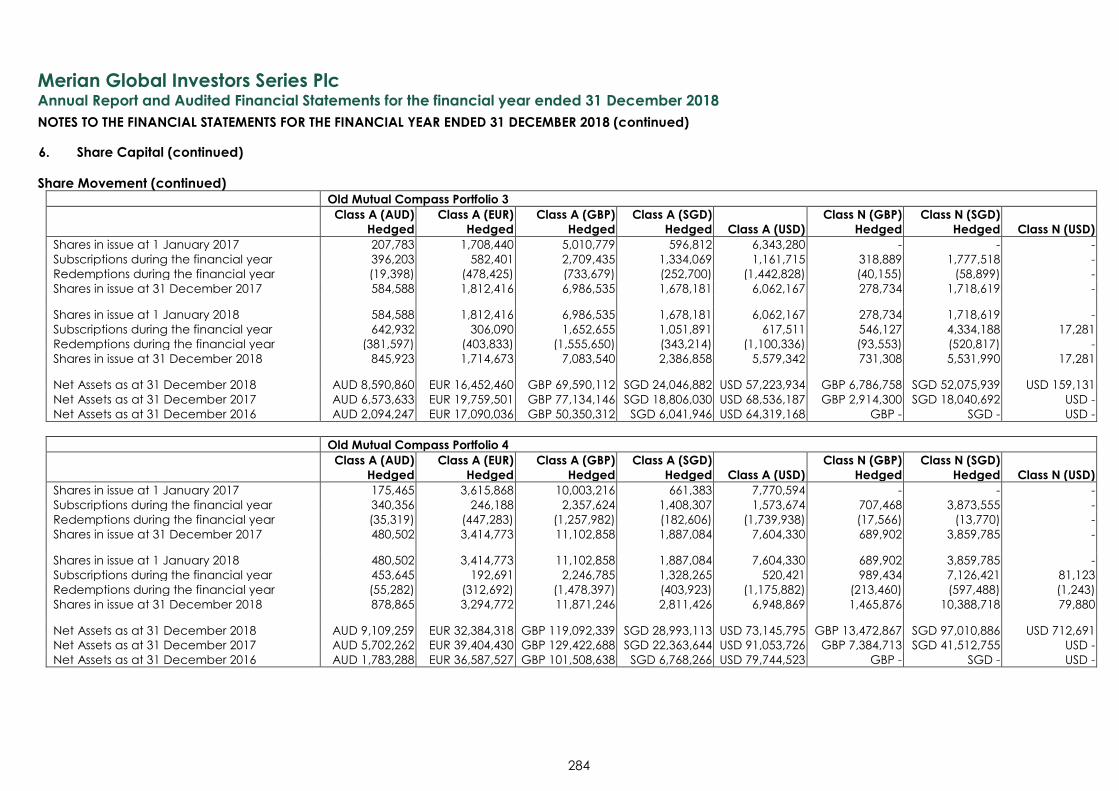
Merian Global Investors Series Plc
Annual Report and Audited Financial Statements for the financial year ended 31 December 2018
NOTES TO THE FINANCIAL STATEMENTS FOR THE FINANCIAL YEAR ENDED 31 DECEMBER 2018 (continued)
284
6. Share Capital (continued)
Share Movement (continued)
Old Mutual Compass Portfolio 3
Class A (AUD)
Hedged
Class A (EUR)
Hedged
Class A (GBP)
Hedged
Class A (SGD)
Hedged Class A (USD)
Class N (GBP)
Hedged
Class N (SGD)
Hedged Class N (USD)
Shares in issue at 1 January 2017 207,783 1,708,440 5,010,779 596,812 6,343,280 - - -
Subscriptions during the financial year 396,203 582,401 2,709,435 1,334,069 1,161,715 318,889 1,777,518 -
Redemptions during the financial year (19,398) (478,425) (733,679) (252,700) (1,442,828) (40,155) (58,899) -
Shares in issue at 31 December 2017 584,588 1,812,416 6,986,535 1,678,181 6,062,167 278,734 1,718,619 -
Shares in issue at 1 January 2018 584,588 1,812,416 6,986,535 1,678,181 6,062,167 278,734 1,718,619 -
Subscriptions during the financial year 642,932 306,090 1,652,655 1,051,891 617,511 546,127 4,334,188 17,281
Redemptions during the financial year (381,597) (403,833) (1,555,650) (343,214) (1,100,336) (93,553) (520,817) -
Shares in issue at 31 December 2018 845,923 1,714,673 7,083,540 2,386,858 5,579,342 731,308 5,531,990 17,281
Net Assets as at 31 December 2018 AUD 8,590,860 EUR 16,452,460 GBP 69,590,112 SGD 24,046,882 USD 57,223,934 GBP 6,786,758 SGD 52,075,939 USD 159,131
Net Assets as at 31 December 2017 AUD 6,573,633 EUR 19,759,501 GBP 77,134,146 SGD 18,806,030 USD 68,536,187 GBP 2,914,300 SGD 18,040,692 USD -
Net Assets as at 31 December 2016 AUD 2,094,247 EUR 17,090,036 GBP 50,350,312 SGD 6,041,946 USD 64,319,168 GBP - SGD - USD -
Old Mutual Compass Portfolio 4
Class A (AUD)
Hedged
Class A (EUR)
Hedged
Class A (GBP)
Hedged
Class A (SGD)
Hedged Class A (USD)
Class N (GBP)
Hedged
Class N (SGD)
Hedged Class N (USD)
Shares in issue at 1 January 2017 175,465 3,615,868 10,003,216 661,383 7,770,594 - - -
Subscriptions during the financial year 340,356 246,188 2,357,624 1,408,307 1,573,674 707,468 3,873,555 -
Redemptions during the financial year (35,319) (447,283) (1,257,982) (182,606) (1,739,938) (17,566) (13,770) -
Shares in issue at 31 December 2017 480,502 3,414,773 11,102,858 1,887,084 7,604,330 689,902 3,859,785 -
Shares in issue at 1 January 2018 480,502 3,414,773 11,102,858 1,887,084 7,604,330 689,902 3,859,785 -
Subscriptions during the financial year 453,645 192,691 2,246,785 1,328,265 520,421 989,434 7,126,421 81,123
Redemptions during the financial year (55,282) (312,692) (1,478,397) (403,923) (1,175,882) (213,460) (597,488) (1,243)
Shares in issue at 31 December 2018 878,865 3,294,772 11,871,246 2,811,426 6,948,869 1,465,876 10,388,718 79,880
Net Assets as at 31 December 2018 AUD 9,109,259 EUR 32,384,318 GBP 119,092,339 SGD 28,993,113 USD 73,145,795 GBP 13,472,867 SGD 97,010,886 USD 712,691
Net Assets as at 31 December 2017 AUD 5,702,262 EUR 39,404,430 GBP 129,422,688 SGD 22,363,644 USD 91,053,726 GBP 7,384,713 SGD 41,512,755 USD -
Net Assets as at 31 December 2016 AUD 1,783,288 EUR 36,587,527 GBP 101,508,638 SGD 6,768,266 USD 79,744,523 GBP - SGD - USD -
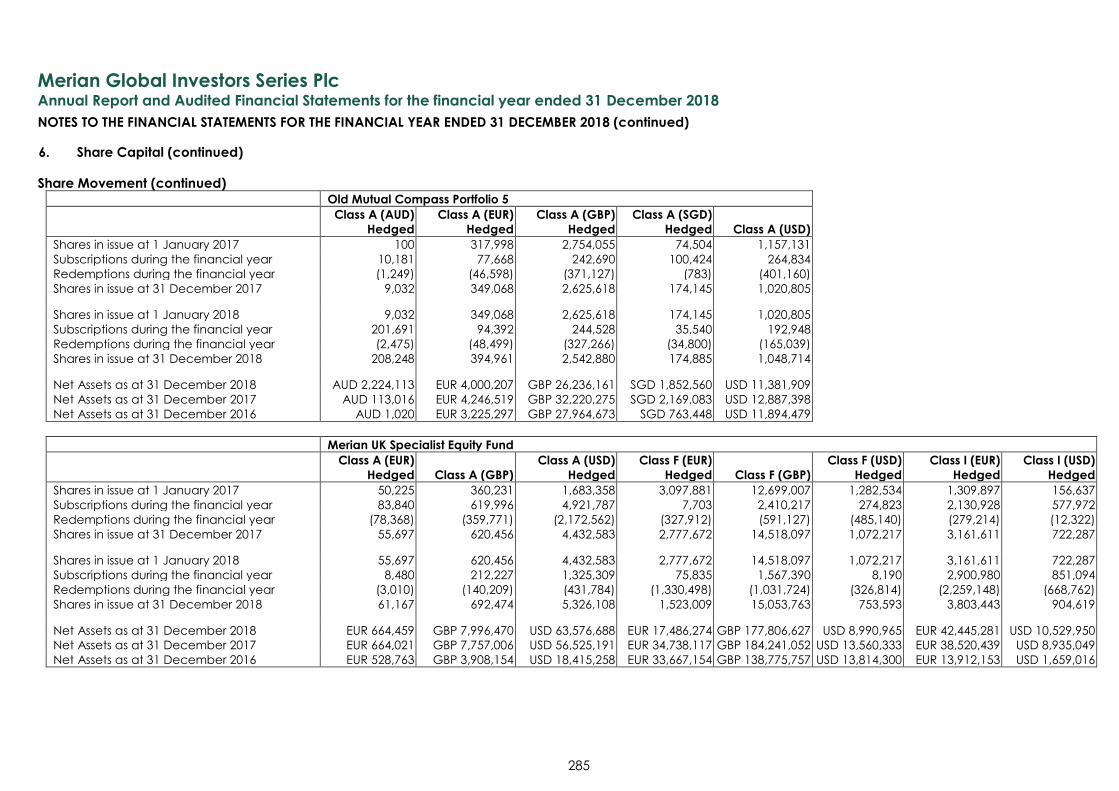
Merian Global Investors Series Plc
Annual Report and Audited Financial Statements for the financial year ended 31 December 2018
NOTES TO THE FINANCIAL STATEMENTS FOR THE FINANCIAL YEAR ENDED 31 DECEMBER 2018 (continued)
285
6. Share Capital (continued)
Share Movement (continued)
Old Mutual Compass Portfolio 5
Class A (AUD)
Hedged
Class A (EUR)
Hedged
Class A (GBP)
Hedged
Class A (SGD)
Hedged Class A (USD)
Shares in issue at 1 January 2017 100 317,998 2,754,055 74,504 1,157,131
Subscriptions during the financial year 10,181 77,668 242,690 100,424 264,834
Redemptions during the financial year (1,249) (46,598) (371,127) (783) (401,160)
Shares in issue at 31 December 2017 9,032 349,068 2,625,618 174,145 1,020,805
Shares in issue at 1 January 2018 9,032 349,068 2,625,618 174,145 1,020,805
Subscriptions during the financial year 201,691 94,392 244,528 35,540 192,948
Redemptions during the financial year (2,475) (48,499) (327,266) (34,800) (165,039)
Shares in issue at 31 December 2018 208,248 394,961 2,542,880 174,885 1,048,714
Net Assets as at 31 December 2018 AUD 2,224,113 EUR 4,000,207 GBP 26,236,161 SGD 1,852,560 USD 11,381,909
Net Assets as at 31 December 2017 AUD 113,016 EUR 4,246,519 GBP 32,220,275 SGD 2,169,083 USD 12,887,398
Net Assets as at 31 December 2016 AUD 1,020 EUR 3,225,297 GBP 27,964,673 SGD 763,448 USD 11,894,479
Merian UK Specialist Equity Fund
Class A (EUR)
Hedged Class A (GBP)
Class A (USD)
Hedged
Class F (EUR)
Hedged Class F (GBP)
Class F (USD)
Hedged
Class I (EUR)
Hedged
Class I (USD)
Hedged
Shares in issue at 1 January 2017 50,225 360,231 1,683,358 3,097,881 12,699,007 1,282,534 1,309,897 156,637
Subscriptions during the financial year 83,840 619,996 4,921,787 7,703 2,410,217 274,823 2,130,928 577,972
Redemptions during the financial year (78,368) (359,771) (2,172,562) (327,912) (591,127) (485,140) (279,214) (12,322)
Shares in issue at 31 December 2017 55,697 620,456 4,432,583 2,777,672 14,518,097 1,072,217 3,161,611 722,287
Shares in issue at 1 January 2018 55,697 620,456 4,432,583 2,777,672 14,518,097 1,072,217 3,161,611 722,287
Subscriptions during the financial year 8,480 212,227 1,325,309 75,835 1,567,390 8,190 2,900,980 851,094
Redemptions during the financial year (3,010) (140,209) (431,784) (1,330,498) (1,031,724) (326,814) (2,259,148) (668,762)
Shares in issue at 31 December 2018 61,167 692,474 5,326,108 1,523,009 15,053,763 753,593 3,803,443 904,619
Net Assets as at 31 December 2018 EUR 664,459 GBP 7,996,470 USD 63,576,688 EUR 17,486,274 GBP 177,806,627 USD 8,990,965 EUR 42,445,281 USD 10,529,950
Net Assets as at 31 December 2017 EUR 664,021 GBP 7,757,006 USD 56,525,191 EUR 34,738,117 GBP 184,241,052 USD 13,560,333 EUR 38,520,439 USD 8,935,049
Net Assets as at 31 December 2016 EUR 528,763 GBP 3,908,154 USD 18,415,258 EUR 33,667,154 GBP 138,775,757 USD 13,814,300 EUR 13,912,153 USD 1,659,016
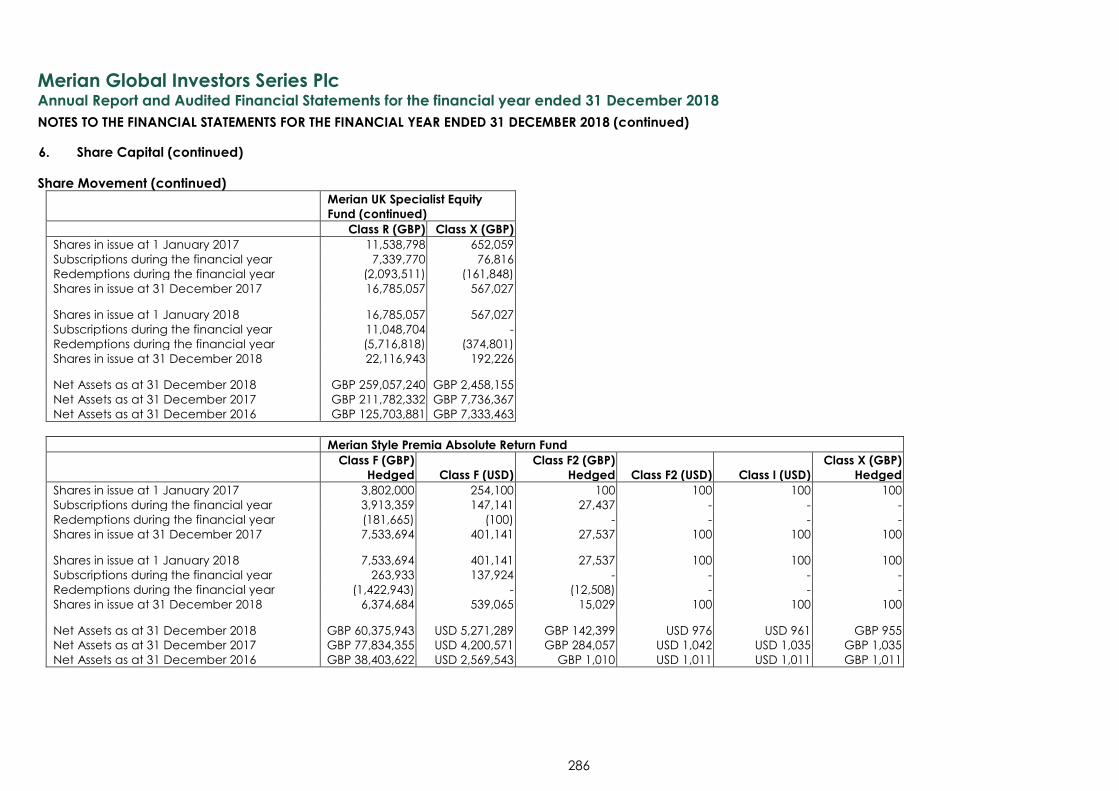
Merian Global Investors Series Plc
Annual Report and Audited Financial Statements for the financial year ended 31 December 2018
NOTES TO THE FINANCIAL STATEMENTS FOR THE FINANCIAL YEAR ENDED 31 DECEMBER 2018 (continued)
286
6. Share Capital (continued)
Share Movement (continued)
Merian UK Specialist Equity
Fund (continued)
Class R (GBP) Class X (GBP)
Shares in issue at 1 January 2017 11,538,798 652,059
Subscriptions during the financial year 7,339,770 76,816
Redemptions during the financial year (2,093,511) (161,848)
Shares in issue at 31 December 2017 16,785,057 567,027
Shares in issue at 1 January 2018 16,785,057 567,027
Subscriptions during the financial year 11,048,704 -
Redemptions during the financial year (5,716,818) (374,801)
Shares in issue at 31 December 2018 22,116,943 192,226
Net Assets as at 31 December 2018 GBP 259,057,240 GBP 2,458,155
Net Assets as at 31 December 2017 GBP 211,782,332 GBP 7,736,367
Net Assets as at 31 December 2016 GBP 125,703,881 GBP 7,333,463
Merian Style Premia Absolute Return Fund
Class F (GBP)
Hedged Class F (USD)
Class F2 (GBP)
Hedged Class F2 (USD) Class I (USD)
Class X (GBP)
Hedged
Shares in issue at 1 January 2017 3,802,000 254,100 100 100 100 100
Subscriptions during the financial year 3,913,359 147,141 27,437 - - -
Redemptions during the financial year (181,665) (100) - - - -
Shares in issue at 31 December 2017 7,533,694 401,141 27,537 100 100 100
Shares in issue at 1 January 2018 7,533,694 401,141 27,537 100 100 100
Subscriptions during the financial year 263,933 137,924 - - - -
Redemptions during the financial year (1,422,943) - (12,508) - - -
Shares in issue at 31 December 2018 6,374,684 539,065 15,029 100 100 100
Net Assets as at 31 December 2018 GBP 60,375,943 USD 5,271,289 GBP 142,399 USD 976 USD 961 GBP 955
Net Assets as at 31 December 2017 GBP 77,834,355 USD 4,200,571 GBP 284,057 USD 1,042 USD 1,035 GBP 1,035
Net Assets as at 31 December 2016 GBP 38,403,622 USD 2,569,543 GBP 1,010 USD 1,011 USD 1,011 GBP 1,011
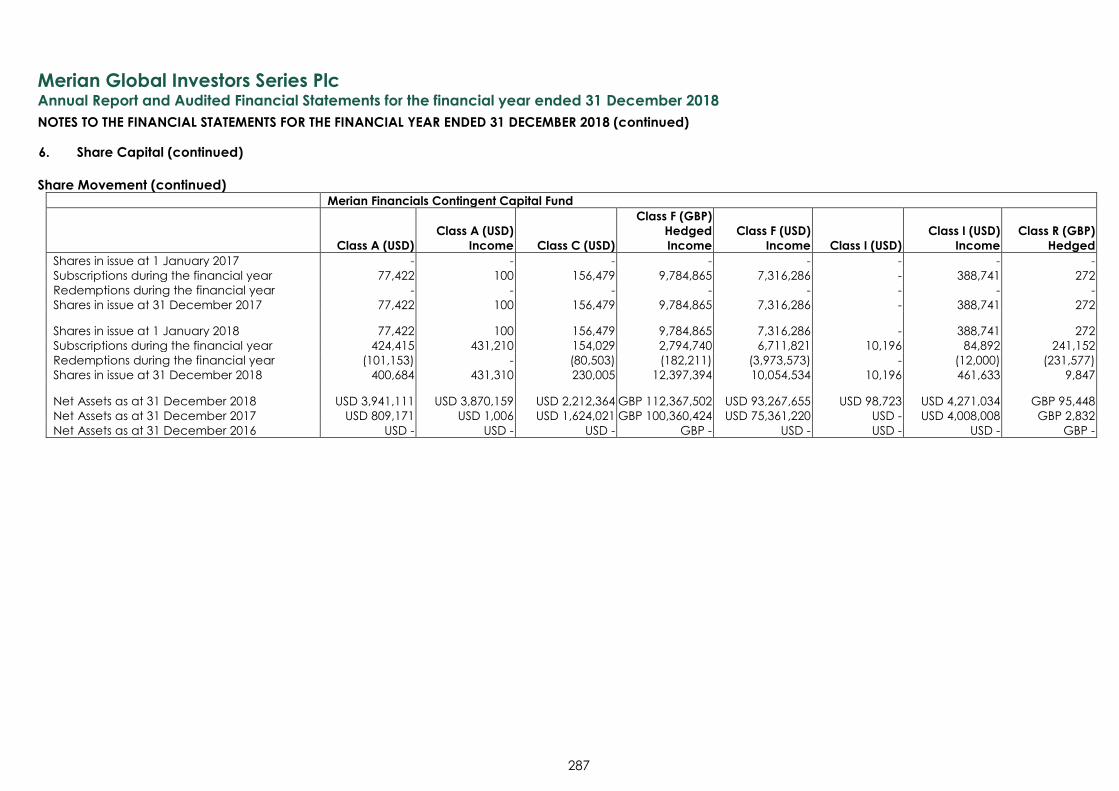
Merian Global Investors Series Plc
Annual Report and Audited Financial Statements for the financial year ended 31 December 2018
NOTES TO THE FINANCIAL STATEMENTS FOR THE FINANCIAL YEAR ENDED 31 DECEMBER 2018 (continued)
287
6. Share Capital (continued)
Share Movement (continued) Merian Financials Contingent Capital Fund
Class A (USD)
Class A (USD)
Income Class C (USD)
Class F (GBP)
Hedged
Income
Class F (USD)
Income Class I (USD)
Class I (USD)
Income
Class R (GBP)
Hedged
Shares in issue at 1 January 2017 - - - - - - - -
Subscriptions during the financial year 77,422 100 156,479 9,784,865 7,316,286 - 388,741 272
Redemptions during the financial year - - - - - - - -
Shares in issue at 31 December 2017 77,422 100 156,479 9,784,865 7,316,286 - 388,741 272
Shares in issue at 1 January 2018 77,422 100 156,479 9,784,865 7,316,286 - 388,741 272
Subscriptions during the financial year 424,415 431,210 154,029 2,794,740 6,711,821 10,196 84,892 241,152
Redemptions during the financial year (101,153) - (80,503) (182,211) (3,973,573) - (12,000) (231,577)
Shares in issue at 31 December 2018 400,684 431,310 230,005 12,397,394 10,054,534 10,196 461,633 9,847
Net Assets as at 31 December 2018 USD 3,941,111 USD 3,870,159 USD 2,212,364 GBP 112,367,502 USD 93,267,655 USD 98,723 USD 4,271,034 GBP 95,448
Net Assets as at 31 December 2017 USD 809,171 USD 1,006 USD 1,624,021 GBP 100,360,424 USD 75,361,220 USD - USD 4,008,008 GBP 2,832
Net Assets as at 31 December 2016 USD - USD - USD - GBP - USD - USD - USD - GBP -
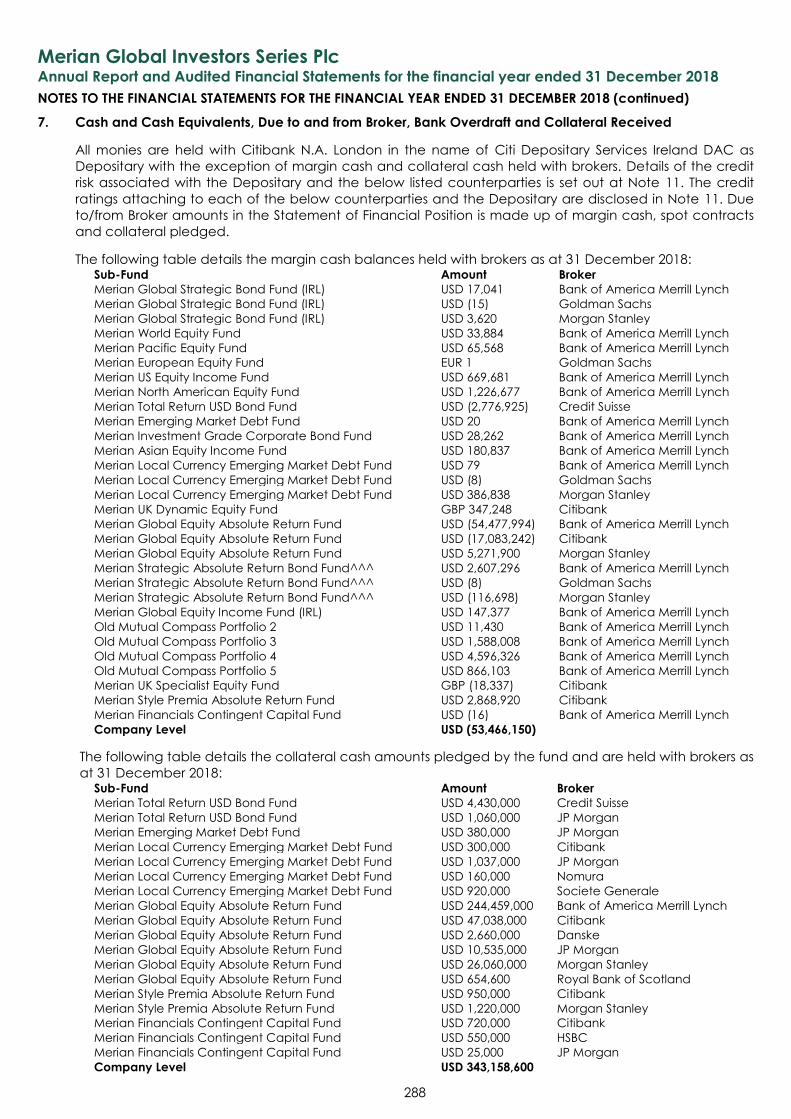
Merian Global Investors Series Plc
Annual Report and Audited Financial Statements for the financial year ended 31 December 2018
NOTES TO THE FINANCIAL STATEMENTS FOR THE FINANCIAL YEAR ENDED 31 DECEMBER 2018 (continued)
288
7. Cash and Cash Equivalents, Due to and from Broker, Bank Overdraft and Collateral Received
All monies are held with Citibank N.A. London in the name of Citi Depositary Services Ireland DAC as
Depositary with the exception of margin cash and collateral cash held with brokers. Details of the credit
risk associated with the Depositary and the below listed counterparties is set out at Note 11. The credit
ratings attaching to each of the below counterparties and the Depositary are disclosed in Note 11. Due
to/from Broker amounts in the Statement of Financial Position is made up of margin cash, spot contracts
and collateral pledged.
The following table details the margin cash balances held with brokers as at 31 December 2018: Sub-Fund Amount Broker
Merian Global Strategic Bond Fund (IRL) USD 17,041 Bank of America Merrill Lynch
Merian Global Strategic Bond Fund (IRL) USD (15) Goldman Sachs
Merian Global Strategic Bond Fund (IRL) USD 3,620 Morgan Stanley
Merian World Equity Fund USD 33,884 Bank of America Merrill Lynch
Merian Pacific Equity Fund USD 65,568 Bank of America Merrill Lynch
Merian European Equity Fund EUR 1 Goldman Sachs
Merian US Equity Income Fund USD 669,681 Bank of America Merrill Lynch
Merian North American Equity Fund USD 1,226,677 Bank of America Merrill Lynch
Merian Total Return USD Bond Fund USD (2,776,925) Credit Suisse
Merian Emerging Market Debt Fund USD 20 Bank of America Merrill Lynch
Merian Investment Grade Corporate Bond Fund USD 28,262 Bank of America Merrill Lynch
Merian Asian Equity Income Fund USD 180,837 Bank of America Merrill Lynch
Merian Local Currency Emerging Market Debt Fund USD 79 Bank of America Merrill Lynch
Merian Local Currency Emerging Market Debt Fund USD (8) Goldman Sachs
Merian Local Currency Emerging Market Debt Fund USD 386,838 Morgan Stanley
Merian UK Dynamic Equity Fund GBP 347,248 Citibank
Merian Global Equity Absolute Return Fund USD (54,477,994) Bank of America Merrill Lynch
Merian Global Equity Absolute Return Fund USD (17,083,242) Citibank
Merian Global Equity Absolute Return Fund USD 5,271,900 Morgan Stanley
Merian Strategic Absolute Return Bond Fund^^^ USD 2,607,296 Bank of America Merrill Lynch
Merian Strategic Absolute Return Bond Fund^^^ USD (8) Goldman Sachs
Merian Strategic Absolute Return Bond Fund^^^ USD (116,698) Morgan Stanley
Merian Global Equity Income Fund (IRL) USD 147,377 Bank of America Merrill Lynch
Old Mutual Compass Portfolio 2 USD 11,430 Bank of America Merrill Lynch
Old Mutual Compass Portfolio 3 USD 1,588,008 Bank of America Merrill Lynch
Old Mutual Compass Portfolio 4 USD 4,596,326 Bank of America Merrill Lynch
Old Mutual Compass Portfolio 5 USD 866,103 Bank of America Merrill Lynch
Merian UK Specialist Equity Fund GBP (18,337) Citibank
Merian Style Premia Absolute Return Fund USD 2,868,920 Citibank
Merian Financials Contingent Capital Fund USD (16) Bank of America Merrill Lynch
Company Level USD (53,466,150)
The following table details the collateral cash amounts pledged by the fund and are held with brokers as
at 31 December 2018: Sub-Fund Amount Broker
Merian Total Return USD Bond Fund USD 4,430,000 Credit Suisse
Merian Total Return USD Bond Fund USD 1,060,000 JP Morgan
Merian Emerging Market Debt Fund USD 380,000 JP Morgan
Merian Local Currency Emerging Market Debt Fund USD 300,000 Citibank
Merian Local Currency Emerging Market Debt Fund USD 1,037,000 JP Morgan
Merian Local Currency Emerging Market Debt Fund USD 160,000 Nomura
Merian Local Currency Emerging Market Debt Fund USD 920,000 Societe Generale
Merian Global Equity Absolute Return Fund USD 244,459,000 Bank of America Merrill Lynch
Merian Global Equity Absolute Return Fund USD 47,038,000 Citibank
Merian Global Equity Absolute Return Fund USD 2,660,000 Danske
Merian Global Equity Absolute Return Fund USD 10,535,000 JP Morgan
Merian Global Equity Absolute Return Fund USD 26,060,000 Morgan Stanley
Merian Global Equity Absolute Return Fund USD 654,600 Royal Bank of Scotland
Merian Style Premia Absolute Return Fund USD 950,000 Citibank
Merian Style Premia Absolute Return Fund USD 1,220,000 Morgan Stanley
Merian Financials Contingent Capital Fund USD 720,000 Citibank
Merian Financials Contingent Capital Fund USD 550,000 HSBC
Merian Financials Contingent Capital Fund USD 25,000 JP Morgan
Company Level USD 343,158,600
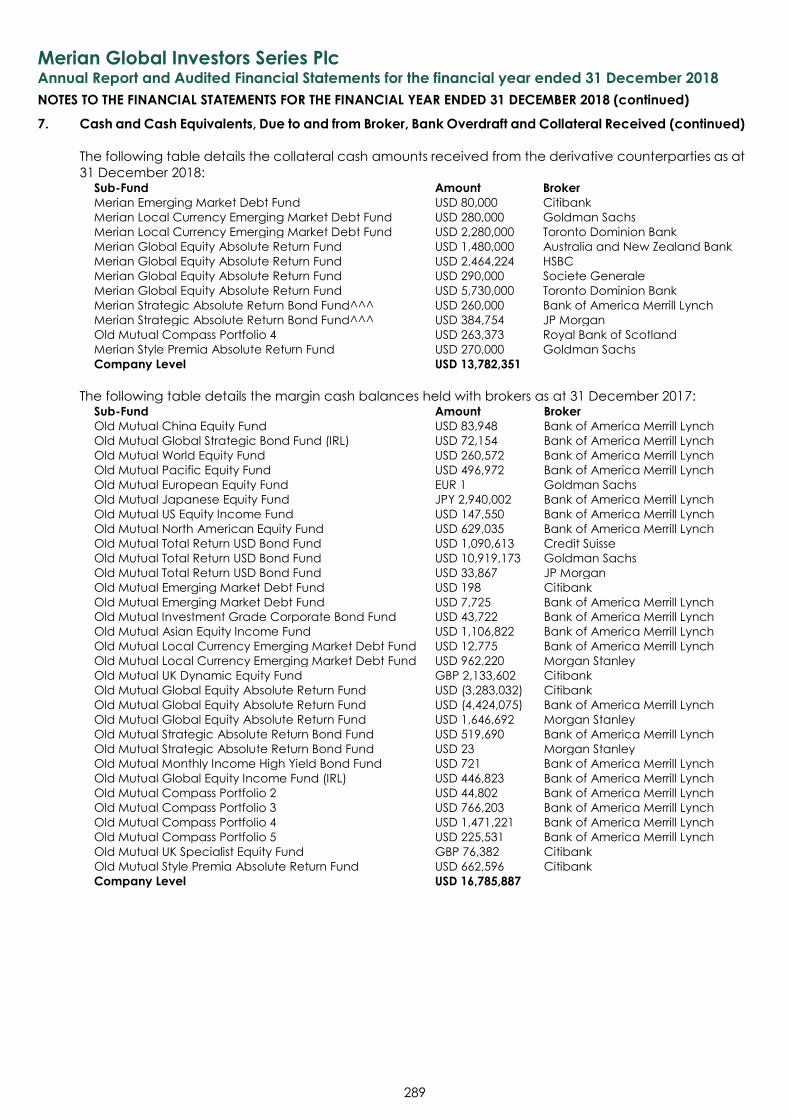
Merian Global Investors Series Plc
Annual Report and Audited Financial Statements for the financial year ended 31 December 2018
NOTES TO THE FINANCIAL STATEMENTS FOR THE FINANCIAL YEAR ENDED 31 DECEMBER 2018 (continued)
289
7. Cash and Cash Equivalents, Due to and from Broker, Bank Overdraft and Collateral Received (continued)
The following table details the collateral cash amounts received from the derivative counterparties as at
31 December 2018: Sub-Fund Amount Broker
Merian Emerging Market Debt Fund USD 80,000 Citibank
Merian Local Currency Emerging Market Debt Fund USD 280,000 Goldman Sachs
Merian Local Currency Emerging Market Debt Fund USD 2,280,000 Toronto Dominion Bank
Merian Global Equity Absolute Return Fund USD 1,480,000 Australia and New Zealand Bank
Merian Global Equity Absolute Return Fund USD 2,464,224 HSBC
Merian Global Equity Absolute Return Fund USD 290,000 Societe Generale
Merian Global Equity Absolute Return Fund USD 5,730,000 Toronto Dominion Bank
Merian Strategic Absolute Return Bond Fund^^^ USD 260,000 Bank of America Merrill Lynch
Merian Strategic Absolute Return Bond Fund^^^ USD 384,754 JP Morgan
Old Mutual Compass Portfolio 4 USD 263,373 Royal Bank of Scotland
Merian Style Premia Absolute Return Fund USD 270,000 Goldman Sachs
Company Level USD 13,782,351
The following table details the margin cash balances held with brokers as at 31 December 2017: Sub-Fund Amount Broker
Old Mutual China Equity Fund USD 83,948 Bank of America Merrill Lynch
Old Mutual Global Strategic Bond Fund (IRL) USD 72,154 Bank of America Merrill Lynch
Old Mutual World Equity Fund USD 260,572 Bank of America Merrill Lynch
Old Mutual Pacific Equity Fund USD 496,972 Bank of America Merrill Lynch
Old Mutual European Equity Fund EUR 1 Goldman Sachs
Old Mutual Japanese Equity Fund JPY 2,940,002 Bank of America Merrill Lynch
Old Mutual US Equity Income Fund USD 147,550 Bank of America Merrill Lynch
Old Mutual North American Equity Fund USD 629,035 Bank of America Merrill Lynch
Old Mutual Total Return USD Bond Fund USD 1,090,613 Credit Suisse
Old Mutual Total Return USD Bond Fund USD 10,919,173 Goldman Sachs
Old Mutual Total Return USD Bond Fund USD 33,867 JP Morgan
Old Mutual Emerging Market Debt Fund USD 198 Citibank
Old Mutual Emerging Market Debt Fund USD 7,725 Bank of America Merrill Lynch
Old Mutual Investment Grade Corporate Bond Fund USD 43,722 Bank of America Merrill Lynch
Old Mutual Asian Equity Income Fund USD 1,106,822 Bank of America Merrill Lynch
Old Mutual Local Currency Emerging Market Debt Fund USD 12,775 Bank of America Merrill Lynch
Old Mutual Local Currency Emerging Market Debt Fund USD 962,220 Morgan Stanley
Old Mutual UK Dynamic Equity Fund GBP 2,133,602 Citibank
Old Mutual Global Equity Absolute Return Fund USD (3,283,032) Citibank
Old Mutual Global Equity Absolute Return Fund USD (4,424,075) Bank of America Merrill Lynch
Old Mutual Global Equity Absolute Return Fund USD 1,646,692 Morgan Stanley
Old Mutual Strategic Absolute Return Bond Fund USD 519,690 Bank of America Merrill Lynch
Old Mutual Strategic Absolute Return Bond Fund USD 23 Morgan Stanley
Old Mutual Monthly Income High Yield Bond Fund USD 721 Bank of America Merrill Lynch
Old Mutual Global Equity Income Fund (IRL) USD 446,823 Bank of America Merrill Lynch
Old Mutual Compass Portfolio 2 USD 44,802 Bank of America Merrill Lynch
Old Mutual Compass Portfolio 3 USD 766,203 Bank of America Merrill Lynch
Old Mutual Compass Portfolio 4 USD 1,471,221 Bank of America Merrill Lynch
Old Mutual Compass Portfolio 5 USD 225,531 Bank of America Merrill Lynch
Old Mutual UK Specialist Equity Fund GBP 76,382 Citibank
Old Mutual Style Premia Absolute Return Fund USD 662,596 Citibank
Company Level USD 16,785,887
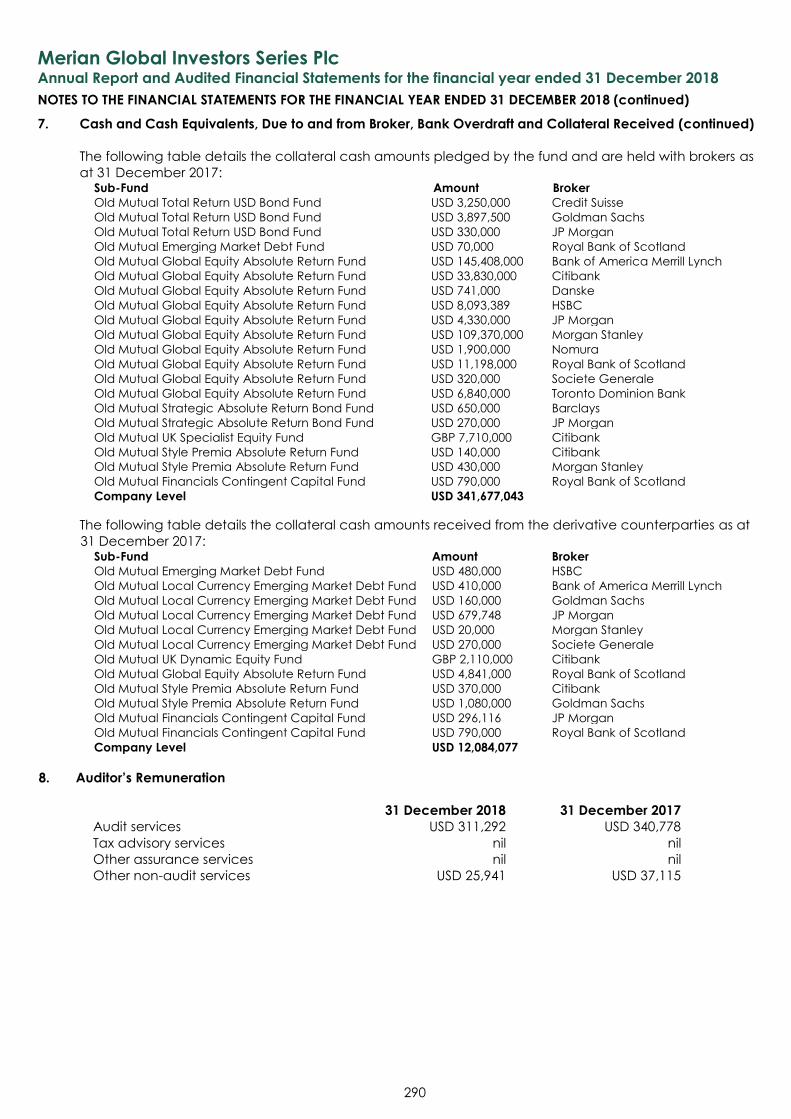
Merian Global Investors Series Plc
Annual Report and Audited Financial Statements for the financial year ended 31 December 2018
NOTES TO THE FINANCIAL STATEMENTS FOR THE FINANCIAL YEAR ENDED 31 DECEMBER 2018 (continued)
290
7. Cash and Cash Equivalents, Due to and from Broker, Bank Overdraft and Collateral Received (continued)
The following table details the collateral cash amounts pledged by the fund and are held with brokers as
at 31 December 2017: Sub-Fund Amount Broker
Old Mutual Total Return USD Bond Fund USD 3,250,000 Credit Suisse
Old Mutual Total Return USD Bond Fund USD 3,897,500 Goldman Sachs
Old Mutual Total Return USD Bond Fund USD 330,000 JP Morgan
Old Mutual Emerging Market Debt Fund USD 70,000 Royal Bank of Scotland
Old Mutual Global Equity Absolute Return Fund USD 145,408,000 Bank of America Merrill Lynch
Old Mutual Global Equity Absolute Return Fund USD 33,830,000 Citibank
Old Mutual Global Equity Absolute Return Fund USD 741,000 Danske
Old Mutual Global Equity Absolute Return Fund USD 8,093,389 HSBC
Old Mutual Global Equity Absolute Return Fund USD 4,330,000 JP Morgan
Old Mutual Global Equity Absolute Return Fund USD 109,370,000 Morgan Stanley
Old Mutual Global Equity Absolute Return Fund USD 1,900,000 Nomura
Old Mutual Global Equity Absolute Return Fund USD 11,198,000 Royal Bank of Scotland
Old Mutual Global Equity Absolute Return Fund USD 320,000 Societe Generale
Old Mutual Global Equity Absolute Return Fund USD 6,840,000 Toronto Dominion Bank
Old Mutual Strategic Absolute Return Bond Fund USD 650,000 Barclays
Old Mutual Strategic Absolute Return Bond Fund USD 270,000 JP Morgan
Old Mutual UK Specialist Equity Fund GBP 7,710,000 Citibank
Old Mutual Style Premia Absolute Return Fund USD 140,000 Citibank
Old Mutual Style Premia Absolute Return Fund USD 430,000 Morgan Stanley
Old Mutual Financials Contingent Capital Fund USD 790,000 Royal Bank of Scotland
Company Level USD 341,677,043
The following table details the collateral cash amounts received from the derivative counterparties as at
31 December 2017: Sub-Fund Amount Broker
Old Mutual Emerging Market Debt Fund USD 480,000 HSBC
Old Mutual Local Currency Emerging Market Debt Fund USD 410,000 Bank of America Merrill Lynch
Old Mutual Local Currency Emerging Market Debt Fund USD 160,000 Goldman Sachs
Old Mutual Local Currency Emerging Market Debt Fund USD 679,748 JP Morgan
Old Mutual Local Currency Emerging Market Debt Fund USD 20,000 Morgan Stanley
Old Mutual Local Currency Emerging Market Debt Fund USD 270,000 Societe Generale
Old Mutual UK Dynamic Equity Fund GBP 2,110,000 Citibank
Old Mutual Global Equity Absolute Return Fund USD 4,841,000 Royal Bank of Scotland
Old Mutual Style Premia Absolute Return Fund USD 370,000 Citibank
Old Mutual Style Premia Absolute Return Fund USD 1,080,000 Goldman Sachs
Old Mutual Financials Contingent Capital Fund USD 296,116 JP Morgan
Old Mutual Financials Contingent Capital Fund USD 790,000 Royal Bank of Scotland
Company Level USD 12,084,077
8. Auditor’s Remuneration
31 December 2018 31 December 2017
Audit services USD 311,292 USD 340,778
Tax advisory services nil nil
Other assurance services nil nil
Other non-audit services USD 25,941 USD 37,115
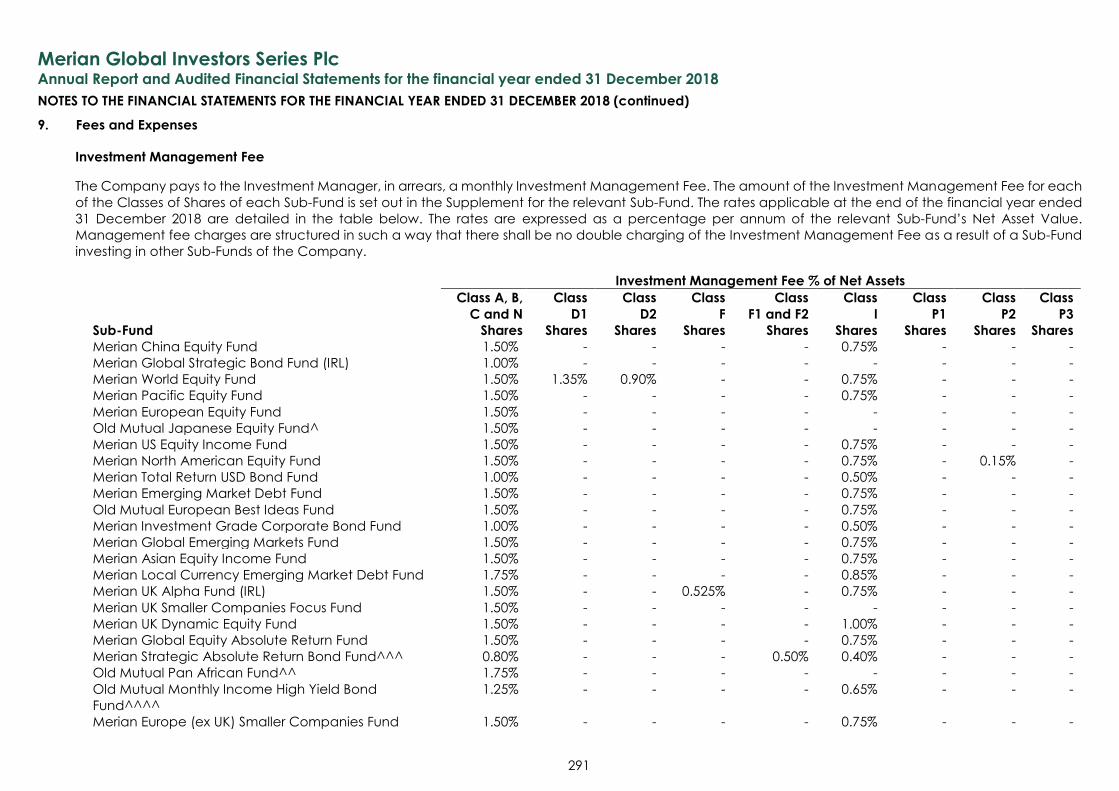
Merian Global Investors Series Plc
Annual Report and Audited Financial Statements for the financial year ended 31 December 2018
NOTES TO THE FINANCIAL STATEMENTS FOR THE FINANCIAL YEAR ENDED 31 DECEMBER 2018 (continued)
291
9. Fees and Expenses
Investment Management Fee
The Company pays to the Investment Manager, in arrears, a monthly Investment Management Fee. The amount of the Investment Management Fee for each
of the Classes of Shares of each Sub-Fund is set out in the Supplement for the relevant Sub-Fund. The rates applicable at the end of the financial year ended
31 December 2018 are detailed in the table below. The rates are expressed as a percentage per annum of the relevant Sub-Fund’s Net Asset Value.
Management fee charges are structured in such a way that there shall be no double charging of the Investment Management Fee as a result of a Sub-Fund
investing in other Sub-Funds of the Company.
Investment Management Fee % of Net Assets
Sub-Fund
Class A, B,
C and N
Shares
Class
D1
Shares
Class
D2
Shares
Class
F
Shares
Class
F1 and F2
Shares
Class
I
Shares
Class
P1
Shares
Class
P2
Shares
Class
P3
Shares
Merian China Equity Fund 1.50% - - - - 0.75% - - -
Merian Global Strategic Bond Fund (IRL) 1.00% - - - - - - - -
Merian World Equity Fund 1.50% 1.35% 0.90% - - 0.75% - - -
Merian Pacific Equity Fund 1.50% - - - - 0.75% - - -
Merian European Equity Fund 1.50% - - - - - - - -
Old Mutual Japanese Equity Fund^ 1.50% - - - - - - - -
Merian US Equity Income Fund 1.50% - - - - 0.75% - - -
Merian North American Equity Fund 1.50% - - - - 0.75% - 0.15% -
Merian Total Return USD Bond Fund 1.00% - - - - 0.50% - - -
Merian Emerging Market Debt Fund 1.50% - - - - 0.75% - - -
Old Mutual European Best Ideas Fund 1.50% - - - - 0.75% - - -
Merian Investment Grade Corporate Bond Fund 1.00% - - - - 0.50% - - -
Merian Global Emerging Markets Fund 1.50% - - - - 0.75% - - -
Merian Asian Equity Income Fund 1.50% - - - - 0.75% - - -
Merian Local Currency Emerging Market Debt Fund 1.75% - - - - 0.85% - - -
Merian UK Alpha Fund (IRL) 1.50% - - 0.525% - 0.75% - - -
Merian UK Smaller Companies Focus Fund 1.50% - - - - - - - -
Merian UK Dynamic Equity Fund 1.50% - - - - 1.00% - - -
Merian Global Equity Absolute Return Fund 1.50% - - - - 0.75% - - -
Merian Strategic Absolute Return Bond Fund^^^ 0.80% - - - 0.50% 0.40% - - -
Old Mutual Pan African Fund^^ 1.75% - - - - - - - -
Old Mutual Monthly Income High Yield Bond
Fund^^^^
1.25% - - - - 0.65% - - -
Merian Europe (ex UK) Smaller Companies Fund 1.50% - - - - 0.75% - - -
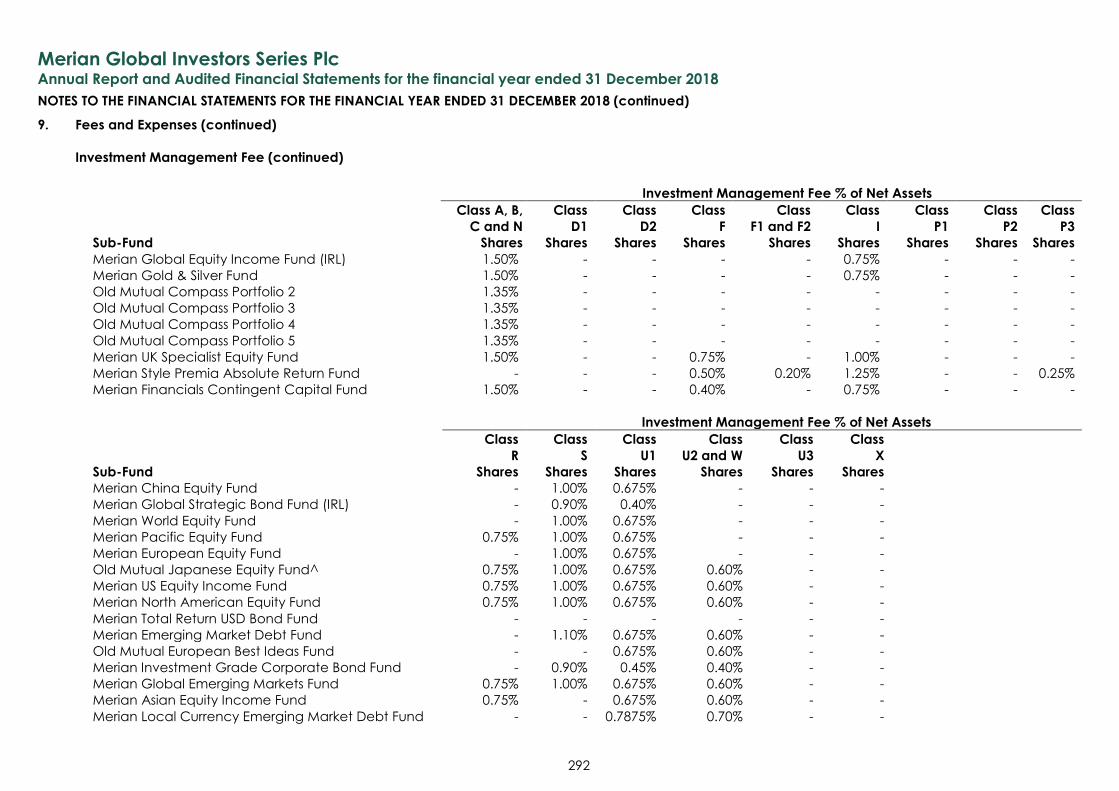
Merian Global Investors Series Plc
Annual Report and Audited Financial Statements for the financial year ended 31 December 2018
NOTES TO THE FINANCIAL STATEMENTS FOR THE FINANCIAL YEAR ENDED 31 DECEMBER 2018 (continued)
292
9. Fees and Expenses (continued)
Investment Management Fee (continued)
Investment Management Fee % of Net Assets
Sub-Fund
Class A, B,
C and N
Shares
Class
D1
Shares
Class
D2
Shares
Class
F
Shares
Class
F1 and F2
Shares
Class
I
Shares
Class
P1
Shares
Class
P2
Shares
Class
P3
Shares
Merian Global Equity Income Fund (IRL) 1.50% - - - - 0.75% - - -
Merian Gold & Silver Fund 1.50% - - - - 0.75% - - -
Old Mutual Compass Portfolio 2 1.35% - - - - - - - -
Old Mutual Compass Portfolio 3 1.35% - - - - - - - -
Old Mutual Compass Portfolio 4 1.35% - - - - - - - -
Old Mutual Compass Portfolio 5 1.35% - - - - - - - -
Merian UK Specialist Equity Fund 1.50% - - 0.75% - 1.00% - - -
Merian Style Premia Absolute Return Fund - - - 0.50% 0.20% 1.25% - - 0.25%
Merian Financials Contingent Capital Fund 1.50% - - 0.40% - 0.75% - - -
Investment Management Fee % of Net Assets
Sub-Fund
Class
R
Shares
Class
S
Shares
Class
U1
Shares
Class
U2 and W
Shares
Class
U3
Shares
Class
X
Shares
Merian China Equity Fund - 1.00% 0.675% - - -
Merian Global Strategic Bond Fund (IRL) - 0.90% 0.40% - - -
Merian World Equity Fund - 1.00% 0.675% - - -
Merian Pacific Equity Fund 0.75% 1.00% 0.675% - - -
Merian European Equity Fund - 1.00% 0.675% - - -
Old Mutual Japanese Equity Fund^ 0.75% 1.00% 0.675% 0.60% - -
Merian US Equity Income Fund 0.75% 1.00% 0.675% 0.60% - -
Merian North American Equity Fund 0.75% 1.00% 0.675% 0.60% - -
Merian Total Return USD Bond Fund - - - - - -
Merian Emerging Market Debt Fund - 1.10% 0.675% 0.60% - -
Old Mutual European Best Ideas Fund - - 0.675% 0.60% - -
Merian Investment Grade Corporate Bond Fund - 0.90% 0.45% 0.40% - -
Merian Global Emerging Markets Fund 0.75% 1.00% 0.675% 0.60% - -
Merian Asian Equity Income Fund 0.75% - 0.675% 0.60% - -
Merian Local Currency Emerging Market Debt Fund - - 0.7875% 0.70% - -
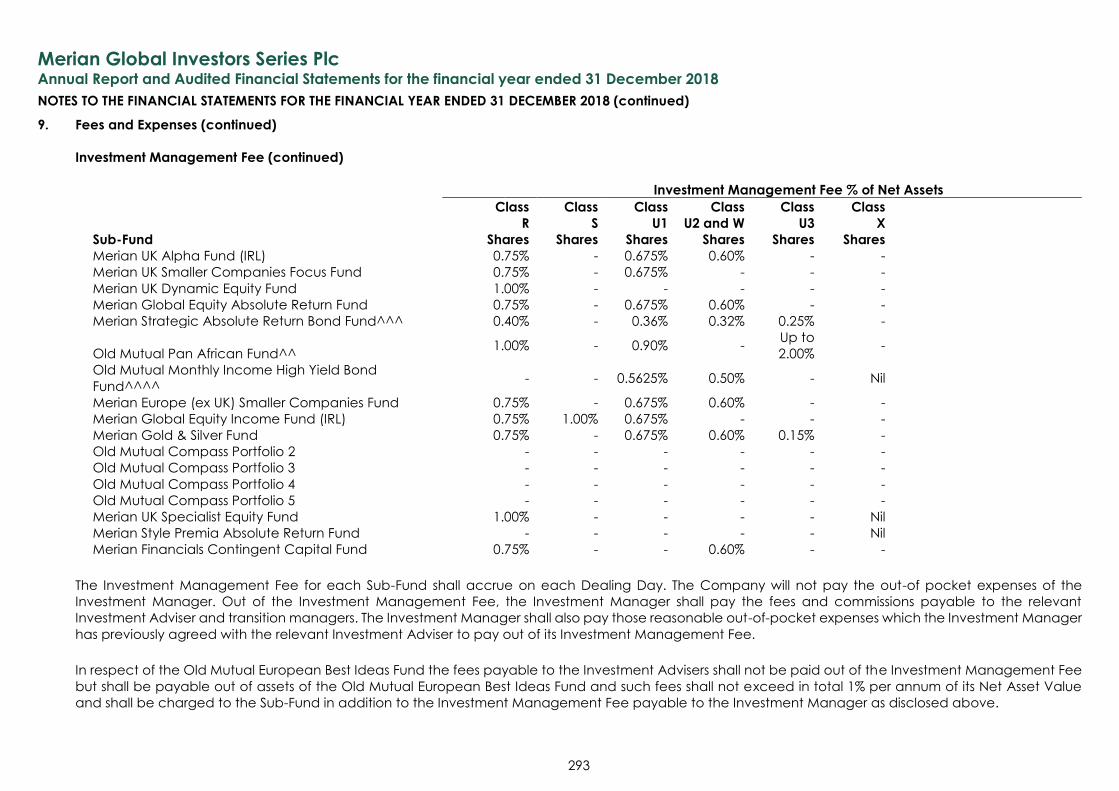
Merian Global Investors Series Plc
Annual Report and Audited Financial Statements for the financial year ended 31 December 2018
NOTES TO THE FINANCIAL STATEMENTS FOR THE FINANCIAL YEAR ENDED 31 DECEMBER 2018 (continued)
293
9. Fees and Expenses (continued)
Investment Management Fee (continued)
Investment Management Fee % of Net Assets
Sub-Fund
Class
R
Shares
Class
S
Shares
Class
U1
Shares
Class
U2 and W
Shares
Class
U3
Shares
Class
X
Shares
Merian UK Alpha Fund (IRL) 0.75% - 0.675% 0.60% - -
Merian UK Smaller Companies Focus Fund 0.75% - 0.675% - - -
Merian UK Dynamic Equity Fund 1.00% - - - - -
Merian Global Equity Absolute Return Fund 0.75% - 0.675% 0.60% - -
Merian Strategic Absolute Return Bond Fund^^^ 0.40% - 0.36% 0.32% 0.25% -
Old Mutual Pan African Fund^^ 1.00% - 0.90% -
Up to
2.00% -
Old Mutual Monthly Income High Yield Bond
Fund^^^^ - - 0.5625% 0.50% - Nil
Merian Europe (ex UK) Smaller Companies Fund 0.75% - 0.675% 0.60% - -
Merian Global Equity Income Fund (IRL) 0.75% 1.00% 0.675% - - -
Merian Gold & Silver Fund 0.75% - 0.675% 0.60% 0.15% -
Old Mutual Compass Portfolio 2 - - - - - -
Old Mutual Compass Portfolio 3 - - - - - -
Old Mutual Compass Portfolio 4 - - - - - -
Old Mutual Compass Portfolio 5 - - - - - -
Merian UK Specialist Equity Fund 1.00% - - - - Nil
Merian Style Premia Absolute Return Fund - - - - - Nil
Merian Financials Contingent Capital Fund 0.75% - - 0.60% - -
The Investment Management Fee for each Sub-Fund shall accrue on each Dealing Day. The Company will not pay the out-of pocket expenses of the
Investment Manager. Out of the Investment Management Fee, the Investment Manager shall pay the fees and commissions payable to the relevant
Investment Adviser and transition managers. The Investment Manager shall also pay those reasonable out-of-pocket expenses which the Investment Manager
has previously agreed with the relevant Investment Adviser to pay out of its Investment Management Fee.
In respect of the Old Mutual European Best Ideas Fund the fees payable to the Investment Advisers shall not be paid out of the Investment Management Fee
but shall be payable out of assets of the Old Mutual European Best Ideas Fund and such fees shall not exceed in total 1% per annum of its Net Asset Value
and shall be charged to the Sub-Fund in addition to the Investment Management Fee payable to the Investment Manager as disclosed above.
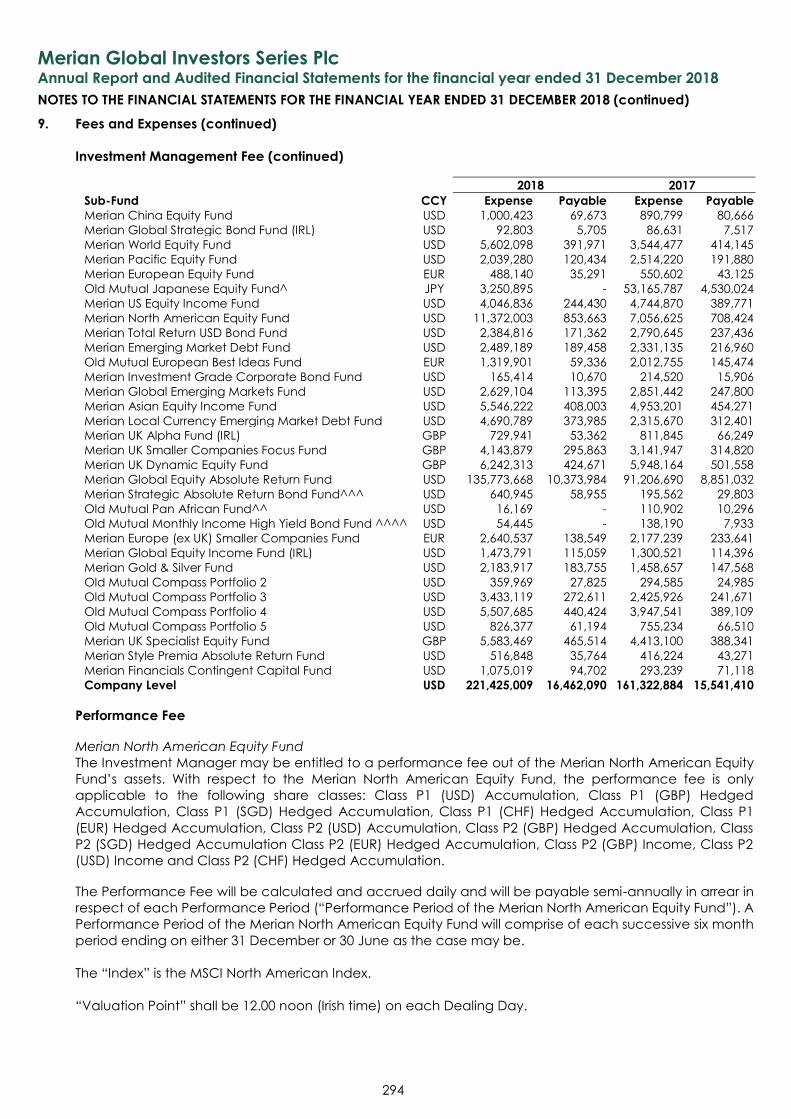
Merian Global Investors Series Plc
Annual Report and Audited Financial Statements for the financial year ended 31 December 2018
NOTES TO THE FINANCIAL STATEMENTS FOR THE FINANCIAL YEAR ENDED 31 DECEMBER 2018 (continued)
294
9. Fees and Expenses (continued)
Investment Management Fee (continued)
2018 2017
Sub-Fund CCY Expense Payable Expense Payable
Merian China Equity Fund USD 1,000,423 69,673 890,799 80,666
Merian Global Strategic Bond Fund (IRL) USD 92,803 5,705 86,631 7,517
Merian World Equity Fund USD 5,602,098 391,971 3,544,477 414,145
Merian Pacific Equity Fund USD 2,039,280 120,434 2,514,220 191,880
Merian European Equity Fund EUR 488,140 35,291 550,602 43,125
Old Mutual Japanese Equity Fund^ JPY 3,250,895 - 53,165,787 4,530,024
Merian US Equity Income Fund USD 4,046,836 244,430 4,744,870 389,771
Merian North American Equity Fund USD 11,372,003 853,663 7,056,625 708,424
Merian Total Return USD Bond Fund USD 2,384,816 171,362 2,790,645 237,436
Merian Emerging Market Debt Fund USD 2,489,189 189,458 2,331,135 216,960
Old Mutual European Best Ideas Fund EUR 1,319,901 59,336 2,012,755 145,474
Merian Investment Grade Corporate Bond Fund USD 165,414 10,670 214,520 15,906
Merian Global Emerging Markets Fund USD 2,629,104 113,395 2,851,442 247,800
Merian Asian Equity Income Fund USD 5,546,222 408,003 4,953,201 454,271
Merian Local Currency Emerging Market Debt Fund USD 4,690,789 373,985 2,315,670 312,401
Merian UK Alpha Fund (IRL) GBP 729,941 53,362 811,845 66,249
Merian UK Smaller Companies Focus Fund GBP 4,143,879 295,863 3,141,947 314,820
Merian UK Dynamic Equity Fund GBP 6,242,313 424,671 5,948,164 501,558
Merian Global Equity Absolute Return Fund USD 135,773,668 10,373,984 91,206,690 8,851,032
Merian Strategic Absolute Return Bond Fund^^^ USD 640,945 58,955 195,562 29,803
Old Mutual Pan African Fund^^ USD 16,169 - 110,902 10,296
Old Mutual Monthly Income High Yield Bond Fund ^^^^ USD 54,445 - 138,190 7,933
Merian Europe (ex UK) Smaller Companies Fund EUR 2,640,537 138,549 2,177,239 233,641
Merian Global Equity Income Fund (IRL) USD 1,473,791 115,059 1,300,521 114,396
Merian Gold & Silver Fund USD 2,183,917 183,755 1,458,657 147,568
Old Mutual Compass Portfolio 2 USD 359,969 27,825 294,585 24,985
Old Mutual Compass Portfolio 3 USD 3,433,119 272,611 2,425,926 241,671
Old Mutual Compass Portfolio 4 USD 5,507,685 440,424 3,947,541 389,109
Old Mutual Compass Portfolio 5 USD 826,377 61,194 755,234 66,510
Merian UK Specialist Equity Fund GBP 5,583,469 465,514 4,413,100 388,341
Merian Style Premia Absolute Return Fund USD 516,848 35,764 416,224 43,271
Merian Financials Contingent Capital Fund USD 1,075,019 94,702 293,239 71,118
Company Level USD 221,425,009 16,462,090 161,322,884 15,541,410
Performance Fee
Merian North American Equity Fund
The Investment Manager may be entitled to a performance fee out of the Merian North American Equity
Fund’s assets. With respect to the Merian North American Equity Fund, the performance fee is only
applicable to the following share classes: Class P1 (USD) Accumulation, Class P1 (GBP) Hedged
Accumulation, Class P1 (SGD) Hedged Accumulation, Class P1 (CHF) Hedged Accumulation, Class P1
(EUR) Hedged Accumulation, Class P2 (USD) Accumulation, Class P2 (GBP) Hedged Accumulation, Class
P2 (SGD) Hedged Accumulation Class P2 (EUR) Hedged Accumulation, Class P2 (GBP) Income, Class P2
(USD) Income and Class P2 (CHF) Hedged Accumulation.
The Performance Fee will be calculated and accrued daily and will be payable semi-annually in arrear in
respect of each Performance Period (“Performance Period of the Merian North American Equity Fund”). A
Performance Period of the Merian North American Equity Fund will comprise of each successive six month
period ending on either 31 December or 30 June as the case may be.
The “Index” is the MSCI North American Index.
“Valuation Point” shall be 12.00 noon (Irish time) on each Dealing Day.
Merian Global Investors Series Plc
Annual Report and Audited Financial Statements for the financial year ended 31 December 2018
NOTES TO THE FINANCIAL STATEMENTS FOR THE FINANCIAL YEAR ENDED 31 DECEMBER 2018 (continued)
295
9. Fees and Expenses (continued)
Performance Fee (continued)
Merian North American Equity Fund (continued)
“The Index Performance” in respect of a Performance Period of the Merian North American Equity Fund is
the difference between the level of the Index calculated at the Valuation Point on the last Business Day of
the previous Performance Period of the Merian North American Equity Fund and the level of the Index
calculated at the Valuation Point on the last Business Day of the relevant Performance Period of the Merian
North American Equity Fund, expressed as a percentage.
The “Sub-Fund Performance” in respect of the first Performance Period of the Merian North American Equity
Fund is the difference between the opening Net Asset Value per Share and the Net Asset Value per Share
at the Valuation Point on the last Business Day of the Performance Period of the Merian North American
Equity Fund, expressed as a percentage. For each Performance Period of the Merian North American
Equity Fund thereafter, the Sub-Fund Performance is the difference between the Net Asset Value per Share
at the Valuation Point on the last Business Day of the previous Performance Period of the Merian North
American Equity Fund and the Net Asset Value per Share at the Valuation Point on the last Business Day of
the relevant Performance Period of the Merian North American Equity Fund, expressed as a percentage.
Where a fair value adjustment has been made to the Net Asset Value per Share at the Valuation Point on
the last Business Day of the previous Performance Period of the Merian North American Equity Fund then
this will be excluded for the purposes of the calculation of the Performance Fee.
For hedged share classes the Index will be the relevant hedged version of the Index, priced using the
prevailing exchange rates at the Index valuation point. The exchange rates used in calculating the net
asset values for hedged share classes will be the prevailing exchange rates at the Sub-Fund’s Valuation
Point.
In calculating the Net Asset Value per Share of each Class for Performance Fee purposes no deduction is
made on account of Performance Fees accrued in the Performance Period of the Merian North American
Equity Fund and any net income distributed to Shareholders in respect of the Performance Period of the
Merian North American Equity Fund is added back.
The “Percentage Outperformance” in respect of Performance Periods of the Merian North American Equity
Fund where Sub-Fund Performance is greater than Index Performance is the arithmetical difference
between Sub-Fund Performance and Index Performance, expressed as a percentage. In respect of
Performance Periods of the Merian North American Equity Fund where Sub-Fund Performance is less than
Index Performance, such underperformance, being the arithmetical difference between Sub-Fund
Performance and Index Performance expressed in percentage points, will be carried forward and no
Performance Fee will be payable in any subsequent Performance Period of 10 the Merian North American
Equity Fund unless Sub-Fund Performance measured against Index Performance has recovered any
accumulated percentage underperformance for previous periods. In the Performance Period of the
Merian North American Equity Fund in which any accumulated percentage underperformance is
recovered, only that part of the Percentage Outperformance for such period as exceeds the
accumulated percentage underperformance carried forward is taken into account for the purposes of
calculating the performance fee payable for the Performance Period of the Merian North American Equity
Fund.
The amount of Performance Fee payable in respect of each Share is a US Dollar amount equivalent to the
opening Net Asset Value per Share on the first Business Day of the Performance Period of the Merian North
American Equity Fund x Percentage Outperformance x 20 %. and is payable on the average number of
Shares in issue during the Performance Period of the Merian North American Equity Fund.
For the purposes of the first calculation of the Performance Fee, the initial offer price in respect of each
Share Class was taken as the opening Net Asset Value.
Merian Global Investors Series Plc
Annual Report and Audited Financial Statements for the financial year ended 31 December 2018
NOTES TO THE FINANCIAL STATEMENTS FOR THE FINANCIAL YEAR ENDED 31 DECEMBER 2018 (continued)
296
9. Fees and Expenses (continued)
Performance Fee (continued)
Merian North American Equity Fund (continued)
The Performance Fee accrues and is taken into account in the calculation of the Net Asset Value per Share
on a daily basis.
The amount of the Performance Fee will be calculated by the Administrator. The calculation of the
Performance Fee shall be verified by the Depositary.
The Investment Manager may, at its discretion, waive the Performance Fee payable in respect of a
Performance Period of the Merian North American Equity Fund.
Performance Fees are payable on net realised and net unrealised gains and losses as at the end of each
Performance Period of the Merian North American Equity Fund and as a result, Performance Fees may be
paid on unrealised gains which may subsequently never be realised.
Performance Fees may also be payable during a Performance Period of the Merian North American Equity
Fund where there is a decline in the Net Asset Value per Share.
Performance Fees were USD 4,959 for the financial year ended 31 December 2018 (2017: USD Nil) and the
amount accrued at the financial year ended 31 December 2018 was USD Nil (2017: USD Nil).
Merian UK Smaller Companies Focus Fund
The Investment Manager may be entitled to a performance fee (a portion of which may be payable to
the Investment Adviser) out of the Merian UK Smaller Companies Focus Fund’s assets. With respect to the
Merian UK Smaller Companies Focus Fund, the performance fee is only applicable to the following share
classes: Class A (GBP) Income Shares, Class R (GBP) Income Shares and Class U1 (GBP) Income Shares.
The Performance Fee will be calculated and accrued daily and will be payable semi-annually in arrears in
respect of each Performance Period (“Performance Period of the Merian UK Smaller Companies Focus
Fund”). A Performance Period of the Merian UK Smaller Companies Focus Fund will comprise of each
successive six month period ending on either 31 December or 30 June as the case may be.
“The Index” is the Numis Smaller Companies Index excluding Investment Companies.
“The Index Performance” in respect of a Performance Period of the Merian UK Smaller Companies Focus
Fund is the difference between the opening level of the Index on the first Business Day and on the closing
level of the Index on the last Business Day of the Performance Period of the Merian UK Smaller Companies
Focus Fund, expressed as a percentage.
The “Sub-Fund Performance” in respect of a Performance Period of the Merian UK Smaller Companies
Focus Fund is the difference between the opening Net Asset Value per Share on the first Business Day of
the relevant Performance Period of the Merian UK Smaller Companies Focus Fund, which reflects the
charging of a Performance Fee, if any, in respect of the previous Performance Period of the Merian UK
Smaller Companies Focus Fund, and the Net Asset Value per Share (before the deduction of any unrealised
Performance Fee) on the last Business Day of the relevant Performance Period of the Merian UK Smaller
Companies Focus Fund, expressed as a percentage.
In calculating the Net Asset Value per Share for Performance Fee purposes no deduction is made on
account of Performance Fees accrued in the Performance Period of the Merian UK Smaller Companies
Focus Fund and any net income distributed to Shareholders in respect of the period is added back.
The “Percentage Outperformance” in respect of Performance Periods of the Merian UK Smaller Companies
Focus Fund where Sub-Fund Performance is greater than Index Performance is the arithmetical difference
between Sub-Fund Performance and Index Performance, expressed as a percentage.
Merian Global Investors Series Plc
Annual Report and Audited Financial Statements for the financial year ended 31 December 2018
NOTES TO THE FINANCIAL STATEMENTS FOR THE FINANCIAL YEAR ENDED 31 DECEMBER 2018 (continued)
297
9. Fees and Expenses (continued)
Performance Fee (continued)
Merian UK Smaller Companies Focus Fund (continued)
In respect of Performance Periods of the Merian UK Smaller Companies Focus Fund where Sub-Fund
Performance is less than Index Performance, such underperformance, being the arithmetical difference
between Sub-Fund Performance and Index Performance expressed in percentage points, will be carried
forward and no Performance Fee will be payable in any subsequent Performance Period of the Merian UK
Smaller Companies Focus Fund unless Sub-Fund Performance measured against Index Performance has
recovered any accumulated percentage underperformance for previous Performance Periods of the
Merian UK Smaller Companies Focus Fund. In the Performance Period of the Merian UK Smaller Companies
Focus Fund in which any accumulated percentage underperformance is recovered, only that part of the
Percentage Outperformance for such period as exceeds the accumulated percentage
underperformance carried forward is taken into account for the purposes of calculating the performance
fee payable for the Performance Period of the Merian UK Smaller Companies Focus Fund.
The amount of Performance Fee payable in respect of each Share is a Sterling amount equivalent to the
opening Net Asset Value per Share on the first Business Day of the Performance Period of the Merian UK
Smaller Companies Focus Fund x Percentage Outperformance x 10% and is payable on the average
number of Shares in issue during the Performance Period of the Merian UK Smaller Companies Focus Fund.
Furthermore the amount of Performance Fee payable in respect of a Performance Period of the Merian
UK Smaller Companies Focus Fund is subject to a maximum amount (the “Cap”). The Cap is a Sterling
amount equivalent to the opening Net Asset Value per Share on the first Business Day of the Performance
Period of the Merian UK Smaller Companies Focus Fund x opening number of Shares in issue on the first
Business Day of the Performance Period of the Merian UK Smaller Companies Focus Fund x 0.75%.
The Performance Fee accrues and is taken into account in the calculation of the Net Asset Value per Share
on a daily basis.
The amount of the Performance Fee will be calculated by the Administrator. The calculation of the
Performance Fee shall be verified by the Depositary.
The Investment Manager may, at its discretion, waive the Performance Fee payable in respect of a
Performance Period of the Merian UK Smaller Companies Focus Fund.
Performance Fees are payable on net realised and net unrealised gains and losses as at the end of each
Performance Period of the Merian UK Smaller Companies Focus Fund and as a result, Performance Fees
may be paid on unrealised gains which may subsequently never be realised.
Performance Fees may also be payable during a Performance Period of the Merian UK Smaller Companies
Focus Fund where there is a decline in the Net Asset Value per Share.
Performance Fees were GBP 2,274,722 for the financial year ended 31 December 2018 (2017: GBP
3,054,624) and the amount accrued at the financial year ended 31 December 2018 was GBP Nil (2017:
GBP 1,826,583).
Merian UK Dynamic Equity Fund
The Investment Manager may be entitled to a performance fee (a portion of which may be payable to
the Investment Adviser) out of the Merian UK Dynamic Equity Fund’s assets. With respect to the Merian UK
Dynamic Equity Fund, the performance fee is only applicable to the following share classes: Class I (EUR)
Hedged Accumulation Shares, Class A (GBP) Income Shares and Class R (GBP) Income Shares.
Merian Global Investors Series Plc
Annual Report and Audited Financial Statements for the financial year ended 31 December 2018
NOTES TO THE FINANCIAL STATEMENTS FOR THE FINANCIAL YEAR ENDED 31 DECEMBER 2018 (continued)
298
9. Fees and Expenses (continued)
Performance Fee (continued)
Merian UK Dynamic Equity Fund (continued)
The Performance Fee will be calculated and accrued daily and will be payable semi-annually in arrears in
respect of each Performance Period (“Performance Period of the Merian UK Dynamic Equity Fund”). A
Performance Period of the Merian UK Dynamic Equity Fund will comprise of each successive six month
period ending on either 31 December or 30 June as the case may be.
“The Index” is the FTSE 250 Index Excluding Investment Trusts.
“The Index Performance” in respect of a Performance Period of the Merian UK Dynamic Equity Fund, is the
difference between the level of the Index calculated at the Valuation Point on the last Business Day of the
previous Performance Period of the Merian UK Dynamic Equity Fund and the level of the Index calculated
at the Valuation Point on the last Business Day of the relevant Performance Period of the Merian UK
Dynamic Equity Fund, expressed as a percentage.
The “Sub-Fund Performance” in respect of the first Performance Period of the Merian UK Dynamic Equity
Fund is the difference between the opening Net Asset Value per Share and the Net Asset Value per Share
at the Valuation Point on the last Business Day of the Performance Period of the Merian UK Dynamic Equity
Fund, expressed as a percentage. For each Performance Period of the Merian UK Dynamic Equity Fund
thereafter, the Sub-Fund Performance is the difference between the Net Asset Value per Share at the
Valuation Point on the last Business Day of the previous Performance Period of the Merian UK Dynamic
Equity Fund and the Net Asset Value per Share at the Valuation Point on the last Business Day of the relevant
Performance Period of the Merian UK Dynamic Equity Fund, expressed as a percentage.
In calculating the Net Asset Value per Share of each Class for Performance Fee purposes no deduction is
made on account of Performance Fees accrued in the Performance Period of the Merian UK Dynamic
Equity Fund and any net income distributed to Shareholders in respect of the Performance Period of the
Merian UK Dynamic Equity Fund is added back.
The “Percentage Outperformance” in respect of Performance Periods of the Merian UK Dynamic Equity
Fund where Sub-Fund Performance is greater than Index Performance is the arithmetical difference
between Sub-Fund Performance and Index Performance, expressed as a percentage. In respect of
Performance Periods of the Merian UK Dynamic Equity Fund where Sub-Fund Performance is less than Index
Performance, such underperformance, being the arithmetical difference between Sub-Fund Performance
and Index Performance expressed in percentage points, will be carried forward and no Performance Fee
will be payable in any subsequent Performance Period of the Merian UK Dynamic Equity Fund unless Sub-
Fund Performance measured against Index Performance has recovered any accumulated percentage
underperformance for previous periods. In the Performance Period of the Merian UK Dynamic Equity Fund
in which any accumulated percentage underperformance is recovered, only that part of the Percentage
Outperformance for such period as exceeds the accumulated percentage underperformance carried
forward is taken into account for the purposes of calculating the performance fee payable for the
Performance Period of the Merian UK Dynamic Equity Fund.
The amount of Performance Fee payable in respect of each Share is a Sterling amount equivalent to the
opening Net Asset Value per Share on the first Business Day of the Performance Period of the Merian UK
Dynamic Equity Fund x Percentage Outperformance x 20% and is payable on the average number of
Shares in issue during the Performance Period of the Merian UK Dynamic Equity Fund.
For the purposes of the first calculation of the Performance Fee, the initial offer price in respect of each
Share Class was taken as the opening Net Asset Value.
The Performance Fee accrues and is taken into account in the calculation of the Net Asset Value per Share
on a daily basis.
Merian Global Investors Series Plc
Annual Report and Audited Financial Statements for the financial year ended 31 December 2018
NOTES TO THE FINANCIAL STATEMENTS FOR THE FINANCIAL YEAR ENDED 31 DECEMBER 2018 (continued)
299
9. Fees and Expenses (continued)
Performance Fee (continued)
Merian UK Dynamic Equity Fund (continued)
The amount of the Performance Fee will be calculated by the Administrator. The calculation of the
Performance Fee shall be verified by the Depositary.
The Investment Manager may, at its discretion, waive the Performance Fee payable in respect of a
Performance Period of the Merian UK Dynamic Equity Fund.
Performance Fees are payable on net realised and net unrealised gains and losses as at the end of each
Performance Period of the Merian UK Dynamic Equity Fund and as a result, Performance Fees may be paid
on unrealised gains which may subsequently never be realised.
Performance Fees may also be payable during a Performance Period of the Merian UK Dynamic Equity
Fund where there is a decline in the Net Asset Value per Share.
Performance Fees were GBP Nil for the financial year ended 31 December 2018 (2017: GBP 14,881,108)
and the amount accrued at the financial year ended 31 December 2018 was GBP Nil (2017: GBP
3,727,152).
Merian Global Equity Absolute Return Fund
The Investment Manager may be entitled to a performance fee (a portion of which may be payable to
the Investment Adviser) out of the Merian Global Equity Absolute Return Fund’s assets. The Performance
Fee is applicable to all share classes with the exception of: Class A (CHF) Hedged Accumulation Shares
and Class X (GBP) Hedged Accumulation Shares.
The Performance Fee will accrue on a daily basis and the accrual will be reflected in the Net Asset Value
and will be payable semi-annually in arrears in respect of each Performance Period which will comprise of
each successive six month period ending on either 31 December or 30 June as the case may be (a
“Performance Period of the Merian Global Equity Absolute Return Fund”).
The Performance Fee as at the end of each Performance Period of the Merian Global Equity Absolute
Return Fund for all share classes shall be equal in aggregate to 20% of the amount by which any increase
in the Net Asset Value per Share of each Class during the Performance Period of the Merian Global Equity
Absolute Return Fund exceeds the “Hurdle Rate” which will be the average (1) Bank of England Base Rate
for the GBP share classes, (2) European Central Bank Base Rate for the EUR share classes, (3) Federal
Reserve Funds Base Rate for the USD share classes, (4) 3 month Swiss franc (CHF) LIBOR interest rate for the
CHF share classes, (5) Swedish National Bank Base Rate for the SEK share classes and (6) Singapore Average
Overnight Interest Rate for the SGD share classes, Performance Period of the Merian Global Equity Absolute
Return Fund multiplied by the weighted average number of total Shares in issue of each Class on each
Dealing Day during the Performance Period of the Merian Global Equity Absolute Return Fund. Where no
central bank base rate exists, an equivalent inter-bank reference rate will be used.
The initial issue price as set out in the section of the Supplement headed “Initial Offer Period and
Subscription Price” was the starting price for the calculation of the first performance fee payable of any
share class to which a performance fee is applicable.
In calculating the Net Asset Value per Share of each Class for Performance Fee purposes, no deduction is
made on account of Performance Fees accrued in the Performance Period of the Merian Global Equity
Absolute Return Fund and any net income distributed to Shareholders in respect of the period is added
back.
The Performance Fee is only payable when the Net Asset Value of each Class exceeds the Hurdle Rate. If,
during a performance fee period, the performance of the Shares does not exceed the Hurdle Rate, no
Performance Fee is payable until such unachieved performance is reclaimed.
Merian Global Investors Series Plc
Annual Report and Audited Financial Statements for the financial year ended 31 December 2018
NOTES TO THE FINANCIAL STATEMENTS FOR THE FINANCIAL YEAR ENDED 31 DECEMBER 2018 (continued)
300
9. Fees and Expenses (continued)
Performance Fee (continued)
Merian Global Equity Absolute Return Fund (continued)
All Performance Fee payments shall be subject to the restriction that in paying a Performance Fee, the Net
Asset Value per Share of each Class at the relevant Performance Period of the Merian Global Equity
Absolute Return Fund shall not be less than the Net Asset Value per Share Class on the last day that a
Performance Fee was paid (the “Net Asset Value High Water Mark”). The Performance Fee is only payable
on the increase in the Net Asset Value per Share of each Class during the Performance Period of the Merian
Global Equity Absolute Return Fund over the relevant Hurdle Rate during the Performance Period of the
Merian Global Equity Absolute Return Fund.
The amount of the Performance Fee will be calculated by the Administrator. The calculation of the
Performance Fee shall be verified by the Depositary.
The Investment Manager may, at its discretion, waive the Performance Fee payable in respect of a
Performance Period of the Merian Global Equity Absolute Return Fund.
Performance Fees are payable on net realised and net unrealised gains and losses as at the end of each
Performance Period of the Merian Global Equity Absolute Return Fund and as a result, Performance Fees
may be paid on unrealised gains which may subsequently never be realised.
Performance Fees were USD 1,610,730 for the financial year ended 31 December 2018 (2017: USD
153,496,777) and the amount accrued at the financial year ended 31 December 2018 was USD Nil (2017:
USD 146,641,214).
Merian Strategic Absolute Return Bond Fund^^^
The Investment Manager may be entitled to a performance fee out of the Merian Strategic Absolute Return
Bond Fund’s assets. In 2018, the Merian Strategic Absolute Return Bond Fund introduced Share Classes
subject to Performance Fee. Performance Fee is applicable to all Share Classes with the exception of: Class
X, Class F1, Class F2 and Class L2.
The Performance Fee will accrue on a daily basis and the accrual will be reflected in the Net Asset Value
and will be payable semi-annually in arrears in respect of each Performance Period (a “Performance
Period of the Merian Strategic Absolute Return Bond Fund”). A Performance Period of the Merian Strategic
Absolute Return Bond Fund will comprise of each successive six month period ending on either 31
December or 30 June as the case may be. The first Performance Period for each Class will begin on the
date on which the first Shares of the relevant Class are issued and will end on 30 June or 31 December
respectively in that year.
The Performance Fee as at the end of each Performance Period of the Merian Strategic Absolute Return
Bond Fund shall be equal in aggregate to 10 per cent. of the amount by which any increase in the Net
Asset Value per Share of each Class during the Performance Period of the Merian Strategic Absolute Return
Bond Fund exceeds the “Hurdle Rate”. For all Share Classes, the Hurdle Rate will be the average (1) Sterling
Overnight Interbank Average Rate for the GBP Share Classes, (2) Euro Overnight Index Average Rate for
the EUR Share Classes, (3) Federal Funds Effective Overnight Rate for the USD Share Classes, and (4) Swiss
Average Overnight Rate for the CHF Share Classes, for the relevant Class currency during the Performance
Period of the Merian Strategic Absolute Return Bond Fund multiplied by the weighted average number of
total Shares in issue of each Class on each Dealing Day during the Performance Period of the Merian
Strategic Absolute Return Bond Fund. Where no central bank base rate exists, an equivalent inter-bank
reference rate will be used.
The initial issue price as set out above in the section of the Supplement headed “Initial Offer Period and
Subscription Price” was the starting price for the calculation of the first performance fee payable of any
share class to which a performance fee is applicable. The first Performance Period will begin on the Business
Day after the date of this Supplement and will end on 31 December 2017.
Merian Global Investors Series Plc
Annual Report and Audited Financial Statements for the financial year ended 31 December 2018
NOTES TO THE FINANCIAL STATEMENTS FOR THE FINANCIAL YEAR ENDED 31 DECEMBER 2018 (continued)
301
9. Fees and Expenses (continued)
Performance Fee (continued)
Merian Strategic Absolute Return Bond Fund^^^ (continued)
In calculating the Net Asset Value per Share of each Class for Performance Fee purposes, no deduction is
made on account of Performance Fees accrued in the Performance Period of the Merian Strategic
Absolute Return Bond Fund and any net income distributed to Shareholders in respect of the period is
added back.
The Performance Fee is only payable when the Net Asset Value of each Class exceeds the Hurdle Rate. If,
during a performance fee period, the performance of the Shares does not exceed the Hurdle Rate, no
Performance Fee is payable until such unachieved performance is reclaimed.
All Performance Fee payments shall be subject to the restriction that in paying/accruing a Performance
Fee, the Net Asset Value per Share of each Class at the relevant Performance Period of Merian Strategic
Absolute Return Bond Fund shall not be less than the Net Asset Value per Share Class on the last day that
a Performance Fee was paid (or the initial subscription price if higher) (the “Net Asset Value High Water
Mark”). The Performance Fee is only payable on the increase in the Net Asset Value per Share of each
Class during the Performance Period of the Merian Strategic Absolute Return Bond Fund in excess of the
relevant Hurdle Rate during the Performance Period of the Merian Strategic Absolute Return Bond Fund.
The Investment Manager may, at its discretion, waive the Performance Fee payable in respect of a
Performance Period of the Merian Strategic Absolute Return Bond Fund.
Performance Fees are payable on net realised and net unrealised gains and losses as at the end of each
Performance Period of the Merian Strategic Absolute Return Bond Fund and as a result, Performance Fees
may be paid on unrealised gains which may subsequently never be realised.
Performance Fees were USD Nil for the financial year ended 31 December 2018 (2017: N/A) and the
amount accrued at the financial year ended 31 December 2018 was USD Nil (2017: N/A).
Merian Gold & Silver Fund
The Investment Manager may be entitled to a performance fee out of the Merian Gold & Silver Fund’s
assets. With respect to the Merian Gold & Silver Fund, the performance fee is only applicable to the
following share classes: Class U3 (EUR) Accumulation Shares, Class U3 (GBP) Accumulation Shares and Class
U3 (USD) Accumulation Shares.
The Performance Fee will be calculated and accrued daily and will be payable semi-annually in arrears in
respect of each Performance Period (“Performance Period of the Merian Gold & Silver Fund”). A
Performance Period of the Merian Gold & Silver Fund will comprise of each successive six month period
ending on either 31 December or 30 June as the case may be.
“The Index” is a composite, made up of (i) a 50:50 split between the FTSE Gold Miners Index expressed in
GBP and XAU:GBP for the U3 (GBP) Accumulation Shares, (ii) a 50:50 split between the FTSE Gold Miners
Index expressed in EUR and XAU:EUR for the U3 (EUR) Accumulation Shares and (iii) a 50:50 split between
the FTSE Gold Miners Index expressed in USD and XAU: USD for the U3 (USD) Accumulation Shares.
“The Index Performance” in respect of a Performance Period of the Merian Gold & Silver Fund, is the
difference between the level of the Index calculated at the Valuation Point on the last Business Day of the
previous Performance Period of the Merian Gold & Silver Fund and the level of the Index calculated at the
Valuation Point on the last Business Day of the relevant Performance Period of the Merian Gold & Silver
Fund, expressed as a percentage. The first Performance Period for each new class will begin on the date
on which the first Shares of the U3 (GBP) Accumulation, U3 (EUR) Accumulation and U3 (USD) Accumulation
Shares are issued respectively up to 31 December 2018.
Merian Global Investors Series Plc
Annual Report and Audited Financial Statements for the financial year ended 31 December 2018
NOTES TO THE FINANCIAL STATEMENTS FOR THE FINANCIAL YEAR ENDED 31 DECEMBER 2018 (continued)
302
9. Fees and Expenses (continued)
Performance Fee (continued)
Merian Gold & Silver Fund (continued)
The “Sub-Fund Performance” in respect of the first Performance Period of the Merian Gold & Silver Fund is
the difference between the opening Net Asset Value per Share and the Net Asset Value per Share at the
Valuation Point on the last Business Day of the Performance Period of the Merian Gold & Silver Fund,
expressed as a percentage. For each Performance Period of the Merian Gold & Silver Fund thereafter, the
Sub-Fund Performance is the difference between the Net Asset Value per Share at the Valuation Point on
the last Business Day of the previous Performance Period of the Merian Gold & Silver Fund and the Net Asset
Value per Share at the Valuation Point on the last Business Day of the relevant Performance Period of the
Merian Gold & Silver Fund, expressed as a percentage.
In calculating the Net Asset Value per Share of each Class U3 for Performance Fee purposes no deduction
is made on account of Performance Fees accrued in the Performance Period of the Merian Gold & Silver
Fund and any net income distributed to Shareholders in respect of the Performance Period of the Merian
Gold & Silver Fund is added back.
The “Percentage Outperformance” in respect of Performance Periods of the Merian Gold & Silver Fund
where Sub-Fund Performance is greater than Index Performance is the arithmetical difference between
Sub-Fund Performance and Index Performance, expressed as a percentage. In respect of Performance
Periods of the Merian Gold & Silver Fund where Sub-Fund Performance is less than Index Performance, such
underperformance, being the arithmetical difference between Sub-Fund Performance and Index
Performance expressed in percentage points, will be carried forward and no Performance Fee will be
payable in any subsequent Performance Period of the Merian Gold & Silver Fund unless Sub-Fund
Performance measured against Index Performance has recovered any accumulated percentage
underperformance for previous periods. In the Performance Period of the Merian Gold & Silver Fund in
which any accumulated percentage underperformance is recovered, only that part of the Percentage
Outperformance for such period as exceeds the accumulated percentage underperformance carried
forward is taken into account for the purposes of calculating the performance fee payable for the
Performance Period of the Merian Gold & Silver Fund.
The amount of Performance Fee payable in respect of each Share is a USD amount equivalent to the
opening Net Asset Value per Share on the first Business Day of the Performance Period of the Merian Gold
& Silver Fund x Percentage Outperformance x 20% and is payable based on the number of Shares in issue
for the Class U3 (EUR) Accumulation Shares, Class U3 (GBP) Accumulation Shares and Class U3 (USD)
Accumulation Shares during the Performance Period of the Merian Gold & Silver Fund.
For the purposes of the first calculation of the Performance Fee, the initial offer price in respect of each
Share Class was taken as the opening Net Asset Value. The Performance Fee accrues and is taken into
account in the calculation of the Net Asset Value per Share on a daily basis.
The amount of the Performance Fee will be calculated by the Administrator. The calculation of the
Performance Fee shall be verified by the Depositary.
The Investment Manager may, at its discretion, waive the Performance Fee payable in respect of a
Performance Period of the Merian Gold & Silver Fund.
Performance Fees are payable on net realised and net unrealised gains and losses as at the end of each
Performance Period of the Merian Gold & Silver Fund and as a result, Performance Fees may be paid on
unrealised gains which may subsequently never be realised.
Performance Fees may also be payable during a Performance Period of the Merian Gold & Silver Fund
where there is a decline in the Net Asset Value per Share.
Performance Fees were USD 15,317 for the financial year ended 31 December 2018 (2017: USD Nil) and the
amount accrued at the financial year ended 31 December 2018 was USD 15,317 (2017: USD Nil).
Merian Global Investors Series Plc
Annual Report and Audited Financial Statements for the financial year ended 31 December 2018
NOTES TO THE FINANCIAL STATEMENTS FOR THE FINANCIAL YEAR ENDED 31 DECEMBER 2018 (continued)
303
9. Fees and Expenses (continued)
Performance Fee (continued)
Merian UK Specialist Equity Fund
The Investment Manager may be entitled to a performance fee (a portion of which may be payable to
the Investment Adviser) out of the Merian UK Specialist Equity Fund’s assets. With respect to the Merian UK
Specialist Equity Fund, the performance fee is applicable to all share classes with the exception of the Class
X (GBP) Accumulation Shares.
The Performance Fee will accrue on a daily basis and the accrual will be reflected in the Net Asset Value
and will be payable semi-annually in arrear in respect of each Performance Period (a “Performance Period
of the Merian UK Specialist Equity Fund”). A Performance Period of the Merian UK Specialist Equity Fund will
comprise of each successive six month period ending on either 31 December or 30 June as the case may
be. The first Performance Period for each Class will begin on the date on which the first Shares of the
relevant Class are issued and will end on 30 June or 31 December respectively in that year.
The Performance Fee as at the end of each Performance Period of the Merian UK Specialist Equity Fund
for all share classes shall be equal in aggregate to 20%. of the amount by which any increase in the Net
Asset Value per Share of each Class during the Performance Period of the Merian UK Specialist Equity Fund
exceeds the “Hurdle Rate” which will be the average (1) Sterling Overnight Interbank Average Rate for the
GBP share classes, (2) Euro Overnight Index Average for the EUR share classes, (3) Federal Funds Effective
Overnight Rate for the USD share classes, and (4) Swiss Average Overnight Rate for the CHF share classes
for the relevant Class currency during the Performance Period of the Merian UK Specialist Equity Fund
multiplied by the weighted average number of total Shares in issue of each Class on each Dealing Day
during the Performance Period of the Merian UK Specialist Equity Fund.
The initial issue price, as set out in the section of the Supplement headed “Initial Offer Period and
Subscription Price”, was the starting price for the calculation of the first performance fee payable of any
share class to which a performance fee is applicable.
In calculating the Net Asset Value per Share of each Class for Performance Fee purposes, no deduction is
made on account of Performance Fees accrued in the Performance Period of the Merian UK Specialist
Equity Fund and any net income distributed to Shareholders in respect of the period is added back.
The Performance Fee is only payable when the Net Asset Value of each Class exceeds the Hurdle Rate. If,
during a performance fee period, the performance of the Shares does not exceed the Hurdle Rate, no
Performance Fee is payable until such unachieved performance is reclaimed.
All Performance Fee payments shall be subject to the restriction that in paying a Performance Fee, the Net
Asset Value per Share of each Class at the relevant Performance Period of the Merian UK Specialist Equity
Fund shall not be less than the Net Asset Value per Share Class on the last day that a Performance Fee was
paid (the “Net Asset Value High Water Mark”). The Performance Fee is only payable on the increase in the
Net Asset Value per Share of each Class during the Performance Period of the Merian UK Specialist Equity
Fund over the relevant Hurdle Rate during the Performance Period of the Merian UK Specialist Equity Fund.
The amount of the Performance Fee will be calculated by the Administrator. The calculation of the
Performance Fee shall be verified by the Depositary.
The Investment Manager may, at its discretion, waive the Performance Fee payable in respect of a
Performance Period of the Merian UK Specialist Equity Fund.
Performance Fees are payable on net realised and net unrealised gains and losses as at the end of each
Performance Period of the Merian UK Specialist Equity Fund and as a result, Performance Fees may be paid
on unrealised gains which may subsequently never be realised. Performance Fees were GBP Nil for the
financial year ended 31 December 2018 (2017: GBP 16,773,792) and the amount accrued at the financial
year ended 31 December 2018 was GBP Nil (2017: GBP 8,714,095).
Merian Global Investors Series Plc
Annual Report and Audited Financial Statements for the financial year ended 31 December 2018
NOTES TO THE FINANCIAL STATEMENTS FOR THE FINANCIAL YEAR ENDED 31 DECEMBER 2018 (continued)
304
9. Fees and Expenses (continued)
Performance Fee (continued)
Merian Style Premia Absolute Return Fund
The Investment Manager may be entitled to a performance fee out of the Merian Style Premia Absolute
Return Fund’s assets.
The Performance Fee will accrue on a daily basis and the accrual will be reflected in the Net Asset Value
and will be payable semi-annually in arrears in respect of each Performance Period (a “Performance
Period of the Merian Style Premia Absolute Return Fund”). A Performance Period of the Merian Style Premia
Absolute Return Fund will comprise of each successive six month period ending on either 31 December or
30 June as the case may be. The first Performance Period for each Class will begin on the date on which
the first Shares of the relevant Class are issued and will end on 30 June or 31 December respectively in that
year.
For the P2 and P3 share classes, the Performance Fee as at the end of each Performance Period of the
Merian Style Premia Absolute Return Fund shall be equal in aggregate to 15 % of the amount by which any
increase in the Net Asset Value per Share of each Class during the Performance Period of the Merian Style
Premia Absolute Return Fund exceeds the “Hurdle Rate”. For the F2 share classes, the Performance Fee as
at the end of each Performance Period of the Merian Style Premia Absolute Return Fund shall be equal in
aggregate to 10% of the amount by which any increase in the Net Asset Value per Share of each Class
during the Performance Period of the Merian Style Premia Absolute Return Fund exceeds the “Hurdle Rate”.
For all share classes, the Hurdle Rate will be the average (1) Sterling Overnight Interbank Average Rate for
the GBP share classes, (2) Euro Overnight Index Average Rate for the EUR share classes, (3) Federal Funds
Effective Overnight Rate for the USD share classes, and (4) Swiss Average Overnight Rate for the CHF share
classes for the relevant Class currency during the Performance Period of the Merian Style Premia Absolute
Return Fund multiplied by the weighted average number of total Shares in issue of each Class on each
Dealing Day during the Performance Period of the Merian Style Premia Absolute Return Fund. Where no
central bank base rate exists, an equivalent inter-bank reference rate will be used.
The initial issue price as set out in the section of the Supplement headed “Initial Offer Period and
Subscription Price” was the starting price for the calculation of the first performance fee payable of any
share class to which a performance fee is applicable.
In calculating the Net Asset Value per Share of each Class for Performance Fee purposes, no deduction is
made on account of Performance Fees accrued in the Performance Period of the Merian Style Premia
Absolute Return Fund and any net income distributed to Shareholders in respect of the period is added
back.
The Performance Fee is only payable when the Net Asset Value of each Class exceeds the Hurdle Rate. If,
during a performance fee period, the performance of the Shares does not exceed the Hurdle Rate, no
Performance Fee is payable until such unachieved performance is reclaimed.
All Performance Fee payments shall be subject to the restriction that in paying/accruing a Performance
Fee, the Net Asset Value per Share of each Class at the relevant Performance Period of Merian Style Premia
Absolute Return Fund shall not be less than the Net Asset Value per Share Class on the last day that a
Performance Fee was paid (or the initial subscription price if higher) (the “Net Asset Value High Water
Mark”). The Performance Fee is only payable on the increase in the Net Asset Value per Share of each
Class during the Performance Period of the Merian Style Premia Absolute Return Fund in excess of the
relevant Hurdle Rate during the Performance Period of the Merian Style Premia Absolute Return Fund.
The amount of the Performance Fee will be calculated by the Administrator. The calculation of the
Performance Fee shall be verified by the Depositary at each Performance Period.
Merian Global Investors Series Plc
Annual Report and Audited Financial Statements for the financial year ended 31 December 2018
NOTES TO THE FINANCIAL STATEMENTS FOR THE FINANCIAL YEAR ENDED 31 DECEMBER 2018 (continued)
305
9. Fees and Expenses (continued)
Performance Fee (continued)
Merian Style Premia Absolute Return Fund (continued)
The Investment Manager may, at its discretion, waive the Performance Fee payable in respect of a
Performance Period of the Merian Style Premia Absolute Return Fund.
Performance Fees are payable on net realised and net unrealised gains and losses as at the end of each
Performance Period of the Merian Style Premia Absolute Return Fund and as a result, Performance Fees
may be paid on unrealised gains which may subsequently never be realised.
Performance Fees were USD Nil for the financial year ended 31 December 2018 (2017: USD 372) and the
amount accrued at the financial year ended 31 December 2018 was USD Nil (2017: USD Nil).
Administration Fee, Registrar and Transfer Agency Fees
Merian Global Investors Series Plc will pay to the Administrator monthly in arrears an administration fee of
up to 3.75 basis points per annum of the combined average Net Asset Value of the Sub-Funds and in the
case of each Sub-Fund subject to a minimum fee per Sub-Fund of EUR 15,000 per annum. The
administration fee shall accrue on each Dealing Day. Additional annual fees shall be payable for the
second and each subsequent Class of Shares in each Sub-Fund which shall be charged at normal
commercial rates.
The Administrator is also entitled to transaction fees it incurs for the Sub-Funds and fees for the registrar and
transfer agency functions and maintenance services it performs payable out of Merian Global Investors
Series Plc’s assets. These services are (i) maintaining the register of each Share Class of Merian Global
Investors Series Plc and the annual shareholder account, (ii) servicing, and (iii) reporting, all of which shall
be charged at normal commercial rates.
The Administrator will also be entitled to be reimbursed by the Company out of the assets of each Sub-
Fund for all reasonable and vouched out-of-pocket expenses incurred by it and charged to it for the
benefit of the Fund in the performance of its duties to the Company. All fees will be invoiced and payable
monthly.
The Administrator is entitled to the following fees for the registrar and transfer agency functions it performs,
payable out of the Company assets: annual Fund maintenance fee of EUR 3,500 per Sub-Fund per annum;
annual account servicing fees of EUR 26 for each direct Account, EUR 12 for statutory financial statements
maintained electronically through NSCC Networking and EUR 26 for Accounts maintained electronically
through Fund settle/Vestima; transaction fees of EUR 5 for each automatic transaction and EUR 12 for each
manual transaction.
All Sub-Funds are also subject to FATCA fees. The fees are included in the Transfer Agency fees and are
recognised in the Statement of Operations on an accruals basis.
Merian Global Investors Series Plc
Annual Report and Audited Financial Statements for the financial year ended 31 December 2018
NOTES TO THE FINANCIAL STATEMENTS FOR THE FINANCIAL YEAR ENDED 31 DECEMBER 2018 (continued)
306
9. Fees and Expenses (continued)
Administration Fee, Registrar and Transfer Agency Fees (continued)
The following are the Administrator expense and related payables for each of the Sub-Funds.
2018 2017
Sub-Fund CCY Expense Payable Expense Payable
Merian China Equity Fund USD 207,131 56,592 59,176 41,294
Merian Global Strategic Bond Fund (IRL) USD 116,541 32,221 67,090 45,356
Merian World Equity Fund USD 342,783 71,413 136,300 92,020
Merian Pacific Equity Fund USD 370,564 122,545 100,435 65,663
Merian European Equity Fund EUR 68,770 11,572 42,283 27,513
Old Mutual Japanese Equity Fund^ JPY 973,616 - 7,521,258 4,923,931
Merian US Equity Income Fund USD 419,365 73,929 185,353 111,550
Merian North American Equity Fund USD 760,038 197,015 229,357 145,240
Merian Total Return USD Bond Fund USD 472,350 131,206 143,785 86,795
Merian Emerging Market Debt Fund USD 394,697 128,872 152,912 95,024
Old Mutual European Best Ideas Fund EUR 132,525 19,948 95,340 86,385
Merian Investment Grade Corporate Bond Fund USD 115,928 24,884 67,444 43,282
Merian Global Emerging Markets Fund USD 283,183 64,350 142,889 81,034
Merian Asian Equity Income Fund USD 282,181 73,185 199,274 123,685
Merian Local Currency Emerging Market Debt Fund USD 803,962 143,362 144,482 93,367
Merian UK Alpha Fund (IRL) GBP 182,577 38,931 136,374 82,370
Merian UK Smaller Companies Focus Fund GBP 250,204 57,932 90,847 52,915
Merian UK Dynamic Equity Fund GBP 194,457 41,343 113,825 71,120
Merian Global Equity Absolute Return Fund USD 3,822,570 591,095 1,867,916 1,081,269
Merian Strategic Absolute Return Bond Fund^^^ USD 98,559 14,829 10,118 13,531
Old Mutual Pan African Fund^^ USD 4,341 - 24,304 -
Old Mutual Monthly Income High Yield Bond
Fund^^^^ USD 78,878 9,709 160,156 97,542
Merian Europe (ex UK) Smaller Companies Fund EUR 324,795 72,809 162,334 91,620
Merian Global Equity Income Fund (IRL) USD 219,466 55,455 111,312 84,342
Merian Gold & Silver Fund USD 371,130 104,594 115,268 64,302
Old Mutual Compass Portfolio 2 USD 67,587 19,343 43,116 24,735
Old Mutual Compass Portfolio 3 USD 175,974 40,723 91,159 54,397
Old Mutual Compass Portfolio 4 USD 212,845 46,677 122,705 71,552
Old Mutual Compass Portfolio 5 USD 77,971 22,736 47,599 26,968
Merian UK Specialist Equity Fund GBP 262,555 48,009 159,789 89,605
Merian Style Premia Absolute Return Fund USD 127,802 34,883 158,490 108,037
Merian Financials Contingent Capital Fund USD 202,706 25,043 35,635 35,635
Company Level USD 11,842,123 2,441,088 5,476,090 3,377,543
Merian Global Investors Series Plc
Annual Report and Audited Financial Statements for the financial year ended 31 December 2018
NOTES TO THE FINANCIAL STATEMENTS FOR THE FINANCIAL YEAR ENDED 31 DECEMBER 2018 (continued)
307
9. Fees and Expenses (continued)
Depositary Fee
Merian Global Investors Series Plc will pay to the Depositary monthly in arrears a fiduciary fee of 1 basis
point per annum of the combined average Net Asset Value of the Sub-Funds plus VAT (if any), and in the
case of each Sub-Fund subject to a minimum fee of EUR 3,500 per annum. The fiduciary fee shall accrue
on each Dealing Day.
The Depositary is also entitled to sub-depositary fees and transaction charges which shall be charged at
normal commercial rates and paid monthly in arrears. The Depositary is also entitled to be reimbursed by
Merian Global Investors Series Plc for all reasonable disbursements and out-of-pocket expenses.
Total Depositary fees were USD 4,354,880 for the financial year ended 31 December 2018 (2017: USD
3,233,496) and the amount payable at the financial year ended 31 December 2018 was USD 657,987 (2017:
USD 254,920).
2018 2017
Sub-Fund CCY Expense Payable Expense Payable
Merian China Equity Fund USD 44,493 9,712 34,036 4,508
Merian Global Strategic Bond Fund (IRL) USD 39,811 5,201 25,180 1,803
Merian World Equity Fund USD 253,890 30,760 170,356 -
Merian Pacific Equity Fund USD 278,012 48,706 221,959 25,181
Merian European Equity Fund EUR 11,383 2,446 14,960 3,635
Old Mutual Japanese Equity Fund^ JPY 162,858 - 2,389,543 436,395
Merian US Equity Income Fund USD 64,470 11,104 37,541 6,774
Merian North American Equity Fund USD 141,807 16,087 83,500 13,139
Merian Total Return USD Bond Fund USD 49,709 10,943 55,234 13,055
Merian Emerging Market Debt Fund USD 81,152 10,521 32,356 4,400
Old Mutual European Best Ideas Fund EUR 18,572 3,511 46,028 10,503
Merian Investment Grade Corporate Bond Fund USD 21,832 5,544 21,663 5,073
Merian Global Emerging Markets Fund USD 157,480 28,548 83,617 -
Merian Asian Equity Income Fund USD 299,118 28,498 154,013 9,997
Merian Local Currency Emerging Market Debt Fund USD 460,842 61,654 194,097 2,445
Merian UK Alpha Fund (IRL) GBP 8,306 1,928 18,455 5,247
Merian UK Smaller Companies Focus Fund GBP 29,695 4,567 36,811 2,436
Merian UK Dynamic Equity Fund GBP 38,089 5,801 39,731 1,240
Merian Global Equity Absolute Return Fund USD 1,616,393 273,332 1,391,302 81,387
Merian Strategic Absolute Return Bond Fund^^^ USD 45,396 4,526 36,337 3,692
Old Mutual Pan African Fund^^ USD 13,896 - 35,671 3,517
Old Mutual Monthly Income High Yield Bond Fund^^^^ USD 8,316 - 35,288 12,490
Merian Europe (ex UK) Smaller Companies Fund EUR 71,215 11,009 34,185 2
Merian Global Equity Income Fund (IRL) USD 231,504 32,136 162,992 11,494
Merian Gold & Silver Fund USD 35,748 5,997 19,527 121
Old Mutual Compass Portfolio 2 USD 16,517 3,444 15,326 3,262
Old Mutual Compass Portfolio 3 USD 48,107 7,070 32,116 3,440
Old Mutual Compass Portfolio 4 USD 67,181 8,809 40,589 3,500
Old Mutual Compass Portfolio 5 USD 20,914 3,404 16,042 2,578
Merian UK Specialist Equity Fund GBP 38,006 2,578 28,339 352
Merian Style Premia Absolute Return Fund USD 50,263 7,345 37,219 7,441
Merian Financials Contingent Capital Fund USD 35,386 6,308 7,506 2,223
Company Level USD 4,354,880 657,987 3,233,496 254,920
Transaction Costs
Transaction costs are expenses incurred when buying or selling a security. Transaction costs represents the
brokers' commissions and spreads, which are the differences between the price the dealer paid for a
security and the price the buyer pays.
Transaction costs on the purchase and sale of bonds, currency exchange contracts and swaps are
included in the purchase and sale price of the investment. They cannot be practically or reliably gathered
as they are embedded in the cost of the investment and cannot be separately verified or disclosed.
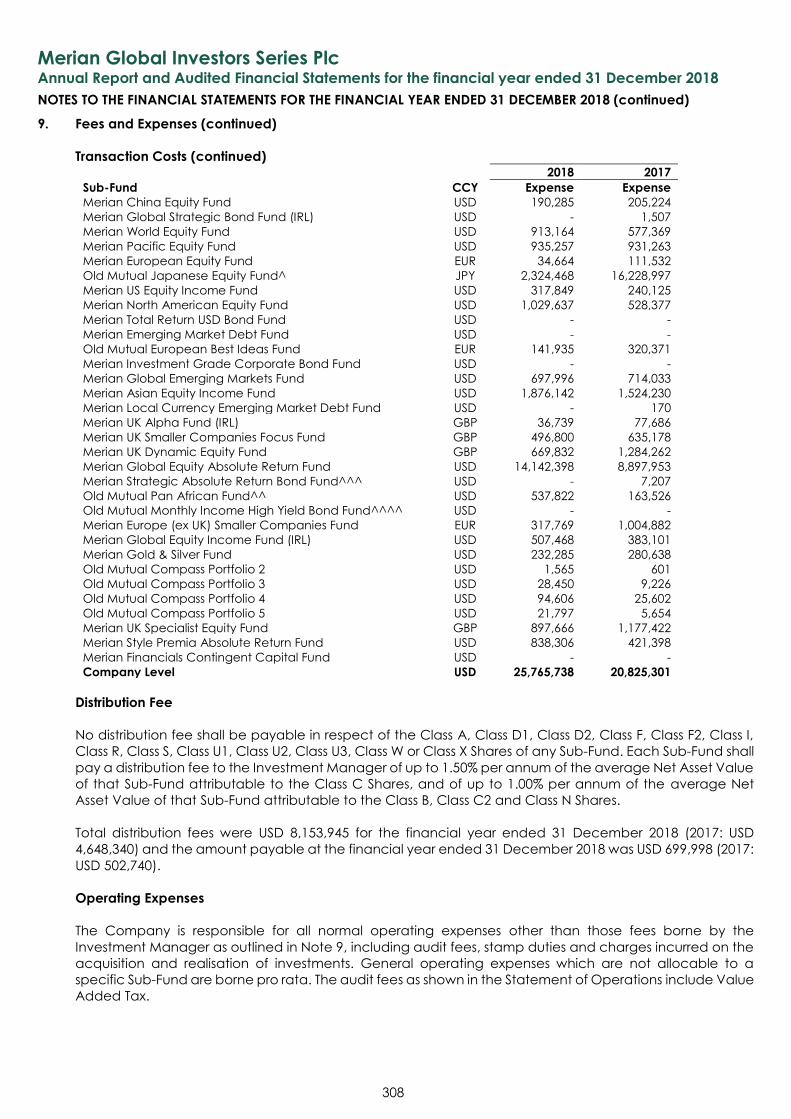
Merian Global Investors Series Plc
Annual Report and Audited Financial Statements for the financial year ended 31 December 2018
NOTES TO THE FINANCIAL STATEMENTS FOR THE FINANCIAL YEAR ENDED 31 DECEMBER 2018 (continued)
308
9. Fees and Expenses (continued)
Transaction Costs (continued) 2018 2017
Sub-Fund CCY Expense Expense
Merian China Equity Fund USD 190,285 205,224
Merian Global Strategic Bond Fund (IRL) USD - 1,507
Merian World Equity Fund USD 913,164 577,369
Merian Pacific Equity Fund USD 935,257 931,263
Merian European Equity Fund EUR 34,664 111,532
Old Mutual Japanese Equity Fund^ JPY 2,324,468 16,228,997
Merian US Equity Income Fund USD 317,849 240,125
Merian North American Equity Fund USD 1,029,637 528,377
Merian Total Return USD Bond Fund USD - -
Merian Emerging Market Debt Fund USD - -
Old Mutual European Best Ideas Fund EUR 141,935 320,371
Merian Investment Grade Corporate Bond Fund USD - -
Merian Global Emerging Markets Fund USD 697,996 714,033
Merian Asian Equity Income Fund USD 1,876,142 1,524,230
Merian Local Currency Emerging Market Debt Fund USD - 170
Merian UK Alpha Fund (IRL) GBP 36,739 77,686
Merian UK Smaller Companies Focus Fund GBP 496,800 635,178
Merian UK Dynamic Equity Fund GBP 669,832 1,284,262
Merian Global Equity Absolute Return Fund USD 14,142,398 8,897,953
Merian Strategic Absolute Return Bond Fund^^^ USD - 7,207
Old Mutual Pan African Fund^^ USD 537,822 163,526
Old Mutual Monthly Income High Yield Bond Fund^^^^ USD - -
Merian Europe (ex UK) Smaller Companies Fund EUR 317,769 1,004,882
Merian Global Equity Income Fund (IRL) USD 507,468 383,101
Merian Gold & Silver Fund USD 232,285 280,638
Old Mutual Compass Portfolio 2 USD 1,565 601
Old Mutual Compass Portfolio 3 USD 28,450 9,226
Old Mutual Compass Portfolio 4 USD 94,606 25,602
Old Mutual Compass Portfolio 5 USD 21,797 5,654
Merian UK Specialist Equity Fund GBP 897,666 1,177,422
Merian Style Premia Absolute Return Fund USD 838,306 421,398
Merian Financials Contingent Capital Fund USD - -
Company Level USD 25,765,738 20,825,301
Distribution Fee
No distribution fee shall be payable in respect of the Class A, Class D1, Class D2, Class F, Class F2, Class I,
Class R, Class S, Class U1, Class U2, Class U3, Class W or Class X Shares of any Sub-Fund. Each Sub-Fund shall
pay a distribution fee to the Investment Manager of up to 1.50% per annum of the average Net Asset Value
of that Sub-Fund attributable to the Class C Shares, and of up to 1.00% per annum of the average Net
Asset Value of that Sub-Fund attributable to the Class B, Class C2 and Class N Shares.
Total distribution fees were USD 8,153,945 for the financial year ended 31 December 2018 (2017: USD
4,648,340) and the amount payable at the financial year ended 31 December 2018 was USD 699,998 (2017:
USD 502,740).
Operating Expenses
The Company is responsible for all normal operating expenses other than those fees borne by the
Investment Manager as outlined in Note 9, including audit fees, stamp duties and charges incurred on the
acquisition and realisation of investments. General operating expenses which are not allocable to a
specific Sub-Fund are borne pro rata. The audit fees as shown in the Statement of Operations include Value
Added Tax.
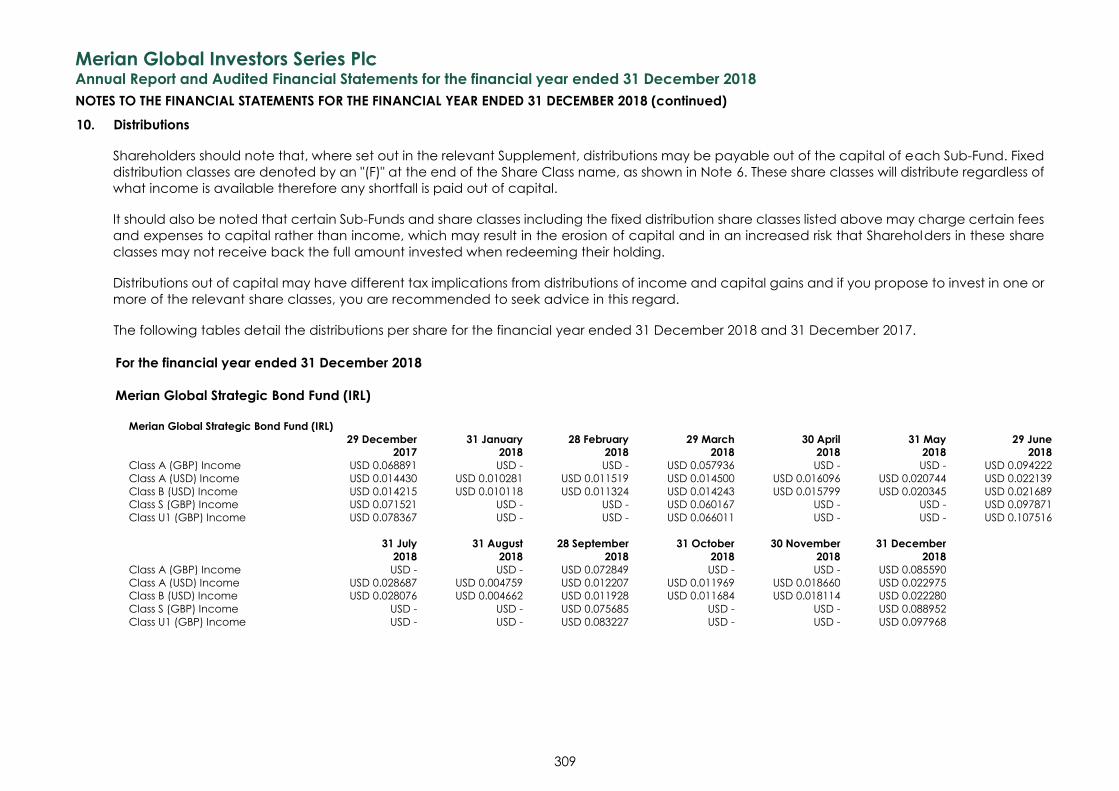
Merian Global Investors Series Plc
Annual Report and Audited Financial Statements for the financial year ended 31 December 2018
NOTES TO THE FINANCIAL STATEMENTS FOR THE FINANCIAL YEAR ENDED 31 DECEMBER 2018 (continued)
309
10. Distributions
Shareholders should note that, where set out in the relevant Supplement, distributions may be payable out of the capital of each Sub-Fund. Fixed
distribution classes are denoted by an "(F)" at the end of the Share Class name, as shown in Note 6. These share classes will distribute regardless of
what income is available therefore any shortfall is paid out of capital.
It should also be noted that certain Sub-Funds and share classes including the fixed distribution share classes listed above may charge certain fees
and expenses to capital rather than income, which may result in the erosion of capital and in an increased risk that Shareholders in these share
classes may not receive back the full amount invested when redeeming their holding.
Distributions out of capital may have different tax implications from distributions of income and capital gains and if you propose to invest in one or
more of the relevant share classes, you are recommended to seek advice in this regard.
The following tables detail the distributions per share for the financial year ended 31 December 2018 and 31 December 2017.
For the financial year ended 31 December 2018
Merian Global Strategic Bond Fund (IRL)
Merian Global Strategic Bond Fund (IRL)
29 December
2017
31 January
2018
28 February
2018
29 March
2018
30 April
2018
31 May
2018
29 June
2018
Class A (GBP) Income USD 0.068891 USD - USD - USD 0.057936 USD - USD - USD 0.094222
Class A (USD) Income USD 0.014430 USD 0.010281 USD 0.011519 USD 0.014500 USD 0.016096 USD 0.020744 USD 0.022139
Class B (USD) Income USD 0.014215 USD 0.010118 USD 0.011324 USD 0.014243 USD 0.015799 USD 0.020345 USD 0.021689
Class S (GBP) Income USD 0.071521 USD - USD - USD 0.060167 USD - USD - USD 0.097871
Class U1 (GBP) Income USD 0.078367 USD - USD - USD 0.066011 USD - USD - USD 0.107516
31 July
2018
31 August
2018
28 September
2018
31 October
2018
30 November
2018
31 December
2018
Class A (GBP) Income USD - USD - USD 0.072849 USD - USD - USD 0.085590
Class A (USD) Income USD 0.028687 USD 0.004759 USD 0.012207 USD 0.011969 USD 0.018660 USD 0.022975
Class B (USD) Income USD 0.028076 USD 0.004662 USD 0.011928 USD 0.011684 USD 0.018114 USD 0.022280
Class S (GBP) Income USD - USD - USD 0.075685 USD - USD - USD 0.088952
Class U1 (GBP) Income USD - USD - USD 0.083227 USD - USD - USD 0.097968
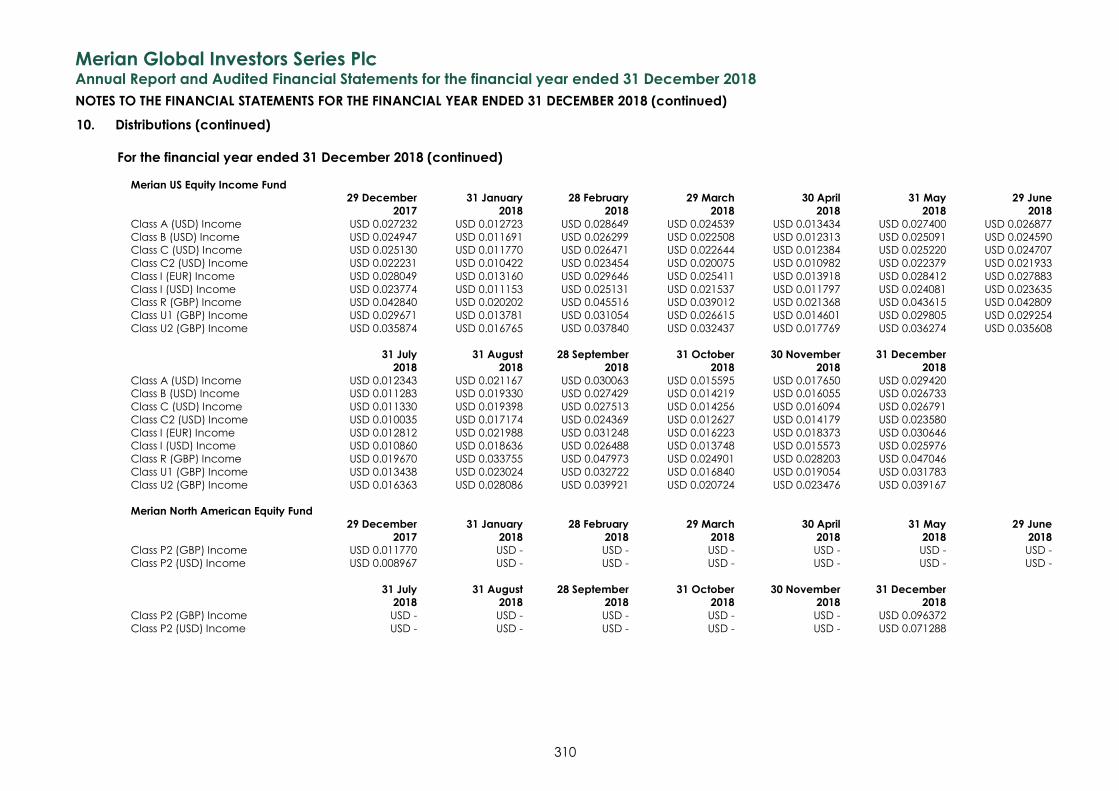
Merian Global Investors Series Plc
Annual Report and Audited Financial Statements for the financial year ended 31 December 2018
NOTES TO THE FINANCIAL STATEMENTS FOR THE FINANCIAL YEAR ENDED 31 DECEMBER 2018 (continued)
310
10. Distributions (continued)
For the financial year ended 31 December 2018 (continued)
Merian US Equity Income Fund
29 December
2017
31 January
2018
28 February
2018
29 March
2018
30 April
2018
31 May
2018
29 June
2018
Class A (USD) Income USD 0.027232 USD 0.012723 USD 0.028649 USD 0.024539 USD 0.013434 USD 0.027400 USD 0.026877
Class B (USD) Income USD 0.024947 USD 0.011691 USD 0.026299 USD 0.022508 USD 0.012313 USD 0.025091 USD 0.024590
Class C (USD) Income USD 0.025130 USD 0.011770 USD 0.026471 USD 0.022644 USD 0.012384 USD 0.025220 USD 0.024707
Class C2 (USD) Income USD 0.022231 USD 0.010422 USD 0.023454 USD 0.020075 USD 0.010982 USD 0.022379 USD 0.021933
Class I (EUR) Income USD 0.028049 USD 0.013160 USD 0.029646 USD 0.025411 USD 0.013918 USD 0.028412 USD 0.027883
Class I (USD) Income USD 0.023774 USD 0.011153 USD 0.025131 USD 0.021537 USD 0.011797 USD 0.024081 USD 0.023635
Class R (GBP) Income USD 0.042840 USD 0.020202 USD 0.045516 USD 0.039012 USD 0.021368 USD 0.043615 USD 0.042809
Class U1 (GBP) Income USD 0.029671 USD 0.013781 USD 0.031054 USD 0.026615 USD 0.014601 USD 0.029805 USD 0.029254
Class U2 (GBP) Income USD 0.035874 USD 0.016765 USD 0.037840 USD 0.032437 USD 0.017769 USD 0.036274 USD 0.035608
31 July
2018
31 August
2018
28 September
2018
31 October
2018
30 November
2018
31 December
2018
Class A (USD) Income USD 0.012343 USD 0.021167 USD 0.030063 USD 0.015595 USD 0.017650 USD 0.029420
Class B (USD) Income USD 0.011283 USD 0.019330 USD 0.027429 USD 0.014219 USD 0.016055 USD 0.026733
Class C (USD) Income USD 0.011330 USD 0.019398 USD 0.027513 USD 0.014256 USD 0.016094 USD 0.026791
Class C2 (USD) Income USD 0.010035 USD 0.017174 USD 0.024369 USD 0.012627 USD 0.014179 USD 0.023580
Class I (EUR) Income USD 0.012812 USD 0.021988 USD 0.031248 USD 0.016223 USD 0.018373 USD 0.030646
Class I (USD) Income USD 0.010860 USD 0.018636 USD 0.026488 USD 0.013748 USD 0.015573 USD 0.025976
Class R (GBP) Income USD 0.019670 USD 0.033755 USD 0.047973 USD 0.024901 USD 0.028203 USD 0.047046
Class U1 (GBP) Income USD 0.013438 USD 0.023024 USD 0.032722 USD 0.016840 USD 0.019054 USD 0.031783
Class U2 (GBP) Income USD 0.016363 USD 0.028086 USD 0.039921 USD 0.020724 USD 0.023476 USD 0.039167
Merian North American Equity Fund
29 December
2017
31 January
2018
28 February
2018
29 March
2018
30 April
2018
31 May
2018
29 June
2018
Class P2 (GBP) Income USD 0.011770 USD - USD - USD - USD - USD - USD -
Class P2 (USD) Income USD 0.008967 USD - USD - USD - USD - USD - USD -
31 July
2018
31 August
2018
28 September
2018
31 October
2018
30 November
2018
31 December
2018
Class P2 (GBP) Income USD - USD - USD - USD - USD - USD 0.096372
Class P2 (USD) Income USD - USD - USD - USD - USD - USD 0.071288
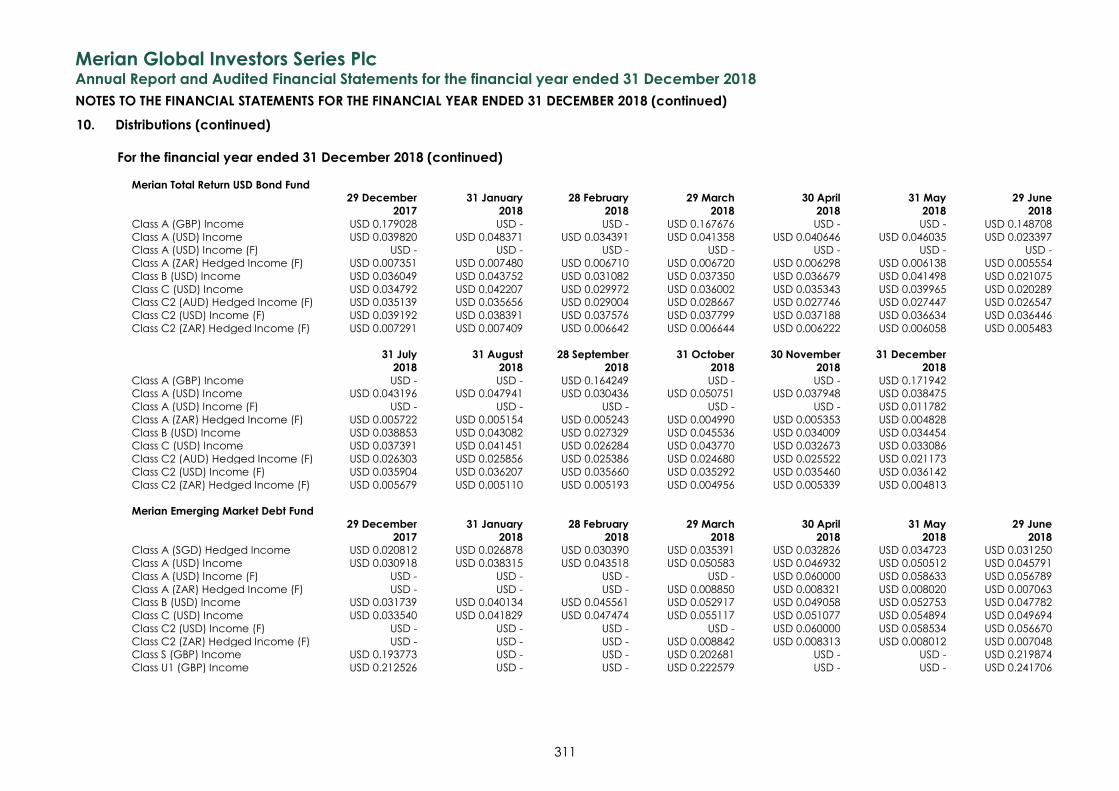
Merian Global Investors Series Plc
Annual Report and Audited Financial Statements for the financial year ended 31 December 2018
NOTES TO THE FINANCIAL STATEMENTS FOR THE FINANCIAL YEAR ENDED 31 DECEMBER 2018 (continued)
311
10. Distributions (continued)
For the financial year ended 31 December 2018 (continued)
Merian Total Return USD Bond Fund
29 December
2017
31 January
2018
28 February
2018
29 March
2018
30 April
2018
31 May
2018
29 June
2018
Class A (GBP) Income USD 0.179028 USD - USD - USD 0.167676 USD - USD - USD 0.148708
Class A (USD) Income USD 0.039820 USD 0.048371 USD 0.034391 USD 0.041358 USD 0.040646 USD 0.046035 USD 0.023397
Class A (USD) Income (F) USD - USD - USD - USD - USD - USD - USD -
Class A (ZAR) Hedged Income (F) USD 0.007351 USD 0.007480 USD 0.006710 USD 0.006720 USD 0.006298 USD 0.006138 USD 0.005554
Class B (USD) Income USD 0.036049 USD 0.043752 USD 0.031082 USD 0.037350 USD 0.036679 USD 0.041498 USD 0.021075
Class C (USD) Income USD 0.034792 USD 0.042207 USD 0.029972 USD 0.036002 USD 0.035343 USD 0.039965 USD 0.020289
Class C2 (AUD) Hedged Income (F) USD 0.035139 USD 0.035656 USD 0.029004 USD 0.028667 USD 0.027746 USD 0.027447 USD 0.026547
Class C2 (USD) Income (F) USD 0.039192 USD 0.038391 USD 0.037576 USD 0.037799 USD 0.037188 USD 0.036634 USD 0.036446
Class C2 (ZAR) Hedged Income (F) USD 0.007291 USD 0.007409 USD 0.006642 USD 0.006644 USD 0.006222 USD 0.006058 USD 0.005483
31 July
2018
31 August
2018
28 September
2018
31 October
2018
30 November
2018
31 December
2018
Class A (GBP) Income USD - USD - USD 0.164249 USD - USD - USD 0.171942
Class A (USD) Income USD 0.043196 USD 0.047941 USD 0.030436 USD 0.050751 USD 0.037948 USD 0.038475
Class A (USD) Income (F) USD - USD - USD - USD - USD - USD 0.011782
Class A (ZAR) Hedged Income (F) USD 0.005722 USD 0.005154 USD 0.005243 USD 0.004990 USD 0.005353 USD 0.004828
Class B (USD) Income USD 0.038853 USD 0.043082 USD 0.027329 USD 0.045536 USD 0.034009 USD 0.034454
Class C (USD) Income USD 0.037391 USD 0.041451 USD 0.026284 USD 0.043770 USD 0.032673 USD 0.033086
Class C2 (AUD) Hedged Income (F) USD 0.026303 USD 0.025856 USD 0.025386 USD 0.024680 USD 0.025522 USD 0.021173
Class C2 (USD) Income (F) USD 0.035904 USD 0.036207 USD 0.035660 USD 0.035292 USD 0.035460 USD 0.036142
Class C2 (ZAR) Hedged Income (F) USD 0.005679 USD 0.005110 USD 0.005193 USD 0.004956 USD 0.005339 USD 0.004813
Merian Emerging Market Debt Fund
29 December
2017
31 January
2018
28 February
2018
29 March
2018
30 April
2018
31 May
2018
29 June
2018
Class A (SGD) Hedged Income USD 0.020812 USD 0.026878 USD 0.030390 USD 0.035391 USD 0.032826 USD 0.034723 USD 0.031250
Class A (USD) Income USD 0.030918 USD 0.038315 USD 0.043518 USD 0.050583 USD 0.046932 USD 0.050512 USD 0.045791
Class A (USD) Income (F) USD - USD - USD - USD - USD 0.060000 USD 0.058633 USD 0.056789
Class A (ZAR) Hedged Income (F) USD - USD - USD - USD 0.008850 USD 0.008321 USD 0.008020 USD 0.007063
Class B (USD) Income USD 0.031739 USD 0.040134 USD 0.045561 USD 0.052917 USD 0.049058 USD 0.052753 USD 0.047782
Class C (USD) Income USD 0.033540 USD 0.041829 USD 0.047474 USD 0.055117 USD 0.051077 USD 0.054894 USD 0.049694
Class C2 (USD) Income (F) USD - USD - USD - USD - USD 0.060000 USD 0.058534 USD 0.056670
Class C2 (ZAR) Hedged Income (F) USD - USD - USD - USD 0.008842 USD 0.008313 USD 0.008012 USD 0.007048
Class S (GBP) Income USD 0.193773 USD - USD - USD 0.202681 USD - USD - USD 0.219874
Class U1 (GBP) Income USD 0.212526 USD - USD - USD 0.222579 USD - USD - USD 0.241706
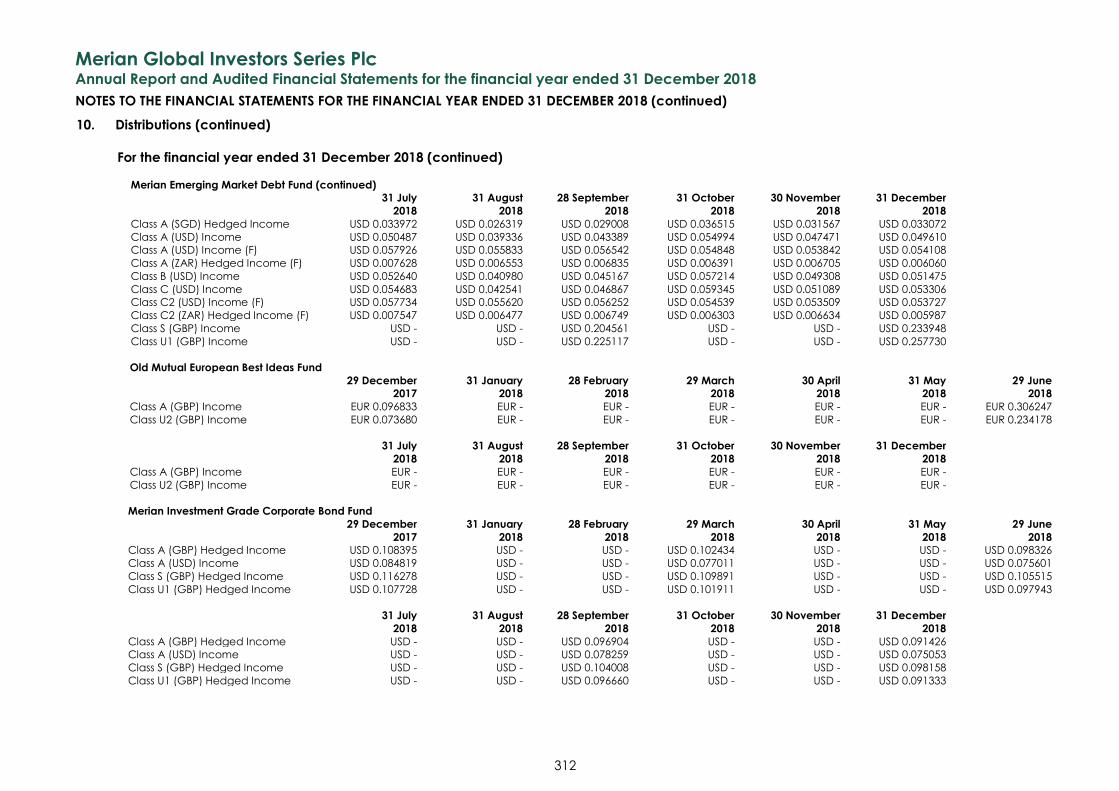
Merian Global Investors Series Plc
Annual Report and Audited Financial Statements for the financial year ended 31 December 2018
NOTES TO THE FINANCIAL STATEMENTS FOR THE FINANCIAL YEAR ENDED 31 DECEMBER 2018 (continued)
312
10. Distributions (continued)
For the financial year ended 31 December 2018 (continued)
Merian Emerging Market Debt Fund (continued)
31 July
2018
31 August
2018
28 September
2018
31 October
2018
30 November
2018
31 December
2018
Class A (SGD) Hedged Income USD 0.033972 USD 0.026319 USD 0.029008 USD 0.036515 USD 0.031567 USD 0.033072
Class A (USD) Income USD 0.050487 USD 0.039336 USD 0.043389 USD 0.054994 USD 0.047471 USD 0.049610
Class A (USD) Income (F) USD 0.057926 USD 0.055833 USD 0.056542 USD 0.054848 USD 0.053842 USD 0.054108
Class A (ZAR) Hedged Income (F) USD 0.007628 USD 0.006553 USD 0.006835 USD 0.006391 USD 0.006705 USD 0.006060
Class B (USD) Income USD 0.052640 USD 0.040980 USD 0.045167 USD 0.057214 USD 0.049308 USD 0.051475
Class C (USD) Income USD 0.054683 USD 0.042541 USD 0.046867 USD 0.059345 USD 0.051089 USD 0.053306
Class C2 (USD) Income (F) USD 0.057734 USD 0.055620 USD 0.056252 USD 0.054539 USD 0.053509 USD 0.053727
Class C2 (ZAR) Hedged Income (F) USD 0.007547 USD 0.006477 USD 0.006749 USD 0.006303 USD 0.006634 USD 0.005987
Class S (GBP) Income USD - USD - USD 0.204561 USD - USD - USD 0.233948
Class U1 (GBP) Income USD - USD - USD 0.225117 USD - USD - USD 0.257730
Old Mutual European Best Ideas Fund
29 December
2017
31 January
2018
28 February
2018
29 March
2018
30 April
2018
31 May
2018
29 June
2018
Class A (GBP) Income EUR 0.096833 EUR - EUR - EUR - EUR - EUR - EUR 0.306247
Class U2 (GBP) Income EUR 0.073680 EUR - EUR - EUR - EUR - EUR - EUR 0.234178
31 July
2018
31 August
2018
28 September
2018
31 October
2018
30 November
2018
31 December
2018
Class A (GBP) Income EUR - EUR - EUR - EUR - EUR - EUR -
Class U2 (GBP) Income EUR - EUR - EUR - EUR - EUR - EUR -
Merian Investment Grade Corporate Bond Fund
29 December
2017
31 January
2018
28 February
2018
29 March
2018
30 April
2018
31 May
2018
29 June
2018
Class A (GBP) Hedged Income USD 0.108395 USD - USD - USD 0.102434 USD - USD - USD 0.098326
Class A (USD) Income USD 0.084819 USD - USD - USD 0.077011 USD - USD - USD 0.075601
Class S (GBP) Hedged Income USD 0.116278 USD - USD - USD 0.109891 USD - USD - USD 0.105515
Class U1 (GBP) Hedged Income USD 0.107728 USD - USD - USD 0.101911 USD - USD - USD 0.097943
31 July
2018
31 August
2018
28 September
2018
31 October
2018
30 November
2018
31 December
2018
Class A (GBP) Hedged Income USD - USD - USD 0.096904 USD - USD - USD 0.091426
Class A (USD) Income USD - USD - USD 0.078259 USD - USD - USD 0.075053
Class S (GBP) Hedged Income USD - USD - USD 0.104008 USD - USD - USD 0.098158
Class U1 (GBP) Hedged Income USD - USD - USD 0.096660 USD - USD - USD 0.091333
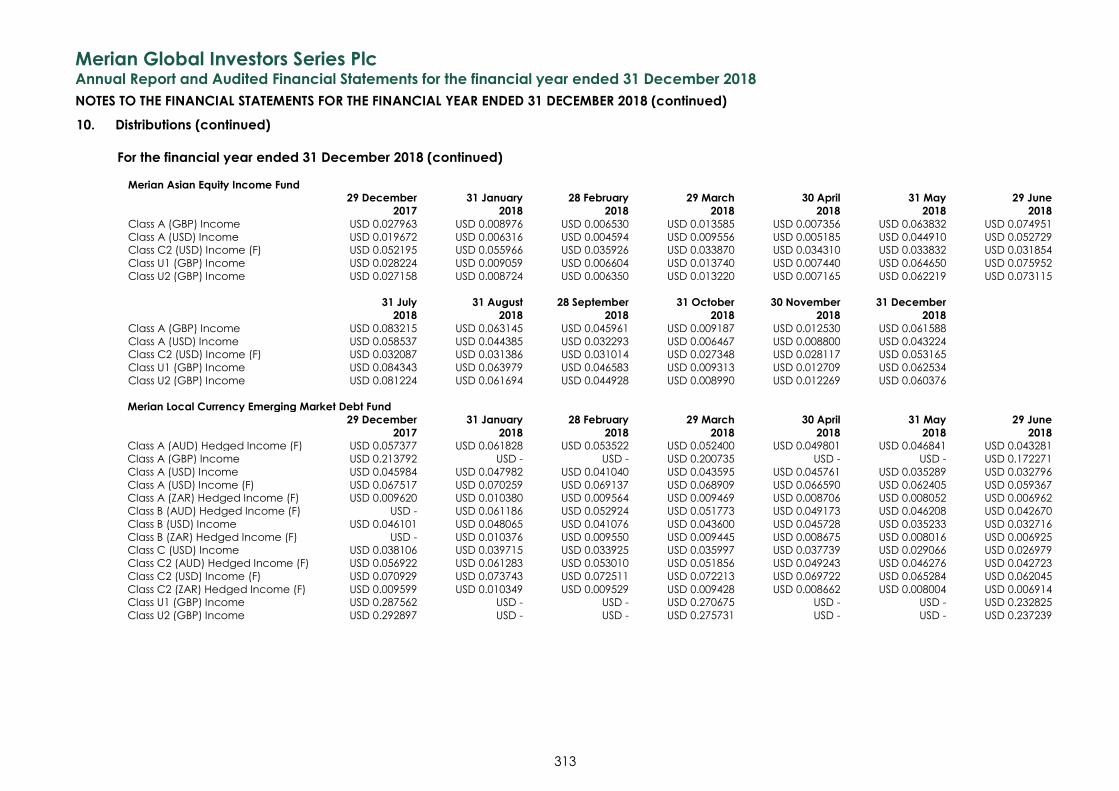
Merian Global Investors Series Plc
Annual Report and Audited Financial Statements for the financial year ended 31 December 2018
NOTES TO THE FINANCIAL STATEMENTS FOR THE FINANCIAL YEAR ENDED 31 DECEMBER 2018 (continued)
313
10. Distributions (continued)
For the financial year ended 31 December 2018 (continued)
Merian Asian Equity Income Fund
29 December
2017
31 January
2018
28 February
2018
29 March
2018
30 April
2018
31 May
2018
29 June
2018
Class A (GBP) Income USD 0.027963 USD 0.008976 USD 0.006530 USD 0.013585 USD 0.007356 USD 0.063832 USD 0.074951
Class A (USD) Income USD 0.019672 USD 0.006316 USD 0.004594 USD 0.009556 USD 0.005185 USD 0.044910 USD 0.052729
Class C2 (USD) Income (F) USD 0.052195 USD 0.055966 USD 0.035926 USD 0.033870 USD 0.034310 USD 0.033832 USD 0.031854
Class U1 (GBP) Income USD 0.028224 USD 0.009059 USD 0.006604 USD 0.013740 USD 0.007440 USD 0.064650 USD 0.075952
Class U2 (GBP) Income USD 0.027158 USD 0.008724 USD 0.006350 USD 0.013220 USD 0.007165 USD 0.062219 USD 0.073115
31 July
2018
31 August
2018
28 September
2018
31 October
2018
30 November
2018
31 December
2018
Class A (GBP) Income USD 0.083215 USD 0.063145 USD 0.045961 USD 0.009187 USD 0.012530 USD 0.061588
Class A (USD) Income USD 0.058537 USD 0.044385 USD 0.032293 USD 0.006467 USD 0.008800 USD 0.043224
Class C2 (USD) Income (F) USD 0.032087 USD 0.031386 USD 0.031014 USD 0.027348 USD 0.028117 USD 0.053165
Class U1 (GBP) Income USD 0.084343 USD 0.063979 USD 0.046583 USD 0.009313 USD 0.012709 USD 0.062534
Class U2 (GBP) Income USD 0.081224 USD 0.061694 USD 0.044928 USD 0.008990 USD 0.012269 USD 0.060376
Merian Local Currency Emerging Market Debt Fund
29 December
2017
31 January
2018
28 February
2018
29 March
2018
30 April
2018
31 May
2018
29 June
2018
Class A (AUD) Hedged Income (F) USD 0.057377 USD 0.061828 USD 0.053522 USD 0.052400 USD 0.049801 USD 0.046841 USD 0.043281
Class A (GBP) Income USD 0.213792 USD - USD - USD 0.200735 USD - USD - USD 0.172271
Class A (USD) Income USD 0.045984 USD 0.047982 USD 0.041040 USD 0.043595 USD 0.045761 USD 0.035289 USD 0.032796
Class A (USD) Income (F) USD 0.067517 USD 0.070259 USD 0.069137 USD 0.068909 USD 0.066590 USD 0.062405 USD 0.059367
Class A (ZAR) Hedged Income (F) USD 0.009620 USD 0.010380 USD 0.009564 USD 0.009469 USD 0.008706 USD 0.008052 USD 0.006962
Class B (AUD) Hedged Income (F) USD - USD 0.061186 USD 0.052924 USD 0.051773 USD 0.049173 USD 0.046208 USD 0.042670
Class B (USD) Income USD 0.046101 USD 0.048065 USD 0.041076 USD 0.043600 USD 0.045728 USD 0.035233 USD 0.032716
Class B (ZAR) Hedged Income (F) USD - USD 0.010376 USD 0.009550 USD 0.009445 USD 0.008675 USD 0.008016 USD 0.006925
Class C (USD) Income USD 0.038106 USD 0.039715 USD 0.033925 USD 0.035997 USD 0.037739 USD 0.029066 USD 0.026979
Class C2 (AUD) Hedged Income (F) USD 0.056922 USD 0.061283 USD 0.053010 USD 0.051856 USD 0.049243 USD 0.046276 USD 0.042723
Class C2 (USD) Income (F) USD 0.070929 USD 0.073743 USD 0.072511 USD 0.072213 USD 0.069722 USD 0.065284 USD 0.062045
Class C2 (ZAR) Hedged Income (F) USD 0.009599 USD 0.010349 USD 0.009529 USD 0.009428 USD 0.008662 USD 0.008004 USD 0.006914
Class U1 (GBP) Income USD 0.287562 USD - USD - USD 0.270675 USD - USD - USD 0.232825
Class U2 (GBP) Income USD 0.292897 USD - USD - USD 0.275731 USD - USD - USD 0.237239
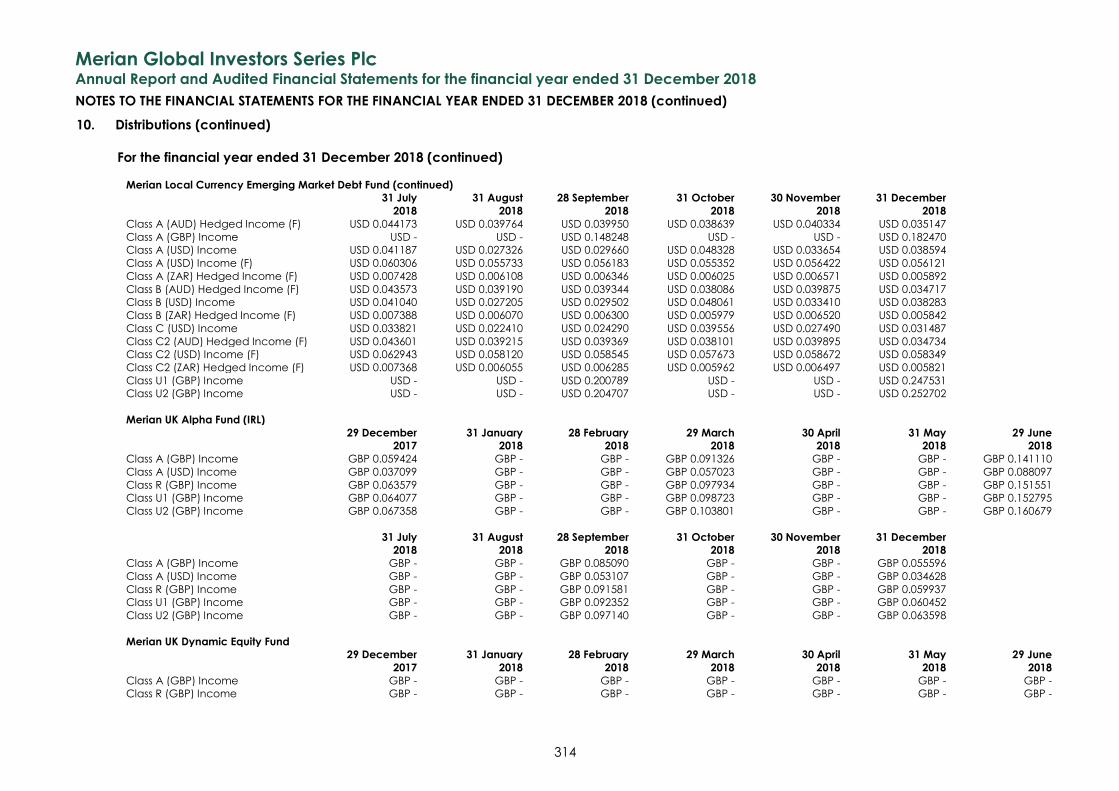
Merian Global Investors Series Plc
Annual Report and Audited Financial Statements for the financial year ended 31 December 2018
NOTES TO THE FINANCIAL STATEMENTS FOR THE FINANCIAL YEAR ENDED 31 DECEMBER 2018 (continued)
314
10. Distributions (continued)
For the financial year ended 31 December 2018 (continued)
Merian Local Currency Emerging Market Debt Fund (continued)
31 July
2018
31 August
2018
28 September
2018
31 October
2018
30 November
2018
31 December
2018
Class A (AUD) Hedged Income (F) USD 0.044173 USD 0.039764 USD 0.039950 USD 0.038639 USD 0.040334 USD 0.035147
Class A (GBP) Income USD - USD - USD 0.148248 USD - USD - USD 0.182470
Class A (USD) Income USD 0.041187 USD 0.027326 USD 0.029660 USD 0.048328 USD 0.033654 USD 0.038594
Class A (USD) Income (F) USD 0.060306 USD 0.055733 USD 0.056183 USD 0.055352 USD 0.056422 USD 0.056121
Class A (ZAR) Hedged Income (F) USD 0.007428 USD 0.006108 USD 0.006346 USD 0.006025 USD 0.006571 USD 0.005892
Class B (AUD) Hedged Income (F) USD 0.043573 USD 0.039190 USD 0.039344 USD 0.038086 USD 0.039875 USD 0.034717
Class B (USD) Income USD 0.041040 USD 0.027205 USD 0.029502 USD 0.048061 USD 0.033410 USD 0.038283
Class B (ZAR) Hedged Income (F) USD 0.007388 USD 0.006070 USD 0.006300 USD 0.005979 USD 0.006520 USD 0.005842
Class C (USD) Income USD 0.033821 USD 0.022410 USD 0.024290 USD 0.039556 USD 0.027490 USD 0.031487
Class C2 (AUD) Hedged Income (F) USD 0.043601 USD 0.039215 USD 0.039369 USD 0.038101 USD 0.039895 USD 0.034734
Class C2 (USD) Income (F) USD 0.062943 USD 0.058120 USD 0.058545 USD 0.057673 USD 0.058672 USD 0.058349
Class C2 (ZAR) Hedged Income (F) USD 0.007368 USD 0.006055 USD 0.006285 USD 0.005962 USD 0.006497 USD 0.005821
Class U1 (GBP) Income USD - USD - USD 0.200789 USD - USD - USD 0.247531
Class U2 (GBP) Income USD - USD - USD 0.204707 USD - USD - USD 0.252702
Merian UK Alpha Fund (IRL)
29 December
2017
31 January
2018
28 February
2018
29 March
2018
30 April
2018
31 May
2018
29 June
2018
Class A (GBP) Income GBP 0.059424 GBP - GBP - GBP 0.091326 GBP - GBP - GBP 0.141110
Class A (USD) Income GBP 0.037099 GBP - GBP - GBP 0.057023 GBP - GBP - GBP 0.088097
Class R (GBP) Income GBP 0.063579 GBP - GBP - GBP 0.097934 GBP - GBP - GBP 0.151551
Class U1 (GBP) Income GBP 0.064077 GBP - GBP - GBP 0.098723 GBP - GBP - GBP 0.152795
Class U2 (GBP) Income GBP 0.067358 GBP - GBP - GBP 0.103801 GBP - GBP - GBP 0.160679
31 July
2018
31 August
2018
28 September
2018
31 October
2018
30 November
2018
31 December
2018
Class A (GBP) Income GBP - GBP - GBP 0.085090 GBP - GBP - GBP 0.055596
Class A (USD) Income GBP - GBP - GBP 0.053107 GBP - GBP - GBP 0.034628
Class R (GBP) Income GBP - GBP - GBP 0.091581 GBP - GBP - GBP 0.059937
Class U1 (GBP) Income GBP - GBP - GBP 0.092352 GBP - GBP - GBP 0.060452
Class U2 (GBP) Income GBP - GBP - GBP 0.097140 GBP - GBP - GBP 0.063598
Merian UK Dynamic Equity Fund
29 December
2017
31 January
2018
28 February
2018
29 March
2018
30 April
2018
31 May
2018
29 June
2018
Class A (GBP) Income GBP - GBP - GBP - GBP - GBP - GBP - GBP -
Class R (GBP) Income GBP - GBP - GBP - GBP - GBP - GBP - GBP -
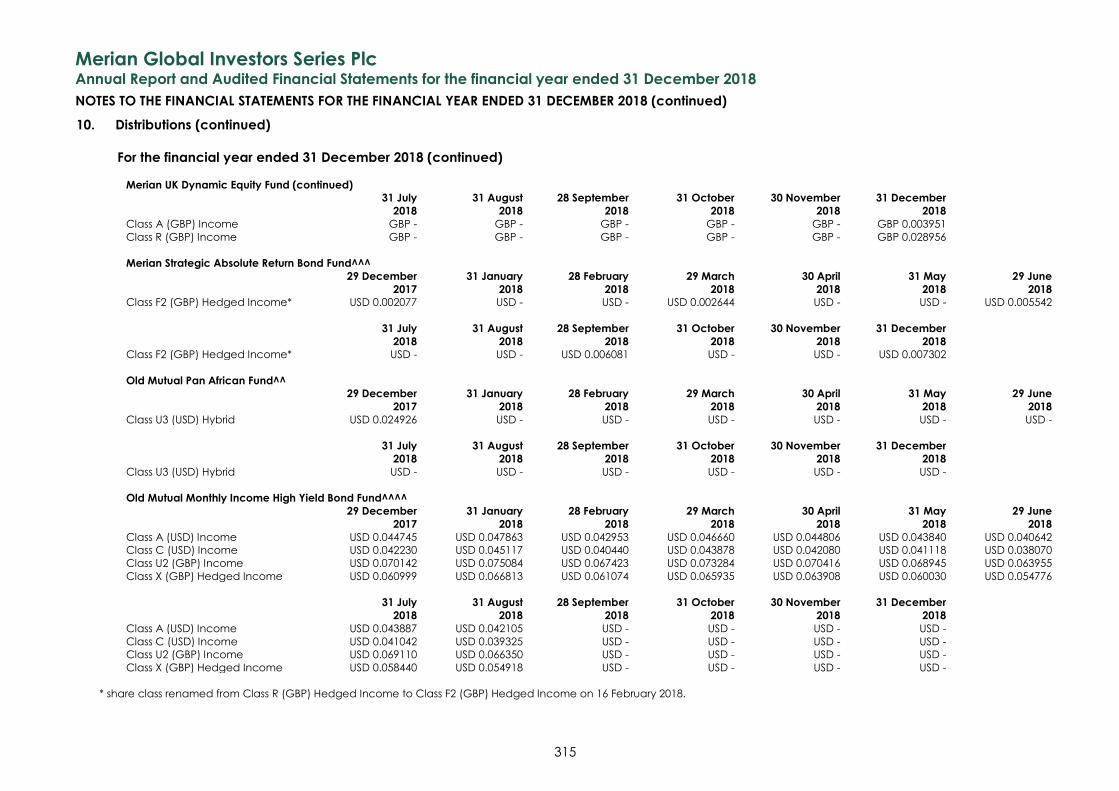
Merian Global Investors Series Plc
Annual Report and Audited Financial Statements for the financial year ended 31 December 2018
NOTES TO THE FINANCIAL STATEMENTS FOR THE FINANCIAL YEAR ENDED 31 DECEMBER 2018 (continued)
315
10. Distributions (continued)
For the financial year ended 31 December 2018 (continued)
Merian UK Dynamic Equity Fund (continued)
31 July
2018
31 August
2018
28 September
2018
31 October
2018
30 November
2018
31 December
2018
Class A (GBP) Income GBP - GBP - GBP - GBP - GBP - GBP 0.003951
Class R (GBP) Income GBP - GBP - GBP - GBP - GBP - GBP 0.028956
Merian Strategic Absolute Return Bond Fund^^^
29 December
2017
31 January
2018
28 February
2018
29 March
2018
30 April
2018
31 May
2018
29 June
2018
Class F2 (GBP) Hedged Income* USD 0.002077 USD - USD - USD 0.002644 USD - USD - USD 0.005542
31 July
2018
31 August
2018
28 September
2018
31 October
2018
30 November
2018
31 December
2018
Class F2 (GBP) Hedged Income* USD - USD - USD 0.006081 USD - USD - USD 0.007302
Old Mutual Pan African Fund^^
29 December
2017
31 January
2018
28 February
2018
29 March
2018
30 April
2018
31 May
2018
29 June
2018
Class U3 (USD) Hybrid USD 0.024926 USD - USD - USD - USD - USD - USD -
31 July
2018
31 August
2018
28 September
2018
31 October
2018
30 November
2018
31 December
2018
Class U3 (USD) Hybrid USD - USD - USD - USD - USD - USD -
Old Mutual Monthly Income High Yield Bond Fund^^^^
29 December
2017
31 January
2018
28 February
2018
29 March
2018
30 April
2018
31 May
2018
29 June
2018
Class A (USD) Income USD 0.044745 USD 0.047863 USD 0.042953 USD 0.046660 USD 0.044806 USD 0.043840 USD 0.040642
Class C (USD) Income USD 0.042230 USD 0.045117 USD 0.040440 USD 0.043878 USD 0.042080 USD 0.041118 USD 0.038070
Class U2 (GBP) Income USD 0.070142 USD 0.075084 USD 0.067423 USD 0.073284 USD 0.070416 USD 0.068945 USD 0.063955
Class X (GBP) Hedged Income USD 0.060999 USD 0.066813 USD 0.061074 USD 0.065935 USD 0.063908 USD 0.060030 USD 0.054776
31 July
2018
31 August
2018
28 September
2018
31 October
2018
30 November
2018
31 December
2018
Class A (USD) Income USD 0.043887 USD 0.042105 USD - USD - USD - USD -
Class C (USD) Income USD 0.041042 USD 0.039325 USD - USD - USD - USD -
Class U2 (GBP) Income USD 0.069110 USD 0.066350 USD - USD - USD - USD -
Class X (GBP) Hedged Income USD 0.058440 USD 0.054918 USD - USD - USD - USD -
* share class renamed from Class R (GBP) Hedged Income to Class F2 (GBP) Hedged Income on 16 February 2018.
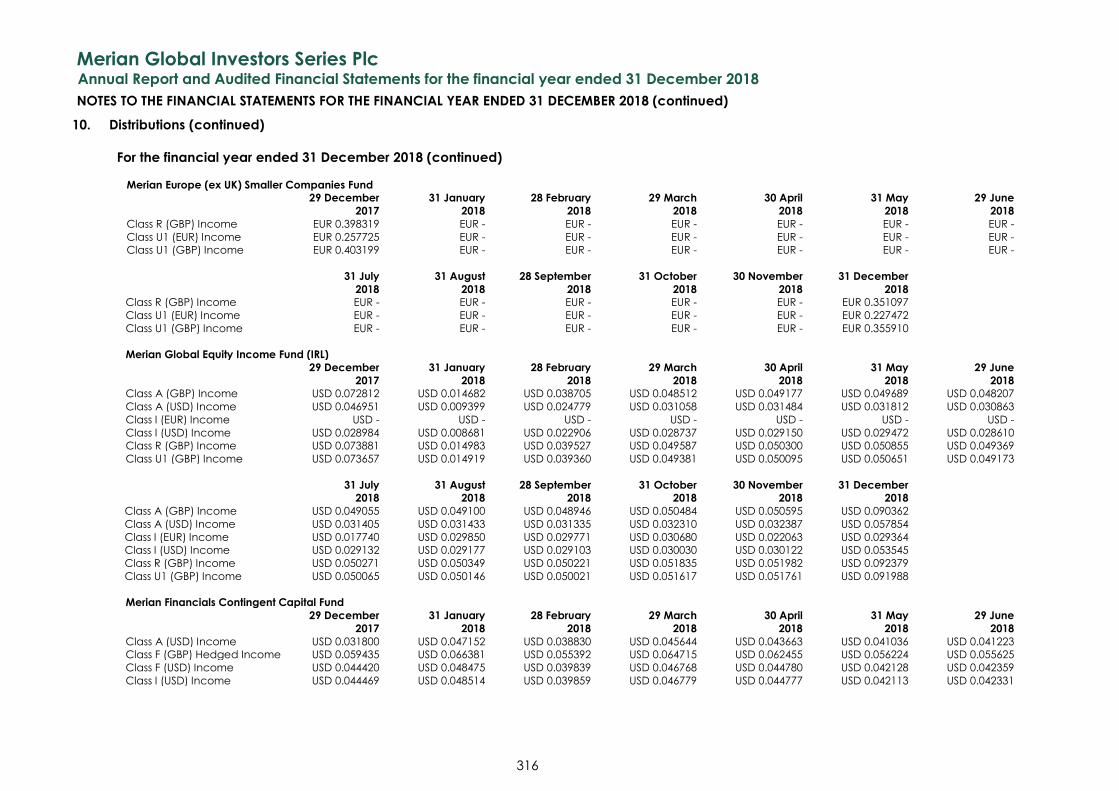
Merian Global Investors Series Plc
Annual Report and Audited Financial Statements for the financial year ended 31 December 2018
NOTES TO THE FINANCIAL STATEMENTS FOR THE FINANCIAL YEAR ENDED 31 DECEMBER 2018 (continued)
316
10. Distributions (continued)
For the financial year ended 31 December 2018 (continued)
Merian Europe (ex UK) Smaller Companies Fund
29 December
2017
31 January
2018
28 February
2018
29 March
2018
30 April
2018
31 May
2018
29 June
2018
Class R (GBP) Income EUR 0.398319 EUR - EUR - EUR - EUR - EUR - EUR -
Class U1 (EUR) Income EUR 0.257725 EUR - EUR - EUR - EUR - EUR - EUR -
Class U1 (GBP) Income EUR 0.403199 EUR - EUR - EUR - EUR - EUR - EUR -
31 July
2018
31 August
2018
28 September
2018
31 October
2018
30 November
2018
31 December
2018
Class R (GBP) Income EUR - EUR - EUR - EUR - EUR - EUR 0.351097
Class U1 (EUR) Income EUR - EUR - EUR - EUR - EUR - EUR 0.227472
Class U1 (GBP) Income EUR - EUR - EUR - EUR - EUR - EUR 0.355910
Merian Global Equity Income Fund (IRL)
29 December
2017
31 January
2018
28 February
2018
29 March
2018
30 April
2018
31 May
2018
29 June
2018
Class A (GBP) Income USD 0.072812 USD 0.014682 USD 0.038705 USD 0.048512 USD 0.049177 USD 0.049689 USD 0.048207
Class A (USD) Income USD 0.046951 USD 0.009399 USD 0.024779 USD 0.031058 USD 0.031484 USD 0.031812 USD 0.030863
Class I (EUR) Income USD - USD - USD - USD - USD - USD - USD -
Class I (USD) Income USD 0.028984 USD 0.008681 USD 0.022906 USD 0.028737 USD 0.029150 USD 0.029472 USD 0.028610
Class R (GBP) Income USD 0.073881 USD 0.014983 USD 0.039527 USD 0.049587 USD 0.050300 USD 0.050855 USD 0.049369
Class U1 (GBP) Income USD 0.073657 USD 0.014919 USD 0.039360 USD 0.049381 USD 0.050095 USD 0.050651 USD 0.049173
31 July
2018
31 August
2018
28 September
2018
31 October
2018
30 November
2018
31 December
2018
Class A (GBP) Income USD 0.049055 USD 0.049100 USD 0.048946 USD 0.050484 USD 0.050595 USD 0.090362
Class A (USD) Income USD 0.031405 USD 0.031433 USD 0.031335 USD 0.032310 USD 0.032387 USD 0.057854
Class I (EUR) Income USD 0.017740 USD 0.029850 USD 0.029771 USD 0.030680 USD 0.022063 USD 0.029364
Class I (USD) Income USD 0.029132 USD 0.029177 USD 0.029103 USD 0.030030 USD 0.030122 USD 0.053545
Class R (GBP) Income USD 0.050271 USD 0.050349 USD 0.050221 USD 0.051835 USD 0.051982 USD 0.092379
Class U1 (GBP) Income USD 0.050065 USD 0.050146 USD 0.050021 USD 0.051617 USD 0.051761 USD 0.091988
Merian Financials Contingent Capital Fund
29 December
2017
31 January
2018
28 February
2018
29 March
2018
30 April
2018
31 May
2018
29 June
2018
Class A (USD) Income USD 0.031800 USD 0.047152 USD 0.038830 USD 0.045644 USD 0.043663 USD 0.041036 USD 0.041223
Class F (GBP) Hedged Income USD 0.059435 USD 0.066381 USD 0.055392 USD 0.064715 USD 0.062455 USD 0.056224 USD 0.055625
Class F (USD) Income USD 0.044420 USD 0.048475 USD 0.039839 USD 0.046768 USD 0.044780 USD 0.042128 USD 0.042359
Class I (USD) Income USD 0.044469 USD 0.048514 USD 0.039859 USD 0.046779 USD 0.044777 USD 0.042113 USD 0.042331
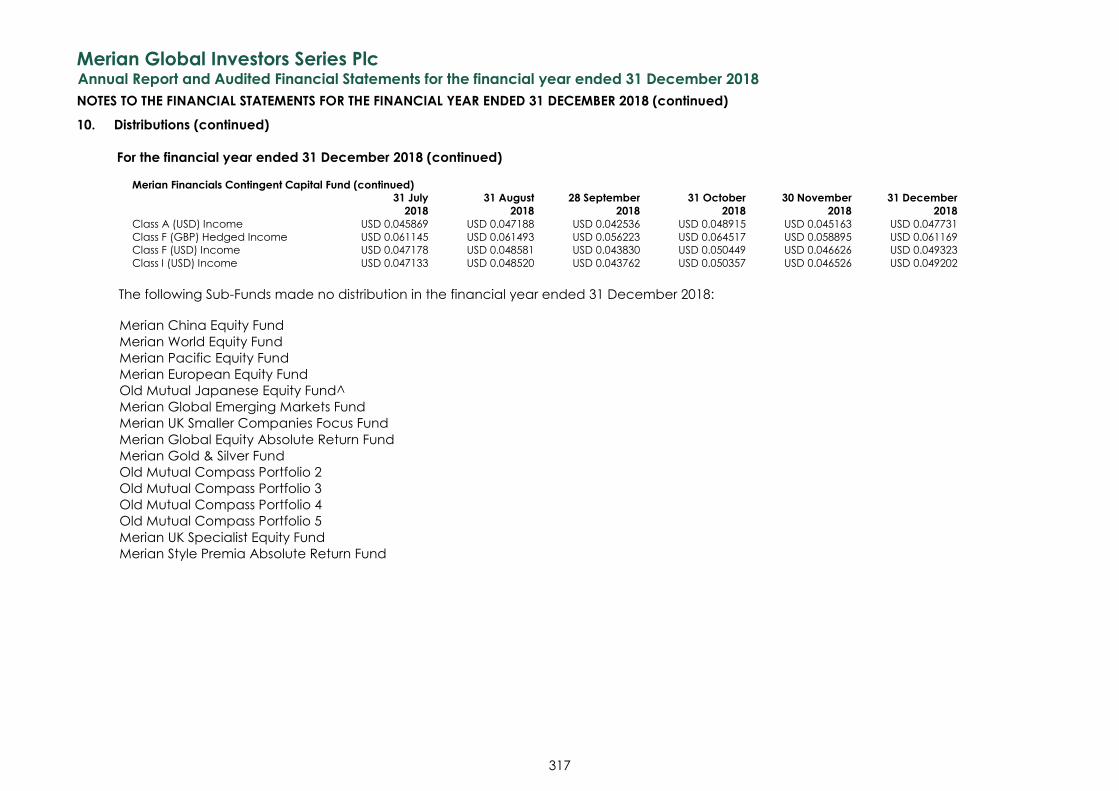
Merian Global Investors Series Plc
Annual Report and Audited Financial Statements for the financial year ended 31 December 2018
NOTES TO THE FINANCIAL STATEMENTS FOR THE FINANCIAL YEAR ENDED 31 DECEMBER 2018 (continued)
317
10. Distributions (continued)
For the financial year ended 31 December 2018 (continued)
Merian Financials Contingent Capital Fund (continued)
31 July
2018
31 August
2018
28 September
2018
31 October
2018
30 November
2018
31 December
2018
Class A (USD) Income USD 0.045869 USD 0.047188 USD 0.042536 USD 0.048915 USD 0.045163 USD 0.047731
Class F (GBP) Hedged Income USD 0.061145 USD 0.061493 USD 0.056223 USD 0.064517 USD 0.058895 USD 0.061169
Class F (USD) Income USD 0.047178 USD 0.048581 USD 0.043830 USD 0.050449 USD 0.046626 USD 0.049323
Class I (USD) Income USD 0.047133 USD 0.048520 USD 0.043762 USD 0.050357 USD 0.046526 USD 0.049202
The following Sub-Funds made no distribution in the financial year ended 31 December 2018:
Merian China Equity Fund
Merian World Equity Fund
Merian Pacific Equity Fund
Merian European Equity Fund
Old Mutual Japanese Equity Fund^
Merian Global Emerging Markets Fund
Merian UK Smaller Companies Focus Fund
Merian Global Equity Absolute Return Fund
Merian Gold & Silver Fund
Old Mutual Compass Portfolio 2
Old Mutual Compass Portfolio 3
Old Mutual Compass Portfolio 4
Old Mutual Compass Portfolio 5
Merian UK Specialist Equity Fund
Merian Style Premia Absolute Return Fund
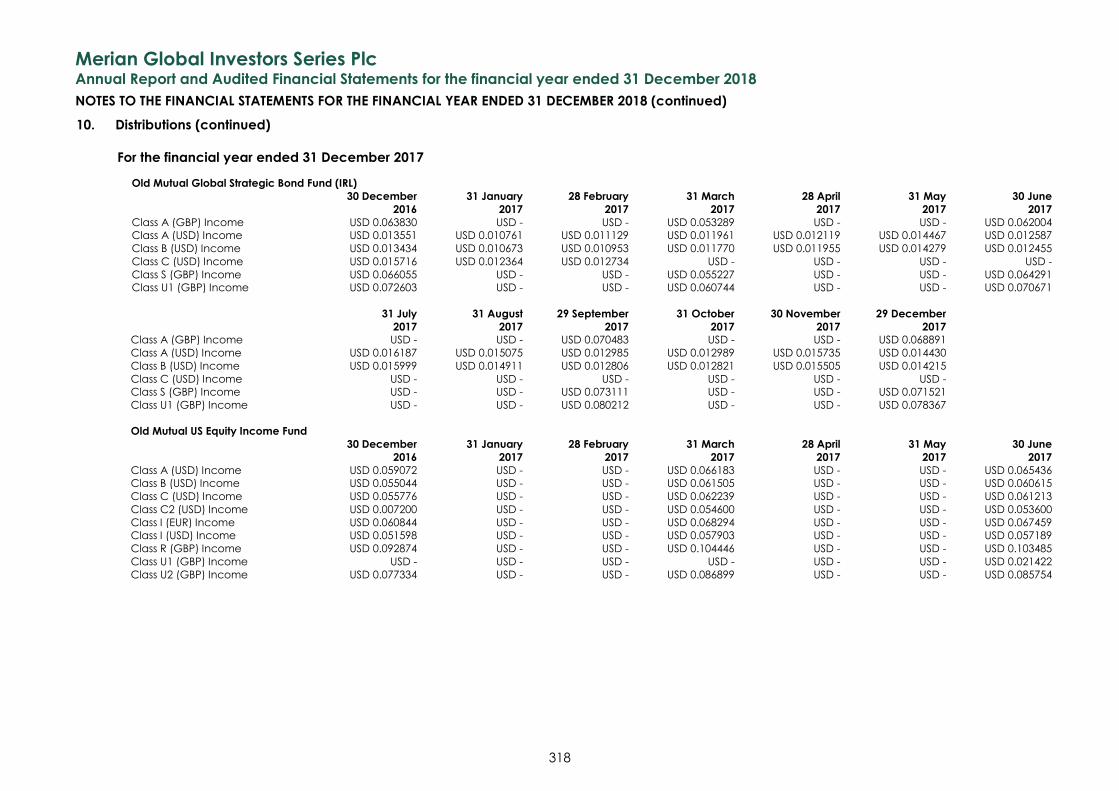
Merian Global Investors Series Plc
Annual Report and Audited Financial Statements for the financial year ended 31 December 2018
NOTES TO THE FINANCIAL STATEMENTS FOR THE FINANCIAL YEAR ENDED 31 DECEMBER 2018 (continued)
318
10. Distributions (continued)
For the financial year ended 31 December 2017
Old Mutual Global Strategic Bond Fund (IRL)
30 December
2016
31 January
2017
28 February
2017
31 March
2017
28 April
2017
31 May
2017
30 June
2017
Class A (GBP) Income USD 0.063830 USD - USD - USD 0.053289 USD - USD - USD 0.062004
Class A (USD) Income USD 0.013551 USD 0.010761 USD 0.011129 USD 0.011961 USD 0.012119 USD 0.014467 USD 0.012587
Class B (USD) Income USD 0.013434 USD 0.010673 USD 0.010953 USD 0.011770 USD 0.011955 USD 0.014279 USD 0.012455
Class C (USD) Income USD 0.015716 USD 0.012364 USD 0.012734 USD - USD - USD - USD -
Class S (GBP) Income USD 0.066055 USD - USD - USD 0.055227 USD - USD - USD 0.064291
Class U1 (GBP) Income USD 0.072603 USD - USD - USD 0.060744 USD - USD - USD 0.070671
31 July
2017
31 August
2017
29 September
2017
31 October
2017
30 November
2017
29 December
2017
Class A (GBP) Income USD - USD - USD 0.070483 USD - USD - USD 0.068891
Class A (USD) Income USD 0.016187 USD 0.015075 USD 0.012985 USD 0.012989 USD 0.015735 USD 0.014430
Class B (USD) Income USD 0.015999 USD 0.014911 USD 0.012806 USD 0.012821 USD 0.015505 USD 0.014215
Class C (USD) Income USD - USD - USD - USD - USD - USD -
Class S (GBP) Income USD - USD - USD 0.073111 USD - USD - USD 0.071521
Class U1 (GBP) Income USD - USD - USD 0.080212 USD - USD - USD 0.078367
Old Mutual US Equity Income Fund
30 December
2016
31 January
2017
28 February
2017
31 March
2017
28 April
2017
31 May
2017
30 June
2017
Class A (USD) Income USD 0.059072 USD - USD - USD 0.066183 USD - USD - USD 0.065436
Class B (USD) Income USD 0.055044 USD - USD - USD 0.061505 USD - USD - USD 0.060615
Class C (USD) Income USD 0.055776 USD - USD - USD 0.062239 USD - USD - USD 0.061213
Class C2 (USD) Income USD 0.007200 USD - USD - USD 0.054600 USD - USD - USD 0.053600
Class I (EUR) Income USD 0.060844 USD - USD - USD 0.068294 USD - USD - USD 0.067459
Class I (USD) Income USD 0.051598 USD - USD - USD 0.057903 USD - USD - USD 0.057189
Class R (GBP) Income USD 0.092874 USD - USD - USD 0.104446 USD - USD - USD 0.103485
Class U1 (GBP) Income USD - USD - USD - USD - USD - USD - USD 0.021422
Class U2 (GBP) Income USD 0.077334 USD - USD - USD 0.086899 USD - USD - USD 0.085754
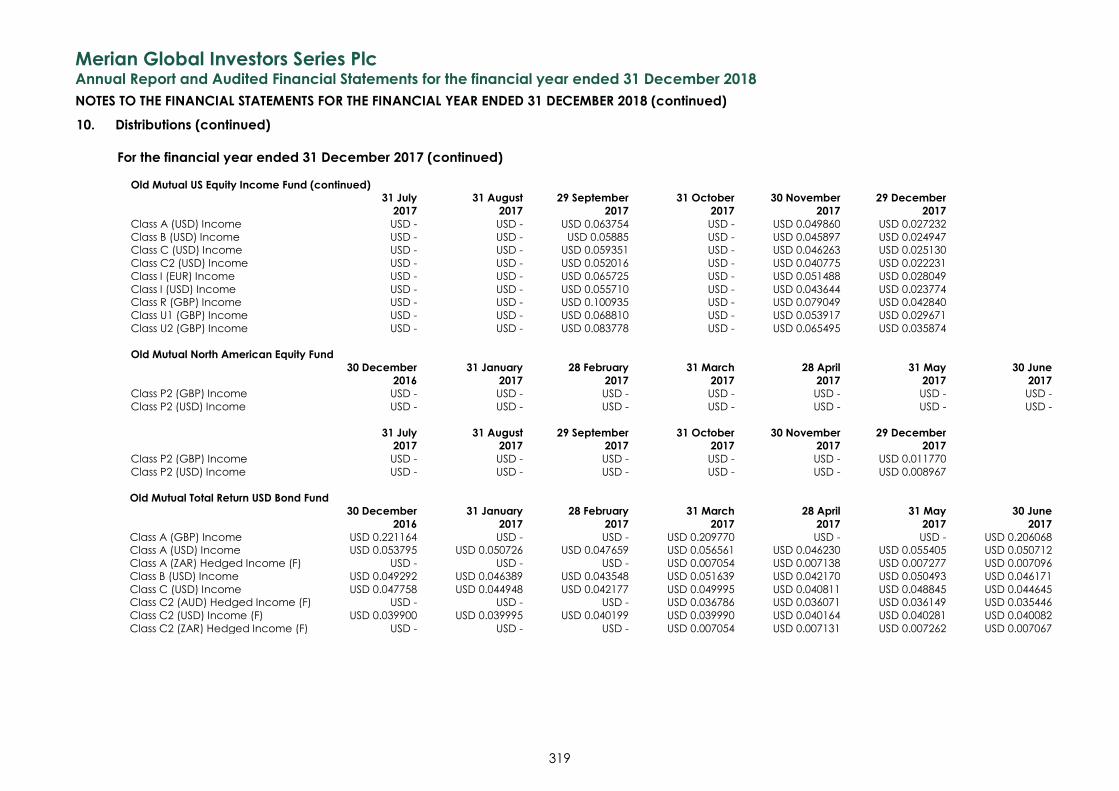
Merian Global Investors Series Plc
Annual Report and Audited Financial Statements for the financial year ended 31 December 2018
NOTES TO THE FINANCIAL STATEMENTS FOR THE FINANCIAL YEAR ENDED 31 DECEMBER 2018 (continued)
319
10. Distributions (continued)
For the financial year ended 31 December 2017 (continued)
Old Mutual US Equity Income Fund (continued)
31 July
2017
31 August
2017
29 September
2017
31 October
2017
30 November
2017
29 December
2017
Class A (USD) Income USD - USD - USD 0.063754 USD - USD 0.049860 USD 0.027232
Class B (USD) Income USD - USD - USD 0.05885 USD - USD 0.045897 USD 0.024947
Class C (USD) Income USD - USD - USD 0.059351 USD - USD 0.046263 USD 0.025130
Class C2 (USD) Income USD - USD - USD 0.052016 USD - USD 0.040775 USD 0.022231
Class I (EUR) Income USD - USD - USD 0.065725 USD - USD 0.051488 USD 0.028049
Class I (USD) Income USD - USD - USD 0.055710 USD - USD 0.043644 USD 0.023774
Class R (GBP) Income USD - USD - USD 0.100935 USD - USD 0.079049 USD 0.042840
Class U1 (GBP) Income USD - USD - USD 0.068810 USD - USD 0.053917 USD 0.029671
Class U2 (GBP) Income USD - USD - USD 0.083778 USD - USD 0.065495 USD 0.035874
Old Mutual North American Equity Fund
30 December
2016
31 January
2017
28 February
2017
31 March
2017
28 April
2017
31 May
2017
30 June
2017
Class P2 (GBP) Income USD - USD - USD - USD - USD - USD - USD -
Class P2 (USD) Income USD - USD - USD - USD - USD - USD - USD -
31 July
2017
31 August
2017
29 September
2017
31 October
2017
30 November
2017
29 December
2017
Class P2 (GBP) Income USD - USD - USD - USD - USD - USD 0.011770
Class P2 (USD) Income USD - USD - USD - USD - USD - USD 0.008967
Old Mutual Total Return USD Bond Fund
30 December
2016
31 January
2017
28 February
2017
31 March
2017
28 April
2017
31 May
2017
30 June
2017
Class A (GBP) Income USD 0.221164 USD - USD - USD 0.209770 USD - USD - USD 0.206068
Class A (USD) Income USD 0.053795 USD 0.050726 USD 0.047659 USD 0.056561 USD 0.046230 USD 0.055405 USD 0.050712
Class A (ZAR) Hedged Income (F) USD - USD - USD - USD 0.007054 USD 0.007138 USD 0.007277 USD 0.007096
Class B (USD) Income USD 0.049292 USD 0.046389 USD 0.043548 USD 0.051639 USD 0.042170 USD 0.050493 USD 0.046171
Class C (USD) Income USD 0.047758 USD 0.044948 USD 0.042177 USD 0.049995 USD 0.040811 USD 0.048845 USD 0.044645
Class C2 (AUD) Hedged Income (F) USD - USD - USD - USD 0.036786 USD 0.036071 USD 0.036149 USD 0.035446
Class C2 (USD) Income (F) USD 0.039900 USD 0.039995 USD 0.040199 USD 0.039990 USD 0.040164 USD 0.040281 USD 0.040082
Class C2 (ZAR) Hedged Income (F) USD - USD - USD - USD 0.007054 USD 0.007131 USD 0.007262 USD 0.007067
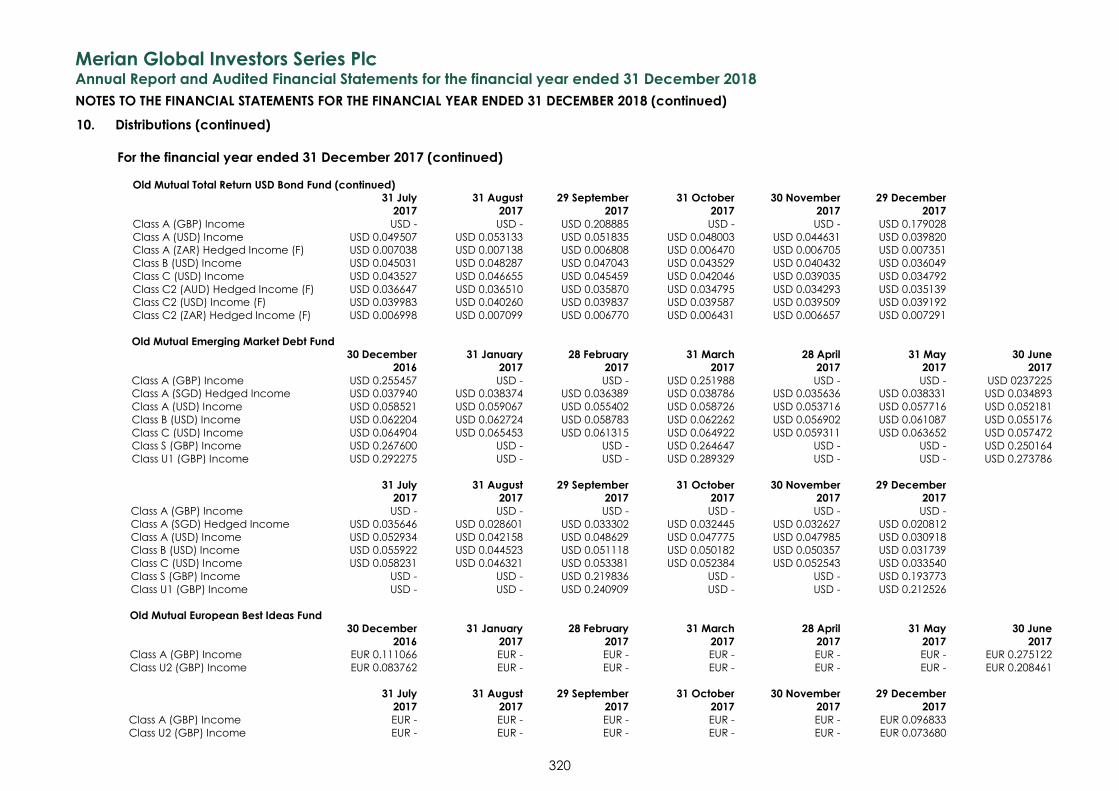
Merian Global Investors Series Plc
Annual Report and Audited Financial Statements for the financial year ended 31 December 2018
NOTES TO THE FINANCIAL STATEMENTS FOR THE FINANCIAL YEAR ENDED 31 DECEMBER 2018 (continued)
320
10. Distributions (continued)
For the financial year ended 31 December 2017 (continued)
Old Mutual Total Return USD Bond Fund (continued)
31 July
2017
31 August
2017
29 September
2017
31 October
2017
30 November
2017
29 December
2017
Class A (GBP) Income USD - USD - USD 0.208885 USD - USD - USD 0.179028
Class A (USD) Income USD 0.049507 USD 0.053133 USD 0.051835 USD 0.048003 USD 0.044631 USD 0.039820
Class A (ZAR) Hedged Income (F) USD 0.007038 USD 0.007138 USD 0.006808 USD 0.006470 USD 0.006705 USD 0.007351
Class B (USD) Income USD 0.045031 USD 0.048287 USD 0.047043 USD 0.043529 USD 0.040432 USD 0.036049
Class C (USD) Income USD 0.043527 USD 0.046655 USD 0.045459 USD 0.042046 USD 0.039035 USD 0.034792
Class C2 (AUD) Hedged Income (F) USD 0.036647 USD 0.036510 USD 0.035870 USD 0.034795 USD 0.034293 USD 0.035139
Class C2 (USD) Income (F) USD 0.039983 USD 0.040260 USD 0.039837 USD 0.039587 USD 0.039509 USD 0.039192
Class C2 (ZAR) Hedged Income (F) USD 0.006998 USD 0.007099 USD 0.006770 USD 0.006431 USD 0.006657 USD 0.007291
Old Mutual Emerging Market Debt Fund
30 December
2016
31 January
2017
28 February
2017
31 March
2017
28 April
2017
31 May
2017
30 June
2017
Class A (GBP) Income USD 0.255457 USD - USD - USD 0.251988 USD - USD - USD 0237225
Class A (SGD) Hedged Income USD 0.037940 USD 0.038374 USD 0.036389 USD 0.038786 USD 0.035636 USD 0.038331 USD 0.034893
Class A (USD) Income USD 0.058521 USD 0.059067 USD 0.055402 USD 0.058726 USD 0.053716 USD 0.057716 USD 0.052181
Class B (USD) Income USD 0.062204 USD 0.062724 USD 0.058783 USD 0.062262 USD 0.056902 USD 0.061087 USD 0.055176
Class C (USD) Income USD 0.064904 USD 0.065453 USD 0.061315 USD 0.064922 USD 0.059311 USD 0.063652 USD 0.057472
Class S (GBP) Income USD 0.267600 USD - USD - USD 0.264647 USD - USD - USD 0.250164
Class U1 (GBP) Income USD 0.292275 USD - USD - USD 0.289329 USD - USD - USD 0.273786
31 July
2017
31 August
2017
29 September
2017
31 October
2017
30 November
2017
29 December
2017
Class A (GBP) Income USD - USD - USD - USD - USD - USD -
Class A (SGD) Hedged Income USD 0.035646 USD 0.028601 USD 0.033302 USD 0.032445 USD 0.032627 USD 0.020812
Class A (USD) Income USD 0.052934 USD 0.042158 USD 0.048629 USD 0.047775 USD 0.047985 USD 0.030918
Class B (USD) Income USD 0.055922 USD 0.044523 USD 0.051118 USD 0.050182 USD 0.050357 USD 0.031739
Class C (USD) Income USD 0.058231 USD 0.046321 USD 0.053381 USD 0.052384 USD 0.052543 USD 0.033540
Class S (GBP) Income USD - USD - USD 0.219836 USD - USD - USD 0.193773
Class U1 (GBP) Income USD - USD - USD 0.240909 USD - USD - USD 0.212526
Old Mutual European Best Ideas Fund
30 December
2016
31 January
2017
28 February
2017
31 March
2017
28 April
2017
31 May
2017
30 June
2017
Class A (GBP) Income EUR 0.111066 EUR - EUR - EUR - EUR - EUR - EUR 0.275122
Class U2 (GBP) Income EUR 0.083762 EUR - EUR - EUR - EUR - EUR - EUR 0.208461
31 July
2017
31 August
2017
29 September
2017
31 October
2017
30 November
2017
29 December
2017
Class A (GBP) Income EUR - EUR - EUR - EUR - EUR - EUR 0.096833
Class U2 (GBP) Income EUR - EUR - EUR - EUR - EUR - EUR 0.073680
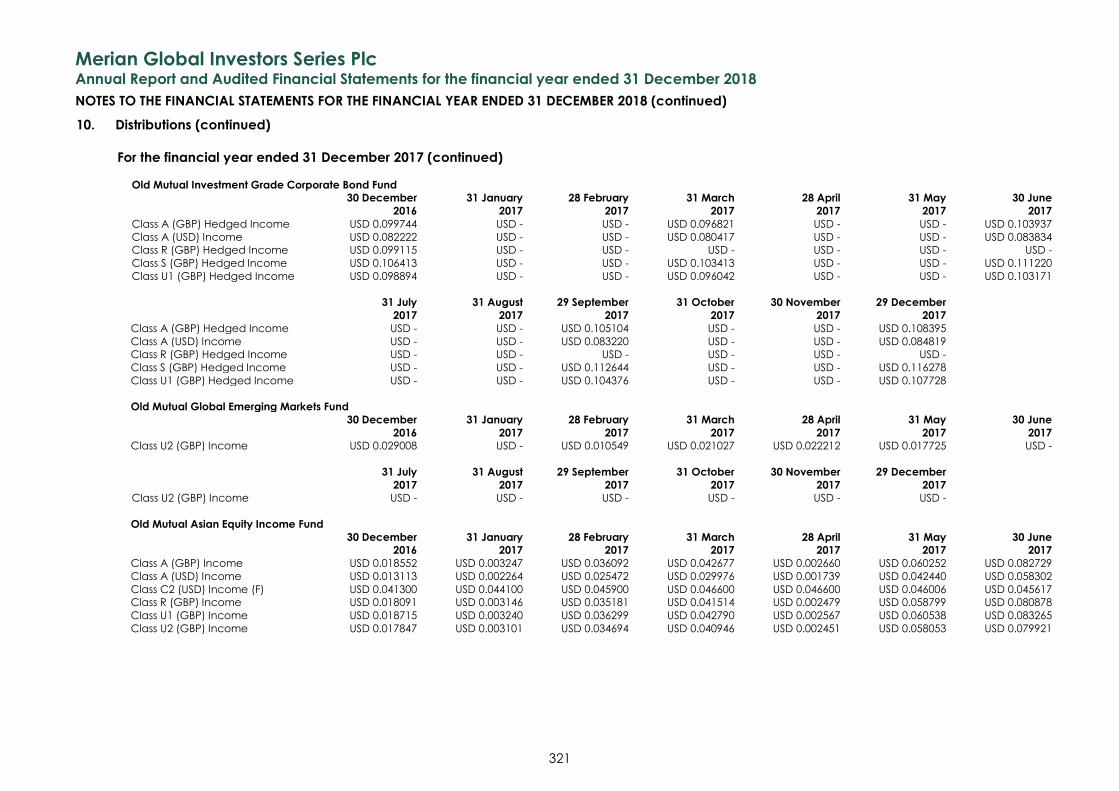
Merian Global Investors Series Plc
Annual Report and Audited Financial Statements for the financial year ended 31 December 2018
NOTES TO THE FINANCIAL STATEMENTS FOR THE FINANCIAL YEAR ENDED 31 DECEMBER 2018 (continued)
321
10. Distributions (continued)
For the financial year ended 31 December 2017 (continued)
Old Mutual Investment Grade Corporate Bond Fund
30 December
2016
31 January
2017
28 February
2017
31 March
2017
28 April
2017
31 May
2017
30 June
2017
Class A (GBP) Hedged Income USD 0.099744 USD - USD - USD 0.096821 USD - USD - USD 0.103937
Class A (USD) Income USD 0.082222 USD - USD - USD 0.080417 USD - USD - USD 0.083834
Class R (GBP) Hedged Income USD 0.099115 USD - USD - USD - USD - USD - USD -
Class S (GBP) Hedged Income USD 0.106413 USD - USD - USD 0.103413 USD - USD - USD 0.111220
Class U1 (GBP) Hedged Income USD 0.098894 USD - USD - USD 0.096042 USD - USD - USD 0.103171
31 July
2017
31 August
2017
29 September
2017
31 October
2017
30 November
2017
29 December
2017
Class A (GBP) Hedged Income USD - USD - USD 0.105104 USD - USD - USD 0.108395
Class A (USD) Income USD - USD - USD 0.083220 USD - USD - USD 0.084819
Class R (GBP) Hedged Income USD - USD - USD - USD - USD - USD -
Class S (GBP) Hedged Income USD - USD - USD 0.112644 USD - USD - USD 0.116278
Class U1 (GBP) Hedged Income USD - USD - USD 0.104376 USD - USD - USD 0.107728
Old Mutual Global Emerging Markets Fund
30 December
2016
31 January
2017
28 February
2017
31 March
2017
28 April
2017
31 May
2017
30 June
2017
Class U2 (GBP) Income USD 0.029008 USD - USD 0.010549 USD 0.021027 USD 0.022212 USD 0.017725 USD -
31 July
2017
31 August
2017
29 September
2017
31 October
2017
30 November
2017
29 December
2017
Class U2 (GBP) Income USD - USD - USD - USD - USD - USD -
Old Mutual Asian Equity Income Fund
30 December
2016
31 January
2017
28 February
2017
31 March
2017
28 April
2017
31 May
2017
30 June
2017
Class A (GBP) Income USD 0.018552 USD 0.003247 USD 0.036092 USD 0.042677 USD 0.002660 USD 0.060252 USD 0.082729
Class A (USD) Income USD 0.013113 USD 0.002264 USD 0.025472 USD 0.029976 USD 0.001739 USD 0.042440 USD 0.058302
Class C2 (USD) Income (F) USD 0.041300 USD 0.044100 USD 0.045900 USD 0.046600 USD 0.046600 USD 0.046006 USD 0.045617
Class R (GBP) Income USD 0.018091 USD 0.003146 USD 0.035181 USD 0.041514 USD 0.002479 USD 0.058799 USD 0.080878
Class U1 (GBP) Income USD 0.018715 USD 0.003240 USD 0.036299 USD 0.042790 USD 0.002567 USD 0.060538 USD 0.083265
Class U2 (GBP) Income USD 0.017847 USD 0.003101 USD 0.034694 USD 0.040946 USD 0.002451 USD 0.058053 USD 0.079921
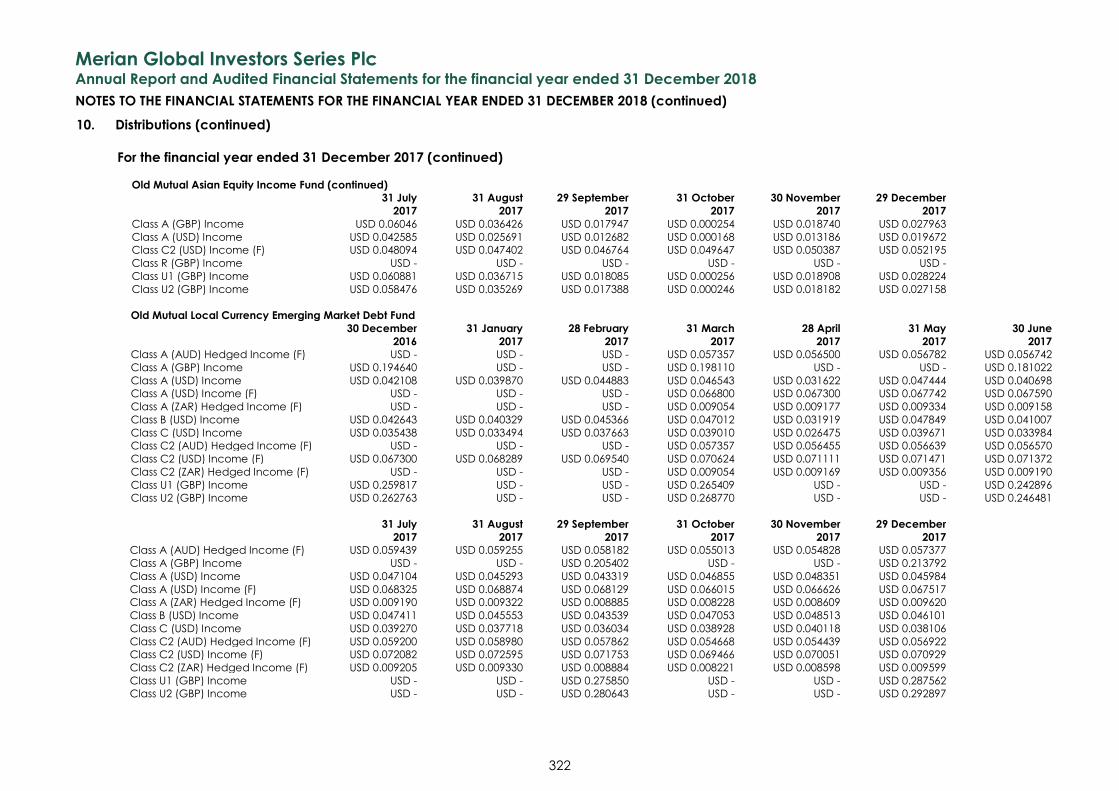
Merian Global Investors Series Plc
Annual Report and Audited Financial Statements for the financial year ended 31 December 2018
NOTES TO THE FINANCIAL STATEMENTS FOR THE FINANCIAL YEAR ENDED 31 DECEMBER 2018 (continued)
322
10. Distributions (continued)
For the financial year ended 31 December 2017 (continued)
Old Mutual Asian Equity Income Fund (continued)
31 July
2017
31 August
2017
29 September
2017
31 October
2017
30 November
2017
29 December
2017
Class A (GBP) Income USD 0.06046 USD 0.036426 USD 0.017947 USD 0.000254 USD 0.018740 USD 0.027963
Class A (USD) Income USD 0.042585 USD 0.025691 USD 0.012682 USD 0.000168 USD 0.013186 USD 0.019672
Class C2 (USD) Income (F) USD 0.048094 USD 0.047402 USD 0.046764 USD 0.049647 USD 0.050387 USD 0.052195
Class R (GBP) Income USD - USD - USD - USD - USD - USD -
Class U1 (GBP) Income USD 0.060881 USD 0.036715 USD 0.018085 USD 0.000256 USD 0.018908 USD 0.028224
Class U2 (GBP) Income USD 0.058476 USD 0.035269 USD 0.017388 USD 0.000246 USD 0.018182 USD 0.027158
Old Mutual Local Currency Emerging Market Debt Fund
30 December
2016
31 January
2017
28 February
2017
31 March
2017
28 April
2017
31 May
2017
30 June
2017
Class A (AUD) Hedged Income (F) USD - USD - USD - USD 0.057357 USD 0.056500 USD 0.056782 USD 0.056742
Class A (GBP) Income USD 0.194640 USD - USD - USD 0.198110 USD - USD - USD 0.181022
Class A (USD) Income USD 0.042108 USD 0.039870 USD 0.044883 USD 0.046543 USD 0.031622 USD 0.047444 USD 0.040698
Class A (USD) Income (F) USD - USD - USD - USD 0.066800 USD 0.067300 USD 0.067742 USD 0.067590
Class A (ZAR) Hedged Income (F) USD - USD - USD - USD 0.009054 USD 0.009177 USD 0.009334 USD 0.009158
Class B (USD) Income USD 0.042643 USD 0.040329 USD 0.045366 USD 0.047012 USD 0.031919 USD 0.047849 USD 0.041007
Class C (USD) Income USD 0.035438 USD 0.033494 USD 0.037663 USD 0.039010 USD 0.026475 USD 0.039671 USD 0.033984
Class C2 (AUD) Hedged Income (F) USD - USD - USD - USD 0.057357 USD 0.056455 USD 0.056639 USD 0.056570
Class C2 (USD) Income (F) USD 0.067300 USD 0.068289 USD 0.069540 USD 0.070624 USD 0.071111 USD 0.071471 USD 0.071372
Class C2 (ZAR) Hedged Income (F) USD - USD - USD - USD 0.009054 USD 0.009169 USD 0.009356 USD 0.009190
Class U1 (GBP) Income USD 0.259817 USD - USD - USD 0.265409 USD - USD - USD 0.242896
Class U2 (GBP) Income USD 0.262763 USD - USD - USD 0.268770 USD - USD - USD 0.246481
31 July
2017
31 August
2017
29 September
2017
31 October
2017
30 November
2017
29 December
2017
Class A (AUD) Hedged Income (F) USD 0.059439 USD 0.059255 USD 0.058182 USD 0.055013 USD 0.054828 USD 0.057377
Class A (GBP) Income USD - USD - USD 0.205402 USD - USD - USD 0.213792
Class A (USD) Income USD 0.047104 USD 0.045293 USD 0.043319 USD 0.046855 USD 0.048351 USD 0.045984
Class A (USD) Income (F) USD 0.068325 USD 0.068874 USD 0.068129 USD 0.066015 USD 0.066626 USD 0.067517
Class A (ZAR) Hedged Income (F) USD 0.009190 USD 0.009322 USD 0.008885 USD 0.008228 USD 0.008609 USD 0.009620
Class B (USD) Income USD 0.047411 USD 0.045553 USD 0.043539 USD 0.047053 USD 0.048513 USD 0.046101
Class C (USD) Income USD 0.039270 USD 0.037718 USD 0.036034 USD 0.038928 USD 0.040118 USD 0.038106
Class C2 (AUD) Hedged Income (F) USD 0.059200 USD 0.058980 USD 0.057862 USD 0.054668 USD 0.054439 USD 0.056922
Class C2 (USD) Income (F) USD 0.072082 USD 0.072595 USD 0.071753 USD 0.069466 USD 0.070051 USD 0.070929
Class C2 (ZAR) Hedged Income (F) USD 0.009205 USD 0.009330 USD 0.008884 USD 0.008221 USD 0.008598 USD 0.009599
Class U1 (GBP) Income USD - USD - USD 0.275850 USD - USD - USD 0.287562
Class U2 (GBP) Income USD - USD - USD 0.280643 USD - USD - USD 0.292897
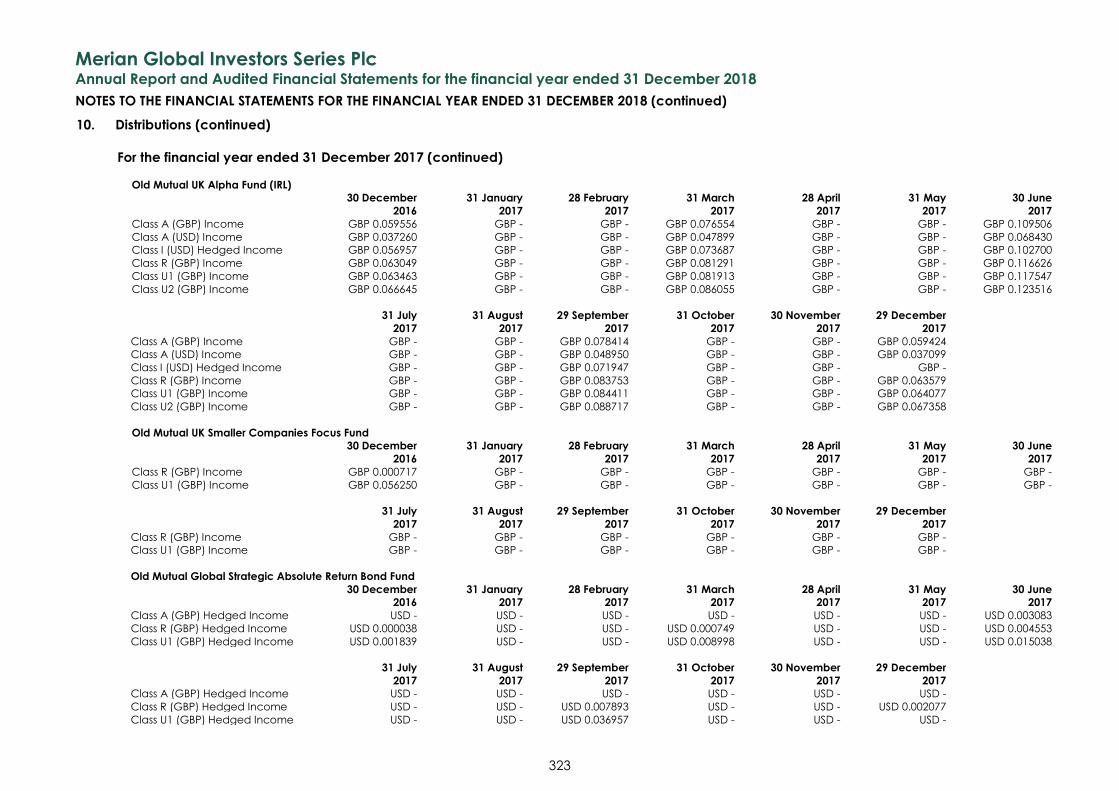
Merian Global Investors Series Plc
Annual Report and Audited Financial Statements for the financial year ended 31 December 2018
NOTES TO THE FINANCIAL STATEMENTS FOR THE FINANCIAL YEAR ENDED 31 DECEMBER 2018 (continued)
323
10. Distributions (continued)
For the financial year ended 31 December 2017 (continued)
Old Mutual UK Alpha Fund (IRL)
30 December
2016
31 January
2017
28 February
2017
31 March
2017
28 April
2017
31 May
2017
30 June
2017
Class A (GBP) Income GBP 0.059556 GBP - GBP - GBP 0.076554 GBP - GBP - GBP 0.109506
Class A (USD) Income GBP 0.037260 GBP - GBP - GBP 0.047899 GBP - GBP - GBP 0.068430
Class I (USD) Hedged Income GBP 0.056957 GBP - GBP - GBP 0.073687 GBP - GBP - GBP 0.102700
Class R (GBP) Income GBP 0.063049 GBP - GBP - GBP 0.081291 GBP - GBP - GBP 0.116626
Class U1 (GBP) Income GBP 0.063463 GBP - GBP - GBP 0.081913 GBP - GBP - GBP 0.117547
Class U2 (GBP) Income GBP 0.066645 GBP - GBP - GBP 0.086055 GBP - GBP - GBP 0.123516
31 July
2017
31 August
2017
29 September
2017
31 October
2017
30 November
2017
29 December
2017
Class A (GBP) Income GBP - GBP - GBP 0.078414 GBP - GBP - GBP 0.059424
Class A (USD) Income GBP - GBP - GBP 0.048950 GBP - GBP - GBP 0.037099
Class I (USD) Hedged Income GBP - GBP - GBP 0.071947 GBP - GBP - GBP -
Class R (GBP) Income GBP - GBP - GBP 0.083753 GBP - GBP - GBP 0.063579
Class U1 (GBP) Income GBP - GBP - GBP 0.084411 GBP - GBP - GBP 0.064077
Class U2 (GBP) Income GBP - GBP - GBP 0.088717 GBP - GBP - GBP 0.067358
Old Mutual UK Smaller Companies Focus Fund
30 December
2016
31 January
2017
28 February
2017
31 March
2017
28 April
2017
31 May
2017
30 June
2017
Class R (GBP) Income GBP 0.000717 GBP - GBP - GBP - GBP - GBP - GBP -
Class U1 (GBP) Income GBP 0.056250 GBP - GBP - GBP - GBP - GBP - GBP -
31 July
2017
31 August
2017
29 September
2017
31 October
2017
30 November
2017
29 December
2017
Class R (GBP) Income GBP - GBP - GBP - GBP - GBP - GBP -
Class U1 (GBP) Income GBP - GBP - GBP - GBP - GBP - GBP -
Old Mutual Global Strategic Absolute Return Bond Fund
30 December
2016
31 January
2017
28 February
2017
31 March
2017
28 April
2017
31 May
2017
30 June
2017
Class A (GBP) Hedged Income USD - USD - USD - USD - USD - USD - USD 0.003083
Class R (GBP) Hedged Income USD 0.000038 USD - USD - USD 0.000749 USD - USD - USD 0.004553
Class U1 (GBP) Hedged Income USD 0.001839 USD - USD - USD 0.008998 USD - USD - USD 0.015038
31 July
2017
31 August
2017
29 September
2017
31 October
2017
30 November
2017
29 December
2017
Class A (GBP) Hedged Income USD - USD - USD - USD - USD - USD -
Class R (GBP) Hedged Income USD - USD - USD 0.007893 USD - USD - USD 0.002077
Class U1 (GBP) Hedged Income USD - USD - USD 0.036957 USD - USD - USD -
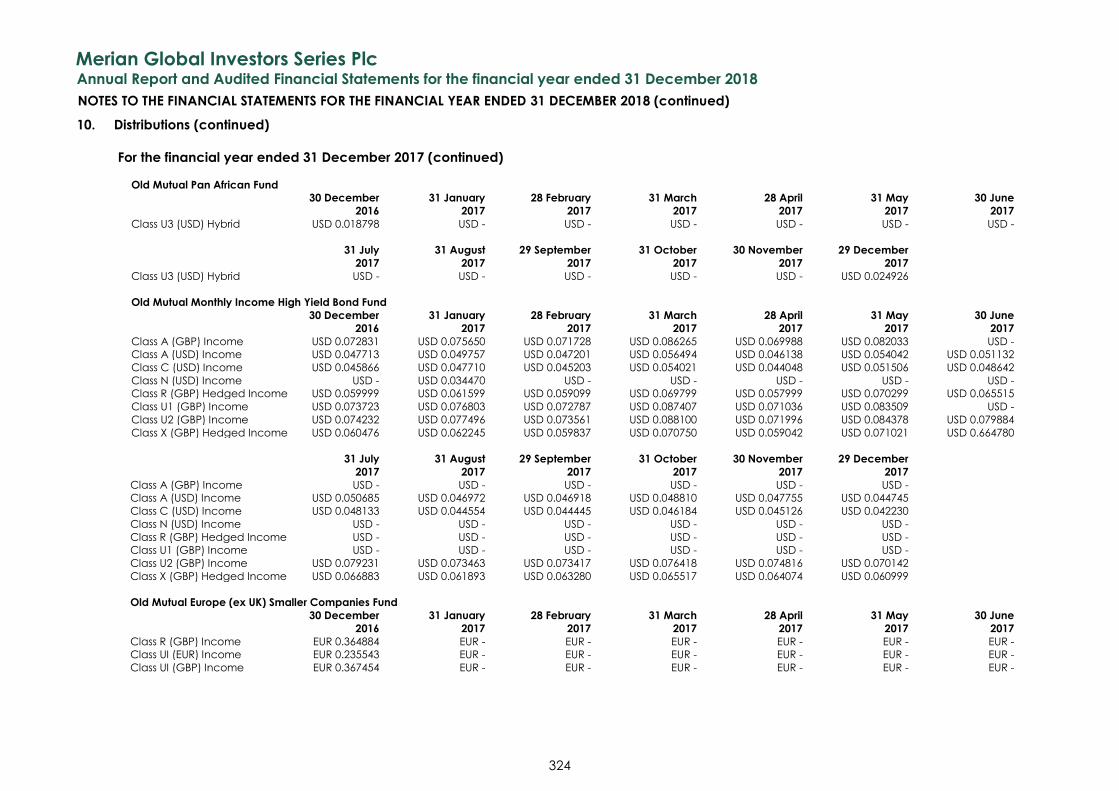
Merian Global Investors Series Plc
Annual Report and Audited Financial Statements for the financial year ended 31 December 2018
NOTES TO THE FINANCIAL STATEMENTS FOR THE FINANCIAL YEAR ENDED 31 DECEMBER 2018 (continued)
324
10. Distributions (continued)
For the financial year ended 31 December 2017 (continued)
Old Mutual Pan African Fund
30 December
2016
31 January
2017
28 February
2017
31 March
2017
28 April
2017
31 May
2017
30 June
2017
Class U3 (USD) Hybrid USD 0.018798 USD - USD - USD - USD - USD - USD -
31 July
2017
31 August
2017
29 September
2017
31 October
2017
30 November
2017
29 December
2017
Class U3 (USD) Hybrid USD - USD - USD - USD - USD - USD 0.024926
Old Mutual Monthly Income High Yield Bond Fund
30 December
2016
31 January
2017
28 February
2017
31 March
2017
28 April
2017
31 May
2017
30 June
2017
Class A (GBP) Income USD 0.072831 USD 0.075650 USD 0.071728 USD 0.086265 USD 0.069988 USD 0.082033 USD -
Class A (USD) Income USD 0.047713 USD 0.049757 USD 0.047201 USD 0.056494 USD 0.046138 USD 0.054042 USD 0.051132
Class C (USD) Income USD 0.045866 USD 0.047710 USD 0.045203 USD 0.054021 USD 0.044048 USD 0.051506 USD 0.048642
Class N (USD) Income USD - USD 0.034470 USD - USD - USD - USD - USD -
Class R (GBP) Hedged Income USD 0.059999 USD 0.061599 USD 0.059099 USD 0.069799 USD 0.057999 USD 0.070299 USD 0.065515
Class U1 (GBP) Income USD 0.073723 USD 0.076803 USD 0.072787 USD 0.087407 USD 0.071036 USD 0.083509 USD -
Class U2 (GBP) Income USD 0.074232 USD 0.077496 USD 0.073561 USD 0.088100 USD 0.071996 USD 0.084378 USD 0.079884
Class X (GBP) Hedged Income USD 0.060476 USD 0.062245 USD 0.059837 USD 0.070750 USD 0.059042 USD 0.071021 USD 0.664780
31 July
2017
31 August
2017
29 September
2017
31 October
2017
30 November
2017
29 December
2017
Class A (GBP) Income USD - USD - USD - USD - USD - USD -
Class A (USD) Income USD 0.050685 USD 0.046972 USD 0.046918 USD 0.048810 USD 0.047755 USD 0.044745
Class C (USD) Income USD 0.048133 USD 0.044554 USD 0.044445 USD 0.046184 USD 0.045126 USD 0.042230
Class N (USD) Income USD - USD - USD - USD - USD - USD -
Class R (GBP) Hedged Income USD - USD - USD - USD - USD - USD -
Class U1 (GBP) Income USD - USD - USD - USD - USD - USD -
Class U2 (GBP) Income USD 0.079231 USD 0.073463 USD 0.073417 USD 0.076418 USD 0.074816 USD 0.070142
Class X (GBP) Hedged Income USD 0.066883 USD 0.061893 USD 0.063280 USD 0.065517 USD 0.064074 USD 0.060999
Old Mutual Europe (ex UK) Smaller Companies Fund
30 December
2016
31 January
2017
28 February
2017
31 March
2017
28 April
2017
31 May
2017
30 June
2017
Class R (GBP) Income EUR 0.364884 EUR - EUR - EUR - EUR - EUR - EUR -
Class UI (EUR) Income EUR 0.235543 EUR - EUR - EUR - EUR - EUR - EUR -
Class UI (GBP) Income EUR 0.367454 EUR - EUR - EUR - EUR - EUR - EUR -
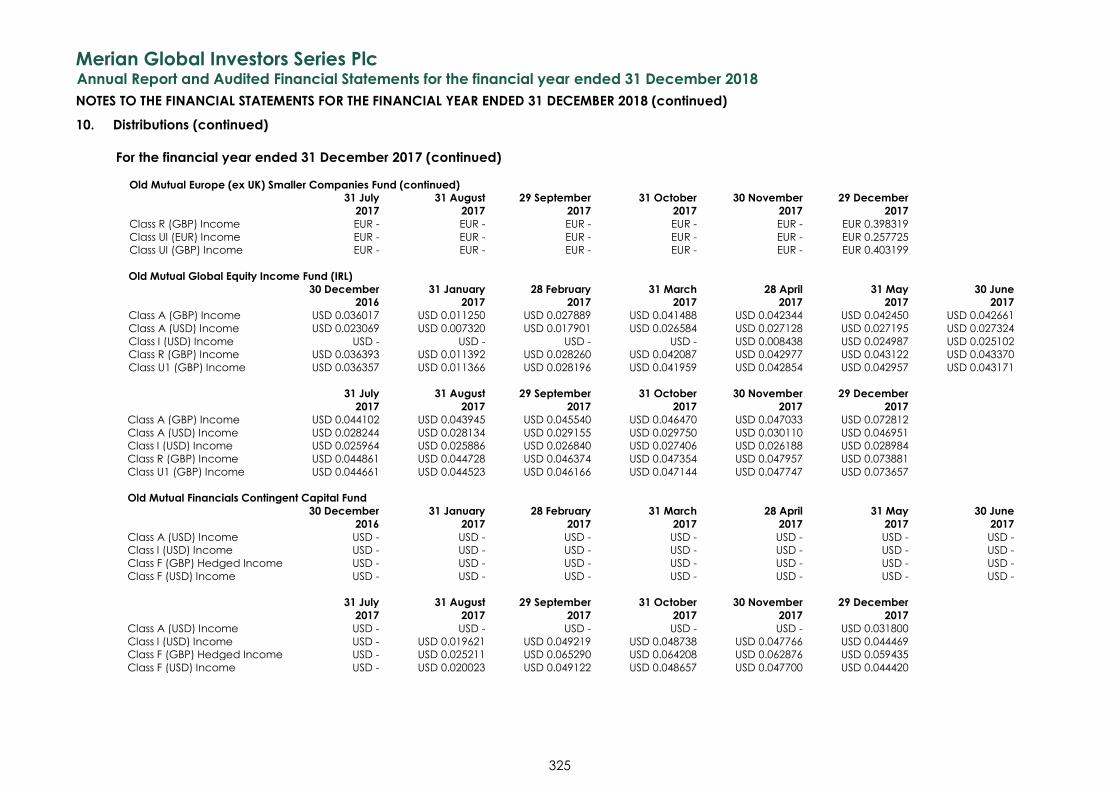
Merian Global Investors Series Plc
Annual Report and Audited Financial Statements for the financial year ended 31 December 2018
NOTES TO THE FINANCIAL STATEMENTS FOR THE FINANCIAL YEAR ENDED 31 DECEMBER 2018 (continued)
325
10. Distributions (continued)
For the financial year ended 31 December 2017 (continued)
Old Mutual Europe (ex UK) Smaller Companies Fund (continued)
31 July
2017
31 August
2017
29 September
2017
31 October
2017
30 November
2017
29 December
2017
Class R (GBP) Income EUR - EUR - EUR - EUR - EUR - EUR 0.398319
Class UI (EUR) Income EUR - EUR - EUR - EUR - EUR - EUR 0.257725
Class UI (GBP) Income EUR - EUR - EUR - EUR - EUR - EUR 0.403199
Old Mutual Global Equity Income Fund (IRL)
30 December
2016
31 January
2017
28 February
2017
31 March
2017
28 April
2017
31 May
2017
30 June
2017
Class A (GBP) Income USD 0.036017 USD 0.011250 USD 0.027889 USD 0.041488 USD 0.042344 USD 0.042450 USD 0.042661
Class A (USD) Income USD 0.023069 USD 0.007320 USD 0.017901 USD 0.026584 USD 0.027128 USD 0.027195 USD 0.027324
Class I (USD) Income USD - USD - USD - USD - USD 0.008438 USD 0.024987 USD 0.025102
Class R (GBP) Income USD 0.036393 USD 0.011392 USD 0.028260 USD 0.042087 USD 0.042977 USD 0.043122 USD 0.043370
Class U1 (GBP) Income USD 0.036357 USD 0.011366 USD 0.028196 USD 0.041959 USD 0.042854 USD 0.042957 USD 0.043171
31 July
2017
31 August
2017
29 September
2017
31 October
2017
30 November
2017
29 December
2017
Class A (GBP) Income USD 0.044102 USD 0.043945 USD 0.045540 USD 0.046470 USD 0.047033 USD 0.072812
Class A (USD) Income USD 0.028244 USD 0.028134 USD 0.029155 USD 0.029750 USD 0.030110 USD 0.046951
Class I (USD) Income USD 0.025964 USD 0.025886 USD 0.026840 USD 0.027406 USD 0.026188 USD 0.028984
Class R (GBP) Income USD 0.044861 USD 0.044728 USD 0.046374 USD 0.047354 USD 0.047957 USD 0.073881
Class U1 (GBP) Income USD 0.044661 USD 0.044523 USD 0.046166 USD 0.047144 USD 0.047747 USD 0.073657
Old Mutual Financials Contingent Capital Fund
30 December
2016
31 January
2017
28 February
2017
31 March
2017
28 April
2017
31 May
2017
30 June
2017
Class A (USD) Income USD - USD - USD - USD - USD - USD - USD -
Class I (USD) Income USD - USD - USD - USD - USD - USD - USD -
Class F (GBP) Hedged Income USD - USD - USD - USD - USD - USD - USD -
Class F (USD) Income USD - USD - USD - USD - USD - USD - USD -
31 July
2017
31 August
2017
29 September
2017
31 October
2017
30 November
2017
29 December
2017
Class A (USD) Income USD - USD - USD - USD - USD - USD 0.031800
Class I (USD) Income USD - USD 0.019621 USD 0.049219 USD 0.048738 USD 0.047766 USD 0.044469
Class F (GBP) Hedged Income USD - USD 0.025211 USD 0.065290 USD 0.064208 USD 0.062876 USD 0.059435
Class F (USD) Income USD - USD 0.020023 USD 0.049122 USD 0.048657 USD 0.047700 USD 0.044420
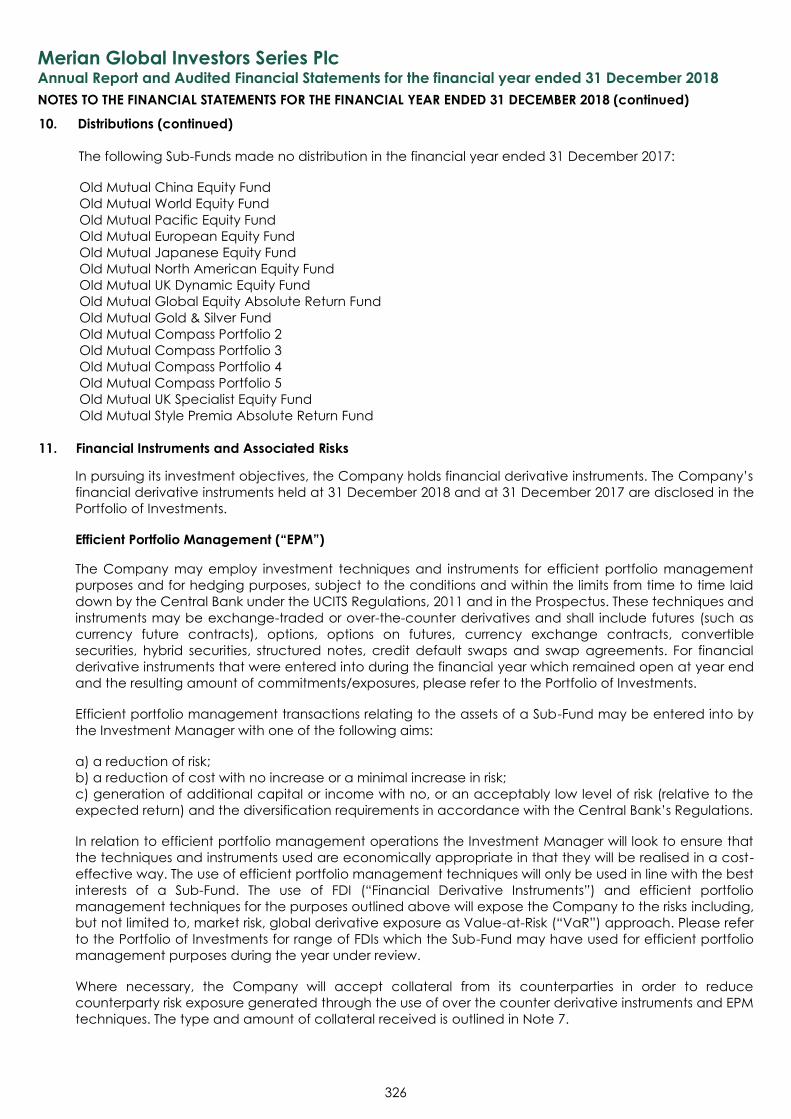
Merian Global Investors Series Plc
Annual Report and Audited Financial Statements for the financial year ended 31 December 2018
NOTES TO THE FINANCIAL STATEMENTS FOR THE FINANCIAL YEAR ENDED 31 DECEMBER 2018 (continued)
326
10. Distributions (continued)
The following Sub-Funds made no distribution in the financial year ended 31 December 2017:
Old Mutual China Equity Fund
Old Mutual World Equity Fund
Old Mutual Pacific Equity Fund
Old Mutual European Equity Fund
Old Mutual Japanese Equity Fund
Old Mutual North American Equity Fund
Old Mutual UK Dynamic Equity Fund
Old Mutual Global Equity Absolute Return Fund
Old Mutual Gold & Silver Fund
Old Mutual Compass Portfolio 2
Old Mutual Compass Portfolio 3
Old Mutual Compass Portfolio 4
Old Mutual Compass Portfolio 5
Old Mutual UK Specialist Equity Fund
Old Mutual Style Premia Absolute Return Fund
11. Financial Instruments and Associated Risks
In pursuing its investment objectives, the Company holds financial derivative instruments. The Company’s
financial derivative instruments held at 31 December 2018 and at 31 December 2017 are disclosed in the
Portfolio of Investments.
Efficient Portfolio Management (“EPM”)
The Company may employ investment techniques and instruments for efficient portfolio management
purposes and for hedging purposes, subject to the conditions and within the limits from time to time laid
down by the Central Bank under the UCITS Regulations, 2011 and in the Prospectus. These techniques and
instruments may be exchange-traded or over-the-counter derivatives and shall include futures (such as
currency future contracts), options, options on futures, currency exchange contracts, convertible
securities, hybrid securities, structured notes, credit default swaps and swap agreements. For financial
derivative instruments that were entered into during the financial year which remained open at year end
and the resulting amount of commitments/exposures, please refer to the Portfolio of Investments.
Efficient portfolio management transactions relating to the assets of a Sub-Fund may be entered into by
the Investment Manager with one of the following aims:
a) a reduction of risk;
b) a reduction of cost with no increase or a minimal increase in risk;
c) generation of additional capital or income with no, or an acceptably low level of risk (relative to the
expected return) and the diversification requirements in accordance with the Central Bank’s Regulations.
In relation to efficient portfolio management operations the Investment Manager will look to ensure that
the techniques and instruments used are economically appropriate in that they will be realised in a cost-
effective way. The use of efficient portfolio management techniques will only be used in line with the best
interests of a Sub-Fund. The use of FDI (“Financial Derivative Instruments”) and efficient portfolio
management techniques for the purposes outlined above will expose the Company to the risks including,
but not limited to, market risk, global derivative exposure as Value-at-Risk (“VaR”) approach. Please refer
to the Portfolio of Investments for range of FDIs which the Sub-Fund may have used for efficient portfolio
management purposes during the year under review.
Where necessary, the Company will accept collateral from its counterparties in order to reduce
counterparty risk exposure generated through the use of over the counter derivative instruments and EPM
techniques. The type and amount of collateral received is outlined in Note 7.
Merian Global Investors Series Plc
Annual Report and Audited Financial Statements for the financial year ended 31 December 2018
NOTES TO THE FINANCIAL STATEMENTS FOR THE FINANCIAL YEAR ENDED 31 DECEMBER 2018 (continued)
327
11. Financial Instruments and Associated Risks (continued)
Efficient Portfolio Management (“EPM”) (continued)
For UCITS which have engaged in EPM techniques disclosures are required under the Central Bank UCITS
Regulations. A UCITS is required to disclose the revenues arising from EPM techniques for the entire reporting
year together with the direct and indirect operational costs and fees incurred, unless the costs associated
with EPM techniques are embedded and not separately identifiable.
All revenues from EPM techniques, net of direct and indirect operational costs, will be returned to the
relevant Sub-Fund. Any direct and indirect operational costs/fees arising from EPM techniques do not
include hidden revenue. Any gains or losses arising from EPM techniques and investments are recognised
in the Statement of Operations.
Repurchase, reverse repurchase and stock lending arrangements are EPM techniques. The Sub-Funds did
not engage in any repurchase, reverse repurchase and stock lending arrangements during the financial
year.
Futures contracts will be used to hedge against market risk or gain exposure to an underlying market.
Currency exchange contracts will be used to hedge or gain exposure to an increase in the value of an
asset, currency, or deposit. Options will be used to hedge or achieve exposure to a particular market
instead of using a physical security. Swaps (including swaptions) will be used to achieve profit as well as to
hedge existing long positions. Currency exchange contracts will be used to reduce the risk of adverse
market changes in exchange rates or to increase exposure to foreign currencies or to shift exposure to
foreign currency fluctuations from one country to another. Credit default swaps will be used to isolate and
transfer the exposure to or transfer the credit risk associated with a reference asset or index of reference
assets.
The Company may, for the purposes of efficient portfolio management, enter into futures contracts,
currency exchange contracts, options, swaps, swaptions, convertible securities and structured notes, in
order to hedge currency and market exposure and/or for investment purposes. Futures, swaps, options,
swaptions and currency exchange contracts open as at 31 December 2018 are disclosed in the Portfolio
of Investments.
Risk is inherent in the activities of each Sub-Fund but it is managed through a process of ongoing
identification, measurement and monitoring, subject to risks limits and other controls. The main risks arising
from the Company’s financial instruments are market risk, liquidity risk and credit risk.
(a) Market Price Risk
Market price risk results mainly from uncertainty about the future prices of financial instruments held. It
represents the potential loss a Sub-Fund may suffer through holding market positions in the face of market
movements and changes in exchange rates.
The Sub-Funds manage the risk by ensuring careful selection of securities and other financial instruments
within the specified limits detailed in the Prospectus. In practice, the actual trading results may differ from
the sensitivity analysis below and the difference could be material.
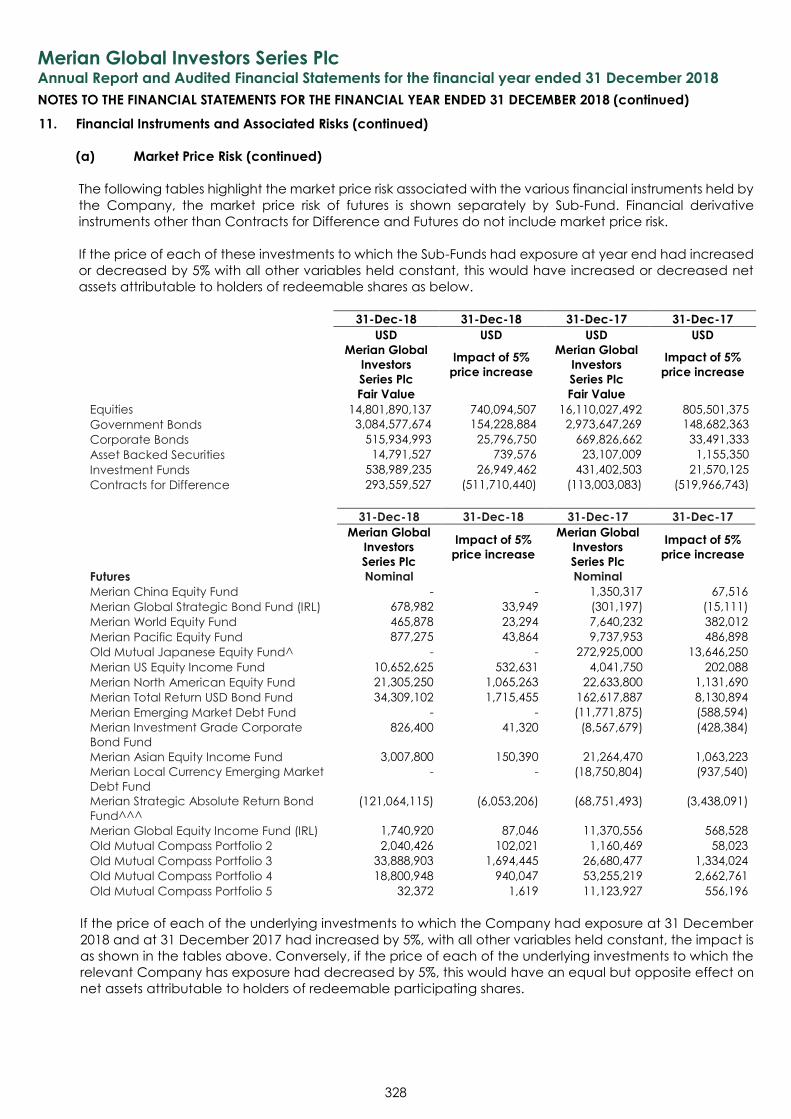
Merian Global Investors Series Plc
Annual Report and Audited Financial Statements for the financial year ended 31 December 2018
NOTES TO THE FINANCIAL STATEMENTS FOR THE FINANCIAL YEAR ENDED 31 DECEMBER 2018 (continued)
328
11. Financial Instruments and Associated Risks (continued)
(a) Market Price Risk (continued)
The following tables highlight the market price risk associated with the various financial instruments held by
the Company, the market price risk of futures is shown separately by Sub-Fund. Financial derivative
instruments other than Contracts for Difference and Futures do not include market price risk.
If the price of each of these investments to which the Sub-Funds had exposure at year end had increased
or decreased by 5% with all other variables held constant, this would have increased or decreased net
assets attributable to holders of redeemable shares as below.
31-Dec-18 31-Dec-18 31-Dec-17 31-Dec-17
USD USD USD USD
Merian Global
Investors
Series Plc
Impact of 5%
price increase
Merian Global
Investors
Series Plc
Impact of 5%
price increase
Fair Value Fair Value
Equities 14,801,890,137 740,094,507 16,110,027,492 805,501,375
Government Bonds 3,084,577,674 154,228,884 2,973,647,269 148,682,363
Corporate Bonds 515,934,993 25,796,750 669,826,662 33,491,333
Asset Backed Securities 14,791,527 739,576 23,107,009 1,155,350
Investment Funds 538,989,235 26,949,462 431,402,503 21,570,125
Contracts for Difference 293,559,527 (511,710,440) (113,003,083) (519,966,743)
31-Dec-18 31-Dec-18 31-Dec-17 31-Dec-17
Merian Global
Investors
Series Plc
Impact of 5%
price increase
Merian Global
Investors
Series Plc
Impact of 5%
price increase
Futures Nominal Nominal
Merian China Equity Fund - - 1,350,317 67,516
Merian Global Strategic Bond Fund (IRL) 678,982 33,949 (301,197) (15,111)
Merian World Equity Fund 465,878 23,294 7,640,232 382,012
Merian Pacific Equity Fund 877,275 43,864 9,737,953 486,898
Old Mutual Japanese Equity Fund^ - - 272,925,000 13,646,250
Merian US Equity Income Fund 10,652,625 532,631 4,041,750 202,088
Merian North American Equity Fund 21,305,250 1,065,263 22,633,800 1,131,690
Merian Total Return USD Bond Fund 34,309,102 1,715,455 162,617,887 8,130,894
Merian Emerging Market Debt Fund - - (11,771,875) (588,594)
Merian Investment Grade Corporate
Bond Fund
826,400 41,320 (8,567,679) (428,384)
Merian Asian Equity Income Fund 3,007,800 150,390 21,264,470 1,063,223
Merian Local Currency Emerging Market
Debt Fund
- - (18,750,804) (937,540)
Merian Strategic Absolute Return Bond
Fund^^^
(121,064,115) (6,053,206) (68,751,493) (3,438,091)
Merian Global Equity Income Fund (IRL) 1,740,920 87,046 11,370,556 568,528
Old Mutual Compass Portfolio 2 2,040,426 102,021 1,160,469 58,023
Old Mutual Compass Portfolio 3 33,888,903 1,694,445 26,680,477 1,334,024
Old Mutual Compass Portfolio 4 18,800,948 940,047 53,255,219 2,662,761
Old Mutual Compass Portfolio 5 32,372 1,619 11,123,927 556,196
If the price of each of the underlying investments to which the Company had exposure at 31 December
2018 and at 31 December 2017 had increased by 5%, with all other variables held constant, the impact is
as shown in the tables above. Conversely, if the price of each of the underlying investments to which the
relevant Company has exposure had decreased by 5%, this would have an equal but opposite effect on
net assets attributable to holders of redeemable participating shares.
Merian Global Investors Series Plc
Annual Report and Audited Financial Statements for the financial year ended 31 December 2018
NOTES TO THE FINANCIAL STATEMENTS FOR THE FINANCIAL YEAR ENDED 31 DECEMBER 2018 (continued)
329
11. Financial Instruments and Associated Risks (continued)
(a) Market Price Risk (continued)
The above analysis is strictly a mathematical exercise and has many improbable assumptions including,
(i) stocks of financial services companies perform exactly in line with the broad equities market (ii) both
long and short positions in the portfolio perform exactly in line with stocks of financial services companies
and (iii) the Investment Manager does not change the composition of the portfolio intra-period (Investors
and prospective investors should not place any reliance on this analysis, as the actual effect of a 5%
change in equity prices will differ materially from the effect described in the above). The Investment
Manager does not believe this analysis should be used to assess the risk or potential performance of its
strategy.
Adherence to the investment guidelines and to investment and borrowing powers set out in the instrument
of incorporation, the Prospectus and the notices issued by the Central Bank mitigates the risk of excessive
exposure per industry to any particular type of security or issuer.
Each Sub-Fund’s market risk is managed on a daily basis by Merian Global Investors (UK) Limited and the
policies and processes are detailed in the Company's risk management process. Each Sub-Fund's overall
market positions are advised on a regular basis to the Board of Directors.
Emerging markets provide new investment opportunities, such as elevated economic growth rates, higher
expected returns and diversification benefits. Accordingly, these markets may be insufficiently liquid and
levels of volatility in price movements may be greater than those experienced in more developed
economies and markets. The value of the assets of a Sub-Fund investing in developing markets may be
adversely affected by uncertainties. There can be no assurance that the Sub-Funds will achieve their
investment objectives.
Merian Global Investors Series Plc
Annual Report and Audited Financial Statements for the financial year ended 31 December 2018
NOTES TO THE FINANCIAL STATEMENTS FOR THE FINANCIAL YEAR ENDED 31 DECEMBER 2018 (continued)
330
11. Financial Instruments and Associated Risks (continued)
(b) Liquidity Risk
Liquidity risk is the risk that an entity will encounter difficulty in meeting obligations associated with financial
liabilities. The Company’s constitutional documents provides for the creation and cancellation of Shares
on each Dealing Day and it is therefore exposed to the liquidity risk of meeting shareholder redemptions
at any time. Assets from a Sub-Fund may need to be sold if insufficient cash is available to finance
redemptions.
The Sub-Funds’ listed securities are considered to be readily realisable as they are principally listed on Major
European, Asian and US stock exchanges.
In the case of transferable securities not traded on a Regulated Market liquidity is not automatically
presumed. The Sub-Funds therefore assess the liquidity of such securities where this is necessary. If the
security is assessed as insufficiently liquid to meet foreseeable redemption requests the security must only
be bought or held if the other securities held in the portfolio are deemed sufficiently liquid so as to be able
to ensure compliance with Regulation 104(1) of the UCITS Regulations.
Therefore before making an investment, the Investment Manager may consider in relation to liquidity risk:
1. The volume and turnover in the transferable security;
2. If price is determined by supply and demand in the market, the issue size and the portion of the issue
that the investment manager plans to buy;
3. The opportunity and timeframe to buy or sell the transferable security; and
4. The quality of the secondary market in a transferable security and an analysis of the quality and
number of intermediaries and market makers available for that security.
The risks associated with securities in which the Sub-Funds have invested are assessed on an ongoing basis.
The Company considers that, as at the reporting date, all of the investments shown in the Portfolio
Statement would have been realisable at the Dealing Day, other than the Level 3 investments as detailed
in Note 11.
The Company may temporarily suspend the repurchase of Shares in any Fund. No suspensions have taken
place during the financial year. More information on this type of liquidity risk can be found in the
Prospectus.
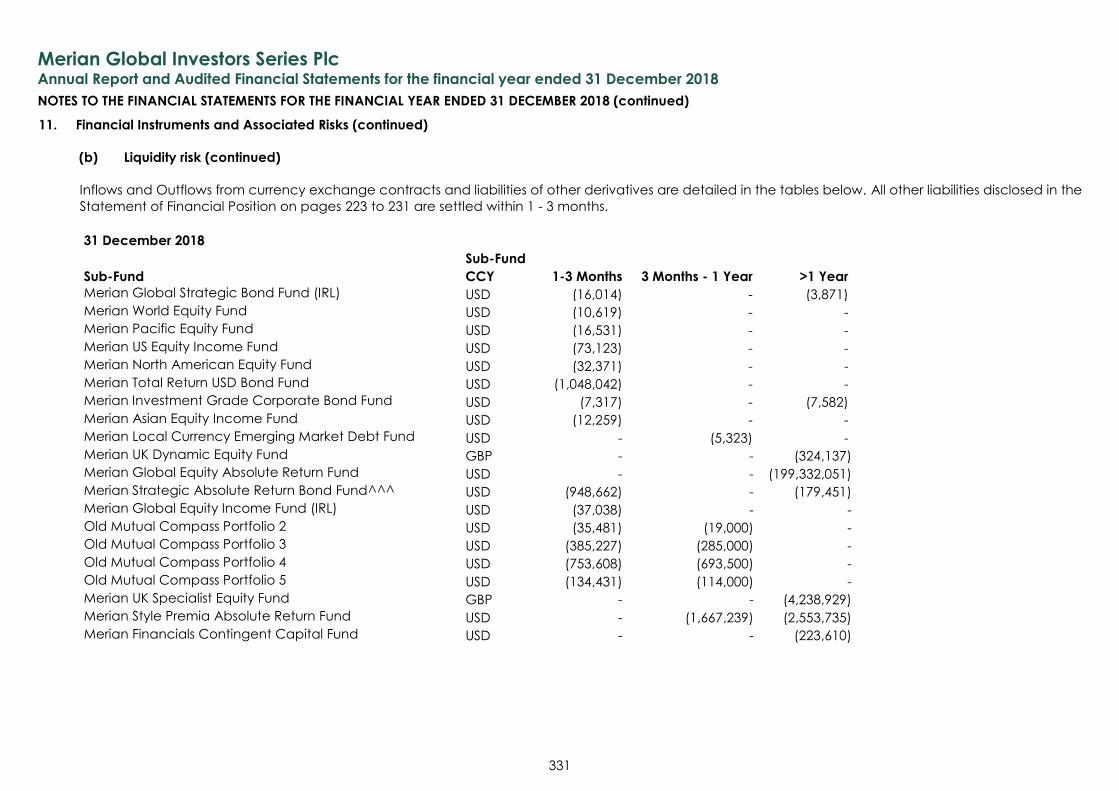
Merian Global Investors Series Plc
Annual Report and Audited Financial Statements for the financial year ended 31 December 2018
NOTES TO THE FINANCIAL STATEMENTS FOR THE FINANCIAL YEAR ENDED 31 DECEMBER 2018 (continued)
331
11. Financial Instruments and Associated Risks (continued)
(b) Liquidity risk (continued)
Inflows and Outflows from currency exchange contracts and liabilities of other derivatives are detailed in the tables below. All other liabilities disclosed in the
Statement of Financial Position on pages 223 to 231 are settled within 1 - 3 months.
31 December 2018
Sub-Fund
Sub-Fund CCY 1-3 Months 3 Months - 1 Year >1 Year
Merian Global Strategic Bond Fund (IRL) USD (16,014) - (3,871)
Merian World Equity Fund USD (10,619) - -
Merian Pacific Equity Fund USD (16,531) - -
Merian US Equity Income Fund USD (73,123) - -
Merian North American Equity Fund USD (32,371) - -
Merian Total Return USD Bond Fund USD (1,048,042) - -
Merian Investment Grade Corporate Bond Fund USD (7,317) - (7,582)
Merian Asian Equity Income Fund USD (12,259) - -
Merian Local Currency Emerging Market Debt Fund USD - (5,323) -
Merian UK Dynamic Equity Fund GBP - - (324,137)
Merian Global Equity Absolute Return Fund USD - - (199,332,051)
Merian Strategic Absolute Return Bond Fund^^^ USD (948,662) - (179,451)
Merian Global Equity Income Fund (IRL) USD (37,038) - -
Old Mutual Compass Portfolio 2 USD (35,481) (19,000) -
Old Mutual Compass Portfolio 3 USD (385,227) (285,000) -
Old Mutual Compass Portfolio 4 USD (753,608) (693,500) -
Old Mutual Compass Portfolio 5 USD (134,431) (114,000) -
Merian UK Specialist Equity Fund GBP - - (4,238,929)
Merian Style Premia Absolute Return Fund USD - (1,667,239) (2,553,735)
Merian Financials Contingent Capital Fund USD - - (223,610)
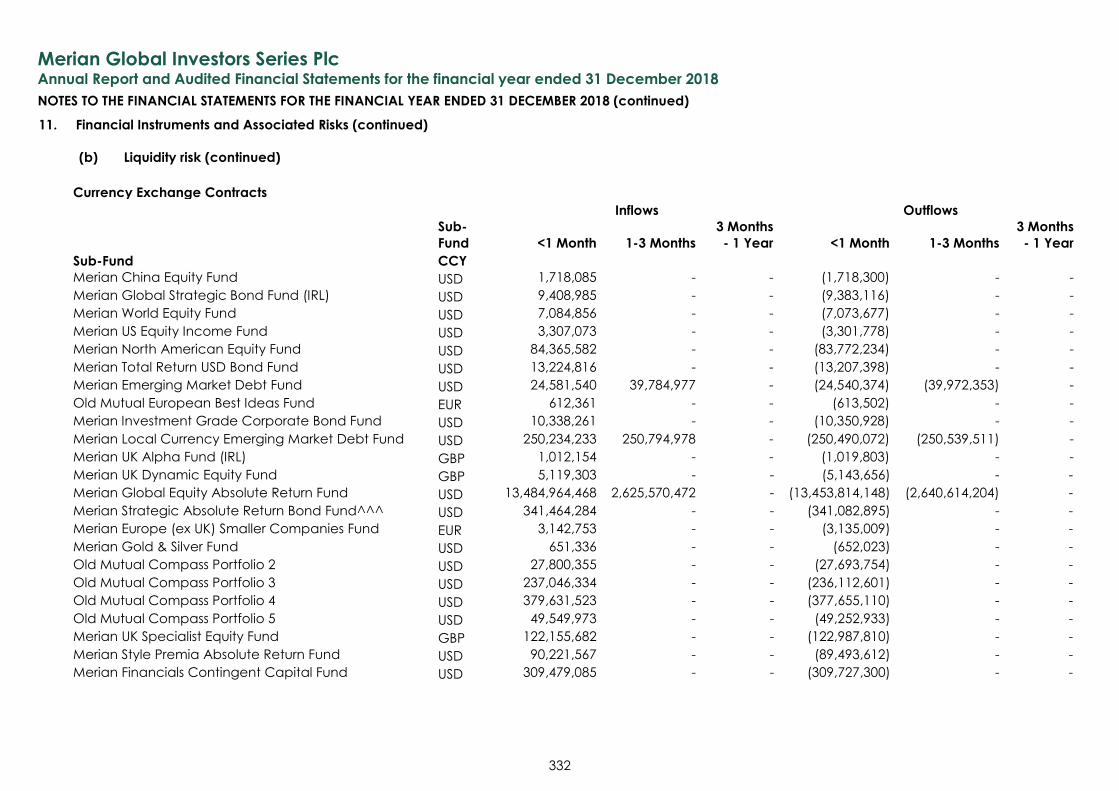
Merian Global Investors Series Plc
Annual Report and Audited Financial Statements for the financial year ended 31 December 2018
NOTES TO THE FINANCIAL STATEMENTS FOR THE FINANCIAL YEAR ENDED 31 DECEMBER 2018 (continued)
332
11. Financial Instruments and Associated Risks (continued)
(b) Liquidity risk (continued)
Currency Exchange Contracts
Inflows Outflows
Sub-
Fund <1 Month 1-3 Months
3 Months
- 1 Year <1 Month 1-3 Months
3 Months
- 1 Year
Sub-Fund CCY Merian China Equity Fund USD 1,718,085 - - (1,718,300) - -
Merian Global Strategic Bond Fund (IRL) USD 9,408,985 - - (9,383,116) - -
Merian World Equity Fund USD 7,084,856 - - (7,073,677) - -
Merian US Equity Income Fund USD 3,307,073 - - (3,301,778) - -
Merian North American Equity Fund USD 84,365,582 - - (83,772,234) - -
Merian Total Return USD Bond Fund USD 13,224,816 - - (13,207,398) - -
Merian Emerging Market Debt Fund USD 24,581,540 39,784,977 - (24,540,374) (39,972,353) -
Old Mutual European Best Ideas Fund EUR 612,361 - - (613,502) - -
Merian Investment Grade Corporate Bond Fund USD 10,338,261 - - (10,350,928) - -
Merian Local Currency Emerging Market Debt Fund USD 250,234,233 250,794,978 - (250,490,072) (250,539,511) -
Merian UK Alpha Fund (IRL) GBP 1,012,154 - - (1,019,803) - -
Merian UK Dynamic Equity Fund GBP 5,119,303 - - (5,143,656) - -
Merian Global Equity Absolute Return Fund USD 13,484,964,468 2,625,570,472 - (13,453,814,148) (2,640,614,204) -
Merian Strategic Absolute Return Bond Fund^^^ USD 341,464,284 - - (341,082,895) - -
Merian Europe (ex UK) Smaller Companies Fund EUR 3,142,753 - - (3,135,009) - -
Merian Gold & Silver Fund USD 651,336 - - (652,023) - -
Old Mutual Compass Portfolio 2 USD 27,800,355 - - (27,693,754) - -
Old Mutual Compass Portfolio 3 USD 237,046,334 - - (236,112,601) - -
Old Mutual Compass Portfolio 4 USD 379,631,523 - - (377,655,110) - -
Old Mutual Compass Portfolio 5 USD 49,549,973 - - (49,252,933) - -
Merian UK Specialist Equity Fund GBP 122,155,682 - - (122,987,810) - -
Merian Style Premia Absolute Return Fund USD 90,221,567 - - (89,493,612) - -
Merian Financials Contingent Capital Fund USD 309,479,085 - - (309,727,300) - -
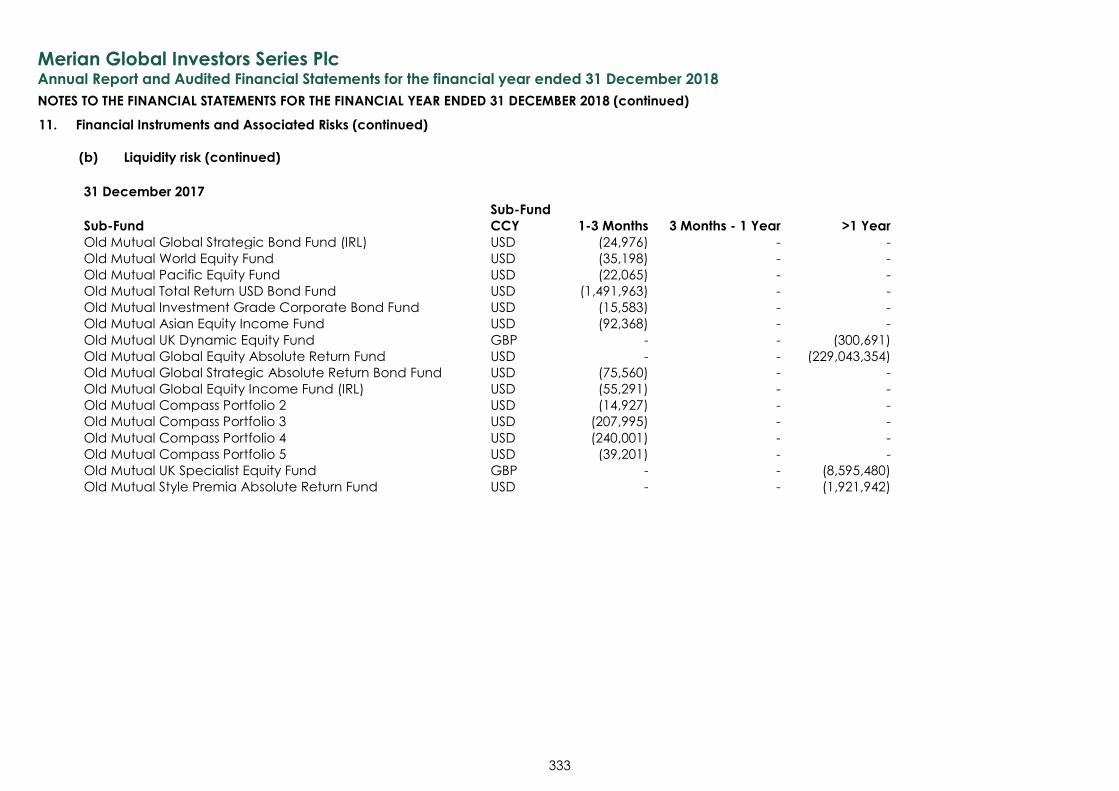
Merian Global Investors Series Plc
Annual Report and Audited Financial Statements for the financial year ended 31 December 2018
NOTES TO THE FINANCIAL STATEMENTS FOR THE FINANCIAL YEAR ENDED 31 DECEMBER 2018 (continued)
333
11. Financial Instruments and Associated Risks (continued)
(b) Liquidity risk (continued)
31 December 2017
Sub-Fund
Sub-Fund CCY 1-3 Months 3 Months - 1 Year >1 Year
Old Mutual Global Strategic Bond Fund (IRL) USD (24,976) - -
Old Mutual World Equity Fund USD (35,198) - -
Old Mutual Pacific Equity Fund USD (22,065) - -
Old Mutual Total Return USD Bond Fund USD (1,491,963) - -
Old Mutual Investment Grade Corporate Bond Fund USD (15,583) - -
Old Mutual Asian Equity Income Fund USD (92,368) - -
Old Mutual UK Dynamic Equity Fund GBP - - (300,691)
Old Mutual Global Equity Absolute Return Fund USD - - (229,043,354)
Old Mutual Global Strategic Absolute Return Bond Fund USD (75,560) - -
Old Mutual Global Equity Income Fund (IRL) USD (55,291) - -
Old Mutual Compass Portfolio 2 USD (14,927) - -
Old Mutual Compass Portfolio 3 USD (207,995) - -
Old Mutual Compass Portfolio 4 USD (240,001) - -
Old Mutual Compass Portfolio 5 USD (39,201) - -
Old Mutual UK Specialist Equity Fund GBP - - (8,595,480)
Old Mutual Style Premia Absolute Return Fund USD - - (1,921,942)
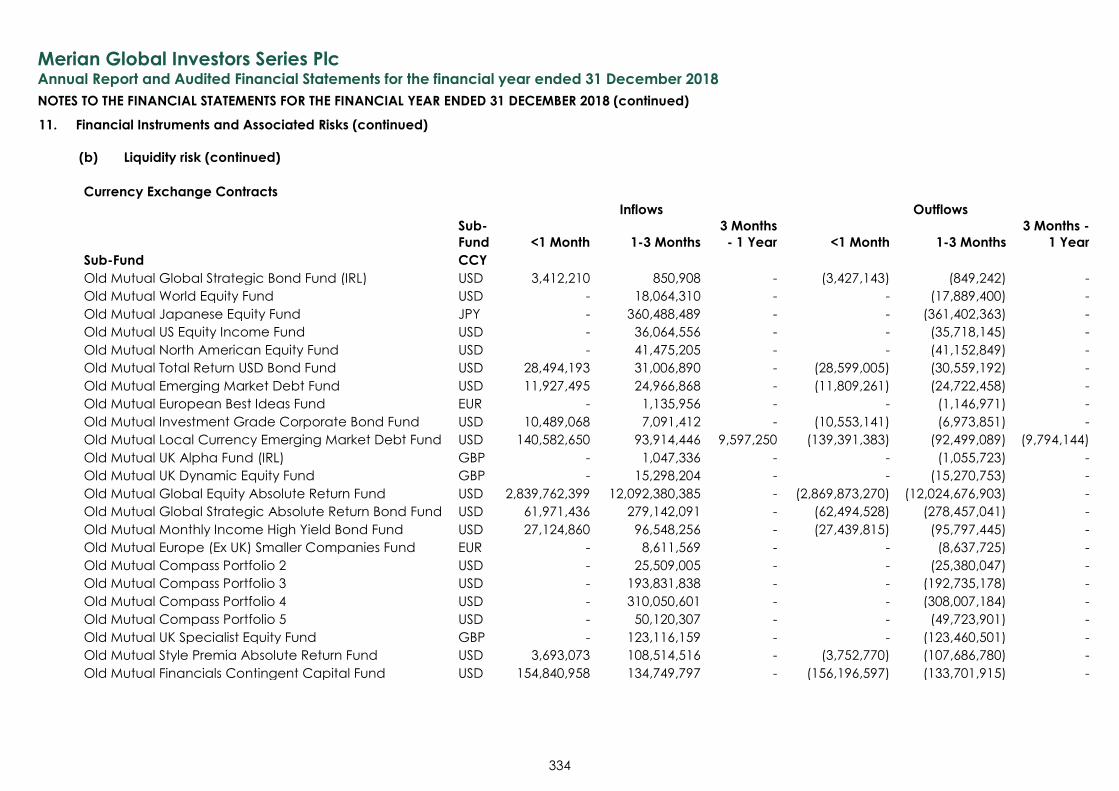
Merian Global Investors Series Plc
Annual Report and Audited Financial Statements for the financial year ended 31 December 2018
NOTES TO THE FINANCIAL STATEMENTS FOR THE FINANCIAL YEAR ENDED 31 DECEMBER 2018 (continued)
334
11. Financial Instruments and Associated Risks (continued)
(b) Liquidity risk (continued)
Currency Exchange Contracts
Inflows Outflows
Sub-
Fund <1 Month 1-3 Months
3 Months
- 1 Year <1 Month 1-3 Months
3 Months -
1 Year
Sub-Fund CCY Old Mutual Global Strategic Bond Fund (IRL) USD 3,412,210 850,908 - (3,427,143) (849,242) -
Old Mutual World Equity Fund USD - 18,064,310 - - (17,889,400) -
Old Mutual Japanese Equity Fund JPY - 360,488,489 - - (361,402,363) -
Old Mutual US Equity Income Fund USD - 36,064,556 - - (35,718,145) -
Old Mutual North American Equity Fund USD - 41,475,205 - - (41,152,849) -
Old Mutual Total Return USD Bond Fund USD 28,494,193 31,006,890 - (28,599,005) (30,559,192) -
Old Mutual Emerging Market Debt Fund USD 11,927,495 24,966,868 - (11,809,261) (24,722,458) -
Old Mutual European Best Ideas Fund EUR - 1,135,956 - - (1,146,971) -
Old Mutual Investment Grade Corporate Bond Fund USD 10,489,068 7,091,412 - (10,553,141) (6,973,851) -
Old Mutual Local Currency Emerging Market Debt Fund USD 140,582,650 93,914,446 9,597,250 (139,391,383) (92,499,089) (9,794,144)
Old Mutual UK Alpha Fund (IRL) GBP - 1,047,336 - - (1,055,723) -
Old Mutual UK Dynamic Equity Fund GBP - 15,298,204 - - (15,270,753) -
Old Mutual Global Equity Absolute Return Fund USD 2,839,762,399 12,092,380,385 - (2,869,873,270) (12,024,676,903) -
Old Mutual Global Strategic Absolute Return Bond Fund USD 61,971,436 279,142,091 - (62,494,528) (278,457,041) -
Old Mutual Monthly Income High Yield Bond Fund USD 27,124,860 96,548,256 - (27,439,815) (95,797,445) -
Old Mutual Europe (Ex UK) Smaller Companies Fund EUR - 8,611,569 - - (8,637,725) -
Old Mutual Compass Portfolio 2 USD - 25,509,005 - - (25,380,047) -
Old Mutual Compass Portfolio 3 USD - 193,831,838 - - (192,735,178) -
Old Mutual Compass Portfolio 4 USD - 310,050,601 - - (308,007,184) -
Old Mutual Compass Portfolio 5 USD - 50,120,307 - - (49,723,901) -
Old Mutual UK Specialist Equity Fund GBP - 123,116,159 - - (123,460,501) -
Old Mutual Style Premia Absolute Return Fund USD 3,693,073 108,514,516 - (3,752,770) (107,686,780) -
Old Mutual Financials Contingent Capital Fund USD 154,840,958 134,749,797 - (156,196,597) (133,701,915) -
Merian Global Investors Series Plc
Annual Report and Audited Financial Statements for the financial year ended 31 December 2018
NOTES TO THE FINANCIAL STATEMENTS FOR THE FINANCIAL YEAR ENDED 31 DECEMBER 2018 (continued)
335
11. Financial Instruments and Associated Risks (continued)
(c) Credit Risk
Credit risk is the risk that a counterparty to a financial instrument will fail to discharge an obligation or
commitment that it has entered into with the Sub-Fund. Credit risk is monitored in accordance with the
UCITS Regulations.
This risk exists in relation to the transactions the Company enters into with brokers, banks and other third
parties. However investments in equities are not exposed to credit risk except for exposure to the Depositary
which is periodically monitored by the Company.
Credit risk arises from receivables from investee funds relating to redemptions or transactions awaiting
settlement. Risk relating to unsettled receivables is considered small due to the short settlement period
involved and the due diligence permitted on the investee funds. The maximum exposure related to
unsettled is included in other assets and other liabilities in the Statement of Financial Position.
The Investment Manager ensures that the ratings and limits for counterparties are adhered to.
Risk exposure may be reduced where the counterparty will provide the Sub-Fund with collateral, subject
to certain conditions. The Investment Manager is responsible for ensuring this collateral meets the relevant
criteria set out in UCITS Regulations. Details of collateral pledged and received as at 31 December 2018 is
disclosed in Note 7. Cash due from/to broker balances held with counterparties at 31 December 2018 are
disclosed in Note 7. This amount is the minimum required by the brokers and counterparties for collateral
requirements.
Credit default swaps will be used to isolate and transfer the exposure to or transfer the credit risk associated
with a reference asset or index of reference assets. Credit default swaps provide a measure of protection
against defaults of debt issuers. The Sub-Funds’ use of credit default swaps does not assure their use will be
effective or will have the desired result. If a Sub-Fund is the buyer of a credit default swap, it would be
entitled to receive the agreed-upon value (or par) of a referenced debt obligation from the counterparty
to the swap on the occurrence of certain credit events in relation to the relevant reference entity. In
circumstances in which a Sub-Fund does not own the debt securities that are deliverable under a credit
default swap, the Fund is exposed to the risk that deliverable securities will not be available in the market.
The Sub-Fund may not be able to realise the full value of the credit default swap upon a default by the
reference entity. As a seller of credit default swaps, a Sub-Fund incurs exposure to the credit of the
reference entity and is subject to many of the same risks it would incur if it were holding debt securities
issued by the reference entity. The notional amounts and counterparties for purchased and sold protection
are disclosed in the Portfolio Statements. The credit rating of the counterparties can be found below.
The Company minimises concentration of credit risk by undertaking transactions with a large number of
customers and counterparties on recognised and reputable exchanges.
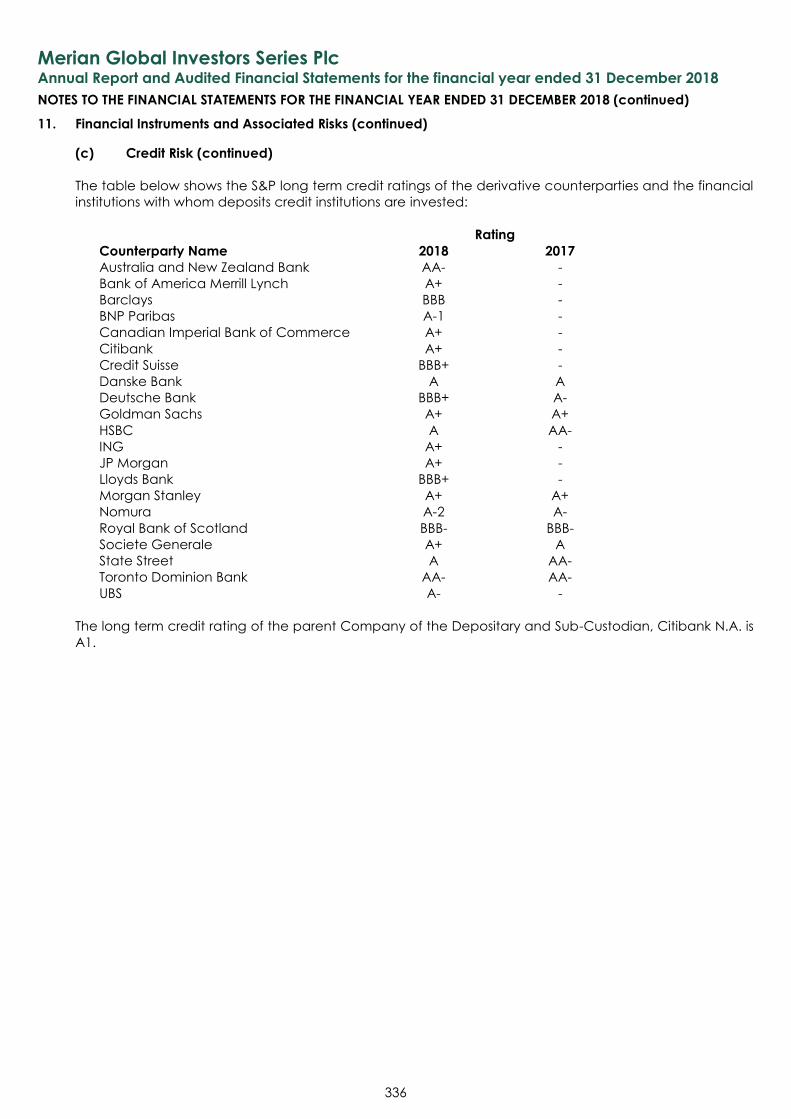
Merian Global Investors Series Plc
Annual Report and Audited Financial Statements for the financial year ended 31 December 2018
NOTES TO THE FINANCIAL STATEMENTS FOR THE FINANCIAL YEAR ENDED 31 DECEMBER 2018 (continued)
336
11. Financial Instruments and Associated Risks (continued)
(c) Credit Risk (continued)
The table below shows the S&P long term credit ratings of the derivative counterparties and the financial
institutions with whom deposits credit institutions are invested:
Rating
Counterparty Name 2018 2017
Australia and New Zealand Bank AA- -
Bank of America Merrill Lynch A+ -
Barclays BBB -
BNP Paribas A-1 -
Canadian Imperial Bank of Commerce A+ -
Citibank A+ -
Credit Suisse BBB+ -
Danske Bank A A
Deutsche Bank BBB+ A-
Goldman Sachs A+ A+
HSBC A AA-
ING A+ -
JP Morgan A+ -
Lloyds Bank BBB+ -
Morgan Stanley A+ A+
Nomura A-2 A-
Royal Bank of Scotland BBB- BBB-
Societe Generale A+ A
State Street A AA-
Toronto Dominion Bank AA- AA-
UBS A- -
The long term credit rating of the parent Company of the Depositary and Sub-Custodian, Citibank N.A. is
A1.
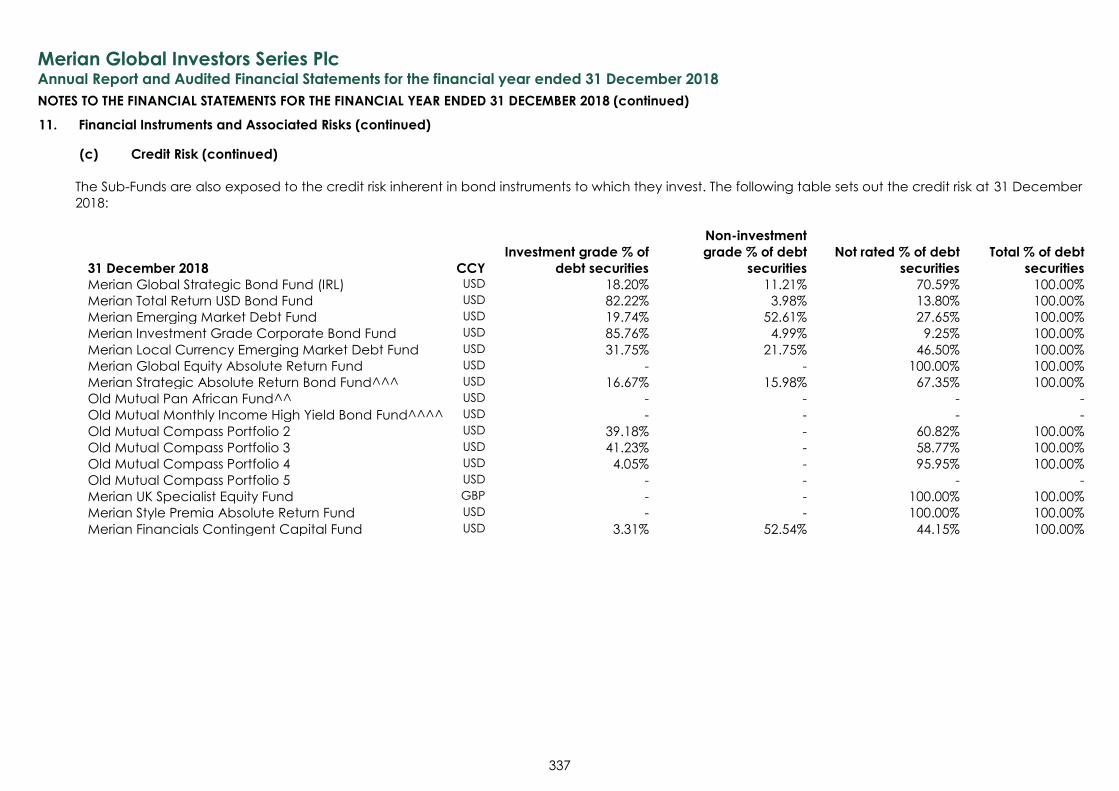
Merian Global Investors Series Plc
Annual Report and Audited Financial Statements for the financial year ended 31 December 2018
NOTES TO THE FINANCIAL STATEMENTS FOR THE FINANCIAL YEAR ENDED 31 DECEMBER 2018 (continued)
337
11. Financial Instruments and Associated Risks (continued)
(c) Credit Risk (continued)
The Sub-Funds are also exposed to the credit risk inherent in bond instruments to which they invest. The following table sets out the credit risk at 31 December
2018:
31 December 2018 CCY
Investment grade % of
debt securities
Non-investment
grade % of debt
securities
Not rated % of debt
securities
Total % of debt
securities
Merian Global Strategic Bond Fund (IRL) USD 18.20% 11.21% 70.59% 100.00%
Merian Total Return USD Bond Fund USD 82.22% 3.98% 13.80% 100.00%
Merian Emerging Market Debt Fund USD 19.74% 52.61% 27.65% 100.00%
Merian Investment Grade Corporate Bond Fund USD 85.76% 4.99% 9.25% 100.00%
Merian Local Currency Emerging Market Debt Fund USD 31.75% 21.75% 46.50% 100.00%
Merian Global Equity Absolute Return Fund USD - - 100.00% 100.00%
Merian Strategic Absolute Return Bond Fund^^^ USD 16.67% 15.98% 67.35% 100.00%
Old Mutual Pan African Fund^^ USD - - - -
Old Mutual Monthly Income High Yield Bond Fund^^^^ USD - - - -
Old Mutual Compass Portfolio 2 USD 39.18% - 60.82% 100.00%
Old Mutual Compass Portfolio 3 USD 41.23% - 58.77% 100.00%
Old Mutual Compass Portfolio 4 USD 4.05% - 95.95% 100.00%
Old Mutual Compass Portfolio 5 USD - - - -
Merian UK Specialist Equity Fund GBP - - 100.00% 100.00%
Merian Style Premia Absolute Return Fund USD - - 100.00% 100.00%
Merian Financials Contingent Capital Fund USD 3.31% 52.54% 44.15% 100.00%
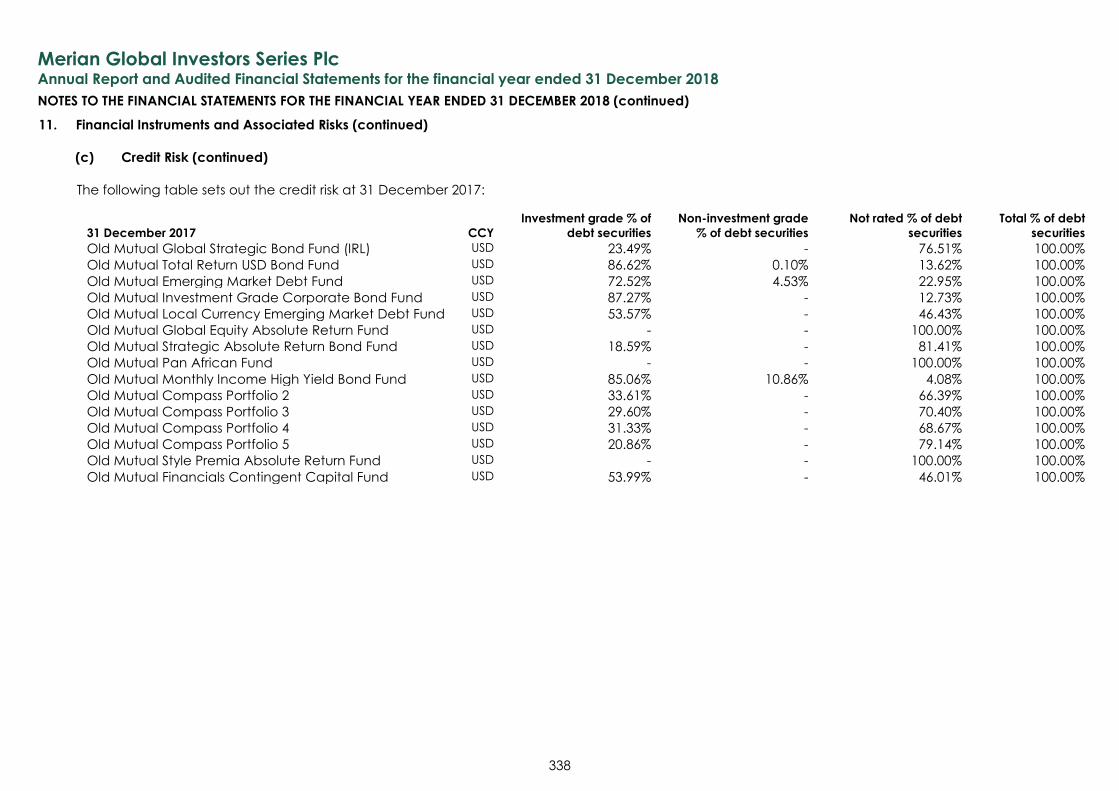
Merian Global Investors Series Plc
Annual Report and Audited Financial Statements for the financial year ended 31 December 2018
NOTES TO THE FINANCIAL STATEMENTS FOR THE FINANCIAL YEAR ENDED 31 DECEMBER 2018 (continued)
338
11. Financial Instruments and Associated Risks (continued)
(c) Credit Risk (continued)
The following table sets out the credit risk at 31 December 2017:
31 December 2017 CCY
Investment grade % of
debt securities Non-investment grade
% of debt securities Not rated % of debt
securities Total % of debt
securities
Old Mutual Global Strategic Bond Fund (IRL) USD 23.49% - 76.51% 100.00%
Old Mutual Total Return USD Bond Fund USD 86.62% 0.10% 13.62% 100.00%
Old Mutual Emerging Market Debt Fund USD 72.52% 4.53% 22.95% 100.00%
Old Mutual Investment Grade Corporate Bond Fund USD 87.27% - 12.73% 100.00%
Old Mutual Local Currency Emerging Market Debt Fund USD 53.57% - 46.43% 100.00%
Old Mutual Global Equity Absolute Return Fund USD - - 100.00% 100.00%
Old Mutual Strategic Absolute Return Bond Fund USD 18.59% - 81.41% 100.00%
Old Mutual Pan African Fund USD - - 100.00% 100.00%
Old Mutual Monthly Income High Yield Bond Fund USD 85.06% 10.86% 4.08% 100.00%
Old Mutual Compass Portfolio 2 USD 33.61% - 66.39% 100.00%
Old Mutual Compass Portfolio 3 USD 29.60% - 70.40% 100.00%
Old Mutual Compass Portfolio 4 USD 31.33% - 68.67% 100.00%
Old Mutual Compass Portfolio 5 USD 20.86% - 79.14% 100.00%
Old Mutual Style Premia Absolute Return Fund USD - - 100.00% 100.00%
Old Mutual Financials Contingent Capital Fund USD 53.99% - 46.01% 100.00%
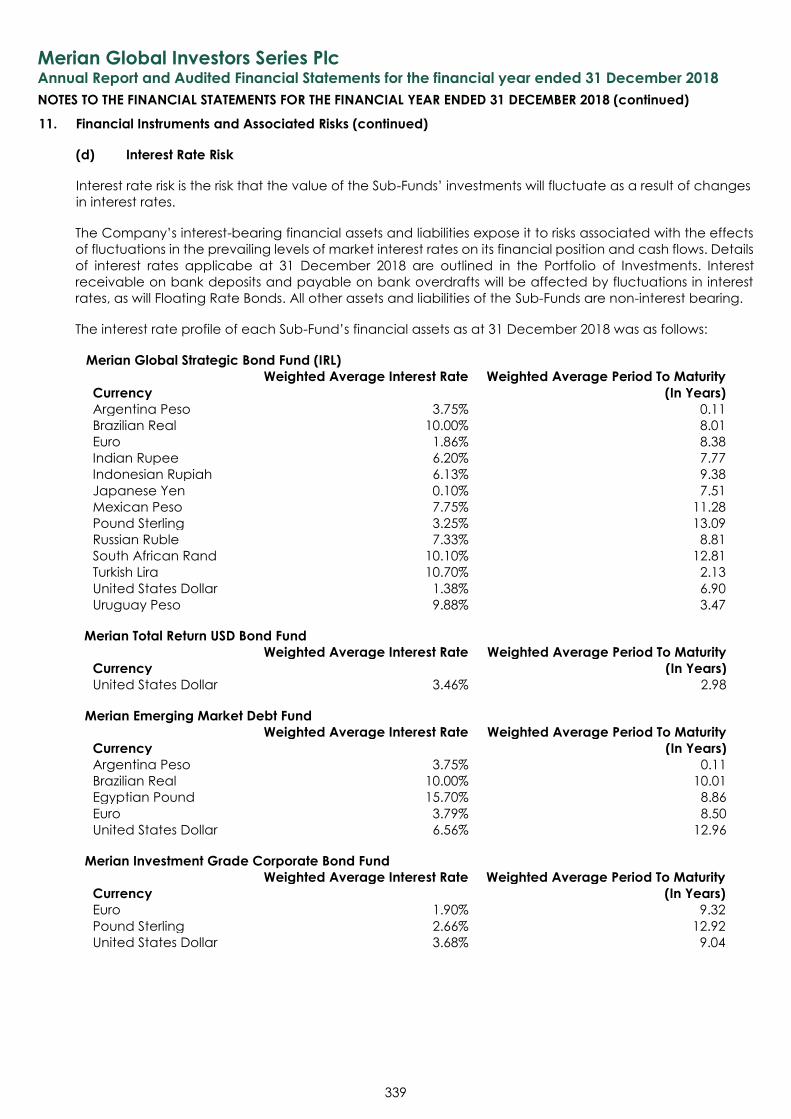
Merian Global Investors Series Plc
Annual Report and Audited Financial Statements for the financial year ended 31 December 2018
NOTES TO THE FINANCIAL STATEMENTS FOR THE FINANCIAL YEAR ENDED 31 DECEMBER 2018 (continued)
339
11. Financial Instruments and Associated Risks (continued)
(d) Interest Rate Risk
Interest rate risk is the risk that the value of the Sub-Funds’ investments will fluctuate as a result of changes
in interest rates.
The Company’s interest-bearing financial assets and liabilities expose it to risks associated with the effects
of fluctuations in the prevailing levels of market interest rates on its financial position and cash flows. Details
of interest rates applicabe at 31 December 2018 are outlined in the Portfolio of Investments. Interest
receivable on bank deposits and payable on bank overdrafts will be affected by fluctuations in interest
rates, as will Floating Rate Bonds. All other assets and liabilities of the Sub-Funds are non-interest bearing.
The interest rate profile of each Sub-Fund’s financial assets as at 31 December 2018 was as follows:
Merian Global Strategic Bond Fund (IRL)
Weighted Average Interest Rate Weighted Average Period To Maturity
Currency (In Years)
Argentina Peso 3.75% 0.11
Brazilian Real 10.00% 8.01
Euro 1.86% 8.38
Indian Rupee 6.20% 7.77
Indonesian Rupiah 6.13% 9.38
Japanese Yen 0.10% 7.51
Mexican Peso 7.75% 11.28
Pound Sterling 3.25% 13.09
Russian Ruble 7.33% 8.81
South African Rand 10.10% 12.81
Turkish Lira 10.70% 2.13
United States Dollar 1.38% 6.90
Uruguay Peso 9.88% 3.47
Merian Total Return USD Bond Fund
Weighted Average Interest Rate Weighted Average Period To Maturity
Currency (In Years)
United States Dollar 3.46% 2.98
Merian Emerging Market Debt Fund
Weighted Average Interest Rate Weighted Average Period To Maturity
Currency (In Years)
Argentina Peso 3.75% 0.11
Brazilian Real 10.00% 10.01
Egyptian Pound 15.70% 8.86
Euro 3.79% 8.50
United States Dollar 6.56% 12.96
Merian Investment Grade Corporate Bond Fund
Weighted Average Interest Rate Weighted Average Period To Maturity
Currency (In Years)
Euro 1.90% 9.32
Pound Sterling 2.66% 12.92
United States Dollar 3.68% 9.04
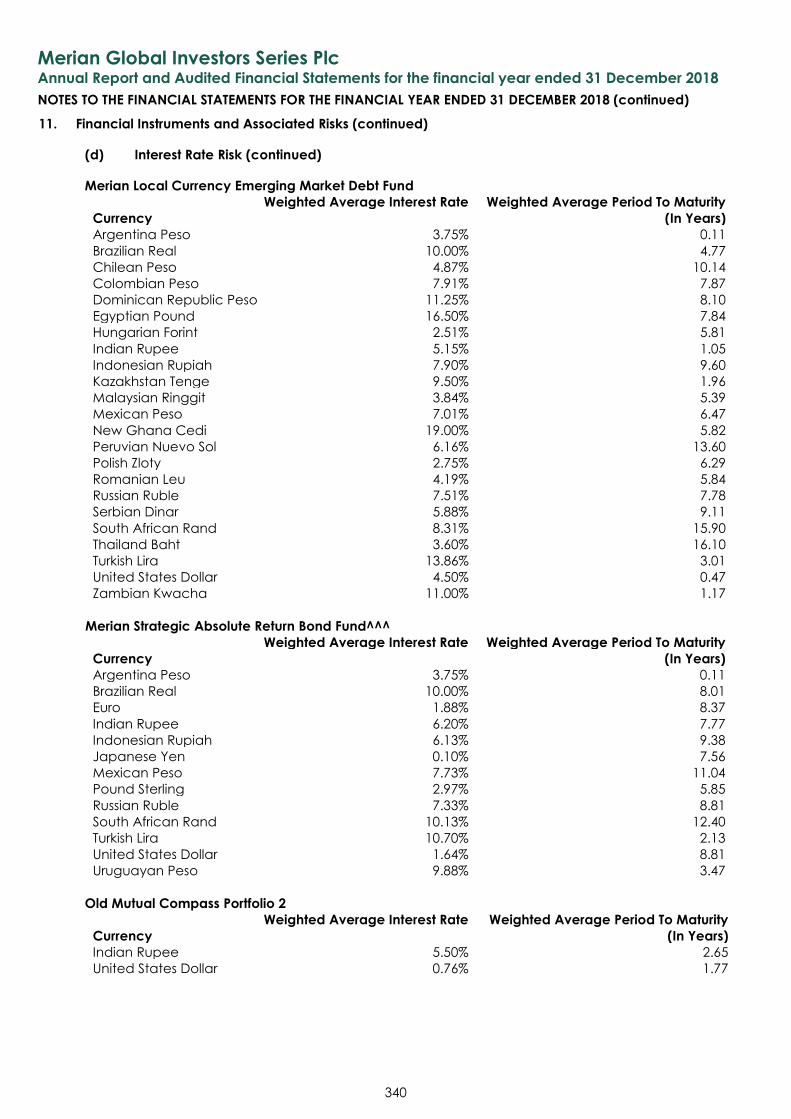
Merian Global Investors Series Plc
Annual Report and Audited Financial Statements for the financial year ended 31 December 2018
NOTES TO THE FINANCIAL STATEMENTS FOR THE FINANCIAL YEAR ENDED 31 DECEMBER 2018 (continued)
340
11. Financial Instruments and Associated Risks (continued)
(d) Interest Rate Risk (continued)
Merian Local Currency Emerging Market Debt Fund
Weighted Average Interest Rate Weighted Average Period To Maturity
Currency (In Years)
Argentina Peso 3.75% 0.11
Brazilian Real 10.00% 4.77
Chilean Peso 4.87% 10.14
Colombian Peso 7.91% 7.87
Dominican Republic Peso 11.25% 8.10
Egyptian Pound 16.50% 7.84
Hungarian Forint 2.51% 5.81
Indian Rupee 5.15% 1.05
Indonesian Rupiah 7.90% 9.60
Kazakhstan Tenge 9.50% 1.96
Malaysian Ringgit 3.84% 5.39
Mexican Peso 7.01% 6.47
New Ghana Cedi 19.00% 5.82
Peruvian Nuevo Sol 6.16% 13.60
Polish Zloty 2.75% 6.29
Romanian Leu 4.19% 5.84
Russian Ruble 7.51% 7.78
Serbian Dinar 5.88% 9.11
South African Rand 8.31% 15.90
Thailand Baht 3.60% 16.10
Turkish Lira 13.86% 3.01
United States Dollar 4.50% 0.47
Zambian Kwacha 11.00% 1.17
Merian Strategic Absolute Return Bond Fund^^^
Weighted Average Interest Rate Weighted Average Period To Maturity
Currency (In Years)
Argentina Peso 3.75% 0.11
Brazilian Real 10.00% 8.01
Euro 1.88% 8.37
Indian Rupee 6.20% 7.77
Indonesian Rupiah 6.13% 9.38
Japanese Yen 0.10% 7.56
Mexican Peso 7.73% 11.04
Pound Sterling 2.97% 5.85
Russian Ruble 7.33% 8.81
South African Rand 10.13% 12.40
Turkish Lira 10.70% 2.13
United States Dollar 1.64% 8.81
Uruguayan Peso 9.88% 3.47
Old Mutual Compass Portfolio 2
Weighted Average Interest Rate Weighted Average Period To Maturity
Currency (In Years)
Indian Rupee 5.50% 2.65
United States Dollar 0.76% 1.77
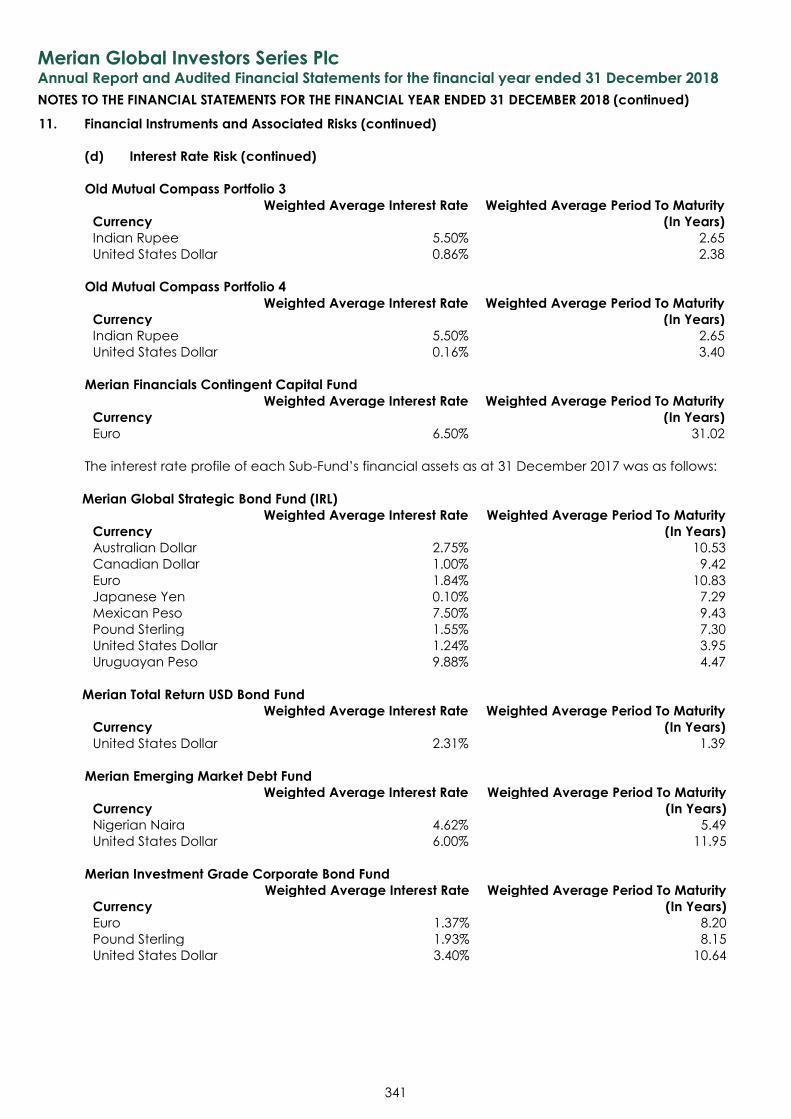
Merian Global Investors Series Plc
Annual Report and Audited Financial Statements for the financial year ended 31 December 2018
NOTES TO THE FINANCIAL STATEMENTS FOR THE FINANCIAL YEAR ENDED 31 DECEMBER 2018 (continued)
341
11. Financial Instruments and Associated Risks (continued)
(d) Interest Rate Risk (continued)
Old Mutual Compass Portfolio 3
Weighted Average Interest Rate Weighted Average Period To Maturity
Currency (In Years)
Indian Rupee 5.50% 2.65
United States Dollar 0.86% 2.38
Old Mutual Compass Portfolio 4
Weighted Average Interest Rate Weighted Average Period To Maturity
Currency (In Years)
Indian Rupee 5.50% 2.65
United States Dollar 0.16% 3.40
Merian Financials Contingent Capital Fund
Weighted Average Interest Rate Weighted Average Period To Maturity
Currency (In Years)
Euro 6.50% 31.02
The interest rate profile of each Sub-Fund’s financial assets as at 31 December 2017 was as follows:
Merian Global Strategic Bond Fund (IRL)
Weighted Average Interest Rate Weighted Average Period To Maturity
Currency (In Years)
Australian Dollar 2.75% 10.53
Canadian Dollar 1.00% 9.42
Euro 1.84% 10.83
Japanese Yen 0.10% 7.29
Mexican Peso 7.50% 9.43
Pound Sterling 1.55% 7.30
United States Dollar 1.24% 3.95
Uruguayan Peso 9.88% 4.47
Merian Total Return USD Bond Fund
Weighted Average Interest Rate Weighted Average Period To Maturity
Currency (In Years)
United States Dollar 2.31% 1.39
Merian Emerging Market Debt Fund
Weighted Average Interest Rate Weighted Average Period To Maturity
Currency (In Years)
Nigerian Naira 4.62% 5.49
United States Dollar 6.00% 11.95
Merian Investment Grade Corporate Bond Fund
Weighted Average Interest Rate Weighted Average Period To Maturity
Currency (In Years)
Euro 1.37% 8.20
Pound Sterling 1.93% 8.15
United States Dollar 3.40% 10.64
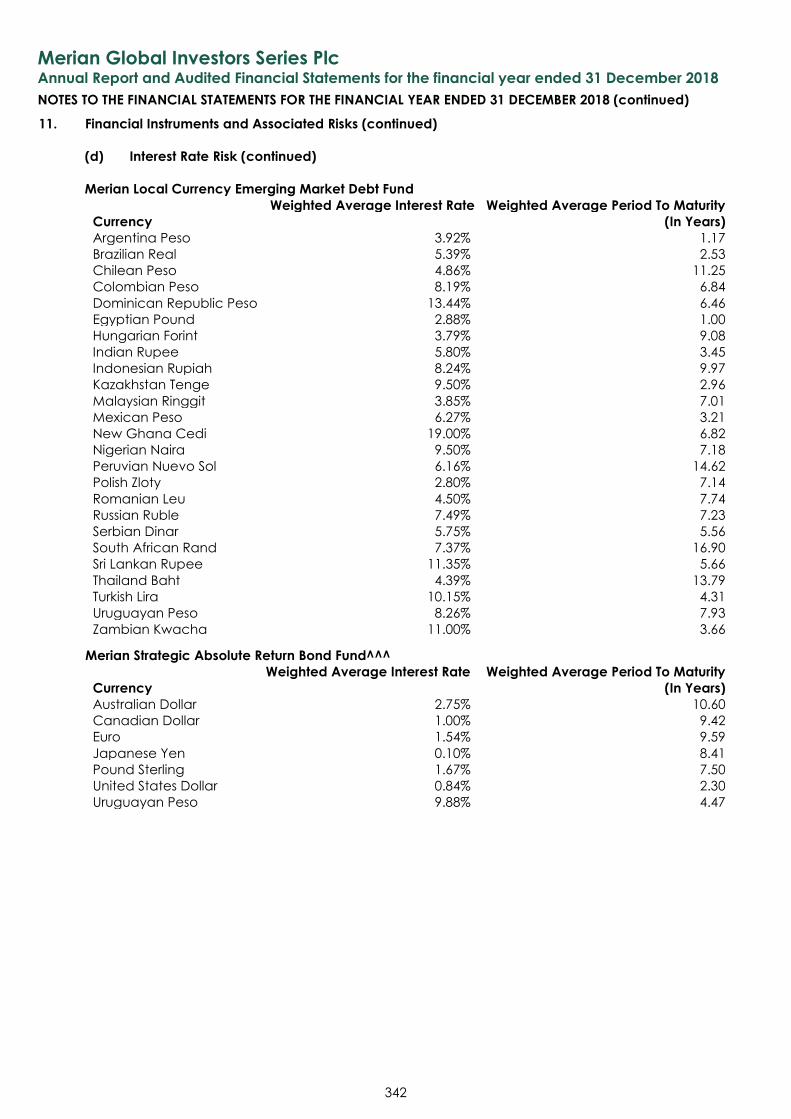
Merian Global Investors Series Plc
Annual Report and Audited Financial Statements for the financial year ended 31 December 2018
NOTES TO THE FINANCIAL STATEMENTS FOR THE FINANCIAL YEAR ENDED 31 DECEMBER 2018 (continued)
342
11. Financial Instruments and Associated Risks (continued)
(d) Interest Rate Risk (continued)
Merian Local Currency Emerging Market Debt Fund
Weighted Average Interest Rate Weighted Average Period To Maturity
Currency (In Years)
Argentina Peso 3.92% 1.17
Brazilian Real 5.39% 2.53
Chilean Peso 4.86% 11.25
Colombian Peso 8.19% 6.84
Dominican Republic Peso 13.44% 6.46
Egyptian Pound 2.88% 1.00
Hungarian Forint 3.79% 9.08
Indian Rupee 5.80% 3.45
Indonesian Rupiah 8.24% 9.97
Kazakhstan Tenge 9.50% 2.96
Malaysian Ringgit 3.85% 7.01
Mexican Peso 6.27% 3.21
New Ghana Cedi 19.00% 6.82
Nigerian Naira 9.50% 7.18
Peruvian Nuevo Sol 6.16% 14.62
Polish Zloty 2.80% 7.14
Romanian Leu 4.50% 7.74
Russian Ruble 7.49% 7.23
Serbian Dinar 5.75% 5.56
South African Rand 7.37% 16.90
Sri Lankan Rupee 11.35% 5.66
Thailand Baht 4.39% 13.79
Turkish Lira 10.15% 4.31
Uruguayan Peso 8.26% 7.93
Zambian Kwacha 11.00% 3.66
Merian Strategic Absolute Return Bond Fund^^^
Weighted Average Interest Rate Weighted Average Period To Maturity
Currency (In Years)
Australian Dollar 2.75% 10.60
Canadian Dollar 1.00% 9.42
Euro 1.54% 9.59
Japanese Yen 0.10% 8.41
Pound Sterling 1.67% 7.50
United States Dollar 0.84% 2.30
Uruguayan Peso 9.88% 4.47
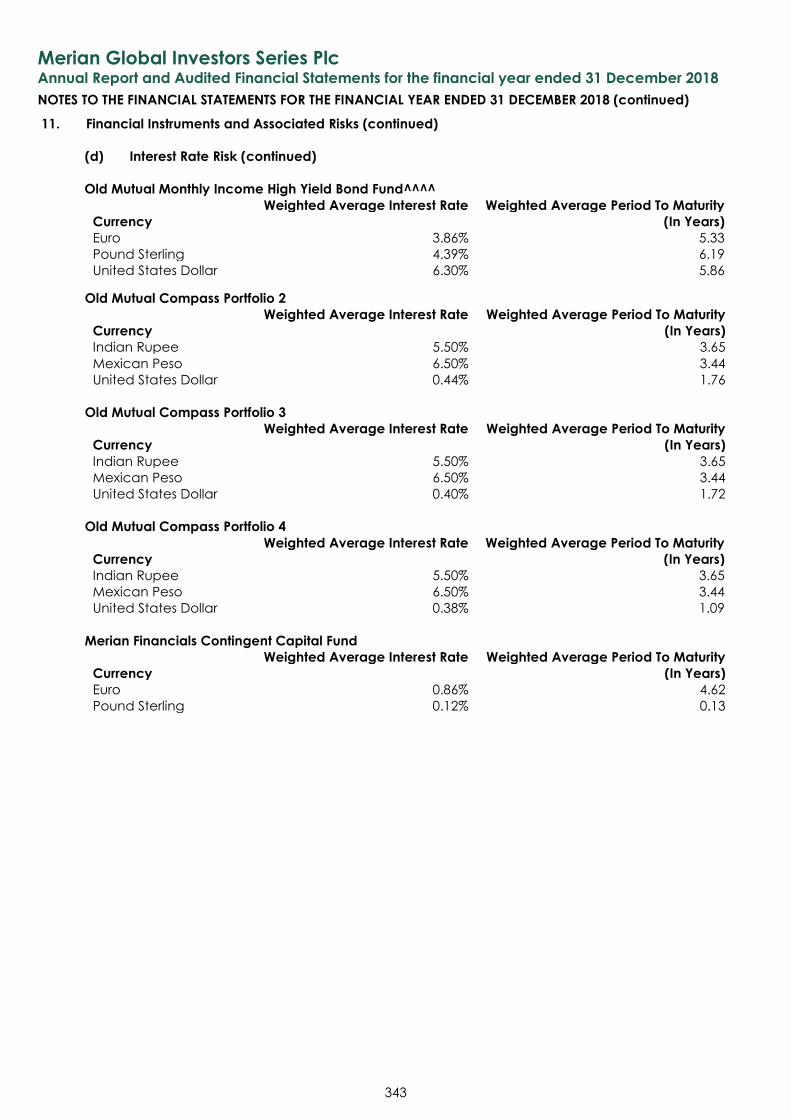
Merian Global Investors Series Plc
Annual Report and Audited Financial Statements for the financial year ended 31 December 2018
NOTES TO THE FINANCIAL STATEMENTS FOR THE FINANCIAL YEAR ENDED 31 DECEMBER 2018 (continued)
343
11. Financial Instruments and Associated Risks (continued)
(d) Interest Rate Risk (continued)
Old Mutual Monthly Income High Yield Bond Fund^^^^
Weighted Average Interest Rate Weighted Average Period To Maturity
Currency (In Years)
Euro 3.86% 5.33
Pound Sterling 4.39% 6.19
United States Dollar 6.30% 5.86
Old Mutual Compass Portfolio 2
Weighted Average Interest Rate Weighted Average Period To Maturity
Currency (In Years)
Indian Rupee 5.50% 3.65
Mexican Peso 6.50% 3.44
United States Dollar 0.44% 1.76
Old Mutual Compass Portfolio 3
Weighted Average Interest Rate Weighted Average Period To Maturity
Currency (In Years)
Indian Rupee 5.50% 3.65
Mexican Peso 6.50% 3.44
United States Dollar 0.40% 1.72
Old Mutual Compass Portfolio 4
Weighted Average Interest Rate Weighted Average Period To Maturity
Currency (In Years)
Indian Rupee 5.50% 3.65
Mexican Peso 6.50% 3.44
United States Dollar 0.38% 1.09
Merian Financials Contingent Capital Fund
Weighted Average Interest Rate Weighted Average Period To Maturity
Currency (In Years)
Euro 0.86% 4.62
Pound Sterling 0.12% 0.13
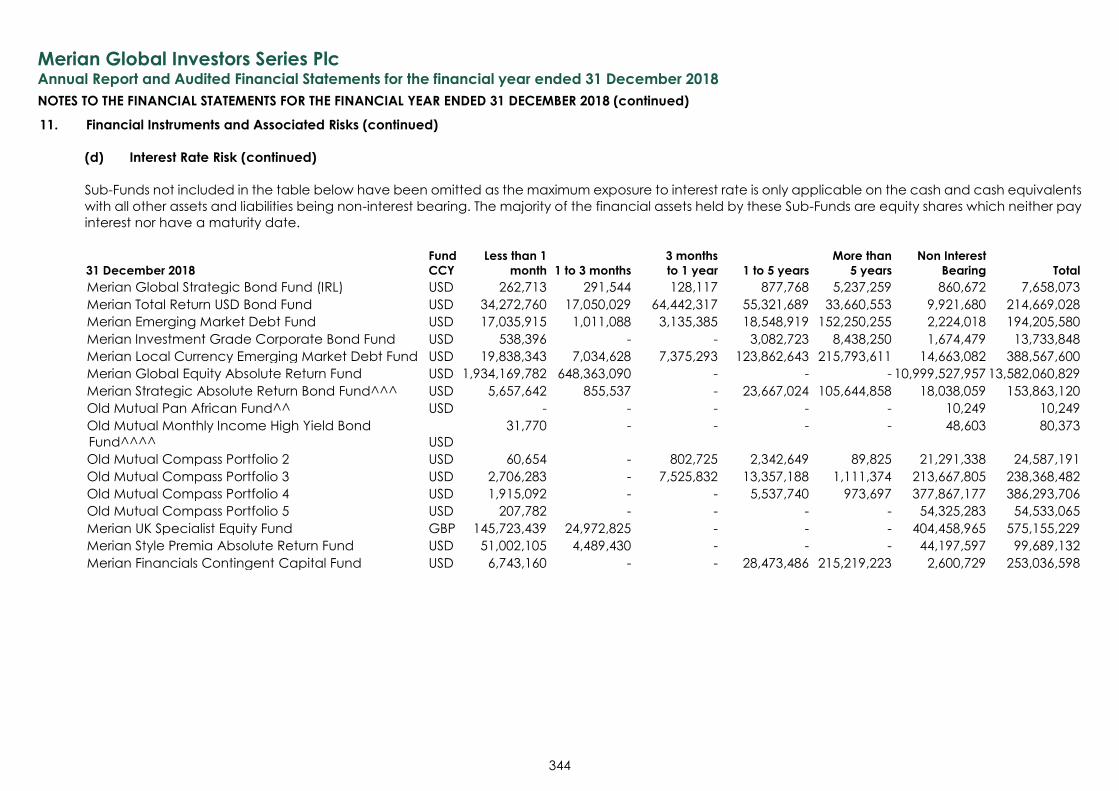
Merian Global Investors Series Plc
Annual Report and Audited Financial Statements for the financial year ended 31 December 2018
NOTES TO THE FINANCIAL STATEMENTS FOR THE FINANCIAL YEAR ENDED 31 DECEMBER 2018 (continued)
344
11. Financial Instruments and Associated Risks (continued)
(d) Interest Rate Risk (continued)
Sub-Funds not included in the table below have been omitted as the maximum exposure to interest rate is only applicable on the cash and cash equivalents
with all other assets and liabilities being non-interest bearing. The majority of the financial assets held by these Sub-Funds are equity shares which neither pay
interest nor have a maturity date.
31 December 2018
Fund
CCY
Less than 1
month 1 to 3 months
3 months
to 1 year 1 to 5 years
More than
5 years
Non Interest
Bearing Total
Merian Global Strategic Bond Fund (IRL) USD 262,713 291,544 128,117 877,768 5,237,259 860,672 7,658,073
Merian Total Return USD Bond Fund USD 34,272,760 17,050,029 64,442,317 55,321,689 33,660,553 9,921,680 214,669,028
Merian Emerging Market Debt Fund USD 17,035,915 1,011,088 3,135,385 18,548,919 152,250,255 2,224,018 194,205,580
Merian Investment Grade Corporate Bond Fund USD 538,396 - - 3,082,723 8,438,250 1,674,479 13,733,848
Merian Local Currency Emerging Market Debt Fund USD 19,838,343 7,034,628 7,375,293 123,862,643 215,793,611 14,663,082 388,567,600
Merian Global Equity Absolute Return Fund USD 1,934,169,782 648,363,090 - - - 10,999,527,957 13,582,060,829
Merian Strategic Absolute Return Bond Fund^^^ USD 5,657,642 855,537 - 23,667,024 105,644,858 18,038,059 153,863,120
Old Mutual Pan African Fund^^ USD - - - - - 10,249 10,249
Old Mutual Monthly Income High Yield Bond
Fund^^^^ USD
31,770 - - - - 48,603 80,373
Old Mutual Compass Portfolio 2 USD 60,654 - 802,725 2,342,649 89,825 21,291,338 24,587,191
Old Mutual Compass Portfolio 3 USD 2,706,283 - 7,525,832 13,357,188 1,111,374 213,667,805 238,368,482
Old Mutual Compass Portfolio 4 USD 1,915,092 - - 5,537,740 973,697 377,867,177 386,293,706
Old Mutual Compass Portfolio 5 USD 207,782 - - - - 54,325,283 54,533,065
Merian UK Specialist Equity Fund GBP 145,723,439 24,972,825 - - - 404,458,965 575,155,229
Merian Style Premia Absolute Return Fund USD 51,002,105 4,489,430 - - - 44,197,597 99,689,132
Merian Financials Contingent Capital Fund USD 6,743,160 - - 28,473,486 215,219,223 2,600,729 253,036,598
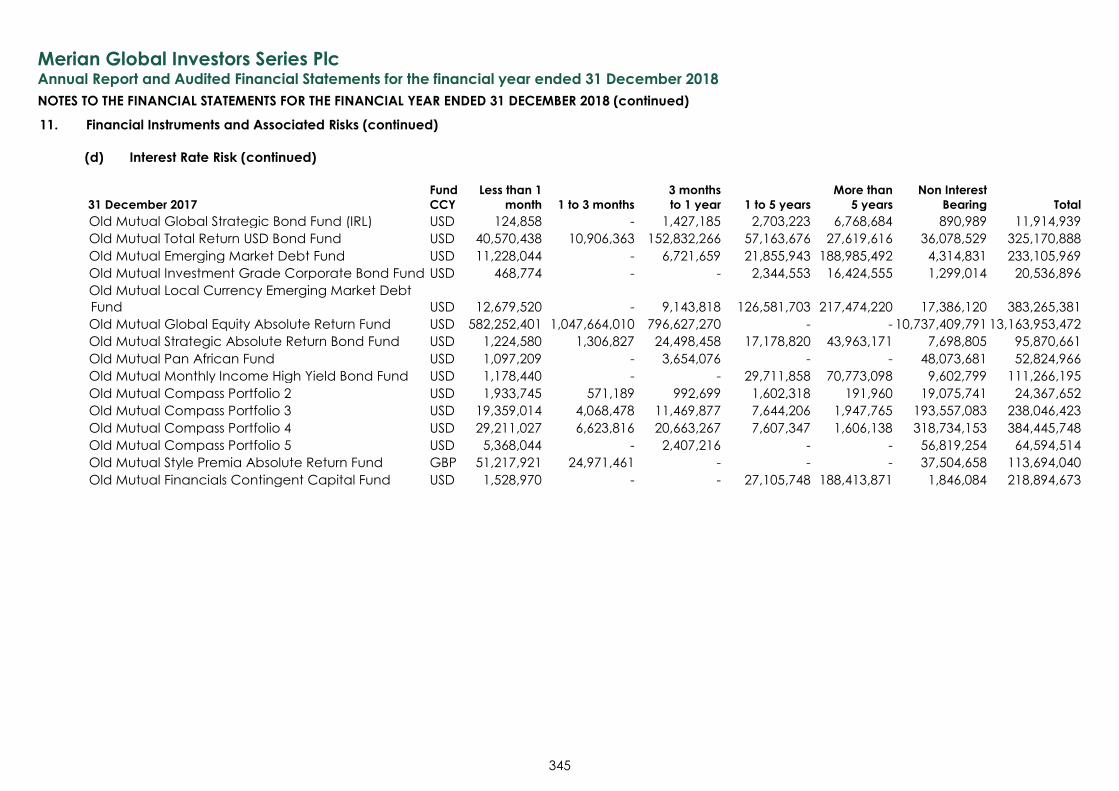
Merian Global Investors Series Plc
Annual Report and Audited Financial Statements for the financial year ended 31 December 2018
NOTES TO THE FINANCIAL STATEMENTS FOR THE FINANCIAL YEAR ENDED 31 DECEMBER 2018 (continued)
345
11. Financial Instruments and Associated Risks (continued)
(d) Interest Rate Risk (continued)
31 December 2017
Fund
CCY
Less than 1
month 1 to 3 months
3 months
to 1 year 1 to 5 years
More than
5 years
Non Interest
Bearing Total
Old Mutual Global Strategic Bond Fund (IRL) USD 124,858 - 1,427,185 2,703,223 6,768,684 890,989 11,914,939
Old Mutual Total Return USD Bond Fund USD 40,570,438 10,906,363 152,832,266 57,163,676 27,619,616 36,078,529 325,170,888
Old Mutual Emerging Market Debt Fund USD 11,228,044 - 6,721,659 21,855,943 188,985,492 4,314,831 233,105,969
Old Mutual Investment Grade Corporate Bond Fund USD 468,774 - - 2,344,553 16,424,555 1,299,014 20,536,896
Old Mutual Local Currency Emerging Market Debt
Fund USD 12,679,520 - 9,143,818 126,581,703 217,474,220 17,386,120 383,265,381
Old Mutual Global Equity Absolute Return Fund USD 582,252,401 1,047,664,010 796,627,270 - - 10,737,409,791 13,163,953,472
Old Mutual Strategic Absolute Return Bond Fund USD 1,224,580 1,306,827 24,498,458 17,178,820 43,963,171 7,698,805 95,870,661
Old Mutual Pan African Fund USD 1,097,209 - 3,654,076 - - 48,073,681 52,824,966
Old Mutual Monthly Income High Yield Bond Fund USD 1,178,440 - - 29,711,858 70,773,098 9,602,799 111,266,195
Old Mutual Compass Portfolio 2 USD 1,933,745 571,189 992,699 1,602,318 191,960 19,075,741 24,367,652
Old Mutual Compass Portfolio 3 USD 19,359,014 4,068,478 11,469,877 7,644,206 1,947,765 193,557,083 238,046,423
Old Mutual Compass Portfolio 4 USD 29,211,027 6,623,816 20,663,267 7,607,347 1,606,138 318,734,153 384,445,748
Old Mutual Compass Portfolio 5 USD 5,368,044 - 2,407,216 - - 56,819,254 64,594,514
Old Mutual Style Premia Absolute Return Fund GBP 51,217,921 24,971,461 - - - 37,504,658 113,694,040
Old Mutual Financials Contingent Capital Fund USD 1,528,970 - - 27,105,748 188,413,871 1,846,084 218,894,673
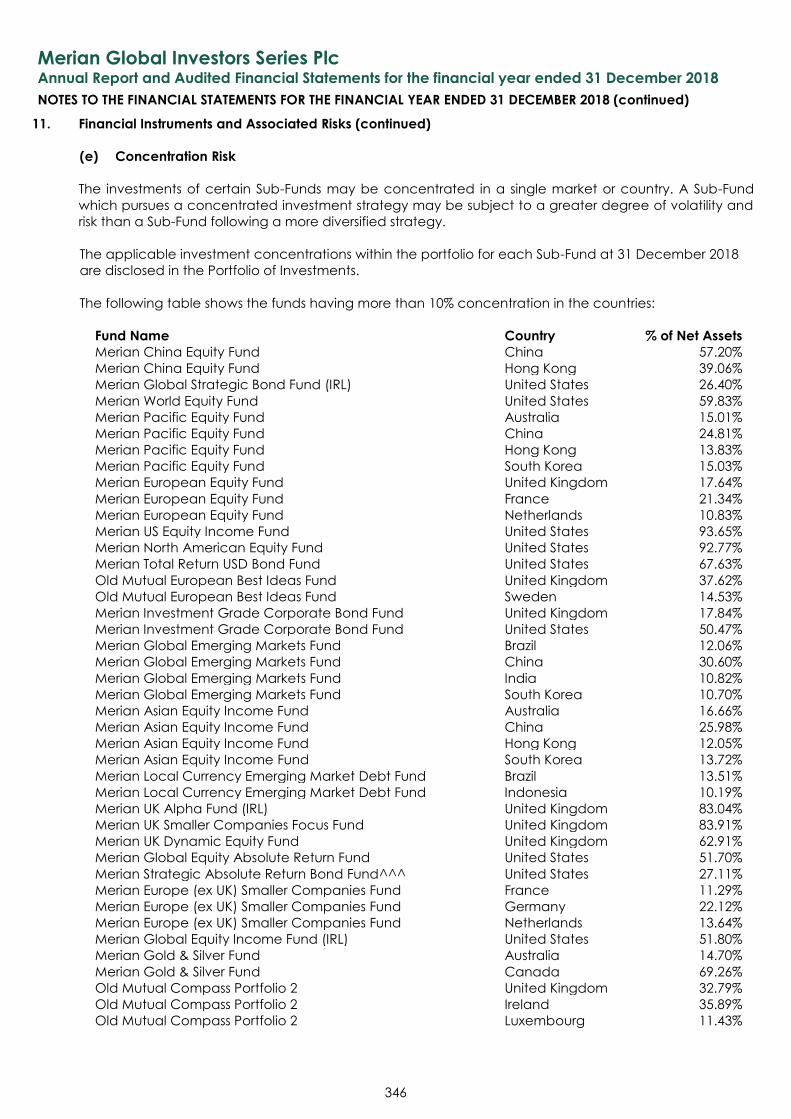
Merian Global Investors Series Plc
Annual Report and Audited Financial Statements for the financial year ended 31 December 2018
NOTES TO THE FINANCIAL STATEMENTS FOR THE FINANCIAL YEAR ENDED 31 DECEMBER 2018 (continued)
346
11. Financial Instruments and Associated Risks (continued)
(e) Concentration Risk
The investments of certain Sub-Funds may be concentrated in a single market or country. A Sub-Fund
which pursues a concentrated investment strategy may be subject to a greater degree of volatility and
risk than a Sub-Fund following a more diversified strategy.
The applicable investment concentrations within the portfolio for each Sub-Fund at 31 December 2018
are disclosed in the Portfolio of Investments.
The following table shows the funds having more than 10% concentration in the countries:
Fund Name Country % of Net Assets
Merian China Equity Fund China 57.20%
Merian China Equity Fund Hong Kong 39.06%
Merian Global Strategic Bond Fund (IRL) United States 26.40%
Merian World Equity Fund United States 59.83%
Merian Pacific Equity Fund Australia 15.01%
Merian Pacific Equity Fund China 24.81%
Merian Pacific Equity Fund Hong Kong 13.83%
Merian Pacific Equity Fund South Korea 15.03%
Merian European Equity Fund United Kingdom 17.64%
Merian European Equity Fund France 21.34%
Merian European Equity Fund Netherlands 10.83%
Merian US Equity Income Fund United States 93.65%
Merian North American Equity Fund United States 92.77%
Merian Total Return USD Bond Fund United States 67.63%
Old Mutual European Best Ideas Fund United Kingdom 37.62%
Old Mutual European Best Ideas Fund Sweden 14.53%
Merian Investment Grade Corporate Bond Fund United Kingdom 17.84%
Merian Investment Grade Corporate Bond Fund United States 50.47%
Merian Global Emerging Markets Fund Brazil 12.06%
Merian Global Emerging Markets Fund China 30.60%
Merian Global Emerging Markets Fund India 10.82%
Merian Global Emerging Markets Fund South Korea 10.70%
Merian Asian Equity Income Fund Australia 16.66%
Merian Asian Equity Income Fund China 25.98%
Merian Asian Equity Income Fund Hong Kong 12.05%
Merian Asian Equity Income Fund South Korea 13.72%
Merian Local Currency Emerging Market Debt Fund Brazil 13.51%
Merian Local Currency Emerging Market Debt Fund Indonesia 10.19%
Merian UK Alpha Fund (IRL) United Kingdom 83.04%
Merian UK Smaller Companies Focus Fund United Kingdom 83.91%
Merian UK Dynamic Equity Fund United Kingdom 62.91%
Merian Global Equity Absolute Return Fund United States 51.70%
Merian Strategic Absolute Return Bond Fund^^^ United States 27.11%
Merian Europe (ex UK) Smaller Companies Fund France 11.29%
Merian Europe (ex UK) Smaller Companies Fund Germany 22.12%
Merian Europe (ex UK) Smaller Companies Fund Netherlands 13.64%
Merian Global Equity Income Fund (IRL) United States 51.80%
Merian Gold & Silver Fund Australia 14.70%
Merian Gold & Silver Fund Canada 69.26%
Old Mutual Compass Portfolio 2 United Kingdom 32.79%
Old Mutual Compass Portfolio 2 Ireland 35.89%
Old Mutual Compass Portfolio 2 Luxembourg 11.43%
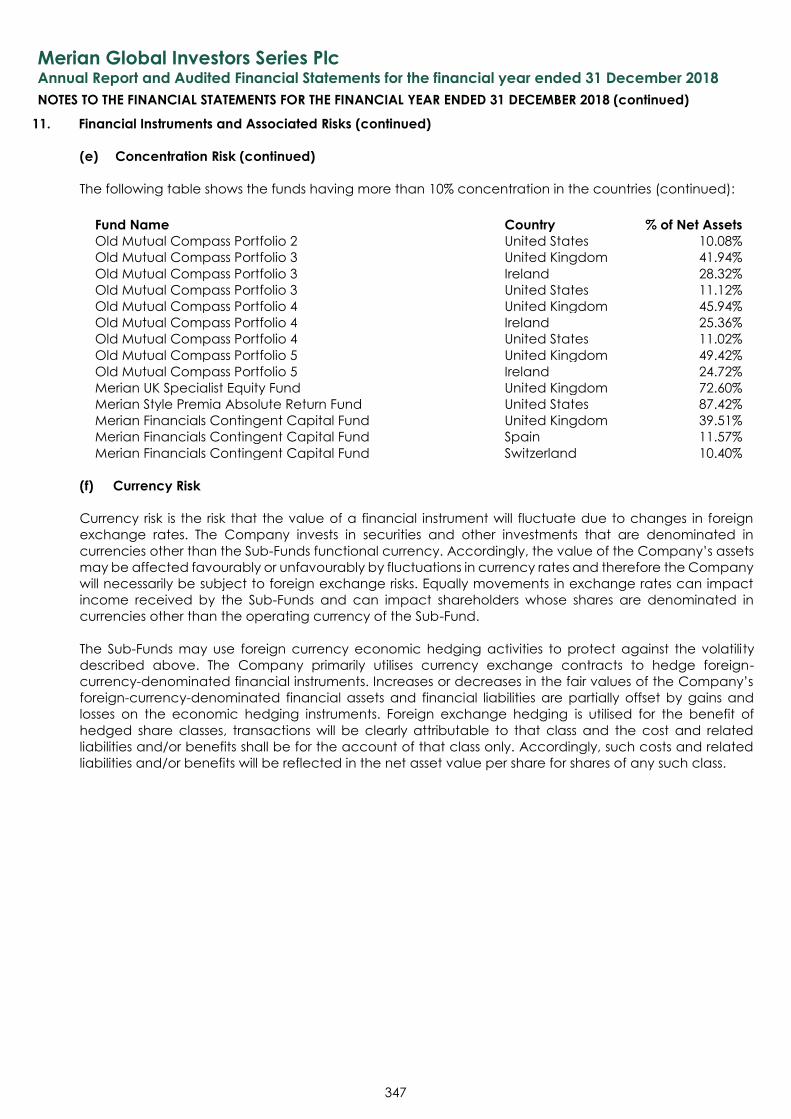
Merian Global Investors Series Plc
Annual Report and Audited Financial Statements for the financial year ended 31 December 2018
NOTES TO THE FINANCIAL STATEMENTS FOR THE FINANCIAL YEAR ENDED 31 DECEMBER 2018 (continued)
347
11. Financial Instruments and Associated Risks (continued)
(e) Concentration Risk (continued)
The following table shows the funds having more than 10% concentration in the countries (continued):
Fund Name Country % of Net Assets
Old Mutual Compass Portfolio 2 United States 10.08%
Old Mutual Compass Portfolio 3 United Kingdom 41.94%
Old Mutual Compass Portfolio 3 Ireland 28.32%
Old Mutual Compass Portfolio 3 United States 11.12%
Old Mutual Compass Portfolio 4 United Kingdom 45.94%
Old Mutual Compass Portfolio 4 Ireland 25.36%
Old Mutual Compass Portfolio 4 United States 11.02%
Old Mutual Compass Portfolio 5 United Kingdom 49.42%
Old Mutual Compass Portfolio 5 Ireland 24.72%
Merian UK Specialist Equity Fund United Kingdom 72.60%
Merian Style Premia Absolute Return Fund United States 87.42%
Merian Financials Contingent Capital Fund United Kingdom 39.51%
Merian Financials Contingent Capital Fund Spain 11.57%
Merian Financials Contingent Capital Fund Switzerland 10.40%
(f) Currency Risk
Currency risk is the risk that the value of a financial instrument will fluctuate due to changes in foreign
exchange rates. The Company invests in securities and other investments that are denominated in
currencies other than the Sub-Funds functional currency. Accordingly, the value of the Company’s assets
may be affected favourably or unfavourably by fluctuations in currency rates and therefore the Company
will necessarily be subject to foreign exchange risks. Equally movements in exchange rates can impact
income received by the Sub-Funds and can impact shareholders whose shares are denominated in
currencies other than the operating currency of the Sub-Fund.
The Sub-Funds may use foreign currency economic hedging activities to protect against the volatility
described above. The Company primarily utilises currency exchange contracts to hedge foreign-
currency-denominated financial instruments. Increases or decreases in the fair values of the Company’s
foreign-currency-denominated financial assets and financial liabilities are partially offset by gains and
losses on the economic hedging instruments. Foreign exchange hedging is utilised for the benefit of
hedged share classes, transactions will be clearly attributable to that class and the cost and related
liabilities and/or benefits shall be for the account of that class only. Accordingly, such costs and related
liabilities and/or benefits will be reflected in the net asset value per share for shares of any such class.
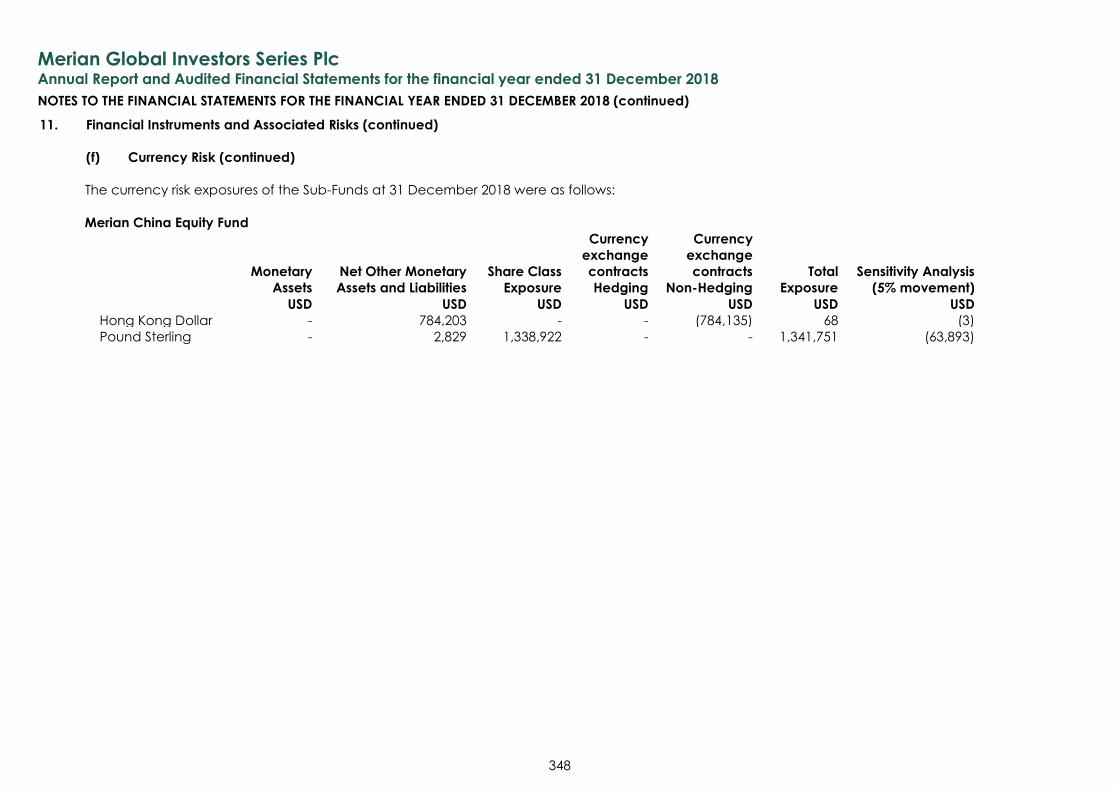
Merian Global Investors Series Plc
Annual Report and Audited Financial Statements for the financial year ended 31 December 2018
NOTES TO THE FINANCIAL STATEMENTS FOR THE FINANCIAL YEAR ENDED 31 DECEMBER 2018 (continued)
348
11. Financial Instruments and Associated Risks (continued)
(f) Currency Risk (continued)
The currency risk exposures of the Sub-Funds at 31 December 2018 were as follows:
Merian China Equity Fund
Monetary
Assets
Net Other Monetary
Assets and Liabilities
Share Class
Exposure
Currency
exchange
contracts
Hedging
Currency
exchange
contracts
Non-Hedging
Total
Exposure
Sensitivity Analysis
(5% movement)
USD USD USD USD USD USD USD
Hong Kong Dollar - 784,203 - - (784,135) 68 (3)
Pound Sterling - 2,829 1,338,922 - - 1,341,751 (63,893)
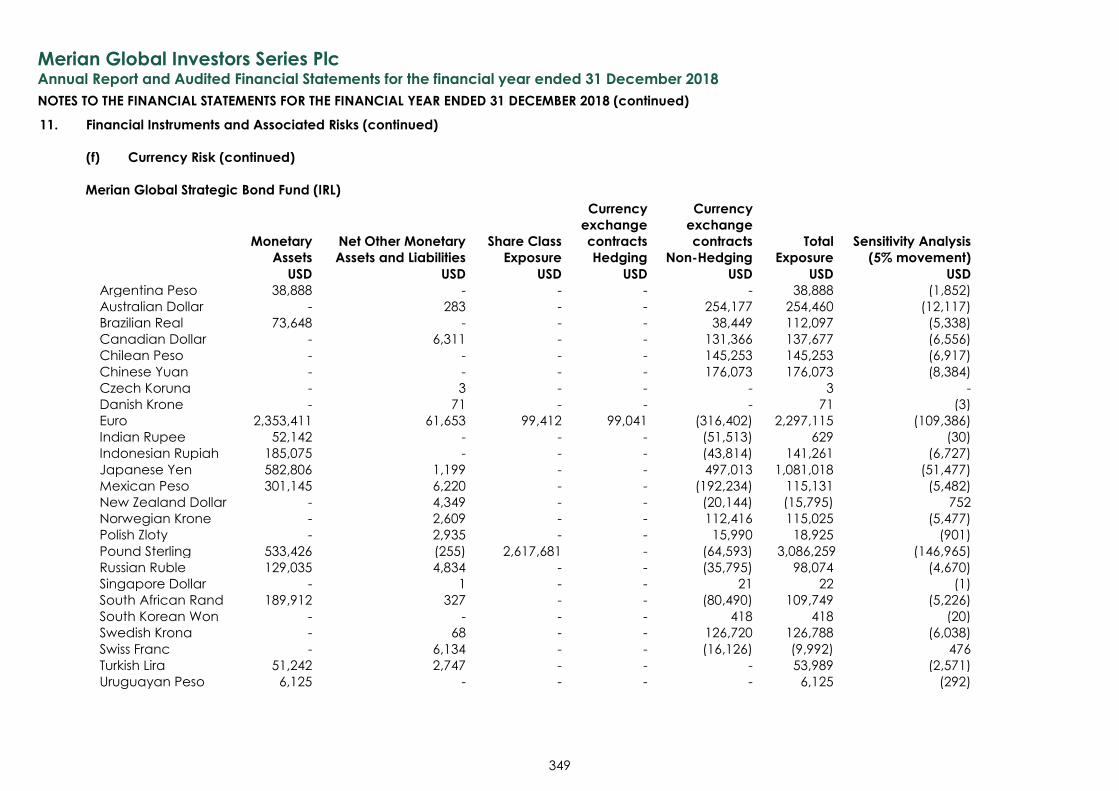
Merian Global Investors Series Plc
Annual Report and Audited Financial Statements for the financial year ended 31 December 2018
NOTES TO THE FINANCIAL STATEMENTS FOR THE FINANCIAL YEAR ENDED 31 DECEMBER 2018 (continued)
349
11. Financial Instruments and Associated Risks (continued)
(f) Currency Risk (continued)
Merian Global Strategic Bond Fund (IRL)
Monetary
Assets
Net Other Monetary
Assets and Liabilities
Share Class
Exposure
Currency
exchange
contracts
Hedging
Currency
exchange
contracts
Non-Hedging
Total
Exposure
Sensitivity Analysis
(5% movement)
USD USD USD USD USD USD USD
Argentina Peso 38,888 - - - - 38,888 (1,852)
Australian Dollar - 283 - - 254,177 254,460 (12,117)
Brazilian Real 73,648 - - - 38,449 112,097 (5,338)
Canadian Dollar - 6,311 - - 131,366 137,677 (6,556)
Chilean Peso - - - - 145,253 145,253 (6,917)
Chinese Yuan - - - - 176,073 176,073 (8,384)
Czech Koruna - 3 - - - 3 -
Danish Krone - 71 - - - 71 (3)
Euro 2,353,411 61,653 99,412 99,041 (316,402) 2,297,115 (109,386)
Indian Rupee 52,142 - - - (51,513) 629 (30)
Indonesian Rupiah 185,075 - - - (43,814) 141,261 (6,727)
Japanese Yen 582,806 1,199 - - 497,013 1,081,018 (51,477)
Mexican Peso 301,145 6,220 - - (192,234) 115,131 (5,482)
New Zealand Dollar - 4,349 - - (20,144) (15,795) 752
Norwegian Krone - 2,609 - - 112,416 115,025 (5,477)
Polish Zloty - 2,935 - - 15,990 18,925 (901)
Pound Sterling 533,426 (255) 2,617,681 - (64,593) 3,086,259 (146,965)
Russian Ruble 129,035 4,834 - - (35,795) 98,074 (4,670)
Singapore Dollar - 1 - - 21 22 (1)
South African Rand 189,912 327 - - (80,490) 109,749 (5,226)
South Korean Won - - - - 418 418 (20)
Swedish Krona - 68 - - 126,720 126,788 (6,038)
Swiss Franc - 6,134 - - (16,126) (9,992) 476
Turkish Lira 51,242 2,747 - - - 53,989 (2,571)
Uruguayan Peso 6,125 - - - - 6,125 (292)
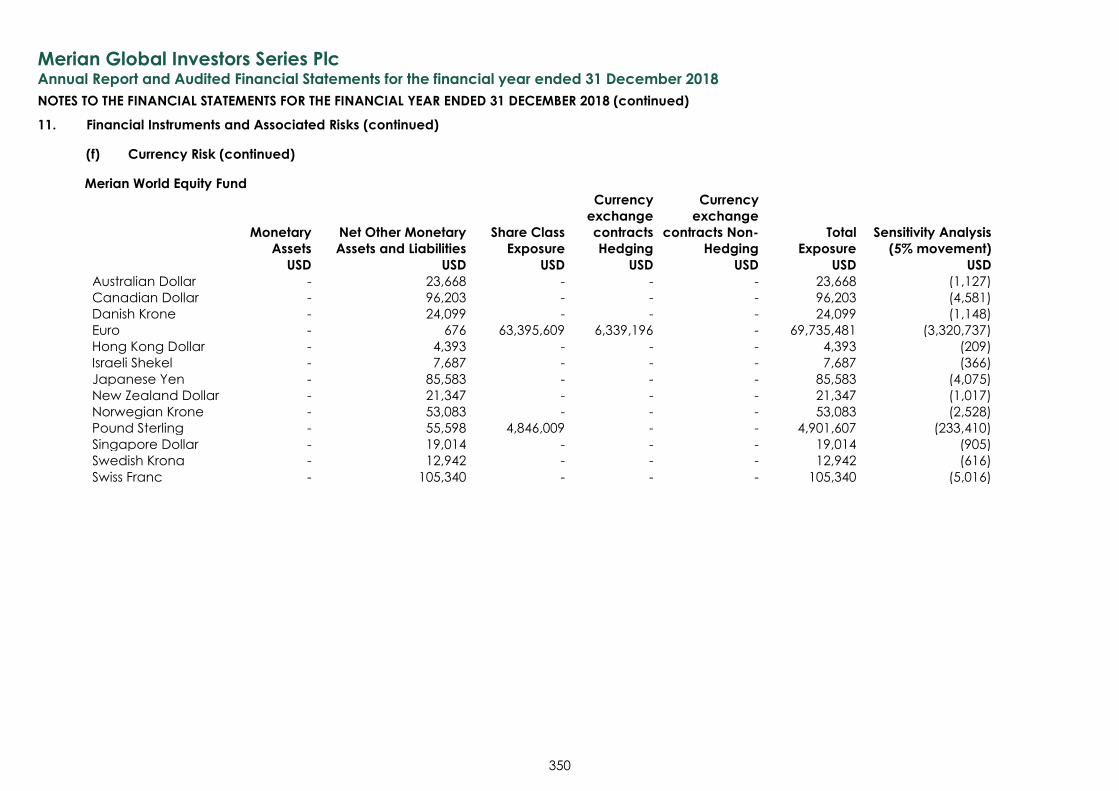
Merian Global Investors Series Plc
Annual Report and Audited Financial Statements for the financial year ended 31 December 2018
NOTES TO THE FINANCIAL STATEMENTS FOR THE FINANCIAL YEAR ENDED 31 DECEMBER 2018 (continued)
350
11. Financial Instruments and Associated Risks (continued)
(f) Currency Risk (continued)
Merian World Equity Fund
Monetary
Assets
Net Other Monetary
Assets and Liabilities
Share Class
Exposure
Currency
exchange
contracts
Hedging
Currency
exchange
contracts Non-
Hedging
Total
Exposure
Sensitivity Analysis
(5% movement)
USD USD USD USD USD USD USD
Australian Dollar - 23,668 - - - 23,668 (1,127)
Canadian Dollar - 96,203 - - - 96,203 (4,581)
Danish Krone - 24,099 - - - 24,099 (1,148)
Euro - 676 63,395,609 6,339,196 - 69,735,481 (3,320,737)
Hong Kong Dollar - 4,393 - - - 4,393 (209)
Israeli Shekel - 7,687 - - - 7,687 (366)
Japanese Yen - 85,583 - - - 85,583 (4,075)
New Zealand Dollar - 21,347 - - - 21,347 (1,017)
Norwegian Krone - 53,083 - - - 53,083 (2,528)
Pound Sterling - 55,598 4,846,009 - - 4,901,607 (233,410)
Singapore Dollar - 19,014 - - - 19,014 (905)
Swedish Krona - 12,942 - - - 12,942 (616)
Swiss Franc - 105,340 - - - 105,340 (5,016)
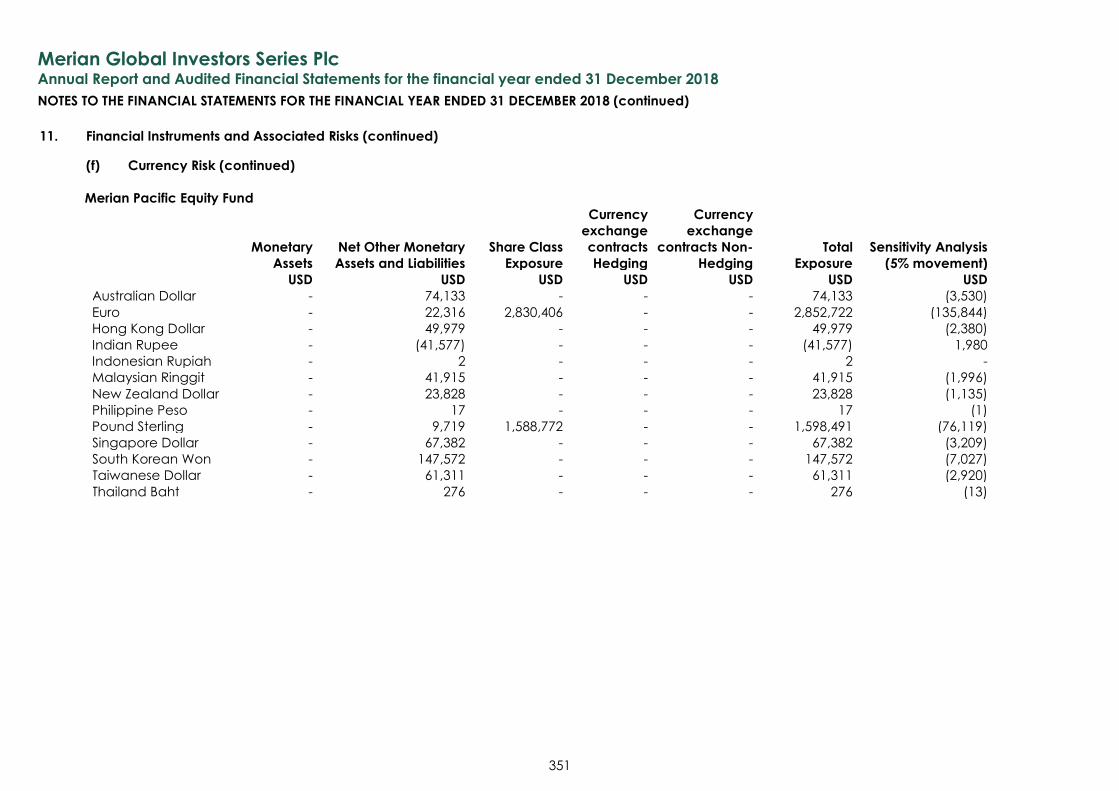
Merian Global Investors Series Plc
Annual Report and Audited Financial Statements for the financial year ended 31 December 2018
NOTES TO THE FINANCIAL STATEMENTS FOR THE FINANCIAL YEAR ENDED 31 DECEMBER 2018 (continued)
351
11. Financial Instruments and Associated Risks (continued)
(f) Currency Risk (continued)
Merian Pacific Equity Fund
Monetary
Assets
Net Other Monetary
Assets and Liabilities
Share Class
Exposure
Currency
exchange
contracts
Hedging
Currency
exchange
contracts Non-
Hedging
Total
Exposure
Sensitivity Analysis
(5% movement)
USD USD USD USD USD USD USD
Australian Dollar - 74,133 - - - 74,133 (3,530)
Euro - 22,316 2,830,406 - - 2,852,722 (135,844)
Hong Kong Dollar - 49,979 - - - 49,979 (2,380)
Indian Rupee - (41,577) - - - (41,577) 1,980
Indonesian Rupiah - 2 - - - 2 -
Malaysian Ringgit - 41,915 - - - 41,915 (1,996)
New Zealand Dollar - 23,828 - - - 23,828 (1,135)
Philippine Peso - 17 - - - 17 (1)
Pound Sterling - 9,719 1,588,772 - - 1,598,491 (76,119)
Singapore Dollar - 67,382 - - - 67,382 (3,209)
South Korean Won - 147,572 - - - 147,572 (7,027)
Taiwanese Dollar - 61,311 - - - 61,311 (2,920)
Thailand Baht - 276 - - - 276 (13)
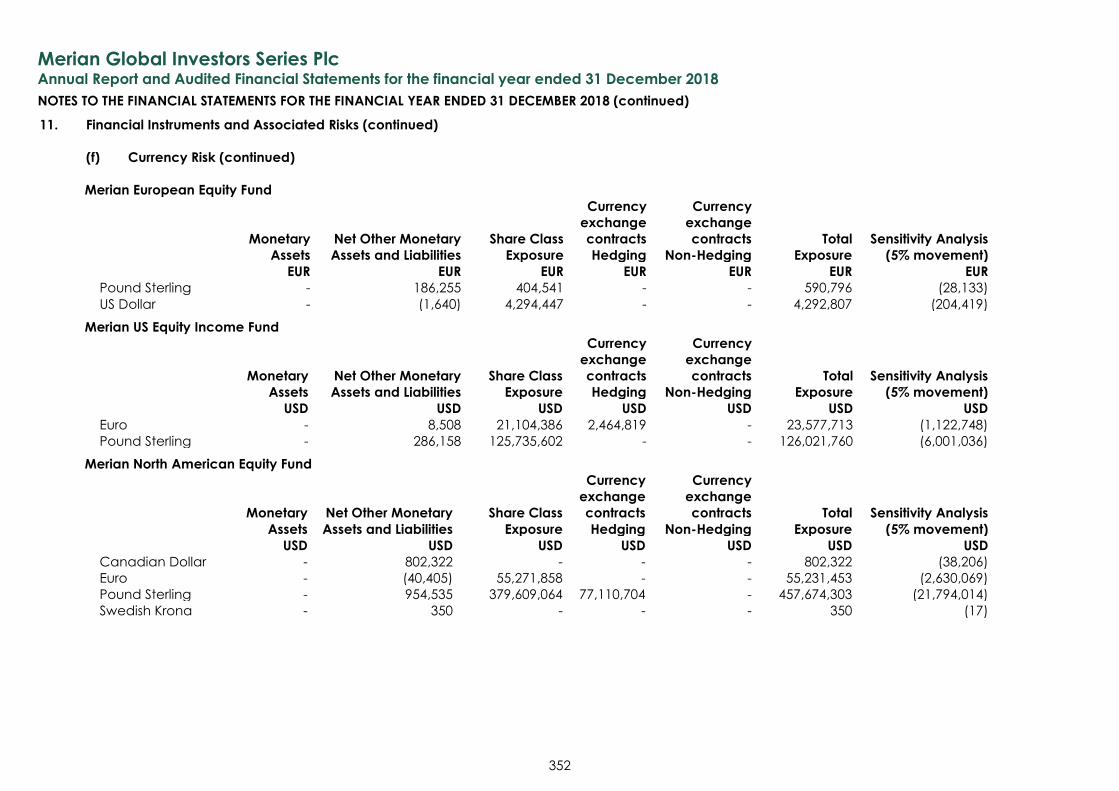
Merian Global Investors Series Plc
Annual Report and Audited Financial Statements for the financial year ended 31 December 2018
NOTES TO THE FINANCIAL STATEMENTS FOR THE FINANCIAL YEAR ENDED 31 DECEMBER 2018 (continued)
352
11. Financial Instruments and Associated Risks (continued)
(f) Currency Risk (continued)
Merian European Equity Fund
Monetary
Assets
Net Other Monetary
Assets and Liabilities
Share Class
Exposure
Currency
exchange
contracts
Hedging
Currency
exchange
contracts
Non-Hedging
Total
Exposure
Sensitivity Analysis
(5% movement)
EUR EUR EUR EUR EUR EUR EUR Pound Sterling - 186,255 404,541 - - 590,796 (28,133)
US Dollar - (1,640) 4,294,447 - - 4,292,807 (204,419)
Merian US Equity Income Fund
Monetary
Assets
Net Other Monetary
Assets and Liabilities
Share Class
Exposure
Currency
exchange
contracts
Hedging
Currency
exchange
contracts
Non-Hedging
Total
Exposure
Sensitivity Analysis
(5% movement)
USD USD USD USD USD USD USD
Euro - 8,508 21,104,386 2,464,819 - 23,577,713 (1,122,748)
Pound Sterling - 286,158 125,735,602 - - 126,021,760 (6,001,036)
Merian North American Equity Fund
Monetary
Assets
Net Other Monetary
Assets and Liabilities
Share Class
Exposure
Currency
exchange
contracts
Hedging
Currency
exchange
contracts
Non-Hedging
Total
Exposure
Sensitivity Analysis
(5% movement)
USD USD USD USD USD USD USD
Canadian Dollar - 802,322 - - - 802,322 (38,206)
Euro - (40,405) 55,271,858 - - 55,231,453 (2,630,069)
Pound Sterling - 954,535 379,609,064 77,110,704 - 457,674,303 (21,794,014)
Swedish Krona - 350 - - - 350 (17)
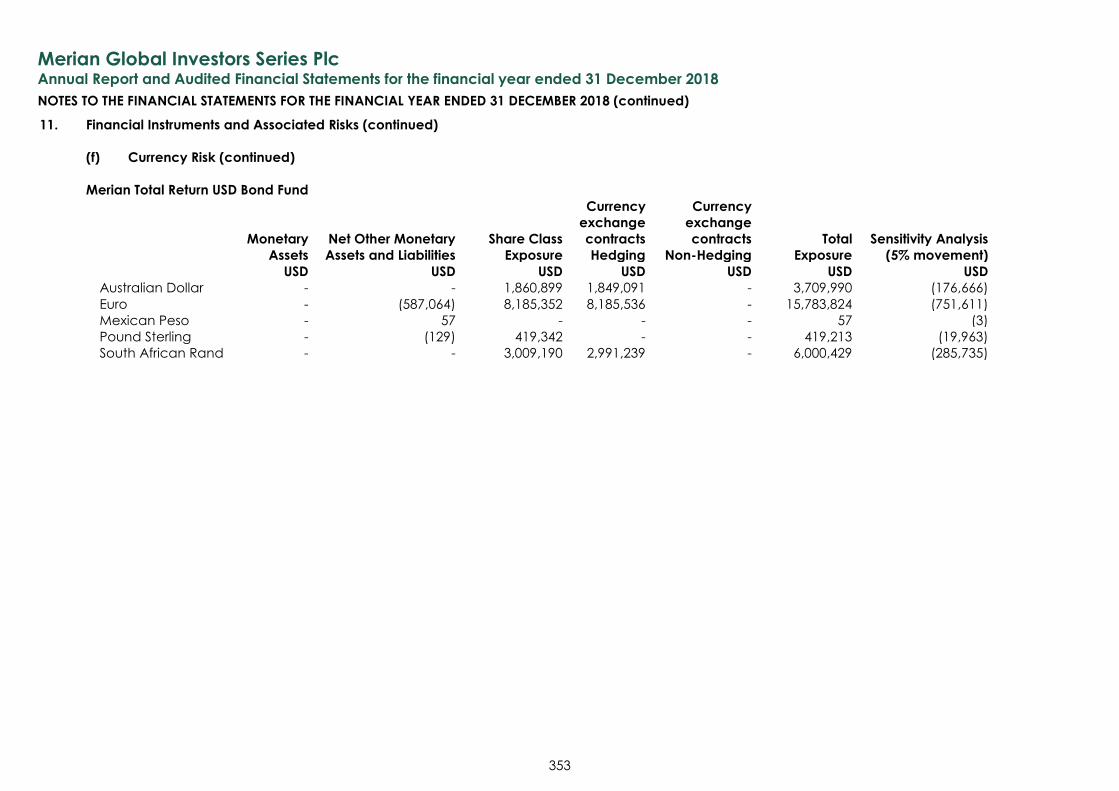
Merian Global Investors Series Plc
Annual Report and Audited Financial Statements for the financial year ended 31 December 2018
NOTES TO THE FINANCIAL STATEMENTS FOR THE FINANCIAL YEAR ENDED 31 DECEMBER 2018 (continued)
353
11. Financial Instruments and Associated Risks (continued)
(f) Currency Risk (continued)
Merian Total Return USD Bond Fund
Monetary
Assets
Net Other Monetary
Assets and Liabilities
Share Class
Exposure
Currency
exchange
contracts
Hedging
Currency
exchange
contracts
Non-Hedging
Total
Exposure
Sensitivity Analysis
(5% movement)
USD USD USD USD USD USD USD
Australian Dollar - - 1,860,899 1,849,091 - 3,709,990 (176,666)
Euro - (587,064) 8,185,352 8,185,536 - 15,783,824 (751,611)
Mexican Peso - 57 - - - 57 (3)
Pound Sterling - (129) 419,342 - - 419,213 (19,963)
South African Rand - - 3,009,190 2,991,239 - 6,000,429 (285,735)
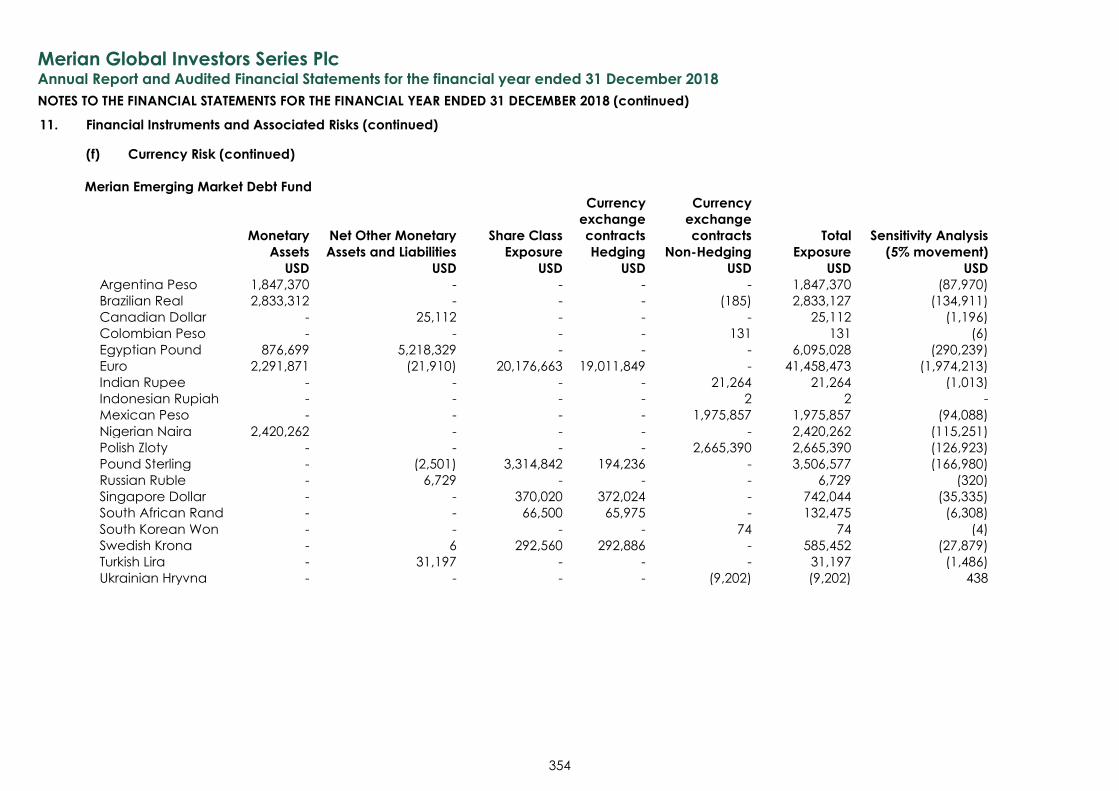
Merian Global Investors Series Plc
Annual Report and Audited Financial Statements for the financial year ended 31 December 2018
NOTES TO THE FINANCIAL STATEMENTS FOR THE FINANCIAL YEAR ENDED 31 DECEMBER 2018 (continued)
354
11. Financial Instruments and Associated Risks (continued)
(f) Currency Risk (continued)
Merian Emerging Market Debt Fund
Monetary
Assets
Net Other Monetary
Assets and Liabilities
Share Class
Exposure
Currency
exchange
contracts
Hedging
Currency
exchange
contracts
Non-Hedging
Total
Exposure
Sensitivity Analysis
(5% movement)
USD USD USD USD USD USD USD
Argentina Peso 1,847,370 - - - - 1,847,370 (87,970)
Brazilian Real 2,833,312 - - - (185) 2,833,127 (134,911)
Canadian Dollar - 25,112 - - - 25,112 (1,196)
Colombian Peso - - - - 131 131 (6)
Egyptian Pound 876,699 5,218,329 - - - 6,095,028 (290,239)
Euro 2,291,871 (21,910) 20,176,663 19,011,849 - 41,458,473 (1,974,213)
Indian Rupee - - - - 21,264 21,264 (1,013)
Indonesian Rupiah - - - - 2 2 -
Mexican Peso - - - - 1,975,857 1,975,857 (94,088)
Nigerian Naira 2,420,262 - - - - 2,420,262 (115,251)
Polish Zloty - - - - 2,665,390 2,665,390 (126,923)
Pound Sterling - (2,501) 3,314,842 194,236 - 3,506,577 (166,980)
Russian Ruble - 6,729 - - - 6,729 (320)
Singapore Dollar - - 370,020 372,024 - 742,044 (35,335)
South African Rand - - 66,500 65,975 - 132,475 (6,308)
South Korean Won - - - - 74 74 (4)
Swedish Krona - 6 292,560 292,886 - 585,452 (27,879)
Turkish Lira - 31,197 - - - 31,197 (1,486)
Ukrainian Hryvna - - - - (9,202) (9,202) 438
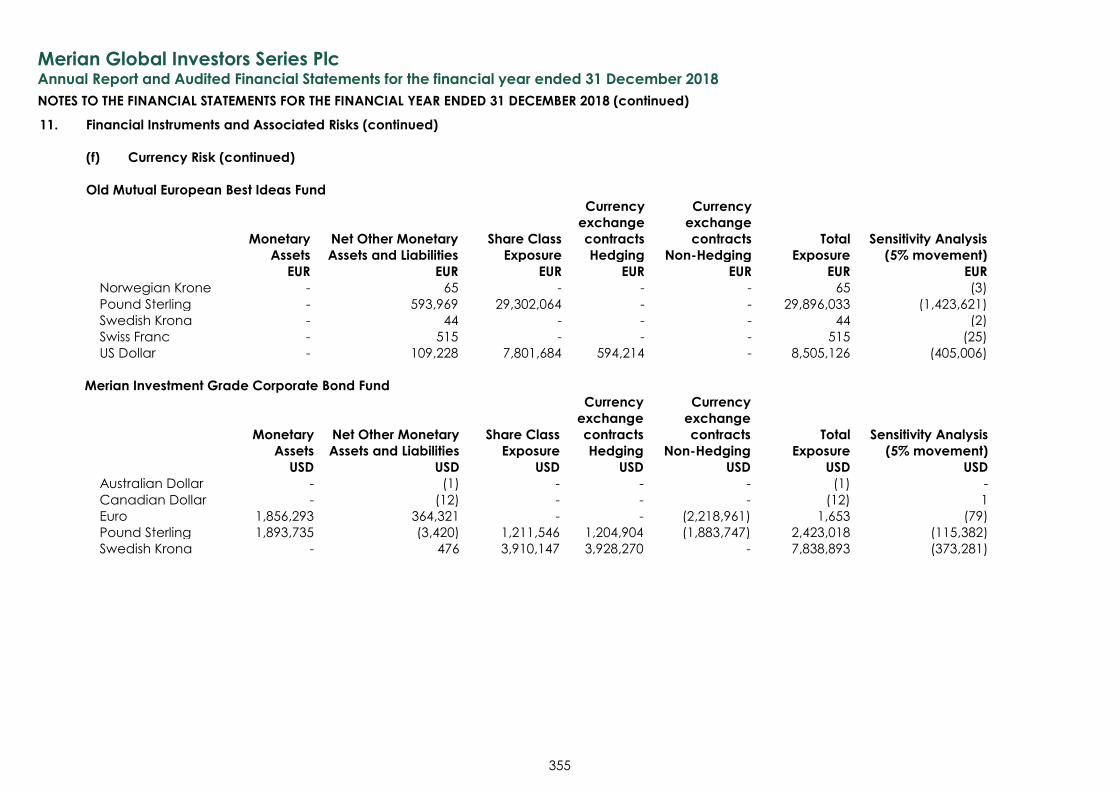
Merian Global Investors Series Plc
Annual Report and Audited Financial Statements for the financial year ended 31 December 2018
NOTES TO THE FINANCIAL STATEMENTS FOR THE FINANCIAL YEAR ENDED 31 DECEMBER 2018 (continued)
355
11. Financial Instruments and Associated Risks (continued)
(f) Currency Risk (continued)
Old Mutual European Best Ideas Fund
Monetary
Assets
Net Other Monetary
Assets and Liabilities
Share Class
Exposure
Currency
exchange
contracts
Hedging
Currency
exchange
contracts
Non-Hedging
Total
Exposure
Sensitivity Analysis
(5% movement)
EUR EUR EUR EUR EUR EUR EUR Norwegian Krone - 65 - - - 65 (3)
Pound Sterling - 593,969 29,302,064 - - 29,896,033 (1,423,621)
Swedish Krona - 44 - - - 44 (2)
Swiss Franc - 515 - - - 515 (25)
US Dollar - 109,228 7,801,684 594,214 - 8,505,126 (405,006)
Merian Investment Grade Corporate Bond Fund
Monetary
Assets
Net Other Monetary
Assets and Liabilities
Share Class
Exposure
Currency
exchange
contracts
Hedging
Currency
exchange
contracts
Non-Hedging
Total
Exposure
Sensitivity Analysis
(5% movement)
USD USD USD USD USD USD USD
Australian Dollar - (1) - - - (1) -
Canadian Dollar - (12) - - - (12) 1
Euro 1,856,293 364,321 - - (2,218,961) 1,653 (79)
Pound Sterling 1,893,735 (3,420) 1,211,546 1,204,904 (1,883,747) 2,423,018 (115,382)
Swedish Krona - 476 3,910,147 3,928,270 - 7,838,893 (373,281)
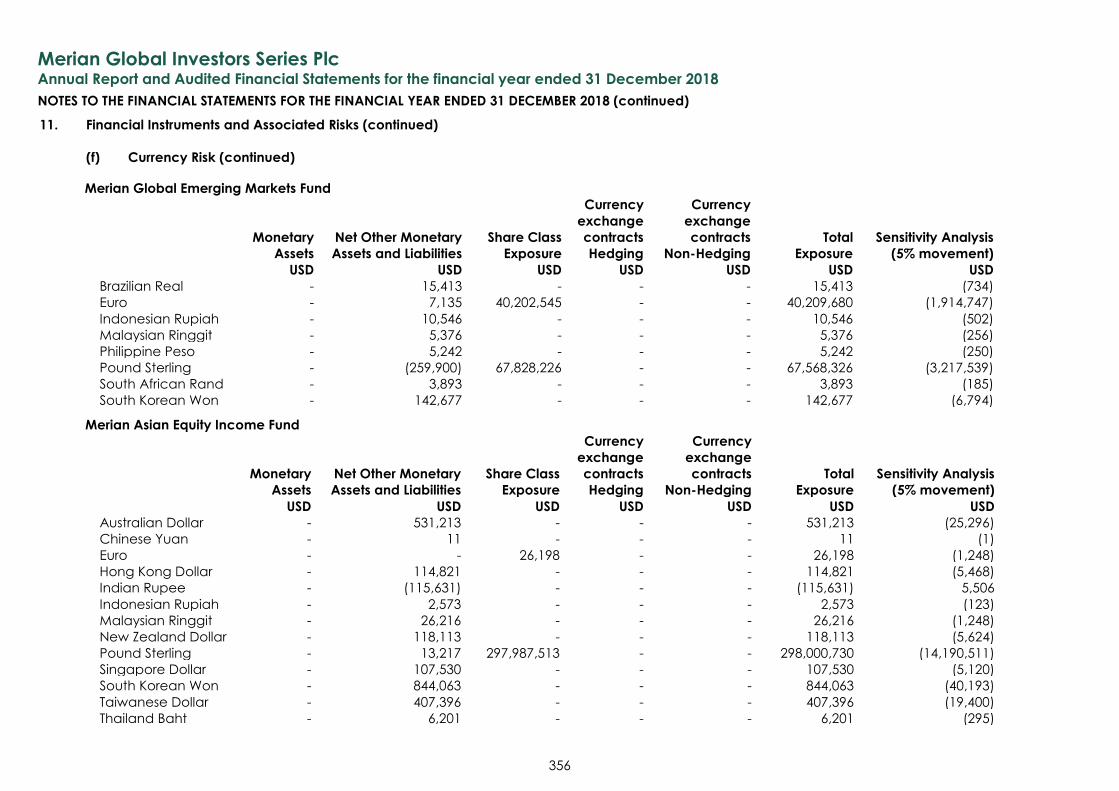
Merian Global Investors Series Plc
Annual Report and Audited Financial Statements for the financial year ended 31 December 2018
NOTES TO THE FINANCIAL STATEMENTS FOR THE FINANCIAL YEAR ENDED 31 DECEMBER 2018 (continued)
356
11. Financial Instruments and Associated Risks (continued)
(f) Currency Risk (continued)
Merian Global Emerging Markets Fund
Monetary
Assets
Net Other Monetary
Assets and Liabilities
Share Class
Exposure
Currency
exchange
contracts
Hedging
Currency
exchange
contracts
Non-Hedging
Total
Exposure
Sensitivity Analysis
(5% movement)
USD USD USD USD USD USD USD
Brazilian Real - 15,413 - - - 15,413 (734)
Euro - 7,135 40,202,545 - - 40,209,680 (1,914,747)
Indonesian Rupiah - 10,546 - - - 10,546 (502)
Malaysian Ringgit - 5,376 - - - 5,376 (256)
Philippine Peso - 5,242 - - - 5,242 (250)
Pound Sterling - (259,900) 67,828,226 - - 67,568,326 (3,217,539)
South African Rand - 3,893 - - - 3,893 (185)
South Korean Won - 142,677 - - - 142,677 (6,794)
Merian Asian Equity Income Fund
Monetary
Assets
Net Other Monetary
Assets and Liabilities
Share Class
Exposure
Currency
exchange
contracts
Hedging
Currency
exchange
contracts
Non-Hedging
Total
Exposure
Sensitivity Analysis
(5% movement)
USD USD USD USD USD USD USD
Australian Dollar - 531,213 - - - 531,213 (25,296)
Chinese Yuan - 11 - - - 11 (1)
Euro - - 26,198 - - 26,198 (1,248)
Hong Kong Dollar - 114,821 - - - 114,821 (5,468)
Indian Rupee - (115,631) - - - (115,631) 5,506
Indonesian Rupiah - 2,573 - - - 2,573 (123)
Malaysian Ringgit - 26,216 - - - 26,216 (1,248)
New Zealand Dollar - 118,113 - - - 118,113 (5,624)
Pound Sterling - 13,217 297,987,513 - - 298,000,730 (14,190,511)
Singapore Dollar - 107,530 - - - 107,530 (5,120)
South Korean Won - 844,063 - - - 844,063 (40,193)
Taiwanese Dollar - 407,396 - - - 407,396 (19,400)
Thailand Baht - 6,201 - - - 6,201 (295)
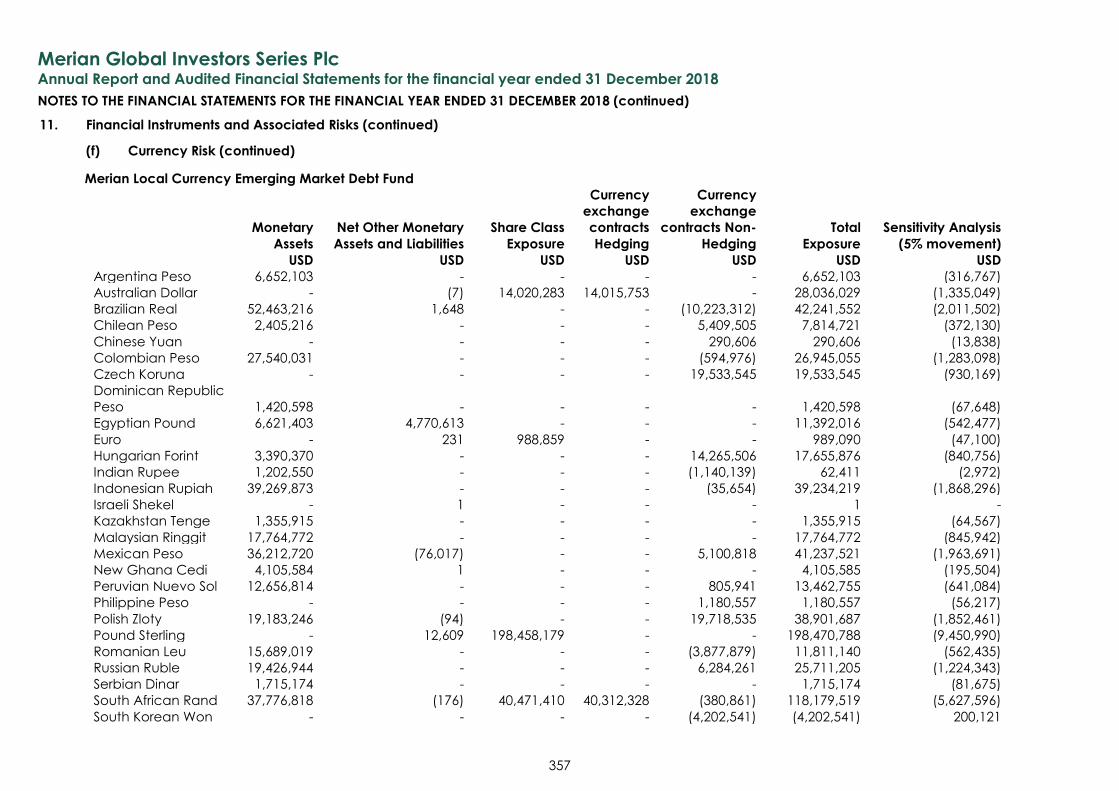
Merian Global Investors Series Plc
Annual Report and Audited Financial Statements for the financial year ended 31 December 2018
NOTES TO THE FINANCIAL STATEMENTS FOR THE FINANCIAL YEAR ENDED 31 DECEMBER 2018 (continued)
357
11. Financial Instruments and Associated Risks (continued)
(f) Currency Risk (continued)
Merian Local Currency Emerging Market Debt Fund
Monetary
Assets
Net Other Monetary
Assets and Liabilities
Share Class
Exposure
Currency
exchange
contracts
Hedging
Currency
exchange
contracts Non-
Hedging
Total
Exposure
Sensitivity Analysis
(5% movement)
USD USD USD USD USD USD USD
Argentina Peso 6,652,103 - - - - 6,652,103 (316,767)
Australian Dollar - (7) 14,020,283 14,015,753 - 28,036,029 (1,335,049)
Brazilian Real 52,463,216 1,648 - - (10,223,312) 42,241,552 (2,011,502)
Chilean Peso 2,405,216 - - - 5,409,505 7,814,721 (372,130)
Chinese Yuan - - - - 290,606 290,606 (13,838)
Colombian Peso 27,540,031 - - - (594,976) 26,945,055 (1,283,098)
Czech Koruna - - - - 19,533,545 19,533,545 (930,169)
Dominican Republic
Peso 1,420,598 - - - - 1,420,598 (67,648)
Egyptian Pound 6,621,403 4,770,613 - - - 11,392,016 (542,477)
Euro - 231 988,859 - - 989,090 (47,100)
Hungarian Forint 3,390,370 - - - 14,265,506 17,655,876 (840,756)
Indian Rupee 1,202,550 - - - (1,140,139) 62,411 (2,972)
Indonesian Rupiah 39,269,873 - - - (35,654) 39,234,219 (1,868,296)
Israeli Shekel - 1 - - - 1 -
Kazakhstan Tenge 1,355,915 - - - - 1,355,915 (64,567)
Malaysian Ringgit 17,764,772 - - - - 17,764,772 (845,942)
Mexican Peso 36,212,720 (76,017) - - 5,100,818 41,237,521 (1,963,691)
New Ghana Cedi 4,105,584 1 - - - 4,105,585 (195,504)
Peruvian Nuevo Sol 12,656,814 - - - 805,941 13,462,755 (641,084)
Philippine Peso - - - - 1,180,557 1,180,557 (56,217)
Polish Zloty 19,183,246 (94) - - 19,718,535 38,901,687 (1,852,461)
Pound Sterling - 12,609 198,458,179 - - 198,470,788 (9,450,990)
Romanian Leu 15,689,019 - - - (3,877,879) 11,811,140 (562,435)
Russian Ruble 19,426,944 - - - 6,284,261 25,711,205 (1,224,343)
Serbian Dinar 1,715,174 - - - - 1,715,174 (81,675)
South African Rand 37,776,818 (176) 40,471,410 40,312,328 (380,861) 118,179,519 (5,627,596)
South Korean Won - - - - (4,202,541) (4,202,541) 200,121
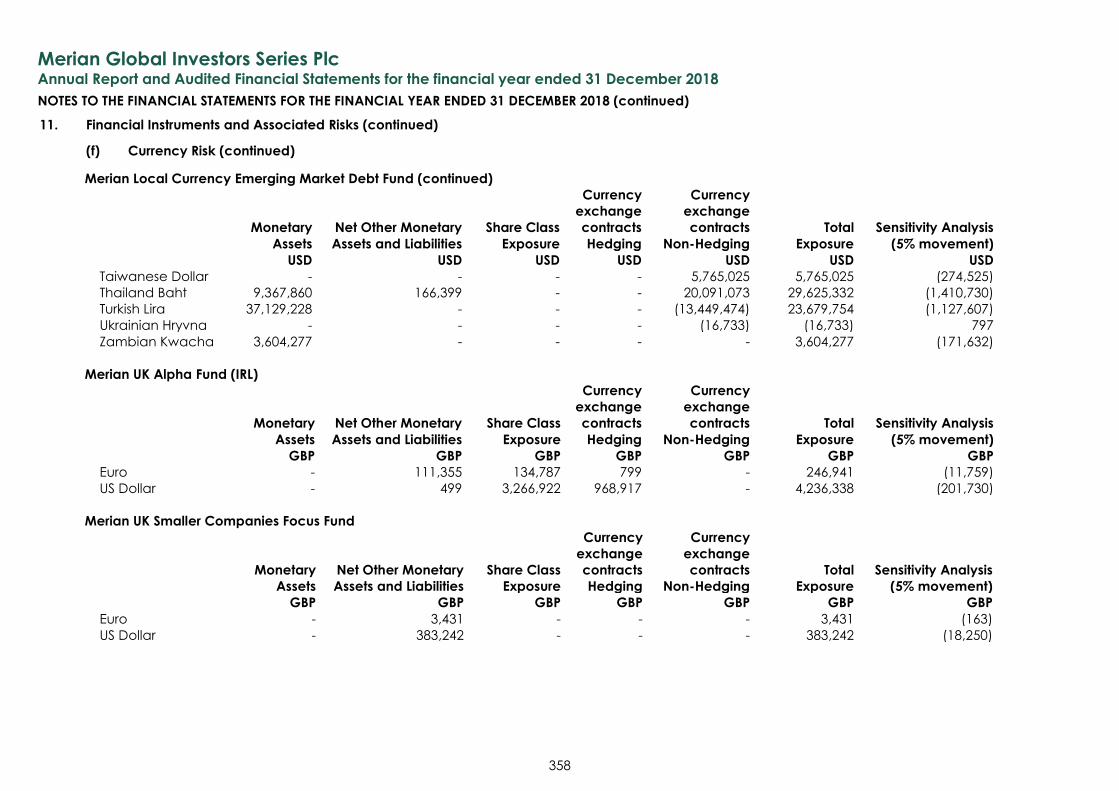
Merian Global Investors Series Plc
Annual Report and Audited Financial Statements for the financial year ended 31 December 2018
NOTES TO THE FINANCIAL STATEMENTS FOR THE FINANCIAL YEAR ENDED 31 DECEMBER 2018 (continued)
358
11. Financial Instruments and Associated Risks (continued)
(f) Currency Risk (continued)
Merian Local Currency Emerging Market Debt Fund (continued)
Monetary
Assets
Net Other Monetary
Assets and Liabilities
Share Class
Exposure
Currency
exchange
contracts
Hedging
Currency
exchange
contracts
Non-Hedging
Total
Exposure
Sensitivity Analysis
(5% movement)
USD USD USD USD USD USD USD
Taiwanese Dollar - - - - 5,765,025 5,765,025 (274,525)
Thailand Baht 9,367,860 166,399 - - 20,091,073 29,625,332 (1,410,730)
Turkish Lira 37,129,228 - - - (13,449,474) 23,679,754 (1,127,607)
Ukrainian Hryvna - - - - (16,733) (16,733) 797
Zambian Kwacha 3,604,277 - - - - 3,604,277 (171,632)
Merian UK Alpha Fund (IRL)
Monetary
Assets
Net Other Monetary
Assets and Liabilities
Share Class
Exposure
Currency
exchange
contracts
Hedging
Currency
exchange
contracts
Non-Hedging
Total
Exposure
Sensitivity Analysis
(5% movement)
GBP GBP GBP GBP GBP GBP GBP
Euro - 111,355 134,787 799 - 246,941 (11,759)
US Dollar - 499 3,266,922 968,917 - 4,236,338 (201,730)
Merian UK Smaller Companies Focus Fund
Monetary
Assets
Net Other Monetary
Assets and Liabilities
Share Class
Exposure
Currency
exchange
contracts
Hedging
Currency
exchange
contracts
Non-Hedging
Total
Exposure
Sensitivity Analysis
(5% movement)
GBP GBP GBP GBP GBP GBP GBP
Euro - 3,431 - - - 3,431 (163)
US Dollar - 383,242 - - - 383,242 (18,250)
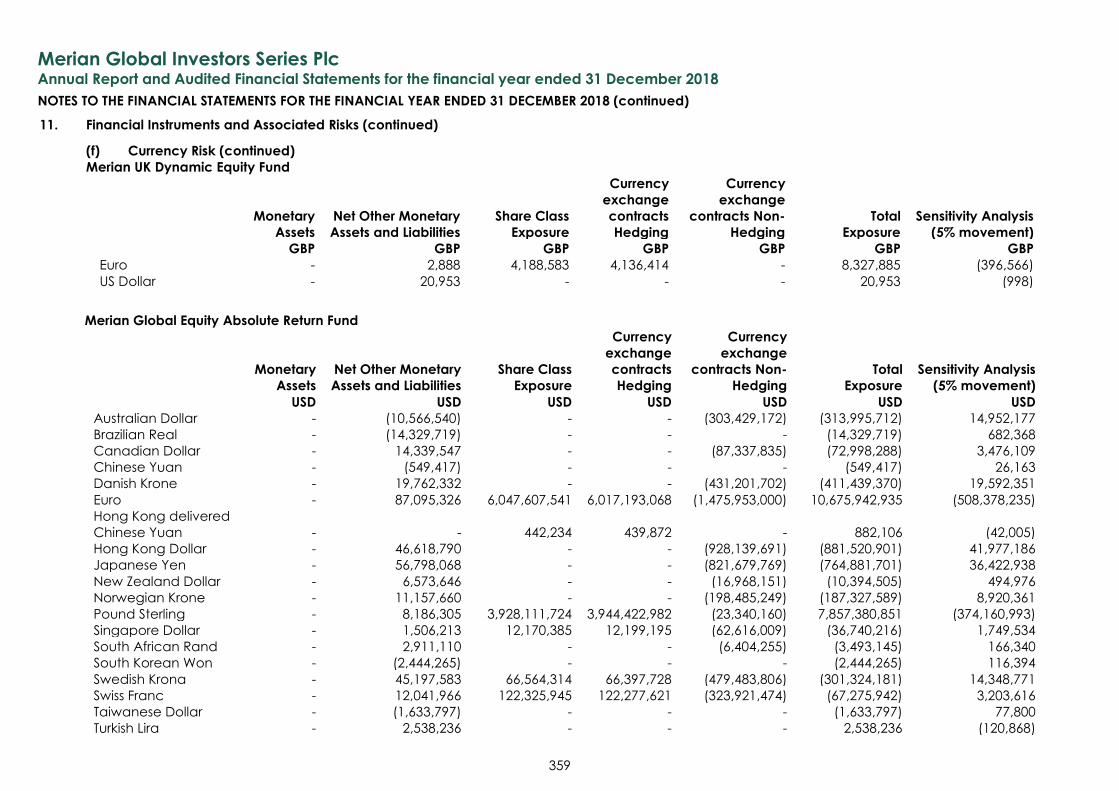
Merian Global Investors Series Plc
Annual Report and Audited Financial Statements for the financial year ended 31 December 2018
NOTES TO THE FINANCIAL STATEMENTS FOR THE FINANCIAL YEAR ENDED 31 DECEMBER 2018 (continued)
359
11. Financial Instruments and Associated Risks (continued)
(f) Currency Risk (continued)
Merian UK Dynamic Equity Fund
Monetary
Assets
Net Other Monetary
Assets and Liabilities
Share Class
Exposure
Currency
exchange
contracts
Hedging
Currency
exchange
contracts Non-
Hedging
Total
Exposure
Sensitivity Analysis
(5% movement)
GBP GBP GBP GBP GBP GBP GBP
Euro - 2,888 4,188,583 4,136,414 - 8,327,885 (396,566)
US Dollar - 20,953 - - - 20,953 (998)
Merian Global Equity Absolute Return Fund
Monetary
Assets
Net Other Monetary
Assets and Liabilities
Share Class
Exposure
Currency
exchange
contracts
Hedging
Currency
exchange
contracts Non-
Hedging
Total
Exposure
Sensitivity Analysis
(5% movement)
USD USD USD USD USD USD USD
Australian Dollar - (10,566,540) - - (303,429,172) (313,995,712) 14,952,177
Brazilian Real - (14,329,719) - - - (14,329,719) 682,368
Canadian Dollar - 14,339,547 - - (87,337,835) (72,998,288) 3,476,109
Chinese Yuan - (549,417) - - - (549,417) 26,163
Danish Krone - 19,762,332 - - (431,201,702) (411,439,370) 19,592,351
Euro - 87,095,326 6,047,607,541 6,017,193,068 (1,475,953,000) 10,675,942,935 (508,378,235)
Hong Kong delivered
Chinese Yuan - - 442,234 439,872 - 882,106 (42,005)
Hong Kong Dollar - 46,618,790 - - (928,139,691) (881,520,901) 41,977,186
Japanese Yen - 56,798,068 - - (821,679,769) (764,881,701) 36,422,938
New Zealand Dollar - 6,573,646 - - (16,968,151) (10,394,505) 494,976
Norwegian Krone - 11,157,660 - - (198,485,249) (187,327,589) 8,920,361
Pound Sterling - 8,186,305 3,928,111,724 3,944,422,982 (23,340,160) 7,857,380,851 (374,160,993)
Singapore Dollar - 1,506,213 12,170,385 12,199,195 (62,616,009) (36,740,216) 1,749,534
South African Rand - 2,911,110 - - (6,404,255) (3,493,145) 166,340
South Korean Won - (2,444,265) - - - (2,444,265) 116,394
Swedish Krona - 45,197,583 66,564,314 66,397,728 (479,483,806) (301,324,181) 14,348,771
Swiss Franc - 12,041,966 122,325,945 122,277,621 (323,921,474) (67,275,942) 3,203,616
Taiwanese Dollar - (1,633,797) - - - (1,633,797) 77,800
Turkish Lira - 2,538,236 - - - 2,538,236 (120,868)
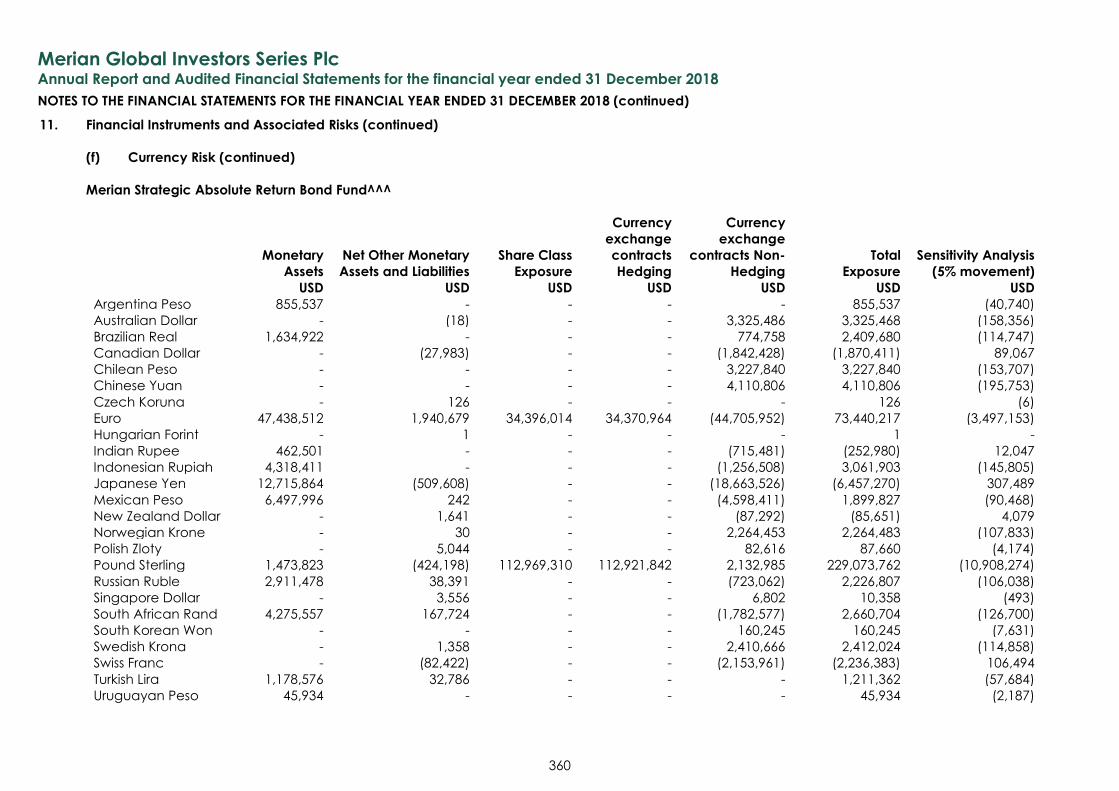
Merian Global Investors Series Plc
Annual Report and Audited Financial Statements for the financial year ended 31 December 2018
NOTES TO THE FINANCIAL STATEMENTS FOR THE FINANCIAL YEAR ENDED 31 DECEMBER 2018 (continued)
360
11. Financial Instruments and Associated Risks (continued)
(f) Currency Risk (continued)
Merian Strategic Absolute Return Bond Fund^^^
Monetary
Assets
Net Other Monetary
Assets and Liabilities
Share Class
Exposure
Currency
exchange
contracts
Hedging
Currency
exchange
contracts Non-
Hedging
Total
Exposure
Sensitivity Analysis
(5% movement)
USD USD USD USD USD USD USD
Argentina Peso 855,537 - - - - 855,537 (40,740)
Australian Dollar - (18) - - 3,325,486 3,325,468 (158,356)
Brazilian Real 1,634,922 - - - 774,758 2,409,680 (114,747)
Canadian Dollar - (27,983) - - (1,842,428) (1,870,411) 89,067
Chilean Peso - - - - 3,227,840 3,227,840 (153,707)
Chinese Yuan - - - - 4,110,806 4,110,806 (195,753)
Czech Koruna - 126 - - - 126 (6)
Euro 47,438,512 1,940,679 34,396,014 34,370,964 (44,705,952) 73,440,217 (3,497,153)
Hungarian Forint - 1 - - - 1 -
Indian Rupee 462,501 - - - (715,481) (252,980) 12,047
Indonesian Rupiah 4,318,411 - - - (1,256,508) 3,061,903 (145,805)
Japanese Yen 12,715,864 (509,608) - - (18,663,526) (6,457,270) 307,489
Mexican Peso 6,497,996 242 - - (4,598,411) 1,899,827 (90,468)
New Zealand Dollar - 1,641 - - (87,292) (85,651) 4,079
Norwegian Krone - 30 - - 2,264,453 2,264,483 (107,833)
Polish Zloty - 5,044 - - 82,616 87,660 (4,174)
Pound Sterling 1,473,823 (424,198) 112,969,310 112,921,842 2,132,985 229,073,762 (10,908,274)
Russian Ruble 2,911,478 38,391 - - (723,062) 2,226,807 (106,038)
Singapore Dollar - 3,556 - - 6,802 10,358 (493)
South African Rand 4,275,557 167,724 - - (1,782,577) 2,660,704 (126,700)
South Korean Won - - - - 160,245 160,245 (7,631)
Swedish Krona - 1,358 - - 2,410,666 2,412,024 (114,858)
Swiss Franc - (82,422) - - (2,153,961) (2,236,383) 106,494
Turkish Lira 1,178,576 32,786 - - - 1,211,362 (57,684)
Uruguayan Peso 45,934 - - - - 45,934 (2,187)
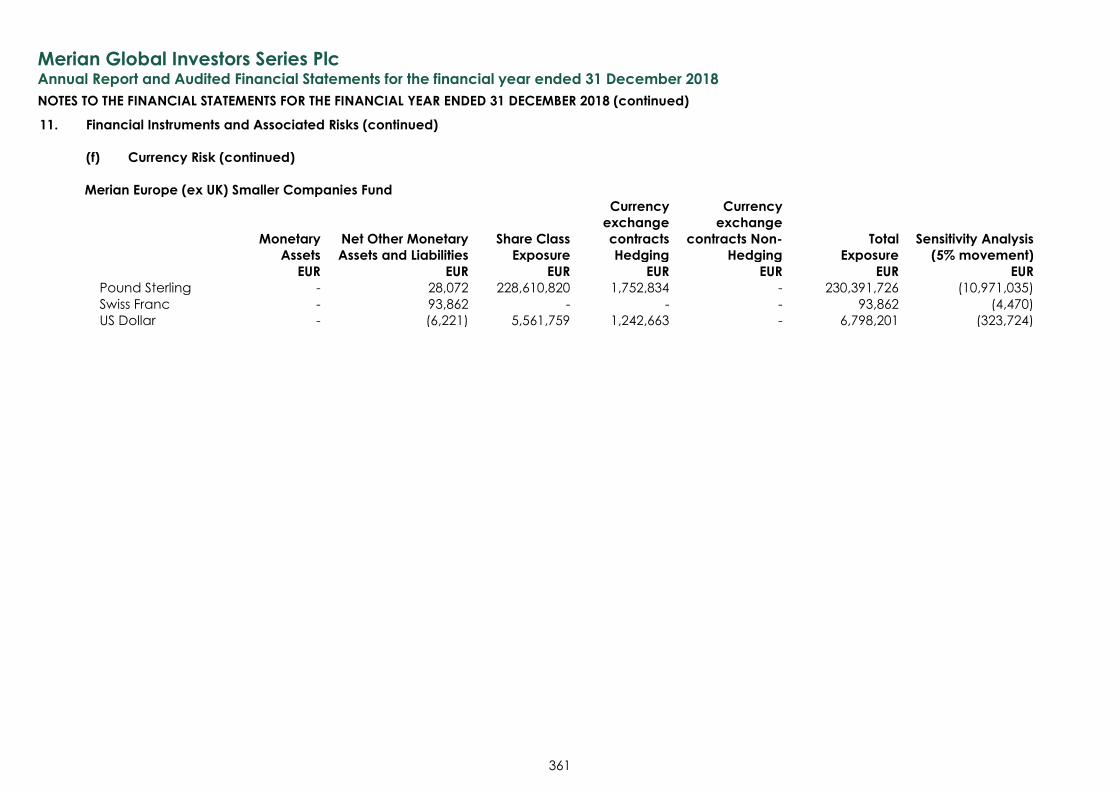
Merian Global Investors Series Plc
Annual Report and Audited Financial Statements for the financial year ended 31 December 2018
NOTES TO THE FINANCIAL STATEMENTS FOR THE FINANCIAL YEAR ENDED 31 DECEMBER 2018 (continued)
361
11. Financial Instruments and Associated Risks (continued)
(f) Currency Risk (continued)
Merian Europe (ex UK) Smaller Companies Fund
Monetary
Assets
Net Other Monetary
Assets and Liabilities
Share Class
Exposure
Currency
exchange
contracts
Hedging
Currency
exchange
contracts Non-
Hedging
Total
Exposure
Sensitivity Analysis
(5% movement)
EUR EUR EUR EUR EUR EUR EUR
Pound Sterling - 28,072 228,610,820 1,752,834 - 230,391,726 (10,971,035)
Swiss Franc - 93,862 - - - 93,862 (4,470)
US Dollar - (6,221) 5,561,759 1,242,663 - 6,798,201 (323,724)
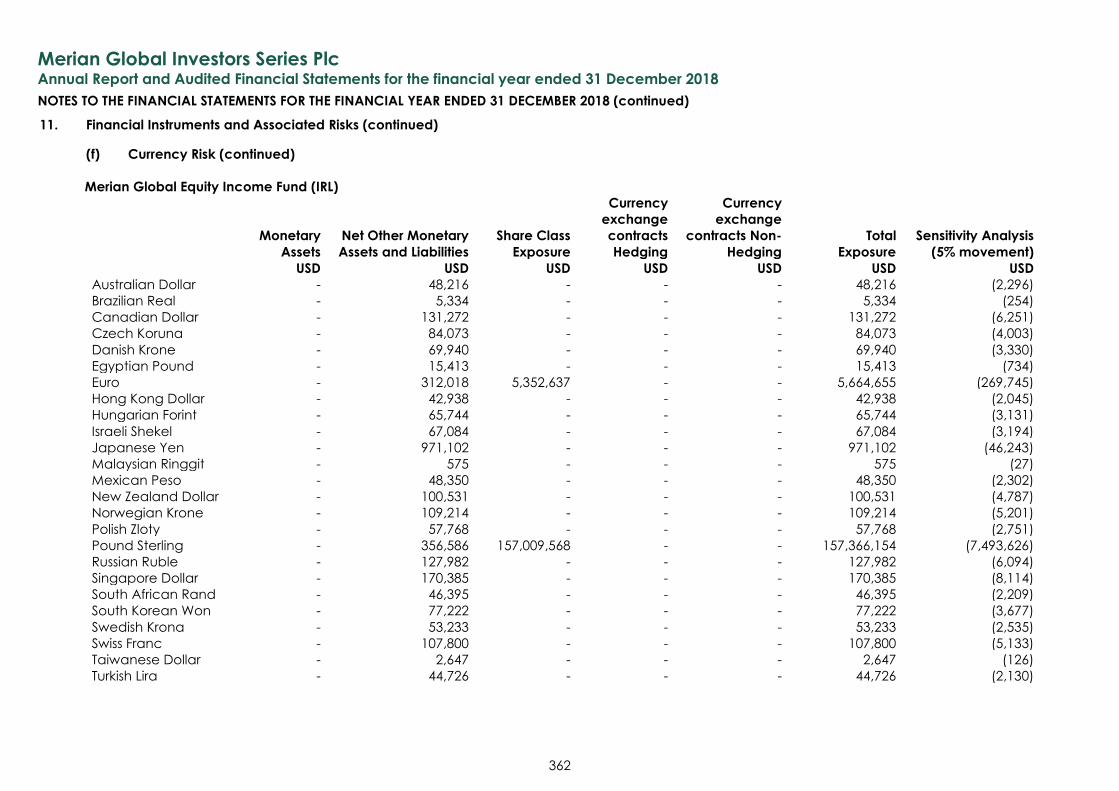
Merian Global Investors Series Plc
Annual Report and Audited Financial Statements for the financial year ended 31 December 2018
NOTES TO THE FINANCIAL STATEMENTS FOR THE FINANCIAL YEAR ENDED 31 DECEMBER 2018 (continued)
362
11. Financial Instruments and Associated Risks (continued)
(f) Currency Risk (continued)
Merian Global Equity Income Fund (IRL)
Monetary
Assets
Net Other Monetary
Assets and Liabilities
Share Class
Exposure
Currency
exchange
contracts
Hedging
Currency
exchange
contracts Non-
Hedging
Total
Exposure
Sensitivity Analysis
(5% movement)
USD USD USD USD USD USD USD
Australian Dollar - 48,216 - - - 48,216 (2,296)
Brazilian Real - 5,334 - - - 5,334 (254)
Canadian Dollar - 131,272 - - - 131,272 (6,251)
Czech Koruna - 84,073 - - - 84,073 (4,003)
Danish Krone - 69,940 - - - 69,940 (3,330)
Egyptian Pound - 15,413 - - - 15,413 (734)
Euro - 312,018 5,352,637 - - 5,664,655 (269,745)
Hong Kong Dollar - 42,938 - - - 42,938 (2,045)
Hungarian Forint - 65,744 - - - 65,744 (3,131)
Israeli Shekel - 67,084 - - - 67,084 (3,194)
Japanese Yen - 971,102 - - - 971,102 (46,243)
Malaysian Ringgit - 575 - - - 575 (27)
Mexican Peso - 48,350 - - - 48,350 (2,302)
New Zealand Dollar - 100,531 - - - 100,531 (4,787)
Norwegian Krone - 109,214 - - - 109,214 (5,201)
Polish Zloty - 57,768 - - - 57,768 (2,751)
Pound Sterling - 356,586 157,009,568 - - 157,366,154 (7,493,626)
Russian Ruble - 127,982 - - - 127,982 (6,094)
Singapore Dollar - 170,385 - - - 170,385 (8,114)
South African Rand - 46,395 - - - 46,395 (2,209)
South Korean Won - 77,222 - - - 77,222 (3,677)
Swedish Krona - 53,233 - - - 53,233 (2,535)
Swiss Franc - 107,800 - - - 107,800 (5,133)
Taiwanese Dollar - 2,647 - - - 2,647 (126)
Turkish Lira - 44,726 - - - 44,726 (2,130)
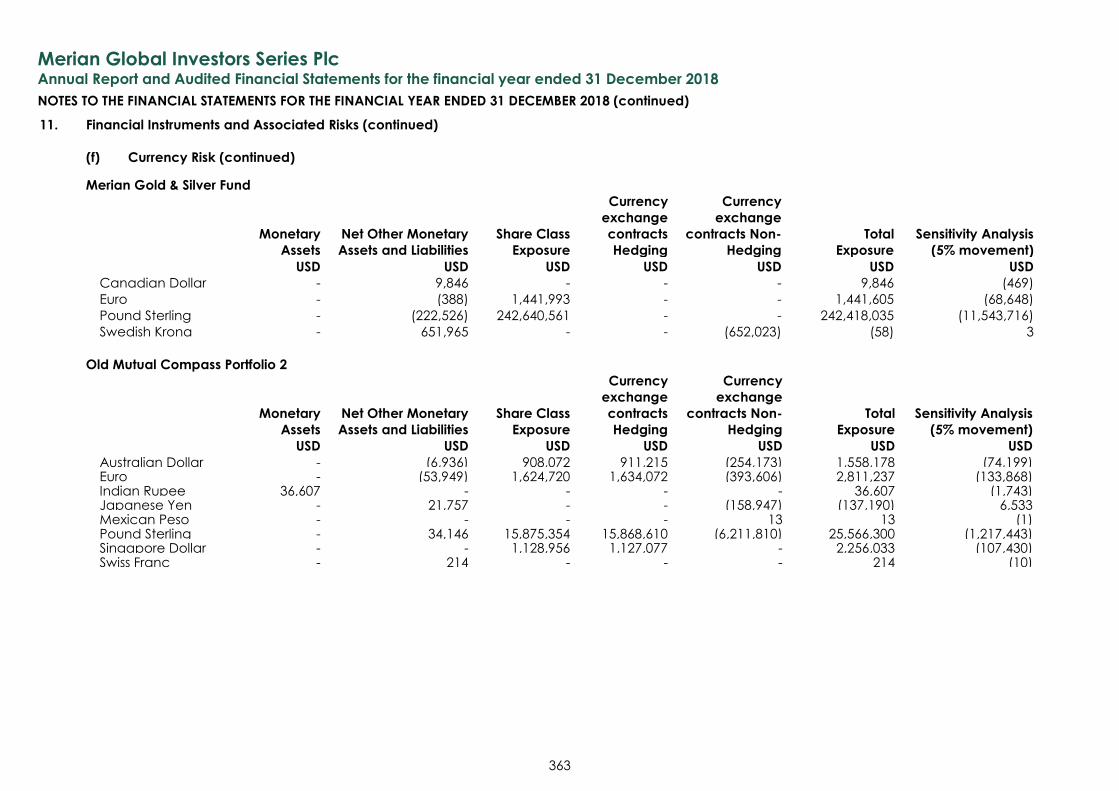
Merian Global Investors Series Plc
Annual Report and Audited Financial Statements for the financial year ended 31 December 2018
NOTES TO THE FINANCIAL STATEMENTS FOR THE FINANCIAL YEAR ENDED 31 DECEMBER 2018 (continued)
363
11. Financial Instruments and Associated Risks (continued)
(f) Currency Risk (continued)
Merian Gold & Silver Fund
Monetary
Assets
Net Other Monetary
Assets and Liabilities
Share Class
Exposure
Currency
exchange
contracts
Hedging
Currency
exchange
contracts Non-
Hedging
Total
Exposure
Sensitivity Analysis
(5% movement)
USD USD USD USD USD USD USD
Canadian Dollar - 9,846 - - - 9,846 (469)
Euro - (388) 1,441,993 - - 1,441,605 (68,648)
Pound Sterling - (222,526) 242,640,561 - - 242,418,035 (11,543,716)
Swedish Krona - 651,965 - - (652,023) (58) 3
Old Mutual Compass Portfolio 2
Monetary
Assets
Net Other Monetary
Assets and Liabilities
Share Class
Exposure
Currency
exchange
contracts
Hedging
Currency
exchange
contracts Non-
Hedging
Total
Exposure
Sensitivity Analysis
(5% movement)
USD USD USD USD USD USD USD
Australian Dollar - (6,936) 908,072 911,215 (254,173) 1,558,178 (74,199) Euro - (53,949) 1,624,720 1,634,072 (393,606) 2,811,237 (133,868) Indian Rupee 36,607 - - - - 36,607 (1,743) Japanese Yen - 21,757 - - (158,947) (137,190) 6,533 Mexican Peso - - - - 13 13 (1) Pound Sterling - 34,146 15,875,354 15,868,610 (6,211,810) 25,566,300 (1,217,443) Singapore Dollar - - 1,128,956 1,127,077 - 2,256,033 (107,430) Swiss Franc - 214 - - - 214 (10)
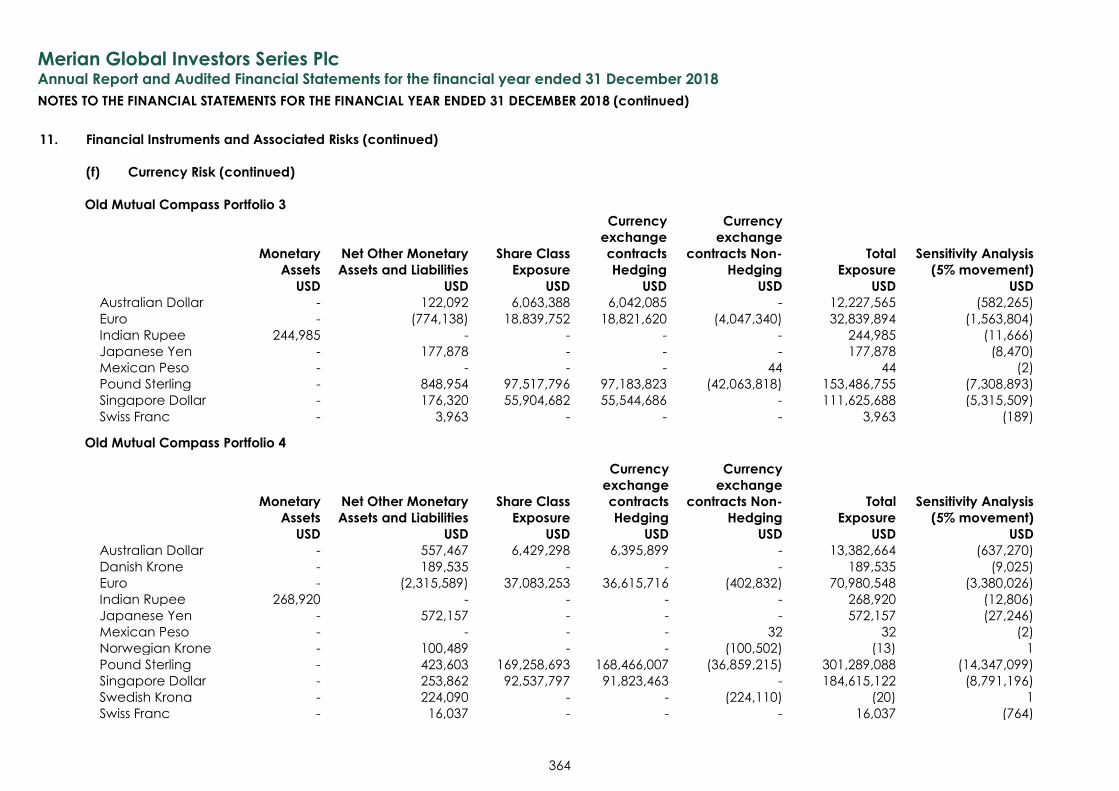
Merian Global Investors Series Plc
Annual Report and Audited Financial Statements for the financial year ended 31 December 2018
NOTES TO THE FINANCIAL STATEMENTS FOR THE FINANCIAL YEAR ENDED 31 DECEMBER 2018 (continued)
364
11. Financial Instruments and Associated Risks (continued)
(f) Currency Risk (continued)
Old Mutual Compass Portfolio 3
Monetary
Assets
Net Other Monetary
Assets and Liabilities
Share Class
Exposure
Currency
exchange
contracts
Hedging
Currency
exchange
contracts Non-
Hedging
Total
Exposure
Sensitivity Analysis
(5% movement)
USD USD USD USD USD USD USD
Australian Dollar - 122,092 6,063,388 6,042,085 - 12,227,565 (582,265)
Euro - (774,138) 18,839,752 18,821,620 (4,047,340) 32,839,894 (1,563,804)
Indian Rupee 244,985 - - - - 244,985 (11,666)
Japanese Yen - 177,878 - - - 177,878 (8,470)
Mexican Peso - - - - 44 44 (2)
Pound Sterling - 848,954 97,517,796 97,183,823 (42,063,818) 153,486,755 (7,308,893)
Singapore Dollar - 176,320 55,904,682 55,544,686 - 111,625,688 (5,315,509)
Swiss Franc - 3,963 - - - 3,963 (189)
Old Mutual Compass Portfolio 4
Monetary
Assets
Net Other Monetary
Assets and Liabilities
Share Class
Exposure
Currency
exchange
contracts
Hedging
Currency
exchange
contracts Non-
Hedging
Total
Exposure
Sensitivity Analysis
(5% movement)
USD USD USD USD USD USD USD
Australian Dollar - 557,467 6,429,298 6,395,899 - 13,382,664 (637,270)
Danish Krone - 189,535 - - - 189,535 (9,025)
Euro - (2,315,589) 37,083,253 36,615,716 (402,832) 70,980,548 (3,380,026)
Indian Rupee 268,920 - - - - 268,920 (12,806)
Japanese Yen - 572,157 - - - 572,157 (27,246)
Mexican Peso - - - - 32 32 (2)
Norwegian Krone - 100,489 - - (100,502) (13) 1
Pound Sterling - 423,603 169,258,693 168,466,007 (36,859,215) 301,289,088 (14,347,099)
Singapore Dollar - 253,862 92,537,797 91,823,463 - 184,615,122 (8,791,196)
Swedish Krona - 224,090 - - (224,110) (20) 1
Swiss Franc - 16,037 - - - 16,037 (764)
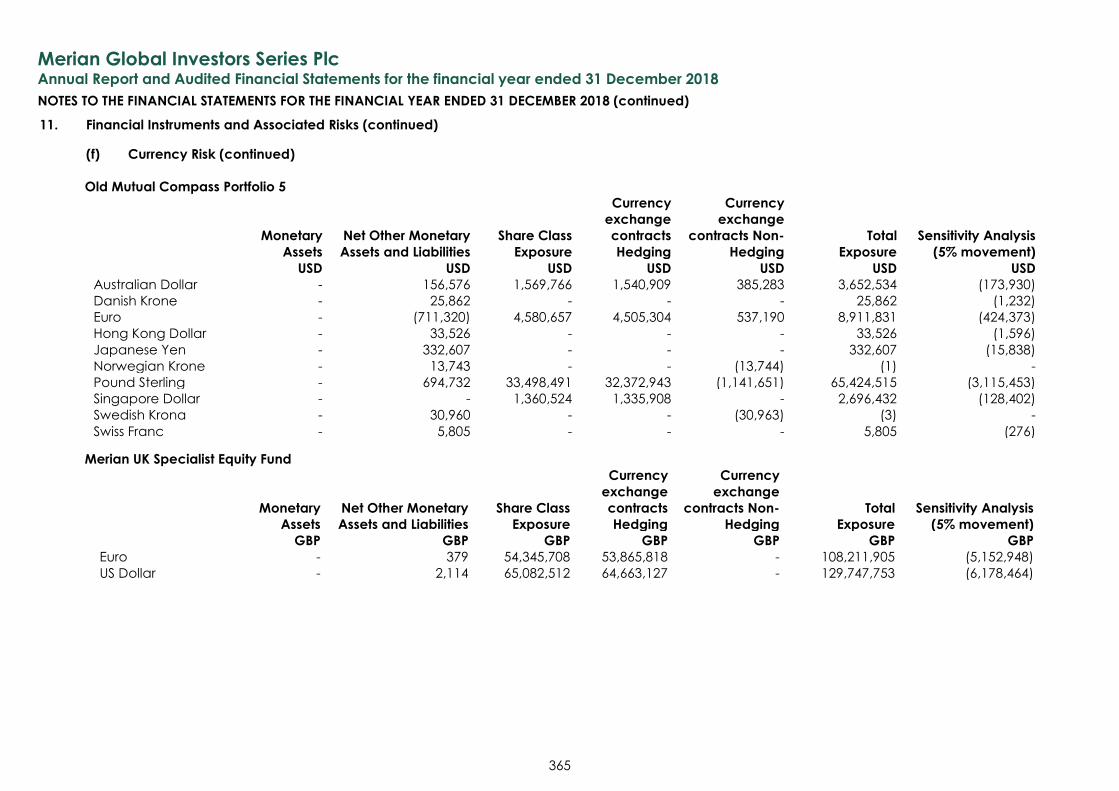
Merian Global Investors Series Plc
Annual Report and Audited Financial Statements for the financial year ended 31 December 2018
NOTES TO THE FINANCIAL STATEMENTS FOR THE FINANCIAL YEAR ENDED 31 DECEMBER 2018 (continued)
365
11. Financial Instruments and Associated Risks (continued)
(f) Currency Risk (continued)
Old Mutual Compass Portfolio 5
Monetary
Assets
Net Other Monetary
Assets and Liabilities
Share Class
Exposure
Currency
exchange
contracts
Hedging
Currency
exchange
contracts Non-
Hedging
Total
Exposure
Sensitivity Analysis
(5% movement)
USD USD USD USD USD USD USD
Australian Dollar - 156,576 1,569,766 1,540,909 385,283 3,652,534 (173,930)
Danish Krone - 25,862 - - - 25,862 (1,232)
Euro - (711,320) 4,580,657 4,505,304 537,190 8,911,831 (424,373)
Hong Kong Dollar - 33,526 - - - 33,526 (1,596)
Japanese Yen - 332,607 - - - 332,607 (15,838)
Norwegian Krone - 13,743 - - (13,744) (1) -
Pound Sterling - 694,732 33,498,491 32,372,943 (1,141,651) 65,424,515 (3,115,453)
Singapore Dollar - - 1,360,524 1,335,908 - 2,696,432 (128,402)
Swedish Krona - 30,960 - - (30,963) (3) -
Swiss Franc - 5,805 - - - 5,805 (276)
Merian UK Specialist Equity Fund
Monetary
Assets
Net Other Monetary
Assets and Liabilities
Share Class
Exposure
Currency
exchange
contracts
Hedging
Currency
exchange
contracts Non-
Hedging
Total
Exposure
Sensitivity Analysis
(5% movement)
GBP GBP GBP GBP GBP GBP GBP
Euro - 379 54,345,708 53,865,818 - 108,211,905 (5,152,948)
US Dollar - 2,114 65,082,512 64,663,127 - 129,747,753 (6,178,464)
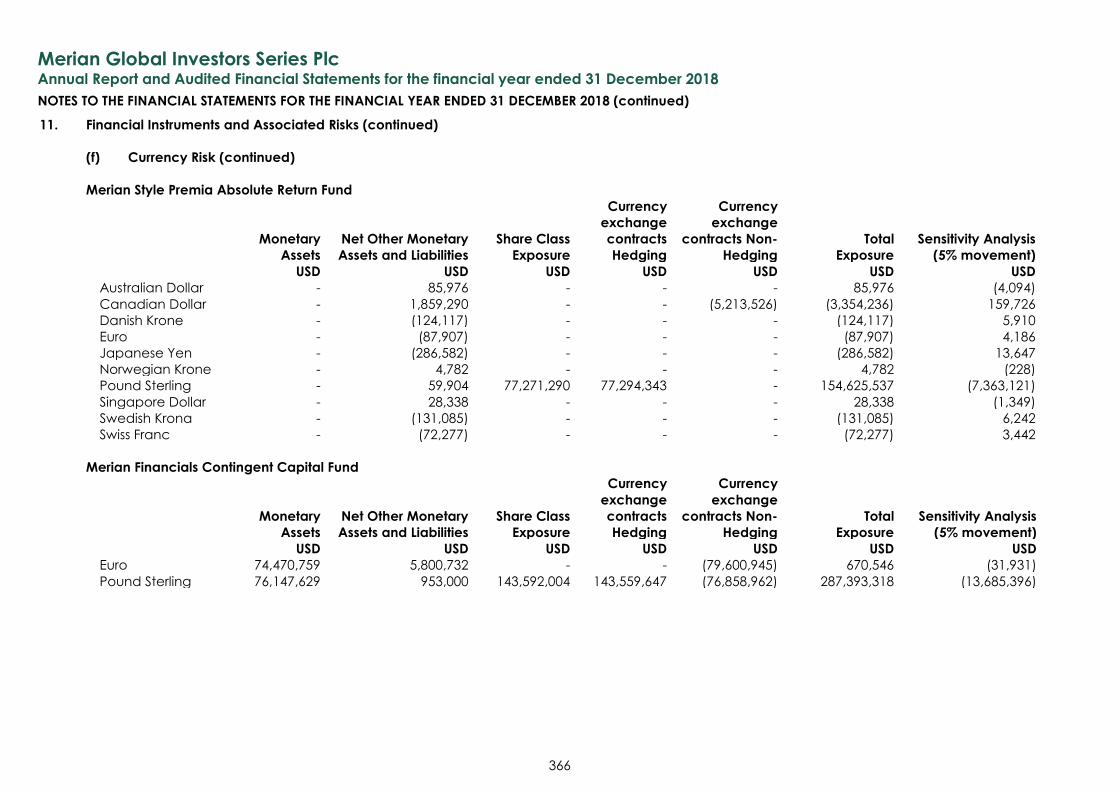
Merian Global Investors Series Plc
Annual Report and Audited Financial Statements for the financial year ended 31 December 2018
NOTES TO THE FINANCIAL STATEMENTS FOR THE FINANCIAL YEAR ENDED 31 DECEMBER 2018 (continued)
366
11. Financial Instruments and Associated Risks (continued)
(f) Currency Risk (continued)
Merian Style Premia Absolute Return Fund
Monetary
Assets
Net Other Monetary
Assets and Liabilities
Share Class
Exposure
Currency
exchange
contracts
Hedging
Currency
exchange
contracts Non-
Hedging
Total
Exposure
Sensitivity Analysis
(5% movement)
USD USD USD USD USD USD USD
Australian Dollar - 85,976 - - - 85,976 (4,094)
Canadian Dollar - 1,859,290 - - (5,213,526) (3,354,236) 159,726
Danish Krone - (124,117) - - - (124,117) 5,910
Euro - (87,907) - - - (87,907) 4,186
Japanese Yen - (286,582) - - - (286,582) 13,647
Norwegian Krone - 4,782 - - - 4,782 (228)
Pound Sterling - 59,904 77,271,290 77,294,343 - 154,625,537 (7,363,121)
Singapore Dollar - 28,338 - - - 28,338 (1,349)
Swedish Krona - (131,085) - - - (131,085) 6,242
Swiss Franc - (72,277) - - - (72,277) 3,442
Merian Financials Contingent Capital Fund
Monetary
Assets
Net Other Monetary
Assets and Liabilities
Share Class
Exposure
Currency
exchange
contracts
Hedging
Currency
exchange
contracts Non-
Hedging
Total
Exposure
Sensitivity Analysis
(5% movement)
USD USD USD USD USD USD USD
Euro 74,470,759 5,800,732 - - (79,600,945) 670,546 (31,931)
Pound Sterling 76,147,629 953,000 143,592,004 143,559,647 (76,858,962) 287,393,318 (13,685,396)
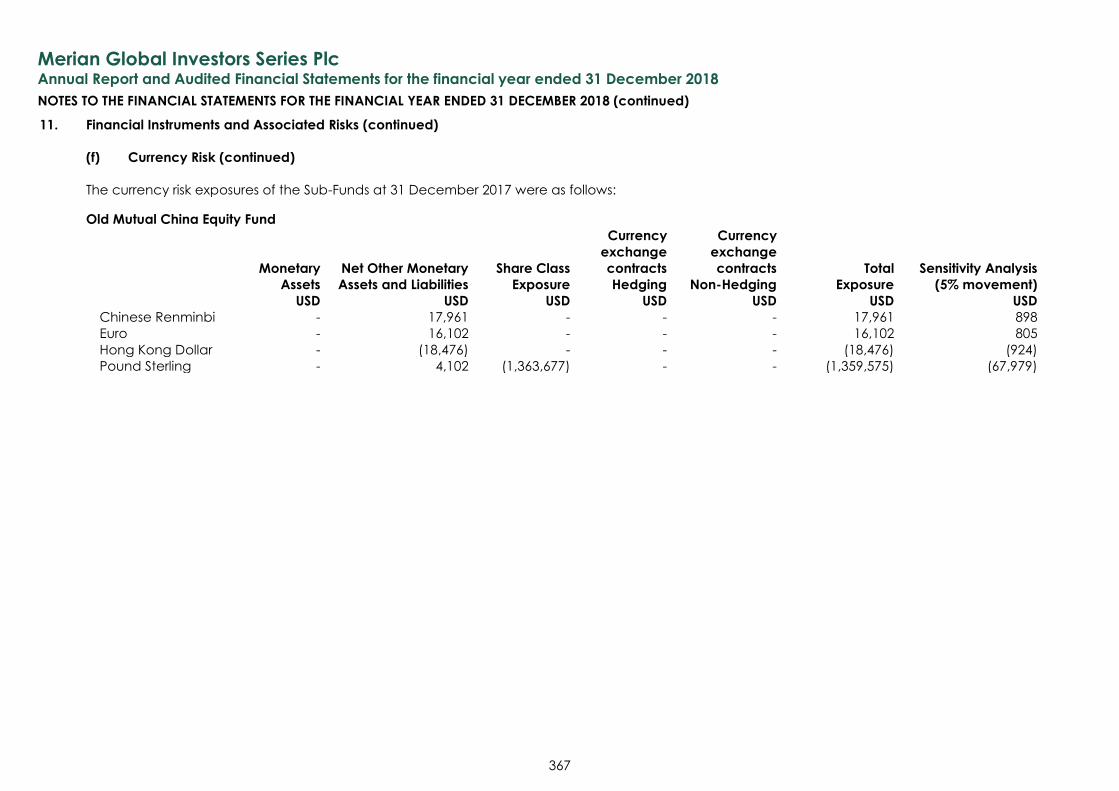
Merian Global Investors Series Plc
Annual Report and Audited Financial Statements for the financial year ended 31 December 2018
NOTES TO THE FINANCIAL STATEMENTS FOR THE FINANCIAL YEAR ENDED 31 DECEMBER 2018 (continued)
367
11. Financial Instruments and Associated Risks (continued)
(f) Currency Risk (continued)
The currency risk exposures of the Sub-Funds at 31 December 2017 were as follows:
Old Mutual China Equity Fund
Monetary
Assets
Net Other Monetary
Assets and Liabilities
Share Class
Exposure
Currency
exchange
contracts
Hedging
Currency
exchange
contracts
Non-Hedging
Total
Exposure
Sensitivity Analysis
(5% movement)
USD USD USD USD USD USD USD
Chinese Renminbi - 17,961 - - - 17,961 898
Euro - 16,102 - - - 16,102 805
Hong Kong Dollar - (18,476) - - - (18,476) (924)
Pound Sterling - 4,102 (1,363,677) - - (1,359,575) (67,979)
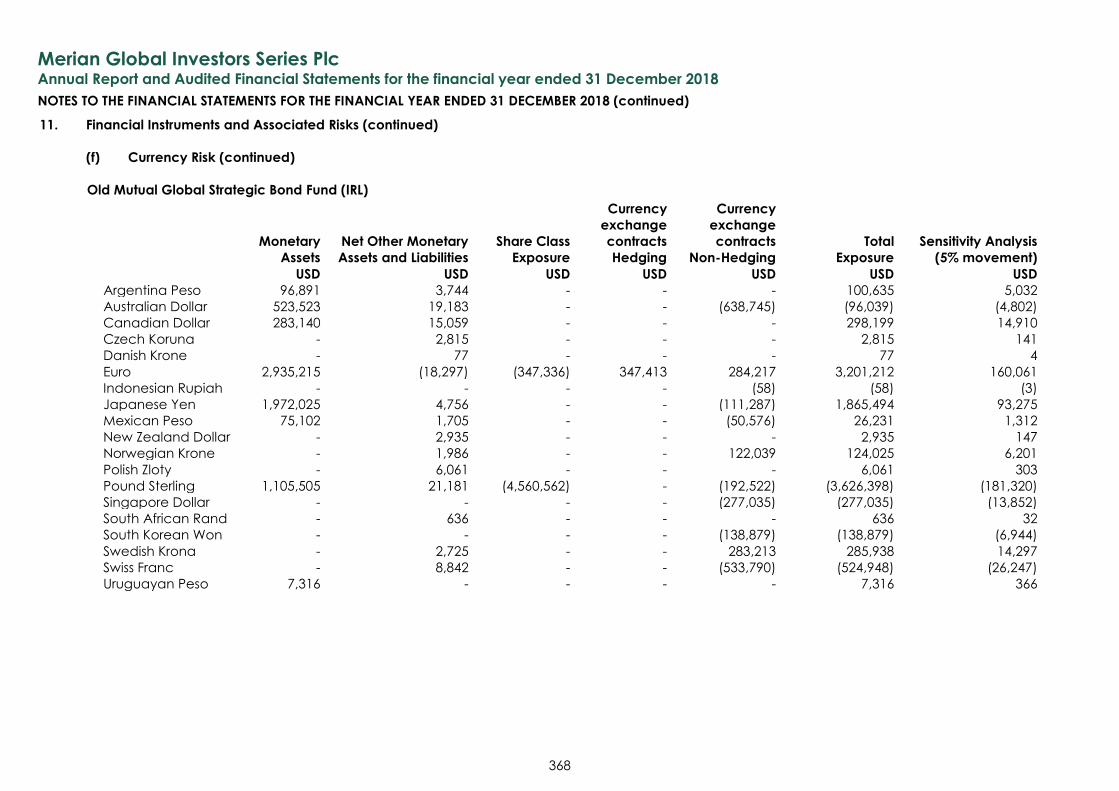
Merian Global Investors Series Plc
Annual Report and Audited Financial Statements for the financial year ended 31 December 2018
NOTES TO THE FINANCIAL STATEMENTS FOR THE FINANCIAL YEAR ENDED 31 DECEMBER 2018 (continued)
368
11. Financial Instruments and Associated Risks (continued)
(f) Currency Risk (continued)
Old Mutual Global Strategic Bond Fund (IRL)
Monetary
Assets
Net Other Monetary
Assets and Liabilities
Share Class
Exposure
Currency
exchange
contracts
Hedging
Currency
exchange
contracts
Non-Hedging
Total
Exposure
Sensitivity Analysis
(5% movement)
USD USD USD USD USD USD USD
Argentina Peso 96,891 3,744 - - - 100,635 5,032
Australian Dollar 523,523 19,183 - - (638,745) (96,039) (4,802)
Canadian Dollar 283,140 15,059 - - - 298,199 14,910
Czech Koruna - 2,815 - - - 2,815 141
Danish Krone - 77 - - - 77 4
Euro 2,935,215 (18,297) (347,336) 347,413 284,217 3,201,212 160,061
Indonesian Rupiah - - - - (58) (58) (3)
Japanese Yen 1,972,025 4,756 - - (111,287) 1,865,494 93,275
Mexican Peso 75,102 1,705 - - (50,576) 26,231 1,312
New Zealand Dollar - 2,935 - - - 2,935 147
Norwegian Krone - 1,986 - - 122,039 124,025 6,201
Polish Zloty - 6,061 - - - 6,061 303
Pound Sterling 1,105,505 21,181 (4,560,562) - (192,522) (3,626,398) (181,320)
Singapore Dollar - - - - (277,035) (277,035) (13,852)
South African Rand - 636 - - - 636 32
South Korean Won - - - - (138,879) (138,879) (6,944)
Swedish Krona - 2,725 - - 283,213 285,938 14,297
Swiss Franc - 8,842 - - (533,790) (524,948) (26,247)
Uruguayan Peso 7,316 - - - - 7,316 366
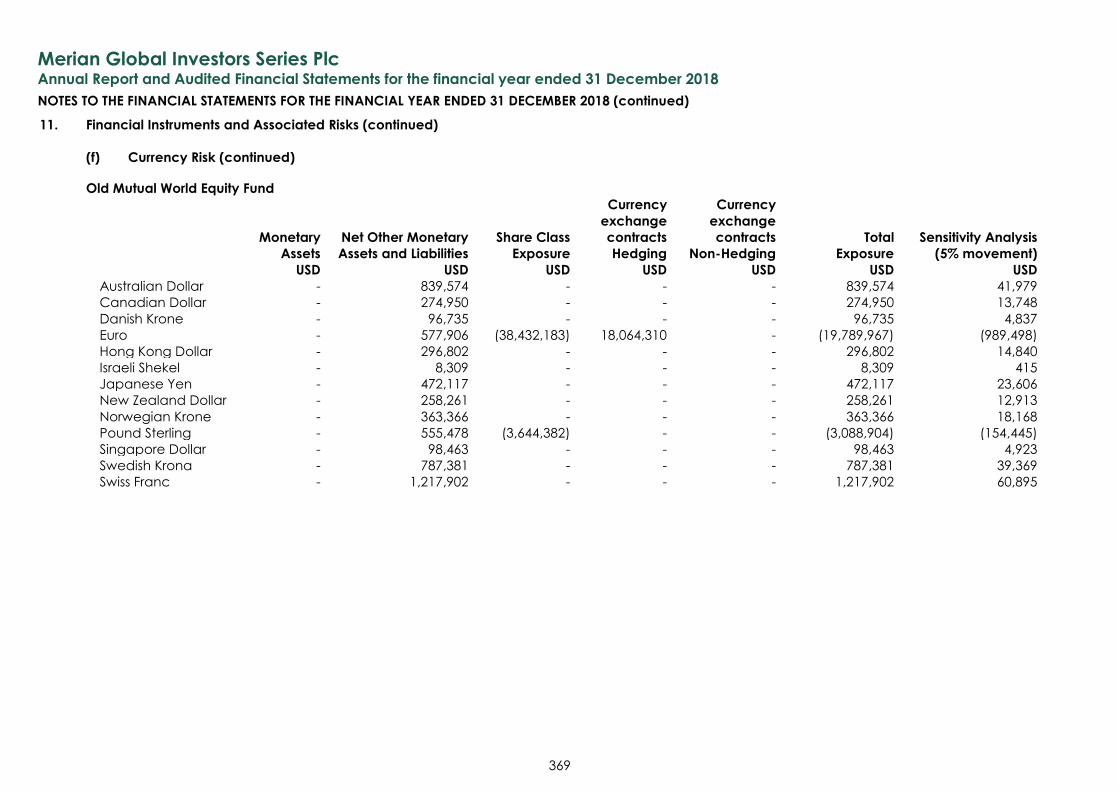
Merian Global Investors Series Plc
Annual Report and Audited Financial Statements for the financial year ended 31 December 2018
NOTES TO THE FINANCIAL STATEMENTS FOR THE FINANCIAL YEAR ENDED 31 DECEMBER 2018 (continued)
369
11. Financial Instruments and Associated Risks (continued)
(f) Currency Risk (continued)
Old Mutual World Equity Fund
Monetary
Assets
Net Other Monetary
Assets and Liabilities
Share Class
Exposure
Currency
exchange
contracts
Hedging
Currency
exchange
contracts
Non-Hedging
Total
Exposure
Sensitivity Analysis
(5% movement)
USD USD USD USD USD USD USD
Australian Dollar - 839,574 - - - 839,574 41,979
Canadian Dollar - 274,950 - - - 274,950 13,748
Danish Krone - 96,735 - - - 96,735 4,837
Euro - 577,906 (38,432,183) 18,064,310 - (19,789,967) (989,498)
Hong Kong Dollar - 296,802 - - - 296,802 14,840
Israeli Shekel - 8,309 - - - 8,309 415
Japanese Yen - 472,117 - - - 472,117 23,606
New Zealand Dollar - 258,261 - - - 258,261 12,913
Norwegian Krone - 363,366 - - - 363,366 18,168
Pound Sterling - 555,478 (3,644,382) - - (3,088,904) (154,445)
Singapore Dollar - 98,463 - - - 98,463 4,923
Swedish Krona - 787,381 - - - 787,381 39,369
Swiss Franc - 1,217,902 - - - 1,217,902 60,895
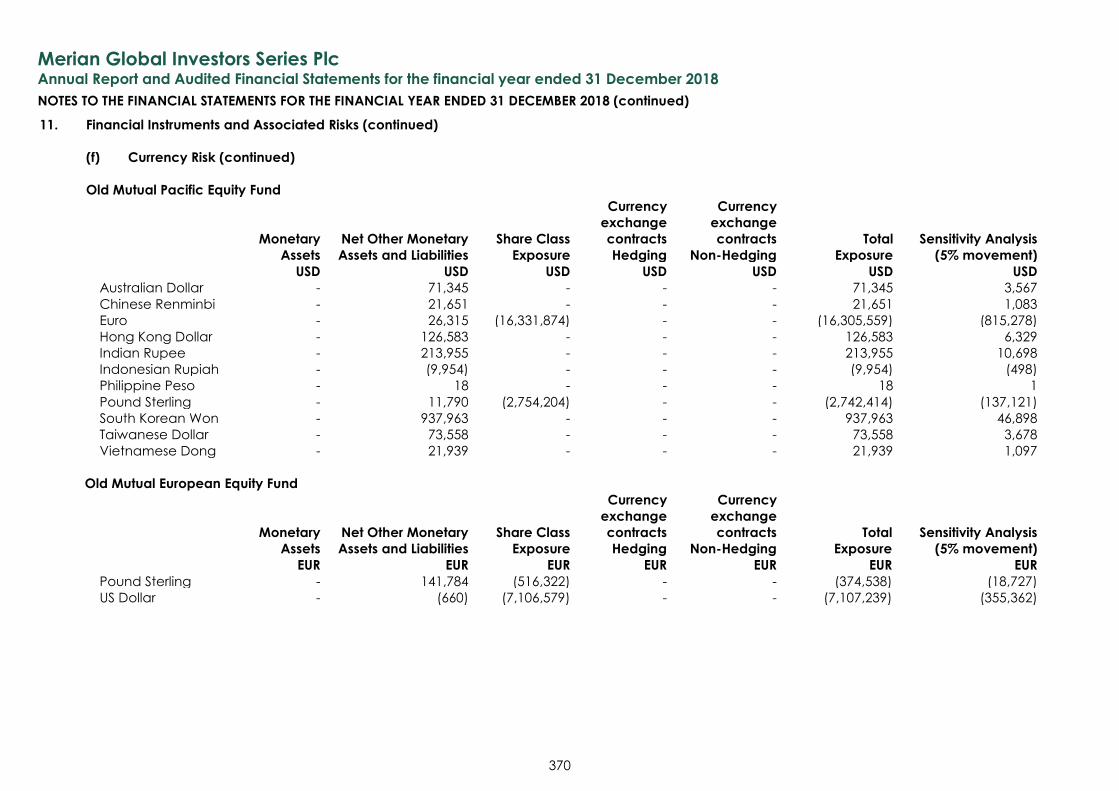
Merian Global Investors Series Plc
Annual Report and Audited Financial Statements for the financial year ended 31 December 2018
NOTES TO THE FINANCIAL STATEMENTS FOR THE FINANCIAL YEAR ENDED 31 DECEMBER 2018 (continued)
370
11. Financial Instruments and Associated Risks (continued)
(f) Currency Risk (continued)
Old Mutual Pacific Equity Fund
Monetary
Assets
Net Other Monetary
Assets and Liabilities
Share Class
Exposure
Currency
exchange
contracts
Hedging
Currency
exchange
contracts
Non-Hedging
Total
Exposure
Sensitivity Analysis
(5% movement)
USD USD USD USD USD USD USD
Australian Dollar - 71,345 - - - 71,345 3,567
Chinese Renminbi - 21,651 - - - 21,651 1,083
Euro - 26,315 (16,331,874) - - (16,305,559) (815,278)
Hong Kong Dollar - 126,583 - - - 126,583 6,329
Indian Rupee - 213,955 - - - 213,955 10,698
Indonesian Rupiah - (9,954) - - - (9,954) (498)
Philippine Peso - 18 - - - 18 1
Pound Sterling - 11,790 (2,754,204) - - (2,742,414) (137,121)
South Korean Won - 937,963 - - - 937,963 46,898
Taiwanese Dollar - 73,558 - - - 73,558 3,678
Vietnamese Dong - 21,939 - - - 21,939 1,097
Old Mutual European Equity Fund
Monetary
Assets
Net Other Monetary
Assets and Liabilities
Share Class
Exposure
Currency
exchange
contracts
Hedging
Currency
exchange
contracts
Non-Hedging
Total
Exposure
Sensitivity Analysis
(5% movement)
EUR EUR EUR EUR EUR EUR EUR Pound Sterling - 141,784 (516,322) - - (374,538) (18,727)
US Dollar - (660) (7,106,579) - - (7,107,239) (355,362)
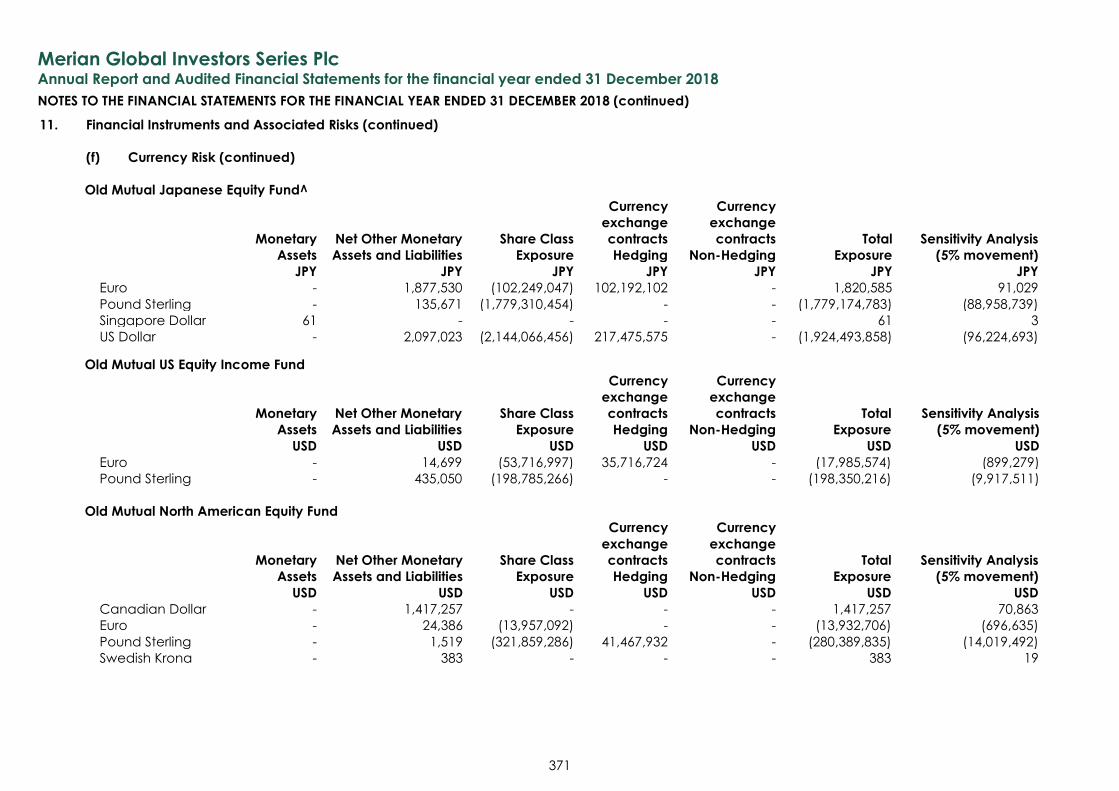
Merian Global Investors Series Plc
Annual Report and Audited Financial Statements for the financial year ended 31 December 2018
NOTES TO THE FINANCIAL STATEMENTS FOR THE FINANCIAL YEAR ENDED 31 DECEMBER 2018 (continued)
371
11. Financial Instruments and Associated Risks (continued)
(f) Currency Risk (continued)
Old Mutual Japanese Equity Fund^
Monetary
Assets
Net Other Monetary
Assets and Liabilities
Share Class
Exposure
Currency
exchange
contracts
Hedging
Currency
exchange
contracts
Non-Hedging
Total
Exposure
Sensitivity Analysis
(5% movement)
JPY JPY JPY JPY JPY JPY JPY
Euro - 1,877,530 (102,249,047) 102,192,102 - 1,820,585 91,029
Pound Sterling - 135,671 (1,779,310,454) - - (1,779,174,783) (88,958,739)
Singapore Dollar 61 - - - - 61 3
US Dollar - 2,097,023 (2,144,066,456) 217,475,575 - (1,924,493,858) (96,224,693)
Old Mutual US Equity Income Fund
Monetary
Assets
Net Other Monetary
Assets and Liabilities
Share Class
Exposure
Currency
exchange
contracts
Hedging
Currency
exchange
contracts
Non-Hedging
Total
Exposure
Sensitivity Analysis
(5% movement)
USD USD USD USD USD USD USD
Euro - 14,699 (53,716,997) 35,716,724 - (17,985,574) (899,279)
Pound Sterling - 435,050 (198,785,266) - - (198,350,216) (9,917,511)
Old Mutual North American Equity Fund
Monetary
Assets
Net Other Monetary
Assets and Liabilities
Share Class
Exposure
Currency
exchange
contracts
Hedging
Currency
exchange
contracts
Non-Hedging
Total
Exposure
Sensitivity Analysis
(5% movement)
USD USD USD USD USD USD USD
Canadian Dollar - 1,417,257 - - - 1,417,257 70,863
Euro - 24,386 (13,957,092) - - (13,932,706) (696,635)
Pound Sterling - 1,519 (321,859,286) 41,467,932 - (280,389,835) (14,019,492)
Swedish Krona - 383 - - - 383 19
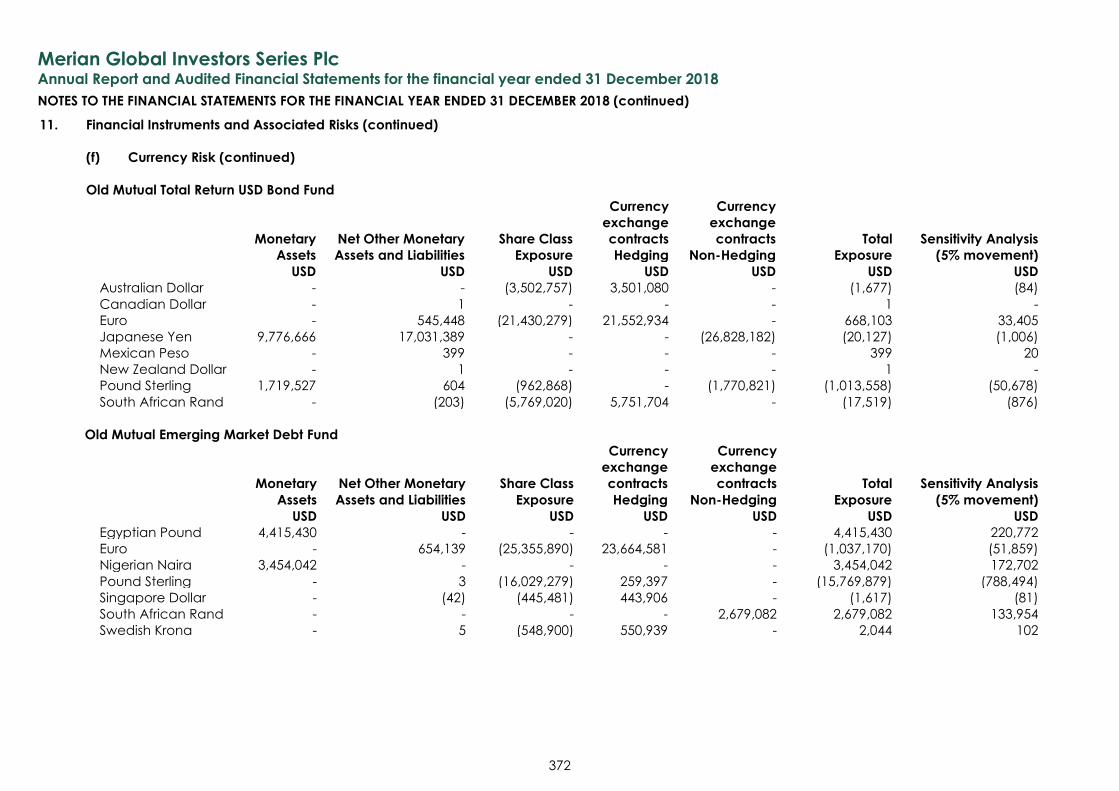
Merian Global Investors Series Plc
Annual Report and Audited Financial Statements for the financial year ended 31 December 2018
NOTES TO THE FINANCIAL STATEMENTS FOR THE FINANCIAL YEAR ENDED 31 DECEMBER 2018 (continued)
372
11. Financial Instruments and Associated Risks (continued)
(f) Currency Risk (continued)
Old Mutual Total Return USD Bond Fund
Monetary
Assets
Net Other Monetary
Assets and Liabilities
Share Class
Exposure
Currency
exchange
contracts
Hedging
Currency
exchange
contracts
Non-Hedging
Total
Exposure
Sensitivity Analysis
(5% movement)
USD USD USD USD USD USD USD
Australian Dollar - - (3,502,757) 3,501,080 - (1,677) (84)
Canadian Dollar - 1 - - - 1 -
Euro - 545,448 (21,430,279) 21,552,934 - 668,103 33,405
Japanese Yen 9,776,666 17,031,389 - - (26,828,182) (20,127) (1,006)
Mexican Peso - 399 - - - 399 20
New Zealand Dollar - 1 - - - 1 -
Pound Sterling 1,719,527 604 (962,868) - (1,770,821) (1,013,558) (50,678)
South African Rand - (203) (5,769,020) 5,751,704 - (17,519) (876)
Old Mutual Emerging Market Debt Fund
Monetary
Assets
Net Other Monetary
Assets and Liabilities
Share Class
Exposure
Currency
exchange
contracts
Hedging
Currency
exchange
contracts
Non-Hedging
Total
Exposure
Sensitivity Analysis
(5% movement)
USD USD USD USD USD USD USD
Egyptian Pound 4,415,430 - - - - 4,415,430 220,772
Euro - 654,139 (25,355,890) 23,664,581 - (1,037,170) (51,859)
Nigerian Naira 3,454,042 - - - - 3,454,042 172,702
Pound Sterling - 3 (16,029,279) 259,397 - (15,769,879) (788,494)
Singapore Dollar - (42) (445,481) 443,906 - (1,617) (81)
South African Rand - - - - 2,679,082 2,679,082 133,954
Swedish Krona - 5 (548,900) 550,939 - 2,044 102
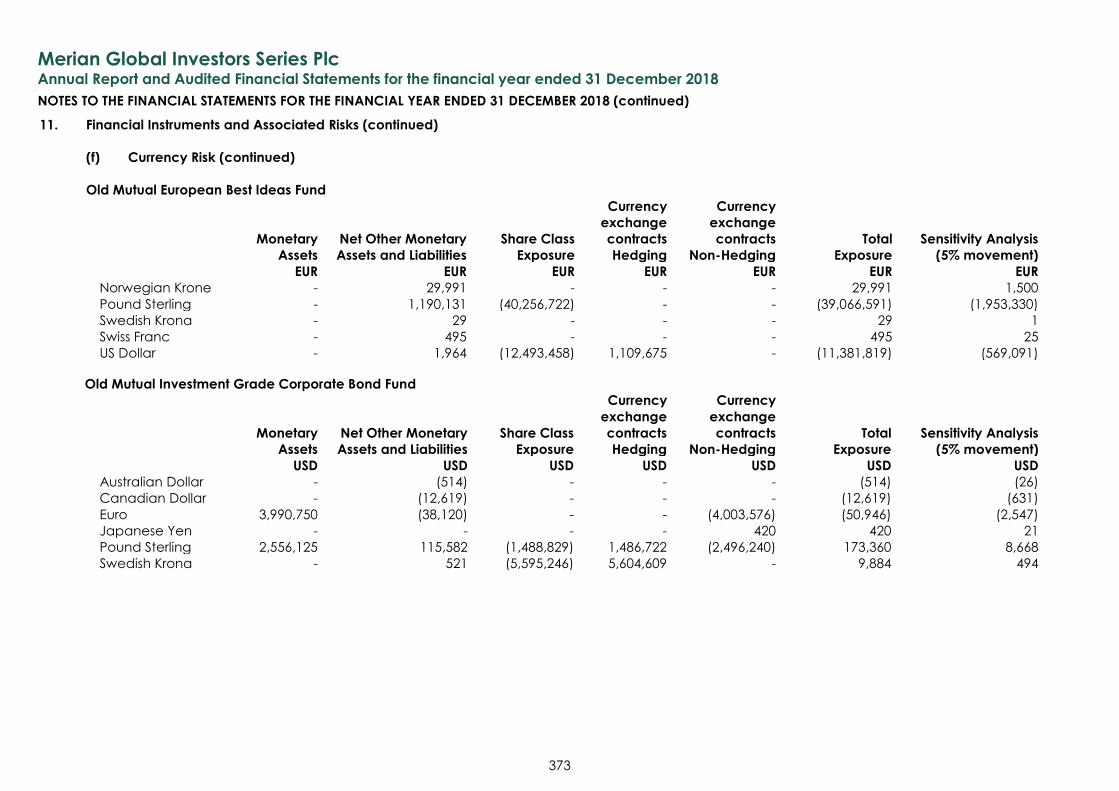
Merian Global Investors Series Plc
Annual Report and Audited Financial Statements for the financial year ended 31 December 2018
NOTES TO THE FINANCIAL STATEMENTS FOR THE FINANCIAL YEAR ENDED 31 DECEMBER 2018 (continued)
373
11. Financial Instruments and Associated Risks (continued)
(f) Currency Risk (continued)
Old Mutual European Best Ideas Fund
Monetary
Assets
Net Other Monetary
Assets and Liabilities
Share Class
Exposure
Currency
exchange
contracts
Hedging
Currency
exchange
contracts
Non-Hedging
Total
Exposure
Sensitivity Analysis
(5% movement)
EUR EUR EUR EUR EUR EUR EUR Norwegian Krone - 29,991 - - - 29,991 1,500
Pound Sterling - 1,190,131 (40,256,722) - - (39,066,591) (1,953,330)
Swedish Krona - 29 - - - 29 1
Swiss Franc - 495 - - - 495 25
US Dollar - 1,964 (12,493,458) 1,109,675 - (11,381,819) (569,091)
Old Mutual Investment Grade Corporate Bond Fund
Monetary
Assets
Net Other Monetary
Assets and Liabilities
Share Class
Exposure
Currency
exchange
contracts
Hedging
Currency
exchange
contracts
Non-Hedging
Total
Exposure
Sensitivity Analysis
(5% movement)
USD USD USD USD USD USD USD
Australian Dollar - (514) - - - (514) (26)
Canadian Dollar - (12,619) - - - (12,619) (631)
Euro 3,990,750 (38,120) - - (4,003,576) (50,946) (2,547)
Japanese Yen - - - - 420 420 21
Pound Sterling 2,556,125 115,582 (1,488,829) 1,486,722 (2,496,240) 173,360 8,668
Swedish Krona - 521 (5,595,246) 5,604,609 - 9,884 494
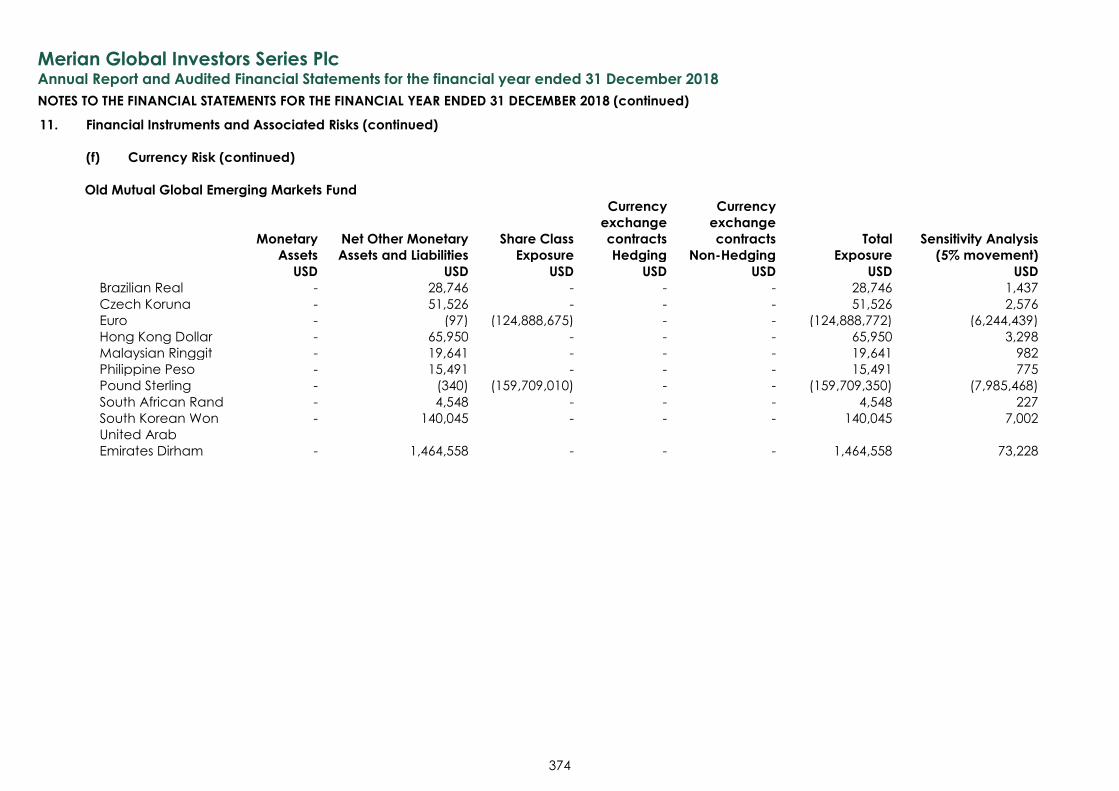
Merian Global Investors Series Plc
Annual Report and Audited Financial Statements for the financial year ended 31 December 2018
NOTES TO THE FINANCIAL STATEMENTS FOR THE FINANCIAL YEAR ENDED 31 DECEMBER 2018 (continued)
374
11. Financial Instruments and Associated Risks (continued)
(f) Currency Risk (continued)
Old Mutual Global Emerging Markets Fund
Monetary
Assets
Net Other Monetary
Assets and Liabilities
Share Class
Exposure
Currency
exchange
contracts
Hedging
Currency
exchange
contracts
Non-Hedging
Total
Exposure
Sensitivity Analysis
(5% movement)
USD USD USD USD USD USD USD
Brazilian Real - 28,746 - - - 28,746 1,437
Czech Koruna - 51,526 - - - 51,526 2,576
Euro - (97) (124,888,675) - - (124,888,772) (6,244,439)
Hong Kong Dollar - 65,950 - - - 65,950 3,298
Malaysian Ringgit - 19,641 - - - 19,641 982
Philippine Peso - 15,491 - - - 15,491 775
Pound Sterling - (340) (159,709,010) - - (159,709,350) (7,985,468)
South African Rand - 4,548 - - - 4,548 227
South Korean Won - 140,045 - - - 140,045 7,002
United Arab
Emirates Dirham - 1,464,558 - - - 1,464,558 73,228
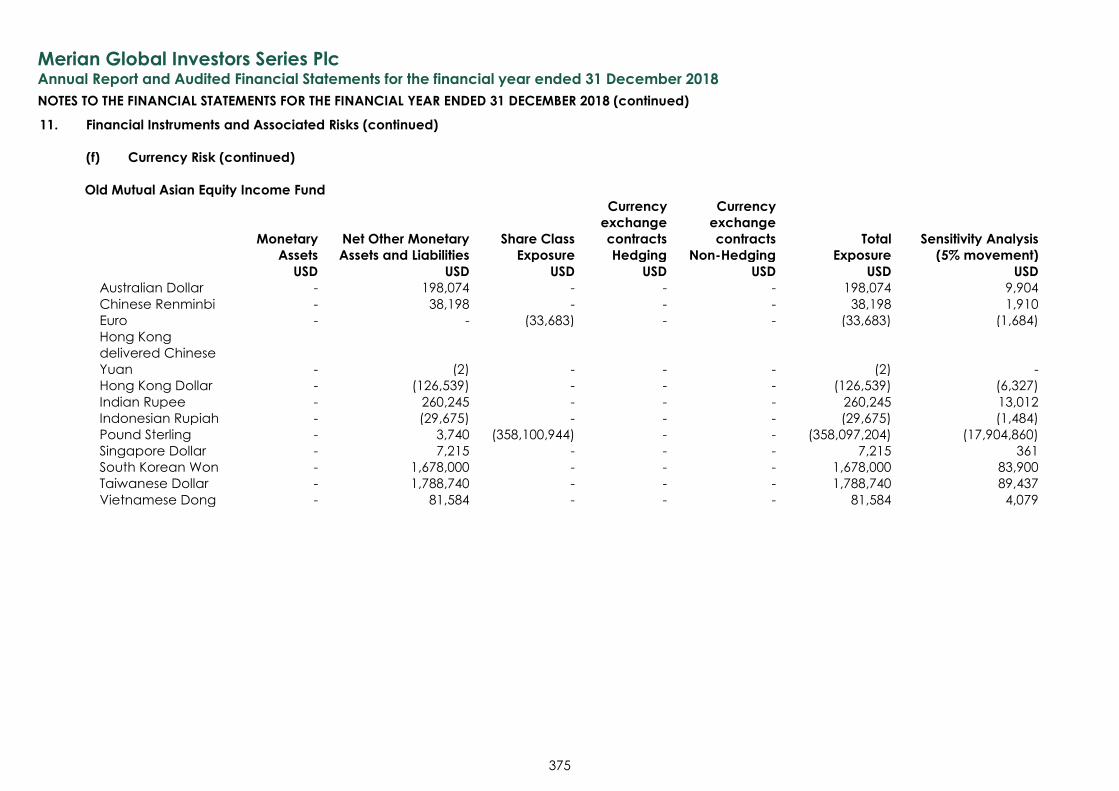
Merian Global Investors Series Plc
Annual Report and Audited Financial Statements for the financial year ended 31 December 2018
NOTES TO THE FINANCIAL STATEMENTS FOR THE FINANCIAL YEAR ENDED 31 DECEMBER 2018 (continued)
375
11. Financial Instruments and Associated Risks (continued)
(f) Currency Risk (continued)
Old Mutual Asian Equity Income Fund
Monetary
Assets
Net Other Monetary
Assets and Liabilities
Share Class
Exposure
Currency
exchange
contracts
Hedging
Currency
exchange
contracts
Non-Hedging
Total
Exposure
Sensitivity Analysis
(5% movement)
USD USD USD USD USD USD USD
Australian Dollar - 198,074 - - - 198,074 9,904
Chinese Renminbi - 38,198 - - - 38,198 1,910
Euro - - (33,683) - - (33,683) (1,684)
Hong Kong
delivered Chinese
Yuan - (2) - - - (2) -
Hong Kong Dollar - (126,539) - - - (126,539) (6,327)
Indian Rupee - 260,245 - - - 260,245 13,012
Indonesian Rupiah - (29,675) - - - (29,675) (1,484)
Pound Sterling - 3,740 (358,100,944) - - (358,097,204) (17,904,860)
Singapore Dollar - 7,215 - - - 7,215 361
South Korean Won - 1,678,000 - - - 1,678,000 83,900
Taiwanese Dollar - 1,788,740 - - - 1,788,740 89,437
Vietnamese Dong - 81,584 - - - 81,584 4,079
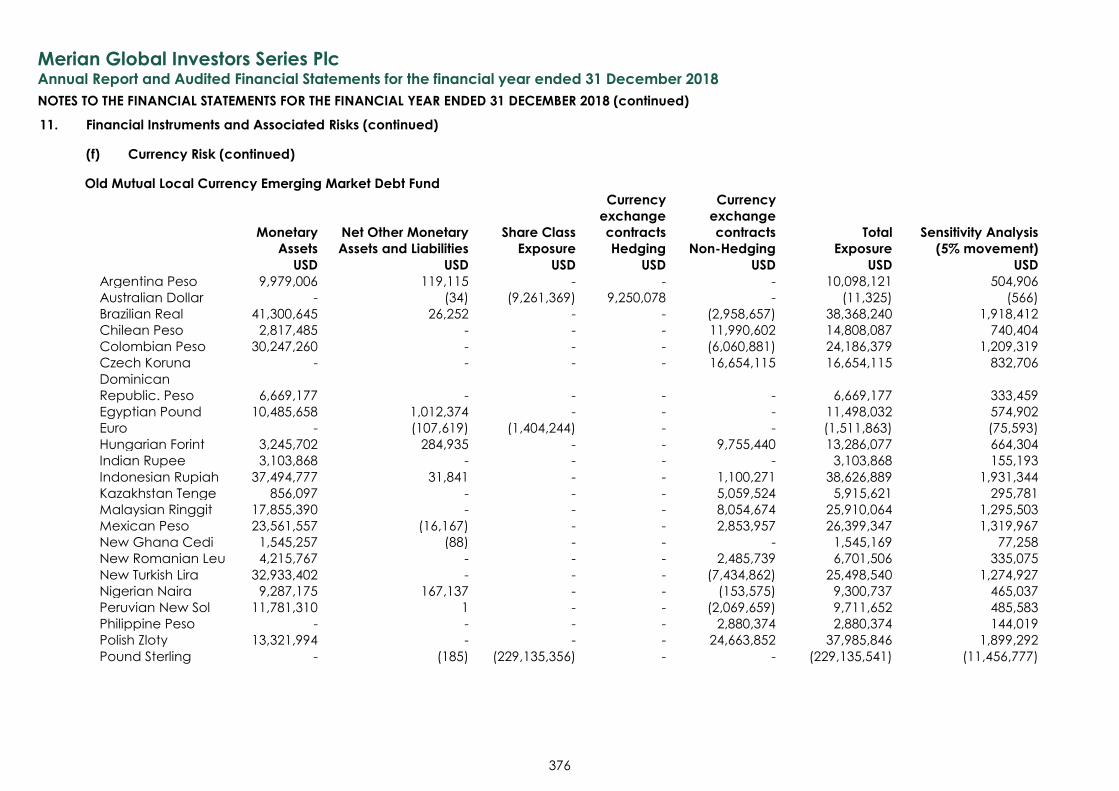
Merian Global Investors Series Plc
Annual Report and Audited Financial Statements for the financial year ended 31 December 2018
NOTES TO THE FINANCIAL STATEMENTS FOR THE FINANCIAL YEAR ENDED 31 DECEMBER 2018 (continued)
376
11. Financial Instruments and Associated Risks (continued)
(f) Currency Risk (continued)
Old Mutual Local Currency Emerging Market Debt Fund
Monetary
Assets
Net Other Monetary
Assets and Liabilities
Share Class
Exposure
Currency
exchange
contracts
Hedging
Currency
exchange
contracts
Non-Hedging
Total
Exposure
Sensitivity Analysis
(5% movement)
USD USD USD USD USD USD USD
Argentina Peso 9,979,006 119,115 - - - 10,098,121 504,906
Australian Dollar - (34) (9,261,369) 9,250,078 - (11,325) (566)
Brazilian Real 41,300,645 26,252 - - (2,958,657) 38,368,240 1,918,412
Chilean Peso 2,817,485 - - - 11,990,602 14,808,087 740,404
Colombian Peso 30,247,260 - - - (6,060,881) 24,186,379 1,209,319
Czech Koruna - - - - 16,654,115 16,654,115 832,706
Dominican
Republic. Peso 6,669,177 - - - - 6,669,177 333,459
Egyptian Pound 10,485,658 1,012,374 - - - 11,498,032 574,902
Euro - (107,619) (1,404,244) - - (1,511,863) (75,593)
Hungarian Forint 3,245,702 284,935 - - 9,755,440 13,286,077 664,304
Indian Rupee 3,103,868 - - - - 3,103,868 155,193
Indonesian Rupiah 37,494,777 31,841 - - 1,100,271 38,626,889 1,931,344
Kazakhstan Tenge 856,097 - - - 5,059,524 5,915,621 295,781
Malaysian Ringgit 17,855,390 - - - 8,054,674 25,910,064 1,295,503
Mexican Peso 23,561,557 (16,167) - - 2,853,957 26,399,347 1,319,967
New Ghana Cedi 1,545,257 (88) - - - 1,545,169 77,258
New Romanian Leu 4,215,767 - - - 2,485,739 6,701,506 335,075
New Turkish Lira 32,933,402 - - - (7,434,862) 25,498,540 1,274,927
Nigerian Naira 9,287,175 167,137 - - (153,575) 9,300,737 465,037
Peruvian New Sol 11,781,310 1 - - (2,069,659) 9,711,652 485,583
Philippine Peso - - - - 2,880,374 2,880,374 144,019
Polish Zloty 13,321,994 - - - 24,663,852 37,985,846 1,899,292
Pound Sterling - (185) (229,135,356) - - (229,135,541) (11,456,777)
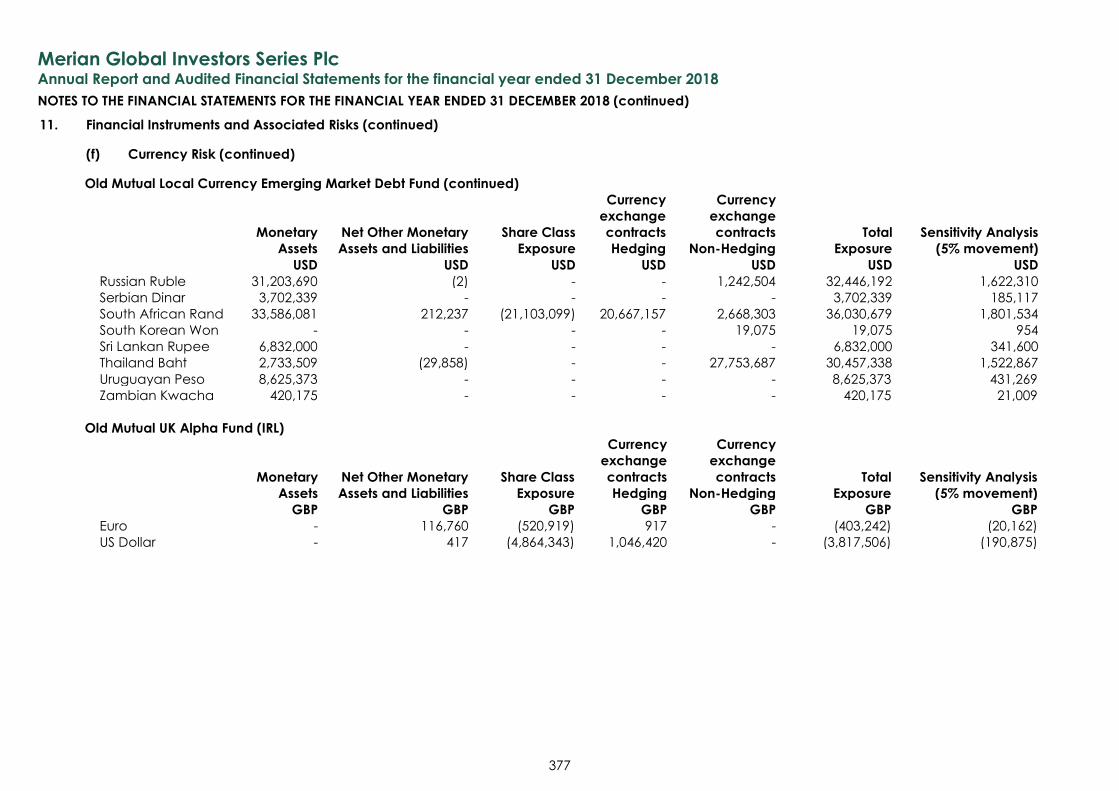
Merian Global Investors Series Plc
Annual Report and Audited Financial Statements for the financial year ended 31 December 2018
NOTES TO THE FINANCIAL STATEMENTS FOR THE FINANCIAL YEAR ENDED 31 DECEMBER 2018 (continued)
377
11. Financial Instruments and Associated Risks (continued)
(f) Currency Risk (continued)
Old Mutual Local Currency Emerging Market Debt Fund (continued)
Monetary
Assets
Net Other Monetary
Assets and Liabilities
Share Class
Exposure
Currency
exchange
contracts
Hedging
Currency
exchange
contracts
Non-Hedging
Total
Exposure
Sensitivity Analysis
(5% movement)
USD USD USD USD USD USD USD
Russian Ruble 31,203,690 (2) - - 1,242,504 32,446,192 1,622,310
Serbian Dinar 3,702,339 - - - - 3,702,339 185,117
South African Rand 33,586,081 212,237 (21,103,099) 20,667,157 2,668,303 36,030,679 1,801,534
South Korean Won - - - - 19,075 19,075 954
Sri Lankan Rupee 6,832,000 - - - - 6,832,000 341,600
Thailand Baht 2,733,509 (29,858) - - 27,753,687 30,457,338 1,522,867
Uruguayan Peso 8,625,373 - - - - 8,625,373 431,269
Zambian Kwacha 420,175 - - - - 420,175 21,009
Old Mutual UK Alpha Fund (IRL)
Monetary
Assets
Net Other Monetary
Assets and Liabilities
Share Class
Exposure
Currency
exchange
contracts
Hedging
Currency
exchange
contracts
Non-Hedging
Total
Exposure
Sensitivity Analysis
(5% movement)
GBP GBP GBP GBP GBP GBP GBP
Euro - 116,760 (520,919) 917 - (403,242) (20,162)
US Dollar - 417 (4,864,343) 1,046,420 - (3,817,506) (190,875)
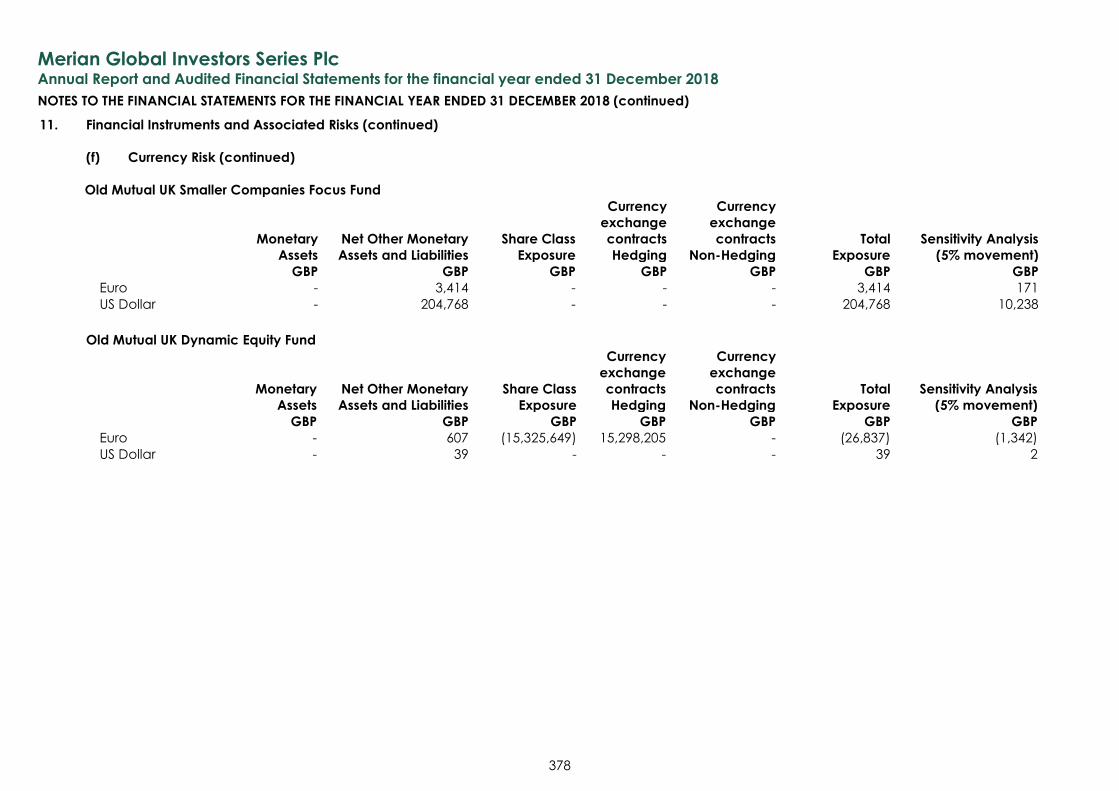
Merian Global Investors Series Plc
Annual Report and Audited Financial Statements for the financial year ended 31 December 2018
NOTES TO THE FINANCIAL STATEMENTS FOR THE FINANCIAL YEAR ENDED 31 DECEMBER 2018 (continued)
378
11. Financial Instruments and Associated Risks (continued)
(f) Currency Risk (continued)
Old Mutual UK Smaller Companies Focus Fund
Monetary
Assets
Net Other Monetary
Assets and Liabilities
Share Class
Exposure
Currency
exchange
contracts
Hedging
Currency
exchange
contracts
Non-Hedging
Total
Exposure
Sensitivity Analysis
(5% movement)
GBP GBP GBP GBP GBP GBP GBP
Euro - 3,414 - - - 3,414 171
US Dollar - 204,768 - - - 204,768 10,238
Old Mutual UK Dynamic Equity Fund
Monetary
Assets
Net Other Monetary
Assets and Liabilities
Share Class
Exposure
Currency
exchange
contracts
Hedging
Currency
exchange
contracts
Non-Hedging
Total
Exposure
Sensitivity Analysis
(5% movement)
GBP GBP GBP GBP GBP GBP GBP
Euro - 607 (15,325,649) 15,298,205 - (26,837) (1,342)
US Dollar - 39 - - - 39 2
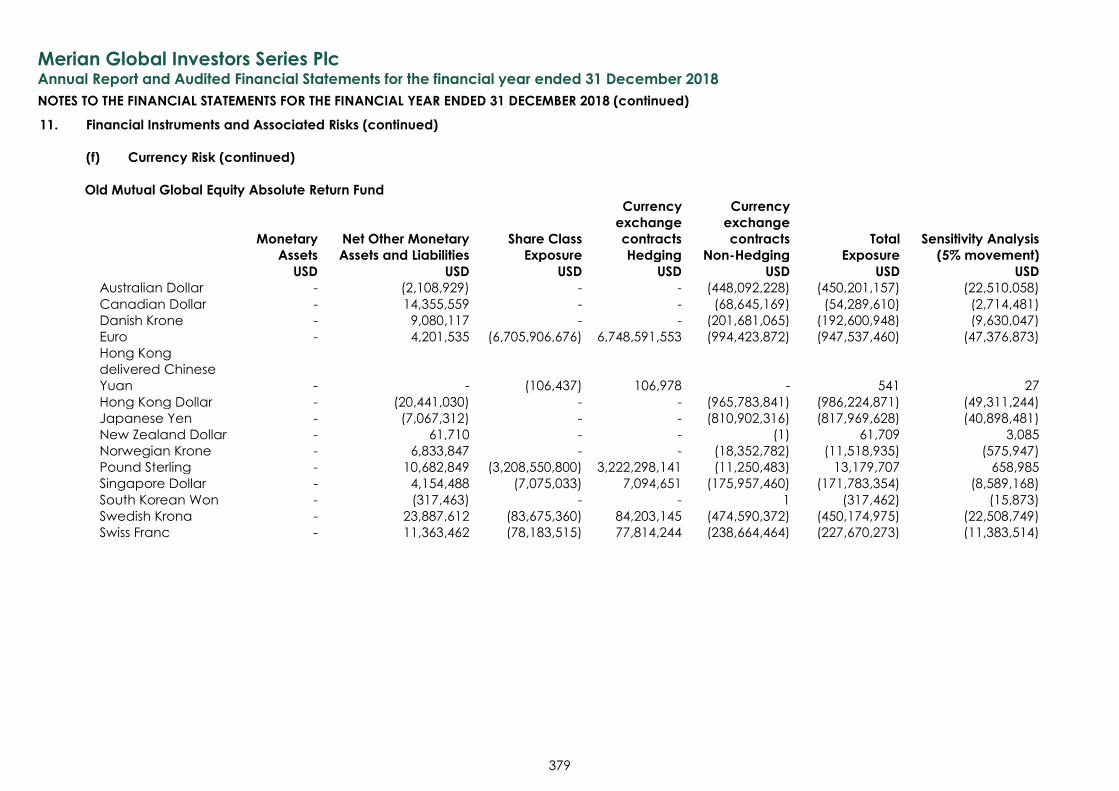
Merian Global Investors Series Plc
Annual Report and Audited Financial Statements for the financial year ended 31 December 2018
NOTES TO THE FINANCIAL STATEMENTS FOR THE FINANCIAL YEAR ENDED 31 DECEMBER 2018 (continued)
379
11. Financial Instruments and Associated Risks (continued)
(f) Currency Risk (continued)
Old Mutual Global Equity Absolute Return Fund
Monetary
Assets
Net Other Monetary
Assets and Liabilities
Share Class
Exposure
Currency
exchange
contracts
Hedging
Currency
exchange
contracts
Non-Hedging
Total
Exposure
Sensitivity Analysis
(5% movement)
USD USD USD USD USD USD USD
Australian Dollar - (2,108,929) - - (448,092,228) (450,201,157) (22,510,058)
Canadian Dollar - 14,355,559 - - (68,645,169) (54,289,610) (2,714,481)
Danish Krone - 9,080,117 - - (201,681,065) (192,600,948) (9,630,047)
Euro - 4,201,535 (6,705,906,676) 6,748,591,553 (994,423,872) (947,537,460) (47,376,873)
Hong Kong
delivered Chinese
Yuan - - (106,437) 106,978 - 541 27
Hong Kong Dollar - (20,441,030) - - (965,783,841) (986,224,871) (49,311,244)
Japanese Yen - (7,067,312) - - (810,902,316) (817,969,628) (40,898,481)
New Zealand Dollar - 61,710 - - (1) 61,709 3,085
Norwegian Krone - 6,833,847 - - (18,352,782) (11,518,935) (575,947)
Pound Sterling - 10,682,849 (3,208,550,800) 3,222,298,141 (11,250,483) 13,179,707 658,985
Singapore Dollar - 4,154,488 (7,075,033) 7,094,651 (175,957,460) (171,783,354) (8,589,168)
South Korean Won - (317,463) - - 1 (317,462) (15,873)
Swedish Krona - 23,887,612 (83,675,360) 84,203,145 (474,590,372) (450,174,975) (22,508,749)
Swiss Franc - 11,363,462 (78,183,515) 77,814,244 (238,664,464) (227,670,273) (11,383,514)
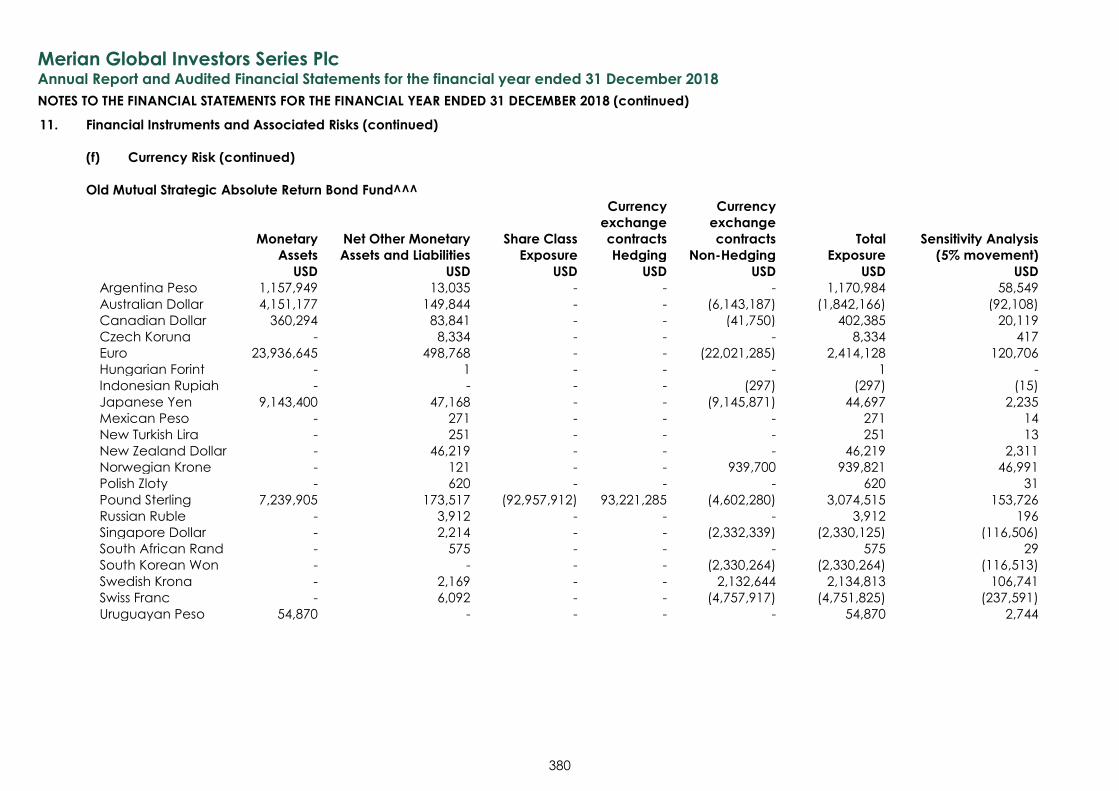
Merian Global Investors Series Plc
Annual Report and Audited Financial Statements for the financial year ended 31 December 2018
NOTES TO THE FINANCIAL STATEMENTS FOR THE FINANCIAL YEAR ENDED 31 DECEMBER 2018 (continued)
380
11. Financial Instruments and Associated Risks (continued)
(f) Currency Risk (continued)
Old Mutual Strategic Absolute Return Bond Fund^^^
Monetary
Assets
Net Other Monetary
Assets and Liabilities
Share Class
Exposure
Currency
exchange
contracts
Hedging
Currency
exchange
contracts
Non-Hedging
Total
Exposure
Sensitivity Analysis
(5% movement)
USD USD USD USD USD USD USD
Argentina Peso 1,157,949 13,035 - - - 1,170,984 58,549
Australian Dollar 4,151,177 149,844 - - (6,143,187) (1,842,166) (92,108)
Canadian Dollar 360,294 83,841 - - (41,750) 402,385 20,119
Czech Koruna - 8,334 - - - 8,334 417
Euro 23,936,645 498,768 - - (22,021,285) 2,414,128 120,706
Hungarian Forint - 1 - - - 1 -
Indonesian Rupiah - - - - (297) (297) (15)
Japanese Yen 9,143,400 47,168 - - (9,145,871) 44,697 2,235
Mexican Peso - 271 - - - 271 14
New Turkish Lira - 251 - - - 251 13
New Zealand Dollar - 46,219 - - - 46,219 2,311
Norwegian Krone - 121 - - 939,700 939,821 46,991
Polish Zloty - 620 - - - 620 31
Pound Sterling 7,239,905 173,517 (92,957,912) 93,221,285 (4,602,280) 3,074,515 153,726
Russian Ruble - 3,912 - - - 3,912 196
Singapore Dollar - 2,214 - - (2,332,339) (2,330,125) (116,506)
South African Rand - 575 - - - 575 29
South Korean Won - - - - (2,330,264) (2,330,264) (116,513)
Swedish Krona - 2,169 - - 2,132,644 2,134,813 106,741
Swiss Franc - 6,092 - - (4,757,917) (4,751,825) (237,591)
Uruguayan Peso 54,870 - - - - 54,870 2,744
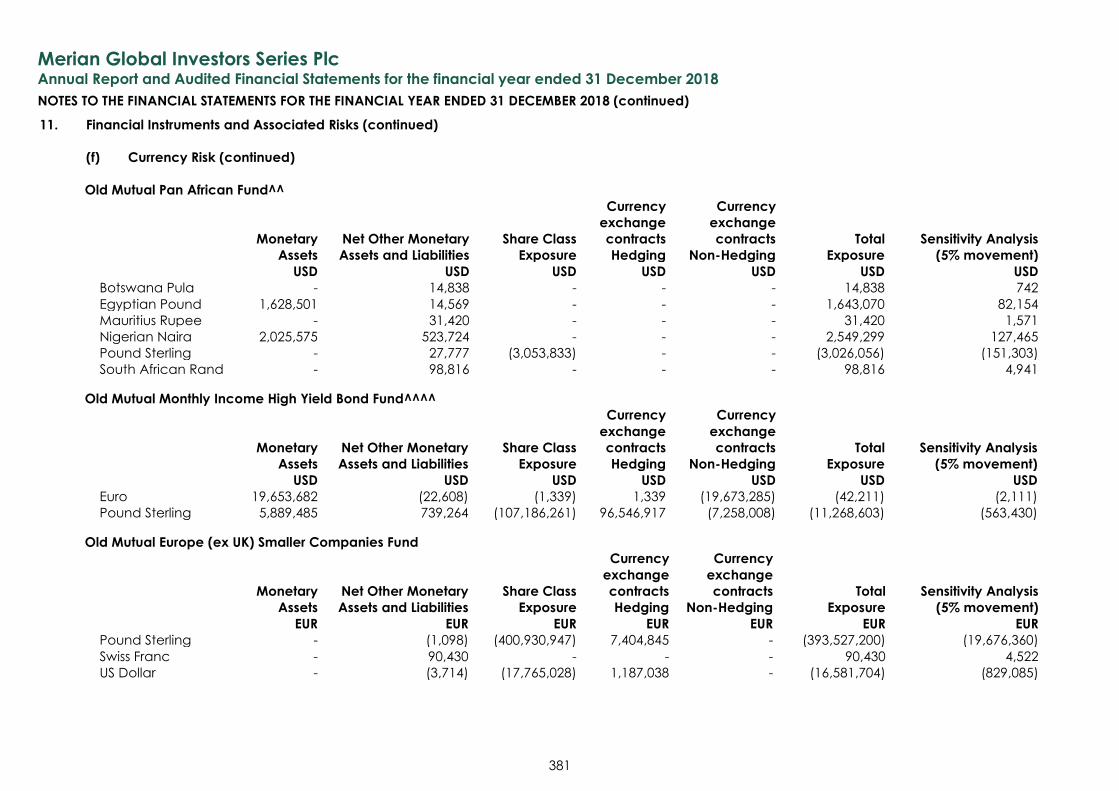
Merian Global Investors Series Plc
Annual Report and Audited Financial Statements for the financial year ended 31 December 2018
NOTES TO THE FINANCIAL STATEMENTS FOR THE FINANCIAL YEAR ENDED 31 DECEMBER 2018 (continued)
381
11. Financial Instruments and Associated Risks (continued)
(f) Currency Risk (continued)
Old Mutual Pan African Fund^^
Monetary
Assets
Net Other Monetary
Assets and Liabilities
Share Class
Exposure
Currency
exchange
contracts
Hedging
Currency
exchange
contracts
Non-Hedging
Total
Exposure
Sensitivity Analysis
(5% movement)
USD USD USD USD USD USD USD
Botswana Pula - 14,838 - - - 14,838 742
Egyptian Pound 1,628,501 14,569 - - - 1,643,070 82,154
Mauritius Rupee - 31,420 - - - 31,420 1,571
Nigerian Naira 2,025,575 523,724 - - - 2,549,299 127,465
Pound Sterling - 27,777 (3,053,833) - - (3,026,056) (151,303)
South African Rand - 98,816 - - - 98,816 4,941
Old Mutual Monthly Income High Yield Bond Fund^^^^
Monetary
Assets
Net Other Monetary
Assets and Liabilities
Share Class
Exposure
Currency
exchange
contracts
Hedging
Currency
exchange
contracts
Non-Hedging
Total
Exposure
Sensitivity Analysis
(5% movement)
USD USD USD USD USD USD USD
Euro 19,653,682 (22,608) (1,339) 1,339 (19,673,285) (42,211) (2,111)
Pound Sterling 5,889,485 739,264 (107,186,261) 96,546,917 (7,258,008) (11,268,603) (563,430)
Old Mutual Europe (ex UK) Smaller Companies Fund
Monetary
Assets
Net Other Monetary
Assets and Liabilities
Share Class
Exposure
Currency
exchange
contracts
Hedging
Currency
exchange
contracts
Non-Hedging
Total
Exposure
Sensitivity Analysis
(5% movement)
EUR EUR EUR EUR EUR EUR EUR
Pound Sterling - (1,098) (400,930,947) 7,404,845 - (393,527,200) (19,676,360)
Swiss Franc - 90,430 - - - 90,430 4,522
US Dollar - (3,714) (17,765,028) 1,187,038 - (16,581,704) (829,085)
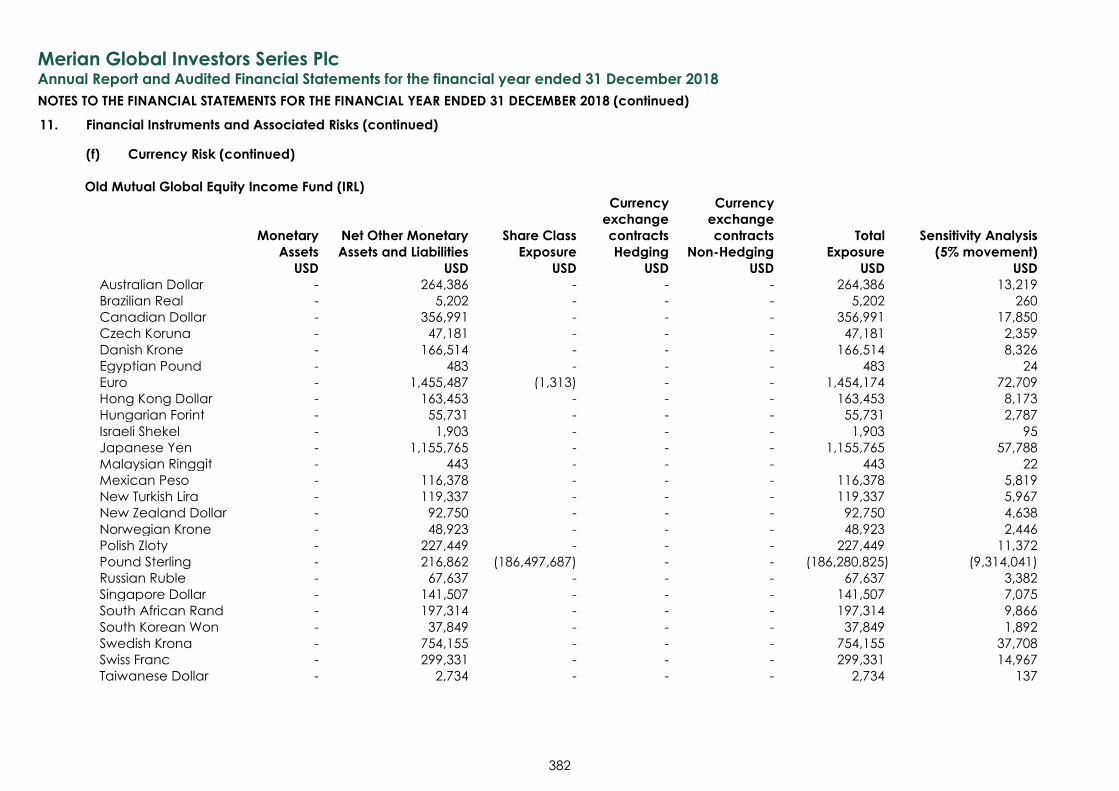
Merian Global Investors Series Plc
Annual Report and Audited Financial Statements for the financial year ended 31 December 2018
NOTES TO THE FINANCIAL STATEMENTS FOR THE FINANCIAL YEAR ENDED 31 DECEMBER 2018 (continued)
382
11. Financial Instruments and Associated Risks (continued)
(f) Currency Risk (continued)
Old Mutual Global Equity Income Fund (IRL)
Monetary
Assets
Net Other Monetary
Assets and Liabilities
Share Class
Exposure
Currency
exchange
contracts
Hedging
Currency
exchange
contracts
Non-Hedging
Total
Exposure
Sensitivity Analysis
(5% movement)
USD USD USD USD USD USD USD
Australian Dollar - 264,386 - - - 264,386 13,219
Brazilian Real - 5,202 - - - 5,202 260
Canadian Dollar - 356,991 - - - 356,991 17,850
Czech Koruna - 47,181 - - - 47,181 2,359
Danish Krone - 166,514 - - - 166,514 8,326
Egyptian Pound - 483 - - - 483 24
Euro - 1,455,487 (1,313) - - 1,454,174 72,709
Hong Kong Dollar - 163,453 - - - 163,453 8,173
Hungarian Forint - 55,731 - - - 55,731 2,787
Israeli Shekel - 1,903 - - - 1,903 95
Japanese Yen - 1,155,765 - - - 1,155,765 57,788
Malaysian Ringgit - 443 - - - 443 22
Mexican Peso - 116,378 - - - 116,378 5,819
New Turkish Lira - 119,337 - - - 119,337 5,967
New Zealand Dollar - 92,750 - - - 92,750 4,638
Norwegian Krone - 48,923 - - - 48,923 2,446
Polish Zloty - 227,449 - - - 227,449 11,372
Pound Sterling - 216,862 (186,497,687) - - (186,280,825) (9,314,041)
Russian Ruble - 67,637 - - - 67,637 3,382
Singapore Dollar - 141,507 - - - 141,507 7,075
South African Rand - 197,314 - - - 197,314 9,866
South Korean Won - 37,849 - - - 37,849 1,892
Swedish Krona - 754,155 - - - 754,155 37,708
Swiss Franc - 299,331 - - - 299,331 14,967
Taiwanese Dollar - 2,734 - - - 2,734 137

Merian Global Investors Series Plc
Annual Report and Audited Financial Statements for the financial year ended 31 December 2018
NOTES TO THE FINANCIAL STATEMENTS FOR THE FINANCIAL YEAR ENDED 31 DECEMBER 2018 (continued)
383
11. Financial Instruments and Associated Risks (continued)
(f) Currency Risk (continued)
Old Mutual Gold & Silver Fund
Monetary
Assets
Net Other Monetary
Assets and Liabilities
Share Class
Exposure
Currency
exchange
contracts
Hedging
Currency
exchange
contracts
Non-Hedging
Total
Exposure
Sensitivity Analysis
(5% movement)
USD USD USD USD USD USD USD
Australian Dollar - (7,931) - - - (7,931) (397)
Canadian Dollar - 3,390 - - - 3,390 170
Euro - (54) (1,691,351) - - (1,691,405) (84,570)
Pound Sterling - 15,618 (206,318,868) - - (206,303,250) (10,315,163)
Old Mutual Compass Portfolio 2
Monetary
Assets
Net Other Monetary
Assets and Liabilities
Share Class
Exposure
Currency
exchange
contracts
Hedging
Currency
exchange
contracts
Non-Hedging
Total
Exposure
Sensitivity Analysis
(5% movement)
USD USD USD USD USD USD USD
Australian Dollar - (7,462) (1,130,196) 1,124,837 - (12,821) (641) Euro - (50,309) (1,895,637) 1,892,820 (225,389) (278,515) (13,926) Indian Rupee 40,256 - - - - 40,256 2,013 Japanese Yen - 14,703 - - - 14,703 735 Mexican Peso 196,011 14 - - (197,963) (1,938) (97) Pound Sterling - (31,532) (15,264,329) 15,221,924 (4,645,102) (4,719,039) (235,952) Singapore Dollar - - (1,841,055) 1,837,524 - (3,531) (177) Swiss Franc - 216 - - - 216 11
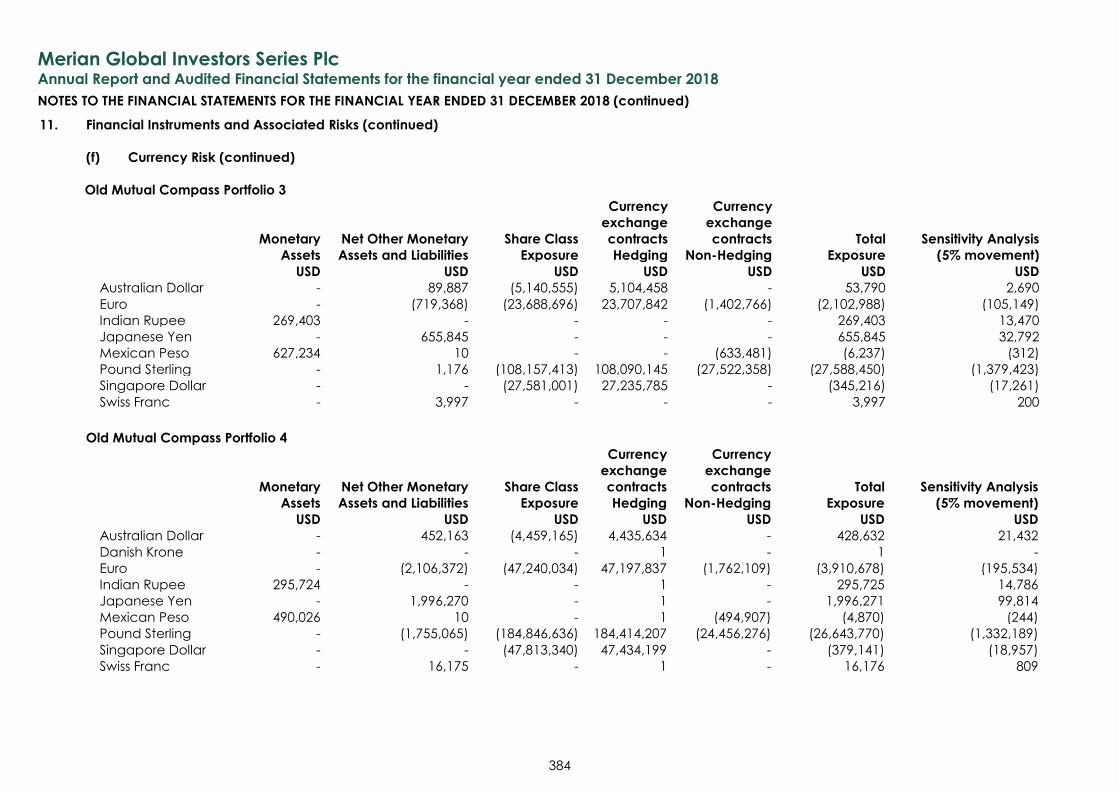
Merian Global Investors Series Plc
Annual Report and Audited Financial Statements for the financial year ended 31 December 2018
NOTES TO THE FINANCIAL STATEMENTS FOR THE FINANCIAL YEAR ENDED 31 DECEMBER 2018 (continued)
384
11. Financial Instruments and Associated Risks (continued)
(f) Currency Risk (continued)
Old Mutual Compass Portfolio 3
Monetary
Assets
Net Other Monetary
Assets and Liabilities
Share Class
Exposure
Currency
exchange
contracts
Hedging
Currency
exchange
contracts
Non-Hedging
Total
Exposure
Sensitivity Analysis
(5% movement)
USD USD USD USD USD USD USD
Australian Dollar - 89,887 (5,140,555) 5,104,458 - 53,790 2,690
Euro - (719,368) (23,688,696) 23,707,842 (1,402,766) (2,102,988) (105,149)
Indian Rupee 269,403 - - - - 269,403 13,470
Japanese Yen - 655,845 - - - 655,845 32,792
Mexican Peso 627,234 10 - - (633,481) (6,237) (312)
Pound Sterling - 1,176 (108,157,413) 108,090,145 (27,522,358) (27,588,450) (1,379,423)
Singapore Dollar - - (27,581,001) 27,235,785 - (345,216) (17,261)
Swiss Franc - 3,997 - - - 3,997 200
Old Mutual Compass Portfolio 4
Monetary
Assets
Net Other Monetary
Assets and Liabilities
Share Class
Exposure
Currency
exchange
contracts
Hedging
Currency
exchange
contracts
Non-Hedging
Total
Exposure
Sensitivity Analysis
(5% movement)
USD USD USD USD USD USD USD
Australian Dollar - 452,163 (4,459,165) 4,435,634 - 428,632 21,432
Danish Krone - - - 1 - 1 -
Euro - (2,106,372) (47,240,034) 47,197,837 (1,762,109) (3,910,678) (195,534)
Indian Rupee 295,724 - - 1 - 295,725 14,786
Japanese Yen - 1,996,270 - 1 - 1,996,271 99,814
Mexican Peso 490,026 10 - 1 (494,907) (4,870) (244)
Pound Sterling - (1,755,065) (184,846,636) 184,414,207 (24,456,276) (26,643,770) (1,332,189)
Singapore Dollar - - (47,813,340) 47,434,199 - (379,141) (18,957)
Swiss Franc - 16,175 - 1 - 16,176 809
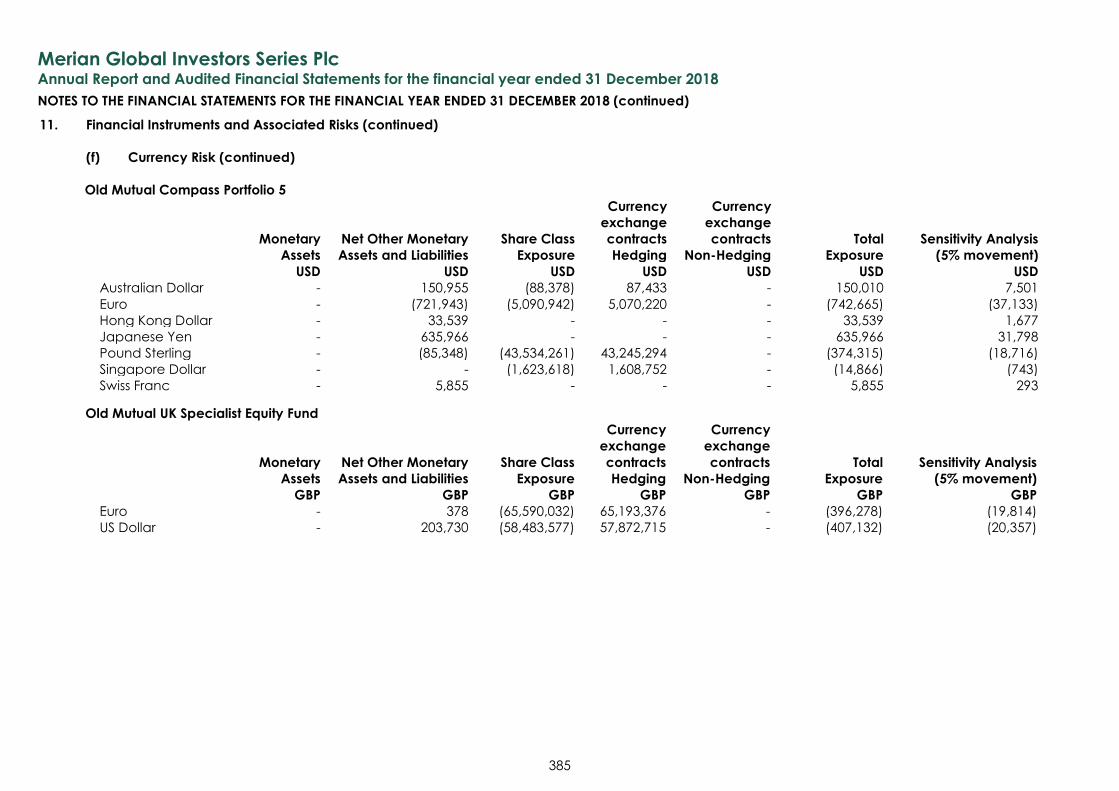
Merian Global Investors Series Plc
Annual Report and Audited Financial Statements for the financial year ended 31 December 2018
NOTES TO THE FINANCIAL STATEMENTS FOR THE FINANCIAL YEAR ENDED 31 DECEMBER 2018 (continued)
385
11. Financial Instruments and Associated Risks (continued)
(f) Currency Risk (continued)
Old Mutual Compass Portfolio 5
Monetary
Assets
Net Other Monetary
Assets and Liabilities
Share Class
Exposure
Currency
exchange
contracts
Hedging
Currency
exchange
contracts
Non-Hedging
Total
Exposure
Sensitivity Analysis
(5% movement)
USD USD USD USD USD USD USD
Australian Dollar - 150,955 (88,378) 87,433 - 150,010 7,501
Euro - (721,943) (5,090,942) 5,070,220 - (742,665) (37,133)
Hong Kong Dollar - 33,539 - - - 33,539 1,677
Japanese Yen - 635,966 - - - 635,966 31,798
Pound Sterling - (85,348) (43,534,261) 43,245,294 - (374,315) (18,716)
Singapore Dollar - - (1,623,618) 1,608,752 - (14,866) (743)
Swiss Franc - 5,855 - - - 5,855 293
Old Mutual UK Specialist Equity Fund
Monetary
Assets
Net Other Monetary
Assets and Liabilities
Share Class
Exposure
Currency
exchange
contracts
Hedging
Currency
exchange
contracts
Non-Hedging
Total
Exposure
Sensitivity Analysis
(5% movement)
GBP GBP GBP GBP GBP GBP GBP
Euro - 378 (65,590,032) 65,193,376 - (396,278) (19,814)
US Dollar - 203,730 (58,483,577) 57,872,715 - (407,132) (20,357)
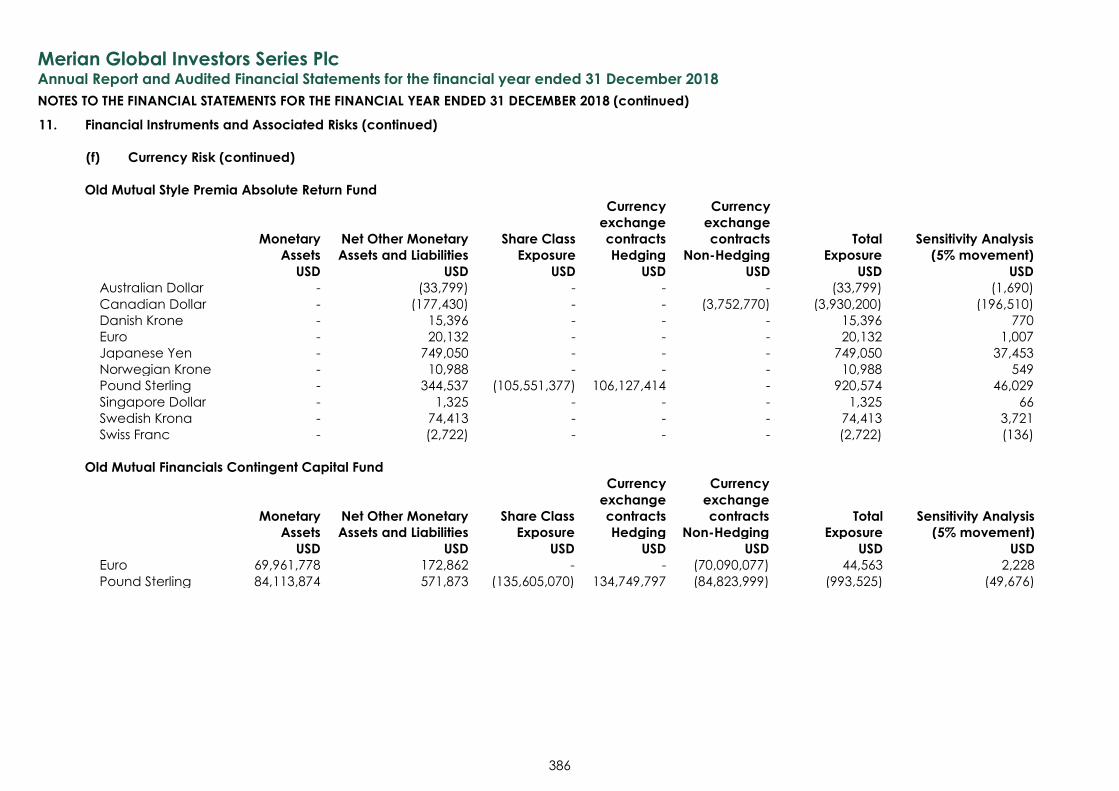
Merian Global Investors Series Plc
Annual Report and Audited Financial Statements for the financial year ended 31 December 2018
NOTES TO THE FINANCIAL STATEMENTS FOR THE FINANCIAL YEAR ENDED 31 DECEMBER 2018 (continued)
386
11. Financial Instruments and Associated Risks (continued)
(f) Currency Risk (continued)
Old Mutual Style Premia Absolute Return Fund
Monetary
Assets
Net Other Monetary
Assets and Liabilities
Share Class
Exposure
Currency
exchange
contracts
Hedging
Currency
exchange
contracts
Non-Hedging
Total
Exposure
Sensitivity Analysis
(5% movement)
USD USD USD USD USD USD USD
Australian Dollar - (33,799) - - - (33,799) (1,690)
Canadian Dollar - (177,430) - - (3,752,770) (3,930,200) (196,510)
Danish Krone - 15,396 - - - 15,396 770
Euro - 20,132 - - - 20,132 1,007
Japanese Yen - 749,050 - - - 749,050 37,453
Norwegian Krone - 10,988 - - - 10,988 549
Pound Sterling - 344,537 (105,551,377) 106,127,414 - 920,574 46,029
Singapore Dollar - 1,325 - - - 1,325 66
Swedish Krona - 74,413 - - - 74,413 3,721
Swiss Franc - (2,722) - - - (2,722) (136)
Old Mutual Financials Contingent Capital Fund
Monetary
Assets
Net Other Monetary
Assets and Liabilities
Share Class
Exposure
Currency
exchange
contracts
Hedging
Currency
exchange
contracts
Non-Hedging
Total
Exposure
Sensitivity Analysis
(5% movement)
USD USD USD USD USD USD USD
Euro 69,961,778 172,862 - - (70,090,077) 44,563 2,228
Pound Sterling 84,113,874 571,873 (135,605,070) 134,749,797 (84,823,999) (993,525) (49,676)
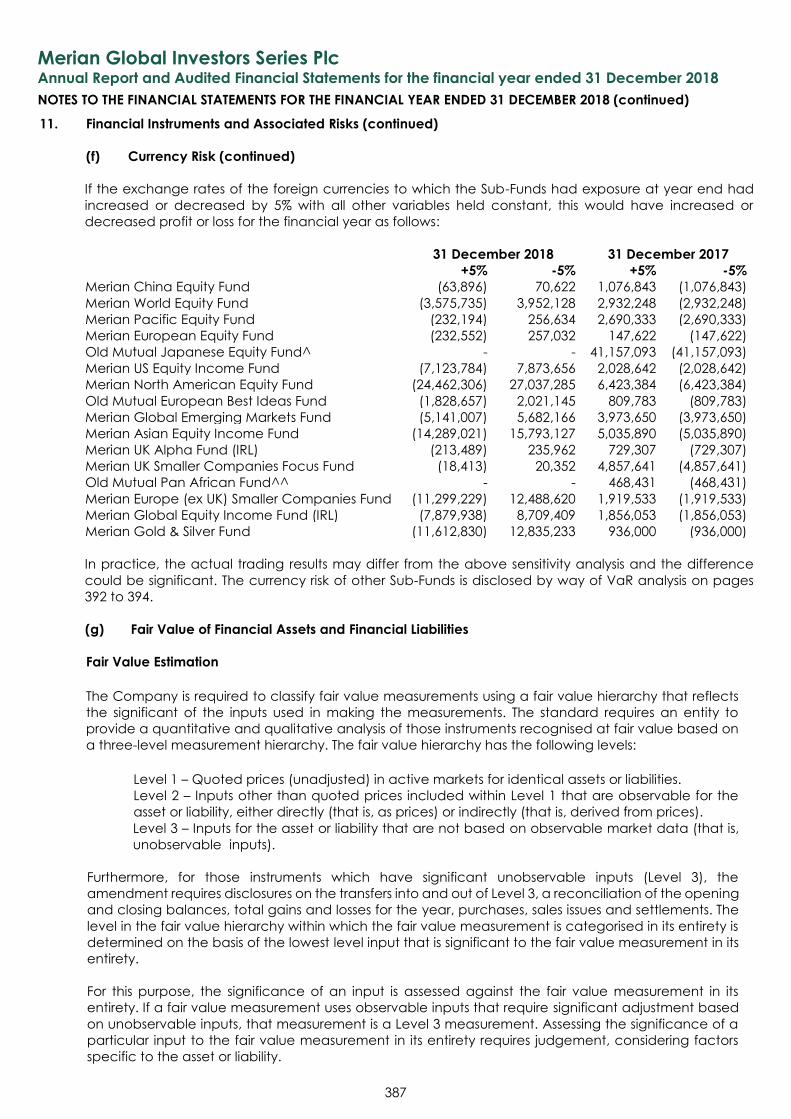
Merian Global Investors Series Plc
Annual Report and Audited Financial Statements for the financial year ended 31 December 2018
NOTES TO THE FINANCIAL STATEMENTS FOR THE FINANCIAL YEAR ENDED 31 DECEMBER 2018 (continued)
387
11. Financial Instruments and Associated Risks (continued)
(f) Currency Risk (continued)
If the exchange rates of the foreign currencies to which the Sub-Funds had exposure at year end had
increased or decreased by 5% with all other variables held constant, this would have increased or
decreased profit or loss for the financial year as follows:
31 December 2018 31 December 2017
+5% -5% +5% -5%
Merian China Equity Fund (63,896) 70,622 1,076,843 (1,076,843)
Merian World Equity Fund (3,575,735) 3,952,128 2,932,248 (2,932,248)
Merian Pacific Equity Fund (232,194) 256,634 2,690,333 (2,690,333)
Merian European Equity Fund (232,552) 257,032 147,622 (147,622)
Old Mutual Japanese Equity Fund^ - - 41,157,093 (41,157,093)
Merian US Equity Income Fund (7,123,784) 7,873,656 2,028,642 (2,028,642)
Merian North American Equity Fund (24,462,306) 27,037,285 6,423,384 (6,423,384)
Old Mutual European Best Ideas Fund (1,828,657) 2,021,145 809,783 (809,783)
Merian Global Emerging Markets Fund (5,141,007) 5,682,166 3,973,650 (3,973,650)
Merian Asian Equity Income Fund (14,289,021) 15,793,127 5,035,890 (5,035,890)
Merian UK Alpha Fund (IRL) (213,489) 235,962 729,307 (729,307)
Merian UK Smaller Companies Focus Fund (18,413) 20,352 4,857,641 (4,857,641)
Old Mutual Pan African Fund^^ - - 468,431 (468,431)
Merian Europe (ex UK) Smaller Companies Fund (11,299,229) 12,488,620 1,919,533 (1,919,533)
Merian Global Equity Income Fund (IRL) (7,879,938) 8,709,409 1,856,053 (1,856,053)
Merian Gold & Silver Fund (11,612,830) 12,835,233 936,000 (936,000)
In practice, the actual trading results may differ from the above sensitivity analysis and the difference
could be significant. The currency risk of other Sub-Funds is disclosed by way of VaR analysis on pages
392 to 394.
(g) Fair Value of Financial Assets and Financial Liabilities
Fair Value Estimation
The Company is required to classify fair value measurements using a fair value hierarchy that reflects
the significant of the inputs used in making the measurements. The standard requires an entity to
provide a quantitative and qualitative analysis of those instruments recognised at fair value based on
a three-level measurement hierarchy. The fair value hierarchy has the following levels:
Level 1 – Quoted prices (unadjusted) in active markets for identical assets or liabilities.
Level 2 – Inputs other than quoted prices included within Level 1 that are observable for the
asset or liability, either directly (that is, as prices) or indirectly (that is, derived from prices).
Level 3 – Inputs for the asset or liability that are not based on observable market data (that is,
unobservable inputs).
Furthermore, for those instruments which have significant unobservable inputs (Level 3), the
amendment requires disclosures on the transfers into and out of Level 3, a reconciliation of the opening
and closing balances, total gains and losses for the year, purchases, sales issues and settlements. The
level in the fair value hierarchy within which the fair value measurement is categorised in its entirety is
determined on the basis of the lowest level input that is significant to the fair value measurement in its
entirety.
For this purpose, the significance of an input is assessed against the fair value measurement in its
entirety. If a fair value measurement uses observable inputs that require significant adjustment based
on unobservable inputs, that measurement is a Level 3 measurement. Assessing the significance of a
particular input to the fair value measurement in its entirety requires judgement, considering factors
specific to the asset or liability.
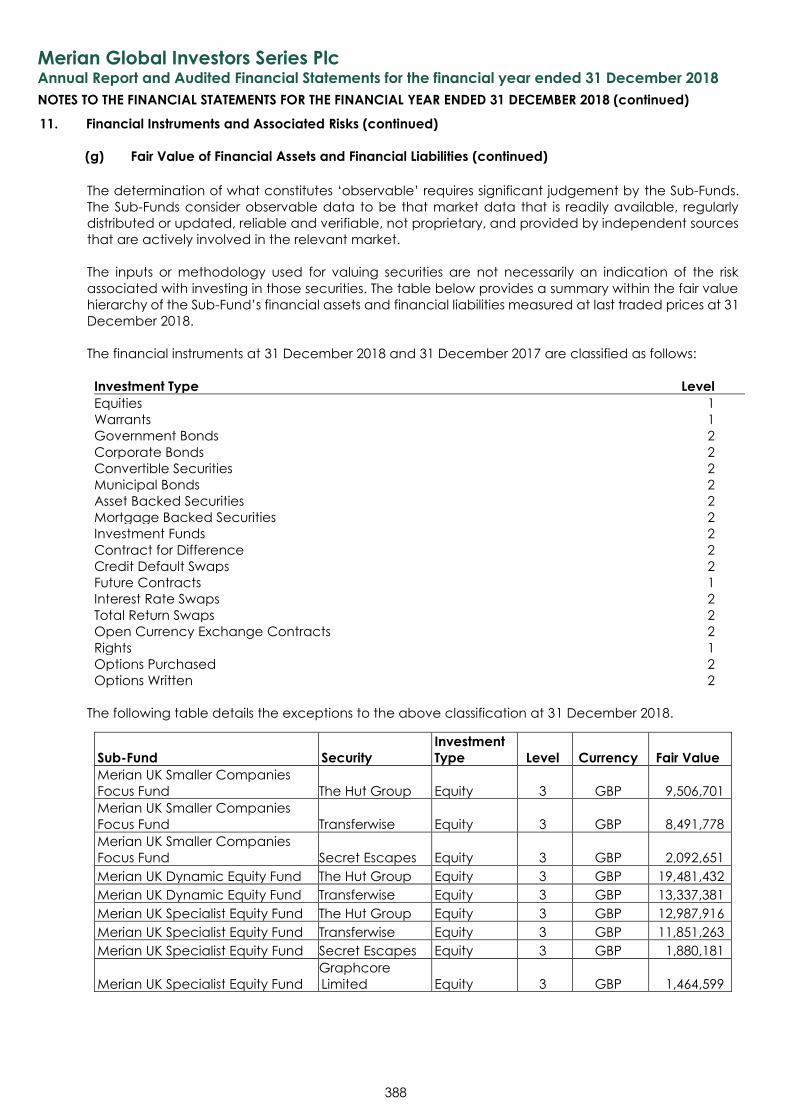
Merian Global Investors Series Plc
Annual Report and Audited Financial Statements for the financial year ended 31 December 2018
NOTES TO THE FINANCIAL STATEMENTS FOR THE FINANCIAL YEAR ENDED 31 DECEMBER 2018 (continued)
388
11. Financial Instruments and Associated Risks (continued)
(g) Fair Value of Financial Assets and Financial Liabilities (continued)
The determination of what constitutes ‘observable’ requires significant judgement by the Sub-Funds.
The Sub-Funds consider observable data to be that market data that is readily available, regularly
distributed or updated, reliable and verifiable, not proprietary, and provided by independent sources
that are actively involved in the relevant market.
The inputs or methodology used for valuing securities are not necessarily an indication of the risk
associated with investing in those securities. The table below provides a summary within the fair value
hierarchy of the Sub-Fund’s financial assets and financial liabilities measured at last traded prices at 31
December 2018.
The financial instruments at 31 December 2018 and 31 December 2017 are classified as follows:
Investment Type Level
Equities 1
Warrants 1
Government Bonds 2
Corporate Bonds 2
Convertible Securities 2
Municipal Bonds 2
Asset Backed Securities 2
Mortgage Backed Securities 2
Investment Funds 2
Contract for Difference 2
Credit Default Swaps 2
Future Contracts 1
Interest Rate Swaps 2
Total Return Swaps 2
Open Currency Exchange Contracts 2
Rights 1
Options Purchased 2
Options Written 2
The following table details the exceptions to the above classification at 31 December 2018.
Sub-Fund Security
Investment
Type Level Currency Fair Value
Merian UK Smaller Companies
Focus Fund The Hut Group Equity 3 GBP 9,506,701
Merian UK Smaller Companies
Focus Fund Transferwise Equity 3 GBP 8,491,778
Merian UK Smaller Companies
Focus Fund Secret Escapes Equity 3 GBP 2,092,651
Merian UK Dynamic Equity Fund The Hut Group Equity 3 GBP 19,481,432
Merian UK Dynamic Equity Fund Transferwise Equity 3 GBP 13,337,381
Merian UK Specialist Equity Fund The Hut Group Equity 3 GBP 12,987,916
Merian UK Specialist Equity Fund Transferwise Equity 3 GBP 11,851,263
Merian UK Specialist Equity Fund Secret Escapes Equity 3 GBP 1,880,181
Merian UK Specialist Equity Fund
Graphcore
Limited Equity 3 GBP 1,464,599
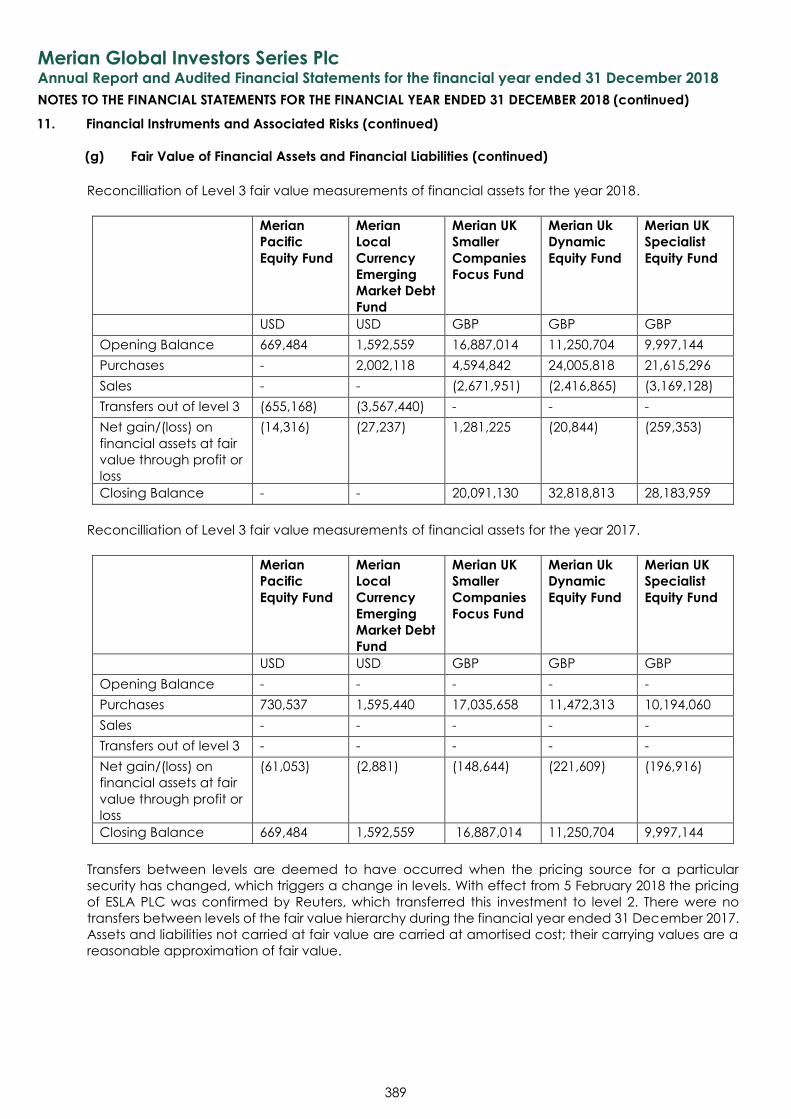
Merian Global Investors Series Plc
Annual Report and Audited Financial Statements for the financial year ended 31 December 2018
NOTES TO THE FINANCIAL STATEMENTS FOR THE FINANCIAL YEAR ENDED 31 DECEMBER 2018 (continued)
389
11. Financial Instruments and Associated Risks (continued)
(g) Fair Value of Financial Assets and Financial Liabilities (continued)
Reconcilliation of Level 3 fair value measurements of financial assets for the year 2018.
Merian
Pacific
Equity Fund
Merian
Local
Currency
Emerging
Market Debt
Fund
Merian UK
Smaller
Companies
Focus Fund
Merian Uk
Dynamic
Equity Fund
Merian UK
Specialist
Equity Fund
USD USD GBP GBP GBP
Opening Balance 669,484 1,592,559 16,887,014 11,250,704 9,997,144
Purchases - 2,002,118 4,594,842 24,005,818 21,615,296
Sales - - (2,671,951) (2,416,865) (3,169,128)
Transfers out of level 3 (655,168) (3,567,440) - - -
Net gain/(loss) on
financial assets at fair
value through profit or
loss
(14,316) (27,237) 1,281,225 (20,844) (259,353)
Closing Balance - - 20,091,130 32,818,813 28,183,959
Reconcilliation of Level 3 fair value measurements of financial assets for the year 2017.
Merian
Pacific
Equity Fund
Merian
Local
Currency
Emerging
Market Debt
Fund
Merian UK
Smaller
Companies
Focus Fund
Merian Uk
Dynamic
Equity Fund
Merian UK
Specialist
Equity Fund
USD USD GBP GBP GBP
Opening Balance - - - - -
Purchases 730,537 1,595,440 17,035,658 11,472,313 10,194,060
Sales - - - - -
Transfers out of level 3 - - - - -
Net gain/(loss) on
financial assets at fair
value through profit or
loss
(61,053) (2,881) (148,644) (221,609) (196,916)
Closing Balance 669,484 1,592,559 16,887,014 11,250,704 9,997,144
Transfers between levels are deemed to have occurred when the pricing source for a particular
security has changed, which triggers a change in levels. With effect from 5 February 2018 the pricing
of ESLA PLC was confirmed by Reuters, which transferred this investment to level 2. There were no
transfers between levels of the fair value hierarchy during the financial year ended 31 December 2017.
Assets and liabilities not carried at fair value are carried at amortised cost; their carrying values are a
reasonable approximation of fair value.
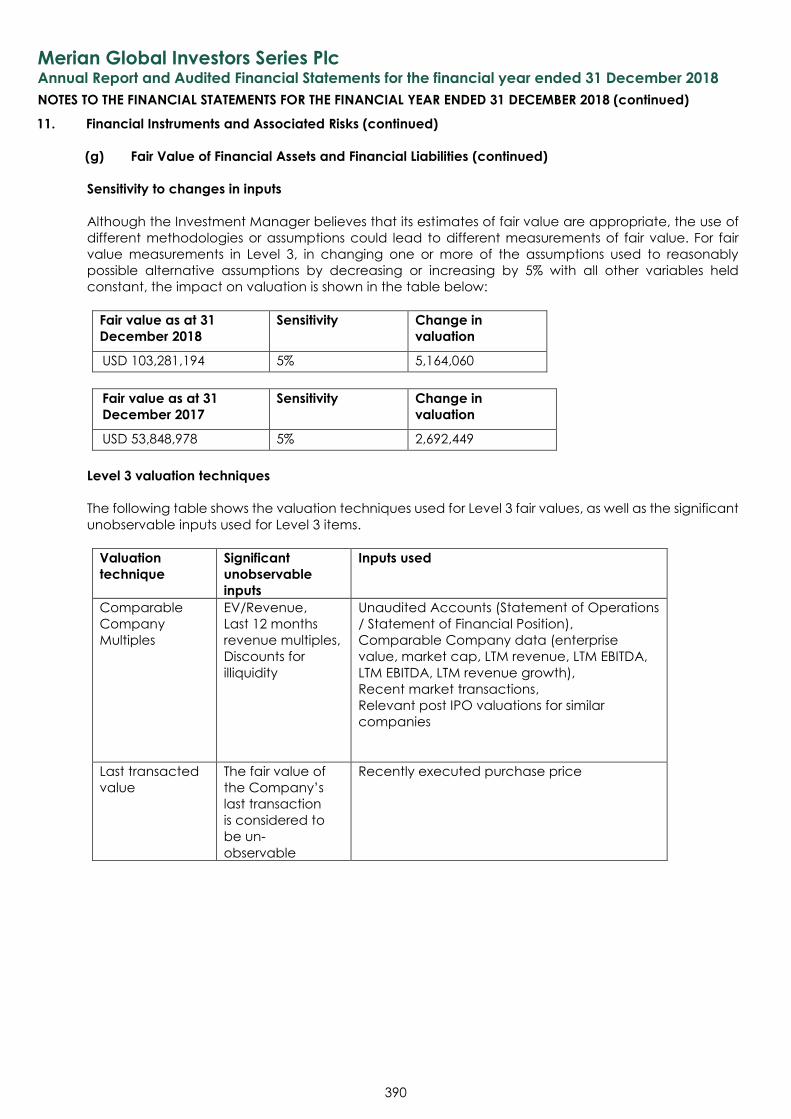
Merian Global Investors Series Plc
Annual Report and Audited Financial Statements for the financial year ended 31 December 2018
NOTES TO THE FINANCIAL STATEMENTS FOR THE FINANCIAL YEAR ENDED 31 DECEMBER 2018 (continued)
390
11. Financial Instruments and Associated Risks (continued)
(g) Fair Value of Financial Assets and Financial Liabilities (continued)
Sensitivity to changes in inputs
Although the Investment Manager believes that its estimates of fair value are appropriate, the use of
different methodologies or assumptions could lead to different measurements of fair value. For fair
value measurements in Level 3, in changing one or more of the assumptions used to reasonably
possible alternative assumptions by decreasing or increasing by 5% with all other variables held
constant, the impact on valuation is shown in the table below:
Fair value as at 31
December 2018
Sensitivity Change in
valuation
USD 103,281,194 5% 5,164,060
Fair value as at 31
December 2017
Sensitivity Change in
valuation
USD 53,848,978 5% 2,692,449
Level 3 valuation techniques
The following table shows the valuation techniques used for Level 3 fair values, as well as the significant
unobservable inputs used for Level 3 items.
Valuation
technique
Significant
unobservable
inputs
Inputs used
Comparable
Company
Multiples
EV/Revenue,
Last 12 months
revenue multiples,
Discounts for
illiquidity
Unaudited Accounts (Statement of Operations
/ Statement of Financial Position),
Comparable Company data (enterprise
value, market cap, LTM revenue, LTM EBITDA,
LTM EBITDA, LTM revenue growth),
Recent market transactions,
Relevant post IPO valuations for similar
companies
Last transacted
value
The fair value of
the Company’s
last transaction
is considered to
be un-
observable
Recently executed purchase price
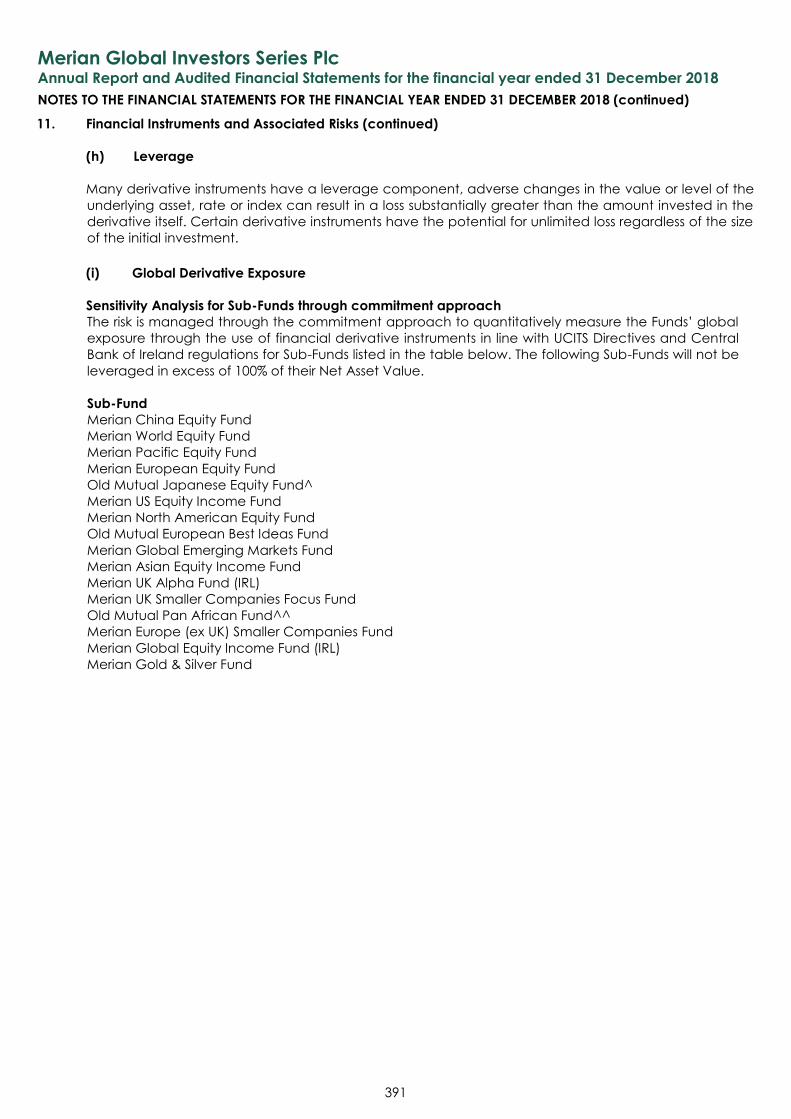
Merian Global Investors Series Plc
Annual Report and Audited Financial Statements for the financial year ended 31 December 2018
NOTES TO THE FINANCIAL STATEMENTS FOR THE FINANCIAL YEAR ENDED 31 DECEMBER 2018 (continued)
391
11. Financial Instruments and Associated Risks (continued)
(h) Leverage
Many derivative instruments have a leverage component, adverse changes in the value or level of the
underlying asset, rate or index can result in a loss substantially greater than the amount invested in the
derivative itself. Certain derivative instruments have the potential for unlimited loss regardless of the size
of the initial investment.
(i) Global Derivative Exposure
Sensitivity Analysis for Sub-Funds through commitment approach
The risk is managed through the commitment approach to quantitatively measure the Funds’ global
exposure through the use of financial derivative instruments in line with UCITS Directives and Central
Bank of Ireland regulations for Sub-Funds listed in the table below. The following Sub-Funds will not be
leveraged in excess of 100% of their Net Asset Value.
Sub-Fund
Merian China Equity Fund
Merian World Equity Fund
Merian Pacific Equity Fund
Merian European Equity Fund
Old Mutual Japanese Equity Fund^
Merian US Equity Income Fund
Merian North American Equity Fund
Old Mutual European Best Ideas Fund
Merian Global Emerging Markets Fund
Merian Asian Equity Income Fund
Merian UK Alpha Fund (IRL)
Merian UK Smaller Companies Focus Fund
Old Mutual Pan African Fund^^
Merian Europe (ex UK) Smaller Companies Fund
Merian Global Equity Income Fund (IRL)
Merian Gold & Silver Fund
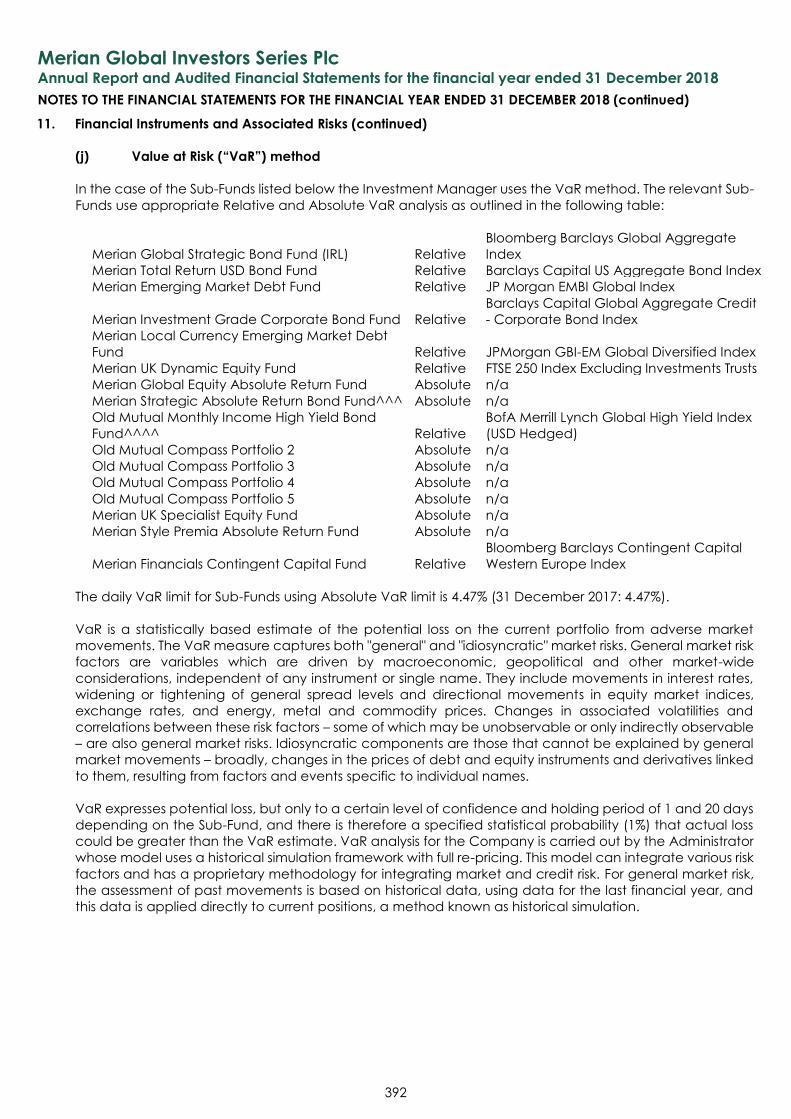
Merian Global Investors Series Plc
Annual Report and Audited Financial Statements for the financial year ended 31 December 2018
NOTES TO THE FINANCIAL STATEMENTS FOR THE FINANCIAL YEAR ENDED 31 DECEMBER 2018 (continued)
392
11. Financial Instruments and Associated Risks (continued)
(j) Value at Risk (“VaR”) method
In the case of the Sub-Funds listed below the Investment Manager uses the VaR method. The relevant Sub-
Funds use appropriate Relative and Absolute VaR analysis as outlined in the following table:
Merian Global Strategic Bond Fund (IRL) Relative
Bloomberg Barclays Global Aggregate
Index
Merian Total Return USD Bond Fund Relative Barclays Capital US Aggregate Bond Index
Merian Emerging Market Debt Fund Relative JP Morgan EMBI Global Index
Merian Investment Grade Corporate Bond Fund Relative
Barclays Capital Global Aggregate Credit
- Corporate Bond Index
Merian Local Currency Emerging Market Debt
Fund Relative JPMorgan GBI-EM Global Diversified Index
Merian UK Dynamic Equity Fund Relative FTSE 250 Index Excluding Investments Trusts
Merian Global Equity Absolute Return Fund Absolute n/a Merian Strategic Absolute Return Bond Fund^^^ Absolute n/a Old Mutual Monthly Income High Yield Bond
Fund^^^^ Relative
BofA Merrill Lynch Global High Yield Index
(USD Hedged) Old Mutual Compass Portfolio 2 Absolute n/a Old Mutual Compass Portfolio 3 Absolute n/a Old Mutual Compass Portfolio 4 Absolute n/a Old Mutual Compass Portfolio 5 Absolute n/a Merian UK Specialist Equity Fund Absolute n/a Merian Style Premia Absolute Return Fund Absolute n/a
Merian Financials Contingent Capital Fund Relative
Bloomberg Barclays Contingent Capital
Western Europe Index
The daily VaR limit for Sub-Funds using Absolute VaR limit is 4.47% (31 December 2017: 4.47%).
VaR is a statistically based estimate of the potential loss on the current portfolio from adverse market
movements. The VaR measure captures both "general" and "idiosyncratic" market risks. General market risk
factors are variables which are driven by macroeconomic, geopolitical and other market-wide
considerations, independent of any instrument or single name. They include movements in interest rates,
widening or tightening of general spread levels and directional movements in equity market indices,
exchange rates, and energy, metal and commodity prices. Changes in associated volatilities and
correlations between these risk factors – some of which may be unobservable or only indirectly observable
– are also general market risks. Idiosyncratic components are those that cannot be explained by general
market movements – broadly, changes in the prices of debt and equity instruments and derivatives linked
to them, resulting from factors and events specific to individual names.
VaR expresses potential loss, but only to a certain level of confidence and holding period of 1 and 20 days
depending on the Sub-Fund, and there is therefore a specified statistical probability (1%) that actual loss
could be greater than the VaR estimate. VaR analysis for the Company is carried out by the Administrator
whose model uses a historical simulation framework with full re-pricing. This model can integrate various risk
factors and has a proprietary methodology for integrating market and credit risk. For general market risk,
the assessment of past movements is based on historical data, using data for the last financial year, and
this data is applied directly to current positions, a method known as historical simulation.
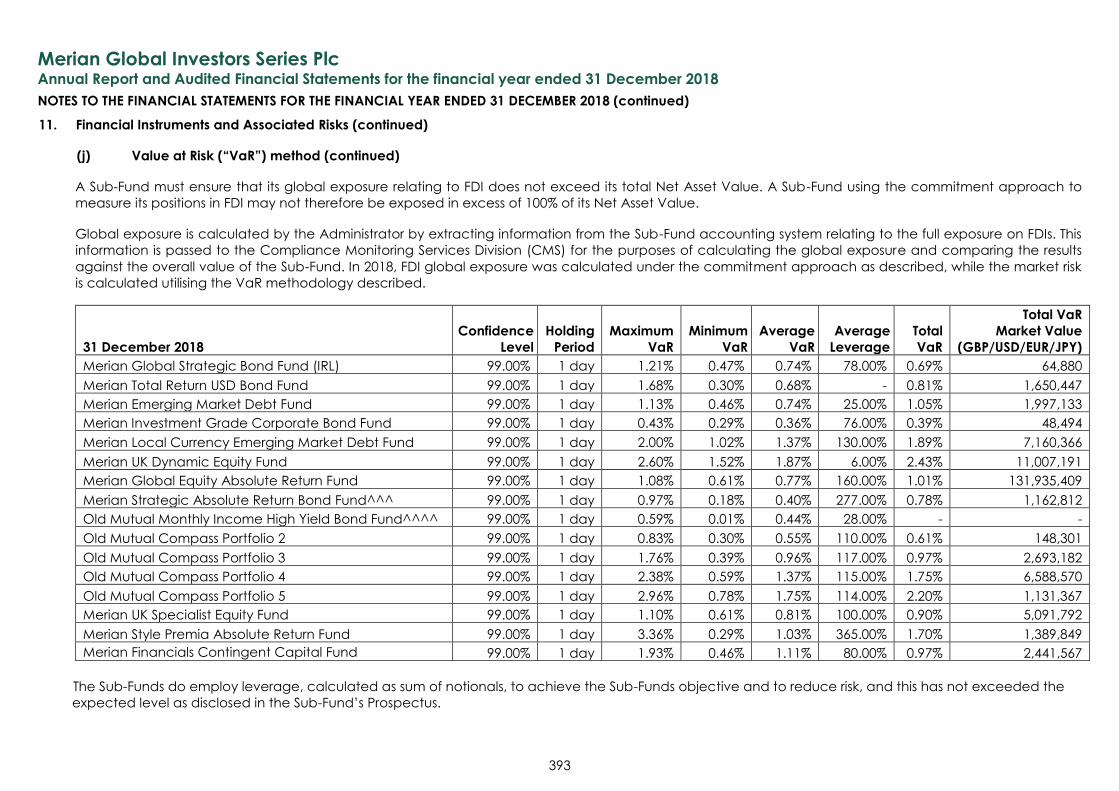
Merian Global Investors Series Plc
Annual Report and Audited Financial Statements for the financial year ended 31 December 2018
NOTES TO THE FINANCIAL STATEMENTS FOR THE FINANCIAL YEAR ENDED 31 DECEMBER 2018 (continued)
393
11. Financial Instruments and Associated Risks (continued)
(j) Value at Risk (“VaR”) method (continued)
A Sub-Fund must ensure that its global exposure relating to FDI does not exceed its total Net Asset Value. A Sub-Fund using the commitment approach to
measure its positions in FDI may not therefore be exposed in excess of 100% of its Net Asset Value.
Global exposure is calculated by the Administrator by extracting information from the Sub-Fund accounting system relating to the full exposure on FDIs. This
information is passed to the Compliance Monitoring Services Division (CMS) for the purposes of calculating the global exposure and comparing the results
against the overall value of the Sub-Fund. In 2018, FDI global exposure was calculated under the commitment approach as described, while the market risk
is calculated utilising the VaR methodology described.
31 December 2018
Confidence
Level
Holding
Period
Maximum
VaR
Minimum
VaR
Average
VaR
Average
Leverage
Total
VaR
Total VaR
Market Value
(GBP/USD/EUR/JPY)
Merian Global Strategic Bond Fund (IRL) 99.00% 1 day 1.21% 0.47% 0.74% 78.00% 0.69% 64,880
Merian Total Return USD Bond Fund 99.00% 1 day 1.68% 0.30% 0.68% - 0.81% 1,650,447
Merian Emerging Market Debt Fund 99.00% 1 day 1.13% 0.46% 0.74% 25.00% 1.05% 1,997,133
Merian Investment Grade Corporate Bond Fund 99.00% 1 day 0.43% 0.29% 0.36% 76.00% 0.39% 48,494
Merian Local Currency Emerging Market Debt Fund 99.00% 1 day 2.00% 1.02% 1.37% 130.00% 1.89% 7,160,366
Merian UK Dynamic Equity Fund 99.00% 1 day 2.60% 1.52% 1.87% 6.00% 2.43% 11,007,191
Merian Global Equity Absolute Return Fund 99.00% 1 day 1.08% 0.61% 0.77% 160.00% 1.01% 131,935,409
Merian Strategic Absolute Return Bond Fund^^^ 99.00% 1 day 0.97% 0.18% 0.40% 277.00% 0.78% 1,162,812
Old Mutual Monthly Income High Yield Bond Fund^^^^ 99.00% 1 day 0.59% 0.01% 0.44% 28.00% - -
Old Mutual Compass Portfolio 2 99.00% 1 day 0.83% 0.30% 0.55% 110.00% 0.61% 148,301
Old Mutual Compass Portfolio 3 99.00% 1 day 1.76% 0.39% 0.96% 117.00% 0.97% 2,693,182
Old Mutual Compass Portfolio 4 99.00% 1 day 2.38% 0.59% 1.37% 115.00% 1.75% 6,588,570
Old Mutual Compass Portfolio 5 99.00% 1 day 2.96% 0.78% 1.75% 114.00% 2.20% 1,131,367
Merian UK Specialist Equity Fund 99.00% 1 day 1.10% 0.61% 0.81% 100.00% 0.90% 5,091,792
Merian Style Premia Absolute Return Fund 99.00% 1 day 3.36% 0.29% 1.03% 365.00% 1.70% 1,389,849
Merian Financials Contingent Capital Fund 99.00% 1 day 1.93% 0.46% 1.11% 80.00% 0.97% 2,441,567
The Sub-Funds do employ leverage, calculated as sum of notionals, to achieve the Sub-Funds objective and to reduce risk, and this has not exceeded the
expected level as disclosed in the Sub-Fund’s Prospectus.
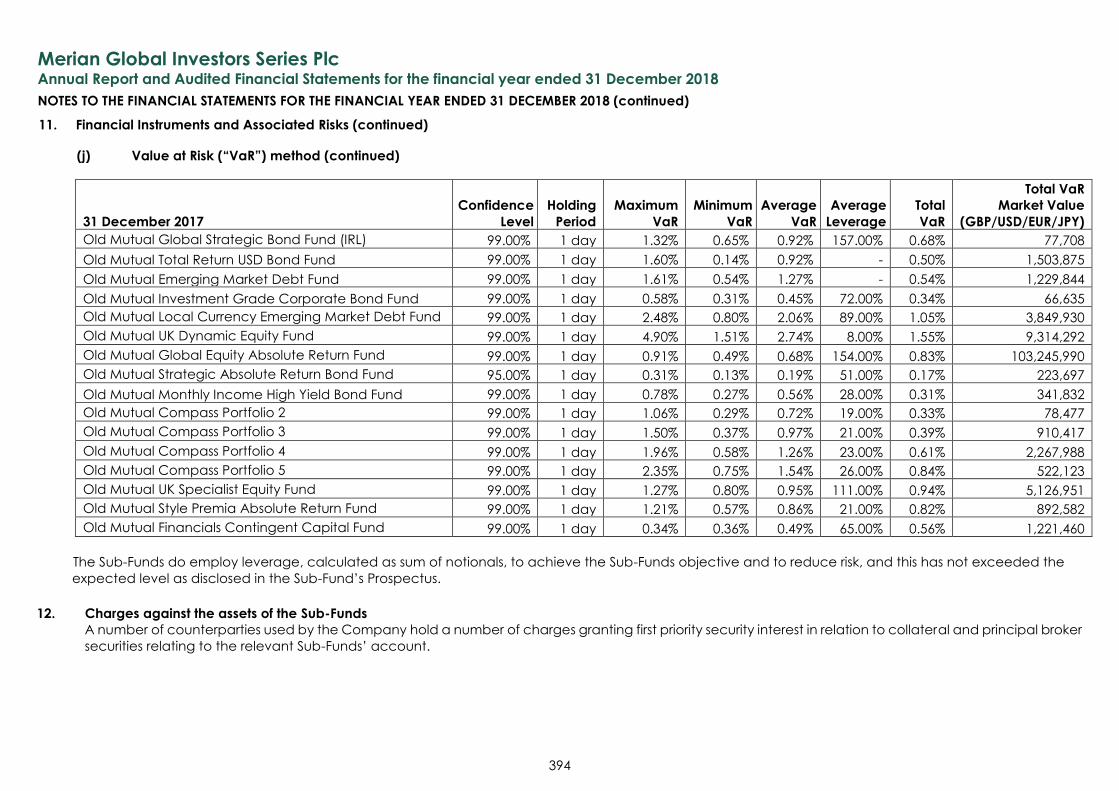
Merian Global Investors Series Plc
Annual Report and Audited Financial Statements for the financial year ended 31 December 2018
NOTES TO THE FINANCIAL STATEMENTS FOR THE FINANCIAL YEAR ENDED 31 DECEMBER 2018 (continued)
394
11. Financial Instruments and Associated Risks (continued)
(j) Value at Risk (“VaR”) method (continued)
31 December 2017
Confidence
Level
Holding
Period
Maximum
VaR
Minimum
VaR
Average
VaR
Average
Leverage
Total
VaR
Total VaR
Market Value
(GBP/USD/EUR/JPY)
Old Mutual Global Strategic Bond Fund (IRL) 99.00% 1 day 1.32% 0.65% 0.92% 157.00% 0.68% 77,708
Old Mutual Total Return USD Bond Fund 99.00% 1 day 1.60% 0.14% 0.92% - 0.50% 1,503,875
Old Mutual Emerging Market Debt Fund 99.00% 1 day 1.61% 0.54% 1.27% - 0.54% 1,229,844
Old Mutual Investment Grade Corporate Bond Fund 99.00% 1 day 0.58% 0.31% 0.45% 72.00% 0.34% 66,635
Old Mutual Local Currency Emerging Market Debt Fund 99.00% 1 day 2.48% 0.80% 2.06% 89.00% 1.05% 3,849,930
Old Mutual UK Dynamic Equity Fund 99.00% 1 day 4.90% 1.51% 2.74% 8.00% 1.55% 9,314,292
Old Mutual Global Equity Absolute Return Fund 99.00% 1 day 0.91% 0.49% 0.68% 154.00% 0.83% 103,245,990
Old Mutual Strategic Absolute Return Bond Fund 95.00% 1 day 0.31% 0.13% 0.19% 51.00% 0.17% 223,697
Old Mutual Monthly Income High Yield Bond Fund 99.00% 1 day 0.78% 0.27% 0.56% 28.00% 0.31% 341,832
Old Mutual Compass Portfolio 2 99.00% 1 day 1.06% 0.29% 0.72% 19.00% 0.33% 78,477
Old Mutual Compass Portfolio 3 99.00% 1 day 1.50% 0.37% 0.97% 21.00% 0.39% 910,417
Old Mutual Compass Portfolio 4 99.00% 1 day 1.96% 0.58% 1.26% 23.00% 0.61% 2,267,988
Old Mutual Compass Portfolio 5 99.00% 1 day 2.35% 0.75% 1.54% 26.00% 0.84% 522,123
Old Mutual UK Specialist Equity Fund 99.00% 1 day 1.27% 0.80% 0.95% 111.00% 0.94% 5,126,951
Old Mutual Style Premia Absolute Return Fund 99.00% 1 day 1.21% 0.57% 0.86% 21.00% 0.82% 892,582
Old Mutual Financials Contingent Capital Fund 99.00% 1 day 0.34% 0.36% 0.49% 65.00% 0.56% 1,221,460
The Sub-Funds do employ leverage, calculated as sum of notionals, to achieve the Sub-Funds objective and to reduce risk, and this has not exceeded the
expected level as disclosed in the Sub-Fund’s Prospectus.
12. Charges against the assets of the Sub-Funds
A number of counterparties used by the Company hold a number of charges granting first priority security interest in relation to collateral and principal broker
securities relating to the relevant Sub-Funds’ account.
Merian Global Investors Series Plc
Annual Report and Audited Financial Statements for the financial year ended 31 December 2018
NOTES TO THE FINANCIAL STATEMENTS FOR THE FINANCIAL YEAR ENDED 31 DECEMBER 2018 (continued)
395
13. Post Statement of Financial Position Events
a) Change of Investment Policy
On 1 April 2019, a number of miscellaneous non material changes were made to the investment policy
of the Merian European Equity Fund. Shareholders were notified by letter of these changes.
b) Change in Distribution Frequency
With effect from 31 December 2018, the income distribution frequency of class P2 (USD) Income of the
Merian North American Equity Fund has changed from annual to quarterly.
c) Closure of Merian Global Strategic Bond Fund (IRL)
On 7 March 2019, Shareholders in the Merian Global Strategic Bond Fund (IRL) were notified of the
proposed closure of the Fund, this closure is due to take place on 25 April 2019.
d) Change of Investment Adviser
On 7 March 2019, Shareholders in the Merian Total Return USD Bond Fund were notified by letter of a series
of changes being made to the Merian Total Return USD Bond Fund. These include the proposed
termination of the existing Investment Adviser of the Fund, Janus Capital International Limited and their
sub-advisor Janus Capital Management LLC so that with effect from 25th April, Merian Global Investors
(UK) Limited will act as Investment Adviser to the Fund. Miscellanous other changes are being made to
the sub-fund, including:
miscellaneous changes to the investment policy;
a change to the definition of Business Day;
a change of name of the Fund from Merian Total Return USD Bond Fund to the Merian Global
Dynamic Bond Fund.
e) Changes to Supplements
The following supplements were updated post year end:
Merian US Equity Income Fund 21 March 2019;
Merian European Equity Fund 1 April 2019.
There have been no other material events affecting the Sub-Funds subsequent to 31 December 2018,
which require amendment to or disclosure in, these financial statements.
14. Financial Statements
These financial statements were approved by the Board of Directors on 25 April 2019.
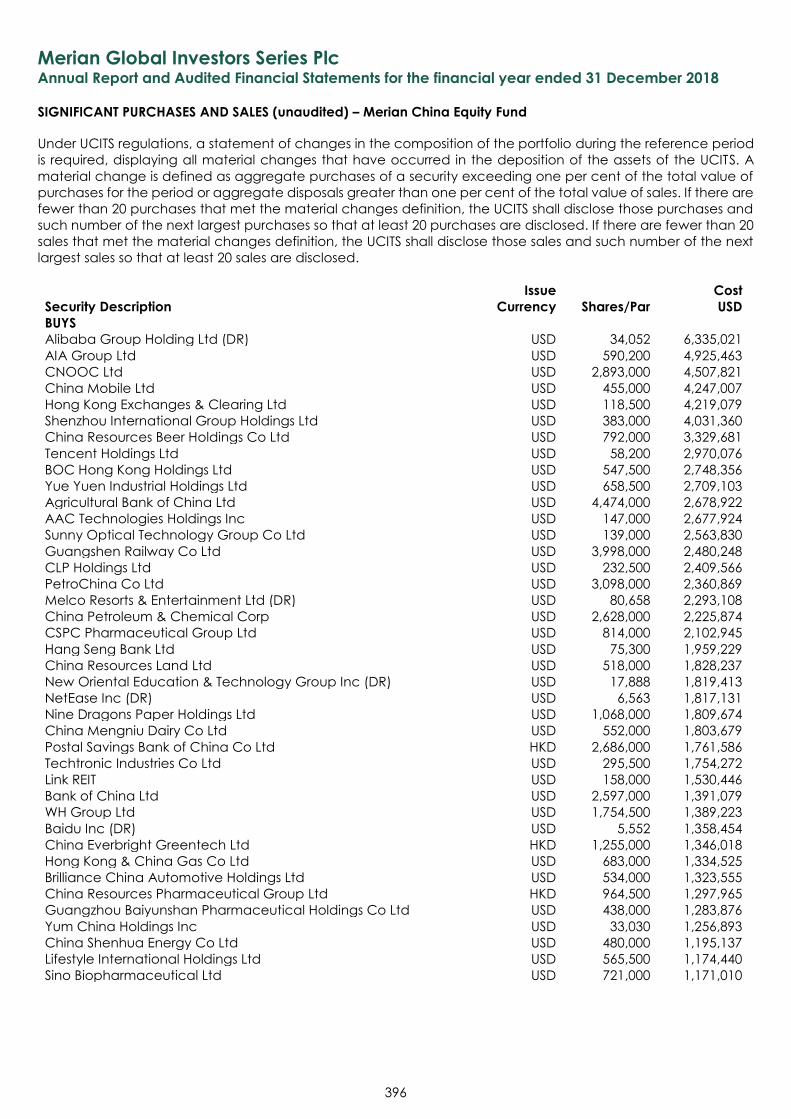
Merian Global Investors Series Plc Annual Report and Audited Financial Statements for the financial year ended 31 December 2018
SIGNIFICANT PURCHASES AND SALES (unaudited) – Merian China Equity Fund
396
Under UCITS regulations, a statement of changes in the composition of the portfolio during the reference period
is required, displaying all material changes that have occurred in the deposition of the assets of the UCITS. A
material change is defined as aggregate purchases of a security exceeding one per cent of the total value of
purchases for the period or aggregate disposals greater than one per cent of the total value of sales. If there are
fewer than 20 purchases that met the material changes definition, the UCITS shall disclose those purchases and
such number of the next largest purchases so that at least 20 purchases are disclosed. If there are fewer than 20
sales that met the material changes definition, the UCITS shall disclose those sales and such number of the next
largest sales so that at least 20 sales are disclosed.
Security Description
Issue
Currency Shares/Par
Cost
USD
BUYS
Alibaba Group Holding Ltd (DR) USD 34,052 6,335,021
AIA Group Ltd USD 590,200 4,925,463
CNOOC Ltd USD 2,893,000 4,507,821
China Mobile Ltd USD 455,000 4,247,007
Hong Kong Exchanges & Clearing Ltd USD 118,500 4,219,079
Shenzhou International Group Holdings Ltd USD 383,000 4,031,360
China Resources Beer Holdings Co Ltd USD 792,000 3,329,681
Tencent Holdings Ltd USD 58,200 2,970,076
BOC Hong Kong Holdings Ltd USD 547,500 2,748,356
Yue Yuen Industrial Holdings Ltd USD 658,500 2,709,103
Agricultural Bank of China Ltd USD 4,474,000 2,678,922
AAC Technologies Holdings Inc USD 147,000 2,677,924
Sunny Optical Technology Group Co Ltd USD 139,000 2,563,830
Guangshen Railway Co Ltd USD 3,998,000 2,480,248
CLP Holdings Ltd USD 232,500 2,409,566
PetroChina Co Ltd USD 3,098,000 2,360,869
Melco Resorts & Entertainment Ltd (DR) USD 80,658 2,293,108
China Petroleum & Chemical Corp USD 2,628,000 2,225,874
CSPC Pharmaceutical Group Ltd USD 814,000 2,102,945
Hang Seng Bank Ltd USD 75,300 1,959,229
China Resources Land Ltd USD 518,000 1,828,237
New Oriental Education & Technology Group Inc (DR) USD 17,888 1,819,413
NetEase Inc (DR) USD 6,563 1,817,131
Nine Dragons Paper Holdings Ltd USD 1,068,000 1,809,674
China Mengniu Dairy Co Ltd USD 552,000 1,803,679
Postal Savings Bank of China Co Ltd HKD 2,686,000 1,761,586
Techtronic Industries Co Ltd USD 295,500 1,754,272
Link REIT USD 158,000 1,530,446
Bank of China Ltd USD 2,597,000 1,391,079
WH Group Ltd USD 1,754,500 1,389,223
Baidu Inc (DR) USD 5,552 1,358,454
China Everbright Greentech Ltd HKD 1,255,000 1,346,018
Hong Kong & China Gas Co Ltd USD 683,000 1,334,525
Brilliance China Automotive Holdings Ltd USD 534,000 1,323,555
China Resources Pharmaceutical Group Ltd HKD 964,500 1,297,965
Guangzhou Baiyunshan Pharmaceutical Holdings Co Ltd USD 438,000 1,283,876
Yum China Holdings Inc USD 33,030 1,256,893
China Shenhua Energy Co Ltd USD 480,000 1,195,137
Lifestyle International Holdings Ltd USD 565,500 1,174,440
Sino Biopharmaceutical Ltd USD 721,000 1,171,010
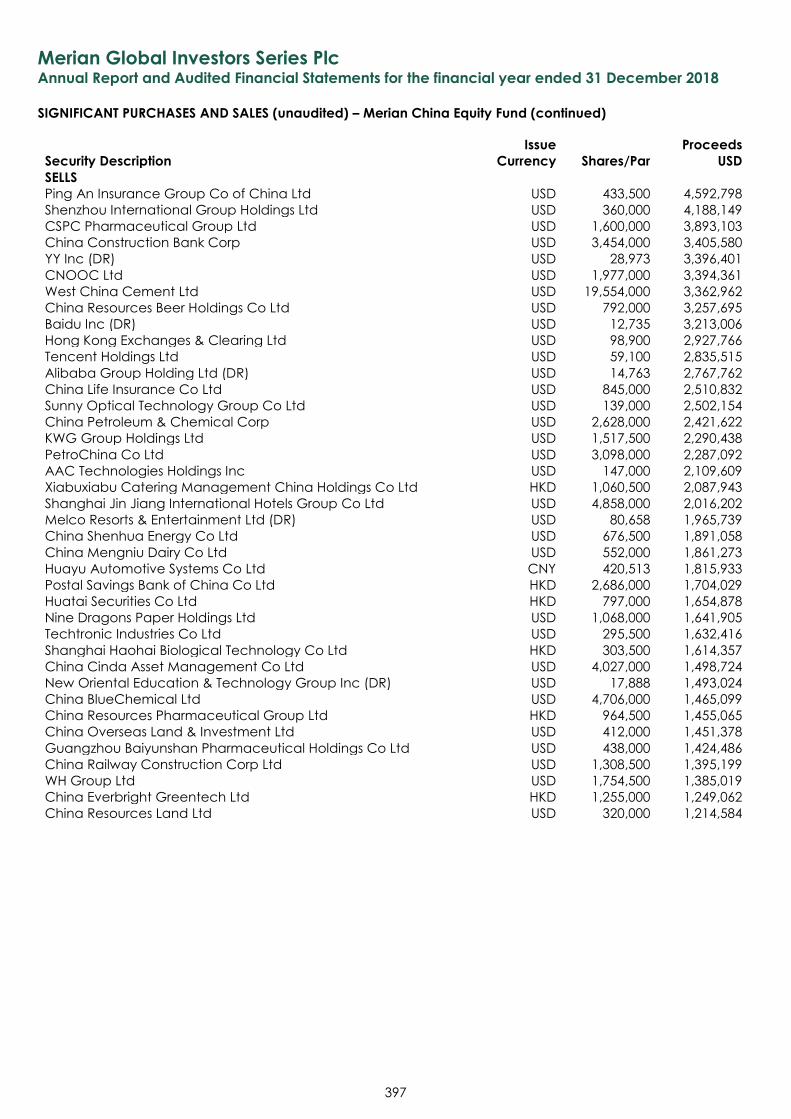
Merian Global Investors Series Plc Annual Report and Audited Financial Statements for the financial year ended 31 December 2018
SIGNIFICANT PURCHASES AND SALES (unaudited) – Merian China Equity Fund (continued)
397
Security Description
Issue
Currency Shares/Par
Proceeds
USD
SELLS
Ping An Insurance Group Co of China Ltd USD 433,500 4,592,798
Shenzhou International Group Holdings Ltd USD 360,000 4,188,149
CSPC Pharmaceutical Group Ltd USD 1,600,000 3,893,103
China Construction Bank Corp USD 3,454,000 3,405,580
YY Inc (DR) USD 28,973 3,396,401
CNOOC Ltd USD 1,977,000 3,394,361
West China Cement Ltd USD 19,554,000 3,362,962
China Resources Beer Holdings Co Ltd USD 792,000 3,257,695
Baidu Inc (DR) USD 12,735 3,213,006
Hong Kong Exchanges & Clearing Ltd USD 98,900 2,927,766
Tencent Holdings Ltd USD 59,100 2,835,515
Alibaba Group Holding Ltd (DR) USD 14,763 2,767,762
China Life Insurance Co Ltd USD 845,000 2,510,832
Sunny Optical Technology Group Co Ltd USD 139,000 2,502,154
China Petroleum & Chemical Corp USD 2,628,000 2,421,622
KWG Group Holdings Ltd USD 1,517,500 2,290,438
PetroChina Co Ltd USD 3,098,000 2,287,092
AAC Technologies Holdings Inc USD 147,000 2,109,609
Xiabuxiabu Catering Management China Holdings Co Ltd HKD 1,060,500 2,087,943
Shanghai Jin Jiang International Hotels Group Co Ltd USD 4,858,000 2,016,202
Melco Resorts & Entertainment Ltd (DR) USD 80,658 1,965,739
China Shenhua Energy Co Ltd USD 676,500 1,891,058
China Mengniu Dairy Co Ltd USD 552,000 1,861,273
Huayu Automotive Systems Co Ltd CNY 420,513 1,815,933
Postal Savings Bank of China Co Ltd HKD 2,686,000 1,704,029
Huatai Securities Co Ltd HKD 797,000 1,654,878
Nine Dragons Paper Holdings Ltd USD 1,068,000 1,641,905
Techtronic Industries Co Ltd USD 295,500 1,632,416
Shanghai Haohai Biological Technology Co Ltd HKD 303,500 1,614,357
China Cinda Asset Management Co Ltd USD 4,027,000 1,498,724
New Oriental Education & Technology Group Inc (DR) USD 17,888 1,493,024
China BlueChemical Ltd USD 4,706,000 1,465,099
China Resources Pharmaceutical Group Ltd HKD 964,500 1,455,065
China Overseas Land & Investment Ltd USD 412,000 1,451,378
Guangzhou Baiyunshan Pharmaceutical Holdings Co Ltd USD 438,000 1,424,486
China Railway Construction Corp Ltd USD 1,308,500 1,395,199
WH Group Ltd USD 1,754,500 1,385,019
China Everbright Greentech Ltd HKD 1,255,000 1,249,062
China Resources Land Ltd USD 320,000 1,214,584
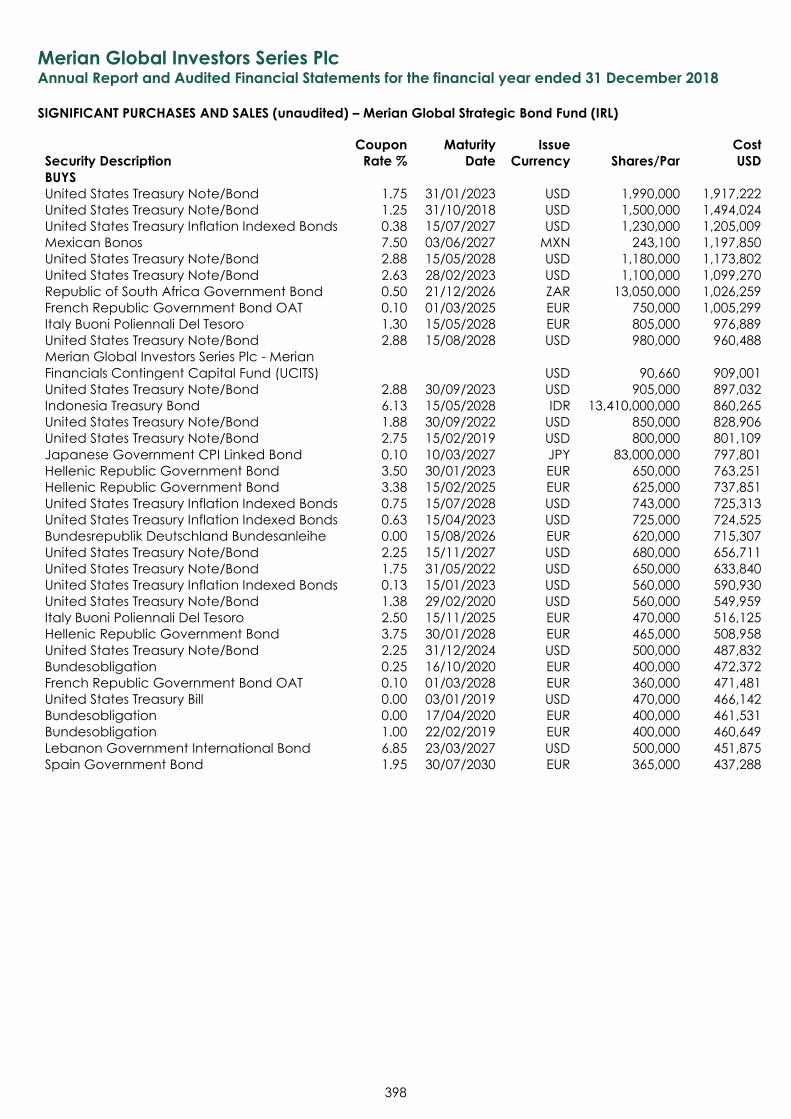
Merian Global Investors Series Plc Annual Report and Audited Financial Statements for the financial year ended 31 December 2018
SIGNIFICANT PURCHASES AND SALES (unaudited) – Merian Global Strategic Bond Fund (IRL)
398
Security Description
Coupon
Rate %
Maturity
Date
Issue
Currency Shares/Par
Cost
USD
BUYS
United States Treasury Note/Bond 1.75 31/01/2023 USD 1,990,000 1,917,222
United States Treasury Note/Bond 1.25 31/10/2018 USD 1,500,000 1,494,024
United States Treasury Inflation Indexed Bonds 0.38 15/07/2027 USD 1,230,000 1,205,009
Mexican Bonos 7.50 03/06/2027 MXN 243,100 1,197,850
United States Treasury Note/Bond 2.88 15/05/2028 USD 1,180,000 1,173,802
United States Treasury Note/Bond 2.63 28/02/2023 USD 1,100,000 1,099,270
Republic of South Africa Government Bond 0.50 21/12/2026 ZAR 13,050,000 1,026,259
French Republic Government Bond OAT 0.10 01/03/2025 EUR 750,000 1,005,299
Italy Buoni Poliennali Del Tesoro 1.30 15/05/2028 EUR 805,000 976,889
United States Treasury Note/Bond 2.88 15/08/2028 USD 980,000 960,488
Merian Global Investors Series Plc - Merian
Financials Contingent Capital Fund (UCITS) USD 90,660 909,001
United States Treasury Note/Bond 2.88 30/09/2023 USD 905,000 897,032
Indonesia Treasury Bond 6.13 15/05/2028 IDR 13,410,000,000 860,265
United States Treasury Note/Bond 1.88 30/09/2022 USD 850,000 828,906
United States Treasury Note/Bond 2.75 15/02/2019 USD 800,000 801,109
Japanese Government CPI Linked Bond 0.10 10/03/2027 JPY 83,000,000 797,801
Hellenic Republic Government Bond 3.50 30/01/2023 EUR 650,000 763,251
Hellenic Republic Government Bond 3.38 15/02/2025 EUR 625,000 737,851
United States Treasury Inflation Indexed Bonds 0.75 15/07/2028 USD 743,000 725,313
United States Treasury Inflation Indexed Bonds 0.63 15/04/2023 USD 725,000 724,525
Bundesrepublik Deutschland Bundesanleihe 0.00 15/08/2026 EUR 620,000 715,307
United States Treasury Note/Bond 2.25 15/11/2027 USD 680,000 656,711
United States Treasury Note/Bond 1.75 31/05/2022 USD 650,000 633,840
United States Treasury Inflation Indexed Bonds 0.13 15/01/2023 USD 560,000 590,930
United States Treasury Note/Bond 1.38 29/02/2020 USD 560,000 549,959
Italy Buoni Poliennali Del Tesoro 2.50 15/11/2025 EUR 470,000 516,125
Hellenic Republic Government Bond 3.75 30/01/2028 EUR 465,000 508,958
United States Treasury Note/Bond 2.25 31/12/2024 USD 500,000 487,832
Bundesobligation 0.25 16/10/2020 EUR 400,000 472,372
French Republic Government Bond OAT 0.10 01/03/2028 EUR 360,000 471,481
United States Treasury Bill 0.00 03/01/2019 USD 470,000 466,142
Bundesobligation 0.00 17/04/2020 EUR 400,000 461,531
Bundesobligation 1.00 22/02/2019 EUR 400,000 460,649
Lebanon Government International Bond 6.85 23/03/2027 USD 500,000 451,875
Spain Government Bond 1.95 30/07/2030 EUR 365,000 437,288
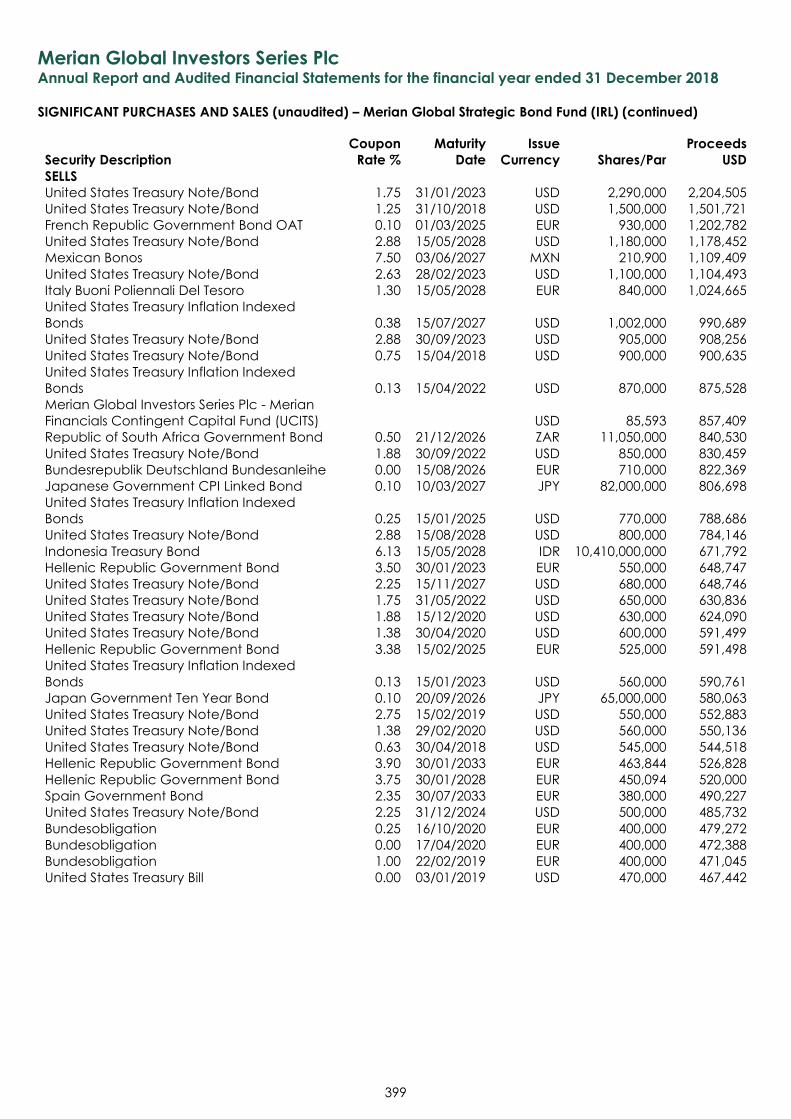
Merian Global Investors Series Plc Annual Report and Audited Financial Statements for the financial year ended 31 December 2018
SIGNIFICANT PURCHASES AND SALES (unaudited) – Merian Global Strategic Bond Fund (IRL) (continued)
399
Security Description
Coupon
Rate %
Maturity
Date
Issue
Currency Shares/Par
Proceeds
USD
SELLS
United States Treasury Note/Bond 1.75 31/01/2023 USD 2,290,000 2,204,505
United States Treasury Note/Bond 1.25 31/10/2018 USD 1,500,000 1,501,721
French Republic Government Bond OAT 0.10 01/03/2025 EUR 930,000 1,202,782
United States Treasury Note/Bond 2.88 15/05/2028 USD 1,180,000 1,178,452
Mexican Bonos 7.50 03/06/2027 MXN 210,900 1,109,409
United States Treasury Note/Bond 2.63 28/02/2023 USD 1,100,000 1,104,493
Italy Buoni Poliennali Del Tesoro 1.30 15/05/2028 EUR 840,000 1,024,665
United States Treasury Inflation Indexed
Bonds 0.38 15/07/2027 USD 1,002,000 990,689
United States Treasury Note/Bond 2.88 30/09/2023 USD 905,000 908,256
United States Treasury Note/Bond 0.75 15/04/2018 USD 900,000 900,635
United States Treasury Inflation Indexed
Bonds 0.13 15/04/2022 USD 870,000 875,528
Merian Global Investors Series Plc - Merian
Financials Contingent Capital Fund (UCITS) USD 85,593 857,409
Republic of South Africa Government Bond 0.50 21/12/2026 ZAR 11,050,000 840,530
United States Treasury Note/Bond 1.88 30/09/2022 USD 850,000 830,459
Bundesrepublik Deutschland Bundesanleihe 0.00 15/08/2026 EUR 710,000 822,369
Japanese Government CPI Linked Bond 0.10 10/03/2027 JPY 82,000,000 806,698
United States Treasury Inflation Indexed
Bonds 0.25 15/01/2025 USD 770,000 788,686
United States Treasury Note/Bond 2.88 15/08/2028 USD 800,000 784,146
Indonesia Treasury Bond 6.13 15/05/2028 IDR 10,410,000,000 671,792
Hellenic Republic Government Bond 3.50 30/01/2023 EUR 550,000 648,747
United States Treasury Note/Bond 2.25 15/11/2027 USD 680,000 648,746
United States Treasury Note/Bond 1.75 31/05/2022 USD 650,000 630,836
United States Treasury Note/Bond 1.88 15/12/2020 USD 630,000 624,090
United States Treasury Note/Bond 1.38 30/04/2020 USD 600,000 591,499
Hellenic Republic Government Bond 3.38 15/02/2025 EUR 525,000 591,498
United States Treasury Inflation Indexed
Bonds 0.13 15/01/2023 USD 560,000 590,761
Japan Government Ten Year Bond 0.10 20/09/2026 JPY 65,000,000 580,063
United States Treasury Note/Bond 2.75 15/02/2019 USD 550,000 552,883
United States Treasury Note/Bond 1.38 29/02/2020 USD 560,000 550,136
United States Treasury Note/Bond 0.63 30/04/2018 USD 545,000 544,518
Hellenic Republic Government Bond 3.90 30/01/2033 EUR 463,844 526,828
Hellenic Republic Government Bond 3.75 30/01/2028 EUR 450,094 520,000
Spain Government Bond 2.35 30/07/2033 EUR 380,000 490,227
United States Treasury Note/Bond 2.25 31/12/2024 USD 500,000 485,732
Bundesobligation 0.25 16/10/2020 EUR 400,000 479,272
Bundesobligation 0.00 17/04/2020 EUR 400,000 472,388
Bundesobligation 1.00 22/02/2019 EUR 400,000 471,045
United States Treasury Bill 0.00 03/01/2019 USD 470,000 467,442
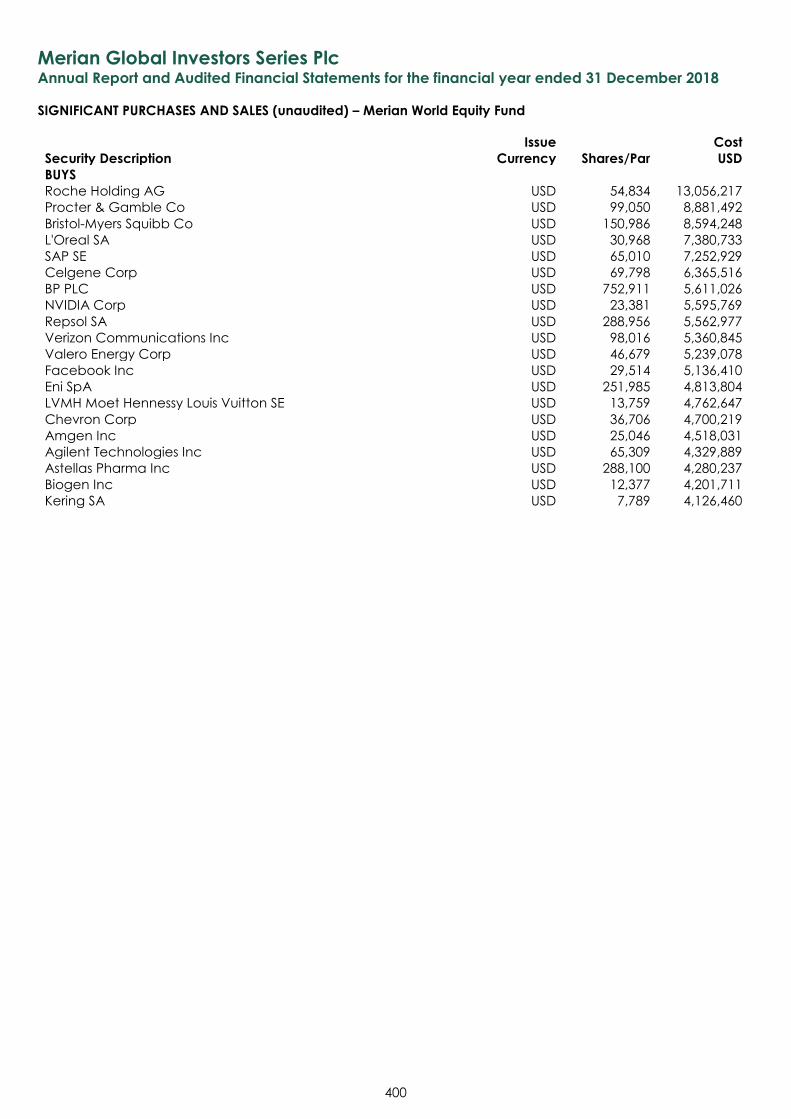
Merian Global Investors Series Plc Annual Report and Audited Financial Statements for the financial year ended 31 December 2018
SIGNIFICANT PURCHASES AND SALES (unaudited) – Merian World Equity Fund
400
Security Description
Issue
Currency Shares/Par
Cost
USD
BUYS
Roche Holding AG USD 54,834 13,056,217
Procter & Gamble Co USD 99,050 8,881,492
Bristol-Myers Squibb Co USD 150,986 8,594,248
L'Oreal SA USD 30,968 7,380,733
SAP SE USD 65,010 7,252,929
Celgene Corp USD 69,798 6,365,516
BP PLC USD 752,911 5,611,026
NVIDIA Corp USD 23,381 5,595,769
Repsol SA USD 288,956 5,562,977
Verizon Communications Inc USD 98,016 5,360,845
Valero Energy Corp USD 46,679 5,239,078
Facebook Inc USD 29,514 5,136,410
Eni SpA USD 251,985 4,813,804
LVMH Moet Hennessy Louis Vuitton SE USD 13,759 4,762,647
Chevron Corp USD 36,706 4,700,219
Amgen Inc USD 25,046 4,518,031
Agilent Technologies Inc USD 65,309 4,329,889
Astellas Pharma Inc USD 288,100 4,280,237
Biogen Inc USD 12,377 4,201,711
Kering SA USD 7,789 4,126,460
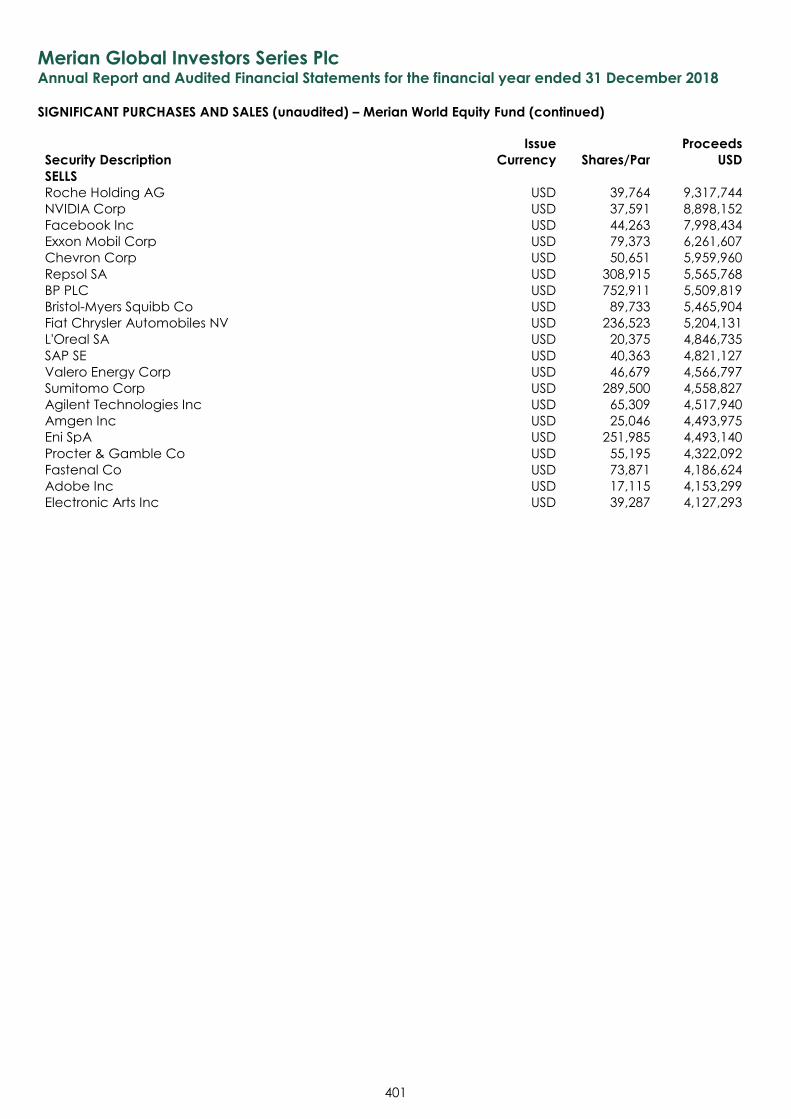
Merian Global Investors Series Plc Annual Report and Audited Financial Statements for the financial year ended 31 December 2018
SIGNIFICANT PURCHASES AND SALES (unaudited) – Merian World Equity Fund (continued)
401
Security Description
Issue
Currency Shares/Par
Proceeds
USD
SELLS
Roche Holding AG USD 39,764 9,317,744
NVIDIA Corp USD 37,591 8,898,152
Facebook Inc USD 44,263 7,998,434
Exxon Mobil Corp USD 79,373 6,261,607
Chevron Corp USD 50,651 5,959,960
Repsol SA USD 308,915 5,565,768
BP PLC USD 752,911 5,509,819
Bristol-Myers Squibb Co USD 89,733 5,465,904
Fiat Chrysler Automobiles NV USD 236,523 5,204,131
L'Oreal SA USD 20,375 4,846,735
SAP SE USD 40,363 4,821,127
Valero Energy Corp USD 46,679 4,566,797
Sumitomo Corp USD 289,500 4,558,827
Agilent Technologies Inc USD 65,309 4,517,940
Amgen Inc USD 25,046 4,493,975
Eni SpA USD 251,985 4,493,140
Procter & Gamble Co USD 55,195 4,322,092
Fastenal Co USD 73,871 4,186,624
Adobe Inc USD 17,115 4,153,299
Electronic Arts Inc USD 39,287 4,127,293
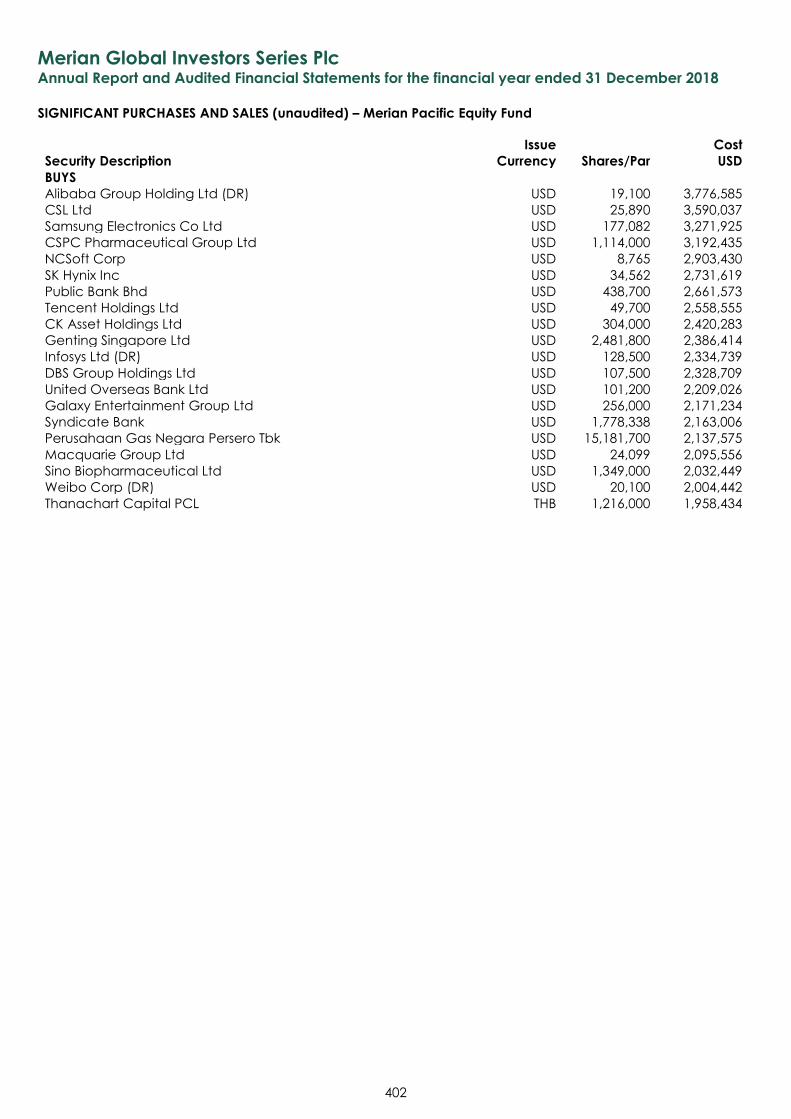
Merian Global Investors Series Plc Annual Report and Audited Financial Statements for the financial year ended 31 December 2018
SIGNIFICANT PURCHASES AND SALES (unaudited) – Merian Pacific Equity Fund
402
Security Description
Issue
Currency Shares/Par
Cost
USD
BUYS
Alibaba Group Holding Ltd (DR) USD 19,100 3,776,585
CSL Ltd USD 25,890 3,590,037
Samsung Electronics Co Ltd USD 177,082 3,271,925
CSPC Pharmaceutical Group Ltd USD 1,114,000 3,192,435
NCSoft Corp USD 8,765 2,903,430
SK Hynix Inc USD 34,562 2,731,619
Public Bank Bhd USD 438,700 2,661,573
Tencent Holdings Ltd USD 49,700 2,558,555
CK Asset Holdings Ltd USD 304,000 2,420,283
Genting Singapore Ltd USD 2,481,800 2,386,414
Infosys Ltd (DR) USD 128,500 2,334,739
DBS Group Holdings Ltd USD 107,500 2,328,709
United Overseas Bank Ltd USD 101,200 2,209,026
Galaxy Entertainment Group Ltd USD 256,000 2,171,234
Syndicate Bank USD 1,778,338 2,163,006
Perusahaan Gas Negara Persero Tbk USD 15,181,700 2,137,575
Macquarie Group Ltd USD 24,099 2,095,556
Sino Biopharmaceutical Ltd USD 1,349,000 2,032,449
Weibo Corp (DR) USD 20,100 2,004,442
Thanachart Capital PCL THB 1,216,000 1,958,434
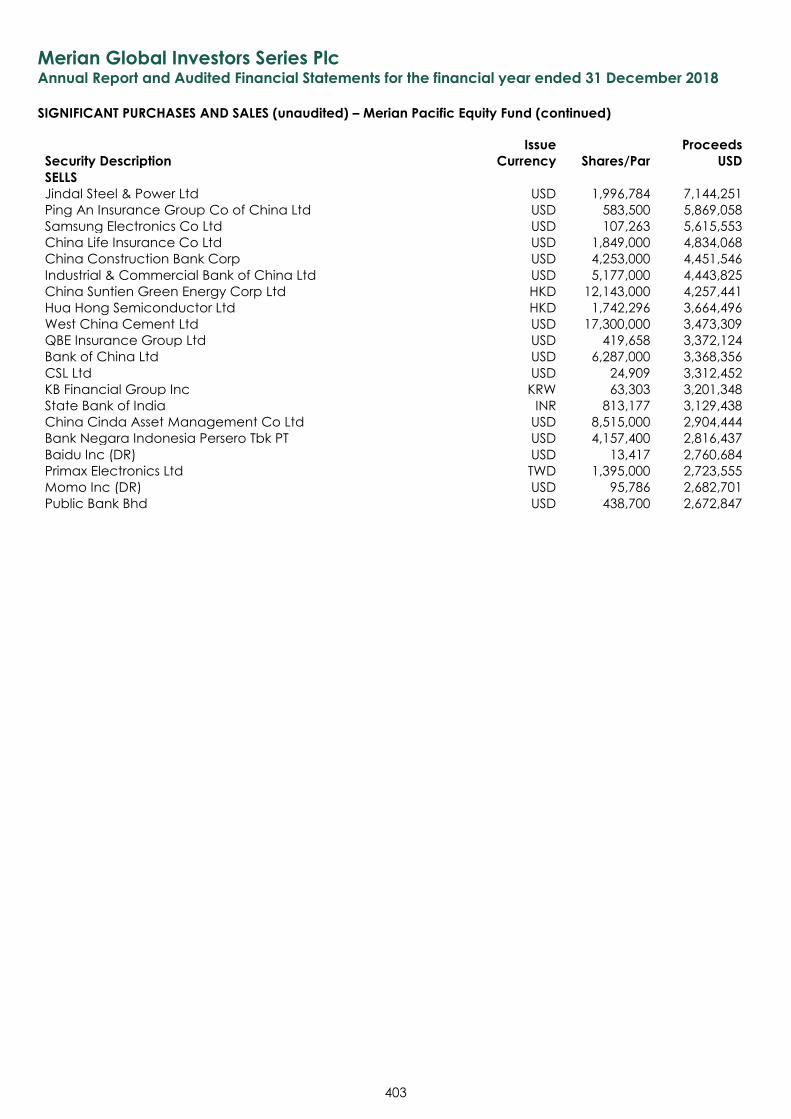
Merian Global Investors Series Plc Annual Report and Audited Financial Statements for the financial year ended 31 December 2018
SIGNIFICANT PURCHASES AND SALES (unaudited) – Merian Pacific Equity Fund (continued)
403
Security Description
Issue
Currency Shares/Par
Proceeds
USD
SELLS
Jindal Steel & Power Ltd USD 1,996,784 7,144,251
Ping An Insurance Group Co of China Ltd USD 583,500 5,869,058
Samsung Electronics Co Ltd USD 107,263 5,615,553
China Life Insurance Co Ltd USD 1,849,000 4,834,068
China Construction Bank Corp USD 4,253,000 4,451,546
Industrial & Commercial Bank of China Ltd USD 5,177,000 4,443,825
China Suntien Green Energy Corp Ltd HKD 12,143,000 4,257,441
Hua Hong Semiconductor Ltd HKD 1,742,296 3,664,496
West China Cement Ltd USD 17,300,000 3,473,309
QBE Insurance Group Ltd USD 419,658 3,372,124
Bank of China Ltd USD 6,287,000 3,368,356
CSL Ltd USD 24,909 3,312,452
KB Financial Group Inc KRW 63,303 3,201,348
State Bank of India INR 813,177 3,129,438
China Cinda Asset Management Co Ltd USD 8,515,000 2,904,444
Bank Negara Indonesia Persero Tbk PT USD 4,157,400 2,816,437
Baidu Inc (DR) USD 13,417 2,760,684
Primax Electronics Ltd TWD 1,395,000 2,723,555
Momo Inc (DR) USD 95,786 2,682,701
Public Bank Bhd USD 438,700 2,672,847
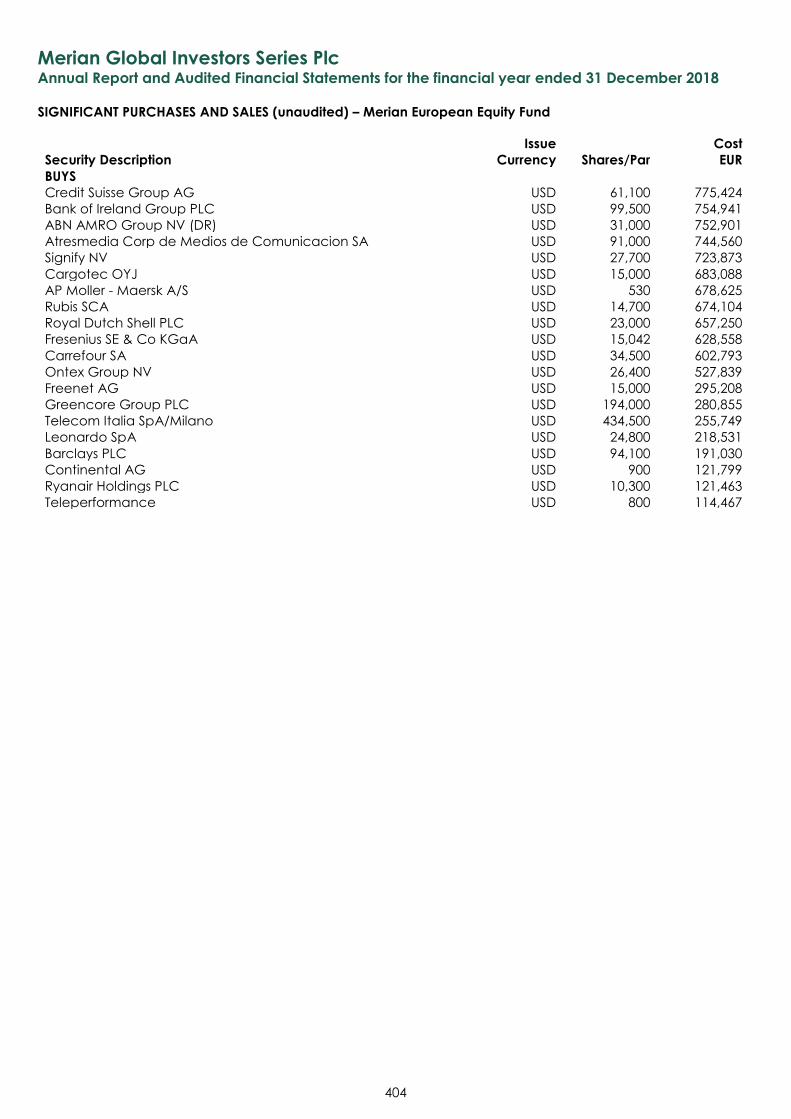
Merian Global Investors Series Plc Annual Report and Audited Financial Statements for the financial year ended 31 December 2018
SIGNIFICANT PURCHASES AND SALES (unaudited) – Merian European Equity Fund
404
Security Description
Issue
Currency Shares/Par
Cost
EUR
BUYS
Credit Suisse Group AG USD 61,100 775,424
Bank of Ireland Group PLC USD 99,500 754,941
ABN AMRO Group NV (DR) USD 31,000 752,901
Atresmedia Corp de Medios de Comunicacion SA USD 91,000 744,560
Signify NV USD 27,700 723,873
Cargotec OYJ USD 15,000 683,088
AP Moller - Maersk A/S USD 530 678,625
Rubis SCA USD 14,700 674,104
Royal Dutch Shell PLC USD 23,000 657,250
Fresenius SE & Co KGaA USD 15,042 628,558
Carrefour SA USD 34,500 602,793
Ontex Group NV USD 26,400 527,839
Freenet AG USD 15,000 295,208
Greencore Group PLC USD 194,000 280,855
Telecom Italia SpA/Milano USD 434,500 255,749
Leonardo SpA USD 24,800 218,531
Barclays PLC USD 94,100 191,030
Continental AG USD 900 121,799
Ryanair Holdings PLC USD 10,300 121,463
Teleperformance USD 800 114,467
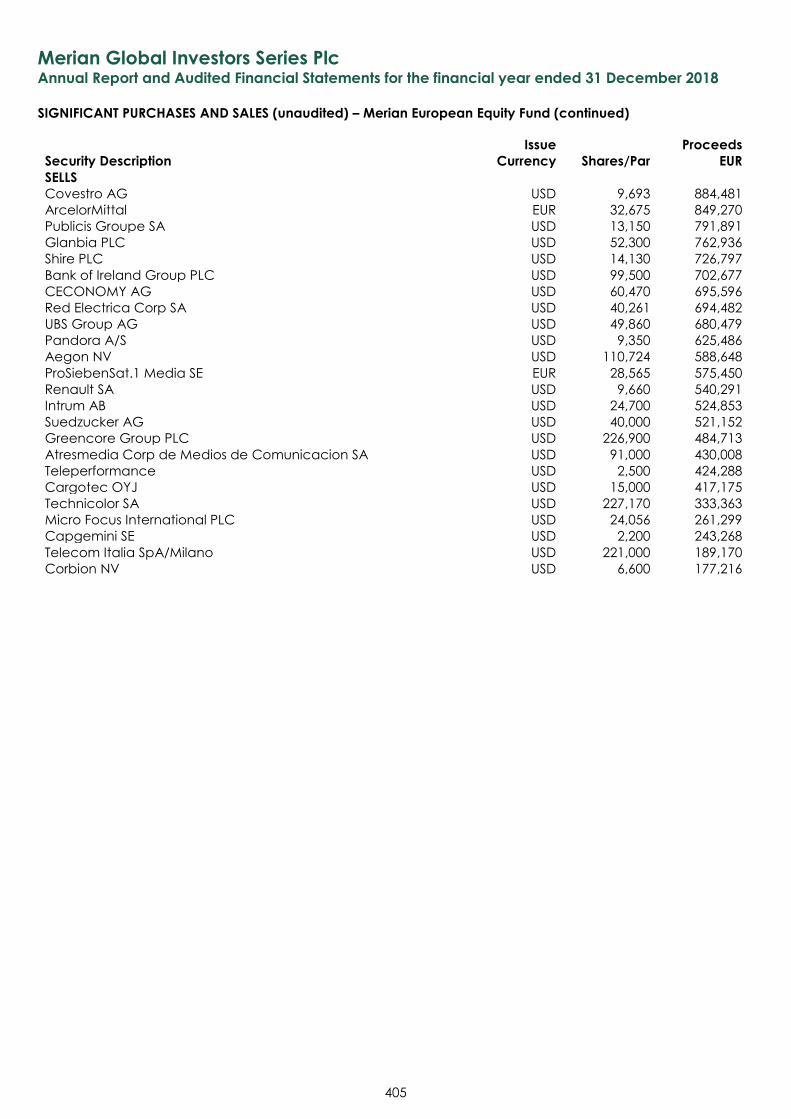
Merian Global Investors Series Plc Annual Report and Audited Financial Statements for the financial year ended 31 December 2018
SIGNIFICANT PURCHASES AND SALES (unaudited) – Merian European Equity Fund (continued)
405
Security Description
Issue
Currency Shares/Par
Proceeds
EUR
SELLS
Covestro AG USD 9,693 884,481
ArcelorMittal EUR 32,675 849,270
Publicis Groupe SA USD 13,150 791,891
Glanbia PLC USD 52,300 762,936
Shire PLC USD 14,130 726,797
Bank of Ireland Group PLC USD 99,500 702,677
CECONOMY AG USD 60,470 695,596
Red Electrica Corp SA USD 40,261 694,482
UBS Group AG USD 49,860 680,479
Pandora A/S USD 9,350 625,486
Aegon NV USD 110,724 588,648
ProSiebenSat.1 Media SE EUR 28,565 575,450
Renault SA USD 9,660 540,291
Intrum AB USD 24,700 524,853
Suedzucker AG USD 40,000 521,152
Greencore Group PLC USD 226,900 484,713
Atresmedia Corp de Medios de Comunicacion SA USD 91,000 430,008
Teleperformance USD 2,500 424,288
Cargotec OYJ USD 15,000 417,175
Technicolor SA USD 227,170 333,363
Micro Focus International PLC USD 24,056 261,299
Capgemini SE USD 2,200 243,268
Telecom Italia SpA/Milano USD 221,000 189,170
Corbion NV USD 6,600 177,216
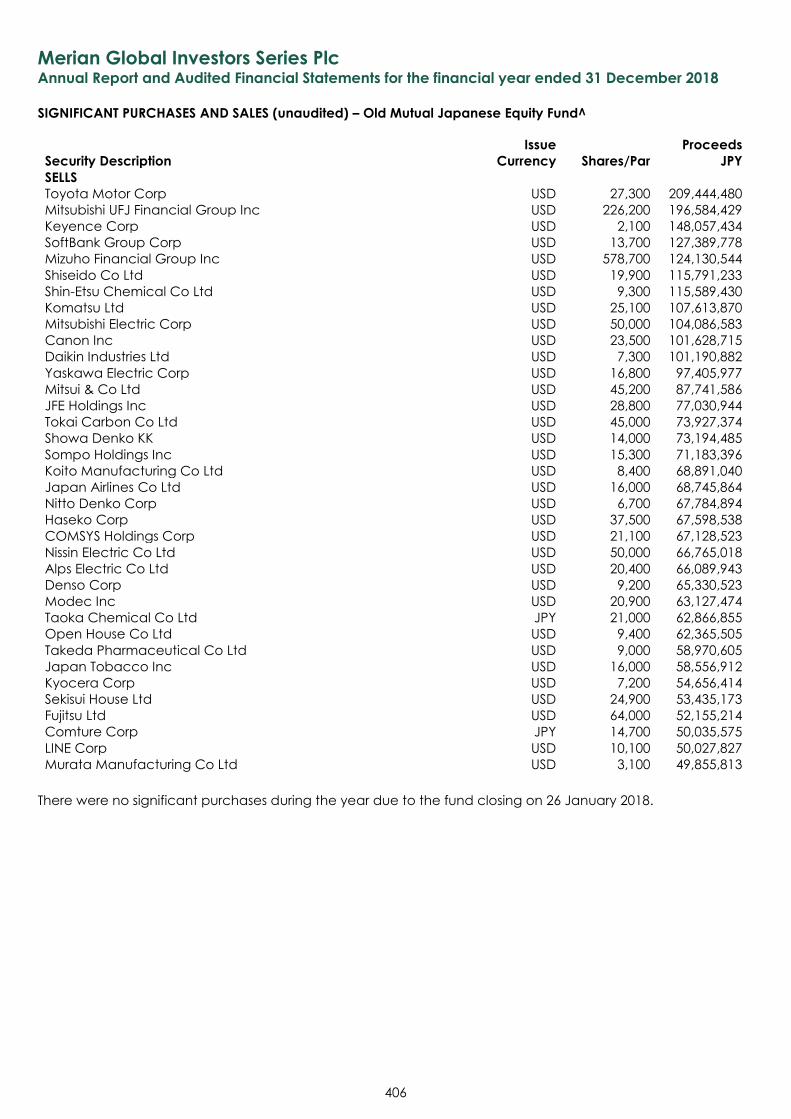
Merian Global Investors Series Plc Annual Report and Audited Financial Statements for the financial year ended 31 December 2018
SIGNIFICANT PURCHASES AND SALES (unaudited) – Old Mutual Japanese Equity Fund^
406
Security Description
Issue
Currency Shares/Par
Proceeds
JPY
SELLS
Toyota Motor Corp USD 27,300 209,444,480
Mitsubishi UFJ Financial Group Inc USD 226,200 196,584,429
Keyence Corp USD 2,100 148,057,434
SoftBank Group Corp USD 13,700 127,389,778
Mizuho Financial Group Inc USD 578,700 124,130,544
Shiseido Co Ltd USD 19,900 115,791,233
Shin-Etsu Chemical Co Ltd USD 9,300 115,589,430
Komatsu Ltd USD 25,100 107,613,870
Mitsubishi Electric Corp USD 50,000 104,086,583
Canon Inc USD 23,500 101,628,715
Daikin Industries Ltd USD 7,300 101,190,882
Yaskawa Electric Corp USD 16,800 97,405,977
Mitsui & Co Ltd USD 45,200 87,741,586
JFE Holdings Inc USD 28,800 77,030,944
Tokai Carbon Co Ltd USD 45,000 73,927,374
Showa Denko KK USD 14,000 73,194,485
Sompo Holdings Inc USD 15,300 71,183,396
Koito Manufacturing Co Ltd USD 8,400 68,891,040
Japan Airlines Co Ltd USD 16,000 68,745,864
Nitto Denko Corp USD 6,700 67,784,894
Haseko Corp USD 37,500 67,598,538
COMSYS Holdings Corp USD 21,100 67,128,523
Nissin Electric Co Ltd USD 50,000 66,765,018
Alps Electric Co Ltd USD 20,400 66,089,943
Denso Corp USD 9,200 65,330,523
Modec Inc USD 20,900 63,127,474
Taoka Chemical Co Ltd JPY 21,000 62,866,855
Open House Co Ltd USD 9,400 62,365,505
Takeda Pharmaceutical Co Ltd USD 9,000 58,970,605
Japan Tobacco Inc USD 16,000 58,556,912
Kyocera Corp USD 7,200 54,656,414
Sekisui House Ltd USD 24,900 53,435,173
Fujitsu Ltd USD 64,000 52,155,214
Comture Corp JPY 14,700 50,035,575
LINE Corp USD 10,100 50,027,827
Murata Manufacturing Co Ltd USD 3,100 49,855,813
There were no significant purchases during the year due to the fund closing on 26 January 2018.
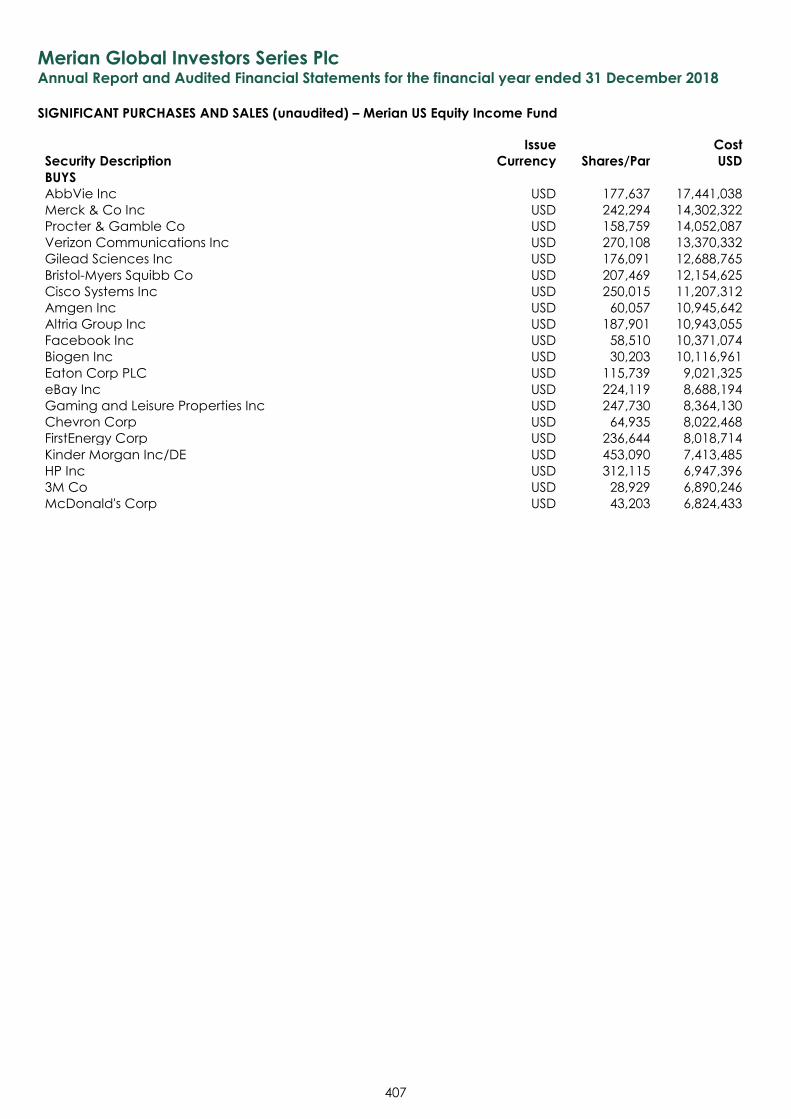
Merian Global Investors Series Plc Annual Report and Audited Financial Statements for the financial year ended 31 December 2018
SIGNIFICANT PURCHASES AND SALES (unaudited) – Merian US Equity Income Fund
407
Security Description
Issue
Currency Shares/Par
Cost
USD
BUYS
AbbVie Inc USD 177,637 17,441,038
Merck & Co Inc USD 242,294 14,302,322
Procter & Gamble Co USD 158,759 14,052,087
Verizon Communications Inc USD 270,108 13,370,332
Gilead Sciences Inc USD 176,091 12,688,765
Bristol-Myers Squibb Co USD 207,469 12,154,625
Cisco Systems Inc USD 250,015 11,207,312
Amgen Inc USD 60,057 10,945,642
Altria Group Inc USD 187,901 10,943,055
Facebook Inc USD 58,510 10,371,074
Biogen Inc USD 30,203 10,116,961
Eaton Corp PLC USD 115,739 9,021,325
eBay Inc USD 224,119 8,688,194
Gaming and Leisure Properties Inc USD 247,730 8,364,130
Chevron Corp USD 64,935 8,022,468
FirstEnergy Corp USD 236,644 8,018,714
Kinder Morgan Inc/DE USD 453,090 7,413,485
HP Inc USD 312,115 6,947,396
3M Co USD 28,929 6,890,246
McDonald's Corp USD 43,203 6,824,433
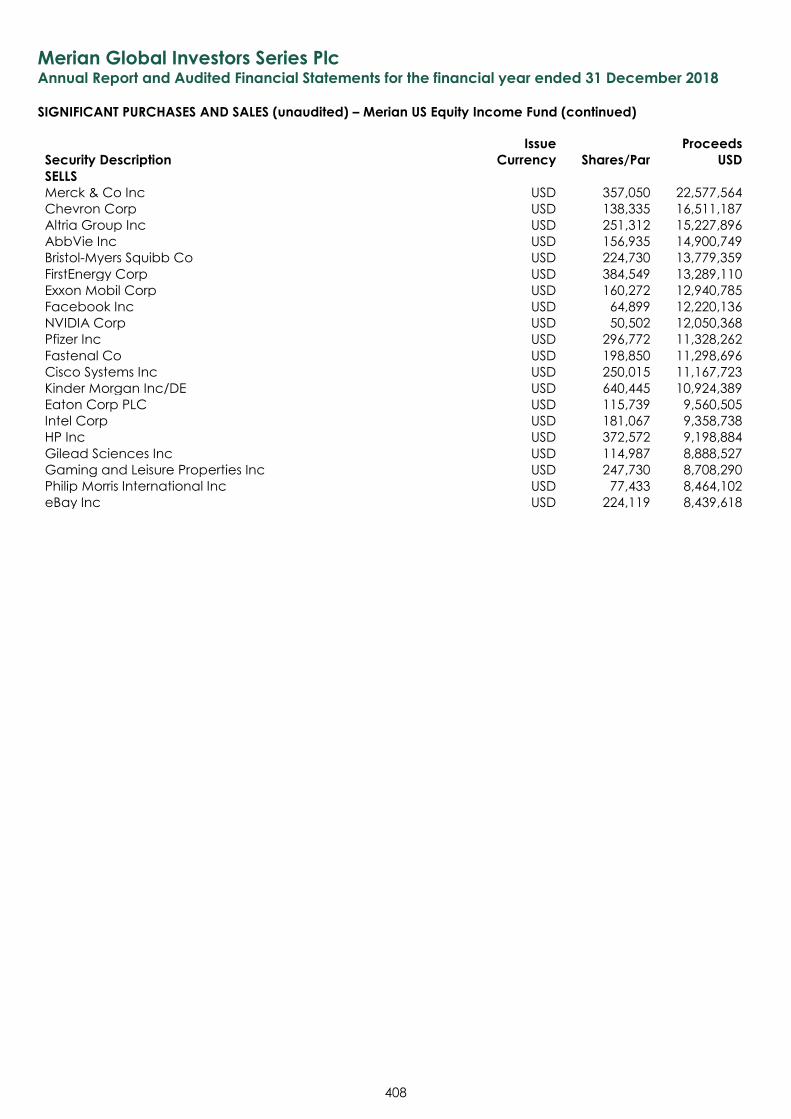
Merian Global Investors Series Plc Annual Report and Audited Financial Statements for the financial year ended 31 December 2018
SIGNIFICANT PURCHASES AND SALES (unaudited) – Merian US Equity Income Fund (continued)
408
Security Description
Issue
Currency Shares/Par
Proceeds
USD
SELLS
Merck & Co Inc USD 357,050 22,577,564
Chevron Corp USD 138,335 16,511,187
Altria Group Inc USD 251,312 15,227,896
AbbVie Inc USD 156,935 14,900,749
Bristol-Myers Squibb Co USD 224,730 13,779,359
FirstEnergy Corp USD 384,549 13,289,110
Exxon Mobil Corp USD 160,272 12,940,785
Facebook Inc USD 64,899 12,220,136
NVIDIA Corp USD 50,502 12,050,368
Pfizer Inc USD 296,772 11,328,262
Fastenal Co USD 198,850 11,298,696
Cisco Systems Inc USD 250,015 11,167,723
Kinder Morgan Inc/DE USD 640,445 10,924,389
Eaton Corp PLC USD 115,739 9,560,505
Intel Corp USD 181,067 9,358,738
HP Inc USD 372,572 9,198,884
Gilead Sciences Inc USD 114,987 8,888,527
Gaming and Leisure Properties Inc USD 247,730 8,708,290
Philip Morris International Inc USD 77,433 8,464,102
eBay Inc USD 224,119 8,439,618
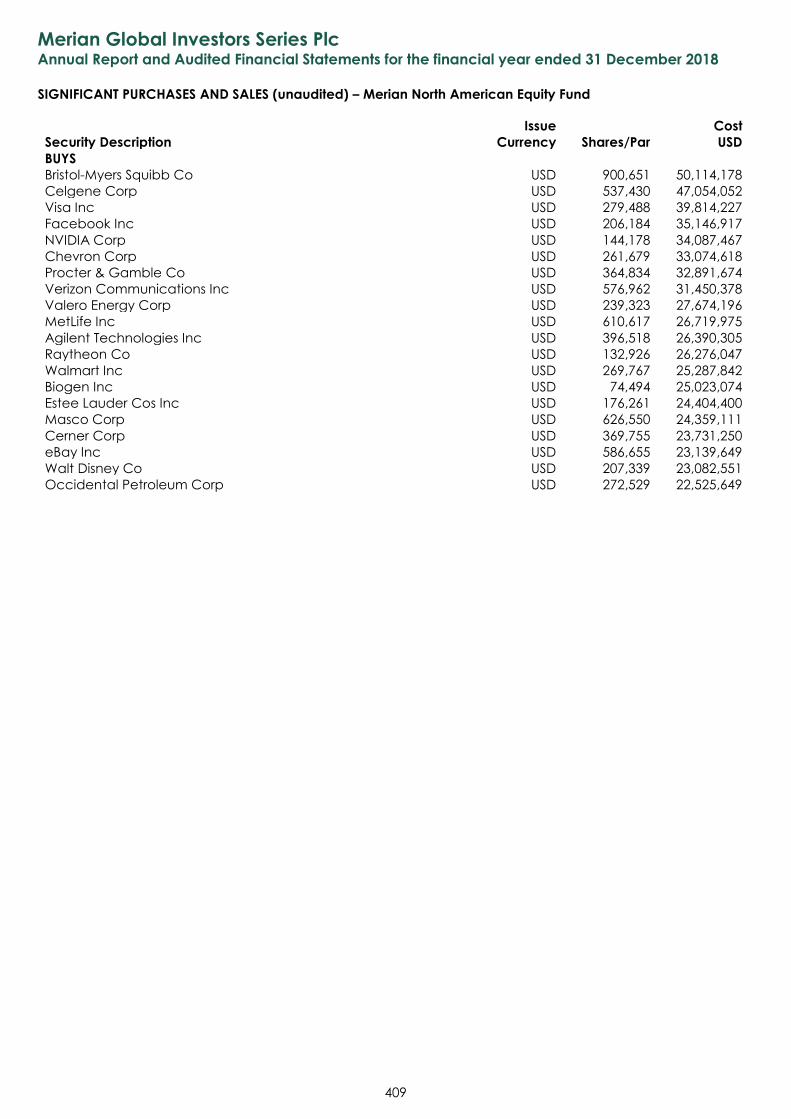
Merian Global Investors Series Plc Annual Report and Audited Financial Statements for the financial year ended 31 December 2018
SIGNIFICANT PURCHASES AND SALES (unaudited) – Merian North American Equity Fund
409
Security Description
Issue
Currency Shares/Par
Cost
USD
BUYS
Bristol-Myers Squibb Co USD 900,651 50,114,178
Celgene Corp USD 537,430 47,054,052
Visa Inc USD 279,488 39,814,227
Facebook Inc USD 206,184 35,146,917
NVIDIA Corp USD 144,178 34,087,467
Chevron Corp USD 261,679 33,074,618
Procter & Gamble Co USD 364,834 32,891,674
Verizon Communications Inc USD 576,962 31,450,378
Valero Energy Corp USD 239,323 27,674,196
MetLife Inc USD 610,617 26,719,975
Agilent Technologies Inc USD 396,518 26,390,305
Raytheon Co USD 132,926 26,276,047
Walmart Inc USD 269,767 25,287,842
Biogen Inc USD 74,494 25,023,074
Estee Lauder Cos Inc USD 176,261 24,404,400
Masco Corp USD 626,550 24,359,111
Cerner Corp USD 369,755 23,731,250
eBay Inc USD 586,655 23,139,649
Walt Disney Co USD 207,339 23,082,551
Occidental Petroleum Corp USD 272,529 22,525,649
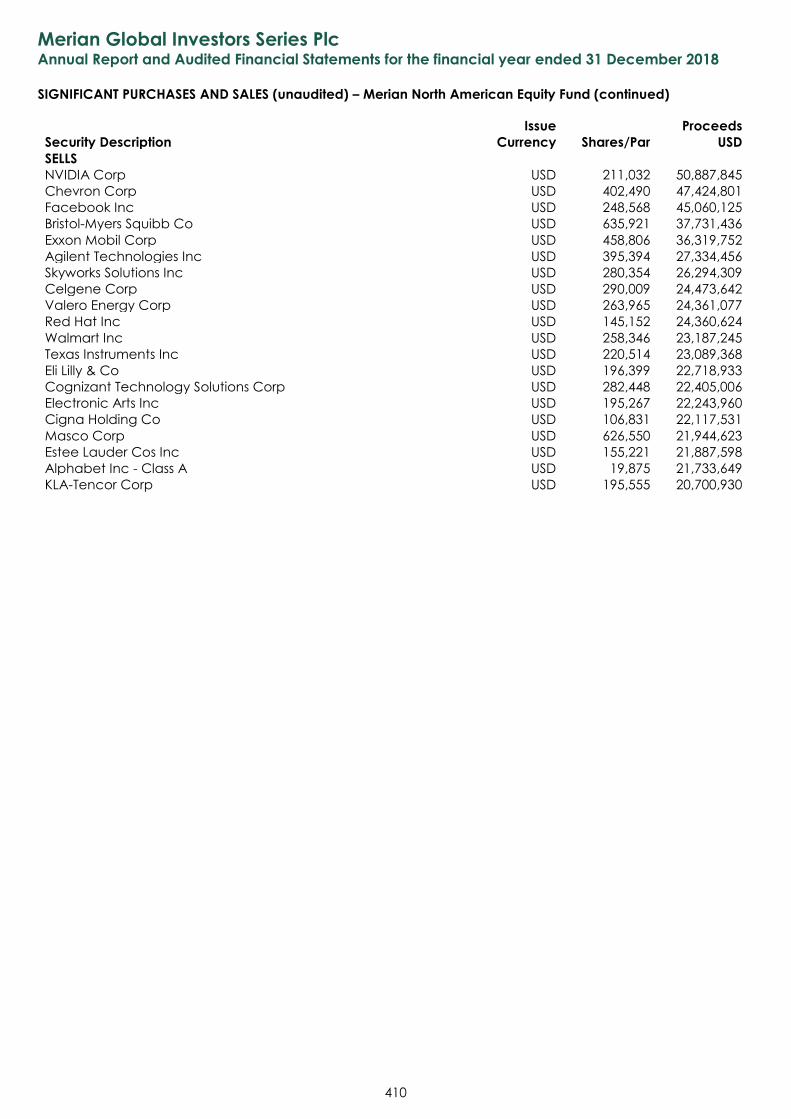
Merian Global Investors Series Plc Annual Report and Audited Financial Statements for the financial year ended 31 December 2018
SIGNIFICANT PURCHASES AND SALES (unaudited) – Merian North American Equity Fund (continued)
410
Security Description
Issue
Currency Shares/Par
Proceeds
USD
SELLS
NVIDIA Corp USD 211,032 50,887,845
Chevron Corp USD 402,490 47,424,801
Facebook Inc USD 248,568 45,060,125
Bristol-Myers Squibb Co USD 635,921 37,731,436
Exxon Mobil Corp USD 458,806 36,319,752
Agilent Technologies Inc USD 395,394 27,334,456
Skyworks Solutions Inc USD 280,354 26,294,309
Celgene Corp USD 290,009 24,473,642
Valero Energy Corp USD 263,965 24,361,077
Red Hat Inc USD 145,152 24,360,624
Walmart Inc USD 258,346 23,187,245
Texas Instruments Inc USD 220,514 23,089,368
Eli Lilly & Co USD 196,399 22,718,933
Cognizant Technology Solutions Corp USD 282,448 22,405,006
Electronic Arts Inc USD 195,267 22,243,960
Cigna Holding Co USD 106,831 22,117,531
Masco Corp USD 626,550 21,944,623
Estee Lauder Cos Inc USD 155,221 21,887,598
Alphabet Inc - Class A USD 19,875 21,733,649
KLA-Tencor Corp USD 195,555 20,700,930
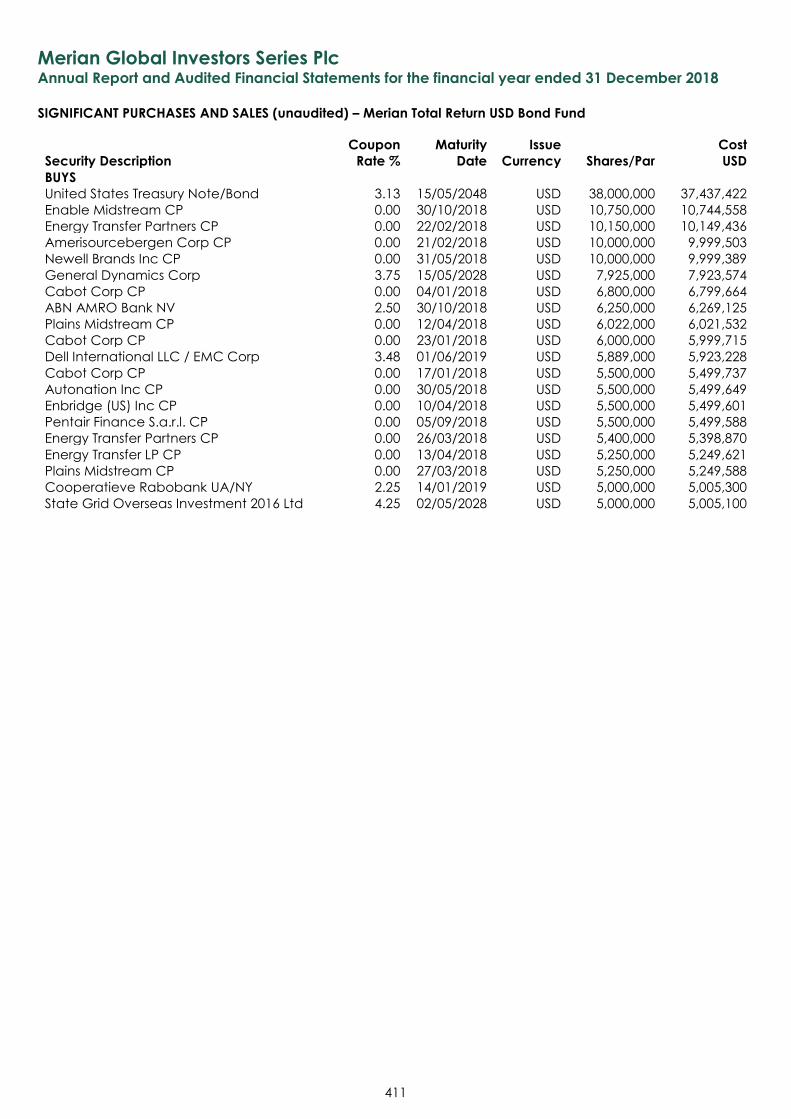
Merian Global Investors Series Plc Annual Report and Audited Financial Statements for the financial year ended 31 December 2018
SIGNIFICANT PURCHASES AND SALES (unaudited) – Merian Total Return USD Bond Fund
411
Security Description
Coupon
Rate %
Maturity
Date
Issue
Currency Shares/Par
Cost
USD
BUYS
United States Treasury Note/Bond 3.13 15/05/2048 USD 38,000,000 37,437,422
Enable Midstream CP 0.00 30/10/2018 USD 10,750,000 10,744,558
Energy Transfer Partners CP 0.00 22/02/2018 USD 10,150,000 10,149,436
Amerisourcebergen Corp CP 0.00 21/02/2018 USD 10,000,000 9,999,503
Newell Brands Inc CP 0.00 31/05/2018 USD 10,000,000 9,999,389
General Dynamics Corp 3.75 15/05/2028 USD 7,925,000 7,923,574
Cabot Corp CP 0.00 04/01/2018 USD 6,800,000 6,799,664
ABN AMRO Bank NV 2.50 30/10/2018 USD 6,250,000 6,269,125
Plains Midstream CP 0.00 12/04/2018 USD 6,022,000 6,021,532
Cabot Corp CP 0.00 23/01/2018 USD 6,000,000 5,999,715
Dell International LLC / EMC Corp 3.48 01/06/2019 USD 5,889,000 5,923,228
Cabot Corp CP 0.00 17/01/2018 USD 5,500,000 5,499,737
Autonation Inc CP 0.00 30/05/2018 USD 5,500,000 5,499,649
Enbridge (US) Inc CP 0.00 10/04/2018 USD 5,500,000 5,499,601
Pentair Finance S.a.r.l. CP 0.00 05/09/2018 USD 5,500,000 5,499,588
Energy Transfer Partners CP 0.00 26/03/2018 USD 5,400,000 5,398,870
Energy Transfer LP CP 0.00 13/04/2018 USD 5,250,000 5,249,621
Plains Midstream CP 0.00 27/03/2018 USD 5,250,000 5,249,588
Cooperatieve Rabobank UA/NY 2.25 14/01/2019 USD 5,000,000 5,005,300
State Grid Overseas Investment 2016 Ltd 4.25 02/05/2028 USD 5,000,000 5,005,100
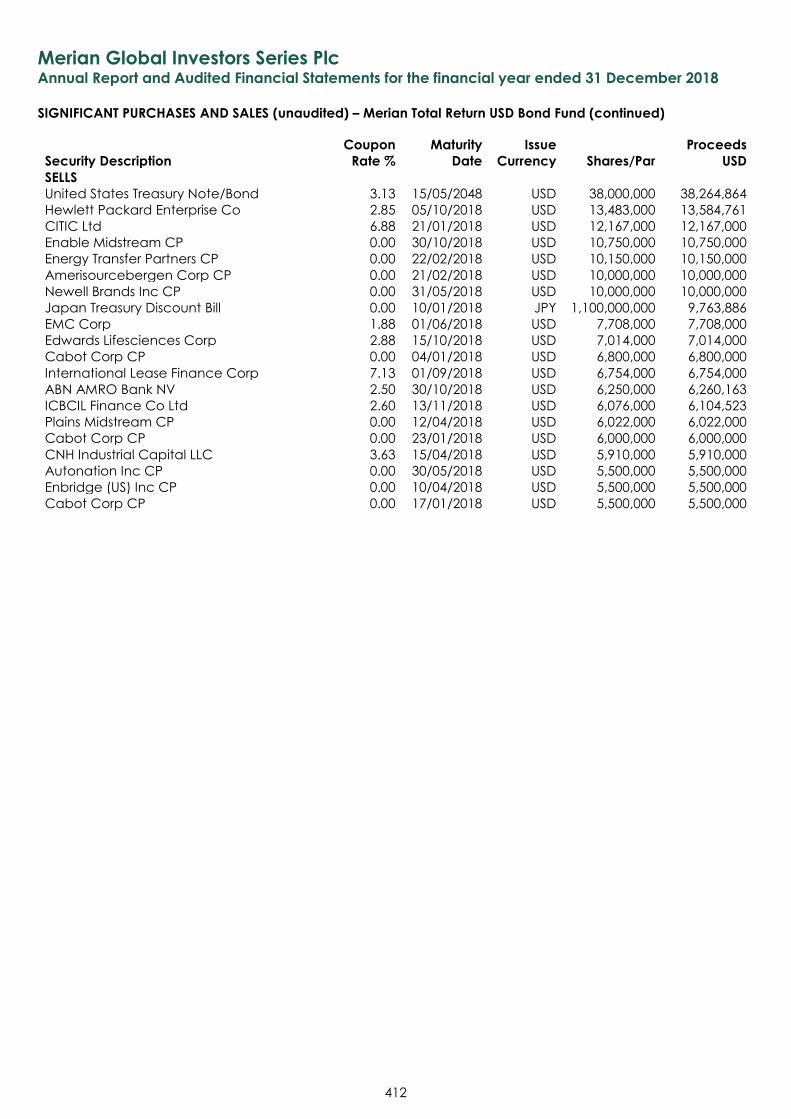
Merian Global Investors Series Plc Annual Report and Audited Financial Statements for the financial year ended 31 December 2018
SIGNIFICANT PURCHASES AND SALES (unaudited) – Merian Total Return USD Bond Fund (continued)
412
Security Description
Coupon
Rate %
Maturity
Date
Issue
Currency Shares/Par
Proceeds
USD
SELLS
United States Treasury Note/Bond 3.13 15/05/2048 USD 38,000,000 38,264,864
Hewlett Packard Enterprise Co 2.85 05/10/2018 USD 13,483,000 13,584,761
CITIC Ltd 6.88 21/01/2018 USD 12,167,000 12,167,000
Enable Midstream CP 0.00 30/10/2018 USD 10,750,000 10,750,000
Energy Transfer Partners CP 0.00 22/02/2018 USD 10,150,000 10,150,000
Amerisourcebergen Corp CP 0.00 21/02/2018 USD 10,000,000 10,000,000
Newell Brands Inc CP 0.00 31/05/2018 USD 10,000,000 10,000,000
Japan Treasury Discount Bill 0.00 10/01/2018 JPY 1,100,000,000 9,763,886
EMC Corp 1.88 01/06/2018 USD 7,708,000 7,708,000
Edwards Lifesciences Corp 2.88 15/10/2018 USD 7,014,000 7,014,000
Cabot Corp CP 0.00 04/01/2018 USD 6,800,000 6,800,000
International Lease Finance Corp 7.13 01/09/2018 USD 6,754,000 6,754,000
ABN AMRO Bank NV 2.50 30/10/2018 USD 6,250,000 6,260,163
ICBCIL Finance Co Ltd 2.60 13/11/2018 USD 6,076,000 6,104,523
Plains Midstream CP 0.00 12/04/2018 USD 6,022,000 6,022,000
Cabot Corp CP 0.00 23/01/2018 USD 6,000,000 6,000,000
CNH Industrial Capital LLC 3.63 15/04/2018 USD 5,910,000 5,910,000
Autonation Inc CP 0.00 30/05/2018 USD 5,500,000 5,500,000
Enbridge (US) Inc CP 0.00 10/04/2018 USD 5,500,000 5,500,000
Cabot Corp CP 0.00 17/01/2018 USD 5,500,000 5,500,000
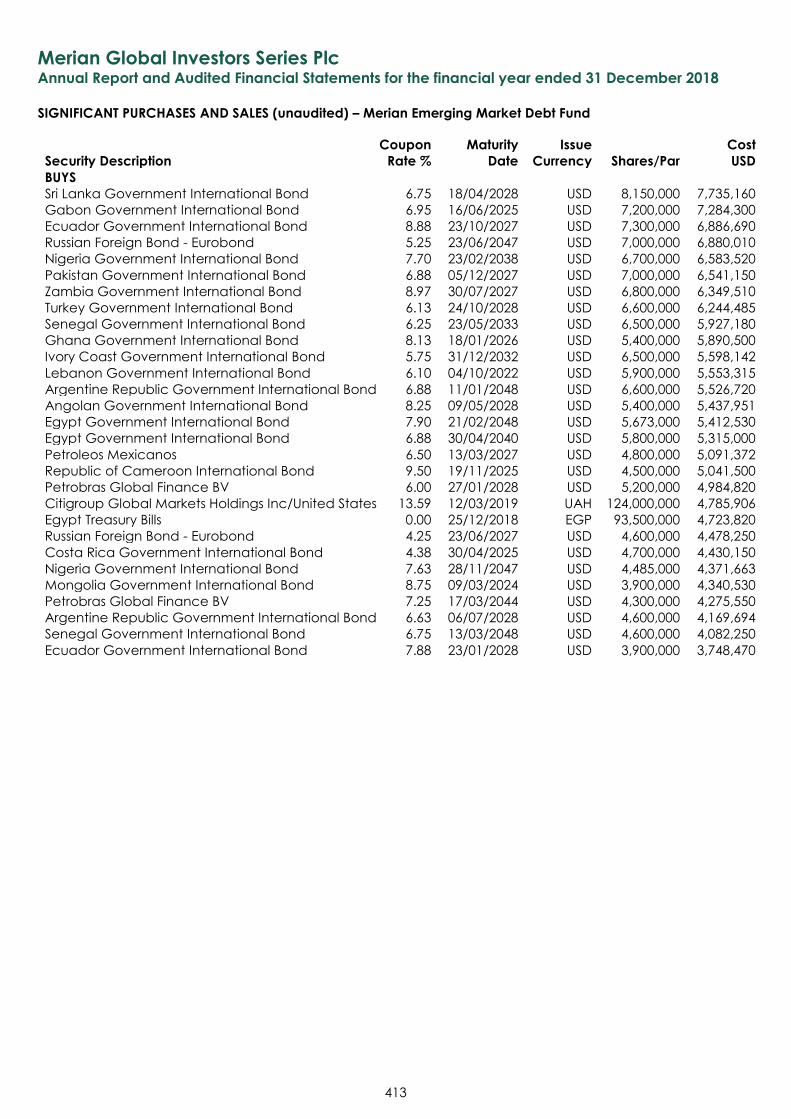
Merian Global Investors Series Plc Annual Report and Audited Financial Statements for the financial year ended 31 December 2018
SIGNIFICANT PURCHASES AND SALES (unaudited) – Merian Emerging Market Debt Fund
413
Security Description
Coupon
Rate %
Maturity
Date
Issue
Currency Shares/Par
Cost
USD
BUYS
Sri Lanka Government International Bond 6.75 18/04/2028 USD 8,150,000 7,735,160
Gabon Government International Bond 6.95 16/06/2025 USD 7,200,000 7,284,300
Ecuador Government International Bond 8.88 23/10/2027 USD 7,300,000 6,886,690
Russian Foreign Bond - Eurobond 5.25 23/06/2047 USD 7,000,000 6,880,010
Nigeria Government International Bond 7.70 23/02/2038 USD 6,700,000 6,583,520
Pakistan Government International Bond 6.88 05/12/2027 USD 7,000,000 6,541,150
Zambia Government International Bond 8.97 30/07/2027 USD 6,800,000 6,349,510
Turkey Government International Bond 6.13 24/10/2028 USD 6,600,000 6,244,485
Senegal Government International Bond 6.25 23/05/2033 USD 6,500,000 5,927,180
Ghana Government International Bond 8.13 18/01/2026 USD 5,400,000 5,890,500
Ivory Coast Government International Bond 5.75 31/12/2032 USD 6,500,000 5,598,142
Lebanon Government International Bond 6.10 04/10/2022 USD 5,900,000 5,553,315
Argentine Republic Government International Bond 6.88 11/01/2048 USD 6,600,000 5,526,720
Angolan Government International Bond 8.25 09/05/2028 USD 5,400,000 5,437,951
Egypt Government International Bond 7.90 21/02/2048 USD 5,673,000 5,412,530
Egypt Government International Bond 6.88 30/04/2040 USD 5,800,000 5,315,000
Petroleos Mexicanos 6.50 13/03/2027 USD 4,800,000 5,091,372
Republic of Cameroon International Bond 9.50 19/11/2025 USD 4,500,000 5,041,500
Petrobras Global Finance BV 6.00 27/01/2028 USD 5,200,000 4,984,820
Citigroup Global Markets Holdings Inc/United States 13.59 12/03/2019 UAH 124,000,000 4,785,906
Egypt Treasury Bills 0.00 25/12/2018 EGP 93,500,000 4,723,820
Russian Foreign Bond - Eurobond 4.25 23/06/2027 USD 4,600,000 4,478,250
Costa Rica Government International Bond 4.38 30/04/2025 USD 4,700,000 4,430,150
Nigeria Government International Bond 7.63 28/11/2047 USD 4,485,000 4,371,663
Mongolia Government International Bond 8.75 09/03/2024 USD 3,900,000 4,340,530
Petrobras Global Finance BV 7.25 17/03/2044 USD 4,300,000 4,275,550
Argentine Republic Government International Bond 6.63 06/07/2028 USD 4,600,000 4,169,694
Senegal Government International Bond 6.75 13/03/2048 USD 4,600,000 4,082,250
Ecuador Government International Bond 7.88 23/01/2028 USD 3,900,000 3,748,470
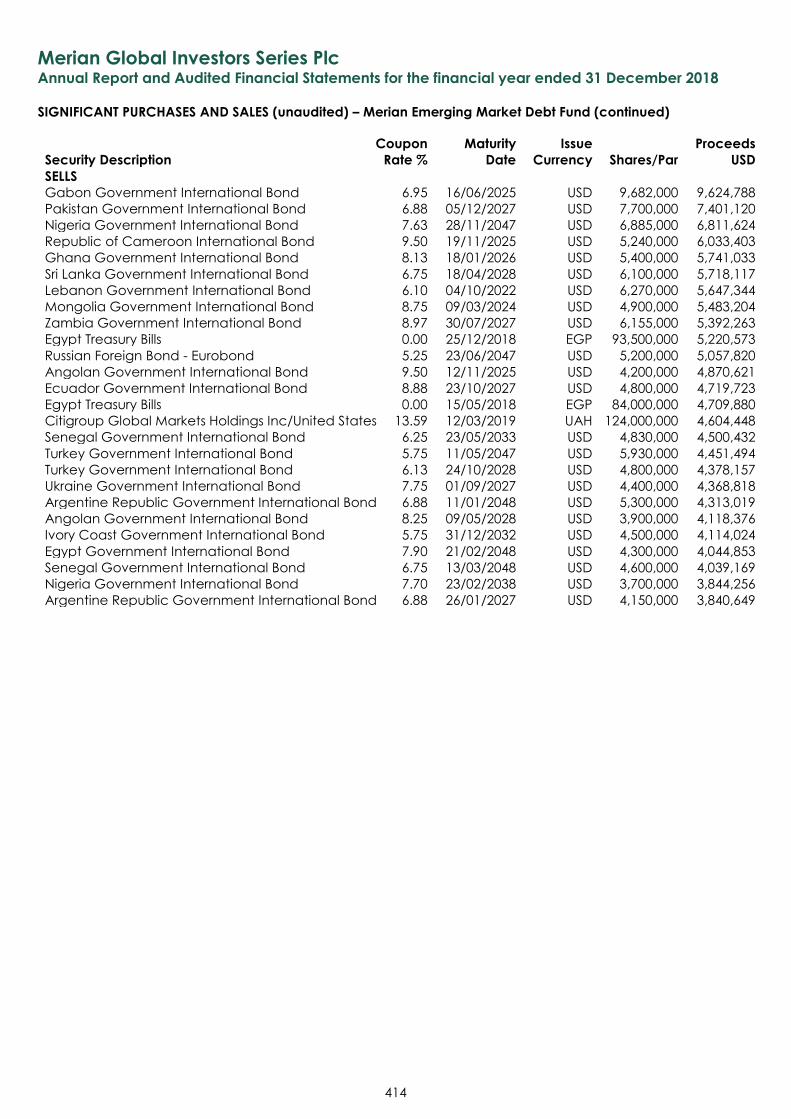
Merian Global Investors Series Plc Annual Report and Audited Financial Statements for the financial year ended 31 December 2018
SIGNIFICANT PURCHASES AND SALES (unaudited) – Merian Emerging Market Debt Fund (continued)
414
Security Description
Coupon
Rate %
Maturity
Date
Issue
Currency Shares/Par
Proceeds
USD
SELLS
Gabon Government International Bond 6.95 16/06/2025 USD 9,682,000 9,624,788
Pakistan Government International Bond 6.88 05/12/2027 USD 7,700,000 7,401,120
Nigeria Government International Bond 7.63 28/11/2047 USD 6,885,000 6,811,624
Republic of Cameroon International Bond 9.50 19/11/2025 USD 5,240,000 6,033,403
Ghana Government International Bond 8.13 18/01/2026 USD 5,400,000 5,741,033
Sri Lanka Government International Bond 6.75 18/04/2028 USD 6,100,000 5,718,117
Lebanon Government International Bond 6.10 04/10/2022 USD 6,270,000 5,647,344
Mongolia Government International Bond 8.75 09/03/2024 USD 4,900,000 5,483,204
Zambia Government International Bond 8.97 30/07/2027 USD 6,155,000 5,392,263
Egypt Treasury Bills 0.00 25/12/2018 EGP 93,500,000 5,220,573
Russian Foreign Bond - Eurobond 5.25 23/06/2047 USD 5,200,000 5,057,820
Angolan Government International Bond 9.50 12/11/2025 USD 4,200,000 4,870,621
Ecuador Government International Bond 8.88 23/10/2027 USD 4,800,000 4,719,723
Egypt Treasury Bills 0.00 15/05/2018 EGP 84,000,000 4,709,880
Citigroup Global Markets Holdings Inc/United States 13.59 12/03/2019 UAH 124,000,000 4,604,448
Senegal Government International Bond 6.25 23/05/2033 USD 4,830,000 4,500,432
Turkey Government International Bond 5.75 11/05/2047 USD 5,930,000 4,451,494
Turkey Government International Bond 6.13 24/10/2028 USD 4,800,000 4,378,157
Ukraine Government International Bond 7.75 01/09/2027 USD 4,400,000 4,368,818
Argentine Republic Government International Bond 6.88 11/01/2048 USD 5,300,000 4,313,019
Angolan Government International Bond 8.25 09/05/2028 USD 3,900,000 4,118,376
Ivory Coast Government International Bond 5.75 31/12/2032 USD 4,500,000 4,114,024
Egypt Government International Bond 7.90 21/02/2048 USD 4,300,000 4,044,853
Senegal Government International Bond 6.75 13/03/2048 USD 4,600,000 4,039,169
Nigeria Government International Bond 7.70 23/02/2038 USD 3,700,000 3,844,256
Argentine Republic Government International Bond 6.88 26/01/2027 USD 4,150,000 3,840,649
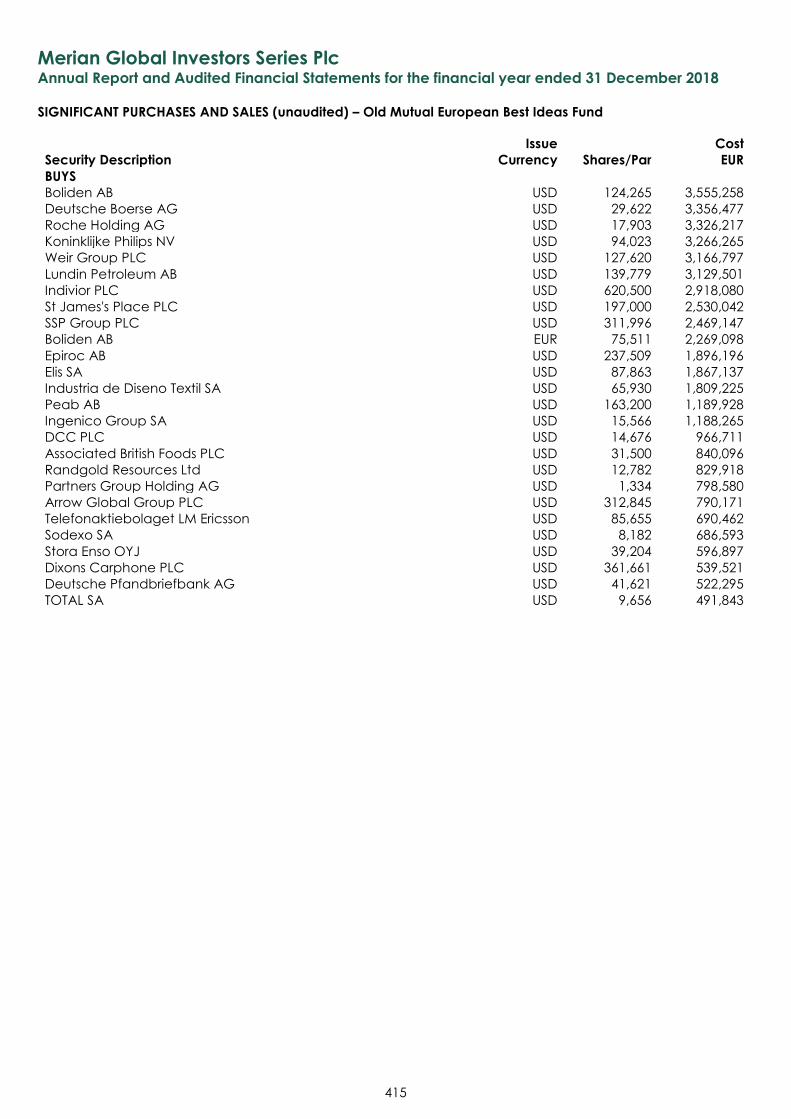
Merian Global Investors Series Plc Annual Report and Audited Financial Statements for the financial year ended 31 December 2018
SIGNIFICANT PURCHASES AND SALES (unaudited) – Old Mutual European Best Ideas Fund
415
Security Description
Issue
Currency Shares/Par
Cost
EUR
BUYS
Boliden AB USD 124,265 3,555,258
Deutsche Boerse AG USD 29,622 3,356,477
Roche Holding AG USD 17,903 3,326,217
Koninklijke Philips NV USD 94,023 3,266,265
Weir Group PLC USD 127,620 3,166,797
Lundin Petroleum AB USD 139,779 3,129,501
Indivior PLC USD 620,500 2,918,080
St James's Place PLC USD 197,000 2,530,042
SSP Group PLC USD 311,996 2,469,147
Boliden AB EUR 75,511 2,269,098
Epiroc AB USD 237,509 1,896,196
Elis SA USD 87,863 1,867,137
Industria de Diseno Textil SA USD 65,930 1,809,225
Peab AB USD 163,200 1,189,928
Ingenico Group SA USD 15,566 1,188,265
DCC PLC USD 14,676 966,711
Associated British Foods PLC USD 31,500 840,096
Randgold Resources Ltd USD 12,782 829,918
Partners Group Holding AG USD 1,334 798,580
Arrow Global Group PLC USD 312,845 790,171
Telefonaktiebolaget LM Ericsson USD 85,655 690,462
Sodexo SA USD 8,182 686,593
Stora Enso OYJ USD 39,204 596,897
Dixons Carphone PLC USD 361,661 539,521
Deutsche Pfandbriefbank AG USD 41,621 522,295
TOTAL SA USD 9,656 491,843
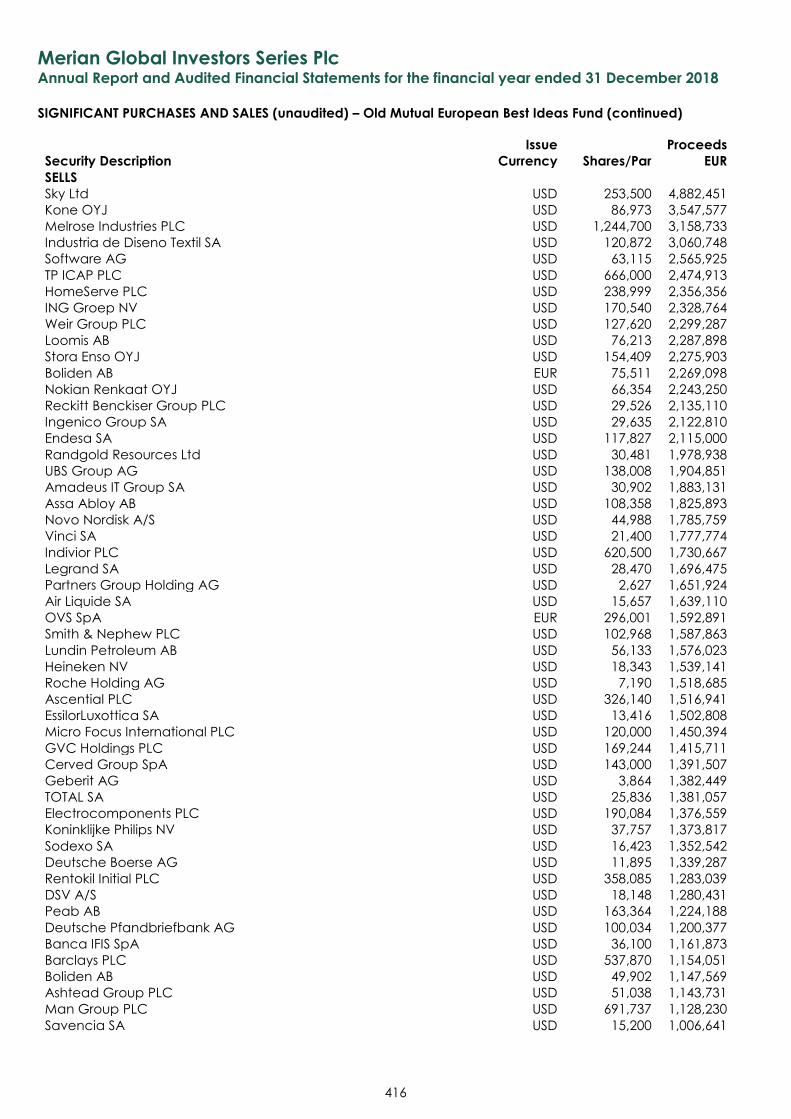
Merian Global Investors Series Plc Annual Report and Audited Financial Statements for the financial year ended 31 December 2018
SIGNIFICANT PURCHASES AND SALES (unaudited) – Old Mutual European Best Ideas Fund (continued)
416
Security Description
Issue
Currency Shares/Par
Proceeds
EUR
SELLS
Sky Ltd USD 253,500 4,882,451
Kone OYJ USD 86,973 3,547,577
Melrose Industries PLC USD 1,244,700 3,158,733
Industria de Diseno Textil SA USD 120,872 3,060,748
Software AG USD 63,115 2,565,925
TP ICAP PLC USD 666,000 2,474,913
HomeServe PLC USD 238,999 2,356,356
ING Groep NV USD 170,540 2,328,764
Weir Group PLC USD 127,620 2,299,287
Loomis AB USD 76,213 2,287,898
Stora Enso OYJ USD 154,409 2,275,903
Boliden AB EUR 75,511 2,269,098
Nokian Renkaat OYJ USD 66,354 2,243,250
Reckitt Benckiser Group PLC USD 29,526 2,135,110
Ingenico Group SA USD 29,635 2,122,810
Endesa SA USD 117,827 2,115,000
Randgold Resources Ltd USD 30,481 1,978,938
UBS Group AG USD 138,008 1,904,851
Amadeus IT Group SA USD 30,902 1,883,131
Assa Abloy AB USD 108,358 1,825,893
Novo Nordisk A/S USD 44,988 1,785,759
Vinci SA USD 21,400 1,777,774
Indivior PLC USD 620,500 1,730,667
Legrand SA USD 28,470 1,696,475
Partners Group Holding AG USD 2,627 1,651,924
Air Liquide SA USD 15,657 1,639,110
OVS SpA EUR 296,001 1,592,891
Smith & Nephew PLC USD 102,968 1,587,863
Lundin Petroleum AB USD 56,133 1,576,023
Heineken NV USD 18,343 1,539,141
Roche Holding AG USD 7,190 1,518,685
Ascential PLC USD 326,140 1,516,941
EssilorLuxottica SA USD 13,416 1,502,808
Micro Focus International PLC USD 120,000 1,450,394
GVC Holdings PLC USD 169,244 1,415,711
Cerved Group SpA USD 143,000 1,391,507
Geberit AG USD 3,864 1,382,449
TOTAL SA USD 25,836 1,381,057
Electrocomponents PLC USD 190,084 1,376,559
Koninklijke Philips NV USD 37,757 1,373,817
Sodexo SA USD 16,423 1,352,542
Deutsche Boerse AG USD 11,895 1,339,287
Rentokil Initial PLC USD 358,085 1,283,039
DSV A/S USD 18,148 1,280,431
Peab AB USD 163,364 1,224,188
Deutsche Pfandbriefbank AG USD 100,034 1,200,377
Banca IFIS SpA USD 36,100 1,161,873
Barclays PLC USD 537,870 1,154,051
Boliden AB USD 49,902 1,147,569
Ashtead Group PLC USD 51,038 1,143,731
Man Group PLC USD 691,737 1,128,230
Savencia SA USD 15,200 1,006,641
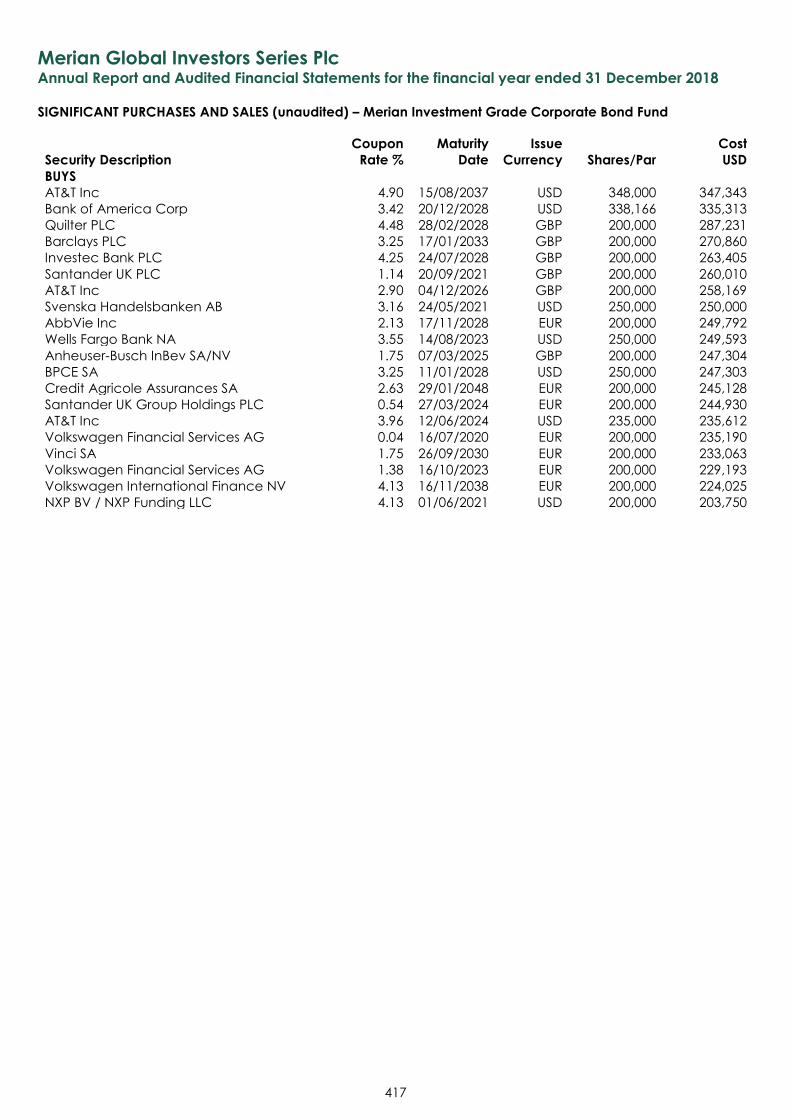
Merian Global Investors Series Plc Annual Report and Audited Financial Statements for the financial year ended 31 December 2018
SIGNIFICANT PURCHASES AND SALES (unaudited) – Merian Investment Grade Corporate Bond Fund
417
Security Description
Coupon
Rate %
Maturity
Date
Issue
Currency Shares/Par
Cost
USD
BUYS
AT&T Inc 4.90 15/08/2037 USD 348,000 347,343
Bank of America Corp 3.42 20/12/2028 USD 338,166 335,313
Quilter PLC 4.48 28/02/2028 GBP 200,000 287,231
Barclays PLC 3.25 17/01/2033 GBP 200,000 270,860
Investec Bank PLC 4.25 24/07/2028 GBP 200,000 263,405
Santander UK PLC 1.14 20/09/2021 GBP 200,000 260,010
AT&T Inc 2.90 04/12/2026 GBP 200,000 258,169
Svenska Handelsbanken AB 3.16 24/05/2021 USD 250,000 250,000
AbbVie Inc 2.13 17/11/2028 EUR 200,000 249,792
Wells Fargo Bank NA 3.55 14/08/2023 USD 250,000 249,593
Anheuser-Busch InBev SA/NV 1.75 07/03/2025 GBP 200,000 247,304
BPCE SA 3.25 11/01/2028 USD 250,000 247,303
Credit Agricole Assurances SA 2.63 29/01/2048 EUR 200,000 245,128
Santander UK Group Holdings PLC 0.54 27/03/2024 EUR 200,000 244,930
AT&T Inc 3.96 12/06/2024 USD 235,000 235,612
Volkswagen Financial Services AG 0.04 16/07/2020 EUR 200,000 235,190
Vinci SA 1.75 26/09/2030 EUR 200,000 233,063
Volkswagen Financial Services AG 1.38 16/10/2023 EUR 200,000 229,193
Volkswagen International Finance NV 4.13 16/11/2038 EUR 200,000 224,025
NXP BV / NXP Funding LLC 4.13 01/06/2021 USD 200,000 203,750
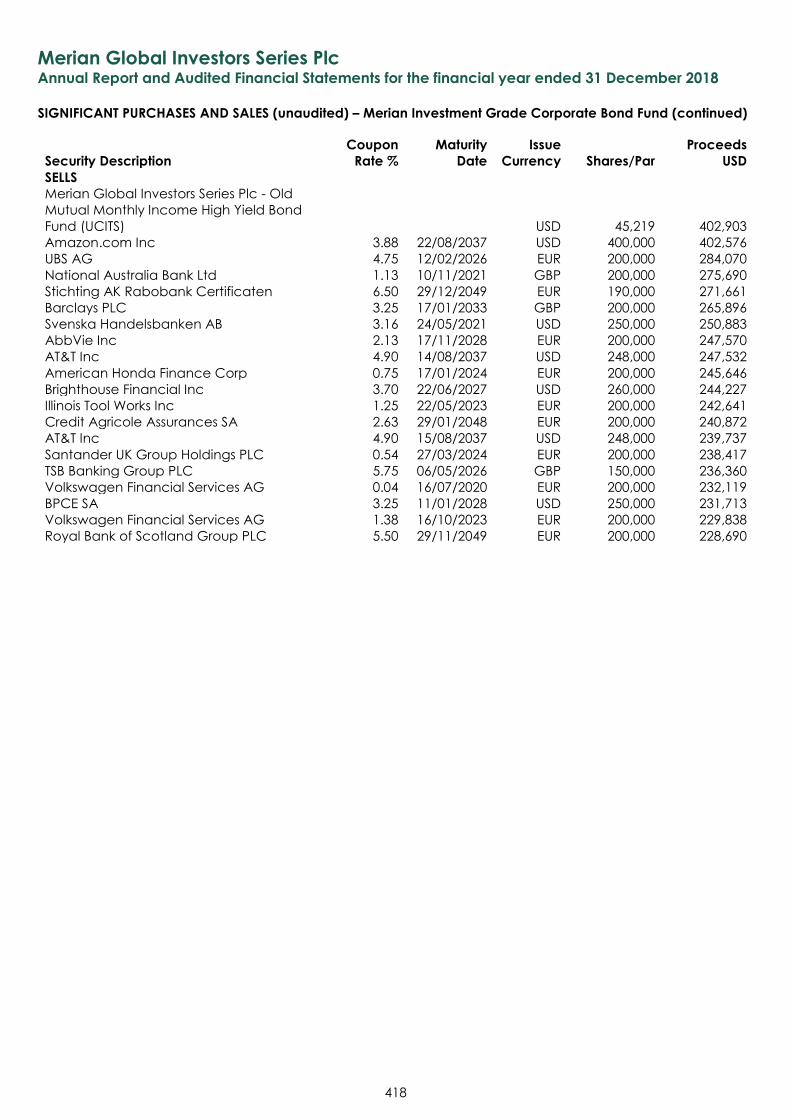
Merian Global Investors Series Plc Annual Report and Audited Financial Statements for the financial year ended 31 December 2018
SIGNIFICANT PURCHASES AND SALES (unaudited) – Merian Investment Grade Corporate Bond Fund (continued)
418
Security Description
Coupon
Rate %
Maturity
Date
Issue
Currency Shares/Par
Proceeds
USD
SELLS
Merian Global Investors Series Plc - Old
Mutual Monthly Income High Yield Bond
Fund (UCITS) USD 45,219 402,903
Amazon.com Inc 3.88 22/08/2037 USD 400,000 402,576
UBS AG 4.75 12/02/2026 EUR 200,000 284,070
National Australia Bank Ltd 1.13 10/11/2021 GBP 200,000 275,690
Stichting AK Rabobank Certificaten 6.50 29/12/2049 EUR 190,000 271,661
Barclays PLC 3.25 17/01/2033 GBP 200,000 265,896
Svenska Handelsbanken AB 3.16 24/05/2021 USD 250,000 250,883
AbbVie Inc 2.13 17/11/2028 EUR 200,000 247,570
AT&T Inc 4.90 14/08/2037 USD 248,000 247,532
American Honda Finance Corp 0.75 17/01/2024 EUR 200,000 245,646
Brighthouse Financial Inc 3.70 22/06/2027 USD 260,000 244,227
Illinois Tool Works Inc 1.25 22/05/2023 EUR 200,000 242,641
Credit Agricole Assurances SA 2.63 29/01/2048 EUR 200,000 240,872
AT&T Inc 4.90 15/08/2037 USD 248,000 239,737
Santander UK Group Holdings PLC 0.54 27/03/2024 EUR 200,000 238,417
TSB Banking Group PLC 5.75 06/05/2026 GBP 150,000 236,360
Volkswagen Financial Services AG 0.04 16/07/2020 EUR 200,000 232,119
BPCE SA 3.25 11/01/2028 USD 250,000 231,713
Volkswagen Financial Services AG 1.38 16/10/2023 EUR 200,000 229,838
Royal Bank of Scotland Group PLC 5.50 29/11/2049 EUR 200,000 228,690
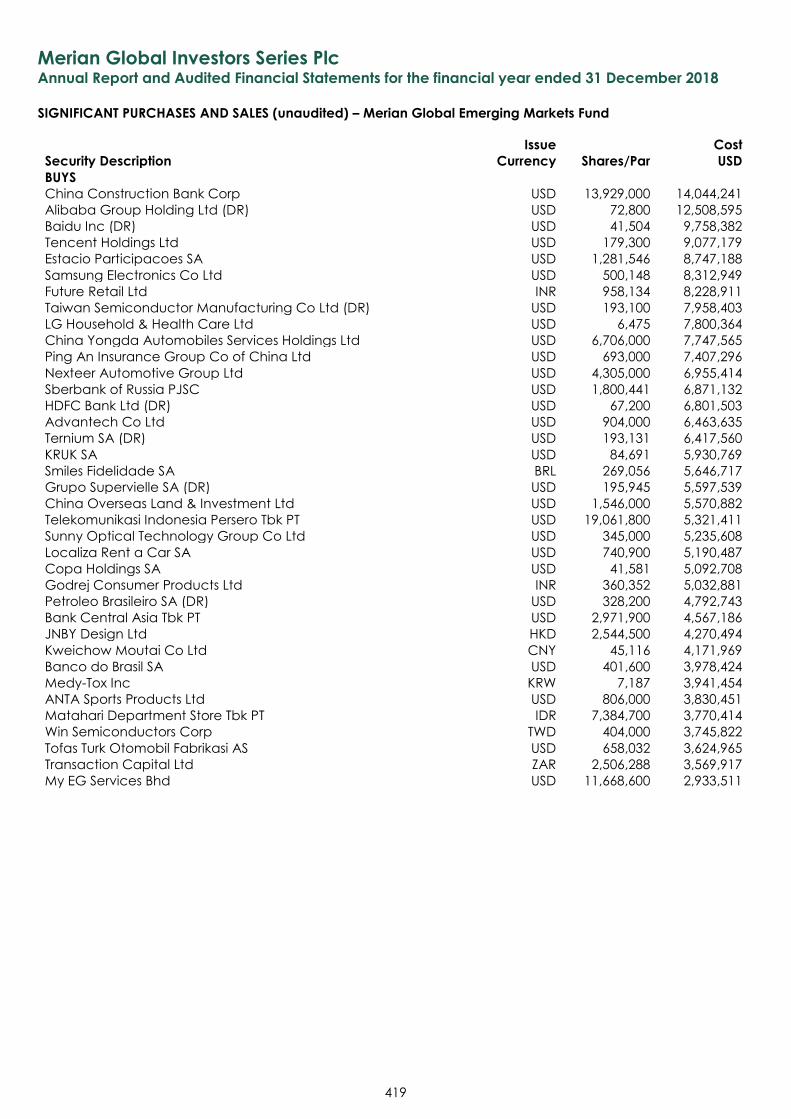
Merian Global Investors Series Plc Annual Report and Audited Financial Statements for the financial year ended 31 December 2018
SIGNIFICANT PURCHASES AND SALES (unaudited) – Merian Global Emerging Markets Fund
419
Security Description
Issue
Currency Shares/Par
Cost
USD
BUYS
China Construction Bank Corp USD 13,929,000 14,044,241
Alibaba Group Holding Ltd (DR) USD 72,800 12,508,595
Baidu Inc (DR) USD 41,504 9,758,382
Tencent Holdings Ltd USD 179,300 9,077,179
Estacio Participacoes SA USD 1,281,546 8,747,188
Samsung Electronics Co Ltd USD 500,148 8,312,949
Future Retail Ltd INR 958,134 8,228,911
Taiwan Semiconductor Manufacturing Co Ltd (DR) USD 193,100 7,958,403
LG Household & Health Care Ltd USD 6,475 7,800,364
China Yongda Automobiles Services Holdings Ltd USD 6,706,000 7,747,565
Ping An Insurance Group Co of China Ltd USD 693,000 7,407,296
Nexteer Automotive Group Ltd USD 4,305,000 6,955,414
Sberbank of Russia PJSC USD 1,800,441 6,871,132
HDFC Bank Ltd (DR) USD 67,200 6,801,503
Advantech Co Ltd USD 904,000 6,463,635
Ternium SA (DR) USD 193,131 6,417,560
KRUK SA USD 84,691 5,930,769
Smiles Fidelidade SA BRL 269,056 5,646,717
Grupo Supervielle SA (DR) USD 195,945 5,597,539
China Overseas Land & Investment Ltd USD 1,546,000 5,570,882
Telekomunikasi Indonesia Persero Tbk PT USD 19,061,800 5,321,411
Sunny Optical Technology Group Co Ltd USD 345,000 5,235,608
Localiza Rent a Car SA USD 740,900 5,190,487
Copa Holdings SA USD 41,581 5,092,708
Godrej Consumer Products Ltd INR 360,352 5,032,881
Petroleo Brasileiro SA (DR) USD 328,200 4,792,743
Bank Central Asia Tbk PT USD 2,971,900 4,567,186
JNBY Design Ltd HKD 2,544,500 4,270,494
Kweichow Moutai Co Ltd CNY 45,116 4,171,969
Banco do Brasil SA USD 401,600 3,978,424
Medy-Tox Inc KRW 7,187 3,941,454
ANTA Sports Products Ltd USD 806,000 3,830,451
Matahari Department Store Tbk PT IDR 7,384,700 3,770,414
Win Semiconductors Corp TWD 404,000 3,745,822
Tofas Turk Otomobil Fabrikasi AS USD 658,032 3,624,965
Transaction Capital Ltd ZAR 2,506,288 3,569,917
My EG Services Bhd USD 11,668,600 2,933,511
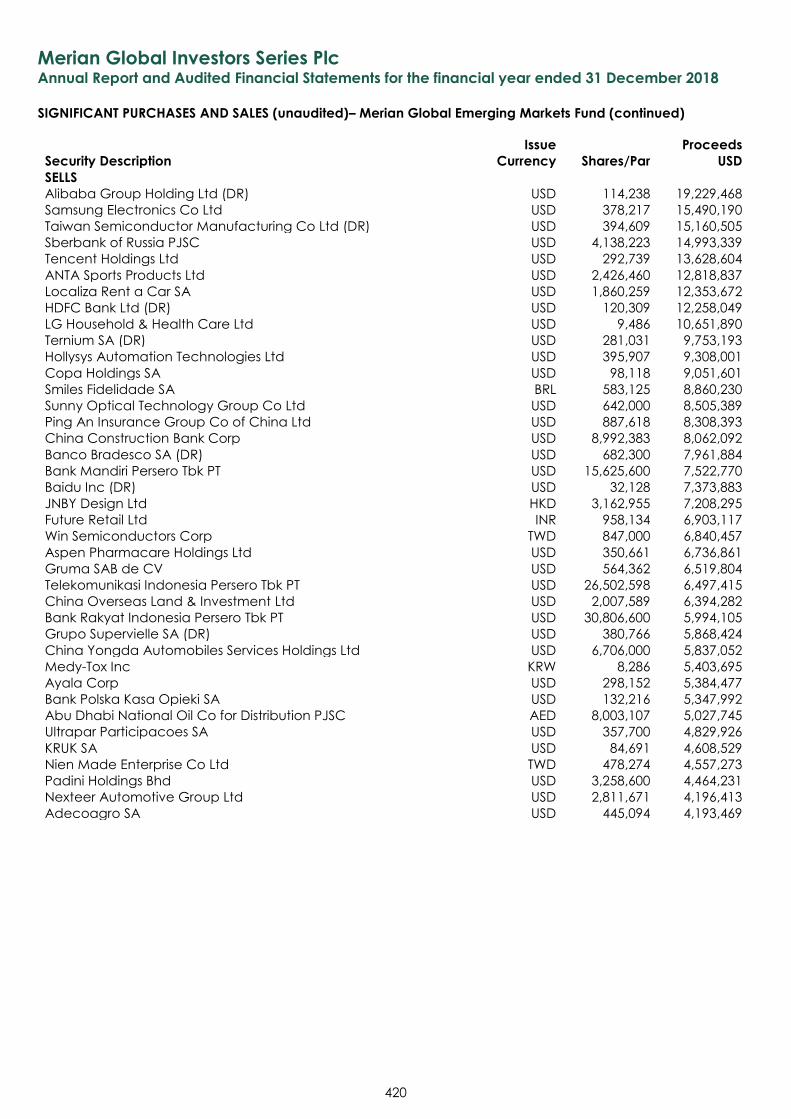
Merian Global Investors Series Plc Annual Report and Audited Financial Statements for the financial year ended 31 December 2018
SIGNIFICANT PURCHASES AND SALES (unaudited)– Merian Global Emerging Markets Fund (continued)
420
Security Description
Issue
Currency Shares/Par
Proceeds
USD
SELLS
Alibaba Group Holding Ltd (DR) USD 114,238 19,229,468
Samsung Electronics Co Ltd USD 378,217 15,490,190
Taiwan Semiconductor Manufacturing Co Ltd (DR) USD 394,609 15,160,505
Sberbank of Russia PJSC USD 4,138,223 14,993,339
Tencent Holdings Ltd USD 292,739 13,628,604
ANTA Sports Products Ltd USD 2,426,460 12,818,837
Localiza Rent a Car SA USD 1,860,259 12,353,672
HDFC Bank Ltd (DR) USD 120,309 12,258,049
LG Household & Health Care Ltd USD 9,486 10,651,890
Ternium SA (DR) USD 281,031 9,753,193
Hollysys Automation Technologies Ltd USD 395,907 9,308,001
Copa Holdings SA USD 98,118 9,051,601
Smiles Fidelidade SA BRL 583,125 8,860,230
Sunny Optical Technology Group Co Ltd USD 642,000 8,505,389
Ping An Insurance Group Co of China Ltd USD 887,618 8,308,393
China Construction Bank Corp USD 8,992,383 8,062,092
Banco Bradesco SA (DR) USD 682,300 7,961,884
Bank Mandiri Persero Tbk PT USD 15,625,600 7,522,770
Baidu Inc (DR) USD 32,128 7,373,883
JNBY Design Ltd HKD 3,162,955 7,208,295
Future Retail Ltd INR 958,134 6,903,117
Win Semiconductors Corp TWD 847,000 6,840,457
Aspen Pharmacare Holdings Ltd USD 350,661 6,736,861
Gruma SAB de CV USD 564,362 6,519,804
Telekomunikasi Indonesia Persero Tbk PT USD 26,502,598 6,497,415
China Overseas Land & Investment Ltd USD 2,007,589 6,394,282
Bank Rakyat Indonesia Persero Tbk PT USD 30,806,600 5,994,105
Grupo Supervielle SA (DR) USD 380,766 5,868,424
China Yongda Automobiles Services Holdings Ltd USD 6,706,000 5,837,052
Medy-Tox Inc KRW 8,286 5,403,695
Ayala Corp USD 298,152 5,384,477
Bank Polska Kasa Opieki SA USD 132,216 5,347,992
Abu Dhabi National Oil Co for Distribution PJSC AED 8,003,107 5,027,745
Ultrapar Participacoes SA USD 357,700 4,829,926
KRUK SA USD 84,691 4,608,529
Nien Made Enterprise Co Ltd TWD 478,274 4,557,273
Padini Holdings Bhd USD 3,258,600 4,464,231
Nexteer Automotive Group Ltd USD 2,811,671 4,196,413
Adecoagro SA USD 445,094 4,193,469
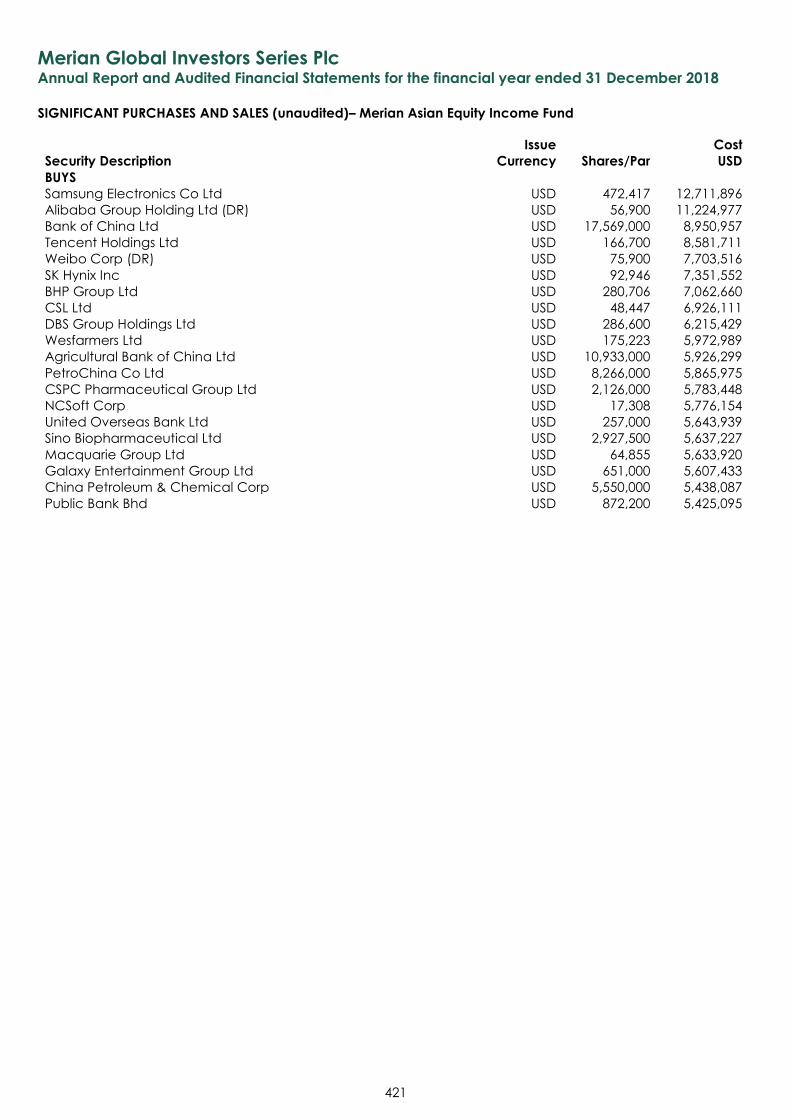
Merian Global Investors Series Plc Annual Report and Audited Financial Statements for the financial year ended 31 December 2018
SIGNIFICANT PURCHASES AND SALES (unaudited)– Merian Asian Equity Income Fund
421
Security Description
Issue
Currency Shares/Par
Cost
USD
BUYS
Samsung Electronics Co Ltd USD 472,417 12,711,896
Alibaba Group Holding Ltd (DR) USD 56,900 11,224,977
Bank of China Ltd USD 17,569,000 8,950,957
Tencent Holdings Ltd USD 166,700 8,581,711
Weibo Corp (DR) USD 75,900 7,703,516
SK Hynix Inc USD 92,946 7,351,552
BHP Group Ltd USD 280,706 7,062,660
CSL Ltd USD 48,447 6,926,111
DBS Group Holdings Ltd USD 286,600 6,215,429
Wesfarmers Ltd USD 175,223 5,972,989
Agricultural Bank of China Ltd USD 10,933,000 5,926,299
PetroChina Co Ltd USD 8,266,000 5,865,975
CSPC Pharmaceutical Group Ltd USD 2,126,000 5,783,448
NCSoft Corp USD 17,308 5,776,154
United Overseas Bank Ltd USD 257,000 5,643,939
Sino Biopharmaceutical Ltd USD 2,927,500 5,637,227
Macquarie Group Ltd USD 64,855 5,633,920
Galaxy Entertainment Group Ltd USD 651,000 5,607,433
China Petroleum & Chemical Corp USD 5,550,000 5,438,087
Public Bank Bhd USD 872,200 5,425,095
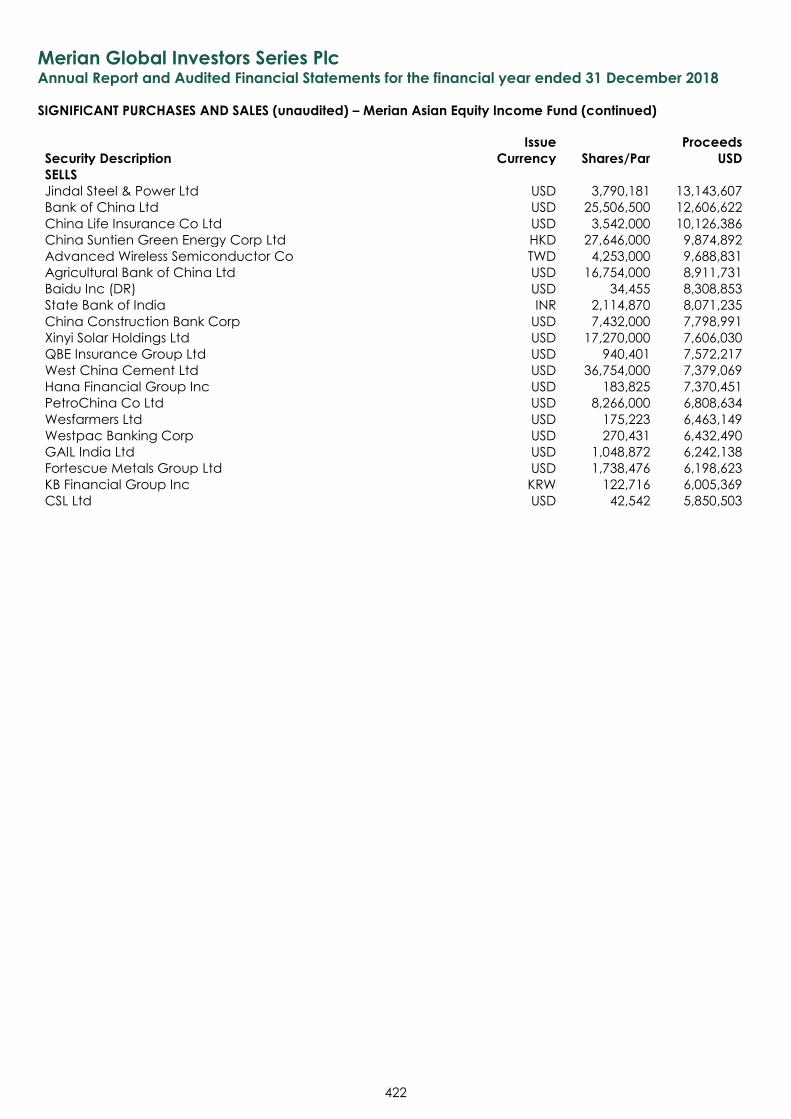
Merian Global Investors Series Plc Annual Report and Audited Financial Statements for the financial year ended 31 December 2018
SIGNIFICANT PURCHASES AND SALES (unaudited) – Merian Asian Equity Income Fund (continued)
422
Security Description
Issue
Currency Shares/Par
Proceeds
USD
SELLS
Jindal Steel & Power Ltd USD 3,790,181 13,143,607
Bank of China Ltd USD 25,506,500 12,606,622
China Life Insurance Co Ltd USD 3,542,000 10,126,386
China Suntien Green Energy Corp Ltd HKD 27,646,000 9,874,892
Advanced Wireless Semiconductor Co TWD 4,253,000 9,688,831
Agricultural Bank of China Ltd USD 16,754,000 8,911,731
Baidu Inc (DR) USD 34,455 8,308,853
State Bank of India INR 2,114,870 8,071,235
China Construction Bank Corp USD 7,432,000 7,798,991
Xinyi Solar Holdings Ltd USD 17,270,000 7,606,030
QBE Insurance Group Ltd USD 940,401 7,572,217
West China Cement Ltd USD 36,754,000 7,379,069
Hana Financial Group Inc USD 183,825 7,370,451
PetroChina Co Ltd USD 8,266,000 6,808,634
Wesfarmers Ltd USD 175,223 6,463,149
Westpac Banking Corp USD 270,431 6,432,490
GAIL India Ltd USD 1,048,872 6,242,138
Fortescue Metals Group Ltd USD 1,738,476 6,198,623
KB Financial Group Inc KRW 122,716 6,005,369
CSL Ltd USD 42,542 5,850,503
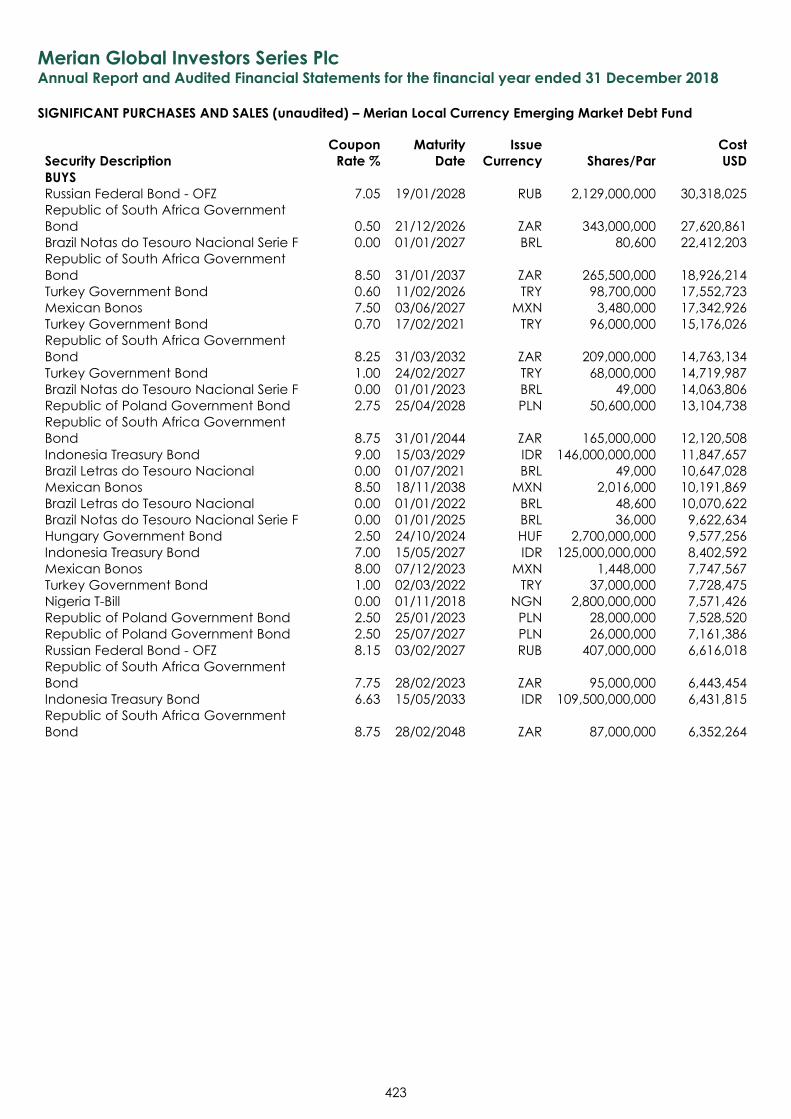
Merian Global Investors Series Plc Annual Report and Audited Financial Statements for the financial year ended 31 December 2018
SIGNIFICANT PURCHASES AND SALES (unaudited) – Merian Local Currency Emerging Market Debt Fund
423
Security Description
Coupon
Rate %
Maturity
Date
Issue
Currency Shares/Par
Cost
USD
BUYS
Russian Federal Bond - OFZ 7.05 19/01/2028 RUB 2,129,000,000 30,318,025
Republic of South Africa Government
Bond 0.50 21/12/2026 ZAR 343,000,000 27,620,861
Brazil Notas do Tesouro Nacional Serie F 0.00 01/01/2027 BRL 80,600 22,412,203
Republic of South Africa Government
Bond 8.50 31/01/2037 ZAR 265,500,000 18,926,214
Turkey Government Bond 0.60 11/02/2026 TRY 98,700,000 17,552,723
Mexican Bonos 7.50 03/06/2027 MXN 3,480,000 17,342,926
Turkey Government Bond 0.70 17/02/2021 TRY 96,000,000 15,176,026
Republic of South Africa Government
Bond 8.25 31/03/2032 ZAR 209,000,000 14,763,134
Turkey Government Bond 1.00 24/02/2027 TRY 68,000,000 14,719,987
Brazil Notas do Tesouro Nacional Serie F 0.00 01/01/2023 BRL 49,000 14,063,806
Republic of Poland Government Bond 2.75 25/04/2028 PLN 50,600,000 13,104,738
Republic of South Africa Government
Bond 8.75 31/01/2044 ZAR 165,000,000 12,120,508
Indonesia Treasury Bond 9.00 15/03/2029 IDR 146,000,000,000 11,847,657
Brazil Letras do Tesouro Nacional 0.00 01/07/2021 BRL 49,000 10,647,028
Mexican Bonos 8.50 18/11/2038 MXN 2,016,000 10,191,869
Brazil Letras do Tesouro Nacional 0.00 01/01/2022 BRL 48,600 10,070,622
Brazil Notas do Tesouro Nacional Serie F 0.00 01/01/2025 BRL 36,000 9,622,634
Hungary Government Bond 2.50 24/10/2024 HUF 2,700,000,000 9,577,256
Indonesia Treasury Bond 7.00 15/05/2027 IDR 125,000,000,000 8,402,592
Mexican Bonos 8.00 07/12/2023 MXN 1,448,000 7,747,567
Turkey Government Bond 1.00 02/03/2022 TRY 37,000,000 7,728,475
Nigeria T-Bill 0.00 01/11/2018 NGN 2,800,000,000 7,571,426
Republic of Poland Government Bond 2.50 25/01/2023 PLN 28,000,000 7,528,520
Republic of Poland Government Bond 2.50 25/07/2027 PLN 26,000,000 7,161,386
Russian Federal Bond - OFZ 8.15 03/02/2027 RUB 407,000,000 6,616,018
Republic of South Africa Government
Bond 7.75 28/02/2023 ZAR 95,000,000 6,443,454
Indonesia Treasury Bond 6.63 15/05/2033 IDR 109,500,000,000 6,431,815
Republic of South Africa Government
Bond 8.75 28/02/2048 ZAR 87,000,000 6,352,264
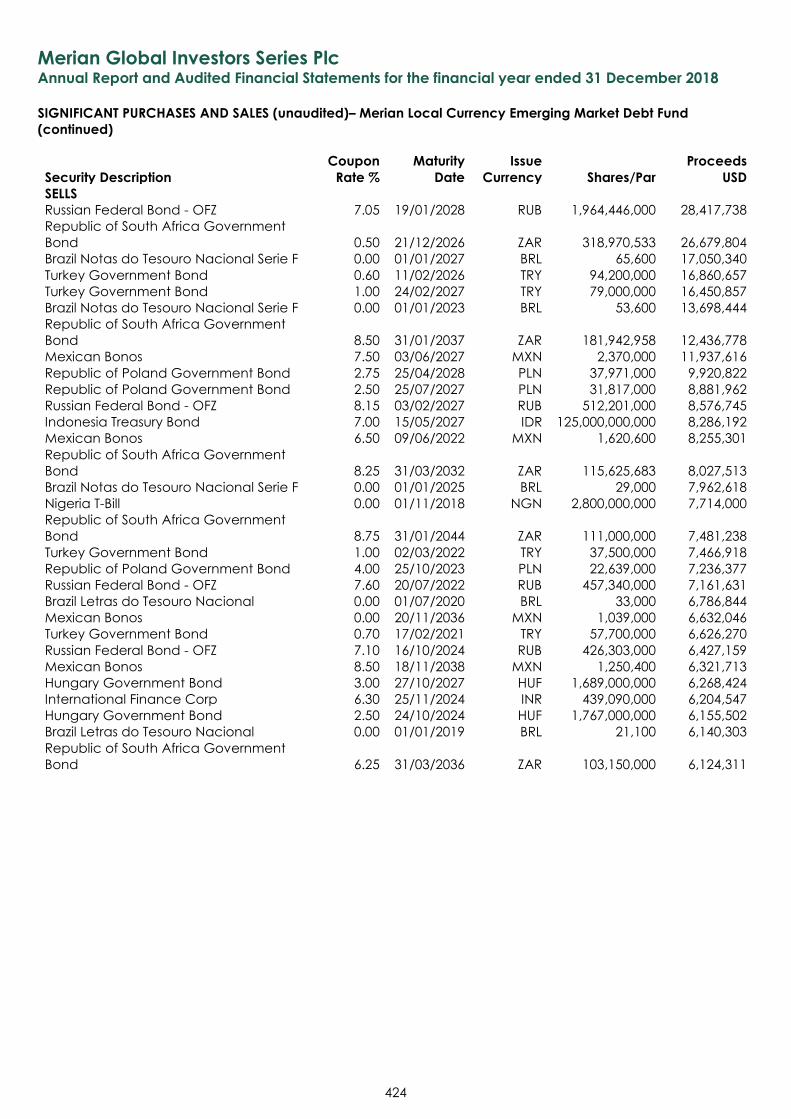
Merian Global Investors Series Plc Annual Report and Audited Financial Statements for the financial year ended 31 December 2018
SIGNIFICANT PURCHASES AND SALES (unaudited)– Merian Local Currency Emerging Market Debt Fund
(continued)
424
Security Description
Coupon
Rate %
Maturity
Date
Issue
Currency Shares/Par
Proceeds
USD
SELLS
Russian Federal Bond - OFZ 7.05 19/01/2028 RUB 1,964,446,000 28,417,738
Republic of South Africa Government
Bond 0.50 21/12/2026 ZAR 318,970,533 26,679,804
Brazil Notas do Tesouro Nacional Serie F 0.00 01/01/2027 BRL 65,600 17,050,340
Turkey Government Bond 0.60 11/02/2026 TRY 94,200,000 16,860,657
Turkey Government Bond 1.00 24/02/2027 TRY 79,000,000 16,450,857
Brazil Notas do Tesouro Nacional Serie F 0.00 01/01/2023 BRL 53,600 13,698,444
Republic of South Africa Government
Bond 8.50 31/01/2037 ZAR 181,942,958 12,436,778
Mexican Bonos 7.50 03/06/2027 MXN 2,370,000 11,937,616
Republic of Poland Government Bond 2.75 25/04/2028 PLN 37,971,000 9,920,822
Republic of Poland Government Bond 2.50 25/07/2027 PLN 31,817,000 8,881,962
Russian Federal Bond - OFZ 8.15 03/02/2027 RUB 512,201,000 8,576,745
Indonesia Treasury Bond 7.00 15/05/2027 IDR 125,000,000,000 8,286,192
Mexican Bonos 6.50 09/06/2022 MXN 1,620,600 8,255,301
Republic of South Africa Government
Bond 8.25 31/03/2032 ZAR 115,625,683 8,027,513
Brazil Notas do Tesouro Nacional Serie F 0.00 01/01/2025 BRL 29,000 7,962,618
Nigeria T-Bill 0.00 01/11/2018 NGN 2,800,000,000 7,714,000
Republic of South Africa Government
Bond 8.75 31/01/2044 ZAR 111,000,000 7,481,238
Turkey Government Bond 1.00 02/03/2022 TRY 37,500,000 7,466,918
Republic of Poland Government Bond 4.00 25/10/2023 PLN 22,639,000 7,236,377
Russian Federal Bond - OFZ 7.60 20/07/2022 RUB 457,340,000 7,161,631
Brazil Letras do Tesouro Nacional 0.00 01/07/2020 BRL 33,000 6,786,844
Mexican Bonos 0.00 20/11/2036 MXN 1,039,000 6,632,046
Turkey Government Bond 0.70 17/02/2021 TRY 57,700,000 6,626,270
Russian Federal Bond - OFZ 7.10 16/10/2024 RUB 426,303,000 6,427,159
Mexican Bonos 8.50 18/11/2038 MXN 1,250,400 6,321,713
Hungary Government Bond 3.00 27/10/2027 HUF 1,689,000,000 6,268,424
International Finance Corp 6.30 25/11/2024 INR 439,090,000 6,204,547
Hungary Government Bond 2.50 24/10/2024 HUF 1,767,000,000 6,155,502
Brazil Letras do Tesouro Nacional 0.00 01/01/2019 BRL 21,100 6,140,303
Republic of South Africa Government
Bond 6.25 31/03/2036 ZAR 103,150,000 6,124,311
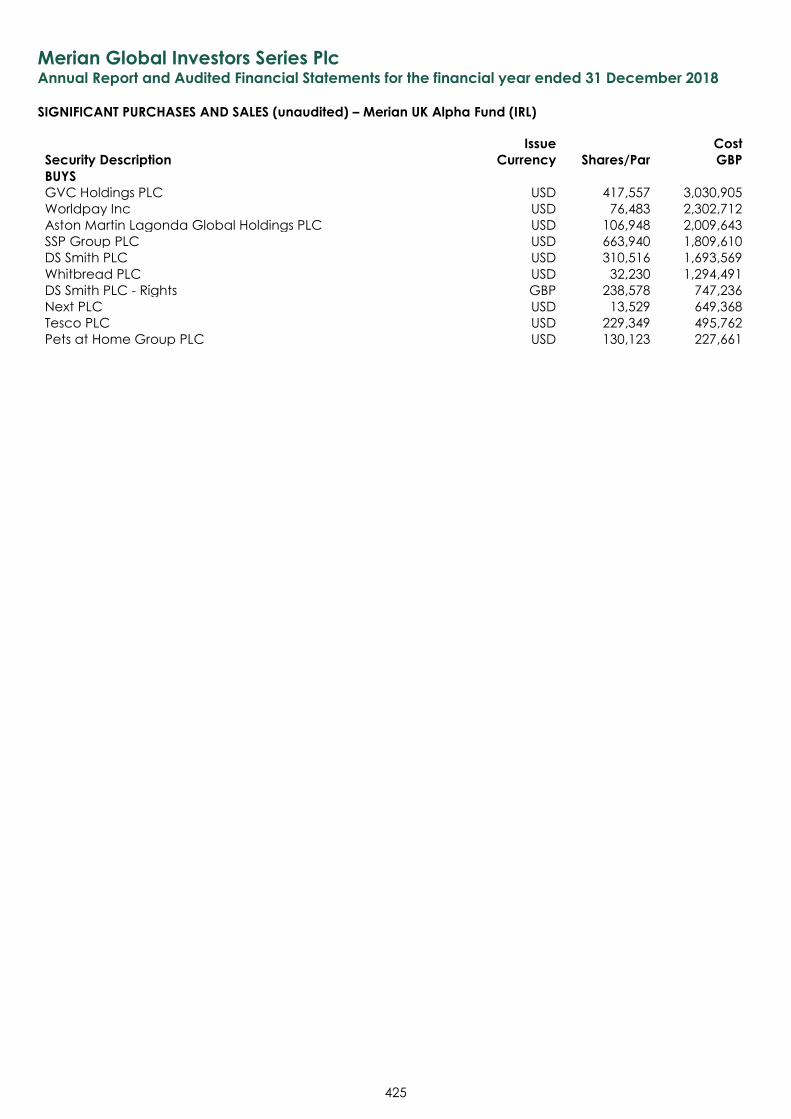
Merian Global Investors Series Plc Annual Report and Audited Financial Statements for the financial year ended 31 December 2018
SIGNIFICANT PURCHASES AND SALES (unaudited) – Merian UK Alpha Fund (IRL)
425
Security Description
Issue
Currency Shares/Par
Cost
GBP
BUYS
GVC Holdings PLC USD 417,557 3,030,905
Worldpay Inc USD 76,483 2,302,712
Aston Martin Lagonda Global Holdings PLC USD 106,948 2,009,643
SSP Group PLC USD 663,940 1,809,610
DS Smith PLC USD 310,516 1,693,569
Whitbread PLC USD 32,230 1,294,491
DS Smith PLC - Rights GBP 238,578 747,236
Next PLC USD 13,529 649,368
Tesco PLC USD 229,349 495,762
Pets at Home Group PLC USD 130,123 227,661
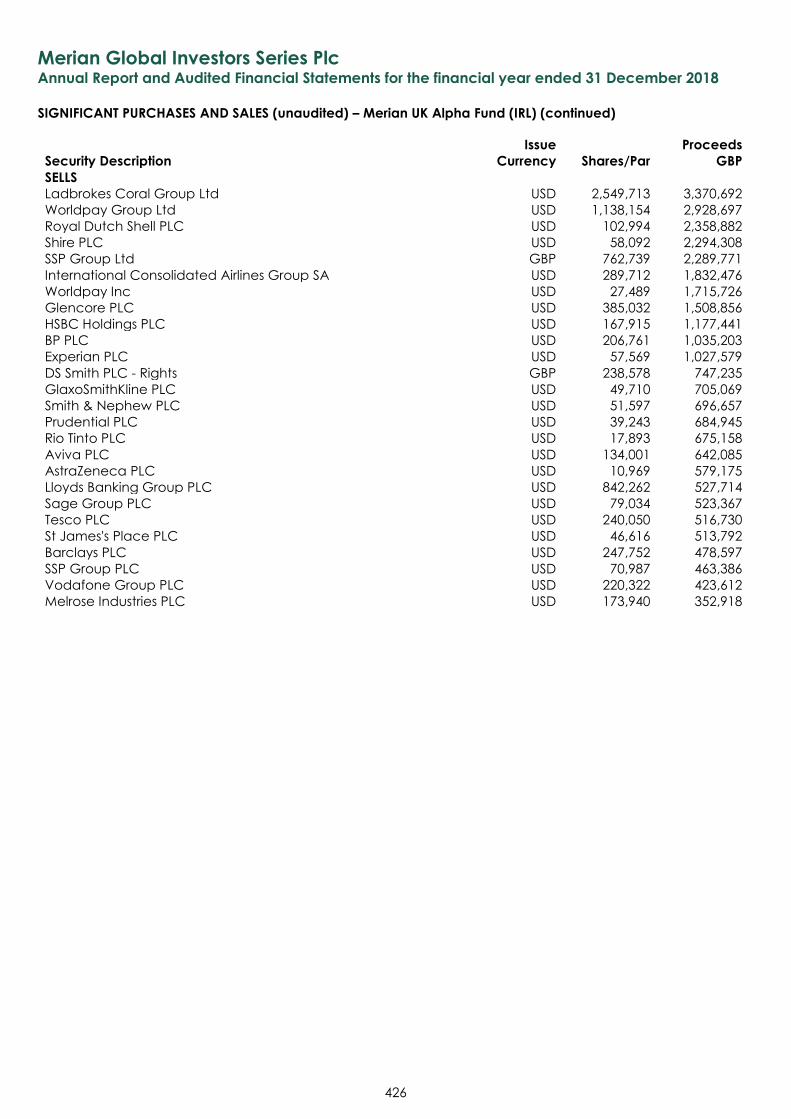
Merian Global Investors Series Plc Annual Report and Audited Financial Statements for the financial year ended 31 December 2018
SIGNIFICANT PURCHASES AND SALES (unaudited) – Merian UK Alpha Fund (IRL) (continued)
426
Security Description
Issue
Currency Shares/Par
Proceeds
GBP
SELLS
Ladbrokes Coral Group Ltd USD 2,549,713 3,370,692
Worldpay Group Ltd USD 1,138,154 2,928,697
Royal Dutch Shell PLC USD 102,994 2,358,882
Shire PLC USD 58,092 2,294,308
SSP Group Ltd GBP 762,739 2,289,771
International Consolidated Airlines Group SA USD 289,712 1,832,476
Worldpay Inc USD 27,489 1,715,726
Glencore PLC USD 385,032 1,508,856
HSBC Holdings PLC USD 167,915 1,177,441
BP PLC USD 206,761 1,035,203
Experian PLC USD 57,569 1,027,579
DS Smith PLC - Rights GBP 238,578 747,235
GlaxoSmithKline PLC USD 49,710 705,069
Smith & Nephew PLC USD 51,597 696,657
Prudential PLC USD 39,243 684,945
Rio Tinto PLC USD 17,893 675,158
Aviva PLC USD 134,001 642,085
AstraZeneca PLC USD 10,969 579,175
Lloyds Banking Group PLC USD 842,262 527,714
Sage Group PLC USD 79,034 523,367
Tesco PLC USD 240,050 516,730
St James's Place PLC USD 46,616 513,792
Barclays PLC USD 247,752 478,597
SSP Group PLC USD 70,987 463,386
Vodafone Group PLC USD 220,322 423,612
Melrose Industries PLC USD 173,940 352,918

Merian Global Investors Series Plc Annual Report and Audited Financial Statements for the financial year ended 31 December 2018
SIGNIFICANT PURCHASES AND SALES (unaudited) – Merian UK Smaller Companies Focus Fund
427
Security Description Issue Currency Shares/Par
Cost
GBP
BUYS
Funding Circle Holdings PLC USD 1,900,804 8,084,480
Huntsworth PLC USD 7,756,456 7,620,932
Mind Gym Ltd GBP 4,426,040 6,828,676
Learning Technologies Group PLC USD 6,829,392 6,813,081
Draper Esprit PLC USD 1,528,097 6,418,008
JTC PLC GBP 2,166,000 6,281,400
Superdry PLC USD 380,140 6,006,672
Alliance Pharma PLC USD 6,015,730 5,615,978
Keystone Law Group PLC GBP 1,814,000 5,519,762
Codemasters Group Holdings PLC GBP 2,506,587 5,481,796
Castleton Technology PLC GBP 6,045,970 5,322,923
Helical PLC USD 1,401,279 5,274,962
AFH Financial Group PLC GBP 1,406,921 5,221,105
Blue Prism Group PLC USD 306,075 4,990,097
Transferwise GBP 26,403 4,594,842
Knights Group Holdings PLC GBP 2,994,732 4,473,745
Boohoo Group PLC USD 2,614,000 4,395,541
Somero Enterprises Inc GBP 1,154,000 4,168,412
IMImobile PLC GBP 1,310,246 4,086,113
Gamma Communications PLC GBP 518,000 4,016,508
Hunting PLC USD 528,000 3,722,923
Bellway PLC USD 139,000 3,668,633
Persimmon PLC USD 178,000 3,522,647
GRC International Group PLC GBP 1,457,000 3,148,509
Clinigen Group PLC USD 349,032 3,125,724
Purplebricks Group PLC USD 1,430,152 3,092,312
Zoo Digital Group PLC USD 2,744,240 3,011,383
DFS Furniture PLC GBP 1,440,000 2,910,326
Marshalls PLC USD 651,000 2,881,612
LoopUp Group PLC USD 701,376 2,838,104
Fenner PLC USD 612,000 2,830,994
Breedon Group PLC GBP 3,621,511 2,770,456
Boku Inc GBP 2,313,582 2,677,267
Albert Technologies Ltd USD 7,173,784 2,654,300
Hilton Food Group PLC GBP 297,219 2,472,603
Elektron Technology PLC USD 7,105,000 2,437,114
1Spatial PLC GBP 14,257,967 2,309,083
Topps Tiles PLC USD 2,485,673 2,217,562
Merian Chrysalis Investment Co Ltd GBP 2,205,360 2,205,360
Aquis Exchange PLC GBP 818,191 2,200,934
Robert Walters PLC GBP 336,000 2,189,731
Cloudcall Group PLC USD 1,254,000 2,154,002
Fevertree Drinks PLC USD 75,000 2,140,748
Nucleus Financial Group PLC GBP 1,147,196 2,099,370
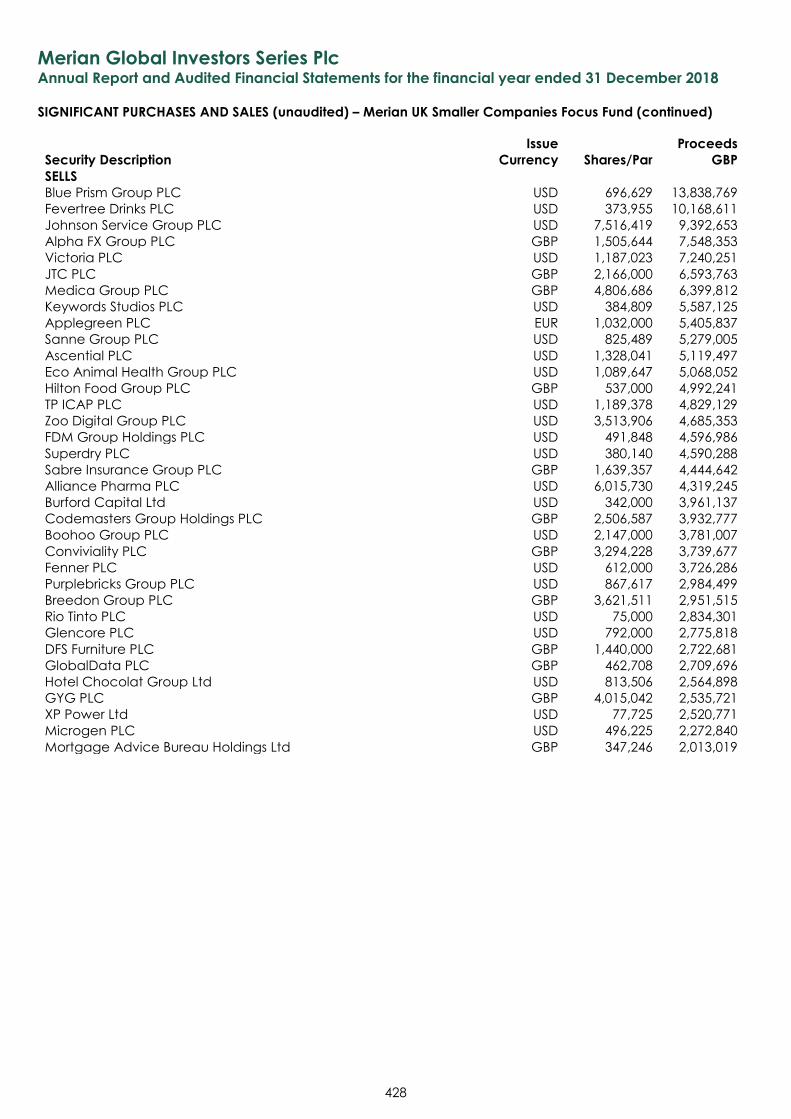
Merian Global Investors Series Plc Annual Report and Audited Financial Statements for the financial year ended 31 December 2018
SIGNIFICANT PURCHASES AND SALES (unaudited) – Merian UK Smaller Companies Focus Fund (continued)
428
Security Description
Issue
Currency Shares/Par
Proceeds
GBP
SELLS
Blue Prism Group PLC USD 696,629 13,838,769
Fevertree Drinks PLC USD 373,955 10,168,611
Johnson Service Group PLC USD 7,516,419 9,392,653
Alpha FX Group PLC GBP 1,505,644 7,548,353
Victoria PLC USD 1,187,023 7,240,251
JTC PLC GBP 2,166,000 6,593,763
Medica Group PLC GBP 4,806,686 6,399,812
Keywords Studios PLC USD 384,809 5,587,125
Applegreen PLC EUR 1,032,000 5,405,837
Sanne Group PLC USD 825,489 5,279,005
Ascential PLC USD 1,328,041 5,119,497
Eco Animal Health Group PLC USD 1,089,647 5,068,052
Hilton Food Group PLC GBP 537,000 4,992,241
TP ICAP PLC USD 1,189,378 4,829,129
Zoo Digital Group PLC USD 3,513,906 4,685,353
FDM Group Holdings PLC USD 491,848 4,596,986
Superdry PLC USD 380,140 4,590,288
Sabre Insurance Group PLC GBP 1,639,357 4,444,642
Alliance Pharma PLC USD 6,015,730 4,319,245
Burford Capital Ltd USD 342,000 3,961,137
Codemasters Group Holdings PLC GBP 2,506,587 3,932,777
Boohoo Group PLC USD 2,147,000 3,781,007
Conviviality PLC GBP 3,294,228 3,739,677
Fenner PLC USD 612,000 3,726,286
Purplebricks Group PLC USD 867,617 2,984,499
Breedon Group PLC GBP 3,621,511 2,951,515
Rio Tinto PLC USD 75,000 2,834,301
Glencore PLC USD 792,000 2,775,818
DFS Furniture PLC GBP 1,440,000 2,722,681
GlobalData PLC GBP 462,708 2,709,696
Hotel Chocolat Group Ltd USD 813,506 2,564,898
GYG PLC GBP 4,015,042 2,535,721
XP Power Ltd USD 77,725 2,520,771
Microgen PLC USD 496,225 2,272,840
Mortgage Advice Bureau Holdings Ltd GBP 347,246 2,013,019
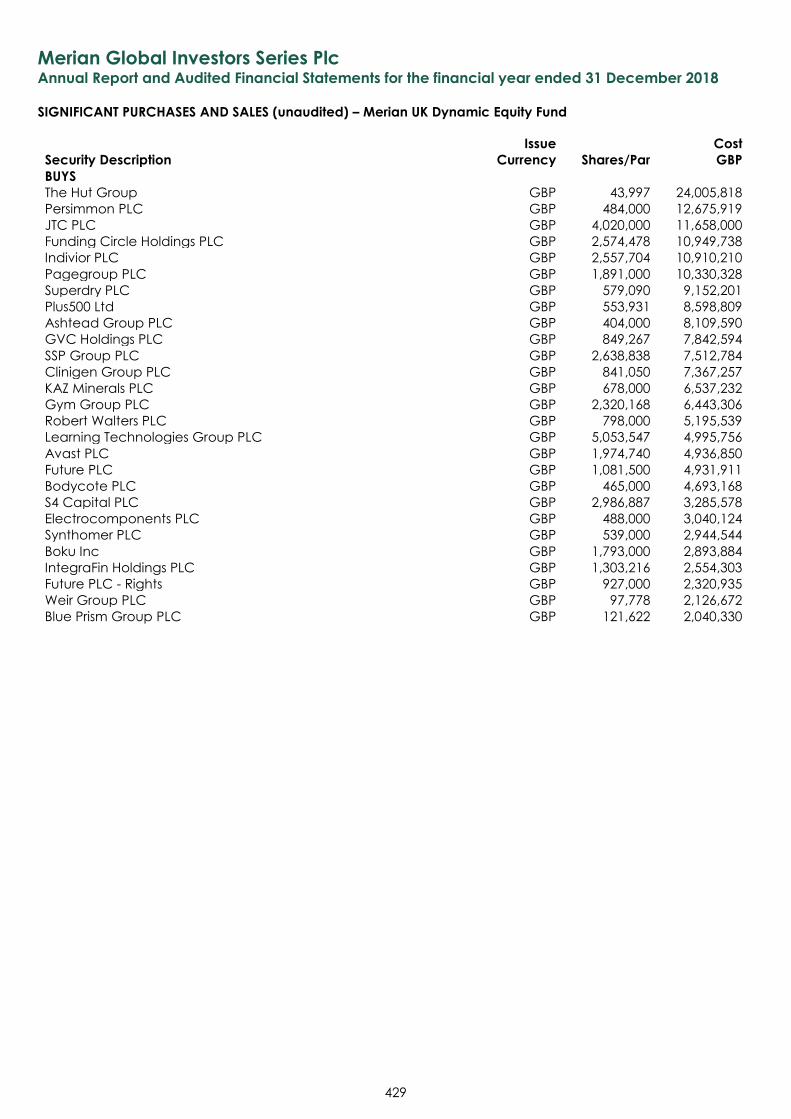
Merian Global Investors Series Plc Annual Report and Audited Financial Statements for the financial year ended 31 December 2018
SIGNIFICANT PURCHASES AND SALES (unaudited) – Merian UK Dynamic Equity Fund
429
Security Description
Issue
Currency
Shares/Par
Cost
GBP
BUYS
The Hut Group GBP 43,997 24,005,818
Persimmon PLC GBP 484,000 12,675,919
JTC PLC GBP 4,020,000 11,658,000
Funding Circle Holdings PLC GBP 2,574,478 10,949,738
Indivior PLC GBP 2,557,704 10,910,210
Pagegroup PLC GBP 1,891,000 10,330,328
Superdry PLC GBP 579,090 9,152,201
Plus500 Ltd GBP 553,931 8,598,809
Ashtead Group PLC GBP 404,000 8,109,590
GVC Holdings PLC GBP 849,267 7,842,594
SSP Group PLC GBP 2,638,838 7,512,784
Clinigen Group PLC GBP 841,050 7,367,257
KAZ Minerals PLC GBP 678,000 6,537,232
Gym Group PLC GBP 2,320,168 6,443,306
Robert Walters PLC GBP 798,000 5,195,539
Learning Technologies Group PLC GBP 5,053,547 4,995,756
Avast PLC GBP 1,974,740 4,936,850
Future PLC GBP 1,081,500 4,931,911
Bodycote PLC GBP 465,000 4,693,168
S4 Capital PLC GBP 2,986,887 3,285,578
Electrocomponents PLC GBP 488,000 3,040,124
Synthomer PLC GBP 539,000 2,944,544
Boku Inc GBP 1,793,000 2,893,884
IntegraFin Holdings PLC GBP 1,303,216 2,554,303
Future PLC - Rights GBP 927,000 2,320,935
Weir Group PLC GBP 97,778 2,126,672
Blue Prism Group PLC GBP 121,622 2,040,330
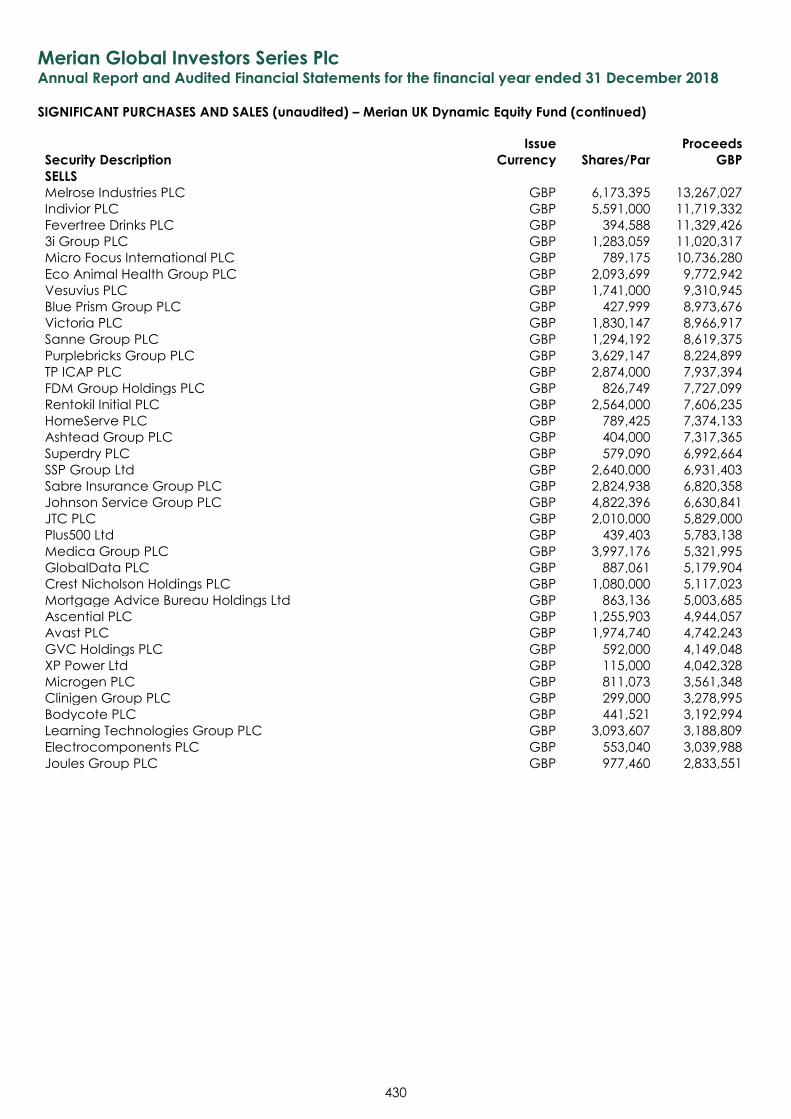
Merian Global Investors Series Plc Annual Report and Audited Financial Statements for the financial year ended 31 December 2018
SIGNIFICANT PURCHASES AND SALES (unaudited) – Merian UK Dynamic Equity Fund (continued)
430
Security Description
Issue
Currency Shares/Par
Proceeds
GBP
SELLS
Melrose Industries PLC GBP 6,173,395 13,267,027
Indivior PLC GBP 5,591,000 11,719,332
Fevertree Drinks PLC GBP 394,588 11,329,426
3i Group PLC GBP 1,283,059 11,020,317
Micro Focus International PLC GBP 789,175 10,736,280
Eco Animal Health Group PLC GBP 2,093,699 9,772,942
Vesuvius PLC GBP 1,741,000 9,310,945
Blue Prism Group PLC GBP 427,999 8,973,676
Victoria PLC GBP 1,830,147 8,966,917
Sanne Group PLC GBP 1,294,192 8,619,375
Purplebricks Group PLC GBP 3,629,147 8,224,899
TP ICAP PLC GBP 2,874,000 7,937,394
FDM Group Holdings PLC GBP 826,749 7,727,099
Rentokil Initial PLC GBP 2,564,000 7,606,235
HomeServe PLC GBP 789,425 7,374,133
Ashtead Group PLC GBP 404,000 7,317,365
Superdry PLC GBP 579,090 6,992,664
SSP Group Ltd GBP 2,640,000 6,931,403
Sabre Insurance Group PLC GBP 2,824,938 6,820,358
Johnson Service Group PLC GBP 4,822,396 6,630,841
JTC PLC GBP 2,010,000 5,829,000
Plus500 Ltd GBP 439,403 5,783,138
Medica Group PLC GBP 3,997,176 5,321,995
GlobalData PLC GBP 887,061 5,179,904
Crest Nicholson Holdings PLC GBP 1,080,000 5,117,023
Mortgage Advice Bureau Holdings Ltd GBP 863,136 5,003,685
Ascential PLC GBP 1,255,903 4,944,057
Avast PLC GBP 1,974,740 4,742,243
GVC Holdings PLC GBP 592,000 4,149,048
XP Power Ltd GBP 115,000 4,042,328
Microgen PLC GBP 811,073 3,561,348
Clinigen Group PLC GBP 299,000 3,278,995
Bodycote PLC GBP 441,521 3,192,994
Learning Technologies Group PLC GBP 3,093,607 3,188,809
Electrocomponents PLC GBP 553,040 3,039,988
Joules Group PLC GBP 977,460 2,833,551
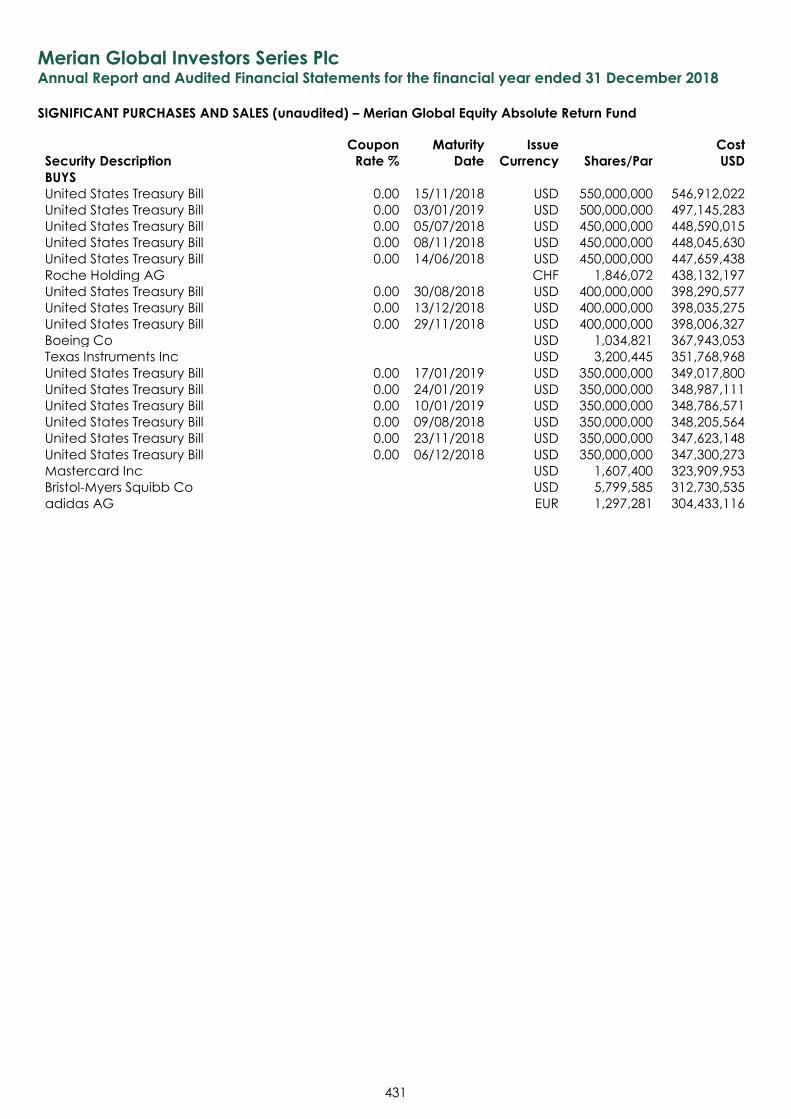
Merian Global Investors Series Plc Annual Report and Audited Financial Statements for the financial year ended 31 December 2018
SIGNIFICANT PURCHASES AND SALES (unaudited) – Merian Global Equity Absolute Return Fund
431
Security Description
Coupon
Rate %
Maturity
Date
Issue
Currency Shares/Par
Cost
USD
BUYS
United States Treasury Bill 0.00 15/11/2018 USD 550,000,000 546,912,022
United States Treasury Bill 0.00 03/01/2019 USD 500,000,000 497,145,283
United States Treasury Bill 0.00 05/07/2018 USD 450,000,000 448,590,015
United States Treasury Bill 0.00 08/11/2018 USD 450,000,000 448,045,630
United States Treasury Bill 0.00 14/06/2018 USD 450,000,000 447,659,438
Roche Holding AG CHF 1,846,072 438,132,197
United States Treasury Bill 0.00 30/08/2018 USD 400,000,000 398,290,577
United States Treasury Bill 0.00 13/12/2018 USD 400,000,000 398,035,275
United States Treasury Bill 0.00 29/11/2018 USD 400,000,000 398,006,327
Boeing Co USD 1,034,821 367,943,053
Texas Instruments Inc USD 3,200,445 351,768,968
United States Treasury Bill 0.00 17/01/2019 USD 350,000,000 349,017,800
United States Treasury Bill 0.00 24/01/2019 USD 350,000,000 348,987,111
United States Treasury Bill 0.00 10/01/2019 USD 350,000,000 348,786,571
United States Treasury Bill 0.00 09/08/2018 USD 350,000,000 348,205,564
United States Treasury Bill 0.00 23/11/2018 USD 350,000,000 347,623,148
United States Treasury Bill 0.00 06/12/2018 USD 350,000,000 347,300,273
Mastercard Inc USD 1,607,400 323,909,953
Bristol-Myers Squibb Co USD 5,799,585 312,730,535
adidas AG EUR 1,297,281 304,433,116
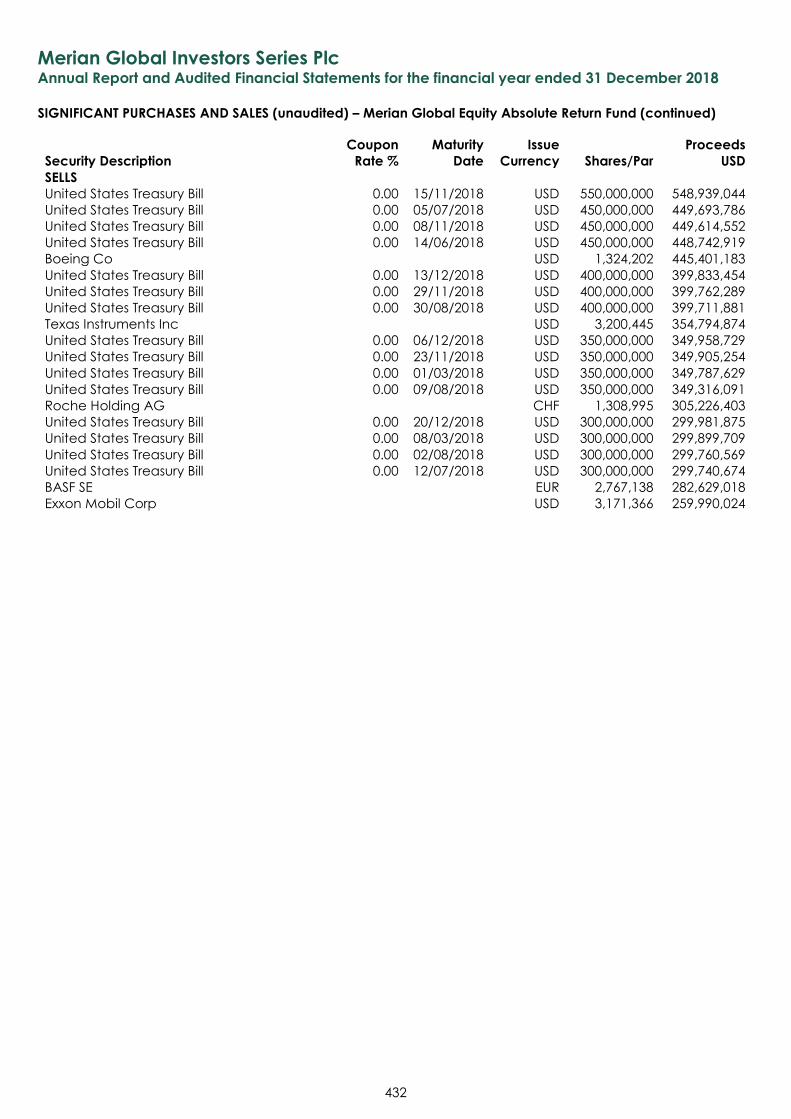
Merian Global Investors Series Plc Annual Report and Audited Financial Statements for the financial year ended 31 December 2018
SIGNIFICANT PURCHASES AND SALES (unaudited) – Merian Global Equity Absolute Return Fund (continued)
432
Security Description
Coupon
Rate %
Maturity
Date
Issue
Currency Shares/Par
Proceeds
USD
SELLS
United States Treasury Bill 0.00 15/11/2018 USD 550,000,000 548,939,044
United States Treasury Bill 0.00 05/07/2018 USD 450,000,000 449,693,786
United States Treasury Bill 0.00 08/11/2018 USD 450,000,000 449,614,552
United States Treasury Bill 0.00 14/06/2018 USD 450,000,000 448,742,919
Boeing Co USD 1,324,202 445,401,183
United States Treasury Bill 0.00 13/12/2018 USD 400,000,000 399,833,454
United States Treasury Bill 0.00 29/11/2018 USD 400,000,000 399,762,289
United States Treasury Bill 0.00 30/08/2018 USD 400,000,000 399,711,881
Texas Instruments Inc USD 3,200,445 354,794,874
United States Treasury Bill 0.00 06/12/2018 USD 350,000,000 349,958,729
United States Treasury Bill 0.00 23/11/2018 USD 350,000,000 349,905,254
United States Treasury Bill 0.00 01/03/2018 USD 350,000,000 349,787,629
United States Treasury Bill 0.00 09/08/2018 USD 350,000,000 349,316,091
Roche Holding AG CHF 1,308,995 305,226,403
United States Treasury Bill 0.00 20/12/2018 USD 300,000,000 299,981,875
United States Treasury Bill 0.00 08/03/2018 USD 300,000,000 299,899,709
United States Treasury Bill 0.00 02/08/2018 USD 300,000,000 299,760,569
United States Treasury Bill 0.00 12/07/2018 USD 300,000,000 299,740,674
BASF SE EUR 2,767,138 282,629,018
Exxon Mobil Corp USD 3,171,366 259,990,024
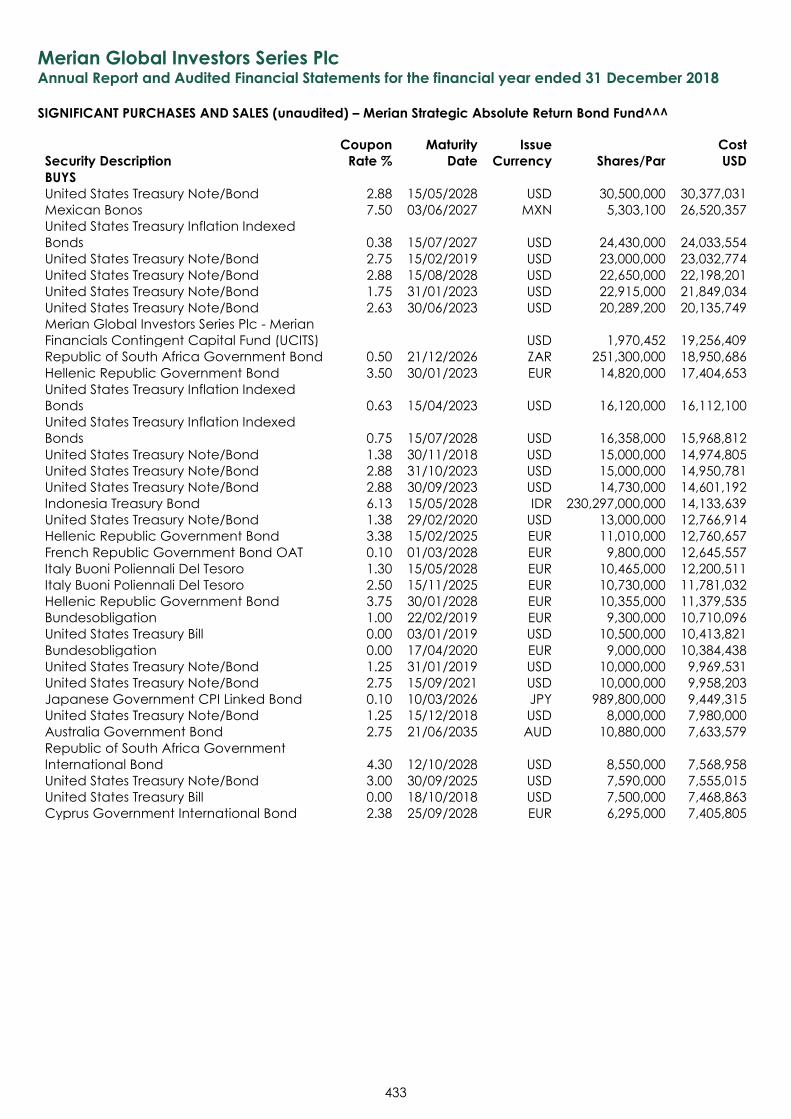
Merian Global Investors Series Plc Annual Report and Audited Financial Statements for the financial year ended 31 December 2018
SIGNIFICANT PURCHASES AND SALES (unaudited) – Merian Strategic Absolute Return Bond Fund^^^
433
Security Description
Coupon
Rate %
Maturity
Date
Issue
Currency Shares/Par
Cost
USD
BUYS
United States Treasury Note/Bond 2.88 15/05/2028 USD 30,500,000 30,377,031
Mexican Bonos 7.50 03/06/2027 MXN 5,303,100 26,520,357
United States Treasury Inflation Indexed
Bonds 0.38 15/07/2027 USD 24,430,000 24,033,554
United States Treasury Note/Bond 2.75 15/02/2019 USD 23,000,000 23,032,774
United States Treasury Note/Bond 2.88 15/08/2028 USD 22,650,000 22,198,201
United States Treasury Note/Bond 1.75 31/01/2023 USD 22,915,000 21,849,034
United States Treasury Note/Bond 2.63 30/06/2023 USD 20,289,200 20,135,749
Merian Global Investors Series Plc - Merian
Financials Contingent Capital Fund (UCITS) USD 1,970,452 19,256,409
Republic of South Africa Government Bond 0.50 21/12/2026 ZAR 251,300,000 18,950,686
Hellenic Republic Government Bond 3.50 30/01/2023 EUR 14,820,000 17,404,653
United States Treasury Inflation Indexed
Bonds 0.63 15/04/2023 USD 16,120,000 16,112,100
United States Treasury Inflation Indexed
Bonds 0.75 15/07/2028 USD 16,358,000 15,968,812
United States Treasury Note/Bond 1.38 30/11/2018 USD 15,000,000 14,974,805
United States Treasury Note/Bond 2.88 31/10/2023 USD 15,000,000 14,950,781
United States Treasury Note/Bond 2.88 30/09/2023 USD 14,730,000 14,601,192
Indonesia Treasury Bond 6.13 15/05/2028 IDR 230,297,000,000 14,133,639
United States Treasury Note/Bond 1.38 29/02/2020 USD 13,000,000 12,766,914
Hellenic Republic Government Bond 3.38 15/02/2025 EUR 11,010,000 12,760,657
French Republic Government Bond OAT 0.10 01/03/2028 EUR 9,800,000 12,645,557
Italy Buoni Poliennali Del Tesoro 1.30 15/05/2028 EUR 10,465,000 12,200,511
Italy Buoni Poliennali Del Tesoro 2.50 15/11/2025 EUR 10,730,000 11,781,032
Hellenic Republic Government Bond 3.75 30/01/2028 EUR 10,355,000 11,379,535
Bundesobligation 1.00 22/02/2019 EUR 9,300,000 10,710,096
United States Treasury Bill 0.00 03/01/2019 USD 10,500,000 10,413,821
Bundesobligation 0.00 17/04/2020 EUR 9,000,000 10,384,438
United States Treasury Note/Bond 1.25 31/01/2019 USD 10,000,000 9,969,531
United States Treasury Note/Bond 2.75 15/09/2021 USD 10,000,000 9,958,203
Japanese Government CPI Linked Bond 0.10 10/03/2026 JPY 989,800,000 9,449,315
United States Treasury Note/Bond 1.25 15/12/2018 USD 8,000,000 7,980,000
Australia Government Bond 2.75 21/06/2035 AUD 10,880,000 7,633,579
Republic of South Africa Government
International Bond 4.30 12/10/2028 USD 8,550,000 7,568,958
United States Treasury Note/Bond 3.00 30/09/2025 USD 7,590,000 7,555,015
United States Treasury Bill 0.00 18/10/2018 USD 7,500,000 7,468,863
Cyprus Government International Bond 2.38 25/09/2028 EUR 6,295,000 7,405,805
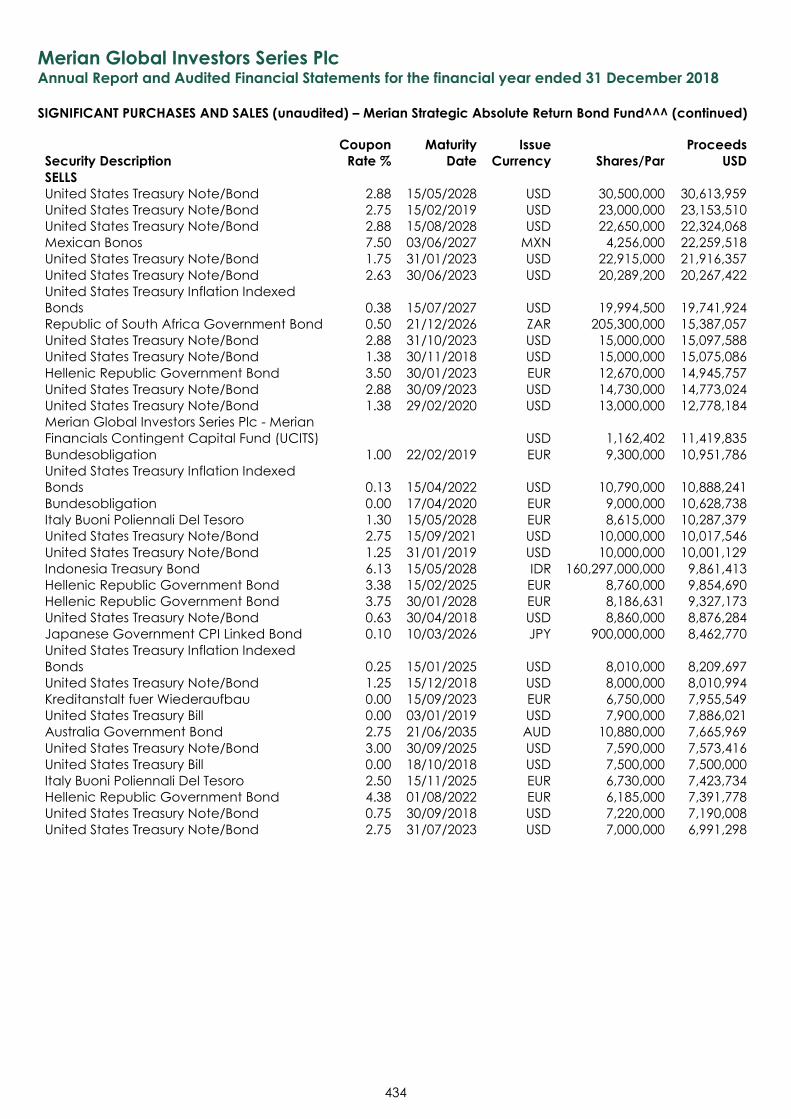
Merian Global Investors Series Plc Annual Report and Audited Financial Statements for the financial year ended 31 December 2018
SIGNIFICANT PURCHASES AND SALES (unaudited) – Merian Strategic Absolute Return Bond Fund^^^ (continued)
434
Security Description
Coupon
Rate %
Maturity
Date
Issue
Currency Shares/Par
Proceeds
USD
SELLS
United States Treasury Note/Bond 2.88 15/05/2028 USD 30,500,000 30,613,959
United States Treasury Note/Bond 2.75 15/02/2019 USD 23,000,000 23,153,510
United States Treasury Note/Bond 2.88 15/08/2028 USD 22,650,000 22,324,068
Mexican Bonos 7.50 03/06/2027 MXN 4,256,000 22,259,518
United States Treasury Note/Bond 1.75 31/01/2023 USD 22,915,000 21,916,357
United States Treasury Note/Bond 2.63 30/06/2023 USD 20,289,200 20,267,422
United States Treasury Inflation Indexed
Bonds 0.38 15/07/2027 USD 19,994,500 19,741,924
Republic of South Africa Government Bond 0.50 21/12/2026 ZAR 205,300,000 15,387,057
United States Treasury Note/Bond 2.88 31/10/2023 USD 15,000,000 15,097,588
United States Treasury Note/Bond 1.38 30/11/2018 USD 15,000,000 15,075,086
Hellenic Republic Government Bond 3.50 30/01/2023 EUR 12,670,000 14,945,757
United States Treasury Note/Bond 2.88 30/09/2023 USD 14,730,000 14,773,024
United States Treasury Note/Bond 1.38 29/02/2020 USD 13,000,000 12,778,184
Merian Global Investors Series Plc - Merian
Financials Contingent Capital Fund (UCITS) USD 1,162,402 11,419,835
Bundesobligation 1.00 22/02/2019 EUR 9,300,000 10,951,786
United States Treasury Inflation Indexed
Bonds 0.13 15/04/2022 USD 10,790,000 10,888,241
Bundesobligation 0.00 17/04/2020 EUR 9,000,000 10,628,738
Italy Buoni Poliennali Del Tesoro 1.30 15/05/2028 EUR 8,615,000 10,287,379
United States Treasury Note/Bond 2.75 15/09/2021 USD 10,000,000 10,017,546
United States Treasury Note/Bond 1.25 31/01/2019 USD 10,000,000 10,001,129
Indonesia Treasury Bond 6.13 15/05/2028 IDR 160,297,000,000 9,861,413
Hellenic Republic Government Bond 3.38 15/02/2025 EUR 8,760,000 9,854,690
Hellenic Republic Government Bond 3.75 30/01/2028 EUR 8,186,631 9,327,173
United States Treasury Note/Bond 0.63 30/04/2018 USD 8,860,000 8,876,284
Japanese Government CPI Linked Bond 0.10 10/03/2026 JPY 900,000,000 8,462,770
United States Treasury Inflation Indexed
Bonds 0.25 15/01/2025 USD 8,010,000 8,209,697
United States Treasury Note/Bond 1.25 15/12/2018 USD 8,000,000 8,010,994
Kreditanstalt fuer Wiederaufbau 0.00 15/09/2023 EUR 6,750,000 7,955,549
United States Treasury Bill 0.00 03/01/2019 USD 7,900,000 7,886,021
Australia Government Bond 2.75 21/06/2035 AUD 10,880,000 7,665,969
United States Treasury Note/Bond 3.00 30/09/2025 USD 7,590,000 7,573,416
United States Treasury Bill 0.00 18/10/2018 USD 7,500,000 7,500,000
Italy Buoni Poliennali Del Tesoro 2.50 15/11/2025 EUR 6,730,000 7,423,734
Hellenic Republic Government Bond 4.38 01/08/2022 EUR 6,185,000 7,391,778
United States Treasury Note/Bond 0.75 30/09/2018 USD 7,220,000 7,190,008
United States Treasury Note/Bond 2.75 31/07/2023 USD 7,000,000 6,991,298
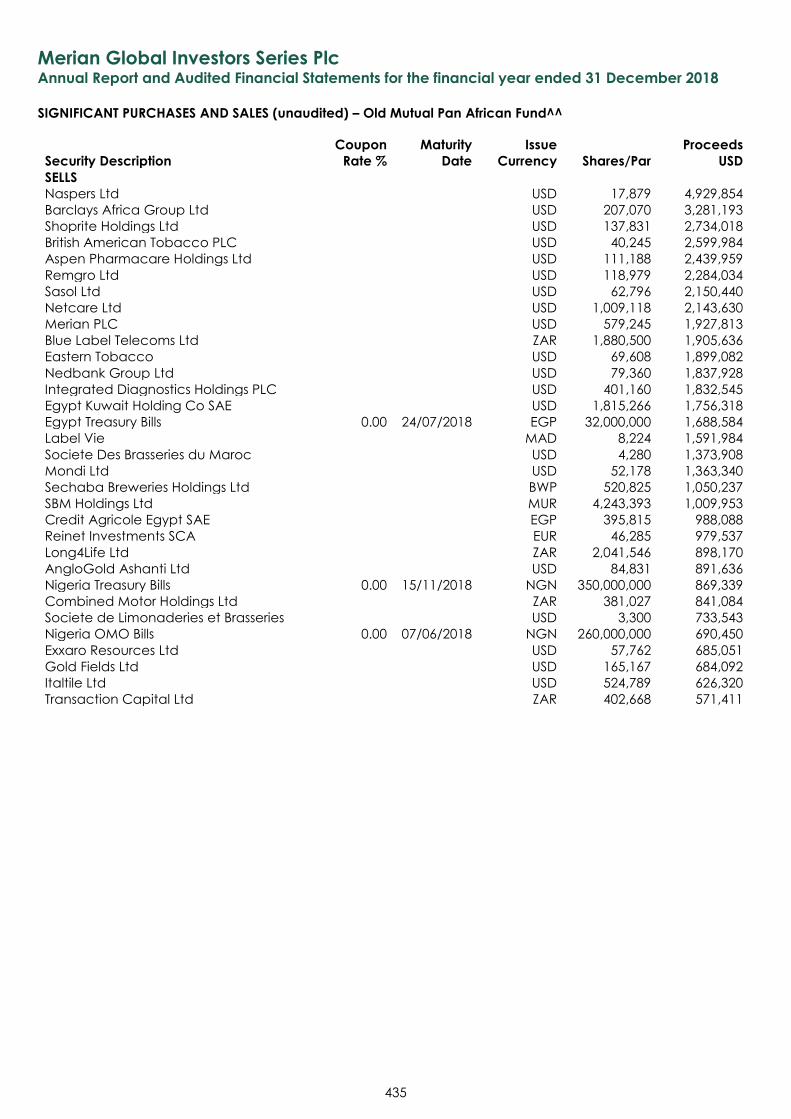
Merian Global Investors Series Plc Annual Report and Audited Financial Statements for the financial year ended 31 December 2018
SIGNIFICANT PURCHASES AND SALES (unaudited) – Old Mutual Pan African Fund^^
435
Security Description
Coupon
Rate %
Maturity
Date
Issue
Currency Shares/Par
Proceeds
USD
SELLS
Naspers Ltd USD 17,879 4,929,854
Barclays Africa Group Ltd USD 207,070 3,281,193
Shoprite Holdings Ltd USD 137,831 2,734,018
British American Tobacco PLC USD 40,245 2,599,984
Aspen Pharmacare Holdings Ltd USD 111,188 2,439,959
Remgro Ltd USD 118,979 2,284,034
Sasol Ltd USD 62,796 2,150,440
Netcare Ltd USD 1,009,118 2,143,630
Merian PLC USD 579,245 1,927,813
Blue Label Telecoms Ltd ZAR 1,880,500 1,905,636
Eastern Tobacco USD 69,608 1,899,082
Nedbank Group Ltd USD 79,360 1,837,928
Integrated Diagnostics Holdings PLC USD 401,160 1,832,545
Egypt Kuwait Holding Co SAE USD 1,815,266 1,756,318
Egypt Treasury Bills 0.00 24/07/2018 EGP 32,000,000 1,688,584
Label Vie MAD 8,224 1,591,984
Societe Des Brasseries du Maroc USD 4,280 1,373,908
Mondi Ltd USD 52,178 1,363,340
Sechaba Breweries Holdings Ltd BWP 520,825 1,050,237
SBM Holdings Ltd MUR 4,243,393 1,009,953
Credit Agricole Egypt SAE EGP 395,815 988,088
Reinet Investments SCA EUR 46,285 979,537
Long4Life Ltd ZAR 2,041,546 898,170
AngloGold Ashanti Ltd USD 84,831 891,636
Nigeria Treasury Bills 0.00 15/11/2018 NGN 350,000,000 869,339
Combined Motor Holdings Ltd ZAR 381,027 841,084
Societe de Limonaderies et Brasseries USD 3,300 733,543
Nigeria OMO Bills 0.00 07/06/2018 NGN 260,000,000 690,450
Exxaro Resources Ltd USD 57,762 685,051
Gold Fields Ltd USD 165,167 684,092
Italtile Ltd USD 524,789 626,320
Transaction Capital Ltd ZAR 402,668 571,411
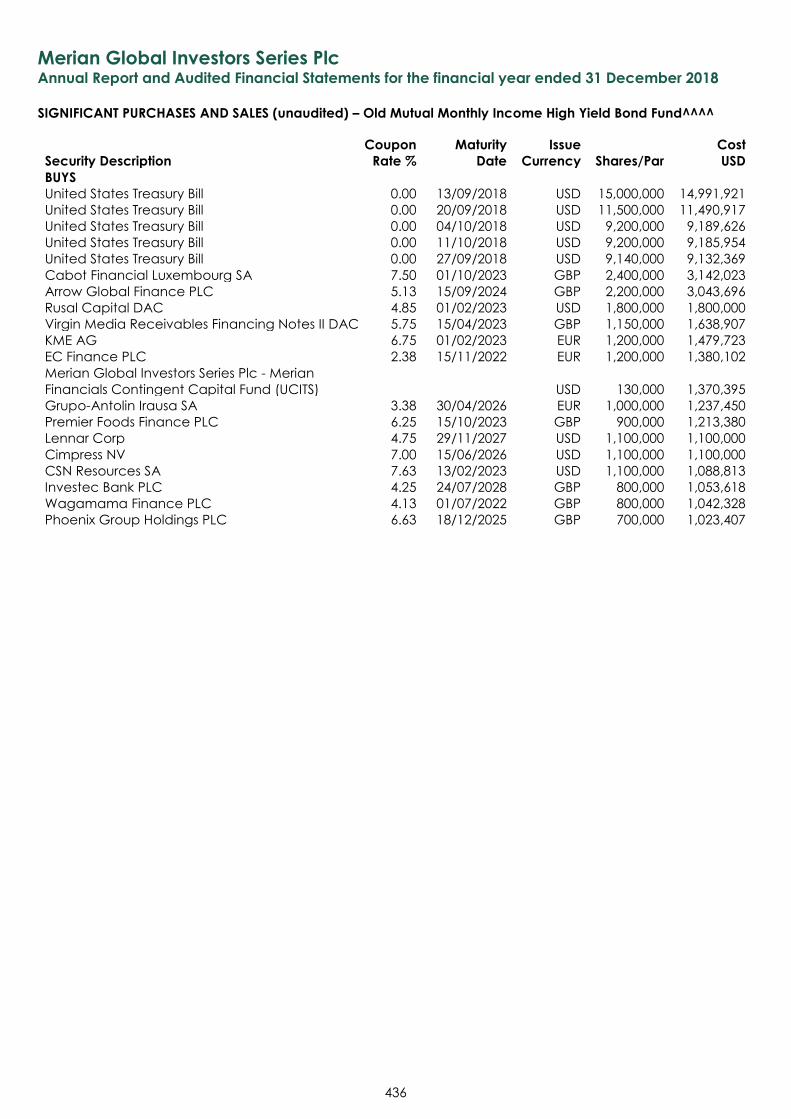
Merian Global Investors Series Plc Annual Report and Audited Financial Statements for the financial year ended 31 December 2018
SIGNIFICANT PURCHASES AND SALES (unaudited) – Old Mutual Monthly Income High Yield Bond Fund^^^^
436
Security Description
Coupon
Rate %
Maturity
Date
Issue
Currency Shares/Par
Cost
USD
BUYS
United States Treasury Bill 0.00 13/09/2018 USD 15,000,000 14,991,921
United States Treasury Bill 0.00 20/09/2018 USD 11,500,000 11,490,917
United States Treasury Bill 0.00 04/10/2018 USD 9,200,000 9,189,626
United States Treasury Bill 0.00 11/10/2018 USD 9,200,000 9,185,954
United States Treasury Bill 0.00 27/09/2018 USD 9,140,000 9,132,369
Cabot Financial Luxembourg SA 7.50 01/10/2023 GBP 2,400,000 3,142,023
Arrow Global Finance PLC 5.13 15/09/2024 GBP 2,200,000 3,043,696
Rusal Capital DAC 4.85 01/02/2023 USD 1,800,000 1,800,000
Virgin Media Receivables Financing Notes II DAC 5.75 15/04/2023 GBP 1,150,000 1,638,907
KME AG 6.75 01/02/2023 EUR 1,200,000 1,479,723
EC Finance PLC 2.38 15/11/2022 EUR 1,200,000 1,380,102
Merian Global Investors Series Plc - Merian
Financials Contingent Capital Fund (UCITS) USD 130,000 1,370,395
Grupo-Antolin Irausa SA 3.38 30/04/2026 EUR 1,000,000 1,237,450
Premier Foods Finance PLC 6.25 15/10/2023 GBP 900,000 1,213,380
Lennar Corp 4.75 29/11/2027 USD 1,100,000 1,100,000
Cimpress NV 7.00 15/06/2026 USD 1,100,000 1,100,000
CSN Resources SA 7.63 13/02/2023 USD 1,100,000 1,088,813
Investec Bank PLC 4.25 24/07/2028 GBP 800,000 1,053,618
Wagamama Finance PLC 4.13 01/07/2022 GBP 800,000 1,042,328
Phoenix Group Holdings PLC 6.63 18/12/2025 GBP 700,000 1,023,407
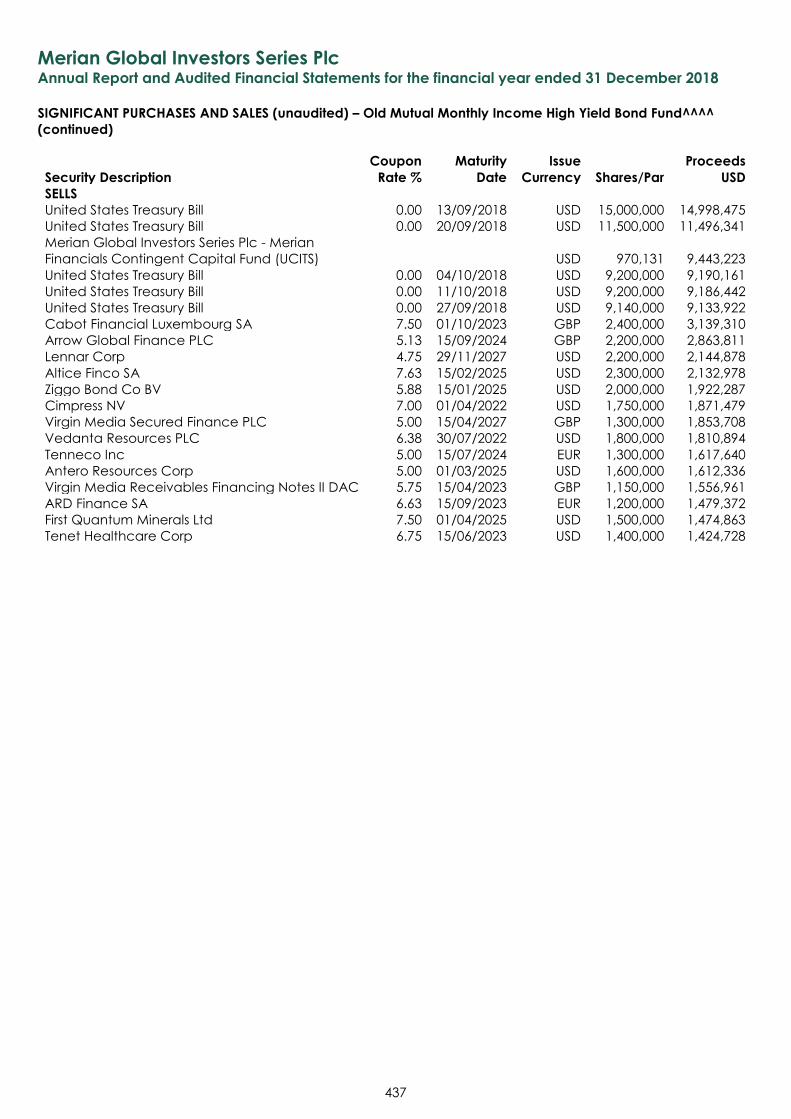
Merian Global Investors Series Plc Annual Report and Audited Financial Statements for the financial year ended 31 December 2018
SIGNIFICANT PURCHASES AND SALES (unaudited) – Old Mutual Monthly Income High Yield Bond Fund^^^^
(continued)
437
Security Description
Coupon
Rate %
Maturity
Date
Issue
Currency Shares/Par
Proceeds
USD
SELLS
United States Treasury Bill 0.00 13/09/2018 USD 15,000,000 14,998,475
United States Treasury Bill 0.00 20/09/2018 USD 11,500,000 11,496,341
Merian Global Investors Series Plc - Merian
Financials Contingent Capital Fund (UCITS) USD 970,131 9,443,223
United States Treasury Bill 0.00 04/10/2018 USD 9,200,000 9,190,161
United States Treasury Bill 0.00 11/10/2018 USD 9,200,000 9,186,442
United States Treasury Bill 0.00 27/09/2018 USD 9,140,000 9,133,922
Cabot Financial Luxembourg SA 7.50 01/10/2023 GBP 2,400,000 3,139,310
Arrow Global Finance PLC 5.13 15/09/2024 GBP 2,200,000 2,863,811
Lennar Corp 4.75 29/11/2027 USD 2,200,000 2,144,878
Altice Finco SA 7.63 15/02/2025 USD 2,300,000 2,132,978
Ziggo Bond Co BV 5.88 15/01/2025 USD 2,000,000 1,922,287
Cimpress NV 7.00 01/04/2022 USD 1,750,000 1,871,479
Virgin Media Secured Finance PLC 5.00 15/04/2027 GBP 1,300,000 1,853,708
Vedanta Resources PLC 6.38 30/07/2022 USD 1,800,000 1,810,894
Tenneco Inc 5.00 15/07/2024 EUR 1,300,000 1,617,640
Antero Resources Corp 5.00 01/03/2025 USD 1,600,000 1,612,336
Virgin Media Receivables Financing Notes II DAC 5.75 15/04/2023 GBP 1,150,000 1,556,961
ARD Finance SA 6.63 15/09/2023 EUR 1,200,000 1,479,372
First Quantum Minerals Ltd 7.50 01/04/2025 USD 1,500,000 1,474,863
Tenet Healthcare Corp 6.75 15/06/2023 USD 1,400,000 1,424,728
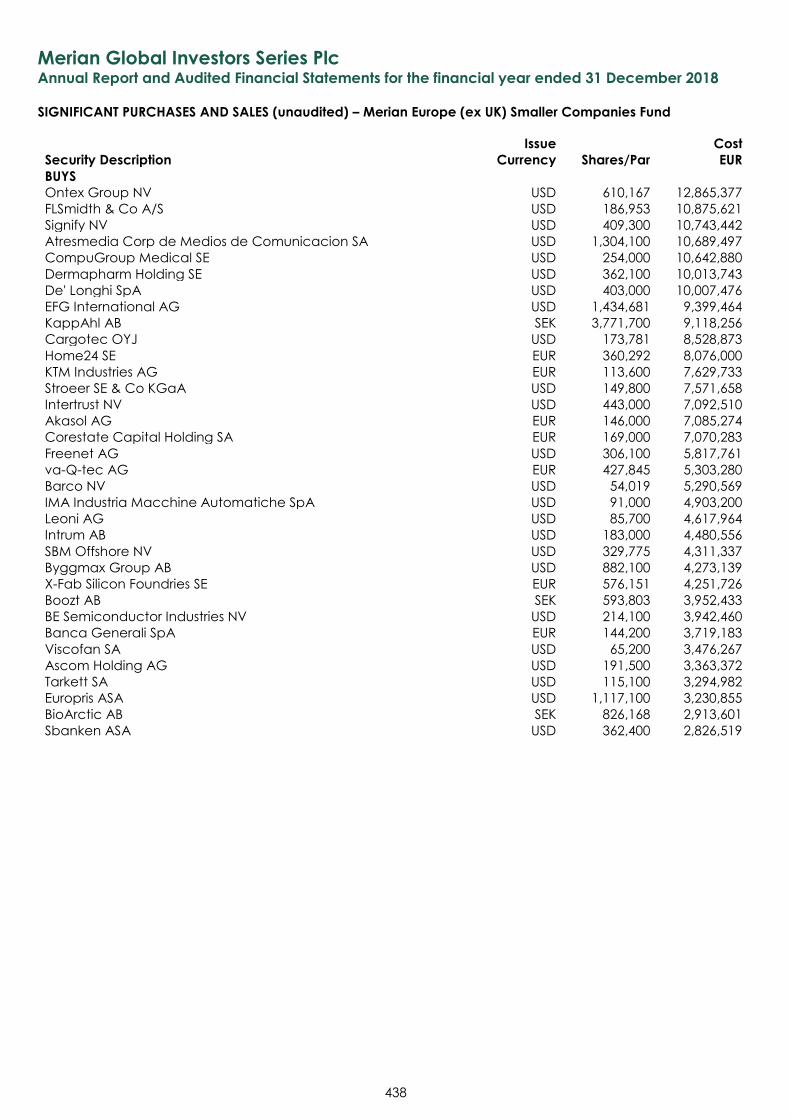
Merian Global Investors Series Plc Annual Report and Audited Financial Statements for the financial year ended 31 December 2018
SIGNIFICANT PURCHASES AND SALES (unaudited) – Merian Europe (ex UK) Smaller Companies Fund
438
Security Description
Issue
Currency Shares/Par
Cost
EUR
BUYS
Ontex Group NV USD 610,167 12,865,377
FLSmidth & Co A/S USD 186,953 10,875,621
Signify NV USD 409,300 10,743,442
Atresmedia Corp de Medios de Comunicacion SA USD 1,304,100 10,689,497
CompuGroup Medical SE USD 254,000 10,642,880
Dermapharm Holding SE USD 362,100 10,013,743
De' Longhi SpA USD 403,000 10,007,476
EFG International AG USD 1,434,681 9,399,464
KappAhl AB SEK 3,771,700 9,118,256
Cargotec OYJ USD 173,781 8,528,873
Home24 SE EUR 360,292 8,076,000
KTM Industries AG EUR 113,600 7,629,733
Stroeer SE & Co KGaA USD 149,800 7,571,658
Intertrust NV USD 443,000 7,092,510
Akasol AG EUR 146,000 7,085,274
Corestate Capital Holding SA EUR 169,000 7,070,283
Freenet AG USD 306,100 5,817,761
va-Q-tec AG EUR 427,845 5,303,280
Barco NV USD 54,019 5,290,569
IMA Industria Macchine Automatiche SpA USD 91,000 4,903,200
Leoni AG USD 85,700 4,617,964
Intrum AB USD 183,000 4,480,556
SBM Offshore NV USD 329,775 4,311,337
Byggmax Group AB USD 882,100 4,273,139
X-Fab Silicon Foundries SE EUR 576,151 4,251,726
Boozt AB SEK 593,803 3,952,433
BE Semiconductor Industries NV USD 214,100 3,942,460
Banca Generali SpA EUR 144,200 3,719,183
Viscofan SA USD 65,200 3,476,267
Ascom Holding AG USD 191,500 3,363,372
Tarkett SA USD 115,100 3,294,982
Europris ASA USD 1,117,100 3,230,855
BioArctic AB SEK 826,168 2,913,601
Sbanken ASA USD 362,400 2,826,519
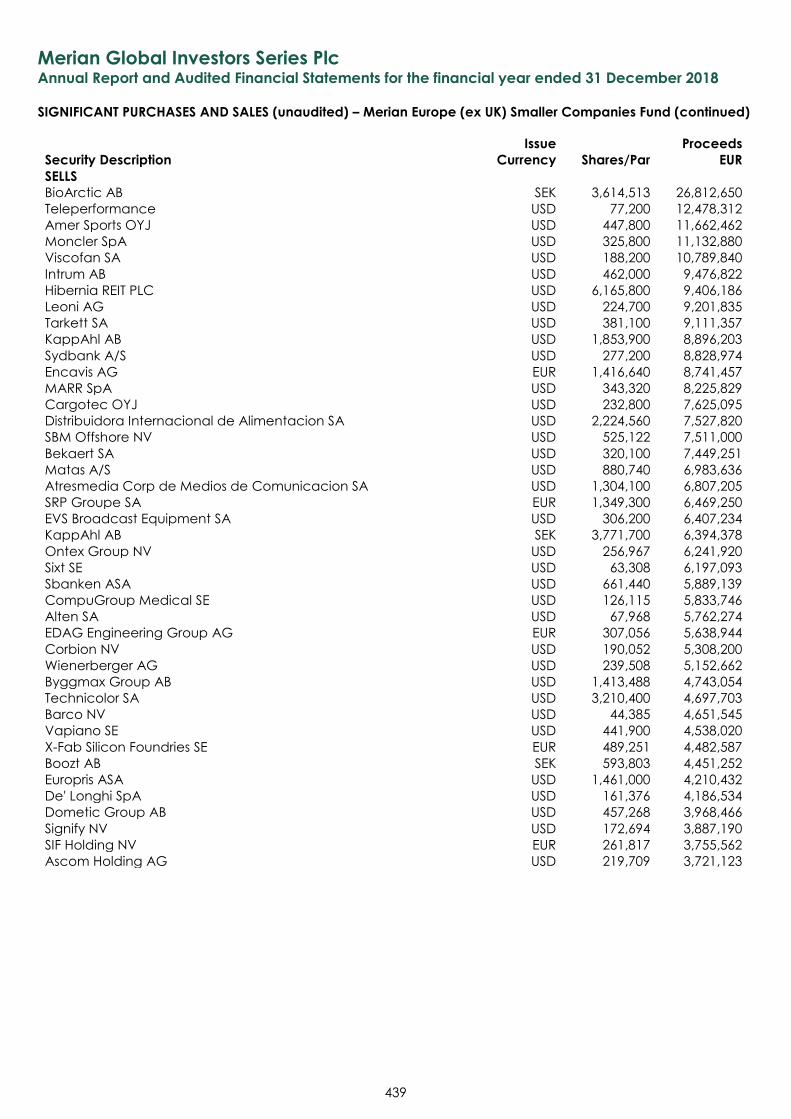
Merian Global Investors Series Plc Annual Report and Audited Financial Statements for the financial year ended 31 December 2018
SIGNIFICANT PURCHASES AND SALES (unaudited) – Merian Europe (ex UK) Smaller Companies Fund (continued)
439
Security Description
Issue
Currency Shares/Par
Proceeds
EUR
SELLS
BioArctic AB SEK 3,614,513 26,812,650
Teleperformance USD 77,200 12,478,312
Amer Sports OYJ USD 447,800 11,662,462
Moncler SpA USD 325,800 11,132,880
Viscofan SA USD 188,200 10,789,840
Intrum AB USD 462,000 9,476,822
Hibernia REIT PLC USD 6,165,800 9,406,186
Leoni AG USD 224,700 9,201,835
Tarkett SA USD 381,100 9,111,357
KappAhl AB USD 1,853,900 8,896,203
Sydbank A/S USD 277,200 8,828,974
Encavis AG EUR 1,416,640 8,741,457
MARR SpA USD 343,320 8,225,829
Cargotec OYJ USD 232,800 7,625,095
Distribuidora Internacional de Alimentacion SA USD 2,224,560 7,527,820
SBM Offshore NV USD 525,122 7,511,000
Bekaert SA USD 320,100 7,449,251
Matas A/S USD 880,740 6,983,636
Atresmedia Corp de Medios de Comunicacion SA USD 1,304,100 6,807,205
SRP Groupe SA EUR 1,349,300 6,469,250
EVS Broadcast Equipment SA USD 306,200 6,407,234
KappAhl AB SEK 3,771,700 6,394,378
Ontex Group NV USD 256,967 6,241,920
Sixt SE USD 63,308 6,197,093
Sbanken ASA USD 661,440 5,889,139
CompuGroup Medical SE USD 126,115 5,833,746
Alten SA USD 67,968 5,762,274
EDAG Engineering Group AG EUR 307,056 5,638,944
Corbion NV USD 190,052 5,308,200
Wienerberger AG USD 239,508 5,152,662
Byggmax Group AB USD 1,413,488 4,743,054
Technicolor SA USD 3,210,400 4,697,703
Barco NV USD 44,385 4,651,545
Vapiano SE USD 441,900 4,538,020
X-Fab Silicon Foundries SE EUR 489,251 4,482,587
Boozt AB SEK 593,803 4,451,252
Europris ASA USD 1,461,000 4,210,432
De' Longhi SpA USD 161,376 4,186,534
Dometic Group AB USD 457,268 3,968,466
Signify NV USD 172,694 3,887,190
SIF Holding NV EUR 261,817 3,755,562
Ascom Holding AG USD 219,709 3,721,123
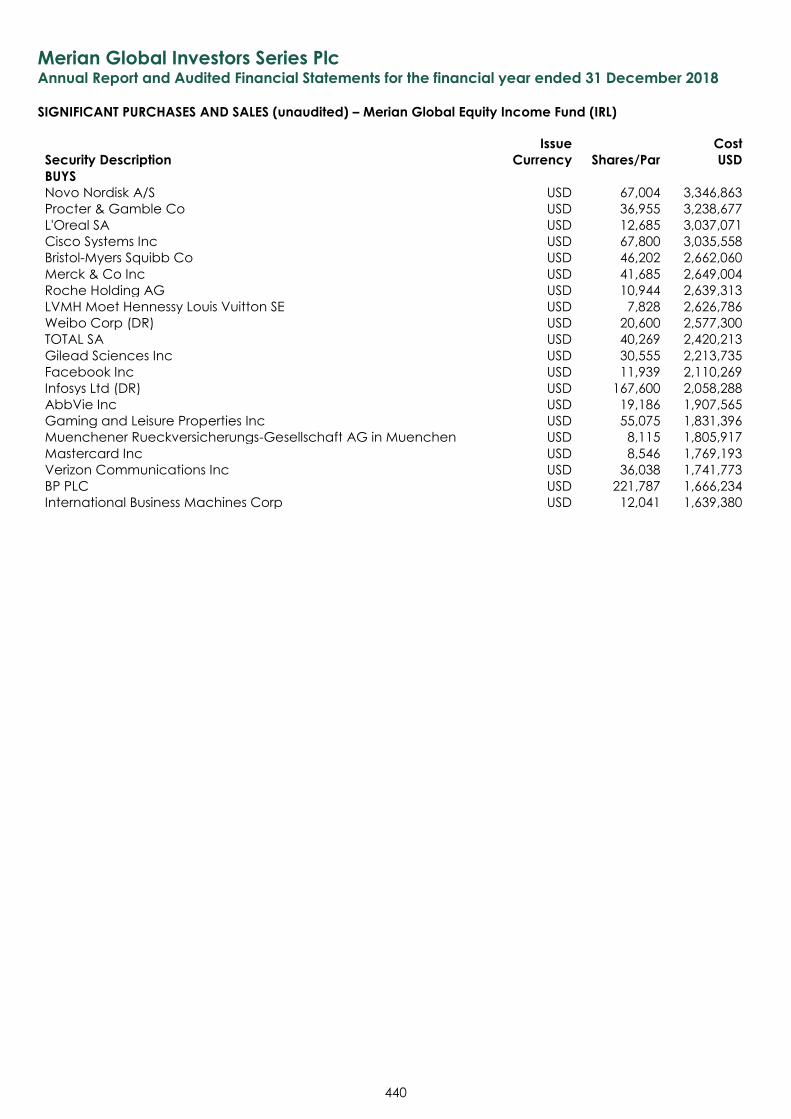
Merian Global Investors Series Plc Annual Report and Audited Financial Statements for the financial year ended 31 December 2018
SIGNIFICANT PURCHASES AND SALES (unaudited) – Merian Global Equity Income Fund (IRL)
440
Security Description
Issue
Currency Shares/Par
Cost
USD
BUYS
Novo Nordisk A/S USD 67,004 3,346,863
Procter & Gamble Co USD 36,955 3,238,677
L'Oreal SA USD 12,685 3,037,071
Cisco Systems Inc USD 67,800 3,035,558
Bristol-Myers Squibb Co USD 46,202 2,662,060
Merck & Co Inc USD 41,685 2,649,004
Roche Holding AG USD 10,944 2,639,313
LVMH Moet Hennessy Louis Vuitton SE USD 7,828 2,626,786
Weibo Corp (DR) USD 20,600 2,577,300
TOTAL SA USD 40,269 2,420,213
Gilead Sciences Inc USD 30,555 2,213,735
Facebook Inc USD 11,939 2,110,269
Infosys Ltd (DR) USD 167,600 2,058,288
AbbVie Inc USD 19,186 1,907,565
Gaming and Leisure Properties Inc USD 55,075 1,831,396
Muenchener Rueckversicherungs-Gesellschaft AG in Muenchen USD 8,115 1,805,917
Mastercard Inc USD 8,546 1,769,193
Verizon Communications Inc USD 36,038 1,741,773
BP PLC USD 221,787 1,666,234
International Business Machines Corp USD 12,041 1,639,380
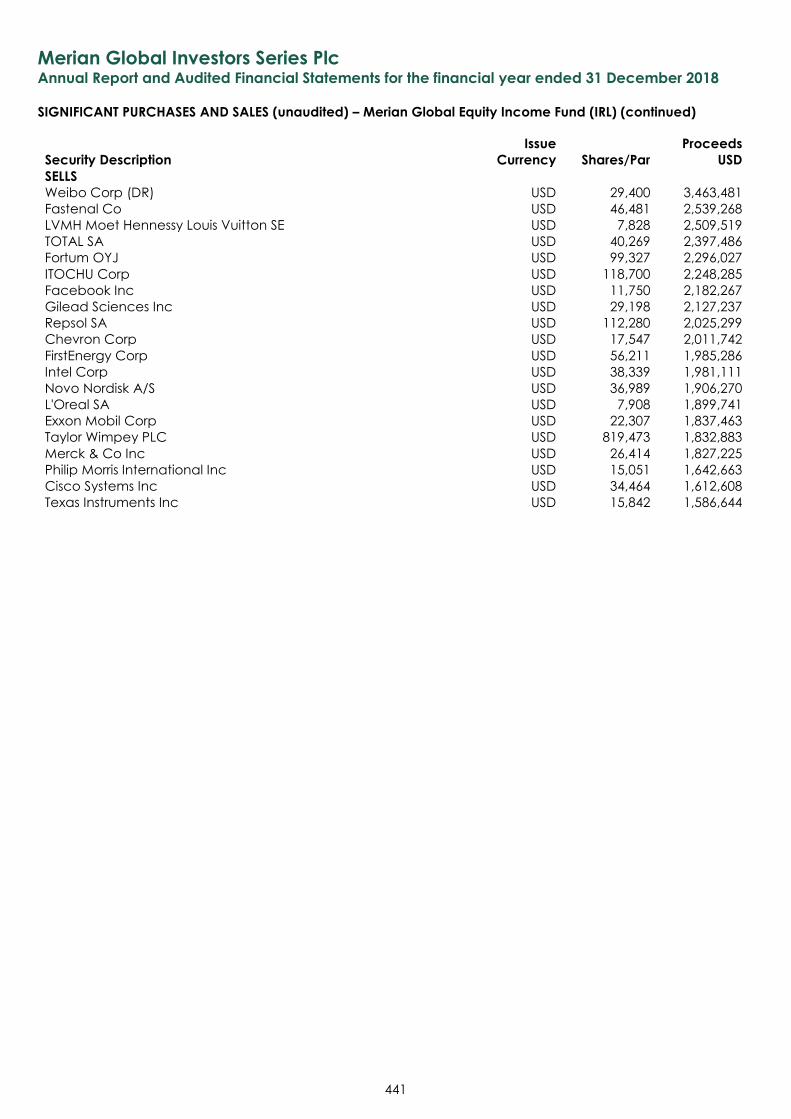
Merian Global Investors Series Plc Annual Report and Audited Financial Statements for the financial year ended 31 December 2018
SIGNIFICANT PURCHASES AND SALES (unaudited) – Merian Global Equity Income Fund (IRL) (continued)
441
Security Description
Issue
Currency Shares/Par
Proceeds
USD
SELLS
Weibo Corp (DR) USD 29,400 3,463,481
Fastenal Co USD 46,481 2,539,268
LVMH Moet Hennessy Louis Vuitton SE USD 7,828 2,509,519
TOTAL SA USD 40,269 2,397,486
Fortum OYJ USD 99,327 2,296,027
ITOCHU Corp USD 118,700 2,248,285
Facebook Inc USD 11,750 2,182,267
Gilead Sciences Inc USD 29,198 2,127,237
Repsol SA USD 112,280 2,025,299
Chevron Corp USD 17,547 2,011,742
FirstEnergy Corp USD 56,211 1,985,286
Intel Corp USD 38,339 1,981,111
Novo Nordisk A/S USD 36,989 1,906,270
L'Oreal SA USD 7,908 1,899,741
Exxon Mobil Corp USD 22,307 1,837,463
Taylor Wimpey PLC USD 819,473 1,832,883
Merck & Co Inc USD 26,414 1,827,225
Philip Morris International Inc USD 15,051 1,642,663
Cisco Systems Inc USD 34,464 1,612,608
Texas Instruments Inc USD 15,842 1,586,644
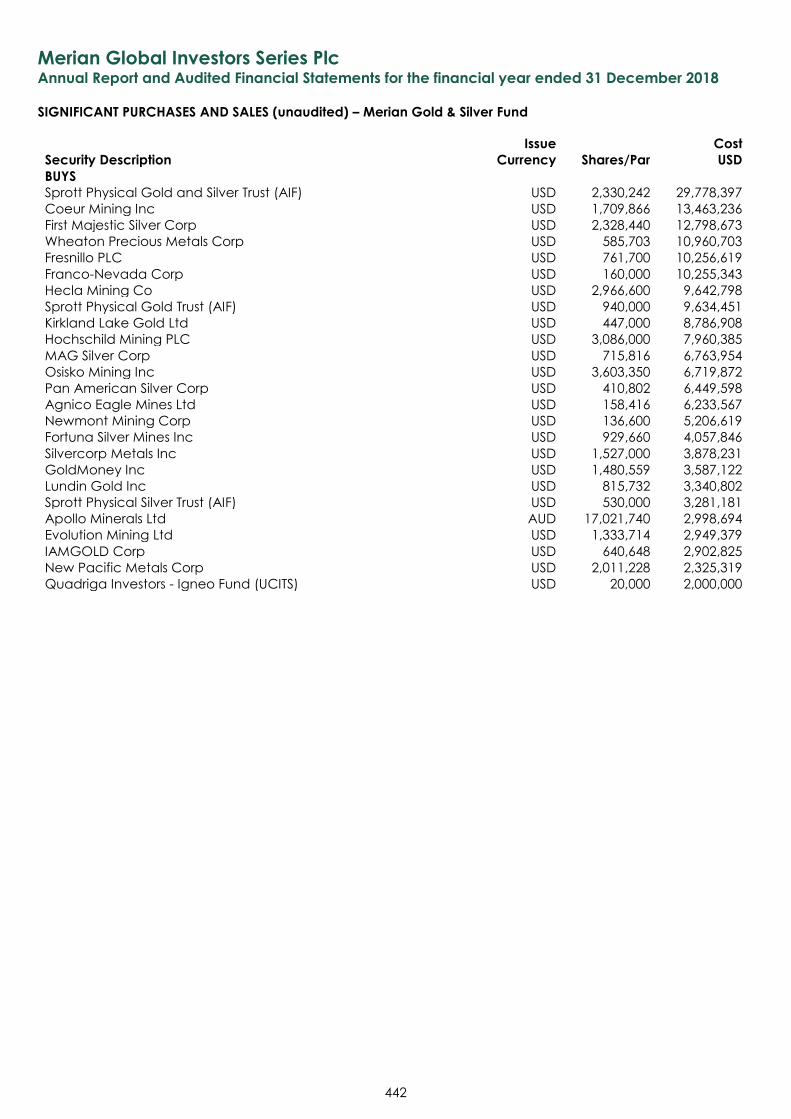
Merian Global Investors Series Plc Annual Report and Audited Financial Statements for the financial year ended 31 December 2018
SIGNIFICANT PURCHASES AND SALES (unaudited) – Merian Gold & Silver Fund
442
Security Description
Issue
Currency Shares/Par
Cost
USD
BUYS
Sprott Physical Gold and Silver Trust (AIF) USD 2,330,242 29,778,397
Coeur Mining Inc USD 1,709,866 13,463,236
First Majestic Silver Corp USD 2,328,440 12,798,673
Wheaton Precious Metals Corp USD 585,703 10,960,703
Fresnillo PLC USD 761,700 10,256,619
Franco-Nevada Corp USD 160,000 10,255,343
Hecla Mining Co USD 2,966,600 9,642,798
Sprott Physical Gold Trust (AIF) USD 940,000 9,634,451
Kirkland Lake Gold Ltd USD 447,000 8,786,908
Hochschild Mining PLC USD 3,086,000 7,960,385
MAG Silver Corp USD 715,816 6,763,954
Osisko Mining Inc USD 3,603,350 6,719,872
Pan American Silver Corp USD 410,802 6,449,598
Agnico Eagle Mines Ltd USD 158,416 6,233,567
Newmont Mining Corp USD 136,600 5,206,619
Fortuna Silver Mines Inc USD 929,660 4,057,846
Silvercorp Metals Inc USD 1,527,000 3,878,231
GoldMoney Inc USD 1,480,559 3,587,122
Lundin Gold Inc USD 815,732 3,340,802
Sprott Physical Silver Trust (AIF) USD 530,000 3,281,181
Apollo Minerals Ltd AUD 17,021,740 2,998,694
Evolution Mining Ltd USD 1,333,714 2,949,379
IAMGOLD Corp USD 640,648 2,902,825
New Pacific Metals Corp USD 2,011,228 2,325,319
Quadriga Investors - Igneo Fund (UCITS) USD 20,000 2,000,000
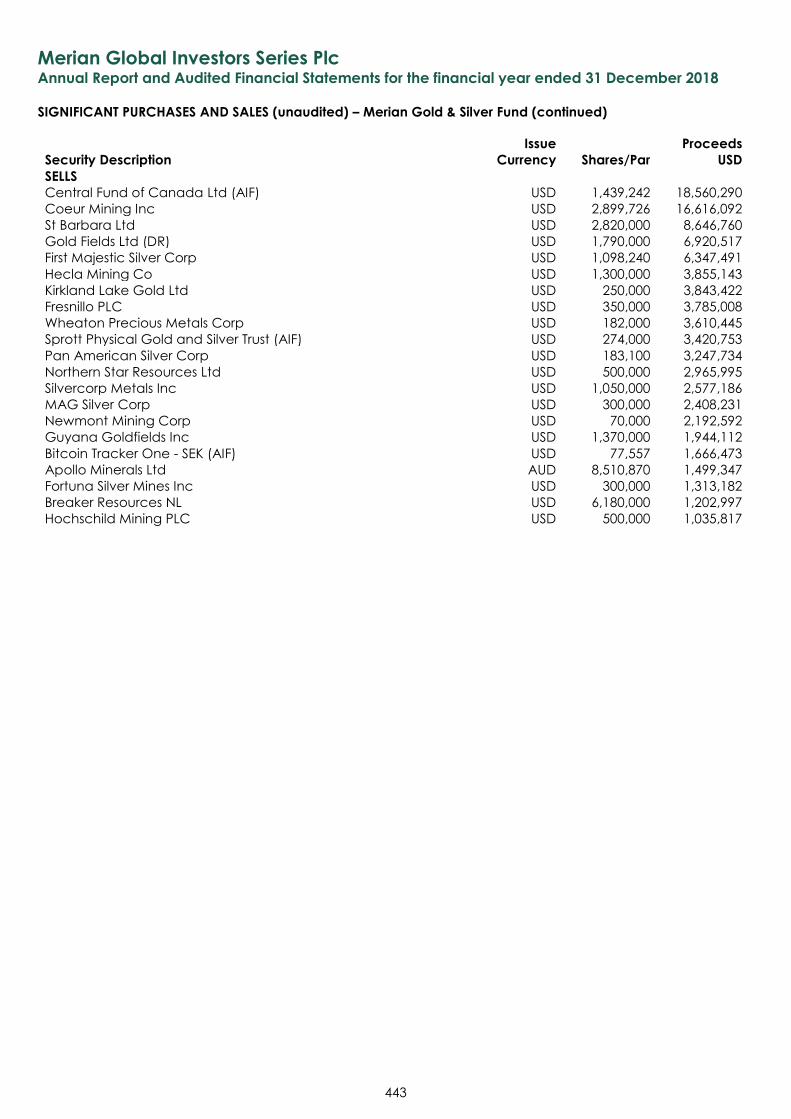
Merian Global Investors Series Plc Annual Report and Audited Financial Statements for the financial year ended 31 December 2018
SIGNIFICANT PURCHASES AND SALES (unaudited) – Merian Gold & Silver Fund (continued)
443
Security Description
Issue
Currency Shares/Par
Proceeds
USD
SELLS
Central Fund of Canada Ltd (AIF) USD 1,439,242 18,560,290
Coeur Mining Inc USD 2,899,726 16,616,092
St Barbara Ltd USD 2,820,000 8,646,760
Gold Fields Ltd (DR) USD 1,790,000 6,920,517
First Majestic Silver Corp USD 1,098,240 6,347,491
Hecla Mining Co USD 1,300,000 3,855,143
Kirkland Lake Gold Ltd USD 250,000 3,843,422
Fresnillo PLC USD 350,000 3,785,008
Wheaton Precious Metals Corp USD 182,000 3,610,445
Sprott Physical Gold and Silver Trust (AIF) USD 274,000 3,420,753
Pan American Silver Corp USD 183,100 3,247,734
Northern Star Resources Ltd USD 500,000 2,965,995
Silvercorp Metals Inc USD 1,050,000 2,577,186
MAG Silver Corp USD 300,000 2,408,231
Newmont Mining Corp USD 70,000 2,192,592
Guyana Goldfields Inc USD 1,370,000 1,944,112
Bitcoin Tracker One - SEK (AIF) USD 77,557 1,666,473
Apollo Minerals Ltd AUD 8,510,870 1,499,347
Fortuna Silver Mines Inc USD 300,000 1,313,182
Breaker Resources NL USD 6,180,000 1,202,997
Hochschild Mining PLC USD 500,000 1,035,817
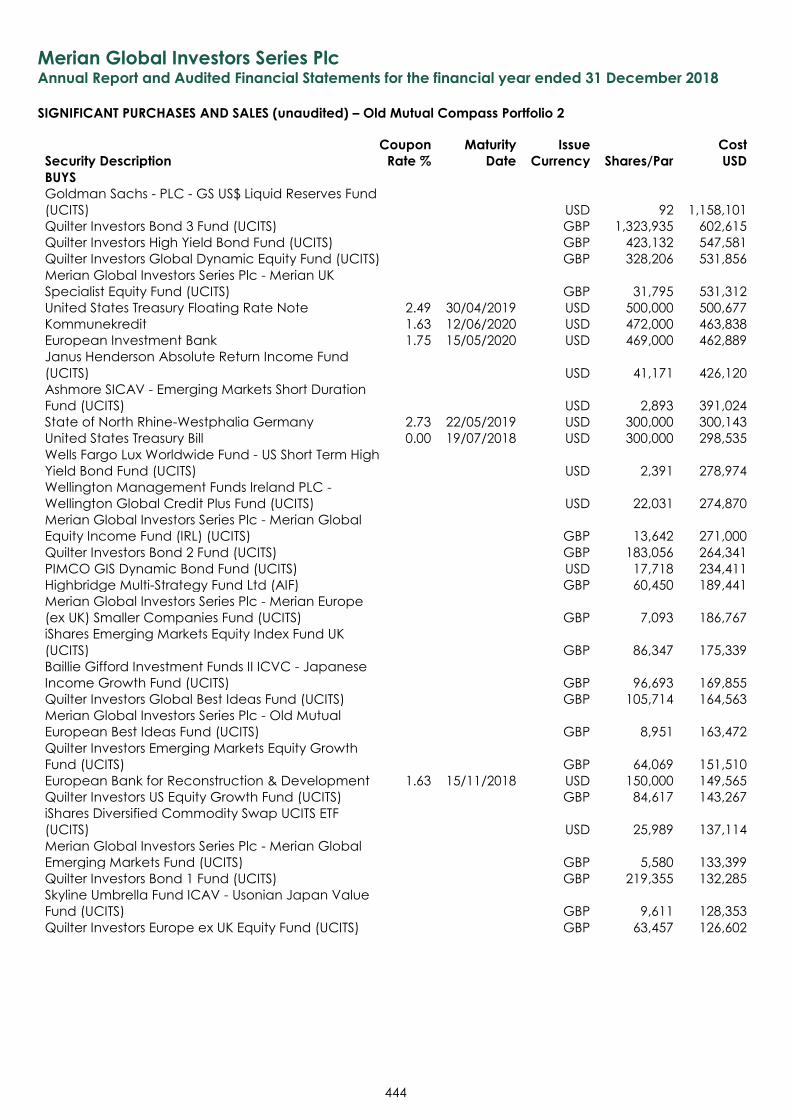
Merian Global Investors Series Plc Annual Report and Audited Financial Statements for the financial year ended 31 December 2018
SIGNIFICANT PURCHASES AND SALES (unaudited) – Old Mutual Compass Portfolio 2
444
Security Description
Coupon
Rate %
Maturity
Date
Issue
Currency Shares/Par
Cost
USD
BUYS
Goldman Sachs - PLC - GS US$ Liquid Reserves Fund
(UCITS) USD 92 1,158,101
Quilter Investors Bond 3 Fund (UCITS) GBP 1,323,935 602,615
Quilter Investors High Yield Bond Fund (UCITS) GBP 423,132 547,581
Quilter Investors Global Dynamic Equity Fund (UCITS) GBP 328,206 531,856
Merian Global Investors Series Plc - Merian UK
Specialist Equity Fund (UCITS) GBP 31,795 531,312
United States Treasury Floating Rate Note 2.49 30/04/2019 USD 500,000 500,677
Kommunekredit 1.63 12/06/2020 USD 472,000 463,838
European Investment Bank 1.75 15/05/2020 USD 469,000 462,889
Janus Henderson Absolute Return Income Fund
(UCITS) USD 41,171 426,120
Ashmore SICAV - Emerging Markets Short Duration
Fund (UCITS) USD 2,893 391,024
State of North Rhine-Westphalia Germany 2.73 22/05/2019 USD 300,000 300,143
United States Treasury Bill 0.00 19/07/2018 USD 300,000 298,535
Wells Fargo Lux Worldwide Fund - US Short Term High
Yield Bond Fund (UCITS) USD 2,391 278,974
Wellington Management Funds Ireland PLC -
Wellington Global Credit Plus Fund (UCITS) USD 22,031 274,870
Merian Global Investors Series Plc - Merian Global
Equity Income Fund (IRL) (UCITS) GBP 13,642 271,000
Quilter Investors Bond 2 Fund (UCITS) GBP 183,056 264,341
PIMCO GIS Dynamic Bond Fund (UCITS) USD 17,718 234,411
Highbridge Multi-Strategy Fund Ltd (AIF) GBP 60,450 189,441
Merian Global Investors Series Plc - Merian Europe
(ex UK) Smaller Companies Fund (UCITS) GBP 7,093 186,767
iShares Emerging Markets Equity Index Fund UK
(UCITS) GBP 86,347 175,339
Baillie Gifford Investment Funds II ICVC - Japanese
Income Growth Fund (UCITS) GBP 96,693 169,855
Quilter Investors Global Best Ideas Fund (UCITS) GBP 105,714 164,563
Merian Global Investors Series Plc - Old Mutual
European Best Ideas Fund (UCITS) GBP 8,951 163,472
Quilter Investors Emerging Markets Equity Growth
Fund (UCITS) GBP 64,069 151,510
European Bank for Reconstruction & Development 1.63 15/11/2018 USD 150,000 149,565
Quilter Investors US Equity Growth Fund (UCITS) GBP 84,617 143,267
iShares Diversified Commodity Swap UCITS ETF
(UCITS) USD 25,989 137,114
Merian Global Investors Series Plc - Merian Global
Emerging Markets Fund (UCITS) GBP 5,580 133,399
Quilter Investors Bond 1 Fund (UCITS) GBP 219,355 132,285
Skyline Umbrella Fund ICAV - Usonian Japan Value
Fund (UCITS) GBP 9,611 128,353
Quilter Investors Europe ex UK Equity Fund (UCITS) GBP 63,457 126,602
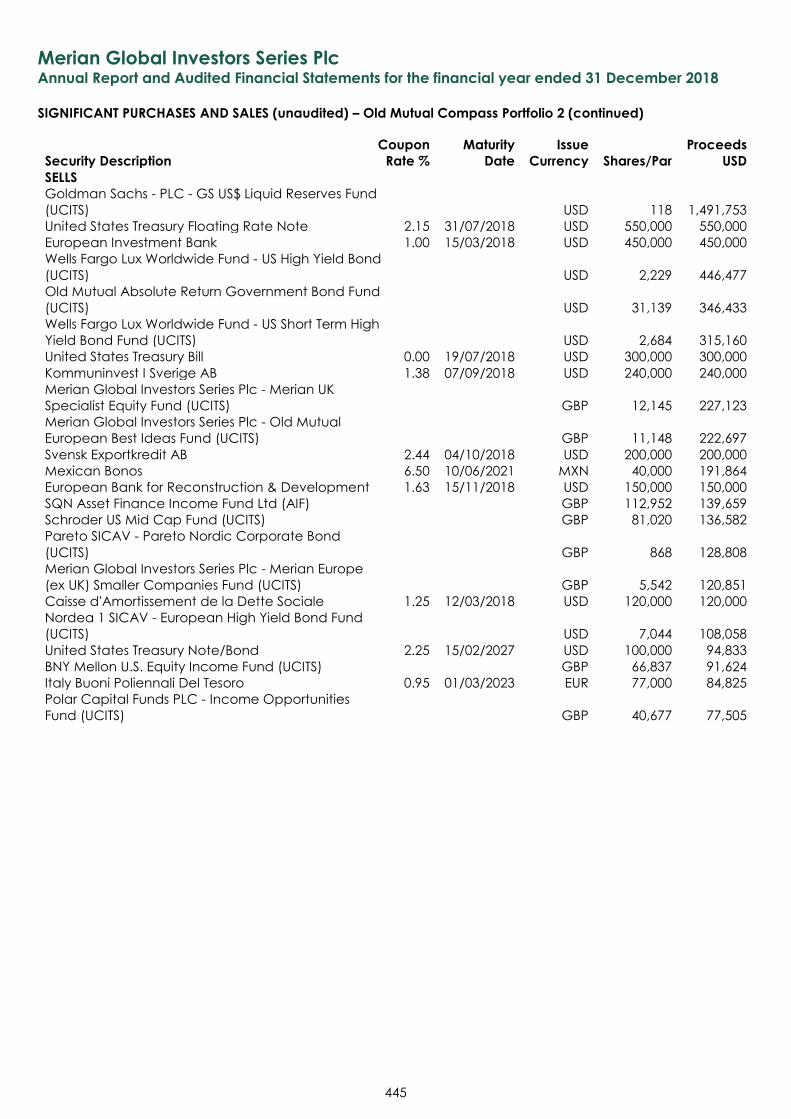
Merian Global Investors Series Plc Annual Report and Audited Financial Statements for the financial year ended 31 December 2018
SIGNIFICANT PURCHASES AND SALES (unaudited) – Old Mutual Compass Portfolio 2 (continued)
445
Security Description
Coupon
Rate %
Maturity
Date
Issue
Currency Shares/Par
Proceeds
USD
SELLS
Goldman Sachs - PLC - GS US$ Liquid Reserves Fund
(UCITS) USD 118 1,491,753
United States Treasury Floating Rate Note 2.15 31/07/2018 USD 550,000 550,000
European Investment Bank 1.00 15/03/2018 USD 450,000 450,000
Wells Fargo Lux Worldwide Fund - US High Yield Bond
(UCITS) USD 2,229 446,477
Old Mutual Absolute Return Government Bond Fund
(UCITS) USD 31,139 346,433
Wells Fargo Lux Worldwide Fund - US Short Term High
Yield Bond Fund (UCITS) USD 2,684 315,160
United States Treasury Bill 0.00 19/07/2018 USD 300,000 300,000
Kommuninvest I Sverige AB 1.38 07/09/2018 USD 240,000 240,000
Merian Global Investors Series Plc - Merian UK
Specialist Equity Fund (UCITS) GBP 12,145 227,123
Merian Global Investors Series Plc - Old Mutual
European Best Ideas Fund (UCITS) GBP 11,148 222,697
Svensk Exportkredit AB 2.44 04/10/2018 USD 200,000 200,000
Mexican Bonos 6.50 10/06/2021 MXN 40,000 191,864
European Bank for Reconstruction & Development 1.63 15/11/2018 USD 150,000 150,000
SQN Asset Finance Income Fund Ltd (AIF) GBP 112,952 139,659
Schroder US Mid Cap Fund (UCITS) GBP 81,020 136,582
Pareto SICAV - Pareto Nordic Corporate Bond
(UCITS) GBP 868 128,808
Merian Global Investors Series Plc - Merian Europe
(ex UK) Smaller Companies Fund (UCITS) GBP 5,542 120,851
Caisse d'Amortissement de la Dette Sociale 1.25 12/03/2018 USD 120,000 120,000
Nordea 1 SICAV - European High Yield Bond Fund
(UCITS) USD 7,044 108,058
United States Treasury Note/Bond 2.25 15/02/2027 USD 100,000 94,833
BNY Mellon U.S. Equity Income Fund (UCITS) GBP 66,837 91,624
Italy Buoni Poliennali Del Tesoro 0.95 01/03/2023 EUR 77,000 84,825
Polar Capital Funds PLC - Income Opportunities
Fund (UCITS) GBP 40,677 77,505
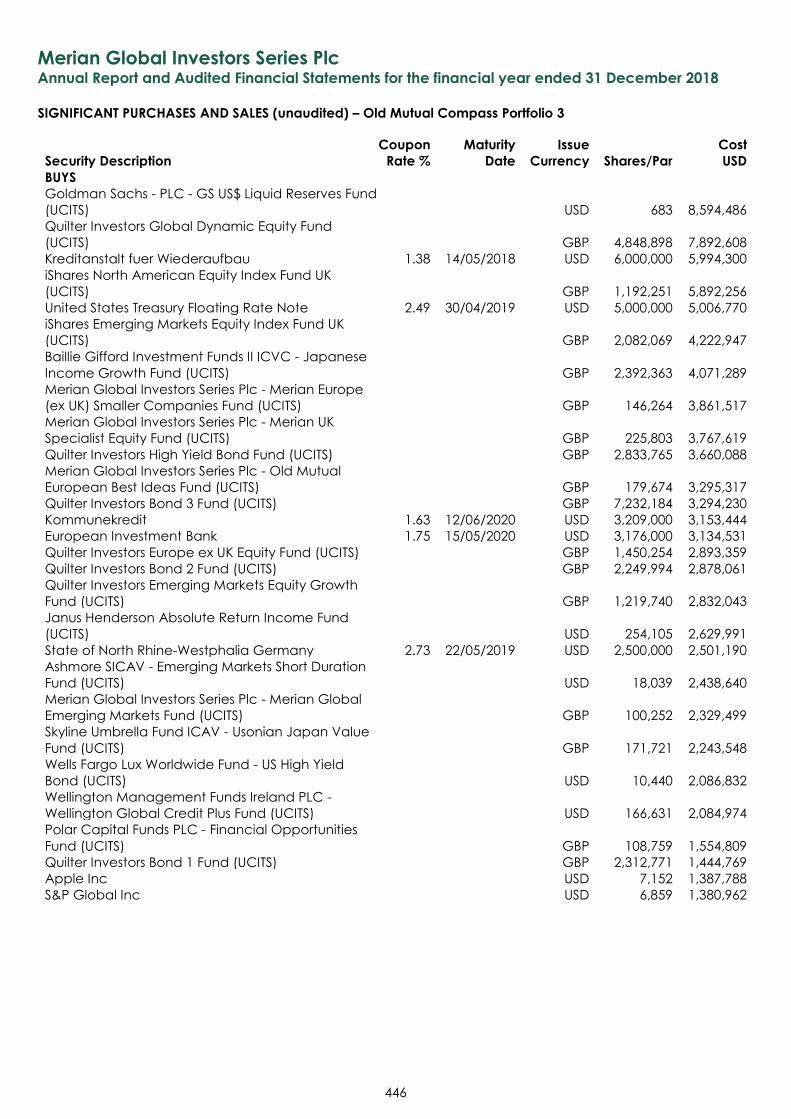
Merian Global Investors Series Plc Annual Report and Audited Financial Statements for the financial year ended 31 December 2018
SIGNIFICANT PURCHASES AND SALES (unaudited) – Old Mutual Compass Portfolio 3
446
Security Description
Coupon
Rate %
Maturity
Date
Issue
Currency Shares/Par
Cost
USD
BUYS
Goldman Sachs - PLC - GS US$ Liquid Reserves Fund
(UCITS) USD 683 8,594,486
Quilter Investors Global Dynamic Equity Fund
(UCITS) GBP 4,848,898 7,892,608
Kreditanstalt fuer Wiederaufbau 1.38 14/05/2018 USD 6,000,000 5,994,300
iShares North American Equity Index Fund UK
(UCITS) GBP 1,192,251 5,892,256
United States Treasury Floating Rate Note 2.49 30/04/2019 USD 5,000,000 5,006,770
iShares Emerging Markets Equity Index Fund UK
(UCITS) GBP 2,082,069 4,222,947
Baillie Gifford Investment Funds II ICVC - Japanese
Income Growth Fund (UCITS) GBP 2,392,363 4,071,289
Merian Global Investors Series Plc - Merian Europe
(ex UK) Smaller Companies Fund (UCITS) GBP 146,264 3,861,517
Merian Global Investors Series Plc - Merian UK
Specialist Equity Fund (UCITS) GBP 225,803 3,767,619
Quilter Investors High Yield Bond Fund (UCITS) GBP 2,833,765 3,660,088
Merian Global Investors Series Plc - Old Mutual
European Best Ideas Fund (UCITS) GBP 179,674 3,295,317
Quilter Investors Bond 3 Fund (UCITS) GBP 7,232,184 3,294,230
Kommunekredit 1.63 12/06/2020 USD 3,209,000 3,153,444
European Investment Bank 1.75 15/05/2020 USD 3,176,000 3,134,531
Quilter Investors Europe ex UK Equity Fund (UCITS) GBP 1,450,254 2,893,359
Quilter Investors Bond 2 Fund (UCITS) GBP 2,249,994 2,878,061
Quilter Investors Emerging Markets Equity Growth
Fund (UCITS) GBP 1,219,740 2,832,043
Janus Henderson Absolute Return Income Fund
(UCITS) USD 254,105 2,629,991
State of North Rhine-Westphalia Germany 2.73 22/05/2019 USD 2,500,000 2,501,190
Ashmore SICAV - Emerging Markets Short Duration
Fund (UCITS) USD 18,039 2,438,640
Merian Global Investors Series Plc - Merian Global
Emerging Markets Fund (UCITS) GBP 100,252 2,329,499
Skyline Umbrella Fund ICAV - Usonian Japan Value
Fund (UCITS) GBP 171,721 2,243,548
Wells Fargo Lux Worldwide Fund - US High Yield
Bond (UCITS) USD 10,440 2,086,832
Wellington Management Funds Ireland PLC -
Wellington Global Credit Plus Fund (UCITS) USD 166,631 2,084,974
Polar Capital Funds PLC - Financial Opportunities
Fund (UCITS) GBP 108,759 1,554,809
Quilter Investors Bond 1 Fund (UCITS) GBP 2,312,771 1,444,769
Apple Inc USD 7,152 1,387,788
S&P Global Inc USD 6,859 1,380,962
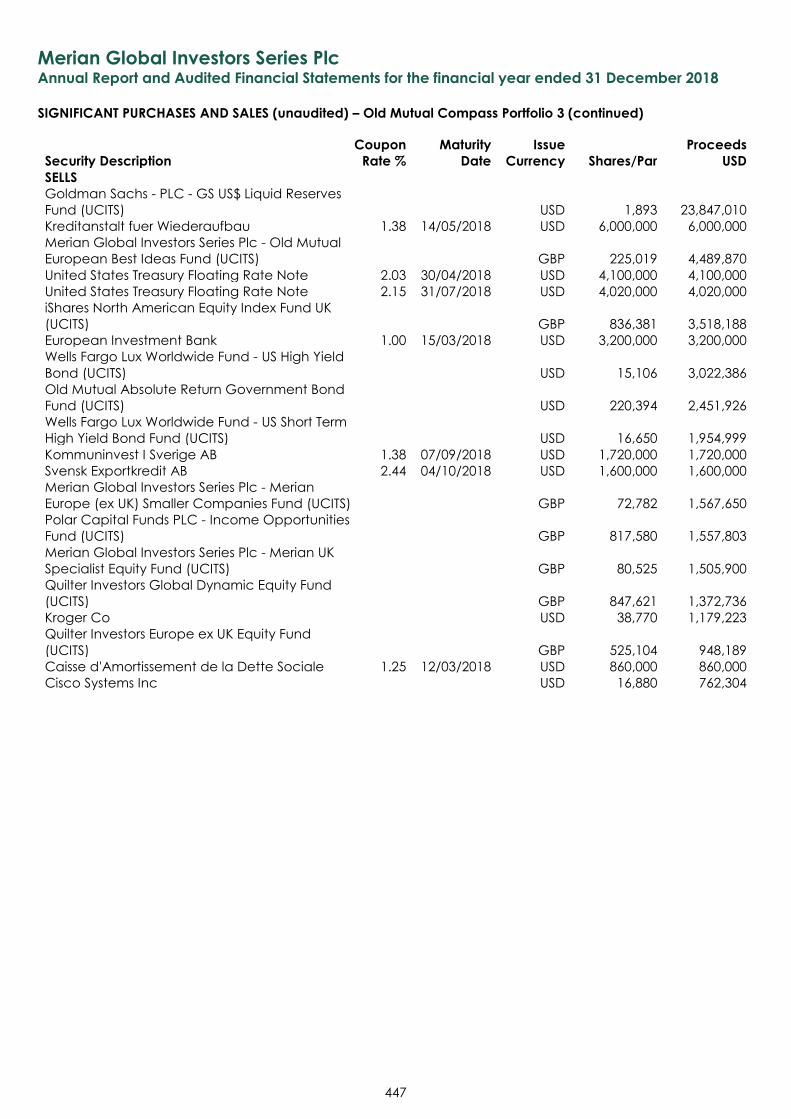
Merian Global Investors Series Plc Annual Report and Audited Financial Statements for the financial year ended 31 December 2018
SIGNIFICANT PURCHASES AND SALES (unaudited) – Old Mutual Compass Portfolio 3 (continued)
447
Security Description
Coupon
Rate %
Maturity
Date
Issue
Currency Shares/Par
Proceeds
USD
SELLS
Goldman Sachs - PLC - GS US$ Liquid Reserves
Fund (UCITS) USD 1,893 23,847,010
Kreditanstalt fuer Wiederaufbau 1.38 14/05/2018 USD 6,000,000 6,000,000
Merian Global Investors Series Plc - Old Mutual
European Best Ideas Fund (UCITS) GBP 225,019 4,489,870
United States Treasury Floating Rate Note 2.03 30/04/2018 USD 4,100,000 4,100,000
United States Treasury Floating Rate Note 2.15 31/07/2018 USD 4,020,000 4,020,000
iShares North American Equity Index Fund UK
(UCITS) GBP 836,381 3,518,188
European Investment Bank 1.00 15/03/2018 USD 3,200,000 3,200,000
Wells Fargo Lux Worldwide Fund - US High Yield
Bond (UCITS) USD 15,106 3,022,386
Old Mutual Absolute Return Government Bond
Fund (UCITS) USD 220,394 2,451,926
Wells Fargo Lux Worldwide Fund - US Short Term
High Yield Bond Fund (UCITS) USD 16,650 1,954,999
Kommuninvest I Sverige AB 1.38 07/09/2018 USD 1,720,000 1,720,000
Svensk Exportkredit AB 2.44 04/10/2018 USD 1,600,000 1,600,000
Merian Global Investors Series Plc - Merian
Europe (ex UK) Smaller Companies Fund (UCITS) GBP 72,782 1,567,650
Polar Capital Funds PLC - Income Opportunities
Fund (UCITS) GBP 817,580 1,557,803
Merian Global Investors Series Plc - Merian UK
Specialist Equity Fund (UCITS) GBP 80,525 1,505,900
Quilter Investors Global Dynamic Equity Fund
(UCITS) GBP 847,621 1,372,736
Kroger Co USD 38,770 1,179,223
Quilter Investors Europe ex UK Equity Fund
(UCITS) GBP 525,104 948,189
Caisse d'Amortissement de la Dette Sociale 1.25 12/03/2018 USD 860,000 860,000
Cisco Systems Inc USD 16,880 762,304
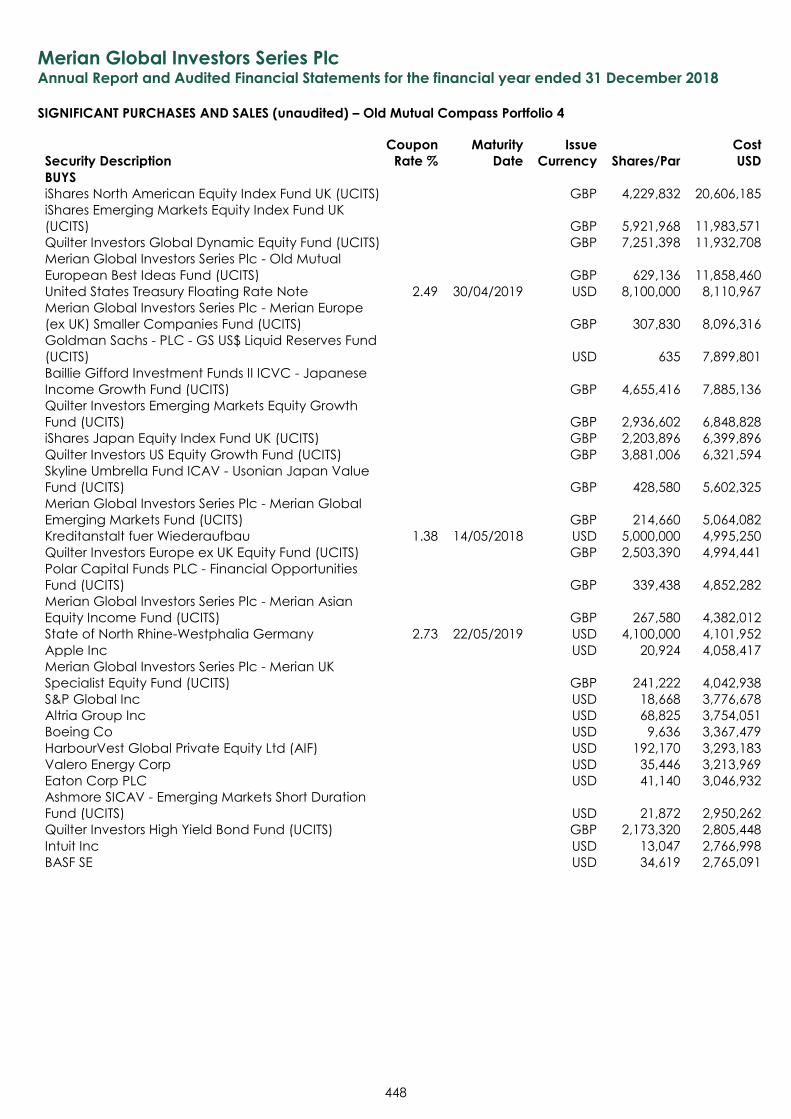
Merian Global Investors Series Plc Annual Report and Audited Financial Statements for the financial year ended 31 December 2018
SIGNIFICANT PURCHASES AND SALES (unaudited) – Old Mutual Compass Portfolio 4
448
Security Description
Coupon
Rate %
Maturity
Date
Issue
Currency Shares/Par
Cost
USD
BUYS
iShares North American Equity Index Fund UK (UCITS) GBP 4,229,832 20,606,185
iShares Emerging Markets Equity Index Fund UK
(UCITS) GBP 5,921,968 11,983,571
Quilter Investors Global Dynamic Equity Fund (UCITS) GBP 7,251,398 11,932,708
Merian Global Investors Series Plc - Old Mutual
European Best Ideas Fund (UCITS) GBP 629,136 11,858,460
United States Treasury Floating Rate Note 2.49 30/04/2019 USD 8,100,000 8,110,967
Merian Global Investors Series Plc - Merian Europe
(ex UK) Smaller Companies Fund (UCITS) GBP 307,830 8,096,316
Goldman Sachs - PLC - GS US$ Liquid Reserves Fund
(UCITS) USD 635 7,899,801
Baillie Gifford Investment Funds II ICVC - Japanese
Income Growth Fund (UCITS) GBP 4,655,416 7,885,136
Quilter Investors Emerging Markets Equity Growth
Fund (UCITS) GBP 2,936,602 6,848,828
iShares Japan Equity Index Fund UK (UCITS) GBP 2,203,896 6,399,896
Quilter Investors US Equity Growth Fund (UCITS) GBP 3,881,006 6,321,594
Skyline Umbrella Fund ICAV - Usonian Japan Value
Fund (UCITS) GBP 428,580 5,602,325
Merian Global Investors Series Plc - Merian Global
Emerging Markets Fund (UCITS) GBP 214,660 5,064,082
Kreditanstalt fuer Wiederaufbau 1.38 14/05/2018 USD 5,000,000 4,995,250
Quilter Investors Europe ex UK Equity Fund (UCITS) GBP 2,503,390 4,994,441
Polar Capital Funds PLC - Financial Opportunities
Fund (UCITS) GBP 339,438 4,852,282
Merian Global Investors Series Plc - Merian Asian
Equity Income Fund (UCITS) GBP 267,580 4,382,012
State of North Rhine-Westphalia Germany 2.73 22/05/2019 USD 4,100,000 4,101,952
Apple Inc USD 20,924 4,058,417
Merian Global Investors Series Plc - Merian UK
Specialist Equity Fund (UCITS) GBP 241,222 4,042,938
S&P Global Inc USD 18,668 3,776,678
Altria Group Inc USD 68,825 3,754,051
Boeing Co USD 9,636 3,367,479
HarbourVest Global Private Equity Ltd (AIF) USD 192,170 3,293,183
Valero Energy Corp USD 35,446 3,213,969
Eaton Corp PLC USD 41,140 3,046,932
Ashmore SICAV - Emerging Markets Short Duration
Fund (UCITS) USD 21,872 2,950,262
Quilter Investors High Yield Bond Fund (UCITS) GBP 2,173,320 2,805,448
Intuit Inc USD 13,047 2,766,998
BASF SE USD 34,619 2,765,091
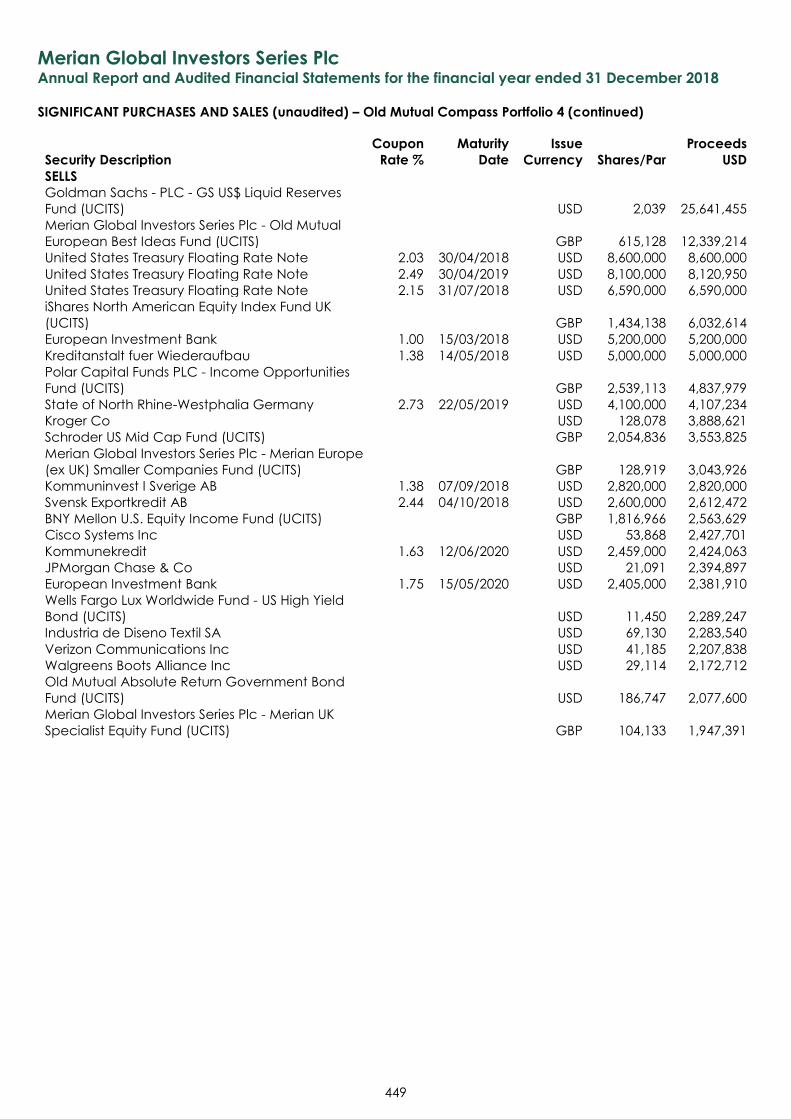
Merian Global Investors Series Plc Annual Report and Audited Financial Statements for the financial year ended 31 December 2018
SIGNIFICANT PURCHASES AND SALES (unaudited) – Old Mutual Compass Portfolio 4 (continued)
449
Security Description
Coupon
Rate %
Maturity
Date
Issue
Currency Shares/Par
Proceeds
USD
SELLS
Goldman Sachs - PLC - GS US$ Liquid Reserves
Fund (UCITS) USD 2,039 25,641,455
Merian Global Investors Series Plc - Old Mutual
European Best Ideas Fund (UCITS) GBP 615,128 12,339,214
United States Treasury Floating Rate Note 2.03 30/04/2018 USD 8,600,000 8,600,000
United States Treasury Floating Rate Note 2.49 30/04/2019 USD 8,100,000 8,120,950
United States Treasury Floating Rate Note 2.15 31/07/2018 USD 6,590,000 6,590,000
iShares North American Equity Index Fund UK
(UCITS) GBP 1,434,138 6,032,614
European Investment Bank 1.00 15/03/2018 USD 5,200,000 5,200,000
Kreditanstalt fuer Wiederaufbau 1.38 14/05/2018 USD 5,000,000 5,000,000
Polar Capital Funds PLC - Income Opportunities
Fund (UCITS) GBP 2,539,113 4,837,979
State of North Rhine-Westphalia Germany 2.73 22/05/2019 USD 4,100,000 4,107,234
Kroger Co USD 128,078 3,888,621
Schroder US Mid Cap Fund (UCITS) GBP 2,054,836 3,553,825
Merian Global Investors Series Plc - Merian Europe
(ex UK) Smaller Companies Fund (UCITS) GBP 128,919 3,043,926
Kommuninvest I Sverige AB 1.38 07/09/2018 USD 2,820,000 2,820,000
Svensk Exportkredit AB 2.44 04/10/2018 USD 2,600,000 2,612,472
BNY Mellon U.S. Equity Income Fund (UCITS) GBP 1,816,966 2,563,629
Cisco Systems Inc USD 53,868 2,427,701
Kommunekredit 1.63 12/06/2020 USD 2,459,000 2,424,063
JPMorgan Chase & Co USD 21,091 2,394,897
European Investment Bank 1.75 15/05/2020 USD 2,405,000 2,381,910
Wells Fargo Lux Worldwide Fund - US High Yield
Bond (UCITS) USD 11,450 2,289,247
Industria de Diseno Textil SA USD 69,130 2,283,540
Verizon Communications Inc USD 41,185 2,207,838
Walgreens Boots Alliance Inc USD 29,114 2,172,712
Old Mutual Absolute Return Government Bond
Fund (UCITS) USD 186,747 2,077,600
Merian Global Investors Series Plc - Merian UK
Specialist Equity Fund (UCITS) GBP 104,133 1,947,391
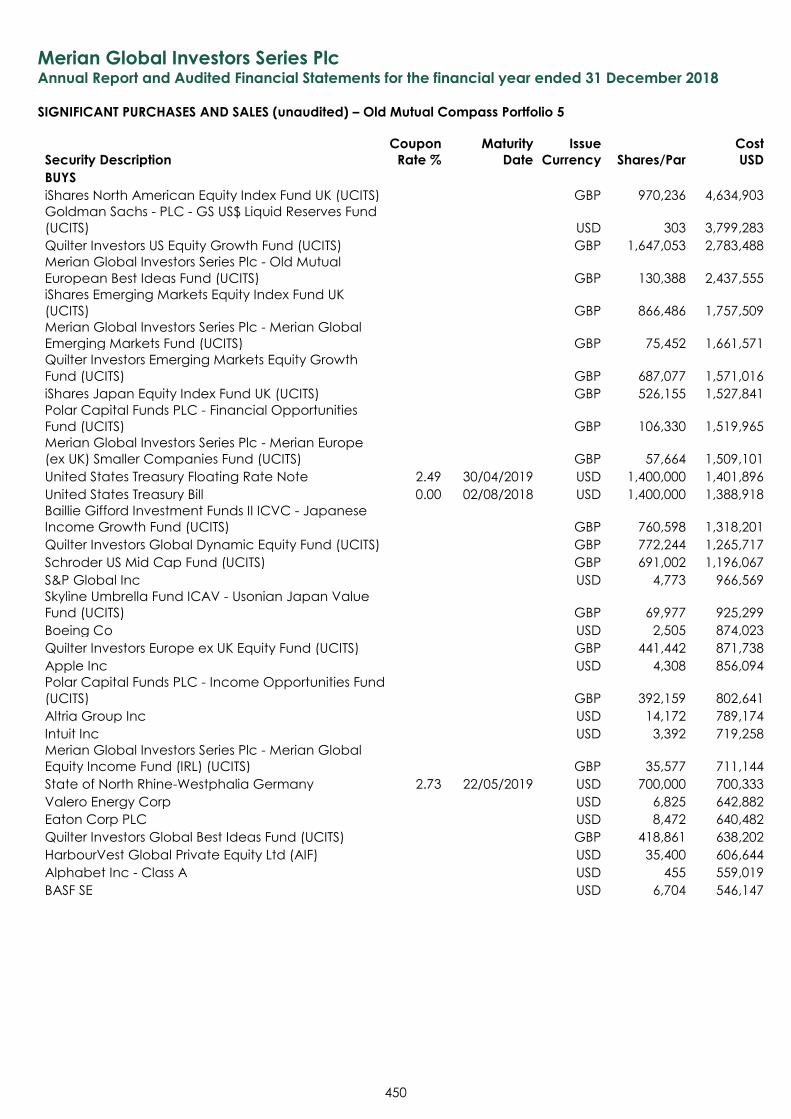
Merian Global Investors Series Plc Annual Report and Audited Financial Statements for the financial year ended 31 December 2018
SIGNIFICANT PURCHASES AND SALES (unaudited) – Old Mutual Compass Portfolio 5
450
Security Description
Coupon
Rate %
Maturity
Date
Issue
Currency Shares/Par
Cost
USD
BUYS
iShares North American Equity Index Fund UK (UCITS) GBP 970,236 4,634,903
Goldman Sachs - PLC - GS US$ Liquid Reserves Fund
(UCITS) USD 303 3,799,283
Quilter Investors US Equity Growth Fund (UCITS) GBP 1,647,053 2,783,488
Merian Global Investors Series Plc - Old Mutual
European Best Ideas Fund (UCITS) GBP 130,388 2,437,555
iShares Emerging Markets Equity Index Fund UK
(UCITS) GBP 866,486 1,757,509
Merian Global Investors Series Plc - Merian Global
Emerging Markets Fund (UCITS) GBP 75,452 1,661,571
Quilter Investors Emerging Markets Equity Growth
Fund (UCITS) GBP 687,077 1,571,016
iShares Japan Equity Index Fund UK (UCITS) GBP 526,155 1,527,841
Polar Capital Funds PLC - Financial Opportunities
Fund (UCITS) GBP 106,330 1,519,965
Merian Global Investors Series Plc - Merian Europe
(ex UK) Smaller Companies Fund (UCITS) GBP 57,664 1,509,101
United States Treasury Floating Rate Note 2.49 30/04/2019 USD 1,400,000 1,401,896
United States Treasury Bill 0.00 02/08/2018 USD 1,400,000 1,388,918
Baillie Gifford Investment Funds II ICVC - Japanese
Income Growth Fund (UCITS) GBP 760,598 1,318,201
Quilter Investors Global Dynamic Equity Fund (UCITS) GBP 772,244 1,265,717
Schroder US Mid Cap Fund (UCITS) GBP 691,002 1,196,067
S&P Global Inc USD 4,773 966,569
Skyline Umbrella Fund ICAV - Usonian Japan Value
Fund (UCITS) GBP 69,977 925,299
Boeing Co USD 2,505 874,023
Quilter Investors Europe ex UK Equity Fund (UCITS) GBP 441,442 871,738
Apple Inc USD 4,308 856,094
Polar Capital Funds PLC - Income Opportunities Fund
(UCITS) GBP 392,159 802,641
Altria Group Inc USD 14,172 789,174
Intuit Inc USD 3,392 719,258
Merian Global Investors Series Plc - Merian Global
Equity Income Fund (IRL) (UCITS) GBP 35,577 711,144
State of North Rhine-Westphalia Germany 2.73 22/05/2019 USD 700,000 700,333
Valero Energy Corp USD 6,825 642,882
Eaton Corp PLC USD 8,472 640,482
Quilter Investors Global Best Ideas Fund (UCITS) GBP 418,861 638,202
HarbourVest Global Private Equity Ltd (AIF) USD 35,400 606,644
Alphabet Inc - Class A USD 455 559,019
BASF SE USD 6,704 546,147
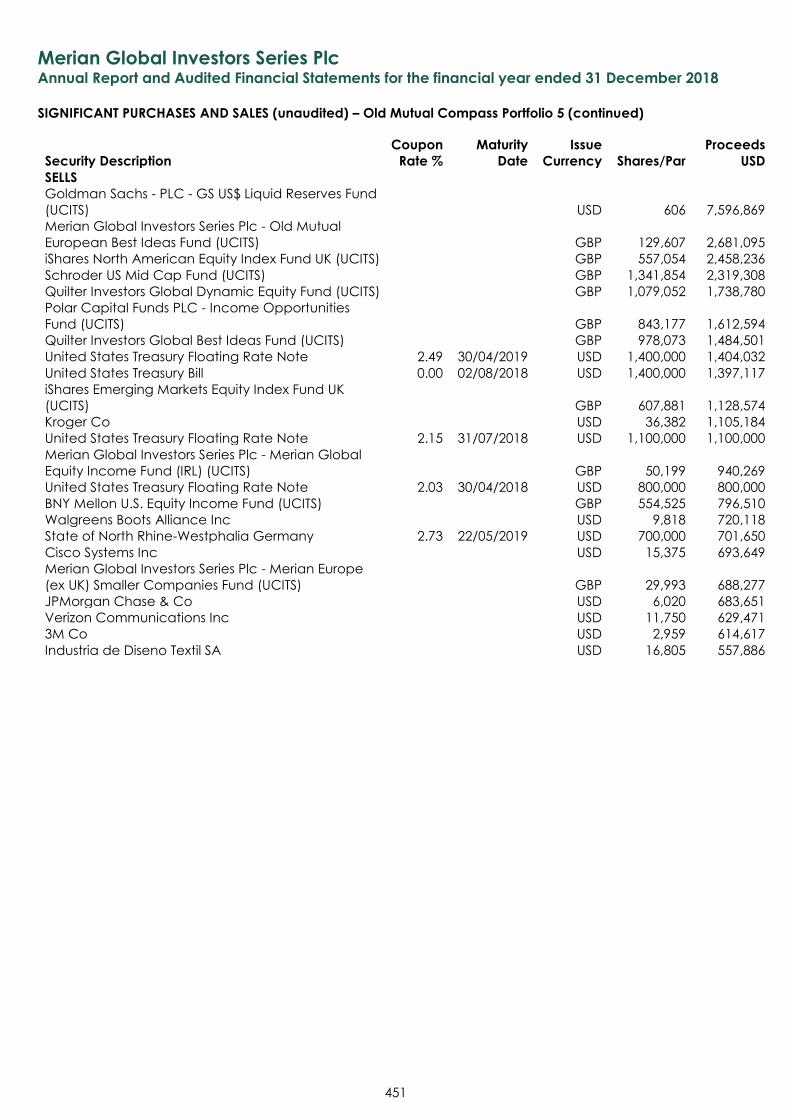
Merian Global Investors Series Plc Annual Report and Audited Financial Statements for the financial year ended 31 December 2018
SIGNIFICANT PURCHASES AND SALES (unaudited) – Old Mutual Compass Portfolio 5 (continued)
451
Security Description
Coupon
Rate %
Maturity
Date
Issue
Currency Shares/Par
Proceeds
USD
SELLS
Goldman Sachs - PLC - GS US$ Liquid Reserves Fund
(UCITS) USD 606 7,596,869
Merian Global Investors Series Plc - Old Mutual
European Best Ideas Fund (UCITS) GBP 129,607 2,681,095
iShares North American Equity Index Fund UK (UCITS) GBP 557,054 2,458,236
Schroder US Mid Cap Fund (UCITS) GBP 1,341,854 2,319,308
Quilter Investors Global Dynamic Equity Fund (UCITS) GBP 1,079,052 1,738,780
Polar Capital Funds PLC - Income Opportunities
Fund (UCITS) GBP 843,177 1,612,594
Quilter Investors Global Best Ideas Fund (UCITS) GBP 978,073 1,484,501
United States Treasury Floating Rate Note 2.49 30/04/2019 USD 1,400,000 1,404,032
United States Treasury Bill 0.00 02/08/2018 USD 1,400,000 1,397,117
iShares Emerging Markets Equity Index Fund UK
(UCITS) GBP 607,881 1,128,574
Kroger Co USD 36,382 1,105,184
United States Treasury Floating Rate Note 2.15 31/07/2018 USD 1,100,000 1,100,000
Merian Global Investors Series Plc - Merian Global
Equity Income Fund (IRL) (UCITS) GBP 50,199 940,269
United States Treasury Floating Rate Note 2.03 30/04/2018 USD 800,000 800,000
BNY Mellon U.S. Equity Income Fund (UCITS) GBP 554,525 796,510
Walgreens Boots Alliance Inc USD 9,818 720,118
State of North Rhine-Westphalia Germany 2.73 22/05/2019 USD 700,000 701,650
Cisco Systems Inc USD 15,375 693,649
Merian Global Investors Series Plc - Merian Europe
(ex UK) Smaller Companies Fund (UCITS) GBP 29,993 688,277
JPMorgan Chase & Co USD 6,020 683,651
Verizon Communications Inc USD 11,750 629,471
3M Co USD 2,959 614,617
Industria de Diseno Textil SA USD 16,805 557,886
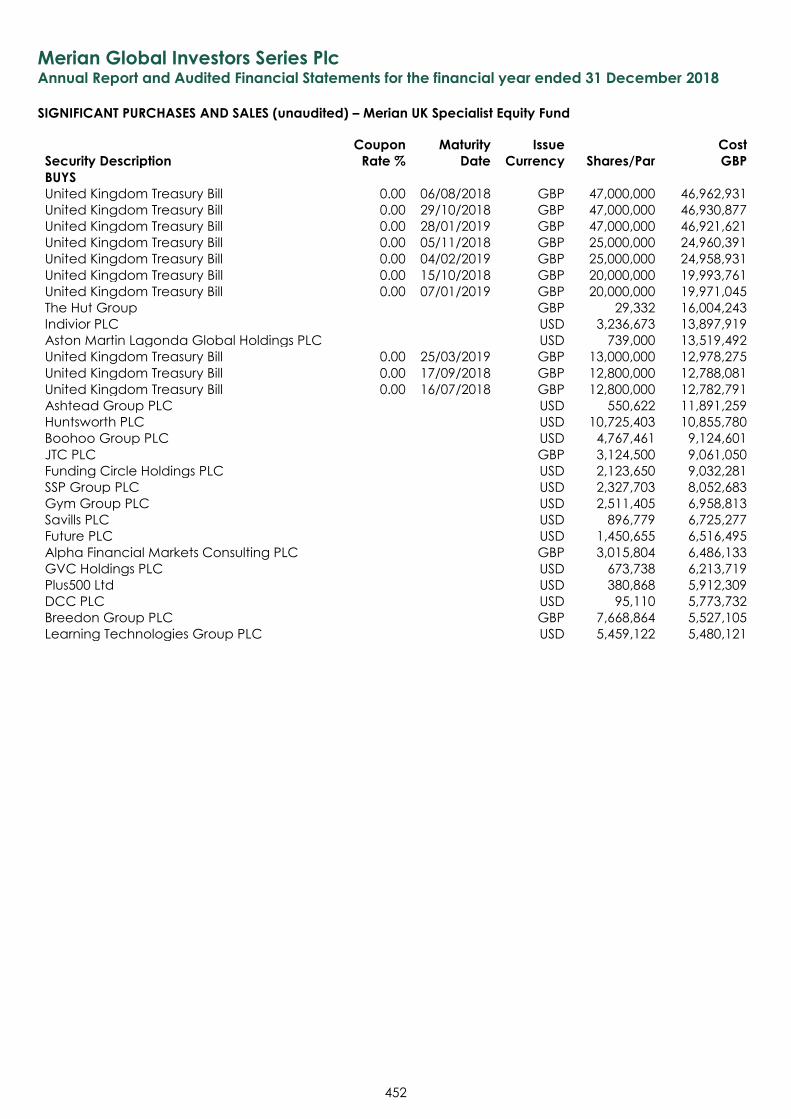
Merian Global Investors Series Plc Annual Report and Audited Financial Statements for the financial year ended 31 December 2018
SIGNIFICANT PURCHASES AND SALES (unaudited) – Merian UK Specialist Equity Fund
452
Security Description
Coupon
Rate %
Maturity
Date
Issue
Currency Shares/Par
Cost
GBP
BUYS
United Kingdom Treasury Bill 0.00 06/08/2018 GBP 47,000,000 46,962,931
United Kingdom Treasury Bill 0.00 29/10/2018 GBP 47,000,000 46,930,877
United Kingdom Treasury Bill 0.00 28/01/2019 GBP 47,000,000 46,921,621
United Kingdom Treasury Bill 0.00 05/11/2018 GBP 25,000,000 24,960,391
United Kingdom Treasury Bill 0.00 04/02/2019 GBP 25,000,000 24,958,931
United Kingdom Treasury Bill 0.00 15/10/2018 GBP 20,000,000 19,993,761
United Kingdom Treasury Bill 0.00 07/01/2019 GBP 20,000,000 19,971,045
The Hut Group GBP 29,332 16,004,243
Indivior PLC USD 3,236,673 13,897,919
Aston Martin Lagonda Global Holdings PLC USD 739,000 13,519,492
United Kingdom Treasury Bill 0.00 25/03/2019 GBP 13,000,000 12,978,275
United Kingdom Treasury Bill 0.00 17/09/2018 GBP 12,800,000 12,788,081
United Kingdom Treasury Bill 0.00 16/07/2018 GBP 12,800,000 12,782,791
Ashtead Group PLC USD 550,622 11,891,259
Huntsworth PLC USD 10,725,403 10,855,780
Boohoo Group PLC USD 4,767,461 9,124,601
JTC PLC GBP 3,124,500 9,061,050
Funding Circle Holdings PLC USD 2,123,650 9,032,281
SSP Group PLC USD 2,327,703 8,052,683
Gym Group PLC USD 2,511,405 6,958,813
Savills PLC USD 896,779 6,725,277
Future PLC USD 1,450,655 6,516,495
Alpha Financial Markets Consulting PLC GBP 3,015,804 6,486,133
GVC Holdings PLC USD 673,738 6,213,719
Plus500 Ltd USD 380,868 5,912,309
DCC PLC USD 95,110 5,773,732
Breedon Group PLC GBP 7,668,864 5,527,105
Learning Technologies Group PLC USD 5,459,122 5,480,121
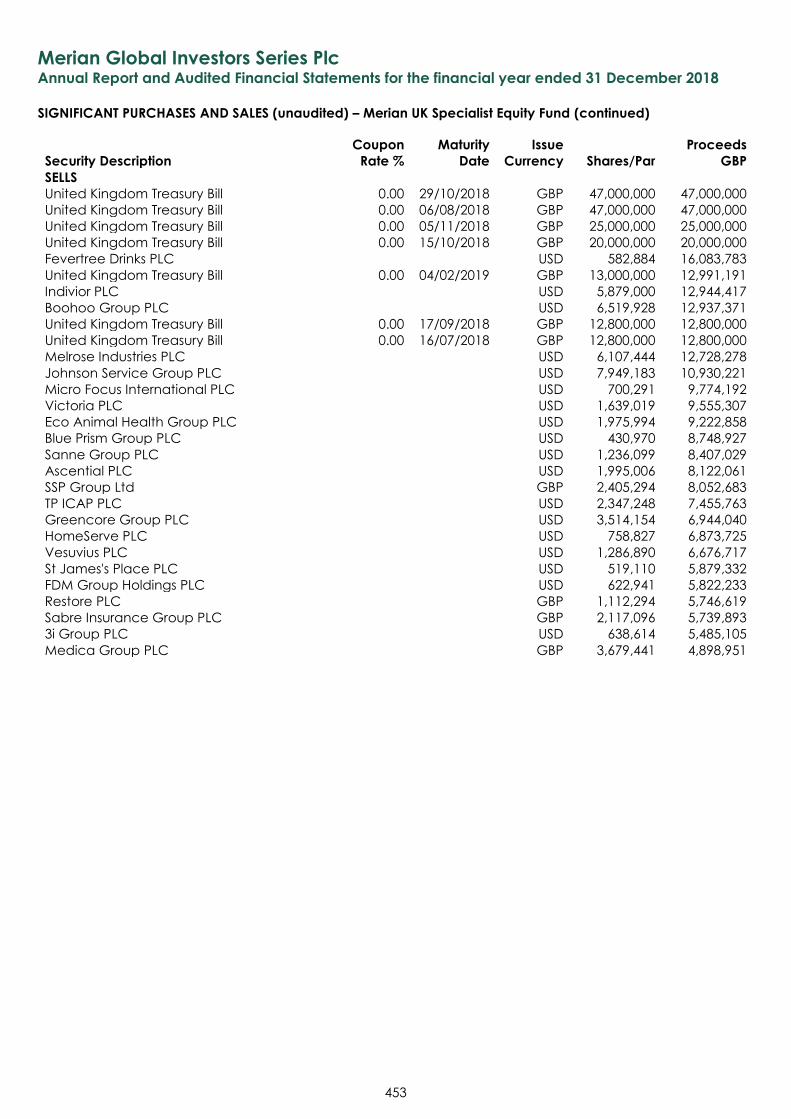
Merian Global Investors Series Plc Annual Report and Audited Financial Statements for the financial year ended 31 December 2018
SIGNIFICANT PURCHASES AND SALES (unaudited) – Merian UK Specialist Equity Fund (continued)
453
Security Description
Coupon
Rate %
Maturity
Date
Issue
Currency Shares/Par
Proceeds
GBP
SELLS
United Kingdom Treasury Bill 0.00 29/10/2018 GBP 47,000,000 47,000,000
United Kingdom Treasury Bill 0.00 06/08/2018 GBP 47,000,000 47,000,000
United Kingdom Treasury Bill 0.00 05/11/2018 GBP 25,000,000 25,000,000
United Kingdom Treasury Bill 0.00 15/10/2018 GBP 20,000,000 20,000,000
Fevertree Drinks PLC USD 582,884 16,083,783
United Kingdom Treasury Bill 0.00 04/02/2019 GBP 13,000,000 12,991,191
Indivior PLC USD 5,879,000 12,944,417
Boohoo Group PLC USD 6,519,928 12,937,371
United Kingdom Treasury Bill 0.00 17/09/2018 GBP 12,800,000 12,800,000
United Kingdom Treasury Bill 0.00 16/07/2018 GBP 12,800,000 12,800,000
Melrose Industries PLC USD 6,107,444 12,728,278
Johnson Service Group PLC USD 7,949,183 10,930,221
Micro Focus International PLC USD 700,291 9,774,192
Victoria PLC USD 1,639,019 9,555,307
Eco Animal Health Group PLC USD 1,975,994 9,222,858
Blue Prism Group PLC USD 430,970 8,748,927
Sanne Group PLC USD 1,236,099 8,407,029
Ascential PLC USD 1,995,006 8,122,061
SSP Group Ltd GBP 2,405,294 8,052,683
TP ICAP PLC USD 2,347,248 7,455,763
Greencore Group PLC USD 3,514,154 6,944,040
HomeServe PLC USD 758,827 6,873,725
Vesuvius PLC USD 1,286,890 6,676,717
St James's Place PLC USD 519,110 5,879,332
FDM Group Holdings PLC USD 622,941 5,822,233
Restore PLC GBP 1,112,294 5,746,619
Sabre Insurance Group PLC GBP 2,117,096 5,739,893
3i Group PLC USD 638,614 5,485,105
Medica Group PLC GBP 3,679,441 4,898,951
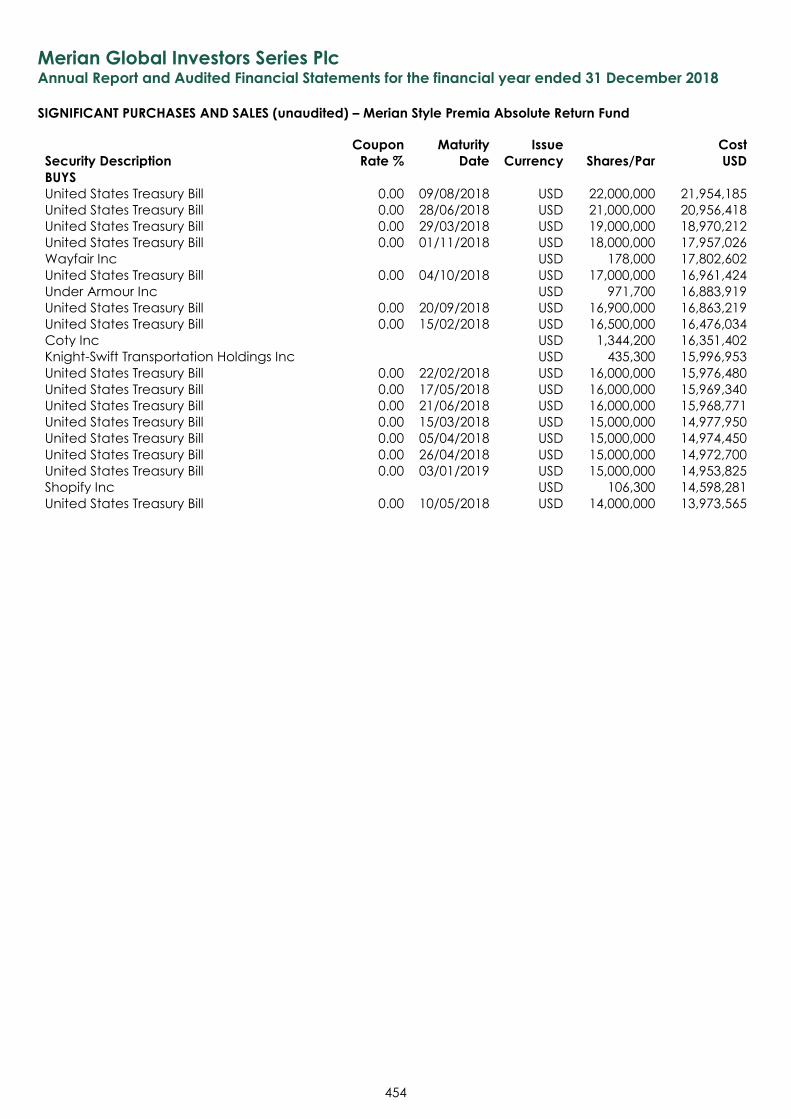
Merian Global Investors Series Plc Annual Report and Audited Financial Statements for the financial year ended 31 December 2018
SIGNIFICANT PURCHASES AND SALES (unaudited) – Merian Style Premia Absolute Return Fund
454
Security Description
Coupon
Rate %
Maturity
Date
Issue
Currency Shares/Par
Cost
USD
BUYS
United States Treasury Bill 0.00 09/08/2018 USD 22,000,000 21,954,185
United States Treasury Bill 0.00 28/06/2018 USD 21,000,000 20,956,418
United States Treasury Bill 0.00 29/03/2018 USD 19,000,000 18,970,212
United States Treasury Bill 0.00 01/11/2018 USD 18,000,000 17,957,026
Wayfair Inc USD 178,000 17,802,602
United States Treasury Bill 0.00 04/10/2018 USD 17,000,000 16,961,424
Under Armour Inc USD 971,700 16,883,919
United States Treasury Bill 0.00 20/09/2018 USD 16,900,000 16,863,219
United States Treasury Bill 0.00 15/02/2018 USD 16,500,000 16,476,034
Coty Inc USD 1,344,200 16,351,402
Knight-Swift Transportation Holdings Inc USD 435,300 15,996,953
United States Treasury Bill 0.00 22/02/2018 USD 16,000,000 15,976,480
United States Treasury Bill 0.00 17/05/2018 USD 16,000,000 15,969,340
United States Treasury Bill 0.00 21/06/2018 USD 16,000,000 15,968,771
United States Treasury Bill 0.00 15/03/2018 USD 15,000,000 14,977,950
United States Treasury Bill 0.00 05/04/2018 USD 15,000,000 14,974,450
United States Treasury Bill 0.00 26/04/2018 USD 15,000,000 14,972,700
United States Treasury Bill 0.00 03/01/2019 USD 15,000,000 14,953,825
Shopify Inc USD 106,300 14,598,281
United States Treasury Bill 0.00 10/05/2018 USD 14,000,000 13,973,565
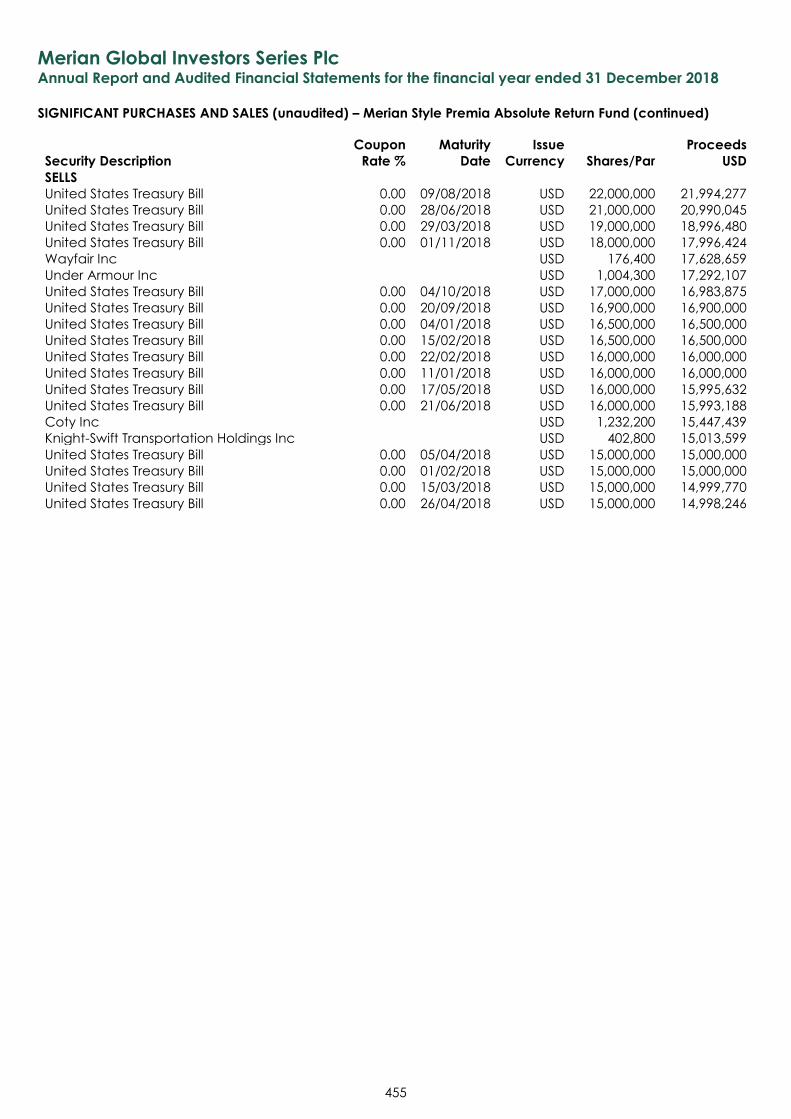
Merian Global Investors Series Plc Annual Report and Audited Financial Statements for the financial year ended 31 December 2018
SIGNIFICANT PURCHASES AND SALES (unaudited) – Merian Style Premia Absolute Return Fund (continued)
455
Security Description
Coupon
Rate %
Maturity
Date
Issue
Currency Shares/Par
Proceeds
USD
SELLS
United States Treasury Bill 0.00 09/08/2018 USD 22,000,000 21,994,277
United States Treasury Bill 0.00 28/06/2018 USD 21,000,000 20,990,045
United States Treasury Bill 0.00 29/03/2018 USD 19,000,000 18,996,480
United States Treasury Bill 0.00 01/11/2018 USD 18,000,000 17,996,424
Wayfair Inc USD 176,400 17,628,659
Under Armour Inc USD 1,004,300 17,292,107
United States Treasury Bill 0.00 04/10/2018 USD 17,000,000 16,983,875
United States Treasury Bill 0.00 20/09/2018 USD 16,900,000 16,900,000
United States Treasury Bill 0.00 04/01/2018 USD 16,500,000 16,500,000
United States Treasury Bill 0.00 15/02/2018 USD 16,500,000 16,500,000
United States Treasury Bill 0.00 22/02/2018 USD 16,000,000 16,000,000
United States Treasury Bill 0.00 11/01/2018 USD 16,000,000 16,000,000
United States Treasury Bill 0.00 17/05/2018 USD 16,000,000 15,995,632
United States Treasury Bill 0.00 21/06/2018 USD 16,000,000 15,993,188
Coty Inc USD 1,232,200 15,447,439
Knight-Swift Transportation Holdings Inc USD 402,800 15,013,599
United States Treasury Bill 0.00 05/04/2018 USD 15,000,000 15,000,000
United States Treasury Bill 0.00 01/02/2018 USD 15,000,000 15,000,000
United States Treasury Bill 0.00 15/03/2018 USD 15,000,000 14,999,770
United States Treasury Bill 0.00 26/04/2018 USD 15,000,000 14,998,246
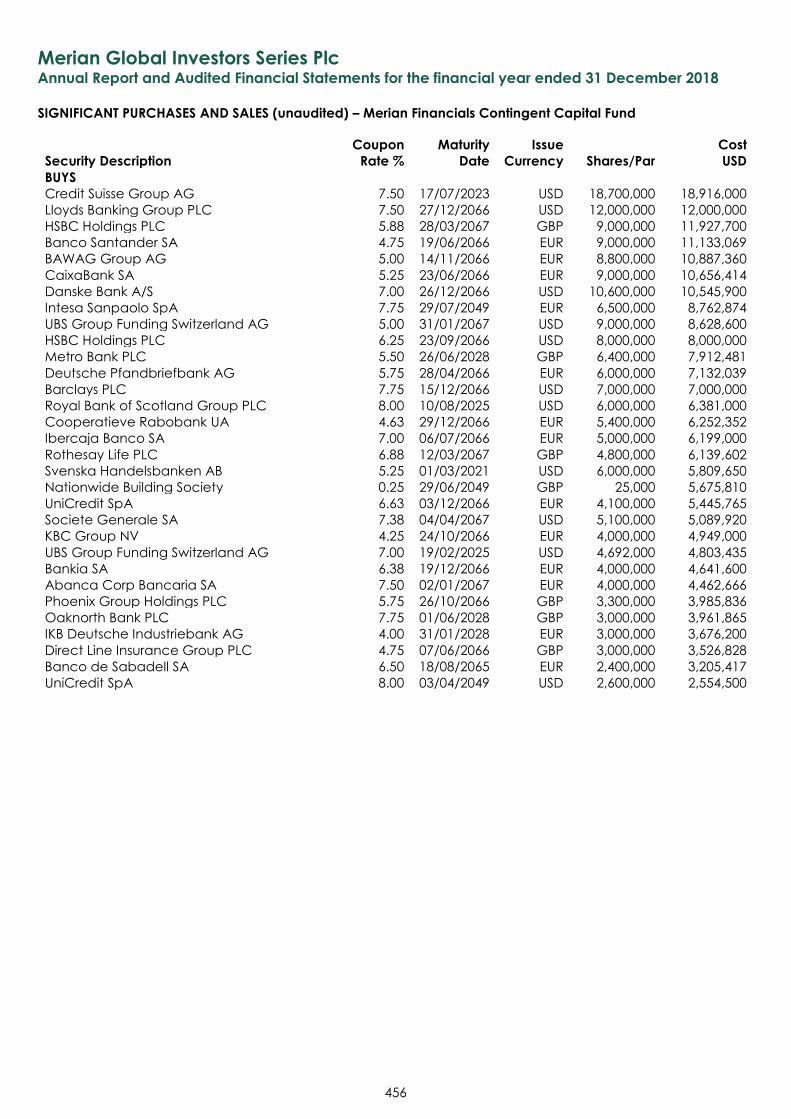
Merian Global Investors Series Plc Annual Report and Audited Financial Statements for the financial year ended 31 December 2018
SIGNIFICANT PURCHASES AND SALES (unaudited) – Merian Financials Contingent Capital Fund
456
Security Description
Coupon
Rate %
Maturity
Date
Issue
Currency Shares/Par
Cost
USD
BUYS
Credit Suisse Group AG 7.50 17/07/2023 USD 18,700,000 18,916,000
Lloyds Banking Group PLC 7.50 27/12/2066 USD 12,000,000 12,000,000
HSBC Holdings PLC 5.88 28/03/2067 GBP 9,000,000 11,927,700
Banco Santander SA 4.75 19/06/2066 EUR 9,000,000 11,133,069
BAWAG Group AG 5.00 14/11/2066 EUR 8,800,000 10,887,360
CaixaBank SA 5.25 23/06/2066 EUR 9,000,000 10,656,414
Danske Bank A/S 7.00 26/12/2066 USD 10,600,000 10,545,900
Intesa Sanpaolo SpA 7.75 29/07/2049 EUR 6,500,000 8,762,874
UBS Group Funding Switzerland AG 5.00 31/01/2067 USD 9,000,000 8,628,600
HSBC Holdings PLC 6.25 23/09/2066 USD 8,000,000 8,000,000
Metro Bank PLC 5.50 26/06/2028 GBP 6,400,000 7,912,481
Deutsche Pfandbriefbank AG 5.75 28/04/2066 EUR 6,000,000 7,132,039
Barclays PLC 7.75 15/12/2066 USD 7,000,000 7,000,000
Royal Bank of Scotland Group PLC 8.00 10/08/2025 USD 6,000,000 6,381,000
Cooperatieve Rabobank UA 4.63 29/12/2066 EUR 5,400,000 6,252,352
Ibercaja Banco SA 7.00 06/07/2066 EUR 5,000,000 6,199,000
Rothesay Life PLC 6.88 12/03/2067 GBP 4,800,000 6,139,602
Svenska Handelsbanken AB 5.25 01/03/2021 USD 6,000,000 5,809,650
Nationwide Building Society 0.25 29/06/2049 GBP 25,000 5,675,810
UniCredit SpA 6.63 03/12/2066 EUR 4,100,000 5,445,765
Societe Generale SA 7.38 04/04/2067 USD 5,100,000 5,089,920
KBC Group NV 4.25 24/10/2066 EUR 4,000,000 4,949,000
UBS Group Funding Switzerland AG 7.00 19/02/2025 USD 4,692,000 4,803,435
Bankia SA 6.38 19/12/2066 EUR 4,000,000 4,641,600
Abanca Corp Bancaria SA 7.50 02/01/2067 EUR 4,000,000 4,462,666
Phoenix Group Holdings PLC 5.75 26/10/2066 GBP 3,300,000 3,985,836
Oaknorth Bank PLC 7.75 01/06/2028 GBP 3,000,000 3,961,865
IKB Deutsche Industriebank AG 4.00 31/01/2028 EUR 3,000,000 3,676,200
Direct Line Insurance Group PLC 4.75 07/06/2066 GBP 3,000,000 3,526,828
Banco de Sabadell SA 6.50 18/08/2065 EUR 2,400,000 3,205,417
UniCredit SpA 8.00 03/04/2049 USD 2,600,000 2,554,500
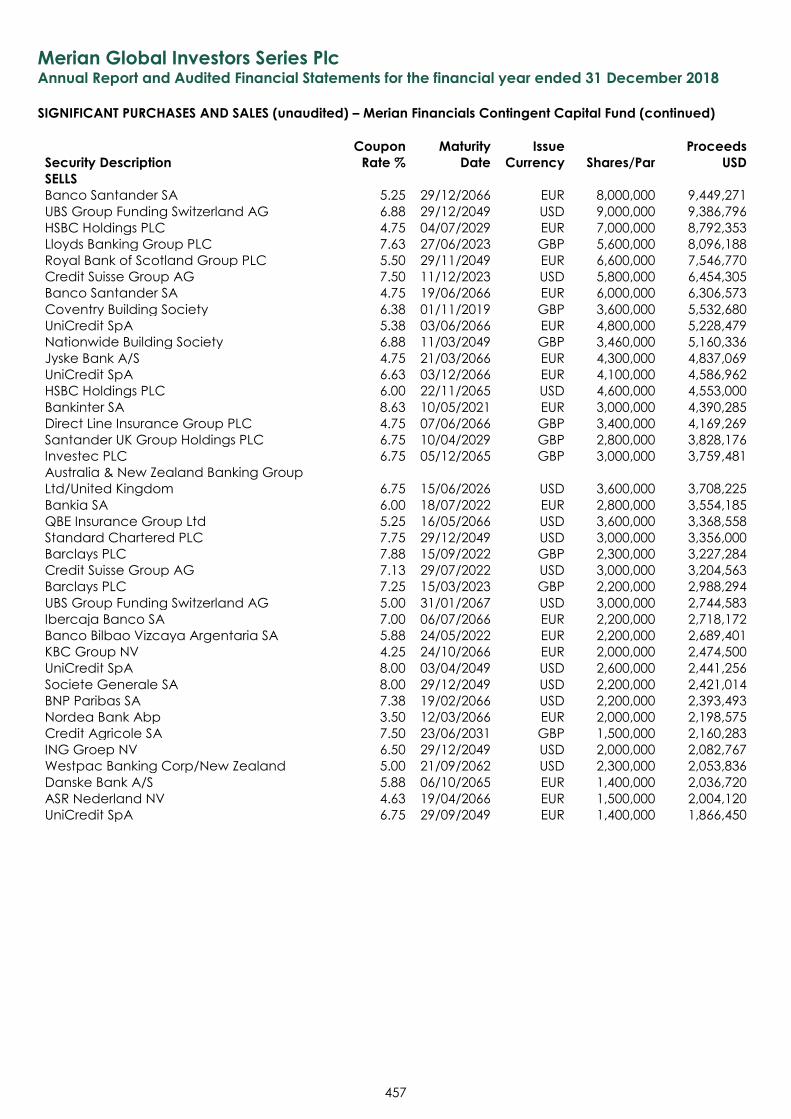
Merian Global Investors Series Plc Annual Report and Audited Financial Statements for the financial year ended 31 December 2018
SIGNIFICANT PURCHASES AND SALES (unaudited) – Merian Financials Contingent Capital Fund (continued)
457
Security Description
Coupon
Rate %
Maturity
Date
Issue
Currency Shares/Par
Proceeds
USD
SELLS
Banco Santander SA 5.25 29/12/2066 EUR 8,000,000 9,449,271
UBS Group Funding Switzerland AG 6.88 29/12/2049 USD 9,000,000 9,386,796
HSBC Holdings PLC 4.75 04/07/2029 EUR 7,000,000 8,792,353
Lloyds Banking Group PLC 7.63 27/06/2023 GBP 5,600,000 8,096,188
Royal Bank of Scotland Group PLC 5.50 29/11/2049 EUR 6,600,000 7,546,770
Credit Suisse Group AG 7.50 11/12/2023 USD 5,800,000 6,454,305
Banco Santander SA 4.75 19/06/2066 EUR 6,000,000 6,306,573
Coventry Building Society 6.38 01/11/2019 GBP 3,600,000 5,532,680
UniCredit SpA 5.38 03/06/2066 EUR 4,800,000 5,228,479
Nationwide Building Society 6.88 11/03/2049 GBP 3,460,000 5,160,336
Jyske Bank A/S 4.75 21/03/2066 EUR 4,300,000 4,837,069
UniCredit SpA 6.63 03/12/2066 EUR 4,100,000 4,586,962
HSBC Holdings PLC 6.00 22/11/2065 USD 4,600,000 4,553,000
Bankinter SA 8.63 10/05/2021 EUR 3,000,000 4,390,285
Direct Line Insurance Group PLC 4.75 07/06/2066 GBP 3,400,000 4,169,269
Santander UK Group Holdings PLC 6.75 10/04/2029 GBP 2,800,000 3,828,176
Investec PLC 6.75 05/12/2065 GBP 3,000,000 3,759,481
Australia & New Zealand Banking Group
Ltd/United Kingdom 6.75 15/06/2026 USD 3,600,000 3,708,225
Bankia SA 6.00 18/07/2022 EUR 2,800,000 3,554,185
QBE Insurance Group Ltd 5.25 16/05/2066 USD 3,600,000 3,368,558
Standard Chartered PLC 7.75 29/12/2049 USD 3,000,000 3,356,000
Barclays PLC 7.88 15/09/2022 GBP 2,300,000 3,227,284
Credit Suisse Group AG 7.13 29/07/2022 USD 3,000,000 3,204,563
Barclays PLC 7.25 15/03/2023 GBP 2,200,000 2,988,294
UBS Group Funding Switzerland AG 5.00 31/01/2067 USD 3,000,000 2,744,583
Ibercaja Banco SA 7.00 06/07/2066 EUR 2,200,000 2,718,172
Banco Bilbao Vizcaya Argentaria SA 5.88 24/05/2022 EUR 2,200,000 2,689,401
KBC Group NV 4.25 24/10/2066 EUR 2,000,000 2,474,500
UniCredit SpA 8.00 03/04/2049 USD 2,600,000 2,441,256
Societe Generale SA 8.00 29/12/2049 USD 2,200,000 2,421,014
BNP Paribas SA 7.38 19/02/2066 USD 2,200,000 2,393,493
Nordea Bank Abp 3.50 12/03/2066 EUR 2,000,000 2,198,575
Credit Agricole SA 7.50 23/06/2031 GBP 1,500,000 2,160,283
ING Groep NV 6.50 29/12/2049 USD 2,000,000 2,082,767
Westpac Banking Corp/New Zealand 5.00 21/09/2062 USD 2,300,000 2,053,836
Danske Bank A/S 5.88 06/10/2065 EUR 1,400,000 2,036,720
ASR Nederland NV 4.63 19/04/2066 EUR 1,500,000 2,004,120
UniCredit SpA 6.75 29/09/2049 EUR 1,400,000 1,866,450
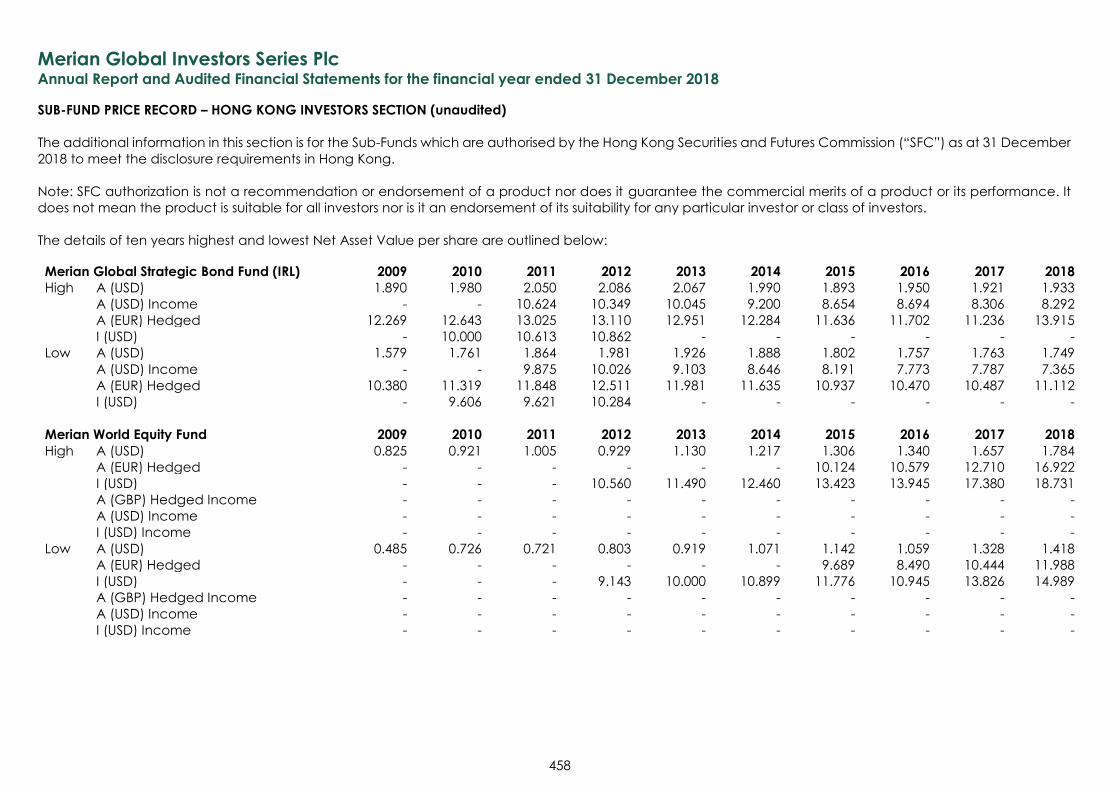
Merian Global Investors Series Plc Annual Report and Audited Financial Statements for the financial year ended 31 December 2018
458
SUB-FUND PRICE RECORD – HONG KONG INVESTORS SECTION (unaudited)
The additional information in this section is for the Sub-Funds which are authorised by the Hong Kong Securities and Futures Commission (“SFC”) as at 31 December
2018 to meet the disclosure requirements in Hong Kong.
Note: SFC authorization is not a recommendation or endorsement of a product nor does it guarantee the commercial merits of a product or its performance. It
does not mean the product is suitable for all investors nor is it an endorsement of its suitability for any particular investor or class of investors.
The details of ten years highest and lowest Net Asset Value per share are outlined below:
Merian Global Strategic Bond Fund (IRL) 2009 2010 2011 2012 2013 2014 2015 2016 2017 2018
High A (USD) 1.890 1.980 2.050 2.086 2.067 1.990 1.893 1.950 1.921 1.933 A (USD) Income - - 10.624 10.349 10.045 9.200 8.654 8.694 8.306 8.292 A (EUR) Hedged 12.269 12.643 13.025 13.110 12.951 12.284 11.636 11.702 11.236 13.915 I (USD) - 10.000 10.613 10.862 - - - - - -
Low A (USD) 1.579 1.761 1.864 1.981 1.926 1.888 1.802 1.757 1.763 1.749 A (USD) Income - - 9.875 10.026 9.103 8.646 8.191 7.773 7.787 7.365 A (EUR) Hedged 10.380 11.319 11.848 12.511 11.981 11.635 10.937 10.470 10.487 11.112 I (USD) - 9.606 9.621 10.284 - - - - - -
Merian World Equity Fund 2009 2010 2011 2012 2013 2014 2015 2016 2017 2018
High A (USD) 0.825 0.921 1.005 0.929 1.130 1.217 1.306 1.340 1.657 1.784 A (EUR) Hedged - - - - - - 10.124 10.579 12.710 16.922 I (USD) - - - 10.560 11.490 12.460 13.423 13.945 17.380 18.731 A (GBP) Hedged Income - - - - - - - - - - A (USD) Income - - - - - - - - - - I (USD) Income - - - - - - - - - -
Low A (USD) 0.485 0.726 0.721 0.803 0.919 1.071 1.142 1.059 1.328 1.418 A (EUR) Hedged - - - - - - 9.689 8.490 10.444 11.988 I (USD) - - - 9.143 10.000 10.899 11.776 10.945 13.826 14.989 A (GBP) Hedged Income - - - - - - - - - - A (USD) Income - - - - - - - - - - I (USD) Income - - - - - - - - - -
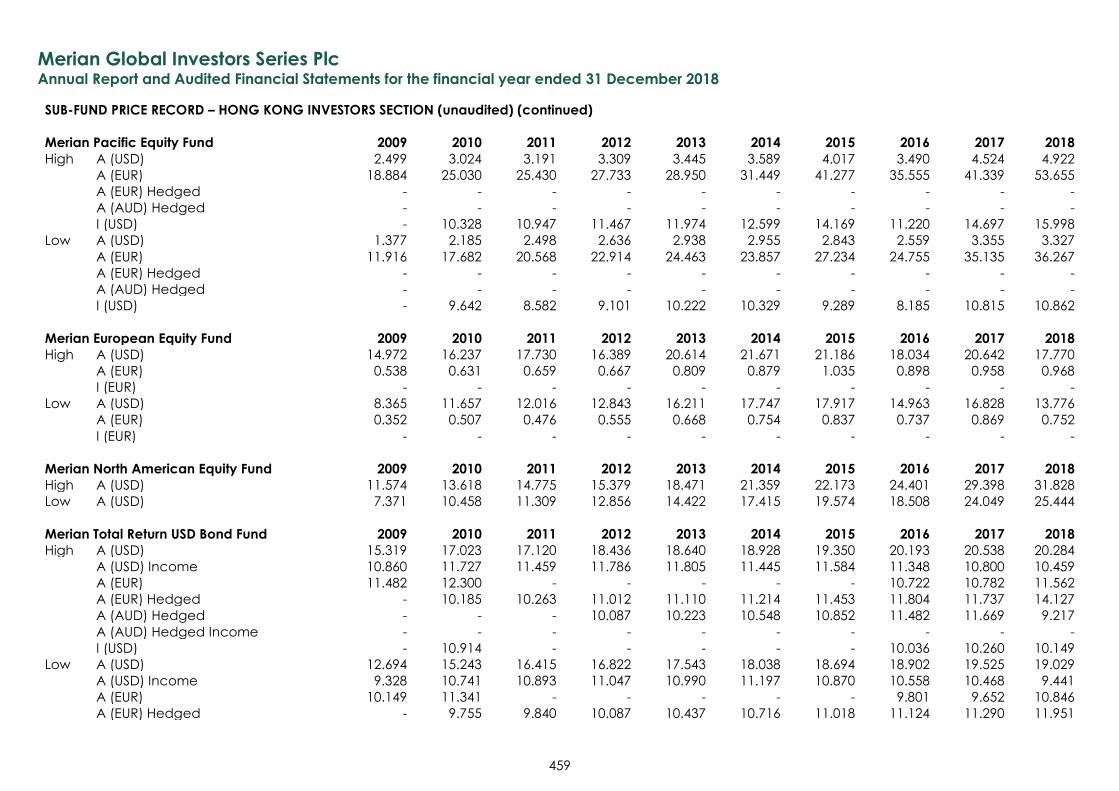
Merian Global Investors Series Plc Annual Report and Audited Financial Statements for the financial year ended 31 December 2018
459
SUB-FUND PRICE RECORD – HONG KONG INVESTORS SECTION (unaudited) (continued)
Merian Pacific Equity Fund 2009 2010 2011 2012 2013 2014 2015 2016 2017 2018
High A (USD) 2.499 3.024 3.191 3.309 3.445 3.589 4.017 3.490 4.524 4.922 A (EUR) 18.884 25.030 25.430 27.733 28.950 31.449 41.277 35.555 41.339 53.655 A (EUR) Hedged - - - - - - - - - - A (AUD) Hedged - - - - - - - - - - I (USD) - 10.328 10.947 11.467 11.974 12.599 14.169 11.220 14.697 15.998
Low A (USD) 1.377 2.185 2.498 2.636 2.938 2.955 2.843 2.559 3.355 3.327 A (EUR) 11.916 17.682 20.568 22.914 24.463 23.857 27.234 24.755 35.135 36.267 A (EUR) Hedged - - - - - - - - - - A (AUD) Hedged - - - - - - - - - - I (USD) - 9.642 8.582 9.101 10.222 10.329 9.289 8.185 10.815 10.862
Merian European Equity Fund 2009 2010 2011 2012 2013 2014 2015 2016 2017 2018
High A (USD) 14.972 16.237 17.730 16.389 20.614 21.671 21.186 18.034 20.642 17.770 A (EUR) 0.538 0.631 0.659 0.667 0.809 0.879 1.035 0.898 0.958 0.968 I (EUR) - - - - - - - - - -
Low A (USD) 8.365 11.657 12.016 12.843 16.211 17.747 17.917 14.963 16.828 13.776 A (EUR) 0.352 0.507 0.476 0.555 0.668 0.754 0.837 0.737 0.869 0.752 I (EUR) - - - - - - - - - -
Merian North American Equity Fund 2009 2010 2011 2012 2013 2014 2015 2016 2017 2018
High A (USD) 11.574 13.618 14.775 15.379 18.471 21.359 22.173 24.401 29.398 31.828
Low A (USD) 7.371 10.458 11.309 12.856 14.422 17.415 19.574 18.508 24.049 25.444
Merian Total Return USD Bond Fund 2009 2010 2011 2012 2013 2014 2015 2016 2017 2018
High A (USD) 15.319 17.023 17.120 18.436 18.640 18.928 19.350 20.193 20.538 20.284 A (USD) Income 10.860 11.727 11.459 11.786 11.805 11.445 11.584 11.348 10.800 10.459 A (EUR) 11.482 12.300 - - - - - 10.722 10.782 11.562 A (EUR) Hedged - 10.185 10.263 11.012 11.110 11.214 11.453 11.804 11.737 14.127 A (AUD) Hedged - - - 10.087 10.223 10.548 10.852 11.482 11.669 9.217 A (AUD) Hedged Income - - - - - - - - - - I (USD) - 10.914 - - - - - 10.036 10.260 10.149
Low A (USD) 12.694 15.243 16.415 16.822 17.543 18.038 18.694 18.902 19.525 19.029 A (USD) Income 9.328 10.741 10.893 11.047 10.990 11.197 10.870 10.558 10.468 9.441 A (EUR) 10.149 11.341 - - - - - 9.801 9.652 10.846 A (EUR) Hedged - 9.755 9.840 10.087 10.437 10.716 11.018 11.124 11.290 11.951
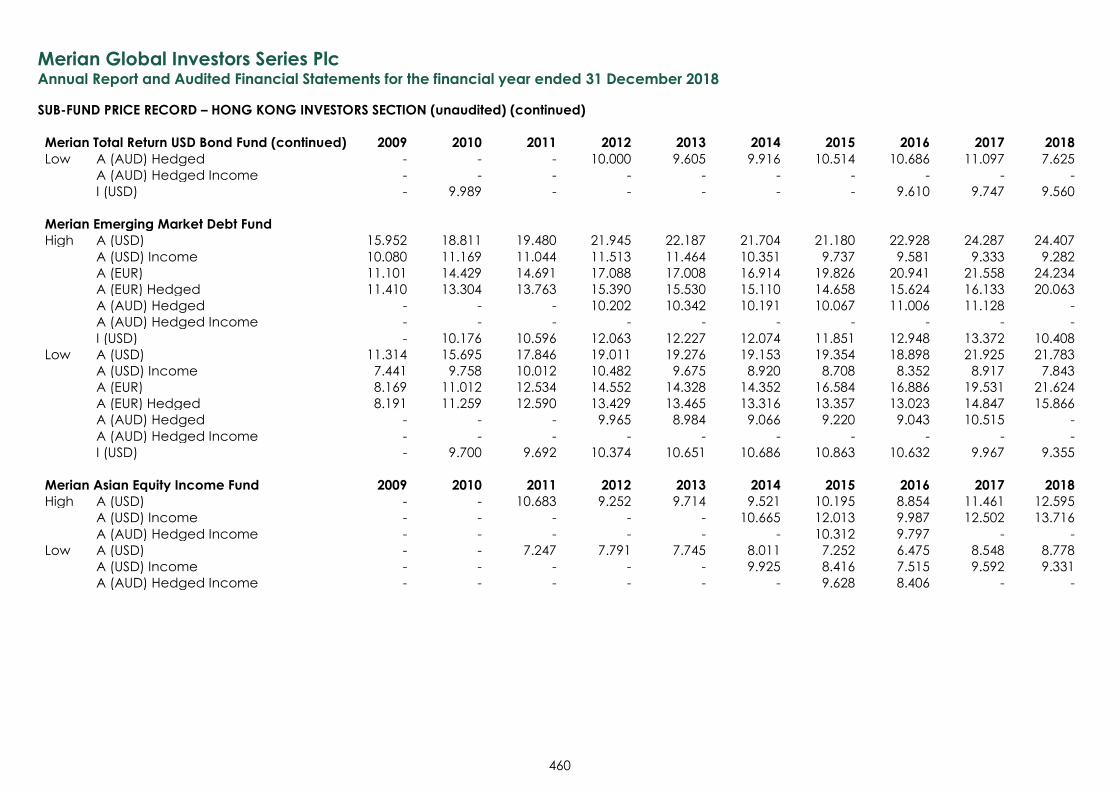
Merian Global Investors Series Plc Annual Report and Audited Financial Statements for the financial year ended 31 December 2018
460
SUB-FUND PRICE RECORD – HONG KONG INVESTORS SECTION (unaudited) (continued)
Merian Total Return USD Bond Fund (continued) 2009 2010 2011 2012 2013 2014 2015 2016 2017 2018
Low A (AUD) Hedged - - - 10.000 9.605 9.916 10.514 10.686 11.097 7.625
A (AUD) Hedged Income - - - - - - - - - -
I (USD) - 9.989 - - - - - 9.610 9.747 9.560
Merian Emerging Market Debt Fund
High A (USD) 15.952 18.811 19.480 21.945 22.187 21.704 21.180 22.928 24.287 24.407 A (USD) Income 10.080 11.169 11.044 11.513 11.464 10.351 9.737 9.581 9.333 9.282 A (EUR) 11.101 14.429 14.691 17.088 17.008 16.914 19.826 20.941 21.558 24.234 A (EUR) Hedged 11.410 13.304 13.763 15.390 15.530 15.110 14.658 15.624 16.133 20.063 A (AUD) Hedged - - - 10.202 10.342 10.191 10.067 11.006 11.128 - A (AUD) Hedged Income - - - - - - - - - - I (USD) - 10.176 10.596 12.063 12.227 12.074 11.851 12.948 13.372 10.408
Low A (USD) 11.314 15.695 17.846 19.011 19.276 19.153 19.354 18.898 21.925 21.783 A (USD) Income 7.441 9.758 10.012 10.482 9.675 8.920 8.708 8.352 8.917 7.843 A (EUR) 8.169 11.012 12.534 14.552 14.328 14.352 16.584 16.886 19.531 21.624 A (EUR) Hedged 8.191 11.259 12.590 13.429 13.465 13.316 13.357 13.023 14.847 15.866 A (AUD) Hedged - - - 9.965 8.984 9.066 9.220 9.043 10.515 - A (AUD) Hedged Income - - - - - - - - - - I (USD) - 9.700 9.692 10.374 10.651 10.686 10.863 10.632 9.967 9.355
Merian Asian Equity Income Fund 2009 2010 2011 2012 2013 2014 2015 2016 2017 2018
High A (USD) - - 10.683 9.252 9.714 9.521 10.195 8.854 11.461 12.595 A (USD) Income - - - - - 10.665 12.013 9.987 12.502 13.716 A (AUD) Hedged Income - - - - - - 10.312 9.797 - -
Low A (USD) - - 7.247 7.791 7.745 8.011 7.252 6.475 8.548 8.778 A (USD) Income - - - - - 9.925 8.416 7.515 9.592 9.331 A (AUD) Hedged Income - - - - - - 9.628 8.406 - -
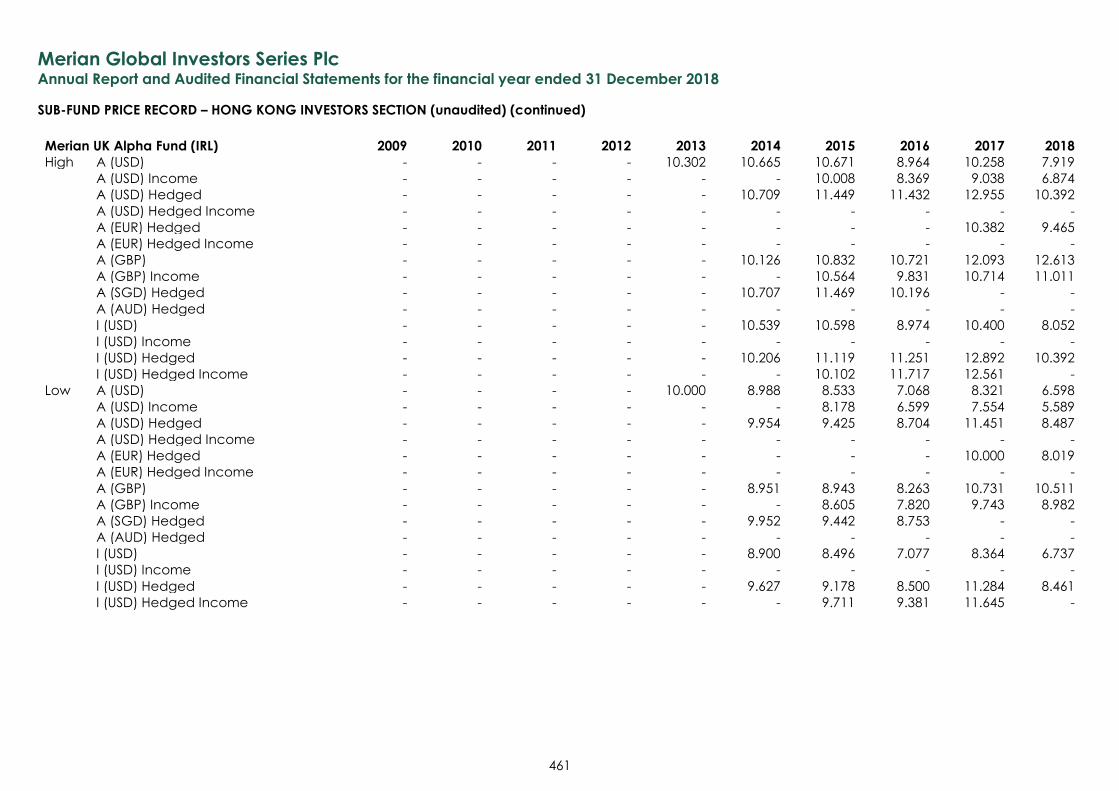
Merian Global Investors Series Plc Annual Report and Audited Financial Statements for the financial year ended 31 December 2018
461
SUB-FUND PRICE RECORD – HONG KONG INVESTORS SECTION (unaudited) (continued)
Merian UK Alpha Fund (IRL) 2009 2010 2011 2012 2013 2014 2015 2016 2017 2018
High A (USD) - - - - 10.302 10.665 10.671 8.964 10.258 7.919 A (USD) Income - - - - - - 10.008 8.369 9.038 6.874 A (USD) Hedged - - - - - 10.709 11.449 11.432 12.955 10.392 A (USD) Hedged Income - - - - - - - - - - A (EUR) Hedged - - - - - - - - 10.382 9.465 A (EUR) Hedged Income - - - - - - - - - - A (GBP) - - - - - 10.126 10.832 10.721 12.093 12.613 A (GBP) Income - - - - - - 10.564 9.831 10.714 11.011 A (SGD) Hedged - - - - - 10.707 11.469 10.196 - - A (AUD) Hedged - - - - - - - - - - I (USD) - - - - - 10.539 10.598 8.974 10.400 8.052 I (USD) Income - - - - - - - - - - I (USD) Hedged - - - - - 10.206 11.119 11.251 12.892 10.392 I (USD) Hedged Income - - - - - - 10.102 11.717 12.561 -
Low A (USD) - - - - 10.000 8.988 8.533 7.068 8.321 6.598 A (USD) Income - - - - - - 8.178 6.599 7.554 5.589 A (USD) Hedged - - - - - 9.954 9.425 8.704 11.451 8.487 A (USD) Hedged Income - - - - - - - - - - A (EUR) Hedged - - - - - - - - 10.000 8.019 A (EUR) Hedged Income - - - - - - - - - - A (GBP) - - - - - 8.951 8.943 8.263 10.731 10.511 A (GBP) Income - - - - - - 8.605 7.820 9.743 8.982 A (SGD) Hedged - - - - - 9.952 9.442 8.753 - - A (AUD) Hedged - - - - - - - - - - I (USD) - - - - - 8.900 8.496 7.077 8.364 6.737 I (USD) Income - - - - - - - - - - I (USD) Hedged - - - - - 9.627 9.178 8.500 11.284 8.461 I (USD) Hedged Income - - - - - - 9.711 9.381 11.645 -
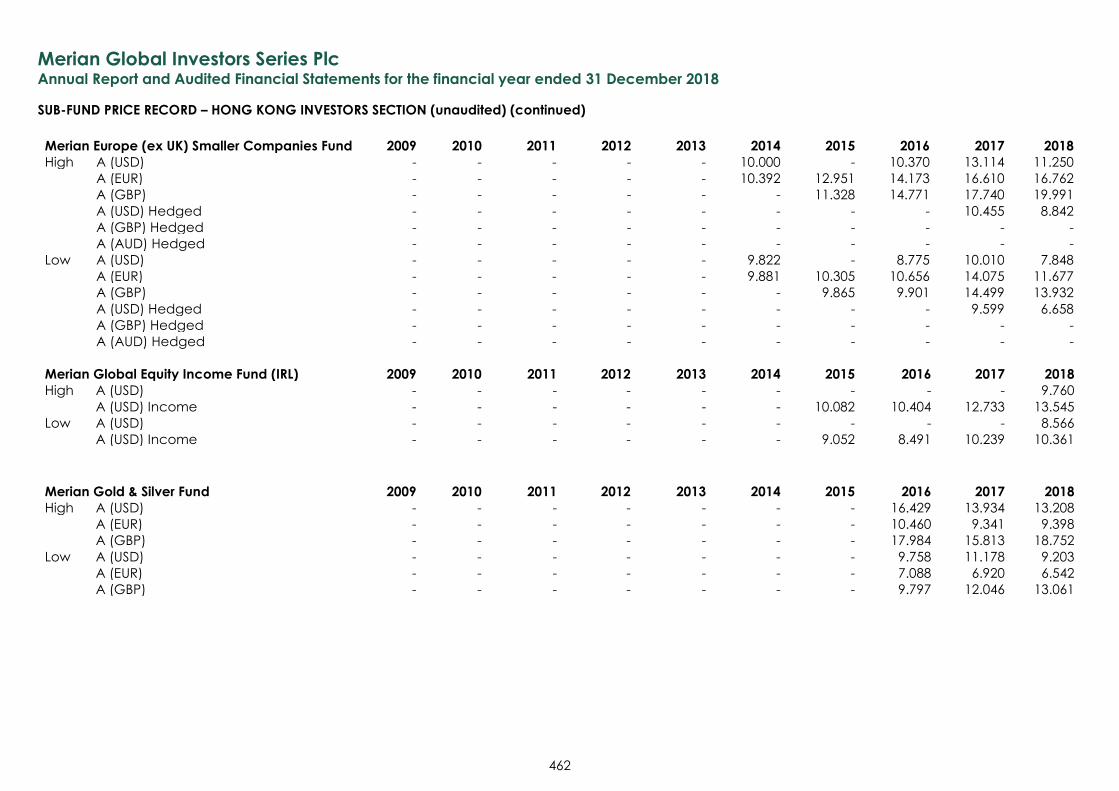
Merian Global Investors Series Plc Annual Report and Audited Financial Statements for the financial year ended 31 December 2018
462
SUB-FUND PRICE RECORD – HONG KONG INVESTORS SECTION (unaudited) (continued)
Merian Europe (ex UK) Smaller Companies Fund 2009 2010 2011 2012 2013 2014 2015 2016 2017 2018
High A (USD) - - - - - 10.000 - 10.370 13.114 11.250 A (EUR) - - - - - 10.392 12.951 14.173 16.610 16.762 A (GBP) - - - - - - 11.328 14.771 17.740 19.991 A (USD) Hedged - - - - - - - - 10.455 8.842 A (GBP) Hedged - - - - - - - - - - A (AUD) Hedged - - - - - - - - - -
Low A (USD) - - - - - 9.822 - 8.775 10.010 7.848 A (EUR) - - - - - 9.881 10.305 10.656 14.075 11.677 A (GBP) - - - - - - 9.865 9.901 14.499 13.932 A (USD) Hedged - - - - - - - - 9.599 6.658 A (GBP) Hedged - - - - - - - - - - A (AUD) Hedged - - - - - - - - - -
Merian Global Equity Income Fund (IRL) 2009 2010 2011 2012 2013 2014 2015 2016 2017 2018
High A (USD) - - - - - - - - - 9.760 A (USD) Income - - - - - - 10.082 10.404 12.733 13.545
Low A (USD) - - - - - - - - - 8.566 A (USD) Income - - - - - - 9.052 8.491 10.239 10.361
Merian Gold & Silver Fund 2009 2010 2011 2012 2013 2014 2015 2016 2017 2018
High A (USD) - - - - - - - 16.429 13.934 13.208 A (EUR) - - - - - - - 10.460 9.341 9.398 A (GBP) - - - - - - - 17.984 15.813 18.752
Low A (USD) - - - - - - - 9.758 11.178 9.203 A (EUR) - - - - - - - 7.088 6.920 6.542 A (GBP) - - - - - - - 9.797 12.046 13.061
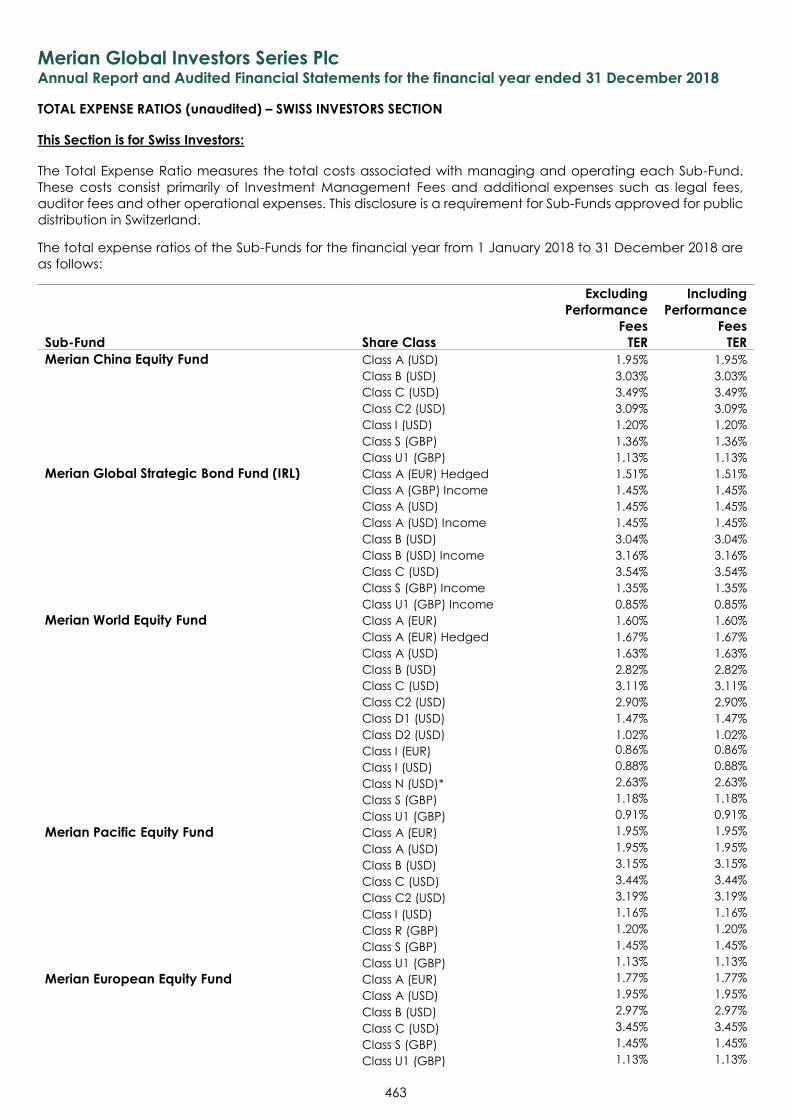
Merian Global Investors Series Plc Annual Report and Audited Financial Statements for the financial year ended 31 December 2018
463
TOTAL EXPENSE RATIOS (unaudited) – SWISS INVESTORS SECTION
This Section is for Swiss Investors:
The Total Expense Ratio measures the total costs associated with managing and operating each Sub-Fund.
These costs consist primarily of Investment Management Fees and additional expenses such as legal fees,
auditor fees and other operational expenses. This disclosure is a requirement for Sub-Funds approved for public
distribution in Switzerland.
The total expense ratios of the Sub-Funds for the financial year from 1 January 2018 to 31 December 2018 are
as follows:
Excluding
Performance
Fees
Including
Performance
Fees
Sub-Fund Share Class TER TER
Merian China Equity Fund Class A (USD) 1.95% 1.95%
Class B (USD) 3.03% 3.03%
Class C (USD) 3.49% 3.49%
Class C2 (USD) 3.09% 3.09%
Class I (USD) 1.20% 1.20%
Class S (GBP) 1.36% 1.36%
Class U1 (GBP) 1.13% 1.13%
Merian Global Strategic Bond Fund (IRL) Class A (EUR) Hedged 1.51% 1.51%
Class A (GBP) Income 1.45% 1.45%
Class A (USD) 1.45% 1.45%
Class A (USD) Income 1.45% 1.45%
Class B (USD) 3.04% 3.04%
Class B (USD) Income 3.16% 3.16%
Class C (USD) 3.54% 3.54%
Class S (GBP) Income 1.35% 1.35%
Class U1 (GBP) Income 0.85% 0.85%
Merian World Equity Fund Class A (EUR) 1.60% 1.60%
Class A (EUR) Hedged 1.67% 1.67%
Class A (USD) 1.63% 1.63%
Class B (USD) 2.82% 2.82%
Class C (USD) 3.11% 3.11%
Class C2 (USD) 2.90% 2.90%
Class D1 (USD) 1.47% 1.47%
Class D2 (USD) 1.02% 1.02%
Class I (EUR) 0.86% 0.86%
Class I (USD) 0.88% 0.88%
Class N (USD)* 2.63% 2.63%
Class S (GBP) 1.18% 1.18%
Class U1 (GBP) 0.91% 0.91%
Merian Pacific Equity Fund Class A (EUR) 1.95% 1.95%
Class A (USD) 1.95% 1.95%
Class B (USD) 3.15% 3.15%
Class C (USD) 3.44% 3.44%
Class C2 (USD) 3.19% 3.19%
Class I (USD) 1.16% 1.16%
Class R (GBP) 1.20% 1.20%
Class S (GBP) 1.45% 1.45%
Class U1 (GBP) 1.13% 1.13%
Merian European Equity Fund Class A (EUR) 1.77% 1.77%
Class A (USD) 1.95% 1.95%
Class B (USD) 2.97% 2.97%
Class C (USD) 3.45% 3.45%
Class S (GBP) 1.45% 1.45%
Class U1 (GBP) 1.13% 1.13%
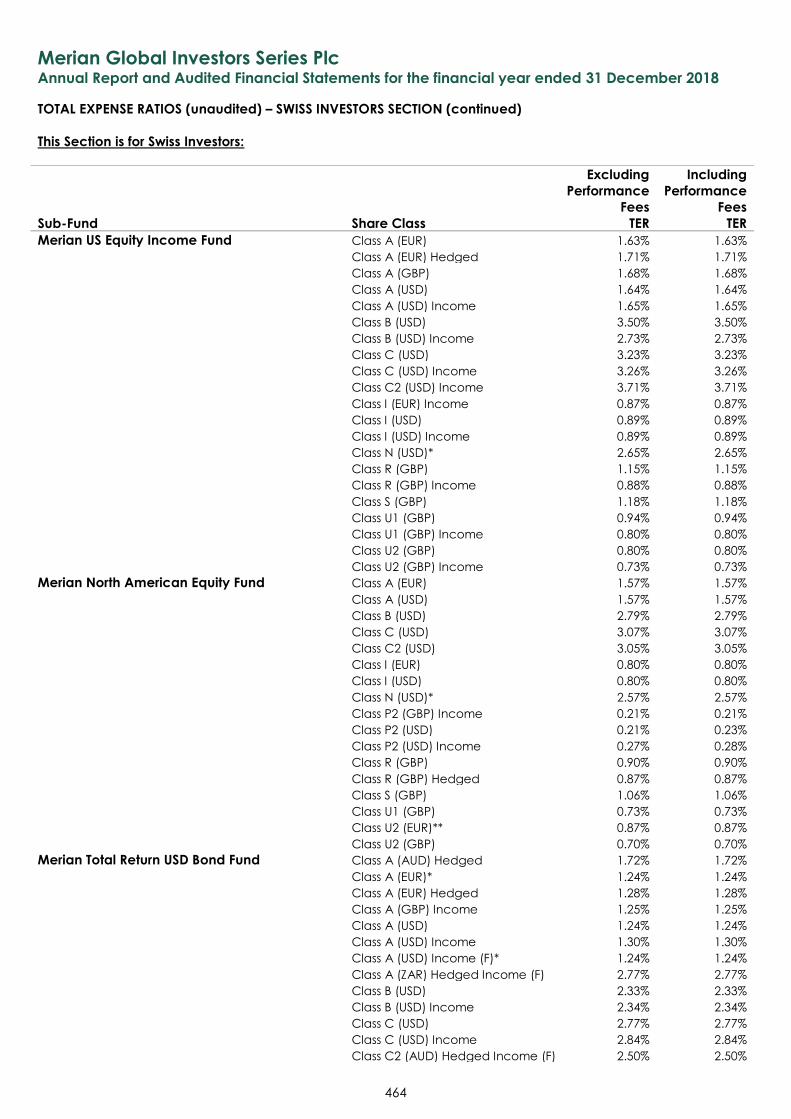
Merian Global Investors Series Plc Annual Report and Audited Financial Statements for the financial year ended 31 December 2018
464
TOTAL EXPENSE RATIOS (unaudited) – SWISS INVESTORS SECTION (continued)
This Section is for Swiss Investors:
Excluding
Performance
Fees
Including
Performance
Fees
Sub-Fund Share Class TER TER
Merian US Equity Income Fund Class A (EUR) 1.63% 1.63%
Class A (EUR) Hedged 1.71% 1.71%
Class A (GBP) 1.68% 1.68%
Class A (USD) 1.64% 1.64%
Class A (USD) Income 1.65% 1.65%
Class B (USD) 3.50% 3.50%
Class B (USD) Income 2.73% 2.73%
Class C (USD) 3.23% 3.23%
Class C (USD) Income 3.26% 3.26%
Class C2 (USD) Income 3.71% 3.71%
Class I (EUR) Income 0.87% 0.87%
Class I (USD) 0.89% 0.89%
Class I (USD) Income 0.89% 0.89%
Class N (USD)* 2.65% 2.65%
Class R (GBP) 1.15% 1.15%
Class R (GBP) Income 0.88% 0.88%
Class S (GBP) 1.18% 1.18%
Class U1 (GBP) 0.94% 0.94%
Class U1 (GBP) Income 0.80% 0.80%
Class U2 (GBP) 0.80% 0.80%
Class U2 (GBP) Income 0.73% 0.73%
Merian North American Equity Fund Class A (EUR) 1.57% 1.57%
Class A (USD) 1.57% 1.57%
Class B (USD) 2.79% 2.79%
Class C (USD) 3.07% 3.07%
Class C2 (USD) 3.05% 3.05%
Class I (EUR) 0.80% 0.80%
Class I (USD) 0.80% 0.80%
Class N (USD)* 2.57% 2.57%
Class P2 (GBP) Income 0.21% 0.21%
Class P2 (USD) 0.21% 0.23%
Class P2 (USD) Income 0.27% 0.28%
Class R (GBP) 0.90% 0.90%
Class R (GBP) Hedged 0.87% 0.87%
Class S (GBP) 1.06% 1.06%
Class U1 (GBP) 0.73% 0.73%
Class U2 (EUR)** 0.87% 0.87%
Class U2 (GBP) 0.70% 0.70%
Merian Total Return USD Bond Fund Class A (AUD) Hedged 1.72% 1.72%
Class A (EUR)* 1.24% 1.24%
Class A (EUR) Hedged 1.28% 1.28%
Class A (GBP) Income 1.25% 1.25%
Class A (USD) 1.24% 1.24%
Class A (USD) Income 1.30% 1.30%
Class A (USD) Income (F)* 1.24% 1.24%
Class A (ZAR) Hedged Income (F) 2.77% 2.77%
Class B (USD) 2.33% 2.33%
Class B (USD) Income 2.34% 2.34%
Class C (USD) 2.77% 2.77%
Class C (USD) Income 2.84% 2.84%
Class C2 (AUD) Hedged Income (F) 2.50% 2.50%
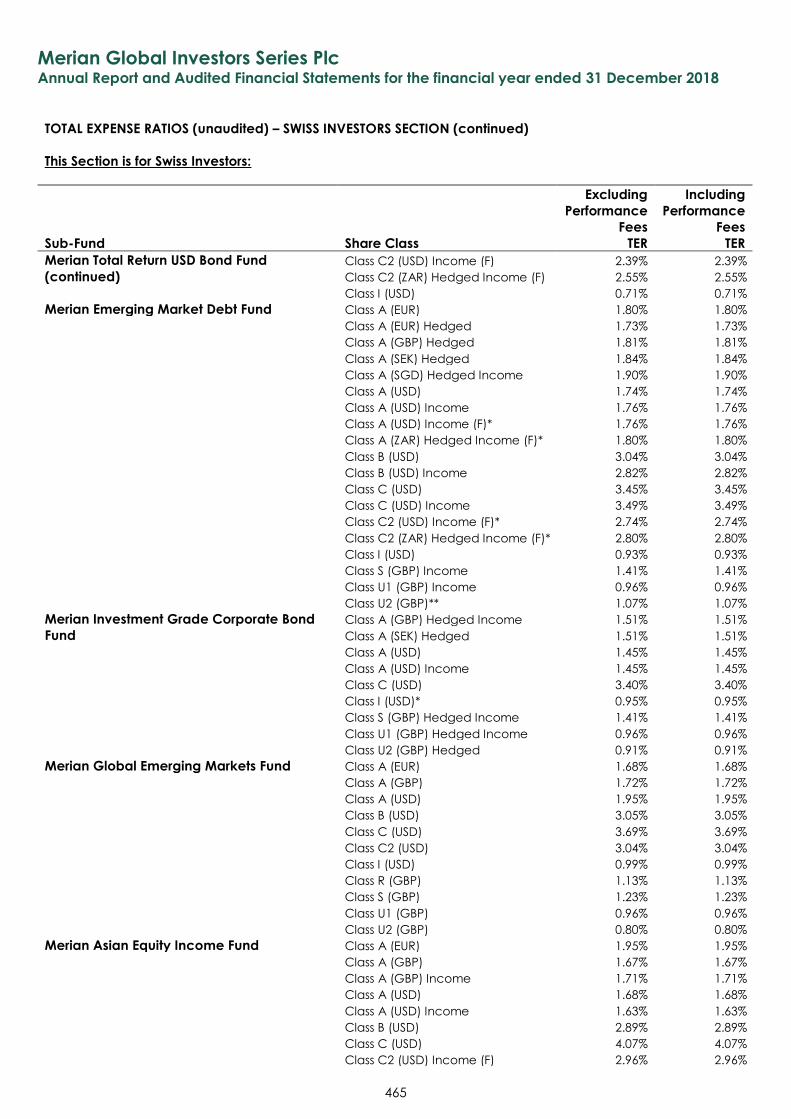
Merian Global Investors Series Plc Annual Report and Audited Financial Statements for the financial year ended 31 December 2018
465
TOTAL EXPENSE RATIOS (unaudited) – SWISS INVESTORS SECTION (continued)
This Section is for Swiss Investors:
Excluding
Performance
Fees
Including
Performance
Fees
Sub-Fund Share Class TER TER
Merian Total Return USD Bond Fund Class C2 (USD) Income (F) 2.39% 2.39%
(continued) Class C2 (ZAR) Hedged Income (F) 2.55% 2.55%
Class I (USD) 0.71% 0.71%
Merian Emerging Market Debt Fund Class A (EUR) 1.80% 1.80%
Class A (EUR) Hedged 1.73% 1.73%
Class A (GBP) Hedged 1.81% 1.81%
Class A (SEK) Hedged 1.84% 1.84%
Class A (SGD) Hedged Income 1.90% 1.90%
Class A (USD) 1.74% 1.74%
Class A (USD) Income 1.76% 1.76%
Class A (USD) Income (F)* 1.76% 1.76%
Class A (ZAR) Hedged Income (F)* 1.80% 1.80%
Class B (USD) 3.04% 3.04%
Class B (USD) Income 2.82% 2.82%
Class C (USD) 3.45% 3.45%
Class C (USD) Income 3.49% 3.49%
Class C2 (USD) Income (F)* 2.74% 2.74%
Class C2 (ZAR) Hedged Income (F)* 2.80% 2.80%
Class I (USD) 0.93% 0.93%
Class S (GBP) Income 1.41% 1.41%
Class U1 (GBP) Income 0.96% 0.96%
Class U2 (GBP)** 1.07% 1.07%
Merian Investment Grade Corporate Bond Class A (GBP) Hedged Income 1.51% 1.51%
Fund Class A (SEK) Hedged 1.51% 1.51%
Class A (USD) 1.45% 1.45%
Class A (USD) Income 1.45% 1.45%
Class C (USD) 3.40% 3.40%
Class I (USD)* 0.95% 0.95%
Class S (GBP) Hedged Income 1.41% 1.41%
Class U1 (GBP) Hedged Income 0.96% 0.96%
Class U2 (GBP) Hedged 0.91% 0.91%
Merian Global Emerging Markets Fund Class A (EUR) 1.68% 1.68%
Class A (GBP) 1.72% 1.72%
Class A (USD) 1.95% 1.95%
Class B (USD) 3.05% 3.05%
Class C (USD) 3.69% 3.69%
Class C2 (USD) 3.04% 3.04%
Class I (USD) 0.99% 0.99%
Class R (GBP) 1.13% 1.13%
Class S (GBP) 1.23% 1.23%
Class U1 (GBP) 0.96% 0.96%
Class U2 (GBP) 0.80% 0.80%
Merian Asian Equity Income Fund Class A (EUR) 1.95% 1.95%
Class A (GBP) 1.67% 1.67%
Class A (GBP) Income 1.71% 1.71%
Class A (USD) 1.68% 1.68%
Class A (USD) Income 1.63% 1.63%
Class B (USD) 2.89% 2.89%
Class C (USD) 4.07% 4.07%
Class C2 (USD) Income (F) 2.96% 2.96%
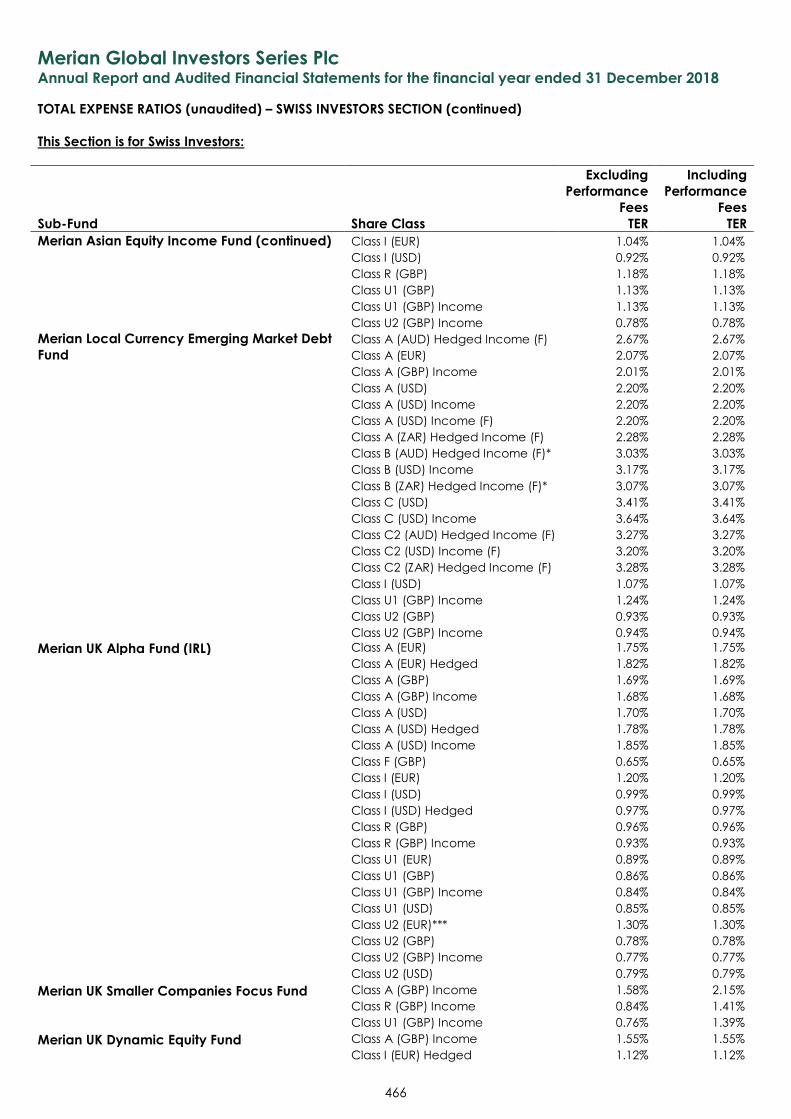
Merian Global Investors Series Plc Annual Report and Audited Financial Statements for the financial year ended 31 December 2018
466
TOTAL EXPENSE RATIOS (unaudited) – SWISS INVESTORS SECTION (continued)
This Section is for Swiss Investors:
Excluding
Performance
Fees
Including
Performance
Fees
Sub-Fund Share Class TER TER
Merian Asian Equity Income Fund (continued) Class I (EUR) 1.04% 1.04%
Class I (USD) 0.92% 0.92%
Class R (GBP) 1.18% 1.18%
Class U1 (GBP) 1.13% 1.13%
Class U1 (GBP) Income 1.13% 1.13%
Class U2 (GBP) Income 0.78% 0.78%
Merian Local Currency Emerging Market Debt Class A (AUD) Hedged Income (F) 2.67% 2.67%
Fund Class A (EUR) 2.07% 2.07%
Class A (GBP) Income 2.01% 2.01%
Class A (USD) 2.20% 2.20%
Class A (USD) Income 2.20% 2.20%
Class A (USD) Income (F) 2.20% 2.20%
Class A (ZAR) Hedged Income (F) 2.28% 2.28%
Class B (AUD) Hedged Income (F)* 3.03% 3.03%
Class B (USD) Income 3.17% 3.17%
Class B (ZAR) Hedged Income (F)* 3.07% 3.07%
Class C (USD) 3.41% 3.41%
Class C (USD) Income 3.64% 3.64%
Class C2 (AUD) Hedged Income (F) 3.27% 3.27%
Class C2 (USD) Income (F) 3.20% 3.20%
Class C2 (ZAR) Hedged Income (F) 3.28% 3.28%
Class I (USD) 1.07% 1.07%
Class U1 (GBP) Income 1.24% 1.24%
Class U2 (GBP) 0.93% 0.93%
Class U2 (GBP) Income 0.94% 0.94%
Merian UK Alpha Fund (IRL) Class A (EUR) 1.75% 1.75%
Class A (EUR) Hedged 1.82% 1.82%
Class A (GBP) 1.69% 1.69%
Class A (GBP) Income 1.68% 1.68%
Class A (USD) 1.70% 1.70%
Class A (USD) Hedged 1.78% 1.78%
Class A (USD) Income 1.85% 1.85%
Class F (GBP) 0.65% 0.65%
Class I (EUR) 1.20% 1.20%
Class I (USD) 0.99% 0.99%
Class I (USD) Hedged 0.97% 0.97%
Class R (GBP) 0.96% 0.96%
Class R (GBP) Income 0.93% 0.93%
Class U1 (EUR) 0.89% 0.89%
Class U1 (GBP) 0.86% 0.86%
Class U1 (GBP) Income 0.84% 0.84%
Class U1 (USD) 0.85% 0.85%
Class U2 (EUR)*** 1.30% 1.30%
Class U2 (GBP) 0.78% 0.78%
Class U2 (GBP) Income 0.77% 0.77%
Class U2 (USD) 0.79% 0.79%
Merian UK Smaller Companies Focus Fund Class A (GBP) Income 1.58% 2.15%
Class R (GBP) Income 0.84% 1.41%
Class U1 (GBP) Income 0.76% 1.39%
Merian UK Dynamic Equity Fund Class A (GBP) Income 1.55% 1.55%
Class I (EUR) Hedged 1.12% 1.12%
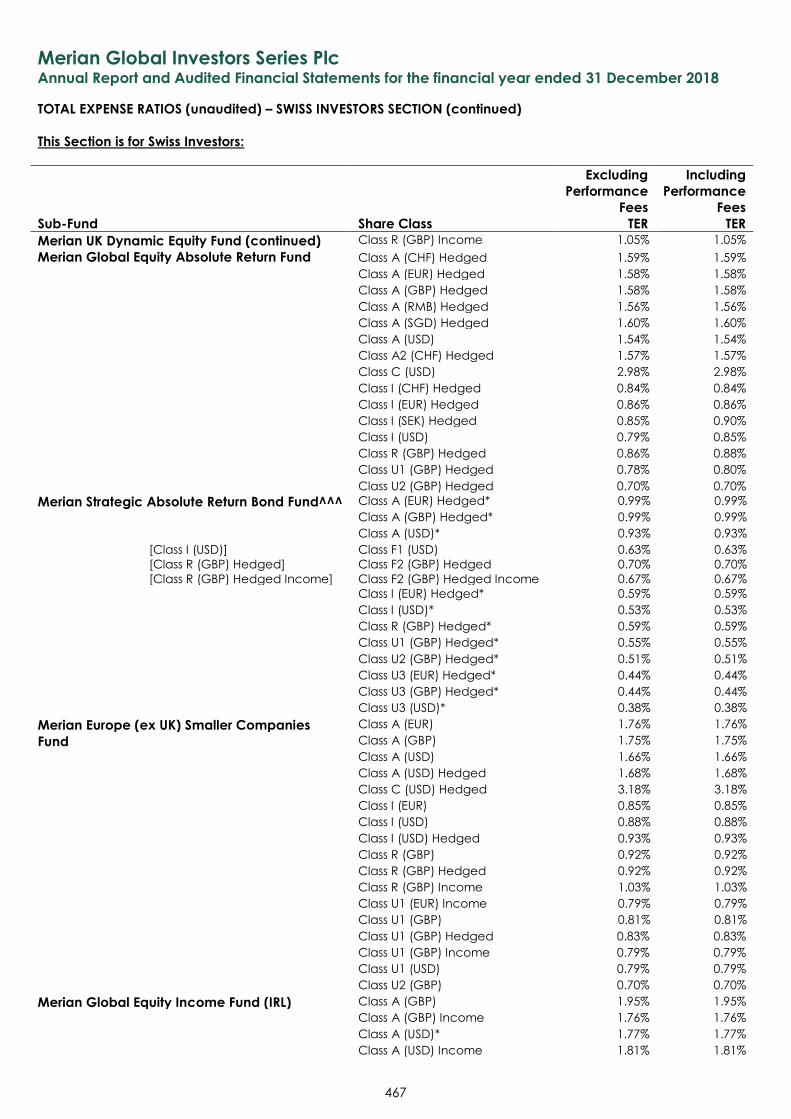
Merian Global Investors Series Plc Annual Report and Audited Financial Statements for the financial year ended 31 December 2018
467
TOTAL EXPENSE RATIOS (unaudited) – SWISS INVESTORS SECTION (continued)
This Section is for Swiss Investors:
Excluding
Performance
Fees
Including
Performance
Fees
Sub-Fund Share Class TER TER
Merian UK Dynamic Equity Fund (continued) Class R (GBP) Income 1.05% 1.05%
Merian Global Equity Absolute Return Fund Class A (CHF) Hedged 1.59% 1.59%
Class A (EUR) Hedged 1.58% 1.58%
Class A (GBP) Hedged 1.58% 1.58%
Class A (RMB) Hedged 1.56% 1.56%
Class A (SGD) Hedged 1.60% 1.60%
Class A (USD) 1.54% 1.54%
Class A2 (CHF) Hedged 1.57% 1.57%
Class C (USD) 2.98% 2.98%
Class I (CHF) Hedged 0.84% 0.84%
Class I (EUR) Hedged 0.86% 0.86%
Class I (SEK) Hedged 0.85% 0.90%
Class I (USD) 0.79% 0.85%
Class R (GBP) Hedged 0.86% 0.88%
Class U1 (GBP) Hedged 0.78% 0.80%
Class U2 (GBP) Hedged 0.70% 0.70%
Merian Strategic Absolute Return Bond Fund^^^ Class A (EUR) Hedged* 0.99% 0.99%
Class A (GBP) Hedged* 0.99% 0.99%
Class A (USD)* 0.93% 0.93%
[Class I (USD)] Class F1 (USD) 0.63% 0.63%
[Class R (GBP) Hedged] Class F2 (GBP) Hedged 0.70% 0.70%
[Class R (GBP) Hedged Income] Class F2 (GBP) Hedged Income 0.67% 0.67%
Class I (EUR) Hedged* 0.59% 0.59%
Class I (USD)* 0.53% 0.53%
Class R (GBP) Hedged* 0.59% 0.59%
Class U1 (GBP) Hedged* 0.55% 0.55%
Class U2 (GBP) Hedged* 0.51% 0.51%
Class U3 (EUR) Hedged* 0.44% 0.44%
Class U3 (GBP) Hedged* 0.44% 0.44%
Class U3 (USD)* 0.38% 0.38%
Merian Europe (ex UK) Smaller Companies Class A (EUR) 1.76% 1.76%
Fund Class A (GBP) 1.75% 1.75%
Class A (USD) 1.66% 1.66%
Class A (USD) Hedged 1.68% 1.68%
Class C (USD) Hedged 3.18% 3.18%
Class I (EUR) 0.85% 0.85%
Class I (USD) 0.88% 0.88%
Class I (USD) Hedged 0.93% 0.93%
Class R (GBP) 0.92% 0.92%
Class R (GBP) Hedged 0.92% 0.92%
Class R (GBP) Income 1.03% 1.03%
Class U1 (EUR) Income 0.79% 0.79%
Class U1 (GBP) 0.81% 0.81%
Class U1 (GBP) Hedged 0.83% 0.83%
Class U1 (GBP) Income 0.79% 0.79%
Class U1 (USD) 0.79% 0.79%
Class U2 (GBP) 0.70% 0.70%
Merian Global Equity Income Fund (IRL) Class A (GBP) 1.95% 1.95%
Class A (GBP) Income 1.76% 1.76%
Class A (USD)* 1.77% 1.77%
Class A (USD) Income 1.81% 1.81%
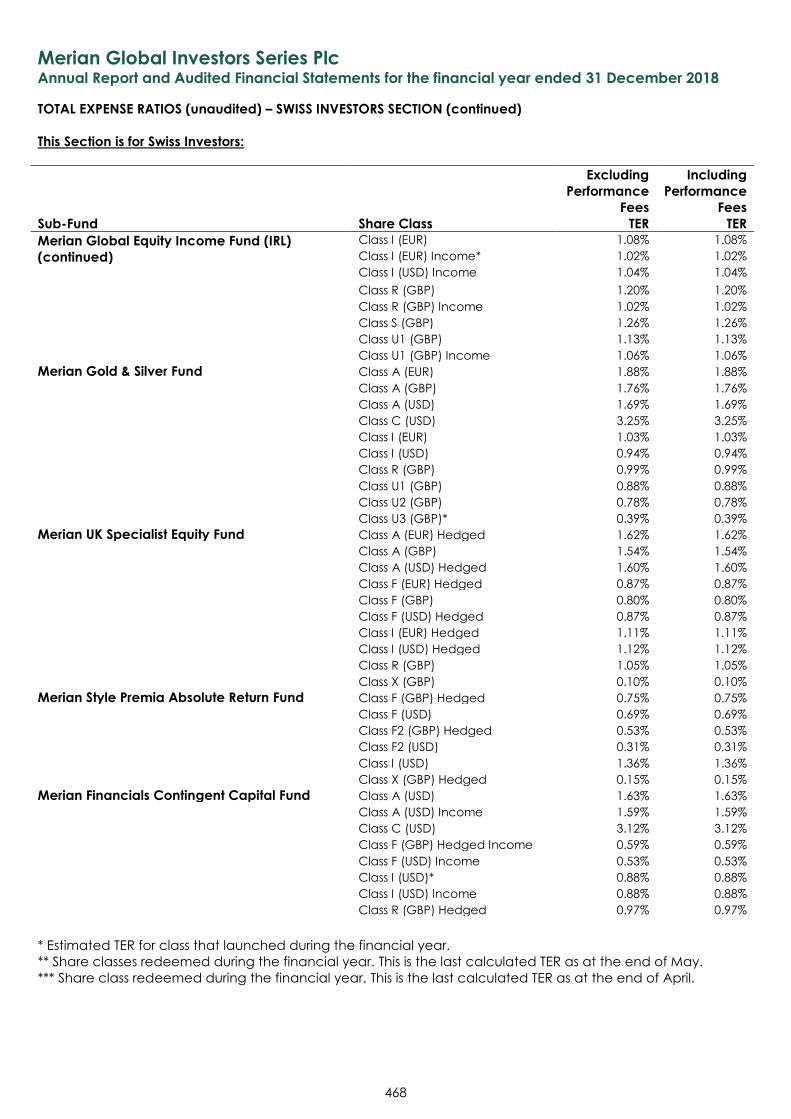
Merian Global Investors Series Plc Annual Report and Audited Financial Statements for the financial year ended 31 December 2018
468
TOTAL EXPENSE RATIOS (unaudited) – SWISS INVESTORS SECTION (continued)
This Section is for Swiss Investors:
Excluding
Performance
Fees
Including
Performance
Fees
Sub-Fund Share Class TER TER
Merian Global Equity Income Fund (IRL) Class I (EUR) 1.08% 1.08%
(continued) Class I (EUR) Income* 1.02% 1.02%
Class I (USD) Income 1.04% 1.04%
Class R (GBP) 1.20% 1.20%
Class R (GBP) Income 1.02% 1.02%
Class S (GBP) 1.26% 1.26%
Class U1 (GBP) 1.13% 1.13%
Class U1 (GBP) Income 1.06% 1.06%
Merian Gold & Silver Fund Class A (EUR) 1.88% 1.88%
Class A (GBP) 1.76% 1.76%
Class A (USD) 1.69% 1.69%
Class C (USD) 3.25% 3.25%
Class I (EUR) 1.03% 1.03%
Class I (USD) 0.94% 0.94%
Class R (GBP) 0.99% 0.99%
Class U1 (GBP) 0.88% 0.88%
Class U2 (GBP) 0.78% 0.78%
Class U3 (GBP)* 0.39% 0.39%
Merian UK Specialist Equity Fund Class A (EUR) Hedged 1.62% 1.62%
Class A (GBP) 1.54% 1.54%
Class A (USD) Hedged 1.60% 1.60%
Class F (EUR) Hedged 0.87% 0.87%
Class F (GBP) 0.80% 0.80%
Class F (USD) Hedged 0.87% 0.87%
Class I (EUR) Hedged 1.11% 1.11%
Class I (USD) Hedged 1.12% 1.12%
Class R (GBP) 1.05% 1.05%
Class X (GBP) 0.10% 0.10%
Merian Style Premia Absolute Return Fund Class F (GBP) Hedged 0.75% 0.75%
Class F (USD) 0.69% 0.69%
Class F2 (GBP) Hedged 0.53% 0.53%
Class F2 (USD) 0.31% 0.31%
Class I (USD) 1.36% 1.36%
Class X (GBP) Hedged 0.15% 0.15%
Merian Financials Contingent Capital Fund Class A (USD) 1.63% 1.63%
Class A (USD) Income 1.59% 1.59%
Class C (USD) 3.12% 3.12%
Class F (GBP) Hedged Income 0.59% 0.59%
Class F (USD) Income 0.53% 0.53%
Class I (USD)* 0.88% 0.88%
Class I (USD) Income 0.88% 0.88%
Class R (GBP) Hedged 0.97% 0.97%
* Estimated TER for class that launched during the financial year.
** Share classes redeemed during the financial year. This is the last calculated TER as at the end of May.
*** Share class redeemed during the financial year. This is the last calculated TER as at the end of April.
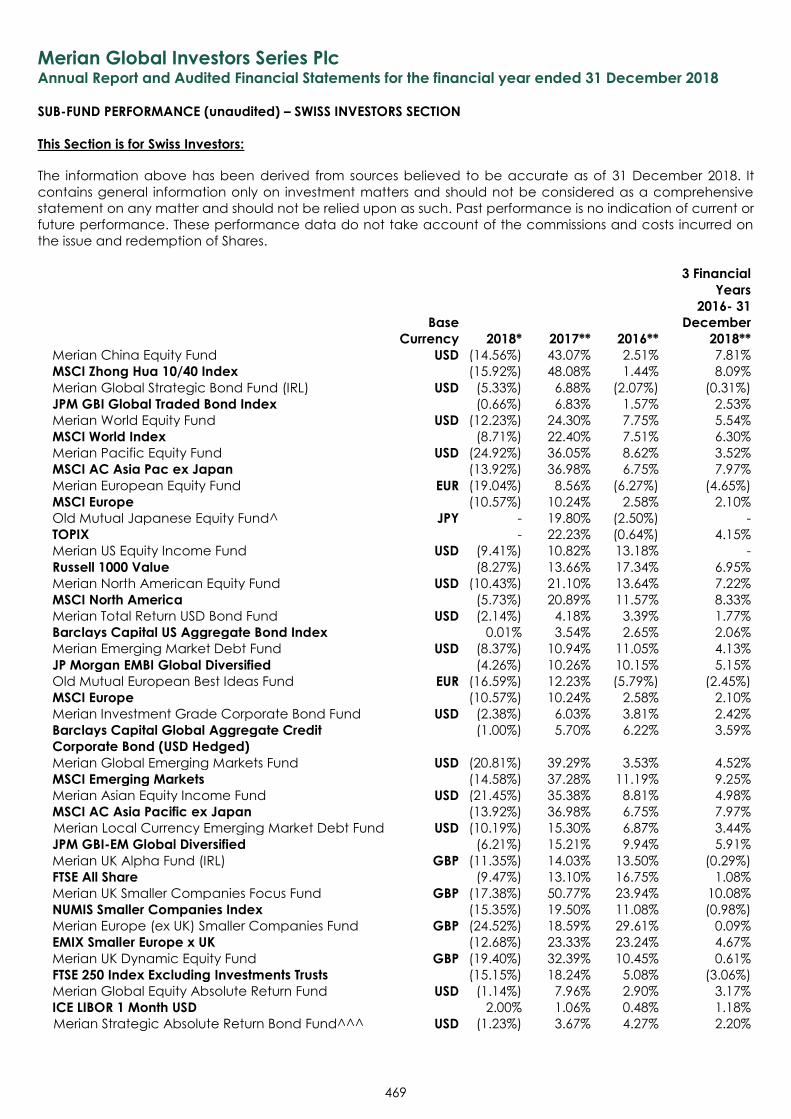
Merian Global Investors Series Plc Annual Report and Audited Financial Statements for the financial year ended 31 December 2018
SUB-FUND PERFORMANCE (unaudited) – SWISS INVESTORS SECTION
This Section is for Swiss Investors:
469
The information above has been derived from sources believed to be accurate as of 31 December 2018. It
contains general information only on investment matters and should not be considered as a comprehensive
statement on any matter and should not be relied upon as such. Past performance is no indication of current or
future performance. These performance data do not take account of the commissions and costs incurred on
the issue and redemption of Shares.
Base
Currency 2018* 2017** 2016**
3 Financial
Years
2016- 31
December
2018**
Merian China Equity Fund USD (14.56%) 43.07% 2.51% 7.81%
MSCI Zhong Hua 10/40 Index (15.92%) 48.08% 1.44% 8.09%
Merian Global Strategic Bond Fund (IRL) USD (5.33%) 6.88% (2.07%) (0.31%)
JPM GBI Global Traded Bond Index (0.66%) 6.83% 1.57% 2.53%
Merian World Equity Fund USD (12.23%) 24.30% 7.75% 5.54%
MSCI World Index (8.71%) 22.40% 7.51% 6.30%
Merian Pacific Equity Fund USD (24.92%) 36.05% 8.62% 3.52%
MSCI AC Asia Pac ex Japan (13.92%) 36.98% 6.75% 7.97%
Merian European Equity Fund EUR (19.04%) 8.56% (6.27%) (4.65%)
MSCI Europe (10.57%) 10.24% 2.58% 2.10%
Old Mutual Japanese Equity Fund^ JPY - 19.80% (2.50%) -
TOPIX - 22.23% (0.64%) 4.15%
Merian US Equity Income Fund USD (9.41%) 10.82% 13.18% -
Russell 1000 Value (8.27%) 13.66% 17.34% 6.95%
Merian North American Equity Fund USD (10.43%) 21.10% 13.64% 7.22%
MSCI North America (5.73%) 20.89% 11.57% 8.33%
Merian Total Return USD Bond Fund USD (2.14%) 4.18% 3.39% 1.77%
Barclays Capital US Aggregate Bond Index 0.01% 3.54% 2.65% 2.06%
Merian Emerging Market Debt Fund USD (8.37%) 10.94% 11.05% 4.13%
JP Morgan EMBI Global Diversified (4.26%) 10.26% 10.15% 5.15%
Old Mutual European Best Ideas Fund EUR (16.59%) 12.23% (5.79%) (2.45%)
MSCI Europe (10.57%) 10.24% 2.58% 2.10%
Merian Investment Grade Corporate Bond Fund USD (2.38%) 6.03% 3.81% 2.42%
Barclays Capital Global Aggregate Credit (1.00%) 5.70% 6.22% 3.59%
Corporate Bond (USD Hedged)
Merian Global Emerging Markets Fund USD (20.81%) 39.29% 3.53% 4.52%
MSCI Emerging Markets (14.58%) 37.28% 11.19% 9.25%
Merian Asian Equity Income Fund USD (21.45%) 35.38% 8.81% 4.98%
MSCI AC Asia Pacific ex Japan (13.92%) 36.98% 6.75% 7.97%
Merian Local Currency Emerging Market Debt Fund USD (10.19%) 15.30% 6.87% 3.44%
JPM GBI-EM Global Diversified (6.21%) 15.21% 9.94% 5.91%
Merian UK Alpha Fund (IRL) GBP (11.35%) 14.03% 13.50% (0.29%)
FTSE All Share (9.47%) 13.10% 16.75% 1.08%
Merian UK Smaller Companies Focus Fund GBP (17.38%) 50.77% 23.94% 10.08%
NUMIS Smaller Companies Index (15.35%) 19.50% 11.08% (0.98%)
Merian Europe (ex UK) Smaller Companies Fund GBP (24.52%) 18.59% 29.61% 0.09%
EMIX Smaller Europe x UK (12.68%) 23.33% 23.24% 4.67%
Merian UK Dynamic Equity Fund GBP (19.40%) 32.39% 10.45% 0.61%
FTSE 250 Index Excluding Investments Trusts (15.15%) 18.24% 5.08% (3.06%)
Merian Global Equity Absolute Return Fund USD (1.14%) 7.96% 2.90% 3.17%
ICE LIBOR 1 Month USD 2.00% 1.06% 0.48% 1.18%
Merian Strategic Absolute Return Bond Fund^^^ USD (1.23%) 3.67% 4.27% 2.20%
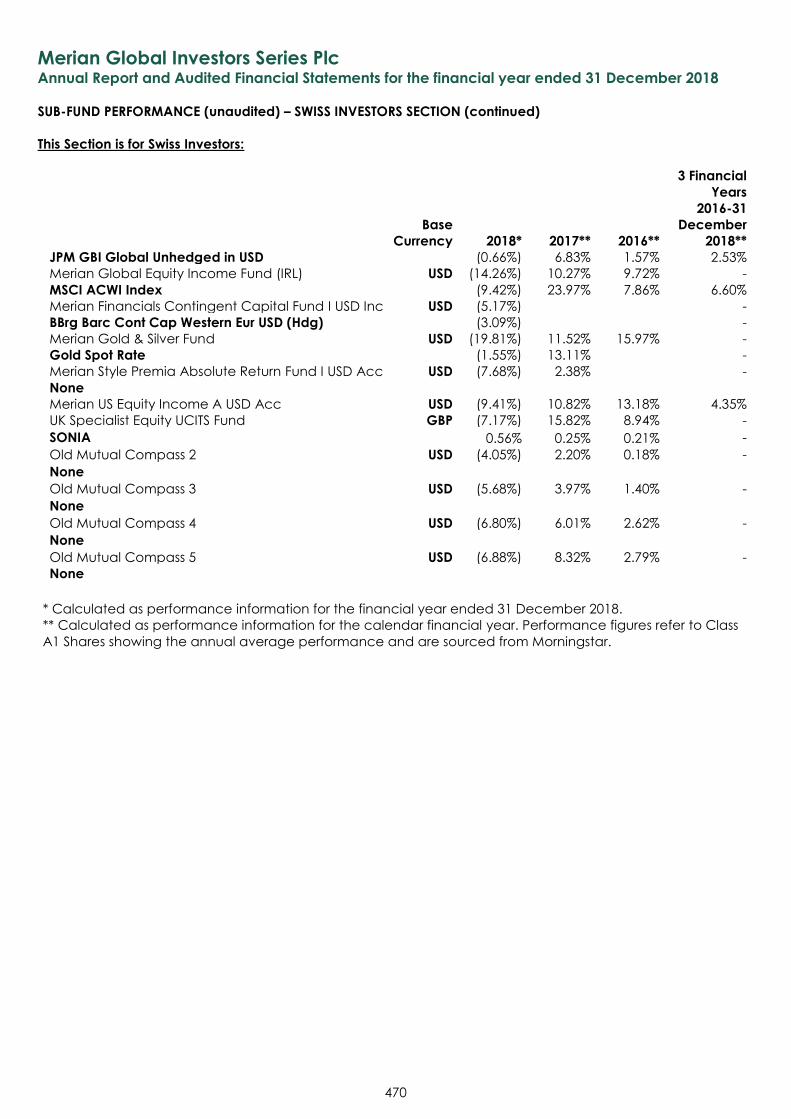
Merian Global Investors Series Plc Annual Report and Audited Financial Statements for the financial year ended 31 December 2018
SUB-FUND PERFORMANCE (unaudited) – SWISS INVESTORS SECTION (continued)
This Section is for Swiss Investors:
470
Base
Currency 2018* 2017** 2016**
3 Financial
Years
2016-31
December
2018**
JPM GBI Global Unhedged in USD (0.66%) 6.83% 1.57% 2.53%
Merian Global Equity Income Fund (IRL) USD (14.26%) 10.27% 9.72% -
MSCI ACWI Index (9.42%) 23.97% 7.86% 6.60%
Merian Financials Contingent Capital Fund I USD Inc USD (5.17%) -
BBrg Barc Cont Cap Western Eur USD (Hdg) (3.09%) -
Merian Gold & Silver Fund USD (19.81%) 11.52% 15.97% -
Gold Spot Rate (1.55%) 13.11% -
Merian Style Premia Absolute Return Fund I USD Acc USD (7.68%) 2.38% -
None
Merian US Equity Income A USD Acc USD (9.41%) 10.82% 13.18% 4.35%
UK Specialist Equity UCITS Fund GBP (7.17%) 15.82% 8.94% -
SONIA 0.56% 0.25% 0.21% -
Old Mutual Compass 2 USD (4.05%) 2.20% 0.18% -
None
Old Mutual Compass 3 USD (5.68%) 3.97% 1.40% -
None
Old Mutual Compass 4 USD (6.80%) 6.01% 2.62% -
None
Old Mutual Compass 5 USD (6.88%) 8.32% 2.79% -
None
* Calculated as performance information for the financial year ended 31 December 2018.
** Calculated as performance information for the calendar financial year. Performance figures refer to Class
A1 Shares showing the annual average performance and are sourced from Morningstar.
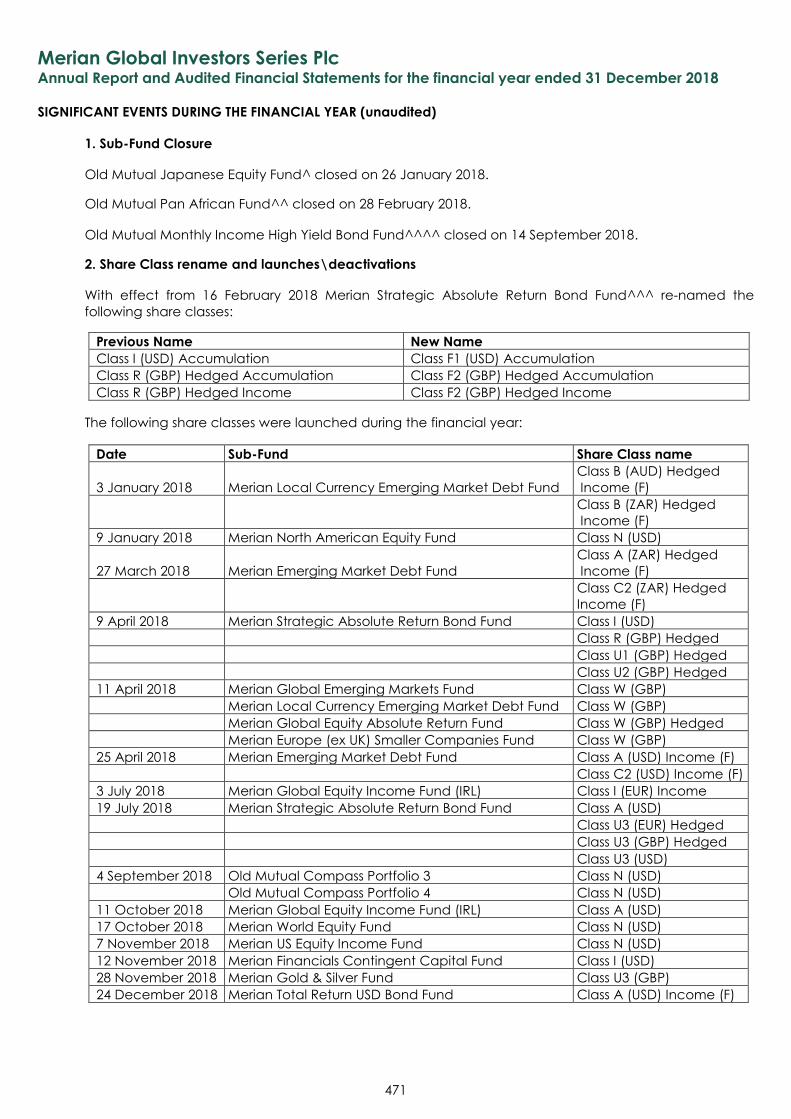
Merian Global Investors Series Plc Annual Report and Audited Financial Statements for the financial year ended 31 December 2018
SIGNIFICANT EVENTS DURING THE FINANCIAL YEAR (unaudited)
471
1. Sub-Fund Closure
Old Mutual Japanese Equity Fund^ closed on 26 January 2018.
Old Mutual Pan African Fund^^ closed on 28 February 2018.
Old Mutual Monthly Income High Yield Bond Fund^^^^ closed on 14 September 2018.
2. Share Class rename and launches\deactivations
With effect from 16 February 2018 Merian Strategic Absolute Return Bond Fund^^^ re-named the
following share classes:
Previous Name New Name
Class I (USD) Accumulation Class F1 (USD) Accumulation
Class R (GBP) Hedged Accumulation Class F2 (GBP) Hedged Accumulation
Class R (GBP) Hedged Income Class F2 (GBP) Hedged Income
The following share classes were launched during the financial year:
Date Sub-Fund Share Class name
3 January 2018 Merian Local Currency Emerging Market Debt Fund
Class B (AUD) Hedged
Income (F)
Class B (ZAR) Hedged
Income (F)
9 January 2018 Merian North American Equity Fund Class N (USD)
27 March 2018 Merian Emerging Market Debt Fund
Class A (ZAR) Hedged
Income (F)
Class C2 (ZAR) Hedged
Income (F)
9 April 2018 Merian Strategic Absolute Return Bond Fund Class I (USD)
Class R (GBP) Hedged
Class U1 (GBP) Hedged
Class U2 (GBP) Hedged
11 April 2018 Merian Global Emerging Markets Fund Class W (GBP)
Merian Local Currency Emerging Market Debt Fund Class W (GBP)
Merian Global Equity Absolute Return Fund Class W (GBP) Hedged
Merian Europe (ex UK) Smaller Companies Fund Class W (GBP)
25 April 2018 Merian Emerging Market Debt Fund Class A (USD) Income (F)
Class C2 (USD) Income (F)
3 July 2018 Merian Global Equity Income Fund (IRL) Class I (EUR) Income
19 July 2018 Merian Strategic Absolute Return Bond Fund Class A (USD)
Class U3 (EUR) Hedged
Class U3 (GBP) Hedged
Class U3 (USD)
4 September 2018 Old Mutual Compass Portfolio 3 Class N (USD)
Old Mutual Compass Portfolio 4 Class N (USD)
11 October 2018 Merian Global Equity Income Fund (IRL) Class A (USD)
17 October 2018 Merian World Equity Fund Class N (USD)
7 November 2018 Merian US Equity Income Fund Class N (USD)
12 November 2018 Merian Financials Contingent Capital Fund Class I (USD)
28 November 2018 Merian Gold & Silver Fund Class U3 (GBP)
24 December 2018 Merian Total Return USD Bond Fund Class A (USD) Income (F)
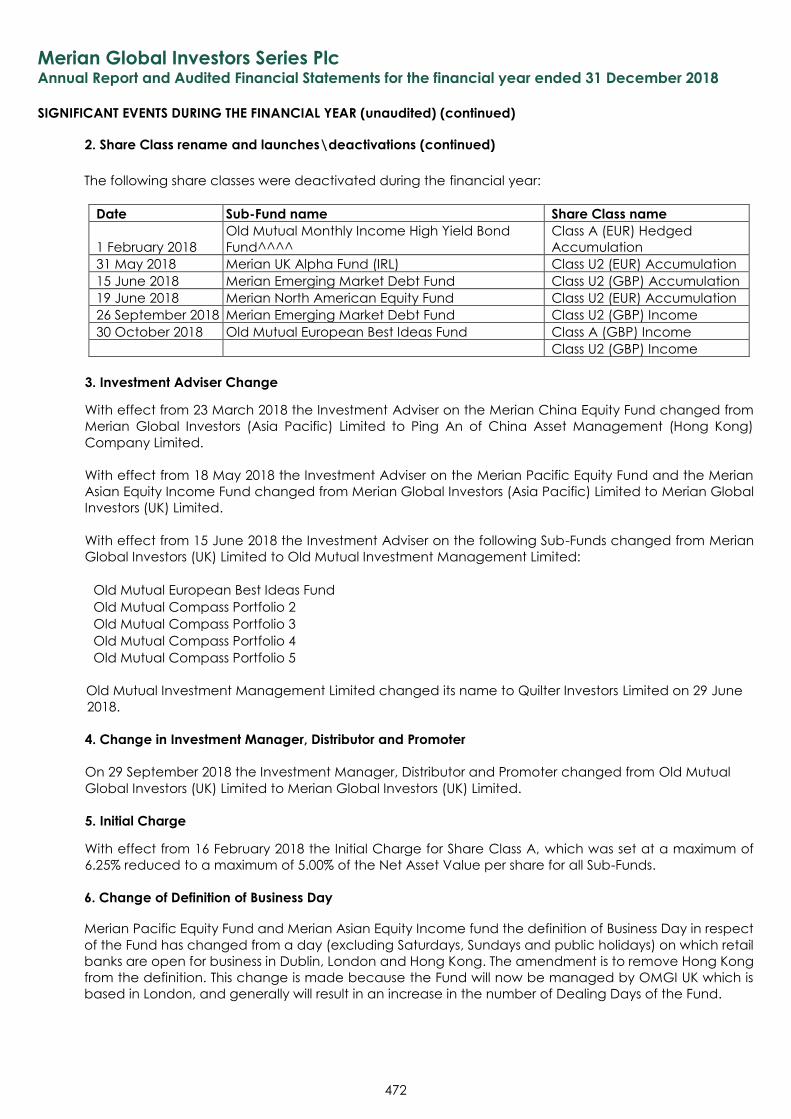
Merian Global Investors Series Plc Annual Report and Audited Financial Statements for the financial year ended 31 December 2018
SIGNIFICANT EVENTS DURING THE FINANCIAL YEAR (unaudited) (continued)
472
2. Share Class rename and launches\deactivations (continued)
The following share classes were deactivated during the financial year:
Date Sub-Fund name Share Class name
1 February 2018
Old Mutual Monthly Income High Yield Bond
Fund^^^^
Class A (EUR) Hedged
Accumulation
31 May 2018 Merian UK Alpha Fund (IRL) Class U2 (EUR) Accumulation
15 June 2018 Merian Emerging Market Debt Fund Class U2 (GBP) Accumulation
19 June 2018 Merian North American Equity Fund Class U2 (EUR) Accumulation
26 September 2018 Merian Emerging Market Debt Fund Class U2 (GBP) Income
30 October 2018 Old Mutual European Best Ideas Fund Class A (GBP) Income
Class U2 (GBP) Income
3. Investment Adviser Change
With effect from 23 March 2018 the Investment Adviser on the Merian China Equity Fund changed from
Merian Global Investors (Asia Pacific) Limited to Ping An of China Asset Management (Hong Kong)
Company Limited.
With effect from 18 May 2018 the Investment Adviser on the Merian Pacific Equity Fund and the Merian
Asian Equity Income Fund changed from Merian Global Investors (Asia Pacific) Limited to Merian Global
Investors (UK) Limited.
With effect from 15 June 2018 the Investment Adviser on the following Sub-Funds changed from Merian
Global Investors (UK) Limited to Old Mutual Investment Management Limited:
Old Mutual European Best Ideas Fund
Old Mutual Compass Portfolio 2
Old Mutual Compass Portfolio 3
Old Mutual Compass Portfolio 4
Old Mutual Compass Portfolio 5
Old Mutual Investment Management Limited changed its name to Quilter Investors Limited on 29 June
2018.
4. Change in Investment Manager, Distributor and Promoter
On 29 September 2018 the Investment Manager, Distributor and Promoter changed from Old Mutual
Global Investors (UK) Limited to Merian Global Investors (UK) Limited.
5. Initial Charge
With effect from 16 February 2018 the Initial Charge for Share Class A, which was set at a maximum of
6.25% reduced to a maximum of 5.00% of the Net Asset Value per share for all Sub-Funds.
6. Change of Definition of Business Day
Merian Pacific Equity Fund and Merian Asian Equity Income fund the definition of Business Day in respect
of the Fund has changed from a day (excluding Saturdays, Sundays and public holidays) on which retail
banks are open for business in Dublin, London and Hong Kong. The amendment is to remove Hong Kong
from the definition. This change is made because the Fund will now be managed by OMGI UK which is
based in London, and generally will result in an increase in the number of Dealing Days of the Fund.
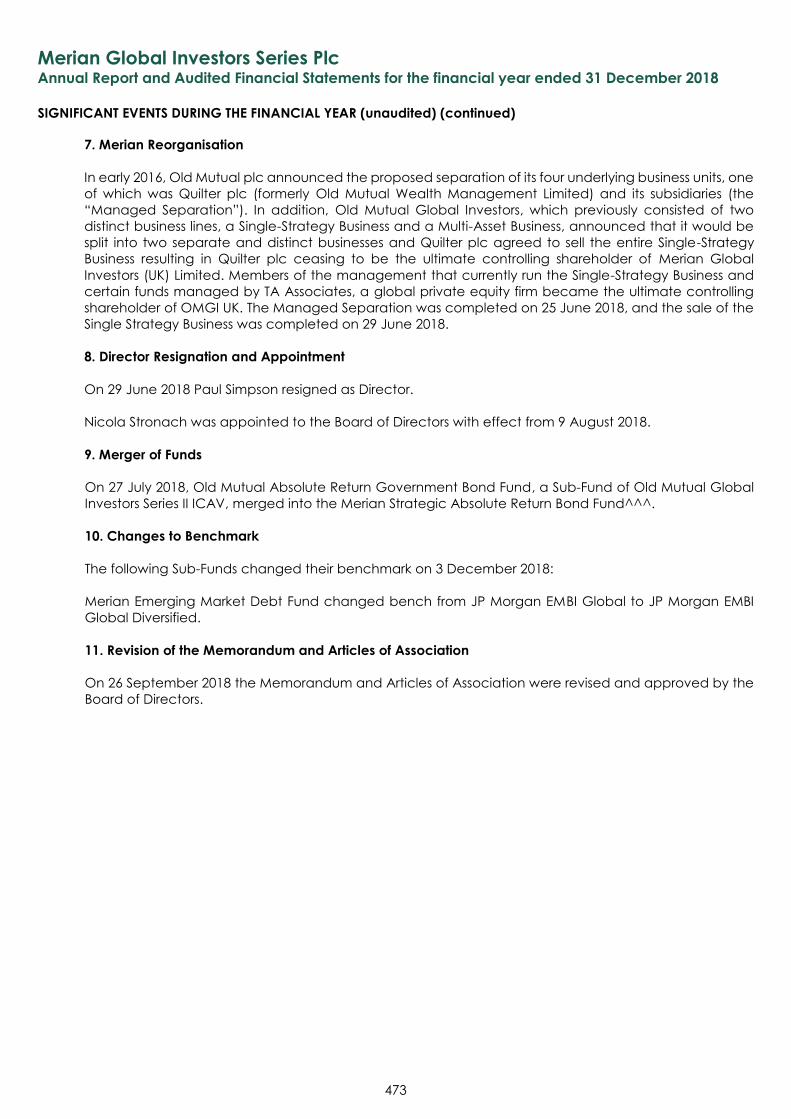
Merian Global Investors Series Plc Annual Report and Audited Financial Statements for the financial year ended 31 December 2018
SIGNIFICANT EVENTS DURING THE FINANCIAL YEAR (unaudited) (continued)
473
7. Merian Reorganisation
In early 2016, Old Mutual plc announced the proposed separation of its four underlying business units, one
of which was Quilter plc (formerly Old Mutual Wealth Management Limited) and its subsidiaries (the
“Managed Separation”). In addition, Old Mutual Global Investors, which previously consisted of two
distinct business lines, a Single-Strategy Business and a Multi-Asset Business, announced that it would be
split into two separate and distinct businesses and Quilter plc agreed to sell the entire Single-Strategy
Business resulting in Quilter plc ceasing to be the ultimate controlling shareholder of Merian Global
Investors (UK) Limited. Members of the management that currently run the Single-Strategy Business and
certain funds managed by TA Associates, a global private equity firm became the ultimate controlling
shareholder of OMGI UK. The Managed Separation was completed on 25 June 2018, and the sale of the
Single Strategy Business was completed on 29 June 2018.
8. Director Resignation and Appointment
On 29 June 2018 Paul Simpson resigned as Director.
Nicola Stronach was appointed to the Board of Directors with effect from 9 August 2018.
9. Merger of Funds
On 27 July 2018, Old Mutual Absolute Return Government Bond Fund, a Sub-Fund of Old Mutual Global
Investors Series II ICAV, merged into the Merian Strategic Absolute Return Bond Fund^^^.
10. Changes to Benchmark
The following Sub-Funds changed their benchmark on 3 December 2018:
Merian Emerging Market Debt Fund changed bench from JP Morgan EMBI Global to JP Morgan EMBI
Global Diversified.
11. Revision of the Memorandum and Articles of Association
On 26 September 2018 the Memorandum and Articles of Association were revised and approved by the
Board of Directors.

Merian Global Investors Series Plc Annual Report and Audited Financial Statements for the financial year ended 31 December 2018
SIGNIFICANT EVENTS DURING THE FINANCIAL YEAR (unaudited) (continued)
474
12. Miscellaneous changes to the Prospectus
A copy of the revised Prospectus is available upon request from the registered office of the Administrator
of the Fund.
An updated Prospectus was filed with the Central Bank of Ireland on 28 September 2018. The Prospectus
was amended to reflect the following:
a) Change of name of Old Mutual Global Investors Series Plc to Merian Global Investors Series plc, and
change of name of the Investment Manager and all Sub-Funds, save for Compass- and European
Best Ideas Fund;
b) Update to reflect the resignation of Paul Simpson and the appointment of Nicola Stronach;
c) Inclusion of detail on Class W Shares;
d) Update to the definition of Emerging Markets;
e) Update to detail the reduction of the Initial Charge for Class A Shares to 5.00%;
f) Update to reflect that Old Mutual Global Investors (UK) Limited is no longer part of the Old Mutual
plc group;
g) Enhancement of disclosure on Paying Agents;
h) Addition of the Saudi Stock Exchange to the Regulated Markets section;
i) Enhancement of disclosures on tax to include the new German tax requirements, setting out more
explicitly their equity exposure so that they can be classified as Equity Funds under this new German
tax act. Wording is added to the Old Mutual World Equity Fund, Old Mutual Europe (ex UK) Smaller
Companies Fund, Old Mutual China Equity Fund, Old Mutual Global Equity Absolute Return Fund,
Old Mutual UK Specialist Equity Fund, Old Mutual North American Equity Fund, Old Mutual UK Alpha
Fund (IRL) and the Old Mutual US Equity Income Fund. Such update does not result in any change
in the investment objective and policies of the Sub-Funds;
j) Update to reflect that Old Mutual Asian Equity Income Fund is now permitted to practice Income
Smoothing. As this is a change to the distribution terms, investors are provided one month’s notice;
k) Inclusion of detail on benchmark revisions: Old Mutual UK Smaller Companies Focus Fund - revising
“Numis Smaller Companies Index excluding Investment Trusts” to “Numis Smaller Companies Index
excluding Investment Companies”. Old Mutual Europe (ex UK) Smaller Companies Fund -
“Euromoney Smaller Europe (Exc. UK) Index” has changed name to “EMIX Smaller Europe ex UK
Companies Index”;
l) Inclusion of the new P2 Share Class for Old Mutual North American Equity Fund.
Merian Global Investors Series Plc Annual Report and Audited Financial Statements for the financial year ended 31 December 2018
SUPPLEMENTARY INFORMATION (unaudited)
Cybersecurity Risk
475
Cybersecurity breaches may occur allowing an unauthorized party to gain access to assets of the Sub-Funds,
Shareholder data, or proprietary information, or may cause the Company, the Investment Manager, the
Distributor, the Administrator or the Depositary to suffer data corruption or lose operational functionality.
The Sub-Funds may be affected by intentional cybersecurity breaches which include unauthorized access to
systems, networks, or devices (such as through “hacking” activity); infection from computer viruses or other
malicious software code; and attacks that shut down, disable, slow, or otherwise disrupt operations, business
processes, or website access or functionality. In addition, unintentional incidents can occur, such as the
inadvertent release of confidential information (possibly resulting in the violation of applicable privacy laws).
Notwithstanding the existence of policies and procedures designed to detect and prevent such breaches and
ensure the security, integrity and confidentiality of such information as well as the existence of business continuity
and disaster recovery measures designed to mitigate any such breach or disruption at the level of the Company
and its delegates, such a cybersecurity breach could result in the loss or theft of Shareholder data or Sub-Funds,
the inability to access electronic systems, loss or theft of proprietary information or corporate data, physical
damage to a computer or network system, or costs associated with system repairs.
Such incidents could cause the Company, the Investment Manager, the Distributor, the Administrator, the
Depositary, or other service providers to incur regulatory penalties, reputational damage, additional compliance
costs, or financial loss. Consequently, Shareholders may lose some or all of their invested capital. In addition, such
incidents could affect issuers in which a Sub-Fund invests, and thereby cause a Sub-Fund’s investments to lose
value, as a result of which investors, including the relevant Sub-Fund and its Shareholders, could potentially lose
all or a portion of their investment with that issuer.
Soft Commission Arrangements
Some Investment Advisers did enter into soft commission arrangements (including commission-sharing
arrangements) on behalf of the Company for the financial year ended 31 December 2018 and 31 December
2017. Where these arrangements have been entered into it has been confirmed that the Sub-Funds’
Shareholders have not been disadvantaged as a result of the arrangements and that best execution has been
provided in all cases. Also it has been confirmed that the benefits provided under the arrangements have
assisted in the provision of investment services to the Sub-Funds’ concerned. The benefits received were related
to covering costs relating to execution of trades or the purchase of research services from the brokers or third
parties. The following Sub-Funds used soft commission arrangements;
Merian China Equity Fund
Merian Pacific Equity Fund
Merian Asian Equity Income Fund
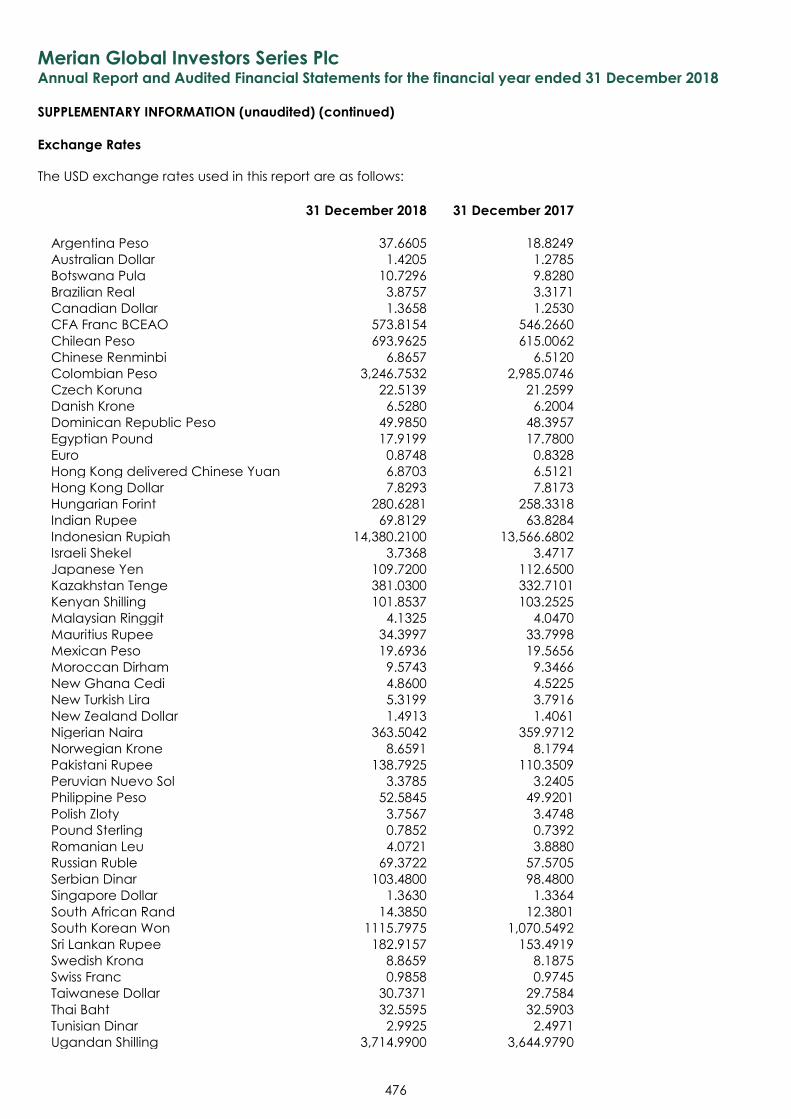
Merian Global Investors Series Plc Annual Report and Audited Financial Statements for the financial year ended 31 December 2018
SUPPLEMENTARY INFORMATION (unaudited) (continued)
Exchange Rates
476
The USD exchange rates used in this report are as follows:
31 December 2018 31 December 2017
Argentina Peso 37.6605 18.8249
Australian Dollar 1.4205 1.2785
Botswana Pula 10.7296 9.8280
Brazilian Real 3.8757 3.3171
Canadian Dollar 1.3658 1.2530
CFA Franc BCEAO 573.8154 546.2660
Chilean Peso 693.9625 615.0062
Chinese Renminbi 6.8657 6.5120
Colombian Peso 3,246.7532 2,985.0746
Czech Koruna 22.5139 21.2599
Danish Krone 6.5280 6.2004
Dominican Republic Peso 49.9850 48.3957
Egyptian Pound 17.9199 17.7800
Euro 0.8748 0.8328
Hong Kong delivered Chinese Yuan 6.8703 6.5121
Hong Kong Dollar 7.8293 7.8173
Hungarian Forint 280.6281 258.3318
Indian Rupee 69.8129 63.8284
Indonesian Rupiah 14,380.2100 13,566.6802
Israeli Shekel 3.7368 3.4717
Japanese Yen 109.7200 112.6500
Kazakhstan Tenge 381.0300 332.7101
Kenyan Shilling 101.8537 103.2525
Malaysian Ringgit 4.1325 4.0470
Mauritius Rupee 34.3997 33.7998
Mexican Peso 19.6936 19.5656
Moroccan Dirham 9.5743 9.3466
New Ghana Cedi 4.8600 4.5225
New Turkish Lira 5.3199 3.7916
New Zealand Dollar 1.4913 1.4061
Nigerian Naira 363.5042 359.9712
Norwegian Krone 8.6591 8.1794
Pakistani Rupee 138.7925 110.3509
Peruvian Nuevo Sol 3.3785 3.2405
Philippine Peso 52.5845 49.9201
Polish Zloty 3.7567 3.4748
Pound Sterling 0.7852 0.7392
Romanian Leu 4.0721 3.8880
Russian Ruble 69.3722 57.5705
Serbian Dinar 103.4800 98.4800
Singapore Dollar 1.3630 1.3364
South African Rand 14.3850 12.3801
South Korean Won 1115.7975 1,070.5492
Sri Lankan Rupee 182.9157 153.4919
Swedish Krona 8.8659 8.1875
Swiss Franc 0.9858 0.9745
Taiwanese Dollar 30.7371 29.7584
Thai Baht 32.5595 32.5903
Tunisian Dinar 2.9925 2.4971
Ugandan Shilling 3,714.9900 3,644.9790
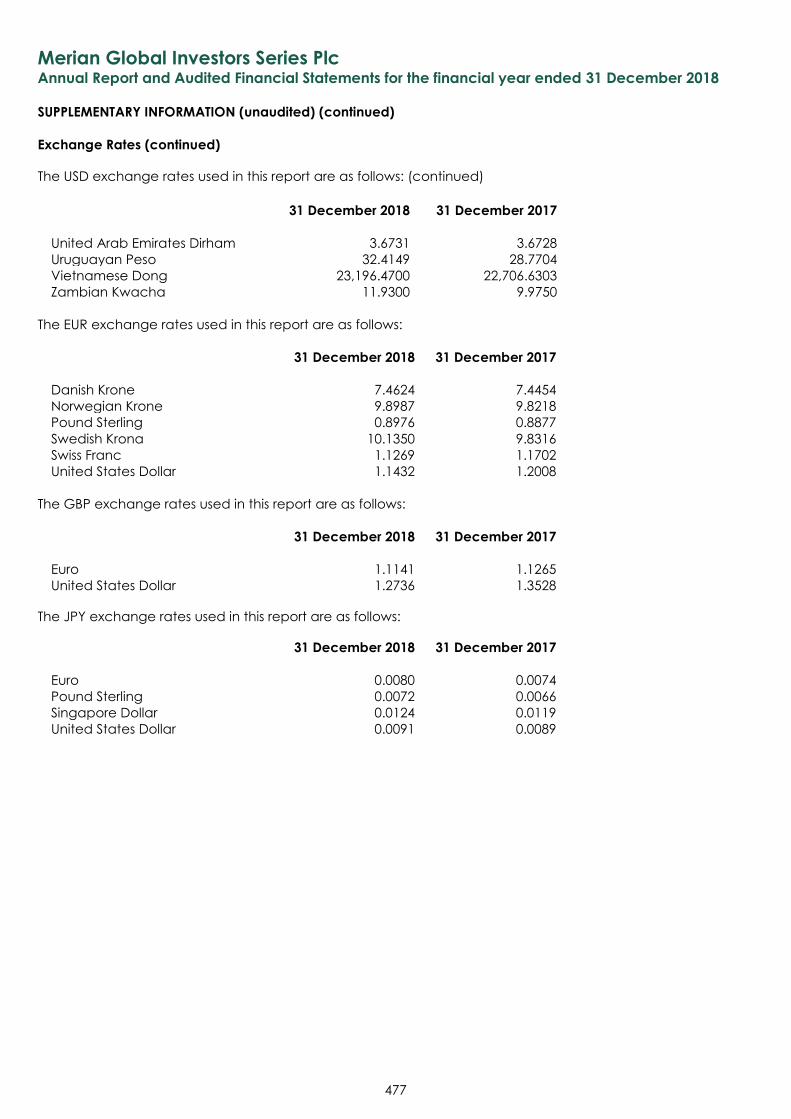
Merian Global Investors Series Plc Annual Report and Audited Financial Statements for the financial year ended 31 December 2018
SUPPLEMENTARY INFORMATION (unaudited) (continued)
Exchange Rates (continued)
477
The USD exchange rates used in this report are as follows: (continued)
31 December 2018 31 December 2017
United Arab Emirates Dirham 3.6731 3.6728
Uruguayan Peso 32.4149 28.7704
Vietnamese Dong 23,196.4700 22,706.6303
Zambian Kwacha 11.9300 9.9750
The EUR exchange rates used in this report are as follows:
31 December 2018 31 December 2017
Danish Krone 7.4624 7.4454
Norwegian Krone 9.8987 9.8218
Pound Sterling 0.8976 0.8877
Swedish Krona 10.1350 9.8316
Swiss Franc 1.1269 1.1702
United States Dollar 1.1432 1.2008
The GBP exchange rates used in this report are as follows:
31 December 2018 31 December 2017
Euro 1.1141 1.1265
United States Dollar 1.2736 1.3528
The JPY exchange rates used in this report are as follows:
31 December 2018 31 December 2017
Euro 0.0080 0.0074
Pound Sterling 0.0072 0.0066
Singapore Dollar 0.0124 0.0119
United States Dollar 0.0091 0.0089
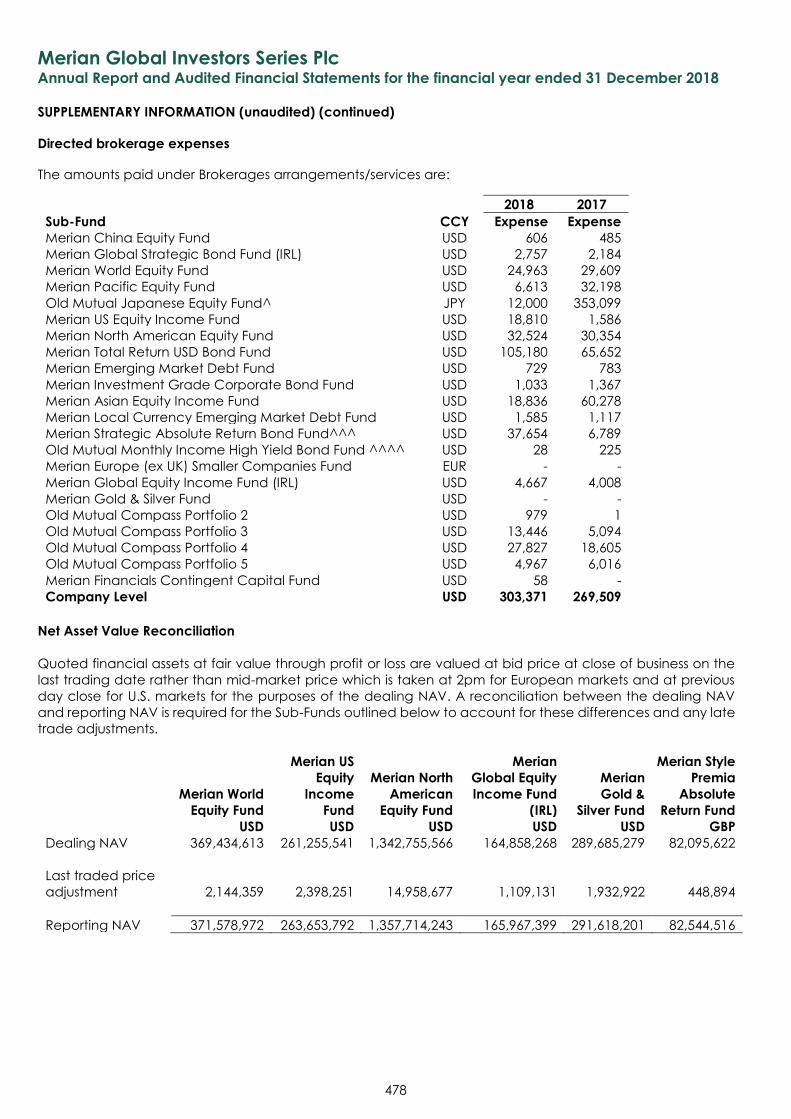
Merian Global Investors Series Plc Annual Report and Audited Financial Statements for the financial year ended 31 December 2018
SUPPLEMENTARY INFORMATION (unaudited) (continued)
478
Directed brokerage expenses
The amounts paid under Brokerages arrangements/services are:
2018 2017
Sub-Fund CCY Expense Expense
Merian China Equity Fund USD 606 485
Merian Global Strategic Bond Fund (IRL) USD 2,757 2,184
Merian World Equity Fund USD 24,963 29,609
Merian Pacific Equity Fund USD 6,613 32,198
Old Mutual Japanese Equity Fund^ JPY 12,000 353,099
Merian US Equity Income Fund USD 18,810 1,586
Merian North American Equity Fund USD 32,524 30,354
Merian Total Return USD Bond Fund USD 105,180 65,652
Merian Emerging Market Debt Fund USD 729 783
Merian Investment Grade Corporate Bond Fund USD 1,033 1,367
Merian Asian Equity Income Fund USD 18,836 60,278
Merian Local Currency Emerging Market Debt Fund USD 1,585 1,117
Merian Strategic Absolute Return Bond Fund^^^ USD 37,654 6,789
Old Mutual Monthly Income High Yield Bond Fund ^^^^ USD 28 225
Merian Europe (ex UK) Smaller Companies Fund EUR - -
Merian Global Equity Income Fund (IRL) USD 4,667 4,008
Merian Gold & Silver Fund USD - -
Old Mutual Compass Portfolio 2 USD 979 1
Old Mutual Compass Portfolio 3 USD 13,446 5,094
Old Mutual Compass Portfolio 4 USD 27,827 18,605
Old Mutual Compass Portfolio 5 USD 4,967 6,016
Merian Financials Contingent Capital Fund USD 58 -
Company Level USD 303,371 269,509
Net Asset Value Reconciliation
Quoted financial assets at fair value through profit or loss are valued at bid price at close of business on the
last trading date rather than mid-market price which is taken at 2pm for European markets and at previous
day close for U.S. markets for the purposes of the dealing NAV. A reconciliation between the dealing NAV
and reporting NAV is required for the Sub-Funds outlined below to account for these differences and any late
trade adjustments.
Merian World
Equity Fund
Merian US
Equity
Income
Fund
Merian North
American
Equity Fund
Merian
Global Equity
Income Fund
(IRL)
Merian
Gold &
Silver Fund
Merian Style
Premia
Absolute
Return Fund
USD USD USD USD USD GBP
Dealing NAV 369,434,613 261,255,541 1,342,755,566 164,858,268 289,685,279 82,095,622
Last traded price
adjustment 2,144,359 2,398,251 14,958,677
1,109,131 1,932,922 448,894
Reporting NAV 371,578,972 263,653,792 1,357,714,243 165,967,399 291,618,201 82,544,516
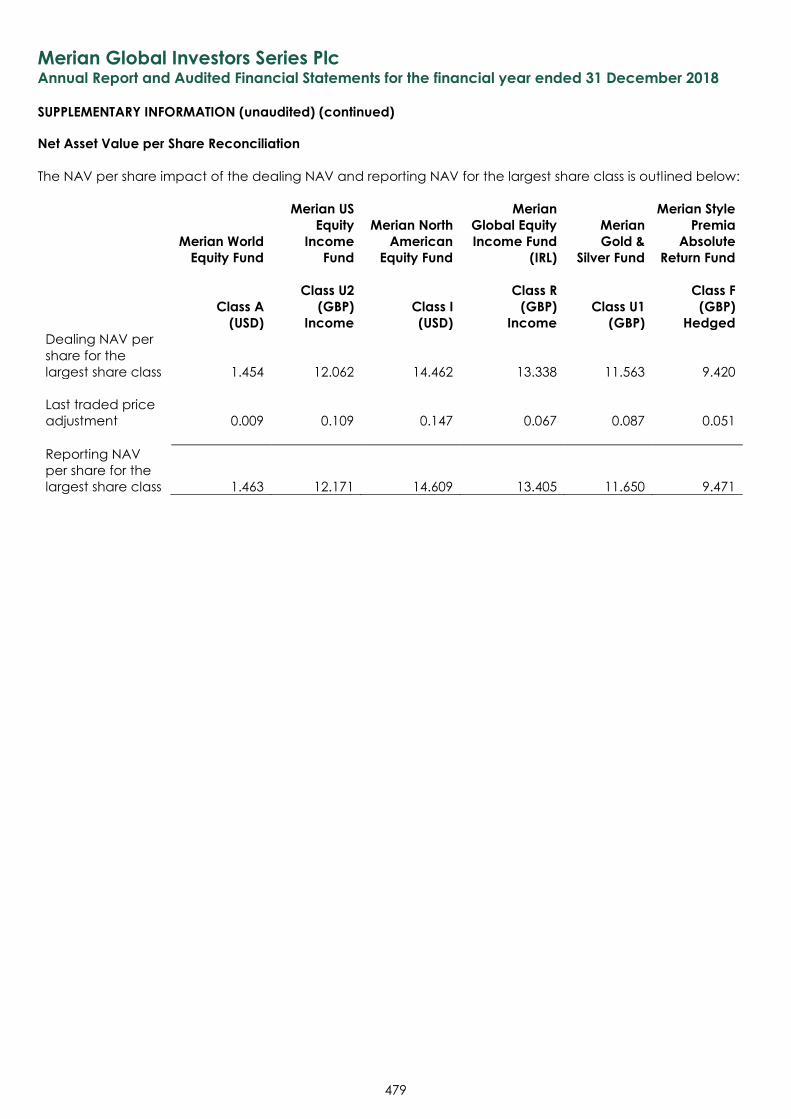
Merian Global Investors Series Plc Annual Report and Audited Financial Statements for the financial year ended 31 December 2018
SUPPLEMENTARY INFORMATION (unaudited) (continued)
479
Net Asset Value per Share Reconciliation
The NAV per share impact of the dealing NAV and reporting NAV for the largest share class is outlined below:
Merian World
Equity Fund
Merian US
Equity
Income
Fund
Merian North
American
Equity Fund
Merian
Global Equity
Income Fund
(IRL)
Merian
Gold &
Silver Fund
Merian Style
Premia
Absolute
Return Fund
Class A
(USD)
Class U2
(GBP)
Income
Class I
(USD)
Class R
(GBP)
Income
Class U1
(GBP)
Class F
(GBP)
Hedged
Dealing NAV per
share for the
largest share class 1.454 12.062 14.462
13.338 11.563 9.420
Last traded price
adjustment 0.009 0.109 0.147
0.067 0.087 0.051
Reporting NAV
per share for the
largest share class 1.463 12.171 14.609
13.405 11.650 9.471
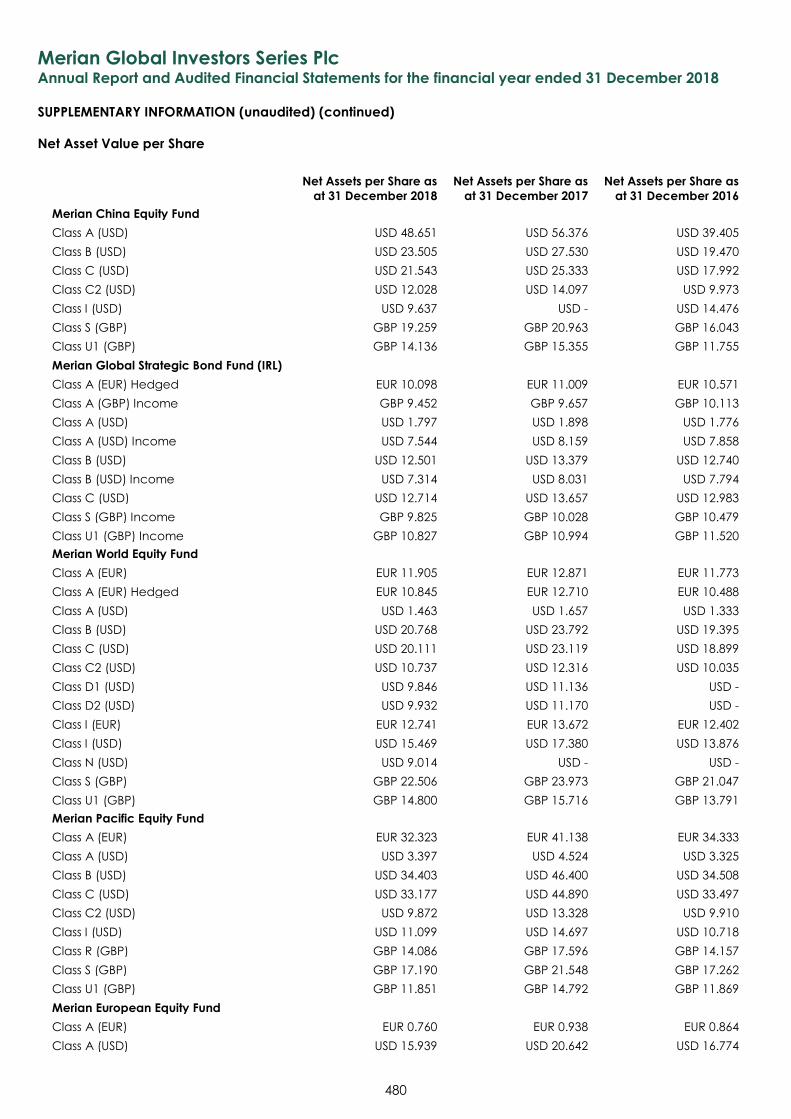
Merian Global Investors Series Plc Annual Report and Audited Financial Statements for the financial year ended 31 December 2018
SUPPLEMENTARY INFORMATION (unaudited) (continued)
480
Net Asset Value per Share
Net Assets per Share as
at 31 December 2018
Net Assets per Share as
at 31 December 2017
Net Assets per Share as
at 31 December 2016
Merian China Equity Fund
Class A (USD) USD 48.651 USD 56.376 USD 39.405
Class B (USD) USD 23.505 USD 27.530 USD 19.470
Class C (USD) USD 21.543 USD 25.333 USD 17.992
Class C2 (USD) USD 12.028 USD 14.097 USD 9.973
Class I (USD) USD 9.637 USD - USD 14.476
Class S (GBP) GBP 19.259 GBP 20.963 GBP 16.043
Class U1 (GBP) GBP 14.136 GBP 15.355 GBP 11.755
Merian Global Strategic Bond Fund (IRL)
Class A (EUR) Hedged EUR 10.098 EUR 11.009 EUR 10.571
Class A (GBP) Income GBP 9.452 GBP 9.657 GBP 10.113
Class A (USD) USD 1.797 USD 1.898 USD 1.776
Class A (USD) Income USD 7.544 USD 8.159 USD 7.858
Class B (USD) USD 12.501 USD 13.379 USD 12.740
Class B (USD) Income USD 7.314 USD 8.031 USD 7.794
Class C (USD) USD 12.714 USD 13.657 USD 12.983
Class S (GBP) Income GBP 9.825 GBP 10.028 GBP 10.479
Class U1 (GBP) Income GBP 10.827 GBP 10.994 GBP 11.520
Merian World Equity Fund
Class A (EUR) EUR 11.905 EUR 12.871 EUR 11.773
Class A (EUR) Hedged EUR 10.845 EUR 12.710 EUR 10.488
Class A (USD) USD 1.463 USD 1.657 USD 1.333
Class B (USD) USD 20.768 USD 23.792 USD 19.395
Class C (USD) USD 20.111 USD 23.119 USD 18.899
Class C2 (USD) USD 10.737 USD 12.316 USD 10.035
Class D1 (USD) USD 9.846 USD 11.136 USD -
Class D2 (USD) USD 9.932 USD 11.170 USD -
Class I (EUR) EUR 12.741 EUR 13.672 EUR 12.402
Class I (USD) USD 15.469 USD 17.380 USD 13.876
Class N (USD) USD 9.014 USD - USD -
Class S (GBP) GBP 22.506 GBP 23.973 GBP 21.047
Class U1 (GBP) GBP 14.800 GBP 15.716 GBP 13.791
Merian Pacific Equity Fund
Class A (EUR) EUR 32.323 EUR 41.138 EUR 34.333
Class A (USD) USD 3.397 USD 4.524 USD 3.325
Class B (USD) USD 34.403 USD 46.400 USD 34.508
Class C (USD) USD 33.177 USD 44.890 USD 33.497
Class C2 (USD) USD 9.872 USD 13.328 USD 9.910
Class I (USD) USD 11.099 USD 14.697 USD 10.718
Class R (GBP) GBP 14.086 GBP 17.596 GBP 14.157
Class S (GBP) GBP 17.190 GBP 21.548 GBP 17.262
Class U1 (GBP) GBP 11.851 GBP 14.792 GBP 11.869
Merian European Equity Fund
Class A (EUR) EUR 0.760 EUR 0.938 EUR 0.864
Class A (USD) USD 15.939 USD 20.642 USD 16.774
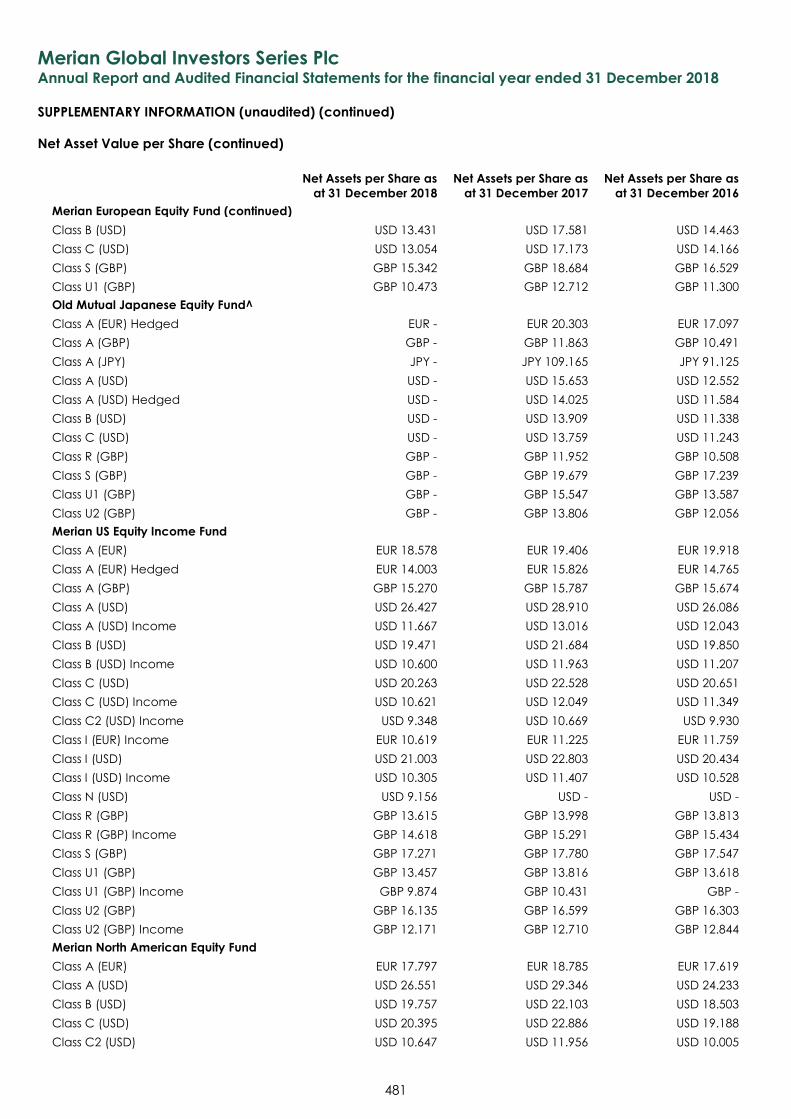
Merian Global Investors Series Plc Annual Report and Audited Financial Statements for the financial year ended 31 December 2018
SUPPLEMENTARY INFORMATION (unaudited) (continued)
481
Net Asset Value per Share (continued)
Net Assets per Share as
at 31 December 2018
Net Assets per Share as
at 31 December 2017
Net Assets per Share as
at 31 December 2016
Merian European Equity Fund (continued)
Class B (USD) USD 13.431 USD 17.581 USD 14.463
Class C (USD) USD 13.054 USD 17.173 USD 14.166
Class S (GBP) GBP 15.342 GBP 18.684 GBP 16.529
Class U1 (GBP) GBP 10.473 GBP 12.712 GBP 11.300
Old Mutual Japanese Equity Fund^
Class A (EUR) Hedged EUR - EUR 20.303 EUR 17.097
Class A (GBP) GBP - GBP 11.863 GBP 10.491
Class A (JPY) JPY - JPY 109.165 JPY 91.125
Class A (USD) USD - USD 15.653 USD 12.552
Class A (USD) Hedged USD - USD 14.025 USD 11.584
Class B (USD) USD - USD 13.909 USD 11.338
Class C (USD) USD - USD 13.759 USD 11.243
Class R (GBP) GBP - GBP 11.952 GBP 10.508
Class S (GBP) GBP - GBP 19.679 GBP 17.239
Class U1 (GBP) GBP - GBP 15.547 GBP 13.587
Class U2 (GBP) GBP - GBP 13.806 GBP 12.056
Merian US Equity Income Fund
Class A (EUR) EUR 18.578 EUR 19.406 EUR 19.918
Class A (EUR) Hedged EUR 14.003 EUR 15.826 EUR 14.765
Class A (GBP) GBP 15.270 GBP 15.787 GBP 15.674
Class A (USD) USD 26.427 USD 28.910 USD 26.086
Class A (USD) Income USD 11.667 USD 13.016 USD 12.043
Class B (USD) USD 19.471 USD 21.684 USD 19.850
Class B (USD) Income USD 10.600 USD 11.963 USD 11.207
Class C (USD) USD 20.263 USD 22.528 USD 20.651
Class C (USD) Income USD 10.621 USD 12.049 USD 11.349
Class C2 (USD) Income USD 9.348 USD 10.669 USD 9.930
Class I (EUR) Income EUR 10.619 EUR 11.225 EUR 11.759
Class I (USD) USD 21.003 USD 22.803 USD 20.434
Class I (USD) Income USD 10.305 USD 11.407 USD 10.528
Class N (USD) USD 9.156 USD - USD -
Class R (GBP) GBP 13.615 GBP 13.998 GBP 13.813
Class R (GBP) Income GBP 14.618 GBP 15.291 GBP 15.434
Class S (GBP) GBP 17.271 GBP 17.780 GBP 17.547
Class U1 (GBP) GBP 13.457 GBP 13.816 GBP 13.618
Class U1 (GBP) Income GBP 9.874 GBP 10.431 GBP -
Class U2 (GBP) GBP 16.135 GBP 16.599 GBP 16.303
Class U2 (GBP) Income GBP 12.171 GBP 12.710 GBP 12.844
Merian North American Equity Fund
Class A (EUR) EUR 17.797 EUR 18.785 EUR 17.619
Class A (USD) USD 26.551 USD 29.346 USD 24.233
Class B (USD) USD 19.757 USD 22.103 USD 18.503
Class C (USD) USD 20.395 USD 22.886 USD 19.188
Class C2 (USD) USD 10.647 USD 11.956 USD 10.005
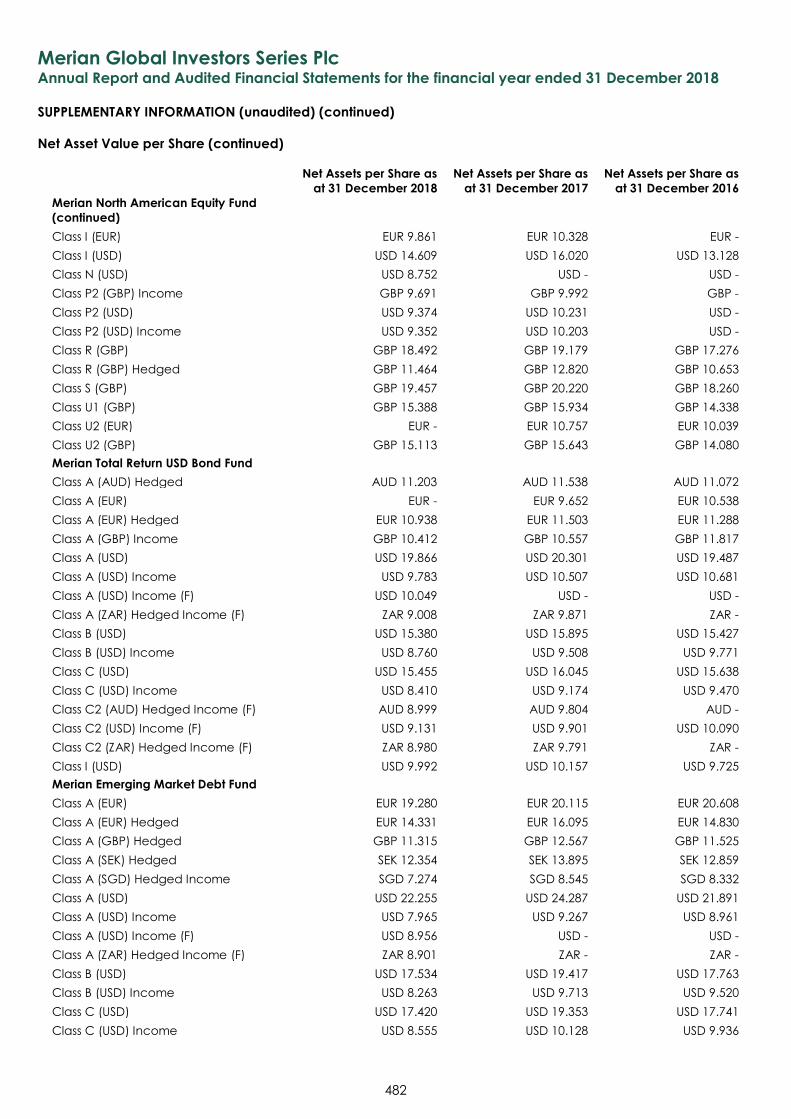
Merian Global Investors Series Plc Annual Report and Audited Financial Statements for the financial year ended 31 December 2018
SUPPLEMENTARY INFORMATION (unaudited) (continued)
482
Net Asset Value per Share (continued)
Net Assets per Share as
at 31 December 2018
Net Assets per Share as
at 31 December 2017
Net Assets per Share as
at 31 December 2016
Merian North American Equity Fund
(continued)
Class I (EUR) EUR 9.861 EUR 10.328 EUR -
Class I (USD) USD 14.609 USD 16.020 USD 13.128
Class N (USD) USD 8.752 USD - USD -
Class P2 (GBP) Income GBP 9.691 GBP 9.992 GBP -
Class P2 (USD) USD 9.374 USD 10.231 USD -
Class P2 (USD) Income USD 9.352 USD 10.203 USD -
Class R (GBP) GBP 18.492 GBP 19.179 GBP 17.276
Class R (GBP) Hedged GBP 11.464 GBP 12.820 GBP 10.653
Class S (GBP) GBP 19.457 GBP 20.220 GBP 18.260
Class U1 (GBP) GBP 15.388 GBP 15.934 GBP 14.338
Class U2 (EUR) EUR - EUR 10.757 EUR 10.039
Class U2 (GBP) GBP 15.113 GBP 15.643 GBP 14.080
Merian Total Return USD Bond Fund
Class A (AUD) Hedged AUD 11.203 AUD 11.538 AUD 11.072
Class A (EUR) EUR - EUR 9.652 EUR 10.538
Class A (EUR) Hedged EUR 10.938 EUR 11.503 EUR 11.288
Class A (GBP) Income GBP 10.412 GBP 10.557 GBP 11.817
Class A (USD) USD 19.866 USD 20.301 USD 19.487
Class A (USD) Income USD 9.783 USD 10.507 USD 10.681
Class A (USD) Income (F) USD 10.049 USD - USD -
Class A (ZAR) Hedged Income (F) ZAR 9.008 ZAR 9.871 ZAR -
Class B (USD) USD 15.380 USD 15.895 USD 15.427
Class B (USD) Income USD 8.760 USD 9.508 USD 9.771
Class C (USD) USD 15.455 USD 16.045 USD 15.638
Class C (USD) Income USD 8.410 USD 9.174 USD 9.470
Class C2 (AUD) Hedged Income (F) AUD 8.999 AUD 9.804 AUD -
Class C2 (USD) Income (F) USD 9.131 USD 9.901 USD 10.090
Class C2 (ZAR) Hedged Income (F) ZAR 8.980 ZAR 9.791 ZAR -
Class I (USD) USD 9.992 USD 10.157 USD 9.725
Merian Emerging Market Debt Fund
Class A (EUR) EUR 19.280 EUR 20.115 EUR 20.608
Class A (EUR) Hedged EUR 14.331 EUR 16.095 EUR 14.830
Class A (GBP) Hedged GBP 11.315 GBP 12.567 GBP 11.525
Class A (SEK) Hedged SEK 12.354 SEK 13.895 SEK 12.859
Class A (SGD) Hedged Income SGD 7.274 SGD 8.545 SGD 8.332
Class A (USD) USD 22.255 USD 24.287 USD 21.891
Class A (USD) Income USD 7.965 USD 9.267 USD 8.961
Class A (USD) Income (F) USD 8.956 USD - USD -
Class A (ZAR) Hedged Income (F) ZAR 8.901 ZAR - ZAR -
Class B (USD) USD 17.534 USD 19.417 USD 17.763
Class B (USD) Income USD 8.263 USD 9.713 USD 9.520
Class C (USD) USD 17.420 USD 19.353 USD 17.741
Class C (USD) Income USD 8.555 USD 10.128 USD 9.936
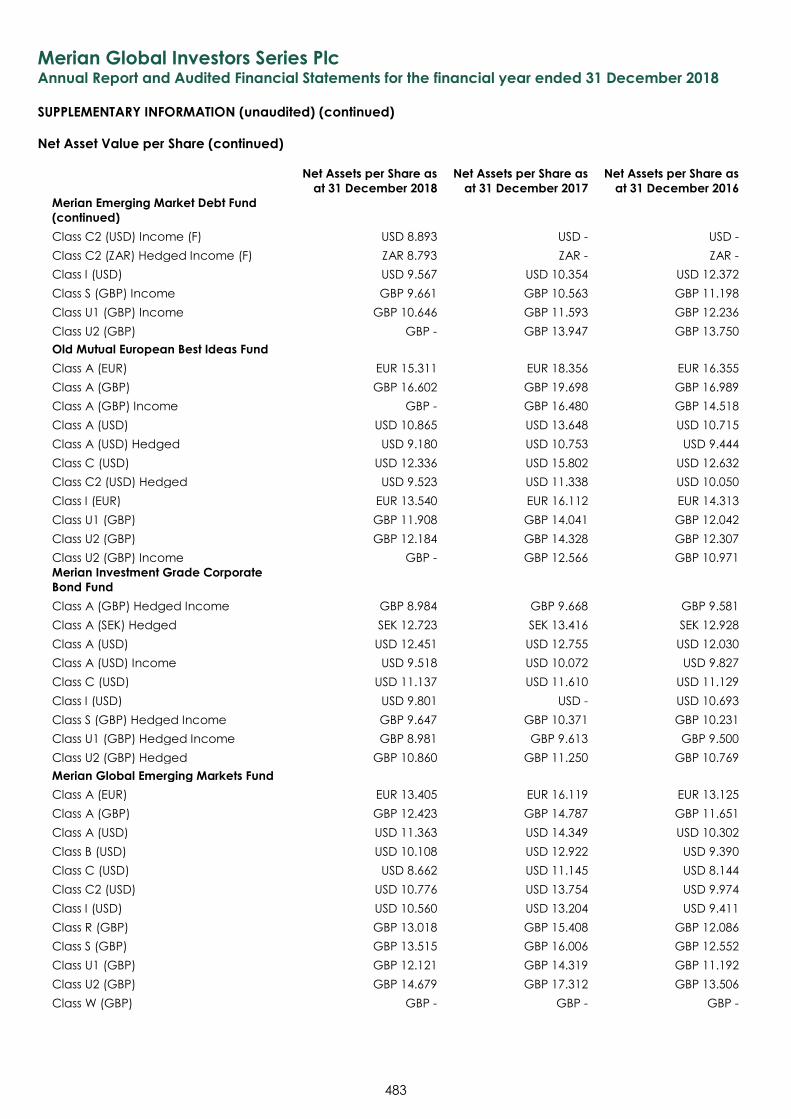
Merian Global Investors Series Plc Annual Report and Audited Financial Statements for the financial year ended 31 December 2018
SUPPLEMENTARY INFORMATION (unaudited) (continued)
483
Net Asset Value per Share (continued)
Net Assets per Share as
at 31 December 2018
Net Assets per Share as
at 31 December 2017
Net Assets per Share as
at 31 December 2016
Merian Emerging Market Debt Fund
(continued)
Class C2 (USD) Income (F) USD 8.893 USD - USD -
Class C2 (ZAR) Hedged Income (F) ZAR 8.793 ZAR - ZAR -
Class I (USD) USD 9.567 USD 10.354 USD 12.372
Class S (GBP) Income GBP 9.661 GBP 10.563 GBP 11.198
Class U1 (GBP) Income GBP 10.646 GBP 11.593 GBP 12.236
Class U2 (GBP) GBP - GBP 13.947 GBP 13.750
Old Mutual European Best Ideas Fund
Class A (EUR) EUR 15.311 EUR 18.356 EUR 16.355
Class A (GBP) GBP 16.602 GBP 19.698 GBP 16.989
Class A (GBP) Income GBP - GBP 16.480 GBP 14.518
Class A (USD) USD 10.865 USD 13.648 USD 10.715
Class A (USD) Hedged USD 9.180 USD 10.753 USD 9.444
Class C (USD) USD 12.336 USD 15.802 USD 12.632
Class C2 (USD) Hedged USD 9.523 USD 11.338 USD 10.050
Class I (EUR) EUR 13.540 EUR 16.112 EUR 14.313
Class U1 (GBP) GBP 11.908 GBP 14.041 GBP 12.042
Class U2 (GBP) GBP 12.184 GBP 14.328 GBP 12.307
Class U2 (GBP) Income GBP - GBP 12.566 GBP 10.971
Merian Investment Grade Corporate
Bond Fund
Class A (GBP) Hedged Income GBP 8.984 GBP 9.668 GBP 9.581
Class A (SEK) Hedged SEK 12.723 SEK 13.416 SEK 12.928
Class A (USD) USD 12.451 USD 12.755 USD 12.030
Class A (USD) Income USD 9.518 USD 10.072 USD 9.827
Class C (USD) USD 11.137 USD 11.610 USD 11.129
Class I (USD) USD 9.801 USD - USD 10.693
Class S (GBP) Hedged Income GBP 9.647 GBP 10.371 GBP 10.231
Class U1 (GBP) Hedged Income GBP 8.981 GBP 9.613 GBP 9.500
Class U2 (GBP) Hedged GBP 10.860 GBP 11.250 GBP 10.769
Merian Global Emerging Markets Fund
Class A (EUR) EUR 13.405 EUR 16.119 EUR 13.125
Class A (GBP) GBP 12.423 GBP 14.787 GBP 11.651
Class A (USD) USD 11.363 USD 14.349 USD 10.302
Class B (USD) USD 10.108 USD 12.922 USD 9.390
Class C (USD) USD 8.662 USD 11.145 USD 8.144
Class C2 (USD) USD 10.776 USD 13.754 USD 9.974
Class I (USD) USD 10.560 USD 13.204 USD 9.411
Class R (GBP) GBP 13.018 GBP 15.408 GBP 12.086
Class S (GBP) GBP 13.515 GBP 16.006 GBP 12.552
Class U1 (GBP) GBP 12.121 GBP 14.319 GBP 11.192
Class U2 (GBP) GBP 14.679 GBP 17.312 GBP 13.506
Class W (GBP) GBP - GBP - GBP -
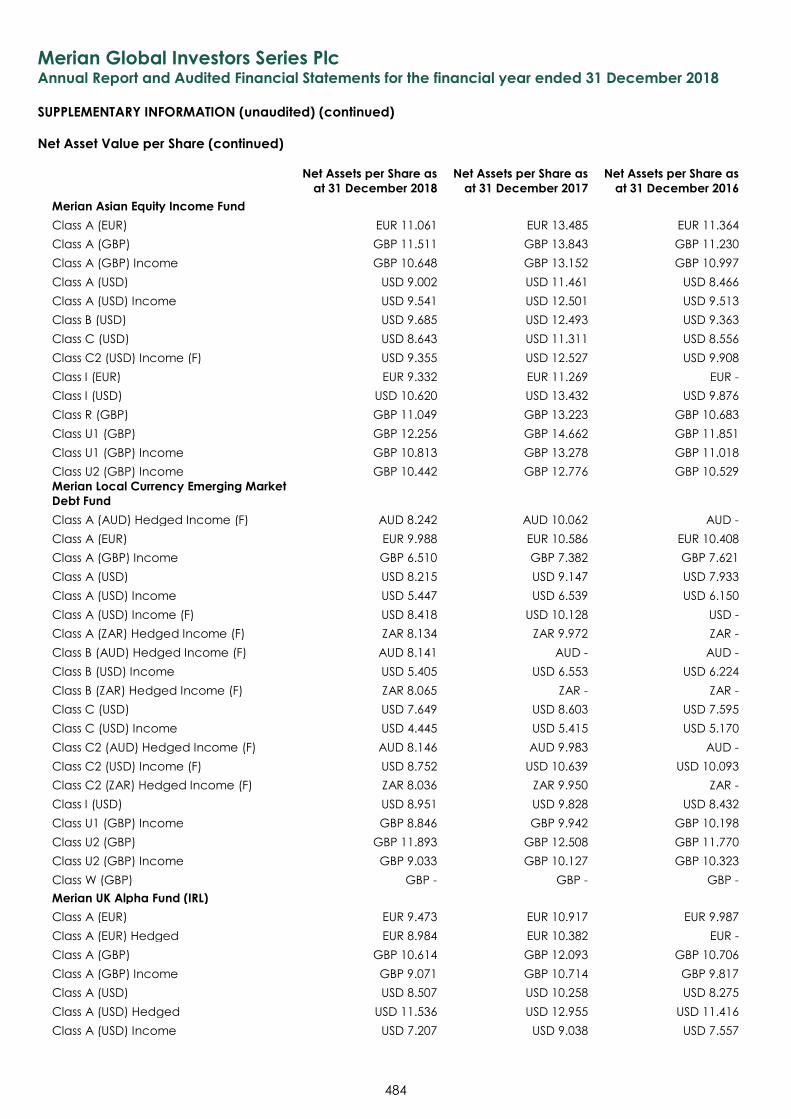
Merian Global Investors Series Plc Annual Report and Audited Financial Statements for the financial year ended 31 December 2018
SUPPLEMENTARY INFORMATION (unaudited) (continued)
484
Net Asset Value per Share (continued)
Net Assets per Share as
at 31 December 2018
Net Assets per Share as
at 31 December 2017
Net Assets per Share as
at 31 December 2016
Merian Asian Equity Income Fund
Class A (EUR) EUR 11.061 EUR 13.485 EUR 11.364
Class A (GBP) GBP 11.511 GBP 13.843 GBP 11.230
Class A (GBP) Income GBP 10.648 GBP 13.152 GBP 10.997
Class A (USD) USD 9.002 USD 11.461 USD 8.466
Class A (USD) Income USD 9.541 USD 12.501 USD 9.513
Class B (USD) USD 9.685 USD 12.493 USD 9.363
Class C (USD) USD 8.643 USD 11.311 USD 8.556
Class C2 (USD) Income (F) USD 9.355 USD 12.527 USD 9.908
Class I (EUR) EUR 9.332 EUR 11.269 EUR -
Class I (USD) USD 10.620 USD 13.432 USD 9.876
Class R (GBP) GBP 11.049 GBP 13.223 GBP 10.683
Class U1 (GBP) GBP 12.256 GBP 14.662 GBP 11.851
Class U1 (GBP) Income GBP 10.813 GBP 13.278 GBP 11.018
Class U2 (GBP) Income GBP 10.442 GBP 12.776 GBP 10.529
Merian Local Currency Emerging Market
Debt Fund
Class A (AUD) Hedged Income (F) AUD 8.242 AUD 10.062 AUD -
Class A (EUR) EUR 9.988 EUR 10.586 EUR 10.408
Class A (GBP) Income GBP 6.510 GBP 7.382 GBP 7.621
Class A (USD) USD 8.215 USD 9.147 USD 7.933
Class A (USD) Income USD 5.447 USD 6.539 USD 6.150
Class A (USD) Income (F) USD 8.418 USD 10.128 USD -
Class A (ZAR) Hedged Income (F) ZAR 8.134 ZAR 9.972 ZAR -
Class B (AUD) Hedged Income (F) AUD 8.141 AUD - AUD -
Class B (USD) Income USD 5.405 USD 6.553 USD 6.224
Class B (ZAR) Hedged Income (F) ZAR 8.065 ZAR - ZAR -
Class C (USD) USD 7.649 USD 8.603 USD 7.595
Class C (USD) Income USD 4.445 USD 5.415 USD 5.170
Class C2 (AUD) Hedged Income (F) AUD 8.146 AUD 9.983 AUD -
Class C2 (USD) Income (F) USD 8.752 USD 10.639 USD 10.093
Class C2 (ZAR) Hedged Income (F) ZAR 8.036 ZAR 9.950 ZAR -
Class I (USD) USD 8.951 USD 9.828 USD 8.432
Class U1 (GBP) Income GBP 8.846 GBP 9.942 GBP 10.198
Class U2 (GBP) GBP 11.893 GBP 12.508 GBP 11.770
Class U2 (GBP) Income GBP 9.033 GBP 10.127 GBP 10.323
Class W (GBP) GBP - GBP - GBP -
Merian UK Alpha Fund (IRL)
Class A (EUR) EUR 9.473 EUR 10.917 EUR 9.987
Class A (EUR) Hedged EUR 8.984 EUR 10.382 EUR -
Class A (GBP) GBP 10.614 GBP 12.093 GBP 10.706
Class A (GBP) Income GBP 9.071 GBP 10.714 GBP 9.817
Class A (USD) USD 8.507 USD 10.258 USD 8.275
Class A (USD) Hedged USD 11.536 USD 12.955 USD 11.416
Class A (USD) Income USD 7.207 USD 9.038 USD 7.557
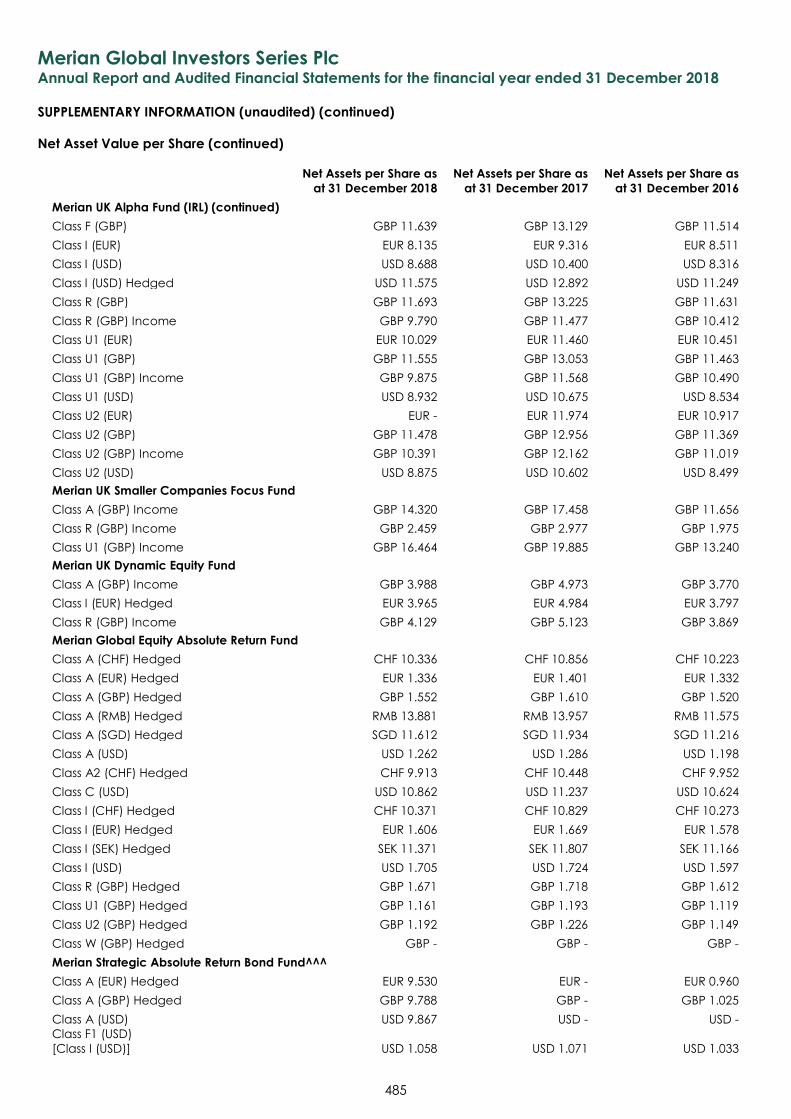
Merian Global Investors Series Plc Annual Report and Audited Financial Statements for the financial year ended 31 December 2018
SUPPLEMENTARY INFORMATION (unaudited) (continued)
485
Net Asset Value per Share (continued)
Net Assets per Share as
at 31 December 2018
Net Assets per Share as
at 31 December 2017
Net Assets per Share as
at 31 December 2016
Merian UK Alpha Fund (IRL) (continued)
Class F (GBP) GBP 11.639 GBP 13.129 GBP 11.514
Class I (EUR) EUR 8.135 EUR 9.316 EUR 8.511
Class I (USD) USD 8.688 USD 10.400 USD 8.316
Class I (USD) Hedged USD 11.575 USD 12.892 USD 11.249
Class R (GBP) GBP 11.693 GBP 13.225 GBP 11.631
Class R (GBP) Income GBP 9.790 GBP 11.477 GBP 10.412
Class U1 (EUR) EUR 10.029 EUR 11.460 EUR 10.451
Class U1 (GBP) GBP 11.555 GBP 13.053 GBP 11.463
Class U1 (GBP) Income GBP 9.875 GBP 11.568 GBP 10.490
Class U1 (USD) USD 8.932 USD 10.675 USD 8.534
Class U2 (EUR) EUR - EUR 11.974 EUR 10.917
Class U2 (GBP) GBP 11.478 GBP 12.956 GBP 11.369
Class U2 (GBP) Income GBP 10.391 GBP 12.162 GBP 11.019
Class U2 (USD) USD 8.875 USD 10.602 USD 8.499
Merian UK Smaller Companies Focus Fund
Class A (GBP) Income GBP 14.320 GBP 17.458 GBP 11.656
Class R (GBP) Income GBP 2.459 GBP 2.977 GBP 1.975
Class U1 (GBP) Income GBP 16.464 GBP 19.885 GBP 13.240
Merian UK Dynamic Equity Fund
Class A (GBP) Income GBP 3.988 GBP 4.973 GBP 3.770
Class I (EUR) Hedged EUR 3.965 EUR 4.984 EUR 3.797
Class R (GBP) Income GBP 4.129 GBP 5.123 GBP 3.869
Merian Global Equity Absolute Return Fund
Class A (CHF) Hedged CHF 10.336 CHF 10.856 CHF 10.223
Class A (EUR) Hedged EUR 1.336 EUR 1.401 EUR 1.332
Class A (GBP) Hedged GBP 1.552 GBP 1.610 GBP 1.520
Class A (RMB) Hedged RMB 13.881 RMB 13.957 RMB 11.575
Class A (SGD) Hedged SGD 11.612 SGD 11.934 SGD 11.216
Class A (USD) USD 1.262 USD 1.286 USD 1.198
Class A2 (CHF) Hedged CHF 9.913 CHF 10.448 CHF 9.952
Class C (USD) USD 10.862 USD 11.237 USD 10.624
Class I (CHF) Hedged CHF 10.371 CHF 10.829 CHF 10.273
Class I (EUR) Hedged EUR 1.606 EUR 1.669 EUR 1.578
Class I (SEK) Hedged SEK 11.371 SEK 11.807 SEK 11.166
Class I (USD) USD 1.705 USD 1.724 USD 1.597
Class R (GBP) Hedged GBP 1.671 GBP 1.718 GBP 1.612
Class U1 (GBP) Hedged GBP 1.161 GBP 1.193 GBP 1.119
Class U2 (GBP) Hedged GBP 1.192 GBP 1.226 GBP 1.149
Class W (GBP) Hedged GBP - GBP - GBP -
Merian Strategic Absolute Return Bond Fund^^^
Class A (EUR) Hedged EUR 9.530 EUR - EUR 0.960
Class A (GBP) Hedged GBP 9.788 GBP - GBP 1.025
Class A (USD) USD 9.867 USD - USD -
Class F1 (USD)
[Class I (USD)] USD 1.058 USD 1.071 USD 1.033
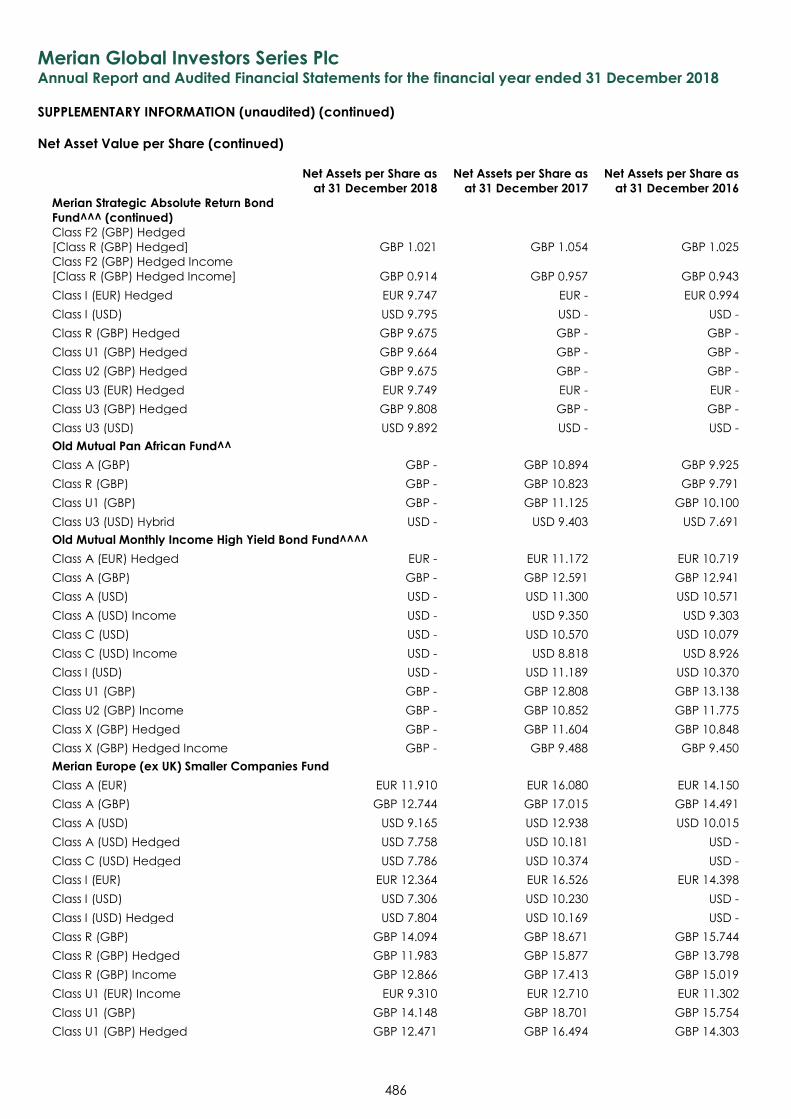
Merian Global Investors Series Plc Annual Report and Audited Financial Statements for the financial year ended 31 December 2018
SUPPLEMENTARY INFORMATION (unaudited) (continued)
486
Net Asset Value per Share (continued)
Net Assets per Share as
at 31 December 2018
Net Assets per Share as
at 31 December 2017
Net Assets per Share as
at 31 December 2016
Merian Strategic Absolute Return Bond
Fund^^^ (continued) Class F2 (GBP) Hedged
[Class R (GBP) Hedged] GBP 1.021 GBP 1.054 GBP 1.025
Class F2 (GBP) Hedged Income
[Class R (GBP) Hedged Income] GBP 0.914 GBP 0.957 GBP 0.943
Class I (EUR) Hedged EUR 9.747 EUR - EUR 0.994
Class I (USD) USD 9.795 USD - USD -
Class R (GBP) Hedged GBP 9.675 GBP - GBP -
Class U1 (GBP) Hedged GBP 9.664 GBP - GBP -
Class U2 (GBP) Hedged GBP 9.675 GBP - GBP -
Class U3 (EUR) Hedged EUR 9.749 EUR - EUR -
Class U3 (GBP) Hedged GBP 9.808 GBP - GBP -
Class U3 (USD) USD 9.892 USD - USD -
Old Mutual Pan African Fund^^
Class A (GBP) GBP - GBP 10.894 GBP 9.925
Class R (GBP) GBP - GBP 10.823 GBP 9.791
Class U1 (GBP) GBP - GBP 11.125 GBP 10.100
Class U3 (USD) Hybrid USD - USD 9.403 USD 7.691
Old Mutual Monthly Income High Yield Bond Fund^^^^
Class A (EUR) Hedged EUR - EUR 11.172 EUR 10.719
Class A (GBP) GBP - GBP 12.591 GBP 12.941
Class A (USD) USD - USD 11.300 USD 10.571
Class A (USD) Income USD - USD 9.350 USD 9.303
Class C (USD) USD - USD 10.570 USD 10.079
Class C (USD) Income USD - USD 8.818 USD 8.926
Class I (USD) USD - USD 11.189 USD 10.370
Class U1 (GBP) GBP - GBP 12.808 GBP 13.138
Class U2 (GBP) Income GBP - GBP 10.852 GBP 11.775
Class X (GBP) Hedged GBP - GBP 11.604 GBP 10.848
Class X (GBP) Hedged Income GBP - GBP 9.488 GBP 9.450
Merian Europe (ex UK) Smaller Companies Fund
Class A (EUR) EUR 11.910 EUR 16.080 EUR 14.150
Class A (GBP) GBP 12.744 GBP 17.015 GBP 14.491
Class A (USD) USD 9.165 USD 12.938 USD 10.015
Class A (USD) Hedged USD 7.758 USD 10.181 USD -
Class C (USD) Hedged USD 7.786 USD 10.374 USD -
Class I (EUR) EUR 12.364 EUR 16.526 EUR 14.398
Class I (USD) USD 7.306 USD 10.230 USD -
Class I (USD) Hedged USD 7.804 USD 10.169 USD -
Class R (GBP) GBP 14.094 GBP 18.671 GBP 15.744
Class R (GBP) Hedged GBP 11.983 GBP 15.877 GBP 13.798
Class R (GBP) Income GBP 12.866 GBP 17.413 GBP 15.019
Class U1 (EUR) Income EUR 9.310 EUR 12.710 EUR 11.302
Class U1 (GBP) GBP 14.148 GBP 18.701 GBP 15.754
Class U1 (GBP) Hedged GBP 12.471 GBP 16.494 GBP 14.303
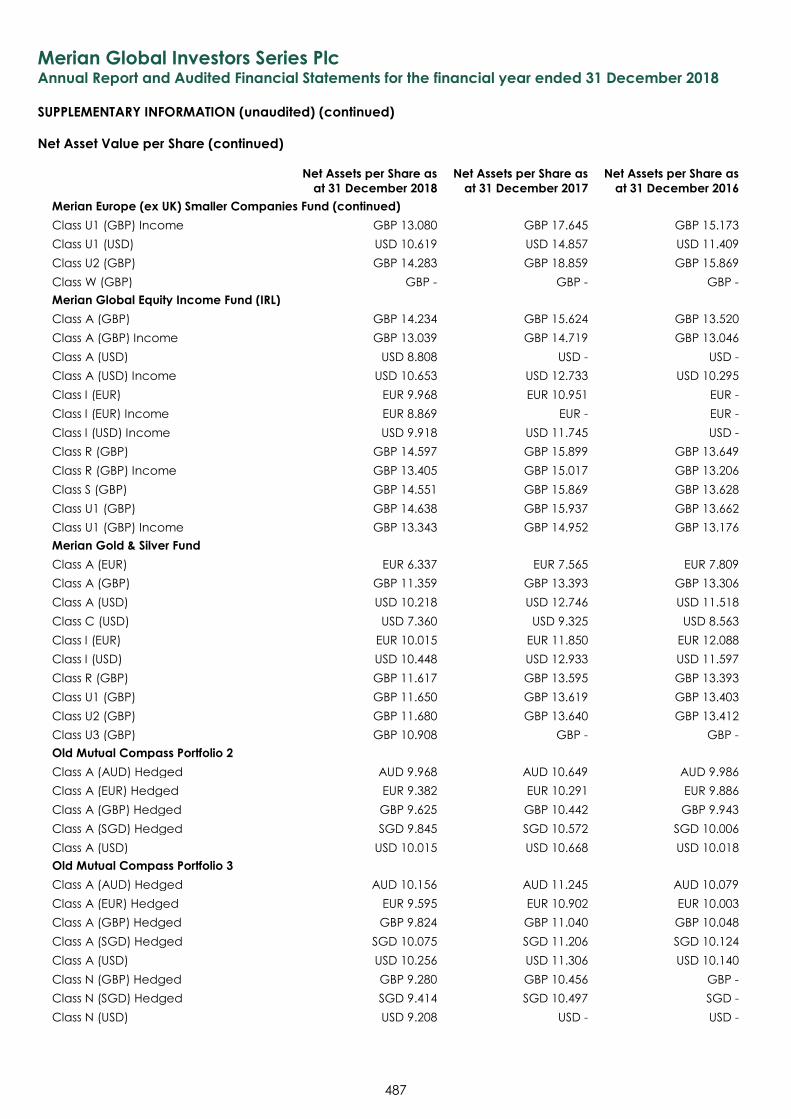
Merian Global Investors Series Plc Annual Report and Audited Financial Statements for the financial year ended 31 December 2018
SUPPLEMENTARY INFORMATION (unaudited) (continued)
487
Net Asset Value per Share (continued)
Net Assets per Share as
at 31 December 2018
Net Assets per Share as
at 31 December 2017
Net Assets per Share as
at 31 December 2016
Merian Europe (ex UK) Smaller Companies Fund (continued)
Class U1 (GBP) Income GBP 13.080 GBP 17.645 GBP 15.173
Class U1 (USD) USD 10.619 USD 14.857 USD 11.409
Class U2 (GBP) GBP 14.283 GBP 18.859 GBP 15.869
Class W (GBP) GBP - GBP - GBP -
Merian Global Equity Income Fund (IRL)
Class A (GBP) GBP 14.234 GBP 15.624 GBP 13.520
Class A (GBP) Income GBP 13.039 GBP 14.719 GBP 13.046
Class A (USD) USD 8.808 USD - USD -
Class A (USD) Income USD 10.653 USD 12.733 USD 10.295
Class I (EUR) EUR 9.968 EUR 10.951 EUR -
Class I (EUR) Income EUR 8.869 EUR - EUR -
Class I (USD) Income USD 9.918 USD 11.745 USD -
Class R (GBP) GBP 14.597 GBP 15.899 GBP 13.649
Class R (GBP) Income GBP 13.405 GBP 15.017 GBP 13.206
Class S (GBP) GBP 14.551 GBP 15.869 GBP 13.628
Class U1 (GBP) GBP 14.638 GBP 15.937 GBP 13.662
Class U1 (GBP) Income GBP 13.343 GBP 14.952 GBP 13.176
Merian Gold & Silver Fund
Class A (EUR) EUR 6.337 EUR 7.565 EUR 7.809
Class A (GBP) GBP 11.359 GBP 13.393 GBP 13.306
Class A (USD) USD 10.218 USD 12.746 USD 11.518
Class C (USD) USD 7.360 USD 9.325 USD 8.563
Class I (EUR) EUR 10.015 EUR 11.850 EUR 12.088
Class I (USD) USD 10.448 USD 12.933 USD 11.597
Class R (GBP) GBP 11.617 GBP 13.595 GBP 13.393
Class U1 (GBP) GBP 11.650 GBP 13.619 GBP 13.403
Class U2 (GBP) GBP 11.680 GBP 13.640 GBP 13.412
Class U3 (GBP) GBP 10.908 GBP - GBP -
Old Mutual Compass Portfolio 2
Class A (AUD) Hedged AUD 9.968 AUD 10.649 AUD 9.986
Class A (EUR) Hedged EUR 9.382 EUR 10.291 EUR 9.886
Class A (GBP) Hedged GBP 9.625 GBP 10.442 GBP 9.943
Class A (SGD) Hedged SGD 9.845 SGD 10.572 SGD 10.006
Class A (USD) USD 10.015 USD 10.668 USD 10.018
Old Mutual Compass Portfolio 3
Class A (AUD) Hedged AUD 10.156 AUD 11.245 AUD 10.079
Class A (EUR) Hedged EUR 9.595 EUR 10.902 EUR 10.003
Class A (GBP) Hedged GBP 9.824 GBP 11.040 GBP 10.048
Class A (SGD) Hedged SGD 10.075 SGD 11.206 SGD 10.124
Class A (USD) USD 10.256 USD 11.306 USD 10.140
Class N (GBP) Hedged GBP 9.280 GBP 10.456 GBP -
Class N (SGD) Hedged SGD 9.414 SGD 10.497 SGD -
Class N (USD) USD 9.208 USD - USD -
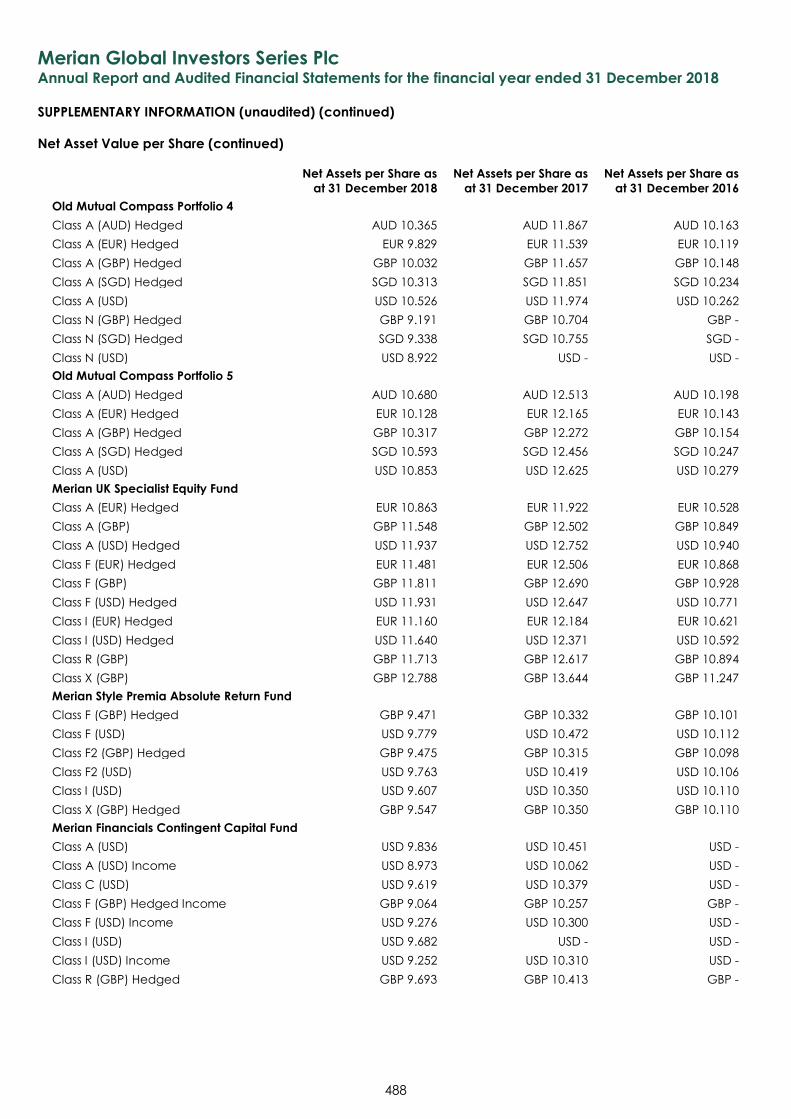
Merian Global Investors Series Plc Annual Report and Audited Financial Statements for the financial year ended 31 December 2018
SUPPLEMENTARY INFORMATION (unaudited) (continued)
488
Net Asset Value per Share (continued)
Net Assets per Share as
at 31 December 2018
Net Assets per Share as
at 31 December 2017
Net Assets per Share as
at 31 December 2016
Old Mutual Compass Portfolio 4
Class A (AUD) Hedged AUD 10.365 AUD 11.867 AUD 10.163
Class A (EUR) Hedged EUR 9.829 EUR 11.539 EUR 10.119
Class A (GBP) Hedged GBP 10.032 GBP 11.657 GBP 10.148
Class A (SGD) Hedged SGD 10.313 SGD 11.851 SGD 10.234
Class A (USD) USD 10.526 USD 11.974 USD 10.262
Class N (GBP) Hedged GBP 9.191 GBP 10.704 GBP -
Class N (SGD) Hedged SGD 9.338 SGD 10.755 SGD -
Class N (USD) USD 8.922 USD - USD -
Old Mutual Compass Portfolio 5
Class A (AUD) Hedged AUD 10.680 AUD 12.513 AUD 10.198
Class A (EUR) Hedged EUR 10.128 EUR 12.165 EUR 10.143
Class A (GBP) Hedged GBP 10.317 GBP 12.272 GBP 10.154
Class A (SGD) Hedged SGD 10.593 SGD 12.456 SGD 10.247
Class A (USD) USD 10.853 USD 12.625 USD 10.279
Merian UK Specialist Equity Fund
Class A (EUR) Hedged EUR 10.863 EUR 11.922 EUR 10.528
Class A (GBP) GBP 11.548 GBP 12.502 GBP 10.849
Class A (USD) Hedged USD 11.937 USD 12.752 USD 10.940
Class F (EUR) Hedged EUR 11.481 EUR 12.506 EUR 10.868
Class F (GBP) GBP 11.811 GBP 12.690 GBP 10.928
Class F (USD) Hedged USD 11.931 USD 12.647 USD 10.771
Class I (EUR) Hedged EUR 11.160 EUR 12.184 EUR 10.621
Class I (USD) Hedged USD 11.640 USD 12.371 USD 10.592
Class R (GBP) GBP 11.713 GBP 12.617 GBP 10.894
Class X (GBP) GBP 12.788 GBP 13.644 GBP 11.247
Merian Style Premia Absolute Return Fund
Class F (GBP) Hedged GBP 9.471 GBP 10.332 GBP 10.101
Class F (USD) USD 9.779 USD 10.472 USD 10.112
Class F2 (GBP) Hedged GBP 9.475 GBP 10.315 GBP 10.098
Class F2 (USD) USD 9.763 USD 10.419 USD 10.106
Class I (USD) USD 9.607 USD 10.350 USD 10.110
Class X (GBP) Hedged GBP 9.547 GBP 10.350 GBP 10.110
Merian Financials Contingent Capital Fund
Class A (USD) USD 9.836 USD 10.451 USD -
Class A (USD) Income USD 8.973 USD 10.062 USD -
Class C (USD) USD 9.619 USD 10.379 USD -
Class F (GBP) Hedged Income GBP 9.064 GBP 10.257 GBP -
Class F (USD) Income USD 9.276 USD 10.300 USD -
Class I (USD) USD 9.682 USD - USD -
Class I (USD) Income USD 9.252 USD 10.310 USD -
Class R (GBP) Hedged GBP 9.693 GBP 10.413 GBP -
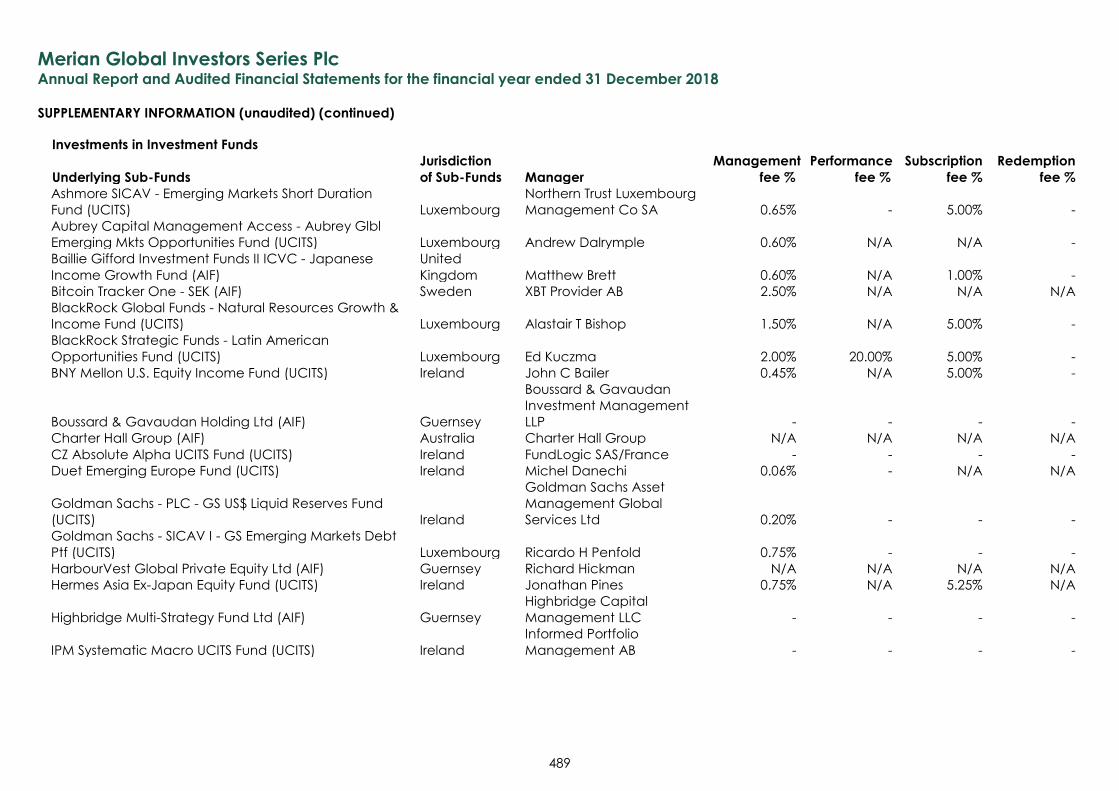
Merian Global Investors Series Plc Annual Report and Audited Financial Statements for the financial year ended 31 December 2018
SUPPLEMENTARY INFORMATION (unaudited) (continued)
489
Investments in Investment Funds
Jurisdiction Management Performance Subscription Redemption
Underlying Sub-Funds of Sub-Funds Manager fee % fee % fee % fee %
Ashmore SICAV - Emerging Markets Short Duration
Fund (UCITS) Luxembourg
Northern Trust Luxembourg
Management Co SA 0.65% - 5.00% -
Aubrey Capital Management Access - Aubrey Glbl
Emerging Mkts Opportunities Fund (UCITS) Luxembourg Andrew Dalrymple 0.60% N/A N/A -
Baillie Gifford Investment Funds II ICVC - Japanese
Income Growth Fund (AIF)
United
Kingdom Matthew Brett 0.60% N/A 1.00% -
Bitcoin Tracker One - SEK (AIF) Sweden XBT Provider AB 2.50% N/A N/A N/A
BlackRock Global Funds - Natural Resources Growth &
Income Fund (UCITS) Luxembourg Alastair T Bishop 1.50% N/A 5.00% -
BlackRock Strategic Funds - Latin American
Opportunities Fund (UCITS) Luxembourg Ed Kuczma 2.00% 20.00% 5.00% -
BNY Mellon U.S. Equity Income Fund (UCITS) Ireland John C Bailer 0.45% N/A 5.00% -
Boussard & Gavaudan Holding Ltd (AIF) Guernsey
Boussard & Gavaudan
Investment Management
LLP - - - -
Charter Hall Group (AIF) Australia Charter Hall Group N/A N/A N/A N/A
CZ Absolute Alpha UCITS Fund (UCITS) Ireland FundLogic SAS/France - - - -
Duet Emerging Europe Fund (UCITS) Ireland Michel Danechi 0.06% - N/A N/A
Goldman Sachs - PLC - GS US$ Liquid Reserves Fund
(UCITS) Ireland
Goldman Sachs Asset
Management Global
Services Ltd 0.20% - - -
Goldman Sachs - SICAV I - GS Emerging Markets Debt
Ptf (UCITS) Luxembourg Ricardo H Penfold 0.75% - - -
HarbourVest Global Private Equity Ltd (AIF) Guernsey Richard Hickman N/A N/A N/A N/A
Hermes Asia Ex-Japan Equity Fund (UCITS) Ireland Jonathan Pines 0.75% N/A 5.25% N/A
Highbridge Multi-Strategy Fund Ltd (AIF) Guernsey
Highbridge Capital
Management LLC - - - -
IPM Systematic Macro UCITS Fund (UCITS) Ireland
Informed Portfolio
Management AB - - - -
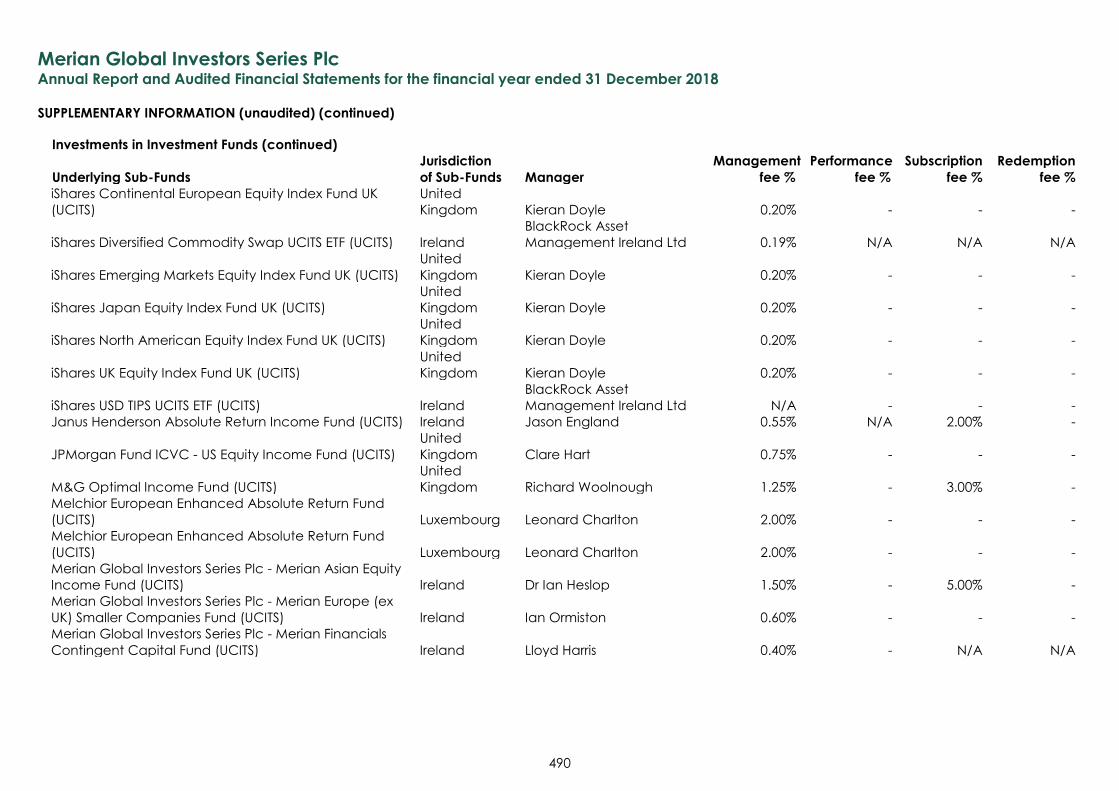
Merian Global Investors Series Plc Annual Report and Audited Financial Statements for the financial year ended 31 December 2018
SUPPLEMENTARY INFORMATION (unaudited) (continued)
490
Investments in Investment Funds (continued)
Jurisdiction Management Performance Subscription Redemption
Underlying Sub-Funds of Sub-Funds Manager fee % fee % fee % fee %
iShares Continental European Equity Index Fund UK
(UCITS)
United
Kingdom Kieran Doyle 0.20% - - -
iShares Diversified Commodity Swap UCITS ETF (UCITS) Ireland
BlackRock Asset
Management Ireland Ltd 0.19% N/A N/A N/A
iShares Emerging Markets Equity Index Fund UK (UCITS)
United
Kingdom Kieran Doyle 0.20% - - -
iShares Japan Equity Index Fund UK (UCITS)
United
Kingdom Kieran Doyle 0.20% - - -
iShares North American Equity Index Fund UK (UCITS)
United
Kingdom Kieran Doyle 0.20% - - -
iShares UK Equity Index Fund UK (UCITS)
United
Kingdom Kieran Doyle 0.20% - - -
iShares USD TIPS UCITS ETF (UCITS) Ireland
BlackRock Asset
Management Ireland Ltd N/A - - -
Janus Henderson Absolute Return Income Fund (UCITS) Ireland Jason England 0.55% N/A 2.00% -
JPMorgan Fund ICVC - US Equity Income Fund (UCITS)
United
Kingdom Clare Hart 0.75% - - -
M&G Optimal Income Fund (UCITS)
United
Kingdom Richard Woolnough 1.25% - 3.00% -
Melchior European Enhanced Absolute Return Fund
(UCITS) Luxembourg Leonard Charlton 2.00% - - -
Melchior European Enhanced Absolute Return Fund
(UCITS) Luxembourg Leonard Charlton 2.00% - - -
Merian Global Investors Series Plc - Merian Asian Equity
Income Fund (UCITS) Ireland Dr Ian Heslop 1.50% - 5.00% -
Merian Global Investors Series Plc - Merian Europe (ex
UK) Smaller Companies Fund (UCITS) Ireland Ian Ormiston 0.60% - - -
Merian Global Investors Series Plc - Merian Financials
Contingent Capital Fund (UCITS) Ireland Lloyd Harris 0.40% - N/A N/A
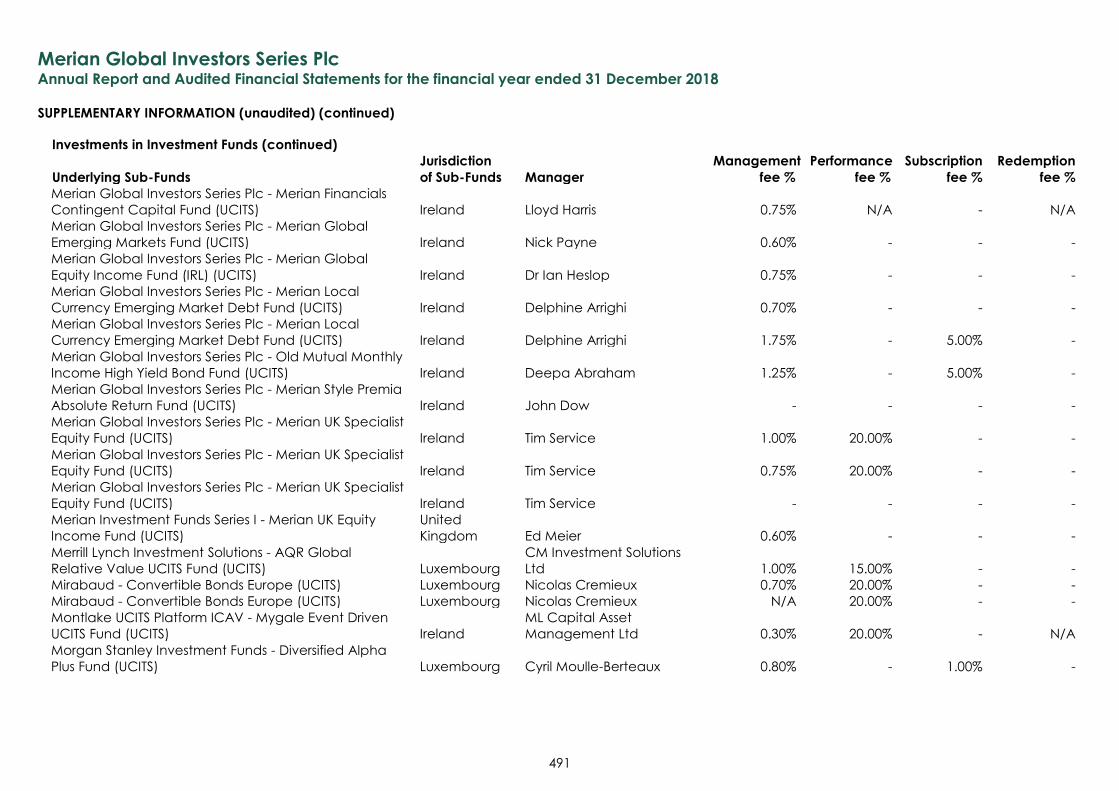
Merian Global Investors Series Plc Annual Report and Audited Financial Statements for the financial year ended 31 December 2018
SUPPLEMENTARY INFORMATION (unaudited) (continued)
491
Investments in Investment Funds (continued)
Jurisdiction Management Performance Subscription Redemption
Underlying Sub-Funds of Sub-Funds Manager fee % fee % fee % fee %
Merian Global Investors Series Plc - Merian Financials
Contingent Capital Fund (UCITS) Ireland Lloyd Harris 0.75% N/A - N/A
Merian Global Investors Series Plc - Merian Global
Emerging Markets Fund (UCITS) Ireland Nick Payne 0.60% - - -
Merian Global Investors Series Plc - Merian Global
Equity Income Fund (IRL) (UCITS) Ireland Dr Ian Heslop 0.75% - - -
Merian Global Investors Series Plc - Merian Local
Currency Emerging Market Debt Fund (UCITS) Ireland Delphine Arrighi 0.70% - - -
Merian Global Investors Series Plc - Merian Local
Currency Emerging Market Debt Fund (UCITS) Ireland Delphine Arrighi 1.75% - 5.00% -
Merian Global Investors Series Plc - Old Mutual Monthly
Income High Yield Bond Fund (UCITS) Ireland Deepa Abraham 1.25% - 5.00% -
Merian Global Investors Series Plc - Merian Style Premia
Absolute Return Fund (UCITS) Ireland John Dow - - - -
Merian Global Investors Series Plc - Merian UK Specialist
Equity Fund (UCITS) Ireland Tim Service 1.00% 20.00% - -
Merian Global Investors Series Plc - Merian UK Specialist
Equity Fund (UCITS) Ireland Tim Service 0.75% 20.00% - -
Merian Global Investors Series Plc - Merian UK Specialist
Equity Fund (UCITS) Ireland Tim Service - - - -
Merian Investment Funds Series I - Merian UK Equity
Income Fund (UCITS)
United
Kingdom Ed Meier 0.60% - - -
Merrill Lynch Investment Solutions - AQR Global
Relative Value UCITS Fund (UCITS) Luxembourg
CM Investment Solutions
Ltd 1.00% 15.00% - -
Mirabaud - Convertible Bonds Europe (UCITS) Luxembourg Nicolas Cremieux 0.70% 20.00% - -
Mirabaud - Convertible Bonds Europe (UCITS) Luxembourg Nicolas Cremieux N/A 20.00% - -
Montlake UCITS Platform ICAV - Mygale Event Driven
UCITS Fund (UCITS) Ireland
ML Capital Asset
Management Ltd 0.30% 20.00% - N/A
Morgan Stanley Investment Funds - Diversified Alpha
Plus Fund (UCITS) Luxembourg Cyril Moulle-Berteaux 0.80% - 1.00% -
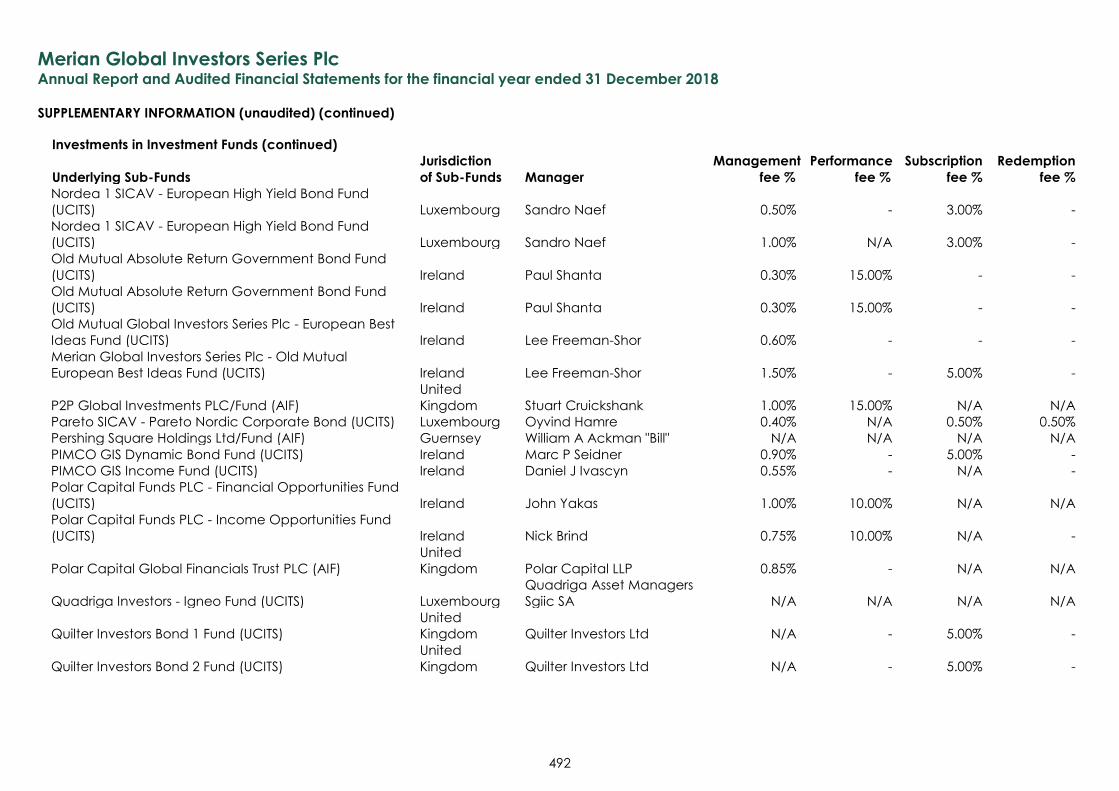
Merian Global Investors Series Plc Annual Report and Audited Financial Statements for the financial year ended 31 December 2018
SUPPLEMENTARY INFORMATION (unaudited) (continued)
492
Investments in Investment Funds (continued)
Jurisdiction Management Performance Subscription Redemption
Underlying Sub-Funds of Sub-Funds Manager fee % fee % fee % fee %
Nordea 1 SICAV - European High Yield Bond Fund
(UCITS) Luxembourg Sandro Naef 0.50% - 3.00% -
Nordea 1 SICAV - European High Yield Bond Fund
(UCITS) Luxembourg Sandro Naef 1.00% N/A 3.00% -
Old Mutual Absolute Return Government Bond Fund
(UCITS) Ireland Paul Shanta 0.30% 15.00% - -
Old Mutual Absolute Return Government Bond Fund
(UCITS) Ireland Paul Shanta 0.30% 15.00% - -
Old Mutual Global Investors Series Plc - European Best
Ideas Fund (UCITS) Ireland Lee Freeman-Shor 0.60% - - -
Merian Global Investors Series Plc - Old Mutual
European Best Ideas Fund (UCITS) Ireland Lee Freeman-Shor 1.50% - 5.00% -
P2P Global Investments PLC/Fund (AIF)
United
Kingdom Stuart Cruickshank 1.00% 15.00% N/A N/A
Pareto SICAV - Pareto Nordic Corporate Bond (UCITS) Luxembourg Oyvind Hamre 0.40% N/A 0.50% 0.50%
Pershing Square Holdings Ltd/Fund (AIF) Guernsey William A Ackman "Bill" N/A N/A N/A N/A
PIMCO GIS Dynamic Bond Fund (UCITS) Ireland Marc P Seidner 0.90% - 5.00% -
PIMCO GIS Income Fund (UCITS) Ireland Daniel J Ivascyn 0.55% - N/A -
Polar Capital Funds PLC - Financial Opportunities Fund
(UCITS) Ireland John Yakas 1.00% 10.00% N/A N/A
Polar Capital Funds PLC - Income Opportunities Fund
(UCITS) Ireland Nick Brind 0.75% 10.00% N/A -
Polar Capital Global Financials Trust PLC (AIF)
United
Kingdom Polar Capital LLP 0.85% - N/A N/A
Quadriga Investors - Igneo Fund (UCITS) Luxembourg
Quadriga Asset Managers
Sgiic SA N/A N/A N/A N/A
Quilter Investors Bond 1 Fund (UCITS)
United
Kingdom Quilter Investors Ltd N/A - 5.00% -
Quilter Investors Bond 2 Fund (UCITS)
United
Kingdom Quilter Investors Ltd N/A - 5.00% -
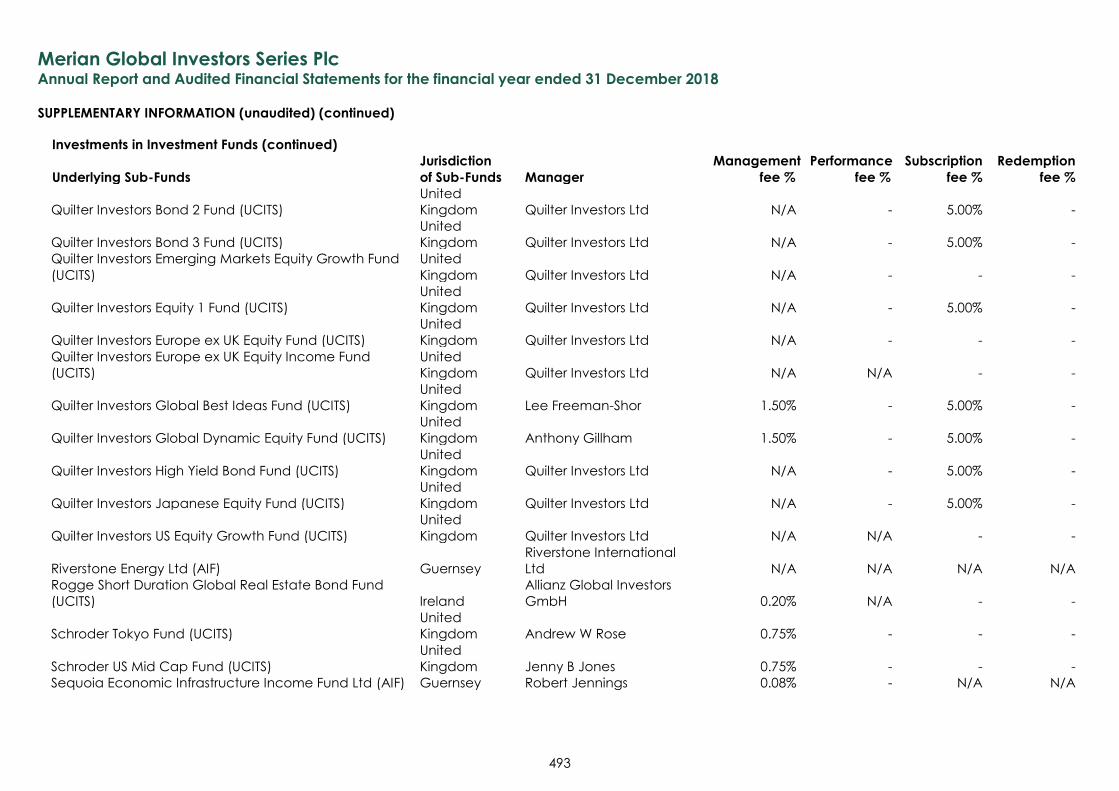
Merian Global Investors Series Plc Annual Report and Audited Financial Statements for the financial year ended 31 December 2018
SUPPLEMENTARY INFORMATION (unaudited) (continued)
493
Investments in Investment Funds (continued)
Jurisdiction Management Performance Subscription Redemption
Underlying Sub-Funds of Sub-Funds Manager fee % fee % fee % fee %
Quilter Investors Bond 2 Fund (UCITS)
United
Kingdom Quilter Investors Ltd N/A - 5.00% -
Quilter Investors Bond 3 Fund (UCITS)
United
Kingdom Quilter Investors Ltd N/A - 5.00% -
Quilter Investors Emerging Markets Equity Growth Fund
(UCITS)
United
Kingdom Quilter Investors Ltd N/A - - -
Quilter Investors Equity 1 Fund (UCITS)
United
Kingdom Quilter Investors Ltd N/A - 5.00% -
Quilter Investors Europe ex UK Equity Fund (UCITS)
United
Kingdom Quilter Investors Ltd N/A - - -
Quilter Investors Europe ex UK Equity Income Fund
(UCITS)
United
Kingdom Quilter Investors Ltd N/A N/A - -
Quilter Investors Global Best Ideas Fund (UCITS)
United
Kingdom Lee Freeman-Shor 1.50% - 5.00% -
Quilter Investors Global Dynamic Equity Fund (UCITS)
United
Kingdom Anthony Gillham 1.50% - 5.00% -
Quilter Investors High Yield Bond Fund (UCITS)
United
Kingdom Quilter Investors Ltd N/A - 5.00% -
Quilter Investors Japanese Equity Fund (UCITS)
United
Kingdom Quilter Investors Ltd N/A - 5.00% -
Quilter Investors US Equity Growth Fund (UCITS)
United
Kingdom Quilter Investors Ltd N/A N/A - -
Riverstone Energy Ltd (AIF) Guernsey
Riverstone International
Ltd N/A N/A N/A N/A
Rogge Short Duration Global Real Estate Bond Fund
(UCITS) Ireland
Allianz Global Investors
GmbH 0.20% N/A - -
Schroder Tokyo Fund (UCITS)
United
Kingdom Andrew W Rose 0.75% - - -
Schroder US Mid Cap Fund (UCITS)
United
Kingdom Jenny B Jones 0.75% - - -
Sequoia Economic Infrastructure Income Fund Ltd (AIF) Guernsey Robert Jennings 0.08% - N/A N/A
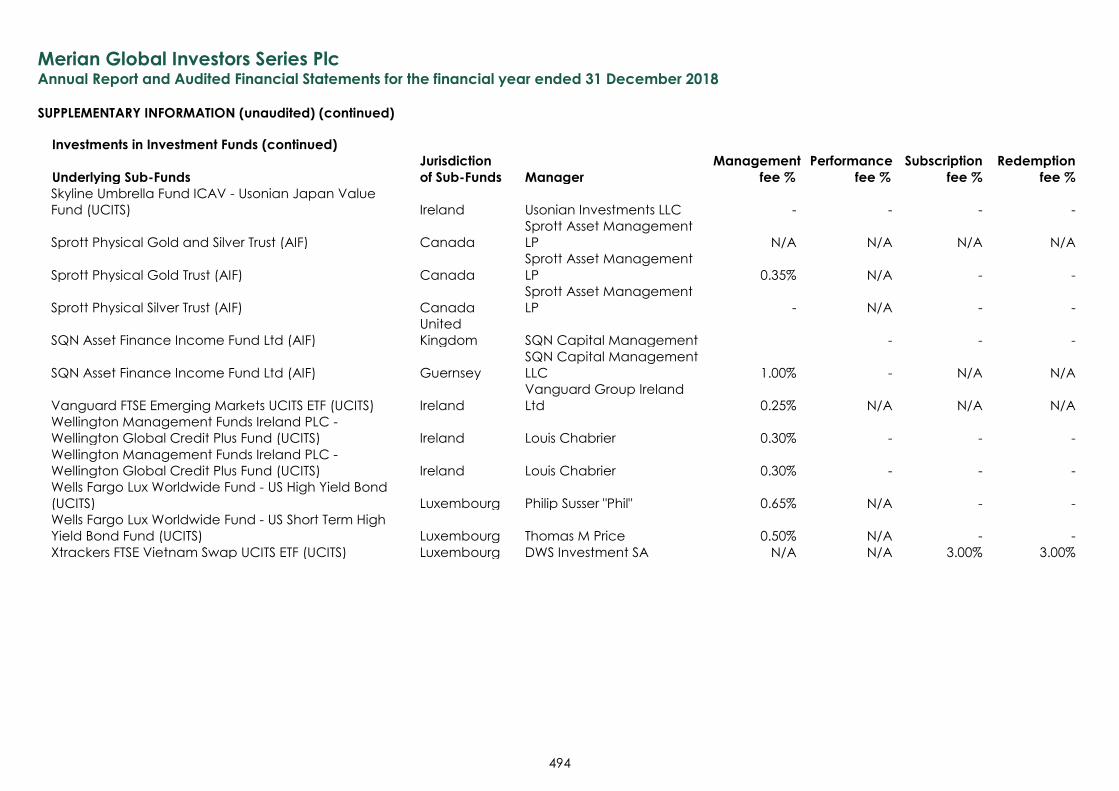
Merian Global Investors Series Plc Annual Report and Audited Financial Statements for the financial year ended 31 December 2018
SUPPLEMENTARY INFORMATION (unaudited) (continued)
494
Investments in Investment Funds (continued)
Jurisdiction Management Performance Subscription Redemption
Underlying Sub-Funds of Sub-Funds Manager fee % fee % fee % fee %
Skyline Umbrella Fund ICAV - Usonian Japan Value
Fund (UCITS) Ireland Usonian Investments LLC - - - -
Sprott Physical Gold and Silver Trust (AIF) Canada
Sprott Asset Management
LP N/A N/A N/A N/A
Sprott Physical Gold Trust (AIF) Canada
Sprott Asset Management
LP 0.35% N/A - -
Sprott Physical Silver Trust (AIF) Canada
Sprott Asset Management
LP - N/A - -
SQN Asset Finance Income Fund Ltd (AIF)
United
Kingdom SQN Capital Management - - -
SQN Asset Finance Income Fund Ltd (AIF) Guernsey
SQN Capital Management
LLC 1.00% - N/A N/A
Vanguard FTSE Emerging Markets UCITS ETF (UCITS) Ireland
Vanguard Group Ireland
Ltd 0.25% N/A N/A N/A
Wellington Management Funds Ireland PLC -
Wellington Global Credit Plus Fund (UCITS) Ireland Louis Chabrier 0.30% - - -
Wellington Management Funds Ireland PLC -
Wellington Global Credit Plus Fund (UCITS) Ireland Louis Chabrier 0.30% - - -
Wells Fargo Lux Worldwide Fund - US High Yield Bond
(UCITS) Luxembourg Philip Susser "Phil" 0.65% N/A - -
Wells Fargo Lux Worldwide Fund - US Short Term High
Yield Bond Fund (UCITS) Luxembourg Thomas M Price 0.50% N/A - -
Xtrackers FTSE Vietnam Swap UCITS ETF (UCITS) Luxembourg DWS Investment SA N/A N/A 3.00% 3.00%
Merian Global Investors Series Plc Annual Report and Audited Financial Statements for the financial year ended 31 December 2018
SUPPLEMENTARY INFORMATION (unaudited) (continued)
Remuneration Policy
495
The Company
Merian Global Investors Series Plc (the “Company”) is authorised by the Central Bank of Ireland (the "Central Bank")
as a self-managed Undertaking for Collective Investment in Transferable Securities (“UCITS”) pursuant to the
European Communities (Undertakings for Collective Investment in Transferable Securities) Regulations, 2011 as may
be amended, consolidated or substituted from time to time (the “UCITS Regulations”).
The Company is managed and its affairs supervised by its Board of Directors. For details on each of the Directors
please refer the Prospectus of the Company.
1. The Policy
The Company established a remuneration policy in accordance with the requirements of Directive
(Directive 2009/65/EC), as amended (the “UCITS Directive”) to the extent that is appropriate to its size,
internal organisation and the nature, scope and complexity of its activities.
The European Securities and Markets Association (“ESMA”) published “Guidelines on sound remuneration
policies under the UCITS Directive and AIFMD” (the “ESMA Guidelines”). As at the date of this remuneration
policy, the ESMA Guidelines have been finalised and published, this remuneration policy has been
reviewed and updated as necessary in accordance with the ESMA Guidelines.
This remuneration policy is adopted by the non-executive members of the Board of Directors in their
supervisory function, who have expertise in risk management and remuneration and any revisions to the
remuneration policy require approval of such members.
It is the Company’s policy to maintain remuneration arrangements that (i) are consistent with and promote
sound and effective risk management, (ii) do not encourage risk-taking that is inconsistent with the risk
profile of the Company, (iii) do not impair compliance with the Company’s duty to act in the best interests
of its shareholders and (iv) are consistent with the principles outlined in Appendix 1 to the remuneration
policy. The Company’s remuneration policy is designed to ensure that any relevant conflicts of interest can
be managed appropriately at all times.
The remuneration policy is subjected to central and independent review at least annually to ensure
compliance with and adherence to the policy.
The remuneration policy itself is reviewed on an annual basis by the non-executive members of the Board
in their supervisory function, who have expertise in risk management and remuneration.
2. Persons subject to the Policy
The Company will apply the provisions of this policy for its ‘Identified Staff’ being “those categories of staff,
including senior management, risk takers, control functions and any employee receiving total
remuneration that falls within the remuneration bracket of senior management and risk takers whose
professional activities have a material impact on the risk profiles of the management companies or of the
UCITS that they manage”.
The Company has determined that the following staff members would fall within the definition of “Identified
staff”:
- Members of the Board of Directors
- Designated Persons responsible for the monitoring of certain management functions of the Company.
Merian Global Investors Series Plc Annual Report and Audited Financial Statements for the financial year ended 31 December 2018
SUPPLEMENTARY INFORMATION (unaudited) (continued)
Remuneration Policy (continued)
496
2. Persons subject to the Policy (continued)
Pursuant to the ESMA Guidelines, the UCITS remuneration principles are not required to be applied to
delegates performing investment management functions when such delegates are subject to regulatory
requirements on remuneration that are "equally as effective" as the UCITS remuneration principles.
It is noted that the ESMA Guidelines provide that entities that are subject to the remuneration rules under
AIFMD or MiFID/CRD IV (Directive 2013/36/EU) can be considered to meet this condition.
Based on prior guidance issued by the Central Bank on the corresponding and identical requirement in the
context of the AIFMD remuneration principles and in the absence of further specific guidance or legal
clarification from the European Commission, ESMA or the Central Bank in the context of the UCITS
remuneration requirements, the Fund considers that the following categories of delegate entities also meet
this condition:
(i) CRD/MiFID firms (including firms still subject to CRD III and which have availed of the CRD IV
exemptions); and
(ii) non-EU firms which are subject to group remuneration policies that are equally as effective as MiFID or
CRD.
This approach will be reviewed and reassessed, as necessary for subsequent financial periods following the
issuance of any further regulatory guidance or legal clarification that conflicts with this current position.
3. Remuneration of Identified Staff
With the exception of those Company Directors who are employed by Merian Global Investors (UK)
Limited (the Investment Manager, Distributor and Promoter), the Company’s Directors will accept a fee in
accordance with the Company’s Articles of Association and as outlined in the ‘Directors’ Fees’ section of
the Prospectus. This is a fixed fee with no variable component. Any remaining Director, who is employed
by the Investment Manager, will waive this fee.
The Directors of the Company receive a fixed fee only and do not receive performance-based
remuneration, thereby avoiding a potential conflict of interest. The basic fee of a Board member is set at
a level that is on par with the rest of the market and reflects the qualifications and contribution required in
view of the Company’s complexity, the extent of the responsibilities and the number of board meetings.
No pension contributions are payable on Board members’ fees.
Duff & Phelps Financial Services (Ireland) Limited receives an annual fixed fee for providing the relevant
‘Designated Persons’ services. Their fee is set at a level that is considered on par with the rest of the market
for such services, and does not include any variable or performance related element.
4. Proportionality Principle
As noted above, the Company must comply with the UCITS Directive remuneration principles in a way
and to the extent that is appropriate to its size, its internal organisation and the nature scope and
complexity of its activities. Accordingly, some UCITS can determine to meet the remuneration
requirements through very sophisticated policies whereas others can do so in a simple and less
burdensome way.
The Company does not pay any variable remuneration to any of its Identified Staff. Accordingly, the
principles in respect of variable remuneration as outlined in the UCITS Directive are not applicable.
Merian Global Investors Series Plc Annual Report and Audited Financial Statements for the financial year ended 31 December 2018
SUPPLEMENTARY INFORMATION (unaudited) (continued)
Remuneration Policy (continued)
497
4. Proportionality Principle (continued)
With respect to the remuneration committee, the Board has determined the remuneration committee
requirement does not apply taking into account the below factors:
(a) all of the above proportionality criteria (i.e. the Company’s size, internal organisation nature, the scope
and complexity of its activities); and
(b) Article 14b(4) of UCITS V outlines a remuneration committee will be, where appropriate, set up in
accordance with the ESMA Guidelines (which are still to be finalised).
5. Disclosure
The general principles of the Company’s remuneration policy and the specific provisions for Identified Staff
are disclosed internally and documented in the remuneration policy.
Total remuneration during the financial year ended 31 December 2018
Fixed remuneration USD 271,884
Number of beneficiaries 4
Merian Global Investors Series Plc Annual Report and Audited Financial Statements for the financial year ended 31 December 2018
SUPPLEMENTARY INFORMATION (unaudited) (continued)
Securities Financing Transactions Regulations
498
The following disclosure follows the requirements of EU Securities Financing Transactions Regulation (“SFTR”) which
came into effect on 12 January 2016.
A Securities Financing Transaction (“SFT”) is defined as per Article 3(11) of the SFTR as:
a repurchase transaction;
securities or commodities lending and securities or commodities borrowing;
a buy-sell back transaction or sell-buy back transaction; or
a margin lending transaction.
There were no securities and commodities on loan as a proportion of total lendable assets (excluding cash and
cash equivalents) as at 31 December 2018.
GLOBAL DATA:
Merian Style Premia Absolute Return Fund
Type of Asset Absolute Amount (USD) Proportion of AUM* (USD)
Total Return Swaps 249,021,686 301.72%
CONCENTRATION DATA:
The top ten counterparties across all SFTs and total return swaps are as follows :
Merian Style Premia Absolute Return Fund Counterparty
Gross volume of
outstanding trades**
(USD)
TRS Goldman Sachs
61,051,282
TRS Morgan Stanley
187,970,404
* Net Asset Value of the relevant Sub-Funds is considered to be the most appropriate representation of Assets
under Management (“AUM”) for the purposes of this disclosure.
** Volume is considered to be the monetary value of relevant transactions.
AGGREGATE TRANSACTION DATA:
Merian Style
Premia Absolute
Return Fund
Type of
collateral Quality Currency
Maturity tenor
(collateral)
Maturity tenor
(STFs/Total
Return Swaps)
Country of
counterparty
establishment
Settlement
and
clearing
TRS
Goldman Sachs Cash N/A-Cash USD N/A-Cash > 1 year US Bilateral
Morgan Stanley Cash N/A-Cash USD N/A-Cash > 1 year US Bilateral
COLLATERAL REUSE:
Collateral is only used for the purpose of hypothecating back into other collateral, as such returns on reinvested
collateral were nil during the financial year ended 31 December 2018.
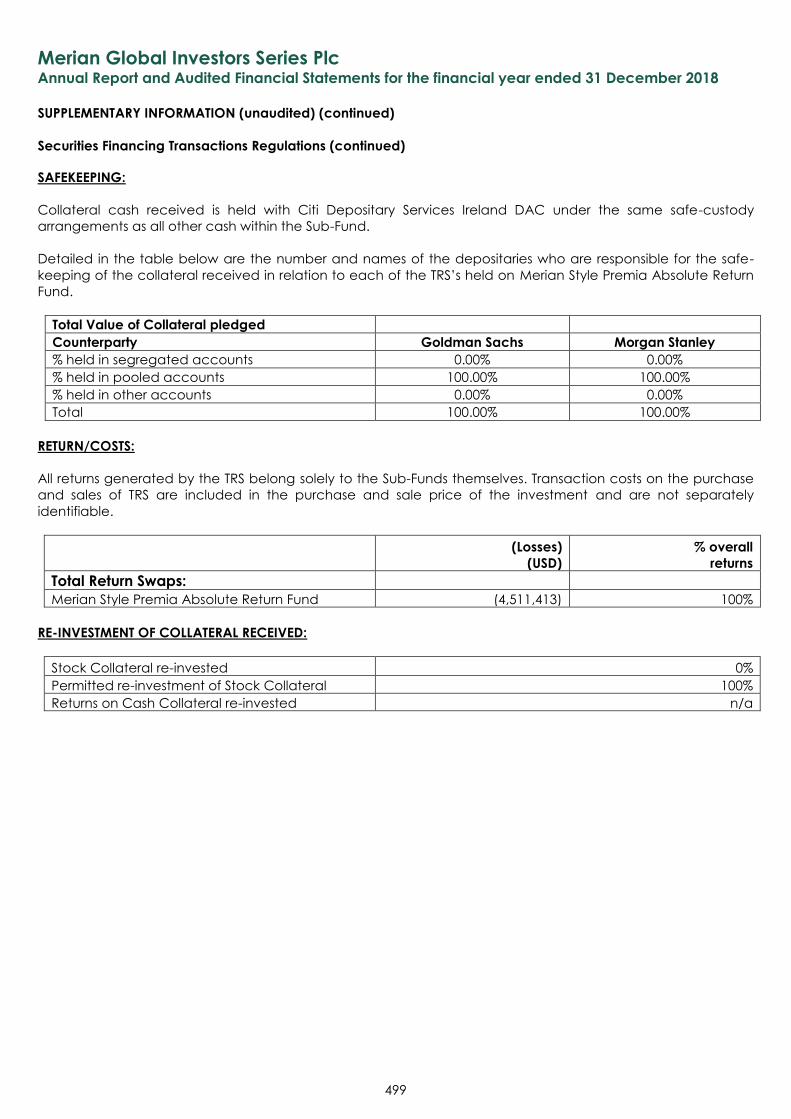
Merian Global Investors Series Plc Annual Report and Audited Financial Statements for the financial year ended 31 December 2018
SUPPLEMENTARY INFORMATION (unaudited) (continued)
Securities Financing Transactions Regulations (continued)
499
SAFEKEEPING:
Collateral cash received is held with Citi Depositary Services Ireland DAC under the same safe-custody
arrangements as all other cash within the Sub-Fund.
Detailed in the table below are the number and names of the depositaries who are responsible for the safe-
keeping of the collateral received in relation to each of the TRS’s held on Merian Style Premia Absolute Return
Fund.
Total Value of Collateral pledged
Counterparty Goldman Sachs Morgan Stanley
% held in segregated accounts 0.00% 0.00%
% held in pooled accounts 100.00% 100.00%
% held in other accounts 0.00% 0.00%
Total 100.00% 100.00%
RETURN/COSTS:
All returns generated by the TRS belong solely to the Sub-Funds themselves. Transaction costs on the purchase
and sales of TRS are included in the purchase and sale price of the investment and are not separately
identifiable.
(Losses)
(USD)
% overall
returns
Total Return Swaps:
Merian Style Premia Absolute Return Fund (4,511,413) 100%
RE-INVESTMENT OF COLLATERAL RECEIVED:
Stock Collateral re-invested 0%
Permitted re-investment of Stock Collateral 100%
Returns on Cash Collateral re-invested n/a
OLD MUTUAL GLOBAL INVESTORS SERIES PLC
An investment company with variable capital incorporated with limited liability in Ireland, establishedas an umbrella fund with segregated liability between Sub-Funds and authorised pursuant to the
European Communities (Undertakings for Collective Investment in Transferable Securities) Regulations,2011, as amended, and the Central Bank (Supervision and Enforcement) Act 2013 (Section 48(1))
(Undertakings for Collective Investment in Transferable Securities) Regulations 2015
(Registered Number 271517)
Interim Report and Unaudited Financial Statementsfor the financial period ended 30 June 2018
Old Mutual Global Investors Series PlcInterim Report and Unaudited Financial Statements for the financial period ended 30 June 2018
CONTENTS PAGE
Directory 4 - 8
General Information 9 - 12
Investment Advisers’ Reports:Old Mutual China Equity Fund 13Old Mutual Global Strategic Bond Fund (IRL) 14Old Mutual World Equity Fund 15Old Mutual Pacific Equity Fund 16Old Mutual European Equity Fund 17Old Mutual Japanese Equity Fund^ 18Old Mutual US Equity Income Fund 19Old Mutual North American Equity Fund 20Old Mutual Total Return USD Bond Fund 21Old Mutual Emerging Market Debt Fund 22Old Mutual European Best Ideas Fund 23Old Mutual Investment Grade Corporate Bond Fund 24Old Mutual Global Emerging Markets Fund 25Old Mutual Asian Equity Income Fund 26Old Mutual Local Currency Emerging Market Debt Fund 27Old Mutual UK Alpha Fund (IRL) 28Old Mutual UK Smaller Companies Focus Fund 29Old Mutual UK Dynamic Equity Fund 30Old Mutual Global Equity Absolute Return Fund 31Old Mutual Strategic Absolute Return Bond Fund^^^ 32Old Mutual Pan African Fund^^ 33Old Mutual Monthly Income High Yield Bond Fund 34Old Mutual Europe (ex UK) Smaller Companies Fund 35Old Mutual Global Equity Income Fund (IRL) 36Old Mutual Gold & Silver Fund 37Old Mutual Compass Portfolio 2 38Old Mutual Compass Portfolio 3 39Old Mutual Compass Portfolio 4 40Old Mutual Compass Portfolio 5 41Old Mutual UK Specialist Equity Fund 42Old Mutual Style Premia Absolute Return Fund 43Old Mutual Financials Contingent Capital Fund 44
Portfolio of Investments:Old Mutual China Equity Fund 45 - 46Old Mutual Global Strategic Bond Fund (IRL) 47 - 50Old Mutual World Equity Fund 51 - 62Old Mutual Pacific Equity Fund 63 - 69Old Mutual European Equity Fund 70 - 71Old Mutual US Equity Income Fund 72 - 75Old Mutual North American Equity Fund 76 - 82Old Mutual Total Return USD Bond Fund 83 - 89Old Mutual Emerging Market Debt Fund 90 - 93Old Mutual European Best Ideas Fund 94 - 95Old Mutual Investment Grade Corporate Bond Fund 96 - 99Old Mutual Global Emerging Markets Fund 100 - 101Old Mutual Asian Equity Income Fund 102 - 108Old Mutual Local Currency Emerging Market Debt Fund 109 - 114Old Mutual UK Alpha Fund (IRL) 115 - 117Old Mutual UK Smaller Companies Focus Fund 118 - 121Old Mutual UK Dynamic Equity Fund 122 - 125Old Mutual Global Equity Absolute Return Fund 126 - 144Old Mutual Strategic Absolute Return Bond Fund^^^ 145 - 148Old Mutual Monthly Income High Yield Bond Fund 149 - 153Old Mutual Europe (ex UK) Smaller Companies Fund 154 - 156Old Mutual Global Equity Income Fund (IRL) 157 - 166
Old Mutual Global Investors Series PlcInterim Report and Unaudited Financial Statements for the financial period ended 30 June 2018
CONTENTS (continued) PAGE
Portfolio of Investments (continued):Old Mutual Gold & Silver Fund 167 - 168Old Mutual Compass Portfolio 2 169 - 174Old Mutual Compass Portfolio 3 175 - 180Old Mutual Compass Portfolio 4 181 - 186Old Mutual Compass Portfolio 5 187 - 190Old Mutual UK Specialist Equity Fund 191 - 195Old Mutual Style Premia Absolute Return Fund 196 - 205Old Mutual Financials Contingent Capital Fund 206 - 207
Financial Statements:Statement of Operations 208 - 215Statement of Financial Position 216 - 223Statement of Changes in Net Assets Attributable to Redeemable Participating Shareholders 224 - 227Notes to the Financial Statements 228 - 327
Significant Purchases and SalesOld Mutual China Equity Fund 328 - 329Old Mutual Global Strategic Bond Fund (IRL) 330 - 331Old Mutual World Equity Fund 332 - 333Old Mutual Pacific Equity Fund 334 - 335Old Mutual European Equity Fund 336 - 337Old Mutual Japanese Equity Fund^ 338Old Mutual US Equity Income Fund 339 - 340Old Mutual North American Equity Fund 341 - 342Old Mutual Total Return USD Bond Fund 343 - 344Old Mutual Emerging Market Debt Fund 345 - 346Old Mutual European Best Ideas Fund 347 - 348Old Mutual Investment Grade Corporate Bond Fund 349 - 350Old Mutual Global Emerging Markets Fund 351 - 352Old Mutual Asian Equity Income Fund 353 - 354Old Mutual Local Currency Emerging Market Debt Fund 355 - 356Old Mutual UK Alpha Fund (IRL) 357 - 358Old Mutual UK Smaller Companies Focus Fund 359 - 360Old Mutual UK Dynamic Equity Fund 361 - 362Old Mutual Global Equity Absolute Return Fund 363 - 364Old Mutual Strategic Absolute Return Bond Fund^^^ 365 – 366Old Mutual Pan African Fund^^ 367Old Mutual Monthly Income High Yield Bond Fund 368 – 369Old Mutual Europe (ex UK) Smaller Companies Fund 370 – 371Old Mutual Global Equity Income Fund (IRL) 372 – 373Old Mutual Gold & Silver Fund 374 – 375Old Mutual Compass Portfolio 2 376 – 377Old Mutual Compass Portfolio 3 378 – 379Old Mutual Compass Portfolio 4 380 – 381Old Mutual Compass Portfolio 5 382 – 383Old Mutual UK Specialist Equity Fund 384 – 385Old Mutual Style Premia Absolute Return Fund 386 – 387Old Mutual Financials Contingent Capital Fund 388 – 389
Total Expense Ratios 390 – 396
Fund Performance 397 – 398
Significant Events During The Financial Period 399 - 400
Supplementary Information 401 - 408
Old Mutual Global Investors Series PlcInterim Report and Unaudited Financial Statements for the financial period ended 30 June 2018
DIRECTORY
4
Board of Directors Bronwyn Wright (Irish)*Tom Murray (Irish)*Adrian Waters (Irish)*Jessica Brescia (British)Paul Simpson (British) (resigned 29 June 2018)
Investment Manager, Distributor and Promoter Old Mutual Global Investors (UK) Limited2 Lambeth HillLondon EC4P 4WRUnited Kingdom
Investment Adviser to the Investment Manager (from 18 May 2018 for the Old Mutual Pacific Equityfor the Old Mutual Global Strategic Bond Fund (IRL) Fund and the Old Mutual Asian Equity Income Fund)for the Old Mutual World Equity Fund (until 14 June 2018 for the Old Mutual European Bestfor the Old Mutual Pacific Equity Fund Ideas Fund, the Old Mutual Compass Portfolio 2, the Oldfor the Old Mutual European Equity Fund Mutual Compass Portfolio 3, the Old Mutual Compassfor the Old Mutual US Equity Income Fund Portfolio 4 and the Old Mutual Compass Portfolio 5)for the Old Mutual North American Equity Fund Old Mutual Global Investors (UK) Limitedfor the Old Mutual Emerging Market Debt Fund 2 Lambeth Hillfor the Old Mutual European Best Ideas Fund London EC4P 4WRfor the Old Mutual Investment Grade Corporate Bond Fund United Kingdomfor the Old Mutual Asian Equity Income Fundfor the Old Mutual Global Emerging Markets Fundfor the Old Mutual Local Currency Emerging Market Debt Fundfor the Old Mutual UK Alpha Fund (IRL)for the Old Mutual UK Smaller Companies Focus Fundfor the Old Mutual UK Dynamic Equity Fundfor the Old Mutual Global Equity Absolute Return Fundfor the Old Mutual Strategic Absolute Return Bond Fund^^^for the Old Mutual Monthly Income High Yield Bond Fundfor the Old Mutual Europe (ex UK) Smaller Companies Fundfor the Old Mutual Global Equity Income Fund (IRL)for the Old Mutual Gold & Silver Fund
for the Old Mutual Compass Portfolio 2
for the Old Mutual Compass Portfolio 3
for the Old Mutual Compass Portfolio 4
for the Old Mutual Compass Portfolio 5
for the Old Mutual UK Specialist Equity Fundfor the Old Mutual Style Premia Absolute Return Fundand for the Old Mutual Financials Contingent Capital Fund
Investment Adviser to the Investment Manager (until 22 March 2018 for the Old Mutual China Equityfor the Old Mutual China Equity Fund Fund)for the Old Mutual Pacific Equity Fund (until 17 May 2018 for the Old Mutual Pacific Equityfor the Old Mutual Japanese Equity Fund^ Fund and the Old Mutual Asian Equity Income Fund)and for the Old Mutual Asian Equity Income Fund Old Mutual Global Investors (Asia Pacific) Limited
Unit 2, 5/F Two Chinachem Central26 Des Voeux Road CentralHong Kong
Investment Adviser to the Investment Manager (from 23 March 2018)for the Old Mutual China Equity Fund Ping An of China Asset Management (Hong Kong) Company
Limited, Suite 2301, Two International Finance Centre8 Finance St, CentralHong Kong
*Independent, Non-Executive Directors^ Old Mutual Japanese Equity Fund closed on 26 January 2018.^^ Old Mutual Pan African Fund closed on 28 February 2018.^^^ Old Mutual Absolute Return Government Bond Fund, a sub-fund of Old Mutual Global Investors Series II ICAV was merged into the Old Mutual Strategic AbsoluteReturn Bond Fund on 27 July 2018 as detailed in Note 12.
The above footnotes are consistently applied throughout the document.
Old Mutual Global Investors Series PlcInterim Report and Unaudited Financial Statements for the financial period ended 30 June 2018
DIRECTORY (continued)
5
Investment Adviser to the Investment Manager Janus Capital International Limitedfor the Old Mutual Total Return USD Bond Fund 26th Floor, Citypoint
1 Ropemaker StreetLondon EC2Y 9HTUnited Kingdom
Sub-Investment AdviserJanus Capital Management LLC151 Detroit StreetDenverColorado 80206United States of America
Investment Advisers to the Investment Manager Liontrust Investment Partners LLPfor the Old Mutual European Best Ideas Fund 2 Savoy Court
London WC2R 0EZUnited Kingdom
Odey Asset Management LLP12 Upper Grosvenor SquareLondon W1K 2NDUnited Kingdom
(from 15 June 2018)Quilter Investors Limited (formerly Old Mutual InvestmentManagement Limited)Millennium Bridge House, 2 Lambeth HillLondon, EC4V 4AJ
Wellington Management International LtdCardinal Place,80 Victoria StreetLondon SW1E 5JLUnited Kingdom
Investment Adviser to the Investment Manager Old Mutual Investment Group (Pty) Limitedfor the Old Mutual Pan African Fund^^ Mutualpark, Jan Smuts Drive
Pinelands, Cape Town7705, South Africa
Investment Adviser to the Investment Manager (from 15 June 2018)for the Old Mutual Compass Portfolio 2 Quilter Investors Limited (formerly Old Mutual Investmentfor the Old Mutual Compass Portfolio 3 Management Limited)for the Old Mutual Compass Portfolio 4 Millennium Bridge House, 2 Lambeth Hillfor the Old Mutual Compass Portfolio 5 London, EC4V 4AJ
Administrator, Registrar and Transfer Agent Citibank Europe plc1 North Wall QuayDublin 1D01 T8Y1Ireland
Company Secretary Tudor Trust Limited33 Sir John Rogerson’s QuayDublin 2D02 XK09Ireland
Old Mutual Global Investors Series PlcInterim Report and Unaudited Financial Statements for the financial period ended 30 June 2018
DIRECTORY (continued)
6
Registered Office 33 Sir John Rogerson’s QuayDublin 2D02 XK09Ireland
Auditors KPMG1 Harbourmaster PlaceInternational Financial Services CentreDublin 1D01 F6F5Ireland
Legal Advisers Dillon Eustace33 Sir John Rogerson’s QuayDublin 2D02 XK09Ireland
Hong Kong Representative Old Mutual Global Investors (Asia Pacific) Limited24th FloorHenley Building5 Queen’s RoadHong Kong
Paying Agent in Luxembourg BNP Paribas Securities ServicesLuxembourg Branch60 Avenue John F. Kennedy1855 LuxembourgGrand Duchy of Luxembourg
Paying Agent in Switzerland BNP Paribas Securities Services, ParisSuccursale de Zurich, Selnaustrasse 168001 ZurichSwitzerland
Representative in Switzerland First Independent Fund Services LimitedKlausstrasse 338008 ZurichSwitzerland
Facilities Agent in the United Kingdom Old Mutual Global Investors (UK) LimitedMillennium Bridge House, 2 Lambeth HillLondon EC4P 4WRUnited Kingdom
French Centralising and Financial Agent BNP Paribas Securities Services3 Rue d’Antin75002, ParisFrance
Paying Agent in Austria Erste Bank der Oesterreichischen Sparkassen AG, FranceGraben 211010 WienAustria
Old Mutual Global Investors Series PlcInterim Report and Unaudited Financial Statements for the financial period ended 30 June 2018
DIRECTORY (continued)
7
Paying Agents in Chile Cruz del Sur, Corredora de Bolsa S.A.Augusto Leguía 70Piso 5Las CondesSantiago,Chile
Larraín Vial S.A., Corredora de BolsaAvenida El Bosque Norte N0 0177, piso 3Las CondesSantiago,Chile
Paying Agents in Italy Allfunds Bank, S.A.Via Santa Margherita720121 MilanItaly
BNP Paribas Securities ServicesAnsperto 520123 MilanoItaly
SGSS. S.p.A, MilanVia Benigno Crespi n19AMAC2,lItaly
Paying Agent in Sweden Skandinaviska Enskilda Banken AB (publ)Kungsträdgårdsgatan 8SE-106 40StockholmSweden
German Information Agent Skandia Portfolio Management GmbHKaiserin-Augusta-Allee 10810553 BerlinGermany
Belgian Financial Agent Caceis Belgium SAB – 1000 Brussels, Avenue du Port 86 C b320Belgium
Copies of the Memorandum and Articles of Association, the Prospectus, the Key Investor Information documents, the annual and semi-annual reports of the Company are available free of charge at the office of the representative or agent of each jurisdiction.
Additionally, a list of the purchases and sales of each Sub-Fund made during the financial period of this report may be obtained free ofcharge from the Representative in Switzerland.
Old Mutual Global Investors Series PlcInterim Report and Unaudited Financial Statements for the financial period ended 30 June 2018
DIRECTORY (continued)
8
The following Sub-Funds are not authorised in Hong Kong and not available to Hong Kong residents:
Old Mutual China Equity FundOld Mutual US Equity Income FundOld Mutual European Best Ideas FundOld Mutual Investment Grade Corporate Bond FundOld Mutual Global Emerging Markets FundOld Mutual Local Currency Emerging Market Debt FundOld Mutual UK Smaller Companies Focus FundOld Mutual UK Dynamic Equity FundOld Mutual Global Equity Absolute Return FundOld Mutual Strategic Absolute Return Bond Fund^^^Old Mutual Compass Portfolio 2Old Mutual Compass Portfolio 3Old Mutual Compass Portfolio 4Old Mutual Compass Portfolio 5Old Mutual UK Specialist Equity FundOld Mutual Style Premia Absolute Return FundOld Mutual Financials Contingent Capital Fund
The following Sub-Funds are not authorised in Sweden and not available to Swedish residents:
Old Mutual Europe (ex UK) Smaller Companies FundOld Mutual Compass Portfolio 2Old Mutual Compass Portfolio 3Old Mutual Compass Portfolio 4Old Mutual Compass Portfolio 5
.
Old Mutual Global Investors Series PlcInterim Report and Unaudited Financial Statements for the financial period ended 30 June 2018
GENERAL INFORMATION
9
StructureOld Mutual Global Investors Series Plc (the “Company”) is an umbrella fund with segregated liability between Sub-Funds establishedas a self-managed open-ended investment company with variable capital, incorporated on 2 September 1997, organised under the lawsof Ireland as a public limited company pursuant to the Companies Act 2014, the Central Bank (Supervision and Enforcement) Act 2013(Section 48(1)) (Undertakings for Collective Investment in Transferable Securities) Regulations 2015 and the European Communities(Undertakings for Collective Investment in Transferable Securities) Regulations, 2011, as amended (the “Regulations”) and has beenauthorised by the Central Bank of Ireland as a UCITS within the meaning of the Regulations.
The share capital of the Company shall at all times equal the Net Asset Value. The initial capital of the Company was EUR 38,082represented by 30,000 Subscriber Shares of no par value. For the period of five financial years from the date of incorporation, theDirectors are empowered to issue up to five hundred billion Shares of no par value in the Company at the Net Asset Value per Share onsuch terms as they may think fit. The subscriber Shares do not entitle the holders to participate in the assets of any Sub-Fund.
Investment Objectives of the Sub-Funds
Old Mutual China Equity FundThe objective of the Old Mutual China Equity Fund is to seek to achieve long-term capital appreciation by investing in a well-diversifiedportfolio of equity securities issued by companies with either the predominant part of their assets in, or the predominant part of theirrevenues derived from, the People’s Republic of China, Hong Kong and/or Taiwan that are listed, traded or dealt in on RegulatedMarkets in the People’s Republic of China, Hong Kong, Taiwan, the United States of America (“US”), Singapore, Korea, Thailand andMalaysia or in a member state of the Organisation for Economic Co-Operation and Development (“OECD”).
Old Mutual Global Strategic Bond Fund (IRL)The objective of the Old Mutual Global Strategic Bond Fund (IRL) is to seek to achieve total return through worldwide investmentprimarily in a diversified portfolio of fixed and variable rate debt securities.
Old Mutual World Equity FundThe objective of the Old Mutual World Equity Fund is to seek to achieve asset growth through investment in a well-diversified portfolioof securities of issuers worldwide. It is not proposed to concentrate investments in any one geographical region, industry or sector.
Old Mutual Pacific Equity FundThe objective of the Old Mutual Pacific Equity Fund is to seek to achieve asset growth through investment in a well-diversified portfolioof securities of Pacific region issuers or of issuers established outside the Pacific region which have a predominant proportion of theirassets or business operations in the Pacific region. It is not proposed to concentrate investments in any one industry or sector.
Old Mutual European Equity FundThe objective of the Old Mutual European Equity Fund is to seek to achieve asset growth through investment in a well-diversifiedportfolio of securities of European issuers, of issuers established outside Europe which have a predominant proportion of their assets orbusiness operations in Europe, or of securities listed or having a listing on a European exchange. It is not proposed to concentrateinvestments in any one industry or sector.
Old Mutual Japanese Equity Fund^The objective of the Old Mutual Japanese Equity Fund^ is to seek to achieve asset growth through investment in a well-diversifiedportfolio of securities of Japanese issuers or of issuers established outside Japan which have a predominant proportion of their assets orbusiness operations in Japan. It is not proposed to concentrate investments in any one industry or sector.
Old Mutual US Equity Income FundThe objective of the Old Mutual US Equity Income Fund is to seek to achieve asset growth through investment in a diversified portfolioof equity and equity-related securities.
Old Mutual North American Equity FundThe objective of the Old Mutual North American Equity Fund is to seek to achieve long term capital growth through the activemanagement of a diversified portfolio invested primarily in North American stock markets. It is not proposed to concentrate investmentsin any one industry or sector.
Old Mutual Global Investors Series PlcInterim Report and Unaudited Financial Statements for the financial period ended 30 June 2018
GENERAL INFORMATION (continued)
10
Investment Objectives of the Sub-Funds (continued)
Old Mutual Total Return USD Bond FundThe objective of the Old Mutual Total Return USD Bond Fund is to seek to maximise total return consistent with preservation of capitaland prudent investment management.
Old Mutual Emerging Market Debt FundThe objective of the Old Mutual Emerging Market Debt Fund is to seek to achieve asset growth through investment in a well-diversifiedportfolio of fixed and variable rate debt securities issued in Emerging Markets.
Old Mutual European Best Ideas FundThe objective of the Old Mutual European Best Ideas Fund is to seek to achieve asset growth through investment in a well-diversifiedportfolio of equities or equity-related securities of European issuers or of issuers established outside Europe which have a predominantproportion of their assets and/or business operations in Europe.
Old Mutual Investment Grade Corporate Bond FundThe objective of the Old Mutual Investment Grade Corporate Bond Fund is to seek to achieve income and capital growth predominantlythrough investment in a well-diversified portfolio of credit securities rated Investment Grade.
Old Mutual Global Emerging Markets FundThe objective of the Old Mutual Global Emerging Markets Fund is to seek to achieve asset growth through investment in a well-diversified portfolio of equity securities of issuers in the Emerging Markets or of issuers established outside of the Emerging Markets,which have a predominant proportion of their assets or business operations in the Emerging Markets and which are listed, traded ordealt in on a Regulated Market worldwide. It is not proposed to concentrate investments in any one industry or sector.
Old Mutual Asian Equity Income FundThe objective of the Old Mutual Asian Equity Income Fund is to seek to achieve a total return through a combination of income andcapital growth.
Old Mutual Local Currency Emerging Market Debt FundThe objective of the Old Mutual Local Currency Emerging Market Debt Fund is to seek to achieve total return through investment in awell-diversified portfolio of fixed and variable rate debt securities issued in the Emerging Markets worldwide and which are primarilydenominated in the local currency of the issuer.
Old Mutual UK Alpha Fund (IRL)The objective of the Old Mutual UK Alpha Fund (IRL) is to seek to achieve capital appreciation. The Old Mutual UK Alpha Fund (IRL)seeks to achieve its objective through investment in a well-diversified portfolio of equities of predominantly United Kingdom (“UK”)issuers or of issuers established outside the UK which have a predominant proportion of their assets and/or business operations in theUK or securities listed on a UK exchange.
Old Mutual UK Smaller Companies Focus FundThe Sub-Fund’s investment objective aims to provide capital growth from investing primarily in an equity portfolio of UK smallercompanies. Smaller companies are defined for this purpose as those companies which are quoted on a Regulated Market and whichhave a market capitalisation no greater than the largest company in the Numis Smaller Companies Index at the time of initial investment.The Numis Smaller Companies Index is designed to monitor the performance of the smaller companies sector.
Old Mutual UK Dynamic Equity FundThe investment objective of the Old Mutual UK Dynamic Equity Fund is to achieve capital appreciation by taking long and shortpositions principally in UK equities outside of the FTSE 100 Index.
Old Mutual Global Equity Absolute Return FundThe investment objective of the Old Mutual Global Equity Absolute Return Fund is capital appreciation while closely controlling risk.In addition, the Sub-Fund intends to deliver absolute returns that have a low correlation with equity and bond markets.
Old Mutual Strategic Absolute Return Bond Fund^^^The investment objective of the Old Mutual Strategic Absolute Return Bond Fund^^^ is to seek to deliver positive total returns on arolling twelve month basis with stable levels of volatility uncorrelated to bond and equity market conditions.
Old Mutual Global Investors Series PlcInterim Report and Unaudited Financial Statements for the financial period ended 30 June 2018
GENERAL INFORMATION (continued)
11
Investment Objectives of the Sub-Funds (continued)
Old Mutual Pan African Fund^^The investment objective of the Old Mutual Pan African^^ Fund is to seek to achieve long term capital growth by investing in companiesthat directly benefit from long term economic growth opportunities in the African continent.
Old Mutual Monthly Income High Yield Bond FundThe objective of the Old Mutual Monthly Income High Yield Bond Fund is to seek to achieve a total return through a combination ofincome and capital growth from a well-diversified portfolio predominantly comprising of fixed and variable rate debt securities locatedworldwide.
Old Mutual Europe (ex UK) Smaller Companies FundThe investment objective of the Old Mutual Europe (ex UK) Smaller Companies Fund is to achieve long term capital growth throughinvesting primarily in an equity portfolio of smaller companies incorporated in Europe (excluding the United Kingdom) or of companiesincorporated outside of Europe (excluding the UK) which have a predominant proportion of their assets and/or business operations inEurope (excluding the UK).
Old Mutual Global Equity Income Fund (IRL)The investment objective of the Old Mutual Global Equity Income Fund (IRL) is to seek to achieve a total return through a combinationof income and capital growth.
Old Mutual Gold & Silver FundThe investment objective of the Old Mutual Gold & Silver Fund is to seek to achieve a total return by investing predominantly in listedequities.
Old Mutual Compass Portfolio 2The investment objective of the Old Mutual Compass Portfolio 2 is to generate a long-term total return.
Old Mutual Compass Portfolio 3The investment objective of the Old Mutual Compass Portfolio 3 is to generate a long-term total return.
Old Mutual Compass Portfolio 4The investment objective of the Old Mutual Compass Portfolio 4 is to generate a long-term total return.
Old Mutual Compass Portfolio 5The investment objective of the Old Mutual Compass Portfolio 5 is to generate a long-term total return.
Old Mutual UK Specialist Equity FundThe investment objective of the Old Mutual UK Specialist Equity Fund is to seek to achieve capital appreciation by taking long andshort positions mainly in UK equities outside the FTSE 100 Index, whilst seeking to deliver absolute returns in all market conditions.
Old Mutual Style Premia Absolute Return FundThe investment objective of the Old Mutual Style Premia Absolute Return Fund is to seek to deliver positive total returns on a rollingtwelve month basis with stable levels of volatility uncorrelated to bond and equity market conditions.
Old Mutual Financials Contingent Capital FundThe Old Mutual Financials Contingent Capital Fund aims to generate a total return.
Distribution PolicyDistributions to holders of Redeemable Participating Shares are recorded in the Statement of Operations as finance costs. Distributionspaid and proposed during the financial periods ended 30 June 2018 and 30 June 2017 with respect to certain Share Classes are outlinedin Note 9. All of the other Sub-Funds’ income and capital gains were reinvested in accordance with the investment objective and policyof the Sub-Funds.
Dilution AdjustmentOn any Dealing Day the Directors may determine when there are net inflows into a Sub-Fund or net outflows from a Sub-Fund to applya dilution adjustment to the dealing Net Asset Value per Share so that the price of a Share in the Sub-Fund is above or below that whichwould have resulted from a latest available market valuation. This adjustment is intended to pass the estimated costs of underlyinginvestment activity of the Sub-Fund to the active Shareholders by adjusting the Net Asset Value of the relevant classes of Shares andthus to protect the Sub-Fund’s long-term Shareholders from costs associated with ongoing subscription and redemption activity. Thesecosts may include dealing charges, commissions and the effects of dealing at prices other than the middle market price.
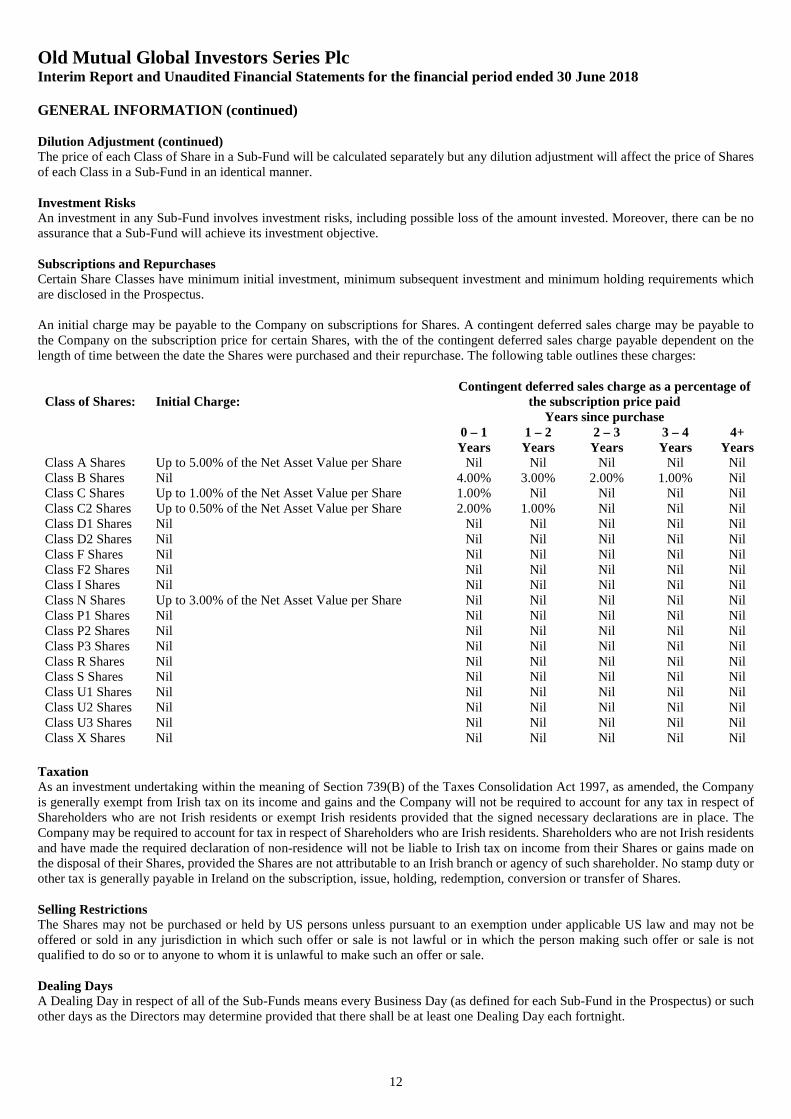
Old Mutual Global Investors Series PlcInterim Report and Unaudited Financial Statements for the financial period ended 30 June 2018
GENERAL INFORMATION (continued)
12
Dilution Adjustment (continued)The price of each Class of Share in a Sub-Fund will be calculated separately but any dilution adjustment will affect the price of Sharesof each Class in a Sub-Fund in an identical manner.
Investment RisksAn investment in any Sub-Fund involves investment risks, including possible loss of the amount invested. Moreover, there can be noassurance that a Sub-Fund will achieve its investment objective.
Subscriptions and RepurchasesCertain Share Classes have minimum initial investment, minimum subsequent investment and minimum holding requirements whichare disclosed in the Prospectus.
An initial charge may be payable to the Company on subscriptions for Shares. A contingent deferred sales charge may be payable tothe Company on the subscription price for certain Shares, with the of the contingent deferred sales charge payable dependent on thelength of time between the date the Shares were purchased and their repurchase. The following table outlines these charges:
Class of Shares: Initial Charge:Contingent deferred sales charge as a percentage of
the subscription price paidYears since purchase
0 – 1Years
1 – 2Years
2 – 3Years
3 – 4Years
4+Years
Class A Shares Up to 5.00% of the Net Asset Value per Share Nil Nil Nil Nil NilClass B Shares Nil 4.00% 3.00% 2.00% 1.00% NilClass C Shares Up to 1.00% of the Net Asset Value per Share 1.00% Nil Nil Nil NilClass C2 Shares Up to 0.50% of the Net Asset Value per Share 2.00% 1.00% Nil Nil NilClass D1 Shares Nil Nil Nil Nil Nil NilClass D2 Shares Nil Nil Nil Nil Nil NilClass F Shares Nil Nil Nil Nil Nil NilClass F2 Shares Nil Nil Nil Nil Nil NilClass I Shares Nil Nil Nil Nil Nil NilClass N Shares Up to 3.00% of the Net Asset Value per Share Nil Nil Nil Nil NilClass P1 Shares Nil Nil Nil Nil Nil NilClass P2 Shares Nil Nil Nil Nil Nil NilClass P3 Shares Nil Nil Nil Nil Nil NilClass R Shares Nil Nil Nil Nil Nil NilClass S Shares Nil Nil Nil Nil Nil NilClass U1 Shares Nil Nil Nil Nil Nil NilClass U2 Shares Nil Nil Nil Nil Nil NilClass U3 Shares Nil Nil Nil Nil Nil NilClass X Shares Nil Nil Nil Nil Nil Nil
TaxationAs an investment undertaking within the meaning of Section 739(B) of the Taxes Consolidation Act 1997, as amended, the Companyis generally exempt from Irish tax on its income and gains and the Company will not be required to account for any tax in respect ofShareholders who are not Irish residents or exempt Irish residents provided that the signed necessary declarations are in place. TheCompany may be required to account for tax in respect of Shareholders who are Irish residents. Shareholders who are not Irish residentsand have made the required declaration of non-residence will not be liable to Irish tax on income from their Shares or gains made onthe disposal of their Shares, provided the Shares are not attributable to an Irish branch or agency of such shareholder. No stamp duty orother tax is generally payable in Ireland on the subscription, issue, holding, redemption, conversion or transfer of Shares.
Selling RestrictionsThe Shares may not be purchased or held by US persons unless pursuant to an exemption under applicable US law and may not beoffered or sold in any jurisdiction in which such offer or sale is not lawful or in which the person making such offer or sale is notqualified to do so or to anyone to whom it is unlawful to make such an offer or sale.
Dealing DaysA Dealing Day in respect of all of the Sub-Funds means every Business Day (as defined for each Sub-Fund in the Prospectus) or suchother days as the Directors may determine provided that there shall be at least one Dealing Day each fortnight.
Old Mutual Global Investors Series PlcInterim Report and Unaudited Financial Statements for the financial period ended 30 June 2018
OLD MUTUAL CHINA EQUITY FUNDINVESTMENT ADVISER’S REPORT FOR THE FINANCIAL PERIOD ENDED 30 JUNE 2018
Old Mutual China Equity Fund – Old Mutual Global Investors (Asia Pacific) Limited (until 22 March 2018)– Ping An of China Asset Management (Hong Kong) Company Limited (from 23 March 2018)
13
Market
The majority of global equity markets continued their ascent in January following a strong year in 2017. However, subsequent tradeconcerns and geopolitical risks weighed over the course of the next few months, especially with regards to China’s stock market. The USFederal Reserve raised interest rates twice in the first half of 2018, with investors expecting two more rate hikes this year. Over the courseof the period, the US dollar strengthened on the normalisation of monetary policy and strong economic growth. The firmer dollar alsonegatively impacted emerging market currencies and shares, with emerging market equities dropping sharply in the period under review.The deleveraging policy in China and the default of several onshore bonds resulted in a tightening in liquidity conditions, subsequentlyraising the cost of finance for Chinese corporations. Trade friction between the US and China is still uncertain and yet to be resolved. Theeffect of all these actions was to dent investor sentiment, with China’s A-share market being one of the biggest losers among globalmarkets.
Performance
Against this background, the sub-fund outperformed its benchmark index. The top three contributing stocks were Shenzhou International,CR Beer and CNOOC. The main detractors were Yue Yuen (due to the failure to list its subsidiary on the stock market and poor resultsguidance), Agricultural Bank of China and AAC Technologies. Management of the sub-fund was outsourced on 23 March 2018 to PingAn of China Asset Management (Hong Kong) Company Limited, a specialist China asset manager with extensive research teams locallyin the region.
Outlook
The managers believe that the stock market may continue to be under pressure in the short run due to trade war concerns and Chinadeleveraging, which, in turn, may hurt China’s economic growth. However, the managers also think that trade disputes will have only alimited impact on China’s economy this year and that companies’ earnings growth for the first half of the year should be on track. Eventhough the authorities are likely to initiate stimulatory measures, overall liquidity conditions towards the end of the year should be morepromising. In addition, even though the renminbi has started to weaken the managers do not believe the currency will depreciate to thesame extent as 2015 given China’s steady growth is still intact. Overall, the managers are cautious on their asset class in the short-termbut positive in the mid to long- run and believe there may be buying opportunities as we enter the second half of 2018. The managerscontinue to focus on high quality companies with strong fundamentals in the consumer, financial, healthcare and energy sectors.
Old Mutual Global Investors Series PlcInterim Report and Unaudited Financial Statements for the financial period ended 30 June 2018
OLD MUTUAL GLOBAL STRATEGIC BOND FUND (IRL)INVESTMENT ADVISER’S REPORT FOR THE FINANCIAL PERIOD ENDED 30 JUNE 2018
Old Mutual Global Strategic Bond Fund (IRL) – Old Mutual Global Investors (UK) Limited
14
Market
Markets started the year in a sweet spot, continuing the positive momentum built up in 2017. Boosted by strong, synchronised globalgrowth, a weak US dollar and US President Trump’s fiscal package agreed in December, risk assets had a ‘melt up’ in January –everything rallied as investors, predominantly retail ones, piled into anything that wasn’t government debt. The S&P 500 Index hit newhighs while the 10-year US Treasury approached 3%. Sentiment in the market then changed for three main reasons. First, valuations inmany asset classes were justifiable only in the context of expensive government debt, but as government debt cheapened up there wasan alternative to buying risk. Second, the synchronised global growth story hit a speed bump as Chinese and European data failed tomatch economists’ arguably overly enthusiastic forecasts. Third, geopolitical risks rose as the Trump administration upped the ante onperceived trade injustices and introduced, or threatened, tariffs on some goods. Consensus trades began to unravel. Short volatility fundsbegan the slide and equities, credit, subordinated bank debt, short US dollar trades and emerging markets all followed. The onlyconsensus trade left standing was shorting US Treasuries as foreign investors balked at the rising deficits and high hedging costs, andthe US Federal Reserve stayed on its tightening path.
Performance
The sub-fund is a collection of the best ideas in fixed income and currencies, scaled into a risk-efficient portfolio. Return is generatedfrom the active management of interest rate risk, currencies, corporate bonds and associated investments in both developed and emergingmarkets. The sub-fund has been positioned for a higher yield environment that would lead to greater volatility, so we have been shortduration and underweight credit. The currency positions that worked well towards the end of 2017 detracted from performance in thefirst four months of 2018.
Outlook
We believe the strength in the US dollar seen for much of the period was a US dollar squeeze. The structural bear market for the dollarremains in place in our view. Weakness in emerging markets where fundamentals are strong and value has been created is being usedto add exposure to the asset class in the portfolio. We remain cautious on prospects for credit.
Old Mutual Global Investors Series PlcInterim Report and Unaudited Financial Statements for the financial period ended 30 June 2018
OLD MUTUAL WORLD EQUITY FUNDINVESTMENT ADVISER’S REPORT FOR THE FINANCIAL PERIOD ENDED 30 JUNE 2018
Old Mutual World Equity Fund – Old Mutual Global Investors (UK) Limited
15
Market
The New Year began with many indices posting historic highs, but this initial burst of market performance was quickly replaced byincreased market volatility, which also characterised most of the first half of 2018 (1H2018). Equity markets recoiled at the increasingprospect of large scale protectionist measures being deployed by the US variously against China, NAFTA and the EU. The managers’proprietary risk appetite measure continued to track movements in investor sentiment, and indicated that the deterioration in marketenvironment, seen from the outset of 2018, accelerated towards the end of 1H2018.
Performance
All of the sub-fund’s five stock selection criteria made a positive contribution to the sub-fund’s returns during 1H2018. Despite thenegative impact on the market of a series of pronounced sector and style rotations, the Market Dynamics criterion was a good source ofalpha for the sub-fund over 1H2018. There was also a positive contribution from the Company Management criterion, which focuseson isolating conservative management teams. The sub-fund’s Dynamic Valuation criterion also contributed positively over the period,as the underlying mix between exposure to attractively valued stocks and those possessing more defensive characteristics consistentlyreflected the continually evolving risk appetite levels across the various parts of the investable universe. The Analyst Sentiment criterionproved impactful in identifying companies whose share price had not always fully priced in the most recent and salient availablecorporate information. The Sustainable Growth criterion, which isolates high quality growth companies from those offering lesssustainable growth prospects, also contributed to performance.
Outlook
The period ended with investors pondering the impact of prospective trade wars, higher interest rates and regulatory challenges to thetechnology sector. There has been a pattern of market rotation, which might be driven by known macroeconomic and geopolitical driversor which might be more of an effect of profit taking. We continue to espouse judicious risk management, which requires offsettingopportunities against the risks inherent in the market. Firstly, there are risks and opportunities inherent in the path towards monetarynormalisation, as central banks continue to wrestle with the timing and form of their respective exit strategies. Secondly, there areongoing effects flowing from the proliferation of structural distortions embedded into the framework of the market, due in part to thegargantuan shift toward passive investing over a relatively short period of time. Such phenomena have been manifest through an increasein the frequency and impact of style and sector rotations. Thirdly, elevated political instability within developed markets should not bediscounted, particularly given how unfamiliar a risk this is for many current market participants. In all of these circumstances, themanagers feel it is important to maintain diversification in terms of stock selection techniques, while achieving a balanced approach toinvestment style exposures across the portfolio.
Old Mutual Global Investors Series PlcInterim Report and Unaudited Financial Statements for the financial period ended 30 June 2018
OLD MUTUAL PACIFIC EQUITY FUNDINVESTMENT ADVISER’S REPORT FOR THE FINANCIAL PERIOD ENDED 30 JUNE 2018
Old Mutual Pacific Equity Fund – Old Mutual Global Investors (Asia Pacific) Limited (until 17 May 2018)– Old Mutual Global Investors (UK) Limited (from 18 May 2018)
16
Market
During the period, rising US interest rates started drawing investment capital out of some markets in the Pacific region, sending monetaryauthorities on the defensive against runaway currency depreciation. In May, Indonesia's central bank raised its policy rate for the firsttime since November 2014. The Hong Kong dollar, which is pegged to its US counterpart, logged its weakest value against the greenbackin around 35 years in mid-April. Australia’s S&P/ASX index was the regional index that most bucked the second quarter blues. It loggeda gain of more than 7% on the back of strong financial, commodity and energy sectors amid higher oil prices. Despite Australia’s usualstatus as a proxy for the Chinese economic cycle, it demonstrated remarkable resilience to the latest bout instability, doubtless bolsteredby the fact it does not belong to the emerging market universe, which, after a strong start in January, sold off over the period. India’srelative lack of dependence on exports and its adequate foreign exchange reserves helped its market remain resilient amid the globaleconomic uncertainty. Conversely, China’s Shanghai Composite moved into bear market territory, declining more than 20% from itsJanuary peak. The selloff in Chinese equities and a weakening renminbi continued as the asset class generally has been under pressurefrom worries of the impact of US tariffs on Chinese exports, compounded by existing concerns around credit tightening and mediocreeconomic readings.
Performance
The sub-fund’s manager was changed on 18 May 2018. The change followed a fund range review, during which OMGI concluded thatinvestors in the sub-fund would benefit from the management of the global equities team. Following the change, the investment approachof the sub-fund was amended to reflect the systematic investment process employed by OMGI’s global equities team. Under that process,stocks are assessed in terms of the attractiveness of their valuation, quality, price trends, stable growth prospects, sentiment and companymanagement, as opposed to the bottom-up approach that was used prior to 18 May. There was no change to the sub-fund’s objective orongoing fees.
Outlook
The new managers espouse judicious risk management, which requires offsetting opportunities against the risks inherent in the market.Firstly, there are risks and opportunities inherent in the path towards monetary normalisation, as central banks continue to wrestle withthe timing and form of their respective exit strategies. Secondly, there are ongoing effects flowing from the proliferation of structuraldistortions embedded into the framework of the market, due in part to the gargantuan shift toward passive investing over a relativelyshort period of time. Such phenomena have been manifest through an increase in the frequency and impact of style and sector rotations.Thirdly, elevated political instability within developed markets should not be discounted, particularly given how unfamiliar a risk thisis for many current market participants. The global equities team’s measures of volatility profile indicate that at the end of the periodthe Asia Pacific region was almost in line with North America, the region which has consistently demonstrated the most advanced stateof volatility. In all of these circumstances, the managers feel it is important to maintain diversification in terms of stock selectiontechniques, while achieving a balanced approach to investment style exposures across the portfolio.
Old Mutual Global Investors Series PlcInterim Report and Unaudited Financial Statements for the financial period ended 30 June 2018
OLD MUTUAL EUROPEAN EQUITY FUNDINVESTMENT ADVISER’S REPORT FOR THE FINANCIAL PERIOD ENDED 30 JUNE 2018
Old Mutual European Equity Fund – Old Mutual Global Investors (UK) Limited
17
Market
European equity markets have gone nowhere in the first half of 2018 but unsurprisingly volatility has increased markedly from therecord lows of 2017. This shift in mood has come as we approach the end of central bank ultra-loose monetary policy after the EuropeanCentral Bank (ECB) announced plans to taper asset purchases and indicated when it expects to start hiking interest rates. The MSCIEurope Index declined by 0.5% during the half in euro terms, led higher by energy stocks after the oil price climbed from US$64 toUS$79 in the period. Healthcare was also strong, while the clear laggards were telecommunications and financials
Performance
Portfolio performance has been poor in this half year with the major drag caused by stock selection. The sub-fund has a modest valuebias to it, and value has been struggling because the market has been led by quality growth and momentum. Sector allocation was alsonegative largely as a result of an underweight in the energy sector, but also from an underweight in telcos and an overweight in financials.There was no single theme in terms of the company level disappointments: Technicolor, Pandora and Micro Focus issued profit warningsand were sold. Other poor performers included Intrum, Suedzucker, Vodafone, ING, Mediobanca and Prosieben. There was a real mixof sectors and type of company amongst the outperformers which included Nokia, Teleperformance, Tesco, Glaxo, Cap Gemini andTotal. In terms of portfolio activity we have cut the positions in several of our underperformers and have invested in new names suchas Cargotec, Credit Suisse, AP Moeller Maersk and Signify. The portfolio retains its pro-cyclical skew.
Outlook
The new coalition in Italy, the fall of the government in Spain and continued tensions in the coalition in Germany have unsettledinvestors who worry that we are returning to the dark days of the euro crisis. Whilst the headlines have turned ugly again this year thereare reasons to remain cheerful. The rate of economic growth has moderated but shows no signs of turning negative with uncertaintyoffset by a central bank that remains very accommodative and very positive pro-market developments in France. Worries about a globaltrade war are valid but have been partly offset by the weakness of the euro versus the US dollar. European markets have seen smalldeclines in the first half of 2018, which combined with rising earnings has left valuations looking very reasonable. The benchmarktrades below 14x forward earnings. The portfolio trades at a discount to the market which leaves us feeling positive with at least acouple more years of solid earnings growth according to consensus.

Old Mutual Global Investors Series PlcInterim Report and Unaudited Financial Statements for the financial period ended 30 June 2018
OLD MUTUAL JAPANESE EQUITY FUND^INVESTMENT ADVISER’S REPORT FOR THE FINANCIAL PERIOD ENDED 30 JUNE 2018
Old Mutual Japanese Equity Fund^ – Old Mutual Global Investors (Asia Pacific) Limited
18
On 22 December 2017, a notification was sent to shareholders informing them of the intention to close the Old Mutual Japanese EquityFund. This became effective on 26 January 2018.
Old Mutual Global Investors Series PlcInterim Report and Unaudited Financial Statements for the financial period ended 30 June 2018
OLD MUTUAL US EQUITY INCOME FUNDINVESTMENT ADVISER’S REPORT FOR THE FINANCIAL PERIOD ENDED 30 JUNE 2018
Old Mutual US Equity Income Fund – Old Mutual Global Investors (UK) Limited
19
Market
The New Year began with many indices posting historic highs, but this initial burst of market performance was quickly replaced byincreased market volatility, which also characterised most of the first half of 2018 (1H2018). Equity markets recoiled at the increasingprospect of large scale protectionist measures being deployed by the US variously against China, NAFTA and the EU. The managers’proprietary risk appetite measure continued to track movements in investor sentiment, and indicated that the deterioration in marketenvironment, seen from the outset of 2018, accelerated towards the end of 1H2018.
Performance
Most of the sub-fund’s five stock selection criteria made a positive contribution to performance during the period. The Analyst Sentimentcriterion proved impactful in identifying companies whose share price had not always fully priced in the most recent and salient availablecorporate information. There was also a positive contribution from the Company Management criterion, a highly qualitative alphasource, which focuses on isolating conservative management teams. Despite the negative impact of a series of pronounced sector andstyle rotations in the market, the Market Dynamics criterion was flat over 1H2018. The Dynamic Valuation criterion, which seeks tocapture the optimal underlying mix between exposure to attractively valued stocks and those with more defensive characteristics didnot contribute positively over this period: in the latter stages of 2Q18, the drawdown seen to value (that is, to relatively cheaper stocks)was, unusually, not offset by positive returns to the quality signals. The Sustainable Growth criterion, which isolates high quality growthcompanies from those offering less sustainable growth prospects, further contributed negatively to performance.
Outlook
The period ended with investors pondering the impact of prospective trade wars, higher interest rates and regulatory challenges to thetechnology sector. There has been a pattern of market rotation, which might be driven by known macroeconomic and geopolitical driversor which might be more of an effect of profit taking. The managers continue to espouse judicious risk management, which requiresoffsetting opportunities against the risks inherent in the market. Firstly, there are risks and opportunities inherent in the path towardsmonetary normalisation, as central banks continue to wrestle with the timing and form of their respective exit strategies. Secondly, thereare ongoing effects flowing from the proliferation of structural distortions embedded into the framework of the market, due in part tothe gargantuan shift toward passive investing over a relatively short period of time. Such phenomena have been manifest through anincrease in the frequency and impact of style and sector rotations. Thirdly, elevated political instability within developed markets shouldnot be discounted, particularly given how unfamiliar a risk this is for many current market participants. In all of these circumstances,the managers feel it is important to maintain diversification in terms of stock selection techniques, while achieving a balanced approachto investment style exposures across the portfolio.
Old Mutual Global Investors Series PlcInterim Report and Unaudited Financial Statements for the financial period ended 30 June 2018
OLD MUTUAL NORTH AMERICAN EQUITY FUNDINVESTMENT ADVISER’S REPORT FOR THE FINANCIAL PERIOD ENDED 30 JUNE 2018
Old Mutual North American Equity Fund – Old Mutual Global Investors (UK) Limited
20
Market
The New Year began with many indices posting historic highs, but this initial burst of market performance was quickly replaced byincreased market volatility, which also characterised most of the first half of 2018 (1H2018). Equity markets recoiled at the increasingprospect of large scale protectionist measures being deployed by the US variously against China, NAFTA and the EU. The managers’proprietary risk appetite measure continued to track movements in investor sentiment, and indicated that the deterioration in marketenvironment, seen from the outset of 2018, accelerated towards the end of 1H2018.
Performance
Four out of the sub-fund’s five stock selection criteria made a positive contribution to the sub-fund’s returns during 1H2018. However,the Sustainable Growth criterion, which seeks to isolate high quality growth companies from those offering less sustainable growthprospects, was negative during this period. The other four stock selection criteria were slightly positive during the period. The CompanyManagement criterion, which focuses on isolating conservative management teams, and the Dynamic Valuation criterion, which seeksto capture the optimal underlying mix between exposure to attractively valued stocks and those with more defensive characteristics,both made small positive contributions. The Market Dynamics criterion, which uses price information, predominantly driven by industryand stock level momentum, and the Analyst Sentiment criterion, which seeks to identify companies whose share price has not alwaysfully priced in the most recent and salient available corporate information, were both marginally positive.
Outlook
The period ended with investors pondering the impact of prospective trade wars, higher interest rates and regulatory challenges to thetechnology sector. There has been a pattern of market rotation, which might be driven by known macroeconomic and geopolitical driversor which might be more of an effect of profit taking. The managers continue to espouse judicious risk management, which requiresoffsetting opportunities against the risks inherent in the market. Firstly, there are risks and opportunities inherent in the path towardsmonetary normalisation, as central banks continue to wrestle with the timing and form of their respective exit strategies. Secondly, thereare ongoing effects flowing from the proliferation of structural distortions embedded into the framework of the market, due in part tothe gargantuan shift toward passive investing over a relatively short period of time. Such phenomena have been manifest through anincrease in the frequency and impact of style and sector rotations. Thirdly, elevated political instability within developed markets shouldnot be discounted, particularly given how unfamiliar a risk this is for many current market participants. In all of these circumstances,the managers feel it is important to maintain diversification in terms of stock selection techniques, while achieving a balanced approachto investment style exposures across the portfolio.
Old Mutual Global Investors Series PlcInterim Report and Unaudited Financial Statements for the financial period ended 30 June 2018
OLD MUTUAL TOTAL RETURN USD BOND FUNDINVESTMENT ADVISER’S REPORT FOR THE FINANCIAL PERIOD ENDED 30 JUNE 2018
Old Mutual Total Return USD Bond Fund – Janus Capital International LimitedSub-Investment Adviser: Janus Capital Management LLC
21
Market
Global bond markets lost ground during the six-month period, as volatility returned early in the year. While the moves were morepronounced in risk assets – namely equities – bonds also suffered, given that the source of investor trepidation was the possibility of anacceleration in inflation. The reaction was different in Europe as concerns about softening eurozone economic data caused investors topile into safe-haven German Bunds. During the spring, price movements in Europe, the US and emerging markets diverged as theywere largely driven by regional developments.
Performance
For the period, the sub-fund’s cash-based core generated positive returns. The sub-fund’s positioning in shorter-duration corporatecredits was able to withstand spread widening, resulting in these securities contributing to performance, as did our allocation tosecuritized products. The sub-fund’s core allocation to US Treasuries also aided performance. The period’s underperformance wasconcentrated in the sub-fund’s Bund positioning. Given the managers’ view that the magnitude of the variance between Bunds andTreasuries is not merited by the economic fundamentals of the two countries, the sub-fund constructed a directional position aimed atbenefiting from a potential convergence, namely via rising Bund yields. We believe that despite some softening of economic data duringthe first half of the year, there is little rationale for yields to be negative for up to seven years on German sovereign debt. Conversely,we believe that the US economy will have difficulty accelerating, as labour markets are extremely tight and the spectre of a trade warcould limit new sources of growth. While Europe continues to face threats from populist movements and the lengths to which politiciansare willing to go to institute pro-growth structural reform are up for debate, our view is that the European economy is largely on trackin its emergence from its debt crisis. Although we maintain our convergence view, during the latter part of the period, we scaled backour positioning in recognition of the factors that have kept a steady bid on Bund prices.
Outlook
The US Federal Reserve has already raised interest rates twice in 2018, and according to its most recent dot plot survey, it anticipatesat least one more hike this year. The market – based on futures prices – is slightly more cautious on the remaining number of increases.With an eye toward the future, we must repeat that past financial crises have been caused by excess leverage. Over the past decade theaggregate global debt burden – as measured by credit growth of corporations, governments and households – has not contracted, and inmany regions has expanded. The most notable development in the global debt situation is the reshuffling of liabilities from householdsand corporations to governments – and more recently, back to corporations. At some point, there will be a level of interest rates thatcauses the system to buckle. While we cannot specifically state exactly what that level is or when we will reach it, financial conditionsare tightening. Consequently, investors should be vigilant.
Old Mutual Global Investors Series PlcInterim Report and Unaudited Financial Statements for the financial period ended 30 June 2018
OLD MUTUAL EMERGING MARKET DEBT FUNDINVESTMENT ADVISER’S REPORT FOR THE FINANCIAL PERIOD ENDED 30 JUNE 2018
Old Mutual Emerging Market Debt Fund – Old Mutual Global Investors (UK) Limited
22
Market
After a very strong start to the year, emerging markets took a turn for the worse in February, sending the sub-fund’s benchmarkJPMorgan EMBIG Index down 5% year to date. The fiscal loosening by US President Donald Trump’s administration and relativelystrong economic data led to a re-pricing of inflation expectations and a re-steepening of the US yield curve. The market then startedrevising its expectations for more aggressive interest rate hikes, all of which contributed to a stronger US dollar. The tightening of globalconditions had seriously dented investors’ confidence in emerging markets, particularly towards those countries with large externalvulnerabilities such as in Argentina and Turkey which both have substantial refinancing needs. Fears of a protracted trade wars sparkedby President Trump didn’t help either and raised fears of a slowdown in global growth. The confidence crisis quickly spread throughoutthe market and investors were forced to liquidate some of their popular overweight positions adding to redemptions pressure that resultedin almost US$10bn leaving the asset class since April.
Performance
The sub-fund under-performed its benchmark in the first half of the year from its overweight positions in Argentina and high-beta oilproducers like Gabon and Nigeria. In Argentina, heavy investor positioning, heavy issuance, a widening current account deficit andconfusion around the central bank’s independence led to a massive unwind of positions in the local market which accelerating thepressure on the currency. Local authorities acted quickly to try and restore market confidence, bringing the policy rate to 40% andnegotiating a US$50bn package with the International Monetary Fund (IMF), but bonds continued to underperform until the end ofJune, in line with other high beta names. Despite stronger oil prices throughout the period, oil exporters also underperformed given theheavy positioning from emerging market investors.
Outlook
With the sub-fund’s benchmark JPM EMBIG Index spread widening by 100 basis points from its trough in January, some value hasbeen recreated in emerging markets. Uncertainty around global growth given the heightened risks from a trade war could see the USFederal Reserve adopt a less hawkish stance, which would improve the backdrop for the asset class. We are therefore adding riskselectively, with a still strong oil outlook favouring underperforming names like Nigeria and Gabon. We also believe that the measuresput in place by the government in Argentina are credible enough. The lack of external issuance until 2020 should help US dollar bondsrebound in the second half. We have also maintained our overweight positions in IMF-backed countries like Egypt which continues tomake progress on its reform agenda. We see further upside in oil prices and therefore have maintained our underweight positions in oilimporters like Kenya.
Old Mutual Global Investors Series PlcInterim Report and Unaudited Financial Statements for the financial period ended 30 June 2018
OLD MUTUAL EUROPEAN BEST IDEAS FUNDINVESTMENT ADVISER’S REPORT FOR THE FINANCIAL PERIOD ENDED 30 JUNE 2018
Old Mutual European Best Ideas Fund – Liontrust Investment Partners LLP– Odey Asset Management LLP– Old Mutual Global Investors (UK) Limited (until 14 June 2018)– Quilter Investors Limited (formerly Old Mutual Investment Management Limited)(from 15 June 2018)– Wellington Management International Limited
23
Market Review
Economic growth still looks healthy and corporate earnings continue to grow strongly, however, Europe’s chief concern remains itspolitics. Italy has appointed a populist coalition government containing numerous anti-EU elements while Brexit continues to rage,Chancellor Merkel fights a constant rear-guard action at home and President Trump’s trade antics continue to escalate.
Political risks are among the most difficult to predict which augurs for a more balanced and well diversified approach from our managersin the second half of the year as we explore the later stages of this already very mature economic cycle.
Performance
After losing ground in line with European equity markets and underperforming its benchmark during the first half of the period, thesubsequent recovery seen in the second quarter of 2018 helped the fund to outperform its index benchmark. Even so, it still delivered anegative return to investors during the first half of 2018, underperforming its Morningstar sector average, which was a modest positivereturn.
After the ignominy of being the worst performing developed equity market in the first quarter, the UK bounced back strongly, buoyedby extreme sterling weakness, to significantly outperform other European markets in the second half of the period.
In general, European stock markets managed to overcome trade war fears to deliver modest positive returns for sterling investors in thesecond quarter of 2018, however, this was not sufficient to redress losses from the first three months of the year.
Old Mutual Global Investors Series PlcInterim Report and Unaudited Financial Statements for the financial period ended 30 June 2018
OLD MUTUAL INVESTMENT GRADE CORPORATE BOND FUNDINVESTMENT ADVISER’S REPORT FOR THE FINANCIAL PERIOD ENDED 30 JUNE 2018
Old Mutual Investment Grade Corporate Bond Fund – Old Mutual Global Investors (UK) Limited
24
Market
Economic and policy divergence was the driving force behind a poor first six months of the year for risk assets. Outside of the US,growth momentum came to a halt. The pace set in the first quarter of 2018 was too quick to be maintained and a number of headwindshit sentiment – Chinese deleveraging, Italian political uncertainty, truckers’ strikes in Brazil, lingering Brexit uncertainty and, of course,the ongoing threat of a trade war. That said, the US economy was firing on all cylinders as fiscal stimulus and deregulation helped toboost pay packets and confidence, and rippled its way through the economy. Relative US economic strength affects the rest of the worldin two ways. On the positive front, it normally boosts trade as the country imports more goods from the rest of the world – althoughrecent academic studies suggest this effect is far less powerful than it was in previous years. On the negative side, a relatively strongAmerican economy boosts the US dollar and, after years of loose US monetary policy, the rest of the world holds a lot of US dollar-denominated debt – these debtholders are seeing their liabilities rise, limiting their ability to invest and forcing some to delever. Someemerging market countries have been forced to hike interest rates to protect their currencies too, tightening domestic credit conditionsfurther. This financial channel impact has been dominating market sentiment in recent months.
Performance
We went into the start of the 2018 positioned with greater credit beta, or sensitivity to market volatility, than the benchmark given therelatively benign economic backdrop and fair valuations. This played out well in January as the credit markets rallied aggressivelywhich gave rise to profit taking opportunities leading us to reduce credit exposure. This was done by increasing both the quality of thecompanies and reducing credit duration, or the sensitivity of portfolio holdings to interest rate changes. The portfolio remained neutrallypositioned throughout the rest of the period under review while looking to take advantage of selective attractive new issue premiumson offer in a relatively weak market. We continue to like the risk/reward on offer in financials and technology while shunning bricksand mortar retail and real estate exposed to this sector.
Outlook
The moves seen in markets – flattening yield curves, US strength, risk asset weakness – have been typical of late-cycle behaviour. Themarket can be ‘end of cycle’ for a long time, however, and given strong US household balance sheets, high employment and a labourmarket that has undergone huge structural changes, it seems too early to call time on the cycle – near-term recession risk is low in ouropinion. We expect a recovery in growth outside of America and for inflationary pressures to be contained, while longer-term structuralforces point to US dollar weakness.
Old Mutual Global Investors Series PlcInterim Report and Unaudited Financial Statements for the financial period ended 30 June 2018
OLD MUTUAL GLOBAL EMERGING MARKETS FUNDINVESTMENT ADVISER’S REPORT FOR THE FINANCIAL PERIOD ENDED 30 JUNE 2018
Old Mutual Global Emerging Markets Fund – Old Mutual Global Investors (UK) Limited
25
Market
In contrast to the smooth sailing of markets in 2017, the first half of 2018 proved to be an altogether more challenging period foremerging market equities. Stock markets came under pressure from geopolitical events and the unexpected strength of the US dollar.Optimism on a breakthrough summit on North Korea gave way to fears of a trade war as simmering trade tensions between the US andChina boiled over into each nation imposing tariffs on the other’s imports. Given the dollar’s strength, particular pressure was exertedon those countries with significant dollar denominated debt, such as Turkey and Argentina – the latter saw a slide in the value of thepeso and was forced to ask the IMF for an emergency US$50bn credit line in order to restore market confidence. Despite the noisygeopolitical background, first quarter profits from corporates across the emerging world were generally positive.
Performance
Against this background, the sub-fund underperformed its benchmark index. Detractors were concentrated in Latin America and Turkey.Banco Supervielle (Argentine bank), Smiles Fidelidade (Brazilian loyalty points provider), Ultrapar (Brazilian fuel distributor), Copaholdings (airline based in Panama) and Arcelik and Turk Traktor in Turkey were the largest negative detractors. By contrast, positivecontributions came from JNBY and ANTA sports in China and Padini in Malaysia. Elsewhere, Sunny Optical (optical component makerin China), Medy-Tox (a South Korean manufacturer of Botox), Ternium (Steel in Mexico and Argentina) and HDFC bank (India’spremier private bank franchise) also contributed. In terms of portfolio activity, we exited Banco Supervielle, Ultrapar and Smiles inArgentina and Brazil, Turk Traktor in Turkey, Bank Rakyat in Indonesia and Metro Pacific in the Philippines. Positions in WinSemiconductor and Nien Made were exited in Taiwan. New purchases included MYEG in Malaysia, Tofas in Turkey, Estacio in Braziland China Construction Bank.
Outlook
Whilst it is tempting to say that the backdrop for emerging market shares has become more challenging in recent months, the managerbelieves that the underlying factors making the asset class attractive remain in place – good global economic growth, the early stagesof a recovery in corporate profitability in our universe, combined with cheap valuations and a sceptical investor base. The most obviousrisk to the asset class remains the threat of an escalation of the trade wars between the USA and other nations – tariffs themselves areless the issue, more the uncertainty that could cause businesses to postpone or change investment plans impacting global supply chains.The manager continues to see a good opportunity set of high-quality companies across a range of emerging market countries and sectorsthat, he believes, sell at less than the team’s assessment of their intrinsic value, or real worth.
Old Mutual Global Investors Series PlcInterim Report and Unaudited Financial Statements for the financial period ended 30 June 2018
OLD MUTUAL ASIAN EQUITY INCOME FUNDINVESTMENT ADVISER’S REPORT FOR THE FINANCIAL PERIOD ENDED 30 JUNE 2018
Old Mutual Asian Equity Income Fund – Old Mutual Global Investors (Asia Pacific) Limited (until 17 May 2018)– Old Mutual Global Investors (UK) Limited (from 18 May 2018)
26
Market
Asian company shares were subjected to considerable share price fluctuations for the period under review. The benchmark indexregistered a fall of 3% over the six months in sterling terms, with two overriding factors dominating investor sentiment. After a strongstart to the year, weakness set in during February, on the back of US Treasury bonds breaching a psychologically important level. Thisresulted in some investors taking advantage of the relatively more attractive US interest rates on offer. Escalation of a trade war betweenthe US and China dampened sentiment further, especially in relation to the US administration’s targeting of China’s intellectualproperty.
Performance
The sub-fund’s manager was changed on 18 May 2018. The change followed a fund range review, during which OMGI concluded thatinvestors in the sub-fund would benefit from the management of the global equities team. Following the change, the investment approachof the sub-fund was amended to reflect the systematic investment process employed by OMGI’s global equities team. Under thatprocess, stocks are assessed in terms of the attractiveness of their valuation, quality, price trends, stable growth prospects, sentimentand company management, as opposed to the bottom-up approach that was used prior to 18 May. There was no change to the sub-fund’sobjective or ongoing fees.
Outlook
The period under review saw investors pondering the impact of prospective Sino-US trade wars and higher US interest rates, leading toa stronger US dollar and subsequent effects on dollar denominated debt. The new mangers of the sub-fund identify a pattern of marketrotation, which might be driven by known macroeconomic and geopolitical drivers, or which might be more the effect of profit taking.The new managers espouse judicious risk management, which requires offsetting opportunities against the risks inherent in the market.They also feel it is important to maintain diversification in terms of their stock selection techniques, while achieving a balanced approachto investment style exposures across the portfolio.
Old Mutual Global Investors Series PlcInterim Report and Unaudited Financial Statements for the financial period ended 30 June 2018
OLD MUTUAL LOCAL CURRENCY EMERGING MARKET DEBT FUNDINVESTMENT ADVISER’S REPORT FOR THE FINANCIAL PERIOD ENDED 30 JUNE 2018
Old Mutual Local Currency Emerging Market Debt Fund – Old Mutual Global Investors (UK) Limited
27
Market
After a very strong start to the year, emerging markets took a turn for the worse which saw currencies coming under pressure. Fiscalloosening by US President Donald Trump’s administration and relatively strong economic data led to a re-pricing of inflationexpectations and a re-steepening of the US yield curve. The market then started revising its expectations for more aggressive interestrate hikes, all of which contributed to a stronger US dollar. The tightening of global conditions seriously dented investors’ confidencein emerging markets, particularly towards those countries with large external vulnerabilities such as in Argentina and Turkey. Fears ofa protracted trade wars, sparked by Trump, did not help either and raised fears of a slowdown in global growth. The confidence crisisquickly spread throughout the market and investors were forced to liquidate some of their popular overweight positions amidstredemption pressure that resulted in almost US$10bn leaving the asset class since April.
Performance
The sub-fund underperformed its benchmark over the period given its overweight positions in Argentina local rates and currency thatlost more than 40% in three months. Exposure to popular overweight positions like Indonesia and South Africa also detracted fromperformance as offshore investors unwound their positions, which saw close to US$4bn leaving local markets in the period. The sub-fund however benefited from its short position in Central European currencies that underperformed year-to-date, and a short position inthe Turkish lira and rates, where the currency lost close to 25% year-to-date amid deteriorating current account dynamic and lack ofcredible response from the central bank. The sub-fund also benefited from its overweight position in Colombian rates and currenciesthat outperformed in the period amid rising oil prices and the victory in the presidential elections by market-friendly president IvanDuque.
Outlook
With the yield on the sub-fund’s benchmark JPM GBI-EM Global Diversified Index having now widened by close to 70 basis pointssince its trough in March, some value has been re-created in the emerging market space. We believe the correction in currencies is notin line with still robust fundamentals and should therefore leave room for some retracement in the months ahead. We continue to favouroil exporting currencies like the Colombian Peso and relative value trades like long Mexican Peso/short Brazilian Real given the carrydifferential and political cycle. We are also turning selectively long Central European currencies amid stronger growth. In the ratesspace, we see value in places like Indonesia where real rates have increased after substantial offshore outflows and pre-emptive ratehikes by the central bank.
Old Mutual Global Investors Series PlcInterim Report and Unaudited Financial Statements for the financial period ended 30 June 2018
OLD MUTUAL UK ALPHA FUND (IRL)INVESTMENT ADVISER’S REPORT FOR THE FINANCIAL PERIOD ENDED 30 JUNE 2018
Old Mutual UK Alpha Fund (IRL) – Old Mutual Global Investors (UK) Limited
28
Market
The trend of economic data, positive for much of 2017, reversed at the start of the year, most notably in Europe. Political instability inItaly and Angela Merkel’s struggle with her coalition partners on European immigration policy cast a cloud over Continental Europe.In the bond markets, yields rose in anticipation of rising US interest rates, putting additional pressure on global equity markets. Investorssaw further fluctuations in share prices following President Donald Trump’s decision to impose a series of tariffs on imports into theUnited States, with a view to targeting China in particular. Yet investor nerves gave way to some recovery in the second quarter. Thedollar moved sharply higher in the second part of the review period, driven by the relative strength of the US economy and tighteningof monetary policy. Consequently, emerging market currencies fell sharply, given that emerging market debt is dollar denominated.The oil price also rose as the United States pulled out of the nuclear agreement with Iran and re-imposed sanctions. In spite of theseissues, the equity market rebounded to leave the index slightly higher by the end of the period.
Performance
Against this background, the sub-fund marginally underperformed its benchmark index. Software groups Sage and Micro Focus werethe biggest detractors following profit warnings, while Pets at Home moved lower on concerns over costs at the groups vets business.By contrast, positive contributions came from Next, Tesco and gaming group GVC. Generator group, Drax, benefited from positivetrading statements and profits upgrades. In terms of portfolio activity, we reduced holdings in payments group Worldpay and RoyalShell Dutch Shell following strong performance. We sold out of our holding in pharmaceutical group, Shire, following the approachfrom Japanese peer Takeda. We added to positions in retailer Next on our belief that the market is underestimating the resilience of thebusiness and the online operation. We also added to packaging group DS Smith and Whitbread.
Outlook
It is clear that the US economy is growing strongly, whilst economic activity in China and Europe are slightly softer. In bond markets,the US yield curve (the curve that plots the path of short and long-dated yields) is flattening, suggesting that, eventually, interest raterises will slow the US economy sufficiently to cause a downturn in 2019/20. In the UK, by contrast, activity has strengthened somewhat,with the growth in inflation- adjusted wages likely to support the economy through the balance of this year. Any interest rate rise, webelieve, will be sufficiently modest so as not to knock growth off track. However, this later cycle environment can be a tricky one forinvestors, with fluctuating share prices a feature. We stick to our belief that valuation ultimately drives future returns, whilst seeking tofind diversified sources of return, such as ‘self-help’ situations like Tesco and Smith & Nephew.
Old Mutual Global Investors Series PlcInterim Report and Unaudited Financial Statements for the financial period ended 30 June 2018
OLD MUTUAL UK SMALLER COMPANIES FOCUS FUNDINVESTMENT ADVISER’S REPORT FOR THE FINANCIAL PERIOD ENDED 30 JUNE 2018
Old Mutual UK Smaller Companies Focus Fund – Old Mutual Global Investors (UK) Limited
29
Market
After a sharp fall in the first quarter, the FTSE All Share Index recovered strongly to deliver a total return of 1.7% over the first sixmonths of the year. The trend of economic data, which for much of 2017 had shown mainly positive surprises, reversed at the start ofthe year, most notably in Europe; this, combined with rising bond yields, which spiked higher in expectation of central bank tightening,put pressure on global equity markets in the first quarter. Elsewhere, trade war rhetoric ramped up between the US and China, and oilprices generally recovered over the period. In the UK, the government agreed a transition period post-Brexit that would ease theadjustment process for businesses. Interest rates were raised twice in the United States, while the European Central Bank announced itwould curtail asset purchases at the end of the year (but not raise interest rates for at least a year). The US dollar moved sharply higherin the second quarter driven by the relative strength of the US economy and the associated tightening of monetary policy. In spite of allthese issues the equity market rebounded in the second quarter to leave the index slightly higher by the end of the period.
Performance
The sub-fund outperformed its benchmark over the period. Of the outperformance, about one fifth was driven by sector allocation, withthe overweight to technology more than offsetting the underweight to oil and gas. On the stock front, the key performers were: BluePrism and Fever-tree, which both continued to deliver upgrades to trading expectations, as well as Ascential, which rerated followingmarket concerns over Cannes Lions abating. Below these names there were a number of good performers, including microcap names:Zoo Digital, Alpha FX and Aquis Exchange (a new addition). Unfortunately, the sub-fund suffered a number of profit warnings,including: Conviviality (position exited); Medica Group and Footasylum (position exited). Despite a number of unpleasant profitwarnings, the bulk of the portfolio has performed well over 1H18. Over this period, we have found a number of interesting new namesin the microcap space, which is partly responsible for the number of companies held by the sub-fund rising, although still within thetypical level of 50-70.
Outlook
Looking into 2H18 we are optimistic over the prospects for our larger holdings, as well as the outlook for these new names. The additionof these smaller names – where we typically favour “growth” names – and the difficult UK trading environment, has meant the portfoliohas become more exposed to growth than at the start of the year. Given the stock specific reasons for this swing, we are comfortable withthis, but continue to search for strong, cyclical ideas to complement where we can.
Old Mutual Global Investors Series PlcInterim Report and Unaudited Financial Statements for the financial period ended 30 June 2018
OLD MUTUAL UK DYNAMIC EQUITY FUNDINVESTMENT ADVISER’S REPORT FOR THE FINANCIAL PERIOD ENDED 30 JUNE 2018
Old Mutual UK Dynamic Equity Fund – Old Mutual Global Investors (UK) Limited
30
Market
Global equity markets were volatile during the first half of 2018. Economic indicators, which had positively surprised marketsthroughout much of 2017, turned more mixed. Bond yields climbed higher on expectation of further central bank tightening and tradewar rhetoric progressively ramped up between the US and China. These factors helped push the US dollar higher which in turn putpressure on the more indebted emerging markets. In the UK, the Brexit plan remains opaque.
Performance
Strong performances came from a variety of stocks - Fevertree, Blue Prism and Burford continued to deliver results materially ahead ofmarket expectations whilst Ascential, GVC and Charter Court benefitted from upward re-rating. The fund suffered from profit warningsin Microfocus, Footasylum, Medica and TP ICAP. Our decision to not own Ocado was detrimental to relative performance after thestock rose 162%. The short book benefitted from another profit warning by Countrywide, accompanied by the announcement of a rightsissue to shore up their overstretched balance sheet. We added new long positions in JTC, Integrafin, Learning Technologies and GymGroup via IPO or share placings. We increased the weighting to recruitment stocks by adding to our Robert Walters holding and boughta new unit in Page Group to take advantage of buoyant employment market conditions. Elsewhere, Kaz Minerals was added to neutralisethe fund’s mining exposure and the fund purchased its second unlisted equity, The Hut Group. Against this, we sold a range of highly-rated smaller companies such as Joules, Keywords, Globaldata, Sanne and XP Power and exited from Microfocus, Footasylum, Lucecoand Superdry after poor trading updates. We also added a new short position in New River Retail, however the short book as a wholeremains negligible.
Outlook
Leading economic indicators are supportive of continued steady global growth. In the UK, we have the added complexity of ongoingBrexit negotiations which are likely to continue to modestly constrain growth relative to other Western economies. Central banks willcontinue their path of gradual interest rate tightening but they are likely to step cautiously as they exit the decade-long era of very loosemonetary policy. Meanwhile, the growing threat of an escalating trade war between US and China is becoming a more pressing themein the nearer term. Against this backdrop we are maintaining our relatively balanced sector exposures. At a thematic level, we remainoverweight structural growth, broadly neutral in those areas of the market sensitive to global economic expansion, and retain ourunderweight in UK consumer cyclical stocks. This broad framework has been in place since the closing months of 2016.
Old Mutual Global Investors Series PlcInterim Report and Unaudited Financial Statements for the financial period ended 30 June 2018
OLD MUTUAL GLOBAL EQUITY ABSOLUTE RETURN FUNDINVESTMENT ADVISER’S REPORT FOR THE FINANCIAL PERIOD ENDED 30 JUNE 2018
Old Mutual Global Equity Absolute Return Fund – Old Mutual Global Investors (UK) Limited
31
Market
The New Year began with many indices posting historic highs, but this initial burst of market performance was quickly replaced byincreased market volatility, which also characterised most of the first half of 2018 (1H2018). Equity markets recoiled at the increasingprospect of large scale protectionist measures being deployed by the US variously against China, NAFTA and the EU. The managers’proprietary risk appetite measure continued to track movements in investor sentiment, and indicated that the deterioration in marketenvironment, seen from the outset of 2018, accelerated towards the end of 1H2018.
Performance
Almost all of the sub-fund’s five stock selection criteria made a positive contribution to its returns during 1H2018. The sub-fund’sAnalyst Sentiment criterion proved impactful in identifying companies whose share price had not always fully priced in the most recentand salient available corporate information. Despite the negative impact of a series of pronounced sector and style rotations in themarket, the Market Dynamics criterion was a robust source of alpha for the sub-fund over 1H2018. The Sustainable Growth criterion,which isolates high quality growth companies from those offering less sustainable growth prospects, further contributed positively toperformance. The sub-fund’s Dynamic Valuation criterion also contributed positively over the period, as the underlying mix betweenexposure to attractively valued stocks and those possessing more defensive characteristics consistently reflected continually evolvinglevels of risk appetite levels across markets. There was a slightly negative contribution over the period from the Company Managementcriterion: the impact of this highly qualitative alpha source, which focuses on isolating conservative management teams, is typicallymore impactful when the market demonstrates a preference for fundamental considerations.
Outlook
The period ended with investors pondering the impact of prospective trade wars, higher interest rates and regulatory challenges to thetechnology sector. There has been a pattern of market rotation, which might be driven by known macroeconomic and geopolitical driversor which might be more of an effect of profit taking. The managers continue to espouse judicious risk management, which requiresoffsetting opportunities against the risks inherent in the market. Firstly, there are risks and opportunities inherent in the path towardsmonetary normalisation, as central banks continue to wrestle with the timing and form of their respective exit strategies. Secondly, thereare ongoing effects flowing from the proliferation of structural distortions embedded into the framework of the market, due in part tothe gargantuan shift toward passive investing over a relatively short period of time. Such phenomena have been manifest through anincrease in the frequency and impact of style and sector rotations. Thirdly, elevated political instability within developed markets shouldnot be discounted, particularly given how unfamiliar a risk this is for many current market participants. In all of these circumstances,the managers feel it is important to maintain diversification in terms of the managers’ stock selection techniques, while achieving abalanced approach to investment style exposures across the managers’ portfolio.
Old Mutual Global Investors Series PlcInterim Report and Unaudited Financial Statements for the financial period ended 30 June 2018
OLD MUTUAL STRATEGIC ABSOLUTE RETURN BOND FUND^^^INVESTMENT ADVISER’S REPORT FOR THE FINANCIAL PERIOD ENDED 30 JUNE 2018
Old Mutual Strategic Absolute Return Bond Fund^^^ – Old Mutual Global Investors (UK) Limited
32
Market
Markets started the year in a sweet sport, continuing the positive momentum built up in 2017. Boosted by strong, synchronised globalgrowth, a weak US dollar and US President Trump’s fiscal package agreed in December, risk assets had a ‘melt up’ in January –everything rallied as investors, predominantly retail ones, piled into anything that was not government debt. The S&P 500 Index hitnew highs while the 10-year US Treasury approached 3%. Sentiment in the market then changed for three main reasons. First, valuationsin many asset classes were justifiable only in the context of expensive government debt, but as government debt cheapened up therewas an alternative to buying risk. Second, the synchronised global growth story hit a speed bump as Chinese and European data failedto match economists’ arguably overly enthusiastic forecasts. Third, geopolitical risks rose as the Trump administration upped the anteon perceived trade injustices and introduced, or threatened, tariffs on some goods. Consensus trades began to unravel. Short volatilityfunds began the slide and equities, credit, subordinated bank debt, short US dollar trades and emerging markets all followed. The onlyconsensus trade left standing was shorting US Treasuries as foreign investors balked at the rising deficits and high hedging costs, andthe Federal Reserve stayed on its tightening path.
Performance
The sub-fund is a collection of the best ideas in fixed income and currencies, scaled into a risk-efficient portfolio. Return is generatedfrom the active management of interest rate risk, currencies, corporate bonds and associated investments in both developed and emergingmarkets. The sub-fund has been positioned for a higher yield environment that would lead to greater volatility, so we have been shortduration and underweight credit.
Outlook
We believe the strength in the US dollar seen for much of the period was a US dollar squeeze. The structural bear market for the dollarremains in place in our view. Weakness in emerging markets where fundamentals are strong and value has been created is being usedto add exposure to the asset class in the portfolio. We remain cautious on prospects for credit.
Old Mutual Global Investors Series PlcInterim Report and Unaudited Financial Statements for the financial period ended 30 June 2018
OLD MUTUAL PAN AFRICAN FUND^^INVESTMENT ADVISER’S REPORT FOR THE FINANCIAL PERIOD ENDED 30 JUNE 2018
Old Mutual Pan African Fund^^ – Old Mutual Investment Group (Pty) Limited
33
Market
After a strong start to equity markets at the start of 2018, stocks in both the developed and the emerging markets tumbled in lateJanuary and February, amid concern US interest rates would rise at a faster pace than expected. The selloff in equities, however, wasless pronounced in frontier markets in Africa.
Performance
The Old Mutual Pan African Fund was officially closed on 28 February, 2018. The sub-fund invested in companies that directlybenefited from economic growth on the African continent.
Old Mutual Global Investors Series PlcInterim Report and Unaudited Financial Statements for the financial period ended 30 June 2018
OLD MUTUAL MONTHLY INCOME HIGH YIELD BOND FUNDINVESTMENT ADVISER’S REPORT FOR THE FINANCIAL PERIOD ENDED 30 JUNE 2018
Old Mutual Monthly Income High Yield Bond Fund – Old Mutual Global Investors (UK) Limited
34
Market
A divergence between economic data and monetary policy was the driving force behind a poor first half for risk assets. Excluding theUS economy, the momentum in global growth came to a halt. The pace set in the second quarter of 2017 and first quarter of 2018 provedtoo quick to be maintained. A number of headwinds hit sentiment including Chinese deleveraging, Italian political uncertainty, truckers’strikes in Brazil, lingering Brexit uncertainty and the ongoing threat of a trade war. Against this, the US economy was firing on allcylinders thanks to fiscal stimulus and deregulation which boosted pay-packets and consumer confidence.
Performance
Relative US economic strength affects the rest of the world in two ways, where one is more positive than the other. It can boost tradeas the US imports more goods from the rest of the world, though recent academic studies suggest this effect is far less powerful than itonce was. On the negative side, a relatively strong US economy strengthens the dollar which can have global ramifications. After yearsof loose US monetary policy, the rest of the world holds a lot of US dollar-denominated debt, which means that those debtholders haveseen their liabilities rise which has limited their ability to invest and forced some to deleverage. In the emerging markets, some countrieshave been forced to hike interest rates to protect their currencies too, tightening domestic credit conditions further. The financial channelimpact has dominated the price action in recent months. The moves seen in markets – flattening yield curves, US dollar strength,weakness in risk assets – have been typical of late cycle behaviour, but we can be stuck in this period for a long time. Given the strengthin US household balance sheets, high employment and a labour market that has undergone huge structural changes, it’s too early to calltime on this cycle. We believe that the risk of a near-term recession risk is low. We expect to see global economic growth recoveroutside of the US and inflationary pressures to be contained. The longer-term structural forces also point to weakness in the US dollar.
Outlook
We went into 2018 positioned with greater credit beta than the benchmark because of the relatively benign economic backdrop and fairvaluations. This played out well in January, as the credit markets rallied aggressively which gave rise to profit taking opportunities. Itled us to reduce credit exposure by increasing both the quality of the companies and reducing credit duration. We remained neutrallypositioned throughout the rest of the period, whilst we looked to take advantage of selective attractive new issue premiums on offer ina relatively weak market. We continue to like the risk reward in financial and technology companies and are avoiding bricks and mortarretailers and any real estate that is exposed to this sector.
Old Mutual Global Investors Series PlcInterim Report and Unaudited Financial Statements for the financial period ended 30 June 2018
OLD MUTUAL EUROPE (ex UK) SMALLER COMPANIES FUNDINVESTMENT ADVISER’S REPORT FOR THE FINANCIAL PERIOD ENDED 30 JUNE 2018
Old Mutual Europe (ex UK) Smaller Companies Fund – Old Mutual Global Investors (UK) Limited
35
Market
European equity markets have gone nowhere in the first half of 2018, but unsurprisingly volatility has increased markedly from therecord lows of 2017. This shift in mood comes as we approach the end of ultra-loose monetary policy after the European Central Bank(ECB) announced plans to taper asset purchases and indicated when it expects to start raising interest rates again. The EMIX (ex UK)Smaller European Companies Index advanced 0.7% in sterling terms over the period, led by energy stocks after the oil price climbedfrom US$64 to US$79 a barrel in the period. Healthcare was also strong, while the clear laggards were cyclicals with consumerdiscretionary and industrial companies both down close to 5%.
Performance
Portfolio performance has been poor in this half year with the major drag caused by stock selection. Sector allocation was also negative,largely as a result of the sub-fund’s overweight in the consumer discretionary sector, but also from an underweight in telco andhealthcare. There was no single theme in terms of disappointments at the company level either. Technicolor issued a profit warning andwas sold off, Ascom saw profit taking after a previously strong performance and va-Q-tec has seen a delay in both growth andprofitability, which after speaking to management we are prepared to be patient with. Other poor performers include Intrum,AcadeMedia, EVS, Byggmax, Tarkett and KappAhl. The sub-fund’s strong performers fit in one bracket, which is quality growth. Ofour holdings, Sixt, Teleperformance and Moncler were the standout contributors. In terms of portfolio activity, we have cut positionsin several of our underperforming companies and have shifted the tone towards structural growth and away from cyclicals and to alesser extent defensive names.
Outlook
The new coalition in Italy, the fall of the government in Spain and continued tensions in the coalition in Germany have unsettledinvestors who worry that we are returning to the dark days of the euro crisis. Whilst the headlines have turned ugly again this year, thereare reasons to remain cheerful. The rate of economic growth has moderated but shows no signs of turning negative. Investor uncertaintyis being offset by a ECB that remains very accommodative as well as very positive pro-market developments in France. Worries abouta global trade war are valid, but they have been partly offset by the weakness in the euro versus the US dollar. European smallercompanies have seen small declines in the first half of 2018, which when combined with rising earnings, have left valuations lookingmore reasonable from the elevated levels in late 2017. The portfolio trades at a discount to the market, which leaves us feeling positivewith at least a couple more years of solid earnings growth according to consensus.
Old Mutual Global Investors Series PlcInterim Report and Unaudited Financial Statements for the financial period ended 30 June 2018
OLD MUTUAL GLOBAL EQUITY INCOME FUND (IRL)INVESTMENT ADVISER’S REPORT FOR THE FINANCIAL PERIOD ENDED 30 JUNE 2018
Old Mutual Global Equity Income Fund (IRL) – Old Mutual Global Investors (UK) Limited
36
Market
The New Year began with many indices posting historic highs, but this initial burst of market performance was quickly replaced byincreased market volatility, which also characterised most of the first half of 2018 (1H2018). Equity markets recoiled at the increasingprospect of large scale protectionist measures being deployed by the US variously against China, NAFTA and the EU. The managers’proprietary risk appetite measure continued to track movements in investor sentiment, and indicated that the deterioration in marketenvironment, seen from the outset of 2018, accelerated towards the end of 1H2018.
Performance
Performance across the sub-fund’s five stock selection criteria was negative during this period. The most significant detractor was theDynamic Valuation criterion. During the period there was a drawdown to value (that is, to relatively cheaper stocks); unusually, thisfall was not offset by positive returns to quality signals. This is why the Dynamic Valuation criterion had a negative impact, even thoughthe portfolio was correctly positioned away from risky value throughout the period. The other four stock selection criteria were slightlynegative during the period. The Analyst Sentiment criterion contributed positively during the second quarter, but this was not enoughto offset its negative contribution during the first quarter. The Sustainable Growth criterion, which isolates high quality growthcompanies from those offering less sustainable growth prospects, also added to performance during the second quarter, but was negativeover the first half of the year. The managers’ use of price information, predominantly driven by industry and stock level momentum,detracted from the sub-fund’s performance during the first half, because increased market instability impacted negatively on returns toprevious winners found within the Market Dynamics criterion. This resulted in areas of the sub-fund which had generated large returnsover the recent 12 months giving up a portion of those returns in the latter stages of the period, as market leadership rotated. There wasa slightly negative contribution over the period from the Company Management criterion: the impact of this highly qualitative alphasource, which focuses on isolating conservative management teams, is typically more impactful when the market demonstrates apreference for fundamental considerations.
Outlook
The period ended with investors pondering the impact of prospective trade wars, higher interest rates and regulatory challenges to thetechnology sector. There has been a pattern of market rotation, which might be driven by known macroeconomic and geopolitical driversor which might be more of an effect of profit taking. The managers continue to espouse judicious risk management, which requiresoffsetting opportunities against the risks inherent in the market. The managers feel it is important to maintain diversification in termsof stock selection techniques, while achieving a balanced approach to investment style exposures across the portfolio.
Old Mutual Global Investors Series PlcInterim Report and Unaudited Financial Statements for the financial period ended 30 June 2018
OLD MUTUAL GOLD & SILVER FUNDINVESTMENT ADVISER’S REPORT FOR THE FINANCIAL PERIOD ENDED 30 JUNE 2018
Old Mutual Gold & Silver Fund – Old Mutual Global Investors (UK) Limited
37
Market
The gold and silver US dollar prices were down 3.9% and 4.8% respectively in the period, during which financial conditions tightenedas the US central bank contracted its balance sheet and interest rates were raised by 0.5 percentage points. Various geopoliticaldevelopments are worth noting. In March, the Shanghai International Energy Exchange’s yuan-denominated oil futures contract finallycame into existence. This contact was the final part of the oil-for-yuan-for-gold mechanism which facilitates trade outside of thepetrodollar system. In June, the secretary-general of the European Commission acknowledged the vulnerability arising from relianceon a US-centric fiat regime at a time when the American administration is flexing its muscle more. He said that the European authoritiesreacted to the US’s decision to cease the dollar convertibility to gold at Bretton Woods in 1971 by forming a new monetary union thatled to the creation of the euro. He added that “Europe needs to take its destiny in its own hands”. Later that month Kyrgyzstan’s centralbank revealed its plan to grow the share of gold in its reserves to 50% and commented: “The rules of the game are changing.”
Performance
It was a busy six months for sub-fund’s managers, who met senior management at over 40 gold and silver companies in the period. Forinstance, we visited some Mexican mines owned by businesses held in the portfolio to see first-hand the utilisation of new high pressuregrind technology that is also being installed elsewhere. Maintaining an intimate knowledge of all of the companies owned by the sub-fund is very important. We have identified potential operational problems at some businesses and divested holdings accordingly. Interms of positioning, the portfolio is allocated 18% to bullion and 80% to miners, being slightly overweight gold versus silver. From atechnical perspective, we believe the outlook is bullish for both gold and silver.
Outlook
We were encouraged to see the gold/silver ratio trend lower after reaching the top of the narrow range it has been trading in for manyyears and expect the ratio to fall further. The new chair of the Federal Reserve (Fed), Jerome Powell, has noted some risks, includingthose associated with fiscal and trade policies. It would not be surprising to see the US central bank point to these risks in order to justifyholding back further rate increases or otherwise slow policy tightening this year. Similarly, it is conceivable that the impact of tradetariffs could interrupt the rate hiking cycle despite inflation of more than 2%. The Fed chair has also spoken about having a “symmetric”inflation objective, implying that he will tolerate inflation persistently overshooting, or undershooting, the 2% target level. Allowinginflation to run hot will ultimately hurt real yields and, in our view, be bullish for gold.
Old Mutual Global Investors Series PlcInterim Report and Unaudited Financial Statements for the financial period ended 30 June 2018
OLD MUTUAL COMPASS PORTFOLIO 2INVESTMENT ADVISER’S REPORT FOR THE FINANCIAL PERIOD ENDED 30 JUNE 2018
Old Mutual Compass Portfolio 2 – Old Mutual Global Investors (UK) Limited (until 14 June 2018)Quilter Investors Limited (formerly Old Mutual Investment Management Limited) (from 15June 2018)
38
Market review
Equity and bond markets suffered a torrid start to the year. After UK and US stock markets both hit record highs in January, globalequities suffered two major setbacks in the first three months of 2018. Thanks to a sudden hike in US inflation and fears of a moreaggressive interest-rate posture in the US, markets sold off sharply on concerns of the global economy overheating.
After briefly recovering ground, markets tumbled a second time as President Trump’s trade-war rhetoric sparked worries of a globaleconomic slowdown, and a data scandal at Facebook triggered a steep fall in tech-sector share prices.
In the second half of the period, markets recovered strongly, driven by the US as technology stocks recovered and overall strongcorporate earnings helped push markets higher, with the Nasdaq index gaining almost 13% in the three months to 30 June.
Emerging markets, in contrast, had a disappointing six months, as the MSCI Emerging Markets index declined 4.2% in sterling termsover the period, driven by trade war rhetoric with the US, China concerns and weakening corporate fundamentals.
Performance
The portfolio declined in the six month period but did a respectable job in protecting the value of our clients’ wealth during a period ofmarket uncertainty. The equity allocation had a disappointing start to the year, but recovered in the final three months of the period asUS equities delivered particularly strong returns, helped by positive performances from well-known names such as Nike and Kroger.
Meanwhile, in Japan, we created a slight overweight to small cap stocks by adding to the Usonian Japan Value fund, a fund introducedto the portfolio at the start of the year, as valuations within small cap Japanese stocks are a bit more interesting than larger capopportunities, although this is currently only a small position.
Fixed income overall delivered a flat performance, as a neutral performance from government and global bonds, was dragged lower byemerging market debt, with the Old Mutual Local Currency Emerging Market Debt Fund, proving to be a large detractor in the secondhalf of the period. Within credit, high yield exposure continued to deliver reasonable returns, and we continue to prefer taking creditrisk rather than duration risk, although there are signs that a lot of the spread benefit of being in high yield has now reduced.
The main story within the alternatives allocation has been the underperformance of alternative beta, with few style factors workingacross the quarter. Other alternatives exposure performed better in contrast, with macro, event driven and long/short all deliveringreasonable performance, while our commodity allocation benefited in the second half of the period from the uplift in crude oil prices.

Old Mutual Global Investors Series PlcInterim Report and Unaudited Financial Statements for the financial period ended 30 June 2018
OLD MUTUAL COMPASS PORTFOLIO 3INVESTMENT ADVISER’S REPORT FOR THE FINANCIAL PERIOD ENDED 30 JUNE 2018
Old Mutual Compass Portfolio 3 – Old Mutual Global Investors (UK) Limited (until 14 June 2018)Quilter Investors Limited (formerly Old Mutual Investment Management Limited) (from 15June 2018)
39
Market review
Equity and bond markets suffered a torrid start to the year. After UK and US stock markets both hit record highs in January, globalequities suffered two major setbacks in the first three months of 2018. Thanks to a sudden hike in US inflation and fears of a moreaggressive interest-rate posture in the US, markets sold off sharply on concerns of the global economy overheating.
After briefly recovering ground, markets tumbled a second time as President Trump’s trade-war rhetoric sparked worries of a globaleconomic slowdown, and a data scandal at Facebook triggered a steep fall in tech-sector share prices.
In the second half of the period, markets recovered strongly, driven by the US as technology stocks recovered and overall strongcorporate earnings helped push markets higher, with the Nasdaq index gaining almost 13% in the three months to 30 June.
Emerging markets, in contrast, had a disappointing six months, as the MSCI Emerging Markets index declined 4.2% in sterling termsover the period, driven by trade war rhetoric with the US, China concerns and weakening corporate fundamentals.
Performance
The portfolio declined in the six month period but did a respectable job in protecting the value of our clients’ wealth during a period ofmarket uncertainty. The equity allocation had a disappointing start to the year, but recovered in the final three months of the period asUS equities delivered particularly strong returns, helped by positive performances from well-known names such as Nike and Kroger.
Meanwhile, in Japan, we created a slight overweight to small cap stocks by adding to the Usonian Japan Value fund, a fund introducedto the portfolio at the start of the year, as valuations within small cap Japanese stocks are a bit more interesting than larger capopportunities, although this is currently only a small position.
Fixed income overall delivered a flat performance, as a neutral performance from government and global bonds, was dragged lower byemerging market debt, with the Old Mutual Local Currency Emerging Market Debt Fund, proving to be a large detractor in the secondhalf of the period. Within credit, high yield exposure continued to deliver reasonable returns, and we continue to prefer taking creditrisk rather than duration risk, although there are signs that a lot of the spread benefit of being in high yield has now reduced.
The main story within the alternatives allocation has been the underperformance of alternative beta, with few style factors workingacross the quarter. Other alternatives exposure performed better in contrast, with macro, event driven and long/short all deliveringreasonable performance, while our commodity allocation benefited in the second half of the period from the uplift in crude oil prices.

Old Mutual Global Investors Series PlcInterim Report and Unaudited Financial Statements for the financial period ended 30 June 2018
OLD MUTUAL COMPASS PORTFOLIO 4INVESTMENT ADVISER’S REPORT FOR THE FINANCIAL PERIOD ENDED 30 JUNE 2018
Old Mutual Compass Portfolio 4 – Old Mutual Global Investors (UK) Limited (until 14 June 2018)Quilter Investors Limited (formerly Old Mutual Investment Management Limited) (from 15June 2018)
40
Market review
Equity and bond markets suffered a torrid start to the year. After UK and US stock markets both hit record highs in January, globalequities suffered two major setbacks in the first three months of 2018. Thanks to a sudden hike in US inflation and fears of a moreaggressive interest-rate posture in the US, markets sold off sharply on concerns of the global economy overheating.
After briefly recovering ground, markets tumbled a second time as President Trump’s trade-war rhetoric sparked worries of a globaleconomic slowdown, and a data scandal at Facebook triggered a steep fall in tech-sector share prices.
In the second half of the period, markets recovered strongly, driven by the US as technology stocks recovered and overall strongcorporate earnings helped push markets higher, with the Nasdaq index gaining almost 13% in the three months to 30 June.
Emerging markets, in contrast, had a disappointing six months, as the MSCI Emerging Markets index declined 4.2% in sterling termsover the period, driven by trade war rhetoric with the US, China concerns and weakening corporate fundamentals.
Performance
The portfolio declined in the six month period but did a respectable job in protecting the value of our clients’ wealth during a period ofmarket uncertainty. The equity allocation had a disappointing start to the year, but recovered in the final three months of the period asUS equities delivered particularly strong returns, helped by positive performances from well-known names such as Nike and Kroger.
Meanwhile, in Japan, we created a slight overweight to small cap stocks by adding to the Usonian Japan Value fund, a fund introducedto the portfolio at the start of the year, as valuations within small cap Japanese stocks are a bit more interesting than larger capopportunities, although this is currently only a small position.
Fixed income overall delivered a flat performance, as a neutral performance from government and global bonds, was dragged lower byemerging market debt, with the Old Mutual Local Currency Emerging Market Debt Fund, proving to be a large detractor in the secondhalf of the period. Within credit, high yield exposure continued to deliver reasonable returns, and we continue to prefer taking creditrisk rather than duration risk, although there are signs that a lot of the spread benefit of being in high yield has now reduced.
The main story within the alternatives allocation has been the underperformance of alternative beta, with few style factors workingacross the quarter. Other alternatives exposure performed better in contrast, with macro, event driven and long/short all deliveringreasonable performance, while our commodity allocation benefited in the second half of the period from the uplift in crude oil prices.
Old Mutual Global Investors Series PlcInterim Report and Unaudited Financial Statements for the financial period ended 30 June 2018
OLD MUTUAL COMPASS PORTFOLIO 5INVESTMENT ADVISER’S REPORT FOR THE FINANCIAL PERIOD ENDED 30 JUNE 2018
Old Mutual Compass Portfolio 5 – Old Mutual Global Investors (UK) Limited (until 14 June 2018)Quilter Investors Limited (formerly Old Mutual Investment Management Limited) (from 15June 2018)
41
Market review
Equity and bond markets suffered a torrid start to the year. After UK and US stock markets both hit record highs in January, globalequities suffered two major setbacks in the first three months of 2018. Thanks to a sudden hike in US inflation and fears of a moreaggressive interest-rate posture in the US, markets sold off sharply on concerns of the global economy overheating.
After briefly recovering ground, markets tumbled a second time as President Trump’s trade-war rhetoric sparked worries of a globaleconomic slowdown, and a data scandal at Facebook triggered a steep fall in tech-sector share prices.
In the second half of the period, markets recovered strongly, driven by the US as technology stocks recovered and overall strongcorporate earnings helped push markets higher, with the Nasdaq index gaining almost 13% in the three months to 30 June.
Emerging markets, in contrast, had a disappointing six months, as the MSCI Emerging Markets index declined 4.2% in sterling termsover the period, driven by trade war rhetoric with the US, China concerns and weakening corporate fundamentals.
Performance
The portfolio declined in the six month period but did a respectable job in protecting the value of our clients’ wealth during a period ofmarket uncertainty. The equity allocation had a disappointing start to the year, but recovered in the final three months of the period asUS equities delivered particularly strong returns, helped by positive performances from well-known names such as Nike and Kroger.
Meanwhile, in Japan, we created a slight overweight to small cap stocks by adding to the Usonian Japan Value fund, a fund introducedto the portfolio at the start of the year, as valuations within small cap Japanese stocks are a bit more interesting than larger capopportunities, although this is currently only a small position.
Fixed income overall delivered a flat performance, as a neutral performance from government and global bonds, was dragged lower byemerging market debt, with the Old Mutual Local Currency Emerging Market Debt Fund, proving to be a large detractor in the secondhalf of the period.
Old Mutual Global Investors Series PlcInterim Report and Unaudited Financial Statements for the financial period ended 30 June 2018
OLD MUTUAL UK SPECIALIST EQUITY FUNDINVESTMENT ADVISER’S REPORT FOR THE FINANCIAL PERIOD ENDED 30 JUNE 2018
Old Mutual UK Specialist Equity Fund – Old Mutual Global Investors (UK) Limited
42
Market
UK stock markets were broadly flat over the first half of the year with notable volatility. Economic data continued to be supportive inmost regions of the world, albeit sentiment surveys dipped from very high levels. Much of the macroeconomic debate centred on thepace of interest rate rises, particularly in the US, and the likely impact this would have on growth. Over the period, the US administrationincreased its hostile rhetoric on trade tariffs, particularly with China. In continental Europe there was some political instability, notablyin Germany and Italy. Emerging markets came under pressure in the latter half of the period, in part due to the strength of the US dollar,the currency in which many emerging market governments borrow money.
Performance
During the period, the sub-fund’s net exposure averaged very close to zero, as is normal for this strategy. Gross exposure averaged closeto 200%. Positions in the short book delivered positive alpha, while the long book delivered negative alpha that more than offset this.The key issues on the long book were predominantly stock specific, rather than thematic or sector led. The primary disappointment onthe long book was a position in alcohol distributor and retailer Conviviality whose trading profits and cash position were affected byirregularities in its internal accounting. We sold the position, but at a substantial loss. It was the biggest single negative driver of the fallin the sub-fund’s NAV over the period. Three other long positions were also weak – Micro Focus, a software business, Superdry, thefashion brand, and Footasylum, a fast growing UK retailer of sportswear. All three announced disappointing trading updates. The shortbook delivered pleasing returns, anticipating a number of significant profit warnings. Notable contributions came from Dignity, Photo-Me, Debenhams, Countrywide, McBride and PZ Cussons. The main drags came from UBM and BCA Marketplace, which both receivedtakeover approaches, and Rightmove where the shares re-rated sharply despite slowing revenue growth.
Outlook
The outlook for the UK economy remains challenged, as Brexit negotiations continue. Globally, the growth outlook is fairly stable,with the principal risks coming from monetary policy and trade tensions. Equity market valuations are slightly above long-termaverages: stretched in small areas, but not extreme versus historical levels in aggregate. Our approach remains to run a relativelybalanced portfolio, albeit one with a moderate skew towards structural growth stocks. Despite the wider uncertainty, we continue tofind excellent UK businesses to invest in and the initial public offering pipeline remains interesting. The key driver of performance inthe second half of 2018, and beyond, will be continued careful stock picking on the long and short books. We will remain relativelyagnostic as to overall market direction.
Old Mutual Global Investors Series PlcInterim Report and Unaudited Financial Statements for the financial period ended 30 June 2018
OLD MUTUAL STYLE PREMIA ABSOLUTE RETURN FUNDINVESTMENT ADVISER’S REPORT FOR THE FINANCIAL PERIOD ENDED 30 JUNE 2018
Old Mutual Style Premia Absolute Return Fund – Old Mutual Global Investors (UK) Limited
43
Market
The year started strongly for equities, in a similar vein to 2017, until a sharp spike in volatility in February hit sentiment and draggeddown markets. Growing concerns of a trade war between the the world’s two largest economies, the US and China, led to further fallsin March. The second half of the period saw something of a bounce in equities, aided by improved economic data, particularly from theUS. The sub-fund delivered a negative return in the period. The first half of 2018 saw very strong returns to Equity Quality and positivereturns to Equity Momentum. These were offset by negative returns to the strategies other style factors, especially Equity Value, FixedIncome Value and FX Momentum. All asset classes delivered a negative return with no single asset class dominating.
Performance
From a style perspective, the sub-fund saw strong positive returns to Quality at an aggregate asset level. Value, Momentum, StatisticalArbitrage and Carry were negative at an aggregate asset level. Value delivered the most significant negative contribution. Realisedvolatility was below target against the benign market. Leverage was in line with expectations throughout the period.
Outlook
The risk of more elevated volatility levels, and surprise spikes, cannot be ruled out in coming months after the spike in volatility seenin February, after which volatility reverted to lower levels. Given the unpredictability of markets we continue to believe there is valuein a strategy that can source returns from persistent styles across many asset classes. Furthermore, the positive skew aspects of StatisticalArbitrage could help investors if markets become especially turbulent.
Old Mutual Global Investors Series PlcInterim Report and Unaudited Financial Statements for the financial period ended 30 June 2018
OLD MUTUAL FINANCIALS CONTINGENT CAPITAL FUNDINVESTMENT ADVISER’S REPORT FOR THE FINANCIAL PERIOD ENDED 30 JUNE 2018
Old Mutual Financials Contingent Capital Fund – Old Mutual Global Investors (UK) Limited
44
Market
Economic and policy divergence was the driving force behind a poor first six months of the year for risk assets. Outside of the US,growth momentum came to a halt. The pace set in the first quarter of 2018 was too quick to be maintained and a number of headwindshit sentiment – Chinese deleveraging, Italian political uncertainty, truckers’ strikes in Brazil, lingering Brexit uncertainty and, of course,the ongoing threat of a trade war. That said, the US economy was firing on all cylinders as fiscal stimulus and deregulation helped toboost pay packets and confidence, and rippled its way through the economy. Relative US economic strength affects the rest of the worldin two ways. On the positive front, it normally boosts trade as the country imports more goods from the rest of the world – althoughrecent academic studies suggest this effect is far less powerful than it was in previous years. On the negative side, a relatively strongAmerican economy boosts the US dollar and, after years of loose US monetary policy, the rest of the world holds a lot of US dollar-denominated debt – these debtholders are seeing their liabilities rise, limiting their ability to invest and forcing some to delever. Someemerging market countries have been forced to hike interest rates to protect their currencies too, tightening domestic credit conditionsfurther. This financial channel impact has been dominating market sentiment in recent months.
Performance
We went into the start of the 2018 positioned with greater credit beta, or sensitivity to market volatility, than the benchmark, given therelatively benign economic backdrop and fair valuations. This played out well in January as the credit markets rallied aggressivelywhich gave rise to profit-taking opportunities against an increasingly attractive new issue market. Given credit fundamentals remainexceptionally strong in developed market banks, we continued to be comfortable taking opportunities to selectively add positions to theportfolio during the period under review. In our view, this unerring focus on the fundamental credit health of the names in the portfoliopositions the sub-fund attractively for the future.
Outlook
The moves seen in markets – flattening yield curves, US strength, risk asset weakness – have been typical of late economic cyclebehaviour. The market can be ‘end of cycle’ for a long time, however, and given strong US household balance sheets, high employmentand a labour market that has undergone huge structural changes, it seems too early to call time on the cycle: near-term recession risk islow, in our opinion. We expect a recovery in growth outside of America and for inflationary pressures to be contained, while longer-term structural forces point to US dollar weakness.
Old Mutual Global Investors Series PlcInterim Report and Unaudited Financial Statements for the financial period ended 30 June 2018
PORTFOLIO OF INVESTMENTS – Old Mutual China Equity Fund
Nominal Security Description Value USD% of Net
Assets
45
Common Stock
Communications - 27.68% (2017 - 22.73%)
31,977 Alibaba Group Holding Ltd (DR) 6,023,827 8.85%
9,095 Baidu Inc (DR) 2,202,900 3.24%
398,500 China Mobile Ltd 3,539,953 5.19%
15,553 Ctrip.com International Ltd (DR) 746,700 1.10%
126,000 Tencent Holdings Ltd 6,323,866 9.30%
18,837,246 27.68%
Consumer, Cyclical - 9.19% (2017 - 7.95%)
353,000 Geely Automobile Holdings Ltd 915,536 1.35%
264,000 Haier Electronics Group Co Ltd 903,409 1.33%
565,500 Lifestyle International Holdings Ltd 1,199,285 1.76%
229,000 Luk Fook Holdings International Ltd 947,080 1.39%
98,000 Shenzhou International Group Holdings Ltd 1,209,657 1.78%
382,500 Yue Yuen Industrial Holdings Ltd 1,079,796 1.58%
6,254,763 9.19%
Consumer, Non-cyclical - 11.96% (2017 - 9.95%)
396,000 China Resources Beer Holdings Co Ltd 1,922,900 2.83%
464,000 CSPC Pharmaceutical Group Ltd 1,401,531 2.06%
161,900 Inner Mongolia Yili Industrial Group Co Ltd 681,784 1.00%
56,764 Jiangsu Hengrui Medicine Co Ltd 649,096 0.95%
6,700 Kweichow Moutai Co Ltd 739,709 1.09%
11,873 New Oriental Education & Technology Group Inc (DR) 1,114,637 1.64%
509,000 Sino Biopharmaceutical Ltd 781,053 1.15%
22,406 TAL Education Group (DR) 843,810 1.24%
8,134,520 11.96%
Energy - 7.38% (2017 - 3.84%)
876,000 China Petroleum & Chemical Corp 782,634 1.15%
417,000 China Shenhua Energy Co Ltd 989,583 1.46%
1,062,000 CNOOC Ltd 1,832,650 2.69%
1,860,000 PetroChina Co Ltd 1,415,219 2.08%
5,020,086 7.38%
Financial - 33.84% (2017 - 36.14%)
4,474,000 Agricultural Bank of China Ltd 2,092,659 3.08%
453,000 AIA Group Ltd 3,960,580 5.82%
7,049,000 Bank of China Ltd 3,494,729 5.14%
517,500 BOC Hong Kong Holdings Ltd 2,437,032 3.57%
3,280,000 China Construction Bank Corp 3,030,737 4.45%
176,000 China Resources Land Ltd 593,301 0.87%
100,000 CK Asset Holdings Ltd 794,007 1.17%
28,600 Hang Seng Bank Ltd 715,157 1.05%
60,700 Hong Kong Exchanges & Clearing Ltd 1,825,732 2.69%
2,972,000 Industrial & Commercial Bank of China Ltd 2,223,429 3.27%
201,500 Ping An Insurance Group Co of China Ltd 1,854,166 2.73%
23,021,529 33.84%
Old Mutual Global Investors Series PlcInterim Report and Unaudited Financial Statements for the financial period ended 30 June 2018
PORTFOLIO OF INVESTMENTS – Old Mutual China Equity Fund (continued)
Nominal Security Description Value USD% of Net
Assets
46
Common Stock (continued)
Industrial - 5.06% (2017 - 8.64%)
28,500 AAC Technologies Holdings Inc 401,369 0.59%
3,998,000 Guangshen Railway Co Ltd 2,252,172 3.32%
42,200 Sunny Optical Technology Group Co Ltd 785,239 1.15%
3,438,780 5.06%
Technology - 1.22% (2017 - 2.66%)
3,363 NetEase Inc (DR) 829,417 1.22%
829,417 1.22%
Utilities - 3.35% (2017 - 0.00%)
211,500 CLP Holdings Ltd 2,277,737 3.35%
2,277,737 3.35%
Total Common Stock 67,814,078 99.68%
Financial Assets at Fair Value Through Profit or Loss(Cost USD 63,901,831) (2017: USD 51,568,983) 67,814,078 99.68%
Cash at Bank 720,812 1.06%
Other Net Liabilities (504,423) (0.74%)
Net Assets Value as at 30 June 2018 68,030,467 100.00%
% of Total
Portfolio Analysis Assets
Transferable securities admitted to official stock exchange listing 95.36%Other current assets 4.64%
Total Assets 100.00%
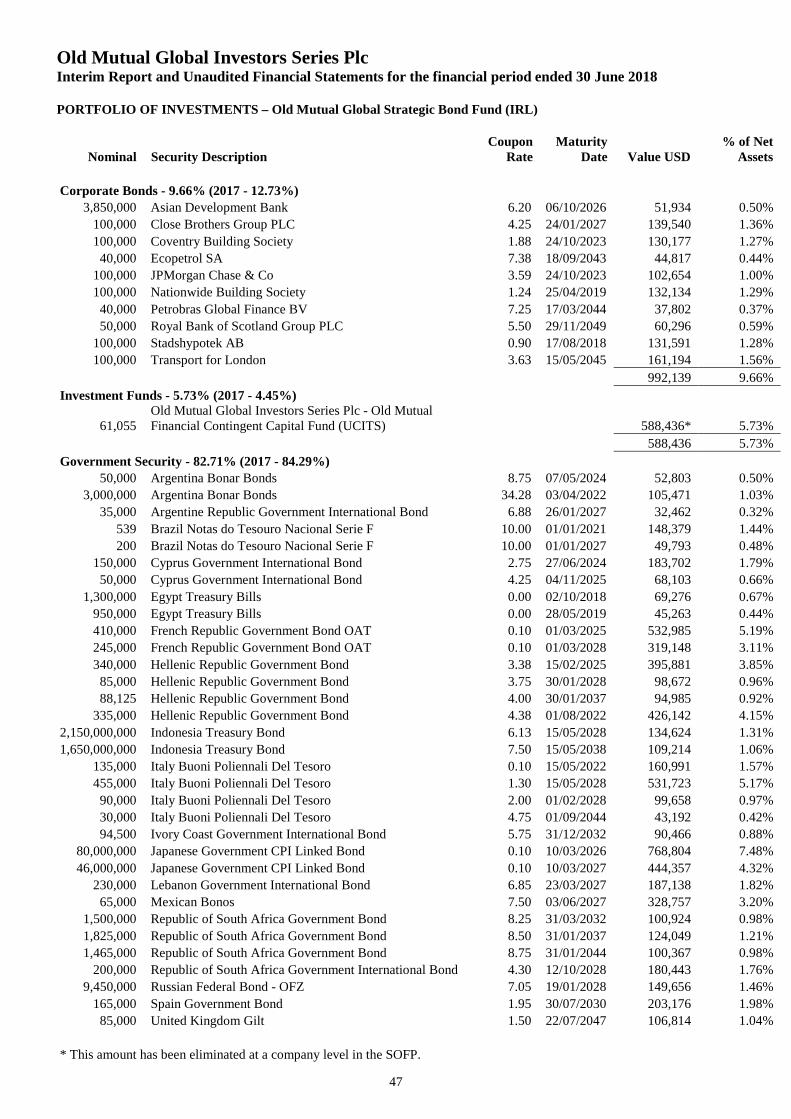
Old Mutual Global Investors Series PlcInterim Report and Unaudited Financial Statements for the financial period ended 30 June 2018
PORTFOLIO OF INVESTMENTS – Old Mutual Global Strategic Bond Fund (IRL)
Nominal Security DescriptionCoupon
RateMaturity
Date Value USD% of Net
Assets
47
Corporate Bonds - 9.66% (2017 - 12.73%)
3,850,000 Asian Development Bank 6.20 06/10/2026 51,934 0.50%
100,000 Close Brothers Group PLC 4.25 24/01/2027 139,540 1.36%
100,000 Coventry Building Society 1.88 24/10/2023 130,177 1.27%
40,000 Ecopetrol SA 7.38 18/09/2043 44,817 0.44%
100,000 JPMorgan Chase & Co 3.59 24/10/2023 102,654 1.00%
100,000 Nationwide Building Society 1.24 25/04/2019 132,134 1.29%
40,000 Petrobras Global Finance BV 7.25 17/03/2044 37,802 0.37%
50,000 Royal Bank of Scotland Group PLC 5.50 29/11/2049 60,296 0.59%
100,000 Stadshypotek AB 0.90 17/08/2018 131,591 1.28%
100,000 Transport for London 3.63 15/05/2045 161,194 1.56%
992,139 9.66%
Investment Funds - 5.73% (2017 - 4.45%)
61,055Old Mutual Global Investors Series Plc - Old MutualFinancial Contingent Capital Fund (UCITS) 588,436* 5.73%
588,436 5.73%
Government Security - 82.71% (2017 - 84.29%)
50,000 Argentina Bonar Bonds 8.75 07/05/2024 52,803 0.50%
3,000,000 Argentina Bonar Bonds 34.28 03/04/2022 105,471 1.03%
35,000 Argentine Republic Government International Bond 6.88 26/01/2027 32,462 0.32%
539 Brazil Notas do Tesouro Nacional Serie F 10.00 01/01/2021 148,379 1.44%
200 Brazil Notas do Tesouro Nacional Serie F 10.00 01/01/2027 49,793 0.48%
150,000 Cyprus Government International Bond 2.75 27/06/2024 183,702 1.79%
50,000 Cyprus Government International Bond 4.25 04/11/2025 68,103 0.66%
1,300,000 Egypt Treasury Bills 0.00 02/10/2018 69,276 0.67%
950,000 Egypt Treasury Bills 0.00 28/05/2019 45,263 0.44%
410,000 French Republic Government Bond OAT 0.10 01/03/2025 532,985 5.19%
245,000 French Republic Government Bond OAT 0.10 01/03/2028 319,148 3.11%
340,000 Hellenic Republic Government Bond 3.38 15/02/2025 395,881 3.85%
85,000 Hellenic Republic Government Bond 3.75 30/01/2028 98,672 0.96%
88,125 Hellenic Republic Government Bond 4.00 30/01/2037 94,985 0.92%
335,000 Hellenic Republic Government Bond 4.38 01/08/2022 426,142 4.15%
2,150,000,000 Indonesia Treasury Bond 6.13 15/05/2028 134,624 1.31%
1,650,000,000 Indonesia Treasury Bond 7.50 15/05/2038 109,214 1.06%
135,000 Italy Buoni Poliennali Del Tesoro 0.10 15/05/2022 160,991 1.57%
455,000 Italy Buoni Poliennali Del Tesoro 1.30 15/05/2028 531,723 5.17%
90,000 Italy Buoni Poliennali Del Tesoro 2.00 01/02/2028 99,658 0.97%
30,000 Italy Buoni Poliennali Del Tesoro 4.75 01/09/2044 43,192 0.42%
94,500 Ivory Coast Government International Bond 5.75 31/12/2032 90,466 0.88%
80,000,000 Japanese Government CPI Linked Bond 0.10 10/03/2026 768,804 7.48%
46,000,000 Japanese Government CPI Linked Bond 0.10 10/03/2027 444,357 4.32%
230,000 Lebanon Government International Bond 6.85 23/03/2027 187,138 1.82%
65,000 Mexican Bonos 7.50 03/06/2027 328,757 3.20%
1,500,000 Republic of South Africa Government Bond 8.25 31/03/2032 100,924 0.98%
1,825,000 Republic of South Africa Government Bond 8.50 31/01/2037 124,049 1.21%
1,465,000 Republic of South Africa Government Bond 8.75 31/01/2044 100,367 0.98%
200,000 Republic of South Africa Government International Bond 4.30 12/10/2028 180,443 1.76%
9,450,000 Russian Federal Bond - OFZ 7.05 19/01/2028 149,656 1.46%
165,000 Spain Government Bond 1.95 30/07/2030 203,176 1.98%
85,000 United Kingdom Gilt 1.50 22/07/2047 106,814 1.04%
* This amount has been eliminated at a company level in the SOFP.
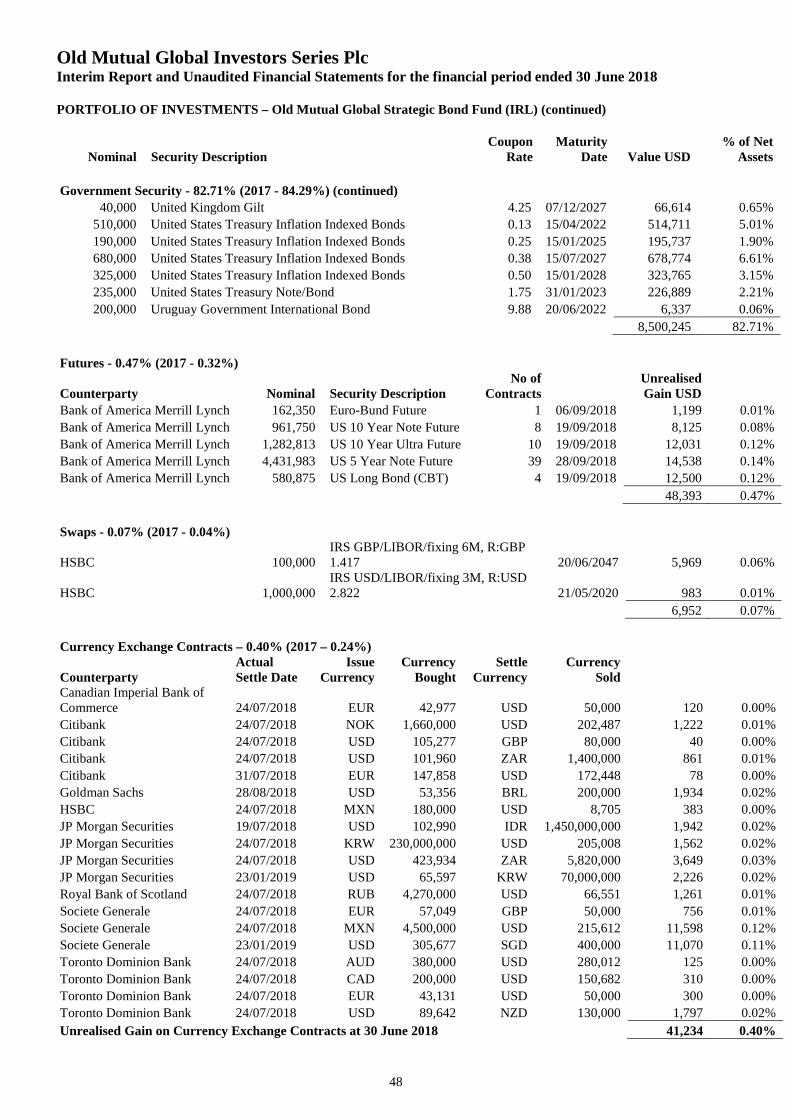
Old Mutual Global Investors Series PlcInterim Report and Unaudited Financial Statements for the financial period ended 30 June 2018
PORTFOLIO OF INVESTMENTS – Old Mutual Global Strategic Bond Fund (IRL) (continued)
Nominal Security DescriptionCoupon
RateMaturity
Date Value USD% of Net
Assets
48
Government Security - 82.71% (2017 - 84.29%) (continued)
40,000 United Kingdom Gilt 4.25 07/12/2027 66,614 0.65%
510,000 United States Treasury Inflation Indexed Bonds 0.13 15/04/2022 514,711 5.01%
190,000 United States Treasury Inflation Indexed Bonds 0.25 15/01/2025 195,737 1.90%
680,000 United States Treasury Inflation Indexed Bonds 0.38 15/07/2027 678,774 6.61%
325,000 United States Treasury Inflation Indexed Bonds 0.50 15/01/2028 323,765 3.15%
235,000 United States Treasury Note/Bond 1.75 31/01/2023 226,889 2.21%
200,000 Uruguay Government International Bond 9.88 20/06/2022 6,337 0.06%
8,500,245 82.71%
Futures - 0.47% (2017 - 0.32%)
Counterparty Nominal Security DescriptionNo of
ContractsUnrealisedGain USD
Bank of America Merrill Lynch 162,350 Euro-Bund Future 1 06/09/2018 1,199 0.01%
Bank of America Merrill Lynch 961,750 US 10 Year Note Future 8 19/09/2018 8,125 0.08%
Bank of America Merrill Lynch 1,282,813 US 10 Year Ultra Future 10 19/09/2018 12,031 0.12%
Bank of America Merrill Lynch 4,431,983 US 5 Year Note Future 39 28/09/2018 14,538 0.14%
Bank of America Merrill Lynch 580,875 US Long Bond (CBT) 4 19/09/2018 12,500 0.12%
48,393 0.47%
Swaps - 0.07% (2017 - 0.04%)
HSBC 100,000IRS GBP/LIBOR/fixing 6M, R:GBP1.417 20/06/2047 5,969 0.06%
HSBC 1,000,000IRS USD/LIBOR/fixing 3M, R:USD2.822 21/05/2020 983 0.01%
6,952 0.07%
Currency Exchange Contracts – 0.40% (2017 – 0.24%)
CounterpartyActualSettle Date
IssueCurrency
CurrencyBought
SettleCurrency
CurrencySold
Canadian Imperial Bank ofCommerce 24/07/2018 EUR 42,977 USD 50,000 120 0.00%
Citibank 24/07/2018 NOK 1,660,000 USD 202,487 1,222 0.01%
Citibank 24/07/2018 USD 105,277 GBP 80,000 40 0.00%
Citibank 24/07/2018 USD 101,960 ZAR 1,400,000 861 0.01%
Citibank 31/07/2018 EUR 147,858 USD 172,448 78 0.00%
Goldman Sachs 28/08/2018 USD 53,356 BRL 200,000 1,934 0.02%
HSBC 24/07/2018 MXN 180,000 USD 8,705 383 0.00%
JP Morgan Securities 19/07/2018 USD 102,990 IDR 1,450,000,000 1,942 0.02%
JP Morgan Securities 24/07/2018 KRW 230,000,000 USD 205,008 1,562 0.02%
JP Morgan Securities 24/07/2018 USD 423,934 ZAR 5,820,000 3,649 0.03%
JP Morgan Securities 23/01/2019 USD 65,597 KRW 70,000,000 2,226 0.02%
Royal Bank of Scotland 24/07/2018 RUB 4,270,000 USD 66,551 1,261 0.01%
Societe Generale 24/07/2018 EUR 57,049 GBP 50,000 756 0.01%
Societe Generale 24/07/2018 MXN 4,500,000 USD 215,612 11,598 0.12%
Societe Generale 23/01/2019 USD 305,677 SGD 400,000 11,070 0.11%
Toronto Dominion Bank 24/07/2018 AUD 380,000 USD 280,012 125 0.00%
Toronto Dominion Bank 24/07/2018 CAD 200,000 USD 150,682 310 0.00%
Toronto Dominion Bank 24/07/2018 EUR 43,131 USD 50,000 300 0.00%
Toronto Dominion Bank 24/07/2018 USD 89,642 NZD 130,000 1,797 0.02%
Unrealised Gain on Currency Exchange Contracts at 30 June 2018 41,234 0.40%
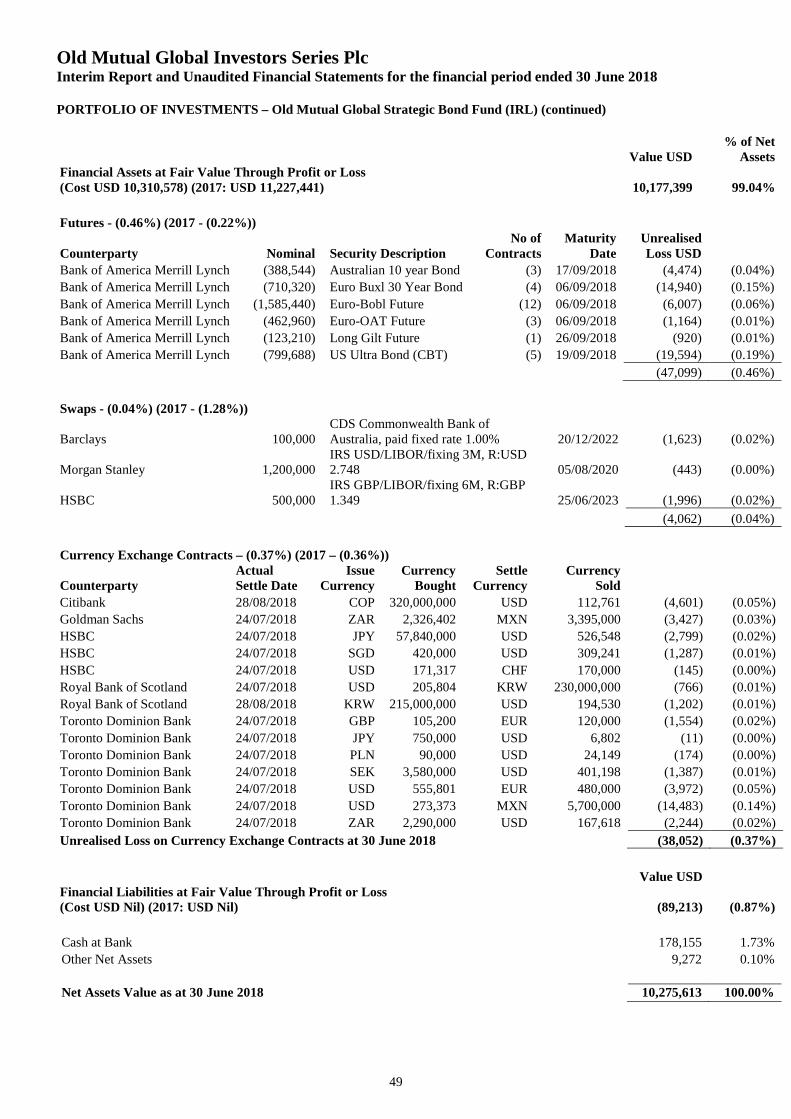
Old Mutual Global Investors Series PlcInterim Report and Unaudited Financial Statements for the financial period ended 30 June 2018
PORTFOLIO OF INVESTMENTS – Old Mutual Global Strategic Bond Fund (IRL) (continued)
49
Value USD% of Net
AssetsFinancial Assets at Fair Value Through Profit or Loss(Cost USD 10,310,578) (2017: USD 11,227,441) 10,177,399 99.04%
Futures - (0.46%) (2017 - (0.22%))
Counterparty Nominal Security DescriptionNo of
ContractsMaturity
DateUnrealisedLoss USD
Bank of America Merrill Lynch (388,544) Australian 10 year Bond (3) 17/09/2018 (4,474) (0.04%)
Bank of America Merrill Lynch (710,320) Euro Buxl 30 Year Bond (4) 06/09/2018 (14,940) (0.15%)
Bank of America Merrill Lynch (1,585,440) Euro-Bobl Future (12) 06/09/2018 (6,007) (0.06%)
Bank of America Merrill Lynch (462,960) Euro-OAT Future (3) 06/09/2018 (1,164) (0.01%)
Bank of America Merrill Lynch (123,210) Long Gilt Future (1) 26/09/2018 (920) (0.01%)
Bank of America Merrill Lynch (799,688) US Ultra Bond (CBT) (5) 19/09/2018 (19,594) (0.19%)
(47,099) (0.46%)
Swaps - (0.04%) (2017 - (1.28%))
Barclays 100,000CDS Commonwealth Bank ofAustralia, paid fixed rate 1.00% 20/12/2022 (1,623) (0.02%)
Morgan Stanley 1,200,000IRS USD/LIBOR/fixing 3M, R:USD2.748 05/08/2020 (443) (0.00%)
HSBC 500,000IRS GBP/LIBOR/fixing 6M, R:GBP1.349 25/06/2023 (1,996) (0.02%)
(4,062) (0.04%)
Currency Exchange Contracts – (0.37%) (2017 – (0.36%))
CounterpartyActualSettle Date
IssueCurrency
CurrencyBought
SettleCurrency
CurrencySold
Citibank 28/08/2018 COP 320,000,000 USD 112,761 (4,601) (0.05%)
Goldman Sachs 24/07/2018 ZAR 2,326,402 MXN 3,395,000 (3,427) (0.03%)
HSBC 24/07/2018 JPY 57,840,000 USD 526,548 (2,799) (0.02%)
HSBC 24/07/2018 SGD 420,000 USD 309,241 (1,287) (0.01%)
HSBC 24/07/2018 USD 171,317 CHF 170,000 (145) (0.00%)
Royal Bank of Scotland 24/07/2018 USD 205,804 KRW 230,000,000 (766) (0.01%)
Royal Bank of Scotland 28/08/2018 KRW 215,000,000 USD 194,530 (1,202) (0.01%)
Toronto Dominion Bank 24/07/2018 GBP 105,200 EUR 120,000 (1,554) (0.02%)
Toronto Dominion Bank 24/07/2018 JPY 750,000 USD 6,802 (11) (0.00%)
Toronto Dominion Bank 24/07/2018 PLN 90,000 USD 24,149 (174) (0.00%)
Toronto Dominion Bank 24/07/2018 SEK 3,580,000 USD 401,198 (1,387) (0.01%)
Toronto Dominion Bank 24/07/2018 USD 555,801 EUR 480,000 (3,972) (0.05%)
Toronto Dominion Bank 24/07/2018 USD 273,373 MXN 5,700,000 (14,483) (0.14%)
Toronto Dominion Bank 24/07/2018 ZAR 2,290,000 USD 167,618 (2,244) (0.02%)
Unrealised Loss on Currency Exchange Contracts at 30 June 2018 (38,052) (0.37%)
Value USDFinancial Liabilities at Fair Value Through Profit or Loss(Cost USD Nil) (2017: USD Nil) (89,213) (0.87%)
Cash at Bank 178,155 1.73%
Other Net Assets 9,272 0.10%
Net Assets Value as at 30 June 2018 10,275,613 100.00%
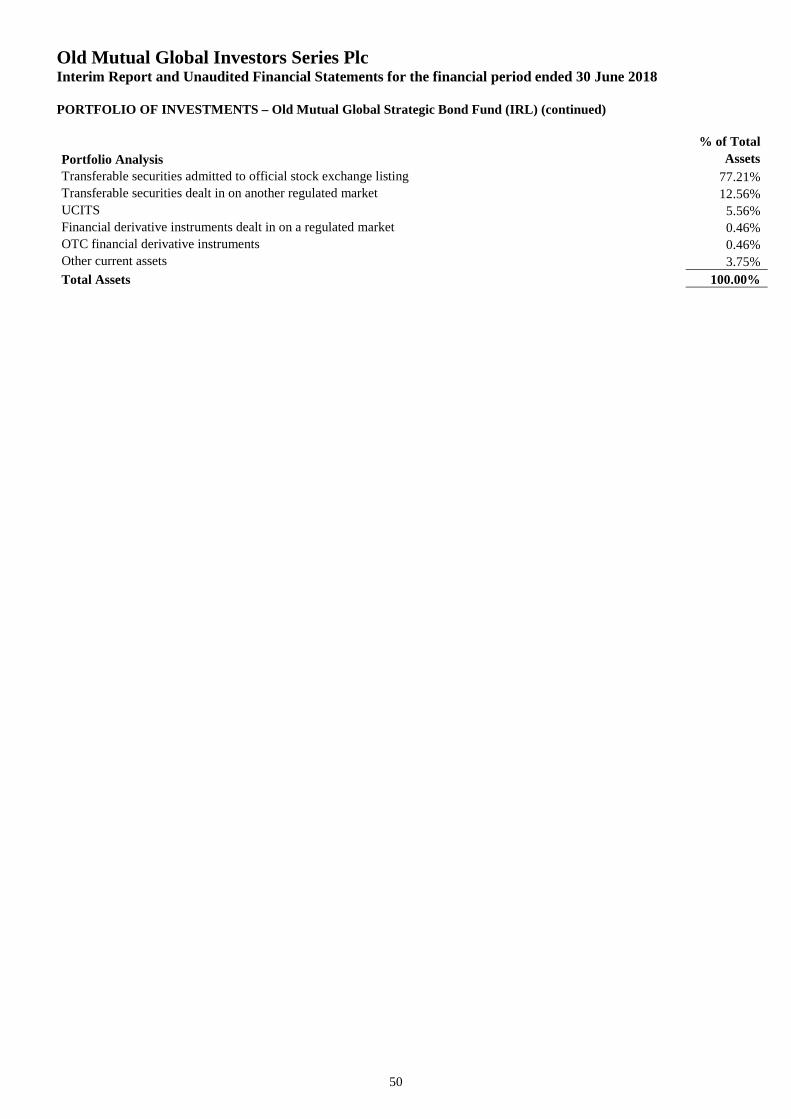
Old Mutual Global Investors Series PlcInterim Report and Unaudited Financial Statements for the financial period ended 30 June 2018
PORTFOLIO OF INVESTMENTS – Old Mutual Global Strategic Bond Fund (IRL) (continued)
50
% of Total
Portfolio Analysis Assets
Transferable securities admitted to official stock exchange listing 77.21%Transferable securities dealt in on another regulated market 12.56%UCITS 5.56%Financial derivative instruments dealt in on a regulated market 0.46%OTC financial derivative instruments 0.46%Other current assets 3.75%
Total Assets 100.00%
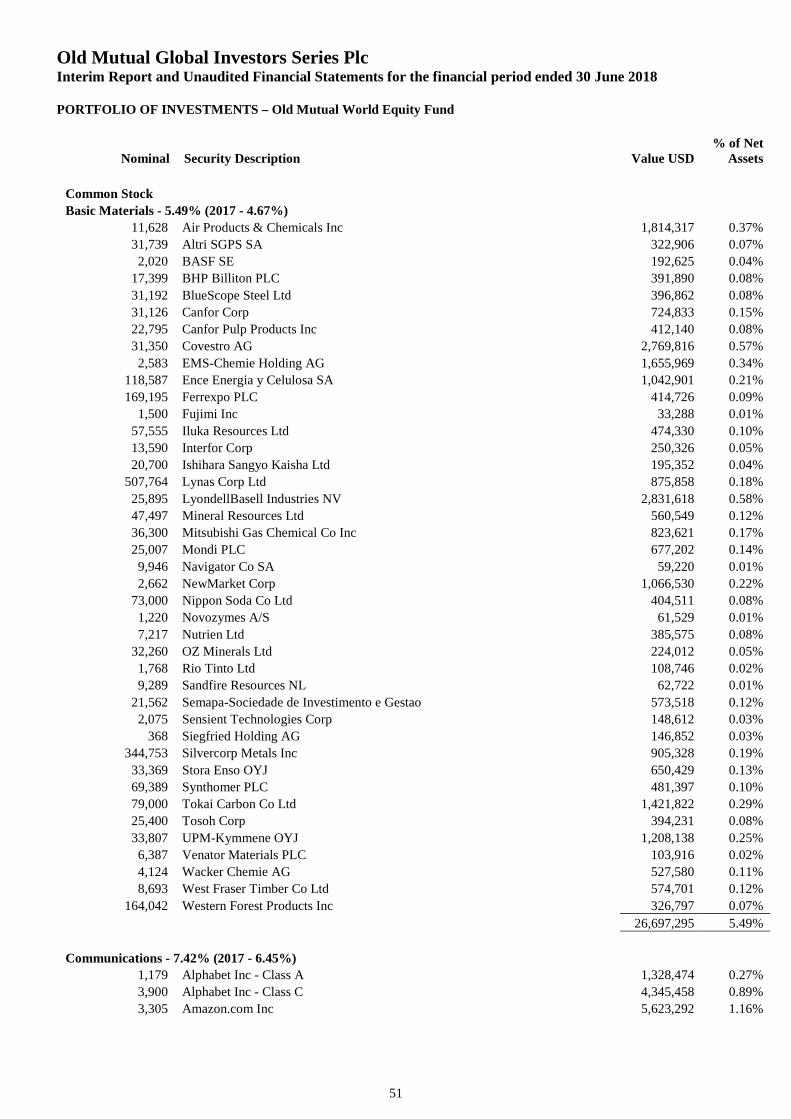
Old Mutual Global Investors Series PlcInterim Report and Unaudited Financial Statements for the financial period ended 30 June 2018
PORTFOLIO OF INVESTMENTS – Old Mutual World Equity Fund
Nominal Security Description Value USD% of Net
Assets
51
Common Stock
Basic Materials - 5.49% (2017 - 4.67%)
11,628 Air Products & Chemicals Inc 1,814,317 0.37%
31,739 Altri SGPS SA 322,906 0.07%
2,020 BASF SE 192,625 0.04%
17,399 BHP Billiton PLC 391,890 0.08%
31,192 BlueScope Steel Ltd 396,862 0.08%
31,126 Canfor Corp 724,833 0.15%
22,795 Canfor Pulp Products Inc 412,140 0.08%
31,350 Covestro AG 2,769,816 0.57%
2,583 EMS-Chemie Holding AG 1,655,969 0.34%
118,587 Ence Energia y Celulosa SA 1,042,901 0.21%
169,195 Ferrexpo PLC 414,726 0.09%
1,500 Fujimi Inc 33,288 0.01%
57,555 Iluka Resources Ltd 474,330 0.10%
13,590 Interfor Corp 250,326 0.05%
20,700 Ishihara Sangyo Kaisha Ltd 195,352 0.04%
507,764 Lynas Corp Ltd 875,858 0.18%
25,895 LyondellBasell Industries NV 2,831,618 0.58%
47,497 Mineral Resources Ltd 560,549 0.12%
36,300 Mitsubishi Gas Chemical Co Inc 823,621 0.17%
25,007 Mondi PLC 677,202 0.14%
9,946 Navigator Co SA 59,220 0.01%
2,662 NewMarket Corp 1,066,530 0.22%
73,000 Nippon Soda Co Ltd 404,511 0.08%
1,220 Novozymes A/S 61,529 0.01%
7,217 Nutrien Ltd 385,575 0.08%
32,260 OZ Minerals Ltd 224,012 0.05%
1,768 Rio Tinto Ltd 108,746 0.02%
9,289 Sandfire Resources NL 62,722 0.01%
21,562 Semapa-Sociedade de Investimento e Gestao 573,518 0.12%
2,075 Sensient Technologies Corp 148,612 0.03%
368 Siegfried Holding AG 146,852 0.03%
344,753 Silvercorp Metals Inc 905,328 0.19%
33,369 Stora Enso OYJ 650,429 0.13%
69,389 Synthomer PLC 481,397 0.10%
79,000 Tokai Carbon Co Ltd 1,421,822 0.29%
25,400 Tosoh Corp 394,231 0.08%
33,807 UPM-Kymmene OYJ 1,208,138 0.25%
6,387 Venator Materials PLC 103,916 0.02%
4,124 Wacker Chemie AG 527,580 0.11%
8,693 West Fraser Timber Co Ltd 574,701 0.12%
164,042 Western Forest Products Inc 326,797 0.07%
26,697,295 5.49%
Communications - 7.42% (2017 - 6.45%)
1,179 Alphabet Inc - Class A 1,328,474 0.27%
3,900 Alphabet Inc - Class C 4,345,458 0.89%
3,305 Amazon.com Inc 5,623,292 1.16%
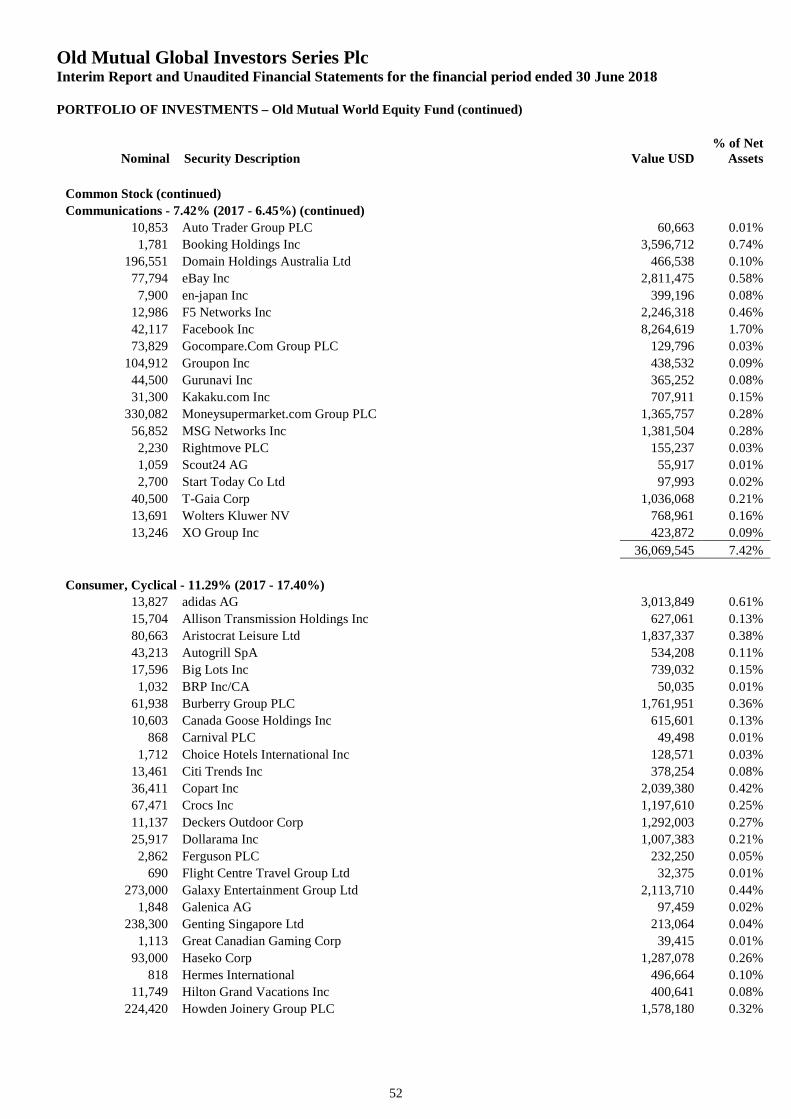
Old Mutual Global Investors Series PlcInterim Report and Unaudited Financial Statements for the financial period ended 30 June 2018
PORTFOLIO OF INVESTMENTS – Old Mutual World Equity Fund (continued)
Nominal Security Description Value USD% of Net
Assets
52
Common Stock (continued)
Communications - 7.42% (2017 - 6.45%) (continued)
10,853 Auto Trader Group PLC 60,663 0.01%
1,781 Booking Holdings Inc 3,596,712 0.74%
196,551 Domain Holdings Australia Ltd 466,538 0.10%
77,794 eBay Inc 2,811,475 0.58%
7,900 en-japan Inc 399,196 0.08%
12,986 F5 Networks Inc 2,246,318 0.46%
42,117 Facebook Inc 8,264,619 1.70%
73,829 Gocompare.Com Group PLC 129,796 0.03%
104,912 Groupon Inc 438,532 0.09%
44,500 Gurunavi Inc 365,252 0.08%
31,300 Kakaku.com Inc 707,911 0.15%
330,082 Moneysupermarket.com Group PLC 1,365,757 0.28%
56,852 MSG Networks Inc 1,381,504 0.28%
2,230 Rightmove PLC 155,237 0.03%
1,059 Scout24 AG 55,917 0.01%
2,700 Start Today Co Ltd 97,993 0.02%
40,500 T-Gaia Corp 1,036,068 0.21%
13,691 Wolters Kluwer NV 768,961 0.16%
13,246 XO Group Inc 423,872 0.09%
36,069,545 7.42%
Consumer, Cyclical - 11.29% (2017 - 17.40%)
13,827 adidas AG 3,013,849 0.61%
15,704 Allison Transmission Holdings Inc 627,061 0.13%
80,663 Aristocrat Leisure Ltd 1,837,337 0.38%
43,213 Autogrill SpA 534,208 0.11%
17,596 Big Lots Inc 739,032 0.15%
1,032 BRP Inc/CA 50,035 0.01%
61,938 Burberry Group PLC 1,761,951 0.36%
10,603 Canada Goose Holdings Inc 615,601 0.13%
868 Carnival PLC 49,498 0.01%
1,712 Choice Hotels International Inc 128,571 0.03%
13,461 Citi Trends Inc 378,254 0.08%
36,411 Copart Inc 2,039,380 0.42%
67,471 Crocs Inc 1,197,610 0.25%
11,137 Deckers Outdoor Corp 1,292,003 0.27%
25,917 Dollarama Inc 1,007,383 0.21%
2,862 Ferguson PLC 232,250 0.05%
690 Flight Centre Travel Group Ltd 32,375 0.01%
273,000 Galaxy Entertainment Group Ltd 2,113,710 0.44%
1,848 Galenica AG 97,459 0.02%
238,300 Genting Singapore Ltd 213,064 0.04%
1,113 Great Canadian Gaming Corp 39,415 0.01%
93,000 Haseko Corp 1,287,078 0.26%
818 Hermes International 496,664 0.10%
11,749 Hilton Grand Vacations Inc 400,641 0.08%
224,420 Howden Joinery Group PLC 1,578,180 0.32%
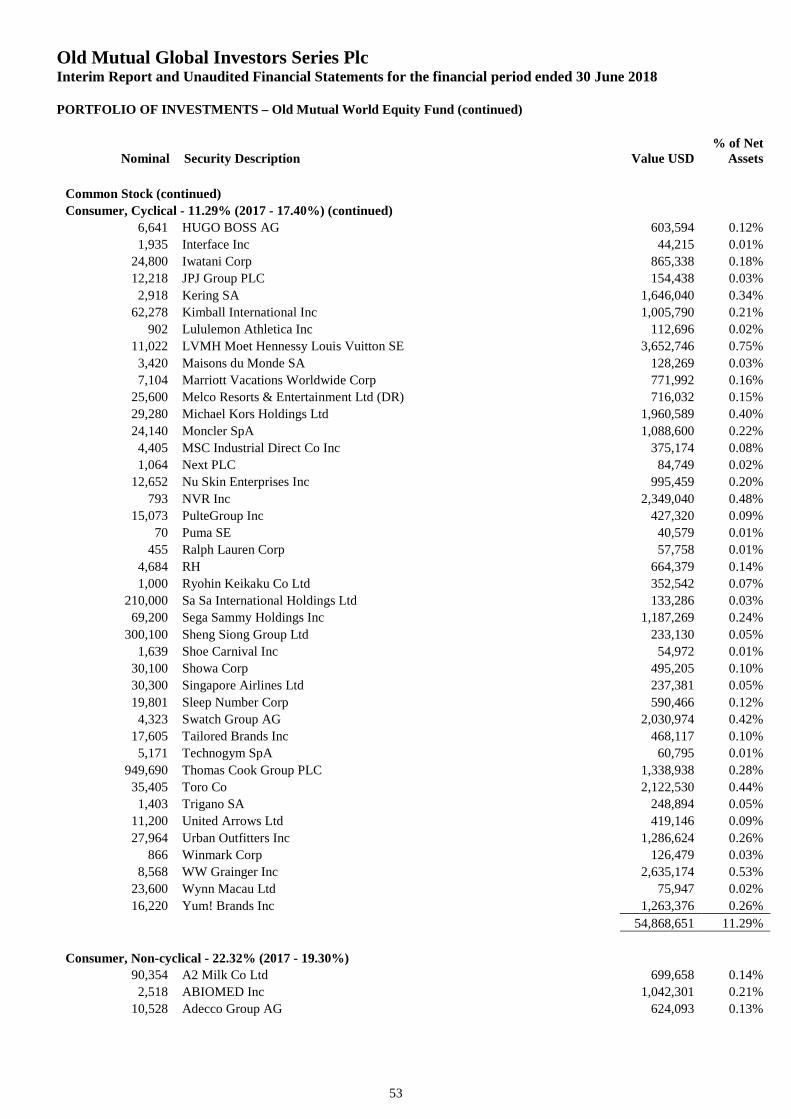
Old Mutual Global Investors Series PlcInterim Report and Unaudited Financial Statements for the financial period ended 30 June 2018
PORTFOLIO OF INVESTMENTS – Old Mutual World Equity Fund (continued)
Nominal Security Description Value USD% of Net
Assets
53
Common Stock (continued)
Consumer, Cyclical - 11.29% (2017 - 17.40%) (continued)
6,641 HUGO BOSS AG 603,594 0.12%
1,935 Interface Inc 44,215 0.01%
24,800 Iwatani Corp 865,338 0.18%
12,218 JPJ Group PLC 154,438 0.03%
2,918 Kering SA 1,646,040 0.34%
62,278 Kimball International Inc 1,005,790 0.21%
902 Lululemon Athletica Inc 112,696 0.02%
11,022 LVMH Moet Hennessy Louis Vuitton SE 3,652,746 0.75%
3,420 Maisons du Monde SA 128,269 0.03%
7,104 Marriott Vacations Worldwide Corp 771,992 0.16%
25,600 Melco Resorts & Entertainment Ltd (DR) 716,032 0.15%
29,280 Michael Kors Holdings Ltd 1,960,589 0.40%
24,140 Moncler SpA 1,088,600 0.22%
4,405 MSC Industrial Direct Co Inc 375,174 0.08%
1,064 Next PLC 84,749 0.02%
12,652 Nu Skin Enterprises Inc 995,459 0.20%
793 NVR Inc 2,349,040 0.48%
15,073 PulteGroup Inc 427,320 0.09%
70 Puma SE 40,579 0.01%
455 Ralph Lauren Corp 57,758 0.01%
4,684 RH 664,379 0.14%
1,000 Ryohin Keikaku Co Ltd 352,542 0.07%
210,000 Sa Sa International Holdings Ltd 133,286 0.03%
69,200 Sega Sammy Holdings Inc 1,187,269 0.24%
300,100 Sheng Siong Group Ltd 233,130 0.05%
1,639 Shoe Carnival Inc 54,972 0.01%
30,100 Showa Corp 495,205 0.10%
30,300 Singapore Airlines Ltd 237,381 0.05%
19,801 Sleep Number Corp 590,466 0.12%
4,323 Swatch Group AG 2,030,974 0.42%
17,605 Tailored Brands Inc 468,117 0.10%
5,171 Technogym SpA 60,795 0.01%
949,690 Thomas Cook Group PLC 1,338,938 0.28%
35,405 Toro Co 2,122,530 0.44%
1,403 Trigano SA 248,894 0.05%
11,200 United Arrows Ltd 419,146 0.09%
27,964 Urban Outfitters Inc 1,286,624 0.26%
866 Winmark Corp 126,479 0.03%
8,568 WW Grainger Inc 2,635,174 0.53%
23,600 Wynn Macau Ltd 75,947 0.02%
16,220 Yum! Brands Inc 1,263,376 0.26%
54,868,651 11.29%
Consumer, Non-cyclical - 22.32% (2017 - 19.30%)
90,354 A2 Milk Co Ltd 699,658 0.14%
2,518 ABIOMED Inc 1,042,301 0.21%
10,528 Adecco Group AG 624,093 0.13%
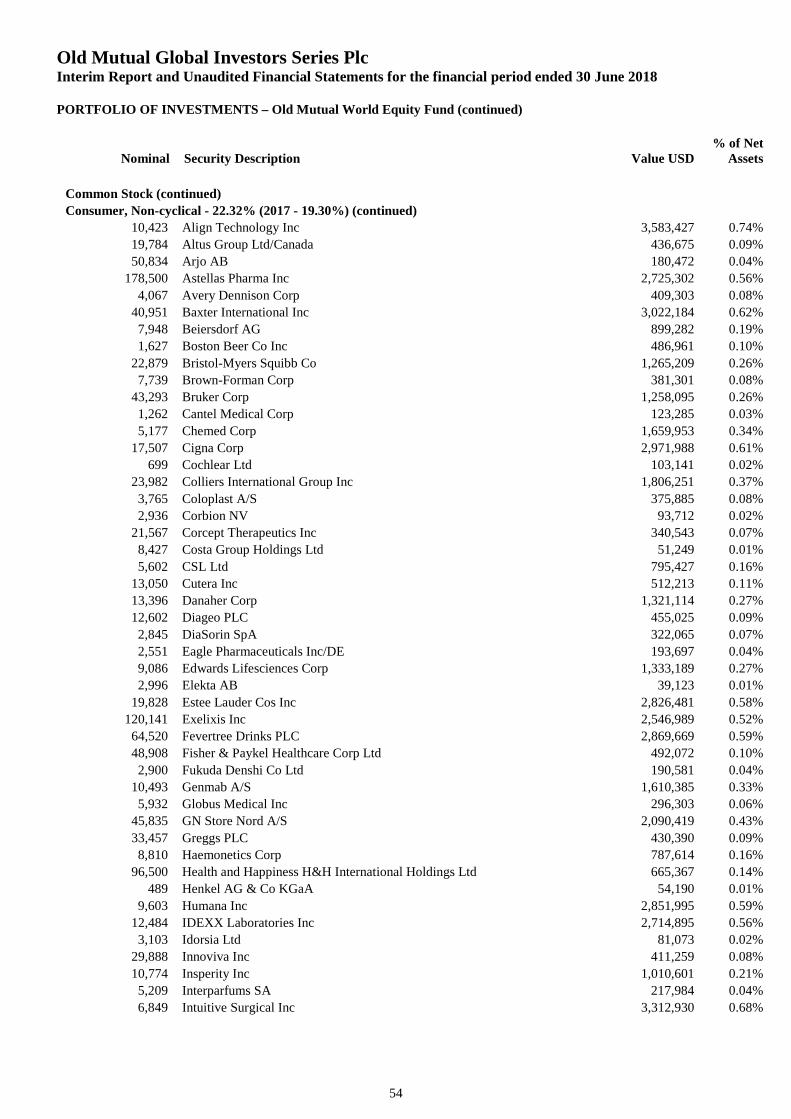
Old Mutual Global Investors Series PlcInterim Report and Unaudited Financial Statements for the financial period ended 30 June 2018
PORTFOLIO OF INVESTMENTS – Old Mutual World Equity Fund (continued)
Nominal Security Description Value USD% of Net
Assets
54
Common Stock (continued)
Consumer, Non-cyclical - 22.32% (2017 - 19.30%) (continued)
10,423 Align Technology Inc 3,583,427 0.74%
19,784 Altus Group Ltd/Canada 436,675 0.09%
50,834 Arjo AB 180,472 0.04%
178,500 Astellas Pharma Inc 2,725,302 0.56%
4,067 Avery Dennison Corp 409,303 0.08%
40,951 Baxter International Inc 3,022,184 0.62%
7,948 Beiersdorf AG 899,282 0.19%
1,627 Boston Beer Co Inc 486,961 0.10%
22,879 Bristol-Myers Squibb Co 1,265,209 0.26%
7,739 Brown-Forman Corp 381,301 0.08%
43,293 Bruker Corp 1,258,095 0.26%
1,262 Cantel Medical Corp 123,285 0.03%
5,177 Chemed Corp 1,659,953 0.34%
17,507 Cigna Corp 2,971,988 0.61%
699 Cochlear Ltd 103,141 0.02%
23,982 Colliers International Group Inc 1,806,251 0.37%
3,765 Coloplast A/S 375,885 0.08%
2,936 Corbion NV 93,712 0.02%
21,567 Corcept Therapeutics Inc 340,543 0.07%
8,427 Costa Group Holdings Ltd 51,249 0.01%
5,602 CSL Ltd 795,427 0.16%
13,050 Cutera Inc 512,213 0.11%
13,396 Danaher Corp 1,321,114 0.27%
12,602 Diageo PLC 455,025 0.09%
2,845 DiaSorin SpA 322,065 0.07%
2,551 Eagle Pharmaceuticals Inc/DE 193,697 0.04%
9,086 Edwards Lifesciences Corp 1,333,189 0.27%
2,996 Elekta AB 39,123 0.01%
19,828 Estee Lauder Cos Inc 2,826,481 0.58%
120,141 Exelixis Inc 2,546,989 0.52%
64,520 Fevertree Drinks PLC 2,869,669 0.59%
48,908 Fisher & Paykel Healthcare Corp Ltd 492,072 0.10%
2,900 Fukuda Denshi Co Ltd 190,581 0.04%
10,493 Genmab A/S 1,610,385 0.33%
5,932 Globus Medical Inc 296,303 0.06%
45,835 GN Store Nord A/S 2,090,419 0.43%
33,457 Greggs PLC 430,390 0.09%
8,810 Haemonetics Corp 787,614 0.16%
96,500 Health and Happiness H&H International Holdings Ltd 665,367 0.14%
489 Henkel AG & Co KGaA 54,190 0.01%
9,603 Humana Inc 2,851,995 0.59%
12,484 IDEXX Laboratories Inc 2,714,895 0.56%
3,103 Idorsia Ltd 81,073 0.02%
29,888 Innoviva Inc 411,259 0.08%
10,774 Insperity Inc 1,010,601 0.21%
5,209 Interparfums SA 217,984 0.04%
6,849 Intuitive Surgical Inc 3,312,930 0.68%
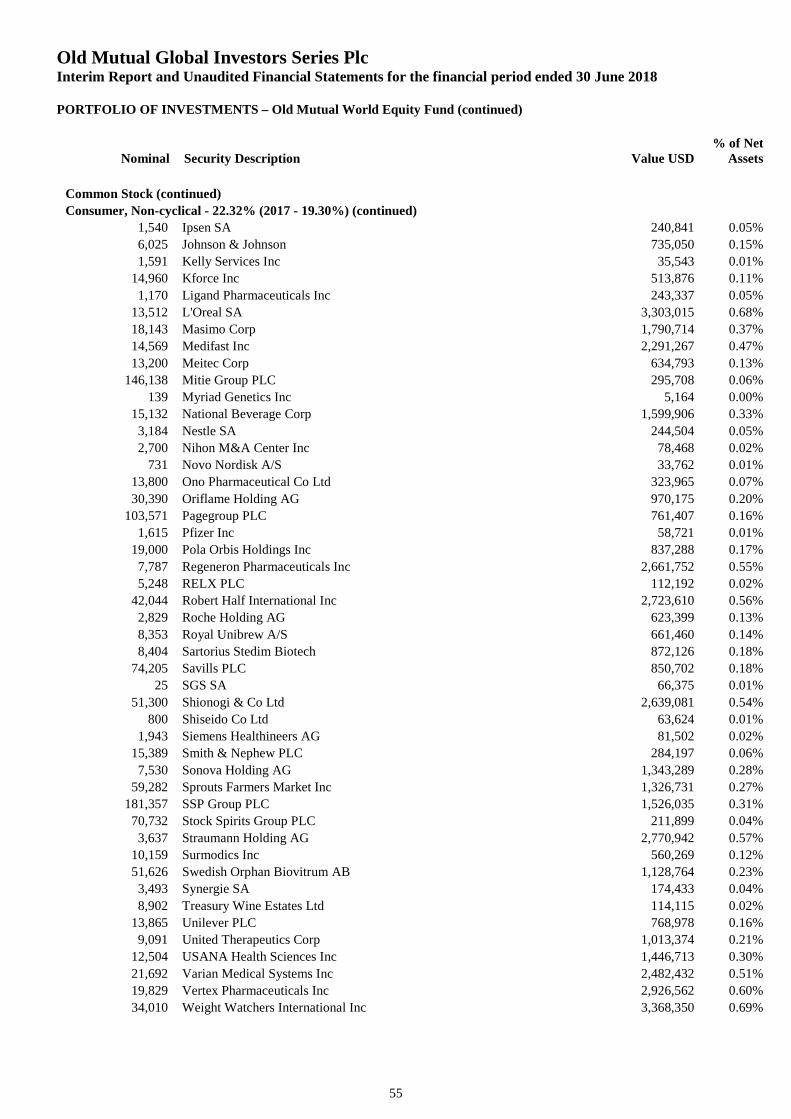
Old Mutual Global Investors Series PlcInterim Report and Unaudited Financial Statements for the financial period ended 30 June 2018
PORTFOLIO OF INVESTMENTS – Old Mutual World Equity Fund (continued)
Nominal Security Description Value USD% of Net
Assets
55
Common Stock (continued)
Consumer, Non-cyclical - 22.32% (2017 - 19.30%) (continued)
1,540 Ipsen SA 240,841 0.05%
6,025 Johnson & Johnson 735,050 0.15%
1,591 Kelly Services Inc 35,543 0.01%
14,960 Kforce Inc 513,876 0.11%
1,170 Ligand Pharmaceuticals Inc 243,337 0.05%
13,512 L'Oreal SA 3,303,015 0.68%
18,143 Masimo Corp 1,790,714 0.37%
14,569 Medifast Inc 2,291,267 0.47%
13,200 Meitec Corp 634,793 0.13%
146,138 Mitie Group PLC 295,708 0.06%
139 Myriad Genetics Inc 5,164 0.00%
15,132 National Beverage Corp 1,599,906 0.33%
3,184 Nestle SA 244,504 0.05%
2,700 Nihon M&A Center Inc 78,468 0.02%
731 Novo Nordisk A/S 33,762 0.01%
13,800 Ono Pharmaceutical Co Ltd 323,965 0.07%
30,390 Oriflame Holding AG 970,175 0.20%
103,571 Pagegroup PLC 761,407 0.16%
1,615 Pfizer Inc 58,721 0.01%
19,000 Pola Orbis Holdings Inc 837,288 0.17%
7,787 Regeneron Pharmaceuticals Inc 2,661,752 0.55%
5,248 RELX PLC 112,192 0.02%
42,044 Robert Half International Inc 2,723,610 0.56%
2,829 Roche Holding AG 623,399 0.13%
8,353 Royal Unibrew A/S 661,460 0.14%
8,404 Sartorius Stedim Biotech 872,126 0.18%
74,205 Savills PLC 850,702 0.18%
25 SGS SA 66,375 0.01%
51,300 Shionogi & Co Ltd 2,639,081 0.54%
800 Shiseido Co Ltd 63,624 0.01%
1,943 Siemens Healthineers AG 81,502 0.02%
15,389 Smith & Nephew PLC 284,197 0.06%
7,530 Sonova Holding AG 1,343,289 0.28%
59,282 Sprouts Farmers Market Inc 1,326,731 0.27%
181,357 SSP Group PLC 1,526,035 0.31%
70,732 Stock Spirits Group PLC 211,899 0.04%
3,637 Straumann Holding AG 2,770,942 0.57%
10,159 Surmodics Inc 560,269 0.12%
51,626 Swedish Orphan Biovitrum AB 1,128,764 0.23%
3,493 Synergie SA 174,433 0.04%
8,902 Treasury Wine Estates Ltd 114,115 0.02%
13,865 Unilever PLC 768,978 0.16%
9,091 United Therapeutics Corp 1,013,374 0.21%
12,504 USANA Health Sciences Inc 1,446,713 0.30%
21,692 Varian Medical Systems Inc 2,482,432 0.51%
19,829 Vertex Pharmaceuticals Inc 2,926,562 0.60%
34,010 Weight Watchers International Inc 3,368,350 0.69%
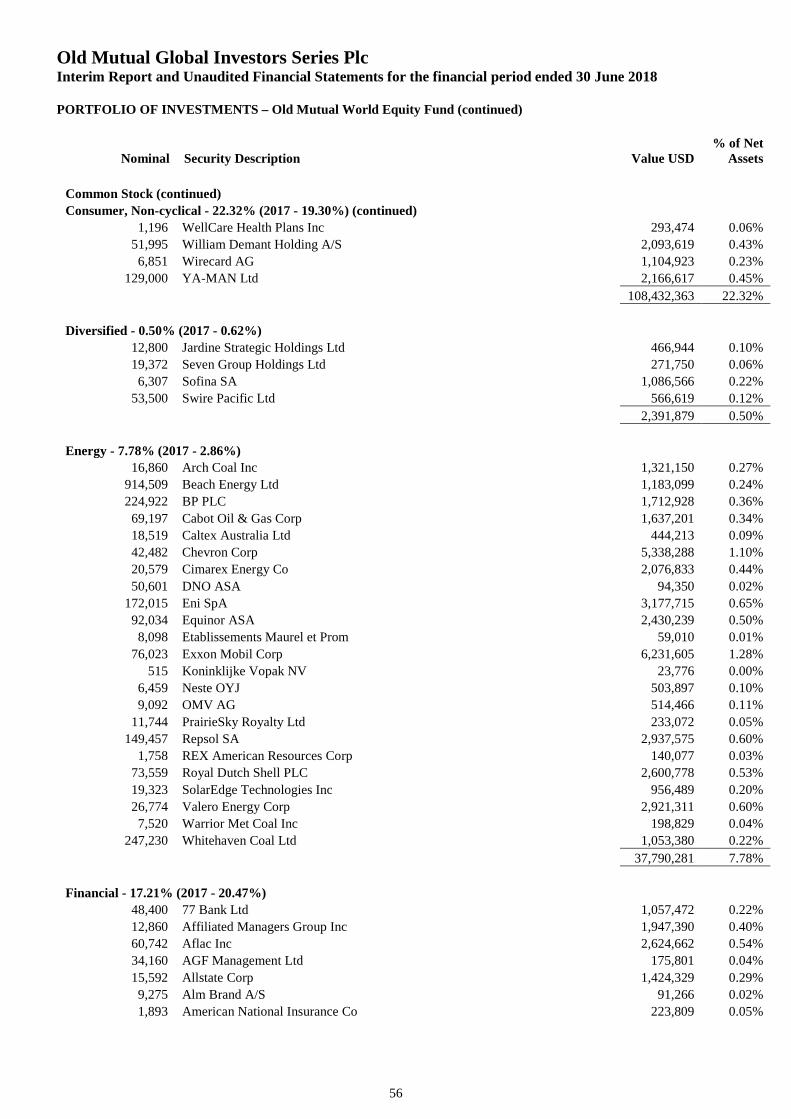
Old Mutual Global Investors Series PlcInterim Report and Unaudited Financial Statements for the financial period ended 30 June 2018
PORTFOLIO OF INVESTMENTS – Old Mutual World Equity Fund (continued)
Nominal Security Description Value USD% of Net
Assets
56
Common Stock (continued)
Consumer, Non-cyclical - 22.32% (2017 - 19.30%) (continued)
1,196 WellCare Health Plans Inc 293,474 0.06%
51,995 William Demant Holding A/S 2,093,619 0.43%
6,851 Wirecard AG 1,104,923 0.23%
129,000 YA-MAN Ltd 2,166,617 0.45%
108,432,363 22.32%
Diversified - 0.50% (2017 - 0.62%)
12,800 Jardine Strategic Holdings Ltd 466,944 0.10%
19,372 Seven Group Holdings Ltd 271,750 0.06%
6,307 Sofina SA 1,086,566 0.22%
53,500 Swire Pacific Ltd 566,619 0.12%
2,391,879 0.50%
Energy - 7.78% (2017 - 2.86%)
16,860 Arch Coal Inc 1,321,150 0.27%
914,509 Beach Energy Ltd 1,183,099 0.24%
224,922 BP PLC 1,712,928 0.36%
69,197 Cabot Oil & Gas Corp 1,637,201 0.34%
18,519 Caltex Australia Ltd 444,213 0.09%
42,482 Chevron Corp 5,338,288 1.10%
20,579 Cimarex Energy Co 2,076,833 0.44%
50,601 DNO ASA 94,350 0.02%
172,015 Eni SpA 3,177,715 0.65%
92,034 Equinor ASA 2,430,239 0.50%
8,098 Etablissements Maurel et Prom 59,010 0.01%
76,023 Exxon Mobil Corp 6,231,605 1.28%
515 Koninklijke Vopak NV 23,776 0.00%
6,459 Neste OYJ 503,897 0.10%
9,092 OMV AG 514,466 0.11%
11,744 PrairieSky Royalty Ltd 233,072 0.05%
149,457 Repsol SA 2,937,575 0.60%
1,758 REX American Resources Corp 140,077 0.03%
73,559 Royal Dutch Shell PLC 2,600,778 0.53%
19,323 SolarEdge Technologies Inc 956,489 0.20%
26,774 Valero Energy Corp 2,921,311 0.60%
7,520 Warrior Met Coal Inc 198,829 0.04%
247,230 Whitehaven Coal Ltd 1,053,380 0.22%
37,790,281 7.78%
Financial - 17.21% (2017 - 20.47%)
48,400 77 Bank Ltd 1,057,472 0.22%
12,860 Affiliated Managers Group Inc 1,947,390 0.40%
60,742 Aflac Inc 2,624,662 0.54%
34,160 AGF Management Ltd 175,801 0.04%
15,592 Allstate Corp 1,424,329 0.29%
9,275 Alm Brand A/S 91,266 0.02%
1,893 American National Insurance Co 223,809 0.05%
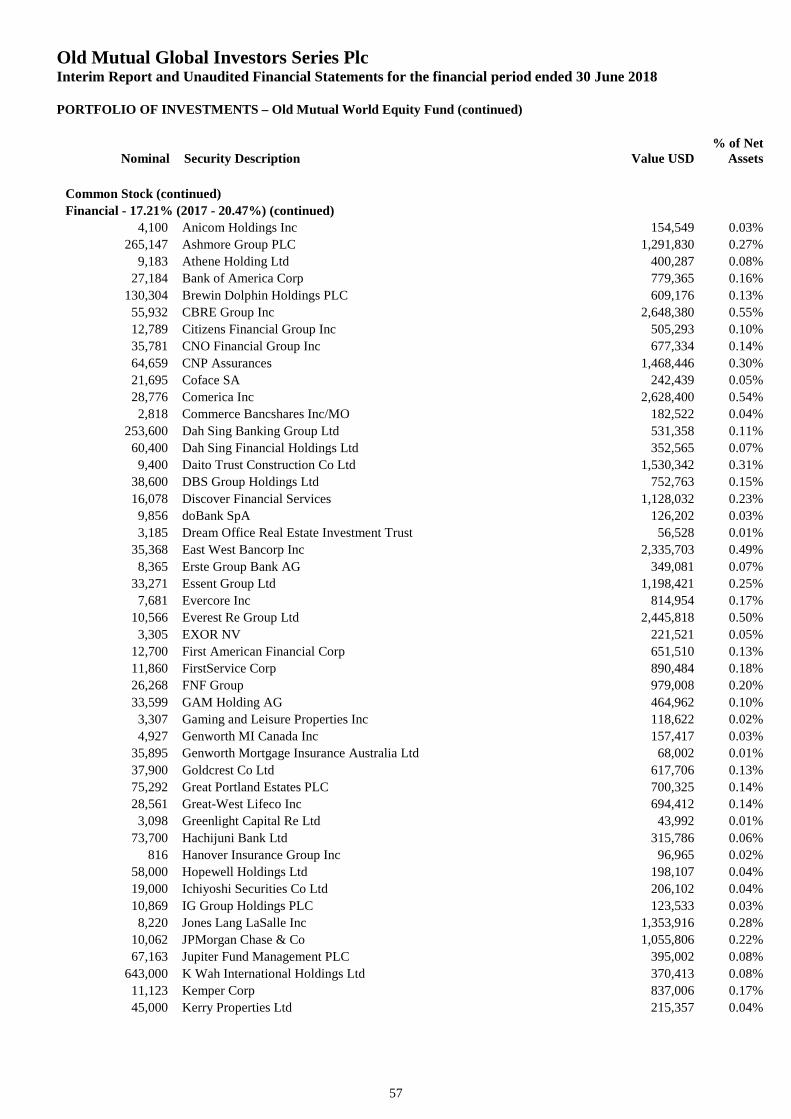
Old Mutual Global Investors Series PlcInterim Report and Unaudited Financial Statements for the financial period ended 30 June 2018
PORTFOLIO OF INVESTMENTS – Old Mutual World Equity Fund (continued)
Nominal Security Description Value USD% of Net
Assets
57
Common Stock (continued)
Financial - 17.21% (2017 - 20.47%) (continued)
4,100 Anicom Holdings Inc 154,549 0.03%
265,147 Ashmore Group PLC 1,291,830 0.27%
9,183 Athene Holding Ltd 400,287 0.08%
27,184 Bank of America Corp 779,365 0.16%
130,304 Brewin Dolphin Holdings PLC 609,176 0.13%
55,932 CBRE Group Inc 2,648,380 0.55%
12,789 Citizens Financial Group Inc 505,293 0.10%
35,781 CNO Financial Group Inc 677,334 0.14%
64,659 CNP Assurances 1,468,446 0.30%
21,695 Coface SA 242,439 0.05%
28,776 Comerica Inc 2,628,400 0.54%
2,818 Commerce Bancshares Inc/MO 182,522 0.04%
253,600 Dah Sing Banking Group Ltd 531,358 0.11%
60,400 Dah Sing Financial Holdings Ltd 352,565 0.07%
9,400 Daito Trust Construction Co Ltd 1,530,342 0.31%
38,600 DBS Group Holdings Ltd 752,763 0.15%
16,078 Discover Financial Services 1,128,032 0.23%
9,856 doBank SpA 126,202 0.03%
3,185 Dream Office Real Estate Investment Trust 56,528 0.01%
35,368 East West Bancorp Inc 2,335,703 0.49%
8,365 Erste Group Bank AG 349,081 0.07%
33,271 Essent Group Ltd 1,198,421 0.25%
7,681 Evercore Inc 814,954 0.17%
10,566 Everest Re Group Ltd 2,445,818 0.50%
3,305 EXOR NV 221,521 0.05%
12,700 First American Financial Corp 651,510 0.13%
11,860 FirstService Corp 890,484 0.18%
26,268 FNF Group 979,008 0.20%
33,599 GAM Holding AG 464,962 0.10%
3,307 Gaming and Leisure Properties Inc 118,622 0.02%
4,927 Genworth MI Canada Inc 157,417 0.03%
35,895 Genworth Mortgage Insurance Australia Ltd 68,002 0.01%
37,900 Goldcrest Co Ltd 617,706 0.13%
75,292 Great Portland Estates PLC 700,325 0.14%
28,561 Great-West Lifeco Inc 694,412 0.14%
3,098 Greenlight Capital Re Ltd 43,992 0.01%
73,700 Hachijuni Bank Ltd 315,786 0.06%
816 Hanover Insurance Group Inc 96,965 0.02%
58,000 Hopewell Holdings Ltd 198,107 0.04%
19,000 Ichiyoshi Securities Co Ltd 206,102 0.04%
10,869 IG Group Holdings PLC 123,533 0.03%
8,220 Jones Lang LaSalle Inc 1,353,916 0.28%
10,062 JPMorgan Chase & Co 1,055,806 0.22%
67,163 Jupiter Fund Management PLC 395,002 0.08%
643,000 K Wah International Holdings Ltd 370,413 0.08%
11,123 Kemper Corp 837,006 0.17%
45,000 Kerry Properties Ltd 215,357 0.04%
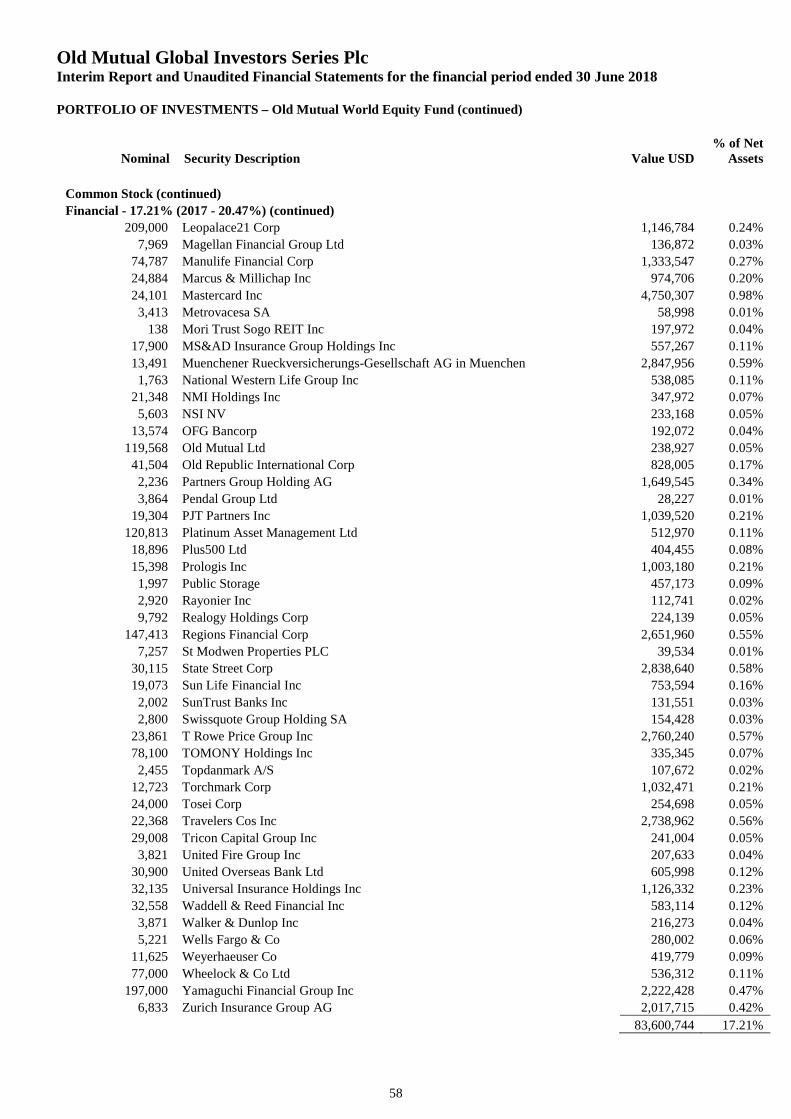
Old Mutual Global Investors Series PlcInterim Report and Unaudited Financial Statements for the financial period ended 30 June 2018
PORTFOLIO OF INVESTMENTS – Old Mutual World Equity Fund (continued)
Nominal Security Description Value USD% of Net
Assets
58
Common Stock (continued)
Financial - 17.21% (2017 - 20.47%) (continued)
209,000 Leopalace21 Corp 1,146,784 0.24%
7,969 Magellan Financial Group Ltd 136,872 0.03%
74,787 Manulife Financial Corp 1,333,547 0.27%
24,884 Marcus & Millichap Inc 974,706 0.20%
24,101 Mastercard Inc 4,750,307 0.98%
3,413 Metrovacesa SA 58,998 0.01%
138 Mori Trust Sogo REIT Inc 197,972 0.04%
17,900 MS&AD Insurance Group Holdings Inc 557,267 0.11%
13,491 Muenchener Rueckversicherungs-Gesellschaft AG in Muenchen 2,847,956 0.59%
1,763 National Western Life Group Inc 538,085 0.11%
21,348 NMI Holdings Inc 347,972 0.07%
5,603 NSI NV 233,168 0.05%
13,574 OFG Bancorp 192,072 0.04%
119,568 Old Mutual Ltd 238,927 0.05%
41,504 Old Republic International Corp 828,005 0.17%
2,236 Partners Group Holding AG 1,649,545 0.34%
3,864 Pendal Group Ltd 28,227 0.01%
19,304 PJT Partners Inc 1,039,520 0.21%
120,813 Platinum Asset Management Ltd 512,970 0.11%
18,896 Plus500 Ltd 404,455 0.08%
15,398 Prologis Inc 1,003,180 0.21%
1,997 Public Storage 457,173 0.09%
2,920 Rayonier Inc 112,741 0.02%
9,792 Realogy Holdings Corp 224,139 0.05%
147,413 Regions Financial Corp 2,651,960 0.55%
7,257 St Modwen Properties PLC 39,534 0.01%
30,115 State Street Corp 2,838,640 0.58%
19,073 Sun Life Financial Inc 753,594 0.16%
2,002 SunTrust Banks Inc 131,551 0.03%
2,800 Swissquote Group Holding SA 154,428 0.03%
23,861 T Rowe Price Group Inc 2,760,240 0.57%
78,100 TOMONY Holdings Inc 335,345 0.07%
2,455 Topdanmark A/S 107,672 0.02%
12,723 Torchmark Corp 1,032,471 0.21%
24,000 Tosei Corp 254,698 0.05%
22,368 Travelers Cos Inc 2,738,962 0.56%
29,008 Tricon Capital Group Inc 241,004 0.05%
3,821 United Fire Group Inc 207,633 0.04%
30,900 United Overseas Bank Ltd 605,998 0.12%
32,135 Universal Insurance Holdings Inc 1,126,332 0.23%
32,558 Waddell & Reed Financial Inc 583,114 0.12%
3,871 Walker & Dunlop Inc 216,273 0.04%
5,221 Wells Fargo & Co 280,002 0.06%
11,625 Weyerhaeuser Co 419,779 0.09%
77,000 Wheelock & Co Ltd 536,312 0.11%
197,000 Yamaguchi Financial Group Inc 2,222,428 0.47%
6,833 Zurich Insurance Group AG 2,017,715 0.42%
83,600,744 17.21%
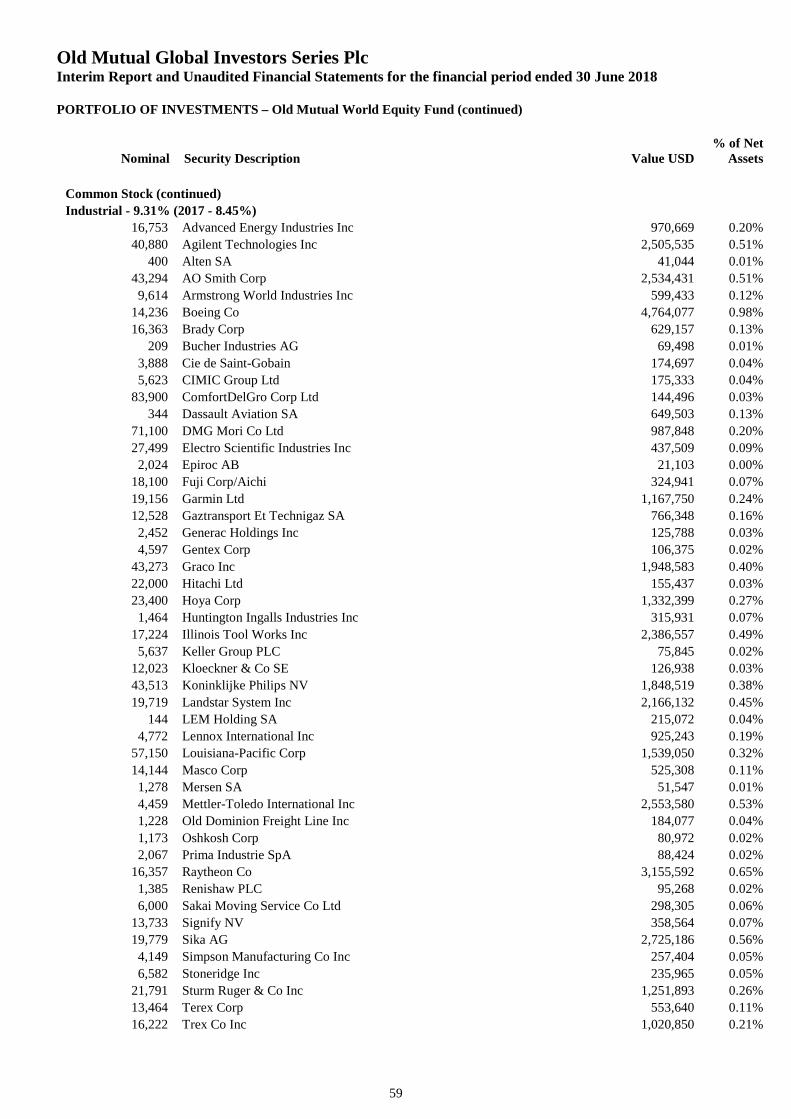
Old Mutual Global Investors Series PlcInterim Report and Unaudited Financial Statements for the financial period ended 30 June 2018
PORTFOLIO OF INVESTMENTS – Old Mutual World Equity Fund (continued)
Nominal Security Description Value USD% of Net
Assets
59
Common Stock (continued)
Industrial - 9.31% (2017 - 8.45%)
16,753 Advanced Energy Industries Inc 970,669 0.20%
40,880 Agilent Technologies Inc 2,505,535 0.51%
400 Alten SA 41,044 0.01%
43,294 AO Smith Corp 2,534,431 0.51%
9,614 Armstrong World Industries Inc 599,433 0.12%
14,236 Boeing Co 4,764,077 0.98%
16,363 Brady Corp 629,157 0.13%
209 Bucher Industries AG 69,498 0.01%
3,888 Cie de Saint-Gobain 174,697 0.04%
5,623 CIMIC Group Ltd 175,333 0.04%
83,900 ComfortDelGro Corp Ltd 144,496 0.03%
344 Dassault Aviation SA 649,503 0.13%
71,100 DMG Mori Co Ltd 987,848 0.20%
27,499 Electro Scientific Industries Inc 437,509 0.09%
2,024 Epiroc AB 21,103 0.00%
18,100 Fuji Corp/Aichi 324,941 0.07%
19,156 Garmin Ltd 1,167,750 0.24%
12,528 Gaztransport Et Technigaz SA 766,348 0.16%
2,452 Generac Holdings Inc 125,788 0.03%
4,597 Gentex Corp 106,375 0.02%
43,273 Graco Inc 1,948,583 0.40%
22,000 Hitachi Ltd 155,437 0.03%
23,400 Hoya Corp 1,332,399 0.27%
1,464 Huntington Ingalls Industries Inc 315,931 0.07%
17,224 Illinois Tool Works Inc 2,386,557 0.49%
5,637 Keller Group PLC 75,845 0.02%
12,023 Kloeckner & Co SE 126,938 0.03%
43,513 Koninklijke Philips NV 1,848,519 0.38%
19,719 Landstar System Inc 2,166,132 0.45%
144 LEM Holding SA 215,072 0.04%
4,772 Lennox International Inc 925,243 0.19%
57,150 Louisiana-Pacific Corp 1,539,050 0.32%
14,144 Masco Corp 525,308 0.11%
1,278 Mersen SA 51,547 0.01%
4,459 Mettler-Toledo International Inc 2,553,580 0.53%
1,228 Old Dominion Freight Line Inc 184,077 0.04%
1,173 Oshkosh Corp 80,972 0.02%
2,067 Prima Industrie SpA 88,424 0.02%
16,357 Raytheon Co 3,155,592 0.65%
1,385 Renishaw PLC 95,268 0.02%
6,000 Sakai Moving Service Co Ltd 298,305 0.06%
13,733 Signify NV 358,564 0.07%
19,779 Sika AG 2,725,186 0.56%
4,149 Simpson Manufacturing Co Inc 257,404 0.05%
6,582 Stoneridge Inc 235,965 0.05%
21,791 Sturm Ruger & Co Inc 1,251,893 0.26%
13,464 Terex Corp 553,640 0.11%
16,222 Trex Co Inc 1,020,850 0.21%
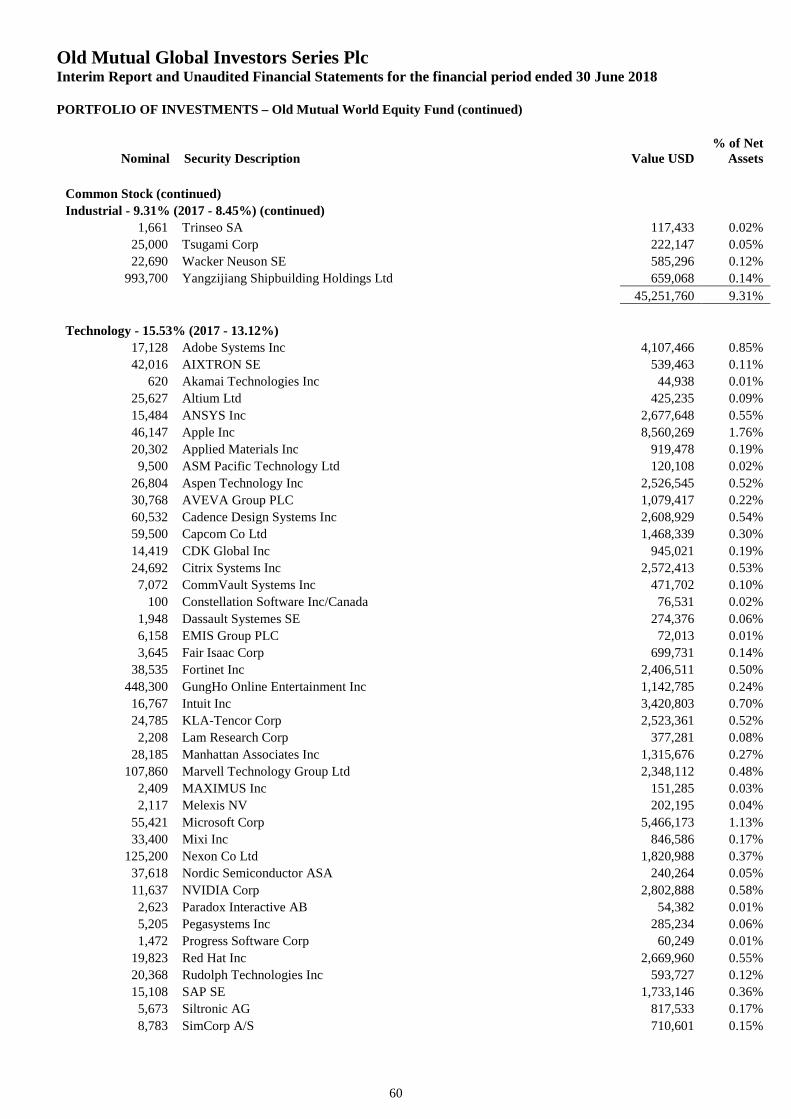
Old Mutual Global Investors Series PlcInterim Report and Unaudited Financial Statements for the financial period ended 30 June 2018
PORTFOLIO OF INVESTMENTS – Old Mutual World Equity Fund (continued)
Nominal Security Description Value USD% of Net
Assets
60
Common Stock (continued)
Industrial - 9.31% (2017 - 8.45%) (continued)
1,661 Trinseo SA 117,433 0.02%
25,000 Tsugami Corp 222,147 0.05%
22,690 Wacker Neuson SE 585,296 0.12%
993,700 Yangzijiang Shipbuilding Holdings Ltd 659,068 0.14%
45,251,760 9.31%
Technology - 15.53% (2017 - 13.12%)
17,128 Adobe Systems Inc 4,107,466 0.85%
42,016 AIXTRON SE 539,463 0.11%
620 Akamai Technologies Inc 44,938 0.01%
25,627 Altium Ltd 425,235 0.09%
15,484 ANSYS Inc 2,677,648 0.55%
46,147 Apple Inc 8,560,269 1.76%
20,302 Applied Materials Inc 919,478 0.19%
9,500 ASM Pacific Technology Ltd 120,108 0.02%
26,804 Aspen Technology Inc 2,526,545 0.52%
30,768 AVEVA Group PLC 1,079,417 0.22%
60,532 Cadence Design Systems Inc 2,608,929 0.54%
59,500 Capcom Co Ltd 1,468,339 0.30%
14,419 CDK Global Inc 945,021 0.19%
24,692 Citrix Systems Inc 2,572,413 0.53%
7,072 CommVault Systems Inc 471,702 0.10%
100 Constellation Software Inc/Canada 76,531 0.02%
1,948 Dassault Systemes SE 274,376 0.06%
6,158 EMIS Group PLC 72,013 0.01%
3,645 Fair Isaac Corp 699,731 0.14%
38,535 Fortinet Inc 2,406,511 0.50%
448,300 GungHo Online Entertainment Inc 1,142,785 0.24%
16,767 Intuit Inc 3,420,803 0.70%
24,785 KLA-Tencor Corp 2,523,361 0.52%
2,208 Lam Research Corp 377,281 0.08%
28,185 Manhattan Associates Inc 1,315,676 0.27%
107,860 Marvell Technology Group Ltd 2,348,112 0.48%
2,409 MAXIMUS Inc 151,285 0.03%
2,117 Melexis NV 202,195 0.04%
55,421 Microsoft Corp 5,466,173 1.13%
33,400 Mixi Inc 846,586 0.17%
125,200 Nexon Co Ltd 1,820,988 0.37%
37,618 Nordic Semiconductor ASA 240,264 0.05%
11,637 NVIDIA Corp 2,802,888 0.58%
2,623 Paradox Interactive AB 54,382 0.01%
5,205 Pegasystems Inc 285,234 0.06%
1,472 Progress Software Corp 60,249 0.01%
19,823 Red Hat Inc 2,669,960 0.55%
20,368 Rudolph Technologies Inc 593,727 0.12%
15,108 SAP SE 1,733,146 0.36%
5,673 Siltronic AG 817,533 0.17%
8,783 SimCorp A/S 710,601 0.15%
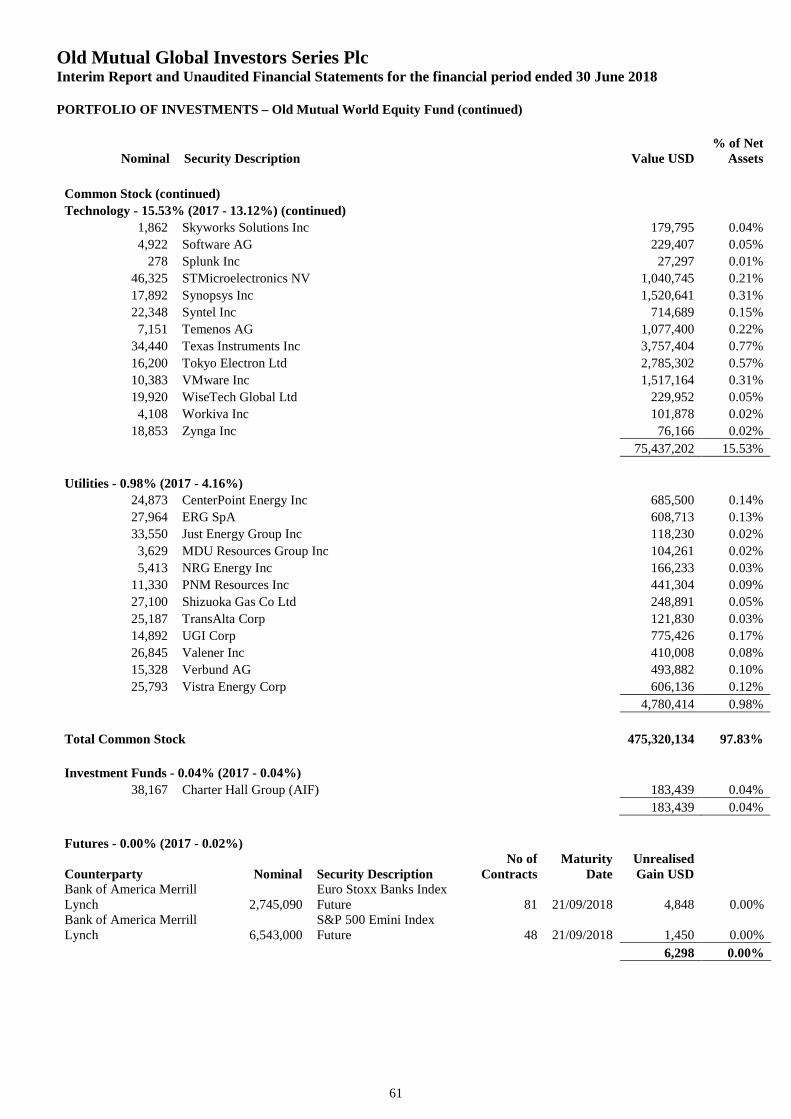
Old Mutual Global Investors Series PlcInterim Report and Unaudited Financial Statements for the financial period ended 30 June 2018
PORTFOLIO OF INVESTMENTS – Old Mutual World Equity Fund (continued)
Nominal Security Description Value USD% of Net
Assets
61
Common Stock (continued)
Technology - 15.53% (2017 - 13.12%) (continued)
1,862 Skyworks Solutions Inc 179,795 0.04%
4,922 Software AG 229,407 0.05%
278 Splunk Inc 27,297 0.01%
46,325 STMicroelectronics NV 1,040,745 0.21%
17,892 Synopsys Inc 1,520,641 0.31%
22,348 Syntel Inc 714,689 0.15%
7,151 Temenos AG 1,077,400 0.22%
34,440 Texas Instruments Inc 3,757,404 0.77%
16,200 Tokyo Electron Ltd 2,785,302 0.57%
10,383 VMware Inc 1,517,164 0.31%
19,920 WiseTech Global Ltd 229,952 0.05%
4,108 Workiva Inc 101,878 0.02%
18,853 Zynga Inc 76,166 0.02%
75,437,202 15.53%
Utilities - 0.98% (2017 - 4.16%)
24,873 CenterPoint Energy Inc 685,500 0.14%
27,964 ERG SpA 608,713 0.13%
33,550 Just Energy Group Inc 118,230 0.02%
3,629 MDU Resources Group Inc 104,261 0.02%
5,413 NRG Energy Inc 166,233 0.03%
11,330 PNM Resources Inc 441,304 0.09%
27,100 Shizuoka Gas Co Ltd 248,891 0.05%
25,187 TransAlta Corp 121,830 0.03%
14,892 UGI Corp 775,426 0.17%
26,845 Valener Inc 410,008 0.08%
15,328 Verbund AG 493,882 0.10%
25,793 Vistra Energy Corp 606,136 0.12%
4,780,414 0.98%
Total Common Stock 475,320,134 97.83%
Investment Funds - 0.04% (2017 - 0.04%)
38,167 Charter Hall Group (AIF) 183,439 0.04%
183,439 0.04%
Futures - 0.00% (2017 - 0.02%)
Counterparty Nominal Security DescriptionNo of
ContractsMaturity
DateUnrealisedGain USD
Bank of America MerrillLynch 2,745,090
Euro Stoxx Banks IndexFuture 81 21/09/2018 4,848 0.00%
Bank of America MerrillLynch 6,543,000
S&P 500 Emini IndexFuture 48 21/09/2018 1,450 0.00%
6,298 0.00%
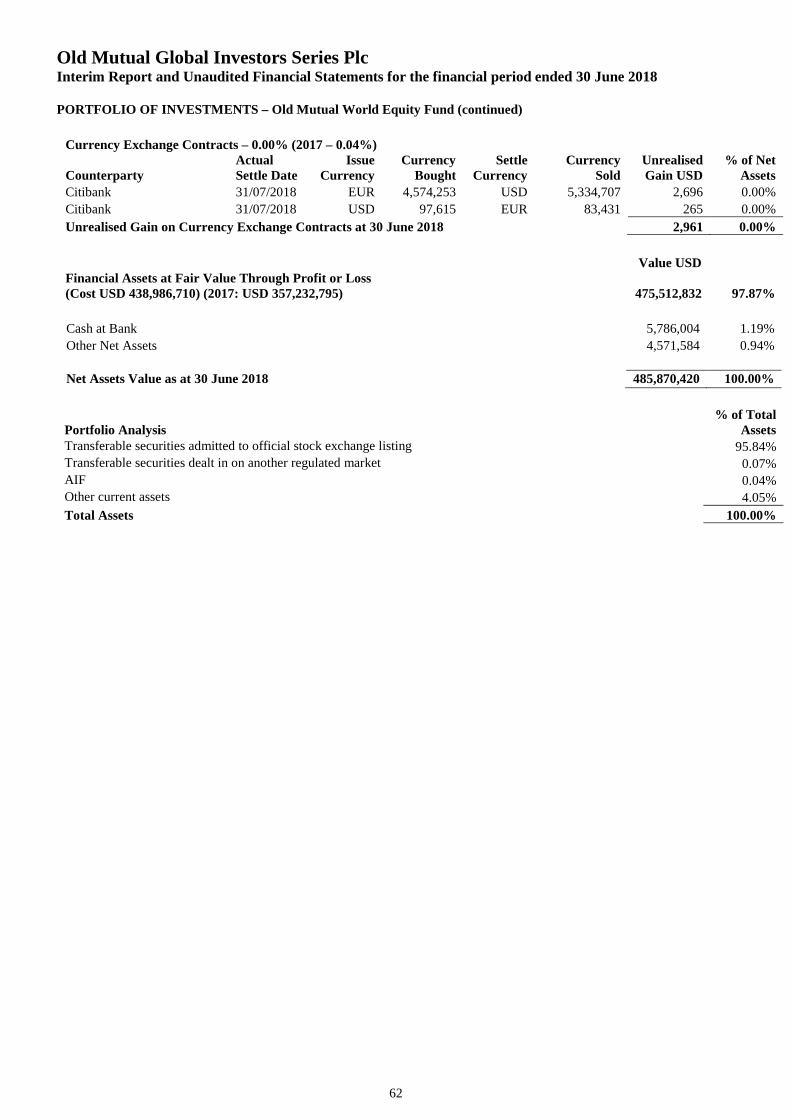
Old Mutual Global Investors Series PlcInterim Report and Unaudited Financial Statements for the financial period ended 30 June 2018
PORTFOLIO OF INVESTMENTS – Old Mutual World Equity Fund (continued)
62
Currency Exchange Contracts – 0.00% (2017 – 0.04%)
CounterpartyActualSettle Date
IssueCurrency
CurrencyBought
SettleCurrency
CurrencySold
UnrealisedGain USD
% of NetAssets
Citibank 31/07/2018 EUR 4,574,253 USD 5,334,707 2,696 0.00%
Citibank 31/07/2018 USD 97,615 EUR 83,431 265 0.00%
Unrealised Gain on Currency Exchange Contracts at 30 June 2018 2,961 0.00%
Value USDFinancial Assets at Fair Value Through Profit or Loss(Cost USD 438,986,710) (2017: USD 357,232,795) 475,512,832 97.87%
Cash at Bank 5,786,004 1.19%
Other Net Assets 4,571,584 0.94%
Net Assets Value as at 30 June 2018 485,870,420 100.00%
Portfolio Analysis% of Total
AssetsTransferable securities admitted to official stock exchange listing 95.84%Transferable securities dealt in on another regulated market 0.07%AIF 0.04%Other current assets 4.05%
Total Assets 100.00%
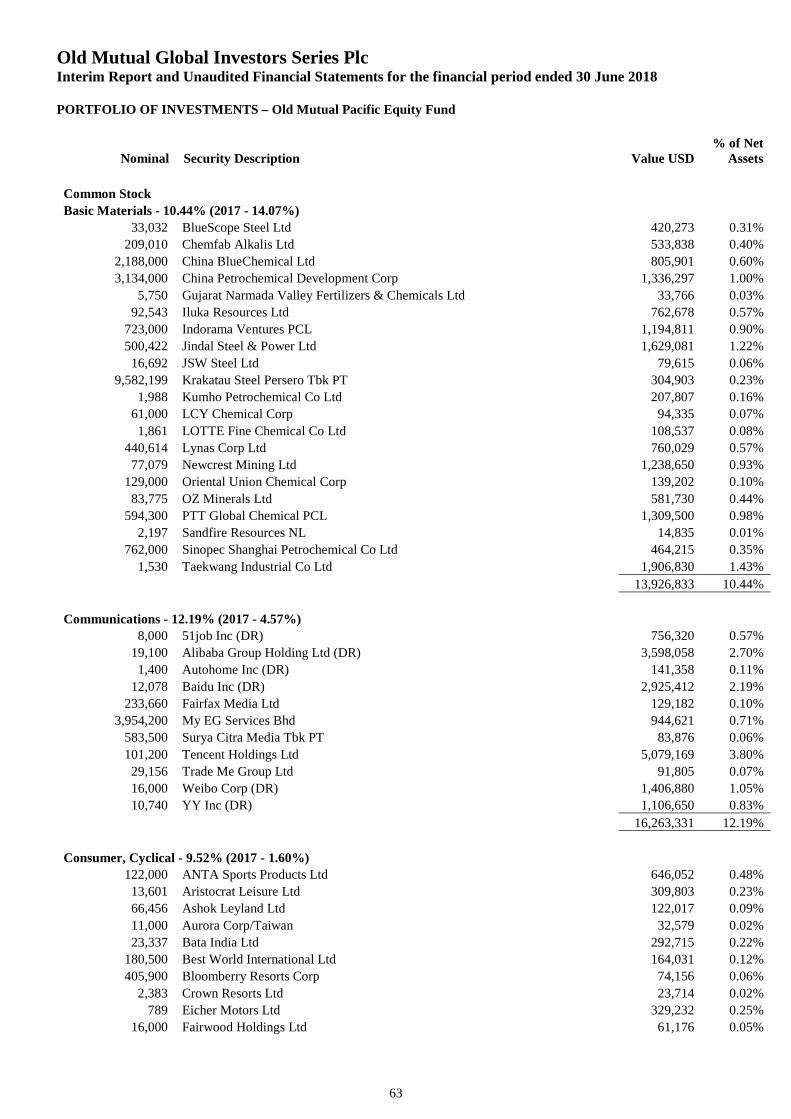
Old Mutual Global Investors Series PlcInterim Report and Unaudited Financial Statements for the financial period ended 30 June 2018
PORTFOLIO OF INVESTMENTS – Old Mutual Pacific Equity Fund
Nominal Security Description Value USD% of Net
Assets
63
Common Stock
Basic Materials - 10.44% (2017 - 14.07%)
33,032 BlueScope Steel Ltd 420,273 0.31%
209,010 Chemfab Alkalis Ltd 533,838 0.40%
2,188,000 China BlueChemical Ltd 805,901 0.60%
3,134,000 China Petrochemical Development Corp 1,336,297 1.00%
5,750 Gujarat Narmada Valley Fertilizers & Chemicals Ltd 33,766 0.03%
92,543 Iluka Resources Ltd 762,678 0.57%
723,000 Indorama Ventures PCL 1,194,811 0.90%
500,422 Jindal Steel & Power Ltd 1,629,081 1.22%
16,692 JSW Steel Ltd 79,615 0.06%
9,582,199 Krakatau Steel Persero Tbk PT 304,903 0.23%
1,988 Kumho Petrochemical Co Ltd 207,807 0.16%
61,000 LCY Chemical Corp 94,335 0.07%
1,861 LOTTE Fine Chemical Co Ltd 108,537 0.08%
440,614 Lynas Corp Ltd 760,029 0.57%
77,079 Newcrest Mining Ltd 1,238,650 0.93%
129,000 Oriental Union Chemical Corp 139,202 0.10%
83,775 OZ Minerals Ltd 581,730 0.44%
594,300 PTT Global Chemical PCL 1,309,500 0.98%
2,197 Sandfire Resources NL 14,835 0.01%
762,000 Sinopec Shanghai Petrochemical Co Ltd 464,215 0.35%
1,530 Taekwang Industrial Co Ltd 1,906,830 1.43%
13,926,833 10.44%
Communications - 12.19% (2017 - 4.57%)
8,000 51job Inc (DR) 756,320 0.57%
19,100 Alibaba Group Holding Ltd (DR) 3,598,058 2.70%
1,400 Autohome Inc (DR) 141,358 0.11%
12,078 Baidu Inc (DR) 2,925,412 2.19%
233,660 Fairfax Media Ltd 129,182 0.10%
3,954,200 My EG Services Bhd 944,621 0.71%
583,500 Surya Citra Media Tbk PT 83,876 0.06%
101,200 Tencent Holdings Ltd 5,079,169 3.80%
29,156 Trade Me Group Ltd 91,805 0.07%
16,000 Weibo Corp (DR) 1,406,880 1.05%
10,740 YY Inc (DR) 1,106,650 0.83%
16,263,331 12.19%
Consumer, Cyclical - 9.52% (2017 - 1.60%)
122,000 ANTA Sports Products Ltd 646,052 0.48%
13,601 Aristocrat Leisure Ltd 309,803 0.23%
66,456 Ashok Leyland Ltd 122,017 0.09%
11,000 Aurora Corp/Taiwan 32,579 0.02%
23,337 Bata India Ltd 292,715 0.22%
180,500 Best World International Ltd 164,031 0.12%
405,900 Bloomberry Resorts Corp 74,156 0.06%
2,383 Crown Resorts Ltd 23,714 0.02%
789 Eicher Motors Ltd 329,232 0.25%
16,000 Fairwood Holdings Ltd 61,176 0.05%
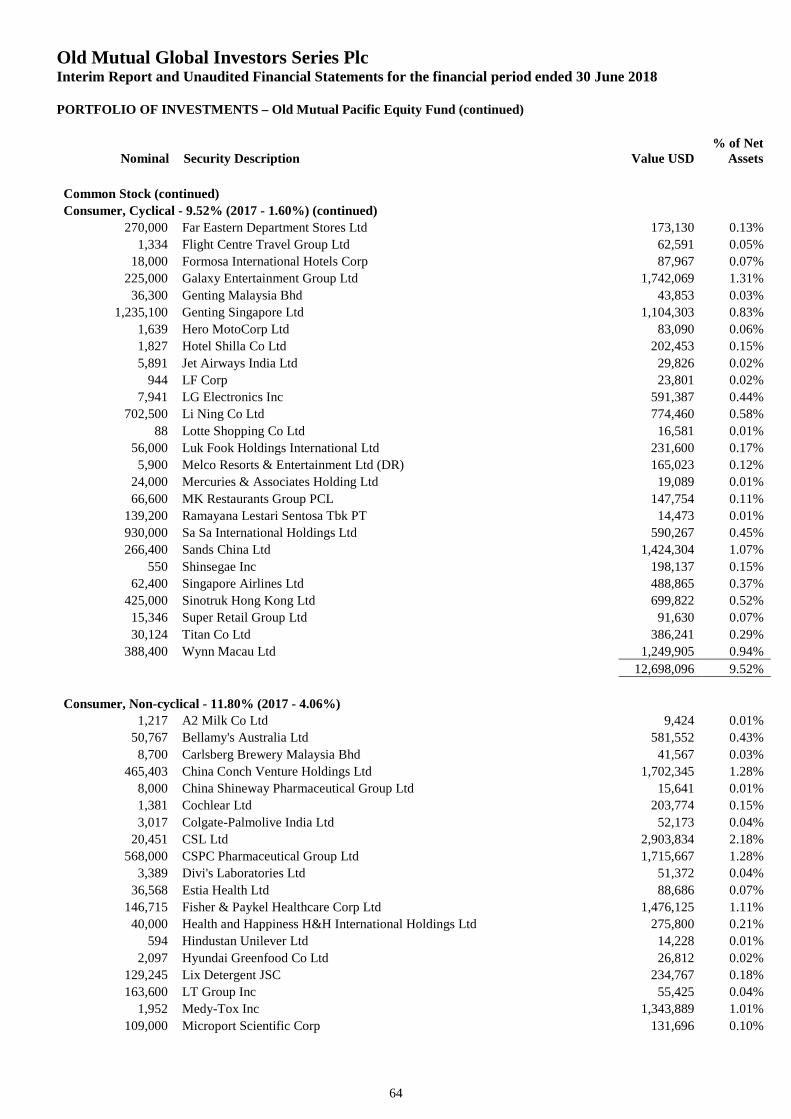
Old Mutual Global Investors Series PlcInterim Report and Unaudited Financial Statements for the financial period ended 30 June 2018
PORTFOLIO OF INVESTMENTS – Old Mutual Pacific Equity Fund (continued)
Nominal Security Description Value USD% of Net
Assets
64
Common Stock (continued)
Consumer, Cyclical - 9.52% (2017 - 1.60%) (continued)
270,000 Far Eastern Department Stores Ltd 173,130 0.13%
1,334 Flight Centre Travel Group Ltd 62,591 0.05%
18,000 Formosa International Hotels Corp 87,967 0.07%
225,000 Galaxy Entertainment Group Ltd 1,742,069 1.31%
36,300 Genting Malaysia Bhd 43,853 0.03%
1,235,100 Genting Singapore Ltd 1,104,303 0.83%
1,639 Hero MotoCorp Ltd 83,090 0.06%
1,827 Hotel Shilla Co Ltd 202,453 0.15%
5,891 Jet Airways India Ltd 29,826 0.02%
944 LF Corp 23,801 0.02%
7,941 LG Electronics Inc 591,387 0.44%
702,500 Li Ning Co Ltd 774,460 0.58%
88 Lotte Shopping Co Ltd 16,581 0.01%
56,000 Luk Fook Holdings International Ltd 231,600 0.17%
5,900 Melco Resorts & Entertainment Ltd (DR) 165,023 0.12%
24,000 Mercuries & Associates Holding Ltd 19,089 0.01%
66,600 MK Restaurants Group PCL 147,754 0.11%
139,200 Ramayana Lestari Sentosa Tbk PT 14,473 0.01%
930,000 Sa Sa International Holdings Ltd 590,267 0.45%
266,400 Sands China Ltd 1,424,304 1.07%
550 Shinsegae Inc 198,137 0.15%
62,400 Singapore Airlines Ltd 488,865 0.37%
425,000 Sinotruk Hong Kong Ltd 699,822 0.52%
15,346 Super Retail Group Ltd 91,630 0.07%
30,124 Titan Co Ltd 386,241 0.29%
388,400 Wynn Macau Ltd 1,249,905 0.94%
12,698,096 9.52%
Consumer, Non-cyclical - 11.80% (2017 - 4.06%)
1,217 A2 Milk Co Ltd 9,424 0.01%
50,767 Bellamy's Australia Ltd 581,552 0.43%
8,700 Carlsberg Brewery Malaysia Bhd 41,567 0.03%
465,403 China Conch Venture Holdings Ltd 1,702,345 1.28%
8,000 China Shineway Pharmaceutical Group Ltd 15,641 0.01%
1,381 Cochlear Ltd 203,774 0.15%
3,017 Colgate-Palmolive India Ltd 52,173 0.04%
20,451 CSL Ltd 2,903,834 2.18%
568,000 CSPC Pharmaceutical Group Ltd 1,715,667 1.28%
3,389 Divi's Laboratories Ltd 51,372 0.04%
36,568 Estia Health Ltd 88,686 0.07%
146,715 Fisher & Paykel Healthcare Corp Ltd 1,476,125 1.11%
40,000 Health and Happiness H&H International Holdings Ltd 275,800 0.21%
594 Hindustan Unilever Ltd 14,228 0.01%
2,097 Hyundai Greenfood Co Ltd 26,812 0.02%
129,245 Lix Detergent JSC 234,767 0.18%
163,600 LT Group Inc 55,425 0.04%
1,952 Medy-Tox Inc 1,343,889 1.01%
109,000 Microport Scientific Corp 131,696 0.10%
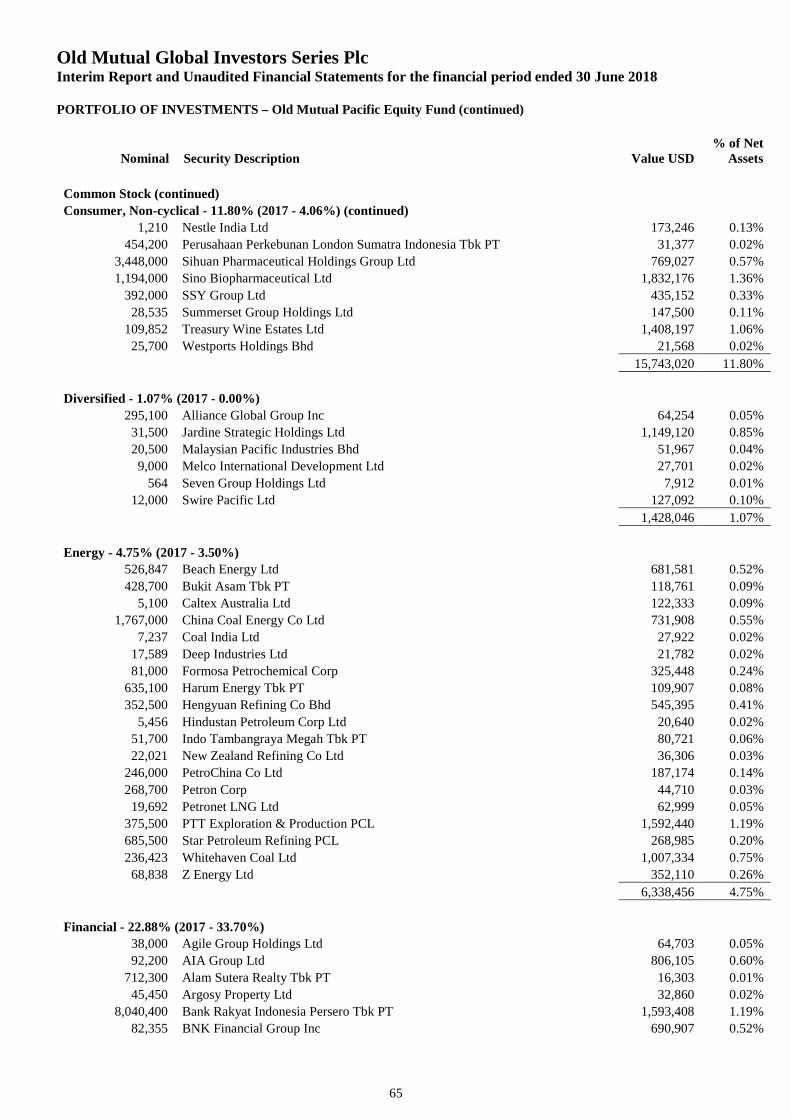
Old Mutual Global Investors Series PlcInterim Report and Unaudited Financial Statements for the financial period ended 30 June 2018
PORTFOLIO OF INVESTMENTS – Old Mutual Pacific Equity Fund (continued)
Nominal Security Description Value USD% of Net
Assets
65
Common Stock (continued)
Consumer, Non-cyclical - 11.80% (2017 - 4.06%) (continued)
1,210 Nestle India Ltd 173,246 0.13%
454,200 Perusahaan Perkebunan London Sumatra Indonesia Tbk PT 31,377 0.02%
3,448,000 Sihuan Pharmaceutical Holdings Group Ltd 769,027 0.57%
1,194,000 Sino Biopharmaceutical Ltd 1,832,176 1.36%
392,000 SSY Group Ltd 435,152 0.33%
28,535 Summerset Group Holdings Ltd 147,500 0.11%
109,852 Treasury Wine Estates Ltd 1,408,197 1.06%
25,700 Westports Holdings Bhd 21,568 0.02%
15,743,020 11.80%
Diversified - 1.07% (2017 - 0.00%)
295,100 Alliance Global Group Inc 64,254 0.05%
31,500 Jardine Strategic Holdings Ltd 1,149,120 0.85%
20,500 Malaysian Pacific Industries Bhd 51,967 0.04%
9,000 Melco International Development Ltd 27,701 0.02%
564 Seven Group Holdings Ltd 7,912 0.01%
12,000 Swire Pacific Ltd 127,092 0.10%
1,428,046 1.07%
Energy - 4.75% (2017 - 3.50%)
526,847 Beach Energy Ltd 681,581 0.52%
428,700 Bukit Asam Tbk PT 118,761 0.09%
5,100 Caltex Australia Ltd 122,333 0.09%
1,767,000 China Coal Energy Co Ltd 731,908 0.55%
7,237 Coal India Ltd 27,922 0.02%
17,589 Deep Industries Ltd 21,782 0.02%
81,000 Formosa Petrochemical Corp 325,448 0.24%
635,100 Harum Energy Tbk PT 109,907 0.08%
352,500 Hengyuan Refining Co Bhd 545,395 0.41%
5,456 Hindustan Petroleum Corp Ltd 20,640 0.02%
51,700 Indo Tambangraya Megah Tbk PT 80,721 0.06%
22,021 New Zealand Refining Co Ltd 36,306 0.03%
246,000 PetroChina Co Ltd 187,174 0.14%
268,700 Petron Corp 44,710 0.03%
19,692 Petronet LNG Ltd 62,999 0.05%
375,500 PTT Exploration & Production PCL 1,592,440 1.19%
685,500 Star Petroleum Refining PCL 268,985 0.20%
236,423 Whitehaven Coal Ltd 1,007,334 0.75%
68,838 Z Energy Ltd 352,110 0.26%
6,338,456 4.75%
Financial - 22.88% (2017 - 33.70%)
38,000 Agile Group Holdings Ltd 64,703 0.05%
92,200 AIA Group Ltd 806,105 0.60%
712,300 Alam Sutera Realty Tbk PT 16,303 0.01%
45,450 Argosy Property Ltd 32,860 0.02%
8,040,400 Bank Rakyat Indonesia Persero Tbk PT 1,593,408 1.19%
82,355 BNK Financial Group Inc 690,907 0.52%
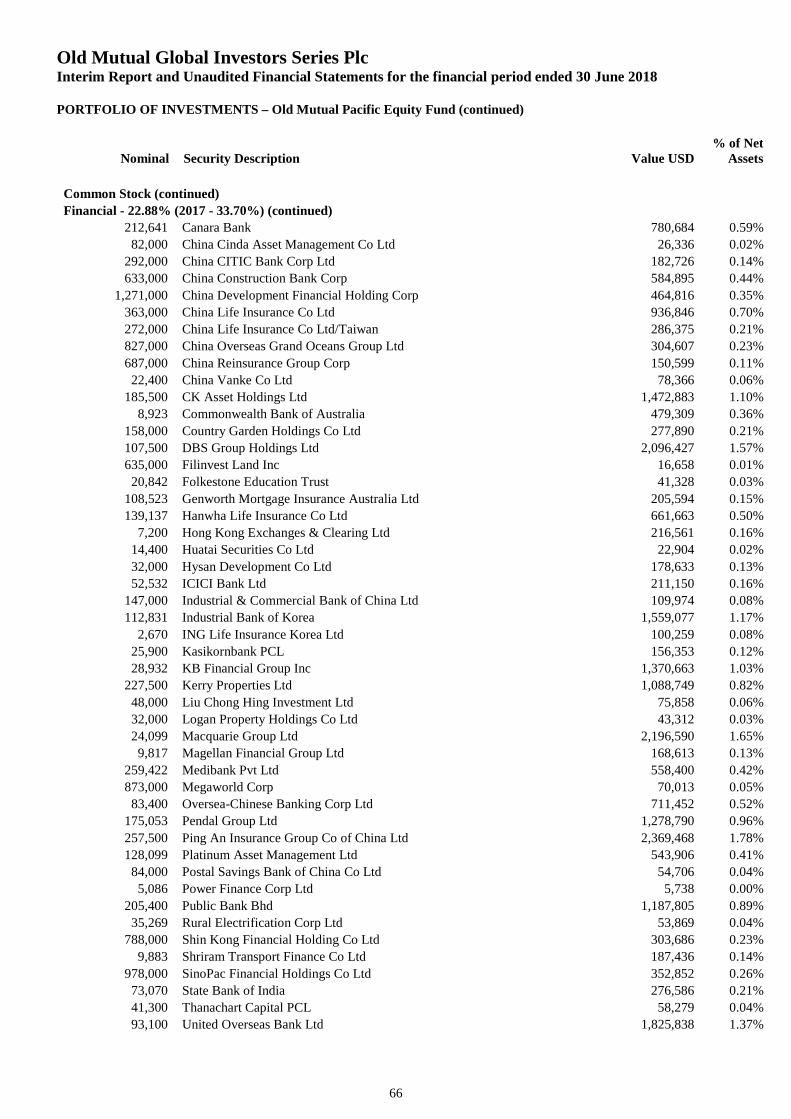
Old Mutual Global Investors Series PlcInterim Report and Unaudited Financial Statements for the financial period ended 30 June 2018
PORTFOLIO OF INVESTMENTS – Old Mutual Pacific Equity Fund (continued)
Nominal Security Description Value USD% of Net
Assets
66
Common Stock (continued)
Financial - 22.88% (2017 - 33.70%) (continued)
212,641 Canara Bank 780,684 0.59%
82,000 China Cinda Asset Management Co Ltd 26,336 0.02%
292,000 China CITIC Bank Corp Ltd 182,726 0.14%
633,000 China Construction Bank Corp 584,895 0.44%
1,271,000 China Development Financial Holding Corp 464,816 0.35%
363,000 China Life Insurance Co Ltd 936,846 0.70%
272,000 China Life Insurance Co Ltd/Taiwan 286,375 0.21%
827,000 China Overseas Grand Oceans Group Ltd 304,607 0.23%
687,000 China Reinsurance Group Corp 150,599 0.11%
22,400 China Vanke Co Ltd 78,366 0.06%
185,500 CK Asset Holdings Ltd 1,472,883 1.10%
8,923 Commonwealth Bank of Australia 479,309 0.36%
158,000 Country Garden Holdings Co Ltd 277,890 0.21%
107,500 DBS Group Holdings Ltd 2,096,427 1.57%
635,000 Filinvest Land Inc 16,658 0.01%
20,842 Folkestone Education Trust 41,328 0.03%
108,523 Genworth Mortgage Insurance Australia Ltd 205,594 0.15%
139,137 Hanwha Life Insurance Co Ltd 661,663 0.50%
7,200 Hong Kong Exchanges & Clearing Ltd 216,561 0.16%
14,400 Huatai Securities Co Ltd 22,904 0.02%
32,000 Hysan Development Co Ltd 178,633 0.13%
52,532 ICICI Bank Ltd 211,150 0.16%
147,000 Industrial & Commercial Bank of China Ltd 109,974 0.08%
112,831 Industrial Bank of Korea 1,559,077 1.17%
2,670 ING Life Insurance Korea Ltd 100,259 0.08%
25,900 Kasikornbank PCL 156,353 0.12%
28,932 KB Financial Group Inc 1,370,663 1.03%
227,500 Kerry Properties Ltd 1,088,749 0.82%
48,000 Liu Chong Hing Investment Ltd 75,858 0.06%
32,000 Logan Property Holdings Co Ltd 43,312 0.03%
24,099 Macquarie Group Ltd 2,196,590 1.65%
9,817 Magellan Financial Group Ltd 168,613 0.13%
259,422 Medibank Pvt Ltd 558,400 0.42%
873,000 Megaworld Corp 70,013 0.05%
83,400 Oversea-Chinese Banking Corp Ltd 711,452 0.52%
175,053 Pendal Group Ltd 1,278,790 0.96%
257,500 Ping An Insurance Group Co of China Ltd 2,369,468 1.78%
128,099 Platinum Asset Management Ltd 543,906 0.41%
84,000 Postal Savings Bank of China Co Ltd 54,706 0.04%
5,086 Power Finance Corp Ltd 5,738 0.00%
205,400 Public Bank Bhd 1,187,805 0.89%
35,269 Rural Electrification Corp Ltd 53,869 0.04%
788,000 Shin Kong Financial Holding Co Ltd 303,686 0.23%
9,883 Shriram Transport Finance Co Ltd 187,436 0.14%
978,000 SinoPac Financial Holdings Co Ltd 352,852 0.26%
73,070 State Bank of India 276,586 0.21%
41,300 Thanachart Capital PCL 58,279 0.04%
93,100 United Overseas Bank Ltd 1,825,838 1.37%
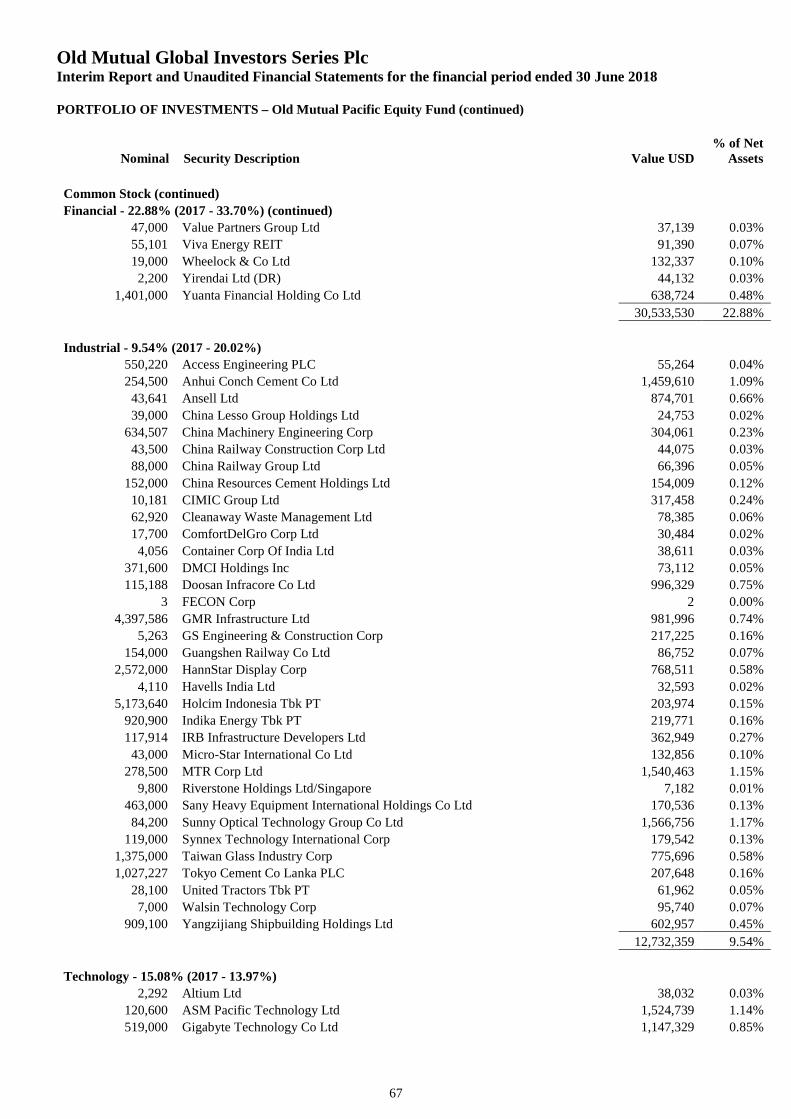
Old Mutual Global Investors Series PlcInterim Report and Unaudited Financial Statements for the financial period ended 30 June 2018
PORTFOLIO OF INVESTMENTS – Old Mutual Pacific Equity Fund (continued)
Nominal Security Description Value USD% of Net
Assets
67
Common Stock (continued)
Financial - 22.88% (2017 - 33.70%) (continued)
47,000 Value Partners Group Ltd 37,139 0.03%
55,101 Viva Energy REIT 91,390 0.07%
19,000 Wheelock & Co Ltd 132,337 0.10%
2,200 Yirendai Ltd (DR) 44,132 0.03%
1,401,000 Yuanta Financial Holding Co Ltd 638,724 0.48%
30,533,530 22.88%
Industrial - 9.54% (2017 - 20.02%)
550,220 Access Engineering PLC 55,264 0.04%
254,500 Anhui Conch Cement Co Ltd 1,459,610 1.09%
43,641 Ansell Ltd 874,701 0.66%
39,000 China Lesso Group Holdings Ltd 24,753 0.02%
634,507 China Machinery Engineering Corp 304,061 0.23%
43,500 China Railway Construction Corp Ltd 44,075 0.03%
88,000 China Railway Group Ltd 66,396 0.05%
152,000 China Resources Cement Holdings Ltd 154,009 0.12%
10,181 CIMIC Group Ltd 317,458 0.24%
62,920 Cleanaway Waste Management Ltd 78,385 0.06%
17,700 ComfortDelGro Corp Ltd 30,484 0.02%
4,056 Container Corp Of India Ltd 38,611 0.03%
371,600 DMCI Holdings Inc 73,112 0.05%
115,188 Doosan Infracore Co Ltd 996,329 0.75%
3 FECON Corp 2 0.00%
4,397,586 GMR Infrastructure Ltd 981,996 0.74%
5,263 GS Engineering & Construction Corp 217,225 0.16%
154,000 Guangshen Railway Co Ltd 86,752 0.07%
2,572,000 HannStar Display Corp 768,511 0.58%
4,110 Havells India Ltd 32,593 0.02%
5,173,640 Holcim Indonesia Tbk PT 203,974 0.15%
920,900 Indika Energy Tbk PT 219,771 0.16%
117,914 IRB Infrastructure Developers Ltd 362,949 0.27%
43,000 Micro-Star International Co Ltd 132,856 0.10%
278,500 MTR Corp Ltd 1,540,463 1.15%
9,800 Riverstone Holdings Ltd/Singapore 7,182 0.01%
463,000 Sany Heavy Equipment International Holdings Co Ltd 170,536 0.13%
84,200 Sunny Optical Technology Group Co Ltd 1,566,756 1.17%
119,000 Synnex Technology International Corp 179,542 0.13%
1,375,000 Taiwan Glass Industry Corp 775,696 0.58%
1,027,227 Tokyo Cement Co Lanka PLC 207,648 0.16%
28,100 United Tractors Tbk PT 61,962 0.05%
7,000 Walsin Technology Corp 95,740 0.07%
909,100 Yangzijiang Shipbuilding Holdings Ltd 602,957 0.45%
12,732,359 9.54%
Technology - 15.08% (2017 - 13.97%)
2,292 Altium Ltd 38,032 0.03%
120,600 ASM Pacific Technology Ltd 1,524,739 1.14%
519,000 Gigabyte Technology Co Ltd 1,147,329 0.85%
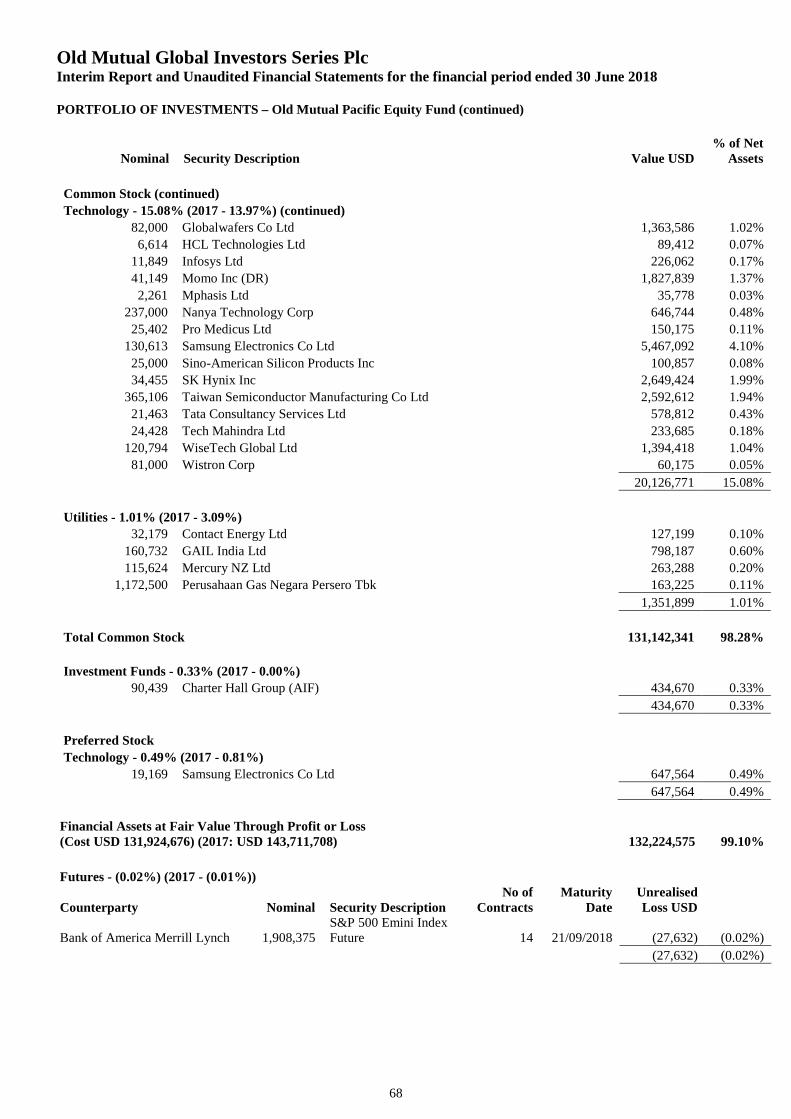
Old Mutual Global Investors Series PlcInterim Report and Unaudited Financial Statements for the financial period ended 30 June 2018
PORTFOLIO OF INVESTMENTS – Old Mutual Pacific Equity Fund (continued)
Nominal Security Description Value USD% of Net
Assets
68
Common Stock (continued)
Technology - 15.08% (2017 - 13.97%) (continued)
82,000 Globalwafers Co Ltd 1,363,586 1.02%
6,614 HCL Technologies Ltd 89,412 0.07%
11,849 Infosys Ltd 226,062 0.17%
41,149 Momo Inc (DR) 1,827,839 1.37%
2,261 Mphasis Ltd 35,778 0.03%
237,000 Nanya Technology Corp 646,744 0.48%
25,402 Pro Medicus Ltd 150,175 0.11%
130,613 Samsung Electronics Co Ltd 5,467,092 4.10%
25,000 Sino-American Silicon Products Inc 100,857 0.08%
34,455 SK Hynix Inc 2,649,424 1.99%
365,106 Taiwan Semiconductor Manufacturing Co Ltd 2,592,612 1.94%
21,463 Tata Consultancy Services Ltd 578,812 0.43%
24,428 Tech Mahindra Ltd 233,685 0.18%
120,794 WiseTech Global Ltd 1,394,418 1.04%
81,000 Wistron Corp 60,175 0.05%
20,126,771 15.08%
Utilities - 1.01% (2017 - 3.09%)
32,179 Contact Energy Ltd 127,199 0.10%
160,732 GAIL India Ltd 798,187 0.60%
115,624 Mercury NZ Ltd 263,288 0.20%
1,172,500 Perusahaan Gas Negara Persero Tbk 163,225 0.11%
1,351,899 1.01%
Total Common Stock 131,142,341 98.28%
Investment Funds - 0.33% (2017 - 0.00%)
90,439 Charter Hall Group (AIF) 434,670 0.33%
434,670 0.33%
Preferred Stock
Technology - 0.49% (2017 - 0.81%)
19,169 Samsung Electronics Co Ltd 647,564 0.49%
647,564 0.49%
Financial Assets at Fair Value Through Profit or Loss(Cost USD 131,924,676) (2017: USD 143,711,708) 132,224,575 99.10%
Futures - (0.02%) (2017 - (0.01%))
Counterparty Nominal Security DescriptionNo of
ContractsMaturity
DateUnrealisedLoss USD
Bank of America Merrill Lynch 1,908,375S&P 500 Emini IndexFuture 14 21/09/2018 (27,632) (0.02%)
(27,632) (0.02%)
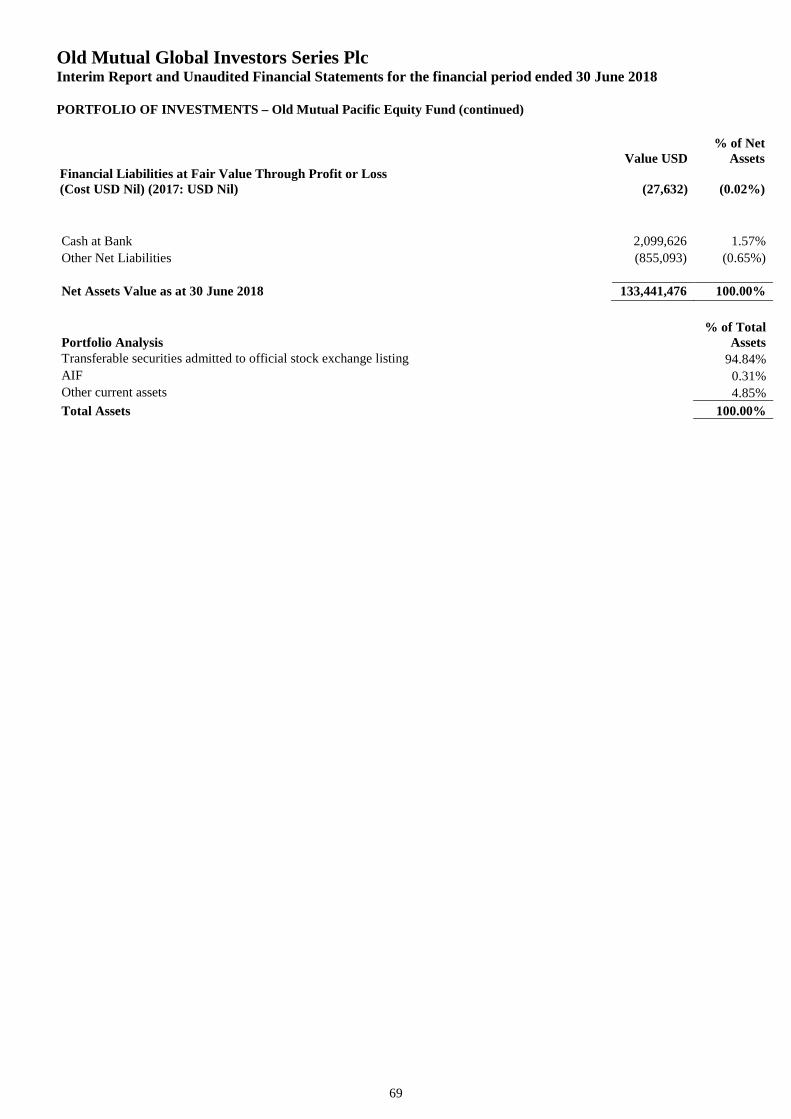
Old Mutual Global Investors Series PlcInterim Report and Unaudited Financial Statements for the financial period ended 30 June 2018
PORTFOLIO OF INVESTMENTS – Old Mutual Pacific Equity Fund (continued)
69
Value USD% of Net
AssetsFinancial Liabilities at Fair Value Through Profit or Loss(Cost USD Nil) (2017: USD Nil) (27,632) (0.02%)
Cash at Bank 2,099,626 1.57%
Other Net Liabilities (855,093) (0.65%)
Net Assets Value as at 30 June 2018 133,441,476 100.00%
Portfolio Analysis% of Total
AssetsTransferable securities admitted to official stock exchange listing 94.84%AIF 0.31%Other current assets 4.85%
Total Assets 100.00%
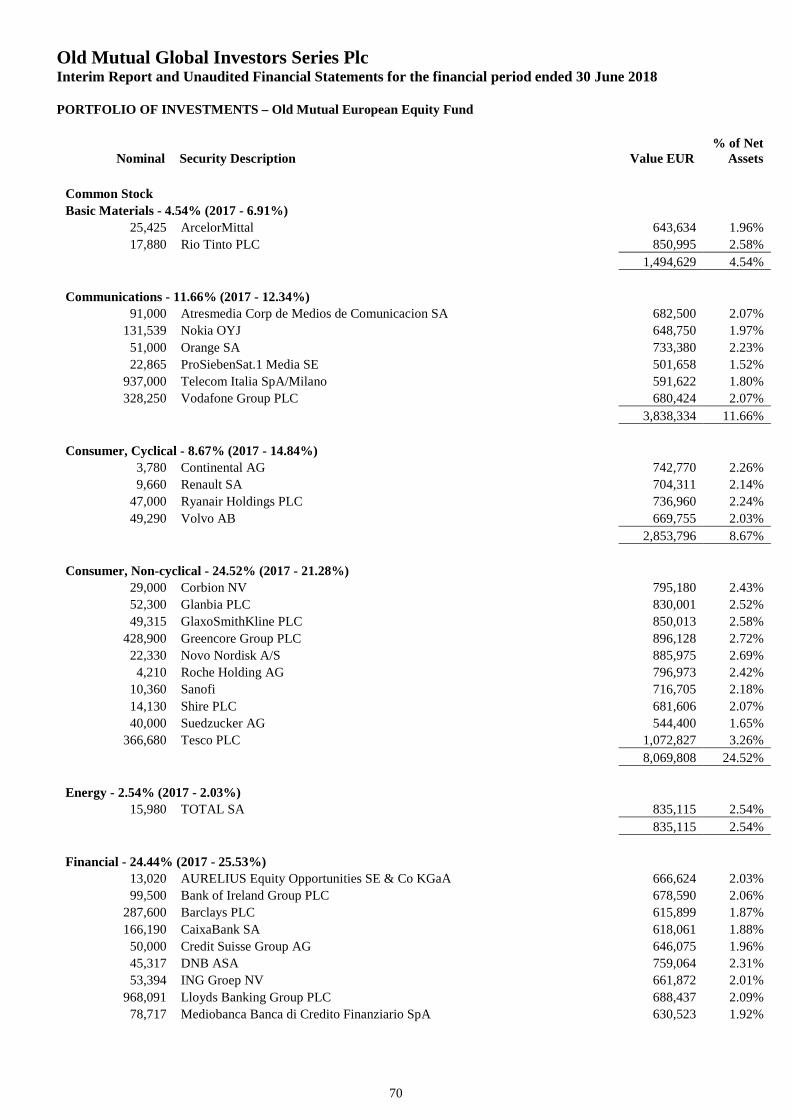
Old Mutual Global Investors Series PlcInterim Report and Unaudited Financial Statements for the financial period ended 30 June 2018
PORTFOLIO OF INVESTMENTS – Old Mutual European Equity Fund
Nominal Security Description Value EUR% of Net
Assets
70
Common Stock
Basic Materials - 4.54% (2017 - 6.91%)
25,425 ArcelorMittal 643,634 1.96%
17,880 Rio Tinto PLC 850,995 2.58%
1,494,629 4.54%
Communications - 11.66% (2017 - 12.34%)
91,000 Atresmedia Corp de Medios de Comunicacion SA 682,500 2.07%
131,539 Nokia OYJ 648,750 1.97%
51,000 Orange SA 733,380 2.23%
22,865 ProSiebenSat.1 Media SE 501,658 1.52%
937,000 Telecom Italia SpA/Milano 591,622 1.80%
328,250 Vodafone Group PLC 680,424 2.07%
3,838,334 11.66%
Consumer, Cyclical - 8.67% (2017 - 14.84%)
3,780 Continental AG 742,770 2.26%
9,660 Renault SA 704,311 2.14%
47,000 Ryanair Holdings PLC 736,960 2.24%
49,290 Volvo AB 669,755 2.03%
2,853,796 8.67%
Consumer, Non-cyclical - 24.52% (2017 - 21.28%)
29,000 Corbion NV 795,180 2.43%
52,300 Glanbia PLC 830,001 2.52%
49,315 GlaxoSmithKline PLC 850,013 2.58%
428,900 Greencore Group PLC 896,128 2.72%
22,330 Novo Nordisk A/S 885,975 2.69%
4,210 Roche Holding AG 796,973 2.42%
10,360 Sanofi 716,705 2.18%
14,130 Shire PLC 681,606 2.07%
40,000 Suedzucker AG 544,400 1.65%
366,680 Tesco PLC 1,072,827 3.26%
8,069,808 24.52%
Energy - 2.54% (2017 - 2.03%)
15,980 TOTAL SA 835,115 2.54%
835,115 2.54%
Financial - 24.44% (2017 - 25.53%)
13,020 AURELIUS Equity Opportunities SE & Co KGaA 666,624 2.03%
99,500 Bank of Ireland Group PLC 678,590 2.06%
287,600 Barclays PLC 615,899 1.87%
166,190 CaixaBank SA 618,061 1.88%
50,000 Credit Suisse Group AG 646,075 1.96%
45,317 DNB ASA 759,064 2.31%
53,394 ING Groep NV 661,872 2.01%
968,091 Lloyds Banking Group PLC 688,437 2.09%
78,717 Mediobanca Banca di Credito Finanziario SpA 630,523 1.92%
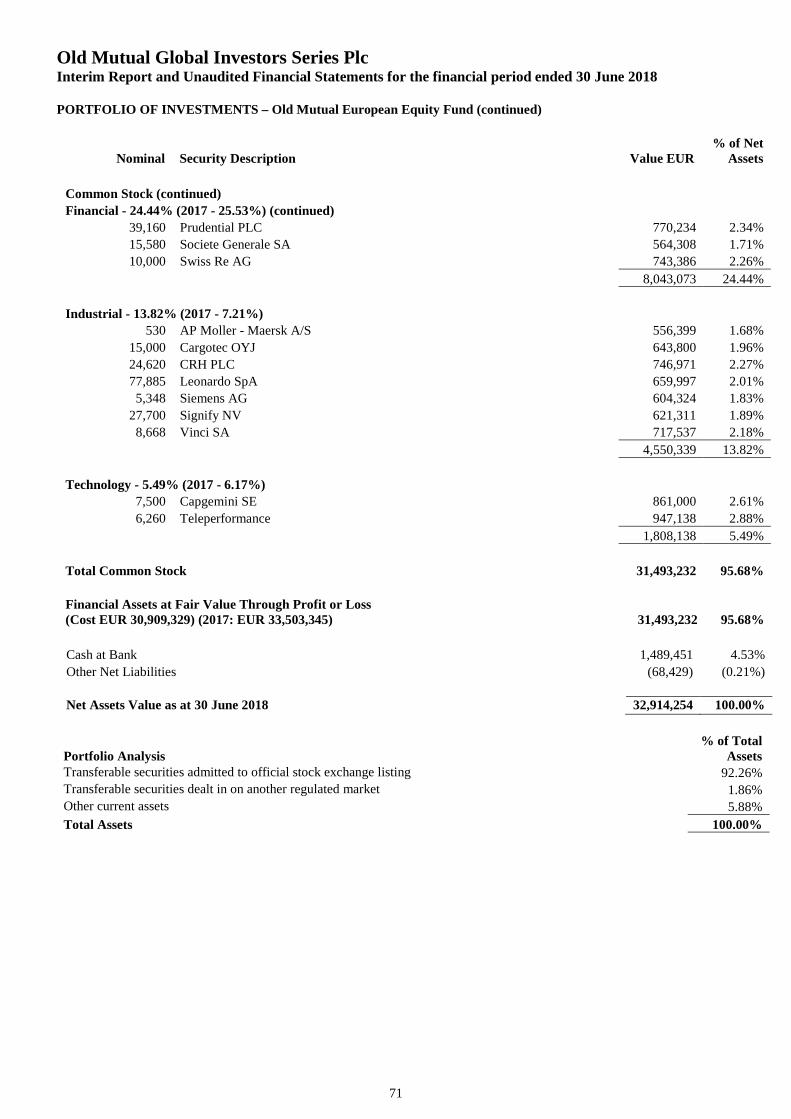
Old Mutual Global Investors Series PlcInterim Report and Unaudited Financial Statements for the financial period ended 30 June 2018
PORTFOLIO OF INVESTMENTS – Old Mutual European Equity Fund (continued)
Nominal Security Description Value EUR% of Net
Assets
71
Common Stock (continued)
Financial - 24.44% (2017 - 25.53%) (continued)
39,160 Prudential PLC 770,234 2.34%
15,580 Societe Generale SA 564,308 1.71%
10,000 Swiss Re AG 743,386 2.26%
8,043,073 24.44%
Industrial - 13.82% (2017 - 7.21%)
530 AP Moller - Maersk A/S 556,399 1.68%
15,000 Cargotec OYJ 643,800 1.96%
24,620 CRH PLC 746,971 2.27%
77,885 Leonardo SpA 659,997 2.01%
5,348 Siemens AG 604,324 1.83%
27,700 Signify NV 621,311 1.89%
8,668 Vinci SA 717,537 2.18%
4,550,339 13.82%
Technology - 5.49% (2017 - 6.17%)
7,500 Capgemini SE 861,000 2.61%
6,260 Teleperformance 947,138 2.88%
1,808,138 5.49%
Total Common Stock 31,493,232 95.68%
Financial Assets at Fair Value Through Profit or Loss(Cost EUR 30,909,329) (2017: EUR 33,503,345) 31,493,232 95.68%
Cash at Bank 1,489,451 4.53%
Other Net Liabilities (68,429) (0.21%)
Net Assets Value as at 30 June 2018 32,914,254 100.00%
Portfolio Analysis% of Total
AssetsTransferable securities admitted to official stock exchange listing 92.26%Transferable securities dealt in on another regulated market 1.86%Other current assets 5.88%
Total Assets 100.00%
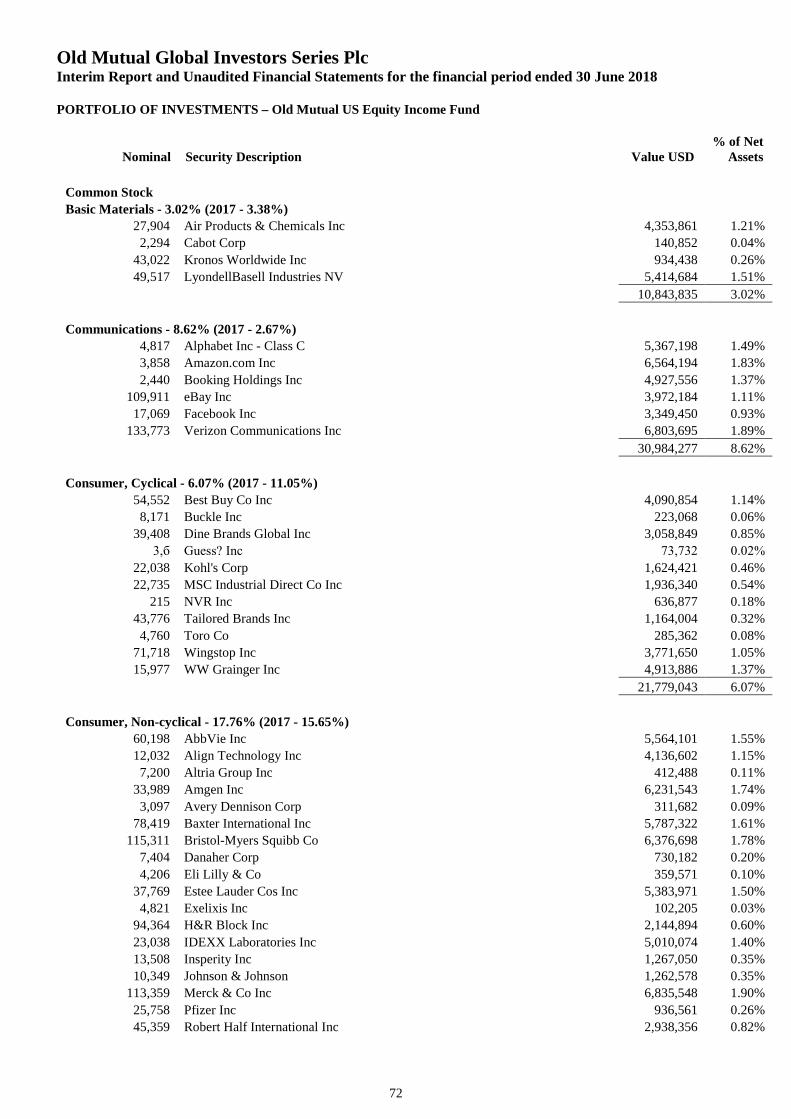
Old Mutual Global Investors Series PlcInterim Report and Unaudited Financial Statements for the financial period ended 30 June 2018
PORTFOLIO OF INVESTMENTS – Old Mutual US Equity Income Fund
Nominal Security Description Value USD% of Net
Assets
72
Common Stock
Basic Materials - 3.02% (2017 - 3.38%)
27,904 Air Products & Chemicals Inc 4,353,861 1.21%
2,294 Cabot Corp 140,852 0.04%
43,022 Kronos Worldwide Inc 934,438 0.26%
49,517 LyondellBasell Industries NV 5,414,684 1.51%
10,843,835 3.02%
Communications - 8.62% (2017 - 2.67%)
4,817 Alphabet Inc - Class C 5,367,198 1.49%
3,858 Amazon.com Inc 6,564,194 1.83%
2,440 Booking Holdings Inc 4,927,556 1.37%
109,911 eBay Inc 3,972,184 1.11%
17,069 Facebook Inc 3,349,450 0.93%
133,773 Verizon Communications Inc 6,803,695 1.89%
30,984,277 8.62%
Consumer, Cyclical - 6.07% (2017 - 11.05%)
54,552 Best Buy Co Inc 4,090,854 1.14%
8,171 Buckle Inc 223,068 0.06%
39,408 Dine Brands Global Inc 3,058,849 0.85%
3,б Guess? Inc 73,732 0.02%
22,038 Kohl's Corp 1,624,421 0.46%
22,735 MSC Industrial Direct Co Inc 1,936,340 0.54%
215 NVR Inc 636,877 0.18%
43,776 Tailored Brands Inc 1,164,004 0.32%
4,760 Toro Co 285,362 0.08%
71,718 Wingstop Inc 3,771,650 1.05%
15,977 WW Grainger Inc 4,913,886 1.37%
21,779,043 6.07%
Consumer, Non-cyclical - 17.76% (2017 - 15.65%)
60,198 AbbVie Inc 5,564,101 1.55%
12,032 Align Technology Inc 4,136,602 1.15%
7,200 Altria Group Inc 412,488 0.11%
33,989 Amgen Inc 6,231,543 1.74%
3,097 Avery Dennison Corp 311,682 0.09%
78,419 Baxter International Inc 5,787,322 1.61%
115,311 Bristol-Myers Squibb Co 6,376,698 1.78%
7,404 Danaher Corp 730,182 0.20%
4,206 Eli Lilly & Co 359,571 0.10%
37,769 Estee Lauder Cos Inc 5,383,971 1.50%
4,821 Exelixis Inc 102,205 0.03%
94,364 H&R Block Inc 2,144,894 0.60%
23,038 IDEXX Laboratories Inc 5,010,074 1.40%
13,508 Insperity Inc 1,267,050 0.35%
10,349 Johnson & Johnson 1,262,578 0.35%
113,359 Merck & Co Inc 6,835,548 1.90%
25,758 Pfizer Inc 936,561 0.26%
45,359 Robert Half International Inc 2,938,356 0.82%
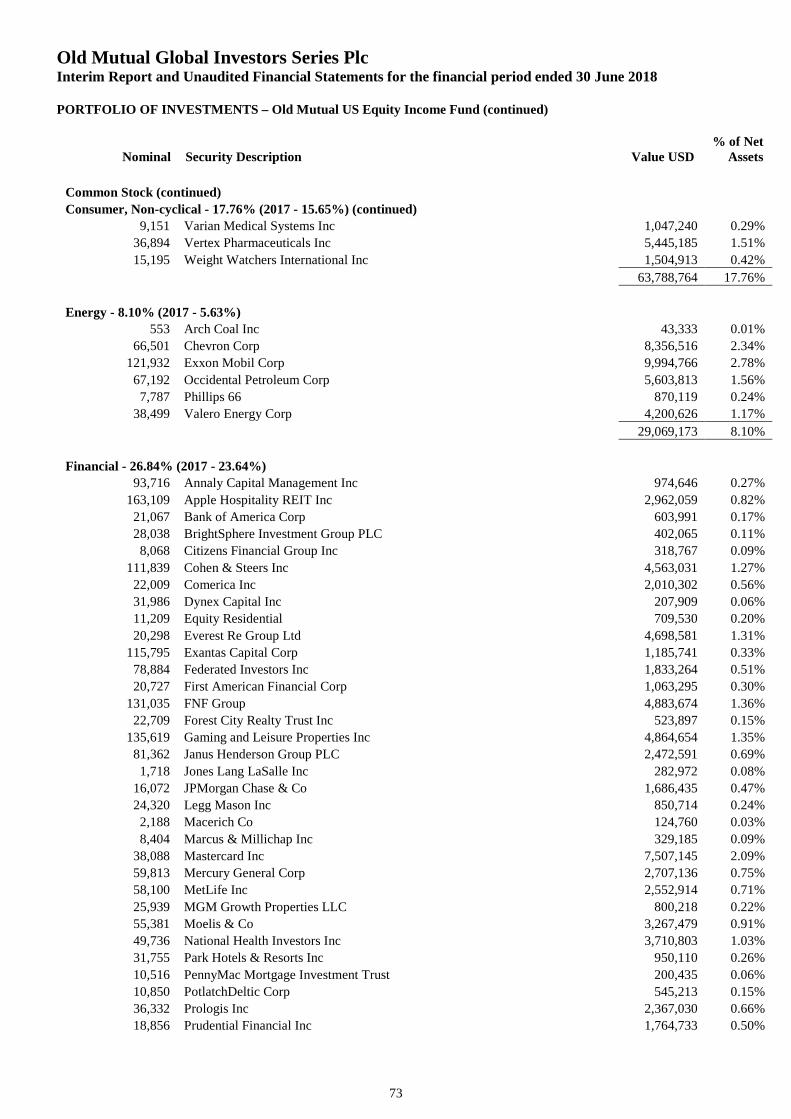
Old Mutual Global Investors Series PlcInterim Report and Unaudited Financial Statements for the financial period ended 30 June 2018
PORTFOLIO OF INVESTMENTS – Old Mutual US Equity Income Fund (continued)
Nominal Security Description Value USD% of Net
Assets
73
Common Stock (continued)
Consumer, Non-cyclical - 17.76% (2017 - 15.65%) (continued)
9,151 Varian Medical Systems Inc 1,047,240 0.29%
36,894 Vertex Pharmaceuticals Inc 5,445,185 1.51%
15,195 Weight Watchers International Inc 1,504,913 0.42%
63,788,764 17.76%
Energy - 8.10% (2017 - 5.63%)
553 Arch Coal Inc 43,333 0.01%
66,501 Chevron Corp 8,356,516 2.34%
121,932 Exxon Mobil Corp 9,994,766 2.78%
67,192 Occidental Petroleum Corp 5,603,813 1.56%
7,787 Phillips 66 870,119 0.24%
38,499 Valero Energy Corp 4,200,626 1.17%
29,069,173 8.10%
Financial - 26.84% (2017 - 23.64%)
93,716 Annaly Capital Management Inc 974,646 0.27%
163,109 Apple Hospitality REIT Inc 2,962,059 0.82%
21,067 Bank of America Corp 603,991 0.17%
28,038 BrightSphere Investment Group PLC 402,065 0.11%
8,068 Citizens Financial Group Inc 318,767 0.09%
111,839 Cohen & Steers Inc 4,563,031 1.27%
22,009 Comerica Inc 2,010,302 0.56%
31,986 Dynex Capital Inc 207,909 0.06%
11,209 Equity Residential 709,530 0.20%
20,298 Everest Re Group Ltd 4,698,581 1.31%
115,795 Exantas Capital Corp 1,185,741 0.33%
78,884 Federated Investors Inc 1,833,264 0.51%
20,727 First American Financial Corp 1,063,295 0.30%
131,035 FNF Group 4,883,674 1.36%
22,709 Forest City Realty Trust Inc 523,897 0.15%
135,619 Gaming and Leisure Properties Inc 4,864,654 1.35%
81,362 Janus Henderson Group PLC 2,472,591 0.69%
1,718 Jones Lang LaSalle Inc 282,972 0.08%
16,072 JPMorgan Chase & Co 1,686,435 0.47%
24,320 Legg Mason Inc 850,714 0.24%
2,188 Macerich Co 124,760 0.03%
8,404 Marcus & Millichap Inc 329,185 0.09%
38,088 Mastercard Inc 7,507,145 2.09%
59,813 Mercury General Corp 2,707,136 0.75%
58,100 MetLife Inc 2,552,914 0.71%
25,939 MGM Growth Properties LLC 800,218 0.22%
55,381 Moelis & Co 3,267,479 0.91%
49,736 National Health Investors Inc 3,710,803 1.03%
31,755 Park Hotels & Resorts Inc 950,110 0.26%
10,516 PennyMac Mortgage Investment Trust 200,435 0.06%
10,850 PotlatchDeltic Corp 545,213 0.15%
36,332 Prologis Inc 2,367,030 0.66%
18,856 Prudential Financial Inc 1,764,733 0.50%
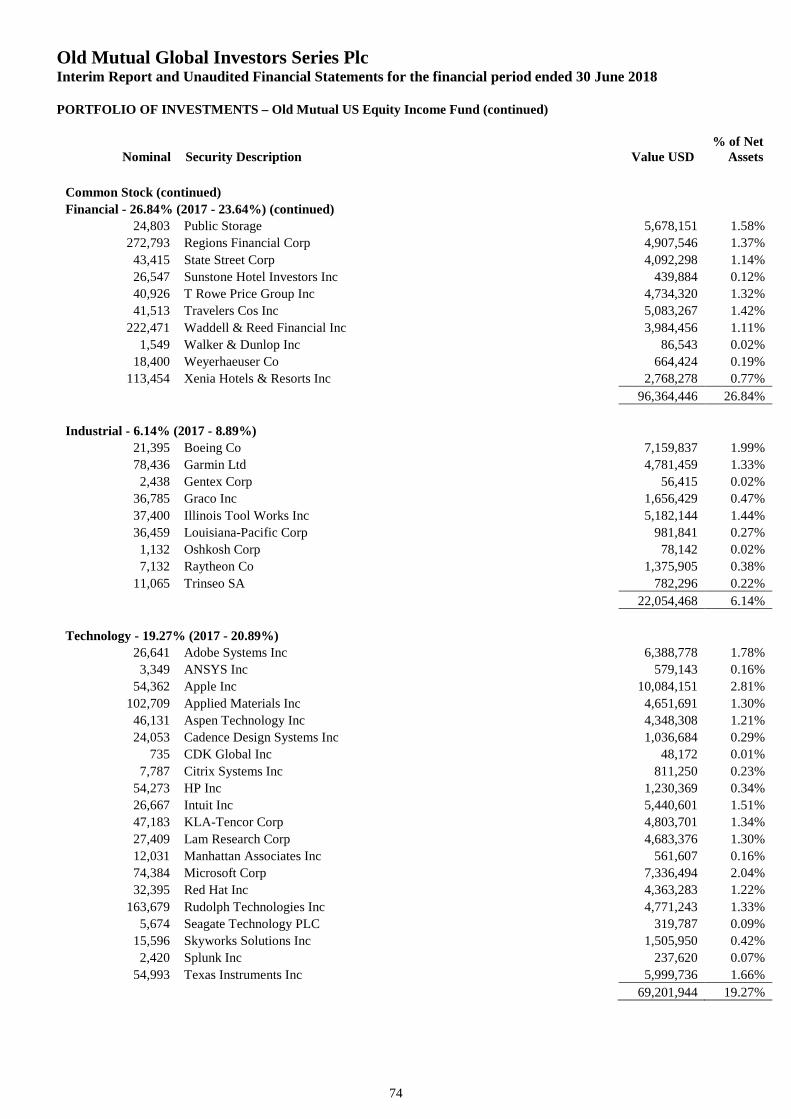
Old Mutual Global Investors Series PlcInterim Report and Unaudited Financial Statements for the financial period ended 30 June 2018
PORTFOLIO OF INVESTMENTS – Old Mutual US Equity Income Fund (continued)
Nominal Security Description Value USD% of Net
Assets
74
Common Stock (continued)
Financial - 26.84% (2017 - 23.64%) (continued)
24,803 Public Storage 5,678,151 1.58%
272,793 Regions Financial Corp 4,907,546 1.37%
43,415 State Street Corp 4,092,298 1.14%
26,547 Sunstone Hotel Investors Inc 439,884 0.12%
40,926 T Rowe Price Group Inc 4,734,320 1.32%
41,513 Travelers Cos Inc 5,083,267 1.42%
222,471 Waddell & Reed Financial Inc 3,984,456 1.11%
1,549 Walker & Dunlop Inc 86,543 0.02%
18,400 Weyerhaeuser Co 664,424 0.19%
113,454 Xenia Hotels & Resorts Inc 2,768,278 0.77%
96,364,446 26.84%
Industrial - 6.14% (2017 - 8.89%)
21,395 Boeing Co 7,159,837 1.99%
78,436 Garmin Ltd 4,781,459 1.33%
2,438 Gentex Corp 56,415 0.02%
36,785 Graco Inc 1,656,429 0.47%
37,400 Illinois Tool Works Inc 5,182,144 1.44%
36,459 Louisiana-Pacific Corp 981,841 0.27%
1,132 Oshkosh Corp 78,142 0.02%
7,132 Raytheon Co 1,375,905 0.38%
11,065 Trinseo SA 782,296 0.22%
22,054,468 6.14%
Technology - 19.27% (2017 - 20.89%)
26,641 Adobe Systems Inc 6,388,778 1.78%
3,349 ANSYS Inc 579,143 0.16%
54,362 Apple Inc 10,084,151 2.81%
102,709 Applied Materials Inc 4,651,691 1.30%
46,131 Aspen Technology Inc 4,348,308 1.21%
24,053 Cadence Design Systems Inc 1,036,684 0.29%
735 CDK Global Inc 48,172 0.01%
7,787 Citrix Systems Inc 811,250 0.23%
54,273 HP Inc 1,230,369 0.34%
26,667 Intuit Inc 5,440,601 1.51%
47,183 KLA-Tencor Corp 4,803,701 1.34%
27,409 Lam Research Corp 4,683,376 1.30%
12,031 Manhattan Associates Inc 561,607 0.16%
74,384 Microsoft Corp 7,336,494 2.04%
32,395 Red Hat Inc 4,363,283 1.22%
163,679 Rudolph Technologies Inc 4,771,243 1.33%
5,674 Seagate Technology PLC 319,787 0.09%
15,596 Skyworks Solutions Inc 1,505,950 0.42%
2,420 Splunk Inc 237,620 0.07%
54,993 Texas Instruments Inc 5,999,736 1.66%
69,201,944 19.27%
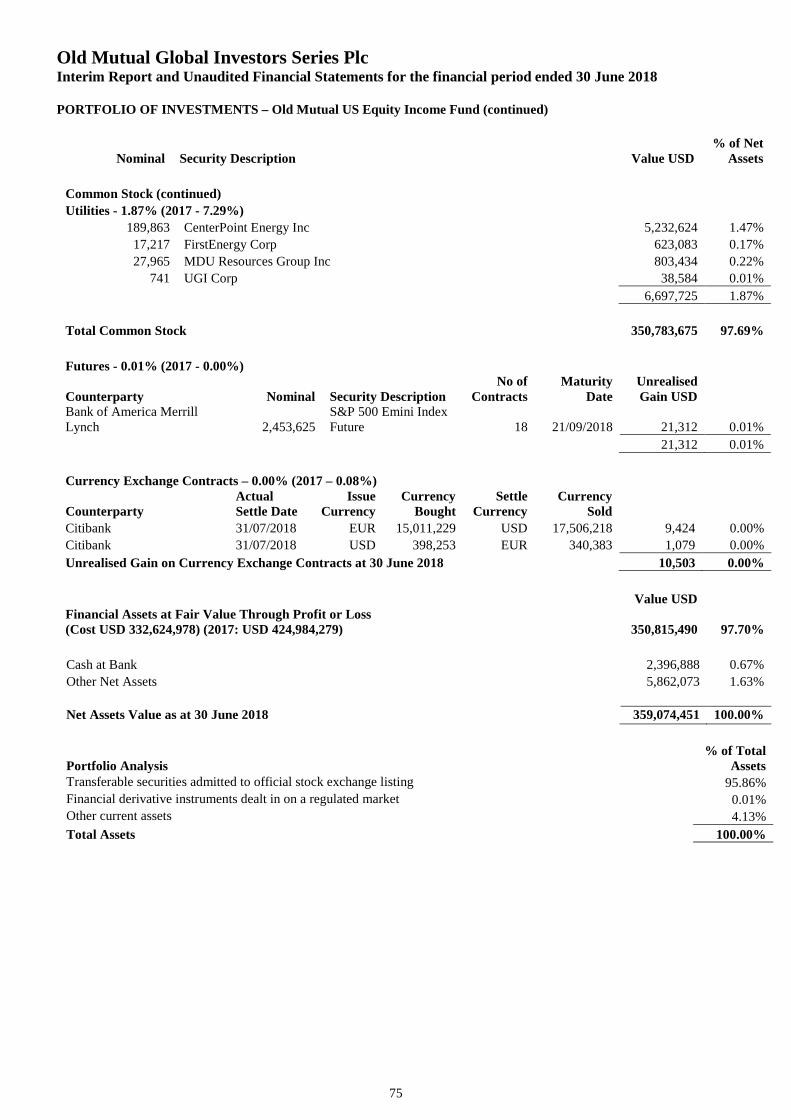
Old Mutual Global Investors Series PlcInterim Report and Unaudited Financial Statements for the financial period ended 30 June 2018
PORTFOLIO OF INVESTMENTS – Old Mutual US Equity Income Fund (continued)
Nominal Security Description Value USD% of Net
Assets
75
Common Stock (continued)
Utilities - 1.87% (2017 - 7.29%)
189,863 CenterPoint Energy Inc 5,232,624 1.47%
17,217 FirstEnergy Corp 623,083 0.17%
27,965 MDU Resources Group Inc 803,434 0.22%
741 UGI Corp 38,584 0.01%
6,697,725 1.87%
Total Common Stock 350,783,675 97.69%
Futures - 0.01% (2017 - 0.00%)
Counterparty Nominal Security DescriptionNo of
ContractsMaturity
DateUnrealisedGain USD
Bank of America MerrillLynch 2,453,625
S&P 500 Emini IndexFuture 18 21/09/2018 21,312 0.01%
21,312 0.01%
Currency Exchange Contracts – 0.00% (2017 – 0.08%)
CounterpartyActualSettle Date
IssueCurrency
CurrencyBought
SettleCurrency
CurrencySold
Citibank 31/07/2018 EUR 15,011,229 USD 17,506,218 9,424 0.00%
Citibank 31/07/2018 USD 398,253 EUR 340,383 1,079 0.00%
Unrealised Gain on Currency Exchange Contracts at 30 June 2018 10,503 0.00%
Value USDFinancial Assets at Fair Value Through Profit or Loss(Cost USD 332,624,978) (2017: USD 424,984,279) 350,815,490 97.70%
Cash at Bank 2,396,888 0.67%
Other Net Assets 5,862,073 1.63%
Net Assets Value as at 30 June 2018 359,074,451 100.00%
Portfolio Analysis% of Total
AssetsTransferable securities admitted to official stock exchange listing 95.86%Financial derivative instruments dealt in on a regulated market 0.01%Other current assets 4.13%
Total Assets 100.00%
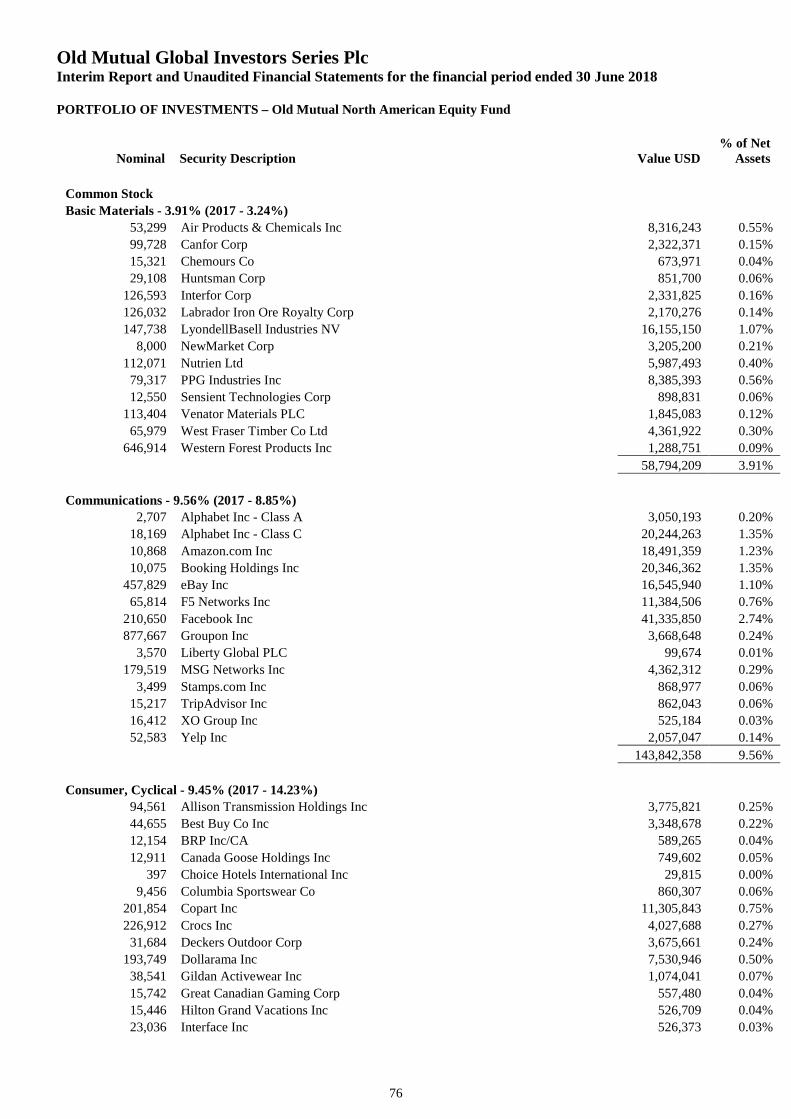
Old Mutual Global Investors Series PlcInterim Report and Unaudited Financial Statements for the financial period ended 30 June 2018
PORTFOLIO OF INVESTMENTS – Old Mutual North American Equity Fund
Nominal Security Description Value USD% of Net
Assets
76
Common Stock
Basic Materials - 3.91% (2017 - 3.24%)
53,299 Air Products & Chemicals Inc 8,316,243 0.55%
99,728 Canfor Corp 2,322,371 0.15%
15,321 Chemours Co 673,971 0.04%
29,108 Huntsman Corp 851,700 0.06%
126,593 Interfor Corp 2,331,825 0.16%
126,032 Labrador Iron Ore Royalty Corp 2,170,276 0.14%
147,738 LyondellBasell Industries NV 16,155,150 1.07%
8,000 NewMarket Corp 3,205,200 0.21%
112,071 Nutrien Ltd 5,987,493 0.40%
79,317 PPG Industries Inc 8,385,393 0.56%
12,550 Sensient Technologies Corp 898,831 0.06%
113,404 Venator Materials PLC 1,845,083 0.12%
65,979 West Fraser Timber Co Ltd 4,361,922 0.30%
646,914 Western Forest Products Inc 1,288,751 0.09%
58,794,209 3.91%
Communications - 9.56% (2017 - 8.85%)
2,707 Alphabet Inc - Class A 3,050,193 0.20%
18,169 Alphabet Inc - Class C 20,244,263 1.35%
10,868 Amazon.com Inc 18,491,359 1.23%
10,075 Booking Holdings Inc 20,346,362 1.35%
457,829 eBay Inc 16,545,940 1.10%
65,814 F5 Networks Inc 11,384,506 0.76%
210,650 Facebook Inc 41,335,850 2.74%
877,667 Groupon Inc 3,668,648 0.24%
3,570 Liberty Global PLC 99,674 0.01%
179,519 MSG Networks Inc 4,362,312 0.29%
3,499 Stamps.com Inc 868,977 0.06%
15,217 TripAdvisor Inc 862,043 0.06%
16,412 XO Group Inc 525,184 0.03%
52,583 Yelp Inc 2,057,047 0.14%
143,842,358 9.56%
Consumer, Cyclical - 9.45% (2017 - 14.23%)
94,561 Allison Transmission Holdings Inc 3,775,821 0.25%
44,655 Best Buy Co Inc 3,348,678 0.22%
12,154 BRP Inc/CA 589,265 0.04%
12,911 Canada Goose Holdings Inc 749,602 0.05%
397 Choice Hotels International Inc 29,815 0.00%
9,456 Columbia Sportswear Co 860,307 0.06%
201,854 Copart Inc 11,305,843 0.75%
226,912 Crocs Inc 4,027,688 0.27%
31,684 Deckers Outdoor Corp 3,675,661 0.24%
193,749 Dollarama Inc 7,530,946 0.50%
38,541 Gildan Activewear Inc 1,074,041 0.07%
15,742 Great Canadian Gaming Corp 557,480 0.04%
15,446 Hilton Grand Vacations Inc 526,709 0.04%
23,036 Interface Inc 526,373 0.03%
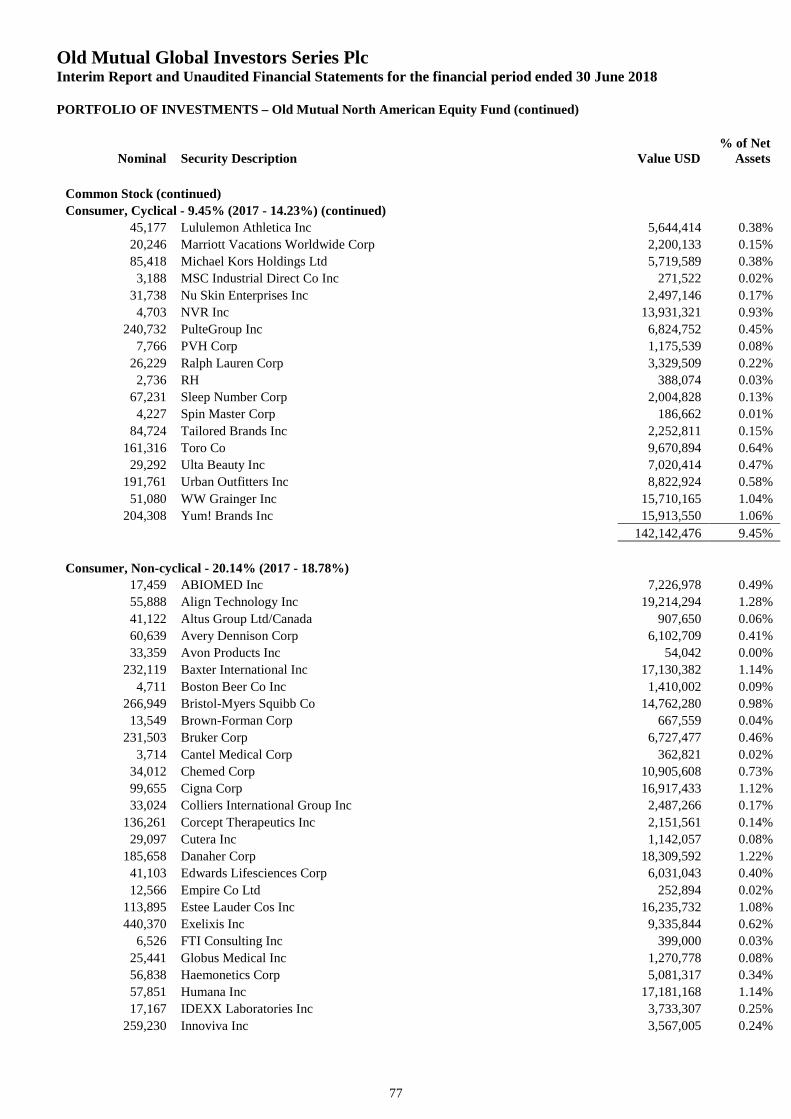
Old Mutual Global Investors Series PlcInterim Report and Unaudited Financial Statements for the financial period ended 30 June 2018
PORTFOLIO OF INVESTMENTS – Old Mutual North American Equity Fund (continued)
Nominal Security Description Value USD% of Net
Assets
77
Common Stock (continued)
Consumer, Cyclical - 9.45% (2017 - 14.23%) (continued)
45,177 Lululemon Athletica Inc 5,644,414 0.38%
20,246 Marriott Vacations Worldwide Corp 2,200,133 0.15%
85,418 Michael Kors Holdings Ltd 5,719,589 0.38%
3,188 MSC Industrial Direct Co Inc 271,522 0.02%
31,738 Nu Skin Enterprises Inc 2,497,146 0.17%
4,703 NVR Inc 13,931,321 0.93%
240,732 PulteGroup Inc 6,824,752 0.45%
7,766 PVH Corp 1,175,539 0.08%
26,229 Ralph Lauren Corp 3,329,509 0.22%
2,736 RH 388,074 0.03%
67,231 Sleep Number Corp 2,004,828 0.13%
4,227 Spin Master Corp 186,662 0.01%
84,724 Tailored Brands Inc 2,252,811 0.15%
161,316 Toro Co 9,670,894 0.64%
29,292 Ulta Beauty Inc 7,020,414 0.47%
191,761 Urban Outfitters Inc 8,822,924 0.58%
51,080 WW Grainger Inc 15,710,165 1.04%
204,308 Yum! Brands Inc 15,913,550 1.06%
142,142,476 9.45%
Consumer, Non-cyclical - 20.14% (2017 - 18.78%)
17,459 ABIOMED Inc 7,226,978 0.49%
55,888 Align Technology Inc 19,214,294 1.28%
41,122 Altus Group Ltd/Canada 907,650 0.06%
60,639 Avery Dennison Corp 6,102,709 0.41%
33,359 Avon Products Inc 54,042 0.00%
232,119 Baxter International Inc 17,130,382 1.14%
4,711 Boston Beer Co Inc 1,410,002 0.09%
266,949 Bristol-Myers Squibb Co 14,762,280 0.98%
13,549 Brown-Forman Corp 667,559 0.04%
231,503 Bruker Corp 6,727,477 0.46%
3,714 Cantel Medical Corp 362,821 0.02%
34,012 Chemed Corp 10,905,608 0.73%
99,655 Cigna Corp 16,917,433 1.12%
33,024 Colliers International Group Inc 2,487,266 0.17%
136,261 Corcept Therapeutics Inc 2,151,561 0.14%
29,097 Cutera Inc 1,142,057 0.08%
185,658 Danaher Corp 18,309,592 1.22%
41,103 Edwards Lifesciences Corp 6,031,043 0.40%
12,566 Empire Co Ltd 252,894 0.02%
113,895 Estee Lauder Cos Inc 16,235,732 1.08%
440,370 Exelixis Inc 9,335,844 0.62%
6,526 FTI Consulting Inc 399,000 0.03%
25,441 Globus Medical Inc 1,270,778 0.08%
56,838 Haemonetics Corp 5,081,317 0.34%
57,851 Humana Inc 17,181,168 1.14%
17,167 IDEXX Laboratories Inc 3,733,307 0.25%
259,230 Innoviva Inc 3,567,005 0.24%
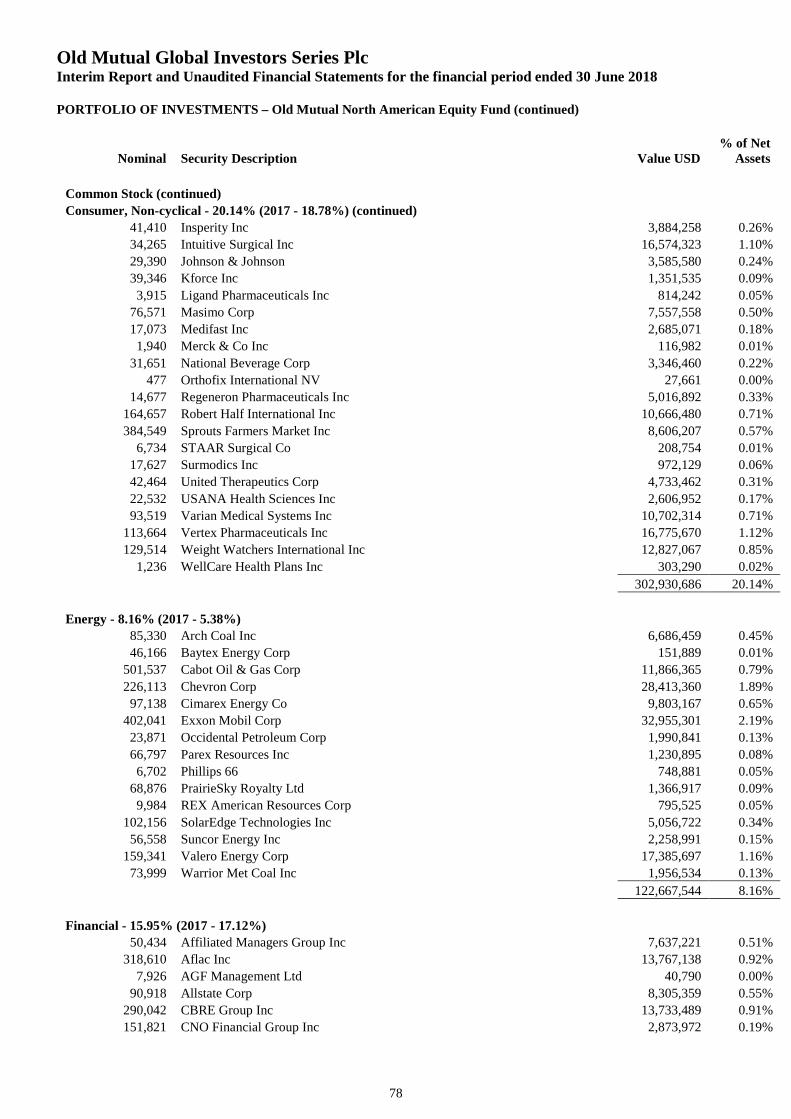
Old Mutual Global Investors Series PlcInterim Report and Unaudited Financial Statements for the financial period ended 30 June 2018
PORTFOLIO OF INVESTMENTS – Old Mutual North American Equity Fund (continued)
Nominal Security Description Value USD% of Net
Assets
78
Common Stock (continued)
Consumer, Non-cyclical - 20.14% (2017 - 18.78%) (continued)
41,410 Insperity Inc 3,884,258 0.26%
34,265 Intuitive Surgical Inc 16,574,323 1.10%
29,390 Johnson & Johnson 3,585,580 0.24%
39,346 Kforce Inc 1,351,535 0.09%
3,915 Ligand Pharmaceuticals Inc 814,242 0.05%
76,571 Masimo Corp 7,557,558 0.50%
17,073 Medifast Inc 2,685,071 0.18%
1,940 Merck & Co Inc 116,982 0.01%
31,651 National Beverage Corp 3,346,460 0.22%
477 Orthofix International NV 27,661 0.00%
14,677 Regeneron Pharmaceuticals Inc 5,016,892 0.33%
164,657 Robert Half International Inc 10,666,480 0.71%
384,549 Sprouts Farmers Market Inc 8,606,207 0.57%
6,734 STAAR Surgical Co 208,754 0.01%
17,627 Surmodics Inc 972,129 0.06%
42,464 United Therapeutics Corp 4,733,462 0.31%
22,532 USANA Health Sciences Inc 2,606,952 0.17%
93,519 Varian Medical Systems Inc 10,702,314 0.71%
113,664 Vertex Pharmaceuticals Inc 16,775,670 1.12%
129,514 Weight Watchers International Inc 12,827,067 0.85%
1,236 WellCare Health Plans Inc 303,290 0.02%
302,930,686 20.14%
Energy - 8.16% (2017 - 5.38%)
85,330 Arch Coal Inc 6,686,459 0.45%
46,166 Baytex Energy Corp 151,889 0.01%
501,537 Cabot Oil & Gas Corp 11,866,365 0.79%
226,113 Chevron Corp 28,413,360 1.89%
97,138 Cimarex Energy Co 9,803,167 0.65%
402,041 Exxon Mobil Corp 32,955,301 2.19%
23,871 Occidental Petroleum Corp 1,990,841 0.13%
66,797 Parex Resources Inc 1,230,895 0.08%
6,702 Phillips 66 748,881 0.05%
68,876 PrairieSky Royalty Ltd 1,366,917 0.09%
9,984 REX American Resources Corp 795,525 0.05%
102,156 SolarEdge Technologies Inc 5,056,722 0.34%
56,558 Suncor Energy Inc 2,258,991 0.15%
159,341 Valero Energy Corp 17,385,697 1.16%
73,999 Warrior Met Coal Inc 1,956,534 0.13%
122,667,544 8.16%
Financial - 15.95% (2017 - 17.12%)
50,434 Affiliated Managers Group Inc 7,637,221 0.51%
318,610 Aflac Inc 13,767,138 0.92%
7,926 AGF Management Ltd 40,790 0.00%
90,918 Allstate Corp 8,305,359 0.55%
290,042 CBRE Group Inc 13,733,489 0.91%
151,821 CNO Financial Group Inc 2,873,972 0.19%
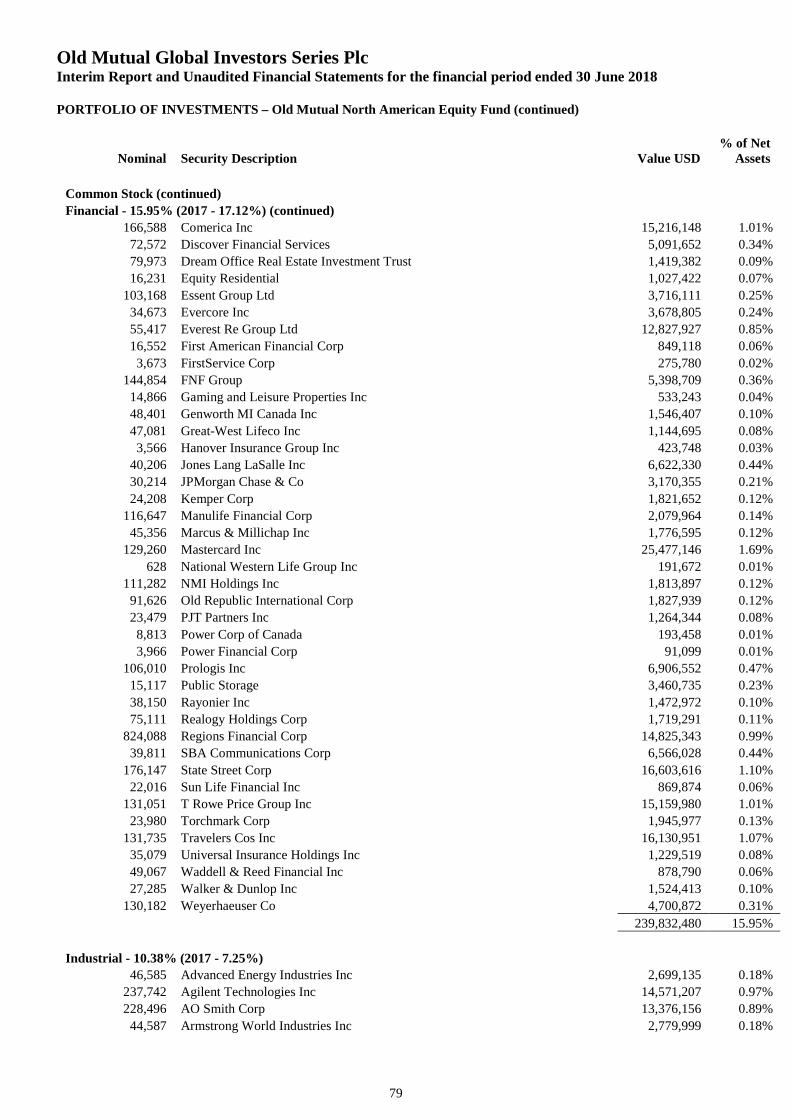
Old Mutual Global Investors Series PlcInterim Report and Unaudited Financial Statements for the financial period ended 30 June 2018
PORTFOLIO OF INVESTMENTS – Old Mutual North American Equity Fund (continued)
Nominal Security Description Value USD% of Net
Assets
79
Common Stock (continued)
Financial - 15.95% (2017 - 17.12%) (continued)
166,588 Comerica Inc 15,216,148 1.01%
72,572 Discover Financial Services 5,091,652 0.34%
79,973 Dream Office Real Estate Investment Trust 1,419,382 0.09%
16,231 Equity Residential 1,027,422 0.07%
103,168 Essent Group Ltd 3,716,111 0.25%
34,673 Evercore Inc 3,678,805 0.24%
55,417 Everest Re Group Ltd 12,827,927 0.85%
16,552 First American Financial Corp 849,118 0.06%
3,673 FirstService Corp 275,780 0.02%
144,854 FNF Group 5,398,709 0.36%
14,866 Gaming and Leisure Properties Inc 533,243 0.04%
48,401 Genworth MI Canada Inc 1,546,407 0.10%
47,081 Great-West Lifeco Inc 1,144,695 0.08%
3,566 Hanover Insurance Group Inc 423,748 0.03%
40,206 Jones Lang LaSalle Inc 6,622,330 0.44%
30,214 JPMorgan Chase & Co 3,170,355 0.21%
24,208 Kemper Corp 1,821,652 0.12%
116,647 Manulife Financial Corp 2,079,964 0.14%
45,356 Marcus & Millichap Inc 1,776,595 0.12%
129,260 Mastercard Inc 25,477,146 1.69%
628 National Western Life Group Inc 191,672 0.01%
111,282 NMI Holdings Inc 1,813,897 0.12%
91,626 Old Republic International Corp 1,827,939 0.12%
23,479 PJT Partners Inc 1,264,344 0.08%
8,813 Power Corp of Canada 193,458 0.01%
3,966 Power Financial Corp 91,099 0.01%
106,010 Prologis Inc 6,906,552 0.47%
15,117 Public Storage 3,460,735 0.23%
38,150 Rayonier Inc 1,472,972 0.10%
75,111 Realogy Holdings Corp 1,719,291 0.11%
824,088 Regions Financial Corp 14,825,343 0.99%
39,811 SBA Communications Corp 6,566,028 0.44%
176,147 State Street Corp 16,603,616 1.10%
22,016 Sun Life Financial Inc 869,874 0.06%
131,051 T Rowe Price Group Inc 15,159,980 1.01%
23,980 Torchmark Corp 1,945,977 0.13%
131,735 Travelers Cos Inc 16,130,951 1.07%
35,079 Universal Insurance Holdings Inc 1,229,519 0.08%
49,067 Waddell & Reed Financial Inc 878,790 0.06%
27,285 Walker & Dunlop Inc 1,524,413 0.10%
130,182 Weyerhaeuser Co 4,700,872 0.31%
239,832,480 15.95%
Industrial - 10.38% (2017 - 7.25%)
46,585 Advanced Energy Industries Inc 2,699,135 0.18%
237,742 Agilent Technologies Inc 14,571,207 0.97%
228,496 AO Smith Corp 13,376,156 0.89%
44,587 Armstrong World Industries Inc 2,779,999 0.18%
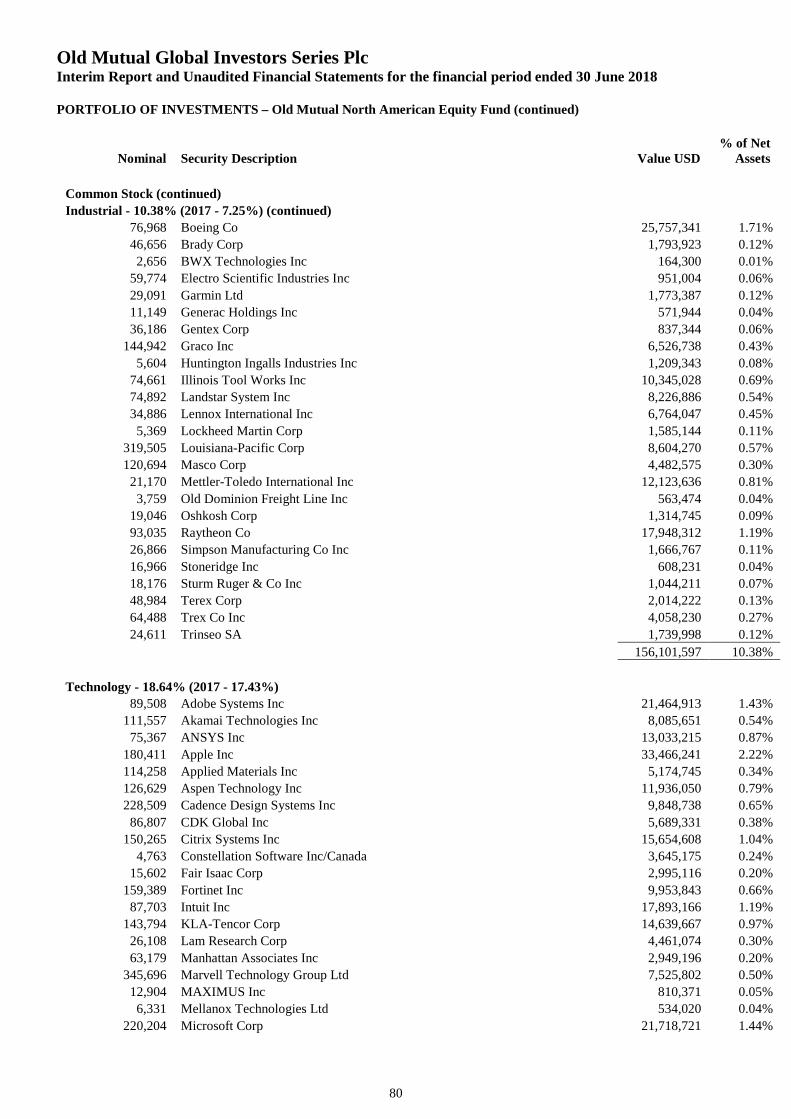
Old Mutual Global Investors Series PlcInterim Report and Unaudited Financial Statements for the financial period ended 30 June 2018
PORTFOLIO OF INVESTMENTS – Old Mutual North American Equity Fund (continued)
Nominal Security Description Value USD% of Net
Assets
80
Common Stock (continued)
Industrial - 10.38% (2017 - 7.25%) (continued)
76,968 Boeing Co 25,757,341 1.71%
46,656 Brady Corp 1,793,923 0.12%
2,656 BWX Technologies Inc 164,300 0.01%
59,774 Electro Scientific Industries Inc 951,004 0.06%
29,091 Garmin Ltd 1,773,387 0.12%
11,149 Generac Holdings Inc 571,944 0.04%
36,186 Gentex Corp 837,344 0.06%
144,942 Graco Inc 6,526,738 0.43%
5,604 Huntington Ingalls Industries Inc 1,209,343 0.08%
74,661 Illinois Tool Works Inc 10,345,028 0.69%
74,892 Landstar System Inc 8,226,886 0.54%
34,886 Lennox International Inc 6,764,047 0.45%
5,369 Lockheed Martin Corp 1,585,144 0.11%
319,505 Louisiana-Pacific Corp 8,604,270 0.57%
120,694 Masco Corp 4,482,575 0.30%
21,170 Mettler-Toledo International Inc 12,123,636 0.81%
3,759 Old Dominion Freight Line Inc 563,474 0.04%
19,046 Oshkosh Corp 1,314,745 0.09%
93,035 Raytheon Co 17,948,312 1.19%
26,866 Simpson Manufacturing Co Inc 1,666,767 0.11%
16,966 Stoneridge Inc 608,231 0.04%
18,176 Sturm Ruger & Co Inc 1,044,211 0.07%
48,984 Terex Corp 2,014,222 0.13%
64,488 Trex Co Inc 4,058,230 0.27%
24,611 Trinseo SA 1,739,998 0.12%
156,101,597 10.38%
Technology - 18.64% (2017 - 17.43%)
89,508 Adobe Systems Inc 21,464,913 1.43%
111,557 Akamai Technologies Inc 8,085,651 0.54%
75,367 ANSYS Inc 13,033,215 0.87%
180,411 Apple Inc 33,466,241 2.22%
114,258 Applied Materials Inc 5,174,745 0.34%
126,629 Aspen Technology Inc 11,936,050 0.79%
228,509 Cadence Design Systems Inc 9,848,738 0.65%
86,807 CDK Global Inc 5,689,331 0.38%
150,265 Citrix Systems Inc 15,654,608 1.04%
4,763 Constellation Software Inc/Canada 3,645,175 0.24%
15,602 Fair Isaac Corp 2,995,116 0.20%
159,389 Fortinet Inc 9,953,843 0.66%
87,703 Intuit Inc 17,893,166 1.19%
143,794 KLA-Tencor Corp 14,639,667 0.97%
26,108 Lam Research Corp 4,461,074 0.30%
63,179 Manhattan Associates Inc 2,949,196 0.20%
345,696 Marvell Technology Group Ltd 7,525,802 0.50%
12,904 MAXIMUS Inc 810,371 0.05%
6,331 Mellanox Technologies Ltd 534,020 0.04%
220,204 Microsoft Corp 21,718,721 1.44%
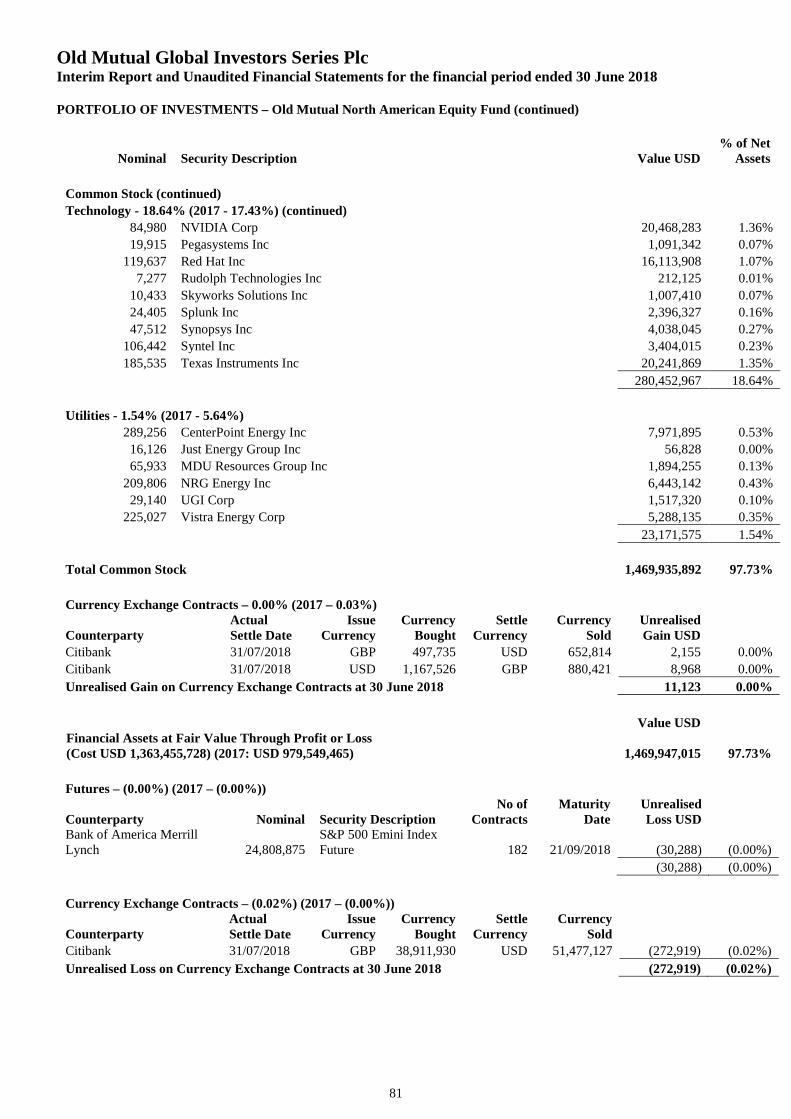
Old Mutual Global Investors Series PlcInterim Report and Unaudited Financial Statements for the financial period ended 30 June 2018
PORTFOLIO OF INVESTMENTS – Old Mutual North American Equity Fund (continued)
Nominal Security Description Value USD% of Net
Assets
81
Common Stock (continued)
Technology - 18.64% (2017 - 17.43%) (continued)
84,980 NVIDIA Corp 20,468,283 1.36%
19,915 Pegasystems Inc 1,091,342 0.07%
119,637 Red Hat Inc 16,113,908 1.07%
7,277 Rudolph Technologies Inc 212,125 0.01%
10,433 Skyworks Solutions Inc 1,007,410 0.07%
24,405 Splunk Inc 2,396,327 0.16%
47,512 Synopsys Inc 4,038,045 0.27%
106,442 Syntel Inc 3,404,015 0.23%
185,535 Texas Instruments Inc 20,241,869 1.35%
280,452,967 18.64%
Utilities - 1.54% (2017 - 5.64%)
289,256 CenterPoint Energy Inc 7,971,895 0.53%
16,126 Just Energy Group Inc 56,828 0.00%
65,933 MDU Resources Group Inc 1,894,255 0.13%
209,806 NRG Energy Inc 6,443,142 0.43%
29,140 UGI Corp 1,517,320 0.10%
225,027 Vistra Energy Corp 5,288,135 0.35%
23,171,575 1.54%
Total Common Stock 1,469,935,892 97.73%
Currency Exchange Contracts – 0.00% (2017 – 0.03%)
CounterpartyActualSettle Date
IssueCurrency
CurrencyBought
SettleCurrency
CurrencySold
UnrealisedGain USD
Citibank 31/07/2018 GBP 497,735 USD 652,814 2,155 0.00%
Citibank 31/07/2018 USD 1,167,526 GBP 880,421 8,968 0.00%
Unrealised Gain on Currency Exchange Contracts at 30 June 2018 11,123 0.00%
Value USDFinancial Assets at Fair Value Through Profit or Loss(Cost USD 1,363,455,728) (2017: USD 979,549,465) 1,469,947,015 97.73%
Futures – (0.00%) (2017 – (0.00%))
Counterparty Nominal Security DescriptionNo of
ContractsMaturity
DateUnrealisedLoss USD
Bank of America MerrillLynch 24,808,875
S&P 500 Emini IndexFuture 182 21/09/2018 (30,288) (0.00%)
(30,288) (0.00%)
Currency Exchange Contracts – (0.02%) (2017 – (0.00%))
CounterpartyActualSettle Date
IssueCurrency
CurrencyBought
SettleCurrency
CurrencySold
Citibank 31/07/2018 GBP 38,911,930 USD 51,477,127 (272,919) (0.02%)
Unrealised Loss on Currency Exchange Contracts at 30 June 2018 (272,919) (0.02%)
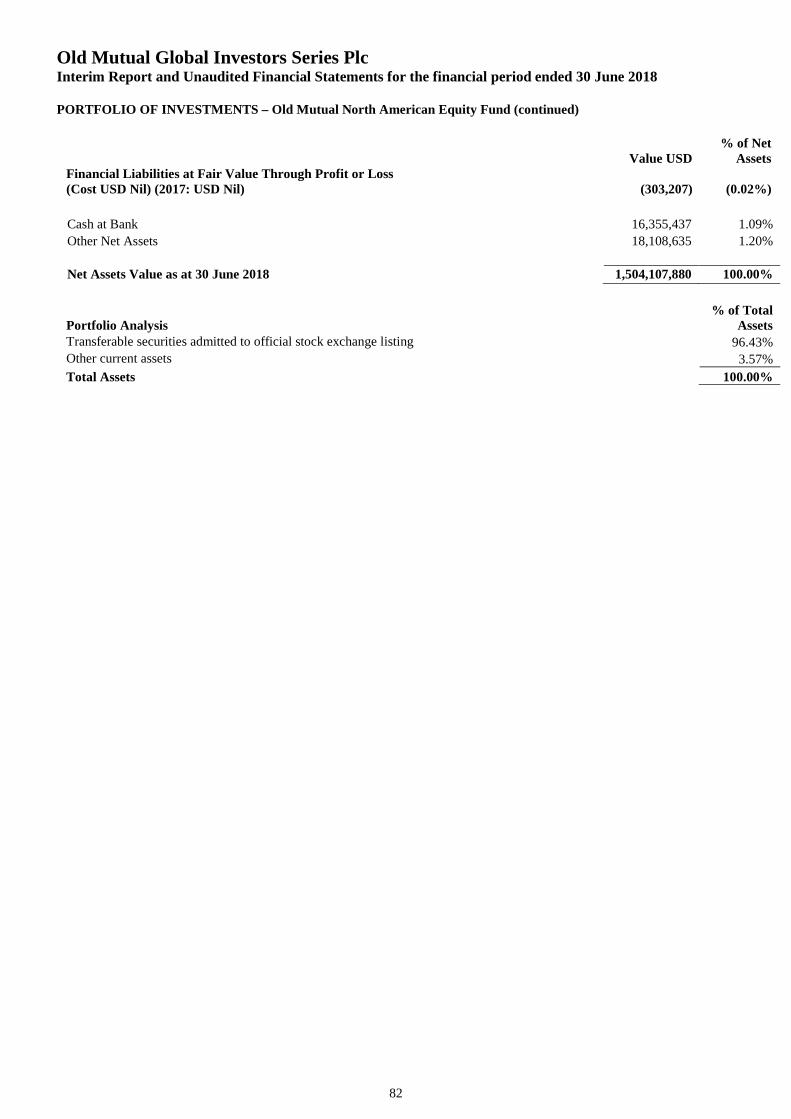
Old Mutual Global Investors Series PlcInterim Report and Unaudited Financial Statements for the financial period ended 30 June 2018
PORTFOLIO OF INVESTMENTS – Old Mutual North American Equity Fund (continued)
82
Value USD% of Net
AssetsFinancial Liabilities at Fair Value Through Profit or Loss(Cost USD Nil) (2017: USD Nil) (303,207) (0.02%)
Cash at Bank 16,355,437 1.09%
Other Net Assets 18,108,635 1.20%
Net Assets Value as at 30 June 2018 1,504,107,880 100.00%
Portfolio Analysis% of Total
AssetsTransferable securities admitted to official stock exchange listing 96.43%Other current assets 3.57%
Total Assets 100.00%
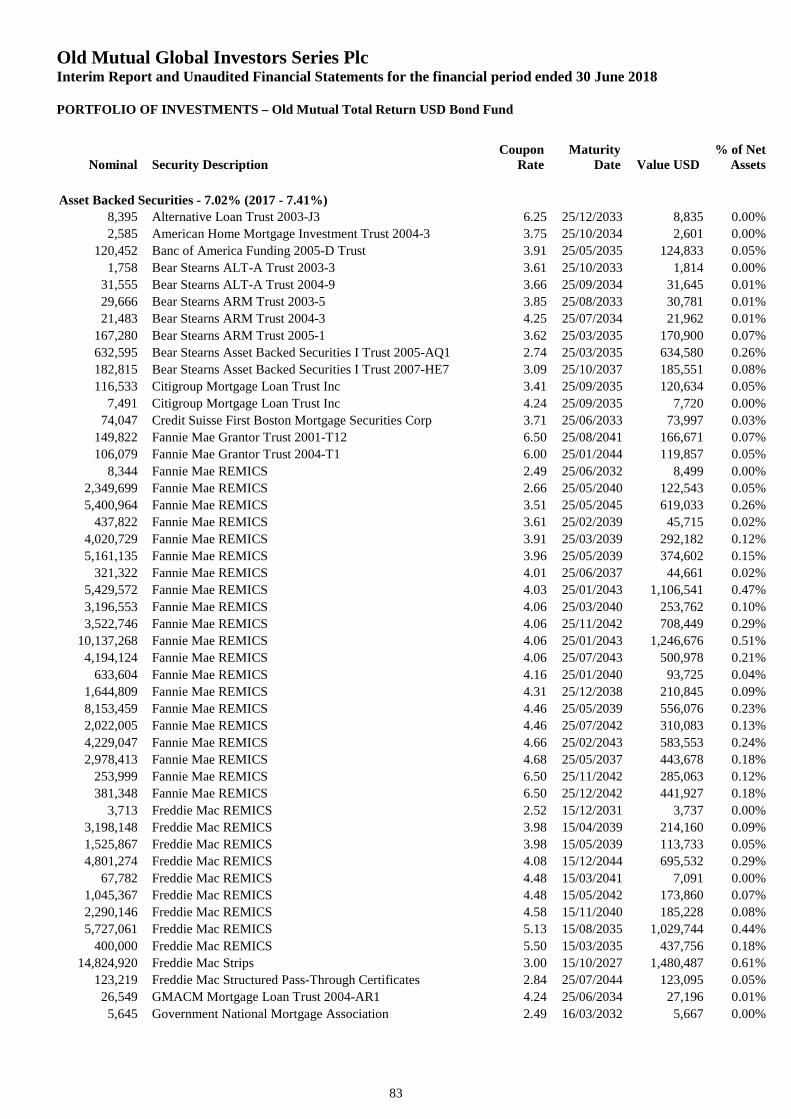
Old Mutual Global Investors Series PlcInterim Report and Unaudited Financial Statements for the financial period ended 30 June 2018
PORTFOLIO OF INVESTMENTS – Old Mutual Total Return USD Bond Fund
Nominal Security DescriptionCoupon
RateMaturity
Date Value USD% of Net
Assets
83
Asset Backed Securities - 7.02% (2017 - 7.41%)
8,395 Alternative Loan Trust 2003-J3 6.25 25/12/2033 8,835 0.00%
2,585 American Home Mortgage Investment Trust 2004-3 3.75 25/10/2034 2,601 0.00%
120,452 Banc of America Funding 2005-D Trust 3.91 25/05/2035 124,833 0.05%
1,758 Bear Stearns ALT-A Trust 2003-3 3.61 25/10/2033 1,814 0.00%
31,555 Bear Stearns ALT-A Trust 2004-9 3.66 25/09/2034 31,645 0.01%
29,666 Bear Stearns ARM Trust 2003-5 3.85 25/08/2033 30,781 0.01%
21,483 Bear Stearns ARM Trust 2004-3 4.25 25/07/2034 21,962 0.01%
167,280 Bear Stearns ARM Trust 2005-1 3.62 25/03/2035 170,900 0.07%
632,595 Bear Stearns Asset Backed Securities I Trust 2005-AQ1 2.74 25/03/2035 634,580 0.26%
182,815 Bear Stearns Asset Backed Securities I Trust 2007-HE7 3.09 25/10/2037 185,551 0.08%
116,533 Citigroup Mortgage Loan Trust Inc 3.41 25/09/2035 120,634 0.05%
7,491 Citigroup Mortgage Loan Trust Inc 4.24 25/09/2035 7,720 0.00%
74,047 Credit Suisse First Boston Mortgage Securities Corp 3.71 25/06/2033 73,997 0.03%
149,822 Fannie Mae Grantor Trust 2001-T12 6.50 25/08/2041 166,671 0.07%
106,079 Fannie Mae Grantor Trust 2004-T1 6.00 25/01/2044 119,857 0.05%
8,344 Fannie Mae REMICS 2.49 25/06/2032 8,499 0.00%
2,349,699 Fannie Mae REMICS 2.66 25/05/2040 122,543 0.05%
5,400,964 Fannie Mae REMICS 3.51 25/05/2045 619,033 0.26%
437,822 Fannie Mae REMICS 3.61 25/02/2039 45,715 0.02%
4,020,729 Fannie Mae REMICS 3.91 25/03/2039 292,182 0.12%
5,161,135 Fannie Mae REMICS 3.96 25/05/2039 374,602 0.15%
321,322 Fannie Mae REMICS 4.01 25/06/2037 44,661 0.02%
5,429,572 Fannie Mae REMICS 4.03 25/01/2043 1,106,541 0.47%
3,196,553 Fannie Mae REMICS 4.06 25/03/2040 253,762 0.10%
3,522,746 Fannie Mae REMICS 4.06 25/11/2042 708,449 0.29%
10,137,268 Fannie Mae REMICS 4.06 25/01/2043 1,246,676 0.51%
4,194,124 Fannie Mae REMICS 4.06 25/07/2043 500,978 0.21%
633,604 Fannie Mae REMICS 4.16 25/01/2040 93,725 0.04%
1,644,809 Fannie Mae REMICS 4.31 25/12/2038 210,845 0.09%
8,153,459 Fannie Mae REMICS 4.46 25/05/2039 556,076 0.23%
2,022,005 Fannie Mae REMICS 4.46 25/07/2042 310,083 0.13%
4,229,047 Fannie Mae REMICS 4.66 25/02/2043 583,553 0.24%
2,978,413 Fannie Mae REMICS 4.68 25/05/2037 443,678 0.18%
253,999 Fannie Mae REMICS 6.50 25/11/2042 285,063 0.12%
381,348 Fannie Mae REMICS 6.50 25/12/2042 441,927 0.18%
3,713 Freddie Mac REMICS 2.52 15/12/2031 3,737 0.00%
3,198,148 Freddie Mac REMICS 3.98 15/04/2039 214,160 0.09%
1,525,867 Freddie Mac REMICS 3.98 15/05/2039 113,733 0.05%
4,801,274 Freddie Mac REMICS 4.08 15/12/2044 695,532 0.29%
67,782 Freddie Mac REMICS 4.48 15/03/2041 7,091 0.00%
1,045,367 Freddie Mac REMICS 4.48 15/05/2042 173,860 0.07%
2,290,146 Freddie Mac REMICS 4.58 15/11/2040 185,228 0.08%
5,727,061 Freddie Mac REMICS 5.13 15/08/2035 1,029,744 0.44%
400,000 Freddie Mac REMICS 5.50 15/03/2035 437,756 0.18%
14,824,920 Freddie Mac Strips 3.00 15/10/2027 1,480,487 0.61%
123,219 Freddie Mac Structured Pass-Through Certificates 2.84 25/07/2044 123,095 0.05%
26,549 GMACM Mortgage Loan Trust 2004-AR1 4.24 25/06/2034 27,196 0.01%
5,645 Government National Mortgage Association 2.49 16/03/2032 5,667 0.00%
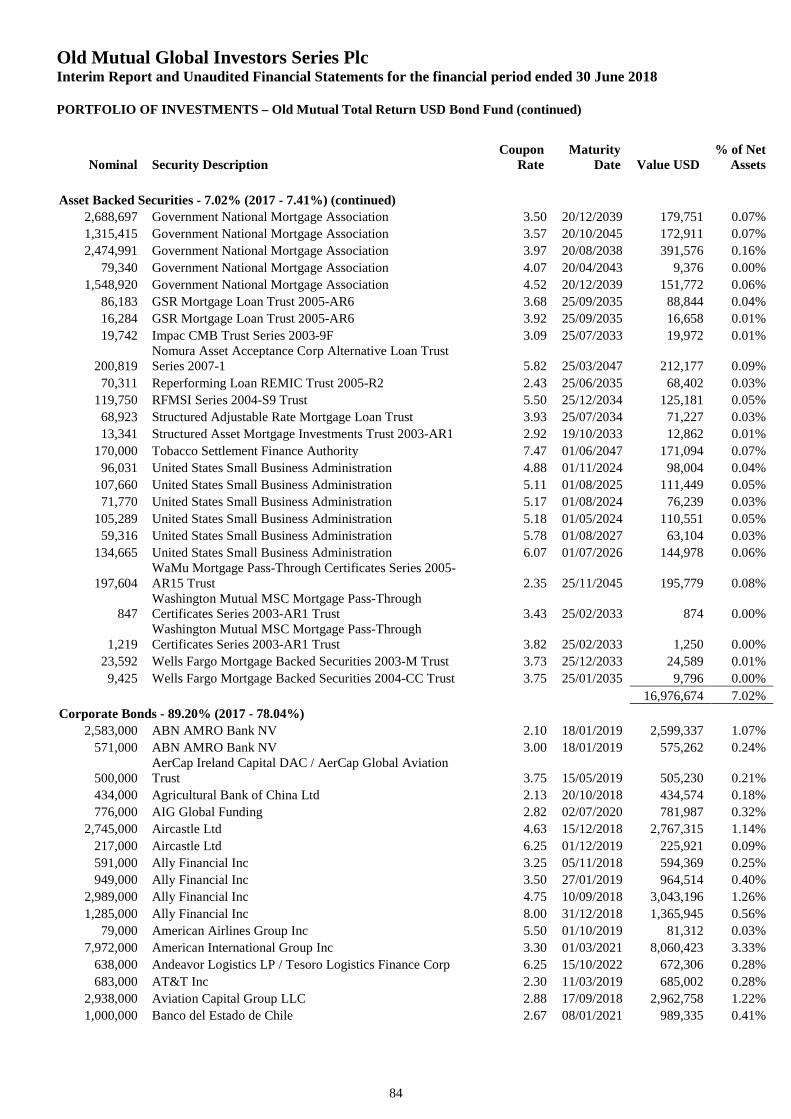
Old Mutual Global Investors Series PlcInterim Report and Unaudited Financial Statements for the financial period ended 30 June 2018
PORTFOLIO OF INVESTMENTS – Old Mutual Total Return USD Bond Fund (continued)
Nominal Security DescriptionCoupon
RateMaturity
Date Value USD% of Net
Assets
84
Asset Backed Securities - 7.02% (2017 - 7.41%) (continued)
2,688,697 Government National Mortgage Association 3.50 20/12/2039 179,751 0.07%
1,315,415 Government National Mortgage Association 3.57 20/10/2045 172,911 0.07%
2,474,991 Government National Mortgage Association 3.97 20/08/2038 391,576 0.16%
79,340 Government National Mortgage Association 4.07 20/04/2043 9,376 0.00%
1,548,920 Government National Mortgage Association 4.52 20/12/2039 151,772 0.06%
86,183 GSR Mortgage Loan Trust 2005-AR6 3.68 25/09/2035 88,844 0.04%
16,284 GSR Mortgage Loan Trust 2005-AR6 3.92 25/09/2035 16,658 0.01%
19,742 Impac CMB Trust Series 2003-9F 3.09 25/07/2033 19,972 0.01%
200,819Nomura Asset Acceptance Corp Alternative Loan TrustSeries 2007-1 5.82 25/03/2047 212,177 0.09%
70,311 Reperforming Loan REMIC Trust 2005-R2 2.43 25/06/2035 68,402 0.03%
119,750 RFMSI Series 2004-S9 Trust 5.50 25/12/2034 125,181 0.05%
68,923 Structured Adjustable Rate Mortgage Loan Trust 3.93 25/07/2034 71,227 0.03%
13,341 Structured Asset Mortgage Investments Trust 2003-AR1 2.92 19/10/2033 12,862 0.01%
170,000 Tobacco Settlement Finance Authority 7.47 01/06/2047 171,094 0.07%
96,031 United States Small Business Administration 4.88 01/11/2024 98,004 0.04%
107,660 United States Small Business Administration 5.11 01/08/2025 111,449 0.05%
71,770 United States Small Business Administration 5.17 01/08/2024 76,239 0.03%
105,289 United States Small Business Administration 5.18 01/05/2024 110,551 0.05%
59,316 United States Small Business Administration 5.78 01/08/2027 63,104 0.03%
134,665 United States Small Business Administration 6.07 01/07/2026 144,978 0.06%
197,604WaMu Mortgage Pass-Through Certificates Series 2005-AR15 Trust 2.35 25/11/2045 195,779 0.08%
847Washington Mutual MSC Mortgage Pass-ThroughCertificates Series 2003-AR1 Trust 3.43 25/02/2033 874 0.00%
1,219Washington Mutual MSC Mortgage Pass-ThroughCertificates Series 2003-AR1 Trust 3.82 25/02/2033 1,250 0.00%
23,592 Wells Fargo Mortgage Backed Securities 2003-M Trust 3.73 25/12/2033 24,589 0.01%
9,425 Wells Fargo Mortgage Backed Securities 2004-CC Trust 3.75 25/01/2035 9,796 0.00%
16,976,674 7.02%
Corporate Bonds - 89.20% (2017 - 78.04%)
2,583,000 ABN AMRO Bank NV 2.10 18/01/2019 2,599,337 1.07%
571,000 ABN AMRO Bank NV 3.00 18/01/2019 575,262 0.24%
500,000AerCap Ireland Capital DAC / AerCap Global AviationTrust 3.75 15/05/2019 505,230 0.21%
434,000 Agricultural Bank of China Ltd 2.13 20/10/2018 434,574 0.18%
776,000 AIG Global Funding 2.82 02/07/2020 781,987 0.32%
2,745,000 Aircastle Ltd 4.63 15/12/2018 2,767,315 1.14%
217,000 Aircastle Ltd 6.25 01/12/2019 225,921 0.09%
591,000 Ally Financial Inc 3.25 05/11/2018 594,369 0.25%
949,000 Ally Financial Inc 3.50 27/01/2019 964,514 0.40%
2,989,000 Ally Financial Inc 4.75 10/09/2018 3,043,196 1.26%
1,285,000 Ally Financial Inc 8.00 31/12/2018 1,365,945 0.56%
79,000 American Airlines Group Inc 5.50 01/10/2019 81,312 0.03%
7,972,000 American International Group Inc 3.30 01/03/2021 8,060,423 3.33%
638,000 Andeavor Logistics LP / Tesoro Logistics Finance Corp 6.25 15/10/2022 672,306 0.28%
683,000 AT&T Inc 2.30 11/03/2019 685,002 0.28%
2,938,000 Aviation Capital Group LLC 2.88 17/09/2018 2,962,758 1.22%
1,000,000 Banco del Estado de Chile 2.67 08/01/2021 989,335 0.41%
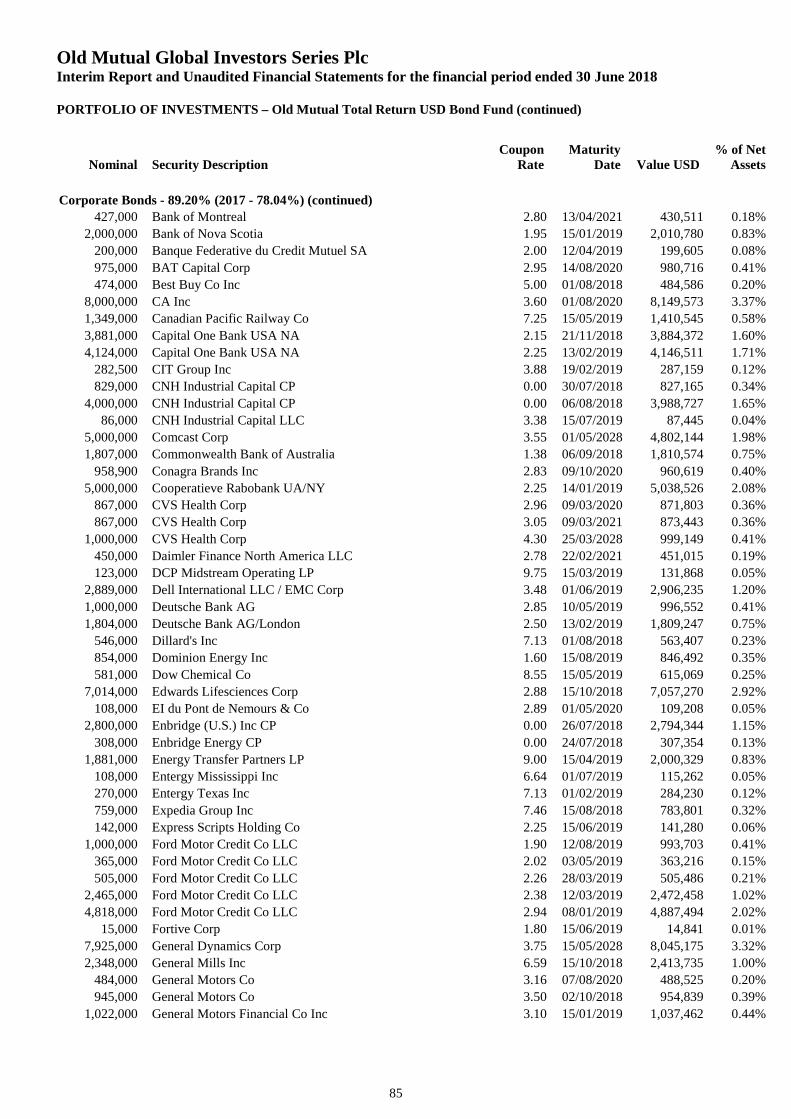
Old Mutual Global Investors Series PlcInterim Report and Unaudited Financial Statements for the financial period ended 30 June 2018
PORTFOLIO OF INVESTMENTS – Old Mutual Total Return USD Bond Fund (continued)
Nominal Security DescriptionCoupon
RateMaturity
Date Value USD% of Net
Assets
85
Corporate Bonds - 89.20% (2017 - 78.04%) (continued)
427,000 Bank of Montreal 2.80 13/04/2021 430,511 0.18%
2,000,000 Bank of Nova Scotia 1.95 15/01/2019 2,010,780 0.83%
200,000 Banque Federative du Credit Mutuel SA 2.00 12/04/2019 199,605 0.08%
975,000 BAT Capital Corp 2.95 14/08/2020 980,716 0.41%
474,000 Best Buy Co Inc 5.00 01/08/2018 484,586 0.20%
8,000,000 CA Inc 3.60 01/08/2020 8,149,573 3.37%
1,349,000 Canadian Pacific Railway Co 7.25 15/05/2019 1,410,545 0.58%
3,881,000 Capital One Bank USA NA 2.15 21/11/2018 3,884,372 1.60%
4,124,000 Capital One Bank USA NA 2.25 13/02/2019 4,146,511 1.71%
282,500 CIT Group Inc 3.88 19/02/2019 287,159 0.12%
829,000 CNH Industrial Capital CP 0.00 30/07/2018 827,165 0.34%
4,000,000 CNH Industrial Capital CP 0.00 06/08/2018 3,988,727 1.65%
86,000 CNH Industrial Capital LLC 3.38 15/07/2019 87,445 0.04%
5,000,000 Comcast Corp 3.55 01/05/2028 4,802,144 1.98%
1,807,000 Commonwealth Bank of Australia 1.38 06/09/2018 1,810,574 0.75%
958,900 Conagra Brands Inc 2.83 09/10/2020 960,619 0.40%
5,000,000 Cooperatieve Rabobank UA/NY 2.25 14/01/2019 5,038,526 2.08%
867,000 CVS Health Corp 2.96 09/03/2020 871,803 0.36%
867,000 CVS Health Corp 3.05 09/03/2021 873,443 0.36%
1,000,000 CVS Health Corp 4.30 25/03/2028 999,149 0.41%
450,000 Daimler Finance North America LLC 2.78 22/02/2021 451,015 0.19%
123,000 DCP Midstream Operating LP 9.75 15/03/2019 131,868 0.05%
2,889,000 Dell International LLC / EMC Corp 3.48 01/06/2019 2,906,235 1.20%
1,000,000 Deutsche Bank AG 2.85 10/05/2019 996,552 0.41%
1,804,000 Deutsche Bank AG/London 2.50 13/02/2019 1,809,247 0.75%
546,000 Dillard's Inc 7.13 01/08/2018 563,407 0.23%
854,000 Dominion Energy Inc 1.60 15/08/2019 846,492 0.35%
581,000 Dow Chemical Co 8.55 15/05/2019 615,069 0.25%
7,014,000 Edwards Lifesciences Corp 2.88 15/10/2018 7,057,270 2.92%
108,000 EI du Pont de Nemours & Co 2.89 01/05/2020 109,208 0.05%
2,800,000 Enbridge (U.S.) Inc CP 0.00 26/07/2018 2,794,344 1.15%
308,000 Enbridge Energy CP 0.00 24/07/2018 307,354 0.13%
1,881,000 Energy Transfer Partners LP 9.00 15/04/2019 2,000,329 0.83%
108,000 Entergy Mississippi Inc 6.64 01/07/2019 115,262 0.05%
270,000 Entergy Texas Inc 7.13 01/02/2019 284,230 0.12%
759,000 Expedia Group Inc 7.46 15/08/2018 783,801 0.32%
142,000 Express Scripts Holding Co 2.25 15/06/2019 141,280 0.06%
1,000,000 Ford Motor Credit Co LLC 1.90 12/08/2019 993,703 0.41%
365,000 Ford Motor Credit Co LLC 2.02 03/05/2019 363,216 0.15%
505,000 Ford Motor Credit Co LLC 2.26 28/03/2019 505,486 0.21%
2,465,000 Ford Motor Credit Co LLC 2.38 12/03/2019 2,472,458 1.02%
4,818,000 Ford Motor Credit Co LLC 2.94 08/01/2019 4,887,494 2.02%
15,000 Fortive Corp 1.80 15/06/2019 14,841 0.01%
7,925,000 General Dynamics Corp 3.75 15/05/2028 8,045,175 3.32%
2,348,000 General Mills Inc 6.59 15/10/2018 2,413,735 1.00%
484,000 General Motors Co 3.16 07/08/2020 488,525 0.20%
945,000 General Motors Co 3.50 02/10/2018 954,839 0.39%
1,022,000 General Motors Financial Co Inc 3.10 15/01/2019 1,037,462 0.44%
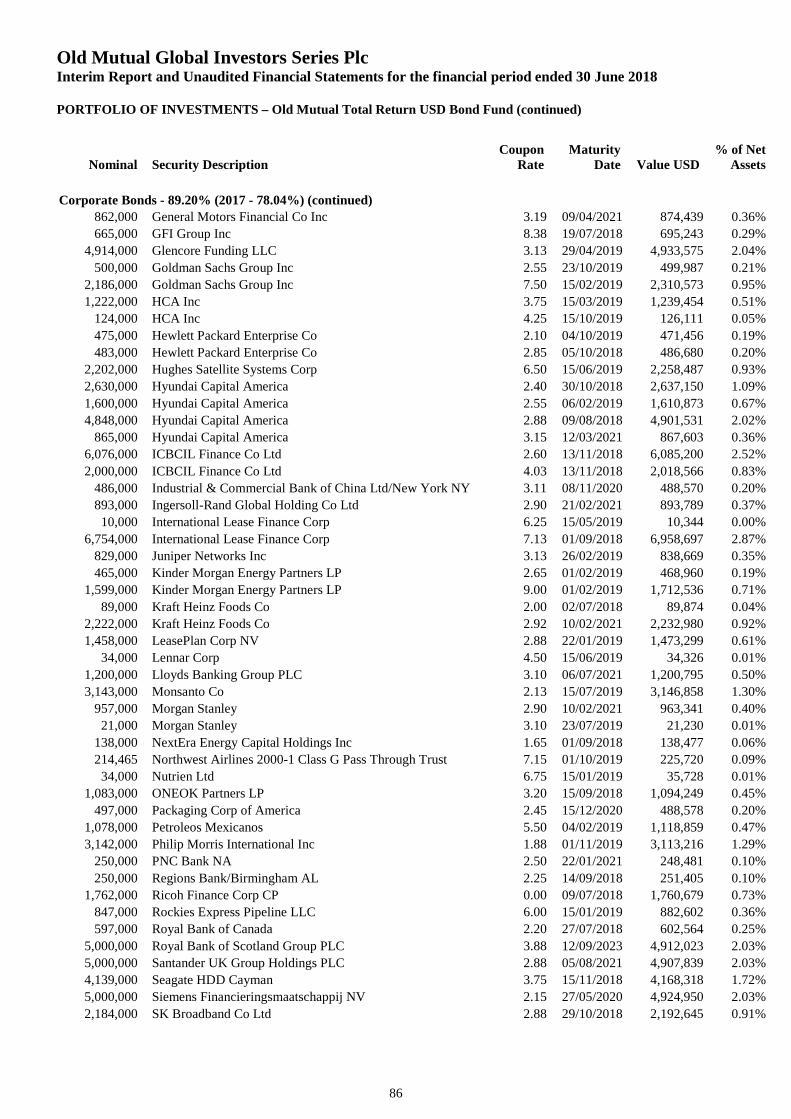
Old Mutual Global Investors Series PlcInterim Report and Unaudited Financial Statements for the financial period ended 30 June 2018
PORTFOLIO OF INVESTMENTS – Old Mutual Total Return USD Bond Fund (continued)
Nominal Security DescriptionCoupon
RateMaturity
Date Value USD% of Net
Assets
86
Corporate Bonds - 89.20% (2017 - 78.04%) (continued)
862,000 General Motors Financial Co Inc 3.19 09/04/2021 874,439 0.36%
665,000 GFI Group Inc 8.38 19/07/2018 695,243 0.29%
4,914,000 Glencore Funding LLC 3.13 29/04/2019 4,933,575 2.04%
500,000 Goldman Sachs Group Inc 2.55 23/10/2019 499,987 0.21%
2,186,000 Goldman Sachs Group Inc 7.50 15/02/2019 2,310,573 0.95%
1,222,000 HCA Inc 3.75 15/03/2019 1,239,454 0.51%
124,000 HCA Inc 4.25 15/10/2019 126,111 0.05%
475,000 Hewlett Packard Enterprise Co 2.10 04/10/2019 471,456 0.19%
483,000 Hewlett Packard Enterprise Co 2.85 05/10/2018 486,680 0.20%
2,202,000 Hughes Satellite Systems Corp 6.50 15/06/2019 2,258,487 0.93%
2,630,000 Hyundai Capital America 2.40 30/10/2018 2,637,150 1.09%
1,600,000 Hyundai Capital America 2.55 06/02/2019 1,610,873 0.67%
4,848,000 Hyundai Capital America 2.88 09/08/2018 4,901,531 2.02%
865,000 Hyundai Capital America 3.15 12/03/2021 867,603 0.36%
6,076,000 ICBCIL Finance Co Ltd 2.60 13/11/2018 6,085,200 2.52%
2,000,000 ICBCIL Finance Co Ltd 4.03 13/11/2018 2,018,566 0.83%
486,000 Industrial & Commercial Bank of China Ltd/New York NY 3.11 08/11/2020 488,570 0.20%
893,000 Ingersoll-Rand Global Holding Co Ltd 2.90 21/02/2021 893,789 0.37%
10,000 International Lease Finance Corp 6.25 15/05/2019 10,344 0.00%
6,754,000 International Lease Finance Corp 7.13 01/09/2018 6,958,697 2.87%
829,000 Juniper Networks Inc 3.13 26/02/2019 838,669 0.35%
465,000 Kinder Morgan Energy Partners LP 2.65 01/02/2019 468,960 0.19%
1,599,000 Kinder Morgan Energy Partners LP 9.00 01/02/2019 1,712,536 0.71%
89,000 Kraft Heinz Foods Co 2.00 02/07/2018 89,874 0.04%
2,222,000 Kraft Heinz Foods Co 2.92 10/02/2021 2,232,980 0.92%
1,458,000 LeasePlan Corp NV 2.88 22/01/2019 1,473,299 0.61%
34,000 Lennar Corp 4.50 15/06/2019 34,326 0.01%
1,200,000 Lloyds Banking Group PLC 3.10 06/07/2021 1,200,795 0.50%
3,143,000 Monsanto Co 2.13 15/07/2019 3,146,858 1.30%
957,000 Morgan Stanley 2.90 10/02/2021 963,341 0.40%
21,000 Morgan Stanley 3.10 23/07/2019 21,230 0.01%
138,000 NextEra Energy Capital Holdings Inc 1.65 01/09/2018 138,477 0.06%
214,465 Northwest Airlines 2000-1 Class G Pass Through Trust 7.15 01/10/2019 225,720 0.09%
34,000 Nutrien Ltd 6.75 15/01/2019 35,728 0.01%
1,083,000 ONEOK Partners LP 3.20 15/09/2018 1,094,249 0.45%
497,000 Packaging Corp of America 2.45 15/12/2020 488,578 0.20%
1,078,000 Petroleos Mexicanos 5.50 04/02/2019 1,118,859 0.47%
3,142,000 Philip Morris International Inc 1.88 01/11/2019 3,113,216 1.29%
250,000 PNC Bank NA 2.50 22/01/2021 248,481 0.10%
250,000 Regions Bank/Birmingham AL 2.25 14/09/2018 251,405 0.10%
1,762,000 Ricoh Finance Corp CP 0.00 09/07/2018 1,760,679 0.73%
847,000 Rockies Express Pipeline LLC 6.00 15/01/2019 882,602 0.36%
597,000 Royal Bank of Canada 2.20 27/07/2018 602,564 0.25%
5,000,000 Royal Bank of Scotland Group PLC 3.88 12/09/2023 4,912,023 2.03%
5,000,000 Santander UK Group Holdings PLC 2.88 05/08/2021 4,907,839 2.03%
4,139,000 Seagate HDD Cayman 3.75 15/11/2018 4,168,318 1.72%
5,000,000 Siemens Financieringsmaatschappij NV 2.15 27/05/2020 4,924,950 2.03%
2,184,000 SK Broadband Co Ltd 2.88 29/10/2018 2,192,645 0.91%
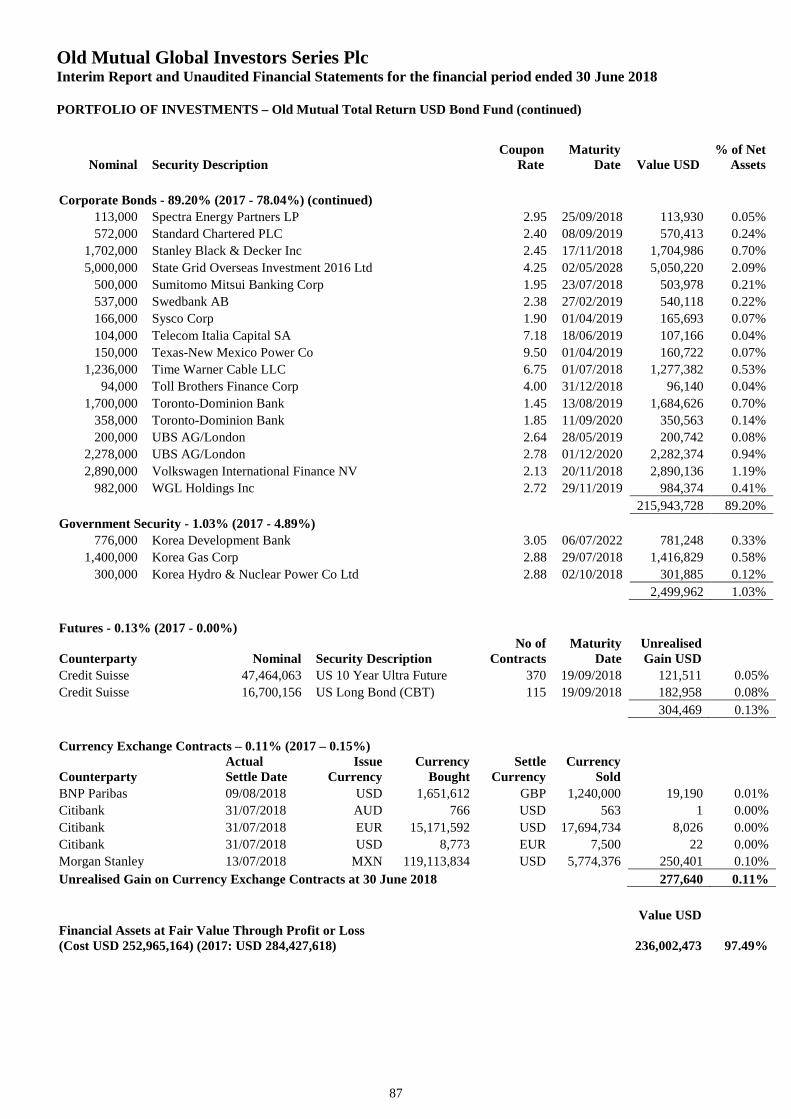
Old Mutual Global Investors Series PlcInterim Report and Unaudited Financial Statements for the financial period ended 30 June 2018
PORTFOLIO OF INVESTMENTS – Old Mutual Total Return USD Bond Fund (continued)
Nominal Security DescriptionCoupon
RateMaturity
Date Value USD% of Net
Assets
87
Corporate Bonds - 89.20% (2017 - 78.04%) (continued)
113,000 Spectra Energy Partners LP 2.95 25/09/2018 113,930 0.05%
572,000 Standard Chartered PLC 2.40 08/09/2019 570,413 0.24%
1,702,000 Stanley Black & Decker Inc 2.45 17/11/2018 1,704,986 0.70%
5,000,000 State Grid Overseas Investment 2016 Ltd 4.25 02/05/2028 5,050,220 2.09%
500,000 Sumitomo Mitsui Banking Corp 1.95 23/07/2018 503,978 0.21%
537,000 Swedbank AB 2.38 27/02/2019 540,118 0.22%
166,000 Sysco Corp 1.90 01/04/2019 165,693 0.07%
104,000 Telecom Italia Capital SA 7.18 18/06/2019 107,166 0.04%
150,000 Texas-New Mexico Power Co 9.50 01/04/2019 160,722 0.07%
1,236,000 Time Warner Cable LLC 6.75 01/07/2018 1,277,382 0.53%
94,000 Toll Brothers Finance Corp 4.00 31/12/2018 96,140 0.04%
1,700,000 Toronto-Dominion Bank 1.45 13/08/2019 1,684,626 0.70%
358,000 Toronto-Dominion Bank 1.85 11/09/2020 350,563 0.14%
200,000 UBS AG/London 2.64 28/05/2019 200,742 0.08%
2,278,000 UBS AG/London 2.78 01/12/2020 2,282,374 0.94%
2,890,000 Volkswagen International Finance NV 2.13 20/11/2018 2,890,136 1.19%
982,000 WGL Holdings Inc 2.72 29/11/2019 984,374 0.41%
215,943,728 89.20%
Government Security - 1.03% (2017 - 4.89%)
776,000 Korea Development Bank 3.05 06/07/2022 781,248 0.33%
1,400,000 Korea Gas Corp 2.88 29/07/2018 1,416,829 0.58%
300,000 Korea Hydro & Nuclear Power Co Ltd 2.88 02/10/2018 301,885 0.12%
2,499,962 1.03%
Futures - 0.13% (2017 - 0.00%)
Counterparty Nominal Security DescriptionNo of
ContractsMaturity
DateUnrealisedGain USD
Credit Suisse 47,464,063 US 10 Year Ultra Future 370 19/09/2018 121,511 0.05%
Credit Suisse 16,700,156 US Long Bond (CBT) 115 19/09/2018 182,958 0.08%
304,469 0.13%
Currency Exchange Contracts – 0.11% (2017 – 0.15%)
CounterpartyActualSettle Date
IssueCurrency
CurrencyBought
SettleCurrency
CurrencySold
BNP Paribas 09/08/2018 USD 1,651,612 GBP 1,240,000 19,190 0.01%
Citibank 31/07/2018 AUD 766 USD 563 1 0.00%
Citibank 31/07/2018 EUR 15,171,592 USD 17,694,734 8,026 0.00%
Citibank 31/07/2018 USD 8,773 EUR 7,500 22 0.00%
Morgan Stanley 13/07/2018 MXN 119,113,834 USD 5,774,376 250,401 0.10%
Unrealised Gain on Currency Exchange Contracts at 30 June 2018 277,640 0.11%
Value USDFinancial Assets at Fair Value Through Profit or Loss(Cost USD 252,965,164) (2017: USD 284,427,618) 236,002,473 97.49%
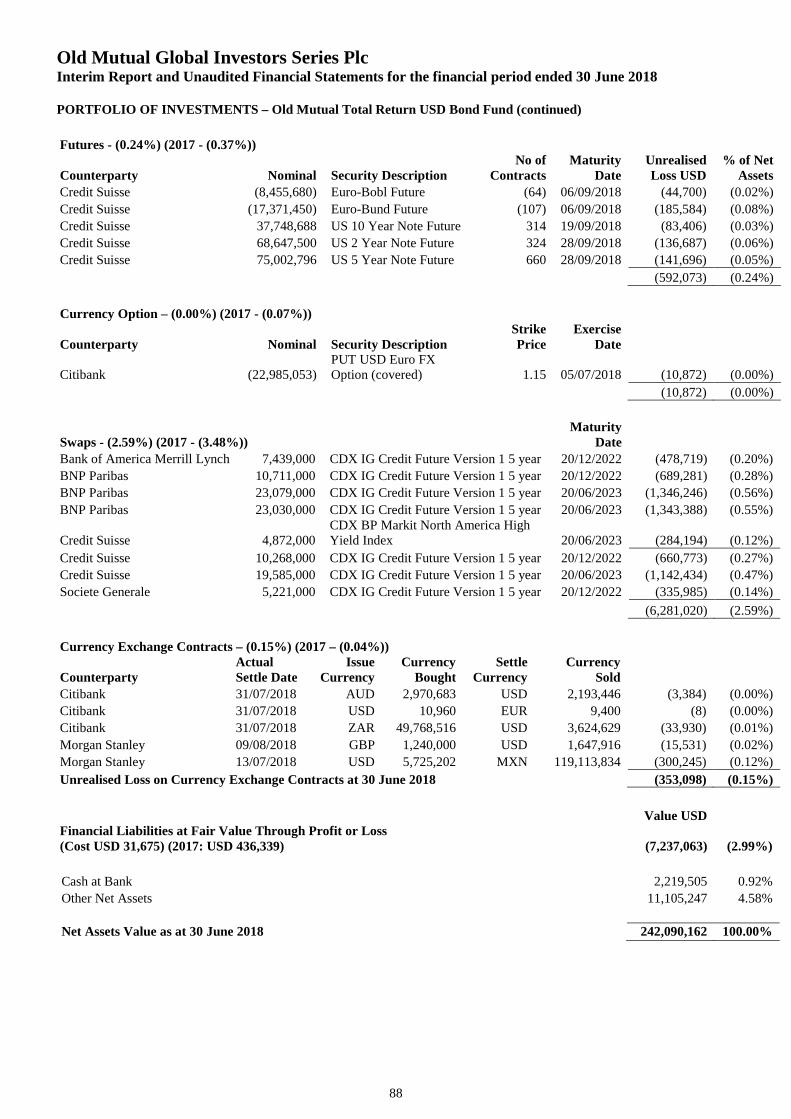
Old Mutual Global Investors Series PlcInterim Report and Unaudited Financial Statements for the financial period ended 30 June 2018
PORTFOLIO OF INVESTMENTS – Old Mutual Total Return USD Bond Fund (continued)
88
Futures - (0.24%) (2017 - (0.37%))
Counterparty Nominal Security DescriptionNo of
ContractsMaturity
DateUnrealisedLoss USD
% of NetAssets
Credit Suisse (8,455,680) Euro-Bobl Future (64) 06/09/2018 (44,700) (0.02%)
Credit Suisse (17,371,450) Euro-Bund Future (107) 06/09/2018 (185,584) (0.08%)
Credit Suisse 37,748,688 US 10 Year Note Future 314 19/09/2018 (83,406) (0.03%)
Credit Suisse 68,647,500 US 2 Year Note Future 324 28/09/2018 (136,687) (0.06%)
Credit Suisse 75,002,796 US 5 Year Note Future 660 28/09/2018 (141,696) (0.05%)
(592,073) (0.24%)
Currency Option – (0.00%) (2017 - (0.07%))
Counterparty Nominal Security DescriptionStrikePrice
ExerciseDate
Citibank (22,985,053)PUT USD Euro FXOption (covered) 1.15 05/07/2018 (10,872) (0.00%)
(10,872) (0.00%)
Swaps - (2.59%) (2017 - (3.48%))Maturity
Date
Bank of America Merrill Lynch 7,439,000 CDX IG Credit Future Version 1 5 year 20/12/2022 (478,719) (0.20%)
BNP Paribas 10,711,000 CDX IG Credit Future Version 1 5 year 20/12/2022 (689,281) (0.28%)
BNP Paribas 23,079,000 CDX IG Credit Future Version 1 5 year 20/06/2023 (1,346,246) (0.56%)
BNP Paribas 23,030,000 CDX IG Credit Future Version 1 5 year 20/06/2023 (1,343,388) (0.55%)
Credit Suisse 4,872,000CDX BP Markit North America HighYield Index 20/06/2023 (284,194) (0.12%)
Credit Suisse 10,268,000 CDX IG Credit Future Version 1 5 year 20/12/2022 (660,773) (0.27%)
Credit Suisse 19,585,000 CDX IG Credit Future Version 1 5 year 20/06/2023 (1,142,434) (0.47%)
Societe Generale 5,221,000 CDX IG Credit Future Version 1 5 year 20/12/2022 (335,985) (0.14%)
(6,281,020) (2.59%)
Currency Exchange Contracts – (0.15%) (2017 – (0.04%))
CounterpartyActualSettle Date
IssueCurrency
CurrencyBought
SettleCurrency
CurrencySold
Citibank 31/07/2018 AUD 2,970,683 USD 2,193,446 (3,384) (0.00%)
Citibank 31/07/2018 USD 10,960 EUR 9,400 (8) (0.00%)
Citibank 31/07/2018 ZAR 49,768,516 USD 3,624,629 (33,930) (0.01%)
Morgan Stanley 09/08/2018 GBP 1,240,000 USD 1,647,916 (15,531) (0.02%)
Morgan Stanley 13/07/2018 USD 5,725,202 MXN 119,113,834 (300,245) (0.12%)
Unrealised Loss on Currency Exchange Contracts at 30 June 2018 (353,098) (0.15%)
Value USDFinancial Liabilities at Fair Value Through Profit or Loss(Cost USD 31,675) (2017: USD 436,339) (7,237,063) (2.99%)
Cash at Bank 2,219,505 0.92%
Other Net Assets 11,105,247 4.58%
Net Assets Value as at 30 June 2018 242,090,162 100.00%
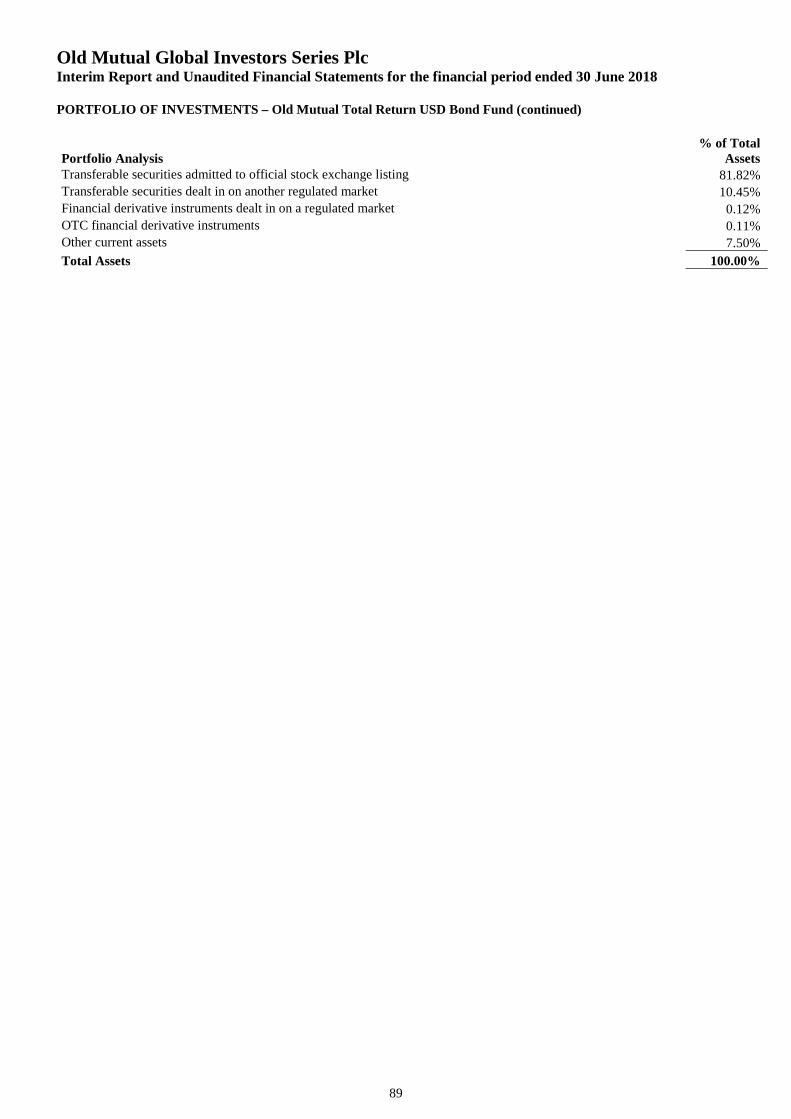
Old Mutual Global Investors Series PlcInterim Report and Unaudited Financial Statements for the financial period ended 30 June 2018
PORTFOLIO OF INVESTMENTS – Old Mutual Total Return USD Bond Fund (continued)
89
Portfolio Analysis% of Total
AssetsTransferable securities admitted to official stock exchange listing 81.82%Transferable securities dealt in on another regulated market 10.45%Financial derivative instruments dealt in on a regulated market 0.12%OTC financial derivative instruments 0.11%Other current assets 7.50%
Total Assets 100.00%
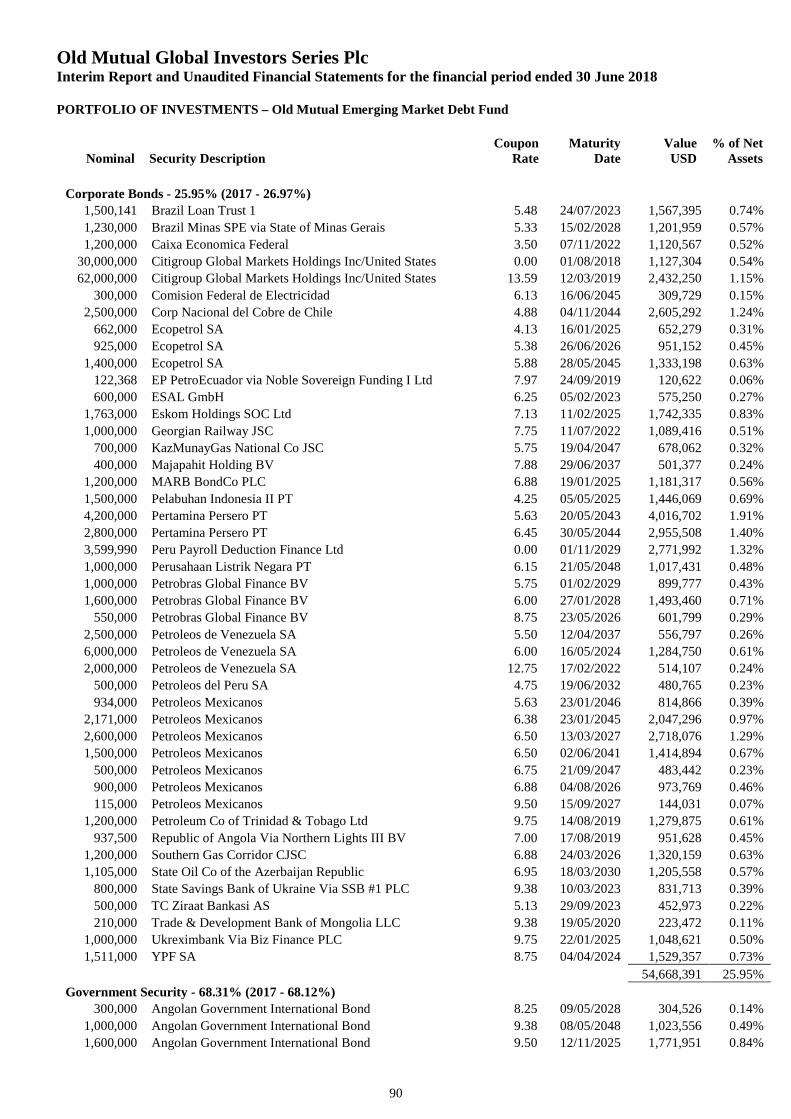
Old Mutual Global Investors Series PlcInterim Report and Unaudited Financial Statements for the financial period ended 30 June 2018
PORTFOLIO OF INVESTMENTS – Old Mutual Emerging Market Debt Fund
Nominal Security DescriptionCoupon
RateMaturity
DateValueUSD
% of NetAssets
90
Corporate Bonds - 25.95% (2017 - 26.97%)
1,500,141 Brazil Loan Trust 1 5.48 24/07/2023 1,567,395 0.74%
1,230,000 Brazil Minas SPE via State of Minas Gerais 5.33 15/02/2028 1,201,959 0.57%
1,200,000 Caixa Economica Federal 3.50 07/11/2022 1,120,567 0.52%
30,000,000 Citigroup Global Markets Holdings Inc/United States 0.00 01/08/2018 1,127,304 0.54%
62,000,000 Citigroup Global Markets Holdings Inc/United States 13.59 12/03/2019 2,432,250 1.15%
300,000 Comision Federal de Electricidad 6.13 16/06/2045 309,729 0.15%
2,500,000 Corp Nacional del Cobre de Chile 4.88 04/11/2044 2,605,292 1.24%
662,000 Ecopetrol SA 4.13 16/01/2025 652,279 0.31%
925,000 Ecopetrol SA 5.38 26/06/2026 951,152 0.45%
1,400,000 Ecopetrol SA 5.88 28/05/2045 1,333,198 0.63%
122,368 EP PetroEcuador via Noble Sovereign Funding I Ltd 7.97 24/09/2019 120,622 0.06%
600,000 ESAL GmbH 6.25 05/02/2023 575,250 0.27%
1,763,000 Eskom Holdings SOC Ltd 7.13 11/02/2025 1,742,335 0.83%
1,000,000 Georgian Railway JSC 7.75 11/07/2022 1,089,416 0.51%
700,000 KazMunayGas National Co JSC 5.75 19/04/2047 678,062 0.32%
400,000 Majapahit Holding BV 7.88 29/06/2037 501,377 0.24%
1,200,000 MARB BondCo PLC 6.88 19/01/2025 1,181,317 0.56%
1,500,000 Pelabuhan Indonesia II PT 4.25 05/05/2025 1,446,069 0.69%
4,200,000 Pertamina Persero PT 5.63 20/05/2043 4,016,702 1.91%
2,800,000 Pertamina Persero PT 6.45 30/05/2044 2,955,508 1.40%
3,599,990 Peru Payroll Deduction Finance Ltd 0.00 01/11/2029 2,771,992 1.32%
1,000,000 Perusahaan Listrik Negara PT 6.15 21/05/2048 1,017,431 0.48%
1,000,000 Petrobras Global Finance BV 5.75 01/02/2029 899,777 0.43%
1,600,000 Petrobras Global Finance BV 6.00 27/01/2028 1,493,460 0.71%
550,000 Petrobras Global Finance BV 8.75 23/05/2026 601,799 0.29%
2,500,000 Petroleos de Venezuela SA 5.50 12/04/2037 556,797 0.26%
6,000,000 Petroleos de Venezuela SA 6.00 16/05/2024 1,284,750 0.61%
2,000,000 Petroleos de Venezuela SA 12.75 17/02/2022 514,107 0.24%
500,000 Petroleos del Peru SA 4.75 19/06/2032 480,765 0.23%
934,000 Petroleos Mexicanos 5.63 23/01/2046 814,866 0.39%
2,171,000 Petroleos Mexicanos 6.38 23/01/2045 2,047,296 0.97%
2,600,000 Petroleos Mexicanos 6.50 13/03/2027 2,718,076 1.29%
1,500,000 Petroleos Mexicanos 6.50 02/06/2041 1,414,894 0.67%
500,000 Petroleos Mexicanos 6.75 21/09/2047 483,442 0.23%
900,000 Petroleos Mexicanos 6.88 04/08/2026 973,769 0.46%
115,000 Petroleos Mexicanos 9.50 15/09/2027 144,031 0.07%
1,200,000 Petroleum Co of Trinidad & Tobago Ltd 9.75 14/08/2019 1,279,875 0.61%
937,500 Republic of Angola Via Northern Lights III BV 7.00 17/08/2019 951,628 0.45%
1,200,000 Southern Gas Corridor CJSC 6.88 24/03/2026 1,320,159 0.63%
1,105,000 State Oil Co of the Azerbaijan Republic 6.95 18/03/2030 1,205,558 0.57%
800,000 State Savings Bank of Ukraine Via SSB #1 PLC 9.38 10/03/2023 831,713 0.39%
500,000 TC Ziraat Bankasi AS 5.13 29/09/2023 452,973 0.22%
210,000 Trade & Development Bank of Mongolia LLC 9.38 19/05/2020 223,472 0.11%
1,000,000 Ukreximbank Via Biz Finance PLC 9.75 22/01/2025 1,048,621 0.50%
1,511,000 YPF SA 8.75 04/04/2024 1,529,357 0.73%
54,668,391 25.95%
Government Security - 68.31% (2017 - 68.12%)
300,000 Angolan Government International Bond 8.25 09/05/2028 304,526 0.14%
1,000,000 Angolan Government International Bond 9.38 08/05/2048 1,023,556 0.49%
1,600,000 Angolan Government International Bond 9.50 12/11/2025 1,771,951 0.84%
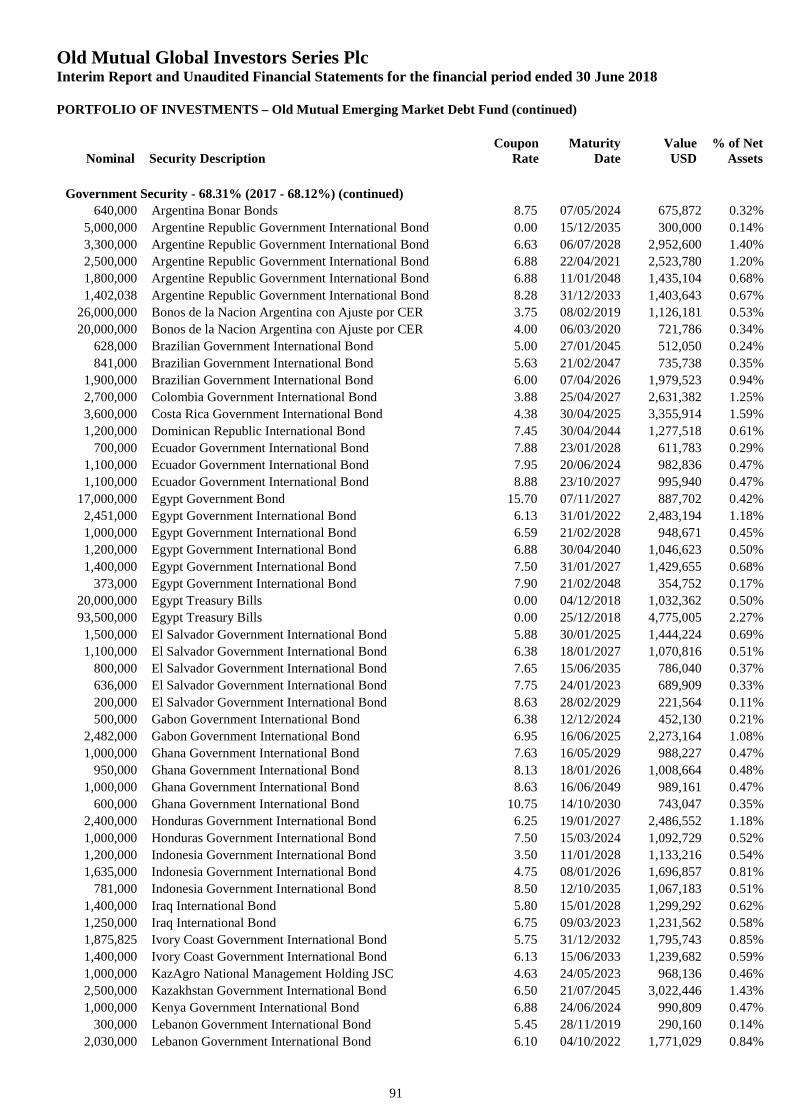
Old Mutual Global Investors Series PlcInterim Report and Unaudited Financial Statements for the financial period ended 30 June 2018
PORTFOLIO OF INVESTMENTS – Old Mutual Emerging Market Debt Fund (continued)
Nominal Security DescriptionCoupon
RateMaturity
DateValueUSD
% of NetAssets
91
Government Security - 68.31% (2017 - 68.12%) (continued)
640,000 Argentina Bonar Bonds 8.75 07/05/2024 675,872 0.32%
5,000,000 Argentine Republic Government International Bond 0.00 15/12/2035 300,000 0.14%
3,300,000 Argentine Republic Government International Bond 6.63 06/07/2028 2,952,600 1.40%
2,500,000 Argentine Republic Government International Bond 6.88 22/04/2021 2,523,780 1.20%
1,800,000 Argentine Republic Government International Bond 6.88 11/01/2048 1,435,104 0.68%
1,402,038 Argentine Republic Government International Bond 8.28 31/12/2033 1,403,643 0.67%
26,000,000 Bonos de la Nacion Argentina con Ajuste por CER 3.75 08/02/2019 1,126,181 0.53%
20,000,000 Bonos de la Nacion Argentina con Ajuste por CER 4.00 06/03/2020 721,786 0.34%
628,000 Brazilian Government International Bond 5.00 27/01/2045 512,050 0.24%
841,000 Brazilian Government International Bond 5.63 21/02/2047 735,738 0.35%
1,900,000 Brazilian Government International Bond 6.00 07/04/2026 1,979,523 0.94%
2,700,000 Colombia Government International Bond 3.88 25/04/2027 2,631,382 1.25%
3,600,000 Costa Rica Government International Bond 4.38 30/04/2025 3,355,914 1.59%
1,200,000 Dominican Republic International Bond 7.45 30/04/2044 1,277,518 0.61%
700,000 Ecuador Government International Bond 7.88 23/01/2028 611,783 0.29%
1,100,000 Ecuador Government International Bond 7.95 20/06/2024 982,836 0.47%
1,100,000 Ecuador Government International Bond 8.88 23/10/2027 995,940 0.47%
17,000,000 Egypt Government Bond 15.70 07/11/2027 887,702 0.42%
2,451,000 Egypt Government International Bond 6.13 31/01/2022 2,483,194 1.18%
1,000,000 Egypt Government International Bond 6.59 21/02/2028 948,671 0.45%
1,200,000 Egypt Government International Bond 6.88 30/04/2040 1,046,623 0.50%
1,400,000 Egypt Government International Bond 7.50 31/01/2027 1,429,655 0.68%
373,000 Egypt Government International Bond 7.90 21/02/2048 354,752 0.17%
20,000,000 Egypt Treasury Bills 0.00 04/12/2018 1,032,362 0.50%
93,500,000 Egypt Treasury Bills 0.00 25/12/2018 4,775,005 2.27%
1,500,000 El Salvador Government International Bond 5.88 30/01/2025 1,444,224 0.69%
1,100,000 El Salvador Government International Bond 6.38 18/01/2027 1,070,816 0.51%
800,000 El Salvador Government International Bond 7.65 15/06/2035 786,040 0.37%
636,000 El Salvador Government International Bond 7.75 24/01/2023 689,909 0.33%
200,000 El Salvador Government International Bond 8.63 28/02/2029 221,564 0.11%
500,000 Gabon Government International Bond 6.38 12/12/2024 452,130 0.21%
2,482,000 Gabon Government International Bond 6.95 16/06/2025 2,273,164 1.08%
1,000,000 Ghana Government International Bond 7.63 16/05/2029 988,227 0.47%
950,000 Ghana Government International Bond 8.13 18/01/2026 1,008,664 0.48%
1,000,000 Ghana Government International Bond 8.63 16/06/2049 989,161 0.47%
600,000 Ghana Government International Bond 10.75 14/10/2030 743,047 0.35%
2,400,000 Honduras Government International Bond 6.25 19/01/2027 2,486,552 1.18%
1,000,000 Honduras Government International Bond 7.50 15/03/2024 1,092,729 0.52%
1,200,000 Indonesia Government International Bond 3.50 11/01/2028 1,133,216 0.54%
1,635,000 Indonesia Government International Bond 4.75 08/01/2026 1,696,857 0.81%
781,000 Indonesia Government International Bond 8.50 12/10/2035 1,067,183 0.51%
1,400,000 Iraq International Bond 5.80 15/01/2028 1,299,292 0.62%
1,250,000 Iraq International Bond 6.75 09/03/2023 1,231,562 0.58%
1,875,825 Ivory Coast Government International Bond 5.75 31/12/2032 1,795,743 0.85%
1,400,000 Ivory Coast Government International Bond 6.13 15/06/2033 1,239,682 0.59%
1,000,000 KazAgro National Management Holding JSC 4.63 24/05/2023 968,136 0.46%
2,500,000 Kazakhstan Government International Bond 6.50 21/07/2045 3,022,446 1.43%
1,000,000 Kenya Government International Bond 6.88 24/06/2024 990,809 0.47%
300,000 Lebanon Government International Bond 5.45 28/11/2019 290,160 0.14%
2,030,000 Lebanon Government International Bond 6.10 04/10/2022 1,771,029 0.84%
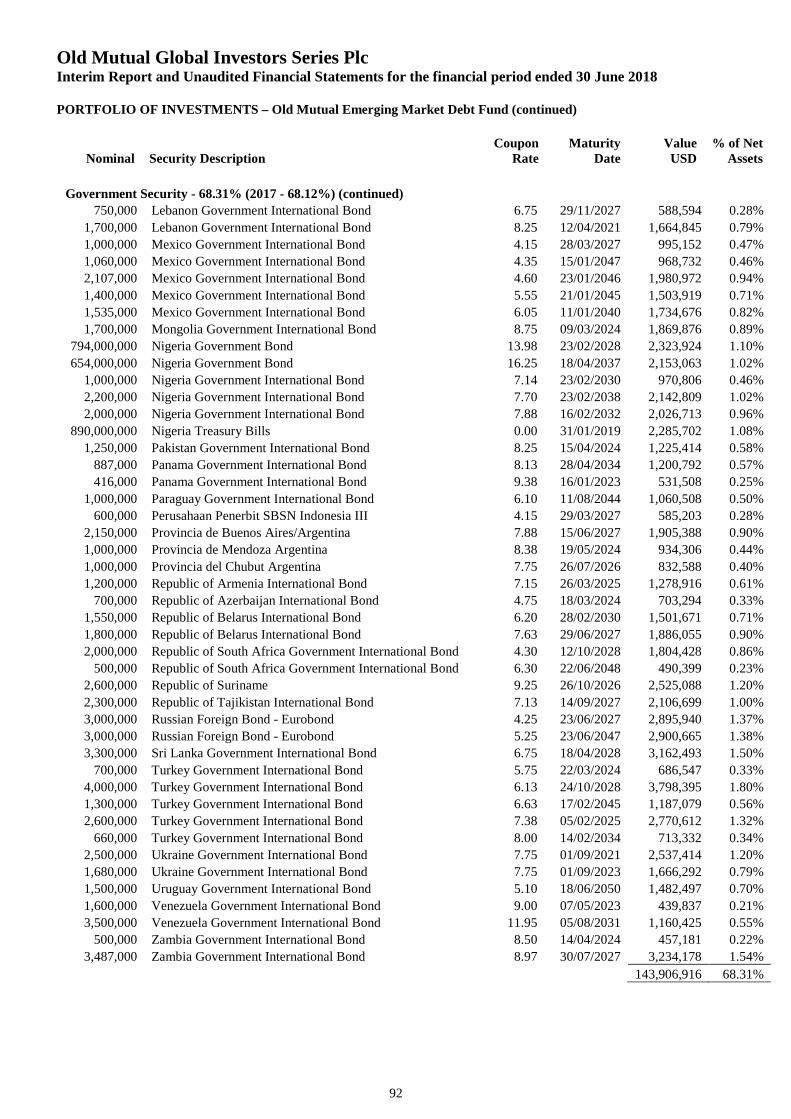
Old Mutual Global Investors Series PlcInterim Report and Unaudited Financial Statements for the financial period ended 30 June 2018
PORTFOLIO OF INVESTMENTS – Old Mutual Emerging Market Debt Fund (continued)
Nominal Security DescriptionCoupon
RateMaturity
DateValueUSD
% of NetAssets
92
Government Security - 68.31% (2017 - 68.12%) (continued)
750,000 Lebanon Government International Bond 6.75 29/11/2027 588,594 0.28%
1,700,000 Lebanon Government International Bond 8.25 12/04/2021 1,664,845 0.79%
1,000,000 Mexico Government International Bond 4.15 28/03/2027 995,152 0.47%
1,060,000 Mexico Government International Bond 4.35 15/01/2047 968,732 0.46%
2,107,000 Mexico Government International Bond 4.60 23/01/2046 1,980,972 0.94%
1,400,000 Mexico Government International Bond 5.55 21/01/2045 1,503,919 0.71%
1,535,000 Mexico Government International Bond 6.05 11/01/2040 1,734,676 0.82%
1,700,000 Mongolia Government International Bond 8.75 09/03/2024 1,869,876 0.89%
794,000,000 Nigeria Government Bond 13.98 23/02/2028 2,323,924 1.10%
654,000,000 Nigeria Government Bond 16.25 18/04/2037 2,153,063 1.02%
1,000,000 Nigeria Government International Bond 7.14 23/02/2030 970,806 0.46%
2,200,000 Nigeria Government International Bond 7.70 23/02/2038 2,142,809 1.02%
2,000,000 Nigeria Government International Bond 7.88 16/02/2032 2,026,713 0.96%
890,000,000 Nigeria Treasury Bills 0.00 31/01/2019 2,285,702 1.08%
1,250,000 Pakistan Government International Bond 8.25 15/04/2024 1,225,414 0.58%
887,000 Panama Government International Bond 8.13 28/04/2034 1,200,792 0.57%
416,000 Panama Government International Bond 9.38 16/01/2023 531,508 0.25%
1,000,000 Paraguay Government International Bond 6.10 11/08/2044 1,060,508 0.50%
600,000 Perusahaan Penerbit SBSN Indonesia III 4.15 29/03/2027 585,203 0.28%
2,150,000 Provincia de Buenos Aires/Argentina 7.88 15/06/2027 1,905,388 0.90%
1,000,000 Provincia de Mendoza Argentina 8.38 19/05/2024 934,306 0.44%
1,000,000 Provincia del Chubut Argentina 7.75 26/07/2026 832,588 0.40%
1,200,000 Republic of Armenia International Bond 7.15 26/03/2025 1,278,916 0.61%
700,000 Republic of Azerbaijan International Bond 4.75 18/03/2024 703,294 0.33%
1,550,000 Republic of Belarus International Bond 6.20 28/02/2030 1,501,671 0.71%
1,800,000 Republic of Belarus International Bond 7.63 29/06/2027 1,886,055 0.90%
2,000,000 Republic of South Africa Government International Bond 4.30 12/10/2028 1,804,428 0.86%
500,000 Republic of South Africa Government International Bond 6.30 22/06/2048 490,399 0.23%
2,600,000 Republic of Suriname 9.25 26/10/2026 2,525,088 1.20%
2,300,000 Republic of Tajikistan International Bond 7.13 14/09/2027 2,106,699 1.00%
3,000,000 Russian Foreign Bond - Eurobond 4.25 23/06/2027 2,895,940 1.37%
3,000,000 Russian Foreign Bond - Eurobond 5.25 23/06/2047 2,900,665 1.38%
3,300,000 Sri Lanka Government International Bond 6.75 18/04/2028 3,162,493 1.50%
700,000 Turkey Government International Bond 5.75 22/03/2024 686,547 0.33%
4,000,000 Turkey Government International Bond 6.13 24/10/2028 3,798,395 1.80%
1,300,000 Turkey Government International Bond 6.63 17/02/2045 1,187,079 0.56%
2,600,000 Turkey Government International Bond 7.38 05/02/2025 2,770,612 1.32%
660,000 Turkey Government International Bond 8.00 14/02/2034 713,332 0.34%
2,500,000 Ukraine Government International Bond 7.75 01/09/2021 2,537,414 1.20%
1,680,000 Ukraine Government International Bond 7.75 01/09/2023 1,666,292 0.79%
1,500,000 Uruguay Government International Bond 5.10 18/06/2050 1,482,497 0.70%
1,600,000 Venezuela Government International Bond 9.00 07/05/2023 439,837 0.21%
3,500,000 Venezuela Government International Bond 11.95 05/08/2031 1,160,425 0.55%
500,000 Zambia Government International Bond 8.50 14/04/2024 457,181 0.22%
3,487,000 Zambia Government International Bond 8.97 30/07/2027 3,234,178 1.54%
143,906,916 68.31%
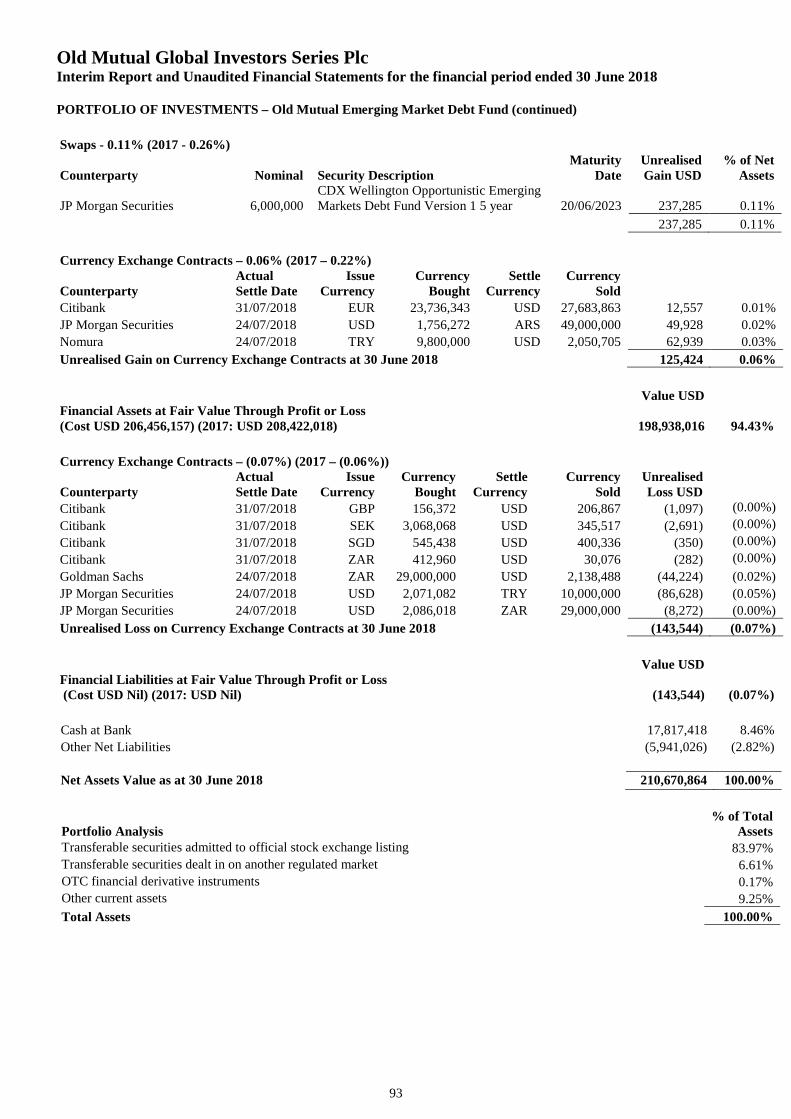
Old Mutual Global Investors Series PlcInterim Report and Unaudited Financial Statements for the financial period ended 30 June 2018
PORTFOLIO OF INVESTMENTS – Old Mutual Emerging Market Debt Fund (continued)
93
Swaps - 0.11% (2017 - 0.26%)
Counterparty Nominal Security DescriptionMaturity
DateUnrealisedGain USD
% of NetAssets
JP Morgan Securities 6,000,000CDX Wellington Opportunistic EmergingMarkets Debt Fund Version 1 5 year 20/06/2023 237,285 0.11%
237,285 0.11%
Currency Exchange Contracts – 0.06% (2017 – 0.22%)
CounterpartyActualSettle Date
IssueCurrency
CurrencyBought
SettleCurrency
CurrencySold
Citibank 31/07/2018 EUR 23,736,343 USD 27,683,863 12,557 0.01%
JP Morgan Securities 24/07/2018 USD 1,756,272 ARS 49,000,000 49,928 0.02%
Nomura 24/07/2018 TRY 9,800,000 USD 2,050,705 62,939 0.03%
Unrealised Gain on Currency Exchange Contracts at 30 June 2018 125,424 0.06%
Value USDFinancial Assets at Fair Value Through Profit or Loss(Cost USD 206,456,157) (2017: USD 208,422,018) 198,938,016 94.43%
Currency Exchange Contracts – (0.07%) (2017 – (0.06%))
CounterpartyActualSettle Date
IssueCurrency
CurrencyBought
SettleCurrency
CurrencySold
UnrealisedLoss USD
Citibank 31/07/2018 GBP 156,372 USD 206,867 (1,097) (0.00%)
Citibank 31/07/2018 SEK 3,068,068 USD 345,517 (2,691) (0.00%)
Citibank 31/07/2018 SGD 545,438 USD 400,336 (350) (0.00%)
Citibank 31/07/2018 ZAR 412,960 USD 30,076 (282) (0.00%)
Goldman Sachs 24/07/2018 ZAR 29,000,000 USD 2,138,488 (44,224) (0.02%)
JP Morgan Securities 24/07/2018 USD 2,071,082 TRY 10,000,000 (86,628) (0.05%)
JP Morgan Securities 24/07/2018 USD 2,086,018 ZAR 29,000,000 (8,272) (0.00%)
Unrealised Loss on Currency Exchange Contracts at 30 June 2018 (143,544) (0.07%)
Value USDFinancial Liabilities at Fair Value Through Profit or Loss(Cost USD Nil) (2017: USD Nil) (143,544) (0.07%)
Cash at Bank 17,817,418 8.46%
Other Net Liabilities (5,941,026) (2.82%)
Net Assets Value as at 30 June 2018 210,670,864 100.00%
Portfolio Analysis% of Total
AssetsTransferable securities admitted to official stock exchange listing 83.97%Transferable securities dealt in on another regulated market 6.61%OTC financial derivative instruments 0.17%Other current assets 9.25%
Total Assets 100.00%
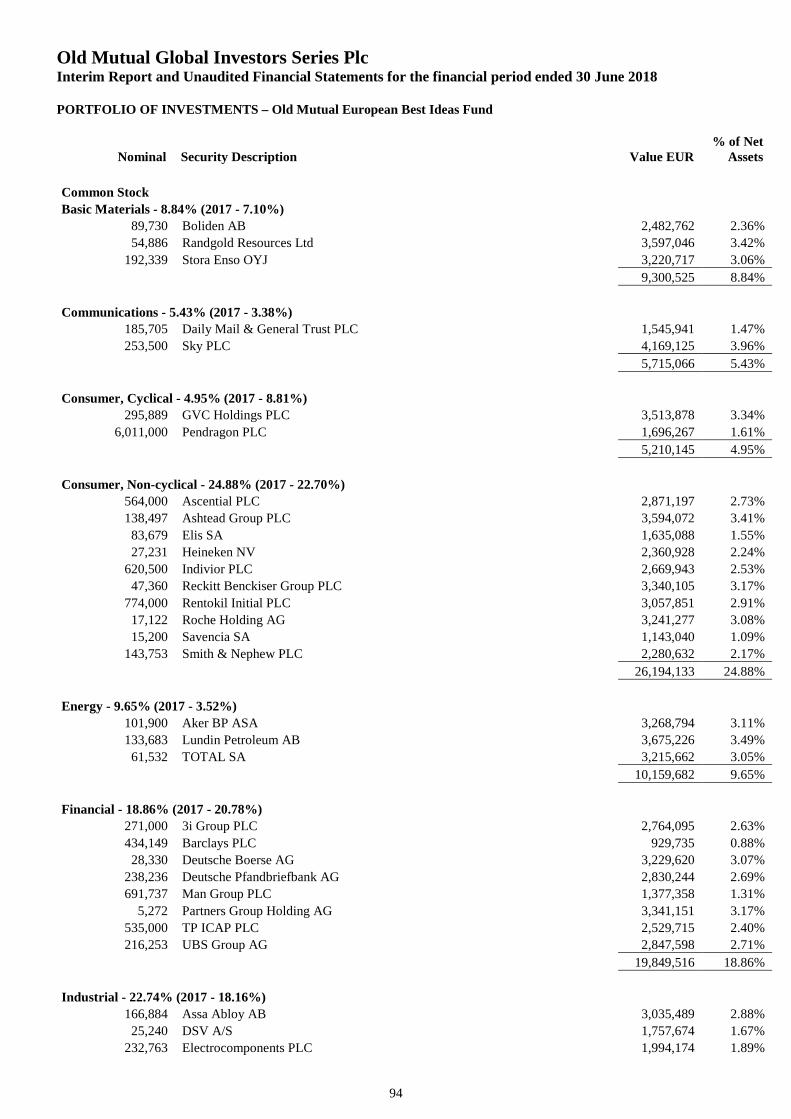
Old Mutual Global Investors Series PlcInterim Report and Unaudited Financial Statements for the financial period ended 30 June 2018
PORTFOLIO OF INVESTMENTS – Old Mutual European Best Ideas Fund
Nominal Security Description Value EUR% of Net
Assets
94
Common Stock
Basic Materials - 8.84% (2017 - 7.10%)
89,730 Boliden AB 2,482,762 2.36%
54,886 Randgold Resources Ltd 3,597,046 3.42%
192,339 Stora Enso OYJ 3,220,717 3.06%
9,300,525 8.84%
Communications - 5.43% (2017 - 3.38%)
185,705 Daily Mail & General Trust PLC 1,545,941 1.47%
253,500 Sky PLC 4,169,125 3.96%
5,715,066 5.43%
Consumer, Cyclical - 4.95% (2017 - 8.81%)
295,889 GVC Holdings PLC 3,513,878 3.34%
6,011,000 Pendragon PLC 1,696,267 1.61%
5,210,145 4.95%
Consumer, Non-cyclical - 24.88% (2017 - 22.70%)
564,000 Ascential PLC 2,871,197 2.73%
138,497 Ashtead Group PLC 3,594,072 3.41%
83,679 Elis SA 1,635,088 1.55%
27,231 Heineken NV 2,360,928 2.24%
620,500 Indivior PLC 2,669,943 2.53%
47,360 Reckitt Benckiser Group PLC 3,340,105 3.17%
774,000 Rentokil Initial PLC 3,057,851 2.91%
17,122 Roche Holding AG 3,241,277 3.08%
15,200 Savencia SA 1,143,040 1.09%
143,753 Smith & Nephew PLC 2,280,632 2.17%
26,194,133 24.88%
Energy - 9.65% (2017 - 3.52%)
101,900 Aker BP ASA 3,268,794 3.11%
133,683 Lundin Petroleum AB 3,675,226 3.49%
61,532 TOTAL SA 3,215,662 3.05%
10,159,682 9.65%
Financial - 18.86% (2017 - 20.78%)
271,000 3i Group PLC 2,764,095 2.63%
434,149 Barclays PLC 929,735 0.88%
28,330 Deutsche Boerse AG 3,229,620 3.07%
238,236 Deutsche Pfandbriefbank AG 2,830,244 2.69%
691,737 Man Group PLC 1,377,358 1.31%
5,272 Partners Group Holding AG 3,341,151 3.17%
535,000 TP ICAP PLC 2,529,715 2.40%
216,253 UBS Group AG 2,847,598 2.71%
19,849,516 18.86%
Industrial - 22.74% (2017 - 18.16%)
166,884 Assa Abloy AB 3,035,489 2.88%
25,240 DSV A/S 1,757,674 1.67%
232,763 Electrocomponents PLC 1,994,174 1.89%
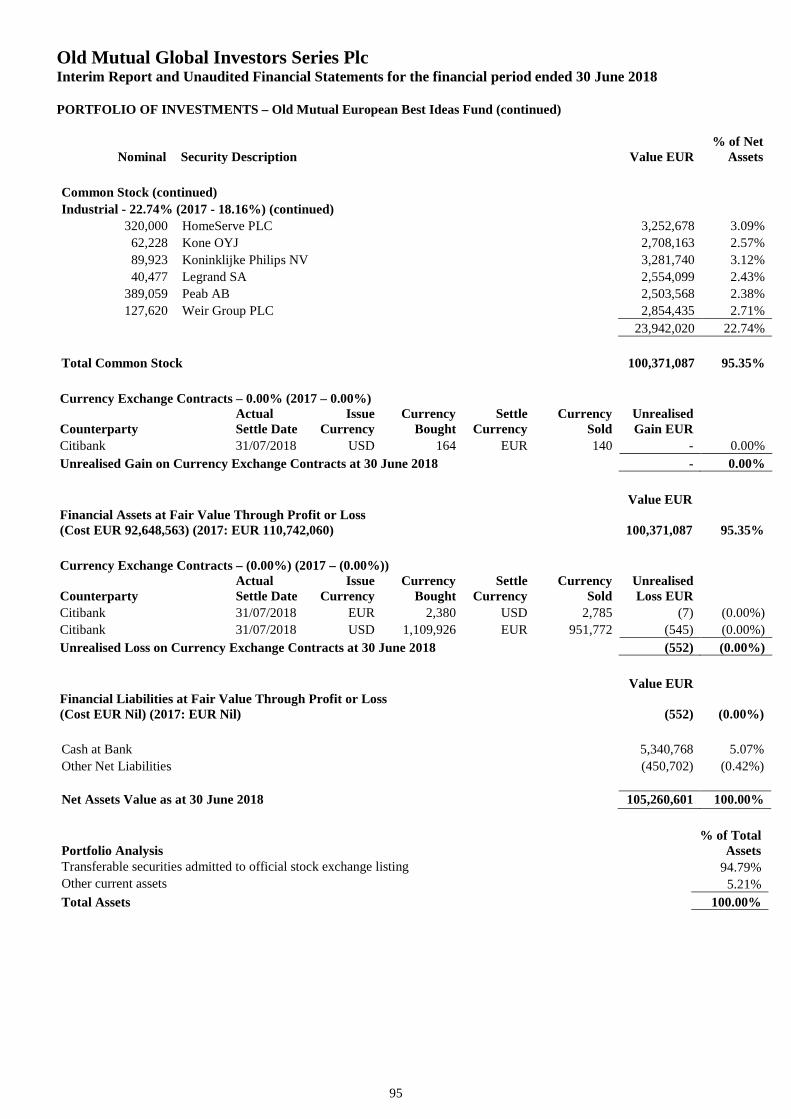
Old Mutual Global Investors Series PlcInterim Report and Unaudited Financial Statements for the financial period ended 30 June 2018
PORTFOLIO OF INVESTMENTS – Old Mutual European Best Ideas Fund (continued)
Nominal Security Description Value EUR% of Net
Assets
95
Common Stock (continued)
Industrial - 22.74% (2017 - 18.16%) (continued)
320,000 HomeServe PLC 3,252,678 3.09%
62,228 Kone OYJ 2,708,163 2.57%
89,923 Koninklijke Philips NV 3,281,740 3.12%
40,477 Legrand SA 2,554,099 2.43%
389,059 Peab AB 2,503,568 2.38%
127,620 Weir Group PLC 2,854,435 2.71%
23,942,020 22.74%
Total Common Stock 100,371,087 95.35%
Currency Exchange Contracts – 0.00% (2017 – 0.00%)
CounterpartyActualSettle Date
IssueCurrency
CurrencyBought
SettleCurrency
CurrencySold
UnrealisedGain EUR
Citibank 31/07/2018 USD 164 EUR 140 - 0.00%
Unrealised Gain on Currency Exchange Contracts at 30 June 2018 - 0.00%
Value EURFinancial Assets at Fair Value Through Profit or Loss(Cost EUR 92,648,563) (2017: EUR 110,742,060) 100,371,087 95.35%
Currency Exchange Contracts – (0.00%) (2017 – (0.00%))
CounterpartyActualSettle Date
IssueCurrency
CurrencyBought
SettleCurrency
CurrencySold
UnrealisedLoss EUR
Citibank 31/07/2018 EUR 2,380 USD 2,785 (7) (0.00%)
Citibank 31/07/2018 USD 1,109,926 EUR 951,772 (545) (0.00%)
Unrealised Loss on Currency Exchange Contracts at 30 June 2018 (552) (0.00%)
Value EURFinancial Liabilities at Fair Value Through Profit or Loss(Cost EUR Nil) (2017: EUR Nil) (552) (0.00%)
Cash at Bank 5,340,768 5.07%
Other Net Liabilities (450,702) (0.42%)
Net Assets Value as at 30 June 2018 105,260,601 100.00%
Portfolio Analysis% of Total
AssetsTransferable securities admitted to official stock exchange listing 94.79%Other current assets 5.21%
Total Assets 100.00%
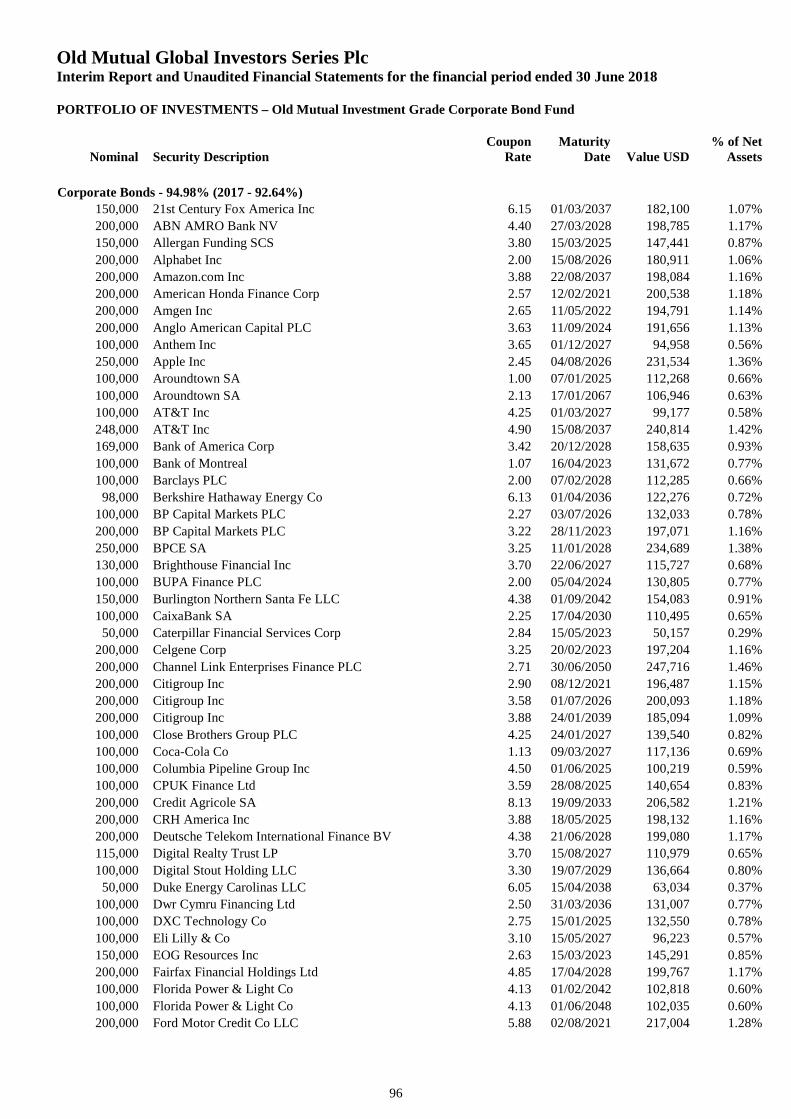
Old Mutual Global Investors Series PlcInterim Report and Unaudited Financial Statements for the financial period ended 30 June 2018
PORTFOLIO OF INVESTMENTS – Old Mutual Investment Grade Corporate Bond Fund
Nominal Security DescriptionCoupon
RateMaturity
Date Value USD% of Net
Assets
96
Corporate Bonds - 94.98% (2017 - 92.64%)
150,000 21st Century Fox America Inc 6.15 01/03/2037 182,100 1.07%
200,000 ABN AMRO Bank NV 4.40 27/03/2028 198,785 1.17%
150,000 Allergan Funding SCS 3.80 15/03/2025 147,441 0.87%
200,000 Alphabet Inc 2.00 15/08/2026 180,911 1.06%
200,000 Amazon.com Inc 3.88 22/08/2037 198,084 1.16%
200,000 American Honda Finance Corp 2.57 12/02/2021 200,538 1.18%
200,000 Amgen Inc 2.65 11/05/2022 194,791 1.14%
200,000 Anglo American Capital PLC 3.63 11/09/2024 191,656 1.13%
100,000 Anthem Inc 3.65 01/12/2027 94,958 0.56%
250,000 Apple Inc 2.45 04/08/2026 231,534 1.36%
100,000 Aroundtown SA 1.00 07/01/2025 112,268 0.66%
100,000 Aroundtown SA 2.13 17/01/2067 106,946 0.63%
100,000 AT&T Inc 4.25 01/03/2027 99,177 0.58%
248,000 AT&T Inc 4.90 15/08/2037 240,814 1.42%
169,000 Bank of America Corp 3.42 20/12/2028 158,635 0.93%
100,000 Bank of Montreal 1.07 16/04/2023 131,672 0.77%
100,000 Barclays PLC 2.00 07/02/2028 112,285 0.66%
98,000 Berkshire Hathaway Energy Co 6.13 01/04/2036 122,276 0.72%
100,000 BP Capital Markets PLC 2.27 03/07/2026 132,033 0.78%
200,000 BP Capital Markets PLC 3.22 28/11/2023 197,071 1.16%
250,000 BPCE SA 3.25 11/01/2028 234,689 1.38%
130,000 Brighthouse Financial Inc 3.70 22/06/2027 115,727 0.68%
100,000 BUPA Finance PLC 2.00 05/04/2024 130,805 0.77%
150,000 Burlington Northern Santa Fe LLC 4.38 01/09/2042 154,083 0.91%
100,000 CaixaBank SA 2.25 17/04/2030 110,495 0.65%
50,000 Caterpillar Financial Services Corp 2.84 15/05/2023 50,157 0.29%
200,000 Celgene Corp 3.25 20/02/2023 197,204 1.16%
200,000 Channel Link Enterprises Finance PLC 2.71 30/06/2050 247,716 1.46%
200,000 Citigroup Inc 2.90 08/12/2021 196,487 1.15%
200,000 Citigroup Inc 3.58 01/07/2026 200,093 1.18%
200,000 Citigroup Inc 3.88 24/01/2039 185,094 1.09%
100,000 Close Brothers Group PLC 4.25 24/01/2027 139,540 0.82%
100,000 Coca-Cola Co 1.13 09/03/2027 117,136 0.69%
100,000 Columbia Pipeline Group Inc 4.50 01/06/2025 100,219 0.59%
100,000 CPUK Finance Ltd 3.59 28/08/2025 140,654 0.83%
200,000 Credit Agricole SA 8.13 19/09/2033 206,582 1.21%
200,000 CRH America Inc 3.88 18/05/2025 198,132 1.16%
200,000 Deutsche Telekom International Finance BV 4.38 21/06/2028 199,080 1.17%
115,000 Digital Realty Trust LP 3.70 15/08/2027 110,979 0.65%
100,000 Digital Stout Holding LLC 3.30 19/07/2029 136,664 0.80%
50,000 Duke Energy Carolinas LLC 6.05 15/04/2038 63,034 0.37%
100,000 Dwr Cymru Financing Ltd 2.50 31/03/2036 131,007 0.77%
100,000 DXC Technology Co 2.75 15/01/2025 132,550 0.78%
100,000 Eli Lilly & Co 3.10 15/05/2027 96,223 0.57%
150,000 EOG Resources Inc 2.63 15/03/2023 145,291 0.85%
200,000 Fairfax Financial Holdings Ltd 4.85 17/04/2028 199,767 1.17%
100,000 Florida Power & Light Co 4.13 01/02/2042 102,818 0.60%
100,000 Florida Power & Light Co 4.13 01/06/2048 102,035 0.60%
200,000 Ford Motor Credit Co LLC 5.88 02/08/2021 217,004 1.28%
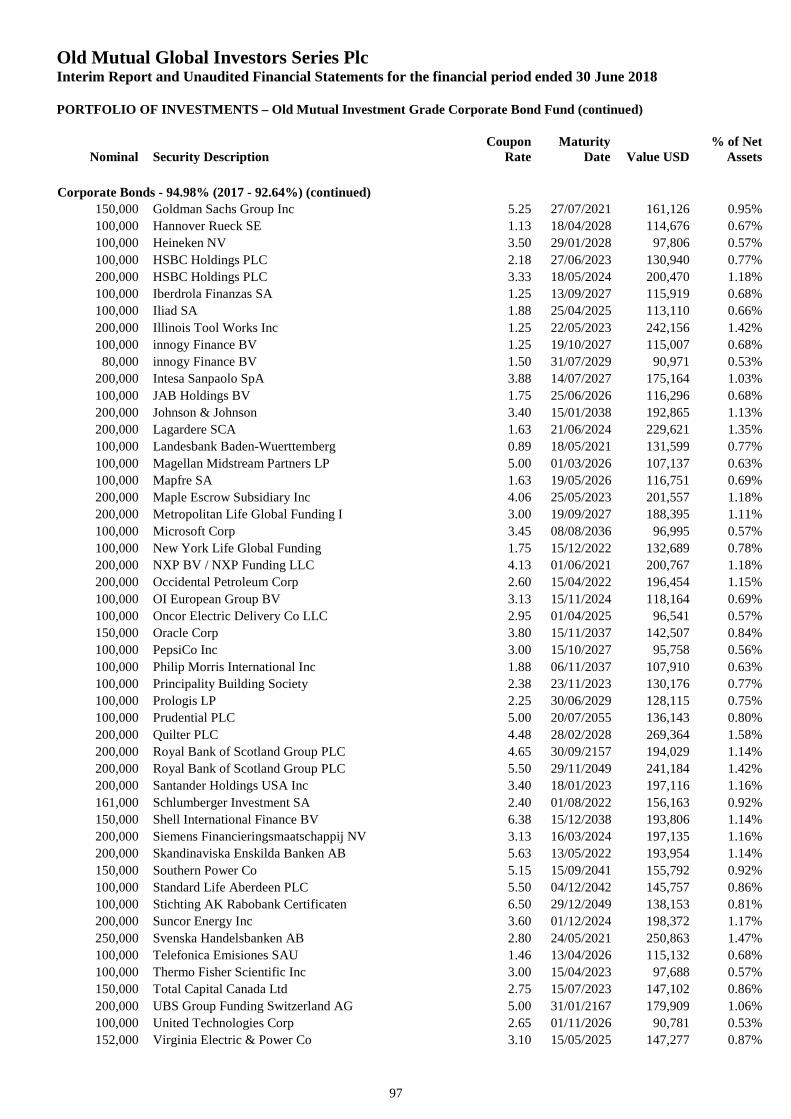
Old Mutual Global Investors Series PlcInterim Report and Unaudited Financial Statements for the financial period ended 30 June 2018
PORTFOLIO OF INVESTMENTS – Old Mutual Investment Grade Corporate Bond Fund (continued)
Nominal Security DescriptionCoupon
RateMaturity
Date Value USD% of Net
Assets
97
Corporate Bonds - 94.98% (2017 - 92.64%) (continued)
150,000 Goldman Sachs Group Inc 5.25 27/07/2021 161,126 0.95%
100,000 Hannover Rueck SE 1.13 18/04/2028 114,676 0.67%
100,000 Heineken NV 3.50 29/01/2028 97,806 0.57%
100,000 HSBC Holdings PLC 2.18 27/06/2023 130,940 0.77%
200,000 HSBC Holdings PLC 3.33 18/05/2024 200,470 1.18%
100,000 Iberdrola Finanzas SA 1.25 13/09/2027 115,919 0.68%
100,000 Iliad SA 1.88 25/04/2025 113,110 0.66%
200,000 Illinois Tool Works Inc 1.25 22/05/2023 242,156 1.42%
100,000 innogy Finance BV 1.25 19/10/2027 115,007 0.68%
80,000 innogy Finance BV 1.50 31/07/2029 90,971 0.53%
200,000 Intesa Sanpaolo SpA 3.88 14/07/2027 175,164 1.03%
100,000 JAB Holdings BV 1.75 25/06/2026 116,296 0.68%
200,000 Johnson & Johnson 3.40 15/01/2038 192,865 1.13%
200,000 Lagardere SCA 1.63 21/06/2024 229,621 1.35%
100,000 Landesbank Baden-Wuerttemberg 0.89 18/05/2021 131,599 0.77%
100,000 Magellan Midstream Partners LP 5.00 01/03/2026 107,137 0.63%
100,000 Mapfre SA 1.63 19/05/2026 116,751 0.69%
200,000 Maple Escrow Subsidiary Inc 4.06 25/05/2023 201,557 1.18%
200,000 Metropolitan Life Global Funding I 3.00 19/09/2027 188,395 1.11%
100,000 Microsoft Corp 3.45 08/08/2036 96,995 0.57%
100,000 New York Life Global Funding 1.75 15/12/2022 132,689 0.78%
200,000 NXP BV / NXP Funding LLC 4.13 01/06/2021 200,767 1.18%
200,000 Occidental Petroleum Corp 2.60 15/04/2022 196,454 1.15%
100,000 OI European Group BV 3.13 15/11/2024 118,164 0.69%
100,000 Oncor Electric Delivery Co LLC 2.95 01/04/2025 96,541 0.57%
150,000 Oracle Corp 3.80 15/11/2037 142,507 0.84%
100,000 PepsiCo Inc 3.00 15/10/2027 95,758 0.56%
100,000 Philip Morris International Inc 1.88 06/11/2037 107,910 0.63%
100,000 Principality Building Society 2.38 23/11/2023 130,176 0.77%
100,000 Prologis LP 2.25 30/06/2029 128,115 0.75%
100,000 Prudential PLC 5.00 20/07/2055 136,143 0.80%
200,000 Quilter PLC 4.48 28/02/2028 269,364 1.58%
200,000 Royal Bank of Scotland Group PLC 4.65 30/09/2157 194,029 1.14%
200,000 Royal Bank of Scotland Group PLC 5.50 29/11/2049 241,184 1.42%
200,000 Santander Holdings USA Inc 3.40 18/01/2023 197,116 1.16%
161,000 Schlumberger Investment SA 2.40 01/08/2022 156,163 0.92%
150,000 Shell International Finance BV 6.38 15/12/2038 193,806 1.14%
200,000 Siemens Financieringsmaatschappij NV 3.13 16/03/2024 197,135 1.16%
200,000 Skandinaviska Enskilda Banken AB 5.63 13/05/2022 193,954 1.14%
150,000 Southern Power Co 5.15 15/09/2041 155,792 0.92%
100,000 Standard Life Aberdeen PLC 5.50 04/12/2042 145,757 0.86%
100,000 Stichting AK Rabobank Certificaten 6.50 29/12/2049 138,153 0.81%
200,000 Suncor Energy Inc 3.60 01/12/2024 198,372 1.17%
250,000 Svenska Handelsbanken AB 2.80 24/05/2021 250,863 1.47%
100,000 Telefonica Emisiones SAU 1.46 13/04/2026 115,132 0.68%
100,000 Thermo Fisher Scientific Inc 3.00 15/04/2023 97,688 0.57%
150,000 Total Capital Canada Ltd 2.75 15/07/2023 147,102 0.86%
200,000 UBS Group Funding Switzerland AG 5.00 31/01/2167 179,909 1.06%
100,000 United Technologies Corp 2.65 01/11/2026 90,781 0.53%
152,000 Virginia Electric & Power Co 3.10 15/05/2025 147,277 0.87%
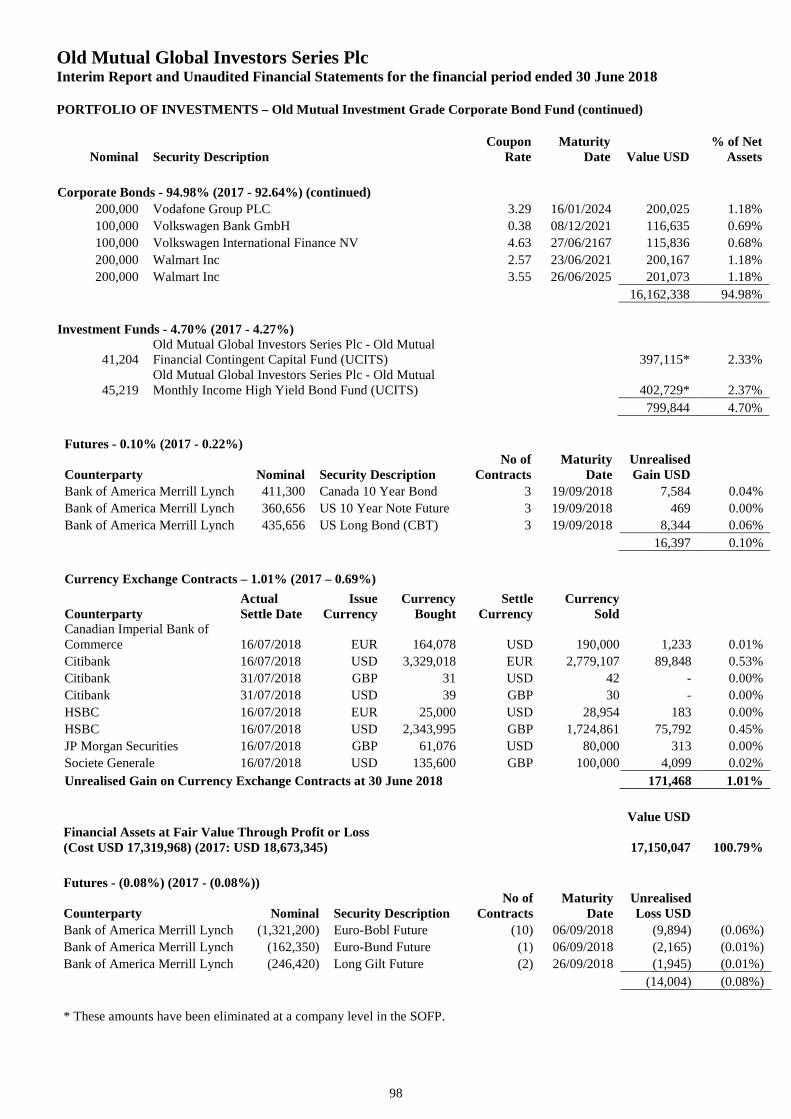
Old Mutual Global Investors Series PlcInterim Report and Unaudited Financial Statements for the financial period ended 30 June 2018
PORTFOLIO OF INVESTMENTS – Old Mutual Investment Grade Corporate Bond Fund (continued)
Nominal Security DescriptionCoupon
RateMaturity
Date Value USD% of Net
Assets
98
Corporate Bonds - 94.98% (2017 - 92.64%) (continued)
200,000 Vodafone Group PLC 3.29 16/01/2024 200,025 1.18%
100,000 Volkswagen Bank GmbH 0.38 08/12/2021 116,635 0.69%
100,000 Volkswagen International Finance NV 4.63 27/06/2167 115,836 0.68%
200,000 Walmart Inc 2.57 23/06/2021 200,167 1.18%
200,000 Walmart Inc 3.55 26/06/2025 201,073 1.18%
16,162,338 94.98%
Investment Funds - 4.70% (2017 - 4.27%)
41,204Old Mutual Global Investors Series Plc - Old MutualFinancial Contingent Capital Fund (UCITS) 397,115* 2.33%
45,219Old Mutual Global Investors Series Plc - Old MutualMonthly Income High Yield Bond Fund (UCITS) 402,729* 2.37%
799,844 4.70%
Futures - 0.10% (2017 - 0.22%)
Counterparty Nominal Security DescriptionNo of
ContractsMaturity
DateUnrealisedGain USD
Bank of America Merrill Lynch 411,300 Canada 10 Year Bond 3 19/09/2018 7,584 0.04%
Bank of America Merrill Lynch 360,656 US 10 Year Note Future 3 19/09/2018 469 0.00%
Bank of America Merrill Lynch 435,656 US Long Bond (CBT) 3 19/09/2018 8,344 0.06%
16,397 0.10%
Currency Exchange Contracts – 1.01% (2017 – 0.69%)
CounterpartyActualSettle Date
IssueCurrency
CurrencyBought
SettleCurrency
CurrencySold
Canadian Imperial Bank ofCommerce 16/07/2018 EUR 164,078 USD 190,000 1,233 0.01%
Citibank 16/07/2018 USD 3,329,018 EUR 2,779,107 89,848 0.53%
Citibank 31/07/2018 GBP 31 USD 42 - 0.00%
Citibank 31/07/2018 USD 39 GBP 30 - 0.00%
HSBC 16/07/2018 EUR 25,000 USD 28,954 183 0.00%
HSBC 16/07/2018 USD 2,343,995 GBP 1,724,861 75,792 0.45%
JP Morgan Securities 16/07/2018 GBP 61,076 USD 80,000 313 0.00%
Societe Generale 16/07/2018 USD 135,600 GBP 100,000 4,099 0.02%
Unrealised Gain on Currency Exchange Contracts at 30 June 2018 171,468 1.01%
Value USDFinancial Assets at Fair Value Through Profit or Loss(Cost USD 17,319,968) (2017: USD 18,673,345) 17,150,047 100.79%
Futures - (0.08%) (2017 - (0.08%))
Counterparty Nominal Security DescriptionNo of
ContractsMaturity
DateUnrealisedLoss USD
Bank of America Merrill Lynch (1,321,200) Euro-Bobl Future (10) 06/09/2018 (9,894) (0.06%)
Bank of America Merrill Lynch (162,350) Euro-Bund Future (1) 06/09/2018 (2,165) (0.01%)
Bank of America Merrill Lynch (246,420) Long Gilt Future (2) 26/09/2018 (1,945) (0.01%)
(14,004) (0.08%)
* These amounts have been eliminated at a company level in the SOFP.
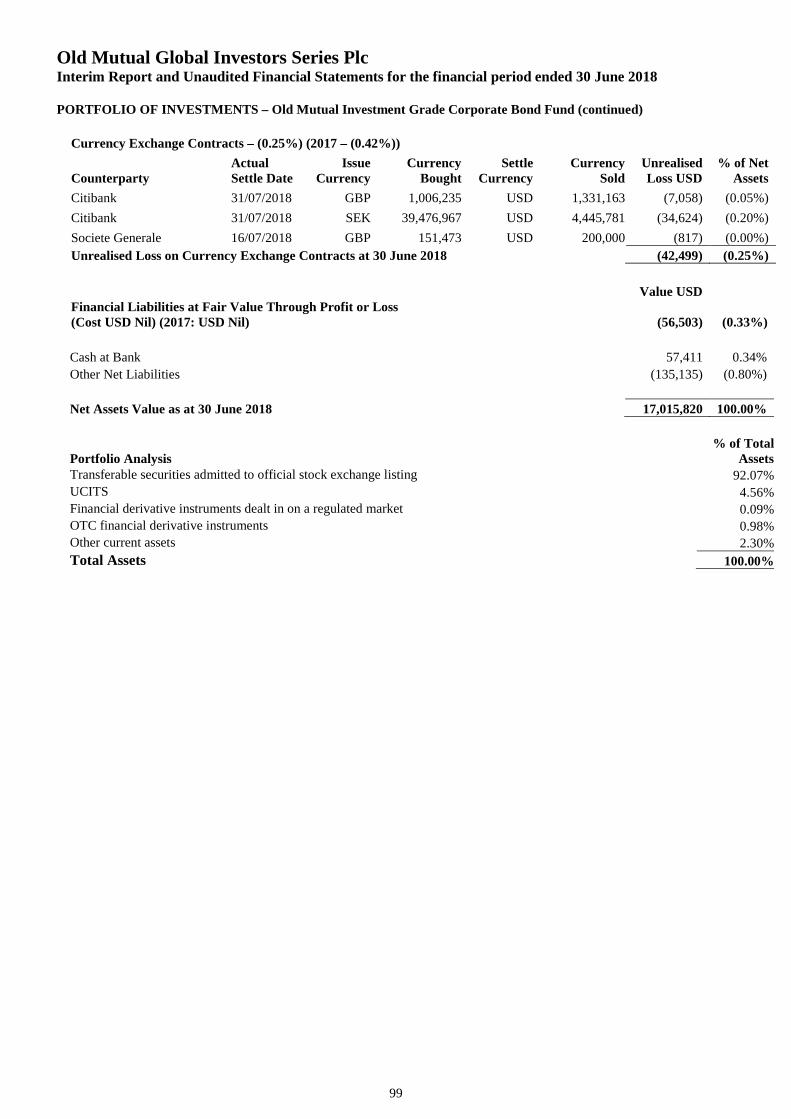
Old Mutual Global Investors Series PlcInterim Report and Unaudited Financial Statements for the financial period ended 30 June 2018
PORTFOLIO OF INVESTMENTS – Old Mutual Investment Grade Corporate Bond Fund (continued)
99
Currency Exchange Contracts – (0.25%) (2017 – (0.42%))
CounterpartyActualSettle Date
IssueCurrency
CurrencyBought
SettleCurrency
CurrencySold
UnrealisedLoss USD
% of NetAssets
Citibank 31/07/2018 GBP 1,006,235 USD 1,331,163 (7,058) (0.05%)
Citibank 31/07/2018 SEK 39,476,967 USD 4,445,781 (34,624) (0.20%)
Societe Generale 16/07/2018 GBP 151,473 USD 200,000 (817) (0.00%)
Unrealised Loss on Currency Exchange Contracts at 30 June 2018 (42,499) (0.25%)
Value USDFinancial Liabilities at Fair Value Through Profit or Loss(Cost USD Nil) (2017: USD Nil) (56,503) (0.33%)
Cash at Bank 57,411 0.34%
Other Net Liabilities (135,135) (0.80%)
Net Assets Value as at 30 June 2018 17,015,820 100.00%
Portfolio Analysis% of Total
AssetsTransferable securities admitted to official stock exchange listing 92.07%UCITS 4.56%Financial derivative instruments dealt in on a regulated market 0.09%OTC financial derivative instruments 0.98%Other current assets 2.30%
Total Assets 100.00%
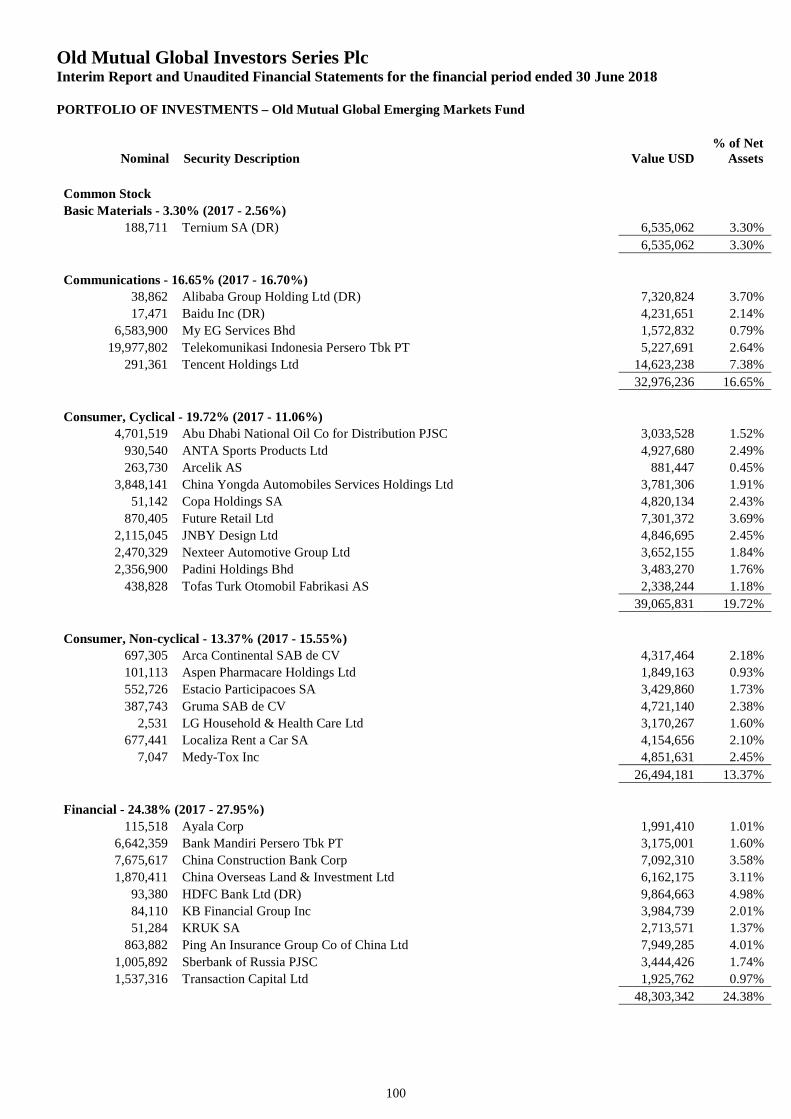
Old Mutual Global Investors Series PlcInterim Report and Unaudited Financial Statements for the financial period ended 30 June 2018
PORTFOLIO OF INVESTMENTS – Old Mutual Global Emerging Markets Fund
Nominal Security Description Value USD% of Net
Assets
100
Common Stock
Basic Materials - 3.30% (2017 - 2.56%)
188,711 Ternium SA (DR) 6,535,062 3.30%
6,535,062 3.30%
Communications - 16.65% (2017 - 16.70%)
38,862 Alibaba Group Holding Ltd (DR) 7,320,824 3.70%
17,471 Baidu Inc (DR) 4,231,651 2.14%
6,583,900 My EG Services Bhd 1,572,832 0.79%
19,977,802 Telekomunikasi Indonesia Persero Tbk PT 5,227,691 2.64%
291,361 Tencent Holdings Ltd 14,623,238 7.38%
32,976,236 16.65%
Consumer, Cyclical - 19.72% (2017 - 11.06%)
4,701,519 Abu Dhabi National Oil Co for Distribution PJSC 3,033,528 1.52%
930,540 ANTA Sports Products Ltd 4,927,680 2.49%
263,730 Arcelik AS 881,447 0.45%
3,848,141 China Yongda Automobiles Services Holdings Ltd 3,781,306 1.91%
51,142 Copa Holdings SA 4,820,134 2.43%
870,405 Future Retail Ltd 7,301,372 3.69%
2,115,045 JNBY Design Ltd 4,846,695 2.45%
2,470,329 Nexteer Automotive Group Ltd 3,652,155 1.84%
2,356,900 Padini Holdings Bhd 3,483,270 1.76%
438,828 Tofas Turk Otomobil Fabrikasi AS 2,338,244 1.18%
39,065,831 19.72%
Consumer, Non-cyclical - 13.37% (2017 - 15.55%)
697,305 Arca Continental SAB de CV 4,317,464 2.18%
101,113 Aspen Pharmacare Holdings Ltd 1,849,163 0.93%
552,726 Estacio Participacoes SA 3,429,860 1.73%
387,743 Gruma SAB de CV 4,721,140 2.38%
2,531 LG Household & Health Care Ltd 3,170,267 1.60%
677,441 Localiza Rent a Car SA 4,154,656 2.10%
7,047 Medy-Tox Inc 4,851,631 2.45%
26,494,181 13.37%
Financial - 24.38% (2017 - 27.95%)
115,518 Ayala Corp 1,991,410 1.01%
6,642,359 Bank Mandiri Persero Tbk PT 3,175,001 1.60%
7,675,617 China Construction Bank Corp 7,092,310 3.58%
1,870,411 China Overseas Land & Investment Ltd 6,162,175 3.11%
93,380 HDFC Bank Ltd (DR) 9,864,663 4.98%
84,110 KB Financial Group Inc 3,984,739 2.01%
51,284 KRUK SA 2,713,571 1.37%
863,882 Ping An Insurance Group Co of China Ltd 7,949,285 4.01%
1,005,892 Sberbank of Russia PJSC 3,444,426 1.74%
1,537,316 Transaction Capital Ltd 1,925,762 0.97%
48,303,342 24.38%
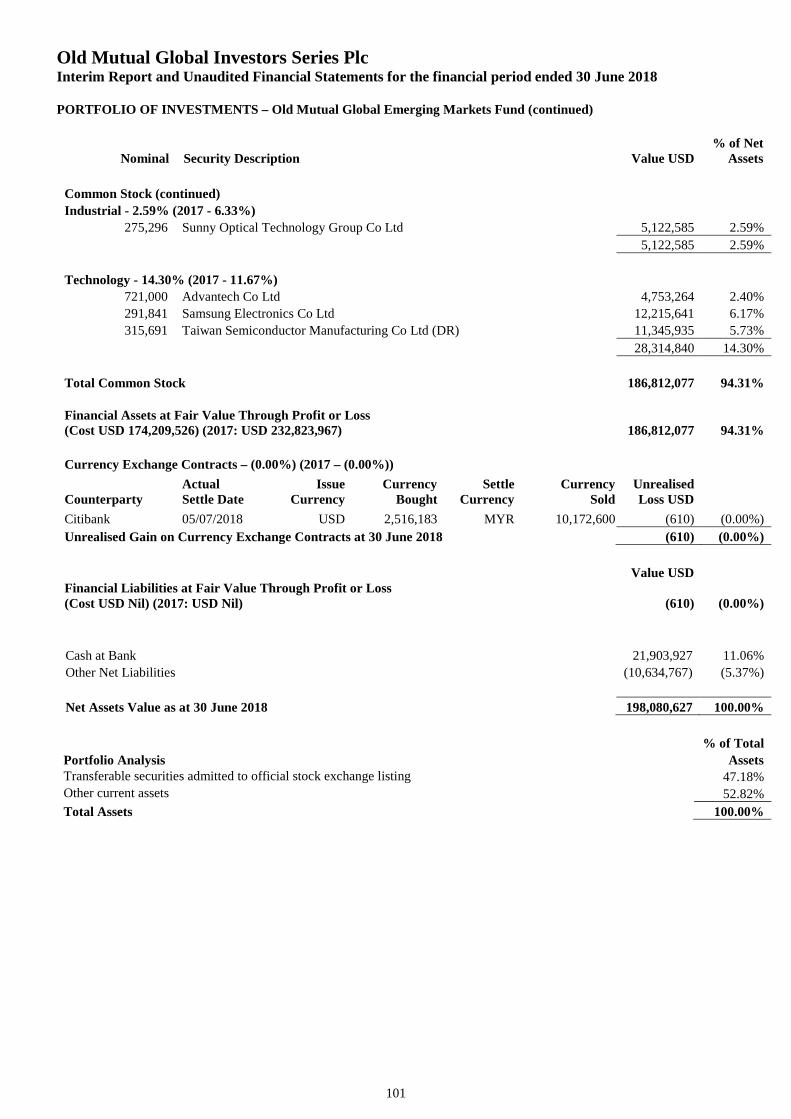
Old Mutual Global Investors Series PlcInterim Report and Unaudited Financial Statements for the financial period ended 30 June 2018
PORTFOLIO OF INVESTMENTS – Old Mutual Global Emerging Markets Fund (continued)
Nominal Security Description Value USD% of Net
Assets
101
Common Stock (continued)
Industrial - 2.59% (2017 - 6.33%)
275,296 Sunny Optical Technology Group Co Ltd 5,122,585 2.59%
5,122,585 2.59%
Technology - 14.30% (2017 - 11.67%)
721,000 Advantech Co Ltd 4,753,264 2.40%
291,841 Samsung Electronics Co Ltd 12,215,641 6.17%
315,691 Taiwan Semiconductor Manufacturing Co Ltd (DR) 11,345,935 5.73%
28,314,840 14.30%
Total Common Stock 186,812,077 94.31%
Financial Assets at Fair Value Through Profit or Loss(Cost USD 174,209,526) (2017: USD 232,823,967) 186,812,077 94.31%
Currency Exchange Contracts – (0.00%) (2017 – (0.00%))
CounterpartyActualSettle Date
IssueCurrency
CurrencyBought
SettleCurrency
CurrencySold
UnrealisedLoss USD
Citibank 05/07/2018 USD 2,516,183 MYR 10,172,600 (610) (0.00%)
Unrealised Gain on Currency Exchange Contracts at 30 June 2018 (610) (0.00%)
Value USDFinancial Liabilities at Fair Value Through Profit or Loss(Cost USD Nil) (2017: USD Nil) (610) (0.00%)
Cash at Bank 21,903,927 11.06%
Other Net Liabilities (10,634,767) (5.37%)
Net Assets Value as at 30 June 2018 198,080,627 100.00%
% of Total
Portfolio Analysis AssetsTransferable securities admitted to official stock exchange listing 47.18%Other current assets 52.82%
Total Assets 100.00%
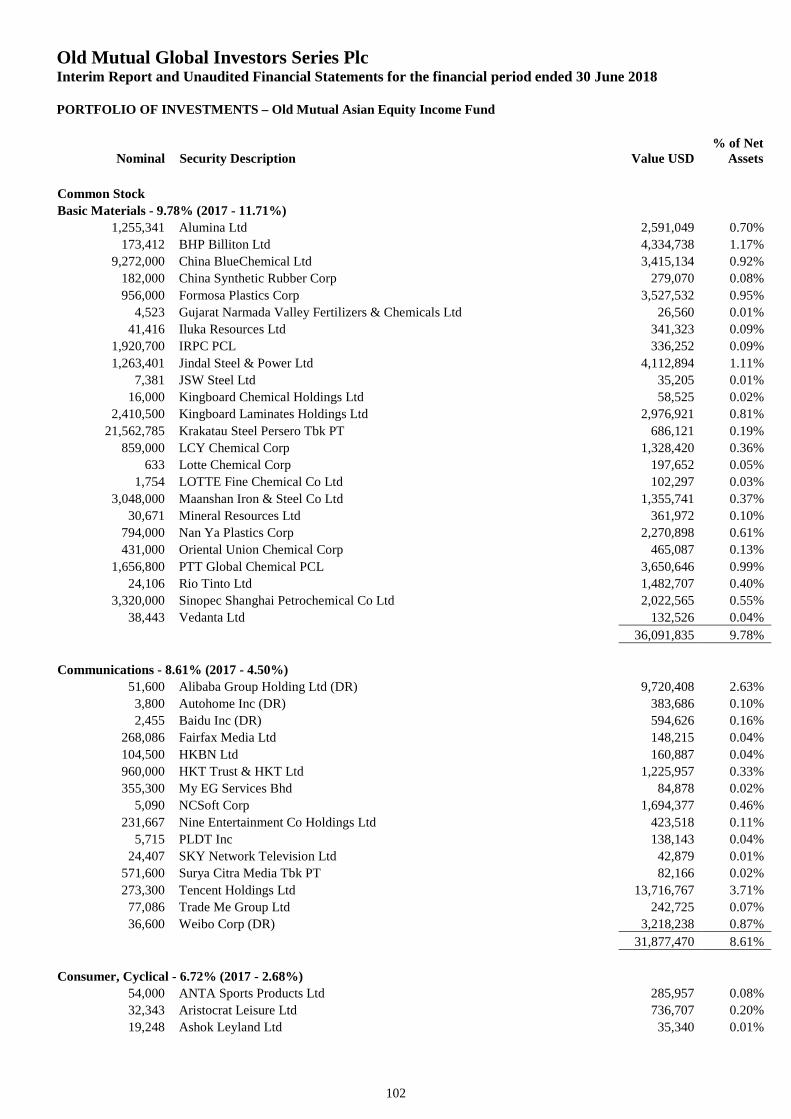
Old Mutual Global Investors Series PlcInterim Report and Unaudited Financial Statements for the financial period ended 30 June 2018
PORTFOLIO OF INVESTMENTS – Old Mutual Asian Equity Income Fund
Nominal Security Description Value USD% of Net
Assets
102
Common Stock
Basic Materials - 9.78% (2017 - 11.71%)
1,255,341 Alumina Ltd 2,591,049 0.70%
173,412 BHP Billiton Ltd 4,334,738 1.17%
9,272,000 China BlueChemical Ltd 3,415,134 0.92%
182,000 China Synthetic Rubber Corp 279,070 0.08%
956,000 Formosa Plastics Corp 3,527,532 0.95%
4,523 Gujarat Narmada Valley Fertilizers & Chemicals Ltd 26,560 0.01%
41,416 Iluka Resources Ltd 341,323 0.09%
1,920,700 IRPC PCL 336,252 0.09%
1,263,401 Jindal Steel & Power Ltd 4,112,894 1.11%
7,381 JSW Steel Ltd 35,205 0.01%
16,000 Kingboard Chemical Holdings Ltd 58,525 0.02%
2,410,500 Kingboard Laminates Holdings Ltd 2,976,921 0.81%
21,562,785 Krakatau Steel Persero Tbk PT 686,121 0.19%
859,000 LCY Chemical Corp 1,328,420 0.36%
633 Lotte Chemical Corp 197,652 0.05%
1,754 LOTTE Fine Chemical Co Ltd 102,297 0.03%
3,048,000 Maanshan Iron & Steel Co Ltd 1,355,741 0.37%
30,671 Mineral Resources Ltd 361,972 0.10%
794,000 Nan Ya Plastics Corp 2,270,898 0.61%
431,000 Oriental Union Chemical Corp 465,087 0.13%
1,656,800 PTT Global Chemical PCL 3,650,646 0.99%
24,106 Rio Tinto Ltd 1,482,707 0.40%
3,320,000 Sinopec Shanghai Petrochemical Co Ltd 2,022,565 0.55%
38,443 Vedanta Ltd 132,526 0.04%
36,091,835 9.78%
Communications - 8.61% (2017 - 4.50%)
51,600 Alibaba Group Holding Ltd (DR) 9,720,408 2.63%
3,800 Autohome Inc (DR) 383,686 0.10%
2,455 Baidu Inc (DR) 594,626 0.16%
268,086 Fairfax Media Ltd 148,215 0.04%
104,500 HKBN Ltd 160,887 0.04%
960,000 HKT Trust & HKT Ltd 1,225,957 0.33%
355,300 My EG Services Bhd 84,878 0.02%
5,090 NCSoft Corp 1,694,377 0.46%
231,667 Nine Entertainment Co Holdings Ltd 423,518 0.11%
5,715 PLDT Inc 138,143 0.04%
24,407 SKY Network Television Ltd 42,879 0.01%
571,600 Surya Citra Media Tbk PT 82,166 0.02%
273,300 Tencent Holdings Ltd 13,716,767 3.71%
77,086 Trade Me Group Ltd 242,725 0.07%
36,600 Weibo Corp (DR) 3,218,238 0.87%
31,877,470 8.61%
Consumer, Cyclical - 6.72% (2017 - 2.68%)
54,000 ANTA Sports Products Ltd 285,957 0.08%
32,343 Aristocrat Leisure Ltd 736,707 0.20%
19,248 Ashok Leyland Ltd 35,340 0.01%
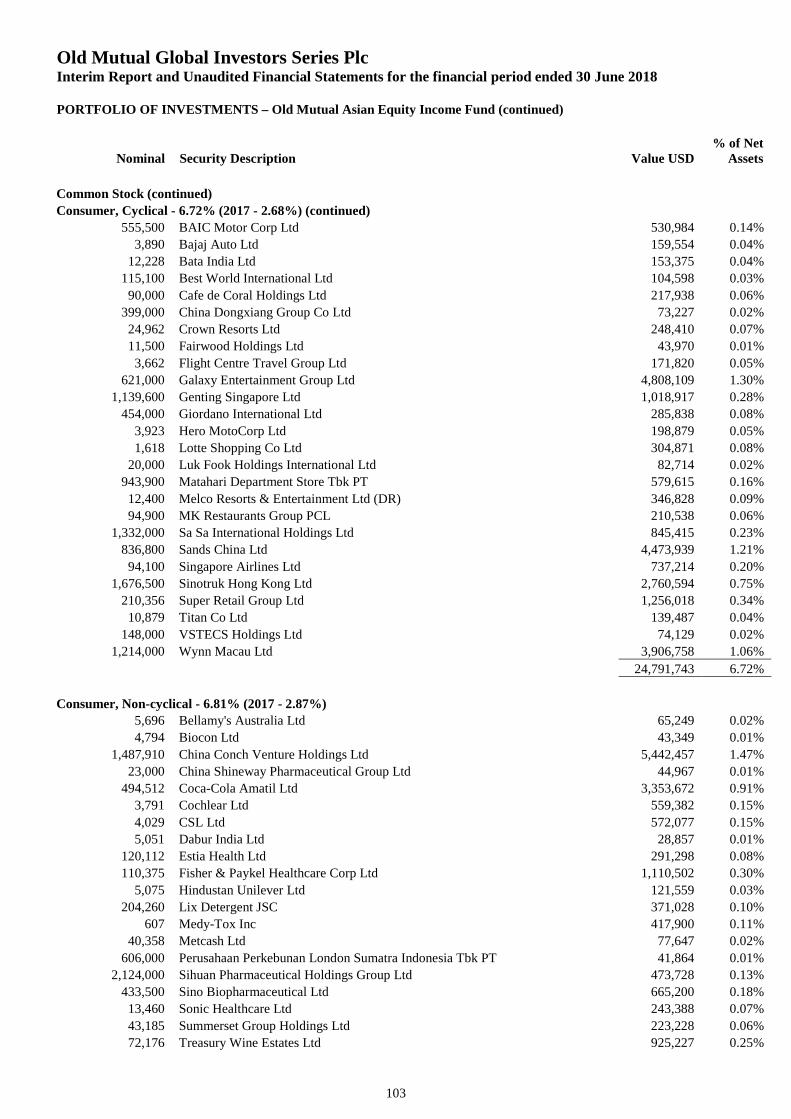
Old Mutual Global Investors Series PlcInterim Report and Unaudited Financial Statements for the financial period ended 30 June 2018
PORTFOLIO OF INVESTMENTS – Old Mutual Asian Equity Income Fund (continued)
Nominal Security Description Value USD% of Net
Assets
103
Common Stock (continued)
Consumer, Cyclical - 6.72% (2017 - 2.68%) (continued)
555,500 BAIC Motor Corp Ltd 530,984 0.14%
3,890 Bajaj Auto Ltd 159,554 0.04%
12,228 Bata India Ltd 153,375 0.04%
115,100 Best World International Ltd 104,598 0.03%
90,000 Cafe de Coral Holdings Ltd 217,938 0.06%
399,000 China Dongxiang Group Co Ltd 73,227 0.02%
24,962 Crown Resorts Ltd 248,410 0.07%
11,500 Fairwood Holdings Ltd 43,970 0.01%
3,662 Flight Centre Travel Group Ltd 171,820 0.05%
621,000 Galaxy Entertainment Group Ltd 4,808,109 1.30%
1,139,600 Genting Singapore Ltd 1,018,917 0.28%
454,000 Giordano International Ltd 285,838 0.08%
3,923 Hero MotoCorp Ltd 198,879 0.05%
1,618 Lotte Shopping Co Ltd 304,871 0.08%
20,000 Luk Fook Holdings International Ltd 82,714 0.02%
943,900 Matahari Department Store Tbk PT 579,615 0.16%
12,400 Melco Resorts & Entertainment Ltd (DR) 346,828 0.09%
94,900 MK Restaurants Group PCL 210,538 0.06%
1,332,000 Sa Sa International Holdings Ltd 845,415 0.23%
836,800 Sands China Ltd 4,473,939 1.21%
94,100 Singapore Airlines Ltd 737,214 0.20%
1,676,500 Sinotruk Hong Kong Ltd 2,760,594 0.75%
210,356 Super Retail Group Ltd 1,256,018 0.34%
10,879 Titan Co Ltd 139,487 0.04%
148,000 VSTECS Holdings Ltd 74,129 0.02%
1,214,000 Wynn Macau Ltd 3,906,758 1.06%
24,791,743 6.72%
Consumer, Non-cyclical - 6.81% (2017 - 2.87%)
5,696 Bellamy's Australia Ltd 65,249 0.02%
4,794 Biocon Ltd 43,349 0.01%
1,487,910 China Conch Venture Holdings Ltd 5,442,457 1.47%
23,000 China Shineway Pharmaceutical Group Ltd 44,967 0.01%
494,512 Coca-Cola Amatil Ltd 3,353,672 0.91%
3,791 Cochlear Ltd 559,382 0.15%
4,029 CSL Ltd 572,077 0.15%
5,051 Dabur India Ltd 28,857 0.01%
120,112 Estia Health Ltd 291,298 0.08%
110,375 Fisher & Paykel Healthcare Corp Ltd 1,110,502 0.30%
5,075 Hindustan Unilever Ltd 121,559 0.03%
204,260 Lix Detergent JSC 371,028 0.10%
607 Medy-Tox Inc 417,900 0.11%
40,358 Metcash Ltd 77,647 0.02%
606,000 Perusahaan Perkebunan London Sumatra Indonesia Tbk PT 41,864 0.01%
2,124,000 Sihuan Pharmaceutical Holdings Group Ltd 473,728 0.13%
433,500 Sino Biopharmaceutical Ltd 665,200 0.18%
13,460 Sonic Healthcare Ltd 243,388 0.07%
43,185 Summerset Group Holdings Ltd 223,228 0.06%
72,176 Treasury Wine Estates Ltd 925,227 0.25%
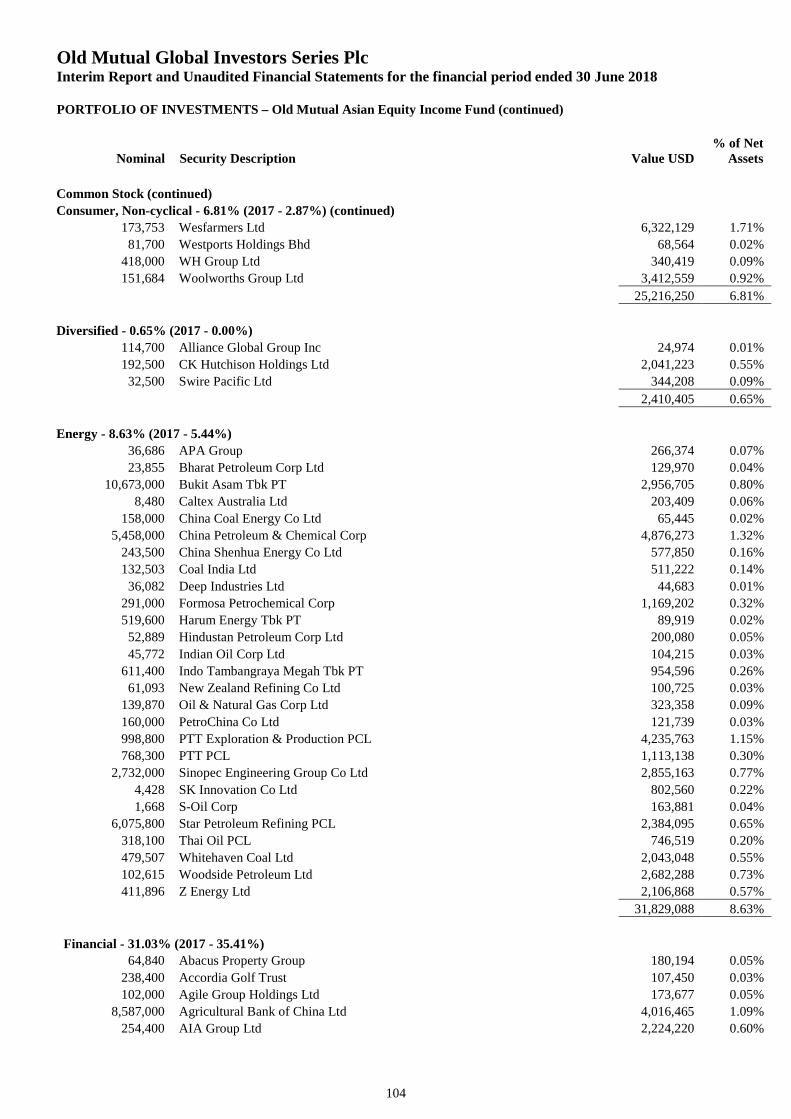
Old Mutual Global Investors Series PlcInterim Report and Unaudited Financial Statements for the financial period ended 30 June 2018
PORTFOLIO OF INVESTMENTS – Old Mutual Asian Equity Income Fund (continued)
Nominal Security Description Value USD% of Net
Assets
104
Common Stock (continued)
Consumer, Non-cyclical - 6.81% (2017 - 2.87%) (continued)
173,753 Wesfarmers Ltd 6,322,129 1.71%
81,700 Westports Holdings Bhd 68,564 0.02%
418,000 WH Group Ltd 340,419 0.09%
151,684 Woolworths Group Ltd 3,412,559 0.92%
25,216,250 6.81%
Diversified - 0.65% (2017 - 0.00%)
114,700 Alliance Global Group Inc 24,974 0.01%
192,500 CK Hutchison Holdings Ltd 2,041,223 0.55%
32,500 Swire Pacific Ltd 344,208 0.09%
2,410,405 0.65%
Energy - 8.63% (2017 - 5.44%)
36,686 APA Group 266,374 0.07%
23,855 Bharat Petroleum Corp Ltd 129,970 0.04%
10,673,000 Bukit Asam Tbk PT 2,956,705 0.80%
8,480 Caltex Australia Ltd 203,409 0.06%
158,000 China Coal Energy Co Ltd 65,445 0.02%
5,458,000 China Petroleum & Chemical Corp 4,876,273 1.32%
243,500 China Shenhua Energy Co Ltd 577,850 0.16%
132,503 Coal India Ltd 511,222 0.14%
36,082 Deep Industries Ltd 44,683 0.01%
291,000 Formosa Petrochemical Corp 1,169,202 0.32%
519,600 Harum Energy Tbk PT 89,919 0.02%
52,889 Hindustan Petroleum Corp Ltd 200,080 0.05%
45,772 Indian Oil Corp Ltd 104,215 0.03%
611,400 Indo Tambangraya Megah Tbk PT 954,596 0.26%
61,093 New Zealand Refining Co Ltd 100,725 0.03%
139,870 Oil & Natural Gas Corp Ltd 323,358 0.09%
160,000 PetroChina Co Ltd 121,739 0.03%
998,800 PTT Exploration & Production PCL 4,235,763 1.15%
768,300 PTT PCL 1,113,138 0.30%
2,732,000 Sinopec Engineering Group Co Ltd 2,855,163 0.77%
4,428 SK Innovation Co Ltd 802,560 0.22%
1,668 S-Oil Corp 163,881 0.04%
6,075,800 Star Petroleum Refining PCL 2,384,095 0.65%
318,100 Thai Oil PCL 746,519 0.20%
479,507 Whitehaven Coal Ltd 2,043,048 0.55%
102,615 Woodside Petroleum Ltd 2,682,288 0.73%
411,896 Z Energy Ltd 2,106,868 0.57%
31,829,088 8.63%
Financial - 31.03% (2017 - 35.41%)
64,840 Abacus Property Group 180,194 0.05%
238,400 Accordia Golf Trust 107,450 0.03%
102,000 Agile Group Holdings Ltd 173,677 0.05%
8,587,000 Agricultural Bank of China Ltd 4,016,465 1.09%
254,400 AIA Group Ltd 2,224,220 0.60%
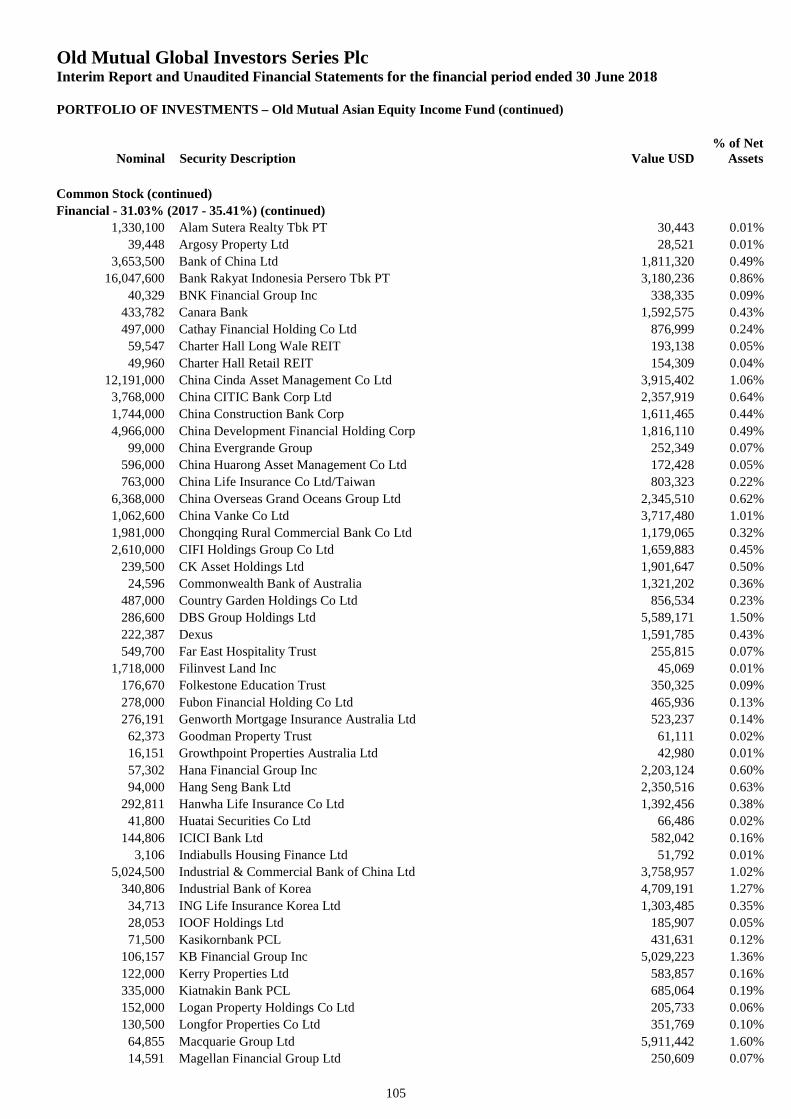
Old Mutual Global Investors Series PlcInterim Report and Unaudited Financial Statements for the financial period ended 30 June 2018
PORTFOLIO OF INVESTMENTS – Old Mutual Asian Equity Income Fund (continued)
Nominal Security Description Value USD% of Net
Assets
105
Common Stock (continued)
Financial - 31.03% (2017 - 35.41%) (continued)
1,330,100 Alam Sutera Realty Tbk PT 30,443 0.01%
39,448 Argosy Property Ltd 28,521 0.01%
3,653,500 Bank of China Ltd 1,811,320 0.49%
16,047,600 Bank Rakyat Indonesia Persero Tbk PT 3,180,236 0.86%
40,329 BNK Financial Group Inc 338,335 0.09%
433,782 Canara Bank 1,592,575 0.43%
497,000 Cathay Financial Holding Co Ltd 876,999 0.24%
59,547 Charter Hall Long Wale REIT 193,138 0.05%
49,960 Charter Hall Retail REIT 154,309 0.04%
12,191,000 China Cinda Asset Management Co Ltd 3,915,402 1.06%
3,768,000 China CITIC Bank Corp Ltd 2,357,919 0.64%
1,744,000 China Construction Bank Corp 1,611,465 0.44%
4,966,000 China Development Financial Holding Corp 1,816,110 0.49%
99,000 China Evergrande Group 252,349 0.07%
596,000 China Huarong Asset Management Co Ltd 172,428 0.05%
763,000 China Life Insurance Co Ltd/Taiwan 803,323 0.22%
6,368,000 China Overseas Grand Oceans Group Ltd 2,345,510 0.62%
1,062,600 China Vanke Co Ltd 3,717,480 1.01%
1,981,000 Chongqing Rural Commercial Bank Co Ltd 1,179,065 0.32%
2,610,000 CIFI Holdings Group Co Ltd 1,659,883 0.45%
239,500 CK Asset Holdings Ltd 1,901,647 0.50%
24,596 Commonwealth Bank of Australia 1,321,202 0.36%
487,000 Country Garden Holdings Co Ltd 856,534 0.23%
286,600 DBS Group Holdings Ltd 5,589,171 1.50%
222,387 Dexus 1,591,785 0.43%
549,700 Far East Hospitality Trust 255,815 0.07%
1,718,000 Filinvest Land Inc 45,069 0.01%
176,670 Folkestone Education Trust 350,325 0.09%
278,000 Fubon Financial Holding Co Ltd 465,936 0.13%
276,191 Genworth Mortgage Insurance Australia Ltd 523,237 0.14%
62,373 Goodman Property Trust 61,111 0.02%
16,151 Growthpoint Properties Australia Ltd 42,980 0.01%
57,302 Hana Financial Group Inc 2,203,124 0.60%
94,000 Hang Seng Bank Ltd 2,350,516 0.63%
292,811 Hanwha Life Insurance Co Ltd 1,392,456 0.38%
41,800 Huatai Securities Co Ltd 66,486 0.02%
144,806 ICICI Bank Ltd 582,042 0.16%
3,106 Indiabulls Housing Finance Ltd 51,792 0.01%
5,024,500 Industrial & Commercial Bank of China Ltd 3,758,957 1.02%
340,806 Industrial Bank of Korea 4,709,191 1.27%
34,713 ING Life Insurance Korea Ltd 1,303,485 0.35%
28,053 IOOF Holdings Ltd 185,907 0.05%
71,500 Kasikornbank PCL 431,631 0.12%
106,157 KB Financial Group Inc 5,029,223 1.36%
122,000 Kerry Properties Ltd 583,857 0.16%
335,000 Kiatnakin Bank PCL 685,064 0.19%
152,000 Logan Property Holdings Co Ltd 205,733 0.06%
130,500 Longfor Properties Co Ltd 351,769 0.10%
64,855 Macquarie Group Ltd 5,911,442 1.60%
14,591 Magellan Financial Group Ltd 250,609 0.07%
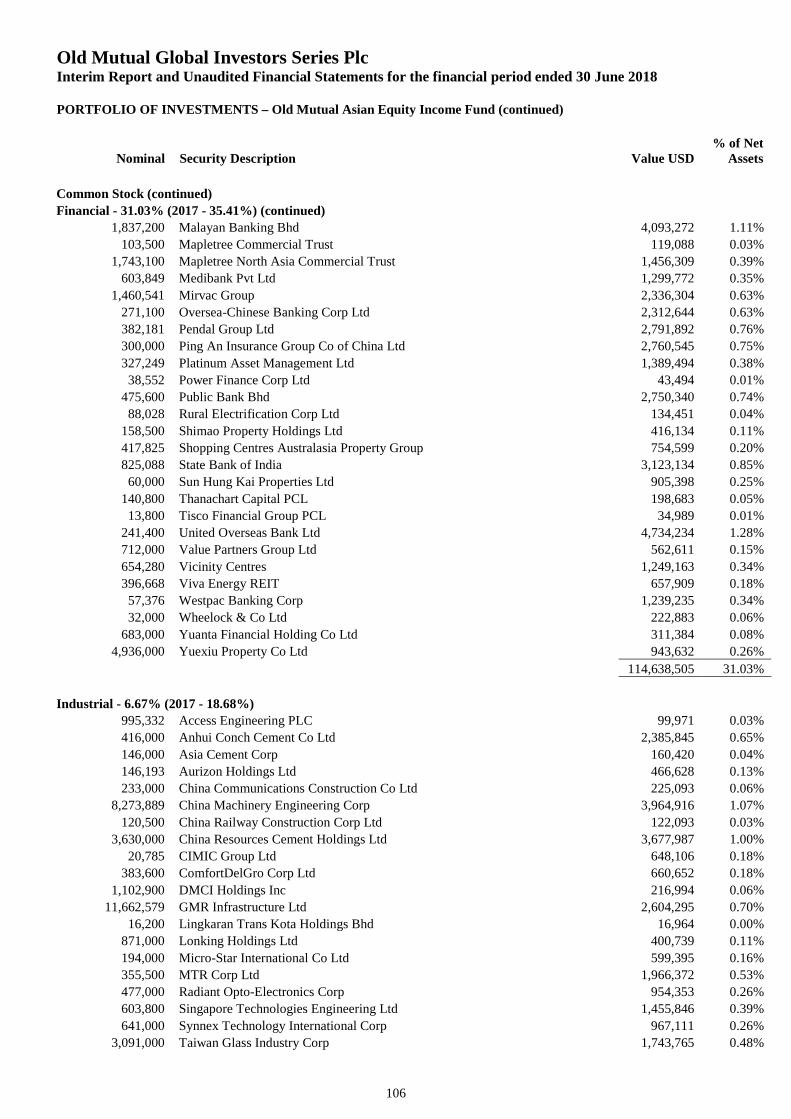
Old Mutual Global Investors Series PlcInterim Report and Unaudited Financial Statements for the financial period ended 30 June 2018
PORTFOLIO OF INVESTMENTS – Old Mutual Asian Equity Income Fund (continued)
Nominal Security Description Value USD% of Net
Assets
106
Common Stock (continued)
Financial - 31.03% (2017 - 35.41%) (continued)
1,837,200 Malayan Banking Bhd 4,093,272 1.11%
103,500 Mapletree Commercial Trust 119,088 0.03%
1,743,100 Mapletree North Asia Commercial Trust 1,456,309 0.39%
603,849 Medibank Pvt Ltd 1,299,772 0.35%
1,460,541 Mirvac Group 2,336,304 0.63%
271,100 Oversea-Chinese Banking Corp Ltd 2,312,644 0.63%
382,181 Pendal Group Ltd 2,791,892 0.76%
300,000 Ping An Insurance Group Co of China Ltd 2,760,545 0.75%
327,249 Platinum Asset Management Ltd 1,389,494 0.38%
38,552 Power Finance Corp Ltd 43,494 0.01%
475,600 Public Bank Bhd 2,750,340 0.74%
88,028 Rural Electrification Corp Ltd 134,451 0.04%
158,500 Shimao Property Holdings Ltd 416,134 0.11%
417,825 Shopping Centres Australasia Property Group 754,599 0.20%
825,088 State Bank of India 3,123,134 0.85%
60,000 Sun Hung Kai Properties Ltd 905,398 0.25%
140,800 Thanachart Capital PCL 198,683 0.05%
13,800 Tisco Financial Group PCL 34,989 0.01%
241,400 United Overseas Bank Ltd 4,734,234 1.28%
712,000 Value Partners Group Ltd 562,611 0.15%
654,280 Vicinity Centres 1,249,163 0.34%
396,668 Viva Energy REIT 657,909 0.18%
57,376 Westpac Banking Corp 1,239,235 0.34%
32,000 Wheelock & Co Ltd 222,883 0.06%
683,000 Yuanta Financial Holding Co Ltd 311,384 0.08%
4,936,000 Yuexiu Property Co Ltd 943,632 0.26%
114,638,505 31.03%
Industrial - 6.67% (2017 - 18.68%)
995,332 Access Engineering PLC 99,971 0.03%
416,000 Anhui Conch Cement Co Ltd 2,385,845 0.65%
146,000 Asia Cement Corp 160,420 0.04%
146,193 Aurizon Holdings Ltd 466,628 0.13%
233,000 China Communications Construction Co Ltd 225,093 0.06%
8,273,889 China Machinery Engineering Corp 3,964,916 1.07%
120,500 China Railway Construction Corp Ltd 122,093 0.03%
3,630,000 China Resources Cement Holdings Ltd 3,677,987 1.00%
20,785 CIMIC Group Ltd 648,106 0.18%
383,600 ComfortDelGro Corp Ltd 660,652 0.18%
1,102,900 DMCI Holdings Inc 216,994 0.06%
11,662,579 GMR Infrastructure Ltd 2,604,295 0.70%
16,200 Lingkaran Trans Kota Holdings Bhd 16,964 0.00%
871,000 Lonking Holdings Ltd 400,739 0.11%
194,000 Micro-Star International Co Ltd 599,395 0.16%
355,500 MTR Corp Ltd 1,966,372 0.53%
477,000 Radiant Opto-Electronics Corp 954,353 0.26%
603,800 Singapore Technologies Engineering Ltd 1,455,846 0.39%
641,000 Synnex Technology International Corp 967,111 0.26%
3,091,000 Taiwan Glass Industry Corp 1,743,765 0.48%
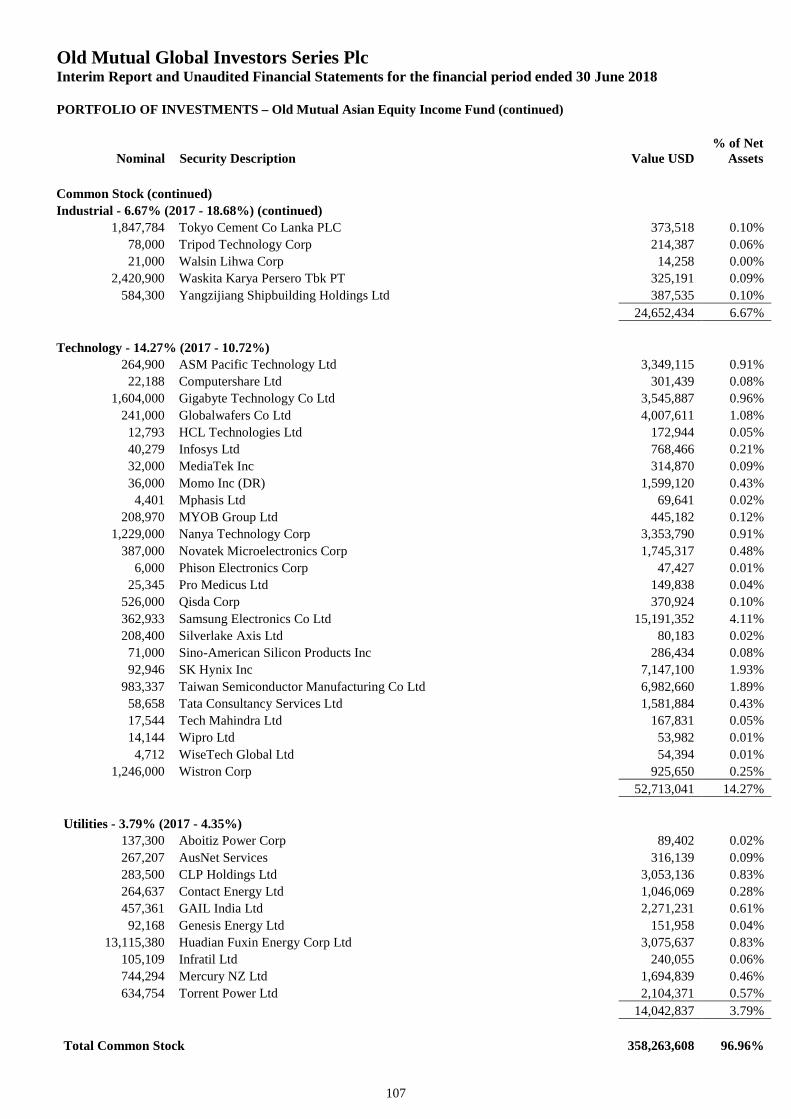
Old Mutual Global Investors Series PlcInterim Report and Unaudited Financial Statements for the financial period ended 30 June 2018
PORTFOLIO OF INVESTMENTS – Old Mutual Asian Equity Income Fund (continued)
Nominal Security Description Value USD% of Net
Assets
107
Common Stock (continued)
Industrial - 6.67% (2017 - 18.68%) (continued)
1,847,784 Tokyo Cement Co Lanka PLC 373,518 0.10%
78,000 Tripod Technology Corp 214,387 0.06%
21,000 Walsin Lihwa Corp 14,258 0.00%
2,420,900 Waskita Karya Persero Tbk PT 325,191 0.09%
584,300 Yangzijiang Shipbuilding Holdings Ltd 387,535 0.10%
24,652,434 6.67%
Technology - 14.27% (2017 - 10.72%)
264,900 ASM Pacific Technology Ltd 3,349,115 0.91%
22,188 Computershare Ltd 301,439 0.08%
1,604,000 Gigabyte Technology Co Ltd 3,545,887 0.96%
241,000 Globalwafers Co Ltd 4,007,611 1.08%
12,793 HCL Technologies Ltd 172,944 0.05%
40,279 Infosys Ltd 768,466 0.21%
32,000 MediaTek Inc 314,870 0.09%
36,000 Momo Inc (DR) 1,599,120 0.43%
4,401 Mphasis Ltd 69,641 0.02%
208,970 MYOB Group Ltd 445,182 0.12%
1,229,000 Nanya Technology Corp 3,353,790 0.91%
387,000 Novatek Microelectronics Corp 1,745,317 0.48%
6,000 Phison Electronics Corp 47,427 0.01%
25,345 Pro Medicus Ltd 149,838 0.04%
526,000 Qisda Corp 370,924 0.10%
362,933 Samsung Electronics Co Ltd 15,191,352 4.11%
208,400 Silverlake Axis Ltd 80,183 0.02%
71,000 Sino-American Silicon Products Inc 286,434 0.08%
92,946 SK Hynix Inc 7,147,100 1.93%
983,337 Taiwan Semiconductor Manufacturing Co Ltd 6,982,660 1.89%
58,658 Tata Consultancy Services Ltd 1,581,884 0.43%
17,544 Tech Mahindra Ltd 167,831 0.05%
14,144 Wipro Ltd 53,982 0.01%
4,712 WiseTech Global Ltd 54,394 0.01%
1,246,000 Wistron Corp 925,650 0.25%
52,713,041 14.27%
Utilities - 3.79% (2017 - 4.35%)
137,300 Aboitiz Power Corp 89,402 0.02%
267,207 AusNet Services 316,139 0.09%
283,500 CLP Holdings Ltd 3,053,136 0.83%
264,637 Contact Energy Ltd 1,046,069 0.28%
457,361 GAIL India Ltd 2,271,231 0.61%
92,168 Genesis Energy Ltd 151,958 0.04%
13,115,380 Huadian Fuxin Energy Corp Ltd 3,075,637 0.83%
105,109 Infratil Ltd 240,055 0.06%
744,294 Mercury NZ Ltd 1,694,839 0.46%
634,754 Torrent Power Ltd 2,104,371 0.57%
14,042,837 3.79%
Total Common Stock 358,263,608 96.96%
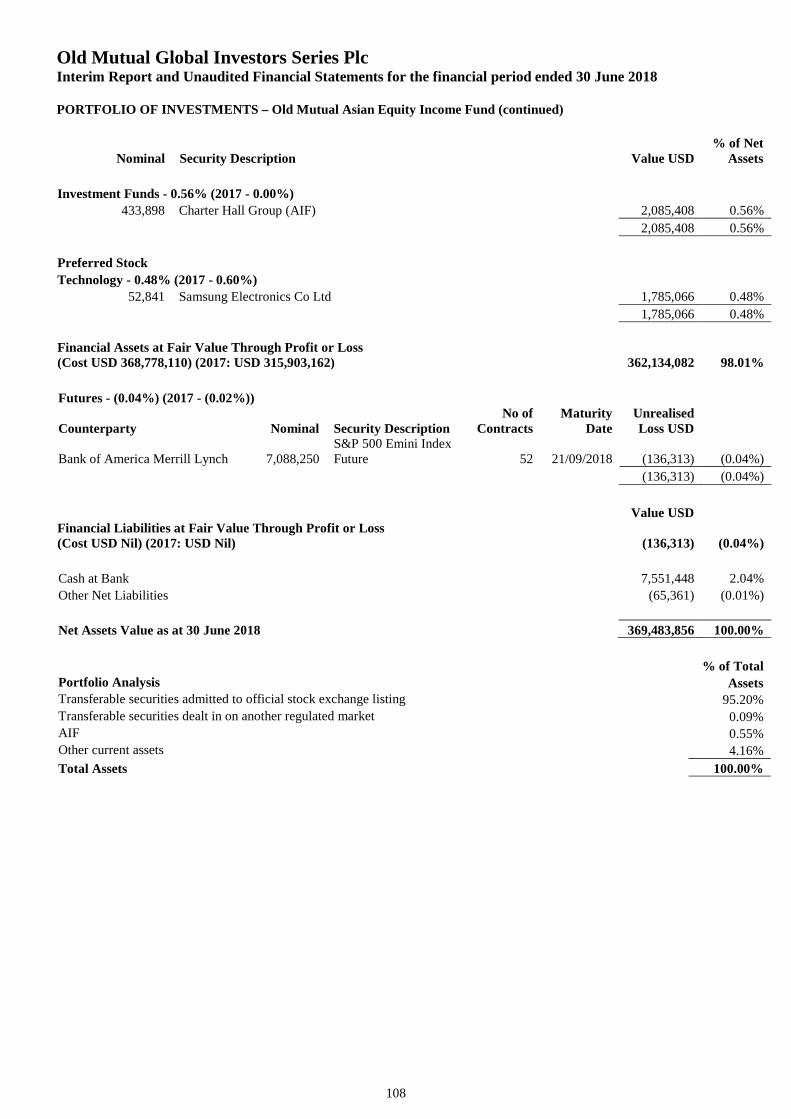
Old Mutual Global Investors Series PlcInterim Report and Unaudited Financial Statements for the financial period ended 30 June 2018
PORTFOLIO OF INVESTMENTS – Old Mutual Asian Equity Income Fund (continued)
Nominal Security Description Value USD% of Net
Assets
108
Investment Funds - 0.56% (2017 - 0.00%)
433,898 Charter Hall Group (AIF) 2,085,408 0.56%
2,085,408 0.56%
Preferred Stock
Technology - 0.48% (2017 - 0.60%)
52,841 Samsung Electronics Co Ltd 1,785,066 0.48%
1,785,066 0.48%
Financial Assets at Fair Value Through Profit or Loss(Cost USD 368,778,110) (2017: USD 315,903,162) 362,134,082 98.01%
Futures - (0.04%) (2017 - (0.02%))
Counterparty Nominal Security DescriptionNo of
ContractsMaturity
DateUnrealisedLoss USD
Bank of America Merrill Lynch 7,088,250S&P 500 Emini IndexFuture 52 21/09/2018 (136,313) (0.04%)
(136,313) (0.04%)
Value USDFinancial Liabilities at Fair Value Through Profit or Loss(Cost USD Nil) (2017: USD Nil) (136,313) (0.04%)
Cash at Bank 7,551,448 2.04%
Other Net Liabilities (65,361) (0.01%)
Net Assets Value as at 30 June 2018 369,483,856 100.00%
% of TotalPortfolio Analysis AssetsTransferable securities admitted to official stock exchange listing 95.20%Transferable securities dealt in on another regulated market 0.09%AIF 0.55%Other current assets 4.16%
Total Assets 100.00%
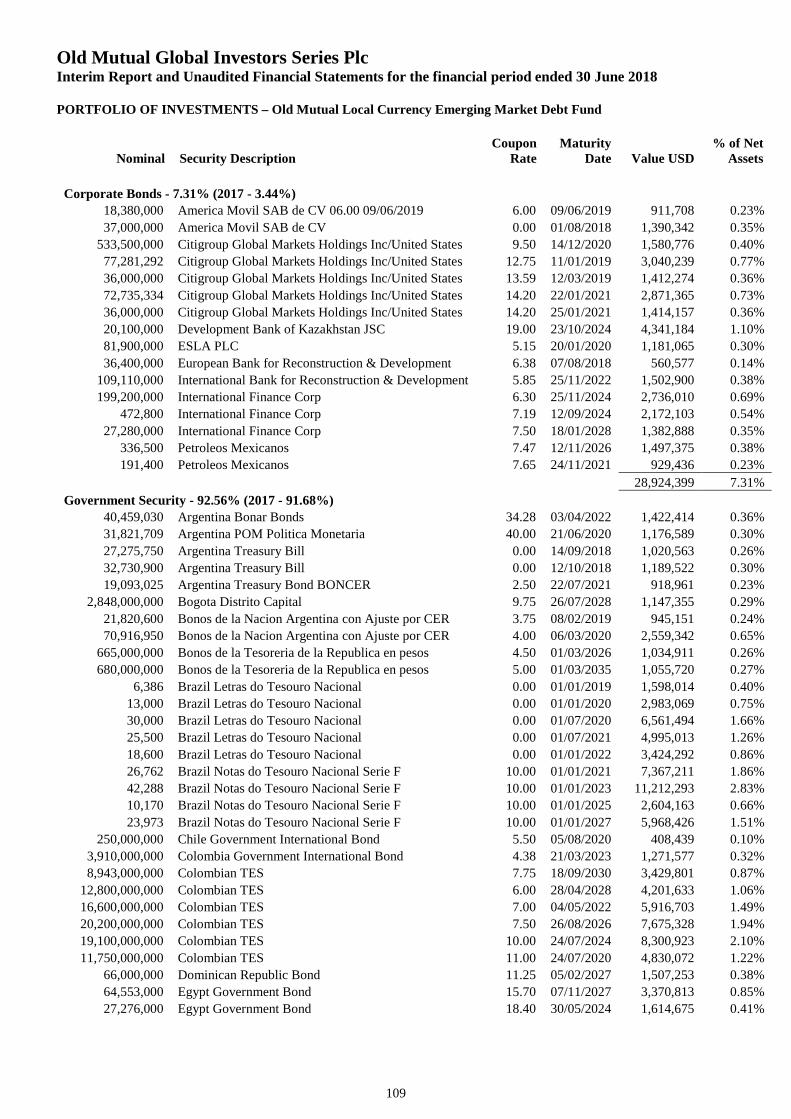
Old Mutual Global Investors Series PlcInterim Report and Unaudited Financial Statements for the financial period ended 30 June 2018
PORTFOLIO OF INVESTMENTS – Old Mutual Local Currency Emerging Market Debt Fund
Nominal Security DescriptionCoupon
RateMaturity
Date Value USD% of Net
Assets
109
Corporate Bonds - 7.31% (2017 - 3.44%)
18,380,000 America Movil SAB de CV 06.00 09/06/2019 6.00 09/06/2019 911,708 0.23%
37,000,000 America Movil SAB de CV 0.00 01/08/2018 1,390,342 0.35%
533,500,000 Citigroup Global Markets Holdings Inc/United States 9.50 14/12/2020 1,580,776 0.40%
77,281,292 Citigroup Global Markets Holdings Inc/United States 12.75 11/01/2019 3,040,239 0.77%
36,000,000 Citigroup Global Markets Holdings Inc/United States 13.59 12/03/2019 1,412,274 0.36%
72,735,334 Citigroup Global Markets Holdings Inc/United States 14.20 22/01/2021 2,871,365 0.73%
36,000,000 Citigroup Global Markets Holdings Inc/United States 14.20 25/01/2021 1,414,157 0.36%
20,100,000 Development Bank of Kazakhstan JSC 19.00 23/10/2024 4,341,184 1.10%
81,900,000 ESLA PLC 5.15 20/01/2020 1,181,065 0.30%
36,400,000 European Bank for Reconstruction & Development 6.38 07/08/2018 560,577 0.14%
109,110,000 International Bank for Reconstruction & Development 5.85 25/11/2022 1,502,900 0.38%
199,200,000 International Finance Corp 6.30 25/11/2024 2,736,010 0.69%
472,800 International Finance Corp 7.19 12/09/2024 2,172,103 0.54%
27,280,000 International Finance Corp 7.50 18/01/2028 1,382,888 0.35%
336,500 Petroleos Mexicanos 7.47 12/11/2026 1,497,375 0.38%
191,400 Petroleos Mexicanos 7.65 24/11/2021 929,436 0.23%
28,924,399 7.31%
Government Security - 92.56% (2017 - 91.68%)
40,459,030 Argentina Bonar Bonds 34.28 03/04/2022 1,422,414 0.36%
31,821,709 Argentina POM Politica Monetaria 40.00 21/06/2020 1,176,589 0.30%
27,275,750 Argentina Treasury Bill 0.00 14/09/2018 1,020,563 0.26%
32,730,900 Argentina Treasury Bill 0.00 12/10/2018 1,189,522 0.30%
19,093,025 Argentina Treasury Bond BONCER 2.50 22/07/2021 918,961 0.23%
2,848,000,000 Bogota Distrito Capital 9.75 26/07/2028 1,147,355 0.29%
21,820,600 Bonos de la Nacion Argentina con Ajuste por CER 3.75 08/02/2019 945,151 0.24%
70,916,950 Bonos de la Nacion Argentina con Ajuste por CER 4.00 06/03/2020 2,559,342 0.65%
665,000,000 Bonos de la Tesoreria de la Republica en pesos 4.50 01/03/2026 1,034,911 0.26%
680,000,000 Bonos de la Tesoreria de la Republica en pesos 5.00 01/03/2035 1,055,720 0.27%
6,386 Brazil Letras do Tesouro Nacional 0.00 01/01/2019 1,598,014 0.40%
13,000 Brazil Letras do Tesouro Nacional 0.00 01/01/2020 2,983,069 0.75%
30,000 Brazil Letras do Tesouro Nacional 0.00 01/07/2020 6,561,494 1.66%
25,500 Brazil Letras do Tesouro Nacional 0.00 01/07/2021 4,995,013 1.26%
18,600 Brazil Letras do Tesouro Nacional 0.00 01/01/2022 3,424,292 0.86%
26,762 Brazil Notas do Tesouro Nacional Serie F 10.00 01/01/2021 7,367,211 1.86%
42,288 Brazil Notas do Tesouro Nacional Serie F 10.00 01/01/2023 11,212,293 2.83%
10,170 Brazil Notas do Tesouro Nacional Serie F 10.00 01/01/2025 2,604,163 0.66%
23,973 Brazil Notas do Tesouro Nacional Serie F 10.00 01/01/2027 5,968,426 1.51%
250,000,000 Chile Government International Bond 5.50 05/08/2020 408,439 0.10%
3,910,000,000 Colombia Government International Bond 4.38 21/03/2023 1,271,577 0.32%
8,943,000,000 Colombian TES 7.75 18/09/2030 3,429,801 0.87%
12,800,000,000 Colombian TES 6.00 28/04/2028 4,201,633 1.06%
16,600,000,000 Colombian TES 7.00 04/05/2022 5,916,703 1.49%
20,200,000,000 Colombian TES 7.50 26/08/2026 7,675,328 1.94%
19,100,000,000 Colombian TES 10.00 24/07/2024 8,300,923 2.10%
11,750,000,000 Colombian TES 11.00 24/07/2020 4,830,072 1.22%
66,000,000 Dominican Republic Bond 11.25 05/02/2027 1,507,253 0.38%
64,553,000 Egypt Government Bond 15.70 07/11/2027 3,370,813 0.85%
27,276,000 Egypt Government Bond 18.40 30/05/2024 1,614,675 0.41%
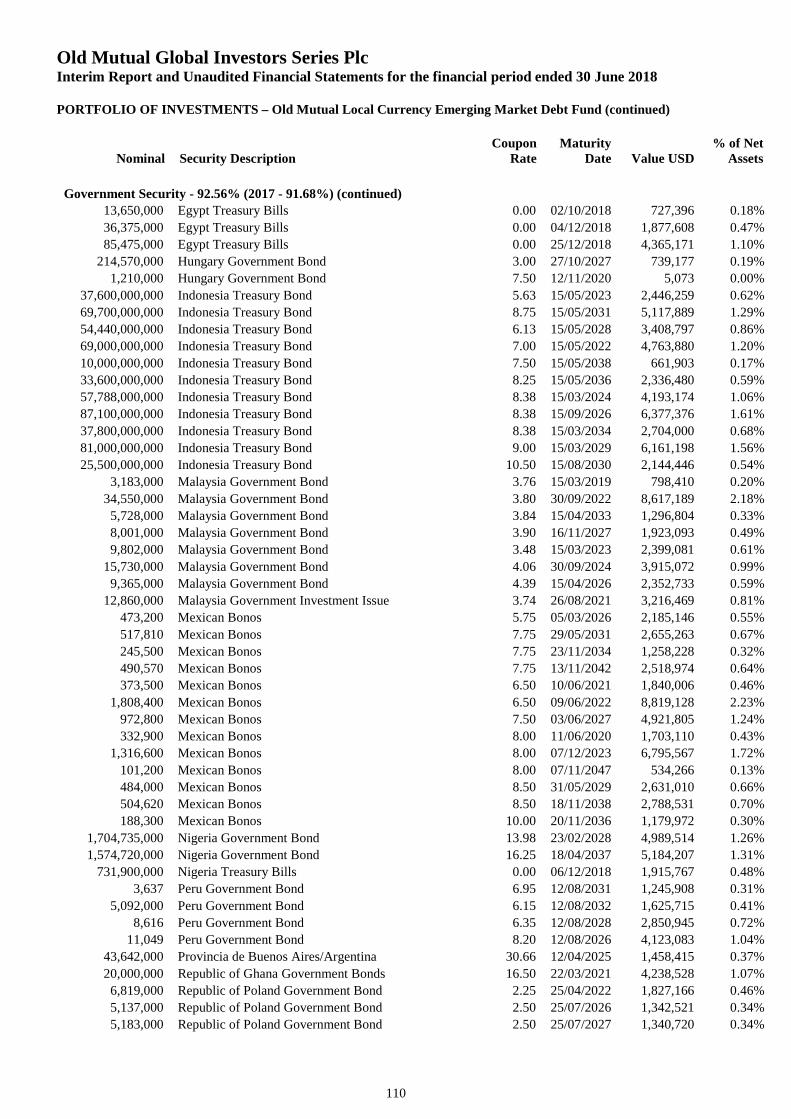
Old Mutual Global Investors Series PlcInterim Report and Unaudited Financial Statements for the financial period ended 30 June 2018
PORTFOLIO OF INVESTMENTS – Old Mutual Local Currency Emerging Market Debt Fund (continued)
Nominal Security DescriptionCoupon
RateMaturity
Date Value USD% of Net
Assets
110
Government Security - 92.56% (2017 - 91.68%) (continued)
13,650,000 Egypt Treasury Bills 0.00 02/10/2018 727,396 0.18%
36,375,000 Egypt Treasury Bills 0.00 04/12/2018 1,877,608 0.47%
85,475,000 Egypt Treasury Bills 0.00 25/12/2018 4,365,171 1.10%
214,570,000 Hungary Government Bond 3.00 27/10/2027 739,177 0.19%
1,210,000 Hungary Government Bond 7.50 12/11/2020 5,073 0.00%
37,600,000,000 Indonesia Treasury Bond 5.63 15/05/2023 2,446,259 0.62%
69,700,000,000 Indonesia Treasury Bond 8.75 15/05/2031 5,117,889 1.29%
54,440,000,000 Indonesia Treasury Bond 6.13 15/05/2028 3,408,797 0.86%
69,000,000,000 Indonesia Treasury Bond 7.00 15/05/2022 4,763,880 1.20%
10,000,000,000 Indonesia Treasury Bond 7.50 15/05/2038 661,903 0.17%
33,600,000,000 Indonesia Treasury Bond 8.25 15/05/2036 2,336,480 0.59%
57,788,000,000 Indonesia Treasury Bond 8.38 15/03/2024 4,193,174 1.06%
87,100,000,000 Indonesia Treasury Bond 8.38 15/09/2026 6,377,376 1.61%
37,800,000,000 Indonesia Treasury Bond 8.38 15/03/2034 2,704,000 0.68%
81,000,000,000 Indonesia Treasury Bond 9.00 15/03/2029 6,161,198 1.56%
25,500,000,000 Indonesia Treasury Bond 10.50 15/08/2030 2,144,446 0.54%
3,183,000 Malaysia Government Bond 3.76 15/03/2019 798,410 0.20%
34,550,000 Malaysia Government Bond 3.80 30/09/2022 8,617,189 2.18%
5,728,000 Malaysia Government Bond 3.84 15/04/2033 1,296,804 0.33%
8,001,000 Malaysia Government Bond 3.90 16/11/2027 1,923,093 0.49%
9,802,000 Malaysia Government Bond 3.48 15/03/2023 2,399,081 0.61%
15,730,000 Malaysia Government Bond 4.06 30/09/2024 3,915,072 0.99%
9,365,000 Malaysia Government Bond 4.39 15/04/2026 2,352,733 0.59%
12,860,000 Malaysia Government Investment Issue 3.74 26/08/2021 3,216,469 0.81%
473,200 Mexican Bonos 5.75 05/03/2026 2,185,146 0.55%
517,810 Mexican Bonos 7.75 29/05/2031 2,655,263 0.67%
245,500 Mexican Bonos 7.75 23/11/2034 1,258,228 0.32%
490,570 Mexican Bonos 7.75 13/11/2042 2,518,974 0.64%
373,500 Mexican Bonos 6.50 10/06/2021 1,840,006 0.46%
1,808,400 Mexican Bonos 6.50 09/06/2022 8,819,128 2.23%
972,800 Mexican Bonos 7.50 03/06/2027 4,921,805 1.24%
332,900 Mexican Bonos 8.00 11/06/2020 1,703,110 0.43%
1,316,600 Mexican Bonos 8.00 07/12/2023 6,795,567 1.72%
101,200 Mexican Bonos 8.00 07/11/2047 534,266 0.13%
484,000 Mexican Bonos 8.50 31/05/2029 2,631,010 0.66%
504,620 Mexican Bonos 8.50 18/11/2038 2,788,531 0.70%
188,300 Mexican Bonos 10.00 20/11/2036 1,179,972 0.30%
1,704,735,000 Nigeria Government Bond 13.98 23/02/2028 4,989,514 1.26%
1,574,720,000 Nigeria Government Bond 16.25 18/04/2037 5,184,207 1.31%
731,900,000 Nigeria Treasury Bills 0.00 06/12/2018 1,915,767 0.48%
3,637 Peru Government Bond 6.95 12/08/2031 1,245,908 0.31%
5,092,000 Peru Government Bond 6.15 12/08/2032 1,625,715 0.41%
8,616 Peru Government Bond 6.35 12/08/2028 2,850,945 0.72%
11,049 Peru Government Bond 8.20 12/08/2026 4,123,083 1.04%
43,642,000 Provincia de Buenos Aires/Argentina 30.66 12/04/2025 1,458,415 0.37%
20,000,000 Republic of Ghana Government Bonds 16.50 22/03/2021 4,238,528 1.07%
6,819,000 Republic of Poland Government Bond 2.25 25/04/2022 1,827,166 0.46%
5,137,000 Republic of Poland Government Bond 2.50 25/07/2026 1,342,521 0.34%
5,183,000 Republic of Poland Government Bond 2.50 25/07/2027 1,340,720 0.34%
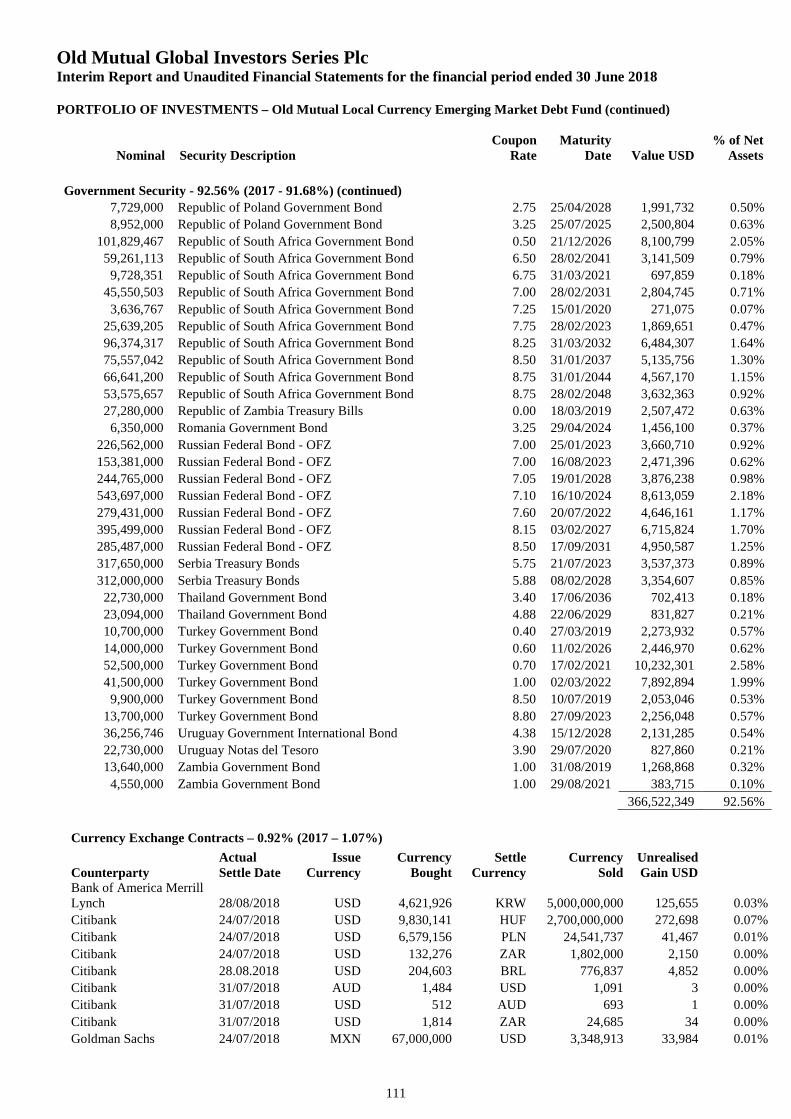
Old Mutual Global Investors Series PlcInterim Report and Unaudited Financial Statements for the financial period ended 30 June 2018
PORTFOLIO OF INVESTMENTS – Old Mutual Local Currency Emerging Market Debt Fund (continued)
Nominal Security DescriptionCoupon
RateMaturity
Date Value USD% of Net
Assets
111
Government Security - 92.56% (2017 - 91.68%) (continued)
7,729,000 Republic of Poland Government Bond 2.75 25/04/2028 1,991,732 0.50%
8,952,000 Republic of Poland Government Bond 3.25 25/07/2025 2,500,804 0.63%
101,829,467 Republic of South Africa Government Bond 0.50 21/12/2026 8,100,799 2.05%
59,261,113 Republic of South Africa Government Bond 6.50 28/02/2041 3,141,509 0.79%
9,728,351 Republic of South Africa Government Bond 6.75 31/03/2021 697,859 0.18%
45,550,503 Republic of South Africa Government Bond 7.00 28/02/2031 2,804,745 0.71%
3,636,767 Republic of South Africa Government Bond 7.25 15/01/2020 271,075 0.07%
25,639,205 Republic of South Africa Government Bond 7.75 28/02/2023 1,869,651 0.47%
96,374,317 Republic of South Africa Government Bond 8.25 31/03/2032 6,484,307 1.64%
75,557,042 Republic of South Africa Government Bond 8.50 31/01/2037 5,135,756 1.30%
66,641,200 Republic of South Africa Government Bond 8.75 31/01/2044 4,567,170 1.15%
53,575,657 Republic of South Africa Government Bond 8.75 28/02/2048 3,632,363 0.92%
27,280,000 Republic of Zambia Treasury Bills 0.00 18/03/2019 2,507,472 0.63%
6,350,000 Romania Government Bond 3.25 29/04/2024 1,456,100 0.37%
226,562,000 Russian Federal Bond - OFZ 7.00 25/01/2023 3,660,710 0.92%
153,381,000 Russian Federal Bond - OFZ 7.00 16/08/2023 2,471,396 0.62%
244,765,000 Russian Federal Bond - OFZ 7.05 19/01/2028 3,876,238 0.98%
543,697,000 Russian Federal Bond - OFZ 7.10 16/10/2024 8,613,059 2.18%
279,431,000 Russian Federal Bond - OFZ 7.60 20/07/2022 4,646,161 1.17%
395,499,000 Russian Federal Bond - OFZ 8.15 03/02/2027 6,715,824 1.70%
285,487,000 Russian Federal Bond - OFZ 8.50 17/09/2031 4,950,587 1.25%
317,650,000 Serbia Treasury Bonds 5.75 21/07/2023 3,537,373 0.89%
312,000,000 Serbia Treasury Bonds 5.88 08/02/2028 3,354,607 0.85%
22,730,000 Thailand Government Bond 3.40 17/06/2036 702,413 0.18%
23,094,000 Thailand Government Bond 4.88 22/06/2029 831,827 0.21%
10,700,000 Turkey Government Bond 0.40 27/03/2019 2,273,932 0.57%
14,000,000 Turkey Government Bond 0.60 11/02/2026 2,446,970 0.62%
52,500,000 Turkey Government Bond 0.70 17/02/2021 10,232,301 2.58%
41,500,000 Turkey Government Bond 1.00 02/03/2022 7,892,894 1.99%
9,900,000 Turkey Government Bond 8.50 10/07/2019 2,053,046 0.53%
13,700,000 Turkey Government Bond 8.80 27/09/2023 2,256,048 0.57%
36,256,746 Uruguay Government International Bond 4.38 15/12/2028 2,131,285 0.54%
22,730,000 Uruguay Notas del Tesoro 3.90 29/07/2020 827,860 0.21%
13,640,000 Zambia Government Bond 1.00 31/08/2019 1,268,868 0.32%
4,550,000 Zambia Government Bond 1.00 29/08/2021 383,715 0.10%
366,522,349 92.56%
Currency Exchange Contracts – 0.92% (2017 – 1.07%)
CounterpartyActualSettle Date
IssueCurrency
CurrencyBought
SettleCurrency
CurrencySold
UnrealisedGain USD
Bank of America MerrillLynch 28/08/2018 USD 4,621,926 KRW 5,000,000,000 125,655 0.03%
Citibank 24/07/2018 USD 9,830,141 HUF 2,700,000,000 272,698 0.07%
Citibank 24/07/2018 USD 6,579,156 PLN 24,541,737 41,467 0.01%
Citibank 24/07/2018 USD 132,276 ZAR 1,802,000 2,150 0.00%
Citibank 28.08.2018 USD 204,603 BRL 776,837 4,852 0.00%
Citibank 31/07/2018 AUD 1,484 USD 1,091 3 0.00%
Citibank 31/07/2018 USD 512 AUD 693 1 0.00%
Citibank 31/07/2018 USD 1,814 ZAR 24,685 34 0.00%
Goldman Sachs 24/07/2018 MXN 67,000,000 USD 3,348,913 33,984 0.01%
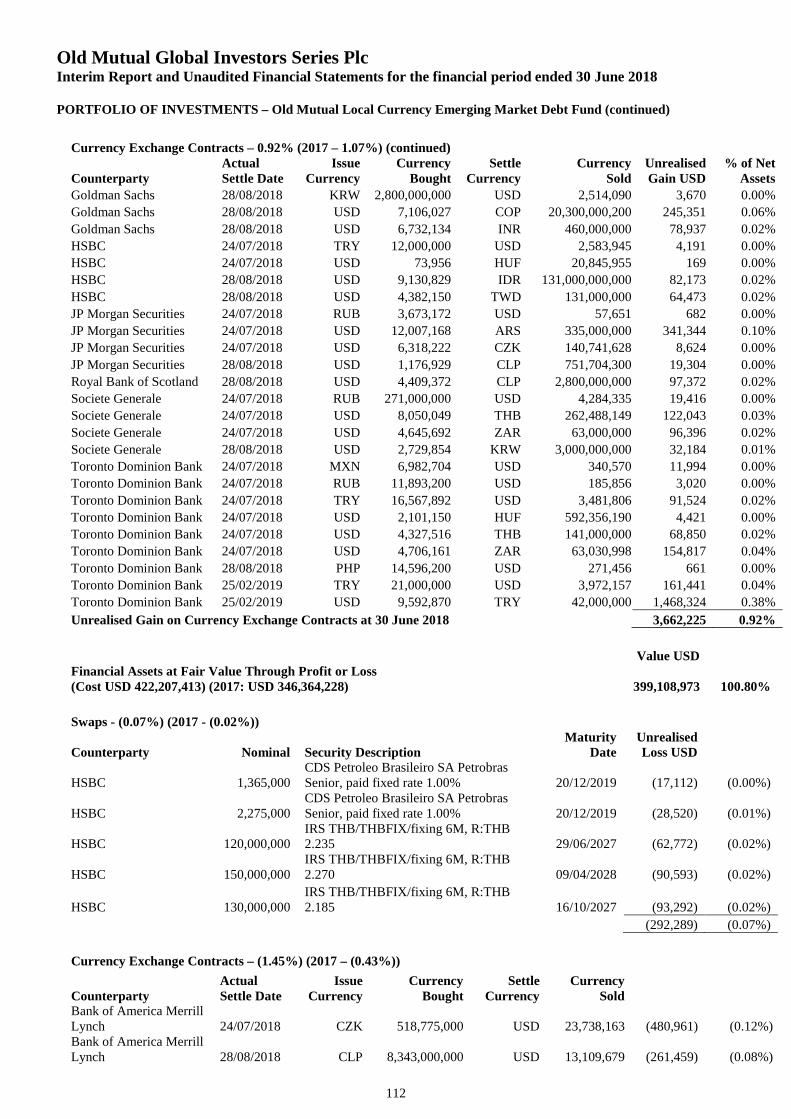
Old Mutual Global Investors Series PlcInterim Report and Unaudited Financial Statements for the financial period ended 30 June 2018
PORTFOLIO OF INVESTMENTS – Old Mutual Local Currency Emerging Market Debt Fund (continued)
112
Currency Exchange Contracts – 0.92% (2017 – 1.07%) (continued)
CounterpartyActualSettle Date
IssueCurrency
CurrencyBought
SettleCurrency
CurrencySold
UnrealisedGain USD
% of NetAssets
Goldman Sachs 28/08/2018 KRW 2,800,000,000 USD 2,514,090 3,670 0.00%
Goldman Sachs 28/08/2018 USD 7,106,027 COP 20,300,000,200 245,351 0.06%
Goldman Sachs 28/08/2018 USD 6,732,134 INR 460,000,000 78,937 0.02%
HSBC 24/07/2018 TRY 12,000,000 USD 2,583,945 4,191 0.00%
HSBC 24/07/2018 USD 73,956 HUF 20,845,955 169 0.00%
HSBC 28/08/2018 USD 9,130,829 IDR 131,000,000,000 82,173 0.02%
HSBC 28/08/2018 USD 4,382,150 TWD 131,000,000 64,473 0.02%
JP Morgan Securities 24/07/2018 RUB 3,673,172 USD 57,651 682 0.00%
JP Morgan Securities 24/07/2018 USD 12,007,168 ARS 335,000,000 341,344 0.10%
JP Morgan Securities 24/07/2018 USD 6,318,222 CZK 140,741,628 8,624 0.00%
JP Morgan Securities 28/08/2018 USD 1,176,929 CLP 751,704,300 19,304 0.00%
Royal Bank of Scotland 28/08/2018 USD 4,409,372 CLP 2,800,000,000 97,372 0.02%
Societe Generale 24/07/2018 RUB 271,000,000 USD 4,284,335 19,416 0.00%
Societe Generale 24/07/2018 USD 8,050,049 THB 262,488,149 122,043 0.03%
Societe Generale 24/07/2018 USD 4,645,692 ZAR 63,000,000 96,396 0.02%
Societe Generale 28/08/2018 USD 2,729,854 KRW 3,000,000,000 32,184 0.01%
Toronto Dominion Bank 24/07/2018 MXN 6,982,704 USD 340,570 11,994 0.00%
Toronto Dominion Bank 24/07/2018 RUB 11,893,200 USD 185,856 3,020 0.00%
Toronto Dominion Bank 24/07/2018 TRY 16,567,892 USD 3,481,806 91,524 0.02%
Toronto Dominion Bank 24/07/2018 USD 2,101,150 HUF 592,356,190 4,421 0.00%
Toronto Dominion Bank 24/07/2018 USD 4,327,516 THB 141,000,000 68,850 0.02%
Toronto Dominion Bank 24/07/2018 USD 4,706,161 ZAR 63,030,998 154,817 0.04%
Toronto Dominion Bank 28/08/2018 PHP 14,596,200 USD 271,456 661 0.00%
Toronto Dominion Bank 25/02/2019 TRY 21,000,000 USD 3,972,157 161,441 0.04%
Toronto Dominion Bank 25/02/2019 USD 9,592,870 TRY 42,000,000 1,468,324 0.38%
Unrealised Gain on Currency Exchange Contracts at 30 June 2018 3,662,225 0.92%
Value USDFinancial Assets at Fair Value Through Profit or Loss(Cost USD 422,207,413) (2017: USD 346,364,228) 399,108,973 100.80%
Swaps - (0.07%) (2017 - (0.02%))
Counterparty Nominal Security DescriptionMaturity
DateUnrealisedLoss USD
HSBC 1,365,000CDS Petroleo Brasileiro SA PetrobrasSenior, paid fixed rate 1.00% 20/12/2019 (17,112) (0.00%)
HSBC 2,275,000CDS Petroleo Brasileiro SA PetrobrasSenior, paid fixed rate 1.00% 20/12/2019 (28,520) (0.01%)
HSBC 120,000,000IRS THB/THBFIX/fixing 6M, R:THB2.235 29/06/2027 (62,772) (0.02%)
HSBC 150,000,000IRS THB/THBFIX/fixing 6M, R:THB2.270 09/04/2028 (90,593) (0.02%)
HSBC 130,000,000IRS THB/THBFIX/fixing 6M, R:THB2.185 16/10/2027 (93,292) (0.02%)
(292,289) (0.07%)
Currency Exchange Contracts – (1.45%) (2017 – (0.43%))
CounterpartyActualSettle Date
IssueCurrency
CurrencyBought
SettleCurrency
CurrencySold
Bank of America MerrillLynch 24/07/2018 CZK 518,775,000 USD 23,738,163 (480,961) (0.12%)Bank of America MerrillLynch 28/08/2018 CLP 8,343,000,000 USD 13,109,679 (261,459) (0.08%)
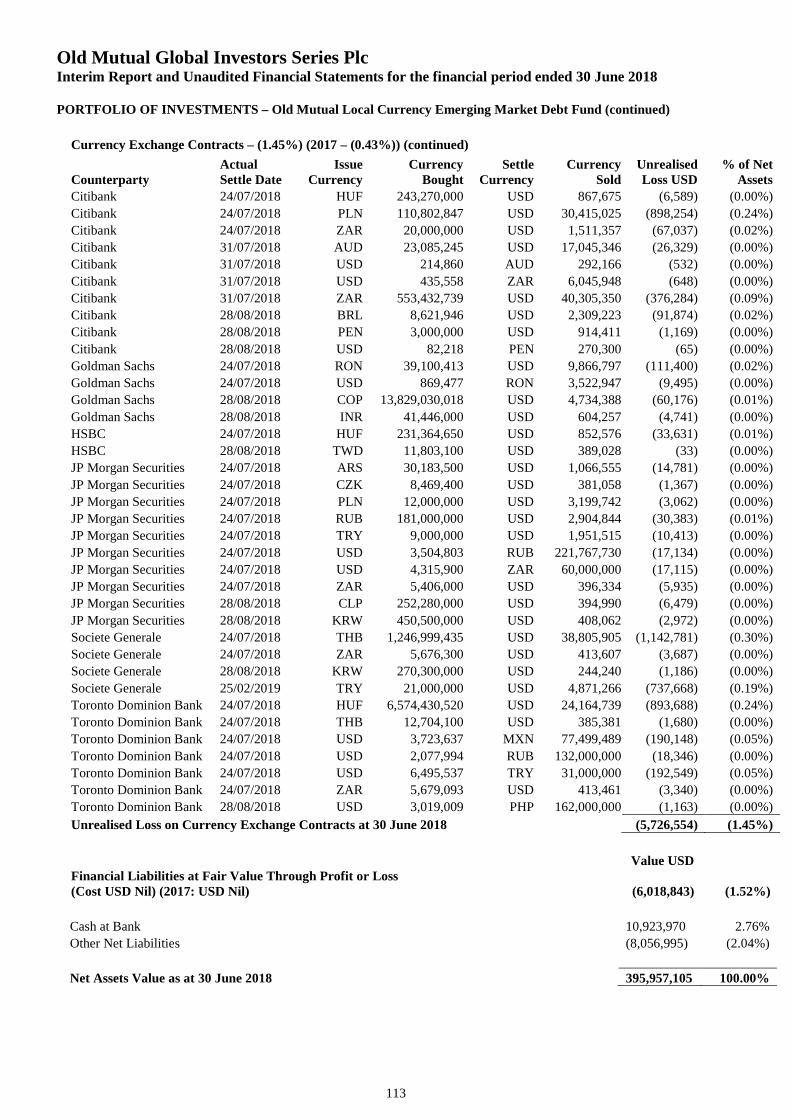
Old Mutual Global Investors Series PlcInterim Report and Unaudited Financial Statements for the financial period ended 30 June 2018
PORTFOLIO OF INVESTMENTS – Old Mutual Local Currency Emerging Market Debt Fund (continued)
113
Currency Exchange Contracts – (1.45%) (2017 – (0.43%)) (continued)
CounterpartyActualSettle Date
IssueCurrency
CurrencyBought
SettleCurrency
CurrencySold
UnrealisedLoss USD
% of NetAssets
Citibank 24/07/2018 HUF 243,270,000 USD 867,675 (6,589) (0.00%)
Citibank 24/07/2018 PLN 110,802,847 USD 30,415,025 (898,254) (0.24%)
Citibank 24/07/2018 ZAR 20,000,000 USD 1,511,357 (67,037) (0.02%)
Citibank 31/07/2018 AUD 23,085,245 USD 17,045,346 (26,329) (0.00%)
Citibank 31/07/2018 USD 214,860 AUD 292,166 (532) (0.00%)
Citibank 31/07/2018 USD 435,558 ZAR 6,045,948 (648) (0.00%)
Citibank 31/07/2018 ZAR 553,432,739 USD 40,305,350 (376,284) (0.09%)
Citibank 28/08/2018 BRL 8,621,946 USD 2,309,223 (91,874) (0.02%)
Citibank 28/08/2018 PEN 3,000,000 USD 914,411 (1,169) (0.00%)
Citibank 28/08/2018 USD 82,218 PEN 270,300 (65) (0.00%)
Goldman Sachs 24/07/2018 RON 39,100,413 USD 9,866,797 (111,400) (0.02%)
Goldman Sachs 24/07/2018 USD 869,477 RON 3,522,947 (9,495) (0.00%)
Goldman Sachs 28/08/2018 COP 13,829,030,018 USD 4,734,388 (60,176) (0.01%)
Goldman Sachs 28/08/2018 INR 41,446,000 USD 604,257 (4,741) (0.00%)
HSBC 24/07/2018 HUF 231,364,650 USD 852,576 (33,631) (0.01%)
HSBC 28/08/2018 TWD 11,803,100 USD 389,028 (33) (0.00%)
JP Morgan Securities 24/07/2018 ARS 30,183,500 USD 1,066,555 (14,781) (0.00%)
JP Morgan Securities 24/07/2018 CZK 8,469,400 USD 381,058 (1,367) (0.00%)
JP Morgan Securities 24/07/2018 PLN 12,000,000 USD 3,199,742 (3,062) (0.00%)
JP Morgan Securities 24/07/2018 RUB 181,000,000 USD 2,904,844 (30,383) (0.01%)
JP Morgan Securities 24/07/2018 TRY 9,000,000 USD 1,951,515 (10,413) (0.00%)
JP Morgan Securities 24/07/2018 USD 3,504,803 RUB 221,767,730 (17,134) (0.00%)
JP Morgan Securities 24/07/2018 USD 4,315,900 ZAR 60,000,000 (17,115) (0.00%)
JP Morgan Securities 24/07/2018 ZAR 5,406,000 USD 396,334 (5,935) (0.00%)
JP Morgan Securities 28/08/2018 CLP 252,280,000 USD 394,990 (6,479) (0.00%)
JP Morgan Securities 28/08/2018 KRW 450,500,000 USD 408,062 (2,972) (0.00%)
Societe Generale 24/07/2018 THB 1,246,999,435 USD 38,805,905 (1,142,781) (0.30%)
Societe Generale 24/07/2018 ZAR 5,676,300 USD 413,607 (3,687) (0.00%)
Societe Generale 28/08/2018 KRW 270,300,000 USD 244,240 (1,186) (0.00%)
Societe Generale 25/02/2019 TRY 21,000,000 USD 4,871,266 (737,668) (0.19%)
Toronto Dominion Bank 24/07/2018 HUF 6,574,430,520 USD 24,164,739 (893,688) (0.24%)
Toronto Dominion Bank 24/07/2018 THB 12,704,100 USD 385,381 (1,680) (0.00%)
Toronto Dominion Bank 24/07/2018 USD 3,723,637 MXN 77,499,489 (190,148) (0.05%)
Toronto Dominion Bank 24/07/2018 USD 2,077,994 RUB 132,000,000 (18,346) (0.00%)
Toronto Dominion Bank 24/07/2018 USD 6,495,537 TRY 31,000,000 (192,549) (0.05%)
Toronto Dominion Bank 24/07/2018 ZAR 5,679,093 USD 413,461 (3,340) (0.00%)
Toronto Dominion Bank 28/08/2018 USD 3,019,009 PHP 162,000,000 (1,163) (0.00%)
Unrealised Loss on Currency Exchange Contracts at 30 June 2018 (5,726,554) (1.45%)
Value USDFinancial Liabilities at Fair Value Through Profit or Loss(Cost USD Nil) (2017: USD Nil) (6,018,843) (1.52%)
Cash at Bank 10,923,970 2.76%
Other Net Liabilities (8,056,995) (2.04%)
Net Assets Value as at 30 June 2018 395,957,105 100.00%
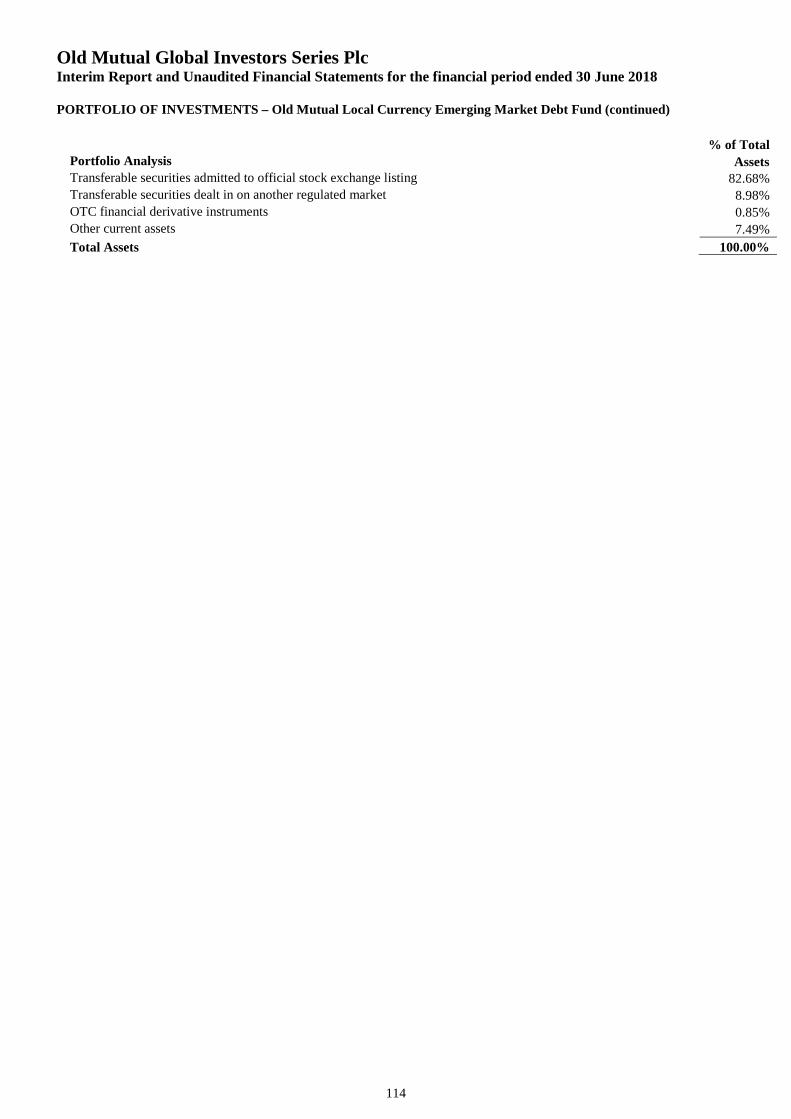
Old Mutual Global Investors Series PlcInterim Report and Unaudited Financial Statements for the financial period ended 30 June 2018
PORTFOLIO OF INVESTMENTS – Old Mutual Local Currency Emerging Market Debt Fund (continued)
114
% of TotalPortfolio Analysis AssetsTransferable securities admitted to official stock exchange listing 82.68%Transferable securities dealt in on another regulated market 8.98%OTC financial derivative instruments 0.85%Other current assets 7.49%
Total Assets 100.00%
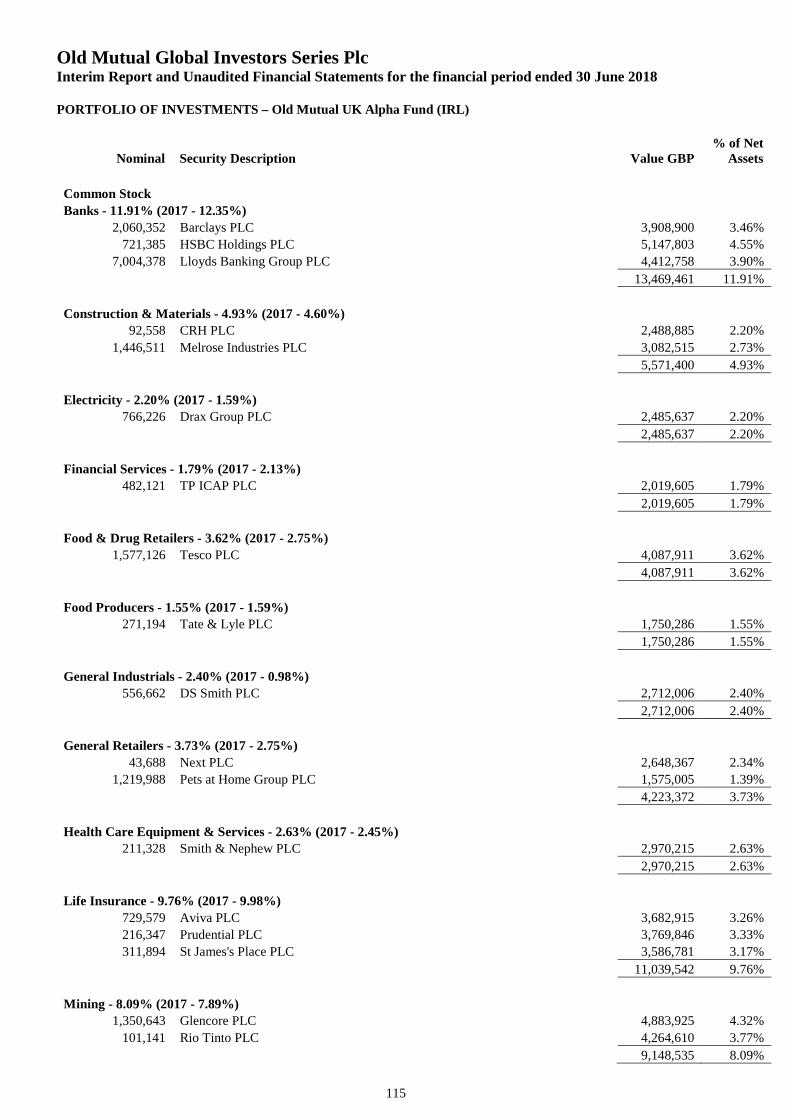
Old Mutual Global Investors Series PlcInterim Report and Unaudited Financial Statements for the financial period ended 30 June 2018
PORTFOLIO OF INVESTMENTS – Old Mutual UK Alpha Fund (IRL)
Nominal Security Description Value GBP% of Net
Assets
115
Common Stock
Banks - 11.91% (2017 - 12.35%)
2,060,352 Barclays PLC 3,908,900 3.46%
721,385 HSBC Holdings PLC 5,147,803 4.55%
7,004,378 Lloyds Banking Group PLC 4,412,758 3.90%
13,469,461 11.91%
Construction & Materials - 4.93% (2017 - 4.60%)
92,558 CRH PLC 2,488,885 2.20%
1,446,511 Melrose Industries PLC 3,082,515 2.73%
5,571,400 4.93%
Electricity - 2.20% (2017 - 1.59%)
766,226 Drax Group PLC 2,485,637 2.20%
2,485,637 2.20%
Financial Services - 1.79% (2017 - 2.13%)
482,121 TP ICAP PLC 2,019,605 1.79%
2,019,605 1.79%
Food & Drug Retailers - 3.62% (2017 - 2.75%)
1,577,126 Tesco PLC 4,087,911 3.62%
4,087,911 3.62%
Food Producers - 1.55% (2017 - 1.59%)
271,194 Tate & Lyle PLC 1,750,286 1.55%
1,750,286 1.55%
General Industrials - 2.40% (2017 - 0.98%)
556,662 DS Smith PLC 2,712,006 2.40%
2,712,006 2.40%
General Retailers - 3.73% (2017 - 2.75%)
43,688 Next PLC 2,648,367 2.34%
1,219,988 Pets at Home Group PLC 1,575,005 1.39%
4,223,372 3.73%
Health Care Equipment & Services - 2.63% (2017 - 2.45%)
211,328 Smith & Nephew PLC 2,970,215 2.63%
2,970,215 2.63%
Life Insurance - 9.76% (2017 - 9.98%)
729,579 Aviva PLC 3,682,915 3.26%
216,347 Prudential PLC 3,769,846 3.33%
311,894 St James's Place PLC 3,586,781 3.17%
11,039,542 9.76%
Mining - 8.09% (2017 - 7.89%)
1,350,643 Glencore PLC 4,883,925 4.32%
101,141 Rio Tinto PLC 4,264,610 3.77%
9,148,535 8.09%
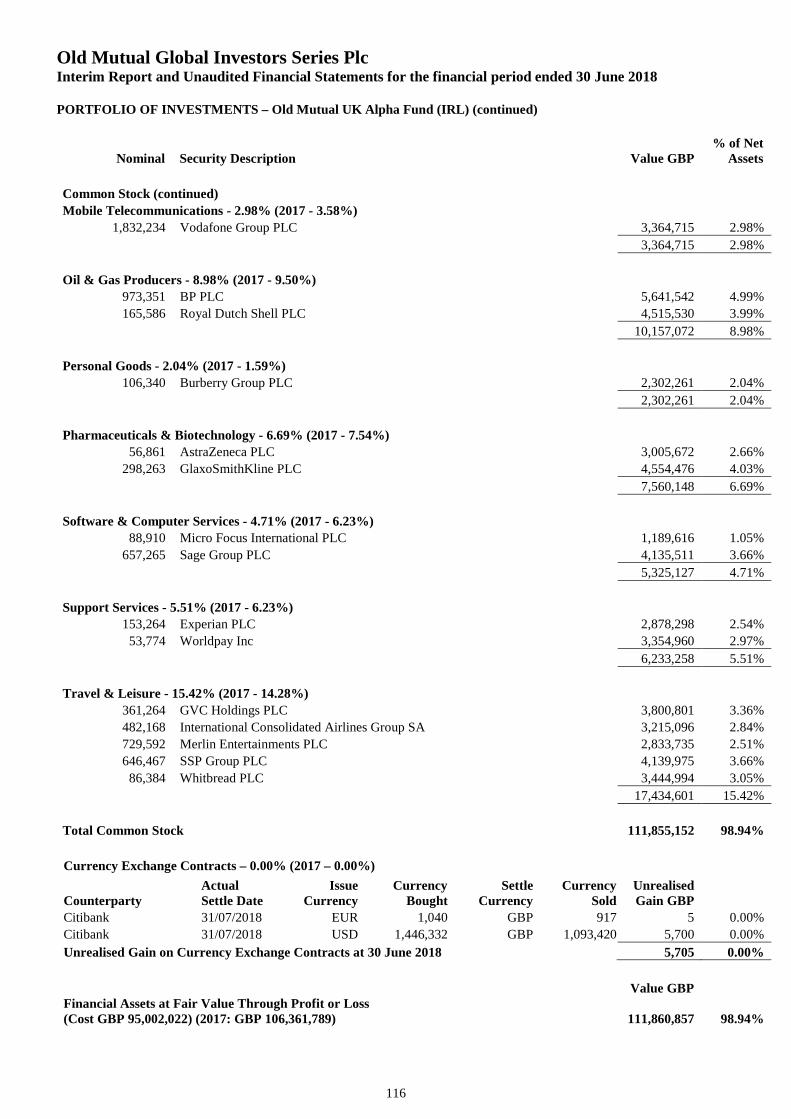
Old Mutual Global Investors Series PlcInterim Report and Unaudited Financial Statements for the financial period ended 30 June 2018
PORTFOLIO OF INVESTMENTS – Old Mutual UK Alpha Fund (IRL) (continued)
Nominal Security Description Value GBP% of Net
Assets
116
Common Stock (continued)
Mobile Telecommunications - 2.98% (2017 - 3.58%)
1,832,234 Vodafone Group PLC 3,364,715 2.98%
3,364,715 2.98%
Oil & Gas Producers - 8.98% (2017 - 9.50%)
973,351 BP PLC 5,641,542 4.99%
165,586 Royal Dutch Shell PLC 4,515,530 3.99%
10,157,072 8.98%
Personal Goods - 2.04% (2017 - 1.59%)
106,340 Burberry Group PLC 2,302,261 2.04%
2,302,261 2.04%
Pharmaceuticals & Biotechnology - 6.69% (2017 - 7.54%)
56,861 AstraZeneca PLC 3,005,672 2.66%
298,263 GlaxoSmithKline PLC 4,554,476 4.03%
7,560,148 6.69%
Software & Computer Services - 4.71% (2017 - 6.23%)
88,910 Micro Focus International PLC 1,189,616 1.05%
657,265 Sage Group PLC 4,135,511 3.66%
5,325,127 4.71%
Support Services - 5.51% (2017 - 6.23%)
153,264 Experian PLC 2,878,298 2.54%
53,774 Worldpay Inc 3,354,960 2.97%
6,233,258 5.51%
Travel & Leisure - 15.42% (2017 - 14.28%)
361,264 GVC Holdings PLC 3,800,801 3.36%
482,168 International Consolidated Airlines Group SA 3,215,096 2.84%
729,592 Merlin Entertainments PLC 2,833,735 2.51%
646,467 SSP Group PLC 4,139,975 3.66%
86,384 Whitbread PLC 3,444,994 3.05%
17,434,601 15.42%
Total Common Stock 111,855,152 98.94%
Currency Exchange Contracts – 0.00% (2017 – 0.00%)
CounterpartyActualSettle Date
IssueCurrency
CurrencyBought
SettleCurrency
CurrencySold
UnrealisedGain GBP
Citibank 31/07/2018 EUR 1,040 GBP 917 5 0.00%
Citibank 31/07/2018 USD 1,446,332 GBP 1,093,420 5,700 0.00%
Unrealised Gain on Currency Exchange Contracts at 30 June 2018 5,705 0.00%
Value GBPFinancial Assets at Fair Value Through Profit or Loss(Cost GBP 95,002,022) (2017: GBP 106,361,789) 111,860,857 98.94%
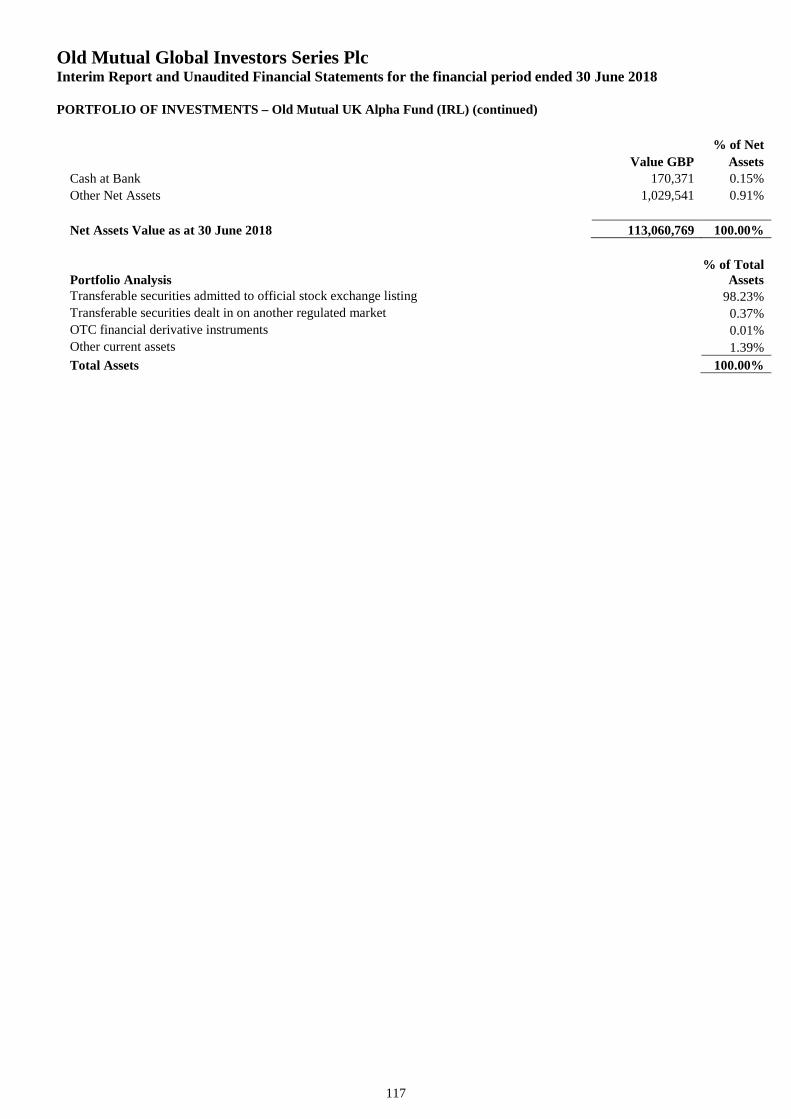
Old Mutual Global Investors Series PlcInterim Report and Unaudited Financial Statements for the financial period ended 30 June 2018
PORTFOLIO OF INVESTMENTS – Old Mutual UK Alpha Fund (IRL) (continued)
117
% of Net
Value GBP Assets
Cash at Bank 170,371 0.15%
Other Net Assets 1,029,541 0.91%
Net Assets Value as at 30 June 2018 113,060,769 100.00%
Portfolio Analysis% of Total
AssetsTransferable securities admitted to official stock exchange listing 98.23%Transferable securities dealt in on another regulated market 0.37%OTC financial derivative instruments 0.01%Other current assets 1.39%
Total Assets 100.00%
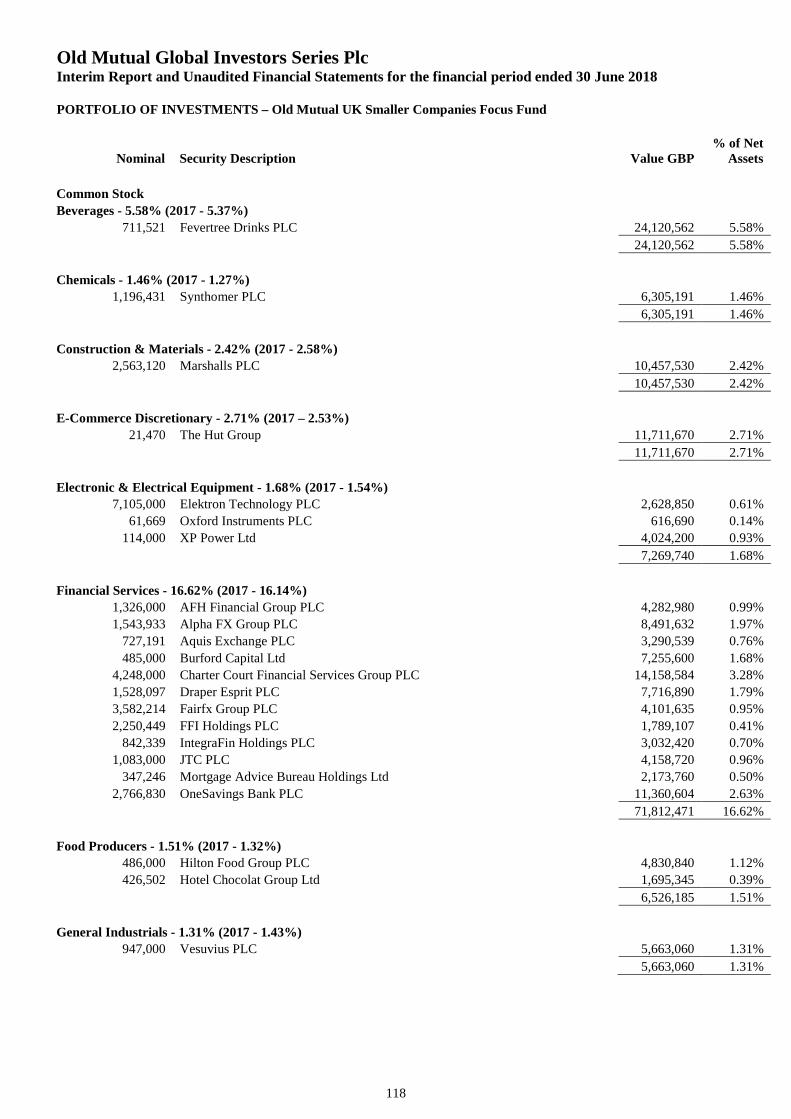
Old Mutual Global Investors Series PlcInterim Report and Unaudited Financial Statements for the financial period ended 30 June 2018
PORTFOLIO OF INVESTMENTS – Old Mutual UK Smaller Companies Focus Fund
Nominal Security Description Value GBP% of Net
Assets
118
Common Stock
Beverages - 5.58% (2017 - 5.37%)
711,521 Fevertree Drinks PLC 24,120,562 5.58%
24,120,562 5.58%
Chemicals - 1.46% (2017 - 1.27%)
1,196,431 Synthomer PLC 6,305,191 1.46%
6,305,191 1.46%
Construction & Materials - 2.42% (2017 - 2.58%)
2,563,120 Marshalls PLC 10,457,530 2.42%
10,457,530 2.42%
E-Commerce Discretionary - 2.71% (2017 – 2.53%)
21,470 The Hut Group 11,711,670 2.71%
11,711,670 2.71%
Electronic & Electrical Equipment - 1.68% (2017 - 1.54%)
7,105,000 Elektron Technology PLC 2,628,850 0.61%
61,669 Oxford Instruments PLC 616,690 0.14%
114,000 XP Power Ltd 4,024,200 0.93%
7,269,740 1.68%
Financial Services - 16.62% (2017 - 16.14%)
1,326,000 AFH Financial Group PLC 4,282,980 0.99%
1,543,933 Alpha FX Group PLC 8,491,632 1.97%
727,191 Aquis Exchange PLC 3,290,539 0.76%
485,000 Burford Capital Ltd 7,255,600 1.68%
4,248,000 Charter Court Financial Services Group PLC 14,158,584 3.28%
1,528,097 Draper Esprit PLC 7,716,890 1.79%
3,582,214 Fairfx Group PLC 4,101,635 0.95%
2,250,449 FFI Holdings PLC 1,789,107 0.41%
842,339 IntegraFin Holdings PLC 3,032,420 0.70%
1,083,000 JTC PLC 4,158,720 0.96%
347,246 Mortgage Advice Bureau Holdings Ltd 2,173,760 0.50%
2,766,830 OneSavings Bank PLC 11,360,604 2.63%
71,812,471 16.62%
Food Producers - 1.51% (2017 - 1.32%)
486,000 Hilton Food Group PLC 4,830,840 1.12%
426,502 Hotel Chocolat Group Ltd 1,695,345 0.39%
6,526,185 1.51%
General Industrials - 1.31% (2017 - 1.43%)
947,000 Vesuvius PLC 5,663,060 1.31%
5,663,060 1.31%
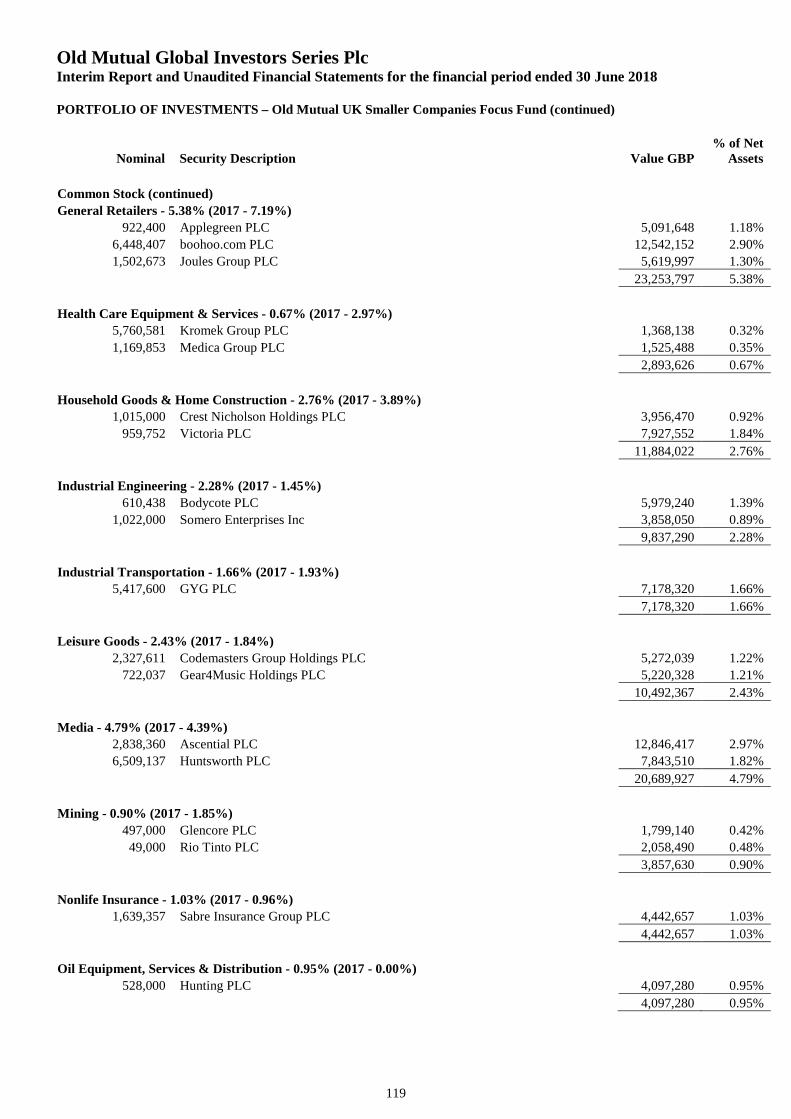
Old Mutual Global Investors Series PlcInterim Report and Unaudited Financial Statements for the financial period ended 30 June 2018
PORTFOLIO OF INVESTMENTS – Old Mutual UK Smaller Companies Focus Fund (continued)
Nominal Security Description Value GBP% of Net
Assets
119
Common Stock (continued)
General Retailers - 5.38% (2017 - 7.19%)
922,400 Applegreen PLC 5,091,648 1.18%
6,448,407 boohoo.com PLC 12,542,152 2.90%
1,502,673 Joules Group PLC 5,619,997 1.30%
23,253,797 5.38%
Health Care Equipment & Services - 0.67% (2017 - 2.97%)
5,760,581 Kromek Group PLC 1,368,138 0.32%
1,169,853 Medica Group PLC 1,525,488 0.35%
2,893,626 0.67%
Household Goods & Home Construction - 2.76% (2017 - 3.89%)
1,015,000 Crest Nicholson Holdings PLC 3,956,470 0.92%
959,752 Victoria PLC 7,927,552 1.84%
11,884,022 2.76%
Industrial Engineering - 2.28% (2017 - 1.45%)
610,438 Bodycote PLC 5,979,240 1.39%
1,022,000 Somero Enterprises Inc 3,858,050 0.89%
9,837,290 2.28%
Industrial Transportation - 1.66% (2017 - 1.93%)
5,417,600 GYG PLC 7,178,320 1.66%
7,178,320 1.66%
Leisure Goods - 2.43% (2017 - 1.84%)
2,327,611 Codemasters Group Holdings PLC 5,272,039 1.22%
722,037 Gear4Music Holdings PLC 5,220,328 1.21%
10,492,367 2.43%
Media - 4.79% (2017 - 4.39%)
2,838,360 Ascential PLC 12,846,417 2.97%
6,509,137 Huntsworth PLC 7,843,510 1.82%
20,689,927 4.79%
Mining - 0.90% (2017 - 1.85%)
497,000 Glencore PLC 1,799,140 0.42%
49,000 Rio Tinto PLC 2,058,490 0.48%
3,857,630 0.90%
Nonlife Insurance - 1.03% (2017 - 0.96%)
1,639,357 Sabre Insurance Group PLC 4,442,657 1.03%
4,442,657 1.03%
Oil Equipment, Services & Distribution - 0.95% (2017 - 0.00%)
528,000 Hunting PLC 4,097,280 0.95%
4,097,280 0.95%
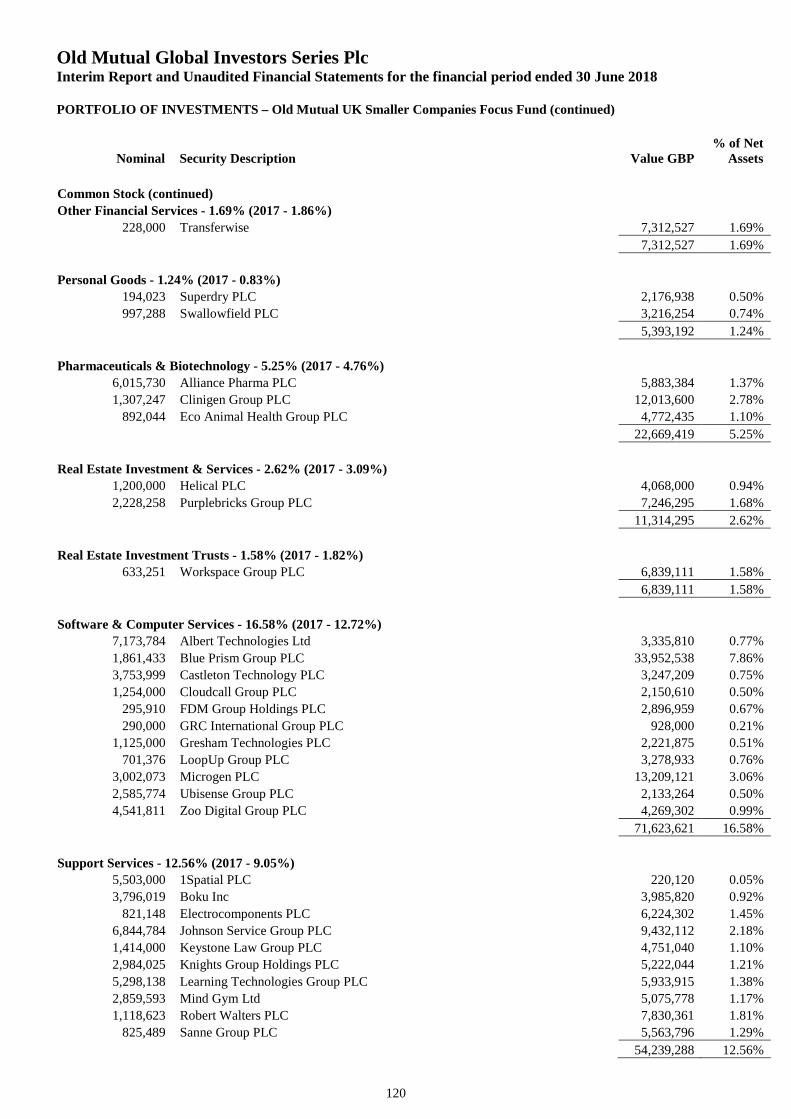
Old Mutual Global Investors Series PlcInterim Report and Unaudited Financial Statements for the financial period ended 30 June 2018
PORTFOLIO OF INVESTMENTS – Old Mutual UK Smaller Companies Focus Fund (continued)
Nominal Security Description Value GBP% of Net
Assets
120
Common Stock (continued)
Other Financial Services - 1.69% (2017 - 1.86%)
228,000 Transferwise 7,312,527 1.69%
7,312,527 1.69%
Personal Goods - 1.24% (2017 - 0.83%)
194,023 Superdry PLC 2,176,938 0.50%
997,288 Swallowfield PLC 3,216,254 0.74%
5,393,192 1.24%
Pharmaceuticals & Biotechnology - 5.25% (2017 - 4.76%)
6,015,730 Alliance Pharma PLC 5,883,384 1.37%
1,307,247 Clinigen Group PLC 12,013,600 2.78%
892,044 Eco Animal Health Group PLC 4,772,435 1.10%
22,669,419 5.25%
Real Estate Investment & Services - 2.62% (2017 - 3.09%)
1,200,000 Helical PLC 4,068,000 0.94%
2,228,258 Purplebricks Group PLC 7,246,295 1.68%
11,314,295 2.62%
Real Estate Investment Trusts - 1.58% (2017 - 1.82%)
633,251 Workspace Group PLC 6,839,111 1.58%
6,839,111 1.58%
Software & Computer Services - 16.58% (2017 - 12.72%)
7,173,784 Albert Technologies Ltd 3,335,810 0.77%
1,861,433 Blue Prism Group PLC 33,952,538 7.86%
3,753,999 Castleton Technology PLC 3,247,209 0.75%
1,254,000 Cloudcall Group PLC 2,150,610 0.50%
295,910 FDM Group Holdings PLC 2,896,959 0.67%
290,000 GRC International Group PLC 928,000 0.21%
1,125,000 Gresham Technologies PLC 2,221,875 0.51%
701,376 LoopUp Group PLC 3,278,933 0.76%
3,002,073 Microgen PLC 13,209,121 3.06%
2,585,774 Ubisense Group PLC 2,133,264 0.50%
4,541,811 Zoo Digital Group PLC 4,269,302 0.99%
71,623,621 16.58%
Support Services - 12.56% (2017 - 9.05%)
5,503,000 1Spatial PLC 220,120 0.05%
3,796,019 Boku Inc 3,985,820 0.92%
821,148 Electrocomponents PLC 6,224,302 1.45%
6,844,784 Johnson Service Group PLC 9,432,112 2.18%
1,414,000 Keystone Law Group PLC 4,751,040 1.10%
2,984,025 Knights Group Holdings PLC 5,222,044 1.21%
5,298,138 Learning Technologies Group PLC 5,933,915 1.38%
2,859,593 Mind Gym Ltd 5,075,778 1.17%
1,118,623 Robert Walters PLC 7,830,361 1.81%
825,489 Sanne Group PLC 5,563,796 1.29%
54,239,288 12.56%
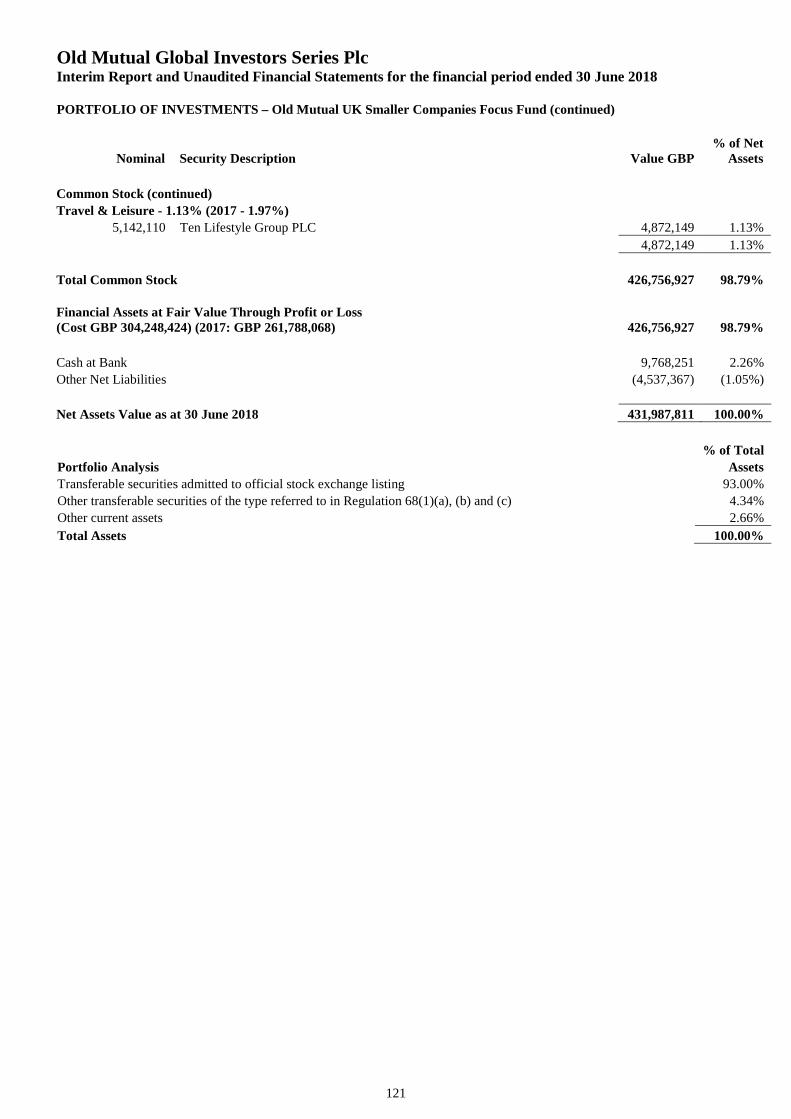
Old Mutual Global Investors Series PlcInterim Report and Unaudited Financial Statements for the financial period ended 30 June 2018
PORTFOLIO OF INVESTMENTS – Old Mutual UK Smaller Companies Focus Fund (continued)
Nominal Security Description Value GBP% of Net
Assets
121
Common Stock (continued)
Travel & Leisure - 1.13% (2017 - 1.97%)
5,142,110 Ten Lifestyle Group PLC 4,872,149 1.13%
4,872,149 1.13%
Total Common Stock 426,756,927 98.79%
Financial Assets at Fair Value Through Profit or Loss(Cost GBP 304,248,424) (2017: GBP 261,788,068) 426,756,927 98.79%
Cash at Bank 9,768,251 2.26%
Other Net Liabilities (4,537,367) (1.05%)
Net Assets Value as at 30 June 2018 431,987,811 100.00%
% of Total
Portfolio Analysis Assets
Transferable securities admitted to official stock exchange listing 93.00%
Other transferable securities of the type referred to in Regulation 68(1)(a), (b) and (c) 4.34%
Other current assets 2.66%
Total Assets 100.00%
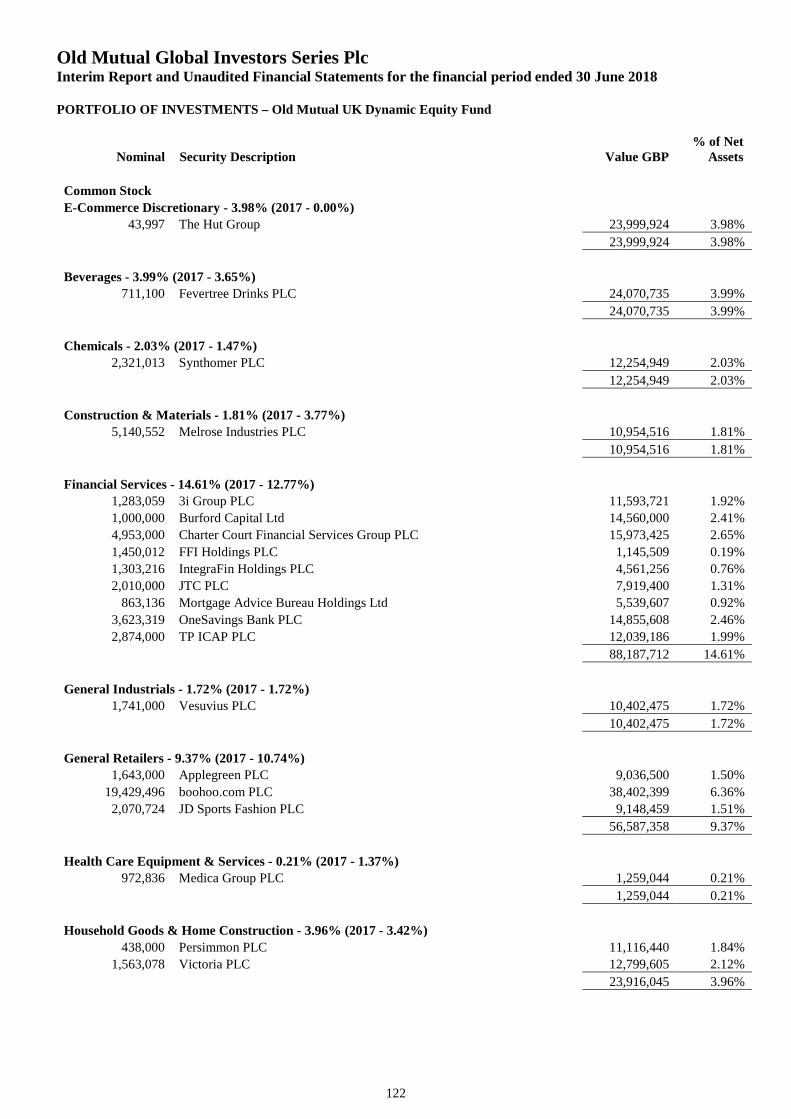
Old Mutual Global Investors Series PlcInterim Report and Unaudited Financial Statements for the financial period ended 30 June 2018
PORTFOLIO OF INVESTMENTS – Old Mutual UK Dynamic Equity Fund
Nominal Security Description Value GBP% of Net
Assets
122
Common Stock
E-Commerce Discretionary - 3.98% (2017 - 0.00%)
43,997 The Hut Group 23,999,924 3.98%
23,999,924 3.98%
Beverages - 3.99% (2017 - 3.65%)
711,100 Fevertree Drinks PLC 24,070,735 3.99%
24,070,735 3.99%
Chemicals - 2.03% (2017 - 1.47%)
2,321,013 Synthomer PLC 12,254,949 2.03%
12,254,949 2.03%
Construction & Materials - 1.81% (2017 - 3.77%)
5,140,552 Melrose Industries PLC 10,954,516 1.81%
10,954,516 1.81%
Financial Services - 14.61% (2017 - 12.77%)
1,283,059 3i Group PLC 11,593,721 1.92%
1,000,000 Burford Capital Ltd 14,560,000 2.41%
4,953,000 Charter Court Financial Services Group PLC 15,973,425 2.65%
1,450,012 FFI Holdings PLC 1,145,509 0.19%
1,303,216 IntegraFin Holdings PLC 4,561,256 0.76%
2,010,000 JTC PLC 7,919,400 1.31%
863,136 Mortgage Advice Bureau Holdings Ltd 5,539,607 0.92%
3,623,319 OneSavings Bank PLC 14,855,608 2.46%
2,874,000 TP ICAP PLC 12,039,186 1.99%
88,187,712 14.61%
General Industrials - 1.72% (2017 - 1.72%)
1,741,000 Vesuvius PLC 10,402,475 1.72%
10,402,475 1.72%
General Retailers - 9.37% (2017 - 10.74%)
1,643,000 Applegreen PLC 9,036,500 1.50%
19,429,496 boohoo.com PLC 38,402,399 6.36%
2,070,724 JD Sports Fashion PLC 9,148,459 1.51%
56,587,358 9.37%
Health Care Equipment & Services - 0.21% (2017 - 1.37%)
972,836 Medica Group PLC 1,259,044 0.21%
1,259,044 0.21%
Household Goods & Home Construction - 3.96% (2017 - 3.42%)
438,000 Persimmon PLC 11,116,440 1.84%
1,563,078 Victoria PLC 12,799,605 2.12%
23,916,045 3.96%
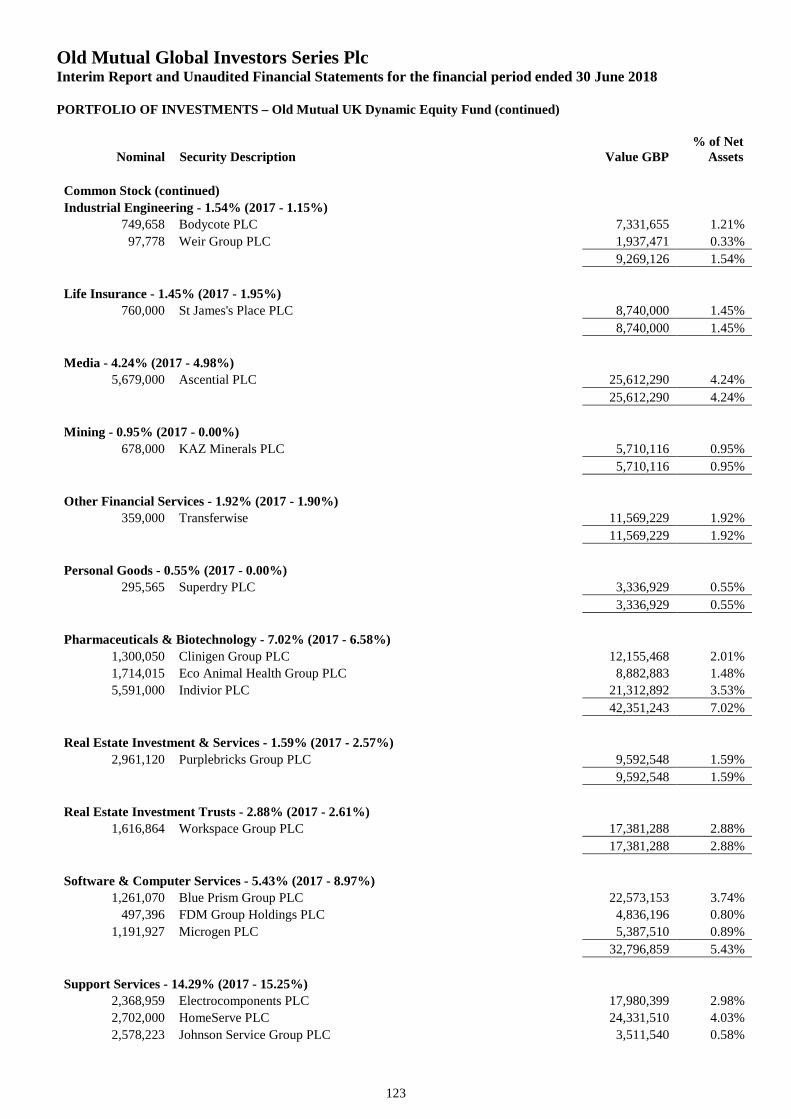
Old Mutual Global Investors Series PlcInterim Report and Unaudited Financial Statements for the financial period ended 30 June 2018
PORTFOLIO OF INVESTMENTS – Old Mutual UK Dynamic Equity Fund (continued)
Nominal Security Description Value GBP% of Net
Assets
123
Common Stock (continued)
Industrial Engineering - 1.54% (2017 - 1.15%)
749,658 Bodycote PLC 7,331,655 1.21%
97,778 Weir Group PLC 1,937,471 0.33%
9,269,126 1.54%
Life Insurance - 1.45% (2017 - 1.95%)
760,000 St James's Place PLC 8,740,000 1.45%
8,740,000 1.45%
Media - 4.24% (2017 - 4.98%)
5,679,000 Ascential PLC 25,612,290 4.24%
25,612,290 4.24%
Mining - 0.95% (2017 - 0.00%)
678,000 KAZ Minerals PLC 5,710,116 0.95%
5,710,116 0.95%
Other Financial Services - 1.92% (2017 - 1.90%)
359,000 Transferwise 11,569,229 1.92%
11,569,229 1.92%
Personal Goods - 0.55% (2017 - 0.00%)
295,565 Superdry PLC 3,336,929 0.55%
3,336,929 0.55%
Pharmaceuticals & Biotechnology - 7.02% (2017 - 6.58%)
1,300,050 Clinigen Group PLC 12,155,468 2.01%
1,714,015 Eco Animal Health Group PLC 8,882,883 1.48%
5,591,000 Indivior PLC 21,312,892 3.53%
42,351,243 7.02%
Real Estate Investment & Services - 1.59% (2017 - 2.57%)
2,961,120 Purplebricks Group PLC 9,592,548 1.59%
9,592,548 1.59%
Real Estate Investment Trusts - 2.88% (2017 - 2.61%)
1,616,864 Workspace Group PLC 17,381,288 2.88%
17,381,288 2.88%
Software & Computer Services - 5.43% (2017 - 8.97%)
1,261,070 Blue Prism Group PLC 22,573,153 3.74%
497,396 FDM Group Holdings PLC 4,836,196 0.80%
1,191,927 Microgen PLC 5,387,510 0.89%
32,796,859 5.43%
Support Services - 14.29% (2017 - 15.25%)
2,368,959 Electrocomponents PLC 17,980,399 2.98%
2,702,000 HomeServe PLC 24,331,510 4.03%
2,578,223 Johnson Service Group PLC 3,511,540 0.58%
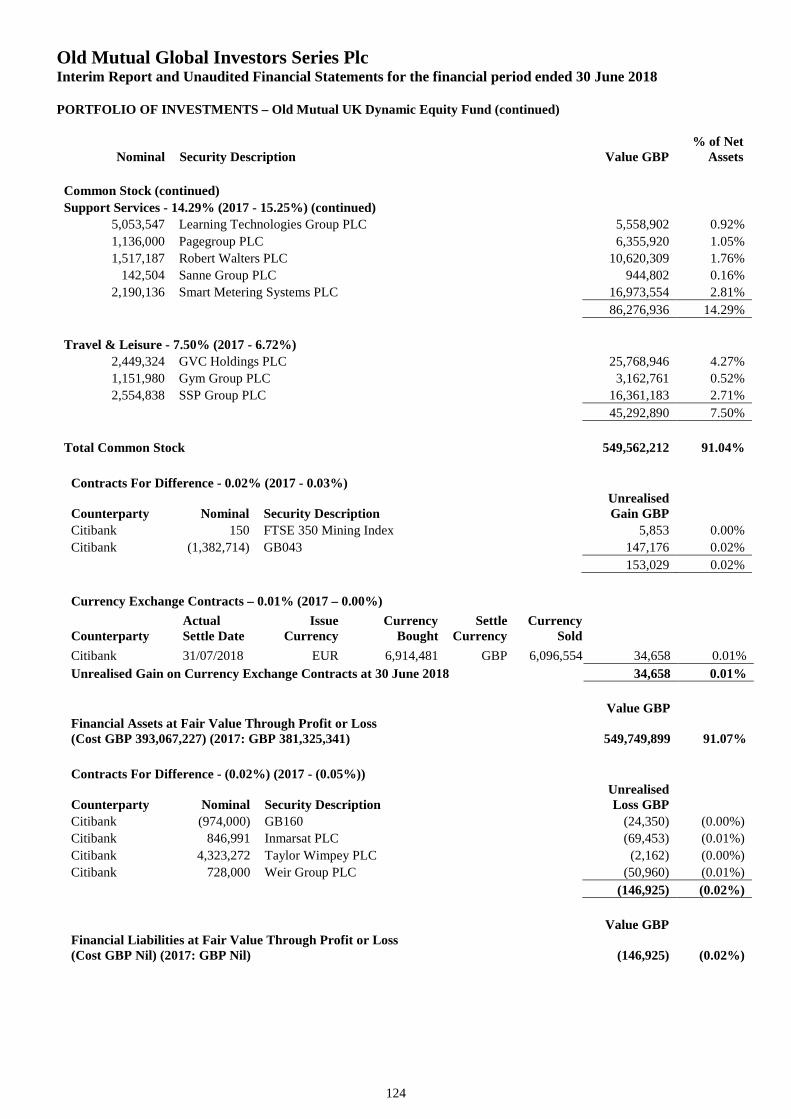
Old Mutual Global Investors Series PlcInterim Report and Unaudited Financial Statements for the financial period ended 30 June 2018
PORTFOLIO OF INVESTMENTS – Old Mutual UK Dynamic Equity Fund (continued)
Nominal Security Description Value GBP% of Net
Assets
124
Common Stock (continued)
Support Services - 14.29% (2017 - 15.25%) (continued)
5,053,547 Learning Technologies Group PLC 5,558,902 0.92%
1,136,000 Pagegroup PLC 6,355,920 1.05%
1,517,187 Robert Walters PLC 10,620,309 1.76%
142,504 Sanne Group PLC 944,802 0.16%
2,190,136 Smart Metering Systems PLC 16,973,554 2.81%
86,276,936 14.29%
Travel & Leisure - 7.50% (2017 - 6.72%)
2,449,324 GVC Holdings PLC 25,768,946 4.27%
1,151,980 Gym Group PLC 3,162,761 0.52%
2,554,838 SSP Group PLC 16,361,183 2.71%
45,292,890 7.50%
Total Common Stock 549,562,212 91.04%
Contracts For Difference - 0.02% (2017 - 0.03%)
Counterparty Nominal Security DescriptionUnrealisedGain GBP
Citibank 150 FTSE 350 Mining Index 5,853 0.00%
Citibank (1,382,714) GB043 147,176 0.02%
153,029 0.02%
Currency Exchange Contracts – 0.01% (2017 – 0.00%)
CounterpartyActualSettle Date
IssueCurrency
CurrencyBought
SettleCurrency
CurrencySold
Citibank 31/07/2018 EUR 6,914,481 GBP 6,096,554 34,658 0.01%
Unrealised Gain on Currency Exchange Contracts at 30 June 2018 34,658 0.01%
Value GBPFinancial Assets at Fair Value Through Profit or Loss(Cost GBP 393,067,227) (2017: GBP 381,325,341) 549,749,899 91.07%
Contracts For Difference - (0.02%) (2017 - (0.05%))
Counterparty Nominal Security DescriptionUnrealisedLoss GBP
Citibank (974,000) GB160 (24,350) (0.00%)
Citibank 846,991 Inmarsat PLC (69,453) (0.01%)
Citibank 4,323,272 Taylor Wimpey PLC (2,162) (0.00%)
Citibank 728,000 Weir Group PLC (50,960) (0.01%)
(146,925) (0.02%)
Value GBPFinancial Liabilities at Fair Value Through Profit or Loss(Cost GBP Nil) (2017: GBP Nil) (146,925) (0.02%)
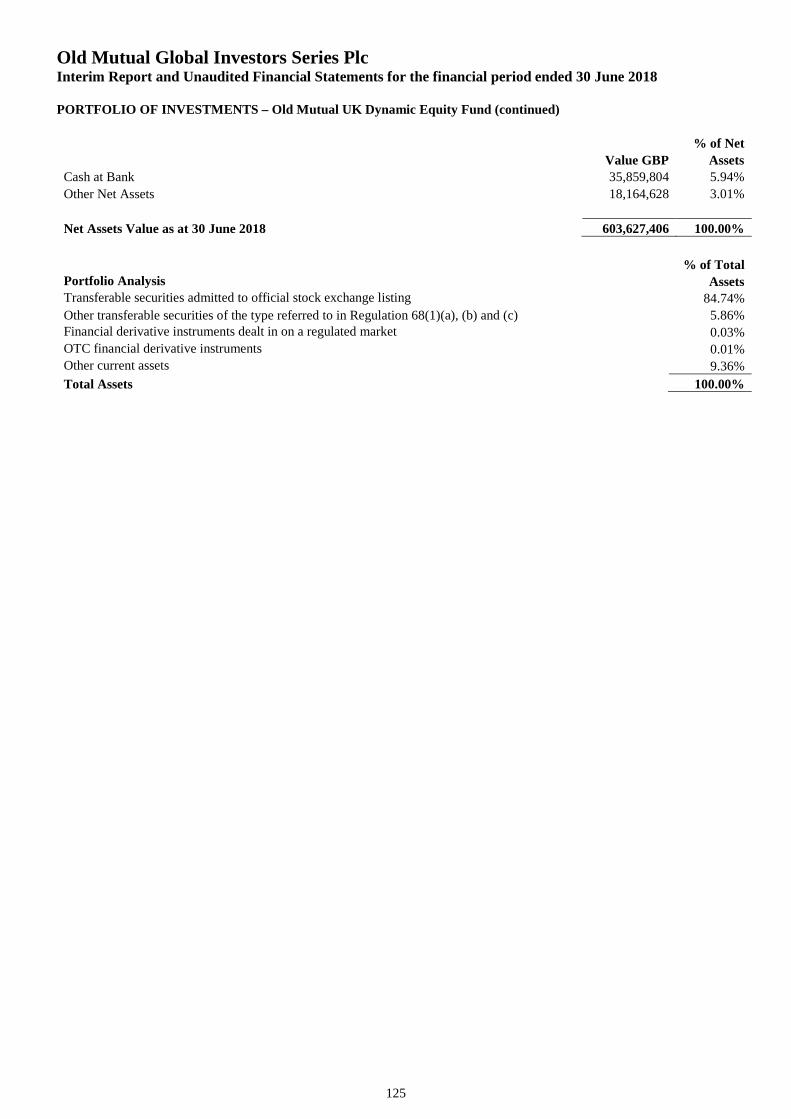
Old Mutual Global Investors Series PlcInterim Report and Unaudited Financial Statements for the financial period ended 30 June 2018
PORTFOLIO OF INVESTMENTS – Old Mutual UK Dynamic Equity Fund (continued)
125
% of Net
Value GBP Assets
Cash at Bank 35,859,804 5.94%
Other Net Assets 18,164,628 3.01%
Net Assets Value as at 30 June 2018 603,627,406 100.00%
% of TotalPortfolio Analysis AssetsTransferable securities admitted to official stock exchange listing 84.74%
Other transferable securities of the type referred to in Regulation 68(1)(a), (b) and (c) 5.86%Financial derivative instruments dealt in on a regulated market 0.03%OTC financial derivative instruments 0.01%Other current assets 9.36%
Total Assets 100.00%
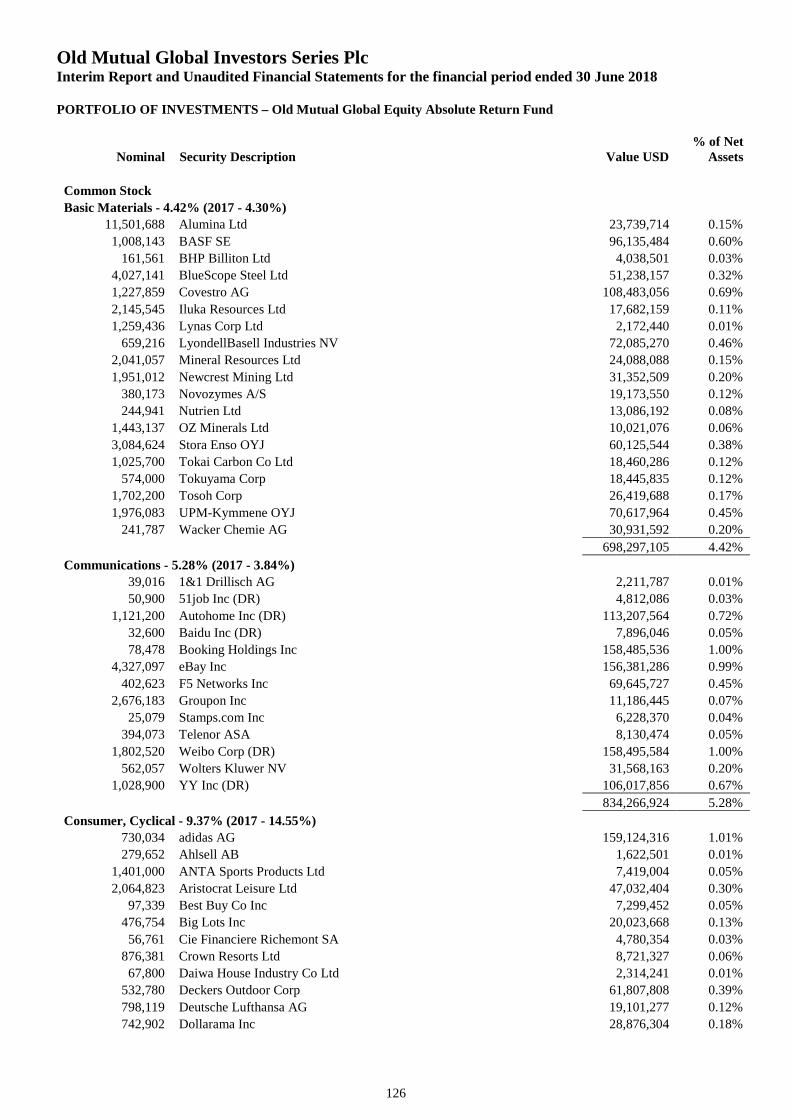
Old Mutual Global Investors Series PlcInterim Report and Unaudited Financial Statements for the financial period ended 30 June 2018
PORTFOLIO OF INVESTMENTS – Old Mutual Global Equity Absolute Return Fund
Nominal Security Description Value USD% of Net
Assets
126
Common Stock
Basic Materials - 4.42% (2017 - 4.30%)
11,501,688 Alumina Ltd 23,739,714 0.15%
1,008,143 BASF SE 96,135,484 0.60%
161,561 BHP Billiton Ltd 4,038,501 0.03%
4,027,141 BlueScope Steel Ltd 51,238,157 0.32%
1,227,859 Covestro AG 108,483,056 0.69%
2,145,545 Iluka Resources Ltd 17,682,159 0.11%
1,259,436 Lynas Corp Ltd 2,172,440 0.01%
659,216 LyondellBasell Industries NV 72,085,270 0.46%
2,041,057 Mineral Resources Ltd 24,088,088 0.15%
1,951,012 Newcrest Mining Ltd 31,352,509 0.20%
380,173 Novozymes A/S 19,173,550 0.12%
244,941 Nutrien Ltd 13,086,192 0.08%
1,443,137 OZ Minerals Ltd 10,021,076 0.06%
3,084,624 Stora Enso OYJ 60,125,544 0.38%
1,025,700 Tokai Carbon Co Ltd 18,460,286 0.12%
574,000 Tokuyama Corp 18,445,835 0.12%
1,702,200 Tosoh Corp 26,419,688 0.17%
1,976,083 UPM-Kymmene OYJ 70,617,964 0.45%
241,787 Wacker Chemie AG 30,931,592 0.20%
698,297,105 4.42%
Communications - 5.28% (2017 - 3.84%)
39,016 1&1 Drillisch AG 2,211,787 0.01%
50,900 51job Inc (DR) 4,812,086 0.03%
1,121,200 Autohome Inc (DR) 113,207,564 0.72%
32,600 Baidu Inc (DR) 7,896,046 0.05%
78,478 Booking Holdings Inc 158,485,536 1.00%
4,327,097 eBay Inc 156,381,286 0.99%
402,623 F5 Networks Inc 69,645,727 0.45%
2,676,183 Groupon Inc 11,186,445 0.07%
25,079 Stamps.com Inc 6,228,370 0.04%
394,073 Telenor ASA 8,130,474 0.05%
1,802,520 Weibo Corp (DR) 158,495,584 1.00%
562,057 Wolters Kluwer NV 31,568,163 0.20%
1,028,900 YY Inc (DR) 106,017,856 0.67%
834,266,924 5.28%
Consumer, Cyclical - 9.37% (2017 - 14.55%)
730,034 adidas AG 159,124,316 1.01%
279,652 Ahlsell AB 1,622,501 0.01%
1,401,000 ANTA Sports Products Ltd 7,419,004 0.05%
2,064,823 Aristocrat Leisure Ltd 47,032,404 0.30%
97,339 Best Buy Co Inc 7,299,452 0.05%
476,754 Big Lots Inc 20,023,668 0.13%
56,761 Cie Financiere Richemont SA 4,780,354 0.03%
876,381 Crown Resorts Ltd 8,721,327 0.06%
67,800 Daiwa House Industry Co Ltd 2,314,241 0.01%
532,780 Deckers Outdoor Corp 61,807,808 0.39%
798,119 Deutsche Lufthansa AG 19,101,277 0.12%
742,902 Dollarama Inc 28,876,304 0.18%
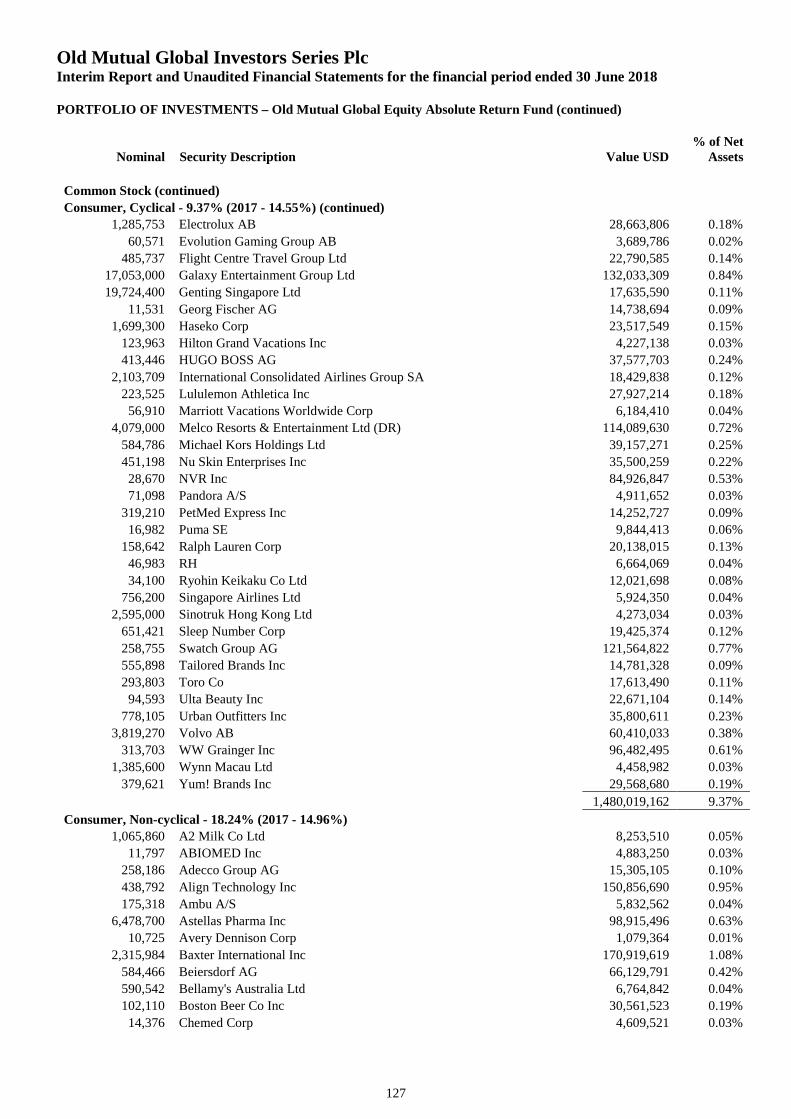
Old Mutual Global Investors Series PlcInterim Report and Unaudited Financial Statements for the financial period ended 30 June 2018
PORTFOLIO OF INVESTMENTS – Old Mutual Global Equity Absolute Return Fund (continued)
Nominal Security Description Value USD% of Net
Assets
127
Common Stock (continued)
Consumer, Cyclical - 9.37% (2017 - 14.55%) (continued)
1,285,753 Electrolux AB 28,663,806 0.18%
60,571 Evolution Gaming Group AB 3,689,786 0.02%
485,737 Flight Centre Travel Group Ltd 22,790,585 0.14%
17,053,000 Galaxy Entertainment Group Ltd 132,033,309 0.84%
19,724,400 Genting Singapore Ltd 17,635,590 0.11%
11,531 Georg Fischer AG 14,738,694 0.09%
1,699,300 Haseko Corp 23,517,549 0.15%
123,963 Hilton Grand Vacations Inc 4,227,138 0.03%
413,446 HUGO BOSS AG 37,577,703 0.24%
2,103,709 International Consolidated Airlines Group SA 18,429,838 0.12%
223,525 Lululemon Athletica Inc 27,927,214 0.18%
56,910 Marriott Vacations Worldwide Corp 6,184,410 0.04%
4,079,000 Melco Resorts & Entertainment Ltd (DR) 114,089,630 0.72%
584,786 Michael Kors Holdings Ltd 39,157,271 0.25%
451,198 Nu Skin Enterprises Inc 35,500,259 0.22%
28,670 NVR Inc 84,926,847 0.53%
71,098 Pandora A/S 4,911,652 0.03%
319,210 PetMed Express Inc 14,252,727 0.09%
16,982 Puma SE 9,844,413 0.06%
158,642 Ralph Lauren Corp 20,138,015 0.13%
46,983 RH 6,664,069 0.04%
34,100 Ryohin Keikaku Co Ltd 12,021,698 0.08%
756,200 Singapore Airlines Ltd 5,924,350 0.04%
2,595,000 Sinotruk Hong Kong Ltd 4,273,034 0.03%
651,421 Sleep Number Corp 19,425,374 0.12%
258,755 Swatch Group AG 121,564,822 0.77%
555,898 Tailored Brands Inc 14,781,328 0.09%
293,803 Toro Co 17,613,490 0.11%
94,593 Ulta Beauty Inc 22,671,104 0.14%
778,105 Urban Outfitters Inc 35,800,611 0.23%
3,819,270 Volvo AB 60,410,033 0.38%
313,703 WW Grainger Inc 96,482,495 0.61%
1,385,600 Wynn Macau Ltd 4,458,982 0.03%
379,621 Yum! Brands Inc 29,568,680 0.19%
1,480,019,162 9.37%
Consumer, Non-cyclical - 18.24% (2017 - 14.96%)
1,065,860 A2 Milk Co Ltd 8,253,510 0.05%
11,797 ABIOMED Inc 4,883,250 0.03%
258,186 Adecco Group AG 15,305,105 0.10%
438,792 Align Technology Inc 150,856,690 0.95%
175,318 Ambu A/S 5,832,562 0.04%
6,478,700 Astellas Pharma Inc 98,915,496 0.63%
10,725 Avery Dennison Corp 1,079,364 0.01%
2,315,984 Baxter International Inc 170,919,619 1.08%
584,466 Beiersdorf AG 66,129,791 0.42%
590,542 Bellamy's Australia Ltd 6,764,842 0.04%
102,110 Boston Beer Co Inc 30,561,523 0.19%
14,376 Chemed Corp 4,609,521 0.03%
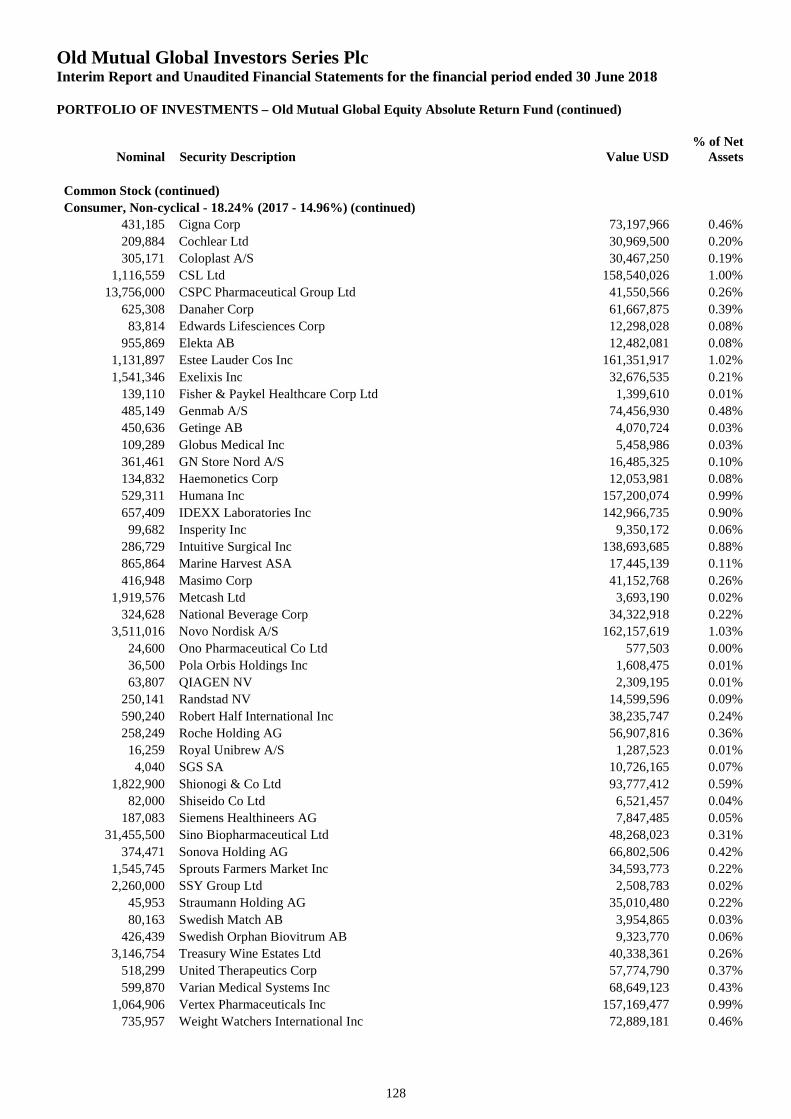
Old Mutual Global Investors Series PlcInterim Report and Unaudited Financial Statements for the financial period ended 30 June 2018
PORTFOLIO OF INVESTMENTS – Old Mutual Global Equity Absolute Return Fund (continued)
Nominal Security Description Value USD% of Net
Assets
128
Common Stock (continued)
Consumer, Non-cyclical - 18.24% (2017 - 14.96%) (continued)
431,185 Cigna Corp 73,197,966 0.46%
209,884 Cochlear Ltd 30,969,500 0.20%
305,171 Coloplast A/S 30,467,250 0.19%
1,116,559 CSL Ltd 158,540,026 1.00%
13,756,000 CSPC Pharmaceutical Group Ltd 41,550,566 0.26%
625,308 Danaher Corp 61,667,875 0.39%
83,814 Edwards Lifesciences Corp 12,298,028 0.08%
955,869 Elekta AB 12,482,081 0.08%
1,131,897 Estee Lauder Cos Inc 161,351,917 1.02%
1,541,346 Exelixis Inc 32,676,535 0.21%
139,110 Fisher & Paykel Healthcare Corp Ltd 1,399,610 0.01%
485,149 Genmab A/S 74,456,930 0.48%
450,636 Getinge AB 4,070,724 0.03%
109,289 Globus Medical Inc 5,458,986 0.03%
361,461 GN Store Nord A/S 16,485,325 0.10%
134,832 Haemonetics Corp 12,053,981 0.08%
529,311 Humana Inc 157,200,074 0.99%
657,409 IDEXX Laboratories Inc 142,966,735 0.90%
99,682 Insperity Inc 9,350,172 0.06%
286,729 Intuitive Surgical Inc 138,693,685 0.88%
865,864 Marine Harvest ASA 17,445,139 0.11%
416,948 Masimo Corp 41,152,768 0.26%
1,919,576 Metcash Ltd 3,693,190 0.02%
324,628 National Beverage Corp 34,322,918 0.22%
3,511,016 Novo Nordisk A/S 162,157,619 1.03%
24,600 Ono Pharmaceutical Co Ltd 577,503 0.00%
36,500 Pola Orbis Holdings Inc 1,608,475 0.01%
63,807 QIAGEN NV 2,309,195 0.01%
250,141 Randstad NV 14,599,596 0.09%
590,240 Robert Half International Inc 38,235,747 0.24%
258,249 Roche Holding AG 56,907,816 0.36%
16,259 Royal Unibrew A/S 1,287,523 0.01%
4,040 SGS SA 10,726,165 0.07%
1,822,900 Shionogi & Co Ltd 93,777,412 0.59%
82,000 Shiseido Co Ltd 6,521,457 0.04%
187,083 Siemens Healthineers AG 7,847,485 0.05%
31,455,500 Sino Biopharmaceutical Ltd 48,268,023 0.31%
374,471 Sonova Holding AG 66,802,506 0.42%
1,545,745 Sprouts Farmers Market Inc 34,593,773 0.22%
2,260,000 SSY Group Ltd 2,508,783 0.02%
45,953 Straumann Holding AG 35,010,480 0.22%
80,163 Swedish Match AB 3,954,865 0.03%
426,439 Swedish Orphan Biovitrum AB 9,323,770 0.06%
3,146,754 Treasury Wine Estates Ltd 40,338,361 0.26%
518,299 United Therapeutics Corp 57,774,790 0.37%
599,870 Varian Medical Systems Inc 68,649,123 0.43%
1,064,906 Vertex Pharmaceuticals Inc 157,169,477 0.99%
735,957 Weight Watchers International Inc 72,889,181 0.46%
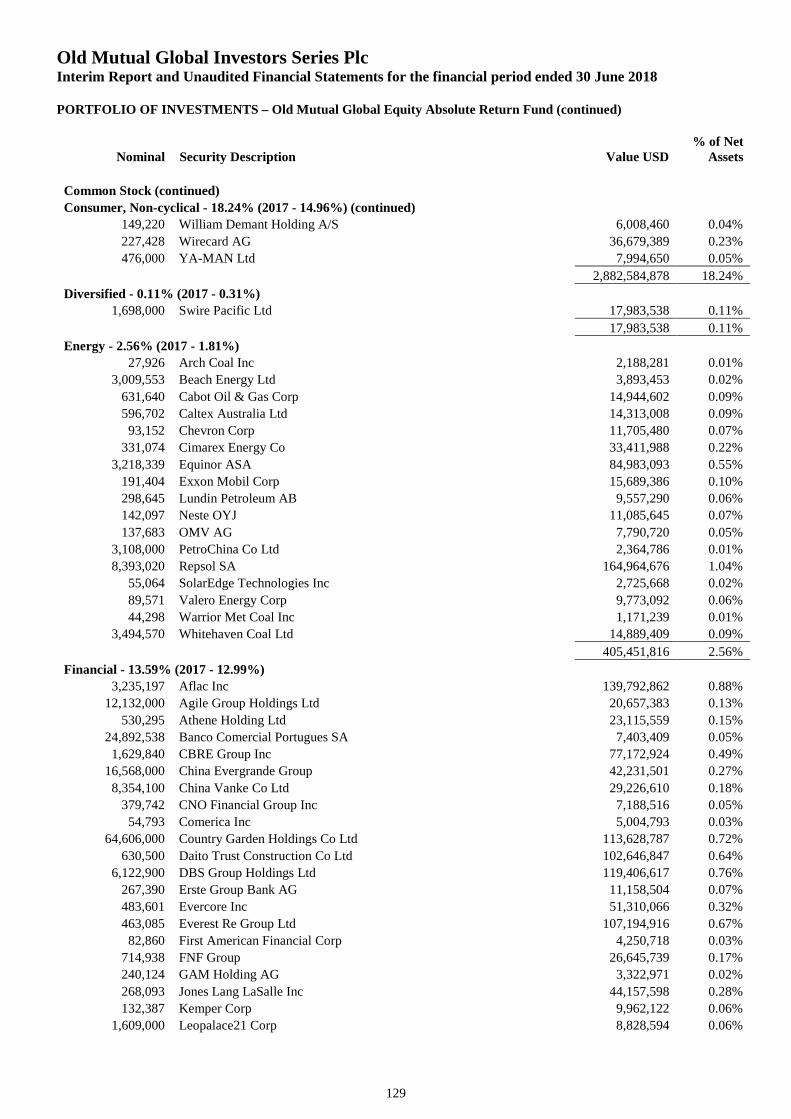
Old Mutual Global Investors Series PlcInterim Report and Unaudited Financial Statements for the financial period ended 30 June 2018
PORTFOLIO OF INVESTMENTS – Old Mutual Global Equity Absolute Return Fund (continued)
Nominal Security Description Value USD% of Net
Assets
129
Common Stock (continued)
Consumer, Non-cyclical - 18.24% (2017 - 14.96%) (continued)
149,220 William Demant Holding A/S 6,008,460 0.04%
227,428 Wirecard AG 36,679,389 0.23%
476,000 YA-MAN Ltd 7,994,650 0.05%
2,882,584,878 18.24%
Diversified - 0.11% (2017 - 0.31%)
1,698,000 Swire Pacific Ltd 17,983,538 0.11%
17,983,538 0.11%
Energy - 2.56% (2017 - 1.81%)
27,926 Arch Coal Inc 2,188,281 0.01%
3,009,553 Beach Energy Ltd 3,893,453 0.02%
631,640 Cabot Oil & Gas Corp 14,944,602 0.09%
596,702 Caltex Australia Ltd 14,313,008 0.09%
93,152 Chevron Corp 11,705,480 0.07%
331,074 Cimarex Energy Co 33,411,988 0.22%
3,218,339 Equinor ASA 84,983,093 0.55%
191,404 Exxon Mobil Corp 15,689,386 0.10%
298,645 Lundin Petroleum AB 9,557,290 0.06%
142,097 Neste OYJ 11,085,645 0.07%
137,683 OMV AG 7,790,720 0.05%
3,108,000 PetroChina Co Ltd 2,364,786 0.01%
8,393,020 Repsol SA 164,964,676 1.04%
55,064 SolarEdge Technologies Inc 2,725,668 0.02%
89,571 Valero Energy Corp 9,773,092 0.06%
44,298 Warrior Met Coal Inc 1,171,239 0.01%
3,494,570 Whitehaven Coal Ltd 14,889,409 0.09%
405,451,816 2.56%
Financial - 13.59% (2017 - 12.99%)
3,235,197 Aflac Inc 139,792,862 0.88%
12,132,000 Agile Group Holdings Ltd 20,657,383 0.13%
530,295 Athene Holding Ltd 23,115,559 0.15%
24,892,538 Banco Comercial Portugues SA 7,403,409 0.05%
1,629,840 CBRE Group Inc 77,172,924 0.49%
16,568,000 China Evergrande Group 42,231,501 0.27%
8,354,100 China Vanke Co Ltd 29,226,610 0.18%
379,742 CNO Financial Group Inc 7,188,516 0.05%
54,793 Comerica Inc 5,004,793 0.03%
64,606,000 Country Garden Holdings Co Ltd 113,628,787 0.72%
630,500 Daito Trust Construction Co Ltd 102,646,847 0.64%
6,122,900 DBS Group Holdings Ltd 119,406,617 0.76%
267,390 Erste Group Bank AG 11,158,504 0.07%
483,601 Evercore Inc 51,310,066 0.32%
463,085 Everest Re Group Ltd 107,194,916 0.67%
82,860 First American Financial Corp 4,250,718 0.03%
714,938 FNF Group 26,645,739 0.17%
240,124 GAM Holding AG 3,322,971 0.02%
268,093 Jones Lang LaSalle Inc 44,157,598 0.28%
132,387 Kemper Corp 9,962,122 0.06%
1,609,000 Leopalace21 Corp 8,828,594 0.06%
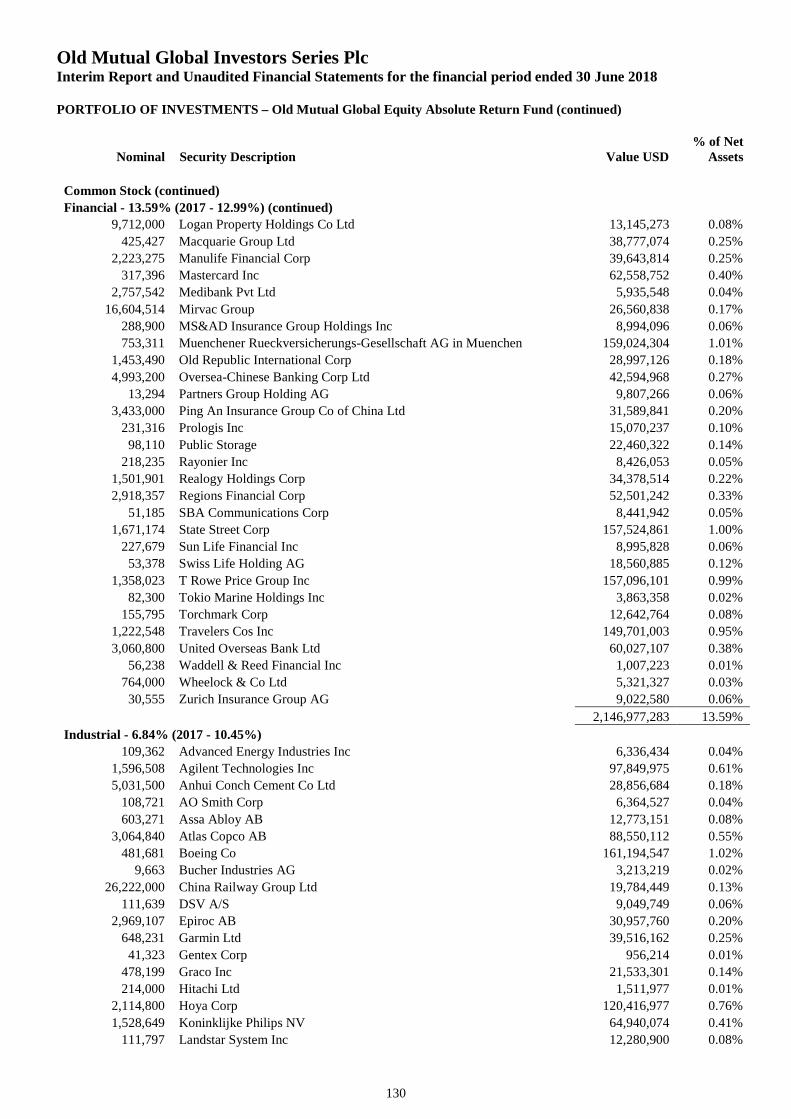
Old Mutual Global Investors Series PlcInterim Report and Unaudited Financial Statements for the financial period ended 30 June 2018
PORTFOLIO OF INVESTMENTS – Old Mutual Global Equity Absolute Return Fund (continued)
Nominal Security Description Value USD% of Net
Assets
130
Common Stock (continued)
Financial - 13.59% (2017 - 12.99%) (continued)
9,712,000 Logan Property Holdings Co Ltd 13,145,273 0.08%
425,427 Macquarie Group Ltd 38,777,074 0.25%
2,223,275 Manulife Financial Corp 39,643,814 0.25%
317,396 Mastercard Inc 62,558,752 0.40%
2,757,542 Medibank Pvt Ltd 5,935,548 0.04%
16,604,514 Mirvac Group 26,560,838 0.17%
288,900 MS&AD Insurance Group Holdings Inc 8,994,096 0.06%
753,311 Muenchener Rueckversicherungs-Gesellschaft AG in Muenchen 159,024,304 1.01%
1,453,490 Old Republic International Corp 28,997,126 0.18%
4,993,200 Oversea-Chinese Banking Corp Ltd 42,594,968 0.27%
13,294 Partners Group Holding AG 9,807,266 0.06%
3,433,000 Ping An Insurance Group Co of China Ltd 31,589,841 0.20%
231,316 Prologis Inc 15,070,237 0.10%
98,110 Public Storage 22,460,322 0.14%
218,235 Rayonier Inc 8,426,053 0.05%
1,501,901 Realogy Holdings Corp 34,378,514 0.22%
2,918,357 Regions Financial Corp 52,501,242 0.33%
51,185 SBA Communications Corp 8,441,942 0.05%
1,671,174 State Street Corp 157,524,861 1.00%
227,679 Sun Life Financial Inc 8,995,828 0.06%
53,378 Swiss Life Holding AG 18,560,885 0.12%
1,358,023 T Rowe Price Group Inc 157,096,101 0.99%
82,300 Tokio Marine Holdings Inc 3,863,358 0.02%
155,795 Torchmark Corp 12,642,764 0.08%
1,222,548 Travelers Cos Inc 149,701,003 0.95%
3,060,800 United Overseas Bank Ltd 60,027,107 0.38%
56,238 Waddell & Reed Financial Inc 1,007,223 0.01%
764,000 Wheelock & Co Ltd 5,321,327 0.03%
30,555 Zurich Insurance Group AG 9,022,580 0.06%
2,146,977,283 13.59%
Industrial - 6.84% (2017 - 10.45%)
109,362 Advanced Energy Industries Inc 6,336,434 0.04%
1,596,508 Agilent Technologies Inc 97,849,975 0.61%
5,031,500 Anhui Conch Cement Co Ltd 28,856,684 0.18%
108,721 AO Smith Corp 6,364,527 0.04%
603,271 Assa Abloy AB 12,773,151 0.08%
3,064,840 Atlas Copco AB 88,550,112 0.55%
481,681 Boeing Co 161,194,547 1.02%
9,663 Bucher Industries AG 3,213,219 0.02%
26,222,000 China Railway Group Ltd 19,784,449 0.13%
111,639 DSV A/S 9,049,749 0.06%
2,969,107 Epiroc AB 30,957,760 0.20%
648,231 Garmin Ltd 39,516,162 0.25%
41,323 Gentex Corp 956,214 0.01%
478,199 Graco Inc 21,533,301 0.14%
214,000 Hitachi Ltd 1,511,977 0.01%
2,114,800 Hoya Corp 120,416,977 0.76%
1,528,649 Koninklijke Philips NV 64,940,074 0.41%
111,797 Landstar System Inc 12,280,900 0.08%
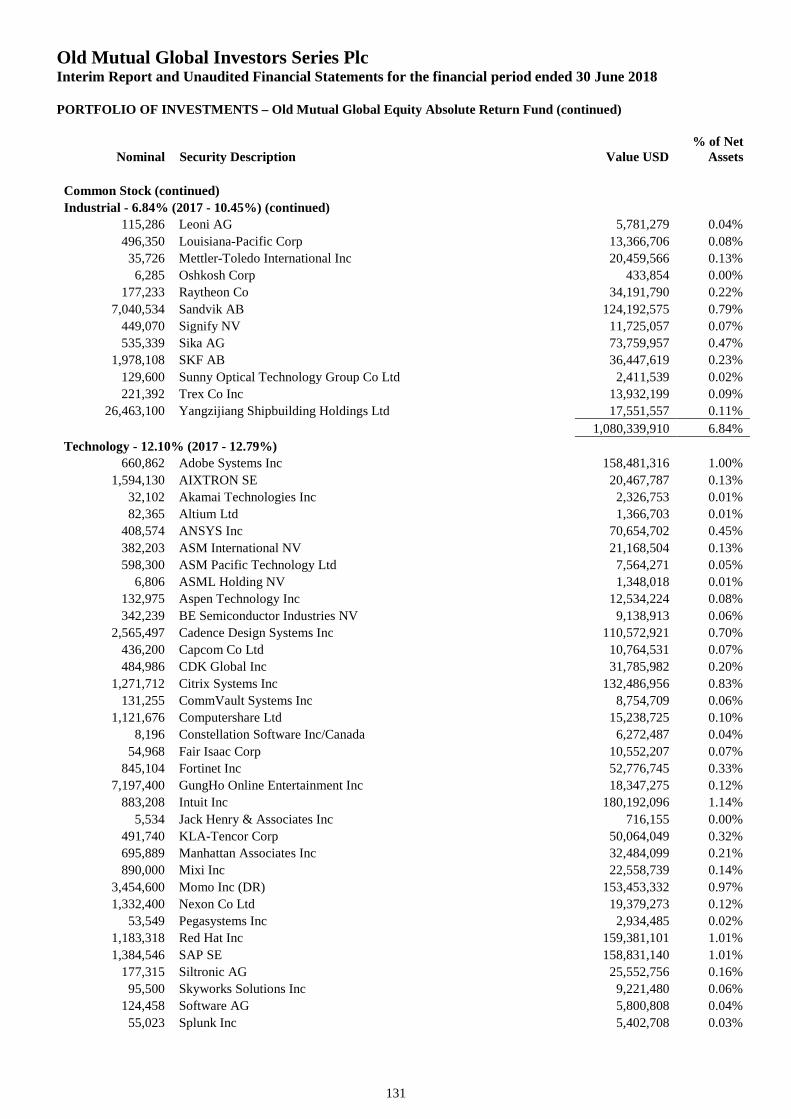
Old Mutual Global Investors Series PlcInterim Report and Unaudited Financial Statements for the financial period ended 30 June 2018
PORTFOLIO OF INVESTMENTS – Old Mutual Global Equity Absolute Return Fund (continued)
Nominal Security Description Value USD% of Net
Assets
131
Common Stock (continued)
Industrial - 6.84% (2017 - 10.45%) (continued)
115,286 Leoni AG 5,781,279 0.04%
496,350 Louisiana-Pacific Corp 13,366,706 0.08%
35,726 Mettler-Toledo International Inc 20,459,566 0.13%
6,285 Oshkosh Corp 433,854 0.00%
177,233 Raytheon Co 34,191,790 0.22%
7,040,534 Sandvik AB 124,192,575 0.79%
449,070 Signify NV 11,725,057 0.07%
535,339 Sika AG 73,759,957 0.47%
1,978,108 SKF AB 36,447,619 0.23%
129,600 Sunny Optical Technology Group Co Ltd 2,411,539 0.02%
221,392 Trex Co Inc 13,932,199 0.09%
26,463,100 Yangzijiang Shipbuilding Holdings Ltd 17,551,557 0.11%
1,080,339,910 6.84%
Technology - 12.10% (2017 - 12.79%)
660,862 Adobe Systems Inc 158,481,316 1.00%
1,594,130 AIXTRON SE 20,467,787 0.13%
32,102 Akamai Technologies Inc 2,326,753 0.01%
82,365 Altium Ltd 1,366,703 0.01%
408,574 ANSYS Inc 70,654,702 0.45%
382,203 ASM International NV 21,168,504 0.13%
598,300 ASM Pacific Technology Ltd 7,564,271 0.05%
6,806 ASML Holding NV 1,348,018 0.01%
132,975 Aspen Technology Inc 12,534,224 0.08%
342,239 BE Semiconductor Industries NV 9,138,913 0.06%
2,565,497 Cadence Design Systems Inc 110,572,921 0.70%
436,200 Capcom Co Ltd 10,764,531 0.07%
484,986 CDK Global Inc 31,785,982 0.20%
1,271,712 Citrix Systems Inc 132,486,956 0.83%
131,255 CommVault Systems Inc 8,754,709 0.06%
1,121,676 Computershare Ltd 15,238,725 0.10%
8,196 Constellation Software Inc/Canada 6,272,487 0.04%
54,968 Fair Isaac Corp 10,552,207 0.07%
845,104 Fortinet Inc 52,776,745 0.33%
7,197,400 GungHo Online Entertainment Inc 18,347,275 0.12%
883,208 Intuit Inc 180,192,096 1.14%
5,534 Jack Henry & Associates Inc 716,155 0.00%
491,740 KLA-Tencor Corp 50,064,049 0.32%
695,889 Manhattan Associates Inc 32,484,099 0.21%
890,000 Mixi Inc 22,558,739 0.14%
3,454,600 Momo Inc (DR) 153,453,332 0.97%
1,332,400 Nexon Co Ltd 19,379,273 0.12%
53,549 Pegasystems Inc 2,934,485 0.02%
1,183,318 Red Hat Inc 159,381,101 1.01%
1,384,546 SAP SE 158,831,140 1.01%
177,315 Siltronic AG 25,552,756 0.16%
95,500 Skyworks Solutions Inc 9,221,480 0.06%
124,458 Software AG 5,800,808 0.04%
55,023 Splunk Inc 5,402,708 0.03%
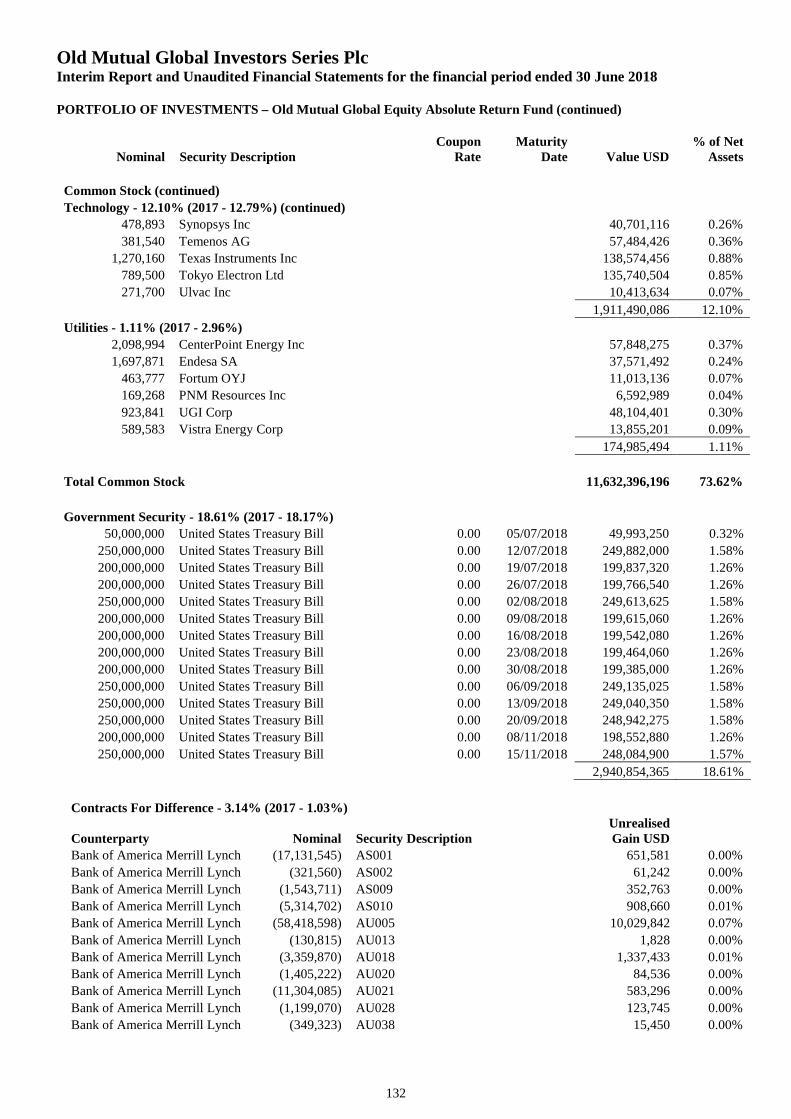
Old Mutual Global Investors Series PlcInterim Report and Unaudited Financial Statements for the financial period ended 30 June 2018
PORTFOLIO OF INVESTMENTS – Old Mutual Global Equity Absolute Return Fund (continued)
Nominal Security DescriptionCoupon
RateMaturity
Date Value USD% of Net
Assets
132
Common Stock (continued)
Technology - 12.10% (2017 - 12.79%) (continued)
478,893 Synopsys Inc 40,701,116 0.26%
381,540 Temenos AG 57,484,426 0.36%
1,270,160 Texas Instruments Inc 138,574,456 0.88%
789,500 Tokyo Electron Ltd 135,740,504 0.85%
271,700 Ulvac Inc 10,413,634 0.07%
1,911,490,086 12.10%
Utilities - 1.11% (2017 - 2.96%)
2,098,994 CenterPoint Energy Inc 57,848,275 0.37%
1,697,871 Endesa SA 37,571,492 0.24%
463,777 Fortum OYJ 11,013,136 0.07%
169,268 PNM Resources Inc 6,592,989 0.04%
923,841 UGI Corp 48,104,401 0.30%
589,583 Vistra Energy Corp 13,855,201 0.09%
174,985,494 1.11%
Total Common Stock 11,632,396,196 73.62%
Government Security - 18.61% (2017 - 18.17%)
50,000,000 United States Treasury Bill 0.00 05/07/2018 49,993,250 0.32%
250,000,000 United States Treasury Bill 0.00 12/07/2018 249,882,000 1.58%
200,000,000 United States Treasury Bill 0.00 19/07/2018 199,837,320 1.26%
200,000,000 United States Treasury Bill 0.00 26/07/2018 199,766,540 1.26%
250,000,000 United States Treasury Bill 0.00 02/08/2018 249,613,625 1.58%
200,000,000 United States Treasury Bill 0.00 09/08/2018 199,615,060 1.26%
200,000,000 United States Treasury Bill 0.00 16/08/2018 199,542,080 1.26%
200,000,000 United States Treasury Bill 0.00 23/08/2018 199,464,060 1.26%
200,000,000 United States Treasury Bill 0.00 30/08/2018 199,385,000 1.26%
250,000,000 United States Treasury Bill 0.00 06/09/2018 249,135,025 1.58%
250,000,000 United States Treasury Bill 0.00 13/09/2018 249,040,350 1.58%
250,000,000 United States Treasury Bill 0.00 20/09/2018 248,942,275 1.58%
200,000,000 United States Treasury Bill 0.00 08/11/2018 198,552,880 1.26%
250,000,000 United States Treasury Bill 0.00 15/11/2018 248,084,900 1.57%
2,940,854,365 18.61%
Contracts For Difference - 3.14% (2017 - 1.03%)
Counterparty Nominal Security DescriptionUnrealisedGain USD
Bank of America Merrill Lynch (17,131,545) AS001 651,581 0.00%
Bank of America Merrill Lynch (321,560) AS002 61,242 0.00%
Bank of America Merrill Lynch (1,543,711) AS009 352,763 0.00%
Bank of America Merrill Lynch (5,314,702) AS010 908,660 0.01%
Bank of America Merrill Lynch (58,418,598) AU005 10,029,842 0.07%
Bank of America Merrill Lynch (130,815) AU013 1,828 0.00%
Bank of America Merrill Lynch (3,359,870) AU018 1,337,433 0.01%
Bank of America Merrill Lynch (1,405,222) AU020 84,536 0.00%
Bank of America Merrill Lynch (11,304,085) AU021 583,296 0.00%
Bank of America Merrill Lynch (1,199,070) AU028 123,745 0.00%
Bank of America Merrill Lynch (349,323) AU038 15,450 0.00%
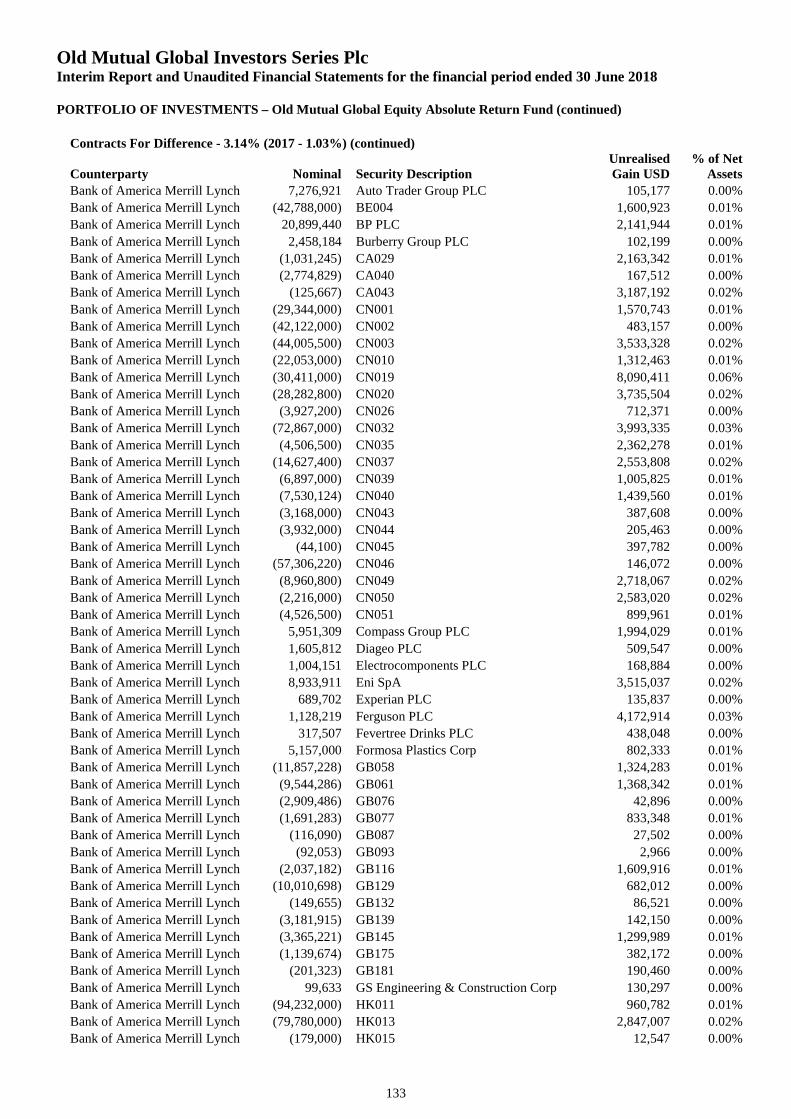
Old Mutual Global Investors Series PlcInterim Report and Unaudited Financial Statements for the financial period ended 30 June 2018
PORTFOLIO OF INVESTMENTS – Old Mutual Global Equity Absolute Return Fund (continued)
133
Contracts For Difference - 3.14% (2017 - 1.03%) (continued)
Counterparty Nominal Security DescriptionUnrealisedGain USD
% of NetAssets
Bank of America Merrill Lynch 7,276,921 Auto Trader Group PLC 105,177 0.00%
Bank of America Merrill Lynch (42,788,000) BE004 1,600,923 0.01%
Bank of America Merrill Lynch 20,899,440 BP PLC 2,141,944 0.01%
Bank of America Merrill Lynch 2,458,184 Burberry Group PLC 102,199 0.00%
Bank of America Merrill Lynch (1,031,245) CA029 2,163,342 0.01%
Bank of America Merrill Lynch (2,774,829) CA040 167,512 0.00%
Bank of America Merrill Lynch (125,667) CA043 3,187,192 0.02%
Bank of America Merrill Lynch (29,344,000) CN001 1,570,743 0.01%
Bank of America Merrill Lynch (42,122,000) CN002 483,157 0.00%
Bank of America Merrill Lynch (44,005,500) CN003 3,533,328 0.02%
Bank of America Merrill Lynch (22,053,000) CN010 1,312,463 0.01%
Bank of America Merrill Lynch (30,411,000) CN019 8,090,411 0.06%
Bank of America Merrill Lynch (28,282,800) CN020 3,735,504 0.02%
Bank of America Merrill Lynch (3,927,200) CN026 712,371 0.00%
Bank of America Merrill Lynch (72,867,000) CN032 3,993,335 0.03%
Bank of America Merrill Lynch (4,506,500) CN035 2,362,278 0.01%
Bank of America Merrill Lynch (14,627,400) CN037 2,553,808 0.02%
Bank of America Merrill Lynch (6,897,000) CN039 1,005,825 0.01%
Bank of America Merrill Lynch (7,530,124) CN040 1,439,560 0.01%
Bank of America Merrill Lynch (3,168,000) CN043 387,608 0.00%
Bank of America Merrill Lynch (3,932,000) CN044 205,463 0.00%
Bank of America Merrill Lynch (44,100) CN045 397,782 0.00%
Bank of America Merrill Lynch (57,306,220) CN046 146,072 0.00%
Bank of America Merrill Lynch (8,960,800) CN049 2,718,067 0.02%
Bank of America Merrill Lynch (2,216,000) CN050 2,583,020 0.02%
Bank of America Merrill Lynch (4,526,500) CN051 899,961 0.01%
Bank of America Merrill Lynch 5,951,309 Compass Group PLC 1,994,029 0.01%
Bank of America Merrill Lynch 1,605,812 Diageo PLC 509,547 0.00%
Bank of America Merrill Lynch 1,004,151 Electrocomponents PLC 168,884 0.00%
Bank of America Merrill Lynch 8,933,911 Eni SpA 3,515,037 0.02%
Bank of America Merrill Lynch 689,702 Experian PLC 135,837 0.00%
Bank of America Merrill Lynch 1,128,219 Ferguson PLC 4,172,914 0.03%
Bank of America Merrill Lynch 317,507 Fevertree Drinks PLC 438,048 0.00%
Bank of America Merrill Lynch 5,157,000 Formosa Plastics Corp 802,333 0.01%
Bank of America Merrill Lynch (11,857,228) GB058 1,324,283 0.01%
Bank of America Merrill Lynch (9,544,286) GB061 1,368,342 0.01%
Bank of America Merrill Lynch (2,909,486) GB076 42,896 0.00%
Bank of America Merrill Lynch (1,691,283) GB077 833,348 0.01%
Bank of America Merrill Lynch (116,090) GB087 27,502 0.00%
Bank of America Merrill Lynch (92,053) GB093 2,966 0.00%
Bank of America Merrill Lynch (2,037,182) GB116 1,609,916 0.01%
Bank of America Merrill Lynch (10,010,698) GB129 682,012 0.00%
Bank of America Merrill Lynch (149,655) GB132 86,521 0.00%
Bank of America Merrill Lynch (3,181,915) GB139 142,150 0.00%
Bank of America Merrill Lynch (3,365,221) GB145 1,299,989 0.01%
Bank of America Merrill Lynch (1,139,674) GB175 382,172 0.00%
Bank of America Merrill Lynch (201,323) GB181 190,460 0.00%
Bank of America Merrill Lynch 99,633 GS Engineering & Construction Corp 130,297 0.00%
Bank of America Merrill Lynch (94,232,000) HK011 960,782 0.01%
Bank of America Merrill Lynch (79,780,000) HK013 2,847,007 0.02%
Bank of America Merrill Lynch (179,000) HK015 12,547 0.00%
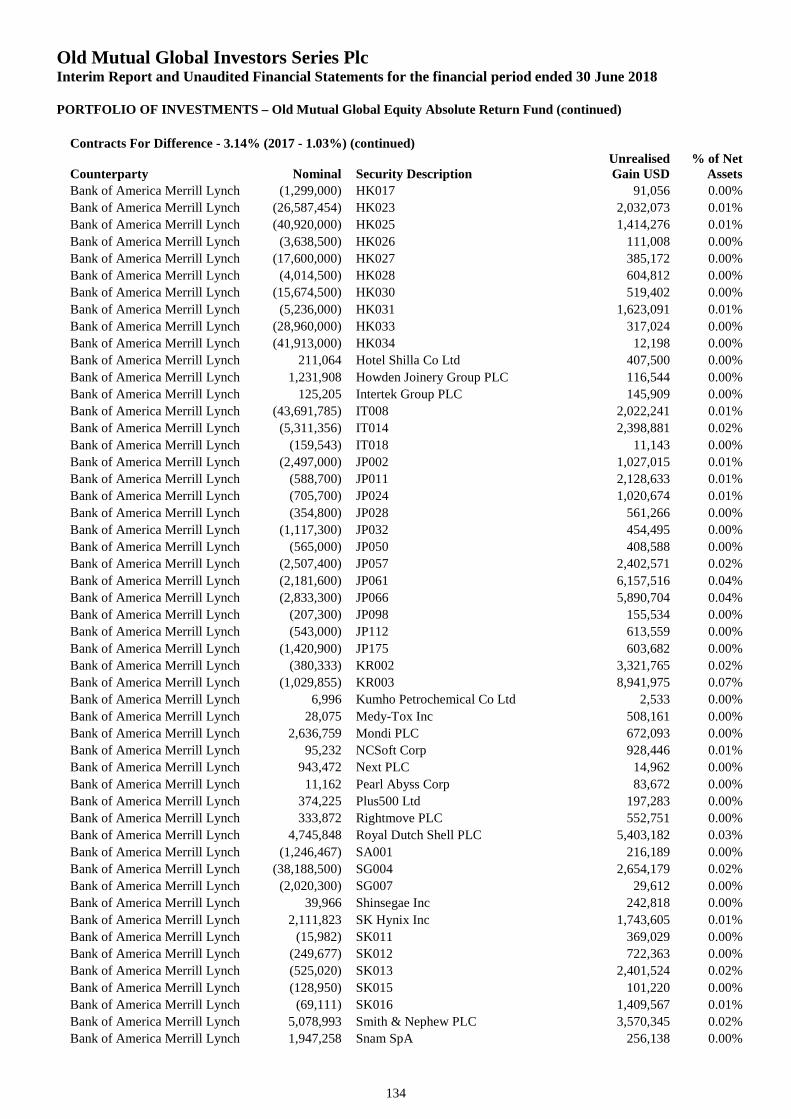
Old Mutual Global Investors Series PlcInterim Report and Unaudited Financial Statements for the financial period ended 30 June 2018
PORTFOLIO OF INVESTMENTS – Old Mutual Global Equity Absolute Return Fund (continued)
134
Contracts For Difference - 3.14% (2017 - 1.03%) (continued)
Counterparty Nominal Security DescriptionUnrealisedGain USD
% of NetAssets
Bank of America Merrill Lynch (1,299,000) HK017 91,056 0.00%
Bank of America Merrill Lynch (26,587,454) HK023 2,032,073 0.01%
Bank of America Merrill Lynch (40,920,000) HK025 1,414,276 0.01%
Bank of America Merrill Lynch (3,638,500) HK026 111,008 0.00%
Bank of America Merrill Lynch (17,600,000) HK027 385,172 0.00%
Bank of America Merrill Lynch (4,014,500) HK028 604,812 0.00%
Bank of America Merrill Lynch (15,674,500) HK030 519,402 0.00%
Bank of America Merrill Lynch (5,236,000) HK031 1,623,091 0.01%
Bank of America Merrill Lynch (28,960,000) HK033 317,024 0.00%
Bank of America Merrill Lynch (41,913,000) HK034 12,198 0.00%
Bank of America Merrill Lynch 211,064 Hotel Shilla Co Ltd 407,500 0.00%
Bank of America Merrill Lynch 1,231,908 Howden Joinery Group PLC 116,544 0.00%
Bank of America Merrill Lynch 125,205 Intertek Group PLC 145,909 0.00%
Bank of America Merrill Lynch (43,691,785) IT008 2,022,241 0.01%
Bank of America Merrill Lynch (5,311,356) IT014 2,398,881 0.02%
Bank of America Merrill Lynch (159,543) IT018 11,143 0.00%
Bank of America Merrill Lynch (2,497,000) JP002 1,027,015 0.01%
Bank of America Merrill Lynch (588,700) JP011 2,128,633 0.01%
Bank of America Merrill Lynch (705,700) JP024 1,020,674 0.01%
Bank of America Merrill Lynch (354,800) JP028 561,266 0.00%
Bank of America Merrill Lynch (1,117,300) JP032 454,495 0.00%
Bank of America Merrill Lynch (565,000) JP050 408,588 0.00%
Bank of America Merrill Lynch (2,507,400) JP057 2,402,571 0.02%
Bank of America Merrill Lynch (2,181,600) JP061 6,157,516 0.04%
Bank of America Merrill Lynch (2,833,300) JP066 5,890,704 0.04%
Bank of America Merrill Lynch (207,300) JP098 155,534 0.00%
Bank of America Merrill Lynch (543,000) JP112 613,559 0.00%
Bank of America Merrill Lynch (1,420,900) JP175 603,682 0.00%
Bank of America Merrill Lynch (380,333) KR002 3,321,765 0.02%
Bank of America Merrill Lynch (1,029,855) KR003 8,941,975 0.07%
Bank of America Merrill Lynch 6,996 Kumho Petrochemical Co Ltd 2,533 0.00%
Bank of America Merrill Lynch 28,075 Medy-Tox Inc 508,161 0.00%
Bank of America Merrill Lynch 2,636,759 Mondi PLC 672,093 0.00%
Bank of America Merrill Lynch 95,232 NCSoft Corp 928,446 0.01%
Bank of America Merrill Lynch 943,472 Next PLC 14,962 0.00%
Bank of America Merrill Lynch 11,162 Pearl Abyss Corp 83,672 0.00%
Bank of America Merrill Lynch 374,225 Plus500 Ltd 197,283 0.00%
Bank of America Merrill Lynch 333,872 Rightmove PLC 552,751 0.00%
Bank of America Merrill Lynch 4,745,848 Royal Dutch Shell PLC 5,403,182 0.03%
Bank of America Merrill Lynch (1,246,467) SA001 216,189 0.00%
Bank of America Merrill Lynch (38,188,500) SG004 2,654,179 0.02%
Bank of America Merrill Lynch (2,020,300) SG007 29,612 0.00%
Bank of America Merrill Lynch 39,966 Shinsegae Inc 242,818 0.00%
Bank of America Merrill Lynch 2,111,823 SK Hynix Inc 1,743,605 0.01%
Bank of America Merrill Lynch (15,982) SK011 369,029 0.00%
Bank of America Merrill Lynch (249,677) SK012 722,363 0.00%
Bank of America Merrill Lynch (525,020) SK013 2,401,524 0.02%
Bank of America Merrill Lynch (128,950) SK015 101,220 0.00%
Bank of America Merrill Lynch (69,111) SK016 1,409,567 0.01%
Bank of America Merrill Lynch 5,078,993 Smith & Nephew PLC 3,570,345 0.02%
Bank of America Merrill Lynch 1,947,258 Snam SpA 256,138 0.00%
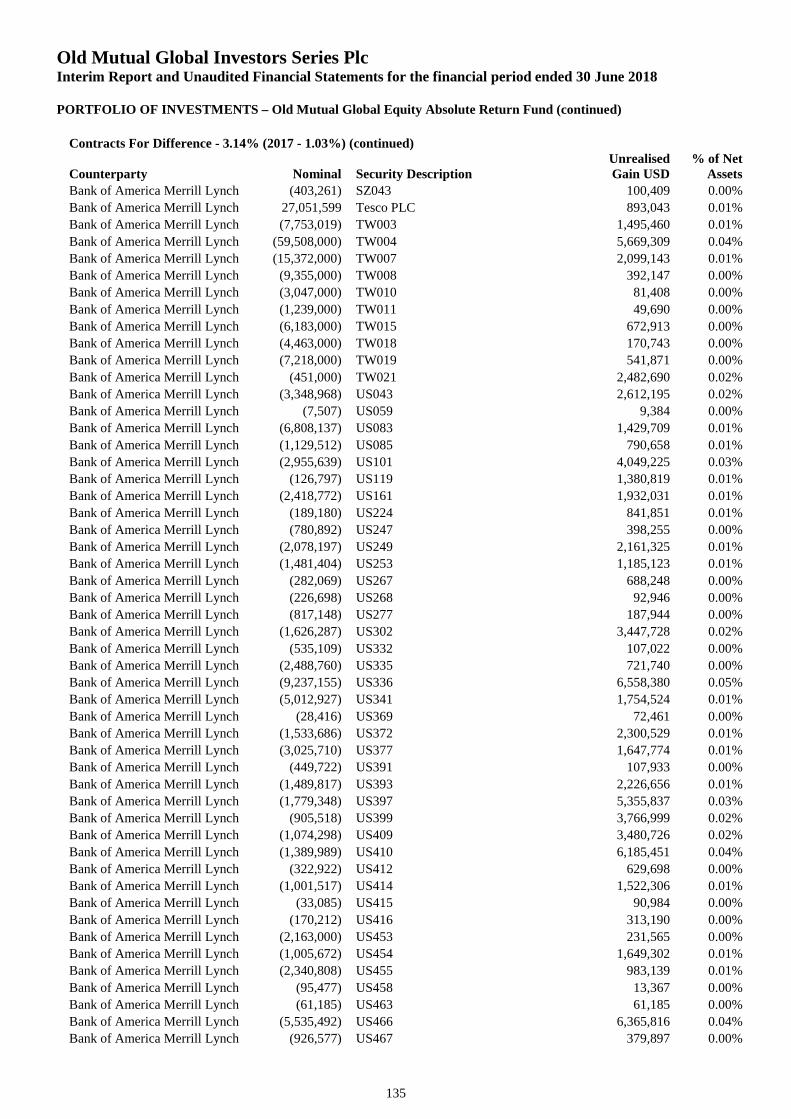
Old Mutual Global Investors Series PlcInterim Report and Unaudited Financial Statements for the financial period ended 30 June 2018
PORTFOLIO OF INVESTMENTS – Old Mutual Global Equity Absolute Return Fund (continued)
135
Contracts For Difference - 3.14% (2017 - 1.03%) (continued)
Counterparty Nominal Security DescriptionUnrealisedGain USD
% of NetAssets
Bank of America Merrill Lynch (403,261) SZ043 100,409 0.00%
Bank of America Merrill Lynch 27,051,599 Tesco PLC 893,043 0.01%
Bank of America Merrill Lynch (7,753,019) TW003 1,495,460 0.01%
Bank of America Merrill Lynch (59,508,000) TW004 5,669,309 0.04%
Bank of America Merrill Lynch (15,372,000) TW007 2,099,143 0.01%
Bank of America Merrill Lynch (9,355,000) TW008 392,147 0.00%
Bank of America Merrill Lynch (3,047,000) TW010 81,408 0.00%
Bank of America Merrill Lynch (1,239,000) TW011 49,690 0.00%
Bank of America Merrill Lynch (6,183,000) TW015 672,913 0.00%
Bank of America Merrill Lynch (4,463,000) TW018 170,743 0.00%
Bank of America Merrill Lynch (7,218,000) TW019 541,871 0.00%
Bank of America Merrill Lynch (451,000) TW021 2,482,690 0.02%
Bank of America Merrill Lynch (3,348,968) US043 2,612,195 0.02%
Bank of America Merrill Lynch (7,507) US059 9,384 0.00%
Bank of America Merrill Lynch (6,808,137) US083 1,429,709 0.01%
Bank of America Merrill Lynch (1,129,512) US085 790,658 0.01%
Bank of America Merrill Lynch (2,955,639) US101 4,049,225 0.03%
Bank of America Merrill Lynch (126,797) US119 1,380,819 0.01%
Bank of America Merrill Lynch (2,418,772) US161 1,932,031 0.01%
Bank of America Merrill Lynch (189,180) US224 841,851 0.01%
Bank of America Merrill Lynch (780,892) US247 398,255 0.00%
Bank of America Merrill Lynch (2,078,197) US249 2,161,325 0.01%
Bank of America Merrill Lynch (1,481,404) US253 1,185,123 0.01%
Bank of America Merrill Lynch (282,069) US267 688,248 0.00%
Bank of America Merrill Lynch (226,698) US268 92,946 0.00%
Bank of America Merrill Lynch (817,148) US277 187,944 0.00%
Bank of America Merrill Lynch (1,626,287) US302 3,447,728 0.02%
Bank of America Merrill Lynch (535,109) US332 107,022 0.00%
Bank of America Merrill Lynch (2,488,760) US335 721,740 0.00%
Bank of America Merrill Lynch (9,237,155) US336 6,558,380 0.05%
Bank of America Merrill Lynch (5,012,927) US341 1,754,524 0.01%
Bank of America Merrill Lynch (28,416) US369 72,461 0.00%
Bank of America Merrill Lynch (1,533,686) US372 2,300,529 0.01%
Bank of America Merrill Lynch (3,025,710) US377 1,647,774 0.01%
Bank of America Merrill Lynch (449,722) US391 107,933 0.00%
Bank of America Merrill Lynch (1,489,817) US393 2,226,656 0.01%
Bank of America Merrill Lynch (1,779,348) US397 5,355,837 0.03%
Bank of America Merrill Lynch (905,518) US399 3,766,999 0.02%
Bank of America Merrill Lynch (1,074,298) US409 3,480,726 0.02%
Bank of America Merrill Lynch (1,389,989) US410 6,185,451 0.04%
Bank of America Merrill Lynch (322,922) US412 629,698 0.00%
Bank of America Merrill Lynch (1,001,517) US414 1,522,306 0.01%
Bank of America Merrill Lynch (33,085) US415 90,984 0.00%
Bank of America Merrill Lynch (170,212) US416 313,190 0.00%
Bank of America Merrill Lynch (2,163,000) US453 231,565 0.00%
Bank of America Merrill Lynch (1,005,672) US454 1,649,302 0.01%
Bank of America Merrill Lynch (2,340,808) US455 983,139 0.01%
Bank of America Merrill Lynch (95,477) US458 13,367 0.00%
Bank of America Merrill Lynch (61,185) US463 61,185 0.00%
Bank of America Merrill Lynch (5,535,492) US466 6,365,816 0.04%
Bank of America Merrill Lynch (926,577) US467 379,897 0.00%
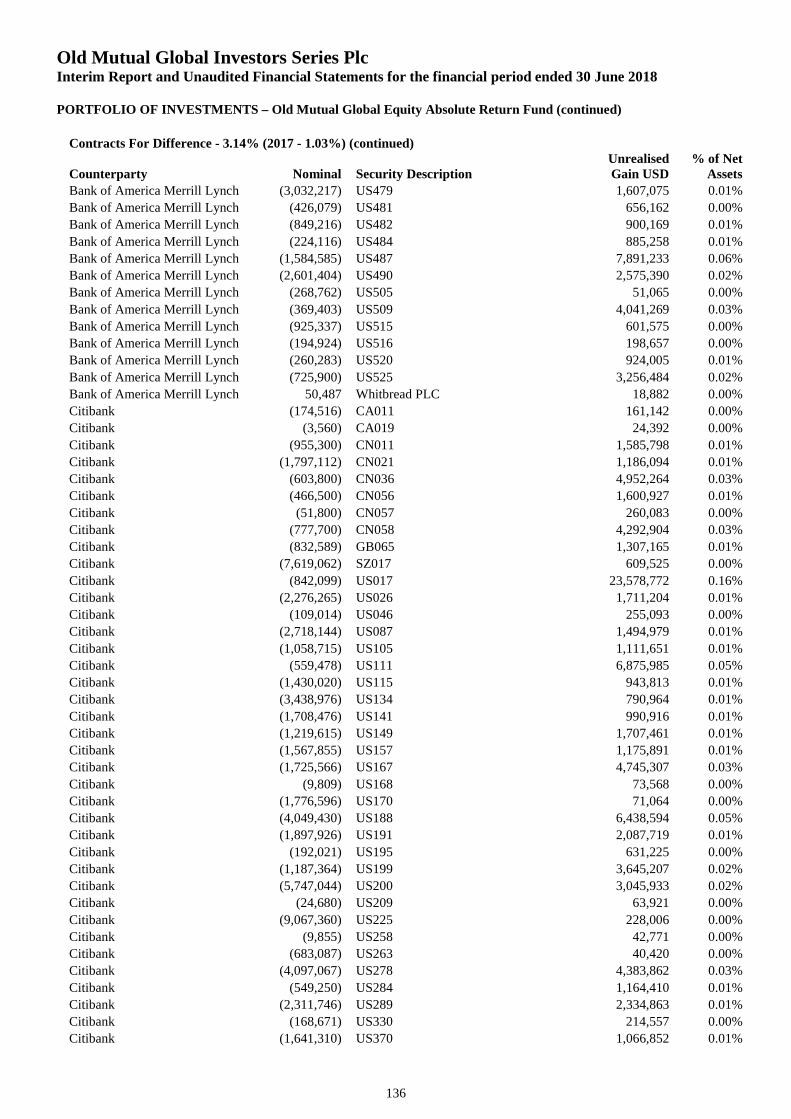
Old Mutual Global Investors Series PlcInterim Report and Unaudited Financial Statements for the financial period ended 30 June 2018
PORTFOLIO OF INVESTMENTS – Old Mutual Global Equity Absolute Return Fund (continued)
136
Contracts For Difference - 3.14% (2017 - 1.03%) (continued)
Counterparty Nominal Security DescriptionUnrealisedGain USD
% of NetAssets
Bank of America Merrill Lynch (3,032,217) US479 1,607,075 0.01%
Bank of America Merrill Lynch (426,079) US481 656,162 0.00%
Bank of America Merrill Lynch (849,216) US482 900,169 0.01%
Bank of America Merrill Lynch (224,116) US484 885,258 0.01%
Bank of America Merrill Lynch (1,584,585) US487 7,891,233 0.06%
Bank of America Merrill Lynch (2,601,404) US490 2,575,390 0.02%
Bank of America Merrill Lynch (268,762) US505 51,065 0.00%
Bank of America Merrill Lynch (369,403) US509 4,041,269 0.03%
Bank of America Merrill Lynch (925,337) US515 601,575 0.00%
Bank of America Merrill Lynch (194,924) US516 198,657 0.00%
Bank of America Merrill Lynch (260,283) US520 924,005 0.01%
Bank of America Merrill Lynch (725,900) US525 3,256,484 0.02%
Bank of America Merrill Lynch 50,487 Whitbread PLC 18,882 0.00%
Citibank (174,516) CA011 161,142 0.00%
Citibank (3,560) CA019 24,392 0.00%
Citibank (955,300) CN011 1,585,798 0.01%
Citibank (1,797,112) CN021 1,186,094 0.01%
Citibank (603,800) CN036 4,952,264 0.03%
Citibank (466,500) CN056 1,600,927 0.01%
Citibank (51,800) CN057 260,083 0.00%
Citibank (777,700) CN058 4,292,904 0.03%
Citibank (832,589) GB065 1,307,165 0.01%
Citibank (7,619,062) SZ017 609,525 0.00%
Citibank (842,099) US017 23,578,772 0.16%
Citibank (2,276,265) US026 1,711,204 0.01%
Citibank (109,014) US046 255,093 0.00%
Citibank (2,718,144) US087 1,494,979 0.01%
Citibank (1,058,715) US105 1,111,651 0.01%
Citibank (559,478) US111 6,875,985 0.05%
Citibank (1,430,020) US115 943,813 0.01%
Citibank (3,438,976) US134 790,964 0.01%
Citibank (1,708,476) US141 990,916 0.01%
Citibank (1,219,615) US149 1,707,461 0.01%
Citibank (1,567,855) US157 1,175,891 0.01%
Citibank (1,725,566) US167 4,745,307 0.03%
Citibank (9,809) US168 73,568 0.00%
Citibank (1,776,596) US170 71,064 0.00%
Citibank (4,049,430) US188 6,438,594 0.05%
Citibank (1,897,926) US191 2,087,719 0.01%
Citibank (192,021) US195 631,225 0.00%
Citibank (1,187,364) US199 3,645,207 0.02%
Citibank (5,747,044) US200 3,045,933 0.02%
Citibank (24,680) US209 63,921 0.00%
Citibank (9,067,360) US225 228,006 0.00%
Citibank (9,855) US258 42,771 0.00%
Citibank (683,087) US263 40,420 0.00%
Citibank (4,097,067) US278 4,383,862 0.03%
Citibank (549,250) US284 1,164,410 0.01%
Citibank (2,311,746) US289 2,334,863 0.01%
Citibank (168,671) US330 214,557 0.00%
Citibank (1,641,310) US370 1,066,852 0.01%
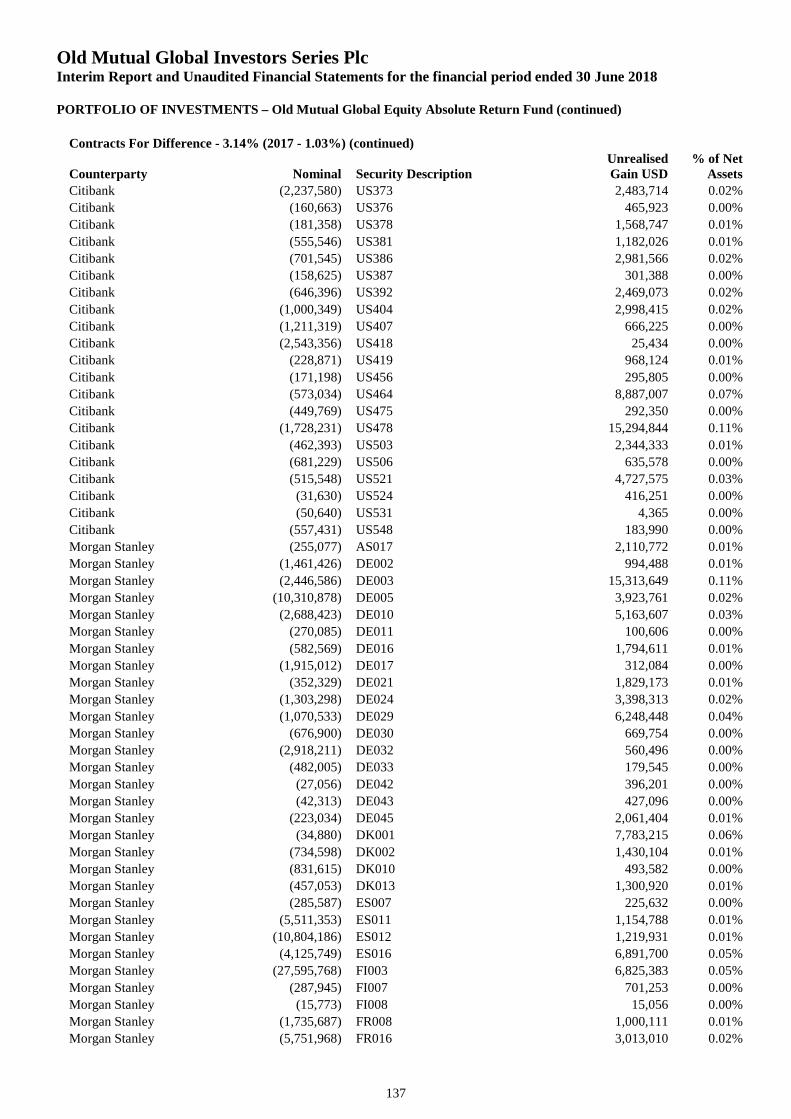
Old Mutual Global Investors Series PlcInterim Report and Unaudited Financial Statements for the financial period ended 30 June 2018
PORTFOLIO OF INVESTMENTS – Old Mutual Global Equity Absolute Return Fund (continued)
137
Contracts For Difference - 3.14% (2017 - 1.03%) (continued)
Counterparty Nominal Security DescriptionUnrealisedGain USD
% of NetAssets
Citibank (2,237,580) US373 2,483,714 0.02%
Citibank (160,663) US376 465,923 0.00%
Citibank (181,358) US378 1,568,747 0.01%
Citibank (555,546) US381 1,182,026 0.01%
Citibank (701,545) US386 2,981,566 0.02%
Citibank (158,625) US387 301,388 0.00%
Citibank (646,396) US392 2,469,073 0.02%
Citibank (1,000,349) US404 2,998,415 0.02%
Citibank (1,211,319) US407 666,225 0.00%
Citibank (2,543,356) US418 25,434 0.00%
Citibank (228,871) US419 968,124 0.01%
Citibank (171,198) US456 295,805 0.00%
Citibank (573,034) US464 8,887,007 0.07%
Citibank (449,769) US475 292,350 0.00%
Citibank (1,728,231) US478 15,294,844 0.11%
Citibank (462,393) US503 2,344,333 0.01%
Citibank (681,229) US506 635,578 0.00%
Citibank (515,548) US521 4,727,575 0.03%
Citibank (31,630) US524 416,251 0.00%
Citibank (50,640) US531 4,365 0.00%
Citibank (557,431) US548 183,990 0.00%
Morgan Stanley (255,077) AS017 2,110,772 0.01%
Morgan Stanley (1,461,426) DE002 994,488 0.01%
Morgan Stanley (2,446,586) DE003 15,313,649 0.11%
Morgan Stanley (10,310,878) DE005 3,923,761 0.02%
Morgan Stanley (2,688,423) DE010 5,163,607 0.03%
Morgan Stanley (270,085) DE011 100,606 0.00%
Morgan Stanley (582,569) DE016 1,794,611 0.01%
Morgan Stanley (1,915,012) DE017 312,084 0.00%
Morgan Stanley (352,329) DE021 1,829,173 0.01%
Morgan Stanley (1,303,298) DE024 3,398,313 0.02%
Morgan Stanley (1,070,533) DE029 6,248,448 0.04%
Morgan Stanley (676,900) DE030 669,754 0.00%
Morgan Stanley (2,918,211) DE032 560,496 0.00%
Morgan Stanley (482,005) DE033 179,545 0.00%
Morgan Stanley (27,056) DE042 396,201 0.00%
Morgan Stanley (42,313) DE043 427,096 0.00%
Morgan Stanley (223,034) DE045 2,061,404 0.01%
Morgan Stanley (34,880) DK001 7,783,215 0.06%
Morgan Stanley (734,598) DK002 1,430,104 0.01%
Morgan Stanley (831,615) DK010 493,582 0.00%
Morgan Stanley (457,053) DK013 1,300,920 0.01%
Morgan Stanley (285,587) ES007 225,632 0.00%
Morgan Stanley (5,511,353) ES011 1,154,788 0.01%
Morgan Stanley (10,804,186) ES012 1,219,931 0.01%
Morgan Stanley (4,125,749) ES016 6,891,700 0.05%
Morgan Stanley (27,595,768) FI003 6,825,383 0.05%
Morgan Stanley (287,945) FI007 701,253 0.00%
Morgan Stanley (15,773) FI008 15,056 0.00%
Morgan Stanley (1,735,687) FR008 1,000,111 0.01%
Morgan Stanley (5,751,968) FR016 3,013,010 0.02%
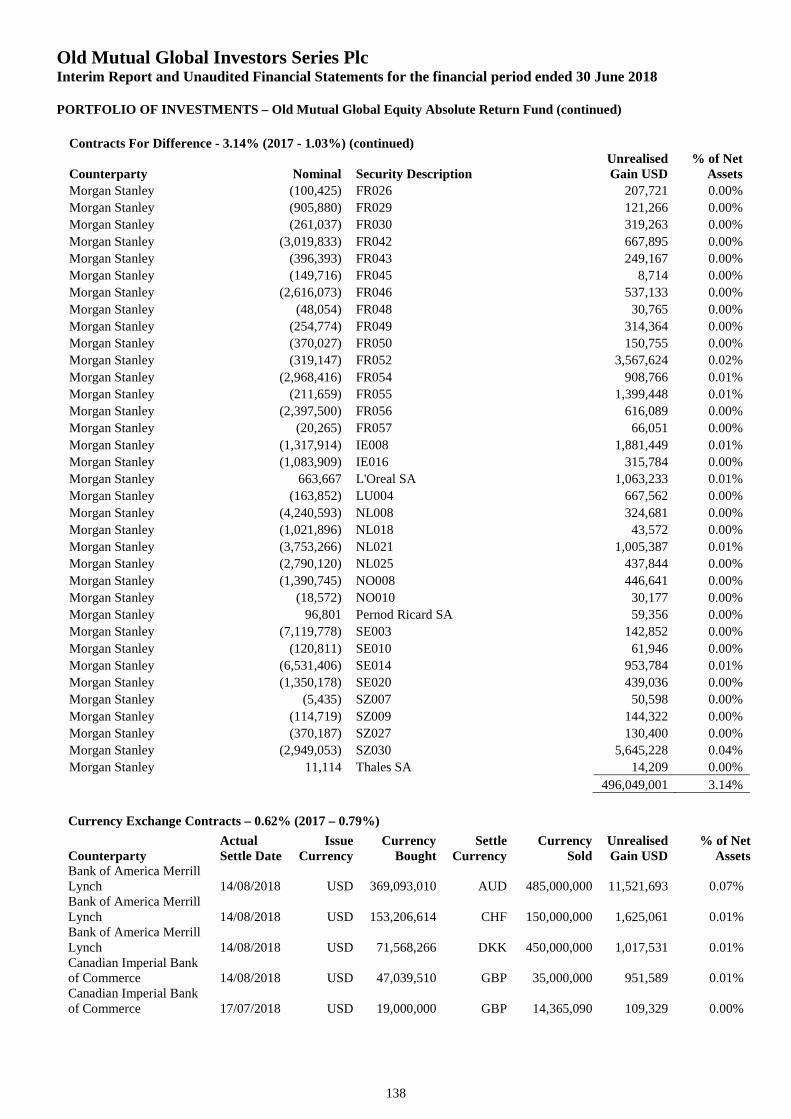
Old Mutual Global Investors Series PlcInterim Report and Unaudited Financial Statements for the financial period ended 30 June 2018
PORTFOLIO OF INVESTMENTS – Old Mutual Global Equity Absolute Return Fund (continued)
138
Contracts For Difference - 3.14% (2017 - 1.03%) (continued)
Counterparty Nominal Security DescriptionUnrealisedGain USD
% of NetAssets
Morgan Stanley (100,425) FR026 207,721 0.00%
Morgan Stanley (905,880) FR029 121,266 0.00%
Morgan Stanley (261,037) FR030 319,263 0.00%
Morgan Stanley (3,019,833) FR042 667,895 0.00%
Morgan Stanley (396,393) FR043 249,167 0.00%
Morgan Stanley (149,716) FR045 8,714 0.00%
Morgan Stanley (2,616,073) FR046 537,133 0.00%
Morgan Stanley (48,054) FR048 30,765 0.00%
Morgan Stanley (254,774) FR049 314,364 0.00%
Morgan Stanley (370,027) FR050 150,755 0.00%
Morgan Stanley (319,147) FR052 3,567,624 0.02%
Morgan Stanley (2,968,416) FR054 908,766 0.01%
Morgan Stanley (211,659) FR055 1,399,448 0.01%
Morgan Stanley (2,397,500) FR056 616,089 0.00%
Morgan Stanley (20,265) FR057 66,051 0.00%
Morgan Stanley (1,317,914) IE008 1,881,449 0.01%
Morgan Stanley (1,083,909) IE016 315,784 0.00%
Morgan Stanley 663,667 L'Oreal SA 1,063,233 0.01%
Morgan Stanley (163,852) LU004 667,562 0.00%
Morgan Stanley (4,240,593) NL008 324,681 0.00%
Morgan Stanley (1,021,896) NL018 43,572 0.00%
Morgan Stanley (3,753,266) NL021 1,005,387 0.01%
Morgan Stanley (2,790,120) NL025 437,844 0.00%
Morgan Stanley (1,390,745) NO008 446,641 0.00%
Morgan Stanley (18,572) NO010 30,177 0.00%
Morgan Stanley 96,801 Pernod Ricard SA 59,356 0.00%
Morgan Stanley (7,119,778) SE003 142,852 0.00%
Morgan Stanley (120,811) SE010 61,946 0.00%
Morgan Stanley (6,531,406) SE014 953,784 0.01%
Morgan Stanley (1,350,178) SE020 439,036 0.00%
Morgan Stanley (5,435) SZ007 50,598 0.00%
Morgan Stanley (114,719) SZ009 144,322 0.00%
Morgan Stanley (370,187) SZ027 130,400 0.00%
Morgan Stanley (2,949,053) SZ030 5,645,228 0.04%
Morgan Stanley 11,114 Thales SA 14,209 0.00%
496,049,001 3.14%
Currency Exchange Contracts – 0.62% (2017 – 0.79%)
CounterpartyActualSettle Date
IssueCurrency
CurrencyBought
SettleCurrency
CurrencySold
UnrealisedGain USD
% of NetAssets
Bank of America MerrillLynch 14/08/2018 USD 369,093,010 AUD 485,000,000 11,521,693 0.07%Bank of America MerrillLynch 14/08/2018 USD 153,206,614 CHF 150,000,000 1,625,061 0.01%Bank of America MerrillLynch 14/08/2018 USD 71,568,266 DKK 450,000,000 1,017,531 0.01%Canadian Imperial Bankof Commerce 14/08/2018 USD 47,039,510 GBP 35,000,000 951,589 0.01%Canadian Imperial Bankof Commerce 17/07/2018 USD 19,000,000 GBP 14,365,090 109,329 0.00%
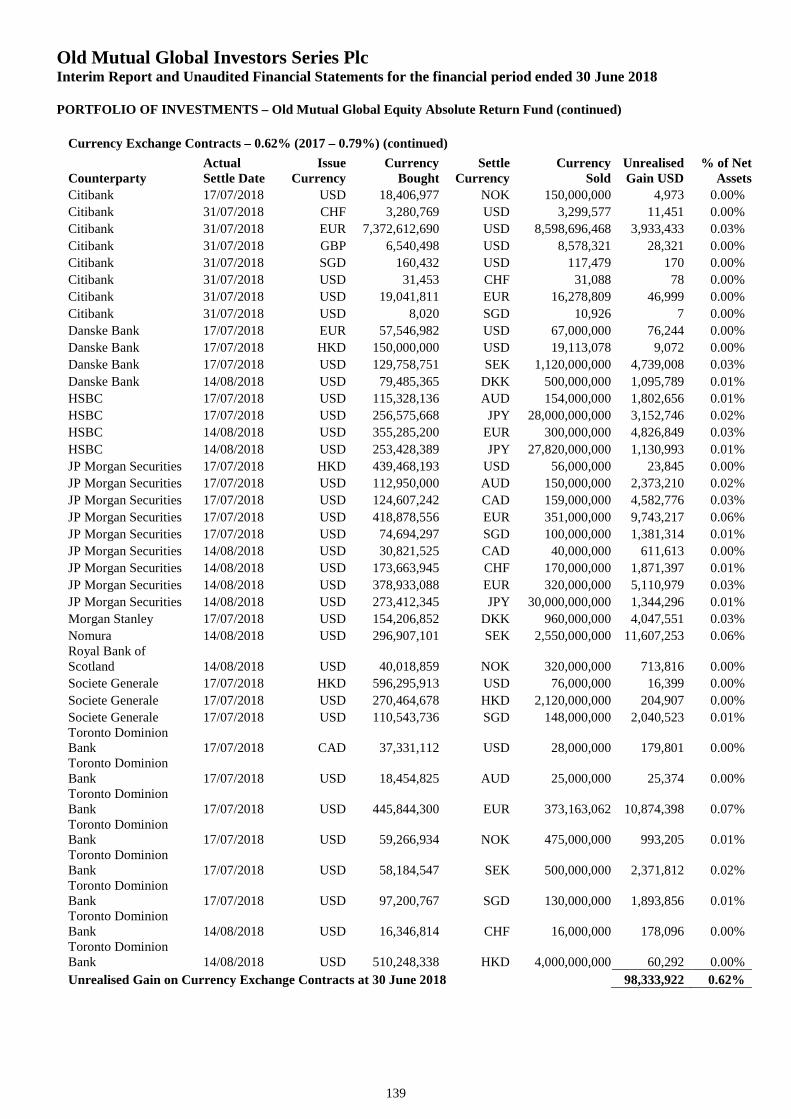
Old Mutual Global Investors Series PlcInterim Report and Unaudited Financial Statements for the financial period ended 30 June 2018
PORTFOLIO OF INVESTMENTS – Old Mutual Global Equity Absolute Return Fund (continued)
139
Currency Exchange Contracts – 0.62% (2017 – 0.79%) (continued)
CounterpartyActualSettle Date
IssueCurrency
CurrencyBought
SettleCurrency
CurrencySold
UnrealisedGain USD
% of NetAssets
Citibank 17/07/2018 USD 18,406,977 NOK 150,000,000 4,973 0.00%
Citibank 31/07/2018 CHF 3,280,769 USD 3,299,577 11,451 0.00%
Citibank 31/07/2018 EUR 7,372,612,690 USD 8,598,696,468 3,933,433 0.03%
Citibank 31/07/2018 GBP 6,540,498 USD 8,578,321 28,321 0.00%
Citibank 31/07/2018 SGD 160,432 USD 117,479 170 0.00%
Citibank 31/07/2018 USD 31,453 CHF 31,088 78 0.00%
Citibank 31/07/2018 USD 19,041,811 EUR 16,278,809 46,999 0.00%
Citibank 31/07/2018 USD 8,020 SGD 10,926 7 0.00%
Danske Bank 17/07/2018 EUR 57,546,982 USD 67,000,000 76,244 0.00%
Danske Bank 17/07/2018 HKD 150,000,000 USD 19,113,078 9,072 0.00%
Danske Bank 17/07/2018 USD 129,758,751 SEK 1,120,000,000 4,739,008 0.03%
Danske Bank 14/08/2018 USD 79,485,365 DKK 500,000,000 1,095,789 0.01%
HSBC 17/07/2018 USD 115,328,136 AUD 154,000,000 1,802,656 0.01%
HSBC 17/07/2018 USD 256,575,668 JPY 28,000,000,000 3,152,746 0.02%
HSBC 14/08/2018 USD 355,285,200 EUR 300,000,000 4,826,849 0.03%
HSBC 14/08/2018 USD 253,428,389 JPY 27,820,000,000 1,130,993 0.01%
JP Morgan Securities 17/07/2018 HKD 439,468,193 USD 56,000,000 23,845 0.00%
JP Morgan Securities 17/07/2018 USD 112,950,000 AUD 150,000,000 2,373,210 0.02%
JP Morgan Securities 17/07/2018 USD 124,607,242 CAD 159,000,000 4,582,776 0.03%
JP Morgan Securities 17/07/2018 USD 418,878,556 EUR 351,000,000 9,743,217 0.06%
JP Morgan Securities 17/07/2018 USD 74,694,297 SGD 100,000,000 1,381,314 0.01%
JP Morgan Securities 14/08/2018 USD 30,821,525 CAD 40,000,000 611,613 0.00%
JP Morgan Securities 14/08/2018 USD 173,663,945 CHF 170,000,000 1,871,397 0.01%
JP Morgan Securities 14/08/2018 USD 378,933,088 EUR 320,000,000 5,110,979 0.03%
JP Morgan Securities 14/08/2018 USD 273,412,345 JPY 30,000,000,000 1,344,296 0.01%
Morgan Stanley 17/07/2018 USD 154,206,852 DKK 960,000,000 4,047,551 0.03%
Nomura 14/08/2018 USD 296,907,101 SEK 2,550,000,000 11,607,253 0.06%Royal Bank ofScotland 14/08/2018 USD 40,018,859 NOK 320,000,000 713,816 0.00%
Societe Generale 17/07/2018 HKD 596,295,913 USD 76,000,000 16,399 0.00%
Societe Generale 17/07/2018 USD 270,464,678 HKD 2,120,000,000 204,907 0.00%
Societe Generale 17/07/2018 USD 110,543,736 SGD 148,000,000 2,040,523 0.01%Toronto DominionBank 17/07/2018 CAD 37,331,112 USD 28,000,000 179,801 0.00%Toronto DominionBank 17/07/2018 USD 18,454,825 AUD 25,000,000 25,374 0.00%Toronto DominionBank 17/07/2018 USD 445,844,300 EUR 373,163,062 10,874,398 0.07%Toronto DominionBank 17/07/2018 USD 59,266,934 NOK 475,000,000 993,205 0.01%Toronto DominionBank 17/07/2018 USD 58,184,547 SEK 500,000,000 2,371,812 0.02%Toronto DominionBank 17/07/2018 USD 97,200,767 SGD 130,000,000 1,893,856 0.01%Toronto DominionBank 14/08/2018 USD 16,346,814 CHF 16,000,000 178,096 0.00%Toronto DominionBank 14/08/2018 USD 510,248,338 HKD 4,000,000,000 60,292 0.00%
Unrealised Gain on Currency Exchange Contracts at 30 June 2018 98,333,922 0.62%
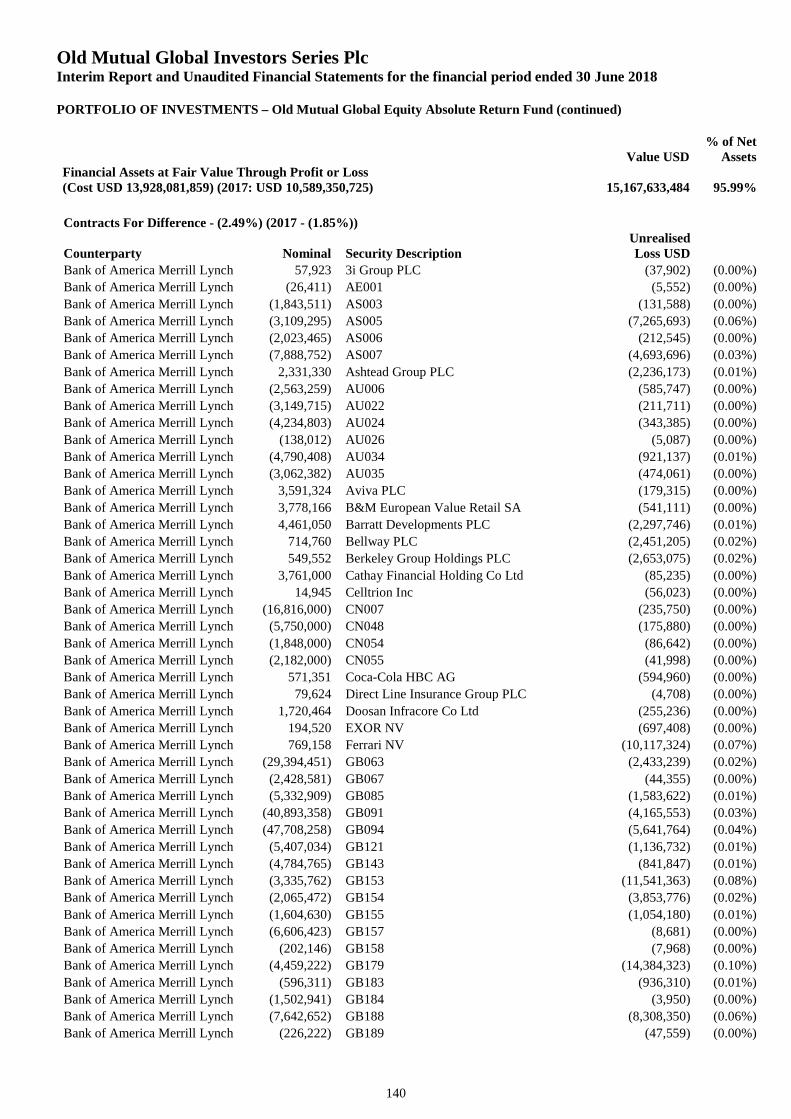
Old Mutual Global Investors Series PlcInterim Report and Unaudited Financial Statements for the financial period ended 30 June 2018
PORTFOLIO OF INVESTMENTS – Old Mutual Global Equity Absolute Return Fund (continued)
140
Value USD% of Net
AssetsFinancial Assets at Fair Value Through Profit or Loss(Cost USD 13,928,081,859) (2017: USD 10,589,350,725) 15,167,633,484 95.99%
Contracts For Difference - (2.49%) (2017 - (1.85%))
Counterparty Nominal Security DescriptionUnrealisedLoss USD
Bank of America Merrill Lynch 57,923 3i Group PLC (37,902) (0.00%)
Bank of America Merrill Lynch (26,411) AE001 (5,552) (0.00%)
Bank of America Merrill Lynch (1,843,511) AS003 (131,588) (0.00%)
Bank of America Merrill Lynch (3,109,295) AS005 (7,265,693) (0.06%)
Bank of America Merrill Lynch (2,023,465) AS006 (212,545) (0.00%)
Bank of America Merrill Lynch (7,888,752) AS007 (4,693,696) (0.03%)
Bank of America Merrill Lynch 2,331,330 Ashtead Group PLC (2,236,173) (0.01%)
Bank of America Merrill Lynch (2,563,259) AU006 (585,747) (0.00%)
Bank of America Merrill Lynch (3,149,715) AU022 (211,711) (0.00%)
Bank of America Merrill Lynch (4,234,803) AU024 (343,385) (0.00%)
Bank of America Merrill Lynch (138,012) AU026 (5,087) (0.00%)
Bank of America Merrill Lynch (4,790,408) AU034 (921,137) (0.01%)
Bank of America Merrill Lynch (3,062,382) AU035 (474,061) (0.00%)
Bank of America Merrill Lynch 3,591,324 Aviva PLC (179,315) (0.00%)
Bank of America Merrill Lynch 3,778,166 B&M European Value Retail SA (541,111) (0.00%)
Bank of America Merrill Lynch 4,461,050 Barratt Developments PLC (2,297,746) (0.01%)
Bank of America Merrill Lynch 714,760 Bellway PLC (2,451,205) (0.02%)
Bank of America Merrill Lynch 549,552 Berkeley Group Holdings PLC (2,653,075) (0.02%)
Bank of America Merrill Lynch 3,761,000 Cathay Financial Holding Co Ltd (85,235) (0.00%)
Bank of America Merrill Lynch 14,945 Celltrion Inc (56,023) (0.00%)
Bank of America Merrill Lynch (16,816,000) CN007 (235,750) (0.00%)
Bank of America Merrill Lynch (5,750,000) CN048 (175,880) (0.00%)
Bank of America Merrill Lynch (1,848,000) CN054 (86,642) (0.00%)
Bank of America Merrill Lynch (2,182,000) CN055 (41,998) (0.00%)
Bank of America Merrill Lynch 571,351 Coca-Cola HBC AG (594,960) (0.00%)
Bank of America Merrill Lynch 79,624 Direct Line Insurance Group PLC (4,708) (0.00%)
Bank of America Merrill Lynch 1,720,464 Doosan Infracore Co Ltd (255,236) (0.00%)
Bank of America Merrill Lynch 194,520 EXOR NV (697,408) (0.00%)
Bank of America Merrill Lynch 769,158 Ferrari NV (10,117,324) (0.07%)
Bank of America Merrill Lynch (29,394,451) GB063 (2,433,239) (0.02%)
Bank of America Merrill Lynch (2,428,581) GB067 (44,355) (0.00%)
Bank of America Merrill Lynch (5,332,909) GB085 (1,583,622) (0.01%)
Bank of America Merrill Lynch (40,893,358) GB091 (4,165,553) (0.03%)
Bank of America Merrill Lynch (47,708,258) GB094 (5,641,764) (0.04%)
Bank of America Merrill Lynch (5,407,034) GB121 (1,136,732) (0.01%)
Bank of America Merrill Lynch (4,784,765) GB143 (841,847) (0.01%)
Bank of America Merrill Lynch (3,335,762) GB153 (11,541,363) (0.08%)
Bank of America Merrill Lynch (2,065,472) GB154 (3,853,776) (0.02%)
Bank of America Merrill Lynch (1,604,630) GB155 (1,054,180) (0.01%)
Bank of America Merrill Lynch (6,606,423) GB157 (8,681) (0.00%)
Bank of America Merrill Lynch (202,146) GB158 (7,968) (0.00%)
Bank of America Merrill Lynch (4,459,222) GB179 (14,384,323) (0.10%)
Bank of America Merrill Lynch (596,311) GB183 (936,310) (0.01%)
Bank of America Merrill Lynch (1,502,941) GB184 (3,950) (0.00%)
Bank of America Merrill Lynch (7,642,652) GB188 (8,308,350) (0.06%)
Bank of America Merrill Lynch (226,222) GB189 (47,559) (0.00%)
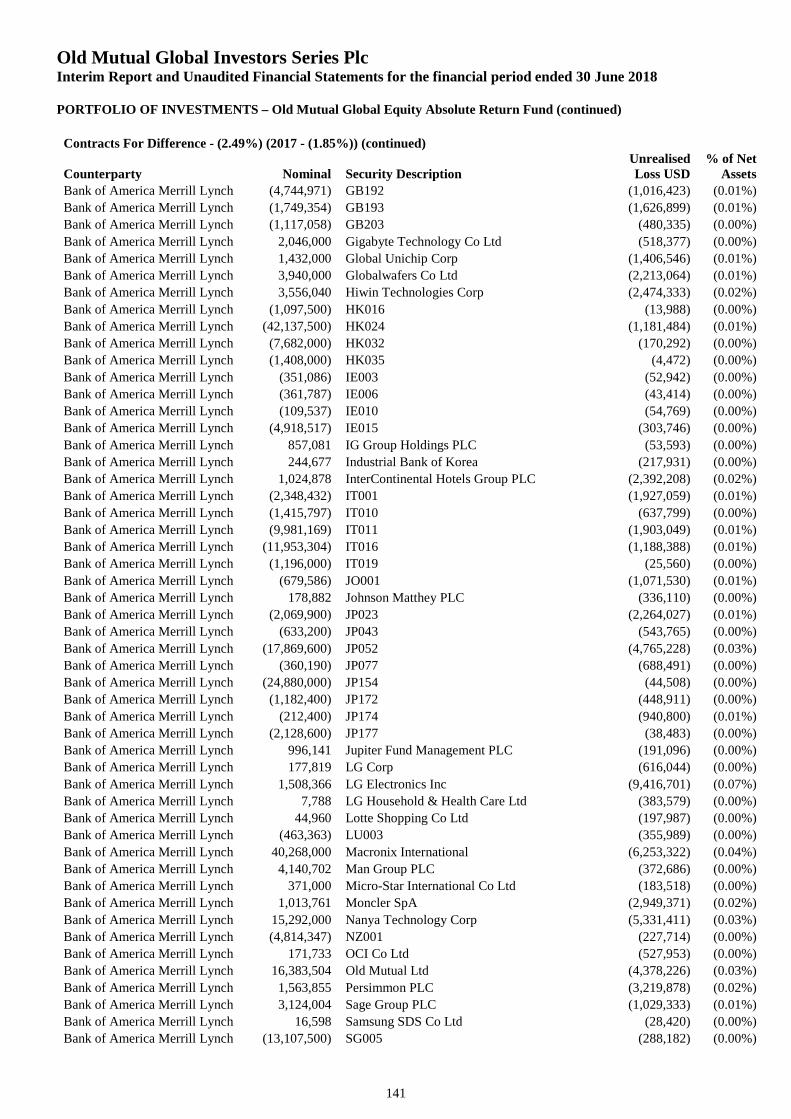
Old Mutual Global Investors Series PlcInterim Report and Unaudited Financial Statements for the financial period ended 30 June 2018
PORTFOLIO OF INVESTMENTS – Old Mutual Global Equity Absolute Return Fund (continued)
141
Contracts For Difference - (2.49%) (2017 - (1.85%)) (continued)
Counterparty Nominal Security DescriptionUnrealisedLoss USD
% of NetAssets
Bank of America Merrill Lynch (4,744,971) GB192 (1,016,423) (0.01%)
Bank of America Merrill Lynch (1,749,354) GB193 (1,626,899) (0.01%)
Bank of America Merrill Lynch (1,117,058) GB203 (480,335) (0.00%)
Bank of America Merrill Lynch 2,046,000 Gigabyte Technology Co Ltd (518,377) (0.00%)
Bank of America Merrill Lynch 1,432,000 Global Unichip Corp (1,406,546) (0.01%)
Bank of America Merrill Lynch 3,940,000 Globalwafers Co Ltd (2,213,064) (0.01%)
Bank of America Merrill Lynch 3,556,040 Hiwin Technologies Corp (2,474,333) (0.02%)
Bank of America Merrill Lynch (1,097,500) HK016 (13,988) (0.00%)
Bank of America Merrill Lynch (42,137,500) HK024 (1,181,484) (0.01%)
Bank of America Merrill Lynch (7,682,000) HK032 (170,292) (0.00%)
Bank of America Merrill Lynch (1,408,000) HK035 (4,472) (0.00%)
Bank of America Merrill Lynch (351,086) IE003 (52,942) (0.00%)
Bank of America Merrill Lynch (361,787) IE006 (43,414) (0.00%)
Bank of America Merrill Lynch (109,537) IE010 (54,769) (0.00%)
Bank of America Merrill Lynch (4,918,517) IE015 (303,746) (0.00%)
Bank of America Merrill Lynch 857,081 IG Group Holdings PLC (53,593) (0.00%)
Bank of America Merrill Lynch 244,677 Industrial Bank of Korea (217,931) (0.00%)
Bank of America Merrill Lynch 1,024,878 InterContinental Hotels Group PLC (2,392,208) (0.02%)
Bank of America Merrill Lynch (2,348,432) IT001 (1,927,059) (0.01%)
Bank of America Merrill Lynch (1,415,797) IT010 (637,799) (0.00%)
Bank of America Merrill Lynch (9,981,169) IT011 (1,903,049) (0.01%)
Bank of America Merrill Lynch (11,953,304) IT016 (1,188,388) (0.01%)
Bank of America Merrill Lynch (1,196,000) IT019 (25,560) (0.00%)
Bank of America Merrill Lynch (679,586) JO001 (1,071,530) (0.01%)
Bank of America Merrill Lynch 178,882 Johnson Matthey PLC (336,110) (0.00%)
Bank of America Merrill Lynch (2,069,900) JP023 (2,264,027) (0.01%)
Bank of America Merrill Lynch (633,200) JP043 (543,765) (0.00%)
Bank of America Merrill Lynch (17,869,600) JP052 (4,765,228) (0.03%)
Bank of America Merrill Lynch (360,190) JP077 (688,491) (0.00%)
Bank of America Merrill Lynch (24,880,000) JP154 (44,508) (0.00%)
Bank of America Merrill Lynch (1,182,400) JP172 (448,911) (0.00%)
Bank of America Merrill Lynch (212,400) JP174 (940,800) (0.01%)
Bank of America Merrill Lynch (2,128,600) JP177 (38,483) (0.00%)
Bank of America Merrill Lynch 996,141 Jupiter Fund Management PLC (191,096) (0.00%)
Bank of America Merrill Lynch 177,819 LG Corp (616,044) (0.00%)
Bank of America Merrill Lynch 1,508,366 LG Electronics Inc (9,416,701) (0.07%)
Bank of America Merrill Lynch 7,788 LG Household & Health Care Ltd (383,579) (0.00%)
Bank of America Merrill Lynch 44,960 Lotte Shopping Co Ltd (197,987) (0.00%)
Bank of America Merrill Lynch (463,363) LU003 (355,989) (0.00%)
Bank of America Merrill Lynch 40,268,000 Macronix International (6,253,322) (0.04%)
Bank of America Merrill Lynch 4,140,702 Man Group PLC (372,686) (0.00%)
Bank of America Merrill Lynch 371,000 Micro-Star International Co Ltd (183,518) (0.00%)
Bank of America Merrill Lynch 1,013,761 Moncler SpA (2,949,371) (0.02%)
Bank of America Merrill Lynch 15,292,000 Nanya Technology Corp (5,331,411) (0.03%)
Bank of America Merrill Lynch (4,814,347) NZ001 (227,714) (0.00%)
Bank of America Merrill Lynch 171,733 OCI Co Ltd (527,953) (0.00%)
Bank of America Merrill Lynch 16,383,504 Old Mutual Ltd (4,378,226) (0.03%)
Bank of America Merrill Lynch 1,563,855 Persimmon PLC (3,219,878) (0.02%)
Bank of America Merrill Lynch 3,124,004 Sage Group PLC (1,029,333) (0.01%)
Bank of America Merrill Lynch 16,598 Samsung SDS Co Ltd (28,420) (0.00%)
Bank of America Merrill Lynch (13,107,500) SG005 (288,182) (0.00%)
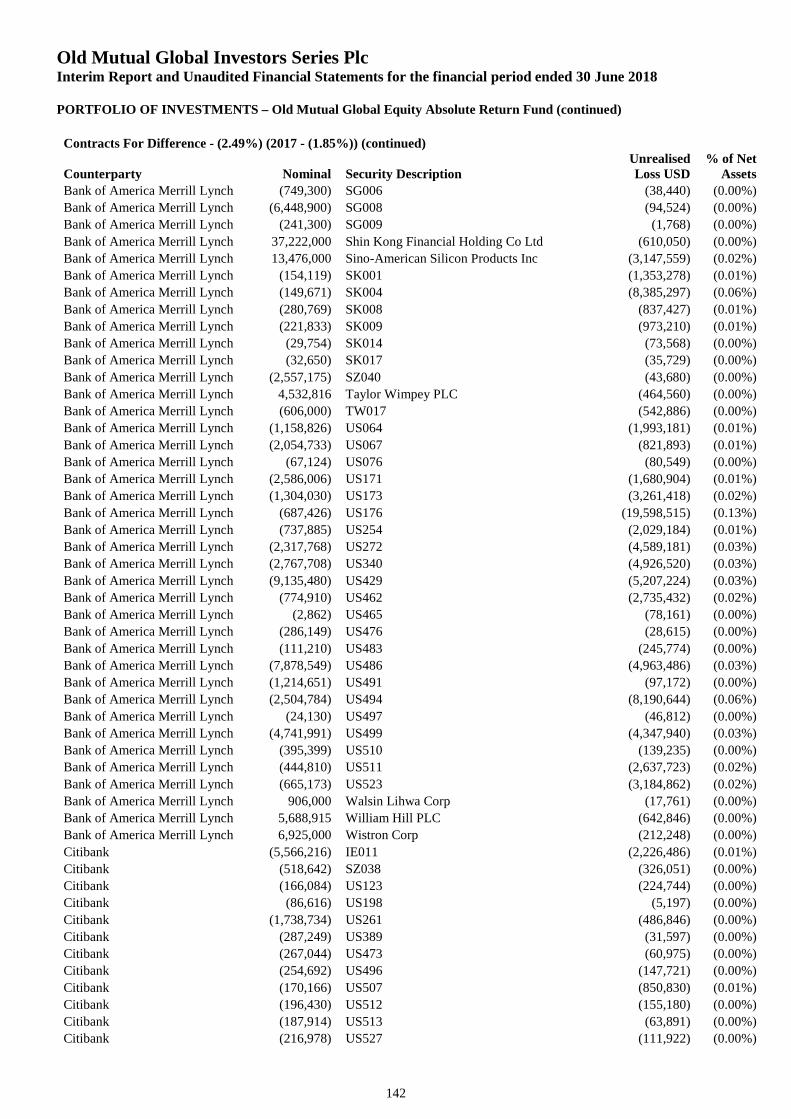
Old Mutual Global Investors Series PlcInterim Report and Unaudited Financial Statements for the financial period ended 30 June 2018
PORTFOLIO OF INVESTMENTS – Old Mutual Global Equity Absolute Return Fund (continued)
142
Contracts For Difference - (2.49%) (2017 - (1.85%)) (continued)
Counterparty Nominal Security DescriptionUnrealisedLoss USD
% of NetAssets
Bank of America Merrill Lynch (749,300) SG006 (38,440) (0.00%)
Bank of America Merrill Lynch (6,448,900) SG008 (94,524) (0.00%)
Bank of America Merrill Lynch (241,300) SG009 (1,768) (0.00%)
Bank of America Merrill Lynch 37,222,000 Shin Kong Financial Holding Co Ltd (610,050) (0.00%)
Bank of America Merrill Lynch 13,476,000 Sino-American Silicon Products Inc (3,147,559) (0.02%)
Bank of America Merrill Lynch (154,119) SK001 (1,353,278) (0.01%)
Bank of America Merrill Lynch (149,671) SK004 (8,385,297) (0.06%)
Bank of America Merrill Lynch (280,769) SK008 (837,427) (0.01%)
Bank of America Merrill Lynch (221,833) SK009 (973,210) (0.01%)
Bank of America Merrill Lynch (29,754) SK014 (73,568) (0.00%)
Bank of America Merrill Lynch (32,650) SK017 (35,729) (0.00%)
Bank of America Merrill Lynch (2,557,175) SZ040 (43,680) (0.00%)
Bank of America Merrill Lynch 4,532,816 Taylor Wimpey PLC (464,560) (0.00%)
Bank of America Merrill Lynch (606,000) TW017 (542,886) (0.00%)
Bank of America Merrill Lynch (1,158,826) US064 (1,993,181) (0.01%)
Bank of America Merrill Lynch (2,054,733) US067 (821,893) (0.01%)
Bank of America Merrill Lynch (67,124) US076 (80,549) (0.00%)
Bank of America Merrill Lynch (2,586,006) US171 (1,680,904) (0.01%)
Bank of America Merrill Lynch (1,304,030) US173 (3,261,418) (0.02%)
Bank of America Merrill Lynch (687,426) US176 (19,598,515) (0.13%)
Bank of America Merrill Lynch (737,885) US254 (2,029,184) (0.01%)
Bank of America Merrill Lynch (2,317,768) US272 (4,589,181) (0.03%)
Bank of America Merrill Lynch (2,767,708) US340 (4,926,520) (0.03%)
Bank of America Merrill Lynch (9,135,480) US429 (5,207,224) (0.03%)
Bank of America Merrill Lynch (774,910) US462 (2,735,432) (0.02%)
Bank of America Merrill Lynch (2,862) US465 (78,161) (0.00%)
Bank of America Merrill Lynch (286,149) US476 (28,615) (0.00%)
Bank of America Merrill Lynch (111,210) US483 (245,774) (0.00%)
Bank of America Merrill Lynch (7,878,549) US486 (4,963,486) (0.03%)
Bank of America Merrill Lynch (1,214,651) US491 (97,172) (0.00%)
Bank of America Merrill Lynch (2,504,784) US494 (8,190,644) (0.06%)
Bank of America Merrill Lynch (24,130) US497 (46,812) (0.00%)
Bank of America Merrill Lynch (4,741,991) US499 (4,347,940) (0.03%)
Bank of America Merrill Lynch (395,399) US510 (139,235) (0.00%)
Bank of America Merrill Lynch (444,810) US511 (2,637,723) (0.02%)
Bank of America Merrill Lynch (665,173) US523 (3,184,862) (0.02%)
Bank of America Merrill Lynch 906,000 Walsin Lihwa Corp (17,761) (0.00%)
Bank of America Merrill Lynch 5,688,915 William Hill PLC (642,846) (0.00%)
Bank of America Merrill Lynch 6,925,000 Wistron Corp (212,248) (0.00%)
Citibank (5,566,216) IE011 (2,226,486) (0.01%)
Citibank (518,642) SZ038 (326,051) (0.00%)
Citibank (166,084) US123 (224,744) (0.00%)
Citibank (86,616) US198 (5,197) (0.00%)
Citibank (1,738,734) US261 (486,846) (0.00%)
Citibank (287,249) US389 (31,597) (0.00%)
Citibank (267,044) US473 (60,975) (0.00%)
Citibank (254,692) US496 (147,721) (0.00%)
Citibank (170,166) US507 (850,830) (0.01%)
Citibank (196,430) US512 (155,180) (0.00%)
Citibank (187,914) US513 (63,891) (0.00%)
Citibank (216,978) US527 (111,922) (0.00%)
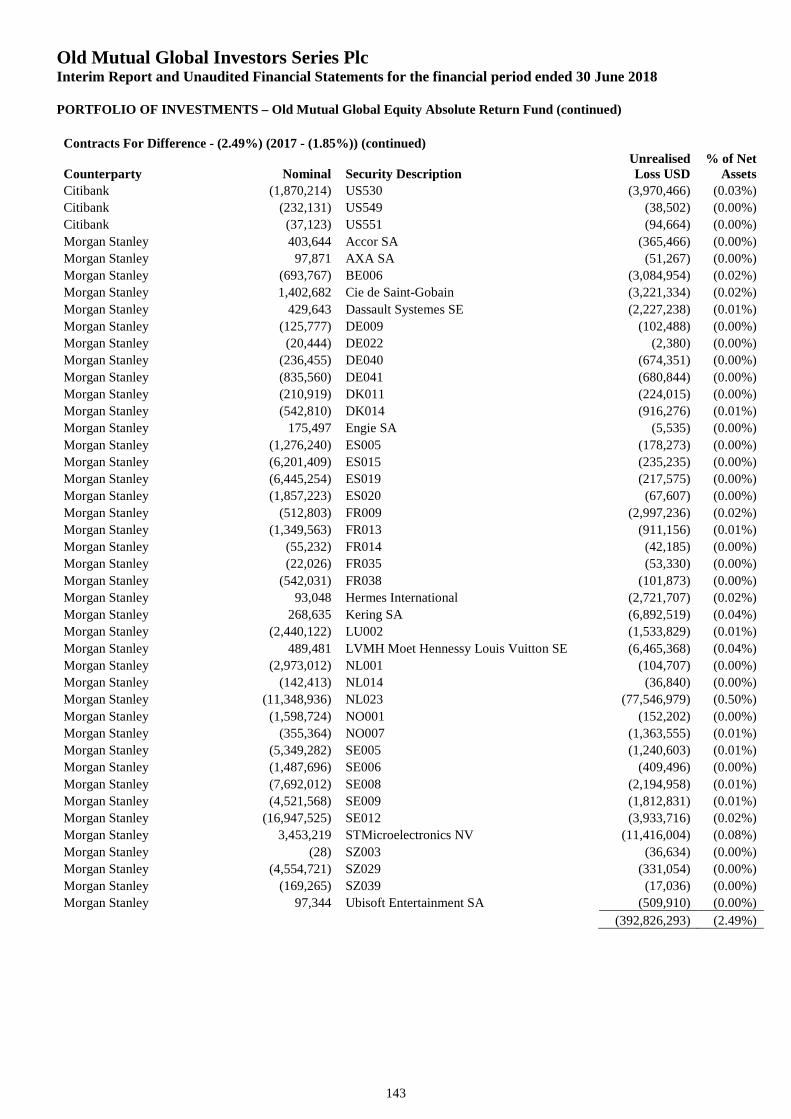
Old Mutual Global Investors Series PlcInterim Report and Unaudited Financial Statements for the financial period ended 30 June 2018
PORTFOLIO OF INVESTMENTS – Old Mutual Global Equity Absolute Return Fund (continued)
143
Contracts For Difference - (2.49%) (2017 - (1.85%)) (continued)
Counterparty Nominal Security DescriptionUnrealisedLoss USD
% of NetAssets
Citibank (1,870,214) US530 (3,970,466) (0.03%)
Citibank (232,131) US549 (38,502) (0.00%)
Citibank (37,123) US551 (94,664) (0.00%)
Morgan Stanley 403,644 Accor SA (365,466) (0.00%)
Morgan Stanley 97,871 AXA SA (51,267) (0.00%)
Morgan Stanley (693,767) BE006 (3,084,954) (0.02%)
Morgan Stanley 1,402,682 Cie de Saint-Gobain (3,221,334) (0.02%)
Morgan Stanley 429,643 Dassault Systemes SE (2,227,238) (0.01%)
Morgan Stanley (125,777) DE009 (102,488) (0.00%)
Morgan Stanley (20,444) DE022 (2,380) (0.00%)
Morgan Stanley (236,455) DE040 (674,351) (0.00%)
Morgan Stanley (835,560) DE041 (680,844) (0.00%)
Morgan Stanley (210,919) DK011 (224,015) (0.00%)
Morgan Stanley (542,810) DK014 (916,276) (0.01%)
Morgan Stanley 175,497 Engie SA (5,535) (0.00%)
Morgan Stanley (1,276,240) ES005 (178,273) (0.00%)
Morgan Stanley (6,201,409) ES015 (235,235) (0.00%)
Morgan Stanley (6,445,254) ES019 (217,575) (0.00%)
Morgan Stanley (1,857,223) ES020 (67,607) (0.00%)
Morgan Stanley (512,803) FR009 (2,997,236) (0.02%)
Morgan Stanley (1,349,563) FR013 (911,156) (0.01%)
Morgan Stanley (55,232) FR014 (42,185) (0.00%)
Morgan Stanley (22,026) FR035 (53,330) (0.00%)
Morgan Stanley (542,031) FR038 (101,873) (0.00%)
Morgan Stanley 93,048 Hermes International (2,721,707) (0.02%)
Morgan Stanley 268,635 Kering SA (6,892,519) (0.04%)
Morgan Stanley (2,440,122) LU002 (1,533,829) (0.01%)
Morgan Stanley 489,481 LVMH Moet Hennessy Louis Vuitton SE (6,465,368) (0.04%)
Morgan Stanley (2,973,012) NL001 (104,707) (0.00%)
Morgan Stanley (142,413) NL014 (36,840) (0.00%)
Morgan Stanley (11,348,936) NL023 (77,546,979) (0.50%)
Morgan Stanley (1,598,724) NO001 (152,202) (0.00%)
Morgan Stanley (355,364) NO007 (1,363,555) (0.01%)
Morgan Stanley (5,349,282) SE005 (1,240,603) (0.01%)
Morgan Stanley (1,487,696) SE006 (409,496) (0.00%)
Morgan Stanley (7,692,012) SE008 (2,194,958) (0.01%)
Morgan Stanley (4,521,568) SE009 (1,812,831) (0.01%)
Morgan Stanley (16,947,525) SE012 (3,933,716) (0.02%)
Morgan Stanley 3,453,219 STMicroelectronics NV (11,416,004) (0.08%)
Morgan Stanley (28) SZ003 (36,634) (0.00%)
Morgan Stanley (4,554,721) SZ029 (331,054) (0.00%)
Morgan Stanley (169,265) SZ039 (17,036) (0.00%)
Morgan Stanley 97,344 Ubisoft Entertainment SA (509,910) (0.00%)
(392,826,293) (2.49%)
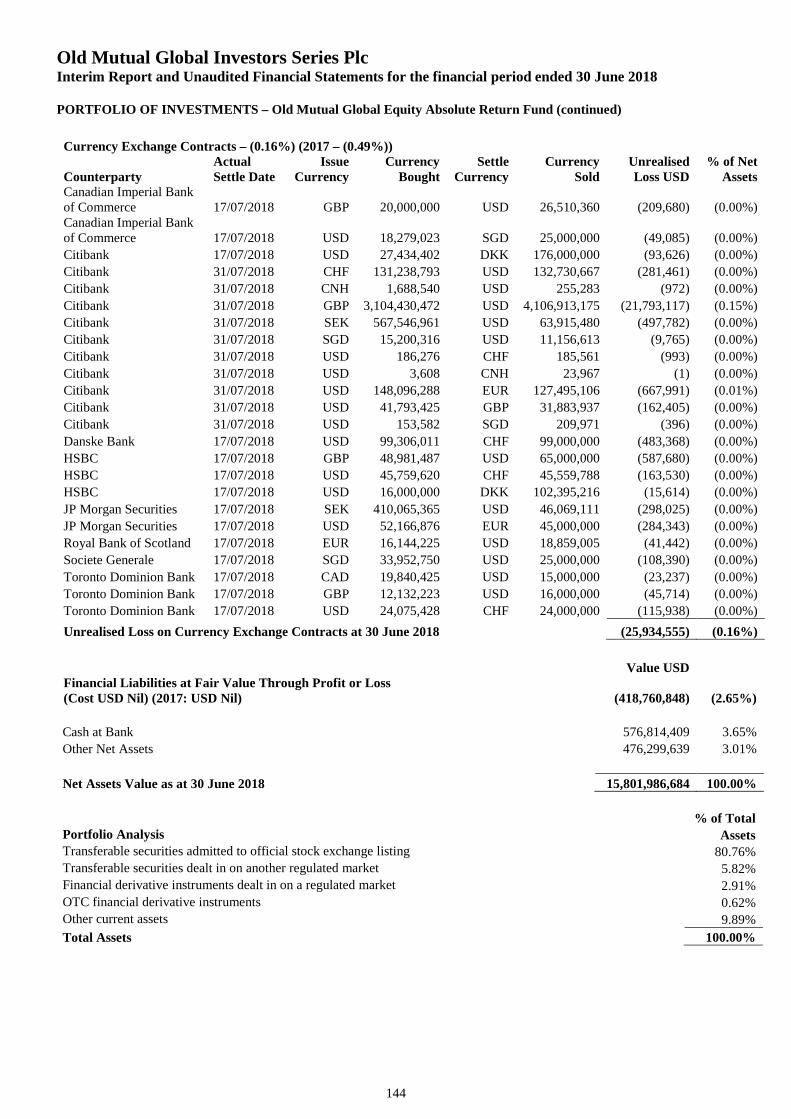
Old Mutual Global Investors Series PlcInterim Report and Unaudited Financial Statements for the financial period ended 30 June 2018
PORTFOLIO OF INVESTMENTS – Old Mutual Global Equity Absolute Return Fund (continued)
144
Currency Exchange Contracts – (0.16%) (2017 – (0.49%))
CounterpartyActualSettle Date
IssueCurrency
CurrencyBought
SettleCurrency
CurrencySold
UnrealisedLoss USD
% of NetAssets
Canadian Imperial Bankof Commerce 17/07/2018 GBP 20,000,000 USD 26,510,360 (209,680) (0.00%)Canadian Imperial Bankof Commerce 17/07/2018 USD 18,279,023 SGD 25,000,000 (49,085) (0.00%)
Citibank 17/07/2018 USD 27,434,402 DKK 176,000,000 (93,626) (0.00%)
Citibank 31/07/2018 CHF 131,238,793 USD 132,730,667 (281,461) (0.00%)
Citibank 31/07/2018 CNH 1,688,540 USD 255,283 (972) (0.00%)
Citibank 31/07/2018 GBP 3,104,430,472 USD 4,106,913,175 (21,793,117) (0.15%)
Citibank 31/07/2018 SEK 567,546,961 USD 63,915,480 (497,782) (0.00%)
Citibank 31/07/2018 SGD 15,200,316 USD 11,156,613 (9,765) (0.00%)
Citibank 31/07/2018 USD 186,276 CHF 185,561 (993) (0.00%)
Citibank 31/07/2018 USD 3,608 CNH 23,967 (1) (0.00%)
Citibank 31/07/2018 USD 148,096,288 EUR 127,495,106 (667,991) (0.01%)
Citibank 31/07/2018 USD 41,793,425 GBP 31,883,937 (162,405) (0.00%)
Citibank 31/07/2018 USD 153,582 SGD 209,971 (396) (0.00%)
Danske Bank 17/07/2018 USD 99,306,011 CHF 99,000,000 (483,368) (0.00%)
HSBC 17/07/2018 GBP 48,981,487 USD 65,000,000 (587,680) (0.00%)
HSBC 17/07/2018 USD 45,759,620 CHF 45,559,788 (163,530) (0.00%)
HSBC 17/07/2018 USD 16,000,000 DKK 102,395,216 (15,614) (0.00%)
JP Morgan Securities 17/07/2018 SEK 410,065,365 USD 46,069,111 (298,025) (0.00%)
JP Morgan Securities 17/07/2018 USD 52,166,876 EUR 45,000,000 (284,343) (0.00%)
Royal Bank of Scotland 17/07/2018 EUR 16,144,225 USD 18,859,005 (41,442) (0.00%)
Societe Generale 17/07/2018 SGD 33,952,750 USD 25,000,000 (108,390) (0.00%)
Toronto Dominion Bank 17/07/2018 CAD 19,840,425 USD 15,000,000 (23,237) (0.00%)
Toronto Dominion Bank 17/07/2018 GBP 12,132,223 USD 16,000,000 (45,714) (0.00%)
Toronto Dominion Bank 17/07/2018 USD 24,075,428 CHF 24,000,000 (115,938) (0.00%)
Unrealised Loss on Currency Exchange Contracts at 30 June 2018 (25,934,555) (0.16%)
Value USDFinancial Liabilities at Fair Value Through Profit or Loss(Cost USD Nil) (2017: USD Nil) (418,760,848) (2.65%)
Cash at Bank 576,814,409 3.65%
Other Net Assets 476,299,639 3.01%
Net Assets Value as at 30 June 2018 15,801,986,684 100.00%
% of TotalPortfolio Analysis AssetsTransferable securities admitted to official stock exchange listing 80.76%Transferable securities dealt in on another regulated market 5.82%Financial derivative instruments dealt in on a regulated market 2.91%OTC financial derivative instruments 0.62%Other current assets 9.89%
Total Assets 100.00%
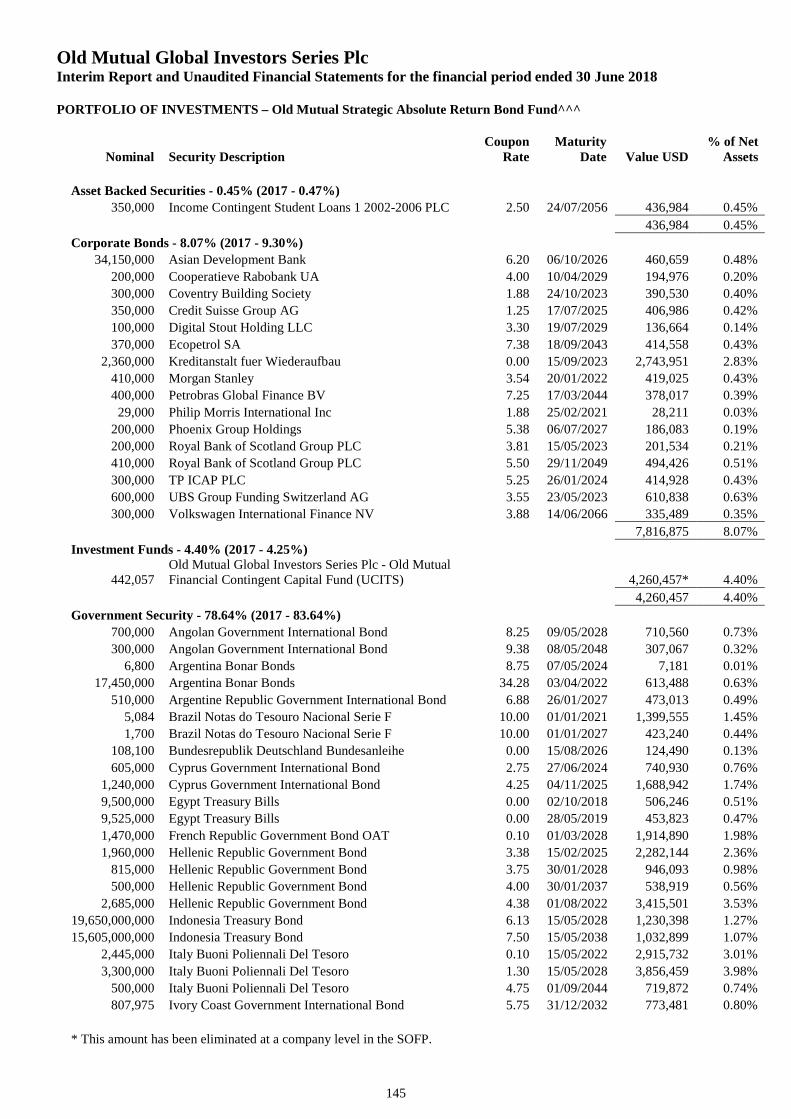
Old Mutual Global Investors Series PlcInterim Report and Unaudited Financial Statements for the financial period ended 30 June 2018
PORTFOLIO OF INVESTMENTS – Old Mutual Strategic Absolute Return Bond Fund^^^
Nominal Security DescriptionCoupon
RateMaturity
Date Value USD% of Net
Assets
145
Asset Backed Securities - 0.45% (2017 - 0.47%)
350,000 Income Contingent Student Loans 1 2002-2006 PLC 2.50 24/07/2056 436,984 0.45%
436,984 0.45%
Corporate Bonds - 8.07% (2017 - 9.30%)
34,150,000 Asian Development Bank 6.20 06/10/2026 460,659 0.48%
200,000 Cooperatieve Rabobank UA 4.00 10/04/2029 194,976 0.20%
300,000 Coventry Building Society 1.88 24/10/2023 390,530 0.40%
350,000 Credit Suisse Group AG 1.25 17/07/2025 406,986 0.42%
100,000 Digital Stout Holding LLC 3.30 19/07/2029 136,664 0.14%
370,000 Ecopetrol SA 7.38 18/09/2043 414,558 0.43%
2,360,000 Kreditanstalt fuer Wiederaufbau 0.00 15/09/2023 2,743,951 2.83%
410,000 Morgan Stanley 3.54 20/01/2022 419,025 0.43%
400,000 Petrobras Global Finance BV 7.25 17/03/2044 378,017 0.39%
29,000 Philip Morris International Inc 1.88 25/02/2021 28,211 0.03%
200,000 Phoenix Group Holdings 5.38 06/07/2027 186,083 0.19%
200,000 Royal Bank of Scotland Group PLC 3.81 15/05/2023 201,534 0.21%
410,000 Royal Bank of Scotland Group PLC 5.50 29/11/2049 494,426 0.51%
300,000 TP ICAP PLC 5.25 26/01/2024 414,928 0.43%
600,000 UBS Group Funding Switzerland AG 3.55 23/05/2023 610,838 0.63%
300,000 Volkswagen International Finance NV 3.88 14/06/2066 335,489 0.35%
7,816,875 8.07%
Investment Funds - 4.40% (2017 - 4.25%)
442,057Old Mutual Global Investors Series Plc - Old MutualFinancial Contingent Capital Fund (UCITS) 4,260,457* 4.40%
4,260,457 4.40%
Government Security - 78.64% (2017 - 83.64%)
700,000 Angolan Government International Bond 8.25 09/05/2028 710,560 0.73%
300,000 Angolan Government International Bond 9.38 08/05/2048 307,067 0.32%
6,800 Argentina Bonar Bonds 8.75 07/05/2024 7,181 0.01%
17,450,000 Argentina Bonar Bonds 34.28 03/04/2022 613,488 0.63%
510,000 Argentine Republic Government International Bond 6.88 26/01/2027 473,013 0.49%
5,084 Brazil Notas do Tesouro Nacional Serie F 10.00 01/01/2021 1,399,555 1.45%
1,700 Brazil Notas do Tesouro Nacional Serie F 10.00 01/01/2027 423,240 0.44%
108,100 Bundesrepublik Deutschland Bundesanleihe 0.00 15/08/2026 124,490 0.13%
605,000 Cyprus Government International Bond 2.75 27/06/2024 740,930 0.76%
1,240,000 Cyprus Government International Bond 4.25 04/11/2025 1,688,942 1.74%
9,500,000 Egypt Treasury Bills 0.00 02/10/2018 506,246 0.51%
9,525,000 Egypt Treasury Bills 0.00 28/05/2019 453,823 0.47%
1,470,000 French Republic Government Bond OAT 0.10 01/03/2028 1,914,890 1.98%
1,960,000 Hellenic Republic Government Bond 3.38 15/02/2025 2,282,144 2.36%
815,000 Hellenic Republic Government Bond 3.75 30/01/2028 946,093 0.98%
500,000 Hellenic Republic Government Bond 4.00 30/01/2037 538,919 0.56%
2,685,000 Hellenic Republic Government Bond 4.38 01/08/2022 3,415,501 3.53%
19,650,000,000 Indonesia Treasury Bond 6.13 15/05/2028 1,230,398 1.27%
15,605,000,000 Indonesia Treasury Bond 7.50 15/05/2038 1,032,899 1.07%
2,445,000 Italy Buoni Poliennali Del Tesoro 0.10 15/05/2022 2,915,732 3.01%
3,300,000 Italy Buoni Poliennali Del Tesoro 1.30 15/05/2028 3,856,459 3.98%
500,000 Italy Buoni Poliennali Del Tesoro 4.75 01/09/2044 719,872 0.74%
807,975 Ivory Coast Government International Bond 5.75 31/12/2032 773,481 0.80%
* This amount has been eliminated at a company level in the SOFP.
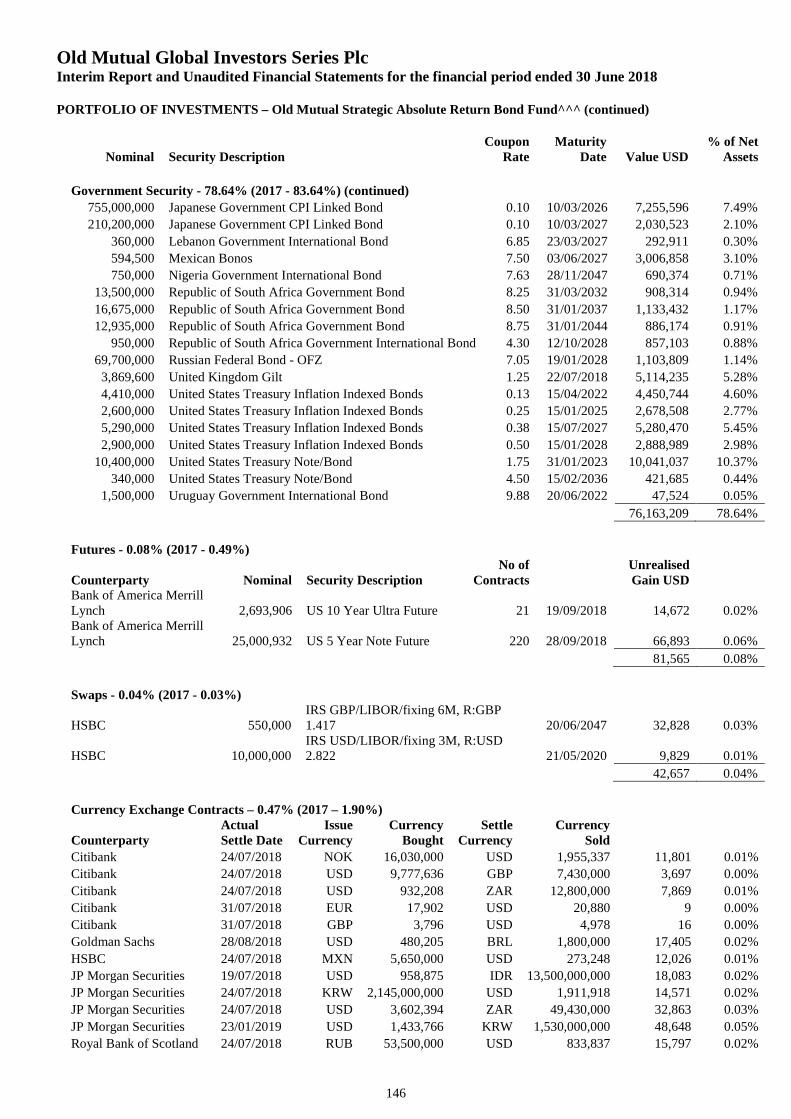
Old Mutual Global Investors Series PlcInterim Report and Unaudited Financial Statements for the financial period ended 30 June 2018
PORTFOLIO OF INVESTMENTS – Old Mutual Strategic Absolute Return Bond Fund^^^ (continued)
Nominal Security DescriptionCoupon
RateMaturity
Date Value USD% of Net
Assets
146
Government Security - 78.64% (2017 - 83.64%) (continued)
755,000,000 Japanese Government CPI Linked Bond 0.10 10/03/2026 7,255,596 7.49%
210,200,000 Japanese Government CPI Linked Bond 0.10 10/03/2027 2,030,523 2.10%
360,000 Lebanon Government International Bond 6.85 23/03/2027 292,911 0.30%
594,500 Mexican Bonos 7.50 03/06/2027 3,006,858 3.10%
750,000 Nigeria Government International Bond 7.63 28/11/2047 690,374 0.71%
13,500,000 Republic of South Africa Government Bond 8.25 31/03/2032 908,314 0.94%
16,675,000 Republic of South Africa Government Bond 8.50 31/01/2037 1,133,432 1.17%
12,935,000 Republic of South Africa Government Bond 8.75 31/01/2044 886,174 0.91%
950,000 Republic of South Africa Government International Bond 4.30 12/10/2028 857,103 0.88%
69,700,000 Russian Federal Bond - OFZ 7.05 19/01/2028 1,103,809 1.14%
3,869,600 United Kingdom Gilt 1.25 22/07/2018 5,114,235 5.28%
4,410,000 United States Treasury Inflation Indexed Bonds 0.13 15/04/2022 4,450,744 4.60%
2,600,000 United States Treasury Inflation Indexed Bonds 0.25 15/01/2025 2,678,508 2.77%
5,290,000 United States Treasury Inflation Indexed Bonds 0.38 15/07/2027 5,280,470 5.45%
2,900,000 United States Treasury Inflation Indexed Bonds 0.50 15/01/2028 2,888,989 2.98%
10,400,000 United States Treasury Note/Bond 1.75 31/01/2023 10,041,037 10.37%
340,000 United States Treasury Note/Bond 4.50 15/02/2036 421,685 0.44%
1,500,000 Uruguay Government International Bond 9.88 20/06/2022 47,524 0.05%
76,163,209 78.64%
Futures - 0.08% (2017 - 0.49%)
Counterparty Nominal Security DescriptionNo of
ContractsUnrealisedGain USD
Bank of America MerrillLynch 2,693,906 US 10 Year Ultra Future 21 19/09/2018 14,672 0.02%Bank of America MerrillLynch 25,000,932 US 5 Year Note Future 220 28/09/2018 66,893 0.06%
81,565 0.08%
Swaps - 0.04% (2017 - 0.03%)
HSBC 550,000IRS GBP/LIBOR/fixing 6M, R:GBP1.417 20/06/2047 32,828 0.03%
HSBC 10,000,000IRS USD/LIBOR/fixing 3M, R:USD2.822 21/05/2020 9,829 0.01%
42,657 0.04%
Currency Exchange Contracts – 0.47% (2017 – 1.90%)
CounterpartyActualSettle Date
IssueCurrency
CurrencyBought
SettleCurrency
CurrencySold
Citibank 24/07/2018 NOK 16,030,000 USD 1,955,337 11,801 0.01%
Citibank 24/07/2018 USD 9,777,636 GBP 7,430,000 3,697 0.00%
Citibank 24/07/2018 USD 932,208 ZAR 12,800,000 7,869 0.01%
Citibank 31/07/2018 EUR 17,902 USD 20,880 9 0.00%
Citibank 31/07/2018 GBP 3,796 USD 4,978 16 0.00%
Goldman Sachs 28/08/2018 USD 480,205 BRL 1,800,000 17,405 0.02%
HSBC 24/07/2018 MXN 5,650,000 USD 273,248 12,026 0.01%
JP Morgan Securities 19/07/2018 USD 958,875 IDR 13,500,000,000 18,083 0.02%
JP Morgan Securities 24/07/2018 KRW 2,145,000,000 USD 1,911,918 14,571 0.02%
JP Morgan Securities 24/07/2018 USD 3,602,394 ZAR 49,430,000 32,863 0.03%
JP Morgan Securities 23/01/2019 USD 1,433,766 KRW 1,530,000,000 48,648 0.05%
Royal Bank of Scotland 24/07/2018 RUB 53,500,000 USD 833,837 15,797 0.02%
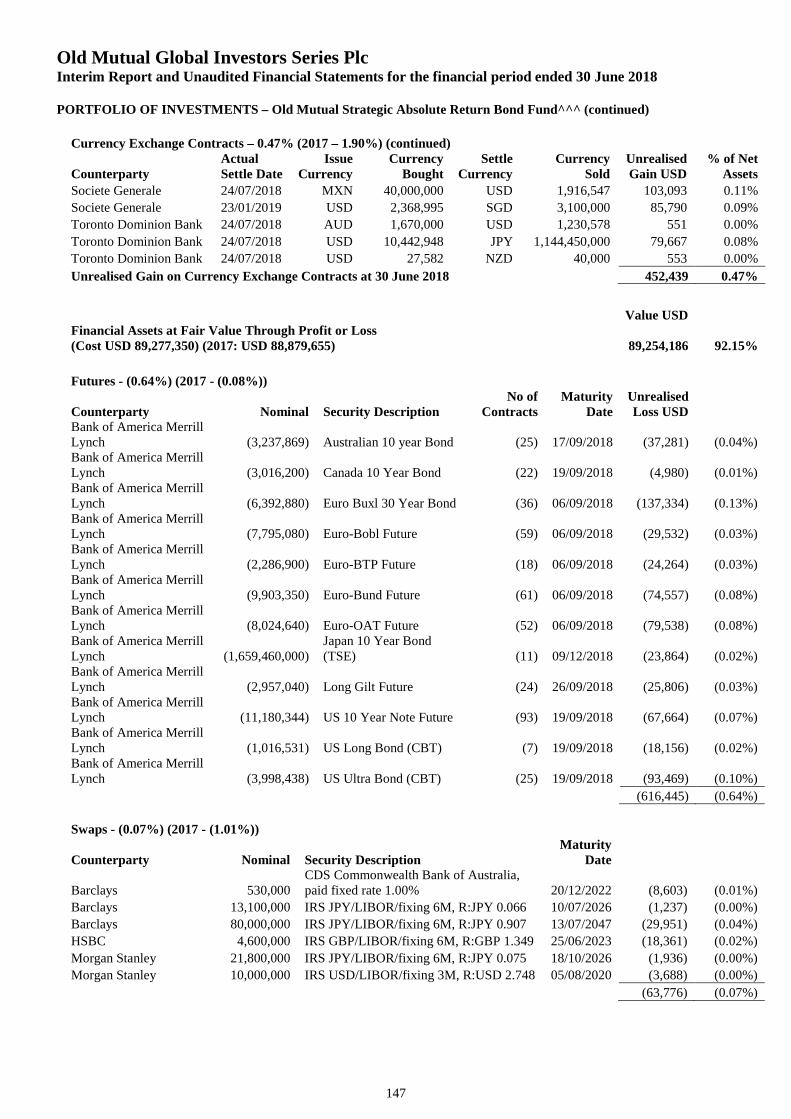
Old Mutual Global Investors Series PlcInterim Report and Unaudited Financial Statements for the financial period ended 30 June 2018
PORTFOLIO OF INVESTMENTS – Old Mutual Strategic Absolute Return Bond Fund^^^ (continued)
147
Currency Exchange Contracts – 0.47% (2017 – 1.90%) (continued)
CounterpartyActualSettle Date
IssueCurrency
CurrencyBought
SettleCurrency
CurrencySold
UnrealisedGain USD
% of NetAssets
Societe Generale 24/07/2018 MXN 40,000,000 USD 1,916,547 103,093 0.11%
Societe Generale 23/01/2019 USD 2,368,995 SGD 3,100,000 85,790 0.09%
Toronto Dominion Bank 24/07/2018 AUD 1,670,000 USD 1,230,578 551 0.00%
Toronto Dominion Bank 24/07/2018 USD 10,442,948 JPY 1,144,450,000 79,667 0.08%
Toronto Dominion Bank 24/07/2018 USD 27,582 NZD 40,000 553 0.00%
Unrealised Gain on Currency Exchange Contracts at 30 June 2018 452,439 0.47%
Value USDFinancial Assets at Fair Value Through Profit or Loss(Cost USD 89,277,350) (2017: USD 88,879,655) 89,254,186 92.15%
Futures - (0.64%) (2017 - (0.08%))
Counterparty Nominal Security DescriptionNo of
ContractsMaturity
DateUnrealisedLoss USD
Bank of America MerrillLynch (3,237,869) Australian 10 year Bond (25) 17/09/2018 (37,281) (0.04%)Bank of America MerrillLynch (3,016,200) Canada 10 Year Bond (22) 19/09/2018 (4,980) (0.01%)Bank of America MerrillLynch (6,392,880) Euro Buxl 30 Year Bond (36) 06/09/2018 (137,334) (0.13%)Bank of America MerrillLynch (7,795,080) Euro-Bobl Future (59) 06/09/2018 (29,532) (0.03%)Bank of America MerrillLynch (2,286,900) Euro-BTP Future (18) 06/09/2018 (24,264) (0.03%)Bank of America MerrillLynch (9,903,350) Euro-Bund Future (61) 06/09/2018 (74,557) (0.08%)Bank of America MerrillLynch (8,024,640) Euro-OAT Future (52) 06/09/2018 (79,538) (0.08%)Bank of America MerrillLynch (1,659,460,000)
Japan 10 Year Bond(TSE) (11) 09/12/2018 (23,864) (0.02%)
Bank of America MerrillLynch (2,957,040) Long Gilt Future (24) 26/09/2018 (25,806) (0.03%)Bank of America MerrillLynch (11,180,344) US 10 Year Note Future (93) 19/09/2018 (67,664) (0.07%)Bank of America MerrillLynch (1,016,531) US Long Bond (CBT) (7) 19/09/2018 (18,156) (0.02%)Bank of America MerrillLynch (3,998,438) US Ultra Bond (CBT) (25) 19/09/2018 (93,469) (0.10%)
(616,445) (0.64%)
Swaps - (0.07%) (2017 - (1.01%))
Counterparty Nominal Security DescriptionMaturity
Date
Barclays 530,000CDS Commonwealth Bank of Australia,paid fixed rate 1.00% 20/12/2022 (8,603) (0.01%)
Barclays 13,100,000 IRS JPY/LIBOR/fixing 6M, R:JPY 0.066 10/07/2026 (1,237) (0.00%)
Barclays 80,000,000 IRS JPY/LIBOR/fixing 6M, R:JPY 0.907 13/07/2047 (29,951) (0.04%)
HSBC 4,600,000 IRS GBP/LIBOR/fixing 6M, R:GBP 1.349 25/06/2023 (18,361) (0.02%)
Morgan Stanley 21,800,000 IRS JPY/LIBOR/fixing 6M, R:JPY 0.075 18/10/2026 (1,936) (0.00%)
Morgan Stanley 10,000,000 IRS USD/LIBOR/fixing 3M, R:USD 2.748 05/08/2020 (3,688) (0.00%)
(63,776) (0.07%)
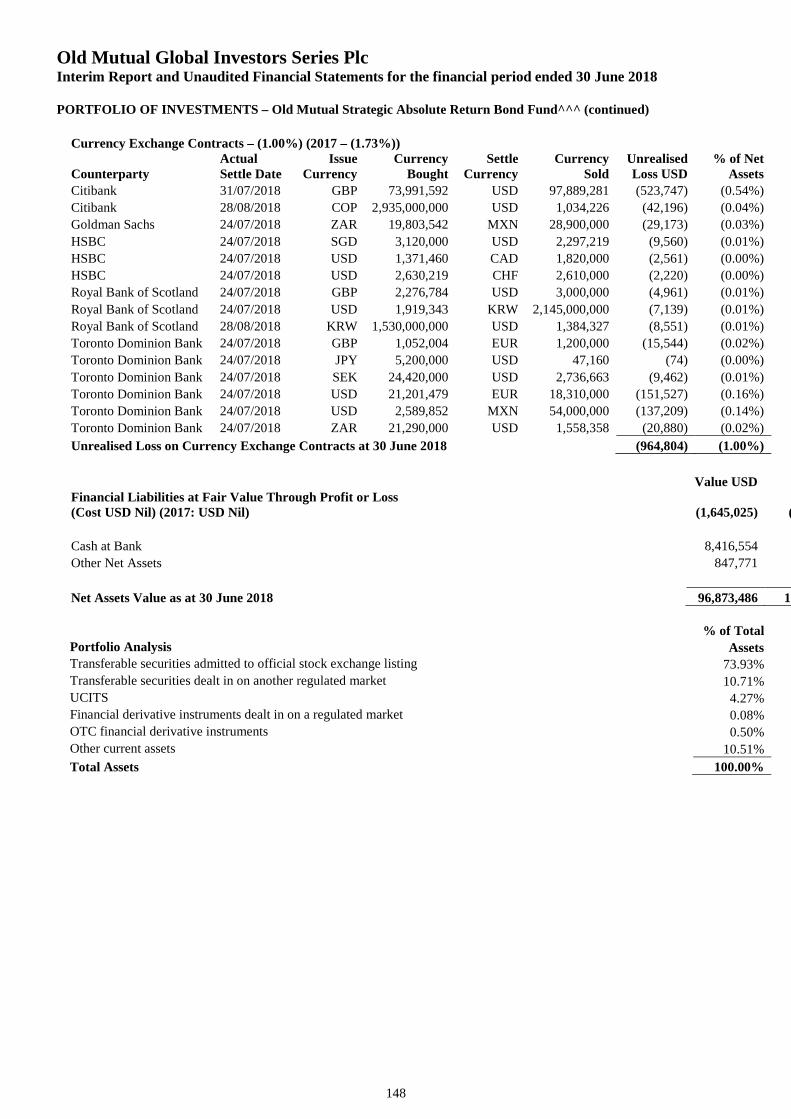
Old Mutual Global Investors Series PlcInterim Report and Unaudited Financial Statements for the financial period ended 30 June 2018
PORTFOLIO OF INVESTMENTS – Old Mutual Strategic Absolute Return Bond Fund^^^ (continued)
148
Currency Exchange Contracts – (1.00%) (2017 – (1.73%))
CounterpartyActualSettle Date
IssueCurrency
CurrencyBought
SettleCurrency
CurrencySold
UnrealisedLoss USD
% of NetAssets
Citibank 31/07/2018 GBP 73,991,592 USD 97,889,281 (523,747) (0.54%)
Citibank 28/08/2018 COP 2,935,000,000 USD 1,034,226 (42,196) (0.04%)
Goldman Sachs 24/07/2018 ZAR 19,803,542 MXN 28,900,000 (29,173) (0.03%)
HSBC 24/07/2018 SGD 3,120,000 USD 2,297,219 (9,560) (0.01%)
HSBC 24/07/2018 USD 1,371,460 CAD 1,820,000 (2,561) (0.00%)
HSBC 24/07/2018 USD 2,630,219 CHF 2,610,000 (2,220) (0.00%)
Royal Bank of Scotland 24/07/2018 GBP 2,276,784 USD 3,000,000 (4,961) (0.01%)
Royal Bank of Scotland 24/07/2018 USD 1,919,343 KRW 2,145,000,000 (7,139) (0.01%)
Royal Bank of Scotland 28/08/2018 KRW 1,530,000,000 USD 1,384,327 (8,551) (0.01%)
Toronto Dominion Bank 24/07/2018 GBP 1,052,004 EUR 1,200,000 (15,544) (0.02%)
Toronto Dominion Bank 24/07/2018 JPY 5,200,000 USD 47,160 (74) (0.00%)
Toronto Dominion Bank 24/07/2018 SEK 24,420,000 USD 2,736,663 (9,462) (0.01%)
Toronto Dominion Bank 24/07/2018 USD 21,201,479 EUR 18,310,000 (151,527) (0.16%)
Toronto Dominion Bank 24/07/2018 USD 2,589,852 MXN 54,000,000 (137,209) (0.14%)
Toronto Dominion Bank 24/07/2018 ZAR 21,290,000 USD 1,558,358 (20,880) (0.02%)
Unrealised Loss on Currency Exchange Contracts at 30 June 2018 (964,804) (1.00%)
Value USDFinancial Liabilities at Fair Value Through Profit or Loss(Cost USD Nil) (2017: USD Nil) (1,645,025) (1.7
Cash at Bank 8,416,554
Other Net Assets 847,771
Net Assets Value as at 30 June 2018 96,873,486 100.00%
% of TotalPortfolio Analysis AssetsTransferable securities admitted to official stock exchange listing 73.93%Transferable securities dealt in on another regulated market 10.71%UCITS 4.27%Financial derivative instruments dealt in on a regulated market 0.08%OTC financial derivative instruments 0.50%Other current assets 10.51%
Total Assets 100.00%
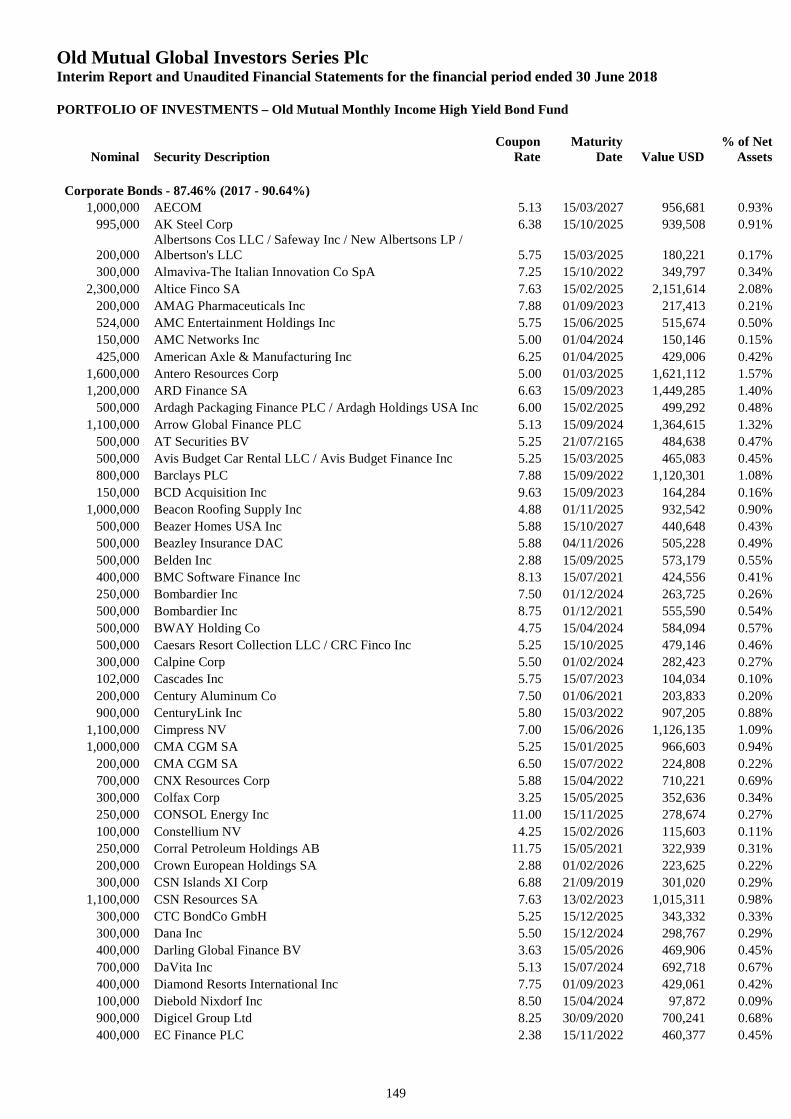
Old Mutual Global Investors Series PlcInterim Report and Unaudited Financial Statements for the financial period ended 30 June 2018
PORTFOLIO OF INVESTMENTS – Old Mutual Monthly Income High Yield Bond Fund
Nominal Security DescriptionCoupon
RateMaturity
Date Value USD% of Net
Assets
149
Corporate Bonds - 87.46% (2017 - 90.64%)
1,000,000 AECOM 5.13 15/03/2027 956,681 0.93%
995,000 AK Steel Corp 6.38 15/10/2025 939,508 0.91%
200,000Albertsons Cos LLC / Safeway Inc / New Albertsons LP /Albertson's LLC 5.75 15/03/2025 180,221 0.17%
300,000 Almaviva-The Italian Innovation Co SpA 7.25 15/10/2022 349,797 0.34%
2,300,000 Altice Finco SA 7.63 15/02/2025 2,151,614 2.08%
200,000 AMAG Pharmaceuticals Inc 7.88 01/09/2023 217,413 0.21%
524,000 AMC Entertainment Holdings Inc 5.75 15/06/2025 515,674 0.50%
150,000 AMC Networks Inc 5.00 01/04/2024 150,146 0.15%
425,000 American Axle & Manufacturing Inc 6.25 01/04/2025 429,006 0.42%
1,600,000 Antero Resources Corp 5.00 01/03/2025 1,621,112 1.57%
1,200,000 ARD Finance SA 6.63 15/09/2023 1,449,285 1.40%
500,000 Ardagh Packaging Finance PLC / Ardagh Holdings USA Inc 6.00 15/02/2025 499,292 0.48%
1,100,000 Arrow Global Finance PLC 5.13 15/09/2024 1,364,615 1.32%
500,000 AT Securities BV 5.25 21/07/2165 484,638 0.47%
500,000 Avis Budget Car Rental LLC / Avis Budget Finance Inc 5.25 15/03/2025 465,083 0.45%
800,000 Barclays PLC 7.88 15/09/2022 1,120,301 1.08%
150,000 BCD Acquisition Inc 9.63 15/09/2023 164,284 0.16%
1,000,000 Beacon Roofing Supply Inc 4.88 01/11/2025 932,542 0.90%
500,000 Beazer Homes USA Inc 5.88 15/10/2027 440,648 0.43%
500,000 Beazley Insurance DAC 5.88 04/11/2026 505,228 0.49%
500,000 Belden Inc 2.88 15/09/2025 573,179 0.55%
400,000 BMC Software Finance Inc 8.13 15/07/2021 424,556 0.41%
250,000 Bombardier Inc 7.50 01/12/2024 263,725 0.26%
500,000 Bombardier Inc 8.75 01/12/2021 555,590 0.54%
500,000 BWAY Holding Co 4.75 15/04/2024 584,094 0.57%
500,000 Caesars Resort Collection LLC / CRC Finco Inc 5.25 15/10/2025 479,146 0.46%
300,000 Calpine Corp 5.50 01/02/2024 282,423 0.27%
102,000 Cascades Inc 5.75 15/07/2023 104,034 0.10%
200,000 Century Aluminum Co 7.50 01/06/2021 203,833 0.20%
900,000 CenturyLink Inc 5.80 15/03/2022 907,205 0.88%
1,100,000 Cimpress NV 7.00 15/06/2026 1,126,135 1.09%
1,000,000 CMA CGM SA 5.25 15/01/2025 966,603 0.94%
200,000 CMA CGM SA 6.50 15/07/2022 224,808 0.22%
700,000 CNX Resources Corp 5.88 15/04/2022 710,221 0.69%
300,000 Colfax Corp 3.25 15/05/2025 352,636 0.34%
250,000 CONSOL Energy Inc 11.00 15/11/2025 278,674 0.27%
100,000 Constellium NV 4.25 15/02/2026 115,603 0.11%
250,000 Corral Petroleum Holdings AB 11.75 15/05/2021 322,939 0.31%
200,000 Crown European Holdings SA 2.88 01/02/2026 223,625 0.22%
300,000 CSN Islands XI Corp 6.88 21/09/2019 301,020 0.29%
1,100,000 CSN Resources SA 7.63 13/02/2023 1,015,311 0.98%
300,000 CTC BondCo GmbH 5.25 15/12/2025 343,332 0.33%
300,000 Dana Inc 5.50 15/12/2024 298,767 0.29%
400,000 Darling Global Finance BV 3.63 15/05/2026 469,906 0.45%
700,000 DaVita Inc 5.13 15/07/2024 692,718 0.67%
400,000 Diamond Resorts International Inc 7.75 01/09/2023 429,061 0.42%
100,000 Diebold Nixdorf Inc 8.50 15/04/2024 97,872 0.09%
900,000 Digicel Group Ltd 8.25 30/09/2020 700,241 0.68%
400,000 EC Finance PLC 2.38 15/11/2022 460,377 0.45%
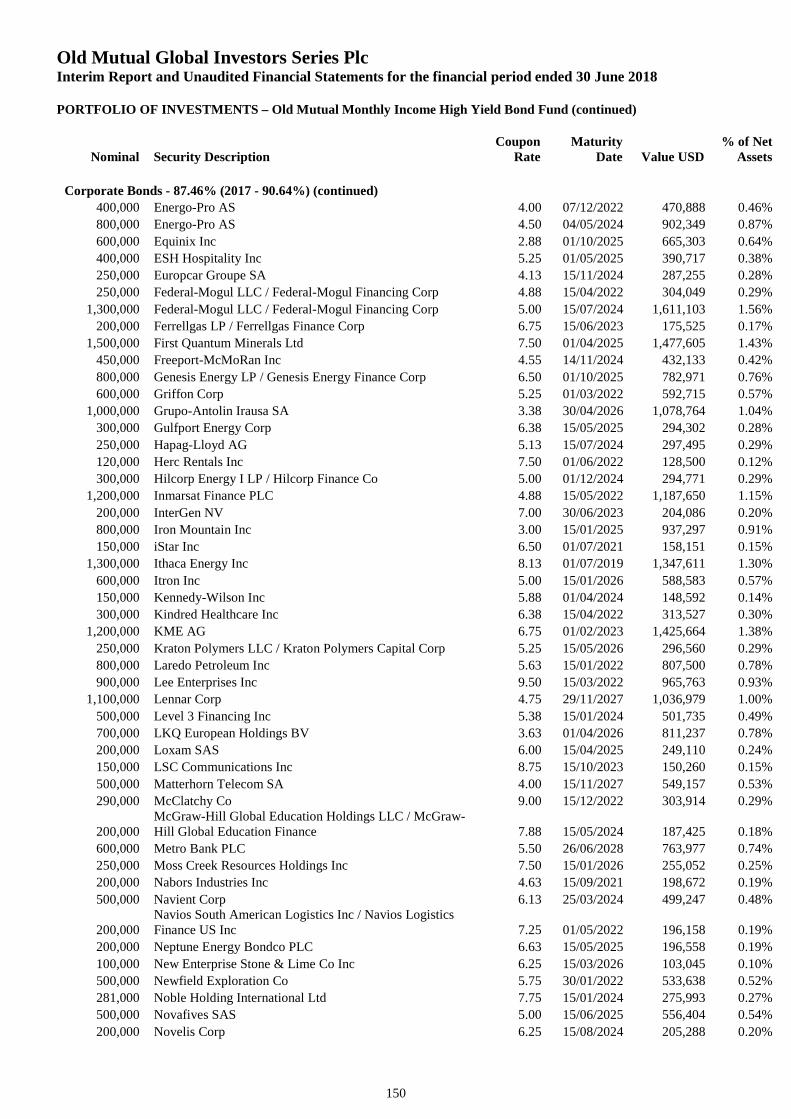
Old Mutual Global Investors Series PlcInterim Report and Unaudited Financial Statements for the financial period ended 30 June 2018
PORTFOLIO OF INVESTMENTS – Old Mutual Monthly Income High Yield Bond Fund (continued)
Nominal Security DescriptionCoupon
RateMaturity
Date Value USD% of Net
Assets
150
Corporate Bonds - 87.46% (2017 - 90.64%) (continued)
400,000 Energo-Pro AS 4.00 07/12/2022 470,888 0.46%
800,000 Energo-Pro AS 4.50 04/05/2024 902,349 0.87%
600,000 Equinix Inc 2.88 01/10/2025 665,303 0.64%
400,000 ESH Hospitality Inc 5.25 01/05/2025 390,717 0.38%
250,000 Europcar Groupe SA 4.13 15/11/2024 287,255 0.28%
250,000 Federal-Mogul LLC / Federal-Mogul Financing Corp 4.88 15/04/2022 304,049 0.29%
1,300,000 Federal-Mogul LLC / Federal-Mogul Financing Corp 5.00 15/07/2024 1,611,103 1.56%
200,000 Ferrellgas LP / Ferrellgas Finance Corp 6.75 15/06/2023 175,525 0.17%
1,500,000 First Quantum Minerals Ltd 7.50 01/04/2025 1,477,605 1.43%
450,000 Freeport-McMoRan Inc 4.55 14/11/2024 432,133 0.42%
800,000 Genesis Energy LP / Genesis Energy Finance Corp 6.50 01/10/2025 782,971 0.76%
600,000 Griffon Corp 5.25 01/03/2022 592,715 0.57%
1,000,000 Grupo-Antolin Irausa SA 3.38 30/04/2026 1,078,764 1.04%
300,000 Gulfport Energy Corp 6.38 15/05/2025 294,302 0.28%
250,000 Hapag-Lloyd AG 5.13 15/07/2024 297,495 0.29%
120,000 Herc Rentals Inc 7.50 01/06/2022 128,500 0.12%
300,000 Hilcorp Energy I LP / Hilcorp Finance Co 5.00 01/12/2024 294,771 0.29%
1,200,000 Inmarsat Finance PLC 4.88 15/05/2022 1,187,650 1.15%
200,000 InterGen NV 7.00 30/06/2023 204,086 0.20%
800,000 Iron Mountain Inc 3.00 15/01/2025 937,297 0.91%
150,000 iStar Inc 6.50 01/07/2021 158,151 0.15%
1,300,000 Ithaca Energy Inc 8.13 01/07/2019 1,347,611 1.30%
600,000 Itron Inc 5.00 15/01/2026 588,583 0.57%
150,000 Kennedy-Wilson Inc 5.88 01/04/2024 148,592 0.14%
300,000 Kindred Healthcare Inc 6.38 15/04/2022 313,527 0.30%
1,200,000 KME AG 6.75 01/02/2023 1,425,664 1.38%
250,000 Kraton Polymers LLC / Kraton Polymers Capital Corp 5.25 15/05/2026 296,560 0.29%
800,000 Laredo Petroleum Inc 5.63 15/01/2022 807,500 0.78%
900,000 Lee Enterprises Inc 9.50 15/03/2022 965,763 0.93%
1,100,000 Lennar Corp 4.75 29/11/2027 1,036,979 1.00%
500,000 Level 3 Financing Inc 5.38 15/01/2024 501,735 0.49%
700,000 LKQ European Holdings BV 3.63 01/04/2026 811,237 0.78%
200,000 Loxam SAS 6.00 15/04/2025 249,110 0.24%
150,000 LSC Communications Inc 8.75 15/10/2023 150,260 0.15%
500,000 Matterhorn Telecom SA 4.00 15/11/2027 549,157 0.53%
290,000 McClatchy Co 9.00 15/12/2022 303,914 0.29%
200,000McGraw-Hill Global Education Holdings LLC / McGraw-Hill Global Education Finance 7.88 15/05/2024 187,425 0.18%
600,000 Metro Bank PLC 5.50 26/06/2028 763,977 0.74%
250,000 Moss Creek Resources Holdings Inc 7.50 15/01/2026 255,052 0.25%
200,000 Nabors Industries Inc 4.63 15/09/2021 198,672 0.19%
500,000 Navient Corp 6.13 25/03/2024 499,247 0.48%
200,000Navios South American Logistics Inc / Navios LogisticsFinance US Inc 7.25 01/05/2022 196,158 0.19%
200,000 Neptune Energy Bondco PLC 6.63 15/05/2025 196,558 0.19%
100,000 New Enterprise Stone & Lime Co Inc 6.25 15/03/2026 103,045 0.10%
500,000 Newfield Exploration Co 5.75 30/01/2022 533,638 0.52%
281,000 Noble Holding International Ltd 7.75 15/01/2024 275,993 0.27%
500,000 Novafives SAS 5.00 15/06/2025 556,404 0.54%
200,000 Novelis Corp 6.25 15/08/2024 205,288 0.20%
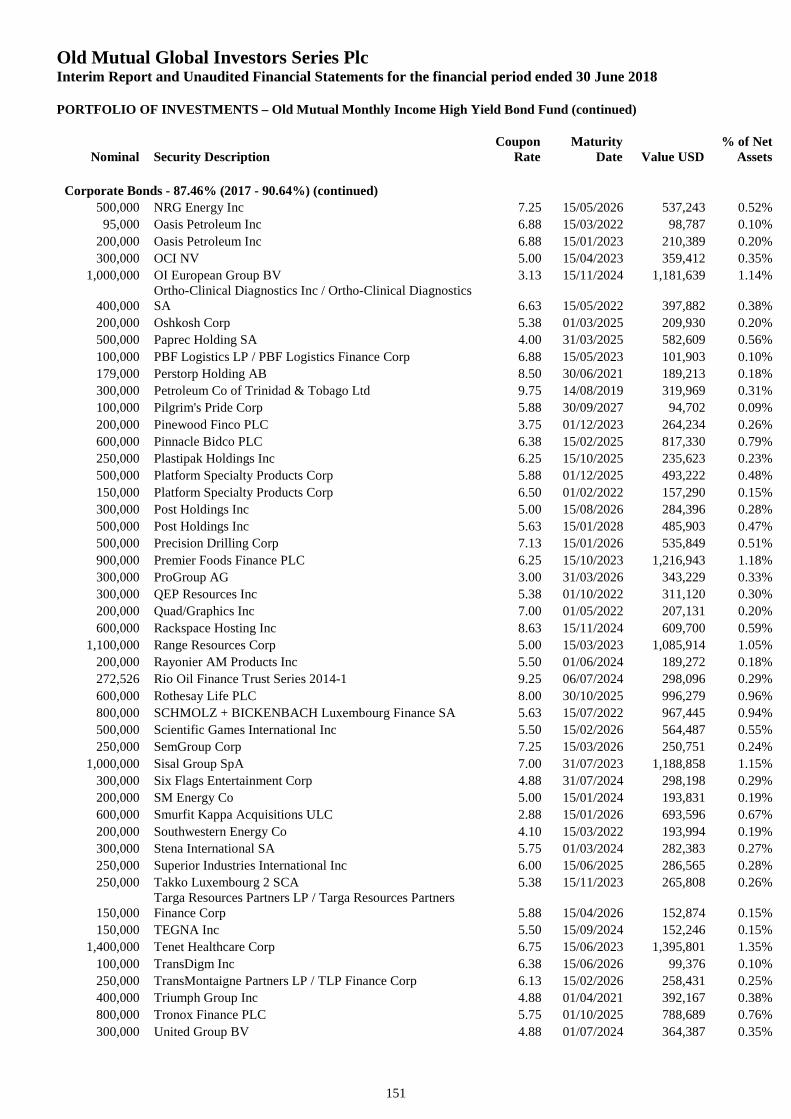
Old Mutual Global Investors Series PlcInterim Report and Unaudited Financial Statements for the financial period ended 30 June 2018
PORTFOLIO OF INVESTMENTS – Old Mutual Monthly Income High Yield Bond Fund (continued)
Nominal Security DescriptionCoupon
RateMaturity
Date Value USD% of Net
Assets
151
Corporate Bonds - 87.46% (2017 - 90.64%) (continued)
500,000 NRG Energy Inc 7.25 15/05/2026 537,243 0.52%
95,000 Oasis Petroleum Inc 6.88 15/03/2022 98,787 0.10%
200,000 Oasis Petroleum Inc 6.88 15/01/2023 210,389 0.20%
300,000 OCI NV 5.00 15/04/2023 359,412 0.35%
1,000,000 OI European Group BV 3.13 15/11/2024 1,181,639 1.14%
400,000Ortho-Clinical Diagnostics Inc / Ortho-Clinical DiagnosticsSA 6.63 15/05/2022 397,882 0.38%
200,000 Oshkosh Corp 5.38 01/03/2025 209,930 0.20%
500,000 Paprec Holding SA 4.00 31/03/2025 582,609 0.56%
100,000 PBF Logistics LP / PBF Logistics Finance Corp 6.88 15/05/2023 101,903 0.10%
179,000 Perstorp Holding AB 8.50 30/06/2021 189,213 0.18%
300,000 Petroleum Co of Trinidad & Tobago Ltd 9.75 14/08/2019 319,969 0.31%
100,000 Pilgrim's Pride Corp 5.88 30/09/2027 94,702 0.09%
200,000 Pinewood Finco PLC 3.75 01/12/2023 264,234 0.26%
600,000 Pinnacle Bidco PLC 6.38 15/02/2025 817,330 0.79%
250,000 Plastipak Holdings Inc 6.25 15/10/2025 235,623 0.23%
500,000 Platform Specialty Products Corp 5.88 01/12/2025 493,222 0.48%
150,000 Platform Specialty Products Corp 6.50 01/02/2022 157,290 0.15%
300,000 Post Holdings Inc 5.00 15/08/2026 284,396 0.28%
500,000 Post Holdings Inc 5.63 15/01/2028 485,903 0.47%
500,000 Precision Drilling Corp 7.13 15/01/2026 535,849 0.51%
900,000 Premier Foods Finance PLC 6.25 15/10/2023 1,216,943 1.18%
300,000 ProGroup AG 3.00 31/03/2026 343,229 0.33%
300,000 QEP Resources Inc 5.38 01/10/2022 311,120 0.30%
200,000 Quad/Graphics Inc 7.00 01/05/2022 207,131 0.20%
600,000 Rackspace Hosting Inc 8.63 15/11/2024 609,700 0.59%
1,100,000 Range Resources Corp 5.00 15/03/2023 1,085,914 1.05%
200,000 Rayonier AM Products Inc 5.50 01/06/2024 189,272 0.18%
272,526 Rio Oil Finance Trust Series 2014-1 9.25 06/07/2024 298,096 0.29%
600,000 Rothesay Life PLC 8.00 30/10/2025 996,279 0.96%
800,000 SCHMOLZ + BICKENBACH Luxembourg Finance SA 5.63 15/07/2022 967,445 0.94%
500,000 Scientific Games International Inc 5.50 15/02/2026 564,487 0.55%
250,000 SemGroup Corp 7.25 15/03/2026 250,751 0.24%
1,000,000 Sisal Group SpA 7.00 31/07/2023 1,188,858 1.15%
300,000 Six Flags Entertainment Corp 4.88 31/07/2024 298,198 0.29%
200,000 SM Energy Co 5.00 15/01/2024 193,831 0.19%
600,000 Smurfit Kappa Acquisitions ULC 2.88 15/01/2026 693,596 0.67%
200,000 Southwestern Energy Co 4.10 15/03/2022 193,994 0.19%
300,000 Stena International SA 5.75 01/03/2024 282,383 0.27%
250,000 Superior Industries International Inc 6.00 15/06/2025 286,565 0.28%
250,000 Takko Luxembourg 2 SCA 5.38 15/11/2023 265,808 0.26%
150,000Targa Resources Partners LP / Targa Resources PartnersFinance Corp 5.88 15/04/2026 152,874 0.15%
150,000 TEGNA Inc 5.50 15/09/2024 152,246 0.15%
1,400,000 Tenet Healthcare Corp 6.75 15/06/2023 1,395,801 1.35%
100,000 TransDigm Inc 6.38 15/06/2026 99,376 0.10%
250,000 TransMontaigne Partners LP / TLP Finance Corp 6.13 15/02/2026 258,431 0.25%
400,000 Triumph Group Inc 4.88 01/04/2021 392,167 0.38%
800,000 Tronox Finance PLC 5.75 01/10/2025 788,689 0.76%
300,000 United Group BV 4.88 01/07/2024 364,387 0.35%
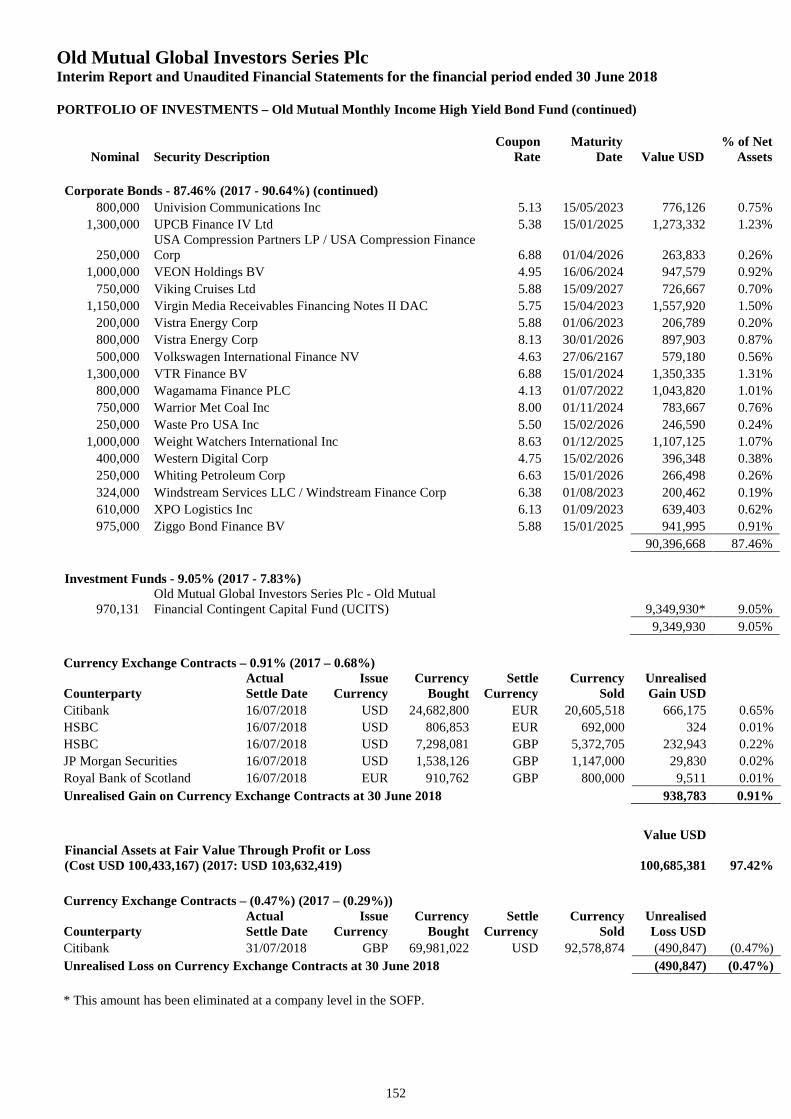
Old Mutual Global Investors Series PlcInterim Report and Unaudited Financial Statements for the financial period ended 30 June 2018
PORTFOLIO OF INVESTMENTS – Old Mutual Monthly Income High Yield Bond Fund (continued)
Nominal Security DescriptionCoupon
RateMaturity
Date Value USD% of Net
Assets
152
Corporate Bonds - 87.46% (2017 - 90.64%) (continued)
800,000 Univision Communications Inc 5.13 15/05/2023 776,126 0.75%
1,300,000 UPCB Finance IV Ltd 5.38 15/01/2025 1,273,332 1.23%
250,000USA Compression Partners LP / USA Compression FinanceCorp 6.88 01/04/2026 263,833 0.26%
1,000,000 VEON Holdings BV 4.95 16/06/2024 947,579 0.92%
750,000 Viking Cruises Ltd 5.88 15/09/2027 726,667 0.70%
1,150,000 Virgin Media Receivables Financing Notes II DAC 5.75 15/04/2023 1,557,920 1.50%
200,000 Vistra Energy Corp 5.88 01/06/2023 206,789 0.20%
800,000 Vistra Energy Corp 8.13 30/01/2026 897,903 0.87%
500,000 Volkswagen International Finance NV 4.63 27/06/2167 579,180 0.56%
1,300,000 VTR Finance BV 6.88 15/01/2024 1,350,335 1.31%
800,000 Wagamama Finance PLC 4.13 01/07/2022 1,043,820 1.01%
750,000 Warrior Met Coal Inc 8.00 01/11/2024 783,667 0.76%
250,000 Waste Pro USA Inc 5.50 15/02/2026 246,590 0.24%
1,000,000 Weight Watchers International Inc 8.63 01/12/2025 1,107,125 1.07%
400,000 Western Digital Corp 4.75 15/02/2026 396,348 0.38%
250,000 Whiting Petroleum Corp 6.63 15/01/2026 266,498 0.26%
324,000 Windstream Services LLC / Windstream Finance Corp 6.38 01/08/2023 200,462 0.19%
610,000 XPO Logistics Inc 6.13 01/09/2023 639,403 0.62%
975,000 Ziggo Bond Finance BV 5.88 15/01/2025 941,995 0.91%
90,396,668 87.46%
Investment Funds - 9.05% (2017 - 7.83%)
970,131Old Mutual Global Investors Series Plc - Old MutualFinancial Contingent Capital Fund (UCITS) 9,349,930* 9.05%
9,349,930 9.05%
Currency Exchange Contracts – 0.91% (2017 – 0.68%)
CounterpartyActualSettle Date
IssueCurrency
CurrencyBought
SettleCurrency
CurrencySold
UnrealisedGain USD
Citibank 16/07/2018 USD 24,682,800 EUR 20,605,518 666,175 0.65%
HSBC 16/07/2018 USD 806,853 EUR 692,000 324 0.01%
HSBC 16/07/2018 USD 7,298,081 GBP 5,372,705 232,943 0.22%
JP Morgan Securities 16/07/2018 USD 1,538,126 GBP 1,147,000 29,830 0.02%
Royal Bank of Scotland 16/07/2018 EUR 910,762 GBP 800,000 9,511 0.01%
Unrealised Gain on Currency Exchange Contracts at 30 June 2018 938,783 0.91%
Value USDFinancial Assets at Fair Value Through Profit or Loss(Cost USD 100,433,167) (2017: USD 103,632,419) 100,685,381 97.42%
Currency Exchange Contracts – (0.47%) (2017 – (0.29%))
CounterpartyActualSettle Date
IssueCurrency
CurrencyBought
SettleCurrency
CurrencySold
UnrealisedLoss USD
Citibank 31/07/2018 GBP 69,981,022 USD 92,578,874 (490,847) (0.47%)
Unrealised Loss on Currency Exchange Contracts at 30 June 2018 (490,847) (0.47%)
* This amount has been eliminated at a company level in the SOFP.
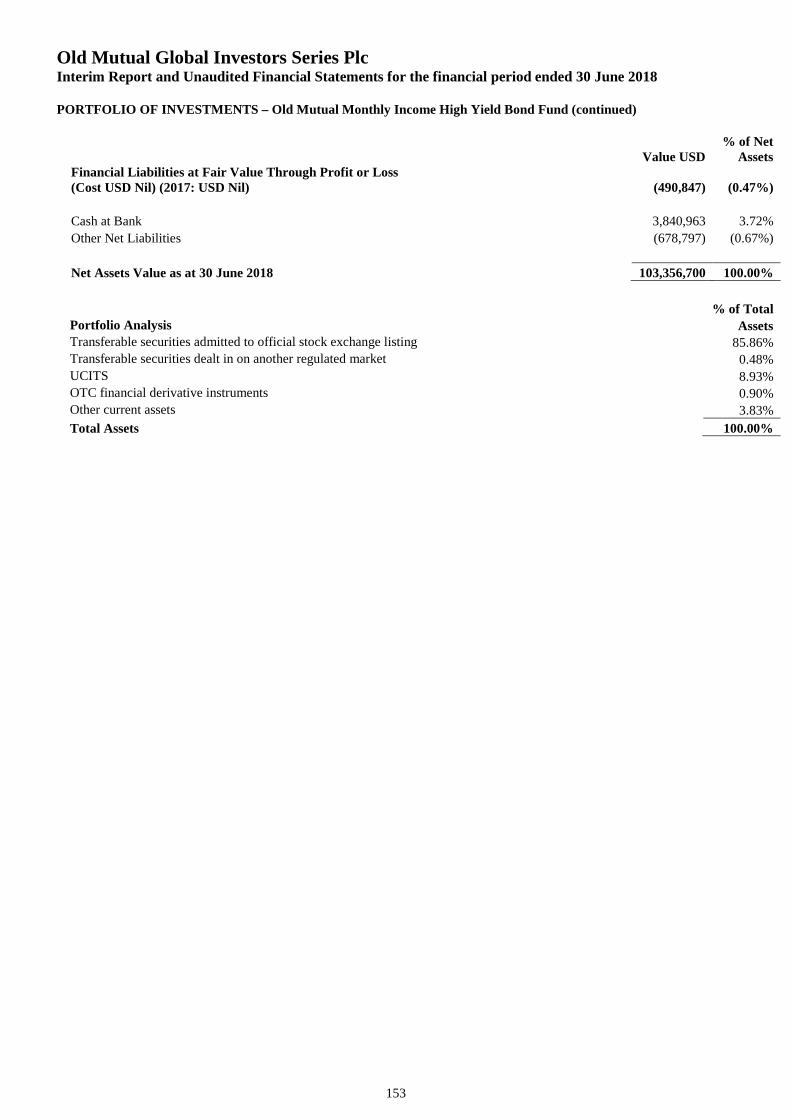
Old Mutual Global Investors Series PlcInterim Report and Unaudited Financial Statements for the financial period ended 30 June 2018
PORTFOLIO OF INVESTMENTS – Old Mutual Monthly Income High Yield Bond Fund (continued)
153
Value USD% of Net
AssetsFinancial Liabilities at Fair Value Through Profit or Loss(Cost USD Nil) (2017: USD Nil) (490,847) (0.47%)
Cash at Bank 3,840,963 3.72%
Other Net Liabilities (678,797) (0.67%)
Net Assets Value as at 30 June 2018 103,356,700 100.00%
% of TotalPortfolio Analysis AssetsTransferable securities admitted to official stock exchange listing 85.86%Transferable securities dealt in on another regulated market 0.48%UCITS 8.93%OTC financial derivative instruments 0.90%Other current assets 3.83%
Total Assets 100.00%
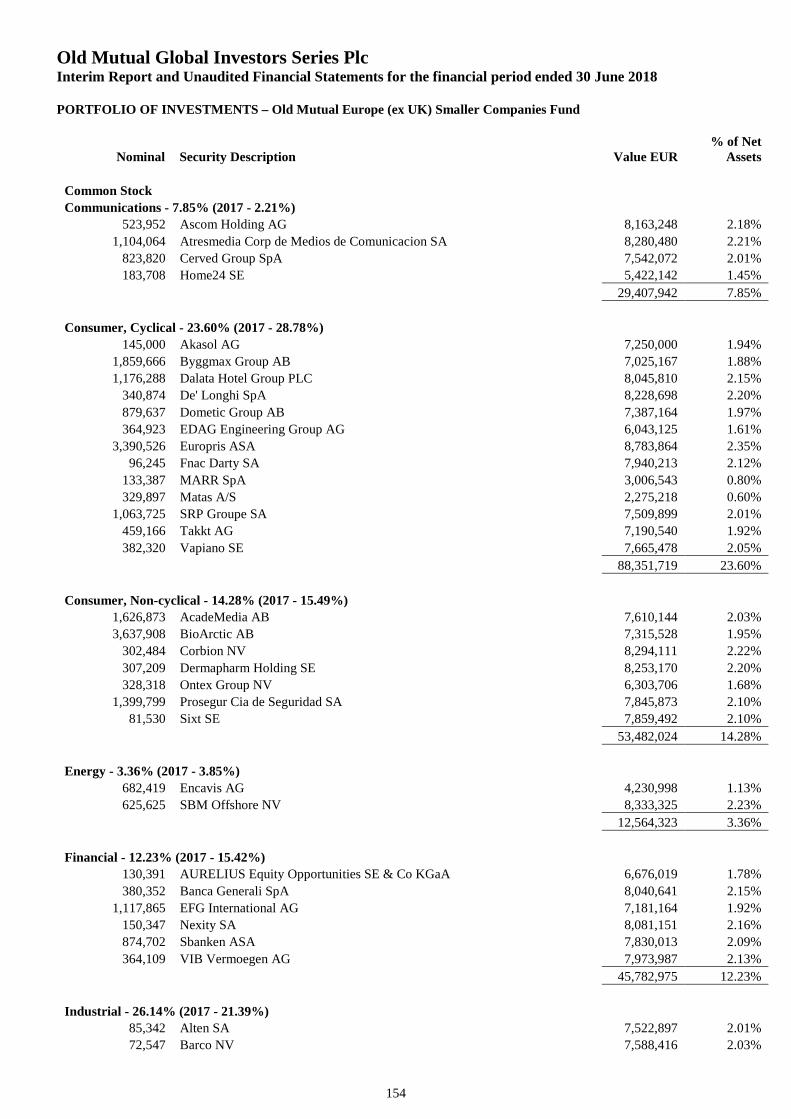
Old Mutual Global Investors Series PlcInterim Report and Unaudited Financial Statements for the financial period ended 30 June 2018
PORTFOLIO OF INVESTMENTS – Old Mutual Europe (ex UK) Smaller Companies Fund
Nominal Security Description Value EUR% of Net
Assets
154
Common Stock
Communications - 7.85% (2017 - 2.21%)
523,952 Ascom Holding AG 8,163,248 2.18%
1,104,064 Atresmedia Corp de Medios de Comunicacion SA 8,280,480 2.21%
823,820 Cerved Group SpA 7,542,072 2.01%
183,708 Home24 SE 5,422,142 1.45%
29,407,942 7.85%
Consumer, Cyclical - 23.60% (2017 - 28.78%)
145,000 Akasol AG 7,250,000 1.94%
1,859,666 Byggmax Group AB 7,025,167 1.88%
1,176,288 Dalata Hotel Group PLC 8,045,810 2.15%
340,874 De' Longhi SpA 8,228,698 2.20%
879,637 Dometic Group AB 7,387,164 1.97%
364,923 EDAG Engineering Group AG 6,043,125 1.61%
3,390,526 Europris ASA 8,783,864 2.35%
96,245 Fnac Darty SA 7,940,213 2.12%
133,387 MARR SpA 3,006,543 0.80%
329,897 Matas A/S 2,275,218 0.60%
1,063,725 SRP Groupe SA 7,509,899 2.01%
459,166 Takkt AG 7,190,540 1.92%
382,320 Vapiano SE 7,665,478 2.05%
88,351,719 23.60%
Consumer, Non-cyclical - 14.28% (2017 - 15.49%)
1,626,873 AcadeMedia AB 7,610,144 2.03%
3,637,908 BioArctic AB 7,315,528 1.95%
302,484 Corbion NV 8,294,111 2.22%
307,209 Dermapharm Holding SE 8,253,170 2.20%
328,318 Ontex Group NV 6,303,706 1.68%
1,399,799 Prosegur Cia de Seguridad SA 7,845,873 2.10%
81,530 Sixt SE 7,859,492 2.10%
53,482,024 14.28%
Energy - 3.36% (2017 - 3.85%)
682,419 Encavis AG 4,230,998 1.13%
625,625 SBM Offshore NV 8,333,325 2.23%
12,564,323 3.36%
Financial - 12.23% (2017 - 15.42%)
130,391 AURELIUS Equity Opportunities SE & Co KGaA 6,676,019 1.78%
380,352 Banca Generali SpA 8,040,641 2.15%
1,117,865 EFG International AG 7,181,164 1.92%
150,347 Nexity SA 8,081,151 2.16%
874,702 Sbanken ASA 7,830,013 2.09%
364,109 VIB Vermoegen AG 7,973,987 2.13%
45,782,975 12.23%
Industrial - 26.14% (2017 - 21.39%)
85,342 Alten SA 7,522,897 2.01%
72,547 Barco NV 7,588,416 2.03%
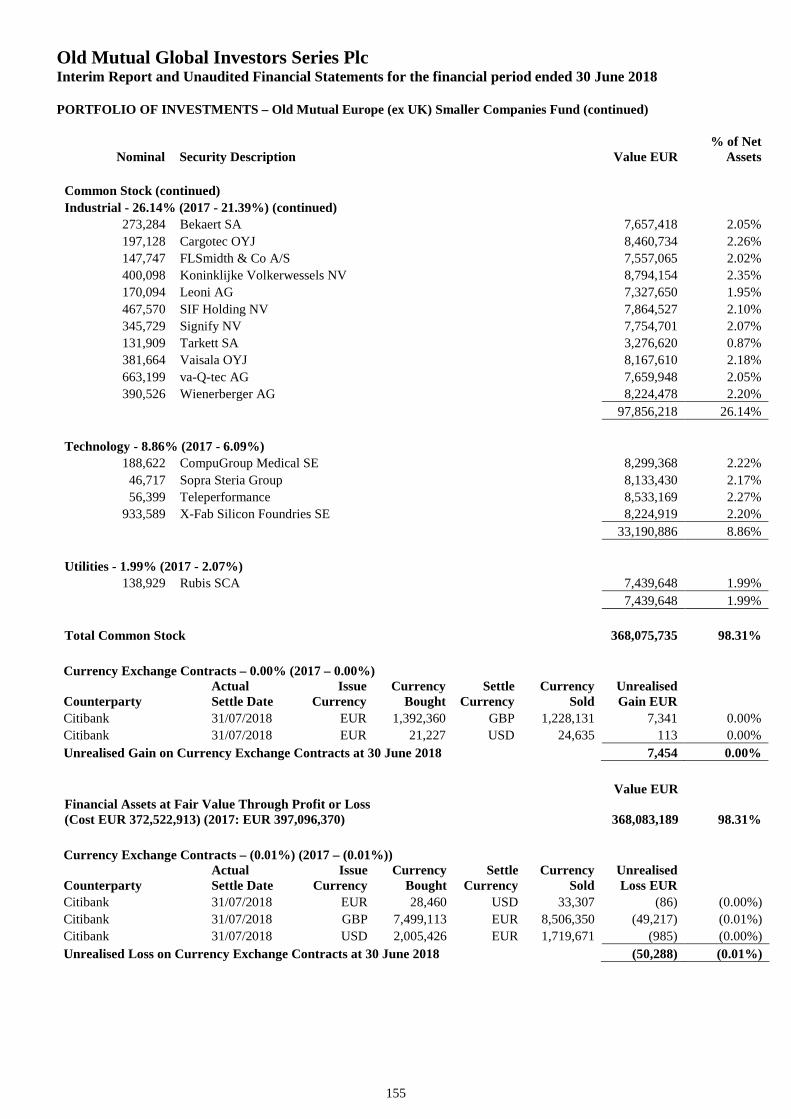
Old Mutual Global Investors Series PlcInterim Report and Unaudited Financial Statements for the financial period ended 30 June 2018
PORTFOLIO OF INVESTMENTS – Old Mutual Europe (ex UK) Smaller Companies Fund (continued)
Nominal Security Description Value EUR% of Net
Assets
155
Common Stock (continued)
Industrial - 26.14% (2017 - 21.39%) (continued)
273,284 Bekaert SA 7,657,418 2.05%
197,128 Cargotec OYJ 8,460,734 2.26%
147,747 FLSmidth & Co A/S 7,557,065 2.02%
400,098 Koninklijke Volkerwessels NV 8,794,154 2.35%
170,094 Leoni AG 7,327,650 1.95%
467,570 SIF Holding NV 7,864,527 2.10%
345,729 Signify NV 7,754,701 2.07%
131,909 Tarkett SA 3,276,620 0.87%
381,664 Vaisala OYJ 8,167,610 2.18%
663,199 va-Q-tec AG 7,659,948 2.05%
390,526 Wienerberger AG 8,224,478 2.20%
97,856,218 26.14%
Technology - 8.86% (2017 - 6.09%)
188,622 CompuGroup Medical SE 8,299,368 2.22%
46,717 Sopra Steria Group 8,133,430 2.17%
56,399 Teleperformance 8,533,169 2.27%
933,589 X-Fab Silicon Foundries SE 8,224,919 2.20%
33,190,886 8.86%
Utilities - 1.99% (2017 - 2.07%)
138,929 Rubis SCA 7,439,648 1.99%
7,439,648 1.99%
Total Common Stock 368,075,735 98.31%
Currency Exchange Contracts – 0.00% (2017 – 0.00%)
CounterpartyActualSettle Date
IssueCurrency
CurrencyBought
SettleCurrency
CurrencySold
UnrealisedGain EUR
Citibank 31/07/2018 EUR 1,392,360 GBP 1,228,131 7,341 0.00%
Citibank 31/07/2018 EUR 21,227 USD 24,635 113 0.00%
Unrealised Gain on Currency Exchange Contracts at 30 June 2018 7,454 0.00%
Value EURFinancial Assets at Fair Value Through Profit or Loss(Cost EUR 372,522,913) (2017: EUR 397,096,370) 368,083,189 98.31%
Currency Exchange Contracts – (0.01%) (2017 – (0.01%))
CounterpartyActualSettle Date
IssueCurrency
CurrencyBought
SettleCurrency
CurrencySold
UnrealisedLoss EUR
Citibank 31/07/2018 EUR 28,460 USD 33,307 (86) (0.00%)
Citibank 31/07/2018 GBP 7,499,113 EUR 8,506,350 (49,217) (0.01%)
Citibank 31/07/2018 USD 2,005,426 EUR 1,719,671 (985) (0.00%)
Unrealised Loss on Currency Exchange Contracts at 30 June 2018 (50,288) (0.01%)
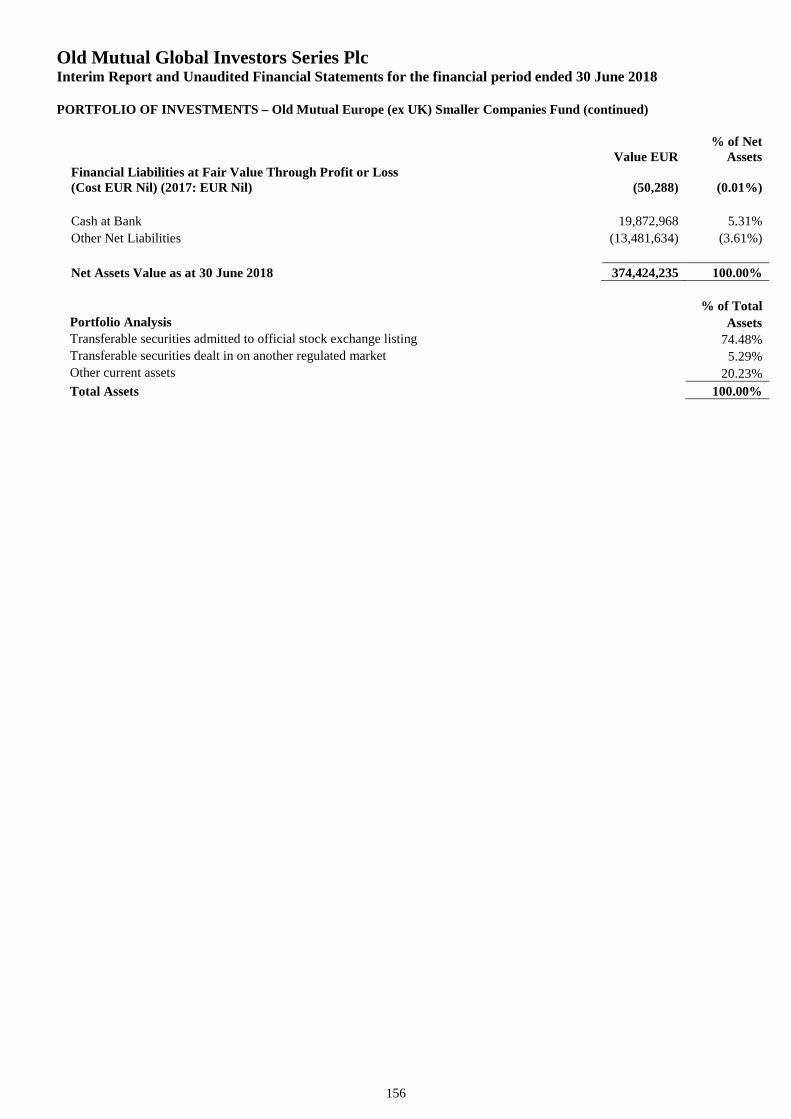
Old Mutual Global Investors Series PlcInterim Report and Unaudited Financial Statements for the financial period ended 30 June 2018
PORTFOLIO OF INVESTMENTS – Old Mutual Europe (ex UK) Smaller Companies Fund (continued)
156
Value EUR% of Net
AssetsFinancial Liabilities at Fair Value Through Profit or Loss(Cost EUR Nil) (2017: EUR Nil) (50,288) (0.01%)
Cash at Bank 19,872,968 5.31%
Other Net Liabilities (13,481,634) (3.61%)
Net Assets Value as at 30 June 2018 374,424,235 100.00%
% of TotalPortfolio Analysis AssetsTransferable securities admitted to official stock exchange listing 74.48%Transferable securities dealt in on another regulated market 5.29%Other current assets 20.23%
Total Assets 100.00%
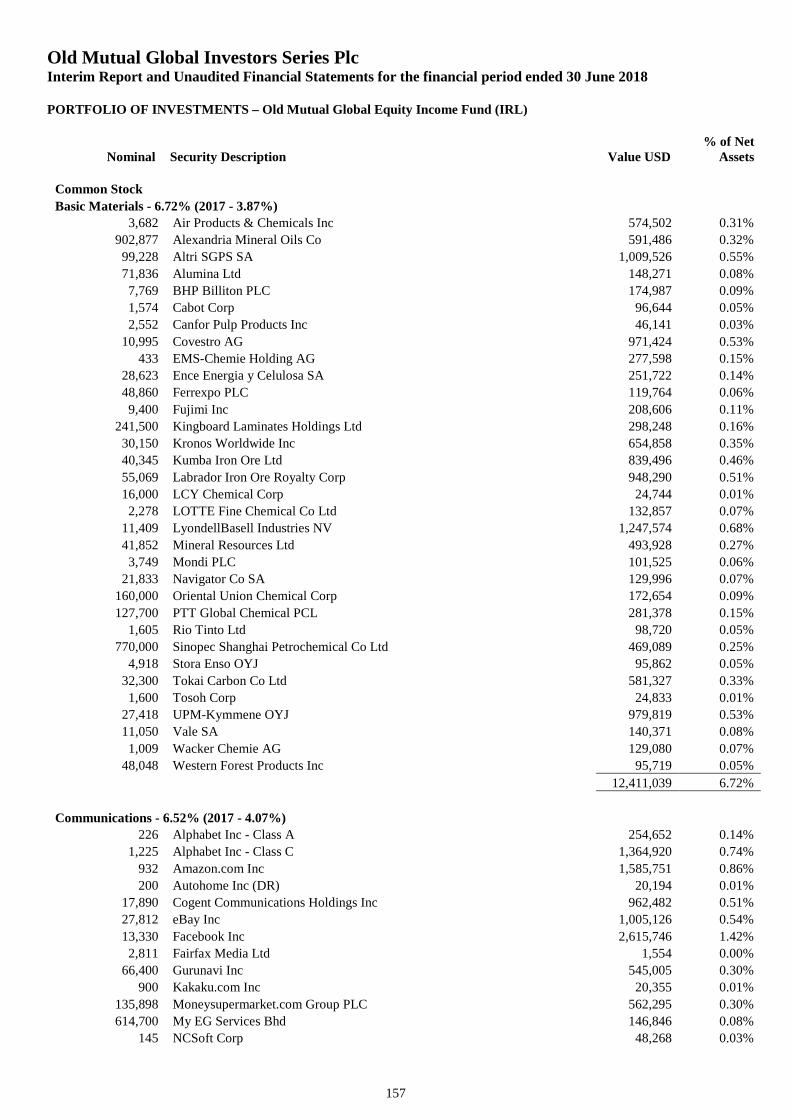
Old Mutual Global Investors Series PlcInterim Report and Unaudited Financial Statements for the financial period ended 30 June 2018
PORTFOLIO OF INVESTMENTS – Old Mutual Global Equity Income Fund (IRL)
Nominal Security Description Value USD% of Net
Assets
157
Common Stock
Basic Materials - 6.72% (2017 - 3.87%)
3,682 Air Products & Chemicals Inc 574,502 0.31%
902,877 Alexandria Mineral Oils Co 591,486 0.32%
99,228 Altri SGPS SA 1,009,526 0.55%
71,836 Alumina Ltd 148,271 0.08%
7,769 BHP Billiton PLC 174,987 0.09%
1,574 Cabot Corp 96,644 0.05%
2,552 Canfor Pulp Products Inc 46,141 0.03%
10,995 Covestro AG 971,424 0.53%
433 EMS-Chemie Holding AG 277,598 0.15%
28,623 Ence Energia y Celulosa SA 251,722 0.14%
48,860 Ferrexpo PLC 119,764 0.06%
9,400 Fujimi Inc 208,606 0.11%
241,500 Kingboard Laminates Holdings Ltd 298,248 0.16%
30,150 Kronos Worldwide Inc 654,858 0.35%
40,345 Kumba Iron Ore Ltd 839,496 0.46%
55,069 Labrador Iron Ore Royalty Corp 948,290 0.51%
16,000 LCY Chemical Corp 24,744 0.01%
2,278 LOTTE Fine Chemical Co Ltd 132,857 0.07%
11,409 LyondellBasell Industries NV 1,247,574 0.68%
41,852 Mineral Resources Ltd 493,928 0.27%
3,749 Mondi PLC 101,525 0.06%
21,833 Navigator Co SA 129,996 0.07%
160,000 Oriental Union Chemical Corp 172,654 0.09%
127,700 PTT Global Chemical PCL 281,378 0.15%
1,605 Rio Tinto Ltd 98,720 0.05%
770,000 Sinopec Shanghai Petrochemical Co Ltd 469,089 0.25%
4,918 Stora Enso OYJ 95,862 0.05%
32,300 Tokai Carbon Co Ltd 581,327 0.33%
1,600 Tosoh Corp 24,833 0.01%
27,418 UPM-Kymmene OYJ 979,819 0.53%
11,050 Vale SA 140,371 0.08%
1,009 Wacker Chemie AG 129,080 0.07%
48,048 Western Forest Products Inc 95,719 0.05%
12,411,039 6.72%
Communications - 6.52% (2017 - 4.07%)
226 Alphabet Inc - Class A 254,652 0.14%
1,225 Alphabet Inc - Class C 1,364,920 0.74%
932 Amazon.com Inc 1,585,751 0.86%
200 Autohome Inc (DR) 20,194 0.01%
17,890 Cogent Communications Holdings Inc 962,482 0.51%
27,812 eBay Inc 1,005,126 0.54%
13,330 Facebook Inc 2,615,746 1.42%
2,811 Fairfax Media Ltd 1,554 0.00%
66,400 Gurunavi Inc 545,005 0.30%
900 Kakaku.com Inc 20,355 0.01%
135,898 Moneysupermarket.com Group PLC 562,295 0.30%
614,700 My EG Services Bhd 146,846 0.08%
145 NCSoft Corp 48,268 0.03%
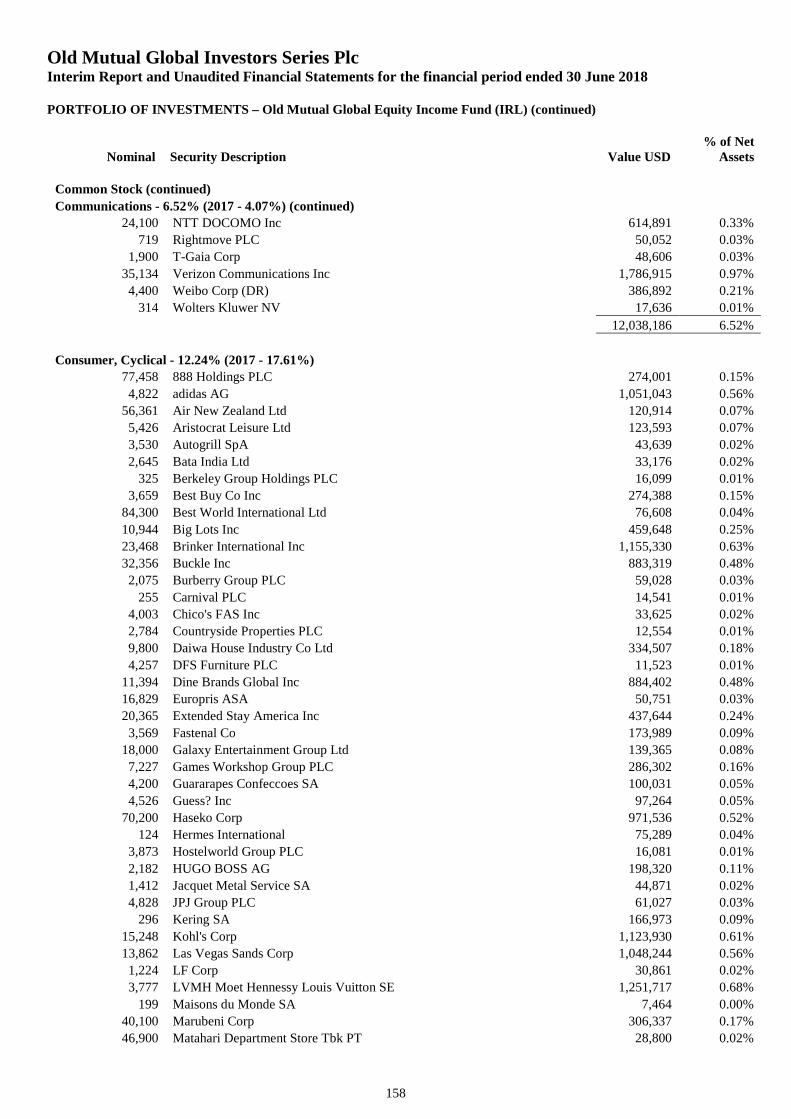
Old Mutual Global Investors Series PlcInterim Report and Unaudited Financial Statements for the financial period ended 30 June 2018
PORTFOLIO OF INVESTMENTS – Old Mutual Global Equity Income Fund (IRL) (continued)
Nominal Security Description Value USD% of Net
Assets
158
Common Stock (continued)
Communications - 6.52% (2017 - 4.07%) (continued)
24,100 NTT DOCOMO Inc 614,891 0.33%
719 Rightmove PLC 50,052 0.03%
1,900 T-Gaia Corp 48,606 0.03%
35,134 Verizon Communications Inc 1,786,915 0.97%
4,400 Weibo Corp (DR) 386,892 0.21%
314 Wolters Kluwer NV 17,636 0.01%
12,038,186 6.52%
Consumer, Cyclical - 12.24% (2017 - 17.61%)
77,458 888 Holdings PLC 274,001 0.15%
4,822 adidas AG 1,051,043 0.56%
56,361 Air New Zealand Ltd 120,914 0.07%
5,426 Aristocrat Leisure Ltd 123,593 0.07%
3,530 Autogrill SpA 43,639 0.02%
2,645 Bata India Ltd 33,176 0.02%
325 Berkeley Group Holdings PLC 16,099 0.01%
3,659 Best Buy Co Inc 274,388 0.15%
84,300 Best World International Ltd 76,608 0.04%
10,944 Big Lots Inc 459,648 0.25%
23,468 Brinker International Inc 1,155,330 0.63%
32,356 Buckle Inc 883,319 0.48%
2,075 Burberry Group PLC 59,028 0.03%
255 Carnival PLC 14,541 0.01%
4,003 Chico's FAS Inc 33,625 0.02%
2,784 Countryside Properties PLC 12,554 0.01%
9,800 Daiwa House Industry Co Ltd 334,507 0.18%
4,257 DFS Furniture PLC 11,523 0.01%
11,394 Dine Brands Global Inc 884,402 0.48%
16,829 Europris ASA 50,751 0.03%
20,365 Extended Stay America Inc 437,644 0.24%
3,569 Fastenal Co 173,989 0.09%
18,000 Galaxy Entertainment Group Ltd 139,365 0.08%
7,227 Games Workshop Group PLC 286,302 0.16%
4,200 Guararapes Confeccoes SA 100,031 0.05%
4,526 Guess? Inc 97,264 0.05%
70,200 Haseko Corp 971,536 0.52%
124 Hermes International 75,289 0.04%
3,873 Hostelworld Group PLC 16,081 0.01%
2,182 HUGO BOSS AG 198,320 0.11%
1,412 Jacquet Metal Service SA 44,871 0.02%
4,828 JPJ Group PLC 61,027 0.03%
296 Kering SA 166,973 0.09%
15,248 Kohl's Corp 1,123,930 0.61%
13,862 Las Vegas Sands Corp 1,048,244 0.56%
1,224 LF Corp 30,861 0.02%
3,777 LVMH Moet Hennessy Louis Vuitton SE 1,251,717 0.68%
199 Maisons du Monde SA 7,464 0.00%
40,100 Marubeni Corp 306,337 0.17%
46,900 Matahari Department Store Tbk PT 28,800 0.02%
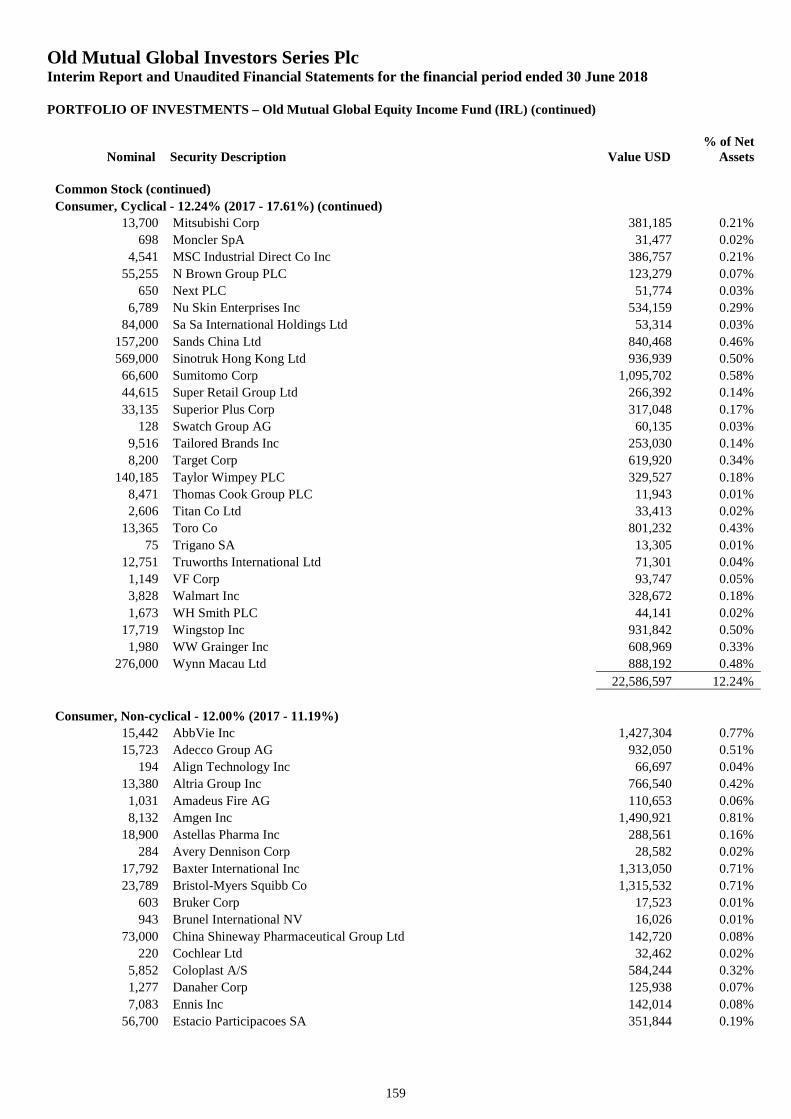
Old Mutual Global Investors Series PlcInterim Report and Unaudited Financial Statements for the financial period ended 30 June 2018
PORTFOLIO OF INVESTMENTS – Old Mutual Global Equity Income Fund (IRL) (continued)
Nominal Security Description Value USD% of Net
Assets
159
Common Stock (continued)
Consumer, Cyclical - 12.24% (2017 - 17.61%) (continued)
13,700 Mitsubishi Corp 381,185 0.21%
698 Moncler SpA 31,477 0.02%
4,541 MSC Industrial Direct Co Inc 386,757 0.21%
55,255 N Brown Group PLC 123,279 0.07%
650 Next PLC 51,774 0.03%
6,789 Nu Skin Enterprises Inc 534,159 0.29%
84,000 Sa Sa International Holdings Ltd 53,314 0.03%
157,200 Sands China Ltd 840,468 0.46%
569,000 Sinotruk Hong Kong Ltd 936,939 0.50%
66,600 Sumitomo Corp 1,095,702 0.58%
44,615 Super Retail Group Ltd 266,392 0.14%
33,135 Superior Plus Corp 317,048 0.17%
128 Swatch Group AG 60,135 0.03%
9,516 Tailored Brands Inc 253,030 0.14%
8,200 Target Corp 619,920 0.34%
140,185 Taylor Wimpey PLC 329,527 0.18%
8,471 Thomas Cook Group PLC 11,943 0.01%
2,606 Titan Co Ltd 33,413 0.02%
13,365 Toro Co 801,232 0.43%
75 Trigano SA 13,305 0.01%
12,751 Truworths International Ltd 71,301 0.04%
1,149 VF Corp 93,747 0.05%
3,828 Walmart Inc 328,672 0.18%
1,673 WH Smith PLC 44,141 0.02%
17,719 Wingstop Inc 931,842 0.50%
1,980 WW Grainger Inc 608,969 0.33%
276,000 Wynn Macau Ltd 888,192 0.48%
22,586,597 12.24%
Consumer, Non-cyclical - 12.00% (2017 - 11.19%)
15,442 AbbVie Inc 1,427,304 0.77%
15,723 Adecco Group AG 932,050 0.51%
194 Align Technology Inc 66,697 0.04%
13,380 Altria Group Inc 766,540 0.42%
1,031 Amadeus Fire AG 110,653 0.06%
8,132 Amgen Inc 1,490,921 0.81%
18,900 Astellas Pharma Inc 288,561 0.16%
284 Avery Dennison Corp 28,582 0.02%
17,792 Baxter International Inc 1,313,050 0.71%
23,789 Bristol-Myers Squibb Co 1,315,532 0.71%
603 Bruker Corp 17,523 0.01%
943 Brunel International NV 16,026 0.01%
73,000 China Shineway Pharmaceutical Group Ltd 142,720 0.08%
220 Cochlear Ltd 32,462 0.02%
5,852 Coloplast A/S 584,244 0.32%
1,277 Danaher Corp 125,938 0.07%
7,083 Ennis Inc 142,014 0.08%
56,700 Estacio Participacoes SA 351,844 0.19%
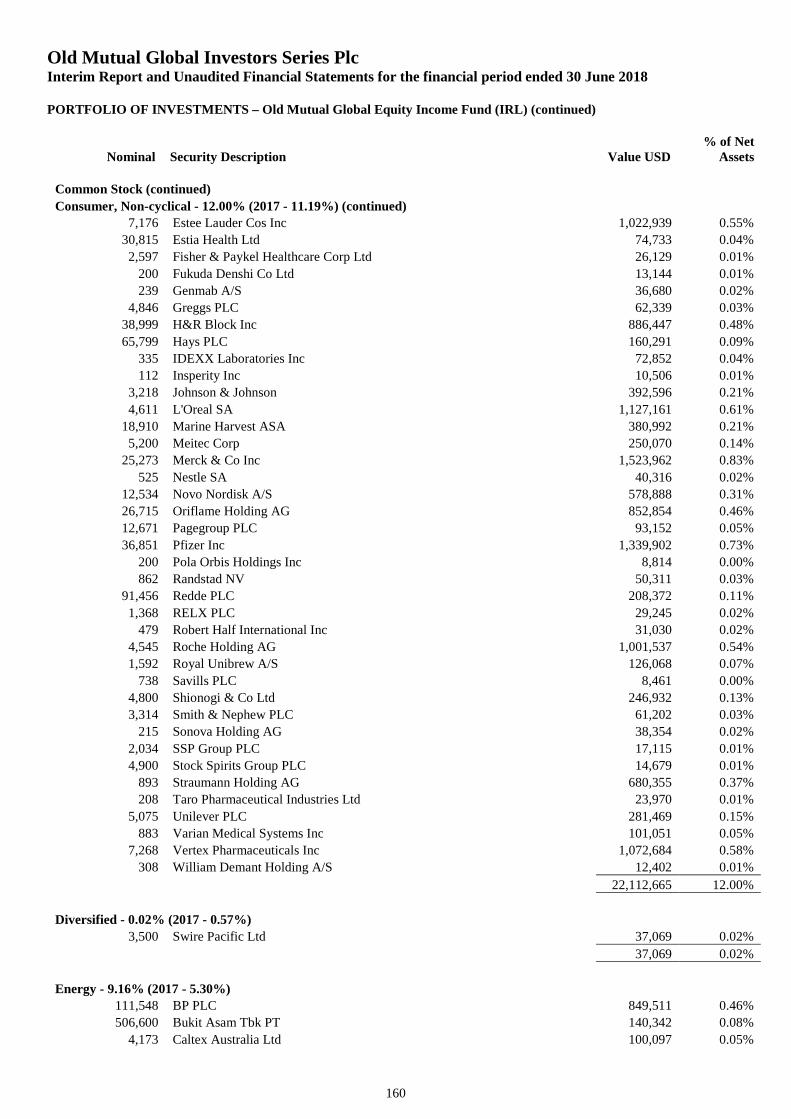
Old Mutual Global Investors Series PlcInterim Report and Unaudited Financial Statements for the financial period ended 30 June 2018
PORTFOLIO OF INVESTMENTS – Old Mutual Global Equity Income Fund (IRL) (continued)
Nominal Security Description Value USD% of Net
Assets
160
Common Stock (continued)
Consumer, Non-cyclical - 12.00% (2017 - 11.19%) (continued)
7,176 Estee Lauder Cos Inc 1,022,939 0.55%
30,815 Estia Health Ltd 74,733 0.04%
2,597 Fisher & Paykel Healthcare Corp Ltd 26,129 0.01%
200 Fukuda Denshi Co Ltd 13,144 0.01%
239 Genmab A/S 36,680 0.02%
4,846 Greggs PLC 62,339 0.03%
38,999 H&R Block Inc 886,447 0.48%
65,799 Hays PLC 160,291 0.09%
335 IDEXX Laboratories Inc 72,852 0.04%
112 Insperity Inc 10,506 0.01%
3,218 Johnson & Johnson 392,596 0.21%
4,611 L'Oreal SA 1,127,161 0.61%
18,910 Marine Harvest ASA 380,992 0.21%
5,200 Meitec Corp 250,070 0.14%
25,273 Merck & Co Inc 1,523,962 0.83%
525 Nestle SA 40,316 0.02%
12,534 Novo Nordisk A/S 578,888 0.31%
26,715 Oriflame Holding AG 852,854 0.46%
12,671 Pagegroup PLC 93,152 0.05%
36,851 Pfizer Inc 1,339,902 0.73%
200 Pola Orbis Holdings Inc 8,814 0.00%
862 Randstad NV 50,311 0.03%
91,456 Redde PLC 208,372 0.11%
1,368 RELX PLC 29,245 0.02%
479 Robert Half International Inc 31,030 0.02%
4,545 Roche Holding AG 1,001,537 0.54%
1,592 Royal Unibrew A/S 126,068 0.07%
738 Savills PLC 8,461 0.00%
4,800 Shionogi & Co Ltd 246,932 0.13%
3,314 Smith & Nephew PLC 61,202 0.03%
215 Sonova Holding AG 38,354 0.02%
2,034 SSP Group PLC 17,115 0.01%
4,900 Stock Spirits Group PLC 14,679 0.01%
893 Straumann Holding AG 680,355 0.37%
208 Taro Pharmaceutical Industries Ltd 23,970 0.01%
5,075 Unilever PLC 281,469 0.15%
883 Varian Medical Systems Inc 101,051 0.05%
7,268 Vertex Pharmaceuticals Inc 1,072,684 0.58%
308 William Demant Holding A/S 12,402 0.01%
22,112,665 12.00%
Diversified - 0.02% (2017 - 0.57%)
3,500 Swire Pacific Ltd 37,069 0.02%
37,069 0.02%
Energy - 9.16% (2017 - 5.30%)
111,548 BP PLC 849,511 0.46%
506,600 Bukit Asam Tbk PT 140,342 0.08%
4,173 Caltex Australia Ltd 100,097 0.05%
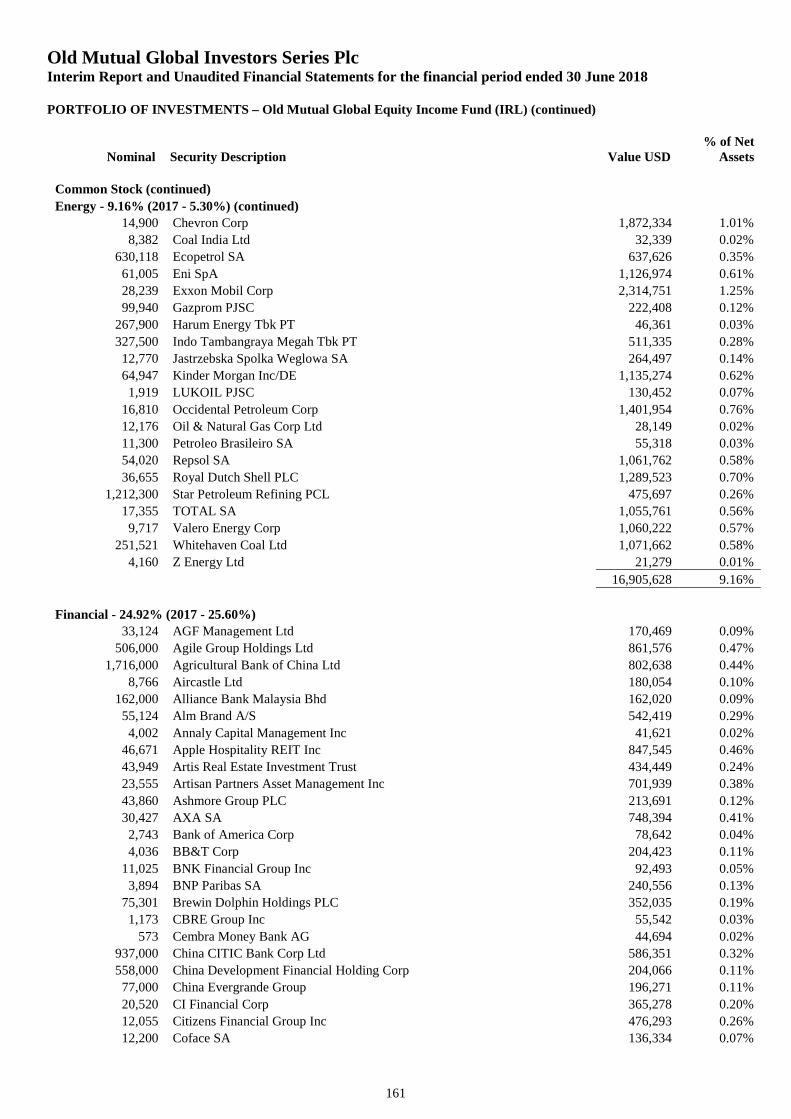
Old Mutual Global Investors Series PlcInterim Report and Unaudited Financial Statements for the financial period ended 30 June 2018
PORTFOLIO OF INVESTMENTS – Old Mutual Global Equity Income Fund (IRL) (continued)
Nominal Security Description Value USD% of Net
Assets
161
Common Stock (continued)
Energy - 9.16% (2017 - 5.30%) (continued)
14,900 Chevron Corp 1,872,334 1.01%
8,382 Coal India Ltd 32,339 0.02%
630,118 Ecopetrol SA 637,626 0.35%
61,005 Eni SpA 1,126,974 0.61%
28,239 Exxon Mobil Corp 2,314,751 1.25%
99,940 Gazprom PJSC 222,408 0.12%
267,900 Harum Energy Tbk PT 46,361 0.03%
327,500 Indo Tambangraya Megah Tbk PT 511,335 0.28%
12,770 Jastrzebska Spolka Weglowa SA 264,497 0.14%
64,947 Kinder Morgan Inc/DE 1,135,274 0.62%
1,919 LUKOIL PJSC 130,452 0.07%
16,810 Occidental Petroleum Corp 1,401,954 0.76%
12,176 Oil & Natural Gas Corp Ltd 28,149 0.02%
11,300 Petroleo Brasileiro SA 55,318 0.03%
54,020 Repsol SA 1,061,762 0.58%
36,655 Royal Dutch Shell PLC 1,289,523 0.70%
1,212,300 Star Petroleum Refining PCL 475,697 0.26%
17,355 TOTAL SA 1,055,761 0.56%
9,717 Valero Energy Corp 1,060,222 0.57%
251,521 Whitehaven Coal Ltd 1,071,662 0.58%
4,160 Z Energy Ltd 21,279 0.01%
16,905,628 9.16%
Financial - 24.92% (2017 - 25.60%)
33,124 AGF Management Ltd 170,469 0.09%
506,000 Agile Group Holdings Ltd 861,576 0.47%
1,716,000 Agricultural Bank of China Ltd 802,638 0.44%
8,766 Aircastle Ltd 180,054 0.10%
162,000 Alliance Bank Malaysia Bhd 162,020 0.09%
55,124 Alm Brand A/S 542,419 0.29%
4,002 Annaly Capital Management Inc 41,621 0.02%
46,671 Apple Hospitality REIT Inc 847,545 0.46%
43,949 Artis Real Estate Investment Trust 434,449 0.24%
23,555 Artisan Partners Asset Management Inc 701,939 0.38%
43,860 Ashmore Group PLC 213,691 0.12%
30,427 AXA SA 748,394 0.41%
2,743 Bank of America Corp 78,642 0.04%
4,036 BB&T Corp 204,423 0.11%
11,025 BNK Financial Group Inc 92,493 0.05%
3,894 BNP Paribas SA 240,556 0.13%
75,301 Brewin Dolphin Holdings PLC 352,035 0.19%
1,173 CBRE Group Inc 55,542 0.03%
573 Cembra Money Bank AG 44,694 0.02%
937,000 China CITIC Bank Corp Ltd 586,351 0.32%
558,000 China Development Financial Holding Corp 204,066 0.11%
77,000 China Evergrande Group 196,271 0.11%
20,520 CI Financial Corp 365,278 0.20%
12,055 Citizens Financial Group Inc 476,293 0.26%
12,200 Coface SA 136,334 0.07%
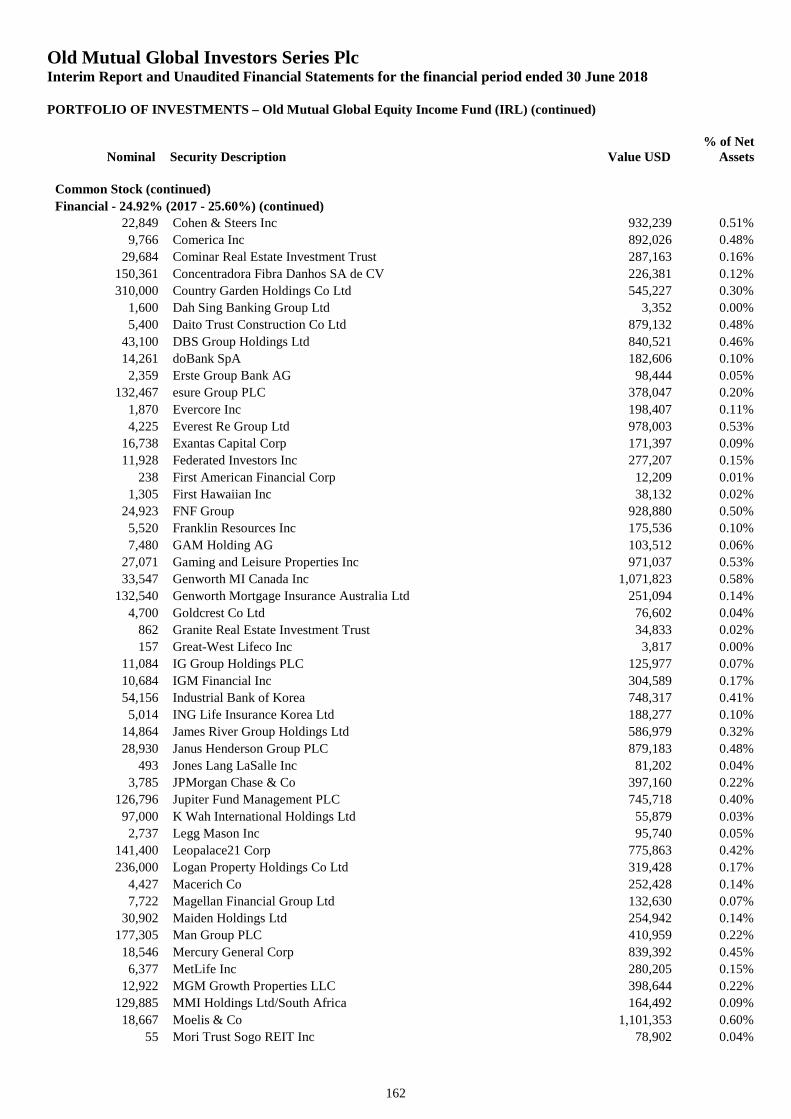
Old Mutual Global Investors Series PlcInterim Report and Unaudited Financial Statements for the financial period ended 30 June 2018
PORTFOLIO OF INVESTMENTS – Old Mutual Global Equity Income Fund (IRL) (continued)
Nominal Security Description Value USD% of Net
Assets
162
Common Stock (continued)
Financial - 24.92% (2017 - 25.60%) (continued)
22,849 Cohen & Steers Inc 932,239 0.51%
9,766 Comerica Inc 892,026 0.48%
29,684 Cominar Real Estate Investment Trust 287,163 0.16%
150,361 Concentradora Fibra Danhos SA de CV 226,381 0.12%
310,000 Country Garden Holdings Co Ltd 545,227 0.30%
1,600 Dah Sing Banking Group Ltd 3,352 0.00%
5,400 Daito Trust Construction Co Ltd 879,132 0.48%
43,100 DBS Group Holdings Ltd 840,521 0.46%
14,261 doBank SpA 182,606 0.10%
2,359 Erste Group Bank AG 98,444 0.05%
132,467 esure Group PLC 378,047 0.20%
1,870 Evercore Inc 198,407 0.11%
4,225 Everest Re Group Ltd 978,003 0.53%
16,738 Exantas Capital Corp 171,397 0.09%
11,928 Federated Investors Inc 277,207 0.15%
238 First American Financial Corp 12,209 0.01%
1,305 First Hawaiian Inc 38,132 0.02%
24,923 FNF Group 928,880 0.50%
5,520 Franklin Resources Inc 175,536 0.10%
7,480 GAM Holding AG 103,512 0.06%
27,071 Gaming and Leisure Properties Inc 971,037 0.53%
33,547 Genworth MI Canada Inc 1,071,823 0.58%
132,540 Genworth Mortgage Insurance Australia Ltd 251,094 0.14%
4,700 Goldcrest Co Ltd 76,602 0.04%
862 Granite Real Estate Investment Trust 34,833 0.02%
157 Great-West Lifeco Inc 3,817 0.00%
11,084 IG Group Holdings PLC 125,977 0.07%
10,684 IGM Financial Inc 304,589 0.17%
54,156 Industrial Bank of Korea 748,317 0.41%
5,014 ING Life Insurance Korea Ltd 188,277 0.10%
14,864 James River Group Holdings Ltd 586,979 0.32%
28,930 Janus Henderson Group PLC 879,183 0.48%
493 Jones Lang LaSalle Inc 81,202 0.04%
3,785 JPMorgan Chase & Co 397,160 0.22%
126,796 Jupiter Fund Management PLC 745,718 0.40%
97,000 K Wah International Holdings Ltd 55,879 0.03%
2,737 Legg Mason Inc 95,740 0.05%
141,400 Leopalace21 Corp 775,863 0.42%
236,000 Logan Property Holdings Co Ltd 319,428 0.17%
4,427 Macerich Co 252,428 0.14%
7,722 Magellan Financial Group Ltd 132,630 0.07%
30,902 Maiden Holdings Ltd 254,942 0.14%
177,305 Man Group PLC 410,959 0.22%
18,546 Mercury General Corp 839,392 0.45%
6,377 MetLife Inc 280,205 0.15%
12,922 MGM Growth Properties LLC 398,644 0.22%
129,885 MMI Holdings Ltd/South Africa 164,492 0.09%
18,667 Moelis & Co 1,101,353 0.60%
55 Mori Trust Sogo REIT Inc 78,902 0.04%
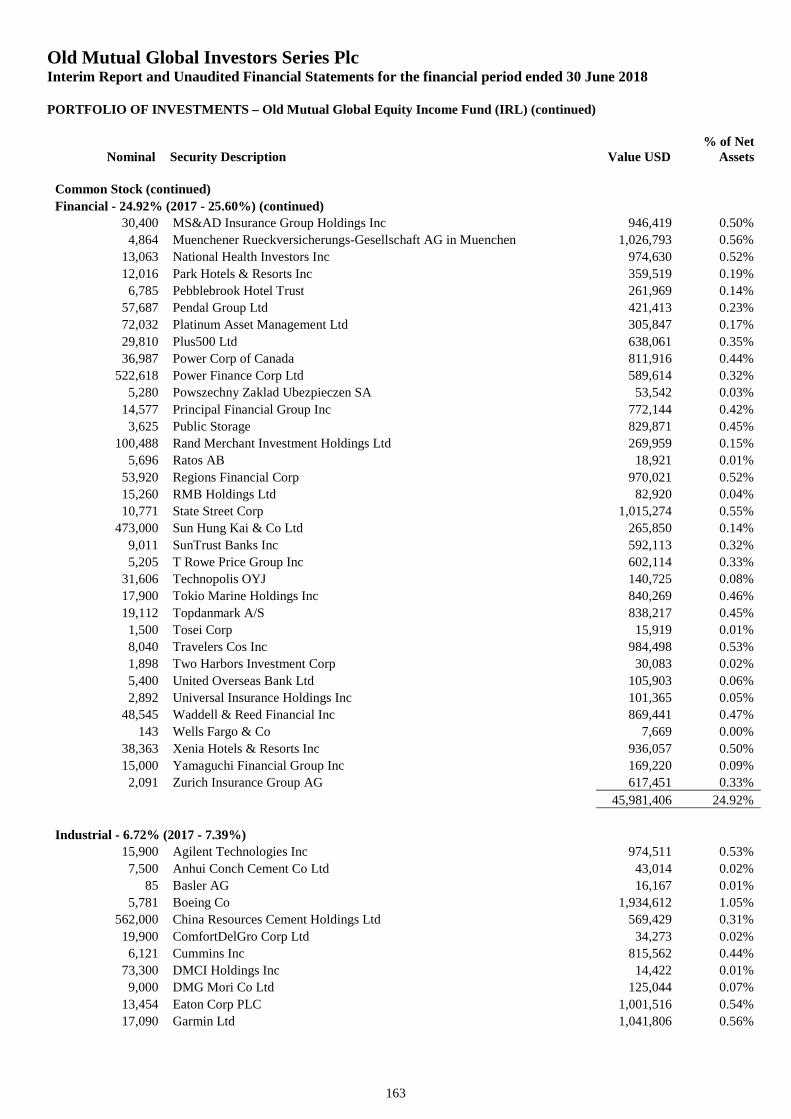
Old Mutual Global Investors Series PlcInterim Report and Unaudited Financial Statements for the financial period ended 30 June 2018
PORTFOLIO OF INVESTMENTS – Old Mutual Global Equity Income Fund (IRL) (continued)
Nominal Security Description Value USD% of Net
Assets
163
Common Stock (continued)
Financial - 24.92% (2017 - 25.60%) (continued)
30,400 MS&AD Insurance Group Holdings Inc 946,419 0.50%
4,864 Muenchener Rueckversicherungs-Gesellschaft AG in Muenchen 1,026,793 0.56%
13,063 National Health Investors Inc 974,630 0.52%
12,016 Park Hotels & Resorts Inc 359,519 0.19%
6,785 Pebblebrook Hotel Trust 261,969 0.14%
57,687 Pendal Group Ltd 421,413 0.23%
72,032 Platinum Asset Management Ltd 305,847 0.17%
29,810 Plus500 Ltd 638,061 0.35%
36,987 Power Corp of Canada 811,916 0.44%
522,618 Power Finance Corp Ltd 589,614 0.32%
5,280 Powszechny Zaklad Ubezpieczen SA 53,542 0.03%
14,577 Principal Financial Group Inc 772,144 0.42%
3,625 Public Storage 829,871 0.45%
100,488 Rand Merchant Investment Holdings Ltd 269,959 0.15%
5,696 Ratos AB 18,921 0.01%
53,920 Regions Financial Corp 970,021 0.52%
15,260 RMB Holdings Ltd 82,920 0.04%
10,771 State Street Corp 1,015,274 0.55%
473,000 Sun Hung Kai & Co Ltd 265,850 0.14%
9,011 SunTrust Banks Inc 592,113 0.32%
5,205 T Rowe Price Group Inc 602,114 0.33%
31,606 Technopolis OYJ 140,725 0.08%
17,900 Tokio Marine Holdings Inc 840,269 0.46%
19,112 Topdanmark A/S 838,217 0.45%
1,500 Tosei Corp 15,919 0.01%
8,040 Travelers Cos Inc 984,498 0.53%
1,898 Two Harbors Investment Corp 30,083 0.02%
5,400 United Overseas Bank Ltd 105,903 0.06%
2,892 Universal Insurance Holdings Inc 101,365 0.05%
48,545 Waddell & Reed Financial Inc 869,441 0.47%
143 Wells Fargo & Co 7,669 0.00%
38,363 Xenia Hotels & Resorts Inc 936,057 0.50%
15,000 Yamaguchi Financial Group Inc 169,220 0.09%
2,091 Zurich Insurance Group AG 617,451 0.33%
45,981,406 24.92%
Industrial - 6.72% (2017 - 7.39%)
15,900 Agilent Technologies Inc 974,511 0.53%
7,500 Anhui Conch Cement Co Ltd 43,014 0.02%
85 Basler AG 16,167 0.01%
5,781 Boeing Co 1,934,612 1.05%
562,000 China Resources Cement Holdings Ltd 569,429 0.31%
19,900 ComfortDelGro Corp Ltd 34,273 0.02%
6,121 Cummins Inc 815,562 0.44%
73,300 DMCI Holdings Inc 14,422 0.01%
9,000 DMG Mori Co Ltd 125,044 0.07%
13,454 Eaton Corp PLC 1,001,516 0.54%
17,090 Garmin Ltd 1,041,806 0.56%
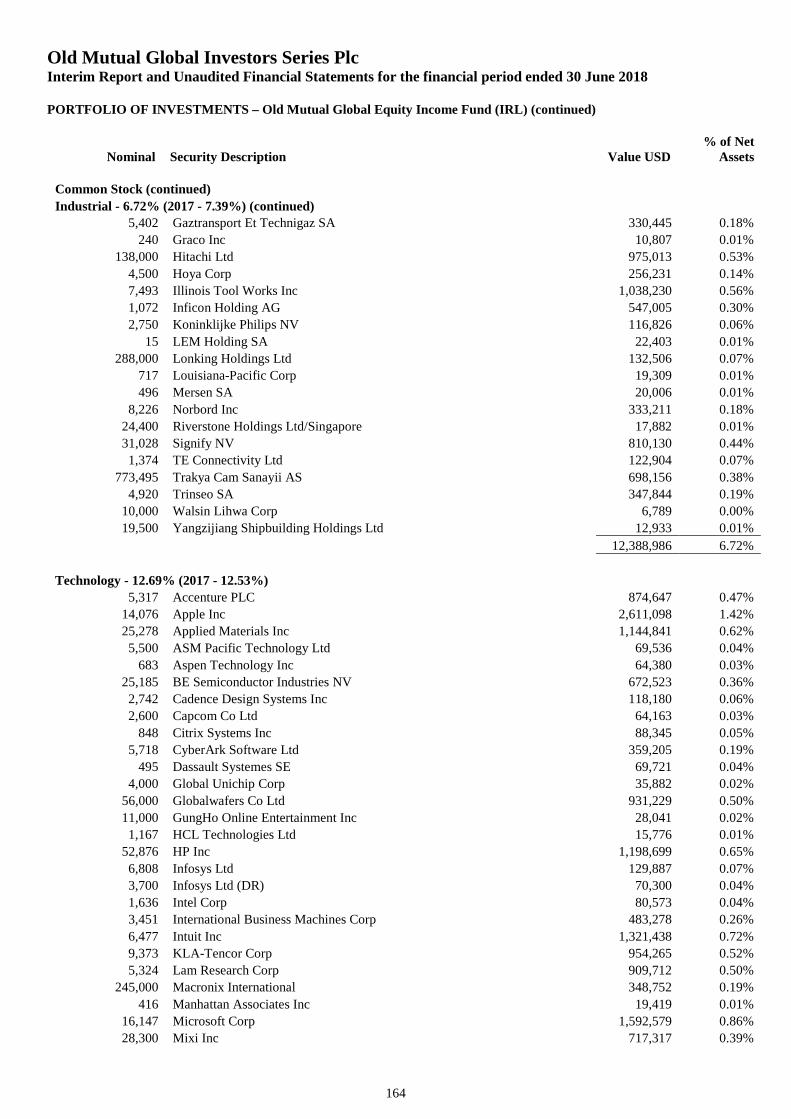
Old Mutual Global Investors Series PlcInterim Report and Unaudited Financial Statements for the financial period ended 30 June 2018
PORTFOLIO OF INVESTMENTS – Old Mutual Global Equity Income Fund (IRL) (continued)
Nominal Security Description Value USD% of Net
Assets
164
Common Stock (continued)
Industrial - 6.72% (2017 - 7.39%) (continued)
5,402 Gaztransport Et Technigaz SA 330,445 0.18%
240 Graco Inc 10,807 0.01%
138,000 Hitachi Ltd 975,013 0.53%
4,500 Hoya Corp 256,231 0.14%
7,493 Illinois Tool Works Inc 1,038,230 0.56%
1,072 Inficon Holding AG 547,005 0.30%
2,750 Koninklijke Philips NV 116,826 0.06%
15 LEM Holding SA 22,403 0.01%
288,000 Lonking Holdings Ltd 132,506 0.07%
717 Louisiana-Pacific Corp 19,309 0.01%
496 Mersen SA 20,006 0.01%
8,226 Norbord Inc 333,211 0.18%
24,400 Riverstone Holdings Ltd/Singapore 17,882 0.01%
31,028 Signify NV 810,130 0.44%
1,374 TE Connectivity Ltd 122,904 0.07%
773,495 Trakya Cam Sanayii AS 698,156 0.38%
4,920 Trinseo SA 347,844 0.19%
10,000 Walsin Lihwa Corp 6,789 0.00%
19,500 Yangzijiang Shipbuilding Holdings Ltd 12,933 0.01%
12,388,986 6.72%
Technology - 12.69% (2017 - 12.53%)
5,317 Accenture PLC 874,647 0.47%
14,076 Apple Inc 2,611,098 1.42%
25,278 Applied Materials Inc 1,144,841 0.62%
5,500 ASM Pacific Technology Ltd 69,536 0.04%
683 Aspen Technology Inc 64,380 0.03%
25,185 BE Semiconductor Industries NV 672,523 0.36%
2,742 Cadence Design Systems Inc 118,180 0.06%
2,600 Capcom Co Ltd 64,163 0.03%
848 Citrix Systems Inc 88,345 0.05%
5,718 CyberArk Software Ltd 359,205 0.19%
495 Dassault Systemes SE 69,721 0.04%
4,000 Global Unichip Corp 35,882 0.02%
56,000 Globalwafers Co Ltd 931,229 0.50%
11,000 GungHo Online Entertainment Inc 28,041 0.02%
1,167 HCL Technologies Ltd 15,776 0.01%
52,876 HP Inc 1,198,699 0.65%
6,808 Infosys Ltd 129,887 0.07%
3,700 Infosys Ltd (DR) 70,300 0.04%
1,636 Intel Corp 80,573 0.04%
3,451 International Business Machines Corp 483,278 0.26%
6,477 Intuit Inc 1,321,438 0.72%
9,373 KLA-Tencor Corp 954,265 0.52%
5,324 Lam Research Corp 909,712 0.50%
245,000 Macronix International 348,752 0.19%
416 Manhattan Associates Inc 19,419 0.01%
16,147 Microsoft Corp 1,592,579 0.86%
28,300 Mixi Inc 717,317 0.39%
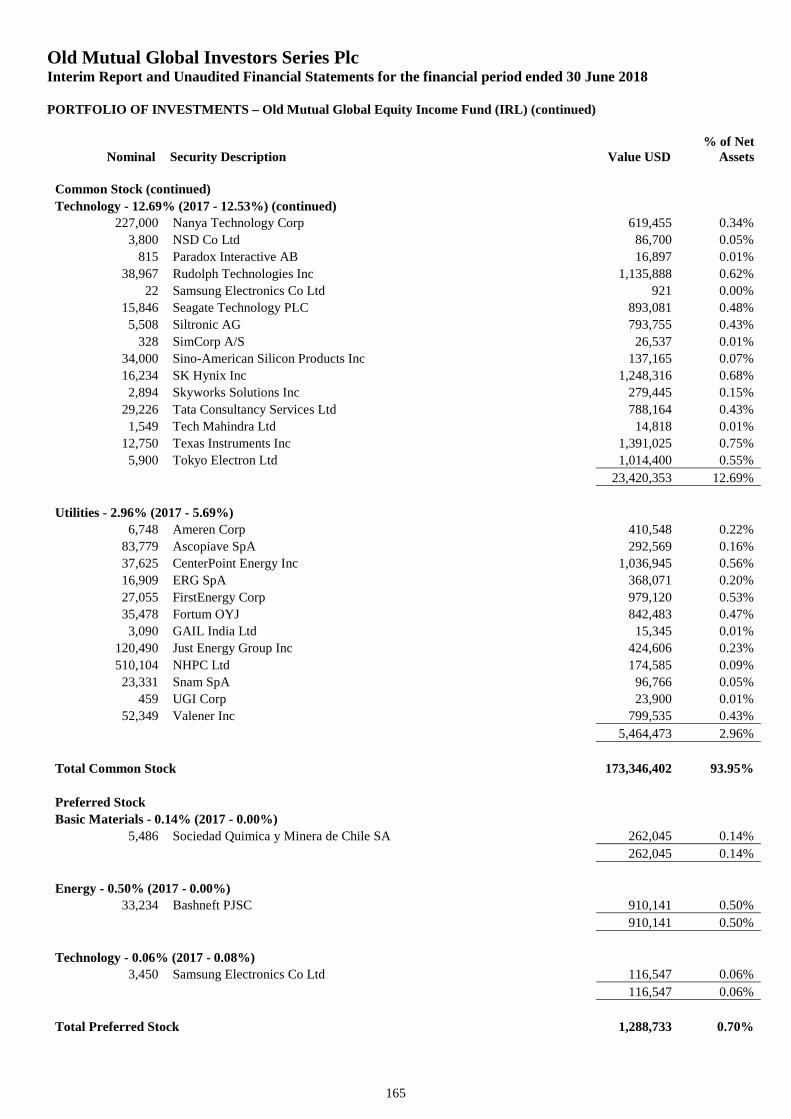
Old Mutual Global Investors Series PlcInterim Report and Unaudited Financial Statements for the financial period ended 30 June 2018
PORTFOLIO OF INVESTMENTS – Old Mutual Global Equity Income Fund (IRL) (continued)
Nominal Security Description Value USD% of Net
Assets
165
Common Stock (continued)
Technology - 12.69% (2017 - 12.53%) (continued)
227,000 Nanya Technology Corp 619,455 0.34%
3,800 NSD Co Ltd 86,700 0.05%
815 Paradox Interactive AB 16,897 0.01%
38,967 Rudolph Technologies Inc 1,135,888 0.62%
22 Samsung Electronics Co Ltd 921 0.00%
15,846 Seagate Technology PLC 893,081 0.48%
5,508 Siltronic AG 793,755 0.43%
328 SimCorp A/S 26,537 0.01%
34,000 Sino-American Silicon Products Inc 137,165 0.07%
16,234 SK Hynix Inc 1,248,316 0.68%
2,894 Skyworks Solutions Inc 279,445 0.15%
29,226 Tata Consultancy Services Ltd 788,164 0.43%
1,549 Tech Mahindra Ltd 14,818 0.01%
12,750 Texas Instruments Inc 1,391,025 0.75%
5,900 Tokyo Electron Ltd 1,014,400 0.55%
23,420,353 12.69%
Utilities - 2.96% (2017 - 5.69%)
6,748 Ameren Corp 410,548 0.22%
83,779 Ascopiave SpA 292,569 0.16%
37,625 CenterPoint Energy Inc 1,036,945 0.56%
16,909 ERG SpA 368,071 0.20%
27,055 FirstEnergy Corp 979,120 0.53%
35,478 Fortum OYJ 842,483 0.47%
3,090 GAIL India Ltd 15,345 0.01%
120,490 Just Energy Group Inc 424,606 0.23%
510,104 NHPC Ltd 174,585 0.09%
23,331 Snam SpA 96,766 0.05%
459 UGI Corp 23,900 0.01%
52,349 Valener Inc 799,535 0.43%
5,464,473 2.96%
Total Common Stock 173,346,402 93.95%
Preferred Stock
Basic Materials - 0.14% (2017 - 0.00%)
5,486 Sociedad Quimica y Minera de Chile SA 262,045 0.14%
262,045 0.14%
Energy - 0.50% (2017 - 0.00%)
33,234 Bashneft PJSC 910,141 0.50%
910,141 0.50%
Technology - 0.06% (2017 - 0.08%)
3,450 Samsung Electronics Co Ltd 116,547 0.06%
116,547 0.06%
Total Preferred Stock 1,288,733 0.70%
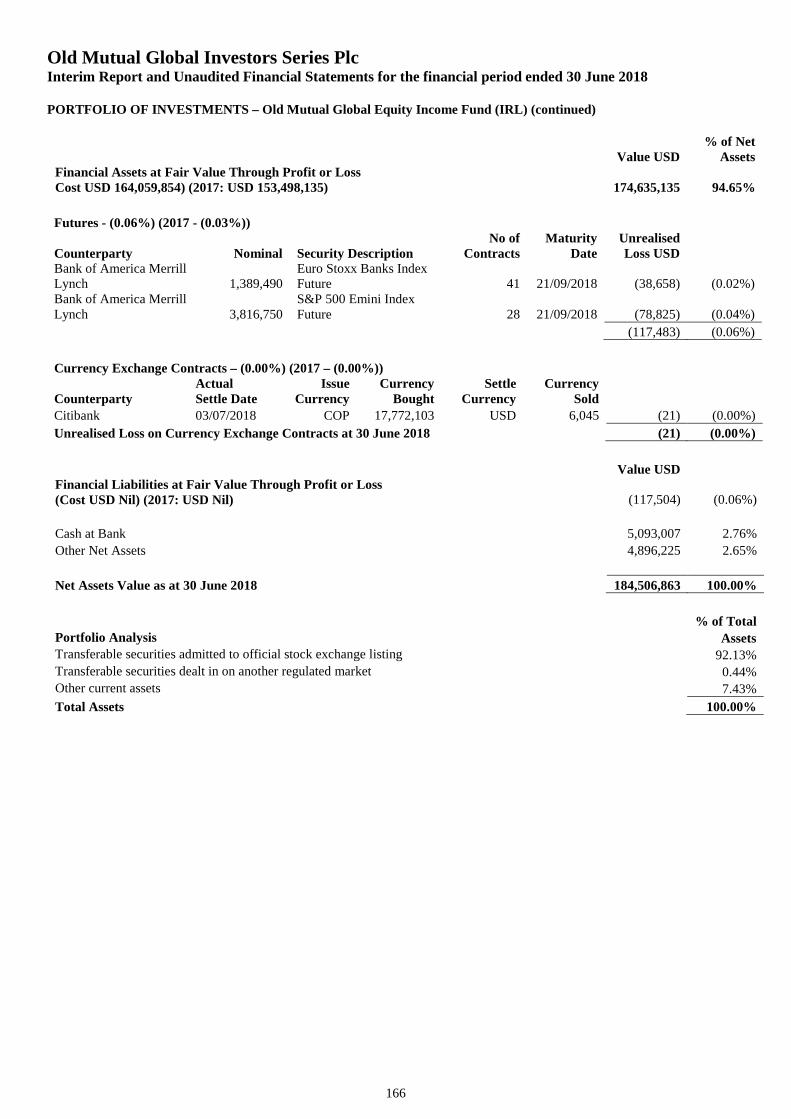
Old Mutual Global Investors Series PlcInterim Report and Unaudited Financial Statements for the financial period ended 30 June 2018
PORTFOLIO OF INVESTMENTS – Old Mutual Global Equity Income Fund (IRL) (continued)
166
Value USD% of Net
AssetsFinancial Assets at Fair Value Through Profit or LossCost USD 164,059,854) (2017: USD 153,498,135) 174,635,135 94.65%
Futures - (0.06%) (2017 - (0.03%))
Counterparty Nominal Security DescriptionNo of
ContractsMaturity
DateUnrealisedLoss USD
Bank of America MerrillLynch 1,389,490
Euro Stoxx Banks IndexFuture 41 21/09/2018 (38,658) (0.02%)
Bank of America MerrillLynch 3,816,750
S&P 500 Emini IndexFuture 28 21/09/2018 (78,825) (0.04%)
(117,483) (0.06%)
Currency Exchange Contracts – (0.00%) (2017 – (0.00%))
CounterpartyActualSettle Date
IssueCurrency
CurrencyBought
SettleCurrency
CurrencySold
Citibank 03/07/2018 COP 17,772,103 USD 6,045 (21) (0.00%)
Unrealised Loss on Currency Exchange Contracts at 30 June 2018 (21) (0.00%)
Value USDFinancial Liabilities at Fair Value Through Profit or Loss(Cost USD Nil) (2017: USD Nil) (117,504) (0.06%)
Cash at Bank 5,093,007 2.76%
Other Net Assets 4,896,225 2.65%
Net Assets Value as at 30 June 2018 184,506,863 100.00%
% of TotalPortfolio Analysis AssetsTransferable securities admitted to official stock exchange listing 92.13%Transferable securities dealt in on another regulated market 0.44%Other current assets 7.43%
Total Assets 100.00%
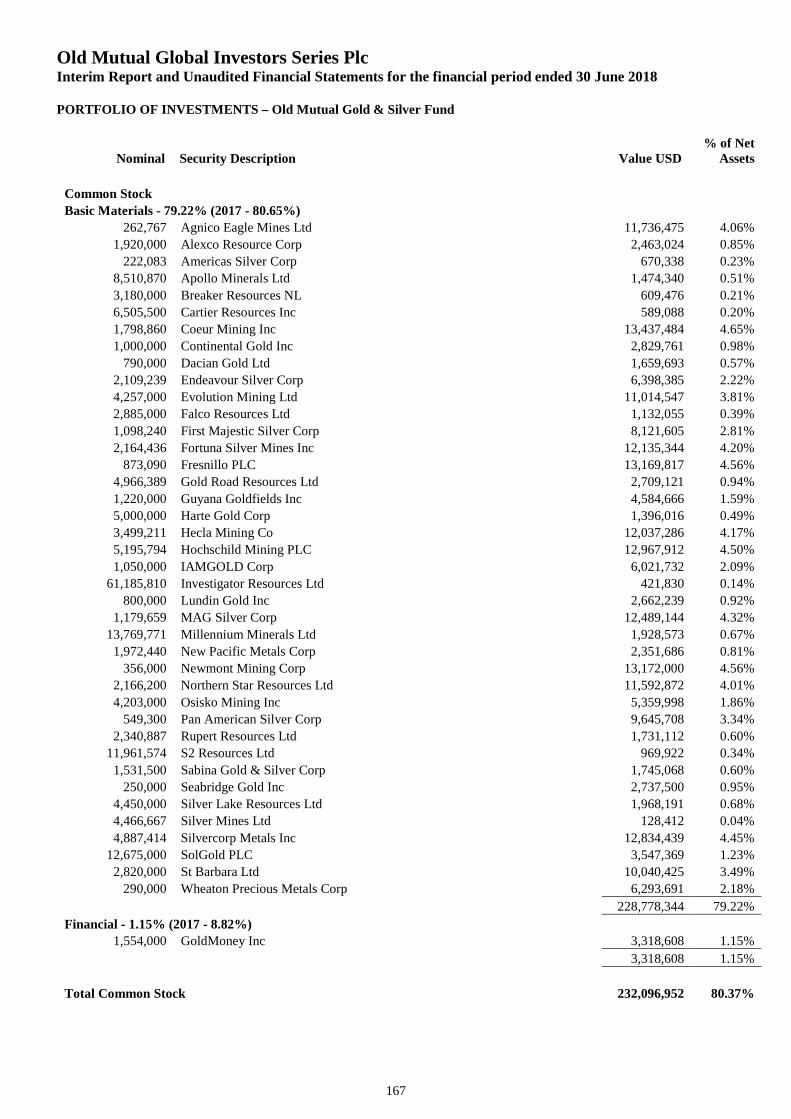
Old Mutual Global Investors Series PlcInterim Report and Unaudited Financial Statements for the financial period ended 30 June 2018
PORTFOLIO OF INVESTMENTS – Old Mutual Gold & Silver Fund
Nominal Security Description Value USD% of Net
Assets
167
Common Stock
Basic Materials - 79.22% (2017 - 80.65%)
262,767 Agnico Eagle Mines Ltd 11,736,475 4.06%
1,920,000 Alexco Resource Corp 2,463,024 0.85%
222,083 Americas Silver Corp 670,338 0.23%
8,510,870 Apollo Minerals Ltd 1,474,340 0.51%
3,180,000 Breaker Resources NL 609,476 0.21%
6,505,500 Cartier Resources Inc 589,088 0.20%
1,798,860 Coeur Mining Inc 13,437,484 4.65%
1,000,000 Continental Gold Inc 2,829,761 0.98%
790,000 Dacian Gold Ltd 1,659,693 0.57%
2,109,239 Endeavour Silver Corp 6,398,385 2.22%
4,257,000 Evolution Mining Ltd 11,014,547 3.81%
2,885,000 Falco Resources Ltd 1,132,055 0.39%
1,098,240 First Majestic Silver Corp 8,121,605 2.81%
2,164,436 Fortuna Silver Mines Inc 12,135,344 4.20%
873,090 Fresnillo PLC 13,169,817 4.56%
4,966,389 Gold Road Resources Ltd 2,709,121 0.94%
1,220,000 Guyana Goldfields Inc 4,584,666 1.59%
5,000,000 Harte Gold Corp 1,396,016 0.49%
3,499,211 Hecla Mining Co 12,037,286 4.17%
5,195,794 Hochschild Mining PLC 12,967,912 4.50%
1,050,000 IAMGOLD Corp 6,021,732 2.09%
61,185,810 Investigator Resources Ltd 421,830 0.14%
800,000 Lundin Gold Inc 2,662,239 0.92%
1,179,659 MAG Silver Corp 12,489,144 4.32%
13,769,771 Millennium Minerals Ltd 1,928,573 0.67%
1,972,440 New Pacific Metals Corp 2,351,686 0.81%
356,000 Newmont Mining Corp 13,172,000 4.56%
2,166,200 Northern Star Resources Ltd 11,592,872 4.01%
4,203,000 Osisko Mining Inc 5,359,998 1.86%
549,300 Pan American Silver Corp 9,645,708 3.34%
2,340,887 Rupert Resources Ltd 1,731,112 0.60%
11,961,574 S2 Resources Ltd 969,922 0.34%
1,531,500 Sabina Gold & Silver Corp 1,745,068 0.60%
250,000 Seabridge Gold Inc 2,737,500 0.95%
4,450,000 Silver Lake Resources Ltd 1,968,191 0.68%
4,466,667 Silver Mines Ltd 128,412 0.04%
4,887,414 Silvercorp Metals Inc 12,834,439 4.45%
12,675,000 SolGold PLC 3,547,369 1.23%
2,820,000 St Barbara Ltd 10,040,425 3.49%
290,000 Wheaton Precious Metals Corp 6,293,691 2.18%
228,778,344 79.22%
Financial - 1.15% (2017 - 8.82%)
1,554,000 GoldMoney Inc 3,318,608 1.15%
3,318,608 1.15%
Total Common Stock 232,096,952 80.37%
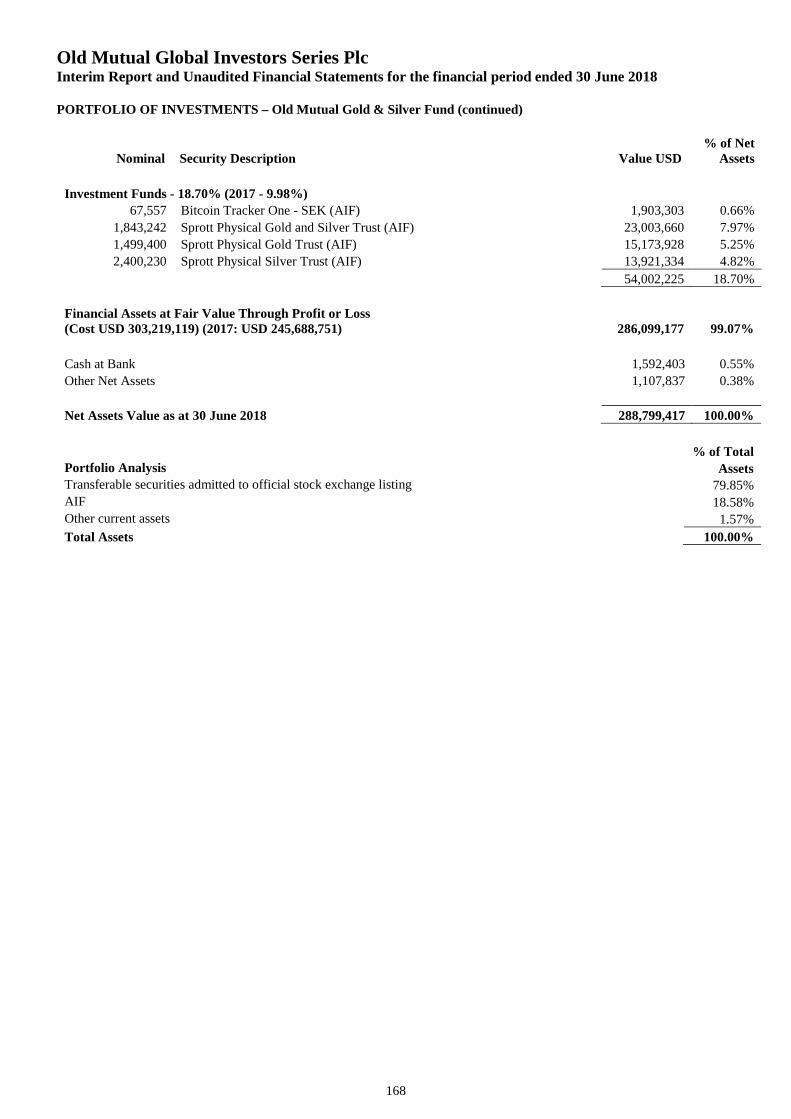
Old Mutual Global Investors Series PlcInterim Report and Unaudited Financial Statements for the financial period ended 30 June 2018
PORTFOLIO OF INVESTMENTS – Old Mutual Gold & Silver Fund (continued)
Nominal Security Description Value USD% of Net
Assets
168
Investment Funds - 18.70% (2017 - 9.98%)
67,557 Bitcoin Tracker One - SEK (AIF) 1,903,303 0.66%
1,843,242 Sprott Physical Gold and Silver Trust (AIF) 23,003,660 7.97%
1,499,400 Sprott Physical Gold Trust (AIF) 15,173,928 5.25%
2,400,230 Sprott Physical Silver Trust (AIF) 13,921,334 4.82%
54,002,225 18.70%
Financial Assets at Fair Value Through Profit or Loss(Cost USD 303,219,119) (2017: USD 245,688,751) 286,099,177 99.07%
Cash at Bank 1,592,403 0.55%
Other Net Assets 1,107,837 0.38%
Net Assets Value as at 30 June 2018 288,799,417 100.00%
% of TotalPortfolio Analysis AssetsTransferable securities admitted to official stock exchange listing 79.85%AIF 18.58%Other current assets 1.57%
Total Assets 100.00%
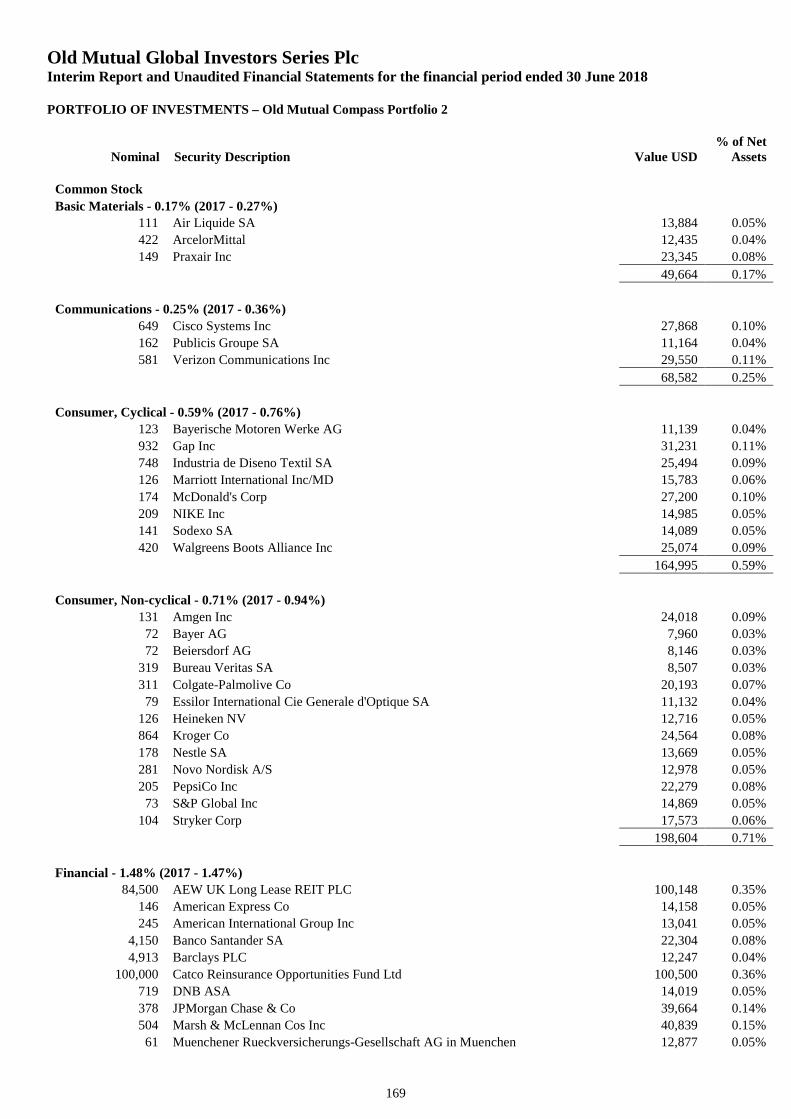
Old Mutual Global Investors Series PlcInterim Report and Unaudited Financial Statements for the financial period ended 30 June 2018
PORTFOLIO OF INVESTMENTS – Old Mutual Compass Portfolio 2
Nominal Security Description Value USD% of Net
Assets
169
Common Stock
Basic Materials - 0.17% (2017 - 0.27%)
111 Air Liquide SA 13,884 0.05%
422 ArcelorMittal 12,435 0.04%
149 Praxair Inc 23,345 0.08%
49,664 0.17%
Communications - 0.25% (2017 - 0.36%)
649 Cisco Systems Inc 27,868 0.10%
162 Publicis Groupe SA 11,164 0.04%
581 Verizon Communications Inc 29,550 0.11%
68,582 0.25%
Consumer, Cyclical - 0.59% (2017 - 0.76%)
123 Bayerische Motoren Werke AG 11,139 0.04%
932 Gap Inc 31,231 0.11%
748 Industria de Diseno Textil SA 25,494 0.09%
126 Marriott International Inc/MD 15,783 0.06%
174 McDonald's Corp 27,200 0.10%
209 NIKE Inc 14,985 0.05%
141 Sodexo SA 14,089 0.05%
420 Walgreens Boots Alliance Inc 25,074 0.09%
164,995 0.59%
Consumer, Non-cyclical - 0.71% (2017 - 0.94%)
131 Amgen Inc 24,018 0.09%
72 Bayer AG 7,960 0.03%
72 Beiersdorf AG 8,146 0.03%
319 Bureau Veritas SA 8,507 0.03%
311 Colgate-Palmolive Co 20,193 0.07%
79 Essilor International Cie Generale d'Optique SA 11,132 0.04%
126 Heineken NV 12,716 0.05%
864 Kroger Co 24,564 0.08%
178 Nestle SA 13,669 0.05%
281 Novo Nordisk A/S 12,978 0.05%
205 PepsiCo Inc 22,279 0.08%
73 S&P Global Inc 14,869 0.05%
104 Stryker Corp 17,573 0.06%
198,604 0.71%
Financial - 1.48% (2017 - 1.47%)
84,500 AEW UK Long Lease REIT PLC 100,148 0.35%
146 American Express Co 14,158 0.05%
245 American International Group Inc 13,041 0.05%
4,150 Banco Santander SA 22,304 0.08%
4,913 Barclays PLC 12,247 0.04%
100,000 Catco Reinsurance Opportunities Fund Ltd 100,500 0.36%
719 DNB ASA 14,019 0.05%
378 JPMorgan Chase & Co 39,664 0.14%
504 Marsh & McLennan Cos Inc 40,839 0.15%
61 Muenchener Rueckversicherungs-Gesellschaft AG in Muenchen 12,877 0.05%
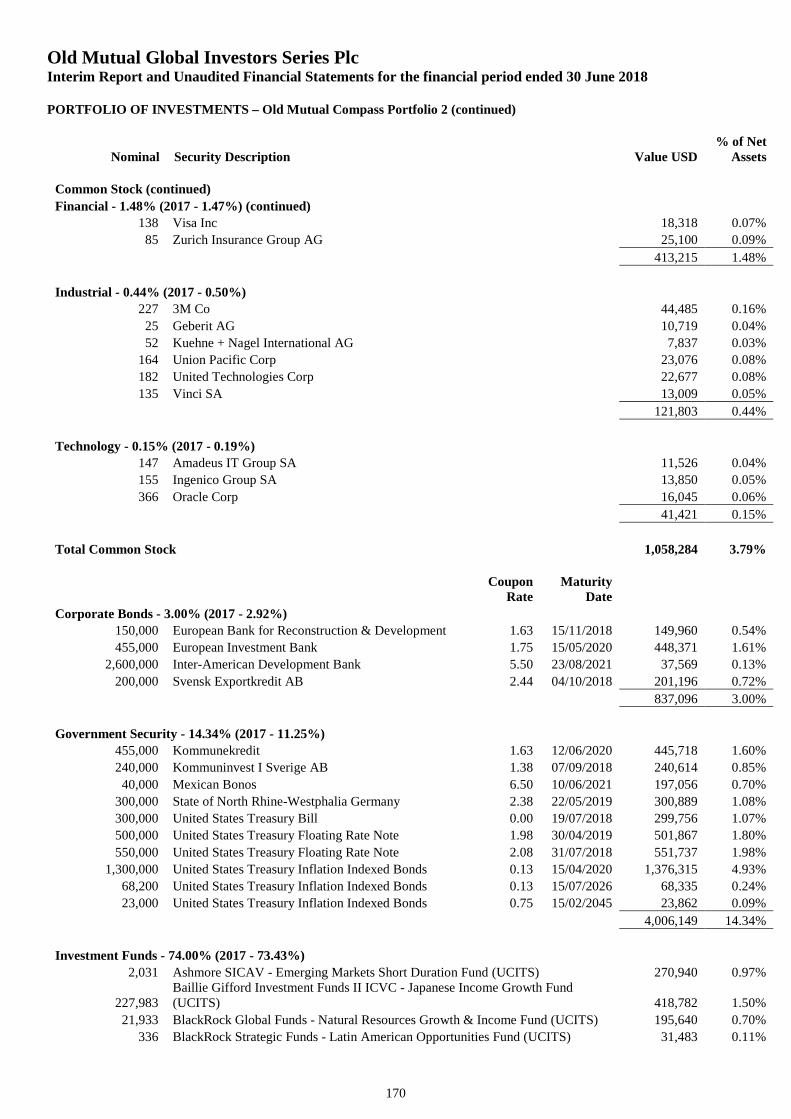
Old Mutual Global Investors Series PlcInterim Report and Unaudited Financial Statements for the financial period ended 30 June 2018
PORTFOLIO OF INVESTMENTS – Old Mutual Compass Portfolio 2 (continued)
Nominal Security Description Value USD% of Net
Assets
170
Common Stock (continued)
Financial - 1.48% (2017 - 1.47%) (continued)
138 Visa Inc 18,318 0.07%
85 Zurich Insurance Group AG 25,100 0.09%
413,215 1.48%
Industrial - 0.44% (2017 - 0.50%)
227 3M Co 44,485 0.16%
25 Geberit AG 10,719 0.04%
52 Kuehne + Nagel International AG 7,837 0.03%
164 Union Pacific Corp 23,076 0.08%
182 United Technologies Corp 22,677 0.08%
135 Vinci SA 13,009 0.05%
121,803 0.44%
Technology - 0.15% (2017 - 0.19%)
147 Amadeus IT Group SA 11,526 0.04%
155 Ingenico Group SA 13,850 0.05%
366 Oracle Corp 16,045 0.06%
41,421 0.15%
Total Common Stock 1,058,284 3.79%
CouponRate
MaturityDate
Corporate Bonds - 3.00% (2017 - 2.92%)
150,000 European Bank for Reconstruction & Development 1.63 15/11/2018 149,960 0.54%
455,000 European Investment Bank 1.75 15/05/2020 448,371 1.61%
2,600,000 Inter-American Development Bank 5.50 23/08/2021 37,569 0.13%
200,000 Svensk Exportkredit AB 2.44 04/10/2018 201,196 0.72%
837,096 3.00%
Government Security - 14.34% (2017 - 11.25%)
455,000 Kommunekredit 1.63 12/06/2020 445,718 1.60%
240,000 Kommuninvest I Sverige AB 1.38 07/09/2018 240,614 0.85%
40,000 Mexican Bonos 6.50 10/06/2021 197,056 0.70%
300,000 State of North Rhine-Westphalia Germany 2.38 22/05/2019 300,889 1.08%
300,000 United States Treasury Bill 0.00 19/07/2018 299,756 1.07%
500,000 United States Treasury Floating Rate Note 1.98 30/04/2019 501,867 1.80%
550,000 United States Treasury Floating Rate Note 2.08 31/07/2018 551,737 1.98%
1,300,000 United States Treasury Inflation Indexed Bonds 0.13 15/04/2020 1,376,315 4.93%
68,200 United States Treasury Inflation Indexed Bonds 0.13 15/07/2026 68,335 0.24%
23,000 United States Treasury Inflation Indexed Bonds 0.75 15/02/2045 23,862 0.09%
4,006,149 14.34%
Investment Funds - 74.00% (2017 - 73.43%)
2,031 Ashmore SICAV - Emerging Markets Short Duration Fund (UCITS) 270,940 0.97%
227,983Baillie Gifford Investment Funds II ICVC - Japanese Income Growth Fund(UCITS) 418,782 1.50%
21,933 BlackRock Global Funds - Natural Resources Growth & Income Fund (UCITS) 195,640 0.70%
336 BlackRock Strategic Funds - Latin American Opportunities Fund (UCITS) 31,483 0.11%
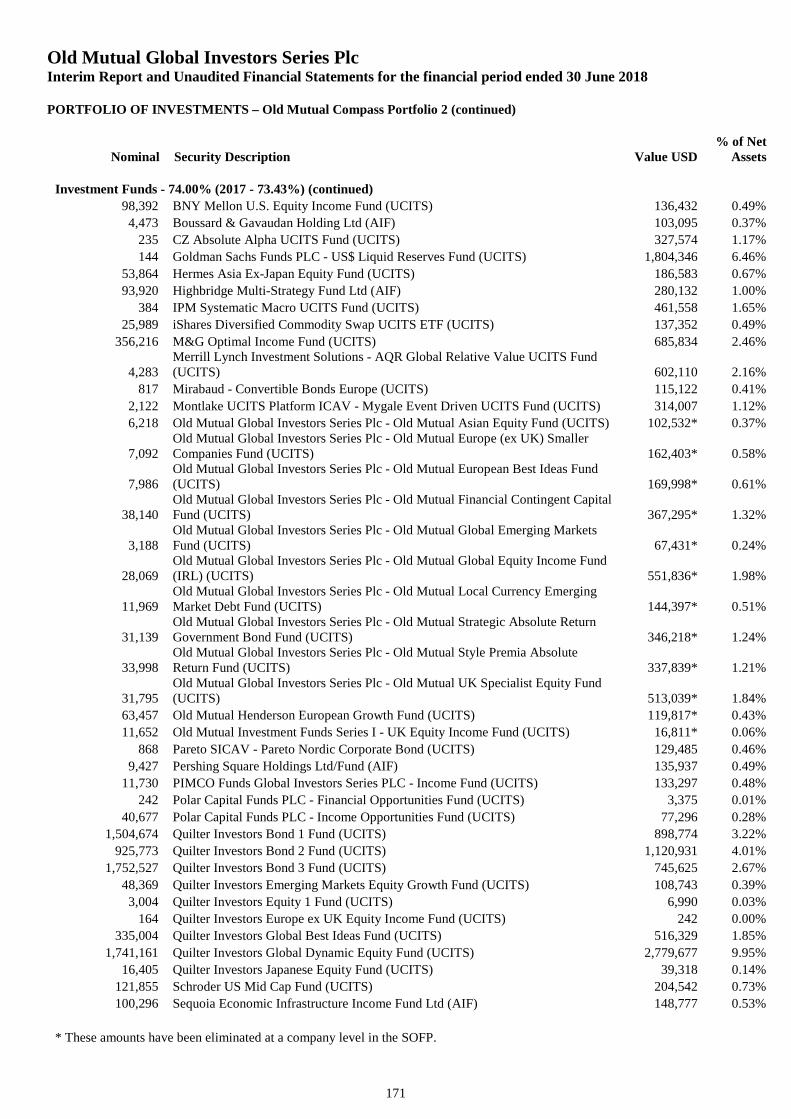
Old Mutual Global Investors Series PlcInterim Report and Unaudited Financial Statements for the financial period ended 30 June 2018
PORTFOLIO OF INVESTMENTS – Old Mutual Compass Portfolio 2 (continued)
Nominal Security Description Value USD% of Net
Assets
171
Investment Funds - 74.00% (2017 - 73.43%) (continued)
98,392 BNY Mellon U.S. Equity Income Fund (UCITS) 136,432 0.49%
4,473 Boussard & Gavaudan Holding Ltd (AIF) 103,095 0.37%
235 CZ Absolute Alpha UCITS Fund (UCITS) 327,574 1.17%
144 Goldman Sachs Funds PLC - US$ Liquid Reserves Fund (UCITS) 1,804,346 6.46%
53,864 Hermes Asia Ex-Japan Equity Fund (UCITS) 186,583 0.67%
93,920 Highbridge Multi-Strategy Fund Ltd (AIF) 280,132 1.00%
384 IPM Systematic Macro UCITS Fund (UCITS) 461,558 1.65%
25,989 iShares Diversified Commodity Swap UCITS ETF (UCITS) 137,352 0.49%
356,216 M&G Optimal Income Fund (UCITS) 685,834 2.46%
4,283Merrill Lynch Investment Solutions - AQR Global Relative Value UCITS Fund(UCITS) 602,110 2.16%
817 Mirabaud - Convertible Bonds Europe (UCITS) 115,122 0.41%
2,122 Montlake UCITS Platform ICAV - Mygale Event Driven UCITS Fund (UCITS) 314,007 1.12%
6,218 Old Mutual Global Investors Series Plc - Old Mutual Asian Equity Fund (UCITS) 102,532* 0.37%
7,092Old Mutual Global Investors Series Plc - Old Mutual Europe (ex UK) SmallerCompanies Fund (UCITS) 162,403* 0.58%
7,986Old Mutual Global Investors Series Plc - Old Mutual European Best Ideas Fund(UCITS) 169,998* 0.61%
38,140Old Mutual Global Investors Series Plc - Old Mutual Financial Contingent CapitalFund (UCITS) 367,295* 1.32%
3,188Old Mutual Global Investors Series Plc - Old Mutual Global Emerging MarketsFund (UCITS) 67,431* 0.24%
28,069Old Mutual Global Investors Series Plc - Old Mutual Global Equity Income Fund(IRL) (UCITS) 551,836* 1.98%
11,969Old Mutual Global Investors Series Plc - Old Mutual Local Currency EmergingMarket Debt Fund (UCITS) 144,397* 0.51%
31,139Old Mutual Global Investors Series Plc - Old Mutual Strategic Absolute ReturnGovernment Bond Fund (UCITS) 346,218* 1.24%
33,998Old Mutual Global Investors Series Plc - Old Mutual Style Premia AbsoluteReturn Fund (UCITS) 337,839* 1.21%
31,795Old Mutual Global Investors Series Plc - Old Mutual UK Specialist Equity Fund(UCITS) 513,039* 1.84%
63,457 Old Mutual Henderson European Growth Fund (UCITS) 119,817* 0.43%
11,652 Old Mutual Investment Funds Series I - UK Equity Income Fund (UCITS) 16,811* 0.06%
868 Pareto SICAV - Pareto Nordic Corporate Bond (UCITS) 129,485 0.46%
9,427 Pershing Square Holdings Ltd/Fund (AIF) 135,937 0.49%
11,730 PIMCO Funds Global Investors Series PLC - Income Fund (UCITS) 133,297 0.48%
242 Polar Capital Funds PLC - Financial Opportunities Fund (UCITS) 3,375 0.01%
40,677 Polar Capital Funds PLC - Income Opportunities Fund (UCITS) 77,296 0.28%
1,504,674 Quilter Investors Bond 1 Fund (UCITS) 898,774 3.22%
925,773 Quilter Investors Bond 2 Fund (UCITS) 1,120,931 4.01%
1,752,527 Quilter Investors Bond 3 Fund (UCITS) 745,625 2.67%
48,369 Quilter Investors Emerging Markets Equity Growth Fund (UCITS) 108,743 0.39%
3,004 Quilter Investors Equity 1 Fund (UCITS) 6,990 0.03%
164 Quilter Investors Europe ex UK Equity Income Fund (UCITS) 242 0.00%
335,004 Quilter Investors Global Best Ideas Fund (UCITS) 516,329 1.85%
1,741,161 Quilter Investors Global Dynamic Equity Fund (UCITS) 2,779,677 9.95%
16,405 Quilter Investors Japanese Equity Fund (UCITS) 39,318 0.14%
121,855 Schroder US Mid Cap Fund (UCITS) 204,542 0.73%
100,296 Sequoia Economic Infrastructure Income Fund Ltd (AIF) 148,777 0.53%
* These amounts have been eliminated at a company level in the SOFP.
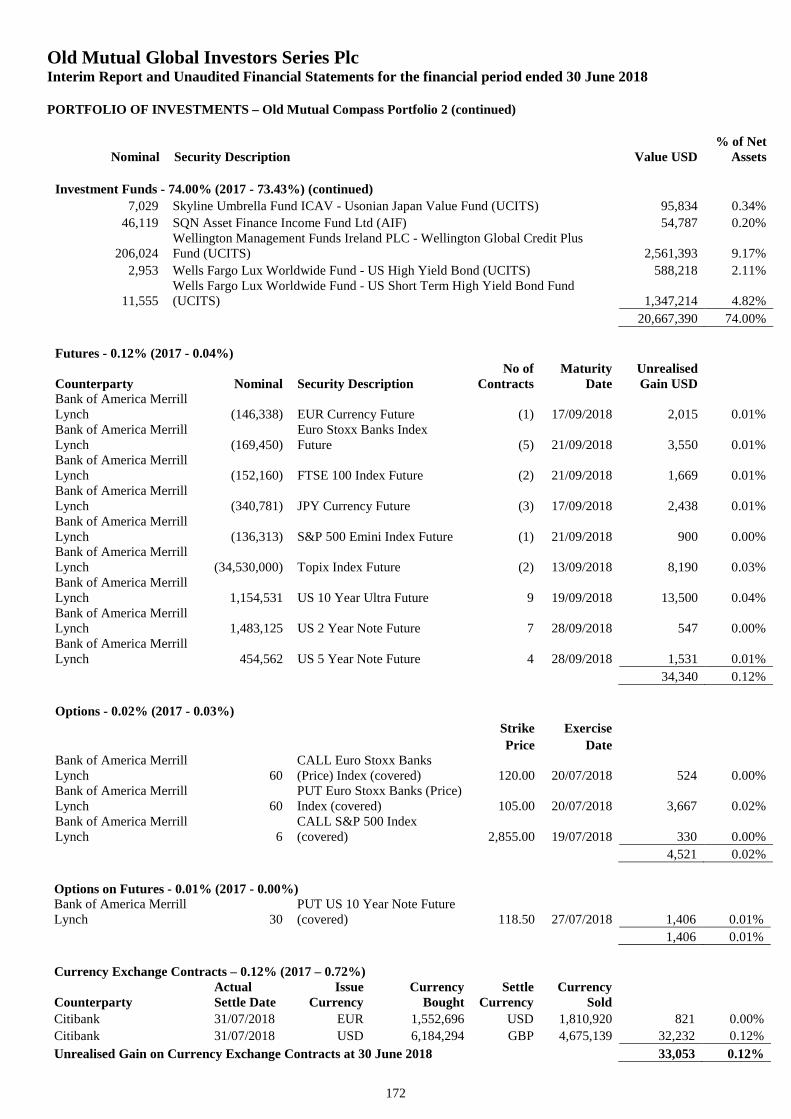
Old Mutual Global Investors Series PlcInterim Report and Unaudited Financial Statements for the financial period ended 30 June 2018
PORTFOLIO OF INVESTMENTS – Old Mutual Compass Portfolio 2 (continued)
Nominal Security Description Value USD% of Net
Assets
172
Investment Funds - 74.00% (2017 - 73.43%) (continued)
7,029 Skyline Umbrella Fund ICAV - Usonian Japan Value Fund (UCITS) 95,834 0.34%
46,119 SQN Asset Finance Income Fund Ltd (AIF) 54,787 0.20%
206,024Wellington Management Funds Ireland PLC - Wellington Global Credit PlusFund (UCITS) 2,561,393 9.17%
2,953 Wells Fargo Lux Worldwide Fund - US High Yield Bond (UCITS) 588,218 2.11%
11,555Wells Fargo Lux Worldwide Fund - US Short Term High Yield Bond Fund(UCITS) 1,347,214 4.82%
20,667,390 74.00%
Futures - 0.12% (2017 - 0.04%)
Counterparty Nominal Security DescriptionNo of
ContractsMaturity
DateUnrealisedGain USD
Bank of America MerrillLynch (146,338) EUR Currency Future (1) 17/09/2018 2,015 0.01%Bank of America MerrillLynch (169,450)
Euro Stoxx Banks IndexFuture (5) 21/09/2018 3,550 0.01%
Bank of America MerrillLynch (152,160) FTSE 100 Index Future (2) 21/09/2018 1,669 0.01%Bank of America MerrillLynch (340,781) JPY Currency Future (3) 17/09/2018 2,438 0.01%Bank of America MerrillLynch (136,313) S&P 500 Emini Index Future (1) 21/09/2018 900 0.00%Bank of America MerrillLynch (34,530,000) Topix Index Future (2) 13/09/2018 8,190 0.03%Bank of America MerrillLynch 1,154,531 US 10 Year Ultra Future 9 19/09/2018 13,500 0.04%Bank of America MerrillLynch 1,483,125 US 2 Year Note Future 7 28/09/2018 547 0.00%Bank of America MerrillLynch 454,562 US 5 Year Note Future 4 28/09/2018 1,531 0.01%
34,340 0.12%
Options - 0.02% (2017 - 0.03%)
Strike Exercise
Price DateBank of America MerrillLynch 60
CALL Euro Stoxx Banks(Price) Index (covered) 120.00 20/07/2018 524 0.00%
Bank of America MerrillLynch 60
PUT Euro Stoxx Banks (Price)Index (covered) 105.00 20/07/2018 3,667 0.02%
Bank of America MerrillLynch 6
CALL S&P 500 Index(covered) 2,855.00 19/07/2018 330 0.00%
4,521 0.02%
Options on Futures - 0.01% (2017 - 0.00%)Bank of America MerrillLynch 30
PUT US 10 Year Note Future(covered) 118.50 27/07/2018 1,406 0.01%
1,406 0.01%
Currency Exchange Contracts – 0.12% (2017 – 0.72%)
CounterpartyActualSettle Date
IssueCurrency
CurrencyBought
SettleCurrency
CurrencySold
Citibank 31/07/2018 EUR 1,552,696 USD 1,810,920 821 0.00%
Citibank 31/07/2018 USD 6,184,294 GBP 4,675,139 32,232 0.12%
Unrealised Gain on Currency Exchange Contracts at 30 June 2018 33,053 0.12%
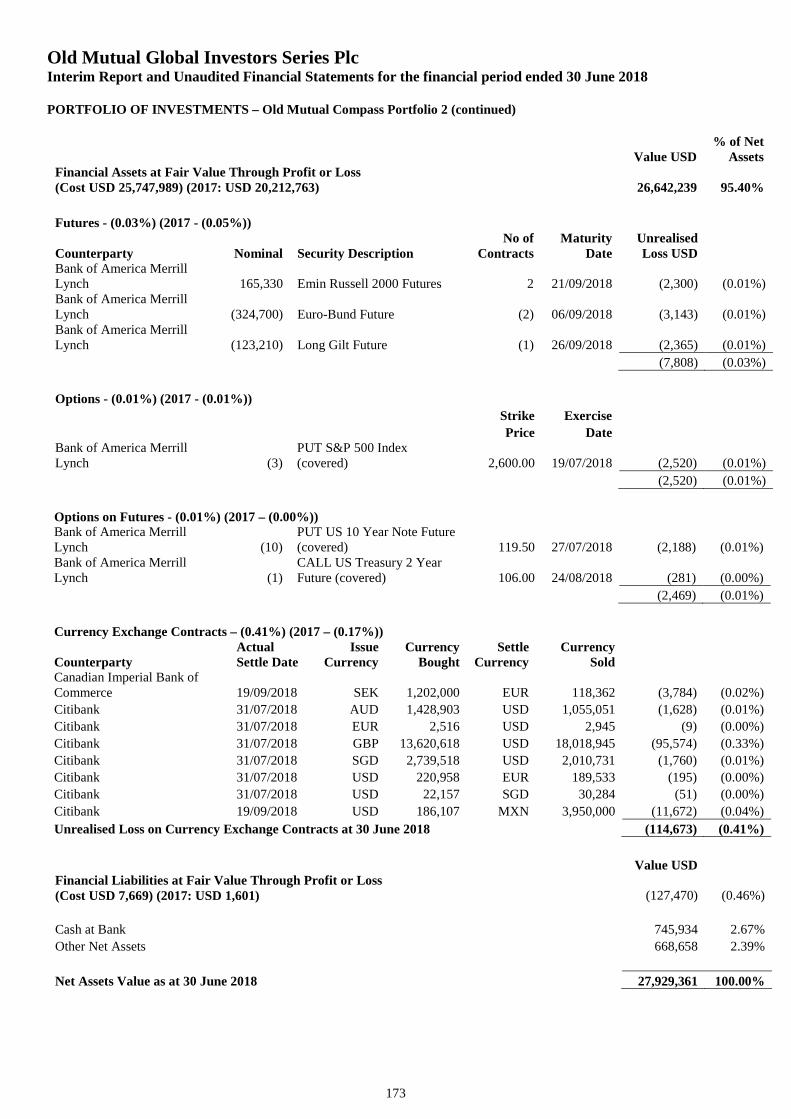
Old Mutual Global Investors Series PlcInterim Report and Unaudited Financial Statements for the financial period ended 30 June 2018
PORTFOLIO OF INVESTMENTS – Old Mutual Compass Portfolio 2 (continued)
173
Value USD% of Net
AssetsFinancial Assets at Fair Value Through Profit or Loss(Cost USD 25,747,989) (2017: USD 20,212,763) 26,642,239 95.40%
Futures - (0.03%) (2017 - (0.05%))
Counterparty Nominal Security DescriptionNo of
ContractsMaturity
DateUnrealisedLoss USD
Bank of America MerrillLynch 165,330 Emin Russell 2000 Futures 2 21/09/2018 (2,300) (0.01%)Bank of America MerrillLynch (324,700) Euro-Bund Future (2) 06/09/2018 (3,143) (0.01%)Bank of America MerrillLynch (123,210) Long Gilt Future (1) 26/09/2018 (2,365) (0.01%)
(7,808) (0.03%)
Options - (0.01%) (2017 - (0.01%))
Strike Exercise
Price DateBank of America MerrillLynch (3)
PUT S&P 500 Index(covered) 2,600.00 19/07/2018 (2,520) (0.01%)
(2,520) (0.01%)
Options on Futures - (0.01%) (2017 – (0.00%))Bank of America MerrillLynch (10)
PUT US 10 Year Note Future(covered) 119.50 27/07/2018 (2,188) (0.01%)
Bank of America MerrillLynch (1)
CALL US Treasury 2 YearFuture (covered) 106.00 24/08/2018 (281) (0.00%)
(2,469) (0.01%)
Currency Exchange Contracts – (0.41%) (2017 – (0.17%))
CounterpartyActualSettle Date
IssueCurrency
CurrencyBought
SettleCurrency
CurrencySold
Canadian Imperial Bank ofCommerce 19/09/2018 SEK 1,202,000 EUR 118,362 (3,784) (0.02%)
Citibank 31/07/2018 AUD 1,428,903 USD 1,055,051 (1,628) (0.01%)
Citibank 31/07/2018 EUR 2,516 USD 2,945 (9) (0.00%)
Citibank 31/07/2018 GBP 13,620,618 USD 18,018,945 (95,574) (0.33%)
Citibank 31/07/2018 SGD 2,739,518 USD 2,010,731 (1,760) (0.01%)
Citibank 31/07/2018 USD 220,958 EUR 189,533 (195) (0.00%)
Citibank 31/07/2018 USD 22,157 SGD 30,284 (51) (0.00%)
Citibank 19/09/2018 USD 186,107 MXN 3,950,000 (11,672) (0.04%)
Unrealised Loss on Currency Exchange Contracts at 30 June 2018 (114,673) (0.41%)
Value USDFinancial Liabilities at Fair Value Through Profit or Loss(Cost USD 7,669) (2017: USD 1,601) (127,470) (0.46%)
Cash at Bank 745,934 2.67%
Other Net Assets 668,658 2.39%
Net Assets Value as at 30 June 2018 27,929,361 100.00%

Old Mutual Global Investors Series PlcInterim Report and Unaudited Financial Statements for the financial period ended 30 June 2018
PORTFOLIO OF INVESTMENTS – Old Mutual Compass Portfolio 2 (continued)
174
% of TotalPortfolio Analysis AssetsTransferable securities admitted to official stock exchange listing 18.91%Transferable securities dealt in on another regulated market 1.95%AIF 2.55%UCITS 70.50%Financial derivative instruments dealt in on a regulated market 0.14%OTC financial derivative instruments 0.12%Other current assets 5.83%
Total Assets 100.00%
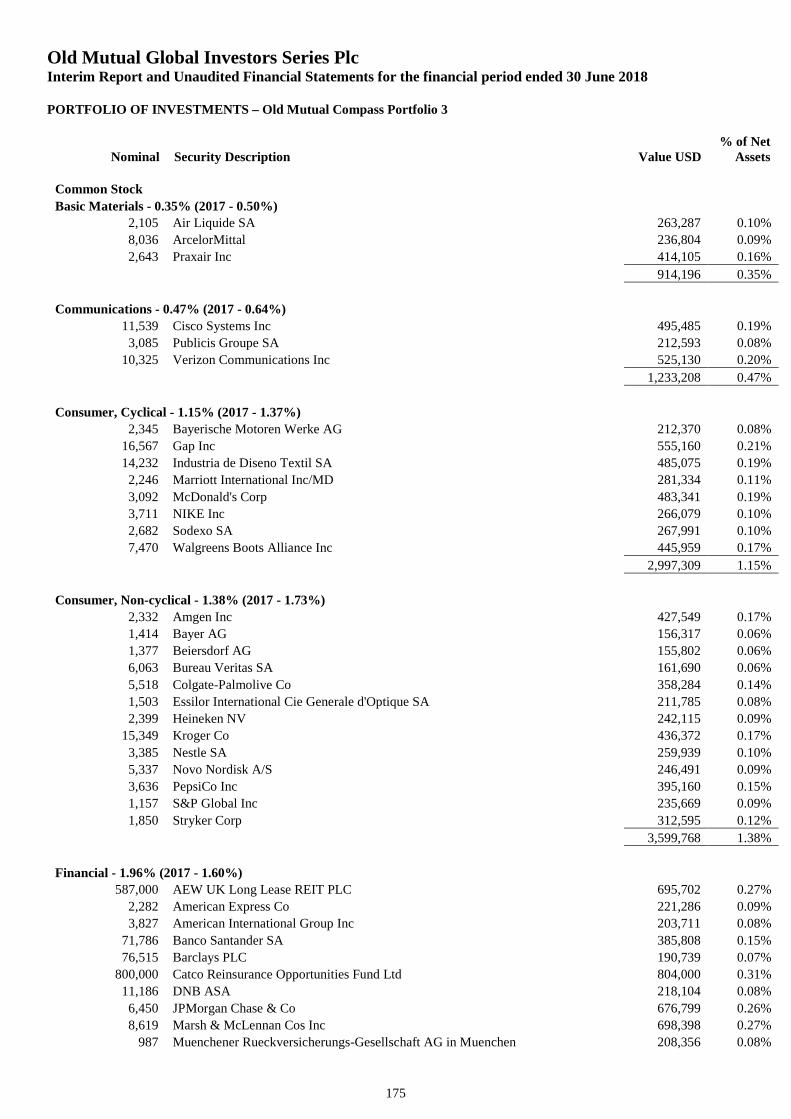
Old Mutual Global Investors Series PlcInterim Report and Unaudited Financial Statements for the financial period ended 30 June 2018
PORTFOLIO OF INVESTMENTS – Old Mutual Compass Portfolio 3
Nominal Security Description Value USD% of Net
Assets
175
Common Stock
Basic Materials - 0.35% (2017 - 0.50%)
2,105 Air Liquide SA 263,287 0.10%
8,036 ArcelorMittal 236,804 0.09%
2,643 Praxair Inc 414,105 0.16%
914,196 0.35%
Communications - 0.47% (2017 - 0.64%)
11,539 Cisco Systems Inc 495,485 0.19%
3,085 Publicis Groupe SA 212,593 0.08%
10,325 Verizon Communications Inc 525,130 0.20%
1,233,208 0.47%
Consumer, Cyclical - 1.15% (2017 - 1.37%)
2,345 Bayerische Motoren Werke AG 212,370 0.08%
16,567 Gap Inc 555,160 0.21%
14,232 Industria de Diseno Textil SA 485,075 0.19%
2,246 Marriott International Inc/MD 281,334 0.11%
3,092 McDonald's Corp 483,341 0.19%
3,711 NIKE Inc 266,079 0.10%
2,682 Sodexo SA 267,991 0.10%
7,470 Walgreens Boots Alliance Inc 445,959 0.17%
2,997,309 1.15%
Consumer, Non-cyclical - 1.38% (2017 - 1.73%)
2,332 Amgen Inc 427,549 0.17%
1,414 Bayer AG 156,317 0.06%
1,377 Beiersdorf AG 155,802 0.06%
6,063 Bureau Veritas SA 161,690 0.06%
5,518 Colgate-Palmolive Co 358,284 0.14%
1,503 Essilor International Cie Generale d'Optique SA 211,785 0.08%
2,399 Heineken NV 242,115 0.09%
15,349 Kroger Co 436,372 0.17%
3,385 Nestle SA 259,939 0.10%
5,337 Novo Nordisk A/S 246,491 0.09%
3,636 PepsiCo Inc 395,160 0.15%
1,157 S&P Global Inc 235,669 0.09%
1,850 Stryker Corp 312,595 0.12%
3,599,768 1.38%
Financial - 1.96% (2017 - 1.60%)
587,000 AEW UK Long Lease REIT PLC 695,702 0.27%
2,282 American Express Co 221,286 0.09%
3,827 American International Group Inc 203,711 0.08%
71,786 Banco Santander SA 385,808 0.15%
76,515 Barclays PLC 190,739 0.07%
800,000 Catco Reinsurance Opportunities Fund Ltd 804,000 0.31%
11,186 DNB ASA 218,104 0.08%
6,450 JPMorgan Chase & Co 676,799 0.26%
8,619 Marsh & McLennan Cos Inc 698,398 0.27%
987 Muenchener Rueckversicherungs-Gesellschaft AG in Muenchen 208,356 0.08%
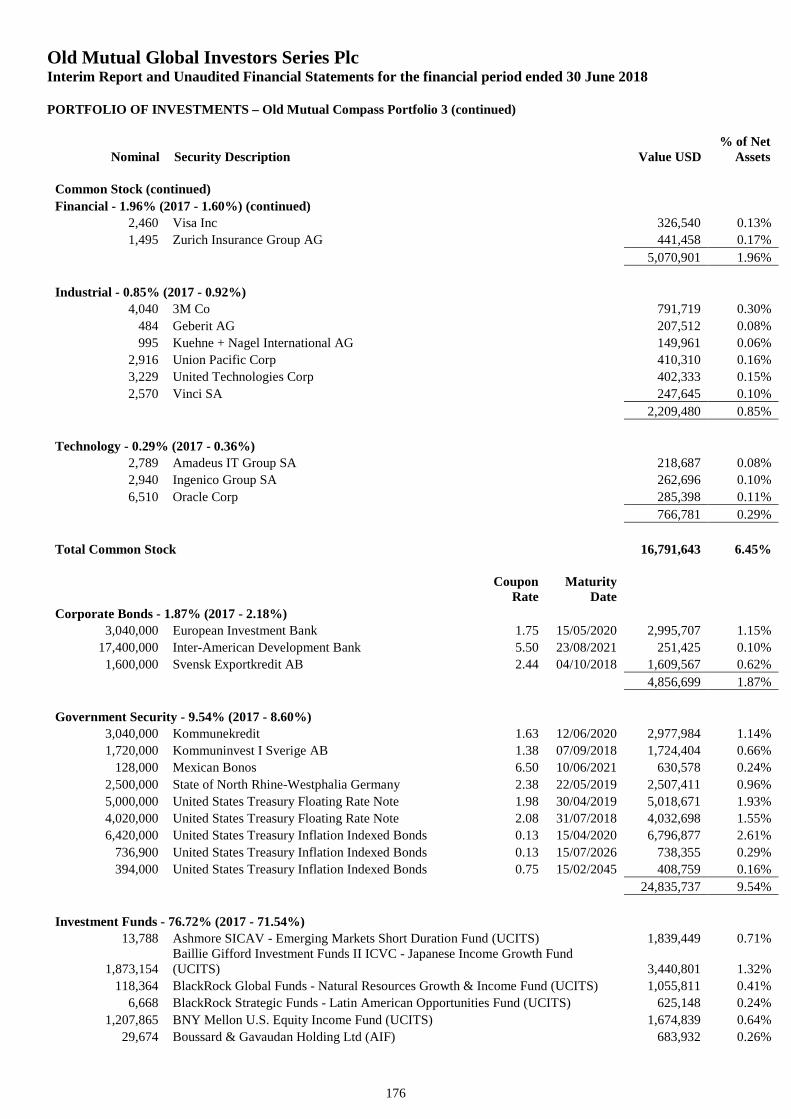
Old Mutual Global Investors Series PlcInterim Report and Unaudited Financial Statements for the financial period ended 30 June 2018
PORTFOLIO OF INVESTMENTS – Old Mutual Compass Portfolio 3 (continued)
Nominal Security Description Value USD% of Net
Assets
176
Common Stock (continued)
Financial - 1.96% (2017 - 1.60%) (continued)
2,460 Visa Inc 326,540 0.13%
1,495 Zurich Insurance Group AG 441,458 0.17%
5,070,901 1.96%
Industrial - 0.85% (2017 - 0.92%)
4,040 3M Co 791,719 0.30%
484 Geberit AG 207,512 0.08%
995 Kuehne + Nagel International AG 149,961 0.06%
2,916 Union Pacific Corp 410,310 0.16%
3,229 United Technologies Corp 402,333 0.15%
2,570 Vinci SA 247,645 0.10%
2,209,480 0.85%
Technology - 0.29% (2017 - 0.36%)
2,789 Amadeus IT Group SA 218,687 0.08%
2,940 Ingenico Group SA 262,696 0.10%
6,510 Oracle Corp 285,398 0.11%
766,781 0.29%
Total Common Stock 16,791,643 6.45%
CouponRate
MaturityDate
Corporate Bonds - 1.87% (2017 - 2.18%)
3,040,000 European Investment Bank 1.75 15/05/2020 2,995,707 1.15%
17,400,000 Inter-American Development Bank 5.50 23/08/2021 251,425 0.10%
1,600,000 Svensk Exportkredit AB 2.44 04/10/2018 1,609,567 0.62%
4,856,699 1.87%
Government Security - 9.54% (2017 - 8.60%)
3,040,000 Kommunekredit 1.63 12/06/2020 2,977,984 1.14%
1,720,000 Kommuninvest I Sverige AB 1.38 07/09/2018 1,724,404 0.66%
128,000 Mexican Bonos 6.50 10/06/2021 630,578 0.24%
2,500,000 State of North Rhine-Westphalia Germany 2.38 22/05/2019 2,507,411 0.96%
5,000,000 United States Treasury Floating Rate Note 1.98 30/04/2019 5,018,671 1.93%
4,020,000 United States Treasury Floating Rate Note 2.08 31/07/2018 4,032,698 1.55%
6,420,000 United States Treasury Inflation Indexed Bonds 0.13 15/04/2020 6,796,877 2.61%
736,900 United States Treasury Inflation Indexed Bonds 0.13 15/07/2026 738,355 0.29%
394,000 United States Treasury Inflation Indexed Bonds 0.75 15/02/2045 408,759 0.16%
24,835,737 9.54%
Investment Funds - 76.72% (2017 - 71.54%)
13,788 Ashmore SICAV - Emerging Markets Short Duration Fund (UCITS) 1,839,449 0.71%
1,873,154Baillie Gifford Investment Funds II ICVC - Japanese Income Growth Fund(UCITS) 3,440,801 1.32%
118,364 BlackRock Global Funds - Natural Resources Growth & Income Fund (UCITS) 1,055,811 0.41%
6,668 BlackRock Strategic Funds - Latin American Opportunities Fund (UCITS) 625,148 0.24%
1,207,865 BNY Mellon U.S. Equity Income Fund (UCITS) 1,674,839 0.64%
29,674 Boussard & Gavaudan Holding Ltd (AIF) 683,932 0.26%
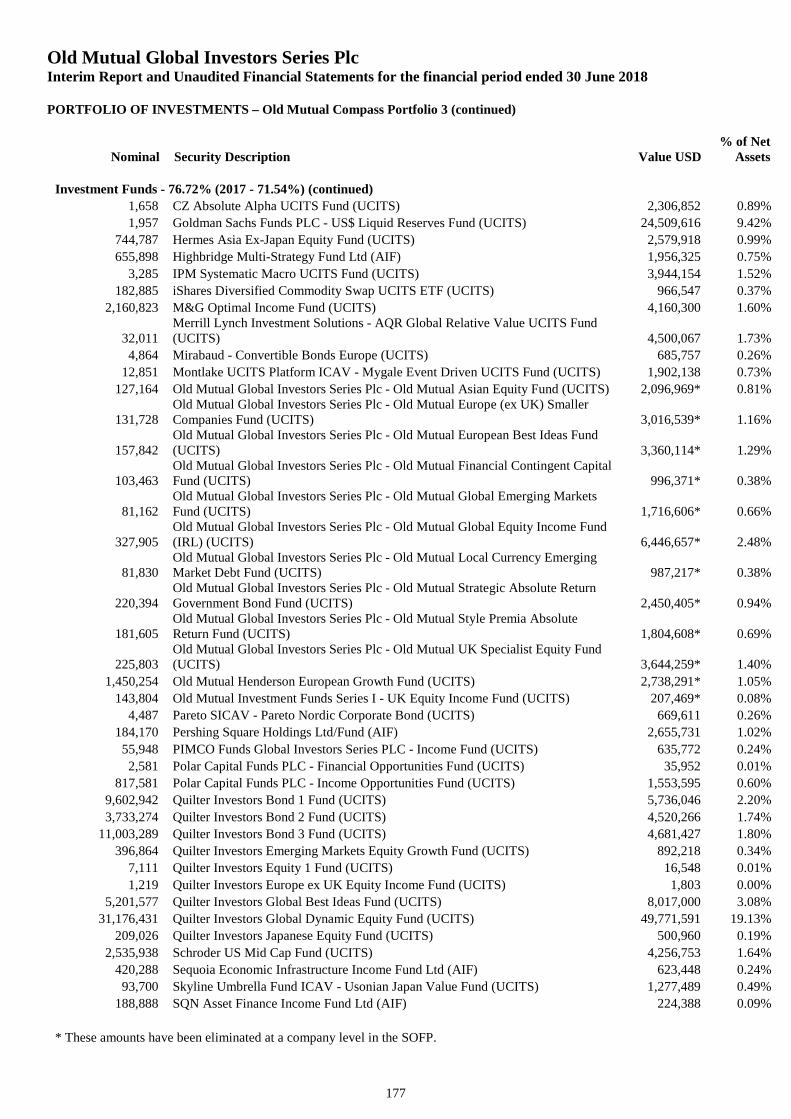
Old Mutual Global Investors Series PlcInterim Report and Unaudited Financial Statements for the financial period ended 30 June 2018
PORTFOLIO OF INVESTMENTS – Old Mutual Compass Portfolio 3 (continued)
Nominal Security Description Value USD% of Net
Assets
177
Investment Funds - 76.72% (2017 - 71.54%) (continued)
1,658 CZ Absolute Alpha UCITS Fund (UCITS) 2,306,852 0.89%
1,957 Goldman Sachs Funds PLC - US$ Liquid Reserves Fund (UCITS) 24,509,616 9.42%
744,787 Hermes Asia Ex-Japan Equity Fund (UCITS) 2,579,918 0.99%
655,898 Highbridge Multi-Strategy Fund Ltd (AIF) 1,956,325 0.75%
3,285 IPM Systematic Macro UCITS Fund (UCITS) 3,944,154 1.52%
182,885 iShares Diversified Commodity Swap UCITS ETF (UCITS) 966,547 0.37%
2,160,823 M&G Optimal Income Fund (UCITS) 4,160,300 1.60%
32,011Merrill Lynch Investment Solutions - AQR Global Relative Value UCITS Fund(UCITS) 4,500,067 1.73%
4,864 Mirabaud - Convertible Bonds Europe (UCITS) 685,757 0.26%
12,851 Montlake UCITS Platform ICAV - Mygale Event Driven UCITS Fund (UCITS) 1,902,138 0.73%
127,164 Old Mutual Global Investors Series Plc - Old Mutual Asian Equity Fund (UCITS) 2,096,969* 0.81%
131,728Old Mutual Global Investors Series Plc - Old Mutual Europe (ex UK) SmallerCompanies Fund (UCITS) 3,016,539* 1.16%
157,842Old Mutual Global Investors Series Plc - Old Mutual European Best Ideas Fund(UCITS) 3,360,114* 1.29%
103,463Old Mutual Global Investors Series Plc - Old Mutual Financial Contingent CapitalFund (UCITS) 996,371* 0.38%
81,162Old Mutual Global Investors Series Plc - Old Mutual Global Emerging MarketsFund (UCITS) 1,716,606* 0.66%
327,905Old Mutual Global Investors Series Plc - Old Mutual Global Equity Income Fund(IRL) (UCITS) 6,446,657* 2.48%
81,830Old Mutual Global Investors Series Plc - Old Mutual Local Currency EmergingMarket Debt Fund (UCITS) 987,217* 0.38%
220,394Old Mutual Global Investors Series Plc - Old Mutual Strategic Absolute ReturnGovernment Bond Fund (UCITS) 2,450,405* 0.94%
181,605Old Mutual Global Investors Series Plc - Old Mutual Style Premia AbsoluteReturn Fund (UCITS) 1,804,608* 0.69%
225,803Old Mutual Global Investors Series Plc - Old Mutual UK Specialist Equity Fund(UCITS) 3,644,259* 1.40%
1,450,254 Old Mutual Henderson European Growth Fund (UCITS) 2,738,291* 1.05%
143,804 Old Mutual Investment Funds Series I - UK Equity Income Fund (UCITS) 207,469* 0.08%
4,487 Pareto SICAV - Pareto Nordic Corporate Bond (UCITS) 669,611 0.26%
184,170 Pershing Square Holdings Ltd/Fund (AIF) 2,655,731 1.02%
55,948 PIMCO Funds Global Investors Series PLC - Income Fund (UCITS) 635,772 0.24%
2,581 Polar Capital Funds PLC - Financial Opportunities Fund (UCITS) 35,952 0.01%
817,581 Polar Capital Funds PLC - Income Opportunities Fund (UCITS) 1,553,595 0.60%
9,602,942 Quilter Investors Bond 1 Fund (UCITS) 5,736,046 2.20%
3,733,274 Quilter Investors Bond 2 Fund (UCITS) 4,520,266 1.74%
11,003,289 Quilter Investors Bond 3 Fund (UCITS) 4,681,427 1.80%
396,864 Quilter Investors Emerging Markets Equity Growth Fund (UCITS) 892,218 0.34%
7,111 Quilter Investors Equity 1 Fund (UCITS) 16,548 0.01%
1,219 Quilter Investors Europe ex UK Equity Income Fund (UCITS) 1,803 0.00%
5,201,577 Quilter Investors Global Best Ideas Fund (UCITS) 8,017,000 3.08%
31,176,431 Quilter Investors Global Dynamic Equity Fund (UCITS) 49,771,591 19.13%
209,026 Quilter Investors Japanese Equity Fund (UCITS) 500,960 0.19%
2,535,938 Schroder US Mid Cap Fund (UCITS) 4,256,753 1.64%
420,288 Sequoia Economic Infrastructure Income Fund Ltd (AIF) 623,448 0.24%
93,700 Skyline Umbrella Fund ICAV - Usonian Japan Value Fund (UCITS) 1,277,489 0.49%
188,888 SQN Asset Finance Income Fund Ltd (AIF) 224,388 0.09%
* These amounts have been eliminated at a company level in the SOFP.
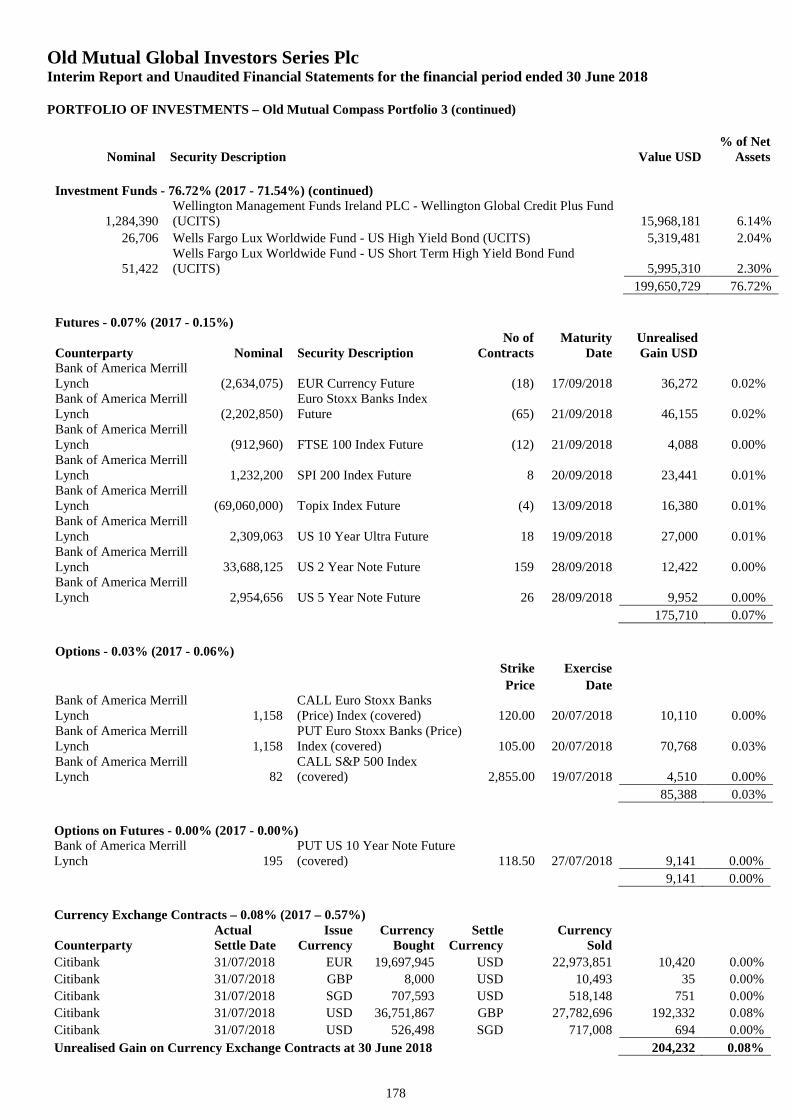
Old Mutual Global Investors Series PlcInterim Report and Unaudited Financial Statements for the financial period ended 30 June 2018
PORTFOLIO OF INVESTMENTS – Old Mutual Compass Portfolio 3 (continued)
Nominal Security Description Value USD% of Net
Assets
178
Investment Funds - 76.72% (2017 - 71.54%) (continued)
1,284,390Wellington Management Funds Ireland PLC - Wellington Global Credit Plus Fund(UCITS) 15,968,181 6.14%
26,706 Wells Fargo Lux Worldwide Fund - US High Yield Bond (UCITS) 5,319,481 2.04%
51,422Wells Fargo Lux Worldwide Fund - US Short Term High Yield Bond Fund(UCITS) 5,995,310 2.30%
199,650,729 76.72%
Futures - 0.07% (2017 - 0.15%)
Counterparty Nominal Security DescriptionNo of
ContractsMaturity
DateUnrealisedGain USD
Bank of America MerrillLynch (2,634,075) EUR Currency Future (18) 17/09/2018 36,272 0.02%Bank of America MerrillLynch (2,202,850)
Euro Stoxx Banks IndexFuture (65) 21/09/2018 46,155 0.02%
Bank of America MerrillLynch (912,960) FTSE 100 Index Future (12) 21/09/2018 4,088 0.00%Bank of America MerrillLynch 1,232,200 SPI 200 Index Future 8 20/09/2018 23,441 0.01%Bank of America MerrillLynch (69,060,000) Topix Index Future (4) 13/09/2018 16,380 0.01%Bank of America MerrillLynch 2,309,063 US 10 Year Ultra Future 18 19/09/2018 27,000 0.01%Bank of America MerrillLynch 33,688,125 US 2 Year Note Future 159 28/09/2018 12,422 0.00%Bank of America MerrillLynch 2,954,656 US 5 Year Note Future 26 28/09/2018 9,952 0.00%
175,710 0.07%
Options - 0.03% (2017 - 0.06%)
Strike Exercise
Price DateBank of America MerrillLynch 1,158
CALL Euro Stoxx Banks(Price) Index (covered) 120.00 20/07/2018 10,110 0.00%
Bank of America MerrillLynch 1,158
PUT Euro Stoxx Banks (Price)Index (covered) 105.00 20/07/2018 70,768 0.03%
Bank of America MerrillLynch 82
CALL S&P 500 Index(covered) 2,855.00 19/07/2018 4,510 0.00%
85,388 0.03%
Options on Futures - 0.00% (2017 - 0.00%)Bank of America MerrillLynch 195
PUT US 10 Year Note Future(covered) 118.50 27/07/2018 9,141 0.00%
9,141 0.00%
Currency Exchange Contracts – 0.08% (2017 – 0.57%)
CounterpartyActualSettle Date
IssueCurrency
CurrencyBought
SettleCurrency
CurrencySold
Citibank 31/07/2018 EUR 19,697,945 USD 22,973,851 10,420 0.00%
Citibank 31/07/2018 GBP 8,000 USD 10,493 35 0.00%
Citibank 31/07/2018 SGD 707,593 USD 518,148 751 0.00%
Citibank 31/07/2018 USD 36,751,867 GBP 27,782,696 192,332 0.08%
Citibank 31/07/2018 USD 526,498 SGD 717,008 694 0.00%
Unrealised Gain on Currency Exchange Contracts at 30 June 2018 204,232 0.08%
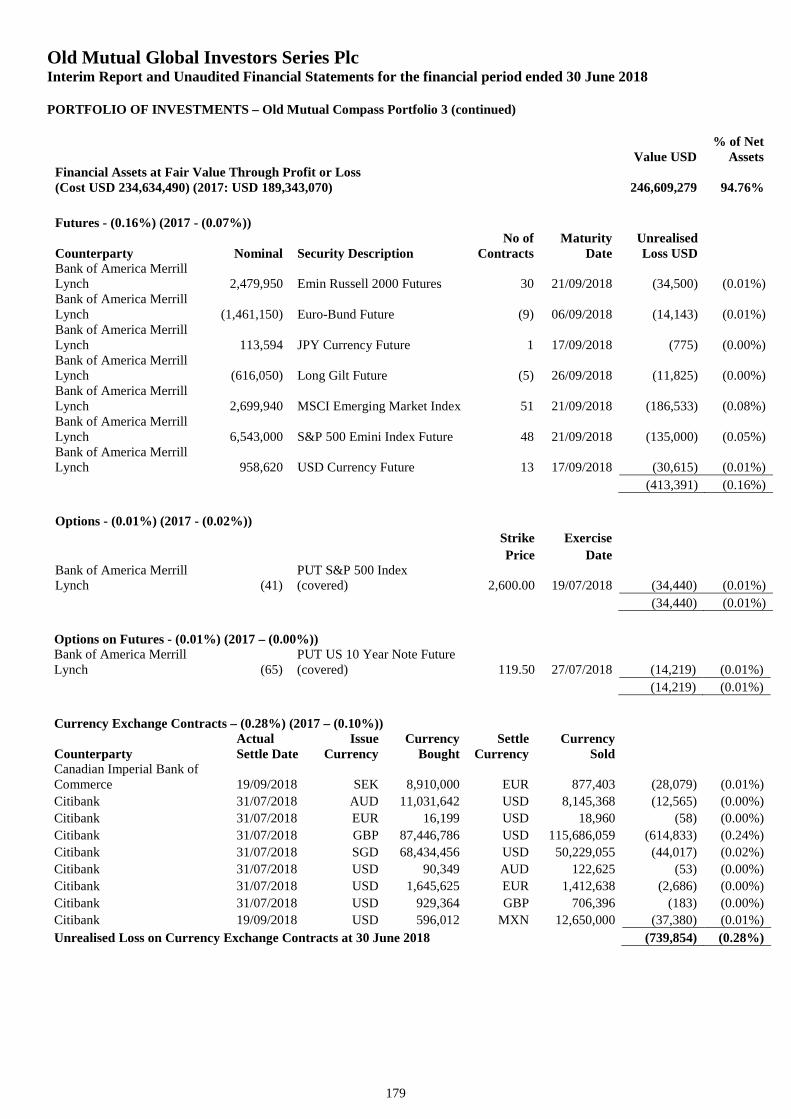
Old Mutual Global Investors Series PlcInterim Report and Unaudited Financial Statements for the financial period ended 30 June 2018
PORTFOLIO OF INVESTMENTS – Old Mutual Compass Portfolio 3 (continued)
179
Value USD% of Net
AssetsFinancial Assets at Fair Value Through Profit or Loss(Cost USD 234,634,490) (2017: USD 189,343,070) 246,609,279 94.76%
Futures - (0.16%) (2017 - (0.07%))
Counterparty Nominal Security DescriptionNo of
ContractsMaturity
DateUnrealisedLoss USD
Bank of America MerrillLynch 2,479,950 Emin Russell 2000 Futures 30 21/09/2018 (34,500) (0.01%)Bank of America MerrillLynch (1,461,150) Euro-Bund Future (9) 06/09/2018 (14,143) (0.01%)Bank of America MerrillLynch 113,594 JPY Currency Future 1 17/09/2018 (775) (0.00%)Bank of America MerrillLynch (616,050) Long Gilt Future (5) 26/09/2018 (11,825) (0.00%)Bank of America MerrillLynch 2,699,940 MSCI Emerging Market Index 51 21/09/2018 (186,533) (0.08%)Bank of America MerrillLynch 6,543,000 S&P 500 Emini Index Future 48 21/09/2018 (135,000) (0.05%)Bank of America MerrillLynch 958,620 USD Currency Future 13 17/09/2018 (30,615) (0.01%)
(413,391) (0.16%)
Options - (0.01%) (2017 - (0.02%))
Strike Exercise
Price DateBank of America MerrillLynch (41)
PUT S&P 500 Index(covered) 2,600.00 19/07/2018 (34,440) (0.01%)
(34,440) (0.01%)
Options on Futures - (0.01%) (2017 – (0.00%))Bank of America MerrillLynch (65)
PUT US 10 Year Note Future(covered) 119.50 27/07/2018 (14,219) (0.01%)
(14,219) (0.01%)
Currency Exchange Contracts – (0.28%) (2017 – (0.10%))
CounterpartyActualSettle Date
IssueCurrency
CurrencyBought
SettleCurrency
CurrencySold
Canadian Imperial Bank ofCommerce 19/09/2018 SEK 8,910,000 EUR 877,403 (28,079) (0.01%)
Citibank 31/07/2018 AUD 11,031,642 USD 8,145,368 (12,565) (0.00%)
Citibank 31/07/2018 EUR 16,199 USD 18,960 (58) (0.00%)
Citibank 31/07/2018 GBP 87,446,786 USD 115,686,059 (614,833) (0.24%)
Citibank 31/07/2018 SGD 68,434,456 USD 50,229,055 (44,017) (0.02%)
Citibank 31/07/2018 USD 90,349 AUD 122,625 (53) (0.00%)
Citibank 31/07/2018 USD 1,645,625 EUR 1,412,638 (2,686) (0.00%)
Citibank 31/07/2018 USD 929,364 GBP 706,396 (183) (0.00%)
Citibank 19/09/2018 USD 596,012 MXN 12,650,000 (37,380) (0.01%)
Unrealised Loss on Currency Exchange Contracts at 30 June 2018 (739,854) (0.28%)
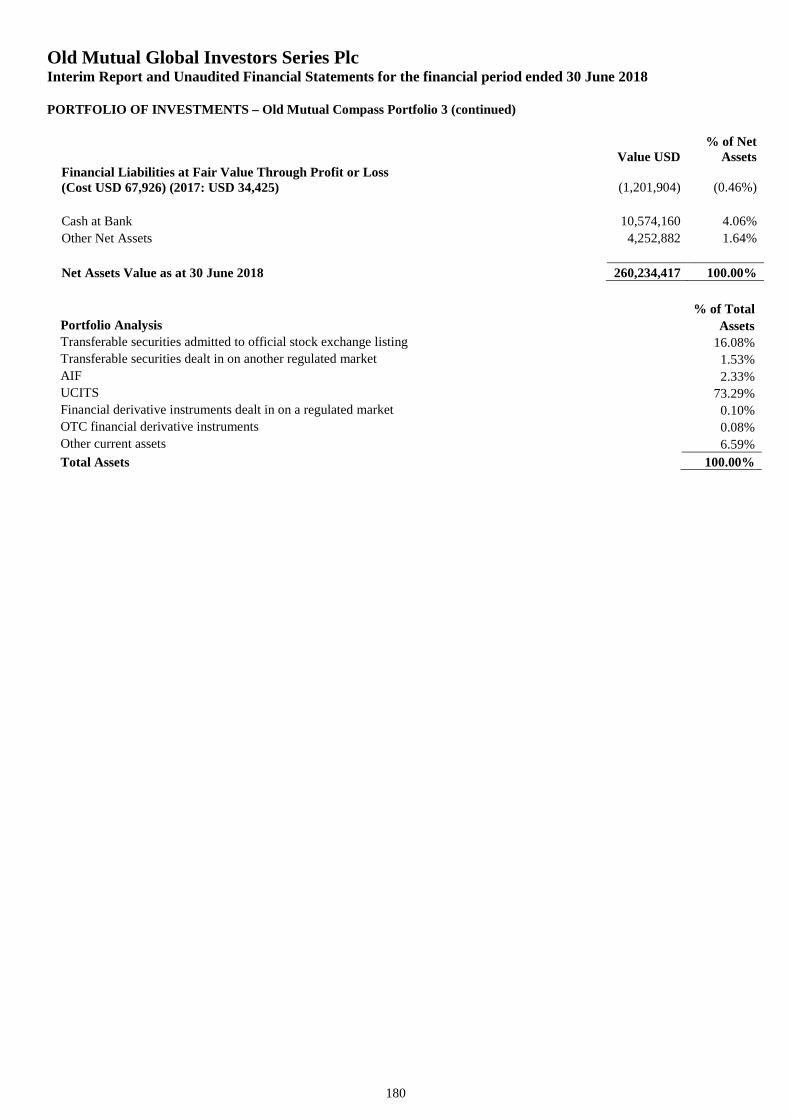
Old Mutual Global Investors Series PlcInterim Report and Unaudited Financial Statements for the financial period ended 30 June 2018
PORTFOLIO OF INVESTMENTS – Old Mutual Compass Portfolio 3 (continued)
180
Value USD% of Net
AssetsFinancial Liabilities at Fair Value Through Profit or Loss(Cost USD 67,926) (2017: USD 34,425) (1,201,904) (0.46%)
Cash at Bank 10,574,160 4.06%
Other Net Assets 4,252,882 1.64%
Net Assets Value as at 30 June 2018 260,234,417 100.00%
% of TotalPortfolio Analysis AssetsTransferable securities admitted to official stock exchange listing 16.08%Transferable securities dealt in on another regulated market 1.53%AIF 2.33%UCITS 73.29%Financial derivative instruments dealt in on a regulated market 0.10%OTC financial derivative instruments 0.08%Other current assets 6.59%
Total Assets 100.00%
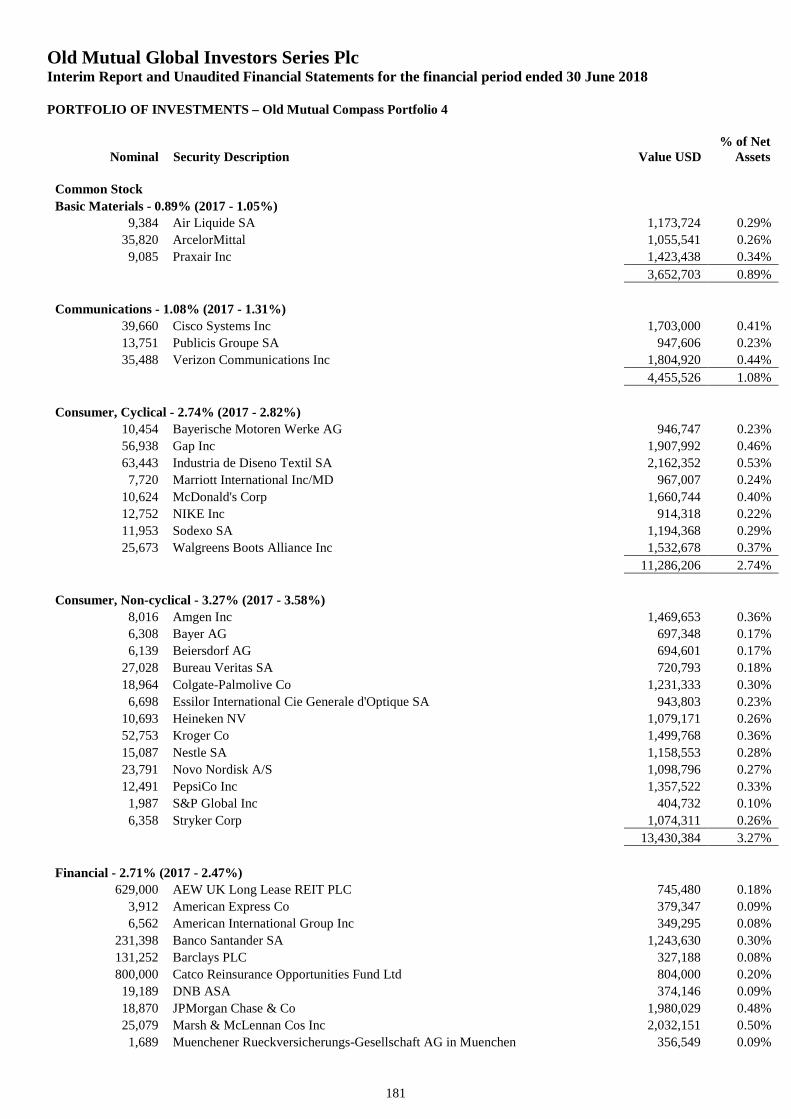
Old Mutual Global Investors Series PlcInterim Report and Unaudited Financial Statements for the financial period ended 30 June 2018
PORTFOLIO OF INVESTMENTS – Old Mutual Compass Portfolio 4
Nominal Security Description Value USD% of Net
Assets
181
Common Stock
Basic Materials - 0.89% (2017 - 1.05%)
9,384 Air Liquide SA 1,173,724 0.29%
35,820 ArcelorMittal 1,055,541 0.26%
9,085 Praxair Inc 1,423,438 0.34%
3,652,703 0.89%
Communications - 1.08% (2017 - 1.31%)
39,660 Cisco Systems Inc 1,703,000 0.41%
13,751 Publicis Groupe SA 947,606 0.23%
35,488 Verizon Communications Inc 1,804,920 0.44%
4,455,526 1.08%
Consumer, Cyclical - 2.74% (2017 - 2.82%)
10,454 Bayerische Motoren Werke AG 946,747 0.23%
56,938 Gap Inc 1,907,992 0.46%
63,443 Industria de Diseno Textil SA 2,162,352 0.53%
7,720 Marriott International Inc/MD 967,007 0.24%
10,624 McDonald's Corp 1,660,744 0.40%
12,752 NIKE Inc 914,318 0.22%
11,953 Sodexo SA 1,194,368 0.29%
25,673 Walgreens Boots Alliance Inc 1,532,678 0.37%
11,286,206 2.74%
Consumer, Non-cyclical - 3.27% (2017 - 3.58%)
8,016 Amgen Inc 1,469,653 0.36%
6,308 Bayer AG 697,348 0.17%
6,139 Beiersdorf AG 694,601 0.17%
27,028 Bureau Veritas SA 720,793 0.18%
18,964 Colgate-Palmolive Co 1,231,333 0.30%
6,698 Essilor International Cie Generale d'Optique SA 943,803 0.23%
10,693 Heineken NV 1,079,171 0.26%
52,753 Kroger Co 1,499,768 0.36%
15,087 Nestle SA 1,158,553 0.28%
23,791 Novo Nordisk A/S 1,098,796 0.27%
12,491 PepsiCo Inc 1,357,522 0.33%
1,987 S&P Global Inc 404,732 0.10%
6,358 Stryker Corp 1,074,311 0.26%
13,430,384 3.27%
Financial - 2.71% (2017 - 2.47%)
629,000 AEW UK Long Lease REIT PLC 745,480 0.18%
3,912 American Express Co 379,347 0.09%
6,562 American International Group Inc 349,295 0.08%
231,398 Banco Santander SA 1,243,630 0.30%
131,252 Barclays PLC 327,188 0.08%
800,000 Catco Reinsurance Opportunities Fund Ltd 804,000 0.20%
19,189 DNB ASA 374,146 0.09%
18,870 JPMorgan Chase & Co 1,980,029 0.48%
25,079 Marsh & McLennan Cos Inc 2,032,151 0.50%
1,689 Muenchener Rueckversicherungs-Gesellschaft AG in Muenchen 356,549 0.09%
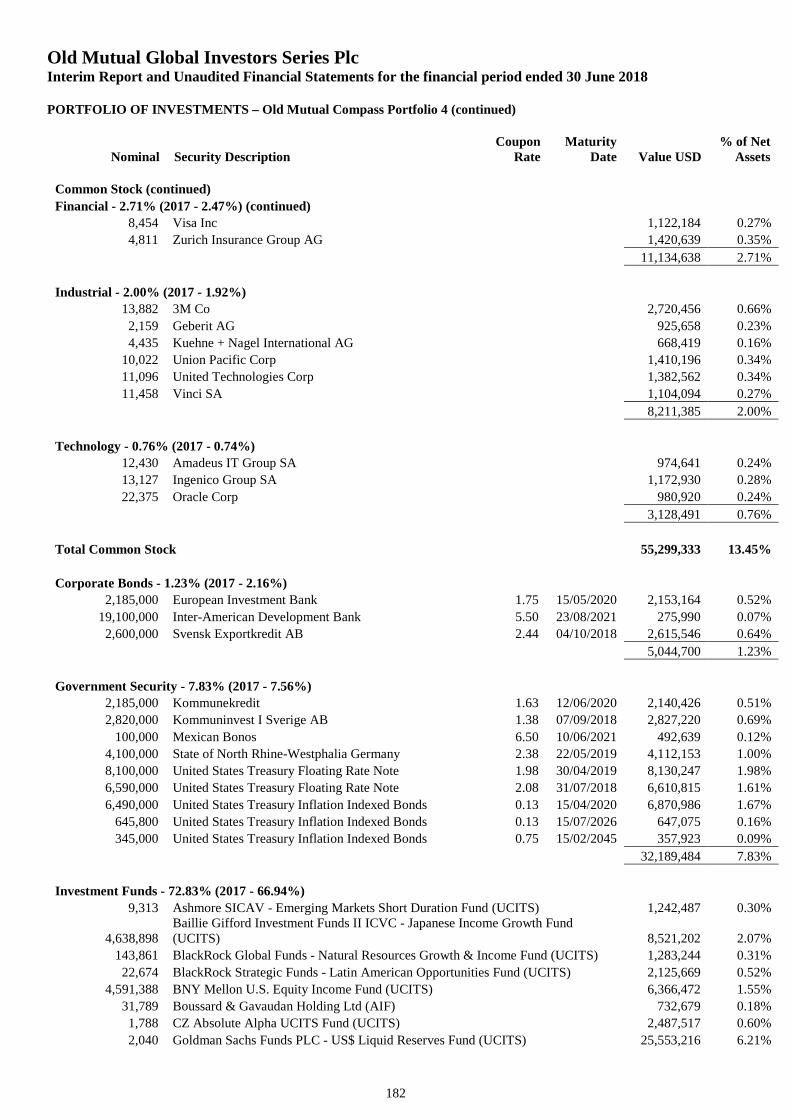
Old Mutual Global Investors Series PlcInterim Report and Unaudited Financial Statements for the financial period ended 30 June 2018
PORTFOLIO OF INVESTMENTS – Old Mutual Compass Portfolio 4 (continued)
Nominal Security DescriptionCoupon
RateMaturity
Date Value USD% of Net
Assets
182
Common Stock (continued)
Financial - 2.71% (2017 - 2.47%) (continued)
8,454 Visa Inc 1,122,184 0.27%
4,811 Zurich Insurance Group AG 1,420,639 0.35%
11,134,638 2.71%
Industrial - 2.00% (2017 - 1.92%)
13,882 3M Co 2,720,456 0.66%
2,159 Geberit AG 925,658 0.23%
4,435 Kuehne + Nagel International AG 668,419 0.16%
10,022 Union Pacific Corp 1,410,196 0.34%
11,096 United Technologies Corp 1,382,562 0.34%
11,458 Vinci SA 1,104,094 0.27%
8,211,385 2.00%
Technology - 0.76% (2017 - 0.74%)
12,430 Amadeus IT Group SA 974,641 0.24%
13,127 Ingenico Group SA 1,172,930 0.28%
22,375 Oracle Corp 980,920 0.24%
3,128,491 0.76%
Total Common Stock 55,299,333 13.45%
Corporate Bonds - 1.23% (2017 - 2.16%)
2,185,000 European Investment Bank 1.75 15/05/2020 2,153,164 0.52%
19,100,000 Inter-American Development Bank 5.50 23/08/2021 275,990 0.07%
2,600,000 Svensk Exportkredit AB 2.44 04/10/2018 2,615,546 0.64%
5,044,700 1.23%
Government Security - 7.83% (2017 - 7.56%)
2,185,000 Kommunekredit 1.63 12/06/2020 2,140,426 0.51%
2,820,000 Kommuninvest I Sverige AB 1.38 07/09/2018 2,827,220 0.69%
100,000 Mexican Bonos 6.50 10/06/2021 492,639 0.12%
4,100,000 State of North Rhine-Westphalia Germany 2.38 22/05/2019 4,112,153 1.00%
8,100,000 United States Treasury Floating Rate Note 1.98 30/04/2019 8,130,247 1.98%
6,590,000 United States Treasury Floating Rate Note 2.08 31/07/2018 6,610,815 1.61%
6,490,000 United States Treasury Inflation Indexed Bonds 0.13 15/04/2020 6,870,986 1.67%
645,800 United States Treasury Inflation Indexed Bonds 0.13 15/07/2026 647,075 0.16%
345,000 United States Treasury Inflation Indexed Bonds 0.75 15/02/2045 357,923 0.09%
32,189,484 7.83%
Investment Funds - 72.83% (2017 - 66.94%)
9,313 Ashmore SICAV - Emerging Markets Short Duration Fund (UCITS) 1,242,487 0.30%
4,638,898Baillie Gifford Investment Funds II ICVC - Japanese Income Growth Fund(UCITS) 8,521,202 2.07%
143,861 BlackRock Global Funds - Natural Resources Growth & Income Fund (UCITS) 1,283,244 0.31%
22,674 BlackRock Strategic Funds - Latin American Opportunities Fund (UCITS) 2,125,669 0.52%
4,591,388 BNY Mellon U.S. Equity Income Fund (UCITS) 6,366,472 1.55%
31,789 Boussard & Gavaudan Holding Ltd (AIF) 732,679 0.18%
1,788 CZ Absolute Alpha UCITS Fund (UCITS) 2,487,517 0.60%
2,040 Goldman Sachs Funds PLC - US$ Liquid Reserves Fund (UCITS) 25,553,216 6.21%
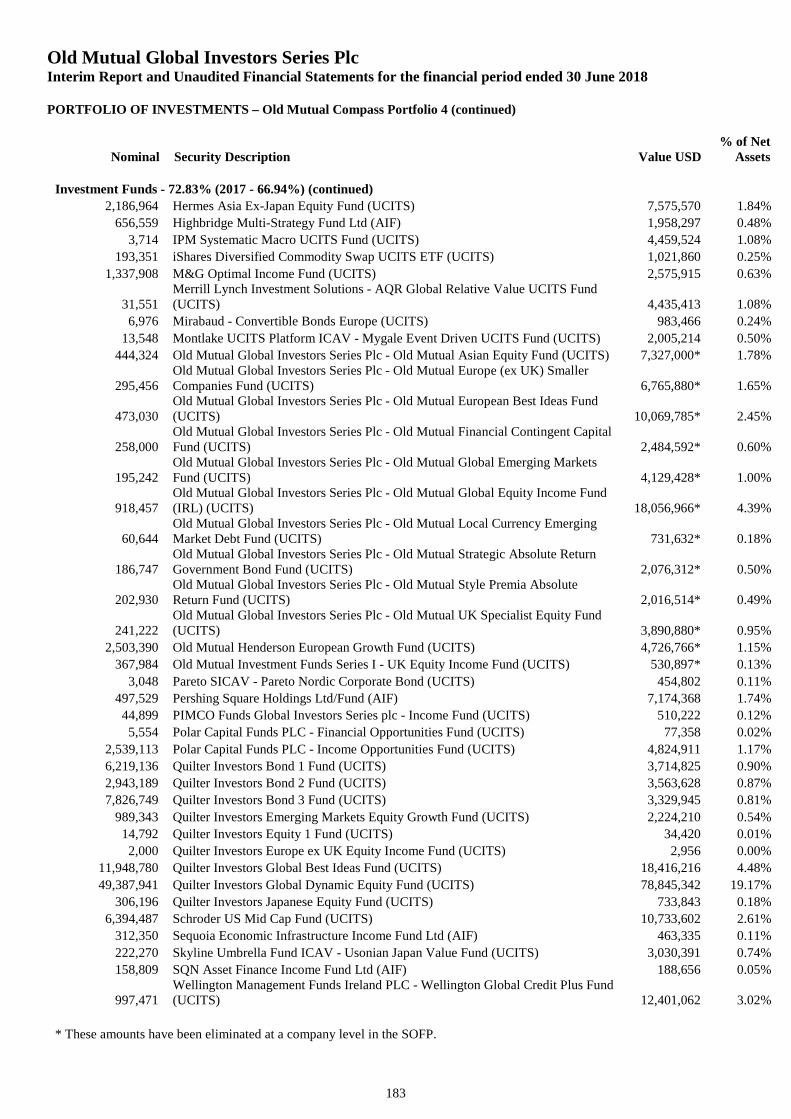
Old Mutual Global Investors Series PlcInterim Report and Unaudited Financial Statements for the financial period ended 30 June 2018
PORTFOLIO OF INVESTMENTS – Old Mutual Compass Portfolio 4 (continued)
Nominal Security Description Value USD% of Net
Assets
183
Investment Funds - 72.83% (2017 - 66.94%) (continued)
2,186,964 Hermes Asia Ex-Japan Equity Fund (UCITS) 7,575,570 1.84%
656,559 Highbridge Multi-Strategy Fund Ltd (AIF) 1,958,297 0.48%
3,714 IPM Systematic Macro UCITS Fund (UCITS) 4,459,524 1.08%
193,351 iShares Diversified Commodity Swap UCITS ETF (UCITS) 1,021,860 0.25%
1,337,908 M&G Optimal Income Fund (UCITS) 2,575,915 0.63%
31,551Merrill Lynch Investment Solutions - AQR Global Relative Value UCITS Fund(UCITS) 4,435,413 1.08%
6,976 Mirabaud - Convertible Bonds Europe (UCITS) 983,466 0.24%
13,548 Montlake UCITS Platform ICAV - Mygale Event Driven UCITS Fund (UCITS) 2,005,214 0.50%
444,324 Old Mutual Global Investors Series Plc - Old Mutual Asian Equity Fund (UCITS) 7,327,000* 1.78%
295,456Old Mutual Global Investors Series Plc - Old Mutual Europe (ex UK) SmallerCompanies Fund (UCITS) 6,765,880* 1.65%
473,030Old Mutual Global Investors Series Plc - Old Mutual European Best Ideas Fund(UCITS) 10,069,785* 2.45%
258,000Old Mutual Global Investors Series Plc - Old Mutual Financial Contingent CapitalFund (UCITS) 2,484,592* 0.60%
195,242Old Mutual Global Investors Series Plc - Old Mutual Global Emerging MarketsFund (UCITS) 4,129,428* 1.00%
918,457Old Mutual Global Investors Series Plc - Old Mutual Global Equity Income Fund(IRL) (UCITS) 18,056,966* 4.39%
60,644Old Mutual Global Investors Series Plc - Old Mutual Local Currency EmergingMarket Debt Fund (UCITS) 731,632* 0.18%
186,747Old Mutual Global Investors Series Plc - Old Mutual Strategic Absolute ReturnGovernment Bond Fund (UCITS) 2,076,312* 0.50%
202,930Old Mutual Global Investors Series Plc - Old Mutual Style Premia AbsoluteReturn Fund (UCITS) 2,016,514* 0.49%
241,222Old Mutual Global Investors Series Plc - Old Mutual UK Specialist Equity Fund(UCITS) 3,890,880* 0.95%
2,503,390 Old Mutual Henderson European Growth Fund (UCITS) 4,726,766* 1.15%
367,984 Old Mutual Investment Funds Series I - UK Equity Income Fund (UCITS) 530,897* 0.13%
3,048 Pareto SICAV - Pareto Nordic Corporate Bond (UCITS) 454,802 0.11%
497,529 Pershing Square Holdings Ltd/Fund (AIF) 7,174,368 1.74%
44,899 PIMCO Funds Global Investors Series plc - Income Fund (UCITS) 510,222 0.12%
5,554 Polar Capital Funds PLC - Financial Opportunities Fund (UCITS) 77,358 0.02%
2,539,113 Polar Capital Funds PLC - Income Opportunities Fund (UCITS) 4,824,911 1.17%
6,219,136 Quilter Investors Bond 1 Fund (UCITS) 3,714,825 0.90%
2,943,189 Quilter Investors Bond 2 Fund (UCITS) 3,563,628 0.87%
7,826,749 Quilter Investors Bond 3 Fund (UCITS) 3,329,945 0.81%
989,343 Quilter Investors Emerging Markets Equity Growth Fund (UCITS) 2,224,210 0.54%
14,792 Quilter Investors Equity 1 Fund (UCITS) 34,420 0.01%
2,000 Quilter Investors Europe ex UK Equity Income Fund (UCITS) 2,956 0.00%
11,948,780 Quilter Investors Global Best Ideas Fund (UCITS) 18,416,216 4.48%
49,387,941 Quilter Investors Global Dynamic Equity Fund (UCITS) 78,845,342 19.17%
306,196 Quilter Investors Japanese Equity Fund (UCITS) 733,843 0.18%
6,394,487 Schroder US Mid Cap Fund (UCITS) 10,733,602 2.61%
312,350 Sequoia Economic Infrastructure Income Fund Ltd (AIF) 463,335 0.11%
222,270 Skyline Umbrella Fund ICAV - Usonian Japan Value Fund (UCITS) 3,030,391 0.74%
158,809 SQN Asset Finance Income Fund Ltd (AIF) 188,656 0.05%
997,471Wellington Management Funds Ireland PLC - Wellington Global Credit Plus Fund(UCITS) 12,401,062 3.02%
* These amounts have been eliminated at a company level in the SOFP.
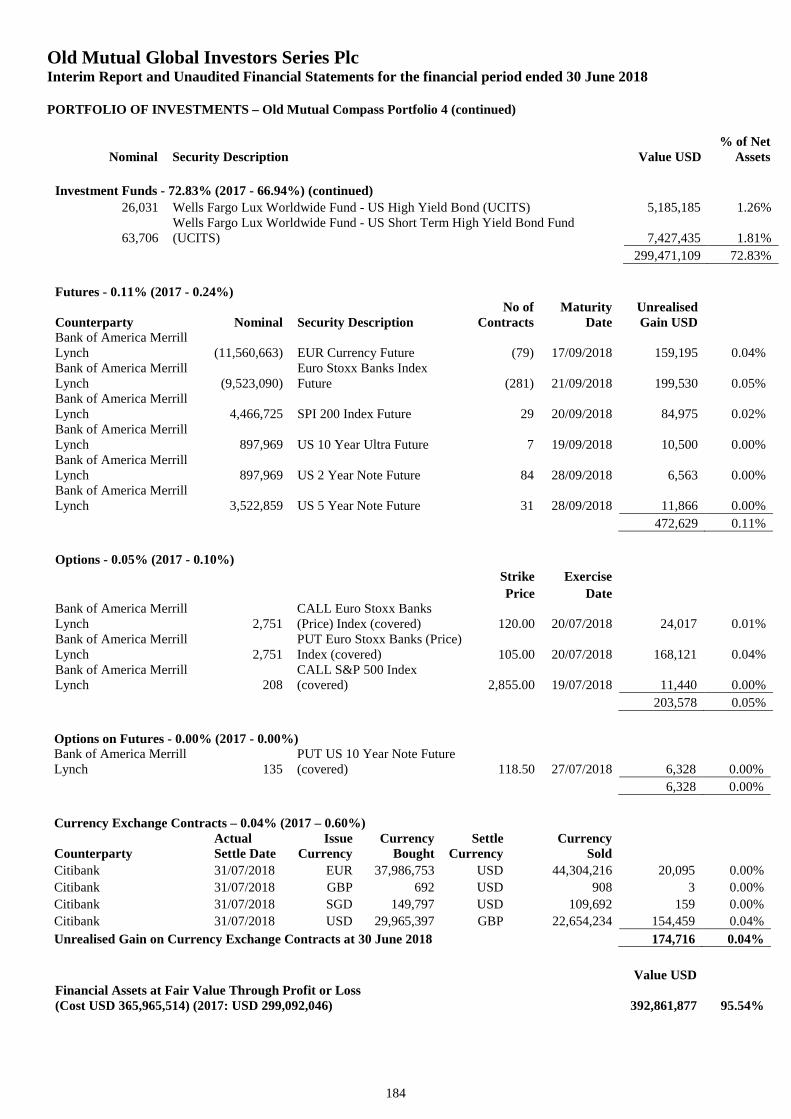
Old Mutual Global Investors Series PlcInterim Report and Unaudited Financial Statements for the financial period ended 30 June 2018
PORTFOLIO OF INVESTMENTS – Old Mutual Compass Portfolio 4 (continued)
Nominal Security Description Value USD% of Net
Assets
184
Investment Funds - 72.83% (2017 - 66.94%) (continued)
26,031 Wells Fargo Lux Worldwide Fund - US High Yield Bond (UCITS) 5,185,185 1.26%
63,706Wells Fargo Lux Worldwide Fund - US Short Term High Yield Bond Fund(UCITS) 7,427,435 1.81%
299,471,109 72.83%
Futures - 0.11% (2017 - 0.24%)
Counterparty Nominal Security DescriptionNo of
ContractsMaturity
DateUnrealisedGain USD
Bank of America MerrillLynch (11,560,663) EUR Currency Future (79) 17/09/2018 159,195 0.04%Bank of America MerrillLynch (9,523,090)
Euro Stoxx Banks IndexFuture (281) 21/09/2018 199,530 0.05%
Bank of America MerrillLynch 4,466,725 SPI 200 Index Future 29 20/09/2018 84,975 0.02%Bank of America MerrillLynch 897,969 US 10 Year Ultra Future 7 19/09/2018 10,500 0.00%Bank of America MerrillLynch 897,969 US 2 Year Note Future 84 28/09/2018 6,563 0.00%Bank of America MerrillLynch 3,522,859 US 5 Year Note Future 31 28/09/2018 11,866 0.00%
472,629 0.11%
Options - 0.05% (2017 - 0.10%)
Strike Exercise
Price DateBank of America MerrillLynch 2,751
CALL Euro Stoxx Banks(Price) Index (covered) 120.00 20/07/2018 24,017 0.01%
Bank of America MerrillLynch 2,751
PUT Euro Stoxx Banks (Price)Index (covered) 105.00 20/07/2018 168,121 0.04%
Bank of America MerrillLynch 208
CALL S&P 500 Index(covered) 2,855.00 19/07/2018 11,440 0.00%
203,578 0.05%
Options on Futures - 0.00% (2017 - 0.00%)Bank of America MerrillLynch 135
PUT US 10 Year Note Future(covered) 118.50 27/07/2018 6,328 0.00%
6,328 0.00%
Currency Exchange Contracts – 0.04% (2017 – 0.60%)
CounterpartyActualSettle Date
IssueCurrency
CurrencyBought
SettleCurrency
CurrencySold
Citibank 31/07/2018 EUR 37,986,753 USD 44,304,216 20,095 0.00%
Citibank 31/07/2018 GBP 692 USD 908 3 0.00%
Citibank 31/07/2018 SGD 149,797 USD 109,692 159 0.00%
Citibank 31/07/2018 USD 29,965,397 GBP 22,654,234 154,459 0.04%
Unrealised Gain on Currency Exchange Contracts at 30 June 2018 174,716 0.04%
Value USDFinancial Assets at Fair Value Through Profit or Loss(Cost USD 365,965,514) (2017: USD 299,092,046) 392,861,877 95.54%
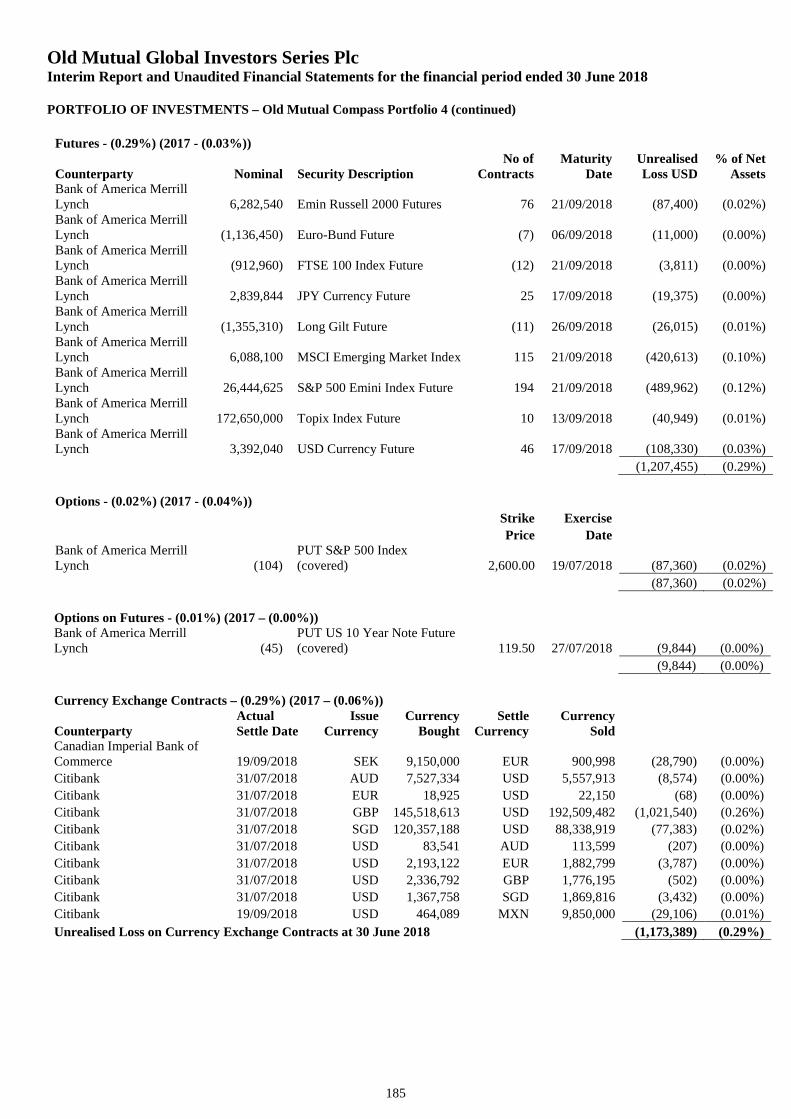
Old Mutual Global Investors Series PlcInterim Report and Unaudited Financial Statements for the financial period ended 30 June 2018
PORTFOLIO OF INVESTMENTS – Old Mutual Compass Portfolio 4 (continued)
185
Futures - (0.29%) (2017 - (0.03%))
Counterparty Nominal Security DescriptionNo of
ContractsMaturity
DateUnrealisedLoss USD
% of NetAssets
Bank of America MerrillLynch 6,282,540 Emin Russell 2000 Futures 76 21/09/2018 (87,400) (0.02%)Bank of America MerrillLynch (1,136,450) Euro-Bund Future (7) 06/09/2018 (11,000) (0.00%)Bank of America MerrillLynch (912,960) FTSE 100 Index Future (12) 21/09/2018 (3,811) (0.00%)Bank of America MerrillLynch 2,839,844 JPY Currency Future 25 17/09/2018 (19,375) (0.00%)Bank of America MerrillLynch (1,355,310) Long Gilt Future (11) 26/09/2018 (26,015) (0.01%)Bank of America MerrillLynch 6,088,100 MSCI Emerging Market Index 115 21/09/2018 (420,613) (0.10%)Bank of America MerrillLynch 26,444,625 S&P 500 Emini Index Future 194 21/09/2018 (489,962) (0.12%)Bank of America MerrillLynch 172,650,000 Topix Index Future 10 13/09/2018 (40,949) (0.01%)Bank of America MerrillLynch 3,392,040 USD Currency Future 46 17/09/2018 (108,330) (0.03%)
(1,207,455) (0.29%)
Options - (0.02%) (2017 - (0.04%))
Strike Exercise
Price DateBank of America MerrillLynch (104)
PUT S&P 500 Index(covered) 2,600.00 19/07/2018 (87,360) (0.02%)
(87,360) (0.02%)
Options on Futures - (0.01%) (2017 – (0.00%))Bank of America MerrillLynch (45)
PUT US 10 Year Note Future(covered) 119.50 27/07/2018 (9,844) (0.00%)
(9,844) (0.00%)
Currency Exchange Contracts – (0.29%) (2017 – (0.06%))
CounterpartyActualSettle Date
IssueCurrency
CurrencyBought
SettleCurrency
CurrencySold
Canadian Imperial Bank ofCommerce 19/09/2018 SEK 9,150,000 EUR 900,998 (28,790) (0.00%)
Citibank 31/07/2018 AUD 7,527,334 USD 5,557,913 (8,574) (0.00%)
Citibank 31/07/2018 EUR 18,925 USD 22,150 (68) (0.00%)
Citibank 31/07/2018 GBP 145,518,613 USD 192,509,482 (1,021,540) (0.26%)
Citibank 31/07/2018 SGD 120,357,188 USD 88,338,919 (77,383) (0.02%)
Citibank 31/07/2018 USD 83,541 AUD 113,599 (207) (0.00%)
Citibank 31/07/2018 USD 2,193,122 EUR 1,882,799 (3,787) (0.00%)
Citibank 31/07/2018 USD 2,336,792 GBP 1,776,195 (502) (0.00%)
Citibank 31/07/2018 USD 1,367,758 SGD 1,869,816 (3,432) (0.00%)
Citibank 19/09/2018 USD 464,089 MXN 9,850,000 (29,106) (0.01%)
Unrealised Loss on Currency Exchange Contracts at 30 June 2018 (1,173,389) (0.29%)

Old Mutual Global Investors Series PlcInterim Report and Unaudited Financial Statements for the financial period ended 30 June 2018
PORTFOLIO OF INVESTMENTS – Old Mutual Compass Portfolio 4 (continued)
186
Value USD% of Net
AssetsFinancial Liabilities at Fair Value Through Profit or Loss(Cost USD 116,327) (2017: USD 82,861) (2,478,048) (0.60%)
Cash at Bank 10,028,515 2.44%
Other Net Assets 10,800,524 2.62%
Net Assets Value as at 30 June 2018 411,212,868 100.00%
% of TotalPortfolio Analysis AssetsTransferable securities admitted to official stock exchange listing 20.52%Transferable securities dealt in on another regulated market 1.58%AIF 2.51%UCITS 69.02%Financial derivative instruments dealt in on a regulated market 0.16%OTC financial derivative instruments 0.04%Other current assets 6.17%
Total Assets 100.00%
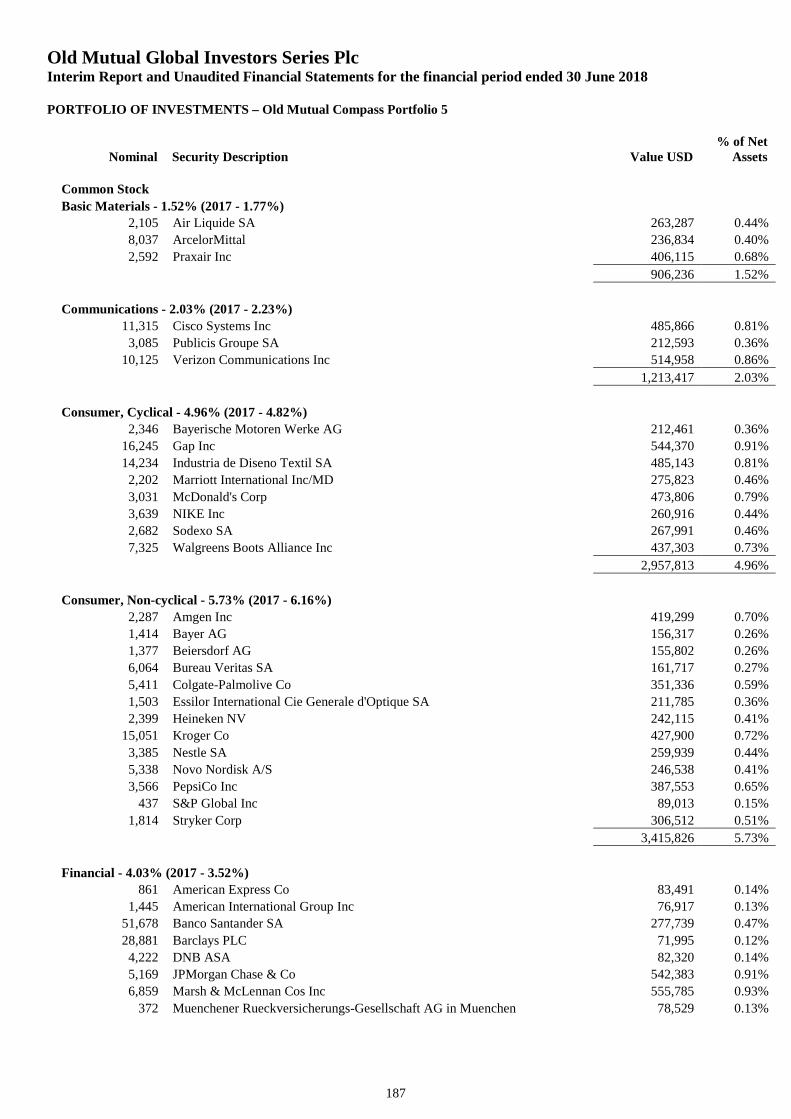
Old Mutual Global Investors Series PlcInterim Report and Unaudited Financial Statements for the financial period ended 30 June 2018
PORTFOLIO OF INVESTMENTS – Old Mutual Compass Portfolio 5
Nominal Security Description Value USD% of Net
Assets
187
Common Stock
Basic Materials - 1.52% (2017 - 1.77%)
2,105 Air Liquide SA 263,287 0.44%
8,037 ArcelorMittal 236,834 0.40%
2,592 Praxair Inc 406,115 0.68%
906,236 1.52%
Communications - 2.03% (2017 - 2.23%)
11,315 Cisco Systems Inc 485,866 0.81%
3,085 Publicis Groupe SA 212,593 0.36%
10,125 Verizon Communications Inc 514,958 0.86%
1,213,417 2.03%
Consumer, Cyclical - 4.96% (2017 - 4.82%)
2,346 Bayerische Motoren Werke AG 212,461 0.36%
16,245 Gap Inc 544,370 0.91%
14,234 Industria de Diseno Textil SA 485,143 0.81%
2,202 Marriott International Inc/MD 275,823 0.46%
3,031 McDonald's Corp 473,806 0.79%
3,639 NIKE Inc 260,916 0.44%
2,682 Sodexo SA 267,991 0.46%
7,325 Walgreens Boots Alliance Inc 437,303 0.73%
2,957,813 4.96%
Consumer, Non-cyclical - 5.73% (2017 - 6.16%)
2,287 Amgen Inc 419,299 0.70%
1,414 Bayer AG 156,317 0.26%
1,377 Beiersdorf AG 155,802 0.26%
6,064 Bureau Veritas SA 161,717 0.27%
5,411 Colgate-Palmolive Co 351,336 0.59%
1,503 Essilor International Cie Generale d'Optique SA 211,785 0.36%
2,399 Heineken NV 242,115 0.41%
15,051 Kroger Co 427,900 0.72%
3,385 Nestle SA 259,939 0.44%
5,338 Novo Nordisk A/S 246,538 0.41%
3,566 PepsiCo Inc 387,553 0.65%
437 S&P Global Inc 89,013 0.15%
1,814 Stryker Corp 306,512 0.51%
3,415,826 5.73%
Financial - 4.03% (2017 - 3.52%)
861 American Express Co 83,491 0.14%
1,445 American International Group Inc 76,917 0.13%
51,678 Banco Santander SA 277,739 0.47%
28,881 Barclays PLC 71,995 0.12%
4,222 DNB ASA 82,320 0.14%
5,169 JPMorgan Chase & Co 542,383 0.91%
6,859 Marsh & McLennan Cos Inc 555,785 0.93%
372 Muenchener Rueckversicherungs-Gesellschaft AG in Muenchen 78,529 0.13%
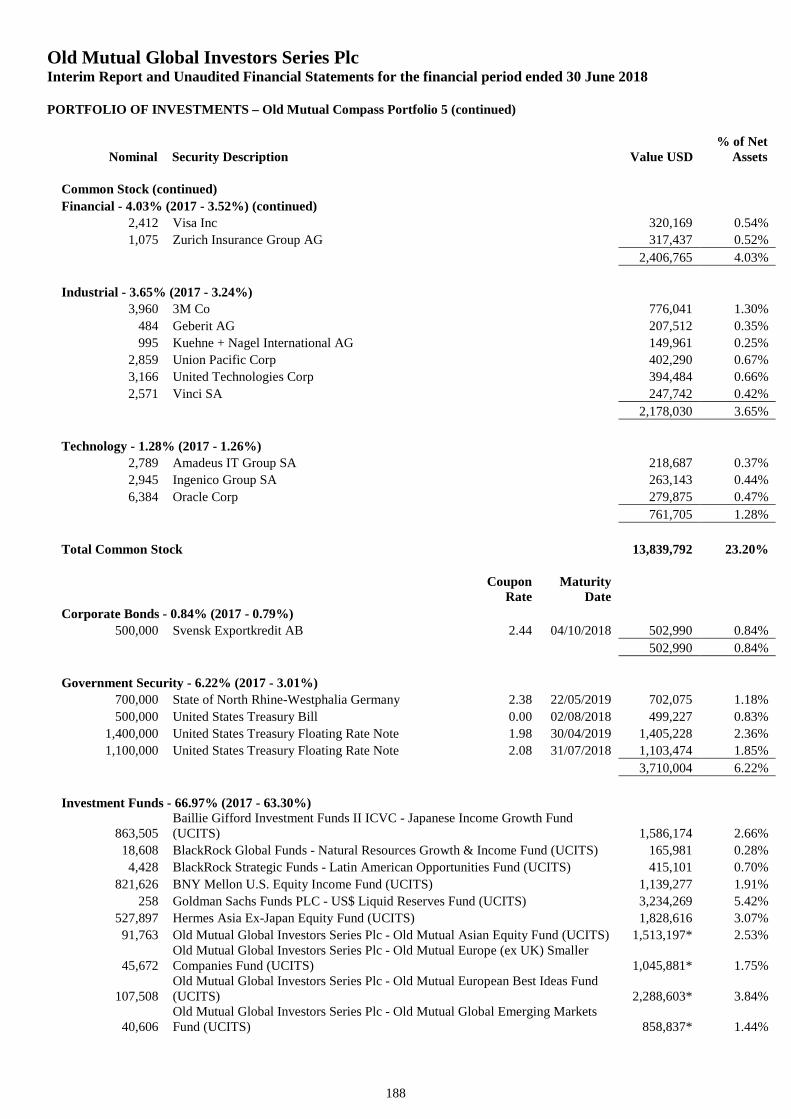
Old Mutual Global Investors Series PlcInterim Report and Unaudited Financial Statements for the financial period ended 30 June 2018
PORTFOLIO OF INVESTMENTS – Old Mutual Compass Portfolio 5 (continued)
Nominal Security Description Value USD% of Net
Assets
188
Common Stock (continued)
Financial - 4.03% (2017 - 3.52%) (continued)
2,412 Visa Inc 320,169 0.54%
1,075 Zurich Insurance Group AG 317,437 0.52%
2,406,765 4.03%
Industrial - 3.65% (2017 - 3.24%)
3,960 3M Co 776,041 1.30%
484 Geberit AG 207,512 0.35%
995 Kuehne + Nagel International AG 149,961 0.25%
2,859 Union Pacific Corp 402,290 0.67%
3,166 United Technologies Corp 394,484 0.66%
2,571 Vinci SA 247,742 0.42%
2,178,030 3.65%
Technology - 1.28% (2017 - 1.26%)
2,789 Amadeus IT Group SA 218,687 0.37%
2,945 Ingenico Group SA 263,143 0.44%
6,384 Oracle Corp 279,875 0.47%
761,705 1.28%
Total Common Stock 13,839,792 23.20%
CouponRate
MaturityDate
Corporate Bonds - 0.84% (2017 - 0.79%)
500,000 Svensk Exportkredit AB 2.44 04/10/2018 502,990 0.84%
502,990 0.84%
Government Security - 6.22% (2017 - 3.01%)
700,000 State of North Rhine-Westphalia Germany 2.38 22/05/2019 702,075 1.18%
500,000 United States Treasury Bill 0.00 02/08/2018 499,227 0.83%
1,400,000 United States Treasury Floating Rate Note 1.98 30/04/2019 1,405,228 2.36%
1,100,000 United States Treasury Floating Rate Note 2.08 31/07/2018 1,103,474 1.85%
3,710,004 6.22%
Investment Funds - 66.97% (2017 - 63.30%)
863,505Baillie Gifford Investment Funds II ICVC - Japanese Income Growth Fund(UCITS) 1,586,174 2.66%
18,608 BlackRock Global Funds - Natural Resources Growth & Income Fund (UCITS) 165,981 0.28%
4,428 BlackRock Strategic Funds - Latin American Opportunities Fund (UCITS) 415,101 0.70%
821,626 BNY Mellon U.S. Equity Income Fund (UCITS) 1,139,277 1.91%
258 Goldman Sachs Funds PLC - US$ Liquid Reserves Fund (UCITS) 3,234,269 5.42%
527,897 Hermes Asia Ex-Japan Equity Fund (UCITS) 1,828,616 3.07%
91,763 Old Mutual Global Investors Series Plc - Old Mutual Asian Equity Fund (UCITS) 1,513,197* 2.53%
45,672Old Mutual Global Investors Series Plc - Old Mutual Europe (ex UK) SmallerCompanies Fund (UCITS) 1,045,881* 1.75%
107,508Old Mutual Global Investors Series Plc - Old Mutual European Best Ideas Fund(UCITS) 2,288,603* 3.84%
40,606Old Mutual Global Investors Series Plc - Old Mutual Global Emerging MarketsFund (UCITS) 858,837* 1.44%
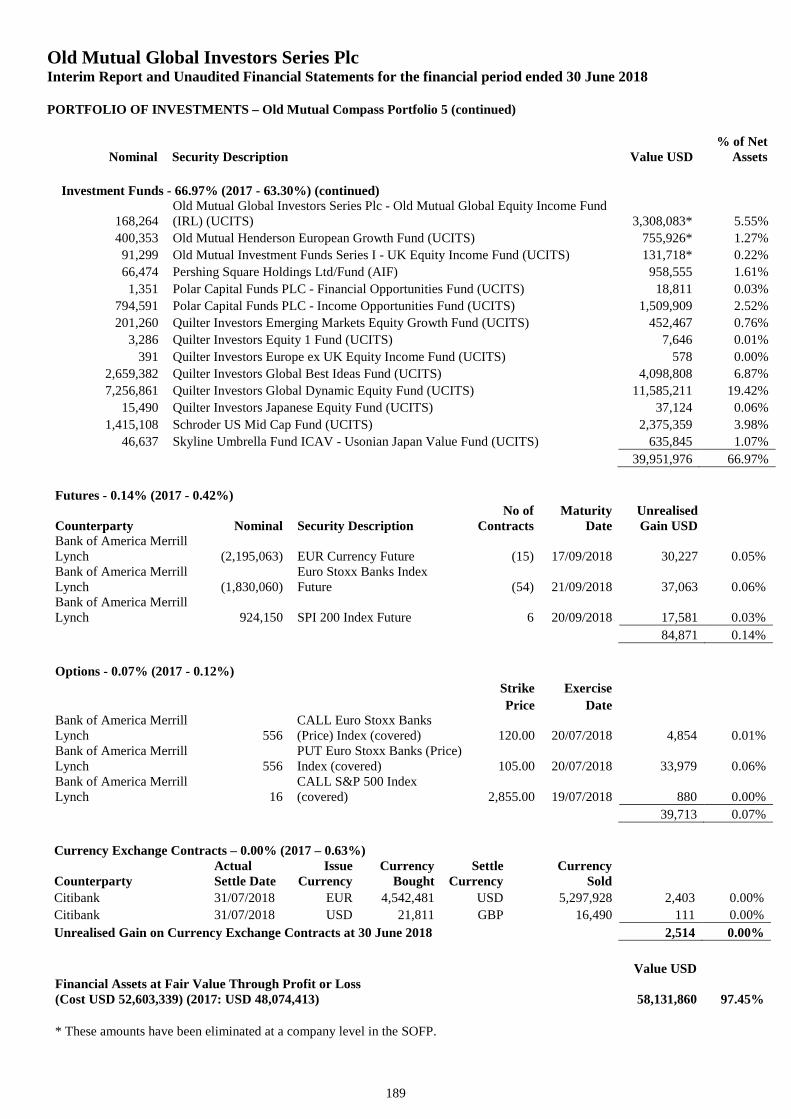
Old Mutual Global Investors Series PlcInterim Report and Unaudited Financial Statements for the financial period ended 30 June 2018
PORTFOLIO OF INVESTMENTS – Old Mutual Compass Portfolio 5 (continued)
Nominal Security Description Value USD% of Net
Assets
189
Investment Funds - 66.97% (2017 - 63.30%) (continued)
168,264Old Mutual Global Investors Series Plc - Old Mutual Global Equity Income Fund(IRL) (UCITS) 3,308,083* 5.55%
400,353 Old Mutual Henderson European Growth Fund (UCITS) 755,926* 1.27%
91,299 Old Mutual Investment Funds Series I - UK Equity Income Fund (UCITS) 131,718* 0.22%
66,474 Pershing Square Holdings Ltd/Fund (AIF) 958,555 1.61%
1,351 Polar Capital Funds PLC - Financial Opportunities Fund (UCITS) 18,811 0.03%
794,591 Polar Capital Funds PLC - Income Opportunities Fund (UCITS) 1,509,909 2.52%
201,260 Quilter Investors Emerging Markets Equity Growth Fund (UCITS) 452,467 0.76%
3,286 Quilter Investors Equity 1 Fund (UCITS) 7,646 0.01%
391 Quilter Investors Europe ex UK Equity Income Fund (UCITS) 578 0.00%
2,659,382 Quilter Investors Global Best Ideas Fund (UCITS) 4,098,808 6.87%
7,256,861 Quilter Investors Global Dynamic Equity Fund (UCITS) 11,585,211 19.42%
15,490 Quilter Investors Japanese Equity Fund (UCITS) 37,124 0.06%
1,415,108 Schroder US Mid Cap Fund (UCITS) 2,375,359 3.98%
46,637 Skyline Umbrella Fund ICAV - Usonian Japan Value Fund (UCITS) 635,845 1.07%
39,951,976 66.97%
Futures - 0.14% (2017 - 0.42%)
Counterparty Nominal Security DescriptionNo of
ContractsMaturity
DateUnrealisedGain USD
Bank of America MerrillLynch (2,195,063) EUR Currency Future (15) 17/09/2018 30,227 0.05%Bank of America MerrillLynch (1,830,060)
Euro Stoxx Banks IndexFuture (54) 21/09/2018 37,063 0.06%
Bank of America MerrillLynch 924,150 SPI 200 Index Future 6 20/09/2018 17,581 0.03%
84,871 0.14%
Options - 0.07% (2017 - 0.12%)
Strike Exercise
Price DateBank of America MerrillLynch 556
CALL Euro Stoxx Banks(Price) Index (covered) 120.00 20/07/2018 4,854 0.01%
Bank of America MerrillLynch 556
PUT Euro Stoxx Banks (Price)Index (covered) 105.00 20/07/2018 33,979 0.06%
Bank of America MerrillLynch 16
CALL S&P 500 Index(covered) 2,855.00 19/07/2018 880 0.00%
39,713 0.07%
Currency Exchange Contracts – 0.00% (2017 – 0.63%)
CounterpartyActualSettle Date
IssueCurrency
CurrencyBought
SettleCurrency
CurrencySold
Citibank 31/07/2018 EUR 4,542,481 USD 5,297,928 2,403 0.00%
Citibank 31/07/2018 USD 21,811 GBP 16,490 111 0.00%
Unrealised Gain on Currency Exchange Contracts at 30 June 2018 2,514 0.00%
Value USDFinancial Assets at Fair Value Through Profit or Loss(Cost USD 52,603,339) (2017: USD 48,074,413) 58,131,860 97.45%
* These amounts have been eliminated at a company level in the SOFP.
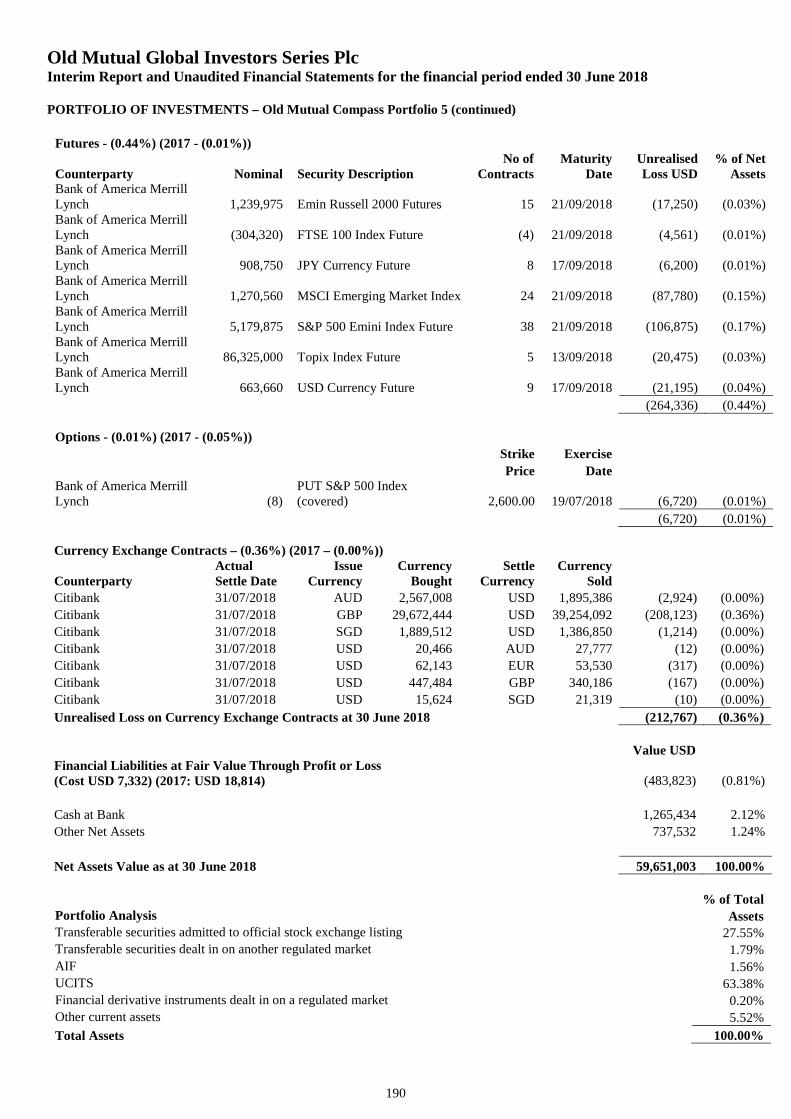
Old Mutual Global Investors Series PlcInterim Report and Unaudited Financial Statements for the financial period ended 30 June 2018
PORTFOLIO OF INVESTMENTS – Old Mutual Compass Portfolio 5 (continued)
190
Futures - (0.44%) (2017 - (0.01%))
Counterparty Nominal Security DescriptionNo of
ContractsMaturity
DateUnrealisedLoss USD
% of NetAssets
Bank of America MerrillLynch 1,239,975 Emin Russell 2000 Futures 15 21/09/2018 (17,250) (0.03%)Bank of America MerrillLynch (304,320) FTSE 100 Index Future (4) 21/09/2018 (4,561) (0.01%)Bank of America MerrillLynch 908,750 JPY Currency Future 8 17/09/2018 (6,200) (0.01%)Bank of America MerrillLynch 1,270,560 MSCI Emerging Market Index 24 21/09/2018 (87,780) (0.15%)Bank of America MerrillLynch 5,179,875 S&P 500 Emini Index Future 38 21/09/2018 (106,875) (0.17%)Bank of America MerrillLynch 86,325,000 Topix Index Future 5 13/09/2018 (20,475) (0.03%)Bank of America MerrillLynch 663,660 USD Currency Future 9 17/09/2018 (21,195) (0.04%)
(264,336) (0.44%)
Options - (0.01%) (2017 - (0.05%))
Strike Exercise
Price DateBank of America MerrillLynch (8)
PUT S&P 500 Index(covered) 2,600.00 19/07/2018 (6,720) (0.01%)
(6,720) (0.01%)
Currency Exchange Contracts – (0.36%) (2017 – (0.00%))
CounterpartyActualSettle Date
IssueCurrency
CurrencyBought
SettleCurrency
CurrencySold
Citibank 31/07/2018 AUD 2,567,008 USD 1,895,386 (2,924) (0.00%)
Citibank 31/07/2018 GBP 29,672,444 USD 39,254,092 (208,123) (0.36%)
Citibank 31/07/2018 SGD 1,889,512 USD 1,386,850 (1,214) (0.00%)
Citibank 31/07/2018 USD 20,466 AUD 27,777 (12) (0.00%)
Citibank 31/07/2018 USD 62,143 EUR 53,530 (317) (0.00%)
Citibank 31/07/2018 USD 447,484 GBP 340,186 (167) (0.00%)
Citibank 31/07/2018 USD 15,624 SGD 21,319 (10) (0.00%)
Unrealised Loss on Currency Exchange Contracts at 30 June 2018 (212,767) (0.36%)
Value USDFinancial Liabilities at Fair Value Through Profit or Loss(Cost USD 7,332) (2017: USD 18,814) (483,823) (0.81%)
Cash at Bank 1,265,434 2.12%
Other Net Assets 737,532 1.24%
Net Assets Value as at 30 June 2018 59,651,003 100.00%
% of TotalPortfolio Analysis AssetsTransferable securities admitted to official stock exchange listing 27.55%Transferable securities dealt in on another regulated market 1.79%AIF 1.56%UCITS 63.38%Financial derivative instruments dealt in on a regulated market 0.20%Other current assets 5.52%
Total Assets 100.00%
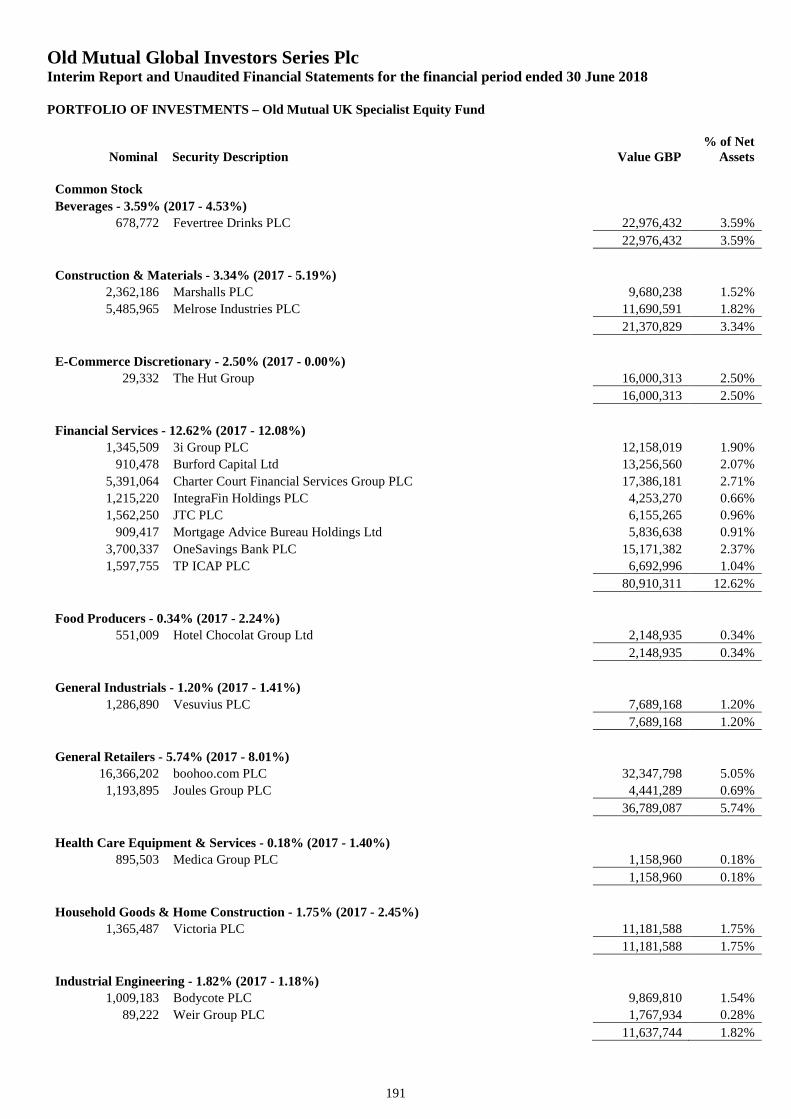
Old Mutual Global Investors Series PlcInterim Report and Unaudited Financial Statements for the financial period ended 30 June 2018
PORTFOLIO OF INVESTMENTS – Old Mutual UK Specialist Equity Fund
Nominal Security Description Value GBP% of Net
Assets
191
Common Stock
Beverages - 3.59% (2017 - 4.53%)
678,772 Fevertree Drinks PLC 22,976,432 3.59%
22,976,432 3.59%
Construction & Materials - 3.34% (2017 - 5.19%)
2,362,186 Marshalls PLC 9,680,238 1.52%
5,485,965 Melrose Industries PLC 11,690,591 1.82%
21,370,829 3.34%
E-Commerce Discretionary - 2.50% (2017 - 0.00%)
29,332 The Hut Group 16,000,313 2.50%
16,000,313 2.50%
Financial Services - 12.62% (2017 - 12.08%)
1,345,509 3i Group PLC 12,158,019 1.90%
910,478 Burford Capital Ltd 13,256,560 2.07%
5,391,064 Charter Court Financial Services Group PLC 17,386,181 2.71%
1,215,220 IntegraFin Holdings PLC 4,253,270 0.66%
1,562,250 JTC PLC 6,155,265 0.96%
909,417 Mortgage Advice Bureau Holdings Ltd 5,836,638 0.91%
3,700,337 OneSavings Bank PLC 15,171,382 2.37%
1,597,755 TP ICAP PLC 6,692,996 1.04%
80,910,311 12.62%
Food Producers - 0.34% (2017 - 2.24%)
551,009 Hotel Chocolat Group Ltd 2,148,935 0.34%
2,148,935 0.34%
General Industrials - 1.20% (2017 - 1.41%)
1,286,890 Vesuvius PLC 7,689,168 1.20%
7,689,168 1.20%
General Retailers - 5.74% (2017 - 8.01%)
16,366,202 boohoo.com PLC 32,347,798 5.05%
1,193,895 Joules Group PLC 4,441,289 0.69%
36,789,087 5.74%
Health Care Equipment & Services - 0.18% (2017 - 1.40%)
895,503 Medica Group PLC 1,158,960 0.18%
1,158,960 0.18%
Household Goods & Home Construction - 1.75% (2017 - 2.45%)
1,365,487 Victoria PLC 11,181,588 1.75%
11,181,588 1.75%
Industrial Engineering - 1.82% (2017 - 1.18%)
1,009,183 Bodycote PLC 9,869,810 1.54%
89,222 Weir Group PLC 1,767,934 0.28%
11,637,744 1.82%
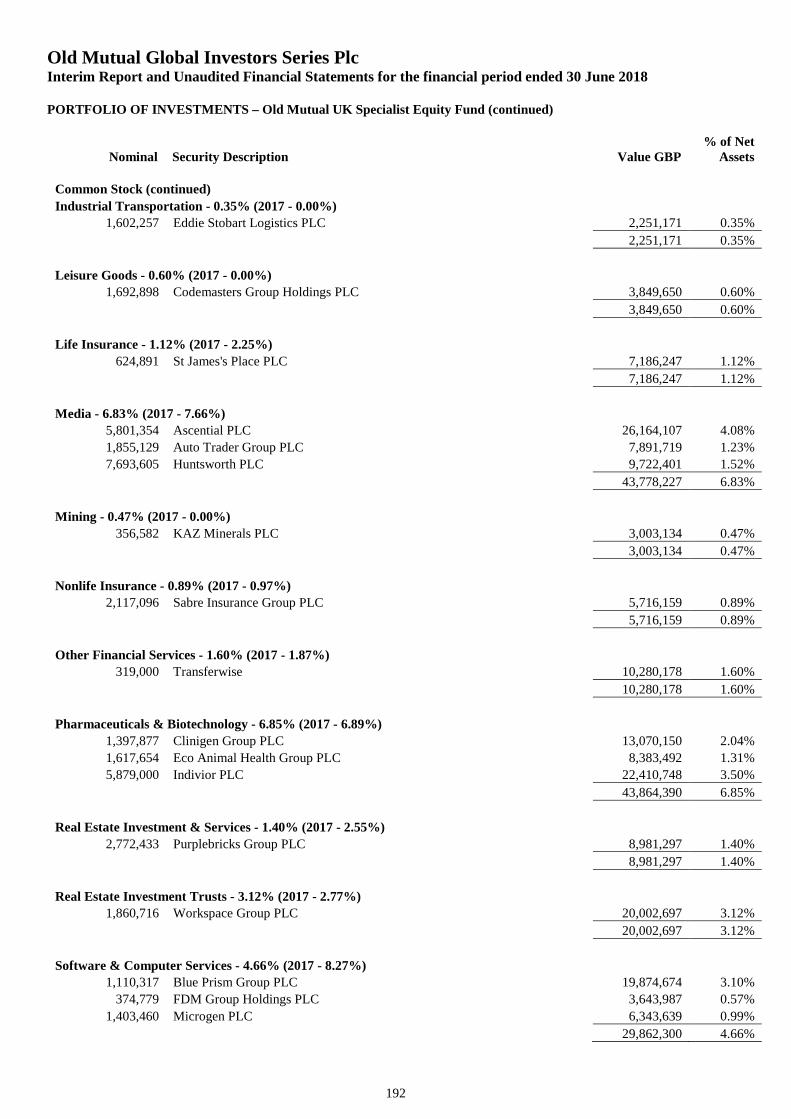
Old Mutual Global Investors Series PlcInterim Report and Unaudited Financial Statements for the financial period ended 30 June 2018
PORTFOLIO OF INVESTMENTS – Old Mutual UK Specialist Equity Fund (continued)
Nominal Security Description Value GBP% of Net
Assets
192
Common Stock (continued)
Industrial Transportation - 0.35% (2017 - 0.00%)
1,602,257 Eddie Stobart Logistics PLC 2,251,171 0.35%
2,251,171 0.35%
Leisure Goods - 0.60% (2017 - 0.00%)
1,692,898 Codemasters Group Holdings PLC 3,849,650 0.60%
3,849,650 0.60%
Life Insurance - 1.12% (2017 - 2.25%)
624,891 St James's Place PLC 7,186,247 1.12%
7,186,247 1.12%
Media - 6.83% (2017 - 7.66%)
5,801,354 Ascential PLC 26,164,107 4.08%
1,855,129 Auto Trader Group PLC 7,891,719 1.23%
7,693,605 Huntsworth PLC 9,722,401 1.52%
43,778,227 6.83%
Mining - 0.47% (2017 - 0.00%)
356,582 KAZ Minerals PLC 3,003,134 0.47%
3,003,134 0.47%
Nonlife Insurance - 0.89% (2017 - 0.97%)
2,117,096 Sabre Insurance Group PLC 5,716,159 0.89%
5,716,159 0.89%
Other Financial Services - 1.60% (2017 - 1.87%)
319,000 Transferwise 10,280,178 1.60%
10,280,178 1.60%
Pharmaceuticals & Biotechnology - 6.85% (2017 - 6.89%)
1,397,877 Clinigen Group PLC 13,070,150 2.04%
1,617,654 Eco Animal Health Group PLC 8,383,492 1.31%
5,879,000 Indivior PLC 22,410,748 3.50%
43,864,390 6.85%
Real Estate Investment & Services - 1.40% (2017 - 2.55%)
2,772,433 Purplebricks Group PLC 8,981,297 1.40%
8,981,297 1.40%
Real Estate Investment Trusts - 3.12% (2017 - 2.77%)
1,860,716 Workspace Group PLC 20,002,697 3.12%
20,002,697 3.12%
Software & Computer Services - 4.66% (2017 - 8.27%)
1,110,317 Blue Prism Group PLC 19,874,674 3.10%
374,779 FDM Group Holdings PLC 3,643,987 0.57%
1,403,460 Microgen PLC 6,343,639 0.99%
29,862,300 4.66%
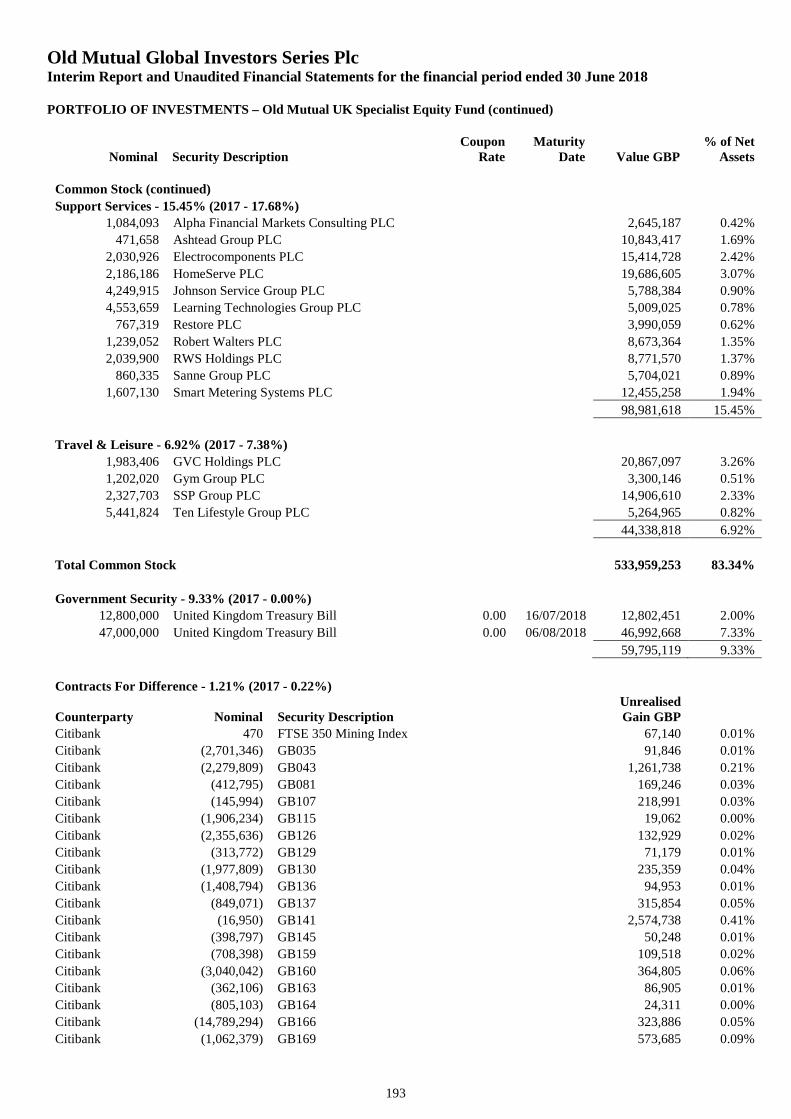
Old Mutual Global Investors Series PlcInterim Report and Unaudited Financial Statements for the financial period ended 30 June 2018
PORTFOLIO OF INVESTMENTS – Old Mutual UK Specialist Equity Fund (continued)
Nominal Security DescriptionCoupon
RateMaturity
Date Value GBP% of Net
Assets
193
Common Stock (continued)
Support Services - 15.45% (2017 - 17.68%)
1,084,093 Alpha Financial Markets Consulting PLC 2,645,187 0.42%
471,658 Ashtead Group PLC 10,843,417 1.69%
2,030,926 Electrocomponents PLC 15,414,728 2.42%
2,186,186 HomeServe PLC 19,686,605 3.07%
4,249,915 Johnson Service Group PLC 5,788,384 0.90%
4,553,659 Learning Technologies Group PLC 5,009,025 0.78%
767,319 Restore PLC 3,990,059 0.62%
1,239,052 Robert Walters PLC 8,673,364 1.35%
2,039,900 RWS Holdings PLC 8,771,570 1.37%
860,335 Sanne Group PLC 5,704,021 0.89%
1,607,130 Smart Metering Systems PLC 12,455,258 1.94%
98,981,618 15.45%
Travel & Leisure - 6.92% (2017 - 7.38%)
1,983,406 GVC Holdings PLC 20,867,097 3.26%
1,202,020 Gym Group PLC 3,300,146 0.51%
2,327,703 SSP Group PLC 14,906,610 2.33%
5,441,824 Ten Lifestyle Group PLC 5,264,965 0.82%
44,338,818 6.92%
Total Common Stock 533,959,253 83.34%
Government Security - 9.33% (2017 - 0.00%)
12,800,000 United Kingdom Treasury Bill 0.00 16/07/2018 12,802,451 2.00%
47,000,000 United Kingdom Treasury Bill 0.00 06/08/2018 46,992,668 7.33%
59,795,119 9.33%
Contracts For Difference - 1.21% (2017 - 0.22%)
Counterparty Nominal Security DescriptionUnrealisedGain GBP
Citibank 470 FTSE 350 Mining Index 67,140 0.01%
Citibank (2,701,346) GB035 91,846 0.01%
Citibank (2,279,809) GB043 1,261,738 0.21%
Citibank (412,795) GB081 169,246 0.03%
Citibank (145,994) GB107 218,991 0.03%
Citibank (1,906,234) GB115 19,062 0.00%
Citibank (2,355,636) GB126 132,929 0.02%
Citibank (313,772) GB129 71,179 0.01%
Citibank (1,977,809) GB130 235,359 0.04%
Citibank (1,408,794) GB136 94,953 0.01%
Citibank (849,071) GB137 315,854 0.05%
Citibank (16,950) GB141 2,574,738 0.41%
Citibank (398,797) GB145 50,248 0.01%
Citibank (708,398) GB159 109,518 0.02%
Citibank (3,040,042) GB160 364,805 0.06%
Citibank (362,106) GB163 86,905 0.01%
Citibank (805,103) GB164 24,311 0.00%
Citibank (14,789,294) GB166 323,886 0.05%
Citibank (1,062,379) GB169 573,685 0.09%
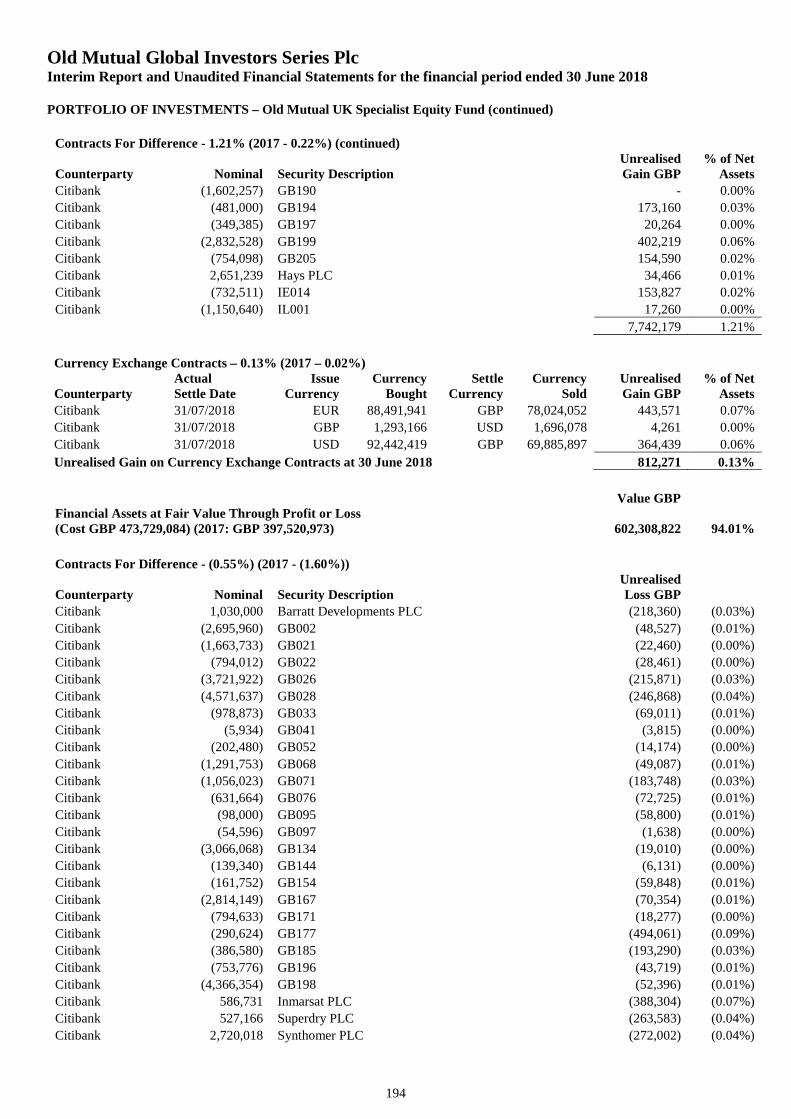
Old Mutual Global Investors Series PlcInterim Report and Unaudited Financial Statements for the financial period ended 30 June 2018
PORTFOLIO OF INVESTMENTS – Old Mutual UK Specialist Equity Fund (continued)
194
Contracts For Difference - 1.21% (2017 - 0.22%) (continued)
Counterparty Nominal Security DescriptionUnrealisedGain GBP
% of NetAssets
Citibank (1,602,257) GB190 - 0.00%
Citibank (481,000) GB194 173,160 0.03%
Citibank (349,385) GB197 20,264 0.00%
Citibank (2,832,528) GB199 402,219 0.06%
Citibank (754,098) GB205 154,590 0.02%
Citibank 2,651,239 Hays PLC 34,466 0.01%
Citibank (732,511) IE014 153,827 0.02%
Citibank (1,150,640) IL001 17,260 0.00%
7,742,179 1.21%
Currency Exchange Contracts – 0.13% (2017 – 0.02%)
CounterpartyActualSettle Date
IssueCurrency
CurrencyBought
SettleCurrency
CurrencySold
UnrealisedGain GBP
% of NetAssets
Citibank 31/07/2018 EUR 88,491,941 GBP 78,024,052 443,571 0.07%
Citibank 31/07/2018 GBP 1,293,166 USD 1,696,078 4,261 0.00%
Citibank 31/07/2018 USD 92,442,419 GBP 69,885,897 364,439 0.06%
Unrealised Gain on Currency Exchange Contracts at 30 June 2018 812,271 0.13%
Value GBPFinancial Assets at Fair Value Through Profit or Loss(Cost GBP 473,729,084) (2017: GBP 397,520,973) 602,308,822 94.01%
Contracts For Difference - (0.55%) (2017 - (1.60%))
Counterparty Nominal Security DescriptionUnrealisedLoss GBP
Citibank 1,030,000 Barratt Developments PLC (218,360) (0.03%)
Citibank (2,695,960) GB002 (48,527) (0.01%)
Citibank (1,663,733) GB021 (22,460) (0.00%)
Citibank (794,012) GB022 (28,461) (0.00%)
Citibank (3,721,922) GB026 (215,871) (0.03%)
Citibank (4,571,637) GB028 (246,868) (0.04%)
Citibank (978,873) GB033 (69,011) (0.01%)
Citibank (5,934) GB041 (3,815) (0.00%)
Citibank (202,480) GB052 (14,174) (0.00%)
Citibank (1,291,753) GB068 (49,087) (0.01%)
Citibank (1,056,023) GB071 (183,748) (0.03%)
Citibank (631,664) GB076 (72,725) (0.01%)
Citibank (98,000) GB095 (58,800) (0.01%)
Citibank (54,596) GB097 (1,638) (0.00%)
Citibank (3,066,068) GB134 (19,010) (0.00%)
Citibank (139,340) GB144 (6,131) (0.00%)
Citibank (161,752) GB154 (59,848) (0.01%)
Citibank (2,814,149) GB167 (70,354) (0.01%)
Citibank (794,633) GB171 (18,277) (0.00%)
Citibank (290,624) GB177 (494,061) (0.09%)
Citibank (386,580) GB185 (193,290) (0.03%)
Citibank (753,776) GB196 (43,719) (0.01%)
Citibank (4,366,354) GB198 (52,396) (0.01%)
Citibank 586,731 Inmarsat PLC (388,304) (0.07%)
Citibank 527,166 Superdry PLC (263,583) (0.04%)
Citibank 2,720,018 Synthomer PLC (272,002) (0.04%)
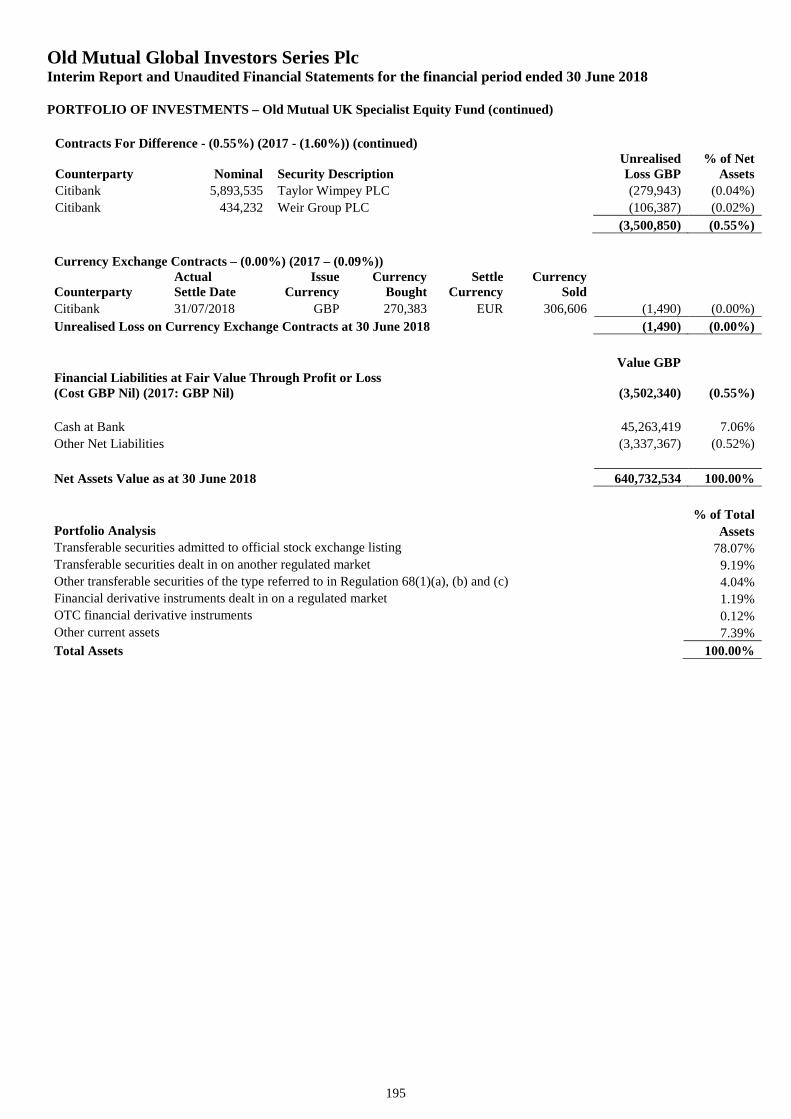
Old Mutual Global Investors Series PlcInterim Report and Unaudited Financial Statements for the financial period ended 30 June 2018
PORTFOLIO OF INVESTMENTS – Old Mutual UK Specialist Equity Fund (continued)
195
Contracts For Difference - (0.55%) (2017 - (1.60%)) (continued)
Counterparty Nominal Security DescriptionUnrealisedLoss GBP
% of NetAssets
Citibank 5,893,535 Taylor Wimpey PLC (279,943) (0.04%)
Citibank 434,232 Weir Group PLC (106,387) (0.02%)
(3,500,850) (0.55%)
Currency Exchange Contracts – (0.00%) (2017 – (0.09%))
CounterpartyActualSettle Date
IssueCurrency
CurrencyBought
SettleCurrency
CurrencySold
Citibank 31/07/2018 GBP 270,383 EUR 306,606 (1,490) (0.00%)
Unrealised Loss on Currency Exchange Contracts at 30 June 2018 (1,490) (0.00%)
Value GBPFinancial Liabilities at Fair Value Through Profit or Loss(Cost GBP Nil) (2017: GBP Nil) (3,502,340) (0.55%)
Cash at Bank 45,263,419 7.06%
Other Net Liabilities (3,337,367) (0.52%)
Net Assets Value as at 30 June 2018 640,732,534 100.00%
% of TotalPortfolio Analysis AssetsTransferable securities admitted to official stock exchange listing 78.07%Transferable securities dealt in on another regulated market 9.19%Other transferable securities of the type referred to in Regulation 68(1)(a), (b) and (c) 4.04%Financial derivative instruments dealt in on a regulated market 1.19%OTC financial derivative instruments 0.12%Other current assets 7.39%
Total Assets 100.00%
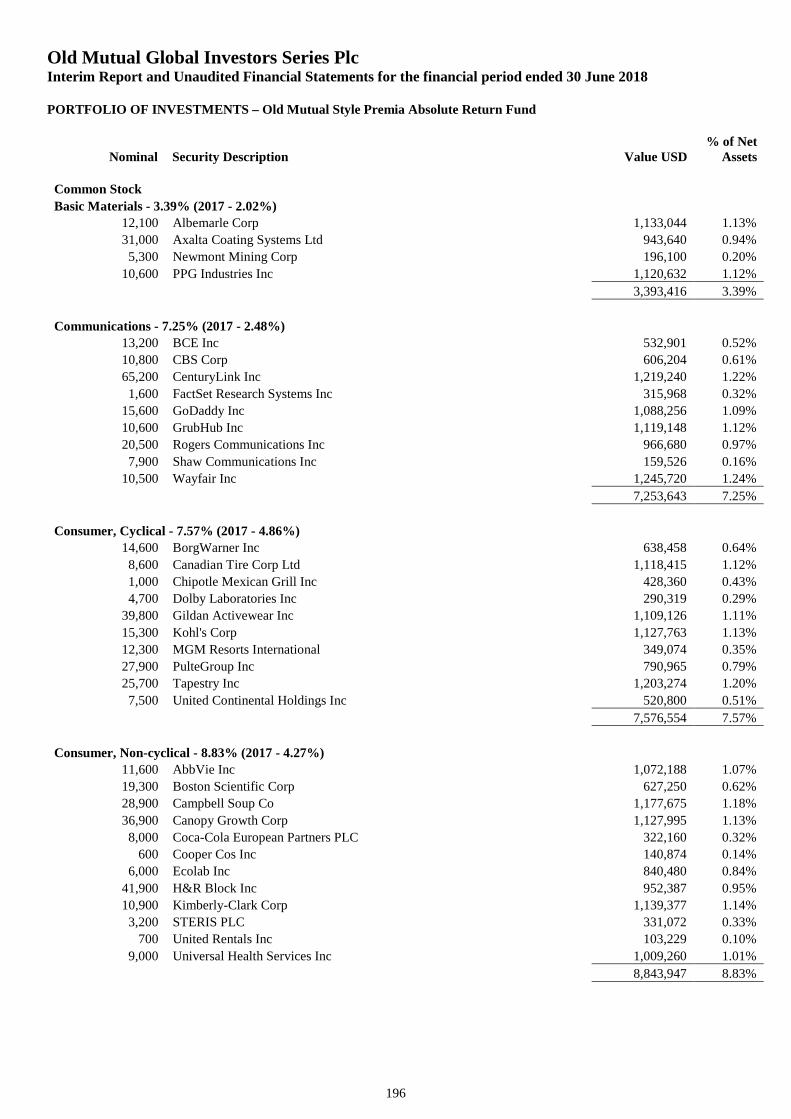
Old Mutual Global Investors Series PlcInterim Report and Unaudited Financial Statements for the financial period ended 30 June 2018
PORTFOLIO OF INVESTMENTS – Old Mutual Style Premia Absolute Return Fund
Nominal Security Description Value USD% of Net
Assets
196
Common Stock
Basic Materials - 3.39% (2017 - 2.02%)
12,100 Albemarle Corp 1,133,044 1.13%
31,000 Axalta Coating Systems Ltd 943,640 0.94%
5,300 Newmont Mining Corp 196,100 0.20%
10,600 PPG Industries Inc 1,120,632 1.12%
3,393,416 3.39%
Communications - 7.25% (2017 - 2.48%)
13,200 BCE Inc 532,901 0.52%
10,800 CBS Corp 606,204 0.61%
65,200 CenturyLink Inc 1,219,240 1.22%
1,600 FactSet Research Systems Inc 315,968 0.32%
15,600 GoDaddy Inc 1,088,256 1.09%
10,600 GrubHub Inc 1,119,148 1.12%
20,500 Rogers Communications Inc 966,680 0.97%
7,900 Shaw Communications Inc 159,526 0.16%
10,500 Wayfair Inc 1,245,720 1.24%
7,253,643 7.25%
Consumer, Cyclical - 7.57% (2017 - 4.86%)
14,600 BorgWarner Inc 638,458 0.64%
8,600 Canadian Tire Corp Ltd 1,118,415 1.12%
1,000 Chipotle Mexican Grill Inc 428,360 0.43%
4,700 Dolby Laboratories Inc 290,319 0.29%
39,800 Gildan Activewear Inc 1,109,126 1.11%
15,300 Kohl's Corp 1,127,763 1.13%
12,300 MGM Resorts International 349,074 0.35%
27,900 PulteGroup Inc 790,965 0.79%
25,700 Tapestry Inc 1,203,274 1.20%
7,500 United Continental Holdings Inc 520,800 0.51%
7,576,554 7.57%
Consumer, Non-cyclical - 8.83% (2017 - 4.27%)
11,600 AbbVie Inc 1,072,188 1.07%
19,300 Boston Scientific Corp 627,250 0.62%
28,900 Campbell Soup Co 1,177,675 1.18%
36,900 Canopy Growth Corp 1,127,995 1.13%
8,000 Coca-Cola European Partners PLC 322,160 0.32%
600 Cooper Cos Inc 140,874 0.14%
6,000 Ecolab Inc 840,480 0.84%
41,900 H&R Block Inc 952,387 0.95%
10,900 Kimberly-Clark Corp 1,139,377 1.14%
3,200 STERIS PLC 331,072 0.33%
700 United Rentals Inc 103,229 0.10%
9,000 Universal Health Services Inc 1,009,260 1.01%
8,843,947 8.83%
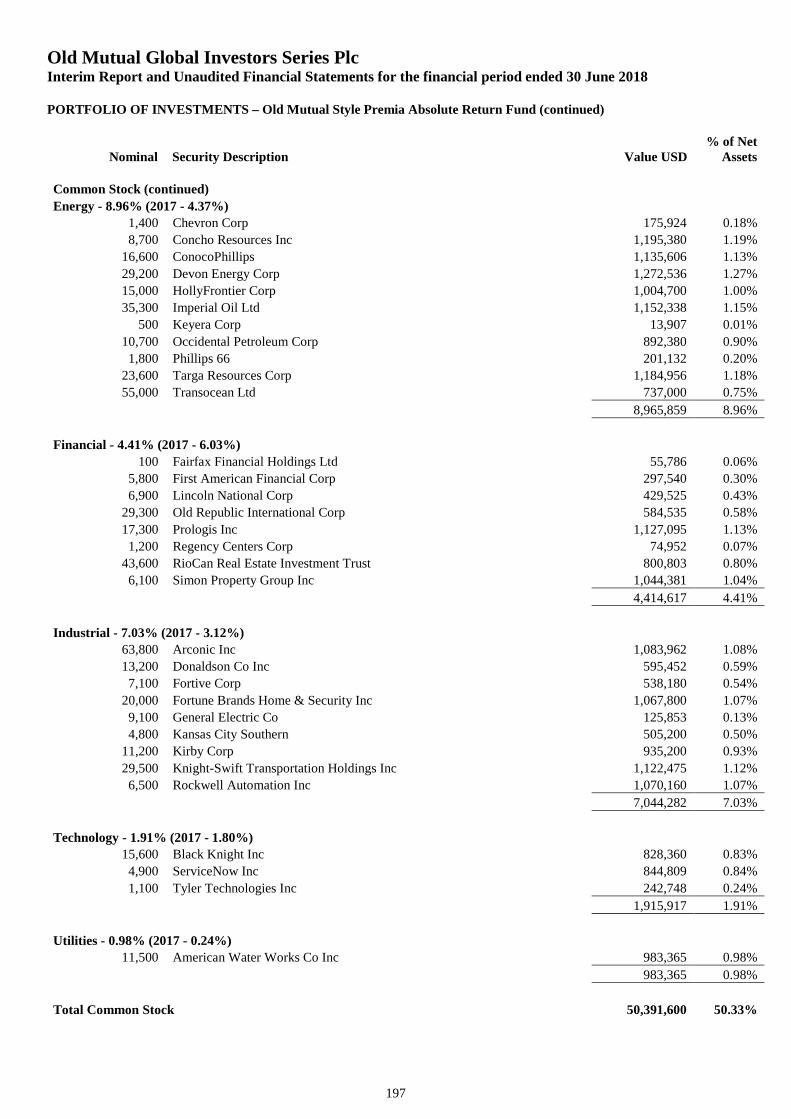
Old Mutual Global Investors Series PlcInterim Report and Unaudited Financial Statements for the financial period ended 30 June 2018
PORTFOLIO OF INVESTMENTS – Old Mutual Style Premia Absolute Return Fund (continued)
Nominal Security Description Value USD% of Net
Assets
197
Common Stock (continued)
Energy - 8.96% (2017 - 4.37%)
1,400 Chevron Corp 175,924 0.18%
8,700 Concho Resources Inc 1,195,380 1.19%
16,600 ConocoPhillips 1,135,606 1.13%
29,200 Devon Energy Corp 1,272,536 1.27%
15,000 HollyFrontier Corp 1,004,700 1.00%
35,300 Imperial Oil Ltd 1,152,338 1.15%
500 Keyera Corp 13,907 0.01%
10,700 Occidental Petroleum Corp 892,380 0.90%
1,800 Phillips 66 201,132 0.20%
23,600 Targa Resources Corp 1,184,956 1.18%
55,000 Transocean Ltd 737,000 0.75%
8,965,859 8.96%
Financial - 4.41% (2017 - 6.03%)
100 Fairfax Financial Holdings Ltd 55,786 0.06%
5,800 First American Financial Corp 297,540 0.30%
6,900 Lincoln National Corp 429,525 0.43%
29,300 Old Republic International Corp 584,535 0.58%
17,300 Prologis Inc 1,127,095 1.13%
1,200 Regency Centers Corp 74,952 0.07%
43,600 RioCan Real Estate Investment Trust 800,803 0.80%
6,100 Simon Property Group Inc 1,044,381 1.04%
4,414,617 4.41%
Industrial - 7.03% (2017 - 3.12%)
63,800 Arconic Inc 1,083,962 1.08%
13,200 Donaldson Co Inc 595,452 0.59%
7,100 Fortive Corp 538,180 0.54%
20,000 Fortune Brands Home & Security Inc 1,067,800 1.07%
9,100 General Electric Co 125,853 0.13%
4,800 Kansas City Southern 505,200 0.50%
11,200 Kirby Corp 935,200 0.93%
29,500 Knight-Swift Transportation Holdings Inc 1,122,475 1.12%
6,500 Rockwell Automation Inc 1,070,160 1.07%
7,044,282 7.03%
Technology - 1.91% (2017 - 1.80%)
15,600 Black Knight Inc 828,360 0.83%
4,900 ServiceNow Inc 844,809 0.84%
1,100 Tyler Technologies Inc 242,748 0.24%
1,915,917 1.91%
Utilities - 0.98% (2017 - 0.24%)
11,500 American Water Works Co Inc 983,365 0.98%
983,365 0.98%
Total Common Stock 50,391,600 50.33%
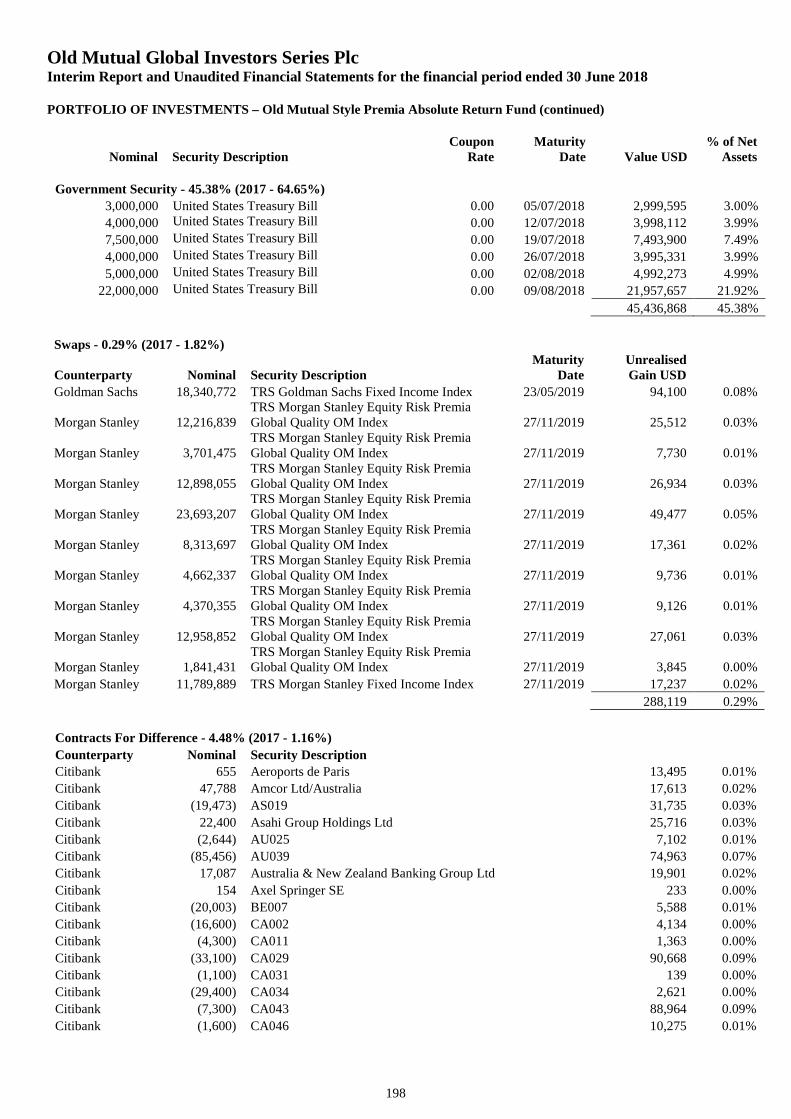
Old Mutual Global Investors Series PlcInterim Report and Unaudited Financial Statements for the financial period ended 30 June 2018
PORTFOLIO OF INVESTMENTS – Old Mutual Style Premia Absolute Return Fund (continued)
Nominal Security DescriptionCoupon
RateMaturity
Date Value USD% of Net
Assets
198
Government Security - 45.38% (2017 - 64.65%)
3,000,000 United States Treasury Bill 0.00 05/07/2018 2,999,595 3.00%
4,000,000 United States Treasury Bill 0.00 12/07/2018 3,998,112 3.99%
7,500,000 United States Treasury Bill 0.00 19/07/2018 7,493,900 7.49%
4,000,000 United States Treasury Bill 0.00 26/07/2018 3,995,331 3.99%
5,000,000 United States Treasury Bill 0.00 02/08/2018 4,992,273 4.99%
22,000,000 United States Treasury Bill 0.00 09/08/2018 21,957,657 21.92%
45,436,868 45.38%
Swaps - 0.29% (2017 - 1.82%)
Counterparty Nominal Security DescriptionMaturity
DateUnrealisedGain USD
Goldman Sachs 18,340,772 TRS Goldman Sachs Fixed Income Index 23/05/2019 94,100 0.08%
Morgan Stanley 12,216,839TRS Morgan Stanley Equity Risk PremiaGlobal Quality OM Index 27/11/2019 25,512 0.03%
Morgan Stanley 3,701,475TRS Morgan Stanley Equity Risk PremiaGlobal Quality OM Index 27/11/2019 7,730 0.01%
Morgan Stanley 12,898,055TRS Morgan Stanley Equity Risk PremiaGlobal Quality OM Index 27/11/2019 26,934 0.03%
Morgan Stanley 23,693,207TRS Morgan Stanley Equity Risk PremiaGlobal Quality OM Index 27/11/2019 49,477 0.05%
Morgan Stanley 8,313,697TRS Morgan Stanley Equity Risk PremiaGlobal Quality OM Index 27/11/2019 17,361 0.02%
Morgan Stanley 4,662,337TRS Morgan Stanley Equity Risk PremiaGlobal Quality OM Index 27/11/2019 9,736 0.01%
Morgan Stanley 4,370,355TRS Morgan Stanley Equity Risk PremiaGlobal Quality OM Index 27/11/2019 9,126 0.01%
Morgan Stanley 12,958,852TRS Morgan Stanley Equity Risk PremiaGlobal Quality OM Index 27/11/2019 27,061 0.03%
Morgan Stanley 1,841,431TRS Morgan Stanley Equity Risk PremiaGlobal Quality OM Index 27/11/2019 3,845 0.00%
Morgan Stanley 11,789,889 TRS Morgan Stanley Fixed Income Index 27/11/2019 17,237 0.02%
288,119 0.29%
Contracts For Difference - 4.48% (2017 - 1.16%)
Counterparty Nominal Security Description
Citibank 655 Aeroports de Paris 13,495 0.01%
Citibank 47,788 Amcor Ltd/Australia 17,613 0.02%
Citibank (19,473) AS019 31,735 0.03%
Citibank 22,400 Asahi Group Holdings Ltd 25,716 0.03%
Citibank (2,644) AU025 7,102 0.01%
Citibank (85,456) AU039 74,963 0.07%
Citibank 17,087 Australia & New Zealand Banking Group Ltd 19,901 0.02%
Citibank 154 Axel Springer SE 233 0.00%
Citibank (20,003) BE007 5,588 0.01%
Citibank (16,600) CA002 4,134 0.00%
Citibank (4,300) CA011 1,363 0.00%
Citibank (33,100) CA029 90,668 0.09%
Citibank (1,100) CA031 139 0.00%
Citibank (29,400) CA034 2,621 0.00%
Citibank (7,300) CA043 88,964 0.09%
Citibank (1,600) CA046 10,275 0.01%
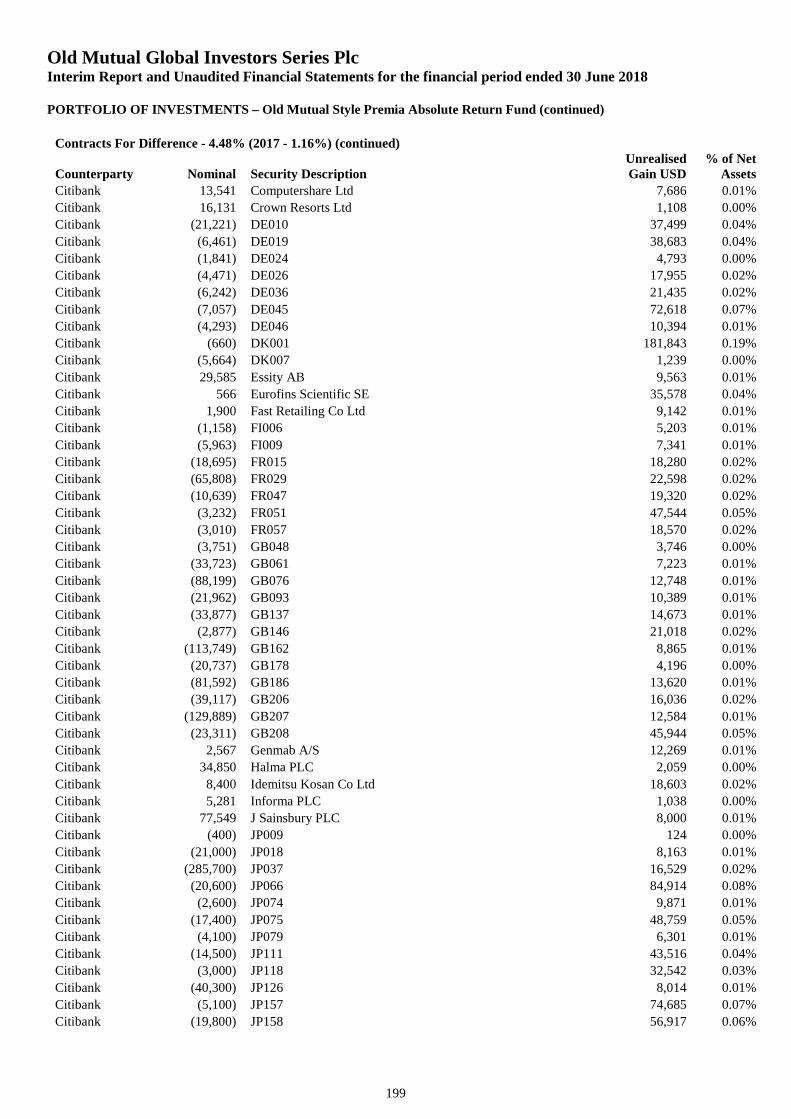
Old Mutual Global Investors Series PlcInterim Report and Unaudited Financial Statements for the financial period ended 30 June 2018
PORTFOLIO OF INVESTMENTS – Old Mutual Style Premia Absolute Return Fund (continued)
199
Contracts For Difference - 4.48% (2017 - 1.16%) (continued)
Counterparty Nominal Security DescriptionUnrealisedGain USD
% of NetAssets
Citibank 13,541 Computershare Ltd 7,686 0.01%
Citibank 16,131 Crown Resorts Ltd 1,108 0.00%
Citibank (21,221) DE010 37,499 0.04%
Citibank (6,461) DE019 38,683 0.04%
Citibank (1,841) DE024 4,793 0.00%
Citibank (4,471) DE026 17,955 0.02%
Citibank (6,242) DE036 21,435 0.02%
Citibank (7,057) DE045 72,618 0.07%
Citibank (4,293) DE046 10,394 0.01%
Citibank (660) DK001 181,843 0.19%
Citibank (5,664) DK007 1,239 0.00%
Citibank 29,585 Essity AB 9,563 0.01%
Citibank 566 Eurofins Scientific SE 35,578 0.04%
Citibank 1,900 Fast Retailing Co Ltd 9,142 0.01%
Citibank (1,158) FI006 5,203 0.01%
Citibank (5,963) FI009 7,341 0.01%
Citibank (18,695) FR015 18,280 0.02%
Citibank (65,808) FR029 22,598 0.02%
Citibank (10,639) FR047 19,320 0.02%
Citibank (3,232) FR051 47,544 0.05%
Citibank (3,010) FR057 18,570 0.02%
Citibank (3,751) GB048 3,746 0.00%
Citibank (33,723) GB061 7,223 0.01%
Citibank (88,199) GB076 12,748 0.01%
Citibank (21,962) GB093 10,389 0.01%
Citibank (33,877) GB137 14,673 0.01%
Citibank (2,877) GB146 21,018 0.02%
Citibank (113,749) GB162 8,865 0.01%
Citibank (20,737) GB178 4,196 0.00%
Citibank (81,592) GB186 13,620 0.01%
Citibank (39,117) GB206 16,036 0.02%
Citibank (129,889) GB207 12,584 0.01%
Citibank (23,311) GB208 45,944 0.05%
Citibank 2,567 Genmab A/S 12,269 0.01%
Citibank 34,850 Halma PLC 2,059 0.00%
Citibank 8,400 Idemitsu Kosan Co Ltd 18,603 0.02%
Citibank 5,281 Informa PLC 1,038 0.00%
Citibank 77,549 J Sainsbury PLC 8,000 0.01%
Citibank (400) JP009 124 0.00%
Citibank (21,000) JP018 8,163 0.01%
Citibank (285,700) JP037 16,529 0.02%
Citibank (20,600) JP066 84,914 0.08%
Citibank (2,600) JP074 9,871 0.01%
Citibank (17,400) JP075 48,759 0.05%
Citibank (4,100) JP079 6,301 0.01%
Citibank (14,500) JP111 43,516 0.04%
Citibank (3,000) JP118 32,542 0.03%
Citibank (40,300) JP126 8,014 0.01%
Citibank (5,100) JP157 74,685 0.07%
Citibank (19,800) JP158 56,917 0.06%
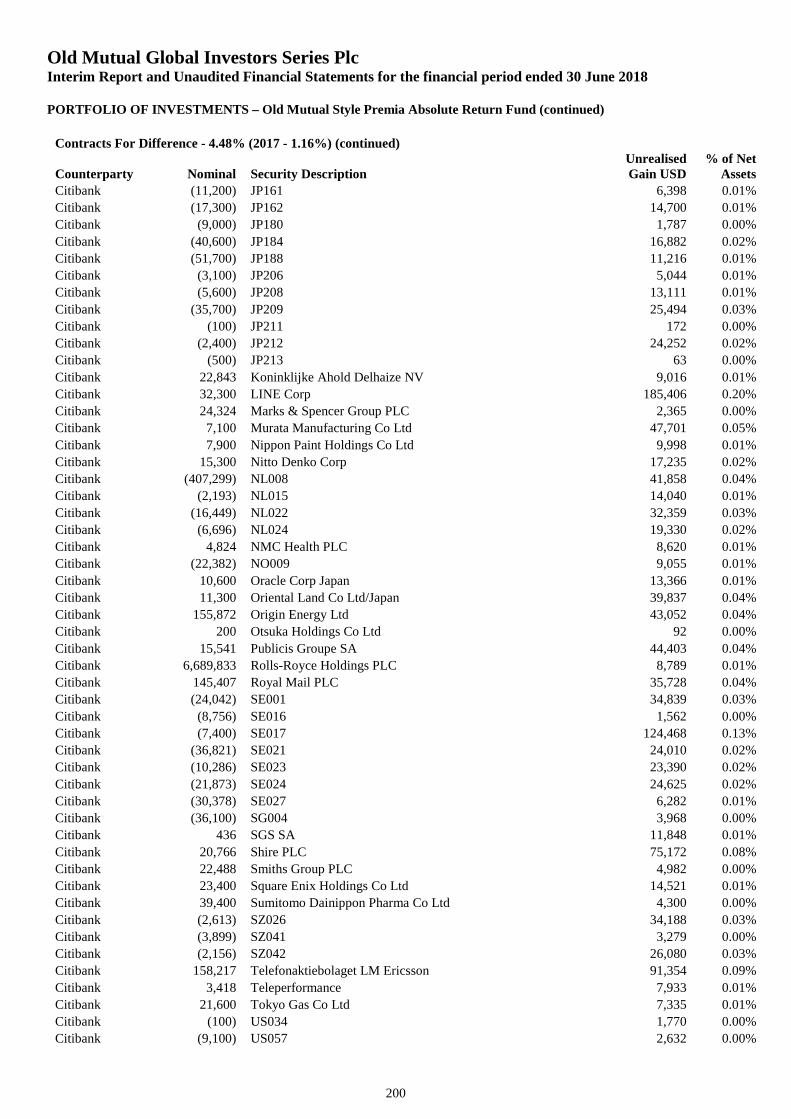
Old Mutual Global Investors Series PlcInterim Report and Unaudited Financial Statements for the financial period ended 30 June 2018
PORTFOLIO OF INVESTMENTS – Old Mutual Style Premia Absolute Return Fund (continued)
200
Contracts For Difference - 4.48% (2017 - 1.16%) (continued)
Counterparty Nominal Security DescriptionUnrealisedGain USD
% of NetAssets
Citibank (11,200) JP161 6,398 0.01%
Citibank (17,300) JP162 14,700 0.01%
Citibank (9,000) JP180 1,787 0.00%
Citibank (40,600) JP184 16,882 0.02%
Citibank (51,700) JP188 11,216 0.01%
Citibank (3,100) JP206 5,044 0.01%
Citibank (5,600) JP208 13,111 0.01%
Citibank (35,700) JP209 25,494 0.03%
Citibank (100) JP211 172 0.00%
Citibank (2,400) JP212 24,252 0.02%
Citibank (500) JP213 63 0.00%
Citibank 22,843 Koninklijke Ahold Delhaize NV 9,016 0.01%
Citibank 32,300 LINE Corp 185,406 0.20%
Citibank 24,324 Marks & Spencer Group PLC 2,365 0.00%
Citibank 7,100 Murata Manufacturing Co Ltd 47,701 0.05%
Citibank 7,900 Nippon Paint Holdings Co Ltd 9,998 0.01%
Citibank 15,300 Nitto Denko Corp 17,235 0.02%
Citibank (407,299) NL008 41,858 0.04%
Citibank (2,193) NL015 14,040 0.01%
Citibank (16,449) NL022 32,359 0.03%
Citibank (6,696) NL024 19,330 0.02%
Citibank 4,824 NMC Health PLC 8,620 0.01%
Citibank (22,382) NO009 9,055 0.01%
Citibank 10,600 Oracle Corp Japan 13,366 0.01%
Citibank 11,300 Oriental Land Co Ltd/Japan 39,837 0.04%
Citibank 155,872 Origin Energy Ltd 43,052 0.04%
Citibank 200 Otsuka Holdings Co Ltd 92 0.00%
Citibank 15,541 Publicis Groupe SA 44,403 0.04%
Citibank 6,689,833 Rolls-Royce Holdings PLC 8,789 0.01%
Citibank 145,407 Royal Mail PLC 35,728 0.04%
Citibank (24,042) SE001 34,839 0.03%
Citibank (8,756) SE016 1,562 0.00%
Citibank (7,400) SE017 124,468 0.13%
Citibank (36,821) SE021 24,010 0.02%
Citibank (10,286) SE023 23,390 0.02%
Citibank (21,873) SE024 24,625 0.02%
Citibank (30,378) SE027 6,282 0.01%
Citibank (36,100) SG004 3,968 0.00%
Citibank 436 SGS SA 11,848 0.01%
Citibank 20,766 Shire PLC 75,172 0.08%
Citibank 22,488 Smiths Group PLC 4,982 0.00%
Citibank 23,400 Square Enix Holdings Co Ltd 14,521 0.01%
Citibank 39,400 Sumitomo Dainippon Pharma Co Ltd 4,300 0.00%
Citibank (2,613) SZ026 34,188 0.03%
Citibank (3,899) SZ041 3,279 0.00%
Citibank (2,156) SZ042 26,080 0.03%
Citibank 158,217 Telefonaktiebolaget LM Ericsson 91,354 0.09%
Citibank 3,418 Teleperformance 7,933 0.01%
Citibank 21,600 Tokyo Gas Co Ltd 7,335 0.01%
Citibank (100) US034 1,770 0.00%
Citibank (9,100) US057 2,632 0.00%
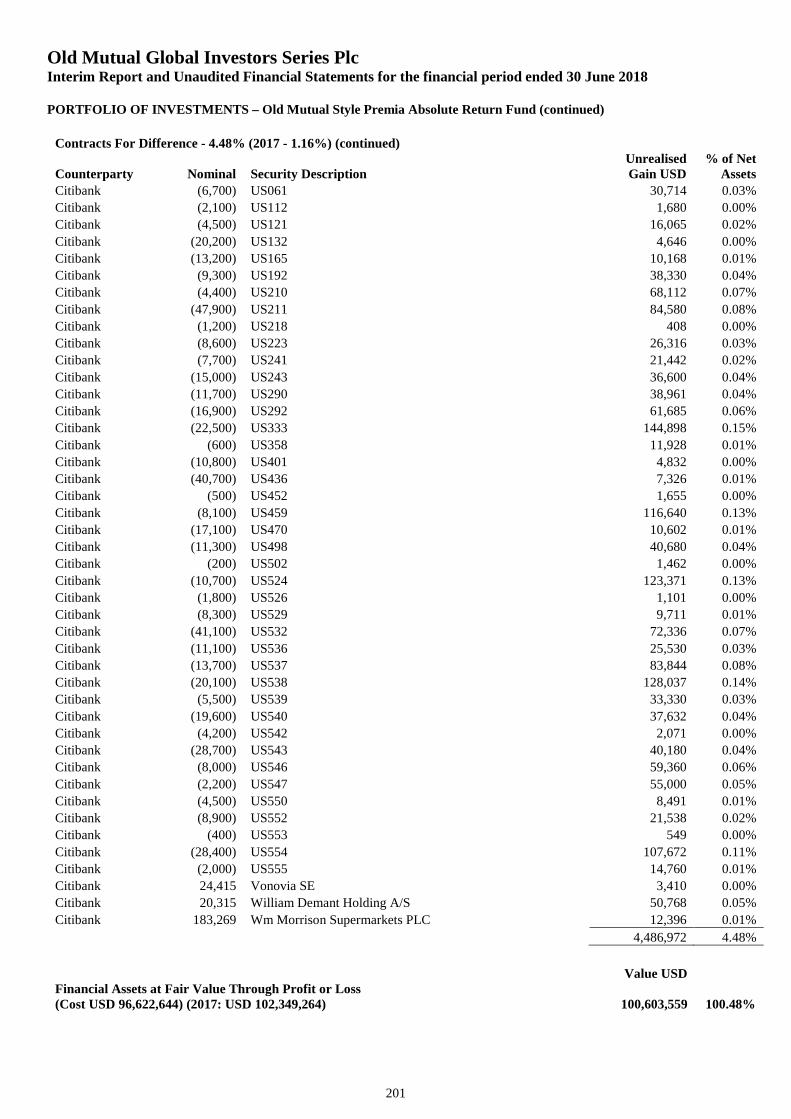
Old Mutual Global Investors Series PlcInterim Report and Unaudited Financial Statements for the financial period ended 30 June 2018
PORTFOLIO OF INVESTMENTS – Old Mutual Style Premia Absolute Return Fund (continued)
201
Contracts For Difference - 4.48% (2017 - 1.16%) (continued)
Counterparty Nominal Security DescriptionUnrealisedGain USD
% of NetAssets
Citibank (6,700) US061 30,714 0.03%
Citibank (2,100) US112 1,680 0.00%
Citibank (4,500) US121 16,065 0.02%
Citibank (20,200) US132 4,646 0.00%
Citibank (13,200) US165 10,168 0.01%
Citibank (9,300) US192 38,330 0.04%
Citibank (4,400) US210 68,112 0.07%
Citibank (47,900) US211 84,580 0.08%
Citibank (1,200) US218 408 0.00%
Citibank (8,600) US223 26,316 0.03%
Citibank (7,700) US241 21,442 0.02%
Citibank (15,000) US243 36,600 0.04%
Citibank (11,700) US290 38,961 0.04%
Citibank (16,900) US292 61,685 0.06%
Citibank (22,500) US333 144,898 0.15%
Citibank (600) US358 11,928 0.01%
Citibank (10,800) US401 4,832 0.00%
Citibank (40,700) US436 7,326 0.01%
Citibank (500) US452 1,655 0.00%
Citibank (8,100) US459 116,640 0.13%
Citibank (17,100) US470 10,602 0.01%
Citibank (11,300) US498 40,680 0.04%
Citibank (200) US502 1,462 0.00%
Citibank (10,700) US524 123,371 0.13%
Citibank (1,800) US526 1,101 0.00%
Citibank (8,300) US529 9,711 0.01%
Citibank (41,100) US532 72,336 0.07%
Citibank (11,100) US536 25,530 0.03%
Citibank (13,700) US537 83,844 0.08%
Citibank (20,100) US538 128,037 0.14%
Citibank (5,500) US539 33,330 0.03%
Citibank (19,600) US540 37,632 0.04%
Citibank (4,200) US542 2,071 0.00%
Citibank (28,700) US543 40,180 0.04%
Citibank (8,000) US546 59,360 0.06%
Citibank (2,200) US547 55,000 0.05%
Citibank (4,500) US550 8,491 0.01%
Citibank (8,900) US552 21,538 0.02%
Citibank (400) US553 549 0.00%
Citibank (28,400) US554 107,672 0.11%
Citibank (2,000) US555 14,760 0.01%
Citibank 24,415 Vonovia SE 3,410 0.00%
Citibank 20,315 William Demant Holding A/S 50,768 0.05%
Citibank 183,269 Wm Morrison Supermarkets PLC 12,396 0.01%
4,486,972 4.48%
Value USDFinancial Assets at Fair Value Through Profit or Loss(Cost USD 96,622,644) (2017: USD 102,349,264) 100,603,559 100.48%

Old Mutual Global Investors Series PlcInterim Report and Unaudited Financial Statements for the financial period ended 30 June 2018
PORTFOLIO OF INVESTMENTS – Old Mutual Style Premia Absolute Return Fund (continued)
202
Swaps - (2.63%) (2017 - (1.45%))
Counterparty Nominal Security DescriptionMaturity
DateUnrealisedLoss USD
% of NetAssets
Morgan Stanley 18,347,277TRS Morgan Stanley Equity Risk Premia GlobalValue OM Index 27/11/2019 (371,585) (0.37%)
Morgan Stanley 10,754,424TRS Morgan Stanley Equity Risk Premia GlobalMomentum OM Index 27/11/2019 (251,267) (0.25%)
Morgan Stanley 5,316,750 TRS Morgan Stanley CUBE Rates Momentum Index 27/11/2019 (20,001) (0.02%)
Goldman Sachs 8,253,407 TRS Goldman Sachs Curve Index 12/02/2019 (19) (0.00%)
Morgan Stanley 4,026,519TRS Morgan Stanley Equity Risk Premia GlobalMomentum OM Index 27/11/2019 (94,076) (0.09%)
Morgan Stanley 5,903,334 TRS Morgan Stanley CUBE Rates Momentum Index 27/11/2019 (22,207) (0.02%)
Goldman Sachs 7,380,309TRS Goldman Sachs FX EM & G10 3 Month CarryIndex 12/02/2019 (17) (0.00%)
Morgan Stanley 15,981,570TRS Morgan Stanley Equity Risk Premia GlobalValue OM Index 27/11/2019 (323,673) (0.32%)
Morgan Stanley 7,737,685TRS Morgan Stanley Equity Risk Premia GlobalValue OM Index 27/11/2019 (156,710) (0.16%)
Goldman Sachs 5,993,046TRS Goldman Sachs FX EM & G10 3 Month CarryIndex 12/05/2019 (14) (0.00%)
Morgan Stanley 6,749,547TRS Morgan Stanley Equity Risk Premia GlobalValue OM Index 27/11/2019 (136,698) (0.14%)
Goldman Sachs 1,623,165TRS Goldman Sachs FX EM & G10 3 Month CarryIndex 12/05/2019 (4) (0.00%)
Morgan Stanley 8,107,980TRS Morgan Stanley Equity Risk Premia GlobalValue OM Index 27/11/2019 (164,210) (0.16%)
Morgan Stanley 8,176,488TRS Morgan Stanley Equity Risk Premia GlobalValue OM Index 27/11/2019 (165,597) (0.17%)
Goldman Sachs 5,675,830TRS Goldman Sachs FX EM & G10 3 Month CarryIndex 12/05/2019 (13) (0.00%)
Morgan Stanley 2,898,153 TRS Morgan Stanley CUBE Rates Momentum Index 27/11/2019 (10,902) (0.01%)
Morgan Stanley 492,308 TRS Morgan Stanley CUBE Rates Momentum Index 27/11/2019 (1,852) (0.00%)
Morgan Stanley 2,839,298 TRS Morgan Stanley CUBE Rates Momentum Index 27/11/2019 (10,681) (0.01%)
Morgan Stanley 2,832,432 TRS Morgan Stanley CUBE Rates Momentum Index 27/11/2019 (10,655) (0.01%)
Morgan Stanley 5,097,884TRS Morgan Stanley Equity Risk Premia GlobalMomentum OM Index 27/11/2019 (119,107) (0.12%)
Goldman Sachs 17,933,790 TRS Goldman Sachs Fixed Income Index 23/05/2019 (47,599) (0.05%)
Goldman Sachs 16,895,256 TRS Goldman Sachs Fixed Income Index 23/05/2019 (1,516) (0.00%)
Goldman Sachs 20,923,197 TRS Goldman Sachs Fixed Income Index 23/05/2019 (26,226) (0.03%)
Morgan Stanley 19,852,608TRS Morgan Stanley Equity Risk Premia GlobalMomentum OM Index 27/11/2019 (463,838) (0.47%)
Morgan Stanley 11,429,367TRS Morgan Stanley Equity Risk Premia GlobalValue OM Index 27/11/2019 (231,477) (0.23%)
(2,629,944) (2.63%)
Contracts For Difference - (3.57%) (2017 - (1.75%))
Counterparty Nominal Security Description
Citibank 50,790 3i Group PLC (42,577) (0.04%)
Citibank 22,219 Accor SA (33,623) (0.03%)
Citibank 125,600 Acom Co Ltd (28,384) (0.03%)
Citibank 1,756 Akzo Nobel NV (4,906) (0.00%)
Citibank 16,456 AMP Ltd (849) (0.00%)
Citibank 2,002 ams AG (27,926) (0.03%)
Citibank 20,616 ArcelorMittal (24,788) (0.02%)
Citibank (14,127) AS005 (29,265) (0.03%)
Citibank (9,115) AS011 (12,531) (0.01%)
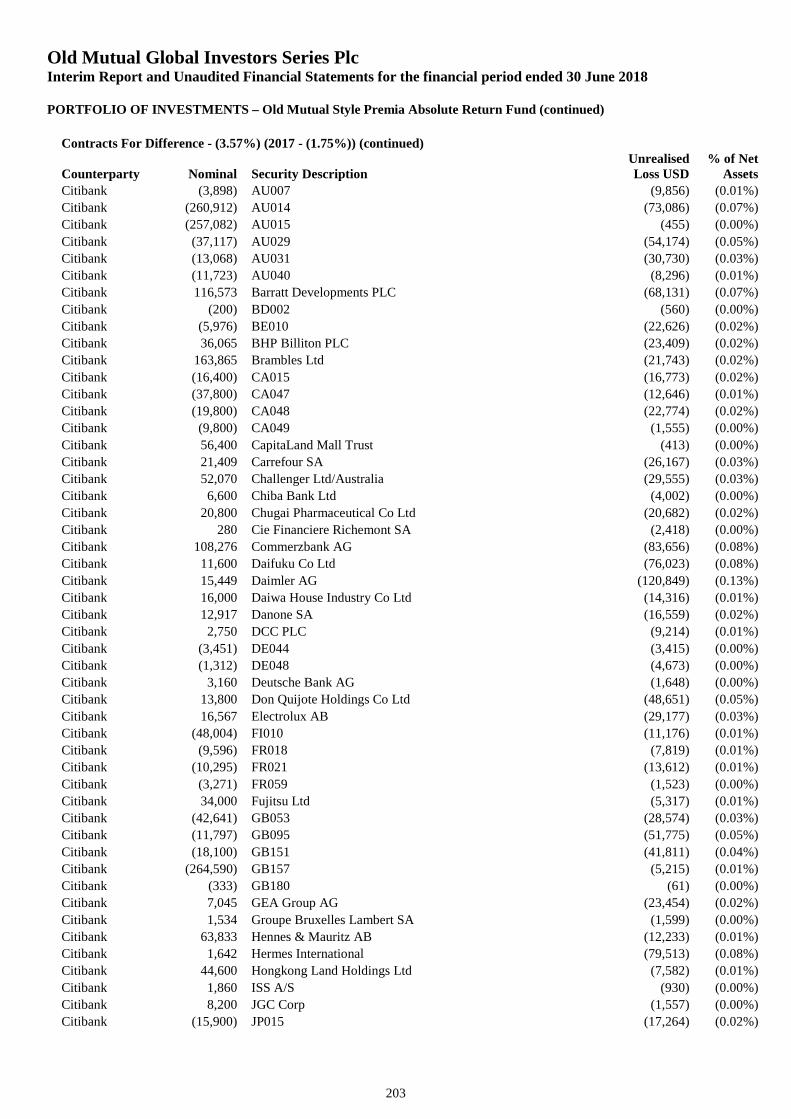
Old Mutual Global Investors Series PlcInterim Report and Unaudited Financial Statements for the financial period ended 30 June 2018
PORTFOLIO OF INVESTMENTS – Old Mutual Style Premia Absolute Return Fund (continued)
203
Contracts For Difference - (3.57%) (2017 - (1.75%)) (continued)
Counterparty Nominal Security DescriptionUnrealisedLoss USD
% of NetAssets
Citibank (3,898) AU007 (9,856) (0.01%)
Citibank (260,912) AU014 (73,086) (0.07%)
Citibank (257,082) AU015 (455) (0.00%)
Citibank (37,117) AU029 (54,174) (0.05%)
Citibank (13,068) AU031 (30,730) (0.03%)
Citibank (11,723) AU040 (8,296) (0.01%)
Citibank 116,573 Barratt Developments PLC (68,131) (0.07%)
Citibank (200) BD002 (560) (0.00%)
Citibank (5,976) BE010 (22,626) (0.02%)
Citibank 36,065 BHP Billiton PLC (23,409) (0.02%)
Citibank 163,865 Brambles Ltd (21,743) (0.02%)
Citibank (16,400) CA015 (16,773) (0.02%)
Citibank (37,800) CA047 (12,646) (0.01%)
Citibank (19,800) CA048 (22,774) (0.02%)
Citibank (9,800) CA049 (1,555) (0.00%)
Citibank 56,400 CapitaLand Mall Trust (413) (0.00%)
Citibank 21,409 Carrefour SA (26,167) (0.03%)
Citibank 52,070 Challenger Ltd/Australia (29,555) (0.03%)
Citibank 6,600 Chiba Bank Ltd (4,002) (0.00%)
Citibank 20,800 Chugai Pharmaceutical Co Ltd (20,682) (0.02%)
Citibank 280 Cie Financiere Richemont SA (2,418) (0.00%)
Citibank 108,276 Commerzbank AG (83,656) (0.08%)
Citibank 11,600 Daifuku Co Ltd (76,023) (0.08%)
Citibank 15,449 Daimler AG (120,849) (0.13%)
Citibank 16,000 Daiwa House Industry Co Ltd (14,316) (0.01%)
Citibank 12,917 Danone SA (16,559) (0.02%)
Citibank 2,750 DCC PLC (9,214) (0.01%)
Citibank (3,451) DE044 (3,415) (0.00%)
Citibank (1,312) DE048 (4,673) (0.00%)
Citibank 3,160 Deutsche Bank AG (1,648) (0.00%)
Citibank 13,800 Don Quijote Holdings Co Ltd (48,651) (0.05%)
Citibank 16,567 Electrolux AB (29,177) (0.03%)
Citibank (48,004) FI010 (11,176) (0.01%)
Citibank (9,596) FR018 (7,819) (0.01%)
Citibank (10,295) FR021 (13,612) (0.01%)
Citibank (3,271) FR059 (1,523) (0.00%)
Citibank 34,000 Fujitsu Ltd (5,317) (0.01%)
Citibank (42,641) GB053 (28,574) (0.03%)
Citibank (11,797) GB095 (51,775) (0.05%)
Citibank (18,100) GB151 (41,811) (0.04%)
Citibank (264,590) GB157 (5,215) (0.01%)
Citibank (333) GB180 (61) (0.00%)
Citibank 7,045 GEA Group AG (23,454) (0.02%)
Citibank 1,534 Groupe Bruxelles Lambert SA (1,599) (0.00%)
Citibank 63,833 Hennes & Mauritz AB (12,233) (0.01%)
Citibank 1,642 Hermes International (79,513) (0.08%)
Citibank 44,600 Hongkong Land Holdings Ltd (7,582) (0.01%)
Citibank 1,860 ISS A/S (930) (0.00%)
Citibank 8,200 JGC Corp (1,557) (0.00%)
Citibank (15,900) JP015 (17,264) (0.02%)
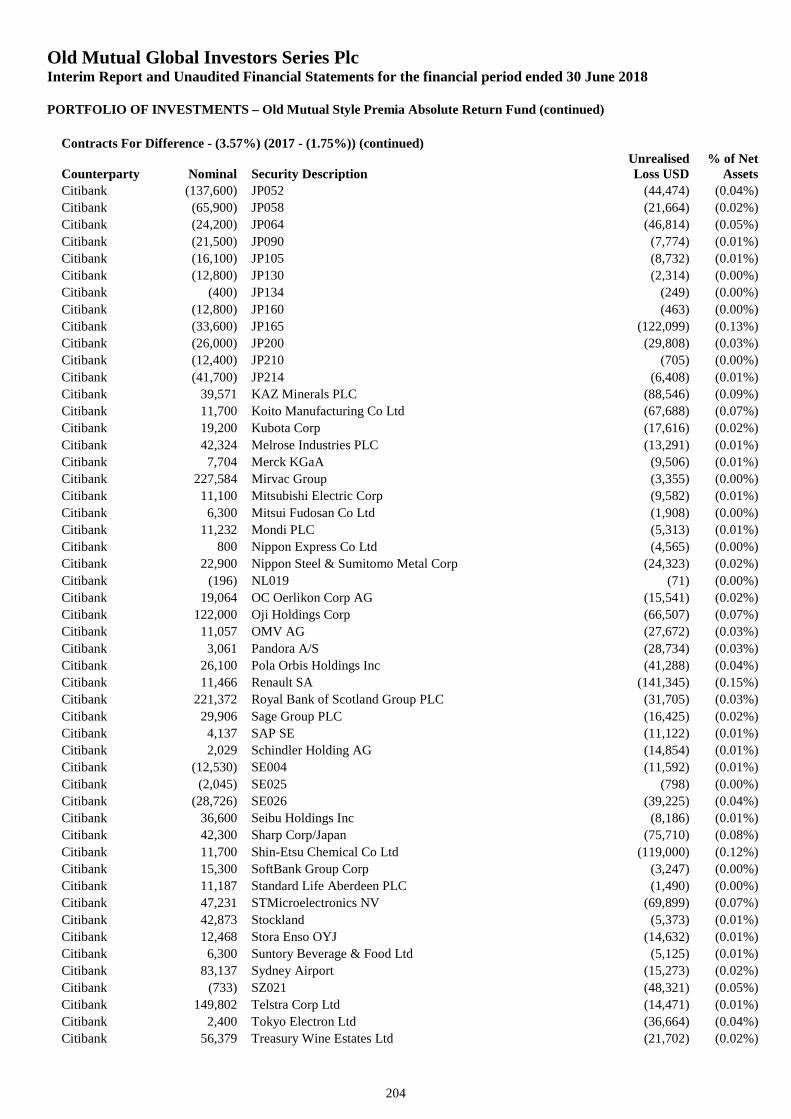
Old Mutual Global Investors Series PlcInterim Report and Unaudited Financial Statements for the financial period ended 30 June 2018
PORTFOLIO OF INVESTMENTS – Old Mutual Style Premia Absolute Return Fund (continued)
204
Contracts For Difference - (3.57%) (2017 - (1.75%)) (continued)
Counterparty Nominal Security DescriptionUnrealisedLoss USD
% of NetAssets
Citibank (137,600) JP052 (44,474) (0.04%)
Citibank (65,900) JP058 (21,664) (0.02%)
Citibank (24,200) JP064 (46,814) (0.05%)
Citibank (21,500) JP090 (7,774) (0.01%)
Citibank (16,100) JP105 (8,732) (0.01%)
Citibank (12,800) JP130 (2,314) (0.00%)
Citibank (400) JP134 (249) (0.00%)
Citibank (12,800) JP160 (463) (0.00%)
Citibank (33,600) JP165 (122,099) (0.13%)
Citibank (26,000) JP200 (29,808) (0.03%)
Citibank (12,400) JP210 (705) (0.00%)
Citibank (41,700) JP214 (6,408) (0.01%)
Citibank 39,571 KAZ Minerals PLC (88,546) (0.09%)
Citibank 11,700 Koito Manufacturing Co Ltd (67,688) (0.07%)
Citibank 19,200 Kubota Corp (17,616) (0.02%)
Citibank 42,324 Melrose Industries PLC (13,291) (0.01%)
Citibank 7,704 Merck KGaA (9,506) (0.01%)
Citibank 227,584 Mirvac Group (3,355) (0.00%)
Citibank 11,100 Mitsubishi Electric Corp (9,582) (0.01%)
Citibank 6,300 Mitsui Fudosan Co Ltd (1,908) (0.00%)
Citibank 11,232 Mondi PLC (5,313) (0.01%)
Citibank 800 Nippon Express Co Ltd (4,565) (0.00%)
Citibank 22,900 Nippon Steel & Sumitomo Metal Corp (24,323) (0.02%)
Citibank (196) NL019 (71) (0.00%)
Citibank 19,064 OC Oerlikon Corp AG (15,541) (0.02%)
Citibank 122,000 Oji Holdings Corp (66,507) (0.07%)
Citibank 11,057 OMV AG (27,672) (0.03%)
Citibank 3,061 Pandora A/S (28,734) (0.03%)
Citibank 26,100 Pola Orbis Holdings Inc (41,288) (0.04%)
Citibank 11,466 Renault SA (141,345) (0.15%)
Citibank 221,372 Royal Bank of Scotland Group PLC (31,705) (0.03%)
Citibank 29,906 Sage Group PLC (16,425) (0.02%)
Citibank 4,137 SAP SE (11,122) (0.01%)
Citibank 2,029 Schindler Holding AG (14,854) (0.01%)
Citibank (12,530) SE004 (11,592) (0.01%)
Citibank (2,045) SE025 (798) (0.00%)
Citibank (28,726) SE026 (39,225) (0.04%)
Citibank 36,600 Seibu Holdings Inc (8,186) (0.01%)
Citibank 42,300 Sharp Corp/Japan (75,710) (0.08%)
Citibank 11,700 Shin-Etsu Chemical Co Ltd (119,000) (0.12%)
Citibank 15,300 SoftBank Group Corp (3,247) (0.00%)
Citibank 11,187 Standard Life Aberdeen PLC (1,490) (0.00%)
Citibank 47,231 STMicroelectronics NV (69,899) (0.07%)
Citibank 42,873 Stockland (5,373) (0.01%)
Citibank 12,468 Stora Enso OYJ (14,632) (0.01%)
Citibank 6,300 Suntory Beverage & Food Ltd (5,125) (0.01%)
Citibank 83,137 Sydney Airport (15,273) (0.02%)
Citibank (733) SZ021 (48,321) (0.05%)
Citibank 149,802 Telstra Corp Ltd (14,471) (0.01%)
Citibank 2,400 Tokyo Electron Ltd (36,664) (0.04%)
Citibank 56,379 Treasury Wine Estates Ltd (21,702) (0.02%)
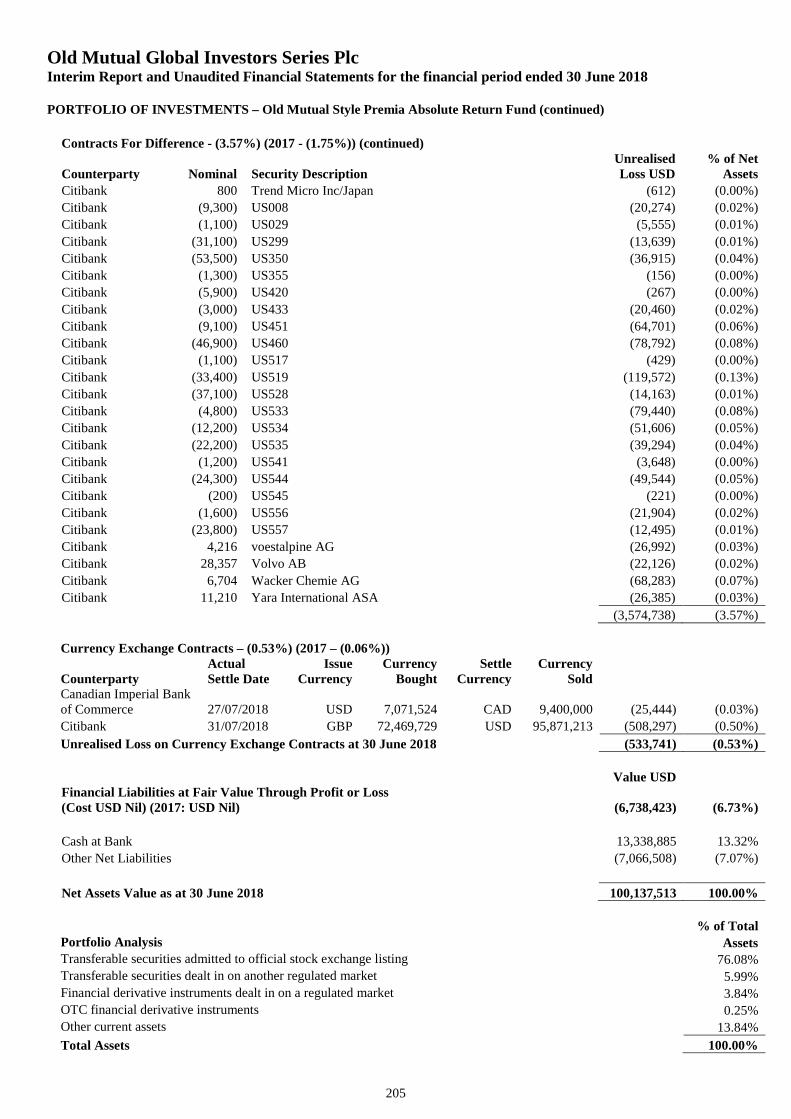
Old Mutual Global Investors Series PlcInterim Report and Unaudited Financial Statements for the financial period ended 30 June 2018
PORTFOLIO OF INVESTMENTS – Old Mutual Style Premia Absolute Return Fund (continued)
205
Contracts For Difference - (3.57%) (2017 - (1.75%)) (continued)
Counterparty Nominal Security DescriptionUnrealisedLoss USD
% of NetAssets
Citibank 800 Trend Micro Inc/Japan (612) (0.00%)
Citibank (9,300) US008 (20,274) (0.02%)
Citibank (1,100) US029 (5,555) (0.01%)
Citibank (31,100) US299 (13,639) (0.01%)
Citibank (53,500) US350 (36,915) (0.04%)
Citibank (1,300) US355 (156) (0.00%)
Citibank (5,900) US420 (267) (0.00%)
Citibank (3,000) US433 (20,460) (0.02%)
Citibank (9,100) US451 (64,701) (0.06%)
Citibank (46,900) US460 (78,792) (0.08%)
Citibank (1,100) US517 (429) (0.00%)
Citibank (33,400) US519 (119,572) (0.13%)
Citibank (37,100) US528 (14,163) (0.01%)
Citibank (4,800) US533 (79,440) (0.08%)
Citibank (12,200) US534 (51,606) (0.05%)
Citibank (22,200) US535 (39,294) (0.04%)
Citibank (1,200) US541 (3,648) (0.00%)
Citibank (24,300) US544 (49,544) (0.05%)
Citibank (200) US545 (221) (0.00%)
Citibank (1,600) US556 (21,904) (0.02%)
Citibank (23,800) US557 (12,495) (0.01%)
Citibank 4,216 voestalpine AG (26,992) (0.03%)
Citibank 28,357 Volvo AB (22,126) (0.02%)
Citibank 6,704 Wacker Chemie AG (68,283) (0.07%)
Citibank 11,210 Yara International ASA (26,385) (0.03%)
(3,574,738) (3.57%)
Currency Exchange Contracts – (0.53%) (2017 – (0.06%))
CounterpartyActualSettle Date
IssueCurrency
CurrencyBought
SettleCurrency
CurrencySold
Canadian Imperial Bankof Commerce 27/07/2018 USD 7,071,524 CAD 9,400,000 (25,444) (0.03%)
Citibank 31/07/2018 GBP 72,469,729 USD 95,871,213 (508,297) (0.50%)
Unrealised Loss on Currency Exchange Contracts at 30 June 2018 (533,741) (0.53%)
Value USDFinancial Liabilities at Fair Value Through Profit or Loss(Cost USD Nil) (2017: USD Nil) (6,738,423) (6.73%)
Cash at Bank 13,338,885 13.32%
Other Net Liabilities (7,066,508) (7.07%)
Net Assets Value as at 30 June 2018 100,137,513 100.00%
% of TotalPortfolio Analysis AssetsTransferable securities admitted to official stock exchange listing 76.08%Transferable securities dealt in on another regulated market 5.99%Financial derivative instruments dealt in on a regulated market 3.84%OTC financial derivative instruments 0.25%Other current assets 13.84%
Total Assets 100.00%
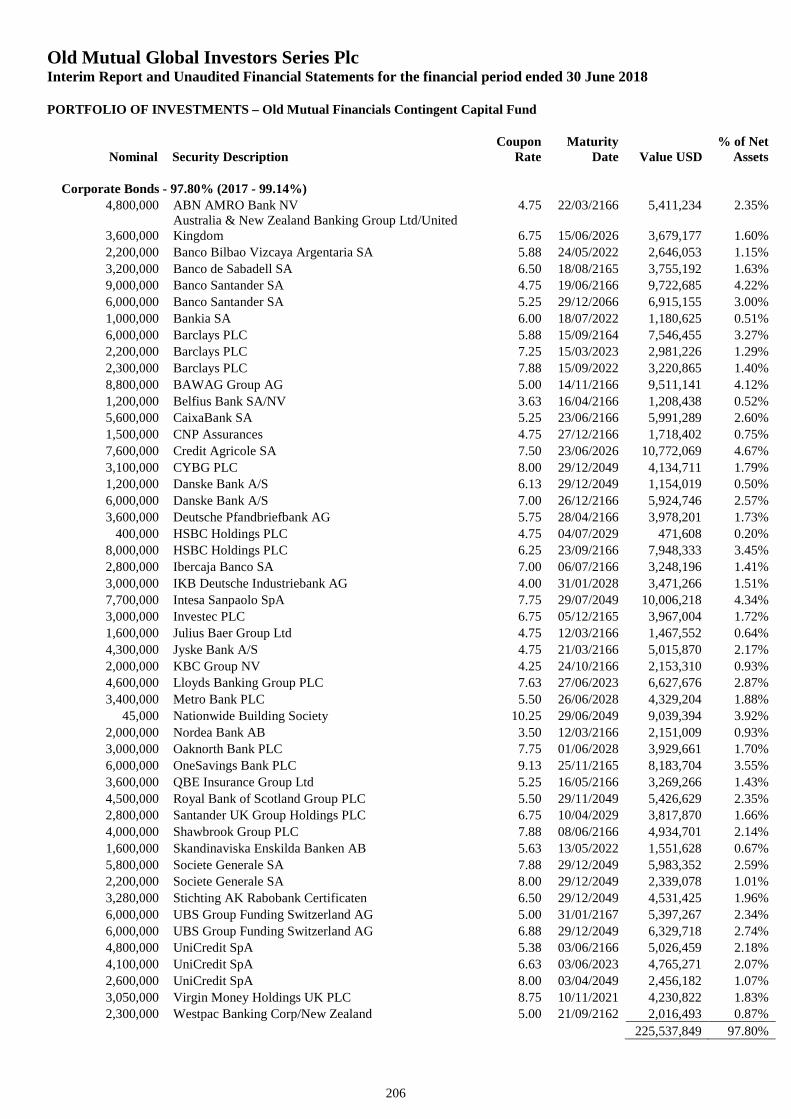
Old Mutual Global Investors Series PlcInterim Report and Unaudited Financial Statements for the financial period ended 30 June 2018
PORTFOLIO OF INVESTMENTS – Old Mutual Financials Contingent Capital Fund
Nominal Security DescriptionCoupon
RateMaturity
Date Value USD% of Net
Assets
206
Corporate Bonds - 97.80% (2017 - 99.14%)4,800,000 ABN AMRO Bank NV 4.75 22/03/2166 5,411,234 2.35%
3,600,000Australia & New Zealand Banking Group Ltd/UnitedKingdom 6.75 15/06/2026 3,679,177 1.60%
2,200,000 Banco Bilbao Vizcaya Argentaria SA 5.88 24/05/2022 2,646,053 1.15%
3,200,000 Banco de Sabadell SA 6.50 18/08/2165 3,755,192 1.63%9,000,000 Banco Santander SA 4.75 19/06/2166 9,722,685 4.22%
6,000,000 Banco Santander SA 5.25 29/12/2066 6,915,155 3.00%
1,000,000 Bankia SA 6.00 18/07/2022 1,180,625 0.51%
6,000,000 Barclays PLC 5.88 15/09/2164 7,546,455 3.27%2,200,000 Barclays PLC 7.25 15/03/2023 2,981,226 1.29%
2,300,000 Barclays PLC 7.88 15/09/2022 3,220,865 1.40%
8,800,000 BAWAG Group AG 5.00 14/11/2166 9,511,141 4.12%
1,200,000 Belfius Bank SA/NV 3.63 16/04/2166 1,208,438 0.52%5,600,000 CaixaBank SA 5.25 23/06/2166 5,991,289 2.60%
1,500,000 CNP Assurances 4.75 27/12/2166 1,718,402 0.75%
7,600,000 Credit Agricole SA 7.50 23/06/2026 10,772,069 4.67%
3,100,000 CYBG PLC 8.00 29/12/2049 4,134,711 1.79%1,200,000 Danske Bank A/S 6.13 29/12/2049 1,154,019 0.50%
6,000,000 Danske Bank A/S 7.00 26/12/2166 5,924,746 2.57%
3,600,000 Deutsche Pfandbriefbank AG 5.75 28/04/2166 3,978,201 1.73%
400,000 HSBC Holdings PLC 4.75 04/07/2029 471,608 0.20%8,000,000 HSBC Holdings PLC 6.25 23/09/2166 7,948,333 3.45%
2,800,000 Ibercaja Banco SA 7.00 06/07/2166 3,248,196 1.41%
3,000,000 IKB Deutsche Industriebank AG 4.00 31/01/2028 3,471,266 1.51%
7,700,000 Intesa Sanpaolo SpA 7.75 29/07/2049 10,006,218 4.34%3,000,000 Investec PLC 6.75 05/12/2165 3,967,004 1.72%
1,600,000 Julius Baer Group Ltd 4.75 12/03/2166 1,467,552 0.64%
4,300,000 Jyske Bank A/S 4.75 21/03/2166 5,015,870 2.17%
2,000,000 KBC Group NV 4.25 24/10/2166 2,153,310 0.93%4,600,000 Lloyds Banking Group PLC 7.63 27/06/2023 6,627,676 2.87%
3,400,000 Metro Bank PLC 5.50 26/06/2028 4,329,204 1.88%
45,000 Nationwide Building Society 10.25 29/06/2049 9,039,394 3.92%
2,000,000 Nordea Bank AB 3.50 12/03/2166 2,151,009 0.93%3,000,000 Oaknorth Bank PLC 7.75 01/06/2028 3,929,661 1.70%
6,000,000 OneSavings Bank PLC 9.13 25/11/2165 8,183,704 3.55%
3,600,000 QBE Insurance Group Ltd 5.25 16/05/2166 3,269,266 1.43%
4,500,000 Royal Bank of Scotland Group PLC 5.50 29/11/2049 5,426,629 2.35%2,800,000 Santander UK Group Holdings PLC 6.75 10/04/2029 3,817,870 1.66%
4,000,000 Shawbrook Group PLC 7.88 08/06/2166 4,934,701 2.14%
1,600,000 Skandinaviska Enskilda Banken AB 5.63 13/05/2022 1,551,628 0.67%
5,800,000 Societe Generale SA 7.88 29/12/2049 5,983,352 2.59%2,200,000 Societe Generale SA 8.00 29/12/2049 2,339,078 1.01%
3,280,000 Stichting AK Rabobank Certificaten 6.50 29/12/2049 4,531,425 1.96%
6,000,000 UBS Group Funding Switzerland AG 5.00 31/01/2167 5,397,267 2.34%
6,000,000 UBS Group Funding Switzerland AG 6.88 29/12/2049 6,329,718 2.74%4,800,000 UniCredit SpA 5.38 03/06/2166 5,026,459 2.18%
4,100,000 UniCredit SpA 6.63 03/06/2023 4,765,271 2.07%
2,600,000 UniCredit SpA 8.00 03/04/2049 2,456,182 1.07%
3,050,000 Virgin Money Holdings UK PLC 8.75 10/11/2021 4,230,822 1.83%2,300,000 Westpac Banking Corp/New Zealand 5.00 21/09/2162 2,016,493 0.87%
225,537,849 97.80%
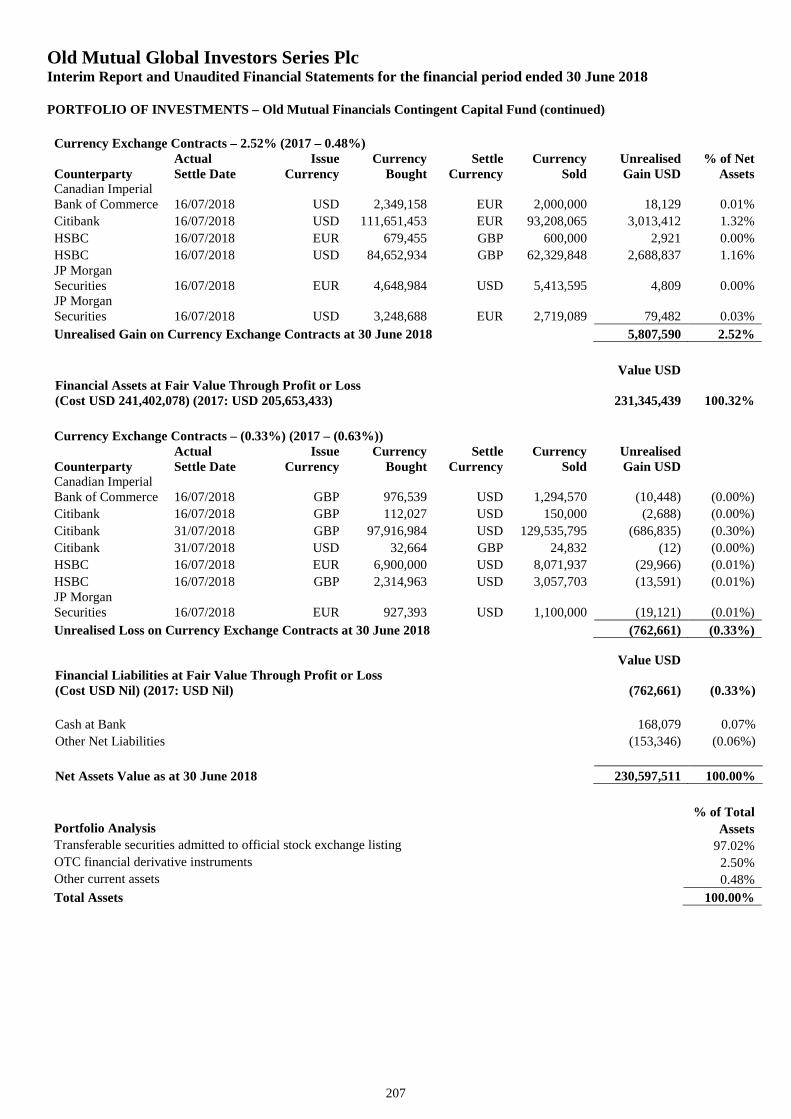
Old Mutual Global Investors Series PlcInterim Report and Unaudited Financial Statements for the financial period ended 30 June 2018
PORTFOLIO OF INVESTMENTS – Old Mutual Financials Contingent Capital Fund (continued)
207
Currency Exchange Contracts – 2.52% (2017 – 0.48%)
CounterpartyActualSettle Date
IssueCurrency
CurrencyBought
SettleCurrency
CurrencySold
UnrealisedGain USD
% of NetAssets
Canadian ImperialBank of Commerce 16/07/2018 USD 2,349,158 EUR 2,000,000 18,129 0.01%
Citibank 16/07/2018 USD 111,651,453 EUR 93,208,065 3,013,412 1.32%
HSBC 16/07/2018 EUR 679,455 GBP 600,000 2,921 0.00%
HSBC 16/07/2018 USD 84,652,934 GBP 62,329,848 2,688,837 1.16%JP MorganSecurities 16/07/2018 EUR 4,648,984 USD 5,413,595 4,809 0.00%JP MorganSecurities 16/07/2018 USD 3,248,688 EUR 2,719,089 79,482 0.03%
Unrealised Gain on Currency Exchange Contracts at 30 June 2018 5,807,590 2.52%
Value USDFinancial Assets at Fair Value Through Profit or Loss(Cost USD 241,402,078) (2017: USD 205,653,433) 231,345,439 100.32%
Currency Exchange Contracts – (0.33%) (2017 – (0.63%))
CounterpartyActualSettle Date
IssueCurrency
CurrencyBought
SettleCurrency
CurrencySold
UnrealisedGain USD
Canadian ImperialBank of Commerce 16/07/2018 GBP 976,539 USD 1,294,570 (10,448) (0.00%)
Citibank 16/07/2018 GBP 112,027 USD 150,000 (2,688) (0.00%)
Citibank 31/07/2018 GBP 97,916,984 USD 129,535,795 (686,835) (0.30%)
Citibank 31/07/2018 USD 32,664 GBP 24,832 (12) (0.00%)
HSBC 16/07/2018 EUR 6,900,000 USD 8,071,937 (29,966) (0.01%)
HSBC 16/07/2018 GBP 2,314,963 USD 3,057,703 (13,591) (0.01%)JP MorganSecurities 16/07/2018 EUR 927,393 USD 1,100,000 (19,121) (0.01%)
Unrealised Loss on Currency Exchange Contracts at 30 June 2018 (762,661) (0.33%)
Value USDFinancial Liabilities at Fair Value Through Profit or Loss(Cost USD Nil) (2017: USD Nil) (762,661) (0.33%)
Cash at Bank 168,079 0.07%
Other Net Liabilities (153,346) (0.06%)
Net Assets Value as at 30 June 2018 230,597,511 100.00%
% of TotalPortfolio Analysis AssetsTransferable securities admitted to official stock exchange listing 97.02%OTC financial derivative instruments 2.50%Other current assets 0.48%
Total Assets 100.00%
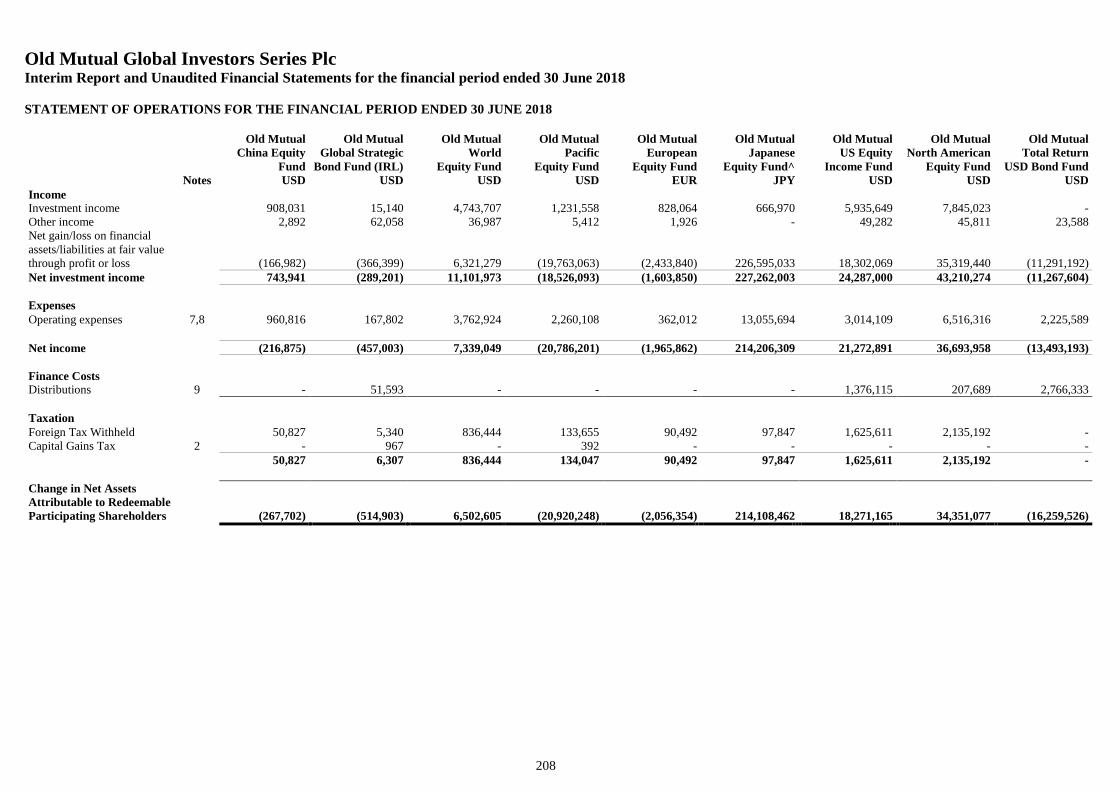
Old Mutual Global Investors Series PlcInterim Report and Unaudited Financial Statements for the financial period ended 30 June 2018
STATEMENT OF OPERATIONS FOR THE FINANCIAL PERIOD ENDED 30 JUNE 2018
208
Old MutualChina Equity
Fund
Old MutualGlobal Strategic
Bond Fund (IRL)
Old MutualWorld
Equity Fund
Old MutualPacific
Equity Fund
Old MutualEuropean
Equity Fund
Old MutualJapanese
Equity Fund^
Old MutualUS Equity
Income Fund
Old MutualNorth American
Equity Fund
Old MutualTotal Return
USD Bond FundNotes USD USD USD USD EUR JPY USD USD USD
IncomeInvestment income 908,031 15,140 4,743,707 1,231,558 828,064 666,970 5,935,649 7,845,023 -Other income 2,892 62,058 36,987 5,412 1,926 - 49,282 45,811 23,588Net gain/loss on financialassets/liabilities at fair valuethrough profit or loss (166,982) (366,399) 6,321,279 (19,763,063) (2,433,840) 226,595,033 18,302,069 35,319,440 (11,291,192)Net investment income 743,941 (289,201) 11,101,973 (18,526,093) (1,603,850) 227,262,003 24,287,000 43,210,274 (11,267,604)
ExpensesOperating expenses 7,8 960,816 167,802 3,762,924 2,260,108 362,012 13,055,694 3,014,109 6,516,316 2,225,589
Net income (216,875) (457,003) 7,339,049 (20,786,201) (1,965,862) 214,206,309 21,272,891 36,693,958 (13,493,193)
Finance CostsDistributions 9 - 51,593 - - - - 1,376,115 207,689 2,766,333
TaxationForeign Tax Withheld 50,827 5,340 836,444 133,655 90,492 97,847 1,625,611 2,135,192 -Capital Gains Tax 2 - 967 - 392 - - - - -
50,827 6,307 836,444 134,047 90,492 97,847 1,625,611 2,135,192 -
Change in Net AssetsAttributable to RedeemableParticipating Shareholders (267,702) (514,903) 6,502,605 (20,920,248) (2,056,354) 214,108,462 18,271,165 34,351,077 (16,259,526)
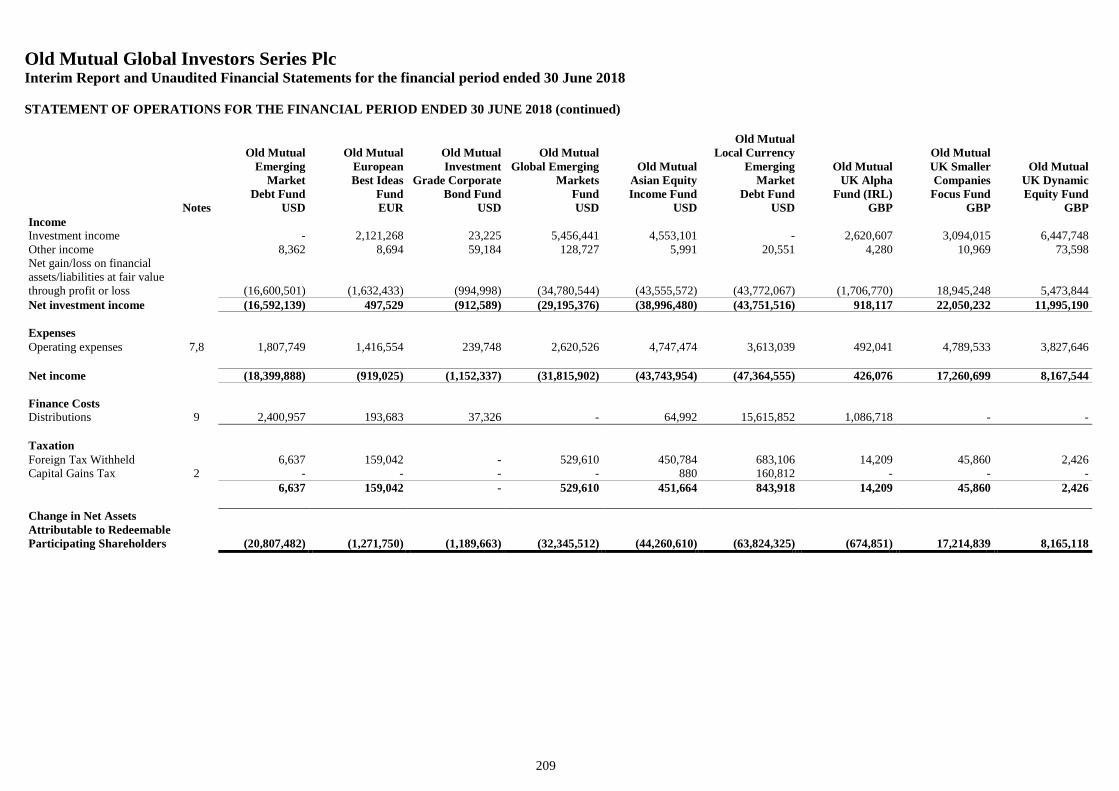
Old Mutual Global Investors Series PlcInterim Report and Unaudited Financial Statements for the financial period ended 30 June 2018
STATEMENT OF OPERATIONS FOR THE FINANCIAL PERIOD ENDED 30 JUNE 2018 (continued)
209
Old MutualEmerging
MarketDebt Fund
Old MutualEuropeanBest Ideas
Fund
Old MutualInvestment
Grade CorporateBond Fund
Old MutualGlobal Emerging
MarketsFund
Old MutualAsian EquityIncome Fund
Old MutualLocal Currency
EmergingMarket
Debt Fund
Old MutualUK Alpha
Fund (IRL)
Old MutualUK SmallerCompanies
Focus Fund
Old MutualUK DynamicEquity Fund
Notes USD EUR USD USD USD USD GBP GBP GBPIncomeInvestment income - 2,121,268 23,225 5,456,441 4,553,101 - 2,620,607 3,094,015 6,447,748Other income 8,362 8,694 59,184 128,727 5,991 20,551 4,280 10,969 73,598Net gain/loss on financialassets/liabilities at fair valuethrough profit or loss (16,600,501) (1,632,433) (994,998) (34,780,544) (43,555,572) (43,772,067) (1,706,770) 18,945,248 5,473,844Net investment income (16,592,139) 497,529 (912,589) (29,195,376) (38,996,480) (43,751,516) 918,117 22,050,232 11,995,190
ExpensesOperating expenses 7,8 1,807,749 1,416,554 239,748 2,620,526 4,747,474 3,613,039 492,041 4,789,533 3,827,646
Net income (18,399,888) (919,025) (1,152,337) (31,815,902) (43,743,954) (47,364,555) 426,076 17,260,699 8,167,544
Finance CostsDistributions 9 2,400,957 193,683 37,326 - 64,992 15,615,852 1,086,718 - -
TaxationForeign Tax Withheld 6,637 159,042 - 529,610 450,784 683,106 14,209 45,860 2,426Capital Gains Tax 2 - - - - 880 160,812 - - -
6,637 159,042 - 529,610 451,664 843,918 14,209 45,860 2,426
Change in Net AssetsAttributable to RedeemableParticipating Shareholders (20,807,482) (1,271,750) (1,189,663) (32,345,512) (44,260,610) (63,824,325) (674,851) 17,214,839 8,165,118
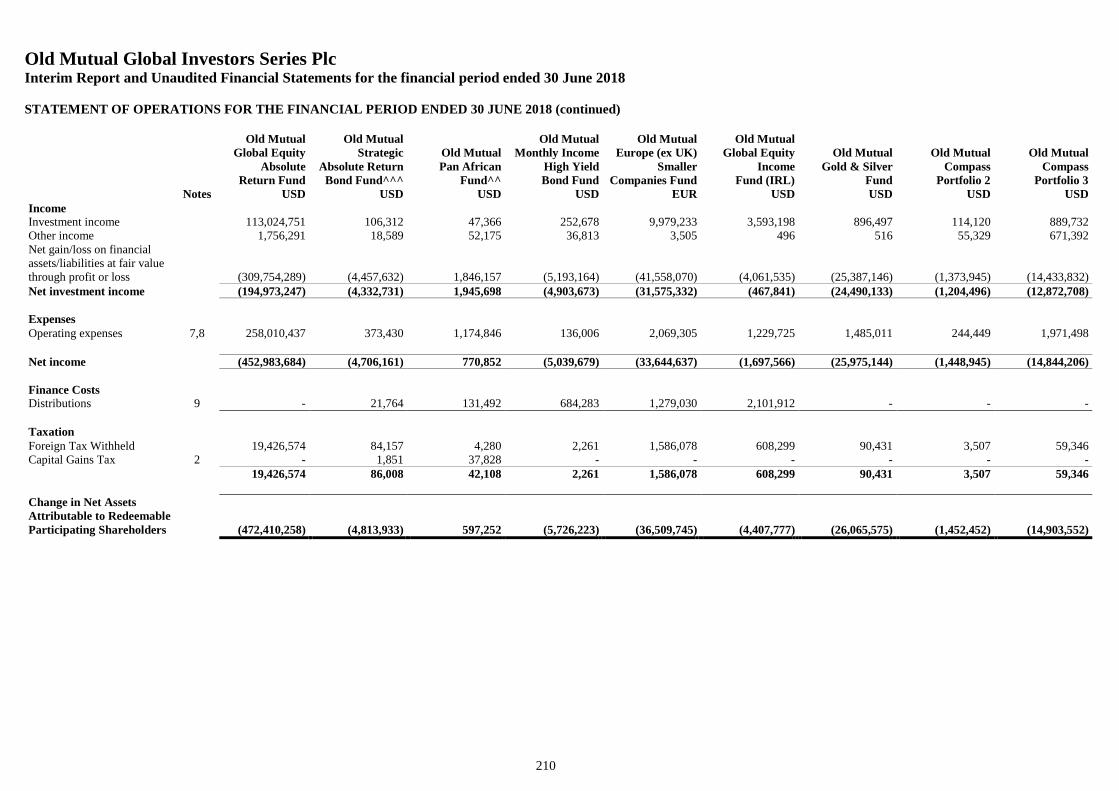
Old Mutual Global Investors Series PlcInterim Report and Unaudited Financial Statements for the financial period ended 30 June 2018
STATEMENT OF OPERATIONS FOR THE FINANCIAL PERIOD ENDED 30 JUNE 2018 (continued)
210
Old MutualGlobal Equity
AbsoluteReturn Fund
Old MutualStrategic
Absolute ReturnBond Fund^^^
Old MutualPan African
Fund^^
Old MutualMonthly Income
High YieldBond Fund
Old MutualEurope (ex UK)
SmallerCompanies Fund
Old MutualGlobal Equity
IncomeFund (IRL)
Old MutualGold & Silver
Fund
Old MutualCompass
Portfolio 2
Old MutualCompass
Portfolio 3Notes USD USD USD USD EUR USD USD USD USD
IncomeInvestment income 113,024,751 106,312 47,366 252,678 9,979,233 3,593,198 896,497 114,120 889,732Other income 1,756,291 18,589 52,175 36,813 3,505 496 516 55,329 671,392Net gain/loss on financialassets/liabilities at fair valuethrough profit or loss (309,754,289) (4,457,632) 1,846,157 (5,193,164) (41,558,070) (4,061,535) (25,387,146) (1,373,945) (14,433,832)Net investment income (194,973,247) (4,332,731) 1,945,698 (4,903,673) (31,575,332) (467,841) (24,490,133) (1,204,496) (12,872,708)
ExpensesOperating expenses 7,8 258,010,437 373,430 1,174,846 136,006 2,069,305 1,229,725 1,485,011 244,449 1,971,498
Net income (452,983,684) (4,706,161) 770,852 (5,039,679) (33,644,637) (1,697,566) (25,975,144) (1,448,945) (14,844,206)
Finance CostsDistributions 9 - 21,764 131,492 684,283 1,279,030 2,101,912 - - -
TaxationForeign Tax Withheld 19,426,574 84,157 4,280 2,261 1,586,078 608,299 90,431 3,507 59,346Capital Gains Tax 2 - 1,851 37,828 - - - - - -
19,426,574 86,008 42,108 2,261 1,586,078 608,299 90,431 3,507 59,346
Change in Net AssetsAttributable to RedeemableParticipating Shareholders (472,410,258) (4,813,933) 597,252 (5,726,223) (36,509,745) (4,407,777) (26,065,575) (1,452,452) (14,903,552)
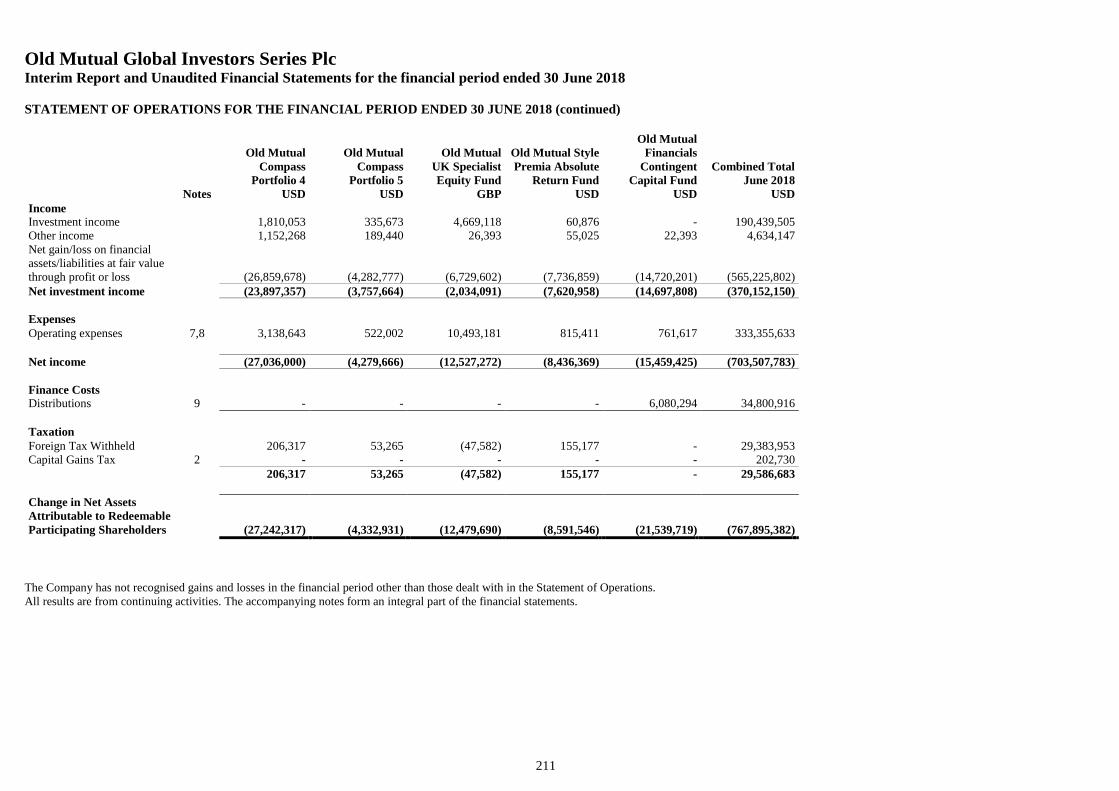
Old Mutual Global Investors Series PlcInterim Report and Unaudited Financial Statements for the financial period ended 30 June 2018
STATEMENT OF OPERATIONS FOR THE FINANCIAL PERIOD ENDED 30 JUNE 2018 (continued)
211
Old MutualCompass
Portfolio 4
Old MutualCompass
Portfolio 5
Old MutualUK SpecialistEquity Fund
Old Mutual StylePremia Absolute
Return Fund
Old MutualFinancials
ContingentCapital Fund
Combined TotalJune 2018
Notes USD USD GBP USD USD USDIncomeInvestment income 1,810,053 335,673 4,669,118 60,876 - 190,439,505Other income 1,152,268 189,440 26,393 55,025 22,393 4,634,147Net gain/loss on financialassets/liabilities at fair valuethrough profit or loss (26,859,678) (4,282,777) (6,729,602) (7,736,859) (14,720,201) (565,225,802)Net investment income (23,897,357) (3,757,664) (2,034,091) (7,620,958) (14,697,808) (370,152,150)
ExpensesOperating expenses 7,8 3,138,643 522,002 10,493,181 815,411 761,617 333,355,633
Net income (27,036,000) (4,279,666) (12,527,272) (8,436,369) (15,459,425) (703,507,783)
Finance CostsDistributions 9 - - - - 6,080,294 34,800,916
TaxationForeign Tax Withheld 206,317 53,265 (47,582) 155,177 - 29,383,953Capital Gains Tax 2 - - - - - 202,730
206,317 53,265 (47,582) 155,177 - 29,586,683
Change in Net AssetsAttributable to RedeemableParticipating Shareholders (27,242,317) (4,332,931) (12,479,690) (8,591,546) (21,539,719) (767,895,382)
The Company has not recognised gains and losses in the financial period other than those dealt with in the Statement of Operations.All results are from continuing activities. The accompanying notes form an integral part of the financial statements.
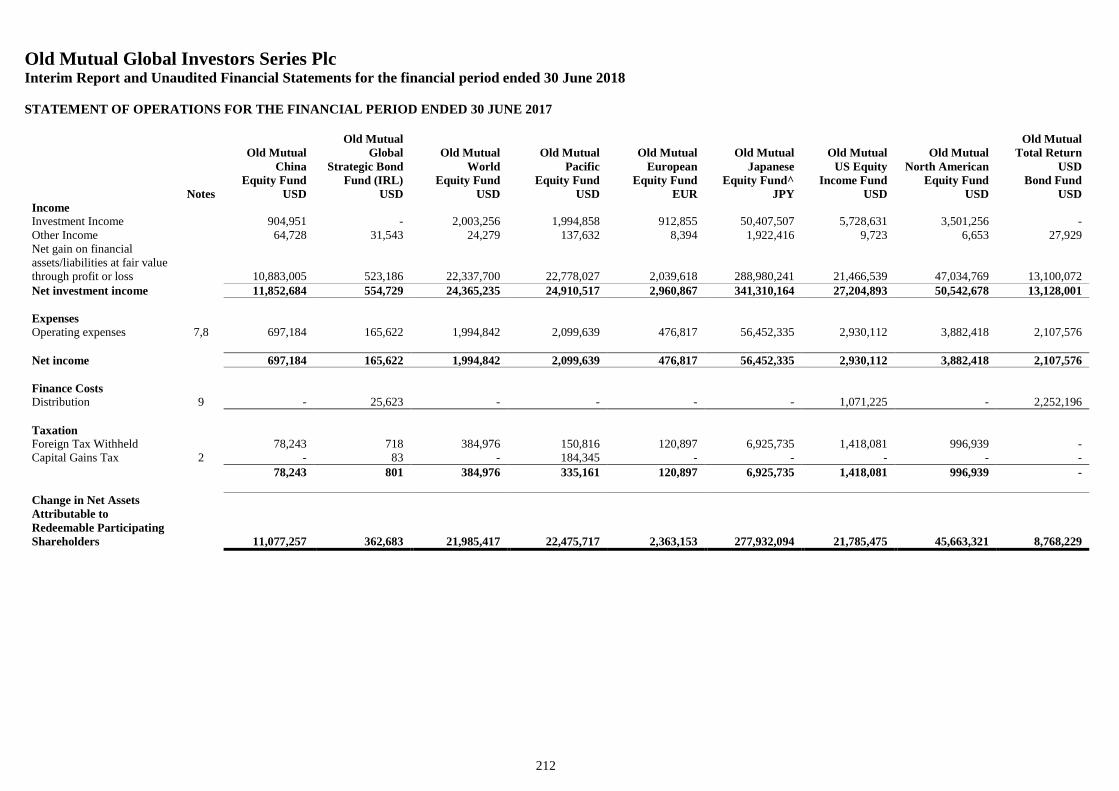
Old Mutual Global Investors Series PlcInterim Report and Unaudited Financial Statements for the financial period ended 30 June 2018
STATEMENT OF OPERATIONS FOR THE FINANCIAL PERIOD ENDED 30 JUNE 2017
212
Old MutualChina
Equity Fund
Old MutualGlobal
Strategic BondFund (IRL)
Old MutualWorld
Equity Fund
Old MutualPacific
Equity Fund
Old MutualEuropean
Equity Fund
Old MutualJapanese
Equity Fund^
Old MutualUS Equity
Income Fund
Old MutualNorth American
Equity Fund
Old MutualTotal Return
USDBond Fund
Notes USD USD USD USD EUR JPY USD USD USDIncomeInvestment Income 904,951 - 2,003,256 1,994,858 912,855 50,407,507 5,728,631 3,501,256 -Other Income 64,728 31,543 24,279 137,632 8,394 1,922,416 9,723 6,653 27,929Net gain on financialassets/liabilities at fair valuethrough profit or loss 10,883,005 523,186 22,337,700 22,778,027 2,039,618 288,980,241 21,466,539 47,034,769 13,100,072Net investment income 11,852,684 554,729 24,365,235 24,910,517 2,960,867 341,310,164 27,204,893 50,542,678 13,128,001
ExpensesOperating expenses 7,8 697,184 165,622 1,994,842 2,099,639 476,817 56,452,335 2,930,112 3,882,418 2,107,576
Net income 697,184 165,622 1,994,842 2,099,639 476,817 56,452,335 2,930,112 3,882,418 2,107,576
Finance CostsDistribution 9 - 25,623 - - - - 1,071,225 - 2,252,196
TaxationForeign Tax Withheld 78,243 718 384,976 150,816 120,897 6,925,735 1,418,081 996,939 -Capital Gains Tax 2 - 83 - 184,345 - - - - -
78,243 801 384,976 335,161 120,897 6,925,735 1,418,081 996,939 -
Change in Net AssetsAttributable toRedeemable ParticipatingShareholders 11,077,257 362,683 21,985,417 22,475,717 2,363,153 277,932,094 21,785,475 45,663,321 8,768,229
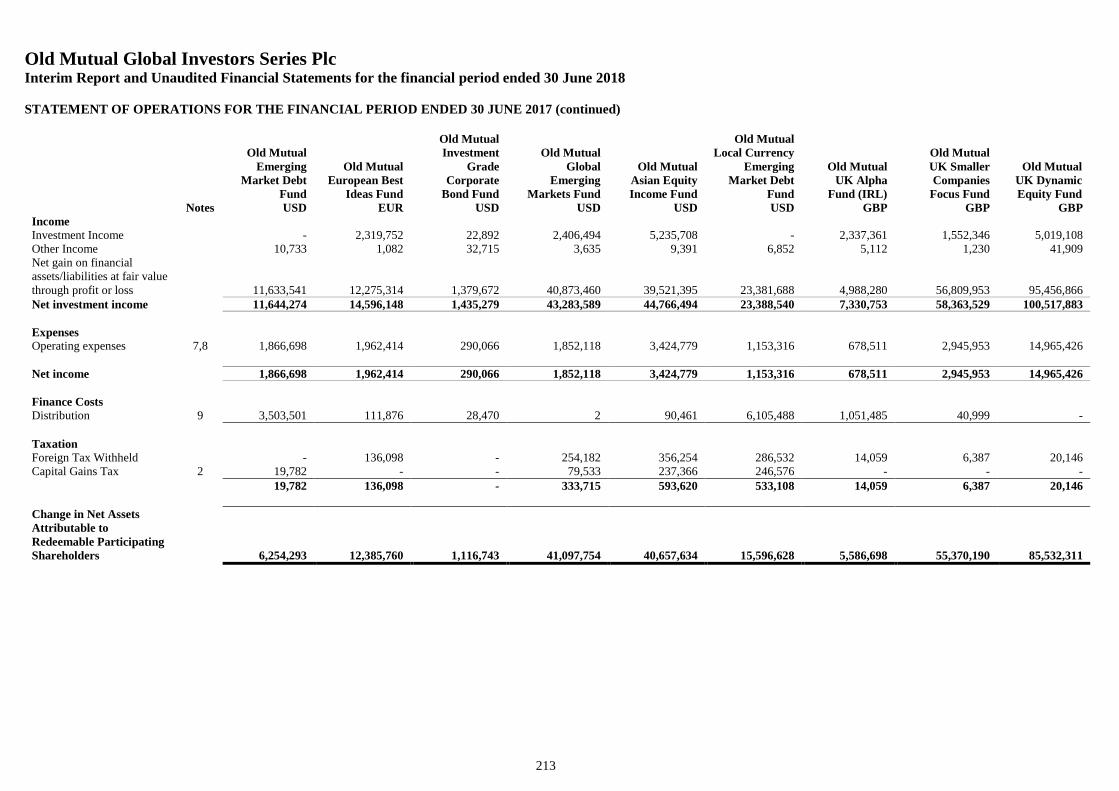
Old Mutual Global Investors Series PlcInterim Report and Unaudited Financial Statements for the financial period ended 30 June 2018
STATEMENT OF OPERATIONS FOR THE FINANCIAL PERIOD ENDED 30 JUNE 2017 (continued)
213
Old MutualEmerging
Market DebtFund
Old MutualEuropean Best
Ideas Fund
Old MutualInvestment
GradeCorporate
Bond Fund
Old MutualGlobal
EmergingMarkets Fund
Old MutualAsian EquityIncome Fund
Old MutualLocal Currency
EmergingMarket Debt
Fund
Old MutualUK Alpha
Fund (IRL)
Old MutualUK SmallerCompanies
Focus Fund
Old MutualUK DynamicEquity Fund
Notes USD EUR USD USD USD USD GBP GBP GBPIncomeInvestment Income - 2,319,752 22,892 2,406,494 5,235,708 - 2,337,361 1,552,346 5,019,108Other Income 10,733 1,082 32,715 3,635 9,391 6,852 5,112 1,230 41,909Net gain on financialassets/liabilities at fair valuethrough profit or loss 11,633,541 12,275,314 1,379,672 40,873,460 39,521,395 23,381,688 4,988,280 56,809,953 95,456,866Net investment income 11,644,274 14,596,148 1,435,279 43,283,589 44,766,494 23,388,540 7,330,753 58,363,529 100,517,883
ExpensesOperating expenses 7,8 1,866,698 1,962,414 290,066 1,852,118 3,424,779 1,153,316 678,511 2,945,953 14,965,426
Net income 1,866,698 1,962,414 290,066 1,852,118 3,424,779 1,153,316 678,511 2,945,953 14,965,426
Finance CostsDistribution 9 3,503,501 111,876 28,470 2 90,461 6,105,488 1,051,485 40,999 -
TaxationForeign Tax Withheld - 136,098 - 254,182 356,254 286,532 14,059 6,387 20,146Capital Gains Tax 2 19,782 - - 79,533 237,366 246,576 - - -
19,782 136,098 - 333,715 593,620 533,108 14,059 6,387 20,146
Change in Net AssetsAttributable toRedeemable ParticipatingShareholders 6,254,293 12,385,760 1,116,743 41,097,754 40,657,634 15,596,628 5,586,698 55,370,190 85,532,311
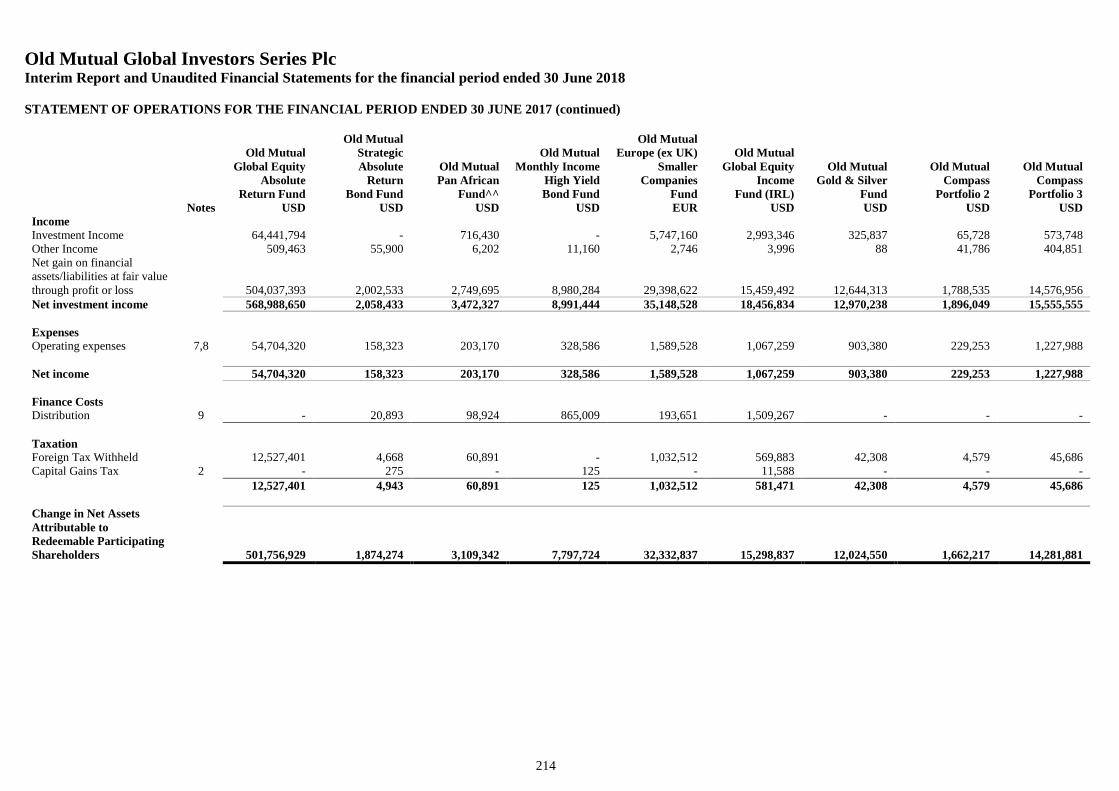
Old Mutual Global Investors Series PlcInterim Report and Unaudited Financial Statements for the financial period ended 30 June 2018
STATEMENT OF OPERATIONS FOR THE FINANCIAL PERIOD ENDED 30 JUNE 2017 (continued)
214
Old MutualGlobal Equity
AbsoluteReturn Fund
Old MutualStrategicAbsolute
ReturnBond Fund
Old MutualPan African
Fund^^
Old MutualMonthly Income
High YieldBond Fund
Old MutualEurope (ex UK)
SmallerCompanies
Fund
Old MutualGlobal Equity
IncomeFund (IRL)
Old MutualGold & Silver
Fund
Old MutualCompass
Portfolio 2
Old MutualCompass
Portfolio 3Notes USD USD USD USD EUR USD USD USD USD
IncomeInvestment Income 64,441,794 - 716,430 - 5,747,160 2,993,346 325,837 65,728 573,748Other Income 509,463 55,900 6,202 11,160 2,746 3,996 88 41,786 404,851Net gain on financialassets/liabilities at fair valuethrough profit or loss 504,037,393 2,002,533 2,749,695 8,980,284 29,398,622 15,459,492 12,644,313 1,788,535 14,576,956Net investment income 568,988,650 2,058,433 3,472,327 8,991,444 35,148,528 18,456,834 12,970,238 1,896,049 15,555,555
ExpensesOperating expenses 7,8 54,704,320 158,323 203,170 328,586 1,589,528 1,067,259 903,380 229,253 1,227,988
Net income 54,704,320 158,323 203,170 328,586 1,589,528 1,067,259 903,380 229,253 1,227,988
Finance CostsDistribution 9 - 20,893 98,924 865,009 193,651 1,509,267 - - -
TaxationForeign Tax Withheld 12,527,401 4,668 60,891 - 1,032,512 569,883 42,308 4,579 45,686Capital Gains Tax 2 - 275 - 125 - 11,588 - - -
12,527,401 4,943 60,891 125 1,032,512 581,471 42,308 4,579 45,686
Change in Net AssetsAttributable toRedeemable ParticipatingShareholders 501,756,929 1,874,274 3,109,342 7,797,724 32,332,837 15,298,837 12,024,550 1,662,217 14,281,881
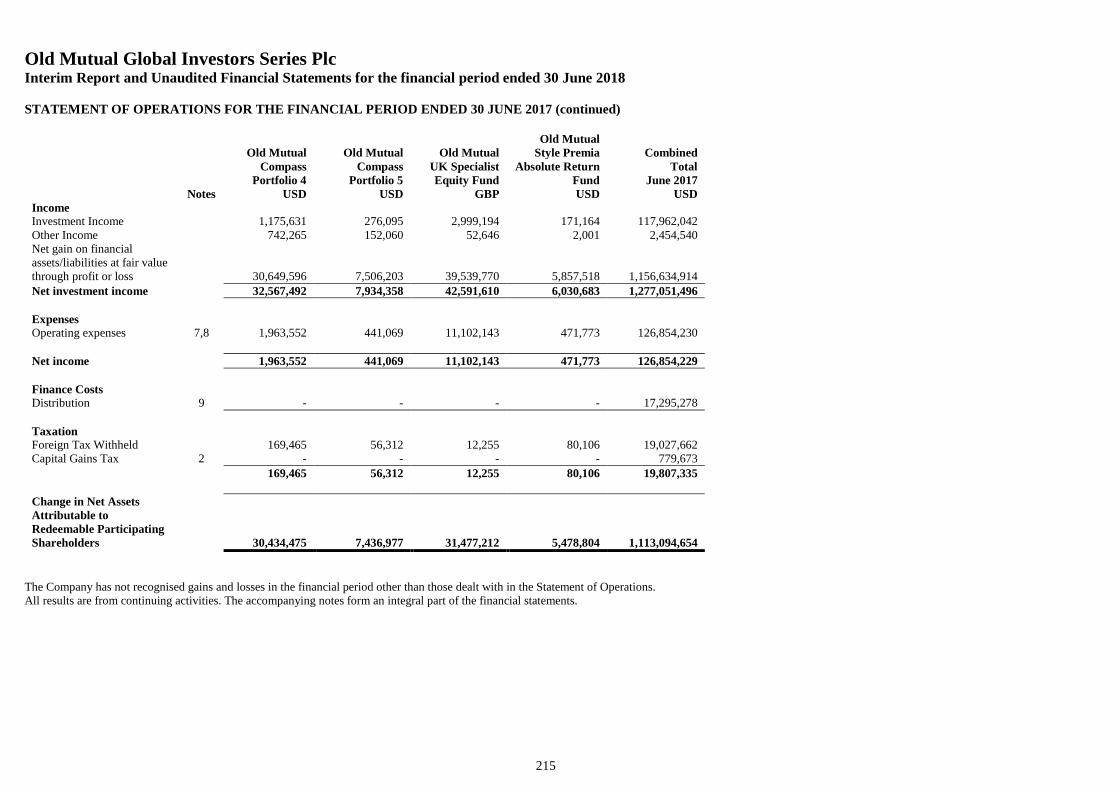
Old Mutual Global Investors Series PlcInterim Report and Unaudited Financial Statements for the financial period ended 30 June 2018
STATEMENT OF OPERATIONS FOR THE FINANCIAL PERIOD ENDED 30 JUNE 2017 (continued)
215
Old MutualCompass
Portfolio 4
Old MutualCompass
Portfolio 5
Old MutualUK SpecialistEquity Fund
Old MutualStyle Premia
Absolute ReturnFund
CombinedTotal
June 2017Notes USD USD GBP USD USD
IncomeInvestment Income 1,175,631 276,095 2,999,194 171,164 117,962,042Other Income 742,265 152,060 52,646 2,001 2,454,540Net gain on financialassets/liabilities at fair valuethrough profit or loss 30,649,596 7,506,203 39,539,770 5,857,518 1,156,634,914Net investment income 32,567,492 7,934,358 42,591,610 6,030,683 1,277,051,496
ExpensesOperating expenses 7,8 1,963,552 441,069 11,102,143 471,773 126,854,230
Net income 1,963,552 441,069 11,102,143 471,773 126,854,229
Finance CostsDistribution 9 - - - - 17,295,278
TaxationForeign Tax Withheld 169,465 56,312 12,255 80,106 19,027,662Capital Gains Tax 2 - - - - 779,673
169,465 56,312 12,255 80,106 19,807,335
Change in Net AssetsAttributable toRedeemable ParticipatingShareholders 30,434,475 7,436,977 31,477,212 5,478,804 1,113,094,654
The Company has not recognised gains and losses in the financial period other than those dealt with in the Statement of Operations.All results are from continuing activities. The accompanying notes form an integral part of the financial statements.
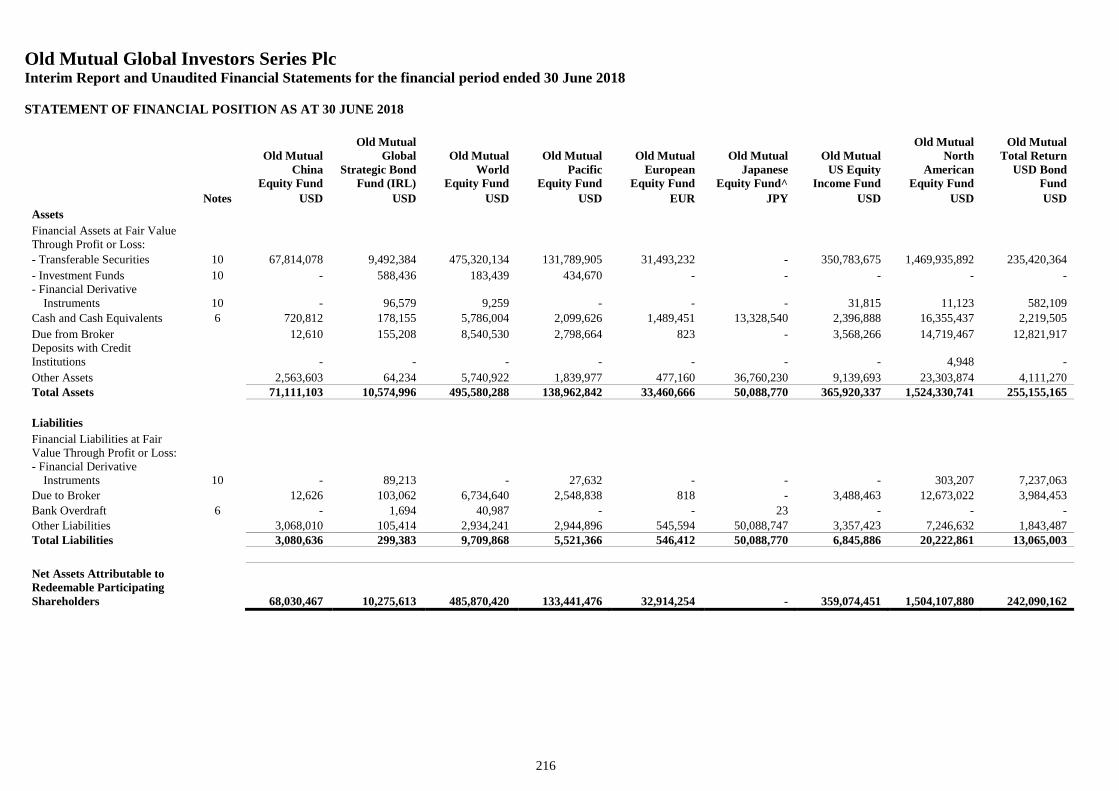
Old Mutual Global Investors Series PlcInterim Report and Unaudited Financial Statements for the financial period ended 30 June 2018
STATEMENT OF FINANCIAL POSITION AS AT 30 JUNE 2018
216
Old MutualChina
Equity Fund
Old MutualGlobal
Strategic BondFund (IRL)
Old MutualWorld
Equity Fund
Old MutualPacific
Equity Fund
Old MutualEuropean
Equity Fund
Old MutualJapanese
Equity Fund^
Old MutualUS Equity
Income Fund
Old MutualNorth
AmericanEquity Fund
Old MutualTotal Return
USD BondFund
Notes USD USD USD USD EUR JPY USD USD USD
Assets
Financial Assets at Fair ValueThrough Profit or Loss:
- Transferable Securities 10 67,814,078 9,492,384 475,320,134 131,789,905 31,493,232 - 350,783,675 1,469,935,892 235,420,364
- Investment Funds 10 - 588,436 183,439 434,670 - - - - -- Financial Derivative
Instruments 10 - 96,579 9,259 - - - 31,815 11,123 582,109
Cash and Cash Equivalents 6 720,812 178,155 5,786,004 2,099,626 1,489,451 13,328,540 2,396,888 16,355,437 2,219,505
Due from Broker 12,610 155,208 8,540,530 2,798,664 823 - 3,568,266 14,719,467 12,821,917Deposits with CreditInstitutions - - - - - - - 4,948 -
Other Assets 2,563,603 64,234 5,740,922 1,839,977 477,160 36,760,230 9,139,693 23,303,874 4,111,270Total Assets 71,111,103 10,574,996 495,580,288 138,962,842 33,460,666 50,088,770 365,920,337 1,524,330,741 255,155,165
Liabilities
Financial Liabilities at FairValue Through Profit or Loss:- Financial Derivative
Instruments 10 - 89,213 - 27,632 - - - 303,207 7,237,063
Due to Broker 12,626 103,062 6,734,640 2,548,838 818 - 3,488,463 12,673,022 3,984,453
Bank Overdraft 6 - 1,694 40,987 - - 23 - - -
Other Liabilities 3,068,010 105,414 2,934,241 2,944,896 545,594 50,088,747 3,357,423 7,246,632 1,843,487Total Liabilities 3,080,636 299,383 9,709,868 5,521,366 546,412 50,088,770 6,845,886 20,222,861 13,065,003
Net Assets Attributable toRedeemable ParticipatingShareholders 68,030,467 10,275,613 485,870,420 133,441,476 32,914,254 - 359,074,451 1,504,107,880 242,090,162
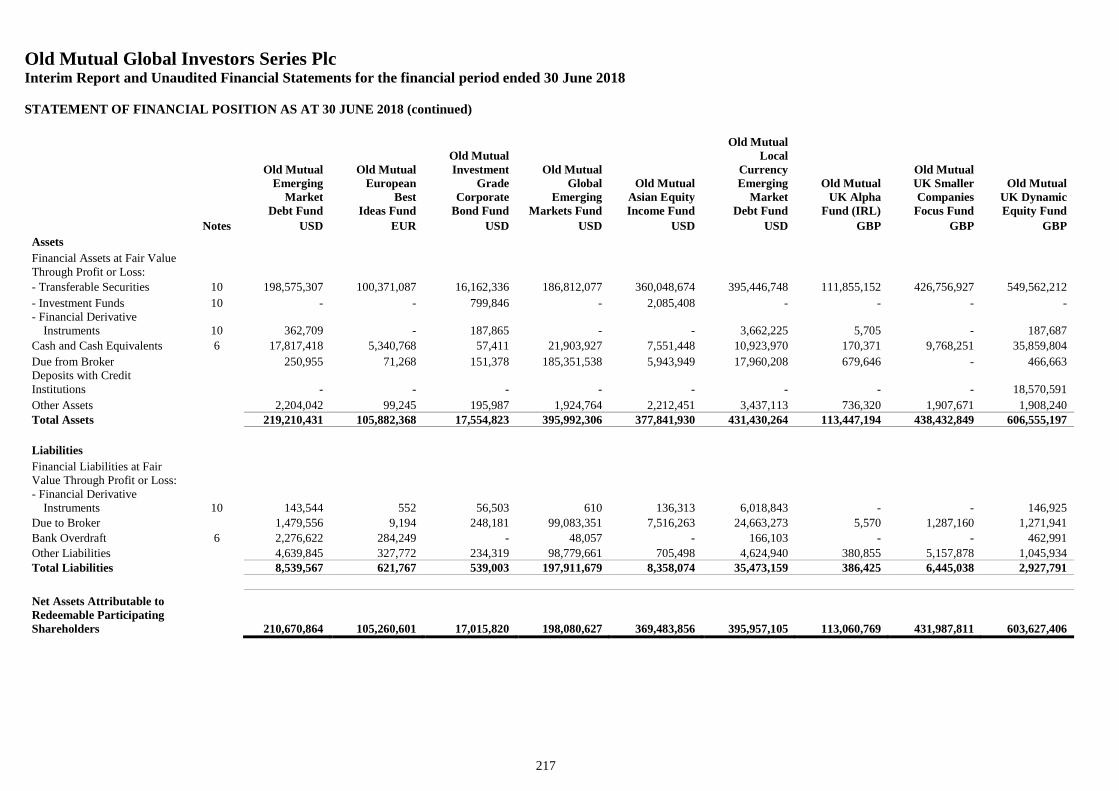
Old Mutual Global Investors Series PlcInterim Report and Unaudited Financial Statements for the financial period ended 30 June 2018
STATEMENT OF FINANCIAL POSITION AS AT 30 JUNE 2018 (continued)
217
Old MutualEmerging
MarketDebt Fund
Old MutualEuropean
BestIdeas Fund
Old MutualInvestment
GradeCorporate
Bond Fund
Old MutualGlobal
EmergingMarkets Fund
Old MutualAsian EquityIncome Fund
Old MutualLocal
CurrencyEmerging
MarketDebt Fund
Old MutualUK Alpha
Fund (IRL)
Old MutualUK SmallerCompanies
Focus Fund
Old MutualUK DynamicEquity Fund
Notes USD EUR USD USD USD USD GBP GBP GBP
Assets
Financial Assets at Fair ValueThrough Profit or Loss:
- Transferable Securities 10 198,575,307 100,371,087 16,162,336 186,812,077 360,048,674 395,446,748 111,855,152 426,756,927 549,562,212
- Investment Funds 10 - - 799,846 - 2,085,408 - - - -- Financial Derivative
Instruments 10 362,709 - 187,865 - - 3,662,225 5,705 - 187,687
Cash and Cash Equivalents 6 17,817,418 5,340,768 57,411 21,903,927 7,551,448 10,923,970 170,371 9,768,251 35,859,804
Due from Broker 250,955 71,268 151,378 185,351,538 5,943,949 17,960,208 679,646 - 466,663Deposits with CreditInstitutions - - - - - - - - 18,570,591
Other Assets 2,204,042 99,245 195,987 1,924,764 2,212,451 3,437,113 736,320 1,907,671 1,908,240Total Assets 219,210,431 105,882,368 17,554,823 395,992,306 377,841,930 431,430,264 113,447,194 438,432,849 606,555,197
Liabilities
Financial Liabilities at FairValue Through Profit or Loss:- Financial Derivative
Instruments 10 143,544 552 56,503 610 136,313 6,018,843 - - 146,925
Due to Broker 1,479,556 9,194 248,181 99,083,351 7,516,263 24,663,273 5,570 1,287,160 1,271,941
Bank Overdraft 6 2,276,622 284,249 - 48,057 - 166,103 - - 462,991
Other Liabilities 4,639,845 327,772 234,319 98,779,661 705,498 4,624,940 380,855 5,157,878 1,045,934Total Liabilities 8,539,567 621,767 539,003 197,911,679 8,358,074 35,473,159 386,425 6,445,038 2,927,791
Net Assets Attributable toRedeemable ParticipatingShareholders 210,670,864 105,260,601 17,015,820 198,080,627 369,483,856 395,957,105 113,060,769 431,987,811 603,627,406
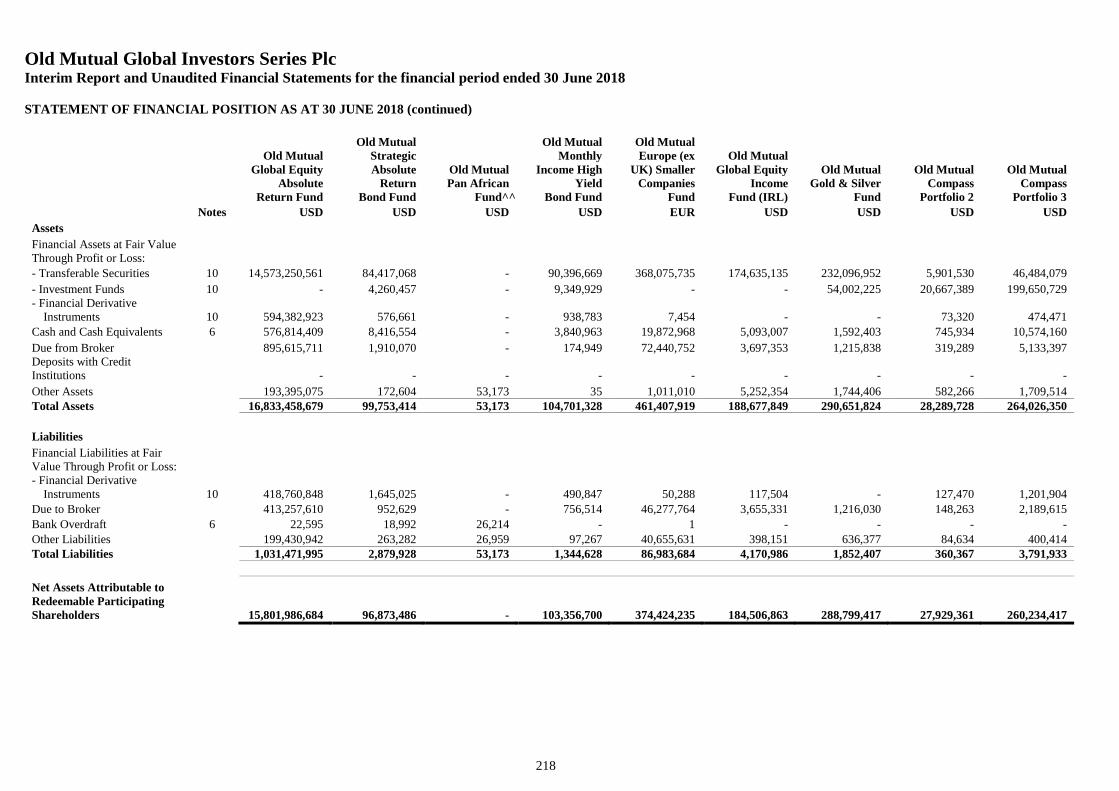
Old Mutual Global Investors Series PlcInterim Report and Unaudited Financial Statements for the financial period ended 30 June 2018
STATEMENT OF FINANCIAL POSITION AS AT 30 JUNE 2018 (continued)
218
Old MutualGlobal Equity
AbsoluteReturn Fund
Old MutualStrategicAbsolute
ReturnBond Fund
Old MutualPan African
Fund^^
Old MutualMonthly
Income HighYield
Bond Fund
Old MutualEurope (ex
UK) SmallerCompanies
Fund
Old MutualGlobal Equity
IncomeFund (IRL)
Old MutualGold & Silver
Fund
Old MutualCompass
Portfolio 2
Old MutualCompass
Portfolio 3
Notes USD USD USD USD EUR USD USD USD USD
Assets
Financial Assets at Fair ValueThrough Profit or Loss:
- Transferable Securities 10 14,573,250,561 84,417,068 - 90,396,669 368,075,735 174,635,135 232,096,952 5,901,530 46,484,079
- Investment Funds 10 - 4,260,457 - 9,349,929 - - 54,002,225 20,667,389 199,650,729- Financial Derivative
Instruments 10 594,382,923 576,661 - 938,783 7,454 - - 73,320 474,471
Cash and Cash Equivalents 6 576,814,409 8,416,554 - 3,840,963 19,872,968 5,093,007 1,592,403 745,934 10,574,160
Due from Broker 895,615,711 1,910,070 - 174,949 72,440,752 3,697,353 1,215,838 319,289 5,133,397Deposits with CreditInstitutions - - - - - - - - -
Other Assets 193,395,075 172,604 53,173 35 1,011,010 5,252,354 1,744,406 582,266 1,709,514Total Assets 16,833,458,679 99,753,414 53,173 104,701,328 461,407,919 188,677,849 290,651,824 28,289,728 264,026,350
Liabilities
Financial Liabilities at FairValue Through Profit or Loss:- Financial Derivative
Instruments 10 418,760,848 1,645,025 - 490,847 50,288 117,504 - 127,470 1,201,904
Due to Broker 413,257,610 952,629 - 756,514 46,277,764 3,655,331 1,216,030 148,263 2,189,615
Bank Overdraft 6 22,595 18,992 26,214 - 1 - - - -
Other Liabilities 199,430,942 263,282 26,959 97,267 40,655,631 398,151 636,377 84,634 400,414Total Liabilities 1,031,471,995 2,879,928 53,173 1,344,628 86,983,684 4,170,986 1,852,407 360,367 3,791,933
Net Assets Attributable toRedeemable ParticipatingShareholders 15,801,986,684 96,873,486 - 103,356,700 374,424,235 184,506,863 288,799,417 27,929,361 260,234,417
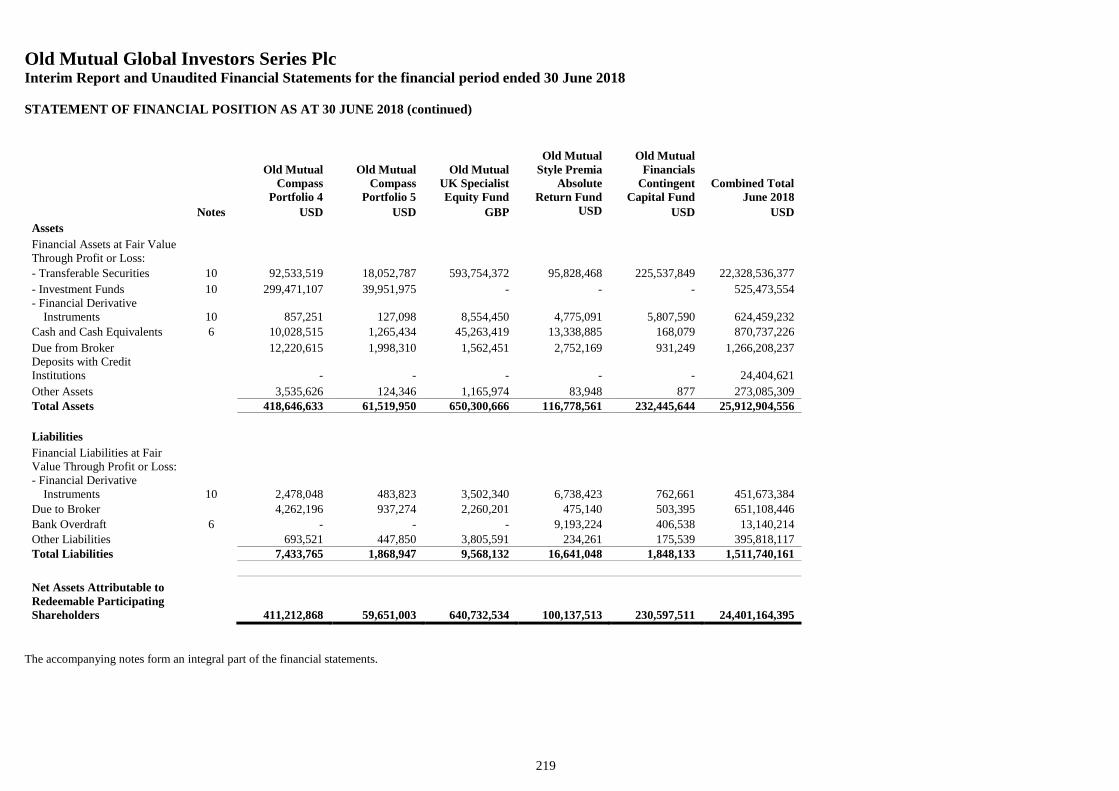
Old Mutual Global Investors Series PlcInterim Report and Unaudited Financial Statements for the financial period ended 30 June 2018
STATEMENT OF FINANCIAL POSITION AS AT 30 JUNE 2018 (continued)
219
Old MutualCompass
Portfolio 4
Old MutualCompass
Portfolio 5
Old MutualUK SpecialistEquity Fund
Old MutualStyle Premia
AbsoluteReturn Fund
Old MutualFinancials
ContingentCapital Fund
Combined TotalJune 2018
Notes USD USD GBP USD USD USD
Assets
Financial Assets at Fair ValueThrough Profit or Loss:
- Transferable Securities 10 92,533,519 18,052,787 593,754,372 95,828,468 225,537,849 22,328,536,377
- Investment Funds 10 299,471,107 39,951,975 - - - 525,473,554- Financial Derivative
Instruments 10 857,251 127,098 8,554,450 4,775,091 5,807,590 624,459,232
Cash and Cash Equivalents 6 10,028,515 1,265,434 45,263,419 13,338,885 168,079 870,737,226
Due from Broker 12,220,615 1,998,310 1,562,451 2,752,169 931,249 1,266,208,237Deposits with CreditInstitutions - - - - - 24,404,621
Other Assets 3,535,626 124,346 1,165,974 83,948 877 273,085,309Total Assets 418,646,633 61,519,950 650,300,666 116,778,561 232,445,644 25,912,904,556
Liabilities
Financial Liabilities at FairValue Through Profit or Loss:- Financial Derivative
Instruments 10 2,478,048 483,823 3,502,340 6,738,423 762,661 451,673,384
Due to Broker 4,262,196 937,274 2,260,201 475,140 503,395 651,108,446
Bank Overdraft 6 - - - 9,193,224 406,538 13,140,214
Other Liabilities 693,521 447,850 3,805,591 234,261 175,539 395,818,117Total Liabilities 7,433,765 1,868,947 9,568,132 16,641,048 1,848,133 1,511,740,161
Net Assets Attributable toRedeemable ParticipatingShareholders 411,212,868 59,651,003 640,732,534 100,137,513 230,597,511 24,401,164,395
The accompanying notes form an integral part of the financial statements.
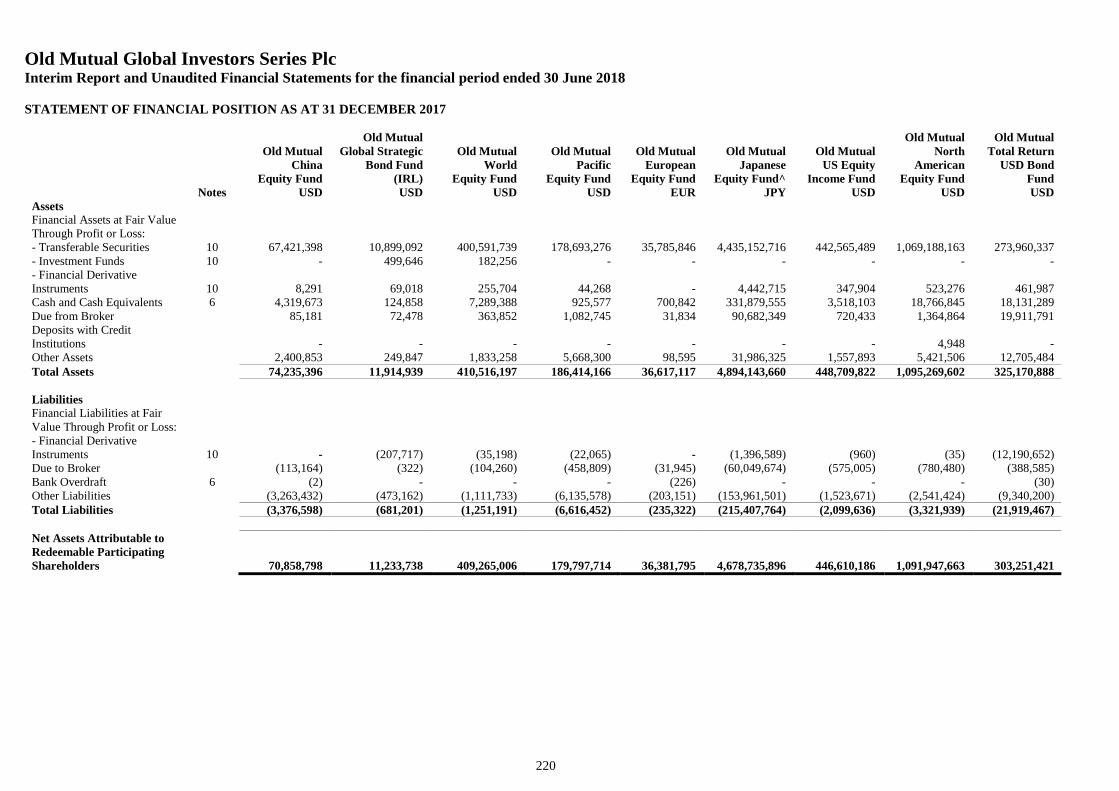
Old Mutual Global Investors Series PlcInterim Report and Unaudited Financial Statements for the financial period ended 30 June 2018
STATEMENT OF FINANCIAL POSITION AS AT 31 DECEMBER 2017
220
Old MutualChina
Equity Fund
Old MutualGlobal Strategic
Bond Fund(IRL)
Old MutualWorld
Equity Fund
Old MutualPacific
Equity Fund
Old MutualEuropean
Equity Fund
Old MutualJapanese
Equity Fund^
Old MutualUS Equity
Income Fund
Old MutualNorth
AmericanEquity Fund
Old MutualTotal Return
USD BondFund
Notes USD USD USD USD EUR JPY USD USD USDAssetsFinancial Assets at Fair ValueThrough Profit or Loss:- Transferable Securities 10 67,421,398 10,899,092 400,591,739 178,693,276 35,785,846 4,435,152,716 442,565,489 1,069,188,163 273,960,337- Investment Funds 10 - 499,646 182,256 - - - - - -- Financial DerivativeInstruments 10 8,291 69,018 255,704 44,268 - 4,442,715 347,904 523,276 461,987Cash and Cash Equivalents 6 4,319,673 124,858 7,289,388 925,577 700,842 331,879,555 3,518,103 18,766,845 18,131,289Due from Broker 85,181 72,478 363,852 1,082,745 31,834 90,682,349 720,433 1,364,864 19,911,791Deposits with CreditInstitutions - - - - - - - 4,948 -Other Assets 2,400,853 249,847 1,833,258 5,668,300 98,595 31,986,325 1,557,893 5,421,506 12,705,484Total Assets 74,235,396 11,914,939 410,516,197 186,414,166 36,617,117 4,894,143,660 448,709,822 1,095,269,602 325,170,888
LiabilitiesFinancial Liabilities at FairValue Through Profit or Loss:- Financial DerivativeInstruments 10 - (207,717) (35,198) (22,065) - (1,396,589) (960) (35) (12,190,652)Due to Broker (113,164) (322) (104,260) (458,809) (31,945) (60,049,674) (575,005) (780,480) (388,585)Bank Overdraft 6 (2) - - - (226) - - - (30)Other Liabilities (3,263,432) (473,162) (1,111,733) (6,135,578) (203,151) (153,961,501) (1,523,671) (2,541,424) (9,340,200)Total Liabilities (3,376,598) (681,201) (1,251,191) (6,616,452) (235,322) (215,407,764) (2,099,636) (3,321,939) (21,919,467)
Net Assets Attributable toRedeemable ParticipatingShareholders 70,858,798 11,233,738 409,265,006 179,797,714 36,381,795 4,678,735,896 446,610,186 1,091,947,663 303,251,421
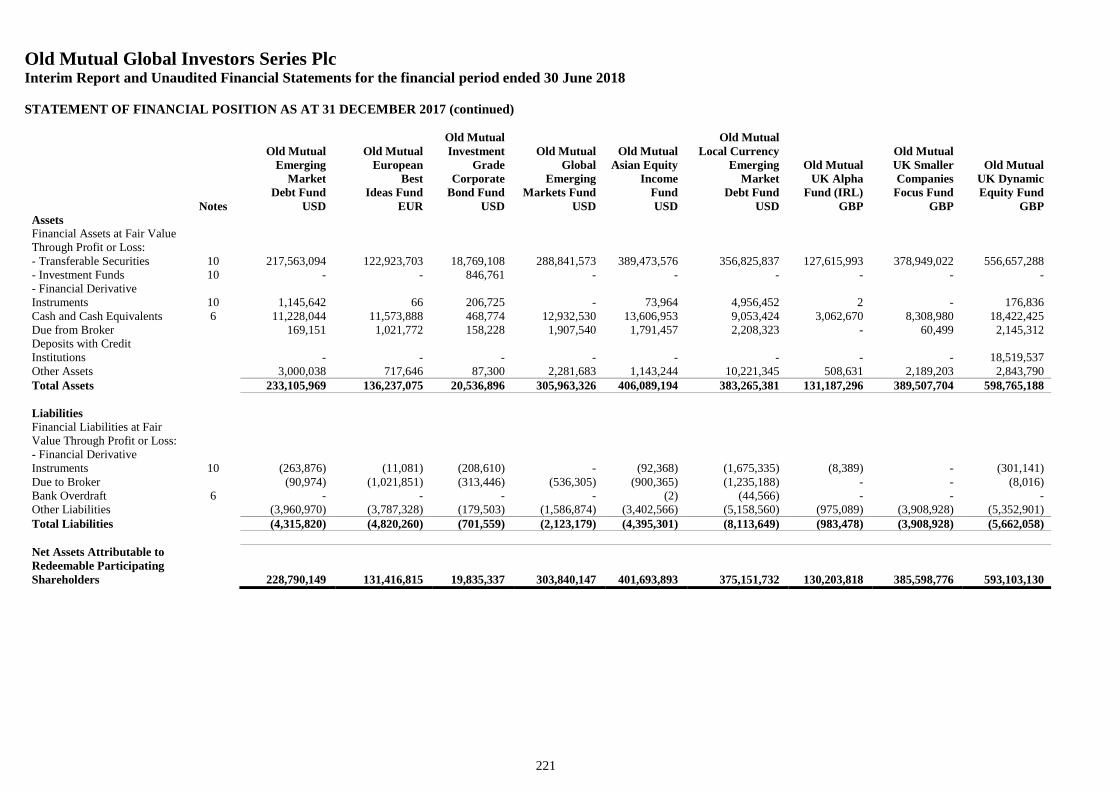
Old Mutual Global Investors Series PlcInterim Report and Unaudited Financial Statements for the financial period ended 30 June 2018
STATEMENT OF FINANCIAL POSITION AS AT 31 DECEMBER 2017 (continued)
221
Old MutualEmerging
MarketDebt Fund
Old MutualEuropean
BestIdeas Fund
Old MutualInvestment
GradeCorporate
Bond Fund
Old MutualGlobal
EmergingMarkets Fund
Old MutualAsian Equity
IncomeFund
Old MutualLocal Currency
EmergingMarket
Debt Fund
Old MutualUK Alpha
Fund (IRL)
Old MutualUK SmallerCompanies
Focus Fund
Old MutualUK DynamicEquity Fund
Notes USD EUR USD USD USD USD GBP GBP GBPAssetsFinancial Assets at Fair ValueThrough Profit or Loss:- Transferable Securities 10 217,563,094 122,923,703 18,769,108 288,841,573 389,473,576 356,825,837 127,615,993 378,949,022 556,657,288- Investment Funds 10 - - 846,761 - - - - - -- Financial DerivativeInstruments 10 1,145,642 66 206,725 - 73,964 4,956,452 2 - 176,836Cash and Cash Equivalents 6 11,228,044 11,573,888 468,774 12,932,530 13,606,953 9,053,424 3,062,670 8,308,980 18,422,425Due from Broker 169,151 1,021,772 158,228 1,907,540 1,791,457 2,208,323 - 60,499 2,145,312Deposits with CreditInstitutions - - - - - - - - 18,519,537Other Assets 3,000,038 717,646 87,300 2,281,683 1,143,244 10,221,345 508,631 2,189,203 2,843,790Total Assets 233,105,969 136,237,075 20,536,896 305,963,326 406,089,194 383,265,381 131,187,296 389,507,704 598,765,188
LiabilitiesFinancial Liabilities at FairValue Through Profit or Loss:- Financial DerivativeInstruments 10 (263,876) (11,081) (208,610) - (92,368) (1,675,335) (8,389) - (301,141)Due to Broker (90,974) (1,021,851) (313,446) (536,305) (900,365) (1,235,188) - - (8,016)Bank Overdraft 6 - - - - (2) (44,566) - - -Other Liabilities (3,960,970) (3,787,328) (179,503) (1,586,874) (3,402,566) (5,158,560) (975,089) (3,908,928) (5,352,901)Total Liabilities (4,315,820) (4,820,260) (701,559) (2,123,179) (4,395,301) (8,113,649) (983,478) (3,908,928) (5,662,058)
Net Assets Attributable toRedeemable ParticipatingShareholders 228,790,149 131,416,815 19,835,337 303,840,147 401,693,893 375,151,732 130,203,818 385,598,776 593,103,130
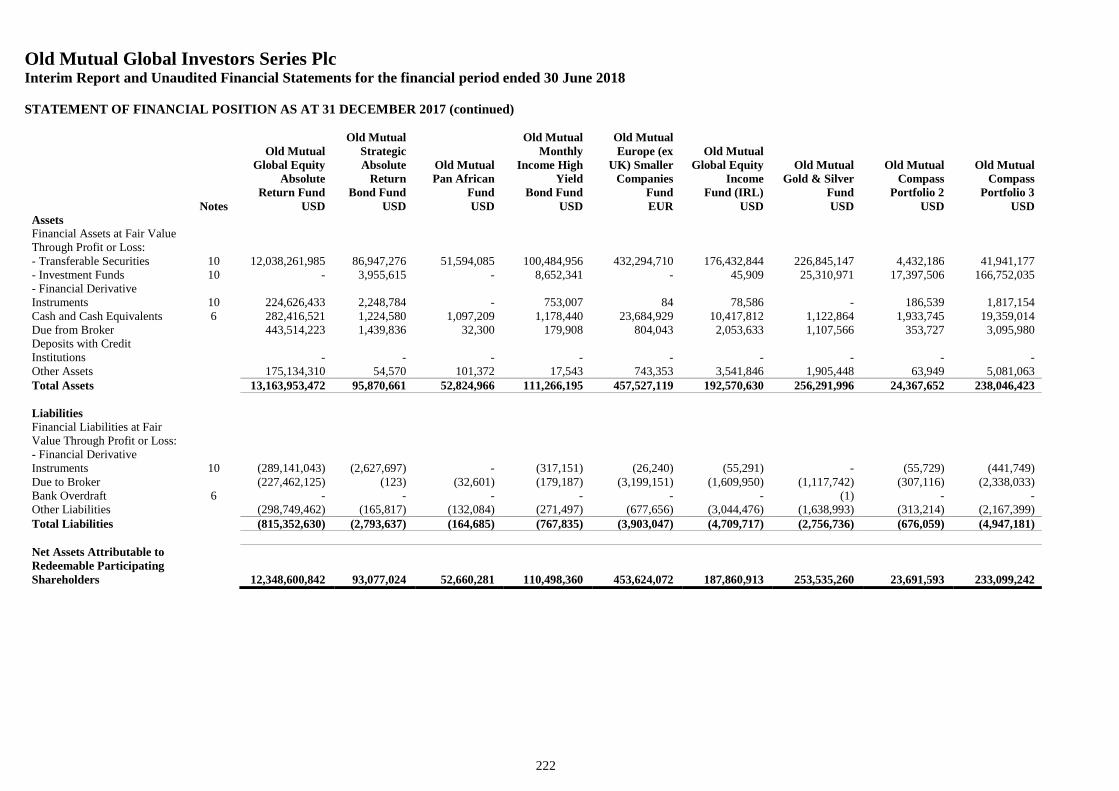
Old Mutual Global Investors Series PlcInterim Report and Unaudited Financial Statements for the financial period ended 30 June 2018
STATEMENT OF FINANCIAL POSITION AS AT 31 DECEMBER 2017 (continued)
222
Old MutualGlobal Equity
AbsoluteReturn Fund
Old MutualStrategicAbsolute
ReturnBond Fund
Old MutualPan African
Fund
Old MutualMonthly
Income HighYield
Bond Fund
Old MutualEurope (ex
UK) SmallerCompanies
Fund
Old MutualGlobal Equity
IncomeFund (IRL)
Old MutualGold & Silver
Fund
Old MutualCompass
Portfolio 2
Old MutualCompass
Portfolio 3Notes USD USD USD USD EUR USD USD USD USD
AssetsFinancial Assets at Fair ValueThrough Profit or Loss:- Transferable Securities 10 12,038,261,985 86,947,276 51,594,085 100,484,956 432,294,710 176,432,844 226,845,147 4,432,186 41,941,177- Investment Funds 10 - 3,955,615 - 8,652,341 - 45,909 25,310,971 17,397,506 166,752,035- Financial DerivativeInstruments 10 224,626,433 2,248,784 - 753,007 84 78,586 - 186,539 1,817,154Cash and Cash Equivalents 6 282,416,521 1,224,580 1,097,209 1,178,440 23,684,929 10,417,812 1,122,864 1,933,745 19,359,014Due from Broker 443,514,223 1,439,836 32,300 179,908 804,043 2,053,633 1,107,566 353,727 3,095,980Deposits with CreditInstitutions - - - - - - - - -Other Assets 175,134,310 54,570 101,372 17,543 743,353 3,541,846 1,905,448 63,949 5,081,063Total Assets 13,163,953,472 95,870,661 52,824,966 111,266,195 457,527,119 192,570,630 256,291,996 24,367,652 238,046,423
LiabilitiesFinancial Liabilities at FairValue Through Profit or Loss:- Financial DerivativeInstruments 10 (289,141,043) (2,627,697) - (317,151) (26,240) (55,291) - (55,729) (441,749)Due to Broker (227,462,125) (123) (32,601) (179,187) (3,199,151) (1,609,950) (1,117,742) (307,116) (2,338,033)Bank Overdraft 6 - - - - - - (1) - -Other Liabilities (298,749,462) (165,817) (132,084) (271,497) (677,656) (3,044,476) (1,638,993) (313,214) (2,167,399)Total Liabilities (815,352,630) (2,793,637) (164,685) (767,835) (3,903,047) (4,709,717) (2,756,736) (676,059) (4,947,181)
Net Assets Attributable toRedeemable ParticipatingShareholders 12,348,600,842 93,077,024 52,660,281 110,498,360 453,624,072 187,860,913 253,535,260 23,691,593 233,099,242
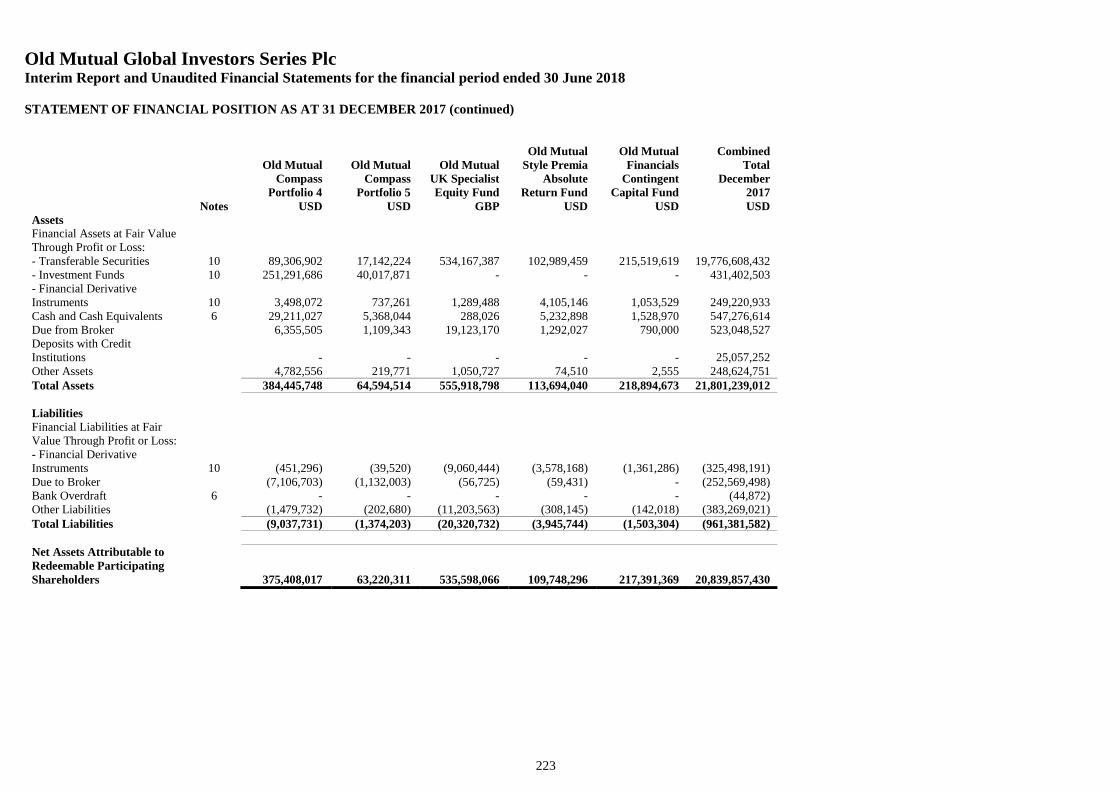
Old Mutual Global Investors Series PlcInterim Report and Unaudited Financial Statements for the financial period ended 30 June 2018
STATEMENT OF FINANCIAL POSITION AS AT 31 DECEMBER 2017 (continued)
223
Old MutualCompass
Portfolio 4
Old MutualCompass
Portfolio 5
Old MutualUK SpecialistEquity Fund
Old MutualStyle Premia
AbsoluteReturn Fund
Old MutualFinancials
ContingentCapital Fund
CombinedTotal
December2017
Notes USD USD GBP USD USD USDAssetsFinancial Assets at Fair ValueThrough Profit or Loss:- Transferable Securities 10 89,306,902 17,142,224 534,167,387 102,989,459 215,519,619 19,776,608,432- Investment Funds 10 251,291,686 40,017,871 - - - 431,402,503- Financial DerivativeInstruments 10 3,498,072 737,261 1,289,488 4,105,146 1,053,529 249,220,933Cash and Cash Equivalents 6 29,211,027 5,368,044 288,026 5,232,898 1,528,970 547,276,614Due from Broker 6,355,505 1,109,343 19,123,170 1,292,027 790,000 523,048,527Deposits with CreditInstitutions - - - - - 25,057,252Other Assets 4,782,556 219,771 1,050,727 74,510 2,555 248,624,751Total Assets 384,445,748 64,594,514 555,918,798 113,694,040 218,894,673 21,801,239,012
LiabilitiesFinancial Liabilities at FairValue Through Profit or Loss:- Financial DerivativeInstruments 10 (451,296) (39,520) (9,060,444) (3,578,168) (1,361,286) (325,498,191)Due to Broker (7,106,703) (1,132,003) (56,725) (59,431) - (252,569,498)Bank Overdraft 6 - - - - - (44,872)Other Liabilities (1,479,732) (202,680) (11,203,563) (308,145) (142,018) (383,269,021)Total Liabilities (9,037,731) (1,374,203) (20,320,732) (3,945,744) (1,503,304) (961,381,582)
Net Assets Attributable toRedeemable ParticipatingShareholders 375,408,017 63,220,311 535,598,066 109,748,296 217,391,369 20,839,857,430
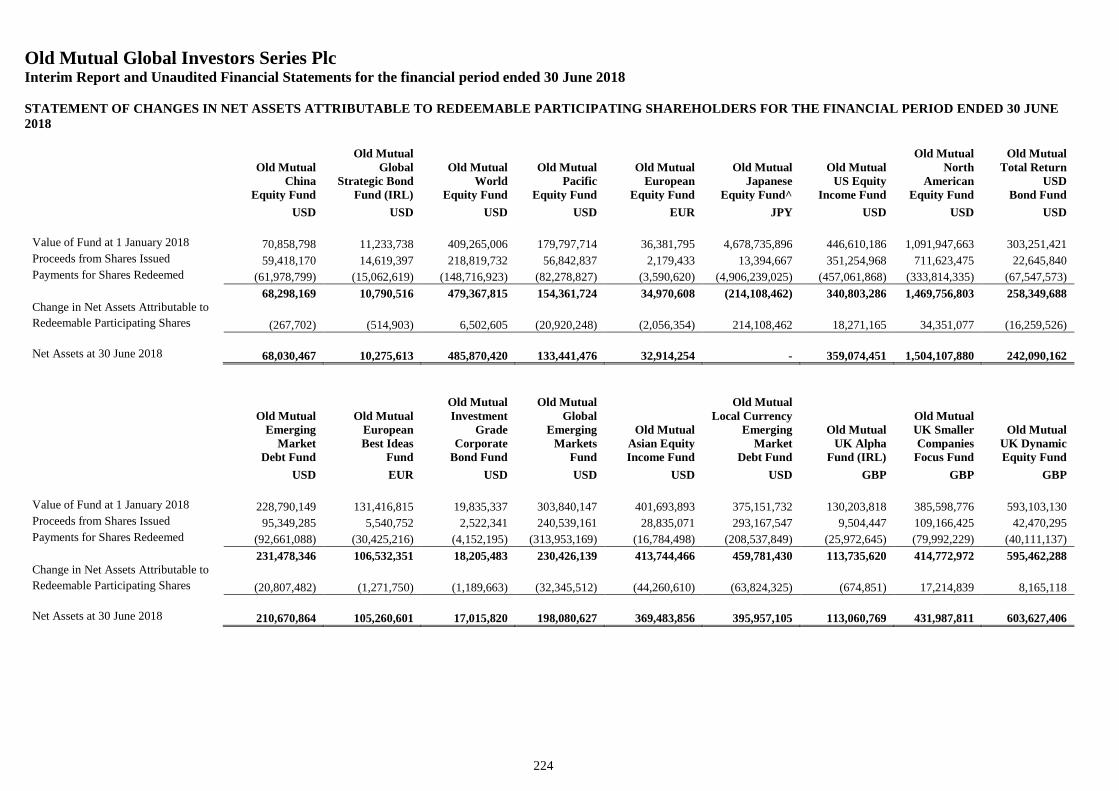
Old Mutual Global Investors Series PlcInterim Report and Unaudited Financial Statements for the financial period ended 30 June 2018
STATEMENT OF CHANGES IN NET ASSETS ATTRIBUTABLE TO REDEEMABLE PARTICIPATING SHAREHOLDERS FOR THE FINANCIAL PERIOD ENDED 30 JUNE2018
224
Old MutualChina
Equity Fund
Old MutualGlobal
Strategic BondFund (IRL)
Old MutualWorld
Equity Fund
Old MutualPacific
Equity Fund
Old MutualEuropean
Equity Fund
Old MutualJapanese
Equity Fund^
Old MutualUS Equity
Income Fund
Old MutualNorth
AmericanEquity Fund
Old MutualTotal Return
USDBond Fund
USD USD USD USD EUR JPY USD USD USD
Value of Fund at 1 January 2018 70,858,798 11,233,738 409,265,006 179,797,714 36,381,795 4,678,735,896 446,610,186 1,091,947,663 303,251,421Proceeds from Shares Issued 59,418,170 14,619,397 218,819,732 56,842,837 2,179,433 13,394,667 351,254,968 711,623,475 22,645,840Payments for Shares Redeemed (61,978,799) (15,062,619) (148,716,923) (82,278,827) (3,590,620) (4,906,239,025) (457,061,868) (333,814,335) (67,547,573)
68,298,169 10,790,516 479,367,815 154,361,724 34,970,608 (214,108,462) 340,803,286 1,469,756,803 258,349,688Change in Net Assets Attributable to
Redeemable Participating Shares (267,702) (514,903) 6,502,605 (20,920,248) (2,056,354) 214,108,462 18,271,165 34,351,077 (16,259,526)
Net Assets at 30 June 2018 68,030,467 10,275,613 485,870,420 133,441,476 32,914,254 - 359,074,451 1,504,107,880 242,090,162
Old MutualEmerging
MarketDebt Fund
Old MutualEuropeanBest Ideas
Fund
Old MutualInvestment
GradeCorporate
Bond Fund
Old MutualGlobal
EmergingMarkets
Fund
Old MutualAsian EquityIncome Fund
Old MutualLocal Currency
EmergingMarket
Debt Fund
Old MutualUK Alpha
Fund (IRL)
Old MutualUK SmallerCompanies
Focus Fund
Old MutualUK DynamicEquity Fund
USD EUR USD USD USD USD GBP GBP GBP
Value of Fund at 1 January 2018 228,790,149 131,416,815 19,835,337 303,840,147 401,693,893 375,151,732 130,203,818 385,598,776 593,103,130Proceeds from Shares Issued 95,349,285 5,540,752 2,522,341 240,539,161 28,835,071 293,167,547 9,504,447 109,166,425 42,470,295Payments for Shares Redeemed (92,661,088) (30,425,216) (4,152,195) (313,953,169) (16,784,498) (208,537,849) (25,972,645) (79,992,229) (40,111,137)
231,478,346 106,532,351 18,205,483 230,426,139 413,744,466 459,781,430 113,735,620 414,772,972 595,462,288Change in Net Assets Attributable to
Redeemable Participating Shares (20,807,482) (1,271,750) (1,189,663) (32,345,512) (44,260,610) (63,824,325) (674,851) 17,214,839 8,165,118
Net Assets at 30 June 2018 210,670,864 105,260,601 17,015,820 198,080,627 369,483,856 395,957,105 113,060,769 431,987,811 603,627,406
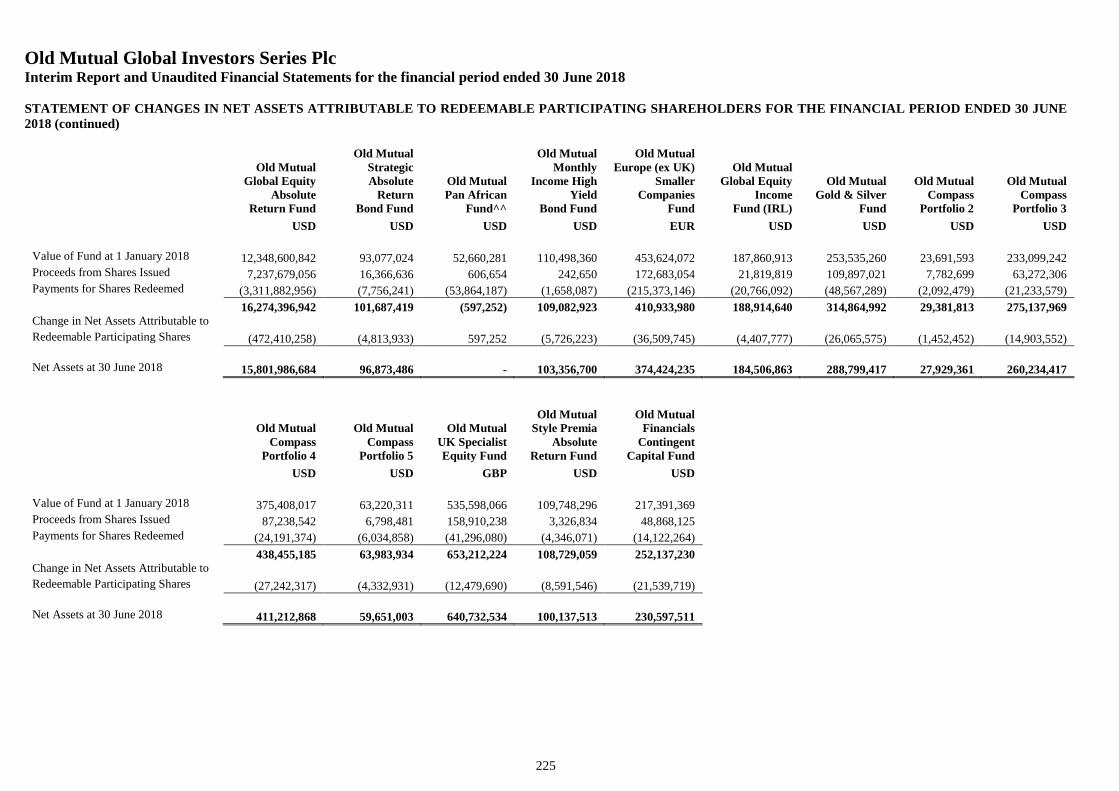
Old Mutual Global Investors Series PlcInterim Report and Unaudited Financial Statements for the financial period ended 30 June 2018
STATEMENT OF CHANGES IN NET ASSETS ATTRIBUTABLE TO REDEEMABLE PARTICIPATING SHAREHOLDERS FOR THE FINANCIAL PERIOD ENDED 30 JUNE2018 (continued)
225
Old MutualGlobal Equity
AbsoluteReturn Fund
Old MutualStrategicAbsolute
ReturnBond Fund
Old MutualPan African
Fund^^
Old MutualMonthly
Income HighYield
Bond Fund
Old MutualEurope (ex UK)
SmallerCompanies
Fund
Old MutualGlobal Equity
IncomeFund (IRL)
Old MutualGold & Silver
Fund
Old MutualCompass
Portfolio 2
Old MutualCompass
Portfolio 3
USD USD USD USD EUR USD USD USD USD
Value of Fund at 1 January 2018 12,348,600,842 93,077,024 52,660,281 110,498,360 453,624,072 187,860,913 253,535,260 23,691,593 233,099,242Proceeds from Shares Issued 7,237,679,056 16,366,636 606,654 242,650 172,683,054 21,819,819 109,897,021 7,782,699 63,272,306Payments for Shares Redeemed (3,311,882,956) (7,756,241) (53,864,187) (1,658,087) (215,373,146) (20,766,092) (48,567,289) (2,092,479) (21,233,579)
16,274,396,942 101,687,419 (597,252) 109,082,923 410,933,980 188,914,640 314,864,992 29,381,813 275,137,969Change in Net Assets Attributable to
Redeemable Participating Shares (472,410,258) (4,813,933) 597,252 (5,726,223) (36,509,745) (4,407,777) (26,065,575) (1,452,452) (14,903,552)
Net Assets at 30 June 2018 15,801,986,684 96,873,486 - 103,356,700 374,424,235 184,506,863 288,799,417 27,929,361 260,234,417
Old MutualCompass
Portfolio 4
Old MutualCompass
Portfolio 5
Old MutualUK SpecialistEquity Fund
Old MutualStyle Premia
AbsoluteReturn Fund
Old MutualFinancials
ContingentCapital Fund
USD USD GBP USD USD
Value of Fund at 1 January 2018 375,408,017 63,220,311 535,598,066 109,748,296 217,391,369Proceeds from Shares Issued 87,238,542 6,798,481 158,910,238 3,326,834 48,868,125Payments for Shares Redeemed (24,191,374) (6,034,858) (41,296,080) (4,346,071) (14,122,264)
438,455,185 63,983,934 653,212,224 108,729,059 252,137,230Change in Net Assets Attributable to
Redeemable Participating Shares (27,242,317) (4,332,931) (12,479,690) (8,591,546) (21,539,719)
Net Assets at 30 June 2018 411,212,868 59,651,003 640,732,534 100,137,513 230,597,511
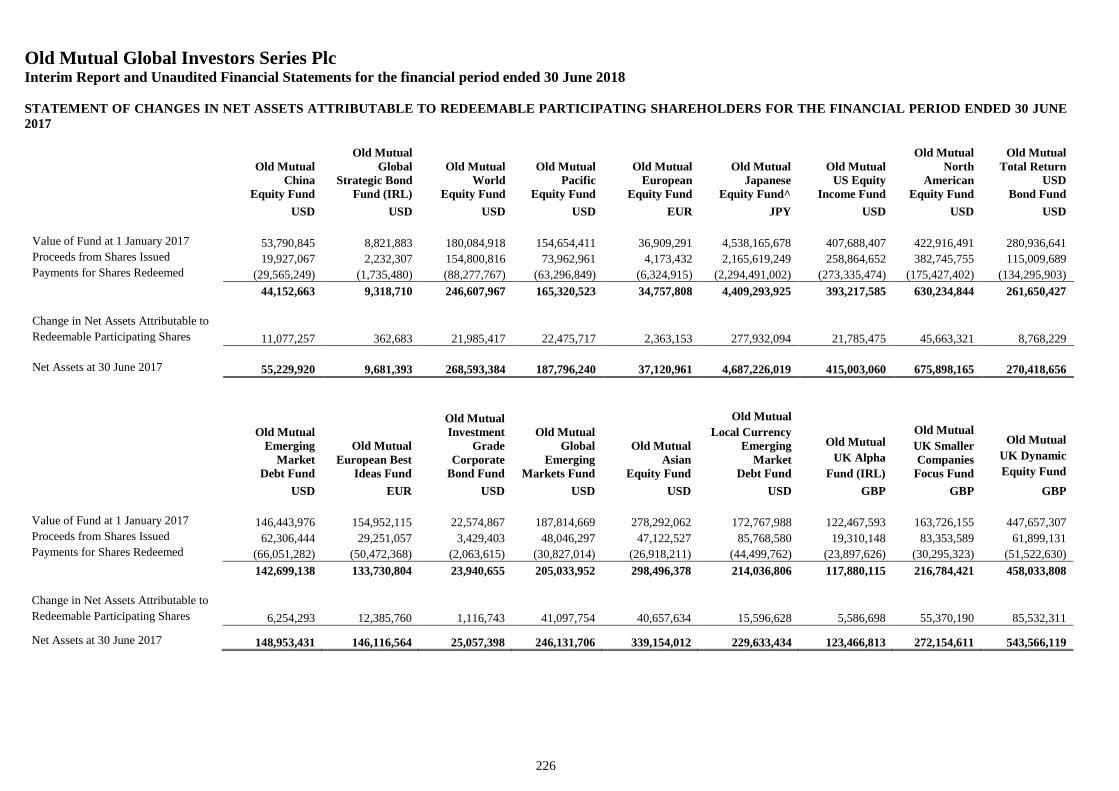
Old Mutual Global Investors Series PlcInterim Report and Unaudited Financial Statements for the financial period ended 30 June 2018
STATEMENT OF CHANGES IN NET ASSETS ATTRIBUTABLE TO REDEEMABLE PARTICIPATING SHAREHOLDERS FOR THE FINANCIAL PERIOD ENDED 30 JUNE2017
226
Old MutualChina
Equity Fund
Old MutualGlobal
Strategic BondFund (IRL)
Old MutualWorld
Equity Fund
Old MutualPacific
Equity Fund
Old MutualEuropean
Equity Fund
Old MutualJapanese
Equity Fund^
Old MutualUS Equity
Income Fund
Old MutualNorth
AmericanEquity Fund
Old MutualTotal Return
USDBond Fund
USD USD USD USD EUR JPY USD USD USD
Value of Fund at 1 January 2017 53,790,845 8,821,883 180,084,918 154,654,411 36,909,291 4,538,165,678 407,688,407 422,916,491 280,936,641Proceeds from Shares Issued 19,927,067 2,232,307 154,800,816 73,962,961 4,173,432 2,165,619,249 258,864,652 382,745,755 115,009,689Payments for Shares Redeemed (29,565,249) (1,735,480) (88,277,767) (63,296,849) (6,324,915) (2,294,491,002) (273,335,474) (175,427,402) (134,295,903)
44,152,663 9,318,710 246,607,967 165,320,523 34,757,808 4,409,293,925 393,217,585 630,234,844 261,650,427
Change in Net Assets Attributable to
Redeemable Participating Shares 11,077,257 362,683 21,985,417 22,475,717 2,363,153 277,932,094 21,785,475 45,663,321 8,768,229
Net Assets at 30 June 2017 55,229,920 9,681,393 268,593,384 187,796,240 37,120,961 4,687,226,019 415,003,060 675,898,165 270,418,656
Old MutualEmerging
MarketDebt Fund
Old MutualEuropean Best
Ideas Fund
Old MutualInvestment
GradeCorporate
Bond Fund
Old MutualGlobal
EmergingMarkets Fund
Old MutualAsian
Equity Fund
Old Mutual
Local CurrencyEmerging
MarketDebt Fund
Old Mutual
UK Alpha
Fund (IRL)
Old Mutual
UK SmallerCompanies
Focus Fund
Old Mutual
UK Dynamic
Equity Fund
USD EUR USD USD USD USD GBP GBP GBP
Value of Fund at 1 January 2017 146,443,976 154,952,115 22,574,867 187,814,669 278,292,062 172,767,988 122,467,593 163,726,155 447,657,307Proceeds from Shares Issued 62,306,444 29,251,057 3,429,403 48,046,297 47,122,527 85,768,580 19,310,148 83,353,589 61,899,131Payments for Shares Redeemed (66,051,282) (50,472,368) (2,063,615) (30,827,014) (26,918,211) (44,499,762) (23,897,626) (30,295,323) (51,522,630)
142,699,138 133,730,804 23,940,655 205,033,952 298,496,378 214,036,806 117,880,115 216,784,421 458,033,808
Change in Net Assets Attributable to
Redeemable Participating Shares 6,254,293 12,385,760 1,116,743 41,097,754 40,657,634 15,596,628 5,586,698 55,370,190 85,532,311
Net Assets at 30 June 2017 148,953,431 146,116,564 25,057,398 246,131,706 339,154,012 229,633,434 123,466,813 272,154,611 543,566,119
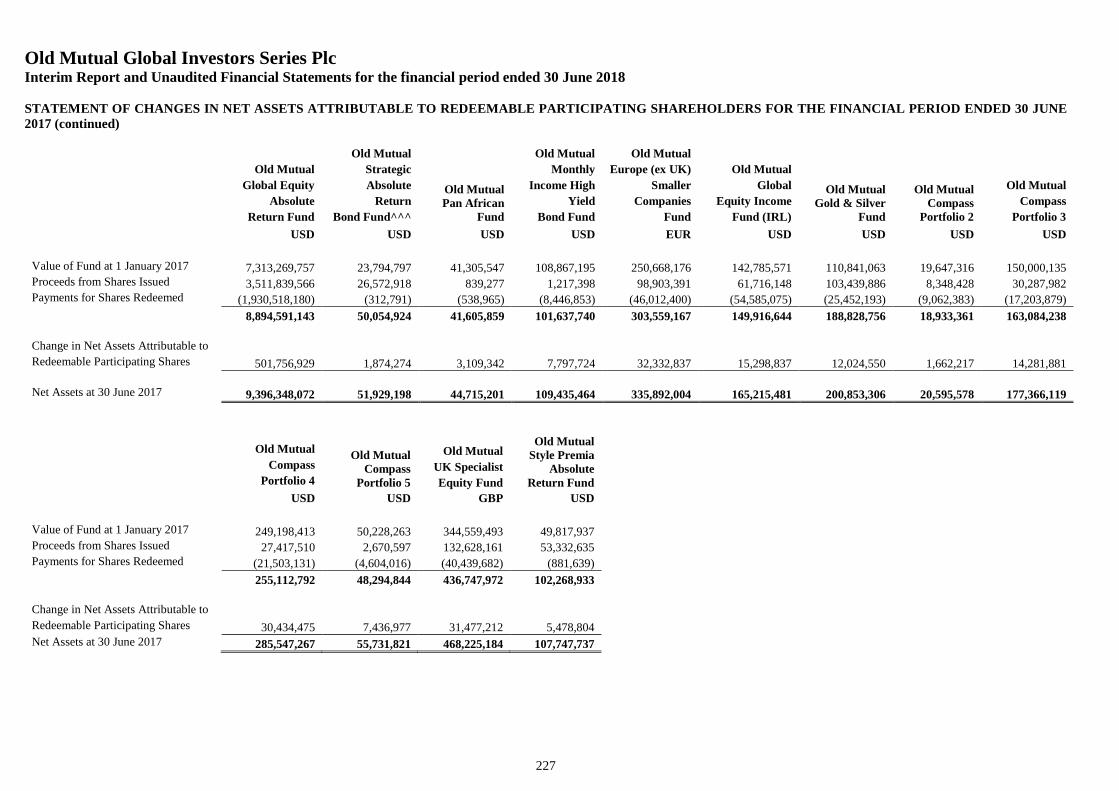
Old Mutual Global Investors Series PlcInterim Report and Unaudited Financial Statements for the financial period ended 30 June 2018
STATEMENT OF CHANGES IN NET ASSETS ATTRIBUTABLE TO REDEEMABLE PARTICIPATING SHAREHOLDERS FOR THE FINANCIAL PERIOD ENDED 30 JUNE2017 (continued)
227
Old Mutual
Global Equity
Absolute
Return Fund
Old Mutual
Strategic
Absolute
Return
Bond Fund^^^
Old MutualPan African
Fund
Old Mutual
Monthly
Income High
Yield
Bond Fund
Old Mutual
Europe (ex UK)
Smaller
Companies
Fund
Old Mutual
Global
Equity Income
Fund (IRL)
Old MutualGold & Silver
Fund
Old MutualCompass
Portfolio 2
Old Mutual
Compass
Portfolio 3
USD USD USD USD EUR USD USD USD USD
Value of Fund at 1 January 2017 7,313,269,757 23,794,797 41,305,547 108,867,195 250,668,176 142,785,571 110,841,063 19,647,316 150,000,135Proceeds from Shares Issued 3,511,839,566 26,572,918 839,277 1,217,398 98,903,391 61,716,148 103,439,886 8,348,428 30,287,982Payments for Shares Redeemed (1,930,518,180) (312,791) (538,965) (8,446,853) (46,012,400) (54,585,075) (25,452,193) (9,062,383) (17,203,879)
8,894,591,143 50,054,924 41,605,859 101,637,740 303,559,167 149,916,644 188,828,756 18,933,361 163,084,238
Change in Net Assets Attributable to
Redeemable Participating Shares 501,756,929 1,874,274 3,109,342 7,797,724 32,332,837 15,298,837 12,024,550 1,662,217 14,281,881
Net Assets at 30 June 2017 9,396,348,072 51,929,198 44,715,201 109,435,464 335,892,004 165,215,481 200,853,306 20,595,578 177,366,119
Old Mutual
Compass
Portfolio 4
Old MutualCompass
Portfolio 5
Old Mutual
UK Specialist
Equity Fund
Old MutualStyle Premia
AbsoluteReturn Fund
USD USD GBP USD
Value of Fund at 1 January 2017 249,198,413 50,228,263 344,559,493 49,817,937Proceeds from Shares Issued 27,417,510 2,670,597 132,628,161 53,332,635Payments for Shares Redeemed (21,503,131) (4,604,016) (40,439,682) (881,639)
255,112,792 48,294,844 436,747,972 102,268,933
Change in Net Assets Attributable to
Redeemable Participating Shares 30,434,475 7,436,977 31,477,212 5,478,804Net Assets at 30 June 2017 285,547,267 55,731,821 468,225,184 107,747,737
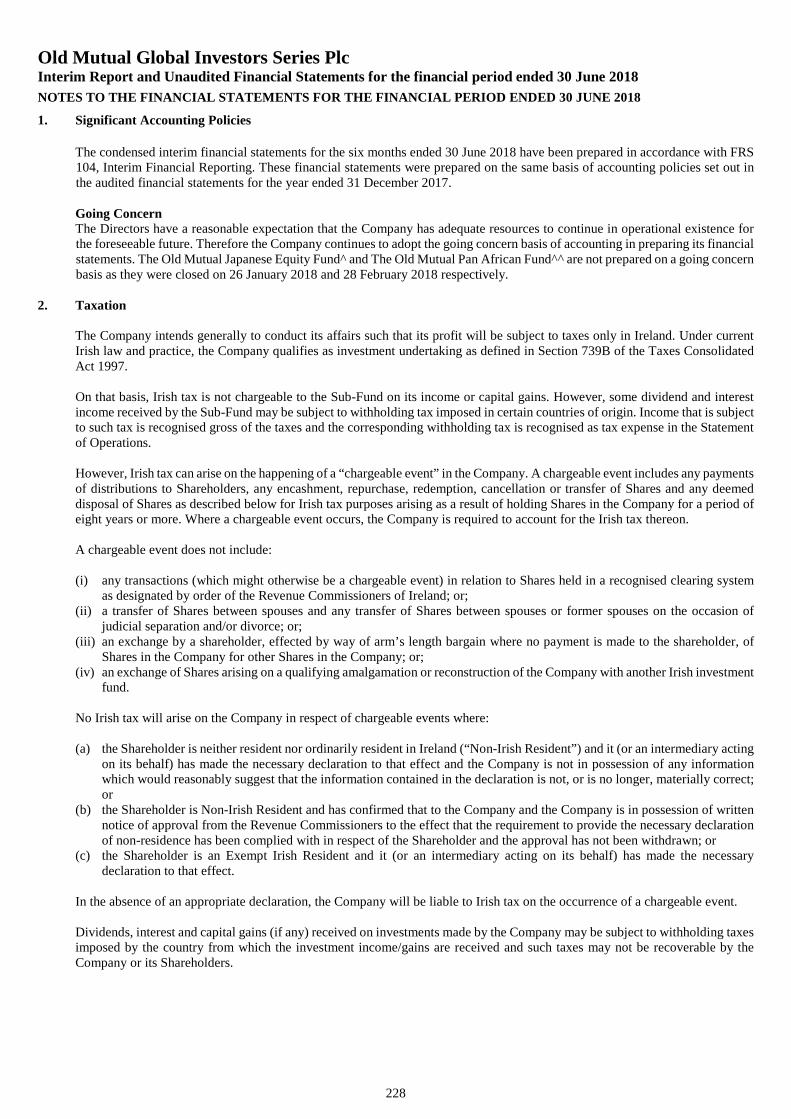
Old Mutual Global Investors Series PlcInterim Report and Unaudited Financial Statements for the financial period ended 30 June 2018
NOTES TO THE FINANCIAL STATEMENTS FOR THE FINANCIAL PERIOD ENDED 30 JUNE 2018
228
1. Significant Accounting Policies
The condensed interim financial statements for the six months ended 30 June 2018 have been prepared in accordance with FRS104, Interim Financial Reporting. These financial statements were prepared on the same basis of accounting policies set out inthe audited financial statements for the year ended 31 December 2017.
Going ConcernThe Directors have a reasonable expectation that the Company has adequate resources to continue in operational existence forthe foreseeable future. Therefore the Company continues to adopt the going concern basis of accounting in preparing its financialstatements. The Old Mutual Japanese Equity Fund^ and The Old Mutual Pan African Fund^^ are not prepared on a going concernbasis as they were closed on 26 January 2018 and 28 February 2018 respectively.
2. Taxation
The Company intends generally to conduct its affairs such that its profit will be subject to taxes only in Ireland. Under currentIrish law and practice, the Company qualifies as investment undertaking as defined in Section 739B of the Taxes ConsolidatedAct 1997.
On that basis, Irish tax is not chargeable to the Sub-Fund on its income or capital gains. However, some dividend and interestincome received by the Sub-Fund may be subject to withholding tax imposed in certain countries of origin. Income that is subjectto such tax is recognised gross of the taxes and the corresponding withholding tax is recognised as tax expense in the Statementof Operations.
However, Irish tax can arise on the happening of a “chargeable event” in the Company. A chargeable event includes any paymentsof distributions to Shareholders, any encashment, repurchase, redemption, cancellation or transfer of Shares and any deemeddisposal of Shares as described below for Irish tax purposes arising as a result of holding Shares in the Company for a period ofeight years or more. Where a chargeable event occurs, the Company is required to account for the Irish tax thereon.
A chargeable event does not include:
(i) any transactions (which might otherwise be a chargeable event) in relation to Shares held in a recognised clearing systemas designated by order of the Revenue Commissioners of Ireland; or;
(ii) a transfer of Shares between spouses and any transfer of Shares between spouses or former spouses on the occasion ofjudicial separation and/or divorce; or;
(iii) an exchange by a shareholder, effected by way of arm’s length bargain where no payment is made to the shareholder, ofShares in the Company for other Shares in the Company; or;
(iv) an exchange of Shares arising on a qualifying amalgamation or reconstruction of the Company with another Irish investmentfund.
No Irish tax will arise on the Company in respect of chargeable events where:
(a) the Shareholder is neither resident nor ordinarily resident in Ireland (“Non-Irish Resident”) and it (or an intermediary actingon its behalf) has made the necessary declaration to that effect and the Company is not in possession of any informationwhich would reasonably suggest that the information contained in the declaration is not, or is no longer, materially correct;or
(b) the Shareholder is Non-Irish Resident and has confirmed that to the Company and the Company is in possession of writtennotice of approval from the Revenue Commissioners to the effect that the requirement to provide the necessary declarationof non-residence has been complied with in respect of the Shareholder and the approval has not been withdrawn; or
(c) the Shareholder is an Exempt Irish Resident and it (or an intermediary acting on its behalf) has made the necessarydeclaration to that effect.
In the absence of an appropriate declaration, the Company will be liable to Irish tax on the occurrence of a chargeable event.
Dividends, interest and capital gains (if any) received on investments made by the Company may be subject to withholding taxesimposed by the country from which the investment income/gains are received and such taxes may not be recoverable by theCompany or its Shareholders.
Old Mutual Global Investors Series PlcInterim Report and Unaudited Financial Statements for the financial period ended 30 June 2018
NOTES TO THE FINANCIAL STATEMENTS FOR THE FINANCIAL PERIOD ENDED 30 JUNE 2018 (continued)
229
2. Taxation (continued)
The Company may be subject to taxes imposed on realised and unrealised gains on securities of certain foreign countries inwhich the Company invests. The foreign tax expense, if any, is recorded on an accrual basis and is included in capital gains taxesin the Statement of Operations. The amount of foreign tax owed, if any, is included in other liabilities in the Statement ofFinancial Position.
Under Brazilian, Indian and Pakistani income tax laws, capital gains tax is payable on the sale of assets, investments and capitalaccumulation. Included in the capital gains tax expense in the Statement of Operations is USD 23,197 (30 June 2017: USD779,673), included in other liabilities in the Statement of Financial Position is a payable of USD 330,034 (31 December 2017:USD 766,216).
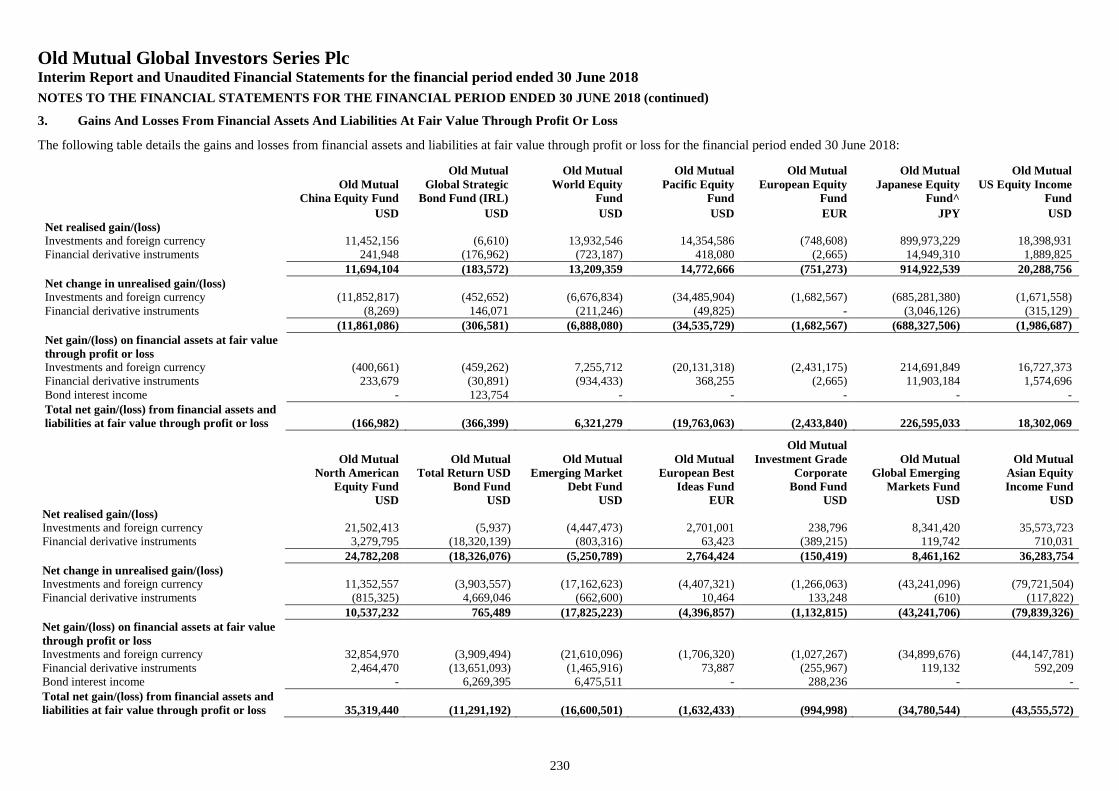
Old Mutual Global Investors Series PlcInterim Report and Unaudited Financial Statements for the financial period ended 30 June 2018
NOTES TO THE FINANCIAL STATEMENTS FOR THE FINANCIAL PERIOD ENDED 30 JUNE 2018 (continued)
230
3. Gains And Losses From Financial Assets And Liabilities At Fair Value Through Profit Or Loss
The following table details the gains and losses from financial assets and liabilities at fair value through profit or loss for the financial period ended 30 June 2018:
Old MutualChina Equity Fund
Old MutualGlobal Strategic
Bond Fund (IRL)
Old MutualWorld Equity
Fund
Old MutualPacific Equity
Fund
Old MutualEuropean Equity
Fund
Old MutualJapanese Equity
Fund^
Old MutualUS Equity Income
Fund
USD USD USD USD EUR JPY USDNet realised gain/(loss)Investments and foreign currency 11,452,156 (6,610) 13,932,546 14,354,586 (748,608) 899,973,229 18,398,931Financial derivative instruments 241,948 (176,962) (723,187) 418,080 (2,665) 14,949,310 1,889,825
11,694,104 (183,572) 13,209,359 14,772,666 (751,273) 914,922,539 20,288,756Net change in unrealised gain/(loss)Investments and foreign currency (11,852,817) (452,652) (6,676,834) (34,485,904) (1,682,567) (685,281,380) (1,671,558)Financial derivative instruments (8,269) 146,071 (211,246) (49,825) - (3,046,126) (315,129)
(11,861,086) (306,581) (6,888,080) (34,535,729) (1,682,567) (688,327,506) (1,986,687)Net gain/(loss) on financial assets at fair valuethrough profit or lossInvestments and foreign currency (400,661) (459,262) 7,255,712 (20,131,318) (2,431,175) 214,691,849 16,727,373Financial derivative instruments 233,679 (30,891) (934,433) 368,255 (2,665) 11,903,184 1,574,696Bond interest income - 123,754 - - - - -Total net gain/(loss) from financial assets andliabilities at fair value through profit or loss (166,982) (366,399) 6,321,279 (19,763,063) (2,433,840) 226,595,033 18,302,069
Old MutualNorth American
Equity Fund
Old MutualTotal Return USD
Bond Fund
Old MutualEmerging Market
Debt Fund
Old MutualEuropean Best
Ideas Fund
Old MutualInvestment Grade
CorporateBond Fund
Old MutualGlobal Emerging
Markets Fund
Old MutualAsian EquityIncome Fund
USD USD USD EUR USD USD USDNet realised gain/(loss)Investments and foreign currency 21,502,413 (5,937) (4,447,473) 2,701,001 238,796 8,341,420 35,573,723Financial derivative instruments 3,279,795 (18,320,139) (803,316) 63,423 (389,215) 119,742 710,031
24,782,208 (18,326,076) (5,250,789) 2,764,424 (150,419) 8,461,162 36,283,754Net change in unrealised gain/(loss)Investments and foreign currency 11,352,557 (3,903,557) (17,162,623) (4,407,321) (1,266,063) (43,241,096) (79,721,504)Financial derivative instruments (815,325) 4,669,046 (662,600) 10,464 133,248 (610) (117,822)
10,537,232 765,489 (17,825,223) (4,396,857) (1,132,815) (43,241,706) (79,839,326)Net gain/(loss) on financial assets at fair valuethrough profit or lossInvestments and foreign currency 32,854,970 (3,909,494) (21,610,096) (1,706,320) (1,027,267) (34,899,676) (44,147,781)Financial derivative instruments 2,464,470 (13,651,093) (1,465,916) 73,887 (255,967) 119,132 592,209Bond interest income - 6,269,395 6,475,511 - 288,236 - -Total net gain/(loss) from financial assets andliabilities at fair value through profit or loss 35,319,440 (11,291,192) (16,600,501) (1,632,433) (994,998) (34,780,544) (43,555,572)
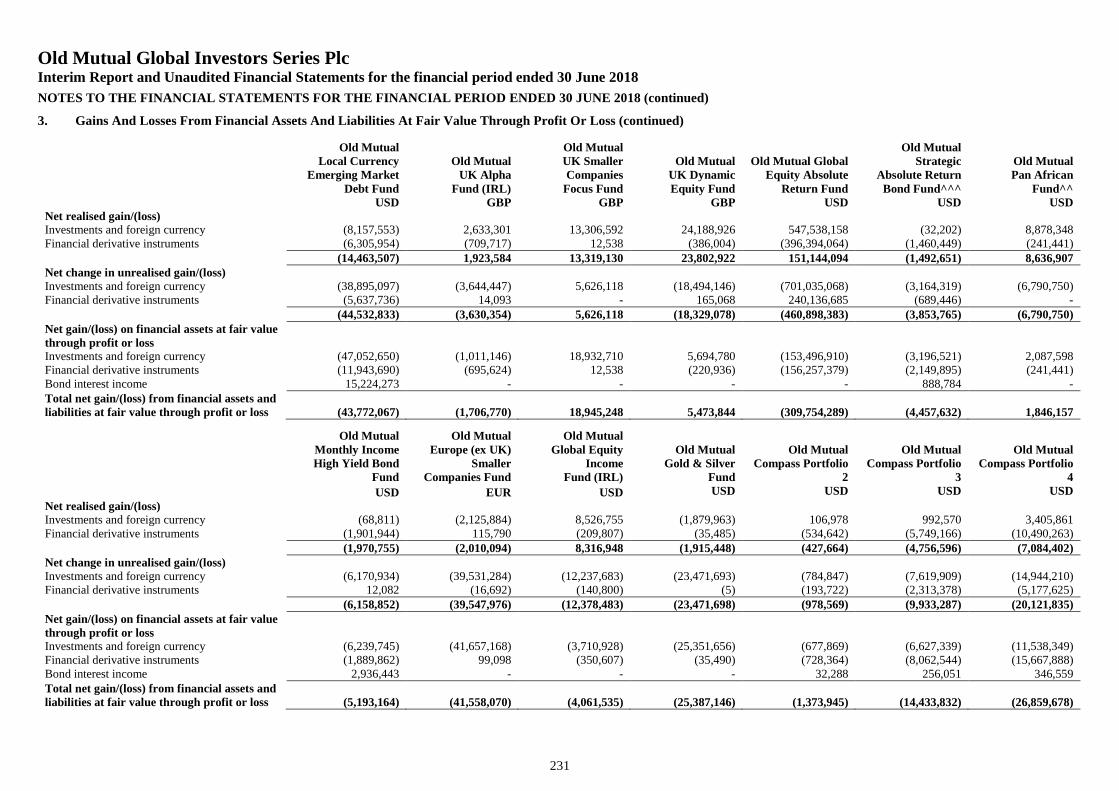
Old Mutual Global Investors Series PlcInterim Report and Unaudited Financial Statements for the financial period ended 30 June 2018
NOTES TO THE FINANCIAL STATEMENTS FOR THE FINANCIAL PERIOD ENDED 30 JUNE 2018 (continued)
231
3. Gains And Losses From Financial Assets And Liabilities At Fair Value Through Profit Or Loss (continued)
Old MutualLocal Currency
Emerging MarketDebt Fund
Old MutualUK Alpha
Fund (IRL)
Old MutualUK SmallerCompanies
Focus Fund
Old MutualUK DynamicEquity Fund
Old Mutual GlobalEquity Absolute
Return Fund
Old MutualStrategic
Absolute ReturnBond Fund^^^
Old MutualPan African
Fund^^USD GBP GBP GBP USD USD USD
Net realised gain/(loss)Investments and foreign currency (8,157,553) 2,633,301 13,306,592 24,188,926 547,538,158 (32,202) 8,878,348Financial derivative instruments (6,305,954) (709,717) 12,538 (386,004) (396,394,064) (1,460,449) (241,441)
(14,463,507) 1,923,584 13,319,130 23,802,922 151,144,094 (1,492,651) 8,636,907Net change in unrealised gain/(loss)Investments and foreign currency (38,895,097) (3,644,447) 5,626,118 (18,494,146) (701,035,068) (3,164,319) (6,790,750)Financial derivative instruments (5,637,736) 14,093 - 165,068 240,136,685 (689,446) -
(44,532,833) (3,630,354) 5,626,118 (18,329,078) (460,898,383) (3,853,765) (6,790,750)Net gain/(loss) on financial assets at fair valuethrough profit or lossInvestments and foreign currency (47,052,650) (1,011,146) 18,932,710 5,694,780 (153,496,910) (3,196,521) 2,087,598Financial derivative instruments (11,943,690) (695,624) 12,538 (220,936) (156,257,379) (2,149,895) (241,441)Bond interest income 15,224,273 - - - - 888,784 -Total net gain/(loss) from financial assets andliabilities at fair value through profit or loss (43,772,067) (1,706,770) 18,945,248 5,473,844 (309,754,289) (4,457,632) 1,846,157
Old MutualMonthly IncomeHigh Yield Bond
Fund
Old MutualEurope (ex UK)
SmallerCompanies Fund
Old MutualGlobal Equity
IncomeFund (IRL)
Old MutualGold & Silver
Fund
Old MutualCompass Portfolio
2
Old MutualCompass Portfolio
3
Old MutualCompass Portfolio
4
USD EUR USD USD USD USD USD
Net realised gain/(loss)Investments and foreign currency (68,811) (2,125,884) 8,526,755 (1,879,963) 106,978 992,570 3,405,861Financial derivative instruments (1,901,944) 115,790 (209,807) (35,485) (534,642) (5,749,166) (10,490,263)
(1,970,755) (2,010,094) 8,316,948 (1,915,448) (427,664) (4,756,596) (7,084,402)Net change in unrealised gain/(loss)Investments and foreign currency (6,170,934) (39,531,284) (12,237,683) (23,471,693) (784,847) (7,619,909) (14,944,210)Financial derivative instruments 12,082 (16,692) (140,800) (5) (193,722) (2,313,378) (5,177,625)
(6,158,852) (39,547,976) (12,378,483) (23,471,698) (978,569) (9,933,287) (20,121,835)Net gain/(loss) on financial assets at fair valuethrough profit or lossInvestments and foreign currency (6,239,745) (41,657,168) (3,710,928) (25,351,656) (677,869) (6,627,339) (11,538,349)Financial derivative instruments (1,889,862) 99,098 (350,607) (35,490) (728,364) (8,062,544) (15,667,888)Bond interest income 2,936,443 - - - 32,288 256,051 346,559Total net gain/(loss) from financial assets andliabilities at fair value through profit or loss (5,193,164) (41,558,070) (4,061,535) (25,387,146) (1,373,945) (14,433,832) (26,859,678)
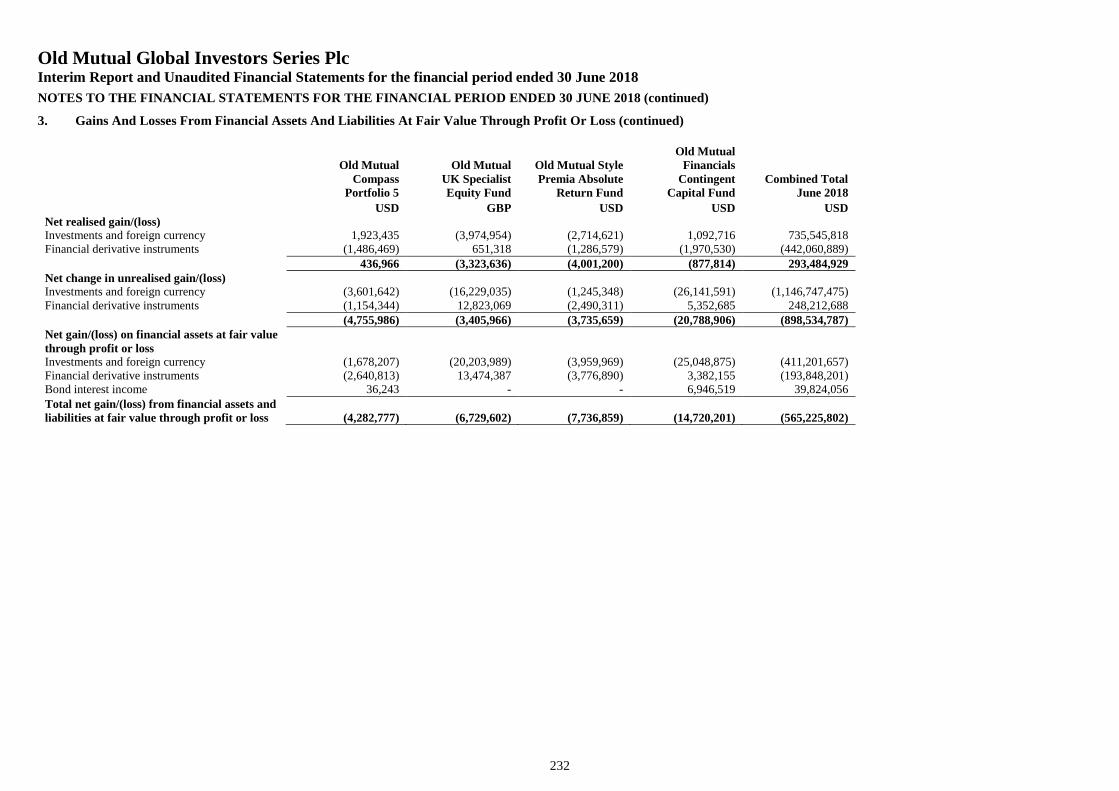
Old Mutual Global Investors Series PlcInterim Report and Unaudited Financial Statements for the financial period ended 30 June 2018
NOTES TO THE FINANCIAL STATEMENTS FOR THE FINANCIAL PERIOD ENDED 30 JUNE 2018 (continued)
232
3. Gains And Losses From Financial Assets And Liabilities At Fair Value Through Profit Or Loss (continued)
Old MutualCompass
Portfolio 5
Old MutualUK SpecialistEquity Fund
Old Mutual StylePremia Absolute
Return Fund
Old MutualFinancials
ContingentCapital Fund
Combined TotalJune 2018
USD GBP USD USD USDNet realised gain/(loss)Investments and foreign currency 1,923,435 (3,974,954) (2,714,621) 1,092,716 735,545,818Financial derivative instruments (1,486,469) 651,318 (1,286,579) (1,970,530) (442,060,889)
436,966 (3,323,636) (4,001,200) (877,814) 293,484,929Net change in unrealised gain/(loss)Investments and foreign currency (3,601,642) (16,229,035) (1,245,348) (26,141,591) (1,146,747,475)Financial derivative instruments (1,154,344) 12,823,069 (2,490,311) 5,352,685 248,212,688
(4,755,986) (3,405,966) (3,735,659) (20,788,906) (898,534,787)Net gain/(loss) on financial assets at fair valuethrough profit or lossInvestments and foreign currency (1,678,207) (20,203,989) (3,959,969) (25,048,875) (411,201,657)Financial derivative instruments (2,640,813) 13,474,387 (3,776,890) 3,382,155 (193,848,201)Bond interest income 36,243 - - 6,946,519 39,824,056Total net gain/(loss) from financial assets andliabilities at fair value through profit or loss (4,282,777) (6,729,602) (7,736,859) (14,720,201) (565,225,802)
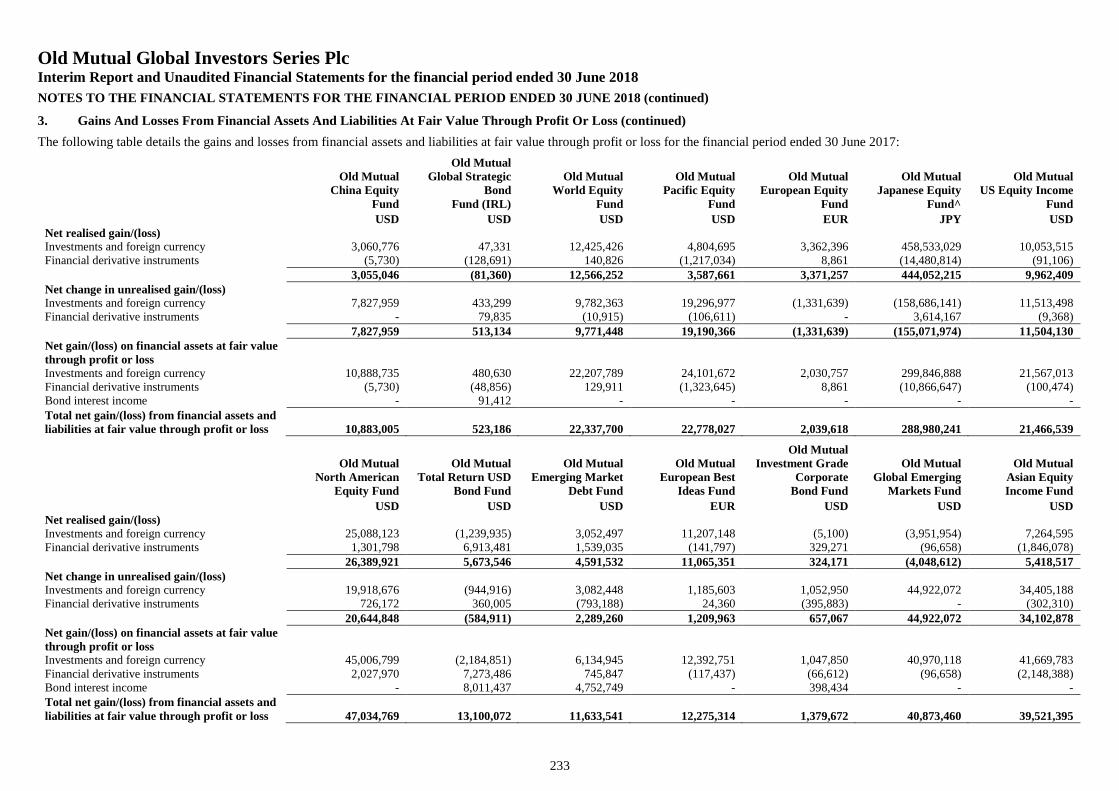
Old Mutual Global Investors Series PlcInterim Report and Unaudited Financial Statements for the financial period ended 30 June 2018
NOTES TO THE FINANCIAL STATEMENTS FOR THE FINANCIAL PERIOD ENDED 30 JUNE 2018 (continued)
233
3. Gains And Losses From Financial Assets And Liabilities At Fair Value Through Profit Or Loss (continued)
The following table details the gains and losses from financial assets and liabilities at fair value through profit or loss for the financial period ended 30 June 2017:
Old MutualChina Equity
Fund
Old MutualGlobal Strategic
BondFund (IRL)
Old MutualWorld Equity
Fund
Old MutualPacific Equity
Fund
Old MutualEuropean Equity
Fund
Old MutualJapanese Equity
Fund^
Old MutualUS Equity Income
Fund
USD USD USD USD EUR JPY USDNet realised gain/(loss)Investments and foreign currency 3,060,776 47,331 12,425,426 4,804,695 3,362,396 458,533,029 10,053,515Financial derivative instruments (5,730) (128,691) 140,826 (1,217,034) 8,861 (14,480,814) (91,106)
3,055,046 (81,360) 12,566,252 3,587,661 3,371,257 444,052,215 9,962,409Net change in unrealised gain/(loss)Investments and foreign currency 7,827,959 433,299 9,782,363 19,296,977 (1,331,639) (158,686,141) 11,513,498Financial derivative instruments - 79,835 (10,915) (106,611) - 3,614,167 (9,368)
7,827,959 513,134 9,771,448 19,190,366 (1,331,639) (155,071,974) 11,504,130Net gain/(loss) on financial assets at fair valuethrough profit or lossInvestments and foreign currency 10,888,735 480,630 22,207,789 24,101,672 2,030,757 299,846,888 21,567,013Financial derivative instruments (5,730) (48,856) 129,911 (1,323,645) 8,861 (10,866,647) (100,474)Bond interest income - 91,412 - - - - -Total net gain/(loss) from financial assets andliabilities at fair value through profit or loss 10,883,005 523,186 22,337,700 22,778,027 2,039,618 288,980,241 21,466,539
Old MutualNorth American
Equity Fund
Old MutualTotal Return USD
Bond Fund
Old MutualEmerging Market
Debt Fund
Old MutualEuropean Best
Ideas Fund
Old MutualInvestment Grade
CorporateBond Fund
Old MutualGlobal Emerging
Markets Fund
Old MutualAsian EquityIncome Fund
USD USD USD EUR USD USD USDNet realised gain/(loss)Investments and foreign currency 25,088,123 (1,239,935) 3,052,497 11,207,148 (5,100) (3,951,954) 7,264,595Financial derivative instruments 1,301,798 6,913,481 1,539,035 (141,797) 329,271 (96,658) (1,846,078)
26,389,921 5,673,546 4,591,532 11,065,351 324,171 (4,048,612) 5,418,517Net change in unrealised gain/(loss)Investments and foreign currency 19,918,676 (944,916) 3,082,448 1,185,603 1,052,950 44,922,072 34,405,188Financial derivative instruments 726,172 360,005 (793,188) 24,360 (395,883) - (302,310)
20,644,848 (584,911) 2,289,260 1,209,963 657,067 44,922,072 34,102,878Net gain/(loss) on financial assets at fair valuethrough profit or lossInvestments and foreign currency 45,006,799 (2,184,851) 6,134,945 12,392,751 1,047,850 40,970,118 41,669,783Financial derivative instruments 2,027,970 7,273,486 745,847 (117,437) (66,612) (96,658) (2,148,388)Bond interest income - 8,011,437 4,752,749 - 398,434 - -Total net gain/(loss) from financial assets andliabilities at fair value through profit or loss 47,034,769 13,100,072 11,633,541 12,275,314 1,379,672 40,873,460 39,521,395

Old Mutual Global Investors Series PlcInterim Report and Unaudited Financial Statements for the financial period ended 30 June 2018
NOTES TO THE FINANCIAL STATEMENTS FOR THE FINANCIAL PERIOD ENDED 30 JUNE 2018 (continued)
234
3. Gains And Losses From Financial Assets And Liabilities At Fair Value Through Profit Or Loss (continued)
Old MutualLocal Currency
Emerging MarketDebt Fund
Old MutualUK Alpha
Fund (IRL)
Old MutualUK SmallerCompanies
Focus Fund
Old MutualUK DynamicEquity Fund
Old Mutual GlobalEquity Absolute
Return Fund
Old MutualStrategic
Absolute ReturnBond Fund^^^
Old MutualPan African
Fund
USD GBP GBP GBP USD USD USDNet realised gain/(loss)Investments and foreign currency 1,465,152 1,197,603 11,450,894 34,703,424 410,850,954 839,865 (876,480)Financial derivative instruments (661,338) (51,629) (8,308) (1,316,862) (236,213,514) (203,997) 106,630
803,814 1,145,974 11,442,586 33,386,562 174,637,440 635,868 (769,850)Net change in unrealised gain/(loss)Investments and foreign currency 12,834,802 3,861,415 45,367,367 61,971,335 444,399,933 679,421 3,519,545Financial derivative instruments 1,963,430 (19,109) - 98,969 (114,999,980) 370,164 -
14,798,232 3,842,306 45,367,367 62,070,304 329,399,953 1,049,585 3,519,545Net gain/(loss) on financial assets at fair valuethrough profit or lossInvestments and foreign currency 14,299,954 5,059,018 56,818,261 96,674,759 855,250,887 1,519,286 2,643,065Financial derivative instruments 1,302,092 (70,738) (8,308) (1,217,893) (351,213,494) 166,167 106,630Bond interest income 7,779,642 - - - - 317,080 -Total net gain/(loss) from financial assets andliabilities at fair value through profit or loss 23,381,688 4,988,280 56,809,953 95,456,866 504,037,393 2,002,533 2,749,695
Old MutualMonthly IncomeHigh Yield Bond
Fund
Old MutualEurope (ex UK)
SmallerCompanies Fund
Old MutualGlobal Equity
IncomeFund (IRL)
Old MutualGold & Silver
Fund
Old MutualCompass Portfolio
2
Old MutualCompass Portfolio
3
Old MutualCompass Portfolio
4
USD EUR USD USD USD USD USD
Net realised gain/(loss)Investments and foreign currency 528,752 13,161,246 11,335,029 (932,259) 91,871 528,417 3,171,759Financial derivative instruments 2,283,920 (249,164) 386,229 79,409 608,686 3,652,087 8,020,278
2,812,672 12,912,082 11,721,258 (852,850) 700,557 4,180,504 11,192,037Net change in unrealised gain/(loss)Investments and foreign currency 2,603,830 16,394,886 3,750,655 13,498,736 892,124 9,675,245 18,522,455Financial derivative instruments 154,468 91,654 (12,421) (1,573) 175,019 621,244 816,321
2,758,298 16,486,540 3,738,234 13,497,163 1,067,143 10,296,489 19,338,776Net gain/(loss) on financial assets at fair valuethrough profit or lossInvestments and foreign currency 3,132,582 29,556,132 15,085,684 12,566,477 983,995 10,203,662 21,694,214Financial derivative instruments 2,438,388 (157,510) 373,808 77,836 783,705 4,273,331 8,836,599Bond interest income 3,409,314 - - - 20,835 99,963 118,783Total net gain/(loss) from financial assets andliabilities at fair value through profit or loss 8,980,284 29,398,622 15,459,492 12,644,313 1,788,535 14,576,956 30,649,596
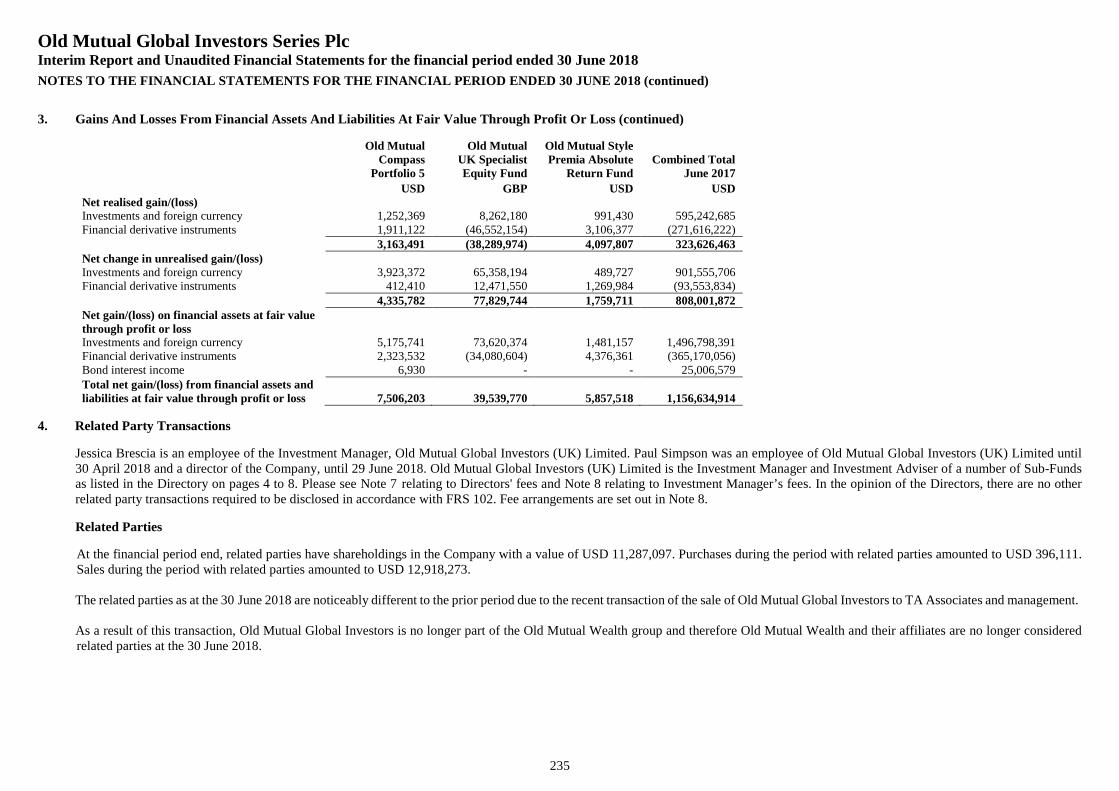
Old Mutual Global Investors Series PlcInterim Report and Unaudited Financial Statements for the financial period ended 30 June 2018
NOTES TO THE FINANCIAL STATEMENTS FOR THE FINANCIAL PERIOD ENDED 30 JUNE 2018 (continued)
235
3. Gains And Losses From Financial Assets And Liabilities At Fair Value Through Profit Or Loss (continued)
Old MutualCompass
Portfolio 5
Old MutualUK SpecialistEquity Fund
Old Mutual StylePremia Absolute
Return FundCombined Total
June 2017
USD GBP USD USDNet realised gain/(loss)Investments and foreign currency 1,252,369 8,262,180 991,430 595,242,685Financial derivative instruments 1,911,122 (46,552,154) 3,106,377 (271,616,222)
3,163,491 (38,289,974) 4,097,807 323,626,463Net change in unrealised gain/(loss)Investments and foreign currency 3,923,372 65,358,194 489,727 901,555,706Financial derivative instruments 412,410 12,471,550 1,269,984 (93,553,834)
4,335,782 77,829,744 1,759,711 808,001,872Net gain/(loss) on financial assets at fair valuethrough profit or lossInvestments and foreign currency 5,175,741 73,620,374 1,481,157 1,496,798,391Financial derivative instruments 2,323,532 (34,080,604) 4,376,361 (365,170,056)Bond interest income 6,930 - - 25,006,579Total net gain/(loss) from financial assets andliabilities at fair value through profit or loss 7,506,203 39,539,770 5,857,518 1,156,634,914
4. Related Party Transactions
Jessica Brescia is an employee of the Investment Manager, Old Mutual Global Investors (UK) Limited. Paul Simpson was an employee of Old Mutual Global Investors (UK) Limited until30 April 2018 and a director of the Company, until 29 June 2018. Old Mutual Global Investors (UK) Limited is the Investment Manager and Investment Adviser of a number of Sub-Fundsas listed in the Directory on pages 4 to 8. Please see Note 7 relating to Directors' fees and Note 8 relating to Investment Manager’s fees. In the opinion of the Directors, there are no otherrelated party transactions required to be disclosed in accordance with FRS 102. Fee arrangements are set out in Note 8.
Related Parties
At the financial period end, related parties have shareholdings in the Company with a value of USD 11,287,097. Purchases during the period with related parties amounted to USD 396,111.Sales during the period with related parties amounted to USD 12,918,273.
The related parties as at the 30 June 2018 are noticeably different to the prior period due to the recent transaction of the sale of Old Mutual Global Investors to TA Associates and management.
As a result of this transaction, Old Mutual Global Investors is no longer part of the Old Mutual Wealth group and therefore Old Mutual Wealth and their affiliates are no longer consideredrelated parties at the 30 June 2018.
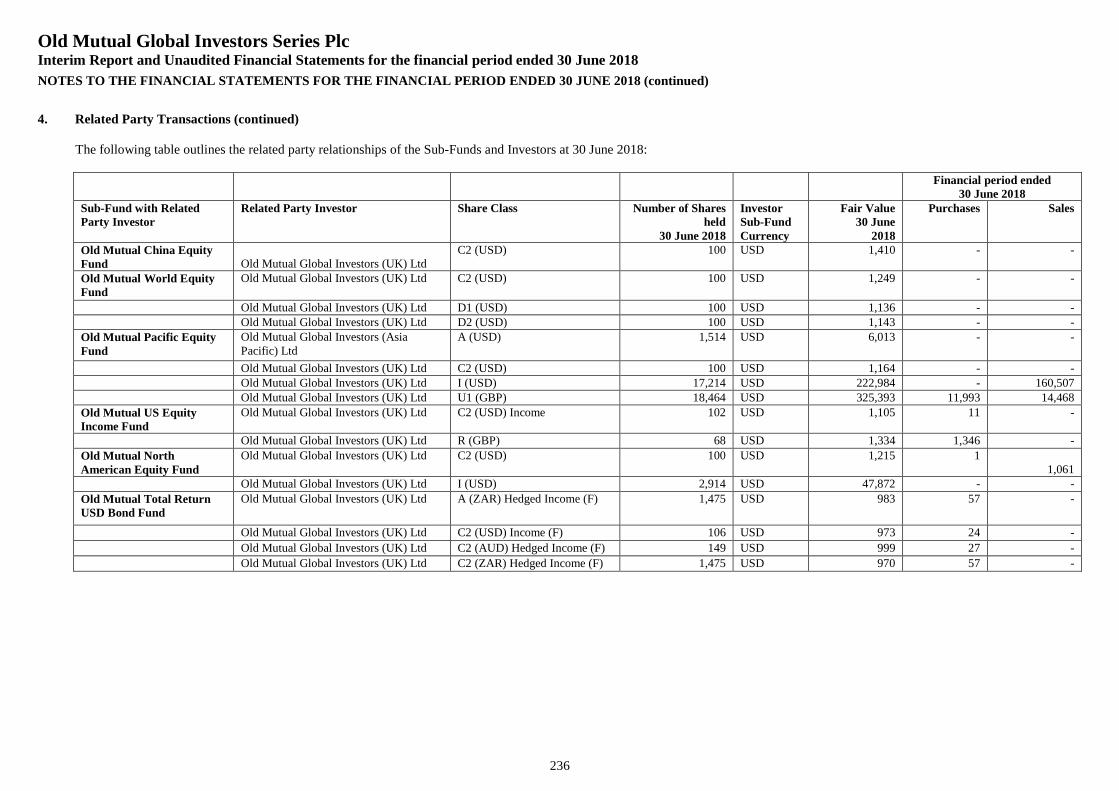
Old Mutual Global Investors Series PlcInterim Report and Unaudited Financial Statements for the financial period ended 30 June 2018
NOTES TO THE FINANCIAL STATEMENTS FOR THE FINANCIAL PERIOD ENDED 30 JUNE 2018 (continued)
236
4. Related Party Transactions (continued)
The following table outlines the related party relationships of the Sub-Funds and Investors at 30 June 2018:
Financial period ended30 June 2018
Sub-Fund with RelatedParty Investor
Related Party Investor Share Class Number of Sharesheld
30 June 2018
InvestorSub-FundCurrency
Fair Value30 June
2018
Purchases Sales
Old Mutual China EquityFund Old Mutual Global Investors (UK) Ltd
C2 (USD) 100 USD 1,410 - -
Old Mutual World EquityFund
Old Mutual Global Investors (UK) Ltd C2 (USD) 100 USD 1,249 - -
Old Mutual Global Investors (UK) Ltd D1 (USD) 100 USD 1,136 - -Old Mutual Global Investors (UK) Ltd D2 (USD) 100 USD 1,143 - -
Old Mutual Pacific EquityFund
Old Mutual Global Investors (AsiaPacific) Ltd
A (USD) 1,514 USD 6,013 - -
Old Mutual Global Investors (UK) Ltd C2 (USD) 100 USD 1,164 - -Old Mutual Global Investors (UK) Ltd I (USD) 17,214 USD 222,984 - 160,507Old Mutual Global Investors (UK) Ltd U1 (GBP) 18,464 USD 325,393 11,993 14,468
Old Mutual US EquityIncome Fund
Old Mutual Global Investors (UK) Ltd C2 (USD) Income 102 USD 1,105 11 -
Old Mutual Global Investors (UK) Ltd R (GBP) 68 USD 1,334 1,346 -
Old Mutual NorthAmerican Equity Fund
Old Mutual Global Investors (UK) Ltd C2 (USD) 100 USD 1,215 11,061
Old Mutual Global Investors (UK) Ltd I (USD) 2,914 USD 47,872 - -
Old Mutual Total ReturnUSD Bond Fund
Old Mutual Global Investors (UK) Ltd A (ZAR) Hedged Income (F) 1,475 USD 983 57 -
Old Mutual Global Investors (UK) Ltd C2 (USD) Income (F) 106 USD 973 24 -
Old Mutual Global Investors (UK) Ltd C2 (AUD) Hedged Income (F) 149 USD 999 27 -
Old Mutual Global Investors (UK) Ltd C2 (ZAR) Hedged Income (F) 1,475 USD 970 57 -
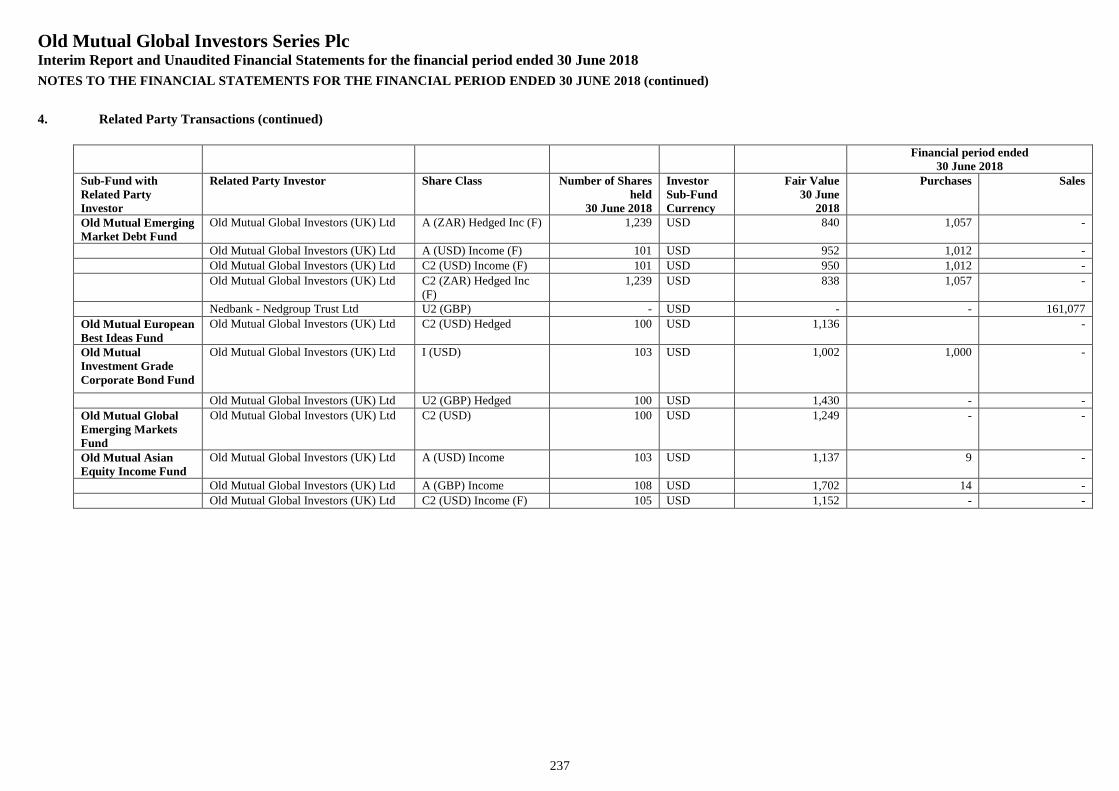
Old Mutual Global Investors Series PlcInterim Report and Unaudited Financial Statements for the financial period ended 30 June 2018
NOTES TO THE FINANCIAL STATEMENTS FOR THE FINANCIAL PERIOD ENDED 30 JUNE 2018 (continued)
237
4. Related Party Transactions (continued)
Financial period ended30 June 2018
Sub-Fund withRelated PartyInvestor
Related Party Investor Share Class Number of Sharesheld
30 June 2018
InvestorSub-FundCurrency
Fair Value30 June
2018
Purchases Sales
Old Mutual EmergingMarket Debt Fund
Old Mutual Global Investors (UK) Ltd A (ZAR) Hedged Inc (F) 1,239 USD 840 1,057 -
Old Mutual Global Investors (UK) Ltd A (USD) Income (F) 101 USD 952 1,012 -
Old Mutual Global Investors (UK) Ltd C2 (USD) Income (F) 101 USD 950 1,012 -
Old Mutual Global Investors (UK) Ltd C2 (ZAR) Hedged Inc(F)
1,239 USD 838 1,057 -
Nedbank - Nedgroup Trust Ltd U2 (GBP) - USD - - 161,077
Old Mutual EuropeanBest Ideas Fund
Old Mutual Global Investors (UK) Ltd C2 (USD) Hedged 100 USD 1,136 -
Old MutualInvestment GradeCorporate Bond Fund
Old Mutual Global Investors (UK) Ltd I (USD) 103 USD 1,002 1,000 -
Old Mutual Global Investors (UK) Ltd U2 (GBP) Hedged 100 USD 1,430 - -
Old Mutual GlobalEmerging MarketsFund
Old Mutual Global Investors (UK) Ltd C2 (USD) 100 USD 1,249 - -
Old Mutual AsianEquity Income Fund
Old Mutual Global Investors (UK) Ltd A (USD) Income 103 USD 1,137 9 -
Old Mutual Global Investors (UK) Ltd A (GBP) Income 108 USD 1,702 14 -
Old Mutual Global Investors (UK) Ltd C2 (USD) Income (F) 105 USD 1,152 - -
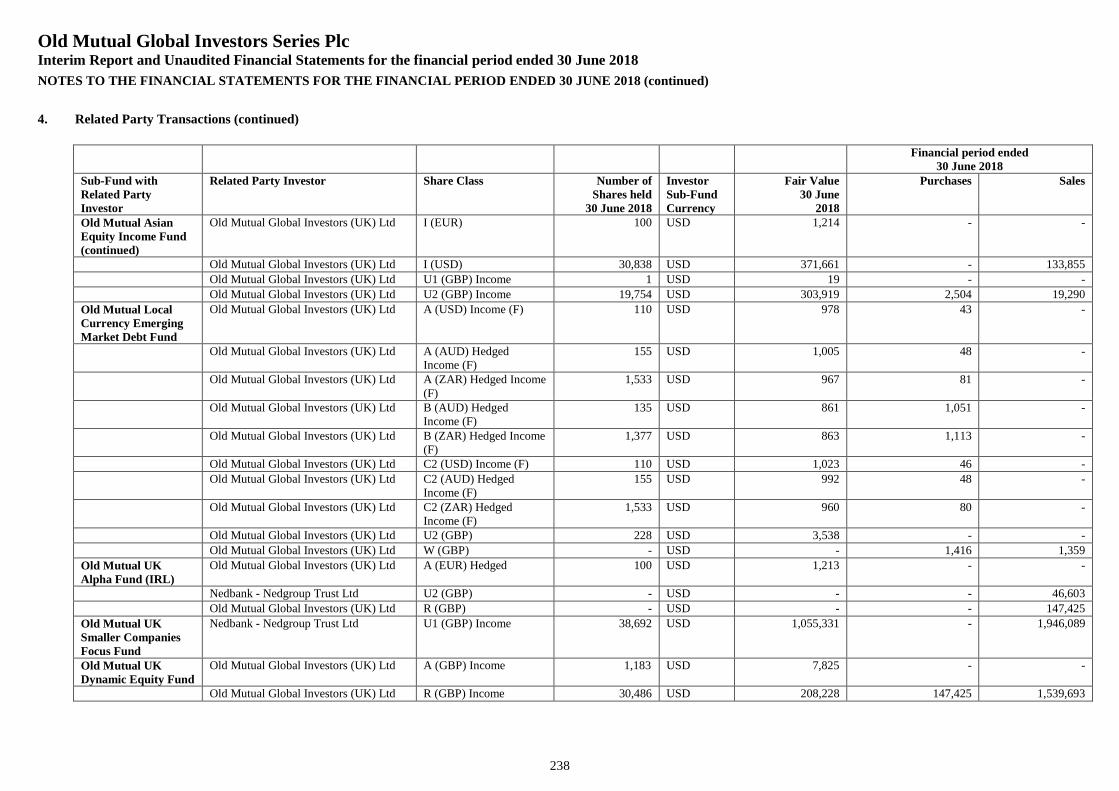
Old Mutual Global Investors Series PlcInterim Report and Unaudited Financial Statements for the financial period ended 30 June 2018
NOTES TO THE FINANCIAL STATEMENTS FOR THE FINANCIAL PERIOD ENDED 30 JUNE 2018 (continued)
238
4. Related Party Transactions (continued)
Financial period ended30 June 2018
Sub-Fund withRelated PartyInvestor
Related Party Investor Share Class Number ofShares held
30 June 2018
InvestorSub-FundCurrency
Fair Value30 June
2018
Purchases Sales
Old Mutual AsianEquity Income Fund(continued)
Old Mutual Global Investors (UK) Ltd I (EUR) 100 USD 1,214 - -
Old Mutual Global Investors (UK) Ltd I (USD) 30,838 USD 371,661 - 133,855
Old Mutual Global Investors (UK) Ltd U1 (GBP) Income 1 USD 19 - -
Old Mutual Global Investors (UK) Ltd U2 (GBP) Income 19,754 USD 303,919 2,504 19,290
Old Mutual LocalCurrency EmergingMarket Debt Fund
Old Mutual Global Investors (UK) Ltd A (USD) Income (F) 110 USD 978 43 -
Old Mutual Global Investors (UK) Ltd A (AUD) HedgedIncome (F)
155 USD 1,005 48 -
Old Mutual Global Investors (UK) Ltd A (ZAR) Hedged Income(F)
1,533 USD 967 81 -
Old Mutual Global Investors (UK) Ltd B (AUD) HedgedIncome (F)
135 USD 861 1,051 -
Old Mutual Global Investors (UK) Ltd B (ZAR) Hedged Income(F)
1,377 USD 863 1,113 -
Old Mutual Global Investors (UK) Ltd C2 (USD) Income (F) 110 USD 1,023 46 -
Old Mutual Global Investors (UK) Ltd C2 (AUD) HedgedIncome (F)
155 USD 992 48 -
Old Mutual Global Investors (UK) Ltd C2 (ZAR) HedgedIncome (F)
1,533 USD 960 80 -
Old Mutual Global Investors (UK) Ltd U2 (GBP) 228 USD 3,538 - -
Old Mutual Global Investors (UK) Ltd W (GBP) - USD - 1,416 1,359
Old Mutual UKAlpha Fund (IRL)
Old Mutual Global Investors (UK) Ltd A (EUR) Hedged 100 USD 1,213 - -
Nedbank - Nedgroup Trust Ltd U2 (GBP) - USD - - 46,603
Old Mutual Global Investors (UK) Ltd R (GBP) - USD - - 147,425
Old Mutual UKSmaller CompaniesFocus Fund
Nedbank - Nedgroup Trust Ltd U1 (GBP) Income 38,692 USD 1,055,331 - 1,946,089
Old Mutual UKDynamic Equity Fund
Old Mutual Global Investors (UK) Ltd A (GBP) Income 1,183 USD 7,825 - -
Old Mutual Global Investors (UK) Ltd R (GBP) Income 30,486 USD 208,228 147,425 1,539,693
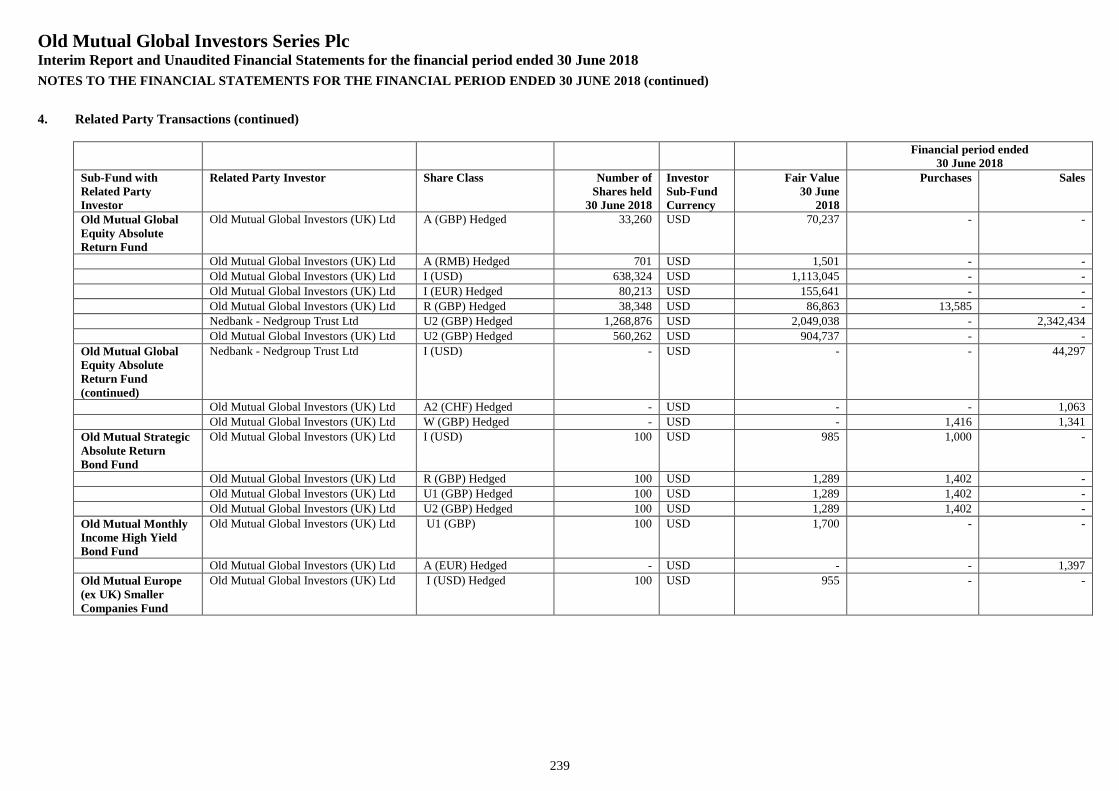
Old Mutual Global Investors Series PlcInterim Report and Unaudited Financial Statements for the financial period ended 30 June 2018
NOTES TO THE FINANCIAL STATEMENTS FOR THE FINANCIAL PERIOD ENDED 30 JUNE 2018 (continued)
239
4. Related Party Transactions (continued)
Financial period ended30 June 2018
Sub-Fund withRelated PartyInvestor
Related Party Investor Share Class Number ofShares held
30 June 2018
InvestorSub-FundCurrency
Fair Value30 June
2018
Purchases Sales
Old Mutual GlobalEquity AbsoluteReturn Fund
Old Mutual Global Investors (UK) Ltd A (GBP) Hedged 33,260 USD 70,237 - -
Old Mutual Global Investors (UK) Ltd A (RMB) Hedged 701 USD 1,501 - -
Old Mutual Global Investors (UK) Ltd I (USD) 638,324 USD 1,113,045 - -
Old Mutual Global Investors (UK) Ltd I (EUR) Hedged 80,213 USD 155,641 - -
Old Mutual Global Investors (UK) Ltd R (GBP) Hedged 38,348 USD 86,863 13,585 -Nedbank - Nedgroup Trust Ltd U2 (GBP) Hedged 1,268,876 USD 2,049,038 - 2,342,434
Old Mutual Global Investors (UK) Ltd U2 (GBP) Hedged 560,262 USD 904,737 - -
Old Mutual GlobalEquity AbsoluteReturn Fund(continued)
Nedbank - Nedgroup Trust Ltd I (USD) - USD - - 44,297
Old Mutual Global Investors (UK) Ltd A2 (CHF) Hedged - USD - - 1,063
Old Mutual Global Investors (UK) Ltd W (GBP) Hedged - USD - 1,416 1,341
Old Mutual StrategicAbsolute ReturnBond Fund
Old Mutual Global Investors (UK) Ltd I (USD) 100 USD 985 1,000 -
Old Mutual Global Investors (UK) Ltd R (GBP) Hedged 100 USD 1,289 1,402 -
Old Mutual Global Investors (UK) Ltd U1 (GBP) Hedged 100 USD 1,289 1,402 -
Old Mutual Global Investors (UK) Ltd U2 (GBP) Hedged 100 USD 1,289 1,402 -
Old Mutual MonthlyIncome High YieldBond Fund
Old Mutual Global Investors (UK) Ltd U1 (GBP) 100 USD 1,700 - -
Old Mutual Global Investors (UK) Ltd A (EUR) Hedged - USD - - 1,397
Old Mutual Europe(ex UK) SmallerCompanies Fund
Old Mutual Global Investors (UK) Ltd I (USD) Hedged 100 USD 955 - -
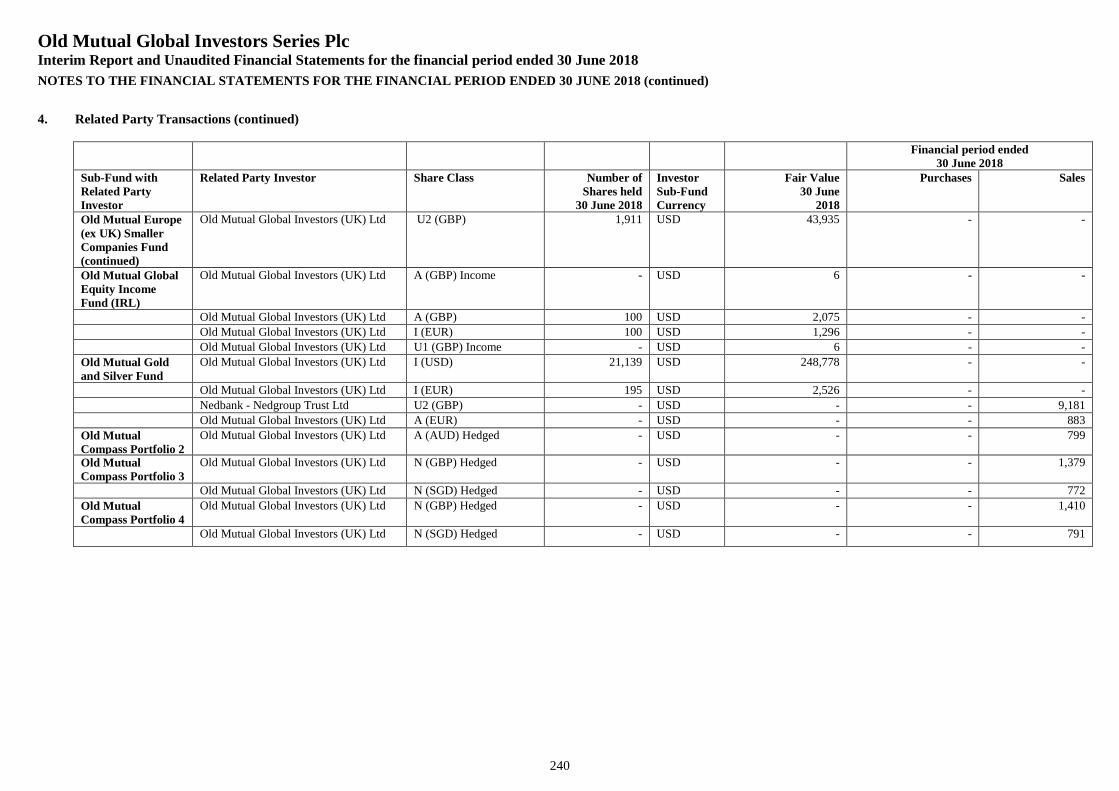
Old Mutual Global Investors Series PlcInterim Report and Unaudited Financial Statements for the financial period ended 30 June 2018
NOTES TO THE FINANCIAL STATEMENTS FOR THE FINANCIAL PERIOD ENDED 30 JUNE 2018 (continued)
240
4. Related Party Transactions (continued)
Financial period ended30 June 2018
Sub-Fund withRelated PartyInvestor
Related Party Investor Share Class Number ofShares held
30 June 2018
InvestorSub-FundCurrency
Fair Value30 June
2018
Purchases Sales
Old Mutual Europe(ex UK) SmallerCompanies Fund(continued)
Old Mutual Global Investors (UK) Ltd U2 (GBP) 1,911 USD 43,935 - -
Old Mutual GlobalEquity IncomeFund (IRL)
Old Mutual Global Investors (UK) Ltd A (GBP) Income - USD 6 - -
Old Mutual Global Investors (UK) Ltd A (GBP) 100 USD 2,075 - -
Old Mutual Global Investors (UK) Ltd I (EUR) 100 USD 1,296 - -
Old Mutual Global Investors (UK) Ltd U1 (GBP) Income - USD 6 - -
Old Mutual Goldand Silver Fund
Old Mutual Global Investors (UK) Ltd I (USD) 21,139 USD 248,778 - -
Old Mutual Global Investors (UK) Ltd I (EUR) 195 USD 2,526 - -
Nedbank - Nedgroup Trust Ltd U2 (GBP) - USD - - 9,181
Old Mutual Global Investors (UK) Ltd A (EUR) - USD - - 883
Old MutualCompass Portfolio 2
Old Mutual Global Investors (UK) Ltd A (AUD) Hedged - USD - - 799
Old MutualCompass Portfolio 3
Old Mutual Global Investors (UK) Ltd N (GBP) Hedged - USD - - 1,379
Old Mutual Global Investors (UK) Ltd N (SGD) Hedged - USD - - 772
Old MutualCompass Portfolio 4
Old Mutual Global Investors (UK) Ltd N (GBP) Hedged - USD - - 1,410
Old Mutual Global Investors (UK) Ltd N (SGD) Hedged - USD - - 791
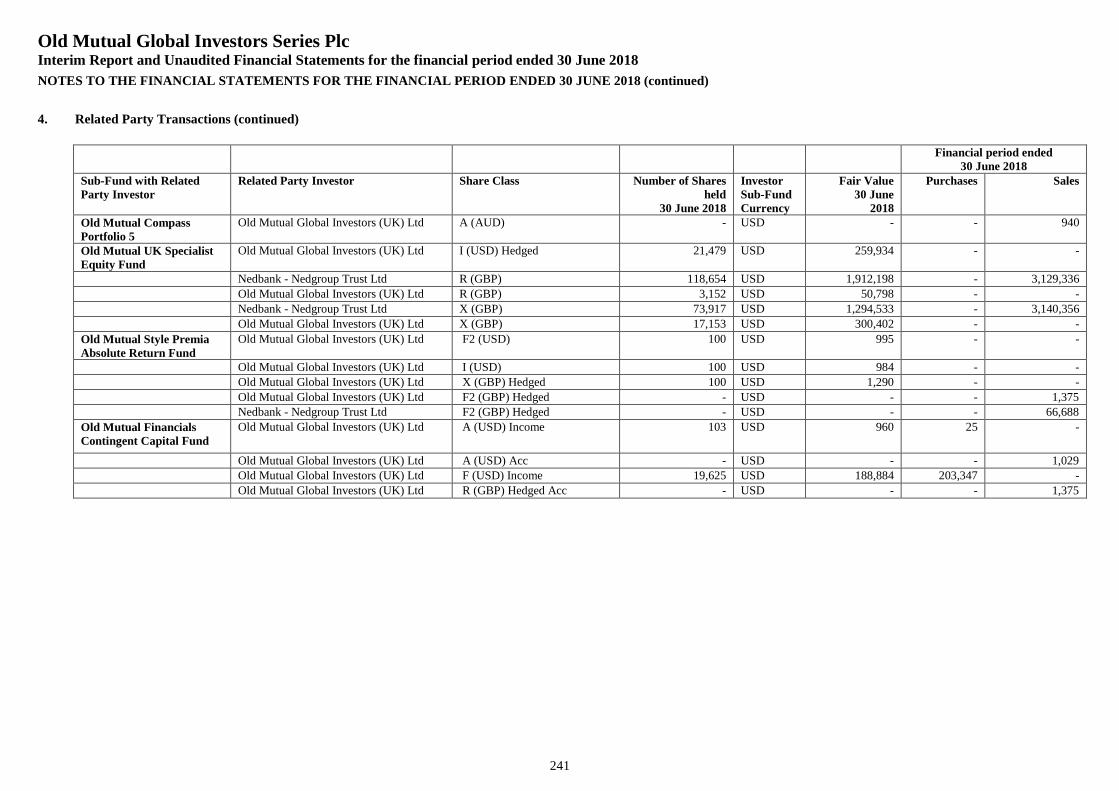
Old Mutual Global Investors Series PlcInterim Report and Unaudited Financial Statements for the financial period ended 30 June 2018
NOTES TO THE FINANCIAL STATEMENTS FOR THE FINANCIAL PERIOD ENDED 30 JUNE 2018 (continued)
241
4. Related Party Transactions (continued)
Financial period ended30 June 2018
Sub-Fund with RelatedParty Investor
Related Party Investor Share Class Number of Sharesheld
30 June 2018
InvestorSub-FundCurrency
Fair Value30 June
2018
Purchases Sales
Old Mutual CompassPortfolio 5
Old Mutual Global Investors (UK) Ltd A (AUD) - USD - - 940
Old Mutual UK SpecialistEquity Fund
Old Mutual Global Investors (UK) Ltd I (USD) Hedged 21,479 USD 259,934 - -
Nedbank - Nedgroup Trust Ltd R (GBP) 118,654 USD 1,912,198 - 3,129,336
Old Mutual Global Investors (UK) Ltd R (GBP) 3,152 USD 50,798 - -
Nedbank - Nedgroup Trust Ltd X (GBP) 73,917 USD 1,294,533 - 3,140,356
Old Mutual Global Investors (UK) Ltd X (GBP) 17,153 USD 300,402 - -
Old Mutual Style PremiaAbsolute Return Fund
Old Mutual Global Investors (UK) Ltd F2 (USD) 100 USD 995 - -
Old Mutual Global Investors (UK) Ltd I (USD) 100 USD 984 - -
Old Mutual Global Investors (UK) Ltd X (GBP) Hedged 100 USD 1,290 - -
Old Mutual Global Investors (UK) Ltd F2 (GBP) Hedged - USD - - 1,375Nedbank - Nedgroup Trust Ltd F2 (GBP) Hedged - USD - - 66,688
Old Mutual FinancialsContingent Capital Fund
Old Mutual Global Investors (UK) Ltd A (USD) Income 103 USD 960 25 -
Old Mutual Global Investors (UK) Ltd A (USD) Acc - USD - - 1,029Old Mutual Global Investors (UK) Ltd F (USD) Income 19,625 USD 188,884 203,347 -
Old Mutual Global Investors (UK) Ltd R (GBP) Hedged Acc - USD - - 1,375
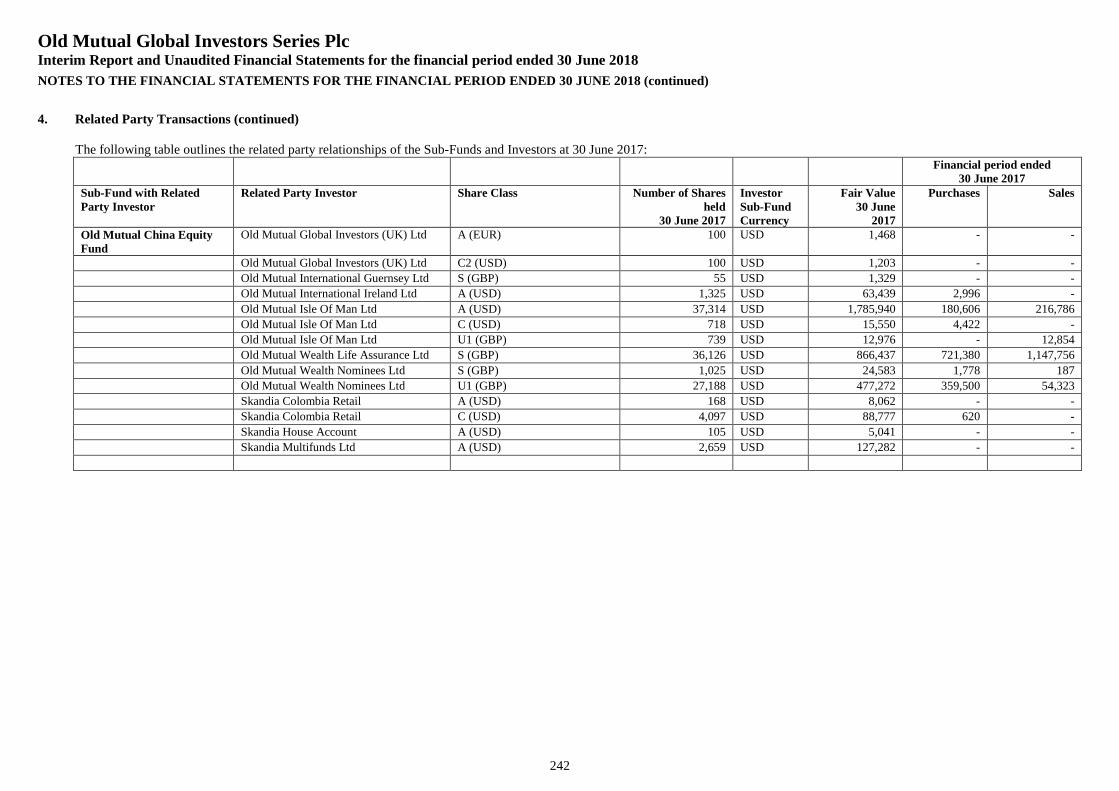
Old Mutual Global Investors Series PlcInterim Report and Unaudited Financial Statements for the financial period ended 30 June 2018
NOTES TO THE FINANCIAL STATEMENTS FOR THE FINANCIAL PERIOD ENDED 30 JUNE 2018 (continued)
242
4. Related Party Transactions (continued)
The following table outlines the related party relationships of the Sub-Funds and Investors at 30 June 2017:Financial period ended
30 June 2017Sub-Fund with RelatedParty Investor
Related Party Investor Share Class Number of Sharesheld
30 June 2017
InvestorSub-FundCurrency
Fair Value30 June
2017
Purchases Sales
Old Mutual China EquityFund
Old Mutual Global Investors (UK) Ltd A (EUR) 100 USD 1,468 - -
Old Mutual Global Investors (UK) Ltd C2 (USD) 100 USD 1,203 - -
Old Mutual International Guernsey Ltd S (GBP) 55 USD 1,329 - -
Old Mutual International Ireland Ltd A (USD) 1,325 USD 63,439 2,996 -
Old Mutual Isle Of Man Ltd A (USD) 37,314 USD 1,785,940 180,606 216,786
Old Mutual Isle Of Man Ltd C (USD) 718 USD 15,550 4,422 -
Old Mutual Isle Of Man Ltd U1 (GBP) 739 USD 12,976 - 12,854
Old Mutual Wealth Life Assurance Ltd S (GBP) 36,126 USD 866,437 721,380 1,147,756
Old Mutual Wealth Nominees Ltd S (GBP) 1,025 USD 24,583 1,778 187
Old Mutual Wealth Nominees Ltd U1 (GBP) 27,188 USD 477,272 359,500 54,323
Skandia Colombia Retail A (USD) 168 USD 8,062 - -
Skandia Colombia Retail C (USD) 4,097 USD 88,777 620 -
Skandia House Account A (USD) 105 USD 5,041 - -
Skandia Multifunds Ltd A (USD) 2,659 USD 127,282 - -
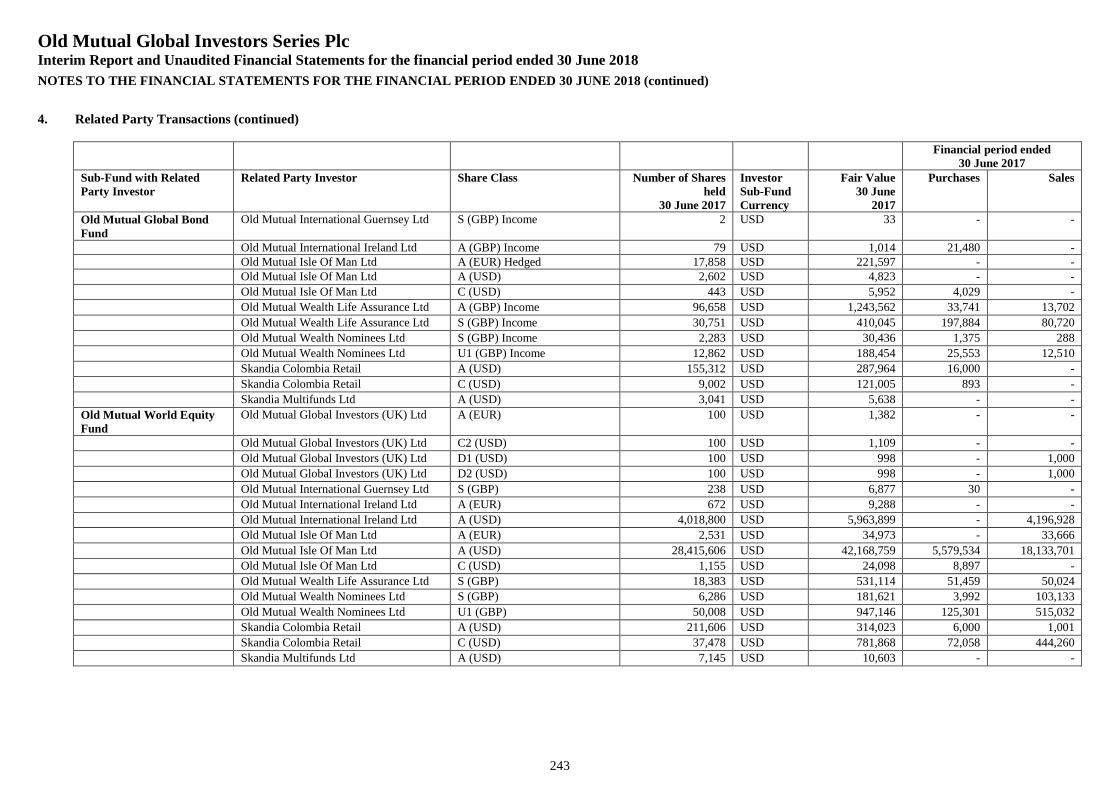
Old Mutual Global Investors Series PlcInterim Report and Unaudited Financial Statements for the financial period ended 30 June 2018
NOTES TO THE FINANCIAL STATEMENTS FOR THE FINANCIAL PERIOD ENDED 30 JUNE 2018 (continued)
243
4. Related Party Transactions (continued)
Financial period ended30 June 2017
Sub-Fund with RelatedParty Investor
Related Party Investor Share Class Number of Sharesheld
30 June 2017
InvestorSub-FundCurrency
Fair Value30 June
2017
Purchases Sales
Old Mutual Global BondFund
Old Mutual International Guernsey Ltd S (GBP) Income 2 USD 33 - -
Old Mutual International Ireland Ltd A (GBP) Income 79 USD 1,014 21,480 -Old Mutual Isle Of Man Ltd A (EUR) Hedged 17,858 USD 221,597 - -Old Mutual Isle Of Man Ltd A (USD) 2,602 USD 4,823 - -
Old Mutual Isle Of Man Ltd C (USD) 443 USD 5,952 4,029 -
Old Mutual Wealth Life Assurance Ltd A (GBP) Income 96,658 USD 1,243,562 33,741 13,702
Old Mutual Wealth Life Assurance Ltd S (GBP) Income 30,751 USD 410,045 197,884 80,720
Old Mutual Wealth Nominees Ltd S (GBP) Income 2,283 USD 30,436 1,375 288
Old Mutual Wealth Nominees Ltd U1 (GBP) Income 12,862 USD 188,454 25,553 12,510
Skandia Colombia Retail A (USD) 155,312 USD 287,964 16,000 -
Skandia Colombia Retail C (USD) 9,002 USD 121,005 893 -
Skandia Multifunds Ltd A (USD) 3,041 USD 5,638 - -
Old Mutual World EquityFund
Old Mutual Global Investors (UK) Ltd A (EUR) 100 USD 1,382 - -
Old Mutual Global Investors (UK) Ltd C2 (USD) 100 USD 1,109 - -
Old Mutual Global Investors (UK) Ltd D1 (USD) 100 USD 998 - 1,000
Old Mutual Global Investors (UK) Ltd D2 (USD) 100 USD 998 - 1,000
Old Mutual International Guernsey Ltd S (GBP) 238 USD 6,877 30 -
Old Mutual International Ireland Ltd A (EUR) 672 USD 9,288 - -
Old Mutual International Ireland Ltd A (USD) 4,018,800 USD 5,963,899 - 4,196,928
Old Mutual Isle Of Man Ltd A (EUR) 2,531 USD 34,973 - 33,666
Old Mutual Isle Of Man Ltd A (USD) 28,415,606 USD 42,168,759 5,579,534 18,133,701
Old Mutual Isle Of Man Ltd C (USD) 1,155 USD 24,098 8,897 -
Old Mutual Wealth Life Assurance Ltd S (GBP) 18,383 USD 531,114 51,459 50,024
Old Mutual Wealth Nominees Ltd S (GBP) 6,286 USD 181,621 3,992 103,133
Old Mutual Wealth Nominees Ltd U1 (GBP) 50,008 USD 947,146 125,301 515,032
Skandia Colombia Retail A (USD) 211,606 USD 314,023 6,000 1,001
Skandia Colombia Retail C (USD) 37,478 USD 781,868 72,058 444,260
Skandia Multifunds Ltd A (USD) 7,145 USD 10,603 - -
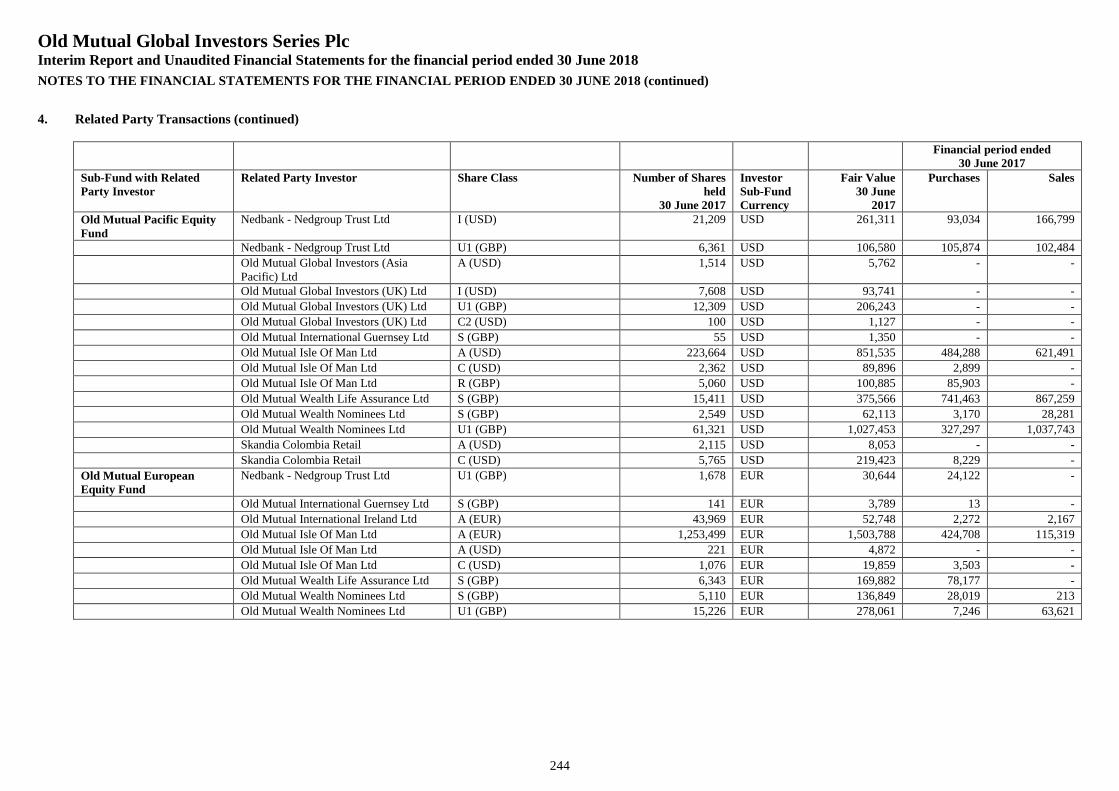
Old Mutual Global Investors Series PlcInterim Report and Unaudited Financial Statements for the financial period ended 30 June 2018
NOTES TO THE FINANCIAL STATEMENTS FOR THE FINANCIAL PERIOD ENDED 30 JUNE 2018 (continued)
244
4. Related Party Transactions (continued)
Financial period ended30 June 2017
Sub-Fund with RelatedParty Investor
Related Party Investor Share Class Number of Sharesheld
30 June 2017
InvestorSub-FundCurrency
Fair Value30 June
2017
Purchases Sales
Old Mutual Pacific EquityFund
Nedbank - Nedgroup Trust Ltd I (USD) 21,209 USD 261,311 93,034 166,799
Nedbank - Nedgroup Trust Ltd U1 (GBP) 6,361 USD 106,580 105,874 102,484
Old Mutual Global Investors (AsiaPacific) Ltd
A (USD) 1,514 USD 5,762 - -
Old Mutual Global Investors (UK) Ltd I (USD) 7,608 USD 93,741 - -
Old Mutual Global Investors (UK) Ltd U1 (GBP) 12,309 USD 206,243 - -
Old Mutual Global Investors (UK) Ltd C2 (USD) 100 USD 1,127 - -
Old Mutual International Guernsey Ltd S (GBP) 55 USD 1,350 - -
Old Mutual Isle Of Man Ltd A (USD) 223,664 USD 851,535 484,288 621,491
Old Mutual Isle Of Man Ltd C (USD) 2,362 USD 89,896 2,899 -
Old Mutual Isle Of Man Ltd R (GBP) 5,060 USD 100,885 85,903 -
Old Mutual Wealth Life Assurance Ltd S (GBP) 15,411 USD 375,566 741,463 867,259
Old Mutual Wealth Nominees Ltd S (GBP) 2,549 USD 62,113 3,170 28,281
Old Mutual Wealth Nominees Ltd U1 (GBP) 61,321 USD 1,027,453 327,297 1,037,743
Skandia Colombia Retail A (USD) 2,115 USD 8,053 - -
Skandia Colombia Retail C (USD) 5,765 USD 219,423 8,229 -
Old Mutual EuropeanEquity Fund
Nedbank - Nedgroup Trust Ltd U1 (GBP) 1,678 EUR 30,644 24,122 -
Old Mutual International Guernsey Ltd S (GBP) 141 EUR 3,789 13 -
Old Mutual International Ireland Ltd A (EUR) 43,969 EUR 52,748 2,272 2,167
Old Mutual Isle Of Man Ltd A (EUR) 1,253,499 EUR 1,503,788 424,708 115,319
Old Mutual Isle Of Man Ltd A (USD) 221 EUR 4,872 - -
Old Mutual Isle Of Man Ltd C (USD) 1,076 EUR 19,859 3,503 -
Old Mutual Wealth Life Assurance Ltd S (GBP) 6,343 EUR 169,882 78,177 -
Old Mutual Wealth Nominees Ltd S (GBP) 5,110 EUR 136,849 28,019 213
Old Mutual Wealth Nominees Ltd U1 (GBP) 15,226 EUR 278,061 7,246 63,621
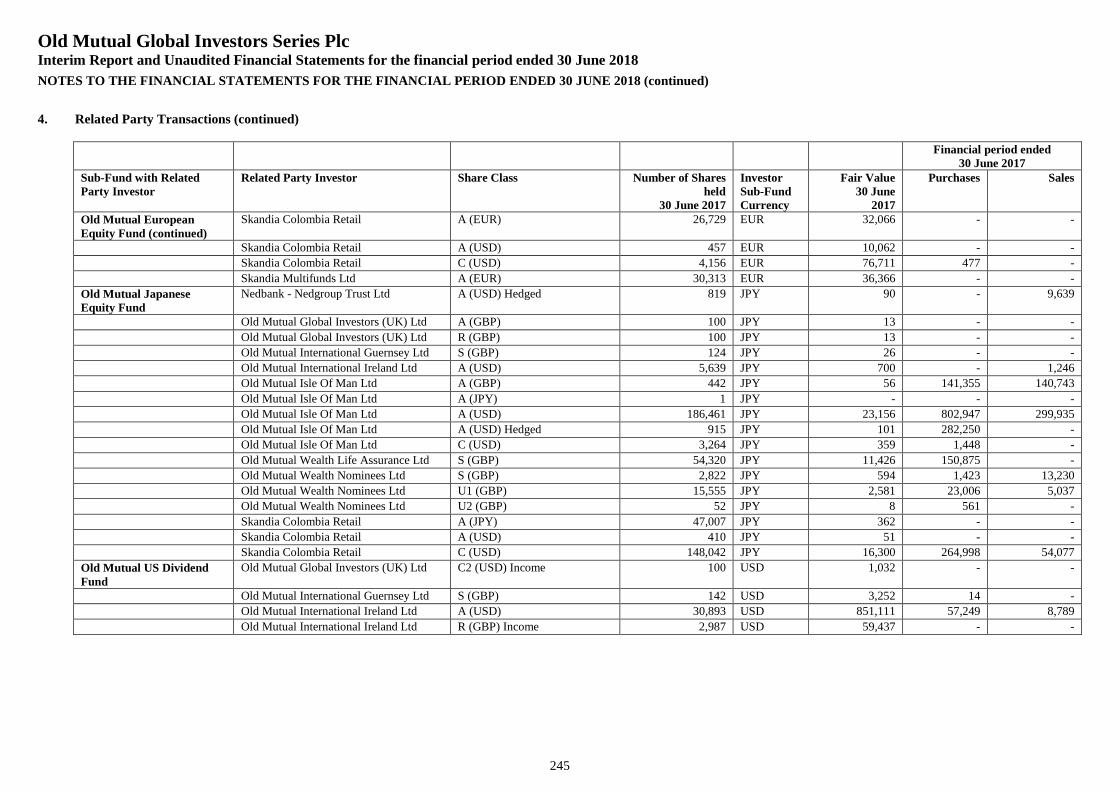
Old Mutual Global Investors Series PlcInterim Report and Unaudited Financial Statements for the financial period ended 30 June 2018
NOTES TO THE FINANCIAL STATEMENTS FOR THE FINANCIAL PERIOD ENDED 30 JUNE 2018 (continued)
245
4. Related Party Transactions (continued)
Financial period ended30 June 2017
Sub-Fund with RelatedParty Investor
Related Party Investor Share Class Number of Sharesheld
30 June 2017
InvestorSub-FundCurrency
Fair Value30 June
2017
Purchases Sales
Old Mutual EuropeanEquity Fund (continued)
Skandia Colombia Retail A (EUR) 26,729 EUR 32,066 - -
Skandia Colombia Retail A (USD) 457 EUR 10,062 - -
Skandia Colombia Retail C (USD) 4,156 EUR 76,711 477 -
Skandia Multifunds Ltd A (EUR) 30,313 EUR 36,366 - -
Old Mutual JapaneseEquity Fund
Nedbank - Nedgroup Trust Ltd A (USD) Hedged 819 JPY 90 - 9,639
Old Mutual Global Investors (UK) Ltd A (GBP) 100 JPY 13 - -
Old Mutual Global Investors (UK) Ltd R (GBP) 100 JPY 13 - -
Old Mutual International Guernsey Ltd S (GBP) 124 JPY 26 - -
Old Mutual International Ireland Ltd A (USD) 5,639 JPY 700 - 1,246
Old Mutual Isle Of Man Ltd A (GBP) 442 JPY 56 141,355 140,743
Old Mutual Isle Of Man Ltd A (JPY) 1 JPY - - -
Old Mutual Isle Of Man Ltd A (USD) 186,461 JPY 23,156 802,947 299,935
Old Mutual Isle Of Man Ltd A (USD) Hedged 915 JPY 101 282,250 -
Old Mutual Isle Of Man Ltd C (USD) 3,264 JPY 359 1,448 -
Old Mutual Wealth Life Assurance Ltd S (GBP) 54,320 JPY 11,426 150,875 -
Old Mutual Wealth Nominees Ltd S (GBP) 2,822 JPY 594 1,423 13,230
Old Mutual Wealth Nominees Ltd U1 (GBP) 15,555 JPY 2,581 23,006 5,037
Old Mutual Wealth Nominees Ltd U2 (GBP) 52 JPY 8 561 -
Skandia Colombia Retail A (JPY) 47,007 JPY 362 - -
Skandia Colombia Retail A (USD) 410 JPY 51 - -
Skandia Colombia Retail C (USD) 148,042 JPY 16,300 264,998 54,077
Old Mutual US DividendFund
Old Mutual Global Investors (UK) Ltd C2 (USD) Income 100 USD 1,032 - -
Old Mutual International Guernsey Ltd S (GBP) 142 USD 3,252 14 -
Old Mutual International Ireland Ltd A (USD) 30,893 USD 851,111 57,249 8,789
Old Mutual International Ireland Ltd R (GBP) Income 2,987 USD 59,437 - -
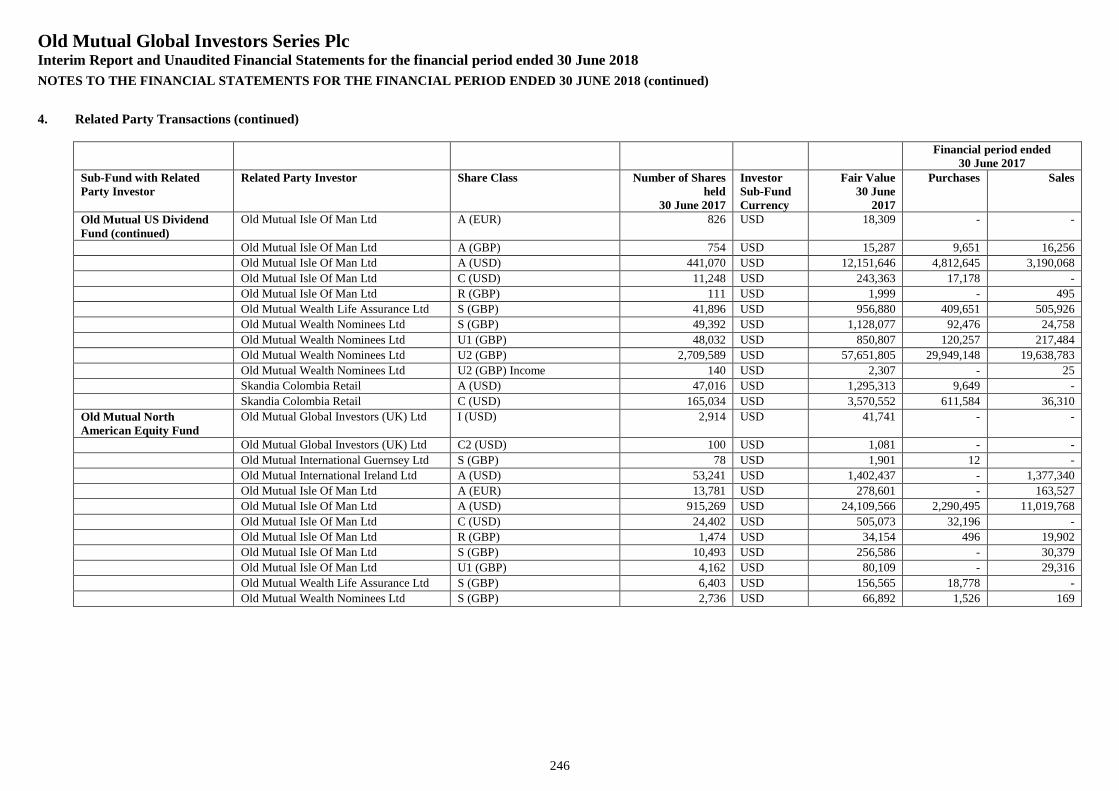
Old Mutual Global Investors Series PlcInterim Report and Unaudited Financial Statements for the financial period ended 30 June 2018
NOTES TO THE FINANCIAL STATEMENTS FOR THE FINANCIAL PERIOD ENDED 30 JUNE 2018 (continued)
246
4. Related Party Transactions (continued)
Financial period ended30 June 2017
Sub-Fund with RelatedParty Investor
Related Party Investor Share Class Number of Sharesheld
30 June 2017
InvestorSub-FundCurrency
Fair Value30 June
2017
Purchases Sales
Old Mutual US DividendFund (continued)
Old Mutual Isle Of Man Ltd A (EUR) 826 USD 18,309 - -
Old Mutual Isle Of Man Ltd A (GBP) 754 USD 15,287 9,651 16,256
Old Mutual Isle Of Man Ltd A (USD) 441,070 USD 12,151,646 4,812,645 3,190,068
Old Mutual Isle Of Man Ltd C (USD) 11,248 USD 243,363 17,178 -
Old Mutual Isle Of Man Ltd R (GBP) 111 USD 1,999 - 495
Old Mutual Wealth Life Assurance Ltd S (GBP) 41,896 USD 956,880 409,651 505,926
Old Mutual Wealth Nominees Ltd S (GBP) 49,392 USD 1,128,077 92,476 24,758
Old Mutual Wealth Nominees Ltd U1 (GBP) 48,032 USD 850,807 120,257 217,484
Old Mutual Wealth Nominees Ltd U2 (GBP) 2,709,589 USD 57,651,805 29,949,148 19,638,783
Old Mutual Wealth Nominees Ltd U2 (GBP) Income 140 USD 2,307 - 25
Skandia Colombia Retail A (USD) 47,016 USD 1,295,313 9,649 -
Skandia Colombia Retail C (USD) 165,034 USD 3,570,552 611,584 36,310
Old Mutual NorthAmerican Equity Fund
Old Mutual Global Investors (UK) Ltd I (USD) 2,914 USD 41,741 - -
Old Mutual Global Investors (UK) Ltd C2 (USD) 100 USD 1,081 - -
Old Mutual International Guernsey Ltd S (GBP) 78 USD 1,901 12 -
Old Mutual International Ireland Ltd A (USD) 53,241 USD 1,402,437 - 1,377,340
Old Mutual Isle Of Man Ltd A (EUR) 13,781 USD 278,601 - 163,527
Old Mutual Isle Of Man Ltd A (USD) 915,269 USD 24,109,566 2,290,495 11,019,768
Old Mutual Isle Of Man Ltd C (USD) 24,402 USD 505,073 32,196 -
Old Mutual Isle Of Man Ltd R (GBP) 1,474 USD 34,154 496 19,902
Old Mutual Isle Of Man Ltd S (GBP) 10,493 USD 256,586 - 30,379
Old Mutual Isle Of Man Ltd U1 (GBP) 4,162 USD 80,109 - 29,316
Old Mutual Wealth Life Assurance Ltd S (GBP) 6,403 USD 156,565 18,778 -
Old Mutual Wealth Nominees Ltd S (GBP) 2,736 USD 66,892 1,526 169
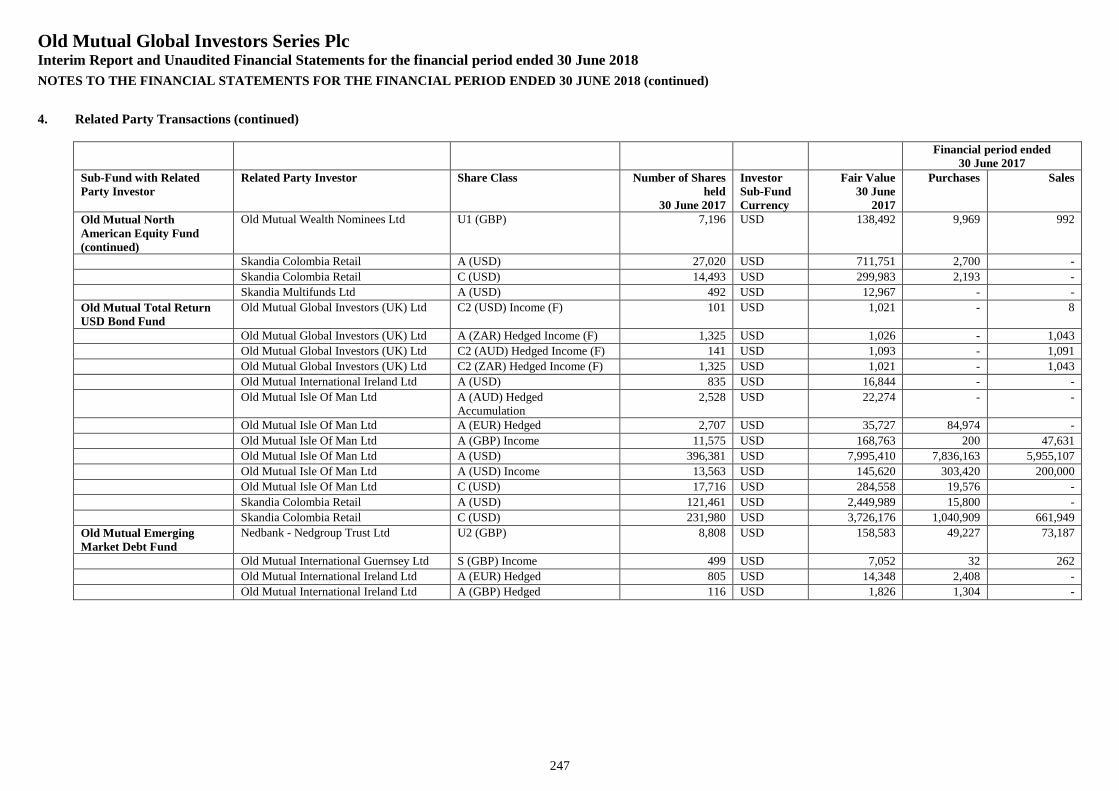
Old Mutual Global Investors Series PlcInterim Report and Unaudited Financial Statements for the financial period ended 30 June 2018
NOTES TO THE FINANCIAL STATEMENTS FOR THE FINANCIAL PERIOD ENDED 30 JUNE 2018 (continued)
247
4. Related Party Transactions (continued)
Financial period ended30 June 2017
Sub-Fund with RelatedParty Investor
Related Party Investor Share Class Number of Sharesheld
30 June 2017
InvestorSub-FundCurrency
Fair Value30 June
2017
Purchases Sales
Old Mutual NorthAmerican Equity Fund(continued)
Old Mutual Wealth Nominees Ltd U1 (GBP) 7,196 USD 138,492 9,969 992
Skandia Colombia Retail A (USD) 27,020 USD 711,751 2,700 -
Skandia Colombia Retail C (USD) 14,493 USD 299,983 2,193 -
Skandia Multifunds Ltd A (USD) 492 USD 12,967 - -
Old Mutual Total ReturnUSD Bond Fund
Old Mutual Global Investors (UK) Ltd C2 (USD) Income (F) 101 USD 1,021 - 8
Old Mutual Global Investors (UK) Ltd A (ZAR) Hedged Income (F) 1,325 USD 1,026 - 1,043
Old Mutual Global Investors (UK) Ltd C2 (AUD) Hedged Income (F) 141 USD 1,093 - 1,091
Old Mutual Global Investors (UK) Ltd C2 (ZAR) Hedged Income (F) 1,325 USD 1,021 - 1,043
Old Mutual International Ireland Ltd A (USD) 835 USD 16,844 - -
Old Mutual Isle Of Man Ltd A (AUD) HedgedAccumulation
2,528 USD 22,274 - -
Old Mutual Isle Of Man Ltd A (EUR) Hedged 2,707 USD 35,727 84,974 -
Old Mutual Isle Of Man Ltd A (GBP) Income 11,575 USD 168,763 200 47,631
Old Mutual Isle Of Man Ltd A (USD) 396,381 USD 7,995,410 7,836,163 5,955,107
Old Mutual Isle Of Man Ltd A (USD) Income 13,563 USD 145,620 303,420 200,000
Old Mutual Isle Of Man Ltd C (USD) 17,716 USD 284,558 19,576 -
Skandia Colombia Retail A (USD) 121,461 USD 2,449,989 15,800 -
Skandia Colombia Retail C (USD) 231,980 USD 3,726,176 1,040,909 661,949
Old Mutual EmergingMarket Debt Fund
Nedbank - Nedgroup Trust Ltd U2 (GBP) 8,808 USD 158,583 49,227 73,187
Old Mutual International Guernsey Ltd S (GBP) Income 499 USD 7,052 32 262
Old Mutual International Ireland Ltd A (EUR) Hedged 805 USD 14,348 2,408 -
Old Mutual International Ireland Ltd A (GBP) Hedged 116 USD 1,826 1,304 -
Old Mutual Global Investors Series PlcInterim Report and Unaudited Financial Statements for the financial period ended 30 June 2018
NOTES TO THE FINANCIAL STATEMENTS FOR THE FINANCIAL PERIOD ENDED 30 JUNE 2018 (continued)
248
4. Related Party Transactions (continued)
Significant ShareholdersAs at the financial period end, there were no investors holding greater than 20% of the AUM of any of the Company’s Sub-Funds (2017: Nil). All transactions were entered into on an arm’slength basis.
Connected Person TransactionsIn accordance with the requirements of the Central Bank UCITS Regulations, any transaction carried out with the Company by its Manager, Depositary, Investment Adviser and/or associatedor group companies of these entities (“connected person”) must be carried out as if negotiated at arm’s length. Such transactions must be in the best interests of the shareholders. In additionto those transactions, there are also transactions carried out by connected persons on behalf of the Company to which the Directors have no direct access and in respect of which the Directorsmust rely upon assurances from its delegates that the connected persons carrying out these transactions do carry them out on a similar basis.
The Board of Directors are satisfied that: (i) there are arrangements (evidenced by written procedures) in place to ensure that theobligations set out in Central Bank of Ireland’s UCITS Regulations are applied to all transactions with connected parties; and (ii) transactions with connected parties entered into during thefinancial year complied with the obligations set out in the UCITS Regulations.
Although not deemed to be related parties under FRS 102 as they do not exercise significant influence over the activities of the Company, UCITS Regulations also deems a “Depositary” andits “associated or group companies” to be related parties to the Company. As such, Citi Depositary Services Ireland DAC, the Depositary, and Citibank Europe plc, the Administrator, arerelated parties to the Company. During the financial year, Citi Depositary Services Ireland DAC and Citibank Europe plc earned fees for provision of depositary and administration servicesto the Company as disclosed in Note 8. Citibank International plc Ireland Branch were selected by the Company to execute foreign exchange transactions and purchase and sell securities onbehalf of the Sub-Funds, the terms of such transactions were negotiated by the Company with such companies and were at normal commercial terms.
In-specieDuring the financial period ended 30 June 2018 there were no in-species transfers (2017: Nil).
Investments in related entitiesDuring the financial period ended 30 June 2018 a number of the Sub-Funds invested in other Sub-Funds in the Company (the “Cross Investments”). The fair value of these investments as of30 June 2018 is disclosed within each relevant Sub-Fund’s Portfolio of Investments.
For the purposes of producing the combined Company financial statements, the value of investments in related entities and the gains and losses arising at Sub-Fund level from investments inrelated entities during the financial period must be eliminated in order to prevent double counting. The value of Cross Investments eliminated on combination is USD 105,972,056 (2017:USD 83,550,094) on Statement of Financial Position and USD (6,414,738) (30 June 2017: USD 6,670,235) on the Statement of Operations.
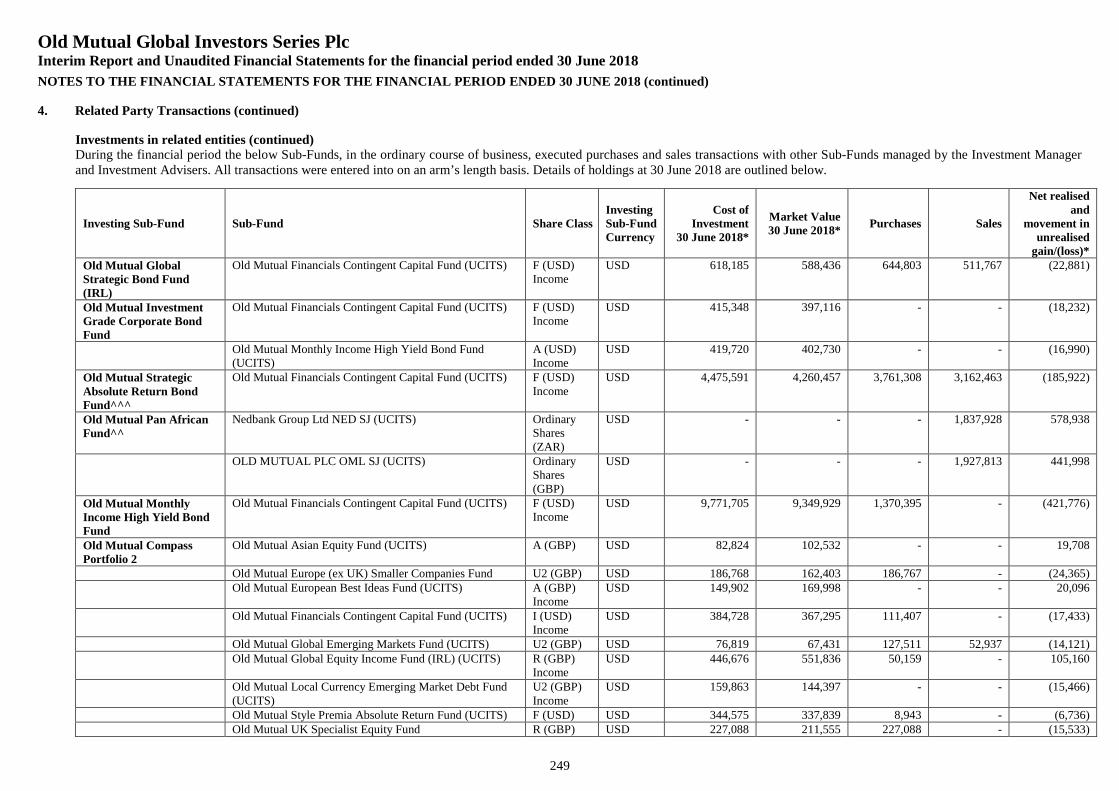
Old Mutual Global Investors Series PlcInterim Report and Unaudited Financial Statements for the financial period ended 30 June 2018
NOTES TO THE FINANCIAL STATEMENTS FOR THE FINANCIAL PERIOD ENDED 30 JUNE 2018 (continued)
249
4. Related Party Transactions (continued)
Investments in related entities (continued)During the financial period the below Sub-Funds, in the ordinary course of business, executed purchases and sales transactions with other Sub-Funds managed by the Investment Managerand Investment Advisers. All transactions were entered into on an arm’s length basis. Details of holdings at 30 June 2018 are outlined below.
Investing Sub-Fund Sub-Fund Share ClassInvestingSub-FundCurrency
Cost ofInvestment
30 June 2018*
Market Value30 June 2018*
Purchases Sales
Net realisedand
movement inunrealised
gain/(loss)*Old Mutual GlobalStrategic Bond Fund(IRL)
Old Mutual Financials Contingent Capital Fund (UCITS) F (USD)Income
USD 618,185 588,436 644,803 511,767 (22,881)
Old Mutual InvestmentGrade Corporate BondFund
Old Mutual Financials Contingent Capital Fund (UCITS) F (USD)Income
USD 415,348 397,116 - - (18,232)
Old Mutual Monthly Income High Yield Bond Fund(UCITS)
A (USD)Income
USD 419,720 402,730 - - (16,990)
Old Mutual StrategicAbsolute Return BondFund^^^
Old Mutual Financials Contingent Capital Fund (UCITS) F (USD)Income
USD 4,475,591 4,260,457 3,761,308 3,162,463 (185,922)
Old Mutual Pan AfricanFund^^
Nedbank Group Ltd NED SJ (UCITS) OrdinaryShares(ZAR)
USD - - - 1,837,928 578,938
OLD MUTUAL PLC OML SJ (UCITS) OrdinaryShares(GBP)
USD - - - 1,927,813 441,998
Old Mutual MonthlyIncome High Yield BondFund
Old Mutual Financials Contingent Capital Fund (UCITS) F (USD)Income
USD 9,771,705 9,349,929 1,370,395 - (421,776)
Old Mutual CompassPortfolio 2
Old Mutual Asian Equity Fund (UCITS) A (GBP) USD 82,824 102,532 - - 19,708
Old Mutual Europe (ex UK) Smaller Companies Fund U2 (GBP) USD 186,768 162,403 186,767 - (24,365)Old Mutual European Best Ideas Fund (UCITS) A (GBP)
IncomeUSD 149,902 169,998 - - 20,096
Old Mutual Financials Contingent Capital Fund (UCITS) I (USD)Income
USD 384,728 367,295 111,407 - (17,433)
Old Mutual Global Emerging Markets Fund (UCITS) U2 (GBP) USD 76,819 67,431 127,511 52,937 (14,121)Old Mutual Global Equity Income Fund (IRL) (UCITS) R (GBP)
IncomeUSD 446,676 551,836 50,159 - 105,160
Old Mutual Local Currency Emerging Market Debt Fund(UCITS)
U2 (GBP)Income
USD 159,863 144,397 - - (15,466)
Old Mutual Style Premia Absolute Return Fund (UCITS) F (USD) USD 344,575 337,839 8,943 - (6,736)Old Mutual UK Specialist Equity Fund R (GBP) USD 227,088 211,555 227,088 - (15,533)
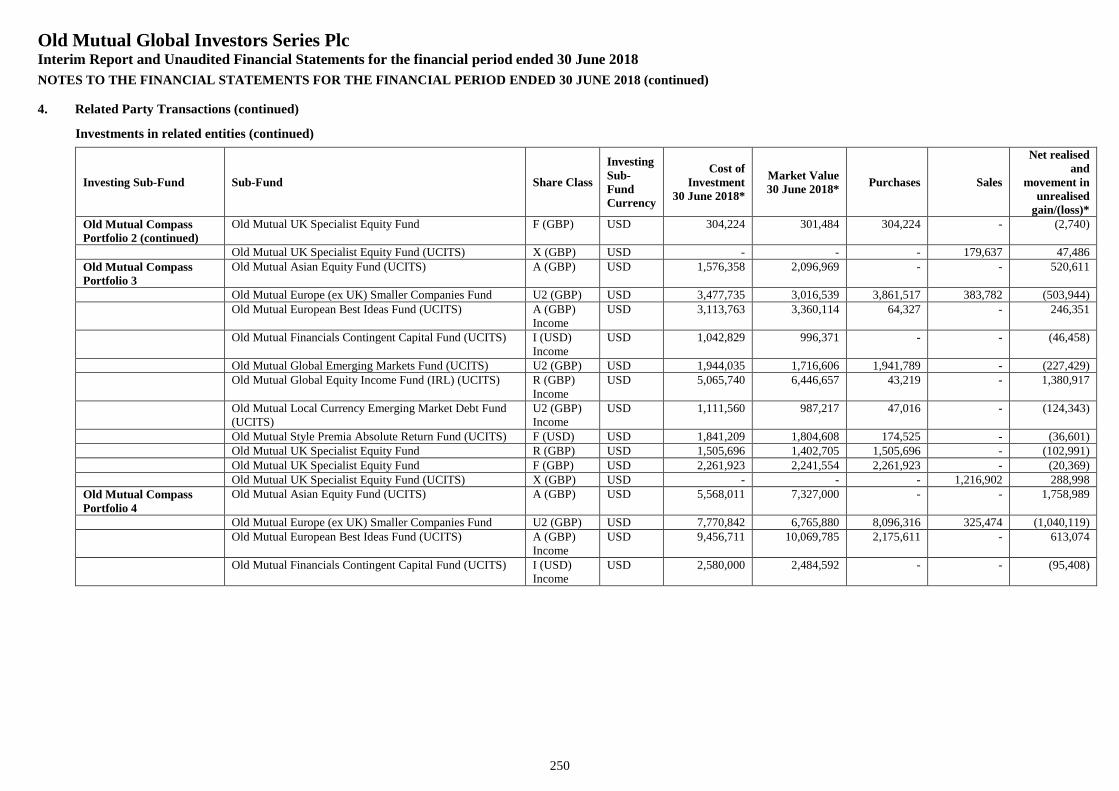
Old Mutual Global Investors Series PlcInterim Report and Unaudited Financial Statements for the financial period ended 30 June 2018
NOTES TO THE FINANCIAL STATEMENTS FOR THE FINANCIAL PERIOD ENDED 30 JUNE 2018 (continued)
250
4. Related Party Transactions (continued)
Investments in related entities (continued)
Investing Sub-Fund Sub-Fund Share Class
InvestingSub-FundCurrency
Cost ofInvestment
30 June 2018*
Market Value30 June 2018*
Purchases Sales
Net realisedand
movement inunrealised
gain/(loss)*Old Mutual CompassPortfolio 2 (continued)
Old Mutual UK Specialist Equity Fund F (GBP) USD 304,224 301,484 304,224 - (2,740)
Old Mutual UK Specialist Equity Fund (UCITS) X (GBP) USD - - - 179,637 47,486Old Mutual CompassPortfolio 3
Old Mutual Asian Equity Fund (UCITS) A (GBP) USD 1,576,358 2,096,969 - - 520,611
Old Mutual Europe (ex UK) Smaller Companies Fund U2 (GBP) USD 3,477,735 3,016,539 3,861,517 383,782 (503,944)Old Mutual European Best Ideas Fund (UCITS) A (GBP)
IncomeUSD 3,113,763 3,360,114 64,327 - 246,351
Old Mutual Financials Contingent Capital Fund (UCITS) I (USD)Income
USD 1,042,829 996,371 - - (46,458)
Old Mutual Global Emerging Markets Fund (UCITS) U2 (GBP) USD 1,944,035 1,716,606 1,941,789 - (227,429)Old Mutual Global Equity Income Fund (IRL) (UCITS) R (GBP)
IncomeUSD 5,065,740 6,446,657 43,219 - 1,380,917
Old Mutual Local Currency Emerging Market Debt Fund(UCITS)
U2 (GBP)Income
USD 1,111,560 987,217 47,016 - (124,343)
Old Mutual Style Premia Absolute Return Fund (UCITS) F (USD) USD 1,841,209 1,804,608 174,525 - (36,601)Old Mutual UK Specialist Equity Fund R (GBP) USD 1,505,696 1,402,705 1,505,696 - (102,991)Old Mutual UK Specialist Equity Fund F (GBP) USD 2,261,923 2,241,554 2,261,923 - (20,369)Old Mutual UK Specialist Equity Fund (UCITS) X (GBP) USD - - - 1,216,902 288,998
Old Mutual CompassPortfolio 4
Old Mutual Asian Equity Fund (UCITS) A (GBP) USD 5,568,011 7,327,000 - - 1,758,989
Old Mutual Europe (ex UK) Smaller Companies Fund U2 (GBP) USD 7,770,842 6,765,880 8,096,316 325,474 (1,040,119)Old Mutual European Best Ideas Fund (UCITS) A (GBP)
IncomeUSD 9,456,711 10,069,785 2,175,611 - 613,074
Old Mutual Financials Contingent Capital Fund (UCITS) I (USD)Income
USD 2,580,000 2,484,592 - - (95,408)
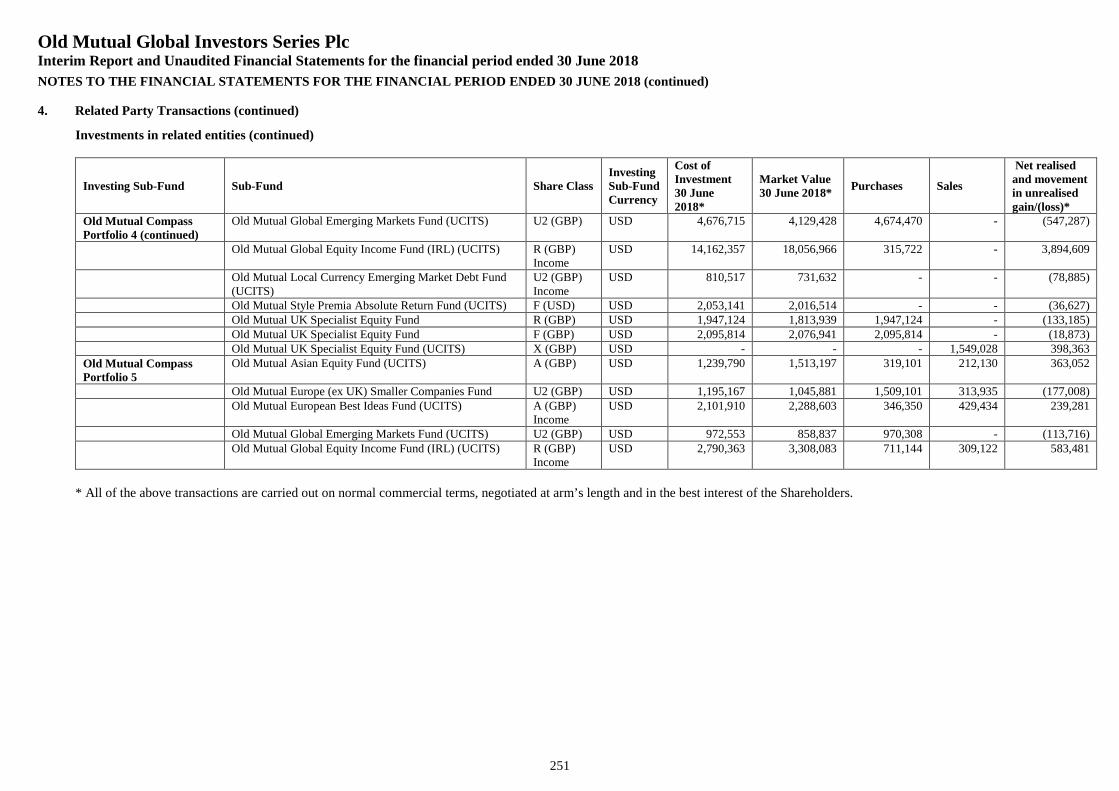
Old Mutual Global Investors Series PlcInterim Report and Unaudited Financial Statements for the financial period ended 30 June 2018
NOTES TO THE FINANCIAL STATEMENTS FOR THE FINANCIAL PERIOD ENDED 30 JUNE 2018 (continued)
251
4. Related Party Transactions (continued)
Investments in related entities (continued)
Investing Sub-Fund Sub-Fund Share ClassInvestingSub-FundCurrency
Cost ofInvestment30 June2018*
Market Value30 June 2018*
Purchases Sales
Net realisedand movementin unrealisedgain/(loss)*
Old Mutual CompassPortfolio 4 (continued)
Old Mutual Global Emerging Markets Fund (UCITS) U2 (GBP) USD 4,676,715 4,129,428 4,674,470 - (547,287)
Old Mutual Global Equity Income Fund (IRL) (UCITS) R (GBP)Income
USD 14,162,357 18,056,966 315,722 - 3,894,609
Old Mutual Local Currency Emerging Market Debt Fund(UCITS)
U2 (GBP)Income
USD 810,517 731,632 - - (78,885)
Old Mutual Style Premia Absolute Return Fund (UCITS) F (USD) USD 2,053,141 2,016,514 - - (36,627)Old Mutual UK Specialist Equity Fund R (GBP) USD 1,947,124 1,813,939 1,947,124 - (133,185)Old Mutual UK Specialist Equity Fund F (GBP) USD 2,095,814 2,076,941 2,095,814 - (18,873)Old Mutual UK Specialist Equity Fund (UCITS) X (GBP) USD - - - 1,549,028 398,363
Old Mutual CompassPortfolio 5
Old Mutual Asian Equity Fund (UCITS) A (GBP) USD 1,239,790 1,513,197 319,101 212,130 363,052
Old Mutual Europe (ex UK) Smaller Companies Fund U2 (GBP) USD 1,195,167 1,045,881 1,509,101 313,935 (177,008)Old Mutual European Best Ideas Fund (UCITS) A (GBP)
IncomeUSD 2,101,910 2,288,603 346,350 429,434 239,281
Old Mutual Global Emerging Markets Fund (UCITS) U2 (GBP) USD 972,553 858,837 970,308 - (113,716)Old Mutual Global Equity Income Fund (IRL) (UCITS) R (GBP)
IncomeUSD 2,790,363 3,308,083 711,144 309,122 583,481
* All of the above transactions are carried out on normal commercial terms, negotiated at arm’s length and in the best interest of the Shareholders.
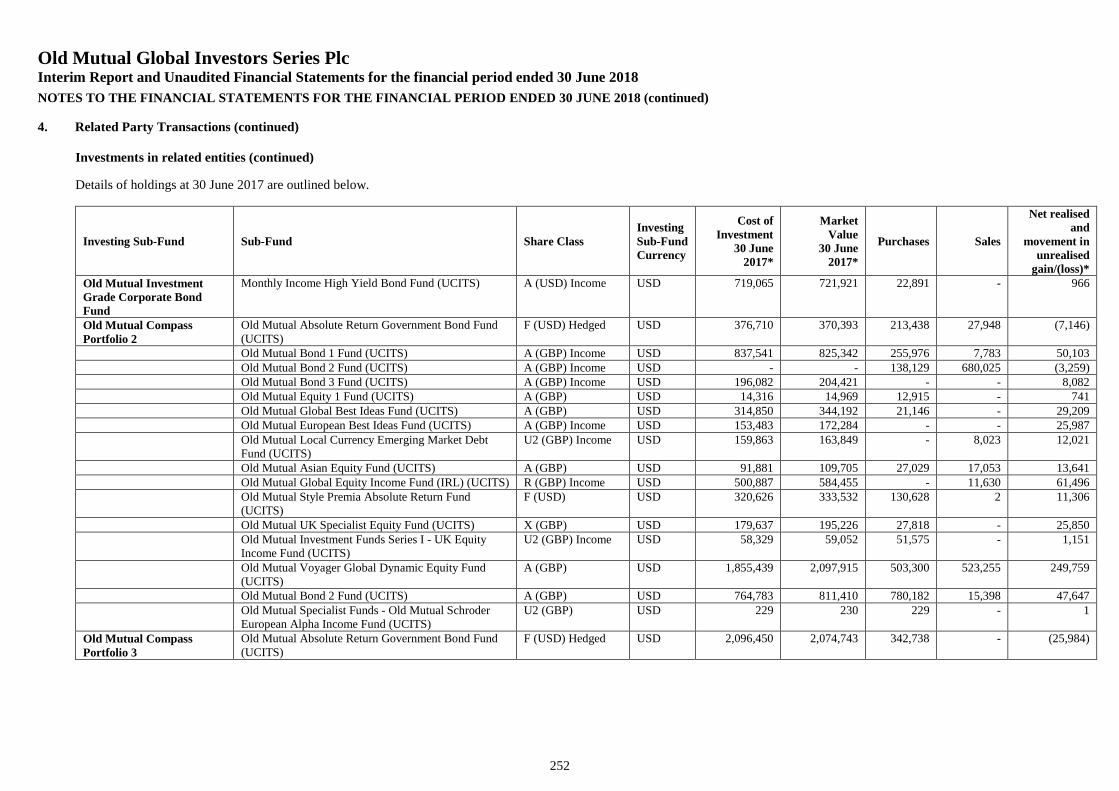
Old Mutual Global Investors Series PlcInterim Report and Unaudited Financial Statements for the financial period ended 30 June 2018
NOTES TO THE FINANCIAL STATEMENTS FOR THE FINANCIAL PERIOD ENDED 30 JUNE 2018 (continued)
252
4. Related Party Transactions (continued)
Investments in related entities (continued)
Details of holdings at 30 June 2017 are outlined below.
Investing Sub-Fund Sub-Fund Share ClassInvestingSub-FundCurrency
Cost ofInvestment
30 June2017*
MarketValue
30 June2017*
Purchases Sales
Net realisedand
movement inunrealised
gain/(loss)*Old Mutual InvestmentGrade Corporate BondFund
Monthly Income High Yield Bond Fund (UCITS) A (USD) Income USD 719,065 721,921 22,891 - 966
Old Mutual CompassPortfolio 2
Old Mutual Absolute Return Government Bond Fund(UCITS)
F (USD) Hedged USD 376,710 370,393 213,438 27,948 (7,146)
Old Mutual Bond 1 Fund (UCITS) A (GBP) Income USD 837,541 825,342 255,976 7,783 50,103Old Mutual Bond 2 Fund (UCITS) A (GBP) Income USD - - 138,129 680,025 (3,259)Old Mutual Bond 3 Fund (UCITS) A (GBP) Income USD 196,082 204,421 - - 8,082Old Mutual Equity 1 Fund (UCITS) A (GBP) USD 14,316 14,969 12,915 - 741Old Mutual Global Best Ideas Fund (UCITS) A (GBP) USD 314,850 344,192 21,146 - 29,209Old Mutual European Best Ideas Fund (UCITS) A (GBP) Income USD 153,483 172,284 - - 25,987Old Mutual Local Currency Emerging Market DebtFund (UCITS)
U2 (GBP) Income USD 159,863 163,849 - 8,023 12,021
Old Mutual Asian Equity Fund (UCITS) A (GBP) USD 91,881 109,705 27,029 17,053 13,641Old Mutual Global Equity Income Fund (IRL) (UCITS) R (GBP) Income USD 500,887 584,455 - 11,630 61,496Old Mutual Style Premia Absolute Return Fund(UCITS)
F (USD) USD 320,626 333,532 130,628 2 11,306
Old Mutual UK Specialist Equity Fund (UCITS) X (GBP) USD 179,637 195,226 27,818 - 25,850Old Mutual Investment Funds Series I - UK EquityIncome Fund (UCITS)
U2 (GBP) Income USD 58,329 59,052 51,575 - 1,151
Old Mutual Voyager Global Dynamic Equity Fund(UCITS)
A (GBP) USD 1,855,439 2,097,915 503,300 523,255 249,759
Old Mutual Bond 2 Fund (UCITS) A (GBP) USD 764,783 811,410 780,182 15,398 47,647Old Mutual Specialist Funds - Old Mutual SchroderEuropean Alpha Income Fund (UCITS)
U2 (GBP) USD 229 230 229 - 1
Old Mutual CompassPortfolio 3
Old Mutual Absolute Return Government Bond Fund(UCITS)
F (USD) Hedged USD 2,096,450 2,074,743 342,738 - (25,984)
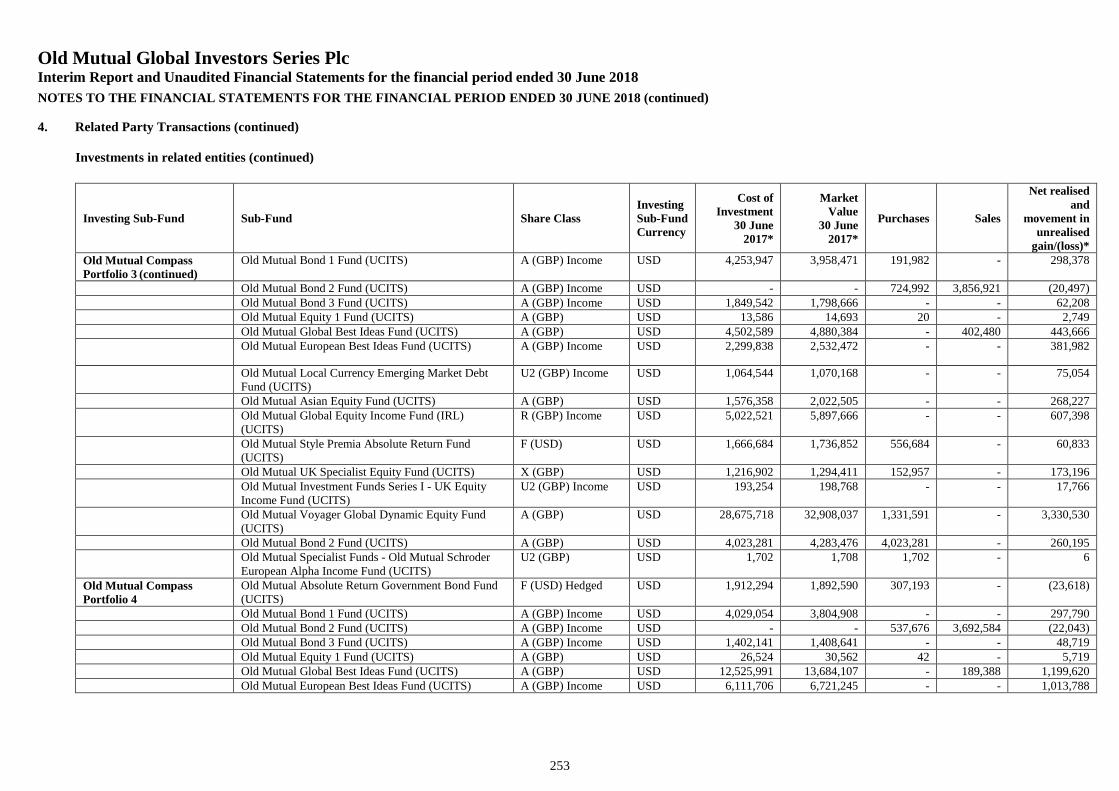
Old Mutual Global Investors Series PlcInterim Report and Unaudited Financial Statements for the financial period ended 30 June 2018
NOTES TO THE FINANCIAL STATEMENTS FOR THE FINANCIAL PERIOD ENDED 30 JUNE 2018 (continued)
253
4. Related Party Transactions (continued)
Investments in related entities (continued)
Investing Sub-Fund Sub-Fund Share ClassInvestingSub-FundCurrency
Cost ofInvestment
30 June2017*
MarketValue
30 June2017*
Purchases Sales
Net realisedand
movement inunrealised
gain/(loss)*Old Mutual CompassPortfolio 3 (continued)
Old Mutual Bond 1 Fund (UCITS) A (GBP) Income USD 4,253,947 3,958,471 191,982 - 298,378
Old Mutual Bond 2 Fund (UCITS) A (GBP) Income USD - - 724,992 3,856,921 (20,497)Old Mutual Bond 3 Fund (UCITS) A (GBP) Income USD 1,849,542 1,798,666 - - 62,208Old Mutual Equity 1 Fund (UCITS) A (GBP) USD 13,586 14,693 20 - 2,749Old Mutual Global Best Ideas Fund (UCITS) A (GBP) USD 4,502,589 4,880,384 - 402,480 443,666Old Mutual European Best Ideas Fund (UCITS) A (GBP) Income USD 2,299,838 2,532,472 - - 381,982
Old Mutual Local Currency Emerging Market DebtFund (UCITS)
U2 (GBP) Income USD 1,064,544 1,070,168 - - 75,054
Old Mutual Asian Equity Fund (UCITS) A (GBP) USD 1,576,358 2,022,505 - - 268,227Old Mutual Global Equity Income Fund (IRL)(UCITS)
R (GBP) Income USD 5,022,521 5,897,666 - - 607,398
Old Mutual Style Premia Absolute Return Fund(UCITS)
F (USD) USD 1,666,684 1,736,852 556,684 - 60,833
Old Mutual UK Specialist Equity Fund (UCITS) X (GBP) USD 1,216,902 1,294,411 152,957 - 173,196Old Mutual Investment Funds Series I - UK EquityIncome Fund (UCITS)
U2 (GBP) Income USD 193,254 198,768 - - 17,766
Old Mutual Voyager Global Dynamic Equity Fund(UCITS)
A (GBP) USD 28,675,718 32,908,037 1,331,591 - 3,330,530
Old Mutual Bond 2 Fund (UCITS) A (GBP) USD 4,023,281 4,283,476 4,023,281 - 260,195Old Mutual Specialist Funds - Old Mutual SchroderEuropean Alpha Income Fund (UCITS)
U2 (GBP) USD 1,702 1,708 1,702 - 6
Old Mutual CompassPortfolio 4
Old Mutual Absolute Return Government Bond Fund(UCITS)
F (USD) Hedged USD 1,912,294 1,892,590 307,193 - (23,618)
Old Mutual Bond 1 Fund (UCITS) A (GBP) Income USD 4,029,054 3,804,908 - - 297,790Old Mutual Bond 2 Fund (UCITS) A (GBP) Income USD - - 537,676 3,692,584 (22,043)Old Mutual Bond 3 Fund (UCITS) A (GBP) Income USD 1,402,141 1,408,641 - - 48,719Old Mutual Equity 1 Fund (UCITS) A (GBP) USD 26,524 30,562 42 - 5,719Old Mutual Global Best Ideas Fund (UCITS) A (GBP) USD 12,525,991 13,684,107 - 189,388 1,199,620Old Mutual European Best Ideas Fund (UCITS) A (GBP) Income USD 6,111,706 6,721,245 - - 1,013,788
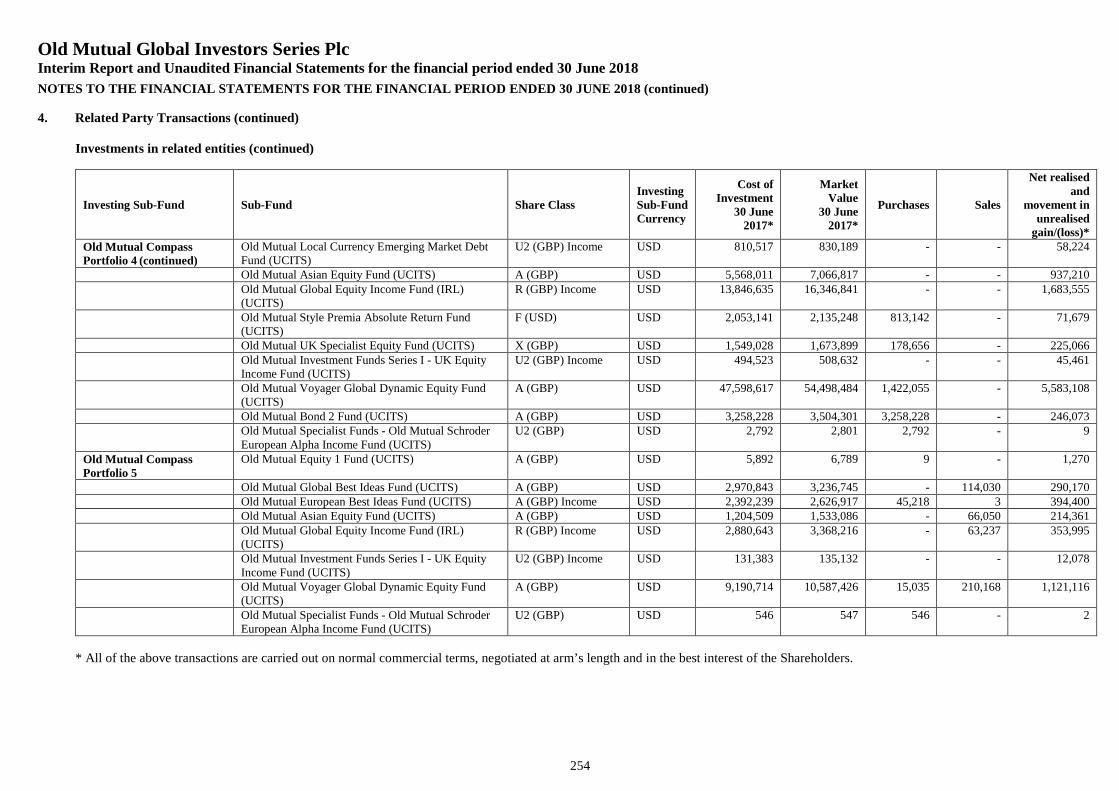
Old Mutual Global Investors Series PlcInterim Report and Unaudited Financial Statements for the financial period ended 30 June 2018
NOTES TO THE FINANCIAL STATEMENTS FOR THE FINANCIAL PERIOD ENDED 30 JUNE 2018 (continued)
254
4. Related Party Transactions (continued)
Investments in related entities (continued)
Investing Sub-Fund Sub-Fund Share ClassInvestingSub-FundCurrency
Cost ofInvestment
30 June2017*
MarketValue
30 June2017*
Purchases Sales
Net realisedand
movement inunrealised
gain/(loss)*Old Mutual CompassPortfolio 4 (continued)
Old Mutual Local Currency Emerging Market DebtFund (UCITS)
U2 (GBP) Income USD 810,517 830,189 - - 58,224
Old Mutual Asian Equity Fund (UCITS) A (GBP) USD 5,568,011 7,066,817 - - 937,210Old Mutual Global Equity Income Fund (IRL)(UCITS)
R (GBP) Income USD 13,846,635 16,346,841 - - 1,683,555
Old Mutual Style Premia Absolute Return Fund(UCITS)
F (USD) USD 2,053,141 2,135,248 813,142 - 71,679
Old Mutual UK Specialist Equity Fund (UCITS) X (GBP) USD 1,549,028 1,673,899 178,656 - 225,066Old Mutual Investment Funds Series I - UK EquityIncome Fund (UCITS)
U2 (GBP) Income USD 494,523 508,632 - - 45,461
Old Mutual Voyager Global Dynamic Equity Fund(UCITS)
A (GBP) USD 47,598,617 54,498,484 1,422,055 - 5,583,108
Old Mutual Bond 2 Fund (UCITS) A (GBP) USD 3,258,228 3,504,301 3,258,228 - 246,073Old Mutual Specialist Funds - Old Mutual SchroderEuropean Alpha Income Fund (UCITS)
U2 (GBP) USD 2,792 2,801 2,792 - 9
Old Mutual CompassPortfolio 5
Old Mutual Equity 1 Fund (UCITS) A (GBP) USD 5,892 6,789 9 - 1,270
Old Mutual Global Best Ideas Fund (UCITS) A (GBP) USD 2,970,843 3,236,745 - 114,030 290,170Old Mutual European Best Ideas Fund (UCITS) A (GBP) Income USD 2,392,239 2,626,917 45,218 3 394,400Old Mutual Asian Equity Fund (UCITS) A (GBP) USD 1,204,509 1,533,086 - 66,050 214,361Old Mutual Global Equity Income Fund (IRL)(UCITS)
R (GBP) Income USD 2,880,643 3,368,216 - 63,237 353,995
Old Mutual Investment Funds Series I - UK EquityIncome Fund (UCITS)
U2 (GBP) Income USD 131,383 135,132 - - 12,078
Old Mutual Voyager Global Dynamic Equity Fund(UCITS)
A (GBP) USD 9,190,714 10,587,426 15,035 210,168 1,121,116
Old Mutual Specialist Funds - Old Mutual SchroderEuropean Alpha Income Fund (UCITS)
U2 (GBP) USD 546 547 546 - 2
* All of the above transactions are carried out on normal commercial terms, negotiated at arm’s length and in the best interest of the Shareholders.
Old Mutual Global Investors Series PlcInterim Report and Unaudited Financial Statements for the financial period ended 30 June 2018
NOTES TO THE FINANCIAL STATEMENTS FOR THE FINANCIAL PERIOD ENDED 30 JUNE 2018 (continued)
255
5. Share Capital
Subscriber SharesThe authorised share capital of the Company is EUR 38,082 represented by 30,000 subscriber Shares of no par value and500,000,000,000 Shares of no par value. The Company has repurchased all but seven of the subscriber Shares. The subscriberShares entitle the Shareholders holding them to attend and vote at all meetings of the Company. The subscriber Shares entitlesthe Shareholder to participate equally on a pro rata basis in the dividends and net assets of the Company, this entitlement shallbe limited to the amount subscribed and any accrued income thereon.
Redeemable Participating SharesThe creation of the various Share Classes is intended to offer greater flexibility to both retail and institutional clients. Each ShareClass may also be distinguished by the Investment Management Fee, initial charge, contingent deferred sales charge andredemption charges applicable and the minimum subscription requirements. Each Share Class in each Sub-Fund has equal voting,distribution and liquidation rights in proportion to the number of the Shares held in that Sub-Fund. Please refer to the Prospectusfor the further details on Share capital. The management, performance and distribution fees applicable are disclosed in Note 8.The movement in share capital during the financial period ended 30 June 2018 and 30 June 2017 is disclosed as part of theStatement of Changes in Net Assets Attributable to Redeemable Participating Shareholders on pages 224 to 227.
The net assets attributable to holders of Redeemable Participating Shares are at all times equal to the Net Asset Value of theCompany. The participating shares which comprise the equity capital of the Company are in substance a liability of the Companyto shareholders under the terms of FRS 102 as they can be redeemed at the option of the shareholder.
Participating shares may be redeemed on each dealing date or such other date or dates as the Board of Directors shall from timeto time determine (Valuation Day) at the Net Asset Value per share.
Capital ManagementThe Company is a self-managed UCITS Company and by taking into consideration of Subscriber Shares, has met the minimumcapital requirements whereby the Company must, at all time, maintain a minimum capital requirement equivalent to €300,000.The Company endeavours to manage the investment of redeemable shares in investments that meet the Company’s investmentobjectives while maintaining sufficient liquidity to meet shareholders redemptions.
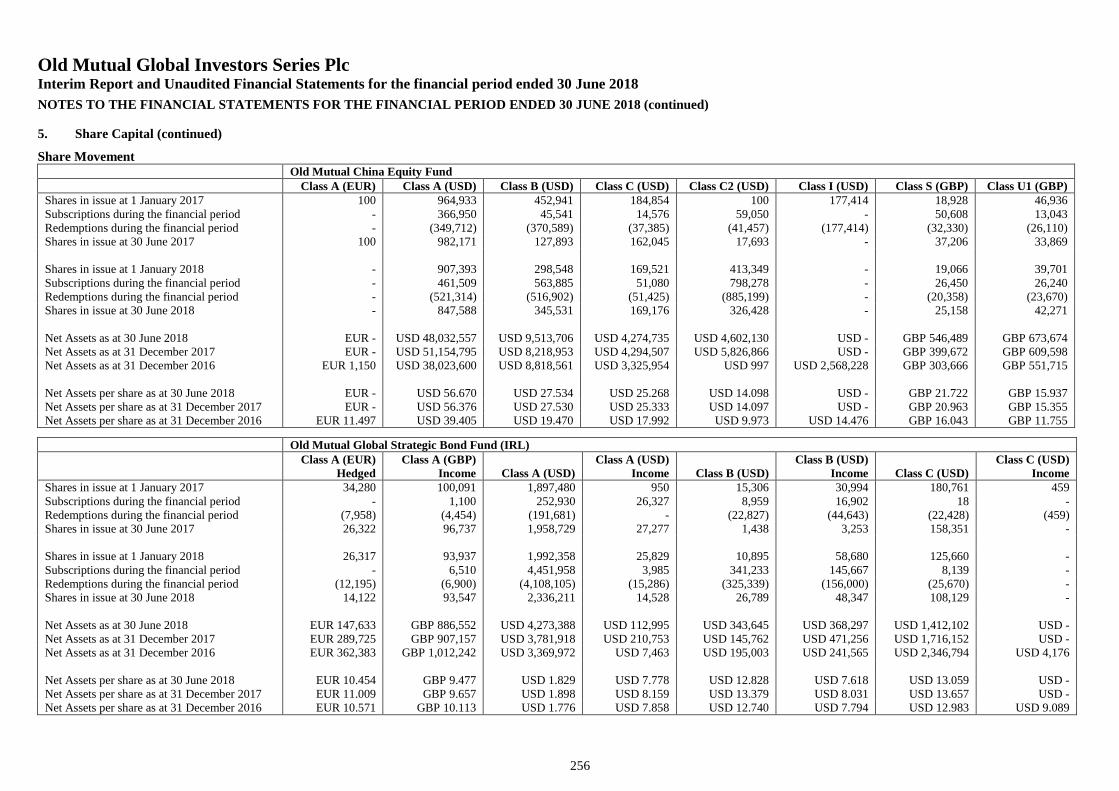
Old Mutual Global Investors Series PlcInterim Report and Unaudited Financial Statements for the financial period ended 30 June 2018
NOTES TO THE FINANCIAL STATEMENTS FOR THE FINANCIAL PERIOD ENDED 30 JUNE 2018 (continued)
256
5. Share Capital (continued)
Share MovementOld Mutual China Equity Fund
Class A (EUR) Class A (USD) Class B (USD) Class C (USD) Class C2 (USD) Class I (USD) Class S (GBP) Class U1 (GBP)Shares in issue at 1 January 2017 100 964,933 452,941 184,854 100 177,414 18,928 46,936Subscriptions during the financial period - 366,950 45,541 14,576 59,050 - 50,608 13,043Redemptions during the financial period - (349,712) (370,589) (37,385) (41,457) (177,414) (32,330) (26,110)Shares in issue at 30 June 2017 100 982,171 127,893 162,045 17,693 - 37,206 33,869
Shares in issue at 1 January 2018 - 907,393 298,548 169,521 413,349 - 19,066 39,701Subscriptions during the financial period - 461,509 563,885 51,080 798,278 - 26,450 26,240Redemptions during the financial period - (521,314) (516,902) (51,425) (885,199) - (20,358) (23,670)Shares in issue at 30 June 2018 - 847,588 345,531 169,176 326,428 - 25,158 42,271
Net Assets as at 30 June 2018 EUR - USD 48,032,557 USD 9,513,706 USD 4,274,735 USD 4,602,130 USD - GBP 546,489 GBP 673,674Net Assets as at 31 December 2017 EUR - USD 51,154,795 USD 8,218,953 USD 4,294,507 USD 5,826,866 USD - GBP 399,672 GBP 609,598Net Assets as at 31 December 2016 EUR 1,150 USD 38,023,600 USD 8,818,561 USD 3,325,954 USD 997 USD 2,568,228 GBP 303,666 GBP 551,715
Net Assets per share as at 30 June 2018 EUR - USD 56.670 USD 27.534 USD 25.268 USD 14.098 USD - GBP 21.722 GBP 15.937Net Assets per share as at 31 December 2017 EUR - USD 56.376 USD 27.530 USD 25.333 USD 14.097 USD - GBP 20.963 GBP 15.355Net Assets per share as at 31 December 2016 EUR 11.497 USD 39.405 USD 19.470 USD 17.992 USD 9.973 USD 14.476 GBP 16.043 GBP 11.755
Old Mutual Global Strategic Bond Fund (IRL)Class A (EUR)
HedgedClass A (GBP)
Income Class A (USD)Class A (USD)
Income Class B (USD)Class B (USD)
Income Class C (USD)Class C (USD)
IncomeShares in issue at 1 January 2017 34,280 100,091 1,897,480 950 15,306 30,994 180,761 459Subscriptions during the financial period - 1,100 252,930 26,327 8,959 16,902 18 -Redemptions during the financial period (7,958) (4,454) (191,681) - (22,827) (44,643) (22,428) (459)Shares in issue at 30 June 2017 26,322 96,737 1,958,729 27,277 1,438 3,253 158,351 -
Shares in issue at 1 January 2018 26,317 93,937 1,992,358 25,829 10,895 58,680 125,660 -Subscriptions during the financial period - 6,510 4,451,958 3,985 341,233 145,667 8,139 -Redemptions during the financial period (12,195) (6,900) (4,108,105) (15,286) (325,339) (156,000) (25,670) -Shares in issue at 30 June 2018 14,122 93,547 2,336,211 14,528 26,789 48,347 108,129 -
Net Assets as at 30 June 2018 EUR 147,633 GBP 886,552 USD 4,273,388 USD 112,995 USD 343,645 USD 368,297 USD 1,412,102 USD -Net Assets as at 31 December 2017 EUR 289,725 GBP 907,157 USD 3,781,918 USD 210,753 USD 145,762 USD 471,256 USD 1,716,152 USD -Net Assets as at 31 December 2016 EUR 362,383 GBP 1,012,242 USD 3,369,972 USD 7,463 USD 195,003 USD 241,565 USD 2,346,794 USD 4,176
Net Assets per share as at 30 June 2018 EUR 10.454 GBP 9.477 USD 1.829 USD 7.778 USD 12.828 USD 7.618 USD 13.059 USD -Net Assets per share as at 31 December 2017 EUR 11.009 GBP 9.657 USD 1.898 USD 8.159 USD 13.379 USD 8.031 USD 13.657 USD -Net Assets per share as at 31 December 2016 EUR 10.571 GBP 10.113 USD 1.776 USD 7.858 USD 12.740 USD 7.794 USD 12.983 USD 9.089
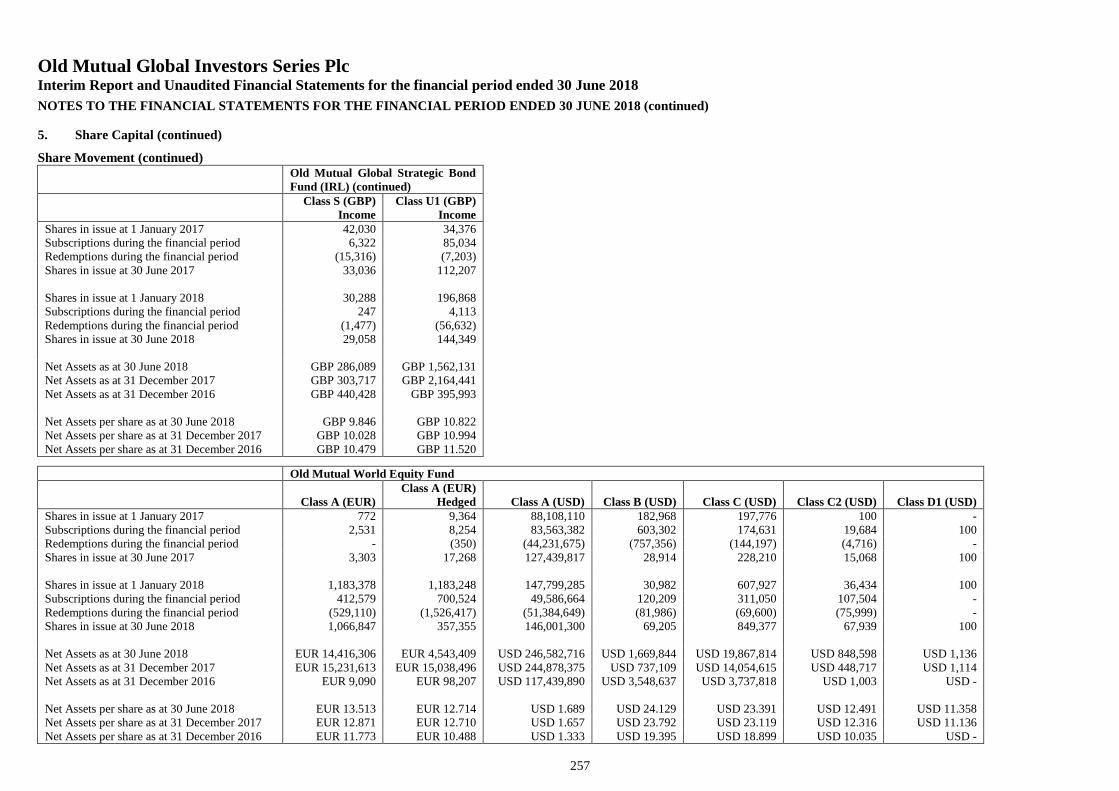
Old Mutual Global Investors Series PlcInterim Report and Unaudited Financial Statements for the financial period ended 30 June 2018
NOTES TO THE FINANCIAL STATEMENTS FOR THE FINANCIAL PERIOD ENDED 30 JUNE 2018 (continued)
257
5. Share Capital (continued)
Share Movement (continued)Old Mutual Global Strategic BondFund (IRL) (continued)
Class S (GBP)Income
Class U1 (GBP)Income
Shares in issue at 1 January 2017 42,030 34,376Subscriptions during the financial period 6,322 85,034Redemptions during the financial period (15,316) (7,203)Shares in issue at 30 June 2017 33,036 112,207
Shares in issue at 1 January 2018 30,288 196,868Subscriptions during the financial period 247 4,113Redemptions during the financial period (1,477) (56,632)Shares in issue at 30 June 2018 29,058 144,349
Net Assets as at 30 June 2018 GBP 286,089 GBP 1,562,131Net Assets as at 31 December 2017 GBP 303,717 GBP 2,164,441Net Assets as at 31 December 2016 GBP 440,428 GBP 395,993
Net Assets per share as at 30 June 2018 GBP 9.846 GBP 10.822Net Assets per share as at 31 December 2017 GBP 10.028 GBP 10.994Net Assets per share as at 31 December 2016 GBP 10.479 GBP 11.520
Old Mutual World Equity Fund
Class A (EUR)Class A (EUR)
Hedged Class A (USD) Class B (USD) Class C (USD) Class C2 (USD) Class D1 (USD)Shares in issue at 1 January 2017 772 9,364 88,108,110 182,968 197,776 100 -Subscriptions during the financial period 2,531 8,254 83,563,382 603,302 174,631 19,684 100Redemptions during the financial period - (350) (44,231,675) (757,356) (144,197) (4,716) -Shares in issue at 30 June 2017 3,303 17,268 127,439,817 28,914 228,210 15,068 100
Shares in issue at 1 January 2018 1,183,378 1,183,248 147,799,285 30,982 607,927 36,434 100Subscriptions during the financial period 412,579 700,524 49,586,664 120,209 311,050 107,504 -Redemptions during the financial period (529,110) (1,526,417) (51,384,649) (81,986) (69,600) (75,999) -Shares in issue at 30 June 2018 1,066,847 357,355 146,001,300 69,205 849,377 67,939 100
Net Assets as at 30 June 2018 EUR 14,416,306 EUR 4,543,409 USD 246,582,716 USD 1,669,844 USD 19,867,814 USD 848,598 USD 1,136Net Assets as at 31 December 2017 EUR 15,231,613 EUR 15,038,496 USD 244,878,375 USD 737,109 USD 14,054,615 USD 448,717 USD 1,114Net Assets as at 31 December 2016 EUR 9,090 EUR 98,207 USD 117,439,890 USD 3,548,637 USD 3,737,818 USD 1,003 USD -
Net Assets per share as at 30 June 2018 EUR 13.513 EUR 12.714 USD 1.689 USD 24.129 USD 23.391 USD 12.491 USD 11.358Net Assets per share as at 31 December 2017 EUR 12.871 EUR 12.710 USD 1.657 USD 23.792 USD 23.119 USD 12.316 USD 11.136Net Assets per share as at 31 December 2016 EUR 11.773 EUR 10.488 USD 1.333 USD 19.395 USD 18.899 USD 10.035 USD -
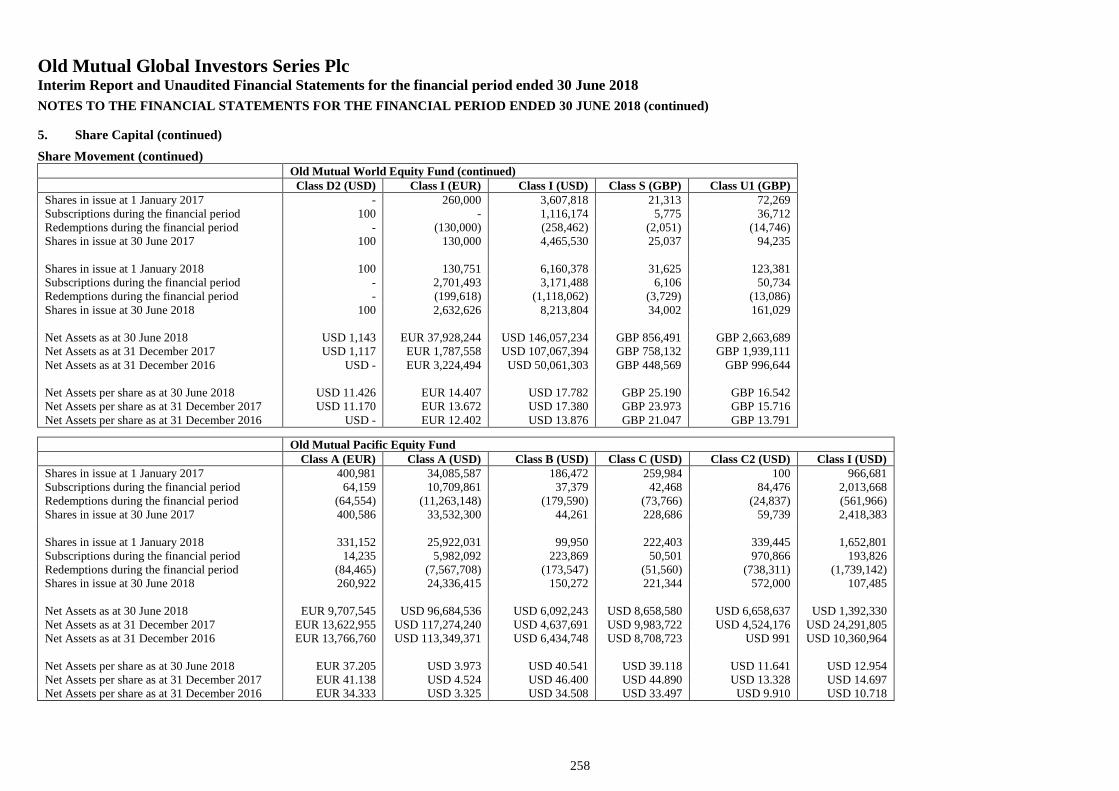
Old Mutual Global Investors Series PlcInterim Report and Unaudited Financial Statements for the financial period ended 30 June 2018
NOTES TO THE FINANCIAL STATEMENTS FOR THE FINANCIAL PERIOD ENDED 30 JUNE 2018 (continued)
258
5. Share Capital (continued)
Share Movement (continued)Old Mutual World Equity Fund (continued)
Class D2 (USD) Class I (EUR) Class I (USD) Class S (GBP) Class U1 (GBP)Shares in issue at 1 January 2017 - 260,000 3,607,818 21,313 72,269Subscriptions during the financial period 100 - 1,116,174 5,775 36,712Redemptions during the financial period - (130,000) (258,462) (2,051) (14,746)Shares in issue at 30 June 2017 100 130,000 4,465,530 25,037 94,235
Shares in issue at 1 January 2018 100 130,751 6,160,378 31,625 123,381Subscriptions during the financial period - 2,701,493 3,171,488 6,106 50,734Redemptions during the financial period - (199,618) (1,118,062) (3,729) (13,086)Shares in issue at 30 June 2018 100 2,632,626 8,213,804 34,002 161,029
Net Assets as at 30 June 2018 USD 1,143 EUR 37,928,244 USD 146,057,234 GBP 856,491 GBP 2,663,689Net Assets as at 31 December 2017 USD 1,117 EUR 1,787,558 USD 107,067,394 GBP 758,132 GBP 1,939,111Net Assets as at 31 December 2016 USD - EUR 3,224,494 USD 50,061,303 GBP 448,569 GBP 996,644
Net Assets per share as at 30 June 2018 USD 11.426 EUR 14.407 USD 17.782 GBP 25.190 GBP 16.542Net Assets per share as at 31 December 2017 USD 11.170 EUR 13.672 USD 17.380 GBP 23.973 GBP 15.716Net Assets per share as at 31 December 2016 USD - EUR 12.402 USD 13.876 GBP 21.047 GBP 13.791
Old Mutual Pacific Equity FundClass A (EUR) Class A (USD) Class B (USD) Class C (USD) Class C2 (USD) Class I (USD)
Shares in issue at 1 January 2017 400,981 34,085,587 186,472 259,984 100 966,681Subscriptions during the financial period 64,159 10,709,861 37,379 42,468 84,476 2,013,668Redemptions during the financial period (64,554) (11,263,148) (179,590) (73,766) (24,837) (561,966)Shares in issue at 30 June 2017 400,586 33,532,300 44,261 228,686 59,739 2,418,383
Shares in issue at 1 January 2018 331,152 25,922,031 99,950 222,403 339,445 1,652,801Subscriptions during the financial period 14,235 5,982,092 223,869 50,501 970,866 193,826Redemptions during the financial period (84,465) (7,567,708) (173,547) (51,560) (738,311) (1,739,142)Shares in issue at 30 June 2018 260,922 24,336,415 150,272 221,344 572,000 107,485
Net Assets as at 30 June 2018 EUR 9,707,545 USD 96,684,536 USD 6,092,243 USD 8,658,580 USD 6,658,637 USD 1,392,330Net Assets as at 31 December 2017 EUR 13,622,955 USD 117,274,240 USD 4,637,691 USD 9,983,722 USD 4,524,176 USD 24,291,805Net Assets as at 31 December 2016 EUR 13,766,760 USD 113,349,371 USD 6,434,748 USD 8,708,723 USD 991 USD 10,360,964
Net Assets per share as at 30 June 2018 EUR 37.205 USD 3.973 USD 40.541 USD 39.118 USD 11.641 USD 12.954Net Assets per share as at 31 December 2017 EUR 41.138 USD 4.524 USD 46.400 USD 44.890 USD 13.328 USD 14.697Net Assets per share as at 31 December 2016 EUR 34.333 USD 3.325 USD 34.508 USD 33.497 USD 9.910 USD 10.718
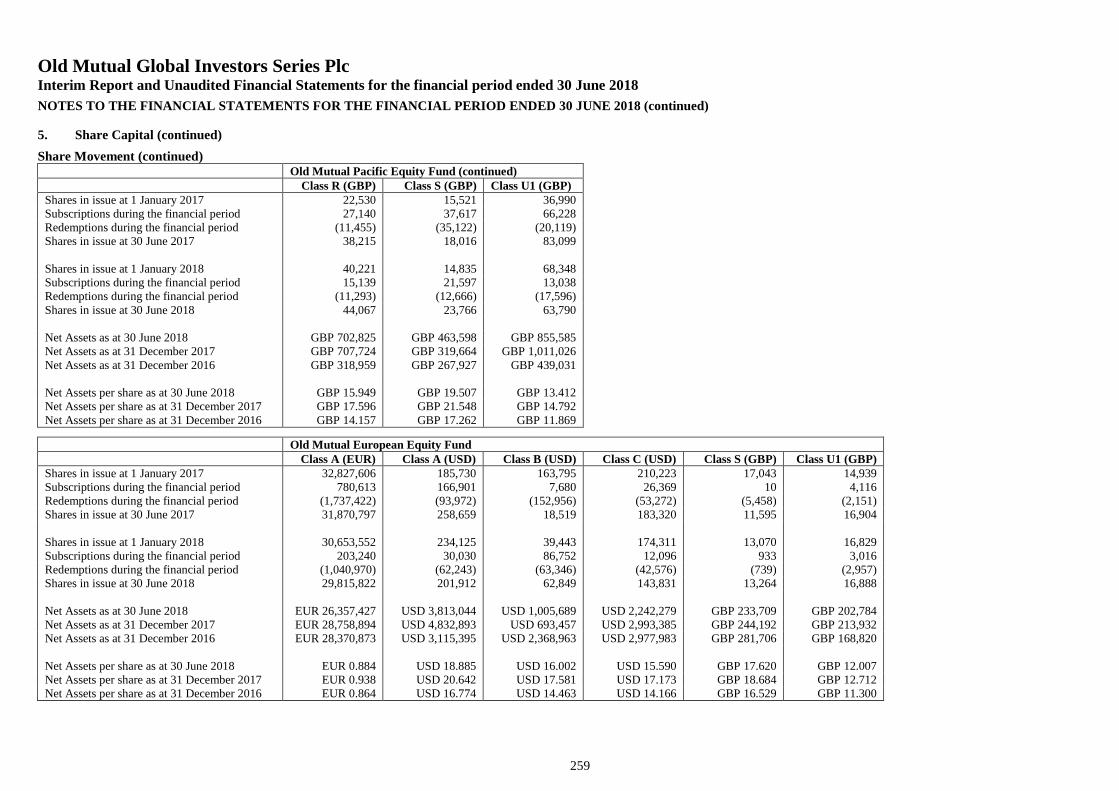
Old Mutual Global Investors Series PlcInterim Report and Unaudited Financial Statements for the financial period ended 30 June 2018
NOTES TO THE FINANCIAL STATEMENTS FOR THE FINANCIAL PERIOD ENDED 30 JUNE 2018 (continued)
259
5. Share Capital (continued)
Share Movement (continued)Old Mutual Pacific Equity Fund (continued)
Class R (GBP) Class S (GBP) Class U1 (GBP)Shares in issue at 1 January 2017 22,530 15,521 36,990Subscriptions during the financial period 27,140 37,617 66,228Redemptions during the financial period (11,455) (35,122) (20,119)Shares in issue at 30 June 2017 38,215 18,016 83,099
Shares in issue at 1 January 2018 40,221 14,835 68,348Subscriptions during the financial period 15,139 21,597 13,038Redemptions during the financial period (11,293) (12,666) (17,596)Shares in issue at 30 June 2018 44,067 23,766 63,790
Net Assets as at 30 June 2018 GBP 702,825 GBP 463,598 GBP 855,585Net Assets as at 31 December 2017 GBP 707,724 GBP 319,664 GBP 1,011,026Net Assets as at 31 December 2016 GBP 318,959 GBP 267,927 GBP 439,031
Net Assets per share as at 30 June 2018 GBP 15.949 GBP 19.507 GBP 13.412Net Assets per share as at 31 December 2017 GBP 17.596 GBP 21.548 GBP 14.792Net Assets per share as at 31 December 2016 GBP 14.157 GBP 17.262 GBP 11.869
Old Mutual European Equity FundClass A (EUR) Class A (USD) Class B (USD) Class C (USD) Class S (GBP) Class U1 (GBP)
Shares in issue at 1 January 2017 32,827,606 185,730 163,795 210,223 17,043 14,939Subscriptions during the financial period 780,613 166,901 7,680 26,369 10 4,116Redemptions during the financial period (1,737,422) (93,972) (152,956) (53,272) (5,458) (2,151)Shares in issue at 30 June 2017 31,870,797 258,659 18,519 183,320 11,595 16,904
Shares in issue at 1 January 2018 30,653,552 234,125 39,443 174,311 13,070 16,829Subscriptions during the financial period 203,240 30,030 86,752 12,096 933 3,016Redemptions during the financial period (1,040,970) (62,243) (63,346) (42,576) (739) (2,957)Shares in issue at 30 June 2018 29,815,822 201,912 62,849 143,831 13,264 16,888
Net Assets as at 30 June 2018 EUR 26,357,427 USD 3,813,044 USD 1,005,689 USD 2,242,279 GBP 233,709 GBP 202,784Net Assets as at 31 December 2017 EUR 28,758,894 USD 4,832,893 USD 693,457 USD 2,993,385 GBP 244,192 GBP 213,932Net Assets as at 31 December 2016 EUR 28,370,873 USD 3,115,395 USD 2,368,963 USD 2,977,983 GBP 281,706 GBP 168,820
Net Assets per share as at 30 June 2018 EUR 0.884 USD 18.885 USD 16.002 USD 15.590 GBP 17.620 GBP 12.007Net Assets per share as at 31 December 2017 EUR 0.938 USD 20.642 USD 17.581 USD 17.173 GBP 18.684 GBP 12.712Net Assets per share as at 31 December 2016 EUR 0.864 USD 16.774 USD 14.463 USD 14.166 GBP 16.529 GBP 11.300
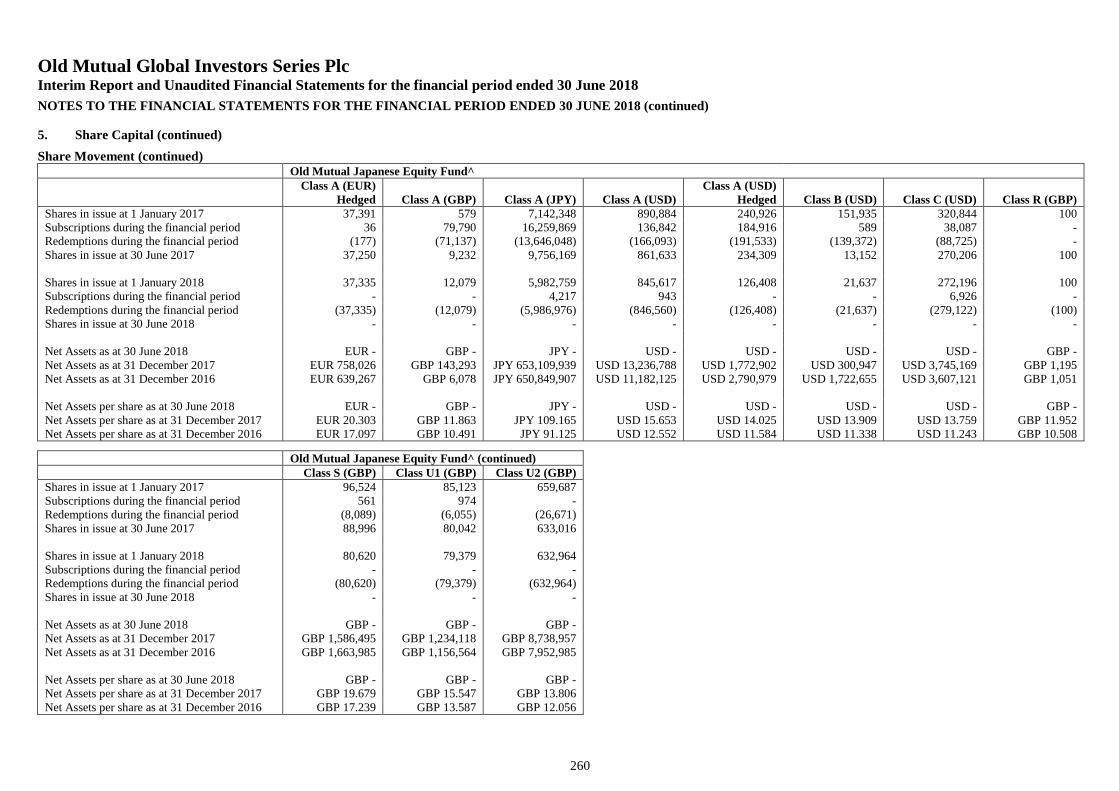
Old Mutual Global Investors Series PlcInterim Report and Unaudited Financial Statements for the financial period ended 30 June 2018
NOTES TO THE FINANCIAL STATEMENTS FOR THE FINANCIAL PERIOD ENDED 30 JUNE 2018 (continued)
260
5. Share Capital (continued)
Share Movement (continued)Old Mutual Japanese Equity Fund^
Class A (EUR)Hedged Class A (GBP) Class A (JPY) Class A (USD)
Class A (USD)Hedged Class B (USD) Class C (USD) Class R (GBP)
Shares in issue at 1 January 2017 37,391 579 7,142,348 890,884 240,926 151,935 320,844 100Subscriptions during the financial period 36 79,790 16,259,869 136,842 184,916 589 38,087 -Redemptions during the financial period (177) (71,137) (13,646,048) (166,093) (191,533) (139,372) (88,725) -Shares in issue at 30 June 2017 37,250 9,232 9,756,169 861,633 234,309 13,152 270,206 100
Shares in issue at 1 January 2018 37,335 12,079 5,982,759 845,617 126,408 21,637 272,196 100Subscriptions during the financial period - - 4,217 943 - - 6,926 -Redemptions during the financial period (37,335) (12,079) (5,986,976) (846,560) (126,408) (21,637) (279,122) (100)Shares in issue at 30 June 2018 - - - - - - - -
Net Assets as at 30 June 2018 EUR - GBP - JPY - USD - USD - USD - USD - GBP -Net Assets as at 31 December 2017 EUR 758,026 GBP 143,293 JPY 653,109,939 USD 13,236,788 USD 1,772,902 USD 300,947 USD 3,745,169 GBP 1,195Net Assets as at 31 December 2016 EUR 639,267 GBP 6,078 JPY 650,849,907 USD 11,182,125 USD 2,790,979 USD 1,722,655 USD 3,607,121 GBP 1,051
Net Assets per share as at 30 June 2018 EUR - GBP - JPY - USD - USD - USD - USD - GBP -Net Assets per share as at 31 December 2017 EUR 20.303 GBP 11.863 JPY 109.165 USD 15.653 USD 14.025 USD 13.909 USD 13.759 GBP 11.952Net Assets per share as at 31 December 2016 EUR 17.097 GBP 10.491 JPY 91.125 USD 12.552 USD 11.584 USD 11.338 USD 11.243 GBP 10.508
Old Mutual Japanese Equity Fund^ (continued)Class S (GBP) Class U1 (GBP) Class U2 (GBP)
Shares in issue at 1 January 2017 96,524 85,123 659,687Subscriptions during the financial period 561 974 -Redemptions during the financial period (8,089) (6,055) (26,671)Shares in issue at 30 June 2017 88,996 80,042 633,016
Shares in issue at 1 January 2018 80,620 79,379 632,964Subscriptions during the financial period - - -Redemptions during the financial period (80,620) (79,379) (632,964)Shares in issue at 30 June 2018 - - -
Net Assets as at 30 June 2018 GBP - GBP - GBP -Net Assets as at 31 December 2017 GBP 1,586,495 GBP 1,234,118 GBP 8,738,957Net Assets as at 31 December 2016 GBP 1,663,985 GBP 1,156,564 GBP 7,952,985
Net Assets per share as at 30 June 2018 GBP - GBP - GBP -Net Assets per share as at 31 December 2017 GBP 19.679 GBP 15.547 GBP 13.806Net Assets per share as at 31 December 2016 GBP 17.239 GBP 13.587 GBP 12.056
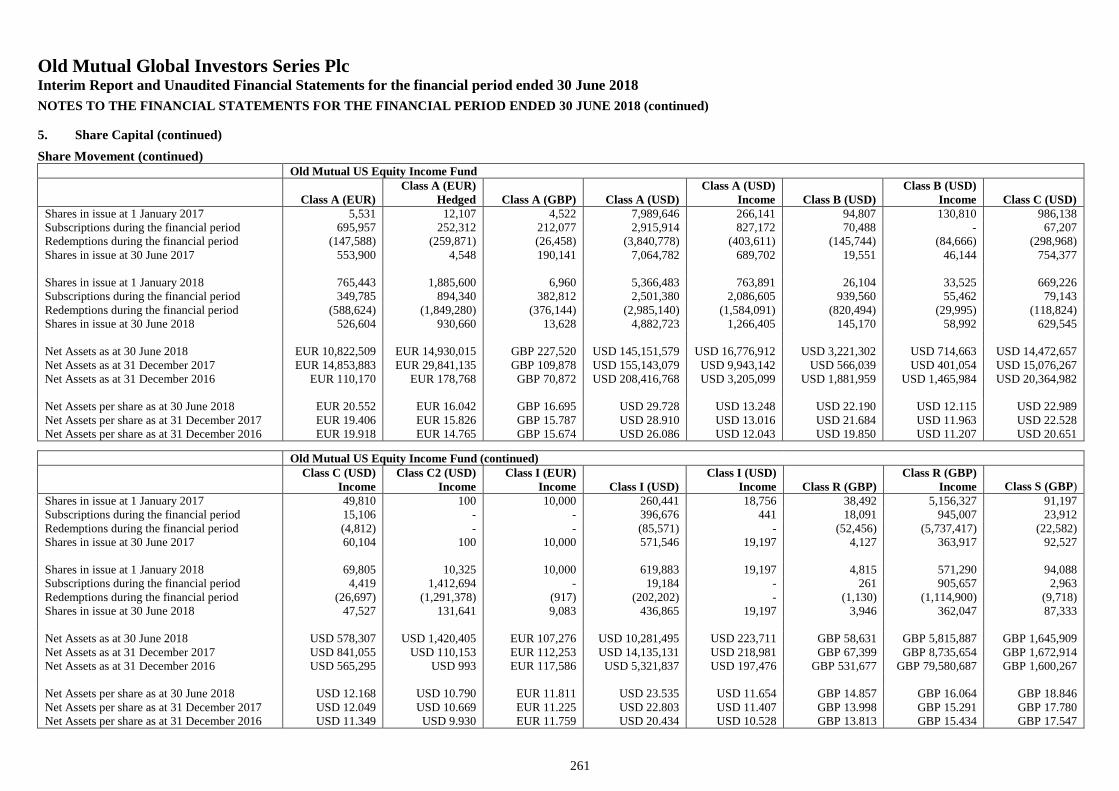
Old Mutual Global Investors Series PlcInterim Report and Unaudited Financial Statements for the financial period ended 30 June 2018
NOTES TO THE FINANCIAL STATEMENTS FOR THE FINANCIAL PERIOD ENDED 30 JUNE 2018 (continued)
261
5. Share Capital (continued)
Share Movement (continued)Old Mutual US Equity Income Fund
Class A (EUR)Class A (EUR)
Hedged Class A (GBP) Class A (USD)Class A (USD)
Income Class B (USD)Class B (USD)
Income Class C (USD)Shares in issue at 1 January 2017 5,531 12,107 4,522 7,989,646 266,141 94,807 130,810 986,138Subscriptions during the financial period 695,957 252,312 212,077 2,915,914 827,172 70,488 - 67,207Redemptions during the financial period (147,588) (259,871) (26,458) (3,840,778) (403,611) (145,744) (84,666) (298,968)Shares in issue at 30 June 2017 553,900 4,548 190,141 7,064,782 689,702 19,551 46,144 754,377
Shares in issue at 1 January 2018 765,443 1,885,600 6,960 5,366,483 763,891 26,104 33,525 669,226Subscriptions during the financial period 349,785 894,340 382,812 2,501,380 2,086,605 939,560 55,462 79,143Redemptions during the financial period (588,624) (1,849,280) (376,144) (2,985,140) (1,584,091) (820,494) (29,995) (118,824)Shares in issue at 30 June 2018 526,604 930,660 13,628 4,882,723 1,266,405 145,170 58,992 629,545
Net Assets as at 30 June 2018 EUR 10,822,509 EUR 14,930,015 GBP 227,520 USD 145,151,579 USD 16,776,912 USD 3,221,302 USD 714,663 USD 14,472,657Net Assets as at 31 December 2017 EUR 14,853,883 EUR 29,841,135 GBP 109,878 USD 155,143,079 USD 9,943,142 USD 566,039 USD 401,054 USD 15,076,267Net Assets as at 31 December 2016 EUR 110,170 EUR 178,768 GBP 70,872 USD 208,416,768 USD 3,205,099 USD 1,881,959 USD 1,465,984 USD 20,364,982
Net Assets per share as at 30 June 2018 EUR 20.552 EUR 16.042 GBP 16.695 USD 29.728 USD 13.248 USD 22.190 USD 12.115 USD 22.989Net Assets per share as at 31 December 2017 EUR 19.406 EUR 15.826 GBP 15.787 USD 28.910 USD 13.016 USD 21.684 USD 11.963 USD 22.528Net Assets per share as at 31 December 2016 EUR 19.918 EUR 14.765 GBP 15.674 USD 26.086 USD 12.043 USD 19.850 USD 11.207 USD 20.651
Old Mutual US Equity Income Fund (continued)Class C (USD)
IncomeClass C2 (USD)
IncomeClass I (EUR)
Income Class I (USD)Class I (USD)
Income Class R (GBP)Class R (GBP)
Income Class S (GBP)Shares in issue at 1 January 2017 49,810 100 10,000 260,441 18,756 38,492 5,156,327 91,197Subscriptions during the financial period 15,106 - - 396,676 441 18,091 945,007 23,912Redemptions during the financial period (4,812) - - (85,571) - (52,456) (5,737,417) (22,582)Shares in issue at 30 June 2017 60,104 100 10,000 571,546 19,197 4,127 363,917 92,527
Shares in issue at 1 January 2018 69,805 10,325 10,000 619,883 19,197 4,815 571,290 94,088Subscriptions during the financial period 4,419 1,412,694 - 19,184 - 261 905,657 2,963Redemptions during the financial period (26,697) (1,291,378) (917) (202,202) - (1,130) (1,114,900) (9,718)Shares in issue at 30 June 2018 47,527 131,641 9,083 436,865 19,197 3,946 362,047 87,333
Net Assets as at 30 June 2018 USD 578,307 USD 1,420,405 EUR 107,276 USD 10,281,495 USD 223,711 GBP 58,631 GBP 5,815,887 GBP 1,645,909Net Assets as at 31 December 2017 USD 841,055 USD 110,153 EUR 112,253 USD 14,135,131 USD 218,981 GBP 67,399 GBP 8,735,654 GBP 1,672,914Net Assets as at 31 December 2016 USD 565,295 USD 993 EUR 117,586 USD 5,321,837 USD 197,476 GBP 531,677 GBP 79,580,687 GBP 1,600,267
Net Assets per share as at 30 June 2018 USD 12.168 USD 10.790 EUR 11.811 USD 23.535 USD 11.654 GBP 14.857 GBP 16.064 GBP 18.846Net Assets per share as at 31 December 2017 USD 12.049 USD 10.669 EUR 11.225 USD 22.803 USD 11.407 GBP 13.998 GBP 15.291 GBP 17.780Net Assets per share as at 31 December 2016 USD 11.349 USD 9.930 EUR 11.759 USD 20.434 USD 10.528 GBP 13.813 GBP 15.434 GBP 17.547
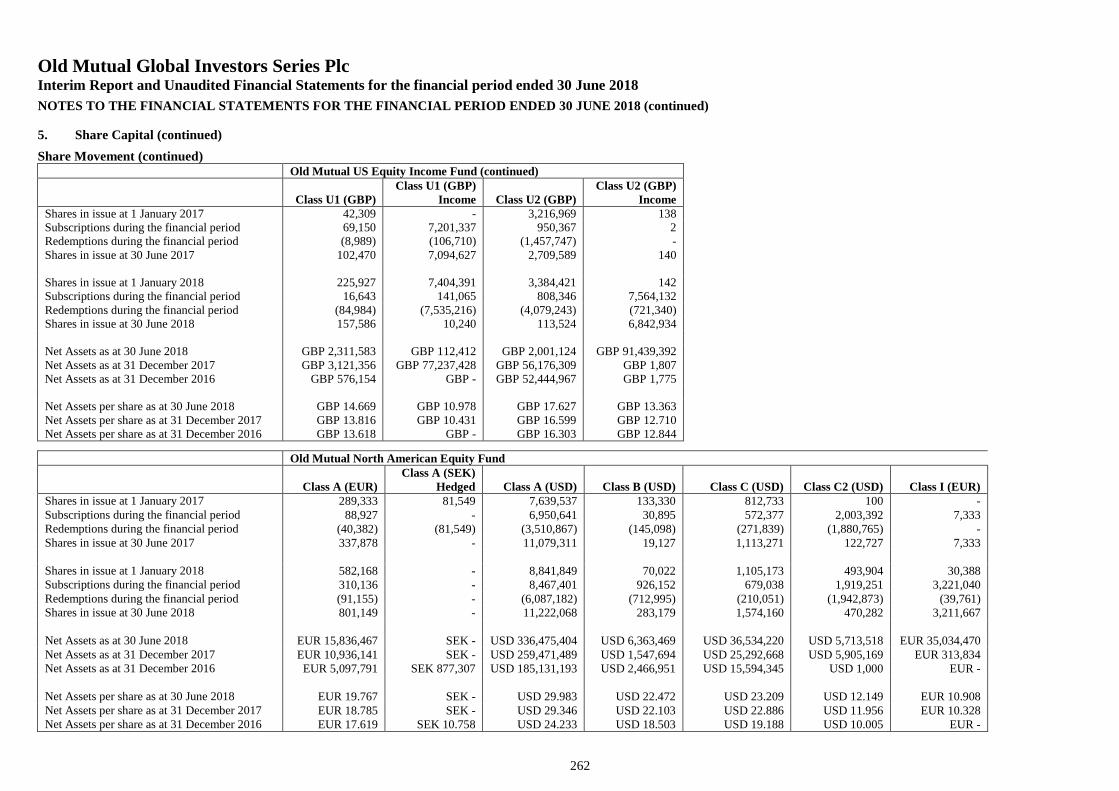
Old Mutual Global Investors Series PlcInterim Report and Unaudited Financial Statements for the financial period ended 30 June 2018
NOTES TO THE FINANCIAL STATEMENTS FOR THE FINANCIAL PERIOD ENDED 30 JUNE 2018 (continued)
262
5. Share Capital (continued)
Share Movement (continued)Old Mutual US Equity Income Fund (continued)
Class U1 (GBP)Class U1 (GBP)
Income Class U2 (GBP)Class U2 (GBP)
IncomeShares in issue at 1 January 2017 42,309 - 3,216,969 138Subscriptions during the financial period 69,150 7,201,337 950,367 2Redemptions during the financial period (8,989) (106,710) (1,457,747) -Shares in issue at 30 June 2017 102,470 7,094,627 2,709,589 140
Shares in issue at 1 January 2018 225,927 7,404,391 3,384,421 142Subscriptions during the financial period 16,643 141,065 808,346 7,564,132Redemptions during the financial period (84,984) (7,535,216) (4,079,243) (721,340)Shares in issue at 30 June 2018 157,586 10,240 113,524 6,842,934
Net Assets as at 30 June 2018 GBP 2,311,583 GBP 112,412 GBP 2,001,124 GBP 91,439,392Net Assets as at 31 December 2017 GBP 3,121,356 GBP 77,237,428 GBP 56,176,309 GBP 1,807Net Assets as at 31 December 2016 GBP 576,154 GBP - GBP 52,444,967 GBP 1,775
Net Assets per share as at 30 June 2018 GBP 14.669 GBP 10.978 GBP 17.627 GBP 13.363Net Assets per share as at 31 December 2017 GBP 13.816 GBP 10.431 GBP 16.599 GBP 12.710Net Assets per share as at 31 December 2016 GBP 13.618 GBP - GBP 16.303 GBP 12.844
Old Mutual North American Equity Fund
Class A (EUR)Class A (SEK)
Hedged Class A (USD) Class B (USD) Class C (USD) Class C2 (USD) Class I (EUR)Shares in issue at 1 January 2017 289,333 81,549 7,639,537 133,330 812,733 100 -Subscriptions during the financial period 88,927 - 6,950,641 30,895 572,377 2,003,392 7,333Redemptions during the financial period (40,382) (81,549) (3,510,867) (145,098) (271,839) (1,880,765) -Shares in issue at 30 June 2017 337,878 - 11,079,311 19,127 1,113,271 122,727 7,333
Shares in issue at 1 January 2018 582,168 - 8,841,849 70,022 1,105,173 493,904 30,388Subscriptions during the financial period 310,136 - 8,467,401 926,152 679,038 1,919,251 3,221,040Redemptions during the financial period (91,155) - (6,087,182) (712,995) (210,051) (1,942,873) (39,761)Shares in issue at 30 June 2018 801,149 - 11,222,068 283,179 1,574,160 470,282 3,211,667
Net Assets as at 30 June 2018 EUR 15,836,467 SEK - USD 336,475,404 USD 6,363,469 USD 36,534,220 USD 5,713,518 EUR 35,034,470Net Assets as at 31 December 2017 EUR 10,936,141 SEK - USD 259,471,489 USD 1,547,694 USD 25,292,668 USD 5,905,169 EUR 313,834Net Assets as at 31 December 2016 EUR 5,097,791 SEK 877,307 USD 185,131,193 USD 2,466,951 USD 15,594,345 USD 1,000 EUR -
Net Assets per share as at 30 June 2018 EUR 19.767 SEK - USD 29.983 USD 22.472 USD 23.209 USD 12.149 EUR 10.908Net Assets per share as at 31 December 2017 EUR 18.785 SEK - USD 29.346 USD 22.103 USD 22.886 USD 11.956 EUR 10.328Net Assets per share as at 31 December 2016 EUR 17.619 SEK 10.758 USD 24.233 USD 18.503 USD 19.188 USD 10.005 EUR -
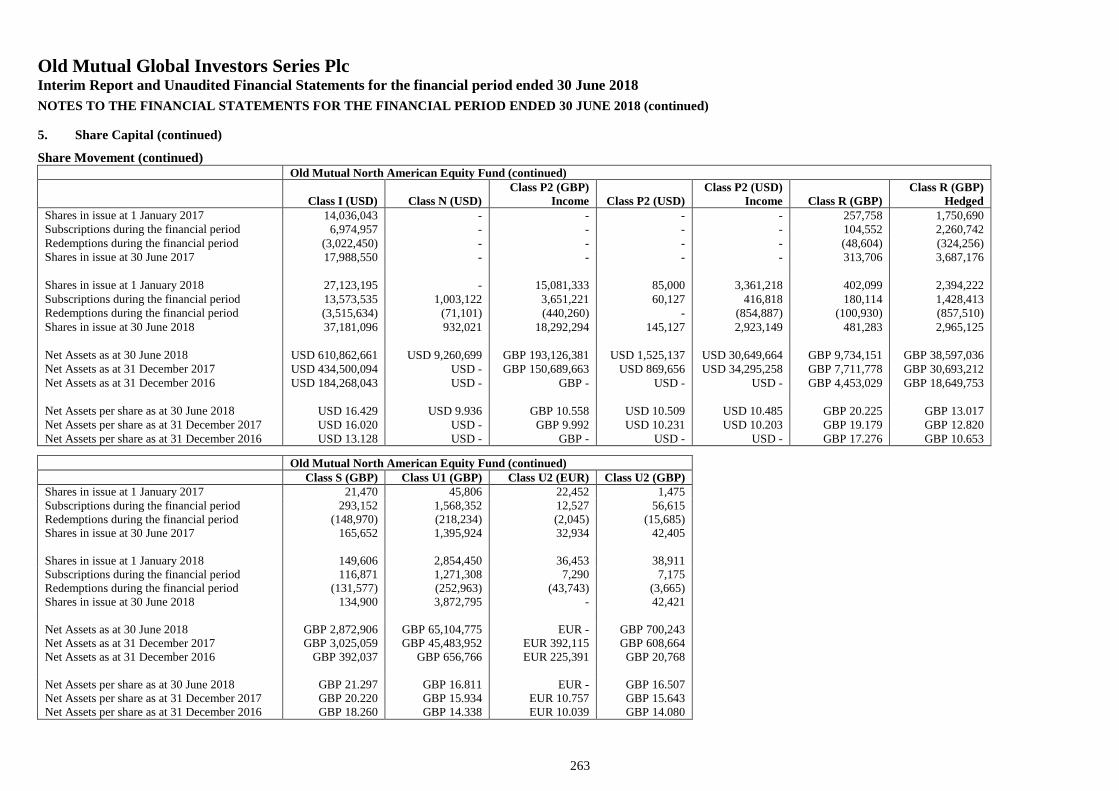
Old Mutual Global Investors Series PlcInterim Report and Unaudited Financial Statements for the financial period ended 30 June 2018
NOTES TO THE FINANCIAL STATEMENTS FOR THE FINANCIAL PERIOD ENDED 30 JUNE 2018 (continued)
263
5. Share Capital (continued)
Share Movement (continued)Old Mutual North American Equity Fund (continued)
Class I (USD) Class N (USD)Class P2 (GBP)
Income Class P2 (USD)Class P2 (USD)
Income Class R (GBP)Class R (GBP)
HedgedShares in issue at 1 January 2017 14,036,043 - - - - 257,758 1,750,690Subscriptions during the financial period 6,974,957 - - - - 104,552 2,260,742Redemptions during the financial period (3,022,450) - - - - (48,604) (324,256)Shares in issue at 30 June 2017 17,988,550 - - - - 313,706 3,687,176
Shares in issue at 1 January 2018 27,123,195 - 15,081,333 85,000 3,361,218 402,099 2,394,222Subscriptions during the financial period 13,573,535 1,003,122 3,651,221 60,127 416,818 180,114 1,428,413Redemptions during the financial period (3,515,634) (71,101) (440,260) - (854,887) (100,930) (857,510)Shares in issue at 30 June 2018 37,181,096 932,021 18,292,294 145,127 2,923,149 481,283 2,965,125
Net Assets as at 30 June 2018 USD 610,862,661 USD 9,260,699 GBP 193,126,381 USD 1,525,137 USD 30,649,664 GBP 9,734,151 GBP 38,597,036Net Assets as at 31 December 2017 USD 434,500,094 USD - GBP 150,689,663 USD 869,656 USD 34,295,258 GBP 7,711,778 GBP 30,693,212Net Assets as at 31 December 2016 USD 184,268,043 USD - GBP - USD - USD - GBP 4,453,029 GBP 18,649,753
Net Assets per share as at 30 June 2018 USD 16.429 USD 9.936 GBP 10.558 USD 10.509 USD 10.485 GBP 20.225 GBP 13.017Net Assets per share as at 31 December 2017 USD 16.020 USD - GBP 9.992 USD 10.231 USD 10.203 GBP 19.179 GBP 12.820Net Assets per share as at 31 December 2016 USD 13.128 USD - GBP - USD - USD - GBP 17.276 GBP 10.653
Old Mutual North American Equity Fund (continued)Class S (GBP) Class U1 (GBP) Class U2 (EUR) Class U2 (GBP)
Shares in issue at 1 January 2017 21,470 45,806 22,452 1,475Subscriptions during the financial period 293,152 1,568,352 12,527 56,615Redemptions during the financial period (148,970) (218,234) (2,045) (15,685)Shares in issue at 30 June 2017 165,652 1,395,924 32,934 42,405
Shares in issue at 1 January 2018 149,606 2,854,450 36,453 38,911Subscriptions during the financial period 116,871 1,271,308 7,290 7,175Redemptions during the financial period (131,577) (252,963) (43,743) (3,665)Shares in issue at 30 June 2018 134,900 3,872,795 - 42,421
Net Assets as at 30 June 2018 GBP 2,872,906 GBP 65,104,775 EUR - GBP 700,243Net Assets as at 31 December 2017 GBP 3,025,059 GBP 45,483,952 EUR 392,115 GBP 608,664Net Assets as at 31 December 2016 GBP 392,037 GBP 656,766 EUR 225,391 GBP 20,768
Net Assets per share as at 30 June 2018 GBP 21.297 GBP 16.811 EUR - GBP 16.507Net Assets per share as at 31 December 2017 GBP 20.220 GBP 15.934 EUR 10.757 GBP 15.643Net Assets per share as at 31 December 2016 GBP 18.260 GBP 14.338 EUR 10.039 GBP 14.080
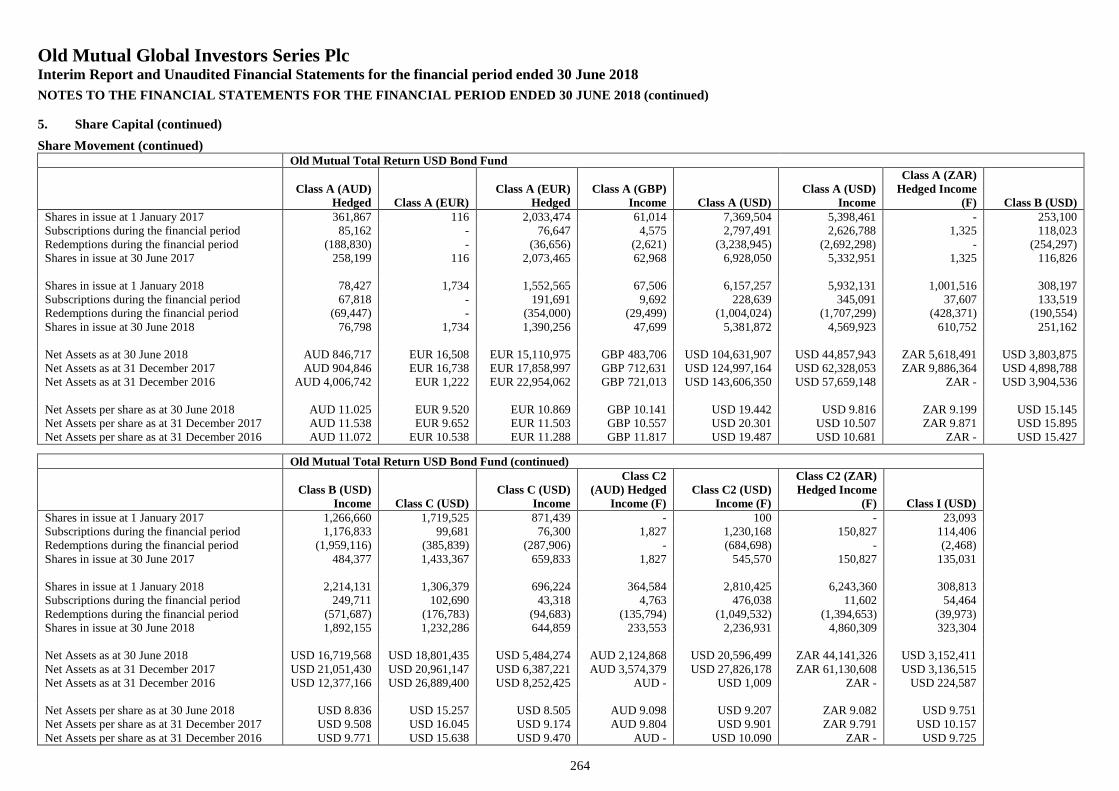
Old Mutual Global Investors Series PlcInterim Report and Unaudited Financial Statements for the financial period ended 30 June 2018
NOTES TO THE FINANCIAL STATEMENTS FOR THE FINANCIAL PERIOD ENDED 30 JUNE 2018 (continued)
264
5. Share Capital (continued)
Share Movement (continued)Old Mutual Total Return USD Bond Fund
Class A (AUD)Hedged Class A (EUR)
Class A (EUR)Hedged
Class A (GBP)Income Class A (USD)
Class A (USD)Income
Class A (ZAR)Hedged Income
(F) Class B (USD)Shares in issue at 1 January 2017 361,867 116 2,033,474 61,014 7,369,504 5,398,461 - 253,100Subscriptions during the financial period 85,162 - 76,647 4,575 2,797,491 2,626,788 1,325 118,023Redemptions during the financial period (188,830) - (36,656) (2,621) (3,238,945) (2,692,298) - (254,297)Shares in issue at 30 June 2017 258,199 116 2,073,465 62,968 6,928,050 5,332,951 1,325 116,826
Shares in issue at 1 January 2018 78,427 1,734 1,552,565 67,506 6,157,257 5,932,131 1,001,516 308,197Subscriptions during the financial period 67,818 - 191,691 9,692 228,639 345,091 37,607 133,519Redemptions during the financial period (69,447) - (354,000) (29,499) (1,004,024) (1,707,299) (428,371) (190,554)Shares in issue at 30 June 2018 76,798 1,734 1,390,256 47,699 5,381,872 4,569,923 610,752 251,162
Net Assets as at 30 June 2018 AUD 846,717 EUR 16,508 EUR 15,110,975 GBP 483,706 USD 104,631,907 USD 44,857,943 ZAR 5,618,491 USD 3,803,875Net Assets as at 31 December 2017 AUD 904,846 EUR 16,738 EUR 17,858,997 GBP 712,631 USD 124,997,164 USD 62,328,053 ZAR 9,886,364 USD 4,898,788Net Assets as at 31 December 2016 AUD 4,006,742 EUR 1,222 EUR 22,954,062 GBP 721,013 USD 143,606,350 USD 57,659,148 ZAR - USD 3,904,536
Net Assets per share as at 30 June 2018 AUD 11.025 EUR 9.520 EUR 10.869 GBP 10.141 USD 19.442 USD 9.816 ZAR 9.199 USD 15.145Net Assets per share as at 31 December 2017 AUD 11.538 EUR 9.652 EUR 11.503 GBP 10.557 USD 20.301 USD 10.507 ZAR 9.871 USD 15.895Net Assets per share as at 31 December 2016 AUD 11.072 EUR 10.538 EUR 11.288 GBP 11.817 USD 19.487 USD 10.681 ZAR - USD 15.427
Old Mutual Total Return USD Bond Fund (continued)
Class B (USD)Income Class C (USD)
Class C (USD)Income
Class C2(AUD) Hedged
Income (F)Class C2 (USD)
Income (F)
Class C2 (ZAR)Hedged Income
(F) Class I (USD)Shares in issue at 1 January 2017 1,266,660 1,719,525 871,439 - 100 - 23,093Subscriptions during the financial period 1,176,833 99,681 76,300 1,827 1,230,168 150,827 114,406Redemptions during the financial period (1,959,116) (385,839) (287,906) - (684,698) - (2,468)Shares in issue at 30 June 2017 484,377 1,433,367 659,833 1,827 545,570 150,827 135,031
Shares in issue at 1 January 2018 2,214,131 1,306,379 696,224 364,584 2,810,425 6,243,360 308,813Subscriptions during the financial period 249,711 102,690 43,318 4,763 476,038 11,602 54,464Redemptions during the financial period (571,687) (176,783) (94,683) (135,794) (1,049,532) (1,394,653) (39,973)Shares in issue at 30 June 2018 1,892,155 1,232,286 644,859 233,553 2,236,931 4,860,309 323,304
Net Assets as at 30 June 2018 USD 16,719,568 USD 18,801,435 USD 5,484,274 AUD 2,124,868 USD 20,596,499 ZAR 44,141,326 USD 3,152,411Net Assets as at 31 December 2017 USD 21,051,430 USD 20,961,147 USD 6,387,221 AUD 3,574,379 USD 27,826,178 ZAR 61,130,608 USD 3,136,515Net Assets as at 31 December 2016 USD 12,377,166 USD 26,889,400 USD 8,252,425 AUD - USD 1,009 ZAR - USD 224,587
Net Assets per share as at 30 June 2018 USD 8.836 USD 15.257 USD 8.505 AUD 9.098 USD 9.207 ZAR 9.082 USD 9.751Net Assets per share as at 31 December 2017 USD 9.508 USD 16.045 USD 9.174 AUD 9.804 USD 9.901 ZAR 9.791 USD 10.157Net Assets per share as at 31 December 2016 USD 9.771 USD 15.638 USD 9.470 AUD - USD 10.090 ZAR - USD 9.725
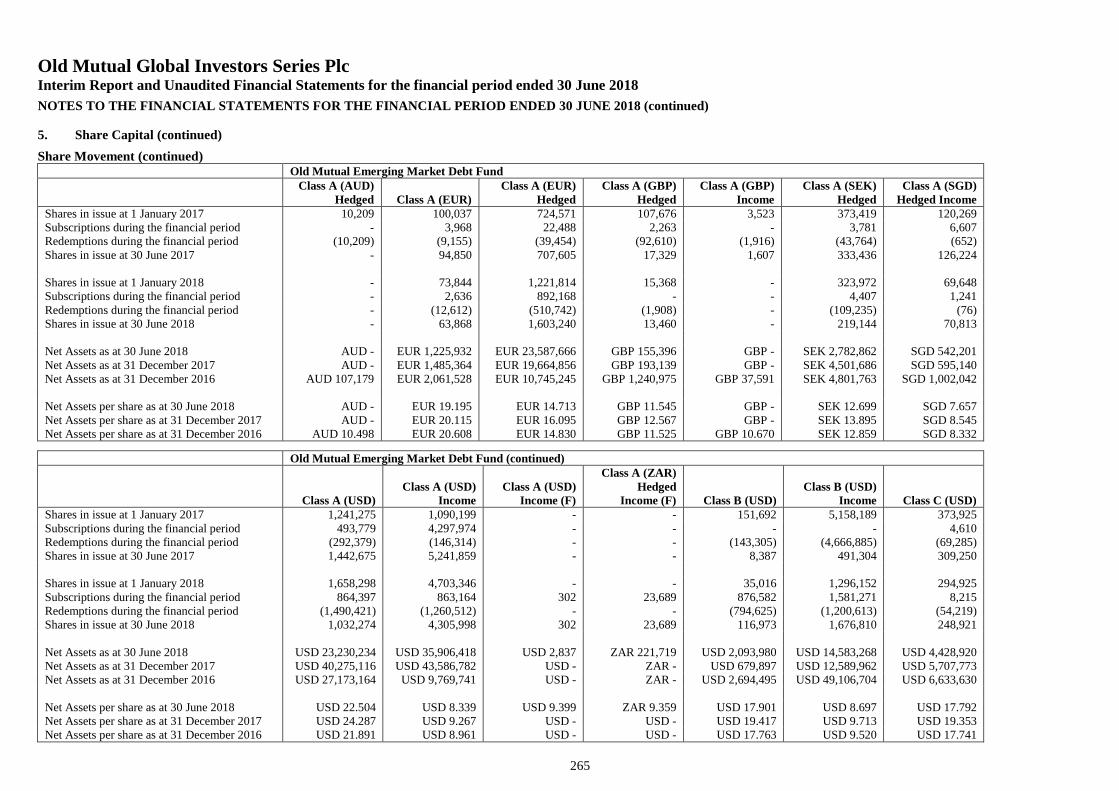
Old Mutual Global Investors Series PlcInterim Report and Unaudited Financial Statements for the financial period ended 30 June 2018
NOTES TO THE FINANCIAL STATEMENTS FOR THE FINANCIAL PERIOD ENDED 30 JUNE 2018 (continued)
265
5. Share Capital (continued)
Share Movement (continued)Old Mutual Emerging Market Debt Fund
Class A (AUD)Hedged Class A (EUR)
Class A (EUR)Hedged
Class A (GBP)Hedged
Class A (GBP)Income
Class A (SEK)Hedged
Class A (SGD)Hedged Income
Shares in issue at 1 January 2017 10,209 100,037 724,571 107,676 3,523 373,419 120,269Subscriptions during the financial period - 3,968 22,488 2,263 - 3,781 6,607Redemptions during the financial period (10,209) (9,155) (39,454) (92,610) (1,916) (43,764) (652)Shares in issue at 30 June 2017 - 94,850 707,605 17,329 1,607 333,436 126,224
Shares in issue at 1 January 2018 - 73,844 1,221,814 15,368 - 323,972 69,648Subscriptions during the financial period - 2,636 892,168 - - 4,407 1,241Redemptions during the financial period - (12,612) (510,742) (1,908) - (109,235) (76)Shares in issue at 30 June 2018 - 63,868 1,603,240 13,460 - 219,144 70,813
Net Assets as at 30 June 2018 AUD - EUR 1,225,932 EUR 23,587,666 GBP 155,396 GBP - SEK 2,782,862 SGD 542,201Net Assets as at 31 December 2017 AUD - EUR 1,485,364 EUR 19,664,856 GBP 193,139 GBP - SEK 4,501,686 SGD 595,140Net Assets as at 31 December 2016 AUD 107,179 EUR 2,061,528 EUR 10,745,245 GBP 1,240,975 GBP 37,591 SEK 4,801,763 SGD 1,002,042
Net Assets per share as at 30 June 2018 AUD - EUR 19.195 EUR 14.713 GBP 11.545 GBP - SEK 12.699 SGD 7.657Net Assets per share as at 31 December 2017 AUD - EUR 20.115 EUR 16.095 GBP 12.567 GBP - SEK 13.895 SGD 8.545Net Assets per share as at 31 December 2016 AUD 10.498 EUR 20.608 EUR 14.830 GBP 11.525 GBP 10.670 SEK 12.859 SGD 8.332
Old Mutual Emerging Market Debt Fund (continued)
Class A (USD)Class A (USD)
IncomeClass A (USD)
Income (F)
Class A (ZAR)Hedged
Income (F) Class B (USD)Class B (USD)
Income Class C (USD)Shares in issue at 1 January 2017 1,241,275 1,090,199 - - 151,692 5,158,189 373,925Subscriptions during the financial period 493,779 4,297,974 - - - - 4,610Redemptions during the financial period (292,379) (146,314) - - (143,305) (4,666,885) (69,285)Shares in issue at 30 June 2017 1,442,675 5,241,859 - - 8,387 491,304 309,250
Shares in issue at 1 January 2018 1,658,298 4,703,346 - - 35,016 1,296,152 294,925Subscriptions during the financial period 864,397 863,164 302 23,689 876,582 1,581,271 8,215Redemptions during the financial period (1,490,421) (1,260,512) - - (794,625) (1,200,613) (54,219)Shares in issue at 30 June 2018 1,032,274 4,305,998 302 23,689 116,973 1,676,810 248,921
Net Assets as at 30 June 2018 USD 23,230,234 USD 35,906,418 USD 2,837 ZAR 221,719 USD 2,093,980 USD 14,583,268 USD 4,428,920Net Assets as at 31 December 2017 USD 40,275,116 USD 43,586,782 USD - ZAR - USD 679,897 USD 12,589,962 USD 5,707,773Net Assets as at 31 December 2016 USD 27,173,164 USD 9,769,741 USD - ZAR - USD 2,694,495 USD 49,106,704 USD 6,633,630
Net Assets per share as at 30 June 2018 USD 22.504 USD 8.339 USD 9.399 ZAR 9.359 USD 17.901 USD 8.697 USD 17.792Net Assets per share as at 31 December 2017 USD 24.287 USD 9.267 USD - USD - USD 19.417 USD 9.713 USD 19.353Net Assets per share as at 31 December 2016 USD 21.891 USD 8.961 USD - USD - USD 17.763 USD 9.520 USD 17.741
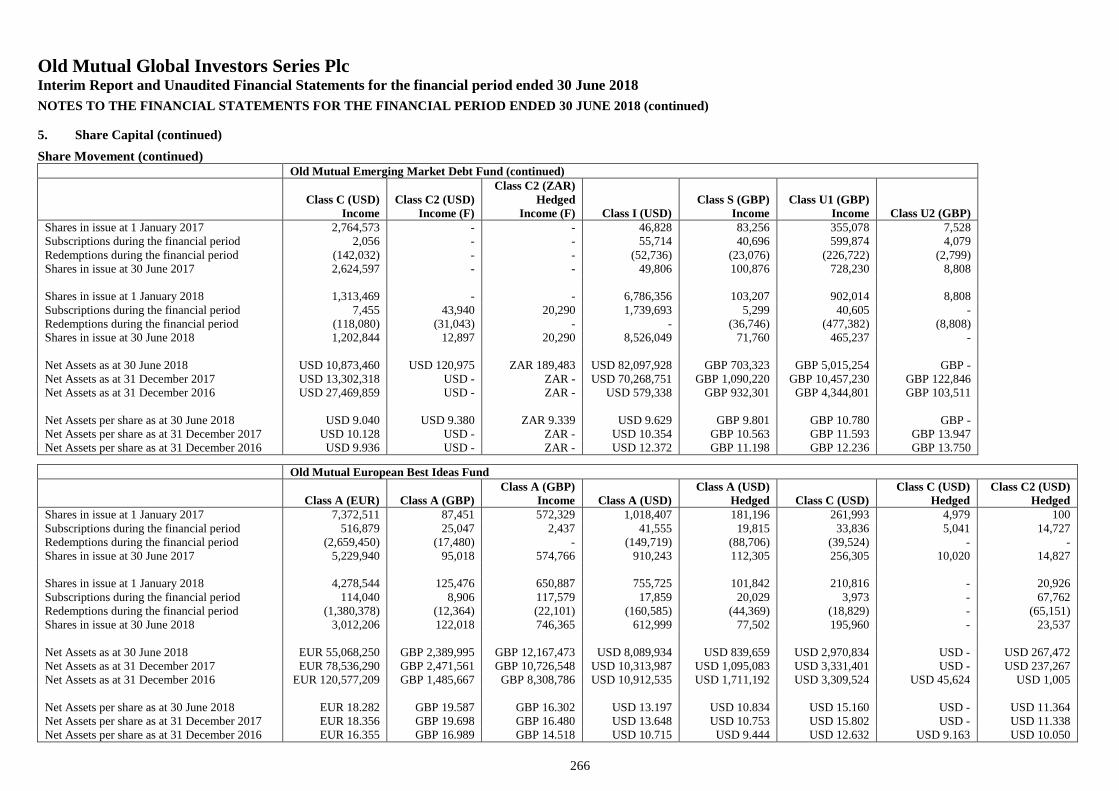
Old Mutual Global Investors Series PlcInterim Report and Unaudited Financial Statements for the financial period ended 30 June 2018
NOTES TO THE FINANCIAL STATEMENTS FOR THE FINANCIAL PERIOD ENDED 30 JUNE 2018 (continued)
266
5. Share Capital (continued)
Share Movement (continued)Old Mutual Emerging Market Debt Fund (continued)
Class C (USD)Income
Class C2 (USD)Income (F)
Class C2 (ZAR)Hedged
Income (F) Class I (USD)Class S (GBP)
IncomeClass U1 (GBP)
Income Class U2 (GBP)Shares in issue at 1 January 2017 2,764,573 - - 46,828 83,256 355,078 7,528Subscriptions during the financial period 2,056 - - 55,714 40,696 599,874 4,079Redemptions during the financial period (142,032) - - (52,736) (23,076) (226,722) (2,799)Shares in issue at 30 June 2017 2,624,597 - - 49,806 100,876 728,230 8,808
Shares in issue at 1 January 2018 1,313,469 - - 6,786,356 103,207 902,014 8,808Subscriptions during the financial period 7,455 43,940 20,290 1,739,693 5,299 40,605 -Redemptions during the financial period (118,080) (31,043) - - (36,746) (477,382) (8,808)Shares in issue at 30 June 2018 1,202,844 12,897 20,290 8,526,049 71,760 465,237 -
Net Assets as at 30 June 2018 USD 10,873,460 USD 120,975 ZAR 189,483 USD 82,097,928 GBP 703,323 GBP 5,015,254 GBP -Net Assets as at 31 December 2017 USD 13,302,318 USD - ZAR - USD 70,268,751 GBP 1,090,220 GBP 10,457,230 GBP 122,846Net Assets as at 31 December 2016 USD 27,469,859 USD - ZAR - USD 579,338 GBP 932,301 GBP 4,344,801 GBP 103,511
Net Assets per share as at 30 June 2018 USD 9.040 USD 9.380 ZAR 9.339 USD 9.629 GBP 9.801 GBP 10.780 GBP -Net Assets per share as at 31 December 2017 USD 10.128 USD - ZAR - USD 10.354 GBP 10.563 GBP 11.593 GBP 13.947Net Assets per share as at 31 December 2016 USD 9.936 USD - ZAR - USD 12.372 GBP 11.198 GBP 12.236 GBP 13.750
Old Mutual European Best Ideas Fund
Class A (EUR) Class A (GBP)Class A (GBP)
Income Class A (USD)Class A (USD)
Hedged Class C (USD)Class C (USD)
HedgedClass C2 (USD)
HedgedShares in issue at 1 January 2017 7,372,511 87,451 572,329 1,018,407 181,196 261,993 4,979 100Subscriptions during the financial period 516,879 25,047 2,437 41,555 19,815 33,836 5,041 14,727Redemptions during the financial period (2,659,450) (17,480) - (149,719) (88,706) (39,524) - -Shares in issue at 30 June 2017 5,229,940 95,018 574,766 910,243 112,305 256,305 10,020 14,827
Shares in issue at 1 January 2018 4,278,544 125,476 650,887 755,725 101,842 210,816 - 20,926Subscriptions during the financial period 114,040 8,906 117,579 17,859 20,029 3,973 - 67,762Redemptions during the financial period (1,380,378) (12,364) (22,101) (160,585) (44,369) (18,829) - (65,151)Shares in issue at 30 June 2018 3,012,206 122,018 746,365 612,999 77,502 195,960 - 23,537
Net Assets as at 30 June 2018 EUR 55,068,250 GBP 2,389,995 GBP 12,167,473 USD 8,089,934 USD 839,659 USD 2,970,834 USD - USD 267,472Net Assets as at 31 December 2017 EUR 78,536,290 GBP 2,471,561 GBP 10,726,548 USD 10,313,987 USD 1,095,083 USD 3,331,401 USD - USD 237,267Net Assets as at 31 December 2016 EUR 120,577,209 GBP 1,485,667 GBP 8,308,786 USD 10,912,535 USD 1,711,192 USD 3,309,524 USD 45,624 USD 1,005
Net Assets per share as at 30 June 2018 EUR 18.282 GBP 19.587 GBP 16.302 USD 13.197 USD 10.834 USD 15.160 USD - USD 11.364Net Assets per share as at 31 December 2017 EUR 18.356 GBP 19.698 GBP 16.480 USD 13.648 USD 10.753 USD 15.802 USD - USD 11.338Net Assets per share as at 31 December 2016 EUR 16.355 GBP 16.989 GBP 14.518 USD 10.715 USD 9.444 USD 12.632 USD 9.163 USD 10.050
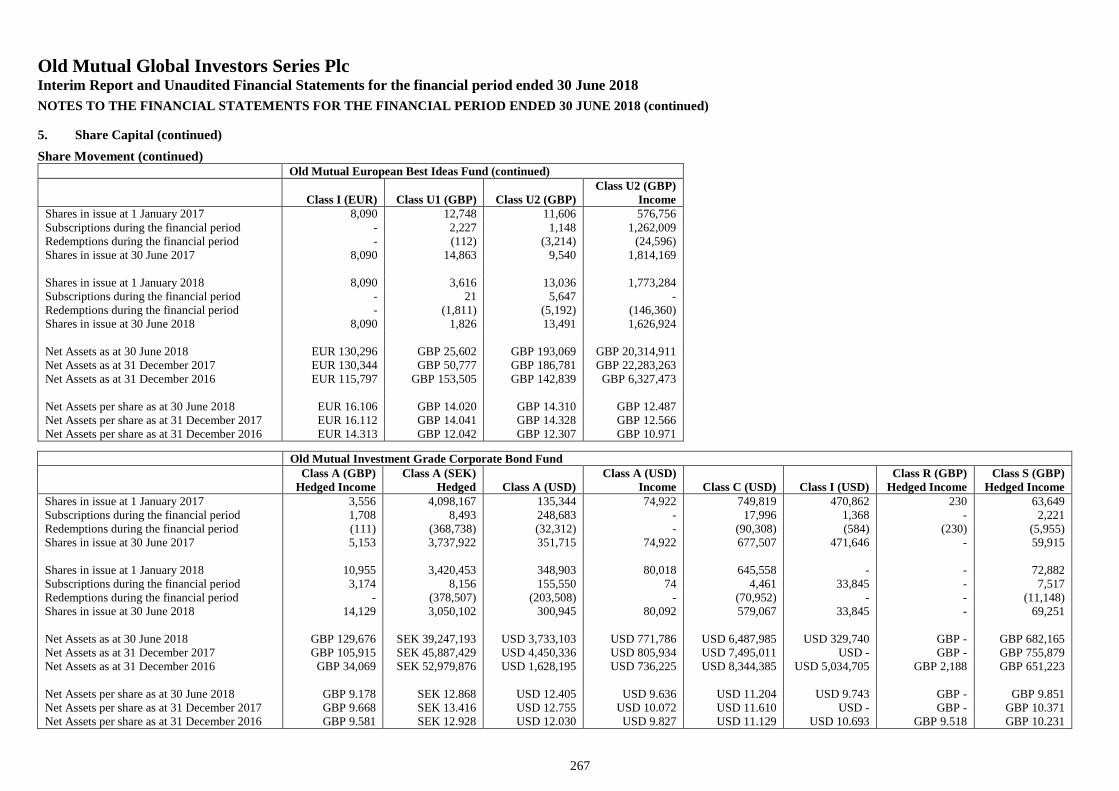
Old Mutual Global Investors Series PlcInterim Report and Unaudited Financial Statements for the financial period ended 30 June 2018
NOTES TO THE FINANCIAL STATEMENTS FOR THE FINANCIAL PERIOD ENDED 30 JUNE 2018 (continued)
267
5. Share Capital (continued)
Share Movement (continued)
Old Mutual Investment Grade Corporate Bond FundClass A (GBP)
Hedged IncomeClass A (SEK)
Hedged Class A (USD)Class A (USD)
Income Class C (USD) Class I (USD)Class R (GBP)
Hedged IncomeClass S (GBP)
Hedged IncomeShares in issue at 1 January 2017 3,556 4,098,167 135,344 74,922 749,819 470,862 230 63,649Subscriptions during the financial period 1,708 8,493 248,683 - 17,996 1,368 - 2,221Redemptions during the financial period (111) (368,738) (32,312) - (90,308) (584) (230) (5,955)Shares in issue at 30 June 2017 5,153 3,737,922 351,715 74,922 677,507 471,646 - 59,915
Shares in issue at 1 January 2018 10,955 3,420,453 348,903 80,018 645,558 - - 72,882Subscriptions during the financial period 3,174 8,156 155,550 74 4,461 33,845 - 7,517Redemptions during the financial period - (378,507) (203,508) - (70,952) - - (11,148)Shares in issue at 30 June 2018 14,129 3,050,102 300,945 80,092 579,067 33,845 - 69,251
Net Assets as at 30 June 2018 GBP 129,676 SEK 39,247,193 USD 3,733,103 USD 771,786 USD 6,487,985 USD 329,740 GBP - GBP 682,165Net Assets as at 31 December 2017 GBP 105,915 SEK 45,887,429 USD 4,450,336 USD 805,934 USD 7,495,011 USD - GBP - GBP 755,879Net Assets as at 31 December 2016 GBP 34,069 SEK 52,979,876 USD 1,628,195 USD 736,225 USD 8,344,385 USD 5,034,705 GBP 2,188 GBP 651,223
Net Assets per share as at 30 June 2018 GBP 9.178 SEK 12.868 USD 12.405 USD 9.636 USD 11.204 USD 9.743 GBP - GBP 9.851Net Assets per share as at 31 December 2017 GBP 9.668 SEK 13.416 USD 12.755 USD 10.072 USD 11.610 USD - GBP - GBP 10.371Net Assets per share as at 31 December 2016 GBP 9.581 SEK 12.928 USD 12.030 USD 9.827 USD 11.129 USD 10.693 GBP 9.518 GBP 10.231
Old Mutual European Best Ideas Fund (continued)
Class I (EUR) Class U1 (GBP) Class U2 (GBP)Class U2 (GBP)
IncomeShares in issue at 1 January 2017 8,090 12,748 11,606 576,756Subscriptions during the financial period - 2,227 1,148 1,262,009Redemptions during the financial period - (112) (3,214) (24,596)Shares in issue at 30 June 2017 8,090 14,863 9,540 1,814,169
Shares in issue at 1 January 2018 8,090 3,616 13,036 1,773,284Subscriptions during the financial period - 21 5,647 -Redemptions during the financial period - (1,811) (5,192) (146,360)Shares in issue at 30 June 2018 8,090 1,826 13,491 1,626,924
Net Assets as at 30 June 2018 EUR 130,296 GBP 25,602 GBP 193,069 GBP 20,314,911Net Assets as at 31 December 2017 EUR 130,344 GBP 50,777 GBP 186,781 GBP 22,283,263Net Assets as at 31 December 2016 EUR 115,797 GBP 153,505 GBP 142,839 GBP 6,327,473
Net Assets per share as at 30 June 2018 EUR 16.106 GBP 14.020 GBP 14.310 GBP 12.487Net Assets per share as at 31 December 2017 EUR 16.112 GBP 14.041 GBP 14.328 GBP 12.566Net Assets per share as at 31 December 2016 EUR 14.313 GBP 12.042 GBP 12.307 GBP 10.971
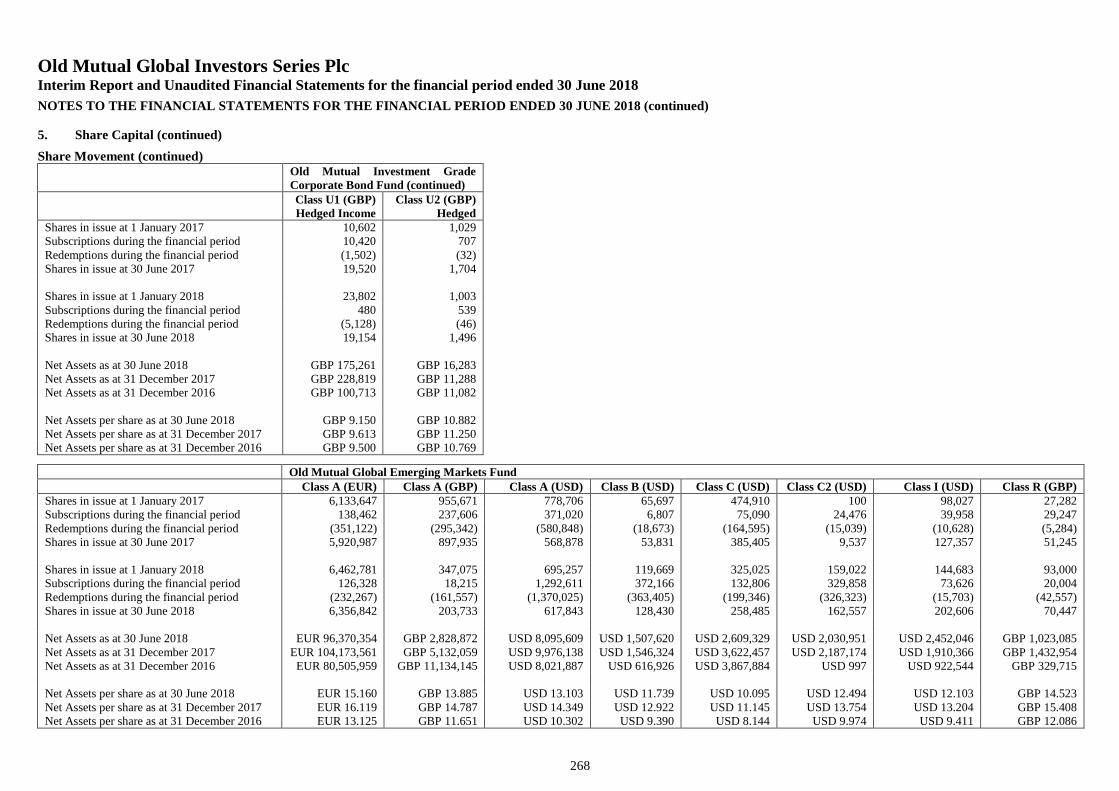
Old Mutual Global Investors Series PlcInterim Report and Unaudited Financial Statements for the financial period ended 30 June 2018
NOTES TO THE FINANCIAL STATEMENTS FOR THE FINANCIAL PERIOD ENDED 30 JUNE 2018 (continued)
268
5. Share Capital (continued)
Share Movement (continued)Old Mutual Investment GradeCorporate Bond Fund (continued)Class U1 (GBP)Hedged Income
Class U2 (GBP)Hedged
Shares in issue at 1 January 2017 10,602 1,029Subscriptions during the financial period 10,420 707Redemptions during the financial period (1,502) (32)Shares in issue at 30 June 2017 19,520 1,704
Shares in issue at 1 January 2018 23,802 1,003Subscriptions during the financial period 480 539Redemptions during the financial period (5,128) (46)Shares in issue at 30 June 2018 19,154 1,496
Net Assets as at 30 June 2018 GBP 175,261 GBP 16,283Net Assets as at 31 December 2017 GBP 228,819 GBP 11,288Net Assets as at 31 December 2016 GBP 100,713 GBP 11,082
Net Assets per share as at 30 June 2018 GBP 9.150 GBP 10.882Net Assets per share as at 31 December 2017 GBP 9.613 GBP 11.250Net Assets per share as at 31 December 2016 GBP 9.500 GBP 10.769
Old Mutual Global Emerging Markets FundClass A (EUR) Class A (GBP) Class A (USD) Class B (USD) Class C (USD) Class C2 (USD) Class I (USD) Class R (GBP)
Shares in issue at 1 January 2017 6,133,647 955,671 778,706 65,697 474,910 100 98,027 27,282Subscriptions during the financial period 138,462 237,606 371,020 6,807 75,090 24,476 39,958 29,247Redemptions during the financial period (351,122) (295,342) (580,848) (18,673) (164,595) (15,039) (10,628) (5,284)Shares in issue at 30 June 2017 5,920,987 897,935 568,878 53,831 385,405 9,537 127,357 51,245
Shares in issue at 1 January 2018 6,462,781 347,075 695,257 119,669 325,025 159,022 144,683 93,000Subscriptions during the financial period 126,328 18,215 1,292,611 372,166 132,806 329,858 73,626 20,004Redemptions during the financial period (232,267) (161,557) (1,370,025) (363,405) (199,346) (326,323) (15,703) (42,557)Shares in issue at 30 June 2018 6,356,842 203,733 617,843 128,430 258,485 162,557 202,606 70,447
Net Assets as at 30 June 2018 EUR 96,370,354 GBP 2,828,872 USD 8,095,609 USD 1,507,620 USD 2,609,329 USD 2,030,951 USD 2,452,046 GBP 1,023,085Net Assets as at 31 December 2017 EUR 104,173,561 GBP 5,132,059 USD 9,976,138 USD 1,546,324 USD 3,622,457 USD 2,187,174 USD 1,910,366 GBP 1,432,954Net Assets as at 31 December 2016 EUR 80,505,959 GBP 11,134,145 USD 8,021,887 USD 616,926 USD 3,867,884 USD 997 USD 922,544 GBP 329,715
Net Assets per share as at 30 June 2018 EUR 15.160 GBP 13.885 USD 13.103 USD 11.739 USD 10.095 USD 12.494 USD 12.103 GBP 14.523Net Assets per share as at 31 December 2017 EUR 16.119 GBP 14.787 USD 14.349 USD 12.922 USD 11.145 USD 13.754 USD 13.204 GBP 15.408Net Assets per share as at 31 December 2016 EUR 13.125 GBP 11.651 USD 10.302 USD 9.390 USD 8.144 USD 9.974 USD 9.411 GBP 12.086
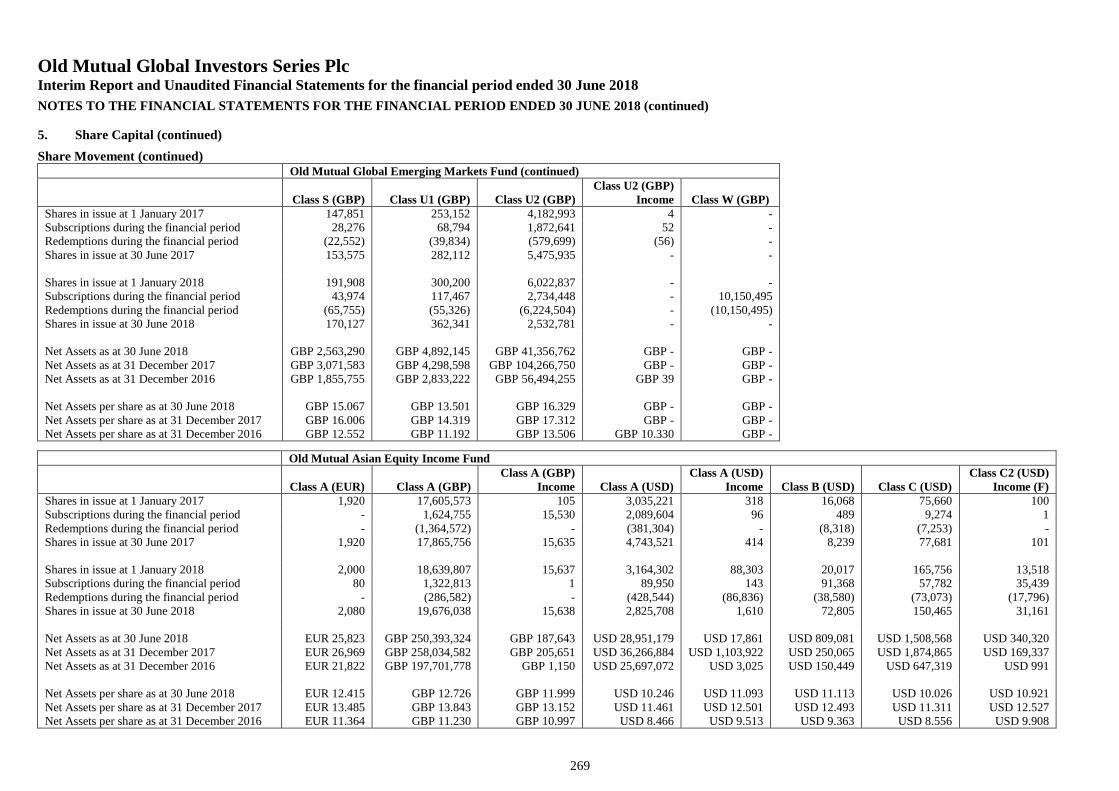
Old Mutual Global Investors Series PlcInterim Report and Unaudited Financial Statements for the financial period ended 30 June 2018
NOTES TO THE FINANCIAL STATEMENTS FOR THE FINANCIAL PERIOD ENDED 30 JUNE 2018 (continued)
269
5. Share Capital (continued)
Share Movement (continued)Old Mutual Global Emerging Markets Fund (continued)
Class S (GBP) Class U1 (GBP) Class U2 (GBP)Class U2 (GBP)
Income Class W (GBP)Shares in issue at 1 January 2017 147,851 253,152 4,182,993 4 -Subscriptions during the financial period 28,276 68,794 1,872,641 52 -Redemptions during the financial period (22,552) (39,834) (579,699) (56) -Shares in issue at 30 June 2017 153,575 282,112 5,475,935 - -
Shares in issue at 1 January 2018 191,908 300,200 6,022,837 - -Subscriptions during the financial period 43,974 117,467 2,734,448 - 10,150,495Redemptions during the financial period (65,755) (55,326) (6,224,504) - (10,150,495)Shares in issue at 30 June 2018 170,127 362,341 2,532,781 - -
Net Assets as at 30 June 2018 GBP 2,563,290 GBP 4,892,145 GBP 41,356,762 GBP - GBP -Net Assets as at 31 December 2017 GBP 3,071,583 GBP 4,298,598 GBP 104,266,750 GBP - GBP -Net Assets as at 31 December 2016 GBP 1,855,755 GBP 2,833,222 GBP 56,494,255 GBP 39 GBP -
Net Assets per share as at 30 June 2018 GBP 15.067 GBP 13.501 GBP 16.329 GBP - GBP -Net Assets per share as at 31 December 2017 GBP 16.006 GBP 14.319 GBP 17.312 GBP - GBP -Net Assets per share as at 31 December 2016 GBP 12.552 GBP 11.192 GBP 13.506 GBP 10.330 GBP -
Old Mutual Asian Equity Income Fund
Class A (EUR) Class A (GBP)Class A (GBP)
Income Class A (USD)Class A (USD)
Income Class B (USD) Class C (USD)Class C2 (USD)
Income (F)Shares in issue at 1 January 2017 1,920 17,605,573 105 3,035,221 318 16,068 75,660 100Subscriptions during the financial period - 1,624,755 15,530 2,089,604 96 489 9,274 1Redemptions during the financial period - (1,364,572) - (381,304) - (8,318) (7,253) -Shares in issue at 30 June 2017 1,920 17,865,756 15,635 4,743,521 414 8,239 77,681 101
Shares in issue at 1 January 2018 2,000 18,639,807 15,637 3,164,302 88,303 20,017 165,756 13,518Subscriptions during the financial period 80 1,322,813 1 89,950 143 91,368 57,782 35,439Redemptions during the financial period - (286,582) - (428,544) (86,836) (38,580) (73,073) (17,796)Shares in issue at 30 June 2018 2,080 19,676,038 15,638 2,825,708 1,610 72,805 150,465 31,161
Net Assets as at 30 June 2018 EUR 25,823 GBP 250,393,324 GBP 187,643 USD 28,951,179 USD 17,861 USD 809,081 USD 1,508,568 USD 340,320Net Assets as at 31 December 2017 EUR 26,969 GBP 258,034,582 GBP 205,651 USD 36,266,884 USD 1,103,922 USD 250,065 USD 1,874,865 USD 169,337Net Assets as at 31 December 2016 EUR 21,822 GBP 197,701,778 GBP 1,150 USD 25,697,072 USD 3,025 USD 150,449 USD 647,319 USD 991
Net Assets per share as at 30 June 2018 EUR 12.415 GBP 12.726 GBP 11.999 USD 10.246 USD 11.093 USD 11.113 USD 10.026 USD 10.921Net Assets per share as at 31 December 2017 EUR 13.485 GBP 13.843 GBP 13.152 USD 11.461 USD 12.501 USD 12.493 USD 11.311 USD 12.527Net Assets per share as at 31 December 2016 EUR 11.364 GBP 11.230 GBP 10.997 USD 8.466 USD 9.513 USD 9.363 USD 8.556 USD 9.908
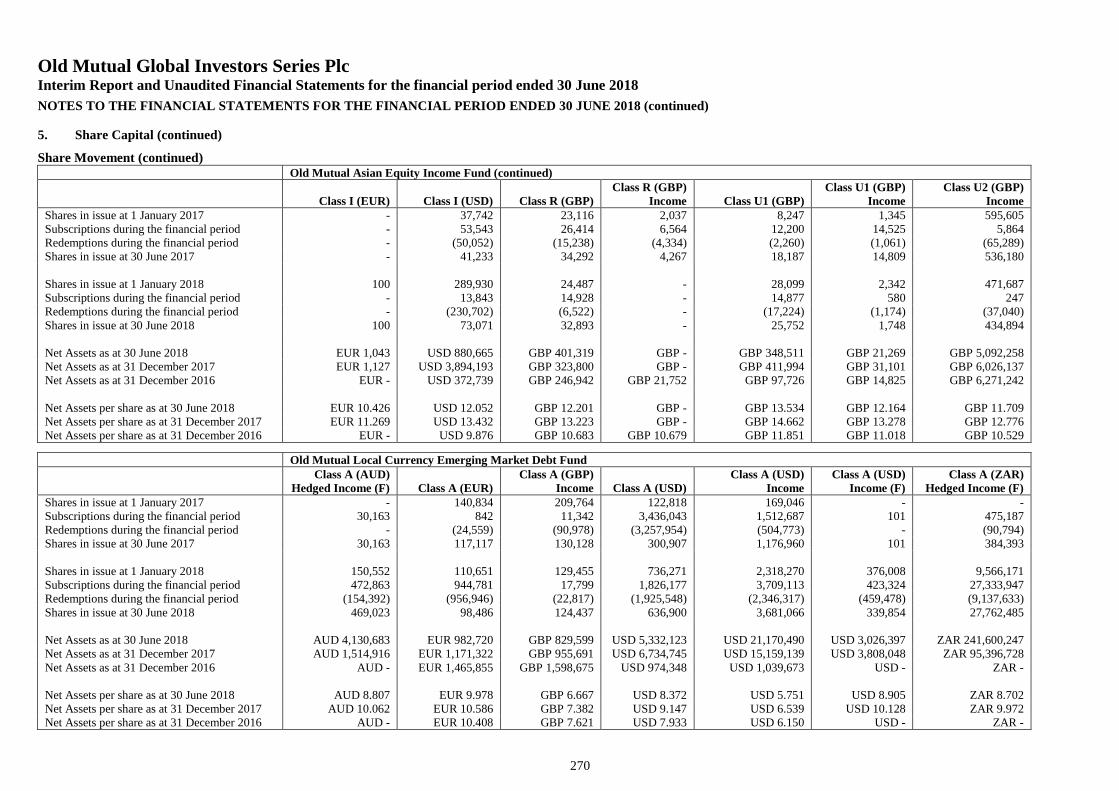
Old Mutual Global Investors Series PlcInterim Report and Unaudited Financial Statements for the financial period ended 30 June 2018
NOTES TO THE FINANCIAL STATEMENTS FOR THE FINANCIAL PERIOD ENDED 30 JUNE 2018 (continued)
270
5. Share Capital (continued)
Share Movement (continued)Old Mutual Asian Equity Income Fund (continued)
Class I (EUR) Class I (USD) Class R (GBP)Class R (GBP)
Income Class U1 (GBP)Class U1 (GBP)
IncomeClass U2 (GBP)
IncomeShares in issue at 1 January 2017 - 37,742 23,116 2,037 8,247 1,345 595,605Subscriptions during the financial period - 53,543 26,414 6,564 12,200 14,525 5,864Redemptions during the financial period - (50,052) (15,238) (4,334) (2,260) (1,061) (65,289)Shares in issue at 30 June 2017 - 41,233 34,292 4,267 18,187 14,809 536,180
Shares in issue at 1 January 2018 100 289,930 24,487 - 28,099 2,342 471,687Subscriptions during the financial period - 13,843 14,928 - 14,877 580 247Redemptions during the financial period - (230,702) (6,522) - (17,224) (1,174) (37,040)Shares in issue at 30 June 2018 100 73,071 32,893 - 25,752 1,748 434,894
Net Assets as at 30 June 2018 EUR 1,043 USD 880,665 GBP 401,319 GBP - GBP 348,511 GBP 21,269 GBP 5,092,258Net Assets as at 31 December 2017 EUR 1,127 USD 3,894,193 GBP 323,800 GBP - GBP 411,994 GBP 31,101 GBP 6,026,137Net Assets as at 31 December 2016 EUR - USD 372,739 GBP 246,942 GBP 21,752 GBP 97,726 GBP 14,825 GBP 6,271,242
Net Assets per share as at 30 June 2018 EUR 10.426 USD 12.052 GBP 12.201 GBP - GBP 13.534 GBP 12.164 GBP 11.709Net Assets per share as at 31 December 2017 EUR 11.269 USD 13.432 GBP 13.223 GBP - GBP 14.662 GBP 13.278 GBP 12.776Net Assets per share as at 31 December 2016 EUR - USD 9.876 GBP 10.683 GBP 10.679 GBP 11.851 GBP 11.018 GBP 10.529
Old Mutual Local Currency Emerging Market Debt FundClass A (AUD)
Hedged Income (F) Class A (EUR)Class A (GBP)
Income Class A (USD)Class A (USD)
IncomeClass A (USD)
Income (F)Class A (ZAR)
Hedged Income (F)Shares in issue at 1 January 2017 - 140,834 209,764 122,818 169,046 - -Subscriptions during the financial period 30,163 842 11,342 3,436,043 1,512,687 101 475,187Redemptions during the financial period - (24,559) (90,978) (3,257,954) (504,773) - (90,794)Shares in issue at 30 June 2017 30,163 117,117 130,128 300,907 1,176,960 101 384,393
Shares in issue at 1 January 2018 150,552 110,651 129,455 736,271 2,318,270 376,008 9,566,171Subscriptions during the financial period 472,863 944,781 17,799 1,826,177 3,709,113 423,324 27,333,947Redemptions during the financial period (154,392) (956,946) (22,817) (1,925,548) (2,346,317) (459,478) (9,137,633)Shares in issue at 30 June 2018 469,023 98,486 124,437 636,900 3,681,066 339,854 27,762,485
Net Assets as at 30 June 2018 AUD 4,130,683 EUR 982,720 GBP 829,599 USD 5,332,123 USD 21,170,490 USD 3,026,397 ZAR 241,600,247Net Assets as at 31 December 2017 AUD 1,514,916 EUR 1,171,322 GBP 955,691 USD 6,734,745 USD 15,159,139 USD 3,808,048 ZAR 95,396,728Net Assets as at 31 December 2016 AUD - EUR 1,465,855 GBP 1,598,675 USD 974,348 USD 1,039,673 USD - ZAR -
Net Assets per share as at 30 June 2018 AUD 8.807 EUR 9.978 GBP 6.667 USD 8.372 USD 5.751 USD 8.905 ZAR 8.702Net Assets per share as at 31 December 2017 AUD 10.062 EUR 10.586 GBP 7.382 USD 9.147 USD 6.539 USD 10.128 ZAR 9.972Net Assets per share as at 31 December 2016 AUD - EUR 10.408 GBP 7.621 USD 7.933 USD 6.150 USD - ZAR -
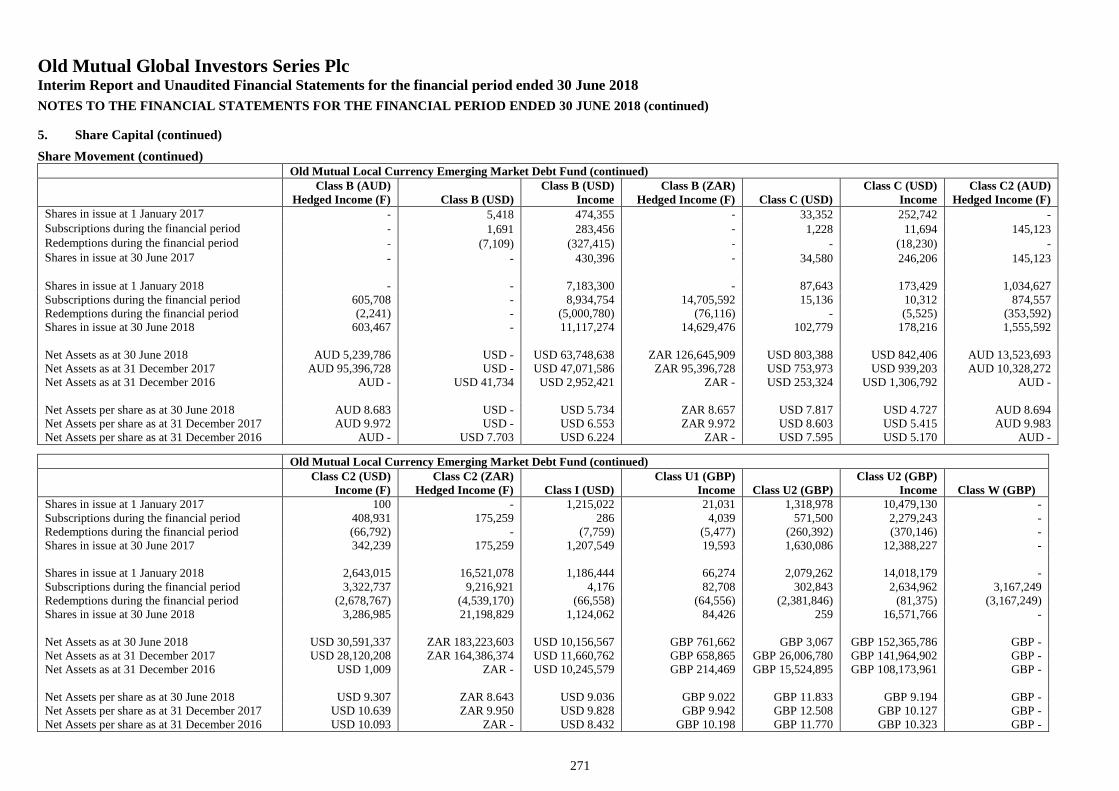
Old Mutual Global Investors Series PlcInterim Report and Unaudited Financial Statements for the financial period ended 30 June 2018
NOTES TO THE FINANCIAL STATEMENTS FOR THE FINANCIAL PERIOD ENDED 30 JUNE 2018 (continued)
271
5. Share Capital (continued)
Share Movement (continued)Old Mutual Local Currency Emerging Market Debt Fund (continued)
Class B (AUD)Hedged Income (F) Class B (USD)
Class B (USD)Income
Class B (ZAR)Hedged Income (F) Class C (USD)
Class C (USD)Income
Class C2 (AUD)Hedged Income (F)
Shares in issue at 1 January 2017 - 5,418 474,355 - 33,352 252,742 -Subscriptions during the financial period - 1,691 283,456 - 1,228 11,694 145,123Redemptions during the financial period - (7,109) (327,415) - - (18,230) -Shares in issue at 30 June 2017 - - 430,396 - 34,580 246,206 145,123
Shares in issue at 1 January 2018 - - 7,183,300 - 87,643 173,429 1,034,627Subscriptions during the financial period 605,708 - 8,934,754 14,705,592 15,136 10,312 874,557Redemptions during the financial period (2,241) - (5,000,780) (76,116) - (5,525) (353,592)Shares in issue at 30 June 2018 603,467 - 11,117,274 14,629,476 102,779 178,216 1,555,592
Net Assets as at 30 June 2018 AUD 5,239,786 USD - USD 63,748,638 ZAR 126,645,909 USD 803,388 USD 842,406 AUD 13,523,693Net Assets as at 31 December 2017 AUD 95,396,728 USD - USD 47,071,586 ZAR 95,396,728 USD 753,973 USD 939,203 AUD 10,328,272Net Assets as at 31 December 2016 AUD - USD 41,734 USD 2,952,421 ZAR - USD 253,324 USD 1,306,792 AUD -
Net Assets per share as at 30 June 2018 AUD 8.683 USD - USD 5.734 ZAR 8.657 USD 7.817 USD 4.727 AUD 8.694Net Assets per share as at 31 December 2017 AUD 9.972 USD - USD 6.553 ZAR 9.972 USD 8.603 USD 5.415 AUD 9.983Net Assets per share as at 31 December 2016 AUD - USD 7.703 USD 6.224 ZAR - USD 7.595 USD 5.170 AUD -
Old Mutual Local Currency Emerging Market Debt Fund (continued)Class C2 (USD)
Income (F)Class C2 (ZAR)
Hedged Income (F) Class I (USD)Class U1 (GBP)
Income Class U2 (GBP)Class U2 (GBP)
Income Class W (GBP)Shares in issue at 1 January 2017 100 - 1,215,022 21,031 1,318,978 10,479,130 -Subscriptions during the financial period 408,931 175,259 286 4,039 571,500 2,279,243 -Redemptions during the financial period (66,792) - (7,759) (5,477) (260,392) (370,146) -Shares in issue at 30 June 2017 342,239 175,259 1,207,549 19,593 1,630,086 12,388,227 -
Shares in issue at 1 January 2018 2,643,015 16,521,078 1,186,444 66,274 2,079,262 14,018,179 -Subscriptions during the financial period 3,322,737 9,216,921 4,176 82,708 302,843 2,634,962 3,167,249Redemptions during the financial period (2,678,767) (4,539,170) (66,558) (64,556) (2,381,846) (81,375) (3,167,249)Shares in issue at 30 June 2018 3,286,985 21,198,829 1,124,062 84,426 259 16,571,766 -
Net Assets as at 30 June 2018 USD 30,591,337 ZAR 183,223,603 USD 10,156,567 GBP 761,662 GBP 3,067 GBP 152,365,786 GBP -Net Assets as at 31 December 2017 USD 28,120,208 ZAR 164,386,374 USD 11,660,762 GBP 658,865 GBP 26,006,780 GBP 141,964,902 GBP -Net Assets as at 31 December 2016 USD 1,009 ZAR - USD 10,245,579 GBP 214,469 GBP 15,524,895 GBP 108,173,961 GBP -
Net Assets per share as at 30 June 2018 USD 9.307 ZAR 8.643 USD 9.036 GBP 9.022 GBP 11.833 GBP 9.194 GBP -Net Assets per share as at 31 December 2017 USD 10.639 ZAR 9.950 USD 9.828 GBP 9.942 GBP 12.508 GBP 10.127 GBP -Net Assets per share as at 31 December 2016 USD 10.093 ZAR - USD 8.432 GBP 10.198 GBP 11.770 GBP 10.323 GBP -
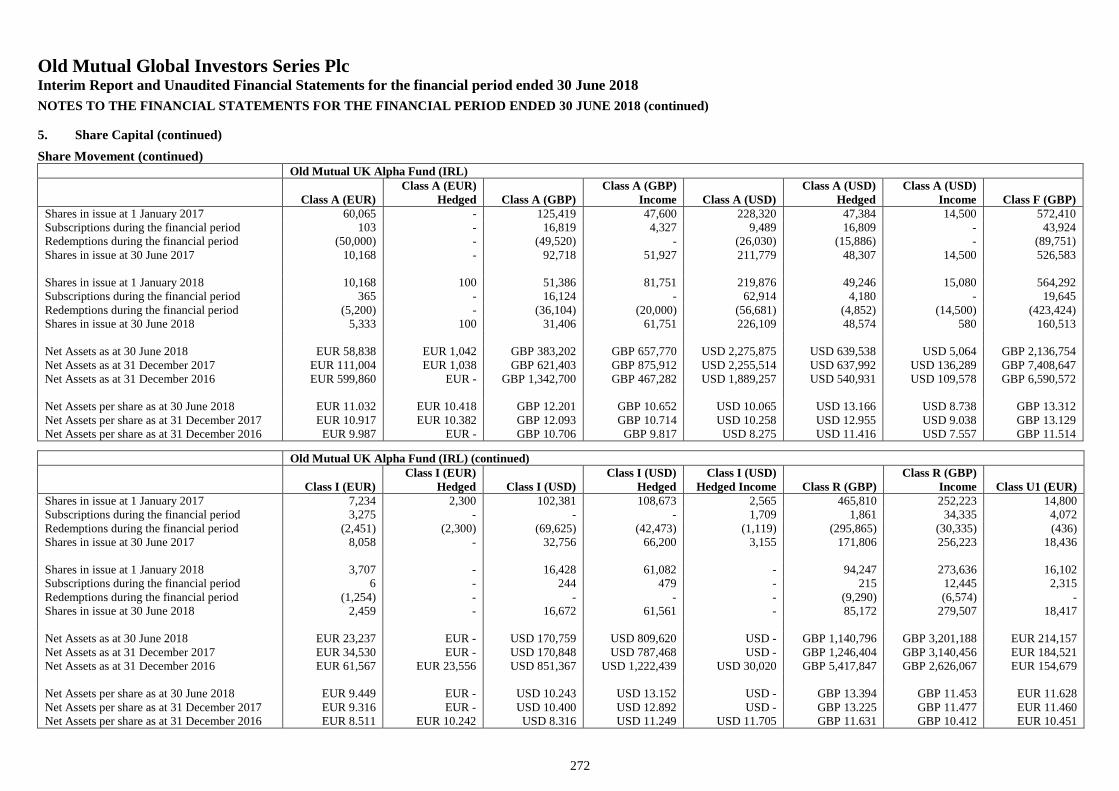
Old Mutual Global Investors Series PlcInterim Report and Unaudited Financial Statements for the financial period ended 30 June 2018
NOTES TO THE FINANCIAL STATEMENTS FOR THE FINANCIAL PERIOD ENDED 30 JUNE 2018 (continued)
272
5. Share Capital (continued)
Share Movement (continued)Old Mutual UK Alpha Fund (IRL)
Class A (EUR)Class A (EUR)
Hedged Class A (GBP)Class A (GBP)
Income Class A (USD)Class A (USD)
HedgedClass A (USD)
Income Class F (GBP)Shares in issue at 1 January 2017 60,065 - 125,419 47,600 228,320 47,384 14,500 572,410Subscriptions during the financial period 103 - 16,819 4,327 9,489 16,809 - 43,924Redemptions during the financial period (50,000) - (49,520) - (26,030) (15,886) - (89,751)Shares in issue at 30 June 2017 10,168 - 92,718 51,927 211,779 48,307 14,500 526,583
Shares in issue at 1 January 2018 10,168 100 51,386 81,751 219,876 49,246 15,080 564,292Subscriptions during the financial period 365 - 16,124 - 62,914 4,180 - 19,645Redemptions during the financial period (5,200) - (36,104) (20,000) (56,681) (4,852) (14,500) (423,424)Shares in issue at 30 June 2018 5,333 100 31,406 61,751 226,109 48,574 580 160,513
Net Assets as at 30 June 2018 EUR 58,838 EUR 1,042 GBP 383,202 GBP 657,770 USD 2,275,875 USD 639,538 USD 5,064 GBP 2,136,754Net Assets as at 31 December 2017 EUR 111,004 EUR 1,038 GBP 621,403 GBP 875,912 USD 2,255,514 USD 637,992 USD 136,289 GBP 7,408,647Net Assets as at 31 December 2016 EUR 599,860 EUR - GBP 1,342,700 GBP 467,282 USD 1,889,257 USD 540,931 USD 109,578 GBP 6,590,572
Net Assets per share as at 30 June 2018 EUR 11.032 EUR 10.418 GBP 12.201 GBP 10.652 USD 10.065 USD 13.166 USD 8.738 GBP 13.312Net Assets per share as at 31 December 2017 EUR 10.917 EUR 10.382 GBP 12.093 GBP 10.714 USD 10.258 USD 12.955 USD 9.038 GBP 13.129Net Assets per share as at 31 December 2016 EUR 9.987 EUR - GBP 10.706 GBP 9.817 USD 8.275 USD 11.416 USD 7.557 GBP 11.514
Old Mutual UK Alpha Fund (IRL) (continued)
Class I (EUR)Class I (EUR)
Hedged Class I (USD)Class I (USD)
HedgedClass I (USD)
Hedged Income Class R (GBP)Class R (GBP)
Income Class U1 (EUR)Shares in issue at 1 January 2017 7,234 2,300 102,381 108,673 2,565 465,810 252,223 14,800Subscriptions during the financial period 3,275 - - - 1,709 1,861 34,335 4,072Redemptions during the financial period (2,451) (2,300) (69,625) (42,473) (1,119) (295,865) (30,335) (436)Shares in issue at 30 June 2017 8,058 - 32,756 66,200 3,155 171,806 256,223 18,436
Shares in issue at 1 January 2018 3,707 - 16,428 61,082 - 94,247 273,636 16,102Subscriptions during the financial period 6 - 244 479 - 215 12,445 2,315Redemptions during the financial period (1,254) - - - - (9,290) (6,574) -Shares in issue at 30 June 2018 2,459 - 16,672 61,561 - 85,172 279,507 18,417
Net Assets as at 30 June 2018 EUR 23,237 EUR - USD 170,759 USD 809,620 USD - GBP 1,140,796 GBP 3,201,188 EUR 214,157Net Assets as at 31 December 2017 EUR 34,530 EUR - USD 170,848 USD 787,468 USD - GBP 1,246,404 GBP 3,140,456 EUR 184,521Net Assets as at 31 December 2016 EUR 61,567 EUR 23,556 USD 851,367 USD 1,222,439 USD 30,020 GBP 5,417,847 GBP 2,626,067 EUR 154,679
Net Assets per share as at 30 June 2018 EUR 9.449 EUR - USD 10.243 USD 13.152 USD - GBP 13.394 GBP 11.453 EUR 11.628Net Assets per share as at 31 December 2017 EUR 9.316 EUR - USD 10.400 USD 12.892 USD - GBP 13.225 GBP 11.477 EUR 11.460Net Assets per share as at 31 December 2016 EUR 8.511 EUR 10.242 USD 8.316 USD 11.249 USD 11.705 GBP 11.631 GBP 10.412 EUR 10.451
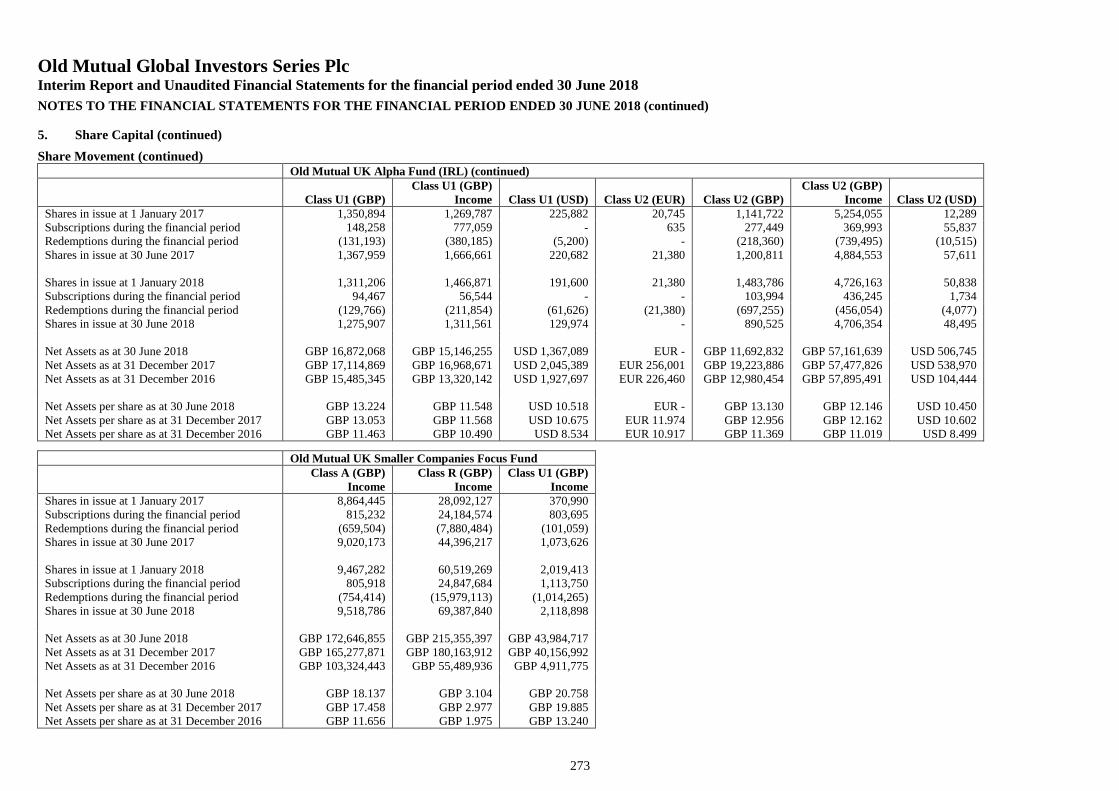
Old Mutual Global Investors Series PlcInterim Report and Unaudited Financial Statements for the financial period ended 30 June 2018
NOTES TO THE FINANCIAL STATEMENTS FOR THE FINANCIAL PERIOD ENDED 30 JUNE 2018 (continued)
273
5. Share Capital (continued)
Share Movement (continued)Old Mutual UK Alpha Fund (IRL) (continued)
Class U1 (GBP)Class U1 (GBP)
Income Class U1 (USD) Class U2 (EUR) Class U2 (GBP)Class U2 (GBP)
Income Class U2 (USD)Shares in issue at 1 January 2017 1,350,894 1,269,787 225,882 20,745 1,141,722 5,254,055 12,289Subscriptions during the financial period 148,258 777,059 - 635 277,449 369,993 55,837Redemptions during the financial period (131,193) (380,185) (5,200) - (218,360) (739,495) (10,515)Shares in issue at 30 June 2017 1,367,959 1,666,661 220,682 21,380 1,200,811 4,884,553 57,611
Shares in issue at 1 January 2018 1,311,206 1,466,871 191,600 21,380 1,483,786 4,726,163 50,838Subscriptions during the financial period 94,467 56,544 - - 103,994 436,245 1,734Redemptions during the financial period (129,766) (211,854) (61,626) (21,380) (697,255) (456,054) (4,077)Shares in issue at 30 June 2018 1,275,907 1,311,561 129,974 - 890,525 4,706,354 48,495
Net Assets as at 30 June 2018 GBP 16,872,068 GBP 15,146,255 USD 1,367,089 EUR - GBP 11,692,832 GBP 57,161,639 USD 506,745Net Assets as at 31 December 2017 GBP 17,114,869 GBP 16,968,671 USD 2,045,389 EUR 256,001 GBP 19,223,886 GBP 57,477,826 USD 538,970Net Assets as at 31 December 2016 GBP 15,485,345 GBP 13,320,142 USD 1,927,697 EUR 226,460 GBP 12,980,454 GBP 57,895,491 USD 104,444
Net Assets per share as at 30 June 2018 GBP 13.224 GBP 11.548 USD 10.518 EUR - GBP 13.130 GBP 12.146 USD 10.450Net Assets per share as at 31 December 2017 GBP 13.053 GBP 11.568 USD 10.675 EUR 11.974 GBP 12.956 GBP 12.162 USD 10.602Net Assets per share as at 31 December 2016 GBP 11.463 GBP 10.490 USD 8.534 EUR 10.917 GBP 11.369 GBP 11.019 USD 8.499
Old Mutual UK Smaller Companies Focus FundClass A (GBP)
IncomeClass R (GBP)
IncomeClass U1 (GBP)
IncomeShares in issue at 1 January 2017 8,864,445 28,092,127 370,990Subscriptions during the financial period 815,232 24,184,574 803,695Redemptions during the financial period (659,504) (7,880,484) (101,059)Shares in issue at 30 June 2017 9,020,173 44,396,217 1,073,626
Shares in issue at 1 January 2018 9,467,282 60,519,269 2,019,413Subscriptions during the financial period 805,918 24,847,684 1,113,750Redemptions during the financial period (754,414) (15,979,113) (1,014,265)Shares in issue at 30 June 2018 9,518,786 69,387,840 2,118,898
Net Assets as at 30 June 2018 GBP 172,646,855 GBP 215,355,397 GBP 43,984,717Net Assets as at 31 December 2017 GBP 165,277,871 GBP 180,163,912 GBP 40,156,992Net Assets as at 31 December 2016 GBP 103,324,443 GBP 55,489,936 GBP 4,911,775
Net Assets per share as at 30 June 2018 GBP 18.137 GBP 3.104 GBP 20.758Net Assets per share as at 31 December 2017 GBP 17.458 GBP 2.977 GBP 19.885Net Assets per share as at 31 December 2016 GBP 11.656 GBP 1.975 GBP 13.240
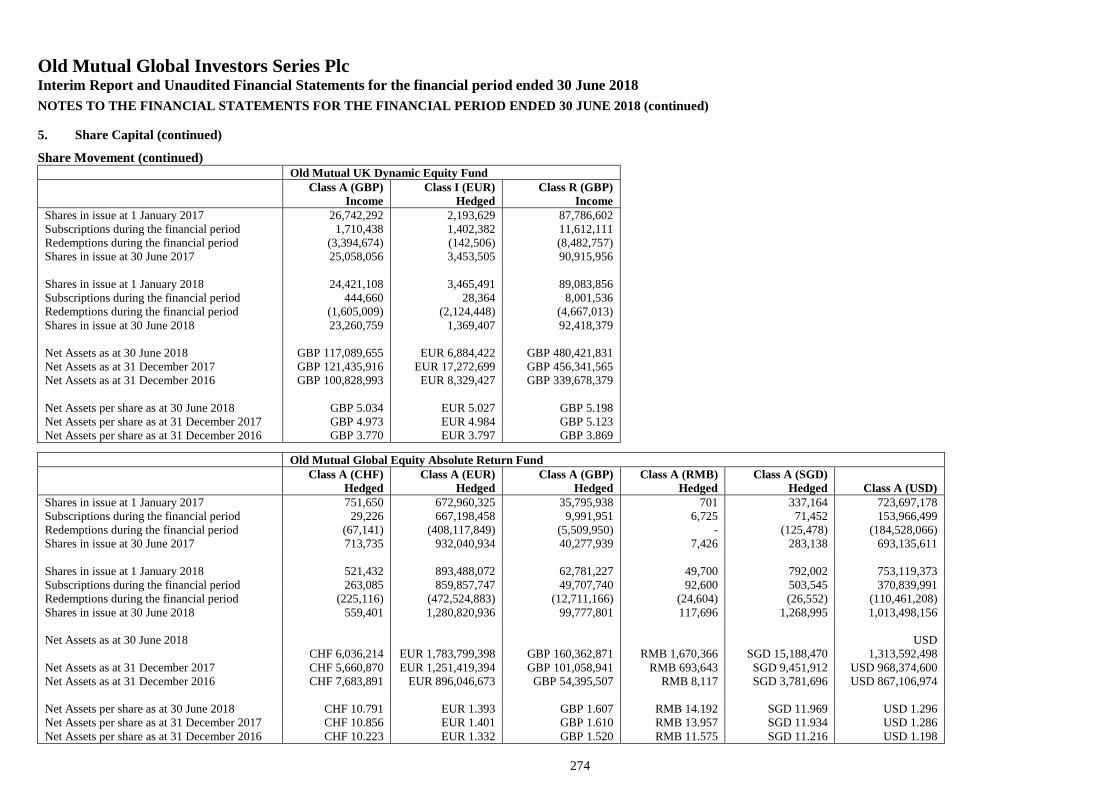
Old Mutual Global Investors Series PlcInterim Report and Unaudited Financial Statements for the financial period ended 30 June 2018
NOTES TO THE FINANCIAL STATEMENTS FOR THE FINANCIAL PERIOD ENDED 30 JUNE 2018 (continued)
274
5. Share Capital (continued)
Share Movement (continued)Old Mutual UK Dynamic Equity Fund
Class A (GBP)Income
Class I (EUR)Hedged
Class R (GBP)Income
Shares in issue at 1 January 2017 26,742,292 2,193,629 87,786,602Subscriptions during the financial period 1,710,438 1,402,382 11,612,111Redemptions during the financial period (3,394,674) (142,506) (8,482,757)Shares in issue at 30 June 2017 25,058,056 3,453,505 90,915,956
Shares in issue at 1 January 2018 24,421,108 3,465,491 89,083,856Subscriptions during the financial period 444,660 28,364 8,001,536Redemptions during the financial period (1,605,009) (2,124,448) (4,667,013)Shares in issue at 30 June 2018 23,260,759 1,369,407 92,418,379
Net Assets as at 30 June 2018 GBP 117,089,655 EUR 6,884,422 GBP 480,421,831Net Assets as at 31 December 2017 GBP 121,435,916 EUR 17,272,699 GBP 456,341,565Net Assets as at 31 December 2016 GBP 100,828,993 EUR 8,329,427 GBP 339,678,379
Net Assets per share as at 30 June 2018 GBP 5.034 EUR 5.027 GBP 5.198Net Assets per share as at 31 December 2017 GBP 4.973 EUR 4.984 GBP 5.123Net Assets per share as at 31 December 2016 GBP 3.770 EUR 3.797 GBP 3.869
Old Mutual Global Equity Absolute Return FundClass A (CHF)
HedgedClass A (EUR)
HedgedClass A (GBP)
HedgedClass A (RMB)
HedgedClass A (SGD)
Hedged Class A (USD)Shares in issue at 1 January 2017 751,650 672,960,325 35,795,938 701 337,164 723,697,178Subscriptions during the financial period 29,226 667,198,458 9,991,951 6,725 71,452 153,966,499Redemptions during the financial period (67,141) (408,117,849) (5,509,950) - (125,478) (184,528,066)Shares in issue at 30 June 2017 713,735 932,040,934 40,277,939 7,426 283,138 693,135,611
Shares in issue at 1 January 2018 521,432 893,488,072 62,781,227 49,700 792,002 753,119,373Subscriptions during the financial period 263,085 859,857,747 49,707,740 92,600 503,545 370,839,991Redemptions during the financial period (225,116) (472,524,883) (12,711,166) (24,604) (26,552) (110,461,208)Shares in issue at 30 June 2018 559,401 1,280,820,936 99,777,801 117,696 1,268,995 1,013,498,156
Net Assets as at 30 June 2018CHF 6,036,214 EUR 1,783,799,398 GBP 160,362,871 RMB 1,670,366 SGD 15,188,470
USD1,313,592,498
Net Assets as at 31 December 2017 CHF 5,660,870 EUR 1,251,419,394 GBP 101,058,941 RMB 693,643 SGD 9,451,912 USD 968,374,600Net Assets as at 31 December 2016 CHF 7,683,891 EUR 896,046,673 GBP 54,395,507 RMB 8,117 SGD 3,781,696 USD 867,106,974
Net Assets per share as at 30 June 2018 CHF 10.791 EUR 1.393 GBP 1.607 RMB 14.192 SGD 11.969 USD 1.296Net Assets per share as at 31 December 2017 CHF 10.856 EUR 1.401 GBP 1.610 RMB 13.957 SGD 11.934 USD 1.286Net Assets per share as at 31 December 2016 CHF 10.223 EUR 1.332 GBP 1.520 RMB 11.575 SGD 11.216 USD 1.198
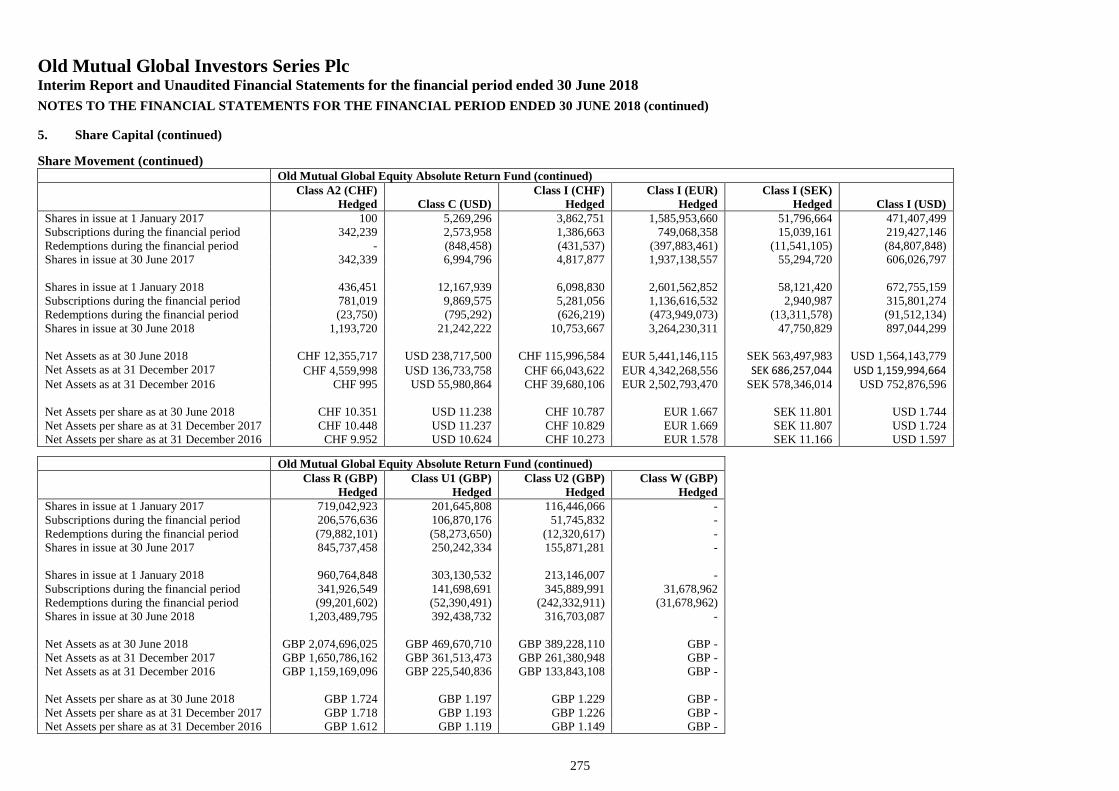
Old Mutual Global Investors Series PlcInterim Report and Unaudited Financial Statements for the financial period ended 30 June 2018
NOTES TO THE FINANCIAL STATEMENTS FOR THE FINANCIAL PERIOD ENDED 30 JUNE 2018 (continued)
275
5. Share Capital (continued)
Share Movement (continued)Old Mutual Global Equity Absolute Return Fund (continued)
Class A2 (CHF)Hedged Class C (USD)
Class I (CHF)Hedged
Class I (EUR)Hedged
Class I (SEK)Hedged Class I (USD)
Shares in issue at 1 January 2017 100 5,269,296 3,862,751 1,585,953,660 51,796,664 471,407,499Subscriptions during the financial period 342,239 2,573,958 1,386,663 749,068,358 15,039,161 219,427,146Redemptions during the financial period - (848,458) (431,537) (397,883,461) (11,541,105) (84,807,848)Shares in issue at 30 June 2017 342,339 6,994,796 4,817,877 1,937,138,557 55,294,720 606,026,797
Shares in issue at 1 January 2018 436,451 12,167,939 6,098,830 2,601,562,852 58,121,420 672,755,159Subscriptions during the financial period 781,019 9,869,575 5,281,056 1,136,616,532 2,940,987 315,801,274Redemptions during the financial period (23,750) (795,292) (626,219) (473,949,073) (13,311,578) (91,512,134)Shares in issue at 30 June 2018 1,193,720 21,242,222 10,753,667 3,264,230,311 47,750,829 897,044,299
Net Assets as at 30 June 2018 CHF 12,355,717 USD 238,717,500 CHF 115,996,584 EUR 5,441,146,115 SEK 563,497,983 USD 1,564,143,779Net Assets as at 31 December 2017 CHF 4,559,998 USD 136,733,758 CHF 66,043,622 EUR 4,342,268,556 SEK 686,257,044 USD 1,159,994,664Net Assets as at 31 December 2016 CHF 995 USD 55,980,864 CHF 39,680,106 EUR 2,502,793,470 SEK 578,346,014 USD 752,876,596
Net Assets per share as at 30 June 2018 CHF 10.351 USD 11.238 CHF 10.787 EUR 1.667 SEK 11.801 USD 1.744Net Assets per share as at 31 December 2017 CHF 10.448 USD 11.237 CHF 10.829 EUR 1.669 SEK 11.807 USD 1.724Net Assets per share as at 31 December 2016 CHF 9.952 USD 10.624 CHF 10.273 EUR 1.578 SEK 11.166 USD 1.597
Old Mutual Global Equity Absolute Return Fund (continued)Class R (GBP)
HedgedClass U1 (GBP)
HedgedClass U2 (GBP)
HedgedClass W (GBP)
HedgedShares in issue at 1 January 2017 719,042,923 201,645,808 116,446,066 -Subscriptions during the financial period 206,576,636 106,870,176 51,745,832 -Redemptions during the financial period (79,882,101) (58,273,650) (12,320,617) -Shares in issue at 30 June 2017 845,737,458 250,242,334 155,871,281 -
Shares in issue at 1 January 2018 960,764,848 303,130,532 213,146,007 -Subscriptions during the financial period 341,926,549 141,698,691 345,889,991 31,678,962Redemptions during the financial period (99,201,602) (52,390,491) (242,332,911) (31,678,962)Shares in issue at 30 June 2018 1,203,489,795 392,438,732 316,703,087 -
Net Assets as at 30 June 2018 GBP 2,074,696,025 GBP 469,670,710 GBP 389,228,110 GBP -Net Assets as at 31 December 2017 GBP 1,650,786,162 GBP 361,513,473 GBP 261,380,948 GBP -Net Assets as at 31 December 2016 GBP 1,159,169,096 GBP 225,540,836 GBP 133,843,108 GBP -
Net Assets per share as at 30 June 2018 GBP 1.724 GBP 1.197 GBP 1.229 GBP -Net Assets per share as at 31 December 2017 GBP 1.718 GBP 1.193 GBP 1.226 GBP -Net Assets per share as at 31 December 2016 GBP 1.612 GBP 1.119 GBP 1.149 GBP -
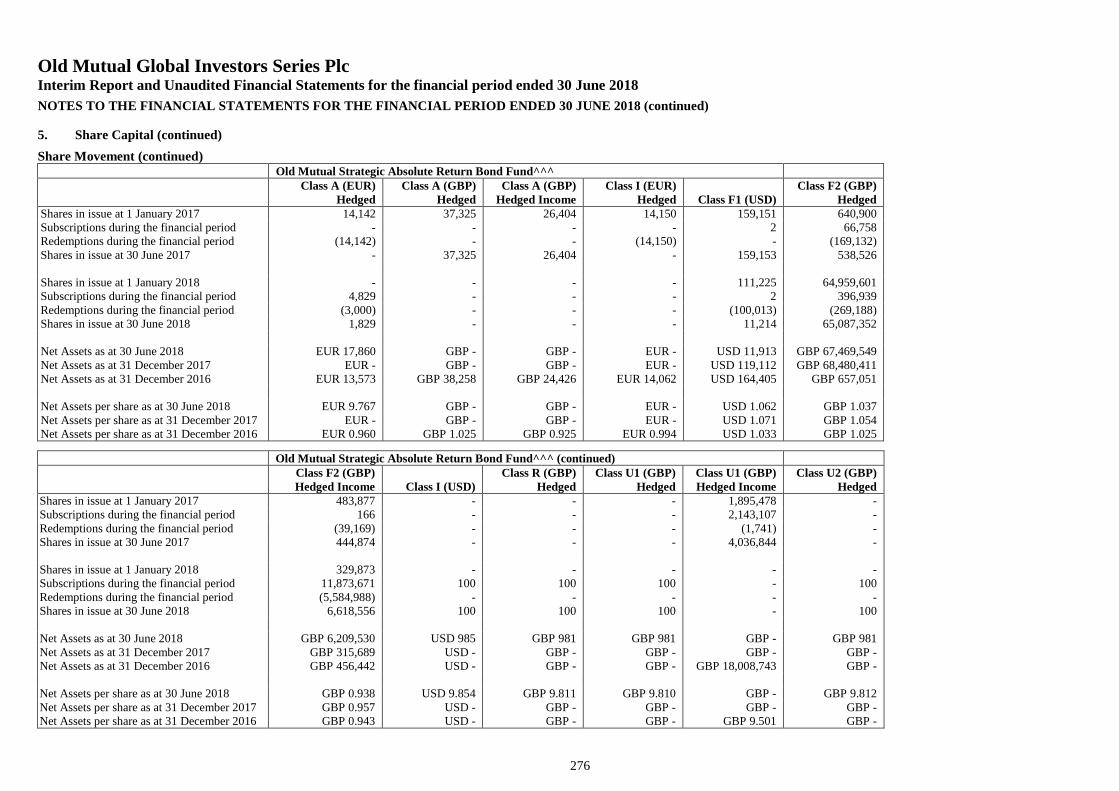
Old Mutual Global Investors Series PlcInterim Report and Unaudited Financial Statements for the financial period ended 30 June 2018
NOTES TO THE FINANCIAL STATEMENTS FOR THE FINANCIAL PERIOD ENDED 30 JUNE 2018 (continued)
276
5. Share Capital (continued)
Share Movement (continued)Old Mutual Strategic Absolute Return Bond Fund^^^
Class A (EUR)Hedged
Class A (GBP)Hedged
Class A (GBP)Hedged Income
Class I (EUR)Hedged Class F1 (USD)
Class F2 (GBP)Hedged
Shares in issue at 1 January 2017 14,142 37,325 26,404 14,150 159,151 640,900Subscriptions during the financial period - - - - 2 66,758Redemptions during the financial period (14,142) - - (14,150) - (169,132)Shares in issue at 30 June 2017 - 37,325 26,404 - 159,153 538,526
Shares in issue at 1 January 2018 - - - - 111,225 64,959,601Subscriptions during the financial period 4,829 - - - 2 396,939Redemptions during the financial period (3,000) - - - (100,013) (269,188)Shares in issue at 30 June 2018 1,829 - - - 11,214 65,087,352
Net Assets as at 30 June 2018 EUR 17,860 GBP - GBP - EUR - USD 11,913 GBP 67,469,549Net Assets as at 31 December 2017 EUR - GBP - GBP - EUR - USD 119,112 GBP 68,480,411Net Assets as at 31 December 2016 EUR 13,573 GBP 38,258 GBP 24,426 EUR 14,062 USD 164,405 GBP 657,051
Net Assets per share as at 30 June 2018 EUR 9.767 GBP - GBP - EUR - USD 1.062 GBP 1.037Net Assets per share as at 31 December 2017 EUR - GBP - GBP - EUR - USD 1.071 GBP 1.054Net Assets per share as at 31 December 2016 EUR 0.960 GBP 1.025 GBP 0.925 EUR 0.994 USD 1.033 GBP 1.025
Old Mutual Strategic Absolute Return Bond Fund^^^ (continued)Class F2 (GBP)Hedged Income Class I (USD)
Class R (GBP)Hedged
Class U1 (GBP)Hedged
Class U1 (GBP)Hedged Income
Class U2 (GBP)Hedged
Shares in issue at 1 January 2017 483,877 - - - 1,895,478 -Subscriptions during the financial period 166 - - - 2,143,107 -Redemptions during the financial period (39,169) - - - (1,741) -Shares in issue at 30 June 2017 444,874 - - - 4,036,844 -
Shares in issue at 1 January 2018 329,873 - - - - -Subscriptions during the financial period 11,873,671 100 100 100 - 100Redemptions during the financial period (5,584,988) - - - - -Shares in issue at 30 June 2018 6,618,556 100 100 100 - 100
Net Assets as at 30 June 2018 GBP 6,209,530 USD 985 GBP 981 GBP 981 GBP - GBP 981Net Assets as at 31 December 2017 GBP 315,689 USD - GBP - GBP - GBP - GBP -Net Assets as at 31 December 2016 GBP 456,442 USD - GBP - GBP - GBP 18,008,743 GBP -
Net Assets per share as at 30 June 2018 GBP 0.938 USD 9.854 GBP 9.811 GBP 9.810 GBP - GBP 9.812Net Assets per share as at 31 December 2017 GBP 0.957 USD - GBP - GBP - GBP - GBP -Net Assets per share as at 31 December 2016 GBP 0.943 USD - GBP - GBP - GBP 9.501 GBP -
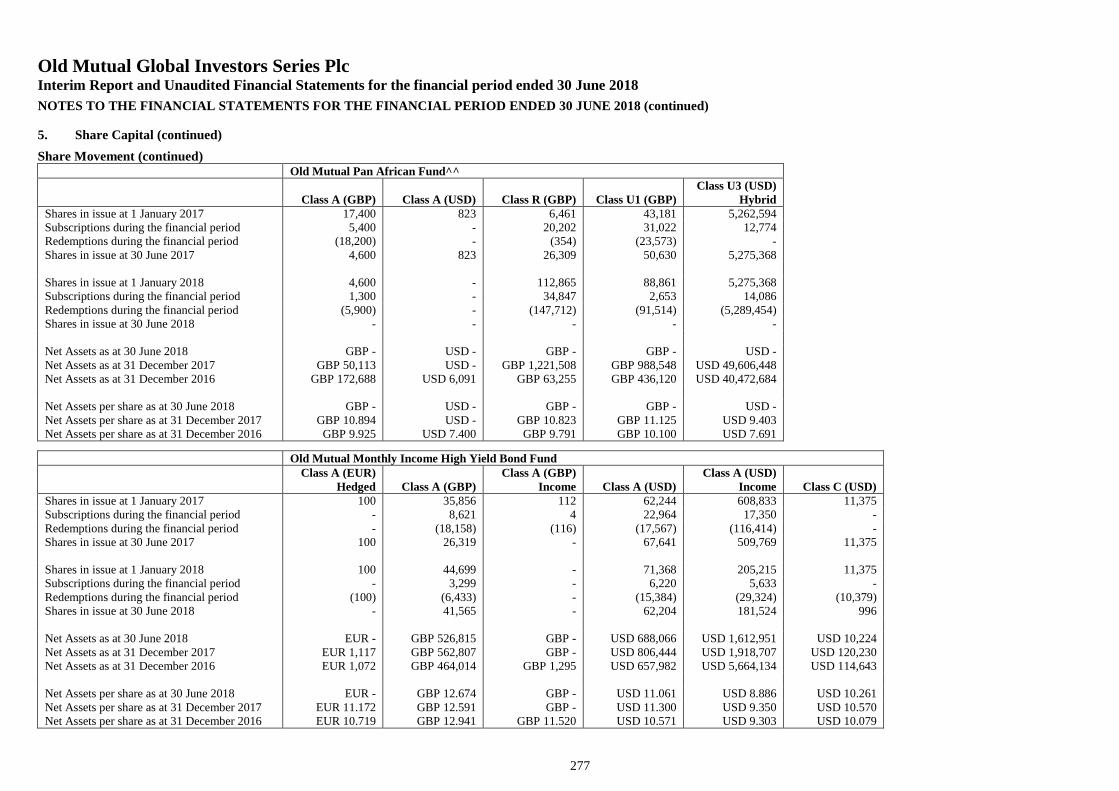
Old Mutual Global Investors Series PlcInterim Report and Unaudited Financial Statements for the financial period ended 30 June 2018
NOTES TO THE FINANCIAL STATEMENTS FOR THE FINANCIAL PERIOD ENDED 30 JUNE 2018 (continued)
277
5. Share Capital (continued)
Share Movement (continued)Old Mutual Pan African Fund^^
Class A (GBP) Class A (USD) Class R (GBP) Class U1 (GBP)Class U3 (USD)
HybridShares in issue at 1 January 2017 17,400 823 6,461 43,181 5,262,594Subscriptions during the financial period 5,400 - 20,202 31,022 12,774Redemptions during the financial period (18,200) - (354) (23,573) -Shares in issue at 30 June 2017 4,600 823 26,309 50,630 5,275,368
Shares in issue at 1 January 2018 4,600 - 112,865 88,861 5,275,368Subscriptions during the financial period 1,300 - 34,847 2,653 14,086Redemptions during the financial period (5,900) - (147,712) (91,514) (5,289,454)Shares in issue at 30 June 2018 - - - - -
Net Assets as at 30 June 2018 GBP - USD - GBP - GBP - USD -Net Assets as at 31 December 2017 GBP 50,113 USD - GBP 1,221,508 GBP 988,548 USD 49,606,448Net Assets as at 31 December 2016 GBP 172,688 USD 6,091 GBP 63,255 GBP 436,120 USD 40,472,684
Net Assets per share as at 30 June 2018 GBP - USD - GBP - GBP - USD -Net Assets per share as at 31 December 2017 GBP 10.894 USD - GBP 10.823 GBP 11.125 USD 9.403Net Assets per share as at 31 December 2016 GBP 9.925 USD 7.400 GBP 9.791 GBP 10.100 USD 7.691
Old Mutual Monthly Income High Yield Bond FundClass A (EUR)
Hedged Class A (GBP)Class A (GBP)
Income Class A (USD)Class A (USD)
Income Class C (USD)Shares in issue at 1 January 2017 100 35,856 112 62,244 608,833 11,375Subscriptions during the financial period - 8,621 4 22,964 17,350 -Redemptions during the financial period - (18,158) (116) (17,567) (116,414) -Shares in issue at 30 June 2017 100 26,319 - 67,641 509,769 11,375
Shares in issue at 1 January 2018 100 44,699 - 71,368 205,215 11,375Subscriptions during the financial period - 3,299 - 6,220 5,633 -Redemptions during the financial period (100) (6,433) - (15,384) (29,324) (10,379)Shares in issue at 30 June 2018 - 41,565 - 62,204 181,524 996
Net Assets as at 30 June 2018 EUR - GBP 526,815 GBP - USD 688,066 USD 1,612,951 USD 10,224Net Assets as at 31 December 2017 EUR 1,117 GBP 562,807 GBP - USD 806,444 USD 1,918,707 USD 120,230Net Assets as at 31 December 2016 EUR 1,072 GBP 464,014 GBP 1,295 USD 657,982 USD 5,664,134 USD 114,643
Net Assets per share as at 30 June 2018 EUR - GBP 12.674 GBP - USD 11.061 USD 8.886 USD 10.261Net Assets per share as at 31 December 2017 EUR 11.172 GBP 12.591 GBP - USD 11.300 USD 9.350 USD 10.570Net Assets per share as at 31 December 2016 EUR 10.719 GBP 12.941 GBP 11.520 USD 10.571 USD 9.303 USD 10.079
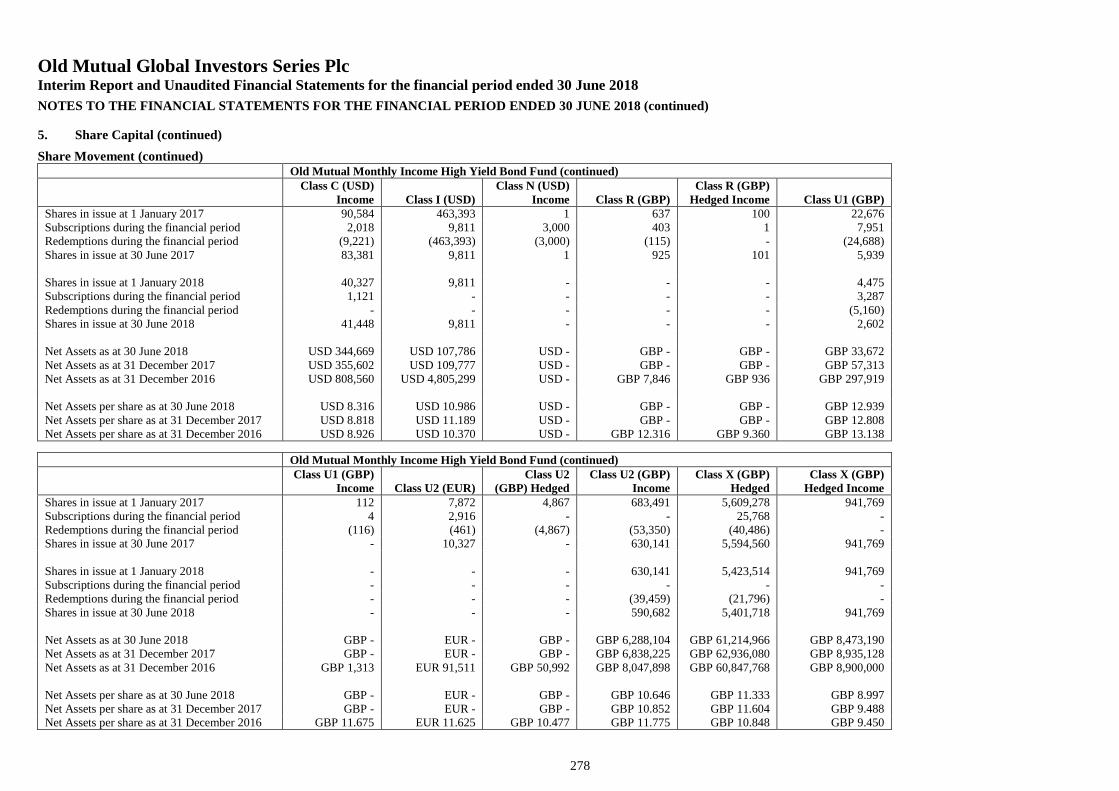
Old Mutual Global Investors Series PlcInterim Report and Unaudited Financial Statements for the financial period ended 30 June 2018
NOTES TO THE FINANCIAL STATEMENTS FOR THE FINANCIAL PERIOD ENDED 30 JUNE 2018 (continued)
278
5. Share Capital (continued)
Share Movement (continued)Old Mutual Monthly Income High Yield Bond Fund (continued)
Class C (USD)Income Class I (USD)
Class N (USD)Income Class R (GBP)
Class R (GBP)Hedged Income Class U1 (GBP)
Shares in issue at 1 January 2017 90,584 463,393 1 637 100 22,676Subscriptions during the financial period 2,018 9,811 3,000 403 1 7,951Redemptions during the financial period (9,221) (463,393) (3,000) (115) - (24,688)Shares in issue at 30 June 2017 83,381 9,811 1 925 101 5,939
Shares in issue at 1 January 2018 40,327 9,811 - - - 4,475Subscriptions during the financial period 1,121 - - - - 3,287Redemptions during the financial period - - - - - (5,160)Shares in issue at 30 June 2018 41,448 9,811 - - - 2,602
Net Assets as at 30 June 2018 USD 344,669 USD 107,786 USD - GBP - GBP - GBP 33,672Net Assets as at 31 December 2017 USD 355,602 USD 109,777 USD - GBP - GBP - GBP 57,313Net Assets as at 31 December 2016 USD 808,560 USD 4,805,299 USD - GBP 7,846 GBP 936 GBP 297,919
Net Assets per share as at 30 June 2018 USD 8.316 USD 10.986 USD - GBP - GBP - GBP 12.939Net Assets per share as at 31 December 2017 USD 8.818 USD 11.189 USD - GBP - GBP - GBP 12.808Net Assets per share as at 31 December 2016 USD 8.926 USD 10.370 USD - GBP 12.316 GBP 9.360 GBP 13.138
Old Mutual Monthly Income High Yield Bond Fund (continued)Class U1 (GBP)
Income Class U2 (EUR)Class U2
(GBP) HedgedClass U2 (GBP)
IncomeClass X (GBP)
HedgedClass X (GBP)
Hedged IncomeShares in issue at 1 January 2017 112 7,872 4,867 683,491 5,609,278 941,769Subscriptions during the financial period 4 2,916 - - 25,768 -Redemptions during the financial period (116) (461) (4,867) (53,350) (40,486) -Shares in issue at 30 June 2017 - 10,327 - 630,141 5,594,560 941,769
Shares in issue at 1 January 2018 - - - 630,141 5,423,514 941,769Subscriptions during the financial period - - - - - -Redemptions during the financial period - - - (39,459) (21,796) -Shares in issue at 30 June 2018 - - - 590,682 5,401,718 941,769
Net Assets as at 30 June 2018 GBP - EUR - GBP - GBP 6,288,104 GBP 61,214,966 GBP 8,473,190Net Assets as at 31 December 2017 GBP - EUR - GBP - GBP 6,838,225 GBP 62,936,080 GBP 8,935,128Net Assets as at 31 December 2016 GBP 1,313 EUR 91,511 GBP 50,992 GBP 8,047,898 GBP 60,847,768 GBP 8,900,000
Net Assets per share as at 30 June 2018 GBP - EUR - GBP - GBP 10.646 GBP 11.333 GBP 8.997Net Assets per share as at 31 December 2017 GBP - EUR - GBP - GBP 10.852 GBP 11.604 GBP 9.488Net Assets per share as at 31 December 2016 GBP 11.675 EUR 11.625 GBP 10.477 GBP 11.775 GBP 10.848 GBP 9.450

Old Mutual Global Investors Series PlcInterim Report and Unaudited Financial Statements for the financial period ended 30 June 2018
NOTES TO THE FINANCIAL STATEMENTS FOR THE FINANCIAL PERIOD ENDED 30 JUNE 2018 (continued)
279
5. Share Capital (continued)
Share Movement (continued)Old Mutual Europe (ex UK) Smaller Companies Fund
Class A (EUR) Class A (GBP) Class A (USD)Class A (USD)
HedgedClass C (USD)
Hedged Class I (EUR) Class I (USD)Shares in issue at 1 January 2017 3,426 54,972 9,900 - - 729,499 -Subscriptions during the financial period 14,048 16,235 360,044 62,769 - 662,769 -Redemptions during the financial period (310) (30,154) (8,207) (38,032) - (24,574) -Shares in issue at 30 June 2017 17,164 41,053 361,737 24,737 - 1,367,694 -
Shares in issue at 1 January 2018 11,483 42,910 743,143 59,951 66,107 1,881,476 938,342Subscriptions during the financial period 1,782 8,163 68,679 14,605 - 179,185 117,713Redemptions during the financial period (4,900) (16,092) (324,821) - (5,000) (621,916) (685,776)Shares in issue at 30 June 2018 8,365 34,981 487,001 74,556 61,107 1,438,745 370,279
Net Assets as at 30 June 2018 EUR 124,453 GBP 549,861 USD 5,660,361 USD 710,730 USD 589,068 EUR 22,083,225 USD 3,415,974Net Assets as at 31 December 2017 EUR 184,640 GBP 730,127 USD 9,614,417 USD 610,361 USD 685,783 EUR 31,093,707 USD 9,598,960Net Assets as at 31 December 2016 EUR 48,475 GBP 796,594 USD 99,149 USD - USD - EUR 10,503,201 USD -
Net Assets per share as at 30 June 2018 EUR 14.878 GBP 15.719 USD 11.623 USD 9.533 USD 9.640 EUR 15.349 USD 9.225Net Assets per share as at 31 December 2017 EUR 16.080 GBP 17.015 USD 12.938 USD 10.181 USD 10.374 EUR 16.526 USD 10.230Net Assets per share as at 31 December 2016 EUR 14.150 GBP 14.491 USD 10.015 USD - USD - EUR 14.398 USD -
Old Mutual Europe (ex UK) Smaller Companies Fund (continued)Class I (USD)
Hedged Class R (GBP)Class R (GBP)
HedgedClass R (GBP)
IncomeClass U1 (EUR)
Income Class U1 (GBP)Class U1 (GBP)
HedgedShares in issue at 1 January 2017 - 173,240 567 8,201 15,000 1,160,793 177,643Subscriptions during the financial period - 1,089,579 28,705 73,430 216,205 495,424 8,108Redemptions during the financial period - (55,028) - (2,150) (645) (287,309) (3,714)Shares in issue at 30 June 2017 - 1,207,791 29,272 79,481 230,560 1,368,908 182,037
Shares in issue at 1 January 2018 13,646 1,414,938 218,795 71,104 287,160 2,488,433 190,731Subscriptions during the financial period 60,011 358,473 93,979 6,623 402,495 732,656 6,085Redemptions during the financial period (5,168) (649,133) (88,281) (35,457) (18,765) (830,008) (9,600)Shares in issue at 30 June 2018 68,489 1,124,278 224,493 42,270 670,890 2,391,081 187,216
Net Assets as at 30 June 2018 USD 654,192 GBP 19,465,296 GBP 3,322,636 GBP 668,713 EUR 7,762,158 GBP 41,480,958 GBP 2,879,983Net Assets as at 31 December 2017 USD 138,760 GBP 26,418,599 GBP 3,473,747 GBP 1,238,151 EUR 3,649,751 GBP 46,536,689 GBP 3,145,995Net Assets as at 31 December 2016 USD - GBP 2,727,461 GBP 7,818 GBP 123,173 EUR 169,531 GBP 18,287,140 GBP 2,540,839
Net Assets per share as at 30 June 2018 USD 9.552 GBP 17.314 GBP 14.801 GBP 15.820 EUR 11.570 GBP 17.348 GBP 15.383Net Assets per share as at 31 December 2017 USD 10.169 GBP 18.671 GBP 15.877 GBP 17.413 EUR 12.710 GBP 18.701 GBP 16.494Net Assets per share as at 31 December 2016 USD - GBP 15.744 GBP 13.798 GBP 15.019 EUR 11.302 GBP 15.754 GBP 14.303
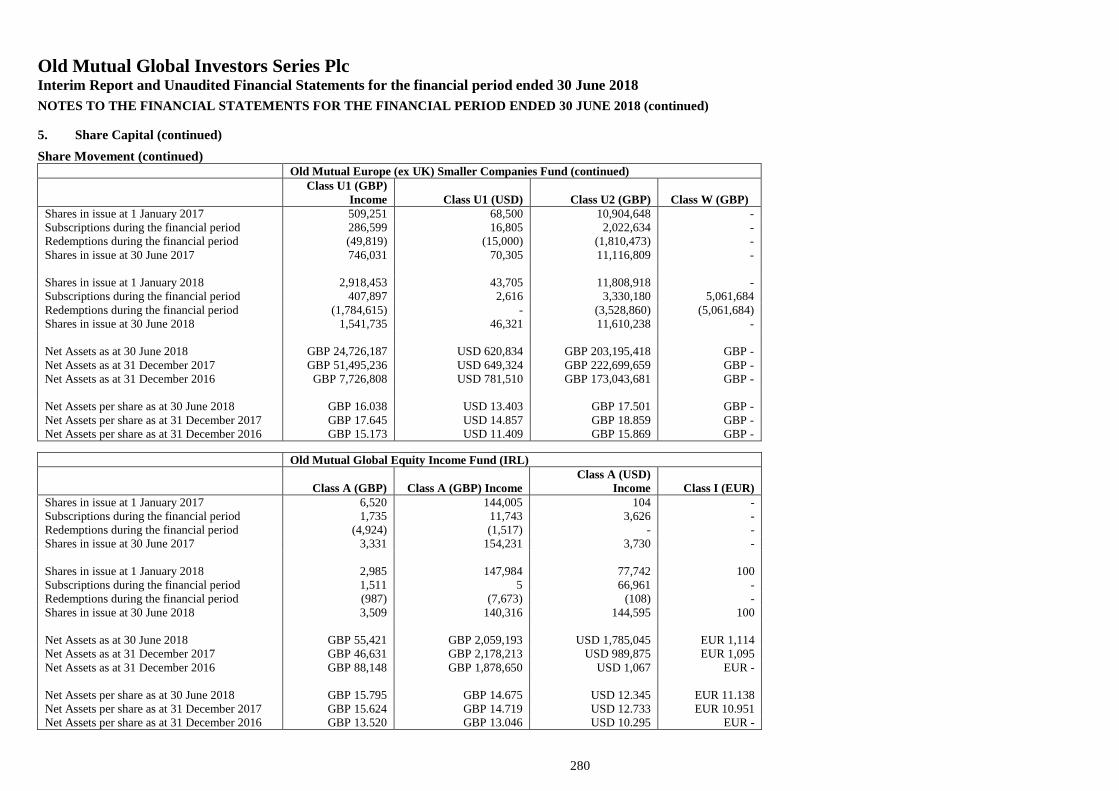
Old Mutual Global Investors Series PlcInterim Report and Unaudited Financial Statements for the financial period ended 30 June 2018
NOTES TO THE FINANCIAL STATEMENTS FOR THE FINANCIAL PERIOD ENDED 30 JUNE 2018 (continued)
280
5. Share Capital (continued)
Share Movement (continued)Old Mutual Europe (ex UK) Smaller Companies Fund (continued)
Class U1 (GBP)Income Class U1 (USD) Class U2 (GBP) Class W (GBP)
Shares in issue at 1 January 2017 509,251 68,500 10,904,648 -Subscriptions during the financial period 286,599 16,805 2,022,634 -Redemptions during the financial period (49,819) (15,000) (1,810,473) -Shares in issue at 30 June 2017 746,031 70,305 11,116,809 -
Shares in issue at 1 January 2018 2,918,453 43,705 11,808,918 -Subscriptions during the financial period 407,897 2,616 3,330,180 5,061,684Redemptions during the financial period (1,784,615) - (3,528,860) (5,061,684)Shares in issue at 30 June 2018 1,541,735 46,321 11,610,238 -
Net Assets as at 30 June 2018 GBP 24,726,187 USD 620,834 GBP 203,195,418 GBP -Net Assets as at 31 December 2017 GBP 51,495,236 USD 649,324 GBP 222,699,659 GBP -Net Assets as at 31 December 2016 GBP 7,726,808 USD 781,510 GBP 173,043,681 GBP -
Net Assets per share as at 30 June 2018 GBP 16.038 USD 13.403 GBP 17.501 GBP -Net Assets per share as at 31 December 2017 GBP 17.645 USD 14.857 GBP 18.859 GBP -Net Assets per share as at 31 December 2016 GBP 15.173 USD 11.409 GBP 15.869 GBP -
Old Mutual Global Equity Income Fund (IRL)
Class A (GBP) Class A (GBP) IncomeClass A (USD)
Income Class I (EUR)Shares in issue at 1 January 2017 6,520 144,005 104 -Subscriptions during the financial period 1,735 11,743 3,626 -Redemptions during the financial period (4,924) (1,517) - -Shares in issue at 30 June 2017 3,331 154,231 3,730 -
Shares in issue at 1 January 2018 2,985 147,984 77,742 100Subscriptions during the financial period 1,511 5 66,961 -Redemptions during the financial period (987) (7,673) (108) -Shares in issue at 30 June 2018 3,509 140,316 144,595 100
Net Assets as at 30 June 2018 GBP 55,421 GBP 2,059,193 USD 1,785,045 EUR 1,114Net Assets as at 31 December 2017 GBP 46,631 GBP 2,178,213 USD 989,875 EUR 1,095Net Assets as at 31 December 2016 GBP 88,148 GBP 1,878,650 USD 1,067 EUR -
Net Assets per share as at 30 June 2018 GBP 15.795 GBP 14.675 USD 12.345 EUR 11.138Net Assets per share as at 31 December 2017 GBP 15.624 GBP 14.719 USD 12.733 EUR 10.951Net Assets per share as at 31 December 2016 GBP 13.520 GBP 13.046 USD 10.295 EUR -
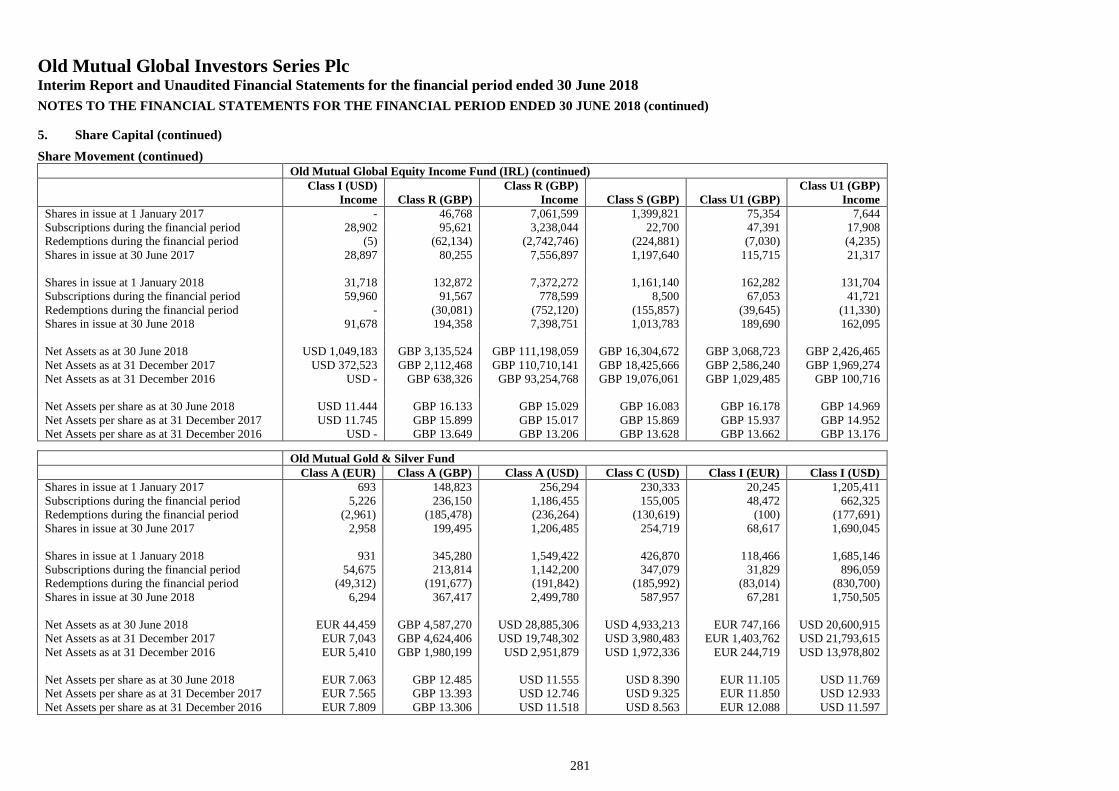
Old Mutual Global Investors Series PlcInterim Report and Unaudited Financial Statements for the financial period ended 30 June 2018
NOTES TO THE FINANCIAL STATEMENTS FOR THE FINANCIAL PERIOD ENDED 30 JUNE 2018 (continued)
281
5. Share Capital (continued)
Share Movement (continued)Old Mutual Global Equity Income Fund (IRL) (continued)
Class I (USD)Income Class R (GBP)
Class R (GBP)Income Class S (GBP) Class U1 (GBP)
Class U1 (GBP)Income
Shares in issue at 1 January 2017 - 46,768 7,061,599 1,399,821 75,354 7,644Subscriptions during the financial period 28,902 95,621 3,238,044 22,700 47,391 17,908Redemptions during the financial period (5) (62,134) (2,742,746) (224,881) (7,030) (4,235)Shares in issue at 30 June 2017 28,897 80,255 7,556,897 1,197,640 115,715 21,317
Shares in issue at 1 January 2018 31,718 132,872 7,372,272 1,161,140 162,282 131,704Subscriptions during the financial period 59,960 91,567 778,599 8,500 67,053 41,721Redemptions during the financial period - (30,081) (752,120) (155,857) (39,645) (11,330)Shares in issue at 30 June 2018 91,678 194,358 7,398,751 1,013,783 189,690 162,095
Net Assets as at 30 June 2018 USD 1,049,183 GBP 3,135,524 GBP 111,198,059 GBP 16,304,672 GBP 3,068,723 GBP 2,426,465Net Assets as at 31 December 2017 USD 372,523 GBP 2,112,468 GBP 110,710,141 GBP 18,425,666 GBP 2,586,240 GBP 1,969,274Net Assets as at 31 December 2016 USD - GBP 638,326 GBP 93,254,768 GBP 19,076,061 GBP 1,029,485 GBP 100,716
Net Assets per share as at 30 June 2018 USD 11.444 GBP 16.133 GBP 15.029 GBP 16.083 GBP 16.178 GBP 14.969Net Assets per share as at 31 December 2017 USD 11.745 GBP 15.899 GBP 15.017 GBP 15.869 GBP 15.937 GBP 14.952Net Assets per share as at 31 December 2016 USD - GBP 13.649 GBP 13.206 GBP 13.628 GBP 13.662 GBP 13.176
Old Mutual Gold & Silver FundClass A (EUR) Class A (GBP) Class A (USD) Class C (USD) Class I (EUR) Class I (USD)
Shares in issue at 1 January 2017 693 148,823 256,294 230,333 20,245 1,205,411Subscriptions during the financial period 5,226 236,150 1,186,455 155,005 48,472 662,325Redemptions during the financial period (2,961) (185,478) (236,264) (130,619) (100) (177,691)Shares in issue at 30 June 2017 2,958 199,495 1,206,485 254,719 68,617 1,690,045
Shares in issue at 1 January 2018 931 345,280 1,549,422 426,870 118,466 1,685,146Subscriptions during the financial period 54,675 213,814 1,142,200 347,079 31,829 896,059Redemptions during the financial period (49,312) (191,677) (191,842) (185,992) (83,014) (830,700)Shares in issue at 30 June 2018 6,294 367,417 2,499,780 587,957 67,281 1,750,505
Net Assets as at 30 June 2018 EUR 44,459 GBP 4,587,270 USD 28,885,306 USD 4,933,213 EUR 747,166 USD 20,600,915Net Assets as at 31 December 2017 EUR 7,043 GBP 4,624,406 USD 19,748,302 USD 3,980,483 EUR 1,403,762 USD 21,793,615Net Assets as at 31 December 2016 EUR 5,410 GBP 1,980,199 USD 2,951,879 USD 1,972,336 EUR 244,719 USD 13,978,802
Net Assets per share as at 30 June 2018 EUR 7.063 GBP 12.485 USD 11.555 USD 8.390 EUR 11.105 USD 11.769Net Assets per share as at 31 December 2017 EUR 7.565 GBP 13.393 USD 12.746 USD 9.325 EUR 11.850 USD 12.933Net Assets per share as at 31 December 2016 EUR 7.809 GBP 13.306 USD 11.518 USD 8.563 EUR 12.088 USD 11.597
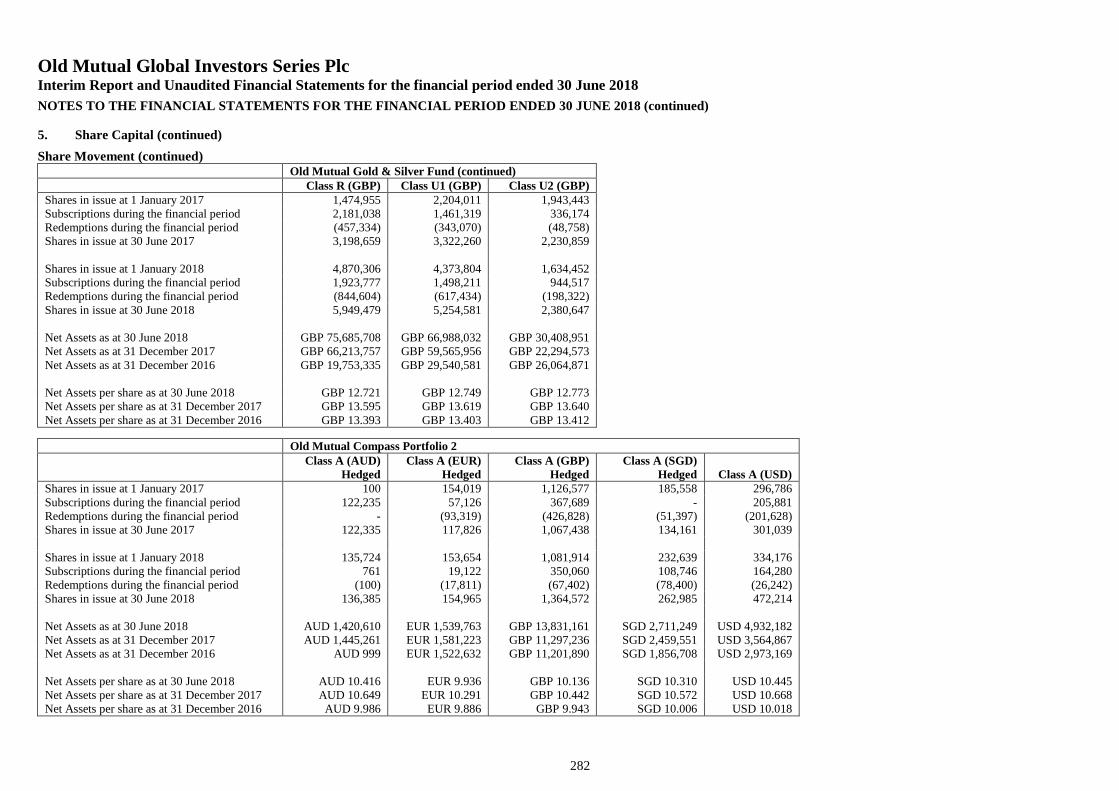
Old Mutual Global Investors Series PlcInterim Report and Unaudited Financial Statements for the financial period ended 30 June 2018
NOTES TO THE FINANCIAL STATEMENTS FOR THE FINANCIAL PERIOD ENDED 30 JUNE 2018 (continued)
282
5. Share Capital (continued)
Share Movement (continued)Old Mutual Gold & Silver Fund (continued)
Class R (GBP) Class U1 (GBP) Class U2 (GBP)Shares in issue at 1 January 2017 1,474,955 2,204,011 1,943,443Subscriptions during the financial period 2,181,038 1,461,319 336,174Redemptions during the financial period (457,334) (343,070) (48,758)Shares in issue at 30 June 2017 3,198,659 3,322,260 2,230,859
Shares in issue at 1 January 2018 4,870,306 4,373,804 1,634,452Subscriptions during the financial period 1,923,777 1,498,211 944,517Redemptions during the financial period (844,604) (617,434) (198,322)Shares in issue at 30 June 2018 5,949,479 5,254,581 2,380,647
Net Assets as at 30 June 2018 GBP 75,685,708 GBP 66,988,032 GBP 30,408,951Net Assets as at 31 December 2017 GBP 66,213,757 GBP 59,565,956 GBP 22,294,573Net Assets as at 31 December 2016 GBP 19,753,335 GBP 29,540,581 GBP 26,064,871
Net Assets per share as at 30 June 2018 GBP 12.721 GBP 12.749 GBP 12.773Net Assets per share as at 31 December 2017 GBP 13.595 GBP 13.619 GBP 13.640Net Assets per share as at 31 December 2016 GBP 13.393 GBP 13.403 GBP 13.412
Old Mutual Compass Portfolio 2Class A (AUD)
HedgedClass A (EUR)
HedgedClass A (GBP)
HedgedClass A (SGD)
Hedged Class A (USD)Shares in issue at 1 January 2017 100 154,019 1,126,577 185,558 296,786Subscriptions during the financial period 122,235 57,126 367,689 - 205,881Redemptions during the financial period - (93,319) (426,828) (51,397) (201,628)Shares in issue at 30 June 2017 122,335 117,826 1,067,438 134,161 301,039
Shares in issue at 1 January 2018 135,724 153,654 1,081,914 232,639 334,176Subscriptions during the financial period 761 19,122 350,060 108,746 164,280Redemptions during the financial period (100) (17,811) (67,402) (78,400) (26,242)Shares in issue at 30 June 2018 136,385 154,965 1,364,572 262,985 472,214
Net Assets as at 30 June 2018 AUD 1,420,610 EUR 1,539,763 GBP 13,831,161 SGD 2,711,249 USD 4,932,182Net Assets as at 31 December 2017 AUD 1,445,261 EUR 1,581,223 GBP 11,297,236 SGD 2,459,551 USD 3,564,867Net Assets as at 31 December 2016 AUD 999 EUR 1,522,632 GBP 11,201,890 SGD 1,856,708 USD 2,973,169
Net Assets per share as at 30 June 2018 AUD 10.416 EUR 9.936 GBP 10.136 SGD 10.310 USD 10.445Net Assets per share as at 31 December 2017 AUD 10.649 EUR 10.291 GBP 10.442 SGD 10.572 USD 10.668Net Assets per share as at 31 December 2016 AUD 9.986 EUR 9.886 GBP 9.943 SGD 10.006 USD 10.018
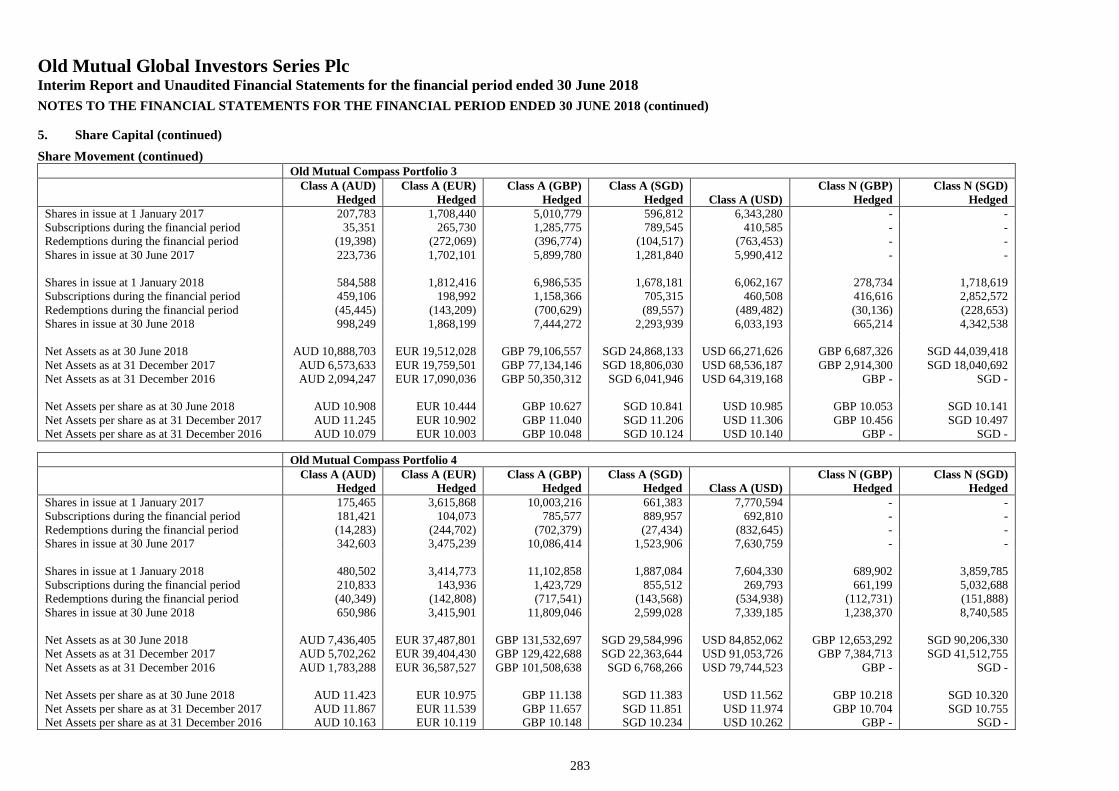
Old Mutual Global Investors Series PlcInterim Report and Unaudited Financial Statements for the financial period ended 30 June 2018
NOTES TO THE FINANCIAL STATEMENTS FOR THE FINANCIAL PERIOD ENDED 30 JUNE 2018 (continued)
283
5. Share Capital (continued)
Share Movement (continued)Old Mutual Compass Portfolio 3
Class A (AUD)Hedged
Class A (EUR)Hedged
Class A (GBP)Hedged
Class A (SGD)Hedged Class A (USD)
Class N (GBP)Hedged
Class N (SGD)Hedged
Shares in issue at 1 January 2017 207,783 1,708,440 5,010,779 596,812 6,343,280 - -Subscriptions during the financial period 35,351 265,730 1,285,775 789,545 410,585 - -Redemptions during the financial period (19,398) (272,069) (396,774) (104,517) (763,453) - -Shares in issue at 30 June 2017 223,736 1,702,101 5,899,780 1,281,840 5,990,412 - -
Shares in issue at 1 January 2018 584,588 1,812,416 6,986,535 1,678,181 6,062,167 278,734 1,718,619Subscriptions during the financial period 459,106 198,992 1,158,366 705,315 460,508 416,616 2,852,572Redemptions during the financial period (45,445) (143,209) (700,629) (89,557) (489,482) (30,136) (228,653)Shares in issue at 30 June 2018 998,249 1,868,199 7,444,272 2,293,939 6,033,193 665,214 4,342,538
Net Assets as at 30 June 2018 AUD 10,888,703 EUR 19,512,028 GBP 79,106,557 SGD 24,868,133 USD 66,271,626 GBP 6,687,326 SGD 44,039,418Net Assets as at 31 December 2017 AUD 6,573,633 EUR 19,759,501 GBP 77,134,146 SGD 18,806,030 USD 68,536,187 GBP 2,914,300 SGD 18,040,692Net Assets as at 31 December 2016 AUD 2,094,247 EUR 17,090,036 GBP 50,350,312 SGD 6,041,946 USD 64,319,168 GBP - SGD -
Net Assets per share as at 30 June 2018 AUD 10.908 EUR 10.444 GBP 10.627 SGD 10.841 USD 10.985 GBP 10.053 SGD 10.141Net Assets per share as at 31 December 2017 AUD 11.245 EUR 10.902 GBP 11.040 SGD 11.206 USD 11.306 GBP 10.456 SGD 10.497Net Assets per share as at 31 December 2016 AUD 10.079 EUR 10.003 GBP 10.048 SGD 10.124 USD 10.140 GBP - SGD -
Old Mutual Compass Portfolio 4Class A (AUD)
HedgedClass A (EUR)
HedgedClass A (GBP)
HedgedClass A (SGD)
Hedged Class A (USD)Class N (GBP)
HedgedClass N (SGD)
HedgedShares in issue at 1 January 2017 175,465 3,615,868 10,003,216 661,383 7,770,594 - -Subscriptions during the financial period 181,421 104,073 785,577 889,957 692,810 - -Redemptions during the financial period (14,283) (244,702) (702,379) (27,434) (832,645) - -Shares in issue at 30 June 2017 342,603 3,475,239 10,086,414 1,523,906 7,630,759 - -
Shares in issue at 1 January 2018 480,502 3,414,773 11,102,858 1,887,084 7,604,330 689,902 3,859,785Subscriptions during the financial period 210,833 143,936 1,423,729 855,512 269,793 661,199 5,032,688Redemptions during the financial period (40,349) (142,808) (717,541) (143,568) (534,938) (112,731) (151,888)Shares in issue at 30 June 2018 650,986 3,415,901 11,809,046 2,599,028 7,339,185 1,238,370 8,740,585
Net Assets as at 30 June 2018 AUD 7,436,405 EUR 37,487,801 GBP 131,532,697 SGD 29,584,996 USD 84,852,062 GBP 12,653,292 SGD 90,206,330Net Assets as at 31 December 2017 AUD 5,702,262 EUR 39,404,430 GBP 129,422,688 SGD 22,363,644 USD 91,053,726 GBP 7,384,713 SGD 41,512,755Net Assets as at 31 December 2016 AUD 1,783,288 EUR 36,587,527 GBP 101,508,638 SGD 6,768,266 USD 79,744,523 GBP - SGD -
Net Assets per share as at 30 June 2018 AUD 11.423 EUR 10.975 GBP 11.138 SGD 11.383 USD 11.562 GBP 10.218 SGD 10.320Net Assets per share as at 31 December 2017 AUD 11.867 EUR 11.539 GBP 11.657 SGD 11.851 USD 11.974 GBP 10.704 SGD 10.755Net Assets per share as at 31 December 2016 AUD 10.163 EUR 10.119 GBP 10.148 SGD 10.234 USD 10.262 GBP - SGD -
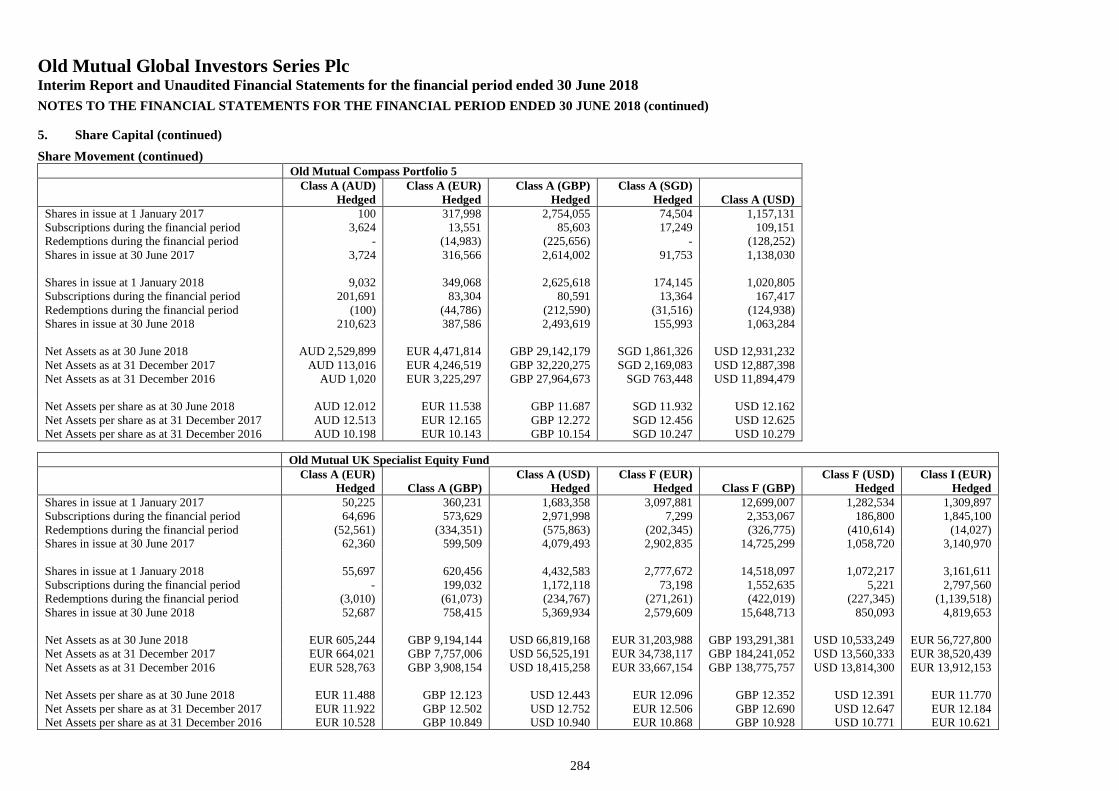
Old Mutual Global Investors Series PlcInterim Report and Unaudited Financial Statements for the financial period ended 30 June 2018
NOTES TO THE FINANCIAL STATEMENTS FOR THE FINANCIAL PERIOD ENDED 30 JUNE 2018 (continued)
284
5. Share Capital (continued)
Share Movement (continued)Old Mutual Compass Portfolio 5
Class A (AUD)Hedged
Class A (EUR)Hedged
Class A (GBP)Hedged
Class A (SGD)Hedged Class A (USD)
Shares in issue at 1 January 2017 100 317,998 2,754,055 74,504 1,157,131Subscriptions during the financial period 3,624 13,551 85,603 17,249 109,151Redemptions during the financial period - (14,983) (225,656) - (128,252)Shares in issue at 30 June 2017 3,724 316,566 2,614,002 91,753 1,138,030
Shares in issue at 1 January 2018 9,032 349,068 2,625,618 174,145 1,020,805Subscriptions during the financial period 201,691 83,304 80,591 13,364 167,417Redemptions during the financial period (100) (44,786) (212,590) (31,516) (124,938)Shares in issue at 30 June 2018 210,623 387,586 2,493,619 155,993 1,063,284
Net Assets as at 30 June 2018 AUD 2,529,899 EUR 4,471,814 GBP 29,142,179 SGD 1,861,326 USD 12,931,232Net Assets as at 31 December 2017 AUD 113,016 EUR 4,246,519 GBP 32,220,275 SGD 2,169,083 USD 12,887,398Net Assets as at 31 December 2016 AUD 1,020 EUR 3,225,297 GBP 27,964,673 SGD 763,448 USD 11,894,479
Net Assets per share as at 30 June 2018 AUD 12.012 EUR 11.538 GBP 11.687 SGD 11.932 USD 12.162Net Assets per share as at 31 December 2017 AUD 12.513 EUR 12.165 GBP 12.272 SGD 12.456 USD 12.625Net Assets per share as at 31 December 2016 AUD 10.198 EUR 10.143 GBP 10.154 SGD 10.247 USD 10.279
Old Mutual UK Specialist Equity FundClass A (EUR)
Hedged Class A (GBP)Class A (USD)
HedgedClass F (EUR)
Hedged Class F (GBP)Class F (USD)
HedgedClass I (EUR)
HedgedShares in issue at 1 January 2017 50,225 360,231 1,683,358 3,097,881 12,699,007 1,282,534 1,309,897Subscriptions during the financial period 64,696 573,629 2,971,998 7,299 2,353,067 186,800 1,845,100Redemptions during the financial period (52,561) (334,351) (575,863) (202,345) (326,775) (410,614) (14,027)Shares in issue at 30 June 2017 62,360 599,509 4,079,493 2,902,835 14,725,299 1,058,720 3,140,970
Shares in issue at 1 January 2018 55,697 620,456 4,432,583 2,777,672 14,518,097 1,072,217 3,161,611Subscriptions during the financial period - 199,032 1,172,118 73,198 1,552,635 5,221 2,797,560Redemptions during the financial period (3,010) (61,073) (234,767) (271,261) (422,019) (227,345) (1,139,518)Shares in issue at 30 June 2018 52,687 758,415 5,369,934 2,579,609 15,648,713 850,093 4,819,653
Net Assets as at 30 June 2018 EUR 605,244 GBP 9,194,144 USD 66,819,168 EUR 31,203,988 GBP 193,291,381 USD 10,533,249 EUR 56,727,800Net Assets as at 31 December 2017 EUR 664,021 GBP 7,757,006 USD 56,525,191 EUR 34,738,117 GBP 184,241,052 USD 13,560,333 EUR 38,520,439Net Assets as at 31 December 2016 EUR 528,763 GBP 3,908,154 USD 18,415,258 EUR 33,667,154 GBP 138,775,757 USD 13,814,300 EUR 13,912,153
Net Assets per share as at 30 June 2018 EUR 11.488 GBP 12.123 USD 12.443 EUR 12.096 GBP 12.352 USD 12.391 EUR 11.770Net Assets per share as at 31 December 2017 EUR 11.922 GBP 12.502 USD 12.752 EUR 12.506 GBP 12.690 USD 12.647 EUR 12.184Net Assets per share as at 31 December 2016 EUR 10.528 GBP 10.849 USD 10.940 EUR 10.868 GBP 10.928 USD 10.771 EUR 10.621
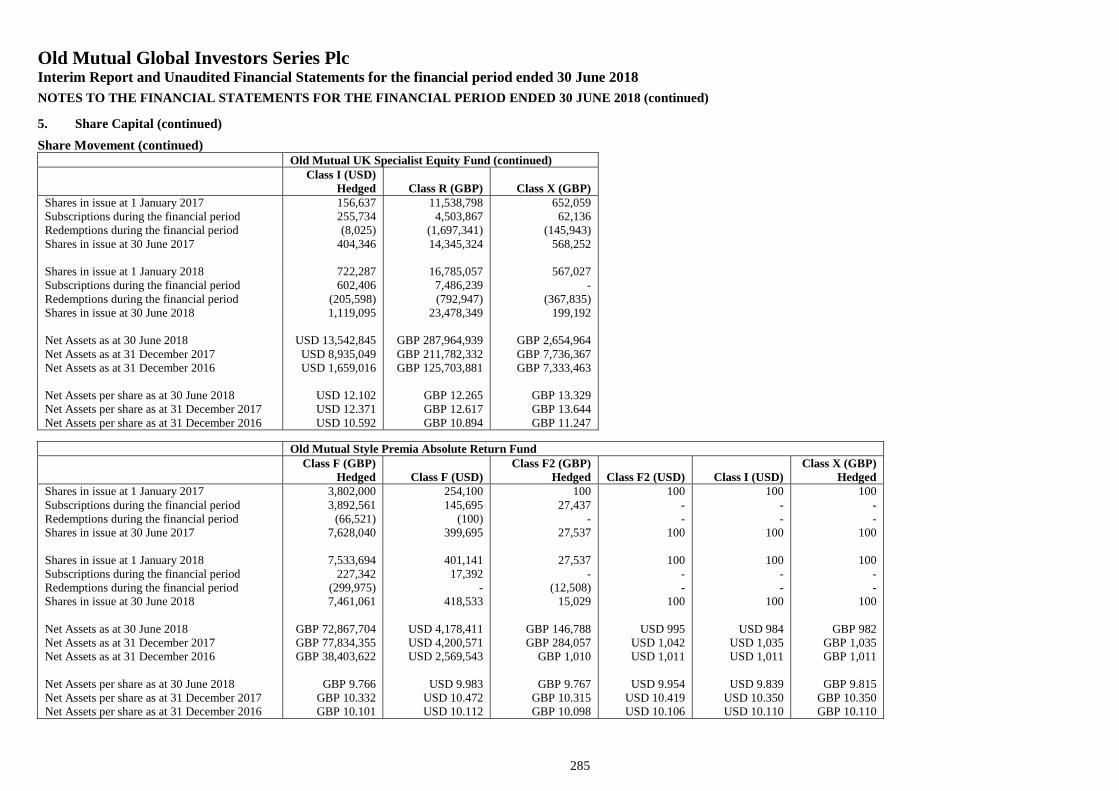
Old Mutual Global Investors Series PlcInterim Report and Unaudited Financial Statements for the financial period ended 30 June 2018
NOTES TO THE FINANCIAL STATEMENTS FOR THE FINANCIAL PERIOD ENDED 30 JUNE 2018 (continued)
285
5. Share Capital (continued)
Share Movement (continued)Old Mutual UK Specialist Equity Fund (continued)
Class I (USD)Hedged Class R (GBP) Class X (GBP)
Shares in issue at 1 January 2017 156,637 11,538,798 652,059Subscriptions during the financial period 255,734 4,503,867 62,136Redemptions during the financial period (8,025) (1,697,341) (145,943)Shares in issue at 30 June 2017 404,346 14,345,324 568,252
Shares in issue at 1 January 2018 722,287 16,785,057 567,027Subscriptions during the financial period 602,406 7,486,239 -Redemptions during the financial period (205,598) (792,947) (367,835)Shares in issue at 30 June 2018 1,119,095 23,478,349 199,192
Net Assets as at 30 June 2018 USD 13,542,845 GBP 287,964,939 GBP 2,654,964Net Assets as at 31 December 2017 USD 8,935,049 GBP 211,782,332 GBP 7,736,367Net Assets as at 31 December 2016 USD 1,659,016 GBP 125,703,881 GBP 7,333,463
Net Assets per share as at 30 June 2018 USD 12.102 GBP 12.265 GBP 13.329Net Assets per share as at 31 December 2017 USD 12.371 GBP 12.617 GBP 13.644Net Assets per share as at 31 December 2016 USD 10.592 GBP 10.894 GBP 11.247
Old Mutual Style Premia Absolute Return FundClass F (GBP)
Hedged Class F (USD)Class F2 (GBP)
Hedged Class F2 (USD) Class I (USD)Class X (GBP)
HedgedShares in issue at 1 January 2017 3,802,000 254,100 100 100 100 100Subscriptions during the financial period 3,892,561 145,695 27,437 - - -Redemptions during the financial period (66,521) (100) - - - -Shares in issue at 30 June 2017 7,628,040 399,695 27,537 100 100 100
Shares in issue at 1 January 2018 7,533,694 401,141 27,537 100 100 100Subscriptions during the financial period 227,342 17,392 - - - -Redemptions during the financial period (299,975) - (12,508) - - -Shares in issue at 30 June 2018 7,461,061 418,533 15,029 100 100 100
Net Assets as at 30 June 2018 GBP 72,867,704 USD 4,178,411 GBP 146,788 USD 995 USD 984 GBP 982Net Assets as at 31 December 2017 GBP 77,834,355 USD 4,200,571 GBP 284,057 USD 1,042 USD 1,035 GBP 1,035Net Assets as at 31 December 2016 GBP 38,403,622 USD 2,569,543 GBP 1,010 USD 1,011 USD 1,011 GBP 1,011
Net Assets per share as at 30 June 2018 GBP 9.766 USD 9.983 GBP 9.767 USD 9.954 USD 9.839 GBP 9.815Net Assets per share as at 31 December 2017 GBP 10.332 USD 10.472 GBP 10.315 USD 10.419 USD 10.350 GBP 10.350Net Assets per share as at 31 December 2016 GBP 10.101 USD 10.112 GBP 10.098 USD 10.106 USD 10.110 GBP 10.110
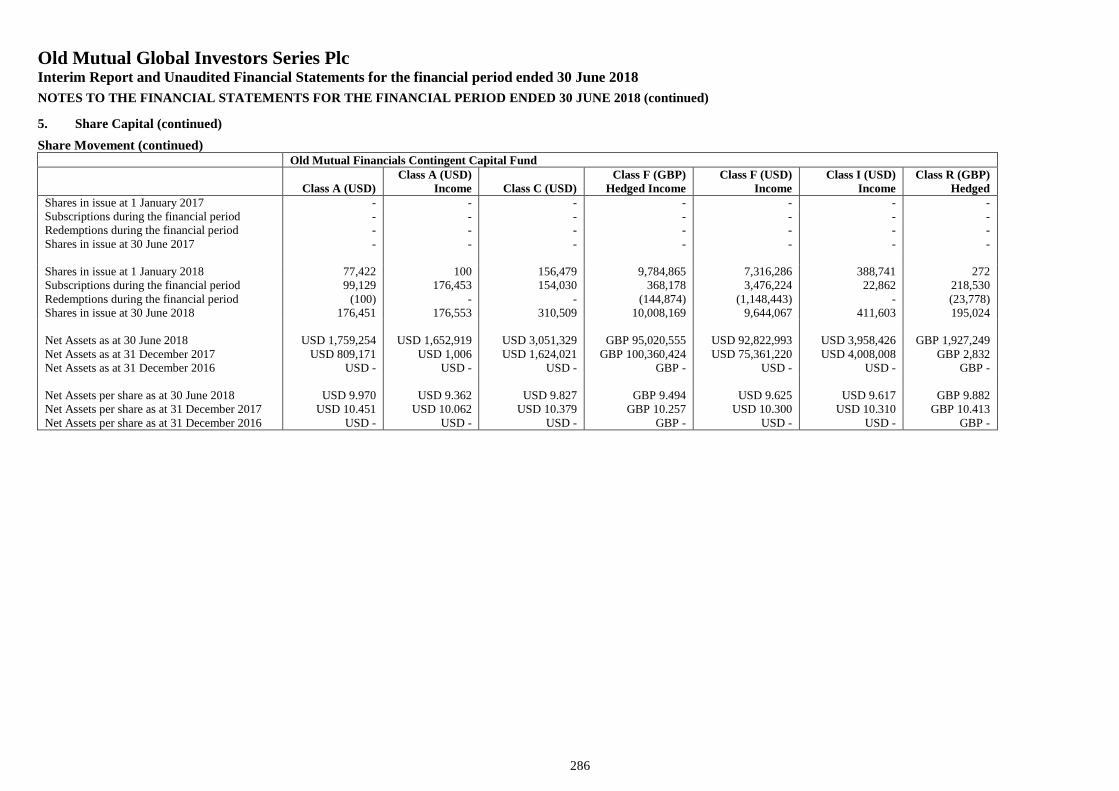
Old Mutual Global Investors Series PlcInterim Report and Unaudited Financial Statements for the financial period ended 30 June 2018
NOTES TO THE FINANCIAL STATEMENTS FOR THE FINANCIAL PERIOD ENDED 30 JUNE 2018 (continued)
286
5. Share Capital (continued)
Share Movement (continued)Old Mutual Financials Contingent Capital Fund
Class A (USD)Class A (USD)
Income Class C (USD)Class F (GBP)
Hedged IncomeClass F (USD)
IncomeClass I (USD)
IncomeClass R (GBP)
HedgedShares in issue at 1 January 2017 - - - - - - -Subscriptions during the financial period - - - - - - -Redemptions during the financial period - - - - - - -Shares in issue at 30 June 2017 - - - - - - -
Shares in issue at 1 January 2018 77,422 100 156,479 9,784,865 7,316,286 388,741 272Subscriptions during the financial period 99,129 176,453 154,030 368,178 3,476,224 22,862 218,530Redemptions during the financial period (100) - - (144,874) (1,148,443) - (23,778)Shares in issue at 30 June 2018 176,451 176,553 310,509 10,008,169 9,644,067 411,603 195,024
Net Assets as at 30 June 2018 USD 1,759,254 USD 1,652,919 USD 3,051,329 GBP 95,020,555 USD 92,822,993 USD 3,958,426 GBP 1,927,249Net Assets as at 31 December 2017 USD 809,171 USD 1,006 USD 1,624,021 GBP 100,360,424 USD 75,361,220 USD 4,008,008 GBP 2,832Net Assets as at 31 December 2016 USD - USD - USD - GBP - USD - USD - GBP -
Net Assets per share as at 30 June 2018 USD 9.970 USD 9.362 USD 9.827 GBP 9.494 USD 9.625 USD 9.617 GBP 9.882Net Assets per share as at 31 December 2017 USD 10.451 USD 10.062 USD 10.379 GBP 10.257 USD 10.300 USD 10.310 GBP 10.413Net Assets per share as at 31 December 2016 USD - USD - USD - GBP - USD - USD - GBP -
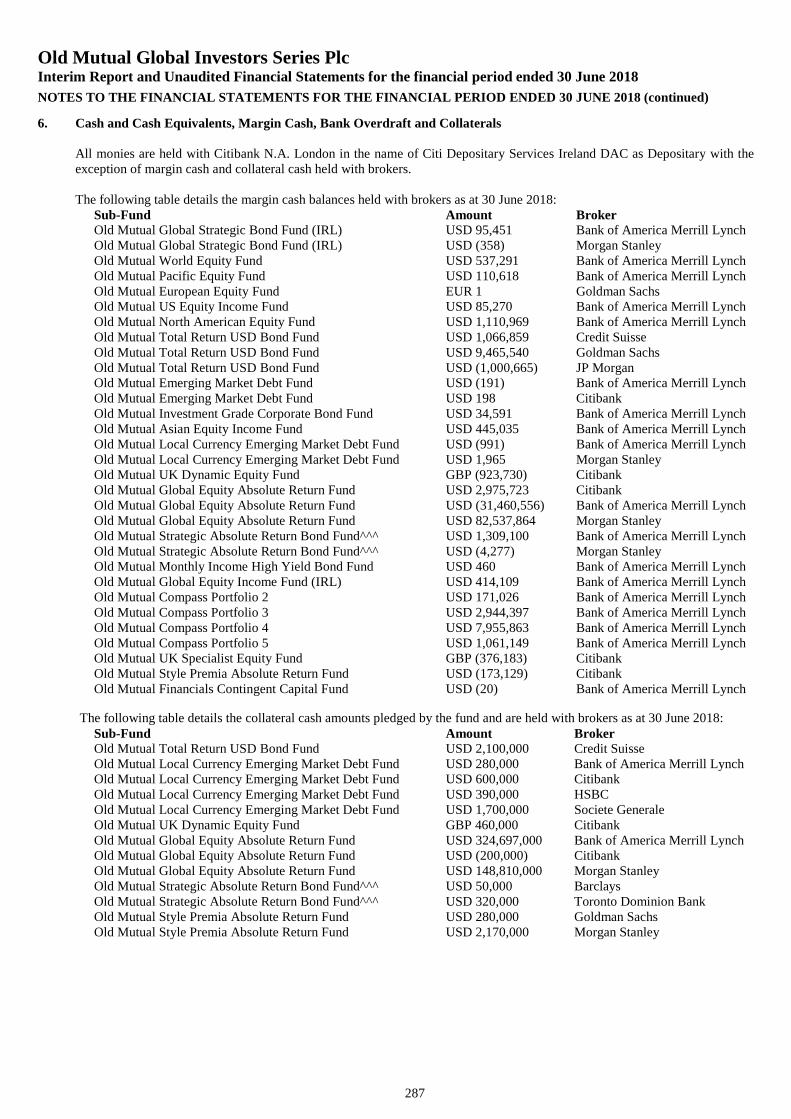
Old Mutual Global Investors Series PlcInterim Report and Unaudited Financial Statements for the financial period ended 30 June 2018
NOTES TO THE FINANCIAL STATEMENTS FOR THE FINANCIAL PERIOD ENDED 30 JUNE 2018 (continued)
287
6. Cash and Cash Equivalents, Margin Cash, Bank Overdraft and Collaterals
All monies are held with Citibank N.A. London in the name of Citi Depositary Services Ireland DAC as Depositary with theexception of margin cash and collateral cash held with brokers.
The following table details the margin cash balances held with brokers as at 30 June 2018:Sub-Fund Amount BrokerOld Mutual Global Strategic Bond Fund (IRL) USD 95,451 Bank of America Merrill LynchOld Mutual Global Strategic Bond Fund (IRL) USD (358) Morgan StanleyOld Mutual World Equity Fund USD 537,291 Bank of America Merrill LynchOld Mutual Pacific Equity Fund USD 110,618 Bank of America Merrill LynchOld Mutual European Equity Fund EUR 1 Goldman SachsOld Mutual US Equity Income Fund USD 85,270 Bank of America Merrill LynchOld Mutual North American Equity Fund USD 1,110,969 Bank of America Merrill LynchOld Mutual Total Return USD Bond Fund USD 1,066,859 Credit SuisseOld Mutual Total Return USD Bond Fund USD 9,465,540 Goldman SachsOld Mutual Total Return USD Bond Fund USD (1,000,665) JP MorganOld Mutual Emerging Market Debt Fund USD (191) Bank of America Merrill LynchOld Mutual Emerging Market Debt Fund USD 198 CitibankOld Mutual Investment Grade Corporate Bond Fund USD 34,591 Bank of America Merrill LynchOld Mutual Asian Equity Income Fund USD 445,035 Bank of America Merrill LynchOld Mutual Local Currency Emerging Market Debt Fund USD (991) Bank of America Merrill LynchOld Mutual Local Currency Emerging Market Debt Fund USD 1,965 Morgan StanleyOld Mutual UK Dynamic Equity Fund GBP (923,730) CitibankOld Mutual Global Equity Absolute Return Fund USD 2,975,723 CitibankOld Mutual Global Equity Absolute Return Fund USD (31,460,556) Bank of America Merrill LynchOld Mutual Global Equity Absolute Return Fund USD 82,537,864 Morgan StanleyOld Mutual Strategic Absolute Return Bond Fund^^^ USD 1,309,100 Bank of America Merrill LynchOld Mutual Strategic Absolute Return Bond Fund^^^ USD (4,277) Morgan StanleyOld Mutual Monthly Income High Yield Bond Fund USD 460 Bank of America Merrill LynchOld Mutual Global Equity Income Fund (IRL) USD 414,109 Bank of America Merrill LynchOld Mutual Compass Portfolio 2 USD 171,026 Bank of America Merrill LynchOld Mutual Compass Portfolio 3 USD 2,944,397 Bank of America Merrill LynchOld Mutual Compass Portfolio 4 USD 7,955,863 Bank of America Merrill LynchOld Mutual Compass Portfolio 5 USD 1,061,149 Bank of America Merrill LynchOld Mutual UK Specialist Equity Fund GBP (376,183) CitibankOld Mutual Style Premia Absolute Return Fund USD (173,129) CitibankOld Mutual Financials Contingent Capital Fund USD (20) Bank of America Merrill Lynch
The following table details the collateral cash amounts pledged by the fund and are held with brokers as at 30 June 2018:Sub-Fund Amount BrokerOld Mutual Total Return USD Bond Fund USD 2,100,000 Credit SuisseOld Mutual Local Currency Emerging Market Debt Fund USD 280,000 Bank of America Merrill LynchOld Mutual Local Currency Emerging Market Debt Fund USD 600,000 CitibankOld Mutual Local Currency Emerging Market Debt Fund USD 390,000 HSBCOld Mutual Local Currency Emerging Market Debt Fund USD 1,700,000 Societe GeneraleOld Mutual UK Dynamic Equity Fund GBP 460,000 CitibankOld Mutual Global Equity Absolute Return Fund USD 324,697,000 Bank of America Merrill LynchOld Mutual Global Equity Absolute Return Fund USD (200,000) CitibankOld Mutual Global Equity Absolute Return Fund USD 148,810,000 Morgan StanleyOld Mutual Strategic Absolute Return Bond Fund^^^ USD 50,000 BarclaysOld Mutual Strategic Absolute Return Bond Fund^^^ USD 320,000 Toronto Dominion BankOld Mutual Style Premia Absolute Return Fund USD 280,000 Goldman SachsOld Mutual Style Premia Absolute Return Fund USD 2,170,000 Morgan Stanley
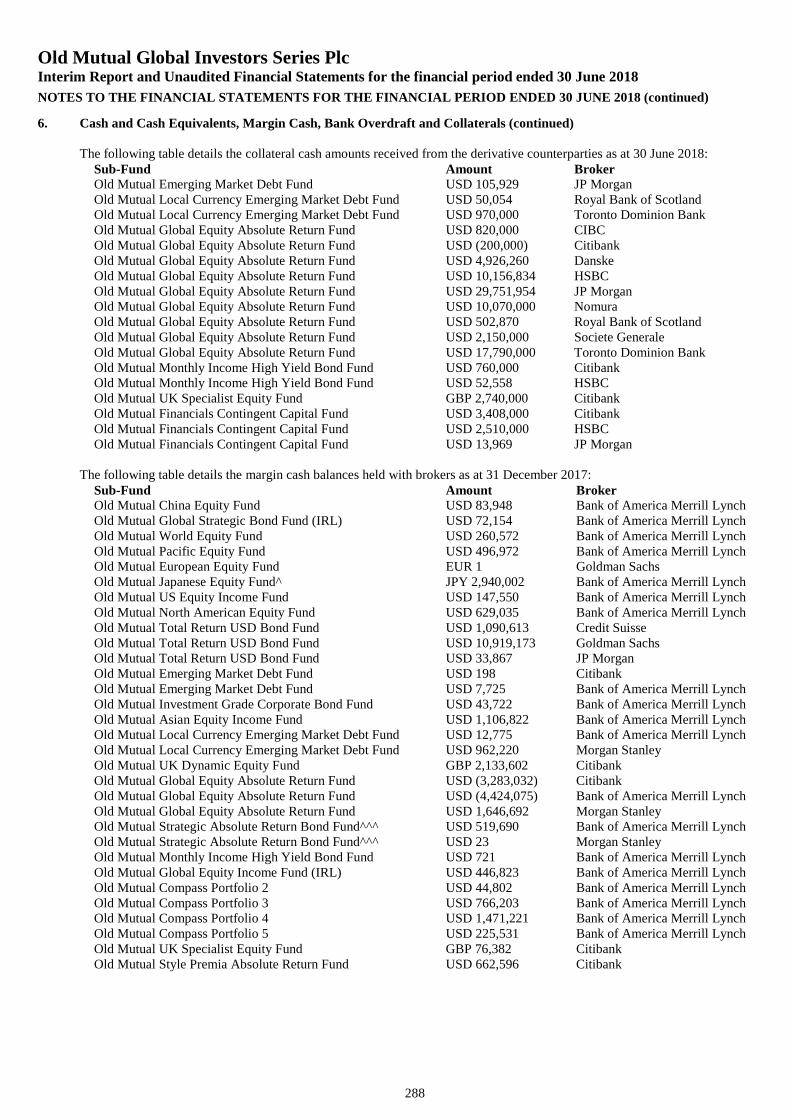
Old Mutual Global Investors Series PlcInterim Report and Unaudited Financial Statements for the financial period ended 30 June 2018
NOTES TO THE FINANCIAL STATEMENTS FOR THE FINANCIAL PERIOD ENDED 30 JUNE 2018 (continued)
288
6. Cash and Cash Equivalents, Margin Cash, Bank Overdraft and Collaterals (continued)
The following table details the collateral cash amounts received from the derivative counterparties as at 30 June 2018:Sub-Fund Amount BrokerOld Mutual Emerging Market Debt Fund USD 105,929 JP MorganOld Mutual Local Currency Emerging Market Debt Fund USD 50,054 Royal Bank of ScotlandOld Mutual Local Currency Emerging Market Debt Fund USD 970,000 Toronto Dominion BankOld Mutual Global Equity Absolute Return Fund USD 820,000 CIBCOld Mutual Global Equity Absolute Return Fund USD (200,000) CitibankOld Mutual Global Equity Absolute Return Fund USD 4,926,260 DanskeOld Mutual Global Equity Absolute Return Fund USD 10,156,834 HSBCOld Mutual Global Equity Absolute Return Fund USD 29,751,954 JP MorganOld Mutual Global Equity Absolute Return Fund USD 10,070,000 NomuraOld Mutual Global Equity Absolute Return Fund USD 502,870 Royal Bank of ScotlandOld Mutual Global Equity Absolute Return Fund USD 2,150,000 Societe GeneraleOld Mutual Global Equity Absolute Return Fund USD 17,790,000 Toronto Dominion BankOld Mutual Monthly Income High Yield Bond Fund USD 760,000 CitibankOld Mutual Monthly Income High Yield Bond Fund USD 52,558 HSBCOld Mutual UK Specialist Equity Fund GBP 2,740,000 CitibankOld Mutual Financials Contingent Capital Fund USD 3,408,000 CitibankOld Mutual Financials Contingent Capital Fund USD 2,510,000 HSBCOld Mutual Financials Contingent Capital Fund USD 13,969 JP Morgan
The following table details the margin cash balances held with brokers as at 31 December 2017:Sub-Fund Amount BrokerOld Mutual China Equity Fund USD 83,948 Bank of America Merrill LynchOld Mutual Global Strategic Bond Fund (IRL) USD 72,154 Bank of America Merrill LynchOld Mutual World Equity Fund USD 260,572 Bank of America Merrill LynchOld Mutual Pacific Equity Fund USD 496,972 Bank of America Merrill LynchOld Mutual European Equity Fund EUR 1 Goldman SachsOld Mutual Japanese Equity Fund^ JPY 2,940,002 Bank of America Merrill LynchOld Mutual US Equity Income Fund USD 147,550 Bank of America Merrill LynchOld Mutual North American Equity Fund USD 629,035 Bank of America Merrill LynchOld Mutual Total Return USD Bond Fund USD 1,090,613 Credit SuisseOld Mutual Total Return USD Bond Fund USD 10,919,173 Goldman SachsOld Mutual Total Return USD Bond Fund USD 33,867 JP MorganOld Mutual Emerging Market Debt Fund USD 198 CitibankOld Mutual Emerging Market Debt Fund USD 7,725 Bank of America Merrill LynchOld Mutual Investment Grade Corporate Bond Fund USD 43,722 Bank of America Merrill LynchOld Mutual Asian Equity Income Fund USD 1,106,822 Bank of America Merrill LynchOld Mutual Local Currency Emerging Market Debt Fund USD 12,775 Bank of America Merrill LynchOld Mutual Local Currency Emerging Market Debt Fund USD 962,220 Morgan StanleyOld Mutual UK Dynamic Equity Fund GBP 2,133,602 CitibankOld Mutual Global Equity Absolute Return Fund USD (3,283,032) CitibankOld Mutual Global Equity Absolute Return Fund USD (4,424,075) Bank of America Merrill LynchOld Mutual Global Equity Absolute Return Fund USD 1,646,692 Morgan StanleyOld Mutual Strategic Absolute Return Bond Fund^^^ USD 519,690 Bank of America Merrill LynchOld Mutual Strategic Absolute Return Bond Fund^^^ USD 23 Morgan StanleyOld Mutual Monthly Income High Yield Bond Fund USD 721 Bank of America Merrill LynchOld Mutual Global Equity Income Fund (IRL) USD 446,823 Bank of America Merrill LynchOld Mutual Compass Portfolio 2 USD 44,802 Bank of America Merrill LynchOld Mutual Compass Portfolio 3 USD 766,203 Bank of America Merrill LynchOld Mutual Compass Portfolio 4 USD 1,471,221 Bank of America Merrill LynchOld Mutual Compass Portfolio 5 USD 225,531 Bank of America Merrill LynchOld Mutual UK Specialist Equity Fund GBP 76,382 CitibankOld Mutual Style Premia Absolute Return Fund USD 662,596 Citibank
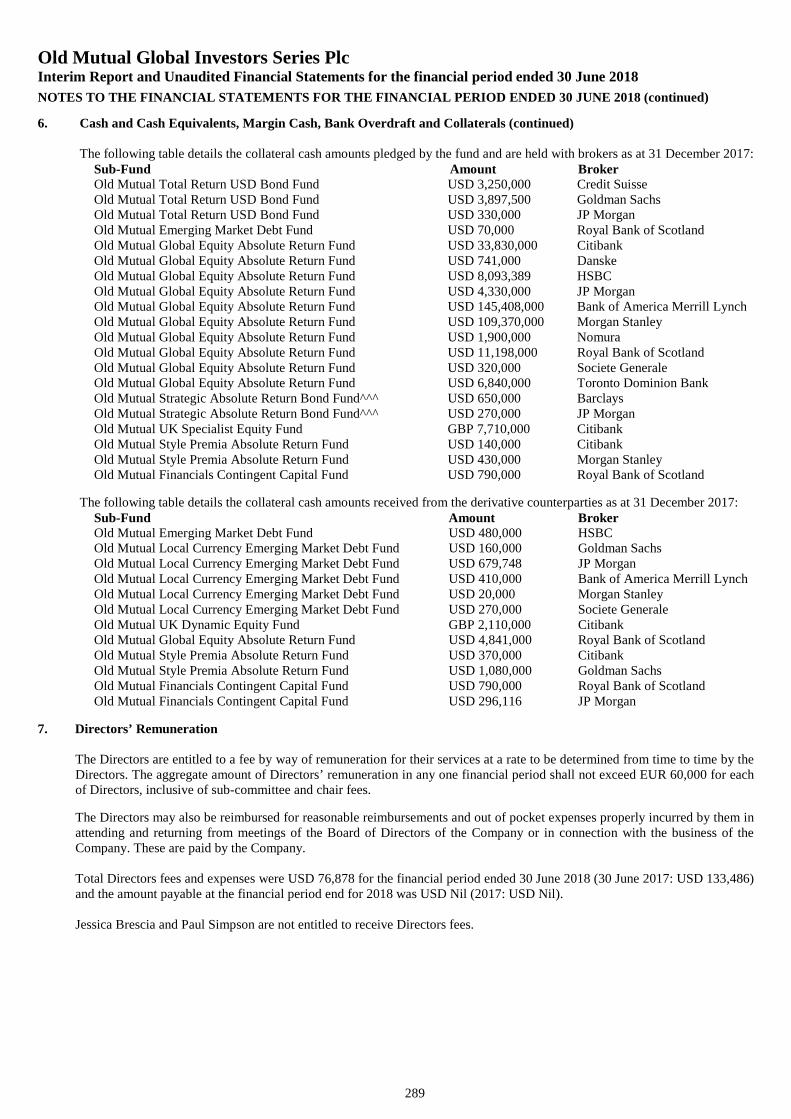
Old Mutual Global Investors Series PlcInterim Report and Unaudited Financial Statements for the financial period ended 30 June 2018
NOTES TO THE FINANCIAL STATEMENTS FOR THE FINANCIAL PERIOD ENDED 30 JUNE 2018 (continued)
289
6. Cash and Cash Equivalents, Margin Cash, Bank Overdraft and Collaterals (continued)
The following table details the collateral cash amounts pledged by the fund and are held with brokers as at 31 December 2017:Sub-Fund Amount BrokerOld Mutual Total Return USD Bond Fund USD 3,250,000 Credit SuisseOld Mutual Total Return USD Bond Fund USD 3,897,500 Goldman SachsOld Mutual Total Return USD Bond Fund USD 330,000 JP MorganOld Mutual Emerging Market Debt Fund USD 70,000 Royal Bank of ScotlandOld Mutual Global Equity Absolute Return Fund USD 33,830,000 CitibankOld Mutual Global Equity Absolute Return Fund USD 741,000 DanskeOld Mutual Global Equity Absolute Return Fund USD 8,093,389 HSBCOld Mutual Global Equity Absolute Return Fund USD 4,330,000 JP MorganOld Mutual Global Equity Absolute Return Fund USD 145,408,000 Bank of America Merrill LynchOld Mutual Global Equity Absolute Return Fund USD 109,370,000 Morgan StanleyOld Mutual Global Equity Absolute Return Fund USD 1,900,000 NomuraOld Mutual Global Equity Absolute Return Fund USD 11,198,000 Royal Bank of ScotlandOld Mutual Global Equity Absolute Return Fund USD 320,000 Societe GeneraleOld Mutual Global Equity Absolute Return Fund USD 6,840,000 Toronto Dominion BankOld Mutual Strategic Absolute Return Bond Fund^^^ USD 650,000 BarclaysOld Mutual Strategic Absolute Return Bond Fund^^^ USD 270,000 JP MorganOld Mutual UK Specialist Equity Fund GBP 7,710,000 CitibankOld Mutual Style Premia Absolute Return Fund USD 140,000 CitibankOld Mutual Style Premia Absolute Return Fund USD 430,000 Morgan StanleyOld Mutual Financials Contingent Capital Fund USD 790,000 Royal Bank of Scotland
The following table details the collateral cash amounts received from the derivative counterparties as at 31 December 2017:Sub-Fund Amount BrokerOld Mutual Emerging Market Debt Fund USD 480,000 HSBCOld Mutual Local Currency Emerging Market Debt Fund USD 160,000 Goldman SachsOld Mutual Local Currency Emerging Market Debt Fund USD 679,748 JP MorganOld Mutual Local Currency Emerging Market Debt Fund USD 410,000 Bank of America Merrill LynchOld Mutual Local Currency Emerging Market Debt Fund USD 20,000 Morgan StanleyOld Mutual Local Currency Emerging Market Debt Fund USD 270,000 Societe GeneraleOld Mutual UK Dynamic Equity Fund GBP 2,110,000 CitibankOld Mutual Global Equity Absolute Return Fund USD 4,841,000 Royal Bank of ScotlandOld Mutual Style Premia Absolute Return Fund USD 370,000 CitibankOld Mutual Style Premia Absolute Return Fund USD 1,080,000 Goldman SachsOld Mutual Financials Contingent Capital Fund USD 790,000 Royal Bank of ScotlandOld Mutual Financials Contingent Capital Fund USD 296,116 JP Morgan
7. Directors’ Remuneration
The Directors are entitled to a fee by way of remuneration for their services at a rate to be determined from time to time by theDirectors. The aggregate amount of Directors’ remuneration in any one financial period shall not exceed EUR 60,000 for eachof Directors, inclusive of sub-committee and chair fees.
The Directors may also be reimbursed for reasonable reimbursements and out of pocket expenses properly incurred by them inattending and returning from meetings of the Board of Directors of the Company or in connection with the business of theCompany. These are paid by the Company.
Total Directors fees and expenses were USD 76,878 for the financial period ended 30 June 2018 (30 June 2017: USD 133,486)and the amount payable at the financial period end for 2018 was USD Nil (2017: USD Nil).
Jessica Brescia and Paul Simpson are not entitled to receive Directors fees.
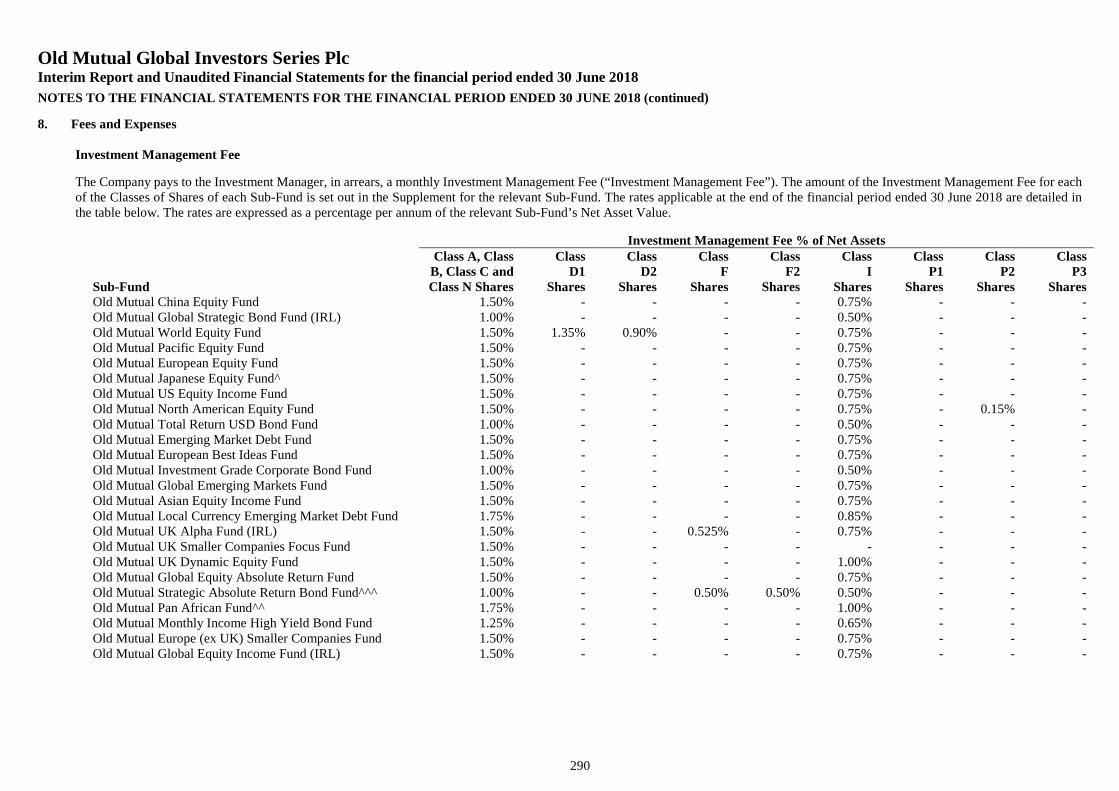
Old Mutual Global Investors Series PlcInterim Report and Unaudited Financial Statements for the financial period ended 30 June 2018
NOTES TO THE FINANCIAL STATEMENTS FOR THE FINANCIAL PERIOD ENDED 30 JUNE 2018 (continued)
290
8. Fees and Expenses
Investment Management Fee
The Company pays to the Investment Manager, in arrears, a monthly Investment Management Fee (“Investment Management Fee”). The amount of the Investment Management Fee for eachof the Classes of Shares of each Sub-Fund is set out in the Supplement for the relevant Sub-Fund. The rates applicable at the end of the financial period ended 30 June 2018 are detailed inthe table below. The rates are expressed as a percentage per annum of the relevant Sub-Fund’s Net Asset Value.
Investment Management Fee % of Net Assets
Sub-Fund
Class A, ClassB, Class C andClass N Shares
ClassD1
Shares
ClassD2
Shares
ClassF
Shares
ClassF2
Shares
ClassI
Shares
ClassP1
Shares
ClassP2
Shares
ClassP3
SharesOld Mutual China Equity Fund 1.50% - - - - 0.75% - - -Old Mutual Global Strategic Bond Fund (IRL) 1.00% - - - - 0.50% - - -Old Mutual World Equity Fund 1.50% 1.35% 0.90% - - 0.75% - - -Old Mutual Pacific Equity Fund 1.50% - - - - 0.75% - - -Old Mutual European Equity Fund 1.50% - - - - 0.75% - - -Old Mutual Japanese Equity Fund^ 1.50% - - - - 0.75% - - -Old Mutual US Equity Income Fund 1.50% - - - - 0.75% - - -Old Mutual North American Equity Fund 1.50% - - - - 0.75% - 0.15% -Old Mutual Total Return USD Bond Fund 1.00% - - - - 0.50% - - -Old Mutual Emerging Market Debt Fund 1.50% - - - - 0.75% - - -Old Mutual European Best Ideas Fund 1.50% - - - - 0.75% - - -Old Mutual Investment Grade Corporate Bond Fund 1.00% - - - - 0.50% - - -Old Mutual Global Emerging Markets Fund 1.50% - - - - 0.75% - - -Old Mutual Asian Equity Income Fund 1.50% - - - - 0.75% - - -Old Mutual Local Currency Emerging Market Debt Fund 1.75% - - - - 0.85% - - -Old Mutual UK Alpha Fund (IRL) 1.50% - - 0.525% - 0.75% - - -Old Mutual UK Smaller Companies Focus Fund 1.50% - - - - - - - -Old Mutual UK Dynamic Equity Fund 1.50% - - - - 1.00% - - -Old Mutual Global Equity Absolute Return Fund 1.50% - - - - 0.75% - - -Old Mutual Strategic Absolute Return Bond Fund^^^ 1.00% - - 0.50% 0.50% 0.50% - - -Old Mutual Pan African Fund^^ 1.75% - - - - 1.00% - - -Old Mutual Monthly Income High Yield Bond Fund 1.25% - - - - 0.65% - - -Old Mutual Europe (ex UK) Smaller Companies Fund 1.50% - - - - 0.75% - - -Old Mutual Global Equity Income Fund (IRL) 1.50% - - - - 0.75% - - -
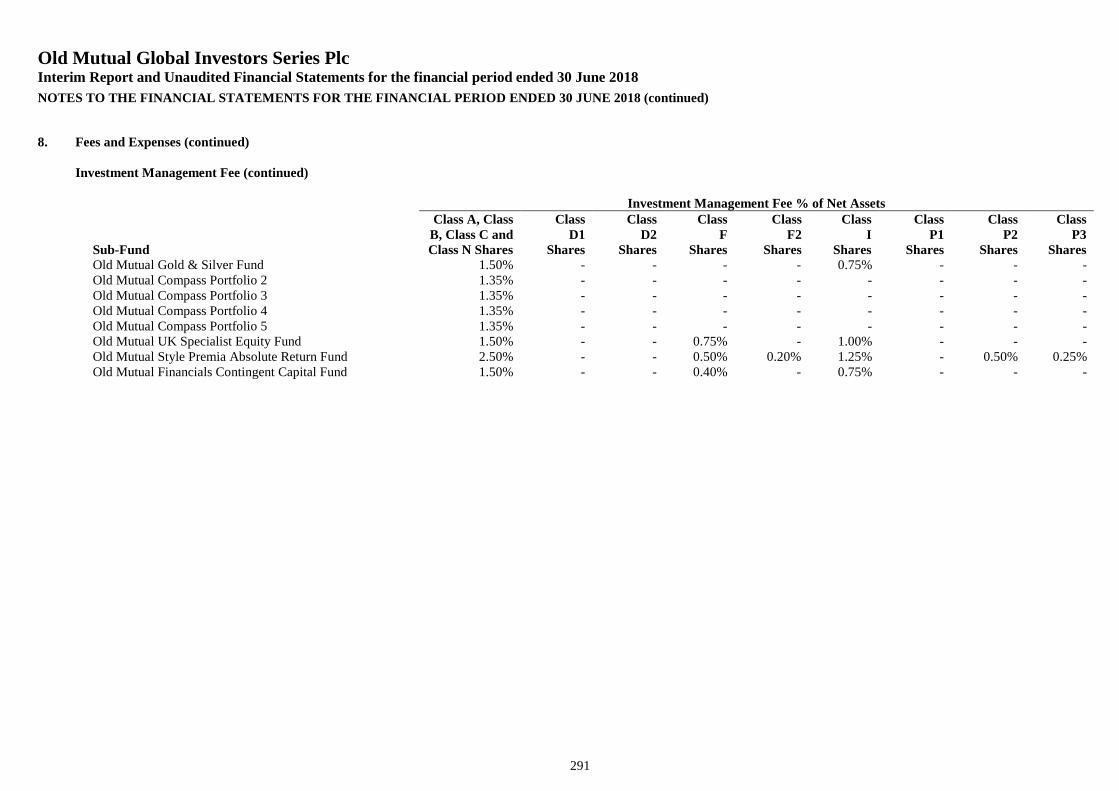
Old Mutual Global Investors Series PlcInterim Report and Unaudited Financial Statements for the financial period ended 30 June 2018
NOTES TO THE FINANCIAL STATEMENTS FOR THE FINANCIAL PERIOD ENDED 30 JUNE 2018 (continued)
291
8. Fees and Expenses (continued)
Investment Management Fee (continued)
Investment Management Fee % of Net Assets
Sub-Fund
Class A, ClassB, Class C andClass N Shares
ClassD1
Shares
ClassD2
Shares
ClassF
Shares
ClassF2
Shares
ClassI
Shares
ClassP1
Shares
ClassP2
Shares
ClassP3
SharesOld Mutual Gold & Silver Fund 1.50% - - - - 0.75% - - -Old Mutual Compass Portfolio 2 1.35% - - - - - - - -Old Mutual Compass Portfolio 3 1.35% - - - - - - - -Old Mutual Compass Portfolio 4 1.35% - - - - - - - -Old Mutual Compass Portfolio 5 1.35% - - - - - - - -Old Mutual UK Specialist Equity Fund 1.50% - - 0.75% - 1.00% - - -Old Mutual Style Premia Absolute Return Fund 2.50% - - 0.50% 0.20% 1.25% - 0.50% 0.25%Old Mutual Financials Contingent Capital Fund 1.50% - - 0.40% - 0.75% - - -
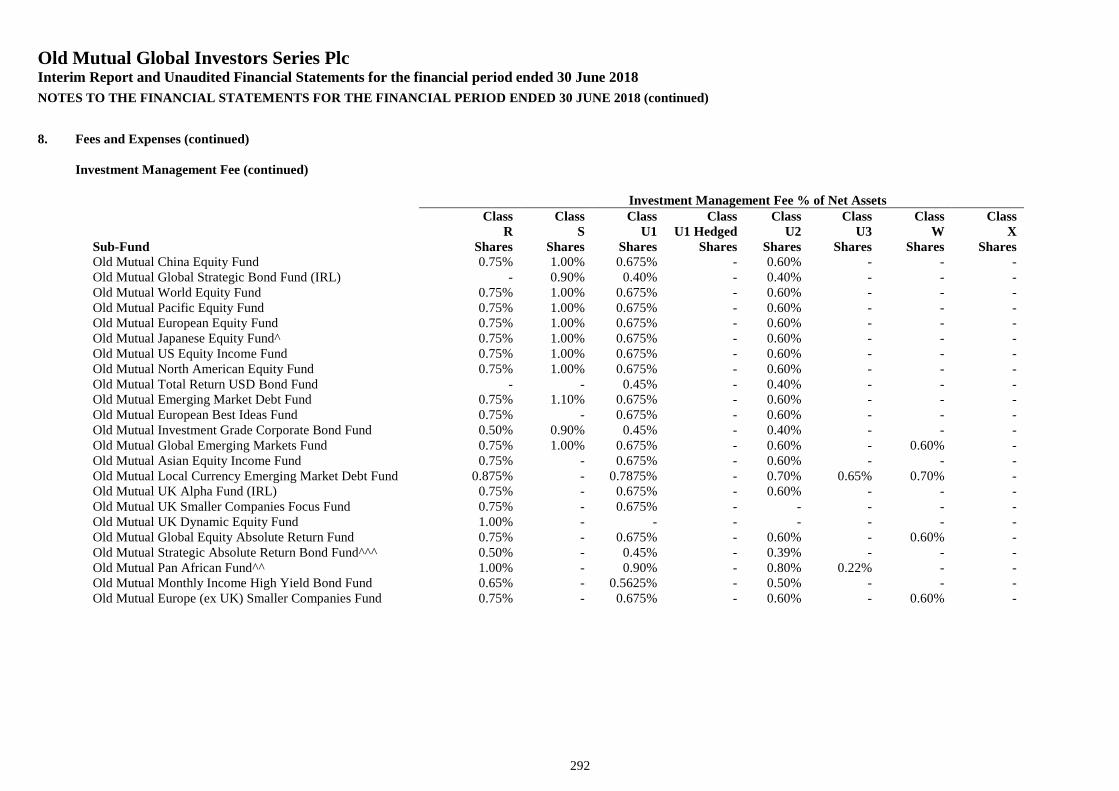
Old Mutual Global Investors Series PlcInterim Report and Unaudited Financial Statements for the financial period ended 30 June 2018
NOTES TO THE FINANCIAL STATEMENTS FOR THE FINANCIAL PERIOD ENDED 30 JUNE 2018 (continued)
292
8. Fees and Expenses (continued)
Investment Management Fee (continued)
Investment Management Fee % of Net Assets
Sub-Fund
ClassR
Shares
ClassS
Shares
ClassU1
Shares
ClassU1 Hedged
Shares
ClassU2
Shares
ClassU3
Shares
ClassW
Shares
ClassX
SharesOld Mutual China Equity Fund 0.75% 1.00% 0.675% - 0.60% - - -Old Mutual Global Strategic Bond Fund (IRL) - 0.90% 0.40% - 0.40% - - -Old Mutual World Equity Fund 0.75% 1.00% 0.675% - 0.60% - - -Old Mutual Pacific Equity Fund 0.75% 1.00% 0.675% - 0.60% - - -Old Mutual European Equity Fund 0.75% 1.00% 0.675% - 0.60% - - -Old Mutual Japanese Equity Fund^ 0.75% 1.00% 0.675% - 0.60% - - -Old Mutual US Equity Income Fund 0.75% 1.00% 0.675% - 0.60% - - -Old Mutual North American Equity Fund 0.75% 1.00% 0.675% - 0.60% - - -Old Mutual Total Return USD Bond Fund - - 0.45% - 0.40% - - -Old Mutual Emerging Market Debt Fund 0.75% 1.10% 0.675% - 0.60% - - -Old Mutual European Best Ideas Fund 0.75% - 0.675% - 0.60% - - -Old Mutual Investment Grade Corporate Bond Fund 0.50% 0.90% 0.45% - 0.40% - - -Old Mutual Global Emerging Markets Fund 0.75% 1.00% 0.675% - 0.60% - 0.60% -Old Mutual Asian Equity Income Fund 0.75% - 0.675% - 0.60% - - -Old Mutual Local Currency Emerging Market Debt Fund 0.875% - 0.7875% - 0.70% 0.65% 0.70% -Old Mutual UK Alpha Fund (IRL) 0.75% - 0.675% - 0.60% - - -Old Mutual UK Smaller Companies Focus Fund 0.75% - 0.675% - - - - -Old Mutual UK Dynamic Equity Fund 1.00% - - - - - - -Old Mutual Global Equity Absolute Return Fund 0.75% - 0.675% - 0.60% - 0.60% -Old Mutual Strategic Absolute Return Bond Fund^^^ 0.50% - 0.45% - 0.39% - - -Old Mutual Pan African Fund^^ 1.00% - 0.90% - 0.80% 0.22% - -Old Mutual Monthly Income High Yield Bond Fund 0.65% - 0.5625% - 0.50% - - -Old Mutual Europe (ex UK) Smaller Companies Fund 0.75% - 0.675% - 0.60% - 0.60% -
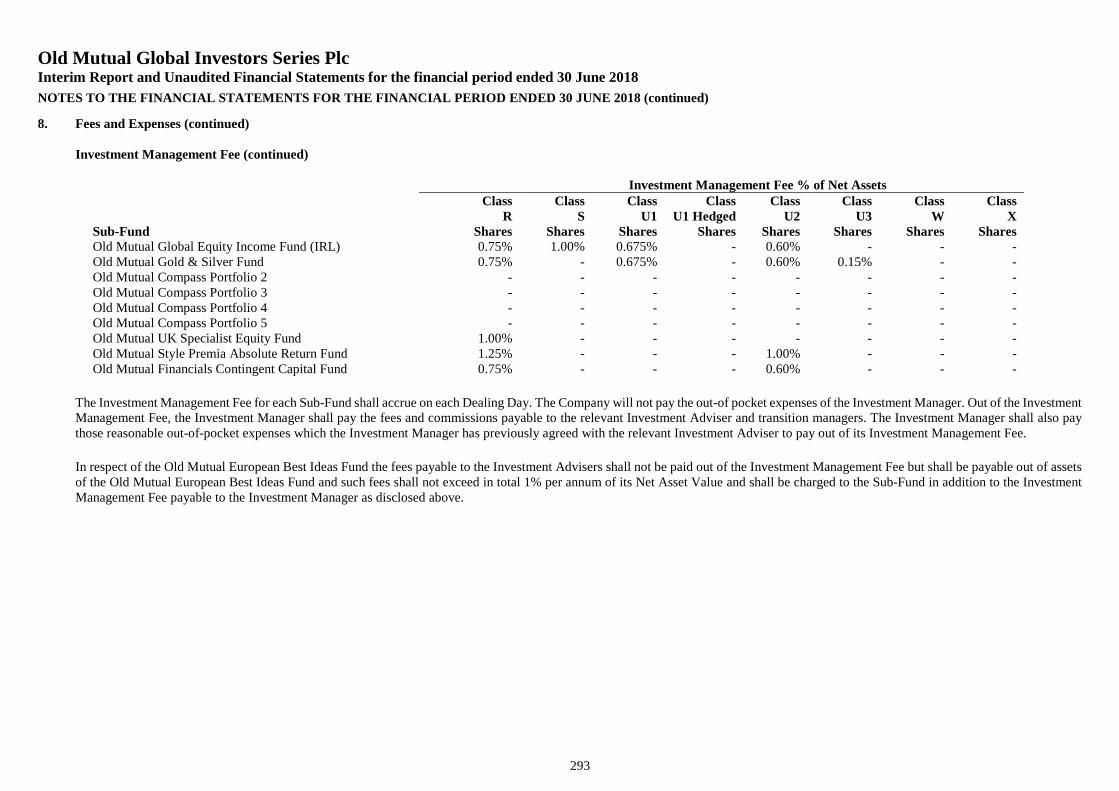
Old Mutual Global Investors Series PlcInterim Report and Unaudited Financial Statements for the financial period ended 30 June 2018
NOTES TO THE FINANCIAL STATEMENTS FOR THE FINANCIAL PERIOD ENDED 30 JUNE 2018 (continued)
293
8. Fees and Expenses (continued)
Investment Management Fee (continued)
Investment Management Fee % of Net Assets
Sub-Fund
ClassR
Shares
ClassS
Shares
ClassU1
Shares
ClassU1 Hedged
Shares
ClassU2
Shares
ClassU3
Shares
ClassW
Shares
ClassX
SharesOld Mutual Global Equity Income Fund (IRL) 0.75% 1.00% 0.675% - 0.60% - - -Old Mutual Gold & Silver Fund 0.75% - 0.675% - 0.60% 0.15% - -Old Mutual Compass Portfolio 2 - - - - - - - -Old Mutual Compass Portfolio 3 - - - - - - - -Old Mutual Compass Portfolio 4 - - - - - - - -Old Mutual Compass Portfolio 5 - - - - - - - -Old Mutual UK Specialist Equity Fund 1.00% - - - - - - -Old Mutual Style Premia Absolute Return Fund 1.25% - - - 1.00% - - -Old Mutual Financials Contingent Capital Fund 0.75% - - - 0.60% - - -
The Investment Management Fee for each Sub-Fund shall accrue on each Dealing Day. The Company will not pay the out-of pocket expenses of the Investment Manager. Out of the InvestmentManagement Fee, the Investment Manager shall pay the fees and commissions payable to the relevant Investment Adviser and transition managers. The Investment Manager shall also paythose reasonable out-of-pocket expenses which the Investment Manager has previously agreed with the relevant Investment Adviser to pay out of its Investment Management Fee.
In respect of the Old Mutual European Best Ideas Fund the fees payable to the Investment Advisers shall not be paid out of the Investment Management Fee but shall be payable out of assetsof the Old Mutual European Best Ideas Fund and such fees shall not exceed in total 1% per annum of its Net Asset Value and shall be charged to the Sub-Fund in addition to the InvestmentManagement Fee payable to the Investment Manager as disclosed above.
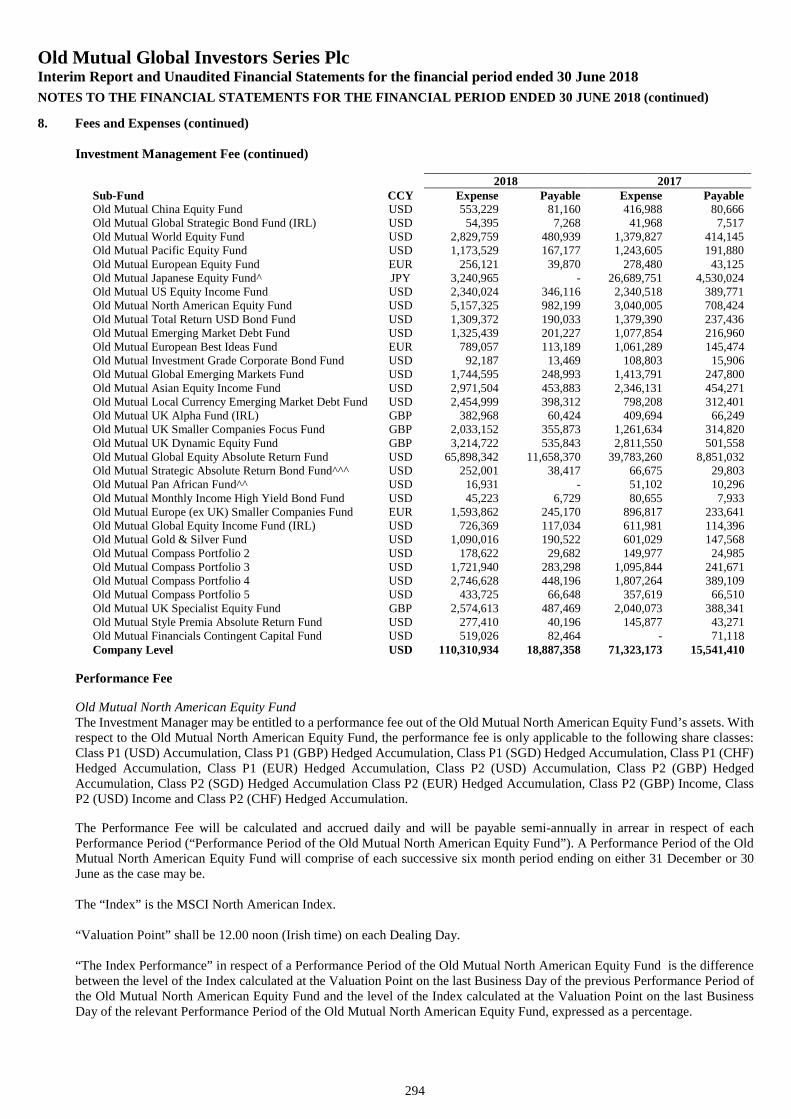
Old Mutual Global Investors Series PlcInterim Report and Unaudited Financial Statements for the financial period ended 30 June 2018
NOTES TO THE FINANCIAL STATEMENTS FOR THE FINANCIAL PERIOD ENDED 30 JUNE 2018 (continued)
294
8. Fees and Expenses (continued)
Investment Management Fee (continued)
2018 2017Sub-Fund CCY Expense Payable Expense PayableOld Mutual China Equity Fund USD 553,229 81,160 416,988 80,666Old Mutual Global Strategic Bond Fund (IRL) USD 54,395 7,268 41,968 7,517Old Mutual World Equity Fund USD 2,829,759 480,939 1,379,827 414,145Old Mutual Pacific Equity Fund USD 1,173,529 167,177 1,243,605 191,880Old Mutual European Equity Fund EUR 256,121 39,870 278,480 43,125Old Mutual Japanese Equity Fund^ JPY 3,240,965 - 26,689,751 4,530,024Old Mutual US Equity Income Fund USD 2,340,024 346,116 2,340,518 389,771Old Mutual North American Equity Fund USD 5,157,325 982,199 3,040,005 708,424Old Mutual Total Return USD Bond Fund USD 1,309,372 190,033 1,379,390 237,436Old Mutual Emerging Market Debt Fund USD 1,325,439 201,227 1,077,854 216,960Old Mutual European Best Ideas Fund EUR 789,057 113,189 1,061,289 145,474Old Mutual Investment Grade Corporate Bond Fund USD 92,187 13,469 108,803 15,906Old Mutual Global Emerging Markets Fund USD 1,744,595 248,993 1,413,791 247,800Old Mutual Asian Equity Income Fund USD 2,971,504 453,883 2,346,131 454,271Old Mutual Local Currency Emerging Market Debt Fund USD 2,454,999 398,312 798,208 312,401Old Mutual UK Alpha Fund (IRL) GBP 382,968 60,424 409,694 66,249Old Mutual UK Smaller Companies Focus Fund GBP 2,033,152 355,873 1,261,634 314,820Old Mutual UK Dynamic Equity Fund GBP 3,214,722 535,843 2,811,550 501,558Old Mutual Global Equity Absolute Return Fund USD 65,898,342 11,658,370 39,783,260 8,851,032Old Mutual Strategic Absolute Return Bond Fund^^^ USD 252,001 38,417 66,675 29,803Old Mutual Pan African Fund^^ USD 16,931 - 51,102 10,296Old Mutual Monthly Income High Yield Bond Fund USD 45,223 6,729 80,655 7,933Old Mutual Europe (ex UK) Smaller Companies Fund EUR 1,593,862 245,170 896,817 233,641Old Mutual Global Equity Income Fund (IRL) USD 726,369 117,034 611,981 114,396Old Mutual Gold & Silver Fund USD 1,090,016 190,522 601,029 147,568Old Mutual Compass Portfolio 2 USD 178,622 29,682 149,977 24,985Old Mutual Compass Portfolio 3 USD 1,721,940 283,298 1,095,844 241,671Old Mutual Compass Portfolio 4 USD 2,746,628 448,196 1,807,264 389,109Old Mutual Compass Portfolio 5 USD 433,725 66,648 357,619 66,510Old Mutual UK Specialist Equity Fund GBP 2,574,613 487,469 2,040,073 388,341Old Mutual Style Premia Absolute Return Fund USD 277,410 40,196 145,877 43,271Old Mutual Financials Contingent Capital Fund USD 519,026 82,464 - 71,118Company Level USD 110,310,934 18,887,358 71,323,173 15,541,410
Performance Fee
Old Mutual North American Equity FundThe Investment Manager may be entitled to a performance fee out of the Old Mutual North American Equity Fund’s assets. Withrespect to the Old Mutual North American Equity Fund, the performance fee is only applicable to the following share classes:Class P1 (USD) Accumulation, Class P1 (GBP) Hedged Accumulation, Class P1 (SGD) Hedged Accumulation, Class P1 (CHF)Hedged Accumulation, Class P1 (EUR) Hedged Accumulation, Class P2 (USD) Accumulation, Class P2 (GBP) HedgedAccumulation, Class P2 (SGD) Hedged Accumulation Class P2 (EUR) Hedged Accumulation, Class P2 (GBP) Income, ClassP2 (USD) Income and Class P2 (CHF) Hedged Accumulation.
The Performance Fee will be calculated and accrued daily and will be payable semi-annually in arrear in respect of eachPerformance Period (“Performance Period of the Old Mutual North American Equity Fund”). A Performance Period of the OldMutual North American Equity Fund will comprise of each successive six month period ending on either 31 December or 30June as the case may be.
The “Index” is the MSCI North American Index.
“Valuation Point” shall be 12.00 noon (Irish time) on each Dealing Day.
“The Index Performance” in respect of a Performance Period of the Old Mutual North American Equity Fund is the differencebetween the level of the Index calculated at the Valuation Point on the last Business Day of the previous Performance Period ofthe Old Mutual North American Equity Fund and the level of the Index calculated at the Valuation Point on the last BusinessDay of the relevant Performance Period of the Old Mutual North American Equity Fund, expressed as a percentage.
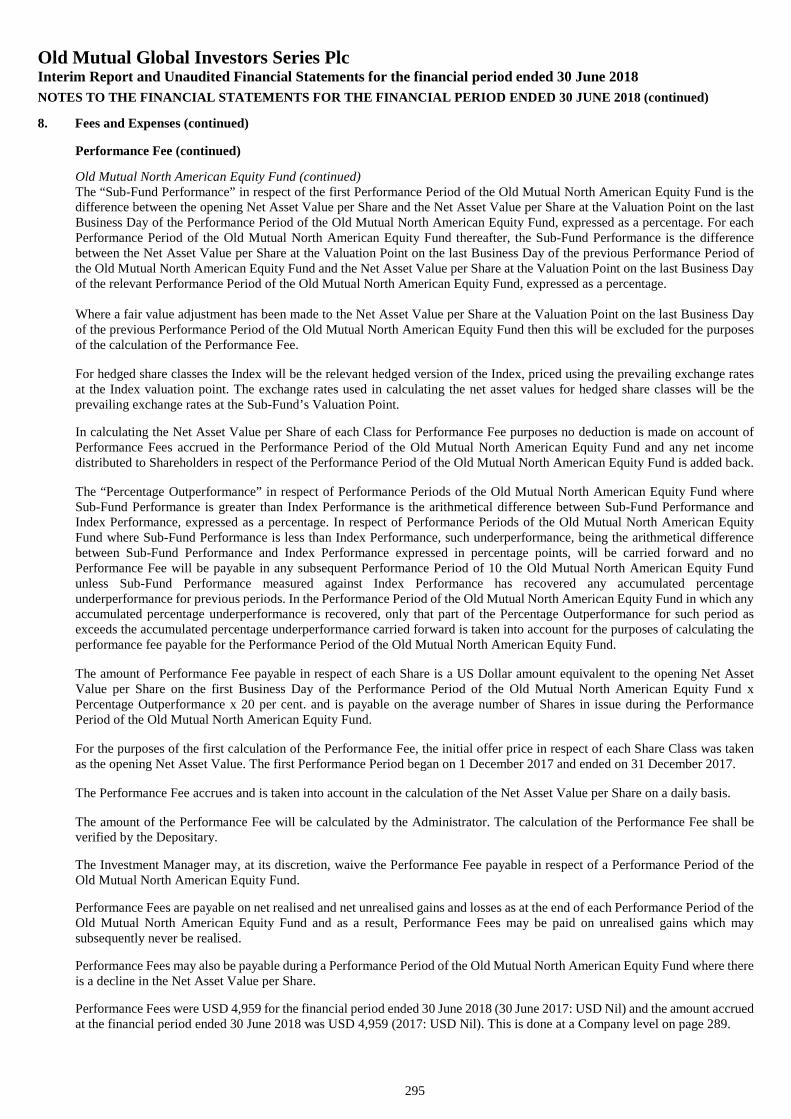
Old Mutual Global Investors Series PlcInterim Report and Unaudited Financial Statements for the financial period ended 30 June 2018
NOTES TO THE FINANCIAL STATEMENTS FOR THE FINANCIAL PERIOD ENDED 30 JUNE 2018 (continued)
295
8. Fees and Expenses (continued)
Performance Fee (continued)
Old Mutual North American Equity Fund (continued)The “Sub-Fund Performance” in respect of the first Performance Period of the Old Mutual North American Equity Fund is thedifference between the opening Net Asset Value per Share and the Net Asset Value per Share at the Valuation Point on the lastBusiness Day of the Performance Period of the Old Mutual North American Equity Fund, expressed as a percentage. For eachPerformance Period of the Old Mutual North American Equity Fund thereafter, the Sub-Fund Performance is the differencebetween the Net Asset Value per Share at the Valuation Point on the last Business Day of the previous Performance Period ofthe Old Mutual North American Equity Fund and the Net Asset Value per Share at the Valuation Point on the last Business Dayof the relevant Performance Period of the Old Mutual North American Equity Fund, expressed as a percentage.
Where a fair value adjustment has been made to the Net Asset Value per Share at the Valuation Point on the last Business Dayof the previous Performance Period of the Old Mutual North American Equity Fund then this will be excluded for the purposesof the calculation of the Performance Fee.
For hedged share classes the Index will be the relevant hedged version of the Index, priced using the prevailing exchange ratesat the Index valuation point. The exchange rates used in calculating the net asset values for hedged share classes will be theprevailing exchange rates at the Sub-Fund’s Valuation Point.
In calculating the Net Asset Value per Share of each Class for Performance Fee purposes no deduction is made on account ofPerformance Fees accrued in the Performance Period of the Old Mutual North American Equity Fund and any net incomedistributed to Shareholders in respect of the Performance Period of the Old Mutual North American Equity Fund is added back.
The “Percentage Outperformance” in respect of Performance Periods of the Old Mutual North American Equity Fund whereSub-Fund Performance is greater than Index Performance is the arithmetical difference between Sub-Fund Performance andIndex Performance, expressed as a percentage. In respect of Performance Periods of the Old Mutual North American EquityFund where Sub-Fund Performance is less than Index Performance, such underperformance, being the arithmetical differencebetween Sub-Fund Performance and Index Performance expressed in percentage points, will be carried forward and noPerformance Fee will be payable in any subsequent Performance Period of 10 the Old Mutual North American Equity Fundunless Sub-Fund Performance measured against Index Performance has recovered any accumulated percentageunderperformance for previous periods. In the Performance Period of the Old Mutual North American Equity Fund in which anyaccumulated percentage underperformance is recovered, only that part of the Percentage Outperformance for such period asexceeds the accumulated percentage underperformance carried forward is taken into account for the purposes of calculating theperformance fee payable for the Performance Period of the Old Mutual North American Equity Fund.
The amount of Performance Fee payable in respect of each Share is a US Dollar amount equivalent to the opening Net AssetValue per Share on the first Business Day of the Performance Period of the Old Mutual North American Equity Fund xPercentage Outperformance x 20 per cent. and is payable on the average number of Shares in issue during the PerformancePeriod of the Old Mutual North American Equity Fund.
For the purposes of the first calculation of the Performance Fee, the initial offer price in respect of each Share Class was takenas the opening Net Asset Value. The first Performance Period began on 1 December 2017 and ended on 31 December 2017.
The Performance Fee accrues and is taken into account in the calculation of the Net Asset Value per Share on a daily basis.
The amount of the Performance Fee will be calculated by the Administrator. The calculation of the Performance Fee shall beverified by the Depositary.
The Investment Manager may, at its discretion, waive the Performance Fee payable in respect of a Performance Period of theOld Mutual North American Equity Fund.
Performance Fees are payable on net realised and net unrealised gains and losses as at the end of each Performance Period of theOld Mutual North American Equity Fund and as a result, Performance Fees may be paid on unrealised gains which maysubsequently never be realised.
Performance Fees may also be payable during a Performance Period of the Old Mutual North American Equity Fund where thereis a decline in the Net Asset Value per Share.
Performance Fees were USD 4,959 for the financial period ended 30 June 2018 (30 June 2017: USD Nil) and the amount accruedat the financial period ended 30 June 2018 was USD 4,959 (2017: USD Nil). This is done at a Company level on page 289.
Old Mutual Global Investors Series PlcInterim Report and Unaudited Financial Statements for the financial period ended 30 June 2018
NOTES TO THE FINANCIAL STATEMENTS FOR THE FINANCIAL PERIOD ENDED 30 JUNE 2018 (continued)
296
8. Fees and Expenses (continued)
Performance Fee (continued)
Old Mutual UK Smaller Companies Focus FundThe Investment Manager may be entitled to a performance fee (a portion of which may be payable to the Investment Adviser)out of the Old Mutual UK Smaller Companies Focus Fund’s assets. With respect to the Old Mutual UK Smaller CompaniesFocus Fund, the performance fee is only applicable to the following share classes: Class A (GBP) Income Shares, Class R (GBP)Income Shares and Class U1 (GBP) Income Shares.
The Performance Fee will be calculated and accrued daily and will be payable semi-annually in arrears in respect of eachPerformance Period (“Performance Period of the Old Mutual UK Smaller Companies Focus Fund”). A Performance Period ofthe Old Mutual UK Smaller Companies Focus Fund will comprise of each successive six month period ending on either 31December or 30 June as the case may be.
“The Index” is the Numis Smaller Companies Index excluding Investment Trusts.
“The Index Performance” in respect of a Performance Period of the Old Mutual UK Smaller Companies Focus Fund is thedifference between the opening level of the Index on the first Business Day and on the closing level of the Index on the lastBusiness Day of the Performance Period of the Old Mutual UK Smaller Companies Focus Fund, expressed as a percentage.
The “Sub-Fund Performance” in respect of a Performance Period of the Old Mutual UK Smaller Companies Focus Fund is thedifference between the opening Net Asset Value per Share on the first Business Day of the relevant Performance Period of theOld Mutual UK Smaller Companies Focus Fund, which reflects the charging of a Performance Fee, if any, in respect of theprevious Performance Period of the Old Mutual UK Smaller Companies Focus Fund, and the Net Asset Value per Share (beforethe deduction of any unrealised Performance Fee) on the last Business Day of the relevant Performance Period of the Old MutualUK Smaller Companies Focus Fund, expressed as a percentage.
In calculating the Net Asset Value per Share for Performance Fee purposes no deduction is made on account of PerformanceFees accrued in the Performance Period of the Old Mutual UK Smaller Companies Focus Fund and any net income distributedto Shareholders in respect of the period is added back.
The “Percentage Outperformance” in respect of Performance Periods of the Old Mutual UK Smaller Companies Focus Fundwhere Sub-Fund Performance is greater than Index Performance is the arithmetical difference between Sub-Fund Performanceand Index Performance, expressed as a percentage. In respect of Performance Periods of the Old Mutual UK Smaller CompaniesFocus Fund where Sub-Fund Performance is less than Index Performance, such underperformance, being the arithmeticaldifference between Sub-Fund Performance and Index Performance expressed in percentage points, will be carried forward andno Performance Fee will be payable in any subsequent Performance Period of the Old Mutual UK Smaller Companies FocusFund unless Sub-Fund Performance measured against Index Performance has recovered any accumulated percentageunderperformance for previous Performance Periods of the Old Mutual UK Smaller Companies Focus Fund. In the PerformancePeriod of the Old Mutual UK Smaller Companies Focus Fund in which any accumulated percentage underperformance isrecovered, only that part of the Percentage Outperformance for such period as exceeds the accumulated percentageunderperformance carried forward is taken into account for the purposes of calculating the performance fee payable for thePerformance Period of the Old Mutual UK Smaller Companies Focus Fund.
The amount of Performance Fee payable in respect of each Share is a Sterling amount equivalent to the opening Net Asset Valueper Share on the first Business Day of the Performance Period of the Old Mutual UK Smaller Companies Focus Fund xPercentage Outperformance x 10% and is payable on the average number of Shares in issue during the Performance Period ofthe Old Mutual UK Smaller Companies Focus Fund.
Furthermore the amount of Performance Fee payable in respect of a Performance Period of the Old Mutual UK SmallerCompanies Focus Fund is subject to a maximum amount (the “Cap”). The Cap is a Sterling amount equivalent to the openingNet Asset Value per Share on the first Business Day of the Performance Period of the Old Mutual UK Smaller Companies FocusFund x opening number of Shares in issue on the first Business Day of the Performance Period of the Old Mutual UK SmallerCompanies Focus Fund x 0.75%.
The Performance Fee accrues and is taken into account in the calculation of the Net Asset Value per Share on a daily basis.
The amount of the Performance Fee will be calculated by the Administrator. The calculation of the Performance Fee shall beverified by the Depositary.
Old Mutual Global Investors Series PlcInterim Report and Unaudited Financial Statements for the financial period ended 30 June 2018
NOTES TO THE FINANCIAL STATEMENTS FOR THE FINANCIAL PERIOD ENDED 30 JUNE 2018 (continued)
297
8. Fees and Expenses (continued)
Performance Fee (continued)
Old Mutual UK Smaller Companies Focus Fund (continued)The Investment Manager may, at its discretion, waive the Performance Fee payable in respect of a Performance Period of theOld Mutual UK Smaller Companies Focus Fund.
Performance Fees are payable on net realised and net unrealised gains and losses as at the end of each Performance Period of theOld Mutual UK Smaller Companies Focus Fund and as a result, Performance Fees may be paid on unrealised gains which maysubsequently never be realised.
Performance Fees may also be payable during a Performance Period of the Old Mutual UK Smaller Companies Focus Fundwhere there is a decline in the Net Asset Value per Share.
Performance Fees were GBP 2,274,722 for the financial period ended 30 June 2018 (30 June 2017: GBP 1,228,042) and theamount accrued at the financial period ended 30 June 2018 was GBP 2,274,722 (2017: GBP 1,826,583). This is done at aCompany level on page 289.
Old Mutual UK Dynamic Equity FundThe Investment Manager may be entitled to a performance fee (a portion of which may be payable to the Investment Adviser)out of the Old Mutual UK Dynamic Equity Fund’s assets. With respect to the Old Mutual UK Dynamic Equity Fund, theperformance fee is only applicable to the following share classes: Class I (EUR) Hedged Accumulation Shares, Class A (GBP)Income Shares and Class R (GBP) Income Shares.
The Performance Fee will be calculated and accrued daily and will be payable semi-annually in arrears in respect of eachPerformance Period (“Performance Period of the Old Mutual UK Dynamic Equity Fund”). A Performance Period of the OldMutual UK Dynamic Equity Fund will comprise of each successive six month period ending on either 31 December or 30 Juneas the case may be.
“The Index” is the FTSE 250 Index Excluding Investment Trusts.
“The Index Performance” in respect of a Performance Period of the Old Mutual UK Dynamic Equity Fund, is the differencebetween the level of the Index calculated at the Valuation Point on the last Business Day of the previous Performance Period ofthe Old Mutual UK Dynamic Equity Fund and the level of the Index calculated at the Valuation Point on the last Business Dayof the relevant Performance Period of the Old Mutual UK Dynamic Equity Fund, expressed as a percentage.
The “Sub-Fund Performance” in respect of the first Performance Period of the Old Mutual UK Dynamic Equity Fund is thedifference between the opening Net Asset Value per Share and the Net Asset Value per Share at the Valuation Point on the lastBusiness Day of the Performance Period of the Old Mutual UK Dynamic Equity Fund, expressed as a percentage. For eachPerformance Period of the Old Mutual UK Dynamic Equity Fund thereafter, the Sub-Fund Performance is the difference betweenthe Net Asset Value per Share at the Valuation Point on the last Business Day of the previous Performance Period of the OldMutual UK Dynamic Equity Fund and the Net Asset Value per Share at the Valuation Point on the last Business Day of therelevant Performance Period of the Old Mutual UK Dynamic Equity Fund, expressed as a percentage.
In calculating the Net Asset Value per Share of each Class for Performance Fee purposes no deduction is made on account ofPerformance Fees accrued in the Performance Period of the Old Mutual UK Dynamic Equity Fund and any net income distributedto Shareholders in respect of the Performance Period of the Old Mutual UK Dynamic Equity Fund is added back.
The “Percentage Outperformance” in respect of Performance Periods of the Old Mutual UK Dynamic Equity Fund where Sub-Fund Performance is greater than Index Performance is the arithmetical difference between Sub-Fund Performance and IndexPerformance, expressed as a percentage. In respect of Performance Periods of the Old Mutual UK Dynamic Equity Fund whereSub-Fund Performance is less than Index Performance, such underperformance, being the arithmetical difference between Sub-Fund Performance and Index Performance expressed in percentage points, will be carried forward and no Performance Fee willbe payable in any subsequent Performance Period of the Old Mutual UK Dynamic Equity Fund unless Sub-Fund Performancemeasured against Index Performance has recovered any accumulated percentage underperformance for previous periods. In thePerformance Period of the Old Mutual UK Dynamic Equity Fund in which any accumulated percentage underperformance isrecovered, only that part of the Percentage Outperformance for such period as exceeds the accumulated percentageunderperformance carried forward is taken into account for the purposes of calculating the performance fee payable for thePerformance Period of the Old Mutual UK Dynamic Equity Fund.
Old Mutual Global Investors Series PlcInterim Report and Unaudited Financial Statements for the financial period ended 30 June 2018
NOTES TO THE FINANCIAL STATEMENTS FOR THE FINANCIAL PERIOD ENDED 30 JUNE 2018 (continued)
298
8. Fees and Expenses (continued)
Performance Fee (continued)
Old Mutual UK Dynamic Equity Fund (continued)The amount of Performance Fee payable in respect of each Share is a Sterling amount equivalent to the opening Net Asset Valueper Share on the first Business Day of the Performance Period of the Old Mutual UK Dynamic Equity Fund x PercentageOutperformance x 20% and is payable on the average number of Shares in issue during the Performance Period of the Old MutualUK Dynamic Equity Fund.
For the purposes of the first calculation of the Performance Fee, the initial offer price in respect of each Share Class was takenas the opening Net Asset Value.
The Performance Fee accrues and is taken into account in the calculation of the Net Asset Value per Share on a daily basis.
The amount of the Performance Fee will be calculated by the Administrator. The calculation of the Performance Fee shall beverified by the Depositary.
The Investment Manager may, at its discretion, waive the Performance Fee payable in respect of a Performance Period of theOld Mutual UK Dynamic Equity Fund.
Performance Fees are payable on net realised and net unrealised gains and losses as at the end of each Performance Period of theOld Mutual UK Dynamic Equity Fund and as a result, Performance Fees may be paid on unrealised gains which maysubsequently never be realised.
Performance Fees may also be payable during a Performance Period of the Old Mutual UK Dynamic Equity Fund where thereis a decline in the Net Asset Value per Share.
Performance Fees were GBP Nil for the financial period ended 30 June 2018 (30 June 2017: GBP 11,153,957) and the amountaccrued at the financial period ended 30 June 2018 was GBP Nil (2017: GBP 3,727,152). This is done at a Company level onpage 289.
Old Mutual Global Equity Absolute Return FundThe Investment Manager may be entitled to a performance fee (a portion of which may be payable to the Investment Adviser)out of the Old Mutual Global Equity Absolute Return Fund’s assets. The Performance Fee is applicable to all Share Classes withthe exception of: Class A (CHF) Hedged Accumulation Shares and Class X (GBP) Hedged Accumulation Shares.
The Performance Fee will accrue on a daily basis and the accrual will be reflected in the Net Asset Value and will be payablesemi-annually in arrears in respect of each Performance Period which will comprise of each successive six month period endingon either 31 December or 30 June as the case may be (a “Performance Period of the Old Mutual Global Equity Absolute ReturnFund”).
The Performance Fee as at the end of each Performance Period of the Old Mutual Global Equity Absolute Return Fund for allShare Classes shall be equal in aggregate to 20% of the amount by which any increase in the Net Asset Value per Share of eachClass during the Performance Period of the Old Mutual Global Equity Absolute Return Fund exceeds the “Hurdle Rate” whichwill be the average (1) Bank of England Base Rate for the GBP Share Classes, (2) European Central Bank Base Rate for theEUR Share Classes, (3) Federal Reserve Funds Base Rate for the USD Share Classes, (4) 3 month Swiss franc (CHF) LIBORinterest rate for the CHF Share Classes, (5) Swedish National Bank Base Rate for the SEK Share Classes and (6) SingaporeAverage Overnight Interest Rate for the SGD Share Classes, Performance Period of the Old Mutual Global Equity AbsoluteReturn Fund multiplied by the weighted average number of total Shares in issue of each Class on each Dealing Day during thePerformance Period of the Old Mutual Global Equity Absolute Return Fund. Where no central bank base rate exists, an equivalentinter-bank reference rate will be used.
The initial issue price as set out in the section of the Supplement headed “Initial Offer Period and Subscription Price” was thestarting price for the calculation of the first performance fee payable of any share class to which a performance fee is applicable.
In calculating the Net Asset Value per Share of each Class for Performance Fee purposes, no deduction is made on account ofPerformance Fees accrued in the Performance Period of the Old Mutual Global Equity Absolute Return Fund and any net incomedistributed to Shareholders in respect of the period is added back.
Old Mutual Global Investors Series PlcInterim Report and Unaudited Financial Statements for the financial period ended 30 June 2018
NOTES TO THE FINANCIAL STATEMENTS FOR THE FINANCIAL PERIOD ENDED 30 JUNE 2018 (continued)
299
8. Fees and Expenses (continued)
Performance Fee (continued)
Old Mutual Global Equity Absolute Return Fund (continued)The Performance Fee is only payable when the Net Asset Value of each Class exceeds the Hurdle Rate. If, during a performancefee period, the performance of the Shares does not exceed the Hurdle Rate, no Performance Fee is payable until such unachievedperformance is reclaimed.
All Performance Fee payments shall be subject to the restriction that in paying a Performance Fee, the Net Asset Value per Shareof each Class at the relevant Performance Period of the Old Mutual Global Equity Absolute Return Fund shall not be less thanthe Net Asset Value per Share Class on the last day that a Performance Fee was paid (the “Net Asset Value High Water Mark”).The Performance Fee is only payable on the increase in the Net Asset Value per Share of each Class during the PerformancePeriod of the Old Mutual Global Equity Absolute Return Fund over the relevant Hurdle Rate during the Performance Period ofthe Old Mutual Global Equity Absolute Return Fund.
The amount of the Performance Fee will be calculated by the Administrator. The calculation of the Performance Fee shall beverified by the Depositary.
The Investment Manager may, at its discretion, waive the Performance Fee payable in respect of a Performance Period of theOld Mutual Global Equity Absolute Return Fund.
Performance Fees are payable on net realised and net unrealised gains and losses as at the end of each Performance Period of theOld Mutual Global Equity Absolute Return Fund and as a result, Performance Fees may be paid on unrealised gains which maysubsequently never be realised.
Performance Fees were USD 1,610,729 for the financial period ended 30 June 2018 (30 June 2017: USD 6,855,563) and theamount accrued at the financial period ended 30 June 2018 was USD 1,610,729 (2017: USD 146,641,214). This is done at aCompany level on page 289.
Old Mutual Gold & Silver FundThe Investment Manager may be entitled to a performance fee out of the Old Mutual Gold & Silver Fund’s assets. With respectto the Old Mutual Gold & Silver Fund, the performance fee is only applicable to the following share classes: Class U3 (EUR)Accumulation Shares, Class U3 (GBP) Accumulation Shares and Class U3 (USD) Accumulation Shares.
The Performance Fee will be calculated and accrued daily and will be payable semi-annually in arrears in respect of eachPerformance Period (“Performance Period of the Old Mutual Gold & Silver Fund”). A Performance Period of the Old MutualGold & Silver Fund will comprise of each successive six month period ending on either 31 December or 30 June as the case maybe.
“The Index” is a composite, made up of (i) a 50:50 split between the FTSE Gold Miners Index expressed in GBP and XAU:GBPfor the U3 (GBP) Accumulation Shares, (ii) a 50:50 split between the FTSE Gold Miners Index expressed in EUR and XAU:EURfor the U3 (EUR) Accumulation Shares and (iii) a 50:50 split between the FTSE Gold Miners Index expressed in USD and XAU:USD for the U3 (USD) Accumulation Shares.
“The Index Performance” in respect of a Performance Period of the Old Mutual Gold & Silver Fund, is the difference betweenthe level of the Index calculated at the Valuation Point on the last Business Day of the previous Performance Period of the OldMutual Gold & Silver Fund and the level of the Index calculated at the Valuation Point on the last Business Day of the relevantPerformance Period of the Old Mutual Gold & Silver Fund, expressed as a percentage. The first Performance Period for eachnew class will begin on the date on which the first Shares of the U3 (GBP) Accumulation, U3 (EUR) Accumulation and U3(USD) Accumulation Shares are issued respectively up to 31 December 2017.
The “Sub-Fund Performance” in respect of the first Performance Period of the Old Mutual Gold & Silver Fund is the differencebetween the opening Net Asset Value per Share and the Net Asset Value per Share at the Valuation Point on the last BusinessDay of the Performance Period of the Old Mutual Gold & Silver Fund, expressed as a percentage. For each Performance Periodof the Old Mutual Gold & Silver Fund thereafter, the Sub-Fund Performance is the difference between the Net Asset Value perShare at the Valuation Point on the last Business Day of the previous Performance Period of the Old Mutual Gold & Silver Fundand the Net Asset Value per Share at the Valuation Point on the last Business Day of the relevant Performance Period of the OldMutual Gold & Silver Fund, expressed as a percentage.
Old Mutual Global Investors Series PlcInterim Report and Unaudited Financial Statements for the financial period ended 30 June 2018
NOTES TO THE FINANCIAL STATEMENTS FOR THE FINANCIAL PERIOD ENDED 30 JUNE 2018 (continued)
300
8. Fees and Expenses (continued)
Performance Fee (continued)
Old Mutual Gold & Silver Fund (continued)In calculating the Net Asset Value per Share of each Class U3 for Performance Fee purposes no deduction is made on accountof Performance Fees accrued in the Performance Period of the Old Mutual Gold & Silver Fund and any net income distributedto Shareholders in respect of the Performance Period of the Old Mutual Gold & Silver Fund is added back.
The “Percentage Outperformance” in respect of Performance Periods of the Old Mutual Gold & Silver Fund where Sub-FundPerformance is greater than Index Performance is the arithmetical difference between Sub-Fund Performance and IndexPerformance, expressed as a percentage. In respect of Performance Periods of the Old Mutual Gold & Silver Fund where Sub-Fund Performance is less than Index Performance, such underperformance, being the arithmetical difference between Sub-FundPerformance and Index Performance expressed in percentage points, will be carried forward and no Performance Fee will bepayable in any subsequent Performance Period of the Old Mutual Gold & Silver Fund unless Sub-Fund Performance measuredagainst Index Performance has recovered any accumulated percentage underperformance for previous periods. In thePerformance Period of the Old Mutual Gold & Silver Fund in which any accumulated percentage underperformance is recovered,only that part of the Percentage Outperformance for such period as exceeds the accumulated percentage underperformancecarried forward is taken into account for the purposes of calculating the performance fee payable for the Performance Period ofthe Old Mutual Gold & Silver Fund.
The amount of Performance Fee payable in respect of each Share is a USD amount equivalent to the opening Net Asset Valueper Share on the first Business Day of the Performance Period of the Old Mutual Gold & Silver Fund x PercentageOutperformance x 20% and is payable based on the number of Shares in issue for the Class U3 (EUR) Accumulation Shares,Class U3 (GBP) Accumulation Shares and Class U3 (USD) Accumulation Shares during the Performance Period of the OldMutual Gold & Silver Fund.
For the purposes of the first calculation of the Performance Fee, the initial offer price in respect of each Share Class was takenas the opening Net Asset Value. The Performance Fee accrues and is taken into account in the calculation of the Net Asset Valueper Share on a daily basis.
The amount of the Performance Fee will be calculated by the Administrator. The calculation of the Performance Fee shall beverified by the Depositary.
The Investment Manager may, at its discretion, waive the Performance Fee payable in respect of a Performance Period of theOld Mutual Gold & Silver Fund.
Performance Fees are payable on net realised and net unrealised gains and losses as at the end of each Performance Period of theOld Mutual Gold & Silver Fund and as a result, Performance Fees may be paid on unrealised gains which may subsequentlynever be realised.
Performance Fees may also be payable during a Performance Period of the Old Mutual Gold & Silver Fund where there is adecline in the Net Asset Value per Share.
Performance Fees were USD Nil for the financial period ended 30 June 2018 (30 June 2017: USD Nil) and the amount accruedat the financial period ended 30 June 2018 was USD Nil (2017: USD Nil). This is done at a Company level on page 289.
Old Mutual UK Specialist Equity FundThe Investment Manager may be entitled to a performance fee (a portion of which may be payable to the Investment Adviser)out of the Old Mutual UK Specialist Equity Fund’s assets. With respect to the Old Mutual UK Specialist Equity Fund, theperformance fee is applicable to all share classes with the exception of the Class X (GBP) Accumulation Shares.
The Performance Fee will accrue on a daily basis and the accrual will be reflected in the Net Asset Value and will be payablesemi-annually in arrear in respect of each Performance Period (a “Performance Period of the Old Mutual UK Specialist EquityFund”). A Performance Period of the Old Mutual UK Specialist Equity Fund will comprise of each successive six month periodending on either 31 December or 30 June as the case may be. The first Performance Period for each Class will begin on the dateon which the first Shares of the relevant Class are issued and will end on 30 June or 31 December respectively in that period.
Old Mutual Global Investors Series PlcInterim Report and Unaudited Financial Statements for the financial period ended 30 June 2018
NOTES TO THE FINANCIAL STATEMENTS FOR THE FINANCIAL PERIOD ENDED 30 JUNE 2018 (continued)
301
8. Fees and Expenses (continued)
Performance Fee (continued)
Old Mutual UK Specialist Equity Fund (continued)The Performance Fee as at the end of each Performance Period of the Old Mutual UK Specialist Equity Fund for all ShareClasses shall be equal in aggregate to 20%. of the amount by which any increase in the Net Asset Value per Share of each Classduring the Performance Period of the Old Mutual UK Specialist Equity Fund exceeds the “Hurdle Rate” which will be theaverage (1) Sterling Overnight Interbank Average Rate for the GBP Share Classes, (2) Euro Overnight Index Average for theEUR Share Classes, (3) Federal Funds Effective Overnight Rate for the USD Share Classes, and (4) Swiss Average OvernightRate for the CHF Share Classes for the relevant Class currency during the Performance Period of the Old MutualUK Specialist Equity Fund multiplied by the weighted average number of total Shares in issue of each Class on each DealingDay during the Performance Period of the Old Mutual UK Specialist Equity Fund.
The initial issue price, as set out in the section of the Supplement headed “Initial Offer Period and Subscription Price”, was thestarting price for the calculation of the first performance fee payable of any share class to which a performance fee is applicable.
In calculating the Net Asset Value per Share of each Class for Performance Fee purposes, no deduction is made on account ofPerformance Fees accrued in the Performance Period of the Old Mutual UK Specialist Equity Fund and any net incomedistributed to Shareholders in respect of the period is added back.
The Performance Fee is only payable when the Net Asset Value of each Class exceeds the Hurdle Rate. If, during a performancefee period, the performance of the Shares does not exceed the Hurdle Rate, no Performance Fee is payable until such unachievedperformance is reclaimed.
All Performance Fee payments shall be subject to the restriction that in paying a Performance Fee, the Net Asset Value per Shareof each Class at the relevant Performance Period of the Old Mutual UK Specialist Equity Fund shall not be less than the NetAsset Value per Share Class on the last day that a Performance Fee was paid (the “Net Asset Value High Water Mark”). ThePerformance Fee is only payable on the increase in the Net Asset Value per Share of each Class during the Performance Periodof the Old Mutual UK Specialist Equity Fund over the relevant Hurdle Rate during the Performance Period of the Old MutualUK Specialist Equity Fund.
The amount of the Performance Fee will be calculated by the Administrator. The calculation of the Performance Fee shall beverified by the Depositary.
The Investment Manager may, at its discretion, waive the Performance Fee payable in respect of a Performance Period of theOld Mutual UK Specialist Equity Fund.
Performance Fees are payable on net realised and net unrealised gains and losses as at the end of each Performance Period of theOld Mutual UK Specialist Equity Fund and as a result, Performance Fees may be paid on unrealised gains which maysubsequently never be realised.
Performance Fees were GBP Nil for the financial period ended 30 June 2018 (30 June 2017: GBP 8,059,815) and the amountaccrued at the financial period ended 30 June 2018 was GBP Nil (2017: GBP 8,714,095). This is done at a Company level onpage 289.
Old Mutual Style Premia Absolute Return FundThe Investment Manager may be entitled to a performance fee out of the Old Mutual Style Premia Absolute Return Fund’sassets.
The Performance Fee will accrue on a daily basis and the accrual will be reflected in the Net Asset Value and will be payablesemi-annually in arrears in respect of each Performance Period (a “Performance Period of the Old Mutual Style Premia AbsoluteReturn Fund”). A Performance Period of the Old Mutual Style Premia Absolute Return Fund will comprise of each successivesix month period ending on either 31 December or 30 June as the case may be. The first Performance Period for each Class willbegin on the date on which the first Shares of the relevant Class are issued and will end on 30 June or 31 December respectivelyin that period.
Old Mutual Global Investors Series PlcInterim Report and Unaudited Financial Statements for the financial period ended 30 June 2018
NOTES TO THE FINANCIAL STATEMENTS FOR THE FINANCIAL PERIOD ENDED 30 JUNE 2018 (continued)
302
8. Fees and Expenses (continued)
Performance Fee (continued)
Old Mutual Style Premia Absolute Return Fund (continued)For the P2 and P3 Share Classes, the Performance Fee as at the end of each Performance Period of the Old Mutual Style PremiaAbsolute Return Fund shall be equal in aggregate to 15 per cent of the amount by which any increase in the Net Asset Value perShare of each Class during the Performance Period of the Old Mutual Style Premia Absolute Return Fund exceeds the “HurdleRate”. For the F2 Share Classes, the Performance Fee as at the end of each Performance Period of the Old Mutual Style PremiaAbsolute Return Fund shall be equal in aggregate to 10% of the amount by which any increase in the Net Asset Value per Shareof each Class during the Performance Period of the Old Mutual Style Premia Absolute Return Fund exceeds the “Hurdle Rate”.For all Share Classes, the Hurdle Rate will be the average (1) Sterling Overnight Interbank Average Rate for the GBP ShareClasses, (2) Euro Overnight Index Average Rate for the EUR Share Classes, (3) Federal Funds Effective Overnight Rate for theUSD Share Classes, and (4) Swiss Average Overnight Rate for the CHF Share Classes for the relevant Class currency during thePerformance Period of the Old Mutual Style Premia Absolute Return Fund multiplied by the weighted average number of totalShares in issue of each Class on each Dealing Day during the Performance Period of the Old Mutual Style Premia AbsoluteReturn Fund. Where no central bank base rate exists, an equivalent inter-bank reference rate will be used.
The initial issue price as set out in the section of the Supplement headed “Initial Offer Period and Subscription Price” was thestarting price for the calculation of the first performance fee payable of any share class to which a performance fee is applicable.
In calculating the Net Asset Value per Share of each Class for Performance Fee purposes, no deduction is made on account ofPerformance Fees accrued in the Performance Period of the Old Mutual Style Premia Absolute Return Fund and any net incomedistributed to Shareholders in respect of the period is added back.
The Performance Fee is only payable when the Net Asset Value of each Class exceeds the Hurdle Rate. If, during a performancefee period, the performance of the Shares does not exceed the Hurdle Rate, no Performance Fee is payable until such unachievedperformance is reclaimed.
All Performance Fee payments shall be subject to the restriction that in paying/accruing a Performance Fee, the Net Asset Valueper Share of each Class at the relevant Performance Period of Old Mutual Style Premia Absolute Return Fund shall not be lessthan the Net Asset Value per Share Class on the last day that a Performance Fee was paid (or the initial subscription price ifhigher) (the “Net Asset Value High Water Mark”). The Performance Fee is only payable on the increase in the Net Asset Valueper Share of each Class during the Performance Period of the Old Mutual Style Premia Absolute Return Fund in excess of therelevant Hurdle Rate during the Performance Period of the Old Mutual Style Premia Absolute Return Fund.
The amount of the Performance Fee will be calculated by the Administrator. The calculation of the Performance Fee shall beverified by the Depositary at each Performance Period.
The Investment Manager may, at its discretion, waive the Performance Fee payable in respect of a Performance Period of theOld Mutual Style Premia Absolute Return Fund.
Performance Fees are payable on net realised and net unrealised gains and losses as at the end of each Performance Period of theOld Mutual Style Premia Absolute Return Fund and as a result, Performance Fees may be paid on unrealised gains which maysubsequently never be realised.
Performance Fees were USD Nil for the financial period ended 30 June 2018 (30 June 2017: USD 372) and the amount accruedat the financial period ended 30 June 2018 was USD Nil (2017: USD Nil). This is done at a Company level below.
Total Performance Fees were USD 4,725,659 for the financial period ended 30 July 2018 (30 June 2017: USD 32,865,624) andthe amount accrued at the financial period ended 30 June 2018 was USD 4,604,417 (2017: USD 165,942,021).
Administration Fee, Registrar and Transfer Agency Fees
Old Mutual Global Investors Series Plc will pay to the Administrator monthly in arrears an administration fee of up to 3.75 basispoints per annum of the combined average Net Asset Value of the Sub-Funds and in the case of each Sub-Fund subject to aminimum fee per Sub-Fund of EUR 15,000 per annum. The administration fee shall accrue on each Dealing Day. Additionalannual fees shall be payable for the second and each subsequent Class of Shares in each Sub-Fund which shall be charged atnormal commercial rates.
Old Mutual Global Investors Series PlcInterim Report and Unaudited Financial Statements for the financial period ended 30 June 2018
NOTES TO THE FINANCIAL STATEMENTS FOR THE FINANCIAL PERIOD ENDED 30 JUNE 2018 (continued)
303
8. Fees and Expenses (continued)
Administration Fee, Registrar and Transfer Agency Fees (continued)
The Administrator is also entitled to transaction fees it incurs for the Sub-Funds and fees for the registrar and transfer agencyfunctions and maintenance services it performs payable out of Old Mutual Global Investors Series Plc’s assets. These servicesare (i) maintaining the register of each Share Class of Old Mutual Global Investors Series Plc and the annual shareholder account,(ii) servicing, and (iii) reporting, all of which shall be charged at normal commercial rates.
The Administrator is entitled to be reimbursed by Old Mutual Global Investors Series Plc for all reasonable out-of-pocketexpenses incurred by it. All fees will be invoiced and payable monthly.
The Administrator will also be entitled to be reimbursed by Old Mutual Global Investors Series Plc out of the assets of each Sub-Fund for all reasonable and vouched out-of-pocket expenses incurred by it and charged to it for the benefit of the Fund in theperformance of its duties to the Old Mutual Global Investors Series Plc.
Total Administration Fees were USD 5,401,463 for the financial period ended 30 June 2018 (30 June 2017: USD 2,741,666) andthe amount payable at the financial period ended 30 June 2018 was USD 2,436,677 (2017: USD 3,377,543).
The Administrator is entitled to the following fees for the registrar and transfer agency functions it performs, payable out of theCompany assets: annual Fund maintenance fee of EUR 3,500 per Sub-Fund per annum; annual account servicing fees of EUR26 for each direct Account, EUR 12 for statutory financial statements maintained electronically through NSCC Networking andEUR 26 for Accounts maintained electronically through Fundsettle/Vestima; transaction fees of EUR 5 for each automatictransaction and EUR 12 for each manual transaction.
All Sub-Funds are also subject to FATCA fees. The fees are included in the Transfer Agency fees and are recognised in theStatement of Operations on an accruals basis.
The following are the Administrator expense and related payable for each of the Sub-Funds.
2018 2017Sub-Fund CCY Expense Payable Expense PayableOld Mutual China Equity Fund USD 92,895 48,125 27,922 41,294Old Mutual Global Strategic Bond Fund (IRL) USD 50,547 31,234 32,767 45,356Old Mutual World Equity Fund USD 159,276 82,300 59,417 92,020Old Mutual Pacific Equity Fund USD 166,391 91,770 48,291 65,663Old Mutual European Equity Fund EUR 45,828 31,101 21,084 27,513Old Mutual Japanese Equity Fund^ JPY 954,337 - 3,747,500 4,923,931Old Mutual US Equity Income Fund USD 214,896 105,885 88,647 111,550Old Mutual North American Equity Fund USD 294,683 136,075 113,906 145,240Old Mutual Total Return USD Bond Fund USD 277,813 173,521 68,699 86,795Old Mutual Emerging Market Debt Fund USD 196,389 142,253 78,860 95,024Old Mutual European Best Ideas Fund EUR 76,168 71,470 35,368 86,385Old Mutual Investment Grade Corporate Bond Fund USD 62,606 36,266 35,468 43,282Old Mutual Global Emerging Markets Fund USD 143,995 64,037 71,986 81,034Old Mutual Asian Equity Income Fund USD 160,350 93,434 100,885 123,685Old Mutual Local Currency Emerging Market Debt Fund USD 190,849 30,598 63,976 93,367Old Mutual UK Alpha Fund (IRL) GBP 86,494 47,743 71,186 82,370Old Mutual UK Smaller Companies Focus Fund GBP 89,202 25,053 47,296 52,915Old Mutual UK Dynamic Equity Fund GBP 103,443 49,899 54,020 71,120Old Mutual Global Equity Absolute Return Fund USD 1,812,311 653,516 979,616 1,081,269Old Mutual Strategic Absolute Return Bond Fund^^^ USD 17,325 24,730 4,741 13,531Old Mutual Pan African Fund^^ USD 7,614 9,841 15,121 -Old Mutual Monthly Income High Yield Bond Fund USD 61,661 45,356 83,572 97,542Old Mutual Europe (ex UK) Smaller Companies Fund EUR 139,600 48,834 82,106 91,620Old Mutual Global Equity Income Fund (IRL) USD 74,178 32,957 51,683 84,342Old Mutual Gold & Silver Fund USD 128,252 49,184 60,037 64,302Old Mutual Compass Portfolio 2 USD 30,419 16,520 24,044 24,735Old Mutual Compass Portfolio 3 USD 81,034 30,730 47,926 54,397Old Mutual Compass Portfolio 4 USD 96,658 33,988 66,313 71,552Old Mutual Compass Portfolio 5 USD 33,368 15,242 26,632 26,968Old Mutual UK Specialist Equity Fund GBP 124,110 52,746 85,443 89,605
Old Mutual Style Premia Absolute Return Fund USD 77,035 51,746 77,863 108,037Old Mutual Financials Contingent Capital Fund USD 104,388 30,622 - 35,635Company Level USD 5,409,277 2,436,677 2,741,666 3,377,543
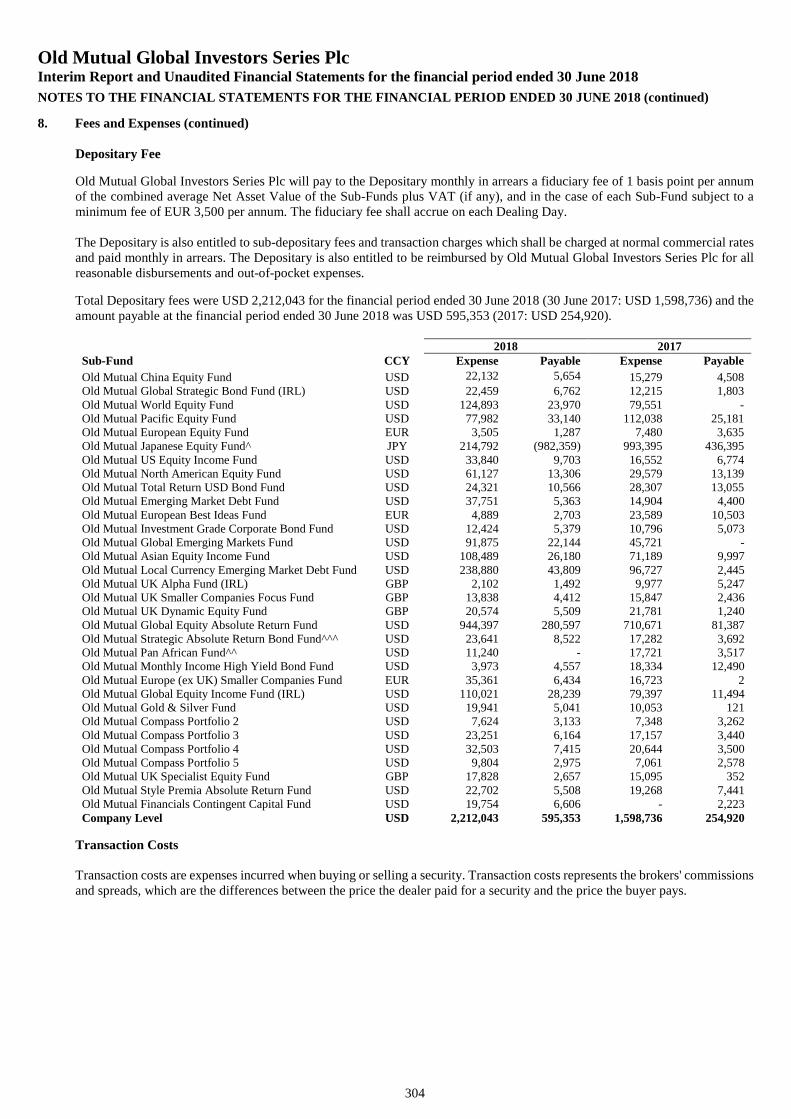
Old Mutual Global Investors Series PlcInterim Report and Unaudited Financial Statements for the financial period ended 30 June 2018
NOTES TO THE FINANCIAL STATEMENTS FOR THE FINANCIAL PERIOD ENDED 30 JUNE 2018 (continued)
304
8. Fees and Expenses (continued)
Depositary Fee
Old Mutual Global Investors Series Plc will pay to the Depositary monthly in arrears a fiduciary fee of 1 basis point per annumof the combined average Net Asset Value of the Sub-Funds plus VAT (if any), and in the case of each Sub-Fund subject to aminimum fee of EUR 3,500 per annum. The fiduciary fee shall accrue on each Dealing Day.
The Depositary is also entitled to sub-depositary fees and transaction charges which shall be charged at normal commercial ratesand paid monthly in arrears. The Depositary is also entitled to be reimbursed by Old Mutual Global Investors Series Plc for allreasonable disbursements and out-of-pocket expenses.
Total Depositary fees were USD 2,212,043 for the financial period ended 30 June 2018 (30 June 2017: USD 1,598,736) and theamount payable at the financial period ended 30 June 2018 was USD 595,353 (2017: USD 254,920).
2018 2017Sub-Fund CCY Expense Payable Expense Payable
Old Mutual China Equity Fund USD 22,132 5,654 15,279 4,508Old Mutual Global Strategic Bond Fund (IRL) USD 22,459 6,762 12,215 1,803Old Mutual World Equity Fund USD 124,893 23,970 79,551 -Old Mutual Pacific Equity Fund USD 77,982 33,140 112,038 25,181Old Mutual European Equity Fund EUR 3,505 1,287 7,480 3,635Old Mutual Japanese Equity Fund^ JPY 214,792 (982,359) 993,395 436,395Old Mutual US Equity Income Fund USD 33,840 9,703 16,552 6,774Old Mutual North American Equity Fund USD 61,127 13,306 29,579 13,139Old Mutual Total Return USD Bond Fund USD 24,321 10,566 28,307 13,055Old Mutual Emerging Market Debt Fund USD 37,751 5,363 14,904 4,400Old Mutual European Best Ideas Fund EUR 4,889 2,703 23,589 10,503Old Mutual Investment Grade Corporate Bond Fund USD 12,424 5,379 10,796 5,073Old Mutual Global Emerging Markets Fund USD 91,875 22,144 45,721 -Old Mutual Asian Equity Income Fund USD 108,489 26,180 71,189 9,997Old Mutual Local Currency Emerging Market Debt Fund USD 238,880 43,809 96,727 2,445Old Mutual UK Alpha Fund (IRL) GBP 2,102 1,492 9,977 5,247Old Mutual UK Smaller Companies Focus Fund GBP 13,838 4,412 15,847 2,436Old Mutual UK Dynamic Equity Fund GBP 20,574 5,509 21,781 1,240Old Mutual Global Equity Absolute Return Fund USD 944,397 280,597 710,671 81,387Old Mutual Strategic Absolute Return Bond Fund^^^ USD 23,641 8,522 17,282 3,692Old Mutual Pan African Fund^^ USD 11,240 - 17,721 3,517Old Mutual Monthly Income High Yield Bond Fund USD 3,973 4,557 18,334 12,490Old Mutual Europe (ex UK) Smaller Companies Fund EUR 35,361 6,434 16,723 2Old Mutual Global Equity Income Fund (IRL) USD 110,021 28,239 79,397 11,494Old Mutual Gold & Silver Fund USD 19,941 5,041 10,053 121Old Mutual Compass Portfolio 2 USD 7,624 3,133 7,348 3,262Old Mutual Compass Portfolio 3 USD 23,251 6,164 17,157 3,440Old Mutual Compass Portfolio 4 USD 32,503 7,415 20,644 3,500Old Mutual Compass Portfolio 5 USD 9,804 2,975 7,061 2,578Old Mutual UK Specialist Equity Fund GBP 17,828 2,657 15,095 352Old Mutual Style Premia Absolute Return Fund USD 22,702 5,508 19,268 7,441Old Mutual Financials Contingent Capital Fund USD 19,754 6,606 - 2,223Company Level USD 2,212,043 595,353 1,598,736 254,920
Transaction Costs
Transaction costs are expenses incurred when buying or selling a security. Transaction costs represents the brokers' commissionsand spreads, which are the differences between the price the dealer paid for a security and the price the buyer pays.
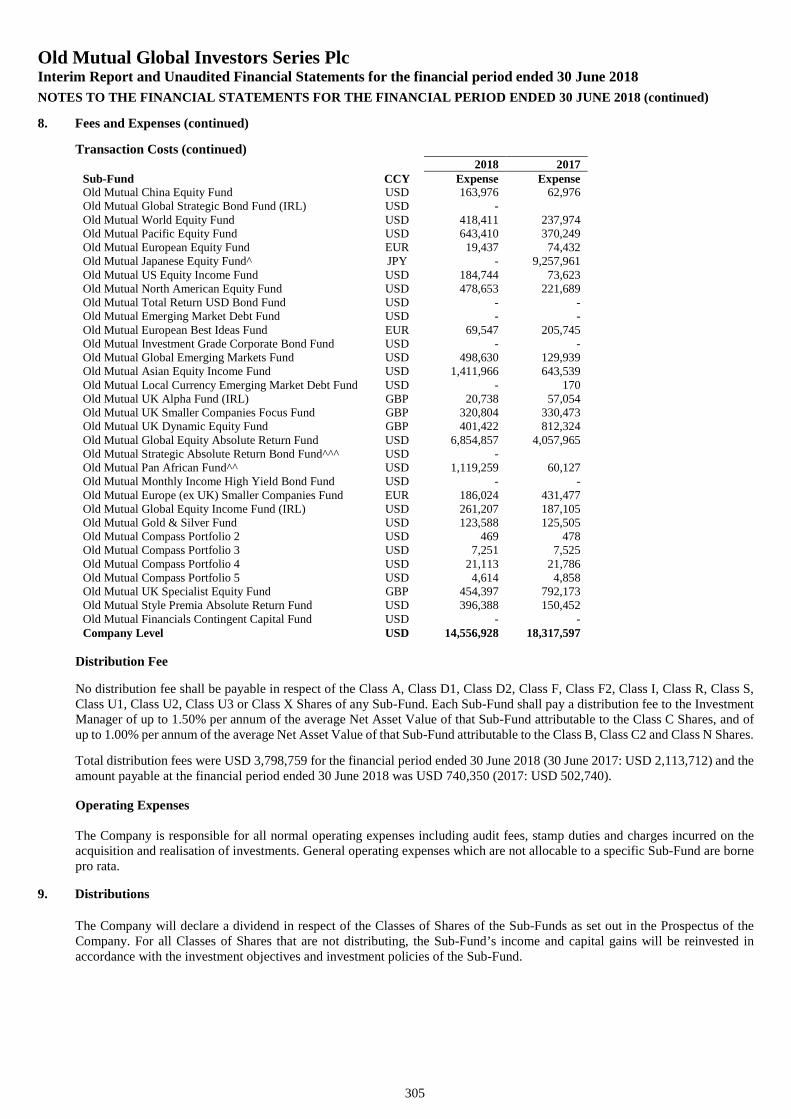
Old Mutual Global Investors Series PlcInterim Report and Unaudited Financial Statements for the financial period ended 30 June 2018
NOTES TO THE FINANCIAL STATEMENTS FOR THE FINANCIAL PERIOD ENDED 30 JUNE 2018 (continued)
305
8. Fees and Expenses (continued)
Transaction Costs (continued)2018 2017
Sub-Fund CCY Expense ExpenseOld Mutual China Equity Fund USD 163,976 62,976Old Mutual Global Strategic Bond Fund (IRL) USD -Old Mutual World Equity Fund USD 418,411 237,974Old Mutual Pacific Equity Fund USD 643,410 370,249Old Mutual European Equity Fund EUR 19,437 74,432Old Mutual Japanese Equity Fund^ JPY - 9,257,961Old Mutual US Equity Income Fund USD 184,744 73,623Old Mutual North American Equity Fund USD 478,653 221,689Old Mutual Total Return USD Bond Fund USD - -Old Mutual Emerging Market Debt Fund USD - -Old Mutual European Best Ideas Fund EUR 69,547 205,745Old Mutual Investment Grade Corporate Bond Fund USD - -Old Mutual Global Emerging Markets Fund USD 498,630 129,939Old Mutual Asian Equity Income Fund USD 1,411,966 643,539Old Mutual Local Currency Emerging Market Debt Fund USD - 170Old Mutual UK Alpha Fund (IRL) GBP 20,738 57,054Old Mutual UK Smaller Companies Focus Fund GBP 320,804 330,473Old Mutual UK Dynamic Equity Fund GBP 401,422 812,324Old Mutual Global Equity Absolute Return Fund USD 6,854,857 4,057,965Old Mutual Strategic Absolute Return Bond Fund^^^ USD -Old Mutual Pan African Fund^^ USD 1,119,259 60,127Old Mutual Monthly Income High Yield Bond Fund USD - -Old Mutual Europe (ex UK) Smaller Companies Fund EUR 186,024 431,477Old Mutual Global Equity Income Fund (IRL) USD 261,207 187,105Old Mutual Gold & Silver Fund USD 123,588 125,505Old Mutual Compass Portfolio 2 USD 469 478Old Mutual Compass Portfolio 3 USD 7,251 7,525Old Mutual Compass Portfolio 4 USD 21,113 21,786Old Mutual Compass Portfolio 5 USD 4,614 4,858Old Mutual UK Specialist Equity Fund GBP 454,397 792,173Old Mutual Style Premia Absolute Return Fund USD 396,388 150,452Old Mutual Financials Contingent Capital Fund USD - -Company Level USD 14,556,928 18,317,597
Distribution Fee
No distribution fee shall be payable in respect of the Class A, Class D1, Class D2, Class F, Class F2, Class I, Class R, Class S,Class U1, Class U2, Class U3 or Class X Shares of any Sub-Fund. Each Sub-Fund shall pay a distribution fee to the InvestmentManager of up to 1.50% per annum of the average Net Asset Value of that Sub-Fund attributable to the Class C Shares, and ofup to 1.00% per annum of the average Net Asset Value of that Sub-Fund attributable to the Class B, Class C2 and Class N Shares.
Total distribution fees were USD 3,798,759 for the financial period ended 30 June 2018 (30 June 2017: USD 2,113,712) and theamount payable at the financial period ended 30 June 2018 was USD 740,350 (2017: USD 502,740).
Operating Expenses
The Company is responsible for all normal operating expenses including audit fees, stamp duties and charges incurred on theacquisition and realisation of investments. General operating expenses which are not allocable to a specific Sub-Fund are bornepro rata.
9. Distributions
The Company will declare a dividend in respect of the Classes of Shares of the Sub-Funds as set out in the Prospectus of theCompany. For all Classes of Shares that are not distributing, the Sub-Fund’s income and capital gains will be reinvested inaccordance with the investment objectives and investment policies of the Sub-Fund.
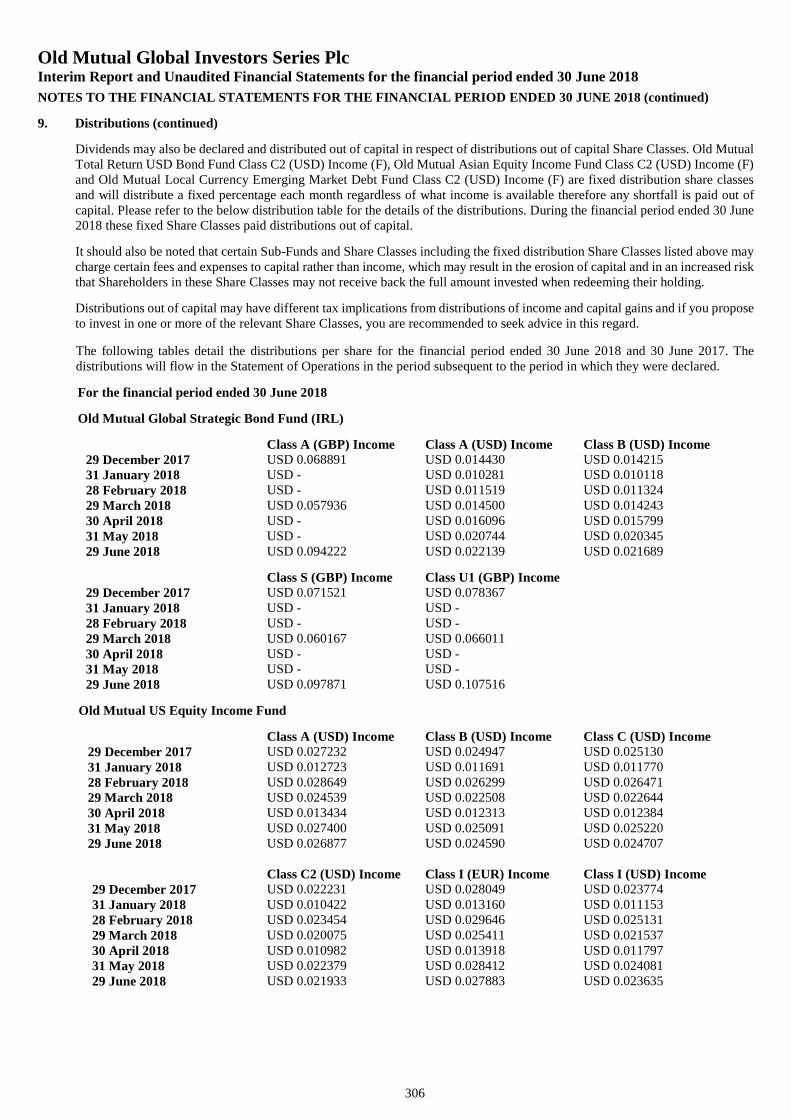
Old Mutual Global Investors Series PlcInterim Report and Unaudited Financial Statements for the financial period ended 30 June 2018
NOTES TO THE FINANCIAL STATEMENTS FOR THE FINANCIAL PERIOD ENDED 30 JUNE 2018 (continued)
306
9. Distributions (continued)
Dividends may also be declared and distributed out of capital in respect of distributions out of capital Share Classes. Old MutualTotal Return USD Bond Fund Class C2 (USD) Income (F), Old Mutual Asian Equity Income Fund Class C2 (USD) Income (F)and Old Mutual Local Currency Emerging Market Debt Fund Class C2 (USD) Income (F) are fixed distribution share classesand will distribute a fixed percentage each month regardless of what income is available therefore any shortfall is paid out ofcapital. Please refer to the below distribution table for the details of the distributions. During the financial period ended 30 June2018 these fixed Share Classes paid distributions out of capital.
It should also be noted that certain Sub-Funds and Share Classes including the fixed distribution Share Classes listed above maycharge certain fees and expenses to capital rather than income, which may result in the erosion of capital and in an increased riskthat Shareholders in these Share Classes may not receive back the full amount invested when redeeming their holding.
Distributions out of capital may have different tax implications from distributions of income and capital gains and if you proposeto invest in one or more of the relevant Share Classes, you are recommended to seek advice in this regard.
The following tables detail the distributions per share for the financial period ended 30 June 2018 and 30 June 2017. Thedistributions will flow in the Statement of Operations in the period subsequent to the period in which they were declared.
For the financial period ended 30 June 2018
Old Mutual Global Strategic Bond Fund (IRL)
Class A (GBP) Income Class A (USD) Income Class B (USD) Income29 December 2017 USD 0.068891 USD 0.014430 USD 0.01421531 January 2018 USD - USD 0.010281 USD 0.01011828 February 2018 USD - USD 0.011519 USD 0.01132429 March 2018 USD 0.057936 USD 0.014500 USD 0.01424330 April 2018 USD - USD 0.016096 USD 0.01579931 May 2018 USD - USD 0.020744 USD 0.02034529 June 2018 USD 0.094222 USD 0.022139 USD 0.021689
Class S (GBP) Income Class U1 (GBP) Income29 December 2017 USD 0.071521 USD 0.07836731 January 2018 USD - USD -28 February 2018 USD - USD -29 March 2018 USD 0.060167 USD 0.06601130 April 2018 USD - USD -31 May 2018 USD - USD -29 June 2018 USD 0.097871 USD 0.107516
Old Mutual US Equity Income Fund
Class A (USD) Income Class B (USD) Income Class C (USD) Income29 December 2017 USD 0.027232 USD 0.024947 USD 0.02513031 January 2018 USD 0.012723 USD 0.011691 USD 0.01177028 February 2018 USD 0.028649 USD 0.026299 USD 0.02647129 March 2018 USD 0.024539 USD 0.022508 USD 0.02264430 April 2018 USD 0.013434 USD 0.012313 USD 0.01238431 May 2018 USD 0.027400 USD 0.025091 USD 0.02522029 June 2018 USD 0.026877 USD 0.024590 USD 0.024707
Class C2 (USD) Income Class I (EUR) Income Class I (USD) Income29 December 2017 USD 0.022231 USD 0.028049 USD 0.02377431 January 2018 USD 0.010422 USD 0.013160 USD 0.01115328 February 2018 USD 0.023454 USD 0.029646 USD 0.02513129 March 2018 USD 0.020075 USD 0.025411 USD 0.02153730 April 2018 USD 0.010982 USD 0.013918 USD 0.01179731 May 2018 USD 0.022379 USD 0.028412 USD 0.02408129 June 2018 USD 0.021933 USD 0.027883 USD 0.023635
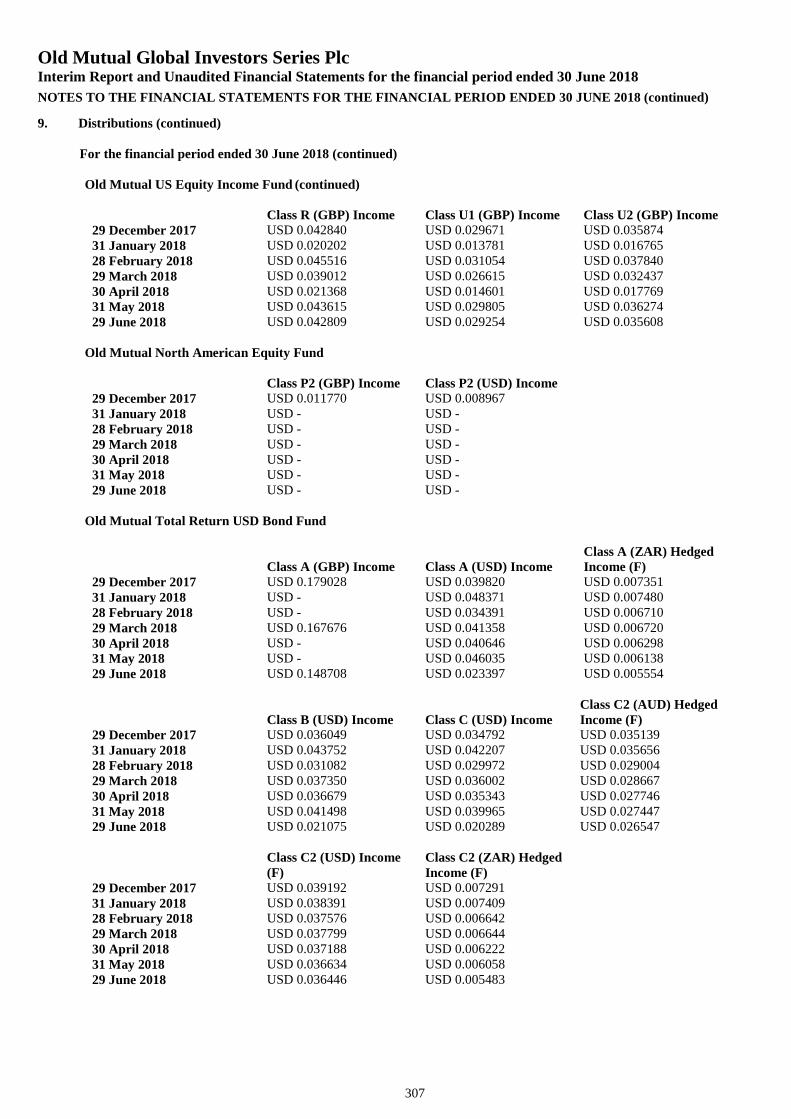
Old Mutual Global Investors Series PlcInterim Report and Unaudited Financial Statements for the financial period ended 30 June 2018
NOTES TO THE FINANCIAL STATEMENTS FOR THE FINANCIAL PERIOD ENDED 30 JUNE 2018 (continued)
307
9. Distributions (continued)
For the financial period ended 30 June 2018 (continued)
Old Mutual US Equity Income Fund (continued)
Class R (GBP) Income Class U1 (GBP) Income Class U2 (GBP) Income29 December 2017 USD 0.042840 USD 0.029671 USD 0.03587431 January 2018 USD 0.020202 USD 0.013781 USD 0.01676528 February 2018 USD 0.045516 USD 0.031054 USD 0.03784029 March 2018 USD 0.039012 USD 0.026615 USD 0.03243730 April 2018 USD 0.021368 USD 0.014601 USD 0.01776931 May 2018 USD 0.043615 USD 0.029805 USD 0.03627429 June 2018 USD 0.042809 USD 0.029254 USD 0.035608
Old Mutual North American Equity Fund
Class P2 (GBP) Income Class P2 (USD) Income29 December 2017 USD 0.011770 USD 0.00896731 January 2018 USD - USD -28 February 2018 USD - USD -29 March 2018 USD - USD -30 April 2018 USD - USD -31 May 2018 USD - USD -29 June 2018 USD - USD -
Old Mutual Total Return USD Bond Fund
Class A (GBP) Income Class A (USD) IncomeClass A (ZAR) HedgedIncome (F)
29 December 2017 USD 0.179028 USD 0.039820 USD 0.00735131 January 2018 USD - USD 0.048371 USD 0.00748028 February 2018 USD - USD 0.034391 USD 0.00671029 March 2018 USD 0.167676 USD 0.041358 USD 0.00672030 April 2018 USD - USD 0.040646 USD 0.00629831 May 2018 USD - USD 0.046035 USD 0.00613829 June 2018 USD 0.148708 USD 0.023397 USD 0.005554
Class B (USD) Income Class C (USD) IncomeClass C2 (AUD) HedgedIncome (F)
29 December 2017 USD 0.036049 USD 0.034792 USD 0.03513931 January 2018 USD 0.043752 USD 0.042207 USD 0.03565628 February 2018 USD 0.031082 USD 0.029972 USD 0.02900429 March 2018 USD 0.037350 USD 0.036002 USD 0.02866730 April 2018 USD 0.036679 USD 0.035343 USD 0.02774631 May 2018 USD 0.041498 USD 0.039965 USD 0.02744729 June 2018 USD 0.021075 USD 0.020289 USD 0.026547
Class C2 (USD) Income(F)
Class C2 (ZAR) HedgedIncome (F)
29 December 2017 USD 0.039192 USD 0.00729131 January 2018 USD 0.038391 USD 0.00740928 February 2018 USD 0.037576 USD 0.00664229 March 2018 USD 0.037799 USD 0.00664430 April 2018 USD 0.037188 USD 0.00622231 May 2018 USD 0.036634 USD 0.00605829 June 2018 USD 0.036446 USD 0.005483
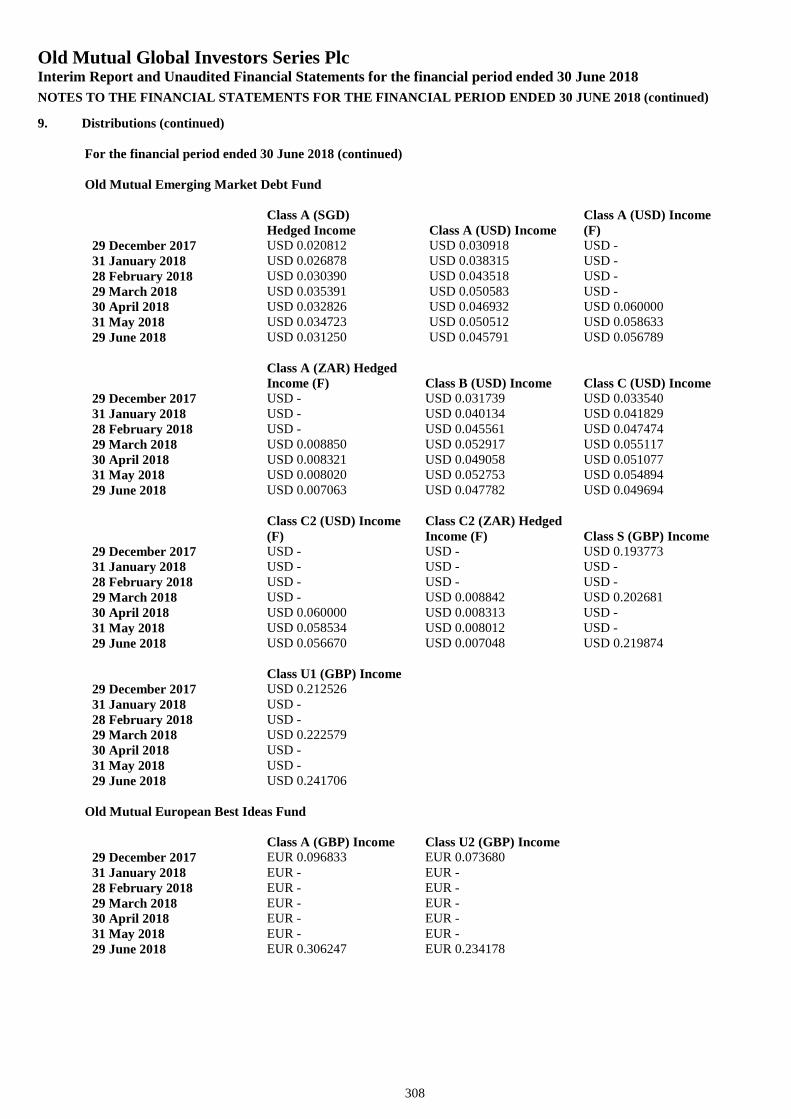
Old Mutual Global Investors Series PlcInterim Report and Unaudited Financial Statements for the financial period ended 30 June 2018
NOTES TO THE FINANCIAL STATEMENTS FOR THE FINANCIAL PERIOD ENDED 30 JUNE 2018 (continued)
308
9. Distributions (continued)
For the financial period ended 30 June 2018 (continued)
Old Mutual Emerging Market Debt Fund
Class A (SGD)Hedged Income Class A (USD) Income
Class A (USD) Income(F)
29 December 2017 USD 0.020812 USD 0.030918 USD -31 January 2018 USD 0.026878 USD 0.038315 USD -28 February 2018 USD 0.030390 USD 0.043518 USD -29 March 2018 USD 0.035391 USD 0.050583 USD -30 April 2018 USD 0.032826 USD 0.046932 USD 0.06000031 May 2018 USD 0.034723 USD 0.050512 USD 0.05863329 June 2018 USD 0.031250 USD 0.045791 USD 0.056789
Class A (ZAR) HedgedIncome (F) Class B (USD) Income Class C (USD) Income
29 December 2017 USD - USD 0.031739 USD 0.03354031 January 2018 USD - USD 0.040134 USD 0.04182928 February 2018 USD - USD 0.045561 USD 0.04747429 March 2018 USD 0.008850 USD 0.052917 USD 0.05511730 April 2018 USD 0.008321 USD 0.049058 USD 0.05107731 May 2018 USD 0.008020 USD 0.052753 USD 0.05489429 June 2018 USD 0.007063 USD 0.047782 USD 0.049694
Class C2 (USD) Income(F)
Class C2 (ZAR) HedgedIncome (F) Class S (GBP) Income
29 December 2017 USD - USD - USD 0.19377331 January 2018 USD - USD - USD -28 February 2018 USD - USD - USD -29 March 2018 USD - USD 0.008842 USD 0.20268130 April 2018 USD 0.060000 USD 0.008313 USD -31 May 2018 USD 0.058534 USD 0.008012 USD -29 June 2018 USD 0.056670 USD 0.007048 USD 0.219874
Class U1 (GBP) Income29 December 2017 USD 0.21252631 January 2018 USD -28 February 2018 USD -29 March 2018 USD 0.22257930 April 2018 USD -31 May 2018 USD -29 June 2018 USD 0.241706
Old Mutual European Best Ideas Fund
Class A (GBP) Income Class U2 (GBP) Income29 December 2017 EUR 0.096833 EUR 0.07368031 January 2018 EUR - EUR -28 February 2018 EUR - EUR -29 March 2018 EUR - EUR -30 April 2018 EUR - EUR -31 May 2018 EUR - EUR -29 June 2018 EUR 0.306247 EUR 0.234178
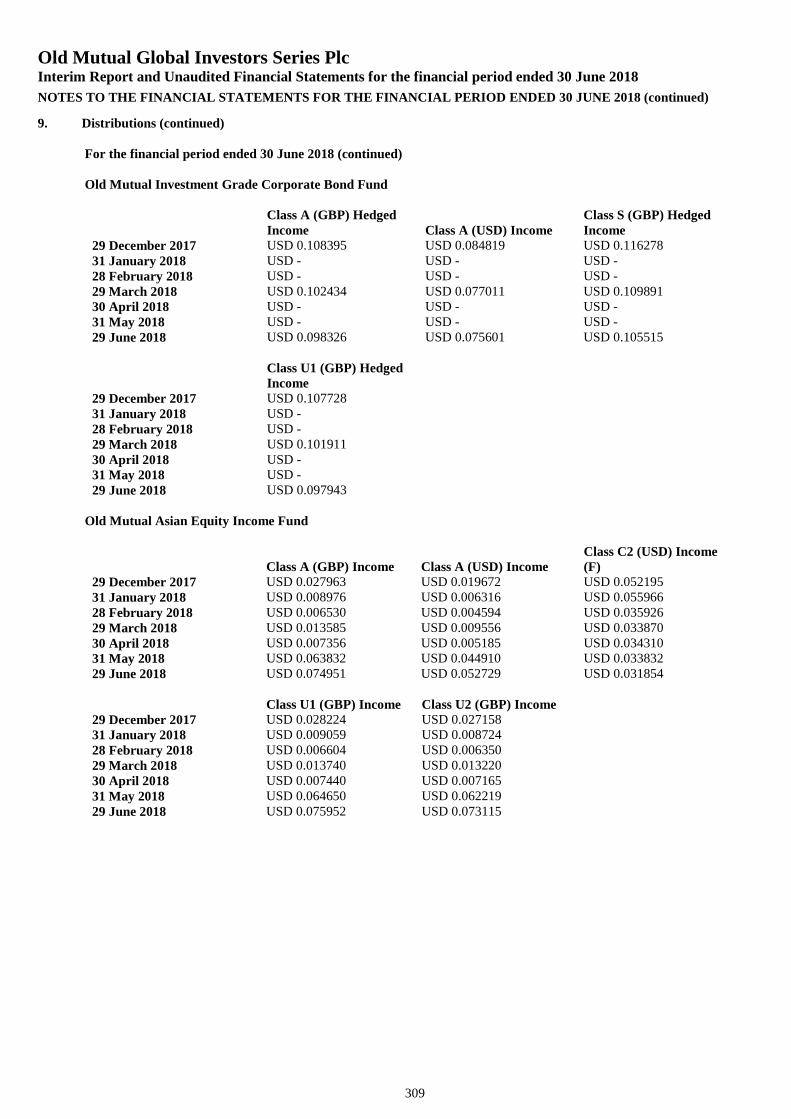
Old Mutual Global Investors Series PlcInterim Report and Unaudited Financial Statements for the financial period ended 30 June 2018
NOTES TO THE FINANCIAL STATEMENTS FOR THE FINANCIAL PERIOD ENDED 30 JUNE 2018 (continued)
309
9. Distributions (continued)
For the financial period ended 30 June 2018 (continued)
Old Mutual Investment Grade Corporate Bond Fund
Class A (GBP) HedgedIncome Class A (USD) Income
Class S (GBP) HedgedIncome
29 December 2017 USD 0.108395 USD 0.084819 USD 0.11627831 January 2018 USD - USD - USD -28 February 2018 USD - USD - USD -29 March 2018 USD 0.102434 USD 0.077011 USD 0.10989130 April 2018 USD - USD - USD -31 May 2018 USD - USD - USD -29 June 2018 USD 0.098326 USD 0.075601 USD 0.105515
Class U1 (GBP) HedgedIncome
29 December 2017 USD 0.10772831 January 2018 USD -28 February 2018 USD -29 March 2018 USD 0.10191130 April 2018 USD -31 May 2018 USD -29 June 2018 USD 0.097943
Old Mutual Asian Equity Income Fund
Class A (GBP) Income Class A (USD) IncomeClass C2 (USD) Income(F)
29 December 2017 USD 0.027963 USD 0.019672 USD 0.05219531 January 2018 USD 0.008976 USD 0.006316 USD 0.05596628 February 2018 USD 0.006530 USD 0.004594 USD 0.03592629 March 2018 USD 0.013585 USD 0.009556 USD 0.03387030 April 2018 USD 0.007356 USD 0.005185 USD 0.03431031 May 2018 USD 0.063832 USD 0.044910 USD 0.03383229 June 2018 USD 0.074951 USD 0.052729 USD 0.031854
Class U1 (GBP) Income Class U2 (GBP) Income29 December 2017 USD 0.028224 USD 0.02715831 January 2018 USD 0.009059 USD 0.00872428 February 2018 USD 0.006604 USD 0.00635029 March 2018 USD 0.013740 USD 0.01322030 April 2018 USD 0.007440 USD 0.00716531 May 2018 USD 0.064650 USD 0.06221929 June 2018 USD 0.075952 USD 0.073115
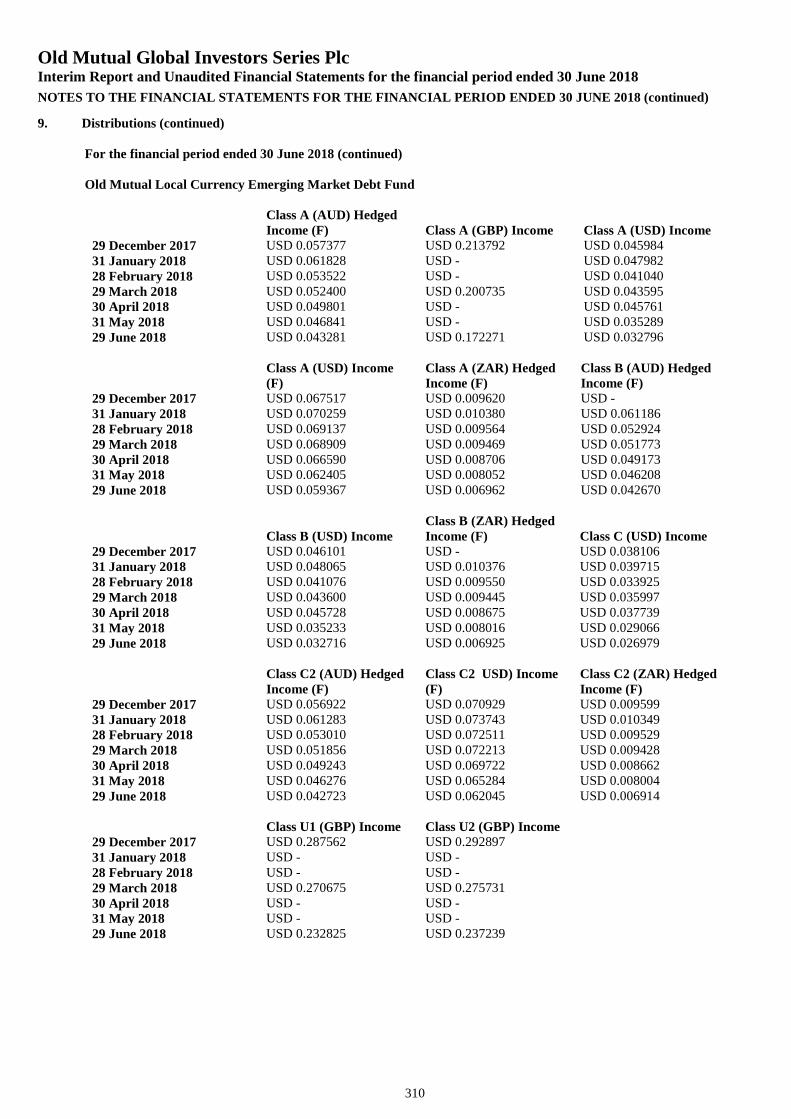
Old Mutual Global Investors Series PlcInterim Report and Unaudited Financial Statements for the financial period ended 30 June 2018
NOTES TO THE FINANCIAL STATEMENTS FOR THE FINANCIAL PERIOD ENDED 30 JUNE 2018 (continued)
310
9. Distributions (continued)
For the financial period ended 30 June 2018 (continued)
Old Mutual Local Currency Emerging Market Debt Fund
Class A (AUD) HedgedIncome (F) Class A (GBP) Income Class A (USD) Income
29 December 2017 USD 0.057377 USD 0.213792 USD 0.04598431 January 2018 USD 0.061828 USD - USD 0.04798228 February 2018 USD 0.053522 USD - USD 0.04104029 March 2018 USD 0.052400 USD 0.200735 USD 0.04359530 April 2018 USD 0.049801 USD - USD 0.04576131 May 2018 USD 0.046841 USD - USD 0.03528929 June 2018 USD 0.043281 USD 0.172271 USD 0.032796
Class A (USD) Income(F)
Class A (ZAR) HedgedIncome (F)
Class B (AUD) HedgedIncome (F)
29 December 2017 USD 0.067517 USD 0.009620 USD -31 January 2018 USD 0.070259 USD 0.010380 USD 0.06118628 February 2018 USD 0.069137 USD 0.009564 USD 0.05292429 March 2018 USD 0.068909 USD 0.009469 USD 0.05177330 April 2018 USD 0.066590 USD 0.008706 USD 0.04917331 May 2018 USD 0.062405 USD 0.008052 USD 0.04620829 June 2018 USD 0.059367 USD 0.006962 USD 0.042670
Class B (USD) IncomeClass B (ZAR) HedgedIncome (F) Class C (USD) Income
29 December 2017 USD 0.046101 USD - USD 0.03810631 January 2018 USD 0.048065 USD 0.010376 USD 0.03971528 February 2018 USD 0.041076 USD 0.009550 USD 0.03392529 March 2018 USD 0.043600 USD 0.009445 USD 0.03599730 April 2018 USD 0.045728 USD 0.008675 USD 0.03773931 May 2018 USD 0.035233 USD 0.008016 USD 0.02906629 June 2018 USD 0.032716 USD 0.006925 USD 0.026979
Class C2 (AUD) HedgedIncome (F)
Class C2 USD) Income(F)
Class C2 (ZAR) HedgedIncome (F)
29 December 2017 USD 0.056922 USD 0.070929 USD 0.00959931 January 2018 USD 0.061283 USD 0.073743 USD 0.01034928 February 2018 USD 0.053010 USD 0.072511 USD 0.00952929 March 2018 USD 0.051856 USD 0.072213 USD 0.00942830 April 2018 USD 0.049243 USD 0.069722 USD 0.00866231 May 2018 USD 0.046276 USD 0.065284 USD 0.00800429 June 2018 USD 0.042723 USD 0.062045 USD 0.006914
Class U1 (GBP) Income Class U2 (GBP) Income29 December 2017 USD 0.287562 USD 0.29289731 January 2018 USD - USD -28 February 2018 USD - USD -29 March 2018 USD 0.270675 USD 0.27573130 April 2018 USD - USD -31 May 2018 USD - USD -29 June 2018 USD 0.232825 USD 0.237239
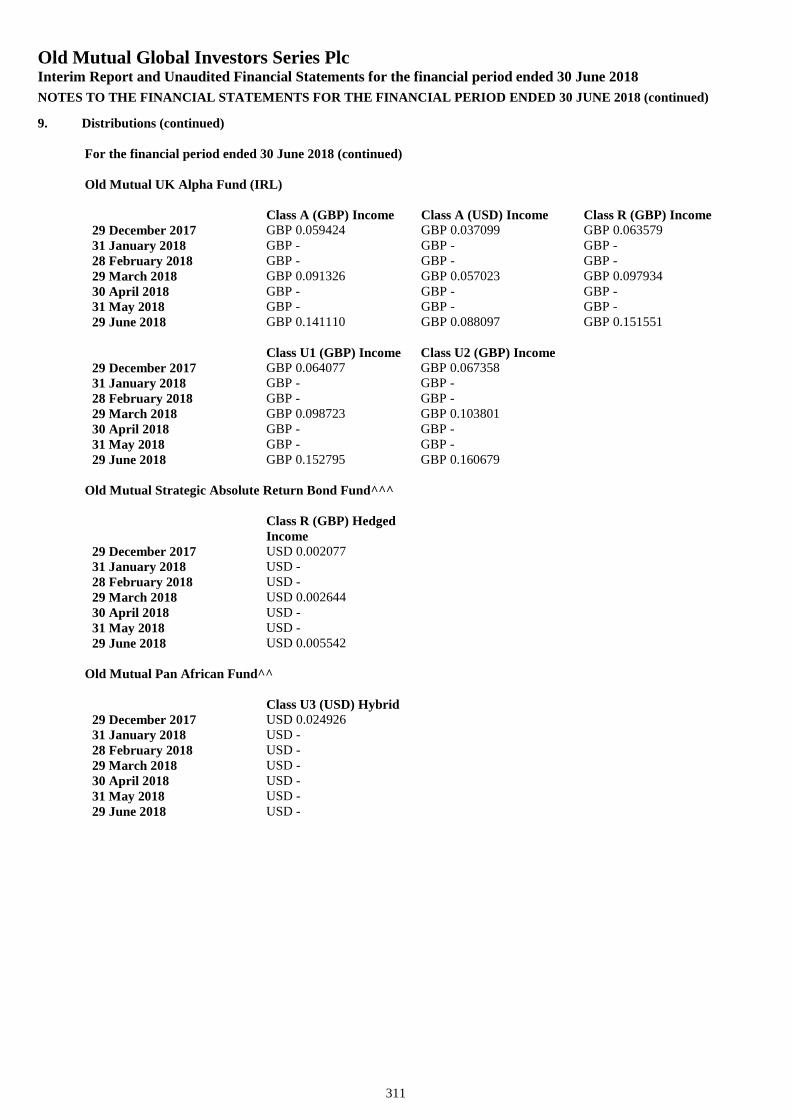
Old Mutual Global Investors Series PlcInterim Report and Unaudited Financial Statements for the financial period ended 30 June 2018
NOTES TO THE FINANCIAL STATEMENTS FOR THE FINANCIAL PERIOD ENDED 30 JUNE 2018 (continued)
311
9. Distributions (continued)
For the financial period ended 30 June 2018 (continued)
Old Mutual UK Alpha Fund (IRL)
Class A (GBP) Income Class A (USD) Income Class R (GBP) Income29 December 2017 GBP 0.059424 GBP 0.037099 GBP 0.06357931 January 2018 GBP - GBP - GBP -28 February 2018 GBP - GBP - GBP -29 March 2018 GBP 0.091326 GBP 0.057023 GBP 0.09793430 April 2018 GBP - GBP - GBP -31 May 2018 GBP - GBP - GBP -29 June 2018 GBP 0.141110 GBP 0.088097 GBP 0.151551
Class U1 (GBP) Income Class U2 (GBP) Income29 December 2017 GBP 0.064077 GBP 0.06735831 January 2018 GBP - GBP -28 February 2018 GBP - GBP -29 March 2018 GBP 0.098723 GBP 0.10380130 April 2018 GBP - GBP -31 May 2018 GBP - GBP -29 June 2018 GBP 0.152795 GBP 0.160679
Old Mutual Strategic Absolute Return Bond Fund^^^
Class R (GBP) HedgedIncome
29 December 2017 USD 0.00207731 January 2018 USD -28 February 2018 USD -29 March 2018 USD 0.00264430 April 2018 USD -31 May 2018 USD -29 June 2018 USD 0.005542
Old Mutual Pan African Fund^^
Class U3 (USD) Hybrid29 December 2017 USD 0.02492631 January 2018 USD -28 February 2018 USD -29 March 2018 USD -30 April 2018 USD -31 May 2018 USD -29 June 2018 USD -
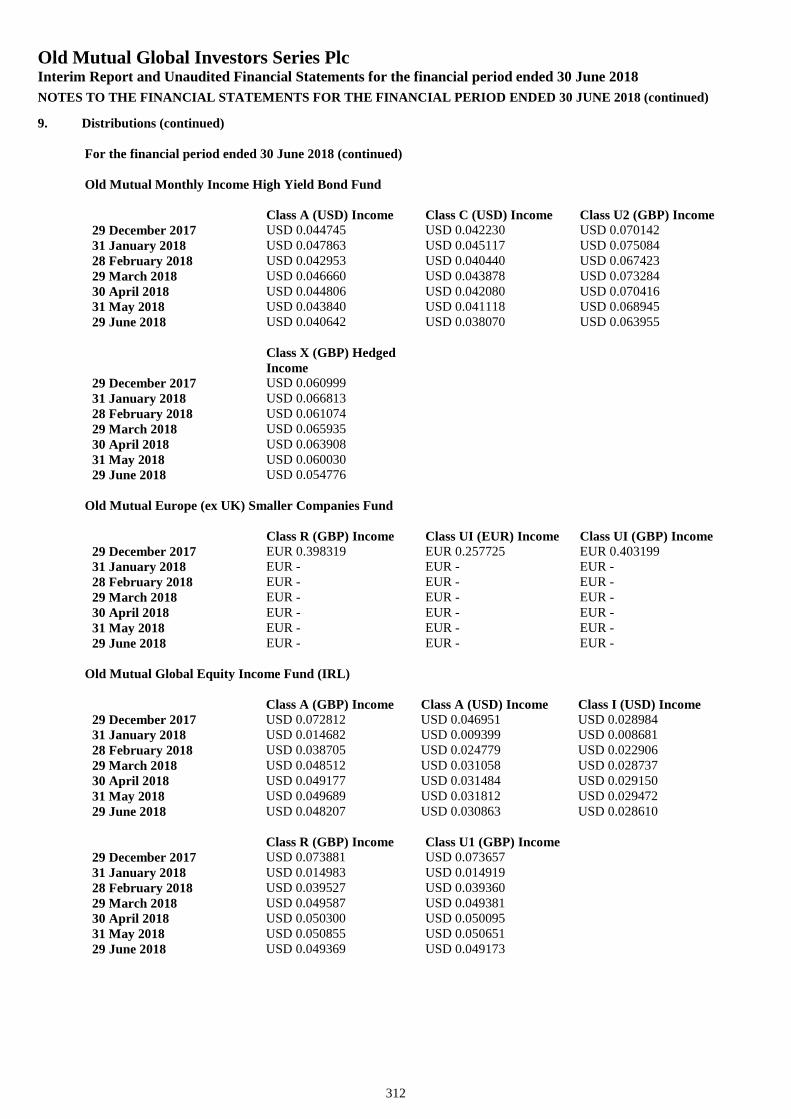
Old Mutual Global Investors Series PlcInterim Report and Unaudited Financial Statements for the financial period ended 30 June 2018
NOTES TO THE FINANCIAL STATEMENTS FOR THE FINANCIAL PERIOD ENDED 30 JUNE 2018 (continued)
312
9. Distributions (continued)
For the financial period ended 30 June 2018 (continued)
Old Mutual Monthly Income High Yield Bond Fund
Class A (USD) Income Class C (USD) Income Class U2 (GBP) Income29 December 2017 USD 0.044745 USD 0.042230 USD 0.07014231 January 2018 USD 0.047863 USD 0.045117 USD 0.07508428 February 2018 USD 0.042953 USD 0.040440 USD 0.06742329 March 2018 USD 0.046660 USD 0.043878 USD 0.07328430 April 2018 USD 0.044806 USD 0.042080 USD 0.07041631 May 2018 USD 0.043840 USD 0.041118 USD 0.06894529 June 2018 USD 0.040642 USD 0.038070 USD 0.063955
Class X (GBP) HedgedIncome
29 December 2017 USD 0.06099931 January 2018 USD 0.06681328 February 2018 USD 0.06107429 March 2018 USD 0.06593530 April 2018 USD 0.06390831 May 2018 USD 0.06003029 June 2018 USD 0.054776
Old Mutual Europe (ex UK) Smaller Companies Fund
Class R (GBP) Income Class UI (EUR) Income Class UI (GBP) Income29 December 2017 EUR 0.398319 EUR 0.257725 EUR 0.40319931 January 2018 EUR - EUR - EUR -28 February 2018 EUR - EUR - EUR -29 March 2018 EUR - EUR - EUR -30 April 2018 EUR - EUR - EUR -31 May 2018 EUR - EUR - EUR -29 June 2018 EUR - EUR - EUR -
Old Mutual Global Equity Income Fund (IRL)
Class A (GBP) Income Class A (USD) Income Class I (USD) Income29 December 2017 USD 0.072812 USD 0.046951 USD 0.02898431 January 2018 USD 0.014682 USD 0.009399 USD 0.00868128 February 2018 USD 0.038705 USD 0.024779 USD 0.02290629 March 2018 USD 0.048512 USD 0.031058 USD 0.02873730 April 2018 USD 0.049177 USD 0.031484 USD 0.02915031 May 2018 USD 0.049689 USD 0.031812 USD 0.02947229 June 2018 USD 0.048207 USD 0.030863 USD 0.028610
Class R (GBP) Income Class U1 (GBP) Income29 December 2017 USD 0.073881 USD 0.07365731 January 2018 USD 0.014983 USD 0.01491928 February 2018 USD 0.039527 USD 0.03936029 March 2018 USD 0.049587 USD 0.04938130 April 2018 USD 0.050300 USD 0.05009531 May 2018 USD 0.050855 USD 0.05065129 June 2018 USD 0.049369 USD 0.049173
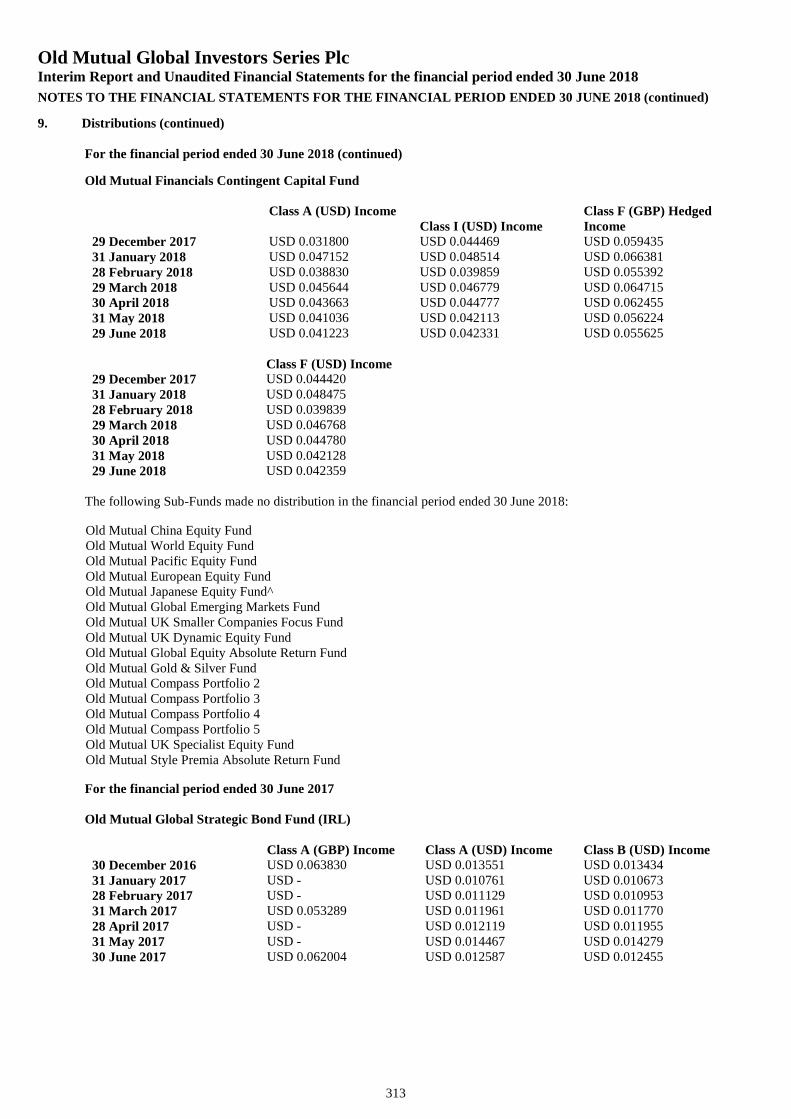
Old Mutual Global Investors Series PlcInterim Report and Unaudited Financial Statements for the financial period ended 30 June 2018
NOTES TO THE FINANCIAL STATEMENTS FOR THE FINANCIAL PERIOD ENDED 30 JUNE 2018 (continued)
313
9. Distributions (continued)
For the financial period ended 30 June 2018 (continued)
Old Mutual Financials Contingent Capital Fund
Class A (USD) IncomeClass I (USD) Income
Class F (GBP) HedgedIncome
29 December 2017 USD 0.031800 USD 0.044469 USD 0.05943531 January 2018 USD 0.047152 USD 0.048514 USD 0.06638128 February 2018 USD 0.038830 USD 0.039859 USD 0.05539229 March 2018 USD 0.045644 USD 0.046779 USD 0.06471530 April 2018 USD 0.043663 USD 0.044777 USD 0.06245531 May 2018 USD 0.041036 USD 0.042113 USD 0.05622429 June 2018 USD 0.041223 USD 0.042331 USD 0.055625
Class F (USD) Income29 December 2017 USD 0.04442031 January 2018 USD 0.04847528 February 2018 USD 0.03983929 March 2018 USD 0.04676830 April 2018 USD 0.04478031 May 2018 USD 0.04212829 June 2018 USD 0.042359
The following Sub-Funds made no distribution in the financial period ended 30 June 2018:
Old Mutual China Equity FundOld Mutual World Equity FundOld Mutual Pacific Equity FundOld Mutual European Equity FundOld Mutual Japanese Equity Fund^Old Mutual Global Emerging Markets FundOld Mutual UK Smaller Companies Focus FundOld Mutual UK Dynamic Equity FundOld Mutual Global Equity Absolute Return FundOld Mutual Gold & Silver FundOld Mutual Compass Portfolio 2Old Mutual Compass Portfolio 3Old Mutual Compass Portfolio 4Old Mutual Compass Portfolio 5Old Mutual UK Specialist Equity FundOld Mutual Style Premia Absolute Return Fund
For the financial period ended 30 June 2017
Old Mutual Global Strategic Bond Fund (IRL)
Class A (GBP) Income Class A (USD) Income Class B (USD) Income30 December 2016 USD 0.063830 USD 0.013551 USD 0.01343431 January 2017 USD - USD 0.010761 USD 0.01067328 February 2017 USD - USD 0.011129 USD 0.01095331 March 2017 USD 0.053289 USD 0.011961 USD 0.01177028 April 2017 USD - USD 0.012119 USD 0.01195531 May 2017 USD - USD 0.014467 USD 0.01427930 June 2017 USD 0.062004 USD 0.012587 USD 0.012455
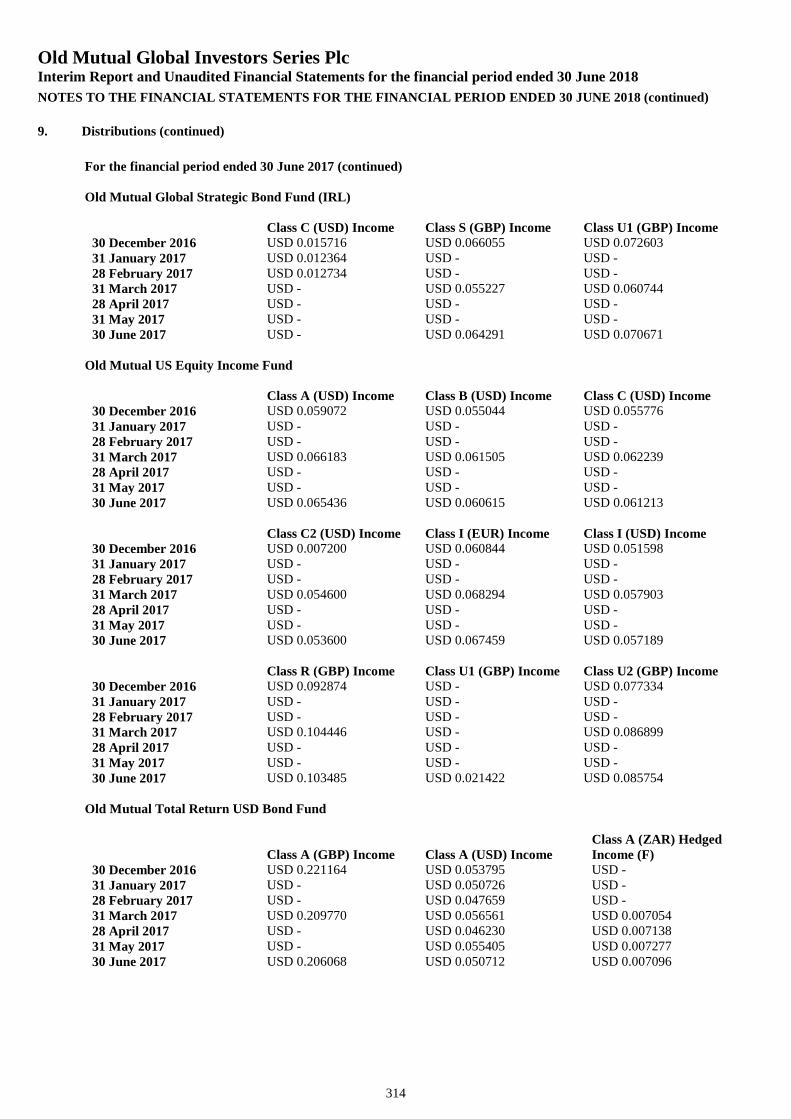
Old Mutual Global Investors Series PlcInterim Report and Unaudited Financial Statements for the financial period ended 30 June 2018
NOTES TO THE FINANCIAL STATEMENTS FOR THE FINANCIAL PERIOD ENDED 30 JUNE 2018 (continued)
314
9. Distributions (continued)
For the financial period ended 30 June 2017 (continued)
Old Mutual Global Strategic Bond Fund (IRL)
Class C (USD) Income Class S (GBP) Income Class U1 (GBP) Income30 December 2016 USD 0.015716 USD 0.066055 USD 0.07260331 January 2017 USD 0.012364 USD - USD -28 February 2017 USD 0.012734 USD - USD -31 March 2017 USD - USD 0.055227 USD 0.06074428 April 2017 USD - USD - USD -31 May 2017 USD - USD - USD -30 June 2017 USD - USD 0.064291 USD 0.070671
Old Mutual US Equity Income Fund
Class A (USD) Income Class B (USD) Income Class C (USD) Income30 December 2016 USD 0.059072 USD 0.055044 USD 0.05577631 January 2017 USD - USD - USD -28 February 2017 USD - USD - USD -31 March 2017 USD 0.066183 USD 0.061505 USD 0.06223928 April 2017 USD - USD - USD -31 May 2017 USD - USD - USD -30 June 2017 USD 0.065436 USD 0.060615 USD 0.061213
Class C2 (USD) Income Class I (EUR) Income Class I (USD) Income30 December 2016 USD 0.007200 USD 0.060844 USD 0.05159831 January 2017 USD - USD - USD -28 February 2017 USD - USD - USD -31 March 2017 USD 0.054600 USD 0.068294 USD 0.05790328 April 2017 USD - USD - USD -31 May 2017 USD - USD - USD -30 June 2017 USD 0.053600 USD 0.067459 USD 0.057189
Class R (GBP) Income Class U1 (GBP) Income Class U2 (GBP) Income30 December 2016 USD 0.092874 USD - USD 0.07733431 January 2017 USD - USD - USD -28 February 2017 USD - USD - USD -31 March 2017 USD 0.104446 USD - USD 0.08689928 April 2017 USD - USD - USD -31 May 2017 USD - USD - USD -30 June 2017 USD 0.103485 USD 0.021422 USD 0.085754
Old Mutual Total Return USD Bond Fund
Class A (GBP) Income Class A (USD) IncomeClass A (ZAR) HedgedIncome (F)
30 December 2016 USD 0.221164 USD 0.053795 USD -31 January 2017 USD - USD 0.050726 USD -28 February 2017 USD - USD 0.047659 USD -31 March 2017 USD 0.209770 USD 0.056561 USD 0.00705428 April 2017 USD - USD 0.046230 USD 0.00713831 May 2017 USD - USD 0.055405 USD 0.00727730 June 2017 USD 0.206068 USD 0.050712 USD 0.007096
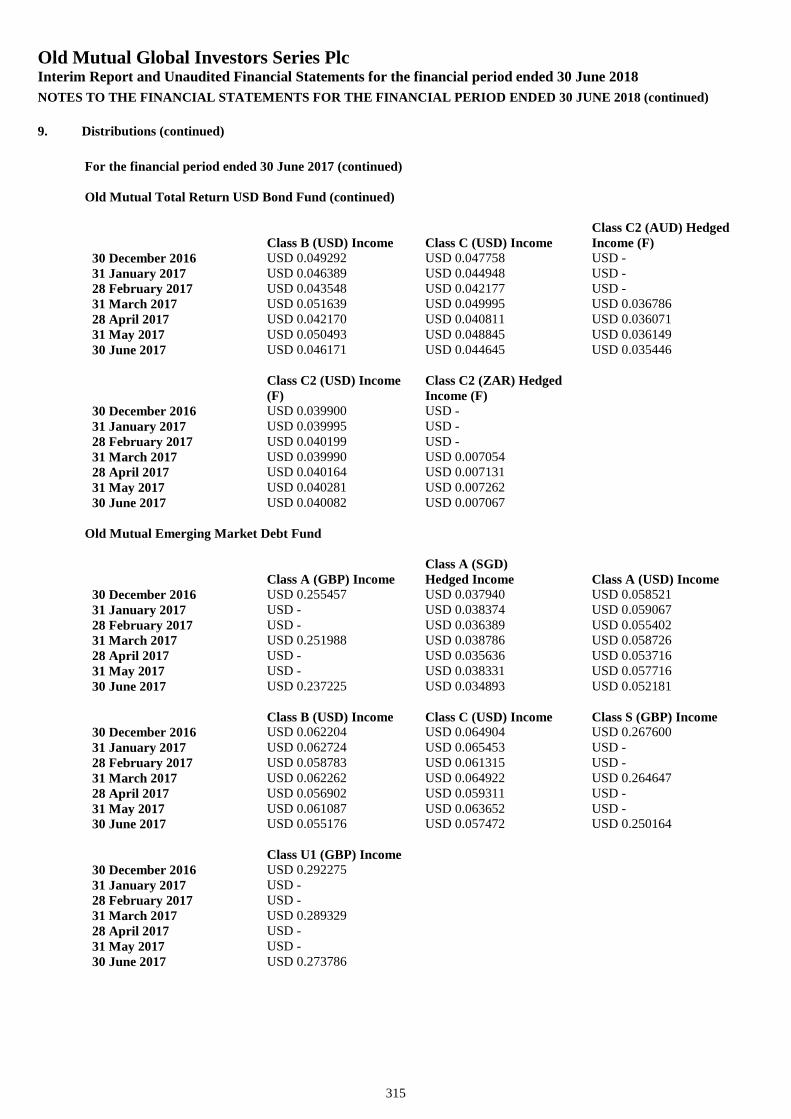
Old Mutual Global Investors Series PlcInterim Report and Unaudited Financial Statements for the financial period ended 30 June 2018
NOTES TO THE FINANCIAL STATEMENTS FOR THE FINANCIAL PERIOD ENDED 30 JUNE 2018 (continued)
315
9. Distributions (continued)
For the financial period ended 30 June 2017 (continued)
Old Mutual Total Return USD Bond Fund (continued)
Class B (USD) Income Class C (USD) IncomeClass C2 (AUD) HedgedIncome (F)
30 December 2016 USD 0.049292 USD 0.047758 USD -31 January 2017 USD 0.046389 USD 0.044948 USD -28 February 2017 USD 0.043548 USD 0.042177 USD -31 March 2017 USD 0.051639 USD 0.049995 USD 0.03678628 April 2017 USD 0.042170 USD 0.040811 USD 0.03607131 May 2017 USD 0.050493 USD 0.048845 USD 0.03614930 June 2017 USD 0.046171 USD 0.044645 USD 0.035446
Class C2 (USD) Income(F)
Class C2 (ZAR) HedgedIncome (F)
30 December 2016 USD 0.039900 USD -31 January 2017 USD 0.039995 USD -28 February 2017 USD 0.040199 USD -31 March 2017 USD 0.039990 USD 0.00705428 April 2017 USD 0.040164 USD 0.00713131 May 2017 USD 0.040281 USD 0.00726230 June 2017 USD 0.040082 USD 0.007067
Old Mutual Emerging Market Debt Fund
Class A (GBP) IncomeClass A (SGD)Hedged Income Class A (USD) Income
30 December 2016 USD 0.255457 USD 0.037940 USD 0.05852131 January 2017 USD - USD 0.038374 USD 0.05906728 February 2017 USD - USD 0.036389 USD 0.05540231 March 2017 USD 0.251988 USD 0.038786 USD 0.05872628 April 2017 USD - USD 0.035636 USD 0.05371631 May 2017 USD - USD 0.038331 USD 0.05771630 June 2017 USD 0.237225 USD 0.034893 USD 0.052181
Class B (USD) Income Class C (USD) Income Class S (GBP) Income30 December 2016 USD 0.062204 USD 0.064904 USD 0.26760031 January 2017 USD 0.062724 USD 0.065453 USD -28 February 2017 USD 0.058783 USD 0.061315 USD -31 March 2017 USD 0.062262 USD 0.064922 USD 0.26464728 April 2017 USD 0.056902 USD 0.059311 USD -31 May 2017 USD 0.061087 USD 0.063652 USD -30 June 2017 USD 0.055176 USD 0.057472 USD 0.250164
Class U1 (GBP) Income30 December 2016 USD 0.29227531 January 2017 USD -28 February 2017 USD -31 March 2017 USD 0.28932928 April 2017 USD -31 May 2017 USD -30 June 2017 USD 0.273786
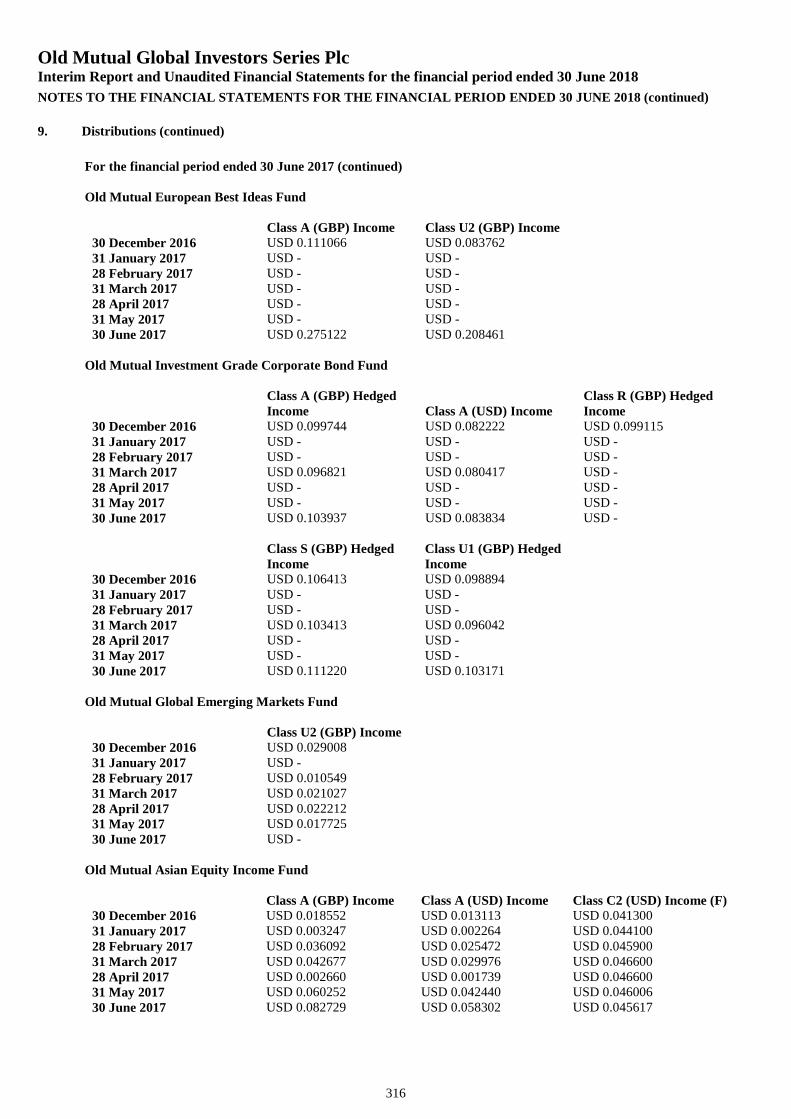
Old Mutual Global Investors Series PlcInterim Report and Unaudited Financial Statements for the financial period ended 30 June 2018
NOTES TO THE FINANCIAL STATEMENTS FOR THE FINANCIAL PERIOD ENDED 30 JUNE 2018 (continued)
316
9. Distributions (continued)
For the financial period ended 30 June 2017 (continued)
Old Mutual European Best Ideas Fund
Class A (GBP) Income Class U2 (GBP) Income30 December 2016 USD 0.111066 USD 0.08376231 January 2017 USD - USD -28 February 2017 USD - USD -31 March 2017 USD - USD -28 April 2017 USD - USD -31 May 2017 USD - USD -30 June 2017 USD 0.275122 USD 0.208461
Old Mutual Investment Grade Corporate Bond Fund
Class A (GBP) HedgedIncome Class A (USD) Income
Class R (GBP) HedgedIncome
30 December 2016 USD 0.099744 USD 0.082222 USD 0.09911531 January 2017 USD - USD - USD -28 February 2017 USD - USD - USD -31 March 2017 USD 0.096821 USD 0.080417 USD -28 April 2017 USD - USD - USD -31 May 2017 USD - USD - USD -30 June 2017 USD 0.103937 USD 0.083834 USD -
Class S (GBP) HedgedIncome
Class U1 (GBP) HedgedIncome
30 December 2016 USD 0.106413 USD 0.09889431 January 2017 USD - USD -28 February 2017 USD - USD -31 March 2017 USD 0.103413 USD 0.09604228 April 2017 USD - USD -31 May 2017 USD - USD -30 June 2017 USD 0.111220 USD 0.103171
Old Mutual Global Emerging Markets Fund
Class U2 (GBP) Income30 December 2016 USD 0.02900831 January 2017 USD -28 February 2017 USD 0.01054931 March 2017 USD 0.02102728 April 2017 USD 0.02221231 May 2017 USD 0.01772530 June 2017 USD -
Old Mutual Asian Equity Income Fund
Class A (GBP) Income Class A (USD) Income Class C2 (USD) Income (F)30 December 2016 USD 0.018552 USD 0.013113 USD 0.04130031 January 2017 USD 0.003247 USD 0.002264 USD 0.04410028 February 2017 USD 0.036092 USD 0.025472 USD 0.04590031 March 2017 USD 0.042677 USD 0.029976 USD 0.04660028 April 2017 USD 0.002660 USD 0.001739 USD 0.04660031 May 2017 USD 0.060252 USD 0.042440 USD 0.04600630 June 2017 USD 0.082729 USD 0.058302 USD 0.045617
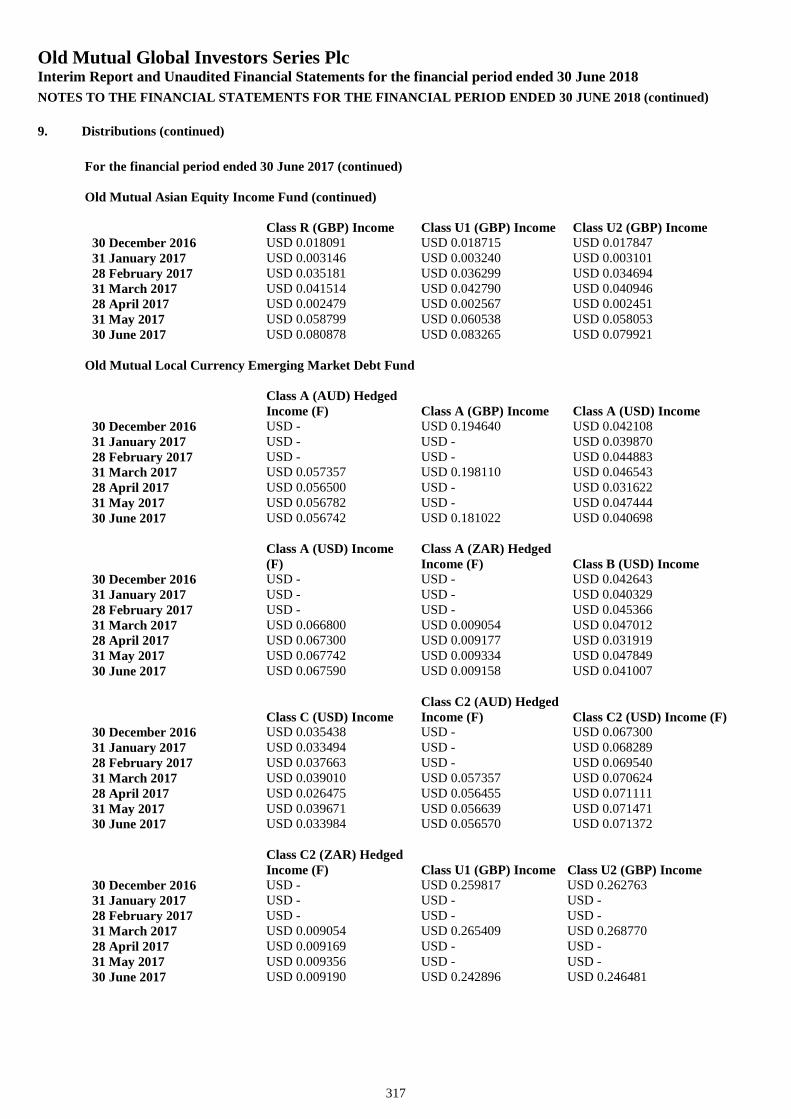
Old Mutual Global Investors Series PlcInterim Report and Unaudited Financial Statements for the financial period ended 30 June 2018
NOTES TO THE FINANCIAL STATEMENTS FOR THE FINANCIAL PERIOD ENDED 30 JUNE 2018 (continued)
317
9. Distributions (continued)
For the financial period ended 30 June 2017 (continued)
Old Mutual Asian Equity Income Fund (continued)
Class R (GBP) Income Class U1 (GBP) Income Class U2 (GBP) Income30 December 2016 USD 0.018091 USD 0.018715 USD 0.01784731 January 2017 USD 0.003146 USD 0.003240 USD 0.00310128 February 2017 USD 0.035181 USD 0.036299 USD 0.03469431 March 2017 USD 0.041514 USD 0.042790 USD 0.04094628 April 2017 USD 0.002479 USD 0.002567 USD 0.00245131 May 2017 USD 0.058799 USD 0.060538 USD 0.05805330 June 2017 USD 0.080878 USD 0.083265 USD 0.079921
Old Mutual Local Currency Emerging Market Debt Fund
Class A (AUD) HedgedIncome (F) Class A (GBP) Income Class A (USD) Income
30 December 2016 USD - USD 0.194640 USD 0.04210831 January 2017 USD - USD - USD 0.03987028 February 2017 USD - USD - USD 0.04488331 March 2017 USD 0.057357 USD 0.198110 USD 0.04654328 April 2017 USD 0.056500 USD - USD 0.03162231 May 2017 USD 0.056782 USD - USD 0.04744430 June 2017 USD 0.056742 USD 0.181022 USD 0.040698
Class A (USD) Income(F)
Class A (ZAR) HedgedIncome (F) Class B (USD) Income
30 December 2016 USD - USD - USD 0.04264331 January 2017 USD - USD - USD 0.04032928 February 2017 USD - USD - USD 0.04536631 March 2017 USD 0.066800 USD 0.009054 USD 0.04701228 April 2017 USD 0.067300 USD 0.009177 USD 0.03191931 May 2017 USD 0.067742 USD 0.009334 USD 0.04784930 June 2017 USD 0.067590 USD 0.009158 USD 0.041007
Class C (USD) IncomeClass C2 (AUD) HedgedIncome (F) Class C2 (USD) Income (F)
30 December 2016 USD 0.035438 USD - USD 0.06730031 January 2017 USD 0.033494 USD - USD 0.06828928 February 2017 USD 0.037663 USD - USD 0.06954031 March 2017 USD 0.039010 USD 0.057357 USD 0.07062428 April 2017 USD 0.026475 USD 0.056455 USD 0.07111131 May 2017 USD 0.039671 USD 0.056639 USD 0.07147130 June 2017 USD 0.033984 USD 0.056570 USD 0.071372
Class C2 (ZAR) HedgedIncome (F) Class U1 (GBP) Income Class U2 (GBP) Income
30 December 2016 USD - USD 0.259817 USD 0.26276331 January 2017 USD - USD - USD -28 February 2017 USD - USD - USD -31 March 2017 USD 0.009054 USD 0.265409 USD 0.26877028 April 2017 USD 0.009169 USD - USD -31 May 2017 USD 0.009356 USD - USD -30 June 2017 USD 0.009190 USD 0.242896 USD 0.246481
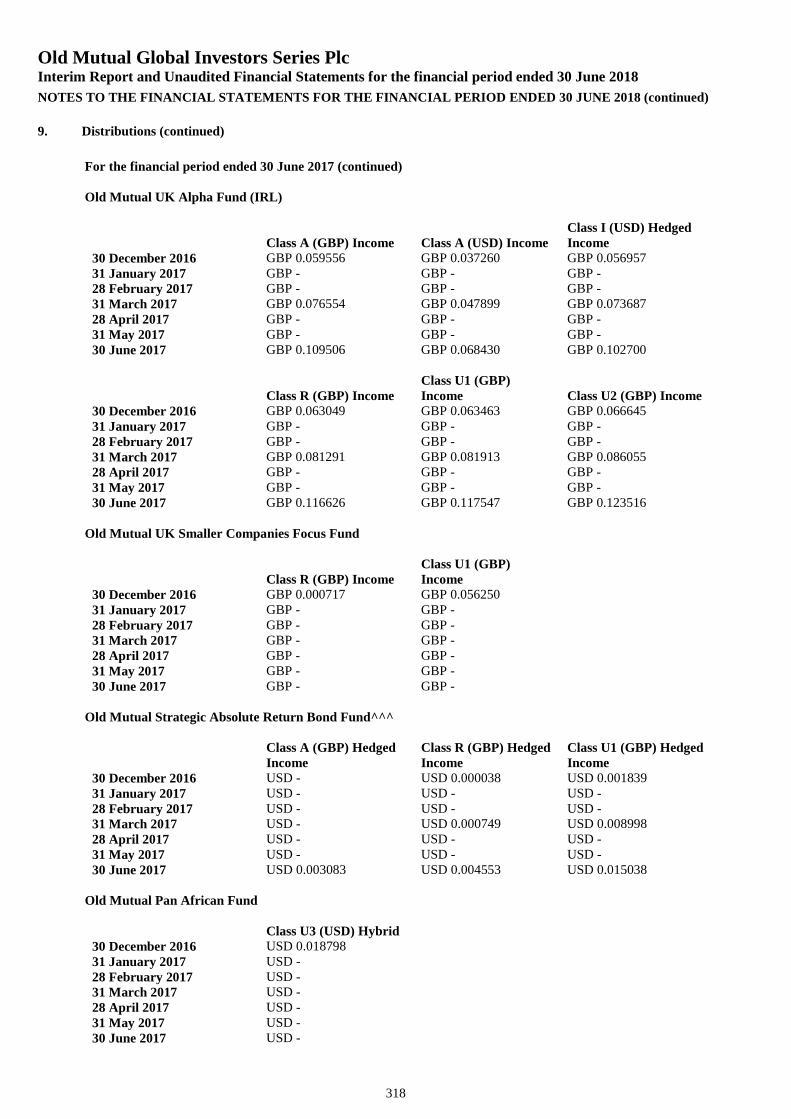
Old Mutual Global Investors Series PlcInterim Report and Unaudited Financial Statements for the financial period ended 30 June 2018
NOTES TO THE FINANCIAL STATEMENTS FOR THE FINANCIAL PERIOD ENDED 30 JUNE 2018 (continued)
318
9. Distributions (continued)
For the financial period ended 30 June 2017 (continued)
Old Mutual UK Alpha Fund (IRL)
Class A (GBP) Income Class A (USD) IncomeClass I (USD) HedgedIncome
30 December 2016 GBP 0.059556 GBP 0.037260 GBP 0.05695731 January 2017 GBP - GBP - GBP -28 February 2017 GBP - GBP - GBP -31 March 2017 GBP 0.076554 GBP 0.047899 GBP 0.07368728 April 2017 GBP - GBP - GBP -31 May 2017 GBP - GBP - GBP -30 June 2017 GBP 0.109506 GBP 0.068430 GBP 0.102700
Class R (GBP) IncomeClass U1 (GBP)Income Class U2 (GBP) Income
30 December 2016 GBP 0.063049 GBP 0.063463 GBP 0.06664531 January 2017 GBP - GBP - GBP -28 February 2017 GBP - GBP - GBP -31 March 2017 GBP 0.081291 GBP 0.081913 GBP 0.08605528 April 2017 GBP - GBP - GBP -31 May 2017 GBP - GBP - GBP -30 June 2017 GBP 0.116626 GBP 0.117547 GBP 0.123516
Old Mutual UK Smaller Companies Focus Fund
Class R (GBP) IncomeClass U1 (GBP)Income
30 December 2016 GBP 0.000717 GBP 0.05625031 January 2017 GBP - GBP -28 February 2017 GBP - GBP -31 March 2017 GBP - GBP -28 April 2017 GBP - GBP -31 May 2017 GBP - GBP -30 June 2017 GBP - GBP -
Old Mutual Strategic Absolute Return Bond Fund^^^
Class A (GBP) HedgedIncome
Class R (GBP) HedgedIncome
Class U1 (GBP) HedgedIncome
30 December 2016 USD - USD 0.000038 USD 0.00183931 January 2017 USD - USD - USD -28 February 2017 USD - USD - USD -31 March 2017 USD - USD 0.000749 USD 0.00899828 April 2017 USD - USD - USD -31 May 2017 USD - USD - USD -30 June 2017 USD 0.003083 USD 0.004553 USD 0.015038
Old Mutual Pan African Fund
Class U3 (USD) Hybrid30 December 2016 USD 0.01879831 January 2017 USD -28 February 2017 USD -31 March 2017 USD -28 April 2017 USD -31 May 2017 USD -30 June 2017 USD -
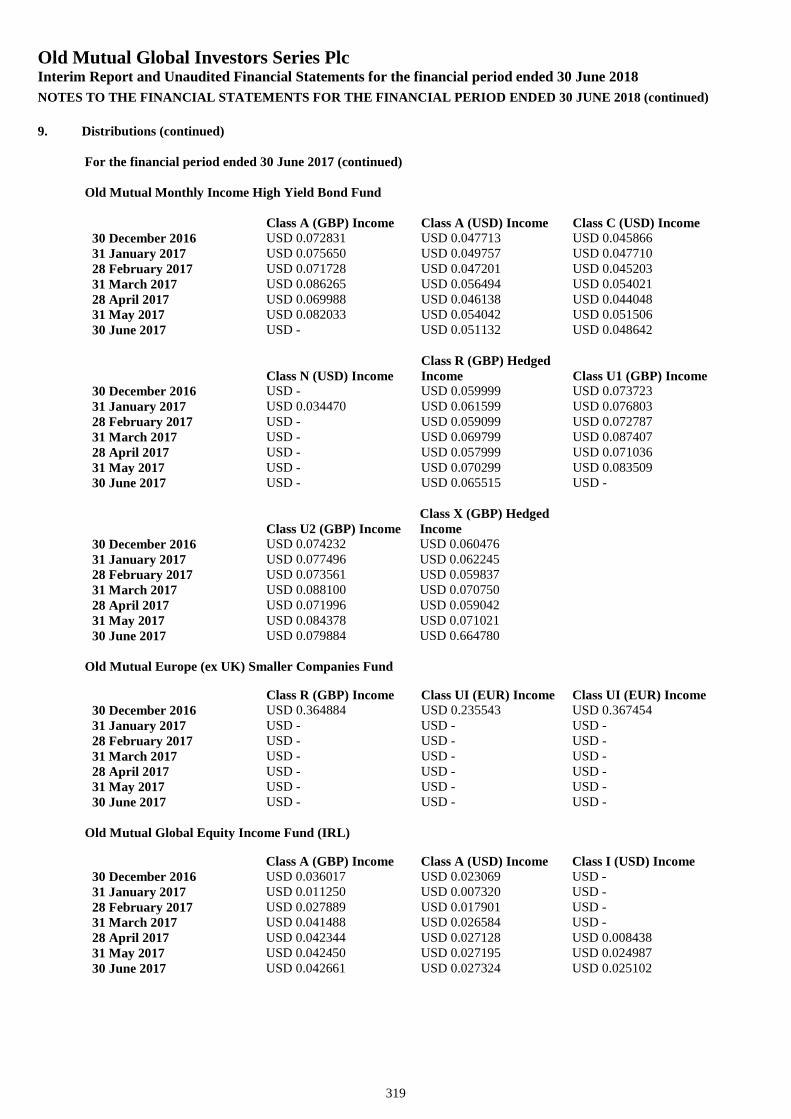
Old Mutual Global Investors Series PlcInterim Report and Unaudited Financial Statements for the financial period ended 30 June 2018
NOTES TO THE FINANCIAL STATEMENTS FOR THE FINANCIAL PERIOD ENDED 30 JUNE 2018 (continued)
319
9. Distributions (continued)
For the financial period ended 30 June 2017 (continued)
Old Mutual Monthly Income High Yield Bond Fund
Class A (GBP) Income Class A (USD) Income Class C (USD) Income30 December 2016 USD 0.072831 USD 0.047713 USD 0.04586631 January 2017 USD 0.075650 USD 0.049757 USD 0.04771028 February 2017 USD 0.071728 USD 0.047201 USD 0.04520331 March 2017 USD 0.086265 USD 0.056494 USD 0.05402128 April 2017 USD 0.069988 USD 0.046138 USD 0.04404831 May 2017 USD 0.082033 USD 0.054042 USD 0.05150630 June 2017 USD - USD 0.051132 USD 0.048642
Class N (USD) IncomeClass R (GBP) HedgedIncome Class U1 (GBP) Income
30 December 2016 USD - USD 0.059999 USD 0.07372331 January 2017 USD 0.034470 USD 0.061599 USD 0.07680328 February 2017 USD - USD 0.059099 USD 0.07278731 March 2017 USD - USD 0.069799 USD 0.08740728 April 2017 USD - USD 0.057999 USD 0.07103631 May 2017 USD - USD 0.070299 USD 0.08350930 June 2017 USD - USD 0.065515 USD -
Class U2 (GBP) IncomeClass X (GBP) HedgedIncome
30 December 2016 USD 0.074232 USD 0.06047631 January 2017 USD 0.077496 USD 0.06224528 February 2017 USD 0.073561 USD 0.05983731 March 2017 USD 0.088100 USD 0.07075028 April 2017 USD 0.071996 USD 0.05904231 May 2017 USD 0.084378 USD 0.07102130 June 2017 USD 0.079884 USD 0.664780
Old Mutual Europe (ex UK) Smaller Companies Fund
Class R (GBP) Income Class UI (EUR) Income Class UI (EUR) Income30 December 2016 USD 0.364884 USD 0.235543 USD 0.36745431 January 2017 USD - USD - USD -28 February 2017 USD - USD - USD -31 March 2017 USD - USD - USD -28 April 2017 USD - USD - USD -31 May 2017 USD - USD - USD -30 June 2017 USD - USD - USD -
Old Mutual Global Equity Income Fund (IRL)
Class A (GBP) Income Class A (USD) Income Class I (USD) Income30 December 2016 USD 0.036017 USD 0.023069 USD -31 January 2017 USD 0.011250 USD 0.007320 USD -28 February 2017 USD 0.027889 USD 0.017901 USD -31 March 2017 USD 0.041488 USD 0.026584 USD -28 April 2017 USD 0.042344 USD 0.027128 USD 0.00843831 May 2017 USD 0.042450 USD 0.027195 USD 0.02498730 June 2017 USD 0.042661 USD 0.027324 USD 0.025102
Old Mutual Global Investors Series PlcInterim Report and Unaudited Financial Statements for the financial period ended 30 June 2018
NOTES TO THE FINANCIAL STATEMENTS FOR THE FINANCIAL PERIOD ENDED 30 JUNE 2018 (continued)
320
9. Distributions (continued)
For the financial period ended 30 June 2017 (continued)
Old Mutual Global Equity Income Fund (IRL) (continued)
Class R (GBP) Income Class U1 (GBP) Income30 December 2016 USD 0.036393 USD 0.03635731 January 2017 USD 0.011392 USD 0.01136628 February 2017 USD 0.028260 USD 0.02819631 March 2017 USD 0.042087 USD 0.04195928 April 2017 USD 0.042977 USD 0.04285431 May 2017 USD 0.043122 USD 0.04295730 June 2017 USD 0.043370 USD 0.043171
The following Sub-Funds made no distribution in the financial period ended 30 June 2017:
Old Mutual China Equity FundOld Mutual World Equity FundOld Mutual Pacific Equity FundOld Mutual European Equity FundOld Mutual Japanese Equity Fund^Old Mutual North American Equity FundOld Mutual UK Smaller Companies Focus FundOld Mutual UK Dynamic Equity FundOld Mutual Global Equity Absolute Return FundOld Mutual Pan African Fund^^Old Mutual Europe (ex UK) Smaller Companies FundOld Mutual Gold & Silver FundOld Mutual Compass Portfolio 2Old Mutual Compass Portfolio 3Old Mutual Compass Portfolio 4Old Mutual Compass Portfolio 5Old Mutual UK Specialist Equity FundOld Mutual Style Premia Absolute Return Fund
10. Derivatives and other Financial Instruments
In pursuing its investment objectives, the Company holds financial derivative instruments. The Company’s financial derivativeinstruments held at 30 June 2018 and at 31 December 2017 are disclosed in the Portfolio of Investments on pages 45 to 207. Fulldetails of all risks are set out in the section of the Prospectus entitled “Risk Factors”.
Efficient Portfolio Management (“EPM”)
The Company may employ investment techniques and instruments for efficient portfolio management purposes and for hedgingpurposes, subject to the conditions and within the limits from time to time laid down by the Central Bank under the UCITSRegulations, 2011 and in the Prospectus. These techniques and instruments may be exchange-traded or over-the-counterderivatives and shall include futures (such as currency future contracts), options, options on futures, forward settled transactions,convertible securities, hybrid securities, structured notes, credit default swaps and swap agreements. For financial derivativeinstruments that were entered into during the financial period which remained open at period end and the resulting amount ofcommitments/exposures, please refer to the Portfolio of Investments.
Efficient portfolio management transactions relating to the assets of a Sub-Fund may be entered into by the Investment Managerwith one of the following aims:
a) a reduction of risk;b) a reduction of cost with no increase or a minimal increase in risk;c) generation of additional capital or income with no, or an acceptably low level of risk (relative to the expected return) and thediversification requirements in accordance with the Central Bank’s Regulations.
Old Mutual Global Investors Series PlcInterim Report and Unaudited Financial Statements for the financial period ended 30 June 2018
NOTES TO THE FINANCIAL STATEMENTS FOR THE FINANCIAL PERIOD ENDED 30 JUNE 2018 (continued)
321
10. Derivatives and other Financial Instruments (continued)
Efficient Portfolio Management (“EPM”) (continued)
In relation to efficient portfolio management operations the Investment Manager will look to ensure that the techniques andinstruments used are economically appropriate in that they will be realised in a cost-effective way. The use of efficient portfoliomanagement techniques will only be used in line with the best interests of a Sub-Fund. The use of FDI (“Financial DerivativeInstruments”) and efficient portfolio management techniques for the purposes outlined above will expose the Company to therisks including, but not limited to, market risk, global derivative exposure as Value-at-Risk (“VaR”) approach as outlined inNote 10 (a). Please refer to the Portfolio of Investments for range of FDIs which the Sub-Fund may have used for efficientportfolio management purposes during the period under review.
Where necessary, the Company will accept collateral from its counterparties in order to reduce counterparty risk exposuregenerated through the use of over the counter derivative instruments and EPM techniques. The type and amount of collateralreceived is outlined in Note 6.
For UCITS which have engaged in EPM techniques disclosures are required under the Central Bank UCITS Regulations. AUCITS is required to disclose the revenues arising from EPM techniques for the entire reporting period together with the directand indirect operational costs and fees incurred, unless the costs associated with EPM techniques are embedded and notseparately identifiable.
All revenues from EPM techniques, net of direct and indirect operational costs, will be returned to the relevant Sub-Fund. Anydirect and indirect operational costs/fees arising from EPM techniques do not include hidden revenue. Any gains or losses arisingfrom EPM techniques and investments are recognised in the Statement of Operations.
Repurchase, reverse repurchase and stock lending arrangements are EPM techniques. The Sub-Funds did not engage in anyrepurchase, reverse repurchase and stock lending arrangements during the financial period.
Futures contracts will be used to hedge against market risk or gain exposure to an underlying market. Forward contracts will beused to hedge or gain exposure to an increase in the value of an asset, currency, or deposit. Options will be used to hedge orachieve exposure to a particular market instead of using a physical security. Swaps (including swaptions) will be used to achieveprofit as well as to hedge existing long positions. Forward foreign exchange transactions will be used to reduce the risk of adversemarket changes in exchange rates or to increase exposure to foreign currencies or to shift exposure to foreign currencyfluctuations from one country to another. Credit default swaps will be used to isolate and transfer the exposure to or transfer thecredit risk associated with a reference asset or index of reference assets.
The Company may, for the purposes of efficient portfolio management, enter into futures contracts, forwards, options, swaps,swaptions, convertible securities and structured notes, in order to hedge currency and market exposure and/or for investmentpurposes. Futures, swaps, options, swaptions and forward currency contracts open as at 30 June 2018 are disclosed in thePortfolio of Investments on pages 45 to 207. The type and amount of collateral received is outlined in Note 6.
Risk is inherent in the activities of each Sub-Fund but it is managed through a process of ongoing identification, measurementand monitoring, subject to risks limits and other controls. The main risks arising from the Company’s financial instruments aremarket risk, liquidity risk and credit risk.
(a) Market Risk
Market risk embodies the potential for both losses and gains and can include various forms of risk including market (includingcurrency risk, interest rate risk and market price risk), credit risk and liquidity risk.
Market Price RiskMarket price risk is the risk of unfavourable changes in the fair values of equities or equity-linked derivatives as the result ofchanges in the levels of equity indices and the value of individual shares. The market price risk exposure arises from theCompany’s investments in equity securities, from equity securities sold short and from equity-linked derivatives. The Companymanages this risk by investing in a variety of stock exchanges.
Management's best estimate of the effect on the profit or loss for a period due to a reasonably possible change in equity indices,with all other variables held constant is indicated in the table below. There is no effect on 'other comprehensive income' as theCompany has no assets classified as 'available-for-sale' or designated hedging instruments. In practice, the actual trading resultsmay differ from the sensitivity analysis below and the difference could be material. Each Sub-Fund’s market risk is managedon a daily basis by Old Mutual Global Investors (UK) Limited and the policies and processes are detailed in the Company's riskmanagement process. Each Sub-Fund's overall market positions are advised on a regular basis to the Board of Directors.
Old Mutual Global Investors Series PlcInterim Report and Unaudited Financial Statements for the financial period ended 30 June 2018
NOTES TO THE FINANCIAL STATEMENTS FOR THE FINANCIAL PERIOD ENDED 30 JUNE 2018 (continued)
322
10. Derivatives and other Financial Instruments (continued)
Concentration RiskThe investments of certain Sub-Funds may be concentrated in a single market or country. A Sub-Fund which pursues aconcentrated investment strategy may be subject to a greater degree of volatility and risk than a Sub-Fund following a morediversified strategy.
The applicable investment concentrations within the portfolio for each Sub-Fund at 31 June 2018 are disclosed in the Portfolioof Investments.
Emerging Market RiskEmerging markets provide new investment opportunities, such as elevated economic growth rates, higher expected returns anddiversification benefits. Accordingly, these markets may be insufficiently liquid and levels of volatility in price movements maybe greater than those experienced in more developed economies and markets. The value of the assets of a Sub-Fund investingin developing markets may be adversely affected by uncertainties. There can be no assurance that the Sub-Funds will achievetheir investment objectives.
Global Derivative Exposure
Sensitivity Analysis for Sub-Funds through commitment approachThe risk is managed through the commitment approach to quantitatively measure the Funds’ global exposure through the useof financial derivative instruments in line with UCITS Directives and Central Bank of Ireland regulations for Sub-Funds listedin the table below. The Sub-Funds will not be leveraged in excess of 100% of its Net Asset Value.
Sub-FundOld Mutual China Equity FundOld Mutual World Equity FundOld Mutual Pacific Equity FundOld Mutual European Equity FundOld Mutual Japanese Equity Fund^Old Mutual US Equity Income FundOld Mutual North American Equity FundOld Mutual European Best Ideas FundOld Mutual Global Emerging Markets FundOld Mutual Asian Equity Income FundOld Mutual UK Alpha Fund (IRL)Old Mutual UK Smaller Companies Focus FundOld Mutual Pan African Fund^^Old Mutual Europe (ex UK) Smaller Companies FundOld Mutual Global Equity Income Fund (IRL)Old Mutual Gold & Silver Fund
Old Mutual Global Investors Series PlcInterim Report and Unaudited Financial Statements for the financial period ended 30 June 2018
NOTES TO THE FINANCIAL STATEMENTS FOR THE FINANCIAL PERIOD ENDED 30 JUNE 2018 (continued)
323
10. Derivatives and other Financial Instruments (continued)
(a) Market Risk
LeverageMany derivative instruments have a leverage component, adverse changes in the value or level of the underlying asset, rate orindex can result in a loss substantially greater than the amount invested in the derivative itself. Certain derivative instrumentshave the potential for unlimited loss regardless of the size of the initial investment.
Value at Risk (“VaR”) method
VaR is a statistically based estimate of the potential loss on the current portfolio from adverse market movements. The VaRmeasure captures both "general" and "idiosyncratic" market risks. General market risk factors are variables which are driven bymacroeconomic, geopolitical and other market-wide considerations, independent of any instrument or single name. They includemovements in interest rates, widening or tightening of general spread levels and directional movements in equity market indices,exchange rates, and energy, metal and commodity prices. Changes in associated volatilities and correlations between these riskfactors – some of which may be unobservable or only indirectly observable – are also general market risks. Idiosyncraticcomponents are those that cannot be explained by general market movements – broadly, changes in the prices of debt and equityinstruments and derivatives linked to them, resulting from factors and events specific to individual names.
VaR expresses potential loss, but only to a certain level of confidence and holding period of 1 and 20 days depending on theSub-Fund, and there is therefore a specified statistical probability (1%) that actual loss could be greater than the VaR estimate.VaR analysis for the Company is carried out by the Administrator whose model uses a historical simulation framework with fullre-pricing. This model can integrate various risk factors and has a proprietary methodology for integrating market and credit risk.For general market risk, the assessment of past movements is based on historical data, using data for the last financial period,and this data is applied directly to current positions, a method known as historical simulation.
A Sub-Fund must ensure that its global exposure relating to FDI does not exceed its total Net Asset Value. A Sub-Fund usingthe commitment approach to measure its positions in FDI may not therefore be exposed in excess of 100% of its Net Asset Value.
Global exposure is calculated by the Administrator by extracting information from the Sub-Fund accounting system relating tothe full exposure on FDIs. This information is passed to the Compliance Monitoring Services Division (CMS) for the purposesof calculating the global exposure and comparing the results against the overall value of the Sub-Fund. In 2018, FDI globalexposure was calculated under the commitment approach as described, while the market risk is calculated utilising the VaRmethodology described.
(b) Liquidity Risk
Liquidity risk is the risk that an entity will encounter difficulty in meeting obligations associated with financial liabilities. TheCompany’s constitutional documents provides for the creation and cancellation of Shares on each Dealing Day (which is definedin the Prospectus means in respect of all of the Sub-Funds every Business Day or such other days as the Directors may determineand provided that there shall be at least one Dealing Day each fortnight) and it is therefore exposed to the liquidity risk of meetingshareholder redemptions at any time.
The risks associated with securities in which the Sub-Funds have invested are assessed on an ongoing basis. Liquidity risk isconsidered when investing in any financial instrument to ensure that the portfolio complies with UCITS Regulations which setsout the general requirement for a UCITS Fund to redeem or repurchase its units at the request of any unit holder.
Therefore before making an investment, an Investment Manager to a Sub-Fund may consider:
1. The volume and turnover in the transferable security;2. If price is determined by supply and demand in the market, the issue size and the portion of the issue that the investment
manager plans to buy;3. The opportunity and timeframe to buy or sell the transferable security; and4. The quality of the secondary market in a transferable security and an analysis of the quality and number of intermediaries
and market makers available for that security.
Old Mutual Global Investors Series PlcInterim Report and Unaudited Financial Statements for the financial period ended 30 June 2018
NOTES TO THE FINANCIAL STATEMENTS FOR THE FINANCIAL PERIOD ENDED 30 JUNE 2018 (continued)
324
10. Derivatives and other Financial Instruments (continued)
(b) Liquidity Risk (continued)
In the case of transferable securities not traded on a Regulated Market liquidity is not automatically presumed. The Sub-Fundstherefore assess the liquidity of such securities where this is necessary. If the security is assessed as insufficiently liquid to meetforeseeable redemption requests the security must only be bought or held if the other securities held in the portfolio are deemedsufficiently liquid so as to be able to ensure compliance with Regulation 104(1) of the UCITS Regulations.
The Sub-Funds’ listed securities are considered to be readily realisable as they are principally listed on Major European, Asianand US stock exchanges.
(c) Credit Risk
Credit risk is the risk that a counterparty to a financial instrument will fail to discharge an obligation or commitment that it hasentered into with the Sub-Fund. Credit risk is monitored in accordance with the UCITS Regulations. The purpose of imposingcounterparty limits on a UCITS is to ensure that the UCITS is not exposed to a single counterparty disproportionately. In theevent of a counterparty failure, the risk of material loss will be reduced due to risk diversification. Over-the-counter (OTC)derivative transactions give rise to counterparty risk exposure as they are bi-lateral contracts for non-exchange traded FDI.Moreover, the counterparty exposure related to OTC derivatives must be added to other non-FDI exposures that the UCITS mayhave to the counterparty in order to ensure that overall counterparty exposure limits are not breached, i.e. the total exposure to asingle counterparty arising from all activities should be captured in the risk management systems. FDI transactions that are tradedon exchanges where daily mark-to-market valuations and margining occur are deemed to be free of counterparty risk (i.e.exchange-traded derivatives). UCITS Regulations limits exposure to OTC derivative counterparties to a maximum of 5% ofNAV. This limit is raised to 10% in the case of credit institutions as defined by UCITS Regulations. A UCITS may not investmore than 10% of its assets in transferable securities or money market instruments issued by the same body.
A UCITS may not invest more than 20% of its assets in deposits made with the same body. A UCITS may only enter intotransaction with a counterparty when the counterparty is a credit institution listed in UCITS Regulations or an investment firm,authorised in accordance with the Investment Services Directive, in an EEA Member State; In the case of a counterparty whichis not a credit institution, the counterparty has a minimum credit rating of A1 or equivalent, or is deemed by the UCITS to havean implied rating of A1. Alternatively, an unrated counterparty will be acceptable where the UCITS is indemnified against lossessuffered as a result of a failure of the counterparty by an entity which has and maintains a rating of A1.
The Investment Adviser ensures that the ratings and limits for counterparties are adhered to.
UCITS Regulations states that the risk exposure to an OTC derivative counterparty may be reduced where the counterparty willprovide the UCITS with collateral, subject to certain conditions. The Investment Adviser is responsible for ensuring this collateralmeets the relevant criteria set out in UCITS Regulations. Details of collateral pledged as at 30 June 2018 is disclosed in Note 6.
The Company minimises concentration of credit risk by undertaking transactions with a large number of customers andcounterparties on recognised and reputable exchanges.
Old Mutual Global Investors Series PlcInterim Report and Unaudited Financial Statements for the financial period ended 30 June 2018
NOTES TO THE FINANCIAL STATEMENTS FOR THE FINANCIAL PERIOD ENDED 30 JUNE 2018 (continued)
325
10. Derivatives and other Financial Instruments (continued)
(c) Credit Risk (continued)
Credit risk also arises on transactions with brokers where transactions are awaiting settlement. Risk relating to unsettledtransactions is considered small due to the short settlement period involved and the high credit quality of the brokers used. TheCompany monitors the credit rating and assets, liabilities, financial position and profit or loss of the brokers used to furthermitigate this risk. Substantially all of the assets of the Company are held by Citibank Depositary Services Ireland DAC (the“Depositary”). Bankruptcy or insolvency of the Depositary may cause a Sub-Fund’s rights with respect to securities held by theDepositary to be delayed. The Company monitors this risk by monitoring the credit quality and assets, liabilities, financialposition and profit or loss of the Depositary. The Depositary is under a duty to take into its custody and to hold the property ofeach Sub-Fund of the Company on behalf of its Shareholders. The Central Bank of Ireland requires the Depositary to hold legallyseparate the non-cash assets of each Sub-Fund and to maintain sufficient records to clearly identify the nature and amount of allassets that it holds, the ownership of each asset and where the documents of title to such assets are physically located.
When the Depositary employs a Sub-Custodian the Depositary retains responsibility for the assets of the Sub-Fund. However, itshould be noted that not all jurisdictions have the same rules and regulations as Ireland regarding the custody of assets and therecognition of the interests of a beneficial owner such as a Sub-Fund. Therefore, in such jurisdictions, there is a risk that if aSub-Custodian becomes bankrupt or insolvent, the Sub-Fund’s beneficial ownership of the assets held by such Sub-Custodianmay not be recognised and consequently the creditors of the Sub-Custodian may seek to have recourse to the assets of the Sub-Fund. In those jurisdictions where the Sub-Fund’s beneficial ownership of its assets is ultimately recognised, the Sub-Fund maysuffer delay and cost in recovering those assets.
The Sub-Funds may invest in markets where custodial and/or settlement systems are not fully developed, such as Russia andArgentina, the assets of a Sub-Fund which are traded in such markets and which have been entrusted to sub-custodians, incircumstances where the use of such sub-custodians is necessary, may be exposed to risk in circumstances whereby theDepositary will have no liability.
The Company will be exposed to the credit risk of the Depositary and any sub-custodians the depositaries has appointed. In theevent of insolvency or bankruptcy of the Depositaries or sub-Custodian, the Depositary will be treated as a general creditor. Thelong term credit rating of the parent Company of the Depositary and Sub-Custodian, Citibank N.A. is A1.
All transferable securities of the Company are held in the Custodial network. Additional credit risk on cash, receivables andfinancial derivative instruments is detailed on pages 216 to 223.
(d) Interest Rate Risk
Interest rate risk is the risk that the value of the Sub-Funds’ investments will fluctuate as a result of changes in interest rates.
Sub-Funds investing in fixed interest securities may be affected by changes to interest rates relevant to particular securities or asa result of the Directors being unable to secure similar returns on the expiry of contracts or sale of securities. The value of fixedinterest securities may be affected by such movements in the future. Interest receivable on bank deposits and payable on bankoverdrafts will be affected by fluctuations in interest rates, as will Floating Rate Bonds. All other assets and liabilities of the Sub-Funds are non-interest bearing.
(e) Currency Risk
Currency risk is the risk that the value of a financial instrument will fluctuate due to changes in foreign exchange rates. TheCompany invests in securities and other investments that are denominated in currencies other than the base currency.Accordingly, the value of the Company’s assets may be affected favourably or unfavourably by fluctuations in currency ratesand therefore the Company will necessarily be subject to foreign exchange risks.
The primary purpose of the Company’s foreign currency economic hedging activities is to protect against the volatility associatedwith investments and other assets and liabilities denominated in foreign currencies in the normal course of business. TheCompany primarily utilises forward exchange contracts to hedge foreign-currency-denominated financial instruments. Increasesor decreases in the fair values of the Company’s foreign-currency-denominated financial assets and liabilities are partially offsetby gains and losses on the economic hedging instruments.
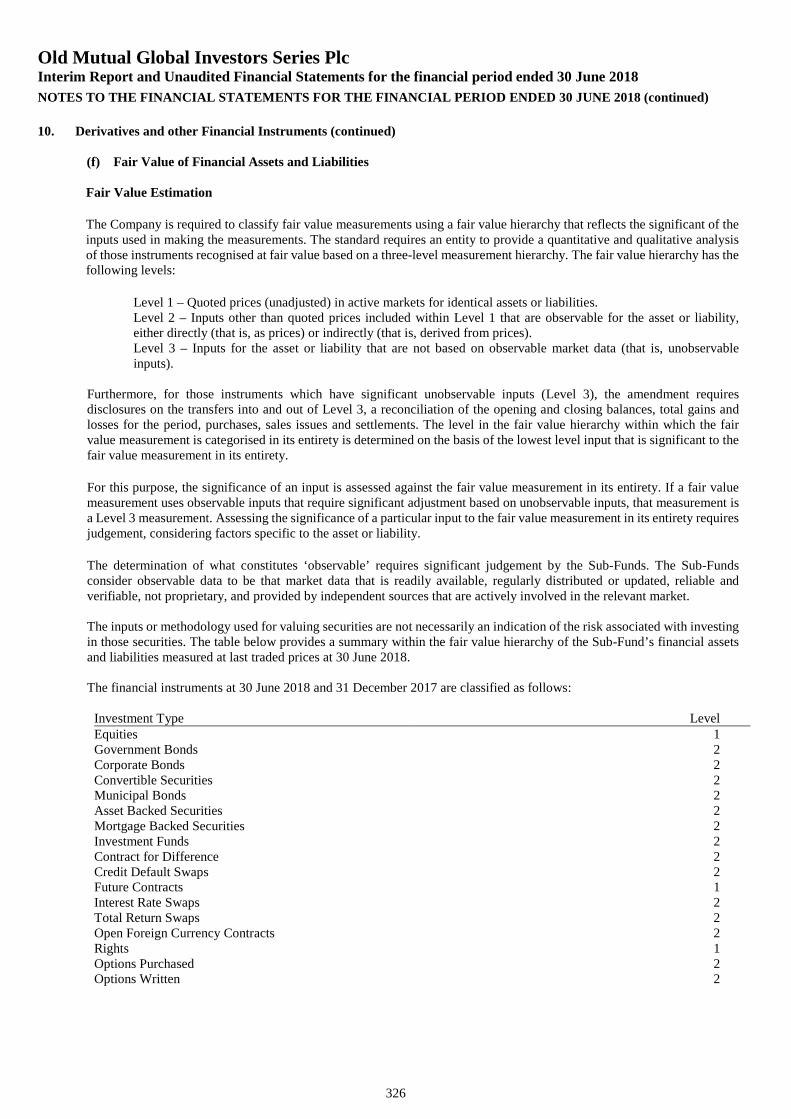
Old Mutual Global Investors Series PlcInterim Report and Unaudited Financial Statements for the financial period ended 30 June 2018
NOTES TO THE FINANCIAL STATEMENTS FOR THE FINANCIAL PERIOD ENDED 30 JUNE 2018 (continued)
326
10. Derivatives and other Financial Instruments (continued)
(f) Fair Value of Financial Assets and Liabilities
Fair Value Estimation
The Company is required to classify fair value measurements using a fair value hierarchy that reflects the significant of theinputs used in making the measurements. The standard requires an entity to provide a quantitative and qualitative analysisof those instruments recognised at fair value based on a three-level measurement hierarchy. The fair value hierarchy has thefollowing levels:
Level 1 – Quoted prices (unadjusted) in active markets for identical assets or liabilities.Level 2 – Inputs other than quoted prices included within Level 1 that are observable for the asset or liability,either directly (that is, as prices) or indirectly (that is, derived from prices).Level 3 – Inputs for the asset or liability that are not based on observable market data (that is, unobservableinputs).
Furthermore, for those instruments which have significant unobservable inputs (Level 3), the amendment requiresdisclosures on the transfers into and out of Level 3, a reconciliation of the opening and closing balances, total gains andlosses for the period, purchases, sales issues and settlements. The level in the fair value hierarchy within which the fairvalue measurement is categorised in its entirety is determined on the basis of the lowest level input that is significant to thefair value measurement in its entirety.
For this purpose, the significance of an input is assessed against the fair value measurement in its entirety. If a fair valuemeasurement uses observable inputs that require significant adjustment based on unobservable inputs, that measurement isa Level 3 measurement. Assessing the significance of a particular input to the fair value measurement in its entirety requiresjudgement, considering factors specific to the asset or liability.
The determination of what constitutes ‘observable’ requires significant judgement by the Sub-Funds. The Sub-Fundsconsider observable data to be that market data that is readily available, regularly distributed or updated, reliable andverifiable, not proprietary, and provided by independent sources that are actively involved in the relevant market.
The inputs or methodology used for valuing securities are not necessarily an indication of the risk associated with investingin those securities. The table below provides a summary within the fair value hierarchy of the Sub-Fund’s financial assetsand liabilities measured at last traded prices at 30 June 2018.
The financial instruments at 30 June 2018 and 31 December 2017 are classified as follows:
Investment Type LevelEquities 1Government Bonds 2Corporate Bonds 2Convertible Securities 2Municipal Bonds 2Asset Backed Securities 2Mortgage Backed Securities 2Investment Funds 2Contract for Difference 2Credit Default Swaps 2Future Contracts 1Interest Rate Swaps 2Total Return Swaps 2Open Foreign Currency Contracts 2Rights 1Options Purchased 2Options Written 2
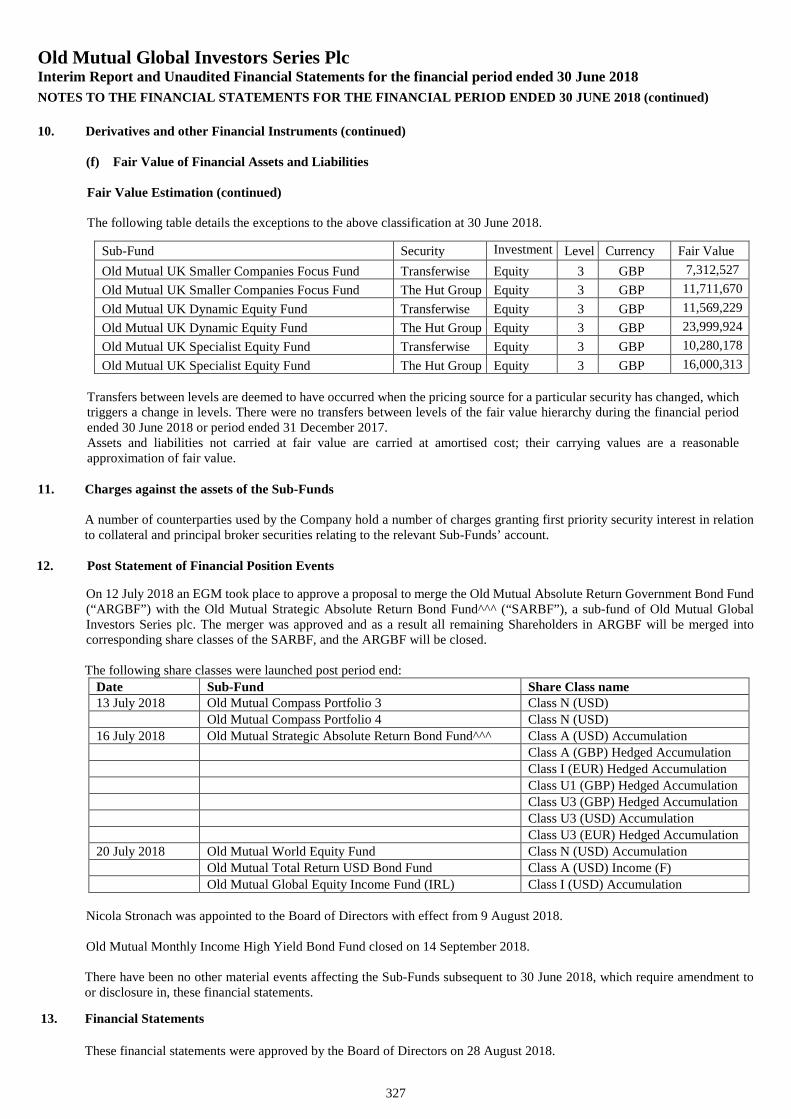
Old Mutual Global Investors Series PlcInterim Report and Unaudited Financial Statements for the financial period ended 30 June 2018
NOTES TO THE FINANCIAL STATEMENTS FOR THE FINANCIAL PERIOD ENDED 30 JUNE 2018 (continued)
327
10. Derivatives and other Financial Instruments (continued)
(f) Fair Value of Financial Assets and Liabilities
Fair Value Estimation (continued)
The following table details the exceptions to the above classification at 30 June 2018.
Sub-Fund Security InvestmentType
Level Currency Fair Value
Old Mutual UK Smaller Companies Focus Fund Transferwise Equity 3 GBP 7,312,527
Old Mutual UK Smaller Companies Focus Fund The Hut Group Equity 3 GBP 11,711,670
Old Mutual UK Dynamic Equity Fund Transferwise Equity 3 GBP 11,569,229
Old Mutual UK Dynamic Equity Fund The Hut Group Equity 3 GBP 23,999,924
Old Mutual UK Specialist Equity Fund Transferwise Equity 3 GBP 10,280,178
Old Mutual UK Specialist Equity Fund The Hut Group Equity 3 GBP 16,000,313
Transfers between levels are deemed to have occurred when the pricing source for a particular security has changed, whichtriggers a change in levels. There were no transfers between levels of the fair value hierarchy during the financial periodended 30 June 2018 or period ended 31 December 2017.Assets and liabilities not carried at fair value are carried at amortised cost; their carrying values are a reasonableapproximation of fair value.
11. Charges against the assets of the Sub-Funds
A number of counterparties used by the Company hold a number of charges granting first priority security interest in relationto collateral and principal broker securities relating to the relevant Sub-Funds’ account.
12. Post Statement of Financial Position Events
On 12 July 2018 an EGM took place to approve a proposal to merge the Old Mutual Absolute Return Government Bond Fund(“ARGBF”) with the Old Mutual Strategic Absolute Return Bond Fund^^^ (“SARBF”), a sub-fund of Old Mutual GlobalInvestors Series plc. The merger was approved and as a result all remaining Shareholders in ARGBF will be merged intocorresponding share classes of the SARBF, and the ARGBF will be closed.
The following share classes were launched post period end:
Date Sub-Fund Share Class name13 July 2018 Old Mutual Compass Portfolio 3 Class N (USD)
Old Mutual Compass Portfolio 4 Class N (USD)
16 July 2018 Old Mutual Strategic Absolute Return Bond Fund^^^ Class A (USD) AccumulationClass A (GBP) Hedged AccumulationClass I (EUR) Hedged Accumulation
Class U1 (GBP) Hedged AccumulationClass U3 (GBP) Hedged AccumulationClass U3 (USD) Accumulation
Class U3 (EUR) Hedged Accumulation20 July 2018 Old Mutual World Equity Fund Class N (USD) Accumulation
Old Mutual Total Return USD Bond Fund Class A (USD) Income (F)
Old Mutual Global Equity Income Fund (IRL) Class I (USD) Accumulation
Nicola Stronach was appointed to the Board of Directors with effect from 9 August 2018.
Old Mutual Monthly Income High Yield Bond Fund closed on 14 September 2018.
There have been no other material events affecting the Sub-Funds subsequent to 30 June 2018, which require amendment toor disclosure in, these financial statements.
13. Financial Statements
These financial statements were approved by the Board of Directors on 28 August 2018.
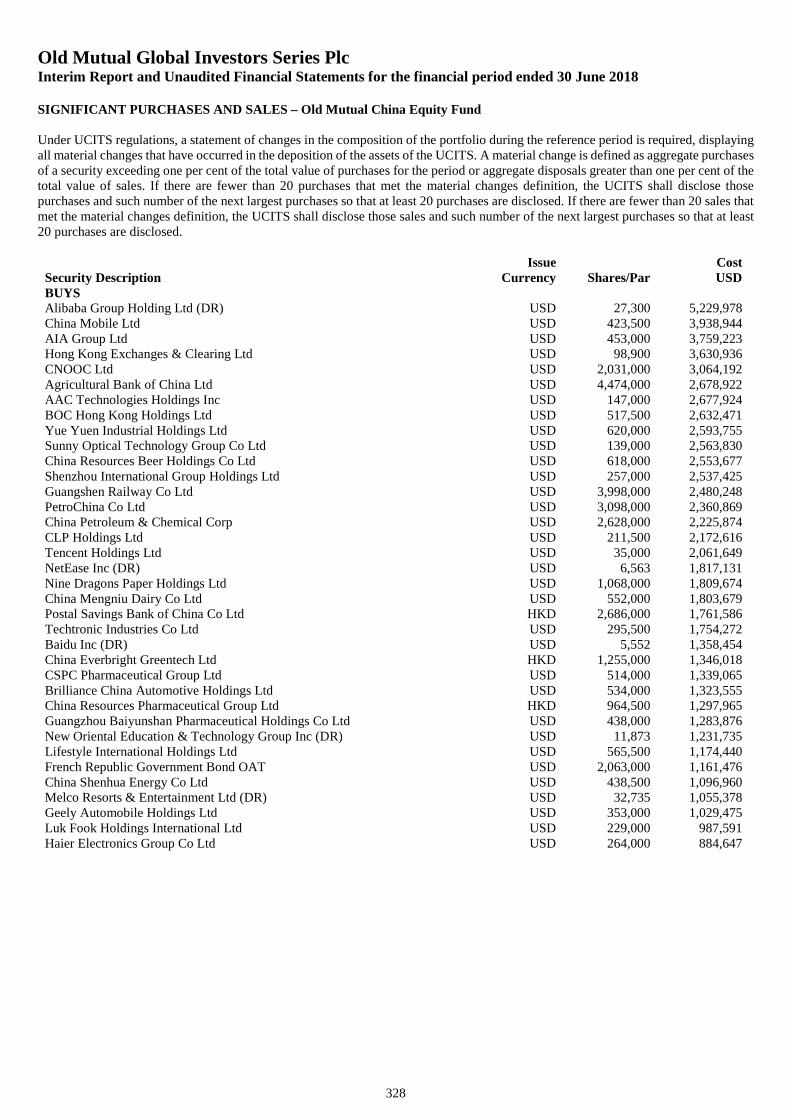
Old Mutual Global Investors Series PlcInterim Report and Unaudited Financial Statements for the financial period ended 30 June 2018
SIGNIFICANT PURCHASES AND SALES – Old Mutual China Equity Fund
328
Under UCITS regulations, a statement of changes in the composition of the portfolio during the reference period is required, displayingall material changes that have occurred in the deposition of the assets of the UCITS. A material change is defined as aggregate purchasesof a security exceeding one per cent of the total value of purchases for the period or aggregate disposals greater than one per cent of thetotal value of sales. If there are fewer than 20 purchases that met the material changes definition, the UCITS shall disclose thosepurchases and such number of the next largest purchases so that at least 20 purchases are disclosed. If there are fewer than 20 sales thatmet the material changes definition, the UCITS shall disclose those sales and such number of the next largest purchases so that at least20 purchases are disclosed.
Security DescriptionIssue
Currency Shares/ParCostUSD
BUYSAlibaba Group Holding Ltd (DR) USD 27,300 5,229,978China Mobile Ltd USD 423,500 3,938,944AIA Group Ltd USD 453,000 3,759,223Hong Kong Exchanges & Clearing Ltd USD 98,900 3,630,936CNOOC Ltd USD 2,031,000 3,064,192Agricultural Bank of China Ltd USD 4,474,000 2,678,922AAC Technologies Holdings Inc USD 147,000 2,677,924BOC Hong Kong Holdings Ltd USD 517,500 2,632,471Yue Yuen Industrial Holdings Ltd USD 620,000 2,593,755Sunny Optical Technology Group Co Ltd USD 139,000 2,563,830China Resources Beer Holdings Co Ltd USD 618,000 2,553,677Shenzhou International Group Holdings Ltd USD 257,000 2,537,425Guangshen Railway Co Ltd USD 3,998,000 2,480,248PetroChina Co Ltd USD 3,098,000 2,360,869China Petroleum & Chemical Corp USD 2,628,000 2,225,874CLP Holdings Ltd USD 211,500 2,172,616Tencent Holdings Ltd USD 35,000 2,061,649NetEase Inc (DR) USD 6,563 1,817,131Nine Dragons Paper Holdings Ltd USD 1,068,000 1,809,674China Mengniu Dairy Co Ltd USD 552,000 1,803,679Postal Savings Bank of China Co Ltd HKD 2,686,000 1,761,586Techtronic Industries Co Ltd USD 295,500 1,754,272Baidu Inc (DR) USD 5,552 1,358,454China Everbright Greentech Ltd HKD 1,255,000 1,346,018CSPC Pharmaceutical Group Ltd USD 514,000 1,339,065Brilliance China Automotive Holdings Ltd USD 534,000 1,323,555China Resources Pharmaceutical Group Ltd HKD 964,500 1,297,965Guangzhou Baiyunshan Pharmaceutical Holdings Co Ltd USD 438,000 1,283,876New Oriental Education & Technology Group Inc (DR) USD 11,873 1,231,735Lifestyle International Holdings Ltd USD 565,500 1,174,440French Republic Government Bond OAT USD 2,063,000 1,161,476China Shenhua Energy Co Ltd USD 438,500 1,096,960Melco Resorts & Entertainment Ltd (DR) USD 32,735 1,055,378Geely Automobile Holdings Ltd USD 353,000 1,029,475Luk Fook Holdings International Ltd USD 229,000 987,591Haier Electronics Group Co Ltd USD 264,000 884,647
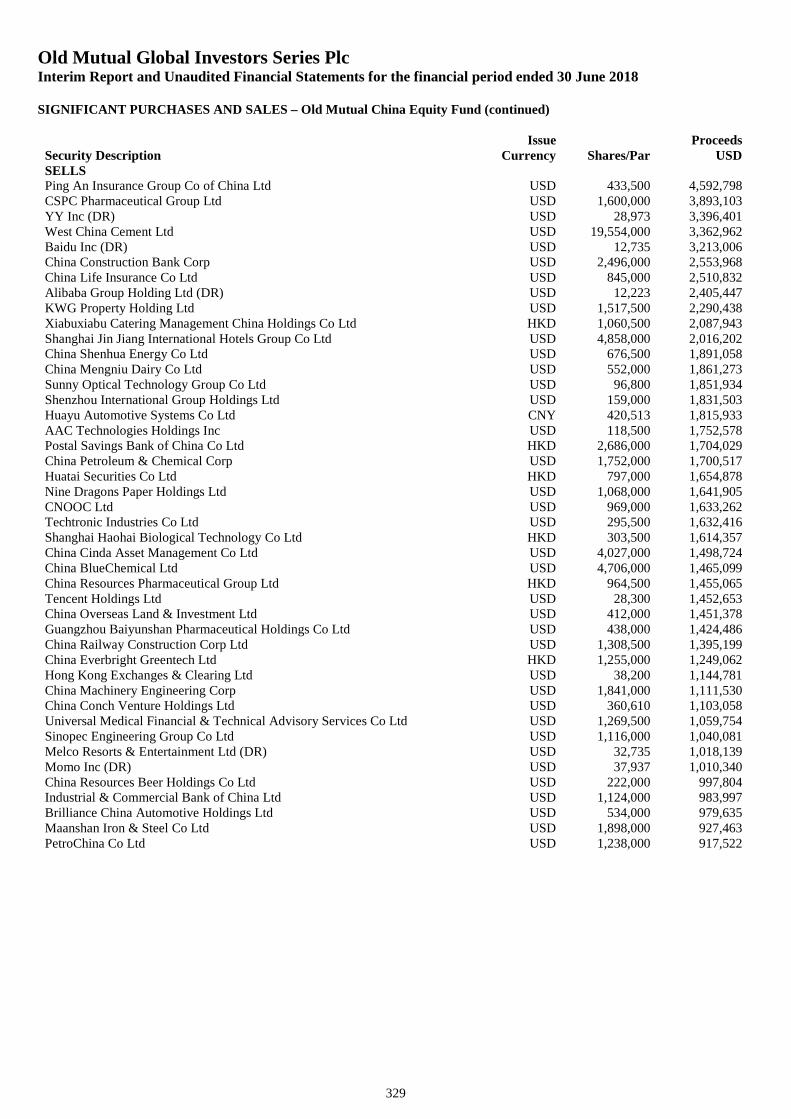
Old Mutual Global Investors Series PlcInterim Report and Unaudited Financial Statements for the financial period ended 30 June 2018
SIGNIFICANT PURCHASES AND SALES – Old Mutual China Equity Fund (continued)
329
Security DescriptionIssue
Currency Shares/ParProceeds
USDSELLSPing An Insurance Group Co of China Ltd USD 433,500 4,592,798CSPC Pharmaceutical Group Ltd USD 1,600,000 3,893,103YY Inc (DR) USD 28,973 3,396,401West China Cement Ltd USD 19,554,000 3,362,962Baidu Inc (DR) USD 12,735 3,213,006China Construction Bank Corp USD 2,496,000 2,553,968China Life Insurance Co Ltd USD 845,000 2,510,832Alibaba Group Holding Ltd (DR) USD 12,223 2,405,447KWG Property Holding Ltd USD 1,517,500 2,290,438Xiabuxiabu Catering Management China Holdings Co Ltd HKD 1,060,500 2,087,943Shanghai Jin Jiang International Hotels Group Co Ltd USD 4,858,000 2,016,202China Shenhua Energy Co Ltd USD 676,500 1,891,058China Mengniu Dairy Co Ltd USD 552,000 1,861,273Sunny Optical Technology Group Co Ltd USD 96,800 1,851,934Shenzhou International Group Holdings Ltd USD 159,000 1,831,503Huayu Automotive Systems Co Ltd CNY 420,513 1,815,933AAC Technologies Holdings Inc USD 118,500 1,752,578Postal Savings Bank of China Co Ltd HKD 2,686,000 1,704,029China Petroleum & Chemical Corp USD 1,752,000 1,700,517Huatai Securities Co Ltd HKD 797,000 1,654,878Nine Dragons Paper Holdings Ltd USD 1,068,000 1,641,905CNOOC Ltd USD 969,000 1,633,262Techtronic Industries Co Ltd USD 295,500 1,632,416Shanghai Haohai Biological Technology Co Ltd HKD 303,500 1,614,357China Cinda Asset Management Co Ltd USD 4,027,000 1,498,724China BlueChemical Ltd USD 4,706,000 1,465,099China Resources Pharmaceutical Group Ltd HKD 964,500 1,455,065Tencent Holdings Ltd USD 28,300 1,452,653China Overseas Land & Investment Ltd USD 412,000 1,451,378Guangzhou Baiyunshan Pharmaceutical Holdings Co Ltd USD 438,000 1,424,486China Railway Construction Corp Ltd USD 1,308,500 1,395,199China Everbright Greentech Ltd HKD 1,255,000 1,249,062Hong Kong Exchanges & Clearing Ltd USD 38,200 1,144,781China Machinery Engineering Corp USD 1,841,000 1,111,530China Conch Venture Holdings Ltd USD 360,610 1,103,058Universal Medical Financial & Technical Advisory Services Co Ltd USD 1,269,500 1,059,754Sinopec Engineering Group Co Ltd USD 1,116,000 1,040,081Melco Resorts & Entertainment Ltd (DR) USD 32,735 1,018,139Momo Inc (DR) USD 37,937 1,010,340China Resources Beer Holdings Co Ltd USD 222,000 997,804Industrial & Commercial Bank of China Ltd USD 1,124,000 983,997Brilliance China Automotive Holdings Ltd USD 534,000 979,635Maanshan Iron & Steel Co Ltd USD 1,898,000 927,463PetroChina Co Ltd USD 1,238,000 917,522
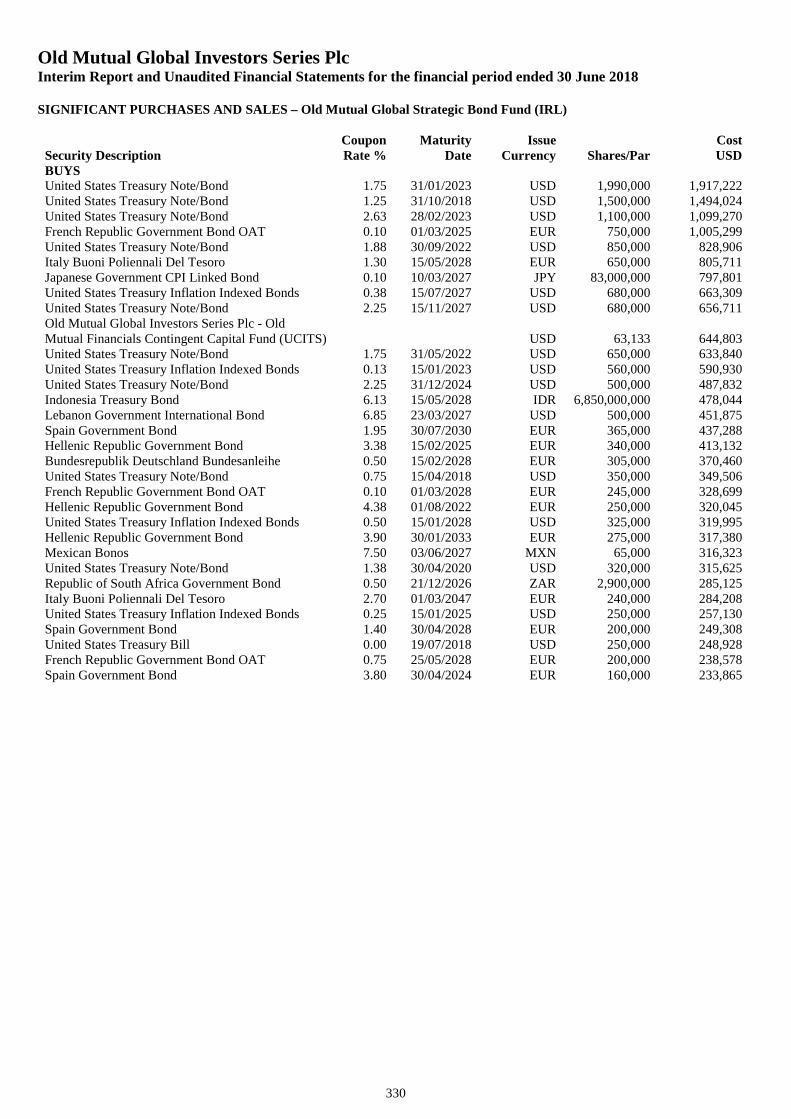
Old Mutual Global Investors Series PlcInterim Report and Unaudited Financial Statements for the financial period ended 30 June 2018
SIGNIFICANT PURCHASES AND SALES – Old Mutual Global Strategic Bond Fund (IRL)
330
Security DescriptionCouponRate %
MaturityDate
IssueCurrency Shares/Par
CostUSD
BUYSUnited States Treasury Note/Bond 1.75 31/01/2023 USD 1,990,000 1,917,222United States Treasury Note/Bond 1.25 31/10/2018 USD 1,500,000 1,494,024United States Treasury Note/Bond 2.63 28/02/2023 USD 1,100,000 1,099,270French Republic Government Bond OAT 0.10 01/03/2025 EUR 750,000 1,005,299United States Treasury Note/Bond 1.88 30/09/2022 USD 850,000 828,906Italy Buoni Poliennali Del Tesoro 1.30 15/05/2028 EUR 650,000 805,711Japanese Government CPI Linked Bond 0.10 10/03/2027 JPY 83,000,000 797,801United States Treasury Inflation Indexed Bonds 0.38 15/07/2027 USD 680,000 663,309United States Treasury Note/Bond 2.25 15/11/2027 USD 680,000 656,711Old Mutual Global Investors Series Plc - OldMutual Financials Contingent Capital Fund (UCITS) USD 63,133 644,803United States Treasury Note/Bond 1.75 31/05/2022 USD 650,000 633,840United States Treasury Inflation Indexed Bonds 0.13 15/01/2023 USD 560,000 590,930United States Treasury Note/Bond 2.25 31/12/2024 USD 500,000 487,832Indonesia Treasury Bond 6.13 15/05/2028 IDR 6,850,000,000 478,044Lebanon Government International Bond 6.85 23/03/2027 USD 500,000 451,875Spain Government Bond 1.95 30/07/2030 EUR 365,000 437,288Hellenic Republic Government Bond 3.38 15/02/2025 EUR 340,000 413,132Bundesrepublik Deutschland Bundesanleihe 0.50 15/02/2028 EUR 305,000 370,460United States Treasury Note/Bond 0.75 15/04/2018 USD 350,000 349,506French Republic Government Bond OAT 0.10 01/03/2028 EUR 245,000 328,699Hellenic Republic Government Bond 4.38 01/08/2022 EUR 250,000 320,045United States Treasury Inflation Indexed Bonds 0.50 15/01/2028 USD 325,000 319,995Hellenic Republic Government Bond 3.90 30/01/2033 EUR 275,000 317,380Mexican Bonos 7.50 03/06/2027 MXN 65,000 316,323United States Treasury Note/Bond 1.38 30/04/2020 USD 320,000 315,625Republic of South Africa Government Bond 0.50 21/12/2026 ZAR 2,900,000 285,125Italy Buoni Poliennali Del Tesoro 2.70 01/03/2047 EUR 240,000 284,208United States Treasury Inflation Indexed Bonds 0.25 15/01/2025 USD 250,000 257,130Spain Government Bond 1.40 30/04/2028 EUR 200,000 249,308United States Treasury Bill 0.00 19/07/2018 USD 250,000 248,928French Republic Government Bond OAT 0.75 25/05/2028 EUR 200,000 238,578Spain Government Bond 3.80 30/04/2024 EUR 160,000 233,865
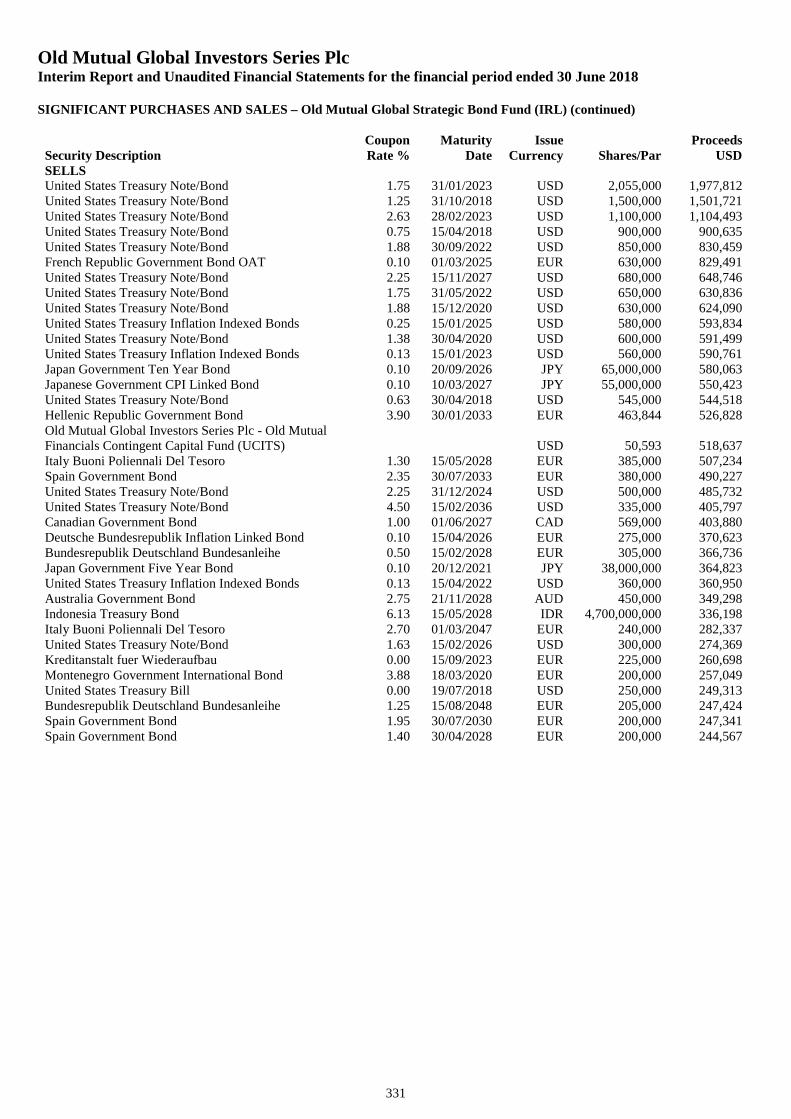
Old Mutual Global Investors Series PlcInterim Report and Unaudited Financial Statements for the financial period ended 30 June 2018
SIGNIFICANT PURCHASES AND SALES – Old Mutual Global Strategic Bond Fund (IRL) (continued)
331
Security DescriptionCouponRate %
MaturityDate
IssueCurrency Shares/Par
ProceedsUSD
SELLSUnited States Treasury Note/Bond 1.75 31/01/2023 USD 2,055,000 1,977,812United States Treasury Note/Bond 1.25 31/10/2018 USD 1,500,000 1,501,721United States Treasury Note/Bond 2.63 28/02/2023 USD 1,100,000 1,104,493United States Treasury Note/Bond 0.75 15/04/2018 USD 900,000 900,635United States Treasury Note/Bond 1.88 30/09/2022 USD 850,000 830,459French Republic Government Bond OAT 0.10 01/03/2025 EUR 630,000 829,491United States Treasury Note/Bond 2.25 15/11/2027 USD 680,000 648,746United States Treasury Note/Bond 1.75 31/05/2022 USD 650,000 630,836United States Treasury Note/Bond 1.88 15/12/2020 USD 630,000 624,090United States Treasury Inflation Indexed Bonds 0.25 15/01/2025 USD 580,000 593,834United States Treasury Note/Bond 1.38 30/04/2020 USD 600,000 591,499United States Treasury Inflation Indexed Bonds 0.13 15/01/2023 USD 560,000 590,761Japan Government Ten Year Bond 0.10 20/09/2026 JPY 65,000,000 580,063Japanese Government CPI Linked Bond 0.10 10/03/2027 JPY 55,000,000 550,423United States Treasury Note/Bond 0.63 30/04/2018 USD 545,000 544,518Hellenic Republic Government Bond 3.90 30/01/2033 EUR 463,844 526,828Old Mutual Global Investors Series Plc - Old MutualFinancials Contingent Capital Fund (UCITS) USD 50,593 518,637Italy Buoni Poliennali Del Tesoro 1.30 15/05/2028 EUR 385,000 507,234Spain Government Bond 2.35 30/07/2033 EUR 380,000 490,227United States Treasury Note/Bond 2.25 31/12/2024 USD 500,000 485,732United States Treasury Note/Bond 4.50 15/02/2036 USD 335,000 405,797Canadian Government Bond 1.00 01/06/2027 CAD 569,000 403,880Deutsche Bundesrepublik Inflation Linked Bond 0.10 15/04/2026 EUR 275,000 370,623Bundesrepublik Deutschland Bundesanleihe 0.50 15/02/2028 EUR 305,000 366,736Japan Government Five Year Bond 0.10 20/12/2021 JPY 38,000,000 364,823United States Treasury Inflation Indexed Bonds 0.13 15/04/2022 USD 360,000 360,950Australia Government Bond 2.75 21/11/2028 AUD 450,000 349,298Indonesia Treasury Bond 6.13 15/05/2028 IDR 4,700,000,000 336,198Italy Buoni Poliennali Del Tesoro 2.70 01/03/2047 EUR 240,000 282,337United States Treasury Note/Bond 1.63 15/02/2026 USD 300,000 274,369Kreditanstalt fuer Wiederaufbau 0.00 15/09/2023 EUR 225,000 260,698Montenegro Government International Bond 3.88 18/03/2020 EUR 200,000 257,049United States Treasury Bill 0.00 19/07/2018 USD 250,000 249,313Bundesrepublik Deutschland Bundesanleihe 1.25 15/08/2048 EUR 205,000 247,424Spain Government Bond 1.95 30/07/2030 EUR 200,000 247,341Spain Government Bond 1.40 30/04/2028 EUR 200,000 244,567
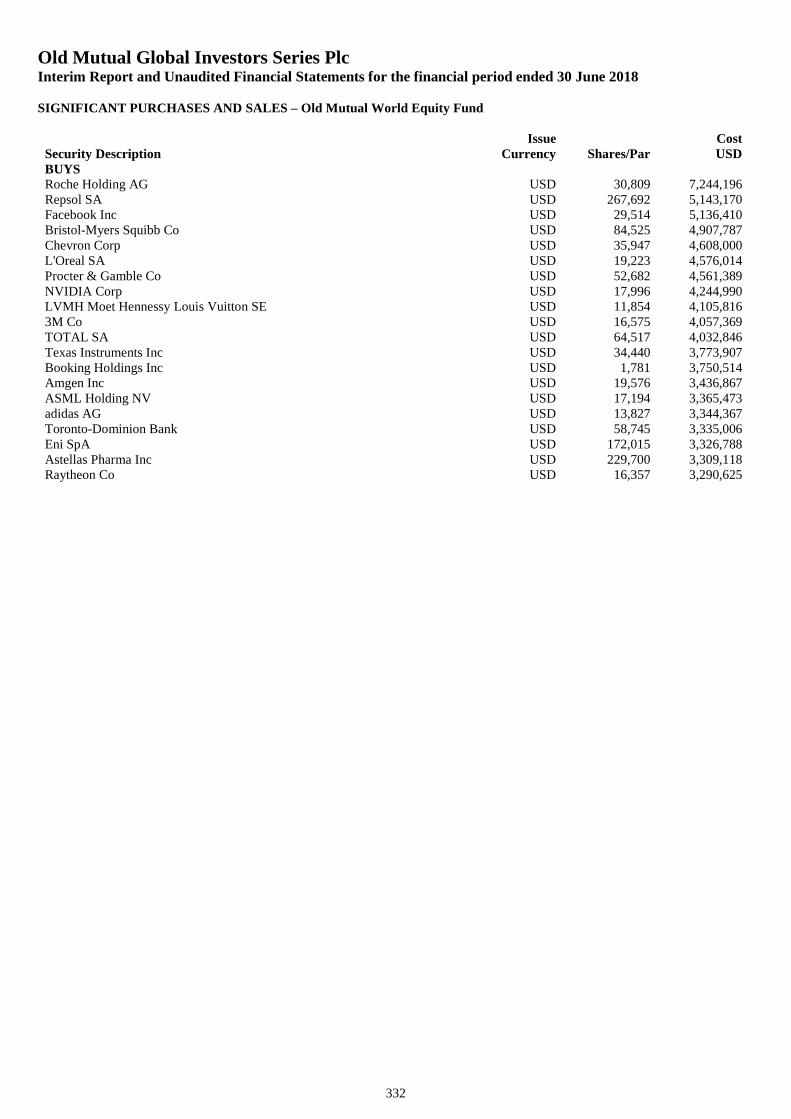
Old Mutual Global Investors Series PlcInterim Report and Unaudited Financial Statements for the financial period ended 30 June 2018
SIGNIFICANT PURCHASES AND SALES – Old Mutual World Equity Fund
332
Security DescriptionIssue
Currency Shares/ParCostUSD
BUYSRoche Holding AG USD 30,809 7,244,196Repsol SA USD 267,692 5,143,170Facebook Inc USD 29,514 5,136,410Bristol-Myers Squibb Co USD 84,525 4,907,787Chevron Corp USD 35,947 4,608,000L'Oreal SA USD 19,223 4,576,014Procter & Gamble Co USD 52,682 4,561,389NVIDIA Corp USD 17,996 4,244,990LVMH Moet Hennessy Louis Vuitton SE USD 11,854 4,105,8163M Co USD 16,575 4,057,369TOTAL SA USD 64,517 4,032,846Texas Instruments Inc USD 34,440 3,773,907Booking Holdings Inc USD 1,781 3,750,514Amgen Inc USD 19,576 3,436,867ASML Holding NV USD 17,194 3,365,473adidas AG USD 13,827 3,344,367Toronto-Dominion Bank USD 58,745 3,335,006Eni SpA USD 172,015 3,326,788Astellas Pharma Inc USD 229,700 3,309,118Raytheon Co USD 16,357 3,290,625
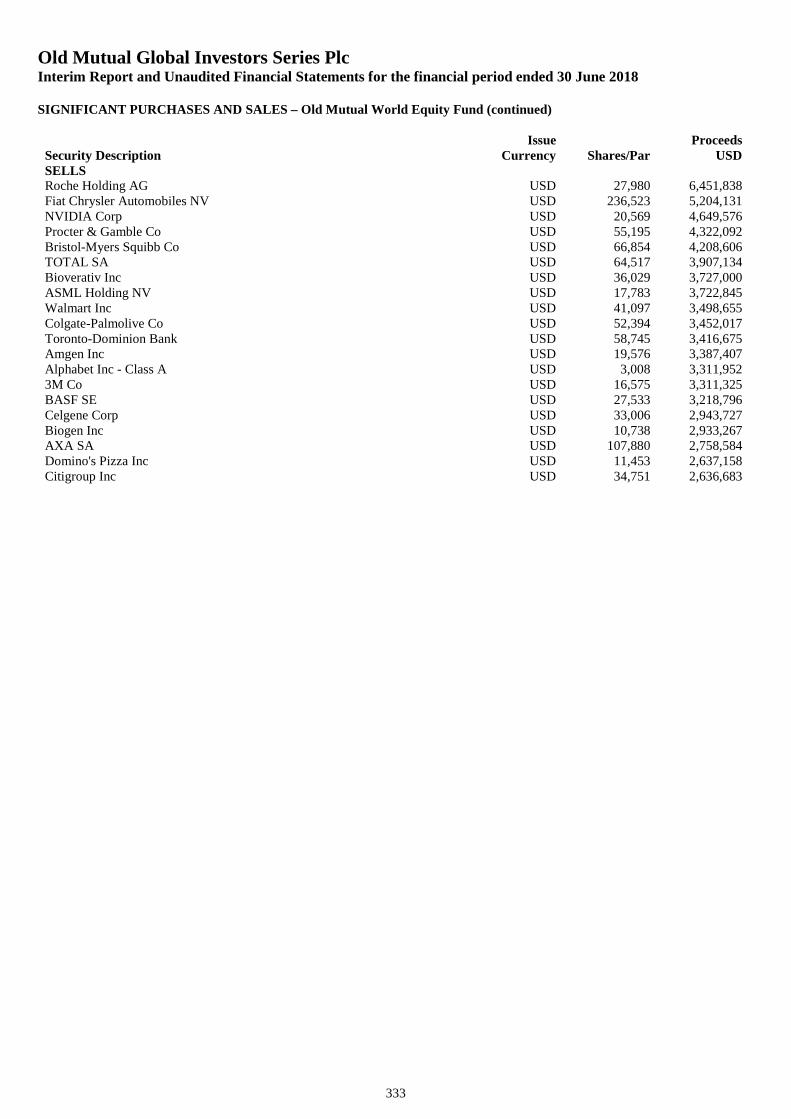
Old Mutual Global Investors Series PlcInterim Report and Unaudited Financial Statements for the financial period ended 30 June 2018
SIGNIFICANT PURCHASES AND SALES – Old Mutual World Equity Fund (continued)
333
Security DescriptionIssue
Currency Shares/ParProceeds
USDSELLSRoche Holding AG USD 27,980 6,451,838Fiat Chrysler Automobiles NV USD 236,523 5,204,131NVIDIA Corp USD 20,569 4,649,576Procter & Gamble Co USD 55,195 4,322,092Bristol-Myers Squibb Co USD 66,854 4,208,606TOTAL SA USD 64,517 3,907,134Bioverativ Inc USD 36,029 3,727,000ASML Holding NV USD 17,783 3,722,845Walmart Inc USD 41,097 3,498,655Colgate-Palmolive Co USD 52,394 3,452,017Toronto-Dominion Bank USD 58,745 3,416,675Amgen Inc USD 19,576 3,387,407Alphabet Inc - Class A USD 3,008 3,311,9523M Co USD 16,575 3,311,325BASF SE USD 27,533 3,218,796Celgene Corp USD 33,006 2,943,727Biogen Inc USD 10,738 2,933,267AXA SA USD 107,880 2,758,584Domino's Pizza Inc USD 11,453 2,637,158Citigroup Inc USD 34,751 2,636,683
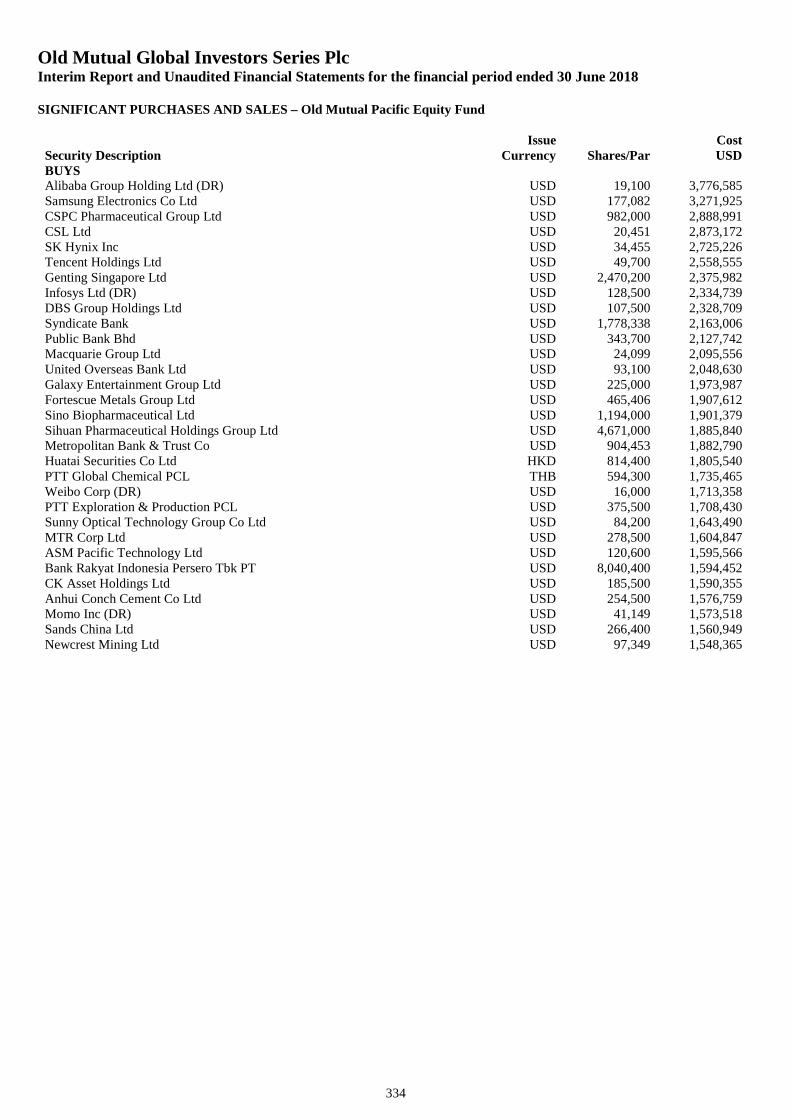
Old Mutual Global Investors Series PlcInterim Report and Unaudited Financial Statements for the financial period ended 30 June 2018
SIGNIFICANT PURCHASES AND SALES – Old Mutual Pacific Equity Fund
334
Security DescriptionIssue
Currency Shares/ParCostUSD
BUYSAlibaba Group Holding Ltd (DR) USD 19,100 3,776,585Samsung Electronics Co Ltd USD 177,082 3,271,925CSPC Pharmaceutical Group Ltd USD 982,000 2,888,991CSL Ltd USD 20,451 2,873,172SK Hynix Inc USD 34,455 2,725,226Tencent Holdings Ltd USD 49,700 2,558,555Genting Singapore Ltd USD 2,470,200 2,375,982Infosys Ltd (DR) USD 128,500 2,334,739DBS Group Holdings Ltd USD 107,500 2,328,709Syndicate Bank USD 1,778,338 2,163,006Public Bank Bhd USD 343,700 2,127,742Macquarie Group Ltd USD 24,099 2,095,556United Overseas Bank Ltd USD 93,100 2,048,630Galaxy Entertainment Group Ltd USD 225,000 1,973,987Fortescue Metals Group Ltd USD 465,406 1,907,612Sino Biopharmaceutical Ltd USD 1,194,000 1,901,379Sihuan Pharmaceutical Holdings Group Ltd USD 4,671,000 1,885,840Metropolitan Bank & Trust Co USD 904,453 1,882,790Huatai Securities Co Ltd HKD 814,400 1,805,540PTT Global Chemical PCL THB 594,300 1,735,465Weibo Corp (DR) USD 16,000 1,713,358PTT Exploration & Production PCL USD 375,500 1,708,430Sunny Optical Technology Group Co Ltd USD 84,200 1,643,490MTR Corp Ltd USD 278,500 1,604,847ASM Pacific Technology Ltd USD 120,600 1,595,566Bank Rakyat Indonesia Persero Tbk PT USD 8,040,400 1,594,452CK Asset Holdings Ltd USD 185,500 1,590,355Anhui Conch Cement Co Ltd USD 254,500 1,576,759Momo Inc (DR) USD 41,149 1,573,518Sands China Ltd USD 266,400 1,560,949Newcrest Mining Ltd USD 97,349 1,548,365
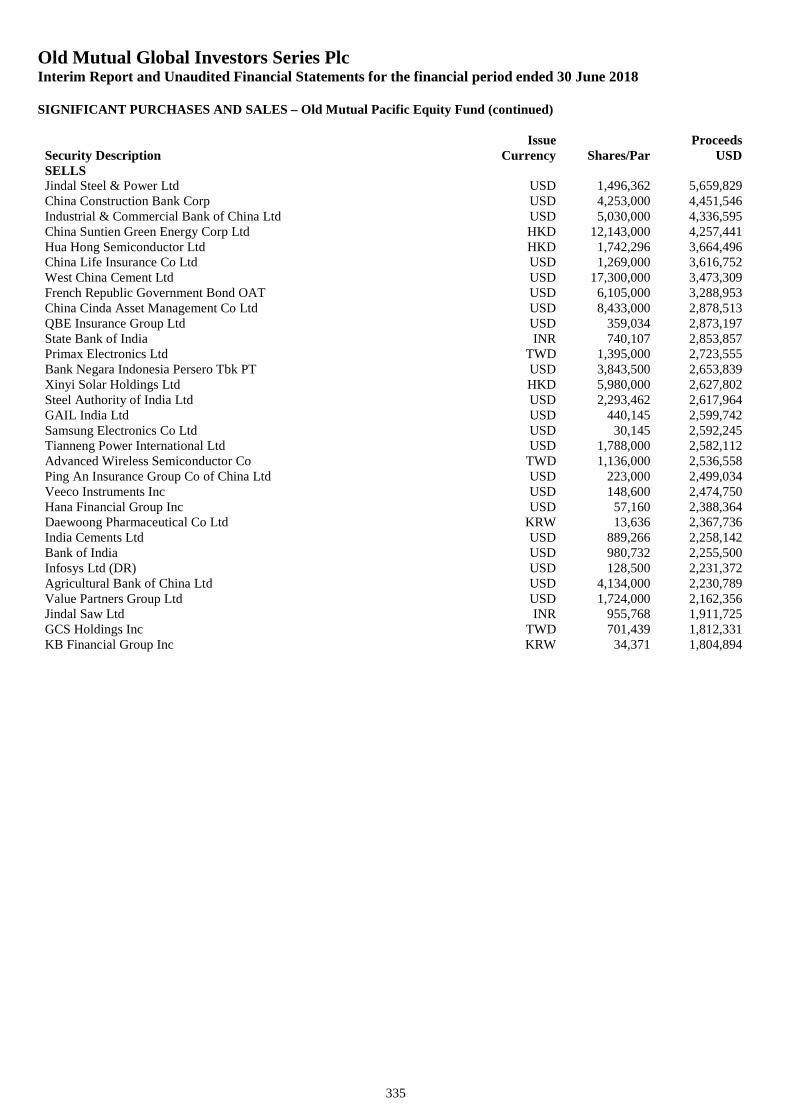
Old Mutual Global Investors Series PlcInterim Report and Unaudited Financial Statements for the financial period ended 30 June 2018
SIGNIFICANT PURCHASES AND SALES – Old Mutual Pacific Equity Fund (continued)
335
Security DescriptionIssue
Currency Shares/ParProceeds
USDSELLSJindal Steel & Power Ltd USD 1,496,362 5,659,829China Construction Bank Corp USD 4,253,000 4,451,546Industrial & Commercial Bank of China Ltd USD 5,030,000 4,336,595China Suntien Green Energy Corp Ltd HKD 12,143,000 4,257,441Hua Hong Semiconductor Ltd HKD 1,742,296 3,664,496China Life Insurance Co Ltd USD 1,269,000 3,616,752West China Cement Ltd USD 17,300,000 3,473,309French Republic Government Bond OAT USD 6,105,000 3,288,953China Cinda Asset Management Co Ltd USD 8,433,000 2,878,513QBE Insurance Group Ltd USD 359,034 2,873,197State Bank of India INR 740,107 2,853,857Primax Electronics Ltd TWD 1,395,000 2,723,555Bank Negara Indonesia Persero Tbk PT USD 3,843,500 2,653,839Xinyi Solar Holdings Ltd HKD 5,980,000 2,627,802Steel Authority of India Ltd USD 2,293,462 2,617,964GAIL India Ltd USD 440,145 2,599,742Samsung Electronics Co Ltd USD 30,145 2,592,245Tianneng Power International Ltd USD 1,788,000 2,582,112Advanced Wireless Semiconductor Co TWD 1,136,000 2,536,558Ping An Insurance Group Co of China Ltd USD 223,000 2,499,034Veeco Instruments Inc USD 148,600 2,474,750Hana Financial Group Inc USD 57,160 2,388,364Daewoong Pharmaceutical Co Ltd KRW 13,636 2,367,736India Cements Ltd USD 889,266 2,258,142Bank of India USD 980,732 2,255,500Infosys Ltd (DR) USD 128,500 2,231,372Agricultural Bank of China Ltd USD 4,134,000 2,230,789Value Partners Group Ltd USD 1,724,000 2,162,356Jindal Saw Ltd INR 955,768 1,911,725GCS Holdings Inc TWD 701,439 1,812,331KB Financial Group Inc KRW 34,371 1,804,894
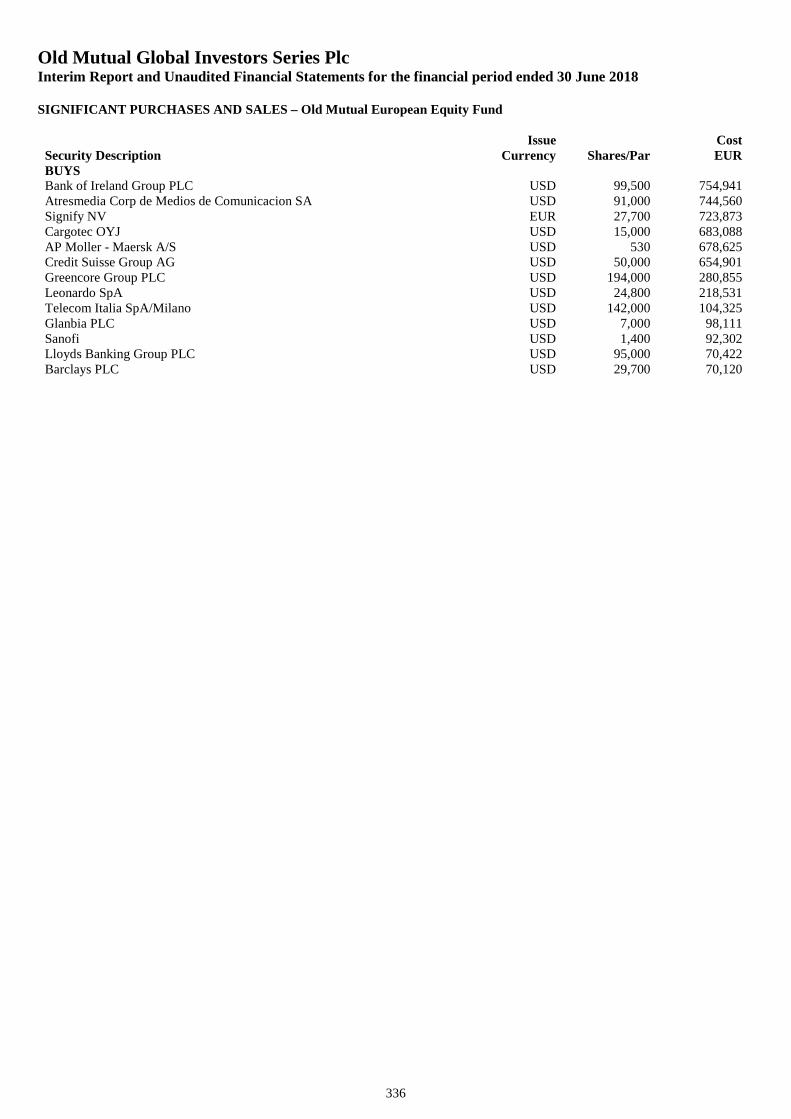
Old Mutual Global Investors Series PlcInterim Report and Unaudited Financial Statements for the financial period ended 30 June 2018
SIGNIFICANT PURCHASES AND SALES – Old Mutual European Equity Fund
336
Security DescriptionIssue
Currency Shares/ParCostEUR
BUYSBank of Ireland Group PLC USD 99,500 754,941Atresmedia Corp de Medios de Comunicacion SA USD 91,000 744,560Signify NV EUR 27,700 723,873Cargotec OYJ USD 15,000 683,088AP Moller - Maersk A/S USD 530 678,625Credit Suisse Group AG USD 50,000 654,901Greencore Group PLC USD 194,000 280,855Leonardo SpA USD 24,800 218,531Telecom Italia SpA/Milano USD 142,000 104,325Glanbia PLC USD 7,000 98,111Sanofi USD 1,400 92,302Lloyds Banking Group PLC USD 95,000 70,422Barclays PLC USD 29,700 70,120
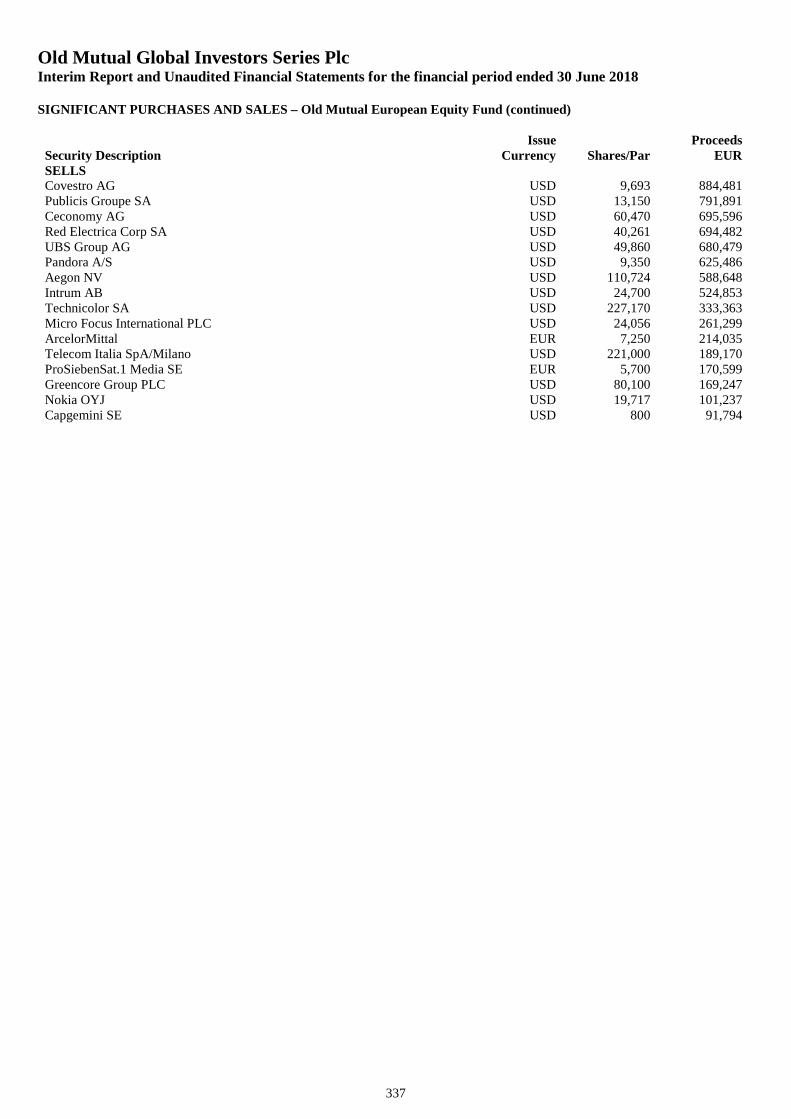
Old Mutual Global Investors Series PlcInterim Report and Unaudited Financial Statements for the financial period ended 30 June 2018
SIGNIFICANT PURCHASES AND SALES – Old Mutual European Equity Fund (continued)
337
Security DescriptionIssue
Currency Shares/ParProceeds
EURSELLSCovestro AG USD 9,693 884,481Publicis Groupe SA USD 13,150 791,891Ceconomy AG USD 60,470 695,596Red Electrica Corp SA USD 40,261 694,482UBS Group AG USD 49,860 680,479Pandora A/S USD 9,350 625,486Aegon NV USD 110,724 588,648Intrum AB USD 24,700 524,853Technicolor SA USD 227,170 333,363Micro Focus International PLC USD 24,056 261,299ArcelorMittal EUR 7,250 214,035Telecom Italia SpA/Milano USD 221,000 189,170ProSiebenSat.1 Media SE EUR 5,700 170,599Greencore Group PLC USD 80,100 169,247Nokia OYJ USD 19,717 101,237Capgemini SE USD 800 91,794
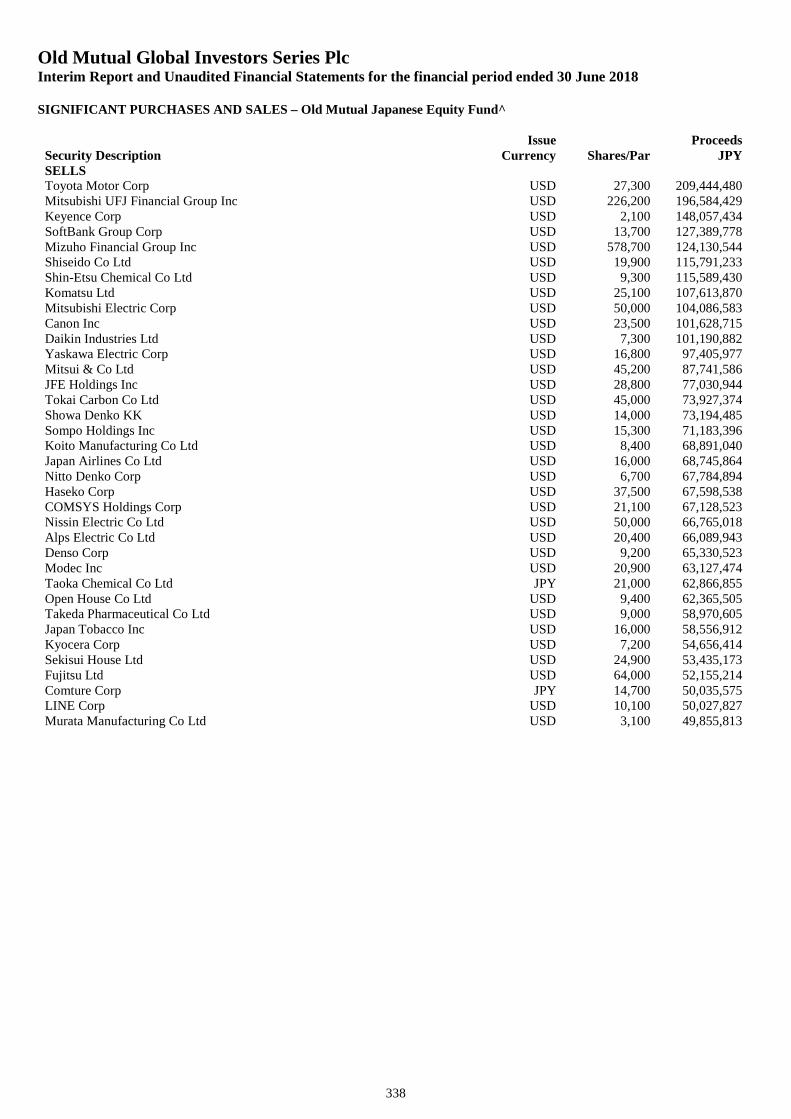
Old Mutual Global Investors Series PlcInterim Report and Unaudited Financial Statements for the financial period ended 30 June 2018
SIGNIFICANT PURCHASES AND SALES – Old Mutual Japanese Equity Fund^
338
Security DescriptionIssue
Currency Shares/ParProceeds
JPYSELLSToyota Motor Corp USD 27,300 209,444,480Mitsubishi UFJ Financial Group Inc USD 226,200 196,584,429Keyence Corp USD 2,100 148,057,434SoftBank Group Corp USD 13,700 127,389,778Mizuho Financial Group Inc USD 578,700 124,130,544Shiseido Co Ltd USD 19,900 115,791,233Shin-Etsu Chemical Co Ltd USD 9,300 115,589,430Komatsu Ltd USD 25,100 107,613,870Mitsubishi Electric Corp USD 50,000 104,086,583Canon Inc USD 23,500 101,628,715Daikin Industries Ltd USD 7,300 101,190,882Yaskawa Electric Corp USD 16,800 97,405,977Mitsui & Co Ltd USD 45,200 87,741,586JFE Holdings Inc USD 28,800 77,030,944Tokai Carbon Co Ltd USD 45,000 73,927,374Showa Denko KK USD 14,000 73,194,485Sompo Holdings Inc USD 15,300 71,183,396Koito Manufacturing Co Ltd USD 8,400 68,891,040Japan Airlines Co Ltd USD 16,000 68,745,864Nitto Denko Corp USD 6,700 67,784,894Haseko Corp USD 37,500 67,598,538COMSYS Holdings Corp USD 21,100 67,128,523Nissin Electric Co Ltd USD 50,000 66,765,018Alps Electric Co Ltd USD 20,400 66,089,943Denso Corp USD 9,200 65,330,523Modec Inc USD 20,900 63,127,474Taoka Chemical Co Ltd JPY 21,000 62,866,855Open House Co Ltd USD 9,400 62,365,505Takeda Pharmaceutical Co Ltd USD 9,000 58,970,605Japan Tobacco Inc USD 16,000 58,556,912Kyocera Corp USD 7,200 54,656,414Sekisui House Ltd USD 24,900 53,435,173Fujitsu Ltd USD 64,000 52,155,214Comture Corp JPY 14,700 50,035,575LINE Corp USD 10,100 50,027,827Murata Manufacturing Co Ltd USD 3,100 49,855,813
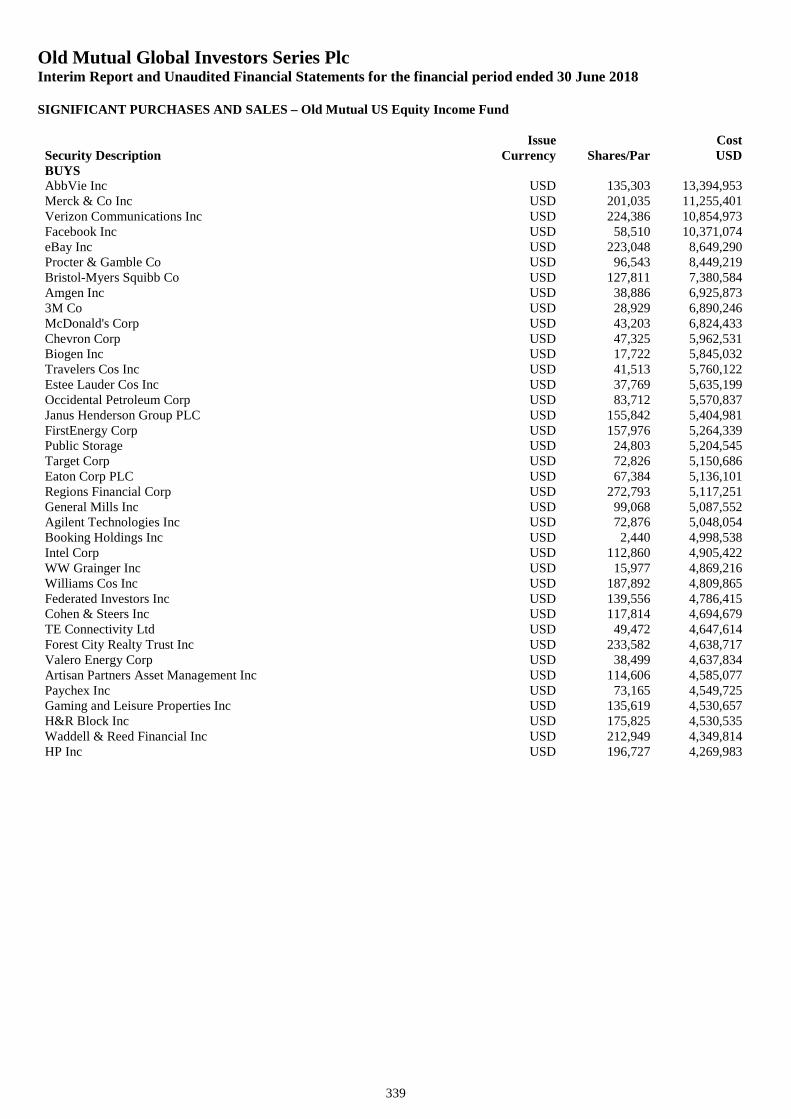
Old Mutual Global Investors Series PlcInterim Report and Unaudited Financial Statements for the financial period ended 30 June 2018
SIGNIFICANT PURCHASES AND SALES – Old Mutual US Equity Income Fund
339
Security DescriptionIssue
Currency Shares/ParCostUSD
BUYSAbbVie Inc USD 135,303 13,394,953Merck & Co Inc USD 201,035 11,255,401Verizon Communications Inc USD 224,386 10,854,973Facebook Inc USD 58,510 10,371,074eBay Inc USD 223,048 8,649,290Procter & Gamble Co USD 96,543 8,449,219Bristol-Myers Squibb Co USD 127,811 7,380,584Amgen Inc USD 38,886 6,925,8733M Co USD 28,929 6,890,246McDonald's Corp USD 43,203 6,824,433Chevron Corp USD 47,325 5,962,531Biogen Inc USD 17,722 5,845,032Travelers Cos Inc USD 41,513 5,760,122Estee Lauder Cos Inc USD 37,769 5,635,199Occidental Petroleum Corp USD 83,712 5,570,837Janus Henderson Group PLC USD 155,842 5,404,981FirstEnergy Corp USD 157,976 5,264,339Public Storage USD 24,803 5,204,545Target Corp USD 72,826 5,150,686Eaton Corp PLC USD 67,384 5,136,101Regions Financial Corp USD 272,793 5,117,251General Mills Inc USD 99,068 5,087,552Agilent Technologies Inc USD 72,876 5,048,054Booking Holdings Inc USD 2,440 4,998,538Intel Corp USD 112,860 4,905,422WW Grainger Inc USD 15,977 4,869,216Williams Cos Inc USD 187,892 4,809,865Federated Investors Inc USD 139,556 4,786,415Cohen & Steers Inc USD 117,814 4,694,679TE Connectivity Ltd USD 49,472 4,647,614Forest City Realty Trust Inc USD 233,582 4,638,717Valero Energy Corp USD 38,499 4,637,834Artisan Partners Asset Management Inc USD 114,606 4,585,077Paychex Inc USD 73,165 4,549,725Gaming and Leisure Properties Inc USD 135,619 4,530,657H&R Block Inc USD 175,825 4,530,535Waddell & Reed Financial Inc USD 212,949 4,349,814HP Inc USD 196,727 4,269,983
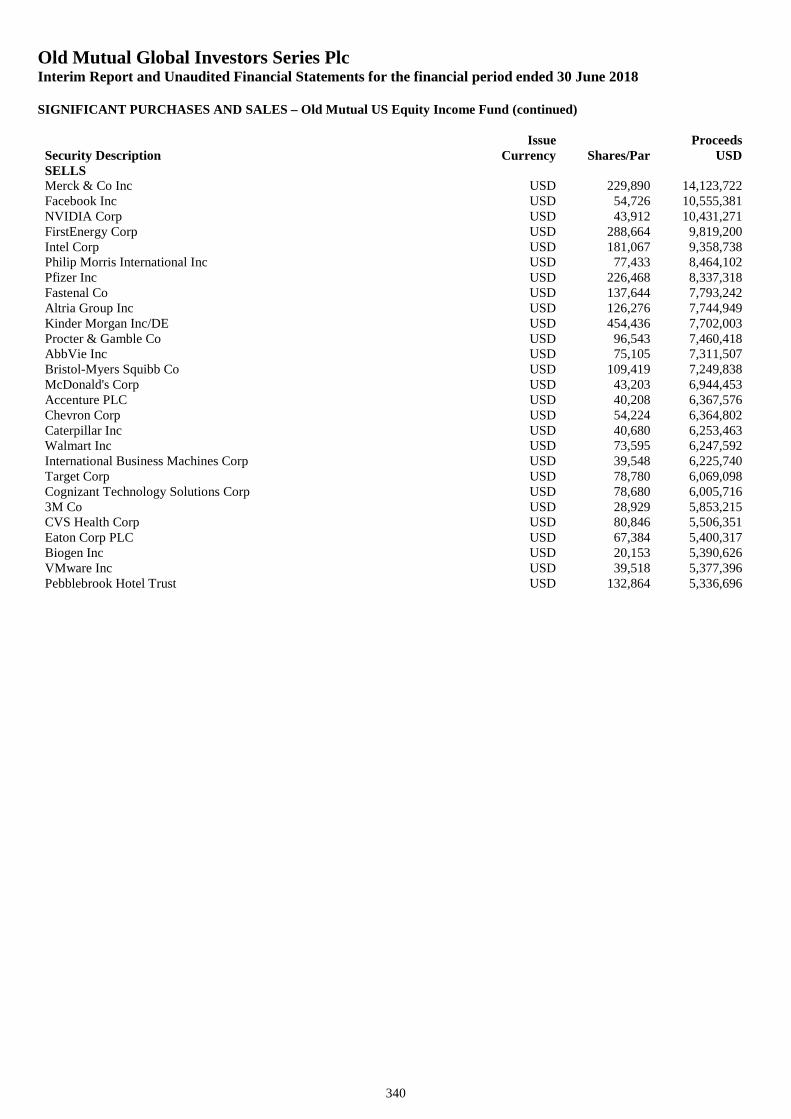
Old Mutual Global Investors Series PlcInterim Report and Unaudited Financial Statements for the financial period ended 30 June 2018
SIGNIFICANT PURCHASES AND SALES – Old Mutual US Equity Income Fund (continued)
340
Security DescriptionIssue
Currency Shares/ParProceeds
USDSELLSMerck & Co Inc USD 229,890 14,123,722Facebook Inc USD 54,726 10,555,381NVIDIA Corp USD 43,912 10,431,271FirstEnergy Corp USD 288,664 9,819,200Intel Corp USD 181,067 9,358,738Philip Morris International Inc USD 77,433 8,464,102Pfizer Inc USD 226,468 8,337,318Fastenal Co USD 137,644 7,793,242Altria Group Inc USD 126,276 7,744,949Kinder Morgan Inc/DE USD 454,436 7,702,003Procter & Gamble Co USD 96,543 7,460,418AbbVie Inc USD 75,105 7,311,507Bristol-Myers Squibb Co USD 109,419 7,249,838McDonald's Corp USD 43,203 6,944,453Accenture PLC USD 40,208 6,367,576Chevron Corp USD 54,224 6,364,802Caterpillar Inc USD 40,680 6,253,463Walmart Inc USD 73,595 6,247,592International Business Machines Corp USD 39,548 6,225,740Target Corp USD 78,780 6,069,098Cognizant Technology Solutions Corp USD 78,680 6,005,7163M Co USD 28,929 5,853,215CVS Health Corp USD 80,846 5,506,351Eaton Corp PLC USD 67,384 5,400,317Biogen Inc USD 20,153 5,390,626VMware Inc USD 39,518 5,377,396Pebblebrook Hotel Trust USD 132,864 5,336,696
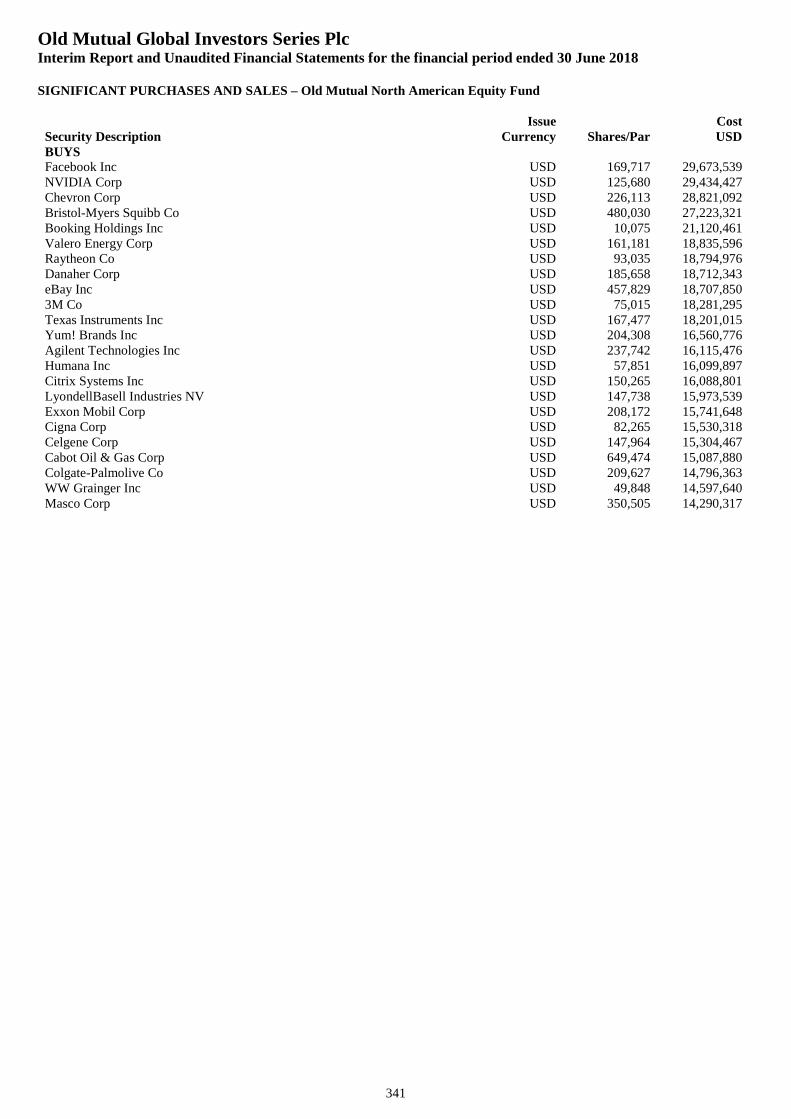
Old Mutual Global Investors Series PlcInterim Report and Unaudited Financial Statements for the financial period ended 30 June 2018
SIGNIFICANT PURCHASES AND SALES – Old Mutual North American Equity Fund
341
Security DescriptionIssue
Currency Shares/ParCostUSD
BUYSFacebook Inc USD 169,717 29,673,539NVIDIA Corp USD 125,680 29,434,427Chevron Corp USD 226,113 28,821,092Bristol-Myers Squibb Co USD 480,030 27,223,321Booking Holdings Inc USD 10,075 21,120,461Valero Energy Corp USD 161,181 18,835,596Raytheon Co USD 93,035 18,794,976Danaher Corp USD 185,658 18,712,343eBay Inc USD 457,829 18,707,8503M Co USD 75,015 18,281,295Texas Instruments Inc USD 167,477 18,201,015Yum! Brands Inc USD 204,308 16,560,776Agilent Technologies Inc USD 237,742 16,115,476Humana Inc USD 57,851 16,099,897Citrix Systems Inc USD 150,265 16,088,801LyondellBasell Industries NV USD 147,738 15,973,539Exxon Mobil Corp USD 208,172 15,741,648Cigna Corp USD 82,265 15,530,318Celgene Corp USD 147,964 15,304,467Cabot Oil & Gas Corp USD 649,474 15,087,880Colgate-Palmolive Co USD 209,627 14,796,363WW Grainger Inc USD 49,848 14,597,640Masco Corp USD 350,505 14,290,317
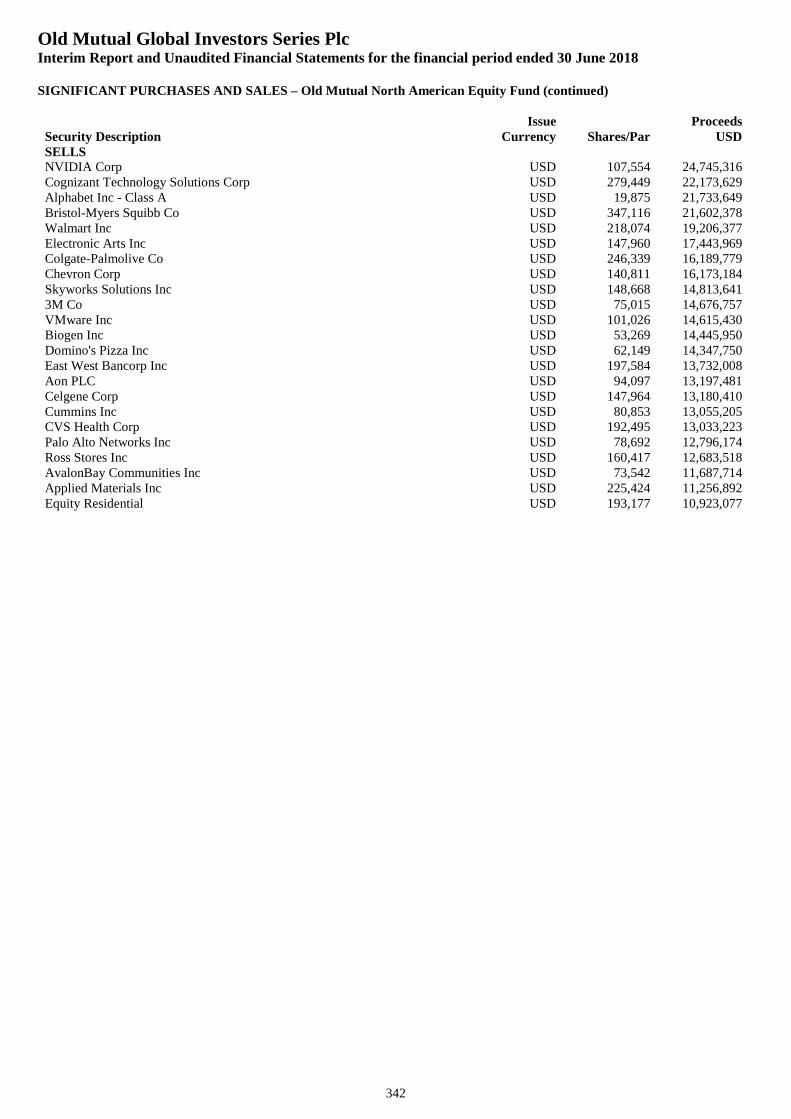
Old Mutual Global Investors Series PlcInterim Report and Unaudited Financial Statements for the financial period ended 30 June 2018
SIGNIFICANT PURCHASES AND SALES – Old Mutual North American Equity Fund (continued)
342
Security DescriptionIssue
Currency Shares/ParProceeds
USDSELLSNVIDIA Corp USD 107,554 24,745,316Cognizant Technology Solutions Corp USD 279,449 22,173,629Alphabet Inc - Class A USD 19,875 21,733,649Bristol-Myers Squibb Co USD 347,116 21,602,378Walmart Inc USD 218,074 19,206,377Electronic Arts Inc USD 147,960 17,443,969Colgate-Palmolive Co USD 246,339 16,189,779Chevron Corp USD 140,811 16,173,184Skyworks Solutions Inc USD 148,668 14,813,6413M Co USD 75,015 14,676,757VMware Inc USD 101,026 14,615,430Biogen Inc USD 53,269 14,445,950Domino's Pizza Inc USD 62,149 14,347,750East West Bancorp Inc USD 197,584 13,732,008Aon PLC USD 94,097 13,197,481Celgene Corp USD 147,964 13,180,410Cummins Inc USD 80,853 13,055,205CVS Health Corp USD 192,495 13,033,223Palo Alto Networks Inc USD 78,692 12,796,174Ross Stores Inc USD 160,417 12,683,518AvalonBay Communities Inc USD 73,542 11,687,714Applied Materials Inc USD 225,424 11,256,892Equity Residential USD 193,177 10,923,077
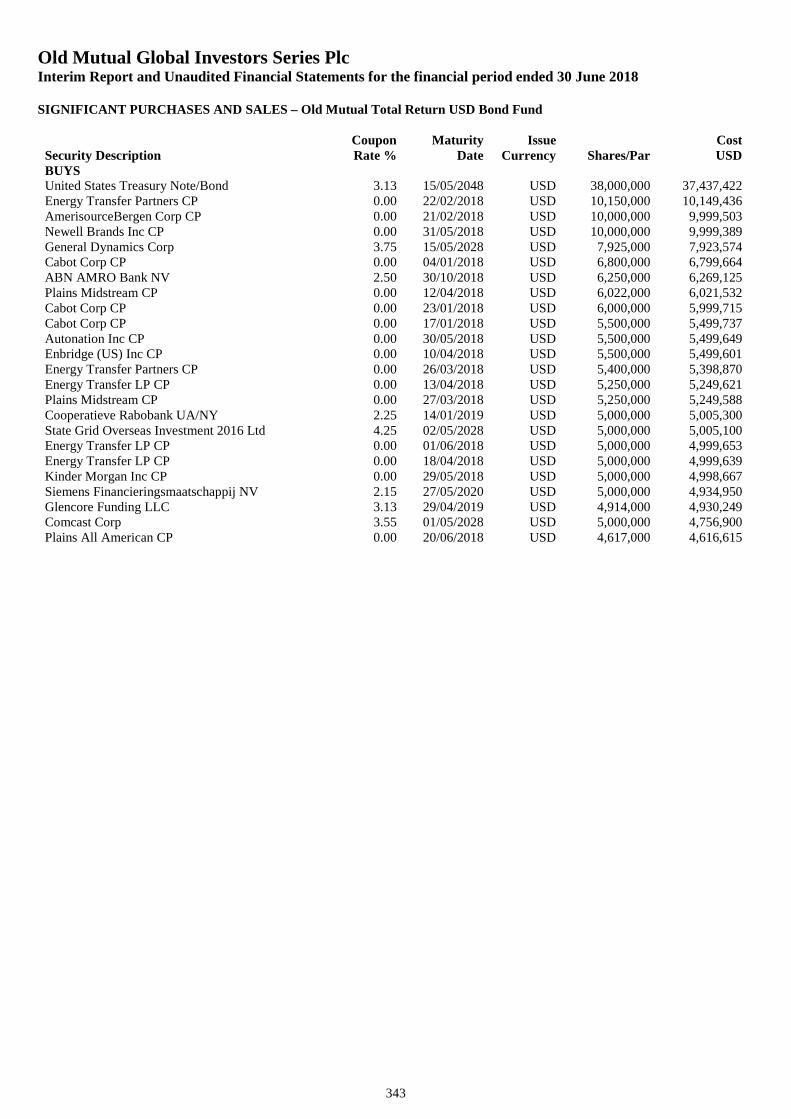
Old Mutual Global Investors Series PlcInterim Report and Unaudited Financial Statements for the financial period ended 30 June 2018
SIGNIFICANT PURCHASES AND SALES – Old Mutual Total Return USD Bond Fund
343
Security DescriptionCouponRate %
MaturityDate
IssueCurrency Shares/Par
CostUSD
BUYSUnited States Treasury Note/Bond 3.13 15/05/2048 USD 38,000,000 37,437,422Energy Transfer Partners CP 0.00 22/02/2018 USD 10,150,000 10,149,436AmerisourceBergen Corp CP 0.00 21/02/2018 USD 10,000,000 9,999,503Newell Brands Inc CP 0.00 31/05/2018 USD 10,000,000 9,999,389General Dynamics Corp 3.75 15/05/2028 USD 7,925,000 7,923,574Cabot Corp CP 0.00 04/01/2018 USD 6,800,000 6,799,664ABN AMRO Bank NV 2.50 30/10/2018 USD 6,250,000 6,269,125Plains Midstream CP 0.00 12/04/2018 USD 6,022,000 6,021,532Cabot Corp CP 0.00 23/01/2018 USD 6,000,000 5,999,715Cabot Corp CP 0.00 17/01/2018 USD 5,500,000 5,499,737Autonation Inc CP 0.00 30/05/2018 USD 5,500,000 5,499,649Enbridge (US) Inc CP 0.00 10/04/2018 USD 5,500,000 5,499,601Energy Transfer Partners CP 0.00 26/03/2018 USD 5,400,000 5,398,870Energy Transfer LP CP 0.00 13/04/2018 USD 5,250,000 5,249,621Plains Midstream CP 0.00 27/03/2018 USD 5,250,000 5,249,588Cooperatieve Rabobank UA/NY 2.25 14/01/2019 USD 5,000,000 5,005,300State Grid Overseas Investment 2016 Ltd 4.25 02/05/2028 USD 5,000,000 5,005,100Energy Transfer LP CP 0.00 01/06/2018 USD 5,000,000 4,999,653Energy Transfer LP CP 0.00 18/04/2018 USD 5,000,000 4,999,639Kinder Morgan Inc CP 0.00 29/05/2018 USD 5,000,000 4,998,667Siemens Financieringsmaatschappij NV 2.15 27/05/2020 USD 5,000,000 4,934,950Glencore Funding LLC 3.13 29/04/2019 USD 4,914,000 4,930,249Comcast Corp 3.55 01/05/2028 USD 5,000,000 4,756,900Plains All American CP 0.00 20/06/2018 USD 4,617,000 4,616,615
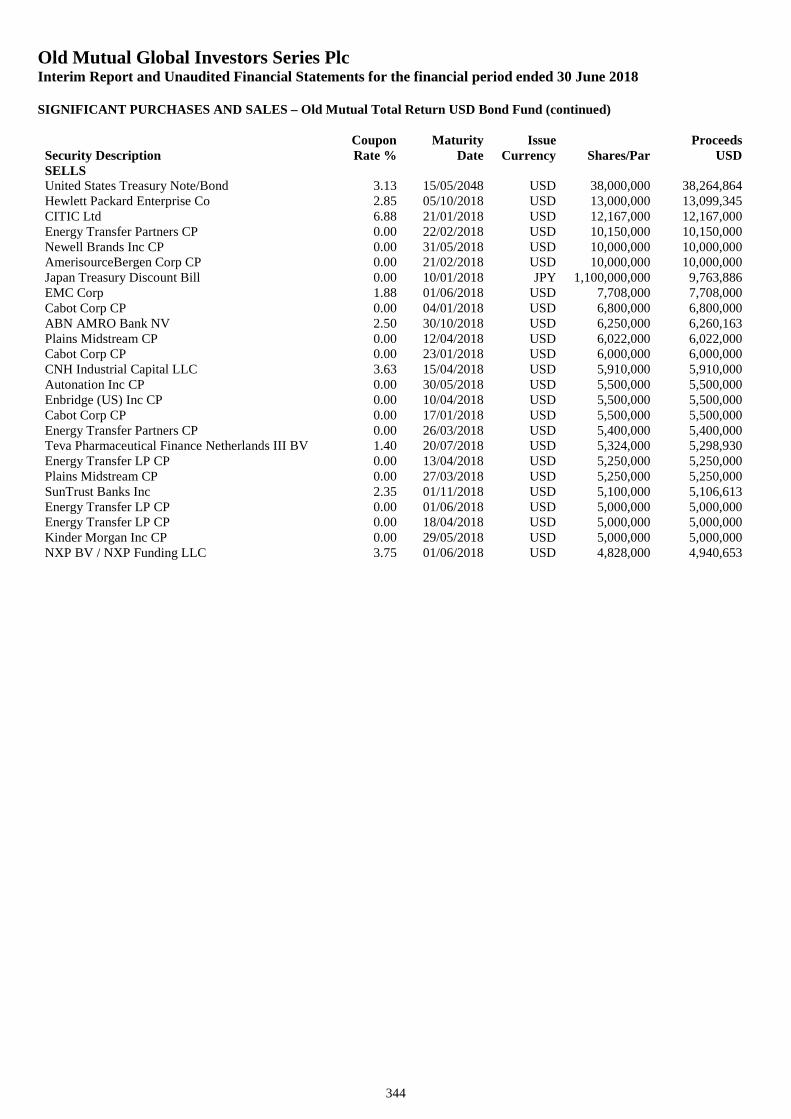
Old Mutual Global Investors Series PlcInterim Report and Unaudited Financial Statements for the financial period ended 30 June 2018
SIGNIFICANT PURCHASES AND SALES – Old Mutual Total Return USD Bond Fund (continued)
344
Security DescriptionCouponRate %
MaturityDate
IssueCurrency Shares/Par
ProceedsUSD
SELLSUnited States Treasury Note/Bond 3.13 15/05/2048 USD 38,000,000 38,264,864Hewlett Packard Enterprise Co 2.85 05/10/2018 USD 13,000,000 13,099,345CITIC Ltd 6.88 21/01/2018 USD 12,167,000 12,167,000Energy Transfer Partners CP 0.00 22/02/2018 USD 10,150,000 10,150,000Newell Brands Inc CP 0.00 31/05/2018 USD 10,000,000 10,000,000AmerisourceBergen Corp CP 0.00 21/02/2018 USD 10,000,000 10,000,000Japan Treasury Discount Bill 0.00 10/01/2018 JPY 1,100,000,000 9,763,886EMC Corp 1.88 01/06/2018 USD 7,708,000 7,708,000Cabot Corp CP 0.00 04/01/2018 USD 6,800,000 6,800,000ABN AMRO Bank NV 2.50 30/10/2018 USD 6,250,000 6,260,163Plains Midstream CP 0.00 12/04/2018 USD 6,022,000 6,022,000Cabot Corp CP 0.00 23/01/2018 USD 6,000,000 6,000,000CNH Industrial Capital LLC 3.63 15/04/2018 USD 5,910,000 5,910,000Autonation Inc CP 0.00 30/05/2018 USD 5,500,000 5,500,000Enbridge (US) Inc CP 0.00 10/04/2018 USD 5,500,000 5,500,000Cabot Corp CP 0.00 17/01/2018 USD 5,500,000 5,500,000Energy Transfer Partners CP 0.00 26/03/2018 USD 5,400,000 5,400,000Teva Pharmaceutical Finance Netherlands III BV 1.40 20/07/2018 USD 5,324,000 5,298,930Energy Transfer LP CP 0.00 13/04/2018 USD 5,250,000 5,250,000Plains Midstream CP 0.00 27/03/2018 USD 5,250,000 5,250,000SunTrust Banks Inc 2.35 01/11/2018 USD 5,100,000 5,106,613Energy Transfer LP CP 0.00 01/06/2018 USD 5,000,000 5,000,000Energy Transfer LP CP 0.00 18/04/2018 USD 5,000,000 5,000,000Kinder Morgan Inc CP 0.00 29/05/2018 USD 5,000,000 5,000,000NXP BV / NXP Funding LLC 3.75 01/06/2018 USD 4,828,000 4,940,653
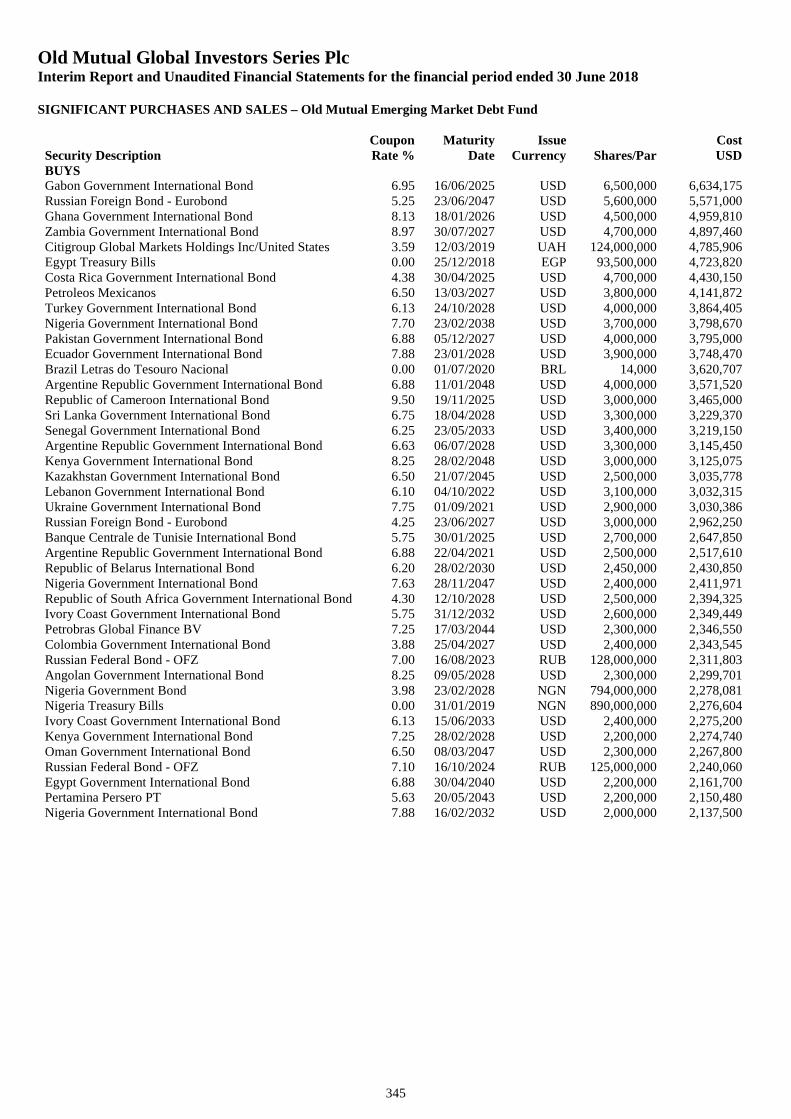
Old Mutual Global Investors Series PlcInterim Report and Unaudited Financial Statements for the financial period ended 30 June 2018
SIGNIFICANT PURCHASES AND SALES – Old Mutual Emerging Market Debt Fund
345
Security DescriptionCouponRate %
MaturityDate
IssueCurrency Shares/Par
CostUSD
BUYSGabon Government International Bond 6.95 16/06/2025 USD 6,500,000 6,634,175Russian Foreign Bond - Eurobond 5.25 23/06/2047 USD 5,600,000 5,571,000Ghana Government International Bond 8.13 18/01/2026 USD 4,500,000 4,959,810Zambia Government International Bond 8.97 30/07/2027 USD 4,700,000 4,897,460Citigroup Global Markets Holdings Inc/United States 3.59 12/03/2019 UAH 124,000,000 4,785,906Egypt Treasury Bills 0.00 25/12/2018 EGP 93,500,000 4,723,820Costa Rica Government International Bond 4.38 30/04/2025 USD 4,700,000 4,430,150Petroleos Mexicanos 6.50 13/03/2027 USD 3,800,000 4,141,872Turkey Government International Bond 6.13 24/10/2028 USD 4,000,000 3,864,405Nigeria Government International Bond 7.70 23/02/2038 USD 3,700,000 3,798,670Pakistan Government International Bond 6.88 05/12/2027 USD 4,000,000 3,795,000Ecuador Government International Bond 7.88 23/01/2028 USD 3,900,000 3,748,470Brazil Letras do Tesouro Nacional 0.00 01/07/2020 BRL 14,000 3,620,707Argentine Republic Government International Bond 6.88 11/01/2048 USD 4,000,000 3,571,520Republic of Cameroon International Bond 9.50 19/11/2025 USD 3,000,000 3,465,000Sri Lanka Government International Bond 6.75 18/04/2028 USD 3,300,000 3,229,370Senegal Government International Bond 6.25 23/05/2033 USD 3,400,000 3,219,150Argentine Republic Government International Bond 6.63 06/07/2028 USD 3,300,000 3,145,450Kenya Government International Bond 8.25 28/02/2048 USD 3,000,000 3,125,075Kazakhstan Government International Bond 6.50 21/07/2045 USD 2,500,000 3,035,778Lebanon Government International Bond 6.10 04/10/2022 USD 3,100,000 3,032,315Ukraine Government International Bond 7.75 01/09/2021 USD 2,900,000 3,030,386Russian Foreign Bond - Eurobond 4.25 23/06/2027 USD 3,000,000 2,962,250Banque Centrale de Tunisie International Bond 5.75 30/01/2025 USD 2,700,000 2,647,850Argentine Republic Government International Bond 6.88 22/04/2021 USD 2,500,000 2,517,610Republic of Belarus International Bond 6.20 28/02/2030 USD 2,450,000 2,430,850Nigeria Government International Bond 7.63 28/11/2047 USD 2,400,000 2,411,971Republic of South Africa Government International Bond 4.30 12/10/2028 USD 2,500,000 2,394,325Ivory Coast Government International Bond 5.75 31/12/2032 USD 2,600,000 2,349,449Petrobras Global Finance BV 7.25 17/03/2044 USD 2,300,000 2,346,550Colombia Government International Bond 3.88 25/04/2027 USD 2,400,000 2,343,545Russian Federal Bond - OFZ 7.00 16/08/2023 RUB 128,000,000 2,311,803Angolan Government International Bond 8.25 09/05/2028 USD 2,300,000 2,299,701Nigeria Government Bond 3.98 23/02/2028 NGN 794,000,000 2,278,081Nigeria Treasury Bills 0.00 31/01/2019 NGN 890,000,000 2,276,604Ivory Coast Government International Bond 6.13 15/06/2033 USD 2,400,000 2,275,200Kenya Government International Bond 7.25 28/02/2028 USD 2,200,000 2,274,740Oman Government International Bond 6.50 08/03/2047 USD 2,300,000 2,267,800Russian Federal Bond - OFZ 7.10 16/10/2024 RUB 125,000,000 2,240,060Egypt Government International Bond 6.88 30/04/2040 USD 2,200,000 2,161,700Pertamina Persero PT 5.63 20/05/2043 USD 2,200,000 2,150,480Nigeria Government International Bond 7.88 16/02/2032 USD 2,000,000 2,137,500
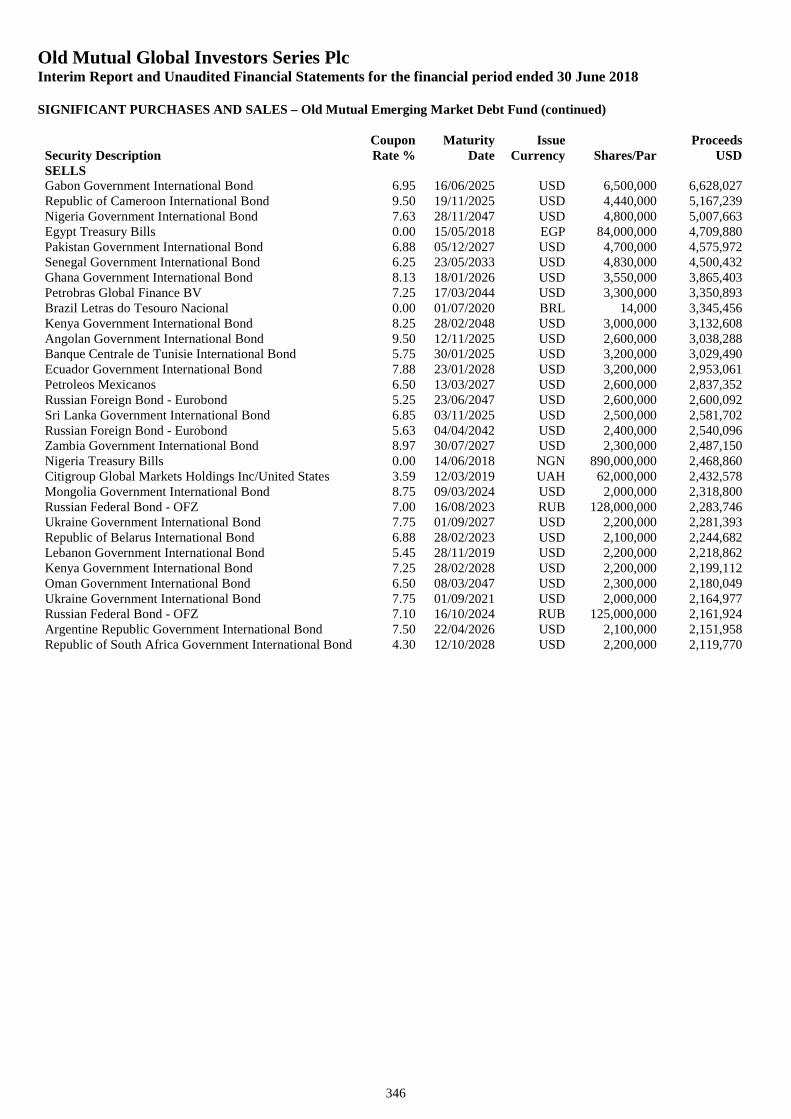
Old Mutual Global Investors Series PlcInterim Report and Unaudited Financial Statements for the financial period ended 30 June 2018
SIGNIFICANT PURCHASES AND SALES – Old Mutual Emerging Market Debt Fund (continued)
346
Security DescriptionCouponRate %
MaturityDate
IssueCurrency Shares/Par
ProceedsUSD
SELLSGabon Government International Bond 6.95 16/06/2025 USD 6,500,000 6,628,027Republic of Cameroon International Bond 9.50 19/11/2025 USD 4,440,000 5,167,239Nigeria Government International Bond 7.63 28/11/2047 USD 4,800,000 5,007,663Egypt Treasury Bills 0.00 15/05/2018 EGP 84,000,000 4,709,880Pakistan Government International Bond 6.88 05/12/2027 USD 4,700,000 4,575,972Senegal Government International Bond 6.25 23/05/2033 USD 4,830,000 4,500,432Ghana Government International Bond 8.13 18/01/2026 USD 3,550,000 3,865,403Petrobras Global Finance BV 7.25 17/03/2044 USD 3,300,000 3,350,893Brazil Letras do Tesouro Nacional 0.00 01/07/2020 BRL 14,000 3,345,456Kenya Government International Bond 8.25 28/02/2048 USD 3,000,000 3,132,608Angolan Government International Bond 9.50 12/11/2025 USD 2,600,000 3,038,288Banque Centrale de Tunisie International Bond 5.75 30/01/2025 USD 3,200,000 3,029,490Ecuador Government International Bond 7.88 23/01/2028 USD 3,200,000 2,953,061Petroleos Mexicanos 6.50 13/03/2027 USD 2,600,000 2,837,352Russian Foreign Bond - Eurobond 5.25 23/06/2047 USD 2,600,000 2,600,092Sri Lanka Government International Bond 6.85 03/11/2025 USD 2,500,000 2,581,702Russian Foreign Bond - Eurobond 5.63 04/04/2042 USD 2,400,000 2,540,096Zambia Government International Bond 8.97 30/07/2027 USD 2,300,000 2,487,150Nigeria Treasury Bills 0.00 14/06/2018 NGN 890,000,000 2,468,860Citigroup Global Markets Holdings Inc/United States 3.59 12/03/2019 UAH 62,000,000 2,432,578Mongolia Government International Bond 8.75 09/03/2024 USD 2,000,000 2,318,800Russian Federal Bond - OFZ 7.00 16/08/2023 RUB 128,000,000 2,283,746Ukraine Government International Bond 7.75 01/09/2027 USD 2,200,000 2,281,393Republic of Belarus International Bond 6.88 28/02/2023 USD 2,100,000 2,244,682Lebanon Government International Bond 5.45 28/11/2019 USD 2,200,000 2,218,862Kenya Government International Bond 7.25 28/02/2028 USD 2,200,000 2,199,112Oman Government International Bond 6.50 08/03/2047 USD 2,300,000 2,180,049Ukraine Government International Bond 7.75 01/09/2021 USD 2,000,000 2,164,977Russian Federal Bond - OFZ 7.10 16/10/2024 RUB 125,000,000 2,161,924Argentine Republic Government International Bond 7.50 22/04/2026 USD 2,100,000 2,151,958Republic of South Africa Government International Bond 4.30 12/10/2028 USD 2,200,000 2,119,770
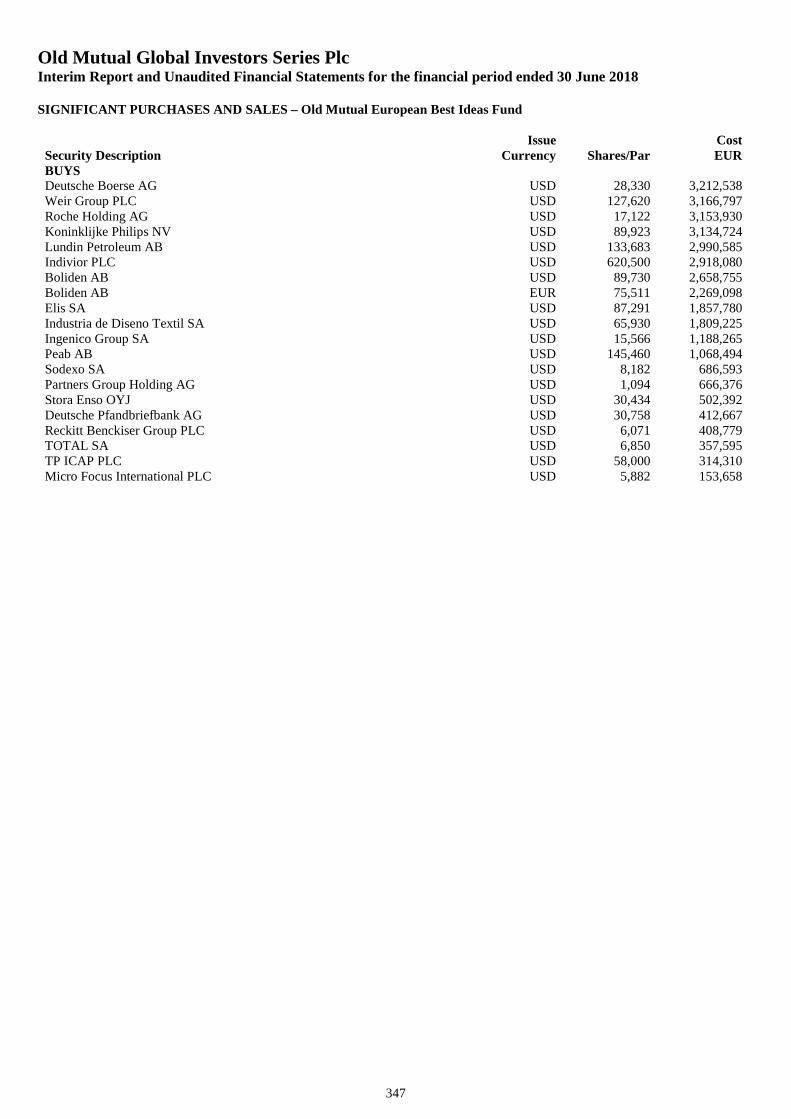
Old Mutual Global Investors Series PlcInterim Report and Unaudited Financial Statements for the financial period ended 30 June 2018
SIGNIFICANT PURCHASES AND SALES – Old Mutual European Best Ideas Fund
347
Security DescriptionIssue
Currency Shares/ParCostEUR
BUYSDeutsche Boerse AG USD 28,330 3,212,538Weir Group PLC USD 127,620 3,166,797Roche Holding AG USD 17,122 3,153,930Koninklijke Philips NV USD 89,923 3,134,724Lundin Petroleum AB USD 133,683 2,990,585Indivior PLC USD 620,500 2,918,080Boliden AB USD 89,730 2,658,755Boliden AB EUR 75,511 2,269,098Elis SA USD 87,291 1,857,780Industria de Diseno Textil SA USD 65,930 1,809,225Ingenico Group SA USD 15,566 1,188,265Peab AB USD 145,460 1,068,494Sodexo SA USD 8,182 686,593Partners Group Holding AG USD 1,094 666,376Stora Enso OYJ USD 30,434 502,392Deutsche Pfandbriefbank AG USD 30,758 412,667Reckitt Benckiser Group PLC USD 6,071 408,779TOTAL SA USD 6,850 357,595TP ICAP PLC USD 58,000 314,310Micro Focus International PLC USD 5,882 153,658
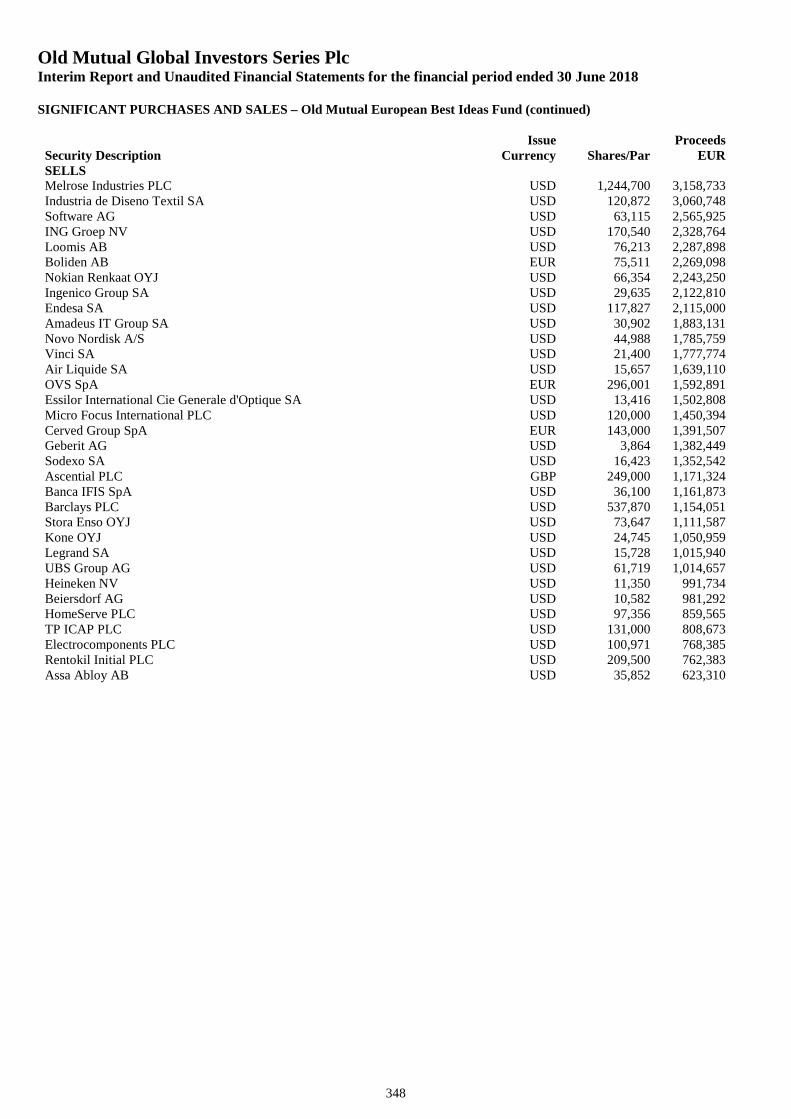
Old Mutual Global Investors Series PlcInterim Report and Unaudited Financial Statements for the financial period ended 30 June 2018
SIGNIFICANT PURCHASES AND SALES – Old Mutual European Best Ideas Fund (continued)
348
Security DescriptionIssue
Currency Shares/ParProceeds
EURSELLSMelrose Industries PLC USD 1,244,700 3,158,733Industria de Diseno Textil SA USD 120,872 3,060,748Software AG USD 63,115 2,565,925ING Groep NV USD 170,540 2,328,764Loomis AB USD 76,213 2,287,898Boliden AB EUR 75,511 2,269,098Nokian Renkaat OYJ USD 66,354 2,243,250Ingenico Group SA USD 29,635 2,122,810Endesa SA USD 117,827 2,115,000Amadeus IT Group SA USD 30,902 1,883,131Novo Nordisk A/S USD 44,988 1,785,759Vinci SA USD 21,400 1,777,774Air Liquide SA USD 15,657 1,639,110OVS SpA EUR 296,001 1,592,891Essilor International Cie Generale d'Optique SA USD 13,416 1,502,808Micro Focus International PLC USD 120,000 1,450,394Cerved Group SpA EUR 143,000 1,391,507Geberit AG USD 3,864 1,382,449Sodexo SA USD 16,423 1,352,542Ascential PLC GBP 249,000 1,171,324Banca IFIS SpA USD 36,100 1,161,873Barclays PLC USD 537,870 1,154,051Stora Enso OYJ USD 73,647 1,111,587Kone OYJ USD 24,745 1,050,959Legrand SA USD 15,728 1,015,940UBS Group AG USD 61,719 1,014,657Heineken NV USD 11,350 991,734Beiersdorf AG USD 10,582 981,292HomeServe PLC USD 97,356 859,565TP ICAP PLC USD 131,000 808,673Electrocomponents PLC USD 100,971 768,385Rentokil Initial PLC USD 209,500 762,383Assa Abloy AB USD 35,852 623,310
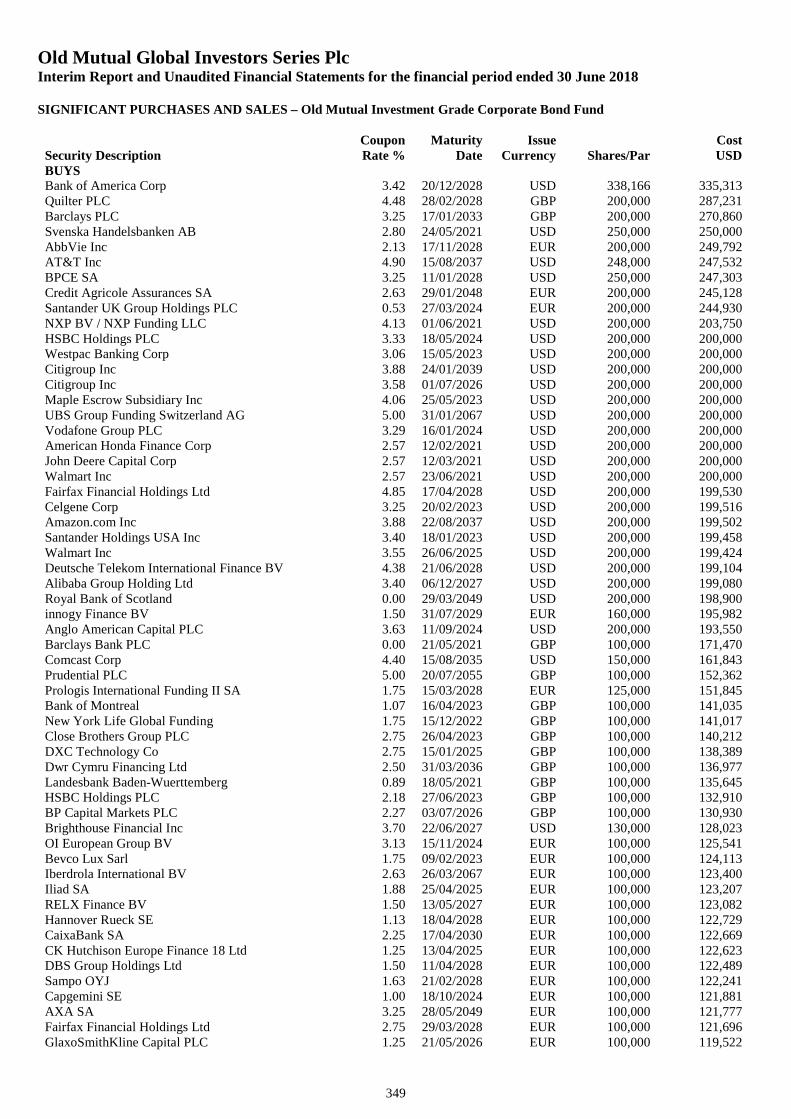
Old Mutual Global Investors Series PlcInterim Report and Unaudited Financial Statements for the financial period ended 30 June 2018
SIGNIFICANT PURCHASES AND SALES – Old Mutual Investment Grade Corporate Bond Fund
349
Security DescriptionCouponRate %
MaturityDate
IssueCurrency Shares/Par
CostUSD
BUYSBank of America Corp 3.42 20/12/2028 USD 338,166 335,313Quilter PLC 4.48 28/02/2028 GBP 200,000 287,231Barclays PLC 3.25 17/01/2033 GBP 200,000 270,860Svenska Handelsbanken AB 2.80 24/05/2021 USD 250,000 250,000AbbVie Inc 2.13 17/11/2028 EUR 200,000 249,792AT&T Inc 4.90 15/08/2037 USD 248,000 247,532BPCE SA 3.25 11/01/2028 USD 250,000 247,303Credit Agricole Assurances SA 2.63 29/01/2048 EUR 200,000 245,128Santander UK Group Holdings PLC 0.53 27/03/2024 EUR 200,000 244,930NXP BV / NXP Funding LLC 4.13 01/06/2021 USD 200,000 203,750HSBC Holdings PLC 3.33 18/05/2024 USD 200,000 200,000Westpac Banking Corp 3.06 15/05/2023 USD 200,000 200,000Citigroup Inc 3.88 24/01/2039 USD 200,000 200,000Citigroup Inc 3.58 01/07/2026 USD 200,000 200,000Maple Escrow Subsidiary Inc 4.06 25/05/2023 USD 200,000 200,000UBS Group Funding Switzerland AG 5.00 31/01/2067 USD 200,000 200,000Vodafone Group PLC 3.29 16/01/2024 USD 200,000 200,000American Honda Finance Corp 2.57 12/02/2021 USD 200,000 200,000John Deere Capital Corp 2.57 12/03/2021 USD 200,000 200,000Walmart Inc 2.57 23/06/2021 USD 200,000 200,000Fairfax Financial Holdings Ltd 4.85 17/04/2028 USD 200,000 199,530Celgene Corp 3.25 20/02/2023 USD 200,000 199,516Amazon.com Inc 3.88 22/08/2037 USD 200,000 199,502Santander Holdings USA Inc 3.40 18/01/2023 USD 200,000 199,458Walmart Inc 3.55 26/06/2025 USD 200,000 199,424Deutsche Telekom International Finance BV 4.38 21/06/2028 USD 200,000 199,104Alibaba Group Holding Ltd 3.40 06/12/2027 USD 200,000 199,080Royal Bank of Scotland 0.00 29/03/2049 USD 200,000 198,900innogy Finance BV 1.50 31/07/2029 EUR 160,000 195,982Anglo American Capital PLC 3.63 11/09/2024 USD 200,000 193,550Barclays Bank PLC 0.00 21/05/2021 GBP 100,000 171,470Comcast Corp 4.40 15/08/2035 USD 150,000 161,843Prudential PLC 5.00 20/07/2055 GBP 100,000 152,362Prologis International Funding II SA 1.75 15/03/2028 EUR 125,000 151,845Bank of Montreal 1.07 16/04/2023 GBP 100,000 141,035New York Life Global Funding 1.75 15/12/2022 GBP 100,000 141,017Close Brothers Group PLC 2.75 26/04/2023 GBP 100,000 140,212DXC Technology Co 2.75 15/01/2025 GBP 100,000 138,389Dwr Cymru Financing Ltd 2.50 31/03/2036 GBP 100,000 136,977Landesbank Baden-Wuerttemberg 0.89 18/05/2021 GBP 100,000 135,645HSBC Holdings PLC 2.18 27/06/2023 GBP 100,000 132,910BP Capital Markets PLC 2.27 03/07/2026 GBP 100,000 130,930Brighthouse Financial Inc 3.70 22/06/2027 USD 130,000 128,023OI European Group BV 3.13 15/11/2024 EUR 100,000 125,541Bevco Lux Sarl 1.75 09/02/2023 EUR 100,000 124,113Iberdrola International BV 2.63 26/03/2067 EUR 100,000 123,400Iliad SA 1.88 25/04/2025 EUR 100,000 123,207RELX Finance BV 1.50 13/05/2027 EUR 100,000 123,082Hannover Rueck SE 1.13 18/04/2028 EUR 100,000 122,729CaixaBank SA 2.25 17/04/2030 EUR 100,000 122,669CK Hutchison Europe Finance 18 Ltd 1.25 13/04/2025 EUR 100,000 122,623DBS Group Holdings Ltd 1.50 11/04/2028 EUR 100,000 122,489Sampo OYJ 1.63 21/02/2028 EUR 100,000 122,241Capgemini SE 1.00 18/10/2024 EUR 100,000 121,881AXA SA 3.25 28/05/2049 EUR 100,000 121,777Fairfax Financial Holdings Ltd 2.75 29/03/2028 EUR 100,000 121,696GlaxoSmithKline Capital PLC 1.25 21/05/2026 EUR 100,000 119,522
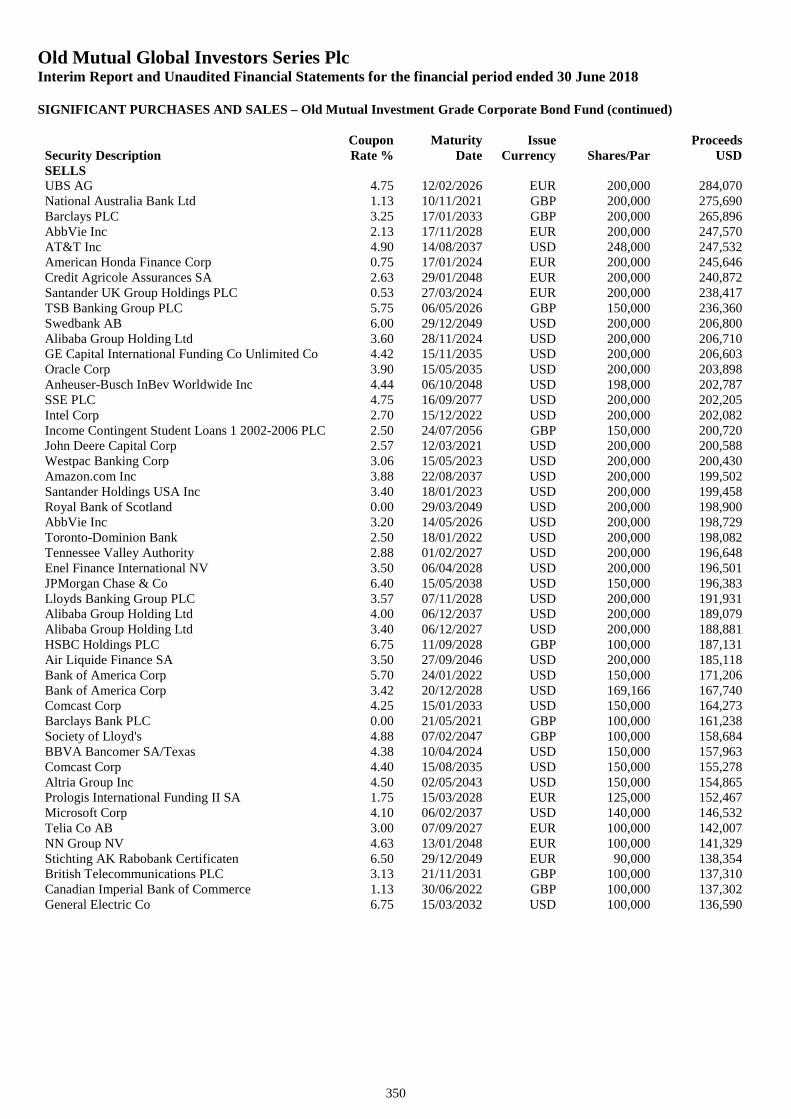
Old Mutual Global Investors Series PlcInterim Report and Unaudited Financial Statements for the financial period ended 30 June 2018
SIGNIFICANT PURCHASES AND SALES – Old Mutual Investment Grade Corporate Bond Fund (continued)
350
Security DescriptionCouponRate %
MaturityDate
IssueCurrency Shares/Par
ProceedsUSD
SELLSUBS AG 4.75 12/02/2026 EUR 200,000 284,070National Australia Bank Ltd 1.13 10/11/2021 GBP 200,000 275,690Barclays PLC 3.25 17/01/2033 GBP 200,000 265,896AbbVie Inc 2.13 17/11/2028 EUR 200,000 247,570AT&T Inc 4.90 14/08/2037 USD 248,000 247,532American Honda Finance Corp 0.75 17/01/2024 EUR 200,000 245,646Credit Agricole Assurances SA 2.63 29/01/2048 EUR 200,000 240,872Santander UK Group Holdings PLC 0.53 27/03/2024 EUR 200,000 238,417TSB Banking Group PLC 5.75 06/05/2026 GBP 150,000 236,360Swedbank AB 6.00 29/12/2049 USD 200,000 206,800Alibaba Group Holding Ltd 3.60 28/11/2024 USD 200,000 206,710GE Capital International Funding Co Unlimited Co 4.42 15/11/2035 USD 200,000 206,603Oracle Corp 3.90 15/05/2035 USD 200,000 203,898Anheuser-Busch InBev Worldwide Inc 4.44 06/10/2048 USD 198,000 202,787SSE PLC 4.75 16/09/2077 USD 200,000 202,205Intel Corp 2.70 15/12/2022 USD 200,000 202,082Income Contingent Student Loans 1 2002-2006 PLC 2.50 24/07/2056 GBP 150,000 200,720John Deere Capital Corp 2.57 12/03/2021 USD 200,000 200,588Westpac Banking Corp 3.06 15/05/2023 USD 200,000 200,430Amazon.com Inc 3.88 22/08/2037 USD 200,000 199,502Santander Holdings USA Inc 3.40 18/01/2023 USD 200,000 199,458Royal Bank of Scotland 0.00 29/03/2049 USD 200,000 198,900AbbVie Inc 3.20 14/05/2026 USD 200,000 198,729Toronto-Dominion Bank 2.50 18/01/2022 USD 200,000 198,082Tennessee Valley Authority 2.88 01/02/2027 USD 200,000 196,648Enel Finance International NV 3.50 06/04/2028 USD 200,000 196,501JPMorgan Chase & Co 6.40 15/05/2038 USD 150,000 196,383Lloyds Banking Group PLC 3.57 07/11/2028 USD 200,000 191,931Alibaba Group Holding Ltd 4.00 06/12/2037 USD 200,000 189,079Alibaba Group Holding Ltd 3.40 06/12/2027 USD 200,000 188,881HSBC Holdings PLC 6.75 11/09/2028 GBP 100,000 187,131Air Liquide Finance SA 3.50 27/09/2046 USD 200,000 185,118Bank of America Corp 5.70 24/01/2022 USD 150,000 171,206Bank of America Corp 3.42 20/12/2028 USD 169,166 167,740Comcast Corp 4.25 15/01/2033 USD 150,000 164,273Barclays Bank PLC 0.00 21/05/2021 GBP 100,000 161,238Society of Lloyd's 4.88 07/02/2047 GBP 100,000 158,684BBVA Bancomer SA/Texas 4.38 10/04/2024 USD 150,000 157,963Comcast Corp 4.40 15/08/2035 USD 150,000 155,278Altria Group Inc 4.50 02/05/2043 USD 150,000 154,865Prologis International Funding II SA 1.75 15/03/2028 EUR 125,000 152,467Microsoft Corp 4.10 06/02/2037 USD 140,000 146,532Telia Co AB 3.00 07/09/2027 EUR 100,000 142,007NN Group NV 4.63 13/01/2048 EUR 100,000 141,329Stichting AK Rabobank Certificaten 6.50 29/12/2049 EUR 90,000 138,354British Telecommunications PLC 3.13 21/11/2031 GBP 100,000 137,310Canadian Imperial Bank of Commerce 1.13 30/06/2022 GBP 100,000 137,302General Electric Co 6.75 15/03/2032 USD 100,000 136,590
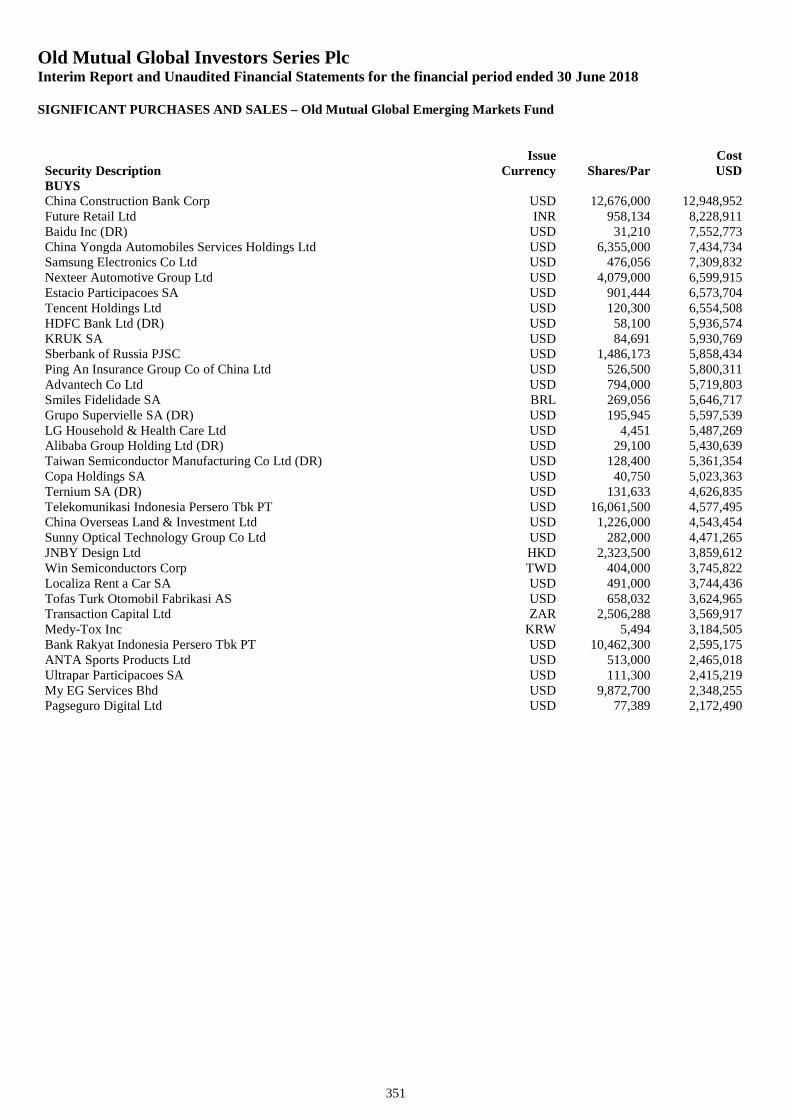
Old Mutual Global Investors Series PlcInterim Report and Unaudited Financial Statements for the financial period ended 30 June 2018
SIGNIFICANT PURCHASES AND SALES – Old Mutual Global Emerging Markets Fund
351
Security DescriptionIssue
Currency Shares/ParCostUSD
BUYSChina Construction Bank Corp USD 12,676,000 12,948,952Future Retail Ltd INR 958,134 8,228,911Baidu Inc (DR) USD 31,210 7,552,773China Yongda Automobiles Services Holdings Ltd USD 6,355,000 7,434,734Samsung Electronics Co Ltd USD 476,056 7,309,832Nexteer Automotive Group Ltd USD 4,079,000 6,599,915Estacio Participacoes SA USD 901,444 6,573,704Tencent Holdings Ltd USD 120,300 6,554,508HDFC Bank Ltd (DR) USD 58,100 5,936,574KRUK SA USD 84,691 5,930,769Sberbank of Russia PJSC USD 1,486,173 5,858,434Ping An Insurance Group Co of China Ltd USD 526,500 5,800,311Advantech Co Ltd USD 794,000 5,719,803Smiles Fidelidade SA BRL 269,056 5,646,717Grupo Supervielle SA (DR) USD 195,945 5,597,539LG Household & Health Care Ltd USD 4,451 5,487,269Alibaba Group Holding Ltd (DR) USD 29,100 5,430,639Taiwan Semiconductor Manufacturing Co Ltd (DR) USD 128,400 5,361,354Copa Holdings SA USD 40,750 5,023,363Ternium SA (DR) USD 131,633 4,626,835Telekomunikasi Indonesia Persero Tbk PT USD 16,061,500 4,577,495China Overseas Land & Investment Ltd USD 1,226,000 4,543,454Sunny Optical Technology Group Co Ltd USD 282,000 4,471,265JNBY Design Ltd HKD 2,323,500 3,859,612Win Semiconductors Corp TWD 404,000 3,745,822Localiza Rent a Car SA USD 491,000 3,744,436Tofas Turk Otomobil Fabrikasi AS USD 658,032 3,624,965Transaction Capital Ltd ZAR 2,506,288 3,569,917Medy-Tox Inc KRW 5,494 3,184,505Bank Rakyat Indonesia Persero Tbk PT USD 10,462,300 2,595,175ANTA Sports Products Ltd USD 513,000 2,465,018Ultrapar Participacoes SA USD 111,300 2,415,219My EG Services Bhd USD 9,872,700 2,348,255Pagseguro Digital Ltd USD 77,389 2,172,490
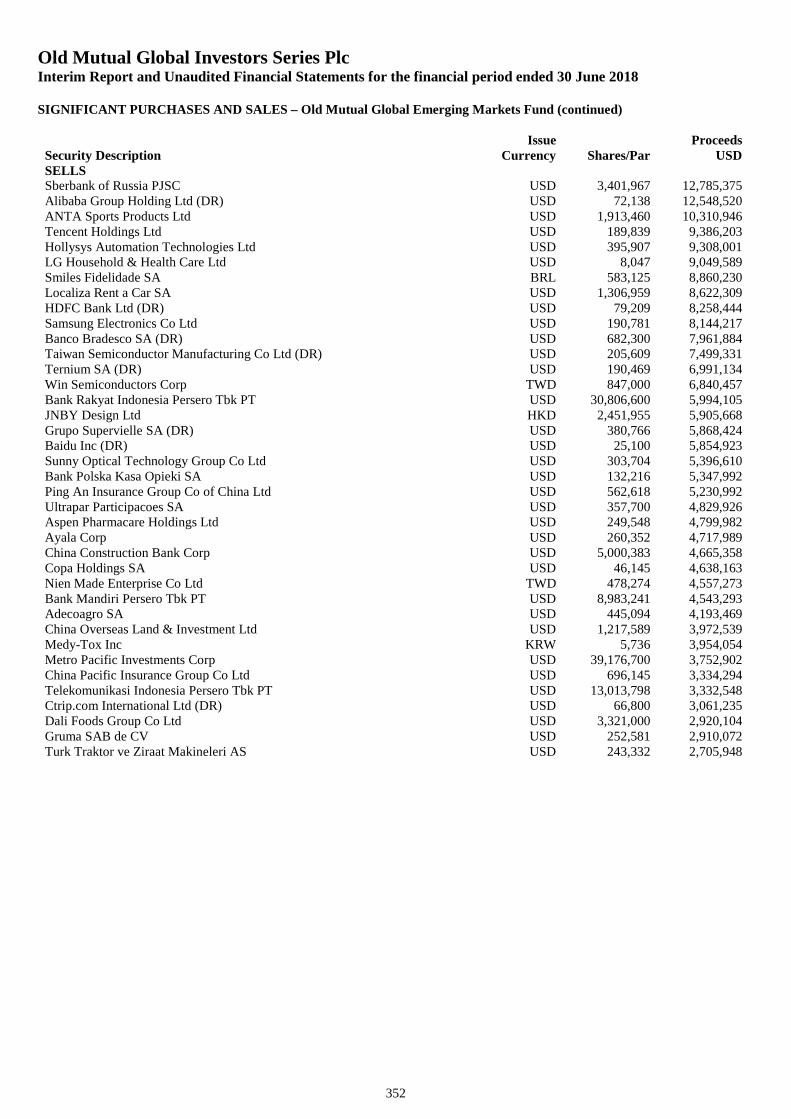
Old Mutual Global Investors Series PlcInterim Report and Unaudited Financial Statements for the financial period ended 30 June 2018
SIGNIFICANT PURCHASES AND SALES – Old Mutual Global Emerging Markets Fund (continued)
352
Security DescriptionIssue
Currency Shares/ParProceeds
USDSELLSSberbank of Russia PJSC USD 3,401,967 12,785,375Alibaba Group Holding Ltd (DR) USD 72,138 12,548,520ANTA Sports Products Ltd USD 1,913,460 10,310,946Tencent Holdings Ltd USD 189,839 9,386,203Hollysys Automation Technologies Ltd USD 395,907 9,308,001LG Household & Health Care Ltd USD 8,047 9,049,589Smiles Fidelidade SA BRL 583,125 8,860,230Localiza Rent a Car SA USD 1,306,959 8,622,309HDFC Bank Ltd (DR) USD 79,209 8,258,444Samsung Electronics Co Ltd USD 190,781 8,144,217Banco Bradesco SA (DR) USD 682,300 7,961,884Taiwan Semiconductor Manufacturing Co Ltd (DR) USD 205,609 7,499,331Ternium SA (DR) USD 190,469 6,991,134Win Semiconductors Corp TWD 847,000 6,840,457Bank Rakyat Indonesia Persero Tbk PT USD 30,806,600 5,994,105JNBY Design Ltd HKD 2,451,955 5,905,668Grupo Supervielle SA (DR) USD 380,766 5,868,424Baidu Inc (DR) USD 25,100 5,854,923Sunny Optical Technology Group Co Ltd USD 303,704 5,396,610Bank Polska Kasa Opieki SA USD 132,216 5,347,992Ping An Insurance Group Co of China Ltd USD 562,618 5,230,992Ultrapar Participacoes SA USD 357,700 4,829,926Aspen Pharmacare Holdings Ltd USD 249,548 4,799,982Ayala Corp USD 260,352 4,717,989China Construction Bank Corp USD 5,000,383 4,665,358Copa Holdings SA USD 46,145 4,638,163Nien Made Enterprise Co Ltd TWD 478,274 4,557,273Bank Mandiri Persero Tbk PT USD 8,983,241 4,543,293Adecoagro SA USD 445,094 4,193,469China Overseas Land & Investment Ltd USD 1,217,589 3,972,539Medy-Tox Inc KRW 5,736 3,954,054Metro Pacific Investments Corp USD 39,176,700 3,752,902China Pacific Insurance Group Co Ltd USD 696,145 3,334,294Telekomunikasi Indonesia Persero Tbk PT USD 13,013,798 3,332,548Ctrip.com International Ltd (DR) USD 66,800 3,061,235Dali Foods Group Co Ltd USD 3,321,000 2,920,104Gruma SAB de CV USD 252,581 2,910,072Turk Traktor ve Ziraat Makineleri AS USD 243,332 2,705,948
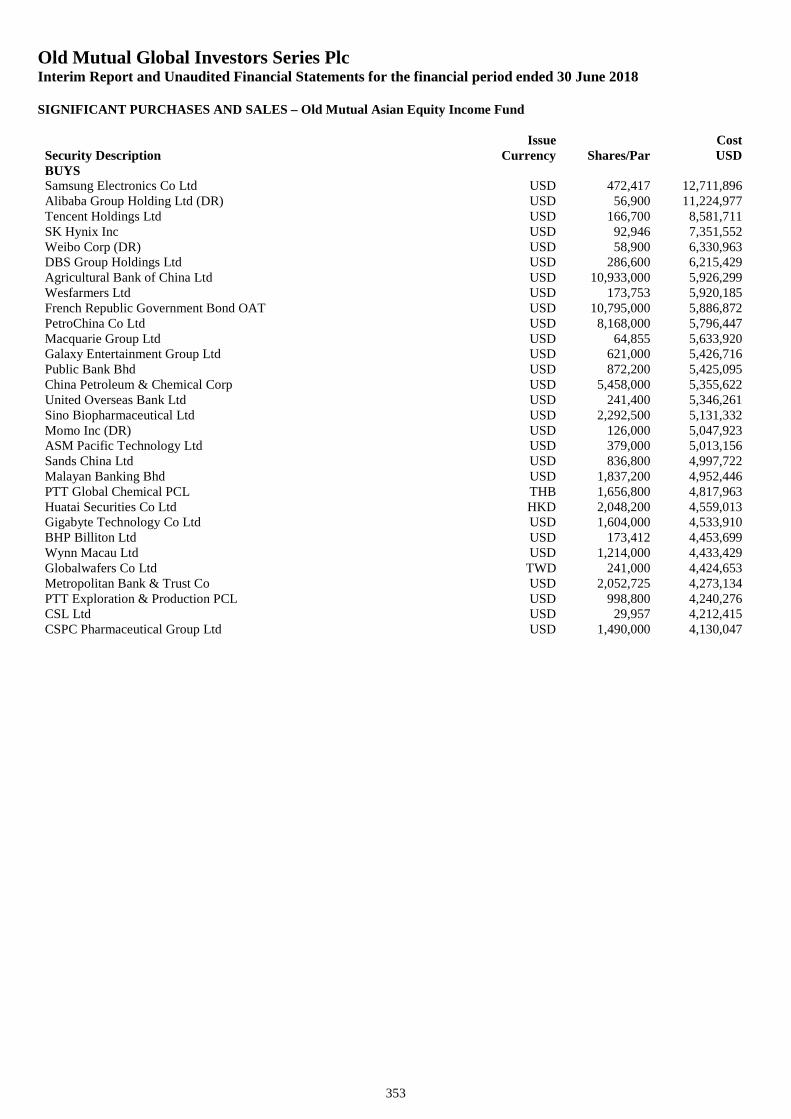
Old Mutual Global Investors Series PlcInterim Report and Unaudited Financial Statements for the financial period ended 30 June 2018
SIGNIFICANT PURCHASES AND SALES – Old Mutual Asian Equity Income Fund
353
Security DescriptionIssue
Currency Shares/ParCostUSD
BUYSSamsung Electronics Co Ltd USD 472,417 12,711,896Alibaba Group Holding Ltd (DR) USD 56,900 11,224,977Tencent Holdings Ltd USD 166,700 8,581,711SK Hynix Inc USD 92,946 7,351,552Weibo Corp (DR) USD 58,900 6,330,963DBS Group Holdings Ltd USD 286,600 6,215,429Agricultural Bank of China Ltd USD 10,933,000 5,926,299Wesfarmers Ltd USD 173,753 5,920,185French Republic Government Bond OAT USD 10,795,000 5,886,872PetroChina Co Ltd USD 8,168,000 5,796,447Macquarie Group Ltd USD 64,855 5,633,920Galaxy Entertainment Group Ltd USD 621,000 5,426,716Public Bank Bhd USD 872,200 5,425,095China Petroleum & Chemical Corp USD 5,458,000 5,355,622United Overseas Bank Ltd USD 241,400 5,346,261Sino Biopharmaceutical Ltd USD 2,292,500 5,131,332Momo Inc (DR) USD 126,000 5,047,923ASM Pacific Technology Ltd USD 379,000 5,013,156Sands China Ltd USD 836,800 4,997,722Malayan Banking Bhd USD 1,837,200 4,952,446PTT Global Chemical PCL THB 1,656,800 4,817,963Huatai Securities Co Ltd HKD 2,048,200 4,559,013Gigabyte Technology Co Ltd USD 1,604,000 4,533,910BHP Billiton Ltd USD 173,412 4,453,699Wynn Macau Ltd USD 1,214,000 4,433,429Globalwafers Co Ltd TWD 241,000 4,424,653Metropolitan Bank & Trust Co USD 2,052,725 4,273,134PTT Exploration & Production PCL USD 998,800 4,240,276CSL Ltd USD 29,957 4,212,415CSPC Pharmaceutical Group Ltd USD 1,490,000 4,130,047
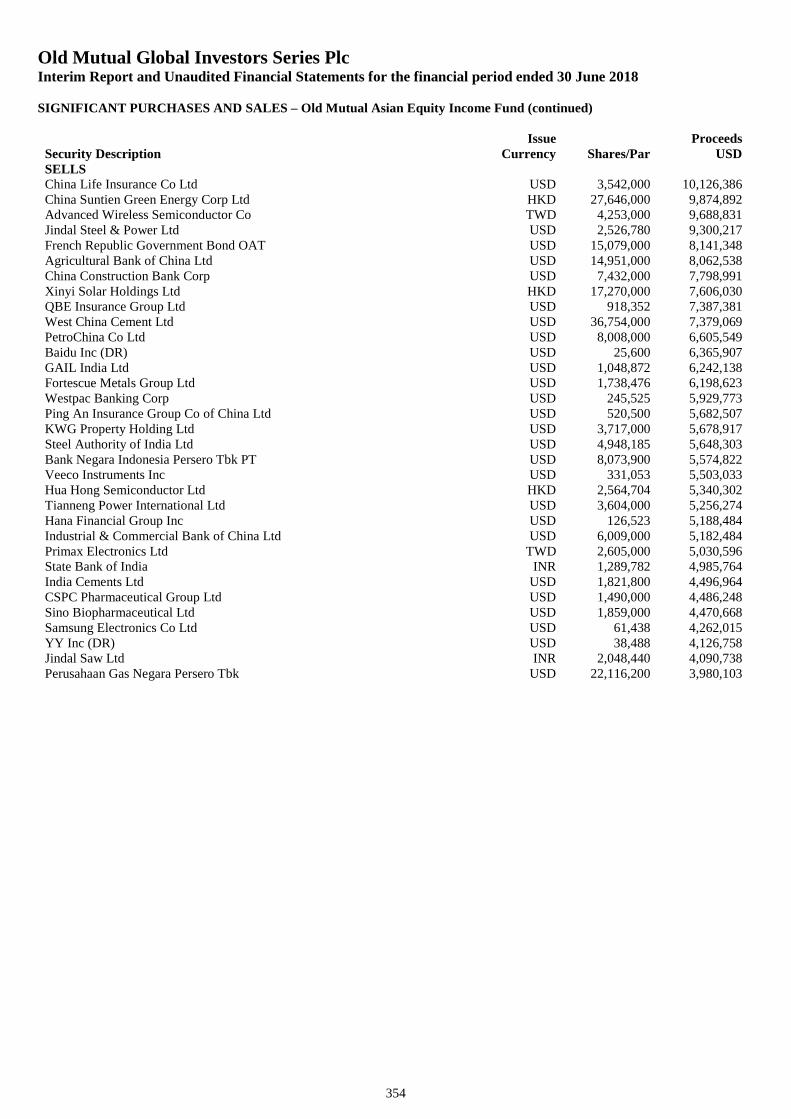
Old Mutual Global Investors Series PlcInterim Report and Unaudited Financial Statements for the financial period ended 30 June 2018
SIGNIFICANT PURCHASES AND SALES – Old Mutual Asian Equity Income Fund (continued)
354
Security DescriptionIssue
Currency Shares/ParProceeds
USDSELLSChina Life Insurance Co Ltd USD 3,542,000 10,126,386China Suntien Green Energy Corp Ltd HKD 27,646,000 9,874,892Advanced Wireless Semiconductor Co TWD 4,253,000 9,688,831Jindal Steel & Power Ltd USD 2,526,780 9,300,217French Republic Government Bond OAT USD 15,079,000 8,141,348Agricultural Bank of China Ltd USD 14,951,000 8,062,538China Construction Bank Corp USD 7,432,000 7,798,991Xinyi Solar Holdings Ltd HKD 17,270,000 7,606,030QBE Insurance Group Ltd USD 918,352 7,387,381West China Cement Ltd USD 36,754,000 7,379,069PetroChina Co Ltd USD 8,008,000 6,605,549Baidu Inc (DR) USD 25,600 6,365,907GAIL India Ltd USD 1,048,872 6,242,138Fortescue Metals Group Ltd USD 1,738,476 6,198,623Westpac Banking Corp USD 245,525 5,929,773Ping An Insurance Group Co of China Ltd USD 520,500 5,682,507KWG Property Holding Ltd USD 3,717,000 5,678,917Steel Authority of India Ltd USD 4,948,185 5,648,303Bank Negara Indonesia Persero Tbk PT USD 8,073,900 5,574,822Veeco Instruments Inc USD 331,053 5,503,033Hua Hong Semiconductor Ltd HKD 2,564,704 5,340,302Tianneng Power International Ltd USD 3,604,000 5,256,274Hana Financial Group Inc USD 126,523 5,188,484Industrial & Commercial Bank of China Ltd USD 6,009,000 5,182,484Primax Electronics Ltd TWD 2,605,000 5,030,596State Bank of India INR 1,289,782 4,985,764India Cements Ltd USD 1,821,800 4,496,964CSPC Pharmaceutical Group Ltd USD 1,490,000 4,486,248Sino Biopharmaceutical Ltd USD 1,859,000 4,470,668Samsung Electronics Co Ltd USD 61,438 4,262,015YY Inc (DR) USD 38,488 4,126,758Jindal Saw Ltd INR 2,048,440 4,090,738Perusahaan Gas Negara Persero Tbk USD 22,116,200 3,980,103
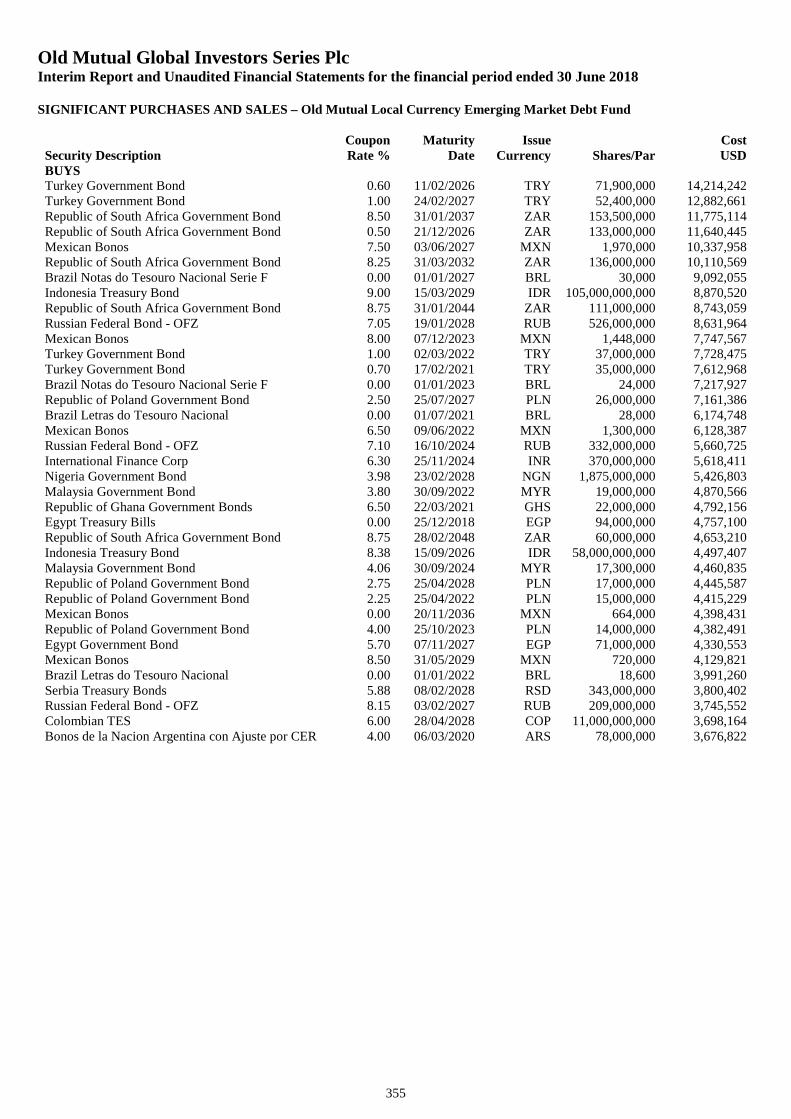
Old Mutual Global Investors Series PlcInterim Report and Unaudited Financial Statements for the financial period ended 30 June 2018
SIGNIFICANT PURCHASES AND SALES – Old Mutual Local Currency Emerging Market Debt Fund
355
Security DescriptionCouponRate %
MaturityDate
IssueCurrency Shares/Par
CostUSD
BUYSTurkey Government Bond 0.60 11/02/2026 TRY 71,900,000 14,214,242Turkey Government Bond 1.00 24/02/2027 TRY 52,400,000 12,882,661Republic of South Africa Government Bond 8.50 31/01/2037 ZAR 153,500,000 11,775,114Republic of South Africa Government Bond 0.50 21/12/2026 ZAR 133,000,000 11,640,445Mexican Bonos 7.50 03/06/2027 MXN 1,970,000 10,337,958Republic of South Africa Government Bond 8.25 31/03/2032 ZAR 136,000,000 10,110,569Brazil Notas do Tesouro Nacional Serie F 0.00 01/01/2027 BRL 30,000 9,092,055Indonesia Treasury Bond 9.00 15/03/2029 IDR 105,000,000,000 8,870,520Republic of South Africa Government Bond 8.75 31/01/2044 ZAR 111,000,000 8,743,059Russian Federal Bond - OFZ 7.05 19/01/2028 RUB 526,000,000 8,631,964Mexican Bonos 8.00 07/12/2023 MXN 1,448,000 7,747,567Turkey Government Bond 1.00 02/03/2022 TRY 37,000,000 7,728,475Turkey Government Bond 0.70 17/02/2021 TRY 35,000,000 7,612,968Brazil Notas do Tesouro Nacional Serie F 0.00 01/01/2023 BRL 24,000 7,217,927Republic of Poland Government Bond 2.50 25/07/2027 PLN 26,000,000 7,161,386Brazil Letras do Tesouro Nacional 0.00 01/07/2021 BRL 28,000 6,174,748Mexican Bonos 6.50 09/06/2022 MXN 1,300,000 6,128,387Russian Federal Bond - OFZ 7.10 16/10/2024 RUB 332,000,000 5,660,725International Finance Corp 6.30 25/11/2024 INR 370,000,000 5,618,411Nigeria Government Bond 3.98 23/02/2028 NGN 1,875,000,000 5,426,803Malaysia Government Bond 3.80 30/09/2022 MYR 19,000,000 4,870,566Republic of Ghana Government Bonds 6.50 22/03/2021 GHS 22,000,000 4,792,156Egypt Treasury Bills 0.00 25/12/2018 EGP 94,000,000 4,757,100Republic of South Africa Government Bond 8.75 28/02/2048 ZAR 60,000,000 4,653,210Indonesia Treasury Bond 8.38 15/09/2026 IDR 58,000,000,000 4,497,407Malaysia Government Bond 4.06 30/09/2024 MYR 17,300,000 4,460,835Republic of Poland Government Bond 2.75 25/04/2028 PLN 17,000,000 4,445,587Republic of Poland Government Bond 2.25 25/04/2022 PLN 15,000,000 4,415,229Mexican Bonos 0.00 20/11/2036 MXN 664,000 4,398,431Republic of Poland Government Bond 4.00 25/10/2023 PLN 14,000,000 4,382,491Egypt Government Bond 5.70 07/11/2027 EGP 71,000,000 4,330,553Mexican Bonos 8.50 31/05/2029 MXN 720,000 4,129,821Brazil Letras do Tesouro Nacional 0.00 01/01/2022 BRL 18,600 3,991,260Serbia Treasury Bonds 5.88 08/02/2028 RSD 343,000,000 3,800,402Russian Federal Bond - OFZ 8.15 03/02/2027 RUB 209,000,000 3,745,552Colombian TES 6.00 28/04/2028 COP 11,000,000,000 3,698,164Bonos de la Nacion Argentina con Ajuste por CER 4.00 06/03/2020 ARS 78,000,000 3,676,822
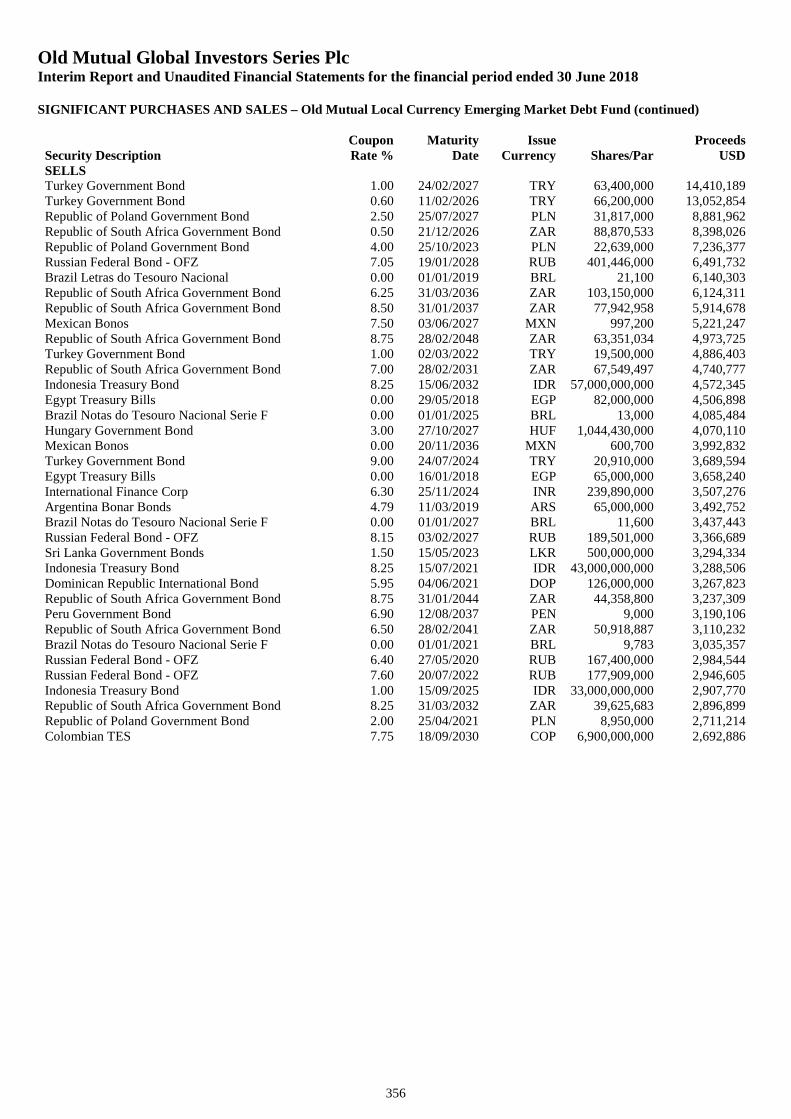
Old Mutual Global Investors Series PlcInterim Report and Unaudited Financial Statements for the financial period ended 30 June 2018
SIGNIFICANT PURCHASES AND SALES – Old Mutual Local Currency Emerging Market Debt Fund (continued)
356
Security DescriptionCouponRate %
MaturityDate
IssueCurrency Shares/Par
ProceedsUSD
SELLSTurkey Government Bond 1.00 24/02/2027 TRY 63,400,000 14,410,189Turkey Government Bond 0.60 11/02/2026 TRY 66,200,000 13,052,854Republic of Poland Government Bond 2.50 25/07/2027 PLN 31,817,000 8,881,962Republic of South Africa Government Bond 0.50 21/12/2026 ZAR 88,870,533 8,398,026Republic of Poland Government Bond 4.00 25/10/2023 PLN 22,639,000 7,236,377Russian Federal Bond - OFZ 7.05 19/01/2028 RUB 401,446,000 6,491,732Brazil Letras do Tesouro Nacional 0.00 01/01/2019 BRL 21,100 6,140,303Republic of South Africa Government Bond 6.25 31/03/2036 ZAR 103,150,000 6,124,311Republic of South Africa Government Bond 8.50 31/01/2037 ZAR 77,942,958 5,914,678Mexican Bonos 7.50 03/06/2027 MXN 997,200 5,221,247Republic of South Africa Government Bond 8.75 28/02/2048 ZAR 63,351,034 4,973,725Turkey Government Bond 1.00 02/03/2022 TRY 19,500,000 4,886,403Republic of South Africa Government Bond 7.00 28/02/2031 ZAR 67,549,497 4,740,777Indonesia Treasury Bond 8.25 15/06/2032 IDR 57,000,000,000 4,572,345Egypt Treasury Bills 0.00 29/05/2018 EGP 82,000,000 4,506,898Brazil Notas do Tesouro Nacional Serie F 0.00 01/01/2025 BRL 13,000 4,085,484Hungary Government Bond 3.00 27/10/2027 HUF 1,044,430,000 4,070,110Mexican Bonos 0.00 20/11/2036 MXN 600,700 3,992,832Turkey Government Bond 9.00 24/07/2024 TRY 20,910,000 3,689,594Egypt Treasury Bills 0.00 16/01/2018 EGP 65,000,000 3,658,240International Finance Corp 6.30 25/11/2024 INR 239,890,000 3,507,276Argentina Bonar Bonds 4.79 11/03/2019 ARS 65,000,000 3,492,752Brazil Notas do Tesouro Nacional Serie F 0.00 01/01/2027 BRL 11,600 3,437,443Russian Federal Bond - OFZ 8.15 03/02/2027 RUB 189,501,000 3,366,689Sri Lanka Government Bonds 1.50 15/05/2023 LKR 500,000,000 3,294,334Indonesia Treasury Bond 8.25 15/07/2021 IDR 43,000,000,000 3,288,506Dominican Republic International Bond 5.95 04/06/2021 DOP 126,000,000 3,267,823Republic of South Africa Government Bond 8.75 31/01/2044 ZAR 44,358,800 3,237,309Peru Government Bond 6.90 12/08/2037 PEN 9,000 3,190,106Republic of South Africa Government Bond 6.50 28/02/2041 ZAR 50,918,887 3,110,232Brazil Notas do Tesouro Nacional Serie F 0.00 01/01/2021 BRL 9,783 3,035,357Russian Federal Bond - OFZ 6.40 27/05/2020 RUB 167,400,000 2,984,544Russian Federal Bond - OFZ 7.60 20/07/2022 RUB 177,909,000 2,946,605Indonesia Treasury Bond 1.00 15/09/2025 IDR 33,000,000,000 2,907,770Republic of South Africa Government Bond 8.25 31/03/2032 ZAR 39,625,683 2,896,899Republic of Poland Government Bond 2.00 25/04/2021 PLN 8,950,000 2,711,214Colombian TES 7.75 18/09/2030 COP 6,900,000,000 2,692,886
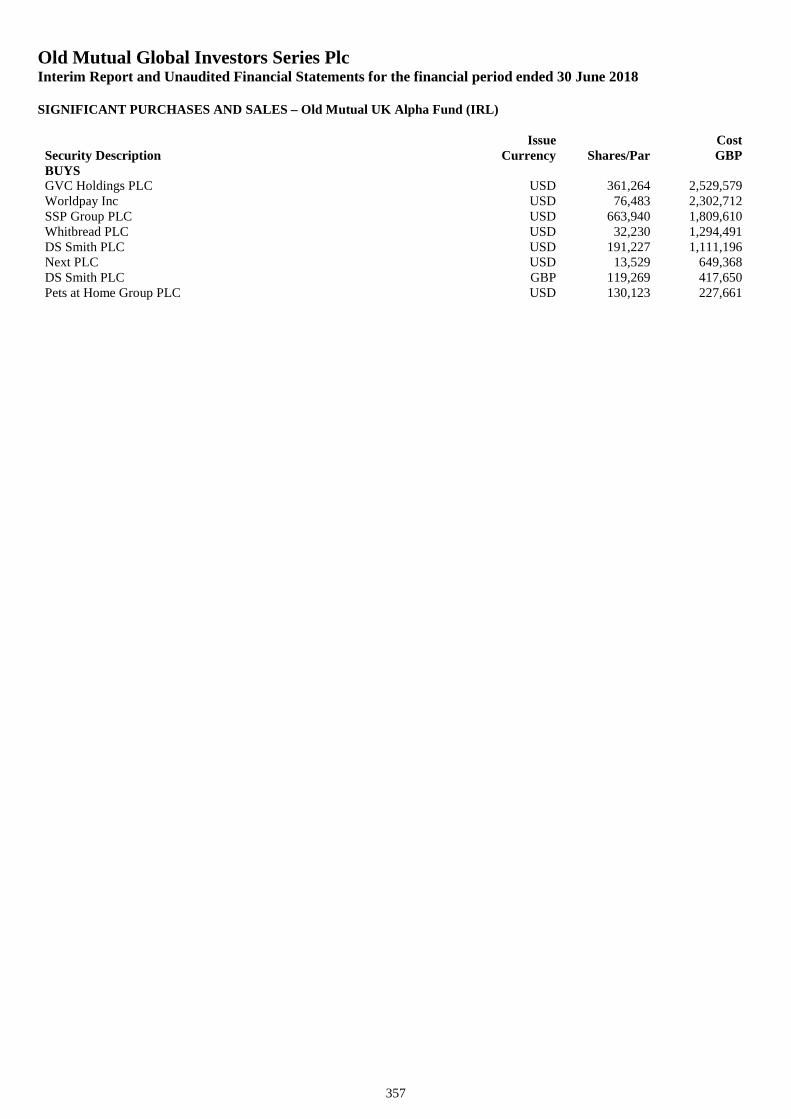
Old Mutual Global Investors Series PlcInterim Report and Unaudited Financial Statements for the financial period ended 30 June 2018
SIGNIFICANT PURCHASES AND SALES – Old Mutual UK Alpha Fund (IRL)
357
Security DescriptionIssue
Currency Shares/ParCostGBP
BUYSGVC Holdings PLC USD 361,264 2,529,579Worldpay Inc USD 76,483 2,302,712SSP Group PLC USD 663,940 1,809,610Whitbread PLC USD 32,230 1,294,491DS Smith PLC USD 191,227 1,111,196Next PLC USD 13,529 649,368DS Smith PLC GBP 119,269 417,650Pets at Home Group PLC USD 130,123 227,661
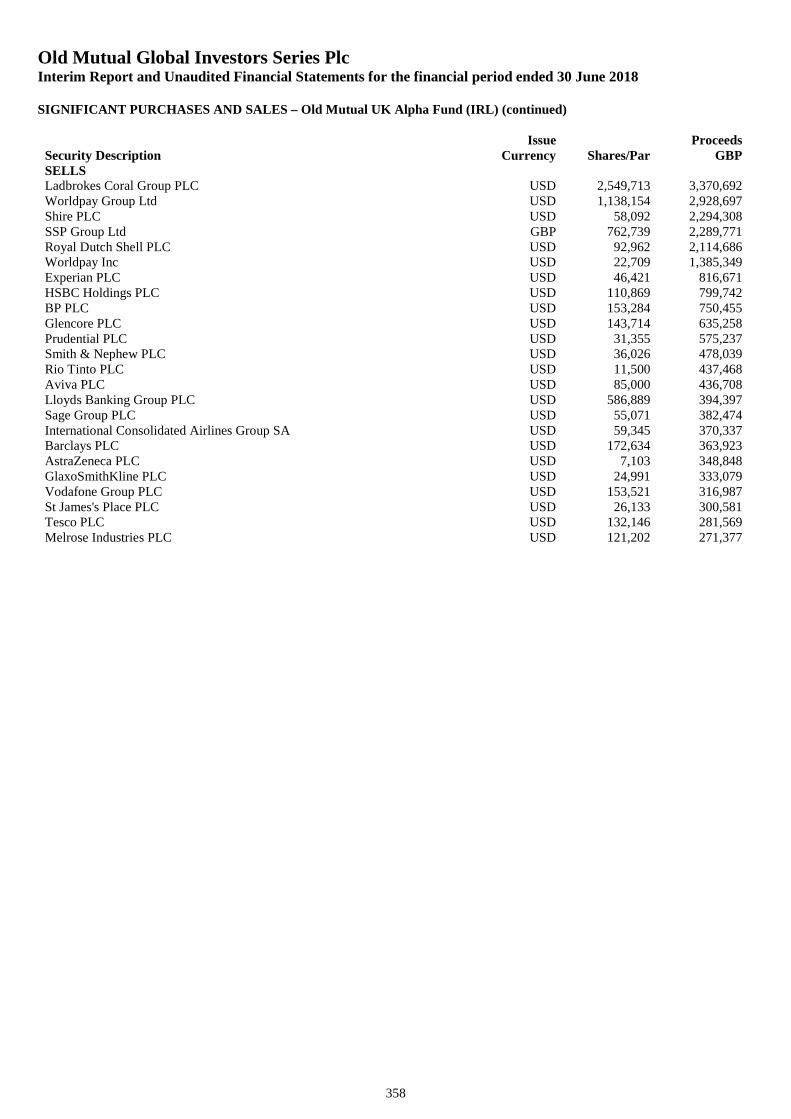
Old Mutual Global Investors Series PlcInterim Report and Unaudited Financial Statements for the financial period ended 30 June 2018
SIGNIFICANT PURCHASES AND SALES – Old Mutual UK Alpha Fund (IRL) (continued)
358
Security DescriptionIssue
Currency Shares/ParProceeds
GBPSELLSLadbrokes Coral Group PLC USD 2,549,713 3,370,692Worldpay Group Ltd USD 1,138,154 2,928,697Shire PLC USD 58,092 2,294,308SSP Group Ltd GBP 762,739 2,289,771Royal Dutch Shell PLC USD 92,962 2,114,686Worldpay Inc USD 22,709 1,385,349Experian PLC USD 46,421 816,671HSBC Holdings PLC USD 110,869 799,742BP PLC USD 153,284 750,455Glencore PLC USD 143,714 635,258Prudential PLC USD 31,355 575,237Smith & Nephew PLC USD 36,026 478,039Rio Tinto PLC USD 11,500 437,468Aviva PLC USD 85,000 436,708Lloyds Banking Group PLC USD 586,889 394,397Sage Group PLC USD 55,071 382,474International Consolidated Airlines Group SA USD 59,345 370,337Barclays PLC USD 172,634 363,923AstraZeneca PLC USD 7,103 348,848GlaxoSmithKline PLC USD 24,991 333,079Vodafone Group PLC USD 153,521 316,987St James's Place PLC USD 26,133 300,581Tesco PLC USD 132,146 281,569Melrose Industries PLC USD 121,202 271,377
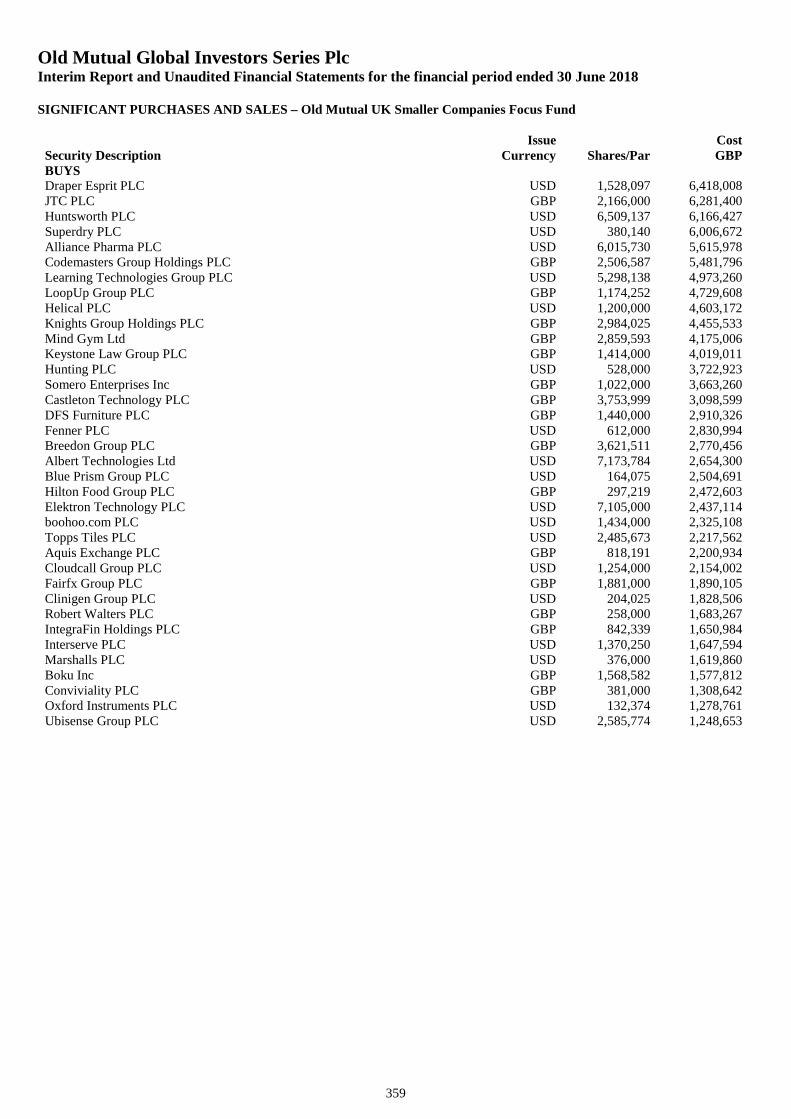
Old Mutual Global Investors Series PlcInterim Report and Unaudited Financial Statements for the financial period ended 30 June 2018
SIGNIFICANT PURCHASES AND SALES – Old Mutual UK Smaller Companies Focus Fund
359
Security DescriptionIssue
Currency Shares/ParCostGBP
BUYSDraper Esprit PLC USD 1,528,097 6,418,008JTC PLC GBP 2,166,000 6,281,400Huntsworth PLC USD 6,509,137 6,166,427Superdry PLC USD 380,140 6,006,672Alliance Pharma PLC USD 6,015,730 5,615,978Codemasters Group Holdings PLC GBP 2,506,587 5,481,796Learning Technologies Group PLC USD 5,298,138 4,973,260LoopUp Group PLC GBP 1,174,252 4,729,608Helical PLC USD 1,200,000 4,603,172Knights Group Holdings PLC GBP 2,984,025 4,455,533Mind Gym Ltd GBP 2,859,593 4,175,006Keystone Law Group PLC GBP 1,414,000 4,019,011Hunting PLC USD 528,000 3,722,923Somero Enterprises Inc GBP 1,022,000 3,663,260Castleton Technology PLC GBP 3,753,999 3,098,599DFS Furniture PLC GBP 1,440,000 2,910,326Fenner PLC USD 612,000 2,830,994Breedon Group PLC GBP 3,621,511 2,770,456Albert Technologies Ltd USD 7,173,784 2,654,300Blue Prism Group PLC USD 164,075 2,504,691Hilton Food Group PLC GBP 297,219 2,472,603Elektron Technology PLC USD 7,105,000 2,437,114boohoo.com PLC USD 1,434,000 2,325,108Topps Tiles PLC USD 2,485,673 2,217,562Aquis Exchange PLC GBP 818,191 2,200,934Cloudcall Group PLC USD 1,254,000 2,154,002Fairfx Group PLC GBP 1,881,000 1,890,105Clinigen Group PLC USD 204,025 1,828,506Robert Walters PLC GBP 258,000 1,683,267IntegraFin Holdings PLC GBP 842,339 1,650,984Interserve PLC USD 1,370,250 1,647,594Marshalls PLC USD 376,000 1,619,860Boku Inc GBP 1,568,582 1,577,812Conviviality PLC GBP 381,000 1,308,642Oxford Instruments PLC USD 132,374 1,278,761Ubisense Group PLC USD 2,585,774 1,248,653
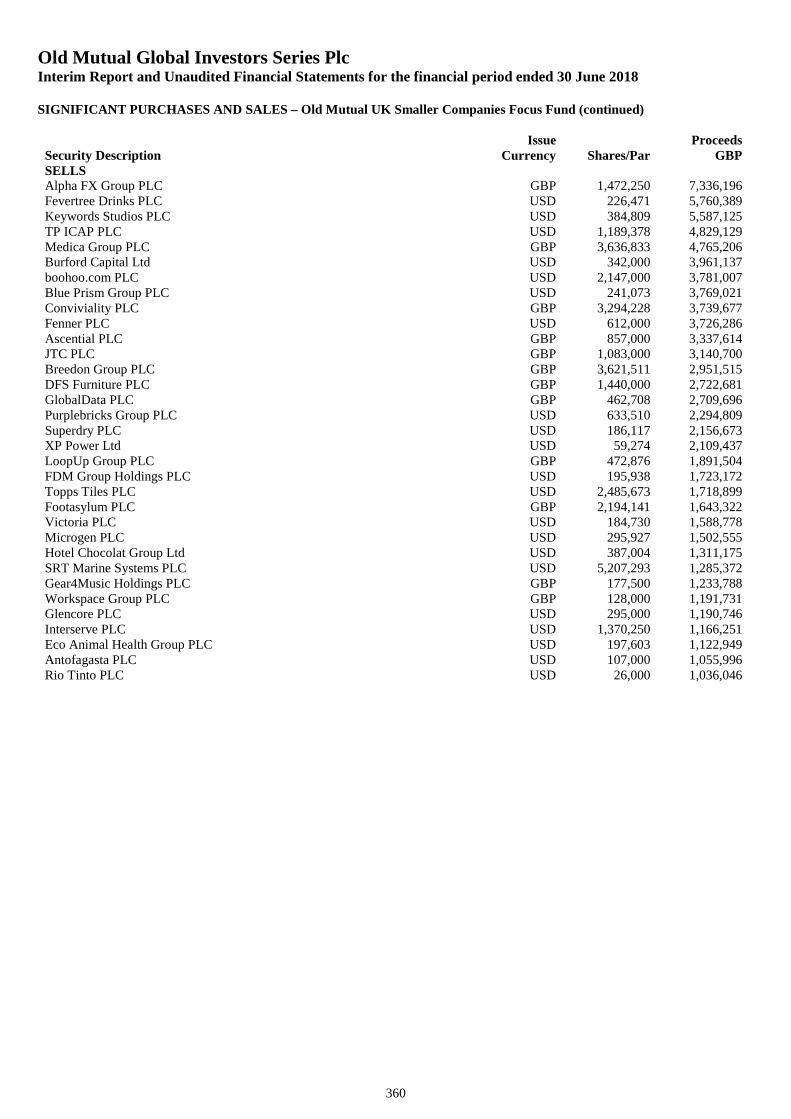
Old Mutual Global Investors Series PlcInterim Report and Unaudited Financial Statements for the financial period ended 30 June 2018
SIGNIFICANT PURCHASES AND SALES – Old Mutual UK Smaller Companies Focus Fund (continued)
360
Security DescriptionIssue
Currency Shares/ParProceeds
GBPSELLSAlpha FX Group PLC GBP 1,472,250 7,336,196Fevertree Drinks PLC USD 226,471 5,760,389Keywords Studios PLC USD 384,809 5,587,125TP ICAP PLC USD 1,189,378 4,829,129Medica Group PLC GBP 3,636,833 4,765,206Burford Capital Ltd USD 342,000 3,961,137boohoo.com PLC USD 2,147,000 3,781,007Blue Prism Group PLC USD 241,073 3,769,021Conviviality PLC GBP 3,294,228 3,739,677Fenner PLC USD 612,000 3,726,286Ascential PLC GBP 857,000 3,337,614JTC PLC GBP 1,083,000 3,140,700Breedon Group PLC GBP 3,621,511 2,951,515DFS Furniture PLC GBP 1,440,000 2,722,681GlobalData PLC GBP 462,708 2,709,696Purplebricks Group PLC USD 633,510 2,294,809Superdry PLC USD 186,117 2,156,673XP Power Ltd USD 59,274 2,109,437LoopUp Group PLC GBP 472,876 1,891,504FDM Group Holdings PLC USD 195,938 1,723,172Topps Tiles PLC USD 2,485,673 1,718,899Footasylum PLC GBP 2,194,141 1,643,322Victoria PLC USD 184,730 1,588,778Microgen PLC USD 295,927 1,502,555Hotel Chocolat Group Ltd USD 387,004 1,311,175SRT Marine Systems PLC USD 5,207,293 1,285,372Gear4Music Holdings PLC GBP 177,500 1,233,788Workspace Group PLC GBP 128,000 1,191,731Glencore PLC USD 295,000 1,190,746Interserve PLC USD 1,370,250 1,166,251Eco Animal Health Group PLC USD 197,603 1,122,949Antofagasta PLC USD 107,000 1,055,996Rio Tinto PLC USD 26,000 1,036,046
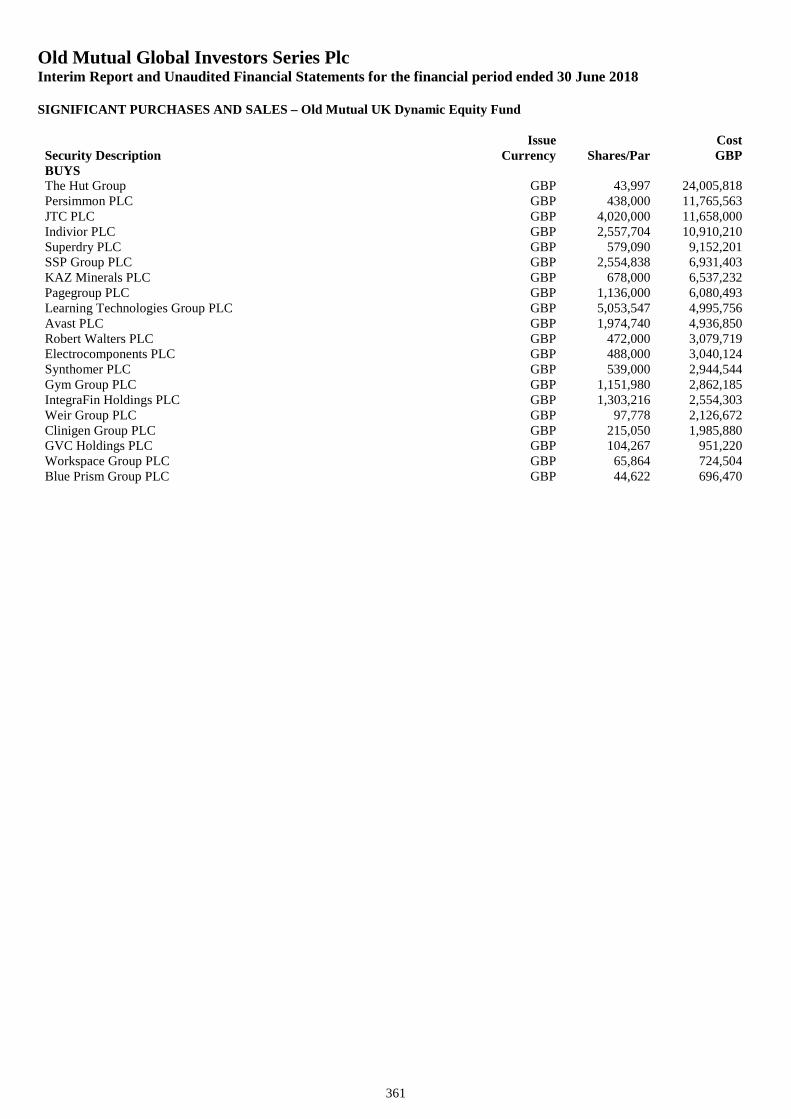
Old Mutual Global Investors Series PlcInterim Report and Unaudited Financial Statements for the financial period ended 30 June 2018
SIGNIFICANT PURCHASES AND SALES – Old Mutual UK Dynamic Equity Fund
361
Security DescriptionIssue
Currency Shares/ParCostGBP
BUYSThe Hut Group GBP 43,997 24,005,818Persimmon PLC GBP 438,000 11,765,563JTC PLC GBP 4,020,000 11,658,000Indivior PLC GBP 2,557,704 10,910,210Superdry PLC GBP 579,090 9,152,201SSP Group PLC GBP 2,554,838 6,931,403KAZ Minerals PLC GBP 678,000 6,537,232Pagegroup PLC GBP 1,136,000 6,080,493Learning Technologies Group PLC GBP 5,053,547 4,995,756Avast PLC GBP 1,974,740 4,936,850Robert Walters PLC GBP 472,000 3,079,719Electrocomponents PLC GBP 488,000 3,040,124Synthomer PLC GBP 539,000 2,944,544Gym Group PLC GBP 1,151,980 2,862,185IntegraFin Holdings PLC GBP 1,303,216 2,554,303Weir Group PLC GBP 97,778 2,126,672Clinigen Group PLC GBP 215,050 1,985,880GVC Holdings PLC GBP 104,267 951,220Workspace Group PLC GBP 65,864 724,504Blue Prism Group PLC GBP 44,622 696,470
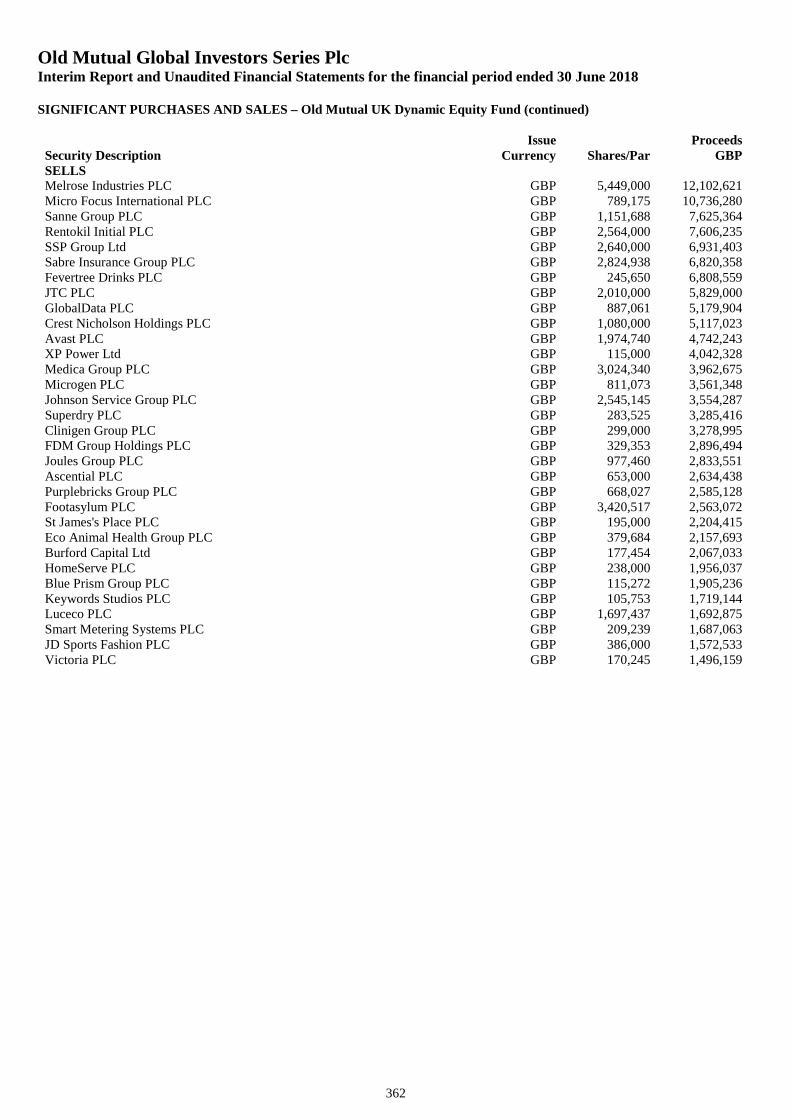
Old Mutual Global Investors Series PlcInterim Report and Unaudited Financial Statements for the financial period ended 30 June 2018
SIGNIFICANT PURCHASES AND SALES – Old Mutual UK Dynamic Equity Fund (continued)
362
Security DescriptionIssue
Currency Shares/ParProceeds
GBPSELLSMelrose Industries PLC GBP 5,449,000 12,102,621Micro Focus International PLC GBP 789,175 10,736,280Sanne Group PLC GBP 1,151,688 7,625,364Rentokil Initial PLC GBP 2,564,000 7,606,235SSP Group Ltd GBP 2,640,000 6,931,403Sabre Insurance Group PLC GBP 2,824,938 6,820,358Fevertree Drinks PLC GBP 245,650 6,808,559JTC PLC GBP 2,010,000 5,829,000GlobalData PLC GBP 887,061 5,179,904Crest Nicholson Holdings PLC GBP 1,080,000 5,117,023Avast PLC GBP 1,974,740 4,742,243XP Power Ltd GBP 115,000 4,042,328Medica Group PLC GBP 3,024,340 3,962,675Microgen PLC GBP 811,073 3,561,348Johnson Service Group PLC GBP 2,545,145 3,554,287Superdry PLC GBP 283,525 3,285,416Clinigen Group PLC GBP 299,000 3,278,995FDM Group Holdings PLC GBP 329,353 2,896,494Joules Group PLC GBP 977,460 2,833,551Ascential PLC GBP 653,000 2,634,438Purplebricks Group PLC GBP 668,027 2,585,128Footasylum PLC GBP 3,420,517 2,563,072St James's Place PLC GBP 195,000 2,204,415Eco Animal Health Group PLC GBP 379,684 2,157,693Burford Capital Ltd GBP 177,454 2,067,033HomeServe PLC GBP 238,000 1,956,037Blue Prism Group PLC GBP 115,272 1,905,236Keywords Studios PLC GBP 105,753 1,719,144Luceco PLC GBP 1,697,437 1,692,875Smart Metering Systems PLC GBP 209,239 1,687,063JD Sports Fashion PLC GBP 386,000 1,572,533Victoria PLC GBP 170,245 1,496,159
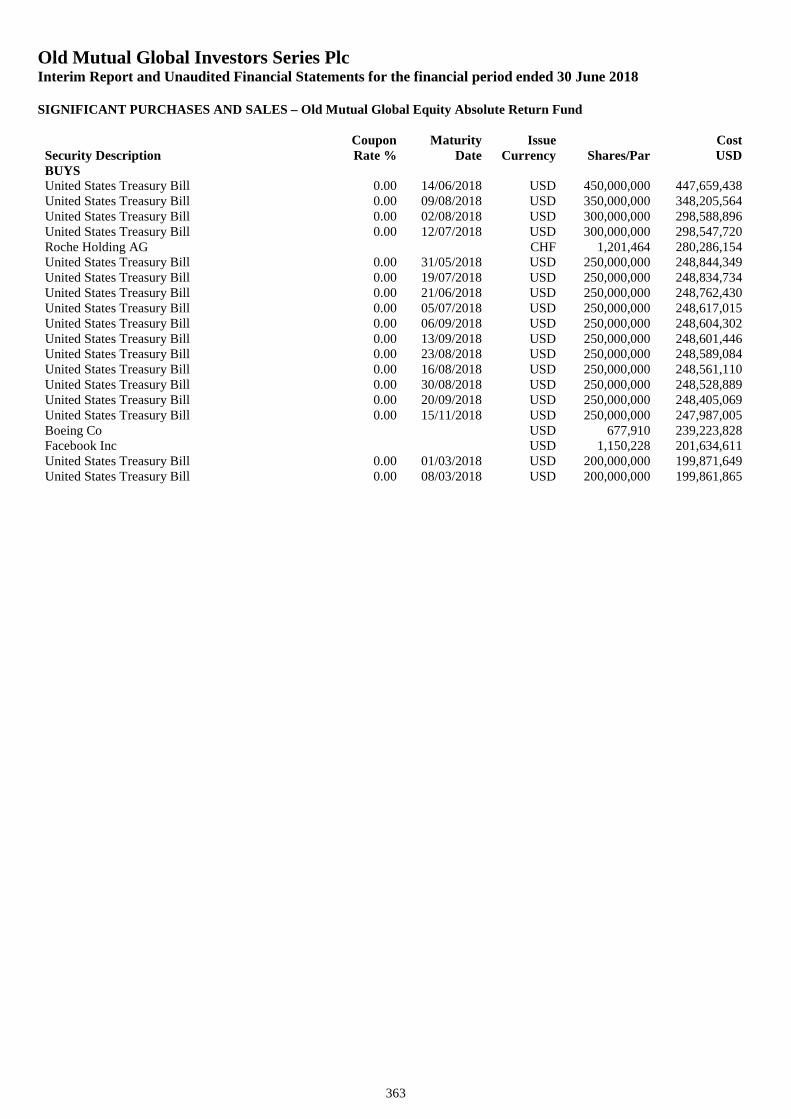
Old Mutual Global Investors Series PlcInterim Report and Unaudited Financial Statements for the financial period ended 30 June 2018
SIGNIFICANT PURCHASES AND SALES – Old Mutual Global Equity Absolute Return Fund
363
Security DescriptionCouponRate %
MaturityDate
IssueCurrency Shares/Par
CostUSD
BUYSUnited States Treasury Bill 0.00 14/06/2018 USD 450,000,000 447,659,438United States Treasury Bill 0.00 09/08/2018 USD 350,000,000 348,205,564United States Treasury Bill 0.00 02/08/2018 USD 300,000,000 298,588,896United States Treasury Bill 0.00 12/07/2018 USD 300,000,000 298,547,720Roche Holding AG CHF 1,201,464 280,286,154United States Treasury Bill 0.00 31/05/2018 USD 250,000,000 248,844,349United States Treasury Bill 0.00 19/07/2018 USD 250,000,000 248,834,734United States Treasury Bill 0.00 21/06/2018 USD 250,000,000 248,762,430United States Treasury Bill 0.00 05/07/2018 USD 250,000,000 248,617,015United States Treasury Bill 0.00 06/09/2018 USD 250,000,000 248,604,302United States Treasury Bill 0.00 13/09/2018 USD 250,000,000 248,601,446United States Treasury Bill 0.00 23/08/2018 USD 250,000,000 248,589,084United States Treasury Bill 0.00 16/08/2018 USD 250,000,000 248,561,110United States Treasury Bill 0.00 30/08/2018 USD 250,000,000 248,528,889United States Treasury Bill 0.00 20/09/2018 USD 250,000,000 248,405,069United States Treasury Bill 0.00 15/11/2018 USD 250,000,000 247,987,005Boeing Co USD 677,910 239,223,828Facebook Inc USD 1,150,228 201,634,611United States Treasury Bill 0.00 01/03/2018 USD 200,000,000 199,871,649United States Treasury Bill 0.00 08/03/2018 USD 200,000,000 199,861,865
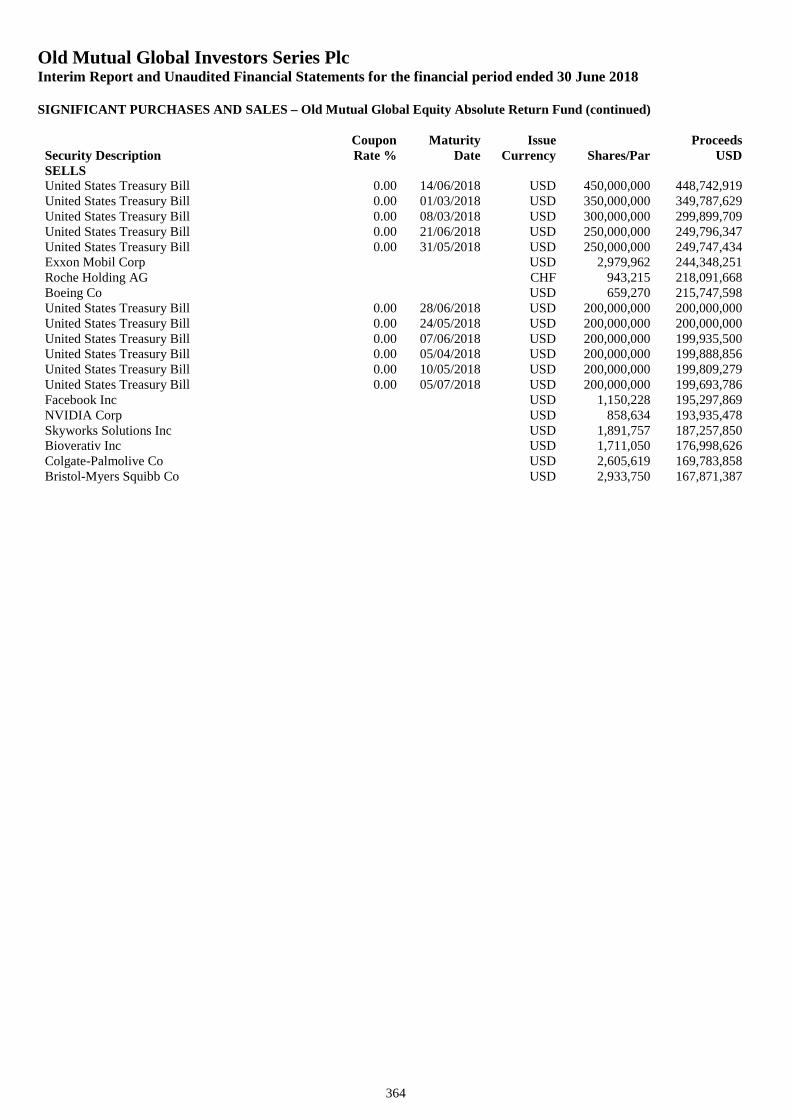
Old Mutual Global Investors Series PlcInterim Report and Unaudited Financial Statements for the financial period ended 30 June 2018
SIGNIFICANT PURCHASES AND SALES – Old Mutual Global Equity Absolute Return Fund (continued)
364
Security DescriptionCouponRate %
MaturityDate
IssueCurrency Shares/Par
ProceedsUSD
SELLSUnited States Treasury Bill 0.00 14/06/2018 USD 450,000,000 448,742,919United States Treasury Bill 0.00 01/03/2018 USD 350,000,000 349,787,629United States Treasury Bill 0.00 08/03/2018 USD 300,000,000 299,899,709United States Treasury Bill 0.00 21/06/2018 USD 250,000,000 249,796,347United States Treasury Bill 0.00 31/05/2018 USD 250,000,000 249,747,434Exxon Mobil Corp USD 2,979,962 244,348,251Roche Holding AG CHF 943,215 218,091,668Boeing Co USD 659,270 215,747,598United States Treasury Bill 0.00 28/06/2018 USD 200,000,000 200,000,000United States Treasury Bill 0.00 24/05/2018 USD 200,000,000 200,000,000United States Treasury Bill 0.00 07/06/2018 USD 200,000,000 199,935,500United States Treasury Bill 0.00 05/04/2018 USD 200,000,000 199,888,856United States Treasury Bill 0.00 10/05/2018 USD 200,000,000 199,809,279United States Treasury Bill 0.00 05/07/2018 USD 200,000,000 199,693,786Facebook Inc USD 1,150,228 195,297,869NVIDIA Corp USD 858,634 193,935,478Skyworks Solutions Inc USD 1,891,757 187,257,850Bioverativ Inc USD 1,711,050 176,998,626Colgate-Palmolive Co USD 2,605,619 169,783,858Bristol-Myers Squibb Co USD 2,933,750 167,871,387
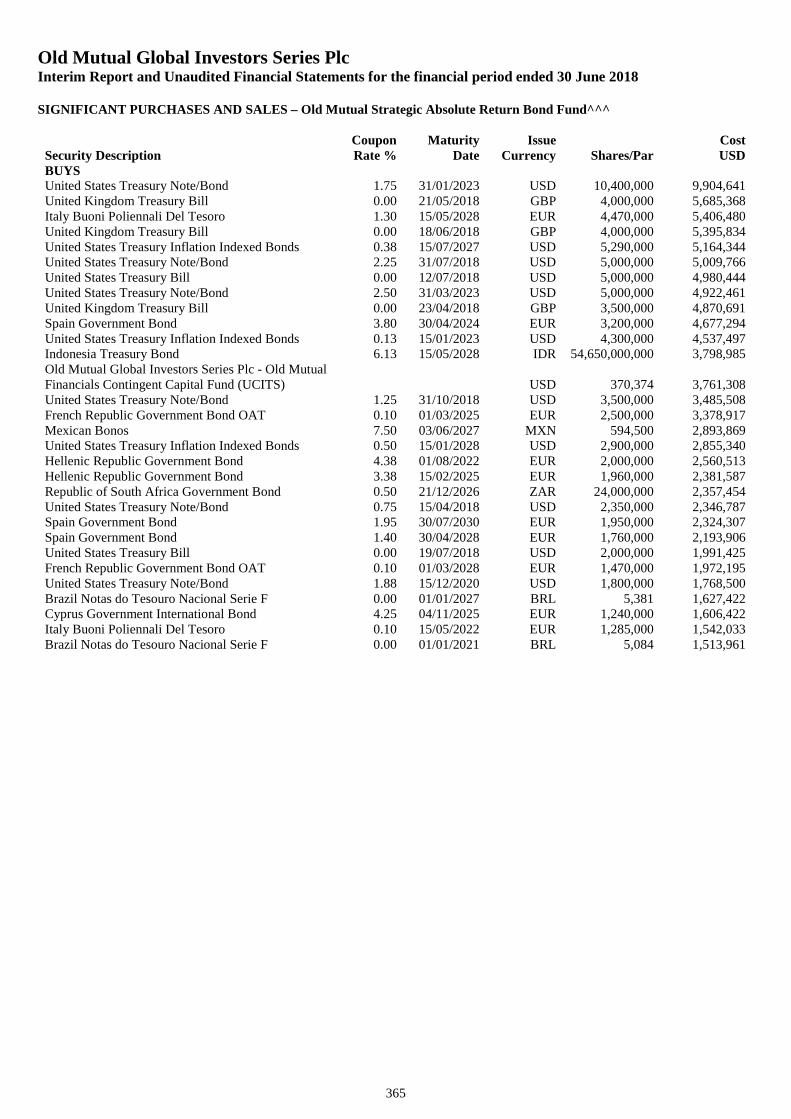
Old Mutual Global Investors Series PlcInterim Report and Unaudited Financial Statements for the financial period ended 30 June 2018
SIGNIFICANT PURCHASES AND SALES – Old Mutual Strategic Absolute Return Bond Fund^^^
365
Security DescriptionCouponRate %
MaturityDate
IssueCurrency Shares/Par
CostUSD
BUYSUnited States Treasury Note/Bond 1.75 31/01/2023 USD 10,400,000 9,904,641United Kingdom Treasury Bill 0.00 21/05/2018 GBP 4,000,000 5,685,368Italy Buoni Poliennali Del Tesoro 1.30 15/05/2028 EUR 4,470,000 5,406,480United Kingdom Treasury Bill 0.00 18/06/2018 GBP 4,000,000 5,395,834United States Treasury Inflation Indexed Bonds 0.38 15/07/2027 USD 5,290,000 5,164,344United States Treasury Note/Bond 2.25 31/07/2018 USD 5,000,000 5,009,766United States Treasury Bill 0.00 12/07/2018 USD 5,000,000 4,980,444United States Treasury Note/Bond 2.50 31/03/2023 USD 5,000,000 4,922,461United Kingdom Treasury Bill 0.00 23/04/2018 GBP 3,500,000 4,870,691Spain Government Bond 3.80 30/04/2024 EUR 3,200,000 4,677,294United States Treasury Inflation Indexed Bonds 0.13 15/01/2023 USD 4,300,000 4,537,497Indonesia Treasury Bond 6.13 15/05/2028 IDR 54,650,000,000 3,798,985Old Mutual Global Investors Series Plc - Old MutualFinancials Contingent Capital Fund (UCITS) USD 370,374 3,761,308United States Treasury Note/Bond 1.25 31/10/2018 USD 3,500,000 3,485,508French Republic Government Bond OAT 0.10 01/03/2025 EUR 2,500,000 3,378,917Mexican Bonos 7.50 03/06/2027 MXN 594,500 2,893,869United States Treasury Inflation Indexed Bonds 0.50 15/01/2028 USD 2,900,000 2,855,340Hellenic Republic Government Bond 4.38 01/08/2022 EUR 2,000,000 2,560,513Hellenic Republic Government Bond 3.38 15/02/2025 EUR 1,960,000 2,381,587Republic of South Africa Government Bond 0.50 21/12/2026 ZAR 24,000,000 2,357,454United States Treasury Note/Bond 0.75 15/04/2018 USD 2,350,000 2,346,787Spain Government Bond 1.95 30/07/2030 EUR 1,950,000 2,324,307Spain Government Bond 1.40 30/04/2028 EUR 1,760,000 2,193,906United States Treasury Bill 0.00 19/07/2018 USD 2,000,000 1,991,425French Republic Government Bond OAT 0.10 01/03/2028 EUR 1,470,000 1,972,195United States Treasury Note/Bond 1.88 15/12/2020 USD 1,800,000 1,768,500Brazil Notas do Tesouro Nacional Serie F 0.00 01/01/2027 BRL 5,381 1,627,422Cyprus Government International Bond 4.25 04/11/2025 EUR 1,240,000 1,606,422Italy Buoni Poliennali Del Tesoro 0.10 15/05/2022 EUR 1,285,000 1,542,033Brazil Notas do Tesouro Nacional Serie F 0.00 01/01/2021 BRL 5,084 1,513,961
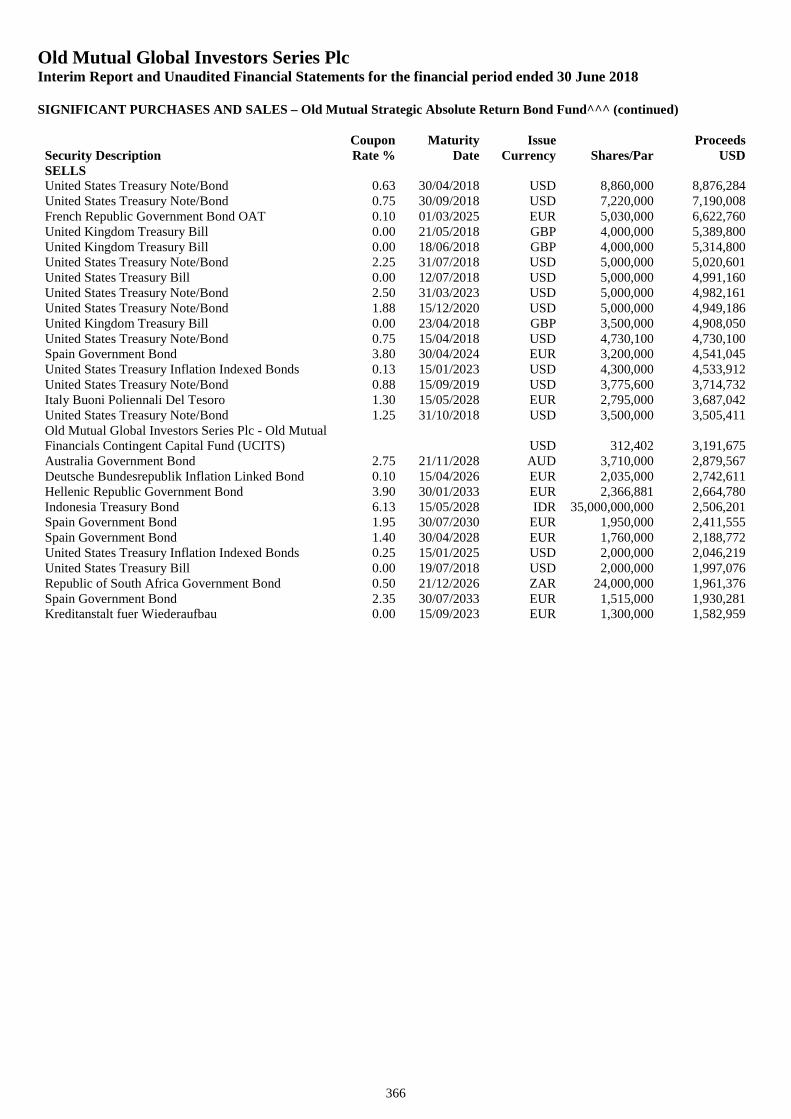
Old Mutual Global Investors Series PlcInterim Report and Unaudited Financial Statements for the financial period ended 30 June 2018
SIGNIFICANT PURCHASES AND SALES – Old Mutual Strategic Absolute Return Bond Fund^^^ (continued)
366
Security DescriptionCouponRate %
MaturityDate
IssueCurrency Shares/Par
ProceedsUSD
SELLSUnited States Treasury Note/Bond 0.63 30/04/2018 USD 8,860,000 8,876,284United States Treasury Note/Bond 0.75 30/09/2018 USD 7,220,000 7,190,008French Republic Government Bond OAT 0.10 01/03/2025 EUR 5,030,000 6,622,760United Kingdom Treasury Bill 0.00 21/05/2018 GBP 4,000,000 5,389,800United Kingdom Treasury Bill 0.00 18/06/2018 GBP 4,000,000 5,314,800United States Treasury Note/Bond 2.25 31/07/2018 USD 5,000,000 5,020,601United States Treasury Bill 0.00 12/07/2018 USD 5,000,000 4,991,160United States Treasury Note/Bond 2.50 31/03/2023 USD 5,000,000 4,982,161United States Treasury Note/Bond 1.88 15/12/2020 USD 5,000,000 4,949,186United Kingdom Treasury Bill 0.00 23/04/2018 GBP 3,500,000 4,908,050United States Treasury Note/Bond 0.75 15/04/2018 USD 4,730,100 4,730,100Spain Government Bond 3.80 30/04/2024 EUR 3,200,000 4,541,045United States Treasury Inflation Indexed Bonds 0.13 15/01/2023 USD 4,300,000 4,533,912United States Treasury Note/Bond 0.88 15/09/2019 USD 3,775,600 3,714,732Italy Buoni Poliennali Del Tesoro 1.30 15/05/2028 EUR 2,795,000 3,687,042United States Treasury Note/Bond 1.25 31/10/2018 USD 3,500,000 3,505,411Old Mutual Global Investors Series Plc - Old MutualFinancials Contingent Capital Fund (UCITS) USD 312,402 3,191,675Australia Government Bond 2.75 21/11/2028 AUD 3,710,000 2,879,567Deutsche Bundesrepublik Inflation Linked Bond 0.10 15/04/2026 EUR 2,035,000 2,742,611Hellenic Republic Government Bond 3.90 30/01/2033 EUR 2,366,881 2,664,780Indonesia Treasury Bond 6.13 15/05/2028 IDR 35,000,000,000 2,506,201Spain Government Bond 1.95 30/07/2030 EUR 1,950,000 2,411,555Spain Government Bond 1.40 30/04/2028 EUR 1,760,000 2,188,772United States Treasury Inflation Indexed Bonds 0.25 15/01/2025 USD 2,000,000 2,046,219United States Treasury Bill 0.00 19/07/2018 USD 2,000,000 1,997,076Republic of South Africa Government Bond 0.50 21/12/2026 ZAR 24,000,000 1,961,376Spain Government Bond 2.35 30/07/2033 EUR 1,515,000 1,930,281Kreditanstalt fuer Wiederaufbau 0.00 15/09/2023 EUR 1,300,000 1,582,959
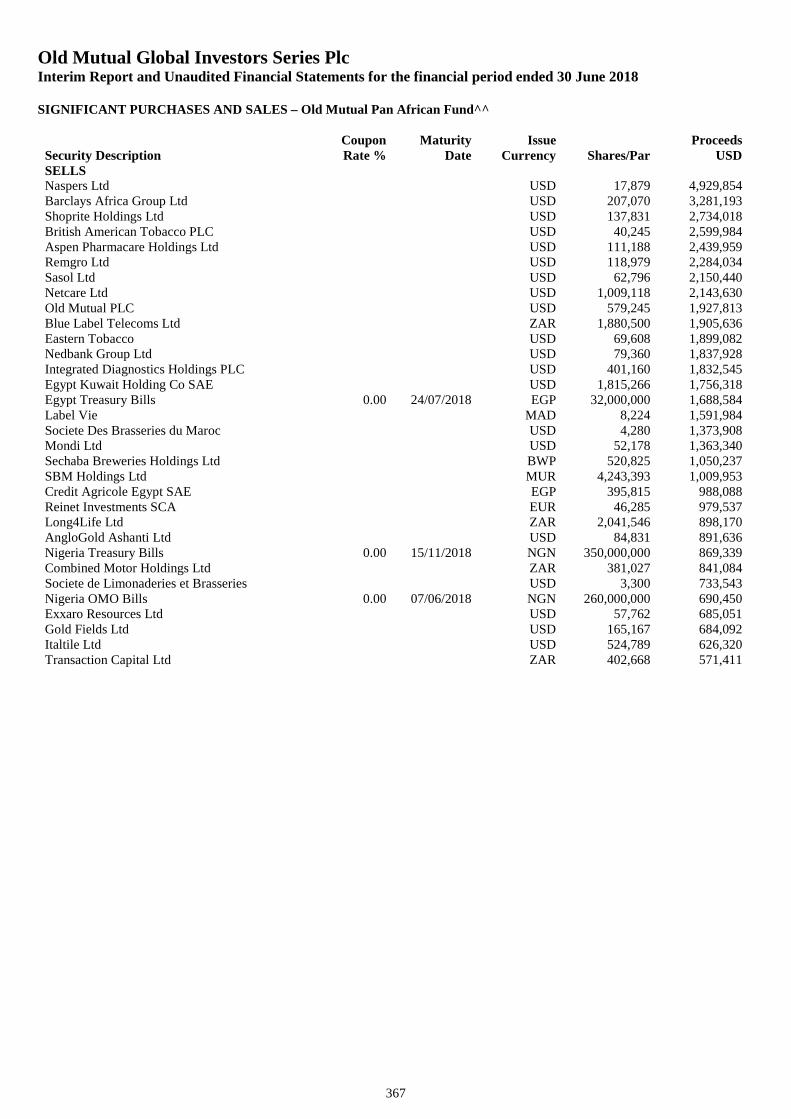
Old Mutual Global Investors Series PlcInterim Report and Unaudited Financial Statements for the financial period ended 30 June 2018
SIGNIFICANT PURCHASES AND SALES – Old Mutual Pan African Fund^^
367
Security DescriptionCouponRate %
MaturityDate
IssueCurrency Shares/Par
ProceedsUSD
SELLSNaspers Ltd USD 17,879 4,929,854Barclays Africa Group Ltd USD 207,070 3,281,193Shoprite Holdings Ltd USD 137,831 2,734,018British American Tobacco PLC USD 40,245 2,599,984Aspen Pharmacare Holdings Ltd USD 111,188 2,439,959Remgro Ltd USD 118,979 2,284,034Sasol Ltd USD 62,796 2,150,440Netcare Ltd USD 1,009,118 2,143,630Old Mutual PLC USD 579,245 1,927,813Blue Label Telecoms Ltd ZAR 1,880,500 1,905,636Eastern Tobacco USD 69,608 1,899,082Nedbank Group Ltd USD 79,360 1,837,928Integrated Diagnostics Holdings PLC USD 401,160 1,832,545Egypt Kuwait Holding Co SAE USD 1,815,266 1,756,318Egypt Treasury Bills 0.00 24/07/2018 EGP 32,000,000 1,688,584Label Vie MAD 8,224 1,591,984Societe Des Brasseries du Maroc USD 4,280 1,373,908Mondi Ltd USD 52,178 1,363,340Sechaba Breweries Holdings Ltd BWP 520,825 1,050,237SBM Holdings Ltd MUR 4,243,393 1,009,953Credit Agricole Egypt SAE EGP 395,815 988,088Reinet Investments SCA EUR 46,285 979,537Long4Life Ltd ZAR 2,041,546 898,170AngloGold Ashanti Ltd USD 84,831 891,636Nigeria Treasury Bills 0.00 15/11/2018 NGN 350,000,000 869,339Combined Motor Holdings Ltd ZAR 381,027 841,084Societe de Limonaderies et Brasseries USD 3,300 733,543Nigeria OMO Bills 0.00 07/06/2018 NGN 260,000,000 690,450Exxaro Resources Ltd USD 57,762 685,051Gold Fields Ltd USD 165,167 684,092Italtile Ltd USD 524,789 626,320Transaction Capital Ltd ZAR 402,668 571,411
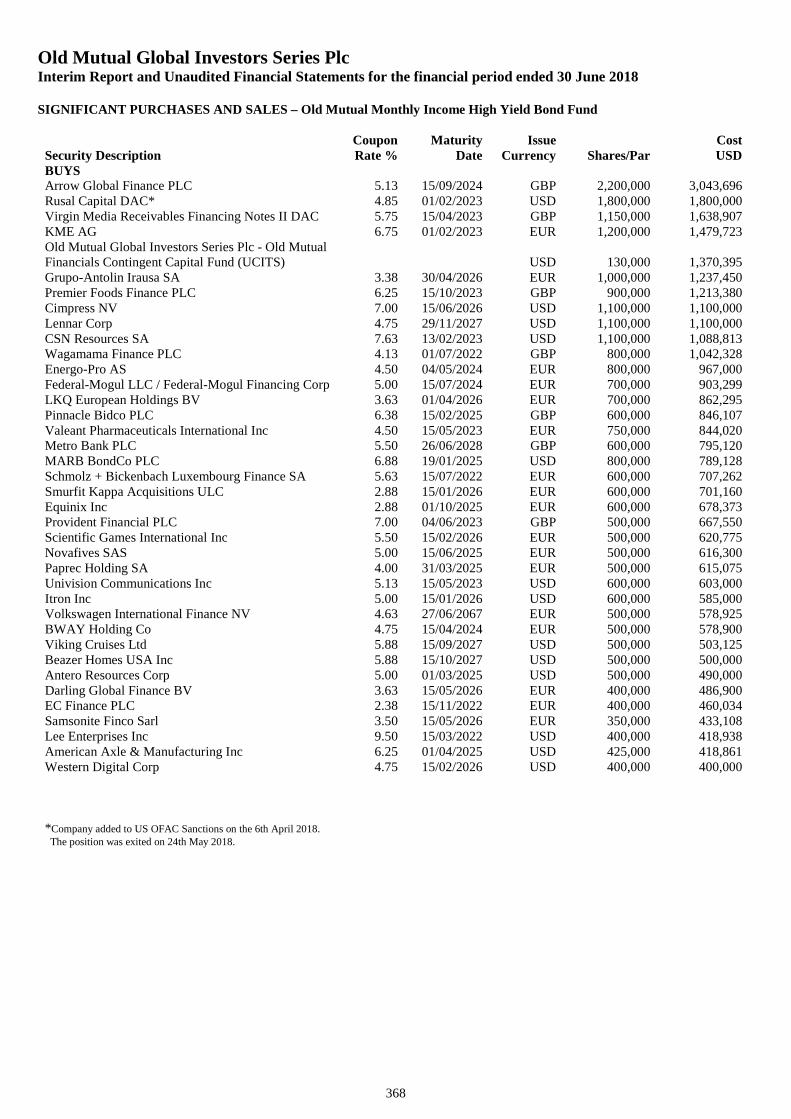
Old Mutual Global Investors Series PlcInterim Report and Unaudited Financial Statements for the financial period ended 30 June 2018
SIGNIFICANT PURCHASES AND SALES – Old Mutual Monthly Income High Yield Bond Fund
368
Security DescriptionCouponRate %
MaturityDate
IssueCurrency Shares/Par
CostUSD
BUYSArrow Global Finance PLC 5.13 15/09/2024 GBP 2,200,000 3,043,696Rusal Capital DAC* 4.85 01/02/2023 USD 1,800,000 1,800,000Virgin Media Receivables Financing Notes II DAC 5.75 15/04/2023 GBP 1,150,000 1,638,907KME AG 6.75 01/02/2023 EUR 1,200,000 1,479,723Old Mutual Global Investors Series Plc - Old MutualFinancials Contingent Capital Fund (UCITS) USD 130,000 1,370,395Grupo-Antolin Irausa SA 3.38 30/04/2026 EUR 1,000,000 1,237,450Premier Foods Finance PLC 6.25 15/10/2023 GBP 900,000 1,213,380Cimpress NV 7.00 15/06/2026 USD 1,100,000 1,100,000Lennar Corp 4.75 29/11/2027 USD 1,100,000 1,100,000CSN Resources SA 7.63 13/02/2023 USD 1,100,000 1,088,813Wagamama Finance PLC 4.13 01/07/2022 GBP 800,000 1,042,328Energo-Pro AS 4.50 04/05/2024 EUR 800,000 967,000Federal-Mogul LLC / Federal-Mogul Financing Corp 5.00 15/07/2024 EUR 700,000 903,299LKQ European Holdings BV 3.63 01/04/2026 EUR 700,000 862,295Pinnacle Bidco PLC 6.38 15/02/2025 GBP 600,000 846,107Valeant Pharmaceuticals International Inc 4.50 15/05/2023 EUR 750,000 844,020Metro Bank PLC 5.50 26/06/2028 GBP 600,000 795,120MARB BondCo PLC 6.88 19/01/2025 USD 800,000 789,128Schmolz + Bickenbach Luxembourg Finance SA 5.63 15/07/2022 EUR 600,000 707,262Smurfit Kappa Acquisitions ULC 2.88 15/01/2026 EUR 600,000 701,160Equinix Inc 2.88 01/10/2025 EUR 600,000 678,373Provident Financial PLC 7.00 04/06/2023 GBP 500,000 667,550Scientific Games International Inc 5.50 15/02/2026 EUR 500,000 620,775Novafives SAS 5.00 15/06/2025 EUR 500,000 616,300Paprec Holding SA 4.00 31/03/2025 EUR 500,000 615,075Univision Communications Inc 5.13 15/05/2023 USD 600,000 603,000Itron Inc 5.00 15/01/2026 USD 600,000 585,000Volkswagen International Finance NV 4.63 27/06/2067 EUR 500,000 578,925BWAY Holding Co 4.75 15/04/2024 EUR 500,000 578,900Viking Cruises Ltd 5.88 15/09/2027 USD 500,000 503,125Beazer Homes USA Inc 5.88 15/10/2027 USD 500,000 500,000Antero Resources Corp 5.00 01/03/2025 USD 500,000 490,000Darling Global Finance BV 3.63 15/05/2026 EUR 400,000 486,900EC Finance PLC 2.38 15/11/2022 EUR 400,000 460,034Samsonite Finco Sarl 3.50 15/05/2026 EUR 350,000 433,108Lee Enterprises Inc 9.50 15/03/2022 USD 400,000 418,938American Axle & Manufacturing Inc 6.25 01/04/2025 USD 425,000 418,861Western Digital Corp 4.75 15/02/2026 USD 400,000 400,000
*Company added to US OFAC Sanctions on the 6th April 2018.The position was exited on 24th May 2018.
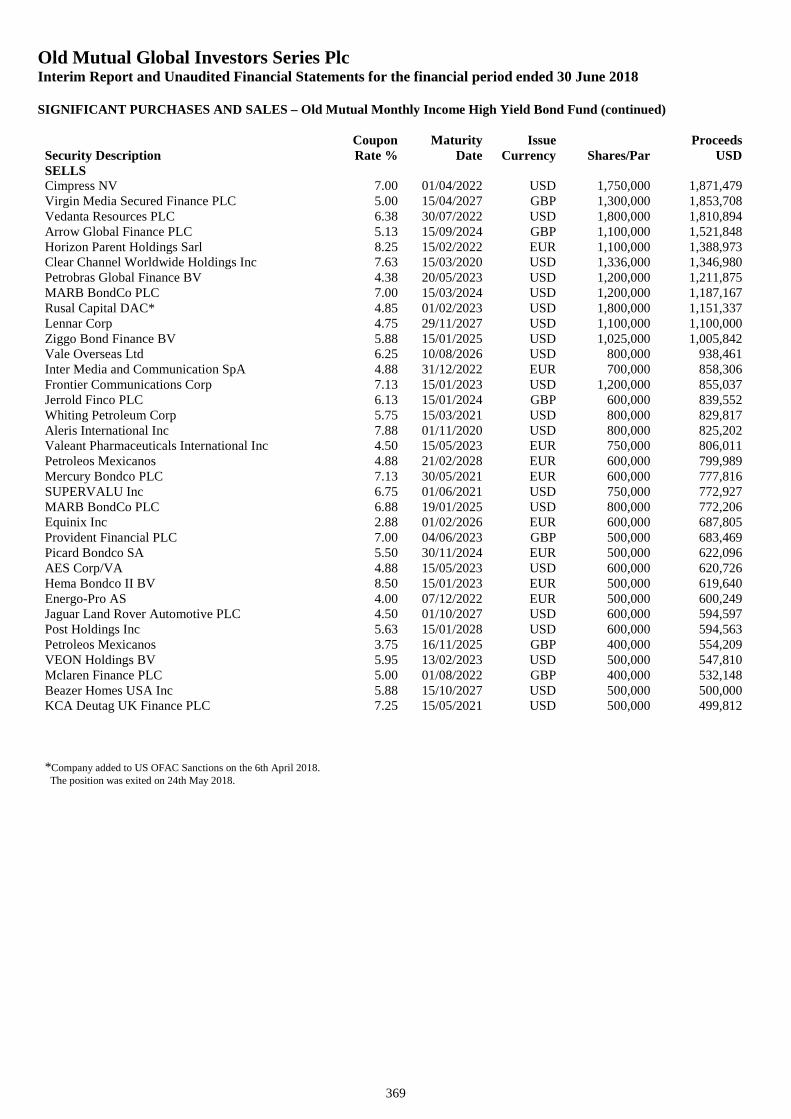
Old Mutual Global Investors Series PlcInterim Report and Unaudited Financial Statements for the financial period ended 30 June 2018
SIGNIFICANT PURCHASES AND SALES – Old Mutual Monthly Income High Yield Bond Fund (continued)
369
Security DescriptionCouponRate %
MaturityDate
IssueCurrency Shares/Par
ProceedsUSD
SELLSCimpress NV 7.00 01/04/2022 USD 1,750,000 1,871,479Virgin Media Secured Finance PLC 5.00 15/04/2027 GBP 1,300,000 1,853,708Vedanta Resources PLC 6.38 30/07/2022 USD 1,800,000 1,810,894Arrow Global Finance PLC 5.13 15/09/2024 GBP 1,100,000 1,521,848Horizon Parent Holdings Sarl 8.25 15/02/2022 EUR 1,100,000 1,388,973Clear Channel Worldwide Holdings Inc 7.63 15/03/2020 USD 1,336,000 1,346,980Petrobras Global Finance BV 4.38 20/05/2023 USD 1,200,000 1,211,875MARB BondCo PLC 7.00 15/03/2024 USD 1,200,000 1,187,167Rusal Capital DAC* 4.85 01/02/2023 USD 1,800,000 1,151,337Lennar Corp 4.75 29/11/2027 USD 1,100,000 1,100,000Ziggo Bond Finance BV 5.88 15/01/2025 USD 1,025,000 1,005,842Vale Overseas Ltd 6.25 10/08/2026 USD 800,000 938,461Inter Media and Communication SpA 4.88 31/12/2022 EUR 700,000 858,306Frontier Communications Corp 7.13 15/01/2023 USD 1,200,000 855,037Jerrold Finco PLC 6.13 15/01/2024 GBP 600,000 839,552Whiting Petroleum Corp 5.75 15/03/2021 USD 800,000 829,817Aleris International Inc 7.88 01/11/2020 USD 800,000 825,202Valeant Pharmaceuticals International Inc 4.50 15/05/2023 EUR 750,000 806,011Petroleos Mexicanos 4.88 21/02/2028 EUR 600,000 799,989Mercury Bondco PLC 7.13 30/05/2021 EUR 600,000 777,816SUPERVALU Inc 6.75 01/06/2021 USD 750,000 772,927MARB BondCo PLC 6.88 19/01/2025 USD 800,000 772,206Equinix Inc 2.88 01/02/2026 EUR 600,000 687,805Provident Financial PLC 7.00 04/06/2023 GBP 500,000 683,469Picard Bondco SA 5.50 30/11/2024 EUR 500,000 622,096AES Corp/VA 4.88 15/05/2023 USD 600,000 620,726Hema Bondco II BV 8.50 15/01/2023 EUR 500,000 619,640Energo-Pro AS 4.00 07/12/2022 EUR 500,000 600,249Jaguar Land Rover Automotive PLC 4.50 01/10/2027 USD 600,000 594,597Post Holdings Inc 5.63 15/01/2028 USD 600,000 594,563Petroleos Mexicanos 3.75 16/11/2025 GBP 400,000 554,209VEON Holdings BV 5.95 13/02/2023 USD 500,000 547,810Mclaren Finance PLC 5.00 01/08/2022 GBP 400,000 532,148Beazer Homes USA Inc 5.88 15/10/2027 USD 500,000 500,000KCA Deutag UK Finance PLC 7.25 15/05/2021 USD 500,000 499,812
*Company added to US OFAC Sanctions on the 6th April 2018.The position was exited on 24th May 2018.
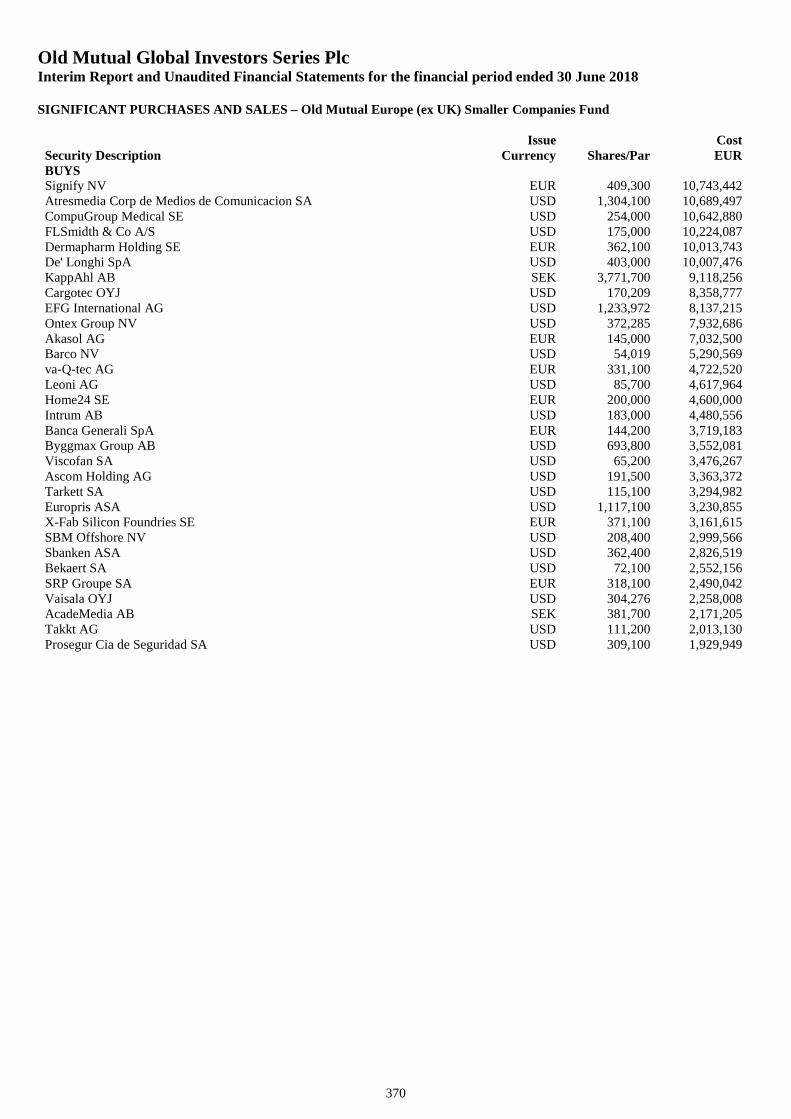
Old Mutual Global Investors Series PlcInterim Report and Unaudited Financial Statements for the financial period ended 30 June 2018
SIGNIFICANT PURCHASES AND SALES – Old Mutual Europe (ex UK) Smaller Companies Fund
370
Security DescriptionIssue
Currency Shares/ParCostEUR
BUYSSignify NV EUR 409,300 10,743,442Atresmedia Corp de Medios de Comunicacion SA USD 1,304,100 10,689,497CompuGroup Medical SE USD 254,000 10,642,880FLSmidth & Co A/S USD 175,000 10,224,087Dermapharm Holding SE EUR 362,100 10,013,743De' Longhi SpA USD 403,000 10,007,476KappAhl AB SEK 3,771,700 9,118,256Cargotec OYJ USD 170,209 8,358,777EFG International AG USD 1,233,972 8,137,215Ontex Group NV USD 372,285 7,932,686Akasol AG EUR 145,000 7,032,500Barco NV USD 54,019 5,290,569va-Q-tec AG EUR 331,100 4,722,520Leoni AG USD 85,700 4,617,964Home24 SE EUR 200,000 4,600,000Intrum AB USD 183,000 4,480,556Banca Generali SpA EUR 144,200 3,719,183Byggmax Group AB USD 693,800 3,552,081Viscofan SA USD 65,200 3,476,267Ascom Holding AG USD 191,500 3,363,372Tarkett SA USD 115,100 3,294,982Europris ASA USD 1,117,100 3,230,855X-Fab Silicon Foundries SE EUR 371,100 3,161,615SBM Offshore NV USD 208,400 2,999,566Sbanken ASA USD 362,400 2,826,519Bekaert SA USD 72,100 2,552,156SRP Groupe SA EUR 318,100 2,490,042Vaisala OYJ USD 304,276 2,258,008AcadeMedia AB SEK 381,700 2,171,205Takkt AG USD 111,200 2,013,130Prosegur Cia de Seguridad SA USD 309,100 1,929,949
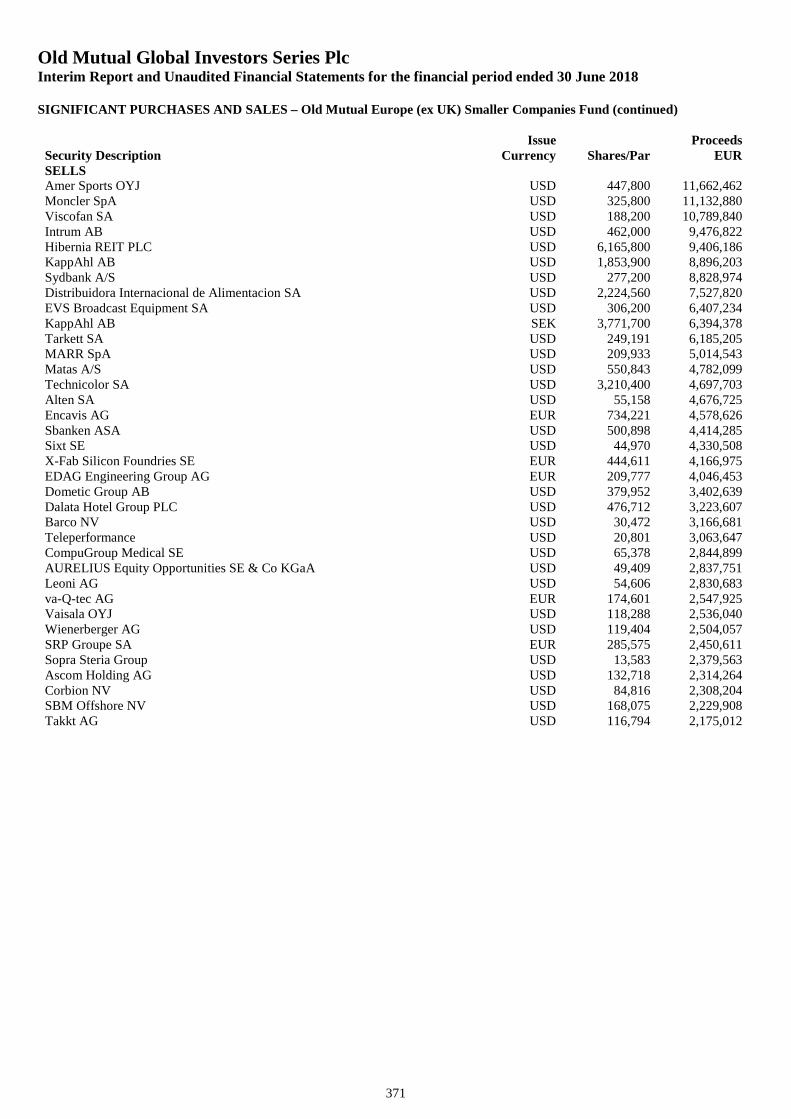
Old Mutual Global Investors Series PlcInterim Report and Unaudited Financial Statements for the financial period ended 30 June 2018
SIGNIFICANT PURCHASES AND SALES – Old Mutual Europe (ex UK) Smaller Companies Fund (continued)
371
Security DescriptionIssue
Currency Shares/ParProceeds
EURSELLSAmer Sports OYJ USD 447,800 11,662,462Moncler SpA USD 325,800 11,132,880Viscofan SA USD 188,200 10,789,840Intrum AB USD 462,000 9,476,822Hibernia REIT PLC USD 6,165,800 9,406,186KappAhl AB USD 1,853,900 8,896,203Sydbank A/S USD 277,200 8,828,974Distribuidora Internacional de Alimentacion SA USD 2,224,560 7,527,820EVS Broadcast Equipment SA USD 306,200 6,407,234KappAhl AB SEK 3,771,700 6,394,378Tarkett SA USD 249,191 6,185,205MARR SpA USD 209,933 5,014,543Matas A/S USD 550,843 4,782,099Technicolor SA USD 3,210,400 4,697,703Alten SA USD 55,158 4,676,725Encavis AG EUR 734,221 4,578,626Sbanken ASA USD 500,898 4,414,285Sixt SE USD 44,970 4,330,508X-Fab Silicon Foundries SE EUR 444,611 4,166,975EDAG Engineering Group AG EUR 209,777 4,046,453Dometic Group AB USD 379,952 3,402,639Dalata Hotel Group PLC USD 476,712 3,223,607Barco NV USD 30,472 3,166,681Teleperformance USD 20,801 3,063,647CompuGroup Medical SE USD 65,378 2,844,899AURELIUS Equity Opportunities SE & Co KGaA USD 49,409 2,837,751Leoni AG USD 54,606 2,830,683va-Q-tec AG EUR 174,601 2,547,925Vaisala OYJ USD 118,288 2,536,040Wienerberger AG USD 119,404 2,504,057SRP Groupe SA EUR 285,575 2,450,611Sopra Steria Group USD 13,583 2,379,563Ascom Holding AG USD 132,718 2,314,264Corbion NV USD 84,816 2,308,204SBM Offshore NV USD 168,075 2,229,908Takkt AG USD 116,794 2,175,012
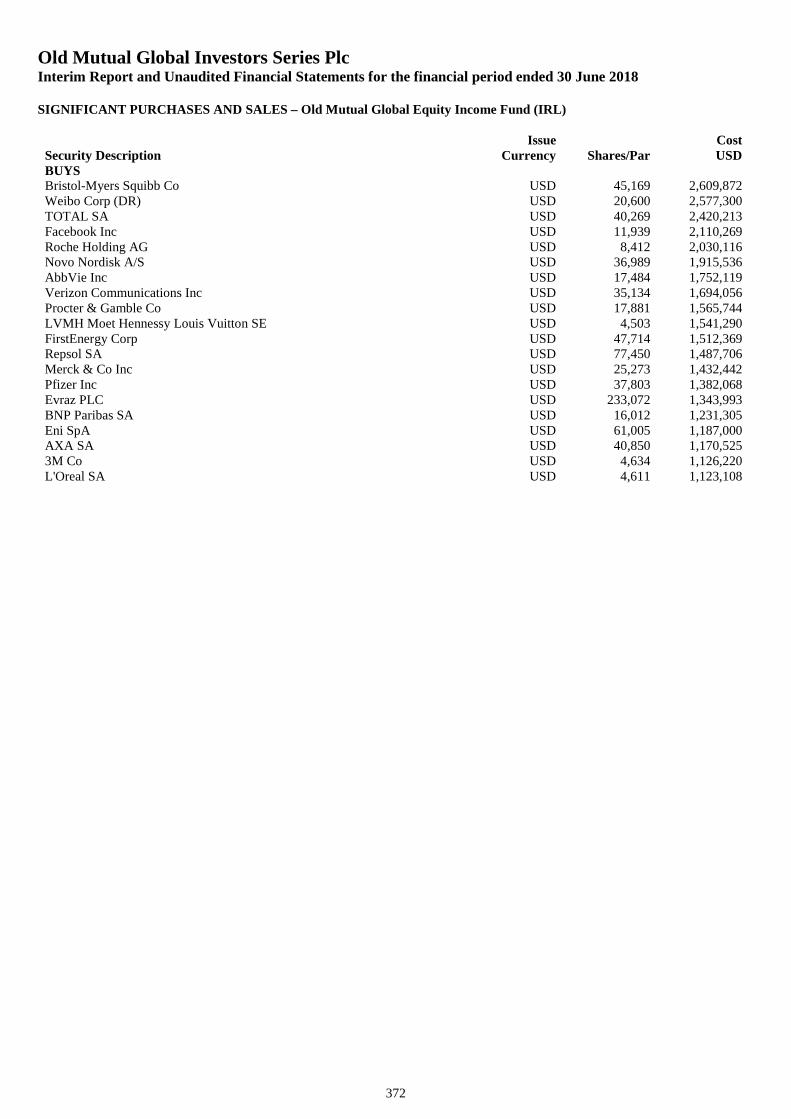
Old Mutual Global Investors Series PlcInterim Report and Unaudited Financial Statements for the financial period ended 30 June 2018
SIGNIFICANT PURCHASES AND SALES – Old Mutual Global Equity Income Fund (IRL)
372
Security DescriptionIssue
Currency Shares/ParCostUSD
BUYSBristol-Myers Squibb Co USD 45,169 2,609,872Weibo Corp (DR) USD 20,600 2,577,300TOTAL SA USD 40,269 2,420,213Facebook Inc USD 11,939 2,110,269Roche Holding AG USD 8,412 2,030,116Novo Nordisk A/S USD 36,989 1,915,536AbbVie Inc USD 17,484 1,752,119Verizon Communications Inc USD 35,134 1,694,056Procter & Gamble Co USD 17,881 1,565,744LVMH Moet Hennessy Louis Vuitton SE USD 4,503 1,541,290FirstEnergy Corp USD 47,714 1,512,369Repsol SA USD 77,450 1,487,706Merck & Co Inc USD 25,273 1,432,442Pfizer Inc USD 37,803 1,382,068Evraz PLC USD 233,072 1,343,993BNP Paribas SA USD 16,012 1,231,305Eni SpA USD 61,005 1,187,000AXA SA USD 40,850 1,170,5253M Co USD 4,634 1,126,220L'Oreal SA USD 4,611 1,123,108
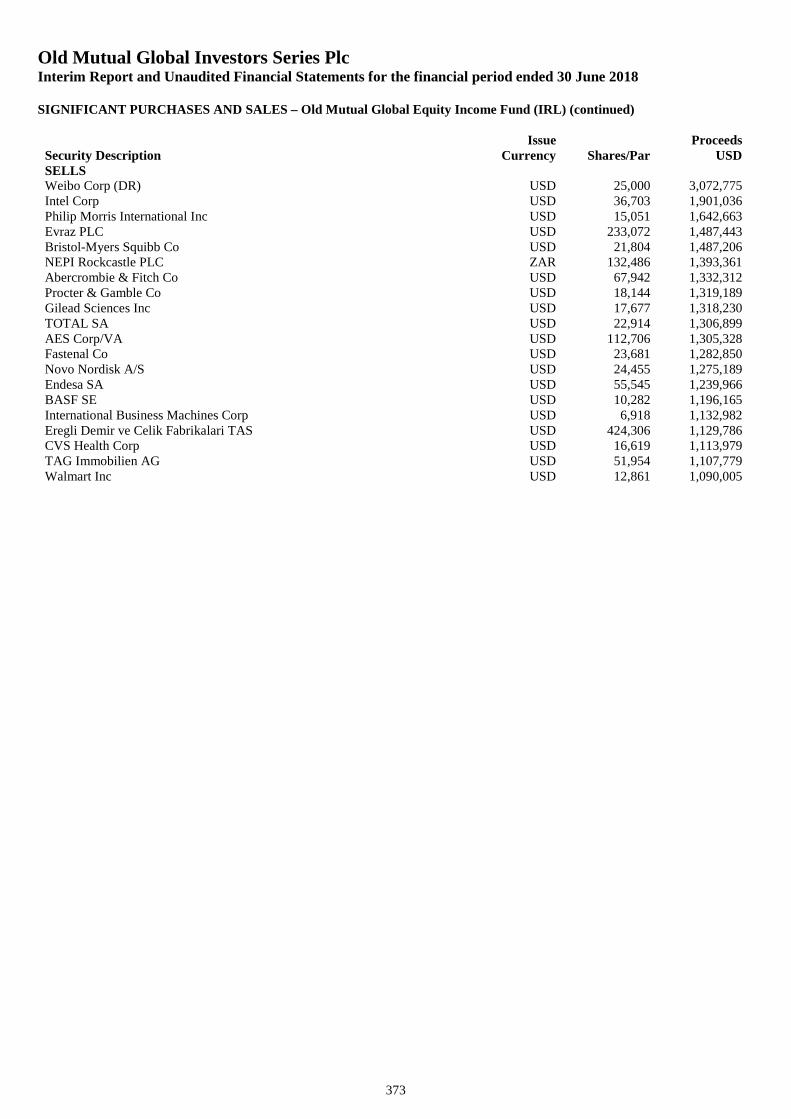
Old Mutual Global Investors Series PlcInterim Report and Unaudited Financial Statements for the financial period ended 30 June 2018
SIGNIFICANT PURCHASES AND SALES – Old Mutual Global Equity Income Fund (IRL) (continued)
373
Security DescriptionIssue
Currency Shares/ParProceeds
USDSELLSWeibo Corp (DR) USD 25,000 3,072,775Intel Corp USD 36,703 1,901,036Philip Morris International Inc USD 15,051 1,642,663Evraz PLC USD 233,072 1,487,443Bristol-Myers Squibb Co USD 21,804 1,487,206NEPI Rockcastle PLC ZAR 132,486 1,393,361Abercrombie & Fitch Co USD 67,942 1,332,312Procter & Gamble Co USD 18,144 1,319,189Gilead Sciences Inc USD 17,677 1,318,230TOTAL SA USD 22,914 1,306,899AES Corp/VA USD 112,706 1,305,328Fastenal Co USD 23,681 1,282,850Novo Nordisk A/S USD 24,455 1,275,189Endesa SA USD 55,545 1,239,966BASF SE USD 10,282 1,196,165International Business Machines Corp USD 6,918 1,132,982Eregli Demir ve Celik Fabrikalari TAS USD 424,306 1,129,786CVS Health Corp USD 16,619 1,113,979TAG Immobilien AG USD 51,954 1,107,779Walmart Inc USD 12,861 1,090,005
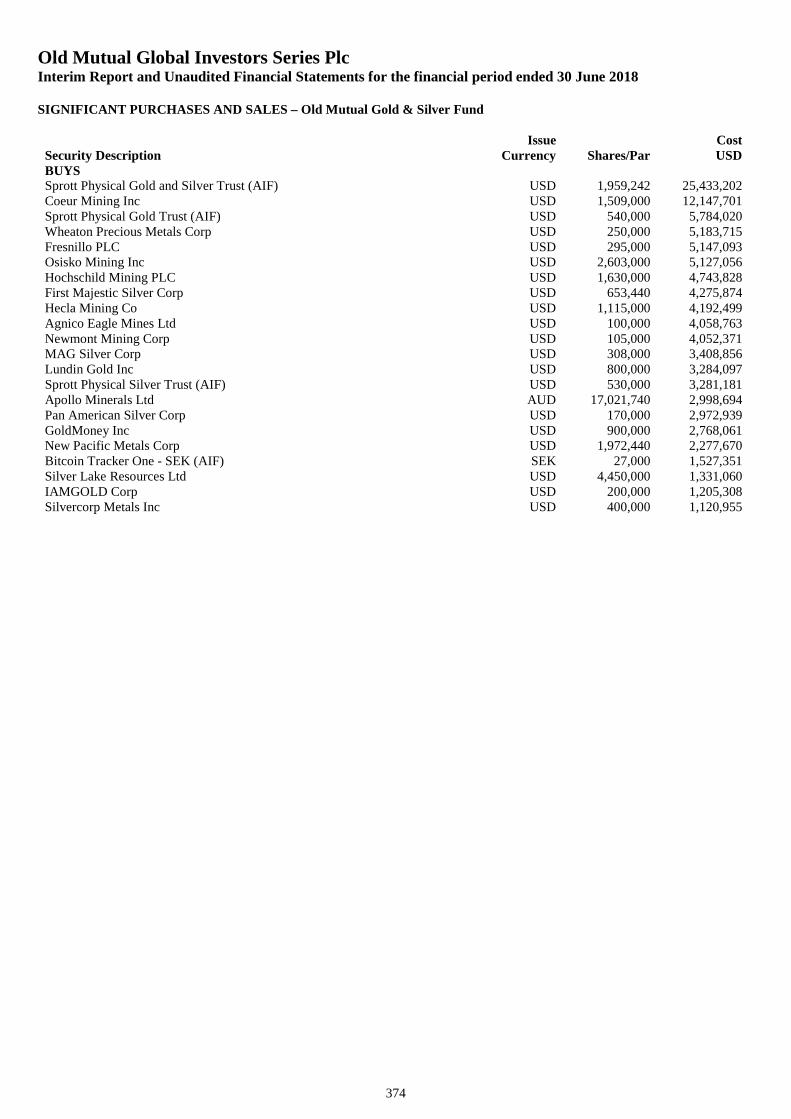
Old Mutual Global Investors Series PlcInterim Report and Unaudited Financial Statements for the financial period ended 30 June 2018
SIGNIFICANT PURCHASES AND SALES – Old Mutual Gold & Silver Fund
374
Security DescriptionIssue
Currency Shares/ParCostUSD
BUYSSprott Physical Gold and Silver Trust (AIF) USD 1,959,242 25,433,202Coeur Mining Inc USD 1,509,000 12,147,701Sprott Physical Gold Trust (AIF) USD 540,000 5,784,020Wheaton Precious Metals Corp USD 250,000 5,183,715Fresnillo PLC USD 295,000 5,147,093Osisko Mining Inc USD 2,603,000 5,127,056Hochschild Mining PLC USD 1,630,000 4,743,828First Majestic Silver Corp USD 653,440 4,275,874Hecla Mining Co USD 1,115,000 4,192,499Agnico Eagle Mines Ltd USD 100,000 4,058,763Newmont Mining Corp USD 105,000 4,052,371MAG Silver Corp USD 308,000 3,408,856Lundin Gold Inc USD 800,000 3,284,097Sprott Physical Silver Trust (AIF) USD 530,000 3,281,181Apollo Minerals Ltd AUD 17,021,740 2,998,694Pan American Silver Corp USD 170,000 2,972,939GoldMoney Inc USD 900,000 2,768,061New Pacific Metals Corp USD 1,972,440 2,277,670Bitcoin Tracker One - SEK (AIF) SEK 27,000 1,527,351Silver Lake Resources Ltd USD 4,450,000 1,331,060IAMGOLD Corp USD 200,000 1,205,308Silvercorp Metals Inc USD 400,000 1,120,955
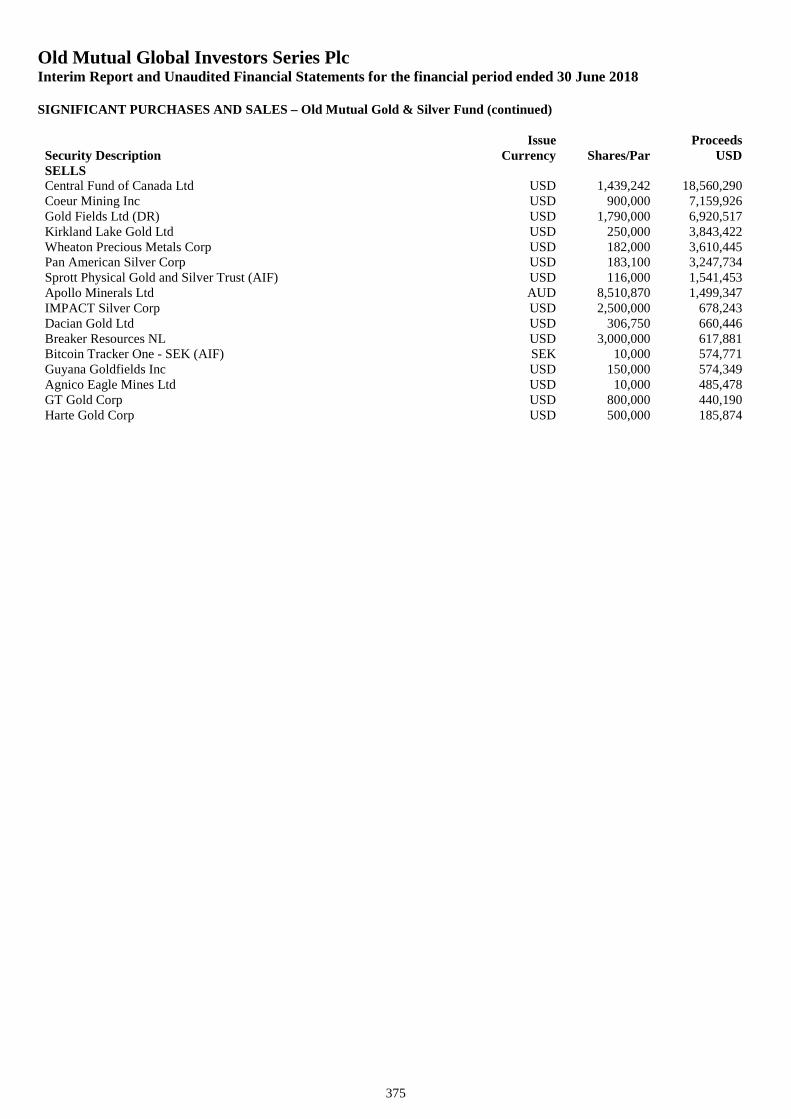
Old Mutual Global Investors Series PlcInterim Report and Unaudited Financial Statements for the financial period ended 30 June 2018
SIGNIFICANT PURCHASES AND SALES – Old Mutual Gold & Silver Fund (continued)
375
Security DescriptionIssue
Currency Shares/ParProceeds
USDSELLSCentral Fund of Canada Ltd USD 1,439,242 18,560,290Coeur Mining Inc USD 900,000 7,159,926Gold Fields Ltd (DR) USD 1,790,000 6,920,517Kirkland Lake Gold Ltd USD 250,000 3,843,422Wheaton Precious Metals Corp USD 182,000 3,610,445Pan American Silver Corp USD 183,100 3,247,734Sprott Physical Gold and Silver Trust (AIF) USD 116,000 1,541,453Apollo Minerals Ltd AUD 8,510,870 1,499,347IMPACT Silver Corp USD 2,500,000 678,243Dacian Gold Ltd USD 306,750 660,446Breaker Resources NL USD 3,000,000 617,881Bitcoin Tracker One - SEK (AIF) SEK 10,000 574,771Guyana Goldfields Inc USD 150,000 574,349Agnico Eagle Mines Ltd USD 10,000 485,478GT Gold Corp USD 800,000 440,190Harte Gold Corp USD 500,000 185,874
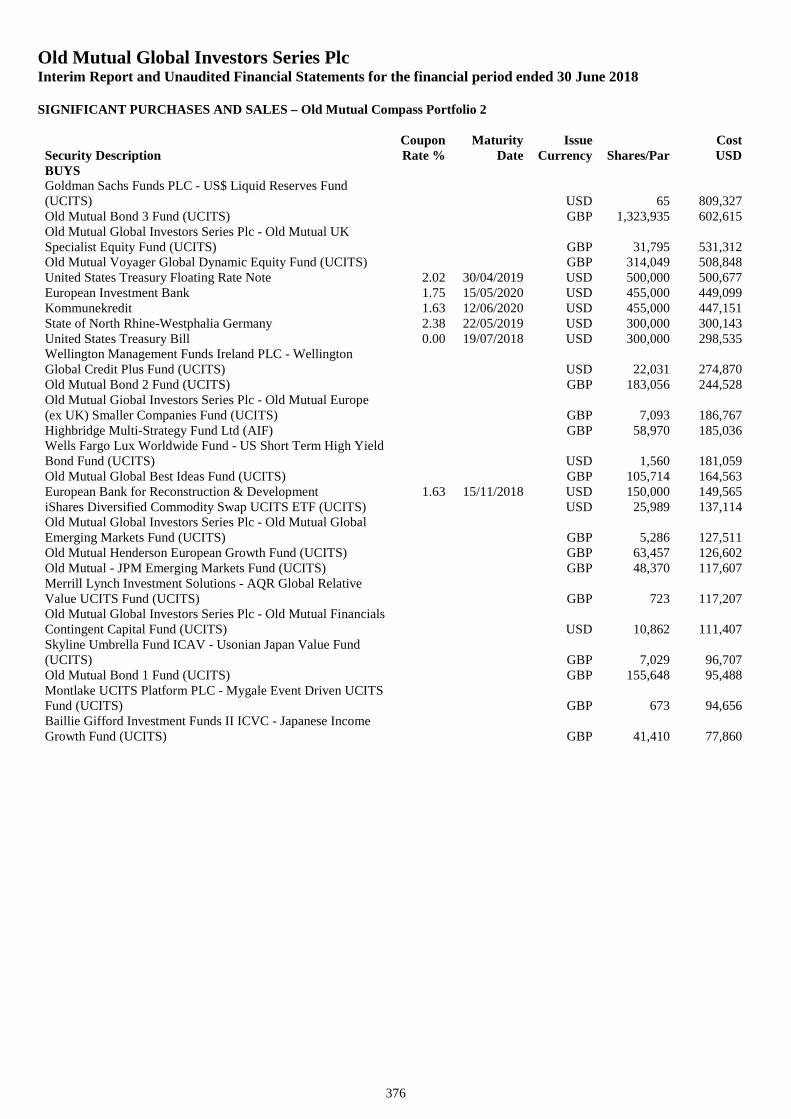
Old Mutual Global Investors Series PlcInterim Report and Unaudited Financial Statements for the financial period ended 30 June 2018
SIGNIFICANT PURCHASES AND SALES – Old Mutual Compass Portfolio 2
376
Security DescriptionCouponRate %
MaturityDate
IssueCurrency Shares/Par
CostUSD
BUYSGoldman Sachs Funds PLC - US$ Liquid Reserves Fund(UCITS) USD 65 809,327Old Mutual Bond 3 Fund (UCITS) GBP 1,323,935 602,615Old Mutual Global Investors Series Plc - Old Mutual UKSpecialist Equity Fund (UCITS) GBP 31,795 531,312Old Mutual Voyager Global Dynamic Equity Fund (UCITS) GBP 314,049 508,848United States Treasury Floating Rate Note 2.02 30/04/2019 USD 500,000 500,677European Investment Bank 1.75 15/05/2020 USD 455,000 449,099Kommunekredit 1.63 12/06/2020 USD 455,000 447,151State of North Rhine-Westphalia Germany 2.38 22/05/2019 USD 300,000 300,143United States Treasury Bill 0.00 19/07/2018 USD 300,000 298,535Wellington Management Funds Ireland PLC - WellingtonGlobal Credit Plus Fund (UCITS) USD 22,031 274,870Old Mutual Bond 2 Fund (UCITS) GBP 183,056 244,528Old Mutual Giobal Investors Series Plc - Old Mutual Europe(ex UK) Smaller Companies Fund (UCITS) GBP 7,093 186,767Highbridge Multi-Strategy Fund Ltd (AIF) GBP 58,970 185,036Wells Fargo Lux Worldwide Fund - US Short Term High YieldBond Fund (UCITS) USD 1,560 181,059Old Mutual Global Best Ideas Fund (UCITS) GBP 105,714 164,563European Bank for Reconstruction & Development 1.63 15/11/2018 USD 150,000 149,565iShares Diversified Commodity Swap UCITS ETF (UCITS) USD 25,989 137,114Old Mutual Global Investors Series Plc - Old Mutual GlobalEmerging Markets Fund (UCITS) GBP 5,286 127,511Old Mutual Henderson European Growth Fund (UCITS) GBP 63,457 126,602Old Mutual - JPM Emerging Markets Fund (UCITS) GBP 48,370 117,607Merrill Lynch Investment Solutions - AQR Global RelativeValue UCITS Fund (UCITS) GBP 723 117,207Old Mutual Global Investors Series Plc - Old Mutual FinancialsContingent Capital Fund (UCITS) USD 10,862 111,407Skyline Umbrella Fund ICAV - Usonian Japan Value Fund(UCITS) GBP 7,029 96,707Old Mutual Bond 1 Fund (UCITS) GBP 155,648 95,488Montlake UCITS Platform PLC - Mygale Event Driven UCITSFund (UCITS) GBP 673 94,656Baillie Gifford Investment Funds II ICVC - Japanese IncomeGrowth Fund (UCITS) GBP 41,410 77,860
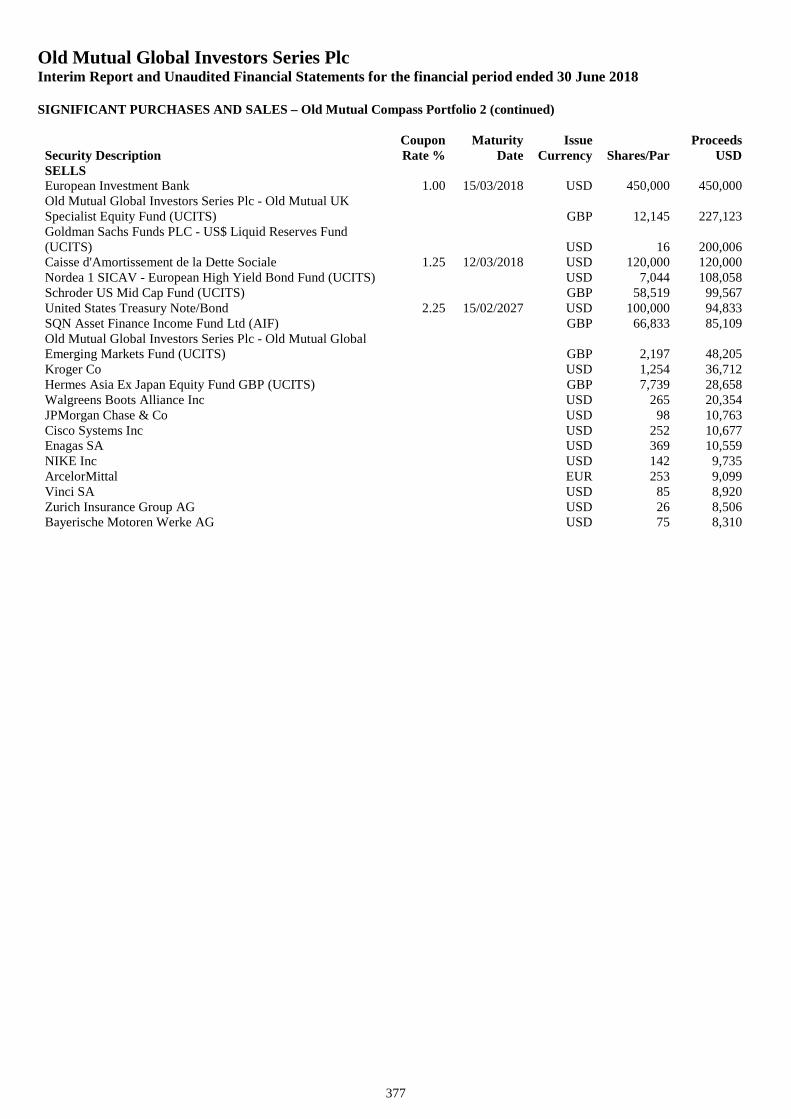
Old Mutual Global Investors Series PlcInterim Report and Unaudited Financial Statements for the financial period ended 30 June 2018
SIGNIFICANT PURCHASES AND SALES – Old Mutual Compass Portfolio 2 (continued)
377
Security DescriptionCouponRate %
MaturityDate
IssueCurrency Shares/Par
ProceedsUSD
SELLSEuropean Investment Bank 1.00 15/03/2018 USD 450,000 450,000Old Mutual Global Investors Series Plc - Old Mutual UKSpecialist Equity Fund (UCITS) GBP 12,145 227,123Goldman Sachs Funds PLC - US$ Liquid Reserves Fund(UCITS) USD 16 200,006Caisse d'Amortissement de la Dette Sociale 1.25 12/03/2018 USD 120,000 120,000Nordea 1 SICAV - European High Yield Bond Fund (UCITS) USD 7,044 108,058Schroder US Mid Cap Fund (UCITS) GBP 58,519 99,567United States Treasury Note/Bond 2.25 15/02/2027 USD 100,000 94,833SQN Asset Finance Income Fund Ltd (AIF) GBP 66,833 85,109Old Mutual Global Investors Series Plc - Old Mutual GlobalEmerging Markets Fund (UCITS) GBP 2,197 48,205Kroger Co USD 1,254 36,712Hermes Asia Ex Japan Equity Fund GBP (UCITS) GBP 7,739 28,658Walgreens Boots Alliance Inc USD 265 20,354JPMorgan Chase & Co USD 98 10,763Cisco Systems Inc USD 252 10,677Enagas SA USD 369 10,559NIKE Inc USD 142 9,735ArcelorMittal EUR 253 9,099Vinci SA USD 85 8,920Zurich Insurance Group AG USD 26 8,506Bayerische Motoren Werke AG USD 75 8,310
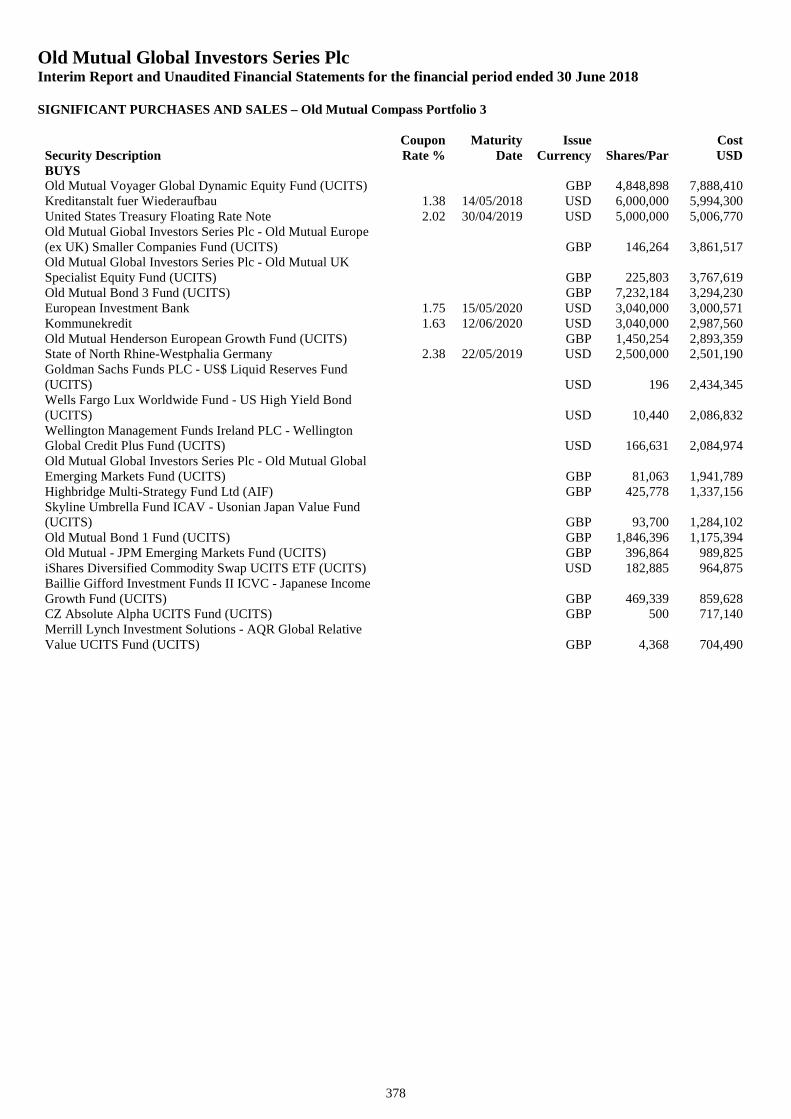
Old Mutual Global Investors Series PlcInterim Report and Unaudited Financial Statements for the financial period ended 30 June 2018
SIGNIFICANT PURCHASES AND SALES – Old Mutual Compass Portfolio 3
378
Security DescriptionCouponRate %
MaturityDate
IssueCurrency Shares/Par
CostUSD
BUYSOld Mutual Voyager Global Dynamic Equity Fund (UCITS) GBP 4,848,898 7,888,410Kreditanstalt fuer Wiederaufbau 1.38 14/05/2018 USD 6,000,000 5,994,300United States Treasury Floating Rate Note 2.02 30/04/2019 USD 5,000,000 5,006,770Old Mutual Giobal Investors Series Plc - Old Mutual Europe(ex UK) Smaller Companies Fund (UCITS) GBP 146,264 3,861,517Old Mutual Global Investors Series Plc - Old Mutual UKSpecialist Equity Fund (UCITS) GBP 225,803 3,767,619Old Mutual Bond 3 Fund (UCITS) GBP 7,232,184 3,294,230European Investment Bank 1.75 15/05/2020 USD 3,040,000 3,000,571Kommunekredit 1.63 12/06/2020 USD 3,040,000 2,987,560Old Mutual Henderson European Growth Fund (UCITS) GBP 1,450,254 2,893,359State of North Rhine-Westphalia Germany 2.38 22/05/2019 USD 2,500,000 2,501,190Goldman Sachs Funds PLC - US$ Liquid Reserves Fund(UCITS) USD 196 2,434,345Wells Fargo Lux Worldwide Fund - US High Yield Bond(UCITS) USD 10,440 2,086,832Wellington Management Funds Ireland PLC - WellingtonGlobal Credit Plus Fund (UCITS) USD 166,631 2,084,974Old Mutual Global Investors Series Plc - Old Mutual GlobalEmerging Markets Fund (UCITS) GBP 81,063 1,941,789Highbridge Multi-Strategy Fund Ltd (AIF) GBP 425,778 1,337,156Skyline Umbrella Fund ICAV - Usonian Japan Value Fund(UCITS) GBP 93,700 1,284,102Old Mutual Bond 1 Fund (UCITS) GBP 1,846,396 1,175,394Old Mutual - JPM Emerging Markets Fund (UCITS) GBP 396,864 989,825iShares Diversified Commodity Swap UCITS ETF (UCITS) USD 182,885 964,875Baillie Gifford Investment Funds II ICVC - Japanese IncomeGrowth Fund (UCITS) GBP 469,339 859,628CZ Absolute Alpha UCITS Fund (UCITS) GBP 500 717,140Merrill Lynch Investment Solutions - AQR Global RelativeValue UCITS Fund (UCITS) GBP 4,368 704,490
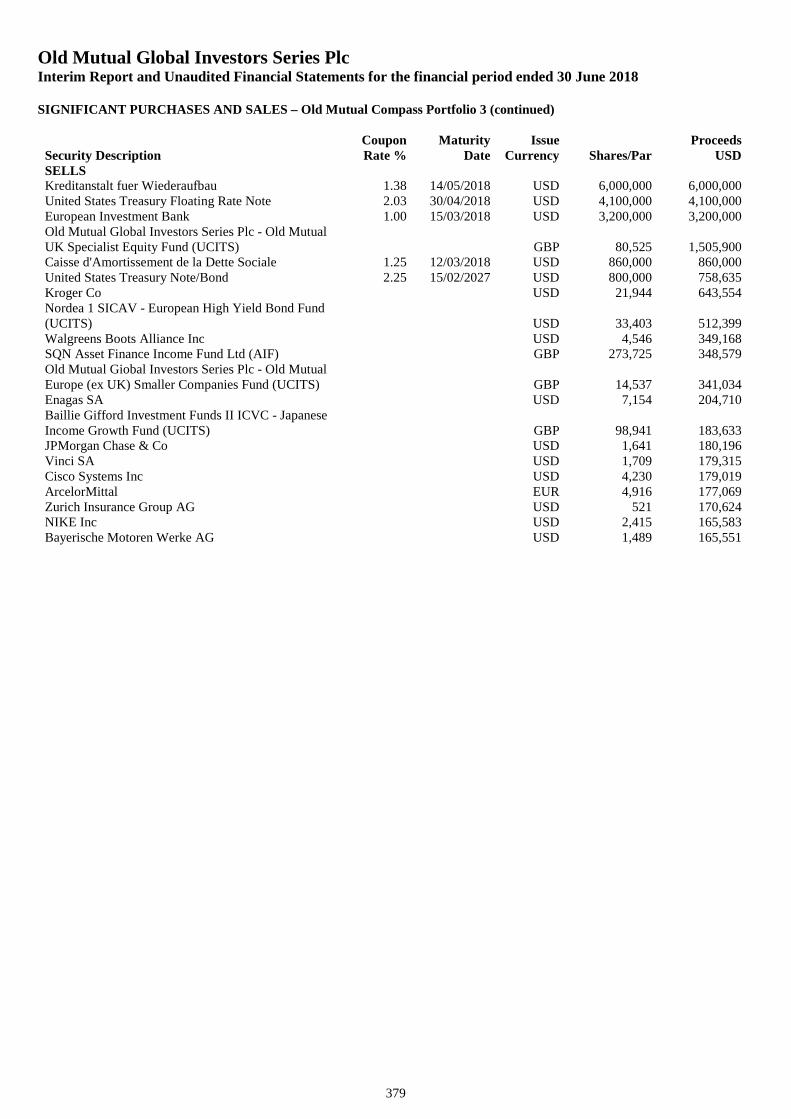
Old Mutual Global Investors Series PlcInterim Report and Unaudited Financial Statements for the financial period ended 30 June 2018
SIGNIFICANT PURCHASES AND SALES – Old Mutual Compass Portfolio 3 (continued)
379
Security DescriptionCouponRate %
MaturityDate
IssueCurrency Shares/Par
ProceedsUSD
SELLSKreditanstalt fuer Wiederaufbau 1.38 14/05/2018 USD 6,000,000 6,000,000United States Treasury Floating Rate Note 2.03 30/04/2018 USD 4,100,000 4,100,000European Investment Bank 1.00 15/03/2018 USD 3,200,000 3,200,000Old Mutual Global Investors Series Plc - Old MutualUK Specialist Equity Fund (UCITS) GBP 80,525 1,505,900Caisse d'Amortissement de la Dette Sociale 1.25 12/03/2018 USD 860,000 860,000United States Treasury Note/Bond 2.25 15/02/2027 USD 800,000 758,635Kroger Co USD 21,944 643,554Nordea 1 SICAV - European High Yield Bond Fund(UCITS) USD 33,403 512,399Walgreens Boots Alliance Inc USD 4,546 349,168SQN Asset Finance Income Fund Ltd (AIF) GBP 273,725 348,579Old Mutual Giobal Investors Series Plc - Old MutualEurope (ex UK) Smaller Companies Fund (UCITS) GBP 14,537 341,034Enagas SA USD 7,154 204,710Baillie Gifford Investment Funds II ICVC - JapaneseIncome Growth Fund (UCITS) GBP 98,941 183,633JPMorgan Chase & Co USD 1,641 180,196Vinci SA USD 1,709 179,315Cisco Systems Inc USD 4,230 179,019ArcelorMittal EUR 4,916 177,069Zurich Insurance Group AG USD 521 170,624NIKE Inc USD 2,415 165,583Bayerische Motoren Werke AG USD 1,489 165,551
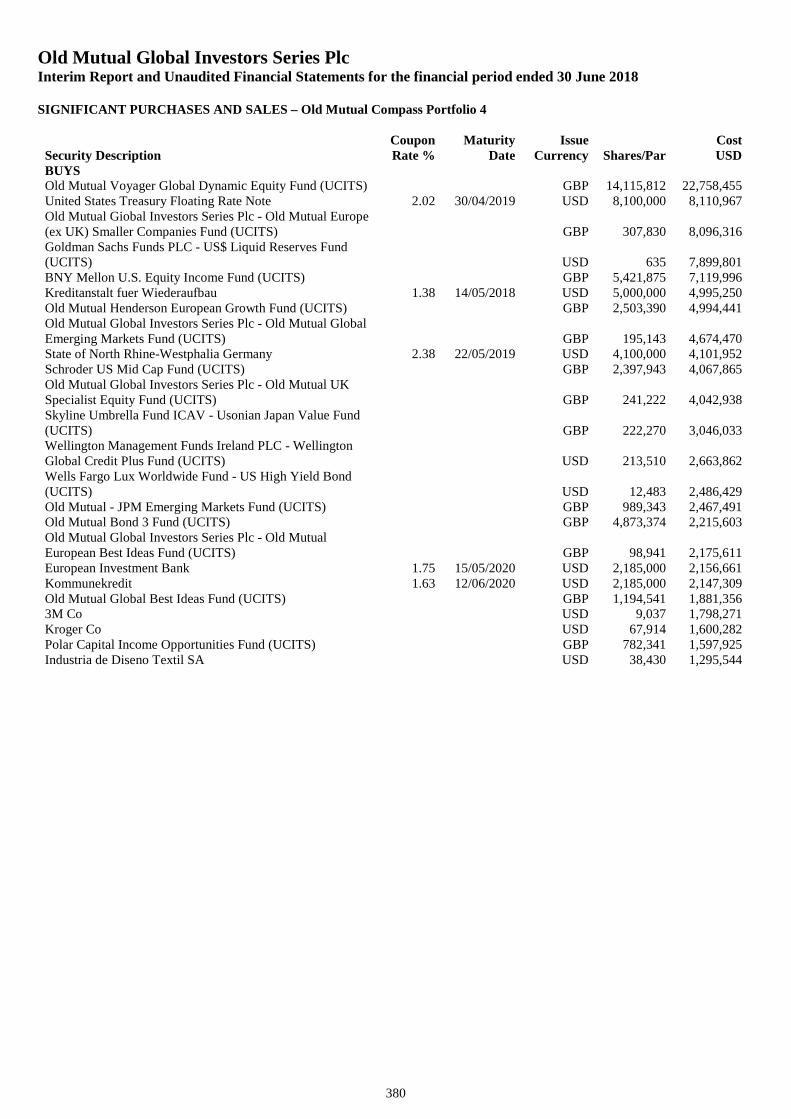
Old Mutual Global Investors Series PlcInterim Report and Unaudited Financial Statements for the financial period ended 30 June 2018
SIGNIFICANT PURCHASES AND SALES – Old Mutual Compass Portfolio 4
380
Security DescriptionCouponRate %
MaturityDate
IssueCurrency Shares/Par
CostUSD
BUYSOld Mutual Voyager Global Dynamic Equity Fund (UCITS) GBP 14,115,812 22,758,455United States Treasury Floating Rate Note 2.02 30/04/2019 USD 8,100,000 8,110,967Old Mutual Giobal Investors Series Plc - Old Mutual Europe(ex UK) Smaller Companies Fund (UCITS) GBP 307,830 8,096,316Goldman Sachs Funds PLC - US$ Liquid Reserves Fund(UCITS) USD 635 7,899,801BNY Mellon U.S. Equity Income Fund (UCITS) GBP 5,421,875 7,119,996Kreditanstalt fuer Wiederaufbau 1.38 14/05/2018 USD 5,000,000 4,995,250Old Mutual Henderson European Growth Fund (UCITS) GBP 2,503,390 4,994,441Old Mutual Global Investors Series Plc - Old Mutual GlobalEmerging Markets Fund (UCITS) GBP 195,143 4,674,470State of North Rhine-Westphalia Germany 2.38 22/05/2019 USD 4,100,000 4,101,952Schroder US Mid Cap Fund (UCITS) GBP 2,397,943 4,067,865Old Mutual Global Investors Series Plc - Old Mutual UKSpecialist Equity Fund (UCITS) GBP 241,222 4,042,938Skyline Umbrella Fund ICAV - Usonian Japan Value Fund(UCITS) GBP 222,270 3,046,033Wellington Management Funds Ireland PLC - WellingtonGlobal Credit Plus Fund (UCITS) USD 213,510 2,663,862Wells Fargo Lux Worldwide Fund - US High Yield Bond(UCITS) USD 12,483 2,486,429Old Mutual - JPM Emerging Markets Fund (UCITS) GBP 989,343 2,467,491Old Mutual Bond 3 Fund (UCITS) GBP 4,873,374 2,215,603Old Mutual Global Investors Series Plc - Old MutualEuropean Best Ideas Fund (UCITS) GBP 98,941 2,175,611European Investment Bank 1.75 15/05/2020 USD 2,185,000 2,156,661Kommunekredit 1.63 12/06/2020 USD 2,185,000 2,147,309Old Mutual Global Best Ideas Fund (UCITS) GBP 1,194,541 1,881,3563M Co USD 9,037 1,798,271Kroger Co USD 67,914 1,600,282Polar Capital Income Opportunities Fund (UCITS) GBP 782,341 1,597,925Industria de Diseno Textil SA USD 38,430 1,295,544
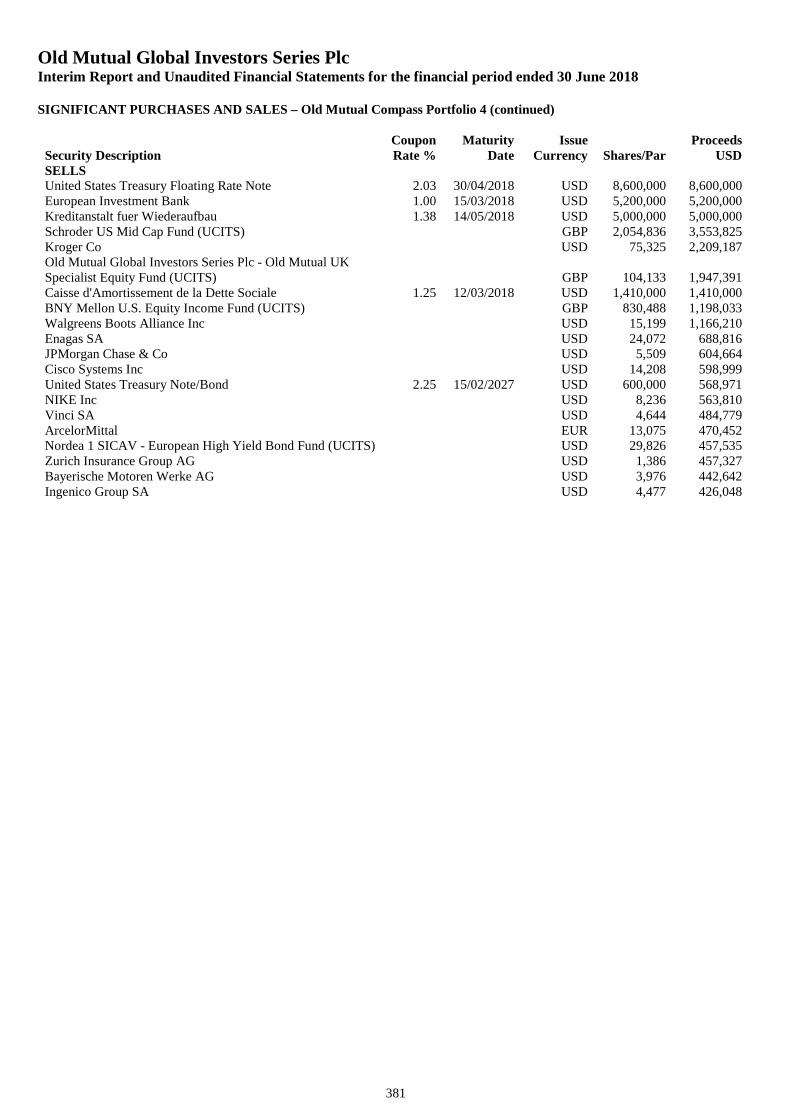
Old Mutual Global Investors Series PlcInterim Report and Unaudited Financial Statements for the financial period ended 30 June 2018
SIGNIFICANT PURCHASES AND SALES – Old Mutual Compass Portfolio 4 (continued)
381
Security DescriptionCouponRate %
MaturityDate
IssueCurrency Shares/Par
ProceedsUSD
SELLSUnited States Treasury Floating Rate Note 2.03 30/04/2018 USD 8,600,000 8,600,000European Investment Bank 1.00 15/03/2018 USD 5,200,000 5,200,000Kreditanstalt fuer Wiederaufbau 1.38 14/05/2018 USD 5,000,000 5,000,000Schroder US Mid Cap Fund (UCITS) GBP 2,054,836 3,553,825Kroger Co USD 75,325 2,209,187Old Mutual Global Investors Series Plc - Old Mutual UKSpecialist Equity Fund (UCITS) GBP 104,133 1,947,391Caisse d'Amortissement de la Dette Sociale 1.25 12/03/2018 USD 1,410,000 1,410,000BNY Mellon U.S. Equity Income Fund (UCITS) GBP 830,488 1,198,033Walgreens Boots Alliance Inc USD 15,199 1,166,210Enagas SA USD 24,072 688,816JPMorgan Chase & Co USD 5,509 604,664Cisco Systems Inc USD 14,208 598,999United States Treasury Note/Bond 2.25 15/02/2027 USD 600,000 568,971NIKE Inc USD 8,236 563,810Vinci SA USD 4,644 484,779ArcelorMittal EUR 13,075 470,452Nordea 1 SICAV - European High Yield Bond Fund (UCITS) USD 29,826 457,535Zurich Insurance Group AG USD 1,386 457,327Bayerische Motoren Werke AG USD 3,976 442,642Ingenico Group SA USD 4,477 426,048
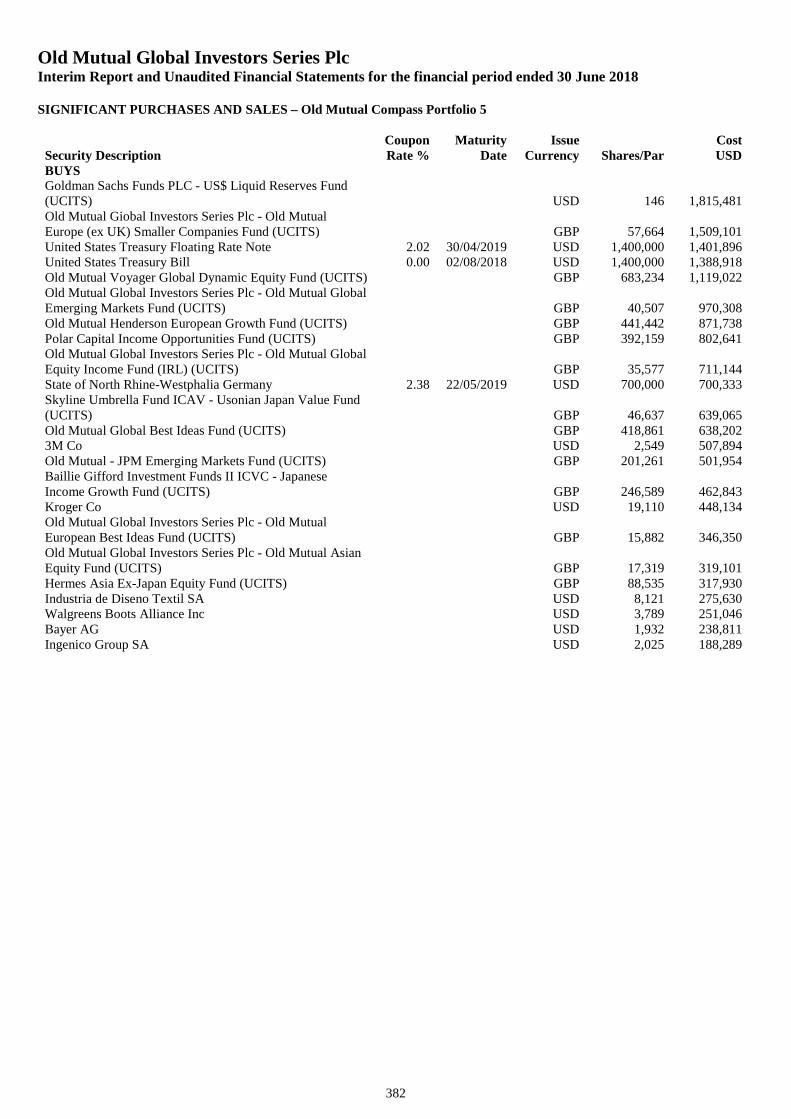
Old Mutual Global Investors Series PlcInterim Report and Unaudited Financial Statements for the financial period ended 30 June 2018
SIGNIFICANT PURCHASES AND SALES – Old Mutual Compass Portfolio 5
382
Security DescriptionCouponRate %
MaturityDate
IssueCurrency Shares/Par
CostUSD
BUYSGoldman Sachs Funds PLC - US$ Liquid Reserves Fund(UCITS) USD 146 1,815,481Old Mutual Giobal Investors Series Plc - Old MutualEurope (ex UK) Smaller Companies Fund (UCITS) GBP 57,664 1,509,101United States Treasury Floating Rate Note 2.02 30/04/2019 USD 1,400,000 1,401,896United States Treasury Bill 0.00 02/08/2018 USD 1,400,000 1,388,918Old Mutual Voyager Global Dynamic Equity Fund (UCITS) GBP 683,234 1,119,022Old Mutual Global Investors Series Plc - Old Mutual GlobalEmerging Markets Fund (UCITS) GBP 40,507 970,308Old Mutual Henderson European Growth Fund (UCITS) GBP 441,442 871,738Polar Capital Income Opportunities Fund (UCITS) GBP 392,159 802,641Old Mutual Global Investors Series Plc - Old Mutual GlobalEquity Income Fund (IRL) (UCITS) GBP 35,577 711,144State of North Rhine-Westphalia Germany 2.38 22/05/2019 USD 700,000 700,333Skyline Umbrella Fund ICAV - Usonian Japan Value Fund(UCITS) GBP 46,637 639,065Old Mutual Global Best Ideas Fund (UCITS) GBP 418,861 638,2023M Co USD 2,549 507,894Old Mutual - JPM Emerging Markets Fund (UCITS) GBP 201,261 501,954Baillie Gifford Investment Funds II ICVC - JapaneseIncome Growth Fund (UCITS) GBP 246,589 462,843Kroger Co USD 19,110 448,134Old Mutual Global Investors Series Plc - Old MutualEuropean Best Ideas Fund (UCITS) GBP 15,882 346,350Old Mutual Global Investors Series Plc - Old Mutual AsianEquity Fund (UCITS) GBP 17,319 319,101Hermes Asia Ex-Japan Equity Fund (UCITS) GBP 88,535 317,930Industria de Diseno Textil SA USD 8,121 275,630Walgreens Boots Alliance Inc USD 3,789 251,046Bayer AG USD 1,932 238,811Ingenico Group SA USD 2,025 188,289
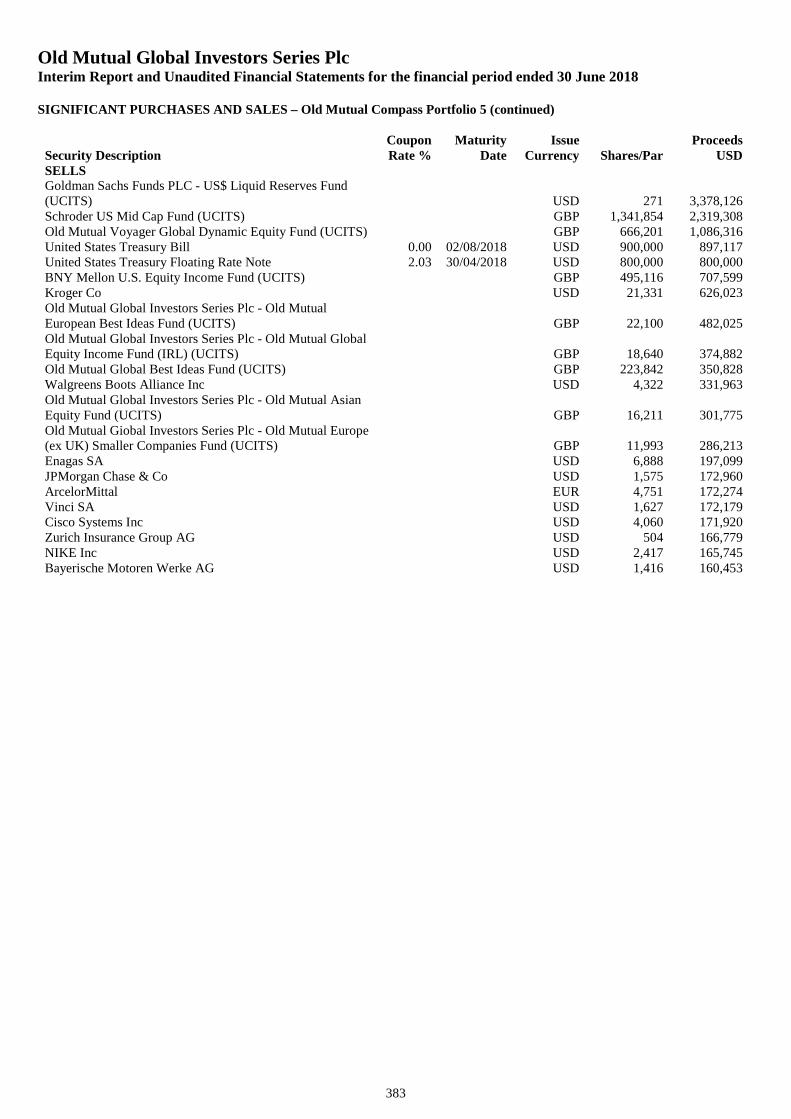
Old Mutual Global Investors Series PlcInterim Report and Unaudited Financial Statements for the financial period ended 30 June 2018
SIGNIFICANT PURCHASES AND SALES – Old Mutual Compass Portfolio 5 (continued)
383
Security DescriptionCouponRate %
MaturityDate
IssueCurrency Shares/Par
ProceedsUSD
SELLSGoldman Sachs Funds PLC - US$ Liquid Reserves Fund(UCITS) USD 271 3,378,126Schroder US Mid Cap Fund (UCITS) GBP 1,341,854 2,319,308Old Mutual Voyager Global Dynamic Equity Fund (UCITS) GBP 666,201 1,086,316United States Treasury Bill 0.00 02/08/2018 USD 900,000 897,117United States Treasury Floating Rate Note 2.03 30/04/2018 USD 800,000 800,000BNY Mellon U.S. Equity Income Fund (UCITS) GBP 495,116 707,599Kroger Co USD 21,331 626,023Old Mutual Global Investors Series Plc - Old MutualEuropean Best Ideas Fund (UCITS) GBP 22,100 482,025Old Mutual Global Investors Series Plc - Old Mutual GlobalEquity Income Fund (IRL) (UCITS) GBP 18,640 374,882Old Mutual Global Best Ideas Fund (UCITS) GBP 223,842 350,828Walgreens Boots Alliance Inc USD 4,322 331,963Old Mutual Global Investors Series Plc - Old Mutual AsianEquity Fund (UCITS) GBP 16,211 301,775Old Mutual Giobal Investors Series Plc - Old Mutual Europe(ex UK) Smaller Companies Fund (UCITS) GBP 11,993 286,213Enagas SA USD 6,888 197,099JPMorgan Chase & Co USD 1,575 172,960ArcelorMittal EUR 4,751 172,274Vinci SA USD 1,627 172,179Cisco Systems Inc USD 4,060 171,920Zurich Insurance Group AG USD 504 166,779NIKE Inc USD 2,417 165,745Bayerische Motoren Werke AG USD 1,416 160,453
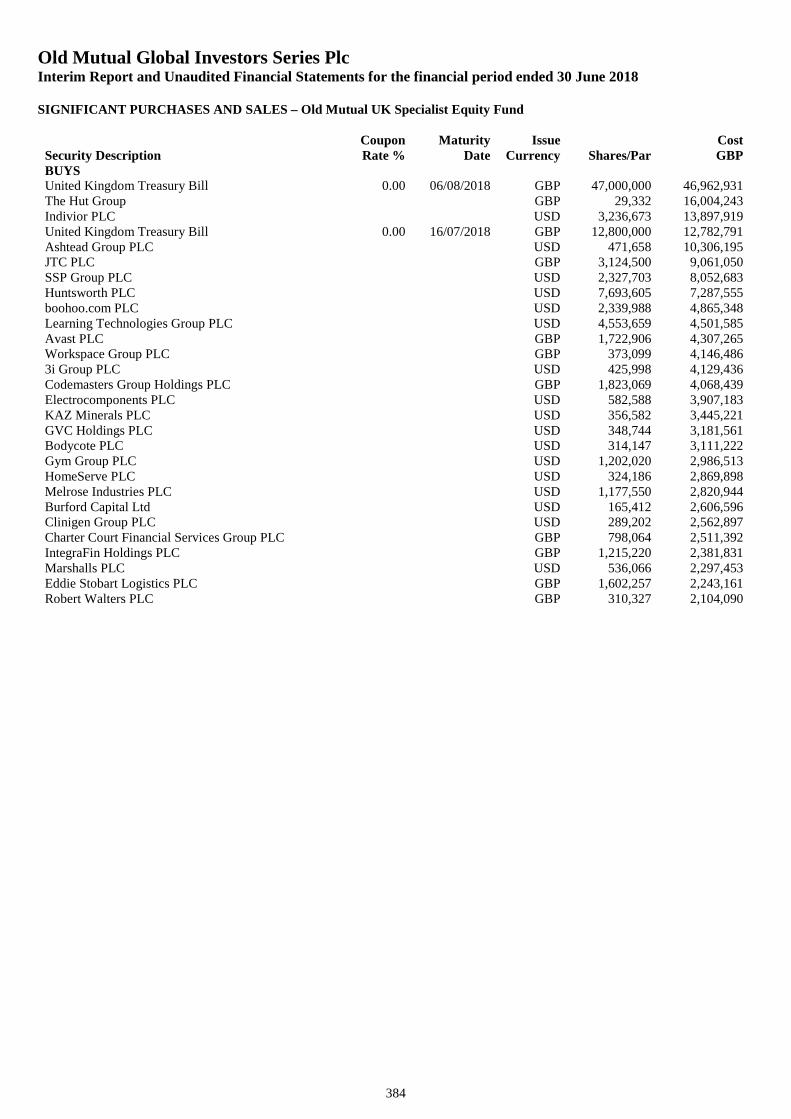
Old Mutual Global Investors Series PlcInterim Report and Unaudited Financial Statements for the financial period ended 30 June 2018
SIGNIFICANT PURCHASES AND SALES – Old Mutual UK Specialist Equity Fund
384
Security DescriptionCouponRate %
MaturityDate
IssueCurrency Shares/Par
CostGBP
BUYSUnited Kingdom Treasury Bill 0.00 06/08/2018 GBP 47,000,000 46,962,931The Hut Group GBP 29,332 16,004,243Indivior PLC USD 3,236,673 13,897,919United Kingdom Treasury Bill 0.00 16/07/2018 GBP 12,800,000 12,782,791Ashtead Group PLC USD 471,658 10,306,195JTC PLC GBP 3,124,500 9,061,050SSP Group PLC USD 2,327,703 8,052,683Huntsworth PLC USD 7,693,605 7,287,555boohoo.com PLC USD 2,339,988 4,865,348Learning Technologies Group PLC USD 4,553,659 4,501,585Avast PLC GBP 1,722,906 4,307,265Workspace Group PLC GBP 373,099 4,146,4863i Group PLC USD 425,998 4,129,436Codemasters Group Holdings PLC GBP 1,823,069 4,068,439Electrocomponents PLC USD 582,588 3,907,183KAZ Minerals PLC USD 356,582 3,445,221GVC Holdings PLC USD 348,744 3,181,561Bodycote PLC USD 314,147 3,111,222Gym Group PLC USD 1,202,020 2,986,513HomeServe PLC USD 324,186 2,869,898Melrose Industries PLC USD 1,177,550 2,820,944Burford Capital Ltd USD 165,412 2,606,596Clinigen Group PLC USD 289,202 2,562,897Charter Court Financial Services Group PLC GBP 798,064 2,511,392IntegraFin Holdings PLC GBP 1,215,220 2,381,831Marshalls PLC USD 536,066 2,297,453Eddie Stobart Logistics PLC GBP 1,602,257 2,243,161Robert Walters PLC GBP 310,327 2,104,090
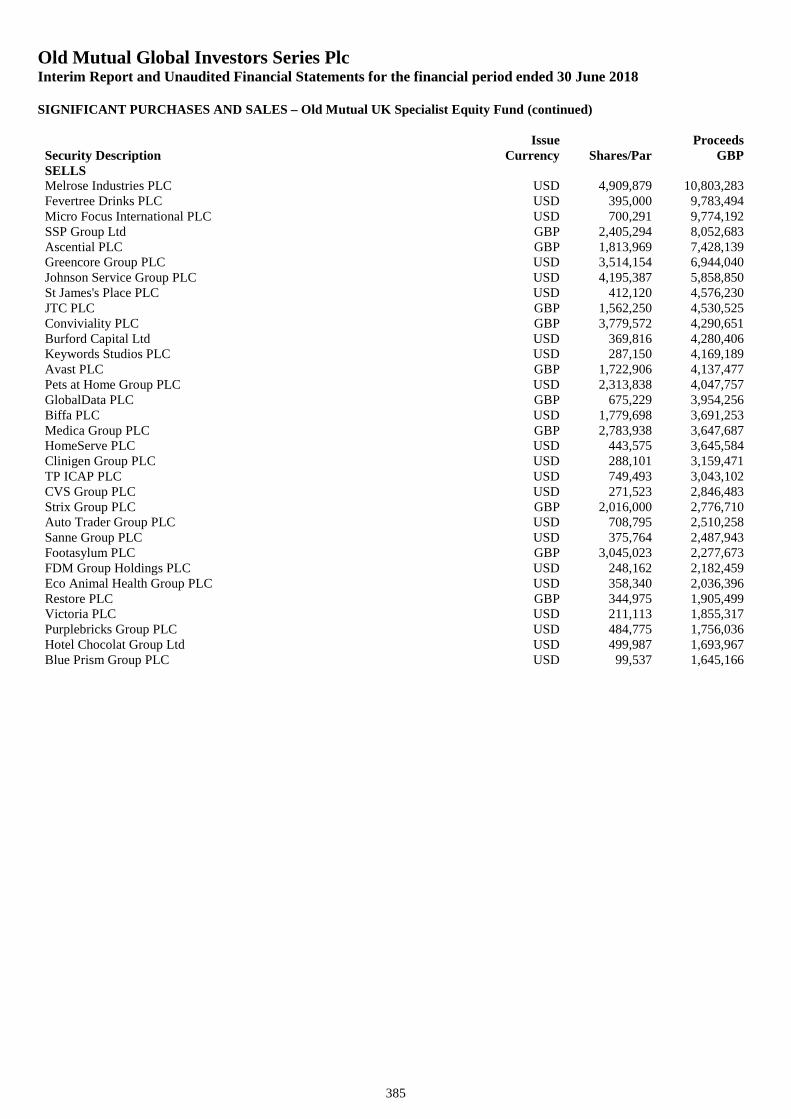
Old Mutual Global Investors Series PlcInterim Report and Unaudited Financial Statements for the financial period ended 30 June 2018
SIGNIFICANT PURCHASES AND SALES – Old Mutual UK Specialist Equity Fund (continued)
385
Security DescriptionIssue
Currency Shares/ParProceeds
GBPSELLSMelrose Industries PLC USD 4,909,879 10,803,283Fevertree Drinks PLC USD 395,000 9,783,494Micro Focus International PLC USD 700,291 9,774,192SSP Group Ltd GBP 2,405,294 8,052,683Ascential PLC GBP 1,813,969 7,428,139Greencore Group PLC USD 3,514,154 6,944,040Johnson Service Group PLC USD 4,195,387 5,858,850St James's Place PLC USD 412,120 4,576,230JTC PLC GBP 1,562,250 4,530,525Conviviality PLC GBP 3,779,572 4,290,651Burford Capital Ltd USD 369,816 4,280,406Keywords Studios PLC USD 287,150 4,169,189Avast PLC GBP 1,722,906 4,137,477Pets at Home Group PLC USD 2,313,838 4,047,757GlobalData PLC GBP 675,229 3,954,256Biffa PLC USD 1,779,698 3,691,253Medica Group PLC GBP 2,783,938 3,647,687HomeServe PLC USD 443,575 3,645,584Clinigen Group PLC USD 288,101 3,159,471TP ICAP PLC USD 749,493 3,043,102CVS Group PLC USD 271,523 2,846,483Strix Group PLC GBP 2,016,000 2,776,710Auto Trader Group PLC USD 708,795 2,510,258Sanne Group PLC USD 375,764 2,487,943Footasylum PLC GBP 3,045,023 2,277,673FDM Group Holdings PLC USD 248,162 2,182,459Eco Animal Health Group PLC USD 358,340 2,036,396Restore PLC GBP 344,975 1,905,499Victoria PLC USD 211,113 1,855,317Purplebricks Group PLC USD 484,775 1,756,036Hotel Chocolat Group Ltd USD 499,987 1,693,967Blue Prism Group PLC USD 99,537 1,645,166
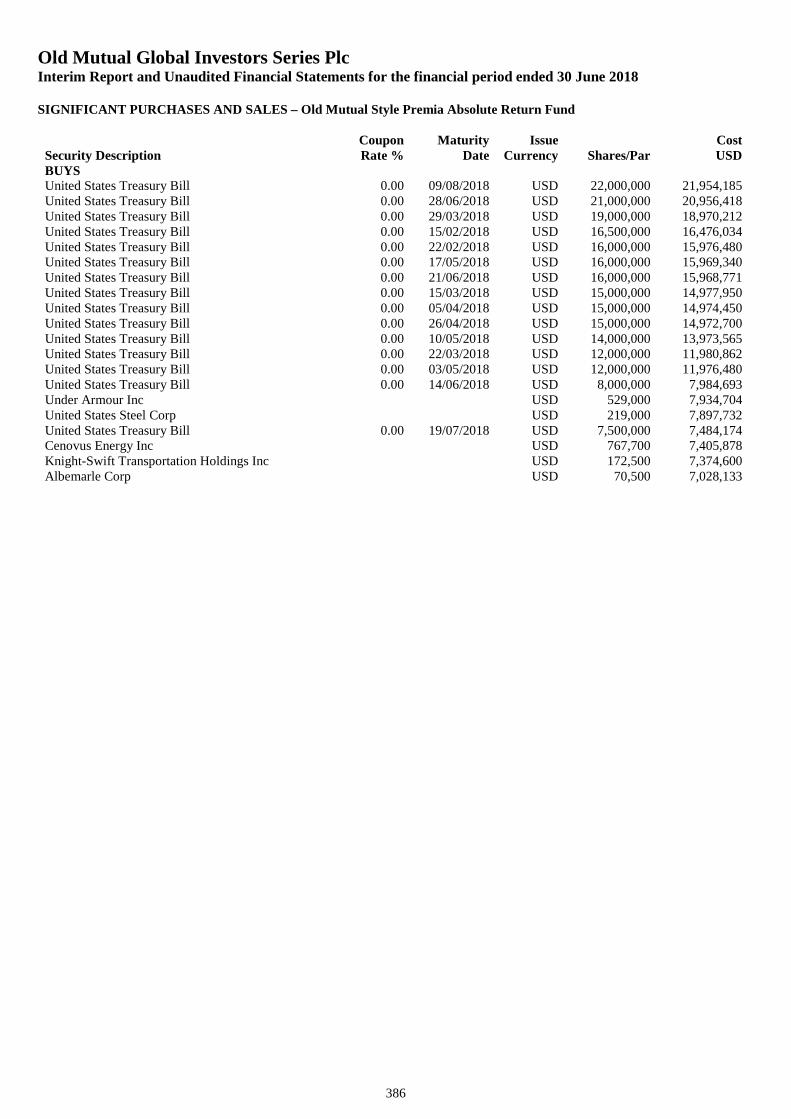
Old Mutual Global Investors Series PlcInterim Report and Unaudited Financial Statements for the financial period ended 30 June 2018
SIGNIFICANT PURCHASES AND SALES – Old Mutual Style Premia Absolute Return Fund
386
Security DescriptionCouponRate %
MaturityDate
IssueCurrency Shares/Par
CostUSD
BUYSUnited States Treasury Bill 0.00 09/08/2018 USD 22,000,000 21,954,185United States Treasury Bill 0.00 28/06/2018 USD 21,000,000 20,956,418United States Treasury Bill 0.00 29/03/2018 USD 19,000,000 18,970,212United States Treasury Bill 0.00 15/02/2018 USD 16,500,000 16,476,034United States Treasury Bill 0.00 22/02/2018 USD 16,000,000 15,976,480United States Treasury Bill 0.00 17/05/2018 USD 16,000,000 15,969,340United States Treasury Bill 0.00 21/06/2018 USD 16,000,000 15,968,771United States Treasury Bill 0.00 15/03/2018 USD 15,000,000 14,977,950United States Treasury Bill 0.00 05/04/2018 USD 15,000,000 14,974,450United States Treasury Bill 0.00 26/04/2018 USD 15,000,000 14,972,700United States Treasury Bill 0.00 10/05/2018 USD 14,000,000 13,973,565United States Treasury Bill 0.00 22/03/2018 USD 12,000,000 11,980,862United States Treasury Bill 0.00 03/05/2018 USD 12,000,000 11,976,480United States Treasury Bill 0.00 14/06/2018 USD 8,000,000 7,984,693Under Armour Inc USD 529,000 7,934,704United States Steel Corp USD 219,000 7,897,732United States Treasury Bill 0.00 19/07/2018 USD 7,500,000 7,484,174Cenovus Energy Inc USD 767,700 7,405,878Knight-Swift Transportation Holdings Inc USD 172,500 7,374,600Albemarle Corp USD 70,500 7,028,133
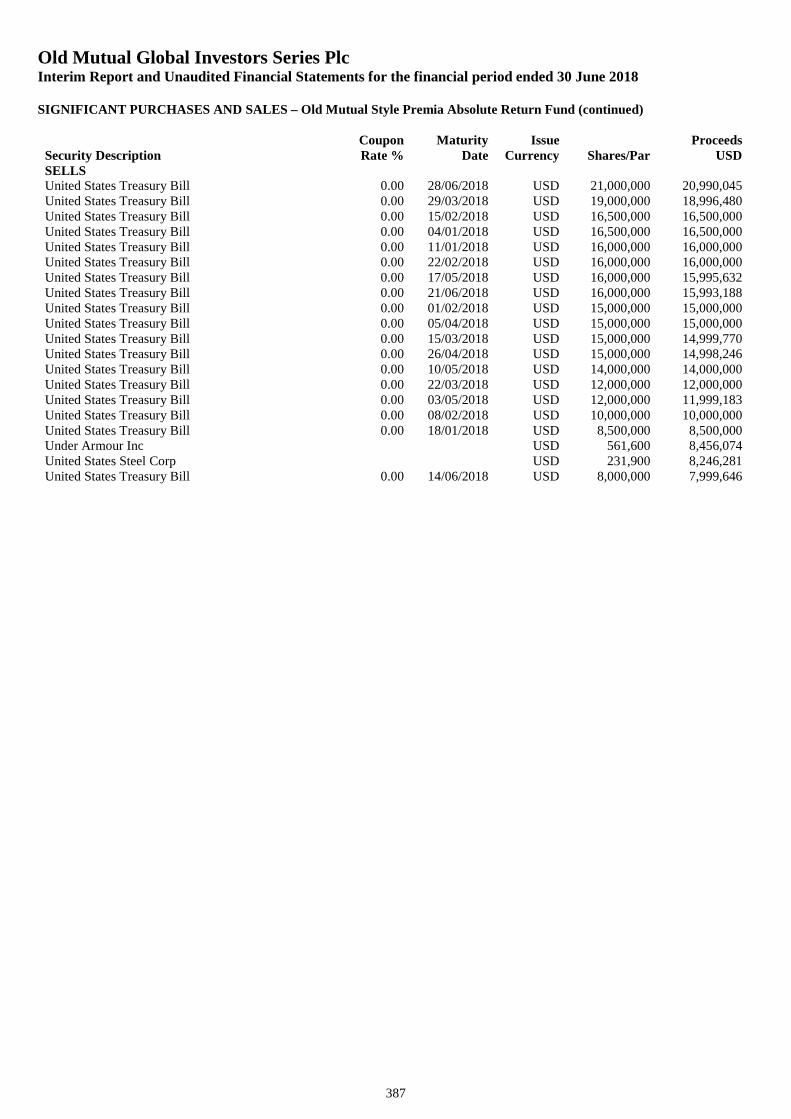
Old Mutual Global Investors Series PlcInterim Report and Unaudited Financial Statements for the financial period ended 30 June 2018
SIGNIFICANT PURCHASES AND SALES – Old Mutual Style Premia Absolute Return Fund (continued)
387
Security DescriptionCouponRate %
MaturityDate
IssueCurrency Shares/Par
ProceedsUSD
SELLSUnited States Treasury Bill 0.00 28/06/2018 USD 21,000,000 20,990,045United States Treasury Bill 0.00 29/03/2018 USD 19,000,000 18,996,480United States Treasury Bill 0.00 15/02/2018 USD 16,500,000 16,500,000United States Treasury Bill 0.00 04/01/2018 USD 16,500,000 16,500,000United States Treasury Bill 0.00 11/01/2018 USD 16,000,000 16,000,000United States Treasury Bill 0.00 22/02/2018 USD 16,000,000 16,000,000United States Treasury Bill 0.00 17/05/2018 USD 16,000,000 15,995,632United States Treasury Bill 0.00 21/06/2018 USD 16,000,000 15,993,188United States Treasury Bill 0.00 01/02/2018 USD 15,000,000 15,000,000United States Treasury Bill 0.00 05/04/2018 USD 15,000,000 15,000,000United States Treasury Bill 0.00 15/03/2018 USD 15,000,000 14,999,770United States Treasury Bill 0.00 26/04/2018 USD 15,000,000 14,998,246United States Treasury Bill 0.00 10/05/2018 USD 14,000,000 14,000,000United States Treasury Bill 0.00 22/03/2018 USD 12,000,000 12,000,000United States Treasury Bill 0.00 03/05/2018 USD 12,000,000 11,999,183United States Treasury Bill 0.00 08/02/2018 USD 10,000,000 10,000,000United States Treasury Bill 0.00 18/01/2018 USD 8,500,000 8,500,000Under Armour Inc USD 561,600 8,456,074United States Steel Corp USD 231,900 8,246,281United States Treasury Bill 0.00 14/06/2018 USD 8,000,000 7,999,646
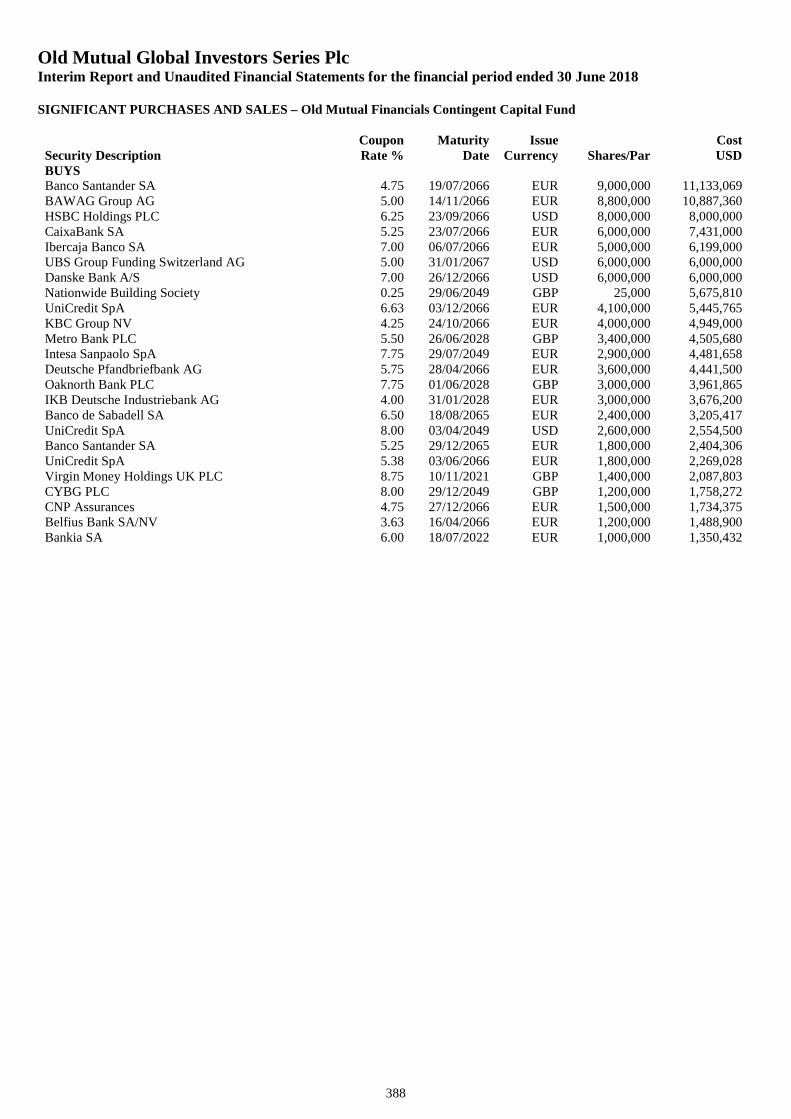
Old Mutual Global Investors Series PlcInterim Report and Unaudited Financial Statements for the financial period ended 30 June 2018
SIGNIFICANT PURCHASES AND SALES – Old Mutual Financials Contingent Capital Fund
388
Security DescriptionCouponRate %
MaturityDate
IssueCurrency Shares/Par
CostUSD
BUYSBanco Santander SA 4.75 19/07/2066 EUR 9,000,000 11,133,069BAWAG Group AG 5.00 14/11/2066 EUR 8,800,000 10,887,360HSBC Holdings PLC 6.25 23/09/2066 USD 8,000,000 8,000,000CaixaBank SA 5.25 23/07/2066 EUR 6,000,000 7,431,000Ibercaja Banco SA 7.00 06/07/2066 EUR 5,000,000 6,199,000UBS Group Funding Switzerland AG 5.00 31/01/2067 USD 6,000,000 6,000,000Danske Bank A/S 7.00 26/12/2066 USD 6,000,000 6,000,000Nationwide Building Society 0.25 29/06/2049 GBP 25,000 5,675,810UniCredit SpA 6.63 03/12/2066 EUR 4,100,000 5,445,765KBC Group NV 4.25 24/10/2066 EUR 4,000,000 4,949,000Metro Bank PLC 5.50 26/06/2028 GBP 3,400,000 4,505,680Intesa Sanpaolo SpA 7.75 29/07/2049 EUR 2,900,000 4,481,658Deutsche Pfandbriefbank AG 5.75 28/04/2066 EUR 3,600,000 4,441,500Oaknorth Bank PLC 7.75 01/06/2028 GBP 3,000,000 3,961,865IKB Deutsche Industriebank AG 4.00 31/01/2028 EUR 3,000,000 3,676,200Banco de Sabadell SA 6.50 18/08/2065 EUR 2,400,000 3,205,417UniCredit SpA 8.00 03/04/2049 USD 2,600,000 2,554,500Banco Santander SA 5.25 29/12/2065 EUR 1,800,000 2,404,306UniCredit SpA 5.38 03/06/2066 EUR 1,800,000 2,269,028Virgin Money Holdings UK PLC 8.75 10/11/2021 GBP 1,400,000 2,087,803CYBG PLC 8.00 29/12/2049 GBP 1,200,000 1,758,272CNP Assurances 4.75 27/12/2066 EUR 1,500,000 1,734,375Belfius Bank SA/NV 3.63 16/04/2066 EUR 1,200,000 1,488,900Bankia SA 6.00 18/07/2022 EUR 1,000,000 1,350,432
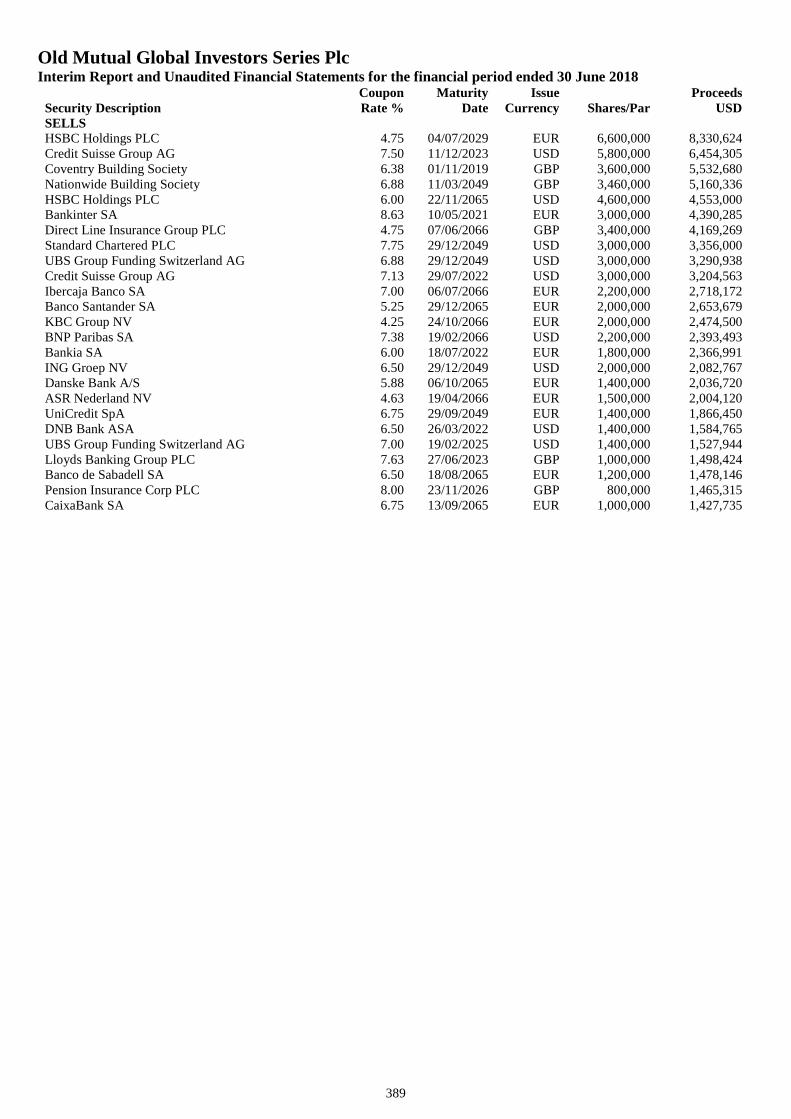
Old Mutual Global Investors Series PlcInterim Report and Unaudited Financial Statements for the financial period ended 30 June 2018
389
Security DescriptionCouponRate %
MaturityDate
IssueCurrency Shares/Par
ProceedsUSD
SELLSHSBC Holdings PLC 4.75 04/07/2029 EUR 6,600,000 8,330,624Credit Suisse Group AG 7.50 11/12/2023 USD 5,800,000 6,454,305Coventry Building Society 6.38 01/11/2019 GBP 3,600,000 5,532,680Nationwide Building Society 6.88 11/03/2049 GBP 3,460,000 5,160,336HSBC Holdings PLC 6.00 22/11/2065 USD 4,600,000 4,553,000Bankinter SA 8.63 10/05/2021 EUR 3,000,000 4,390,285Direct Line Insurance Group PLC 4.75 07/06/2066 GBP 3,400,000 4,169,269Standard Chartered PLC 7.75 29/12/2049 USD 3,000,000 3,356,000UBS Group Funding Switzerland AG 6.88 29/12/2049 USD 3,000,000 3,290,938Credit Suisse Group AG 7.13 29/07/2022 USD 3,000,000 3,204,563Ibercaja Banco SA 7.00 06/07/2066 EUR 2,200,000 2,718,172Banco Santander SA 5.25 29/12/2065 EUR 2,000,000 2,653,679KBC Group NV 4.25 24/10/2066 EUR 2,000,000 2,474,500BNP Paribas SA 7.38 19/02/2066 USD 2,200,000 2,393,493Bankia SA 6.00 18/07/2022 EUR 1,800,000 2,366,991ING Groep NV 6.50 29/12/2049 USD 2,000,000 2,082,767Danske Bank A/S 5.88 06/10/2065 EUR 1,400,000 2,036,720ASR Nederland NV 4.63 19/04/2066 EUR 1,500,000 2,004,120UniCredit SpA 6.75 29/09/2049 EUR 1,400,000 1,866,450DNB Bank ASA 6.50 26/03/2022 USD 1,400,000 1,584,765UBS Group Funding Switzerland AG 7.00 19/02/2025 USD 1,400,000 1,527,944Lloyds Banking Group PLC 7.63 27/06/2023 GBP 1,000,000 1,498,424Banco de Sabadell SA 6.50 18/08/2065 EUR 1,200,000 1,478,146Pension Insurance Corp PLC 8.00 23/11/2026 GBP 800,000 1,465,315CaixaBank SA 6.75 13/09/2065 EUR 1,000,000 1,427,735
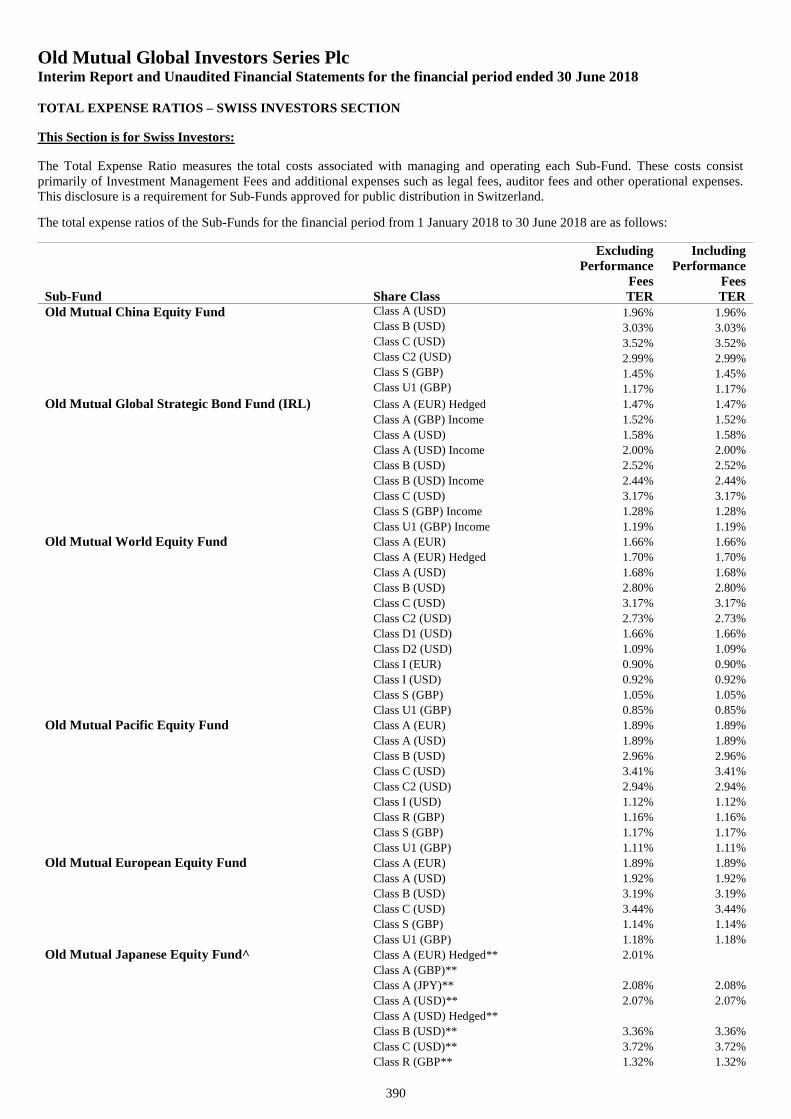
Old Mutual Global Investors Series PlcInterim Report and Unaudited Financial Statements for the financial period ended 30 June 2018
390
TOTAL EXPENSE RATIOS – SWISS INVESTORS SECTION
This Section is for Swiss Investors:
The Total Expense Ratio measures the total costs associated with managing and operating each Sub-Fund. These costs consistprimarily of Investment Management Fees and additional expenses such as legal fees, auditor fees and other operational expenses.This disclosure is a requirement for Sub-Funds approved for public distribution in Switzerland.
The total expense ratios of the Sub-Funds for the financial period from 1 January 2018 to 30 June 2018 are as follows:
ExcludingPerformance
Fees
IncludingPerformance
FeesSub-Fund Share Class TER TEROld Mutual China Equity Fund Class A (USD) 1.96% 1.96%
Class B (USD) 3.03% 3.03%Class C (USD) 3.52% 3.52%Class C2 (USD) 2.99% 2.99%Class S (GBP) 1.45% 1.45%Class U1 (GBP) 1.17% 1.17%
Old Mutual Global Strategic Bond Fund (IRL) Class A (EUR) Hedged 1.47% 1.47%
Class A (GBP) Income 1.52% 1.52%
Class A (USD) 1.58% 1.58%
Class A (USD) Income 2.00% 2.00%
Class B (USD) 2.52% 2.52%
Class B (USD) Income 2.44% 2.44%
Class C (USD) 3.17% 3.17%
Class S (GBP) Income 1.28% 1.28%
Class U1 (GBP) Income 1.19% 1.19%
Old Mutual World Equity Fund Class A (EUR) 1.66% 1.66%
Class A (EUR) Hedged 1.70% 1.70%
Class A (USD) 1.68% 1.68%
Class B (USD) 2.80% 2.80%
Class C (USD) 3.17% 3.17%
Class C2 (USD) 2.73% 2.73%
Class D1 (USD) 1.66% 1.66%
Class D2 (USD) 1.09% 1.09%
Class I (EUR) 0.90% 0.90%
Class I (USD) 0.92% 0.92%
Class S (GBP) 1.05% 1.05%
Class U1 (GBP) 0.85% 0.85%
Old Mutual Pacific Equity Fund Class A (EUR) 1.89% 1.89%
Class A (USD) 1.89% 1.89%
Class B (USD) 2.96% 2.96%
Class C (USD) 3.41% 3.41%
Class C2 (USD) 2.94% 2.94%
Class I (USD) 1.12% 1.12%
Class R (GBP) 1.16% 1.16%
Class S (GBP) 1.17% 1.17%
Class U1 (GBP) 1.11% 1.11%
Old Mutual European Equity Fund Class A (EUR) 1.89% 1.89%
Class A (USD) 1.92% 1.92%
Class B (USD) 3.19% 3.19%
Class C (USD) 3.44% 3.44%
Class S (GBP) 1.14% 1.14%
Class U1 (GBP) 1.18% 1.18%
Old Mutual Japanese Equity Fund^ Class A (EUR) Hedged** 2.01%
Class A (GBP)**
Class A (JPY)** 2.08% 2.08%
Class A (USD)** 2.07% 2.07%
Class A (USD) Hedged**
Class B (USD)** 3.36% 3.36%
Class C (USD)** 3.72% 3.72%
Class R (GBP** 1.32% 1.32%
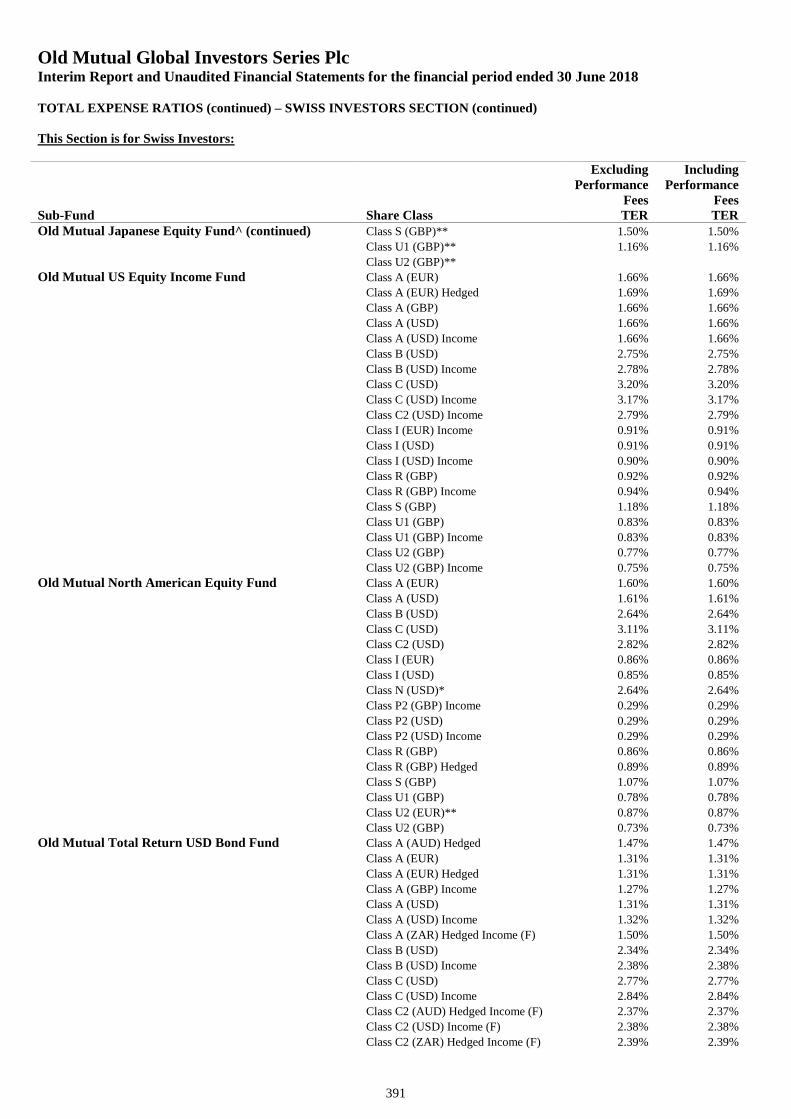
Old Mutual Global Investors Series PlcInterim Report and Unaudited Financial Statements for the financial period ended 30 June 2018
391
TOTAL EXPENSE RATIOS (continued) – SWISS INVESTORS SECTION (continued)
This Section is for Swiss Investors:
ExcludingPerformance
Fees
IncludingPerformance
FeesSub-Fund Share Class TER TEROld Mutual Japanese Equity Fund^ (continued) Class S (GBP)** 1.50% 1.50%
Class U1 (GBP)** 1.16% 1.16%
Class U2 (GBP)**
Old Mutual US Equity Income Fund Class A (EUR) 1.66% 1.66%
Class A (EUR) Hedged 1.69% 1.69%
Class A (GBP) 1.66% 1.66%
Class A (USD) 1.66% 1.66%
Class A (USD) Income 1.66% 1.66%
Class B (USD) 2.75% 2.75%
Class B (USD) Income 2.78% 2.78%
Class C (USD) 3.20% 3.20%
Class C (USD) Income 3.17% 3.17%
Class C2 (USD) Income 2.79% 2.79%
Class I (EUR) Income 0.91% 0.91%
Class I (USD) 0.91% 0.91%
Class I (USD) Income 0.90% 0.90%
Class R (GBP) 0.92% 0.92%
Class R (GBP) Income 0.94% 0.94%
Class S (GBP) 1.18% 1.18%
Class U1 (GBP) 0.83% 0.83%
Class U1 (GBP) Income 0.83% 0.83%
Class U2 (GBP) 0.77% 0.77%
Class U2 (GBP) Income 0.75% 0.75%
Old Mutual North American Equity Fund Class A (EUR) 1.60% 1.60%
Class A (USD) 1.61% 1.61%
Class B (USD) 2.64% 2.64%
Class C (USD) 3.11% 3.11%
Class C2 (USD) 2.82% 2.82%
Class I (EUR) 0.86% 0.86%
Class I (USD) 0.85% 0.85%
Class N (USD)* 2.64% 2.64%
Class P2 (GBP) Income 0.29% 0.29%
Class P2 (USD) 0.29% 0.29%
Class P2 (USD) Income 0.29% 0.29%
Class R (GBP) 0.86% 0.86%
Class R (GBP) Hedged 0.89% 0.89%
Class S (GBP) 1.07% 1.07%
Class U1 (GBP) 0.78% 0.78%
Class U2 (EUR)** 0.87% 0.87%
Class U2 (GBP) 0.73% 0.73%
Old Mutual Total Return USD Bond Fund Class A (AUD) Hedged 1.47% 1.47%
Class A (EUR) 1.31% 1.31%
Class A (EUR) Hedged 1.31% 1.31%
Class A (GBP) Income 1.27% 1.27%
Class A (USD) 1.31% 1.31%
Class A (USD) Income 1.32% 1.32%
Class A (ZAR) Hedged Income (F) 1.50% 1.50%
Class B (USD) 2.34% 2.34%
Class B (USD) Income 2.38% 2.38%
Class C (USD) 2.77% 2.77%
Class C (USD) Income 2.84% 2.84%
Class C2 (AUD) Hedged Income (F) 2.37% 2.37%
Class C2 (USD) Income (F) 2.38% 2.38%
Class C2 (ZAR) Hedged Income (F) 2.39% 2.39%
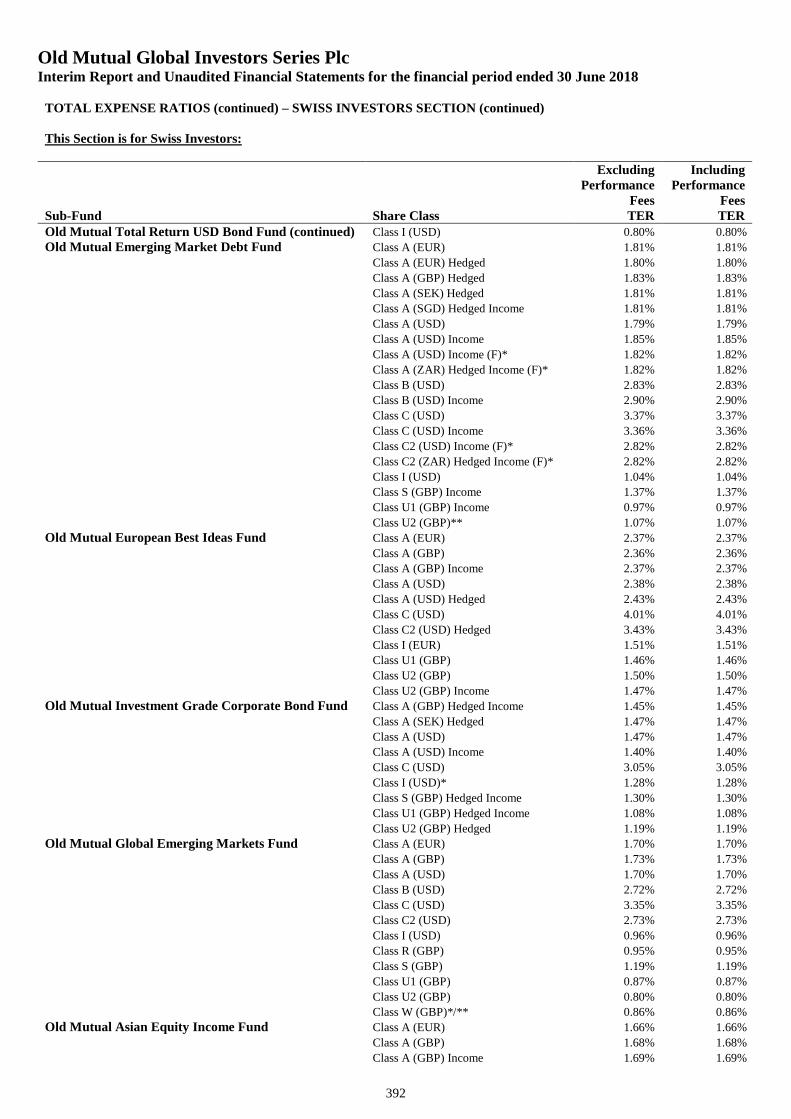
Old Mutual Global Investors Series PlcInterim Report and Unaudited Financial Statements for the financial period ended 30 June 2018
392
TOTAL EXPENSE RATIOS (continued) – SWISS INVESTORS SECTION (continued)
This Section is for Swiss Investors:
ExcludingPerformance
Fees
IncludingPerformance
FeesSub-Fund Share Class TER TEROld Mutual Total Return USD Bond Fund (continued) Class I (USD) 0.80% 0.80%
Old Mutual Emerging Market Debt Fund Class A (EUR) 1.81% 1.81%
Class A (EUR) Hedged 1.80% 1.80%
Class A (GBP) Hedged 1.83% 1.83%
Class A (SEK) Hedged 1.81% 1.81%
Class A (SGD) Hedged Income 1.81% 1.81%
Class A (USD) 1.79% 1.79%
Class A (USD) Income 1.85% 1.85%
Class A (USD) Income (F)* 1.82% 1.82%
Class A (ZAR) Hedged Income (F)* 1.82% 1.82%
Class B (USD) 2.83% 2.83%
Class B (USD) Income 2.90% 2.90%
Class C (USD) 3.37% 3.37%
Class C (USD) Income 3.36% 3.36%
Class C2 (USD) Income (F)* 2.82% 2.82%
Class C2 (ZAR) Hedged Income (F)* 2.82% 2.82%
Class I (USD) 1.04% 1.04%
Class S (GBP) Income 1.37% 1.37%
Class U1 (GBP) Income 0.97% 0.97%
Class U2 (GBP)** 1.07% 1.07%
Old Mutual European Best Ideas Fund Class A (EUR) 2.37% 2.37%
Class A (GBP) 2.36% 2.36%
Class A (GBP) Income 2.37% 2.37%
Class A (USD) 2.38% 2.38%
Class A (USD) Hedged 2.43% 2.43%
Class C (USD) 4.01% 4.01%
Class C2 (USD) Hedged 3.43% 3.43%
Class I (EUR) 1.51% 1.51%
Class U1 (GBP) 1.46% 1.46%
Class U2 (GBP) 1.50% 1.50%
Class U2 (GBP) Income 1.47% 1.47%
Old Mutual Investment Grade Corporate Bond Fund Class A (GBP) Hedged Income 1.45% 1.45%
Class A (SEK) Hedged 1.47% 1.47%
Class A (USD) 1.47% 1.47%
Class A (USD) Income 1.40% 1.40%
Class C (USD) 3.05% 3.05%
Class I (USD)* 1.28% 1.28%
Class S (GBP) Hedged Income 1.30% 1.30%
Class U1 (GBP) Hedged Income 1.08% 1.08%
Class U2 (GBP) Hedged 1.19% 1.19%
Old Mutual Global Emerging Markets Fund Class A (EUR) 1.70% 1.70%
Class A (GBP) 1.73% 1.73%
Class A (USD) 1.70% 1.70%
Class B (USD) 2.72% 2.72%
Class C (USD) 3.35% 3.35%
Class C2 (USD) 2.73% 2.73%
Class I (USD) 0.96% 0.96%
Class R (GBP) 0.95% 0.95%
Class S (GBP) 1.19% 1.19%
Class U1 (GBP) 0.87% 0.87%
Class U2 (GBP) 0.80% 0.80%
Class W (GBP)*/** 0.86% 0.86%
Old Mutual Asian Equity Income Fund Class A (EUR) 1.66% 1.66%
Class A (GBP) 1.68% 1.68%
Class A (GBP) Income 1.69% 1.69%
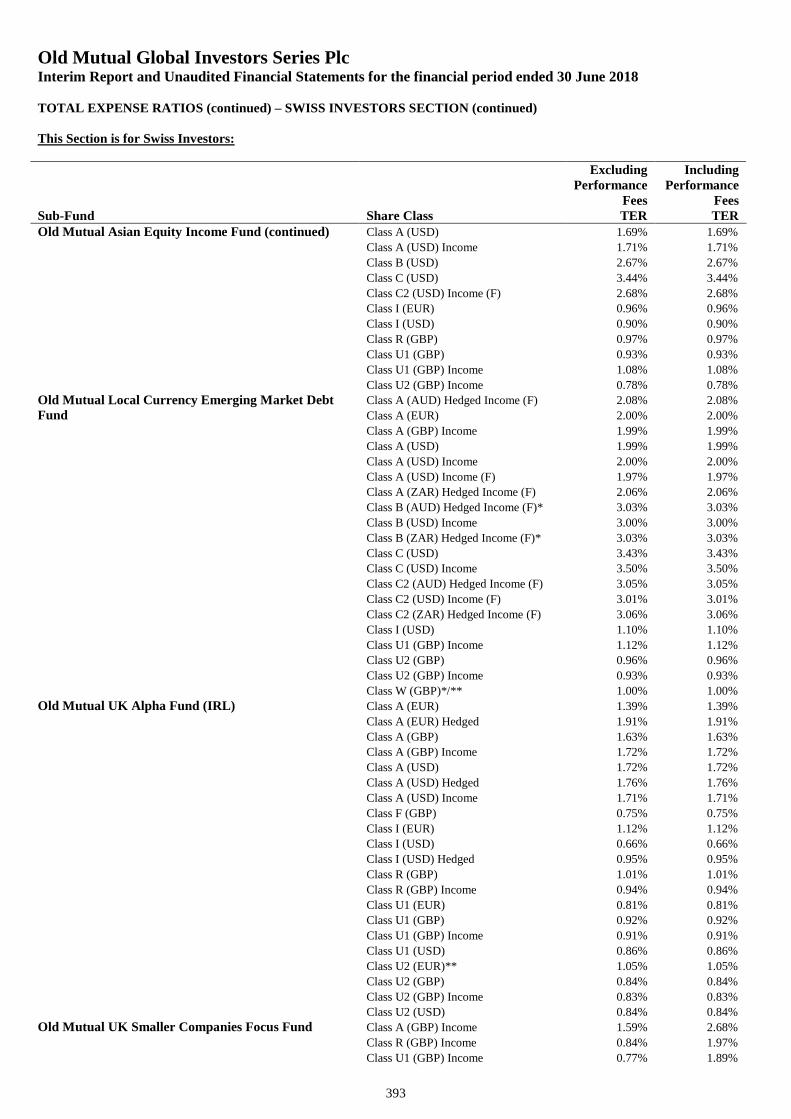
Old Mutual Global Investors Series PlcInterim Report and Unaudited Financial Statements for the financial period ended 30 June 2018
393
TOTAL EXPENSE RATIOS (continued) – SWISS INVESTORS SECTION (continued)
This Section is for Swiss Investors:
ExcludingPerformance
Fees
IncludingPerformance
FeesSub-Fund Share Class TER TEROld Mutual Asian Equity Income Fund (continued) Class A (USD) 1.69% 1.69%
Class A (USD) Income 1.71% 1.71%
Class B (USD) 2.67% 2.67%
Class C (USD) 3.44% 3.44%
Class C2 (USD) Income (F) 2.68% 2.68%
Class I (EUR) 0.96% 0.96%
Class I (USD) 0.90% 0.90%
Class R (GBP) 0.97% 0.97%
Class U1 (GBP) 0.93% 0.93%
Class U1 (GBP) Income 1.08% 1.08%
Class U2 (GBP) Income 0.78% 0.78%
Old Mutual Local Currency Emerging Market Debt Class A (AUD) Hedged Income (F) 2.08% 2.08%
Fund Class A (EUR) 2.00% 2.00%
Class A (GBP) Income 1.99% 1.99%
Class A (USD) 1.99% 1.99%
Class A (USD) Income 2.00% 2.00%
Class A (USD) Income (F) 1.97% 1.97%
Class A (ZAR) Hedged Income (F) 2.06% 2.06%
Class B (AUD) Hedged Income (F)* 3.03% 3.03%
Class B (USD) Income 3.00% 3.00%
Class B (ZAR) Hedged Income (F)* 3.03% 3.03%
Class C (USD) 3.43% 3.43%
Class C (USD) Income 3.50% 3.50%
Class C2 (AUD) Hedged Income (F) 3.05% 3.05%
Class C2 (USD) Income (F) 3.01% 3.01%
Class C2 (ZAR) Hedged Income (F) 3.06% 3.06%
Class I (USD) 1.10% 1.10%
Class U1 (GBP) Income 1.12% 1.12%
Class U2 (GBP) 0.96% 0.96%
Class U2 (GBP) Income 0.93% 0.93%
Class W (GBP)*/** 1.00% 1.00%
Old Mutual UK Alpha Fund (IRL) Class A (EUR) 1.39% 1.39%
Class A (EUR) Hedged 1.91% 1.91%
Class A (GBP) 1.63% 1.63%
Class A (GBP) Income 1.72% 1.72%
Class A (USD) 1.72% 1.72%
Class A (USD) Hedged 1.76% 1.76%
Class A (USD) Income 1.71% 1.71%
Class F (GBP) 0.75% 0.75%
Class I (EUR) 1.12% 1.12%
Class I (USD) 0.66% 0.66%
Class I (USD) Hedged 0.95% 0.95%
Class R (GBP) 1.01% 1.01%
Class R (GBP) Income 0.94% 0.94%
Class U1 (EUR) 0.81% 0.81%
Class U1 (GBP) 0.92% 0.92%
Class U1 (GBP) Income 0.91% 0.91%
Class U1 (USD) 0.86% 0.86%
Class U2 (EUR)** 1.05% 1.05%
Class U2 (GBP) 0.84% 0.84%
Class U2 (GBP) Income 0.83% 0.83%
Class U2 (USD) 0.84% 0.84%
Old Mutual UK Smaller Companies Focus Fund Class A (GBP) Income 1.59% 2.68%
Class R (GBP) Income 0.84% 1.97%
Class U1 (GBP) Income 0.77% 1.89%
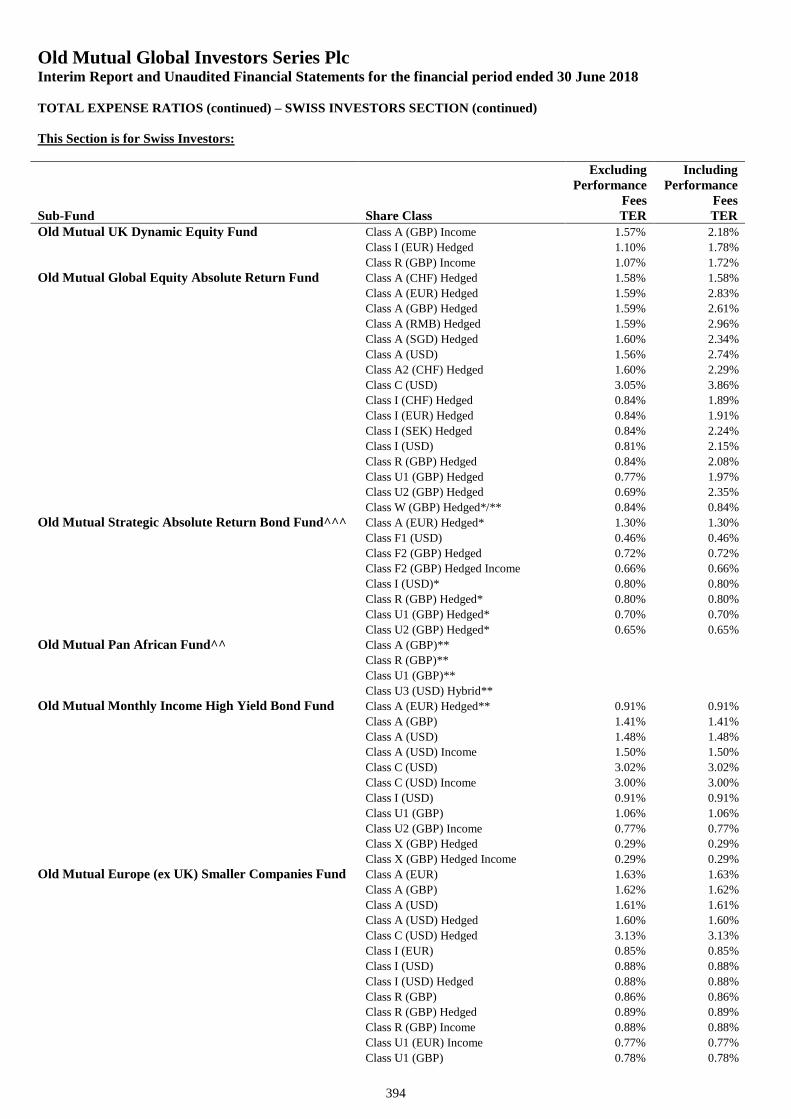
Old Mutual Global Investors Series PlcInterim Report and Unaudited Financial Statements for the financial period ended 30 June 2018
394
TOTAL EXPENSE RATIOS (continued) – SWISS INVESTORS SECTION (continued)
This Section is for Swiss Investors:
ExcludingPerformance
Fees
IncludingPerformance
FeesSub-Fund Share Class TER TEROld Mutual UK Dynamic Equity Fund Class A (GBP) Income 1.57% 2.18%
Class I (EUR) Hedged 1.10% 1.78%
Class R (GBP) Income 1.07% 1.72%
Old Mutual Global Equity Absolute Return Fund Class A (CHF) Hedged 1.58% 1.58%
Class A (EUR) Hedged 1.59% 2.83%
Class A (GBP) Hedged 1.59% 2.61%
Class A (RMB) Hedged 1.59% 2.96%
Class A (SGD) Hedged 1.60% 2.34%
Class A (USD) 1.56% 2.74%
Class A2 (CHF) Hedged 1.60% 2.29%
Class C (USD) 3.05% 3.86%
Class I (CHF) Hedged 0.84% 1.89%
Class I (EUR) Hedged 0.84% 1.91%
Class I (SEK) Hedged 0.84% 2.24%
Class I (USD) 0.81% 2.15%
Class R (GBP) Hedged 0.84% 2.08%
Class U1 (GBP) Hedged 0.77% 1.97%
Class U2 (GBP) Hedged 0.69% 2.35%
Class W (GBP) Hedged*/** 0.84% 0.84%
Old Mutual Strategic Absolute Return Bond Fund^^^ Class A (EUR) Hedged* 1.30% 1.30%
Class F1 (USD) 0.46% 0.46%
Class F2 (GBP) Hedged 0.72% 0.72%
Class F2 (GBP) Hedged Income 0.66% 0.66%
Class I (USD)* 0.80% 0.80%
Class R (GBP) Hedged* 0.80% 0.80%
Class U1 (GBP) Hedged* 0.70% 0.70%
Class U2 (GBP) Hedged* 0.65% 0.65%
Old Mutual Pan African Fund^^ Class A (GBP)**
Class R (GBP)**
Class U1 (GBP)**
Class U3 (USD) Hybrid**
Old Mutual Monthly Income High Yield Bond Fund Class A (EUR) Hedged** 0.91% 0.91%
Class A (GBP) 1.41% 1.41%
Class A (USD) 1.48% 1.48%
Class A (USD) Income 1.50% 1.50%
Class C (USD) 3.02% 3.02%
Class C (USD) Income 3.00% 3.00%
Class I (USD) 0.91% 0.91%
Class U1 (GBP) 1.06% 1.06%
Class U2 (GBP) Income 0.77% 0.77%
Class X (GBP) Hedged 0.29% 0.29%
Class X (GBP) Hedged Income 0.29% 0.29%
Old Mutual Europe (ex UK) Smaller Companies Fund Class A (EUR) 1.63% 1.63%
Class A (GBP) 1.62% 1.62%
Class A (USD) 1.61% 1.61%
Class A (USD) Hedged 1.60% 1.60%
Class C (USD) Hedged 3.13% 3.13%
Class I (EUR) 0.85% 0.85%
Class I (USD) 0.88% 0.88%
Class I (USD) Hedged 0.88% 0.88%
Class R (GBP) 0.86% 0.86%
Class R (GBP) Hedged 0.89% 0.89%
Class R (GBP) Income 0.88% 0.88%
Class U1 (EUR) Income 0.77% 0.77%
Class U1 (GBP) 0.78% 0.78%
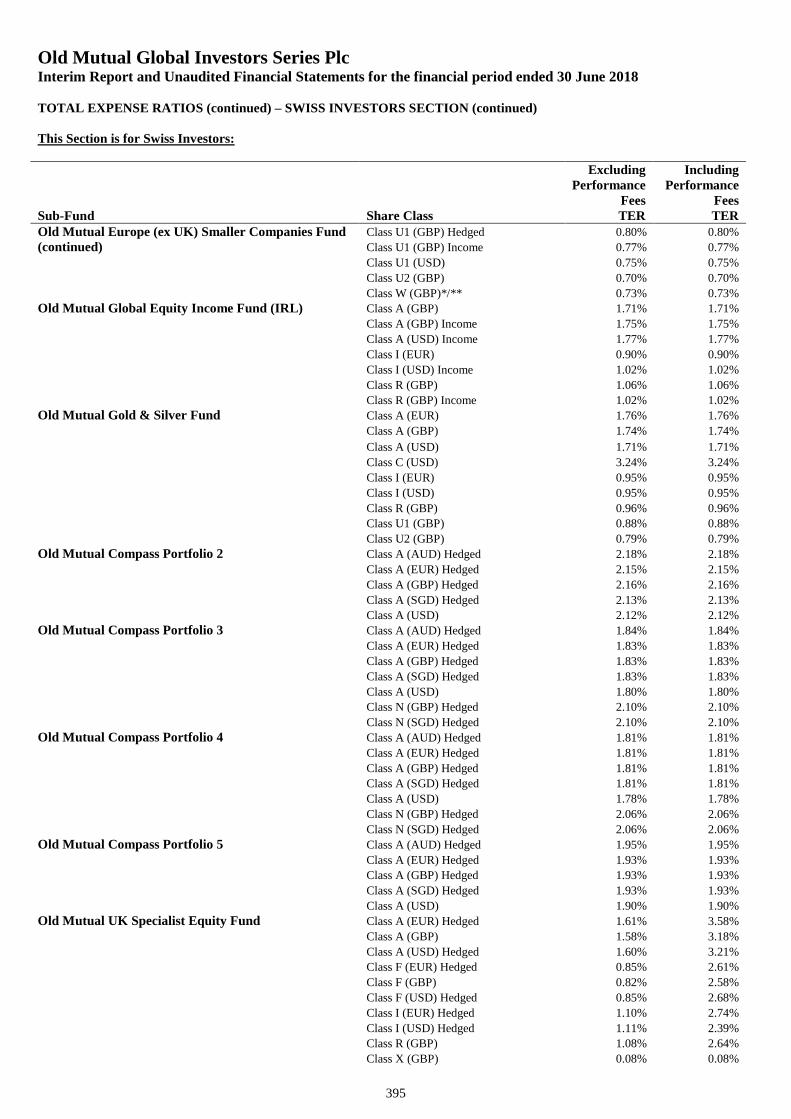
Old Mutual Global Investors Series PlcInterim Report and Unaudited Financial Statements for the financial period ended 30 June 2018
395
TOTAL EXPENSE RATIOS (continued) – SWISS INVESTORS SECTION (continued)
This Section is for Swiss Investors:
ExcludingPerformance
Fees
IncludingPerformance
FeesSub-Fund Share Class TER TEROld Mutual Europe (ex UK) Smaller Companies Fund Class U1 (GBP) Hedged 0.80% 0.80%
(continued) Class U1 (GBP) Income 0.77% 0.77%
Class U1 (USD) 0.75% 0.75%
Class U2 (GBP) 0.70% 0.70%
Class W (GBP)*/** 0.73% 0.73%
Old Mutual Global Equity Income Fund (IRL) Class A (GBP) 1.71% 1.71%
Class A (GBP) Income 1.75% 1.75%
Class A (USD) Income 1.77% 1.77%
Class I (EUR) 0.90% 0.90%
Class I (USD) Income 1.02% 1.02%
Class R (GBP) 1.06% 1.06%
Class R (GBP) Income 1.02% 1.02%
Old Mutual Gold & Silver Fund Class A (EUR) 1.76% 1.76%
Class A (GBP) 1.74% 1.74%
Class A (USD) 1.71% 1.71%
Class C (USD) 3.24% 3.24%
Class I (EUR) 0.95% 0.95%
Class I (USD) 0.95% 0.95%
Class R (GBP) 0.96% 0.96%
Class U1 (GBP) 0.88% 0.88%
Class U2 (GBP) 0.79% 0.79%
Old Mutual Compass Portfolio 2 Class A (AUD) Hedged 2.18% 2.18%
Class A (EUR) Hedged 2.15% 2.15%
Class A (GBP) Hedged 2.16% 2.16%
Class A (SGD) Hedged 2.13% 2.13%
Class A (USD) 2.12% 2.12%
Old Mutual Compass Portfolio 3 Class A (AUD) Hedged 1.84% 1.84%
Class A (EUR) Hedged 1.83% 1.83%
Class A (GBP) Hedged 1.83% 1.83%
Class A (SGD) Hedged 1.83% 1.83%
Class A (USD) 1.80% 1.80%
Class N (GBP) Hedged 2.10% 2.10%
Class N (SGD) Hedged 2.10% 2.10%
Old Mutual Compass Portfolio 4 Class A (AUD) Hedged 1.81% 1.81%
Class A (EUR) Hedged 1.81% 1.81%
Class A (GBP) Hedged 1.81% 1.81%
Class A (SGD) Hedged 1.81% 1.81%
Class A (USD) 1.78% 1.78%
Class N (GBP) Hedged 2.06% 2.06%
Class N (SGD) Hedged 2.06% 2.06%
Old Mutual Compass Portfolio 5 Class A (AUD) Hedged 1.95% 1.95%
Class A (EUR) Hedged 1.93% 1.93%
Class A (GBP) Hedged 1.93% 1.93%
Class A (SGD) Hedged 1.93% 1.93%
Class A (USD) 1.90% 1.90%
Old Mutual UK Specialist Equity Fund Class A (EUR) Hedged 1.61% 3.58%
Class A (GBP) 1.58% 3.18%
Class A (USD) Hedged 1.60% 3.21%
Class F (EUR) Hedged 0.85% 2.61%
Class F (GBP) 0.82% 2.58%
Class F (USD) Hedged 0.85% 2.68%
Class I (EUR) Hedged 1.10% 2.74%
Class I (USD) Hedged 1.11% 2.39%
Class R (GBP) 1.08% 2.64%
Class X (GBP) 0.08% 0.08%
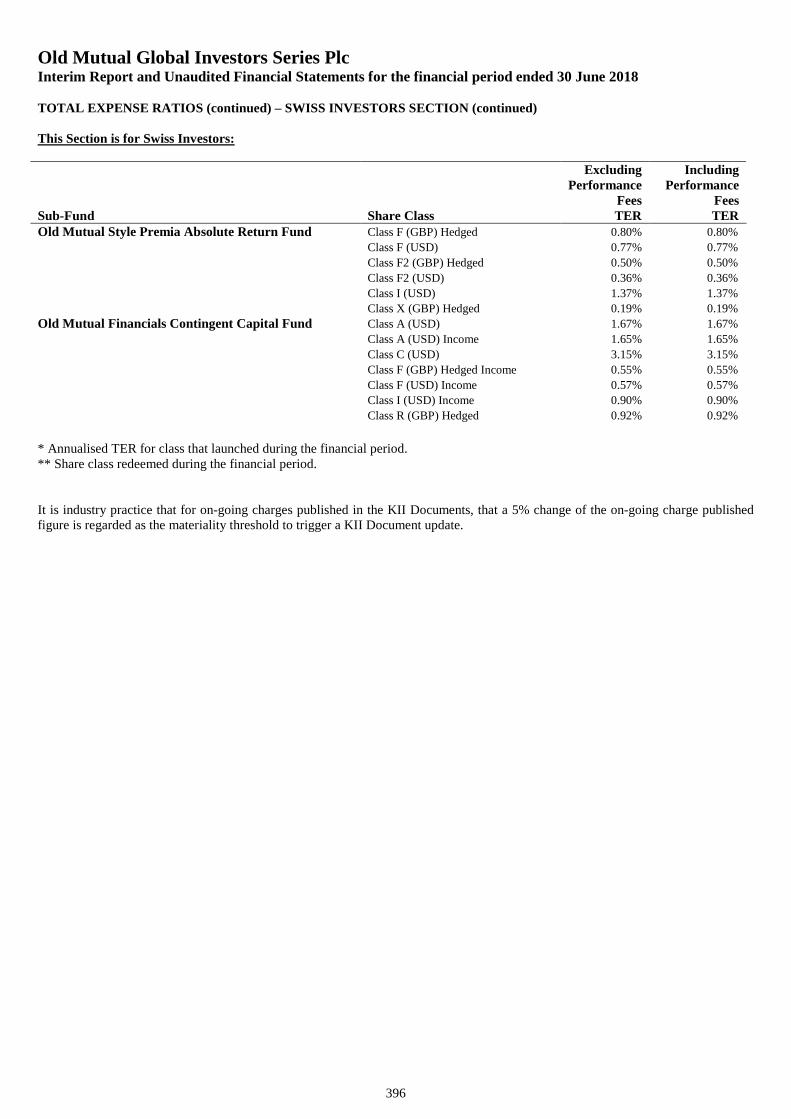
Old Mutual Global Investors Series PlcInterim Report and Unaudited Financial Statements for the financial period ended 30 June 2018
396
TOTAL EXPENSE RATIOS (continued) – SWISS INVESTORS SECTION (continued)
This Section is for Swiss Investors:
ExcludingPerformance
Fees
IncludingPerformance
FeesSub-Fund Share Class TER TEROld Mutual Style Premia Absolute Return Fund Class F (GBP) Hedged 0.80% 0.80%
Class F (USD) 0.77% 0.77%
Class F2 (GBP) Hedged 0.50% 0.50%
Class F2 (USD) 0.36% 0.36%
Class I (USD) 1.37% 1.37%
Class X (GBP) Hedged 0.19% 0.19%
Old Mutual Financials Contingent Capital Fund Class A (USD) 1.67% 1.67%
Class A (USD) Income 1.65% 1.65%
Class C (USD) 3.15% 3.15%
Class F (GBP) Hedged Income 0.55% 0.55%
Class F (USD) Income 0.57% 0.57%
Class I (USD) Income 0.90% 0.90%
Class R (GBP) Hedged 0.92% 0.92%
* Annualised TER for class that launched during the financial period.** Share class redeemed during the financial period.
It is industry practice that for on-going charges published in the KII Documents, that a 5% change of the on-going charge publishedfigure is regarded as the materiality threshold to trigger a KII Document update.
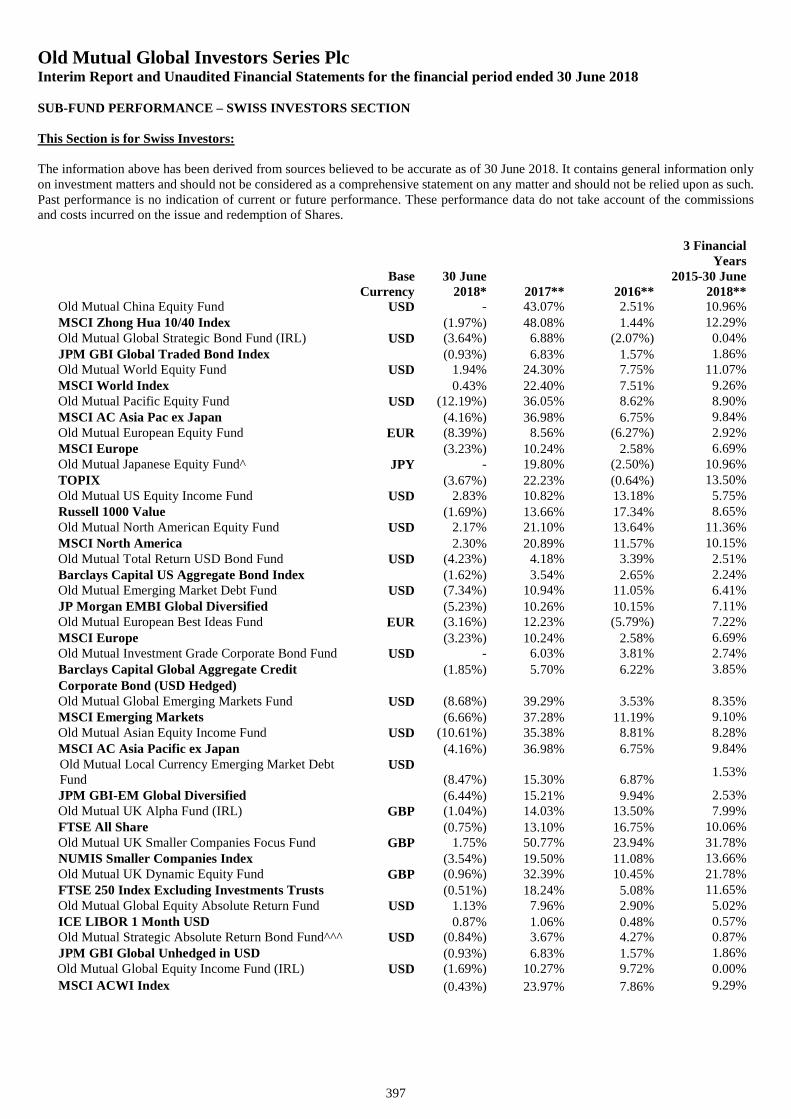
Old Mutual Global Investors Series PlcInterim Report and Unaudited Financial Statements for the financial period ended 30 June 2018
SUB-FUND PERFORMANCE – SWISS INVESTORS SECTION
This Section is for Swiss Investors:
397
The information above has been derived from sources believed to be accurate as of 30 June 2018. It contains general information onlyon investment matters and should not be considered as a comprehensive statement on any matter and should not be relied upon as such.Past performance is no indication of current or future performance. These performance data do not take account of the commissionsand costs incurred on the issue and redemption of Shares.
BaseCurrency
30 June2018* 2017** 2016**
3 FinancialYears
2015-30 June2018**
Old Mutual China Equity Fund USD - 43.07% 2.51% 10.96%MSCI Zhong Hua 10/40 Index (1.97%) 48.08% 1.44% 12.29%Old Mutual Global Strategic Bond Fund (IRL) USD (3.64%) 6.88% (2.07%) 0.04%JPM GBI Global Traded Bond Index (0.93%) 6.83% 1.57% 1.86%Old Mutual World Equity Fund USD 1.94% 24.30% 7.75% 11.07%MSCI World Index 0.43% 22.40% 7.51% 9.26%Old Mutual Pacific Equity Fund USD (12.19%) 36.05% 8.62% 8.90%MSCI AC Asia Pac ex Japan (4.16%) 36.98% 6.75% 9.84%Old Mutual European Equity Fund EUR (8.39%) 8.56% (6.27%) 2.92%MSCI Europe (3.23%) 10.24% 2.58% 6.69%Old Mutual Japanese Equity Fund^ JPY - 19.80% (2.50%) 10.96%TOPIX (3.67%) 22.23% (0.64%) 13.50%Old Mutual US Equity Income Fund USD 2.83% 10.82% 13.18% 5.75%Russell 1000 Value (1.69%) 13.66% 17.34% 8.65%Old Mutual North American Equity Fund USD 2.17% 21.10% 13.64% 11.36%MSCI North America 2.30% 20.89% 11.57% 10.15%Old Mutual Total Return USD Bond Fund USD (4.23%) 4.18% 3.39% 2.51%Barclays Capital US Aggregate Bond Index (1.62%) 3.54% 2.65% 2.24%Old Mutual Emerging Market Debt Fund USD (7.34%) 10.94% 11.05% 6.41%JP Morgan EMBI Global Diversified (5.23%) 10.26% 10.15% 7.11%Old Mutual European Best Ideas Fund EUR (3.16%) 12.23% (5.79%) 7.22%MSCI Europe (3.23%) 10.24% 2.58% 6.69%Old Mutual Investment Grade Corporate Bond Fund USD - 6.03% 3.81% 2.74%Barclays Capital Global Aggregate Credit (1.85%) 5.70% 6.22% 3.85%
Corporate Bond (USD Hedged)Old Mutual Global Emerging Markets Fund USD (8.68%) 39.29% 3.53% 8.35%MSCI Emerging Markets (6.66%) 37.28% 11.19% 9.10%Old Mutual Asian Equity Income Fund USD (10.61%) 35.38% 8.81% 8.28%MSCI AC Asia Pacific ex Japan (4.16%) 36.98% 6.75% 9.84%Old Mutual Local Currency Emerging Market DebtFund
USD(8.47%) 15.30% 6.87%
1.53%
JPM GBI-EM Global Diversified (6.44%) 15.21% 9.94% 2.53%Old Mutual UK Alpha Fund (IRL) GBP (1.04%) 14.03% 13.50% 7.99%FTSE All Share (0.75%) 13.10% 16.75% 10.06%Old Mutual UK Smaller Companies Focus Fund GBP 1.75% 50.77% 23.94% 31.78%NUMIS Smaller Companies Index (3.54%) 19.50% 11.08% 13.66%Old Mutual UK Dynamic Equity Fund GBP (0.96%) 32.39% 10.45% 21.78%FTSE 250 Index Excluding Investments Trusts (0.51%) 18.24% 5.08% 11.65%Old Mutual Global Equity Absolute Return Fund USD 1.13% 7.96% 2.90% 5.02%ICE LIBOR 1 Month USD 0.87% 1.06% 0.48% 0.57%Old Mutual Strategic Absolute Return Bond Fund^^^ USD (0.84%) 3.67% 4.27% 0.87%JPM GBI Global Unhedged in USD (0.93%) 6.83% 1.57% 1.86%Old Mutual Global Equity Income Fund (IRL) USD (1.69%) 10.27% 9.72% 0.00%
MSCI ACWI Index (0.43%) 23.97% 7.86% 9.29%
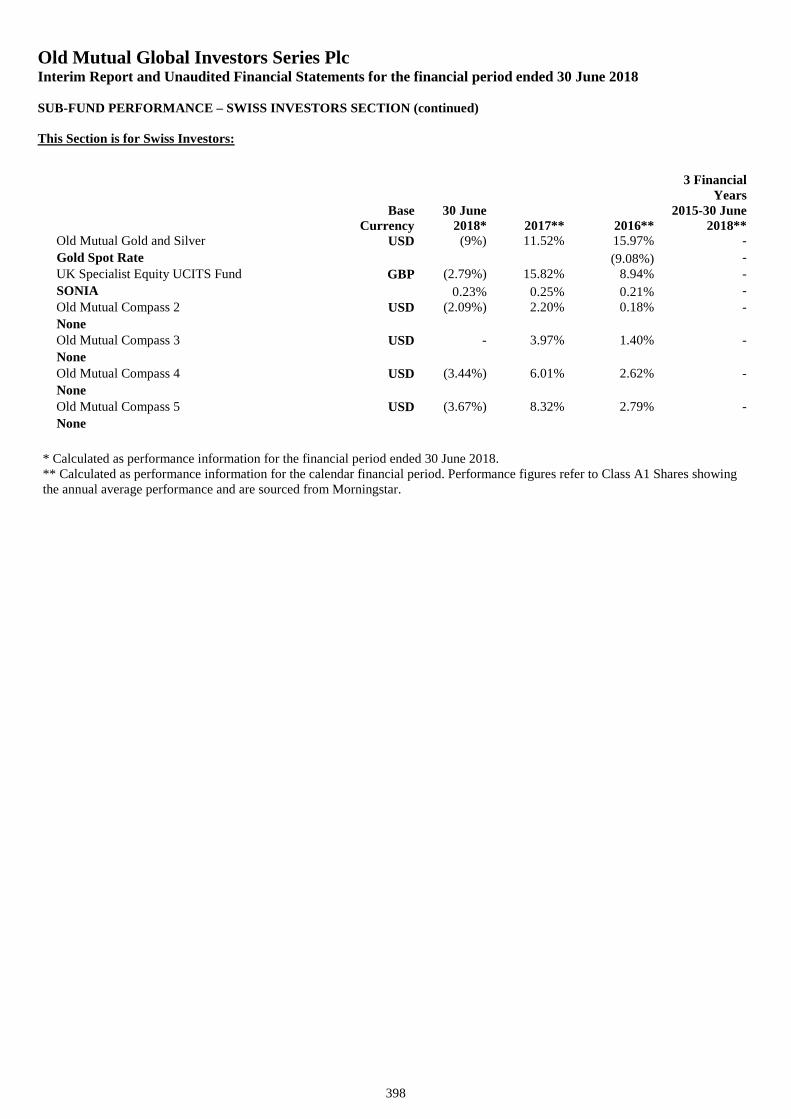
Old Mutual Global Investors Series PlcInterim Report and Unaudited Financial Statements for the financial period ended 30 June 2018
SUB-FUND PERFORMANCE – SWISS INVESTORS SECTION (continued)
This Section is for Swiss Investors:
398
BaseCurrency
30 June2018* 2017** 2016**
3 FinancialYears
2015-30 June2018**
Old Mutual Gold and Silver USD (9%) 11.52% 15.97% -
Gold Spot Rate (9.08%) -
UK Specialist Equity UCITS Fund GBP (2.79%) 15.82% 8.94% -
SONIA 0.23% 0.25% 0.21% -
Old Mutual Compass 2 USD (2.09%) 2.20% 0.18% -
NoneOld Mutual Compass 3 USD - 3.97% 1.40% -
NoneOld Mutual Compass 4 USD (3.44%) 6.01% 2.62% -
NoneOld Mutual Compass 5 USD (3.67%) 8.32% 2.79% -
None
* Calculated as performance information for the financial period ended 30 June 2018.** Calculated as performance information for the calendar financial period. Performance figures refer to Class A1 Shares showingthe annual average performance and are sourced from Morningstar.
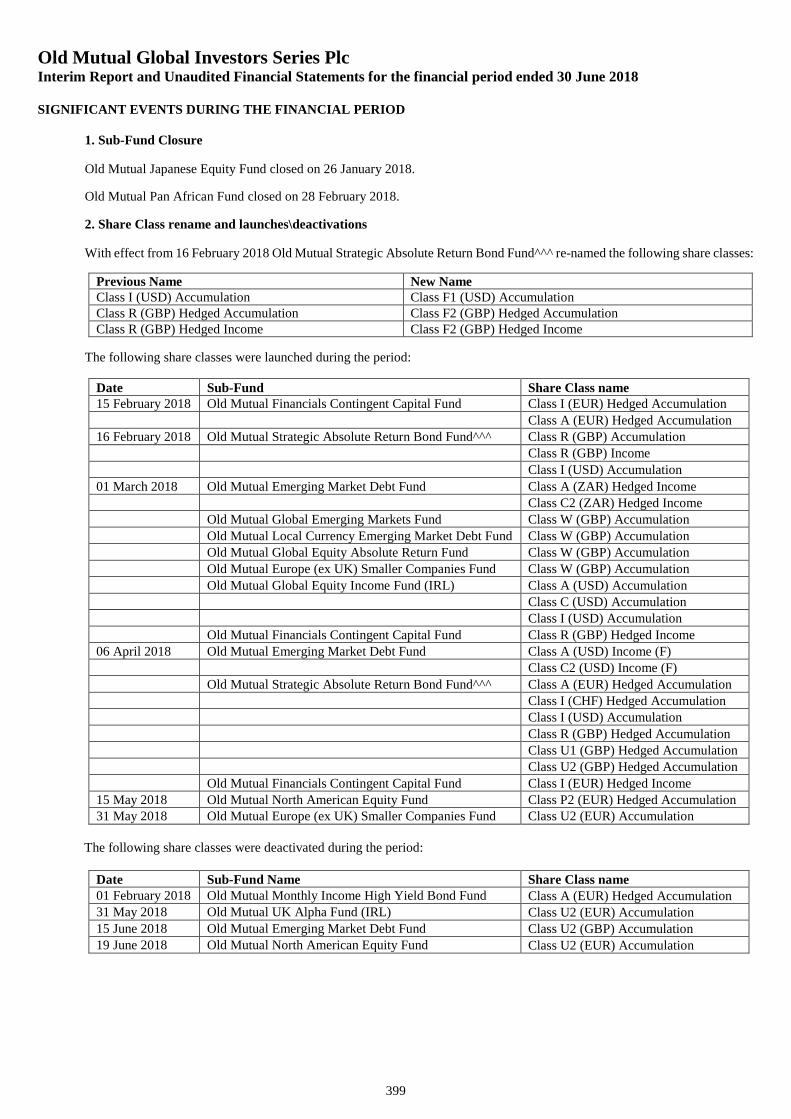
Old Mutual Global Investors Series PlcInterim Report and Unaudited Financial Statements for the financial period ended 30 June 2018
SIGNIFICANT EVENTS DURING THE FINANCIAL PERIOD
399
1. Sub-Fund Closure
Old Mutual Japanese Equity Fund closed on 26 January 2018.
Old Mutual Pan African Fund closed on 28 February 2018.
2. Share Class rename and launches\deactivations
With effect from 16 February 2018 Old Mutual Strategic Absolute Return Bond Fund^^^ re-named the following share classes:
Previous Name New NameClass I (USD) Accumulation Class F1 (USD) AccumulationClass R (GBP) Hedged Accumulation Class F2 (GBP) Hedged AccumulationClass R (GBP) Hedged Income Class F2 (GBP) Hedged Income
The following share classes were launched during the period:
Date Sub-Fund Share Class name15 February 2018 Old Mutual Financials Contingent Capital Fund Class I (EUR) Hedged Accumulation
Class A (EUR) Hedged Accumulation16 February 2018 Old Mutual Strategic Absolute Return Bond Fund^^^ Class R (GBP) Accumulation
Class R (GBP) Income
Class I (USD) Accumulation
01 March 2018 Old Mutual Emerging Market Debt Fund Class A (ZAR) Hedged IncomeClass C2 (ZAR) Hedged Income
Old Mutual Global Emerging Markets Fund Class W (GBP) Accumulation
Old Mutual Local Currency Emerging Market Debt Fund Class W (GBP) AccumulationOld Mutual Global Equity Absolute Return Fund Class W (GBP) AccumulationOld Mutual Europe (ex UK) Smaller Companies Fund Class W (GBP) Accumulation
Old Mutual Global Equity Income Fund (IRL) Class A (USD) AccumulationClass C (USD) AccumulationClass I (USD) Accumulation
Old Mutual Financials Contingent Capital Fund Class R (GBP) Hedged Income06 April 2018 Old Mutual Emerging Market Debt Fund Class A (USD) Income (F)
Class C2 (USD) Income (F)
Old Mutual Strategic Absolute Return Bond Fund^^^ Class A (EUR) Hedged AccumulationClass I (CHF) Hedged AccumulationClass I (USD) Accumulation
Class R (GBP) Hedged AccumulationClass U1 (GBP) Hedged AccumulationClass U2 (GBP) Hedged Accumulation
Old Mutual Financials Contingent Capital Fund Class I (EUR) Hedged Income15 May 2018 Old Mutual North American Equity Fund Class P2 (EUR) Hedged Accumulation31 May 2018 Old Mutual Europe (ex UK) Smaller Companies Fund Class U2 (EUR) Accumulation
The following share classes were deactivated during the period:
Date Sub-Fund Name Share Class name01 February 2018 Old Mutual Monthly Income High Yield Bond Fund Class A (EUR) Hedged Accumulation31 May 2018 Old Mutual UK Alpha Fund (IRL) Class U2 (EUR) Accumulation15 June 2018 Old Mutual Emerging Market Debt Fund Class U2 (GBP) Accumulation19 June 2018 Old Mutual North American Equity Fund Class U2 (EUR) Accumulation
Old Mutual Global Investors Series PlcInterim Report and Unaudited Financial Statements for the financial period ended 30 June 2018
SIGNIFICANT EVENTS DURING THE FINANCIAL PERIOD (continued)
400
3. Investment Adviser Changee
With effect from 23 March 2018 the Investment Adviser on the Old Mutual China Equity Fund changed from Old MutualGlobal Investors (Asia Pacific) Limited to Ping An of China Asset Management (Hong Kong) Company Limited.
With effect from 18 May 2018 the Investment Adviser on the Old Mutual Pacific Equity Fund and the Old Mutual Asian EquityIncome Fund changed from Old Mutual Global Investors (Asia Pacific) Limited to Old Mutual Global Investors (UK) Limited.
With effect from 15 June 2018 the Investment Adviser on the following Sub-Funds changed from Old Mutual Global Investors(UK) Limited to Old Mutual Investment Management Limited:
Old Mutual European Best Ideas Fund
Old Mutual Compass Portfolio 2
Old Mutual Compass Portfolio 3
Old Mutual Compass Portfolio 4
Old Mutual Compass Portfolio 5
Old Mutual Investment Management Limited changed its name to Quilter Investors Limited on 29 June 2018.
4. Initial Charge
With effect from 16 February 2018 the Initial Charge for Share Class A, which was set at a maximum of 6.25% reduced to amaximum of 5.00% of the Net Asset Value per share for all Sub-Funds.
5. Change of Definition of Business Day
Old Mutual Pacific Equity Fund and Old Mutual Asian Equity Income fund the definition of Business Day in respect of theFund has changed from a day (excluding Saturdays, Sundays and public holidays) on which retail banks are open for businessin Dublin, London and Hong Kong. The amendment is to remove Hong Kong from the definition. This change is made becausethe Fund will now be managed by OMGI UK which is based in London, and generally will result in an increase in the numberof Dealing Days of the Fund.
6. Old Mutual Reorganisation
In early 2016, Old Mutual plc announced the proposed separation of its four underlying business units, one of which wasQuilter plc (formerly Old Mutual Wealth Management Limited) and its subsidiaries (the “Managed Separation”). In addition,Old Mutual Global Investors, which previously consisted of two distinct business lines, a Single-Strategy Business and a Multi-Asset Business, announced that it would be split into two separate and distinct businesses and Quilter plc agreed to sell theentire Single-Strategy Business resulting in Quilter plc ceasing to be the ultimate controlling shareholder of OMGI UK.Members of the management that currently run the Single-Strategy Business and certain funds managed by TA Associates, aglobal private equity firm became the ultimate controlling shareholder of OMGI UK.The Managed Separation was completedon 25th June, 2018, and the sale of the Single Strategy Business was completed on 29th June, 2018.
7. Director Resignation
On 29 June 2018 Paul Simpson resigned as Director.
Old Mutual Global Investors Series PlcInterim Report and Unaudited Financial Statements for the financial period ended 30 June 2018
SUPPLEMENTARY INFORMATION
Cybersecurity Risk
401
Cybersecurity breaches may occur allowing an unauthorized party to gain access to assets of the Sub-Funds, Shareholder data, orproprietary information, or may cause the Company, the Investment Manager, the Distributor, the Administrator or the Depositary tosuffer data corruption or lose operational functionality.
The Sub-Funds may be affected by intentional cybersecurity breaches which include unauthorized access to systems, networks, ordevices (such as through “hacking” activity); infection from computer viruses or other malicious software code; and attacks that shutdown, disable, slow, or otherwise disrupt operations, business processes, or website access or functionality. In addition, unintentionalincidents can occur, such as the inadvertent release of confidential information (possibly resulting in the violation of applicable privacylaws).
Notwithstanding the existence of policies and procedures designed to detect and prevent such breaches and ensure the security, integrityand confidentiality of such information as well as the existence of business continuity and disaster recovery measures designed tomitigate any such breach or disruption at the level of the Company and its delegates, such a cybersecurity breach could result in the lossor theft of Shareholder data or Sub-Funds, the inability to access electronic systems, loss or theft of proprietary information or corporatedata, physical damage to a computer or network system, or costs associated with system repairs.
Such incidents could cause the Company, the Investment Manager, the Distributor, the Administrator, the Depositary, or other serviceproviders to incur regulatory penalties, reputational damage, additional compliance costs, or financial loss. Consequently, Shareholdersmay lose some or all of their invested capital. In addition, such incidents could affect issuers in which a Sub-Fund invests, and therebycause a Sub-Fund’s investments to lose value, as a result of which investors, including the relevant Sub-Fund and its Shareholders,could potentially lose all or a portion of their investment with that issuer.
Soft Commission Arrangements
Some Investment Advisers did enter into soft commission arrangements (including commission-sharing arrangements) on behalf of theCompany for the financial period ended 30 June 2018 and 30 June 2017. Where these arrangements have been entered into it has beenconfirmed that the Sub-Funds’ Shareholders have not been disadvantaged as a result of the arrangements and that best execution hasbeen provided in all cases. Also it has been confirmed that the benefits provided under the arrangements have assisted in the provisionof investment services to the Sub-Funds’ concerned. The benefits received were either with regard to covering costs relating to executionof trades or the purchase of research services from the brokers or third parties. The following Sub-Funds used soft commissionarrangements;
Old Mutual China Equity FundOld Mutual Pacific Equity FundOld Mutual Asian Equity Income Fund
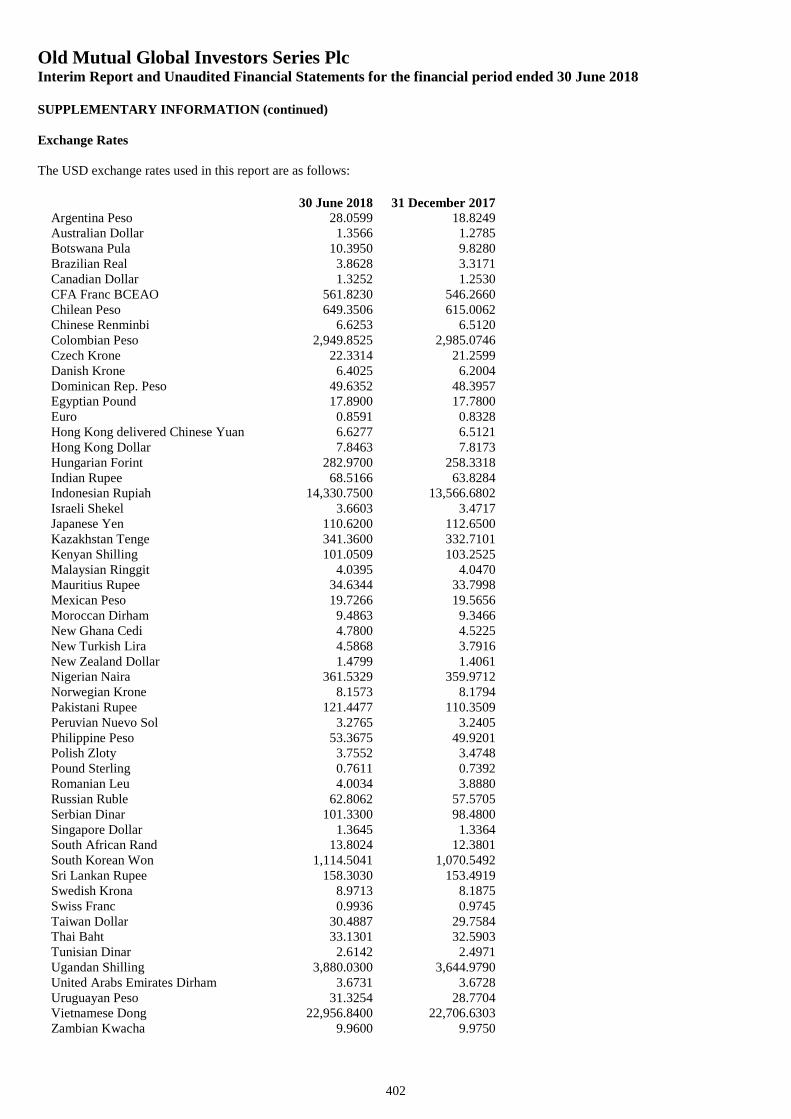
Old Mutual Global Investors Series PlcInterim Report and Unaudited Financial Statements for the financial period ended 30 June 2018
SUPPLEMENTARY INFORMATION (continued)
Exchange Rates
402
The USD exchange rates used in this report are as follows:
30 June 2018 31 December 2017Argentina Peso 28.0599 18.8249Australian Dollar 1.3566 1.2785Botswana Pula 10.3950 9.8280Brazilian Real 3.8628 3.3171Canadian Dollar 1.3252 1.2530CFA Franc BCEAO 561.8230 546.2660Chilean Peso 649.3506 615.0062Chinese Renminbi 6.6253 6.5120Colombian Peso 2,949.8525 2,985.0746Czech Krone 22.3314 21.2599Danish Krone 6.4025 6.2004Dominican Rep. Peso 49.6352 48.3957Egyptian Pound 17.8900 17.7800Euro 0.8591 0.8328Hong Kong delivered Chinese Yuan 6.6277 6.5121Hong Kong Dollar 7.8463 7.8173Hungarian Forint 282.9700 258.3318Indian Rupee 68.5166 63.8284Indonesian Rupiah 14,330.7500 13,566.6802Israeli Shekel 3.6603 3.4717Japanese Yen 110.6200 112.6500Kazakhstan Tenge 341.3600 332.7101Kenyan Shilling 101.0509 103.2525Malaysian Ringgit 4.0395 4.0470Mauritius Rupee 34.6344 33.7998Mexican Peso 19.7266 19.5656Moroccan Dirham 9.4863 9.3466New Ghana Cedi 4.7800 4.5225New Turkish Lira 4.5868 3.7916New Zealand Dollar 1.4799 1.4061Nigerian Naira 361.5329 359.9712Norwegian Krone 8.1573 8.1794Pakistani Rupee 121.4477 110.3509Peruvian Nuevo Sol 3.2765 3.2405Philippine Peso 53.3675 49.9201Polish Zloty 3.7552 3.4748Pound Sterling 0.7611 0.7392Romanian Leu 4.0034 3.8880Russian Ruble 62.8062 57.5705Serbian Dinar 101.3300 98.4800Singapore Dollar 1.3645 1.3364South African Rand 13.8024 12.3801South Korean Won 1,114.5041 1,070.5492Sri Lankan Rupee 158.3030 153.4919Swedish Krona 8.9713 8.1875Swiss Franc 0.9936 0.9745Taiwan Dollar 30.4887 29.7584Thai Baht 33.1301 32.5903Tunisian Dinar 2.6142 2.4971Ugandan Shilling 3,880.0300 3,644.9790United Arabs Emirates Dirham 3.6731 3.6728Uruguayan Peso 31.3254 28.7704Vietnamese Dong 22,956.8400 22,706.6303Zambian Kwacha 9.9600 9.9750
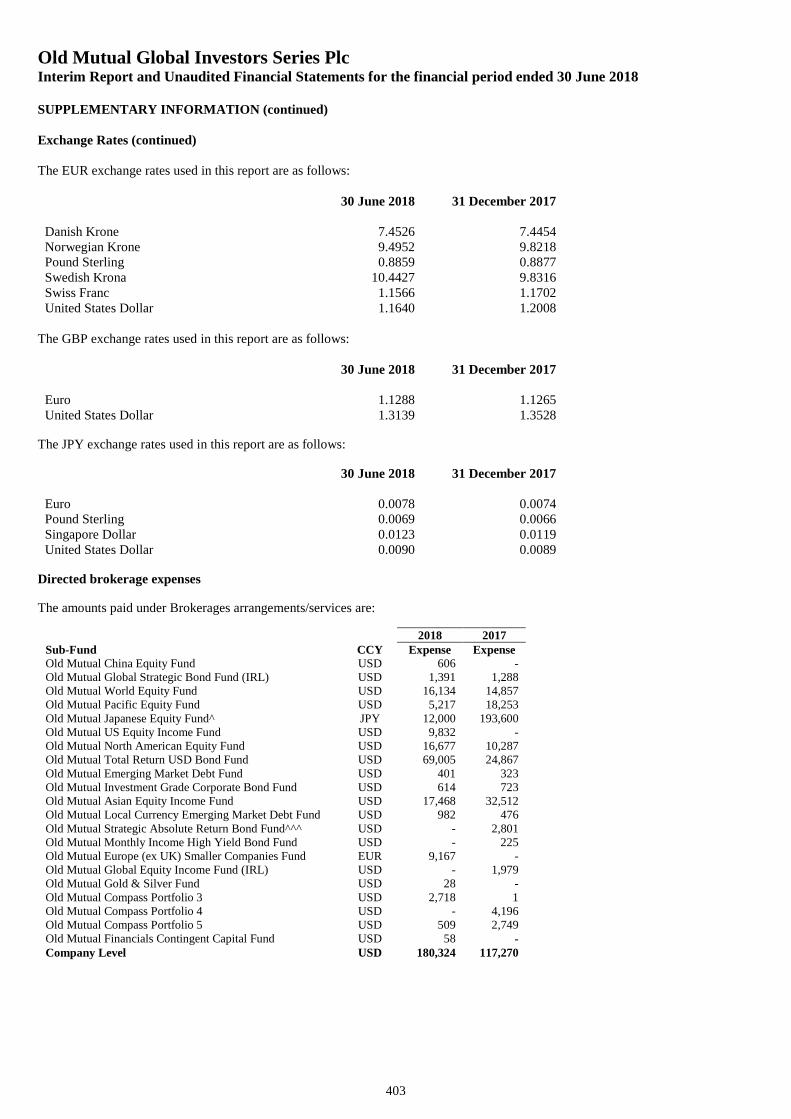
Old Mutual Global Investors Series PlcInterim Report and Unaudited Financial Statements for the financial period ended 30 June 2018
SUPPLEMENTARY INFORMATION (continued)
Exchange Rates (continued)
403
The EUR exchange rates used in this report are as follows:
30 June 2018 31 December 2017
Danish Krone 7.4526 7.4454Norwegian Krone 9.4952 9.8218Pound Sterling 0.8859 0.8877Swedish Krona 10.4427 9.8316Swiss Franc 1.1566 1.1702United States Dollar 1.1640 1.2008
The GBP exchange rates used in this report are as follows:
30 June 2018 31 December 2017
Euro 1.1288 1.1265United States Dollar 1.3139 1.3528
The JPY exchange rates used in this report are as follows:
30 June 2018 31 December 2017
Euro 0.0078 0.0074Pound Sterling 0.0069 0.0066Singapore Dollar 0.0123 0.0119United States Dollar 0.0090 0.0089
Directed brokerage expenses
The amounts paid under Brokerages arrangements/services are:
2018 2017Sub-Fund CCY Expense ExpenseOld Mutual China Equity Fund USD 606 -Old Mutual Global Strategic Bond Fund (IRL) USD 1,391 1,288Old Mutual World Equity Fund USD 16,134 14,857Old Mutual Pacific Equity Fund USD 5,217 18,253Old Mutual Japanese Equity Fund^ JPY 12,000 193,600Old Mutual US Equity Income Fund USD 9,832 -Old Mutual North American Equity Fund USD 16,677 10,287Old Mutual Total Return USD Bond Fund USD 69,005 24,867Old Mutual Emerging Market Debt Fund USD 401 323Old Mutual Investment Grade Corporate Bond Fund USD 614 723Old Mutual Asian Equity Income Fund USD 17,468 32,512Old Mutual Local Currency Emerging Market Debt Fund USD 982 476Old Mutual Strategic Absolute Return Bond Fund^^^ USD - 2,801Old Mutual Monthly Income High Yield Bond Fund USD - 225Old Mutual Europe (ex UK) Smaller Companies Fund EUR 9,167 -Old Mutual Global Equity Income Fund (IRL) USD - 1,979Old Mutual Gold & Silver Fund USD 28 -Old Mutual Compass Portfolio 3 USD 2,718 1Old Mutual Compass Portfolio 4 USD - 4,196Old Mutual Compass Portfolio 5 USD 509 2,749Old Mutual Financials Contingent Capital Fund USD 58 -Company Level USD 180,324 117,270
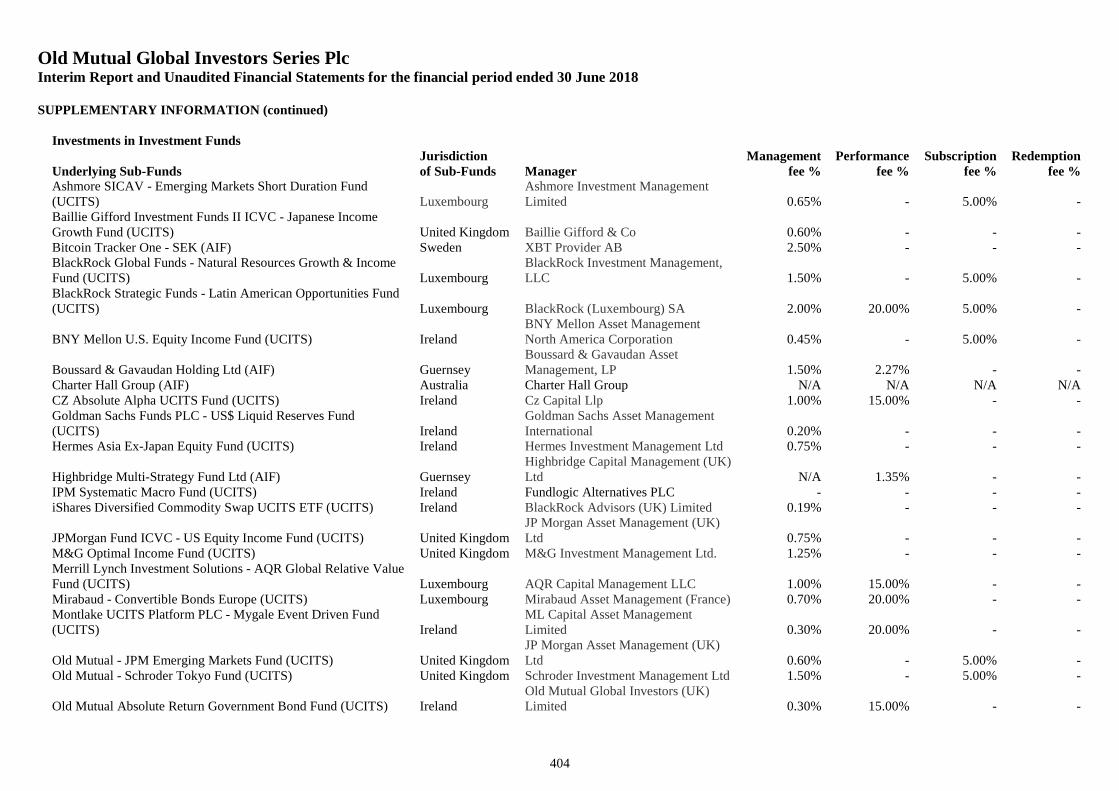
Old Mutual Global Investors Series PlcInterim Report and Unaudited Financial Statements for the financial period ended 30 June 2018
SUPPLEMENTARY INFORMATION (continued)
404
Investments in Investment FundsJurisdiction Management Performance Subscription Redemption
Underlying Sub-Funds of Sub-Funds Manager fee % fee % fee % fee %Ashmore SICAV - Emerging Markets Short Duration Fund(UCITS) Luxembourg
Ashmore Investment ManagementLimited 0.65% - 5.00% -
Baillie Gifford Investment Funds II ICVC - Japanese IncomeGrowth Fund (UCITS) United Kingdom Baillie Gifford & Co 0.60% - - -Bitcoin Tracker One - SEK (AIF) Sweden XBT Provider AB 2.50% - - -BlackRock Global Funds - Natural Resources Growth & IncomeFund (UCITS) Luxembourg
BlackRock Investment Management,LLC 1.50% - 5.00% -
BlackRock Strategic Funds - Latin American Opportunities Fund(UCITS) Luxembourg BlackRock (Luxembourg) SA 2.00% 20.00% 5.00% -
BNY Mellon U.S. Equity Income Fund (UCITS) IrelandBNY Mellon Asset ManagementNorth America Corporation 0.45% - 5.00% -
Boussard & Gavaudan Holding Ltd (AIF) GuernseyBoussard & Gavaudan AssetManagement, LP 1.50% 2.27% - -
Charter Hall Group (AIF) Australia Charter Hall Group N/A N/A N/A N/ACZ Absolute Alpha UCITS Fund (UCITS) Ireland Cz Capital Llp 1.00% 15.00% - -Goldman Sachs Funds PLC - US$ Liquid Reserves Fund(UCITS) Ireland
Goldman Sachs Asset ManagementInternational 0.20% - - -
Hermes Asia Ex-Japan Equity Fund (UCITS) Ireland Hermes Investment Management Ltd 0.75% - - -
Highbridge Multi-Strategy Fund Ltd (AIF) GuernseyHighbridge Capital Management (UK)Ltd N/A 1.35% - -
IPM Systematic Macro Fund (UCITS) Ireland Fundlogic Alternatives PLC - - - -iShares Diversified Commodity Swap UCITS ETF (UCITS) Ireland BlackRock Advisors (UK) Limited 0.19% - - -
JPMorgan Fund ICVC - US Equity Income Fund (UCITS) United KingdomJP Morgan Asset Management (UK)Ltd 0.75% - - -
M&G Optimal Income Fund (UCITS) United Kingdom M&G Investment Management Ltd. 1.25% - - -Merrill Lynch Investment Solutions - AQR Global Relative ValueFund (UCITS) Luxembourg AQR Capital Management LLC 1.00% 15.00% - -Mirabaud - Convertible Bonds Europe (UCITS) Luxembourg Mirabaud Asset Management (France) 0.70% 20.00% - -Montlake UCITS Platform PLC - Mygale Event Driven Fund(UCITS) Ireland
ML Capital Asset ManagementLimited 0.30% 20.00% - -
Old Mutual - JPM Emerging Markets Fund (UCITS) United KingdomJP Morgan Asset Management (UK)Ltd 0.60% - 5.00% -
Old Mutual - Schroder Tokyo Fund (UCITS) United Kingdom Schroder Investment Management Ltd 1.50% - 5.00% -
Old Mutual Absolute Return Government Bond Fund (UCITS) IrelandOld Mutual Global Investors (UK)Limited 0.30% 15.00% - -
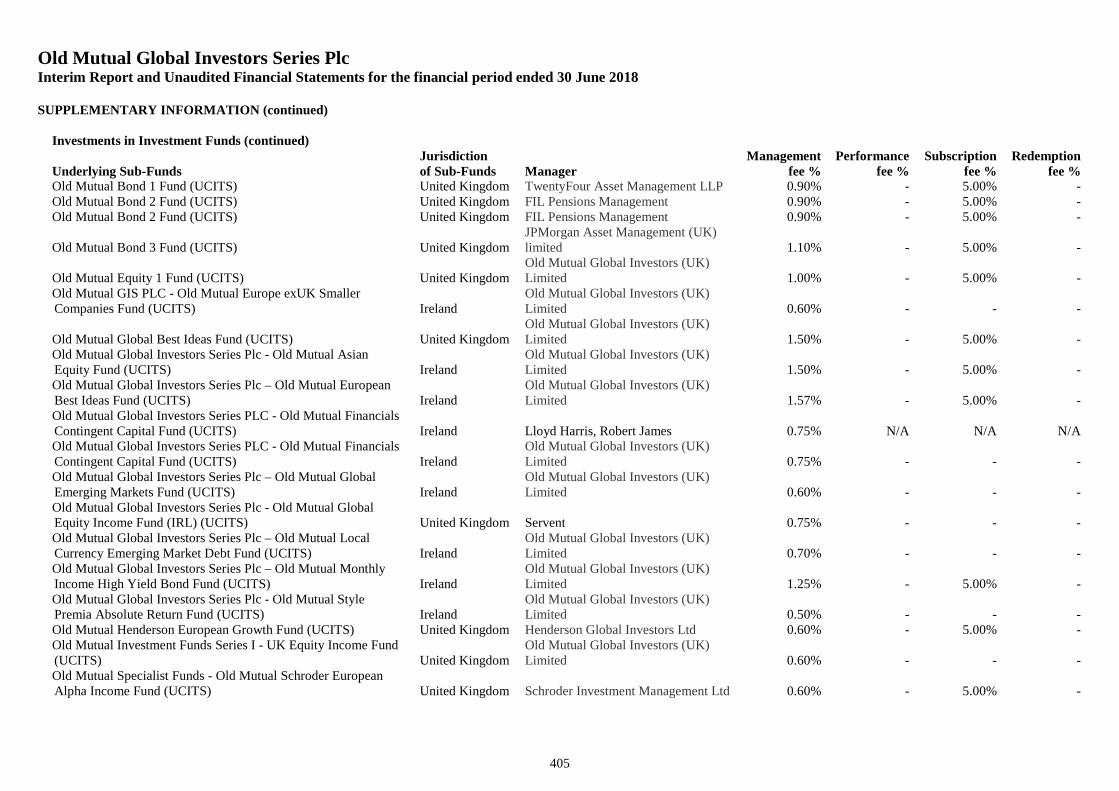
Old Mutual Global Investors Series PlcInterim Report and Unaudited Financial Statements for the financial period ended 30 June 2018
SUPPLEMENTARY INFORMATION (continued)
405
Investments in Investment Funds (continued)Jurisdiction Management Performance Subscription Redemption
Underlying Sub-Funds of Sub-Funds Manager fee % fee % fee % fee %Old Mutual Bond 1 Fund (UCITS) United Kingdom TwentyFour Asset Management LLP 0.90% - 5.00% -Old Mutual Bond 2 Fund (UCITS) United Kingdom FIL Pensions Management 0.90% - 5.00% -Old Mutual Bond 2 Fund (UCITS) United Kingdom FIL Pensions Management 0.90% - 5.00% -
Old Mutual Bond 3 Fund (UCITS) United KingdomJPMorgan Asset Management (UK)limited 1.10% - 5.00% -
Old Mutual Equity 1 Fund (UCITS) United KingdomOld Mutual Global Investors (UK)Limited 1.00% - 5.00% -
Old Mutual GIS PLC - Old Mutual Europe exUK SmallerCompanies Fund (UCITS) Ireland
Old Mutual Global Investors (UK)Limited 0.60% - - -
Old Mutual Global Best Ideas Fund (UCITS) United KingdomOld Mutual Global Investors (UK)Limited 1.50% - 5.00% -
Old Mutual Global Investors Series Plc - Old Mutual AsianEquity Fund (UCITS) Ireland
Old Mutual Global Investors (UK)Limited 1.50% - 5.00% -
Old Mutual Global Investors Series Plc – Old Mutual EuropeanBest Ideas Fund (UCITS) Ireland
Old Mutual Global Investors (UK)Limited 1.57% - 5.00% -
Old Mutual Global Investors Series PLC - Old Mutual FinancialsContingent Capital Fund (UCITS) Ireland Lloyd Harris, Robert James 0.75% N/A N/A N/AOld Mutual Global Investors Series PLC - Old Mutual FinancialsContingent Capital Fund (UCITS) Ireland
Old Mutual Global Investors (UK)Limited 0.75% - - -
Old Mutual Global Investors Series Plc – Old Mutual GlobalEmerging Markets Fund (UCITS) Ireland
Old Mutual Global Investors (UK)Limited 0.60% - - -
Old Mutual Global Investors Series Plc - Old Mutual GlobalEquity Income Fund (IRL) (UCITS) United Kingdom Servent 0.75% - - -Old Mutual Global Investors Series Plc – Old Mutual LocalCurrency Emerging Market Debt Fund (UCITS) Ireland
Old Mutual Global Investors (UK)Limited 0.70% - - -
Old Mutual Global Investors Series Plc – Old Mutual MonthlyIncome High Yield Bond Fund (UCITS) Ireland
Old Mutual Global Investors (UK)Limited 1.25% - 5.00% -
Old Mutual Global Investors Series Plc - Old Mutual StylePremia Absolute Return Fund (UCITS) Ireland
Old Mutual Global Investors (UK)Limited 0.50% - - -
Old Mutual Henderson European Growth Fund (UCITS) United Kingdom Henderson Global Investors Ltd 0.60% - 5.00% -Old Mutual Investment Funds Series I - UK Equity Income Fund(UCITS) United Kingdom
Old Mutual Global Investors (UK)Limited 0.60% - - -
Old Mutual Specialist Funds - Old Mutual Schroder EuropeanAlpha Income Fund (UCITS) United Kingdom Schroder Investment Management Ltd 0.60% - 5.00% -
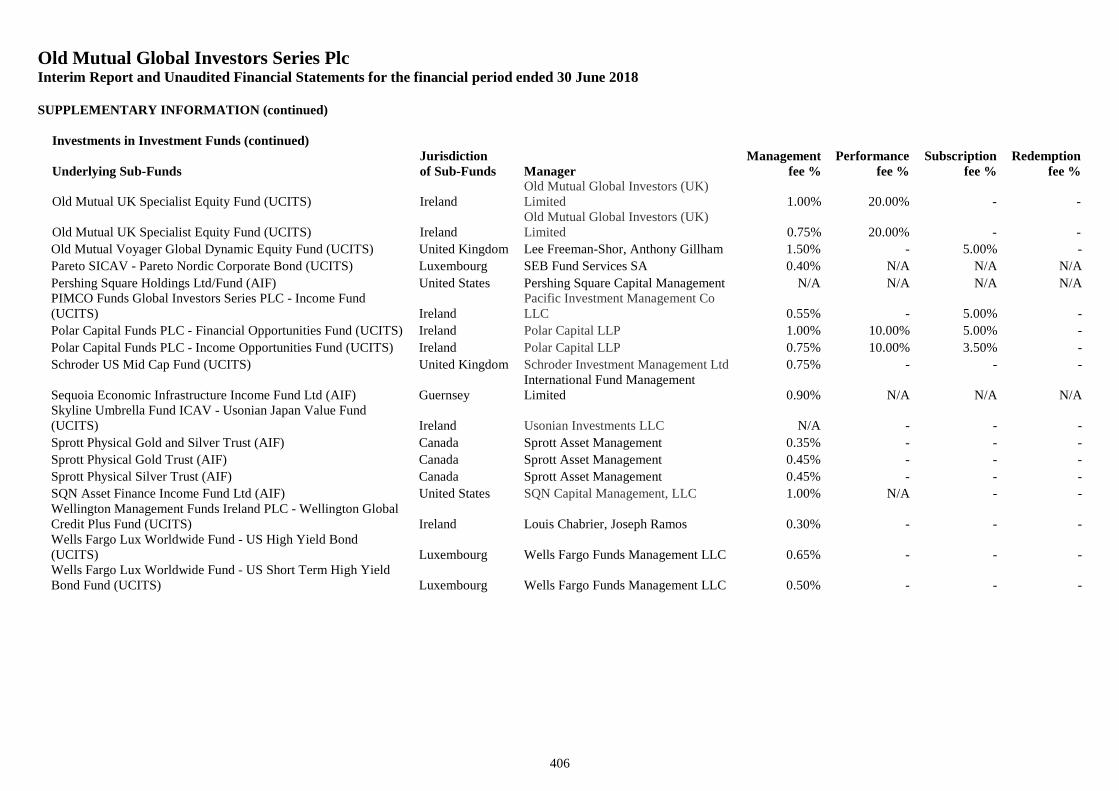
Old Mutual Global Investors Series PlcInterim Report and Unaudited Financial Statements for the financial period ended 30 June 2018
SUPPLEMENTARY INFORMATION (continued)
406
Investments in Investment Funds (continued)Jurisdiction Management Performance Subscription Redemption
Underlying Sub-Funds of Sub-Funds Manager fee % fee % fee % fee %
Old Mutual UK Specialist Equity Fund (UCITS) IrelandOld Mutual Global Investors (UK)Limited 1.00% 20.00% - -
Old Mutual UK Specialist Equity Fund (UCITS) IrelandOld Mutual Global Investors (UK)Limited 0.75% 20.00% - -
Old Mutual Voyager Global Dynamic Equity Fund (UCITS) United Kingdom Lee Freeman-Shor, Anthony Gillham 1.50% - 5.00% -
Pareto SICAV - Pareto Nordic Corporate Bond (UCITS) Luxembourg SEB Fund Services SA 0.40% N/A N/A N/A
Pershing Square Holdings Ltd/Fund (AIF) United States Pershing Square Capital Management N/A N/A N/A N/APIMCO Funds Global Investors Series PLC - Income Fund(UCITS) Ireland
Pacific Investment Management CoLLC 0.55% - 5.00% -
Polar Capital Funds PLC - Financial Opportunities Fund (UCITS) Ireland Polar Capital LLP 1.00% 10.00% 5.00% -
Polar Capital Funds PLC - Income Opportunities Fund (UCITS) Ireland Polar Capital LLP 0.75% 10.00% 3.50% -
Schroder US Mid Cap Fund (UCITS) United Kingdom Schroder Investment Management Ltd 0.75% - - -
Sequoia Economic Infrastructure Income Fund Ltd (AIF) GuernseyInternational Fund ManagementLimited 0.90% N/A N/A N/A
Skyline Umbrella Fund ICAV - Usonian Japan Value Fund(UCITS) Ireland Usonian Investments LLC N/A - - -
Sprott Physical Gold and Silver Trust (AIF) Canada Sprott Asset Management 0.35% - - -
Sprott Physical Gold Trust (AIF) Canada Sprott Asset Management 0.45% - - -
Sprott Physical Silver Trust (AIF) Canada Sprott Asset Management 0.45% - - -
SQN Asset Finance Income Fund Ltd (AIF) United States SQN Capital Management, LLC 1.00% N/A - -Wellington Management Funds Ireland PLC - Wellington GlobalCredit Plus Fund (UCITS) Ireland Louis Chabrier, Joseph Ramos 0.30% - - -Wells Fargo Lux Worldwide Fund - US High Yield Bond(UCITS) Luxembourg Wells Fargo Funds Management LLC 0.65% - - -Wells Fargo Lux Worldwide Fund - US Short Term High YieldBond Fund (UCITS) Luxembourg Wells Fargo Funds Management LLC 0.50% - - -
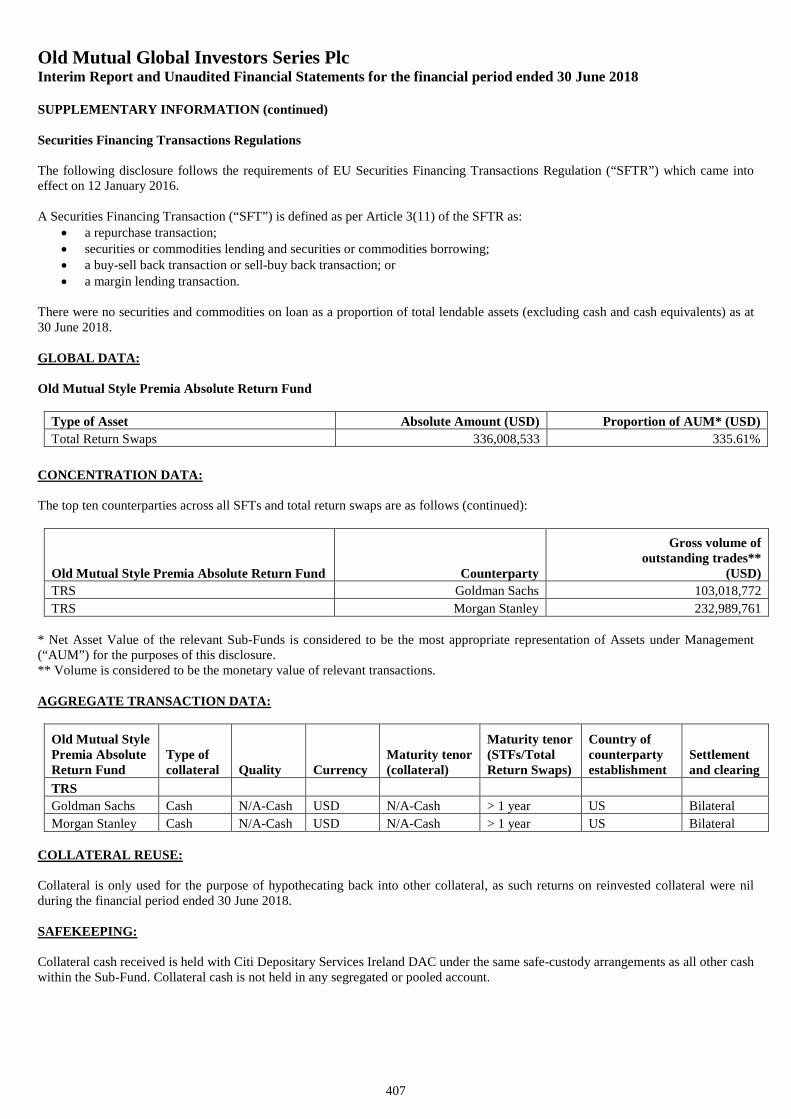
Old Mutual Global Investors Series PlcInterim Report and Unaudited Financial Statements for the financial period ended 30 June 2018
SUPPLEMENTARY INFORMATION (continued)
Securities Financing Transactions Regulations
407
The following disclosure follows the requirements of EU Securities Financing Transactions Regulation (“SFTR”) which came intoeffect on 12 January 2016.
A Securities Financing Transaction (“SFT”) is defined as per Article 3(11) of the SFTR as: a repurchase transaction; securities or commodities lending and securities or commodities borrowing; a buy-sell back transaction or sell-buy back transaction; or a margin lending transaction.
There were no securities and commodities on loan as a proportion of total lendable assets (excluding cash and cash equivalents) as at30 June 2018.
GLOBAL DATA:
Old Mutual Style Premia Absolute Return Fund
Type of Asset Absolute Amount (USD) Proportion of AUM* (USD)
Total Return Swaps 336,008,533 335.61%
CONCENTRATION DATA:
The top ten counterparties across all SFTs and total return swaps are as follows (continued):
Old Mutual Style Premia Absolute Return Fund Counterparty
Gross volume ofoutstanding trades**
(USD)
TRS Goldman Sachs 103,018,772
TRS Morgan Stanley 232,989,761
* Net Asset Value of the relevant Sub-Funds is considered to be the most appropriate representation of Assets under Management(“AUM”) for the purposes of this disclosure.** Volume is considered to be the monetary value of relevant transactions.
AGGREGATE TRANSACTION DATA:
Old Mutual StylePremia AbsoluteReturn Fund
Type ofcollateral Quality Currency
Maturity tenor(collateral)
Maturity tenor(STFs/TotalReturn Swaps)
Country ofcounterpartyestablishment
Settlementand clearing
TRS
Goldman Sachs Cash N/A-Cash USD N/A-Cash > 1 year US Bilateral
Morgan Stanley Cash N/A-Cash USD N/A-Cash > 1 year US Bilateral
COLLATERAL REUSE:
Collateral is only used for the purpose of hypothecating back into other collateral, as such returns on reinvested collateral were nilduring the financial period ended 30 June 2018.
SAFEKEEPING:
Collateral cash received is held with Citi Depositary Services Ireland DAC under the same safe-custody arrangements as all other cashwithin the Sub-Fund. Collateral cash is not held in any segregated or pooled account.
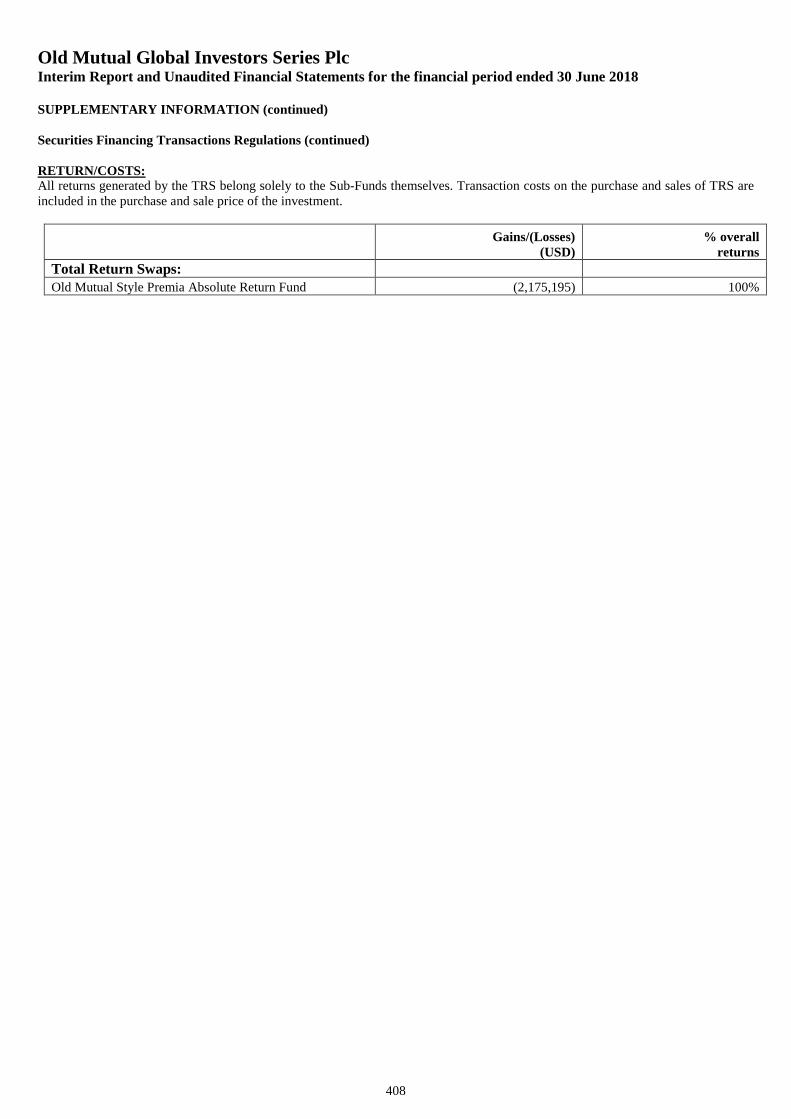
Old Mutual Global Investors Series PlcInterim Report and Unaudited Financial Statements for the financial period ended 30 June 2018
SUPPLEMENTARY INFORMATION (continued)
Securities Financing Transactions Regulations (continued)
408
RETURN/COSTS:All returns generated by the TRS belong solely to the Sub-Funds themselves. Transaction costs on the purchase and sales of TRS areincluded in the purchase and sale price of the investment.
Gains/(Losses)(USD)
% overallreturns
Total Return Swaps:Old Mutual Style Premia Absolute Return Fund (2,175,195) 100%