
MENA B2C E-commerce Report 2014 - Ohjelmisto- ja e ...
38
Global B2C E-commerce Report 2014 Facts, Figures, Infographics & Trends of 2013 and the 2014, 2015 Forecasts of the Latin American B2C E-commerce Market of Goods and Services In cooperation with: Powered by: Under auspices of: MENA B2C E-commerce Report 2014 www.ecommercefoundation.org 1
-
Upload
khangminh22 -
Category
Documents
-
view
3 -
download
0
Transcript of MENA B2C E-commerce Report 2014 - Ohjelmisto- ja e ...
Global B2C E-commerce Report 2014
Facts, Figures, Infographics & Trends of 2013 and the 2014, 2015 Forecasts
of the Latin American B2C E-commerce Market of Goods and Services
In cooperation
with:
Powered
by:
Under auspices
of:
MENA B2C E-commerce Report 2014
www.ecommercefoundation.org
1
Global B2C E-commerce report 2014Colophon
Ecommerce Foundation
Apollolaan 98
1077 BE Amsterdam - Netherlands
Website: www.ecommerce-europe.eu
Contact us at: [email protected]
For reports: [email protected]
Twitter: @Ecommerce_eu
In cooperation with:
Powered by:
In cooperation with:
Austria
Belgium
Czech
Republic
Denmark
Finland
Finland
France
Germany
Greece
Ireland
Italy
Nether-
lands
Norway
Poland
Spain
Switzer-
land
www.ecommercefoundation.org 2© Ecommerce Foundation
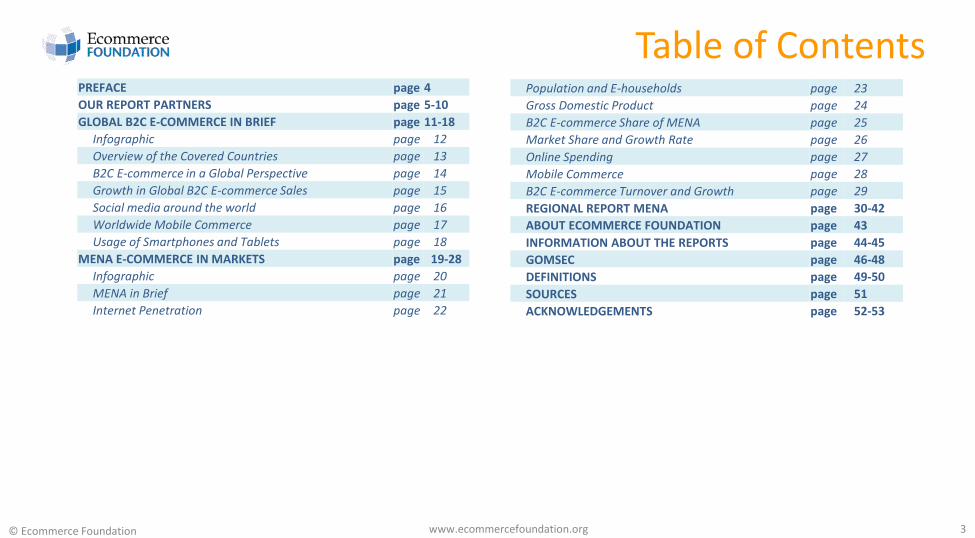
Table of ContentsPREFACE page 4
OUR REPORT PARTNERS page 5-10
GLOBAL B2C E-COMMERCE IN BRIEF page 11-18
Infographic page 12
Overview of the Covered Countries page 13
B2C E-commerce in a Global Perspective page 14
Growth in Global B2C E-commerce Sales page 15
Social media around the world page 16
Worldwide Mobile Commerce page 17
Usage of Smartphones and Tablets page 18
MENA E-COMMERCE IN MARKETS page 19-28
Infographic page 20
MENA in Brief page 21
Internet Penetration page 22
Population and E-households page 23
Gross Domestic Product page 24
B2C E-commerce Share of MENA page 25
Market Share and Growth Rate page 26
Online Spending page 27
Mobile Commerce page 28
B2C E-commerce Turnover and Growth page 29
REGIONAL REPORT MENA page 30-42
ABOUT ECOMMERCE FOUNDATION page 43
INFORMATION ABOUT THE REPORTS page 44-45
GOMSEC page 46-48
DEFINITIONS page 49-50
SOURCES page 51
ACKNOWLEDGEMENTS page 52-53
www.ecommercefoundation.org 3© Ecommerce Foundation

Jorij Abraham
Director Ecommerce Foundation
Global B2C E-commerce Reports 2014Preface
Bert Nagelvoort
Senior Researcher
The importance of e-commerce continuous to grow. More and more people
buy their products and services online and they do so from various places,
such as at home, at work, en route or in the highstreet, and sometimes even
online in the store. Meanwhile, e-commerce has become a major influence
on the global economy. Whereas the Global Gross Domestic Product was
around $74.9trn in 2013, the eGDP accounted for 1.34% of this number. In
addition, e-commerce is responsible for the creation of many new jobs and
all this makes it a significant economic power around the globe.
Measuring the size and growth of the e-commerce sector worldwide is vital
for understanding its economic impact and growing contribution.
Ecommerce Europe strongly believes that it is with economic facts that
messages in support of our industry can be heard.
The newly established Ecommerce Foundation publishes several reports. It
publishes the six European reports under auspices of Ecommerce Europe.
The Ecommerce Foundation also publishes a global report as well as five
regional reports, covering North America, Latin America, Asia-Pacific, the
Middle East and Northern Africa (MENA) and the BRICS countries (Brazil,
Russia, India, China and South Africa).
Through the Ecommerce Foundation B2C Research Reports we want to
share our knowledge with our readers around the world. By means of
figures that are based on the Global Online Measurement Standard for B2C
E-Commerce (GOMSEC), interviews with e-commerce experts and clear
tables and infographics, we provide online retailers and other stakeholders
with practical means that can help them to optimize their businesses.
Naturally, we could not have realized these reports without the help of others.
Therefore we want to use this opportunity to express our gratitude to all
participating national associations and their individual research partners for providing
us with the required data and information. In addition, we are very grateful to the
experts across the world who selflessly invested their time and effort to share their
insights. And finally, a special word of thanks goes to our sponsors GlobalCollect,
Informatica Corp, RichRelevance and Salesupply, who enable us to make the reports
widely available, and to GfK for their close cooperation and involvement.
If you would like to receive additional information, purchase reports or become
involved with Ecommerce Foundation, please contact us via our website
www.ecommerce-europe.eu or send us an email at [email protected]
www.ecommercefoundation.org 4© Ecommerce Foundation

Our Report PartnersThis report is powered by the following partners
GfK is the trusted source of relevant market and consumer information that enables its clients to make smarter decisions. More than 13,000
market research experts combine their passion with GfK’s 80 years of data science experience. By using innovative technologies and data
sciences, GfK turns big data into smart data, enabling its clients to improve their competitive edge and enrich consumers’ experiences and
choices.
GlobalCollect is the most knowledgeable global Payment Service Provider in the world, processing international e-commerce payments for
more than 600 of the world’s most recognized e-commerce brands in the digital goods and services, travel, retail and video gaming industries,
among many others. GlobalCollect’s business intelligence tools, Managed Fraud Services and more than 400 payments experts help our clients
elevate their payment strategies to become a strategic asset to their companies.
RichRelevance is the global leader in omni-channel personalization. More than 160 companies in 40 countries use RichRelevance to turn data
into actionable insight, which delivers the most relevant experience for consumers as they shop across web, store and mobile. RichRelevance
drives more than one billion decisions every day, and has delivered over $8 billion in attributable sales to its clients, which include Target,
Marks & Spencer and PriceMinister.
Salesupply is a global e-business services company that enables online retailers to achieve profitable international growth faster, more
efficiently and with relatively low costs. Salesupply provides a full range of solutions ranging from research and strategy, to effective
localization of online shops, followed by complete operational support, traffic generation and brand management.
Informatica Corporation (Nasdaq:INFA) is the world’s number one independent provider of data integration software. Organizations around
the world rely on Informatica to realize their information potential and drive top business imperatives. Informatica Vibe, the industry’s first
and only embeddable virtual data machine (VDM), powers the unique “Map Once. Deploy Anywhere.” capabilities of the Informatica Platform.
With regard to information technology, Informatica helps wherever possible by delivering the right data in the right way to the right users.
www.ecommercefoundation.org 5© Ecommerce Foundation
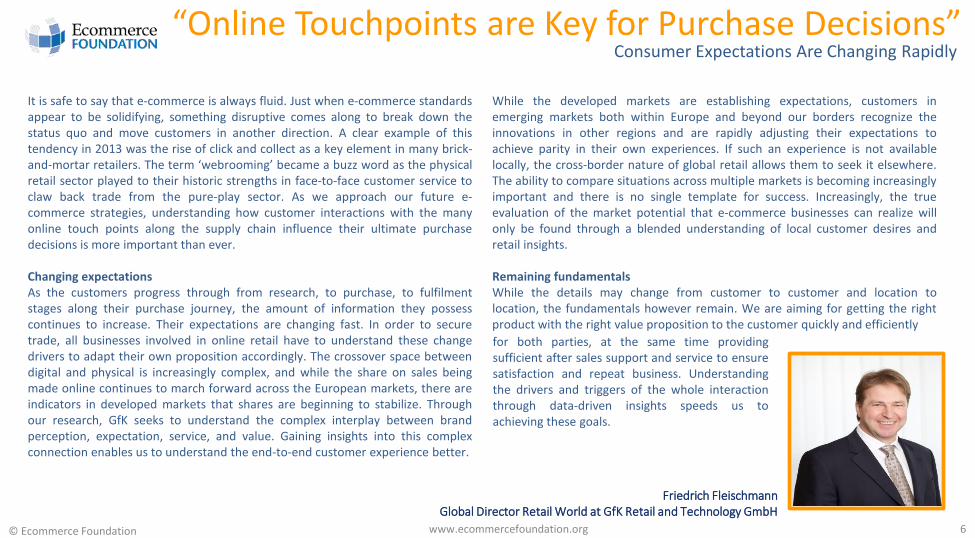
Friedrich Fleischmann
Global Director Retail World at GfK Retail and Technology GmbH
It is safe to say that e-commerce is always fluid. Just when e-commerce standards
appear to be solidifying, something disruptive comes along to break down the
status quo and move customers in another direction. A clear example of this
tendency in 2013 was the rise of click and collect as a key element in many brick-
and-mortar retailers. The term ‘webrooming’ became a buzz word as the physical
retail sector played to their historic strengths in face-to-face customer service to
claw back trade from the pure-play sector. As we approach our future e-
commerce strategies, understanding how customer interactions with the many
online touch points along the supply chain influence their ultimate purchase
decisions is more important than ever.
Changing expectations
As the customers progress through from research, to purchase, to fulfilment
stages along their purchase journey, the amount of information they possess
continues to increase. Their expectations are changing fast. In order to secure
trade, all businesses involved in online retail have to understand these change
drivers to adapt their own proposition accordingly. The crossover space between
digital and physical is increasingly complex, and while the share on sales being
made online continues to march forward across the European markets, there are
indicators in developed markets that shares are beginning to stabilize. Through
our research, GfK seeks to understand the complex interplay between brand
perception, expectation, service, and value. Gaining insights into this complex
connection enables us to understand the end-to-end customer experience better.
While the developed markets are establishing expectations, customers in
emerging markets both within Europe and beyond our borders recognize the
innovations in other regions and are rapidly adjusting their expectations to
achieve parity in their own experiences. If such an experience is not available
locally, the cross-border nature of global retail allows them to seek it elsewhere.
The ability to compare situations across multiple markets is becoming increasingly
important and there is no single template for success. Increasingly, the true
evaluation of the market potential that e-commerce businesses can realize will
only be found through a blended understanding of local customer desires and
retail insights.
Remaining fundamentals
While the details may change from customer to customer and location to
location, the fundamentals however remain. We are aiming for getting the right
product with the right value proposition to the customer quickly and efficiently
“Online Touchpoints are Key for Purchase Decisions”Consumer Expectations Are Changing Rapidly
for both parties, at the same time providing
sufficient after sales support and service to ensure
satisfaction and repeat business. Understanding
the drivers and triggers of the whole interaction
through data-driven insights speeds us to
achieving these goals.
www.ecommercefoundation.org 6© Ecommerce Foundation
John Snoek
Global Vice President Marketing at GlobalCollect
“The European Market Changes Constantly” Key Trends and Best Practices for Cross-border E-commerce
Europe is a mature e-commerce market, but it changes and evolves constantly.
For merchants, there is still plenty of opportunity for growth by expanding into
new European markets. However, the unique dynamics of the European market
place do require careful consideration and planning.
While selecting the right payment mix per country is the necessary basis,
successful merchants also anticipate and act on macro-trends, such as changes in
the regulatory environment, or in consumer behavior and expectations. At the
same time, these merchants actively analyze and optimize their businesses
through aggressive fraud management and the application of big data analytics.
Mobile first strategy
In 2014, mobile commerce well and truly arrived in Europe. The use of mobile
devices for online shopping and payments is accelerating, with Sweden and the
UK in particular matching the global leaders in mobile shopper penetration. In
addition, merchants that have adopted the mobile first strategy in both check out
and payment pages are seeing considerably higher success rates.
Big data to monitor risks and identify opportunities
Another big trend that is further maturing in 2014 is the application of big data
analytics and visualization to the domain of online payments. E-commerce leaders
such as Amazon have been applying big data for years now with the objective of
building sophisticated profiles of their consumers for Conversion Rate
Optimization (CRO). And with good reason.
Cross-border payments can quickly become very complex and hard to manage.
Huge volumes of data need to be analyzed in order to identify issues and
The year of SEPA?
Finally, 2014 is a watershed year for cross-border
payments in the Single Euro Payments Area
(SEPA). The goal of SEPA is to create a harmonized
payments infrastructure throughout the SEPA
countries. This is done through the use of common
payment instruments and standards, supported by
a regular and accepted legal structure.
opportunities. By applying analytics and visualization to payments data,
merchants can track and compare performance per country, per payment method
or per time period, and take appropriate steps to optimize processes.
Combating sophisticated fraud
Fraud is a fact of life for merchants. This is particularly true for international
merchants, because cross-border payments have significantly higher fraud rates
than domestic payments. Increasingly, sophisticated fraudsters also take
advantage of the shift to mobile payments, where fraud losses are higher as a
percentage of revenue.
However, rather than accepting fraud as a cost of doing cross-border business,
merchants can take action to minimize its impact. In addition to improving the
bottom line, this also limits the risk of the kind of reputation damages that go
hand-in-hand with online fraud.
www.ecommercefoundation.org 7© Ecommerce Foundation
Ben Rund
Senior Director Product Marketing
at Informatica Corp
“Information Must Be Relevant to Customers” Omnichannel Tomorrow Means Predicting the Next Logical Purchase Everywhere
To be able to do this, the motto of offering the right product to the right
customer, in the right place and at the right time should be in the company’smindset. In addition, it needs to have the proper technology to execute this
strategy.
Brand-switching
A final aspect that will be very important in the upcoming years is the apparent
lack of brand loyalty. In the US, 75% of the consumers state that they easily switch
between brands, and for the rest of the world this rate amounts to 60%.
Consumers receive an overload of information and in combination with the total
transparency of the markets, buying somewhere else is just one click away.
Companies have to deal with this by ensuring that their marketing activities only
contain relevant information. Commerce Relevancy is taking omnichannel to the
next level for customer experience.
A lot is changing in the landscape of e-commerce. For example, the “e” in e-
commerce is disappearing. There is no longer a strict separation between online
retail and shopping at bricks-and-mortar shops, as all purchases will take place
through omnichannel retailing.
By the end of 2013, 36% of in-store purchases were influenced by digital devices,
for instance as consumers compared prices through comparison websites or
looked for additional information. This number is expected to have increased to
around 50% at the end of 2014.
Companies have to be aware of these developments and invest sufficiently in
reaching customers through the several touch points. This way, they will be able
to create a flawless customer experience, which is very important for attracting
and holding on to customers.
Real-time experience
The biggest challenge for companies will be real-time experience. For customers it
will not be enough to receive information tomorrow or even later today; they
want it right away. In other words, fast anticipation is key. By 2017, customer
experience is what buyers are going to use to make purchase decisions.
Therefore, only companies that can deliver instant information will be successful.
In order to achieve this, retailers must be able to predict the next purchases of
customers. When shoppers are about to make a purchase, merchants should offer
enticing product and/or service bundles. In addition, once a purchase has been
concluded, customers should later receive recommendations through all channels
regarding products and/or services that might be interesting to them.
www.ecommercefoundation.org 8© Ecommerce Foundation
David Selinger
CEO of RichRelevance
The United States is the largest e-commerce market in the world, and as a result,
it is a frontrunner in terms of trends in this area. Already the de facto standard for
location-based services in stores, iBeacon is one of the most important trends
here. It will even gain popularity as the technology of choice due to its price,
scalability and ease of maintenance. In order to make iBeacons and in-store
technology really smart, consumers have to be willing and able to use apps. Then
it will provide a massive opportunity to step up and engage with consumers
through a value proposition centered on service, rather than on offers and
products. Consider an iBeacon that triggers when you enter a store to pick up
your click-and-collect order, enabling you to skip a 15-minute queue, or reminding
you of items you might wish to replenish. This trend offers a lot of opportunities
for retailers.
Service is key
Through technical developments in shops, retailers are able to optimize their
services. And most retailers are realizing that their service arm is going to be a key
area where they can differentiate themselves from the Amazons and Alibabas of
the world. Sales associates are on the cusp of being much more intelligent and
powerful, providing choice, value and time savings to the consumer when armed
with the right tools. A sales associate may have an interaction with a shopper in
the dressing room. Instead of pausing to think about what color looks good with
her skin tone or what pants best match this top, she can access and leverage
online clickstream behavior derived from similar shoppers to guide the customer
with appropriate cross-sells and accessories. Combine the power of this online
data with store availability and sizing, and less experienced sales associates can
now provide the level of customer experience usually delivered by the best-
performing associates.
Preparing for e-commerce giants
Conventional wisdom states that traditional retailers retain one enormous
advantage in their battle against e-commerce superpowers, such as Amazon: the
physical store. However, as price pressures have increased, retail war rooms have
focused on deals and promotions. Still, no matter how many coupons they email
and social media contests they run, America’s retailers cannot play the same old
game and expect to win and beat Amazon in this escalated battle. To stay in the
game, traditional retailers must respond quickly. The real – and only – opportunity
is to let go of deals and embrace consumer data in order to make sales associates
more helpful and stores more entertaining, and ultimately to save consumers
time. By doing this, retailers can offer unique value to customers untouchable by
e-commerce giants. For retailers gearing up for this new marketplace, the goal is
to optimize the human dimension of shopping in-store. Deals and promotions
remain part of the equation, but on their own they will not cut it. It is the
“Service Is Going to Be a Key Area” Technical Developments Help Retailers to Optimize Their Service
connected cycle of discovery, meaningful experiences,
human interaction, and sales connected by data
crunching that will make brick-and-mortar retail more
competitive.
www.ecommercefoundation.org 9© Ecommerce Foundation
Henning Heesen
Cross-Border E-Commerce Specialist
and Board Member at Salesupply AG
“E-commerce Enables Retail Globalization” People Are Becoming Increasingly More Digital and Connected
The MENA region is often considered as one entity an many people believe that
the countries in this region are politically and culturally similar. However, the
socio-political climate and economic developments are very different, and so is
the speed and dynamic of internet usage and penetration.
Internet penetration for instance varies from over 80 percent in Qatar to lower
numbers between 10 and 20 percent in e.g. Yemen. E-Commerce is growing a fast
pace in the region, but is still hampered by barriers such as a lack of trust in this
buying channel and fraud issues related to credit card payments.
The society in this region is increasingly shifting towards digital, with an enormous
boost for mobile usage and social media. There is a lot of growth potential, and
buyers from countries such as Qatar and Dubai are often affluent and interested
in foreign (luxury) brands.
Such as in any market, retailers seeking to sell in the MENA region have to pay
special attention to local preferences, challenges and customer behavior. For
instance for Western European companies, it can be useful to keep in mind the
differences in cultural and religious views and values and when setting up
marketing campaigns, product descriptions and visuals.
Expanding into a region very different from your home market can be very
rewarding. However, we advise to collaborate with a local partner in order to be
up-to-date when it comes to the ins and outs of the local markets and customer
pool. Local experts is the key to successfully approaching new markets!
www.ecommercefoundation.org 10© Ecommerce Foundation
Global B2C E-commerce Report 2014Highlights of the Global B2C E-commerce Market
Global B2C E-commerce in Brief
Under auspices
of:
www.ecommercefoundation.org

2013 and 2014 Forecast Key B2C E-commerce Data of Goods and Services at a Glance
Top 10 e-commerce countries in
turnover (USD billion)
USA $ 419.0
China $ 328.4
UK $ 142.3
Japan $ 136.7
Germany $ 84.2
France $ 67.8
Australia $ 35.7
Canada $ 23.9
Russia $ 20.5
S. Korea $ 20.2* B2C & C2C goods & services, excluding insurances
7,358 millionpeople live in the world
4,164 millionpeople use the Internet
1,036 millionpeople are e-shoppers
14%
56%
100%$ 1,554 bnTurnover E-commerceGoods & Services
“1,878 million estimated social media users”
© Ecommerce Foundation January 2015
www.ecommercefoundation.org
info: [email protected]
for reports: [email protected]
Twitter: @eComFound
Global
Global $1,554.6 bn +23.9%Total B2C e-sales 2013 of Goods and Services
1
2 3
73.4% Share of Internet users accessing the web through a mobile device*
*Average worldwide
Cross-border B2C E- commerce
Most popular countries:
USA 45%
UK 37%
China / HK 26%
Canada 18%
Australia 16%
Germany 14%
% of cross-border shoppers purchased in these
markets the last year.
Asia-Pacific
North America
Europe
Latin America
MENA
$ 567.3 bn
$ 452.4 bn
$ 482.3 bn
$ 33.2 bn
$ 16.8 bn
+44.6%
+10.1%
+17.1%
+21.5%
+30.3%
“94 million consumers buy
cross-border and this number is
expected to grow in 2014”
Estimated shareof online goodsin total retail of goods
4.2%
· 1 Global report
· 10+ regional reports
· 50+ country reports.
The mission of the Ecommerce Foundation is to facilitate
the development of practical knowledge, insights and
learnings for which individual institutions, associations and
B2C selling companies do not have the (financial) resources
and/or capabilities.
Forecast 2014 $1,912.0 bn +23.0%
The Ecommerce Foundation B2C E-commerce Reports

Country Capital VAT Currency Population
Argentina Buenos Aires 21.0% Peso (ARS) 41.4mn
Australia Sydney 10.0% Dollar (AUD) 21.1mn
Brazil Rio de Janeiro 17.0% Real (BRL) 200.3mn
Canada Ottawa 5.0% Dollar (CAD) 35.1mn
Chile Santiago 19.0% Peso (CLP) 17.6mn
China Beijing 17.0% Yuan (CNY) 1,357.3mn
Egypt Cairo 10.0% Pound (EGP) 82.0mn
France Paris 19.0% Euro (EUR) 65.5mn
Germany Berlin 19.0% Euro (EUR) 82.0mn
India New Delhi 12.5% Rupee (INR) 1,252.1mn
Israel Jerusalem 18.0% New Shekel (ILS) 8.0mn
Italy Rome 22.0% Euro (EUR) 59.6mn
Japan Tokyo 5.0% Yen (JPY) 127.3mn
Jordan Amman 16.0% Dinar (JOD) 6.4mn
Kuwait Kuwait City N/A Dinar (KWD) 3.3mn
Mexico Mexico City 16.0% Peso (MXN) 122.3mn
Qatar Doha N/A Riyal (QAR) 2.1mn
Russia Moscow 18.0% Ruble (RUB) 142.5mn
Saudi Arabia Riyadh N/A Riyal (SAR) 28.8mn
South Africa Pretoria 14.0% Rand (ZAR) 52.9mn
South Korea Seoul 10.0% Won (KRW) 50.2mn
Spain Madrid 21.0% Euro (EUR) 46.7mn
United Arab Emirates Abu Dhabi N/A Dirham (AED) 9.3mn
United Kingdom London 20.0% Pound (GBP) 63.8mn
United States Washington D.C. 5.0% Dollar (USD) 315.1mn
Overview of the Covered Countries
Covered countries
This table provides you with some relevant information
regarding the countries that are covered in our global
reports. The countries covered in this report have been
highlighted.
The countries mentioned in the table were selected for the
reports because they are influential in their regions. They are
all discussed in brief in the Global Report, with the exception
of Egypt, Israel, Jordan, Kuwait, Qatar, Saudi Arabia and the
United Arab Emirates, as we covered the MENA region as a
whole there.
B2C E-commerce Worldwide
www.ecommercefoundation.org 13© Ecommerce Foundation
Social media around the world
67
20 15 16 13
71
22 21 18 17
2012
2013
% of online adults who use the following
social media websites, in millions
Global social media sites, 2012 - 2013
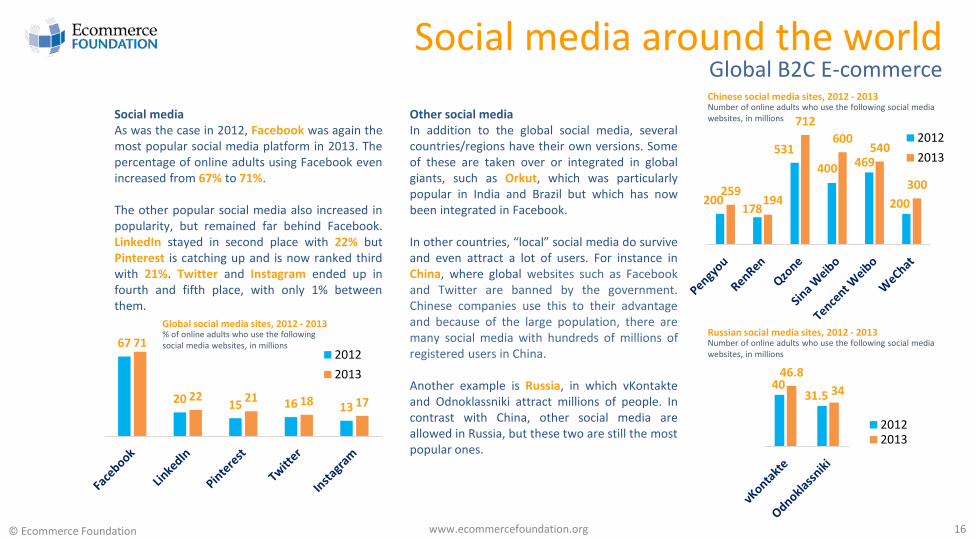
Social media
As was the case in 2012, Facebook was again the
most popular social media platform in 2013. The
percentage of online adults using Facebook even
increased from 67% to 71%.
The other popular social media also increased in
popularity, but remained far behind Facebook.
LinkedIn stayed in second place with 22% but
Pinterest is catching up and is now ranked third
with 21%. Twitter and Instagram ended up in
fourth and fifth place, with only 1% between
them.
200178
531
400469
200259
194
712
600540
300
2012
2013
Number of online adults who use the following social media
websites, in millions
Chinese social media sites, 2012 - 2013
4031.5
46.8
34
20122013
Number of online adults who use the following social media
websites, in millions
Russian social media sites, 2012 - 2013
Other social media
In addition to the global social media, several
countries/regions have their own versions. Some
of these are taken over or integrated in global
giants, such as Orkut, which was particularly
popular in India and Brazil but which has now
been integrated in Facebook.
In other countries, “local” social media do survive
and even attract a lot of users. For instance in
China, where global websites such as Facebook
and Twitter are banned by the government.
Chinese companies use this to their advantage
and because of the large population, there are
many social media with hundreds of millions of
registered users in China.
Another example is Russia, in which vKontakte
and Odnoklassniki attract millions of people. In
contrast with China, other social media are
allowed in Russia, but these two are still the most
popular ones.
Global B2C E-commerce
www.ecommercefoundation.org 16© Ecommerce Foundation
Worldwide Mobile CommerceGlobal B2C E-commerce
Source: Eurostat, Ecommerce Foundation, 2014
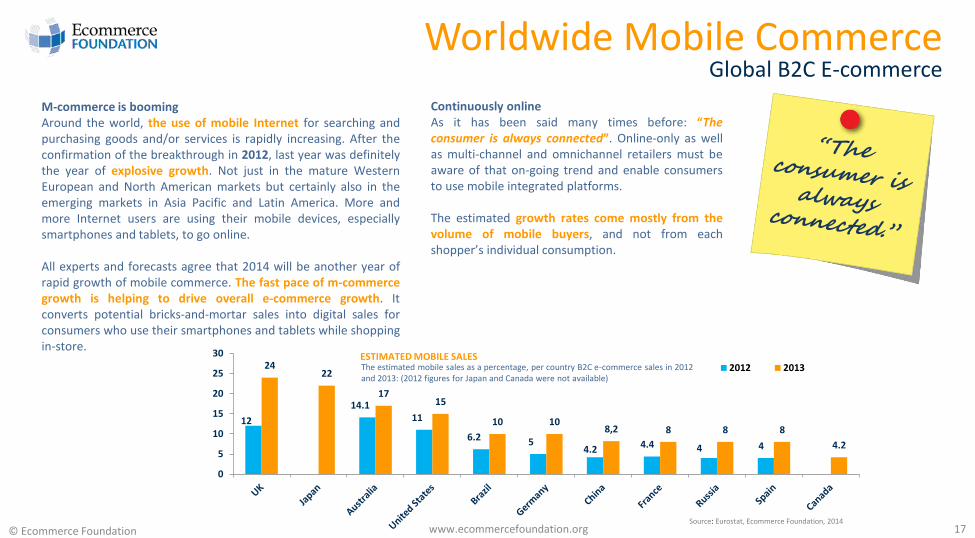
M-commerce is booming
Around the world, the use of mobile Internet for searching and
purchasing goods and/or services is rapidly increasing. After the
confirmation of the breakthrough in 2012, last year was definitely
the year of explosive growth. Not just in the mature Western
European and North American markets but certainly also in the
emerging markets in Asia Pacific and Latin America. More and
more Internet users are using their mobile devices, especially
smartphones and tablets, to go online.
All experts and forecasts agree that 2014 will be another year of
rapid growth of mobile commerce. The fast pace of m-commerce
growth is helping to drive overall e-commerce growth. It
converts potential bricks-and-mortar sales into digital sales for
consumers who use their smartphones and tablets while shopping
in-store.
Continuously online
As it has been said many times before: “Theconsumer is always connected”. Online-only as well
as multi-channel and omnichannel retailers must be
aware of that on-going trend and enable consumers
to use mobile integrated platforms.
The estimated growth rates come mostly from the
volume of mobile buyers, and not from each
shopper’s individual consumption.
12
14.1
11
6.2 54.2
4.4 4 4
2422
1715
10 108,2 8 8 8
4.2
0
5
10
15
20
25
30
2012 2013The estimated mobile sales as a percentage, per country B2C e-commerce sales in 2012
and 2013: (2012 figures for Japan and Canada were not available)
ESTIMATED MOBILE SALES
www.ecommercefoundation.org 17© Ecommerce Foundation
Source: Total market including 2014 estimation by GfK Trends and Forecasting
0
50
100
150
200
250
300
2010 2011 2012 2013 2014
North America
0
50
100
150
200
250
2010 2011 2012 2013 2014
Western Europe
0
20
40
60
80
100
2010 2011 2012 2013 2014
Eastern Europe
0
100
200
300
400
500
2010 2011 2012 2013 2014
China
0
50
100
150
2010 2011 2012 2013 2014
Latin America
0
50
100
150
200
2010 2011 2012 2013 2014
MENA
Usage of Smartphones and TabletsGlobal B2C E-commerce
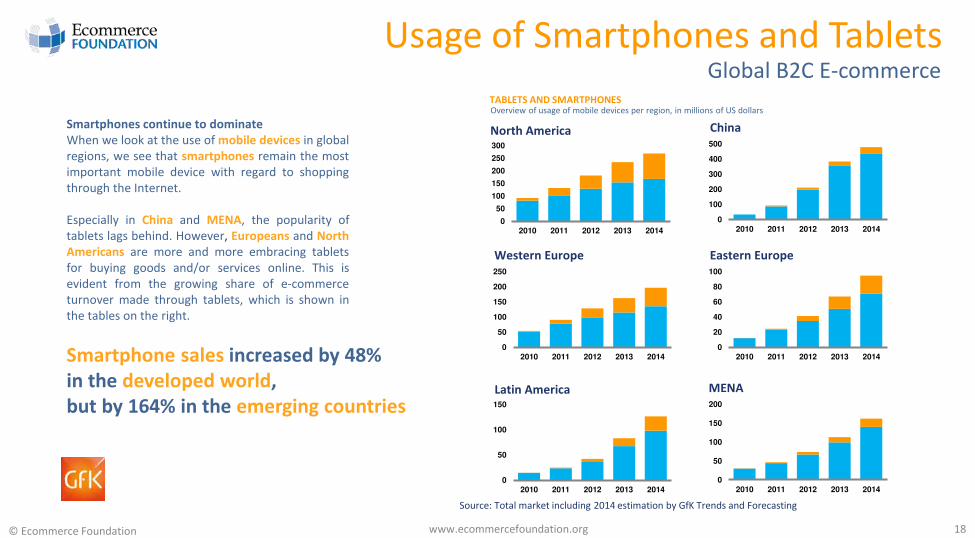
Overview of usage of mobile devices per region, in millions of US dollarsTABLETS AND SMARTPHONES
Smartphones continue to dominate
When we look at the use of mobile devices in global
regions, we see that smartphones remain the most
important mobile device with regard to shopping
through the Internet.
Especially in China and MENA, the popularity of
tablets lags behind. However, Europeans and North
Americans are more and more embracing tablets
for buying goods and/or services online. This is
evident from the growing share of e-commerce
turnover made through tablets, which is shown in
the tables on the right.
Smartphone sales increased by 48%
in the developed world,
but by 164% in the emerging countries
www.ecommercefoundation.org 18© Ecommerce Foundation
An overview of e-commerce markets in MENA region
MENA
Under auspices
of:
www.ecommerce-europe.eu
MENA in BriefMiddle East and Northern Africa (MENA)
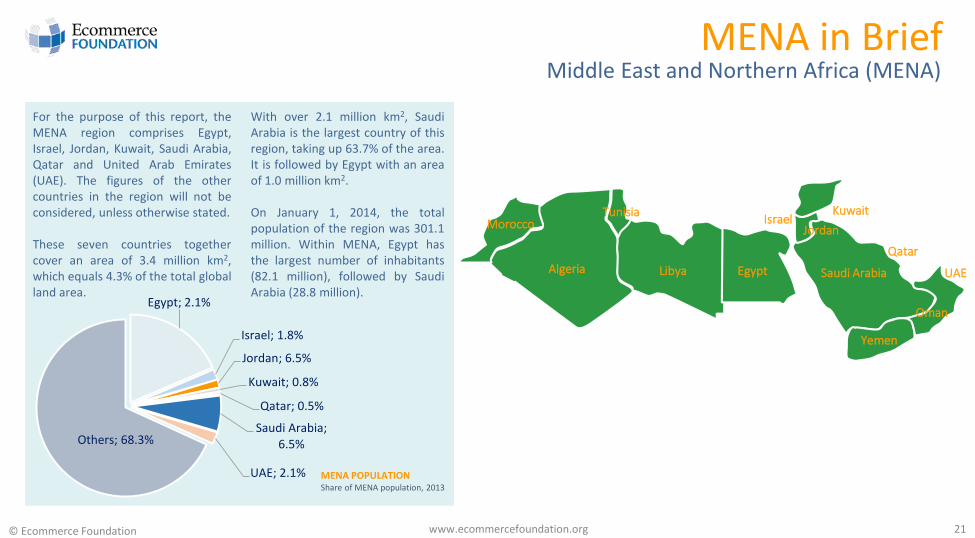
For the purpose of this report, the
MENA region comprises Egypt,
Israel, Jordan, Kuwait, Saudi Arabia,
Qatar and United Arab Emirates
(UAE). The figures of the other
countries in the region will not be
considered, unless otherwise stated.
These seven countries together
cover an area of 3.4 million km2,
which equals 4.3% of the total global
land area.
MENA POPULATIONShare of MENA population, 2013
Egypt; 2.1%
Israel; 1.8%
Jordan; 6.5%
Kuwait; 0.8%
Qatar; 0.5%
Saudi Arabia;
6.5%
UAE; 2.1%
Others; 68.3%
www.ecommercefoundation.org 21
Kuwait
Jordan
Saudi Arabia
Qatar
UAE
Israel
EgyptLibyaAlgeria
TunisiaMorocco
Yemen
Oman
With over 2.1 million km2, Saudi
Arabia is the largest country of this
region, taking up 63.7% of the area.
It is followed by Egypt with an area
of 1.0 million km2.
On January 1, 2014, the total
population of the region was 301.1
million. Within MENA, Egypt has
the largest number of inhabitants
(82.1 million), followed by Saudi
Arabia (28.8 million).
© Ecommerce Foundation
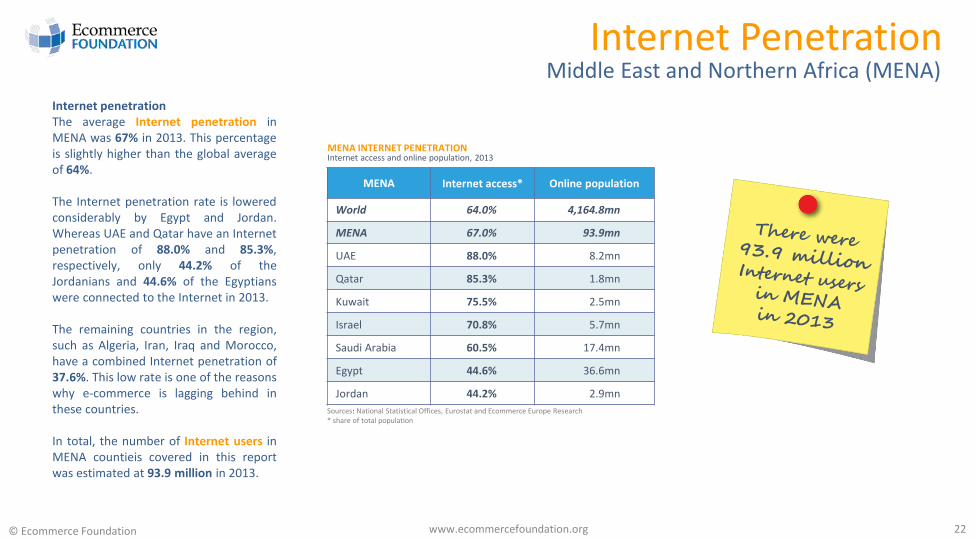
MENA Internet access* Online population
World 64.0% 4,164.8mn
MENA 67.0% 93.9mn
UAE 88.0% 8.2mn
Qatar 85.3% 1.8mn
Kuwait 75.5% 2.5mn
Israel 70.8% 5.7mn
Saudi Arabia 60.5% 17.4mn
Egypt 44.6% 36.6mn
Jordan 44.2% 2.9mn
Internet Penetration
Internet penetration
The average Internet penetration in
MENA was 67% in 2013. This percentage
is slightly higher than the global average
of 64%.
The Internet penetration rate is lowered
considerably by Egypt and Jordan.
Whereas UAE and Qatar have an Internet
penetration of 88.0% and 85.3%,
respectively, only 44.2% of the
Jordanians and 44.6% of the Egyptians
were connected to the Internet in 2013.
The remaining countries in the region,
such as Algeria, Iran, Iraq and Morocco,
have a combined Internet penetration of
37.6%. This low rate is one of the reasons
why e-commerce is lagging behind in
these countries.
In total, the number of Internet users in
MENA countieis covered in this report
was estimated at 93.9 million in 2013.
Sources: National Statistical Offices, Eurostat and Ecommerce Europe Research
* share of total population
Internet access and online population, 2013MENA INTERNET PENETRATION
Middle East and Northern Africa (MENA)
www.ecommercefoundation.org 22© Ecommerce Foundation

Mobile Commerce
89%
44%
15%12% 11%
42%47%
25%29%
32%
63%
25%
10%14% 16%
0%
10%
20%
30%
40%
50%
60%
70%
80%
90%
100%
At home Office/workplace In a shop In public
transport
In public areas
Desktop/Laptop
Smartphone
Tablet
POPULAR PLACES REGARDING MOBILE PURCHASES IN THE MIDDLE EASTPercentage of purchases by e-shoppers per device and location in the Middle East
www.ecommercefoundation.org 28
Mobile commerce
As in the other global regions, mobile commerce is quickly gaining
popularity within the Middle East. In fact, compared to 2011, m-
commerce sales nearly tripled in 2013, to $1.3bn. For 2014, the m-
commerce turnover is estimated to have increased to $1.8bn.
With regard to places where consumers like to shop through a mobile
device, the office/workplace was most popular among smartphone
users in 2013. Tablet users preferred the safe surroundings of their
own homes. In addition, it is clear that the smartphone is the most
popular mobile device for purchases “on the go”.
Middle East and Northern Africa (MENA)
M-COMMERCE MARKET IN THE MIDDLE EASTSize of the m-commerce turnover in the Middle East
$0.5bn
$0.9bn$1.3bn
$1.8bn
2011 2012 2013 2014 (f)
Source: PayPal insights: E-Commerce in the middle East
Source: PayPal insights: E-Commerce in the Middle East
© Ecommerce Foundation

Facts, Figures & Trends of 2013 and Forecast 2014 of MENA’s B2C E-commerce Markets
Regional Report MENA 2014
Under auspices
of:
www.ecommercefoundation.org
Region Profile
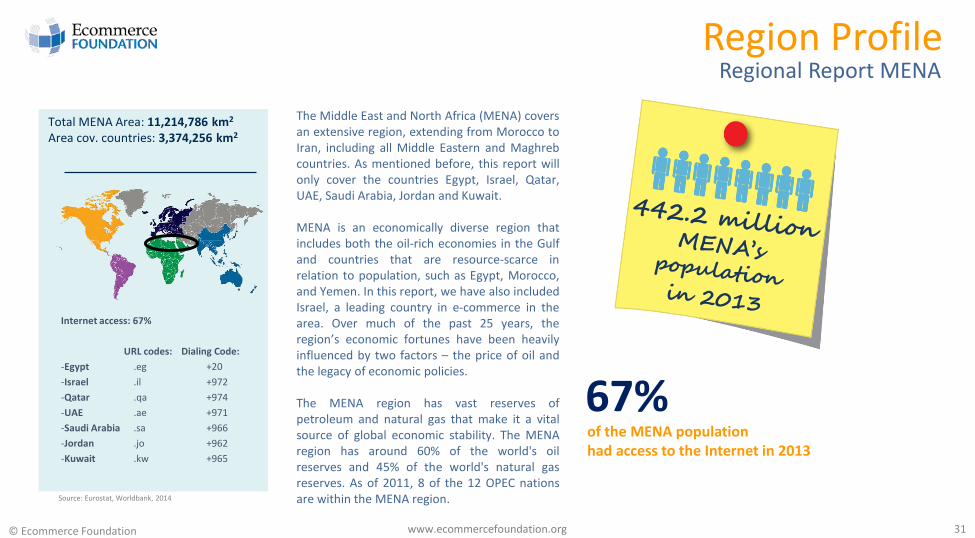
The Middle East and North Africa (MENA) covers
an extensive region, extending from Morocco to
Iran, including all Middle Eastern and Maghreb
countries. As mentioned before, this report will
only cover the countries Egypt, Israel, Qatar,
UAE, Saudi Arabia, Jordan and Kuwait.
MENA is an economically diverse region that
includes both the oil-rich economies in the Gulf
and countries that are resource-scarce in
relation to population, such as Egypt, Morocco,
and Yemen. In this report, we have also included
Israel, a leading country in e-commerce in the
area. Over much of the past 25 years, the
region’s economic fortunes have been heavily
influenced by two factors – the price of oil and
the legacy of economic policies.
The MENA region has vast reserves of
petroleum and natural gas that make it a vital
source of global economic stability. The MENA
region has around 60% of the world's oil
reserves and 45% of the world's natural gas
reserves. As of 2011, 8 of the 12 OPEC nations
are within the MENA region.
Internet access: 67%
URL codes: Dialing Code:
-Egypt .eg +20
-Israel .il +972
-Qatar .qa +974
-UAE .ae +971
-Saudi Arabia .sa +966
-Jordan .jo +962
-Kuwait .kw +965
Total MENA Area: 11,214,786 km2
Area cov. countries: 3,374,256 km2
of the MENA population
had access to the Internet in 2013
67%
Source: Eurostat, Worldbank, 2014
Regional Report MENA
31© Ecommerce Foundation www.ecommercefoundation.org
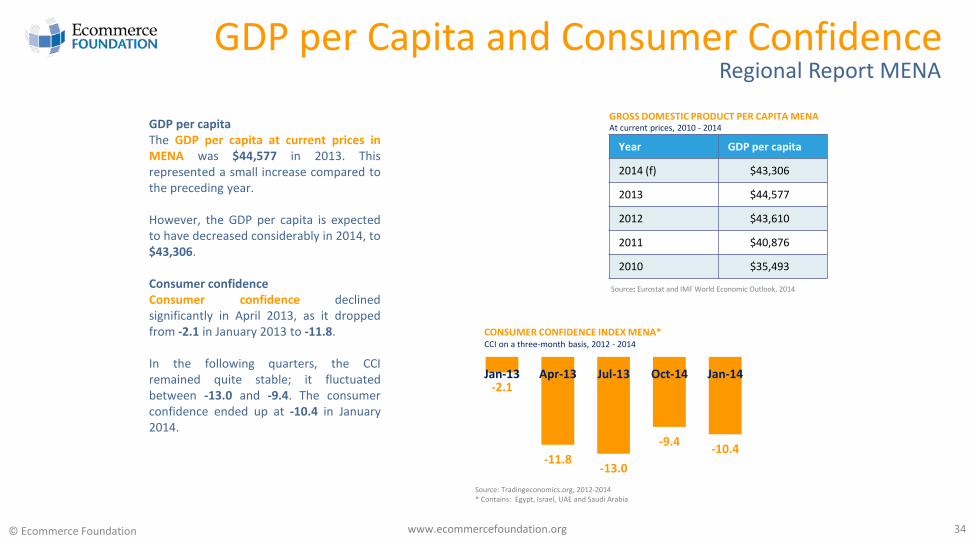
GDP per Capita and Consumer Confidence
GDP per capita
The GDP per capita at current prices in
MENA was $44,577 in 2013. This
represented a small increase compared to
the preceding year.
However, the GDP per capita is expected
to have decreased considerably in 2014, to
$43,306.
Consumer confidence
Consumer confidence declined
significantly in April 2013, as it dropped
from -2.1 in January 2013 to -11.8.
In the following quarters, the CCI
remained quite stable; it fluctuated
between -13.0 and -9.4. The consumer
confidence ended up at -10.4 in January
2014.
Source: Eurostat and IMF World Economic Outlook, 2014
GROSS DOMESTIC PRODUCT PER CAPITA MENA
Year GDP per capita
2014 (f) $43,306
2013 $44,577
2012 $43,610
2011 $40,876
2010 $35,493
CONSUMER CONFIDENCE INDEX MENA*CCI on a three-month basis, 2012 - 2014
Source: Tradingeconomics.org, 2012-2014
* Contains: Egypt, Israel, UAE and Saudi Arabia
At current prices, 2010 - 2014
34
Regional Report MENA
-2.1
-11.8-13.0
-9.4-10.4
Jan-13 Apr-13 Jul-13 Oct-14 Jan-14
© Ecommerce Foundation www.ecommercefoundation.org
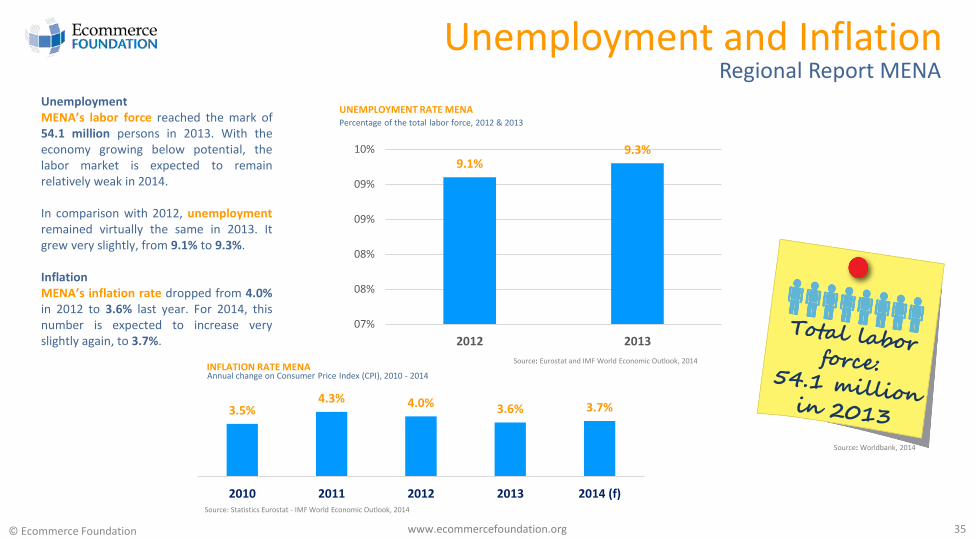
Unemployment and Inflation
Unemployment
MENA’s labor force reached the mark of
54.1 million persons in 2013. With the
economy growing below potential, the
labor market is expected to remain
relatively weak in 2014.
In comparison with 2012, unemployment
remained virtually the same in 2013. It
grew very slightly, from 9.1% to 9.3%.
Inflation
MENA’s inflation rate dropped from 4.0%
in 2012 to 3.6% last year. For 2014, this
number is expected to increase very
slightly again, to 3.7%.
INFLATION RATE MENA
Source: Statistics Eurostat - IMF World Economic Outlook, 2014
Annual change on Consumer Price Index (CPI), 2010 - 2014
3.5%4.3% 4.0% 3.6% 3.7%
2010 2011 2012 2013 2014 (f)
Source: Worldbank, 2014
35
Regional Report MENA
UNEMPLOYMENT RATE MENA
Source: Eurostat and IMF World Economic Outlook, 2014
Percentage of the total labor force, 2012 & 2013
9.1%9.3%
07%
08%
08%
09%
09%
10%
2012 2013
© Ecommerce Foundation www.ecommercefoundation.org
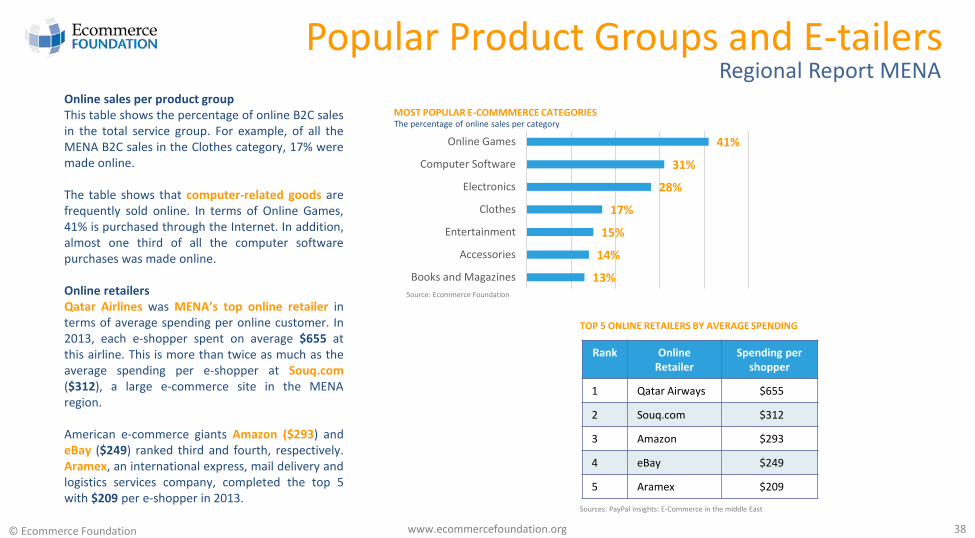
Popular Product Groups and E-tailers
Online sales per product group
This table shows the percentage of online B2C sales
in the total service group. For example, of all the
MENA B2C sales in the Clothes category, 17% were
made online.
The table shows that computer-related goods are
frequently sold online. In terms of Online Games,
41% is purchased through the Internet. In addition,
almost one third of all the computer software
purchases was made online.
Online retailers
Qatar Airlines was MENA’s top online retailer in
terms of average spending per online customer. In
2013, each e-shopper spent on average $655 at
this airline. This is more than twice as much as the
average spending per e-shopper at Souq.com
($312), a large e-commerce site in the MENA
region.
American e-commerce giants Amazon ($293) and
eBay ($249) ranked third and fourth, respectively.
Aramex, an international express, mail delivery and
logistics services company, completed the top 5
with $209 per e-shopper in 2013.
Source: Ecommerce Foundation
38
Regional Report MENA
MOST POPULAR E-COMMMERCE CATEGORIES The percentage of online sales per category
13%
14%
15%
17%
28%
31%
41%
Books and Magazines
Accessories
Entertainment
Clothes
Electronics
Computer Software
Online Games
Rank Online
Retailer
Spending per
shopper
1 Qatar Airways $655
2 Souq.com $312
3 Amazon $293
4 eBay $249
5 Aramex $209
TOP 5 ONLINE RETAILERS BY AVERAGE SPENDING
Sources: PayPal insights: E-Commerce in the middle East
© Ecommerce Foundation www.ecommercefoundation.org
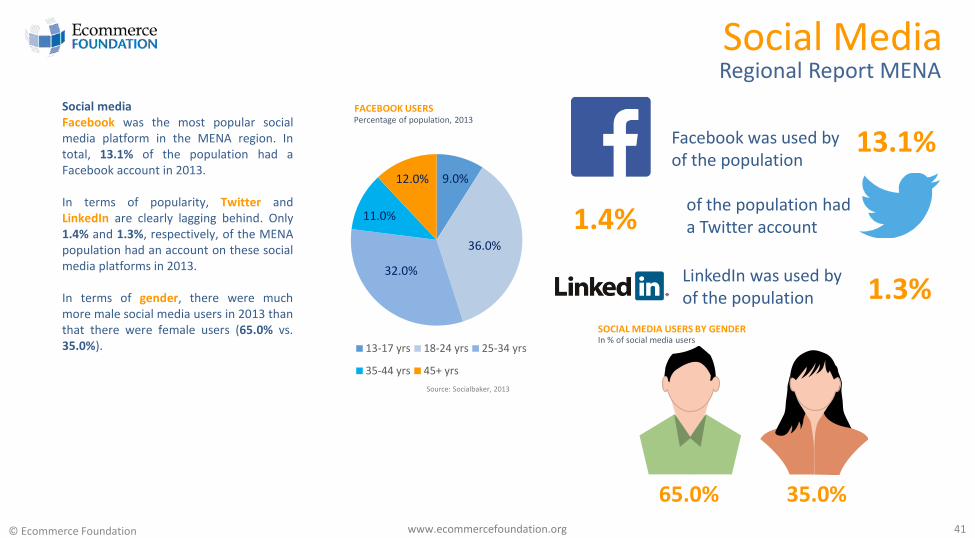
Social media
Facebook was the most popular social
media platform in the MENA region. In
total, 13.1% of the population had a
Facebook account in 2013.
In terms of popularity, Twitter and
LinkedIn are clearly lagging behind. Only
1.4% and 1.3%, respectively, of the MENA
population had an account on these social
media platforms in 2013.
In terms of gender, there were much
more male social media users in 2013 than
that there were female users (65.0% vs.
35.0%).
35.0%
Social Media
FACEBOOK USERS
Source: Socialbaker, 2013
Facebook was used by
of the population
of the population had
a Twitter account
13.1%
1.4%
65.0%
SOCIAL MEDIA USERS BY GENDERIn % of social media users
Percentage of population, 2013
9.0%
36.0%
32.0%
11.0%
12.0%
13-17 yrs 18-24 yrs 25-34 yrs
35-44 yrs 45+ yrs
LinkedIn was used by
of the population 1.3%
41
Regional Report MENA
© Ecommerce Foundation www.ecommercefoundation.org
General Tips and Tricks
www.ecommercefoundation.org
Every country has its own social habits and rules. Therefore, when doing business in a foreign country, you should be aware of
the DOs and DON’Ts of that particular nation.
Below, you will find some general tips and tricks that might help you when expanding to MENA.
• Many states in the MENA region have enacted commercial agency laws. These provide that products may only be distributed
in that country by a local company or agent. Be aware of that and appoint a local agent to distribute products in the region.
• Religion takes a center place in the MENA society.
• Do not be impatient when doing business in MENA. This is viewed as a negative character trait.
• If you do not have a business associate who can help you find a way to prospective customers, consider hiring a professional
intermediary with clout to save you time, money and frustration.
Regional Report MENA
42© Ecommerce Foundation
Global B2C E-commerce Report 2014
Information about Ecommerce Foundation and its Reports
Under auspices
of:
About Ecommerce Foundation
www.ecommercefoundation.org
Information about Ecommerce FoundationAbout Ecommerce Foundation
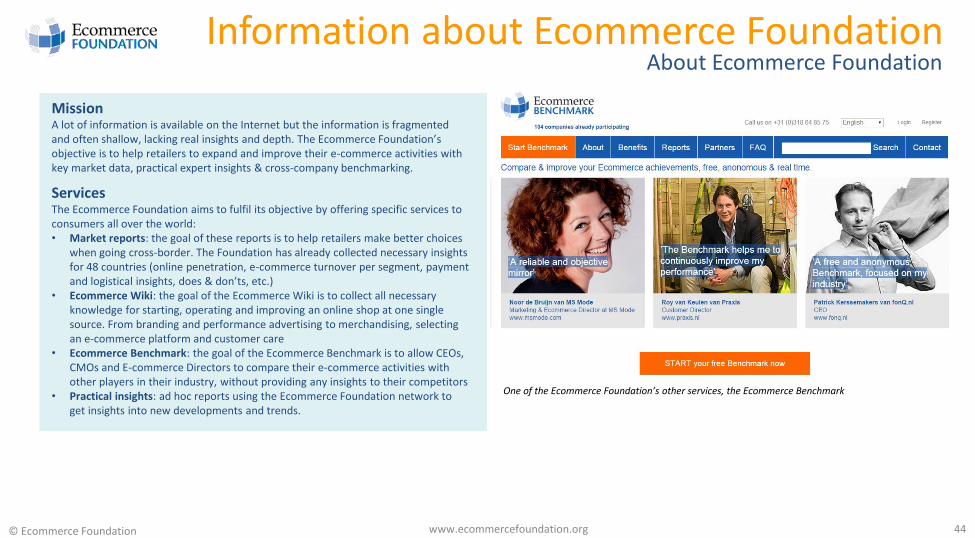
MissionA lot of information is available on the Internet but the information is fragmented
and often shallow, lacking real insights and depth. The Ecommerce Foundation’s objective is to help retailers to expand and improve their e-commerce activities with
key market data, practical expert insights & cross-company benchmarking.
ServicesThe Ecommerce Foundation aims to fulfil its objective by offering specific services to
consumers all over the world:
• Market reports: the goal of these reports is to help retailers make better choices
when going cross-border. The Foundation has already collected necessary insights
for 48 countries (online penetration, e-commerce turnover per segment, payment
and logistical insights, does & don’ts, etc.)• Ecommerce Wiki: the goal of the Ecommerce Wiki is to collect all necessary
knowledge for starting, operating and improving an online shop at one single
source. From branding and performance advertising to merchandising, selecting
an e-commerce platform and customer care
• Ecommerce Benchmark: the goal of the Ecommerce Benchmark is to allow CEOs,
CMOs and E-commerce Directors to compare their e-commerce activities with
other players in their industry, without providing any insights to their competitors
• Practical insights: ad hoc reports using the Ecommerce Foundation network to
get insights into new developments and trends.
One of the Ecommerce Foundation’s other services, the Ecommerce Benchmark
www.ecommercefoundation.org 44© Ecommerce Foundation
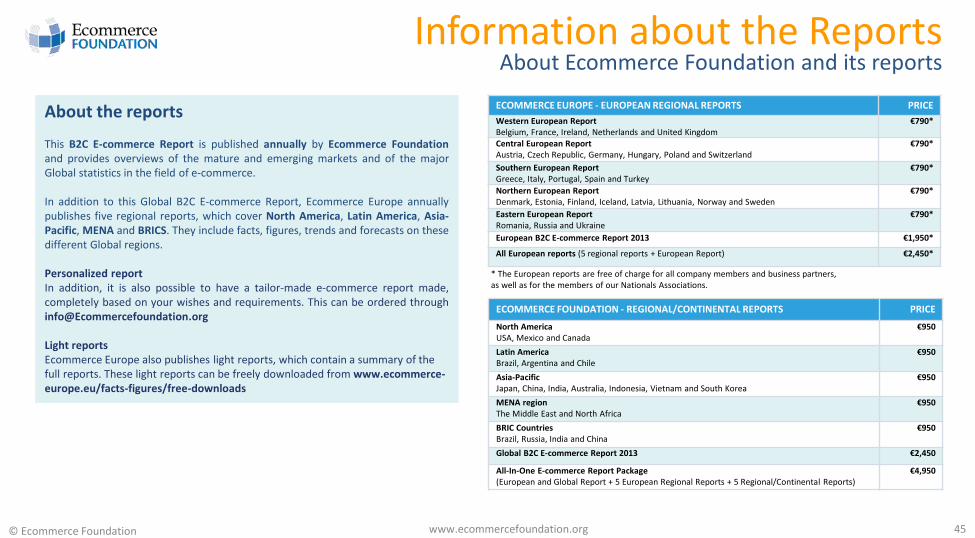
About the reports
This B2C E-commerce Report is published annually by Ecommerce Foundation
and provides overviews of the mature and emerging markets and of the major
Global statistics in the field of e-commerce.
In addition to this Global B2C E-commerce Report, Ecommerce Europe annually
publishes five regional reports, which cover North America, Latin America, Asia-
Pacific, MENA and BRICS. They include facts, figures, trends and forecasts on these
different Global regions.
Personalized report
In addition, it is also possible to have a tailor-made e-commerce report made,
completely based on your wishes and requirements. This can be ordered through
Light reports
Ecommerce Europe also publishes light reports, which contain a summary of the
full reports. These light reports can be freely downloaded from www.ecommerce-
europe.eu/facts-figures/free-downloads
Information about the ReportsAbout Ecommerce Foundation and its reports
ECOMMERCE EUROPE - EUROPEAN REGIONAL REPORTS PRICE
Western European Report
Belgium, France, Ireland, Netherlands and United Kingdom
€790*
Central European Report
Austria, Czech Republic, Germany, Hungary, Poland and Switzerland
€790*
Southern European Report
Greece, Italy, Portugal, Spain and Turkey
€790*
Northern European Report
Denmark, Estonia, Finland, Iceland, Latvia, Lithuania, Norway and Sweden
€790*
Eastern European Report
Romania, Russia and Ukraine
€790*
European B2C E-commerce Report 2013 €1,950*
All European reports (5 regional reports + European Report) €2,450*
ECOMMERCE FOUNDATION - REGIONAL/CONTINENTAL REPORTS PRICE
North America
USA, Mexico and Canada
€950
Latin America
Brazil, Argentina and Chile
€950
Asia-Pacific
Japan, China, India, Australia, Indonesia, Vietnam and South Korea
€950
MENA region
The Middle East and North Africa
€950
BRIC Countries
Brazil, Russia, India and China
€950
Global B2C E-commerce Report 2013 €2,450
All-In-One E-commerce Report Package
(European and Global Report + 5 European Regional Reports + 5 Regional/Continental Reports)
€4,950
* The European reports are free of charge for all company members and business partners,
as well as for the members of our Nationals Associations.
www.ecommercefoundation.org 45© Ecommerce Foundation
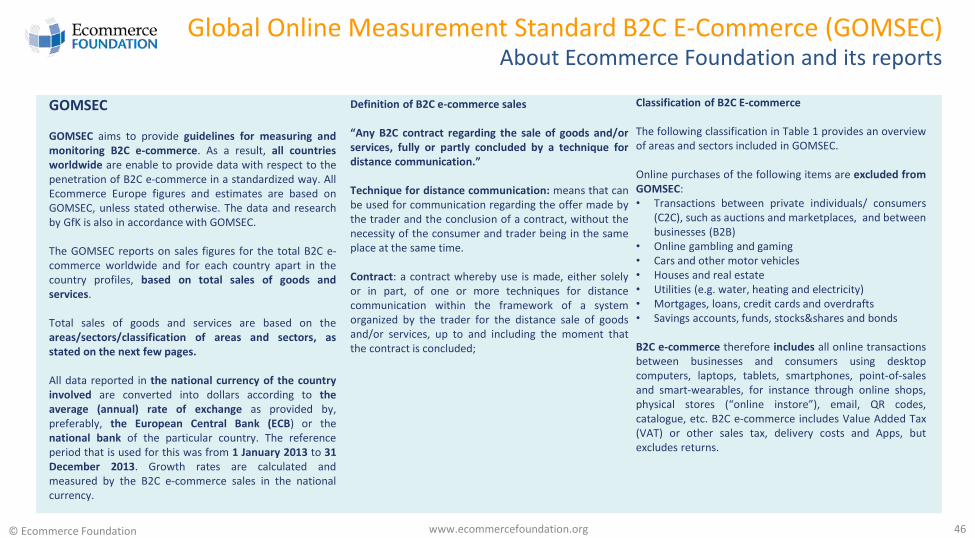
GOMSEC
GOMSEC aims to provide guidelines for measuring and
monitoring B2C e-commerce. As a result, all countries
worldwide are enable to provide data with respect to the
penetration of B2C e-commerce in a standardized way. All
Ecommerce Europe figures and estimates are based on
GOMSEC, unless stated otherwise. The data and research
by GfK is also in accordance with GOMSEC.
The GOMSEC reports on sales figures for the total B2C e-
commerce worldwide and for each country apart in the
country profiles, based on total sales of goods and
services.
Total sales of goods and services are based on the
areas/sectors/classification of areas and sectors, as
stated on the next few pages.
All data reported in the national currency of the country
involved are converted into dollars according to the
average (annual) rate of exchange as provided by,
preferably, the European Central Bank (ECB) or the
national bank of the particular country. The reference
period that is used for this was from 1 January 2013 to 31
December 2013. Growth rates are calculated and
measured by the B2C e-commerce sales in the national
currency.
Definition of B2C e-commerce sales
“Any B2C contract regarding the sale of goods and/or
services, fully or partly concluded by a technique for
distance communication.”
Technique for distance communication: means that can
be used for communication regarding the offer made by
the trader and the conclusion of a contract, without the
necessity of the consumer and trader being in the same
place at the same time.
Contract: a contract whereby use is made, either solely
or in part, of one or more techniques for distance
communication within the framework of a system
organized by the trader for the distance sale of goods
and/or services, up to and including the moment that
the contract is concluded;
Classification of B2C E-commerce
The following classification in Table 1 provides an overview
of areas and sectors included in GOMSEC.
Online purchases of the following items are excluded from
GOMSEC:
• Transactions between private individuals/ consumers
(C2C), such as auctions and marketplaces, and between
businesses (B2B)
• Online gambling and gaming
• Cars and other motor vehicles
• Houses and real estate
• Utilities (e.g. water, heating and electricity)
• Mortgages, loans, credit cards and overdrafts
• Savings accounts, funds, stocks&shares and bonds
B2C e-commerce therefore includes all online transactions
between businesses and consumers using desktop
computers, laptops, tablets, smartphones, point-of-sales
and smart-wearables, for instance through online shops,
physical stores (“online instore”), email, QR codes,
catalogue, etc. B2C e-commerce includes Value Added Tax
(VAT) or other sales tax, delivery costs and Apps, but
excludes returns.
Global Online Measurement Standard B2C E-Commerce (GOMSEC)About Ecommerce Foundation and its reports
www.ecommercefoundation.org 46© Ecommerce Foundation
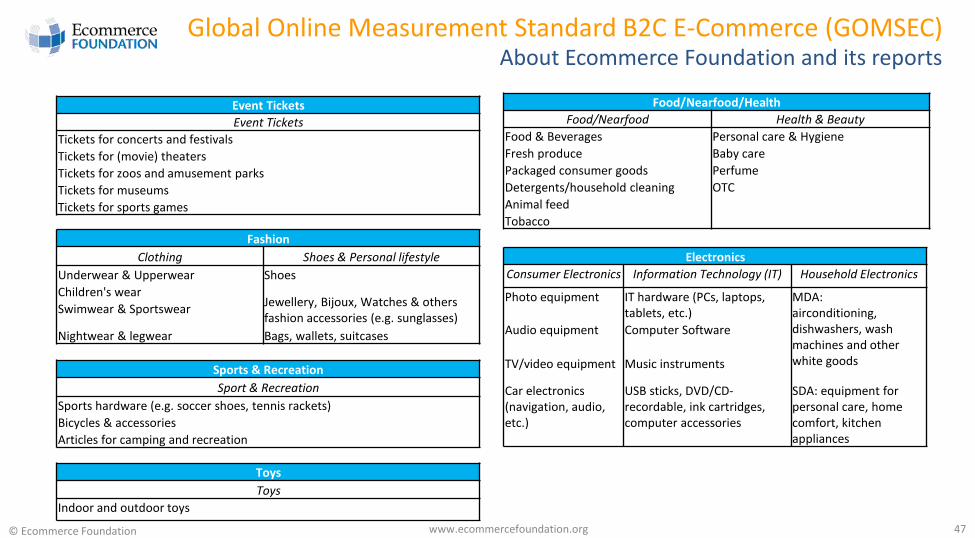
Event Tickets
Event Tickets
Tickets for concerts and festivals
Tickets for (movie) theaters
Tickets for zoos and amusement parks
Tickets for museums
Tickets for sports games
Fashion
Clothing Shoes & Personal lifestyle
Underwear & Upperwear Shoes
Children's wearJewellery, Bijoux, Watches & others
fashion accessories (e.g. sunglasses)Swimwear & Sportswear
Nightwear & legwear Bags, wallets, suitcases
Electronics
Consumer Electronics Information Technology (IT) Household Electronics
Photo equipment IT hardware (PCs, laptops,
tablets, etc.)
MDA:
airconditioning,
dishwashers, wash
machines and other
white goods
Audio equipment Computer Software
TV/video equipment Music instruments
Car electronics
(navigation, audio,
etc.)
USB sticks, DVD/CD-
recordable, ink cartridges,
computer accessories
SDA: equipment for
personal care, home
comfort, kitchen
appliances
Food/Nearfood/Health
Food/Nearfood Health & Beauty
Food & Beverages Personal care & Hygiene
Fresh produce Baby care
Packaged consumer goods Perfume
Detergents/household cleaning OTC
Animal feed
Tobacco
Sports & Recreation
Sport & Recreation
Sports hardware (e.g. soccer shoes, tennis rackets)
Bicycles & accessories
Articles for camping and recreation
Toys
Toys
Indoor and outdoor toys
Global Online Measurement Standard B2C E-Commerce (GOMSEC)About Ecommerce Foundation and its reports
www.ecommercefoundation.org 47© Ecommerce Foundation
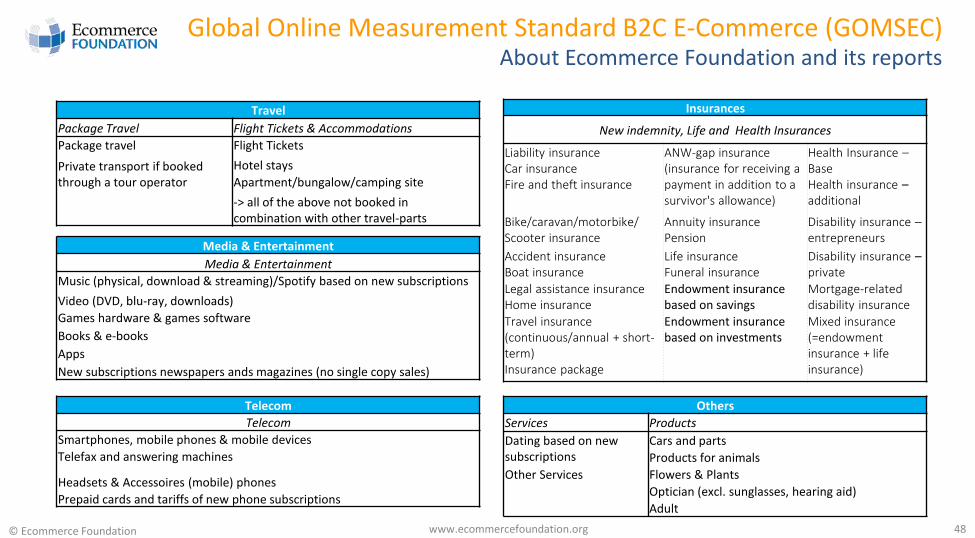
Travel
Package Travel Flight Tickets & Accommodations
Package travel Flight Tickets
Private transport if booked
through a tour operator
Hotel stays
Apartment/bungalow/camping site
-> all of the above not booked in
combination with other travel-parts
Media & Entertainment
Media & Entertainment
Music (physical, download & streaming)/Spotify based on new subscriptions
Video (DVD, blu-ray, downloads)
Games hardware & games software
Books & e-books
Apps
New subscriptions newspapers ands magazines (no single copy sales)
Telecom
Telecom
Smartphones, mobile phones & mobile devices
Telefax and answering machines
Headsets & Accessoires (mobile) phones
Prepaid cards and tariffs of new phone subscriptions
Insurances
New indemnity, Life and Health Insurances
Liability insurance
Car insurance
Fire and theft insurance
ANW-gap insurance
(insurance for receiving a
payment in addition to a
survivor's allowance)
Health Insurance –Base
Health insurance –additional
Bike/caravan/motorbike/
Scooter insurance
Annuity insurance
Pension
Disability insurance –entrepreneurs
Accident insurance
Boat insurance
Life insurance
Funeral insurance
Disability insurance –private
Legal assistance insurance
Home insurance
Endowment insurance
based on savings
Mortgage-related
disability insurance
Travel insurance
(continuous/annual + short-
term)
Insurance package
Endowment insurance
based on investments
Mixed insurance
(=endowment
insurance + life
insurance)
Others
Services Products
Dating based on new
subscriptions
Cars and parts
Products for animals
Other Services Flowers & Plants
Optician (excl. sunglasses, hearing aid)
Adult
Global Online Measurement Standard B2C E-Commerce (GOMSEC)About Ecommerce Foundation and its reports
www.ecommercefoundation.org 48© Ecommerce Foundation
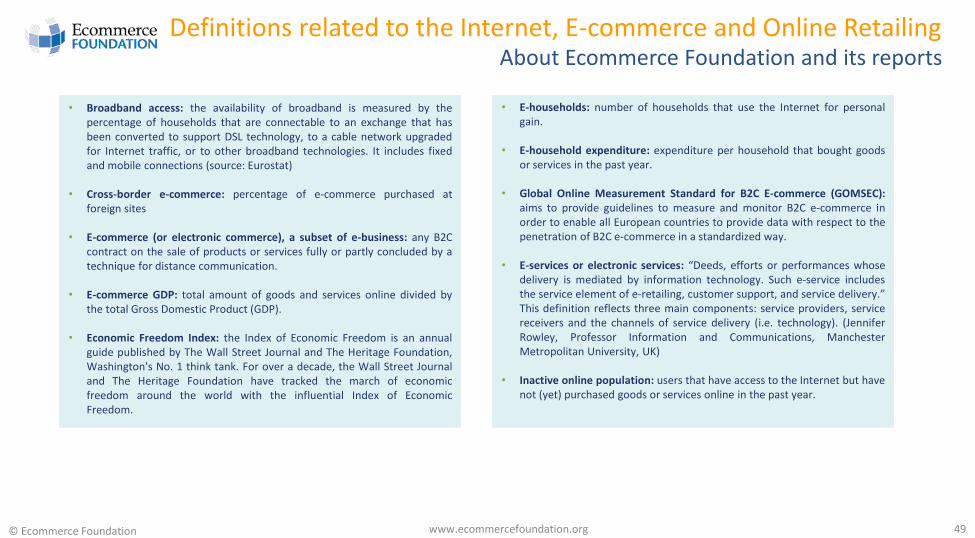
• Broadband access: the availability of broadband is measured by the
percentage of households that are connectable to an exchange that has
been converted to support DSL technology, to a cable network upgraded
for Internet traffic, or to other broadband technologies. It includes fixed
and mobile connections (source: Eurostat)
• Cross-border e-commerce: percentage of e-commerce purchased at
foreign sites
• E-commerce (or electronic commerce), a subset of e-business: any B2C
contract on the sale of products or services fully or partly concluded by a
technique for distance communication.
• E-commerce GDP: total amount of goods and services online divided by
the total Gross Domestic Product (GDP).
• Economic Freedom Index: the Index of Economic Freedom is an annual
guide published by The Wall Street Journal and The Heritage Foundation,
Washington's No. 1 think tank. For over a decade, the Wall Street Journal
and The Heritage Foundation have tracked the march of economic
freedom around the world with the influential Index of Economic
Freedom.
• E-households: number of households that use the Internet for personal
gain.
• E-household expenditure: expenditure per household that bought goods
or services in the past year.
• Global Online Measurement Standard for B2C E-commerce (GOMSEC):
aims to provide guidelines to measure and monitor B2C e-commerce in
order to enable all European countries to provide data with respect to the
penetration of B2C e-commerce in a standardized way.
• E-services or electronic services: “Deeds, efforts or performances whose
delivery is mediated by information technology. Such e-service includes
the service element of e-retailing, customer support, and service delivery.”This definition reflects three main components: service providers, service
receivers and the channels of service delivery (i.e. technology). (Jennifer
Rowley, Professor Information and Communications, Manchester
Metropolitan University, UK)
• Inactive online population: users that have access to the Internet but have
not (yet) purchased goods or services online in the past year.
Definitions related to the Internet, E-commerce and Online Retailing
www.ecommercefoundation.org 49
About Ecommerce Foundation and its reports
© Ecommerce Foundation

• Logistics Performance Index (LPI): The Logistics Performance Index (LPI)
measures the “logistics friendliness” of 155 countries. It helps countries
identify the challenges and opportunities they face in their trade logistics
performance and what they can do to improve this. The Index is developed
by the World Bank and is based on a worldwide survey of operators, such
as global freight forwarders and express carriers.
• Mobile commerce (or m-commerce): the ability to conduct commerce
using a mobile device e.g. a mobile phone, a PDA, a smartphone, a tablet
or other (emerging) mobile equipment.
• Mobile subscriptions: mobile cellular telephone subscriptions are
subscriptions to a public mobile telephone service using cellular
technology, which provide access to the public switched telephone
network. Post-paid and prepaid subscriptions are included (source:
Eurostat)
• Online buyer (or e-shopper, e-buyer): an individual who regularly bought
or ordered goods or services through the Internet.
• Online expenditure: spending per user who purchased goods or services
online.
• Online Retail (or e-retail, electronic retail or retailing or even e-tailing):
the selling of retail goods and services on the Internet. In the limited sense
of the word, sectors such as online leisure travel, event tickets,
downloading music or software are not included. Online-only retail shops
are often referred to as pure players.
• Penetration levels: the percentage of a population using the Internet,
mobile phones, smartphones or tablet devices.
• Retail sales: the selling of mainly goods from businesses to individuals
from a traditional or so-called bricks-and-mortar shop.
• The Ease of Doing Business Index is developed by the World Bank, and
averages the country's percentile rankings on nine topics. It is made up of
a variety of indicators, giving equal weight to each topic. The rankings for
all economies are benchmarked to June 2010. The Index covers 185
countries.
Definitions related to the Internet, E-commerce and Online Retailing
www.ecommercefoundation.org 50
About Ecommerce Foundation and its reports
© Ecommerce Foundation
Methodology , Acknowledgements and Sources
This report could only be realized by consulting a great
many sources, available in various countries and regions
in Europe and around the globe. The wide variety of
sources include public domain publications, blogs,
websites, industry and financial specialist publications,
regional and local news, annual reports and press
releases. Sometimes the information sources are
contradictory. Sometimes different figures and data were
given by different sources within the same country, for
example due to different definitions.
In our reports and country profiles we have mentioned
different sources, definitions and the different outcomes
of such reports, studies and interpretations. This report is
meant solely for use by the recipient and is not for
circulation. This report is based on information that we
consider reliable, but we cannot vouch for it being
accurate or complete, nor should it be relied upon as
such. Opinions expressed are our current opinions as of
the date of this report.
The sources consulted include:
(Inter)national Associations
• Ecommerce Europe
• Distansehandel Norge (Norway)
• FDIH (Denmark)
• KAUPPA (Finland)
• SDH (Sweden)
• Adigital (Spain)
• BeCommerce (Belgium)
• BvH (Germany)
• Händlerbund (Germany)
• ETID (Turkey)
• FEVAD (France)
• National Retail Federation (USA)
• Netcomm (Italy)
• Retail Excellence (Ireland)
• Shop.org (USA)
• Sdh (Sweden)
• Apec (Czech Republic)
• Thuiswinkel.org (Netherlands)
• Netcomm Suisse (Switzerland)
• BritORA (United Kingdom)
Corporate sources
• A.T. Kearney
• Deloitte
• Forrester
• GfK
• Hybris
• Innopay
• Planet Retail
• SaleSupply
• Social Bakers
• TNS NIPO
• I-Research
• TWS Global
Publications
• eMarketer
• E-commercefacts.com
• Eurostat
• Internet Retailing
• Tribes.no
• Digitaleastfactor.com
• Euromonitor.com
Other sources
• Digital Hub Development Agency (DHDA)
• European Commission
• Eurostat
• European Central Bank (ECB)
• European Banking Association (EBA Clearing)
• International Monetary Fund (IMF)
• International Telecommunications Union (ITU)
• Internetworldstats
• National Statistics offices
• The Heritage Foundation
• United Nations (UN)
• CIA: World Factbook
• World Economic Forum
• Statista.com
• Worldbank
• Dibspayment.com
• Ystats.com
• Ekathimerini.com
• Ecommercenews.eu
• About-payments.com
• The Modern Spice Routes (PayPal)
www.ecommercefoundation.org 51
About Ecommerce Foundation and its reports
© Ecommerce Foundation
About the Authors
Aad Weening, Advisor International E-commerce
Aad Weening (1941) has been involved in distance selling and retail practically
all his working life. From 1966 until 1979 he offered legal and economic advice
as well as lobbying services.
From 1979 he managed the Dutch Mail Order Association (currently
Thuiswinkel.org), at first in the Netherlands and later on a European level.
Between 1993 and 2006 he served as the Secretary General of the European
Distance Selling Trade Association (EMOTA). At the moment, Weening is Senior
Advisor at Ecommerce Europe and the Ecommerce Foundation.
Bert Nagelvoort, Senior Researcher E-commerce
Bert Nagelvoort (1977) has been working for Ecommerce Europe since 2013. He
is involved in international e-commerce and develops the Ecommerce Europe
reports and the Ecommerce Foundation reports. He studied Business
Administration at Radboud University Nijmegen and he has a great interest in
the international (digital) economy and e-commerce.
Previously, he worked as a Project Manager in the financial services industry.
Please feel free to contact Bert at: [email protected]
Richard van Welie, Editor
Richard van Welie (1979) has been working for Ecommerce Europe as an
editor since March 2014. Prior to this, he worked as a freelance
translator/copywriter for five of years. One of his main tasks is providing
content for the Ecommerce Europe reports.
After graduating in Communication Sciences in 2004, he studied American
Studies at Radboud University Nijmegen and graduated in 2008.
Jorij Abraham, Director Research & Advice
Jorij Abraham (1972) has been part of the international e-commerce community
since 1997. He was an e-commerce manager at Bijenkorf, TUI and Sanoma
Media and Director of Consulting at Unic.
Since 2013 he has been Director of Research & Advice at Ecommerce Europe.
He is also director of the Ecommerce Foundation, a research institute offering
practical e-commerce research and benchmark services.
Jaap van Erp, Trainee Research & Advice
Jaap van Erp (1988) has been working for Ecommerce Europe since 2014. He
studied Marketing Management at Tilburg University and is interested in
research. He is involved in the research of the e-commerce market and is co-
developer of the Ecommerce Europe reports and the Ecommerce foundation
reports.
Peter van den Brink, Trainee Research & Advice
Peter van den Brink (1992) has worked for Ecommerce Europe since 2014. He
studies Business Management at the University of Applied Sciences in Ede. He
is involved in the research of the e-commerce market and is co-developer of
the Ecommerce Europe reports and the Ecommerce foundation reports.
www.ecommercefoundation.org 52
About Ecommerce Foundation and its reports
© Ecommerce Foundation
Ecommerce Foundation
Apollolaan 98
1077 BE Amsterdam - Netherlands
Website: www.ecommerce-europe.eu
Contact us at: [email protected]
For reports: [email protected]
Twitter: @Ecommerce_eu
Disclaimer
The B2C E-Commerce Reports are publications by Ecommerce Foundation and/or Ecommerce
Europe. Although the utmost care has been taken in the construction of this report, there is
always the possibility that some information is incorrect. No liability is accepted by Ecommerce
Foundation and/or Ecommerce Europe for direct or indirect damage arising pursuant to use of
the report.
Copyright ©
It is allowed to use information published in this report, provided that there is a proper source of
information: Ecommerce Foundation and/or Ecommerce Europe / https://www.ecommerce-
europe.eu/facts-figures/
Address, Disclaimer and Copyright
In cooperation with:
Powered by:
www.ecommercefoundation.org 53
About Ecommerce Foundation and its reports
© Ecommerce Foundation


![Sugestões dos e-consumidores para tornar a interface do comércio eletrônico B2C mais motivadora [Suggestions of e-consumers to making e-commerce B2C interface more motivating]](https://static.fdokumen.com/doc/165x107/631b719fa906b217b906771f/sugestoes-dos-e-consumidores-para-tornar-a-interface-do-comercio-eletronico-b2c.jpg)