"Flexibility and solution-driven work – two of our distinguishing ...
Upload
independentCategory
view
1download
0
�������� ����� ��
MEG in the macaque monkey and human: Distinguishing cortical fields inspace and time
Johanna M. Zumer, Srikantan S. Nagarajan, Leah A. Krubitzer, ZhaoZhu, Robert S. Turner, Elizabeth A. Disbrow
PII: S0006-8993(10)01182-0DOI: doi: 10.1016/j.brainres.2010.05.037Reference: BRES 40398
To appear in: Brain Research
Accepted date: 12 May 2010
Please cite this article as: Johanna M. Zumer, Srikantan S. Nagarajan, Leah A. Krubitzer,Zhao Zhu, Robert S. Turner, Elizabeth A. Disbrow, MEG in the macaque monkey andhuman: Distinguishing cortical fields in space and time, Brain Research (2010), doi:10.1016/j.brainres.2010.05.037
This is a PDF file of an unedited manuscript that has been accepted for publication.As a service to our customers we are providing this early version of the manuscript.The manuscript will undergo copyediting, typesetting, and review of the resulting proofbefore it is published in its final form. Please note that during the production processerrors may be discovered which could affect the content, and all legal disclaimers thatapply to the journal pertain.

ACC
EPTE
D M
ANU
SCR
IPT
ACCEPTED MANUSCRIPT
1
MEG in the macaque monkey and human:
Distinguishing cortical fields in space and time
Johanna M. Zumer1,2,+, Srikantan S. Nagarajan1,2, Leah A. Krubitzer3, Zhao Zhu1,3,
Robert S. Turner4,&, Elizabeth A. Disbrow1,3,5, *
1Biomagnetic Imaging Laboratory, Dept. of Radiology, University of California, San
Francisco, CA,
2UCSF/UC Berkeley Joint Graduate Group in Bioengineering, San Francisco, CA,
3Center for Neuroscience, University of California, Davis, CA,
4Dept. of Neurological Surgery, University of California, San Francisco, CA
5Dept. of Neurology, University of California, Davis, CA.
+Current address
Sir Peter Mansfield Magnetic Resonance Centre, School of Physics and Astronomy,
University of Nottingham, UK

ACC
EPTE
D M
ANU
SCR
IPT
ACCEPTED MANUSCRIPT
2
&Current address
Department of Neurobiology and Center for the Neural Basis of Cognition, University
of Pittsburgh, PA.
*Corresponding author:
Elizabeth Disbrow
Center for Neuroscience
1544 Newton Ct.
Davis, CA 95618
Phone : (530) 752-4484
Fax: (530) 757-8827
Email: [email protected]
Key Words: magnetoencephalography, monkey, human, somatosensory evoked
fields, auditory evoked fields

ACC
EPTE
D M
ANU
SCR
IPT
ACCEPTED MANUSCRIPT
3
Abstract
Magnetoencephalography (MEG) is an increasingly popular non-invasive tool used to
record, on a millisecond timescale, the magnetic field changes generated by cortical
neural activity. MEG has the advantage, over fMRI for example, that it is a direct
measure of neural activity. In the current investigation we used MEG to measure
cortical responses to tactile and auditory stimuli in the macaque monkey. We had two
aims. First, we sought to determine whether MEG, a technique that may have low
spatial accuracy, could be used to distinguish the location and organization of sensory
cortical fields in macaque monkeys, a species with a relatively small brain compared
to that of the human. Second, we wanted to examine the temporal dynamics of
cortical responses in the macaque monkey relative to the human. We recorded MEG
data from anesthetized monkeys and, for comparison, from awake humans that were
presented with simple tactile and auditory stimuli. Neural source reconstruction of
MEG data showed that primary somatosensory and auditory cortex could be
differentiated and, further, that separate representations of the digit and lip within
somatosensory cortex could be identified in macaque monkeys as well as humans.
We compared the latencies of activity from monkey and human data for the three
stimulation types and proposed a correspondence between the neural responses of the
two species. We thus demonstrate the feasibility of using MEG in the macaque
monkey and provide a non-human primate model for examining the relationship
between external evoked magnetic fields and their underlying neural sources.

ACC
EPTE
D M
ANU
SCR
IPT
ACCEPTED MANUSCRIPT
4
1. Introduction
Studies in humans using non-invasive techniques including functional magnetic
resonance imaging (fMRI), magnetoencephalography (MEG) and
electroencephalography (EEG) have provided important information on cortical
organization and processing in humans. While some of these non-invasive techniques
are indirect measures of neural function, such as blood oxygenation (e.g. fMRI), more
direct measures of neural activity have a lower spatial accuracy (MEG or EEG).
However, data on the validity and reliability of these non-invasive techniques are
relatively sparse. In examining the capabilities of MEG in the present study we had
two aims. First, we sought to determine whether MEG could be used to distinguish
the location and organization of sensory cortical fields in macaque monkeys, a species
with a relatively small brain compared to that of the human. Second, we wanted to
examine the temporal dynamics of cortical responses in the macaque monkey relative
to the human.
MEG is a non-invasive tool used to record, on a millisecond timescale, the
magnetic field changes generated by neural activity. The basis of the MEG signal is
hypothesized to be synchronous cellular currents emanating from parallel apical
pyramidal dendrites, based on studies in turtle cerebellar preparations (Lopez et al.,
1991; Okada et al., 1987a; 1987b; 1988a; Okada and Nicholson, 1988b), guinea pig
hippocampal preparations (Kyuhou and Okada, 1993; Okada et al., 1997; Wu and
Okada, 1998), and in vivo studies in rats (Barth and Di, 1990; Barth and Sutherling,
1988; Barth et al., 1984, 1986). Current flowing through a wire (or dendrite)
produces a magnetic field curling around the wire. Thousands to millions of
synchronously active neurons with dendrites arranged in parallel produce a magnetic
field strong enough to be measured outside the skull. Although MEG signal source

ACC
EPTE
D M
ANU
SCR
IPT
ACCEPTED MANUSCRIPT
5
location has been estimated using a variety of mathematical models, source
localization estimates derived from all models have errors due to the inherently ill-
posed inverse problem as well as from other assumptions not met by real data. Based
on a realistic phantom study, the resulting spatial uncertainty is estimated to be about
3mm (Leahy et al., 1998) but may be much larger.
Current data on the feasibility of MEG in the monkey is sparse but promising. In
an early study by Teale et al. (1994) auditory evoked fields were recorded using MEG
in a pigtail monkey and responses were localized to auditory cortex. More recently,
Zhu et al. (2009) and Wilson et al. (2009) examined the response to tactile stimulation
of the hand in macaque monkeys measured with MEG and found similar latencies for
the initial cortical response (17ms and 16ms, respectively).
We used MEG combined with MRI to determine the spatial location of
somatosensory and auditory areas of the cortex, as well as the internal somatotopic
organization of Brodmann’s areas 3b and 1. We measured responses to simple tactile
and auditory stimuli using MEG in 4 anesthetized macaque monkeys, and then
compared the location of somatosensory and auditory sources with the known
location and organization of these fields derived from previous electrophysiological
recording studies (Brugge and Merzenich, 1973; Celesia, 1976, Morel et al., 1993;
Kaas et al., 1979; Nelson et al., 1980). The use of MEG to determine separate brain
regions was demonstrated based on differences in spatial reconstruction localization
and latency. For comparison we recorded MEG responses to similar stimuli in human
subjects. We estimated the corresponding neural sources using the same source
reconstruction methods and compared the latencies of the evoked responses across
species.
ACC
EPTE
D M
ANU
SCR
IPT
ACCEPTED MANUSCRIPT
6
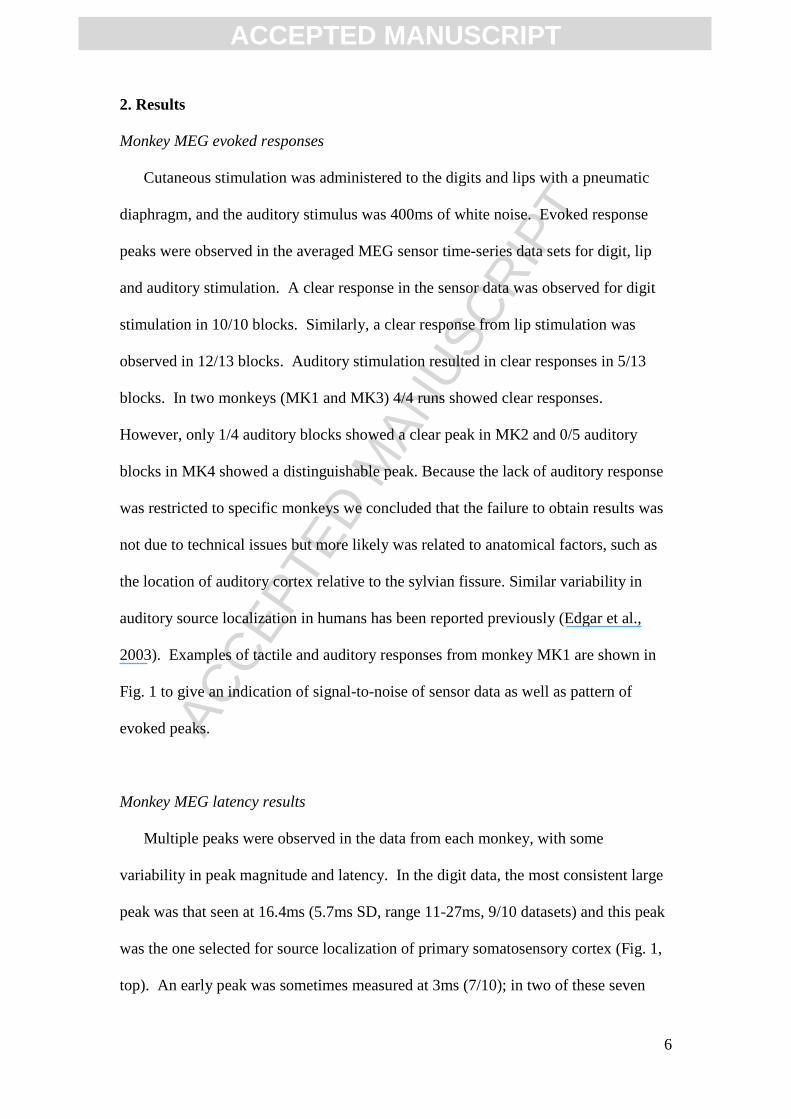
2. Results
Monkey MEG evoked responses
Cutaneous stimulation was administered to the digits and lips with a pneumatic
diaphragm, and the auditory stimulus was 400ms of white noise. Evoked response
peaks were observed in the averaged MEG sensor time-series data sets for digit, lip
and auditory stimulation. A clear response in the sensor data was observed for digit
stimulation in 10/10 blocks. Similarly, a clear response from lip stimulation was
observed in 12/13 blocks. Auditory stimulation resulted in clear responses in 5/13
blocks. In two monkeys (MK1 and MK3) 4/4 runs showed clear responses.
However, only 1/4 auditory blocks showed a clear peak in MK2 and 0/5 auditory
blocks in MK4 showed a distinguishable peak. Because the lack of auditory response
was restricted to specific monkeys we concluded that the failure to obtain results was
not due to technical issues but more likely was related to anatomical factors, such as
the location of auditory cortex relative to the sylvian fissure. Similar variability in
auditory source localization in humans has been reported previously (Edgar et al.,
2003). Examples of tactile and auditory responses from monkey MK1 are shown in
Fig. 1 to give an indication of signal-to-noise of sensor data as well as pattern of
evoked peaks.
Monkey MEG latency results
Multiple peaks were observed in the data from each monkey, with some
variability in peak magnitude and latency. In the digit data, the most consistent large
peak was that seen at 16.4ms (5.7ms SD, range 11-27ms, 9/10 datasets) and this peak
was the one selected for source localization of primary somatosensory cortex (Fig. 1,
top). An early peak was sometimes measured at 3ms (7/10); in two of these seven

ACC
EPTE
D M
ANU
SCR
IPT
ACCEPTED MANUSCRIPT
7
cases this early peak was larger than the 15ms peak. Later peaks were also seen at
33.0ms +/- 3.4ms (range 30-40ms, 7/10) and at 61.4ms +/- 11.2ms (range 47-82ms,
8/10).
The responses to lip stimulation showed consistent peaks, however the variability
in peak amplitude was greater than in the digit response data (Fig. 1, middle). An
early peak was observed in 11/12 datasets at 10.5ms +/- 3.7ms (range 3-15ms) and
was the largest in 7/12 datasets. This primary peak from lip stimulation had a
significantly shorter latency than the primary digit peak (p<0.05). A second peak in
the lip stimulation response was seen at 25.4ms +/- 3.4ms (range 23-30ms) in 10/12
datasets and was largest in 3/12 datasets. Finally, a later peak at 49.6ms +/- 5.0ms
(range 42-57ms) was consistently observed in 12/12 datasets, and was the largest in
2/12 datasets.
The auditory responses also showed some variability in peak latencies. A peak at
43.5ms +/- 1.0ms (range 43-45ms) was measured in 4/5 datasets and was the largest
in 2/5 datasets (Fig 1, bottom). A slightly later peak was also seen at 60.5ms +/-
7.1ms (range 50-65ms) in 4/5 datasets and was the largest in 3/5 datasets. Finally, a
late peak was observed in two cases (77ms in one case and 110ms in a second case;
combined for a mean of 93.5ms +/- 23.3ms).
The overall signal-to-noise ratio was not as high in the monkey data as was
observed in human MEG data, but was sufficiently high to detect peaks and perform
source localization. Therefore anesthetic may have reduced the monkeys’ responses
somewhat, but not prohibitively.
Monkey MEG localization results

ACC
EPTE
D M
ANU
SCR
IPT
ACCEPTED MANUSCRIPT
8
The spatial distribution of the beamformer-localized sources in the brain for tactile
and auditory stimulation generally agreed with known neuroanatomy (Hackett et al.,
2001; Kaas, 1993; see Hackett, 2007 for review). Fig. 2 shows the beamformer
source reconstruction for the MEG dataset from MK1. In the data from MK1, the
digit localization was 6mm medial and 8mm superior to the lip localization on the
central sulcus, corresponding to the known location and somatotopic organization of
area 3b (Powell and Mountcastle, 1959; Nelson et al., 1980; see Krubitzer and
Disbrow, 2008 for review).
The localization of auditory cortex was 12mm inferior to that of lip stimulation,
on the opposite side of the lateral sulcus, likely encompassing the core areas A1 and
R. The reconstructed time series (Figure 2, right) is shown for the voxel with
maximal activation (in green crosshairs on MRI). The largest peak latencies in this
example are at 13ms for digit stimulation, 7ms for lip stimulation, and 62ms for
auditory stimulation. The peak voxel from this digit localization was about 10mm
anterior to the central sulcus, but the ROI voxels extend posteriorly onto the central
sulcus. The lip localization was just on, and slightly posterior to, the central sulcus.
The peak voxel was within 2mm of the central sulcus, which is within the limits of
expected error of MEG source localization. The auditory localization was inferior to
both digit and lip localization and is wholly contained in the temporal lobe, primarily
in the superior temporal sulcus, the known location of primary auditory cortex.
Localization results from the other three monkeys also showed similar spatial
arrangement, although the exact spatial locations varied between animals. In 7/10
digit datasets, the beamformer reconstruction produced a spatial peak in the central
sulcus (at least one dataset from each animal). In the remaining three datasets, the
source estimates were (1) more medial and inferior (into white matter), (2) more

ACC
EPTE
D M
ANU
SCR
IPT
ACCEPTED MANUSCRIPT
9
medial and posterior (in white matter and posterior to the central sulcus), or (3) near
the central sulcus but relatively low in power. Likewise, 7/12 lip datasets showed
activation in the lateral central sulcus (at least one dataset from each animal). The
source estimates in the remaining five datasets were (1) posterior to the central sulcus,
(2) in the center of the head, (3 & 4) inferior into temporal lobe, or (5) near central
sulcus but relatively weak. Finally, 4/5 auditory data sets were localized to the
temporal lobe (in 3/4 monkeys). The remaining localization result was in the most
inferior portion of the temporal lobe. The auditory responses were harder to localize
as the SNR of the sensor data itself was lower, independent of sensor array type (37
versus 275 channel systems). It is possible that the SNR of AEF responses was lower
in monkeys because the source was radial, or because of an increased distance from
neural source to the sensors due to the larger temporal lobe extra-cranial muscle
thickness in macaques relative to humans.
The beamformer localization coordinates in the AC-PC coordinate frame (see
Methods) were averaged and compared across stimulation types (10 digit, 12 lip, 5
auditory). Fig. 3 illustrates that the average localization of digit responses was
significantly different from lip in the medio-lateral dimension, and digit localization
was significantly different from both lip and auditory in the superior-inferior
dimension. While lip and auditory localizations were not significantly different from
each other, in most cases lip localizations were clearly above the lateral sulcus while
auditory localizations were below the lateral sulcus. Note the standard error of the
localization ranged between 2-3mm, well within expected errors of MEG source
localization, and indicating overall agreement across animals.
We computed the source orientation for the primary peaks in all monkey datasets
(Table 1). While there was consistency within animals, variability was higher across

ACC
EPTE
D M
ANU
SCR
IPT
ACCEPTED MANUSCRIPT
10
animals. Taking the number of datasets into account and using a randomly-generated
distribution of mean unit vector strenghts to determine significance, the dipole
orientation to lip stimulation did show a significant (above 95th percentile) similarity
across datasets, but not for digit or auditory. This mean lip dipole was oriented in a
medial, posterior and inferior direction.
Human MEG evoked responses
Evoked response peaks were observed in the averaged human MEG sensor time-
series data sets. Unlike the anesthetized monkeys, a clear response in the sensor data
was observed for all digit (4/4), lip (4/4) and auditory (4/4) blocks. The human data
showed some variability across subjects similar to the variability in the monkey data
with respect to peak amplitude and latency.
Human MEG latency results
In humans it is conventional that well-described peaks in MEG and EEG data are
labeled using a number indicating the response latency in milliseconds, prefaced by a
letter ‘M’ for MEG data or an ‘N’ or ‘P’ for negative or positive-going amplitudes for
EEG data. For digit stimulation, the peak at 44.0ms +/- 5.0ms (range 39-50ms) was
largest for all subjects (Fig. 4, top). This peak corresponds to the well described
somatosensory M50 (Hämäläinen et al., 1993; Hashimoto et al., 1999; Kekoni et al.,
1992). An early peak was observed in 2/4 subjects at 22.5ms +/- 0.7ms (range 22-
23ms) which has also been described elsewhere (Buchner et al., 1994, Disbrow et al.,
2001). Later peaks were measured in all subjects clustering at 80ms +/- 18ms (range
60-96ms; 3/4 subjects), at 119.7ms +/- 3.2ms (range 116-122ms; 3/4 subjects), and at
137ms +/-4.2ms (range 134-140ms; 2/4 subjects). These later peaks around 120ms

ACC
EPTE
D M
ANU
SCR
IPT
ACCEPTED MANUSCRIPT
11
probably correspond to the “late” response described in somatosensory data (Disbrow
et al., 2001; Hämäläinen et al., 1990; Hari et al., 1983; Kekoni et al., 1992) thought to
originate from the second somatosensory area and surrounding cortex.
As in the monkey lip response data, there was more variability in the human lip
data regarding peak latency. All (4/4) subjects show an early 19ms +/- 0ms peak,
which was largest in 2/4 subjects (Fig. 4, middle). All four subjects also showed a
peak averaging 37.0ms +/- 3.7ms (range 33-42ms), which was largest for the two
remaining subjects. Later peaks were also seen at 55ms +/- 0ms (2/4 subjects) and at
106ms +/- 4.0ms (range 101-108ms; 3/4 subjects). The main response to lip
stimulation peaked at a shorter latency (37.0ms +/ 3.7ms) than the equivalent
response to digit stimulation (44.0ms +/- 5.0ms), however this latency was not
significantly shorter (p=0.07). Previous work suggests that the latency of the
response to lip stimulation precedes that of digit stimulation (Baumgartner et al.,
1992; Disbrow et al., 2003).
There was also variability in the human auditory data. All subjects showed a peak
averaging 105.5ms +/- 4.5ms (range 102-112ms), consistent with the auditory M100
commonly reported (Pantev et al., 1990) as well as a peak averaging 162.0ms +/-
10.1ms (range 153-175ms; Fig. 4 bottom). The M100 peak was largest in 2/4
subjects; the other two subjects showed the largest peak at ~162ms. Two subjects
showed an early peak averaging 58ms +/- 4.2ms (range 55-61ms), consistent with the
auditory M50 reported elsewhere (Reite et al., 1988). All four subjects also showed a
later peak at 200.8ms +/- 5.4ms (range 195-208ms), consistent with the auditory
M200 (Jacobson et al., 1991).
Human MEG localization results

ACC
EPTE
D M
ANU
SCR
IPT
ACCEPTED MANUSCRIPT
12
The localization results from the human MEG data were in agreement with
previous MEG studies of somatosensory and auditory stimulation in humans
(Hämäläinen et al., 1993; Hari et al., 1984) and with the monkey data described
above. The averaged sensor data for digit, lip and auditory stimulation from one
human subject (HU4) are shown in Fig. 4, while Fig. 5 shows the estimated
beamformer source localization and the corresponding estimated temporal activity
from the same datasets. Both digit and lip localizations are entirely on the post-
central gyrus with the lip representation lateral and inferior to digit; the auditory
localization in Fig. 5 is in the superior temporal sulcus.
The average MNI coordinates from all four subjects are shown in Fig. 6. The
digit localization was more superior and posterior than the lip localization, although
only significantly different in the anterior-posterior dimension. The auditory
coordinate was found to be significantly inferior to both digit and lip representations.
We also computed the source orientation for the primary peaks in all human
datasets (Table 1). The orientation of the digit dipoles was highly consistent across
subjects (magnitude of mean of unit vector orientations above 99th percentile) and
also significant for lip stimulation (above 95th percentile), but not for auditory dipoles.
Both the digit and lip dipoles were similarly oriented, pointing in a lateral, posterior
and inferior direction. Both digit and lip dipoles within each species were similar.
However, it has been shown that auditory dipoles in humans can be quite variable
(Edgar et al., 2003), which is consistent with the variability seen here in the auditory
dipoles in both species.
3. Discussion

ACC
EPTE
D M
ANU
SCR
IPT
ACCEPTED MANUSCRIPT
13
We have demonstrated that MEG is a robust, non-invasive tool for distinguishing
the spatial location and internal organization of cortical fields in macaque monkeys as
well as humans. This finding is important because MEG is best known for studies of
neural temporal processing. In addition, the latencies of tactile and auditory responses
recorded using MEG in monkeys showed a pattern similar to human data, though
latencies were shorter in monkeys. Finally, the pattern of variability in latency and
morphology of responses was similar across species. In the following discussion we
compare the latency and localization data from digit, lip and auditory stimulation
from our MEG study to existing data from monkeys and humans.
Monkey and human responses: Comparisons of response latencies
MEG, EEG and electrocorticography (ECoG) are sensitive to the same underlying
neural process (Hämäläinen et al., 1993), and while EEG and MEG display differing
spatial sensitivities (Cuffin and Cohen, 1979), a given response will occur at the same
latency using both methods (Fuchs et al., 1998; Nagamine et al., 1998; Sharon et al.,
2007). Thus, we compare our findings with the latencies reported from a wealth of
subdural or scalp EEG recordings as well as less widely available MEG latency data
(Table 2).
Our data on response latency of digit stimulation are in agreement with existing
evoked potential data from macaque monkeys. McCarthy and colleagues (1991)
recorded subdurally from macaque monkeys during median nerve stimulation and
found an N10-P20 wave generated from area 3b and a P12-N25 wave from area 1 in
monkeys. Similarly, Kulics and Cauller (1986) presented electrical cutaneous
stimulation to macaque monkeys and report two negative deflecting peaks at 12ms
and 20ms and a positive peak around 50ms, which they show come from different

ACC
EPTE
D M
ANU
SCR
IPT
ACCEPTED MANUSCRIPT
14
cellular layers within area 3b from cortical source density (CSD) measurements.
Previous studies in humans (Allison et al., 1989; Wood et al., 1988) have examined
the cortical origin of evoked median-nerve stimulation responses using subdurally-
placed electrodes in patients requiring neurosurgery. They found the strongest and
earliest peak in area 3b (N20-P30), with area 1 peaking 5ms later (P25-N35). Thus,
McCarthy, Allison and colleagues (McCarthy et al., 1991; Allison et al., 1991)
proposed the monkey N10-P20 and P12-N25 to be the correlates of the human N20-
P30 and P25-N35.
We propose that the 15ms peak seen in our monkey MEG digit data corresponds
to the 40ms wave in human MEG data of digit stimulation observed in our data and
elsewhere (Disbrow et al., 2001; Hämäläinen et al., 1993; Hashimoto et al., 1999;
Kekoni et al., 1992). It is also likely that the sometimes-seen earlier peak at 3-10ms in
the monkey MEG data corresponds to the sometimes-seen 20ms peak in the human
MEG data for tactile digit stimuli, and that the later 30ms/40ms peak in the monkey
responses corresponds to the human 80ms peak which likely emanates from S2 and
surrounding cortex (Table 2; Disbrow et al., 2001; Hamalainen et al., 1990; Hari et
al., 1984).
In monkeys, previous work recording intracranial somatosensory evoked
potentials (SEP’s) using electrical stimulation applied to median nerve, lip, tongue
and palate showed that, as in our study, latencies were slightly shorter for lip relative
to hand responses (N9-P14 for lip and N10-P20 for hand; McCarthy and Allison,
1995). In humans, the evoked fields resulting from lip stimulation show a clear
~20ms peak as well as a later ~35ms peak (Table 2; Disbrow et al., 2003; Hoshiyama
et al., 1996; Nakahara et al., 2004; Nakamura et al., 1998) with latencies for the lip
response shorter than the digit response (Baumgartner et al. 1992). It is likely that

ACC
EPTE
D M
ANU
SCR
IPT
ACCEPTED MANUSCRIPT
15
the monkey ~10ms and ~25ms peaks observed here from lip stimulation correspond
with the human ~20ms and ~35ms peaks respectively.
More variability was seen in later peaks than early peaks for hand, lip and
auditory stimulation across studies. For example, Gardner et al. (1984) presented air-
puff stimuli to the hand or forearm of alert macaque monkeys while recording
epidural SEPs. They found P15 and P25 peaks followed by a large N43 and P70.
Their early peak matches the early peak (16ms) in our data; however, the later peaks
do not match well (33ms and 61ms). Later peaks tend to be more variable across
individual subjects, as in the present study, and are likely affected by anesthesia. In
addition, median nerve stimulation evokes a response about 5-10ms earlier than
cutaneous stimulation to the hand (e.g. compare Gardner et al. (1984) to Arezzo et al.
(1981) recording intracranially in the monkey or human MEG data from Forss et al.
(1994)).
In the auditory system, Arezzo and colleagues (1975) measured early (12-22ms)
auditory evoked potentials (AEPs) in response to auditory clicks in the monkey using
chronically implanted electrodes on the supratemporal plane. These responses
originated from primary auditory cortex (A1). Later AEPs (N40 and N60) arose from
areas on the superior temporal plane more anterior to A1, and the N70 and N100 arose
from more posterior areas. Similarly, Teale et al. (1984) measured responses to an
auditory tone at 22ms, 46ms, and a slightly later 130ms using MEG in the monkey.
Both of these studies are consistent with the auditory responses we recorded using
MEG in monkeys at 44ms, 61m, and 94ms (Table 2). We propose that the early 44ms
peak in the monkeys corresponds to the earlier auditory M50 in humans.
Evidence exists that the human auditory N100 (and corresponding M100) in
particular seems to arise from either A1 or the planum temporale (Godey et al., 2001;

ACC
EPTE
D M
ANU
SCR
IPT
ACCEPTED MANUSCRIPT
16
Liegeois-Chauvel et al., 1994). Furthermore, Arezzo and colleagues (1975) proposed
that the monkey N70 corresponds to the human N100, which they suggest has a dual
origin in A1 and posterior regions in both species. Our data, which showed large
peaks in monkeys at 61ms, are consistent with this hypothesis, particularly because
secondary auditory areas adjacent to and surrounding the core (A1 and R), such as the
belt and parabelt areas, are likely activated by the noise stimuli presented in this study
(Rauschecker et al., 1995; Rauschecker and Tian 2004; Patterson et al., 2002 and
Wessinger et al., 2001).
The later auditory peaks were more variable; however, it is possible that the 94ms
peak reported here in monkeys corresponds to the 100ms peak found by Arezzo et al.
(1975) in monkeys, which furthermore may correspond to the human auditory peak at
150 or even 200ms. Human data (Chait et al., 2004) supports the idea that the 94ms
peak that we measured in response to noise stimulation in the monkey corresponds to
the human M150, which was of relatively large amplitude in response to noise vs.
tone stimulation.
Latency differences between species for homologous neural responses can be
influenced by conduction distances as well as axon diameter. Within cortex, the
roughly doubling of latencies between macaques and humans can mostly be attributed
to a difference in conduction speeds, with evidence from an elegant study by Caminiti
et al. (2009). Caminiti et al. (1991) showed that cortical conduction speeds were
roughly double for humans compared to macaques for both motor-to-midline and
prefrontal-to-midline measurements, and that this doubling corresponded to increased
axon diameter found in human cortex. However, the doubling of arm length between
species [70cm for humans (Eyre et al., 1991) and 33cm for macaques (Hamada et al.,

ACC
EPTE
D M
ANU
SCR
IPT
ACCEPTED MANUSCRIPT
17
2005)] likely contributes to differences in response latency for digit stimulation as
well.
Taken together, the data from the present investigation as well as previous studies
in humans and monkeys indicate that response latencies can be reliably compared
across studies, species and areas, and that the relative spatial and temporal pattern of
activity in primary somatosensory and auditory cortex is similar in both humans and
macaque monkeys.
Neuroanatomic Variation in Cortical Field Location
In somatosensory cortex we were able to distinguish the digit representation as
superior to the lip representation along the central sulcus. These results are in
agreement with the known organization of somatosensory cortex with a representation
of the body along the post-central gyrus (Nelson et al., 1980; Penfield and Boldrey,
1937; Wood et al., 1988; see Krubitzer and Disbrow, 2008 for review), with the foot
representation most medial and superior, and the hand and then face representation at
the most lateral and inferior portion. Our source location findings for auditory cortex
are also in agreement with the location of auditory cortex described in previous work
(Brugge and Merzenich, 1973; Celesia, 1976, Morel et al., 1993).
However, while we could distinguish primary sensory areas based on location,
there was some variability in the mean locations across stimulation runs and
individuals. The standard error of the mean of the A-P, S-I, and L-R directions for
each of digit, lip and auditory stimulation ranged from 1-3mm in monkeys and 1-5mm
in humans (Figs. 3 and 6). While these errors are within the normal variability seen in
MEG source localization, they can be large with respect to sulcal and gyral

ACC
EPTE
D M
ANU
SCR
IPT
ACCEPTED MANUSCRIPT
18
landmarks. Some of the variability may have been technical; however, some is likely
due to natural neuroanatomic variation across subjects.
Our tactile stimulus activated neurons in areas 3b and 1, and possibly area 2 as
well. Since neurons in area 3b are generally located in the posterior bank of the
central sulcus, their tangential orientation relative to the surface of the head make
them a likely source of the MEG signal, while the radially-oriented source from
neurons in area 1 on the crown of the post-central gyrus are least likely to be detected
with MEG (Hämäläinen et al., 1993). However, the location of cortical fields can be
shifted dramatically relative to the sulcus (Krubitzer et al. 2004; Roland and Zilles,
1998; Caspers et al., 2006). For example, 3a has been observed in different monkeys
on the anterior bank, in the depth, or on the posterior bank of the sulcus (Krubitzer et
al., 2004). Thus it is likely that normal variability in cortical field location and sulcal
anatomy play a role in the observed variability.
Our MEG latency and localization results are consistent with the assertion that the
posterior bank of the central sulcus is the cortical origin of the large early peak seen in
MEG data. However, previous work mentioned above suggests an early response in
area 3b followed shortly by a response in area 1, in both monkeys and humans
(McCarthy et al., 1991; Allison et al., 1989; Wood et al., 1988). The combination of
factors, the response from area 1 closely following that from area 3b, and the possible
shifting of fields with respect to the sulcus could lead to variability in source
localization and latency across subjects.
Adding MEG to the brain mapping toolbox: advantages and challenges
In humans, MEG is increasingly used for spatiotemporal mapping of brain
function. However, validation efforts lag behind the widespread use of this technique.

ACC
EPTE
D M
ANU
SCR
IPT
ACCEPTED MANUSCRIPT
19
A few studies have compared human MEG data to electrocorticography (ECoG)
obtained in patients requiring neurosurgery and have shown good correspondence in
spatial, temporal and frequency domains between the measures, especially for task-
based paradigms in the lower frequency bands, which have inherently higher SNR
(Dalal et al., 2008; Halgren, 2004; Sutherling et al., 1988). However, these studies, as
a tool for MEG validation, are limited by ECoG electrode placement and the rare use
of depth electrodes. Further, brain disease is a potential confounding factor in these
studies. Thus, the challenge remains to provide validation of MEG results.
In the present investigation, we used MEG combined with MRI to determine
the spatial location of somatosensory and auditory areas of the cortex, as well as the
internal somatotopic organization of 3b/1. In addition, MEG also offers high
temporal resolution so that the temporal profile of activity in a given cortical field or
across fields can be measured. In fact, this temporal profile can be used to infer the
site of integration of inputs as well as cortical connectivity. It is critical to examine
the organization and function of the neocortex using multiple criteria (Kaas, 1983),
and MEG is a powerful tool in overcoming the hurdles of studying the human brain
non-invasively, yielding information about multiple characteristics of a cortical field
that have been difficult to obtain in the same subject using non-invasive techniques.
MEG data provide the location and amplitude of activity in a given cortical field,
exquisite temporal information about neural response properties in that field, as well
as insight into cortical connectivity, all of which can now be validated in the monkey
model.
4. Experimental Procedure

ACC
EPTE
D M
ANU
SCR
IPT
ACCEPTED MANUSCRIPT
20
Four adult male macaque monkeys (9-15 kg) were scanned using MEG and MRI
on separate days. Four healthy human volunteers (3 male and 1 female, ages 23-28)
also participated in both MEG and MRI experiments which were performed on
separate days. All studies were performed with approval of the UCSF Institutional
Animal Care and Use Committee or the Committee on Human Research.
Stimuli
Calibrated tactile stimulation was delivered using compressed air-driven balloon
diaphragms clipped onto either the digits or lips. Stimulus intensity was 25 PSI for
monkeys and 18 PSI for humans, and stimulus duration was 140ms with a rise time of
30ms for both hand and lip in both species. For hand stimulation in the monkey, two
clips delivering simultaneous stimulation were placed on the tip of the thumb (digit
one, D1) and the thenar area. Three monkeys (MK2, MK3 and MK4) were stimulated
on the right hand and the other monkey (MK1) on the left hand. In the human, four
clips delivering simultaneous stimulation were placed on the subject’s right hand: one
each on the distal and middle segments of D2 and D3.
For lip stimulation in the monkey, two clips were placed on the lateral upper and
lower lips, on the same side as the hand that was stimulated. In the human, two clips
were place on the right lateral upper lip and two clips on the right lateral lower lip.
All four lip sites were stimulated simultaneously.
All tactile stimuli were presented in blocks of 256 trials with an inter-trial interval
(ITI) of 1000ms +/- 50ms for monkeys and 500ms +/- 50ms for humans. Low level
white noise was presented continuously to the human subjects during tactile
stimulation via binaural earplugs to mask and thereby reduce the effect of sounds
made by the balloon diaphragms; monkeys wore earplugs for this purpose.

ACC
EPTE
D M
ANU
SCR
IPT
ACCEPTED MANUSCRIPT
21
Auditory stimulation for both species consisted of bursts of white noise (350 Hz to
17.6 kHz, 400ms duration, 5 ms rise time) delivered via binaural earplugs, with 128
epochs per block and an ITI of 1500ms +/- 50ms.
MEG acquisition - Monkeys
Macaque monkeys were initially anesthetized using intra-muscular (I.M.)
injections of ketamine hydrochloride (10 mg/kg), and anesthesia was maintained with
intravenous (I.V.) or I.M. boluses of ketamine hydrochloride administered every 15-
30 minutes (3-5 mg/kg/hr) and optionally boluses of I.V. midazolam (0.05-0.36
mg/kg/hr). Heart rate, respiratory rate, temperature and SpO2 were documented every
30 minutes. Heated water bottles and blankets were used to keep the animal warm.
An experimenter stayed in the shielded room to monitor the monkey at all times. Any
large movements, such as a cough or yawn, were noted and that data block was not
analyzed. Sessions lasted 4-6 hours including preparation time, and animals
recovered in their home cage.
Two separate MEG scanners were used to collect data from the macaque
monkeys. Both scanners were located in a shielded room. For two monkeys (MK1
and MK2) a 37-channel magnetometer (BTi, San Diego, CA) was used. Each
monkey’s head geometry, specifically the bony portions of the forehead and
longitudinal fissure, was recorded using a digital sensor position indicator
(FASTRAK, by Polhemus, Colchester, VT). Central forehead and left and right
preauricular points were identified as landmarks to define the MEG spatial reference
frame for later coregistration with the structural MR image. The sensor array was
centered over the central sulcus contralateral to the site of stimulation.
ACC
EPTE
D M
ANU
SCR
IPT
ACCEPTED MANUSCRIPT
22
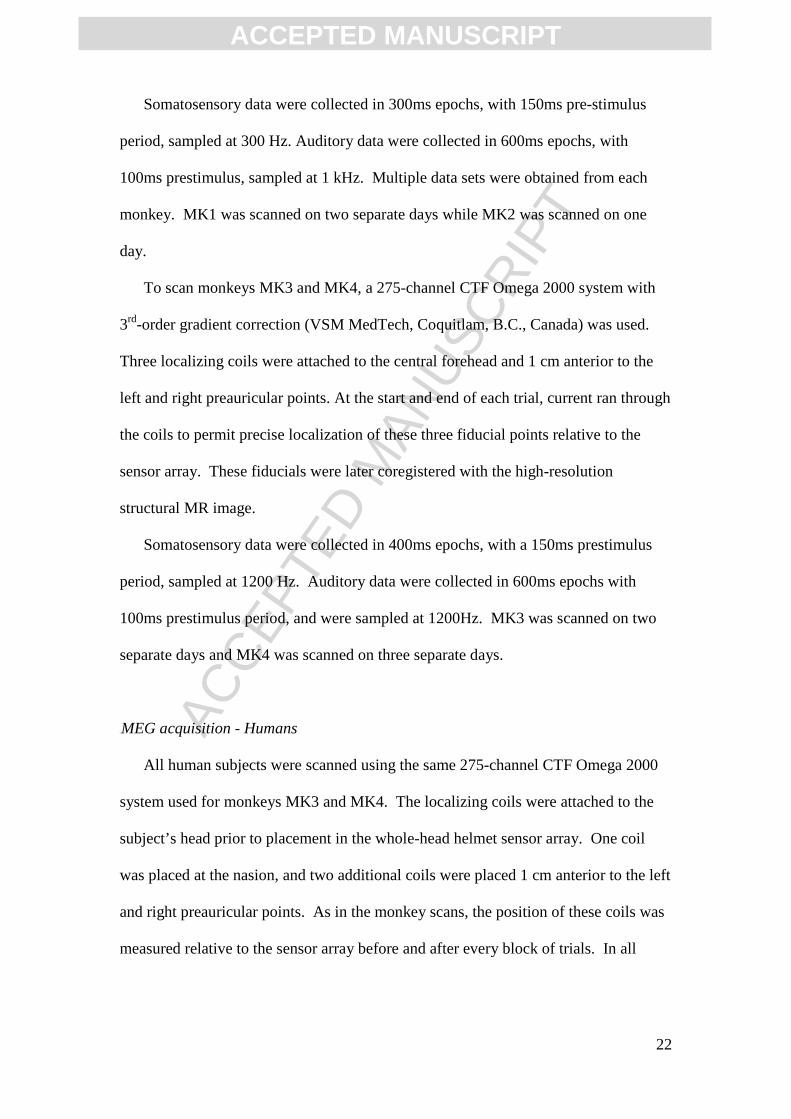
Somatosensory data were collected in 300ms epochs, with 150ms pre-stimulus
period, sampled at 300 Hz. Auditory data were collected in 600ms epochs, with
100ms prestimulus, sampled at 1 kHz. Multiple data sets were obtained from each
monkey. MK1 was scanned on two separate days while MK2 was scanned on one
day.
To scan monkeys MK3 and MK4, a 275-channel CTF Omega 2000 system with
3rd-order gradient correction (VSM MedTech, Coquitlam, B.C., Canada) was used.
Three localizing coils were attached to the central forehead and 1 cm anterior to the
left and right preauricular points. At the start and end of each trial, current ran through
the coils to permit precise localization of these three fiducial points relative to the
sensor array. These fiducials were later coregistered with the high-resolution
structural MR image.
Somatosensory data were collected in 400ms epochs, with a 150ms prestimulus
period, sampled at 1200 Hz. Auditory data were collected in 600ms epochs with
100ms prestimulus period, and were sampled at 1200Hz. MK3 was scanned on two
separate days and MK4 was scanned on three separate days.
0BMEG acquisition - Humans
All human subjects were scanned using the same 275-channel CTF Omega 2000
system used for monkeys MK3 and MK4. The localizing coils were attached to the
subject’s head prior to placement in the whole-head helmet sensor array. One coil
was placed at the nasion, and two additional coils were placed 1 cm anterior to the left
and right preauricular points. As in the monkey scans, the position of these coils was
measured relative to the sensor array before and after every block of trials. In all
ACC
EPTE
D M
ANU
SCR
IPT
ACCEPTED MANUSCRIPT
23
blocks, the subjects moved less than the criterion of 5 mm. These points were later
coregistered with the high-resolution structural MR image.
Somatosensory data were collected in 400ms epochs, with a 150ms prestimulus
period, sampled at 1200 Hz. Auditory data were collected in 600ms epochs with
100ms prestimulus period, and were sampled at 1200Hz. One data set was obtained
from each human subject collected in a single session.
1BMRI acquisition – Monkeys
Macaque monkeys were initially anesthetized using I.M. ketamine hydrochloride
(10 mg/kg). Once anesthetized, the animals were cannulated and intubated.
Throughout the experiment the animals received lactated Ringer’s solution
(10mL/kg/hr) and anesthesia was maintained using 1-2% Isoflurane. Atropine sulfate
(0.04 mg/kg) was also given I.M. to help reduce secretions. Temperature was
maintained and vitals were monitored as described above for the MEG experiments.
All MR scans were performed on a GE Signa 1.5T scanner (GE, Milwaukee, WI).
The monkeys were placed in the prone position and their heads were secured in an
MR-compatible stereotaxic frame. A five inch diameter surface coil was placed on
the superior part of the head. Donut shaped MR contrast fiducials were placed in the
same three positions as the localizing coils in the MEG session to assist in
coregistration. After a sagittal localizing scan, a 3D-SPGR image was acquired with a
flip angle of 40°, TR of 27ms, TE of 7ms, FOV of 190x190mm with 256x256x124
pixels with an in-plane resolution 0.74mm x 0.74mm and a slice thickness of 1.0mm.

ACC
EPTE
D M
ANU
SCR
IPT
ACCEPTED MANUSCRIPT
24
2BMRI acquisition – Humans
All MR scans were performed on the same GE Signa 1.5T scanner that was used
for the monkey scans. A standard GE birdcage volume coil was used and as in the
monkey scans. Donut-shaped MR-contrast fiducials were placed on the subjects’
head in the same positions as the localizing coils in the MEG session to assist in
coregistration of MEG and MR datasets. After a sagittal localizing scan, a 3D-SPGR
image was acquired using a flip angle of 40°, a TR of 27ms, a TE of 6ms, a
FOV=240x240mm, 256x256x124 pixels with an in-plane resolution 0.94mm x
0.94mm and a slice thickness of 1.5mm.
3BMEG processing – Monkeys
To produce comparable data sets we used only the 37 channels closest to the
cortical region of interest for MK3 and MK4 scanned in the 275-channel MEG
system. The sensor spacing of the 275-channel system is identical to that of the 37-
channel system, so both MEG machines provided comparable information. Further,
because the monkey’s head was relatively small, most of the sensors in the 275-
channel system were not near the head and were therefore recording predominantly
noise, and only the hemisphere near the sensors contributed to signal in the
recordings.
To localize neural sources we chose to use a beamformer technique, specifically
the eigenspace beamformer. The eigenspace beamformer has been shown to be more
robust than dipole fits (Gutierrez et al., 2006; Sekihara et al, 2002). While an
equivalent current dipole (ECD) inverse method has been used extensively, and we
have used it successfully with high SNR SEF monkey data (Zhu et al., 2009), it has
been shown to be equivalent to beamforming for high SNR data (Gaetz and Cheyne,

ACC
EPTE
D M
ANU
SCR
IPT
ACCEPTED MANUSCRIPT
25
2003). However, for lower SNR data, the eigenspace beamformer is more robust to
errors in the forward lead field (Sekihara et al., 2002). Therefore, we chose to use the
eigenspace beamformer for this data which could be relatively noisy.
Data processing was carried out using NUTMEG (Dalal et al., 2004;
http://nutmeg.berkeley.edu). The raw sensor data was averaged and the mean of the
prestimulus period was subtracted from the whole waveform. Only the runs with
clear responses in the sensor data were processed for source localization and further
quantification of latency and localization.
The fiducial points or digitized headshape were coregistered with the structural
MRI. A volume-of-interest (VOI) was defined to include the whole cerebrum and a
grid size of 2mm was used. The source power was estimated over the whole cerebrum
so that the maximum activation relative to other regions could be determined. The
forward lead field was calculated for the whole cerebrum using a single-shell
spherical volume conductor model.
To determine the optimal location of the sphere center, we examined additional
data sets and compared a head based location to a sensor based location. The result
was a sphere center location near the center of the monkey’s head that was slightly
skewed in the direction of the center of the sensor curvature. This location was
optimal for both SEF and AEF data.
An adaptive spatial filtering algorithm, specifically the eigenspace vector
beamfomer, was used for MEG source localization (Sekihara et al., 2001). The time
course and power of neural activity at each grid point (voxel) was estimated using a
weight matrix (a data dependent spatial filter), applied to the sensor data. To
determine the weight matrix the time window containing roughly the first 50-70 time
points post-stimulation of unfiltered data was used to calculate the data covariance.

ACC
EPTE
D M
ANU
SCR
IPT
ACCEPTED MANUSCRIPT
26
Two to three eigenvectors corresponding to the largest eigenvalues were used to
calculate the signal subspace. The weight matrix was then calculated as a function of
the forward lead field and the sensor data covariance and its signal subspace. The
result is a full spatio-temporal reconstruction of estimated neural activity: a different
spatial map exists for each latency, and likewise, for each spatial point (voxel) a full
time-series can be extracted (often termed virtual electrode). The estimated neural
location from any MEG inverse method is termed the localization of that source. We
also determined the source orientation by computing the principle eigenvector of the
source power output from the vector beamformer.
To put the monkey data into a standard normalized space we registered each
animal’s structural MRI to the “AC-PC coordinate” frame using translations and
rotations (no warping). This coordinate system is defined with the anterior
commisure (AC) as the origin, the negative y-axis running through the posterior
commisure (PC), and the positive z-axis running up through longitudinal cerebral
fissure. For comparing the mediolateral variation across stimulation types and
animals, the negative of the absolute value of the mediolateral coordinate was used
since MK1 was stimulated on the left while the other three animals were stimulated
on the right.
The source orientation was also converted from the individual structural MRI
space to the “AC-PC” coordinate frame so that orientations could be averaged across
datasets/animals. The unit orientation vectors from all datasets of a stimulation type
were averaged together. If they all pointed consistently in a particular direction, then
the magnitude of this mean should equal 1, while completely randomly oriented
vectors will sum to zero. However, in the case of limited sample size here (e.g. 4-12
vectors), the distribution varies with number of samples (vectors). Therefore we

ACC
EPTE
D M
ANU
SCR
IPT
ACCEPTED MANUSCRIPT
27
computed the distribution of means of groups of randomly-generated unit vectors
(sample sizes 4, 5, 10 and 12) and determined the one-tailed 95% and 99.5% cut-offs
for maximum values to test for significance.
The AC-PC coordinates of the voxel with largest MEG activation across space for
the time peak of interest (~12ms for digit, ~8ms for lip, and ~50ms for auditory
stimulation) and the source power orientation were noted, as well as the actual peak
latencies at that peak and other peaks if present. Significance of differences between
the coordinates of the hand, face and auditory representations for both monkeys and
humans were tested using two-tailed paired Student’s t-tests corrected for family-wise
errors (thus for three tests p<0.016 was considered significant).
MEG processing – Humans
Human MEG data were processed like the monkey CTF data (MK3 and MK4)
using NUTMEG. The spherical homogeneous single-shell model was fitted to the
scalp derived from the structural MRI. Individual trials with eye blinks or other
artifacts were discarded prior to averaging and sources were estimated over a 2mm-
spaced 3D grid over a volume of interest (VOI). Due to computational limits, the
VOI was smaller than a hemisphere (roughly one-tenth the whole brain volume), but
large enough to encompass somatosensory and auditory cortex and surrounding
regions. All sensors were used to reconstruct somatosensory activations, whereas
only sensors on the hemisphere of interest were used for auditory data. Roughly 250
post-stimulus time points of non-filtered data were used to calculate the data
covariance and two to three eigenvalues for the signal subspace.
The individual subject's structural MRI was normalized to MNI space using SPM2
(http://www.fil.ion.ucl.ac.uk/spm). The same spatial warping was then applied to the

ACC
EPTE
D M
ANU
SCR
IPT
ACCEPTED MANUSCRIPT
28
MEG reconstruction (as implemented in NUTMEG) and the MNI coordinate of the
peak MEG voxel and source power orientation were noted as well as the peak
latencies.
Acknowledgements
We thank Marianne Lowenthal, Susanne Honma, Anne Findlay, Evelyn Proctor,
Kavita Vashi, Leighton Hinkley and Geoff Rau for assistance with data acquisition,
Ron Baireuther, Robert English-Fernandez, Patricia Ramsey and Grace Kim for
assistance with anesthesia, and Sarang Dalal for comments on MEG processing. NIH
funding provided by R01 NS44590 to ED and SN, R01 DC4855 and R01 DC6435 to
SN, and R01 NS35103 to LK.

ACC
EPTE
D M
ANU
SCR
IPT
ACCEPTED MANUSCRIPT
29
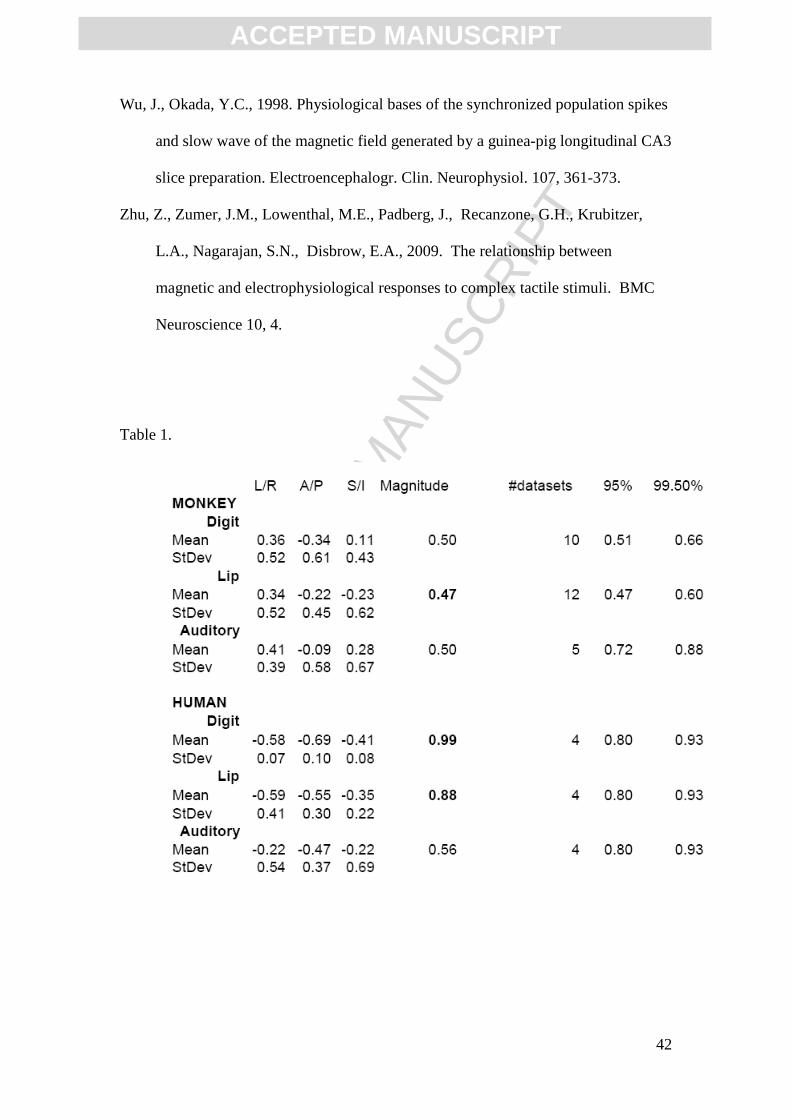
Table 1: Mean orientations of dipole sources for each stimulation type and species.
The mean of the dipole orientations are reported both for each of the 3 cardinal
directions as well as radial magnitude. As defined by AC-PC coordinates for the
monkeys and MNI coordinates for humans, mean directions are reported for the
Left/Right (right=positive), Anterior/Posterior (anterior=positive), and
Superior/Inferior (superior=positive). Random sets of vectors were averaged to
create a probability density function to determine the 95th and 99th percentile (furthest
right columns), as a function of number of datasets (vectors) averaged together. The
mean magnitude is in bold if above the 95th percentile threshold.
Table 2: Summary of the studies measuring responses latencies to hand, lip or
auditory stimulation using MEG or intracranial electrodes from monkeys and humans.
Columns are arranged to relate peaks across studies and across species. For the
present study, mean (standard deviation) are reported. All other studies are reported
as either the mean or a standard peak (e.g. 'M100'). For the hand, when
somatosensory stimulation type was electrical, the median nerve was stimulated
unless otherwise indicated.
Fig. 1: Averaged MEG sensor data from monkey MK1. Top row: Digit stimulation;
Middle row: Lip stimulation; Bottom row: Auditory stimulation. Left column: Two-
dimensional representation of sensor array activity, with conventional representation
indicating magnetic field direction (red going into the head and blue out). This field
pattern indicates an underlying dipolar source, occurring at the latency of the red
vertical bar in the adjacent plot (right). Right column: Averaged time-series for

ACC
EPTE
D M
ANU
SCR
IPT
ACCEPTED MANUSCRIPT
30
magnetic field changes for all 37 sensors, with stimulus onset at time=0ms. Data
shown was filtered from 2-40Hz.
Fig. 2: Beamformer source localization and time series of the primary response in the
MEG dataset from monkey MK1. Response to digit (Top row). lip (Middle row), and
auditory (Bottom row) stimulation. Left and middle columns: MEG source activity
overlaid on coronal and axial MRIs, respectively, occurring at the peak latency
indicated by the blue vertical bar in the time series (right column). The source
localization demonstrates that the digits are represented medial to the lip, and that
both are represented superior to auditory cortex. Crosshairs on MRIs indicate the
voxel with greatest signal magnitude. Right column: source time-series, estimated by
beamforming, at the peak voxel in crosshairs, filtered from 2-40Hz after beamforming
localization. These ‘virtual-electrode’ traces from the most-active voxel for each
stimulation type show evoked peaks at the primary latency described in the results
section.
Fig. 3: Average AC-PC coordinates of all MEG beamformer localization results in
monkeys for digit, lip and auditory stimulation. The digit representation is
significantly medial to the lip representation and auditory cortex. Further, there was a
trend for the digits to be represented slightly posterior to the lip representation and
auditory cortex. Finally, both the digits the lips and were significantly superior to
auditory cortex. The asterisk indicates pairwise significant difference between means
(p<0.016).

ACC
EPTE
D M
ANU
SCR
IPT
ACCEPTED MANUSCRIPT
31
Fig. 4: Averaged MEG sensor data from human subject HU4. Top row: hand
stimulation; Middle row: Lip stimulation; Bottom row: Auditory stimulation. Left
column: Two-dimensional representation of sensor array activity, with conventional
representation indicating magnetic field direction (red going into the head and blue
out). This field pattern indicates an underlying dipolar source pattern, occurring at the
latency of the red vertical bar in the adjacent plot (right). Right column: Averaged
time-series of magnetic field changes for all sensors, filtered from 2-40Hz, with
stimulus onset occurring at time=0ms. Digit and lip plots show overlay of all 275
sensors used in beamformer analysis; auditory plot shows only the left 132 sensors
used in beamformer analysis.
Fig. 5: Beamformer source localization and time series for primary responses in
human HU4 MEG dataset. Top row: digit localization; Middle row: lip localization;
Bottom row: auditory localization. Left and middle column: MEG source activity
overlaid on coronal and axial structural MRIs, respectively, occurring at the peak
latency indicated by the blue vertical bar in the adjacent time-series (right column).
Crosshairs on the MRI indicate the voxel with the largest magnitude activity. The
source localization demonstrates that the digits are represented superior to the lip, and
that both are represented superior to auditory cortex. Right column: source time-
series estimated by beamforming at the peak voxel in crosshairs, filtered from 2-40Hz
after beamforming localization. These ‘virtual-electrode’ traces from the most-active
voxel for each stimulation type show evoked peaks at the primary latency described in
the results.

ACC
EPTE
D M
ANU
SCR
IPT
ACCEPTED MANUSCRIPT
32
Fig. 6: Average MNI coordinates of MEG beamformer localization results in humans
for digit, lip and auditory stimulation. These coordinates indicate that the lip
representation is significantly anterior to the dig representation in S1. Both digit and
lip representations were significantly superior to auditory source location. The
asterisk indicates pairwise significant difference between means (p<0.016).
References
Allison, T., McCarthy, G., Wood, C.C., Williamson, P.D., Spencer, D.D., 1989.
Human cortical potentials evoked by stimulation of the median nerve. II.
Cytoarchitectonic areas generating long-latency activity. J Neurophysiol 62,
711-722.
Allison, T., McCarthy, G., Wood, C.C., Jones, S.J., 1991. Potentials evoked in
human and monkey cerebral cortex by stimulation of the median nerve: A
review of scalp and intracranial recordings. Brain 114, 2465-2503.
Arezzo, J., Pickoff, A., Vaughan, H.G., Jr., 1975. The sources and intracerebral
distribution of auditory evoked potentials in the alert rhesus monkey. Brain Res
90, 57-73.
Arezzo, J.C, Vaughan H.G., Legatt A.D. 1981.Topography and intracranial sources
of somatosensory evoked potentials in the monkey. II. Cortical components.
Electroencephalogr. Clin. Neurophys 51, 1-18.
Barth, D.S., Sutherling, W., Beatty, J., 1984. Fast and slow magnetic phenomena in
focal epileptic seizures. Science 226, 855-857.
Barth, D.S., Sutherling, W., Beatty, J., 1986. Intracellular currents of interictal
penicillin spikes: evidence from neuromagnetic mapping. Brain Res. 368, 36-48.

ACC
EPTE
D M
ANU
SCR
IPT
ACCEPTED MANUSCRIPT
33
Barth, D.S., Sutherling, W., 1988. Current source-density and neuromagnetic analysis
of the direct cortical response in rat cortex. Brain Res. 450, 280-294.
Bau Barth, D.S., Di, S., 1990. Three-dimensional analysis of auditory-evoked
potentials in rat neocortex. J. Neurophysiol. 64, 1527-1536.
Baumgartner, C., Barth, D.S., Levesque, M.F., Sutherling, W.W., 1992. Human hand
and lip sensorimotor cortex as studied on electrocorticography.
Electroencephalogr. Clin. Neurophysiol. 84, 115-126.
Brugge, J.F., Merzenich, M.M., 1973. Responses of neurons in auditory cortex of the
macaque monkey to monaural and binaural stimulation. J. Neurophysiol. 36,
1138-1158.
Buchner, H., Fuchs, M., Wischmann, H.A., Dossel, O., Ludwig, I., Knepper, A., Berg,
P., 1994. Source analysis of median nerve and finger stimulated somatosensory
evoked potentials: multichannel simultaneous recording of electric and magnetic
fields combined with 3D-MR tomography. Brain Topogr. 6, 299-310.
Caminiti, R., Ghaziri, H., Galuske, R., Hof, P.R., Innocenti, G.M. 2009. Evolution
amplified processing with temporally dispersed slow neuronal connectivity in
primates. PNAS 106, 19551-19556.
Caspers, S., Geyer, S., Schleicher, A., Mohlberg, A., Amunts, K., Zilles, K. 2006.
The human inferior parietal cortex: cytoarchetectonic parcellation and
interindividual variability. NeuroImage 33, 430-448.
Celesia, G.G., 1976. Organization of auditory cortical areas in man. Brain 99, 403-
414.
Chait, M., Simon, J.Z., Poeppel, D. 2004. Auditory M50 and M100 responses to
broadband noise: functional implications. NeuroReport 15, 2455-2458.

ACC
EPTE
D M
ANU
SCR
IPT
ACCEPTED MANUSCRIPT
34
Cuffin, B.N., Cohen, D., 1979. Comparison of the magnetoencephalogram and
electroencephalogram. Electroencephalogr. Clin. Neurophysiol. 47, 132–146.
Dalal, S.S., Guggisberg, A.G., Edwards, E., Sekihara, K., Findlay, A.M., Canolty,
R.T., Berger, M.S., Knight, R.T., Barbaro, N.M., Kirsch, H.E., Nagarajan, S.S.,
2008. Five-dimensional neuroimaging: Localization of the time-frequency
dynamics of cortical activity. NeuroImage 40, 1686-1700.
Dalal, S.S., Zumer, J.M., Agrawal, V., Hild, K.E., Sekihara, K., Nagarajan, S.S.,
2004. NUTMEG: a neuromagnetic source reconstruction toolbox. Neurol. Clin.
Neurophysiol. 2004, 52.
Disbrow, E., Roberts, T., Poeppel, D., Krubitzer, L., 2001. Evidence for
interhemispheric processing of inputs from the hands in human S2 and PV. J.
Neurophysiol. 85, 2236-2244.
Disbrow, E.A., Hinkley, L.B., Roberts, T.P., 2003. Ipsilateral representation of oral
structures in human anterior parietal somatosensory cortex and integration of
inputs across the midline. J. Comp. Neurol. 467, 487-495.
Edgar, J.C., Huang, M.X., Weisend, M.P., Sherwood, A., Miller, G.A., Adler, L.E.,
Canive, J.M., 2003. Interpreting abnormality: an EEG and MEG study of P50
and the auditory paired-stimulus paradigm. Biol. Psych., 65, 1-20.
Eyre, J.A., Miller, S., Ramesh, V., 1991. Constancy of central conduction delays
during development in man: investigation of motor and somatosensory
pathways. J. of Physiol., 434, 441-452.
Forss, N., Salmelin, R., Hari, R., 1994. Comparison of somatosensory evoked fields
to airpuff and electric stimuli. Electroencephalogr. Clin. Neurophysiol. 92, 510-
517.

ACC
EPTE
D M
ANU
SCR
IPT
ACCEPTED MANUSCRIPT
35
Fuchs, M., Wagner, M., Wischmann, H.A., Kohler, T., Theissen, A., Drenckhahn, R.,
Buchner, H., 1998. Improving source reconstructions by combining bioelectric
and biomagnetic data. Electroencephalogr. Clin. Neurophysiol. 107, 93–111.
Gardner, E.P., Hamalainen, H.A., Warren, S., Davis, J., Young, W., 1984.
Somatosensory evoked potentials (SEPs) and cortical single unit responses
elicited by mechanical tactile stimuli in awake monkeys. Electroencephalogr.
Clin. Neurophysiol. 58, 537-552.
Gaetz, W. C., Cheyne D. O. 2003. Localization of human somatosensory cortex using
spatially filtered magnetoencephalography. Neurosci. Letters. 340, 161-164.
Godey, B., Schwartz, D., de Graaf, J.B., Chauvel, P., Liegeois-Chauvel, C., 2001.
Neuromagnetic source localization of auditory evoked fields and intracerebral
evoked potentials: a comparison of data in the same patients. Clin.
Neurophysiol. 112, 1850-1859.
Gutierrez, D., Nehorai, A., Dogandzic A. 2006. Performance analysis of reduced-
rank beamformers for estimating dipole source signals using EEG/MEG. IEEE
Trans on Biomed. Eng. 53, 840-844.
Hackett, T.A., Preuss, T.M., Kaas, J.H., 2001. Architectonic identification of the core
region in auditory cortex of macaques, chimpanzees, and humans. J. Comp.
Neurol. 441, 197-222.
Hackett, T.A., 2007. Organization and correspondence of the auditory cortex of
humans and nonhuman primates. In: The Evolution of Nervous Systems. Kaas,
J., Preuss, T., eds. Academic Press, Oxford, pp. 109-119.
Halgren, E., 2004. How can intracranial recordings assist MEG source localization?
Neurol. Clin. Neurophysiol. 2004, 86.

ACC
EPTE
D M
ANU
SCR
IPT
ACCEPTED MANUSCRIPT
36
Hamada, Y., Watanabe, T., Chatani, K., Hayakawa S., Iwamoto M., 2005.
Morphometrical comparison between Indian- and Chinese-derived rhesus
macaques (Macaca mulatta). Anthrop. Sci., 113, 183-188.
Hamalainen, H., Kekoni, J., Sams, M., Reinikainen, K., Naatanen, R., 1990. Human
somatosensory evoked potentials to mechanical pulses and vibration:
contributions of SI and SII somatosensory cortices to P50 and P100
components. Electroencephalogr. Clin. Neurophysiol. 75, 13-21.
Hämäläinen, M., Hari, R., Ilmoniemi, R.J., Knuutila, J., Lounasmaa, O.V., 1993.
Magnetoencephalography - theory, instrumentation, and applications to
noninvasive studies of the working human brain. Reviews of Modern Physics
65, 413.
Hari, R., Hamalainen, M., Kaukoranta, E., Reinikainen, K., Teszner, D., 1983.
Neuromagnetic responses from the second somatosensory cortex in man. Acta
Neurol. Scand. 68, 207-212.
Hari, R., Reinikainen, K., Kaukoranta, E., Hamalainen, M., Ilmoniemi, R., Penttinen,
A., Salminen, J., Teszner, D., 1984. Somatosensory evoked cerebral magnetic
fields from SI and SII in man. Electroencephalogr. Clin. Neurophysiol. 57, 254-
263.
Hashimoto, I., Mashiko, T., Kimura, T., Imada, T., 1999. Are there discrete distal-
proximal representations of the index finger and palm in the human
somatosensory cortex? A neuromagnetic study. Clin. Neurophysiol. 110, 430-
437.
Hoshiyama, M., Kakigi, R., Koyama, S., Kitamura, Y., Shimojo, M., Watanabe, S.,
1996. Somatosensory evoked magnetic fields following stimulation of the lip in
humans. Electroencephalogr. Clin. Neurophysiol. 100, 96-104.

ACC
EPTE
D M
ANU
SCR
IPT
ACCEPTED MANUSCRIPT
37
Jacobson, G.P., Ahmad, B.K., Moran, J., Newman, C.W., Tepley, N., Wharton, J.,
1991. Auditory evoked cortical magnetic field (M100-M200) measurements in
tinnitus and normal groups. Hear. Res. 56, 44-52.
Kaas, J.H., Nelson, R.J., Sur, M., Lin, C.S., Merzenich, M.M., 1979. Multiple
representations of the body within the primary somatosensory cortex of
primates. Science 204, 521-523.
Kaas, J.H., 1983. What, if anything, is SI? Organization of first somatosensory area of
cortex. Physiol. Rev. 63, 206-231.
Kaas, J.H., 1993. The functional organization of somatosensory cortex in primates.
Ann. Anat. 175, 509-518.
Kekoni, J., Tiihonen, J., Hamalainen, H., 1992. Fast decrement with stimulus
repetition in ERPs generated by neuronal systems involving somatosensory SI
and SII cortices: electric and magnetic evoked response recordings in humans.
Int. J. Psychophysiol. 12, 281-288.
Krubitzer, L.A., Huffman, K.J., Disbrow, E.A., Recanzone, G. 2004. Organization of
area 3a in macaque monkeys: contributions to the cortical phenotype. J.
Comp. Neurol 471, 97-111.
Krubitzer, L.A., Disbrow, E.A., 2008. The evolution of parietal areas involved in
hand use in primates. In Somatosensation. Gardner, E., Kaas, J., eds. Elsevier,
London, pp. 183-214.
Kulics, A. T., Cauller L. J. 1986. Cerebral cortical somatosensory evoked responses,
multiple unit activity and current source-densities: their interrelationships and
significance to somatic sensation as revealed by stimulation of the awake
monkey's hand. Exp. Brain Res. 62, 46-60.

ACC
EPTE
D M
ANU
SCR
IPT
ACCEPTED MANUSCRIPT
38
Kyuhou, S., Okada, Y.C., 1993. Detection of magnetic evoked fields associated with
synchronous population activities in the transverse CA1 slice of the guinea pig.
J. Neurophysiol. 70, 2665-2668.
Leahy, R.M., Mosher, J.C., Spencer, M.E., Huang, M.X., Lewine, J.D., 1998. A study
of dipole localization accuracy for MEG and EEG using a human skull phantom.
Electroencephalogr. Clin. Neurophysiol. 107, 159-173.
Liegeois-Chauvel, C., Musolino, A., Badier, J.M., Marquis, P., Chauvel, P., 1994.
Evoked potentials recorded from the auditory cortex in man: evaluation and
topography of the middle latency components. Electroencephalogr. Clin.
Neurophysiol. 92, 204-214.
Lopez, L., Chan, C.Y., Okada, Y.C., Nicholson, C., 1991. Multimodal
characterization of population responses evoked by applied electric field in
vitro: extracellular potential, magnetic evoked field, transmembrane potential,
and current-source density analysis. J. Neurosci. 11, 1998-2010.
McCarthy, G., Wood, C.C., Allison, T., 1991. Cortical somatosensory evoked
potentials. I. Recordings in the monkey Macaca fascicularis. J. Neurophysiol.
66, 53-63.
McCarthy, G., Allison, T., 1995. Trigeminal evoked potentials in somatosensory
cortex of the Macaca mulatta. J. Neurosurg. 82, 1015-1020.
Morel, A., Garraghty, P.E., Kaas, J.H., 1993. Tonotopic organization, architectonic
fields, and connections of auditory cortex in macaque monkeys. J Comp Neurol
335, 437-459.
Nagamine, T., Makela, J., Mima, T., Mikuni, N., Nishitani, N., Satoh, T., Ikeda, A.,
Shibasaki, H., 1998. Serial processing of the somesthetic information revealed

ACC
EPTE
D M
ANU
SCR
IPT
ACCEPTED MANUSCRIPT
39
by different effects of stimulus rate on the somatosensory-evoked potentials and
magnetic fields. Brain Res. 791, 200-208.
Nakahara, H., Nakasato, N., Kanno, A., Murayama, S., Hatanaka, K., Itoh, H.,
Yoshimoto, T., 2004. Somatosensory-evoked fields for gingiva, lip, and tongue.
J. Dent. Res. 83, 307-311.
Nakamura, A., Yamada, T., Goto, A., Kato, T., Ito, K., Abe, Y., Kachi, T., Kakigi, R.,
1998. Somatosensory homunculus as drawn by MEG. NeuroImage 7, 377-386.
Nelson, R.J., Sur, M., Felleman, D.J., Kaas, J.H., 1980. Representations of the body
surface in postcentral parietal cortex of Macaca fascicularis. J. Comp. Neurol.
192, 611-643.
Okada, Y., Lauritzen, M., Nicholson, C., 1987a. MEG source models and physiology.
Phys. Med. Biol. 32, 43-51.
Okada, Y.C., Lauritzen, M., Nicholson, C., 1987b. Magnetic field associated with
neural activities in an isolated cerebellum. Brain Res. 412, 151-155.
Okada, Y.C., Lauritzen, M., Nicholson, C., 1988a. Magnetic field associated with
spreading depression: a model for the detection of migraine. Brain Res. 442,
185-190.
Okada, Y.C., Nicholson, C., 1988b. Magnetic evoked field associated with
transcortical currents in turtle cerebellum. Biophys. J. 53, 723-731.
Okada, Y.C., Wu, J., Kyuhou, S., 1997. Genesis of MEG signals in a mammalian
CNS structure. Electroencephalogr. Clin. Neurophysiol. 103, 474-485.
Olivier, E., Baker, S.N., Lemon, R.N., 2002. Comparison of direct and indirect
measurements of the central motor conduction time in the monkey. Clin.
Neurophys. 113, 469-477.

ACC
EPTE
D M
ANU
SCR
IPT
ACCEPTED MANUSCRIPT
40
Pantev, C., Hoke, M., Lehnertz, K., Lutkenhoner, B., Fahrendorf, G., Stober, U.,
1990. Identification of sources of brain neuronal activity with high
spatiotemporal resolution through combination of neuromagnetic source
localization (NMSL) and magnetic resonance imaging (MRI).
Electroencephalogr. Clin. Neurophysiol. 75, 173-184.
Patterson, R.D., Uppenkamp, S., Johnsrude, I.S., Griffiths, T.D. 2002. The
processing of temporal pitch and melody information in auditory cortex.
Neuron 36, 767-776.
Penfield, W., Boldrey, E., 1937. Somatic motor and sensory representation in the
cerebral cortex of man as studied by electrical stimulation. Brain 60, 389-443.
Powell, T.P., Mountcastle, V.B., 1959. Some aspects of the functional organization of
the cortex of the postcentral gyrus of the monkey: a correlation of findings
obtained in a single unit analysis with cytoarchitecture. Bull. Johns Hopkins
Hosp. 105, 133-162.
Rauschecker, J.P., Tian, B., Hauser, M. 1995. Processing of complex sounds in the
macaque nonprimary auditory cortex. Science 268, 111-114.
Rauschecker, J.P., Tian, B. 2004. Processing of band-passed noise in the lateral
auditory belt cortex of the rhesus monkey. J. Neurophysiol. 91, 2578-2589.
Reite, M., Teale, P., Zimmerman, J., Davis, K., Whalen, J., 1988. Source location of a
50 msec latency auditory evoked field component. Electroencephalogr. Clin.
Neurophysiol. 70, 490-498.
Roland, P.E., Zilles, K. 1998. Structural divisions and functional fields in the human
cerebral cortex. Brain Res. Brain Res. Rev. 26, 87-105.

ACC
EPTE
D M
ANU
SCR
IPT
ACCEPTED MANUSCRIPT
41
Sekihara, K., Nagarajan, S.S., Poeppel, D., Marantz, A., Miyashita, Y., 2001.
Reconstructing spatio-temporal activities of neural sources using an MEG vector
beamformer technique. IEEE Trans. Biomed. Eng. 48, 760-771.
Sekihara, K., Nagarajan S.S., Poeppel D., Marantz A. 2002. Performance of an MEG
adaptive-beamformer technique in the presence of correlated neural activities:
effects on signal intensities and time course estimates. IEEE Trans. Biomed.
Eng. 49, 1534-1546.
Sharon, D., Hamalainen, M.S., Tootell, R.B.H., Halgren, E., Belliveau, J.W., 2007.
The advantage of combining MEG and EEG: comparison to fMRI in focally
stimulated visual cortex. NeuroImage 36, 1225–1235.
Sutherling, W.W., Crandall, P.H., Darcey, T.M., Becker, D.P., Levesque, M.F., Barth,
D.S., 1988. The magnetic and electric fields agree with intracranial localizations
of somatosensory cortex. Neurology 38, 1705-1714.
Teale, P., Delmore, J., Simon, J., Reite, M., 1994. Magnetic auditory source imaging
in macaque monkey. Brain Res. Bull. 33, 615-620.
Wessinger, C.M., VanMeter, J., Tian, B., Van Lare, J., Pekar, J., Rauschecker, J.P.
2001. Hierarchical organization of the human auditory cortex revealed by
functional magnetic resonance imaging. J. of Cogn. Neurosci. 13, 1-7.
Wilson, T.W., Godwin, D.W., Ctozy, P.W., Nader, M.A., Kraft, R.A., Buchheimer,
N.C., Daunais, J.B., 2009. A MEG investigation of somatosensory processing
in rheses monkey. NeuroImage 46, 998-1003.
Wood, C.C., Spencer, D.D., Allison, T., McCarthy, G., Williamson, P.D., Goff, W.R.,
1988. Localization of human sensorimotor cortex during surgery by cortical
surface recording of somatosensory evoked potentials. J. Neurosurg. 68, 99-111.
ACC
EPTE
D M
ANU
SCR
IPT
ACCEPTED MANUSCRIPT
42
Wu, J., Okada, Y.C., 1998. Physiological bases of the synchronized population spikes
and slow wave of the magnetic field generated by a guinea-pig longitudinal CA3
slice preparation. Electroencephalogr. Clin. Neurophysiol. 107, 361-373.
Zhu, Z., Zumer, J.M., Lowenthal, M.E., Padberg, J., Recanzone, G.H., Krubitzer,
L.A., Nagarajan, S.N., Disbrow, E.A., 2009. The relationship between
magnetic and electrophysiological responses to complex tactile stimuli. BMC
Neuroscience 10, 4.
Table 1.

ACC
EPTE
D M
ANU
SCR
IPT
ACCEPTED MANUSCRIPT
43

ACC
EPTE
D M
ANU
SCR
IPT
ACCEPTED MANUSCRIPT
44

ACC
EPTE
D M
ANU
SCR
IPT
ACCEPTED MANUSCRIPT
45

ACC
EPTE
D M
ANU
SCR
IPT
ACCEPTED MANUSCRIPT
46

ACC
EPTE
D M
ANU
SCR
IPT
ACCEPTED MANUSCRIPT
47

ACC
EPTE
D M
ANU
SCR
IPT
ACCEPTED MANUSCRIPT
48

ACC
EPTE
D M
ANU
SCR
IPT
ACCEPTED MANUSCRIPT
49
Copyright © 2022 FDOKUMEN