MEEG 402-010 Chassis Design Report 2017 FSAE Senior ...
79
MEEG 402-010 Chassis Design Report 2017 FSAE Senior Design Adviser: Dr. Steven Timmins Corwin Dodd - [email protected] Nicholas Geneva - [email protected] Patrick Geneva - [email protected] Cory Morris - [email protected] Last Updated February 20, 2017
-
Upload
khangminh22 -
Category
Documents
-
view
1 -
download
0
Transcript of MEEG 402-010 Chassis Design Report 2017 FSAE Senior ...
MEEG 402-010 Chassis Design Report
2017 FSAE Senior Design
Adviser: Dr. Steven Timmins
Corwin Dodd - [email protected] Geneva - [email protected] Geneva - [email protected]
Cory Morris - [email protected]
Last UpdatedFebruary 20, 2017

Contents
1 Executive Summary 1
2 Introduction 22.1 Project Scope . . . . . . . . . . . . . . . . . . . . . . . . . . . . . . . . . . . . . . . . 22.2 Wants & Constraints . . . . . . . . . . . . . . . . . . . . . . . . . . . . . . . . . . . . 2
2.2.1 Constraints . . . . . . . . . . . . . . . . . . . . . . . . . . . . . . . . . . . . . 22.2.2 Wants . . . . . . . . . . . . . . . . . . . . . . . . . . . . . . . . . . . . . . . . 2
2.3 Design Metrics . . . . . . . . . . . . . . . . . . . . . . . . . . . . . . . . . . . . . . . 3
3 Preliminary Design Decisions 43.1 Space-Frame vs. Monocoque . . . . . . . . . . . . . . . . . . . . . . . . . . . . . . . 43.2 Standard vs. Alternate Frame Design . . . . . . . . . . . . . . . . . . . . . . . . . . 43.3 Vehicle Wheelbase . . . . . . . . . . . . . . . . . . . . . . . . . . . . . . . . . . . . . 53.4 Front Bulk Head Size . . . . . . . . . . . . . . . . . . . . . . . . . . . . . . . . . . . . 53.5 Material Selection . . . . . . . . . . . . . . . . . . . . . . . . . . . . . . . . . . . . . 6
4 Concept Generation and Selection 64.1 Benchmarking . . . . . . . . . . . . . . . . . . . . . . . . . . . . . . . . . . . . . . . . 64.2 Concept Generation . . . . . . . . . . . . . . . . . . . . . . . . . . . . . . . . . . . . 7
4.2.1 Preliminary Concepts . . . . . . . . . . . . . . . . . . . . . . . . . . . . . . . 74.2.2 Iteration 1 . . . . . . . . . . . . . . . . . . . . . . . . . . . . . . . . . . . . . . 84.2.3 Iteration 2 . . . . . . . . . . . . . . . . . . . . . . . . . . . . . . . . . . . . . . 104.2.4 Iteration 3 . . . . . . . . . . . . . . . . . . . . . . . . . . . . . . . . . . . . . . 124.2.5 Iteration 4 . . . . . . . . . . . . . . . . . . . . . . . . . . . . . . . . . . . . . . 144.2.6 Iteration 5 . . . . . . . . . . . . . . . . . . . . . . . . . . . . . . . . . . . . . . 164.2.7 Iteration 6 . . . . . . . . . . . . . . . . . . . . . . . . . . . . . . . . . . . . . . 184.2.8 Iteration 7 . . . . . . . . . . . . . . . . . . . . . . . . . . . . . . . . . . . . . . 20
4.3 Concept Selection . . . . . . . . . . . . . . . . . . . . . . . . . . . . . . . . . . . . . . 23
5 Final Design 255.1 Overview . . . . . . . . . . . . . . . . . . . . . . . . . . . . . . . . . . . . . . . . . . 255.2 Design Details . . . . . . . . . . . . . . . . . . . . . . . . . . . . . . . . . . . . . . . 255.3 FSAE Rules Verification . . . . . . . . . . . . . . . . . . . . . . . . . . . . . . . . . . 255.4 Suspension Mounting Analysis . . . . . . . . . . . . . . . . . . . . . . . . . . . . . . 27
6 Manufacturing 296.1 Welder Configuration . . . . . . . . . . . . . . . . . . . . . . . . . . . . . . . . . . . . 316.2 Welding Preparation . . . . . . . . . . . . . . . . . . . . . . . . . . . . . . . . . . . . 326.3 Welding Timeline . . . . . . . . . . . . . . . . . . . . . . . . . . . . . . . . . . . . . . 32
7 Design Validation 347.1 Failure Performance Analysis . . . . . . . . . . . . . . . . . . . . . . . . . . . . . . . 347.2 Testing . . . . . . . . . . . . . . . . . . . . . . . . . . . . . . . . . . . . . . . . . . . 347.3 Validation of Results . . . . . . . . . . . . . . . . . . . . . . . . . . . . . . . . . . . . 36
1
8 Conclusion 368.1 Design Evaluation . . . . . . . . . . . . . . . . . . . . . . . . . . . . . . . . . . . . . 378.2 Path Forward . . . . . . . . . . . . . . . . . . . . . . . . . . . . . . . . . . . . . . . . 37
References 38
Appendix A Design Metrics 39A.1 Metric 1 - Torsional Rigidity . . . . . . . . . . . . . . . . . . . . . . . . . . . . . . . 39A.2 Metric 2 - Bending Stiffness . . . . . . . . . . . . . . . . . . . . . . . . . . . . . . . . 40A.3 Metric 3 - Weight . . . . . . . . . . . . . . . . . . . . . . . . . . . . . . . . . . . . . . 40A.4 Metric 4 - Weight Distribution . . . . . . . . . . . . . . . . . . . . . . . . . . . . . . 40A.5 Metric 5 - Vertical Placement of the Center of Gravity . . . . . . . . . . . . . . . . . 41A.6 Metric 6 - Cost . . . . . . . . . . . . . . . . . . . . . . . . . . . . . . . . . . . . . . . 42A.7 Metric 7 - Ease of Egress . . . . . . . . . . . . . . . . . . . . . . . . . . . . . . . . . 42
Appendix B Torsional Rigidity Analysis 43
Appendix C Acceleration Weight Transfer Analysis 46C.1 Front-Rear Weight Distribution . . . . . . . . . . . . . . . . . . . . . . . . . . . . . . 47C.2 Vertical Location of the Center of Gravity . . . . . . . . . . . . . . . . . . . . . . . . 48
Appendix D Benchmarks 49
Appendix E 2016 Chassis Experiential Validation 52
Appendix F Preliminary Engineering 54F.1 Vehicle Wheelbase . . . . . . . . . . . . . . . . . . . . . . . . . . . . . . . . . . . . . 54F.2 Weight Distribution . . . . . . . . . . . . . . . . . . . . . . . . . . . . . . . . . . . . 56F.3 Finite Element Analysis with SolidWorks . . . . . . . . . . . . . . . . . . . . . . . . 57
Appendix G Tube Notching Procedure 60G.1 SolidWorks Drawing Generation . . . . . . . . . . . . . . . . . . . . . . . . . . . . . 60G.2 Physical Notching of Tubes . . . . . . . . . . . . . . . . . . . . . . . . . . . . . . . . 61
Appendix H Metric Test Plans 64H.1 Torsional Rigidity . . . . . . . . . . . . . . . . . . . . . . . . . . . . . . . . . . . . . 64H.2 Bending Stiffness . . . . . . . . . . . . . . . . . . . . . . . . . . . . . . . . . . . . . . 64H.3 Weight . . . . . . . . . . . . . . . . . . . . . . . . . . . . . . . . . . . . . . . . . . . . 65H.4 Weight Distribution . . . . . . . . . . . . . . . . . . . . . . . . . . . . . . . . . . . . 65H.5 Vertical Location of CG . . . . . . . . . . . . . . . . . . . . . . . . . . . . . . . . . . 67H.6 Ease of Egress . . . . . . . . . . . . . . . . . . . . . . . . . . . . . . . . . . . . . . . . 68
Appendix I FSAE Rules 69

1 Executive Summary
The goal of this design project is to design, analyze, and manufacture a chassis for the Universityof Delaware FSAE team. Through extensive research and design changes, the chassis has beenoptimized to its furthest potential within the given scope of time and other team’s designs. Criticalfeatures that are essential to the performance of the chassis and overall performance of the vehicleare sufficient torsional rigidity, a low weight, and its optimization to contain other componentswithin the chassis itself.
One factor that drives the initial design of the chassis remains to be the suspension node points.The suspension node points determine the structure of the lower half of the chassis given the chassiscan be designed around this and is more critical to the handling of the vehicle. Once the pointswere frozen, the group then needed to check the rulebook to ensure that the chassis would be fitfor competition. This would require designing the different sections, such as the roll hoops andside impact zone, in a manner that takes in these rules in addition to the metric values determinedbefore the initial design phase and the overall manufacturability of the chassis.
During the manufacturing stage of the chassis, it was essential that the concept designed throughour CAD software (SolidWorks) would be the same without any guess work. To do this, an extensiveprocess was performed where each component of the chassis was extruded and manufactured to theexact specification of the model. This was later verified through dimensions and the component’s3-Dimensional placement in SolidWorks. Also, to make manufacturability more ideal, feedbackfrom machinist were incorporated into the design and allowed for the overall manufacturability tobe more manageable.
Finally after the completion of the chassis all the design metrics, and tests required by theFSAE where preformed to ensure it was fit for competition. The chassis design and manufacturingwas a complete success. The report below includes all details of the design process and the manu-facturing of the entire design. At the end of the report the design group has included a section ofrecommendations for future chassis design groups.
1

2 Introduction
2.1 Project Scope
The scope of this project is to design and manufacture a new FSAE chassis for the 2017 racingseason. The team has been given the task of iterating on the successful FSAE 2014 car that wentto competition. Major goals include:
• Conform to all FSAE chassis rules
• Improve on previous year senior designs
• Manufacture the final design
• Document manufacturing process for future senior designs
Along with these major goals, the chassis design plays a large role in impacting the other systemsof the car. The group aims to be as flexible as possible and take into account the needs of thesubsystems of the car.
2.2 Wants & Constraints
The wants and constraints for this project were determined after reviewing the rules and by doingresearch on chassis design. The wants are listed in order of highest priority to lowest priority.The constraints are listed in no particular order since they are all equally important. For all rulesreferenced in the constraints, please refer to Appendix I.
2.2.1 Constraints
• Tubing specifications - The dimensions of the tubing to be used for the frame are specifiedfrom rule T3.4 of the FSAE Rules.
• Roll hoop dimensioning - The main and front roll hoop are to comply with rules T3.11 andT3.12 stating required hoop characteristics such as max angle from vertical, bend require-ments, and minimum dimensions.
• Bracing - The bracing for the main and front roll hoops are explicitly stated in rules T3.13and T3.14 describing the requirements for bracing angle and dimensions.
• Clearance - The minimum requirements for helmet clearance from the frame is given in ruleT3.10 describing the need to fit a 95th percentile male template (Refer to Appendix I).
• Side impact structure - The side structure of the car must comply with rule T3.24 whichplaces restrictions on tubing size used along with tubing placement.
• Cockpit - The dimensions of the cockpit must comply with rule T4.1 and is required to passthe test at the competition. The cockpit must also meet rule T4.2 which gives a predefinedcross section that must remain clear inside the vehicle. The driver must also be able to safelyand quickly exit the cockpit by rule T4.8.
2.2.2 Wants
• High Stiffness - The frame should be stiff to allow for proper suspension tuning along withproviding a sturdy foundation on which all other components can be mounted.
• Light Weight - A low weight allows for greater acceleration and power to weight ratio
2

• Control/Handling - Weight distribution to help encourage oversteer or understeer, whicheverthe driver prefers, while discouraging dive, squat and roll
• Manufacturability - The more cost effective the more affordable this car can be
2.3 Design Metrics
In addition to the metrics pertaining to the chassis group, the group also notes that there are“global” metrics that they must satisfy. These metrics where set by the whole 2017 FSAE seniordesign team and impact each group. Each design decision made needs to take into account thesemetrics.
Table 1: The following table contains the global design metrics for the entire 2017 FSAE designteam.
Rank Metric W/C Units Target Acceptable
1 Weight Distribution Control/Handling % 40F 60R 45F 55R
2 Weight Light Weight lbs <475 <550
3 Vertical Location of CG Control/Handling in <10.0 <12
4 Total Cost Manufacturability USD <4500 <5000
The following metrics in Table 2 have been generated to reflect the prioritized list of constrainsin the Section 2.2. The metrics priorities where determined after researching the impact of each onthe final design. The degree of success of the final design will be evaluated based on how well itmeets the targets values associated with each metric.
Table 2: The following table contains the design metrics, the corresponding want or constraint, adescription of the metric and target values. Please refer to Appendix A for detailed justificationsof each metric and target value.
Rank Metric W/C Units Target Acceptable
1 Torsional Rigidity Stiffness ft-lb/deg >1750 >1600
2 Bending Stiffness Stiffness lbs/in >4000 >3750
3 Weight Light Weight lbs <60 <70
4 Weight Distribution Control/Handling % 40F 60R 45F 55R
5 Vertical Location of CG Control/Handling in <10 <12
6 Total Cost Manufacturability USD <1100 <1250
7 Ease of Egress Cockpit Constraint sec <2.0 <3.0
To determine the ranking of each metric, the design group prioritized the structural integrityof the frame, reflected by both torsional rigidity and bending stiffness, to ensure the safety of thedriver, allow for optimal handling, and provide a strong structure for all other components to bemounted onto. The weight of the chassis is considered the third most important metric largelybecause as mentioned in Table 1, reducing the weight of the car is an important objective for thecar for all groups. Front rear weight distribution was ranked fourth important, this may appearodd considering this is ranked the most important global metric. The reason behind this is thatthe weight distribution is largely controlled by the suspension geometry, not by the structure of thechassis due to the restriction of large component placement such as the engine, driver, differential,etc. Thus in just the scope of a good chassis, weight distribution is less important. The same can be
3

said for the vertical location of the center of gravity, although the chassis group has taken the taskof calculating it, the final value is ultimately left up to suspension, power train, and ergonomicsgroups. The cost was ranked second to last since the performance of vehicle accounts for 90% ofthe FSAE competition score while cost only accounts for the remaining 10%. Finally although easeof egress is a constraint by the rules, this metric is largely dependent of the ergonomic group.
3 Preliminary Design Decisions
Before the concept generation process, some critical design decisions that govern the overall direc-tion and design of the entire chassis need to be made. The intention of this section is to addressthese choices in advance and explain why the respective decision was made.
3.1 Space-Frame vs. Monocoque
When designing a FSAE chassis there are two very different approaches, namely, space-frame ormonocoque. The space frame approach is the more common design methodology for a chassis whichcan be thought as a skeleton connecting the essential parts of the car through a series of metaltubes that are often welded together. Monocoques on the other hand are an entire body or shellthat serves as a rigid structure which often are constructed out of composites that can be lighterand stiffer than metals. Originally developed for the aerospace industry, composite monocoques arenow the select choice for professional formula one cars for their competitive strength to metal andlow weight [1]. More often than not FSAE chassis use a semi-moncoque in which the front part ofthe chassis is a composite or metal shell and the back section that holds the motor and suspensionis a space frame.
Space-frames and monocoques both have their own advantages and disadvantages. A space-frame is arguably the easier option from both a design and fabrication aspect. Additionally, theFSAE team at the University of Delaware has used space-frames for their most recent cars. Spaceframes are also cheaper in terms of raw material and fabrication compared to a monocoque. Chro-moly steel tubing is significantly cheaper than most high strength composites and fabrication re-quires a method of cutting tubes (whether by mill, lathe, laser cutter, etc.) and welding capabilities(welding jig, TIG welder and supplies). As previously mentioned monocoques, if made correctly,can be lighter and just at structurally sound as metals. Furthermore, a monocoque can be designedto be more aerodynamic. However, composites are much costlier than steel tubing and fabricationof a monocoque requires a full size mold for the composite to be placed and cured on [1]. Since amonocoque’s shape is so complex, rigorous finite element analysis must be completed to ensure theshell is indeed strong enough for the safety of the driver and compliance with the FSAE rules. An-other drawback of a monocoque is that repairs are much more difficult compared to a space frame,composite monocoques will often need to be replaced entirely if a critical fracture occurs. Basedoff the numerous difficulties and disadvantages of a monocoque along with the lack of compositeexperience, the design group assesses that a space-frame would be the better approach.
3.2 Standard vs. Alternate Frame Design
The FSAE rules specify a standard tubing size, thickness and applicable locations that teams canuse, see rule T3.4. However, the rules also provide alternate frame design rules that allow formore control overall tubing in the system. The alternative frame design guidelines state that allalternative tubing geometry may be used for all tubes besides that the main roll hoop and mainroll hoop bracing, which must still be made from steel. The main advantage of using an alternate
4

design is to allow the use of composite materials, and light weight substitutes such as aluminumor titanium. If a non-standard material is used the team must submit a “Structural EquivalencySpreadsheet” to prove that the used material demonstrates an equivalent strength to the use ofstandard tubing.
The alternate design allows for much more flexibility with the cost of more engineering analysison the overall design. The group would like to focus on the overall design, and ensuring all compo-nents of the car are compatible with the chassis design instead of focusing on structural equivalenceanalysis to comply with the FSAE rules. Thus the group has selected to not use any alternateframe rules to simplify the workload, and allow for a greater depth of engineering to be spent onfunctionality.
3.3 Vehicle Wheelbase
FSAE regulations require that the car have a minimum track length of 60 inches from centersof ground contact while the steering wheels are straight per rule T2.3. Important characteristicsto consider for car wheelbase include weight, turn radius, and ease of transportation. Generallyspeaking, a shorter car is lighter due to the shorter tubing lengths in the chassis.
Studying the hairpin turns used in the endurance trials for the vehicle, as this will be thetightest turns the vehicle needs to take, the turn radius is an important factor when considering awheelbase. The hairpin turn consists of 3.25 and 14.75 feet for the inside and outside turn radiusrespectively. The assumption provided by the rules is that the track has a minimum width of 11.5feet. During a hairpin turn the radius of the “race” path, or the path that allows for maximumspeed through a turn, is the outside radius of the turn, described in Appendix F.1. Knowing theradius we can look at the trend of what wheel angle is needed to make it around a 14.75 footradius turn. It is shown, see Appendix F.1, that the smaller the wheelbase the smaller the wheelangle is needed achieve the hairpin turn. The group cares about how much the wheel turns as it ispossible that the insides of the wheel can hit suspension geometry. Thus the chassis group wantsto minimize the angle that the wheel has to turn.
Less important but still something to consider is ease of transportation. Both the track andwheelbase will determine how the team can get the vehicle to driving courses and competition. Forexample, the University of Delaware 2014 car could fit in the bed of a truck for transportation.Having the smallest wheelbase will allow for optimal transportation. Thus to help reduce the weightof the chassis, avoid wheel interference with the suspension during sharp turns, and to allow easiervehicle transportation to and from driving sites, the design group decides to design the car with asmall wheel base between 61 to 63 inches. Although the final wheelbase will be determined throughthe suspension, this length range should provide optimal node points while ensuring FSAE rulecompliance.
3.4 Front Bulk Head Size
The size of front bulk head of the chassis should allow the impact attenuator to be properlymounted and supported to comply with all relevant FSAE rules T3.20. While the chassis groupdoes not design and test the impact attenuator itself, the front bulkhead governs the base size ofthe anti-intrusion plate and the impact attenuator. To ensure that the front bulkhead is a size thatwill allow for an impact attenuator that complies with all the rules. The design group uses thestandard impact attenuator design provided by the FSAE rules (see Appendix T-3 in FSAE rules)to provide a guideline for the size of the front bulk head. While undocumented, this appears to bethe approach taken by previous University of Delaware teams.
5

The base size of the standard impact attenuator is 12 inches by 14 inches, however the orientationdirection is up to the discretion of the design group. For the 2014 University of Delaware chassis theimpact attenuator was orientated vertically, i.e. the front bulk head was approximately 14 inchestall and 12 inches wide. However, in the 2016 University of Delaware the chassis was designedto orientate the impact attenuator the horizontally such that the front bulk head’s width was 14inches and the height was 12 inches. For this year’s chassis, the design group decided to keep theimpact attenuator horizontal for several reasons. First having a wider front bulk head shortens theheight of the front of the chassis, thus potentially lowering the vertical location of the center ofgravity which is ideal.
3.5 Material Selection
The FSAE car is generally designed and constructed out of a material that is machinable, weldableand can withstand forces that will not fail while under load. In previous years, the FSAE teamused a grade of steel of 4130, which is more commonly referred to as chromoly steel. This grade ofsteel has a low carbon content (0.30% [2]) which provides for a better fusion when welding. Also, byhaving an annealed metal, the material becomes more ductile benefiting the manufacturing processby reducing the amount of time to bend/form the metal to the desired specifications. The benefitsto 4130 alloy steel is it can be treated by any manufacturing method except for aging, providingmore possibilities depending on the application the metal will be used for. Rule T3.4.1 states thatsteel tubing must have a minimum of 0.1% carbon, thus chromoly steel is an acceptable choice.
4 Concept Generation and Selection
4.1 Benchmarking
While the FSAE rules lay out concise requirements that the chassis must meet, which in termprovides a foundation on how the chassis should be constructed, many aspects of the design such asthe configuration of the front bulk head supports and much of the structural design behind the mainhoop is left to the design team’s discretion. To get a much clearer idea of the key characteristicsof a well-designed chassis the design team completed thorough benchmarking of not only previouscars built at the University of Delaware, but also chassis built by other universities. While a morecomplete list of benchmarks can be referenced in Appendix D, more detail will be focused on 2014and 2016 chassis from University of Delaware.
The 2014 vehicle is considered the primary benchmark for this year’s chassis. The primary goalsof this chassis was similar to all other years: reduce weight and make it as stiff as possible withrespect to torsional rigidity. Although this frame will be used as a starting point for this year’schassis, the design team believes several aspects of this year’s design should be changed. One of themost important aspects that the design team believes should be changed is how the 2014 chassisconsists of two separate parts. While this lends itself to easy maintenance and modularity, a designjudge brought up a critical point that the connection between these two parts changes for everyrun, thus effectively constantly changing the handling of the car. Additionally, the chassis as awhole was largely over designed and could be improved for weight reduction.
The 2016 chassis team’s goal was to reduce the overall weight of the frame. This was accom-plished two ways: the rear box in which the differential is normally mounted in was removed andthe stiffness of the frame was compromised for a reduction in weight. The design team agreesthat past year’s target for torsional rigidity are larger than necessary resulting in over designedframes. However, the design team believes that a rear box has more advantages that disadvantages
6
to justify its removal for weight reduction. For example, a rear box gives the rear suspension muchmore freedom for the rear suspension geometry.
4.2 Concept Generation
To construct the chassis the design team took a “bottom up” approach. This approach allows forflexibility in the final design. As described in Section 3, the initial plan is to design a space framecar with the standard FSAE tubing rules, minimum wheelbase, 14” wide impact attenuator, andconstructed from chromoly steel. The team created possible concepts in SolidWorks, and used finitemodel analysis (FEA) to accurately assess the designs stiffness, weight, etc. This allowed the teamto can easily compare different iterations for positive and negative metric gains.
4.2.1 Preliminary Concepts
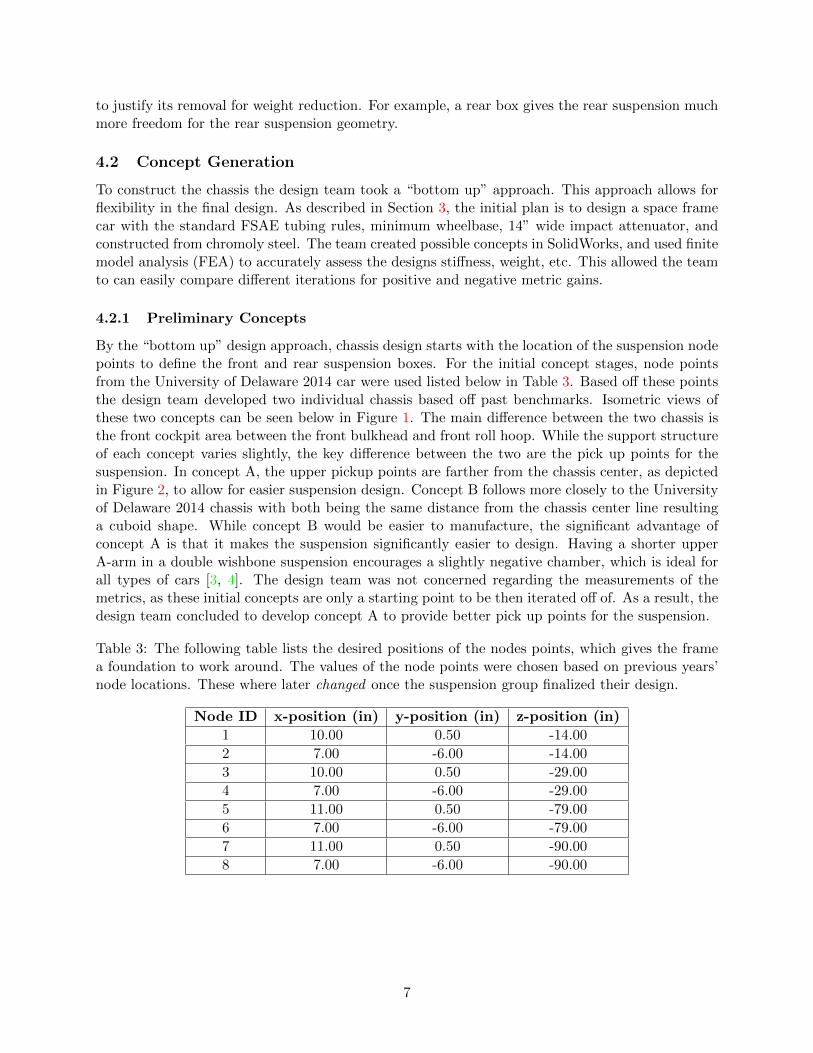
By the “bottom up” design approach, chassis design starts with the location of the suspension nodepoints to define the front and rear suspension boxes. For the initial concept stages, node pointsfrom the University of Delaware 2014 car were used listed below in Table 3. Based off these pointsthe design team developed two individual chassis based off past benchmarks. Isometric views ofthese two concepts can be seen below in Figure 1. The main difference between the two chassis isthe front cockpit area between the front bulkhead and front roll hoop. While the support structureof each concept varies slightly, the key difference between the two are the pick up points for thesuspension. In concept A, the upper pickup points are farther from the chassis center, as depictedin Figure 2, to allow for easier suspension design. Concept B follows more closely to the Universityof Delaware 2014 chassis with both being the same distance from the chassis center line resultinga cuboid shape. While concept B would be easier to manufacture, the significant advantage ofconcept A is that it makes the suspension significantly easier to design. Having a shorter upperA-arm in a double wishbone suspension encourages a slightly negative chamber, which is ideal forall types of cars [3, 4]. The design team was not concerned regarding the measurements of themetrics, as these initial concepts are only a starting point to be then iterated off of. As a result, thedesign team concluded to develop concept A to provide better pick up points for the suspension.
Table 3: The following table lists the desired positions of the nodes points, which gives the framea foundation to work around. The values of the node points were chosen based on previous years’node locations. These where later changed once the suspension group finalized their design.
Node ID x-position (in) y-position (in) z-position (in)
1 10.00 0.50 -14.00
2 7.00 -6.00 -14.00
3 10.00 0.50 -29.00
4 7.00 -6.00 -29.00
5 11.00 0.50 -79.00
6 7.00 -6.00 -79.00
7 11.00 0.50 -90.00
8 7.00 -6.00 -90.00
7

(a) Concept A (b) Concept B
Figure 1: The two initial frame concepts created to start the iteration process.
Figure 2: Node ID layout of the chassis frame. Also note that the origin is defined at the center ofthe front impact attenuator
4.2.2 Iteration 1
The first design iteration aimed to simply satisfy all rules and provide the groundwork for futureiterations. To assess the performance of each iteration the design team completed a series of testsmainly through SolidWorks to provide reasonable metric estimates. To approximate the torsionalrigidity and bending stiffness of each iteration the design team used SolidWorks’ FEA. Additionaldetails on how the FEA tests were conducted can be referenced in Appendix F.3. The weight ofthe chassis was approximated using SolidWorks as well with all piping being made from 4130 alloysteel. The front rear weight distribution along with the vertical location of the center of gravity ofthe chassis was approximated through the use of weighted volumes to account for the placement ofthe driver, engine, gas tank, etc. Details on how the weight distribution is calculated can be foundin Appendix F.2. The cost and ease of egress were not considered relevant during the iterativeprocess, as they would be addresses later in the design process.
8
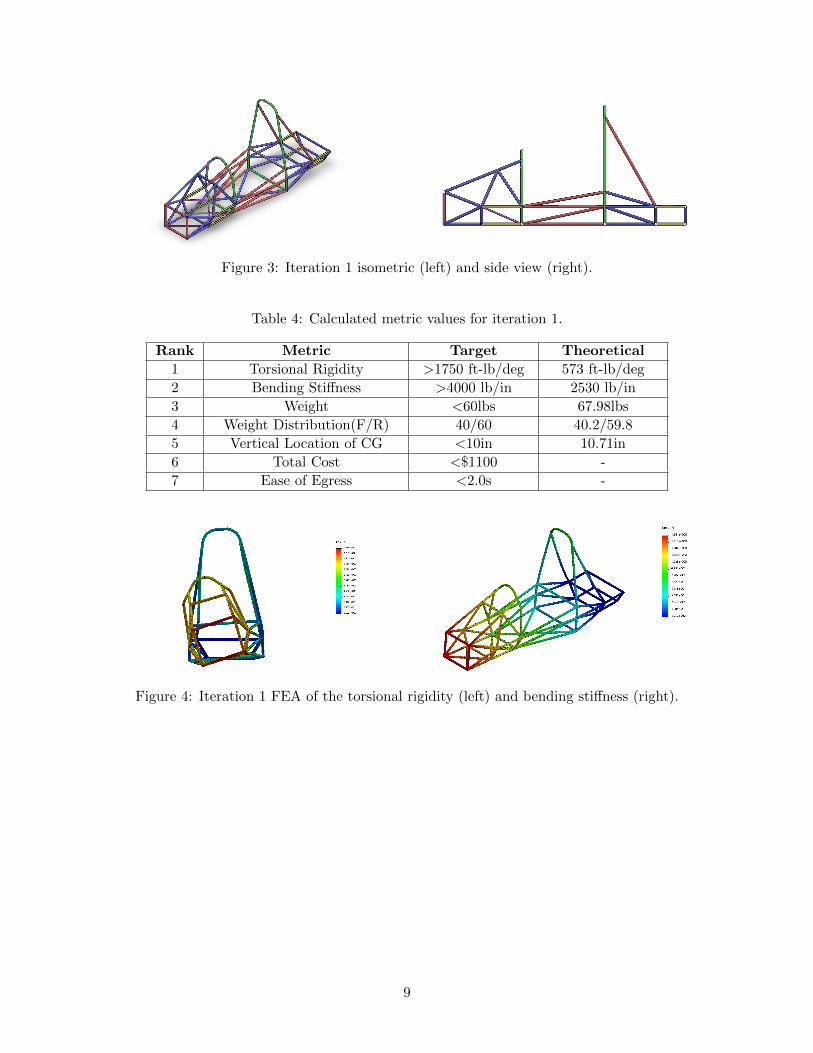
Figure 3: Iteration 1 isometric (left) and side view (right).
Table 4: Calculated metric values for iteration 1.
Rank Metric Target Theoretical
1 Torsional Rigidity >1750 ft-lb/deg 573 ft-lb/deg
2 Bending Stiffness >4000 lb/in 2530 lb/in
3 Weight <60lbs 67.98lbs
4 Weight Distribution(F/R) 40/60 40.2/59.8
5 Vertical Location of CG <10in 10.71in
6 Total Cost <$1100 -
7 Ease of Egress <2.0s -
Figure 4: Iteration 1 FEA of the torsional rigidity (left) and bending stiffness (right).
9
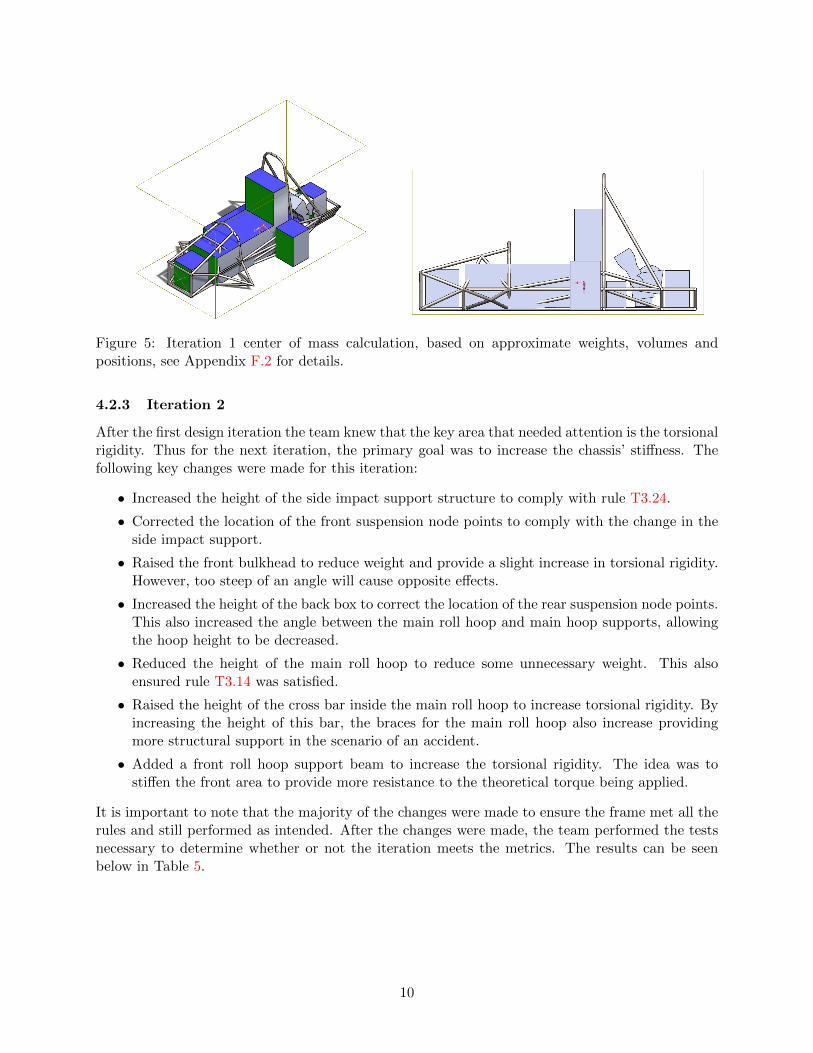
Figure 5: Iteration 1 center of mass calculation, based on approximate weights, volumes andpositions, see Appendix F.2 for details.
4.2.3 Iteration 2
After the first design iteration the team knew that the key area that needed attention is the torsionalrigidity. Thus for the next iteration, the primary goal was to increase the chassis’ stiffness. Thefollowing key changes were made for this iteration:
• Increased the height of the side impact support structure to comply with rule T3.24.
• Corrected the location of the front suspension node points to comply with the change in theside impact support.
• Raised the front bulkhead to reduce weight and provide a slight increase in torsional rigidity.However, too steep of an angle will cause opposite effects.
• Increased the height of the back box to correct the location of the rear suspension node points.This also increased the angle between the main roll hoop and main hoop supports, allowingthe hoop height to be decreased.
• Reduced the height of the main roll hoop to reduce some unnecessary weight. This alsoensured rule T3.14 was satisfied.
• Raised the height of the cross bar inside the main roll hoop to increase torsional rigidity. Byincreasing the height of this bar, the braces for the main roll hoop also increase providingmore structural support in the scenario of an accident.
• Added a front roll hoop support beam to increase the torsional rigidity. The idea was tostiffen the front area to provide more resistance to the theoretical torque being applied.
It is important to note that the majority of the changes were made to ensure the frame met all therules and still performed as intended. After the changes were made, the team performed the testsnecessary to determine whether or not the iteration meets the metrics. The results can be seenbelow in Table 5.
10

Figure 6: Iteration 2 isometric (left) and side view (right).
Table 5: Calculated metric values for iteration 2
Rank Metric Target Theoretical
1 Torsional Rigidity >1750 ft-lb/deg 908 ft-lb/deg
2 Bending Stiffness >4000 lb/in 2449 lb/in
3 Weight <60lbs 70.66 lbs
4 Weight Distribution(F/R) 40/60 50/50
5 Vertical Location of CG <10in 13.05in
6 Total Cost <$1100 -
7 Ease of Egress <2.0s -
Figure 7: Iteration 2 FEA of the torsional rigidity (left) and bending stiffness (right).
11

Figure 8: Iteration 1 chassis (red) with iteration 2 chassis (blue) overlaid on top
4.2.4 Iteration 3
For the third iteration the design team continued to focus on increasing the torsional rigidity ofthe vehicle. It was found through iteration 2 that the largest factors in increasing the torsionalrigidity was increasing the amount of resistance the front cockpit sustained while under torsionalloads. The biggest change that had the largest impact on the design was changing the directionof the hoop bracing. In iteration 2, the bracing was supporting the main roll hoop from the left.By changing the direction the bracing was supporting the front roll hoop, the torsional rigidityincreased by about 500 ft-lb/deg.
Another significant change that was applied to the second iteration was the addition of a crosssection on the top of the cockpit as seen in Figure 9. This increased the torsional rigidity evenfurther without increasing the weight by a large amount. The following changes were also madefor this iteration:
• Increased the back box area to provide a larger foundation for the rear suspension of the car.
• Increased the distance from the front bulkhead to the front suspension nodes to provide moreroom for the pedal box.
• Decreased the cockpit opening area to maintain the same rear dimensioning between the mainroll hoop and the back end of the chassis while compensating for the changes in the frontbulkhead.
• Removed the front roll hoop support beam. This was no longer necessary since the bracingwas now directly going from the front roll hoop to the main roll hoop.
12

Figure 9: Iteration 3 isometric (left) and side view (right).
Table 6: Calculated metric values for iteration 3
Rank Metric Target Theoretical
1 Torsional Rigidity >1750 ft-lb/deg 1886 ft-lb/deg
2 Bending Stiffness >4000 lb/in 3838 lb/in
3 Weight <60lbs 71.63 lbs
4 Weight Distribution(F/R) 40/60 52/47
5 Vertical Location of CG <10in 13.19in
6 Total Cost <$1100 -
7 Ease of Egress <2.0s -
Figure 10: Iteration 3 FEA of the torsional rigidity (left) and bending stiffness (right).
13

Figure 11: Iteration 2 chassis (red) with iteration 3 chassis (blue) overlaid on top
4.2.5 Iteration 4
For iteration 4 the main focus was refinement and finalization of the seat angle, and suspension nodepoints. This iteration was the first one that the team got outside advice from other sub-componentgroups such as ergonomics, power train, and suspension. The ergonomics group decided that itwas up to the chassis group members to design the seat angle. The team also concentrated on theweight distribution throughout the car and the vertical center of mass.
• Increased the height from the base of the car to the top suspension nodes to comply withsuspension requirements.
• Changed the lower bar of the front suspension box from a square tube to round tube for easiermanufacturing.
• Increased the main roll hoop height from 41 to 44 inches to ensure the passing of rule T3.10,the broom stick test
• Increased the width of the dash region within the front roll hoop to allow for more room fordash components
• Moved the position of the driver to be behind the main roll hoop to gain a shallower anglefor the seat, adjust the weight distribution, and reduce the vertical center of gravity (due toseat angle)
• Angled the back box connection points to allow for attachment of the motor directly to theframe, i.e. we want to minimize the use of long engine mount tabs
14

Figure 12: Iteration 4 isometric (left) and side view (right).
Table 7: Calculated bill of materials for iteration 4. Note, the sheet is for the anti-intrusion plateand its cost is USD/in2
TubeType
DimensionsOD x W (in)
Length(ft)
Cost(USD/ft)
Total Cost(USD)
Square 1.0 x 0.049 8 4.87 $40
Round 1.0 x 0.095 14 6.10 86
Round 1.0 x 0.065 21 3.57 75
Round 1.0 x 0.049 63 4.22 266
Round 0.625 x 0.049 17 3.90 67
Sheet 12 x 14 0.063 0.10 17
Shipping 270Total $821
Table 8: Calculated metric values for iteration 4
Rank Metric Target Theoretical
1 Torsional Rigidity >1750 ft-lb/deg 1968 ft-lb/deg
2 Bending Stiffness >4000 lb/in 5166 lb/in
3 Weight <60lbs 69.08 lbs
4 Weight Distribution(F/R) 40/60 52/48
5 Vertical Location of CG <10in 8.83
6 Total Cost <$1100 $821
7 Ease of Egress <2.0s -
15
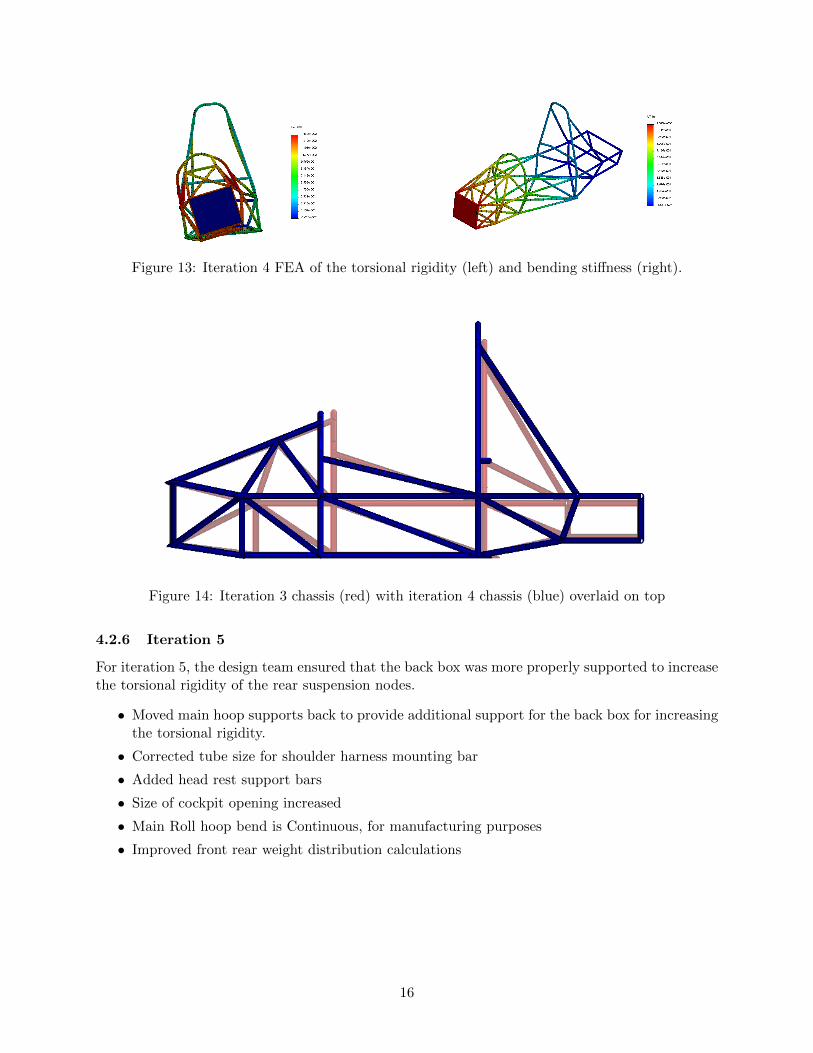
Figure 13: Iteration 4 FEA of the torsional rigidity (left) and bending stiffness (right).
Figure 14: Iteration 3 chassis (red) with iteration 4 chassis (blue) overlaid on top
4.2.6 Iteration 5
For iteration 5, the design team ensured that the back box was more properly supported to increasethe torsional rigidity of the rear suspension nodes.
• Moved main hoop supports back to provide additional support for the back box for increasingthe torsional rigidity.
• Corrected tube size for shoulder harness mounting bar
• Added head rest support bars
• Size of cockpit opening increased
• Main Roll hoop bend is Continuous, for manufacturing purposes
• Improved front rear weight distribution calculations
16

Figure 15: Iteration 5 isometric (left) and side view (right).
Table 9: Calculated bill of materials for iteration 5. Note, the sheet is for the anti-intrusion plateand its cost is USD/in2
TubeType
DimensionsOD x W (in)
Length(ft)
Cost(USD/ft)
Total Cost(USD)
Square 1.0 x 0.049 7 4.87 $34
Round 1.0 x 0.095 17 6.10 104
Round 1.0 x 0.065 30 3.57 107
Round 1.0 x 0.049 44 4.22 186
Round 1.0 x 0.035 7 3.47 25
Round 0.625 x 0.049 22 3.90 86
Sheet 12 x 14 0.063 0.10 17
Shipping 270Total $829
Table 10: Calculated metric values for iteration 5
Rank Metric Target Theoretical
1 Torsional Rigidity (Front) >1750 ft-lb/deg 1808 ft-lb/deg
Torsional Rigidity (Back) >1750 ft-lb/deg 1919 ft-lb/deg
2 Bending Stiffness (Front) >4000 lb/in 4719 lb/in
Bending Stiffness (Back) >4000 lb/in 7007 lb/in
3 Weight <60lbs 70.04 lbs
4 Weight Distribution(F/R) 40/60 49/51
5 Vertical Location of CG <10in 11.05in
6 Total Cost <$1100 $829
7 Ease of Egress <2.0s -
17

Figure 16: Iteration 5 FEA of the torsional rigidity of the front suspension box (left) and backsuspension box (right).
Figure 17: Iteration 4 chassis (red) with iteration 5 chassis (blue) overlaid on top
4.2.7 Iteration 6
Upon finishing iteration 5, the design team discovered a violation of rule T3.13 cause by the newlocation of the main hoop supports, thus reverted the support locations back to the spots usedpreviously in iteration 4. The team sought further to reduce the weight as much as possible whilemaintaining a high torsional rigidity. Key changes are as follows:
• Moved main hoop supports back to original position as in iteration 4.
• Changed front roll hoop bracing to a smaller diameter tube to reduce weight.
• Added triangulation to rear suspension area to ensure high torsional rigidity in the rearsection.
18

Figure 18: Iteration 6 isometric (left) and side view (right).
Table 11: Calculated bill of materials for iteration 6. Note, the sheet is for the anti-intrusion plateand its cost is USD/in2
TubeType
DimensionsOD x W (in)
Length(ft)
Cost(USD/ft)
Total Cost(USD)
Square 1.0 x 0.049 7 10.46 $74
Round 1.0 x 0.095 17 3.79 65
Round 1.0 x 0.065 30 2.52 76
Round 1.0 x 0.049 48 2.25 108
Round 0.625 x 0.049 33 2.33 78
Sheet 12 x 14 0.063 0.10 17
Shipping 270Total $688
Table 12: Calculated metric values for iteration 6
Rank Metric Target Theoretical
1 Torsional Rigidity (Front) >1750 ft-lb/deg 1805 ft-lb/deg
Torsional Rigidity (Back) >1750 ft-lb/deg 1633 ft-lb/deg
2 Bending Stiffness (Front) >4000 lb/in 3738 lb/in
Bending Stiffness (Back) >4000 lb/in 7880 lb/in
3 Weight <60lbs 70.50 lbs
4 Weight Distribution(F/R) 40/60 49/51
5 Vertical Location of CG <10in 10.5
6 Total Cost <$1100 $688
7 Ease of Egress <2.0s -
19

Figure 19: Iteration 6 FEA of the torsional rigidity of the front suspension box (left) and bendingstiffness (right).
Figure 20: Iteration 5 chassis (red) with iteration 6 chassis (blue) overlaid on top
4.2.8 Iteration 7
For iteration 7 the team attempted to solve the problem of the front rear weight distribution. Thiswas not addressed early because it relied on multiple different groups’ designs. Specifically thedecisions of suspension and powertrain. The design team coordinated with these groups to cometo the following decisions:
• “Sweep” the A-arms forward to allow for the wheelbase to be more forward relative to thecenter of mass
• Mount the differential directly to the same tubes as the engine to allow for the differentialto be as close to the engine as possible, allowing the rear tires to be shifted forward with theaxle.
With these key changes, the group was able to
• Correct the back box to allow for reusing of the 2016 differential mounts and allow for therear wheels to be moved forward.
• Adjusted location of head rest bars to allow the reuse of the 2014 head rest.
20

• Added gussets above the front suspension box for mounting the front rockers.
• Reduced the width of the rear box by two inches.
• Added middle support in the rear box for rear rocker and shocks.
• Converted the lower support bars from a set of 8 different tubes to 4 bent tubes as per therecommendation of Jeff Ricketts from the Colburn machine shop.
Figure 21: Iteration 7 isometric (left) and side view (right).
Table 13: Calculated bill of materials for iteration 7. Note, the sheet is for the anti-intrusion plateand its cost is USD/in2
TubeType
DimensionsOD x W (in)
Length(ft)
Cost(USD/ft)
Total Cost(USD)
Square 1.0 x 0.049 5 10.46 $52
Square 1.0 x 0.065 2 10.46 $21
Round 1.0 x 0.095 17 3.79 65
Round 1.0 x 0.065 30 2.52 76
Round 1.0 x 0.049 50 2.25 113
Round 0.625 x 0.049 30 2.33 70
Sheet 12 x 14 0.063 0.10 17
Filler - 3 - 38
Shipping 270Total $723
21
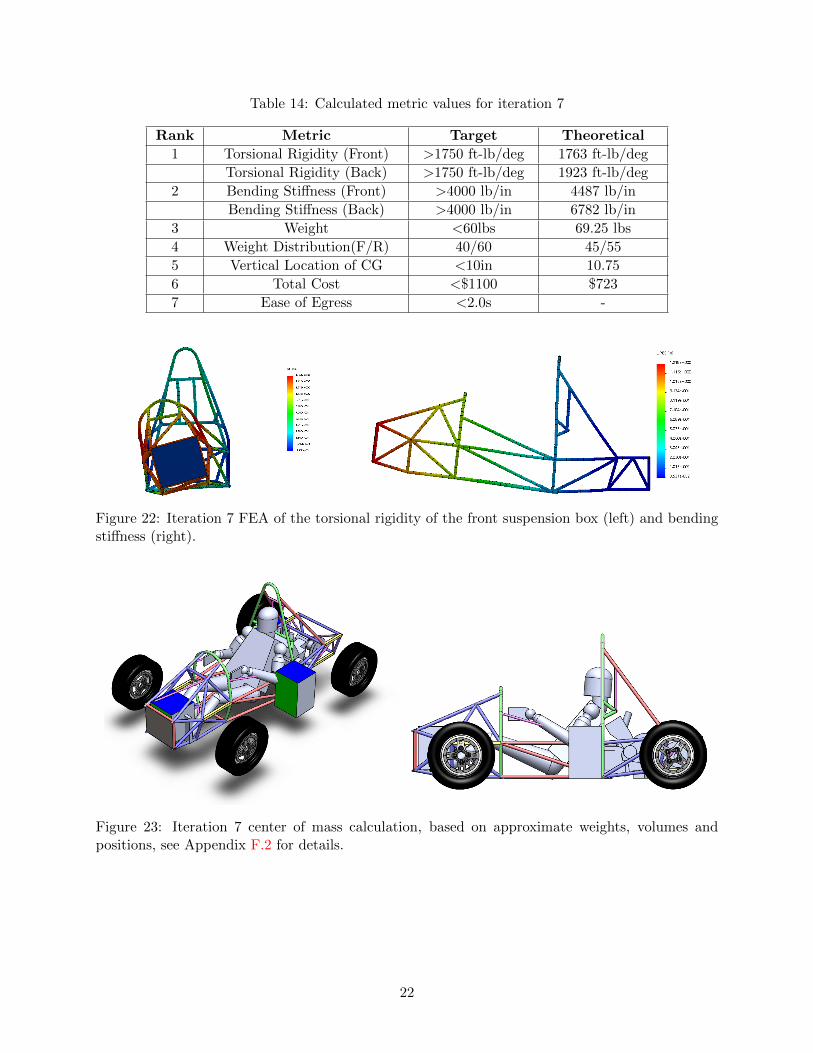
Table 14: Calculated metric values for iteration 7
Rank Metric Target Theoretical
1 Torsional Rigidity (Front) >1750 ft-lb/deg 1763 ft-lb/deg
Torsional Rigidity (Back) >1750 ft-lb/deg 1923 ft-lb/deg
2 Bending Stiffness (Front) >4000 lb/in 4487 lb/in
Bending Stiffness (Back) >4000 lb/in 6782 lb/in
3 Weight <60lbs 69.25 lbs
4 Weight Distribution(F/R) 40/60 45/55
5 Vertical Location of CG <10in 10.75
6 Total Cost <$1100 $723
7 Ease of Egress <2.0s -
Figure 22: Iteration 7 FEA of the torsional rigidity of the front suspension box (left) and bendingstiffness (right).
Figure 23: Iteration 7 center of mass calculation, based on approximate weights, volumes andpositions, see Appendix F.2 for details.
22

Figure 24: Iteration 6 chassis (red) with iteration 7 chassis (blue) overlaid on top
4.3 Concept Selection
The design group has iterated forward multiple times. When we look at how the design progressesmore and more metrics have continued to be satisfied. With our current iteration all metrics arewithin the acceptable range.
The group has considered iteration 7 as the final iteration as it complies with all other FSAEsenior design groups, and additionally satisfies all metrics. For the metrics that are not to theirtarget value, it is likely that without going to alternate frame rules, or a radical suspension designthey are unrealistic. We leave this for the future FSAE senior designs to look into how this couldbe achieved from the onset. Throughout the iterations some of the key things that the design grouphas found are as follows:
• Changing the direction of the bracing above the side impact structure nearly doubled theestimated torsional rigidity for initial iterations. This change to the design, made the torsionalrigidity target value achievable
• Testing both the torsional rigidity and bending stiffness of the front and rear of the chassisproved to be critical considerations. Design changes were made in order to evaluate for thesemetrics in the rear of the chassis. This is due to inherent FEA assumption that there is fixednode points.
• The rules layout what tubes can be used in different locations. Due to this constraint, thegroup focused on optimizing how the different components (front suspension box, front hoop,main hoop, back suspension box) are connected.
• It is necessary to know the suspension node points beforehand, as the chassis design cannotbe finalized without it. For future teams it is recommended to have suspension finish theirsuspension location (node points / A-arm attachment) before the chassis design.
As seen in Table 15, the metrics trended towards a passing value. In the later iterations, the grouphas taken into account the wants and needs of other FSAE senior design groups. This caused thedesign to fluctuate repeatedly as they finalized their integration with the chassis frame. The largestamount of changes came from suspension with minimal changes from ergonomics and power-train.
23
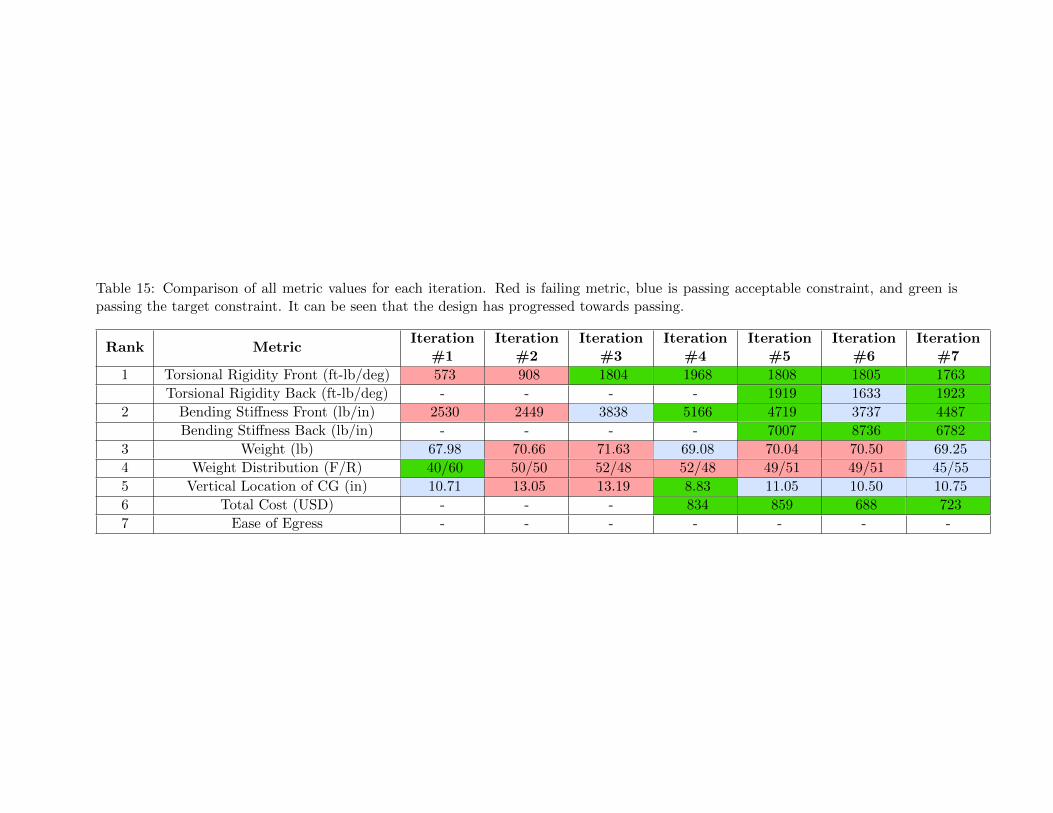
Table 15: Comparison of all metric values for each iteration. Red is failing metric, blue is passing acceptable constraint, and green ispassing the target constraint. It can be seen that the design has progressed towards passing.
Rank MetricIteration
#1Iteration
#2Iteration
#3Iteration
#4Iteration
#5Iteration
#6Iteration
#7
1 Torsional Rigidity Front (ft-lb/deg) 573 908 1804 1968 1808 1805 1763
Torsional Rigidity Back (ft-lb/deg) - - - - 1919 1633 1923
2 Bending Stiffness Front (lb/in) 2530 2449 3838 5166 4719 3737 4487
Bending Stiffness Back (lb/in) - - - - 7007 8736 6782
3 Weight (lb) 67.98 70.66 71.63 69.08 70.04 70.50 69.25
4 Weight Distribution (F/R) 40/60 50/50 52/48 52/48 49/51 49/51 45/55
5 Vertical Location of CG (in) 10.71 13.05 13.19 8.83 11.05 10.50 10.75
6 Total Cost (USD) - - - 834 859 688 723
7 Ease of Egress - - - - - - -
5 Final Design
5.1 Overview
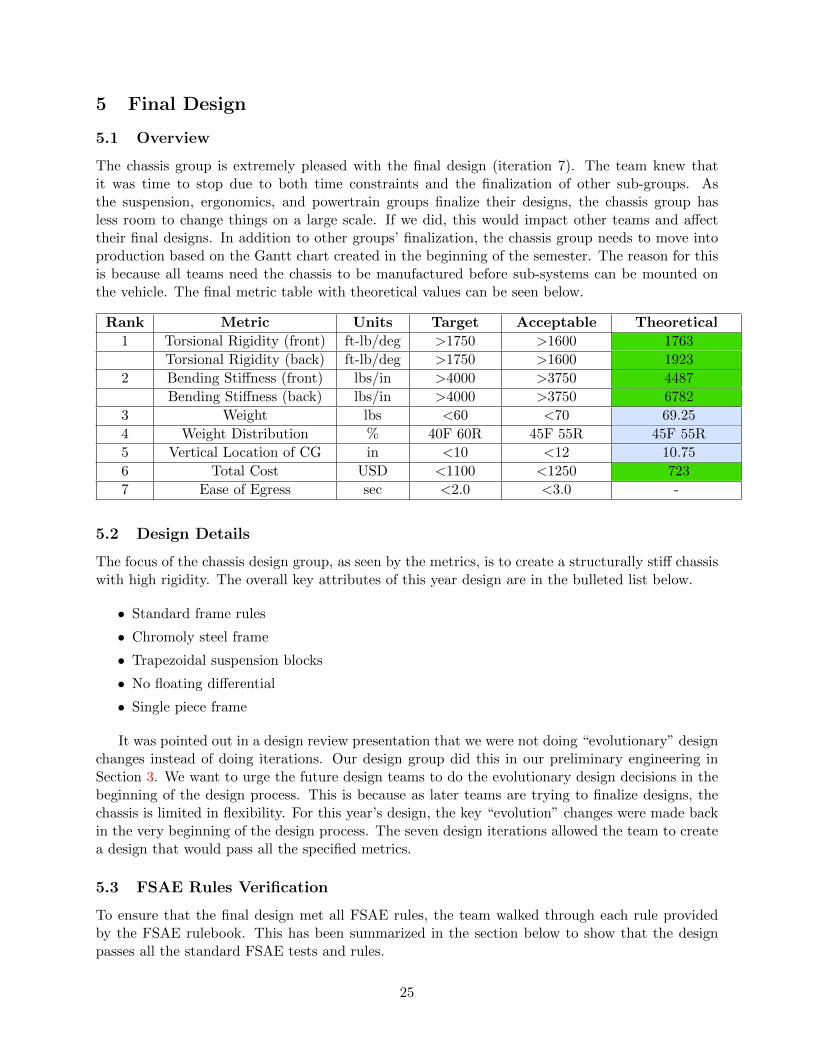
The chassis group is extremely pleased with the final design (iteration 7). The team knew thatit was time to stop due to both time constraints and the finalization of other sub-groups. Asthe suspension, ergonomics, and powertrain groups finalize their designs, the chassis group hasless room to change things on a large scale. If we did, this would impact other teams and affecttheir final designs. In addition to other groups’ finalization, the chassis group needs to move intoproduction based on the Gantt chart created in the beginning of the semester. The reason for thisis because all teams need the chassis to be manufactured before sub-systems can be mounted onthe vehicle. The final metric table with theoretical values can be seen below.
Rank Metric Units Target Acceptable Theoretical
1 Torsional Rigidity (front) ft-lb/deg >1750 >1600 1763
Torsional Rigidity (back) ft-lb/deg >1750 >1600 1923
2 Bending Stiffness (front) lbs/in >4000 >3750 4487
Bending Stiffness (back) lbs/in >4000 >3750 6782
3 Weight lbs <60 <70 69.25
4 Weight Distribution % 40F 60R 45F 55R 45F 55R
5 Vertical Location of CG in <10 <12 10.75
6 Total Cost USD <1100 <1250 723
7 Ease of Egress sec <2.0 <3.0 -
5.2 Design Details
The focus of the chassis design group, as seen by the metrics, is to create a structurally stiff chassiswith high rigidity. The overall key attributes of this year design are in the bulleted list below.
• Standard frame rules
• Chromoly steel frame
• Trapezoidal suspension blocks
• No floating differential
• Single piece frame
It was pointed out in a design review presentation that we were not doing “evolutionary” designchanges instead of doing iterations. Our design group did this in our preliminary engineering inSection 3. We want to urge the future design teams to do the evolutionary design decisions in thebeginning of the design process. This is because as later teams are trying to finalize designs, thechassis is limited in flexibility. For this year’s design, the key “evolution” changes were made backin the very beginning of the design process. The seven design iterations allowed the team to createa design that would pass all the specified metrics.
5.3 FSAE Rules Verification
To ensure that the final design met all FSAE rules, the team walked through each rule providedby the FSAE rulebook. This has been summarized in the section below to show that the designpasses all the standard FSAE tests and rules.
25

Figure 25: Rule T3.10 states that the top of the person’s helmet must be no closer then 2 inches,and the back of the head no closer then two inches to the specified lines.
Figure 26: Rule T5.6 specifies that the head rest support must be able to withstand 200 lbs of forcein the rearward direction. The head rest supports have a minimum factor of safety above 7.5 forthis given load.
26

Figure 27: Rules T4.1 and T4.2 state that specified templates must be passed through the chassisto ensure that there is ample room for the driver to get in and out
5.4 Suspension Mounting Analysis
Upon the completion of the suspension geometry and the finalization of rocker and shock mountinglocations seen in Figure 28, FEA tests were completed for each mounting location to ensure failureof the chassis would not occur at any of these points. For each rocker mount location, a forceof 750 lbs was applied to represent a 5G cornering force. Considering the maximum accelerationexperienced for a small SAE car is at most 2Gs, this load accounts for a factor of safety of 2.5.For each shock mount, a 700 lbs force was applied reflecting the extreme condition of 2 inches ofcompression (twice the travel the suspension is designed for). For the rear shock test, a load of1400 lbs was applied since both shocks are on the same node. As seen in both Figures 29 and 30,all mounting locations have a factor of safety above one for these extreme loads suggesting thatfailure will not occur under normal operating conditions.
27
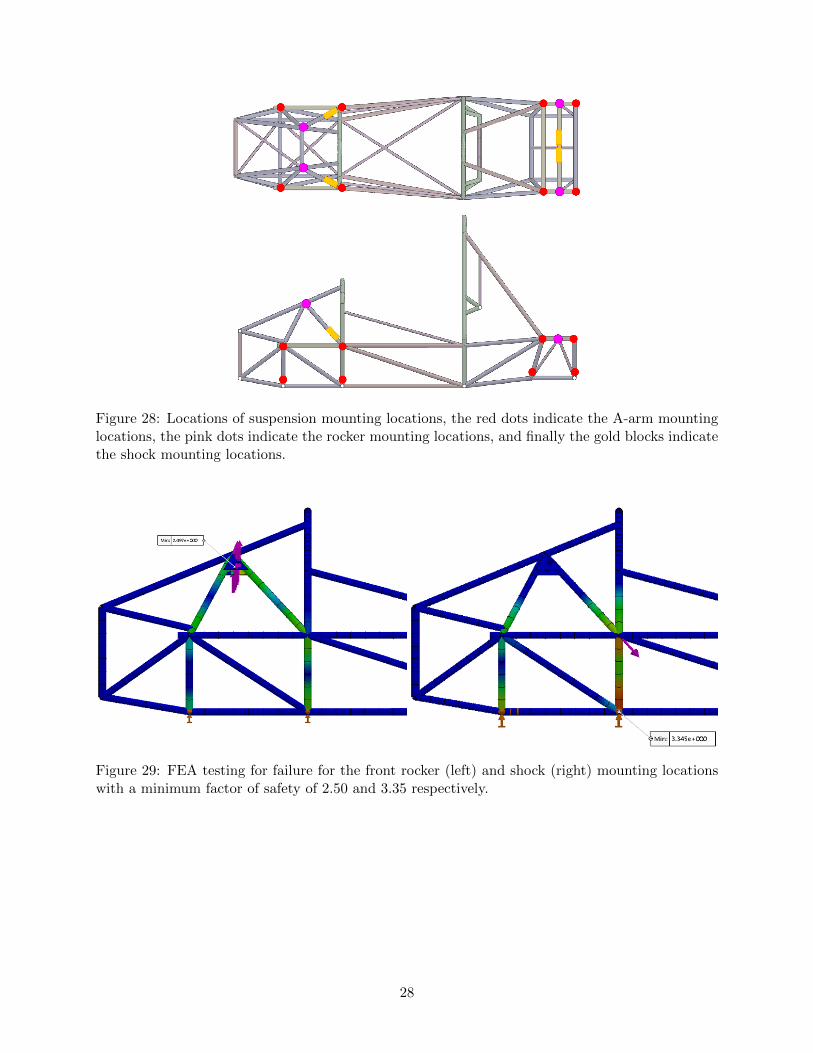
Figure 28: Locations of suspension mounting locations, the red dots indicate the A-arm mountinglocations, the pink dots indicate the rocker mounting locations, and finally the gold blocks indicatethe shock mounting locations.
Figure 29: FEA testing for failure for the front rocker (left) and shock (right) mounting locationswith a minimum factor of safety of 2.50 and 3.35 respectively.
28

Figure 30: FEA testing for failure for the rear rocker (left) and shock (right) mounting locationswith a minimum factor of safety of 7.10 and 1.48 respectively.
Additionally, with the completion of the suspension geometry, torsional rigidity tests werecompleted by loading the rocker points in the plane of action with the 5G corning force of 750 lbswhich again accounts for a factor of safety of 2.5. The calculated torsional rigidity of the chassis,with the moment arm being the distance to the roll center of the suspension, was calculated to be1735 ft-lb/deg for the front suspension box. This is extremely close to our previously calculatedvalue of 1763 ft-lb/deg by loading at the A-arm nodes. As a result we can firmly say our previousmethod of loading the chassis at the A-arm nodes for torsion rigidity in Appendix F.3 is adequate.
Figure 31: Final design FEA of the torsional rigidity of the front rocker mounts with a load of 750lbs applied on each.
6 Manufacturing
It is critical that the manufacturing process of the chassis is done correctly and with high accuracy.Numerous errors can be seen in previous University of Delaware chassis and has caused problematicissues pertaining to the performance and handling of the vehicle. Specifically, the 2016 chassis was
29
warped due to an error in a bend in the front rollhoop. The design group has benchmarked otherFSAE teams and how their process of manufacturing a space-frame is conducted. Most teams sendout their tubes to get laser cut and then are welded in a “self-jigging” fashion. Other teams use acombination of different jig types, ranging from simple standoffs from the welding table, or largesheet metal plates that have notches for tube placement. The potential errors that the group wantsto avoid are the following:
• Incorrect radius dimensions on the roll hoops compared to the specifications provided
• Offset chassis in the sense the frame is not straight when looking at it from the front
• Poor penetration when welding
• Misaligned structure members
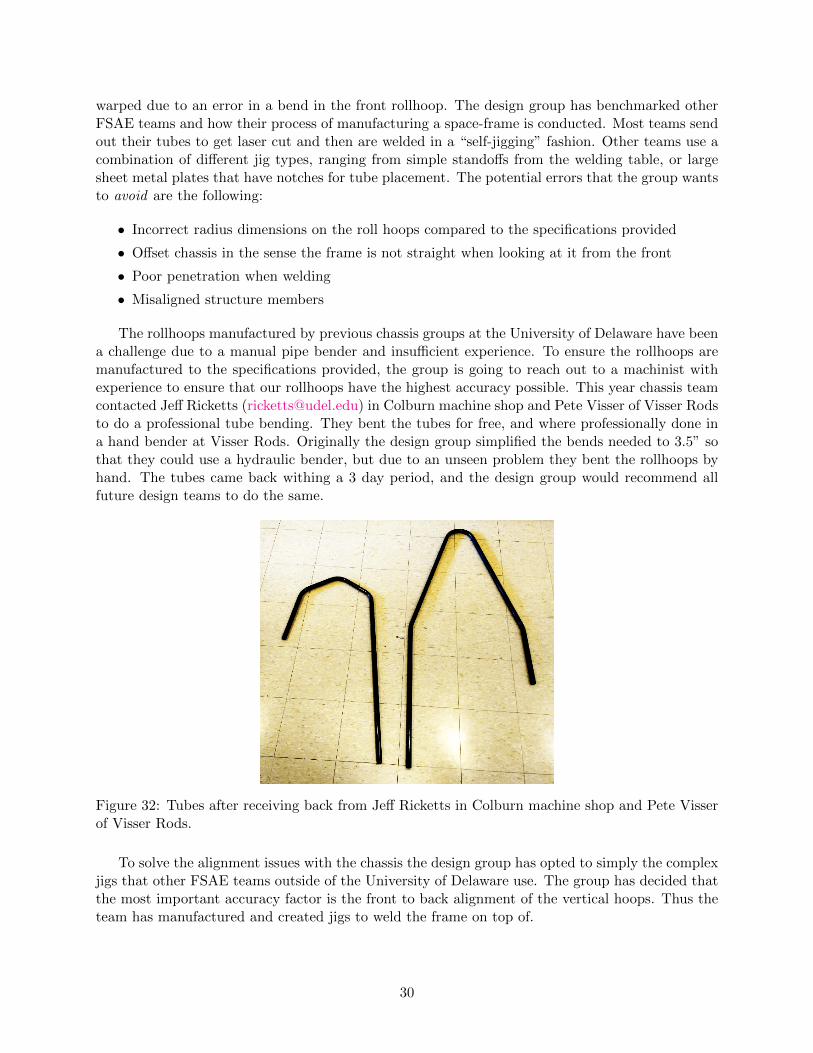
The rollhoops manufactured by previous chassis groups at the University of Delaware have beena challenge due to a manual pipe bender and insufficient experience. To ensure the rollhoops aremanufactured to the specifications provided, the group is going to reach out to a machinist withexperience to ensure that our rollhoops have the highest accuracy possible. This year chassis teamcontacted Jeff Ricketts ([email protected]) in Colburn machine shop and Pete Visser of Visser Rodsto do a professional tube bending. They bent the tubes for free, and where professionally done ina hand bender at Visser Rods. Originally the design group simplified the bends needed to 3.5” sothat they could use a hydraulic bender, but due to an unseen problem they bent the rollhoops byhand. The tubes came back withing a 3 day period, and the design group would recommend allfuture design teams to do the same.
Figure 32: Tubes after receiving back from Jeff Ricketts in Colburn machine shop and Pete Visserof Visser Rods.
To solve the alignment issues with the chassis the design group has opted to simply the complexjigs that other FSAE teams outside of the University of Delaware use. The group has decided thatthe most important accuracy factor is the front to back alignment of the vertical hoops. Thus theteam has manufactured and created jigs to weld the frame on top of.
30
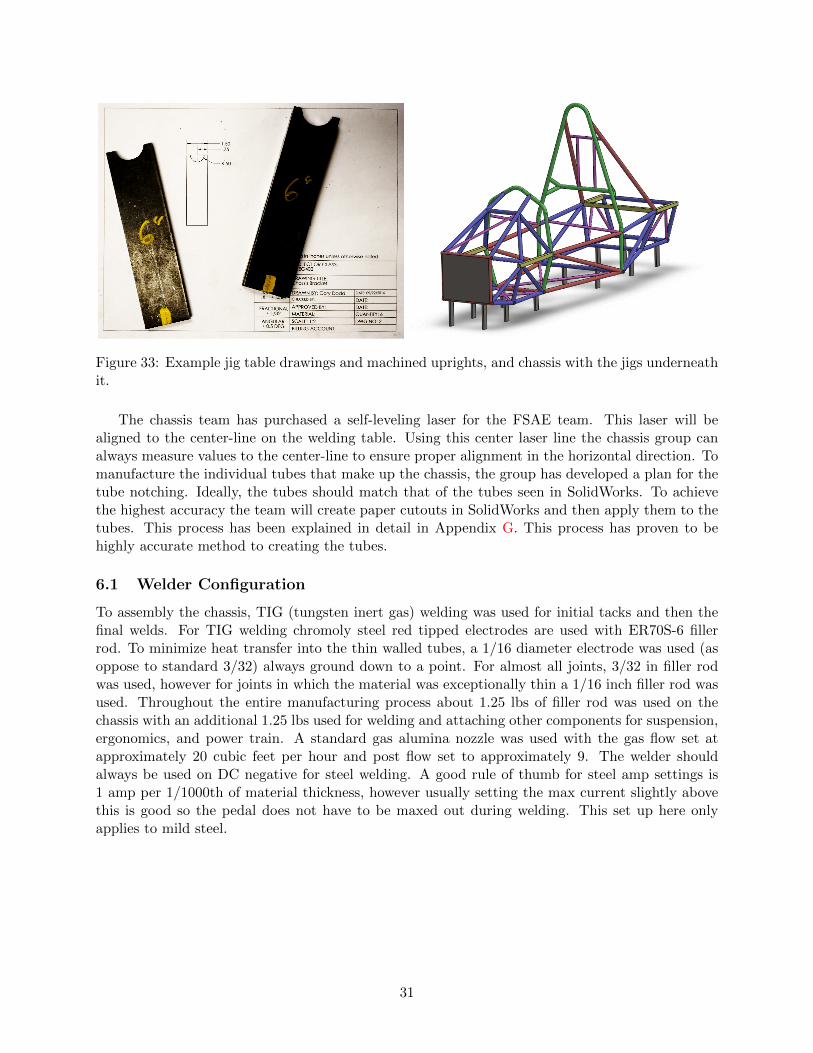
Figure 33: Example jig table drawings and machined uprights, and chassis with the jigs underneathit.
The chassis team has purchased a self-leveling laser for the FSAE team. This laser will bealigned to the center-line on the welding table. Using this center laser line the chassis group canalways measure values to the center-line to ensure proper alignment in the horizontal direction. Tomanufacture the individual tubes that make up the chassis, the group has developed a plan for thetube notching. Ideally, the tubes should match that of the tubes seen in SolidWorks. To achievethe highest accuracy the team will create paper cutouts in SolidWorks and then apply them to thetubes. This process has been explained in detail in Appendix G. This process has proven to behighly accurate method to creating the tubes.
6.1 Welder Configuration
To assembly the chassis, TIG (tungsten inert gas) welding was used for initial tacks and then thefinal welds. For TIG welding chromoly steel red tipped electrodes are used with ER70S-6 fillerrod. To minimize heat transfer into the thin walled tubes, a 1/16 diameter electrode was used (asoppose to standard 3/32) always ground down to a point. For almost all joints, 3/32 in filler rodwas used, however for joints in which the material was exceptionally thin a 1/16 inch filler rod wasused. Throughout the entire manufacturing process about 1.25 lbs of filler rod was used on thechassis with an additional 1.25 lbs used for welding and attaching other components for suspension,ergonomics, and power train. A standard gas alumina nozzle was used with the gas flow set atapproximately 20 cubic feet per hour and post flow set to approximately 9. The welder shouldalways be used on DC negative for steel welding. A good rule of thumb for steel amp settings is1 amp per 1/1000th of material thickness, however usually setting the max current slightly abovethis is good so the pedal does not have to be maxed out during welding. This set up here onlyapplies to mild steel.
31

6.2 Welding Preparation
Figure 34: Above is the air tool used to prepare tubes for welding, and the removal of rust frompipes. 2 inch Aluminum Oxide Quick Change disks with a Type R attachment are used orderedfrom MSC.
One critical factor that is often overlooked is the cleanliness of the metal. Generally, all metals eitherhave or build up a “coating” which helps prevent oxidation or the rusting of the metal. However,during the welding process, having the metal as pure as possible prevents porosity (impurities inthe welds or “holes”) and ensures that the metal is being properly bonded. Porous welds allowfor crack formation and significantly reduce weld strength. For the chassis, ensuring welds are asstrong as possible is essential for the structural integrity of the car and safety of the driver. Toensure that the metal is in the purest form, the group prepped the metal by using a pneumatic 3MScotch-Brite wheel, which removed the outside coat the best and then proceeded to use a Dremelwith a proper fitting to grind or sand away the inside of the tube without the removal of too muchmaterial. The reasoning for cleaning the inside of the metal is because as the heat and gas penetratethe video, both want to escape as rapidly as possible. Thus, pulling anything on the inside of thetube outward leaving potential impurities in the metal.
6.3 Welding Timeline
Initially, the entire chassis was tacked together, trying to maintain complete symmetry betweenthe left and right sides. This kept warping from heat to a minimum and allowed tubes to bepotentially ground off with minimal damage if a critical design change occurred. Full welds wereonly completed on joints that would be covered up. To keep the chassis as square as possible, themain cockpit was welded first. The roll hoops were first correctly positioned on the jig and tackedto the jig to act as a ground truth for the rest of the chassis. The side impact structures were thentacked to give the roll hoop support. From here the design team could have moved to the weldingthe front or rear suspension boxes.
Since the rear suspension nodes were still being actively changed, the design group froze thefront design of the chassis. Since the front bulkhead is perfectly square, this was full welded andthen tacked to the frame to act as a ground truth similar to the roll hoops. From there, the lowerbent tubes and upper front bulk head support tubes were tacked. This allowed the front suspensionbox to finally be assembled. A smaller jig, seen in Fig. 35, was used to hold the two square tubes
32

to ensure proper placement and geometry. The other support tubes were then notched around thesquare tubes placement all the geometry of the suspension box was rigorously checked multipletimes to ensure the chassis was representative of the SolidWorks model. Once the design team wassatisfied the suspension box was tacked. It’s critical to make sure that the assembly of tubes iscompleted in the correct order to prevent the “locking out” of a specific member. In other words,some tubes must be placed and tacked before others or else they will not fit due to notch geometryor reduced space.
Figure 35: A tacked front suspension box member tacked to the lower bent support tube (left).Initial tacks on the lower bent tubes for the rear suspension box (right).
Figure 36: The front suspension box and front bulk head supports tacked.
With the front box tacked, the rear suspension box was then tacked. The top of the suspensionbox, being made of square tubes, was first full welded us used as a ground truth for the rearsuspension geometry. As soon as the engine bay was tacked, the engine was test fitted to ensureclearance. Once the chassis was fully tacked the tacks to the jig were removed, and the full weldswere then completed but rotating the chassis around on two saw horses to allow better access totough joints.
33
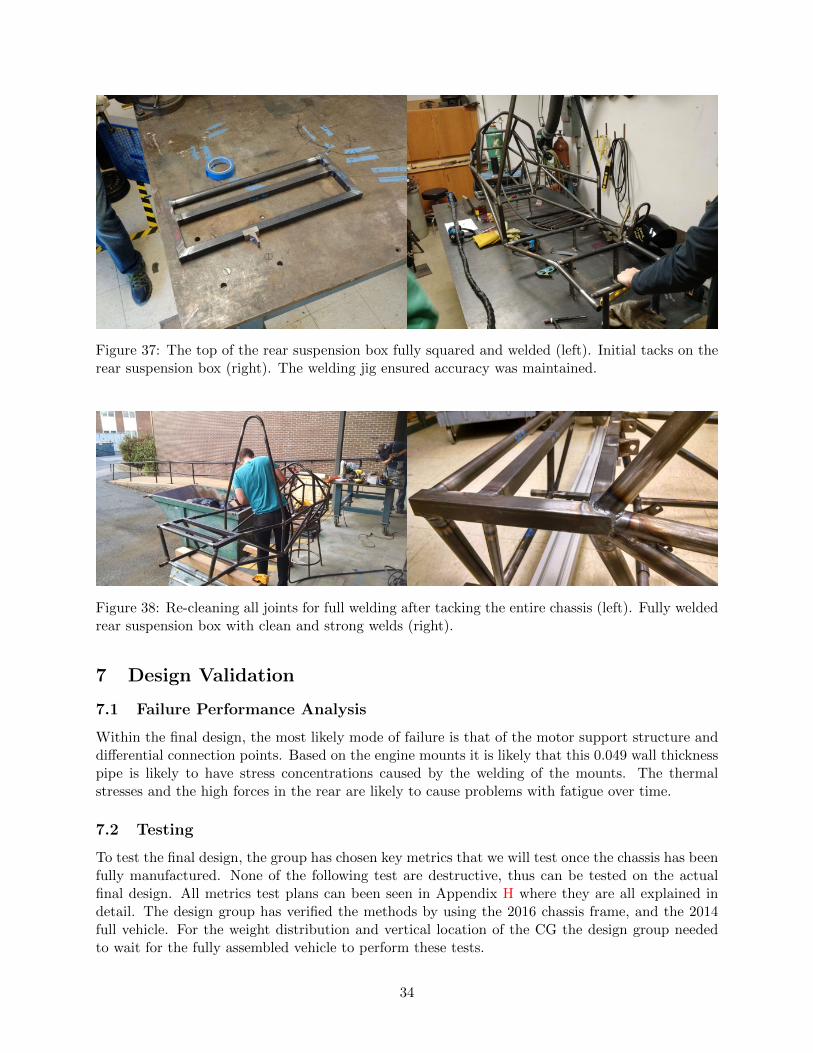
Figure 37: The top of the rear suspension box fully squared and welded (left). Initial tacks on therear suspension box (right). The welding jig ensured accuracy was maintained.
Figure 38: Re-cleaning all joints for full welding after tacking the entire chassis (left). Fully weldedrear suspension box with clean and strong welds (right).
7 Design Validation
7.1 Failure Performance Analysis
Within the final design, the most likely mode of failure is that of the motor support structure anddifferential connection points. Based on the engine mounts it is likely that this 0.049 wall thicknesspipe is likely to have stress concentrations caused by the welding of the mounts. The thermalstresses and the high forces in the rear are likely to cause problems with fatigue over time.
7.2 Testing
To test the final design, the group has chosen key metrics that we will test once the chassis has beenfully manufactured. None of the following test are destructive, thus can be tested on the actualfinal design. All metrics test plans can been seen in Appendix H where they are all explained indetail. The design group has verified the methods by using the 2016 chassis frame, and the 2014full vehicle. For the weight distribution and vertical location of the CG the design group neededto wait for the fully assembled vehicle to perform these tests.
34

Table 16: Final results from all testing done. Note that some tests were unable to be performed asspecified.
Rank Metric Units Target Acceptable Theoretical Experimental
1 Torsional Rigidity (front) ft-lb/deg >1750 >1600 1763 2182
Torsional Rigidity (back) ft-lb/deg >1750 >1600 1923 >1750
2 Bending Stiffness (front) lbs/in >4000 >3750 4487 -
Bending Stiffness (back) lbs/in >4000 >3750 6782 -
3 Weight lbs <60 <70 69.3 69.0
4 Weight Distribution % 40F 60R 45F 55R 45F 55R 45F 55R
5 Vertical Location of CG in <10 <12 10.75 11.90
6 Total Cost USD <1100 <1250 723 723
7 Ease of Egress sec <2.0 <3.0 - ≈ 3.0
Table 17: Final results from all testing done for the global metrics.
Rank Metric Target Theoretical Experimental
1 Weight Distribution (%) 40F 60R 45F 55R 45F 55R
2 Weight (lb) <475 502 440
3 Vertical Location of CG (in) <10.0 10.75 11.90
4 Total Cost (USD) <4500 3521 2625
Figure 39: (Left) The jig used to test the torsional rigidity where the rear end is fixed and the frontwould pivot about a point. A moment was applied to observe the displacement of the chassis whichcould then be related to the torsional rigidity calculation. (Right) The setup used to calculate theweight distribution of the car. Note that the experimental value recorded was performed with adriver.
35

7.3 Validation of Results
In Table 16, it’s clear that the manufactured chassis successfully passed all physical tests. Fromboth the visual inspection, and the chassis’ integration with the other mounted components, thegroup has confidence in the final design performance and its ability to perform in competition.
If there was a component to fail, it would likely be either the engine/differential square tubeyielding or a pink tube yielding due to irregular forces being applied. These failure modes are to beexpected in any car, and it is very likely that other parts of the vehicle, such as suspension a-arms,would fail far before the chassis itself yields.
8 Conclusion
Figure 40: Finished chassis getting weighed, and an example finished weld on the front suspensionbox.
Figure 41: Full welded chassis, in the Spencer student machine shop, with all mounts attached andthe chassis group showing of their hard work.
36
8.1 Design Evaluation
The design group considers this year’s chassis design a complete success. It surpassed all ourmetrics, and previous year’s designs. Overall, we think that this is a chassis that will both enablethe UDEL FSAE team to remain competitive and participate in the coming competition. In doingso, we have learned from all the iterations, and hope that future groups will iterate on top of whatwe have done here.
8.2 Path Forward
Moving forward after designing this frame, the chassis group would like to give recommendationsto future groups about how to design, and how to go about making such a chassis. Overall wefeel that the current design can be tweaked to future optimize the manufacturing, and make itcompatible with future year’s components. Our key points are as follows:
• We cannot stress enough to get as much as the suspension a-arm node points finalized beforefinishing the chassis design. We went through a lot of iterations just to take into accountthe changes that suspension needed in their design. We recommend doing the “wheels in”approach, but this requires that the suspension finishes their design in the summer.
• Doing the system level planning and estimating the volumes of components that are goingin the car was a huge help. Besides allowing us to calculate the COM, it also allowed us toconstrain others design (within reason of course) and jump start their design process.
• It is important to perform the preliminary engineering analysis and decide on the big itemsfirst and then critique the minor things. This worked really well, and allowed us to get pastjumping between different concepts, and instead iterate on our overall design.
• We would still NOT recommend creating a monocoque without the support of the peopleover in the Center for Composite Materials (CCM). We are very glad that we did not makea monocoque and instead focused on a steel spaceframe. This allowed us to go into greaterdetail on the design work, elimination a lot of the guesswork that we would likely have to dootherwise. If the team wants to do a monocoque in the future years, it would have to be donein the summer, with suspension being done in the spring, and do the rest of the steel framein the normal session time.
• We would recommend just using our frame design, and iterating over it. We feel like it hasbeen one of the most compact frames made, and really has a lot of good features. If theframe was just manufacture by the club, the additional time could be spent optimizing othersystems that need the work.
• When designing the chassis, we want to stress that using bent tubes was a huge help withwelding, and the actual manufacturing time. While use of bent tubes is limited by what tubesare required by the FSAE rules, we recommend using more bent tubes in a future design.
• Looking at it after the fact, using a square tube on the front of the chassis did allow for easywelding, but suspension could have easily come up with a different mounting point, and thesquare tube could be replaced with a bent tube to reduce the amount of welds in the mostcomplicated joint on the chassis.
37
References
[1] G Savage. “Formula 1 composites engineering”. In: Engineering failure analysis 17.1 (2010),pp. 92–115.
[2] 4130 Alloy Steel (available in Round, Sheet, Tube). url: https://www.onlinemetals.com/productguides/alloycat.cfm?alloy=4130.
[3] Edmund F Gaffney and Anthony R Salinas. Introduction to Formula SAE® Suspension andFrame Design. Tech. rep. SAE Technical Paper, 1997.
[4] Forbes Aird. Race Car Chassis: Design and Construction. Motorbooks International, 1997.
[5] William B Riley and Albert R George. Design, analysis and testing of a formula SAE carchassis. Tech. rep. SAE Technical Paper, 2002.
[6] William F Milliken and Douglas L Milliken. Race car vehicle dynamics. Vol. 400. Society ofAutomotive Engineers Warrendale, 1995.
[7] Maurice Platt. The Structure of the Automobile. London: The Institute of Mechanical Engi-neers, Automobile Division, 1960.
[8] Massimo Guiggiani. The Science of Vehicle Dynamics: Handling, Braking, and Ride of Roadand Race Cars. Springer Science & Business Media, 2014.
[9] SAE International. 2017-2018 Formula SAE Rules. 2016.
[10] Martin Meywerk. Vehicle Dynamics. John Wiley & Sons, 2015.
[11] Rahul (http://math.stackexchange.com/users/856/rahul). Car racing: How to calculate theradius of the racing line through a turn of varying length. Mathematics Stack Exchange. url:http://math.stackexchange.com/q/289632.
[12] Turning Radius Calculation. url: http://www.davdata.nl/math/turning_radius.html.
[13] Charles E Clauser, John T McConville, and John W Young. Weight, volume, and center ofmass of segments of the human body. Tech. rep. DTIC Document, 1969.
[14] Finding the Car Center of Gravity/Mass (CG/CM). url: http://www.thecartech.com/subjects/auto_eng/Center_of_Gravity.htm.
38

Appendix A: Design Metrics
A.1: Metric 1 - Torsional Rigidity
Torsional rigidity is arguably one of the most important considerations when designing a chassis.During the suspension design process, the chassis is almost always considered perfectly rigid tomake the calculations significantly simpler. However, the fundamentals of material science tell usthat no material is perfectly rigid let alone an entire chassis. Thus one should always expect achassis to have some sort of displacement or compliance.
To better understand the impact of the chassis’ compliance, we can use the simplified torsionspring model proposed by Riley and George [5]. In this model, seen below in Figure 42, thecompliance of the chassis is represented at a torsional spring connected in series with two sets ofparallel springs representing the compliance of the front a rear suspension which are controlledthrough the suspension’s spring rate. Thus the overall stiffness of the chassis directly affects theresponse of the suspension and handling of the vehicle.
Figure 42: The simplified compliant spring and frame model presented by Riley and George [5].Here the horizontal spring from node 13 to 14 represents the compliance of the frame while theremaining represent the spring rate of the suspension.
From Riley and George’s work and discussed in Milliken’s [6] Chapter 18 on chassis design,ensuring that the car has a high stiffness ensures that all the design calculations that use the“rigid” chassis assumption stay valid. Furthermore, the suspension compliance “may be increasedor decreased by bending or twisting of the chassis”. The ultimate goal is to make a chassis rigidenough such that its compliance compared to the suspension is negligible. Milliken recommendsthat for “small formula cars” their torsional stiffness would be approximately 3000lb-ft/deg.
In reality the design team views a target goal 3000lb-ft/deg, specified in Milliken’s book [6] asan ideal target for professional tier SAE race cars. While the University of Delaware wants to be ascompetitive as possible, torsional rigidity comes at a cost, namely weight. Based on benchmarks,seen in Appendix D, the design team estimates that a reasonable target value for the torsionalrigidity of the chassis should be greater than 1750 ft-lb/deg with an acceptable value being above1600 ft-lb/deg. While this is almost half the target proposed by Milliken, the design team carriedout a simple theoretical analysis in Appendix B which determined that the increasing the torsionalrigidity above the current target would be very unlikely to yield results worth the resulting weightgain from additional support structures.
39
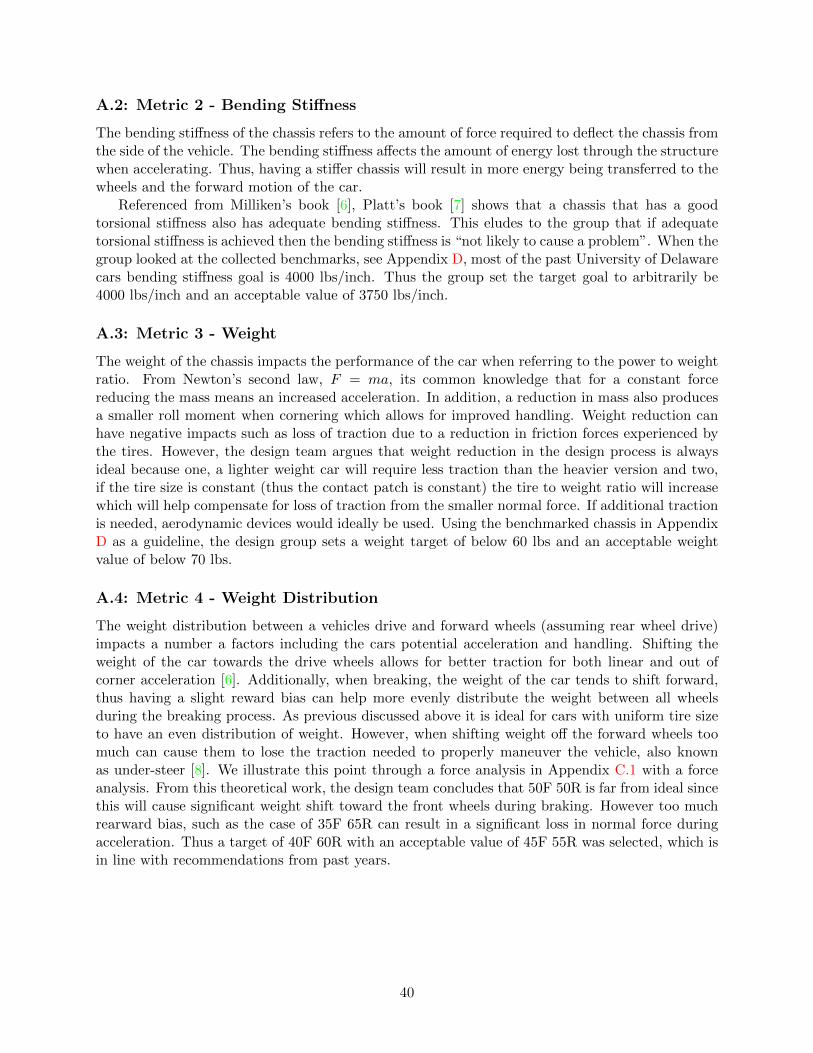
A.2: Metric 2 - Bending Stiffness
The bending stiffness of the chassis refers to the amount of force required to deflect the chassis fromthe side of the vehicle. The bending stiffness affects the amount of energy lost through the structurewhen accelerating. Thus, having a stiffer chassis will result in more energy being transferred to thewheels and the forward motion of the car.
Referenced from Milliken’s book [6], Platt’s book [7] shows that a chassis that has a goodtorsional stiffness also has adequate bending stiffness. This eludes to the group that if adequatetorsional stiffness is achieved then the bending stiffness is “not likely to cause a problem”. When thegroup looked at the collected benchmarks, see Appendix D, most of the past University of Delawarecars bending stiffness goal is 4000 lbs/inch. Thus the group set the target goal to arbitrarily be4000 lbs/inch and an acceptable value of 3750 lbs/inch.
A.3: Metric 3 - Weight
The weight of the chassis impacts the performance of the car when referring to the power to weightratio. From Newton’s second law, F = ma, its common knowledge that for a constant forcereducing the mass means an increased acceleration. In addition, a reduction in mass also producesa smaller roll moment when cornering which allows for improved handling. Weight reduction canhave negative impacts such as loss of traction due to a reduction in friction forces experienced bythe tires. However, the design team argues that weight reduction in the design process is alwaysideal because one, a lighter weight car will require less traction than the heavier version and two,if the tire size is constant (thus the contact patch is constant) the tire to weight ratio will increasewhich will help compensate for loss of traction from the smaller normal force. If additional tractionis needed, aerodynamic devices would ideally be used. Using the benchmarked chassis in AppendixD as a guideline, the design group sets a weight target of below 60 lbs and an acceptable weightvalue of below 70 lbs.
A.4: Metric 4 - Weight Distribution
The weight distribution between a vehicles drive and forward wheels (assuming rear wheel drive)impacts a number a factors including the cars potential acceleration and handling. Shifting theweight of the car towards the drive wheels allows for better traction for both linear and out ofcorner acceleration [6]. Additionally, when breaking, the weight of the car tends to shift forward,thus having a slight reward bias can help more evenly distribute the weight between all wheelsduring the breaking process. As previous discussed above it is ideal for cars with uniform tire sizeto have an even distribution of weight. However, when shifting weight off the forward wheels toomuch can cause them to lose the traction needed to properly maneuver the vehicle, also knownas under-steer [8]. We illustrate this point through a force analysis in Appendix C.1 with a forceanalysis. From this theoretical work, the design team concludes that 50F 50R is far from ideal sincethis will cause significant weight shift toward the front wheels during braking. However too muchrearward bias, such as the case of 35F 65R can result in a significant loss in normal force duringacceleration. Thus a target of 40F 60R with an acceptable value of 45F 55R was selected, which isin line with recommendations from past years.
40

A.5: Metric 5 - Vertical Placement of the Center of Gravity
The vertical position of the center of gravity (CG) from the ground is another very important factorthat directly influences the vehicles handling. It should be noted that this metric is not just thecenter of gravity of just the chassis, but rather the center of gravity of the entire car measured byplacing weighted volumes with in the chassis itself as described in Appendix F.2. We also assumethe car will ride approximately two inches off the ground at rest.
For a SAE car, generally the lower the CG the better the vehicles performance. For example, alower CG also improves handling of the vehicle while cornering. When completing a turn the bodyof the vehicle rotates about its roll center, which is defined as the point in which the chassis rotatesrelative to the ground [3]. The roll center is commonly found geometrically once the suspension’sgeometry is known. When the CG is displaced from the roll center, during a turn this induces amoment that rolls the weight of the vehicle outwards causing the outer wheels to be more heavilyloaded than the inside. Such uneven loading isn’t ideal for the handling of the vehicle; more equalloading allows better traction from both wheels resulting in better traction for the turning or drivewheels. Reducing the distance between the CG and roll center reduces this roll moment whichallows the car to handle better in general [6, 3]. While the location of the roll center can varydepending on suspension geometry, it is reasonable to assume that the roll center is at or very closeto the ground for a well-designed double wish bone suspension design to minimize jacking forces[6]. Thus the CG should be as low as possible to minimize the roll experienced while turning.
For straight line acceleration or breaking the weight of the car is shifted to the rear or front ofthe vehicle respectively. The reason this weight shift occurs is simply due to the moment createdfrom the CG being above the ground that causes the car to squat or dive. Lowering the CG closerto the ground effectively reduces this moment and reduces the overall weight shift of the vehicleduring acceleration or deceleration. However, in some cases this weight transfer can be beneficial,such as the case when the static weight distribution of the is not evenly distributed, because thiscould allow weight to be more evenly distributed between the wheels during braking. This is idealfor vehicles with even sized tires, such as the current FSAE car, since the breaking force for eachtire is identical [6]. Analyzed in detail in Appendix C.2, for a deceleration of 1G, the ideal height ofthe center of gravity is approximately 6 inches from the ground. However, benchmarks in AppendixD generally indicated that the vertical center of gravity is generally higher up.
The final reason why generally a lower center of gravity is ideal is the required 60 degree tippingtest stated in rule T6.7. While tipping stability of the vehicle also depends largely on the track-width, a lower center of gravity also reduces the tipping moment experience by the car when it’son an incline plane. In conclusion, the vertical location of the center of gravity should be as closeto the ground as possible, ideally around 6 inches for ideal breaking weight transfer. Since pastbenchmarks indicate that the center of gravity tends to be slightly higher, the design team selectsa target value of 10 inches above the ground with an acceptable value of 12 inches.
41

A.6: Metric 6 - Cost
The cost analysis of the competing vehicle comprises 10% of the overall FSAE competition score [9].Thus for the University of Delaware to remain as competitive as possible, creating a cost effectivechassis is an important metric to consider. The target cost of a chassis can vary depending onwhether it’s a space frame or monocoque, its material, torsional rigidity, etc. Using the benchmarksin Appendix D as a reference, the design team sets a target cost for a chromoly steel space framechassis to be below $1100 USD and an acceptable value below $1250 USD. Meeting this targetwould improve the chassis cost over the 2015 University of Delaware chassis, and would remaincompetitive with all other chromoly steel chassis benchmarked.
A.7: Metric 7 - Ease of Egress
Based off the 2017 preliminary FSAE rules, according to rule T4.8 the driver must be able to exitthe cockpit of the vehicle in less than five seconds. This test ensures the driver is able to quicklyand easily exit the vehicle in case of an on board fire or other dangerous situation. While thisis metric is heavily dependent on the ergonomics of the car, the chassis must also be designed toallow an easy exit from the cockpit. Given that 5 seconds is the maximum limit; the target exittime should be significantly below this limit. The design team chooses a target egress time fromthe chassis of 2 seconds with an acceptable exit time of 3 seconds. This time should allow enoughof a gap to accommodate the additional ergonomic complications of the finished vehicle such asunbuckling the seat belt, removing the steering wheel, and maneuvering out of the seat itself.
42

Appendix B: Torsional Rigidity Analysis
Torsional rigidity is one of the most important metrics for the chassis, thus a more in depth analysiswas completed to help gain a better understanding of an appropriate target value. This theoreticalapproach is largely based off the work Riley and George [5]. First, consider the simple model of avehicles wheel rates on a perfectly rigid chassis in Figure 43a. If a force is applied to one of thesprings (physically representing a bump) all four springs act in series to resist the motion. The factthat the springs act in series may be difficult to see at first glance, however if we represent eachwheel rate as a torsional spring attached to the chassis, as in Figure 43b, the series configurationbecomes much clearer. A simple force and moment analysis can tell us that if all wheel rates areequal, the force felt by each is identical in magnitude.
(a) (b)
Figure 43: Simplified model of a car’s wheel rates attached to a rigid chassis. (a) represents thewheel rates as a set of translational springs and (b) represents the wheel rates as torsional springsdirectly attached to the chassis.
For considering the stiffness of the vehicle, torsional springs are often more useful since the chassis ischaracterized by torsional rigidity or torsional stiffness. Translational and torsional springs cannotbe combined, which raises the question of how to convert the wheel rates in Figure 43a to a torsionalequivalent in Figure 43b. Consider the spring system below in Figure 44 in which the force exertedby a translation spring is converted into a torsional spring representation.
Figure 44: Torsional spring representation from a translational spring
If theta in the figure above is assumed to be relatively small, we can obtain a very simple relationshipbetween the translational spring and its torsional representation:
kt =T
θ=
FLcos (θ)
tan−1(
dLcos(θ)
)Small angle : cos (θ) ≈ 1 & tan (θ) =
d
Lcos (θ)≈ θ
kt ≈FL2
d= kl · L2
43
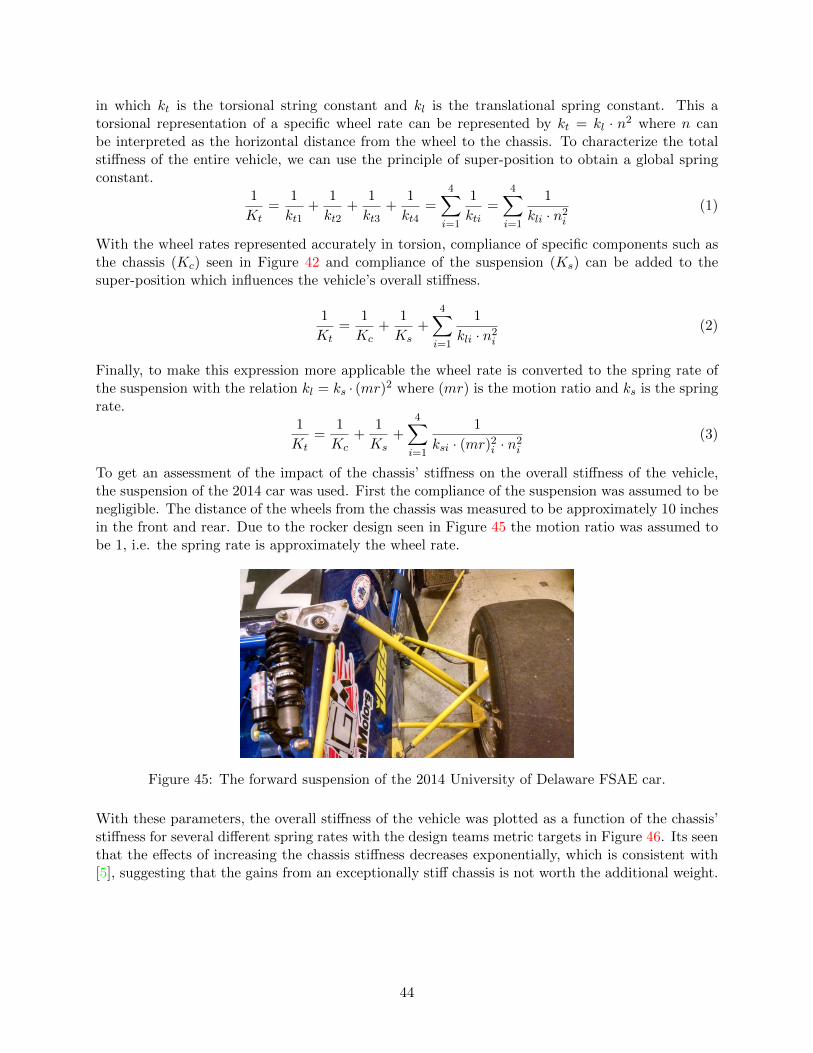
in which kt is the torsional string constant and kl is the translational spring constant. This atorsional representation of a specific wheel rate can be represented by kt = kl · n2 where n canbe interpreted as the horizontal distance from the wheel to the chassis. To characterize the totalstiffness of the entire vehicle, we can use the principle of super-position to obtain a global springconstant.
1
Kt=
1
kt1+
1
kt2+
1
kt3+
1
kt4=
4∑i=1
1
kti=
4∑i=1
1
kli · n2i
(1)
With the wheel rates represented accurately in torsion, compliance of specific components such asthe chassis (Kc) seen in Figure 42 and compliance of the suspension (Ks) can be added to thesuper-position which influences the vehicle’s overall stiffness.
1
Kt=
1
Kc+
1
Ks+
4∑i=1
1
kli · n2i
(2)
Finally, to make this expression more applicable the wheel rate is converted to the spring rate ofthe suspension with the relation kl = ks · (mr)2 where (mr) is the motion ratio and ks is the springrate.
1
Kt=
1
Kc+
1
Ks+
4∑i=1
1
ksi · (mr)2i · n2
i
(3)
To get an assessment of the impact of the chassis’ stiffness on the overall stiffness of the vehicle,the suspension of the 2014 car was used. First the compliance of the suspension was assumed to benegligible. The distance of the wheels from the chassis was measured to be approximately 10 inchesin the front and rear. Due to the rocker design seen in Figure 45 the motion ratio was assumed tobe 1, i.e. the spring rate is approximately the wheel rate.
Figure 45: The forward suspension of the 2014 University of Delaware FSAE car.
With these parameters, the overall stiffness of the vehicle was plotted as a function of the chassis’stiffness for several different spring rates with the design teams metric targets in Figure 46. Its seenthat the effects of increasing the chassis stiffness decreases exponentially, which is consistent with[5], suggesting that the gains from an exceptionally stiff chassis is not worth the additional weight.
44

Figure 46: The overall car stiffness as a function of the chassis’ stiffness for several different springrates.
On the 2014 car, a spring rate of 350 lb/in was used. If an infinitely rigid chassis is assumed, theideal stiffness of the vehicle is found to be about 729 lb-ft/deg. At the design teams current targetwith a chassis stiffness of 1750 lb-ft/deg the overall vehicle’s stiffness is 70% of the ideal stiffness. Ifthis target was increased to 3000 lb-ft/deg as recommended by [6], the overall vehicle’s stiffness isonly 80% the ideal stiffness at a spring rate of 350 lb/in. For almost doubling the torsional rigidityand yielding a vehicle stiffness increase of only 10%, this would clearly not be worth the weightincrease.
In conclusion, while this model is very simplified and makes large assumptions, its clear that thegains of increasing the chassis’ rigidity decreases rapidly. The design team believes their currenttarget yields a reasonable overall vehicle stiffness at 70% of the “ideal” since this should allow forsufficient control of the cars handling without requiring significant weight gain for torsional rigidity.
45

Appendix C: Acceleration Weight Transfer Analysis
When a vehicle accelerates or decelerates its weight is shifted towards the rear or the front respec-tively due to the forward momentum of the center of gravity. This weight shift is directly related tothe front-rear weight distribution along with the vertical location of the center of gravity. Duringdeceleration or breaking an even front to rear weight distribution is ideal for this allows for greaterbreaking forces. During acceleration a weight shift towards the drive wheels, in this case the rear, isideal since this creates additional friction allowing for greater acceleration [6]. To assess the weighttransfer experienced by the vehicle during deceleration the following free-body diagram in Figure47 following the process outlined in [10].
F1 F2
l
h l1 l2mgma
Figure 47: Wheel load schematic under the braking process.
When the car is decelerating the normal forces experienced by each wheel is found by summingthe moments about the contact point of each wheel to the ground.∑
M1 = 0 = −l1 · (mg) + h · (ma) + l·F 2∑M2 = 0 = l2 · (mg) + h · (ma) − l·F 1
Here we are assuming other effects such as rotational inertial are negligible compared the magnitudeof the breaking force [10]. The moment equations can be rearranged to solve for F1 and F2 explicitly
F1 =l2 · (mg) + (ma) · h
l=
(l2 · g + a · h
l
)m =
(l2 +G · h
l
)mg
F2 =l1 · (mg) − (ma) · h
l=
(l1 · g − a · h
l
)m =
(l1 −G · h
l
)mg
in which G is defined as the acceleration of the car divided by the acceleration of gravity. Ideallyas mentioned previously, ideally F1 and F2 are equal for braking and F2 is slightly larger than F1
during acceleration, however this depends greatly on the acceleration the vehicle is experiencing.Instead of comparing the two normal forces directly, the ratio of the two simply defined as
F1
F2=l2 +G · hl1 −G · h
.
46

C.1: Front-Rear Weight Distribution
The lengths l1 and l2 are directly determined from this weight distribution. A simple static forceanalysis can be used to determine the length of l1 and l2 with respect to l. Given the designed wheelbase of 62 inches, Figure 48 plots the front to rear weight distribution as a function of deceleration.It is very clear that a 50F 50R weight distribution has very poor breaking performance since thenormal force weight ratio is significantly larger than one. This indicates that the normal force onthe front wheels is significantly larger than the rear during breaking.
Figure 48: The impact of the front rear weight distribution on the normal force ratio duringdeceleration.
Figure 49 depicts the impact of the weight distribution during acceleration. While 35F 65R hasthe greatest weight on the rear wheels which is ideal, the impact of the reduced normal force onthe front wheel needs to also be considered. Most clearly seen in the 35F 65R weight distribution,an acceleration above 1G could result in below 20% of the cars weight on the front wheels. Thesevere drop in the front normal force could lead to significant understeer.
Figure 49: The impact of the front rear weight distribution on the normal force ratio duringacceleration.
47

C.2: Vertical Location of the Center of Gravity
We will consider our target front rear weight distribution of 40F 60R with a wheelbase of l = 62inches. The weight distribution ratio is plotted as a function of the vertical placement of the centerof gravity, h, in Figure 50. A height of approximately 6 inches above the ground appears to bean ideal height for a deceleration of 1G. This is significantly lower than the benchmarked verticalplacements of the center of gravity of approximately 10 inches indicating that the lower the centerof gravity the better.
Figure 50: The weight distribution ratio plotted as a function of the center of gravity’s verticalheight. The black horizontal line indicated the ideal ratio of 1.
In Figure 51, the ideal height of the center of gravity to obtain F1/F2 = 1 as a function ofdeceleration for a front rear weight distribution of 40F 60R. As we should expect, the greater theacceleration the lower the ideal height, once again confirming that lowering the CG is ideal for SAEcars in which rapid acceleration and deceleration occurs.
Figure 51: The ideal height of the center of gravity for even front rear weight distribution as afunction of deceleration.
48

Appendix D: Benchmarks
This appendix includes tables listing different chassis benchmarks that were analyzed during thedesign process. Due to the difficulty in obtaining other universities’ chassis specifications, themajority of the benchmarks used are from the University of Delaware. The 2016 chassis torsionalrigidity was additionally experimentally validated as shown in Appendix E.
Table 18: A list of several past year chassis designs from the University of Delaware. For someattributes the final value was never explicitly stated thus the target value was used instead.
University/Year Photo Key Attributes
University of Delaware2011
• Material: Steel Tubing
• Torsional Rigidity: 1500 ft-lb/deg(Target)
• Flexural Rigidity: 6200 lb/in
• Cost: $972.40
• Weight: 78 lbs
University of Delaware2013
• Material: Chromoly Steel
• Torsional Rigidity: 1305 ft-lb/deg
• Flexural Rigidity: 2560 lb/in
• Cost: $1483 ($984 materials, $293welding table, $206 welding jig)
• Weight: 85 lbs
• Vertical COM: 12.5 in.
• Weight Distribution: 45-55
University of Delaware2014
Separate front and rearchassis
• Material: Chromoly Steel
• Torsional Rigidity: 1830 ft-lb/deg
• Flexural Rigidity: 4600 lb/in
• Cost: $1025
• Weight: 76 lbs
• Vertical COM: 10.2 in.
University of Delaware2016
Floating Differential
• Material: Chromoly Steel
• Torsional Rigidity: 1636 ft-lb/deg
• Flexural Rigidity: 3000 lb/in
• Cost: $1110.03
• Weight: 68 lbs
• Vertical COM: 10 in. (Target)
• Weight Distribution: 46-54
49

Table 19: A brief list of chassis benchmarks from other universities compiled by the design team isincluded in the table below with key attributes that were able to be obtained.
University/Year Photo Key Attributes
Florida InternationalUniversity
2014
• Material: Chromoly Steel
• Torsional Rigidity: 2107 ft-lb/deg
• Cost: $1146.89 (731.89 materials,415.00 laser notching)
• Weight: 72.73 lbs
Florida InternationalUniversity
2015
Floating Differential
• Material: Chromoly Steel
• Torsional Rigidity: 1489 ft-lb/deg
• Cost: $1044.53 (571.35 materials,473.18 laser notching)
• Weight: 54.63 lbs
Worcester PolytechnicInstitute
2015
• Material: Chromoly Steel
• Weight: 64 lbs
• Vertical COM: 12.0 in.
• Weight Distribution: 50-50
• Wheel Base: 61 in.
University of SouthernQueensland
2004
• Material: Medium Carbon Steel
• Torsional Rigidity: 168.3 ft-lb/deg(Not found with FEA)
• Flexural Rigidity: 4853 lb/in
• Cost: $424.05 (318.78 materials,105.27 machining)
• Vertical COM: 8.85 in.
• Weight Distribution: 45.3-54.7
• Wheel Base: 74 in.
50

Table 20: A brief list of chassis benchmarks from the University of California Berkeley compiled bythe design team is included in the table below with key attributes that were able to be obtained.
University/Year Photo Key Attributes
University of CaliforniaBerkeley
2016
• Material: Chromoly Steel
• Chassis Weight: 70.0 lbs
• Full Weight: 363 lbs (dry)
• Wheelbase: 61 in.
University of CaliforniaBerkeley
2015
• Material: Chromoly Steel
• Chassis Weight: 74.0 lbs
• Full Weight: 315 lbs (dry)
• Wheelbase: 60 in.
University of CaliforniaBerkeley
2014
• Material: Chromoly Steel
• Chassis Weight: 74.0 lbs
• Full Weight: 272 lbs (dry)
• Wheelbase: 60 in.
University of CaliforniaBerkeley
2013
Floating Differential
• Material: Chromoly Steel
• Chassis Weight: 60.0 lbs
• Full Weight: 272 lbs (dry)
• Wheelbase: 60 in.
51

Appendix E: 2016 Chassis Experiential Validation
The team has access to the unfinished 2016 FSAE chassis design. At the end of the last seniordesign a finished chassis with the engine mounted was completed. The design team removed themotor from the chassis and proceeded to experimentally test the torsional stiffness. To validatethe Solidwork simulations done on the 2016 model and verify a valid final metric given in the 2016report a experiential test was desired.
Figure 52: The total mounting platform (left) and the team putting weights on the cantilever beam(right)
Figure 53: Forward looking view of the rig. The weight has been applied on the right side of thebeam, the entire front is supported by a single pivot.
The team fixed the back half of the unit to the floor with the front suspended on a single pivot.Using two dial indicators on the left and the right side of the front beam, the vertical displacementchange was recorded for multiple trials and weights. Below is a toy schematic of the forces actingon the front section.
52

Figure 54: One of the dial indicators used (left) and a toy schematic of the experiment (right)
P (lbs) ∆A (in) ∆B (in) Torsional Stiffness (lbs-ft/deg)
50 0.0610 0.0580 1759.988
50 0.0635 0.0575 1730.897
50 0.0635 0.0570 1738.079
50 0.0610 0.0570 1774.903
100 0.1000 0.1180 1921.434
100 0.1050 0.1160 1895.350
100 0.1050 0.1160 1895.350
100 0.1055 0.1155 1895.350
100 0.1050 0.1140 1912.660
150 0.1410 0.1800 1957.313
To calculate the total stiffness the team followed the work by Riley and George in their technicalreport on the testing of FSAE chassis frames [5]. The final formulation is defined as the followingequations, and the final calculated values are seen in the above table. The following values whereused in the calculation: L1 = 32in and L2 = 29in. The average torsional stiffness found was1874.41 lbs-ft/deg with a deviation of 119.61 lbs-ft/deg. This calculated value is very close to theirreport estimated value of 1636 lbs-ft/deg.
θ = tan−1
(∆A + ∆b
L1
)(4)
K =T
θ(5)
K =P (L1 + 2L2)
tan−1(
∆A+∆bL1
) (6)
53

Appendix F: Preliminary Engineering
F.1: Vehicle Wheelbase
Figure 55: Diagram of the outer, inner, and race radii ro, ri, and rr respectively
We assume we need to turn around a turn of inner radius ri and outer radius ro. As seen in figure 55the race path for the vehicle allows for maximum travel velocity through a turn and is the optimalpath for a vehicle to maintain max velocity. Using the formulas provided by [11] we can look athow the race radius changes as a function of the steer angle α.
x+ ro = rr (7)
x+ ri cosθ
2= rr cos
θ
2(8)
where θ is defined as the angle of the turn. Simplifying we can get the following:
rr = ri +ro − ri
1 − cos θ2(9)
Using the above formulation, we can look at how the race radius changes as a function of the turnangle (note this is not the angle the front wheels will be at, rather it is the physical angle that thethe car needs to go around in a turn):
Figure 56: The race radius as a function of the turn angle θ
54
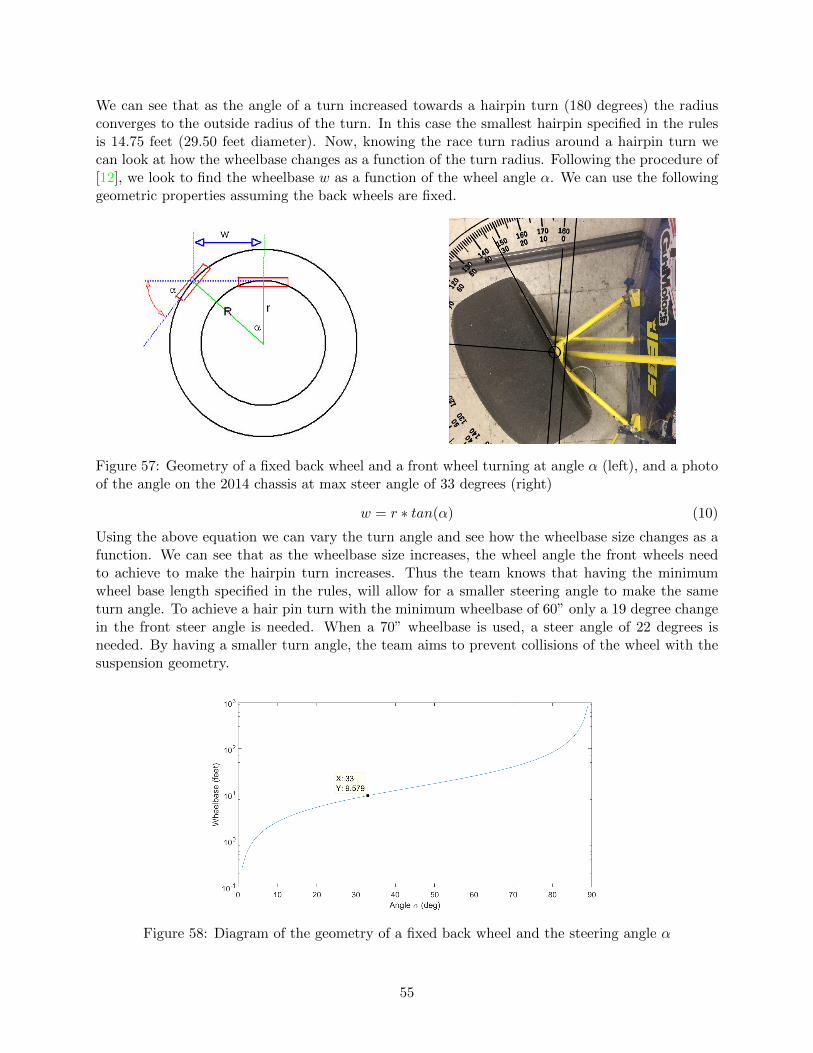
We can see that as the angle of a turn increased towards a hairpin turn (180 degrees) the radiusconverges to the outside radius of the turn. In this case the smallest hairpin specified in the rulesis 14.75 feet (29.50 feet diameter). Now, knowing the race turn radius around a hairpin turn wecan look at how the wheelbase changes as a function of the turn radius. Following the procedure of[12], we look to find the wheelbase w as a function of the wheel angle α. We can use the followinggeometric properties assuming the back wheels are fixed.
Figure 57: Geometry of a fixed back wheel and a front wheel turning at angle α (left), and a photoof the angle on the 2014 chassis at max steer angle of 33 degrees (right)
w = r ∗ tan(α) (10)
Using the above equation we can vary the turn angle and see how the wheelbase size changes as afunction. We can see that as the wheelbase size increases, the wheel angle the front wheels needto achieve to make the hairpin turn increases. Thus the team knows that having the minimumwheel base length specified in the rules, will allow for a smaller steering angle to make the sameturn angle. To achieve a hair pin turn with the minimum wheelbase of 60” only a 19 degree changein the front steer angle is needed. When a 70” wheelbase is used, a steer angle of 22 degrees isneeded. By having a smaller turn angle, the team aims to prevent collisions of the wheel with thesuspension geometry.
Figure 58: Diagram of the geometry of a fixed back wheel and the steering angle α
55

F.2: Weight Distribution
To understand the dynamics of the car the team looks to create a floor plan of all parts that willbe used in the car. First the team gathers data on the weight of each component that will be putinto the chassis. Along with the weights the team determined the center of masses for each objectso that the total center of mass (COM) of the car can be calculated. If the position of all COMare known then the total can be calculated as follows:
XCOM =
∑mixi∑mi
, YCOM =
∑miyi∑mi
, ZCOM =
∑mizi∑mi
(11)
Using the following tables, the team is able to quickly prototype the layout of components inthe car by moving the volumes around in SolidWorks. These volumetric areas can be given to eachsub-component team for use in their design metrics.
Part Type Total Weight (lbs)
Radiator System 10
Exhaust 13
Fuel Tank 17
Differential 18
Engine 136
Driver 216
Driver Seat 10
Pedal Box 7
Steering Assembly 8
Battery 10
Part Type x-axis (in) y-axis (in) z-axis (in)
Radiator System 11 16 10
Exhaust 6 9 27
Fuel Tank 10 9 6.5
Differential 10 12 8
Engine 17 20 1
Driver 18 33 45
Pedal Box 11 13 11
Battery 5.5 6 3.25
To find the center of mass for each object the team used both a combination approximationsand actual measuring of the COM. For most smaller parts the team assumed that the COM waslocated in the center of the volume, but for the engine it was important to exactly find the COMbecause of its large mass. To do so, the team used two scales and suspended the engine betweenthem. By making the scales read equal, the COM is known to be placed exactly between the twoscales. This can be repeated for the three different axes to find the total COM.
To find the COM of the human rider, the team consulted [13] for the location of the center ofmass. They find that the mean distance of the COM from the top of the head is 28 inches with astandard deviation of 0.94 inches. The team used this and a team member in the 95 percentile tocreate a model.
56
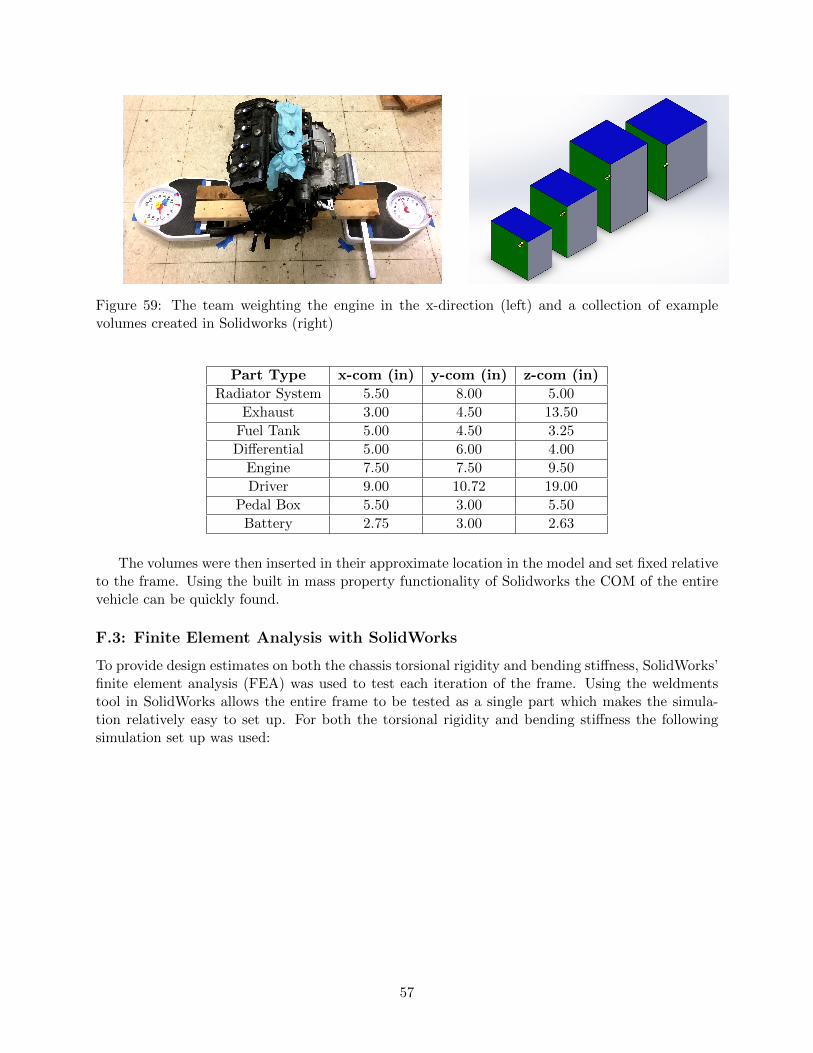
Figure 59: The team weighting the engine in the x-direction (left) and a collection of examplevolumes created in Solidworks (right)
Part Type x-com (in) y-com (in) z-com (in)
Radiator System 5.50 8.00 5.00
Exhaust 3.00 4.50 13.50
Fuel Tank 5.00 4.50 3.25
Differential 5.00 6.00 4.00
Engine 7.50 7.50 9.50
Driver 9.00 10.72 19.00
Pedal Box 5.50 3.00 5.50
Battery 2.75 3.00 2.63
The volumes were then inserted in their approximate location in the model and set fixed relativeto the frame. Using the built in mass property functionality of Solidworks the COM of the entirevehicle can be quickly found.
F.3: Finite Element Analysis with SolidWorks
To provide design estimates on both the chassis torsional rigidity and bending stiffness, SolidWorks’finite element analysis (FEA) was used to test each iteration of the frame. Using the weldmentstool in SolidWorks allows the entire frame to be tested as a single part which makes the simula-tion relatively easy to set up. For both the torsional rigidity and bending stiffness the followingsimulation set up was used:
57

1. First a new static simulation was created. Thanks to the weldments functionalitySolidWorks joints of the frame are automatically detected as seen in Figure 60 (left). Thesejoints are by default considered perfectly rigid, in other words compliance is only producedby the yielding of the bars not the joints. It should be noted that trims do not impact theperformance of the FEA test, thus all tubes are left untrimmed to save time.
Figure 60: Frame joints, indicated by the pink dots, auto-created by SolidWorks (left). Meshvisualization of iteration 3 (right).
2. The material of all bodies in the simulation are then then set to 4130 alloy steel so that therelevant material properties are correct.
3. The front anti-intrusion plate, which is welded directly onto the front bulkhead, is fixed tothe four front bulkhead bars with a component contact.
4. A mesh for the entire frame is then generated as seen in Figure 60 (right). Solidworksessentially treats the frame as a series of individual beams all interconnected which allowsthe mesh and the simulation to remain relatively simple.
5. Fixtures are then applied to the desired node points. In the case of both the torsionalrigidity and bending stiffness tests, the joints on the rear box are fixed as seen in Figure 61.
Figure 61: Fixtures applied to the rear box.
58

6. Finally, the loads are applied to the frame. For both the torsional rigidity and bendingstiffness tests the 8 equal loads are applied at the four front suspension joints seen in Figure62. Forces on both sides are applied in the same direction for the bending stiffness analysis.For the torsional rigidity test, a moment is created by applying forces on each side inopposite directions.
Figure 62: Various loads applied in the FEA tests.
With the simulation completed, the values needed to estimate the design metrics can now beobtained. Torsional rigidity is defined in units of (lb*ft)/deg and can be defined multiple ways.The design team chose the method that appeared most frequently during benchmarking. Given theload applied at each node point, F , the applied moment about the center line of the chassis (rollcenter location) is calculated. This moment is then divided by the angular rotation of the chassisprovided by the SolidWorks simulation to find the torsional rigidity. This process is summarizedbelow.
K =4(F ∗ d1
2
)+ 4
(F ∗ d2
2
)θ
=2F (d1 + d2)
θK = Torsional Rigidity (lb*ft/deg),
F = Force (lb), d1, d2 = Chassis width (ft),
θ = Chassis rotation (deg)
To calculate the bending stiffness of the chassis the force applied to the front suspension nodesis divided by the vertical displacement of the mid-way point between front suspension nodes orwhere the front wheel would be positioned. This process is summarized in the schematic below.
Kb =
∑F
δKb = Torsional Rigidity (lb/in),
F = Force (lb),
δ = Vertical displacement (in)
59

Appendix G: Tube Notching Procedure
G.1: SolidWorks Drawing Generation
There are two different ways to export the paper templates used for tube notching. The way thatthe design team used is unrolling using the SolidWorks sheet metal tools. Originally the teamadded an “offset surface” with a offset equal to zero. This provided good results, but was not asreliable or fast as the sheet metal route. The steps are explained below in the captions of eachimage, reading from left to right.
Figure 63: To export the weldments into separate parts, a user can right click on the cut listand click “save bodies”. From here the bodies that are to be exported can be visually selectedand renamed. We recommend also exporting an assembly so that an overview of the bodies beingexported can be visually seen (left). On the right, it can be seen that in each part we add an axisthrough the pipe center, a point at the end, and then use these two to create a plane (right).
Figure 64: On this plane, we add a single vertical line and use the “thin line” extrude cut to createa small slice (we use a value of 0.005in) in the tube member. This is needed since it is impossibleto unroll a continuous surface (left). From here in the “sheet metals” tab we can insert a bend tounroll the tube (right).
60

Figure 65: We select the line that we just cut, ensure the bend radius and k-factor are both one. Ifthe K-factor is not one, the outside surface will not be stretched enough to have the proper layoutof the cut (left). After applying the bend, the sheet metal will be created, and can be flattened byclicking the flatten button (right).
Figure 66: Finally a drawing can be created for this flattened surface. We added a simple 1” lineto the sheet layout that will always be printed with the drawing. This can then be measured toensure that the drawing is to true 1:1 scale (left). Finally we make it fit on the sheet with a break,and print the final design out (right).
G.2: Physical Notching of Tubes
To physically notch the tubes, the above SolidWorks drawings are printed out, and checked toensure that they are to scale. From there, the paper cutout is cut from the drawing sheet and thenfinally taped to the tube. From there the other end of the paper template is placed the desireddistance from the original paper template and aligned using a center line marked on the tube.
61
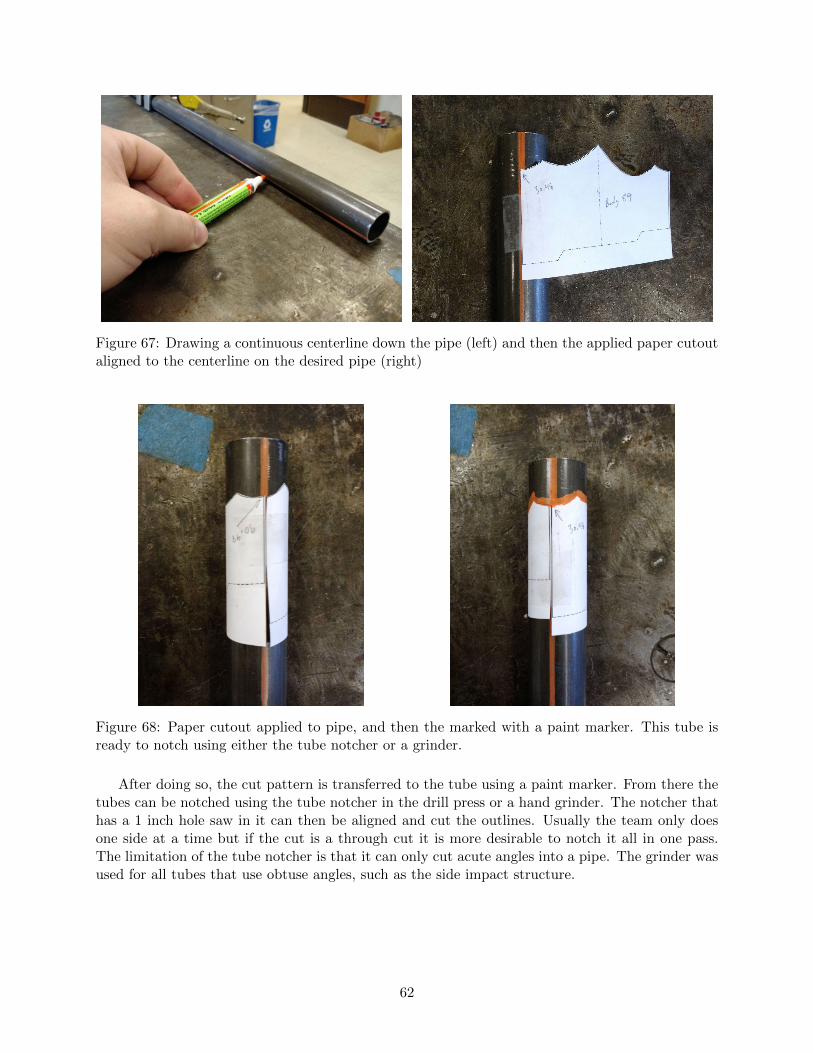
Figure 67: Drawing a continuous centerline down the pipe (left) and then the applied paper cutoutaligned to the centerline on the desired pipe (right)
Figure 68: Paper cutout applied to pipe, and then the marked with a paint marker. This tube isready to notch using either the tube notcher or a grinder.
After doing so, the cut pattern is transferred to the tube using a paint marker. From there thetubes can be notched using the tube notcher in the drill press or a hand grinder. The notcher thathas a 1 inch hole saw in it can then be aligned and cut the outlines. Usually the team only doesone side at a time but if the cut is a through cut it is more desirable to notch it all in one pass.The limitation of the tube notcher is that it can only cut acute angles into a pipe. The grinder wasused for all tubes that use obtuse angles, such as the side impact structure.
62

Figure 69: Tube being ready to notch (note that the paper is removed before notching) and a pipebeing ground to the paint outline outside the FSAE room.
After the tube has been notched, it is then de-burred using a metal file. The group usuallyleaves about a millimeter on the tube so that this last finishing process has material to work with.This ends the process of tube notching and is the most accurate way to notch tubes. Note that inaddition to use a grinder and the above tube notcher, we use most of the air tools in the shop. Anair tool with a 1/4” carbide de-burrer and an air tool with a cutting wheel on it allows for boththe trimming of the pipes, but also for pipes that are unable to be accurately done with these twomethods.
63
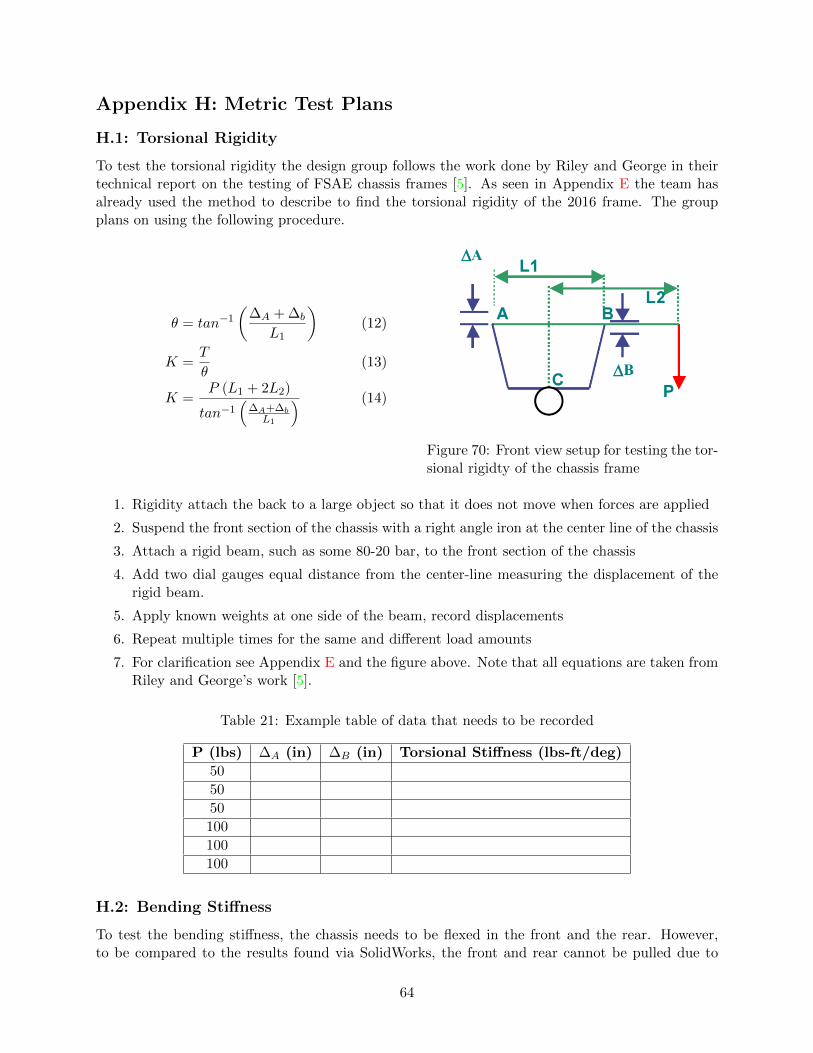
Appendix H: Metric Test Plans
H.1: Torsional Rigidity
To test the torsional rigidity the design group follows the work done by Riley and George in theirtechnical report on the testing of FSAE chassis frames [5]. As seen in Appendix E the team hasalready used the method to describe to find the torsional rigidity of the 2016 frame. The groupplans on using the following procedure.
θ = tan−1
(∆A + ∆b
L1
)(12)
K =T
θ(13)
K =P (L1 + 2L2)
tan−1(
∆A+∆bL1
) (14)
Figure 70: Front view setup for testing the tor-sional rigidty of the chassis frame
1. Rigidity attach the back to a large object so that it does not move when forces are applied
2. Suspend the front section of the chassis with a right angle iron at the center line of the chassis
3. Attach a rigid beam, such as some 80-20 bar, to the front section of the chassis
4. Add two dial gauges equal distance from the center-line measuring the displacement of therigid beam.
5. Apply known weights at one side of the beam, record displacements
6. Repeat multiple times for the same and different load amounts
7. For clarification see Appendix E and the figure above. Note that all equations are taken fromRiley and George’s work [5].
Table 21: Example table of data that needs to be recorded
P (lbs) ∆A (in) ∆B (in) Torsional Stiffness (lbs-ft/deg)
50
50
50
100
100
100
H.2: Bending Stiffness
To test the bending stiffness, the chassis needs to be flexed in the front and the rear. However,to be compared to the results found via SolidWorks, the front and rear cannot be pulled due to
64

insufficient measuring devices. Thus, the group plans rotate the chassis 180° about the z axis tohave a compressive force instead of a tensile force applied to the chassis. To do this, the groupplans on using the following procedure.
1. Position the chassis on a level surface, where the back end can be fixed to prevent movement.
2. Before securing the chassis in the rear, flip it 180° about the z axis to ensure compressiveforces are used.
3. Fix the rear of the chassis.
4. Apply dial indicators in approximate location where the middle of the wheel will be locatedon both the left and the right of the chassis.
5. Zero the dial indicators.
6. Apply weights to the center of the cross section under the front suspension box.
7. Record displacements and weight applied
8. Repeat multiple times for different loads
9. Rotate the chassis so the front is fixed and the back can be under load. (may need to applya beam across the back box for weight to be applied)
10. Repeat steps 4-8
Table 22: Example table of data that needs to be recorded
P (lbs) ∆A (in) ∆B (in) Bending Stiffness (lbs/in)
50
50
50
100
100
100
It should be noted that this test is very hard to do in practice. Thus the team will rely onthe fact that if the chassis has a high torsional rigidity having a high bending stiffness comesproportionally. Thus if the group is unable to construct the proper mounting attire for this test atthe University of Delaware we will consider it sufficient to just test the torsional rigidity.
H.3: Weight
To verify the weight of the chassis, the group will use the fully assembled chassis with no additionalcomponents attached (aside from the anti-intrusion plate). The design group will then place it overtwo scales and note their readings. This will be repeated multiple times to create a distributionthat the average and deviation can be found. The total weight of the frame is the sum of these twoscale weights.
H.4: Weight Distribution
This weight distribution describes the front to rear weight ratio on the front and rear wheels. Tomeasure this the whole car needs to be assembled. This metric will need to be tested after all othergroups have completed their manufacturing and have mounted their components on the chassis.
65

This will likely be untested until the final report. To measure this, the car can be positioned onfour scales and can be reloaded with the chassis multiple times to measure a average value andstandard deviation.
Figure 71: Free-body diagram of the force on a car as viewed from the side. Credit [14]
As seen in the derivations provided by The Car Tech [14] we can calculate the location of thehorizontal location of the center of mass. Given the wheelbase L the following can be said:
L = a+ b (15)
a = L− b (16)
Next we can sum the statics problem, knowing that the sum of the forces is equal to zero, we havethe following:
0 = FW − (Rf +Rr) (17)
FW = (Rf +Rr) (18)
where Rf and Rr are the weight of the two front scales summed, and the two back scales summed.Note that the value FW is the calculated total weight of the car. Next we can sum the momentabout point E to get the following:
0 = Rf ∗ L− FW ∗ b (19)
FW ∗ b = Rf ∗ L (20)
b =Rf ∗ LFW
(21)
Knowing these, we can repeat the experiment multiple times to find the value of b given thedistribution of weights. This can then be used to calculate the weight distribution by preformingb/L to find the back weight percentage. Inversely using equation 16 the value for a can be found.Thus using a L will get the front weight distribution percentage.
66
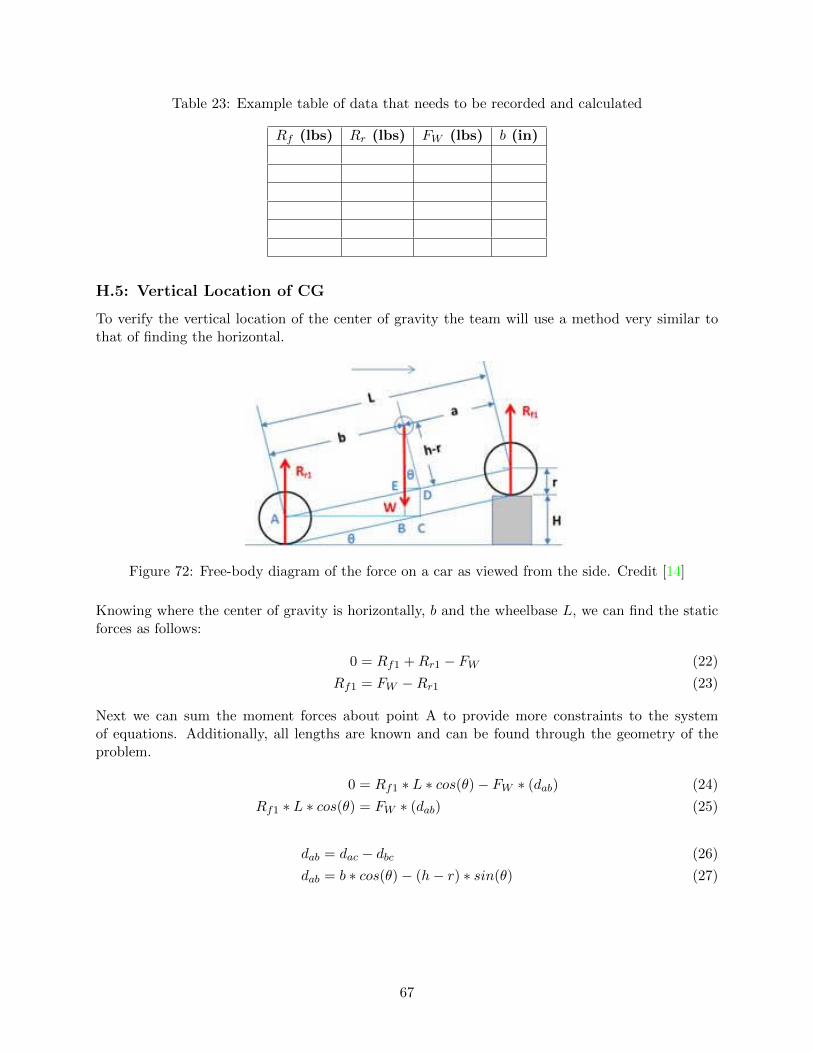
Table 23: Example table of data that needs to be recorded and calculated
Rf (lbs) Rr (lbs) FW (lbs) b (in)
H.5: Vertical Location of CG
To verify the vertical location of the center of gravity the team will use a method very similar tothat of finding the horizontal.
Figure 72: Free-body diagram of the force on a car as viewed from the side. Credit [14]
Knowing where the center of gravity is horizontally, b and the wheelbase L, we can find the staticforces as follows:
0 = Rf1 +Rr1 − FW (22)
Rf1 = FW −Rr1 (23)
Next we can sum the moment forces about point A to provide more constraints to the systemof equations. Additionally, all lengths are known and can be found through the geometry of theproblem.
0 = Rf1 ∗ L ∗ cos(θ) − FW ∗ (dab) (24)
Rf1 ∗ L ∗ cos(θ) = FW ∗ (dab) (25)
dab = dac − dbc (26)
dab = b ∗ cos(θ) − (h− r) ∗ sin(θ) (27)
67
Using the equations above and equation 25 we can then rearrange to get the following value for h.
Rf1 ∗ L ∗ cos(θ) = FW ∗ (b ∗ cos(θ) − (h− r) ∗ sin(θ)) (28)
Rf1 ∗ L ∗ cos(θ) = FW ∗ b ∗ cos(θ) − FW ∗ (h− r) ∗ sin(θ) (29)
FW ∗ (h− r) ∗ sin(θ) = FW ∗ b ∗ cos(θ) −Rf1 ∗ L ∗ cos(θ) (30)
(h− r) =
(b−
Rf1
FW∗ L)∗ cot(θ) (31)
h =
(b−
Rf1
FW∗ L)∗ cot(θ) + r (32)
where we know the angle to be defined as θ = sin−1(H/L). From this we can see that the value ofthe CG h is in respect to the ground, and thus is the value that the team is measuring. Using thesame data collection used to find the horizontal location of the CG the team can repeat the testsby raising either the back or front tires from the ground.
H.6: Ease of Egress
The ease of egress is the measure of the time the driver needs to leave the chassis and get out ontothe ground. This can be measured by having a driver sit in the chassis frame, and then exit. Usinga stopwatch this can be timed and the time needed to exit can be measured. Multiple trials canbe repeated such that an average value and deviation can be collected.
Table 24: Example table of data that needs to be recorded
Driver Name Time Taken (s)
Driver 1
Driver 1
Driver 1
Driver 2
Driver 2
Driver 2
68

Appendix I: FSAE Rules
The design team has compiled the rules that directly or could potentially affect the chassis design.We recommend that the reader references the official documentation [9], as it will be more completethen what we have stated below. We aim to provide brief overview of the key rules that must besatisfies and point the reader to the official FSAE rules [9] for documentation.
T2.1 Vehicle Configuration
• Car must be open cockpit
• Car must have four wheels that are not in a straight line
• Top 180 must be unobstructed
• No part may enter the 75mm buffer zone around the wheels
• There must be no openings (except suspension and cockpit opening) in the body work fromthe front of the car to the main hoop/firewall
T2.3 Wheelbase
• Wheelbase must be at least 1525mm or 60 inches
T3.3 Definitions
• Primary Structure is comprised of the following components
– Main Hoop
– Front Hoop
– Roll Hoop Braces and Supports
– Side Impact Structure
– Front Bulkhead
– Front Bulkhead Support System
69
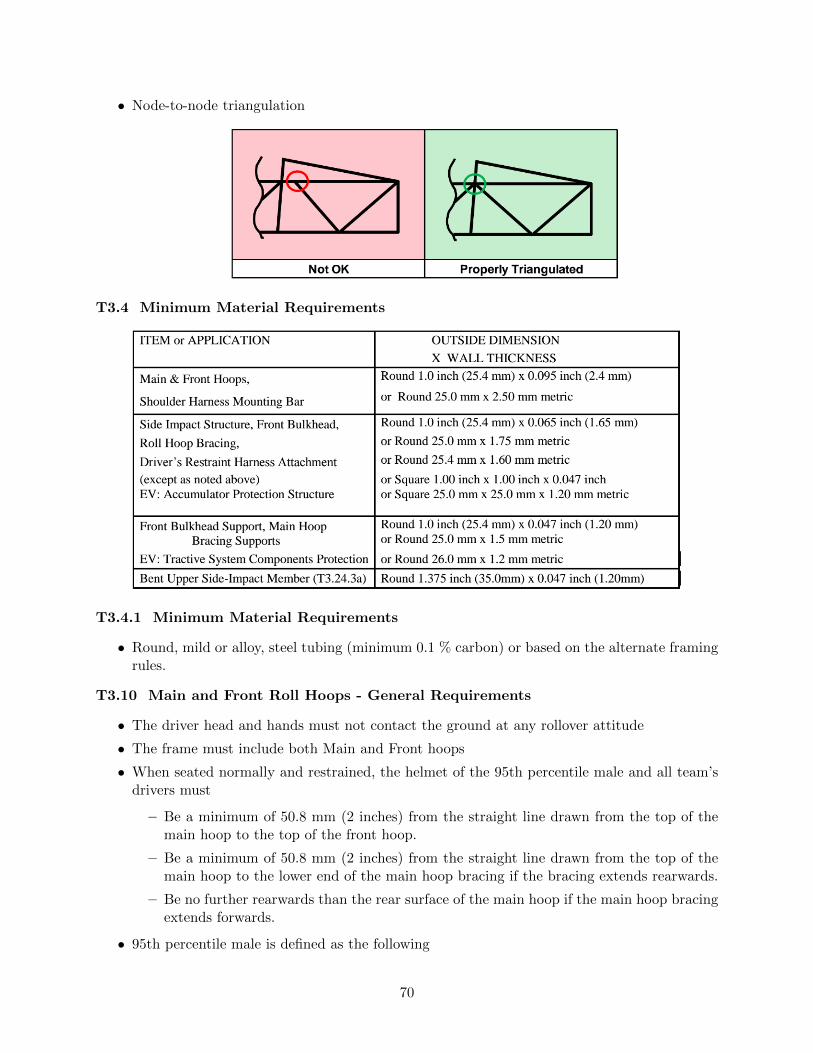
• Node-to-node triangulation
T3.4 Minimum Material Requirements
T3.4.1 Minimum Material Requirements
• Round, mild or alloy, steel tubing (minimum 0.1 % carbon) or based on the alternate framingrules.
T3.10 Main and Front Roll Hoops - General Requirements
• The driver head and hands must not contact the ground at any rollover attitude
• The frame must include both Main and Front hoops
• When seated normally and restrained, the helmet of the 95th percentile male and all team’sdrivers must
– Be a minimum of 50.8 mm (2 inches) from the straight line drawn from the top of themain hoop to the top of the front hoop.
– Be a minimum of 50.8 mm (2 inches) from the straight line drawn from the top of themain hoop to the lower end of the main hoop bracing if the bracing extends rearwards.
– Be no further rearwards than the rear surface of the main hoop if the main hoop bracingextends forwards.
• 95th percentile male is defined as the following
70

– A circle of diameter 200 mm (7.87 inch) will represent the hips and buttocks.
– A circle of diameter 200 mm (7.87 inch) will represent the shoulder/cervical region.
– A circle of diameter 300 mm (11.81 inch) will represent the head (with helmet).
– A straight line measuring 490 mm (19.29 inch) will connect the centers of the two 200mm circles.
T3.11 Main Hoop
• The Main hoop must be constructed of a single piece of uncut, continuous, closed sectionsteel tubing
• The Main Hoop must extend from the lowest Frame Member on one side of the Frame, up,over and down the lowest Frame Member on the other side of the Frame.
• he portion of the Main Roll Hoop that lies above its attachment point to the upper SideImpact Tube, must be within ten degrees (10) of the vertical.
• In the side view of the vehicle, any bends in the Main Roll Hoop above its attachment pointto the Major Structure of the Frame must be braced to a node of the Main Hoop BracingSupport structure. Same tube rules apply to the supports.
• In the front view of the vehicle, the vertical members of the Main Hoop must be at least380mm (15 inch) apart (inside dimension) at the location where the Main Hoop is attachedto the bottom tubes of the Major Structure of the Frame.
T3.12 Front Hoop
• The Front Hoop must extend from the lowest Frame Member on one side of the Frame, up,over and down to the lowest Frame Member on the other side of the Frame.
• With proper triangulation, it is permissible to fabricate the Front Hoop from more than onepiece of tubing.
• The top-most surface of the Front Hoop must be no lower than the top of the steering wheelin any angular position.
71

• The Front Hoop must be no more than 250 mm (9.8 inches) forward of the steering wheel.
• Max incline of the front hoop is 20 degrees.
T3.13 Main Hoop Bracing
• The Main Hoop must be supported by two braces extending in the forward or rearwarddirection.
• If the Main Hoop leans forward, the braces must be forward of the Main Hoop, and if theMain Hoop leans rearward, the braces must be rearward of the Main Hoop.
• The Main Hoop braces must be straight, i.e. without any bends
• The lower end of the Main Hoop Braces must be supported back to the Main Hoop by aminimum of two Frame Members on each side of the vehicle. (Node points of the side impactattenuators.)
T3.13.7 Main Hoop Bracing
• The lower end of the Main Hoop Braces must be supported back to the Main Hoop by aminimum of two Frame Members on each side of the vehicle; an upper member and a lowermember in a properly triangulated configuration.
• The upper support member must attach to the node where the upper Side Impact Memberattaches to the Main Hoop.
• The lower support member must attach to the node where the lower Side Impact Memberattaches to the Main Hoop.
• NOTE: Each of the above members can be multiple or bent tubes provided the requirementsof T3.5.5 are met.
• NOTE: Examples of acceptable configurations of members can be found in Appendix T-4.
72

T3.14 Front Hoop Bracing
• The Front Hoop must be supported by two braces extending in the forward direction on bothsides.
• The Front Hoop braces must be constructed such that they protect the drivers legs and shouldextend to the structure in front of the drivers feet.
• The Front Hoop braces must be attached as near as possible to the top but not more than50.8 mm (2 in) below the top-most surface of the Front Hoop.
• The Front Hoop braces must be straight
T3.20 Impact Attenuator
• Forward of the Front Bulkhead there must be an Impact Attenuator Assembly, consisting ofan Impact Attenuator and an Anti-Intrusion Plate.
• The Impact Attenuator must be at least 200 mm (7.8 in) long, at least 100 mm (3.9 in) highand 200 mm (7.8 in) wide for a minimum distance of 200 mm (7.8 in) forward of the FrontBulkhead and attached securely to the anti-intrusion plate or directly to the front bulkhead.
• The anti-intrusion plate must be a 1.5 mm (0.060 in) solid steel or 4.0 mm (0.157 in) solidaluminum plate or approved alternative and attach securely and directly to the front bulkhead.
• For welded joints the profile of the anti-intrusion plate must extend at least to the centerlineof the Front Bulkhead tubes on all sides.
T3.24 Side Impact Structure
• The Side Impact Structure for tube frame cars must be comprised of at least three tubularmembers
73

• The upper Side Impact Structural member must connect the Main Hoop and the Front Hoop.With a 77kg (170 pound) driver seated in the normal driving position all of the member mustbe at a height between 300 mm (11.8 inches) and 350 mm (13.8 inches) above the ground.
• The lower Side Impact Structural member must connect the bottom of the Main Hoop andthe bottom of the Front Hoop.
• The diagonal member must connect the upper and lower members forward of the Main Hoopand rearward of the Front Hoop.
T4.1 Cockpit Opening
• To ensure that the opening giving access to the cockpit is of adequate size, a template shownbelow will be inserted.
• It will be held horizontally and inserted vertically until it has passed below the top bar of theSide Impact Structure
T4.2 Cockpit Internal Cross Section
• A free vertical cross section, which allows the template show below to be passed horizontallythrough the cockpit to a point 100mm (4 inches) rearward of the face of the rearmost pedalwhen in the inoperative position.
• If the pedals are adjustable, they will be put in their most forward position.
T4.4 Floor Close-out
• All vehicles must have a floor closeout made of one or more panels, which separate the driverfrom the pavement. If multiple panels are used, gaps between panels are not to exceed 3 mm(1/8 inch).
• The closeout must extend from the foot area to the firewall and prevent track debris fromentering the car.
• The panels must be made of a solid, non-brittle material.
T4.5 Firewall
74

• A firewall must separate the driver compartment from all components of the fuel supply, theengine oil, the liquid cooling systems and any high voltage system.
• The firewall must be a non-permeable surface made from a rigid, fire resistant material.
• The vehicle must have a solid, rigid, non-permeable, and fire resistant surface to separate thedriver from all components of the fuel supply, the engine oil and liquid cooling system. Itmust extend high enough such that any point less that 100mm (4) below the driver’s helmetof the tallest driver is not in a direct line of any of these components.
T4.7 Driver Visibility
• In the normal seating position, the driver must have at least 200 degrees of visibility.
• The driver may turn their head or use mirrors to achieve this
• Mirrors must remain in place, and can be adjusted to enable the required visibility throughoutall dynamics events
T4.8 Driver Egress
• All drivers must be able to exit the vehicle under 5 seconds.
• The egress time period begins when the driver is in the fully seated, driving position and endswhen the driver’s feet touch the pavement.
T5.6 Head Restraint
• Head rest restrain must be vertical or near vertical in side view.
• Have a minimum width of 6 inches.
• Have a minimum area of 36 sq. inches.
• Must have a minimum height adjustment of at least 7 inches or have a minimum height of11 inches.
• Be located so that for each driver:
– The restraint is no more than 25 mm (1 inch) away from the back of the driver’s helmet,with the driver in their normal driving position.
– The contact point of the back of the drivers helmet on the head restraint is no less than50 mm (2 inch) from any edge of the head restraint.
• The restraint, its attachment and mounting must be strong enough to withstand a force of890 Newtons (200 lbs. force) applied in a rearward direction.
T6.6 Jacking Points
• A jacking point, which is capable of supporting the cars weight and of engaging the organizers“quick jacks”, must be provided at the rear of the car.
• The jacking point is required to be:
– Visible to a person standing 1 meter (3 feet) behind the car.
– Painted orange
– Oriented horizontally and perpendicular to the centerline of the car
75

– Made from round, 25 - 29 mm (1 - 1 1/8 inch) O.D. aluminum or steel tube
– A minimum of 300 mm (12 inches) long
– Exposed around the lower 180 degrees (180°) of its circumference over a minimum lengthof 280 mm (11 in)
– The height of the tube is required to be such that:
∗ There is a minimum of 75 mm (3 in) clearance from the bottom of the tube to theground measured at tech inspection.
∗ With the bottom of the tube 200 mm (7.9 in) above ground, the wheels do not touchthe ground when they are in full rebound.
• Access from the rear of the tube must be unobstructed for at least 300mm of its length
T6.7 Rollover Stability
• The track and center of gravity of the car must combine to provide adequate rollover stability
• The vehicle must not roll when tilted at an angle of 60 to the horizontal in either direction,corresponding to 1.7 G’s.
T11 Fasteners
• All threaded fasteners utilized in the drivers cell structure, steering, breaking, harness, andsuspension must meet or exceed SAE Grade 5, Metric Grade 8.8 and/or AN/MS specifications
• The use of button head, countersunk, pan, flat, or round heads is prohibited in the following
– Primary structure attachments
– Impact Attenuator
– Driver’s Harness
– Steering System
– Brake System
– suspension
• Any bolt joint in the primary structure using either tabs or brackets, must have an edgedistance e/D of 2 or greater.
76