Dynamic analysis of two wheeler chassis
71
Dynamic Analysis of a Two-wheeler Chassis 2007-08 PROJECT REPORT On “DYNAMIC ANALYSIS OF A TWO WHEELER CHASSIS” Undertaken at PESIT, BANGALORE. Submitted in partial fulfilment of the requirement For the Award of Degree of BACHELOR OF ENGINEERING IN MECHANICAL ENGINEERING Submitted by PRAVEEN K S 1PI04ME066 SANDEEP SHARMA N V 1PI04ME081 VIKRAM K DESHPANDE 1PI04ME110 VINAY ANAND S 1PI04ME111 Under the guidance of Mr. SHARANBASSAPPA S. PATIL Associate Professor, Department Of Mechanical Engineering, P.E.S.I.T, Bangalore. Department of Mechanical Engineering P. E. S. Institute of Technology 100 Feet Ring Road, BSK III Stage, Bangalore - 560 085 Ph: 6721983 For the academic session Feb 2008 – June 2008 Department of Mechanical Engineering 1
Transcript of Dynamic analysis of two wheeler chassis
Dynamic Analysis of a Two-wheeler Chassis 2007-08
PROJECT REPORT
On
“DYNAMIC ANALYSIS OF A TWO WHEELER CHASSIS”
Undertaken at
PESIT, BANGALORE.
Submitted in partial fulfilment of the requirement For the Award of Degree of
BACHELOR OF ENGINEERING IN
MECHANICAL ENGINEERING
Submitted by
PRAVEEN K S 1PI04ME066 SANDEEP SHARMA N V 1PI04ME081 VIKRAM K DESHPANDE 1PI04ME110
VINAY ANAND S 1PI04ME111
Under the guidance of
Mr. SHARANBASSAPPA S. PATIL Associate Professor,
Department Of Mechanical Engineering, P.E.S.I.T, Bangalore.
Department of Mechanical Engineering
P. E. S. Institute of Technology 100 Feet Ring Road, BSK III Stage, Bangalore - 560 085 Ph: 6721983
For the academic session Feb 2008 – June 2008
Department of Mechanical Engineering 1
Dynamic Analysis of a Two-wheeler Chassis 2007-08
Department of Mechanical Engineering 2
PEOPLES EDUCATION SOCIETY I N S T I T U T E O F T E C H N O L O G Y 100 Feet Ring Road, BSK III Stage, Bangalore - 560 085.
DEPARTMENT OF MECHANICAL ENGINEERING
CERTIFICATE
Certified that the project entitled DYNAMIC ANALYSIS OF A TWO WHEELER CHASSIS is a bonafide work carried out by PRAVEEN K S, SANDEEP SHARMA N V, VIKRAM K DESHPANDE and VINAY ANAND S in partial
fulfillment for the award of degree of Bachelor of Engineering in MECHANICAL
of the Visveswaraiah Technological University, Belgaum during the year
2007-2008. It is certified that all corrections/ suggestions indicated for internal
assessment have been incorporated in the report in departmental library. The
project report has been approved as it satisfies the academic requirements in
respect of project work prescribed for the Bachelor of Engineering Degree. Signature of Internal Guide Signature of HOD Signature of Principal Mr. Sharanbassappa S. Patil Dr K Narasimha Murthy Dr K.N Balasubramanya Murthy Associate Professor, Professor & Head, Principal, Dept. of Mechanical Engg. Dept. of Mechanical Engg P.E.S.I.T P.E.S.I.T P.E.S.I.T
Name of Students USN
1. PRAVEEN K S 1PI04ME066 2. SANDEEP SHARMA N V 1PI04ME081 3. VIKRAM K DESHPANDE 1PI04ME110 4. VINAY ANAND S 1PI04ME111 EXTERNAL VIVA Name of Examiners Signature with Date
1.
2.

Dynamic Analysis of a Two-wheeler Chassis 2007-08
ACKNOWLEDGEMENT
The satisfaction and euphoria that accompany the successful completion of any
task would be incomplete without the mention of the people whose constant
guidance and encouragement crowned our effort with success.
We are grateful to Dr. K. Narasimha Murthy, Professor and Head, Department
of Mechanical Engineering, for his encouragement and the facilities extended by
the department. We are also thankful to our Principal, Dr. K. N. Balasubramanya Murthy.
We consider ourselves fortunate to have Mr.Sharanbassappa S. Patil, Associate Professor, Department of Mechanical Engineering, as our guide. We
are grateful to him for his useful guidance and encouragement throughout the
project period.
It is our pleasure to thank Mr. Shirish R. Kala, Lecturer, Department of
Mechanical Engineering, for his constant and valuable guidance.
We express our profound gratitude to Mr.Sanjay Patil, Geometric India
Solutions, for his support. We would like to thank Mr. Kannan, LMS India, for his
valuable guidance.
We would also like to thank all the teaching and non-teaching staff of the
Department of Mechanical Engineering, for their support.
This project would not have completed without the valuable support of our Family
and Friends.
Department of Mechanical Engineering 3
Dynamic Analysis of a Two-wheeler Chassis 2007-08
ABSTRACT
A chassis serves as the basic foundation on which all the parts of a
machine rest. In an automobile, the chassis acts as a skeleton on which the
engine, transmission, driveshaft, differential, gearbox and suspension are
mounted.
In the two wheeler scenario, the ride comfort quality offered by the two
wheeler plays an important role in attracting the potential buyers. The comfort is
significantly affected by noise and vibration which is experienced by the rider
during the travel. These vibrations are caused by road roughness, mass
unbalance etc. and are transmitted to the occupants through the seat floor,
handle bar, foot rests etc, in totality through the frame skeleton of motorcycle
chassis. Hence a thorough understanding of the dynamic behavior of the chassis
is essential.
This work deals with numerical analysis of the chassis for its vibrations
and experimental modal testing. The numerical analysis involves 3D modeling of
the chassis and analyzing its behaviour under varying load conditions. For
experimental modal testing, the chassis is suspended to simulate the free - free
condition and excited by some means. The vibration pattern is recorded by an
FFT analyzer. The results are then extracted using a software. Ultimately, the two
results obtained are corroborated.
Department of Mechanical Engineering 4

Dynamic Analysis of a Two-wheeler Chassis 2007-08
CONTENTS
ACKNOWLEDGEMENT ABSTRACT LIST OF FIGURES LIST OF TABLES Chapter 1: Introduction 1.1 Chassis 1 1.2 Types of chassis 3 Chapter 2: Literature Survey 2.1 Vibrations in motorcycles 7
2.2 Human Body Vibration 11 2.2.1 Vibration Exposure Criteria 13 2.3 Finite Element Analysis 16 2.3.1 Steps involved in FEM 17 2.4 Experimental Modal Testing 18 2.4.1 Procedure for modal testing 21 2.4.2 Modal Testing setup 24 2.4.3 Concept of frequency response system 26 2.4.4 Excitation methods 34 2.4.5 Exciting Modes with Impact Testing 35 2.4.6 Assumptions in modal testing 38
Chapter 3: Dynamic Analysis – FEM Approach 3.1 FEM analysis of the motorcycle chassis 41 3.2 Results 44
Chapter 4: Experimental Modal Testing 4.1 Procurement of the chassis 49 4.2 Dimensions of the chassis 49
4.3 Modal Testing Procedure Implemented 51 4.4 Setting up the modal test 51 4.5 Creating the geometry of the chassis 54 4.6 Documentation of the test 56
Department of Mechanical Engineering 5

Dynamic Analysis of a Two-wheeler Chassis 2007-08
4.7 Experimental Results 60 Chapter 5: Comparison of Results 61 CONCLUSION 62 REFERENCES 63
Department of Mechanical Engineering 6

Dynamic Analysis of a Two-wheeler Chassis 2007-08
LIST OF FIGURES
Figure Description
1.1 Typical model of Backbone frame 1.2 Typical model of a Perimeter Chassis 1.3 Typical model of Trellis frame 2.1 Different motions of a motorcycle 2.2 Forces produced by tyres 2.3 Human body as a mechanical system 2.4 Tolerance of humans to repetitive vertical impact 2.5 Rigid body modes 2.6 Types of curve-fit methods 2.7 Modal testing procedure 2.8 General measurement test setup for Modal testing 2.9 A typical FRF 2.10 Nyquist plot of frequency response 2.11 Frequency response-polar coordinates 2.12 Frequency response-rectangular coordinates 2.13 Typical Instrumentation for Accelerometer 2.14 Types of mounting – Stud mount and Fin mount pad 3.1 Part models of the chassis 3.2 Assembled chassis model 3.3 Meshed Finite Element model 4.1 Suzuki Zeus chassis 4.2 Chassis suspension, Accelerometer, Wax used 4.3 Impact Hammer 4.4 Eight channel FFT Analyzer 4.5 Line diagram and Solid model of the chassis
Department of Mechanical Engineering 7

Dynamic Analysis of a Two-wheeler Chassis 2007-08
LIST OF TABLES Table Description 2.1 Symptoms affecting humans at different frequencies
2.2 Forms of Frequency Response Function
3.1 Natural frequencies of the chassis at different modes
4.1 Co-ordinates of various points on the chassis
4.2 Experimental values of Natural frequencies
5.1 Comparison of Results
Department of Mechanical Engineering 8

Dynamic Analysis of a Two-wheeler Chassis 2007-08
1.1 Chassis
A chassis serves as the basic foundation on which all the parts of a
machine rest. In an automobile, the chassis acts as a skeleton on which the
engine, transmission, driveshaft, differential, gearbox and suspension are
mounted. The chassis should be structurally sound in every way and support the
body panels over the expected life of the vehicle and beyond.
The engine generally sits inside the frame, the rear swing arm is attached
by a pivot bolt (allowing the suspension to move) and the front forks are attached
to the front of the frame. The frame can also help to protect the more sensitive
parts of the motorcycle in a crash.
Any good chassis must do several things:
1. Be structurally sound in every way over the expected life of the vehicle and
beyond. This means nothing will ever break under normal conditions.
2. Maintain the suspension mounting locations so that handling is safe and
consistent under high cornering and bump loads.
3. Support the body panels and other passenger components so that
everything feels solid and has a long, reliable life.
4. Protect the occupants from external intrusion.
5. Help the wheels align on a single straight line.
Department of Mechanical Engineering 9

Dynamic Analysis of a Two-wheeler Chassis 2007-08
Different chassis designs have their own strengths and weaknesses.
Every chassis is a compromise between weight, component size, complexity,
vehicle intent, and ultimate cost. And even within a basic design method,
strength and stiffness can vary significantly, depending on the details. There is
no such thing as the ultimate method of construction for every vehicle, because
each vehicle presents a different set of problems.
Even though an aluminum chassis is the path to the lightest design, it is
not necessarily true. Aluminum is more flexible than steel. In fact, the ratio of
stiffness to weight is almost identical to steel, so an aluminum chassis must
weigh the same as a steel one to achieve the same stiffness. Aluminum has an
advantage only where there may be very thin sections where buckling is possible.
Chassis design works around three major aspects of the motorcycle, the
rider, engine and suspension. The suspension mounting points are fixed in
space and are determined by the geometry of the suspension. The engine is a
large component in the vehicle with a fixed size, and needs to be located as close
to the rear of the vehicle as possible for proper weight distribution. The rider is
the largest lumped mass in the vehicle, with special ergonomic requirements for
comfort and drivability.
These three items directly govern chassis design and must be accounted
for before any subsystem design can begin. A good chassis design
encompasses all of these aspects in an efficient way, providing a stable and
sound foundation for all vehicle components.
Department of Mechanical Engineering 10

Dynamic Analysis of a Two-wheeler Chassis 2007-08
1.2 Types of Chassis
Single cradle frame: The single cradle is the simplest type of motorcycle
frame, and looks similar to the first ever motorcycle frames. It is made from
steel tubes that surround the engine with a main tube above and other,
smaller diameter tubes beneath.
If a single cradle becomes double at the exhaust, as frequently occurs, it is
referred to as a split single cradle frame. Single cradle frames are usually
found in off-road motorcycles. Double cradle frame: Double cradle frames are descended from single
cradle frames. They consist of two cradles that support the engine one
either side. Double cradle frames are commonly used in custom
motorcycles and simpler road bikes. They offer a good compromise
between rigidity, strength and lightness, though they have now been
technically surpassed by perimeter frames.
Backbone frame: Far from the most desirable frame around, the
backbone frame comprises a single, wide main beam from which the
engine is suspended.
The backbone frame allows for great flexibility in design, since it is
concealed inside the finished motorcycle. The engine just seems to hang
in mid air. It is simple and cheap to make, and is used mainly on naked
and off-road motorcycles.
Department of Mechanical Engineering 11

Dynamic Analysis of a Two-wheeler Chassis 2007-08
1.1 Typical model of Backbone frame
Monocoque frame: The monocoque frame is used nearly exclusively on
competition bikes and is very rarely found on road-going bikes.
Monocoque frames act as a single piece unit that functions as seat
mounting, tank and tail section. Though they offer certain advantages in
terms of rigidity, monocoque frames are heavy and generally not worth the
effort.
Perimeter frame: Motorcycle racing research has shown that major
advantages are to be gained in terms of rigidity by joining the steering
head to the swing arm in as short a distance as possible. Flexure and
torsion are dramatically reduced. This is the concept behind the perimeter
frame. Two robust beams descend in the most direct way possible from
the steering head to the swing arm, passing around the engine.
The earliest perimeter frames were made from steel, but the need to
improve rigidity to weight ratios led most manufacturers to adopt aluminum
instead.
Department of Mechanical Engineering 12
Dynamic Analysis of a Two-wheeler Chassis 2007-08
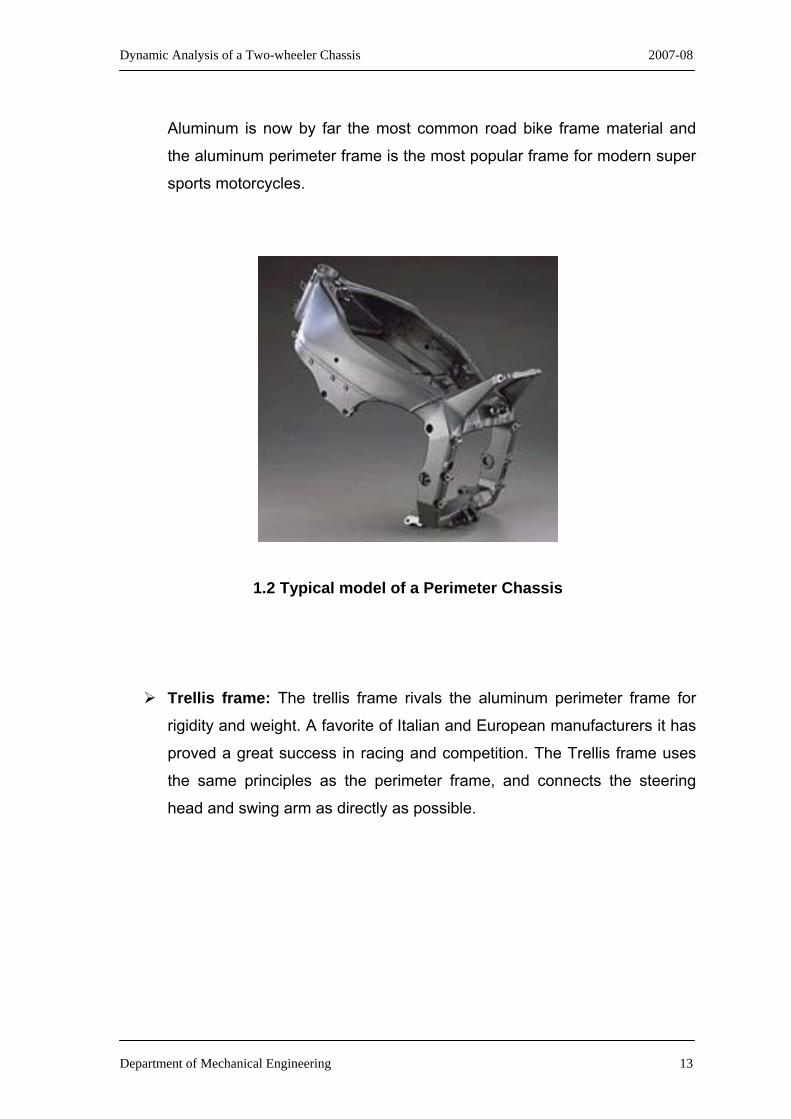
Aluminum is now by far the most common road bike frame material and
the aluminum perimeter frame is the most popular frame for modern super
sports motorcycles.
1.2 Typical model of a Perimeter Chassis
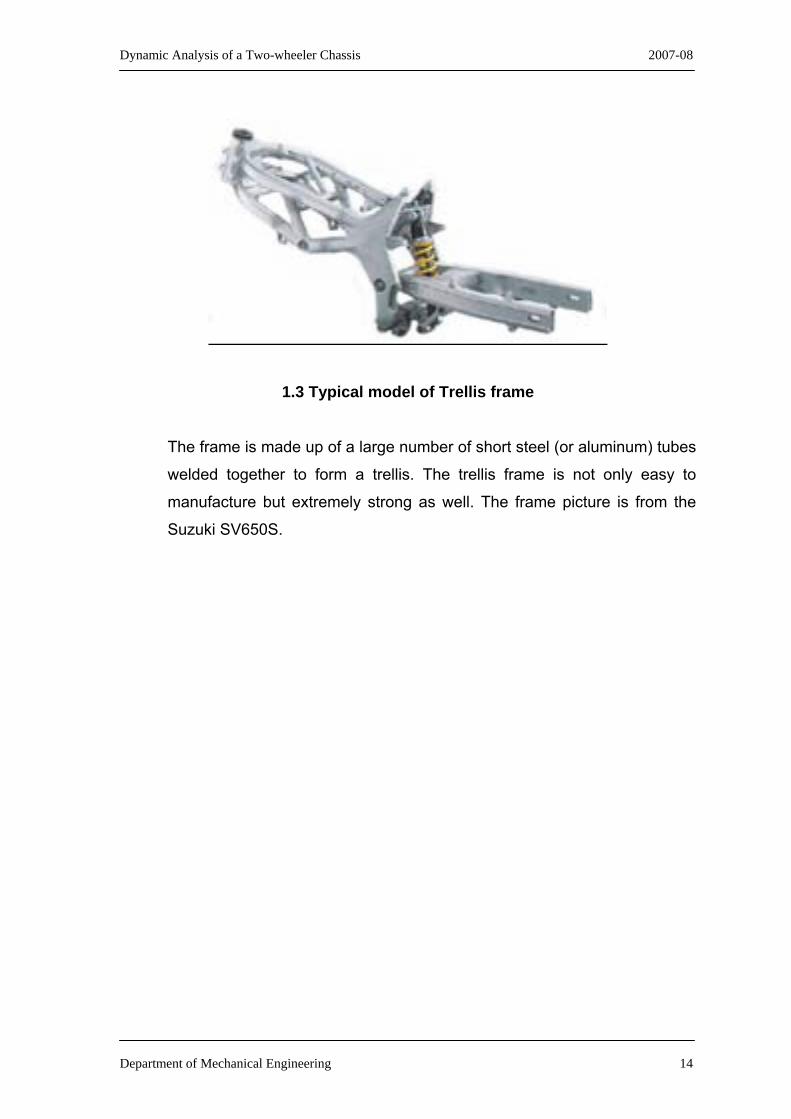
Trellis frame: The trellis frame rivals the aluminum perimeter frame for
rigidity and weight. A favorite of Italian and European manufacturers it has
proved a great success in racing and competition. The Trellis frame uses
the same principles as the perimeter frame, and connects the steering
head and swing arm as directly as possible.
Department of Mechanical Engineering 13
Dynamic Analysis of a Two-wheeler Chassis 2007-08
1.3 Typical model of Trellis frame
The frame is made up of a large number of short steel (or aluminum) tubes
welded together to form a trellis. The trellis frame is not only easy to
manufacture but extremely strong as well. The frame picture is from the
Suzuki SV650S.
Department of Mechanical Engineering 14

Dynamic Analysis of a Two-wheeler Chassis 2007-08
2.1 Vibrations in Motorcycles
The motorcycle is assumed to run straight on a flat, level road surface at a
certain velocity. The rider is thought to be a rigid body fixed to the rear frame,
which can exert no control on the motorcycle. For simplicity's sake, the
motorcycle is considered to have rigid suspension; from a kinematics point of
view it is a spatial system whose motion can be described by means of the
following four coordinates:
• the steering angle;
• the roll angle;
• the yaw angle;
• the lateral displacement of the mass centre.
2.1 Different motions of a motorcycle
The system "motorcycle" may be considered to consist of two parts:
• the rear frame including the rider, the engine, the petrol tank and the seat
and rear wheel;
• the front frame including the forks, the handlebars and the front wheel.
Department of Mechanical Engineering 15

Dynamic Analysis of a Two-wheeler Chassis 2007-08
The rear frame and the front frame are hinged together at the steering axis by
means of a revolute pair. During the motion, the tyres are free to sideslip; so they
produce lateral forces which are a linear function of the sideslip angles and the
camber angle. These forces, from a practical point of view, may be considered to
be restoring forces like those produced by springs.
2.2 Forces produced by tyres
Keeping the above simplification in mind, the steering axis is considered to be
constrained so that it can't move laterally. So the motorcycle may be thought of
as two decoupled systems each having only one degree of freedom:
• The front frame oscillating around the steering axis on which the lateral
front tyre force (with the normal trail as a lever) acts as a restoring force;
• The rear frame oscillating around the steering axis on which the lateral
rear tyre force (with a lever proportional to the wheelbase) acts as a
restoring force.
Department of Mechanical Engineering 16

Dynamic Analysis of a Two-wheeler Chassis 2007-08
The two oscillation modes are:
• An oscillation of the front frame around the steering axis called the wobble
mode.
• An oscillation of the rear frame around the steering axis called the weave
mode.
The frequency of the wobble mode is:
where:
α n is the normal trail;
If is the moment of inertia of the front frame around the steering axis;
k λ f is the front tyre stiffness;
ε is the steering head angle.
The frequency of the weave mode is:
where:
l is the lever of the rear tyre force with respect to the steering axis;
I r is the moment of inertia of the rear frame around the steering axis;
k λ r is the rear tyre slip stiffness.
Department of Mechanical Engineering 17

Dynamic Analysis of a Two-wheeler Chassis 2007-08
In reality, the modes are different in view of the fact that the steer axis is
not blocked. The wobble mode is essentially a steering oscillation of the front
forks; this mode doesn't involve the rear frame in any significant way.
Typical values of the frequencies vary from 4 Hz, in the case of heavy
motorcycles, to 9 Hz, in the case of lightweight motorcycles.
The frequency of the wobble mode goes up as the trail increases and as
the front inertia decreases: this depends essentially on the sideslip stiffness of
the front tire and is also influenced by the lateral flexibility of the front fork. When
the speed of the motorcycle ranges from 10 to 20 m/s (40-80 km/h), the wobble is
only a little damped and can therefore become unstable: the adoption of a
damping steer increases the damping and consequently the degree of stability.
The weave mode is a side-to-side motion of the entire motorcycle
characterized by a coupling of the yaw and roll oscillations with a large lateral
displacement of the steering axis. The weave mode has a natural frequency
increasing from about 0.2 Hz at a low speed to about 3-4 Hz at a high forward
speed.
Its value depends on numerous factors:
• the position of the mass centre of the rear frame;
• the inertia of the wheels;
• the castor angle;
• the trail.
The mode may be unstable at a low speed; at a high speed it may be difficult
to control since its natural frequency may be too high to be controlled by the
driver.
Department of Mechanical Engineering 18

Dynamic Analysis of a Two-wheeler Chassis 2007-08
It is well known that motorcycles, without the action of control exercised by
the rider, are unstable in roll, this motion is a non-oscillatory motion and consists
in the capsize of the two-wheel vehicle. In fact, the motorcycle in uniform
rectilinear motion will eventually fall laterally: the motorcycle is therefore an
intrinsically unstable system, above all in the low speeds range when the
stabilizing action of the gyroscopic effects turns out to be negligible.
The capsize motion is essential for driving the motorcycle; it is used and
controlled by the rider by means of the steering. The time of the vehicle's capsize
depends on numerous factors such as the speed of the vehicle; the inertia of the
wheels (gyroscopic effect); the height of the mass centre; the mass of the
motorcycle; the roll inertia of the vehicle; the castor angle; the trail.
Thus it is essential to have a good understanding of the behaviour of the
motorcycle under varying load conditions.
2.2 Human Body Vibration
Our ultimate aim is to isolate the vibrations and prevent them from
affecting the human body. For this purpose, a sound knowledge of both the
behaviour of chassis to vibrations and the human response to it is required. This
chapter deals about the effects of vibrations on human body.
The human body is both physically and biologically a "system" of an
extremely complex nature. When looked upon as a mechanical system it can be
considered to contain a number of linear as well as non-linear "elements", and
the mechanical properties are quite different from person to person.
Department of Mechanical Engineering 19

Dynamic Analysis of a Two-wheeler Chassis 2007-08
Biologically the situation is by no means simpler, especially when
psychological effects are included. In considering the response of man to
vibrations and shocks it is necessary, however, to take into account both
mechanical and psychological effects.
Considering first the human body as a mechanical system it may, at low
frequencies and low vibration levels, be roughly approximated by a linear lumped
parameter system of the type shown in the figure 2.3.
2.3 Human body as a mechanical system
One of the most important parts of this system with respect to vibration
and shock effect seems to be the part marked "thorax-abdomen system". This is
due to a distinct resonance effect occurring in the 3-6 Hz range. This makes
efficient vibration isolation of a sitting or standing person very difficult.
Department of Mechanical Engineering 20

Dynamic Analysis of a Two-wheeler Chassis 2007-08
A further resonance effect platform is found in the 20 to 30 Hz region and
is caused by the head-neck shoulder system.
Also in the region 60 to 90 Hz disturbances are felt which suggest eyeball
resonances, and a resonance effect in the lower jaw-skull system has been found
between 100 and 200 Hz.
Above 100 Hz, simple lumped parameter models are not very useful. It is
then necessary to apply continuous structural analysis methods which become
very complex. By such methods, however, it has been shown that for the skull
itself, the fundamental mode of vibration seems to be in the region of 300-400 Hz
with resonances for higher modes around 600 to 900 Hz.
At still higher frequencies use must be made of wave theory both in the
form of shear waves and of compression waves (sound waves).
2.2.1 Vibration Exposure Criteria
Apart from the mechanical responses mentioned above, both physiological
and psychological effects are observed. Psychological effects such as
perception, discomfort, and pain, have recently been studied in some detail. Most
of the studies have been carried out on vehicle drivers and aircraft pilots, whose
ability to perform complex tasks under adverse environmental conditions, in-
cluding vibration, is particularly important. The data available is therefore mainly
for sitting or standing subjects.
Vibration at frequencies below 1 Hz occurs in many forms of transport and
produces effects, e.g. Kinetosis (motion sickness), which are completely different
in character from those produced at higher frequencies. These effects cannot be
simply related to the three parameters of the exciting motion, intensity, duration,
and frequency, as has been possible in the range from 1 Hz to 80 Hz.
Department of Mechanical Engineering 21

Dynamic Analysis of a Two-wheeler Chassis 2007-08
In addition, human reaction to vibration below 1 Hz is extremely variable
and seems to depend on a large number of external factors which have nothing
to do with the motion, e.g. age, sex, vision, activity, odours. Despite this variability
and the limited amount of data available, an attempt has been made to formulate
tentative standards for the frequency range from 1 Hz down to 0.
2.4 Tolerance of human subjects in the standing or supine position to
repetitive vertical impact pulses
Department of Mechanical Engineering 22

Dynamic Analysis of a Two-wheeler Chassis 2007-08
Tolerance of human subjects in the standing or supine position to
repetitive vertical impact pulses representative of impacts from pile drivers, heavy
tools, heavy traffic etc. is as shown in the figure. Subjective reaction is plotted as
a function of the maximum displacement of the initial pulse and its rise time.
The numbers indicate the following reactions for the areas between the lines:
I a - threshold of perception;
I b - for easy perception;
I c - of strong perception, annoying;
11a - very unpleasant, potential danger for long exposures;
II b - extremely unpleasant, definitely dangerous.
Symptoms for vibration exposure at frequencies of 1 to 20 Hz are shown in
the table. The frequency ranges given are those where the symptoms are most
predominant.
Symptoms Frequency (Hz)
General feeling of discomfort 4-9
Head symptoms 13-20
Lower jaw symptoms 6-8
Influence on speech 13-20
Lump in the throat 12-16
Chest pains 5-7
Abdominal pains 4-10
Urge to urinate 10-18
Increased muscle tone 13-20
Influence on breathing movements 4-8
Muscle contractions 4-9
2.1 Symptoms affecting humans at different frequencies
Department of Mechanical Engineering 23

Dynamic Analysis of a Two-wheeler Chassis 2007-08
Thus the design of chassis should be such that it does not transmit these
frequencies to the human body. The mass and the stiffness of the chassis are
modified in such a way that these frequencies remain isolated and are not
transmitted from the ground to the human body.
2.3 Finite Element Analysis
Finite Element Analysis consists of a computer model of a material or
design that is stressed and analyzed for specific results. It is used in new product
design, and existing product refinement. Modifying an existing product or
structure is utilized to qualify the product or structure for a new service condition. In case of structural failure, FEA may be used to help determine the design
modifications to meet the new condition.
There are generally two types of analysis that are used: 2-D modeling, and
3-D modeling. While 2-D modeling conserves simplicity and allows the analysis to
be run on a relatively normal computer, it tends to yield less accurate results. 3-D
modeling, however, produces more accurate results while sacrificing the ability to
run on all but the fastest computers effectively.
FEA uses a complex system of points called nodes which make a grid
called a mesh .This mesh is programmed to contain the material and structural
properties which define how the structure will react to certain loading conditions.
Nodes are assigned at a certain density throughout the material depending
on the anticipated stress levels of a particular area. Regions which will receive
large amounts of stress usually have a higher node density than those which
experience little or no stress.
Department of Mechanical Engineering 24

Dynamic Analysis of a Two-wheeler Chassis 2007-08
Points of interest may consist of: fracture point of previously tested
material, fillets, corners, complex detail, and high stress areas. The mesh acts
like a spider web in that from each node, there extends a mesh element to each
of the adjacent nodes. This web of vectors is what carries the material properties
to the object, creating many elements.
2.3.1 Steps involved in FEM
In general, there are three phases in any computer-aided engineering task:
• Pre-processing – defining the finite element model and environmental
factors to be applied to it
• Analysis solver – solution of finite element model
• Post-processing of results using visualization tools
Pre-processing
The first step in using FEA, pre-processing, is constructing a finite element
model of the structure to be analyzed. The input of a topological description of the
structure's geometric features is required in most FEA packages. This can be in
either 1D, 2D, or 3D form, modeled by line, shape, or surface representation,
respectively, although nowadays 3D models are predominantly used.
Once the finite element geometric model has been created, a meshing
procedure is used to define and break up the model into small elements. In
general, a finite element model is defined by a mesh network, which is made up
of the geometric arrangement of elements and nodes. Nodes represent points at
which features such as displacements are calculated. FEA packages use node
numbers to serve as an identification tool in viewing solutions in structures such
as deflections.
Department of Mechanical Engineering 25

Dynamic Analysis of a Two-wheeler Chassis 2007-08
Elements are bounded by sets of nodes, and define localized mass and
stiffness properties of the model. Elements are also defined by mesh numbers,
which allow references to be made to corresponding deflections or stresses at
specific model locations.
Analysis (computation of solution)
The next stage of the FEA process is analysis. The FEM conducts a series
of computational procedures involving applied forces, and the properties of the
elements which produce a model solution. Such as structural analysis allows the
determination of effects such as deformations, strains, and stresses which are
caused by applied structural loads such as force, pressure and gravity.
Post-processing (visualization) These results can then be studied using visualization tools within the FEA
environment to view and to fully identify implications of the analysis. Numerical
and graphical tools allow the precise location of data such as stresses and
deflections to be identified.
2.4 Experimental Modal Testing
Modal Analysis is a well-defined technique, which defines the inherent
dynamic properties of the structure. Modal analysis gives the modal parameters
especially natural frequencies, mode shapes & damping values of the structure.
The main objective here is to obtain the natural frequencies at various modes of
the chassis, thereby predicting any possibility of resonance. In addition, the
corresponding mode shapes are also obtained.
Department of Mechanical Engineering 26

Dynamic Analysis of a Two-wheeler Chassis 2007-08
In the two wheeler scenario, the ride comfort quality is significantly
affected by noise and vibration which is experienced by the rider during the
travel. These vibrations are caused by road roughness, mass unbalance etc. and
are transmitted to the occupants through the seat floor, handle bar, foot rests etc,
in totality through the frame skeleton of motorcycle chassis. Hence to isolate
these vibrations, the understanding of the dynamic behavior of the chassis is
essential.
Modal analysis can be used as a means for visualizing, and thereby
increasing our understanding of the motions which occur when the structure or
system vibrates. Modes are used as a simple and efficient means of
characterizing resonant vibration. That is, under the proper conditions, a structure
can be made to vibrate with excessive, sustained, oscillatory motion.
Resonant vibration is caused by an interaction between the inertial and
elastic properties of the materials within a structure. To better understand any
structural vibration problem, the resonances of a structure need to be identified
and quantified. A common way of doing this is to define the structure’s modal
parameters. Resonant vibration occurs when one or more of the resonances or
natural modes of vibration of a machine or structure is excited. It typically
amplifies the vibration response far beyond the level deflection, stress, and strain
caused by static loading.
What are Modes?
Modes (or resonances) are inherent properties of a structure. Resonances
are determined by the material properties (mass, stiffness, and damping
properties), and boundary conditions of the structure.
Department of Mechanical Engineering 27
Dynamic Analysis of a Two-wheeler Chassis 2007-08
Each mode is defined by a natural (modal or resonant) frequency,
modal damping, and a mode shape. If either the material properties or the
boundary conditions of a structure change, its modes will change. For instance, if
mass is added to a vertical pump, it will vibrate differently because its modes
have changed. At or near the natural frequency of a mode, the overall vibration
shape (operating deflection shape) of a machine or structure will tend to be
dominated by the mode shape of the resonance.
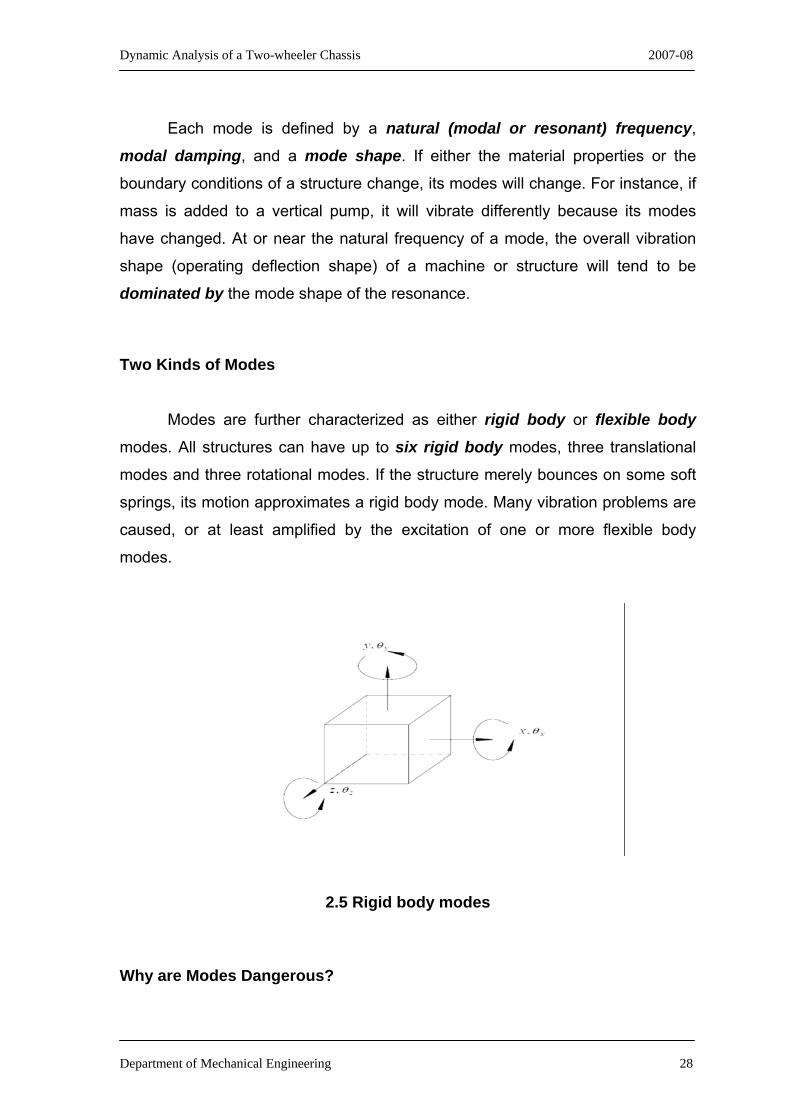
Two Kinds of Modes
Modes are further characterized as either rigid body or flexible body
modes. All structures can have up to six rigid body modes, three translational
modes and three rotational modes. If the structure merely bounces on some soft
springs, its motion approximates a rigid body mode. Many vibration problems are
caused, or at least amplified by the excitation of one or more flexible body
modes.
2.5 Rigid body modes Why are Modes Dangerous?
Department of Mechanical Engineering 28

Dynamic Analysis of a Two-wheeler Chassis 2007-08
Modes cause structures to act as “mechanical amplifiers”. At certain
natural frequencies of the structure (its modal frequencies), a small amount of
input force can cause a very large response. (When a peak is very narrow and
high in value, it is said to be a high Q resonance.)
If the structure is excited at or near one of the peak frequencies, the
response of the structure per unit of input force will be large. On the other hand, if
the structure is excited at or near one of the anti-resonances (zeros or inverted
peaks), the structural response will be very small per unit of input force.
2.4.1 Procedure for modal testing
The general procedure for performing a modal test is
• To select test points on the structure
• To collect frequency response function (FRF) data for each of these points
• To curve fit the data and obtain the modal model of the test structure
Selecting the points on the structure
In order to excite the structure, various points have to determined. These
points must be chosen such that they form the major part of the structure which
vibrates with reasonably high amplitude.
Department of Mechanical Engineering 29
Dynamic Analysis of a Two-wheeler Chassis 2007-08
Frequency response function (FRF)
FRF is defined as the ratio of the Fourier transform of an output
response divided by the Fourier transform of the input force that causes the
output. Experimental modal parameters (frequency, damping, and mode shape)
are also obtained from a set of FRF measurements. The FRF describes the
input-output relationship between two points on a structure as a function of
frequency.
Curve-fitting the data obtained
Curve-fitting processes the data to extract the modal parameters from the
FRF measurements. At the end of Curve-fitting, tables giving frequencies and
damping factors are obtained.
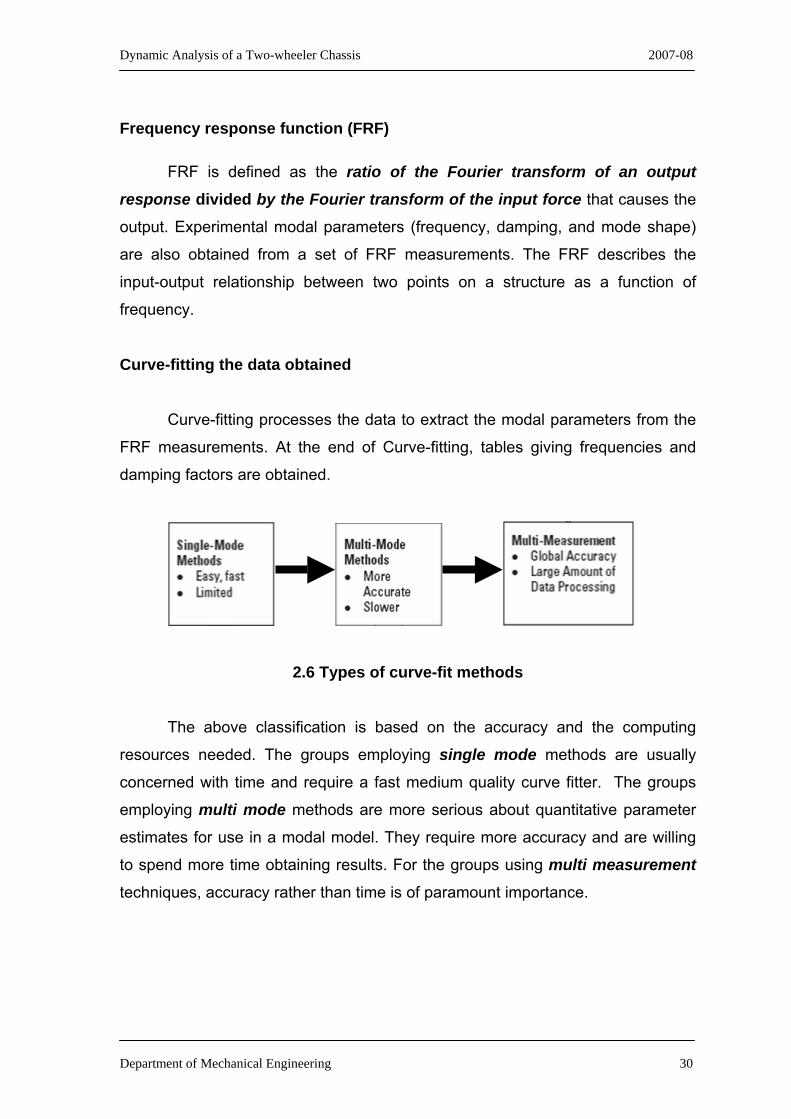
2.6 Types of curve-fit methods
The above classification is based on the accuracy and the computing
resources needed. The groups employing single mode methods are usually
concerned with time and require a fast medium quality curve fitter. The groups
employing multi mode methods are more serious about quantitative parameter
estimates for use in a modal model. They require more accuracy and are willing
to spend more time obtaining results. For the groups using multi measurement
techniques, accuracy rather than time is of paramount importance.
Department of Mechanical Engineering 30

Dynamic Analysis of a Two-wheeler Chassis 2007-08
The phases involved in the experimental modal testing are shown in the figure
2.7 Modal testing procedure
2.4.2 Modal Testing setup
Department of Mechanical Engineering 31

Dynamic Analysis of a Two-wheeler Chassis 2007-08
2.8 General measurement setup for Modal testing
Excitation device
This provides a measurable input of mechanical force into the structure which
sets it into vibratory motion. Excitation may be provided by an electro dynamic
exciter or an impact hammer. A source for the excitation signal will depend on the
type of the test being undertaken and can be any one of the following:
i. Sinusoidal (from an oscillator)
ii. Random (from a noise generator)
iii. Transient (by applying an impact with a hammer)
iv. Periodic (from a special signal generator capable of producing a specific
frequency content)
The best choice of the excitation function depends on several factors which are:
a) Available signal processing equipment
b) Characteristics of the structure
c) Excitation system and General measurement considerations
Power amplifier
Department of Mechanical Engineering 32

Dynamic Analysis of a Two-wheeler Chassis 2007-08
The function of the power amplifier is to amplify the generated signal from
analyzer or any other signal generating devices. The signals coming from the
analyzer or any other signal generating devices will be weak and hence may not
be able to drive the exciter. The power amplifier raises these signals to a
sufficient level to drive with minimum distortion.
Force transducer
The input time history of the excitation force is measured by means of a
force transducer, usually piezoelectric transducer.
Accelerometer
The dynamic response of an excited test structure is normally detected by
one or more piezoelectric transducers attached to the structure. Strain gauges
are often found to be convenient because of their minimal interference with the
test object.
Analyzer
The function of the analyzer is to simply measure the various signals
developed by the transducers in order to ascertain the magnitudes of the
excitation forces and responses. It transforms both the excitation and response
time histories into frequency spectra and calculates the ratio of these two
functions. This ratio is called the FRF.
2.4.3 Concept of frequency response system
Department of Mechanical Engineering 33

Dynamic Analysis of a Two-wheeler Chassis 2007-08
2.9 A typical FRF
Every structure has inherent dynamic properties that determine how the
structure responds to its environment. By subjecting a structure to a known
excitation and measuring the resulting responses, its dynamic properties can be
determined. Conceptually, this can be shown by considering a structure as a
“black box” with dynamic properties h (t), as shown in the diagram.
Excitation Response
f (t) x (t)
Any arbitrary set of time
structure’s dynamic properties
the dynamic characteristics h
excitation.
This type of description
in the analysis of control syste
Department of Mechanical Engineering
Structure
h (t)
varying excitations or inputs f (t) are filtered by the
h (t) to yield responses x (t). Obviously, if we know
(t), we can predict the response caused by any
of the input / output relationship is in common use
ms and electrical circuits.
34

Dynamic Analysis of a Two-wheeler Chassis 2007-08
Describing the dynamic properties of the “black box” is easier in the
frequency domain, i.e., instead of describing the excitation, responses and
dynamic properties as functions of time, they are transformed into functions of
frequency, using the Laplace transformation:
∞ -st F (s) = ∫ f (t) e dt
0
The black box diagram now becomes
F (s) X (s)
The input / output relationship can no
F (s) * H (s) = X(s)
H (s) is called the transfe
characteristics of the structure as a
measuring the excitation f (t) and re
transforms, the transfer function is ob
For practical applications, the
prohibitive. Therefore Fourier transfo
Laplace transform, is made use of to
the dynamic properties. This is known
FRFs can be measured directly with m
The physical interpretation of
frequency ω, will produce a sinusoida
output amplitude will be multiplied by
input will be shifted by θ (ω).
Department of Mechanical Engineering
Structure h (t)
w be written as a simple algebraic equation
i.e. X(s) / F (s) = H (s)
r function and expresses the dynamic
function of the complex variable “s”. By
sponse x (t), and computing their Laplace
tained from the equation X (s) / F (s).
effort in computing Laplace transform is
rm (evaluated at s = jω), a special case of
obtain the frequency domain description of
as the Frequency response function (FRF).
odern dual channel spectrum analyzers.
FRF is that a sinusoidal input force, at a
l output motion at the same frequency. The
I H (ω) I and the phase between output and
35

Dynamic Analysis of a Two-wheeler Chassis 2007-08
The various forms of Frequency Response Function based on the type of
response variable are given in the table.
Response parameter R Standard R/F Inverse F/R
DISPLACEMENT RECEPTANCE
ADMITTANCE
COMPLIANCE
FLEXIBILITY
DYNAMIC STIFFNESS
VELOCITY MOBILITY MECHANICAL IMPEDANCE
ACCELERATION INERTANCE
ACCELERANCE
APPARENT MASS
2.2 Forms of Frequency Response Function
One cannot easily define the mobility of the structure as a whole; one has
to define the mobility of every point as a function of frequency. For modeling, the
FRF most commonly used is Compliance. The FRF generally used for
measurements is Accelerance, since the most convenient motion transducer is
the Accelerometer. Since the FRFs are a complex quantity, they cannot be fully
displayed on a single two dimensional plot. It can, however, be presented in
several formats, each of which has its own uses.
Coherence is related to the FRF and shows the degree of correlation of
one signal with a second signal. Coherence varies from zero to one and is a
function of frequency. In modal analysis, this function shows the quality of a
measurement.
Department of Mechanical Engineering 36
Dynamic Analysis of a Two-wheeler Chassis 2007-08
A good impact produces a vibration response that is perfectly correlated
with the impact, indicated by a coherence plot that is near one over the entire
frequency range. If there is some other source of vibration, or noise, or the
hammer is not exciting the entire frequency range, the coherence plot will drop
below one in some regions.
Getting good measurements from an analyzer requires careful selection of
the measurement settings for the averaging, triggering, and windowing
parameters.
Triggering is a technique for capturing an event when you do not know
exactly when it will occur. A trigger can start data acquisition and processing
when a user-specified voltage level is detected in an input channel. For example,
you can set up a trigger to capture a hammer impact. After you arm the trigger,
the analyzer will wait until the impact occurs before it starts acquiring data.
Averaging improves the quality of the measurement. It applies to both the
frequency and time domains. Frequency domain averaging uses multiple data
blocks to "smooth" the measurements. You can average signals with a linear
average where all data blocks have the same weight; or you can use exponential
weighting. In this case, the last data block has the most weight and the first has
the least. Averaging acts to improve the estimate of the mean value at each
frequency point; it reduces the variance in the measurement. Time domain
averaging is useful in measuring repetitive signals to suppress background noise.
An impact test is good example of repetitive signals. Both the force and
acceleration signals are the same for each measurement. This assumes that the
trigger point is reliable. The presence of high background noise may adversely
affect the reliability of the trigger.
Department of Mechanical Engineering 37

Dynamic Analysis of a Two-wheeler Chassis 2007-08
Windowing is a processing technique used when computing FFTs.
Theoretically, the FFT can only be computed if the input signal is periodic in each
data block(it repeats over and over again and is identical every time). When the
FFT of a non-periodic signal is computed, the FFT suffers from 'leakage.'
Leakage is the effect of the signal energy smearing out over a wide frequency
range. If the signal were periodic, it would be in a narrow frequency range. Since
most signals are not periodic in the data block time period, windowing is applied
to force them to be periodic.
A windowing function should be exactly zero at the beginning and end of
the data block and have some special shape in between. This function is then
multiplied with the time data block, and this forces the signal to be periodic.
Accept/Reject
Because accurate impact testing results depend on the skill of the one
doing the impacting, FRF measurements should be made with spectrum
averaging, a standard capability in all modern FFT analyzers. FRFs should be
measured using 3 to 5 impacts per measurement. Since one or two of the
impacts during the measurement process may be bad hits, an FFT analyzer
designed for impact testing should have the ability to accept or reject the result of
each impact. An accept/reject capability saves a lot of time during impact testing
since you don’t have to restart the measurement process after each bad hit.
One method of presenting the FRF is to plot the real plot versus the
imaginary plot. This is often called the Nyquist plot or a Vector response plot.This
graph emphasizes the area of frequency response at resonance and traces out a
circle, as shown in the figure 2.10
Another method of presenting the data is to plot the polar coordinates,
magnitude and phase versus frequency as illustrated in the figure 2.11. At
resonance, the magnitude is a maximum and is limited only by the amount of
damping in the system.
Department of Mechanical Engineering 38

Dynamic Analysis of a Two-wheeler Chassis 2007-08
The phase ranges from 0° to 180° and the response lags the input by 90°
at resonance.
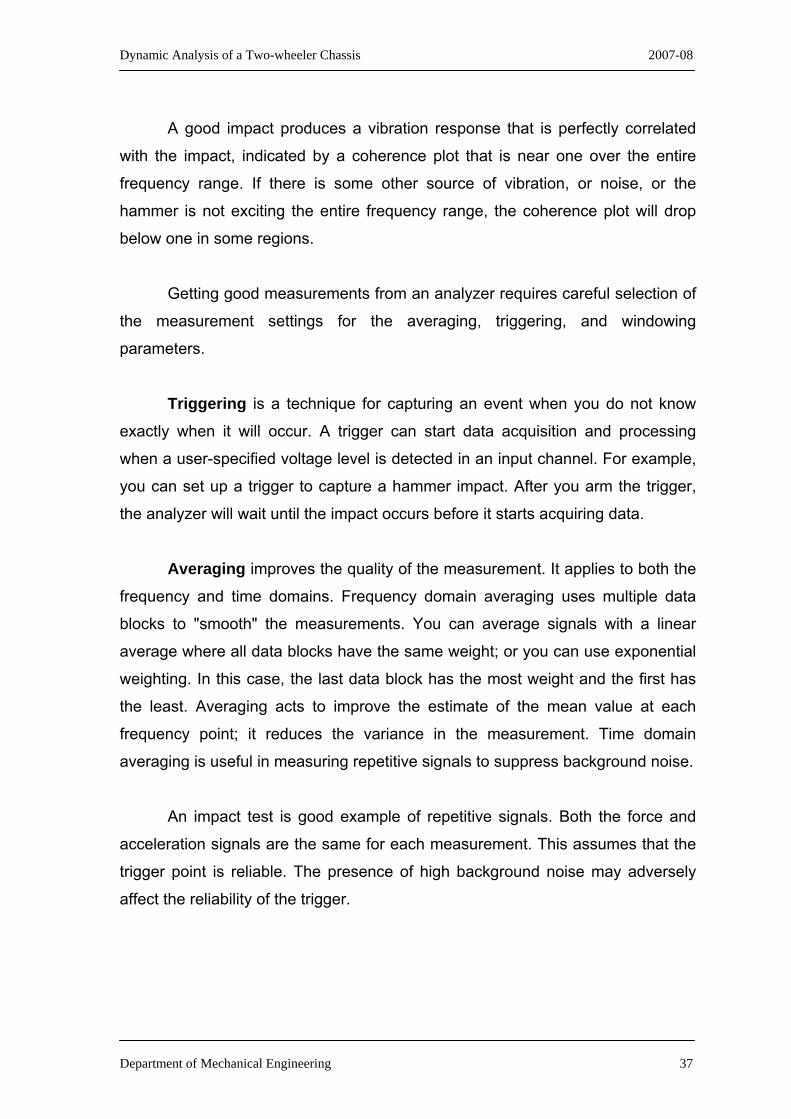
A third method of presenting the data is to plot the rectangular
coordinates, the real part and the imaginary part versus the frequency. For a
proportionally damped system, the imaginary part is maximum at resonance and
the real part is zero, as shown in the figure 2.12
2.10 Nyquist plot of frequency response
Department of Mechanical Engineering 39

Dynamic Analysis of a Two-wheeler Chassis 2007-08
2.11 Frequency response-polar coordinates
Department of Mechanical Engineering 40
Dynamic Analysis of a Two-wheeler Chassis 2007-08
2.12 Frequency response-rectangular coordinates
Department of Mechanical Engineering 41

Dynamic Analysis of a Two-wheeler Chassis 2007-08
2.4.4 Excitation methods The excitation mechanisms mainly fall into two categories:
1. Shaker testing
2. Impact testing
Shaker testing
The most useful shakers for modal testing are the electro dynamic and
electro hydraulic types.
In the electro dynamic shaker, force is generated by an alternating current
that drives a magnetic coil. The maximum frequency limit varies from 5 kHz to 20
kHz depending on the size. Smaller shakers have higher operating range.
Hydraulic shakers can provide much higher force levels. A hydraulic
shaker has the ability to apply a large static preload to the structure. This is useful
for massive structures such as grinding machines that operate under relatively
high preloads which may alter their structural characteristics.
Impact testing
Impact testing is a simple means of exciting the structure into vibration. An
impact hammer is a specialized measurement tool that produces short duration
vibration levels by striking the structure at some point. The hammer incorporates
a sensor (called a load cell) that produces a signal proportional to the force of
impact. This enables precise measurement of the excitation force.
An impact hammer is often used for modal analysis of structures where
use of a mechanical vibrator is not convenient; examples are in the field or with
very large structures.
Department of Mechanical Engineering 42

Dynamic Analysis of a Two-wheeler Chassis 2007-08
Different impact tip materials allow tailoring of the frequency content of the
impact force. For low frequency measurements, a soft rubber tip concentrates the
excitation energy in a narrow frequency range.
Impact testing has two potential signal processing problems associated with it.
1. Noise can be present in either the force or response signal as a result
of a long time record.
2. Leakage can be present in the response signal as a result of short time
record.
Compensation for both these problems can be accomplished with Windowing
technique.
2.4.5 Exciting Modes with Impact Testing
With the ability to compute FRF measurements in an FFT analyzer, impact
testing was developed during the late 1970’s, and has become the most popular
modal testing method used today. Impact testing is a fast, convenient, and low
cost way of finding the modes of machines and structures.
The following equipment is required to perform an impact test,
• Impact hammer
• Accelerometer
• FFT Analyzer
• Post-processing Modal software
I. An impact hammer with a load cell attached to its head to measure the input
force.
Department of Mechanical Engineering 43

Dynamic Analysis of a Two-wheeler Chassis 2007-08
II. An accelerometer is used to measure the response acceleration at a fixed
point & direction. Structural vibration is commonly measured with electronic
sensors called accelerometers. These sensors convert an acceleration signal to
an electronic voltage signal that can then be measured, analyzed and recorded
with electronic hardware. There are many types of accelerometers. The most
common requires a power supply connected by a wire to the accelerometer as
shown in Figure 2.13.
Some accelerometers have internal circuitry that allows the analyzer to
provide the power, eliminating the need for a power supply. The signal analyzer
includes a calibration setting that allows the voltage signal to be converted back
into a measurement of acceleration.
2.13 Typical Instrumentation for Accelerometer
The normal method of MOUNTING accelerometers in intrinsically safe
environments is to drill, spot face, and tap a threaded hole in the machine. This
allows the accelerometer to be stud mounted and have direct metal to metal
contact insuring conductivity between the sensor and the machine.
As shown in the figure 2.14, a small circular flat is machined on the
surface of the machine. A hole is drilled and tapped in the center of the machined
surface. The accelerometer is then attached to the machine by a threaded stud
and tightened with a mounting torque.
Department of Mechanical Engineering 44
Dynamic Analysis of a Two-wheeler Chassis 2007-08
(A) (B)
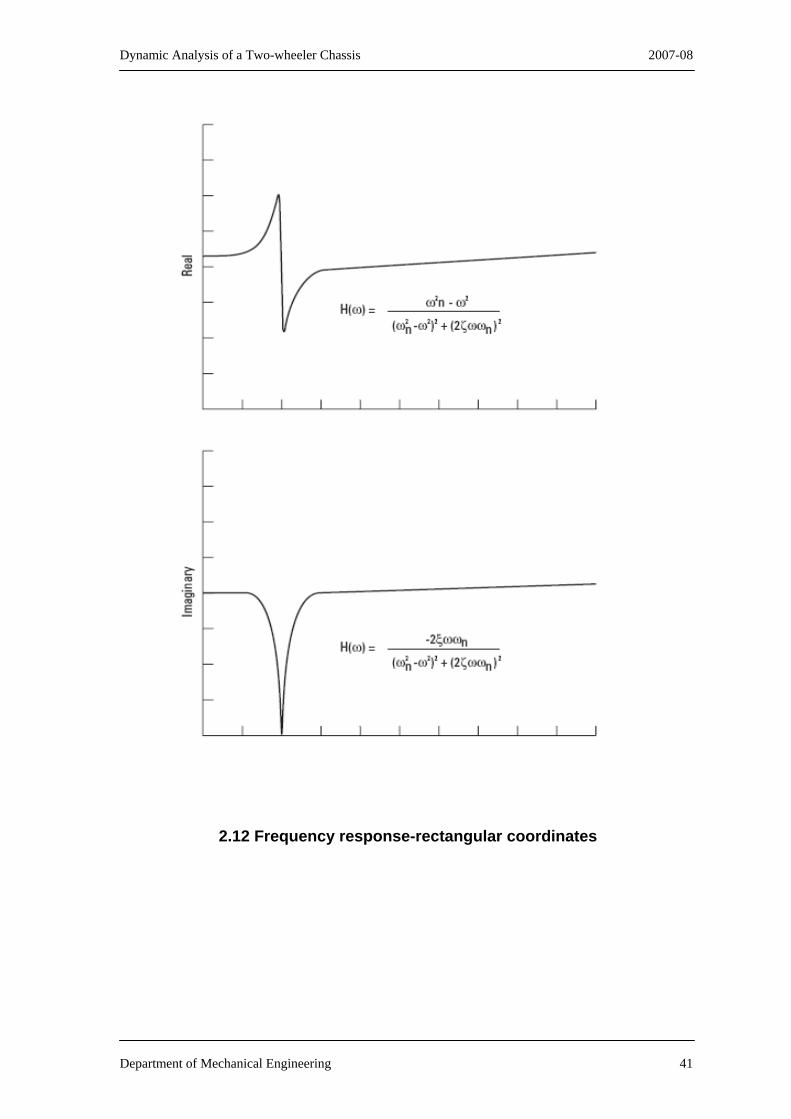
2.14 (A) Stud mount (B) Fin Mount Pad for mounting Accelerometer
The Fin Mount Pad is a universally accepted method of mounting
accelerometers on motors and is available in various sizes as shown in the figure
The Fin Mount Pad is seated in the valley between two cooling fins on the motor,
and by applying an epoxy held in place as shown in the figure.
The accelerometer is then stud mounted or magnet mounted to the Fin
Mount Pad to measure the vibration of the motor. A typical epoxy used in this
case is the Devcon Plastic Welder. Although it has very good adhesive
properties, it is an insulator and will not meet the requirements for intrinsic safety.
III. A multi channel FFT analyzer to compute FRFs - the input signal is digitized
at a high sampling rate, similar to a digitizing oscilloscope. Nyquist's theorem
says that as long as the sampling rate is greater than twice the highest frequency
component of the signal, the sampled data will accurately represent the input
signal.
The FFT is simply a clever set of operations which implements Fourier's
theorem. The resulting spectrum shows the frequency components of the input
signal. The original digital time record comes from discrete samples taken at the
sampling rate.
Department of Mechanical Engineering 45

Dynamic Analysis of a Two-wheeler Chassis 2007-08
The corresponding FFT yields a spectrum with discrete frequency
samples. The advantage of this technique is its speed.
One of the most common applications of FFT analyzers is to measure the
transfer function of a mechanical or electrical system. A transfer function is the
ratio of the output to the input. Single-channel analyzers cannot measure transfer
functions. Single-channel analyzers with integrated sources can measure transfer
functions but only by assuming that the input spectrum of the system is equal to
the spectrum of the integrated source.
In general, to measure a general transfer function, a two-channel analyzer
is required. One channel measures the spectrum of the input, the other measures
the spectrum of the output, and the analyzer performs a complex division to
extract the magnitude and phase of the transfer function. Because the input
spectrum is actually measured and divided out, you’re not limited to using a
predetermined signal as the input to the system under test—any signal will do.
IV. Post-processing modal software for identifying modal parameters and
displaying the mode shapes in animation.
2.4.6 Assumptions in modal testing
The basic assumptions concerning any structure that are made in order to
perform an experimental modal analysis:
1. The structure is assumed to be linear i.e., the response of the
structure to any combination of forces, simultaneously applied, is the sum of the
individual responses to each of the forces acting alone.
Department of Mechanical Engineering 46
Dynamic Analysis of a Two-wheeler Chassis 2007-08
2. The structure is time invariant i.e., the parameters that are to be
determined are constants. In general, a system which is not time invariant will
have components whose mass, stiffness, or damping depend on factors that are
not measured or are not included in the model.
For example, some components may be temperature dependent. In this
case the temperature of the component is viewed as a time varying signal and
hence, the component has time varying characteristics. Therefore, the modal
parameters that would be determined by any measurement and estimation
process would depend on the time (by this temperature dependence) that any
measurements were made. If the structure that is tested changes with time, then
measurements made at the end of the test period would determine a different set
of modal parameters than measurements made at the beginning of the test
period. Thus, the measurements made at the two different times will be
inconsistent, violating the assumption of time invariance.
3. The structure obeys Maxwell’s reciprocity i.e., a force applied at
degree-of-freedom p causes a response at degree-of-freedom q that is the same
as the response at degree-of-freedom p caused by the same force applied at
degree-of-freedom q.
With respect to frequency response function measurements, the frequency
response function between points p and q determined by exciting at p and
measuring the response at q is the same frequency response function as found
by exciting at q and measuring the response at p.
4. The structure is observable i.e., the input-output measurements that
are made contain enough information to generate an adequate behavioral model
of the structure. Structures and machines which have degrees-of-freedom of
motion that are not measured are not completely observable.
Department of Mechanical Engineering 47

Dynamic Analysis of a Two-wheeler Chassis 2007-08
5. The other assumption can be made regarding the system being analyzed. Commonly, the modal parameters are assumed to be global. For
example, this assumption means that, for a given modal frequency, the frequency
and damping information is the same in every measurement. Since
measurements are taken at different times and with slightly different test
conditions, this is often not true with respect to the measured data. This condition
is referred to as inconsistent data. Theoretical models do not attempt to
recognize this problem.
6. Another assumption is made relative to repeated roots. Repeated
roots refer to the situation where one of the complex roots (modal frequency,
Eigen value, pole, etc.) occurs more than once in the characteristic equation.
Each root with the same value has an independent modal vector or eigenvector.
This situation can only be detected by the use of multiple inputs or references.
The basic assumptions are never perfectly achieved in experimental test
situations involving real structural systems. Generally, the assumptions will be
approximately true. The important thing to remember is that each assumption can
be evaluated experimentally, either during the testing or after the testing is
completed and the data analysis has been performed. It is inexcusable to perform
a test without some measure of the validity of the assumptions involved.
Department of Mechanical Engineering 48
Dynamic Analysis of a Two-wheeler Chassis 2007-08
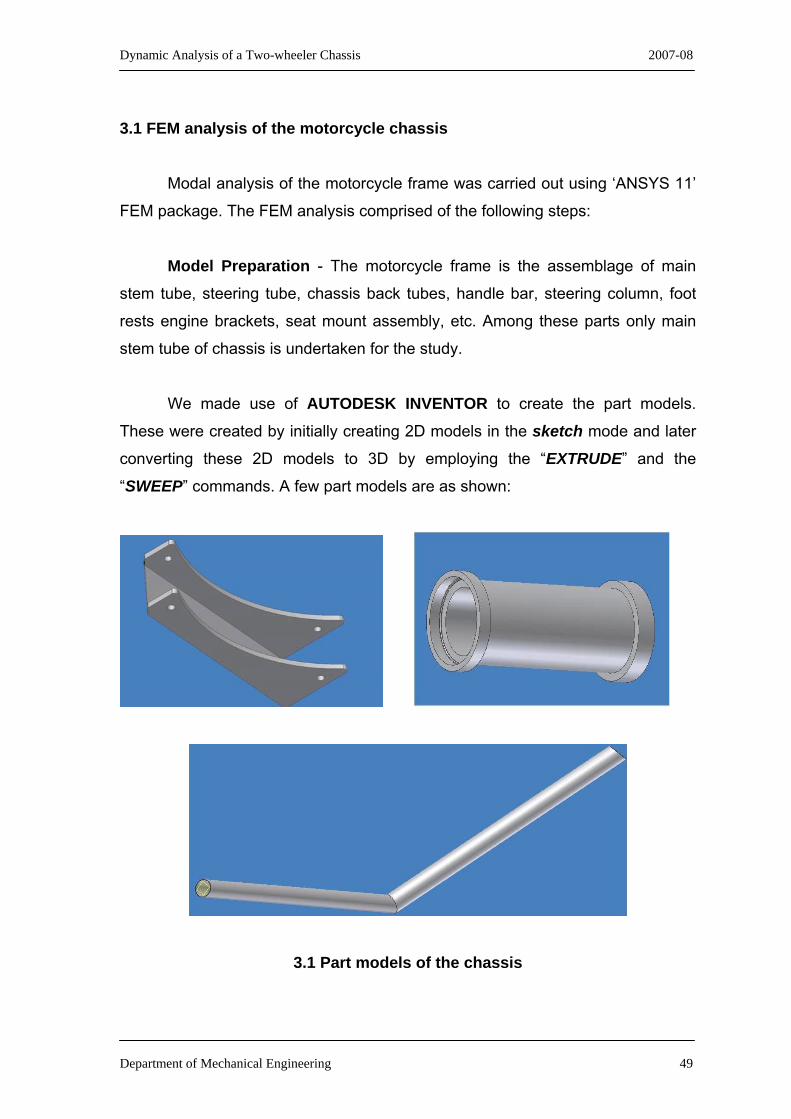
3.1 FEM analysis of the motorcycle chassis
Modal analysis of the motorcycle frame was carried out using ‘ANSYS 11’
FEM package. The FEM analysis comprised of the following steps:
Model Preparation - The motorcycle frame is the assemblage of main
stem tube, steering tube, chassis back tubes, handle bar, steering column, foot
rests engine brackets, seat mount assembly, etc. Among these parts only main
stem tube of chassis is undertaken for the study.
We made use of AUTODESK INVENTOR to create the part models.
These were created by initially creating 2D models in the sketch mode and later
converting these 2D models to 3D by employing the “EXTRUDE” and the
“SWEEP” commands. A few part models are as shown:
3.1 Part models of the chassis
Department of Mechanical Engineering 49
Dynamic Analysis of a Two-wheeler Chassis 2007-08
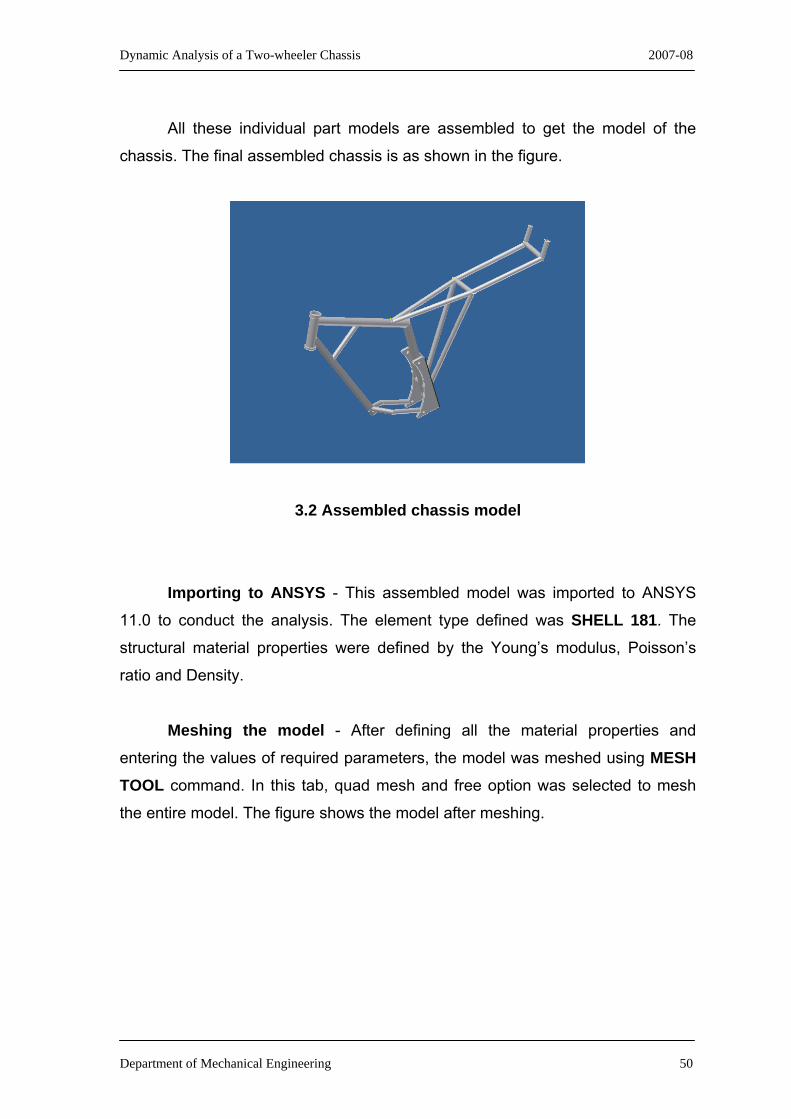
All these individual part models are assembled to get the model of the
chassis. The final assembled chassis is as shown in the figure.
3.2 Assembled chassis model Importing to ANSYS - This assembled model was imported to ANSYS
11.0 to conduct the analysis. The element type defined was SHELL 181. The
structural material properties were defined by the Young’s modulus, Poisson’s
ratio and Density.
Meshing the model - After defining all the material properties and
entering the values of required parameters, the model was meshed using MESH TOOL command. In this tab, quad mesh and free option was selected to mesh
the entire model. The figure shows the model after meshing.
Department of Mechanical Engineering 50

Dynamic Analysis of a Two-wheeler Chassis 2007-08
.3.3 Meshed Finite Element model
Boundary Conditions - The analysis was carried out to predict and
analyze the vibrations induced in the chassis frame. The suspension and shock
absorber elements (road tyre interactions) were not considered. The condition
employed to conduct the test was Free-Free condition.
In the solution stage, the new Analysis type was chosen and the modal
option was selected. Among the different algorithms available on ANSYS for
Modal analysis, Block Lanczos method was used to extract the natural
frequencies and mode shapes of the motorcycle frame. The mode shapes
required for the study of dynamic behavior, were generally the lower mode
shapes of the structure.
After selecting Block Lancoz analysis option, the number of modes
required to extract was entered. A window appeared asking the bandwidth of the
natural frequency. For our analysis, we selected the bandwidth to be between 0 –
150 Hz.
Department of Mechanical Engineering 51

Dynamic Analysis of a Two-wheeler Chassis 2007-08
After solving, the following results are obtained using READ RESULTS option in
the general post processor stage.
3.2 Results The natural frequencies obtained from modal analysis of motorcycle chassis
frame by FEM are given in the table.
Mode No. Natural Frequency in Hz
1 0
2 0
3 0
4 0
5 1.5e-4
6 4.95e-4
7 35.015
8 74.426
9 104.91
10 130.26
3.1 Natural frequencies of the chassis at different modes
Some of the first modes were of very low frequency due to rigid body
motions of the chassis and the unsprung masses. These were followed by the
suspension modes showing bouncing and pitching of the whole body. Then in
higher frequency range, the modes of elastic deflection of the chassis and the
steering column were obtained.
Department of Mechanical Engineering 52
Dynamic Analysis of a Two-wheeler Chassis 2007-08
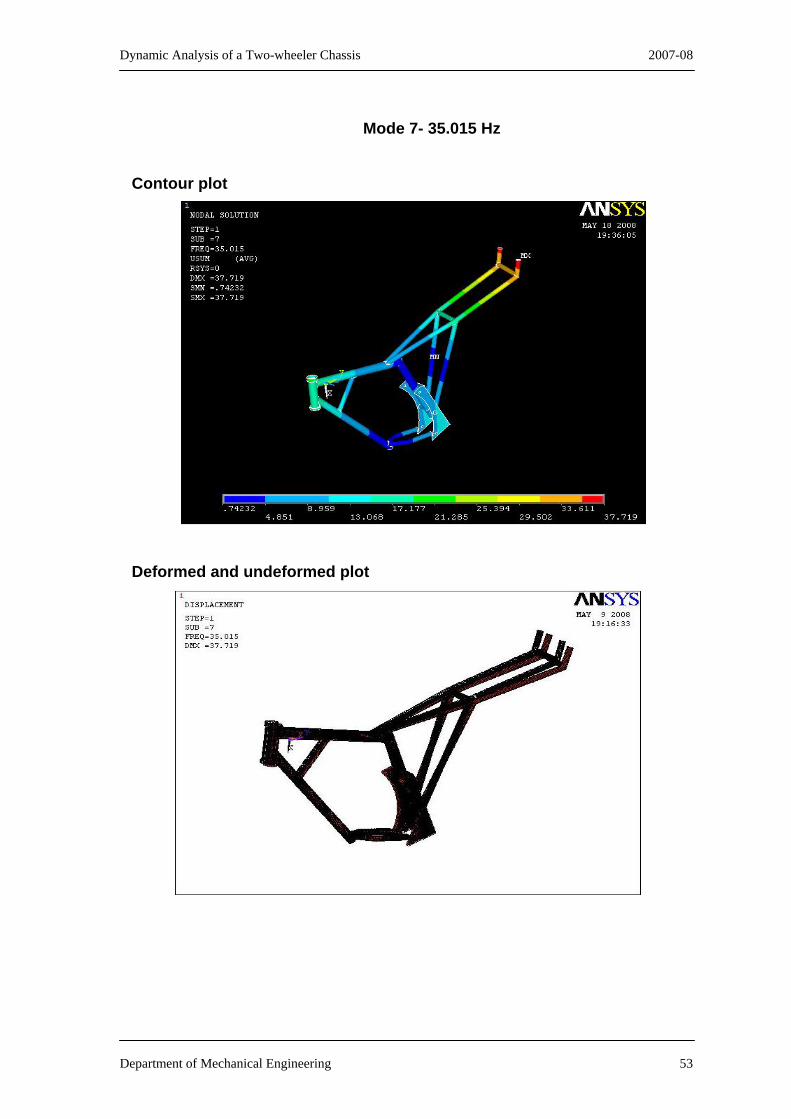
Mode 7- 35.015 Hz
Contour plot
Deformed and undeformed plot
Department of Mechanical Engineering 53

Dynamic Analysis of a Two-wheeler Chassis 2007-08
Mode 8- 74.426 Hz
Contour plot
Deformed and undeformed plot
Department of Mechanical Engineering 54

Dynamic Analysis of a Two-wheeler Chassis 2007-08
Mode 9-104.91 Hz
Contour plot
Deformed and undeformed plot
Department of Mechanical Engineering 55

Dynamic Analysis of a Two-wheeler Chassis 2007-08
Mode 10-130.26 Hz
Contour plot
Deformed and undeformed plot
Department of Mechanical Engineering 56

Dynamic Analysis of a Two-wheeler Chassis 2007-08
4.1 Procurement of the chassis
The first stage of our project comprised of procuring the right kind of
chassis to conduct the analysis on. For this, we had to survey various
manufacturers who could provide us with the right chassis.
After enquiring with various manufacturers like HERO HONDA,
SUZUKI, BAJAJ AUTO and HONDA, we finally decided on the SUZUKI ZEUS
chassis.
Shown below is a picture of the chassis we procured.
4.1 Suzuki Zeus chassis 4.2 Dimensions of the chassis
Most manufacturers do not provide the dimensions of the chassis and
so also was the case with Suzuki. A sketch of the chassis also could not be
obtained. Hence we had to begin from scratch.
Department of Mechanical Engineering 57

Dynamic Analysis of a Two-wheeler Chassis 2007-08
By making use of a measurement tape and a plumb line, we managed
to obtain the lengths of all the individual links. The angles i.e. the orientations
of each link with respect to the others were calculated by using simple
trigonometric ratios. To measure the diameters of each link a screw gauge
was employed.
The co-ordinates of various points on the chassis are given in the table
below. These coordinates were used to build the chassis on the software:
NODES X-COORDINATE Y-COORDINATE Z-COORDINATE
1 0 0 0
2 -5 -16 0
3 18 -42 0
4 18 -57 0
5 20 -57 -5
6 29 -63 -7
7 43 -63 -5
8 43 -63 5
9 29 -63 7
10 20 -57 5
11 48 -60 0
12 48 -50 0
13 37 -15.5 0
14 21 -7 0
15 26 -12.5 0
16 57 -13 -6
17 57 -13 6
18 68 -13 -7.5
19 68 -13 7.5
20 75 -11 -8
Department of Mechanical Engineering 58
Dynamic Analysis of a Two-wheeler Chassis 2007-08
NODES X-COORDINATE Y-COORDINATE Z-COORDINATE
21 75 -11 8
22 89 -8 -8
23 89 -8 8
24 103 -5 -8
25 103 -5 8
26 114 4 -8
27 114 4 8
28 53 -33 -5
29 53 -33 5
30 61 -33 -8
31 61 -33 8
4.1 CO-ORDINATES OF VARIOUS POINTS ON THE CHASSIS 4.3 Modal Testing Procedure Implemented
Our experimental modal testing procedure consists of the following steps:
1. Setting up the modal test
2. Creating the geometry of the chassis
3. Documentation of the test
4.4 Setting up the modal test This involves
a) Structure preparation
b) Suspension of the chassis
c) Connection of exciter and force transducer
d) Transducer conditioning and calibration
e) Setting up the analyzer
Department of Mechanical Engineering 59

Dynamic Analysis of a Two-wheeler Chassis 2007-08
The initial step was to prepare the structure which involved identification
of the points at which impact was to be made. The chassis was then
suspended as shown in the figure. Three elastic chords were used to suspend
the chassis from the ceiling. The accelerometer was mounted using wax on
one of the pre-determined points.
(A) (B)
(C)
4.2 (A) Chassis suspended by elastic cords (B) Uni-Axial Accelerometer (C) Wax used for mounting
Department of Mechanical Engineering 60

Dynamic Analysis of a Two-wheeler Chassis 2007-08
Setting up the software The software employed to carry out the modal testing was LMS TestXpress
and LMS TestLAB.
LMS TestXpress is a software used for data acquisition. The
methodology we employed was to excite the chassis at several points by
means of an impact hammer (fig 4.3) and obtain the time domain curves. We
could either ACCEPT or REJECT these curves depending on their
smoothness, thus ensuring that only the best excitations were selected. An
average of five trials further ensured that the results obtained were optimal.
4.3 Impact Hammer along with the various tips used for excitation
Department of Mechanical Engineering 61
Dynamic Analysis of a Two-wheeler Chassis 2007-08
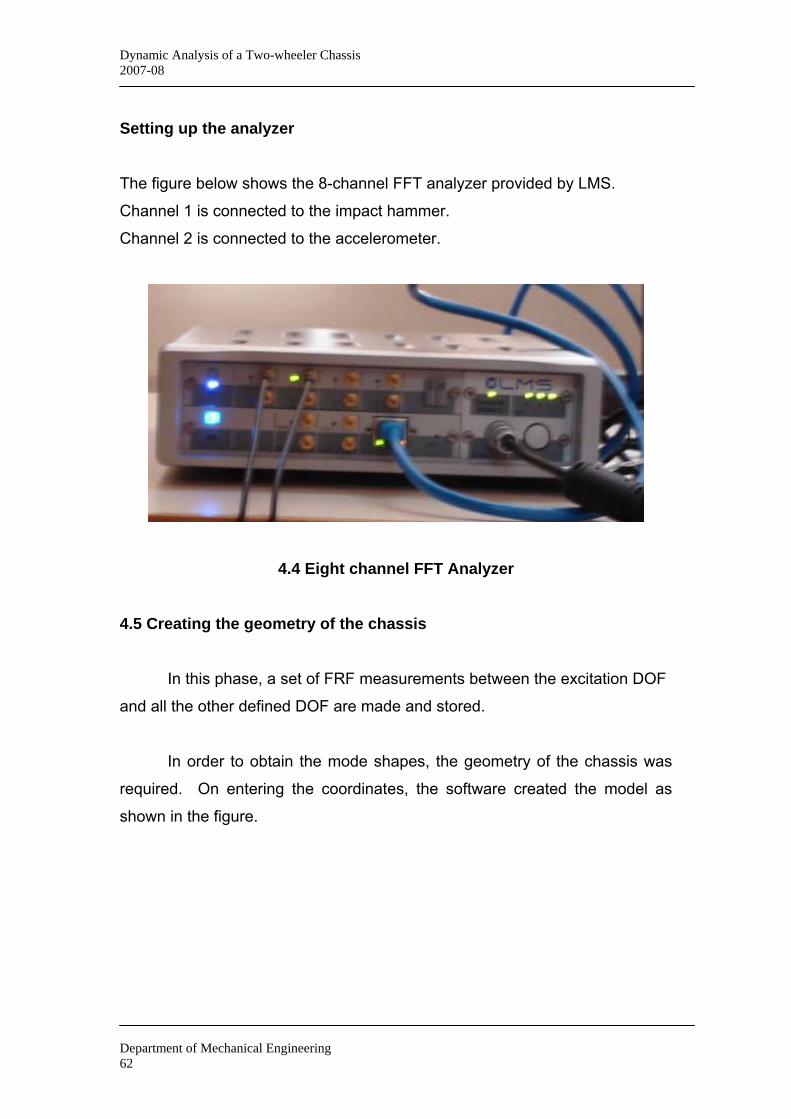
Setting up the analyzer The figure below shows the 8-channel FFT analyzer provided by LMS.
Channel 1 is connected to the impact hammer.
Channel 2 is connected to the accelerometer.
4.4 Eight channel FFT Analyzer 4.5 Creating the geometry of the chassis
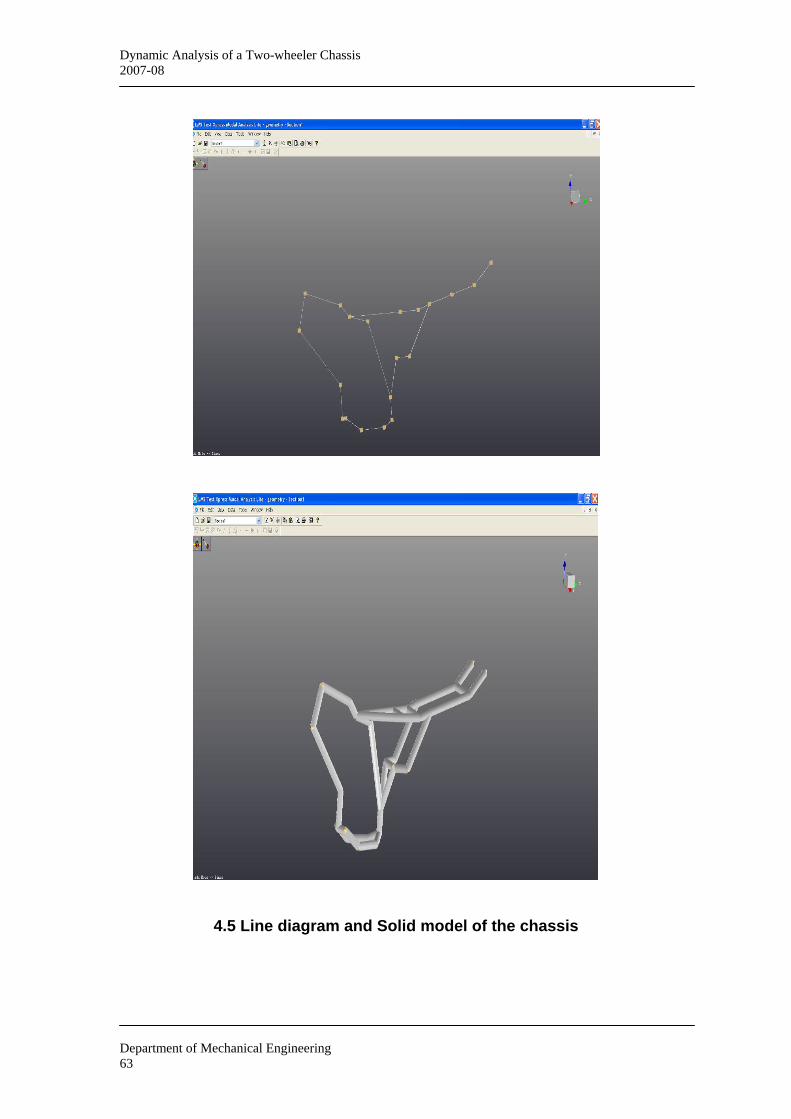
In this phase, a set of FRF measurements between the excitation DOF
and all the other defined DOF are made and stored.
In order to obtain the mode shapes, the geometry of the chassis was
required. On entering the coordinates, the software created the model as
shown in the figure.
Department of Mechanical Engineering 62
Dynamic Analysis of a Two-wheeler Chassis 2007-08
4.5 Line diagram and Solid model of the chassis
Department of Mechanical Engineering 63

Dynamic Analysis of a Two-wheeler Chassis 2007-08
4.6 Documentation of the test
LMS TestLAB was employed to extract the data from TestXpress.
To obtain the various mode shapes and to plot the required FRFs, the
following procedure was adopted.
1. In the NAVIGATOR column, choose a node point. Here select the FRF
option to view the frequency response characteristics.
2. In modal data selection, select SWITCH option which will display all the
created key points.
3. For selecting individual FRFs, just drag the required key point on to the
workspace. This displays the FRF for that particular point.
4. In the display option select sum of all the included FRFs. The following
window will appear.
Department of Mechanical Engineering 64

Dynamic Analysis of a Two-wheeler Chassis 2007-08
The above graphs show the plots of Amplitude v/s Frequency and Phase v/s Frequency. There is an option to view the real and imaginary parts
against the frequency as well.
Department of Mechanical Engineering 65

Dynamic Analysis of a Two-wheeler Chassis 2007-08
5. Next select the Time MDOF tab. Again in the display option select SUM.
The following window appears.
Also the bandwidth is specified as required. For our project, the bandwidth
selected was 0 – 177 Hz. This enables us to easily identify the peaks, which
represent the Natural Frequencies in the summed FRF.
Department of Mechanical Engineering 66

Dynamic Analysis of a Two-wheeler Chassis 2007-08
6. Select stabilization. Here the most stable peaks in the summed FRF
are chosen. This gives the Natural Frequency at various modes.
Upon entering the shapes Tab, select all mode shapes in the ‘poles’ column
and say calculate. Drag the various modes to the workspace to view the
respective mode shapes.
Department of Mechanical Engineering 67
Dynamic Analysis of a Two-wheeler Chassis 2007-08
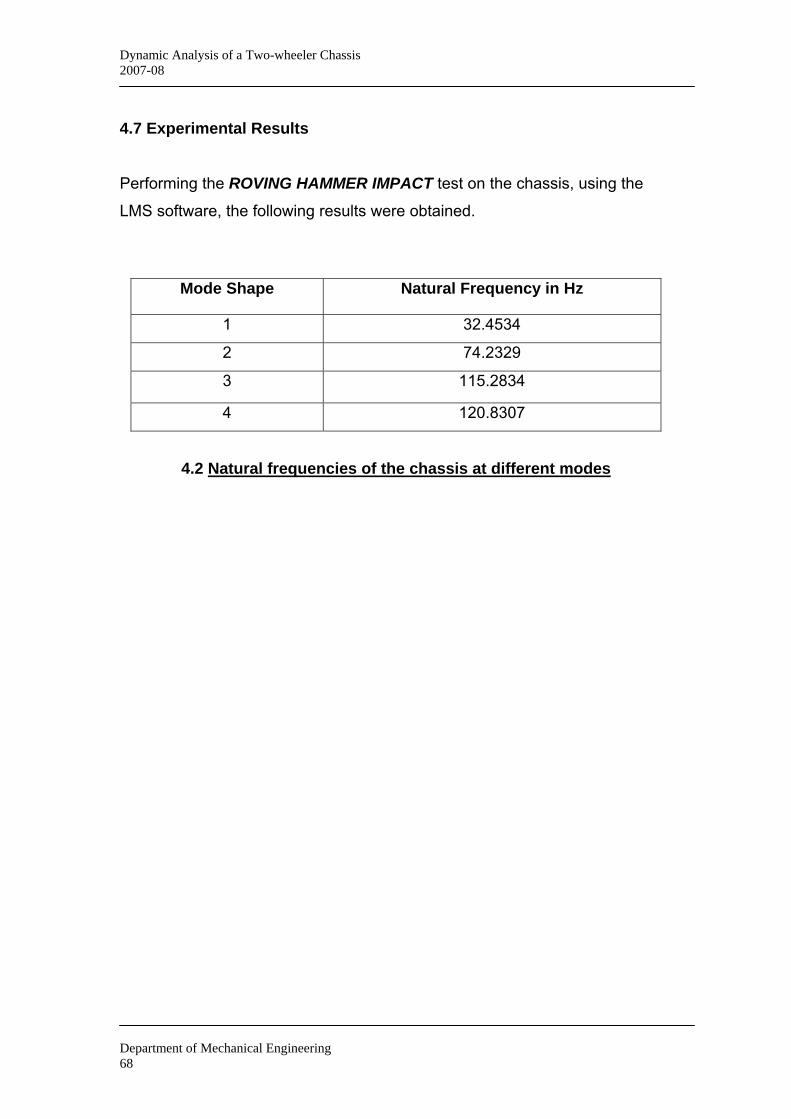
4.7 Experimental Results Performing the ROVING HAMMER IMPACT test on the chassis, using the LMS software, the following results were obtained.
Mode Shape Natural Frequency in Hz
1 32.4534
2 74.2329
3 115.2834
4 120.8307
4.2 Natural frequencies of the chassis at different modes
Department of Mechanical Engineering 68

Dynamic Analysis of a Two-wheeler Chassis 2007-08
The natural frequency for the first four modes was calculated by both
Finite Element Analysis approach and Experimental Modal testing method.
The values for the respective modes are given in the table below.
MODE NUMBER
FREQUENCIES OF ANSYS RESULTS
( Hz)
FREQUENCIES OF
EXPERIMENTAL RESULTS (Hz)
DIFFERENCE PERCENTAGE DIFFERENCE
1 35.015 32.453 2.562 7.89
2 74.426 74.232 0.194 0.26
3 104.910 115.283 10.373 8.99
4 130.260 120.830 9.430 7.80
5.1 Comparison of Results
It can be seen that the results obtained through FEM (ANSYS) i.e. the
theoretical results are in excellent agreement with those obtained by the
experimental approach, done using the modal testing method.
To calculate the percentage difference between the two sets of results,
the experimental approach was set as the reference.
Department of Mechanical Engineering 69

Dynamic Analysis of a Two-wheeler Chassis 2007-08
Successful attempt has been made to predict the vibrations induced in
motorcycle chassis by using Modal analysis. Also the Finite Element method
is made use of to predict the behavior of the chassis at different modes.
The present study was an attempt to find out modal parameters like
natural frequencies, mode shapes and amplitude of vibrations of chassis of a
two wheeler.
Here the modal analysis was done by treating the chassis as a freely
suspended structure. In future, the same work can be carried further to
analyze the chassis, subjecting it to different types of constraints.
The structure can be excited to dynamic harmonic forces and the
responses at handle bar, footrest and seat mount locations can be observed.
Same responses can be obtained using finite element method and further
they can be correlated with each other.
From the results and discussion we come to the conclusion that the
Experimental Modal analysis is very useful tool to find out the vibration
sources correctly and reduce the overall vibration level.
From the comparison of engine excitation frequencies with the FE
Modal analysis results, it was found that the possibility of resonance of the
chassis and the engine were remote.
The finite element vibration analysis not only predicts the natural
frequencies of chassis but also shows the scope for structural modification to
be carried out to minimize the vibration level of the motorcycle.
Department of Mechanical Engineering 70

Dynamic Analysis of a Two-wheeler Chassis 2007-08
Technical Papers 1. Modal analysis of Motorcycle Chassis Frame by Finite Element Method P. S. Shinde, S. R. E. S. C. O. E., Kopargaon.
2. Experimental Modal analysis- A Non Mathematical Presentation - Peter Avitabile, University of Massachusetts, Lowell, USA 3. Basics of Structural Vibration testing and analysis - LDS
4. Applications of Conductive Mounting Pads for Vibration Analysis - Jack D Peters, CTC, Inc, Victor, New York.
5. Human Body Vibration Exposure and its measurement – G. Rasmussen.
6. Fundamentals of Modal Testing - Agilent Technologies
7. Dynamic Analysis - Markus Mock, University Of Pittsburgh, Pittsburgh, USA Internet Sources 1. www.google.co.in/ Dynamic analysis 2. www.Howstuffworks.com/ Motorcycle chassis
3. www.Diseno-art.com/Motorcycle Frames
4. www.Wikipedia.com/ the free encyclopedia/Modal Analysis.html
Text Books
1. Motor Cycle Dynamics, by Vittore Cossalter
2. Modal Analysis, Theory and practice, by D J Ewins
Department of Mechanical Engineering 71