Abiotic and Biotic TNT Transformations - Defense Technical ...
lable at ScienceDirect
Estuarine, Coastal and Shelf Science 149 (2014) 213e222
Contents lists avai
Estuarine, Coastal and Shelf Science
journal homepage: www.elsevier .com/locate/ecss
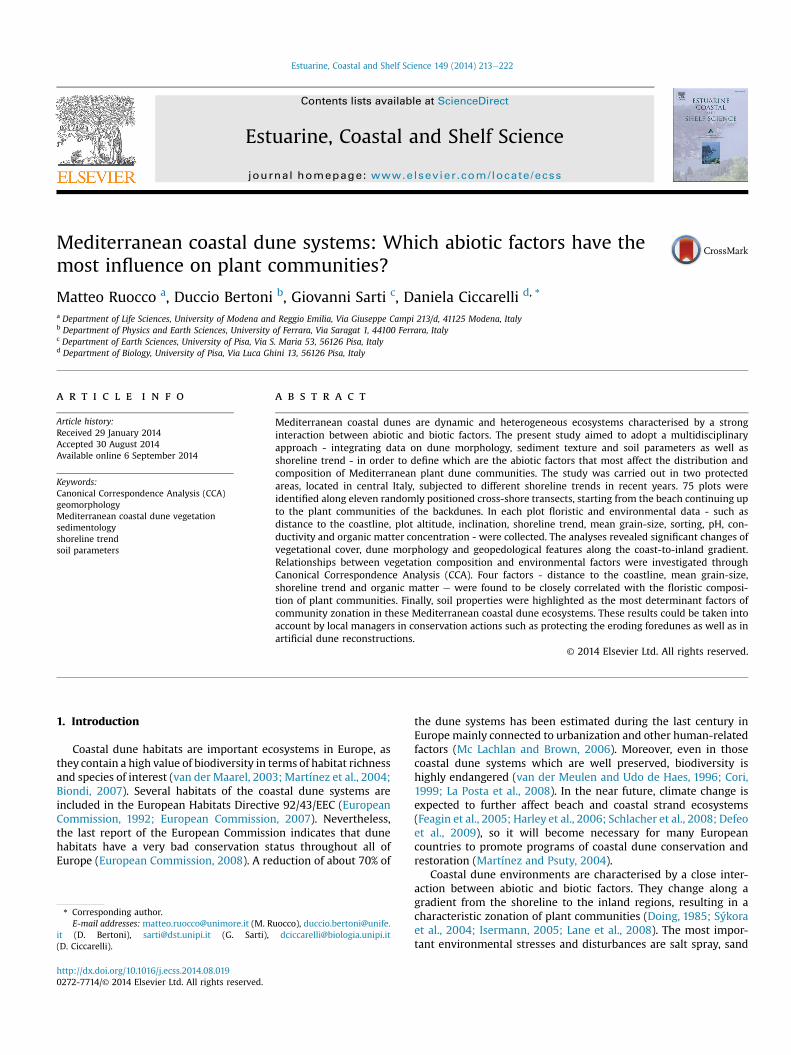
Mediterranean coastal dune systems: Which abiotic factors have themost influence on plant communities?
Matteo Ruocco a, Duccio Bertoni b, Giovanni Sarti c, Daniela Ciccarelli d, *
a Department of Life Sciences, University of Modena and Reggio Emilia, Via Giuseppe Campi 213/d, 41125 Modena, Italyb Department of Physics and Earth Sciences, University of Ferrara, Via Saragat 1, 44100 Ferrara, Italyc Department of Earth Sciences, University of Pisa, Via S. Maria 53, 56126 Pisa, Italyd Department of Biology, University of Pisa, Via Luca Ghini 13, 56126 Pisa, Italy
a r t i c l e i n f o
Article history:Received 29 January 2014Accepted 30 August 2014Available online 6 September 2014
Keywords:Canonical Correspondence Analysis (CCA)geomorphologyMediterranean coastal dune vegetationsedimentologyshoreline trendsoil parameters
* Corresponding author.E-mail addresses: [email protected] (M. R
it (D. Bertoni), [email protected] (G. Sarti),(D. Ciccarelli).
http://dx.doi.org/10.1016/j.ecss.2014.08.0190272-7714/© 2014 Elsevier Ltd. All rights reserved.
a b s t r a c t
Mediterranean coastal dunes are dynamic and heterogeneous ecosystems characterised by a stronginteraction between abiotic and biotic factors. The present study aimed to adopt a multidisciplinaryapproach - integrating data on dune morphology, sediment texture and soil parameters as well asshoreline trend - in order to define which are the abiotic factors that most affect the distribution andcomposition of Mediterranean plant dune communities. The study was carried out in two protectedareas, located in central Italy, subjected to different shoreline trends in recent years. 75 plots wereidentified along eleven randomly positioned cross-shore transects, starting from the beach continuing upto the plant communities of the backdunes. In each plot floristic and environmental data - such asdistance to the coastline, plot altitude, inclination, shoreline trend, mean grain-size, sorting, pH, con-ductivity and organic matter concentration - were collected. The analyses revealed significant changes ofvegetational cover, dune morphology and geopedological features along the coast-to-inland gradient.Relationships between vegetation composition and environmental factors were investigated throughCanonical Correspondence Analysis (CCA). Four factors - distance to the coastline, mean grain-size,shoreline trend and organic matter e were found to be closely correlated with the floristic composi-tion of plant communities. Finally, soil properties were highlighted as the most determinant factors ofcommunity zonation in these Mediterranean coastal dune ecosystems. These results could be taken intoaccount by local managers in conservation actions such as protecting the eroding foredunes as well as inartificial dune reconstructions.
© 2014 Elsevier Ltd. All rights reserved.
1. Introduction
Coastal dune habitats are important ecosystems in Europe, asthey contain a high value of biodiversity in terms of habitat richnessand species of interest (van der Maarel, 2003; Martínez et al., 2004;Biondi, 2007). Several habitats of the coastal dune systems areincluded in the European Habitats Directive 92/43/EEC (EuropeanCommission, 1992; European Commission, 2007). Nevertheless,the last report of the European Commission indicates that dunehabitats have a very bad conservation status throughout all ofEurope (European Commission, 2008). A reduction of about 70% of
uocco), [email protected]@biologia.unipi.it
the dune systems has been estimated during the last century inEurope mainly connected to urbanization and other human-relatedfactors (Mc Lachlan and Brown, 2006). Moreover, even in thosecoastal dune systems which are well preserved, biodiversity ishighly endangered (van der Meulen and Udo de Haes, 1996; Cori,1999; La Posta et al., 2008). In the near future, climate change isexpected to further affect beach and coastal strand ecosystems(Feagin et al., 2005; Harley et al., 2006; Schlacher et al., 2008; Defeoet al., 2009), so it will become necessary for many Europeancountries to promote programs of coastal dune conservation andrestoration (Martínez and Psuty, 2004).
Coastal dune environments are characterised by a close inter-action between abiotic and biotic factors. They change along agradient from the shoreline to the inland regions, resulting in acharacteristic zonation of plant communities (Doing, 1985; Sýkoraet al., 2004; Isermann, 2005; Lane et al., 2008). The most impor-tant environmental stresses and disturbances are salt spray, sand
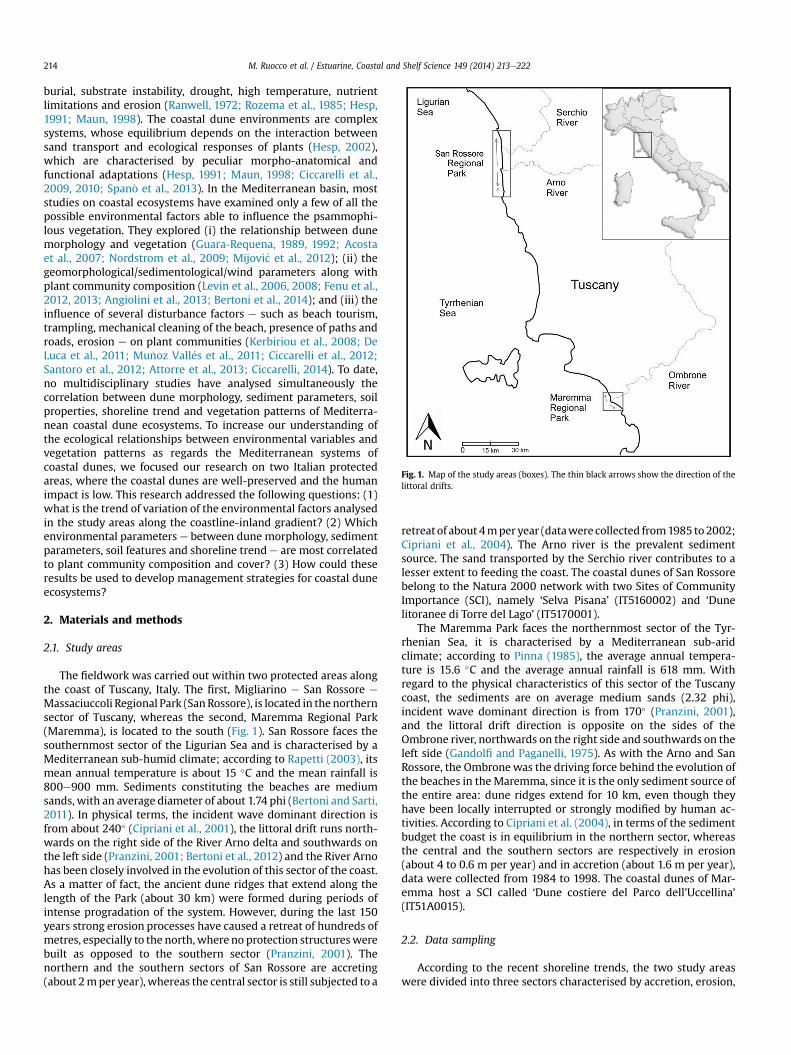
Fig. 1. Map of the study areas (boxes). The thin black arrows show the direction of thelittoral drifts.
M. Ruocco et al. / Estuarine, Coastal and Shelf Science 149 (2014) 213e222214
burial, substrate instability, drought, high temperature, nutrientlimitations and erosion (Ranwell, 1972; Rozema et al., 1985; Hesp,1991; Maun, 1998). The coastal dune environments are complexsystems, whose equilibrium depends on the interaction betweensand transport and ecological responses of plants (Hesp, 2002),which are characterised by peculiar morpho-anatomical andfunctional adaptations (Hesp, 1991; Maun, 1998; Ciccarelli et al.,2009, 2010; Span�o et al., 2013). In the Mediterranean basin, moststudies on coastal ecosystems have examined only a few of all thepossible environmental factors able to influence the psammophi-lous vegetation. They explored (i) the relationship between dunemorphology and vegetation (Guara-Requena, 1989, 1992; Acostaet al., 2007; Nordstrom et al., 2009; Mijovi�c et al., 2012); (ii) thegeomorphological/sedimentological/wind parameters along withplant community composition (Levin et al., 2006, 2008; Fenu et al.,2012, 2013; Angiolini et al., 2013; Bertoni et al., 2014); and (iii) theinfluence of several disturbance factors e such as beach tourism,trampling, mechanical cleaning of the beach, presence of paths androads, erosion e on plant communities (Kerbiriou et al., 2008; DeLuca et al., 2011; Mu�noz Vall�es et al., 2011; Ciccarelli et al., 2012;Santoro et al., 2012; Attorre et al., 2013; Ciccarelli, 2014). To date,no multidisciplinary studies have analysed simultaneously thecorrelation between dune morphology, sediment parameters, soilproperties, shoreline trend and vegetation patterns of Mediterra-nean coastal dune ecosystems. To increase our understanding ofthe ecological relationships between environmental variables andvegetation patterns as regards the Mediterranean systems ofcoastal dunes, we focused our research on two Italian protectedareas, where the coastal dunes are well-preserved and the humanimpact is low. This research addressed the following questions: (1)what is the trend of variation of the environmental factors analysedin the study areas along the coastline-inland gradient? (2) Whichenvironmental parameters e between dune morphology, sedimentparameters, soil features and shoreline trend e are most correlatedto plant community composition and cover? (3) How could theseresults be used to develop management strategies for coastal duneecosystems?
2. Materials and methods
2.1. Study areas
The fieldwork was carried out within two protected areas alongthe coast of Tuscany, Italy. The first, Migliarino e San Rossore e
Massaciuccoli Regional Park (SanRossore), is located in the northernsector of Tuscany, whereas the second, Maremma Regional Park(Maremma), is located to the south (Fig. 1). San Rossore faces thesouthernmost sector of the Ligurian Sea and is characterised by aMediterranean sub-humid climate; according to Rapetti (2003), itsmean annual temperature is about 15 �C and the mean rainfall is800e900 mm. Sediments constituting the beaches are mediumsands, with an average diameter of about 1.74 phi (Bertoni and Sarti,2011). In physical terms, the incident wave dominant direction isfrom about 240� (Cipriani et al., 2001), the littoral drift runs north-wards on the right side of the River Arno delta and southwards onthe left side (Pranzini, 2001; Bertoni et al., 2012) and the River Arnohas been closely involved in the evolution of this sector of the coast.As a matter of fact, the ancient dune ridges that extend along thelength of the Park (about 30 km) were formed during periods ofintense progradation of the system. However, during the last 150years strong erosion processes have caused a retreat of hundreds ofmetres, especially to the north, where no protection structureswerebuilt as opposed to the southern sector (Pranzini, 2001). Thenorthern and the southern sectors of San Rossore are accreting(about 2mper year), whereas the central sector is still subjected to a
retreatof about 4mper year (datawere collected from1985 to2002;Cipriani et al., 2004). The Arno river is the prevalent sedimentsource. The sand transported by the Serchio river contributes to alesser extent to feeding the coast. The coastal dunes of San Rossorebelong to the Natura 2000 network with two Sites of CommunityImportance (SCI), namely ‘Selva Pisana’ (IT5160002) and ‘Dunelitoranee di Torre del Lago’ (IT5170001).
The Maremma Park faces the northernmost sector of the Tyr-rhenian Sea, it is characterised by a Mediterranean sub-aridclimate; according to Pinna (1985), the average annual tempera-ture is 15.6 �C and the average annual rainfall is 618 mm. Withregard to the physical characteristics of this sector of the Tuscanycoast, the sediments are on average medium sands (2.32 phi),incident wave dominant direction is from 170� (Pranzini, 2001),and the littoral drift direction is opposite on the sides of theOmbrone river, northwards on the right side and southwards on theleft side (Gandolfi and Paganelli, 1975). As with the Arno and SanRossore, the Ombronewas the driving force behind the evolution ofthe beaches in theMaremma, since it is the only sediment source ofthe entire area: dune ridges extend for 10 km, even though theyhave been locally interrupted or strongly modified by human ac-tivities. According to Cipriani et al. (2004), in terms of the sedimentbudget the coast is in equilibrium in the northern sector, whereasthe central and the southern sectors are respectively in erosion(about 4 to 0.6 m per year) and in accretion (about 1.6 m per year),data were collected from 1984 to 1998. The coastal dunes of Mar-emma host a SCI called ‘Dune costiere del Parco dell’Uccellina’(IT51A0015).
2.2. Data sampling
According to the recent shoreline trends, the two study areaswere divided into three sectors characterised by accretion, erosion,
M. Ruocco et al. / Estuarine, Coastal and Shelf Science 149 (2014) 213e222 215
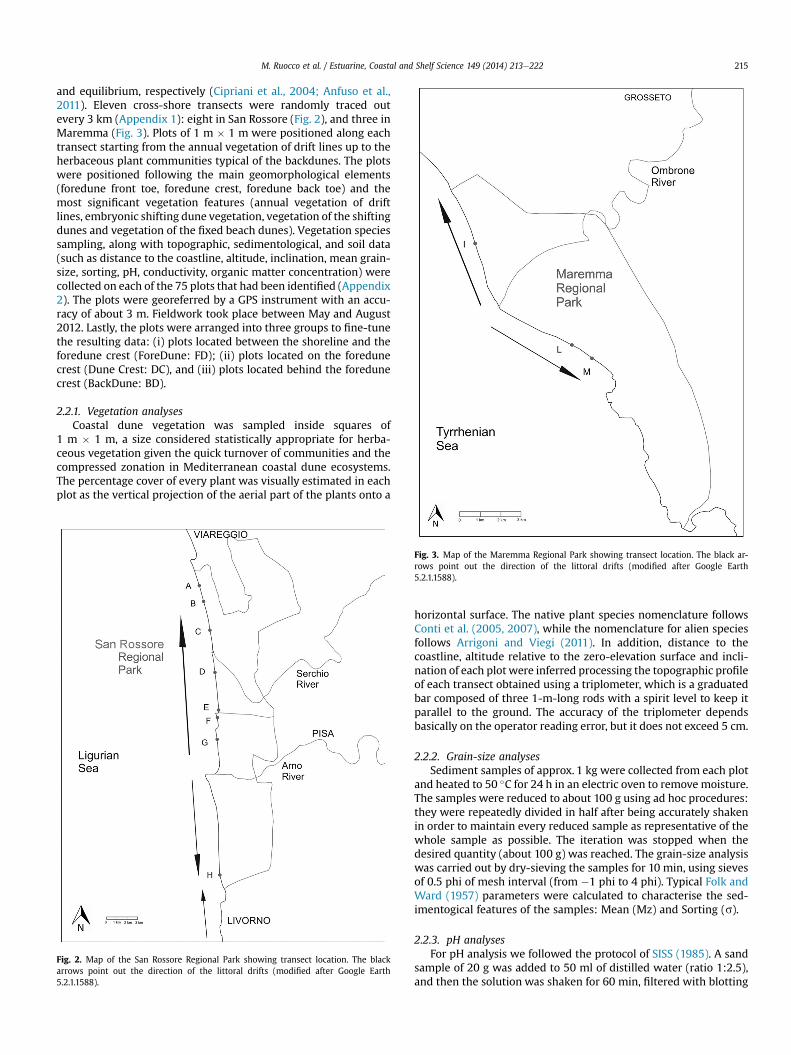
and equilibrium, respectively (Cipriani et al., 2004; Anfuso et al.,2011). Eleven cross-shore transects were randomly traced outevery 3 km (Appendix 1): eight in San Rossore (Fig. 2), and three inMaremma (Fig. 3). Plots of 1 m � 1 m were positioned along eachtransect starting from the annual vegetation of drift lines up to theherbaceous plant communities typical of the backdunes. The plotswere positioned following the main geomorphological elements(foredune front toe, foredune crest, foredune back toe) and themost significant vegetation features (annual vegetation of driftlines, embryonic shifting dune vegetation, vegetation of the shiftingdunes and vegetation of the fixed beach dunes). Vegetation speciessampling, along with topographic, sedimentological, and soil data(such as distance to the coastline, altitude, inclination, mean grain-size, sorting, pH, conductivity, organic matter concentration) werecollected on each of the 75 plots that had been identified (Appendix2). The plots were georeferred by a GPS instrument with an accu-racy of about 3 m. Fieldwork took place between May and August2012. Lastly, the plots were arranged into three groups to fine-tunethe resulting data: (i) plots located between the shoreline and theforedune crest (ForeDune: FD); (ii) plots located on the foredunecrest (Dune Crest: DC), and (iii) plots located behind the foredunecrest (BackDune: BD).
2.2.1. Vegetation analysesCoastal dune vegetation was sampled inside squares of
1 m � 1 m, a size considered statistically appropriate for herba-ceous vegetation given the quick turnover of communities and thecompressed zonation in Mediterranean coastal dune ecosystems.The percentage cover of every plant was visually estimated in eachplot as the vertical projection of the aerial part of the plants onto a
Fig. 3. Map of the Maremma Regional Park showing transect location. The black ar-rows point out the direction of the littoral drifts (modified after Google Earth5.2.1.1588).
Fig. 2. Map of the San Rossore Regional Park showing transect location. The blackarrows point out the direction of the littoral drifts (modified after Google Earth5.2.1.1588).
horizontal surface. The native plant species nomenclature followsConti et al. (2005, 2007), while the nomenclature for alien speciesfollows Arrigoni and Viegi (2011). In addition, distance to thecoastline, altitude relative to the zero-elevation surface and incli-nation of each plot were inferred processing the topographic profileof each transect obtained using a triplometer, which is a graduatedbar composed of three 1-m-long rods with a spirit level to keep itparallel to the ground. The accuracy of the triplometer dependsbasically on the operator reading error, but it does not exceed 5 cm.
2.2.2. Grain-size analysesSediment samples of approx. 1 kg were collected from each plot
and heated to 50 �C for 24 h in an electric oven to remove moisture.The samples were reduced to about 100 g using ad hoc procedures:they were repeatedly divided in half after being accurately shakenin order to maintain every reduced sample as representative of thewhole sample as possible. The iteration was stopped when thedesired quantity (about 100 g) was reached. The grain-size analysiswas carried out by dry-sieving the samples for 10 min, using sievesof 0.5 phi of mesh interval (from �1 phi to 4 phi). Typical Folk andWard (1957) parameters were calculated to characterise the sed-imentogical features of the samples: Mean (Mz) and Sorting (s).
2.2.3. pH analysesFor pH analysis we followed the protocol of SISS (1985). A sand
sample of 20 g was added to 50 ml of distilled water (ratio 1:2.5),and then the solution was shaken for 60 min, filtered with blotting
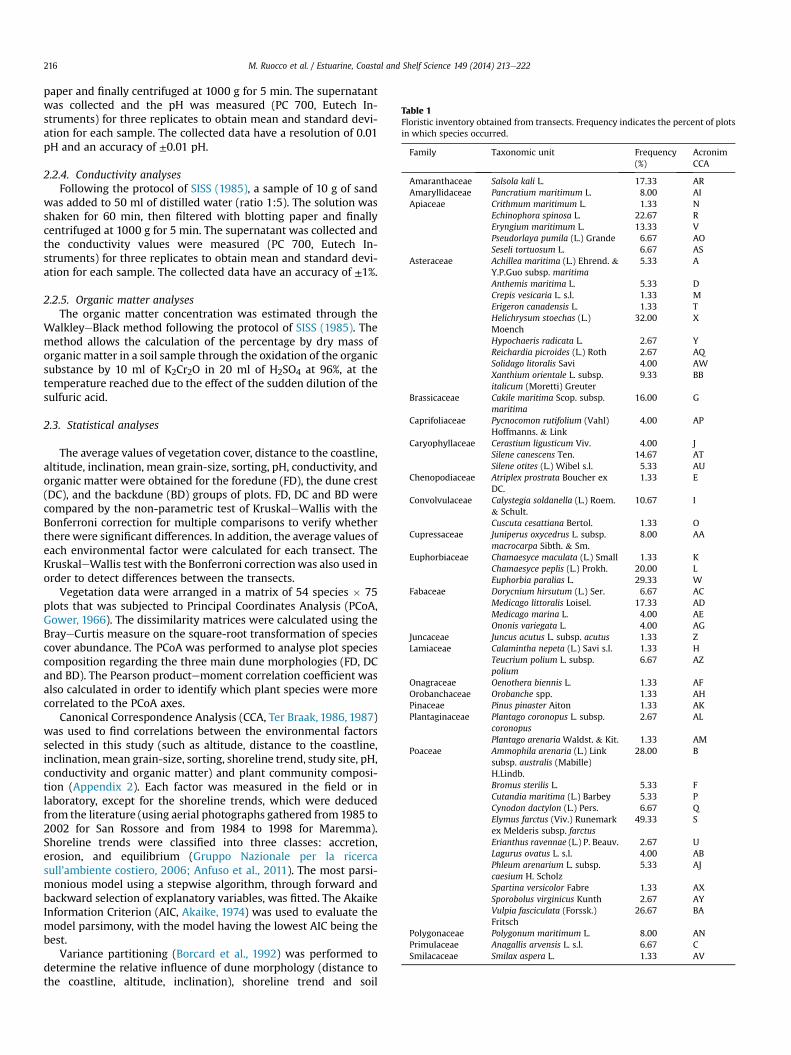
Table 1Floristic inventory obtained from transects. Frequency indicates the percent of plotsin which species occurred.
Family Taxonomic unit Frequency(%)
AcronimCCA
Amaranthaceae Salsola kali L. 17.33 ARAmaryllidaceae Pancratium maritimum L. 8.00 AIApiaceae Crithmum maritimum L. 1.33 N
Echinophora spinosa L. 22.67 REryngium maritimum L. 13.33 VPseudorlaya pumila (L.) Grande 6.67 AOSeseli tortuosum L. 6.67 AS
Asteraceae Achillea maritima (L.) Ehrend. &Y.P.Guo subsp. maritima
5.33 A
Anthemis maritima L. 5.33 DCrepis vesicaria L. s.l. 1.33 MErigeron canadensis L. 1.33 THelichrysum stoechas (L.)Moench
32.00 X
Hypochaeris radicata L. 2.67 YReichardia picroides (L.) Roth 2.67 AQSolidago litoralis Savi 4.00 AWXanthium orientale L. subsp.italicum (Moretti) Greuter
9.33 BB
Brassicaceae Cakile maritima Scop. subsp.maritima
16.00 G
Caprifoliaceae Pycnocomon rutifolium (Vahl)Hoffmanns. & Link
4.00 AP
Caryophyllaceae Cerastium ligusticum Viv. 4.00 JSilene canescens Ten. 14.67 ATSilene otites (L.) Wibel s.l. 5.33 AU
Chenopodiaceae Atriplex prostrata Boucher exDC.
1.33 E
Convolvulaceae Calystegia soldanella (L.) Roem.& Schult.
10.67 I
Cuscuta cesattiana Bertol. 1.33 OCupressaceae Juniperus oxycedrus L. subsp.
macrocarpa Sibth. & Sm.8.00 AA
Euphorbiaceae Chamaesyce maculata (L.) Small 1.33 KChamaesyce peplis (L.) Prokh. 20.00 LEuphorbia paralias L. 29.33 W
Fabaceae Dorycnium hirsutum (L.) Ser. 6.67 ACMedicago littoralis Loisel. 17.33 ADMedicago marina L. 4.00 AEOnonis variegata L. 4.00 AG
Juncaceae Juncus acutus L. subsp. acutus 1.33 ZLamiaceae Calamintha nepeta (L.) Savi s.l. 1.33 H
Teucrium polium L. subsp.polium
6.67 AZ
Onagraceae Oenothera biennis L. 1.33 AFOrobanchaceae Orobanche spp. 1.33 AHPinaceae Pinus pinaster Aiton 1.33 AKPlantaginaceae Plantago coronopus L. subsp.
coronopus2.67 AL
Plantago arenaria Waldst. & Kit. 1.33 AMPoaceae Ammophila arenaria (L.) Link
subsp. australis (Mabille)H.Lindb.
28.00 B
Bromus sterilis L. 5.33 FCutandia maritima (L.) Barbey 5.33 PCynodon dactylon (L.) Pers. 6.67 QElymus farctus (Viv.) Runemarkex Melderis subsp. farctus
49.33 S
Erianthus ravennae (L.) P. Beauv. 2.67 ULagurus ovatus L. s.l. 4.00 ABPhleum arenarium L. subsp.caesium H. Scholz
5.33 AJ
Spartina versicolor Fabre 1.33 AXSporobolus virginicus Kunth 2.67 AYVulpia fasciculata (Forssk.)Fritsch
26.67 BA
Polygonaceae Polygonum maritimum L. 8.00 ANPrimulaceae Anagallis arvensis L. s.l. 6.67 CSmilacaceae Smilax aspera L. 1.33 AV
M. Ruocco et al. / Estuarine, Coastal and Shelf Science 149 (2014) 213e222216
paper and finally centrifuged at 1000 g for 5 min. The supernatantwas collected and the pH was measured (PC 700, Eutech In-struments) for three replicates to obtain mean and standard devi-ation for each sample. The collected data have a resolution of 0.01pH and an accuracy of ±0.01 pH.
2.2.4. Conductivity analysesFollowing the protocol of SISS (1985), a sample of 10 g of sand
was added to 50 ml of distilled water (ratio 1:5). The solution wasshaken for 60 min, then filtered with blotting paper and finallycentrifuged at 1000 g for 5 min. The supernatant was collected andthe conductivity values were measured (PC 700, Eutech In-struments) for three replicates to obtain mean and standard devi-ation for each sample. The collected data have an accuracy of ±1%.
2.2.5. Organic matter analysesThe organic matter concentration was estimated through the
WalkleyeBlack method following the protocol of SISS (1985). Themethod allows the calculation of the percentage by dry mass oforganic matter in a soil sample through the oxidation of the organicsubstance by 10 ml of K2Cr2O in 20 ml of H2SO4 at 96%, at thetemperature reached due to the effect of the sudden dilution of thesulfuric acid.
2.3. Statistical analyses
The average values of vegetation cover, distance to the coastline,altitude, inclination, mean grain-size, sorting, pH, conductivity, andorganic matter were obtained for the foredune (FD), the dune crest(DC), and the backdune (BD) groups of plots. FD, DC and BD werecompared by the non-parametric test of KruskaleWallis with theBonferroni correction for multiple comparisons to verify whetherthere were significant differences. In addition, the average values ofeach environmental factor were calculated for each transect. TheKruskaleWallis test with the Bonferroni correctionwas also used inorder to detect differences between the transects.
Vegetation data were arranged in a matrix of 54 species � 75plots that was subjected to Principal Coordinates Analysis (PCoA,Gower, 1966). The dissimilarity matrices were calculated using theBrayeCurtis measure on the square-root transformation of speciescover abundance. The PCoA was performed to analyse plot speciescomposition regarding the three main dune morphologies (FD, DCand BD). The Pearson productemoment correlation coefficient wasalso calculated in order to identify which plant species were morecorrelated to the PCoA axes.
Canonical Correspondence Analysis (CCA, Ter Braak, 1986, 1987)was used to find correlations between the environmental factorsselected in this study (such as altitude, distance to the coastline,inclination, mean grain-size, sorting, shoreline trend, study site, pH,conductivity and organic matter) and plant community composi-tion (Appendix 2). Each factor was measured in the field or inlaboratory, except for the shoreline trends, which were deducedfrom the literature (using aerial photographs gathered from 1985 to2002 for San Rossore and from 1984 to 1998 for Maremma).Shoreline trends were classified into three classes: accretion,erosion, and equilibrium (Gruppo Nazionale per la ricercasull’ambiente costiero, 2006; Anfuso et al., 2011). The most parsi-monious model using a stepwise algorithm, through forward andbackward selection of explanatory variables, was fitted. The AkaikeInformation Criterion (AIC, Akaike, 1974) was used to evaluate themodel parsimony, with the model having the lowest AIC being thebest.
Variance partitioning (Borcard et al., 1992) was performed todetermine the relative influence of dune morphology (distance tothe coastline, altitude, inclination), shoreline trend and soil
M. Ruocco et al. / Estuarine, Coastal and Shelf Science 149 (2014) 213e222 217
parameters (mean grain-size, sorting, pH, conductivity and organicmatter) using the method and software described in Peres-Netoet al. (2006). The software allows partitioning of the variance inthe vegetation cover percentage into components accounted for bydune morphological characteristics, shoreline trend and soil pa-rameters and their combined effects. The results were representedas a Venn-diagram (Økland, 2003). All the statistical tests wereperformed using R 2.15.2 language software (2012). Vegan packagewas used for PCoA, CCA, and variance partitioning analyses(Oksanen et al., 2012).
3. Results
3.1. Vegetation analyses and dune morphology
The floristic list obtained from the 75 plots showed the presenceof 54 vascular plant species belonging to 22 families (Table 1). Themost represented family was the Poaceae with 11 species, followedby Asteraceae (9 species), Apiaceae (5 species) and Fabaceae (4species). The most common species was Elymus farctus found in49.3% of plots, followed by Helichrysum stoechas (32% of plots),Euphorbia paralias (29.3% of plots), Ammophila arenaria (28% ofplots) and Vulpia fasciculata (26.7% of plots). Four alien species,representing 7.4% of floristic inventory, were found: Chamaesycemaculata (1.3% of plots), Erigeron canadensis (1.3% of plots), Oeno-thera biennis (1.3% of plots) and Xanthium orientale subsp. italicum(9.3% of plots). Furthermore, only one endemic species was found:Solidago littoralis in San Rossore (4% of plots).
The mean total plant cover was significantly lower in FD plotsthan in DC and BD plots (p-value < 0.05), while no difference was
Table 2Mean values ± standard deviation measured for the FD, DC and BD plots. Means followkaleWallis test with the Bonferroni correction).
Transect Vegetationalcover (%)
Distance to thecoastline (m)
Altitude (cm) Inclination (�) M(
A FD 50.75a ± 17.52 47.50a ± 13.47 227.50a ± 12.00 3.00a ± 2.94 1DC 88.00b ± 0.00 79.50a ± 0.00 347.50a ± 0.00 2.00a ± 0.00 1BD 63.5b ± 13.92 119.75b ± 18.78 212.50a ± 49.89 2.75a ± 2.06 1
B FD 70.00a ± 23.26 35.95a ± 14.10 232.33a ± 9.88 4.67a ± 2.08 1DC 91.00b ± 0.00 60.00a ± 0.00 310.50a ± 0.00 11.00a ± 0.00 1BD 85.00b ± 19.27 103.94b ± 34.81 233.80a ± 57.53 4.00a ± 3.74 1
C FD 54.00a ± 12.12 52.00a ± 14.53 219.67a ± 22.91 4.33a ± 4.04 1DC 100.00b ± 0.00 77.00a ± 0.00 434.50a ± 0.00 2.00a ± 0.00 1BD 93.67b ± 2.08 114.17b ± 19.26 214.50a ± 44.14 4.33a ± 4.16 1
D FD 54.50a ± 20.51 18.50a ± 7.78 256.50a ± 36.06 6.00a ± 2.12 1DC 100.00b ± 0.00 43.00a ± 0.00 725.50a ± 0.00 8.00a ± 0.00 2BD 88.50b ± 10.61 66.50b ± 7.68 571.00a ± 81.32 5.50a ± 0.71 1
E FD 76.00a ± 0.00 10.50a ± 0.00 329.00a ± 0.00 5.00a ± 0.00 1DC 93.00b ± 0.00 15.50a ± 0.00 343.50a ± 0.00 8.00a ± 0.00 1BD 67.50b ± 33.23 27.00b ± 7.78 258.25a ± 34.29 2.00a ± 2.83 2
F FD 37.33a ± 40.61 30.33a ± 8.02 239.17a ± 54.65 14.67a ± 6.43 1DC 88.00b ± 0.00 43.00a ± 0.00 400.50a ± 0.00 9.00a ± 0.00 1BD 93.33b ± 9.07 75.57b ± 15.58 229.00a ± 55.70 3.67a ± 0.58 2
G FD 74.00a ± 11.31 24.58a ± 11.56 227.50a ± 21.21 6.50a ± 0.71 1DC 100.00b ± 0.00 35.00a ± 0.00 254.00a ± 0.00 7.00a ± 0.00 1BD 58.00b ± 36.39 51.67b ± 7.51 246.00a ± 27.54 2.00a ± 1.73 2
H FD 66.25a ± 29.17 37.88a ± 10.14 170.13a ± 77.14 6.50a ± 3.11 2DC 100.00b ± 0.00 56.00a ± 0.00 379.50a ± 0.00 13.00a ± 0.00 2BD 98.50b ± 2.12 69.00b ± 2.83 287.50a ± 2.12 6.50a ± 6.36 2
I FD 31.00a ± 33.94 31.00a ± 2.83 78.50a ± 28.28 6.00a ± 5.66 2DC 80.00b ± 0.00 56.70a ± 0.00 131.50a ± 0.00 10.00a ± 0.00 1BD 94.25b ± 5.91 60.00b ± 12.73 79.88a ± 23.56 2.50a ± 1.00 2
L FD 60.00a ± 50.69 28.00a ± 13.53 194.00a ± 64.67 4.67a ± 2.52 2DC 100.00b ± 0.00 56.70a ± 0.00 539.50a ± 0.00 23.00a ± 0.00 2BD 6.00b ± 5.66 73.50b ± 10.61 277.50a ± 26.87 3.50a ± 2.12 2
M FD 43.67a ± 48.21 29.17a ± 10.30 117.50a ± 32.04 5.67a ± 4.51 2DC 100.00b ± 0.00 48.00a ± 0.00 277.50a ± 0.00 9.00a ± 0.00 2BD 55.00b ± 29.05 70.00b ± 9.56 146.13a ± 42.99 4.25a ± 5.44 2
found between DC and BD plots. The values of mean total plantcover in the plots of FD varied from 31% in transect I (shoreline inequilibrium) and 76% in transect E (erosional shoreline); for theplots of DC they varied from 80% in transect I to 100% in transects Cand M (accreting shoreline), D, G and L (erosional shoreline), H(shoreline in equilibrium); finally, in the plots of BD they variedfrom 6% in transect L to 98% in transect H (Table 2). No significantdifferences of the mean total plant cover were recorded betweentransects (Table 3).
Distance to the coastline resulted significantly different be-tween FD and the BD plots (p-value < 0.001), and between DC andBD plots (p-value ¼ 0.0016), while no differences were found be-tween FD and DC plots. FD plots showed the lowest distance(10.5 m) to the shoreline in E transect (erosional shoreline), whilethe highest distance was 52.0 m in transect C (accreting shoreline);15.5 m and 79.5 m were the lowest and highest distance to theshoreline measured in transect E and A (accreting shoreline)respectively for DC plots. Finally, 27.0 m and 119.75 were thesmallest and largest distance to the coastline measured in transectE and A respectively for BD plots (Table 2).
Altitude and inclinationwere not significantly different betweenthe plot of FD, DC and BD. Regarding FD plots, the lowest altitudewas recorded in transect I (78.5 cm; shoreline in equilibrium),while the highest was recorded in transect E (329.0 cm; erosionalshoreline); the lowest inclination was recorded in transect A with3.0� (accreting shoreline), while the highest was found in transect Fwith 14.7� (erosional shoreline). For the plots of DC, 131.5 cm wasthe lowest altitude recorded in transect I (shoreline in equilibrium),while 725.5 cm was the highest recorded in transect D (erosionalshoreline); 2.0� was the lowest inclination recorded in transects A
ed by the same letters are not significantly different (p-value < 0.05 by the Krus-
ean grain-sizephi)
Sorting (phi) pH Conductivity (mS) Organic matter(g/Kg)
.81a ± 0.05 0.41a ± 0.01 7.48b ± 0.06 162.39b ± 74.07 0.78a ± 0.16
.86a ± 0.00 0.42a ± 0.00 7.50ab ± 0.05 90.23ab ± 0.06 0.78a ± 0.00
.93a ± 0.08 0.44a ± 0.02 7.33a ± 0.08 97.98a ± 32.59 4.83b ± 2.17
.79a ± 0.06 0.40a ± 0.02 7.64b ± 0.06 166.94b ± 113.07 1.02a ± 0.11
.79a ± 0.00 0.44a ± 0.00 7.41ab ± 0.04 118.73ab ± 0.21 1.24a ± 0.00
.88a ± 0.04 0.43a ± 0.02 7.40a ± 0.11 109.63a ± 11.60 4.02b ± 2.46
.82a ± 0.13 0.44a ± 0.06 7.63b ± 0.08 140.53b ± 33.42 0.89a ± 0.11
.86a ± 0.00 0.43a ± 0.00 7.39ab ± 0.02 84.77ab ± 0.06 1.89a ± 0.00
.83a ± 0.06 0.43a ± 0.02 7.36a ± 0.10 75.94a ± 0.93 7.22b ± 3.87
.98a ± 0.09 0.42a ± 0.01 7.28b ± 0.03 369.37b ± 244.98 1.89a ± 0.94
.05a ± 0.00 0.48a ± 0.00 7.23ab ± 0.02 142.67ab ± 0.06 4.22a ± 0.00
.92a ± 0.01 0.43a ± 0.02 7.26a ± 0.10 82.67a ± 1.35 2.67b ± 0.94
.82a ± 0.00 0.44a ± 0.00 7.46b ± 0.03 245.00b ± 0.00 1.56a ± 0.00
.90a ± 0.00 0.39a ± 0.00 7.31ab ± 0.01 235.33ab ± 0.58 2.00a ± 0.00
.05a ± 0.11 0.49a ± 0.04 7.21a ± 0.07 195.52a ± 29.01 14.33b ± 0.47
.81a ± 0.18 0.41a ± 0.04 7.59 ± 0.03 218.64b ± 35.03 1.22a ± 0.78
.98a ± 0.00 0.44a ± 0.00 7.38 ± 0.01 189.03ab ± 0.06 4.33a ± 0.00
.09a ± 0.01 0.51a ± 0.01 7.23 ± 0.06 129.82a ± 33.48 12.89b ± 7.45
.75a ± 0.23 0.43a ± 0.08 7.43b ± 0.02 379.17b ± 189.33 0.83a ± 0.08
.66a ± 0.00 0.46a ± 0.00 7.17ab ± 0.17 240.33ab ± 0.58 1.44a ± 0.00
.16a ± 0.08 0.51a ± 0.02 7.28a ± 0.10 179.71a ± 30.70 10.57b ± 6.94
.31a ± 0.13 0.53a ± 0.04 7.57b ± 0.08 96.22b ± 42.03 0.78a ± 0.09
.13a ± 0.00 0.52a ± 0.00 7.68ab ± 0.06 68.93ab ± 0.12 0.67a ± 0.00
.64a ± 0.09 0.48a ± 0.02 7.36a ± 0.06 83.18a ± 3.63 3.11b ± 0.16
.13a ± 0.00 0.40a ± 0.00 8.28b ± 0.07 124.67b ± 8.73 0.94a ± 0.08
.94a ± 0.00 0.42a ± 0.00 8.31ab ± 0.04 198.03ab ± 0.06 0.89a ± 0.00
.16a ± 0.14 0.44a ± 0.03 7.40a ± 0.13 63.87a ± 3.96 3.53b ± 1.73
.07a ± 0.11 0.43a ± 0.02 7.59b ± 0.08 312.40b ± 336.16 0.71a ± 0.06
.17a ± 0.00 0.39a ± 0.00 7.46ab ± 0.00 70.77ab ± 0.06 1.01a ± 0.00
.02a ± 0.07 0.47a ± 0.00 7.54a ± 0.02 76.23a ± 13.29 0.95b ± 0.24
.58a ± 0.04 0.37a ± 0.01 7.69b ± 0.29 191.96b ± 117.19 1.12a ± 0.22
.70a ± 0.00 0.32a ± 0.00 7.26ab ± 0.01 62.87ab ± 0.06 0.89a ± 0.00
.62a ± 0.03 0.37a ± 0.02 7.46a ± 0.11 73.14a ± 9.41 1.20b ± 0.39
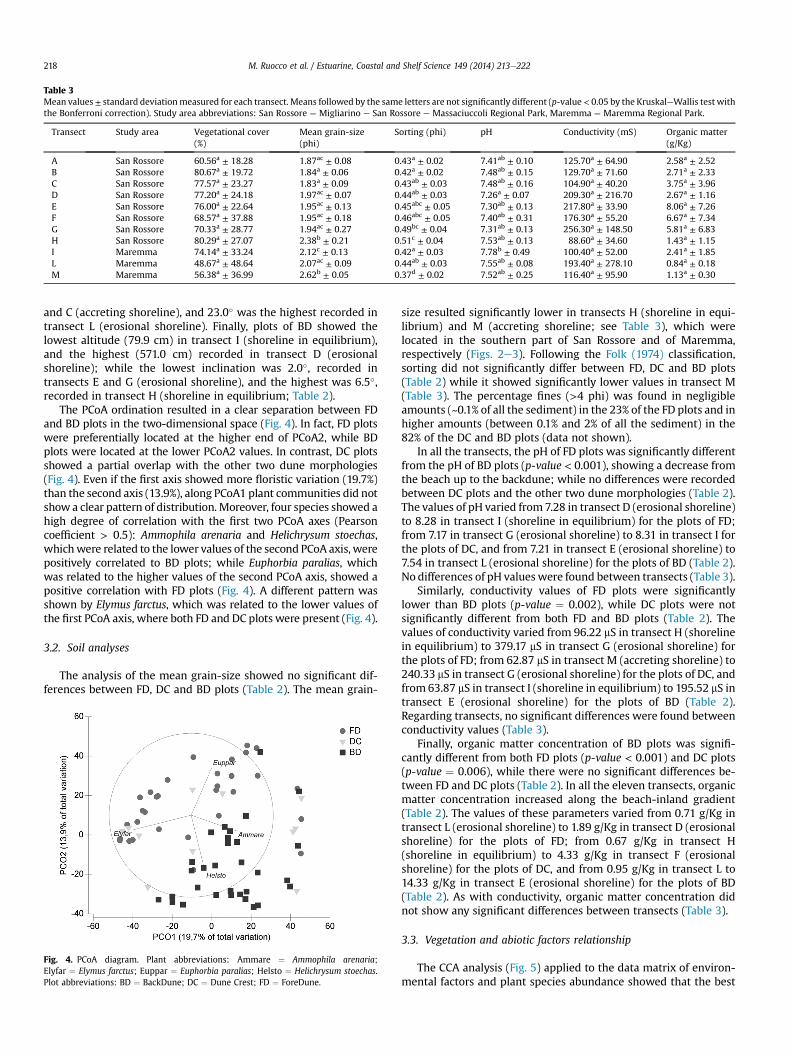
Table 3Mean values± standard deviationmeasured for each transect. Means followed by the same letters are not significantly different (p-value < 0.05 by the KruskaleWallis test withthe Bonferroni correction). Study area abbreviations: San Rossore ¼ Migliarino e San Rossore e Massaciuccoli Regional Park, Maremma ¼ Maremma Regional Park.
Transect Study area Vegetational cover(%)
Mean grain-size(phi)
Sorting (phi) pH Conductivity (mS) Organic matter(g/Kg)
A San Rossore 60.56a ± 18.28 1.87ac ± 0.08 0.43a ± 0.02 7.41ab ± 0.10 125.70a ± 64.90 2.58a ± 2.52B San Rossore 80.67a ± 19.72 1.84a ± 0.06 0.42a ± 0.02 7.48ab ± 0.15 129.70a ± 71.60 2.71a ± 2.33C San Rossore 77.57a ± 23.27 1.83a ± 0.09 0.43ab ± 0.03 7.48ab ± 0.16 104.90a ± 40.20 3.75a ± 3.96D San Rossore 77.20a ± 24.18 1.97ac ± 0.07 0.44ab ± 0.03 7.26a ± 0.07 209.30a ± 216.70 2.67a ± 1.16E San Rossore 76.00a ± 22.64 1.95ac ± 0.13 0.45abc ± 0.05 7.30ab ± 0.13 217.80a ± 33.90 8.06a ± 7.26F San Rossore 68.57a ± 37.88 1.95ac ± 0.18 0.46abc ± 0.05 7.40ab ± 0.31 176.30a ± 55.20 6.67a ± 7.34G San Rossore 70.33a ± 28.77 1.94ac ± 0.27 0.49bc ± 0.04 7.31ab ± 0.13 256.30a ± 148.50 5.81a ± 6.83H San Rossore 80.29a ± 27.07 2.38b ± 0.21 0.51c ± 0.04 7.53ab ± 0.13 88.60a ± 34.60 1.43a ± 1.15I Maremma 74.14a ± 33.24 2.12c ± 0.13 0.42a ± 0.03 7.78b ± 0.49 100.40a ± 52.00 2.41a ± 1.85L Maremma 48.67a ± 48.64 2.07ac ± 0.09 0.44ab ± 0.03 7.55ab ± 0.08 193.40a ± 278.10 0.84a ± 0.18M Maremma 56.38a ± 36.99 2.62b ± 0.05 0.37d ± 0.02 7.52ab ± 0.25 116.40a ± 95.90 1.13a ± 0.30
M. Ruocco et al. / Estuarine, Coastal and Shelf Science 149 (2014) 213e222218
and C (accreting shoreline), and 23.0� was the highest recorded intransect L (erosional shoreline). Finally, plots of BD showed thelowest altitude (79.9 cm) in transect I (shoreline in equilibrium),and the highest (571.0 cm) recorded in transect D (erosionalshoreline); while the lowest inclination was 2.0�, recorded intransects E and G (erosional shoreline), and the highest was 6.5�,recorded in transect H (shoreline in equilibrium; Table 2).
The PCoA ordination resulted in a clear separation between FDand BD plots in the two-dimensional space (Fig. 4). In fact, FD plotswere preferentially located at the higher end of PCoA2, while BDplots were located at the lower PCoA2 values. In contrast, DC plotsshowed a partial overlap with the other two dune morphologies(Fig. 4). Even if the first axis showed more floristic variation (19.7%)than the second axis (13.9%), along PCoA1 plant communities did notshowa clear pattern of distribution. Moreover, four species showed ahigh degree of correlation with the first two PCoA axes (Pearsoncoefficient > 0.5): Ammophila arenaria and Helichrysum stoechas,whichwere related to the lower values of the second PCoA axis, werepositively correlated to BD plots; while Euphorbia paralias, whichwas related to the higher values of the second PCoA axis, showed apositive correlation with FD plots (Fig. 4). A different pattern wasshown by Elymus farctus, which was related to the lower values ofthe first PCoA axis, where both FD and DC plots were present (Fig. 4).
3.2. Soil analyses
The analysis of the mean grain-size showed no significant dif-ferences between FD, DC and BD plots (Table 2). The mean grain-
Fig. 4. PCoA diagram. Plant abbreviations: Ammare ¼ Ammophila arenaria;Elyfar ¼ Elymus farctus; Euppar ¼ Euphorbia paralias; Helsto ¼ Helichrysum stoechas.Plot abbreviations: BD ¼ BackDune; DC ¼ Dune Crest; FD ¼ ForeDune.
size resulted significantly lower in transects H (shoreline in equi-librium) and M (accreting shoreline; see Table 3), which werelocated in the southern part of San Rossore and of Maremma,respectively (Figs. 2e3). Following the Folk (1974) classification,sorting did not significantly differ between FD, DC and BD plots(Table 2) while it showed significantly lower values in transect M(Table 3). The percentage fines (>4 phi) was found in negligibleamounts (~0.1% of all the sediment) in the 23% of the FD plots and inhigher amounts (between 0.1% and 2% of all the sediment) in the82% of the DC and BD plots (data not shown).
In all the transects, the pH of FD plots was significantly differentfrom the pH of BD plots (p-value < 0.001), showing a decrease fromthe beach up to the backdune; while no differences were recordedbetween DC plots and the other two dune morphologies (Table 2).The values of pH varied from 7.28 in transect D (erosional shoreline)to 8.28 in transect I (shoreline in equilibrium) for the plots of FD;from 7.17 in transect G (erosional shoreline) to 8.31 in transect I forthe plots of DC, and from 7.21 in transect E (erosional shoreline) to7.54 in transect L (erosional shoreline) for the plots of BD (Table 2).No differences of pH values were found between transects (Table 3).
Similarly, conductivity values of FD plots were significantlylower than BD plots (p-value ¼ 0.002), while DC plots were notsignificantly different from both FD and BD plots (Table 2). Thevalues of conductivity varied from 96.22 mS in transect H (shorelinein equilibrium) to 379.17 mS in transect G (erosional shoreline) forthe plots of FD; from 62.87 mS in transect M (accreting shoreline) to240.33 mS in transect G (erosional shoreline) for the plots of DC, andfrom 63.87 mS in transect I (shoreline in equilibrium) to 195.52 mS intransect E (erosional shoreline) for the plots of BD (Table 2).Regarding transects, no significant differences were found betweenconductivity values (Table 3).
Finally, organic matter concentration of BD plots was signifi-cantly different from both FD plots (p-value < 0.001) and DC plots(p-value ¼ 0.006), while there were no significant differences be-tween FD and DC plots (Table 2). In all the eleven transects, organicmatter concentration increased along the beach-inland gradient(Table 2). The values of these parameters varied from 0.71 g/Kg intransect L (erosional shoreline) to 1.89 g/Kg in transect D (erosionalshoreline) for the plots of FD; from 0.67 g/Kg in transect H(shoreline in equilibrium) to 4.33 g/Kg in transect F (erosionalshoreline) for the plots of DC, and from 0.95 g/Kg in transect L to14.33 g/Kg in transect E (erosional shoreline) for the plots of BD(Table 2). As with conductivity, organic matter concentration didnot show any significant differences between transects (Table 3).
3.3. Vegetation and abiotic factors relationship
The CCA analysis (Fig. 5) applied to the data matrix of environ-mental factors and plant species abundance showed that the best
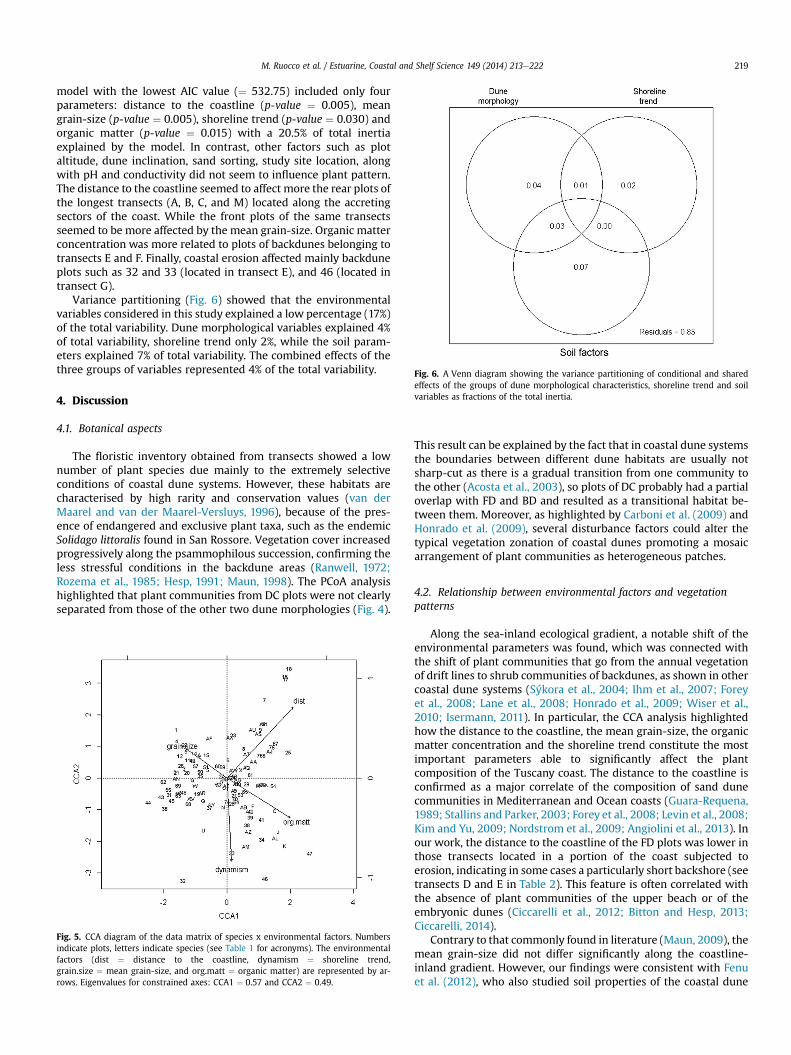
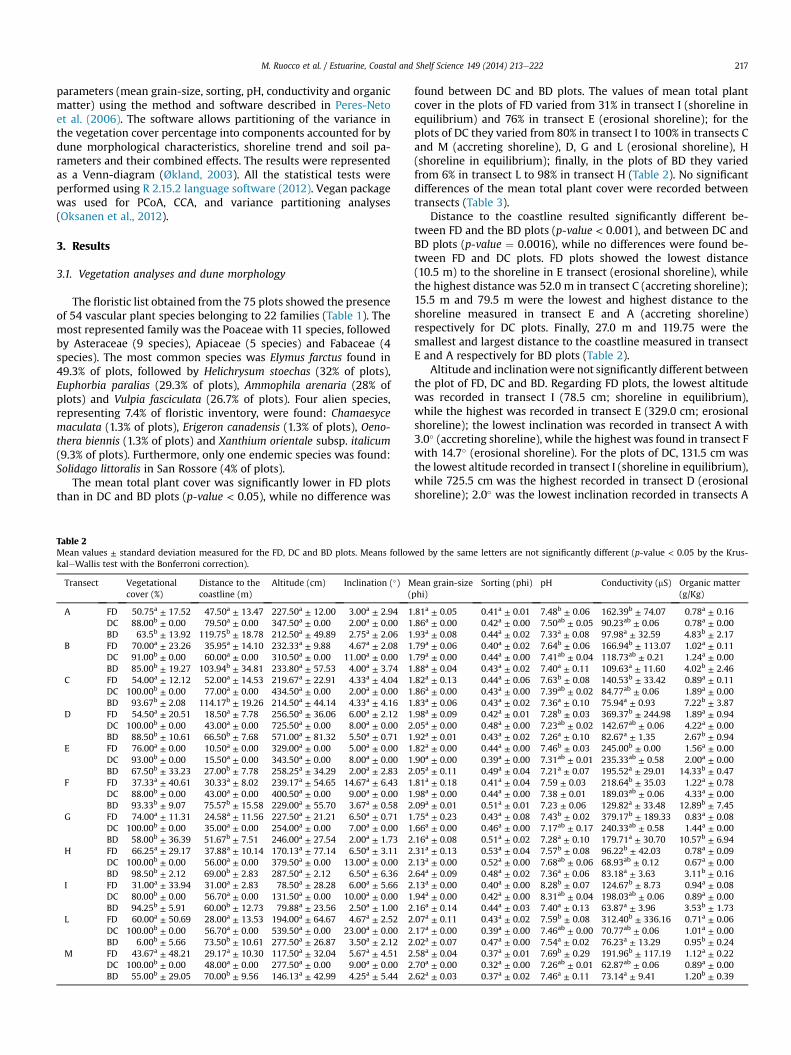
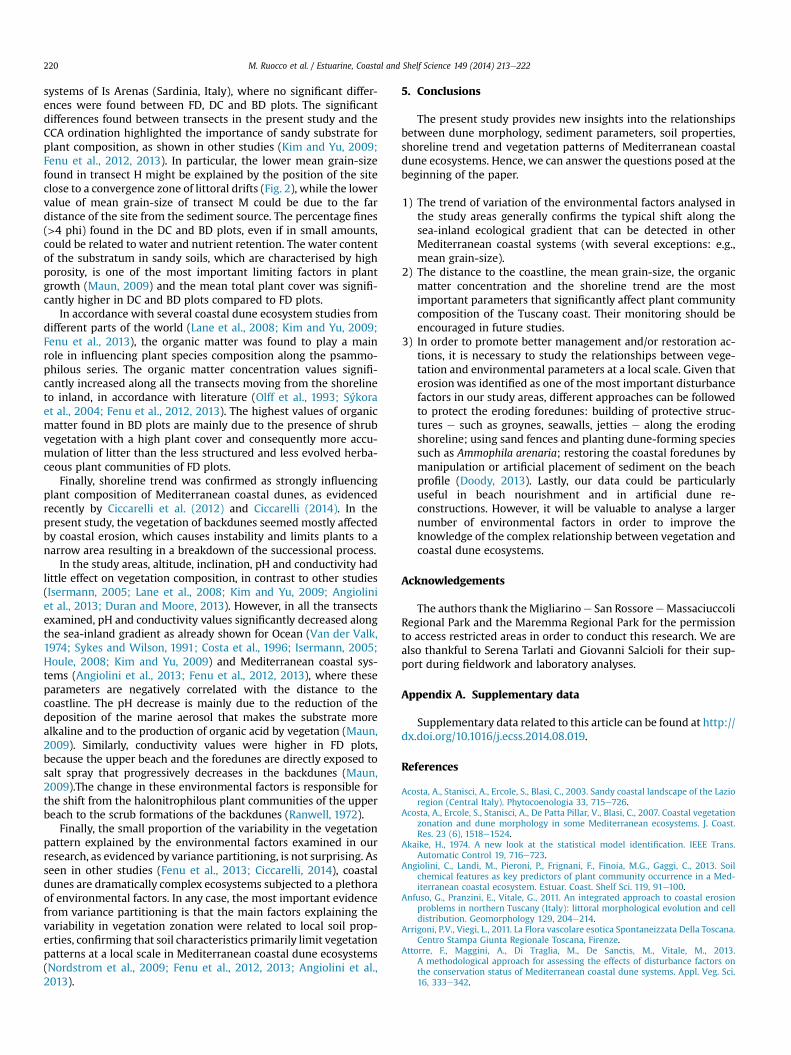
Fig. 6. A Venn diagram showing the variance partitioning of conditional and sharedeffects of the groups of dune morphological characteristics, shoreline trend and soilvariables as fractions of the total inertia.
M. Ruocco et al. / Estuarine, Coastal and Shelf Science 149 (2014) 213e222 219
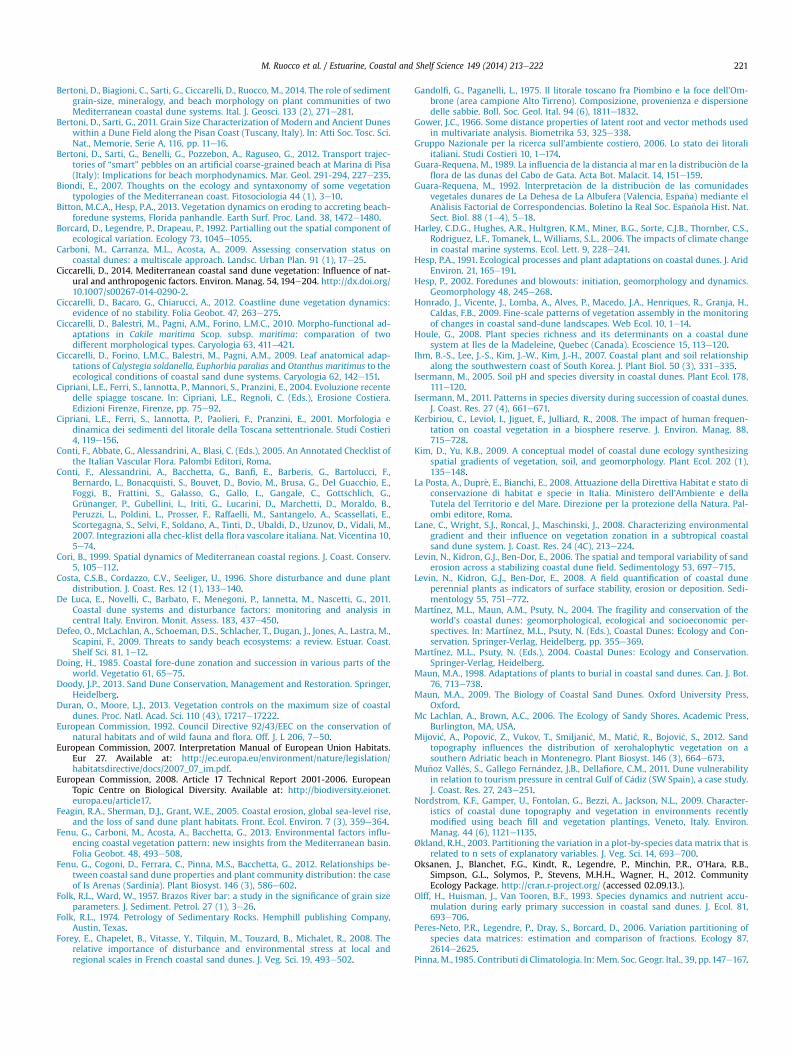
model with the lowest AIC value (¼ 532.75) included only fourparameters: distance to the coastline (p-value ¼ 0.005), meangrain-size (p-value ¼ 0.005), shoreline trend (p-value ¼ 0.030) andorganic matter (p-value ¼ 0.015) with a 20.5% of total inertiaexplained by the model. In contrast, other factors such as plotaltitude, dune inclination, sand sorting, study site location, alongwith pH and conductivity did not seem to influence plant pattern.The distance to the coastline seemed to affect more the rear plots ofthe longest transects (A, B, C, and M) located along the accretingsectors of the coast. While the front plots of the same transectsseemed to be more affected by the mean grain-size. Organic matterconcentration was more related to plots of backdunes belonging totransects E and F. Finally, coastal erosion affected mainly backduneplots such as 32 and 33 (located in transect E), and 46 (located intransect G).
Variance partitioning (Fig. 6) showed that the environmentalvariables considered in this study explained a low percentage (17%)of the total variability. Dune morphological variables explained 4%of total variability, shoreline trend only 2%, while the soil param-eters explained 7% of total variability. The combined effects of thethree groups of variables represented 4% of the total variability.
4. Discussion
4.1. Botanical aspects
The floristic inventory obtained from transects showed a lownumber of plant species due mainly to the extremely selectiveconditions of coastal dune systems. However, these habitats arecharacterised by high rarity and conservation values (van derMaarel and van der Maarel-Versluys, 1996), because of the pres-ence of endangered and exclusive plant taxa, such as the endemicSolidago littoralis found in San Rossore. Vegetation cover increasedprogressively along the psammophilous succession, confirming theless stressful conditions in the backdune areas (Ranwell, 1972;Rozema et al., 1985; Hesp, 1991; Maun, 1998). The PCoA analysishighlighted that plant communities from DC plots were not clearlyseparated from those of the other two dune morphologies (Fig. 4).
Fig. 5. CCA diagram of the data matrix of species x environmental factors. Numbersindicate plots, letters indicate species (see Table 1 for acronyms). The environmentalfactors (dist ¼ distance to the coastline, dynamism ¼ shoreline trend,grain.size ¼ mean grain-size, and org.matt ¼ organic matter) are represented by ar-rows. Eigenvalues for constrained axes: CCA1 ¼ 0.57 and CCA2 ¼ 0.49.
This result can be explained by the fact that in coastal dune systemsthe boundaries between different dune habitats are usually notsharp-cut as there is a gradual transition from one community tothe other (Acosta et al., 2003), so plots of DC probably had a partialoverlap with FD and BD and resulted as a transitional habitat be-tween them. Moreover, as highlighted by Carboni et al. (2009) andHonrado et al. (2009), several disturbance factors could alter thetypical vegetation zonation of coastal dunes promoting a mosaicarrangement of plant communities as heterogeneous patches.
4.2. Relationship between environmental factors and vegetationpatterns
Along the sea-inland ecological gradient, a notable shift of theenvironmental parameters was found, which was connected withthe shift of plant communities that go from the annual vegetationof drift lines to shrub communities of backdunes, as shown in othercoastal dune systems (Sýkora et al., 2004; Ihm et al., 2007; Foreyet al., 2008; Lane et al., 2008; Honrado et al., 2009; Wiser et al.,2010; Isermann, 2011). In particular, the CCA analysis highlightedhow the distance to the coastline, the mean grain-size, the organicmatter concentration and the shoreline trend constitute the mostimportant parameters able to significantly affect the plantcomposition of the Tuscany coast. The distance to the coastline isconfirmed as a major correlate of the composition of sand dunecommunities in Mediterranean and Ocean coasts (Guara-Requena,1989; Stallins and Parker, 2003; Forey et al., 2008; Levin et al., 2008;Kim and Yu, 2009; Nordstrom et al., 2009; Angiolini et al., 2013). Inour work, the distance to the coastline of the FD plots was lower inthose transects located in a portion of the coast subjected toerosion, indicating in some cases a particularly short backshore (seetransects D and E in Table 2). This feature is often correlated withthe absence of plant communities of the upper beach or of theembryonic dunes (Ciccarelli et al., 2012; Bitton and Hesp, 2013;Ciccarelli, 2014).
Contrary to that commonly found in literature (Maun, 2009), themean grain-size did not differ significantly along the coastline-inland gradient. However, our findings were consistent with Fenuet al. (2012), who also studied soil properties of the coastal dune
M. Ruocco et al. / Estuarine, Coastal and Shelf Science 149 (2014) 213e222220
systems of Is Arenas (Sardinia, Italy), where no significant differ-ences were found between FD, DC and BD plots. The significantdifferences found between transects in the present study and theCCA ordination highlighted the importance of sandy substrate forplant composition, as shown in other studies (Kim and Yu, 2009;Fenu et al., 2012, 2013). In particular, the lower mean grain-sizefound in transect H might be explained by the position of the siteclose to a convergence zone of littoral drifts (Fig. 2), while the lowervalue of mean grain-size of transect M could be due to the fardistance of the site from the sediment source. The percentage fines(>4 phi) found in the DC and BD plots, even if in small amounts,could be related to water and nutrient retention. The water contentof the substratum in sandy soils, which are characterised by highporosity, is one of the most important limiting factors in plantgrowth (Maun, 2009) and the mean total plant cover was signifi-cantly higher in DC and BD plots compared to FD plots.
In accordance with several coastal dune ecosystem studies fromdifferent parts of the world (Lane et al., 2008; Kim and Yu, 2009;Fenu et al., 2013), the organic matter was found to play a mainrole in influencing plant species composition along the psammo-philous series. The organic matter concentration values signifi-cantly increased along all the transects moving from the shorelineto inland, in accordance with literature (Olff et al., 1993; Sýkoraet al., 2004; Fenu et al., 2012, 2013). The highest values of organicmatter found in BD plots are mainly due to the presence of shrubvegetation with a high plant cover and consequently more accu-mulation of litter than the less structured and less evolved herba-ceous plant communities of FD plots.
Finally, shoreline trend was confirmed as strongly influencingplant composition of Mediterranean coastal dunes, as evidencedrecently by Ciccarelli et al. (2012) and Ciccarelli (2014). In thepresent study, the vegetation of backdunes seemed mostly affectedby coastal erosion, which causes instability and limits plants to anarrow area resulting in a breakdown of the successional process.
In the study areas, altitude, inclination, pH and conductivity hadlittle effect on vegetation composition, in contrast to other studies(Isermann, 2005; Lane et al., 2008; Kim and Yu, 2009; Angioliniet al., 2013; Duran and Moore, 2013). However, in all the transectsexamined, pH and conductivity values significantly decreased alongthe sea-inland gradient as already shown for Ocean (Van der Valk,1974; Sykes and Wilson, 1991; Costa et al., 1996; Isermann, 2005;Houle, 2008; Kim and Yu, 2009) and Mediterranean coastal sys-tems (Angiolini et al., 2013; Fenu et al., 2012, 2013), where theseparameters are negatively correlated with the distance to thecoastline. The pH decrease is mainly due to the reduction of thedeposition of the marine aerosol that makes the substrate morealkaline and to the production of organic acid by vegetation (Maun,2009). Similarly, conductivity values were higher in FD plots,because the upper beach and the foredunes are directly exposed tosalt spray that progressively decreases in the backdunes (Maun,2009).The change in these environmental factors is responsible forthe shift from the halonitrophilous plant communities of the upperbeach to the scrub formations of the backdunes (Ranwell, 1972).
Finally, the small proportion of the variability in the vegetationpattern explained by the environmental factors examined in ourresearch, as evidenced by variance partitioning, is not surprising. Asseen in other studies (Fenu et al., 2013; Ciccarelli, 2014), coastaldunes are dramatically complex ecosystems subjected to a plethoraof environmental factors. In any case, the most important evidencefrom variance partitioning is that the main factors explaining thevariability in vegetation zonation were related to local soil prop-erties, confirming that soil characteristics primarily limit vegetationpatterns at a local scale in Mediterranean coastal dune ecosystems(Nordstrom et al., 2009; Fenu et al., 2012, 2013; Angiolini et al.,2013).
5. Conclusions
The present study provides new insights into the relationshipsbetween dune morphology, sediment parameters, soil properties,shoreline trend and vegetation patterns of Mediterranean coastaldune ecosystems. Hence, we can answer the questions posed at thebeginning of the paper.
1) The trend of variation of the environmental factors analysed inthe study areas generally confirms the typical shift along thesea-inland ecological gradient that can be detected in otherMediterranean coastal systems (with several exceptions: e.g.,mean grain-size).
2) The distance to the coastline, the mean grain-size, the organicmatter concentration and the shoreline trend are the mostimportant parameters that significantly affect plant communitycomposition of the Tuscany coast. Their monitoring should beencouraged in future studies.
3) In order to promote better management and/or restoration ac-tions, it is necessary to study the relationships between vege-tation and environmental parameters at a local scale. Given thaterosionwas identified as one of the most important disturbancefactors in our study areas, different approaches can be followedto protect the eroding foredunes: building of protective struc-tures e such as groynes, seawalls, jetties e along the erodingshoreline; using sand fences and planting dune-forming speciessuch as Ammophila arenaria; restoring the coastal foredunes bymanipulation or artificial placement of sediment on the beachprofile (Doody, 2013). Lastly, our data could be particularlyuseful in beach nourishment and in artificial dune re-constructions. However, it will be valuable to analyse a largernumber of environmental factors in order to improve theknowledge of the complex relationship between vegetation andcoastal dune ecosystems.
Acknowledgements
The authors thank the Migliarinoe San RossoreeMassaciuccoliRegional Park and the Maremma Regional Park for the permissionto access restricted areas in order to conduct this research. We arealso thankful to Serena Tarlati and Giovanni Salcioli for their sup-port during fieldwork and laboratory analyses.
Appendix A. Supplementary data
Supplementary data related to this article can be found at http://dx.doi.org/10.1016/j.ecss.2014.08.019.
References
Acosta, A., Stanisci, A., Ercole, S., Blasi, C., 2003. Sandy coastal landscape of the Lazioregion (Central Italy). Phytocoenologia 33, 715e726.
Acosta, A., Ercole, S., Stanisci, A., De Patta Pillar, V., Blasi, C., 2007. Coastal vegetationzonation and dune morphology in some Mediterranean ecosystems. J. Coast.Res. 23 (6), 1518e1524.
Akaike, H., 1974. A new look at the statistical model identification. IEEE Trans.Automatic Control 19, 716e723.
Angiolini, C., Landi, M., Pieroni, P., Frignani, F., Finoia, M.G., Gaggi, C., 2013. Soilchemical features as key predictors of plant community occurrence in a Med-iterranean coastal ecosystem. Estuar. Coast. Shelf Sci. 119, 91e100.
Anfuso, G., Pranzini, E., Vitale, G., 2011. An integrated approach to coastal erosionproblems in northern Tuscany (Italy): littoral morphological evolution and celldistribution. Geomorphology 129, 204e214.
Arrigoni, P.V., Viegi, L., 2011. La Flora vascolare esotica Spontaneizzata Della Toscana.Centro Stampa Giunta Regionale Toscana, Firenze.
Attorre, F., Maggini, A., Di Traglia, M., De Sanctis, M., Vitale, M., 2013.A methodological approach for assessing the effects of disturbance factors onthe conservation status of Mediterranean coastal dune systems. Appl. Veg. Sci.16, 333e342.
M. Ruocco et al. / Estuarine, Coastal and Shelf Science 149 (2014) 213e222 221
Bertoni, D., Biagioni, C., Sarti, G., Ciccarelli, D., Ruocco, M., 2014. The role of sedimentgrain-size, mineralogy, and beach morphology on plant communities of twoMediterranean coastal dune systems. Ital. J. Geosci. 133 (2), 271e281.
Bertoni, D., Sarti, G., 2011. Grain Size Characterization of Modern and Ancient Duneswithin a Dune Field along the Pisan Coast (Tuscany, Italy). In: Atti Soc. Tosc. Sci.Nat., Memorie, Serie A, 116, pp. 11e16.
Bertoni, D., Sarti, G., Benelli, G., Pozzebon, A., Raguseo, G., 2012. Transport trajec-tories of “smart” pebbles on an artificial coarse-grained beach at Marina di Pisa(Italy): Implications for beach morphodynamics. Mar. Geol. 291-294, 227e235.
Biondi, E., 2007. Thoughts on the ecology and syntaxonomy of some vegetationtypologies of the Mediterranean coast. Fitosociologia 44 (1), 3e10.
Bitton, M.C.A., Hesp, P.A., 2013. Vegetation dynamics on eroding to accreting beach-foredune systems, Florida panhandle. Earth Surf. Proc. Land. 38, 1472e1480.
Borcard, D., Legendre, P., Drapeau, P., 1992. Partialling out the spatial component ofecological variation. Ecology 73, 1045e1055.
Carboni, M., Carranza, M.L., Acosta, A., 2009. Assessing conservation status oncoastal dunes: a multiscale approach. Landsc. Urban Plan. 91 (1), 17e25.
Ciccarelli, D., 2014. Mediterranean coastal sand dune vegetation: Influence of nat-ural and anthropogenic factors. Environ. Manag. 54, 194e204. http://dx.doi.org/10.1007/s00267-014-0290-2.
Ciccarelli, D., Bacaro, G., Chiarucci, A., 2012. Coastline dune vegetation dynamics:evidence of no stability. Folia Geobot. 47, 263e275.
Ciccarelli, D., Balestri, M., Pagni, A.M., Forino, L.M.C., 2010. Morpho-functional ad-aptations in Cakile maritima Scop. subsp. maritima: comparation of twodifferent morphological types. Caryologia 63, 411e421.
Ciccarelli, D., Forino, L.M.C., Balestri, M., Pagni, A.M., 2009. Leaf anatomical adap-tations of Calystegia soldanella, Euphorbia paralias and Otanthus maritimus to theecological conditions of coastal sand dune systems. Caryologia 62, 142e151.
Cipriani, L.E., Ferri, S., Iannotta, P., Mannori, S., Pranzini, E., 2004. Evoluzione recentedelle spiagge toscane. In: Cipriani, L.E., Regnoli, C. (Eds.), Erosione Costiera.Edizioni Firenze, Firenze, pp. 75e92.
Cipriani, L.E., Ferri, S., Iannotta, P., Paolieri, F., Pranzini, E., 2001. Morfologia edinamica dei sedimenti del litorale della Toscana settentrionale. Studi Costieri4, 119e156.
Conti, F., Abbate, G., Alessandrini, A., Blasi, C. (Eds.), 2005. An Annotated Checklist ofthe Italian Vascular Flora. Palombi Editori, Roma.
Conti, F., Alessandrini, A., Bacchetta, G., Banfi, E., Barberis, G., Bartolucci, F.,Bernardo, L., Bonacquisti, S., Bouvet, D., Bovio, M., Brusa, G., Del Guacchio, E.,Foggi, B., Frattini, S., Galasso, G., Gallo, L., Gangale, C., Gottschlich, G.,Grünanger, P., Gubellini, L., Iriti, G., Lucarini, D., Marchetti, D., Moraldo, B.,Peruzzi, L., Poldini, L., Prosser, F., Raffaelli, M., Santangelo, A., Scassellati, E.,Scortegagna, S., Selvi, F., Soldano, A., Tinti, D., Ubaldi, D., Uzunov, D., Vidali, M.,2007. Integrazioni alla chec-klist della flora vascolare italiana. Nat. Vicentina 10,5e74.
Cori, B., 1999. Spatial dynamics of Mediterranean coastal regions. J. Coast. Conserv.5, 105e112.
Costa, C.S.B., Cordazzo, C.V., Seeliger, U., 1996. Shore disturbance and dune plantdistribution. J. Coast. Res. 12 (1), 133e140.
De Luca, E., Novelli, C., Barbato, F., Menegoni, P., Iannetta, M., Nascetti, G., 2011.Coastal dune systems and disturbance factors: monitoring and analysis incentral Italy. Environ. Monit. Assess. 183, 437e450.
Defeo, O., McLachlan, A., Schoeman, D.S., Schlacher, T., Dugan, J., Jones, A., Lastra, M.,Scapini, F., 2009. Threats to sandy beach ecosystems: a review. Estuar. Coast.Shelf Sci. 81, 1e12.
Doing, H., 1985. Coastal fore-dune zonation and succession in various parts of theworld. Vegetatio 61, 65e75.
Doody, J.P., 2013. Sand Dune Conservation, Management and Restoration. Springer,Heidelberg.
Duran, O., Moore, L.J., 2013. Vegetation controls on the maximum size of coastaldunes. Proc. Natl. Acad. Sci. 110 (43), 17217e17222.
European Commission, 1992. Council Directive 92/43/EEC on the conservation ofnatural habitats and of wild fauna and flora. Off. J. L 206, 7e50.
European Commission, 2007. Interpretation Manual of European Union Habitats.Eur 27. Available at: http://ec.europa.eu/environment/nature/legislation/habitatsdirective/docs/2007_07_im.pdf.
European Commission, 2008. Article 17 Technical Report 2001-2006. EuropeanTopic Centre on Biological Diversity. Available at: http://biodiversity.eionet.europa.eu/article17.
Feagin, R.A., Sherman, D.J., Grant, W.E., 2005. Coastal erosion, global sea-level rise,and the loss of sand dune plant habitats. Front. Ecol. Environ. 7 (3), 359e364.
Fenu, G., Carboni, M., Acosta, A., Bacchetta, G., 2013. Environmental factors influ-encing coastal vegetation pattern: new insights from the Mediterranean basin.Folia Geobot. 48, 493e508.
Fenu, G., Cogoni, D., Ferrara, C., Pinna, M.S., Bacchetta, G., 2012. Relationships be-tween coastal sand dune properties and plant community distribution: the caseof Is Arenas (Sardinia). Plant Biosyst. 146 (3), 586e602.
Folk, R.L., Ward, W., 1957. Brazos River bar: a study in the significance of grain sizeparameters. J. Sediment. Petrol. 27 (1), 3e26.
Folk, R.L., 1974. Petrology of Sedimentary Rocks. Hemphill publishing Company,Austin, Texas.
Forey, E., Chapelet, B., Vitasse, Y., Tilquin, M., Touzard, B., Michalet, R., 2008. Therelative importance of disturbance and environmental stress at local andregional scales in French coastal sand dunes. J. Veg. Sci. 19, 493e502.
Gandolfi, G., Paganelli, L., 1975. Il litorale toscano fra Piombino e la foce dell'Om-brone (area campione Alto Tirreno). Composizione, provenienza e dispersionedelle sabbie. Boll. Soc. Geol. Ital. 94 (6), 1811e1832.
Gower, J.C., 1966. Some distance properties of latent root and vector methods usedin multivariate analysis. Biometrika 53, 325e338.
Gruppo Nazionale per la ricerca sull’ambiente costiero, 2006. Lo stato dei litoraliitaliani. Studi Costieri 10, 1e174.
Guara-Requena, M., 1989. La influencia de la distancia al mar en la distribuci�on de laflora de las dunas del Cabo de Gata. Acta Bot. Malacit. 14, 151e159.
Guara-Requena, M., 1992. Interpretaci�on de la distribuci�on de las comunidadesvegetales dunares de La Dehesa de La Albufera (Valencia, Espa~na) mediante elAn�alisis Factorial de Correspondencias. Boletino la Real Soc. Espa~nola Hist. Nat.Sect. Biol. 88 (1e4), 5e18.
Harley, C.D.G., Hughes, A.R., Hultgren, K.M., Miner, B.G., Sorte, C.J.B., Thornber, C.S.,Rodriguez, L.F., Tomanek, L., Williams, S.L., 2006. The impacts of climate changein coastal marine systems. Ecol. Lett. 9, 228e241.
Hesp, P.A., 1991. Ecological processes and plant adaptations on coastal dunes. J. AridEnviron. 21, 165e191.
Hesp, P., 2002. Foredunes and blowouts: initiation, geomorphology and dynamics.Geomorphology 48, 245e268.
Honrado, J., Vicente, J., Lomba, A., Alves, P., Macedo, J.A., Henriques, R., Granja, H.,Caldas, F.B., 2009. Fine-scale patterns of vegetation assembly in the monitoringof changes in coastal sand-dune landscapes. Web Ecol. 10, 1e14.
Houle, G., 2008. Plant species richness and its determinants on a coastal dunesystem at Iles de la Madeleine, Quebec (Canada). Ecoscience 15, 113e120.
Ihm, B.-S., Lee, J.-S., Kim, J.-W., Kim, J.-H., 2007. Coastal plant and soil relationshipalong the southwestern coast of South Korea. J. Plant Biol. 50 (3), 331e335.
Isermann, M., 2005. Soil pH and species diversity in coastal dunes. Plant Ecol. 178,111e120.
Isermann, M., 2011. Patterns in species diversity during succession of coastal dunes.J. Coast. Res. 27 (4), 661e671.
Kerbiriou, C., Leviol, I., Jiguet, F., Julliard, R., 2008. The impact of human frequen-tation on coastal vegetation in a biosphere reserve. J. Environ. Manag. 88,715e728.
Kim, D., Yu, K.B., 2009. A conceptual model of coastal dune ecology synthesizingspatial gradients of vegetation, soil, and geomorphology. Plant Ecol. 202 (1),135e148.
La Posta, A., Dupr�e, E., Bianchi, E., 2008. Attuazione della Direttiva Habitat e stato diconservazione di habitat e specie in Italia. Ministero dell’Ambiente e dellaTutela del Territorio e del Mare. Direzione per la protezione della Natura. Pal-ombi editore, Roma.
Lane, C., Wright, S.J., Roncal, J., Maschinski, J., 2008. Characterizing environmentalgradient and their influence on vegetation zonation in a subtropical coastalsand dune system. J. Coast. Res. 24 (4C), 213e224.
Levin, N., Kidron, G.J., Ben-Dor, E., 2006. The spatial and temporal variability of sanderosion across a stabilizing coastal dune field. Sedimentology 53, 697e715.
Levin, N., Kidron, G.J., Ben-Dor, E., 2008. A field quantification of coastal duneperennial plants as indicators of surface stability, erosion or deposition. Sedi-mentology 55, 751e772.
Martínez, M.L., Maun, A.M., Psuty, N., 2004. The fragility and conservation of theworld's coastal dunes: geomorphological, ecological and socioeconomic per-spectives. In: Martínez, M.L., Psuty, N. (Eds.), Coastal Dunes: Ecology and Con-servation. Springer-Verlag, Heidelberg, pp. 355e369.
Martínez, M.L., Psuty, N. (Eds.), 2004. Coastal Dunes: Ecology and Conservation.Springer-Verlag, Heidelberg.
Maun, M.A., 1998. Adaptations of plants to burial in coastal sand dunes. Can. J. Bot.76, 713e738.
Maun, M.A., 2009. The Biology of Coastal Sand Dunes. Oxford University Press,Oxford.
Mc Lachlan, A., Brown, A.C., 2006. The Ecology of Sandy Shores. Academic Press,Burlington, MA, USA.
Mijovi�c, A., Popovi�c, Z., Vukov, T., Smiljani�c, M., Mati�c, R., Bojovi�c, S., 2012. Sandtopography influences the distribution of xerohalophytic vegetation on asouthern Adriatic beach in Montenegro. Plant Biosyst. 146 (3), 664e673.
Mu~noz Vall�es, S., Gallego Fern�andez, J.B., Dellafiore, C.M., 2011. Dune vulnerabilityin relation to tourism pressure in central Gulf of C�adiz (SW Spain), a case study.J. Coast. Res. 27, 243e251.
Nordstrom, K.F., Gamper, U., Fontolan, G., Bezzi, A., Jackson, N.L., 2009. Character-istics of coastal dune topography and vegetation in environments recentlymodified using beach fill and vegetation plantings, Veneto, Italy. Environ.Manag. 44 (6), 1121e1135.
Økland, R.H., 2003. Partitioning the variation in a plot-by-species data matrix that isrelated to n sets of explanatory variables. J. Veg. Sci. 14, 693e700.
Oksanen, J., Blanchet, F.G., Kindt, R., Legendre, P., Minchin, P.R., O'Hara, R.B.,Simpson, G.L., Solymos, P., Stevens, M.H.H., Wagner, H., 2012. CommunityEcology Package. http://cran.r-project.org/ (accessed 02.09.13.).
Olff, H., Huisman, J., Van Tooren, B.F., 1993. Species dynamics and nutrient accu-mulation during early primary succession in coastal sand dunes. J. Ecol. 81,693e706.
Peres-Neto, P.R., Legendre, P., Dray, S., Borcard, D., 2006. Variation partitioning ofspecies data matrices: estimation and comparison of fractions. Ecology 87,2614e2625.
Pinna,M.,1985. Contributi di Climatologia. In:Mem. Soc. Geogr. Ital., 39, pp.147e167.
M. Ruocco et al. / Estuarine, Coastal and Shelf Science 149 (2014) 213e222222
Pranzini, E., 2001. Updrift river mouth migration on cuspate deltas: two examplesfrom the coast of Tuscany (Italy). Geomorphology 38 (1e2), 125e132.
R Development Core Team, 2012. R: a Language and Environment for StatisticalComputing. R Foundation for Statistical Computing, Vienna, Austria. Availableat: http://cran.r-project.org/ (accessed 02.09.13.).
Ranwell, D.S., 1972. Ecology of Salt Marshes and Dunes. Chapman and Hall, London.Rapetti, F., 2003. Il clima. In: Federici, P.R. (Ed.), Atlante tematico della Provincia di
Pisa. Pacini Editore, pp. 16e17.Rozema, J., Bijwaard, P., Prast, G., Broekman, R., 1985. Ecophysiological adaptations
of coastal halophytes from foredunes and salt marshes. Vegetatio 62, 499e521.Santoro, R., Jucker, T., Prisco, I., Carboni, M., Battisti, C., Acosta, A.T.R., 2012. Effects of
trampling limitation on coastal dune plant communities. Environ. Manag. 49,534e542.
Schlacher, T.A., Schoeman, D.S., Dugan, J., Lastra, M., Jones, A., Scapini, F.,McLachlan, A., 2008. Sandy beach ecosystems: key features, managementchallenges, climate change impacts, and sampling issues. Mar. Ecol. 29, 70e90.
Societ�a Italiana della Scienza del Suolo (SISS), 1985. Metodi normalizzati di analisidel suolo. Edagricole, Bologna.
Span�o, C., Balestri, M., Bottega, S., Grilli, I., Forino, L.M.C., Ciccarelli, D., 2013.Anthemis maritima L. in different coastal habitats: a tool to explore plantplasticity. Estuar. Coast. Shelf Sci. 129, 105e111.
Stallins, J.A., Parker, R.J., 2003. The influence of complex systems interactions onbarrier island dune vegetation pattern and process. Ann. Assoc. Am. Geogr. 93,13e29.
Sykes, M.T., Wilson, J.B., 1991. Vegetation of a coastal sand dune system in southernNew Zealand. J. Veg. Sci. 2, 531e538.
Sýkora, K., Van Den Bogert, J.C., Berendse, F., 2004. Changes in soil and vegetationduring dune slack succession. J. Veg. Sci. 15, 209e218.
Ter Braak, C.J.F., 1986. Canonical correspondence analysis: a new eigenvectortechnique for multivariate direct gradient analysis. Ecology 67 (5), 1167e1179.
Ter Braak, C.J.F., 1987. The analysis of vegetation-environment relationships by ca-nonical correspondence analysis. Vegetatio 69, 69e77.
van der Maarel, E., 2003. Some remarks on the functions of European coastalecosystems. Phytocoenologia 33 (2e3), 187e202.
van der Maarel, E., van der Maarel-Versluys, M., 1996. Distribution and conservationstatus of littoral vascular plant species along the European coasts. J. Coast.Conserv. 2, 73e92.
van der Meulen, F., Udo de Haes, H.A., 1996. Nature conservation and integratedcoastal zone management in Europe: present and future. Landsc. Urban Plan.34, 401e410.
Van der Valk, A.G., 1974. Environmental factors controlling the distribution of forbsin coastal foredune in Cape Hatteras National Seashore. Can. J. Bot. 52,1057e1073.
Wiser, S.K., Buxton, R.P., Clarkson, B.R., Richardson, S.J., Rogers, G.M., Smale, M.C.,Williams, P.A., 2010. Climate, landscape and microenvironment interact todetermine plant composition in naturally discrete gravel beach communities.J. Veg. Sci. 21, 657e671.
Copyright © 2022 FDOKUMEN