Consideration of Abiotic Natural Resources in Life Cycle ...
176
Consideration of Abiotic Natural Resources in Life Cycle Assessments Mario Schmidt www.mdpi.com/journal/resources Edited by Printed Edition of the Special Issue Published in Resources
-
Upload
khangminh22 -
Category
Documents
-
view
3 -
download
0
Transcript of Consideration of Abiotic Natural Resources in Life Cycle ...
Consideration of Abiotic Natural Resources in Life Cycle Assessments
Mario Schmidt
www.mdpi.com/journal/resources
Edited by
Printed Edition of the Special Issue Published in Resources

Consideration of Abiotic Natural Resources in Life Cycle Assessments


Consideration of Abiotic Natural Resources in Life Cycle Assessments
Special Issue Editor
Mario Schmidt
MDPI • Basel • Beijing • Wuhan • Barcelona • Belgrade
Special Issue Editor
Mario Schmidt
Pforzheim University
Germany
Editorial Office
MDPI
St. Alban-Anlage 66
4052 Basel, Switzerland
This is a reprint of articles from the Special Issue published online in the open access journal Resources
(ISSN 2079-9276) from 2015 to 2019 (available at: https://www.mdpi.com/journal/resources/
special issues/life-cycle)
For citation purposes, cite each article independently as indicated on the article page online and as
indicated below:
LastName, A.A.; LastName, B.B.; LastName, C.C. Article Title. Journal Name Year, Article Number,
Page Range.
ISBN 978-3-03897-545-8 (Pbk)
ISBN 978-3-03897-546-5 (PDF)
Cover image courtesy of Fotolia user Royce Bair.
c© 2019 by the authors. Articles in this book are Open Access and distributed under the Creative
Commons Attribution (CC BY) license, which allows users to download, copy and build upon
published articles, as long as the author and publisher are properly credited, which ensures maximum
dissemination and a wider impact of our publications.
The book as a whole is distributed by MDPI under the terms and conditions of the Creative Commons
license CC BY-NC-ND.

Contents
About the Special Issue Editor . . . . . . . . . . . . . . . . . . . . . . . . . . . . . . . . . . . . . . vii
Preface to ”Consideration of Abiotic Natural Resources in Life Cycle Assessments” . . . . . . ix
Mario Schmidt
Scarcity and Environmental Impact of Mineral Resources—An Old andNever-Ending DiscussionReprinted from: Resources 2019, 8, 2, doi:10.3390/resources8010002 . . . . . . . . . . . . . . . . . 1
Johannes A. Drielsma, Ruth Allington, Thomas Brady, Jeroen Guinee, Jane Hammarstrom, Torsten Hummen, Andrea Russell-Vaccari, Laura Schneider, Guido Sonnemann and Par Weihed
Abiotic Raw-Materials in Life Cycle Impact Assessments: An Emerging Consensus across DisciplinesReprinted from: Resources 2016, 5, 12, doi:10.3390/resources5010012 . . . . . . . . . . . . . . . . . 14
Lawrence D. Meinert, Gilpin R. Robinson Jr. and Nedal T. Nassar
Mineral Resources: Reserves, Peak Production and the FutureReprinted from: Resources 2016, 5, 14, doi:10.3390/resources5010014 . . . . . . . . . . . . . . . . . 24
Lauran van Oers and Jeroen Guinee
The Abiotic Depletion Potential: Background, Updates, and FutureReprinted from: Resources 2016, 5, 16, doi:10.3390/resources5010016 . . . . . . . . . . . . . . . . . 38
Guiomar Calvo, Alicia Valero, Luis Gabriel Carmona and Kai Whiting
Physical Assessment of the Mineral Capital of a Nation: The Case of an Importing and anExporting CountryReprinted from: Resources 2015, 4, 857–870, doi:10.3390/resources4040857 . . . . . . . . . . . . . 50
Marisa M.D. Vieira, Thomas C. Ponsioen, Mark J. Goedkoop and Mark A.J. Huijbregts
Surplus Cost Potential as a Life Cycle Impact Indicator for Metal ExtractionReprinted from: Resources 2016, 5, 2, doi:10.3390/resources5010002 . . . . . . . . . . . . . . . . . 62
Martin Henßler, Vanessa Bach, Markus Berger, Matthias Finkbeiner and Klaus Ruhland
Resource Efficiency Assessment—Comparing a Plug-In Hybrid with a ConventionalCombustion EngineReprinted from: Resources 2016, 5, 5, doi:10.3390/resources5010005 . . . . . . . . . . . . . . . . . 74
Mario Martın-Gamboa and Diego Iribarren
Dynamic Ecocentric Assessment Combining Emergy and Data Envelopment Analysis:Application to Wind FarmsReprinted from: Resources 2016, 5, 8, doi:10.3390/resources5010008 . . . . . . . . . . . . . . . . . 86
Rodrigo A. F. Alvarenga, Ittana de Oliveira Lins and Jose Adolfo de Almeida Neto
Evaluation of Abiotic Resource LCIA MethodsReprinted from: Resources 2016, 5, 13, doi:10.3390/resources5010013 . . . . . . . . . . . . . . . . . 98
Goran Finnveden, Yevgeniya Arushanyan and Miguel Brandao
Exergy as a Measure of Resource Use in Life Cyclet Assessment and Other SustainabilityAssessment ToolsReprinted from: Resources 2016, 5, 23, doi:10.3390/resources5030023 . . . . . . . . . . . . . . . . . 119
v

Felix Muller, Jan Kosmol, Hermann Keßler, Michael Angrick and Bettina Rechenberg
Dematerialization—A Disputable Strategy for Resource Conservation Put under ScrutinyReprinted from: Resources 2017, 6, 68, doi:10.3390/resources6040068 . . . . . . . . . . . . . . . . . 130
vi

About the Special Issue Editor
Mario Schmidt (Prof. Dr.) has been Professor at Pforzheim University (Germany) since 1999 and
is the Director of the Institute of Industrial Ecology (INEC). He studied physics at the universities
of Freiburg and Heidelberg. Since 1985, he has worked in several fields of environmental issues
at IFEU Institute for Energy and Environmental Research in Heidelberg. In 1989 and 1990, he
joined the Ministry of Environment of the State of Hamburg. Afterwards, he built up a research
group on the Life Cycle Assessment at IFEU. From 2002 until 2014, he was responsible for research
at Pforzheim University and spokesman of all 20 institutes for applied research (IAF) in the state
of Baden-Wuerttemberg. In 2011, he founded the bachelor study program “Resource Efficiency
Management”, and in 2014 he built up the master study program “Life Cycle and Sustainability”.
Today he is leading a Ph.D. program ”Energy Systems and Resource Efficiency”, together with K.I.T.
in Karlsruhe. In 2012, he was appointed to the Council on Sustainable Development of the federal
state of Baden-Wuerttemberg. Since 2015, he has been also honorary professor at the Faculty of
Sustainability of Leuphana University Lueneburg. He is member of various committees, e.g., of the
German Association of Engineers (VDI) or ISO standardization committees.
vii


Preface to ”Consideration of Abiotic Natural
Resources in Life Cycle Assessments”
On a global scale, there is a lot of talk about fake news at the moment. The perfidious thing is
that even scientific theories with a high level of empirical evidence and methodically demanding
proof of evidence are suddenly presented to the public as arbitrary. Climate change caused by
greenhouse gases emitted by humans is one such example. However, scientific theories cannot be
voted on democratically; nor can they be normatively defined or prohibited by a party programme
or ideological opinions. They are and must remain part of an inner-scientific discourse.
Accordingly, science must keep its standards for evaluating theories and facts high, ensuring
their quality and being transparent and comprehensible to the public. Scientific discourse is of great
importance here, especially when theories are not yet clearly backed up by facts but are based on
assumptions and plausibility. If the facts are not sufficient to provide clear evidence, there is great
danger that one will be too strongly guided by ideological views or particular social interests.
In my opinion, one such area is that of resource depletion. Since the completion of the work of
Dennis Meadows and his colleagues for the Club of Rome, the exhaustion of metal raw materials in
the near future has become a very plausible assumption, with some factual support. However, there
are also facts that contradict this. We cannot give a clear answer today. One could even cynically say
that evidence can finally only be provided when the case has arisen—in other words, when natural
resources have been exhausted. From this point of view, a cautious approach, i.e., the economical
use of resources, would be the most sensible. However, that does not relieve science of the burden
of dealing with the facts in a proper way. Actually, this is even more difficult because the resource
sector is subject to strong economic interests, but at the same time it is also the focus of political and
ideological positions.
This topic also has practical relevance. Many technologies that are promoted for reasons of
climate protection have a poor resource balance. Within the Life Cycle Assessment, there can therefore
be a trade-off between different environmental goals. In climate protection, mankind must react in
short-term, i.e., within a few decades, and with drastic measures, i.e., a complete substitution of fossil
fuels. However, how much time do we have on the question of resources? A scientific answer to
this question requires discourse. Different opinions must be heard and discussed, in our case even
from different disciplines. One’s own assumptions must be questioned again and again. Are they still
correct in view of the current facts?
This Special Issue of the journal Resources served this purpose and is fully documented in this
book publication. An open and honest discussion also took place in London in 2015 at the Natural
History Museum (see editorial). It has not yet come to an end and must be continued. I would like to
thank everyone who has contributed to it so far and who is open to further discussion.
Mario Schmidt
Special Issue Editor
ix


resources
Editorial
Scarcity and Environmental Impact of MineralResources—An Old and Never-Ending Discussion
Mario Schmidt
Institute for Industrial Ecology, Pforzheim University, Tiefenbronner Str. 65, 75175 Pforzheim, Germany;[email protected]; Tel.: +49-723-128-6406
Received: 6 December 2018; Accepted: 19 December 2018; Published: 21 December 2018
Abstract: A historical overview shows that mankind has feared the scarcity of mineral resources,especially metals, for many centuries. In the first half of the 20th century, this discussion was markedby the great military demand for raw materials, followed by the growing world population, increasingconsumption and environmental awareness. From then on, there was less talk of regional shortages,but more discussion of a global scarcity or even a drying up of raw material sources worldwide.Although these forecasts are still controversially discussed today, the assessment of resource depletionhas become an integral element of Life Cycle Assessments (LCA) or Life Cycle Impact Assessments(LCIA) of product systems. A number of methodological approaches are available for this purpose,which are presented and applied in a series of articles as part of a special issue of “Resources”.The fundamental question is also addressed, namely to what extent the assessment of resourcedepletion in the context of an environmental study such as LCA is appropriate.
Keywords: resource depletion; critical materials; history; life cycle assessment
1. Introduction
In October 2015, a workshop entitled ”Mineral Resources in LCIA: Mapping the path forward”took place in London. Richard Herrington of the Natural History Museum London and JohannesDrielsma of Euromines organized a meeting in which geologists, mining experts, and environmentalscientists came together to present their different views on how to handle mineral resources, but alsoto look for commonalities. A fruitful discussion arose and the idea came up to record some of thethoughts. These records lead to a special issue of the magazine “Resources”, which was publishedonline in 2016. At the same time, there were other activities on this topic, e.g., various studies ofthe German Federal Environmental Agency, which contributed to the magazine with an article anddelivered another paper in 2017 [1]. Meanwhile, there are other important publications on the subject,e.g., a statement and a joint report by the German Academy of Sciences of Technology, the NationalAcademy of Sciences Leopoldina, and the Union of German Academies of Sciences [2,3], as well as apreviously unreleased report by an international working group of experts of Life Cycle Assessment(LCA) [4]. There is still no uniform opinion on this important issue, but there is an intensive debateinvolving many different disciplines. The topic of scarcity and supply reliability has been discussedfor a very long time, again and again, which proves a look into history. Therefore, in this introduction,not only are the contributions of the special edition briefly presented, but a reference to the long historyof the discussion is made, and some rare sources are quoted by way of example.
2. Resource Scarcity in the Past
Two things make it so difficult to supply the industrial society with mineral raw materials andwith metals in particular—they are limited on earth, and their extraction is associated with great effortand environmental pollution, both of which have concerned mankind for many centuries. In the
Resources 2019, 8, 2; doi:10.3390/resources8010002 www.mdpi.com/journal/resources1

Resources 2019, 8, 2
16th century, however, even a renewable resource threatened to become scarce—forests were cleared allover Europe because wood was the predominant raw material for mining and for the fires of meltingfurnaces. The Italian metallurgist Vannoccio Biringuccio (1480–1539) already warned in his “De laPirotechnia” in 1540:
“I rather believe that someday people can no longer use the fire for the melting furnaces due tothe lack of ores, because they process so much of it” (Chapter 10 in [5]).
It was not sure if the metal ores were a non-renewable resource at all. From the Italian island ofElba, which was an important iron ore deposit at the time, the following was said:
“With the quantities of ore that have been gained in so many centuries and still are gained,the mountains and islands would have to be completely leveled. Nevertheless, today more and betterore is produced than ever. Therefore, many believe that the ore, where it is mined, regenerates in theground in a certain amount of time. If it is true, it would be something great, and it showed the greatwisdom of nature and the great power of heaven”. (Chapter 6 in [5]).
Unfortunately, it is not true, at least not in the time scale that is relevant to mankind. Thus,the search for the rare resource deposits has always been a great challenge to mankind. In thissearch, a variety of means has been employed, such as divining rods, which were already graphicallydemonstrated by the great German mining expert Georgius Agricola (1494–1555) (Figure 1). It wasalso Agricola who cited the critics of his time and described the environmental impact of miningand smelting:
“By mining for ore, the fields are devastated. By clearing the forests and groves, the birds andother animal species are eradicated. The ores are washed; but by this washing, because it poisoned thestreams and rivers, the fish are either expelled from them or killed”. (1st book in [6]).
Figure 1. Searching the lodes with the divining rod in the 16th century [6].
But Agricola, of course, defended mining, for it was already an important basis of civilizationat that time. Previously, the use conflicts and the interventions in the landscape by mining wereaddressed by Paulus Niavis (1455–1517) [7].
The real scarcity of metal ores came during industrialization, when demand for metals sharplyincreased. Three hundred years ago, local shortages in England led to a nationwide ore trade [8].
2

Resources 2019, 8, 2
The famous British economist Stanley Jevons posed the “coal question” in 1865. He saw limited coalsupplies in face of rampant economic growth and advocated more moderate growth [9].
3. Critical and Strategic Metals
With modern times, the demand for metals increased immeasurably. In 1820, 1.65 million tonsof pig iron was produced worldwide compared to 41 million tons in 1900, 250 million tons in 1960,and 1.2 billion tons today [10,11]. At the beginning of the twentieth century, a broad conservationmovement was emerging in the U.S., focusing primarily on the limitations and protection of naturalresources, including minerals, forests, soil, and fisheries, especially in the face of the rapidly growingUS economy [12,13].
With the First World War, there was a growing concern in the United States that the supply ofstrategic raw materials could become difficult because international trade came partially to a halt [14].An initial list of materials (Table 1), the supply of which could be of concern to the U.S., was publishedby C.K. Leith in 1917 for the War Industries Board [15]. The boundaries between military and industrialsignificance were still blurring. A second list of 42 materials was produced after World War I in 1921by a committee led by General Harbord with a primarily military orientation [16]. The distinctionbetween strategic and critical materials was first made in 1932. In 1939, the War Department compileda list that included the term “essential material” [17]. The definitions were:
• Strategic Materials are those materials essential to the national defense for the supply of whichin war dependence must be placed in whole, or in large part, on sources outside the continentallimits of the United States, and for which strict conservation and distribution control measureswill be necessary.
• Critical Materials are those materials essential in the national defense, the procurement problemsof which in war, while difficult, are less serious than those of strategic materials, because theycan be either domestically produced or obtained in more adequate quantities or have a lesserdegree of essentiality, and for which some degree of conservation and distribution control willbe necessary.
• Essential Materials are those materials essential to the national defense for which no procurementproblems in war are anticipated, but whose status is such as to require constant surveillancebecause future developments may necessitate reclassification as strategic or critical.
Table 1. The first lists of strategic and critical materials in the U.S.
Leith List 1917
Deficient in a major degree: Tin, Nickel, Platinum and metals of the platinum group, Antimony, Vanadium,Zirconium, Mica, Monazite, Graphite, Asbestos, Ball clay and kaolin, Chalk, Cobalt, Naxos emery,Grinding pebbles.Deficient in a lesser degree: Nitrates (except potassium nitrates), Potash, Manganese, Chromite, Magnesite.
Harbord List 1921
Agar, Antimony, Arsenic, Asphalt, Balsa, Camphor, Chromium, Coconut Shells, Coffee, Cork, Graphite, Hemp,Hides, Iodine, Jute, Kapok, Linseed Oil, Manila Fiber, Mercury, Mica, Nickel, Nitrogen, Nux Vomica, Opium,Palm Oil, Phosphorus, Platinum, Potassium Nitrate, Quinine, Rubber, Silk, Manganese (Ferro-grade), Shellac,Sodium Nitrate, Sugar, Sulphur, Thymol, Tin, Tungsten, Uranium, Vanadium, Wool.
War Department List 1939
Strategic: Aluminum, Antimony, Chromium, Manganese, Mercury, Mica, Nickel, Tin, Tungsten.Critical: Asbestos, Cadmium, Cryolite, Fluorspar, Graphite, Iodine, Platinum, Titanium, Vanadium.Essential: Abrasives, Arsenic, Chlorine, Copper, Helium, Iron and Steel, Lead, Magnesium, Molybdenum,Ammonia and Nitric Acid, Petroleum, Phosphates, Potash, Refractories, Sulfur and Pyrite, Uranium,Zinc, Zirconium.
3

Resources 2019, 8, 2
In the 1930s, several of the U.S.-governmental institutions’ other authors recommended thecreation of strategic stocks of so-called scarce minerals [17–19]. In 1939, the first federal law authorizingstockpiling of strategic materials was enacted in the U.S. This stockpiling exists still today in the U.S.and is operated by the National Defense Stockpile (NDS). The total inventory of the NDS representeda market value of $1.15 billion in 2016 [20].
Thus, the concept of critical materials was introduced, as well as the academic attention to thescarcity of industrial or defense-related raw materials. It was always more about the topic of whichraw materials were available for the U.S. economy (or military forces) and less about how many rawmaterials were available worldwide.
The scarcity and availability of resources was then repeatedly addressed, e.g., with the “Roadof Depletion”, which was presented in a hearing of the U.S. Senate 1949 by James Boyd, the directorof the U.S. Department of Mining (Figure 2) [21]. At that time, it was already very clear that only7% of the world’s population, namely in the U.S., use 50% of the world’s minerals and 70% of theworld’s oil. The U.S. president installed a Materials Policy Commission, which in 1952 submitteda major report titled “Resources for Freedom” [22]. The Cold War was also a contest for economicpower and access to natural resources. In 1963, a large systematic empirical study by Barnett andMorse of historic trends for various natural resources between 1870 and 1958 eventually supportedthe hypothesis of a decreasing (rather than an increasing) scarcity [23]. They represented a critical butnevertheless optimistic picture of the resource question. They believed in technical progress and inraising efficiency.
Figure 2. James Boyd: “The chart indicates the number of years of normal requirements our presentknown reserves of critical materials will supply” [21].
This optimistic picture changed fundamentally in the 60s through wake-up calls such as Ehrlich’sbook, “The Population Bomb” [24], but especially with the Club of Rome study by Meadows,“The Limits to Growth” in 1972 [25]. Limited natural resources would be confronted with an almostrampant growth of world population and global economic output. Now, it was increasingly about theglobal development, and the careless handling of the resources was criticized. For example, a study bythe U.S. National Academy of Sciences (NAS) asked for increased recycling in 1969: “The automobile isa prime target for improvement. The copper content of the average car should be reduced from about1.4 percent to 0.4 percent or less of the total carcass and problems of metal recovery simplified” [26].Recycling became a guiding theme of environmental policy in the following decades.
In 1975, the NAS prepared another report on “Mineral Resources and the Environment” [27].Not only was the scarcity of raw materials—both energetic and non-energetic—addressed, but also the
4

Resources 2019, 8, 2
environmental impact in particular, which was demonstrated by the example of coal extraction anduse. A “conservation ethic” was demanded, which could just as well have been formulated today:
“Because of limits to natural resources as well as to means for alleviating these limits it isrecommended that the Federal Government proclaim and deliberately pursue a national policy ofconservation of material, energy and environmental resources, informing the public and the privatesectors fully about needs and techniques for reducing energy consumption, the development ofsubstitute materials, increasing the durability and maintainability of products, and reclamation andrecycling” (page 37 in [27]).
The NAS pointed out that the stockpiling of materials in the past was mainly for military reasons.It was stated that “similar considerations can often be applied to the protection of the U.S. economyand the essential needs of the civilian sector“ (page 34 in [27]). This had changed little until today.
The two updates to the Barnett & Morse study, “Scarcity and Growth Reconsidered” [28] andthe study of Menzie, Singer, and DeYoung, Jr. in “Scarcity and Growth Revisited” [29] essentiallyconfirmed the old results that there is no geological scarcity. Menzie et al. noted that the physicalavailability of resources in itself does not constitute a growth limit. However, the effort requiredto obtain them is growing, although many resources remain abound. It is obvious that suppliesof mineral resources were first used most intensively in the areas closest to their use. As demandincreased, exploration and eventually extraction across oceans in inhospitable climates, always deeperinto land and water, occurred. Thus, costs, energy input, and the destruction of the environmentassociated with the extraction increased. Menzie et al. directed the attention to the fact that it is not thelimited quantities of raw materials but the accompanying circumstances of their extraction that are thereal problem.
Nevertheless, the image of the ebbing raw material sources became apparent to the public.The study by Meadows, which has made popular the very descriptive concept of resource lifetime [25],has contributed significantly to this. The Meadows team introduced the “static reserve life index”,which states how many years the known reserves of a given resource will last when the current annualconsumption is assumed. With the exponential index, a continuously increasing consumption isexpected, which again significantly reduces the time the reserves are available. It hit a nerve with thepublic and was quoted from time to time, but it was also discussed controversially. Yet, Gerling andWellmer found out that raw material lifetimes did not decrease over the decades, but mostly stayedthe same or even increased [30]. The indicator describes the economic effects of exploration in themining industry rather than a geological scarcity.
The discussion of the past decades was also marked by reports from the U.S. For its first report in1988, the U.S. National Critical Materials Council, founded by president Ronald Reagan, selected sevenkey commodities from three basic categories into which strategic and critical materials were broadlydivided [31]. These included: (1) critical alloys—cobalt, chromium, and ferrosilicon; (2) potential highgrowth security materials—germanium and titanium; and (3) high-volume materials—aluminum andcopper. Again, the strategic importance of supply and demand, the current status of the so-calledNational Defense Stockpile, and the global situation of the import dependence and vulnerability of theU.S. economy were discussed.
Recently, various incidents have come together; countries in Asia, South America, and Africa areclaiming an ever-increasing share of resources to build their economies and to supply their populations.The global commodity prices rose rapidly in the first decade of the 21st century, causing a public“resource shock”. At the same time, technical innovation has become increasingly dependent on thequantity and variety of raw materials. Many high-tech products have become indispensable in today’slife, but they cannot be produced without certain raw materials. A possible scarcity of raw materialsendangers not only the military-strategic position of nations, but the way-of-life of the previouslywealthy countries and their primacy in the technological development of new products. In addition,there is a global ecological conscience that questions the social and ecological consequences of the useof resources.
5

Resources 2019, 8, 2
These thoughts have been reflected in the report “Minerals, Critical Minerals, and the U.S.Economy” of the Committee on Critical Mineral Impacts of the U.S. Economy of the NationalResearch Council, which was published in 2008 [32]. The report developed the current method of thesemi-qualitative description of the criticality of raw materials with a multi-dimensional evaluationmatrix. The impact of supply restriction is plotted against the supply risk as a two-dimensional graphand determined individually for the various raw materials.
An important boost provided the work of the International Resource Panel of United NationsEnvironmental Programme (UNEP), which published several reports on the subject of metal resourcesbetween 2009 and 2014 [33] and in particular called for increased efforts to recycle. In 2016, the U.S.National Science and Technology Council (NSTC) published a report that provided a systematicmethodology for screening potentially critical minerals [34,35]. Another detailed report was issued bythe U.S. Geological Survey in 2017 [36]. In Europe, a corresponding list was issued by the EuropeanCommission. The first list of “Critical Raw Materials” was prepared in 2010; updates were made in2014 and 2017 [37–39]. Most recently, the 2017 assessment included a total of 78 individual materials.
The disadvantage of these presentations is that they are only short to medium term aligned,and thus the long-term supply situation is not taken into account for the obvious and above mentionedreasons. Furthermore, it is purely economically oriented and ecological aspects are largely missing.
It was Thomas Graedel and his team who developed a three-dimensional criticality system inwhich the environmental impact has its own dimension [40]. A similar approach was recently publishedby the German Federal Environment Agency [41]. It is currently being applied to a variety of chemicalelements. Results can be expected for 2019. However, it is already evident that the environmentalimpact associated with the extraction and processing of raw materials can hardly be described withcardinal scales, as is known from LCA. For this purpose, too many site-specific qualitative aspects, at themining sites for example, have to be considered. This makes the implementation in the framework ofLCA difficult.
What can we learn from the past? The scarcity of resources is not new. Concern for the dryingup of raw materials is probably as old as mankind itself. The striking of raw materials has alwaysbeen associated with labor and effort. The estimation of scarcity in each epoch was always doneagainst the background of the respective knowledge available, but the interests connected with theraw materials were also very decisive. It becomes very clear that, especially in the past 100 years,the military interests played an important role and still do today. Many high-tech products that requirespecial raw materials are indispensable to the military. They have a strategic meaning. In the publicand scientific discussion, however, it is argued as increasingly “civil” and linked to the material andenergy-intensive “way-of-life”. An important role is played by the LCA of products and services,which quantifies the impact on the environment. The use of resources is an integral part of the analysisand evaluation.
4. Abiotic Resources in Life Cycle Assessment (LCA)
When an LCA is carried out for products or services, it is now standard practice to includeand quantify the use of natural resources. The Life Cycle Inventory still does this on a physicaland quantitative basis, i.e., the amount of required raw materials and the withdrawals from natureis quantified. For example, the use of water as a natural resource is included. It has also becomecustomary to consider the required land use. However, the pure quantities (m3 of water or km2 of area)are not sufficient to describe the environmental quality of the resource input, yet this is needed in thefollowing step of an LCA, the Life Cycle Impact Assessment (LCIA), where the ecological relevanceof the energy and material flows is quantified. To get from the amount of a substance to the effect ofthe substance, so-called characterization factors are used in the LCA. They are a simplification for theLCA calculation, and all the knowledge about the ecological effect of a substance is hidden behindthem. Their investigation is therefore always in the focus of the interests of many authors from theLCA community.
6
Resources 2019, 8, 2
This task also arises for the mineral resources taken from the lithosphere. The input of metals thatoriginate from nature and enter the technosphere is one thing, but what is the ecological relevance ofthe volume flows of iron, copper, tantalum, indium, gold, etc.? The energy demands, the wastewater,and the emissions associated with the extraction and processing of raw materials are already includedin an LCA. These environmental aspects of mining and metalworking are automatically considered;thus double counting must be avoided. Rather, it is about the question of how the extraction of rawmaterials from the lithosphere “in itself” can be evaluated.
In the field of Life Cycle Assessments, the safeguard objects and the so called “Areas of Protection”(AoP) have been discussed for many years [42–44]. It is not only interesting to know what impact ahuman action has on the climate, the acid rain, or the eutrophication, but what that impact meansfor the safeguard objects, especially for human health and for the integrity of nature, which is oftencircumscribed with the preservation of biodiversity. In addition, there is a third safeguard object,namely the preservation of natural resources [45–47]. Strictly speaking, this is not an ecological aspect,but it is more subject to the idea of sustainability. The consumption of a limited natural resourceeventually leads to its depletion. What is not kept in the cycle of nature disappears at some point andis no longer available for future generations, which would not meet the idea of sustainability.
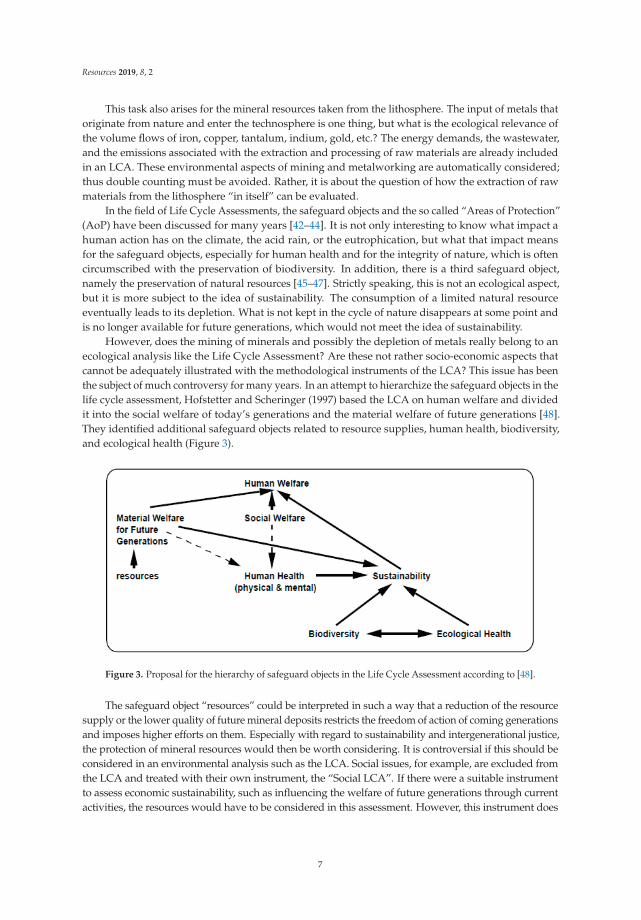
However, does the mining of minerals and possibly the depletion of metals really belong to anecological analysis like the Life Cycle Assessment? Are these not rather socio-economic aspects thatcannot be adequately illustrated with the methodological instruments of the LCA? This issue has beenthe subject of much controversy for many years. In an attempt to hierarchize the safeguard objects in thelife cycle assessment, Hofstetter and Scheringer (1997) based the LCA on human welfare and dividedit into the social welfare of today’s generations and the material welfare of future generations [48].They identified additional safeguard objects related to resource supplies, human health, biodiversity,and ecological health (Figure 3).
Figure 3. Proposal for the hierarchy of safeguard objects in the Life Cycle Assessment according to [48].
The safeguard object “resources” could be interpreted in such a way that a reduction of the resourcesupply or the lower quality of future mineral deposits restricts the freedom of action of coming generationsand imposes higher efforts on them. Especially with regard to sustainability and intergenerational justice,the protection of mineral resources would then be worth considering. It is controversial if this should beconsidered in an environmental analysis such as the LCA. Social issues, for example, are excluded fromthe LCA and treated with their own instrument, the “Social LCA”. If there were a suitable instrumentto assess economic sustainability, such as influencing the welfare of future generations through currentactivities, the resources would have to be considered in this assessment. However, this instrument does
7

Resources 2019, 8, 2
not exist. This can be seen as a justification for today’s explicit inclusion of resources as safeguard objectsby the LCA methodology as a stopgap for the inability of economics, so to speak.
The basic aspect of whether or not resources should be considered as safeguard objects is hardlyquestioned by the LCA community today [4]. One may criticize this because it is based on the claimto model nearly everything with the LCA that concerns the metabolism of the technosphere and itsexchange with the biosphere. There are far more relevant questions to be asked, such as whether thesimple linear LCA approach can adequately address the dynamic effects of technological innovationor market developments. Another difficulty is finding suitable indicators for a quantitative assessmentwithin the LCA. Finally, the amount of remaining inventory or usage restriction for future generationswould have to be quantified in some way. However, this is largely unknown today, just as in the past(see Chapter 1) it was unknown what resources would be available to us in the 20th or 21st century.
In summary, three questions play a role at the interface between the resource topic and the LifeCycle Assessment:
1. How scarce are the mineral resources, and in particular the metals, and do we really know theamount of mineral resources left in the earth?
2. Do we have to understand the mineral resources in nature as protective goods that, in addition tohealth and biodiversity, have to be protected and preserved for reasons of sustainability?
3. Which environmental impacts occur through the mining of resources and the extraction of metals,and are they adequately reflected in the method of the Life Cycle Assessment?
5. Contributions to the Main Topic
The discussion at the 2015 workshop in London triggered this discussion and is well documentedby some articles from participants. There are also additional contributions that round off the topicaltogether. Drielsma et al. [49] gave an overview of the discussion in London that included the points ofcontact of the various scientific disciplines, the different perspectives on the subject, and the difficultiesof definition that sometimes complicate scientific exchange.
Meinert et al. [50] advanced a point of view that can be found among many geologists. Theydescribed how mineral resources are explored and discovered, which leads to predictions about knowndeposits and which definitions are used for them. They used the example of copper because verydifferent opinions about the scarcity of this metal exist and it has been mined in large quantities fora long time. In this example, they tried to show that the lifetime concept—or the peak concept—isbased on wrong assumptions and therefore leads to misinterpretations. According to their statements,by 2050, only half of the previously known and already economically degradable stocks will beneeded, and the undiscovered copper deposits are not yet included. By estimating these deposits, theiroptimistic prognosis was that primary copper will still be available for many generations. The authorsargued that less concern should be paid to the depletion of primary resources but rather what happensto resources after their extraction and how they are used with regard to dissipation. On this point, thereis certainly a broad consensus with other experts who have a more “resource-pessimistic” attitude.But the most important point of their contribution may be to suggest that society is investing too littlein education, research, and development to ensure the supply of raw materials for future generations.The mining sector in particular needs stronger state support. When more environmentally compatibleand efficient mining methods are used, there will certainly be broad consensus on this point.
The article by Oers and Guinée [51] was particularly special because it was a kind of update andreflection on an approach that is widely used in the LCA community. In 1995, Guinée and Heijungsproposed characterization factors for abiotic depletion potential (ADP), which were widely used inthe application of the LCA [52]. Again, the use of terms played an important role. Do we talk aboutdepletion, scarcity, or criticality? Should the ultimate reserves, the reserve base, or the crustal contentbe used as a basis for comparisons between different metals? The authors emphasized that there isprobably more than a dilution problem, namely when resources are released into the environmentthrough emissions or wastes and are irretrievably lost. However, they also pointed out that it is difficult
8
Resources 2019, 8, 2
to define the correct method because the parameters to be chosen depend on the question and cannotbe empirically verified in practice.
Calvo et al. [53] drew attention to an interesting aspect—what does the mineral capital of variouscountries look like? Through the mining and export of minerals, this capital is changing. What exergywould be needed to rebuild this lost mineral capital? An average concentration of minerals in theearth’s crust is assumed. The authors created a kind of a mineral balance based on exergy replicationcosts. Evaluating the exergy with prices (for electricity or coal) leads to an economic statement. Usingthe examples of Colombia and Spain, the authors showed that mining and exporting minerals producesa lower gross domestic product than one would have to pay for exergy replacement costs to rebuild themineral capital. The figures could also be used to produce net balances between countries. This issuehas a high economic and developmental importance due to the unequal distribution of raw materialsamong countries and the question of fair pay for raw materials supplies.
Vieira et al. [54] calculated the surplus costs arising from current resource extraction on futuresituations and used these as a basis to calculate characterization factors for 12 metals and the platinumgroup metals. In the tradition of many environmental scientists, they assumed the absolute finitenessof mineral resources. They further assumed that with increasing mine production, the ore gradesdecrease and a grade-tonnage relationship can be set up. They derived a function for the operatingcosts per metal extracted, which depends on the previous amount of cumulative metal extracted andthe total amount of a metal that can be mined on earth or has already been mined. The interestingthing about the approach is that the choice of this last value has only a limited effect on the result.The authors pointed out that they had not yet considered many cost drivers and therefore need togather more data.
At the focus of the article by Henßler et al. [55] was the application of a method called ESSENZ,which was developed at the Technical University of Berlin to evaluate many aspects of the use ofresources. These aspects included physical availability as well as socioeconomic availability andenvironmental impacts. A total of 18 categories were taken into account, some category examplesbeing abiotic resource depletion, the political stability of producing countries, and the impact ofsummer smog. The authors presented a case study in which ESSENZ was applied to the comparisonof a conventional car and an e-car from Mercedes. The method provides greatly differentiated resultsfor the different categories. In particular, it allows the comparison of tradeoffs that may occur whenenvironmental impacts are reduced, but the use of resources increases at the same time.
In their article, Martin-Gamboa and Iribarren [56] examined and compared the performance ofwind turbines, taking into account the use of raw materials. The starting point was, of course, datafrom the LCA, but they used a method that goes far beyond the pure LCA approach. They usedemergy as an indicator, which is the solar energy that is or was ultimately required to manufacture aproduct by extracting resources from the geo-biosphere. This approach is similar to correspondingexergy approaches in resource use assessment. This is connected, as they wrote, with a departure fromthe purely anthropocentric perspective. Gamboa and Iribarren went even further and used the dataenvelopment analysis (DEA) for time-dependent efficiency measurements of various wind farms.
Alvarenga et al. [57] analyzed, in a very extensive study, the different methods with whichabiotic raw materials are evaluated in LCA. They also dealt with the question of the area of protectionand which impact assessments are useful. In total, they considered 19 different Life Cycle ImpactAssessment methods, some of which treat the topic of resources very differently. They tested themethods using a case study comparing fossil and bioethanol-based ethylene production.
Finnveden et al. [58] made a very important contribution by considering the crucial questionof what is actually depleted or consumed. Their answer was that it is neither matter nor energy,but usable energy, i.e., exergy. The big advantage to this is that the evaluation of matter and energycan be integrated into a unified concept. However, this thermodynamic approach requires extensivecalculations. The question that remains open is what practical relevance the calculation of the moretheoretical exergy values has. This must be further discussed in the future at case studies.
9

Resources 2019, 8, 2
Müller et al. [1], in a very committed, detailed, and far-reaching article, dealt with the fundamentalquestions of which goals one wants to achieve with dematerialization and which indicators aremeaningful for this purpose. They dealt with normative aspects in the discussion, cited examplesfrom German and European resource efficiency policies, and came to the conclusion that mass-basedindicators are rather unsuitable to describe the desired AoP of environmental protection. At the sametime, however, they also advocated an environmental policy that does not stop at national borders buttakes a life cycle perspective.
6. Outlook
The presented articles show that the question of the depletion of resources and their assessmentin the LCA is by no means conclusively answered. There are many opinions and different approaches.Above all, however, it is an interdisciplinary question that has a lot to do with methods and experiencesfrom environmental sciences, but most significantly with geology, resource economics, and mining.The positions on the depletion question depend very much on different specialists’ knowledge,but also on the normative positions of the various disciplines. It is therefore quite understandablethat representatives from the environmental sciences assume that resources will soon be exhausted.Representatives from the mining sector, on the other hand, must start from the inexhaustibility ofresources. This is the basis of their business model.
Nevertheless, recommendations for politics and for the economy are necessary, such as whichcriteria are used to assess recycling strategies or a circular economy. If the depletion of resources is anindependent and urgent issue, a circular economy would have absolute priority. In this case, this mighthave to be weighed against other objectives, e.g., climate protection. Conflicting goals could arise heresince the achievement of the 1.5◦ goal requires an enormous expansion and the restructuring of energysupply structures worldwide. This would require a considerable use of resources that could only becovered by additional primary resources. If, however, the problem of resource depletion is postponedor perceived only as an exergy or entropy problem, then the energy balance and the environmentalimpacts of resource supply come to the fore, both from mining and from recycling. These can be dealtwith very well in today’s LCA framework.
This is why the discussion on this topic is more important than ever. However, this time it mustlead to a result and must not get stuck in different schools of thought as it did 40 years ago. Above all,the exchanges between the various scientific disciplines and applications in economy are important.Therefore, the meeting in London, which resulted in most of the articles presented in this paper, was animportant event that urgently needs to be repeated on an interdisciplinary and open platform.
Funding: This research received no external funding.
Conflicts of Interest: The author declares no conflict of interest.
References
1. Müller, F.; Kosmol, J.; Keßler, H.; Angrick, M.; Rechenberger, B. Dematerialization—A disputable strategyfor resource conservation put under scrutiny. Resources 2017, 6, 68. [CrossRef]
2. German National Academy of Sciences Leopoldina; National Academy of Science and Engineering (acatech);Union of the German Academies of Sciences and Humanities. Raw Materials for the Energy Transition; Acatech:Munich, Germany, 2018.
3. Wellmer, F.-W.; Buchholz, P.; Gutzmer, J.; Hagelüken, C.; Herzig, P.; Littke, R.; Thauer, R.K. Raw Materials forFuture Energy Supply; Springer: Berlin, Germany, 2018.
4. Berger, M.; Sonderegger, T. Global Guidance for Life Cycle Impact Assessment of Mineral Resource Use. WhitePaper of the Task Force Resources of Life Cycle Initiative; Berger, M., Sonderegger, T., Eds.; Life Cycle Initiative ofUN Environment: Paris, France, 2018; unpublished.
5. Johannsen, O. Biringuccios Pirotechnia; Vieweg: Braunschweig, Germany, 1925. (In German)
10
Resources 2019, 8, 2
6. Agricola, G. De Re Metallica Libri XII, Basel, 1556, 2nd German ed.; Ludwig Königs: Basel, Switzerland, 1621.(In German)
7. Niavis, P. Iudicium Iovis. In Paulus Niavis Iudicium Iovis oder Das Gericht der Götter über den Bergbau FreibergerForschungshefte D3; Krenkel, P., Ed.; Akademie-Verlag: Berlin, Germany, 1953. (In German)
8. Selmeier, F. Eisen, Kohle und Dampf. Die Schrittmacher der Industriellen Revolution; Deutsches Museum:München, Germany, 1984; p. 87. (In German)
9. Jevons, W.S. The Coal Question, 3rd ed.; Sentry Press: New York, NY, USA, 1965.10. Riegraf, H. Geographie der Rohstoffwirtschaft der Erde; Deutscher Verlag der Wissenschaften: Berlin, Germany,
1961; p. 282. (In German)11. World Steel Association. Steel Statistical Yearbook 2018; World Steel Association: Brussels, Belgium, 2018.12. Pinchot, G. The Fight for Conservation, Doubleday; Page & Company: New York, NY, USA, 1911.13. Blanchard, N.C. (Ed.) Proceedings of a Conference of Governors in the White House Washington, DC 13–15 May
1908; Government Printing Office GPO: Washington, DC, USA, 1909.14. Leith, C.K. The Economic Aspects of Geology; Henry Holt and Company: New York, NY, USA, 1921.15. Leith, C.K. International Control of Minerals. In Mineral Resources of the United States; McCaskey, H.D., Ed.;
Department of the Interior: Washington, DC, USA, 1917; pp. 7–17.16. Spicer, L.G. Stock Piling of Strategic Materials. Master’s Thesis, Boston University, Boston, MA, USA, 1950.17. Roush, G.A. Strategic Mineral Supplies; McGraw-Hill: New York, NY, USA, 1939.18. Emeny, B. The Strategy of Raw Materials; MacMillan: New York, NY, USA, 1936.19. Eckes, A.E. The United States and the Global Struggle for Minerals; University of Texas Press: Austin, TX,
USA, 1979.20. U.S. Department of Defense, DLA Strategic Materials. Strategic and Critical Materials Operations Report to
Congress; Fort Belvoir: Fairfax, VA, USA, 2017.21. U.S. Senate. Mineral Resources Development. Hearings before the Committee on Interior and Insular Affairs;
U.S. Senate: Washington, DC, USA, 1949.22. House of Representatives. Resources for Freedom; A Report to the President by The President’s Materials
Policy Commission; House of Representatives: Washington, DC, USA, 1952; Volume I–V.23. Barnett, H.J.; Morse, C. Scarcity and Growth. In The Economics of Natural Resource Availability; John Hopkins
Press: Baltimore, Maryland, 1963.24. Ehrlich, P.R. The Population Bomb; Sierra Club: San Fransisco, CA, USA, 1968.25. Meadows, D.H.; Meadows, D.L.; Randers, J.; Behrens, W.W. The Limits to Growth; Universe: New York, NY,
USA, 1972.26. National Academy of Sciences. Resources and Man; Freeman: San Francisco, CA, USA, 1969.27. National Academy of Sciences. Mineral Resources and the Environment; A Report by the Committee on Mineral
Resources and the Environment; National Academy of Sciences: Washington, DC, USA, 1975.28. Smith, V.K. Scarcity and Growth Reconsidered; John Hopkins Press: Baltimore, Maryland, 1979.29. Simpson, R.D.; Toman, M.A.; Ayres, R.U. Scarcity and Growth Revisited. In Natural Resources and the
Environment in the New Millennium; Resources for the Future: Washington, DC, USA, 2005.30. Gerling, J.P.; Wellmer, F.-W. Reserven, Ressourcen und Reichweiten. Wie lange gibt es noch Erdöl und
Erdgas? Chem. Uns. Zeit. 2005, 39, 236–245. (In German) [CrossRef]31. Executive Office of the President National Critical Materials Council. A Critical Materials Report—The
Continuation of a Presidential Commitment; Executive Office of the President National Critical MaterialsCouncil: Washington, DC, USA, 1988.
32. Committee on Critical Mineral Impacts of the U.S. Economy. Minerals, Critical Minerals, and the U.S. Economy;National Research Council: Washington, DC, USA, 2008.
33. International Resource Panel. Work on Global Metal Flows; United Nations Environment Programme: Paris,France, 2013.
34. Committee on Environment, Natural Resources, and Sustainability. Assessment of Critical Minerals: ScreeningMethodology and Initial Application; National Science and Technology Council: Washington, DC, USA, 2016.
35. Committee on Environment, Natural Resources, and Sustainability. Assessment of Critical Minerals: UpdatedApplication of Screening Methodology; National Science and Technology Council: Washington, DC, USA, 2018.
36. U.S. Geological Survey. Critical Mineral Resources of the United States—Economic and Environmental Geologyand Prospects for Future Supply; USGS: Reston, VA, USA, 2017.
11

Resources 2019, 8, 2
37. European Commission. Tackling the Challenges in Commodity Markets and on Raw Materials; COM(2011) 25final; European Commission: Brussels, Belgium, 2011.
38. European Commission. On the Review of the List of Critical Raw Materials for the EU and the Implementation ofthe Raw Materials Initiative; COM(2014) 297 final; European Commission: Brussels, Belgium, 2014.
39. European Commission. On the 2017 List of Critical Raw Materials for the EU; COM(2017) 490 final; EuropeanCommission: Brussels, Belgium, 2017.
40. Graedel, T.E.; Barr, R.; Chandler, C.; Chase, T.; Choi, J.; Christoffersen, L.; Friedlander, E.; Henly, C.; Jun, C.;Nassar, N.T.; et al. Methodology of Metal Criticality Determination. Environ. Sci. Technol. 2012, 46, 1063–1070.[CrossRef] [PubMed]
41. Manhart, A.; Vogt, R.; Priester, M.; Dehoust, G.; Auberger, A.; Blepp, M.; Dolega, P.; Kämper, C.; Giegrich, J.;Schmidt, G.; et al. The environmental criticality of primary raw materials—A new methodology to assessglobal environmental hazard potentials of minerals and metals from mining. Min. Econ. 2018. [CrossRef]
42. Consoli, F. Guidelines for Life Cycle Assessment: A ”Code of Practice”; SETAC (Society of EnvironmentalToxicology and Chemistry): Pensacola, FL, USA, 1993.
43. Beltrani, G. Safeguard Subjects. The Conflict Between Operationalization and Ethical Justification. Int. J. LifeCycle Assess. 1997, 2, 45–51. [CrossRef]
44. Vadenbo, C.; Rørbech, J.; Haupt, M.; Frischknecht, R. Abiotic resources: New impact assessment approachesin view of resource efficiency and resource criticality—55th Discussion Forum on Life Cycle Assessment,Zurich, Switzerland, 11 April 2014. Int. J. Life Cycle Assess. 2014, 19, 1686–1692. [CrossRef]
45. Steen, B.A. Abiotic resource depletion. Different perceptions of the problem with mineral deposits. Int. J.Life Cycle Assess. 2006, 11, 49–54. [CrossRef]
46. Strauss, K.; Brent, A.C.; Hietkamp, S. Characterisation and normalisation factors for life cycle impactassessment mined abiotic resources categories in South Africa. Int. J. Life Cycle Assess. 2006, 11, 162–171.[CrossRef]
47. Mancini, L.; De Camillis, C.; Pennington, D. Security of supply and scarcity of raw materials. In Towards aMethodological Framework for Sustainability Assessment; European Commission Joint Research Centre: Ispra,Italy, 2013.
48. Hofstetter, P.; Scheringer, M. Schutzgüter und ihre Abwägung aus der Sicht verschiedener Disziplinen;5. Diskussionsforum Ökobilanzen vom 17. Oktober 1997 an der ETH Zürich; ETH Zürich: Zürich, Switzerland,1997. (In German)
49. Drielsma, J.A.; Allington, R.; Brady, T.; Guinée, J.; Hammarstrom, J.; Hummen, T.; Russell-Vaccari, A.;Schneider, L.; Sonnemann, G.; Weihed, P. Abiotic raw-materials in life cycle impact assessments: An emergingconsensus across disciplines. Resources 2016, 5, 12. [CrossRef]
50. Meinert, L.D.; Robinson, G.R., Jr.; Nassar, N.T. Mineral resources: Reserves, peak production and the future.Resources 2016, 5, 14. [CrossRef]
51. Van Oers, L.; Guinée, J. The abiotic depletion potential: Background, updates, and future. Resources 2016,5, 16. [CrossRef]
52. Guinée, J.; Heijungs, R. A proposal for the definition of resource equivalency factors for use in productLife-Cycle Assessment. Environ. Toxicol. Chem. 1995, 14, 917–925. [CrossRef]
53. Calvo, G.; Valero, A.; Carmona, L.G.; Whiting, K. Physical assessment of the mineral capital of a nation:The case of an importing and an exporting country. Resources 2015, 4, 857–870. [CrossRef]
54. Vieira, M.D.M.; Ponsioen, T.C.; Goedkoop, M.J.; Huijbregts, M.A.J. Surplus cost potential as a life cycleimpact indicator for metal extraction. Resources 2016, 5, 2. [CrossRef]
55. Henßler, M.; Bach, V.; Berger, M.; Finkbeiner, M.; Ruhland, K. Resource efficiency assessment—Comparing aplug-in hybrid with a conventional combustion engine. Resources 2016, 5, 5. [CrossRef]
56. Martin-Gamboa, M.; Iribarren, D. Dynamic ecocentric assessment combining emergy and data envelopmentanalysis: Application to wind farms. Resources 2016, 5, 8. [CrossRef]
12

Resources 2019, 8, 2
57. Alvarenga, R.A.F.; de Olivera Lins, I.; de Almeida Neto, J.A. Evaluation of abiotic resource LCIA methods.Resources 2016, 5, 13. [CrossRef]
58. Finnveden, G.; Arushanyan, Y.; Brandao, M. Exergy as a measure of resource use in life cycle assessmentand other sustainability assessment tools. Resources 2016, 5, 23. [CrossRef]
© 2018 by the author. Licensee MDPI, Basel, Switzerland. This article is an open accessarticle distributed under the terms and conditions of the Creative Commons Attribution(CC BY) license (http://creativecommons.org/licenses/by/4.0/).
13

resources
Communication
Abiotic Raw-Materials in Life Cycle ImpactAssessments: An Emerging Consensusacross Disciplines
Johannes A. Drielsma 1,*, Ruth Allington 2,†, Thomas Brady 3,†, Jeroen Guinée 4,†,
Jane Hammarstrom 5,†, Torsten Hummen 6,†, Andrea Russell-Vaccari 7,†,
Laura Schneider 8,†, Guido Sonnemann 9,† and Pär Weihed 10,†
1 European Association of Mining Industries, Metal Ores and Industrial Minerals (Euromines),Avenue de Broqueville/Broquevillelaan 12, Brussels 1150, Belgium
2 Committee for Mineral Reserves International Reporting Standards (CRIRSCO), c/o Pan-European Reserves& Resources Reporting Committee (PERC), c/o EFG Office, Service Géologique de Belgique, Rue Jenner 13,Brussels 1000, Belgium; [email protected]
3 Newmont Mining, 6363 South Fiddler’s Green Circle Suite 800, Greenwood Village, CO 80111, USA;[email protected]
4 Institute of Environmental Sciences CML, Leiden University, Einsteinweg 2, Leiden 2333 CC,The Netherlands; [email protected]
5 United States Geological Survey (USGS), 954 National Center, Reston, VA 20192, USA; [email protected] Competence Center Sustainability and Infrastructure Systems, Fraunhofer Institute for Systems and
Innovation Research ISI, Breslauer Straße 48, Karlsruhe 76139, Germany; [email protected] Align Consulting, 1134 Cross Creek Ct., Sheridan, WY 82801, USA; [email protected] econsense—Forum for Sustainable Development of German Business, Oberwallstraße 24, Berlin 10117,
Germany; [email protected] The Life Cycle Group CyVi Institut des Sciences Moléculaires (ISM), Université de Bordeaux 1—UMR 5255
CNRS, 351 Cours de la libération—Bât A12, TALENCE cedex 33 405, France;[email protected]
10 Lulea Technical University, Luleå 971 87, Sweden; [email protected]* Correspondence: [email protected]; Tel.: +32-2-775-6305; Fax: +32-2-770-6303† These authors contributed equally to this work.
Academic Editors: Mario Schmidt and Benjamin C. McLellanReceived: 15 December 2015; Accepted: 16 February 2016; Published: 26 February 2016
Abstract: This paper captures some of the emerging consensus points that came out of the workshop“Mineral Resources in Life Cycle Impact Assessment: Mapping the path forward”, held at the NaturalHistory Museum London on 14 October 2015: that current practices rely in many instances onobsolete data, often confuse resource depletion with impacts on resource availability, which cantherefore provide inconsistent decision support and lead to misguided claims about environmentalperformance. Participants agreed it would be helpful to clarify which models estimate depletionand which estimate availability, so that results can be correctly reported in the most appropriateframework. Most participants suggested that resource availability will be more meaningfullyaddressed within a comprehensive Life Cycle Sustainability Assessment framework rather thanlimited to an environmental Life Cycle Assessment or Footprint. Presentations from each of theauthors are available for download [1].
Keywords: abiotic natural resources; Life Cycle Assessment; minerals; mining; ore grades; reserves;resource availability; resource scarcity; safeguard subject; raw-materials
Resources 2016, 5, 12; doi:10.3390/resources5010012 www.mdpi.com/journal/resources14
Resources 2016, 5, 12
1. Introduction
On Wednesday 14 October 2015, a global group of approximately 50 experts from academia,consulting, regulators, primary industry, down-stream sectors and standards bodies gathered at theNatural History Museum London to exchange recent findings on the way that life cycle assessment iscurrently applied to the use of raw-materials.
In welcoming workshop participants, the hosts explained that the road travelled in developingNatural Resources as a safeguard subject (or Area of Protection (AoP)) in Life Cycle Impact Assessment(LCIA) had been a long one, but that some more recent milestones along the way served as usefulbackground for the day’s discussion. Namely, the mining industry (Euromines and the InternationalCouncil on Mining & Metals (ICMM)) had held a series of key workshops during the years 2011–2014to bring experts from within and outside the mining industry together to discuss Life Cycle Assessment(LCA) in the context of Resource Efficiency policies. This led to greater mining industry participationin other forums such as the European Commission Joint Research Centre Workshop on “Security ofsupply and scarcity of raw-materials: a methodological framework for sustainability assessment” in2012 [2] and the 55th Discussion Forum on LCA (DF-55) held in Zurich in 2014 [3].
It was announced that the industry had drafted a journal article drawing upon its experienceswith LCA and the knowledge of its exploration, geology, and economic experts that is now freelyavailable from the International Journal of Life Cycle Assessment [4].
The authors of that article suggested that development of a globally agreed upon methodfor assessment of abiotic raw-material inputs in Life Cycle Impact Assessment (LCIA) could becharacterized by a certain amount of confusion, resistance and frustration and that, according toKnoster et al. [5], this quite possibly stemmed, respectively, from the lack of a common vision acrossdisciplines of the potential threat or impact to measure; from a lack of aligned incentives amongst thedifferent experts for developing such a method; and therefore a general lack of knowledge sharing anddata availability between disciplines. The Workshop hosts invited the participants to begin a processof improving the sharing of knowledge and the seeking of common goals at the Workshop.
All presentations at the Workshop are available for download [1].
2. Results and Discussion
2.1. Status and Limitations: The Data
The first session of the workshop centered on the data typically drawn upon for estimatingpotential environmental impacts on abiotic natural resources in LCA. These data are typically generatedby or for the mining industry and its (financial) stakeholders, but also for various governmentdepartments. The discussions were therefore designed to increase LCA-practitioners’ familiaritywith mining.
2.1.1. Economics of Resource Supply and Use
Tom Brady (Chief Economist, Newmont Mining, Greenwich Village, CO, USA) presented a visualsummary of the typical process of identifying and reporting Mineral Reserves from the perspective ofa mining executive. Central to his presentation was the use of the Committee for Mineral ReservesInternational Reporting Standards (CRIRSCO) definitions to classify different materials identifiedduring exploration work. Mine planning (both in terms of the size and shape of the proposedmine, but also the schedule and sequence of mining) guides the identification of different classes ofMineral Resources and Mineral Reserves. Successive iterations of sampling, data interpretation andmine planning alter the estimates of each—even after a mine begins operation (Newmont typicallyonly reports Proven Mineral Reserves once a mine has been operating as designed for 12 months).This involves consideration of several modifying factors that include processing, metallurgical,economic, marketing, legal, environmental, socio-economic and geopolitical factors. In particular,Mineral Reserve estimates fluctuate greatly as assumptions about future commodity prices change.
15

Resources 2016, 5, 12
As of 31 December 2014, Newmont Mining Gold Reserves varied by up to 30% depending on whethera gold price of USD 1100/ounce was assumed, or USD 1500/ounce. In addition, when metal prices arehigh, exploration expenditure and discoveries tend to increase such that new Mineral Resources morethan make up for the Mineral Reserves extracted. Whereas LCIA methods often assume that the stockof Mineral Resources and Mineral Reserves is fixed and depleting, in fact they increase or decreasewith fluctuations in availability of infrastructure, exploration budgets, geological knowledge, marketprices, projected production costs and technology development.
2.1.2. Resource Data: The Providers’ Perspective
Jane Hammarstrom (Co-Chief, Global Mineral Resource Assessment Project, USGS, Reston, VA,USA) presented an explanation of the information services that the USGS provides, underlining howit compiles estimates of global Mineral Resources and Reserves and also explaining how it providesscience-based assessments of likely Undiscovered Mineral Resources. While USGS definitions ofMineral Resources and Mineral Reserves largely match those of CRIRSCO, estimates from differentsources may lack consistency owing to the different needs of, say, government and individual miningcompanies. Depending on the purpose and the timeframe considered, estimation methods andprofessional judgments may differ (e.g., commodity price and production cost forecasts). Reservefigures are estimates and they are snapshots in time that depend on several factors including demand,exploration budgets, recycling rates, technology, economics, social license to operate and environmentalperformance and therefore should only be interpreted together with the accompanying qualitativeinformation provided by the Survey. Therefore, the notion that reserve figures tell us how many yearsremain until a natural resource is depleted must be rejected. Copper data also demonstrate the falsityof the notion that as ore is mined reserves necessarily decrease (copper reserves doubled from 1990 to2013). It is questionable which of the different estimates of Resources and Reserves provided by theUSGS could plausibly serve as a basis for measuring resource depletion. Neither the USGS ReserveBase nor the theoretical world resources is an immediately obvious or justified choice.
2.1.3. Resource Data: The Users’ Perspective
Ruth Allington (Treasurer of Pan-European Reserves & Resources Reporting Committee,CRIRSCO, Brussels, Belgium) presented an overview of CRIRSCO, its aims, history, make-up andgovernance. The CRIRSCO-aligned definitions of Mineral Resources and Mineral Reserves havea history stretching back at least as far as the 1980s, with broad acceptance globally. The accurateand reliable reporting of mineral exploration results, Mineral Resources and Mineral Reserves isfundamental not only to mining stakeholders (for transparency of commodity markets), but also towider society including the LCA community. CRIRSCO requirements follow some main principlesrelated to transparency, materiality, competence and impartiality. In-particular, the role of the Competent(Qualified) Person, as required by CRIRSCO-aligned reporting codes and standards [6], is critical toupholding those principles. The Competent Person is named publicly as being personally responsiblefor proper estimation of Mineral Resources and Mineral Reserves and is subject to potential disciplinaryaction from the relevant CRIRSCO-affiliated professional organization. When the Competent Personidentifies a Mineral Reserve, it must be demonstrated and this was done through a thorough analysisof the modifying factors described by others (see above) including relatively volatile socio-economicaspects such as commodity price. It is argued that CRIRSCO and its Competent Person conceptare the keys to stakeholder confidence in any public reporting of LCA results based on estimates ofMineral Resources or Mineral Reserves and the LCA community should beware of embracing thiseconomic data without acknowledging its limitations for their environmental work. To do so gives riseto misleading results and, given the CRIRSCO principles of transparency, materiality, competence andimpartiality, would raise an ethical issue.
16

Resources 2016, 5, 12
2.2. Status and Limitations: The Methods
The second session of the workshop centered on the methods typically used to estimate potentialenvironmental impacts on abiotic natural resources in LCA. These methods have typically beendeveloped by academics or LCA practitioners in the context of overall LCA frameworks or software.The discussions were therefore designed to increase mining professionals’ familiarity with LCA.
2.2.1. Drivers for LCA of Resource Supply and Use
Andrea Russell-Vaccari (Principal Consultant, Align Consulting, Sheridan, WY, USA) introducedLCIA and safeguard subjects (Areas of Protection), their state of development and decision-makers’needs related to abiotic raw-materials. For impact category selection, the International Organizationfor Standardization (ISO) recommends characterization methods for the AoP be broadly agreed,environmentally relevant and describing a “distinct identifiable environmental mechanism” [7].The resource depletion impact category is hampered by insufficient understanding of the NaturalResources AoP and hence the issue to address [8]. This is due to the variability of concepts like resourceavailability over space and time. Figure 1 is a visual representation of the questions that stakeholdersask about abiotic raw-materials: from environmental impacts to economic impacts; from short-termeffects to long-term effects; and from micro-economics (product systems) to macro-economics (wholeeconomies). Whereas Abiotic Depletion Potential (ADP) is easy to assess for LCIA methodologydevelopers (top right of Figure 1), the results are not meaningful for those in the other three quadrantsof Figure 1.
Figure 1. A proposed mapping of different decision-makers across a range of different abiotic rawmaterial information needs (adapted from [9]).
The proposed constraint with which the assessment is made (Ultimate Reserve or Crustal Content)is so remote that it is of little relevance to decision-makers. Availability of materials is of more generalconcern. The sensitivity analysis of using other constraints, recommended by [10], demonstrates thatthe distinction between depletion and availability is critical, because it can actually be decisive forproduct selection. Because the needs of decision-makers are different to the environmental focusprovided by LCIA and the AoP concept, abiotic raw-material assessment needs to expand beyondthe confines of LCA and embrace other tools. LCIA alone is not able to provide adequately robustinformation for all decision making.
2.2.2. Abiotic Depletion Potential Method, Its Variants and Example Results
Jeroen Guinée (Assistant Profesor, CML, Leiden, The Netherlands) is one of the main authors ofthe original ADP method most commonly used in LCA and he presented a history of the philosophybehind it. There can be no scientifically correct method for assessing potential environmental impacts
17

Resources 2016, 5, 12
on abiotic natural resources because the concept of “resource” straddles the economic–environmentaldivide and none of the physical parameters or results can actually be validated empirically. Thisrequires LCA practitioners to make a number of philosophical choices—rather than use inductivereasoning—when developing resource assessment models. Choices include a definition of the resourceproblem to be addressed; whether or not to consider it a problem distinct from deterioration of theenvironment; and which data to use. While availability, criticality, etc. are also of interest, the Instituteof Environmental Sciences (CML) ADP method only addresses depletion of a resource in terms ofreduction of the geological stocks present on Earth (Ultimate Reserve or Crustal Content). LCAresults are highly sensitive to deviations from the use of Ultimate Reserves (Crustal Content). CMLdefinitions differ from those of CRIRSCO because “resource” is commonly used to describe a categoryof mineral occurrences as well as to a material in its own right and is therefore ambiguous (Oneshould perhaps rather refer to Natural Resources as natural materials or raw-materials, in order tobetter distinguish them from Mineral Resources as defined by CRIRSCO and USGS). The preferredparameter to describe the stock available for all of humankind would be the Ultimately ExtractableResources (or Extractable Global Resource), but this is impossible to determine because of our inabilityto predict what will ultimately be extracted in the future as technology advances and economic andsocial conditions evolve. Crustal Content is the second best parameter available and CML recommendsusing it as the baseline with other parameters providing an understanding of the sensitivity of theresult to the choice made [8]. Unfortunately, such sensitivity analysis may not assist decision-making,because contradictory indications can often be the result. This is because USGS Reserve Base andEconomic Reserve (Mineral Reserve) data involve economic considerations not directly related toresource depletion (such as structure of individual material markets, social conditions reflected inlabor costs, negotiating power of mining companies and relative cost of identifying new reserves).
2.2.3. Supply as an Alternative Safeguard Subject
Torsten Hummen (Researcher, Fraunhofer ISI, Karlsruhe, Germany) introduced raw-materialscriticality assessment as it is developed and practiced by the European Union. WhereasADP[Crustal Content] looks at environmental impacts on the resource itself (depletion of natural stocksover the long term), criticality assessment looks at short-term impacts on an economy due todisturbances in a supply chain. As for classical risk management [11], criticality typically has twodimensions—a supply risk dimension and an economic importance dimension, which gives an idea ofthe potential consequences of a supply disruption. Criticality assessment is not yet an internationallystandardized method. Criticality is tied to a particular viewpoint, i.e., no raw-material is criticalitself in an absolute sense, but it may be critical to somebody somewhere, under the prevailingconditions at some point in time. For example, heavy rare earth elements are considered critical forEU manufacturing in the period 2014–2024 because of their relatively high economic importancefor the EU economy and the relatively high risk associated with their supply to the EU. Criticalityassessment highlights current issues and informs policy or business decisions. As criticality is a relativeassessment, there is no one correct place to draw the line between critical and non-critical raw-materials.In the EU, expert judgment and benchmarking with real-world markets (e.g., that of tantalum) haveinformed placement of the thresholds. LCA, on the other hand, is an internationally standardizedmethodology [7]. The environmental impact assessment of established, already employed technologiesis the standard application of LCA. There are a number of questions about whether it is appropriateto integrate criticality or supply risk issues (not directly related to environmental impacts) into theNatural Resources AoP of LCA. Though Life Cycle Sustainability Assessment (LCSA) might be a moreappropriate place for such assessments, current difficulties related to interdependency of criteria mayincrease there.
18

Resources 2016, 5, 12
2.3. Paths Forward
Having attempted to bring delegates from different backgrounds to a shared level of basicunderstanding, the third session of the workshop centered on how better to employ life-cycle thinkingin meeting decision-makers’ needs related to abiotic raw-materials. The discussions were thereforedesigned to help ensure that the basis of future research is clear across the relevant disciplines.
2.3.1. Potential Paths Forward and Some Dead-Ends
Pär Weihed (Professor, LTU, Luleå, Sweden) summarized an International Journal of Life CycleAssessment article he had recently co-authored: “Mineral resources in life cycle impact assessment—definingthe path forward” [4]. He recommended a multi-stakeholder report titled “Breaking New Ground” [12]to all participants as an invaluable reference for assessment of potential impacts of the use ofabiotic raw-materials. Current LCA models introduce unacceptable levels of uncertainty and arenot working correctly as decision-making tools. “USGS data are intended to inform about eachindividual commodity’s market conditions and can only be correctly interpreted together with thequalitative information provided in USGS commodity summaries” [4]. Harmonized terminologyshould be used so that LCA practitioners can build better mutual understanding with the mineralindustry. Only Crustal Content data are stable and comprehensive enough to support a physicalestimate of ADP—if that is desired and deemed useful. Some more promising tools are being exploredwithin LCSA for assessing the availability of abiotic materials, which is defined at any given moment intime by market demand, politics, markets and technology. Observed periods of decline in average oregrades must neither be interpreted as a sign of depletion, nor as an indicator of reduced availability.In a circular economy, metals must be regarded as flows and not stocks and all five forms of capital(i.e., natural, manufactured, human, social and financial capital) that are critical in the context of futureabiotic raw-materials availability should eventually be considered within an LCSA tool.
2.3.2. Environmental Depletion and Economic Scarcity
Laura Schneider (Manager Environmental Issues, econsense, Berlin, Germany) presented one ofthe tools previously mentioned—the economic resource scarcity potential model (ESP, [13]). The ESPmodel allows for an assessment of raw-material availability beyond geologic finiteness and enablesan identification of potential supply risks associated with the use of abiotic raw-materials. ESPdefines “scarcity” as limited supply of a demanded raw-material, which could either be causedby depletion of physical stocks (long-term concern) or caused by constraints in the supply chain(short-term concern). Potential physical and economic drivers of scarcity could create direct constraintsupon raw-material provision capability and environmental and social drivers could create indirectconstraints. Because raw-material provision capability is potentially affected by all these constraints,it should be assessed with a multi-dimensional approach (e.g., LCSA) (here, raw-material provisioncapability—or supply—is the safeguard subject that can introduce risk to the studied system, whereasLCA is designed to assess the impacts of the studied system upon the external environment).Schneider et al. [14] further propose that ADP assessment should be extended to include anthropogenicstocks (potential secondary raw-materials) in its scope. ADP[Crustal Content] and ESP provide differentinformation for different decisions. For example, ADP[Crustal Content] highlights the use of nickel inhybrid cars, whereas ESP highlights use of rare earths in the same hybrid cars. Comprehensiveassessment of abiotic raw-material provision capability, including physical, environmental, economicand social constraints should complement and enhance current LCA practice.
2.3.3. Possibilities in Life Cycle Sustainability Assessment
Guido Sonnemann (Professor, Université de Bordeaux, ISM, TALENCE cedex, France) presenteda proposed framework for integrating criticality of raw-materials into LCSA [15]. A new perspectivewas called for to move from assessing geological stock depletion to including security of supply
19

Resources 2016, 5, 12
aspects—as criticality assessment and some water scarcity assessment methods do. LCSA couldintegrate environmental, social and economic impacts of the studied system. For both water and otherraw-materials, a greater geographical explicitness of sophisticated LCA models could take account ofvariation in climate-related and geopolitical supply risks. Sonnemann et al. [15] propose a frameworkand ISM continues to develop models for individual strands of the framework. The complementarityof criticality assessment and LCA of products suggests there is high potential for LCSA to answerstakeholders’ raw-materials concerns. Data generated for LCA can provide information about abioticraw-material use that can be usable in LCSA, but these data are more valuable the more geographicallyexplicit they become. Supply risk is an economic problem that is perceived differently in various partsof the world and can be addressed in the full LCSA framework—not by isolated indicators hidden inan environmental LCA or footprint result (here, it is proposed that LCSA assess the studied system’scontribution to increased supply risk for others, which is consistent with the general life cycle approachof assessing impacts of the studied system upon its surroundings). Using other tools to address thecapability gaps left by LCA regarding raw-materials is one way to support better decision making.The Natural Resources AoP needs to be rethought by developing a multi-dimensional approach aspart of LCSA—going beyond environmental LCA.
2.4. Discussion
Discussions throughout the day confirmed that there is no common understanding about whatthe Natural Resources AoP represents and how impacts upon it should be assessed (see also [3,8]).Part of the confusion comes from different and overlapping definitions of key terms in two key areas.
Firstly, whereas most LCIA literature refers to assessing resource depletion as an environmentalimpact, most decision-makers, stakeholders, and researchers try to understand resource availability asa sustainability issue that may either impinge upon the studied system or arise from it (here, we havechosen to use the definitions proposed by [4]).
Secondly, while the generators and users of Mineral Resources and Mineral Reserves data usespecific definitions of each, LCA-practitioners use the term reserve more generally and English-speakersuse the term resource to refer to a Mineral Resource as well as to a material in its own right.
The CML ADP[Crustal Content] method addresses resource depletion in terms of reductions of theEarth’s geological stocks and the entire Crustal Content is not a Mineral Resource and is thereforenot relevant to raw-material availability. On the other hand, whereas the International Life CycleDatabase (ILCD) Handbook proposes that the CML ADP[Reserve Base] method be used, USGS ReserveBase data incorporate economic considerations not directly related to resource depletion. The groupheard that the ILCD Handbook also redefined the aim of ADP to reflect availability of resources forhuman use, rather than depletion potential [16]. This is not trivial—depending on whether depletion oravailability is assessed in an LCIA, one is either dealing with an environmental or an economic issueand workshop participants had seen during the day that contradictory material or product selectionscan and do result.
Apart from this, there is the problem that it has not been possible to implement the ILCDHandbook recommendation because the USGS had ceased estimating Reserve Base when theHandbook was adopted. This means that calculations of ADP[Reserve Base] now rely on obsolete data.After the US Bureau of Mines closed, the USGS discontinued its Reserve Base estimates. Each annualUSGS Mineral Commodity Summary includes a discussion of world resources for a given commodity.From 1996 until 2009, Reserve Base estimates were only updated with changes in reserves becauseavailable updates on the non-reserve component of the Reserve Base were insufficient to supportdefensible Reserve Base estimates. Therefore, starting with Mineral Commodity Summaries 2010,publication of a Reserve Base was discontinued [17].
Application of ADP[Reserve Base] requires regular updating of characterization factors becauseMineral Resources and production change over time. The group discussed how the lack of suchupdates had serious ramifications for the current Product Environment Footprint (PEF) pilot project of
20

Resources 2016, 5, 12
the EU, as it had adopted the ILCD Handbook recommendation in its rules for participants. One of theEuropean Union’s intended uses of its PEF Guide and relevant PEF category rules is to support claimsabout the environmental superiority or equivalence of a product when compared to others that performthe same function [18]. If results using ADP[Reserve Base] only are used in this way based on obsolete data,it cannot be considered good practice and will certainly lead to misguided claims about environmentalperformance. To illustrate the dangers of miscommunicating about environmental performance, oneparticipant raised the possibility that a bridge designed to minimize its environmental footprint,could soon afterwards be assessed with a sub-optimal footprint due only to prevailing economicschanging ADP[Reserve Base] characterization factors—not because of any change in the environmentalperformance of the bridge. Should the bridge then be replaced?
Given the consensus on the above aspects, different views were expressed as to the usefulness ofthe ADP[Crustal Content] for assessing availability of raw-materials. Some academics argued that partialdepletion of geological stocks could contribute to reduced availability of raw-materials over the verylong term. That is, a raw-material may become less available to future generations even if functionallyit is replaced by other materials or technologies. Geologists remained concerned that if availability isto be assessed, Crustal Content is an inappropriate yardstick to use because much of it can safely beassumed to be unavailable. Most participants seemed to agree that availability was an economic issuemore meaningfully addressed within a comprehensive LCSA framework.
At the request of CML, it was agreed that in future discussions it should always be specified whichparticular CML option for ADP calculation is being referred to. The ILCD Handbook of the EuropeanCommission Joint Research Centre contradicts CML Guidance by specifying use of USGS ReserveBase data instead of Crustal Content data. When this particular ILCD Handbook recommendationis criticized, it should be clearly stated rather than criticizing the whole ADP method as publishedby CML.
Some extra suggestions were made to advance the search for a suitable tool to assess availabilityof raw-materials. The available quantity of raw-materials at any given time is always a subset of thetotal natural occurrence of that material. Therefore, there was some agreement across disciplines thatavailable quantities of raw-materials (e.g., any class of Mineral Resources or Mineral Reserves) shouldbe modeled as fund resources (rather than stock resources) and that dissipative outflows from studiedsystems—rather than inflows to them—were the concern to address in order to maximize continuedavailability of raw-materials. This would also give recognition to the fact that raw-materials are notalways consumed or dissipated, but often remain available as an anthropogenic source for recycling.It may prove more practical and relevant to use data on dissipative outflows as a proxy for reducedavailability (See also [3]).
Finally, although several participants were working on stand-alone frameworks to includeassessment of raw-material availability and supply risks, it was acknowledged that a tool-box approachmay prove to be more appropriate and that eventually only one set of globally agreed tools should bepromoted as good practice in the field.
3. Conclusions
Over the last 20 years, the idea that Natural Resources exist separately from Human Health andthe Natural Environment has been maintained in LCA theory and yet, as this workshop showed, theidea is not a simple one. Dictionary definitions of the term resource invariably refer to availability to oruse by humans. Some contend that Natural Resources are components of the Natural Environmentseen through a utilitarian lens. It is easier to understand that health and environment obey their ownfundamental laws (i.e., the laws of thermodynamics and quantum mechanics) and exist in some formwithout human interaction. Such a distinct set of environmental mechanisms is missing for NaturalResources, which makes them difficult to characterize or evaluate within the logical construct of LCIA.
To better understand each other, delegates at this Workshop often found it necessary to talkinstead of raw-materials. As defined by leading geological institutions, Mineral Resources and Mineral
21

Resources 2016, 5, 12
Reserves are snapshots of raw-material availability at a given point in time given prevailing marketconditions. They do not represent the total stock of material available to humankind for all time andthey are not necessarily diminished by the mining of ore. It is impossible to predict future humancapabilities and therefore how much of a raw-material will ultimately prove extractable from the Earth.
CML therefore considers that Crustal Content is the best available baseline to determine resourcedepletion and recommends using it as such in LCIA. European Commission Joint Research CentreGuidance addresses materials in terms of availability for human use and suggests ADP[Reserve Base]should be used to express that. However, USGS Reserve Base data are obsolete (no alternative sourceof Reserve Base data exists) and largely underestimate long-term raw-material availability for humanuse. If used to support claims about the environmental performance of a product or organization,ADP[Reserve Base] will certainly lead to misguided claims being made.
The weight of available evidence suggests that extraction of natural resources from theenvironment is not decreasing foreseeable availability of natural materials for human use. Evenobserved periods of decline in average ore grades have been accompanied by significant increases inMineral Reserves (See also [4,19,20]). Such ore grade trends can neither be interpreted as a signof depletion, nor as indicating reduced availability. Raw-material availability and the associatedsupply risks are overwhelmingly the result of economic, technological and geo-political forces andmost participants seemed to agree that such an AoP will be more meaningfully addressed within acomprehensive LCSA framework rather than limited to an environmental LCA or Footprint.
To better define how life cycle thinking can help answer questions related to the extraction anduse of abiotic raw-materials, it would be helpful to clearly distinguish availability from depletion andclarify which of these is estimated by each of the existing LCIA methods, so that results can be correctlyreported in the most appropriate framework. It could also be a helpful convention to refer to NaturalResources used in studied systems as raw-materials and to clearly distinguish them from MineralResources and Mineral Reserves as defined by CRIRSCO and USGS.
Without a shared vision, agreed terminology and common incentives, collaboration acrossdisciplines on assessment of impacts of abiotic raw-material inputs to production and consumptionsystems will continue to be very difficult. The only satisfactory path forward is more dialoguebetween experts in the fields of LCA, commodities trading, environmental science, exploration geology,industrial ecology, technological innovation, metallurgy, mineral economics, minerals policy, productpolicy and sustainable development.
Acknowledgments: The authors would like to thank all the workshop participants for their contributions.Additionally, we would like to acknowledge the European Copper Institute, the European Association of MiningIndustries Metal Ores and Industrial Minerals (Euromines), the International Council on Mining & Metals (ICMM),the Natural History Museum London and the Nickel Institute for their financial and technical support during theorganization of the workshop.
Conflicts of Interest: The authors declare no conflict of interest.
References
1. Mineral Resources in LCIA: Mapping the path forward. Available online: http://www.euromines.org/events/2015-10-14-mineral-resources-lcia-mapping-path-forward (accessed on 19 October 2015).
2. Mancini, L.; de Camillis, C.; Pennington, D. Security of Supply and Scarcity of Raw Materials. Towards aMethodological Framework for Sustainability Assessment; Publications Office of the European Union:Luxembourg, Luxembourg, 2013.
3. Vadenbo, C.; Rorbech, J.; Haupt, M.; Frischknecht, R. Abiotic resources: New Impact Assessment Approachesin View of Resource Efficiency and Resource Criticality—55th Discussion Forum on Life Cycle Assessment,Zurich, Switzerland, 11 April 2014. Int. J. Life Cycle Assess. 2014, 19, 1686–1692. [CrossRef]
4. Drielsma, J.A.; Russell-Vaccari, A.J.; Drnek, T.; Brady, T.; Weihed, P.; Mistry, M.; Perez Simbor, L.Mineral resources in life cycle impact assessment—Defining the path forward. Int. J. Life Cycle Assess.2016, 21, 85–105. [CrossRef]
22

Resources 2016, 5, 12
5. Knoster, T.; Villa, R.; Thousand, J. A framework for thinking about systems change. In Restructuring for Caringand Effective Education: Piecing the Puzzle Together; Villa, R., Thousand, J., Eds.; Paul H Brookes PublishingCo.: Baltimore, MD, USA, 2000; pp. 93–128.
6. Committee for Mineral Reserves International Reporting Standards: National Reporting Standards.Available online: http://www.crirsco.com/national.asp (accessed on 19 October 2015).
7. International Standardization Organization (ISO). Standard 14044: Environmental Management—Life CycleAssessment—Requirements and Guidelines; ISO: Geneva, Switzerland, 2006.
8. Hauschild, M.Z.; Goedkoop, M.; Guinée, J.; Heijungs, R.; Huijbregts, M.; Jolliet, O.; Margni, M.;de Scrhyver, A.; Humbert, S.; Laurent, A.; et al. Identifying best existing practice for characterizationmodelling in life cycle impact assessment. Int. J. Life Cycle Assess. 2013, 18, 683–697. [CrossRef]
9. Russell-Vaccari, A.J. Global Drivers for LCA of Resource Supply & Use. Available online:http://www.euromines.org/system/files/events/2015-10-14-mineral-resources-lcia-mapping-path-forward/6-drivers-and-needs-vaccari-2015-workshop.pdf (accessed on 19 October 2015).
10. Van Oers, L.; de Koning, A.; Guinée, J.B.; Huppes, G. Abiotic Resource Depletion in LCA: ImprovingCharacterisation Factors for Abiotic Resource Depletion as Recommended in the New Dutch LCA Handbook; Roadand Hydraulic Engineering Institute, Ministry of Transport and Water: Amsterdam, The Netherlands, 2002.
11. International Standardization Organization (ISO). Standard 31000: Risk Management—Principles and Guidelines;ISO: Geneva, Switzerland, 2009.
12. International Institute for Environment and Development (IIED). Breaking New Ground: The Report of theMining, Minerals, and Sustainable Development Project; Earthscan Publications Ltd.: London, UK, 2002.
13. Schneider, L.; Berger, M.; Schüler-Hainsch, E.; Knöfel, S.; Ruhland, K.; Mosig, J.; Bach, V.; Finkbeiner, M.The economic resource scarcity potential (ESP) for evaluating resource use based on life cycle assessment.Int. J. Life Cycle Assess. 2013, 19, 601–610. [CrossRef]
14. Schneider, L.; Berger, M.; Finkbeiner, M. Abiotic resource depletion in LCA—Background and update of theanthropogenic stock extended abiotic depletion potential (AADP) model. Int. J. Life Cycle Assess. 2015, 20,709–721. [CrossRef]
15. Sonnemann, G.; Gemechu, E.D.; Adibi, N.; De Bruille, V.; Bulle, C. From a critical review to a conceptualframework for integrating the criticality of resources into life cycle sustainability assessment. J. Clean Prod.2015, 94, 20–34. [CrossRef]
16. European Commission Joint Research Centre. ILCD Handbook. Recommendations Based on ExistingEnvironmental Impact Assessment Models and Factors for Life Cycle Assessment in European Context; IES,Joint Research Centre: Ispra, Italy, 2011.
17. US Geological Survey. Mineral. Commodity Summaries 2010; U.S. Department of the Interior: Reston, VA,USA, 2010.
18. European Union. Commission recommendation of 9 April 2013 on the use of common methods to measureand communicate the life cycle environmental performance of products and organisations. Off. J. Eur. Union.2013, 56, 1–210.
19. Schodde, R. The Key Drivers behind Resource Growth: An Analysis of the Copper Industry over the Last100 Years. Available online: http://www.minexconsulting.com/publications/ Growth%20Factors%20for%20Copper%20SME-MEMS%20March%202010.pdf (accessed on 29 January 2016).
20. West, J. Decreasing metal ore grades: Are They Really Being Driven by the Depletion of High-GradeDeposits? J. Ind. Ecol. 2011, 15, 165–168. [CrossRef]
© 2016 by the authors. Licensee MDPI, Basel, Switzerland. This article is an open accessarticle distributed under the terms and conditions of the Creative Commons Attribution(CC BY) license (http://creativecommons.org/licenses/by/4.0/).
23

resources
Article
Mineral Resources: Reserves, Peak Production andthe Future
Lawrence D. Meinert *, Gilpin R. Robinson Jr. and Nedal T. Nassar
U.S. Geological Survey, 12201 Sunrise Valley Drive, MS 913, Reston, VA 20192, USA;[email protected] (G.R.R.); [email protected] (N.T.N.)* Correspondence: [email protected]; Tel.: +1-703-648-6100
Academic Editor: Mario SchmidtReceived: 22 December 2015 ; Accepted: 16 February 2016 ; Published: 29 February 2016
Abstract: The adequacy of mineral resources in light of population growth and rising standards ofliving has been a concern since the time of Malthus (1798), but many studies erroneously forecastimpending peak production or exhaustion because they confuse reserves with “all there is”. Reservesare formally defined as a subset of resources, and even current and potential resources are only a smallsubset of “all there is”. Peak production or exhaustion cannot be modeled accurately from reserves.Using copper as an example, identified resources are twice as large as the amount projected to beneeded through 2050. Estimates of yet-to-be discovered copper resources are up to 40-times morethan currently-identified resources, amounts that could last for many centuries. Thus, forecasts ofimminent peak production due to resource exhaustion in the next 20–30 years are not valid. Short-termsupply problems may arise, however, and supply-chain disruptions are possible at any time due tonatural disasters (earthquakes, tsunamis, hurricanes) or political complications. Needed to resolvethese problems are education and exploration technology development, access to prospective terrain,better recycling and better accounting of externalities associated with production (pollution, loss ofecosystem services and water and energy use).
Keywords: mineral resources; peak copper; sustainability; limits to growth; reserves; production;depletion; life cycle assessment; material flow; ecosystem services
1. Introduction
At least since the time of Malthus (1798) [1], there has been concern about the adequacy ofresources to support a growing human population on planet Earth. In more recent times, there hasbeen an ebb and flow between studies that predict the near-term exhaustion or peak production ofresources [2–13] and those that are more optimistic [14–20]. The one thing that is common amongevery prediction about the exhaustion or production peak of resources by a particular date is that theyhave been wrong. This is well illustrated, but by no means proven or vindicated, by the famous betbetween Julian Simon and Paul Erlich about the price of five benchmark metals, chromium, copper,nickel, tin and tungsten, ten years in the future [21]. Even though Dr. Erlich was quite confident thatprices would have to be higher in the future due to resource scarcity, he lost that bet because priceswere actually lower, both in real and inflation-adjusted dollars. However, had the bet been made at adifferent time, the outcome could have been the opposite of what transpired. Therefore, what is it thatleads to such uncertainty about what seems to be a straightforward argument?
On the one hand, there is no disputing that Earth has a finite mass and if resources are consumedat some definable rate, then eventually they will be used up [22]. On the other hand, we have notyet run out of any mineral commodity, and exploration and technology have more than kept upwith changing demands for mineral resources throughout human history. As was said by Sheikh
Resources 2016, 5, 14; doi:10.3390/resources5010014 www.mdpi.com/journal/resources24

Resources 2016, 5, 14
Zaki Yamani, “The Stone Age did not end for lack of stone...” (quoted in [23]) How do we reconcilesuch contradictions?
Perhaps a useful analogy for understanding this seeming paradox between the unarguably finiteamount of mineral resources on Earth and the continuing ability of society to meet its resource needsis the continuous increase in human performance in athletic endeavors, even though elementary logicdictates that it cannot continue forever. It is a demonstrable fact that new world records continue to beset in every athletic event despite the real limits to human achievement: humans will never be able torun faster than a rifle bullet, except in comic books and movies.
Although many sports analogies could be considered in this regard, running might be the mostuseful because the records are easily quantifiable and because most people have run at some point intheir lives, even if not at a competitive level. A running event that illustrates this logic conundrum isthe mile, because the 4-min benchmark was long considered unreachable. There are many excellentliterary and historical accounts of the quest to break this once unbreakable mark [24]. That pace todaywould not even qualify for entry into the Olympics, and the current world record for the mile is 3:43.13,set in 1999 by Morocco’s Hicham El Guerrouj. However, any particular record is not the point. If a4-min mile is not the limit, is 3:40, 3:30 or 3:00? History says that no record lasts forever, yet elementaryphysiology tells us that improvement cannot continue indefinitely. Therefore, although obviously thisis not a perfect analogy for the ultimate limits to mineral resources, it does illustrate the difficulty inreconciling finite limits with the absence of evidence of reaching those limits. That is the central themeof the present paper.
2. Background
Before discussing a framework for thinking about limits to mineral resource availability andconsequences of use, it is useful to first explore the important terms, reserves and resources [11]. Theseterms are poorly understood by many and widely misused, particularly in the well-known Limits toGrowth study of Meadows et al. [2] and more recent incarnations [10,25,26]. Reserves have a definedmeaning as codified by several widely-used standards, such as the Australian Joint Ore ReservesCommittee (JORC) [27], the South African Mineral Resource Committee (SAMREC) [28] and Canada’sNational Instrument 43-101 [29]. Furthermore, the Committee for Mineral Reserves InternationalReporting Standards (CRIRSCO) [30] has harmonized the various country-level codes into a commoninternational reporting standard. A summary of various resource and reserve classifications is outlinedin Table 1.
Table 1. Mineral resource and reserve classifications.
Guidelines Resource/Reserve Classification
U.S. Geological SurveyU.S. Bureau of Mines and U.S. Geological Survey, 1980, Principles of a resource/reserveclassification for minerals: U.S. Geological Survey Circular 831, p. 5 [31]
International
CRIRSCO (the Committee for Mineral Reserves International Reporting Standards),a committee of the National Mineral Reserve Reporting Organizations of Australia,Canada, Chile, South Africa, USA, U.K./Ireland and Western Europe has prepared theCRIRSCO International Reporting Template drawing on CRIRSCO-style reportingstandards, the JORC Code (Australasia), SAMREC Code (South Africa), Reporting Code(U.K./Ireland/Western Europe), Canadian Institute of Mining, Metallurgy, and Petroleum(CIM) Definition Standards and Guidelines (Canada), Society for Mining, Metallurgy,& Exploration (SME) Guide (USA) and Certification Code (Chile).(URL: http://www.crirsco.com) [30]
United NationsUnited Nations Economic Commission for Europe, 2003, Framework Classification forFossil Energy and Mineral Resources: United Nations Economic Commission for Europe,Geneva [32]
25
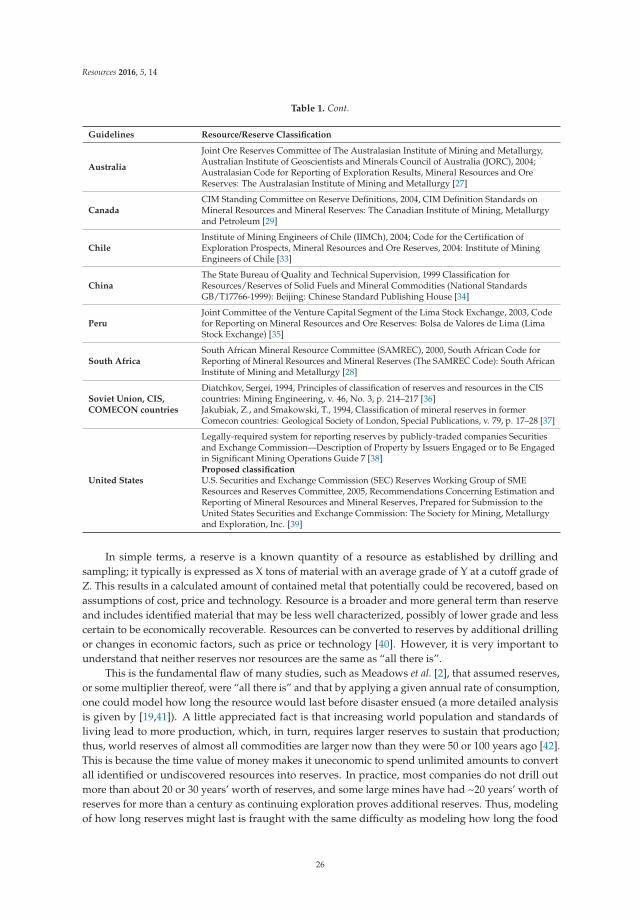
Resources 2016, 5, 14
Table 1. Cont.
Guidelines Resource/Reserve Classification
Australia
Joint Ore Reserves Committee of The Australasian Institute of Mining and Metallurgy,Australian Institute of Geoscientists and Minerals Council of Australia (JORC), 2004;Australasian Code for Reporting of Exploration Results, Mineral Resources and OreReserves: The Australasian Institute of Mining and Metallurgy [27]
CanadaCIM Standing Committee on Reserve Definitions, 2004, CIM Definition Standards onMineral Resources and Mineral Reserves: The Canadian Institute of Mining, Metallurgyand Petroleum [29]
ChileInstitute of Mining Engineers of Chile (IIMCh), 2004; Code for the Certification ofExploration Prospects, Mineral Resources and Ore Reserves, 2004: Institute of MiningEngineers of Chile [33]
ChinaThe State Bureau of Quality and Technical Supervision, 1999 Classification forResources/Reserves of Solid Fuels and Mineral Commodities (National StandardsGB/T17766-1999): Beijing: Chinese Standard Publishing House [34]
PeruJoint Committee of the Venture Capital Segment of the Lima Stock Exchange, 2003, Codefor Reporting on Mineral Resources and Ore Reserves: Bolsa de Valores de Lima (LimaStock Exchange) [35]
South AfricaSouth African Mineral Resource Committee (SAMREC), 2000, South African Code forReporting of Mineral Resources and Mineral Reserves (The SAMREC Code): South AfricanInstitute of Mining and Metallurgy [28]
Soviet Union, CIS,COMECON countries
Diatchkov, Sergei, 1994, Principles of classification of reserves and resources in the CIScountries: Mining Engineering, v. 46, No. 3, p. 214–217 [36]Jakubiak, Z., and Smakowski, T., 1994, Classification of mineral reserves in formerComecon countries: Geological Society of London, Special Publications, v. 79, p. 17–28 [37]
United States
Legally-required system for reporting reserves by publicly-traded companies Securitiesand Exchange Commission—Description of Property by Issuers Engaged or to Be Engagedin Significant Mining Operations Guide 7 [38]Proposed classificationU.S. Securities and Exchange Commission (SEC) Reserves Working Group of SMEResources and Reserves Committee, 2005, Recommendations Concerning Estimation andReporting of Mineral Resources and Mineral Reserves, Prepared for Submission to theUnited States Securities and Exchange Commission: The Society for Mining, Metallurgyand Exploration, Inc. [39]
In simple terms, a reserve is a known quantity of a resource as established by drilling andsampling; it typically is expressed as X tons of material with an average grade of Y at a cutoff grade ofZ. This results in a calculated amount of contained metal that potentially could be recovered, based onassumptions of cost, price and technology. Resource is a broader and more general term than reserveand includes identified material that may be less well characterized, possibly of lower grade and lesscertain to be economically recoverable. Resources can be converted to reserves by additional drillingor changes in economic factors, such as price or technology [40]. However, it is very important tounderstand that neither reserves nor resources are the same as “all there is”.
This is the fundamental flaw of many studies, such as Meadows et al. [2], that assumed reserves,or some multiplier thereof, were “all there is” and that by applying a given annual rate of consumption,one could model how long the resource would last before disaster ensued (a more detailed analysisis given by [19,41]). A little appreciated fact is that increasing world population and standards ofliving lead to more production, which, in turn, requires larger reserves to sustain that production;thus, world reserves of almost all commodities are larger now than they were 50 or 100 years ago [42].This is because the time value of money makes it uneconomic to spend unlimited amounts to convertall identified or undiscovered resources into reserves. In practice, most companies do not drill outmore than about 20 or 30 years’ worth of reserves, and some large mines have had ~20 years’ worth ofreserves for more than a century as continuing exploration proves additional reserves. Thus, modelingof how long reserves might last is fraught with the same difficulty as modeling how long the food
26

Resources 2016, 5, 14
in one’s refrigerator might last: even though you keep eating three meals a day, there is still food inthe refrigerator.
It is worth repeating that reserves are an economically-defined quantity and never have andnever will equate to “all there is”. In spite of this reality, a recent article went so far as to assert thatthe majority of Earth’s reserves have already been consumed: “80% of the world’s mercury reserves,75% of its silver, tin, and lead, 70% of gold and zinc, and 50% of copper and manganese had alreadybeen processed through human products” [26] (p. 239), even though it is a simple fact that the world’sreserves of these elements continue to evolve with improved geological assurance, technologicaladvances and economic conditions and are presently as large as they have ever been [43].
Another way of approaching this question of how long resources will last is the “peak” concept asapplied to petroleum resources by M. K. Hubbert [13,44]. It is based on an empirical observation aboutU.S. oil fields that production follows a bell-shaped curve of a normal distribution, and thus, the peak ofproduction occurs when roughly half of the resource has been extracted. Thus, changes in productionare used to model the entire extractable resource. Such an approach is based on many assumptions, themost important of which are that prices and technology are relatively stable. Hubbert’s prediction thatpeak oil production for the conterminous United States would occur in the early 1970s was a reasonableextrapolation of trends leading up to the supposed “peak oil” and has been cited by many as proofthat such production trend modeling is accurate [5,6,45]. However, the recent application of new andimproved drilling technology (horizontal drilling and fracking) has shown that the assumptions of theHubbert peak oil methodology were restricted to “conventional” petroleum production and have notaccurately tracked the large increases in both production and reserves of petroleum and natural gasthat have recently resulted from these new technologies (Figure 1) [46].
0
5
10
15
20
25
30
35
40
45
0
500
1,000
1,500
2,000
2,500
3,000
3,500
4,000
1900 1910 1920 1930 1940 1950 1960 1970 1980 1990 2000 2010
U.S
. fie
ld p
rodu
ctio
n of
cru
de o
il (m
illoin
bar
rels
)
U.S
. cru
de o
il pr
oved
rese
rves
(bill
ion
barr
els)
Year
U.S. crude oil proved reservesU.S. field production of crude oil
Figure 1. U.S. crude oil reserves and production showing apparent “peak oil” for conventionalpetroleum reserves in 1972 and growth in reserves in the past ~10 years as a result of theapplication of new drilling technology. U.S. barrels are equivalent to approximately 0.159 cubic meters.Data source: [47].
The point of the present paper is not to assess previous studies of resource adequacy, but ratherto provide a conceptual framework for thinking about how resources, particularly mineral resources,are explored for, discovered and put into production in order to satisfy the continuing needs ofsociety. An underlying concept is that mineral resources have been the foundation of civilizationthroughout history [12,48–50] and that the adequacy of such resources for future generations remainsone of the central issues of our time [51,52]. Although many mineral resources could be used asexamples, the below discussion will focus on copper, because it has been used throughout history; it is
27

Resources 2016, 5, 14
a major ingredient in modern construction and technology; its geologic occurrence is relatively wellknown; and it has a rich historical record of production data. In addition, there have been numerousstudies [53,54] about copper, as well as recent predictions of “peak copper” occurring within the next20–30 years [9,10,55].
3. Copper
Historic mine production has recovered more than 658 million metric tons (Mt) of copper (Cu)from 1700 to 2015 [43,56,57]. Of this total, over 45 percent has been produced during the past 20years, and approximately 26 percent has been produced during the previous 10 years. In other words,roughly one quarter of all of the copper mined throughout human history has been produced in justthe past 10 years (Figure 2). These percentages suggest that global copper production has doubledevery 25 years in order to accommodate trends in global copper consumption.
A research group at Monash University in Australia analyzed current estimates of copperresources based on published company reports and tabulated a total of 1781 Mt of Cu containedwithin a total of 730 projects, with a further 80.4 Mt of Cu in China from an unknown number ofdeposits, yielding a world total of 1861 Mt of Cu [53]. This is very similar to a recent U.S. GeologicalSurvey (USGS) estimate of identified Cu resources of 2100 Mt of Cu [54]. To reiterate a previous point,this 2100 Mt of Cu is the amount of identified resources, and further drilling or possible changes inprices/technology will almost certainly add to the total. However, neither reserves nor resources are“all there is”. Before addressing the questions of what is known about, and the potential adequacyof, “all there is”, it is useful to compare current estimates of reserves to current and projected ratesof production.
Modeling based on identified resources has led some researchers to suggest that mine productionof copper will peak and begin to decline within decades due to increasing demand and resourcedepletion [8,55]. Is this realistic? The U.S. Census Bureau estimates that world population will growfrom 7.3 billion people in 2015 to 9.4 billion in 2050 [58]. At current rates of global per capita productionof copper, estimated at about 2.6 kg/year in 2015, the production of primary (mine-produced) copperwould grow to 24.2 Mt of copper in 2050 from the level of 18.7 Mt in 2015 [43].
However, assuming a global per capita production value of 2.6 kg/year does not take intoaccount regional variations in per capita consumption and how they are changing due to changesin affluence or lifestyles. Nor does it take into account the increasing quantities of copper that willlikely become available for recycling and thus offset the need for primary copper. Studies of variouscountries (e.g., [59–62]) show that per capita consumption of copper is related to the level of economicdevelopment. Per capita consumption of copper is relatively stable over time in high-GDP countries,such as the United States and Japan, at about 6 kg/year [63]. Very low levels of consumption occur incountries with low economic activity and low income levels, whereas increasing levels of per capitaconsumption are observed in rapidly developing countries, such as Indonesia and China [63].
(A)
Figure 2. Cont.
28
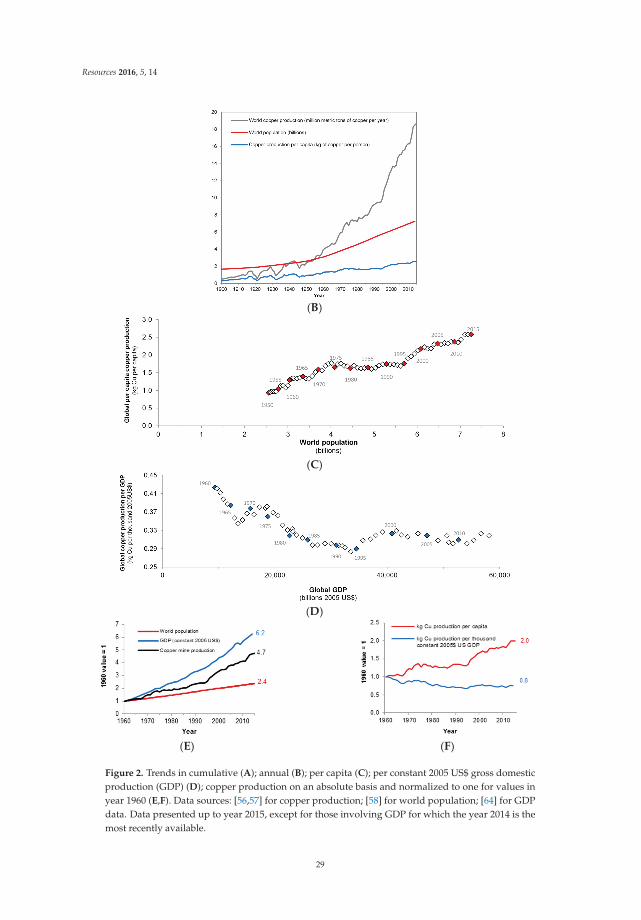
Resources 2016, 5, 14
(B)
(C)
(D)
(E) (F)
Figure 2. Trends in cumulative (A); annual (B); per capita (C); per constant 2005 US$ gross domesticproduction (GDP) (D); copper production on an absolute basis and normalized to one for values inyear 1960 (E,F). Data sources: [56,57] for copper production; [58] for world population; [64] for GDPdata. Data presented up to year 2015, except for those involving GDP for which the year 2014 is themost recently available.
29

Resources 2016, 5, 14
Factoring in projected growth in population and global per capita GDP to 2050 provides a forecastof copper consumption that needs to be satisfied by mine production of 30.4 Mt of Cu. These projectionsindicate that between 750 and 990 Mt of primary copper will be required to satisfy projected globaldemand from 2012 to 2050. The projected range of estimated demand considers modest changes inthe amount of copper recycling, which has increased in recent years [65]; but does not account fornew technology-driven changes in demand patterns, substitution by alternative materials or otherfactors that could alter future demand growth for copper. To restate this, we can estimate amountsand project trends, but we cannot know the actual mix of mineral resources needed 30–50 years in thefuture any more than someone in 1970 could have predicted today’s high-tech need for a variety ofspecialty metals, such as rare-earth elements.
Using these assumptions and constraints, the current estimate of 2100 Mt of copper in identifiedresources in major copper deposits worldwide is about twice as much copper as is estimated to beneeded through 2050. Even without considering the almost certain expansion of reserves that will takeplace with future exploration and drilling, this makes it very unlikely that copper production will peakby 2040 due to resource depletion (Figure 3), as predicted by the studies of [9,10,55].
Figure 3. World copper production: historical and projected based on the modeling in [9].
Furthermore, because many of these studies dating back to Meadows et al. [2] confuse reserveswith “all there is”, their conclusions about reserve exhaustion, whether substantiated or not, do notreally address the underlying question of the adequacy of mineral resources for future generations. Tobest address this important question, we need to know future world demand (net of recycling) forminerals, estimate as well as we can the amount of identified resources and assess the location, quality,quantity and the environmental and economic aspects of the extraction of undiscovered resources.This is a daunting task that has never been seriously undertaken for any major commodity. The besteffort for copper is a recently completed global assessment of the major sources of onshore worldcopper resources in two, but not all, of the most important types of copper-rich deposits by the U.S.Geological Survey (USGS) [54].
Before addressing the implications of that study for the questions of “peak copper” and theadequacy of copper resources for future generations, it is important to realize what is not included inthat assessment. The USGS study focused mainly on deposits to a depth of one kilometer and did notinclude resources in the ocean basins that cover more than 75% of the Earth’s surface, nor the possibilityfor utilization of resources from space. Some studies have indicated that seafloor resources [66] maybe as much or greater than onshore resources and others have proposed direct recovery of metals from
30

Resources 2016, 5, 14
seawater, which if economically viable, would likely eclipse all onshore resources [67]. Neither of theseideas about potential resources has been developed sufficiently to know if they are even possible, buttheir relevance to the present discussion is simply that it is not possible to predict the exhaustion ofmineral resources when only considering part of the potential resource.
Also important is the fact that the USGS study was constrained to current prices and technology forconsidering what might be an economic mineral resource. If prices were 10-times higher or technology10-times more efficient (both of which have taken place in the history of resource extraction [42]), thenthe assessed copper resources would be considerably higher than the presented estimates. Thus, theundiscovered copper resources estimated by Johnson et al. [54] are still a small subset of “all there is”,but at least this estimate is closer to an ultimate resource than the identified resources categorized byMudd et al. [53] and similar studies.
The USGS global copper resource assessment [54] estimated that more than 3500 Mt of copper arepresent in undiscovered porphyry and sediment-hosted continental copper deposits; the majority ofthese resources are located in Asia, followed by the Americas. Of this 3500-Mt estimate of in-groundcopper resources, approximately 2000 Mt of copper is estimated as economic to recover under currenteconomic conditions and mining technology.
A significant fraction of these undiscovered resources is estimated to occur deep beneath coveringrock and sediment and commonly in remote areas. These deposits will be difficult and time consumingto discover, and many potentially economic deposits in remote and deep settings may not be discoveredand developed before 2050. An estimate of undiscovered resources that are most likely to be discoveredand characterized by 2050 is approximately 1100 Mt of copper [68].
Using the production rates (16.9–30.4 Mt/y of copper) previously discussed for current reserves,the range of undiscovered copper resources by the USGS study of 1100–3500 Mt of copper (keeping inmind the previously discussed caveats about this being a minimum estimate) could last more thana century. This would be in addition to the currently identified resources, which by themselves areestimated to be twice the amount needed through 2050. Therefore, the combined total is likely to lastat least through the end of this century and possibly the century after that.
Kesler and Wilkinson [69] used a different, largely hypothetical, approach to estimating worldcopper resources. Their tectonic diffusion model predicts world copper resources of 89 billion metrictons (Bt) of copper within mineable depths, an amount that would last for millennia. Thus, although itis true that copper is not an infinite resource on planet Earth, based on current knowledge, a sufficientamount exists to fulfill the needs of at least several generations.
Of course, copper, like any other mineral resource, is not really “consumed” in the same way thatenergy loses its ability to perform useful work when it is “consumed.” Thus, discussions of mineralresource exhaustion are implicitly referring to the lack of availability of resources in the ground andnot their lack of availability in an absolute sense given that many metals are available for multiplecycles of use and re-use. Within this paradigm of ultimate resources, it is useful to discuss how muchof a resource is currently in use, how much might be needed in the future to fulfill the services desiredby an increasingly affluent global population and how much of what is in the ground can be put intouse to satisfy these requirements [7,70,71].
Therefore, instead of worrying about reaching “peak” production or “exhausting” a resource, weshould instead be more concerned about what we do with the resource after it has been extracted. Is itbeing used in dissipative applications [72]? How much is being “lost” (i.e., placed in a state where it isprohibitively difficult or costly to recover) at each life cycle stage? Further concerns are the externalities(pollution, loss of ecosystem services and water and energy use) associated with resource production.A full life cycle assessment and material flow accounting of mineral resources would be a more fruitfulconversation than just peak production due to resource exhaustion.
31

Resources 2016, 5, 14
4. The Future
All of the preceding discussion boils down to when, but not if, a given quantity of resource willbe exhausted. However, this begs the question of, “what then?” This is not as dramatic as it may seembecause the common analogy between resource exhaustion and falling off a cliff is not appropriate.Resource use does not proceed full bore until the last unit of an element is consumed and then disasterunfolds. Rather, resource use follows the basic laws of supply and demand. As resources are consumed,scarcity will drive prices up, which in turn will affect demand, consumption and production. To greatlysimplify, if the equilibrium price of a commodity rises ten-fold, then this will both increase supply,because previously marginal or unknown deposits will be put into production, and decrease demand,because some uses of that commodity will no longer be economic, and either production will decrease,thrifting (reducing unit consumption) will occur or other materials will be substituted. This willgradually reduce the need for the commodity in question in the long term and bring production inline with the available reserves, even though short-term supply disruption or imbalance is possible.To return to an earlier analogy, “the Stone Age did not end because we ran out of stone”, we do notknow which metals will be in demand 30–50 years from now; changes in technology and lifestyle maymean that society’s future needs are very different from today’s.
This does not mean that we should be unconcerned about resource adequacy. We should.However, we should not confuse the adequacy of mineral resource supply with the actions needed toaddress the needs of future generations for mineral resources.
The main resource issue for the future likely will be the development of capacity to discoverand produce additional resources. There may well be enough undiscovered copper to meet globalneeds for the foreseeable future, but rates of exploration, discovery success and mine developmentwill need to increase to supply the needed copper resources. Cost-effective technology will need to bedeveloped to discover additional mineral deposits in new, deeper and concealed settings and to extractand recover resources from earth materials, while minimizing environmental impact. This technologywill only be effective if it can be applied to lands where new resources may be discovered and minesdeveloped. Nature, not society, controls where mineral concentrations occur, but society determineswhether to mine or not, and land access becomes more difficult as population increases.
As much as recycling [65] and substitution [73] will be part of the solution, they cannot bythemselves solve the problem. Population growth and rising standards of living, combined withthe sequestration of elements, like copper in buildings, cars, cell phones, etc., for periods of years todecades and, in some cases, centuries will require new primary supplies of mineral resources. Thelead time from discovery to mine development can be 10–30 years. Extensive mineral exploration willbe required to meet this future resource demand, because many of the undiscovered deposits will beharder to find and more costly to mine than near-surface deposits located in more accessible areas.
At a global level, it is not clear that society is making the investments in education, researchand development to ensure that these mineral resources will be available for future generations [74].The number of universities that teach and do research on mineral resources, mining engineering andmetallurgy is decreasing rather than increasing, and this is paralleled by decreases in governmentalfunding to support geoscience research (Figure 4). National, state and provincial geological surveys andthe knowledge infrastructure that they create, manage and publically provide are instrumental in thediscovery process, particularly by conducting modern geologic mapping and related geochemical andgeophysical surveys to identify favorable geologic environments likely to contain mineral resources.They also compile data on known deposits, conduct research into the processes that form mineraldeposits, track mineral commodity production and use and update assessments to estimate theamounts, quality and location of future resources on local, national and global scales.
In most countries, exploration and discovery is done largely by private companies and individuals,building on, but independent of, the underlying research and data development of universities andgovernmental geological surveys. Some companies conduct their own research or fund others to dotargeted research. However, private companies are particularly susceptible to economic cycles with
32
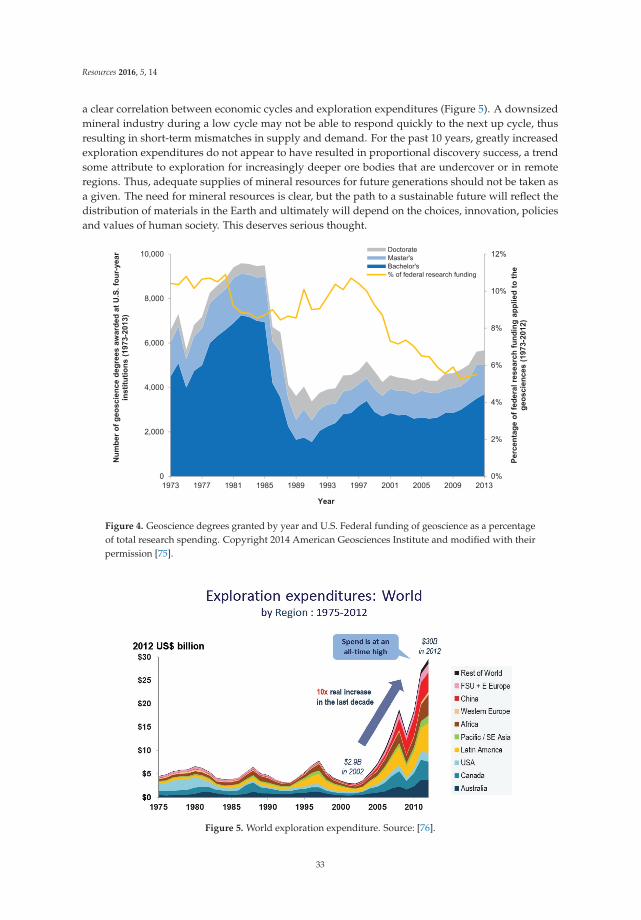
Resources 2016, 5, 14
a clear correlation between economic cycles and exploration expenditures (Figure 5). A downsizedmineral industry during a low cycle may not be able to respond quickly to the next up cycle, thusresulting in short-term mismatches in supply and demand. For the past 10 years, greatly increasedexploration expenditures do not appear to have resulted in proportional discovery success, a trendsome attribute to exploration for increasingly deeper ore bodies that are undercover or in remoteregions. Thus, adequate supplies of mineral resources for future generations should not be taken asa given. The need for mineral resources is clear, but the path to a sustainable future will reflect thedistribution of materials in the Earth and ultimately will depend on the choices, innovation, policiesand values of human society. This deserves serious thought.
0%
2%
4%
6%
8%
10%
12%
0
2,000
4,000
6,000
8,000
10,000
1973 1977 1981 1985 1989 1993 1997 2001 2005 2009 2013
Perc
enta
ge o
f fed
eral
rese
arch
fund
ing
appl
ied
to th
e ge
osci
ence
s (1
973-
2012
)
Num
ber o
f geo
scie
nce
degr
ees
awar
ded
at U
.S. f
our-
year
in
stitu
tions
(197
3-20
13)
Year
DoctorateMaster'sBachelor's% of federal research funding
Figure 4. Geoscience degrees granted by year and U.S. Federal funding of geoscience as a percentageof total research spending. Copyright 2014 American Geosciences Institute and modified with theirpermission [75].
Figure 5. World exploration expenditure. Source: [76].
33

Resources 2016, 5, 14
Even with the problems identified above, the future is not grim. Discoveries continue to be madeeven in well-explored districts. Most exploration has been concentrated in the upper part of the upperkilometer of the Earth’s crust, even though economic deposits have been discovered down to threeor more kilometers. Thus, deeper drilling combined with new exploration technology promises newdiscoveries, even in mature districts. We do not know what the limits to mineral resources might be,but we do know that we have not come close to reaching them yet.
Acknowledgments: We wish to acknowledge the many scientists of the USGS who have compiled over manydecades the data that underlie this and most studies needing minerals information. We received thoughtfulinformal reviews from Nick Arndt, Dan Edelstein, Rich Goldfarb, Jane Hammarstrom, Simon Jowitt, Jon Priceand Brian Skinner, as well as formal reviews by John DeYoung and Jeff Hedenquist. We thank all reviewers fortheir insights, but any shortcomings of the final manuscript are solely the responsibility of the authors.
Author Contributions: L. Meinert received the original invitation to write the paper and wrote the bulk of thetext. G. Robinson wrote the analysis of the USGS study of undiscovered copper resources. N. Nassar wrote thesections dealing with recycling and substitution, as well as doing the analysis for and creating Figure 2.
Conflicts of Interest: The authors declare no conflict of interest.
Abbreviations
The following abbreviations are frequently used in this manuscript:
Bt billion metric tonsCRIRSCO Committee for Mineral Reserves International Reporting StandardsCu copperGDP gross domestic productionJORC Australian Joint Ore Reserves CommitteeMt million metric tonsSAMREC South African Mineral Resource CommitteeUSGS U.S. Geological Survey
References
1. Malthus, T.R. An Essay on the Principle of Population; J. Johnson: London, UK, 1798.2. Meadows, D.H.; Meadows, D.L.; Randers, J.; Behrens, W.W. The Limits to Growth; Universe Books:
New York, NY, USA, 1972.3. Gordon, R.; Koopmans, T.C.; Nordhaus, W.D.; Skinner, B.J. Toward a New Iron Age? Quantitative Modeling of
Resource Exhaustion; Harvard University Press: Cambridge, MA, USA, 1987.4. Ayres, R.U. Cowboys, cornucopians and long-run sustainability. Ecol. Econ. 1993, 8, 189–207. [CrossRef]5. Deffeyes, K.S. Hubbert's Peak—The Impending World Oil Shortage; Princeton University Press:
Princeton, NJ, USA, 2001.6. Deffeyes, K.S. Beyond Oil—The View from Hubbert's Peak; Farrar, Straus and Giroux: New York, NY, USA, 2005.7. Gordon, R.B.; Bertram, M.; Graedel, T.E. Metal stocks and sustainability. Proc. Natl. Acad. Sci. USA 2006, 103,
1209–1214. [CrossRef] [PubMed]8. Prior, T.; Giurco, D.; Mudd, G.; Mason, L.; Behrisch, J. Resource depletion, peak minerals and the implications
for sustainable resource management. Glob. Environ. Chang. 2012, 22, 577–587. [CrossRef]9. Northey, S.; Mohr, S.; Mudd, G.; Weng, Z.; Giurco, D. Modelling future copper ore grade decline based on a
detailed assessment of copper resources and mining. Resour. Conserv. Recycl. 2014, 83, 190–201. [CrossRef]10. Ragnarsdottir, K.V.; Sverdrup, H.U. Limits to growth revisited. Geoscientist 2015, 25, 10–16.11. Blondel, F.; Lasky, S.G. Mineral reserves and mineral resources. Econ. Geol. 1956, 51, 686–697. [CrossRef]12. U.S. President's Materials Policy Commission (The Paley Commission). Resources for Freedom—Foundations
for Growth and Security; U.S. Government Printing Office: Washington, DC, USA, 1952; Volume I.13. Hubbert, M.K. Energy Resources. In Resources and Man; Cloud, P., Ed.; W.H. Freeman:
San Francisco, CA, USA, 1969; pp. 157–239.
34

Resources 2016, 5, 14
14. DeYoung, J.H.J.; Singer, D.A. Physical Factors that Could Restrict Mineral Supply. In Economic Geology 75thAnniversary Volume, 1905–1980; Skinner, B.J., Ed.; Lancaster Press, Inc.: Lancaster, PA, USA, 1981; pp. 939–954.
15. Simon, J.L. The Ultimate Resource 2; Princeton University Press: Princeton, NJ, USA, 1998.16. Lomborg, B. The Skeptical Environmentalist; Cambridge University Press: Cambridge, UK, 2001.17. Beckerman, W. A Poverty of Reason—Sustainable Development and Economic Growth; The Independent Institute:
Oakland, CA, USA, 2003.18. Tilton, J.E. Depletion and the Long-Run Availability of Mineral Commodities. In Wealth Creation in the
Minerals Industry: Integrating Science, Business, and Education; Special Publication, No. 12; Doggett, M.D.,Parry, J.R., Eds.; Society of Economic Geologists, Inc.: Easton, MD, USA, 2006; pp. 61–70.
19. Tilton, J.E. Is Mineral Depletion a Threat to Sustainable Mining? Available online: http://inside.mines.edu/UserFiles/File/economicsBusiness/Tilton/Sustainable_Mining_Paper.pdf (accessed on 23 February 2016).
20. Strauss, S.D. Trouble in the Third Kingdom—Minerals industry in transition; Mining Journal Books: London,UK, 1986.
21. Sabin, P. The Bet; Yale University Press: New Haven, CT, USA, 2013.22. Hewett, D.F. Cycles in Metal Production. In Transactions of the American Institute of Mining and Metallurgical
Engineers Yearbook; American Institute of Mining and Metallurgical Engineers: Littleton, CO, USA, 1929;pp. 65–98.
23. The Economist The end of the Oil Age. Available online: http://www.economist.com/node/2155717/print(accessed on 2 February 2016).
24. Bryant, J. 3:59.4—The Quest to Break the 4 Minute Mile; Hutchinson: London, UK, 2005.25. Cohen, D. Earth audit. New Sci. 2007, 26, 34–41. [CrossRef]26. Sackett, P.D. Endangered Elements—Conserving the Building Blocks of Life. In Creating a Sustainable and
Desirable Future; Costanza, R., Kubiszewski, I., Eds.; World Scientific Publishing Co.: Singapore, 2014;pp. 239–248.
27. Joint Ore Reserves Committee (JORC). Australasian Code for Reporting of Exploration Results, Mineral Resourcesand ore Reserves (The JORC Code); Joint Ore Reserves Committee (JORC): Carlton South, Australia, 2012.
28. South African Mineral Resource Committee (SAMREC). South African Code for Reporting of Mineral Resourcesand Mineral Reserves (The SAMREC Code); South African Institute of Mining and Metallurgy: Johannesburg,South Africa, 2000.
29. CIM Standing Committee on Reserve Definitions. CIM Definition Standards on Mineral Resources and MineralReserves; The Canadian Institute of Mining, Metallurgy and Petroleum: Westmount, QC, Canada, 2004.
30. CRIRSCO (The Committee for Mineral Reserves International Reporting Standards). International ReportingTemplate for the Public Reporting of Exploration Results, Mineral Resources and Mineral Reserves; CRIRSCO:London, UK, 2013.
31. U.S. Bureau of Mines; U.S. Geological Survey. Principles of a Resource/Reserve Classification for Minerals; U.S.Geological Survey Circular 831: Reston, VA, USA, 1980.
32. United Nations Economic Commission for Europe. Framework Classification for Fossil Energy and MineralResources; United Nations Economic Commission for Europe: Geneva, Switzerland, 2003.
33. Institute of Mining Engineers of Chile (IIMCh). Code for the Certification of Exploration Prospects, MineralResources and Ore Reserves; Institute of Mining Engineers of Chile: Santiago, Chile, 2004.
34. The State Bureau of Quality and Technical Supervision. Classification for Resources/Reserves of Solid Fuelsand Mineral Commodities (National Standards GB/T17766–1999); Chinese Standard Publishing House: Beijing,China, 1999.
35. Joint Committee of the Venture Capital Segment of the Lima Stock Exchange. Code for Reporting on MineralResources and Ore Reserves; Bolsa de Valores de Lima (Lima Stock Exchange): Lima, Peru, 2003.
36. Diatchkov, S. Principles of classification of reserves and resources in the CIS countries. Min. Eng. 1994, 46,214–217.
37. Jakubiak, Z.; Smakowski, T. Classification of mineral reserves in former Comecon countries. Geol. Soc. Lond.Spec. Publ. 1994, 79, 17–28. [CrossRef]
38. U.S. Securities and exchange commission. Industry Guide 7—Description of Property by IssuersEngaged or to Be Engaged in Significant Mining Operations; U.S. Securities and exchange commission:Washington, DC, USA, 2016.
35

Resources 2016, 5, 14
39. SEC Reserves Working Group of SME Resources and Reserves Committee. Recommendations concerningEstimation and Reporting of Mineral Resources and Mineral Reserves, Prepared for Submission to the United StatesSecurities and Exchange Commission; The Society for Mining, Metallurgy and Exploration, Inc.: Engelwood,CO, USA, 2005.
40. Doggett, M.D. Global Mineral Exploration and Production—The Impact of Technology. In Proceedingsfor a Workshop on Deposit Modeling, Mineral Resource Assessment, and Their Role in Sustainable Development;Briskey, J.A., Schultz, K.J., Eds.; U.S. Geological Survey: Reston, VA, USA, 2007; pp. 63–68.
41. Tilton, J.E. Assessing the long-run availability of copper. Resour. Policy 2007, 32, 19–23. [CrossRef]42. Kelly, T.; Buckingham, D.; DiFrancesco, C.; Porter, K.; Goonan, T.; Sznopek, J.; Berry, C.; Crane, M.
Historical Statistics for Mineral Commodities in the United States; Open-File Report 01–006; U.S. GeologicalSurvey: Reston, VA, USA, 2005.
43. U.S. Geological Survey. Mineral Commodity Summaries 2016; U.S. Geological Survey: Reston, VA, USA, 2016.44. Hubbert, M.K. Energy Resources—A Report to the Committee on Natural Resources; National Academy Press:
Washington, DC, USA, 1962.45. Kerr, R.A. Peak oil production may already be here. Science 2011, 331, 1510–1511. [CrossRef] [PubMed]46. Harris, D.P. Conventional crude oil resources of the United States—Recent estimates, methods for estimation
and policy considerations. Mater. Soc. 1977, 1, 263–286.47. U.S. Energy Information Administration (EIA). Petroleum and Other Liquids. Available online:
http://www.eia.gov/petroleum/data.cfm#crude (accessed on 23 February 2016).48. Barnett, H.J.; Morse, C. Scarcity and Growth—The Economics of Natural Resource Availability; Resources for the
Future: Washington, DC, USA, 1963.49. Smith, V.K. Scarcity and Growth—Reconsidered; Resources for the Future: Washington, DC, USA, 1979.50. Simpson, D.R.; Toman, M.A.; Ayres, R.U. Scarcity and Growth Revisted; Resources for the Future:
Washington, DC, USA, 2005.51. Nickless, E.; Bloodworth, A.; Meinert, L.; Giurco, D.; Mohr, S.; Littleboy, A. Resourcing Future Generations
White Paper—Mineral Resources and Future Supply; International Union of Geological Sciences: Paris, France,2014.
52. Graedel, T.E.; Harper, E.M.; Nassar, N.T.; Reck, B.K. On the materials basis of modern society. Proc. Natl.Acad. Sci. USA 2015, 112, 6295–6300. [CrossRef] [PubMed]
53. Mudd, G.M.; Weng, Z.; Jowitt, S.M. Assessment of global Cu resource trends and endowments. Econ. Geol.2013, 108, 1163–1183. [CrossRef]
54. Johnson, K.M.; Hammarstrom, J.M.; Zientek, M.L.; Dicken, C.L. Estimate of Undiscovered Copper Resources ofthe World; U.S. Geological Survey: Reston, VA, USA, 2014.
55. Kerr, R.A. The coming copper peak. Science 2014, 343, 722–724. [CrossRef] [PubMed]56. U.S. Geological Survey Copper Statistics. In Historical Statistics for Mineral and Material Commodities in the
United States. Data Series 140; Kelly, T.D., Matos, G.R., Eds.; U.S. Geological Survey: Reston, VA, USA, 2014.57. Gordon, R.B. Production residues in copper technological cycles. Resour. Conserv. Recycl. 2002, 36, 87–106.
[CrossRef]58. U.S. Census Bureau International Data Base. Available online: http://www.census.gov/population/
international/data/idb/informationGateway.php (accessed on 23 February 2016).59. Menzie, W.D.; DeYoung, J.H., Jr.; Steblez, W.G. Some Implications of Changing Patterns of Mineral Consumption;
U.S. Geological Survey Open-File Report 03–382; U.S. Geological Survey: Reston, VA, USA, 2003.60. Graedel, T.E.; Cao, J. Metal spectra as indicators of development. Proc. Natl. Acad. Sci. 2010, 107, 20905–20910.
[CrossRef] [PubMed]61. Graedel, T.E.; van Beers, D.; Bertram, M.; Fuse, K.; Gordon, R.B.; Gritsinin, A.; Kapur, A.; Klee, R.J.;
Lifset, R.J.; Memon, L.; et al. Multilevel cycle of anthropogenic copper. Environ. Sci. Technol. 2004, 38,1242–1252. [CrossRef] [PubMed]
62. Kesler, S.E. Mineral supply and demand into the 21st century. In Proceedings for a Workshop on DepositModeling, Mineral Resource Assessment, and Their Role in Sustainable Development. Circular 1294; U.S. GeologicalSurvey: Reston, VA, USA, 2007; pp. 55–62.
63. International Copper Study Group. ICSG 2015 Statistical Yearbook; International Copper Study Group:Lisbon, Portugal, 2015.
64. World Bank Open Data. Available online: http://data.worldbank.org/ (accessed on 23 February 2016).
36

Resources 2016, 5, 14
65. Graedel, T.E.; Allwood, J.; Birat, J.P.; Buchert, M.; Hagelüken, C.; Reck, B.K.; Sibley, S.F.; Sonnemann, G.What do we know about metal recycling rates? J. Ind. Ecol. 2011, 15, 355–366. [CrossRef]
66. Hein, J.R.; Mizell, K.; Koschinsky, A.; Conrad, T.A. Deep-ocean mineral deposits as a source of critical metalsfor high- and green-technology applications—comparison with land-based resources. Ore Geol. Rev. 2013,51, 1–14. [CrossRef]
67. Cathles, L.M. A Path Forward. Available online: https://www.segweb.org/pdf/views/2010/08/SEG-Newsletter-Views-Lawrence-Cathles.pdf (accessed on 23 February 2016).
68. Robinson, G.R. J.; Menzie, W.D. Economic Filters for Evaluating Porphyry Copper Deposit Resource AssessmentsUsing Grade-Tonnage Deposit Models, with Examples from the U.S. Geological Survey Global Mineral ResourceAssessment; U.S. Geological Survey Scientific Investigations Report 2010–5090–H; U.S. Geological Survey:Reston, VA, USA, 2012.
69. Kesler, S.; Wilkinson, B.H. Earth's copper resources estimated from tectonic diffusion of porphyry copperdeposits. Geology 2008, 36, 255–258. [CrossRef]
70. Gerst, M.D.; Graedel, T.E. In-Use Stocks of Metals: Status and Implications. Environ. Sci. Technol. 2008, 42,7038–7045. [CrossRef] [PubMed]
71. Graedel, T.E.; Dubreuil, A.; Gerst, M.D.; Hashimoto, S.; Moriguchi, Y.; Müller, D.; Pena, C.; Rauch, J.;Sinkala, T.; Sonnemann, G. Metal Stocks in Society—Scientific Synthesis; United Nations EnvironmentProgramme: Paris, France, 2010.
72. Ciacci, L.; Reck, B.K.; Nassar, N.T.; Graedel, T.E. Lost by design. Environ. Sci. Technol. 2015, 49, 9443–9451.[CrossRef] [PubMed]
73. Nassar, N.T. Limitations to elemental substitution as exemplified by the platinum-group metals. Green Chem.2015, 17, 2226–2235. [CrossRef]
74. Vidal, O.; Goffé, B.; Arndt, N. Metals for a low-carbon society. Nat. Geosci. 2013, 6, 894–896. [CrossRef]75. Wilson, C. Status of the Geoscience Workforce 2014; American Geosciences Institute:
Washington, DC, USA, 2014.76. Schodde, R.C. The Impact of Commodity Prices and Other Factors on the Level of Exploration; Centre for Exploration
Targeting, University of Western Australia: Perth, Australia, 2013.
© 2016 by the authors. Licensee MDPI, Basel, Switzerland. This article is an open accessarticle distributed under the terms and conditions of the Creative Commons Attribution(CC BY) license (http://creativecommons.org/licenses/by/4.0/).
37
resources
Review
The Abiotic Depletion Potential: Background,Updates, and Future
Lauran van Oers †,* and Jeroen Guinée †
Faculty of Science Institute of Environmental Sciences (CML)—Department of Industrial Ecology,Leiden University, P.O. Box 9518, Leiden 2300, RA, The Netherlands* Correspondence: [email protected]; Tel.: +31-(0)71-527-5640† These authors contributed equally to this work.
Academic Editors: Damien Giurco and Mario SchmidtReceived: 17 December 2015; Accepted: 23 February 2016; Published: 2 March 2016
Abstract: Depletion of abiotic resources is a much disputed impact category in life cycle assessment(LCA). The reason is that the problem can be defined in different ways. Furthermore, within aspecified problem definition, many choices can still be made regarding which parameters to includein the characterization model and which data to use. This article gives an overview of the problemdefinition and the choices that have been made when defining the abiotic depletion potentials (ADPs)for a characterization model for abiotic resource depletion in LCA. Updates of the ADPs since 2002are also briefly discussed. Finally, some possible new developments of the impact category of abioticresource depletion are suggested, such as redefining the depletion problem as a dilution problem.This means taking the reserves in the environment and the economy into account in the reserveparameter and using leakage from the economy, instead of extraction rate, as a dilution parameter.
Keywords: ADP; abiotic depletion potential; life cycle assessment; abiotic natural resources; elements;minerals; resource availability; scarcity; criticality; reserves
1. Introduction
From the beginning of the life cycle assessment (LCA) approach, the depletion of abiotic resourceshas been one of the impact categories taken into account in the environmental impact assessment.Natural resources are defined as an area of protection by the SETAC WIA (Society of EnvironmentalToxicology and Chemistry Working group on life cycle Impact Assessment) [1] and are part of the LifeCycle Impact Midpoint-Damage Framework developed by the UNEP (United Nations EnvironmentProgram)/SETAC life cycle initiative [2].
However, abiotic resource depletion is one of the most debated impact categories because there isno scientifically “correct” method to derive characterization factors [3]. There are several reasons forthis: (1) abiotic depletion is a problem crossing the economy–environment system boundary, sincereserves of resources depend on future technologies for extracting them; (2) there are different waysto define the depletion problem, and all can be justified from different perspectives; (3) there aredifferent ways of quantifying a depletion definition, and none of them can be empirically verified,since they all depend on the assumed availability of, and demand, for resources in the future and onfuture technologies.
The debate on abiotic resource depletion and how to evaluate it has recently started again. Thisis partly because of the ongoing debate in the LCA community; see for example the guidelinesof the International Reference Life Cycle Data System (ILCD) and the PEF, in Europe. (The ILCDHandbook on LCA aims to provide guidance for good practice in LCA in business and government.The development of the ILCD was coordinated by the European Commission and has been carried outin a broad international consultation process with experts, stakeholders, and the general public [4,5].
Resources 2016, 5, 16; doi:10.3390/resources5010016 www.mdpi.com/journal/resources38
Resources 2016, 5, 16
DG Environment has worked together with the European Commission's Joint Research Centre (JRC IES)and other European Commission services towards the development of a harmonized methodology forthe calculation of the environmental footprint of products (including carbon). This methodologyhas been developed building on the ILCD Handbook as well as other existing methodologicalstandards and guidance documents (ISO 14040-44, PAS 2050, BP X30, WRI/WBCSD GHG protocol,Sustainability Consortium, ISO 14025, Ecological Footprint, etc.) [6]. In addition, the debate on thecriticality of resources has revived the debate on how to evaluate the use and depletion of resources bysociety [7–13].
In the context of the ILCD handbook on LCA, different characterization models for abiotic resourcedepletion have been reviewed by the LCA impact assessment community [12,14]. The characterizationfactors for abiotic resource depletion defined by Oers et al. [15] and recommended in the Dutch LCAHandbook [16], were selected as the best available operational method at present for so-called “useto availability ratio” methods [12]. However, contrary to the baseline method recommended in theDutch LCA Handbook [16], the ILCD handbook and the PEF adopted a version of the abiotic depletionpotential (ADP) that is calculated using the reserve base instead of the ultimate reserve estimations.This alternative choice was one of the reasons why the debate was resumed.
In this context it is useful to reflect on the assumptions that were made when developing the ADPand to think about possible future developments. This article aims to briefly describe the backgroundconsiderations, options, and final choices made at the time of the original development (1995) andthe latest update (2002) of the ADP. This description largely builds on the elaborate reporting of theoriginal method developed by the Leiden Institute of Environmental Sciences (CML) [3,15,16].
2. Description of the Characterization Model for ADP, Considerations, Options, and Choices
2.1. Fundamentals and Choices (1995–2002)
Life cycle impact assessment (LCIA) is the phase in which the set of results of the inventoryanalysis—mainly the inventory table—is further processed and interpreted in terms of environmentalimpacts. Based on an evaluation, the different elementary flows contributing to a specific impactcategory are aggregated into one impact score. Thus, the core issue addressed by the characterizationmodel for abiotic resource depletion is: how serious is the depletion of one particular natural resourcein relation to that of another, and how can this be expressed in terms of characterization factors (ADPs)for these resources?
The development of the model requires many decisions to be made, which together framethe problem. This paper focuses only on the depletion problem of abiotic resource deposits [3,15].The present section describes a selection of these issues and choices in more detail.
2.1.1. Definition of the Problem
When conducting an environmental assessment, it is debatable whether or not abiotic resourcedepletion should be part of the environmental impact assessment. After all, the problem mainly refersto the depletion of functions that natural resources have for the economy. One might, therefore, arguethat resource depletion is basically an economic problem, rather than an environmental problem.This would imply that no separate impact category should be defined for the depletion of resources.Note that the environmental impact of the extraction process itself will, however, still be assessedthrough the contribution of current extraction processes to other impact categories.
Next to this, the problem of depletion of abiotic resources can still be defined in different ways,such as a decrease in the amount of the resource itself, a decrease in world reserves of usefulenergy/exergy, or an incremental change in the environmental impact of extraction processes atsome point in the future (e.g., due to having to extract lower-grade ores or recover materials fromscrap) etc. [12,16–18].
39

Resources 2016, 5, 16
In Guinée and Heijungs [3] and Oers et al. [15], resource depletion was considered anenvironmental problem in its own right, while recognizing that views differ on this. The problemwas defined as the decreasing natural availability of abiotic natural resources, including fossil energyresources, elements, and minerals.
2.1.2. Concepts for Assessing Depletion
How can the “decreasing availability” of a given resource be determined? In other words, whatare possible indicators of resource depletion? The number of indicators that have been proposed evenexceeds that of the definitions (see for an overview, for example, ILCD [12,14] and Klinglmair et al. [8]).
Many discussions focus on the dichotomy between price-based and physics-based indicators.Although the price of a resource can be regarded as a measure of its scarcity and societal value, itreflects more than just that. Prices are also influenced by the structure of particular economic markets,national social conditions reflected in labor cost, the power of mining companies with a monopoly,the costs of identifying new reserves, etc. For these reasons, prices of resources do not seem to be anappropriate indicator of depletion.
A depletion indicator could also be based on the various unique functions that resources canfulfill in materials and products. When trying to assess the availability of possible resources onewould like to take into account possibilities for substitution. Oers et al. [15] undertook a preliminaryexploration of taking substitution possibilities into account. However, elements and compounds mayhave very different potential functions, and possible shifts in potential functions in the future arevery difficult to anticipate. Hence, it was concluded at the time that including substitution was notfeasible in a characterization model for resource depletion. An exception was made for fossil energycarriers, as they were assumed to be fully interchangeable, particularly regarding their energy carrierfunction. It was therefore suggested to define a separate impact category for fossil fuels, based on theirsimilar function as energy carriers [15]. However, this recommendation was not yet implemented inthe baseline characterization factors described in the Dutch LCA Handbook [16].
Guinée and Heijungs [3] decided to base the characterization model for abiotic resource depletionon physical data on reserves and annual de-accumulation, with de-accumulation defined as the annualproduction (e.g., in kg/yr) minus the annual regeneration (e.g., in kg/yr) of a resource, the latter ofwhich was assumed to be zero. In addition to this, Oers et al. decided that the implementation ofsubstitution options (which touches upon issues of scarcity and criticality) was not (or not yet) feasiblewithin LCA [15].
2.1.3. Definition of Availability and Natural Stocks Versus Stocks in the Economy
When assessing the availability of resources one can use the concept of availability in a narrowor a broad sense. Availability in the narrow sense focuses on the extraction of the resource from thestock in the environment, the primary extraction medium, whereas availability in the broad sensefocuses on the presence of resources in stocks in the environment as well as the economy (geo- andanthropospheres).
Ideally based on the definition of the depletion of abiotic resources, the available resource shouldencompass both natural stocks and stocks in the economy. The criterion for depletion of the resource iswhether the resource derived from the environment is still present and (easily) available in the stocksof materials in the economy. After all, as long as resources are still available in the economic stock afterextraction, there is no depletion problem.
Guinée and Heijungs [3] and Oers et al. [15] decided to adopt the narrow definition of availability,while recognizing that, eventually, a broad sense definition would be preferable, assuming that itwould be possible and practically feasible to define a proper indicator for this and that the necessarydata would be available. The Discussion section below briefly introduces a preview of a possiblenew approach.
40

Resources 2016, 5, 16
2.1.4. Types of Reserves and Definitions
Estimates of the amounts of resources (elements, minerals, fuels) available for future generationsdepend on the definition of reserve that is used. When talking about the reserves of resourcesthere might be confusion about the type of reserve being considered. The LCIA and geologicalcommunity do not use the same definitions as traditionally used by leading geological institutions.Drielsma et al. [18] have compared the definitions as used by the Committee for Mineral ReservesInternational Reporting Standards (CRIRSCO) with definitions of reserves as used in the ADP [15](Table 1). For better communication between both communities in the future the terminology ofresources and reserves should be harmonized. Within the geological community the institutionsare currently converging towards the CRIRSCO definitions. It seems logical that within the LCIAcommunity the same terminology and definitions will be adopted.
Table 1. Types of reserves and definitions.
Terminology Definition
Oers et al. [15] Drielsma et al. [19] A Resource/Reserve Classification for Minerals, USGS [3,20,21].
ultimate reserve crustal content
The quantity of a resource (like a chemical element or compound) thatis ultimately available, estimated by multiplying the average naturalconcentration of the resource in the primary extraction media (e.g.,the earth’s crust) by the mass or volume of these media (e.g., the massof the crust assuming a depth of e.g., 10 km) [3].
ultimately extractablereserve
extractable globalresource
Those reserves that can ultimately be technically extracted may betermed the “ultimately extractable reserves”. This ultimatelyextractable reserve (“extractable global resource”) is situatedsomewhere between the ultimate reserve and the reserve base [20,21].
reserve base mineral resource
Part of an identified resource that meets specified minimum physicaland chemical criteria relating to current mining practice. The reservebase may encompass those parts of the resources that have areasonable potential for becoming economically available withinplanning horizons beyond those that assume proven technology andcurrent economics. The reserve base includes those resources that arecurrently economic (reserves) or marginally economic (marginalreserves), and some of those that are currently subeconomic(subeconomic resources) (for further definitions see the originalreferences) [20,21].
economic reserve mineral reserve The part of the natural reserve base which can be economicallyextracted at the time of determination [20,21].
The disadvantage of the “reserve base” and “economic reserve” is that estimating the size ofthe reserve involves a variety of technical and economic considerations not directly related to theenvironmental problem of resource depletion. The estimates, however, are relatively certain, as theyare based on present practice while, on the other hand, they are highly unstable as they continuouslychange over time. In contrast, the “ultimately extractable reserve” is more directly related to theenvironmental problem of resource depletion, and relatively stable over time. However, it is highlyuncertain how much of the scattered concentrations of elements and compounds will eventuallybecome available, as technical and economic developments in the far future are unpredictable.
The ultimate reserve and ultimately extractable reserve are expected to differ substantially.However, data on the ultimately extractable reserve are unavailable and will never be exactly knownbecause of their dependence on future technological developments. Nevertheless, one might assumethat the “ultimate reserve” is a proxy for the “ultimately extractable reserve”, implicitly assuming thatthe ratio between the ultimately extractable reserve and the ultimate reserve is equal for all resourcetypes. In reality this will not be the case, because the concentration-presence-distribution (see Figure 1)of different resources will most likely be different [15]. Hence, there is insufficient information todecide which of these reserves gives the best indication of the ultimately extractable reserve. Whilst
41

Resources 2016, 5, 16
we acknowledge some authors propose a mineralogical barrier as described by Skinner [22] this hasnot been considered in the research.
Guinée and Heijungs [3] and Oers et al. [15] adopted the “ultimate reserve” as the presumablybest proxy for the “ultimately extractable reserve” in their characterization model for abiotic resourcedepletion. They recommended that alternative indicators be used for a sensitivity analysis, like the“reserve base”, and to a lesser extent the “economic reserve”.
Earth crust mass (kg)
Con
cent
ratio
n(k
g re
sour
ce/ k
g ea
rth c
rust
)
economic reserve
reserve base
ultimately extractable reserve
ultimate reserve
mineral reserve
mineral resource
extractable global resource
crustal content
Figure 1. Concentration-presence-distribution of several theoretical resources in the Earth’s crust.The average Earth crust thickness is assumed to be 17 km. The Earth crust surface is assumed to be5.14 ˆ 1014 m2. The average earth crust density is 2670 kg¨ m´3. The ultimate reserve of a resource isthe surface area enclosed by the curve. The size of the other estimates of the reserves is given by thesurface area enclosed by the curve and the given secant with the x-axis [15].
2.1.5. Equations for Characterization Factors
Based on all the choices described above, the characterization model can be described.The haracterization model is a function of natural reserves (stocks/deposits in the environment)of the abiotic resources combined with their rates of extraction (see Equation (2)). The method hasbeen made operational for many elements and fossil fuels (actually: the energy content of fossil fuels).The natural reserves of these resources are based on “ultimate reserves”; that is, on concentrations ofthe elements and fossil carbon in the Earth’s crust.
The characterization factor is the abiotic depletion potential (ADP). This factor is derived for eachextraction of elements and fossil fuels and is a relative measure, with the depletion of the elementantimony as a reference (see Equation (2)).
In accordance with the general structure of the LCIA, the impact category indicator result for theimpact category of “abiotic depletion” is calculated by multiplying LCI results, extractions of elementsand fossil fuels (in kg) by the characterization factors (ADPs in kg antimony equivalents/kg extraction,The choice of the reference substance is arbitrary. Choosing another reference will not change therelative sizes of the characterization factors. Antimony was chosen as a reference substance becauseit is the first element in the alphabet for which a complete set of necessary data (extraction rate andultimate reserve) is available, and aggregating the results of these multiplications in one score to obtainthe indicator result (in kg antimony equivalents) (see Equation (1)):
abiotic depletion “ÿ
i
ADPi ˆ mi (1)
with:
ADPi “ DRi{pRiq2
DRre f {´
Rre f
¯2 (2)
42

Resources 2016, 5, 16
where,
ADPi: abiotic depletion potential of resource i (kg antimony equivalents/kg of resource i);mi: quantity of resource i extracted (kg);Ri: ultimate reserve of resource i (kg);DRi: extraction rate of resource i (kg¨ yr´1) (regeneration is assumed to be zero);Rre f : ultimate reserve of the reference resource, antimony (kg);DRre f : extraction rate of the reference resource, Rref (kg¨ yr´1).
The first operational set of ADPs was developed by Guinée [3]. In 2002, these ADPs were updatedby Oers et al. [15]. This update included new extraction rates (DRs) of resources for the base year 1999.To facilitate sensitivity analysis, alternative ADPs were developed based on different definitions ofreserves, viz. economic reserve, reserve base and ultimate reserve. Oers et al. [15] adjusted the ADPsof fossil fuels and defined a separate impact category for fossil fuels based on the assumption thatfossil fuels are mutually substitutable as energy carriers. However, in the LCA handbook [16], fossilfuels and elements were still considered to be part of one impact category, “abiotic resource depletion”.The split into two separate impact categories was implemented in 2009.
2.2. Developments after 2002
Since 2002, the ADPs have been reported in a spreadsheet together with characterization factors forother impact categories. The Centrum voor Milieuwetenschappen Leiden Impact Assessment (CMLIA)spreadsheet with impact assessment factors as recommended by the Dutch LCA Handbook [16] can bedownloaded from the CMLIA website [23].
2.2.1. Update of Impact Categories by CML: Impact Category of “Abiotic Resource Depletion” Splitinto Two Separate Impact Categories
In 2009, the impact category of “abiotic resource depletion” was split into two separateimpact categories:
‚ “abiotic resource depletion—elements”; and‚ “abiotic resource depletion—fossil fuels”.
The impact category for elements is a heterogeneous group, consisting of elements and compoundswith a variety of functions (all functions being considered of equal importance). The resources in theimpact category of fossil fuels are fuels like oil, natural gas, and coal, which are all energy carriers andassumed to be mutually substitutable. As a consequence, the stock of the fossil fuels is formed by thetotal amount of fossil fuels, expressed in Megajoules (MJ).
Despite the fact that uranium is also an energy carrier, the extraction of uranium is classified underthe impact category of “abiotic resource depletion—elements” and not together with the fossil fuels,under the impact category of “abiotic resource depletion—energy carriers”. Uranium and fossil fuelsalso have other applications besides “energy carrier”. Fossil fuels are considered to be interchangeablefor these other applications, like the production of plastics, while uranium is not. However, one mightargue that the largest application of both fossil fuels and uranium is that of an energy carrier, and forthis reason they should be classified under the same impact category. Future versions of the CMLIAmight be adapted accordingly.
2.2.2. Update of ADP Values by CML
In 2009, the ADPs reported in the Dutch Handbook on LCA [16], based on Guinée [3], wereupdated using the ADPs reported by Oers et al. [15] (R and DR data based on 1999 data). Since 2009,the basic data underlying the ADPs and, thus, the ADPs themselves, have not been updated anymore.
43

Resources 2016, 5, 16
2.2.3. Update of R and DR Values by Others
Some new DR and R data have been reported by Frischknecht et al. [24]. However, ADPs derivedfrom these data have not been implemented in the CMLIA spreadsheet.
Until 2010, the US Geological Survey (USGS) [20] reported the extraction rates, (economic) reserve,and reserve base data for many resources on an annual basis. However, the reserve base data have nolonger been reported since 2010.
3. Discussion and Possible New Approaches in Abiotic Resource Depletion in CMLIA
3.1. Depletion, Scarcity, and Criticality
When trying to assess the “sustainability” of the use of resources by society, different definitionsof the problem of the resource use are used in terms of depletion, scarcity, and criticality.
Depletion of a resource means that its presence on Earth is reduced. This refers to geological(or natural) stocks. Scarcity of a resource means that the amount available for use is, or will soon be,insufficient (“demand higher than supply flow”). Criticality of a resource means that it is scarce and, atthe same time, essential for today’s society. In addition to environmental aspects, criticality assessmentoften also considers economic, social, and geopolitical issues [9].
Interest in natural resources has recently increased, due to the growing interest in policiesto ensure the security of supply of critical metals like tantalum, indium, neodymium, etc. [10,11].It should be noted, however, that this assessment of the criticality of metals is often based onmore criteria than environmental issues alone. The criticality of a metal is based on a mixture ofenvironmental, geopolitical, social, and economic considerations. Furthermore, the criticality debatedoes not necessarily take into account the cradle-to-grave chain perspective; it often only focuses on asupply of elements at the company or national economy level.
It is our opinion that the environmental impact assessment of LCA should not strive to take intoaccount all these different aspects of criticality assessment, i.e., environment, economy, and social aspects.They may be part of a broader life cycle sustainability assessment (LCSA), but even then a generalapproach will be difficult, as many of the criticality aspects are highly time- and region-dependent andeven differ for different stakeholders. LCSA is a framework for (cradle-to grave) system analysis which,besides environmental aspects, may also focus on economic and social issues [25,26]. However, the impactcategories for “abiotic resource depletion” only deal with the environmental pillar of the sustainabilityassessment, and the indicator is based on the problem of depletion only.
3.2. Ultimate Reserve, Reserve Base, and Economic Reserve
The ADPs developed by Guinée [3] and Oers et al. [15] are based on ultimate reserves ascalculated from the average element concentrations in the Earth’s crust [27] assuming a crust mass of2.31 ˆ 1022 kg (average depth of the earth’s crust (m): 17,000; average density (kg/m3): 2670; surfaceof the Earth (m2): 5.1 ˆ 1014) [3].
Drielsma et al. [19] stated that “crustal content” (a synonym of ultimate reserve) is a stable,comprehensive dataset that can be used to derive a physical estimate of resource depletion for abioticresources. They base this conclusion on a study by Rudnick and Gao [28], which compared severalstudies done since the initial study by Clarke and Washington [29] on estimates for the total stock ofresources. The study by Rudnick and Gao [28] provided updated figures on crustal content that can beused for updated ADPs based on ultimate reserves.
Given the fact that estimates of economic reserves are far less stable due to technological changesand economic developments, and that reserve base data are no longer provided by USGS [20], the useof “ultimate reserves” as a basis for the calculation of ADPs seems justified and confirmed.
We, therefore, argued here that the ILCD-recommended characterization model for abioticresource depletion [12] based on Oers et al. [15] should be readjusted to the original reserve definition,involving ultimate reserve, instead of reserve base.
44

Resources 2016, 5, 16
3.3. Availability in the Broad Sense, ADP Based on Stocks in Environment and Economy
Resources are not only produced from natural resource supplies, but are also recycled fromthe growing amount of stocks in the economy and wastes (“urban stocks”). Should these stocks ofmaterials in the economy, which can potentially be recycled, be included when estimating the totalamount of available resources? In other words, should the reserve be based on the natural reserve onlyor also on the reserve in the economy?
As discussed above, resources fulfill specific unique functions in materials and products.Theoretically, there is no depletion problem as long as the resource after extraction is still available inthe economic stock. As a consequence, resource availability should encompass both natural stocks andstocks in the economy [15].
Schneider et al. [30] made preliminary attempts to derive ADPs based on stocks in both theeconomy and the environment, the so-called anthropogenic stock-extended abiotic depletion potential(AADP). Their first results emphasize the relevance of anthropogenic stocks for the assessment ofabiotic resource depletion. However, a larger set of characterization factors and further researchare needed to verify the applicability of the concept within LCA practice. [30]. The AADPs wereupdated in 2015, including an approach to the estimation of the ultimately extractable reserves fromthe environment. The update resulted in 35 operational AADPs [31]. However, gathering informationon anthropogenic stocks still remains a challenge.
The problem could therefore be redefined as follows: abiotic resource depletion is the decrease inthe availability of resources, both in the environment and the economy.
3.4. Emissions from Economic Stocks and Processes as an Indicator of Dilution
If we adopt the broader definition of reserve described above, the de-accumulation parameter“DR” in the ADP equation becomes meaningless. After all, the extraction (DR) of resources fromenvironmental sources for use in the economy is just a shift from environmental stock to economicstock. Thus, when redefining the reserve parameter (R) in the ADP model, the other parameter in themodel, the “extraction rate” (DR) should also be redefined.
As originally suggested by Oers et al [15], the emission of resources to the environment, instead ofthe extraction rate, might be a promising parameter for use in the characterization model. Oers et al. [15]suggested that the loss of resources from economic processes and stocks due to emissions of elements andcompounds to air, water, and soil can be used as a measure of the dilution of resources. The argumentationis that when environmental and economic stocks are regarded as a total reserve of resources, the problemof depletion is in fact a dilution problem (see Figure 2). The assumption is that the resources that areemitted to the environment are too diffuse to be ultimately extractable and, thus, are not part of theultimately extractable reserve. Hence, abiotic resource depletion can also be redefined as a problem ofdilution of resources; that is, a reduction of concentrated reserves of resources.
Frischknecht (in: Vadenbo et al. [7]) also suggested focusing on the role of borrowing anddissipative resource use in impact assessment of abiotic resources. Material resources on Earth cannotbe lost (unless converted into energy or lost into space) but might be dispersed. The impact assessmentfactors derived by Frischknecht are still based on the original ADP model (using environmentalreserves only), but extraction rates are applied to the dissipative use of resources, which is defined asthe difference between the amounts of resources extracted and recycled, i.e., the aggregated amountlost during manufacture, use, and end-of-life treatment. This new concept of assessing the dissipativeuse of resources using ADP factors is recommended by the new version of the ecoscarcity method [24].
Oers et al. [15] suggested a different elaboration of the characterization model for the dilutionproblem of resources. If depletion of abiotic resources is defined as the dilution of the resources, theleakage (L) of elements, minerals, and energy (heat) from the economy is suggested as a parameterfor the characterization model, as an alternative to the extraction rate (DR). This leakage of resourcescan then be combined with the total reserve of resources in the environment and the economy(Rtotal = Renv + Rec) into a new characterization model for the dilution of abiotic resources. This new
45

Resources 2016, 5, 16
model can still use the original ADP equation, but the parameter extraction rate (DR) is replaced byLeakage (L), and the reserve parameter (R) refers to reserves in both the economy and the environment.Making these new characterization factors operational requires an estimation of stocks of elementsin the economy and the total emissions of elements to the environment in the world. A preliminaryapproach to estimating these stocks can be based on the method and data described by Schneider [30,31]and the United Nations Environment Program (UNEP) (stocks per capita) [9]. The total emissions inthe world can be based on the inventories made to derive normalization factors, as in the work byWegener Sleeswijk et al. [32].
The result for the impact category of “abiotic resource dilution” can then be calculated bymultiplying the emission, instead of extraction, of elements (in kg) by the characterization factors(ADPs in kg antimony equivalents/kg emission) and by aggregating the results of these multiplicationsin one score to obtain the indicator result (in kg antimony equivalents).
annual ex traction
(DR
)
rese
rve
(Ren
v)(c
once
ntra
ted
reso
urce
)
Figure 2. Relevant parameters for the abiotic resource depletion model, reserves in economy andenvironment and annual extraction or emission of the resource (adapted from [15]).
4. Conclusions
It is impossible to define one correct method for assessing the problem of depletion of abioticresources, since the choice of relevant parameters that make up the model will depend on the problemdefinition, and the correctness of the parameters cannot be verified empirically.
46

Resources 2016, 5, 16
However, the definition of the problem and the choices made to define the characterization modelwill result in different sets of characterizations.
The model of abiotic resource depletion as defined in the ADP [3,15] is a function of the annualextraction rate and geological reserve of a resource.
In the model as presently defined, the ultimate reserve is considered the best estimate of theultimately extractable reserve and also the most stable parameter for the reserve parameter. However,data for this parameter will by definition never be available. As a proxy, we suggest the ultimatereserve (crustal content).
Extraction rates and reserves are regularly updated by USGS [19], partly as a result of changesin technology and new insights. As a consequence, characterization factors should also be regularlyupdated, but this is unfortunately no longer being done.
The impact category of abiotic resource depletion as defined by CML [3,15] comprises only thedepletion of environmental resources. Criticality of resources is not part of the problem definition.We recommend not including criticality in environmental LCA, as it deals with more than justenvironmental aspects. It could be included in the broader LCSA framework, which also tries toincorporate economic and social assessment into life cycle thinking.
A possible new development for the characterization model defined by Oers et al. [15] is theredefinition of resource depletion as a dilution problem. This implies the inclusion of reserves in theeconomy into the reserve parameter and using leakage from the economy, instead of extraction rate, asa dilution parameter. However, this idea remains to be worked out, and no operational characterizationfactors are as yet available.
Acknowledgments: Part of the development of the ADP is based on the project “Abiotic resource depletion inLCA; Improving characterization factors for abiotic resource depletion as recommended in the new Dutch LCAhandbook”. This project was commissioned by the Dutch Ministry of Infrastructure and the Environment.
Conflicts of Interest: The authors declare no conflict of interest. The sponsors had no role in the design of thestudy; in the collection, analysis, or interpretation of data; in the writing of the manuscript; or in the decision topublish the results.
Abbreviations
The following abbreviations are used in this manuscript:
AADP anthropogenic stock extended abiotic depletion potentialADP abiotic depletion potentialCML Centrum voor Milieuwetenschappen Universiteit Leiden (Institute of Environmental
Sciences, Leiden University)CMLIA Centrum voor Milieuwetenschappen Universiteit Leiden Impact AssessmentCRIRSCO Committee for Mineral Reserves International Reporting StandardsDR extraction rate of resource, originally defined as annual de-accumulation, with
de-accumulation defined as the annual extraction (e.g., in kg/yr) minus the annualregeneration (e.g., in kg/yr) of a resource, the latter of which is assumed to be zero
ILCD International Reference Life Cycle Data SystemLCA life cycle assessmentLCIA life cycle impact assessmentLCSA life cycle sustainability assessmentPEF product environmental footprintR reserve of resourceSETAC Society of Environmental Toxicology and ChemistryUNEP United Nations Environment ProgramUSGS United States Geological SurveyWIA Working Group on Life Cycle Impact Assessment
47
Resources 2016, 5, 16
References
1. Udo de Haes, H.A., Jolliet, O., Finnveden, G., Hauschild, M., Krewit, W., Müller-Wenk, R. (Eds.) Bestavailable practice regarding impact categories and category indicators in life cycle impact assessment. Int. J.Life Cycle Assess. 1999, 4, 167–174.
2. Jolliet, O.; Muller-Wenk, R.; Bare, J.; Brent, A.; Goedkoop, M.; Heijungs, R.; Itsubo, N.; Pena, C.;Pennington, D.; Potting, J.; et al. The LCIA midpoint-damage framework of the UNEP/SETAC life cycleinitiative. Int. J. Life Cycle Assess. 2004, 9, 394–404. [CrossRef]
3. Guinée, J.; Heijungs, R. A proposal for the definition of resource equivalency factors for use in productLife-Cycle Assessment. Environ. Toxicol. Chem. 1995, 14, 917–925. [CrossRef]
4. European Commission. ILCD Handbook, General Guide for Life Cycle Assessment—Detailed Guidance; EuropeanCommission: Ispra, Italy, 2010. Available online: http://publications.jrc.ec.europa.eu/repository/bitstream/JRC48157/ilcd_handbook-general_guide_for_lca-detailed_guidance_12march2010_isbn_fin.pdf (accessedon 29 February 2016).
5. European Commission. European Platform on Life Cycle Assessment. 2015. Available online: http://eplca.jrc.ec.europa.eu/?page_id=86 (accessed on 29 February 2016).
6. European Commission. Environmental Footprint News. 2016. Available online: http://ec.europa.eu/environment/eussd/smgp/ef_news.htm (accessed on 29 February 2016).
7. Vadenbo, C.; Rørbech, J.; Haupt, M.; Frischknecht, R. Abiotic resources: New impact assessment approachesin view of resource efficiency and resource criticality—55th Discussion Forum on Life Cycle Assessment,Zurich, Switzerland, April 11, 2014. Int. J. Life Cycle Assess. 2014, 19, 1686–1692. [CrossRef]
8. Klinglmair, M; Sala, S.; Brandão, M. Assessing resource depletion in LCA: A review of methods andmethodological issues. Int. J. Life Cycle Assess. 2014, 19, 580–592.
9. Van der Voet, E. Criticality and abiotic resource depletion in life cycle assessment. In Security of Supplyand Scarcity of Raw Materials. Towards a Methodological Framework for Sustainability Assessment; Mancini, L.,De Camillis, C., Pennington, D., Eds.; European Commission: Luxemburg, 2013; pp. 21–23.
10. United Nations Environment Programme. Environmental Risks and Challenges of AnthropogenicMetals Flows and Cycles. 2013. Available online: http://www.unep.org/resourcepanel/Publications/EnvironmentalChallengesMetals/tabid/106142/Default.aspx (accessed on 29 February 2016).
11. European Commission. Critical raw materials for the EU; Report of the Ad-hoc Working Group ondefining critical raw materials; European Commission: Brussels, Belgium, 2010. Available online:http://ec.europa.eu/growth/sectors/raw-materials/specific-interest/critical/index_en.htm (accessed on29 February 2016).
12. European Commission. In ILCD handbook: Recommendations for Life Cycle Impact Assessment in the Europeancontext—Based on Existing Environmental Impact Assessment Models and Factors; European Commission,Joint Research Centre, Institute for Environment and Sustainability: Ispra, Italy, 2011. Available online:http://publications.jrc.ec.europa.eu/repository/handle/JRC61049 (accessed on 29 February 2016).
13. European Commission. Report on Critical Raw Materials for the EU; European Commission:Brussels, Belgium, 2014. Available online: http://ec.europa.eu/growth/sectors/raw-materials/specific-interest/critical/index_en.htm (accessed on 29 February 2016).
14. European Commission. Analysis of existing Environmental Impact Assessment methodologies for use inLife Cycle Assessment; European Commission, Joint Research Centre, Institute for Environment andSustainability, 2010. Available online: http://eplca.jrc.ec.europa.eu/uploads/ILCD-Handbook-LCIA-Background-analysis-online-12March2010.pdf (accessed on 29 February 2016).
15. Van Oers, L.; De Koning, A.; Guinée, J.B.; Huppes, G. Abiotic resource depletion in LCA. Improvingcharacterisation factors for abiotic resource depletion as recommended in the new Dutch LCAhandbook. RWS-DWW: Delft, The Netherlands, 2002. Available online: http://www.leidenuniv.nl/cml/ssp/projects/lca2/report_abiotic_depletion_web.pdf (accessed on 29 February 2016).
16. Guinée, J.B.; Gorée, M.; Heijungs, R.; Huppes, G.; Kleijn, R.; de Koning, A.; van Oers, L.;Wegener Sleeswijk, A.; Suh, S.; Udo de Haes, H.A.; et al. Handbook on Life Cycle Assessment: Operational Guideto the ISO Standards; Kluwer Academic Publisher: Dordrecht, The Netherlands, 2002. Available Online:http://www.leidenuniv.nl/cml/lca2/index.html (accessed on 29 February 2016).
48

Resources 2016, 5, 16
17. Finnveden, G. “Resources” and related impact categories. In Towards a Methodology for Life Cycle ImpactAssessment; Udo de Haes, H.A., Ed.; SETAC-Europe: Brussels, Belgium, 1996.
18. Heijungs, R.; Guinée, J.; Huppes, G. Impact Categories for Natural Resources and Land Use; CML-report 138;Leiden University: Leiden, The Netherlands, 1997.
19. Drielsma, J.A.; Russell-Vaccari, A.J.; Drnek, T.; Brady, T.; Weihed, P.; Mistry, M.; Perez Simbor, L. Mineralresources in life cycle impact assessment—Defining the path forward. Int. J. Life Cycle Assess. 2016, 21,85–105. [CrossRef]
20. United States Geological Survey. Commodity Statistics and Information, Statistics and informationon the worldwide supply of, demand for, and flow of minerals and materials essential to theU.S. economy, the national security, and protection of the environment. 2015. Available online:http://minerals.usgs.gov/minerals/pubs/commodity/ (accessed on 29 February 2016).
21. United States Geological Survey. Appendix of Commodity Statistics and Information, Statistics andinformation on the worldwide supply of, demand for, and flow of minerals and materials essential to theU.S. economy, the national security, and protection of the environment A Resource/Reserve Classificationfor Minerals. 2015. Available online: http://minerals.usgs.gov/minerals/pubs/mcs/2007/mcsapp07.pdf(accessed on 29 February 2016).
22. Skinner, B.J. Exploring the resource base. In Proceedings of the workshop on “The Long-Run Availabilityof Minerals”, Washington, DC, USA, 22–23 April 2001; Available online: http://www.rff.org/files/sharepoint/WorkImages/Download/RFF-Event-April01-keynote.pdf (accessed on 29 February 2016).
23. CML-IA Characterisation Factors. Available online: https://www.universiteitleiden.nl/en/research/research-output/science/cml-ia-characterisation-factors (accessed on 29 February 2016).
24. Frischknecht, R.; Büsser Knöpfel, S. Swiss Eco-Factors 2013 according to the Ecological Scarcity Method.Methodological fundamentals and their application in Switzerland. Environmental studies No. 1330. FederalOffice for the Environment: Bern, Switzerland, 2013; p. 254. Available online: http://www.bafu.admin.ch/publikationen/publikation/01750/index.html?lang=en (accessed on 29 February 2016).
25. UNEP-SETAC. Towards a Life Cycle Sustainability Assessment. Making informed choices on products.2011. Available online: http://www.unep.org/pdf/UNEP_LifecycleInit_Dec_FINAL.pdf (accessed on29 February 2016).
26. UNEP-SETAC. Life Cycle Sustainability Assessment. 2015. Available online: http://www.lifecycleinitiative.org/starting-life-cycle-thinking/life-cycle-approaches/life-cycle-sustainability-assessment/ (accessed on29 February 2016).
27. Lide, D.R., Ed.; CRC Handbook of Chemistry and Physics, 71st ed.; CRC Press: Boston, MA, USA, 1990.28. Rudnick, R.L.; Gao, S. Composition of the continental crust. In The Crust; Rudnick, R.L., Ed.; Elsevier:
Philadelphia, PA, USA, 2005; Volume 3, pp. 1–64.29. Clarke, F.W.; Washington, H.S. The Composition of the Earth’s Crust; USGS Professional Paper 127; USGS:
Washington, DC, USA, 1924; p. 117.30. Schneider, L.; Berger, M.; Finkbeiner, M. The anthropogenic stock extended abiotic depletion potential
(AADP) as a new parameterisation to model the depletion of abiotic resources. Int. J. Life Cycle Assess. 2011,16, 929–936. [CrossRef]
31. Schneider, L.; Berger, M.; Finkbeiner, M. Abiotic resource depletion in LCA-background and update of theanthropogenic stock extended abiotic depletion potential (AADP) model. Int. J. Life Cycle Assess. 2015, 20,709–721. [CrossRef]
32. Wegener Sleeswijk, A.; van Oers, L.F.C.M.; Guinée, J.B.; Struijs, J.; Huijbregts, M.A.J. Normalisation inproduct life cycle assessment: An LCA of the global and European economic systems in the year 2000.Sci. Total Environ. 2008, 390, 227–240. [CrossRef] [PubMed]
© 2016 by the authors. Licensee MDPI, Basel, Switzerland. This article is an open accessarticle distributed under the terms and conditions of the Creative Commons Attribution(CC BY) license (http://creativecommons.org/licenses/by/4.0/).
49

resources
Article
Physical Assessment of the Mineral Capital of aNation: The Case of an Importing and anExporting Country
Guiomar Calvo 1,*, Alicia Valero 1, Luis Gabriel Carmona 2,3 and Kai Whiting 3
1 Research Centre for Energy Resources and Consumption (CIRCE), Mariano Esquillor n.15, Zaragoza 50018,Spain; [email protected]
2 Faculty of Environmental Sciences, Universidad Piloto de Colombia. Carrera 9 No. 45A-44, Bogotá 110231,Colombia; [email protected]
3 MARETEC, Department of Mechanical Engineering, Instituto Superior Técnico, Universidade de Lisboa,Avenida Rovisco Pais, 1, Lisboa 1049-001, Portugal; [email protected]
* Author to whom correspondence should be addressed; [email protected]; Tel.: +34-876-555-624;Fax: +34-976-732-078.
Academic Editor: Mario SchmidtReceived: 23 September 2015; Accepted: 10 November 2015; Published: 16 November 2015
Abstract: Intensified mineral consumption and reserve depletion means that it is becomingincreasingly important for policymakers to account for and manage national mineral capital. Exergyreplacement costs (ERC), an indicator based on the second law of thermodynamics, provides aphysical value of mineral loss. When only a unit mass analysis is used, the role of scarcer minerals,such as gold, is obscured. ERC can identify those minerals which are most critical and more difficultto re-concentrate. This paper compares the mineral depletion of that of Colombia and Spain for 2011,both in mass and ERC terms. The Colombian mineral balance for that year is predominately based onfossil fuel extraction and exports, whilst Spain produced industrial minerals but relied heavily uponmetals and fossil fuel imports. Using exergy replacement costs, an economic analysis was carried outto determine the impact of mineral extraction, in monetary terms, should the cost of re-concentratingsuch minerals be taken into account. In 2011, the GDP derived from the extractive sectors of eithercountry did not compensate the mineral resource loss, meaning that mineral patrimony is not beingproperly evaluated.
Keywords: exergy analysis; exergy replacement costs; domestic material consumption; assessment ofmineral trade; foreign dependency
1. Introduction
Mineral resource depletion and mineral capital management are critical issues that need to beaddressed objectively and efficiently on an international scale across disciplines and professions.According to Krausmann et al. [1] the global total of material extraction has multiplied eightfold sincethe beginning of the 20th century. The highest increase corresponds to construction minerals andore/industrial minerals, which grew by a factor of 34 and 27, respectively. In the European Union,domestic material consumption (DMC) is the main flow indicator within material flow accounting(MFA), a system which quantifies extractive activities in tonnes [2]. DMC measures the annual amountof raw materials extracted nationally, plus imports minus exports. A related concept is domesticextraction which considers the annual amount of raw materials (except water and air), extracted on anational level. The ratio between domestic extraction (DE) and DMC may be used to indicate nationaldependence on mineral extraction and trade, hence why Weisz et al. [3] refer to it as a “domestic
Resources 2015, 4, 857–870; doi:10.3390/resources4040857 www.mdpi.com/journal/resources50

Resources 2015, 4, 857–870
resource dependency” ratio. One way to complement this ratio is through exergy replacement costs(ERC) [4].
ERC quantitatively evaluate the effort, or useful energy, needed to re-concentrate extracted mineralwealth with current best available technology. ERC depend on the mineral’s composition, a deposit’saverage ore grade and the energy intensity of the mining and beneficiation process. Consequently,scarcer minerals, such as gold or mercury, carry more weight in this non-conventional accountingprocess, than the common minerals of, say, limestone or phosphate rock. This is useful because mass,the predominate measure of resource extraction, and used in the DMC, does not take quality intoconsideration and is thus not robust enough to properly assess the loss of mineral capital. The qualityof a mineral deposit is a key consideration when it comes to evaluating sustainable development,specifically in terms of mineral scarcity and criticality. Quality and not just quantity measurements,translate into a more reliable set of results from which national and international policymakers canimprove sustainable assessments and make informed decisions. These themes are currently underdiscussion and of foremost importance in various States [5–7].
2. Methodology
Using a thermoeconomic approach, via the unit exergy and more specifically ERC, the authorsundertake a comparative case study between an exporting (Colombia) and importing (Spain) countryto assess the effect trade has on their respective mineral capital. Exergy, and specifically, its applicationin the novel thermoeconomic branch of Physical Geonomics, first introduced by Valero [8], is onemethod that can, through its objective measure of quality, permit a more rigorous data analysis ofmineral depletion. Exergy has been traditionally used to quantitatively measure any energy, suchas heat, in terms of its pure forms (mechanical work or electricity) and may be used as an efficiencygauge which states the maximum amount of work that can be obtained when a system is broughtto equilibrium with the surrounding environment. This is because, from a physical perspective, andaccording to the Second Law of Thermodynamics, energy is always conserved at the expense of exergy,which is always destroyed, unless the process is 100 percent reversible. In the same way, exergy can beused to assess the quality of material flows such as mineral resources [9,10].
The mineral capital assessment is accomplished through ERC, on the basis that the greater thedifference between the concentration of a randomly dispersed mineral in the Earth’s crust (xc) tothat in an accumulation that could be mined (xm), the greater the exergy registered. This in turnexplains why the exergy (and energy) consumed in mining increases exponentially, tending towardsinfinity, as concentration and particle size decreases. The key to making an exergy analysis suitablefor any abiotic resource evaluation—that of minerals as well as water—is the appropriateness of thechosen reference point. Reference baselines that could be used include the conventional ReferenceEnvironment [11] or the commercially dead planet, Thanatia [12]. The former is commonly usedto assess the chemical exergy of elements. However, it is rejected in this instance because it doesnot consider the exergy required to recuperate minerals in terms of their crustal concentration. Thebaseline reference employed in this paper is that of Thanatia because it can be used to give an estimateof the Earth’s current level of degradation, since it includes a list of minerals with their respectiveconcentrations in the crust [13,14]. The latter constitutes the lower ore grade limit. Taking this intoaccount, the concentration exergy of each mineral can be calculated as follows (Equation (1)):
bc,i = −RT0[
ln xi +(1 − xi)
xiln(1 − xi)
](1)
where xi is the concentration of substance i, R is the gas constant (8.314 J/molK) and T0 is the referencetemperature (298.15 K). Note, this formula is only valid for ideal gas mixtures and when no chemicalcohesion among the substances exists. It is valid for solid mixtures.
51

Resources 2015, 4, 857–870
The difference obtained between the concentration exergies of a mineral concentration in a mineraldeposit (xm) and that of average concentration in the Earth’s crust, i.e., Thanatia (xc) is the minimumamount of energy that Nature had to spend to concentrate the minerals in a deposit (Equation (2)).
Δbc = bc(x = xc)− bc(x = xm) (2)
The exergy replacement costs (b*) are calculated as follows (Equation (3)):
b* = k(xc)·Δb(xc → xm) (3)
where k is a dimensionless variable that represents the unit exergy cost of a mineral, defined as theratio between the energy invested in the real obtaining process for mining and concentrating themineral, and the minimum theoretical energy required if the process from the ore to the final productwas reversible. Therefore, k is a measure of the irreversibility of man-made processes and amplifiesmaximum exergy by a factor of ten to several thousand times, depending on the commodity analyzed.
Another way to understand the relevance of mineral capital losses, caused by domestic extraction,is to convert exergy replacement costs into money, through current energy prices. Together with theDMC ratio, of Equation (4), the impact that economic costs associated with mineral depletion mayhave on GDP and sustainable development can be assessed.
DMC ratio =domestic extaction (DE)
extraction + imports – exports(4)
Note that Equation (4) can be calculated in terms of mass or exergy units, and DE can be replacedwith import or export flows to evaluate their respective ratios.
The monetary cost of reversing the extractive process using current energy quantities and prices,can be represented in Equation (5):
Monetary costs o f ERC = b∗ · p (5)
where, p corresponds to the national or world market price of the total amount of energy, from agiven source (coal, oil, gas, electricity), required to reverse the mining and beneficiation process andeffectively place a mineral back into its original deposit, using current best available technology.
In the case of fossil fuels, economic costs can be directly calculated using their correspondingmarket prices of the year under consideration. The prices used are the price per barrel in the case of oil,the UK Heren NBP Index price for natural gas and the Northwest Europe marker price for coal [15,16].For non-fuel minerals the authors considered a range. The lower boundary is calculated assumingthat coal is used to re-concentrate mineral capital. The upper boundary calculates with electricity.Electricity prices were obtained from the national statistics services of both respective countries.
The minerals considered are presented in Table 1. The detailed methodology for obtaining thenon-fuel mineral data, included in this table, is described in [17]. In the case of fossil fuels, since oncethey are consumed and burned they cannot be replaced, their exergy content corresponds to their highheating values [18].
52

Resources 2015, 4, 857–870
Table 1. Exergy replacement costs of the minerals considered in this study [17]).
Substance Mineral OreExergy
ReplacementCosts (GJ/ton)
MineralsAnalysed for
Colombia
MineralsAnalysed for
Spain
Non fuels
Aluminium Gibbsite 627.3 XAntimony Stibnite 474.5 X
Arsenic Arsenopyrite 399.8 XBismuth Bismuthinite 489.2 X
Cadmium Greenockite 5898.4 XChromium Chromite 4.5 X
Cobalt Linaeite 10871.9 XCopper Chalcopyrite 110.4 X X
Fluorspar Fluorite 182.7 XGold Native gold 583668.4 X X
Gypsum Gypsum 15.4 XIron ore Hematite 17.8 X X
Lead Galena 36.6 XLimestone Calcite 2.6 X X
Lithium Li in brines 545.8 XManganese Pyrolusite 15.6 X
Mercury Cinnabar 28,298.0 XMolybdenum Molybdenite 907.9 X
Nickel Pentlandite 761.0 X XPhosphate rock Fluorapatite 0.4 X
Potassium Sylvite 1224.2 XSilicon Quartz 0.7 XSilver Argentite 7371.4 X X
Sodium Halite 44.1 XTin Cassiterite 426.4 X
Titanium Ilmenite 4.5 XUranium Uraninite 901.4 XWolfram Scheelite 7429.3 X
Zinc Sphalerite 24.8 XZirconium Zircon 654.4 X
Fossil fuels
Coal 24.3–31.6 X XNatural Gas 39.4 X X
Oil 44.0–46.3 X X
Data categories include the following: mineral capital loss includes extraction, imports, exportsand recycling for 2011, as a common reference year [19,20].
Colombian data is taken predominately from the Colombian Mining Information System (SIMCO)and Ministry of Mines and Energy (Ministerio de Minas y Energía). Copper recycling was taken fromthe National Register for the Generation of Hazardous Waste (Registro Nacional de Generadores deResiduos Peligrosos). For Spain, the data comes from the Ministry of Industry, Energy and Tourism ofSpain (Ministerio de Industria, Energía y Turismo) and Spanish Statistical Office (Instituto Nacionalde Estadística) The import/export information was taken from the Chamber of Commerce (Cámarade Comercio). Spanish mineral recycling rates were obtained from a report published by the UnitedNations Environment Programme [21]. United States Geological Survey (U.S.G.S.) statistics were usedas supplementary information for both Colombia and Spain [22,23].
The input and output flows were represented in a Sankey diagram to support visualunderstanding. Note, even though recycling can be considered both an input and an output, suchflows, in this case, were considered only as an output, given that the analysis is carried out for a single
53

Resources 2015, 4, 857–870
year and subsequently it is not logical to assume that the amount recycled in that year was producedthat same year.
3. Colombian and Spanish Mineral Resources
3.1. Colombia
In 2011, 40% of Colombian land had either been licensed or solicited for mining concessions [24].Colombia represented the fifth largest economy in Latin America in 2011 [25]. In addition, 11.3% of theGDP corresponded to the mining sector; mineral export specifically, in monetary value, accounted for55% of the country’s total exported goods in 2011 [26].
According to British Petroleum [16], Colombian proven reserves of oil and natural gas bothrepresent 0.1% respectively of the global reserves. Proven coal reserves, meanwhile, correspond to0.8%. In 2011, Colombia was the number one coal producer in Latin America, the tenth producer ofcoal globally and the fourth largest thermal coal exporter [22].
Regarding non-fuel minerals, the country is the number one producer of emeralds in the world,the number one producer of nickel and coal in South America, the only producer of platinum of LatinAmerica and the tenth largest producer of gold in the world. In 2011, non-fuel mineral productionwas led by limestone (97%) and iron (1.2%) followed by nickel, copper, gold, silver and platinum(accounting for 0.9% in total) [27].
3.2. Spain
In 2011, Spain was the third global producer of gypsum and the sixth producer of fluorspar andSpain’s mining and mineral processing industries contributed to 0.8% of Spain’s GDP [23].
According to British Petroleum [16], the country does not have proven reserves of oil nor naturalgas but does have 530 million tonnes of coal reserves, equivalent to less than 0.1% of world coalreserves. Spain has an almost negligible extraction of natural gas and oil, leaving coal as the mostimportant fuel. In 2011, approximately 6.7 million tonnes of anthracite, bituminous and subbituminouscoal were extracted.
The highest level of extraction of any mineral is that of limestone, with 129.6 million tonnesextracted in 2011, a significant amount when compared to the 7.8 million tonnes of gypsum extractedthat same year [28]. Regarding metals, there are still some mines, in the northern and eastern zones ofthe country that extract copper, gold, lead, silver and zinc.
4. Comparative Case Studies: Colombia and Spain
Colombia is investigated due to the national and global developments occurring in its extractiveindustry and its desire to export. Mining and hydrocarbons form an important part of the drive fordevelopment, evidenced by the government’s vision to become a mining nation by 2019 [29]. Spainwas selected following a general analysis of European Union mineral trade, where it was shown be anaverage and representative importing and consuming Member State [30].
4.1. Analysis in Unit Tonnes
4.1.1. Colombia
As seen in Figure 1A, Colombian production and export predominate over imports, recyclingand consumption. Fossil fuel extraction represents 91.2% of the total. Limestone is the second mostextracted mineral, accounting for 8.6%, and contributing, albeit in small quantities, to the exportmarket. The remainder (0.2%) corresponds to iron, nickel, copper, gold, silver and PGM (platinumgroup metals). Fossil fuel imports represent less than 0.01% of the total mineral balance whilst thecontribution of recycling is almost negligible.
54

Resources 2015, 4, 857–870
Figure 1B is obtained upon removing both fossil fuels and limestone data from Figure 1A. It issubsequently much easier to see that there is an appreciable consumption of iron and that nickel is themost important exported metallic mineral. Even when fossil fuels and limestone are removed from theSankey diagram, copper, gold, PGM and silver production is still not large enough to register.
4.1.2. Spain
Figure 1C is the graphical representation of the Spanish mineral balance. Limestone predominatesover the rest of the materials, representing 86%, in mass terms, of the total fuel and non-fuel mineralproduction. Imports represent 19.3% of the global mineral balance, and correspond to that of oil,natural gas and aluminium. Recycling and exports do not play a significant role, accounting foronly 2.6% between them. If, as before with Colombia, data related to fossil fuels and limestoneis removed from Figure 1C, to create Figure 1D, gypsum, salt, potash and feldspar were the mostextracted substances in 2011. Gypsum remains one of the most extracted and exported substances inthe country, although a little more than half of the production is consumed domestically. Metals, suchas aluminium, iron, copper and zinc, are imported.
Figure 1. Sankey diagrams representing mineral balance for the year 2011 expressed in tonnes. (A)Colombian mineral balance; (B) Colombian mineral balance without fossil fuels and limestone; (C)Spanish mineral balance; (D) Spanish mineral balance without fossil fuels and limestone.
4.2. Comparative Analysis in Exergy Replacement Costs
4.2.1. Colombia
If the 2011 mineral balance is represented, not in mass, but instead in ERC terms (Figure 2A), oiland coal remain the most important Colombian commodities. Oil extraction, measured in percentagemass represents 31.1% of the total. This percentage increases to 43.3%, if oil extraction is measuredusing exergy replacement costs. The same thing happens for gas extraction (going from 4.6% to 7.2%),and coal extraction changes too (going from 55.4% to 47.6%). Exports, for their part, correspond to 73%of all mineral resources mined nationally.
55

Resources 2015, 4, 857–870
Figure 2. Sankey diagrams representing mineral balance for 2011 expressed in exergy replacementcosts. (A) Colombian mineral balance; (B) Colombian mineral balance without fossil fuels; (C) Spanishmineral balance; (D) Spanish mineral balance without fossil fuels and limestone.
If fossil fuel data are discarded from the Sankey diagram (to create Figure 2B), the iron ornickel that played an important role in unit mass, become less relevant when considered in exergyreplacement terms. Gold, almost exclusively extracted for the export market, occupies a much moresignificant position. Its mass is almost negligible, but its exergy replacement cost constitutes 35.3% ofthe total, as it requires more energy intensive processes, and thus is more difficult, to concentrate (orre-concentrate) than say limestone, iron or copper. Comparing the average energy intensity of copperand gold, in the former it is 22.2 GJ per tonne, and, in the case of gold, it is 143 GJ per kilo [31,32]. Theimportance of limestone extraction thus decreases. It contributed to 97.7% of the non-fuel mineralmass balance but only 37.8% of the exergy replacement costs. This is caused by the predominance offossil fuel extraction and export, which masks the relevance of other minerals. If fossil fuel data areremoved from the Colombian mineral balance, 0.21% of the total comes from imports, when expressedin tonnes, and 17.58 % when presented as exergy replacement costs. Iron is the most imported metal.
4.2.2. Spain
The significance of both oil and gas imports is identical, whether expressed as exergy replacementcosts (Figure 2C) or mass (Figure 1C). The most striking variation corresponds to limestone. Limestoneextraction measured 86% of the total domestic extraction in mass units but decreases to 23% whenusing exergy replacement costs. Exports correspond to 23% of the total output minerals. Potash,gypsum and salt (halite) are the most exported commodities.
Aluminium, which has the highest level of import and consumption of any metal in Spain,experiences a notable difference. In terms of percentage in tonnes, it contributed little. Representedthrough exergy replacement costs, however, and aluminium accounts for 32% of the total import. If, asbefore, fossil fuels and limestone data are removed from the scenario (Figure 2D), the role of potashand halite in national production and export becomes more apparent.
56

Resources 2015, 4, 857–870
A summary of the percentage total in mass terms and in exergy replacement costs of production,imports, exports, recycling and consumption for both countries can be found in the Table 2.
Table 2. Percentages for production, imports, exports, recycling and consumption. 2011 data expressedin mass terms and in exergy replacement costs for Colombia and Spain.
Balance Stage FlowColombia
(mass)Colombia
(ERC)Spain (mass) Spain (ERC)
Inputs Production 99.98 99.60 61.42 18.92Imports 0.02 0.40 35.58 81.08
OutputsExports 71.57 72.37 8.80 23.01
Recycling <0.01 0.08 1.65 10.02Consumption
(P+I-E-R) 28.42 27.55 89.54 66.97
In both countries, mineral recycling is extremely low, accounting for less than 0.01% and 1.65% inColombia and Spain respectively in mass terms. Comparing the mineral balance in mass terms, onecan see that the Colombian economy is one of export (71.57%). In 2011, 3.9% of its total exports wentto Spain. In the period January to December, Spanish imports of Colombian minerals increased by204.4%, mainly due to fuels and their derived products [33]. In fact, Spain depends almost entirely onimported fossil fuel supply and almost everything that is imported or Spanish produced is consumedwithin the country’s borders.
On comparing the values in mass and exergy replacement costs terms, it becomes clear thatColombian net values remain within the same magnitude. For Spain, the difference between mass andexergy replacement percentages are noticeable, since Spanish mineral imports consist essentially ofthose minerals that require highly energy intensive processes to re-concentrate them from a dispersedstate (i.e., Thanatia) back into the original natural deposit (i.e., the condition of mineral’s existencebefore having been mined).
4.3. Domestic Mineral Resource Dependency Ratio
For Colombia, the domestic mineral resource dependency ratio (DE/DMC), in the case of non-fuelminerals, is greater than one, indicating that the country is self-sufficient for the minerals analysed, asevidenced by Figures 1A and 2A. In the case of I/DMC, Colombia depends on an external supply ofiron, which is subtly identified by the value of exergy replacement costs. For E/DMC, as stated before,gold and nickel were the main minerals exported, and this higher quality, as opposed to quantity, isthe main characteristic reflected in these results.
In the case of Colombian fossil fuels, the DE/DMC ratio, when mass is used, is high. This isbecause, and as aforementioned, Colombia is an exporting country—around 78% of the fossil fuelsextracted in 2011 were sent abroad. The DE/DMC ratio decreases by approximately 20% whenexpressed in exergy replacement costs. As shown in Figure 1A, coal has a significant role in Colombianexports and since all types of coal have lower high heating values than either oil or natural gas, thetotal exergy value is lower than when expressed in mass terms.
Since the order of magnitude is noticeable, and in an effort to maintain representativeness in theresults, the data for non-fuel minerals and fuel minerals has been kept separate, as shown in Table 3.
57
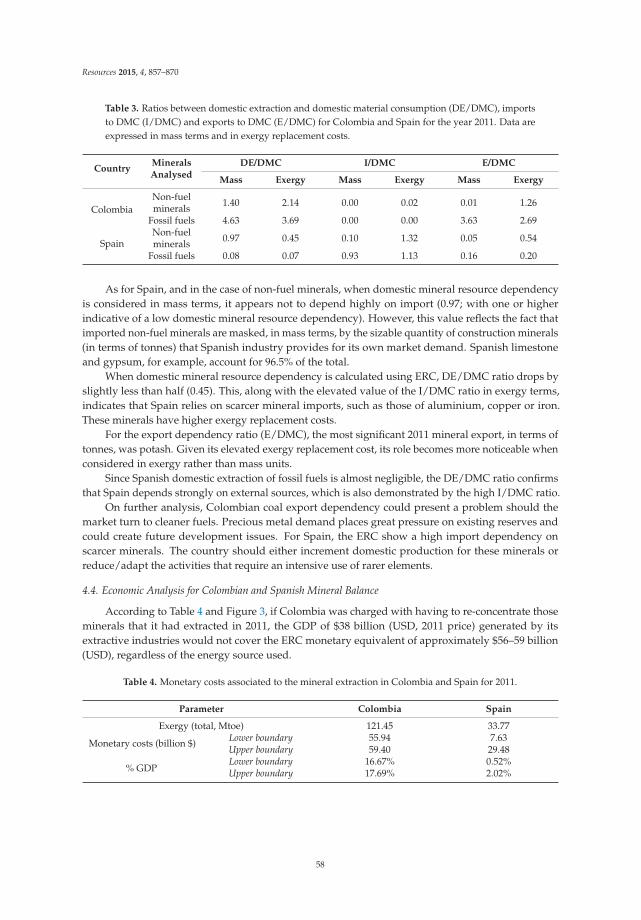
Resources 2015, 4, 857–870
Table 3. Ratios between domestic extraction and domestic material consumption (DE/DMC), importsto DMC (I/DMC) and exports to DMC (E/DMC) for Colombia and Spain for the year 2011. Data areexpressed in mass terms and in exergy replacement costs.
CountryMineralsAnalysed
DE/DMC I/DMC E/DMC
Mass Exergy Mass Exergy Mass Exergy
ColombiaNon-fuelminerals 1.40 2.14 0.00 0.02 0.01 1.26
Fossil fuels 4.63 3.69 0.00 0.00 3.63 2.69
SpainNon-fuelminerals 0.97 0.45 0.10 1.32 0.05 0.54
Fossil fuels 0.08 0.07 0.93 1.13 0.16 0.20
As for Spain, and in the case of non-fuel minerals, when domestic mineral resource dependencyis considered in mass terms, it appears not to depend highly on import (0.97; with one or higherindicative of a low domestic mineral resource dependency). However, this value reflects the fact thatimported non-fuel minerals are masked, in mass terms, by the sizable quantity of construction minerals(in terms of tonnes) that Spanish industry provides for its own market demand. Spanish limestoneand gypsum, for example, account for 96.5% of the total.
When domestic mineral resource dependency is calculated using ERC, DE/DMC ratio drops byslightly less than half (0.45). This, along with the elevated value of the I/DMC ratio in exergy terms,indicates that Spain relies on scarcer mineral imports, such as those of aluminium, copper or iron.These minerals have higher exergy replacement costs.
For the export dependency ratio (E/DMC), the most significant 2011 mineral export, in terms oftonnes, was potash. Given its elevated exergy replacement cost, its role becomes more noticeable whenconsidered in exergy rather than mass units.
Since Spanish domestic extraction of fossil fuels is almost negligible, the DE/DMC ratio confirmsthat Spain depends strongly on external sources, which is also demonstrated by the high I/DMC ratio.
On further analysis, Colombian coal export dependency could present a problem should themarket turn to cleaner fuels. Precious metal demand places great pressure on existing reserves andcould create future development issues. For Spain, the ERC show a high import dependency onscarcer minerals. The country should either increment domestic production for these minerals orreduce/adapt the activities that require an intensive use of rarer elements.
4.4. Economic Analysis for Colombian and Spanish Mineral Balance
According to Table 4 and Figure 3, if Colombia was charged with having to re-concentrate thoseminerals that it had extracted in 2011, the GDP of $38 billion (USD, 2011 price) generated by itsextractive industries would not cover the ERC monetary equivalent of approximately $56–59 billion(USD), regardless of the energy source used.
Table 4. Monetary costs associated to the mineral extraction in Colombia and Spain for 2011.
Parameter Colombia Spain
Exergy (total, Mtoe) 121.45 33.77
Monetary costs (billion $) Lower boundary 55.94 7.63Upper boundary 59.40 29.48
% GDPLower boundary 16.67% 0.52%Upper boundary 17.69% 2.02%
58

Resources 2015, 4, 857–870
Figure 3. Monetary equivalent of ERC and GDP generated by the extractive sector for Colombia (A)and Spain (B) from 2000 to 2012.
For Spain, the contribution of the extractive industry was approximately $11.2 billion (USD). Thisis substantially less than the theoretical amount required to re-concentrate the extracted assets, uponconsidering the upper boundary. This issue appeared in 2009, as studied by Valero et al. [34] whodiscovered that, on average, prices were 39 times lower than what they needed to be in order to reflectthe loss of mineral capital, calculated via exergy replacement costs.
5. Conclusions
A DMC analysis, with exergy replacement costs, makes it possible to evaluate not only thequantity but the quality of international flows transferred between nations. This allows for a morecomplete picture of mineral dependency and sustainable development.
The economic analysis indicates that Colombia would have lost a monetary equivalent of $56 to$59 billion (USD), if it had to re-concentrate its mineral deposits using energy derived from either coalor electricity, a figure higher than the Colombian mining sector’s contribution of $38 billion (USD).Spain’s alleged losses would be considerably lower than Colombia’s but still between $7 and $29billion (USD). That said, given the Spanish reliance on imports, most of the country’s ERC would beallocated to Colombia and the other trade partners, which supply the mineral demand beyond Spain’sown domestic production capabilities.
If exergy replacement costs are considered, the theoretical figures presented in this paper canlink market prices to values that more readily correlate to physical costs. Currently, the fact that thetrue cost of mineral resource extraction is not considered in ERC terms means that current rates ofextraction at 2011 prices are not sustainable.
Acknowledgments: This study has been carried out under the framework of the ENE2014-59933-R project,financed by the Spanish Ministry of Economy and Competitiveness.
Author Contributions: These authors contributed equally to this work.
Conflicts of Interest: The authors declare no conflict of interest.
References
1. Krausmann, F.; Gingrich, S.; Eisenmenger, N.; Erb, K.H.; Haberl, H.; Fischer-Kowalski, M. Growth in globalmaterials use, GDP and population during the 20th century. Ecol. Econ. 2009, 68, 2696–2705. [CrossRef]
2. Eurostat. Glossary: Domestic Material Consumption (DMC). Available online: http://ec.europa.eu/eurostat/statistics-explained/index.php/Glossary:Domestic_material_consumption_(DMC) (accessed on30 October 2015).
59
Resources 2015, 4, 857–870
3. Weisz, H.; Krausmann, F.; Amann, C.; Eisenmenger, N.; Erb, K.H.; Fischer-Kowalski, M.; Hubacek, K.The physical economy of the European Union: Cross-country comparison and determinants of materialconsumption. Ecol. Econ. 2006, 58, 676–698. [CrossRef]
4. Valero, A.; Valero, A.; Calvo, G. Using thermodynamics to improve the resource efficiency indicatorGDP/DMC. Resour. Conserv. Recycl. 2015, 94, 110–117. [CrossRef]
5. British Geological Survey. Risk list 2012. Available online: https://www.bgs.ac.uk/downloads/start.cfm?id=2643 (accessed on 11 November 2015).
6. European Commission. Report on Critical Raw Materials for the EU. Report of the Ad hoc Working Groupon Defining Critical Raw Materials. Available online: https://ec.europa.eu/growth/tools-databases/eip-raw-materials/en/community/document/critical-raw-materials-eu-report-ad-hoc-working-group-defining-critical-raw (accessed on 30 October 2015).
7. Henckens, M.L.C.M.; Driessen, P.P.J.; Worrell, E. Metal scarcity and sustainability, analyzing the necessity toreduce the extraction of scare metals. Resour. Conserv. Recycl. 2014, 93, 1–8. [CrossRef]
8. Valero, A. Thermoeconomics as a conceptual basis for energy-ecological analysis. In Advances in EnergyStudies; Ulgiati, S., Ed.; Musis: Roma, Italy, 1998; pp. 415–444.
9. Ayres, R.U. Eco-thermodynamics: Economics and the second law. Ecol. Econ. 1998, 26, 189–209. [CrossRef]10. Sciubba, E. “Exergo-economics: Thermodynamic foundation for a more rational resource use”. Int. J.
Energy Res. 2005, 29, 613–636. [CrossRef]11. Szargut, J.; Morris, D.R.; Steward, F.R. Exergy Analysis of Thermal, Chemical, and Metallurgical Processes;
Hemisphere Pub. Co.: New York, NY, USA, 1988.12. Valero, A.; Valero, A. From grave to cradle. A thermodynamic approach for accounting for abiotic resource
depletion. J. Ind. Ecol. 2013, 17, 43–52. [CrossRef]13. Valero, A.; Valero, A.; Gómez, J.B. The crepuscular planet. A model for the exhausted continental crust.
Energy 2011, 36, 694–707. [CrossRef]14. Valero, A.; Agudelo, A.; Valero, A. The crepuscular planet. A model for exhausted atmosphere and
hydrosphere. Energy 2011, 36, 3745–3753. [CrossRef]15. BP Global. British Petroleum Statistical Review of World Energy; BP Global: London, UK, June 2012; p. 48.16. BP Global. British Petroleum Statistical Review of World Energy; BP Global: London, UK, June 2014; p. 48.17. Valero, A.; Valero, A. Thanatia: The Destiny of the Earth’s Mineral Resources: A Thermodynamic Cradle-to-Craddle
Assessment; World Scientific Publishing Company: Singapore, 2014.18. Valero, A.; Valero, A. What are the clean reserves of fossil fuels? Resour. Conserv. Recycl. 2012, 68, 126–131.
[CrossRef]19. Carmona, L.G.; Whiting, K.; Valero, A.; Valero, A. Colombian Mineral Resources: An Analysis from a
Thermodynamic Second Law Perspective. Resour. Policy 2015, 45, 23–28. [CrossRef]20. Calvo, G.; Valero, A.; Valero, A.; Carpintero, Ó. An exergoecological analysis of the mineral economy in
Spain. Energy 2015, 88, 2–8. [CrossRef]21. Graedel, T.E.; Allwood, J.; Birat, J.-P.; Reck, B.K.; Sibley, S.F.; Sonnemann, G.; Buchert, M.; Hagelüken, C.
(Eds.) Recycling Rates of Metals—A Status Report. Available online: http://www.unep.org/resourcepanel/Portals/24102/PDFs/Metals_Recycling_Rates_110412-1.pdf (accessed on 11 November 2015).
22. Wacaster, S. United States Geological Survey: 2012 Minerals Yearbook. Available online: http://minerals.usgs.gov/minerals/pubs/country/2012/myb3-2012-co.pdf (accessed on 11 November 2015).
23. Gurmendi, A.C. United States Geological Survey: The mineral industry of Spain (2011). 2013; p. 11.Available online: http://minerals.usgs.gov/minerals/pubs/country/2011/myb3-2011-sp.pdf (accessed on11 November 2015).
24. Sanchez-Garzoli, G. Stopping irreparable harm: Acting on Colombia’s Afro-Colombian and Indigenous CommunitiesProtection Crisis. Available online: http://www.peacebuilding.no/var/ezflow_site/storage/original/application/04fcd8f818b16e1c31c4306ad74dfb70.pdf (accessed on 11 November 2015).
25. Rebossio, A. ¿Cuál es la tercera economía latinoamericana? ¿Y la sexta? El Pais Colombia 23/12/2011.Available online: http://blogs.elpais.com/eco-americano/2011/12/cu%C3%A1l-es-la-tercera-econom%C3%ADa-latinoamericana-y-la-sexta.html (accessed on 11 November 2015).
26. Wacaster, S. United States Geological Survey: 2011 Minerals yearbook, Colombia. Available online: http://minerals.usgs.gov/minerals/pubs/country/2011/myb3-2011-co.pdf (accessed on 11 November 2015).
60

Resources 2015, 4, 857–870
27. Sistema de Información Minero Colombiano (SIMCO). Producción Oficial de Minerales en Colombia.Available online: http://www.simco.gov.co/simco/Estad%C3%ADsticas/Producci%C3%B3n/tabid/121/Default.aspx?PageContentID=99 (accessed on 30 October 2015).
28. Ministerio de Industria, Energía y Turismo. Estadística minera: 2011. Available online: http://www.minetur.gob.es/energia/mineria/Estadistica/2011/anual%202011.pdf (accessed on 11 November 2015).
29. UPME. Colombia País Minero: Plan Nacional para el Desarrollo Minero, Visión 2019. Subdirección dePlaneación Minero. Available online: http://www.upme.gov.co/Docs/PNDM_2019_Final.pdf (accessed on30 October 2015).
30. Calvo, G.; Valero, A.; Valero, A. Material flow analysis for Europe: An exergoecological approach. Ecol. Indic.2016, 60, 603–610. [CrossRef]
31. Mudd, G. Global trends in gold mining towards quantifying environmental and resource sustainability.Resour. Policy 2007, 32, 42–56. [CrossRef]
32. Northey, S.; Haque, N.; Mudd, G. Using sustainability reporting to assess the environmental footprint ofcopper mining. J. Clean. Product. 2013, 40, 118–128. [CrossRef]
33. Departamento Administrativo Nacional de Estadística (DANE). Boletín de prensa: Comercio exterior,exportaciones y balanza comercial de diciembre de 2011. Available online: https://www.dane.gov.co/files/investigaciones/boletines/exportaciones/bol_exp_dic11.pdf (accessed on 11 November 2015).
34. Valero, A.; Carpintero, Ó.; Valero, A.; Calvo, G. How to account for mineral depletion. The exergy andeconomic mineral balance of Spain as a case study. Ecol. Indic. 2014, 46, 548–559. [CrossRef]
© 2015 by the authors. Licensee MDPI, Basel, Switzerland. This article is an open accessarticle distributed under the terms and conditions of the Creative Commons Attribution(CC BY) license (http://creativecommons.org/licenses/by/4.0/).
61

resources
Article
Surplus Cost Potential as a Life Cycle ImpactIndicator for Metal Extraction
Marisa D.M. Vieira 1,2,*, Thomas C. Ponsioen 2, Mark J. Goedkoop 2 and Mark A.J. Huijbregts 1
1 Radboud University Nijmegen, Faculty of Science, Department of Environmental Science, P.O. Box 9010,Nijmegen 6500 GL, The Netherlands; [email protected]
2 PRé Consultants b.v., Stationsplein 121, Amersfoort 3818 LE, The Netherlands;[email protected] (T.C.P.); [email protected] (M.J.G.)
* Correspondence: [email protected]
Academic Editor: Mario SchmidtReceived: 28 October 2015; Accepted: 22 December 2015; Published: 6 January 2016
Abstract: In the evaluation of product life cycles, methods to assess the increase in scarcity ofresources are still under development. Indicators that can express the importance of an increase inscarcity of metals extracted include surplus ore produced, surplus energy required, and surplus costsin the mining and the milling stage. Particularly the quantification of surplus costs per unit of metalextracted as an indicator is still in an early stage of development. Here, we developed a method thatquantifies the surplus cost potential of mining and milling activities per unit of metal extracted, fullyaccounting for mine-specific differences in costs. The surplus cost potential indicator is calculatedas the average cost increase resulting from all future metal extractions, as quantified via cumulativecost-tonnage relationships. We tested the calculation procedure with 12 metals and platinum-groupmetals as a separate group. We found that the surplus costs range six orders of magnitude betweenthe metals included, i.e., between $0.01–$0.02 (iron) and $13,533–$17,098 (rhodium) USD (year 2013)per kilogram of metal extracted. The choice of the reserve estimate (reserves vs. ultimate recoverableresource) influenced the surplus costs only to a limited extent, i.e., between a factor of 0.7 and 3.2 forthe metals included. Our results provide a good basis to regularly include surplus cost estimates asresource scarcity indicator in life cycle assessment.
Keywords: characterization factors; endpoint; life cycle assessment; metals; mining; resource scarcity
1. Introduction
The need for reduction of greenhouse gas emissions will most likely shift energy generation fromfossil fuels to alternative sources of energy such as solar, wind and nuclear power [1]. Renewableenergy production technologies often require significantly more metals in their construction, such ascopper, indium, lead, and molybdenum, compared to fossil energy [2]. It is, therefore, important tounderstand the trade-offs in using different types of mineral, metal, and fossil resources. Life cycleassessment (LCA) is a method that is capable of quantifying trade-offs in terms of potential impacts onhuman health, natural environment and natural resources [3]. Particularly, life cycle impact assessment(LCIA) methods assessing impacts on natural resources are still in an early stage of development [4–6].
Many indicators previously developed for resource use in LCA focused on evaluating theexhaustion of resources in the earth. Tilton [7] defined this as the fixed stock paradigm, whichimplies that resources are limited and will eventually deplete. However, physical availability is mostlikely not the main problem as many metals are not destroyed after their use, but their economicavailability is [8–12]. Even though there may be commodities available to mine in the Earth’s crust, thecost of extraction can be higher than the price consumers are willing to pay [7,9–14]. For fossil resourcesthe same is observed, with costs being the limiting factor for fossil resource extraction [15]. Since
Resources 2016, 5, 2; doi:10.3390/resources5010002 www.mdpi.com/journal/resources62
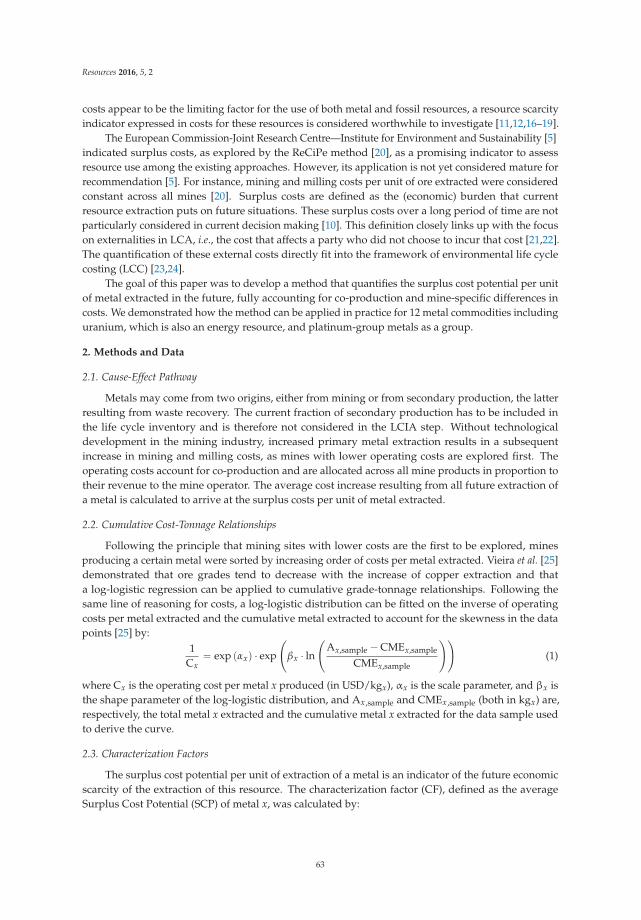
Resources 2016, 5, 2
costs appear to be the limiting factor for the use of both metal and fossil resources, a resource scarcityindicator expressed in costs for these resources is considered worthwhile to investigate [11,12,16–19].
The European Commission-Joint Research Centre—Institute for Environment and Sustainability [5]indicated surplus costs, as explored by the ReCiPe method [20], as a promising indicator to assessresource use among the existing approaches. However, its application is not yet considered mature forrecommendation [5]. For instance, mining and milling costs per unit of ore extracted were consideredconstant across all mines [20]. Surplus costs are defined as the (economic) burden that currentresource extraction puts on future situations. These surplus costs over a long period of time are notparticularly considered in current decision making [10]. This definition closely links up with the focuson externalities in LCA, i.e., the cost that affects a party who did not choose to incur that cost [21,22].The quantification of these external costs directly fit into the framework of environmental life cyclecosting (LCC) [23,24].
The goal of this paper was to develop a method that quantifies the surplus cost potential per unitof metal extracted in the future, fully accounting for co-production and mine-specific differences incosts. We demonstrated how the method can be applied in practice for 12 metal commodities includinguranium, which is also an energy resource, and platinum-group metals as a group.
2. Methods and Data
2.1. Cause-Effect Pathway
Metals may come from two origins, either from mining or from secondary production, the latterresulting from waste recovery. The current fraction of secondary production has to be included inthe life cycle inventory and is therefore not considered in the LCIA step. Without technologicaldevelopment in the mining industry, increased primary metal extraction results in a subsequentincrease in mining and milling costs, as mines with lower operating costs are explored first. Theoperating costs account for co-production and are allocated across all mine products in proportion totheir revenue to the mine operator. The average cost increase resulting from all future extraction ofa metal is calculated to arrive at the surplus costs per unit of metal extracted.
2.2. Cumulative Cost-Tonnage Relationships
Following the principle that mining sites with lower costs are the first to be explored, minesproducing a certain metal were sorted by increasing order of costs per metal extracted. Vieira et al. [25]demonstrated that ore grades tend to decrease with the increase of copper extraction and thata log-logistic regression can be applied to cumulative grade-tonnage relationships. Following thesame line of reasoning for costs, a log-logistic distribution can be fitted on the inverse of operatingcosts per metal extracted and the cumulative metal extracted to account for the skewness in the datapoints [25] by:
1Cx
“ exp pαxq ¨ exp
˜βx ¨ ln
˜Ax,sample ´ CMEx,sample
CMEx,sample
¸¸(1)
where Cx is the operating cost per metal x produced (in USD/kgx), αx is the scale parameter, and βx isthe shape parameter of the log-logistic distribution, and Ax ,sample and CMEx ,sample (both in kgx) are,respectively, the total metal x extracted and the cumulative metal x extracted for the data sample usedto derive the curve.
2.3. Characterization Factors
The surplus cost potential per unit of extraction of a metal is an indicator of the future economicscarcity of the extraction of this resource. The characterization factor (CF), defined as the averageSurplus Cost Potential (SCP) of metal x, was calculated by:
63

Resources 2016, 5, 2
CFx “� MMEx
CMEx,totalCx pMExq dMEx
Rx“
� MMExCMEx,total
Cx pMExq dMEx
MMEx ´ CMEx,total(2)
where Cx is the operating cost determined via the cumulative cost-tonnage curve of metal x foran amount of metal x extracted (MEx), Rx (kgx) is the reserve of metal x, defined as the differencebetween all current known cumulative tonnage of metal x extracted (CMEx ,total) and the globalmaximum tonnage of metal x ever extracted (MMEx). This is illustrated in Figure 1.
Figure 1. Visualization of the derivation of the surplus cost potential following an average approachand a log-logistic cumulative cost-tonnage curve from the current cumulative metal extracted (CMEtotal)up to global maximum metal extracted (MME).
The overall surplus cost potential caused by a product, e.g., production of photovoltaic electricityin Spain, can be calculated by:
ISnr “ÿx
CFx ˆ Mx (3)
where ISnr is the impact score of natural resource extraction per functional unit of the product analyzed,e.g., production of 1 kWh of photovoltaic electricity in Spain (USD/kWh solar electricity); CFx isthe characterization factor for resource x extracted (USD/kgx); and Mx is the amount of resource xextracted per functional unit (e.g., kgx/kWh solar electricity). This impact score is measured at theendpoint level, thus measuring the potential damage caused, and aggregates the impact score ofvarious types of abiotic natural resources, namely metal, mineral, and fossil resources.
2.4. Sensitivity Analysis
Alternative scenarios were calculated and analyzed with regards to the future production ofmetals. Since it is unclear what the exact future production of each metal will be, reserves data wereused. Reserves data are variable because, on the one hand, ores are constantly being explored andthe extraction feasibility may decrease and, on the other hand, new deposits are being discovered orbecome economically viable. To study the uncertainty of the future production of metals two differentreserve estimates were applied. The first type of reserve estimate is the “Reserves (RR)” which isdefined as that part of a mineral resource “which could be economically extracted or produced atthe time of determination”, meaning at current prices, state of technology, etc. [26]. The other typeof reserve estimate, the “ultimate recoverable resource (RURR)”, refers to “the amount available in theupper earth’s crust that is ultimately recoverable”. The definition of ultimate recoverable resource asused by UNEP [27], there called extractable global resource (EGR), was used here. This is assumingthat 0.01% of the total amount in the crust to 3 km depth will ultimately be available.
64

Resources 2016, 5, 2
2.5. Data Selection and Fitting
Characterization factors were derived for copper (Cu), iron (Fe), lead (Pb), manganese (Mn),molybdenum (Mo), nickel (Ni), palladium (Pd), platinum (Pt), rhodium (Rh), silver (Ag), uranium (U),zinc (Zn), and for platinum-group metals (PGM) as a group. Table 1 shows the data for the metalsincluded in the calculation of the characterization factors.
Table 1. Global cumulative extraction and reserve estimates used for deriving the characterizationfactors expressed as surplus cost potential [26–32].
MetalCumulative Metal Extracted Maximum Metal Extracted
CMEtotal (kgx) MMER (kgx) MMEURR (kgx)
Copper 5.92 ˆ 1011 1.28 ˆ 1012 5.22 ˆ 1012
Iron 3.41 ˆ 1013 1.15 ˆ 1014 6.49 ˆ 1015
Lead 2.35 ˆ 1011 3.24 ˆ 1011 3.04 ˆ 1012
Manganese 5.80 ˆ 1011 1.15 ˆ 1012 1.28 ˆ 1014
Molybdenum 6.62 ˆ 109 1.76 ˆ 1010 1.89 ˆ 1011
Nickel 5.53 ˆ 1010 1.29 ˆ 1011 7.82 ˆ 1012
Palladium 5.15 ˆ 106 2.83 ˆ 107 8.25 ˆ 107
Platinum 6.97 ˆ 106 3.82 ˆ 107 1.12 ˆ 108
Rhodium 7.36 ˆ 105 4.04 ˆ 106 1.18 ˆ 107
Silver 1.13 ˆ 109 1.65 ˆ 109 2.11 ˆ 1010
Uranium 2.71 ˆ 109 5.23 ˆ 109 4.33 ˆ 1011
Zinc 4.58 ˆ 1011 7.08 ˆ 1011 1.16 ˆ 1013
Platinum-Group Metals 1.47 ˆ 107 8.07 ˆ 107 2.36 ˆ 108
2.5.1. Cumulative Cost-Tonnage Relationships
To derive log-logistic cumulative cost-tonnage relationships, yearly metal production (in kgx)and mining and milling costs per metal produced data (in USD/kgx) between 2000 and 2013 werepurchased from the World Mine Cost Data Exchange (WMCDE) [33]. The database contained for eachmetal one cost curve per year with production and cost data for each mine. The data used for derivingthe cumulative cost-tonnage relationships are presented in Table S1 in the Supplementary Material.
The log-logistic distribution for each metal was derived as follows:
- Typically, deposits contain various metals but there is often a main metal that justifies theoperation of a mine exploring that deposit. As such, the operating costs of a mine are to beshared by all outputs with a market value. In the World Mine Cost Data Exchange [33], the costswere allocated across all mine products in proportion to their production (monetary) value to themine operator.
- Each table includes data in U.S. dollars valued in the year it represents, e.g., the costs for 2004 areexpressed in constant USD valued in 2004. The CPI Inflation Calculator [34] was used to convertall costs into U.S. dollars for 2013 (USD2013).
- For each mine, the weighted average costs per amount of metal produced, calculated on basis ofthe operating costs per metal in that mine each year and the production tonnages for the sameyears, and the total metal extracted in the period covered for that mine were calculated.
- The mines were then ranked in increasing order of costs per amount of metal extracted and thecumulative metal extracted for each mine was calculated by adding the metal extracted of thatmine to that of all previous mines with lower operating costs.
- A log-logistic fit was applied to the inverted costs for every mine with the software R for statisticalcomputing [35] to derive the scale parameter α and the shape parameter β, including their 95%confidence interval (95% CI). The R square (R2) of the log-logistic fit was also determined. For thederivation of α and β, the total tonnage of metal extracted Ax was set equal to the total metalextracted as reported in the WMCDE database between 2000 and 2012 or 2013, depending on themetal [33].
65

Resources 2016, 5, 2
2.5.2. Characterization Factors
To derive the surplus cost potential per metal x, the cumulative metal extracted up to now(CMEx ,total) is calculated as the total production from Kelly and Matos [28] which contains world mineproduction tonnage since 1900 until 2012 for every metal under study except for uranium. For uranium,data was retrieved from Nuclear Energy Agency and International Atomic Energy Agency [29].
To calculate the maximum amount of metal x extracted (MMEx), global reserve estimates foreach metal are required. As mentioned above, two types of reserves were used: reserves and ultimaterecoverable resource. Reserves were set equal to the global mineral reserves as specified by the U.S.Geological Survey [26]. U.S. Geological Survey [26] estimated the reserves for all metals under study,except for the individual platinum-group metals (PGM) and uranium. For uranium, the global reserves,following the same definition, were taken from Hall and Coleman [30]. Reserves fraction of platinum(47.3%), palladium (35.0%), and rhodium (5.0%) were calculated from data for the three PGM ore typesmined in the Bushveld deposit situated in South Africa which accounts for nearly 90 percent of PGM’sreserves [31].
Schneider et al. [32] estimated the ultimate recoverable resource (URR) for 19 metals and forPGM as a group, eight of which are relevant for this study. The URR data for silver and uranium,following the same definition, was taken from UNEP [27]. The data used for the two types of reservesare presented in Table S2 in the Supplementary Material.
3. Results
3.1. Cumulative Cost-Tonnage Relationships
Figure 2 shows the log-logistic relationships between cumulative extraction of metal x and increasein operating costs per unit of metal x. A number of metals (copper, lead, manganese, molybdenum,nickel, palladium, platinum) and PGM indicate relatively high costs with low production for a fewmines. This can be seen from Figure 2, as a few data points on the right hand side of the curve arealmost in a vertical line, meaning low production tonnage and at the same time substantially highercosts compared to other mines. These costs often result from co-production in which the main metalbeing extracted is another than the one under study. Taking Figure 2a for copper as an example, themine with the highest cost per kilogram of copper extracted is Copper Rand in Canada, with gold andsilver as co-products [33]. Since 2009, this mine has been closed due to high costs in comparison withthe low copper prices [36]. However, if prices rise this mine may be reopened. This effect is in linewith the method here proposed in which mines with lower operating costs per output of metal areextracted first.
The log-logistic fit between costs and cumulative extraction of a metal resulted in explainedvariances between 77% (for palladium) and 97% (for iron, lead, silver, and zinc). Theparameters derived for the log-logistic cost-tonnage relationships are presented in Table S3 in theSupplementary Material.
(a) (b)
Figure 2. Cont.
66
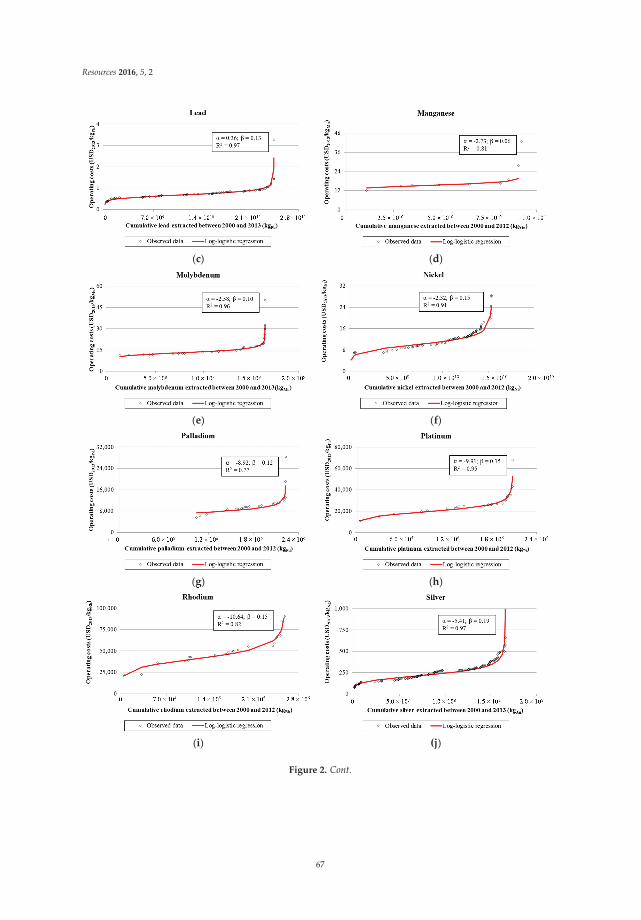
Resources 2016, 5, 2
(c) (d)
(e) (f)
(g) (h)
(i) (j)
Figure 2. Cont.
67

Resources 2016, 5, 2
(k) (l)
(m)
Figure 2. Cumulative cost-tonnage relationships and scale α and shape β derived with the log-logisticdistribution for copper (a), iron (b), lead (c), manganese (d), molybdenum (e), nickel (f), palladium (g),platinum (h), rhodium (i), silver (j), uranium (k), zinc (l), and platinum-group metals (m). The datawere taken from the World Mine Cost Data Exchange [33] for the period from 2000 to 2012/2013.
3.2. Characterization Factors
The characterization factors derived for the metals under study are presented in Figure 3 andcan also be found in Table S4 in the Supplementary Material. The CFs obtained vary up to six ordersof magnitude. Rhodium resulted in the highest CF of $13,533–$17,098 USD2013 per kg of rhodiumextracted, while the lowest CF derived was for iron with $0.01–$0.02 USD2013 per kg of iron extracted.
With the exception of zinc, the surplus cost potentials derived are always largest using ultimaterecoverable resource compared to using the reserves. The CF depends on the combination of the scaleparameter (α), the shape parameter (β), CME, and MME of a metal. It is not necessarily true that thatthe CF gets always higher when MME becomes larger. In fact with very small MME values, so verylow reserves, the starting point of the cumulative cost calculation (CMEtotal) is in the steepest partof the curve and the CFs become very large. This means that getting the last amount of metal out ofthe ground will be very costly. Applying ultimate recoverable resource instead of reserves alwaysresult in a lower fraction mined of the total amount available another working point. For instance,for copper 46% of the total amount is already mined using reserves, while 11% is mined accordingto ultimate recoverable resources. For zinc this is 56% versus 4%. Depending on the shape (β) of thelog-logistic curve (relatively steep for copper and relative shallow for zinc), the increase in costs overthe full amount of metal mined can be larger or lower. In this case, the average steepness of the costcurve for copper is larger for 11% to 100% metal extracted compared to 46% to 100%. In contrast, theaverage steepness of the cost curve for zinc is larger for 56% to 100% metal extracted compared to 4%to 100%.
68

Resources 2016, 5, 2
Figure 3. Characterization factors expressed as surplus cost potential (USD2013/kgx extracted) usingreserves and ultimate recoverable resource as future extraction estimates.
4. Discussion
4.1. Comparison with other Indicators
Although log-logistic functions can be applied to derive both cumulative cost and ore gradecurves, the exact causal relationship between ore grade decrease and surplus costs is unknown asfar as we know of. Though ore grade can be considered as an important factor for determining theoperating costs in a mine [37], other factors that change over time can be important as well. These arefurther discussed in the Limitations section.
For all metals under study the current operating costs were derived, calculated as the weightedaverage operating costs of all mines for 2013 on basis of their yearly production of that metal, from theWorld Mine Cost Data Exchange [33]. Goedkoop and De Schryver [20] derived characterization factorsin the ReCiPe method expressed as surplus costs following a simplified approach of the method hereproposed, e.g., with mining and milling costs per unit of ore considered constant across all mines.Steen [38] derived characterization factors in the method to environmental priority strategies forproduct development (EPS), defined as the costs to be paid to extract the mineral resources usingfuture technologies. For this method, a market scenario was created, where all future generations areincluded and are imagined to bid on the present abiotic stock reserves [38]. All three monetary resultsper metal can be seen in Table S5 in the Supplementary Material.
In Figure 4, the current operating costs, the CFs derived in the ReCiPe method with 3%discounting, and the CFs derived in the EPS method are compared to the CFs here derived usingreserves as reserve estimate. For all metals except for zinc, the current operating costs are larger thanthe surplus costs derived here. There is a factor difference of between 0.7 for zinc and a factor ofabout 16 for manganese. From the log-linear regression in Figure 4, it can be seen that the surpluscost potentials will be about 5.6 (equal to the intercept of the regression) times lower than its currentoperating costs.
According to the log-linear regression derived in Figure 4 the CFs here derived give typicallya factor of 1.3 lower CFs compared to the ReCiPe method with a coefficient of determination (R2) of0.81. Note that for individual metals, the differences between the two methods can be much larger, i.e.,a factor of seven lower for molybdenum and a factor of 57 higher for zinc in our study compared tothe Goedkoop and De Schryver [20] method.
Compared to the EPS method, the CFs derived here give on average a factor of 126 lower witha coefficient of determination (R2) of 0.88 (see log-linear regression in Figure 4). The differences
69

Resources 2016, 5, 2
between the CFs derived by each method for individual metals can differ to up to four orders ofmagnitude, i.e., a factor of four for manganese and of 4 ˆ 103 for palladium.
Figure 4. Log-linear relationship between the characterization factors (SCP) here derived, currentoperating costs [33], the CFs derived in the ReCiPe method [20], and the CFs derived in the EPSmethod [38]. Both axis are presented in logarithmic scale.
4.2. Limitations
Although we improved the surplus cost calculations of metals compared to current practice,there are still limitations in our calculations as we assumed that costs increase with the increaseof metal extracted without explicitly considering the mine type, ore type, new discoveries andtechnological developments. Currently, open pit mining is preferred due to lower operational costseven though underground mines often contain higher metal grades [39–41]. As open pit mines willmost likely become depleted in the future, a shift towards underground mining is likely to occur.Gerst [42] estimated that mining operations have to become deeper than the current open pit miningoperations. Furthermore, different ores have different characteristics and moving from one to theother may result in substantially different mining conditions and, as a result, in different operatingcosts [43]. The cost and tonnage data used to derive the cumulative cost-tonnage curves, however,does not contain information on the mine type and ore type. This is why we did not separatelyderive cumulative cost-tonnage curves for open pit and underground mines and different ore typesin our study. Additionally, there is evidence of overall reduction in mining costs per amount ofore extracted due to technological advances in the mining sector [39,44]. For instance, mines havebeen increasing in size and the larger the mine size the lower the costs per output extracted dueto economies of scale [39,45]. Since we used actual cost data, difference in mine sizes and otherdifferences in technological developments are included in the cumulative cost-tonnage relationshipsderived. However, the time frame covered by the data is relatively short (13 years). Mining cost dataover a longer period of time for deriving the cumulative cost-tonnage relationships would thereforebe desirable.
Finally, the method here proposed also assumes that mines with lower operating costs per mineoutput are mined first. However, there may be both mines with high and low costs operating at thesame time and this may be justified by higher metal prices.
70

Resources 2016, 5, 2
5. Conclusions
In this paper, we demonstrated how characterization factors for resource scarcity can be derived,reflecting the surplus cost potential due to a unit increase in metal extraction. Although the surplus costindicator we propose is measured in monetary units, the surplus cost potential is about quantifyingexternalities and not about current economic costs as such. The surplus costs are an (economic)burden that we put on future generations resulting from a decrease in highly concentrated andeasily accessible resources and can be used in environmental LCC. Our results emphasize theimportance of (1) metal-specific cumulative cost-tonnage relationships and (2) future metal extractionestimates. Additional cost and mining data is required to expand the method to include other mineralcommodities in evaluating scarcity of mineral commodities in an LCA context.
Acknowledgments: The research was funded by the European Commission under the 7th framework program onenvironment; ENV.2009.3.3.2.1: LC-IMPACT—Improved Life Cycle Impact Assessment methods (LCIA) for bettersustainability assessment of technologies, grant agreement number 243827. M. Vieira was further supported by theDutch National Institute for Public Health and the Environment RIVM-project S/607020, Measurably Sustainablewithin the spearhead Healthy and Sustainable Living Environment, commissioned by the Director-General ofRIVM, and run under the auspices of RIVM’s Science Advisory Board.
Author Contributions: Marisa Vieira is the main author and is responsible for gathering the data and performingthe analysis described in this paper. Thomas Ponsioen assisted with the regression analysis. Mark Goedkoophelped to define the research questions. Mark Huijbregts guided the worked, contributed to the interpretation ofthe results and suggested revisions to original text.
Conflicts of Interest: The authors declare no conflict of interest.
References
1. Kleijn, R. Materials and Energy: A Story of Linkages. Ph.D. Thesis, Leiden University, Leiden,The Netherlands, 5 September 2012.
2. Kleijn, R.; van der Voet, E.; Kramer, G.J.; van Oers, L.; van der Giesen, C. Metal requirements of low-carbonpower generation. Energy 2011, 36, 5640–5648. [CrossRef]
3. Guinée, J.B.; Gorrée, M.; Heijungs, R.; Huppes, G.; Kleijn, R.; de Koning, A.; van Oers, L.;Wegener Sleeswijk, A.; Suh, S.; Udo de Haes, H.A.; et al. Handbook on Life Cycle Assessment. Operational Guideto the ISO Standards. I: LCA in Perspective. IIa: Guide. IIb: Operational annex. III: Scientific Background; KluwerAcademic Publishers: Dordrecht, The Netherlands, 2002.
4. Steen, B. Abiotic resource depletion: Different perceptions of the problem with mineral deposits. Int. J. LifeCycle Assess. 2006, 11, 49–54. [CrossRef]
5. European Commission-Joint Research Centre-Institute for Environment and Sustainability. InternationalReference Life Cycle Data System (ILCD) Handbook—Recommendations for Life Cycle Impact Assessment in theEuropean Context, 1st ed.; Publications Office of the European Union: Luxemburg, 2011.
6. Klinglmair, M.; Sala, S.; Brandão, M. Assessing resource depletion in LCA: A review of methods andmethodological issues. Int. J. Life Cycle Assess. 2014, 19, 580–592. [CrossRef]
7. Tilton, J.E. Exhaustible resources and sustainable development: Two different paradigms. Resour. Policy 1996,22, 91–97. [CrossRef]
8. Sonnemann, G.; Gemechu, E.D.; Adibi, N.; de Bruille, V.; Bulle, C. From a critical review to a conceptualframework for integrating the criticality of resources into Life Cycle Sustainability Assessment. J. Clean Prod.2015, 94, 20–34. [CrossRef]
9. Tilton, J.E. Depletion and the long-run availability of mineral commodities. In International Institutefor Environment and Development, Prepared for Workshop on the Long-Run Availability of MineralCommodities Sponsored by the Mining, Minerals and Sustainable Development Project and Resources for theFuture. Washington, DC, USA, 22–23 April 2001. Available online: http://pubs.iied.org/pdfs/G01035.pdf(accessed on 8 July 2013).
10. Tilton, J.E. On borrowed time? In Assessing the Threat of Mineral Depletion; Resources for the Future:Washington, DC, USA, 2002.
71
Resources 2016, 5, 2
11. Vieira, M.D.M.; Storm, P.; Goedkoop, M.J. Stakeholder Consultation: What do decision makers in publicpolicy and industry want to know regarding abiotic resource use? In Towards Life Cycle SustainabilityManagement; Finkbeiner, M., Ed.; Springer: Berlin, Germany, 2011; pp. 27–34.
12. Drielsma, J.A.; Russel-Vaccari, A.J.; Drnek, T.; Brady, T.; Weihed, P.; Mistry, M.; Perez Simbor, L. Mineralresources in life cycle impact assessment—Defining the path forward. Int. J. Life Cycle Assess. 2016, 21,85–105. [CrossRef]
13. Backman, C.-M. Global Supply and Demand of Metals in the Future. J. Toxicol. Environ. Health A 2008, 71,1244–1253. [CrossRef] [PubMed]
14. Giurco, D.; Evans, G.; Cooper, C.; Mason, L.; Franks, D. Mineral Futures Discussion Paper:Sustainability Issues, Challenges and Opportunities. 2009. Available online: http://www.csiro.au/Organisation-Structure/Flagships/Minerals-Down-Under-Flagship/mineral-futures/mineral-futures-collaboration-cluster/minerals-futures-discussion-paper.aspx (accessed on 22 August 2012).
15. International Energy Agency. World Energy Outlook. International Energy Agency, 2011. Availableonline: http://www.iea.org/publications/freepublications/publication/WEO2011_WEB.pdf (accessed on22 November 2013).
16. Meadows, D.; Randers, J.; Meadows, D. Limits to Growth—The 30 Year Update; Earthscan: London, UK, 2005.17. Tilton, J.E.; Lagos, G. Assessing the long-run availability of copper. Resour. Policy 2007, 32, 19–23. [CrossRef]18. Schneider, L.; Berger, M.; Schüler-Hainsch, E.; Knöfel, S.; Ruhland, K.; Mosig, J.; Bach, V.; Finkbeiner, M. The
economic resource scarcity potential (ESP) for evaluating resource use based on life cycle assessment. Int. J.Life Cycle Assess. 2014, 19, 601–610. [CrossRef]
19. Ponsioen, T.C.; Vieira, M.D.M.; Goedkoop, M.J. Surplus cost as a life cycle impact indicator for fossil resourcescarcity. Int. J. Life Cycle Assess. 2014, 19, 872–881. [CrossRef]
20. Goedkoop, M.; de Schryver, A. Mineral Resource Depletion. In ReCiPe 2008: A life cycle impact assessmentmethod which comprises harmonised category indicators at the midpoint and the endpoint level. In Report I:Characterisation Factors, 1st ed.; Goedkoop, M., Heijungs, R., Huijbregts, M.A.J., de Schryver, A., Struijs, J.,van Zelm, R., Eds.; Ministerie van Volkhuisvesting, Ruimtelijke Ordening en Milieubeheer: Den Haag,The Netherlands, 2009; pp. 108–117.
21. Dahlman, C.J. The problem of externality. J. Law Econ. 1979, 22, 141–162. [CrossRef]22. Weidema, B.P. Using the budget constraint to monetarise impact assessment results. Ecol. Econ. 2009, 68,
1591–1598. [CrossRef]23. Hunkeler, D., Lichtenvort, K., Rebitzer, G., Eds. Environmental Life Cycle Costing; Society of Environmental
Toxicology and Chemistry (SETAC): New York, NY, USA, 2008.24. Hochschorner, E.; Noring, M. Practitioners’ use of life cycle costing with environmental costs—A Swedish
study. Int. J. Life Cycle Assess. 2011, 16, 897–902. [CrossRef]25. Vieira, M.D.M.; Goedkoop, M.J.; Storm, P.; Huijbregts, M.A.J. Ore Grade Decrease As Life Cycle Impact
Indicator for Metal Scarcity: The Case of Copper. Environ. Sci. Technol. 2012, 46, 12772–12778. [CrossRef][PubMed]
26. U.S. Geological Survey. Mineral Commodity Summaries 2014; U.S. Geological Survey: Reston, VA, USA,2014. Available online: http://minerals.usgs.gov/minerals/pubs/mcs/2014/mcs2014.pdf (accessed on3 October 2014).
27. UNEP. Estimating Long-Run Geological Stocks of Metals; UNEP International Panel on Sustainable ResourceManagement, Working Group on Geological Stocks of Metal: Paris, France, 2011. Available online:http://www.unep.org/resourcepanel/Portals/24102/PDFs/GeolResourcesWorkingpaperfinal040711.pdf(accessed on 24 December 2015).
28. Kelly, T.D.; Matos, G.R. Historical Statistics for Mineral and Material Commodities in the United States (2014Version). Available online: http://minerals.usgs.gov/minerals/pubs/historical-statistics/ (accessed on12 November 2014).
29. Nuclear Energy Agency and International Atomic Energy Agency (NEA-IAEA). Uranium 2014:Resources, Production and Demand, NEA No. 7209. Available online: http://www.oecd-nea.org/ndd/pubs/2014/7209-uranium-2014.pdf (accessed on 12 November 2014).
30. Hall, S.; Coleman, M. Critical Analysis of World Uranium Resources; U.S. Scientific Investigations Report2012–5239; U.S. Geological Survey: Reston, VA, USA, 2012.
72
Resources 2016, 5, 2
31. Pincock, Allen and Holt. The Processing of Platinum Group Metals (PGM)—Part 1. Pincock Perspectives 89,March 2008. Available online: http://www.pincock.com/perspectives/Issue89-PGM-Processing-Part1.pdf(accessed on 5 November 2012).
32. Schneider, L.; Berger, M.; Finkbeiner, M. Abiotic resource depletion in LCA—Background and update of theanthropogenic stock extended abiotic depletion potential (AADP) model. Int. J. Life Cycle Assess. 2015, 20,709–721. [CrossRef]
33. World Mine Cost Data Exchange. Cost Curves. Available online: http://www.minecost.com/curves.htm(accessed on 2 July 2014).
34. Bureau of Labor Statistics. CPI Inflation Calculator. Available online: http://www.bls.gov/data/inflation_calculator.htm (accessed on 9 July 2014).
35. R Development Core Team. R: A Language and Environment for Statistical Computing, Version3.0.1 (2013–05–16). R Foundation for Statistical Computing: Vienna, Austria, 2013. Available online:http://www.R-project.org (accessed on 1 November 2013).
36. Coulas, M. Copper. In Canadian Minerals Yearbook 2008; Birchfield, G., Trelawny, P., Eds.; NaturalResources Canada: Vancouver, Canada, 2008. Available online: http://www.nrcan.gc.ca/mining-materials/markets/canadian-minerals-yearbook/2008/commodity-reviews/8522?destination=node/3012(accessed on 3 September 2014).
37. Philips, W.G.B.; Edwards, D.P. Metal prices as a function of ore grade. Resour. Policy 1976, 2, 167–178.[CrossRef]
38. Steen, B. A Systematic Approach to Environmental Priority Strategies in Product Development (EPS). Version2000—Models and Data of the Default Method; Chalmers University of Technology: Göteburg, Sweden, 1999.
39. Crowson, P. Mine size and the structure of costs. Resour. Policy 2003, 29, 15–36. [CrossRef]40. Rudenno, V. The Mining Valuation Handbook: Mining and Energy Valuation for Investors and Management, 4th ed.;
John Wiley & Sons Australia: Brisbane, Australia, 2012.41. Swart, P.; Dewulf, J. Quantifying the impacts of primary metal resource use in life cycle assessment based on
recent mining data. Resour. Conserv. Recycl. 2013, 73, 180–187. [CrossRef]42. Gerst, M.D. Linking Material Flow Analysis and Resource Policy via Future Scenarios of In-Use Stock:
An Example for Copper. Environ. Sci. Technol. 2009, 43, 6320–6325. [CrossRef] [PubMed]43. Gerst, M.D. Revisiting the cumulative grade-tonnage relationship for major copper ore types. Econ. Geol.
2008, 103, 615–628. [CrossRef]44. Reynolds, D.B. The mineral economy: How prices and costs can falsely signal decreasing scarcity. Ecol. Econ.
1999, 31, 155–166. [CrossRef]45. Mudd, G. An analysis of historic production trends in Australian basic metal mining. Ore Geol. Rev. 2007, 32,
227–261. [CrossRef]
© 2016 by the authors. Licensee MDPI, Basel, Switzerland. This article is an open accessarticle distributed under the terms and conditions of the Creative Commons Attribution(CC BY) license (http://creativecommons.org/licenses/by/4.0/).
73

resources
Article
Resource Efficiency Assessment—Comparing aPlug-In Hybrid with a ConventionalCombustion Engine
Martin Henßler 1,*, Vanessa Bach 2,*, Markus Berger 2, Matthias Finkbeiner 2 and
Klaus Ruhland 1
1 Group Environmental Protection, Daimler AG, Stuttgart 70546, Germany; [email protected] Chair of Sustainable Engineering, Technische Universität Berlin, Straße des 17. Juni 135, Berlin 10623,
Germany; [email protected] (M.B.); [email protected] (M.F.)* Correspondence: [email protected] (M.H.), [email protected] (V.B.);
Tel.:+49-30-314-27941 (V.B.)
Academic Editor: Mario SchmidtReceived: 22 October 2015; Accepted: 22 December 2015; Published: 21 January 2016
Abstract: The strong economic growth in recent years has led to an intensive use of natural resources,which causes environmental stress as well as restrictions on the availability of resources. Therefore, amore efficient use of resources is necessary as an important contribution to sustainable development.The ESSENZ method presented in this article comprehensively assesses a product’s resource efficiencyby going beyond existing approaches and considering the pollution of the environment as well as thephysical and socio-economic availability of resources. This paper contains a short description of theESSENZ methodology as well as a case study of the Mercedes-Benz C-Class (W 205)—comparing theconventional C 250 (petrol engine) with the C 350 e Plug-In Hybrid (electric motor and petrol engine).By applying the ESSENZ method it can be shown that the use of more and different materials forthe Plug-In-Hybrid influences the dimensions physical and socio-economic availability significantly.However, for environmental impacts, especially climate change and summer smog, clear advantagesof the C 350 e occur due to lower demand of fossil energy carriers. As shown within the case study,the when applying the ESSENZ method a comprehensive evaluation of the used materials and fossilenergy carriers can be achieved.
Keywords: resource efficiency; life cycle assessment; physical availability; socio-economic availability;environmental impact
1. Introduction
The demand of abiotic resources like metals, or fossil fuels has increased significantly in recentdecades due to the global industrial and technological development. Additionally, the pollution ofnatural resources like water has risen as well. As these patterns of resource consumption will lead toan exceedance of the sustainable capacity of ecosystems worldwide, enhancing resource efficiency is akey goal of national and international strategies (e.g., [1,2]).
There is no commonly accepted definition of the term “resources” yet. Often it is defined asmaterials and energy as well as knowledge, services, or staff. With regard to the assessment ofefficiency of a resource the term is mostly used evaluating the use of minerals, metals, and fossil energycarriers [2–5]. The Strategy on the sustainable use of natural resources [6] includes the environment inthe definition as well, leading to a more comprehensive view of resources.
Resource efficiency is mostly regarded as a macro economic strategy because resources arekey components of every society to sustain production and the wellbeing of current and future
Resources 2016, 5, 5; doi:10.3390/resources5010005 www.mdpi.com/journal/resources74

Resources 2016, 5, 5
generations [5,7]. However, often resource efficiency is implemented on a micro economic level e.g., byreducing material inputs. Thus, measuring resource efficiency in a methodologically correct yetapplicable way on a product level enables companies to address scarcity of resources and decreaseenvironmental impacts on a corporate level.
Evaluating the resource efficiency of products can be established by the ESSENZ method(Integrated method to assess/measure resource efficiency) [8–11].
In the following sections, the applied ESSENZ method is introduced as well as the subjects of thecase study. Results are shown for the individual dimensions as well as for the summarized results.
2. Method
In cooperation with TU Berlin (Chair of Sustainable Engineering), Daimler AG, DeutschesKupferinstitut Berufsverband e. V., Evonik Industries AG, Siemens AG, ThyssenKrupp Steel EuropeAG, and Wissenschaftlicher Gerätebau Dr.-Ing. Herbert Knauer GmbH a comprehensive method hasbeen developed to measure resource efficiency of products. Overall, 18 categories and correspondingindicators were established to enable a holistic assessment of resource efficiency in the context ofsustainable development considering the three dimensions ”physical availability”, “socio-economicavailability”, and “environmental impacts” (Figure 1) [8–11]. Within the ESSENZ approach next tothe environment (including all environmental compartments e.g., water, air, soil), raw materials areconsidered as a resource as well. Even though the developed approach can be applied to all resourcesin theory, practical experience has so far been limited to metals, fossil energy carriers, as well as partsof the environment.
Figure 1. Dimensions and categories to assess resource efficiency within the ESSENZ method.
Existing geological deposits (physical availability) as well as socio-economic factors(socio-economic availability) might be restricting the availability of resources and thus influencing theirsupply security. The physical availability is evaluated by means of the abiotic depletion potential (ADP)indicator (baseline approach—ultimate reserves), which is subdivided to assess resource depletionof raw materials (ADPelemental) and resource depletion of fossil fuels (ADPfossil) [12]. To evaluatethe socio-economic availability of resources, economic constraints leading to supply shortages alongthe product’s value chain are quantified [13]. Possible constraints include, for example, the politicalstability of countries, which can be impaired due to factors such as corruption within the government,disrupting the capacity to effectively implement robust policies [14]. Based on existing work [15–17]11 categories with corresponding category indicators are identified (Table 1). Characterization factorsfor all categories are determined based on the ecological scarcity approach [18,19]. Indicator valuesare compared with regard to a category specific target. These targets have been determined based ona stakeholder survey and expert interviews. Applying normalization and scaling (up to 1.5 ˆ 1019
representing the overall production of all considered materials within the year 2013) the calculation ofthe final characterization factors is concluded. They are provided for a portfolio of 36 metals and four
75

Resources 2016, 5, 5
fossil energy carriers [8–11]. So far, the physical and socio-economic availability of a product can onlybe determined for the BoM of the considered product. Due to the fact that current LCA databases useeconomic allocation to assign metal contents from mixed ores to metal datasets, the mass of metalsin the datasets does not reflect the physically present metal content but rather represents an over- orunderestimation depending on the economic value of the considered metals.
Table 1. Socio-economic categories and related category indicators.
Category Description Category Indicator
Political stability Governance stability of producingcountries World Governance Indicators [14]
Demand growth Increase of demand over the lastfive years
Percentage of annual growthbased on past developments(based on data from BritishGeological Service [20])
Companion metal Companion metals within host metalore bodies
Percentage of production ascompanion metal [21]
Primary material use Recycling content of a material Percentage of new materialcontent [22]
Mining capacities Overall mining time of a materialconsidering current production
Reserve-to-annual-productionratio (based on data from UnitedStates Geological Service [23] andBritish Geological Service [20])
Company concentration Company concentration based onproducing companies
HHI(1)—index is calculated bysquaring the market share of eachcompany or country with regardto the production or reserves [24]
Concentration of reservesReserve concentration of certainmaterials based on reservesin countries
Concentration of production Concentration of mine productionbased on production in countries
Trade barriers Materials underlying trade barriers Enabling Trade Index [25]
Feasibility ofexploration projects
Political and societal factorsinfluencing opening of mines Policy Potential Index [26]
Price fluctuation Unexpected price fluctuations Volatility [27]
Note: (1) HHI: Herfindahl-Hirschman-Index.
For determining impacts of resource use on the environment five different indicators are appliedusing the CML-IA impact assessment method (CML 2001—Version: April 2013, baseline approach) [28]for the subjects’ climate change, acidification, eutrophication, ozone layer depletion, and summersmog. The considered environmental impact categories as well as methods are chosen based on theirapplicability and maturity [29]. Thus, biodiversity and land use are not included as no adequate andapplicable methods exist so far [30].
For an overall result regarding the resource efficiency of a product system the consideredcategories are analyzed together to achieve a comprehensive evaluation enabling meaningful decisionmaking [8–11].
3. Case Study of Mercedes-Benz C-Class
In the following section, the resource efficiency assessment according to the ESSENZ methodis presented for the example of the C-Class (W 205). The study compares the conventional C 250(petrol engine) with the C 350 e Plug-In Hybrid (electric motor and petrol engine). First, in Section 3.1
76

Resources 2016, 5, 5
technical data and a detailed analysis of materials for the considered passenger cars are provided.Results of the resource efficiency assessment with the ESSENZ method are shown in Section 3.2.
3.1. Product Documentation of the C 250 and C 350 e
This section documents significant specifications of the different variants of the C-Class analyzedin this study. Section 3.1.1. provides an overview of the technical data of the C 250 and C 350 e.The material composition is discussed in Section 3.1.2.
3.1.1. Technical Data
The Plug-In Hybrid model in the current C-Class, the C 350 e, combines a 60 kW electric motorand an externally rechargeable battery with a four-cylinder petrol engine with 155 kW (Table 2).The high voltage lithium-ion battery of the C 350 e has an energy content of 6.38 kWh. With theaid of the synchronous electric motor, the C 350 e has an all-electric range of 31 km. The certifiedcombined consumption according to the New European Driving Circle (NEDC) of the C 350 e is 2.1 land 11.0 kWh per 100 kilometer (ECE-R101). This corresponds to CO2-emissions of 48 g/km.
Table 2. Technical data of C 250 and C 350 e [31].
Technical Data C 250 C 350 e
Weight (kg) 1435 1 1705Output (kW) 155 155 + 60 (electric motor)
Fuel consumption NEDC 2 combined (l/100 km) 5.3 2.1Electric energy consumption NEDC 2 combined (kWh/100 km) - 11.0
Electric range (km) - 31Driving share petrol engine (%) 100 45 3
Driving share electric motor (%) - 55 3
CO2 (g/km) 123 48
Notes: 1 Comparably equipped as C 350 e; 2 NEDC: New European Driving Circle; 3 Determination of electricdriving share according to type approval directive ECE-R101; percentages related to driving distance.
The C 250 is powered by the 155 kW four-cylinder petrol engine (Table 2). The fuel consumptionis 5.3 l/100 km (NEDC). This causes CO2-emissions of 123 g/km which are more than twice as high asthe CO2-emissions of the C 350 e.
The C 250 and the C 350 e can be assumed to be functionally equivalent as they have similardriving performance as well as safety and comfort features (Table 2). The use phase is calculated onthe basis of a mileage of 200,000 km. The key components of both vehicles (incl. battery) do not requirereplacement over the life cycle.
3.1.2. Material Composition
The weight and material data for the C 250 and C 350 e are determined on the basis of internaldocumentation of the components used in the vehicle (parts list, drawings). The kerb weight accordingto DIN 70020 (without driver and luggage, fuel tank 90 percent full) serves as a basis for the life cycleassessment (LCA). Figure 2 shows the material composition of the C 250 and C 350 e.
The weight of the C 250 is 1435 kg. The weight of the C 350 e is 1705 kg and thus 270 kg heavier thanthe C 250. Steel/ferrous materials account for slightly less than half the vehicle weight (approximately47 percent) in both cars. The next largest shares are light alloys at 21 percent and polymer materialsat 19 (C 250) and 21 percent (C 350 e). Service fluids and other metals comprise around 5 (C 350 e)and 6 percent (C 250); and 2 (C 250) and 5 percent (C 350 e), respectively. The proportions of othermaterials are somewhat lower, at about 4 percent.
77

Resources 2016, 5, 5
Figure 2. Material composition of C 250 and C 350 e [31].
Figure 3 shows the main differences in weight and material mix in the modules exterior, interior,chassis, powertrain, and electric comparing the C 350 e with the C 250. The biggest difference canbe found regarding electric constituents. Due to the hybrid components, especially the high voltagebattery, the power electronics, and the cabling, the additional weight is about 140 kg. In the powertrain,an extra weight of about 76 kg is derived primarily from the electric motor. Larger breaks and tires aswell as air suspension cause an extra weight of the chassis of about 66 kg. The weight of the exterioris about 25 kg higher due to the high voltage crash package of the battery. The alternative drivecomponents and the related mix of materials—especially the material group of other metals—used inthe C 350 e change the weight substantially compared to the conventional C-Class.
Figure 3. Main weight differences—C 350 e compared to the C 250.
3.2. Assessment of Different Resource Efficiency Dimensions Considered in the ESSENZ Method
The ESSENZ method described in Section 2 was applied, leading to the following results regardingphysical availability (Section 3.2.1.), socio-economic availability (Section 3.2.2.), and environmentalimpacts (Section 3.2.3.). The section concludes by summarizing the results of all considered dimensionsof the C 250 compared to the C 350 e (Section 3.2.4.).
For the C 350 e, two energy consumption scenarios for the use phase are considered. In additionto the EU electricity grid mix, electricity from hydro power is accounted for. The results of theuse phase (electricity generation, fuel production, and operation) are based on the certified NEDCelectricity/fuel consumption and the certified specific emissions of each car via a mileage of 200,000 km.The study includes environmental impacts of the recovery phase on the basis of the standard processes
78

Resources 2016, 5, 5
of drainage, shredding, and recovery of energy from the shredder light fraction. Environmental creditsare not considered.
3.2.1. Physical Availability
Figure 4 shows the results for the category abiotic resource depletion (quantified by ADPelementalin kg Sbeq and ADPfossil in GJ). For the calculation of the ADPelemental only the BoM of the vehicleis taken into account since no consistent background data for the whole supply chain are availableandno materials are required in the use phase. Assessing resource depletion of fossil energy carriers(ADPfossil) the whole life cycle (car production, fuel production, operation, electricity generation, andend of life) of the vehicle is included. The additional hybrid-specific components (Section 3.1.2.) leadto a higher resource depletion potential of metals for the C 350 e, which is about 170 percent higher(0.63 kg Sbeq) compared to the C 250 (0.23 kg Sbeq).
Figure 4. ADPelemental and ADPfossil—C 250 compared to the C 350 e.
The abiotic depletion potential (ADPfossil) of the C 350 e with electricity from hydro power is40 percent lower (205.6 GJ) than of the C 250 (511 GJ—comprised of 385.6 GJ crude oil, 78.8 GJ naturalgas, 34.6 GJ hard coal, and 12.7 GJ lignite). Due to additional hybrid-specific components in the carproduction and the generation of electricity during the operation phase, the consumption of natural gas,hard coal, and lignite rises for the C 350 e using EU electricity grid mix to 112.9 GJ (natural gas), 84.1 GJ(hard coal), and 41.8 GJ (lignite). Crude oil consumption can be reduced by over 50 percent to 185.6 GJdue to the high efficiency of the Plug-In Hybrid. When the vehicle is charged with renewably generatedelectricity, the consumption of lignite, natural gas, crude oil, and hard coal can be reduced further.
Evaluating the abiotic resource depletion enables a comprehensive assessment of the physicalavailability of metals and fossil energy carriers. Advantages in the production of conventional vehicleconcepts compared to alternative vehicle concepts due to the reduced consumption of materials couldbe shown. Furthermore, alternative engines show benefits in the use phase (electricity generation, fuelproduction, and operation) due to lower fuel consumption.
3.2.2. Socio-Economic Availability
The dimension “socio-economic availability” is quantified by 11 categories (Section 2). Regardingthe socio-economic availability of metals the BoMs of the respective cars are taken into account.As most fossil energy carriers are consumed in the use phase, the whole life cycle is considered whenanalyzing their socio-economic availability. The results of the comparison of C 250 and C 350 e areshown in Figure 5 (C 250 is scaled to 100 percent).
79

Resources 2016, 5, 5
Overall, for the calculation of the socio-economic availability, 33 metals (Section 2) are taken intoaccount in addition to the fossil energy carriers’ lignite, natural gas, crude oil, and hard coal. As shownin Figure 5, the fossil energy carriers have little influence on the 11 categories. Exceptions are “Primarymaterial use“ (19 to 39 percent), “Price fluctuation“ (12 to 28 percent), and “Company concentration”(2 to 5 percent). Due to the higher material consumption of the C 350 e the C 250 performs far betterin all categories except for “Mining capacities”. The source of electricity used to charge the C 350 ehas no impact regarding the socio-economic availability. The C 350 e using EU electricity grid mix isalmost on par with C 350 e using electricity from hydro power—except differences in the categories“Primary material use” and “Price fluctuation” due to higher amounts of used fossil energy carriers(see Section 3.2.1.).
Figure 5. Assessment of the socio-economic availability—C 250 compared to the C 350 e.
The greatest differences between the C 250 and the C 350 e (EU electricity grid mix) occur inthe categories “Primary material use” (+ 150 percent), “Price fluctuation” (+ 93 percent), “Companyconcentration” (+ 45 percent), “Concentration of production” (38 percent), and “Demand growth”(+ 37 percent). Regarding the categories “Demand growth” and “Primary material use”, the differencesare caused by the use of lithium, which is an essential part of the high voltage battery of thePlug-In Hybrid. The categories “Company concentration”, “Concentration of production”, and“Price fluctuation” are primarily affected by rare earth elements, which are mainly required for themagnets of the electric motor.
For the categories “Political stability”, “Companion metal”, “Mining capacities”, “Concentrationof reserves”, “Trade barriers”, and “Feasibility of exploration projects” the C 350 e performs up to26 percent worse than the C 250. These categories are mainly affected by platinum and palladium(exhaust catalyst), magnesium (alloy material), lithium (high voltage battery), rare earth elements(electric motor), and tantalum (condensers).
Overall, it can be concluded that the socio-economic categories in this case study are particularlyaffected by platinum, palladium, magnesium, lithium, rare earth and tantalum. Except for magnesium,all materials occur in the car in very small amounts.
3.2.3. Environmental Impacts
Figure 6 shows the results of the considered environmental categories climate change(CO2eq-emissions), eutrophication (phosphateeq-emissions), acidification (SO2eq-emissions), and
80

Resources 2016, 5, 5
summer smog (etheneeq-emissions) over the individual life cycle phases (car production, fuelproduction, operation, electricity generation, and end of life) of the C 250 and C 350 e.
The production of the C 350 e entails visibly higher CO2eq-emissions on account of the additionalhybrid-specific components. The CO2eq-emissions in the production phase (11.3 t CO2eq) are 32 percenthigher than those of the C 250 (8.6 t CO2eq). Over the entire life cycle the Plug-In Hybrid has clearadvantages as external charging with the EU electricity grid mix can cut overall CO2eq-emissionsby about 13 percent (4.9 t CO2eq) compared to the C 250. A reduction of 39 percent (15.3 t CO2eq) ispossible through the use of renewably generated electricity from hydro power.
Figure 6. Selected environmental categories—C 250 compared to the C 350 e (unit/car) [24].
Considering the category eutrophication, the C 350 e using electricity from hydro power causesthe lowest emissions with 4.9 kg phosphateeq. Charging the C 350 e with EU electricity grid mix thephosphateeq-emissions add up to 7.5 kg phosphateeq, thus being respectively 15 and 53 percent higherthan the phosphateeq-emissions of the C 250 (6.5 kg phosphateeq) or the C 350 e with electricity fromhydro power.
In the production phase of the C 350 e (53.2 kg SO2eq) the SO2eq-emissions are 29 percent higherthan those of the C 250 (41.2 kg SO2eq). In the use phase (electricity generation, fuel production, andoperation) most SO2eq-emissions (65.5 kg SO2eq) are produced during the charging of the vehicle withEU electricity grid mix. Thus, 40 and 76 percent more emissions occur than for the C 250 or the C 350 ewith electricity from hydro power respectivly. Over the entire life cycle, the C 350 e with electricityfrom hydro power saves 42 percent (50.0 kg SO2eq) in comparison to the C 350 e with EU electricitygrid mix and 14 percent (11.6 kg SO2eq) compared to the C 250.
The summer smog emissions during production of the C 350 e (4.7 kg etheneeq) are 36 percenthigher than those of the C 250 (3.4 kg etheneeq). Regarding the use phase (electricity generation, fuelproduction and operation) summer smog emissions can be reduced by 22 percent charging the C 350 ewith EU electricity grid mix respectively by 55 percent using electricity from hydro power comparedto the C 250. The highest summer smog emissions with 12.1 kg etheneeq are caused by the C 250.
81

Resources 2016, 5, 5
Compared to the C 350 e charged with EU electricity grid mix as well as renewable generated electricitysummer smog can be reduced by 5 or 29 percent, translating in a reduction of 11.5 or 8.6 kg etheneeq.
In conclusion, it can be stated that over the entire life cycle the C 350 e using electricity from hydropower has clear benefits in all considered categories (shown in Figure 6) compared to the C 250. If theEU electricity grid mix is used for charging advantages with respect to climate change and summersmog occur. However, with regard to eutrophication and acidification, the C 350 e respectively has15 percent (1.0 kg etheneeq) and 48 percent (38.4 kg SO2eq) more impacts than the C 250.
3.2.4. Summary of the Results
Figure 7 shows the summary of the three dimensions considered in this case study. The referenceC 250 is scaled to 100 percent.
Figure 7. Summary of resource efficiency dimensions of the ESSENZ method—C 250 compared to theC 350 e.
It can be seen that the C 250 performs better within the category abiotic resource depletion ofmetals (ADPelemental) compared to the C 350 e due to its lower overall use of metals. This is alsoreflected in the dimension “socio economic availability”. As the C 250 has a higher fossil energycarrier consumption in the use phase, it performs worse in the category resource depletion of fossilenergy carriers (ADPfossil). Both C 350 e’s have advantages in the use phase (electricity generation,fuel production and operation) due to their lower fuel consumption.
Only minor differences for the dimension “socio-economic availability” as well as the categoryresource depletion of raw materials (ADPelemental) occur when comparing the C 350 e charged withelectricity from hydro power with the C 350 e charged with EU electricity grid mix. The metals usedfor car production influence the categories more significantly than the energy consumption in the usephase. For the category resource depletion of fossil energy carriers (ADPfossil) the C 350 e (electricityfrom hydro power) performs only slightly better.
The results of the environmental impacts measured over the entire life cycle show clear advantagesfor the C 350 e especially for the categories climate change and summer smog, regardless of the kind ofelectricity used for external charging of the Plug-In Hybrid. The results for the categories eutrophicationand acidification, however, depend on the electricity used for charging the vehicle. Using EU electricity
82
Resources 2016, 5, 5
grid mix eutrophying or acidifying emissions of C 350 e are higher than those of C 250. Using electricityfrom hydro power, the eutrophication potential or acidification potential are lower compared to C 250.
4. Conclusions
The ESSENZ method allows a transparent evaluation of product systems with regard to thephysical and socio-economic availability of fossil energy carriers and metals as well as relatedenvironmental impacts over the life cycle.
The case study presented in this article—comparing a plug-in hybrid with a conventionalengine—is a good example of why such a comprehensive assessment is necessary. The higher use ofmaterial resources for the Plug-In Hybrid vehicle has a strong influence on socio-economic and physicalavailability, whereas some of the environmental impact categories (e.g., climate change and summersmog) show clear advantages for the C 350 e due to the lower demand of fossil energy carriers. As aconsequence, it is necessary for a scientifically robust and sustainability oriented resource assessmentto consider both materials and energy resources as well as the whole lifecycle of the product.
The comprehensive ESSENZ method enables the user to transparently evaluate various views onthe multitude of parameters applicable. It further empowers companies to take appropriate actionsregarding the specific materials used in their products, e.g., material specific sourcing strategies ordevelopment of recycling technologies.
Acknowledgments: The paper is based on the project “ESSENZ—Integrierte Methode zur ganzheitlichenBerechnung/Messung von Ressourceneffizienz” which was funded by the German Federal Ministry of Educationand Research (BMBF)—project code number: 033R094A. We would like to thank the Federal Ministry of Educationand Research for their financial support.
Author Contributions: Martin Henßler was the lead in carrying out the case study. Vanessa Bach was leadingin the development of the ESSENZ method. Markus Berger and Matthias Finkbeiner both provided substantialcontributions to the design of the ESSENZ method as well as valuable comments to deepen the conclusion.Klaus Ruhland gave substantial input to the design of the case study as well as valuable comments to draw theconclusion. All authors proofread and approved the final manuscript.
Conflicts of Interest: The authors declare no conflict of interest.
References
1. European Commission. Roadmap to a Resource Efficient Europe; European Commission: Brüssel, Belgium, 2011.2. Bundesregierung Deutschland. Nationale Nachhaltigkeitsstrategie Fortschrittsbericht 2012. Available online:
http://www.bundesregierung.de/Webs/Breg/DE/Themen/Nachhaltigkeitsstrategie/1-die-nationale-nachhaltigkeitsstrategie/nachhaltigkeitsstrategie/_node.html;jsessionid=AB7764D74BA79942AF3B8D330034811D.s3t2 (accessed on 18 January 2016).
3. Ritthoff, M.; Rohn, H.; Liedtke, C. Calculating MIPS—Resource Productivity of Products and Services;Environment and Energy Report; Wuppertal Institute for Climate: Wuppertal, Germany, 2002. Availableonline: http://epub.wupperinst.org/files/1577/WS27e.pdf (accessed on 18 January 2016).
4. European Commission. Resource Efficiency. The Roadmap’s Approach to Resource Efficiency Indicators.Available online: http://ec.europa.eu/environment/resource_efficiency/targets_indicators/roadmap/index_en.htm (accessed on 18 December 2015).
5. Schneider, L.; Bach, V.; Finkbeiner, M. LCA Perspectives for Resource Efficiency Assessment. In Special Typesof LCA; Springer: Berlin, Germany, 2015.
6. Thematic Strategy on the Sustainable Use of Natural Resources. Available online: http://eur-lex.europa.eu/legal-content/EN/TXT/?uri=celex%3A52005DC0670 (accessed on 18 January 2016).
7. Mikesell, R.F. Viewpoint—Sustainable development and mineral resources. Resour. Policy 1994, 20, 83–86.[CrossRef]
8. Bach, V.; Berger, M.; Henßler, M.; Kirchner, M.; Leiser, S.; Mohr, L.; Rother, E.; Ruhland, K.;Schneider, L.; Tikana, L.; et al. Integrierte Methode zur Ganzheitlichen Berechnung/Messung von Ressourceneffizienz(ESSENZ-Methode); Springer, 2016; in press.
83
Resources 2016, 5, 5
9. Bach, V.; Schneider, L.; Berger, M.; Finkbeiner, M. ESSENZ-Projekt: Entwicklung einer Methode zurBewertung von Ressourceneffizienz auf Produktebene. In 3. Symposium Rohstoffeffizienz und Rohstoffinnovation;Fraunhofer Verlag: Stuttgart, Germany, 2014; pp. 463–474.
10. Bach, V.; Schneider, L.; Berger, M.; Finkbeiner, M. Methoden und Indikatoren zur Messung vonRessourceneffizienz im Kontext der Nachhaltigkeit. In Recycling und Rohstoffe; Thome-Kozmiensky, K.J.,Goldmann, D., Eds.; TK Verlag: Neuruppin, Germany, 2014; pp. 87–101.
11. Bach, V.; Berger, M.; Helbig, T.; Finkbeiner, M. Measuring a product’s resource efficiency—A case study ofsmartphones. In Proceedings of the CILCA 2015—VI International Conference on Life Cycle Assessment,Lima, Peru, 13–16 March 2015.
12. Van Oers, L.; de Koning, A.; Guinée, J.B.; Huppes, G. Abiotic Ressource Depletion in LCA ImprovingCharacterisation Factors for Abiotic Resource Depletion as Recommended in the Dutch LCA Handbook, 2002.Available online: http://www.leidenuniv.nl/cml/ssp/projects/lca2/report_abiotic_depletion_web.pdf(accessed on 24 December 2015).
13. Schneider, L.; Berger, M.; Schüler-Hainsch, E.; Knöfel, S.; Ruhland, K.; Mosig, J.; Bach, V.; Finkbeiner, M.The economic resource scarcity potential (ESP) for evaluating resource use based on life cycle assessment.Int. J. Life Cycle Assess. 2014, 19, 601–610. [CrossRef]
14. The World Bank Group. The Worldwide Governance Indicators. Available online: http://info.worldbank.org/governance/wgi/index.aspx#home (accessed on 18 December 2015).
15. Graedel, T.E.; Barr, R.; Chandler, C.; Chase, T.; Choi, J.; Christoffersen, L.; Friedlander, E.; Henly, C.; Jun, C.;Nassar, N.T.; et al. Methodology of metal criticality determination. Environ. Sci. Technol. 2012, 46, 1063–1070.[CrossRef] [PubMed]
16. Schneider, L. A Comprehensive Approach to Model Abiotic Resource Provision Capability in the Context ofSustainable Development. Ph.D. Thesis, Technische Universität Berlin, Berlin, Germany, 6 August 2014.
17. Erdmann, L.; Behrendt, S.; Feil, M. Kritische Rohstoffe für Deutschland “Identifikation aus SichtDeutscher Unternehmen Wirtschaftlich Bedeutsamer Mineralischer Rohstoffe, Deren VersorgungslageSich Mittel-Bis Langfristig als Kritisch Erweisen Könnte”, 2011. Available online: https://www.kfw.de/Download-Center/Konzernthemen/Research/PDF-Dokumente-Sonderpublikationen/Kritische-Rohstoffe-KF.pdf (accessed on 24 December 2015).
18. Frischknecht, R.; Steiner, R.; Jungbluth, N. The Ecological Scarcity Method—Eco-Factors 2006; Federal Office forthe Environment FOEN: Bern, Switzerland, 2009.
19. Müller-Wenk, R.; Ahbe, S.; Braunschweig, A.; Müller-Wenk, R. Methodik für Ökobilanzen auf der Basisökologischer Optimierung; Schriftenreihe Umwelt 133; Bundesamt für Umwelt BAFU (former BUWAL):Bern, Switzerland, 1990.
20. Brown, J.; Wrighto, C.E.; Raycraft, E.R.; Shaw, R.A.; Deady, E.A.; Rippingale, J.; Bide, T.; Idoine, N.World Mineral Production; British Geological Survey: Keyworth, UK, 2014.
21. Angerer, G.; Erdmann, L.; Marscheider-Weidemann, F.; Scharp, M.; Lüllmann, A.; Handke, V.; Marwerde, M.Rohstoffe für Zukunftstechnologien Rohstoffe für Zukunftstechnologien; Fraunhofer IRB Verlag: Stuttgart,Germany, 2009. Available online: http://www.isi.fraunhofer.de/isi-wAssets/docs/n/de/publikationen/Schlussbericht_lang_20090515_final.pdf (accessed on 18 January 2016).
22. Graedel, T.E. UNEP Recycling Rates of Metals—A Status Report; Working Group on the GlobalMetal Flows; International Resource Panel, United Nations Environment Programme: Nairobi,Kenya, 2011. Available online: http://www.unep.org/resourcepanel-old/portals/24102/pdfs/UNEP_report2_Recycling_130920.pdf (accessed on 24 December 2015).
23. United States. Geological. Service (USGS). Commodity Statistics and Information, 2015. Available online:http://minerals.usgs.gov/minerals/pubs/commodity/ (accessed on 20 May 2004).
24. Rhoades, S.A. The Herfindahl-Hirschman index. Fed. Reserv. Bull. 1993, 79, 188.25. Hanouz, M.D.; Geiger, T.; Doherty, S. The Global Enabling Trade Report 2014; World Economic Forum:
Geneva, Switzerland, 2014.26. Cervantes, M.; McMahon, F.; Wilson, A. Survey of Mining Companies: 2012/2013; Fraser Institut:
Vancouver, BC, Canada, 2013.27. Bundesanstalt für Geowissenschaften und Rohstoffe. In Volatilitätsmonitor; Bundesanstalt für
Geowissenschaften und Rohstoffe: Hanover, Germany, 2014.
84

Resources 2016, 5, 5
28. Guinée, J.B.; Gorrée, M.; Heijungs, R.; Huppes, G.; Kleijn, R.; de Koning, A.; van Oers, L.; Sleeswijk, A.W.;Suh, S.; de Haes, H.A.U.; et al. Handbook on Life Cycle Assessment Operational Guide to the ISO Standards;Kluwer Academic Publishers: New York, NY, USA, 2002.
29. Lehmann, A.; Bach, V.; Finkbeiner, M. Product environmental footprint in policy and marketdecisions—Applicability and impact assessment. Integr. Environ. Assess. Manag. 2015. [CrossRef] [PubMed]
30. Finkbeiner, M.; Ackermann, R.; Bach, V.; Berger, M.; Brankatschk, G.; Chang, Y.-J.; Grinberg, M.; Lehmann, A.;Martínez-Blanco, J.; Minkov, N.; et al. Challenges in Life Cycle Assessment: An Overview of Current Gapsand Research Needs. In LCA Compendium—The Complete World of Life Cycle Assessment—Volume 1: Backgroundand Future Prospects in Life Cycle Assessment; Klöpffer, W., Ed.; Springer: Dodrecht, The Netherlands, 2014;pp. 207–258.
31. Daimler, A.G. Life cycle—Environmental Certificate Mercedes-Benz C-Class including Plug-In Hybrid C350 e. Stuttgart 2015, in press.
© 2016 by the authors. Licensee MDPI, Basel, Switzerland. This article is an open accessarticle distributed under the terms and conditions of the Creative Commons Attribution(CC BY) license (http://creativecommons.org/licenses/by/4.0/).
85
resources
Article
Dynamic Ecocentric Assessment Combining Emergyand Data Envelopment Analysis: Application toWind Farms
Mario Martín-Gamboa † and Diego Iribarren †,*
Systems Analysis Unit, Instituto IMDEA Energía, Av. Ramón de la Sagra 3, Móstoles E-28935, Spain;[email protected]* Correspondence: [email protected]; Tel.: +34-91-737-11-19† These authors contributed equally to this work.
Academic Editor: Mario SchmidtReceived: 3 December 2015; Accepted: 21 January 2016; Published: 29 January 2016
Abstract: Most of current life-cycle approaches show an anthropocentric standpoint for the evaluationof human-dominated activities. However, this perspective is insufficient when it comes to assessingthe contribution of natural resources to production processes. In this respect, emergy analysisevaluates human-driven systems from a donor-side perspective, accounting for the environmentaleffort performed to make the resources available. This article presents a novel methodologicalframework, which combines emergy analysis and dynamic Data Envelopment Analysis (DEA) for theecocentric assessment of multiple resembling entities over an extended period of time. The use of thisapproach is shown through a case study of wind energy farms. Furthermore, the results obtained arecompared with those of previous studies from two different angles. On the one hand, a comparisonwith results from anthropocentric approaches (combined life cycle assessment and DEA) is drawn.On the other hand, results from similar ecocentric approaches, but without a dynamic model, arealso subject to comparison. The combined use of emergy analysis and dynamic DEA is found to bea valid methodological framework for the computation of resource efficiency and the valuation ofecosystem services. It complements traditional anthropocentric assessments while appropriatelyincluding relevant time effects.
Keywords: dynamic data envelopment analysis; efficiency; emergy; life cycle assessment
1. Introduction
The current level of extraction of primary resources—around 60 billion tons per year globally—isnot sustainable [1]. Moreover, the global consumption of natural resources for the production of goodsand services is expected to increase significantly in next decades [1,2]. Fundamental changes and policymeasures are therefore required in order to promote a shift in production processes, supply-chainmanagement and consumption patterns [2–4]. In this sense, a dematerialization strategy should befollowed, i.e., decoupling natural resource use from economic growth and social prosperity [1,2].This calls for a sustainable and efficient use of resources, security in the supply of raw materials andreduction in life-cycle environmental impacts. Furthermore, within this context, novel methodologicalframeworks for assessing systems performance are needed to ensure the rational use of naturalresources [4].
Life-cycle methodologies are one of the main instruments for the comprehensive evaluation ofsupply-chains and product systems due to its holistic nature [5]. However, most of current life-cycleapproaches show an anthropocentric standpoint for the evaluation of human-dominated activities,generally disregarding flows beyond the present state of a resource in the current ecosphere [6,7].
Resources 2016, 5, 8; doi:10.3390/resources5010008 www.mdpi.com/journal/resources86

Resources 2016, 5, 8
Moreover, the evaluation of resource criticality within the life cycle assessment (LCA) methodologyremains underdeveloped [8]. Hence, LCA alone is insufficient when it comes to assessing flawlesslythe contribution of natural resources to product systems. In this respect, emergy analysis evaluateshuman-driven systems from a donor-side perspective, accounting for the environmental effortperformed to make the resources available [9,10].
Emergy estimates the solar energy previously provided to generate a product [11,12]. It isinterpreted as the memory of the geobiosphere exergy provision related to economic systems throughthe use of natural resources [13,14]. Thus, emergy analysis complements LCA by providing adonor-side perspective, a unified measure of the provision of environmental support, and an indicationof the work of the environment that would be needed to replace what is consumed [9,10]. LCA andemergy analysis have been applied jointly to a number of case studies, e.g., within the primary [15],building [16] and energy [6,7,17] sectors.
When assessing multiple homogeneous entities involving a number of inputs and outputs, anothersuitable tool for combination with emergy analysis is data envelopment analysis (DEA), which is alinear programming methodology to measure the relative efficiency of multiple “decision makingunits” (DMUs, i.e., the homogeneous entities under assessment) [18]. In this respect, Iribarren et al. [10]proposed the combined use of emergy and DEA—the Em + DEA method—to enhance benchmarkingprocesses in terms of environmental sustainability, offering an ecocentric life-cycle perspective.
In case of systems with significant time variability, the use of the Em + DEA method—and, ingeneral, of the currently available life-cycle approaches coupled with DEA [19]—provides a staticpicture of the “historical” use of natural resources. To deal with this flaw, dynamic (time-dependent)DEA models might be used [20]. This article presents a novel methodological framework combiningemergy analysis and dynamic DEA—the Em + DynDEA method hereinafter—for the ecocentricassessment of multiple resembling entities over an extended period of time. The feasibility of thisnovel approach is shown through a case study of wind farms. Furthermore, the results obtained arecompared with those of previous studies from two different angles. On the one hand, a comparisonwith results from anthropocentric approaches (combined LCA and DEA) is drawn. On the otherhand, results from similar ecocentric approaches, but without a dynamic model, are also subjectto comparison.
2. Material and Methods
2.1. Em + DynDEA Method
The goal of the study is to extend the applicability of the available Em + DEA method [10] totime-dependent systems by using a dynamic DEA model. The resultant Em + DynDEA methodis outlined in Figure 1. Three key steps are included: (i) data collection, (ii) emergy analysis, and(iii) dynamic DEA.
The first step focuses on the preparation of the life-cycle inventory (LCI) of each individual DMUfor each individual period. In the second step, these LCIs are used to carry out the emergy analysis ofeach DMU for each period by using the SCALE software developed by Marvuglia et al. [21]. In thisstudy, the total value of emergy (in seMJ, i.e., million solar emjoules) is considered, which is calculatedas the sum of the seven resource categories computed with SCALE (viz., fossil resources, metal ores,mineral resources, nuclear resources, renewable energy resources, water resources, and land resources).It should be noted that the use of the SCALE software involves an appropriate consideration of theemergy algebra rules [21], thus distinguishing itself from other attempts that define solar energydemand indicators based on the use of characterization factors suitable for implementation into LCAsoftware [22].
87
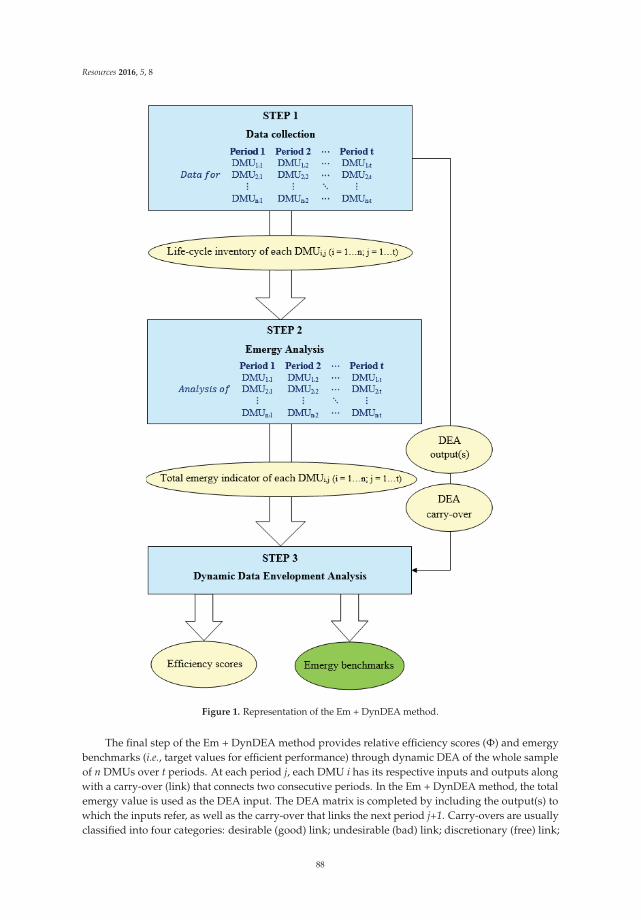
Resources 2016, 5, 8
Figure 1. Representation of the Em + DynDEA method.
The final step of the Em + DynDEA method provides relative efficiency scores (Φ) and emergybenchmarks (i.e., target values for efficient performance) through dynamic DEA of the whole sampleof n DMUs over t periods. At each period j, each DMU i has its respective inputs and outputs alongwith a carry-over (link) that connects two consecutive periods. In the Em + DynDEA method, the totalemergy value is used as the DEA input. The DEA matrix is completed by including the output(s) towhich the inputs refer, as well as the carry-over that links the next period j+1. Carry-overs are usuallyclassified into four categories: desirable (good) link; undesirable (bad) link; discretionary (free) link;
88

Resources 2016, 5, 8
and non-discretionary (fixed) link [20]. Once the DEA matrix is ready, key features must be selectedregarding the DEA model, which includes the type of carry-over, the orientation of the model andthe display of the production possibility set [10]. When compared to other alternatives for efficiencycomputation, the use of DEA benefits from advantages mainly associated with the definition of theproduction possibility set and, subsequently, of the efficient frontier, making DEA also a powerfulmethodology for the benchmarking of performance indicators [18,19]. When using dynamic DEAunder time-dependent situations, additional benefits are associated with the use of time-series dataand the carry-over [20]. The need for both inventory data and carry-over data may give rise to potentiallinks to other analytical methods such as (time-dependent) material flow analysis [23].
When solving the dynamic DEA model, efficiency scores are provided for each DMU and period(Φi,j), in addition to the overall efficiency of each DMU (Φi, average of the t efficiency scores of DMUi). The relative efficiency scores lead to distinguish between efficient (Φ = 1) and inefficient (Φ < 1)entities within a certain number of periods. Moreover, target emergy values are provided as the desiredbenchmarks to turn inefficient entities into efficient DMUs.
2.2. Definition of the Case Study
The feasibility of the Em + DynDEA method is shown through a case study of wind farms (WFs).Wind power is selected as case study because it shows time variability and it is a key power generationoption in a wide range of countries [24,25]. A sample of 16 WFs located in Spain (regions of Castile-LaMancha and Andalusia) is used in the current study as homogeneous entities (DMUs). The analysis iscarried out on an annual basis for a time frame of five years, from 2007 to 2011, a key period for windpower growth in Spain [26].
Table 1 presents the evolution of wind power generation over 2007–2011 for the evaluated sample.These data are retrieved from the annual statistics published in the Spanish Ministry of Industry,Energy and Tourism database [27]. During this period, the average production of the whole set of WFswas 85.55 GWh¨ y´1. Additionally, the installed capacity and the average wind speed ranged from 30to 50 MW and from 5.5 to 10.5 m¨ s´1, respectively. The installed capacity (also reported in Table 1)was unintentionally constant for the specific sample under study.
Table 1. Electricity produced by the wind farms over 2007–2011 (GWh) and installed capacity (MW).
Wind FarmCode
Year 2007 Year 2008 Year 2009 Year 2010 Year 2011InstalledCapacity
WF1 91.88 102.01 91.63 101.93 109.25 44.80WF2 81.60 93.36 91.26 82.27 89.98 33.40WF3 109.29 128.76 124.62 123.29 107.22 50.00WF4 93.30 100.39 99.85 96.61 83.92 49.50WF5 102.29 113.00 99.91 100.86 91.71 49.50WF6 98.51 94.41 95.71 94.78 83.84 49.30WF7 22.09 90.26 76.75 73.30 79.89 48.00WF8 89.61 100.89 98.65 94.08 80.98 45.05WF9 83.22 92.03 93.98 88.01 74.30 41.65WF10 76.41 84.91 71.06 73.98 77.45 42.00WF11 77.98 88.84 86.26 83.80 73.67 37.60WF12 82.21 90.83 90.19 84.01 77.83 37.40WF13 86.89 91.71 85.48 81.41 84.69 36.96WF14 62.77 71.00 70.68 69.44 68.54 31.45WF15 60.76 65.04 62.64 61.15 53.63 31.02WF16 66.30 61.83 74.35 71.23 59.74 30.00
Figure 2 illustrates the structure of the dynamic DEA study of WFs. This analysis involves 16 WFs(n = 16) over 5 years (t = 5). For each of the years, each WF encompasses one input (total emergy) andone output (electricity production). The choice of total emergy as an input provides an exhaustive
89
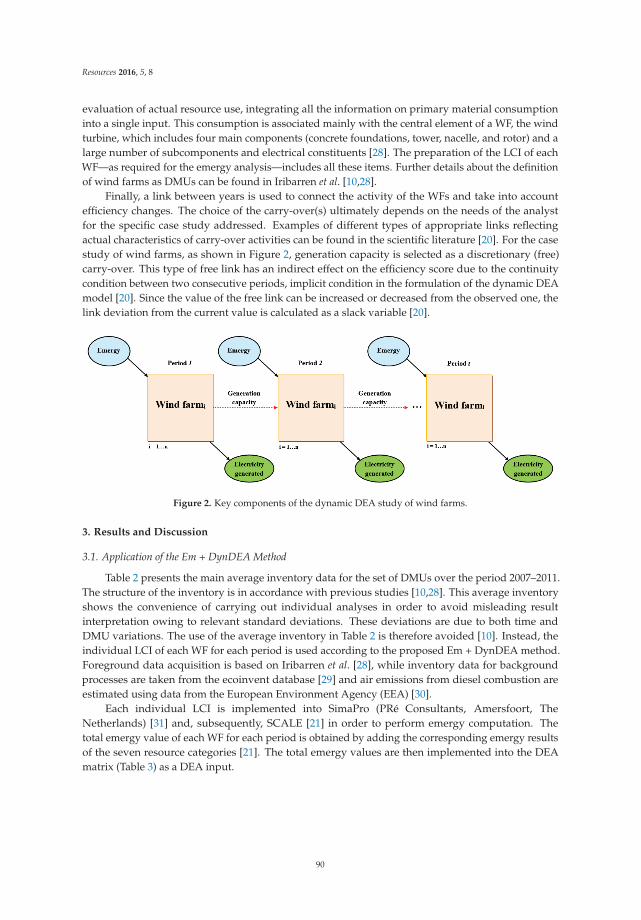
Resources 2016, 5, 8
evaluation of actual resource use, integrating all the information on primary material consumptioninto a single input. This consumption is associated mainly with the central element of a WF, the windturbine, which includes four main components (concrete foundations, tower, nacelle, and rotor) and alarge number of subcomponents and electrical constituents [28]. The preparation of the LCI of eachWF—as required for the emergy analysis—includes all these items. Further details about the definitionof wind farms as DMUs can be found in Iribarren et al. [10,28].
Finally, a link between years is used to connect the activity of the WFs and take into accountefficiency changes. The choice of the carry-over(s) ultimately depends on the needs of the analystfor the specific case study addressed. Examples of different types of appropriate links reflectingactual characteristics of carry-over activities can be found in the scientific literature [20]. For the casestudy of wind farms, as shown in Figure 2, generation capacity is selected as a discretionary (free)carry-over. This type of free link has an indirect effect on the efficiency score due to the continuitycondition between two consecutive periods, implicit condition in the formulation of the dynamic DEAmodel [20]. Since the value of the free link can be increased or decreased from the observed one, thelink deviation from the current value is calculated as a slack variable [20].
Figure 2. Key components of the dynamic DEA study of wind farms.
3. Results and Discussion
3.1. Application of the Em + DynDEA Method
Table 2 presents the main average inventory data for the set of DMUs over the period 2007–2011.The structure of the inventory is in accordance with previous studies [10,28]. This average inventoryshows the convenience of carrying out individual analyses in order to avoid misleading resultinterpretation owing to relevant standard deviations. These deviations are due to both time andDMU variations. The use of the average inventory in Table 2 is therefore avoided [10]. Instead, theindividual LCI of each WF for each period is used according to the proposed Em + DynDEA method.Foreground data acquisition is based on Iribarren et al. [28], while inventory data for backgroundprocesses are taken from the ecoinvent database [29] and air emissions from diesel combustion areestimated using data from the European Environment Agency (EEA) [30].
Each individual LCI is implemented into SimaPro (PRé Consultants, Amersfoort, TheNetherlands) [31] and, subsequently, SCALE [21] in order to perform emergy computation. Thetotal emergy value of each WF for each period is obtained by adding the corresponding emergy resultsof the seven resource categories [21]. The total emergy values are then implemented into the DEAmatrix (Table 3) as a DEA input.
90

Resources 2016, 5, 8
Table 2. Average inventory data of the sample of wind farms (values per MWh of generated power).
Inputs Units Average ˘ Standard Deviation
From Nature
Land m2a 4.24 ˘ 1.60Kinetic energy (converted) MWh 1.08 ˘ 0.00
From the Technosphere
Concrete (foundations) kg 19.30 ˘ 11.63Iron (foundations) kg 0.69 ˘ 0.42Steel (foundations) kg 0.41 ˘ 0.25
Steel (tower) kg 3.33 ˘ 1.82Paint (tower) g 44.97 ˘ 24.6Iron (nacelle) kg 0.51 ˘ 0.31Steel (nacelle) kg 0.49 ˘ 0.31Silica (nacelle) g 9.49 ˘ 5.71
Copper (nacelle) kg 0.10 ˘ 0.06Plastic (nacelle) g 13.79 ˘ 8.30
Aluminum (nacelle) g 4.96 ˘ 2.99Fiberglass (nacelle) g 22.06 ˘ 13.29
Epoxy resin (nacelle) g 33.08 ˘ 19.92Epoxy resin (rotor) kg 0.31 ˘ 0.33Fiberglass (rotor) kg 0.15 ˘ 0.07
Iron (rotor) kg 0.38 ˘ 0.23Lubricating oil g 16.85 ˘ 6.70
Diesel, combusted g 44.15 ˘ 44.17
Outputs Units Average ˘ Standard Deviation
Products
Electricity MWh 1.00 ˘ 0.00
Waste to treatment
Waste to recycling kg 6.60 ˘ 3.83Waste to incineration kg 0.47 ˘ 0.23
91

Resources 2016, 5, 8
Table 3. DEA matrix for the Em + DynDEA study (values per MWh of generated power).
WindFarm
Year 2007 Year 2008 Year 2009 Year 2010 Year 2011
Code EI CCO EI CCO EI CCO EI CCO EI CCO
WF1 1.54 ˆ108 0.49 1.39 ˆ
108 0.44 1.55 ˆ108 0.49 1.40 ˆ
108 0.44 1.31 ˆ108 0.41
WF2 2.00 ˆ108 0.41 1.75 ˆ
108 0.36 1.79 ˆ108 0.37 1.98 ˆ
108 0.41 1.82 ˆ108 0.37
WF3 1.18 ˆ108 0.46 1.01 ˆ
108 0.39 1.05 ˆ108 0.40 1.06 ˆ
108 0.41 1.21 ˆ108 0.47
WF4 3.29 ˆ108 0.53 3.06 ˆ
108 0.49 3.07 ˆ108 0.50 3.17 ˆ
108 0.51 3.65 ˆ108 0.59
WF5 1.72 ˆ108 0.48 1.57 ˆ
108 0.44 1.76 ˆ108 0.50 1.75 ˆ
108 0.49 1.92 ˆ108 0.54
WF6 2.50 ˆ108 0.50 2.60 ˆ
108 0.52 2.57 ˆ108 0.52 2.59 ˆ
108 0.52 2.92 ˆ108 0.59
WF7 1.20 ˆ109 2.17 2.97 ˆ
108 0.53 3.48 ˆ108 0.63 3.64 ˆ
108 0.65 3.35 ˆ108 0.60
WF8 2.51 ˆ108 0.50 2.23 ˆ
108 0.45 2.28 ˆ108 0.46 2.39 ˆ
108 0.48 2.77 ˆ108 0.56
WF9 2.50 ˆ108 0.50 2.27 ˆ
108 0.45 2.22 ˆ108 0.44 2.37 ˆ
108 0.47 2.79 ˆ108 0.56
WF10 1.42 ˆ108 0.55 1.28 ˆ
108 0.49 1.52 ˆ108 0.59 1.47 ˆ
108 0.57 1.40 ˆ108 0.54
WF11 2.99 ˆ108 0.48 2.63 ˆ
108 0.42 2.71 ˆ108 0.44 2.78 ˆ
108 0.45 3.16 ˆ108 0.51
WF12 2.26 ˆ108 0.45 2.06 ˆ
108 0.41 2.07 ˆ108 0.41 2.22 ˆ
108 0.45 2.39 ˆ108 0.48
WF13 2.64 ˆ108 0.43 2.51 ˆ
108 0.40 2.68 ˆ108 0.43 2.82 ˆ
108 0.45 2.71 ˆ108 0.44
WF14 2.56 ˆ108 0.50 2.27 ˆ
108 0.44 2.28 ˆ108 0.44 2.32 ˆ
108 0.45 2.35 ˆ108 0.46
WF15 3.16 ˆ108 0.51 2.96 ˆ
108 0.48 3.07 ˆ108 0.50 3.14 ˆ
108 0.51 3.57 ˆ108 0.58
WF16 1.26 ˆ108 0.45 1.34 ˆ
108 0.49 1.13 ˆ108 0.40 1.17 ˆ
108 0.42 1.39 ˆ108 0.50
Notes: EI: emergy input (seMJ¨ y´1¨ MWh´1); CCO: capacity carry-over (kW¨ MWh´1).
The DEA matrix presented in Table 3 undergoes dynamic DEA. The selected model is a dynamicinput-oriented slacks-based measure of efficiency model with constant returns to scale (DSBM-I-CRSmodel) [20]. This model is an extension of the slacks-based measure framework proposed by Tone [32]and Pastor et al. [33]. The choice of the key features of the model (non-radial metrics, input orientationand constant returns to scale) is based on previous DEA studies of wind farms [10,28]. Thus, thestudy focuses on the reduction of the emergy input while maintaining the observed output level.This is in line with the final goal of minimizing resource consumption. Finally, regarding the selectedcarry-over, the stability over time observed for the generation capacity supports its use as a carry-over,performing the continuity condition between consecutive periods in the dynamic model [20]. Thesuitability of generation capacity as a discretionary (free) link is in agreement with other DEA studiesin the scientific literature [34].
The relative efficiency of each WF for each period, as well as the overall relative efficiency ofeach WF, is calculated by implementing the DEA matrix in DEA-Solver Pro (Saitech, Holmdel, NJ,USA) [35]. The same relevance is considered for the five individual periods (2007, 2008, 2009, 2010 and2011). Table 4 shows the individual and overall efficiency scores of the assessed WFs. According tothe overall scores, only 1 (WF3) out of 16 WFs is found to be efficient through the entire time frame(i.e., overall Φ = 100%). In terms of individual periods, 2011 is—on average—the year with higher
92

Resources 2016, 5, 8
efficiency, arising as the only period with two efficient entities: WF1 and WF3. Regarding inefficiententities, more than half of the WFs present scores below 50%. Although the calculation of emergybenchmarks (i.e., target emergy values) is feasible, it is out of the scope of the present study.
Table 4. Individual and overall efficiency scores (%) of the sample of wind farms.
DMU Code Φ Year 2007 Φ Year 2008 Φ Year 2009 Φ Year 2010 Φ Year 2011 Overall Φ
WF1 81.85 82.01 81.95 81.86 100.00 85.83WF2 59.28 59.50 59.44 59.44 71.38 61.81WF3 100.00 100.00 100.00 100.00 100.00 100.00WF4 36.05 36.24 36.18 36.16 36.08 36.14WF5 68.68 68.92 68.86 68.87 68.85 68.84WF6 47.46 47.69 47.58 47.58 47.58 47.58WF7 34.30 34.14 34.03 34.02 37.48 34.79WF8 47.22 47.43 47.37 47.35 47.28 47.33WF9 47.36 47.58 47.52 47.50 47.43 47.48WF10 83.33 83.56 83.61 83.59 87.85 84.39WF11 39.65 39.85 39.79 39.78 39.65 39.74WF12 52.30 52.53 52.46 52.44 52.32 52.41WF13 44.84 45.06 44.95 44.95 44.83 44.93WF14 46.26 46.48 46.42 46.41 54.89 48.09WF15 37.47 37.66 37.59 37.58 37.52 37.56WF16 94.21 94.82 94.27 94.34 94.55 94.44
3.2. Comparison of Ecocentric and Anthropocentric Approaches
A comparison between the efficiency scores calculated for a given period through the ecocentricEm + DynDEA method and those calculated through the anthropocentric LCA + DEA method forthe same sample of wind farms is carried out in this section. The LCA + DEA efficiency scores arecomputed for the reference year 2010 as explained in Iribarren et al. [28], but using the reduced sampleof WFs considered in the present article. These LCA + DEA efficiency scores are calculated throughthe five-step LCA + DEA method [28] and, therefore, characterize the operational performance ofthe evaluated WFs following an anthropocentric perspective [19]. Because the comparison is limitedto efficiency scores, thus excluding the benchmarking of operational and environmental targets, thechoice of the life cycle impact assessment method does not affect the results presented in this section.
Figure 3 shows the comparison between Em + DynDEA and LCA + DEA scores for the year 2010.As it can be observed, 3 entities (WF2, WF3 and WF16) are found to operate efficiently when usingthe anthropocentric (and static) approach, whereas the ecocentric (and dynamic) approach leads toidentify only one efficient entity (WF3). In particular, WF2 constitutes a singular case since it is deemedefficient according to the LCA + DEA method, but significantly inefficient (Φ = 0.59) according to theEm + DynDEA method. Moreover, 75% of the WFs present efficiency scores above 0.6 when using theanthropocentric approach, while more than half of the WFs present scores below 0.5 when using theecocentric method. According to other authors [20], the overestimation of efficiency scores in separatemodels (i.e., models with no linkage between consecutive periods) is a common result since thesemodels measure each term efficiency as completely independent, while dynamic models provide stablescores reflecting the continuity of links between periods. Hence, differences between Em + DynDEAand LCA + DEA results are associated with both the ecocentric/anthropocentric nature of the inputs(emergy versus operational inputs) and the dynamic/static character of the method. Nevertheless, itshould be noted that Em + DynDEA and LCA + DEA are not seen as irreconcilable methods but ascomplementary approaches to enrich decision-making processes.
93

Resources 2016, 5, 8
Figure 3. Comparison of the efficiency scores from ecocentric and anthropocentric approaches.
3.3. Comparison of Dynamic and Static Ecocentric Approaches
A comparison between the efficiency scores calculated for a given period through the dynamicEm + DynDEA method and those calculated through the static Em + DEA method for the same sampleof wind farms is also carried out. The Em + DEA efficiency scores are computed for the referenceyear (2010) as detailed in Iribarren et al. [10], but using the reduced sample of WFs considered in thepresent work.
Figure 4 shows the comparison between the Em + DynDEA and Em + DEA scores for the year2010. As it can be observed in this figure, the use of the static approach leads to identify WF2 and WF3as efficient entities, while the dynamic approach leads to only one efficient DMU (WF3). Even thoughthe efficiency scores are generally similar for both ecocentric approaches, the choice of a static/dynamicapproach is likely to affect the identification of efficient entities (e.g., WF2) as well as the ranking ofDMUs (e.g., WF10). Because emergy values are used as inputs in both approaches, the singularitiesfound in the comparison are associated with the inclusion of the carry-over [20] and the differentstructure of the DEA matrix [10]. In this sense, the Em + DynDEA method should be understood as anenhancement of the Em + DEA method when evaluating entities with significant time variability.
94

Resources 2016, 5, 8
Figure 4. Comparison of the efficiency scores from dynamic and static ecocentric approaches.
4. Conclusions
When dealing with multiple similar entities, the use of emergy analysis as a life-cycle approachin combination with DEA facilitates a thorough evaluation and benchmarking of the environmentaleffort made by the biosphere to replace the resources consumed. In particular, when the entitiesunder assessment involve relevant time variations, the combination of emergy analysis with dynamicDEA is concluded to be feasible. Under these circumstances, the use of this novel dynamic ecocentricapproach—the Em + DynDEA method—is recommended, rather than the use of static ecocentricapproaches. This should be understood as a helpful complement to anthropocentric approaches inorder to enrich decision-making processes. As shown through the case study of wind farms, thecombined use of emergy analysis and dynamic DEA succeeds in computing resource efficiency for thevaluation of ecosystem services, thus complementing anthropocentric assessments while appropriatelyincluding relevant time effects.
Acknowledgments: All work presented in this article is part of the internal research activity at the InstitutoIMDEA Energía (Spain).
Author Contributions: Both Mario Martín-Gamboa and Diego Iribarren contributed equally to the developmentof the Em + DynDEA method and its application to wind farms.
Conflicts of Interest: The authors declare no conflict of interest.
References
1. Bliesner, A.; Liedtke, C.; Welfens, M.J.; Baedeker, C.; Hasselkuß, M.; Rohn, H. “Norm-oriented interpretationlearning” and resource use: The concept of “open-didactic exploration” as a contribution to raising awarenessof a responsible resource use. Resources 2014, 3, 1–30. [CrossRef]
2. Liedtke, C.; Bienge, K.; Wiesen, K.; Teubler, J.; Greiff, K.; Lettenmeier, M.; Rohn, H. Resource use in theproduction and consumption system—The MIPS approach. Resources 2014, 3, 544–574. [CrossRef]
3. Bahn-Walkowiak, B.; Steger, S. Resource targets in Europe and worldwide: An overview. Resources 2015, 4,597–620. [CrossRef]
4. Huysman, S.; Sala, S.; Mancini, L.; Ardente, F.; Alvarenga, R.A.F.; De Meester, S.; Mathieux, F.; Dewulf, J.Toward a systematized framework for resource efficiency indicators. Resour. Conserv. Recy. 2015, 95, 68–76.[CrossRef]
95
Resources 2016, 5, 8
5. Hagelaar, G.J.L.F.; van der Vorst, J.G.A.J. Environmental supply chain management: Using life cycleassessment to structure supply chains. Int. Food Agribus. Manage. Rev. 2001, 4, 399–412. [CrossRef]
6. Buonocore, E.; Vanoli, L.; Carotenuto, A.; Ulgiati, S. Integrating life cycle assessment and emergy synthesisfor the evaluation of a dry steam geothermal power plan in Italy. Energy 2015, 86, 476–487. [CrossRef]
7. Neri, E.; Rugani, B.; Benetto, E.; Bastianoni, S. Emergy evaluation vs. life cycle-based embodied energy (solar,tidal and geothermal) of wood biomass resources. Ecol. Indic. 2014, 36, 419–430. [CrossRef]
8. Sonnemann, G.; Gemechu, E.D.; Adibi, N.; De Bruille, V.; Bulle, C. From a critical review to a conceptualframework for integrating the criticality of resources into life cycle sustainability assessment. J. Clean Prod.2015, 94, 20–34. [CrossRef]
9. Raugei, M.; Rugani, B.; Benetto, E.; Ingwersen, W.W. Integrating emergy into LCA: Potential added valueand lingering obstacles. Ecol. Model. 2014, 271, 4–9. [CrossRef]
10. Iribarren, D.; Vázquez-Rowe, I.; Rugani, B.; Benetto, E. On the feasibility of using emergy analysis as a sourceof benchmarking criteria through data envelopment analysis: A case study for wind energy. Energy 2014, 67,527–537. [CrossRef]
11. Odum, H.T. Self-organization, transformity, and information. Science 1988, 242, 1132–1139. [CrossRef][PubMed]
12. Odum, H.T. Environmental Accounting: Emergy and Environmental Decision Making; John Wiley & Sons: NewYork, NY, USA, 1996.
13. Sciubba, E.; Ulgiati, S. Emergy and exergy analyses: Complementary methods or irreducible ideologicaloptions? Energy 2005, 30, 1953–1988. [CrossRef]
14. Raugei, M. Emergy indicators applied to human economic systems—A word of caution. Ecol. Model. 2011,222, 3821–3822. [CrossRef]
15. Pizzigallo, A.C.I.; Granai, C.; Borsa, S. The joint use of LCA and emergy evaluation for the analysis of twoItalian wine farms. J. Environ. Manage. 2008, 86, 396–406. [CrossRef] [PubMed]
16. Reza, B.; Sadiq, R.; Hewage, K. Emergy-based life cycle assessment (Em-LCA) of multi-unit and single-familyresidential buildings in Canada. Int. J. Sust. Built Environ. 2014, 3, 207–224. [CrossRef]
17. Brown, M.T.; Raugei, M.; Ulgiati, S. On boundaries and ‘investments’ in emergy synthesis and LCA: A casestudy on thermal vs. photovoltaic electricity. Ecol. Indic. 2012, 15, 227–235. [CrossRef]
18. Cooper, W.W.; Seiford, L.M.; Tone, K. Data Envelopment Analysis: A Comprehensive Text with Models,Applications, References and DEA-Solver Software; Springer: New York, NY, USA, 2007.
19. Vázquez-Rowe, I.; Iribarren, D. Review of life-cycle approaches coupled with data envelopment analysis:Launching the CFP + DEA method for energy policy making. Sci. World J. 2015, 2015. [CrossRef] [PubMed]
20. Tone, K.; Tsutsui, M. Dynamic DEA: A slacks-based measure approach. Omega 2010, 38, 145–156. [CrossRef]21. Marvuglia, A.; Benetto, E.; Rios, G.; Rugani, B. SCALE: Software for calculating emergy based on life cycle
inventories. Ecol. Model. 2013, 248, 80–91. [CrossRef]22. Rugani, B.; Huijbregts, M.A.J.; Mutel, C.; Bastianoni, S.; Hellweg, S. Solar energy demand (SED) of commodity
life cycles. Environ. Sci. Technol. 2011, 45, 5426–5433. [CrossRef] [PubMed]23. Zhou, Y.; Yang, N.; Hu, S. Industrial metabolism of PVC in China: A dynamic material flow analysis. Resour.
Conserv. Recy. 2013, 73, 33–40. [CrossRef]24. Kumar, Y.; Ringenberg, J.; Depuru, S.S.; Devabhaktuni, V.K.; Lee, J.W.; Nikolaidis, E.; Andersen, B.; Afjeh, A.
Wind energy: Trends and enabling technologies. Renew. Sust. Energ. Rev. 2016, 53, 209–224. [CrossRef]25. Kaplan, Y.A. Overview of wind energy in the world and assessment of current wind energy policies in
Turkey. Renew. Sust. Energ. Rev. 2015, 43, 562–568. [CrossRef]26. Macroeconomic Study on the Impact of Wind Energy in Spain; Spanish Wind Energy Association; AEE:
Madrid, Spain, 2011.27. Spanish Ministry of Industry, Energy and Tourism. Available online: http://www.minetur.gob.es
(accessed on 3 December 2015).28. Iribarren, D.; Martín-Gamboa, M.; Dufour, J. Environmental benchmarking of wind farms according to their
operational performance. Energy 2013, 61, 589–597. [CrossRef]29. Frischknecht, R.; Jungbluth, N.; Althaus, H.J.; Doka, G.; Heck, T.; Hellweg, S.; Hischier, R.; Nemecek, T.;
Rebitzer, G.; Spielmann, M.; et al. Overview and Methodology; Ecoinvent Report No. 1; Swiss Centre for LifeCycle Inventories: Dübendorf, Switzerland, 2007.
96
Resources 2016, 5, 8
30. European Environment Agency. EMEP/EEA Air Pollutant Emission Inventory Guide Book 2009; EEA:Copenhagen, Denmark, 2009.
31. Goedkoop, M.; Oele, M.; Leijting, J.; Ponsioen, T.; Meijer, E. Introduction to LCA with SimaPro; PRé Consultants:Amersfoort, the Netherlands, 2013.
32. Tone, K. A slacks-based measure of efficiency in data envelopment analysis. Eur. J. Oper. Res. 2001, 130,498–509. [CrossRef]
33. Pastor, J.T.; Ruiz, J.L.; Sirvent, I. An enhanced DEA Russell graph efficiency measure. Eur. J. Oper. Res. 1999,115, 596–607. [CrossRef]
34. Tone, K.; Tsutsui, M. Dynamic DEA with network structure: A slacks-based measure approach. Omega 2014,42, 124–131. [CrossRef]
35. Saitech, Data Envelopment Analysis Software. Available online: http://www.saitech-inc.com/Products/Prod-DSP.asp (accessed on 3 December 2015).
© 2016 by the authors. Licensee MDPI, Basel, Switzerland. This article is an open accessarticle distributed under the terms and conditions of the Creative Commons Attribution(CC BY) license (http://creativecommons.org/licenses/by/4.0/).
97

resources
Article
Evaluation of Abiotic Resource LCIA Methods
Rodrigo A. F. Alvarenga 1,*, Ittana de Oliveira Lins 2,† and José Adolfo de Almeida Neto 2,†
1 Departamento de Engenharia Ambiental, Programa de Pós-graduação em Ciências Ambientais,Universidade do Estado de Santa Catarina (UDESC), Av. Luiz de Camões, 2090 Conta Dinheiro,Lages-SC 88.520-000, Brazil
2 Departamento de Ciências Agrárias e Ambientais, Programa de Pós-graduação em Desenvolvimento e MeioAmbiente, Universidade Estadual de Santa Cruz (UESC), Rod. Ilhéus-Itabuna,km 16 s/n-Salobrinho-Ilhéus-BA 45.662-900, Brazil; [email protected] (I.O.L.);[email protected] (J.A.A.N.)
* Correspondence: [email protected]; Tel.: +55-49-3289-9295† These authors contributed equally to this work.
Academic Editor: Mario SchmidtReceived: 9 December 2015; Accepted: 17 February 2016; Published: 29 February 2016
Abstract: In a life cycle assessment (LCA), the impacts on resources are evaluated at the area ofprotection (AoP) with the same name, through life cycle impact assessment (LCIA) methods. Thereare different LCIA methods available in literature that assesses abiotic resources, and the goal of thisstudy was to propose recommendations for that impact category. We evaluated 19 different LCIAmethods, through two criteria (scientific robustness and scope), divided into three assessment levels,i.e., resource accounting methods (RAM), midpoint, and endpoint. In order to support the assessment,we applied some LCIA methods to a case study of ethylene production. For RAM, the most suitableLCIA method was CEENE (Cumulative Exergy Extraction from the Natural Environment) (but SED(Solar Energy Demand) and ICEC (Industrial Cumulative Exergy Consumption)/ECEC (EcologicalCumulative Exergy Consumption) may also be recommended), while the midpoint level was ADP(Abiotic Depletion Potential), and the endpoint level was both the Recipe Endpoint and EPS2000(Environmental Priority Strategies). We could notice that the assessment for the AoP Resources is notyet well established in the LCA community, since new LCIA methods (with different approaches)and assessment frameworks are showing up, and this trend may continue in the future.
Keywords: abiotic; resource; life cycle assessment; LCA; life cycle impact assessment; LCIA;method; Brazil
1. Introduction
Natural resources are essential for our society, either for provision, supporting, regulating orcultural services [1]. However, due to the world population growth, together with the increase in theconsumption per capita and poor resource management, we are being led to a sustainability crisis.Natural resources may be classified in several ways, (a) renewable or non-renewable, (b) stocks, fundsor flows, (c) biotic or abiotic, among other classifications [2]. Regarding the latter, biotic resourcesare those that come from living organisms, while abiotic resources are the result of past biologicalprocesses (e.g., crude oil) or chemical processes (e.g., metal).
One of the tools that may assist in sustainable resource management, at the industrial scale, isa Life Cycle Assessment (LCA). Resources are seen in two ways in an LCA: (1) In one way, they arethe inputs needed in industrial processes for the production of a product, and in this sense they areevaluated at the life cycle inventory (LCI) stage; and (2) in another way, they are evaluated as an area
Resources 2016, 5, 13; doi:10.3390/resources5010013 www.mdpi.com/journal/resources98

Resources 2016, 5, 13
of protection (AoP), in life cycle impact assessments (LCIAs), i.e., natural resources are one type ofenvironmental impact assessed, and there are different methods to evaluate these impacts.
According to traditional classifications [2,3], these methods may be categorized into three groups:(1) Resource accounting methods (RAM), which make a more simplified impact analysis, focusedmainly on grouping the resources into single score indicators, as energy or mass; (2) Midpoint resourcedepletion methods, that go beyond RAM, evaluating impacts related to resource depletion due toits use, as the use-to-availability ratio; and (3) Endpoint resource depletion methods, that go evenbeyond the previous group, taking into account the consequences of resource depletion, in many cases,through backup technology [4,5], e.g., evaluating the extra effort (energy or cost) needed to extract lesseconomically feasible resources.
Due to the lack of consensus in the LCA community regarding impacts on natural resources, thereare other approaches of how the LCIA methods evaluate that AoP. Rorbech et al. [6] classified LCIAmethods into three groups: (1) Methods that account for the consumption of limited resources, whichrather evaluate the resource competition and assume that they are exchangeable (as RAM); (2) Methodsthat evaluate the depletion of resources, which may be subdivided into midpoint and endpoint (andaccording to the authors would better represent the AoP Resources); and (3) Methods that evaluatethe extra effort needed in the future due to actual resource extraction (e.g., Recipe Endpoint), whichaccording to the authors do not represent a specific AoP as Resources, but are midpoint impacts thataffect other AoPs (human health and natural environment). Dewulf et al. [7] suggested new AoPs forLCA and Life Cycle Sustainability Assessment (LCSA), proposing five perspectives: (P1) the safeguardsubject is the resource itself; (P2) the concern is the capacity of this resource to generate provisionalservices; (P3) the safeguard subject is the capacity of this resource to generate other ecosystem services;(P4) where consequential aspects are considered, e.g., socioeconomic mechanisms are taken intoaccount; and (P5) the concern is human well-being, giving a rather holistic perception by grouping allprevious perspectives. The authors also mention that P4 and P5 go beyond classical LCA, and wouldbetter fit in LCSA.
Even though there are different ways of grouping LCIA methods in LCA, and how they affect(different) AoPs, in this manuscript we used the rather traditional overview, proposed by ILCD(International Reference Life Cycle Data System) and Swart et al. [2,3] (Figure 1). In this sense, thereare some studies that already critically evaluated different LCIA methods, for instance, Liao et al. [8]evaluated thermodynamic-based RAM, and pointed out the Cumulative Exergy Extraction from theNatural Environment (CEENE) [9] and the Solar Energy Demand (SED) [10], as the recommendedLCIA methods for that approach. In ILCD [3], where different LCIAs were evaluated in order to makerecommendations for the European context, the Abiotic Depletion Potential (ADP) [11], adapted tothe reserve base (Reserve base, according to the USGS (United States Geological Survey), accountsfor all reserves that have the actual potential of extraction and may be economically viable in thefuture. The ADP method originally considered the ultimate reserve, which would be the amount of acertain resource in the Earth’s crust), was recommended for midpoint assessment, while there was norecommendation for endpoint LCIA methods. The Life Cycle Initiative, from UNEP-SETAC (UnitedNations Environment Programme and the Society for Environmental Toxicology and Chemistry),is an ongoing project to create a worldwide consensus on recommendations of LCIA methods(http://www.lifecycleinitiative.org/activities/phase-i/life-cycle-impact-assessment-programme/) [12]which may be considered as a step forward to what has been done by ILCD [3].
Due to the variety of LCIA methods available in literature and the complexity in choosing onefor an LCA study, there is a demand by LCA practitioners for support in decision making in privateand public organizations. Therefore, the Brazilian Life Cycle Impact Assessment Network (Rede dePesquisa em Avaliação do Ciclo de Vida, RAICV, 2014), (Regimento da Rede de Pesquisa em Avaliaçãode Impacto do Ciclo de Vida. São Bernardo do Campo, 11 November 2014, RAICV) evaluated differentLCIA methods, for several impact categories, including Abiotic Resources. Nevertheless, due tocertain characteristics from the Abiotic Resources category (e.g., a relative site-generic impact), the
99

Resources 2016, 5, 13
results for this category may be applied to other countries as well. As will be seen later, some RAMcreate characterization factors (CF) for both biotic and abiotic resources; thus, in some cases therecommendation went beyond abiotic resources (for RAM). Therefore, the objective of this manuscriptwas to evaluate different operational LCIA methods for (abiotic) resources available in literaturein order to propose a recommendation .To facilitate the assessment, we applied some of theseoperational LCIA methods to a case study of ethylene production in Brazil through bio-based andfossil-based routes.
Figure 1. Simplified representation of cause-effect on AoP Resources, based on traditional LCIAgroupings proposed by ILCD [3] and Swart et al. [2]
2. Results and Discussion
2.1. Operational Resource-Based LCIA Methods
For the evaluation of the LCIA methods, we adopted the classification according to ILCD [3] andSwart et al. [2], i.e., in three levels of impact assessment (Figure 1): RAM, midpoint, and endpointmethods. In total, we found 19 operational LCIA methods, which are described and assessed below.The values for each LCIA method can be seen in Table 1 (for RAM), Table 2 (for midpoint), and Table 3(for endpoint).
2.1.1. Resource Accounting Methods (RAM)
CED
The Cumulative Energy Demand (CED) [13] is one example of an operational LCIA methodfor quantifying the cumulative energy use, which was introduced in the 1970s by Boustead andHancock [14] and Pimentel et al. [15], and standardized by VDI (the Association of GermanEngineers) [16]. It is an RAM that uses the heating value of materials as an aggregation unit.Frischknecht et al. [17] evaluated several operational LCIA methods with this approach, pointingout some differences among them, such as the use of high or low heating values. The CED can also beused as a proxy in LCA, since it presented a direct correlation with several other LCIA indicators [18,19],especially for the fossil energy category. Generally, CED (and similar methods) accounts solely forthe resources that have a certain energy or heating value, which may be seen as a limitation of theapproach because it becomes restricted to energetic resources (fossil, nuclear, solar, geothermal, wind,and hydropower) and biomass. It is not a regionalized method, but according to Alvarenga [20],spatial-differentiation may be considered for land use if an adaptation is previously performed toavoid double-counting with biomass, as suggested in Alvarenga et al. [21]. Since it uses energy, basedon the first law of thermodynamics, the scientific robustness is not so high since there are other LCIAmethods that use the second law of thermodynamics, which has a higher scientific robustness (seebelow). Further, since it has CF entirely for energy resources and biomass (and site-generic), the CEDhad low scores for both criteria.
100

Resources 2016, 5, 13
CExD
The Cumulative Exergy Demand (CExD) [22] is a RAM that uses the CED as a baseline, but insteadof using energy as the indicator, it uses exergy. Exergy of a resource or system is the maximum amountof useful work that can be obtained from it [23]. By using exergy, the CExD is able to account forseveral types of resources (fossil, nuclear, wind, solar, potential, biomass, water, metals, and minerals),including those with no heating value. Land use is not accounted for in order to avoid double-countingwith biomass. This method does not have spatial-differentiated CF, but according to Alvarenga [20],it may be adapted to consider the regionalization for land use (as in CED). Dewulf et al. [9] andSwart et al. [2] mentioned several inconsistencies in the CExD model to calculate the exergy value ofmetals, minerals, and biotic resources. Since CExD uses exergy (2nd law of thermodynamics), it has ahigher scientific robustness than CED and a higher amount of CF. Therefore, it had a medium score(higher than CED) for the criteria evaluated.
CEENE
The CEENE method [9] is a RAM that tries to aggregate different types of resources in a singleunit (exergy). It considers several elementary flows, with a higher number of CF than other RAM thatuse the same approach (e.g., CExD). Moreover, it is seen as an evolution of CExD, and by using exergyinstead of energy, it has a higher scientific robustness than CED. Liao et al. [8] considered CEENE as(one of) the best thermodynamic-based LCIA method(s). One of the differences between CEENE andCExD is the approach used to account for the exergy of metals and minerals and for biotic resources(biomass and/or land use). CEENE 1.0 does not have spatially-differentiated CF; however, in CEENE2.0 (There is an even more recent version (3.0), where there is also spatial-differentiation for oceanoccupation (e.g., for aquaculture), but it was not considered since it was published after 2014), thereis spatial-differentiation for land use through the work of Alvarenga et al. [21]. In this case, CF arepresented in different scales (see in below). Due to the advance in the model to calculate exergy forsome resources, CEENE has a higher score for scientific robustness than CExD and higher number ofCF. Further, CEENE 2.0 has regionalized CF for land use. Therefore, CEENE had the highest score forboth criteria, in comparison to other RAM.
SED
The Solar Energy Demand (SED), developed by Rugani et al. [10], is a RAM that uses the Emergyconcept [24] as a baseline. In Emergy, the cradle of an LCA is not in the boundary between theecosphere and anthroposphere, as considered by several RAM (e.g., CEENE), but within the limitsof the geobiosphere, i.e., the Sun, tidal energy, and geothermal energy, aggregated into an indicatorcalled solar energy equivalent [2]. In this LCIA method, the authors focused on creating a high amountof CF through the compilation of several published works that had quantified the transformities(Transformity is the name give in Emergy scientific community to what is called as CF in LCAcommunity) of different natural resources. Regarding the possible double-counting between bioticresources and land use, SED follows the approach of CEENE, which chooses to account for land use (incontrary to CED and CExD); therefore, we can say that SED and CEENE are equivalent in this aspect.As previously mentioned, SED has a high number of CF, but they are not regionalized. Emergy is anapproach that is still challenged by the scientific community, even though there are some efforts tosolve some of the problems and align it to LCA [25,26], in which SED was a result of that effort. Due tothose reasons, SED received a medium-high score for both criteria.
MIPS
Material Inputs Per Service (MIPS) [27,28] is an indicator of the cumulative amount of resourcesof product/service through its life cycle, and sometimes is called a Material Footprint. MIPS is basedon material flow analysis, separating materials in five classes: abiotic resources, biotic resources, earth
101
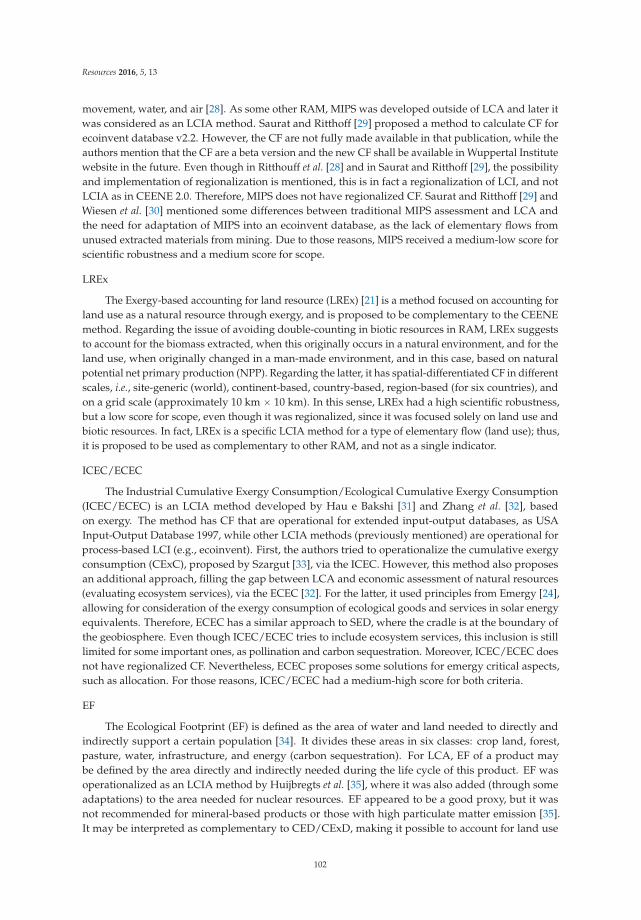
Resources 2016, 5, 13
movement, water, and air [28]. As some other RAM, MIPS was developed outside of LCA and later itwas considered as an LCIA method. Saurat and Ritthoff [29] proposed a method to calculate CF forecoinvent database v2.2. However, the CF are not fully made available in that publication, while theauthors mention that the CF are a beta version and the new CF shall be available in Wuppertal Institutewebsite in the future. Even though in Ritthouff et al. [28] and in Saurat and Ritthoff [29], the possibilityand implementation of regionalization is mentioned, this is in fact a regionalization of LCI, and notLCIA as in CEENE 2.0. Therefore, MIPS does not have regionalized CF. Saurat and Ritthoff [29] andWiesen et al. [30] mentioned some differences between traditional MIPS assessment and LCA andthe need for adaptation of MIPS into an ecoinvent database, as the lack of elementary flows fromunused extracted materials from mining. Due to those reasons, MIPS received a medium-low score forscientific robustness and a medium score for scope.
LREx
The Exergy-based accounting for land resource (LREx) [21] is a method focused on accounting forland use as a natural resource through exergy, and is proposed to be complementary to the CEENEmethod. Regarding the issue of avoiding double-counting in biotic resources in RAM, LREx suggeststo account for the biomass extracted, when this originally occurs in a natural environment, and for theland use, when originally changed in a man-made environment, and in this case, based on naturalpotential net primary production (NPP). Regarding the latter, it has spatial-differentiated CF in differentscales, i.e., site-generic (world), continent-based, country-based, region-based (for six countries), andon a grid scale (approximately 10 km ˆ 10 km). In this sense, LREx had a high scientific robustness,but a low score for scope, even though it was regionalized, since it was focused solely on land use andbiotic resources. In fact, LREx is a specific LCIA method for a type of elementary flow (land use); thus,it is proposed to be used as complementary to other RAM, and not as a single indicator.
ICEC/ECEC
The Industrial Cumulative Exergy Consumption/Ecological Cumulative Exergy Consumption(ICEC/ECEC) is an LCIA method developed by Hau e Bakshi [31] and Zhang et al. [32], basedon exergy. The method has CF that are operational for extended input-output databases, as USAInput-Output Database 1997, while other LCIA methods (previously mentioned) are operational forprocess-based LCI (e.g., ecoinvent). First, the authors tried to operationalize the cumulative exergyconsumption (CExC), proposed by Szargut [33], via the ICEC. However, this method also proposesan additional approach, filling the gap between LCA and economic assessment of natural resources(evaluating ecosystem services), via the ECEC [32]. For the latter, it used principles from Emergy [24],allowing for consideration of the exergy consumption of ecological goods and services in solar energyequivalents. Therefore, ECEC has a similar approach to SED, where the cradle is at the boundary ofthe geobiosphere. Even though ICEC/ECEC tries to include ecosystem services, this inclusion is stilllimited for some important ones, as pollination and carbon sequestration. Moreover, ICEC/ECEC doesnot have regionalized CF. Nevertheless, ECEC proposes some solutions for emergy critical aspects,such as allocation. For those reasons, ICEC/ECEC had a medium-high score for both criteria.
EF
The Ecological Footprint (EF) is defined as the area of water and land needed to directly andindirectly support a certain population [34]. It divides these areas in six classes: crop land, forest,pasture, water, infrastructure, and energy (carbon sequestration). For LCA, EF of a product maybe defined by the area directly and indirectly needed during the life cycle of this product. EF wasoperationalized as an LCIA method by Huijbregts et al. [35], where it was also added (through someadaptations) to the area needed for nuclear resources. EF appeared to be a good proxy, but it wasnot recommended for mineral-based products or those with high particulate matter emission [35].It may be interpreted as complementary to CED/CExD, making it possible to account for land use
102

Resources 2016, 5, 13
with low uncertainty, but for that, some adaptations are needed to avoid double counting with bioticresources. EF may be regionalized for different scales, based on specific biocapacities, but there is nooperational LCIA method with spatially-differentiated CF. On the other hand, EF (as an LCIA method)only considers elementary flows related to fossil and nuclear resources, land use, and CO2 emission.Therefore, it has a limited scope (it does not account for metals and minerals), and goes beyond theAoP Resources by accounting for CO2 emissions. For these reasons, the final score of this RAM wasrather low.
Table 1. Quali-quantitative assessment of the LCIA methods at the RAM level for the AoP Resources.
LCIA Method CEENE CExD CED SED MIPS LREx ICEC/ECEC EF
Base reference [9] [22] [13,16] [10] [28] [21] [31,32] [34,35]Criterion #1 (Scope) 5 3 1 4 3 1 4 3
Criterion #2(Scientific
robustness)5 3 2 4 2 5 4 2
Final score 5.0 3.0 1.5 4.0 2.5 3.0 4.0 2.5
ObservationWe
evaluatedv1.0 and v2.0
- - - - Specific forland use - -
2.1.2. Midpoint LCIA Methods
ADP
Abiotic Depletion Potential (ADP) was initially developed by Guinée [11], was later modifiedin van Oers et al. [36], and included in the LCIA methodology CML-IA (from the Institute ofEnvironmental Sciences (CML), named CML-IA). To calculate CF, ADP uses an equation that involvesthe extraction rate of a certain resource and the squared of the availability of this resource in deposits.All resources are normalized to the CF of antimony (Sb); therefore, the indicator is Sb equivalent(Sb-eq). Regarding the deposits used to calculate the CF, original ADP used the ultimate reserves,which may be defined as the total amount of a certain substance (e.g., iron) available in the Earth’scrust, oceans and atmosphere. In this sense, the ultimate reserve also includes deposits that are noteconomically or technically feasible for extraction. Later, ADP created CF for other approaches as well,i.e., for reserve base and economic reserves. ADP has CF for metals and minerals, and the total amountof CF is dependent on the approach used (ultimate reserve, reserve base or economic reserve). Forfossil fuels, ADP also has CF, but in the latter versions of the ultimate reserve approach (e.g., v4.2), theCF are based on the net heating value of the fossil fuel, similar to CED (a RAM), thus not providing amidpoint resource depletion assessment. ADP has high scientific robustness in LCA community, andthe approach based on the reserve base is recommended by ILCD [3] as the LCIA method to be usedfor midpoint assessment. Furthermore, the amount of CF provided by this method is quite high incomparison to other depletion LCIA methods, despite the approach considered. In this sense, ADPreceived high scores for the criteria considered.
EDIP
EDIP (Environmental Design of Industrial Products) 1997/2003 [37] is an LCIA methodologyestablished in the LCA community and traditionally used for the assessment of products. This LCIAmethodology considers several impact categories, including the depletion of resources, with CF formetals, minerals, and fossil fuels. For this category, the CF are calculated by an equation that exclusivelyinvolves the amount of available resources in deposits, i.e., not considering the extraction rate, as inADP. Therefore, the property of a resource for having a high/low extraction rate is not accounted forby the CF. For this reason, EDIP received a lower score than ADP in the criterion scientific robustness.The deposits considered in this LCIA method are based on the economic reserves. EDIP has a high
103

Resources 2016, 5, 13
amount of CF for the resources previously mentioned, higher than Recipe Midpoint [38], but slightlylower than ADP (depending on the approach used). For that reason, EDIP had a medium-high scorefor scope.
Recipe Midpoint
Recipe Midpoint (Recipe has two versions (midpoint and endpoint) and, regarding resourcedepletion, there are differences in the analysis. For this reason they were evaluated separately.) [39] hasCF for fossil fuels, metals and minerals, and the approach used is different for the types of resources.For fossil fuels, Recipe Midpoint considers the heating value, i.e., a RAM approach, similar to CED. Formetals and minerals, the approach is different, considering the depletion of those resources at midpointlevel. Recipe Midpoint has an innovative approach, in comparison to ADP and EDIP, evaluatedthrough the deposits of minerals, and not by the metals per se. According to the authors, by doing this,the LCIA method better represents the reality of the metals’ geological distribution, allowing themto cover a higher number of commodities, especially those extracted as by-products. This methodconsiders the change in the ore grade, i.e., the decrease in the concentration of minerals in an ore dueto extraction. Recipe Midpoint has less CF than ADP and EDIP, and this is probably due to the highercomplexity level to obtain the data needed to create the CF by the approach from the former. Further,Recipe Midpoint has some inconsistencies in the creation of CF [40] (e.g., allocation procedure). Forthose reasons, this method had a medium score for both criteria.
ORI
ORI (Ore Requirement Indicator) [40] is a specific LCIA method for the evaluation of metal andmineral depletion; therefore, it does not have CF for fossil fuels, for instance. It uses a similar approachto Recipe Midpoint, i.e., considers the change in ore grade, and its equation is the reciprocal of theore grade variation, thus the change in ore mass by mass of metal extracted. However, instead ofusing a small database (locally or temporally) to generate CF, as performed in Recipe Midpoint, theauthors use a more robust database that has information from different mines for more than a decade.In order to guarantee scientific soundness, the authors created CF solely for the metals in which thesource from the database represented more than 50% of worldwide production. In this way, it has ahigher scientific robustness than Recipe Midpoint. On the other hand, it had a limited number of CF(9 metals). ORI has an interesting approach, indicating an option to be followed for midpointassessment, especially with the expansion of data for metals and minerals. However, since it has solely9 CF and is focused on metals and minerals (no CF for fossil fuels), it has a low operationalization forLCA (later this LCIA method may be enhanced by the inclusion of more CF), and as a consequence, ithad a low score for scope and a high score for scientific robustness.
AADP
The Anthropogenic Stock Extended Abiotic Depletion Potential (AADP) [41] may be considereda complementary method for the ADP, by including the depletion assessment resources that havealready been extracted from their deposits and are now available in the anthroposphere (e.g., landfill),bringing an innovative concept. However, due to the difficulty of obtaining consistent data, it has CFfor solely 10 metals. Since it is a specific LCIA method for metals, it does not have CF for fossil fuels.For those reasons, it had a high score for scientific robustness and a low score for scope, as ORI. AADPwent through some adaptations, where more CF were created (35 in total), but this new version [42]was not considered in this study because it was published after December 2014.
OGD
The Ore Grade Decrease (OGD) was proposed by Vieira et al. [43], and it has a similar approach toORI, i.e., it evaluated the ore grade change due to extraction of metals, based on a geologic distributionmodel. For this reason, it has a high scientific robustness, but the authors created only one CF, for
104

Resources 2016, 5, 13
copper, giving a low score for the scope criterion. In order to differentiate this from other low-scoringLCIA methods at the scope criterion (ORI and AADP), we gave an even lower score for OGD.
Table 2. Quali-quantitative assessment of the LCIA methods at midpoint level for the AoP Resources.
LCIA Method ADP EDIPRecipe
MidpointORI AADP OGD
Base reference [11,36] [37] [39] [40] [41] [43]Criterion #1 (Scope) 5 4 3 1 1 0.5
Criterion #2(Scientific
robustness)4 3 3 5 5 5
Final score 4.5 3.5 3.0 3.0 3.0 2.75
Observation - - - Specific formetals
Specific formetals at
anthroposphere
Since it hadonly one CF
2.1.3. Endpoint LCIA Methods
Eco-Indicator 99
Eco-Indicator 99 is an LCIA endpoint method, i.e., it evaluates the final impact from using fossilfuels, metals and minerals by the approach proposed in Muller-Wenk [4], which considers the increased(future) workload in the extraction of more inaccessible reserves resources (e.g., marginal reserves). InEco-indicator 99, the surplus energy (MJse) is used as an aggregated unit for resource depletion [44].This resource depletion characterization model is used in other LCIA methodologies as well, such asin TRACI (the Tool for the Reduction and Assessment of Chemical and other environmental Impacts),BEES (Building for Environmental and Economic Sustainability), and Impact 2002+ [13]. The base forthe Eco-indicator 99 assessment is through the estimated surplus energy required for the extraction ofminerals, based on the decline of the concentration rate in time [4,45]. The analysis uses geostatisticalmodels to indicate the distribution structure, quantity and quality of the minerals and the futureeffort needed, to calculate the surplus energy for extraction of resources. Following the same trendfrom other endpoint LCIA methods, the Eco-indicator 99 has fewer CF than midpoint LCIA methods.In addition, compared to other endpoint LCIA methods (e.g., Recipe Endpoint and EPS2000), thenumber of CF is also lower, and with the absence of important minerals in the global context, suchas gold, iron, palladium, molybdenum, lead and platinum. For this reason, the score for scope wasmedium. On one hand, the characterization model is part of different methods LCIA (e.g., Impact2002+), which are consolidated and accepted by the scientific community, but on the other hand, thecharacterization models was based (for metals) on a limited number of low accuracy curves. Therefore,Eco-indicator 99’s scientific robustness was considered medium-low, in comparison to other endpointLCIA methods.
Recipe Endpoint
Recipe Endpoint [39] assesses the depletion of fossil fuels, metals and minerals through anotherapproach (compared to its midpoint version), going beyond the cause-effect relationship, i.e., to anendpoint level [2,3]. The approach, somewhat similar to the Eco-indicator 99, evaluates the increasein the cost of extracting those resources due to their depletion, thus using the approach proposed byMüller-Wenk [4] and Stewart and Weidema [5]. Because it is an LCIA method that goes beyond thecause and effect of resource depletion impacts, it has greater complexity of data to create CF, and inthis sense, it has fewer CF than midpoint LCIA methods (e.g., ADP). Moreover, when compared toother endpoint LCIA methods, it has more CF than the Eco-indicator 99, for instance. For metals andminerals, CF were calculated based on extraction costs and on the CF of Recipe Midpoint. Therefore,the endpoint CF also has the same calculation inconsistencies mentioned in Swart and Dewulf [40]
105

Resources 2016, 5, 13
(e.g., allocation procedure). Regarding fossil fuels, the CF for crude oil was based on data fromthe International Energy Agency, assuming constant annual production over time, using a limitedrelationship of price and production and determining an arbitrary time period [46]. Additionally, dueto a lack of data, coal and natural gas CF were calculated using extrapolated data from crude oil. Thus,the Recipe Endpoint received a medium-high score for the scope criterion and a medium score for thescientific robustness criterion.
EPS2000
The Environmental Priority Strategies (EPS) is an endpoint LCIA method, proposed for the firsttime in 1990, and it was later modified; the final version is named EPS2000 [47,48]. The principle fordamage assessment is through the willingness-to-pay (WTP) approach, in which natural resources andenvironmental impacts are put in monetary values. One of the impact categories is named abiotic stockresource (or depletion of reserves), which evaluates the depletion impacts (at endpoint level) frommetals, minerals and fossil resources. The unit used is the Environmental Load Unit (ELU), whichrepresents the costs of sustainable extraction of non-renewable resources. Considering the limitationsof WTP for abiotic resources, EPS2000 proposes a market scenario, in which the production costs of acertain substance are used to estimate the CF for resource depletion. The characterization models fromEPS are not entirely transparent, considering that they are based on political and sociocultural values.Therefore, EPS2000 had a medium-low score for scientific robustness. The current version of EPS2000has a significant amount of CF, higher than other endpoint LCIA methods (e.g., Recipe Endpoint), andfor this reason it received a high score for scope. As a consequence, EPS2000 received the same finalscore from Recipe Endpoint.
SuCo
The Surplus Cost (SuCo) method, proposed in Ponsioen et al. [46], aims to adapt or integrateelementary flows related to fossil resources to LCA. Therefore, this LCIA method is specific for thattype of resource, not generating CF for metals and minerals (amongst other resource types). Theproposal from SuCo is to assess fossil resource scarcity based on the future increase in global costs dueto the use of marginal fossil resources used in the life cycle of products. Therefore, SuCo follows thesame trend as Eco-indicator 99 and Recipe Endpoint. In practice, SuCo may be seen as an evolutionfrom Recipe Endpoint (which may be seen as an evolution from Eco-indicator 99), and that there is apossibility to incorporate SuCo to Recipe Endpoint in the next versions of the latter [49]. SuCo hasCF for three types of fossil fuels (crude oil, natural gas, and coal), from which it used specific data forthe calculation of the respective resource. Therefore, it has higher scientific robustness than RecipeEndpoint, in which only data from crude oil was used. For that reason, it received a medium-high scorefor that criterion. Since it is a specific LCIA method for fossil fuels, it received a low score for scope.
Exergoecology
Exergoecology, proposed by Valero e Valero [50,51], brings an innovative approach to the LCAcommunity, where the authors try to quantify the depletion of metals and minerals through the exergycost, which, in a simplified way, would be to make a cumulative exergy consumption assessment, but inthe opposite direction, i.e., from grave-to-cradle. The main idea is that the method quantifies the exergyneeded to let the metal be ready for extraction through mining, from its reference state (where exergyis zero). This method may be considered as evaluating the AoP Resources at the endpoint level, sinceit considers the consequences from resource depletion. Exergoecology has an interesting alternativeapproach, but it is not yet completely operational for LCA, mainly for two reasons: (1) Through thepublished articles, we were able to quantify only seven CF; and (2) this originates from a scientific areathat needs more research, and more CF should be generated. Regarding the latter reason, even thoughexergy is already established in LCA, the scientific proposal from Valero and Valero [50,51] goes beyond
106
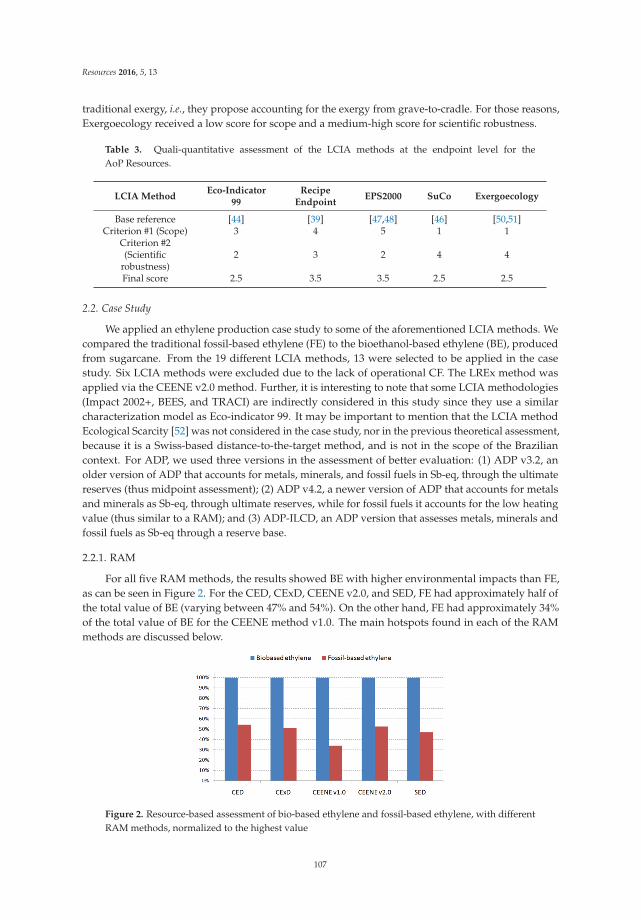
Resources 2016, 5, 13
traditional exergy, i.e., they propose accounting for the exergy from grave-to-cradle. For those reasons,Exergoecology received a low score for scope and a medium-high score for scientific robustness.
Table 3. Quali-quantitative assessment of the LCIA methods at the endpoint level for theAoP Resources.
LCIA MethodEco-Indicator
99Recipe
EndpointEPS2000 SuCo Exergoecology
Base reference [44] [39] [47,48] [46] [50,51]Criterion #1 (Scope) 3 4 5 1 1
Criterion #2(Scientific
robustness)2 3 2 4 4
Final score 2.5 3.5 3.5 2.5 2.5
2.2. Case Study
We applied an ethylene production case study to some of the aforementioned LCIA methods. Wecompared the traditional fossil-based ethylene (FE) to the bioethanol-based ethylene (BE), producedfrom sugarcane. From the 19 different LCIA methods, 13 were selected to be applied in the casestudy. Six LCIA methods were excluded due to the lack of operational CF. The LREx method wasapplied via the CEENE v2.0 method. Further, it is interesting to note that some LCIA methodologies(Impact 2002+, BEES, and TRACI) are indirectly considered in this study since they use a similarcharacterization model as Eco-indicator 99. It may be important to mention that the LCIA methodEcological Scarcity [52] was not considered in the case study, nor in the previous theoretical assessment,because it is a Swiss-based distance-to-the-target method, and is not in the scope of the Braziliancontext. For ADP, we used three versions in the assessment of better evaluation: (1) ADP v3.2, anolder version of ADP that accounts for metals, minerals, and fossil fuels in Sb-eq, through the ultimatereserves (thus midpoint assessment); (2) ADP v4.2, a newer version of ADP that accounts for metalsand minerals as Sb-eq, through ultimate reserves, while for fossil fuels it accounts for the low heatingvalue (thus similar to a RAM); and (3) ADP-ILCD, an ADP version that assesses metals, minerals andfossil fuels as Sb-eq through a reserve base.
2.2.1. RAM
For all five RAM methods, the results showed BE with higher environmental impacts than FE,as can be seen in Figure 2. For the CED, CExD, CEENE v2.0, and SED, FE had approximately half ofthe total value of BE (varying between 47% and 54%). On the other hand, FE had approximately 34%of the total value of BE for the CEENE method v1.0. The main hotspots found in each of the RAMmethods are discussed below.
Figure 2. Resource-based assessment of bio-based ethylene and fossil-based ethylene, with differentRAM methods, normalized to the highest value
107

Resources 2016, 5, 13
CED and CExD had similar results, i.e., BE had greater environmental impact, mainly due to theenergy content of the sugarcane (86%–87%), and a considerable fraction of the total value was due tofossil energy consumption (10%–11%), mainly due to natural gas consumed during ethanol-to-ethyleneproduction and diesel consumed in the sugarcane stage. For the FE, most of the environmental impactswere due to the crude oil (63%–64%) and natural gas (31%–33%) consumption in the ethylene supplychain. An interesting difference between CED and CExD was the results for water resources, i.e., forCED, water resources were consumed mainly due to hydropower (potential energy), while the CExDaccounted not only for water from hydropower (potential energy), but water was also used in theethanol production process.
For the CEENE method, BE environmental impacts were mainly due to land occupation for thesugarcane cultivation (90% in v1.0 and 85% in v2.0). Fossil fuels also had a significant contribution inthe total value (7% in v1.0 and 11% in v2.0), and from that approximately 53% was due to natural gasconsumption in the ethanol-to-ethylene production process and 22% was due to diesel consumptionduring sugarcane cultivation. The main difference between v1.0 and v2.0 was land occupation, i.e., whilethe former uses average European solar irradiation as a proxy, giving a higher result, the latter usesregionalized data on natural potential NPP as a proxy (which for this case study, gave a lower value).
When using the SED, BE had more than double the total environmental impacts, and the mainhotspot was the consumption of gypsum (mineral) in the sugarcane stage, which was responsible formore than 66% of the total environmental impact. After that, the consumption of limestone (mineral),with 10% of total, natural gas in the ethanol-to-ethylene process (4%), and diesel at the sugarcane stage(3%) were also relevant contributors for the SED. Regarding the FE, most of the environmental impactswere due to crude oil (67%) and natural gas (26%) consumed in the ethylene supply chain. Sodiumchloride had also a relevant share of contribution (3%) for FE.
It is interesting to note that for FE, the results among the five RAM showed similar hotspots. Onthe other hand, while for CED, CExD, CEENE v1.0 and CEENE v2.0, the main hotspot for BE was thesugarcane (either as a biomass or the land occupation for its cultivation); in SED the land occupationimpacts accounted for only 2% of the total environmental impacts, and the minerals consumed duringthe sugarcane stage were the main hotspots. This is due to the different approach used in SED, whichsets the geobiosphere as system boundaries to create the CF, while the former four RAM set theboundary between the ecosphere and the anthroposphere [2,21].
2.2.2. Midpoint
For the midpoint level, the results were slightly divergent among the LCIA methods (Figure 3). ForADP v3.2, ADP v4.2, and the Recipe Midpoint, BE was the most beneficial option for the environment,with values of approximately 20%–30% of the environmental impact of FE. On the other hand,ADP-ILCD, EDIP2003, ORI and AADP had opposite results, and the degree of how beneficial FE wasvaried considerably. The main reason was the higher importance given to metals and minerals inthe latter LCIA methods. The relevance of the elementary flows for each LCIA method can be bettervisualized in Table 4, Figures 4 and 5.
Figure 3. Resource-based assessment of bio-based ethylene and fossil-based ethylene, with differentmidpoint LCIA methods, normalized to the highest value.
108

Resources 2016, 5, 13
Ta
ble
4.
Rel
ativ
eco
ntri
buti
onof
spec
ific
elem
enta
ryflo
ws
for
bio-
base
det
hyle
ne(B
E)an
dfo
ssil-
base
det
hyle
ne(F
E)at
the
mid
poin
tand
endp
oint
LCIA
met
hods
cons
ider
edin
this
case
stud
y.
Ele
men
tary
Flo
ws
(Natu
ral
Reso
urc
es)
AD
Pv
3.2
(Ult
imate
)A
DP
v4.2
(Ult
imate
)A
DP
-IL
CD
(Res.
Base
)E
DIP
2003
Reci
pe
Mid
po
int
OR
IA
AD
PE
co-I
nd
icato
r99
Reci
pe
En
dp
oin
tE
PS
2000
BE
FE
BE
FE
BE
FE
BE
FE
BE
FE
BE
FE
BE
FE
BE
FE
BE
FE
BE
FE
Met
als
and
min
eral
s
Chr
omiu
m-
--
--
--
-2%
--
--
--
-1%
-2%
-C
oppe
r-
-2%
-4%
-7%
-4%
-34
%28
%-
-1%
-2%
-13
%-
Iron
--
--
--
--
6%-
--
-1%
--
2%-
2%-
Lead
--
1%-
30%
-12
%-
--
1%1%
-1%
--
--
7%-
Nic
kel
--
--
4%-
35%
-3%
-57
%61
%89
%92
%1%
-1%
-14
%-
Ura
nium
--
--
-49
%-
8%-
1%-
--
--
--
--
-Ph
osph
ate
rock
--
--
1%-
--
--
--
--
--
--
3%-
Zin
c-
-2%
-58
%-
23%
--
-1%
-2%
--
--
-14
%-
Foss
ilfu
els
Cru
deoi
l(di
esel
-can
e)20
%-
21%
--
-2%
-14
%-
--
--
23%
-22
%-
5%-
Cru
deoi
l(FE
)-
36%
-34
%-
28%
-59
%-
66%
--
--
-66
%-
66%
-51
%C
rude
oil(
othe
r)8%
-8%
--
-1%
-11
%-
--
--
9%-
8%-
3%-
Nat
ural
gas
(BE)
54%
-51
%-
--
5%-
40%
--
--
-55
%-
50%
-25
%-
Nat
ural
gas
(FE)
-62
%-
65%
-15
%-
32%
-32
%-
--
--
34%
-32
%-
49%
Nat
ural
gas
(oth
er)
8%-
7%-
--
1%-
6%-
--
--
8%-
7%-
4%-
Har
dco
al6%
-4%
--
--
-4%
--
--
--
-4%
--
-
Oth
erel
emen
tary
flow
s4%
2%6%
1%3%
8%14
%1%
10%
1%7%
10%
9%6%
4%0%
5%2%
8%0%
109
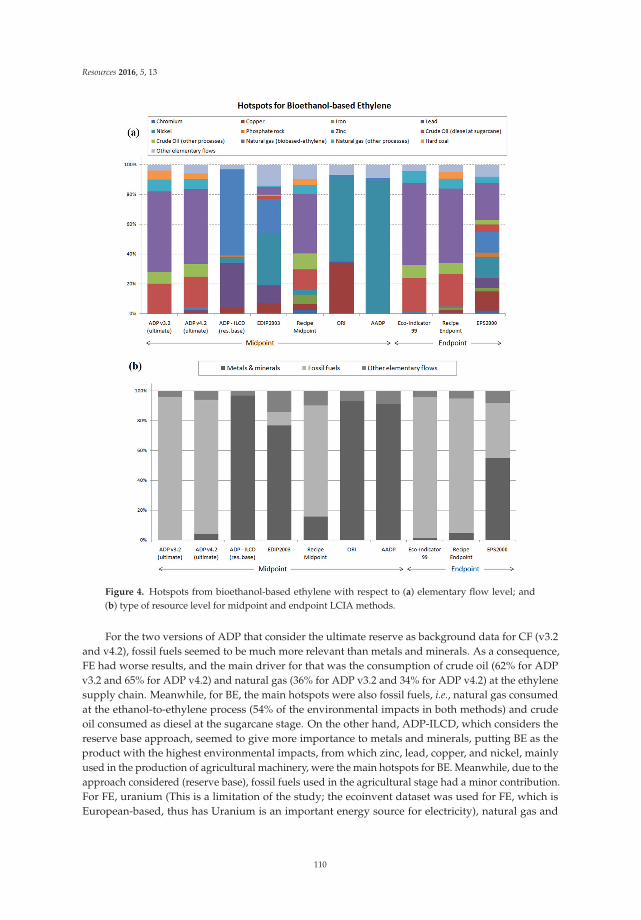
Resources 2016, 5, 13
Figure 4. Hotspots from bioethanol-based ethylene with respect to (a) elementary flow level; and(b) type of resource level for midpoint and endpoint LCIA methods.
For the two versions of ADP that consider the ultimate reserve as background data for CF (v3.2and v4.2), fossil fuels seemed to be much more relevant than metals and minerals. As a consequence,FE had worse results, and the main driver for that was the consumption of crude oil (62% for ADPv3.2 and 65% for ADP v4.2) and natural gas (36% for ADP v3.2 and 34% for ADP v4.2) at the ethylenesupply chain. Meanwhile, for BE, the main hotspots were also fossil fuels, i.e., natural gas consumedat the ethanol-to-ethylene process (54% of the environmental impacts in both methods) and crudeoil consumed as diesel at the sugarcane stage. On the other hand, ADP-ILCD, which considers thereserve base approach, seemed to give more importance to metals and minerals, putting BE as theproduct with the highest environmental impacts, from which zinc, lead, copper, and nickel, mainlyused in the production of agricultural machinery, were the main hotspots for BE. Meanwhile, due to theapproach considered (reserve base), fossil fuels used in the agricultural stage had a minor contribution.For FE, uranium (This is a limitation of the study; the ecoinvent dataset was used for FE, which isEuropean-based, thus has Uranium is an important energy source for electricity), natural gas and
110

Resources 2016, 5, 13
crude oil were the main hotspots, all of which were consumed in the ethylene supply chain (Table 4,Figures 4 and 5).
Figure 5. Hotspots from fossil-based ethylene with respect to (a) elementary flow level; and (b) type ofresource level for midpoint and endpoint LCIA methods.
Similar to ADP v3.2 and v4.2, the Recipe Midpoint also gave more importance to fossil fuels (afternormalization), identifying FE as the product with the highest environmental impacts. Crude oil (66%)and natural gas (32%) consumed in the ethylene supply chain were the main hotspots for FE. The mainhotspots for BE were natural gas (46%) and crude oil (25%), consumed in several processes. Moreover,some metals also had a considerable contribution to BE, especially chromium, copper, iron, and nickel
111

Resources 2016, 5, 13
(summing to 15% of the environmental impacts), mainly used in the production of agricultural andindustrial machinery (Table 4, Figures 4 and 5).
EDIP 2003 seemed to give more importance to metals and minerals, probably due to the economicreserve approach. BE was the product with the highest environmental impacts, mainly due to nickel,zinc, lead, and copper (total of 77%), primarily used in the production of agricultural and industrialmachinery. Similar to ADP-ILCD, fossil fuels used in the agricultural stage had minor contributions.The main hotspots for FE were crude oil (59%) and natural gas (32%) consumed in the ethylene supplychain (Table 4, Figures 4 and 5).
Regarding ORI and AADP, BE was the product with the highest environmental impacts, sincethese methods have CF solely for metals and minerals thus far. In AADP, BE was highly influencedby nickel (89%), while in ORI it was mainly influenced by nickel (57%) and copper (34%). The samemetals were the main hotspots for FE, showing that a low number of CF may indicate a misleadinginterpretation (if we consider the results from the other midpoint LCIA methods). In this sense, it isimportant to mention that these LCIA methods may be currently used in LCA with caution, i.e., itshould be complemented by other LCIA methods for other types of resources (e.g., fossil fuels), andavoid making a joint overall abiotic resource assessment.
From the results at the midpoint level, we could see that certain LCIA methods gave morefocus to metals and minerals, as those considering a reserve base (ADP-ILCD) and an economicreserve (EDIP2003) as the background approach for creating CF. This is probably due to the loweramount of metal deposits available in higher concentrations. Meanwhile, ADP versions consideringthe ultimate reserves (v3.2 and v4.2) and the Recipe Midpoint gave more focus to fossil fuels.Furthermore, we could notice that using LCIA methods with a low amount of CF, such as ORIand AADP, may show inconsistent results, especially for products highly based on fossil fuels (asFE). Therefore, this case study highlights the importance of the criterion assessing the number ofreference flows with CF, when dealing with abiotic resource depletion. In this sense, it is important tohighlight that a possible procedure to choose an LCIA method is to make a preliminary environmentalimpact assessment, finding possible hotspots (e.g., iron may be a hotspot when performing an LCAof industrial machinery), and then making sure that the chosen LCIA method has CF for thoseelementary flows.
2.2.3. Endpoint
For the endpoint LCIA methods, the results of the case study were more convergent than themidpoint LCIA methods, i.e., they all considered the BE as more beneficial to the environment(Figure 6).
Figure 6. Resource-based assessment of bio-based ethylene and fossil-based ethylene, with differentendpoint LCIA methods, normalized to the highest value.
112

Resources 2016, 5, 13
For the Eco-indicator 99, the environmental impacts from FE were mainly due to crude oil (66%)and natural gas (34%) consumed in the ethylene supply chain. Thus, the environmental impacts frommetals and minerals were negligible. Meanwhile, for the BE, 63% of the environmental impacts weredue to overall natural gas consumption (87% of those in the ethanol-to-ethylene process), 32% due tocrude oil consumption (72% of those due to diesel in the sugarcane stage), 1% from copper and 1%from nickel, both mainly due to agricultural machinery (Table 4, Figures 4 and 5).
The Recipe Endpoint had similar results as the Eco-indicator 99, i.e., crude oil (66%) and naturalgas (32%) consumed in the ethylene supply chain were the main hotspots for FE. For BE, the mainhotspots were natural gas and crude oil, but some metals (chromium, copper, iron, and nickel) alsohad a significant contribution to the environmental impacts (Table 4, Figures 4 and 5).
The method EPS2000, which uses a different approach from the Recipe Endpoint and Eco-indicator99, indicated different hotspots for BE. Natural gas and crude oil in different processes contributedto approximately 37% of the impacts, while several metals (chromium, copper, iron, lead, nickel,phosphate rock, and zinc) contributed to approximately 55% of the impacts (Table 4, Figures 4 and 5).For FE, the results were more similar to the other endpoint LCIA methods, i.e., crude oil and naturalgas consumed in the ethylene supply chain were the main hotspots.
2.2.4. Discussion
Liao et al. [8] analyzed different LCIA methods in a case study of titania produced in Chinathrough different routes (chloride and sulphate). Even though the products analyzed were quitedifferent from our study, some results were similar among the RAM methods, showing that CED,CExD and CEENE were mainly influenced by fossil resources (since titania is not a bio-based product),while SED was mainly influenced by metals and minerals. Moreover, for the endpoint LCIA methodsconsidered in Liao et al. [8], the results also highlight a higher contribution of fossil fuels for theEco-indicator 99, in comparison to the EPS2000, which also had a significant contribution of metals.Therefore, Liao et al. [8] can corroborate our findings in both approaches (RAM and Endpoint).
Robech et al. [6] compared different resource-based LCIA methods by applying them to 2744market datasets from the ecoinvent database. The results showed that the ADP (ultimate reserves), theEco-indicator 99, and the Recipe Endpoint were mainly influenced by fossil fuels, while EDIP2003,ADP-ILCD and EPS2000 were mainly influenced by metals and minerals, corroborating the resultsof this study; except for EPS2000, which may have to do with the products analyzed, i.e., ourproduct system may be more fossil influenced than the averaged 2744 product systems analyzed byRobech et al. [6]. Further, even though our case study was still mainly influenced by fossil fuels in theEPS2000, the share of contribution was lower than the Recipe Endpoint and the Eco-indicator 99. Forthe RAM methods of Robech et al. [6], SED showed many more contributions to metals and mineralsthan CEENE v1.0 and CExD, validating the results of this study at the RAM level as well.
Moreover, similar results were found in the case study between the ADP (v3.2 and v4.2) andthe Eco-indicator 99, identifying BE as the better option with approximately 20%–22% of the impactsfrom FE; this can be verified by the high correlation between these two LCIA methods found inBerger et al. [53]. Meanwhile, the similar results from our case study between ADP-ILCD and EDIP2003(BE as the worst option), and among Eco-indicator 99, ADP (v4.2 and v3.2), and the Recipe Endpoint(BE as the best option) can also be corroborated by the high correlation found by Robech et al. [6]among those LCIA methods.
Klinglmair et al. [38] compared the CF of different resource-based LCIA methods, normalizedwith respect to iron, showing that ADP (It was not clear which version they used, but it seemed tobe a version considering the ultimate reserve approach) has a higher relative CF for crude oil thanother metals, confirming the results of this case study, and is mainly influenced by fossil fuels in ADPv3.2 and ADP v4.2. Meanwhile, the relative CF of crude oil (relative to iron) was not much higherfor EPS2000 and the Recipe Endpoint, supporting our findings that showed iron with a significantcontribution for those LCIA methods (Table 4, Figures 4 and 5), while the contribution of that metal in
113

Resources 2016, 5, 13
ADP (v3.2 and v4.2) was negligible. On the other hand, according to Klinglmair et al. [38], Eco-indicator99 has a lower relative CF for crude oil, similar to the Recipe Endpoint and EPS2000, but in the casestudy presented here, iron did not show significant contributions, and this is probably due to thespecificities of the product system. The highest relative CF in AADP was from nickel [38], whichconfirms the reason why this metal was the main hotspot from our case study.
2.3. Recommendation of Abiotic Resource LCIA Methods
For each of one of the resource assessment levels (RAM, midpoint, endpoint), we proposedrecommendations for the use of LCIA methods, based on the theoretical criteria assessment (Section 2.1),and with support from the case study (Section 2.2). As we can see in Table 1, CEENE v2.0 (CEENE withregionalized CF based on LREx) is the most suitable RAM due to the highest final score. However, wenoticed that ICEC/ECEC also had a high final score; thus, since this method is operational for extendedinput-output LCI, we recommend it for that LCI approach; while CEENE v2.0 is recommended forprocess-based and hybrid LCI approaches. Further, based on Liao et al. [8], who recommends the SEDmethod, and the concept introduced by ICEC/ECEC, which proposed complementary assessment forRAM, we make an additional (and optional) recommendation for using SED as complementary to theCEENE v2.0 (for the applicable LCI approaches).
For the midpoint assessment, ADP presented the higher final scores (Table 2) and thus isrecommended as the midpoint LCIA method. Since it has different approaches (e.g., ultimate reserves),our recommendation is for the reserve base approach, as suggested in ILCD [3]. This is mainly dueto the higher environmental relevance of that approach, i.e., on one hand, the increase in resourcescarcity leads to the exploitation of reserves that are less economic (e.g., marginal reserves), whichare not accounted for in the economic reserve approach, and on the other hand, the ultimate reserveapproach also includes reserves with a very low concentration, which may provide inconsistent results.This decision can be corroborated by the case study (Figure 4), in which the relevance of metals andminerals seemed to be negligible in the ultimate reserve approach.
For the endpoint assessment, the Recipe Endpoint and EPS2000 had the highest scores (Table 3),and are recommended as the endpoint LCIA method. Nevertheless, due to their low final score(3.5) in comparison to other LCIA methods from other approaches (CEENE v2.0 and ADP), thisrecommendation is made with limitations. Additionally, considering that the authors from the RecipeEndpoint, OGD and SuCo are from the same team (Radboud University and PRé Consultants), andalso based on [49], we can assume that new versions of the Recipe Endpoint may include those newLCIA models. In that case, based on Tables 2 and 3 the score from the Recipe Endpoint in scientificrobustness could increase. Thus, a study similar to this one should be performed again in the nearfuture, in order to update the scores according to new versions that may come up.
2.4. Future Challenges and New Trends
The LCA scientific community has not yet reached consensus on how to evaluate resources. Aspreviously mentioned, traditional approaches may be classified into three levels (Figure 1). However,there are new frameworks for the impact assessment of this category [6,7], showing that the LCIAmethods available in literature are not yet consolidated, and new trends may appear in the future.
According to van Oers [36], resource depletion assessment at the midpoint and endpoint levelsdoes not need to be regionalized. However, we cannot draw the same conclusion for RAM, wheresome type of resources may need to be assessed by spatial-differentiated CF, as done in CEENE v2.0for land use (by LREx). Other RAM may follow the same trend, as ICEC/ECEC and SED for landuse. Further, RAM may also need to regionalize other elementary flows, such as biotic resourcesand water. Regarding midpoint LCIA methods, we noticed an evolution, from the more traditionalapproach (EDIP), which assesses the availability of resources and, for the ADP, their extraction rate,for more recent methods that evaluate the decrease in the ore grade, as the Recipe Midpoint, ORI andOGD. Moreover, there are new trends that include the resources in the anthroposphere, for metals,
114

Resources 2016, 5, 13
as proposed in AADP. Currently, these new approaches are not totally suitable for LCA, due to thelow number of CF, but this reality might change in the future (e.g., [42]). At the endpoint level, theassessment usually has higher uncertainties than at the midpoint level. However, newer LCIA modelsseem to be more scientifically robust, with fewer uncertainties (e.g., SuCo), and may be incorporatedinto traditional endpoint LCIA methods (e.g., Recipe Endpoint). Likewise, even though criticalitydoes not yet have an operational LCIA method available, it is a well-established resource managementmethodology that may be incorporated into LCA in the future, especially when considering economicand social issues in LCSA [7,54].
Moreover, we could see that there are already a few operational LCIA methods with alternativeapproaches (outside of traditional LCA), for instance ICEC/ECEC, SED and Exergoecology, whereconcepts from Emergy and cradle-to-cradle (or grave-to-cradle) approaches, that have a highsustainability appeal, are brought into LCA.
3. Experimental Section
In order to search for different operational LCIA methods available in literature, we used differentkeyword combinations (e.g., resources and LCA) on web tools, such as Web of Science. Articlespublished from the last 20 years, until December of 2014, were considered. After that, the articlesthat referred to the LCIA methods per se were selected, i.e., we excluded case studies that used thoseLCIA methods. Finally, we evaluated them through two criteria: (1) Scope: in which the amount ofelementary flows that could be accounted for was evaluated, i.e., the amount of CF available in theLCIA method. The availability of regionalized CF was also considered, but since spatial-differentiationin LCIA is not applicable to resource depletion assessment [36], this was considered solely for theRAM (not for midpoint and endpoint LCIA methods); (2) Scientific robustness: in which the modelbehind the LCIA method was evaluated, how it was scientifically proposed (theory used and/orcause-and-effect relation), how clear was the documentation, and if the method was fully operational.Other criteria could be used in our evaluation (e.g., acceptance by LCA community), but we preferredto focus on rather technical criteria. We gave scores between one (the lowest) and five (the highest) foreach of these criteria and later we calculated an arithmetic average in order to provide a final score foreach of the LCIA methods evaluated.
After the theoretical assessment of the LCIA methods, some of them were applied in a case studyof ethylene production. For that, two scenarios were considered:
‚ A traditional FE, which was based on the data in the ecoinvent [55] dataset named “ethylene,average (RER) production, Alloc Def” (There is no dataset in ecoinvent for Brazilian ethylene).The inputs and outputs in this dataset are arranged as aggregated LCI; thus, it is not possible toclearly identify the life cycle stage of each elementary flow;
‚ A BE, from Brazil, where sugarcane is produced to generate ethanol, that is further dehydratedinto ethylene. Therefore, Cavalett et al. [56] was used for sugarcane and ethanol data and theSwedish Life Cycle Center (CPM) database [57] for the ethanol-to-ethylene process unit. Sugarcaneand ethanol production considered in reference [56] is from advanced technologic cultivation andproduction systems, from the state of São Paulo (Brazil). The ethanol-to-ethylene process unit isbased on pilot scale data.
After modeling the life cycle of these two scenarios of ethylene, we performed an LCIA throughdifferent resource-based LCIA methods. Then, we evaluated which scenario had the best/worst resultsand searched for the main hotspots that each of these LCIA methods identified.
4. Conclusions
Through this study, we found 19 different LCIA methods for assessing the AoP Resources. We thenmade an assessment based on two criteria and, with support from a case study, were able to recommendthe CEENE method v2.0 (with optional complementary assessment by SED) for process-based and
115

Resources 2016, 5, 13
hybrid LCI, and ICEC/ECEC for extended input-output LCI, at RAM level; ADP (reserve base) formidpoint level; and EPS2000 and the Recipe Endpoint for the endpoint level (with the possibilityof only being the Recipe Endpoint in the future). In addition, it was possible to notice that theevaluation of the AoP Resources is not yet well established in the LCA community, not only due tothe recent development of several new LCIA methods with different approaches, but also due to thenew propositions on how this AoP should be assessed. In this sense, it is important to highlight theimportance of performing a study similar to this one in the near future, as new LCIA methods andalso new (and upgraded) versions of the current LCIA methods may appear.
Conflicts of Interest: The authors declare no conflict of interest.
References
1. MEA. Ecosystem and Human Well-Being: The Millennium Ecosystem Assessment; Island Press: Washington, DC,USA, 2015.
2. Swart, P.; Alvarenga, R.A.F.; Dewulf, J. Abiotic resource use. In LCA Compendium—The Complete World of LifeCycle Assessment: Life Cycle Impact Assessment, 1st ed.; Hauschild, M., Huijbregts, M.A.J., Eds.; Springer Press:Dordrecht, The Netherlands, 2015; Volume 4, pp. 247–269.
3. European Commission Joint Research Centre. International Reference Life Cycle Data System (ILCD)Handbook—Recommendations for Life Cycle Assessment in the European Context; Publications Office of theEuropean Union: Luxembourg, Luxembourg, 2011.
4. Müller-Wenk, R. Depletion of Abiotic Resources Weighted on the Base of 'Virtual' Impacts of Lower Grade Depositsin Future; IWO Diskussionsbeitrag Nr. 57; Universität St. Gallen: St. Gallen, Switzerland, 1998.
5. Stewart, M.; Weidema, B.P. A consistent framework for assessing the impacts from resource use—A focus onresource functionality (8 pp). Int. J. Life Cycle Assess. 2005, 10, 240–247. [CrossRef]
6. Robech, J.T.; Vadenbo, C.; Hellweg, S.; Astrup, T.F. Impact assessment of abiotic resources in LCA:Quantitative comparison of selected characterization models. Environ. Sci. Technol. 2014, 48, 11072–11081.[CrossRef] [PubMed]
7. Dewulf, J.; Benini, L.; Mancini, L.; Sala, S.; Blengini, G.A.; Ardente, F.; Recchioni, M.; Maes, J.; Pant, R.;Pennington, D. Rethinking the area of protection “natural resources” in life cycle assessment. Environ. Sci.Technol. 2015, 49, 5310–5317. [CrossRef] [PubMed]
8. Liao, W.; Heijungs, R.; Huppes, G. Thermodynamic resource indicators in LCA: A case study on the titaniaproduced in Panzhihua city, southwest China. Int. J. Life Cycle Assess. 2012, 17, 951–961. [CrossRef]
9. Dewulf, J.; Bosch, M.E.; Meester, B.D.; Vorst, G.V.D.; Langenhove, H.V.; Hellweg, S.; Huijbregts, M.A.J.Cumulative exergy extraction from the natural environment (CEENE): A comprehensive life cycle impactassessment method for resource accounting. Environ. Sci. Technol. 2007, 41, 8477–8483. [CrossRef] [PubMed]
10. Rugani, B.; Huijbregts, M.A.J.; Mutel, C.; Bastianoni, S.; Hellweg, S. Solar energy demand (SED) of commoditylife cycles. Environ. Sci. Technol. 2011, 45, 5426–5433. [CrossRef] [PubMed]
11. Guinée, J. Development of a Methodology for the Environmental Life-Cycle Assessment of Products. PhDdissertation, Leiden University, Leiden, The Netherlands, 2 March 1995.
12. Life Cycle Impact Assessment Programme. Available online: http://www.lifecycleinitiative.org/activities/phase-i/life-cycle-impact-assessment-programme/ (accessed on 25 January 2016).
13. Hischier, R.; Weidema, B.; Althaus, H.-J.; Doka, G.; Dones, R.; Frischknecht, R.; Hellweg, S.; Humbert, S.;Jungbluth, N.; Loerincik, Y.; et al. Implementation of Life Cycle Impact Assessment Methods: Final Report Ecoinventv2.1.; Swiss Centre for Life Cycle Inventories: St. Gallen, Switzerland, 2009; Volume 3.
14. Boustead, I.; Hancock, G.F. Handbook of Industrial Energy Analysis; Ellis Horwood Ltd.: New York, NY,USA, 1979.
15. Pimentel, D.; Hurd, L.E.; Bellotti, A.C.; Forster, M.J.; Oka, I.N.; Sholes, O.D.; Whitman, R.J. Food productionand the energy crisis. Science 1973, 182, 443–449. [CrossRef] [PubMed]
16. VDI. Cumulative Energy Demand—Terms, Definitions, Methods of Calculation; VDI guideline 4600;Verein Deutscher Ingenieure: Dusseldorf, Germany, 1997.
17. Frischknecht, R.; Wyss, F.; Knöpfel, S.B.; Lützkendorf, T.; Balouktsi, M. Cumulative energy demand in LCA:The energy harvested approach. Int. J. Life Cycle Assess. 2015, 20, 957–969. [CrossRef]
116

Resources 2016, 5, 13
18. Huijbregts, M.A.J.; Rombouts, L.J.A.; Hellweg, S.; Frischknecht, R.; Hendriks, A.J.; van de Meent, D.;Ragas, A.M.J.; Reijnders, L.; Struijs, J. Is cumulative fossil energy demand a useful indicator for theenvironmental performance of products? Environ. Sci. Technol. 2006, 40, 641–648. [CrossRef] [PubMed]
19. Huijbregts, M.A.J.; Hellweg, S.; Frischknecht, R.; Hendriks, H.W.M.; Hungerbuhler, K.; Hendriks, A.J.Cumulative energy demand as predictor for the environmental burden of commodity production. Environ.Sci. Technol. 2010, 44, 2189–2196. [CrossRef] [PubMed]
20. Alvarenga, R.A.F. Environmental Sustainability of Biobased Products: New Assessment Methods and CaseStudies. PhD Dissertation, Ghent University, Ghent, Belgium, 13 June 2013.
21. Alvarenga, R.A.F.; Dewulf, J.; Langenhove, H.; Huijbregts, M.A.J. Exergy-based accounting for land as anatural resource in life cycle assessment. Int. J. Life Cycle Assess. 2013, 18, 939–947. [CrossRef]
22. Bösch, M.; Hellweg, S.; Huijbregts, M.; Frischknecht, R. Applying cumulative exergy demand (CExD)indicators to the ecoinvent database. Int. J. Life Cycle Assess. 2007, 12, 181–190. [CrossRef]
23. Dewulf, J.; Van Langenhove, H.; Muys, B.; Bruers, S.; Bakshi, B.R.; Grubb, G.F.; Paulus, D.M.; Sciubba, E.Exergy: Its potential and limitations in environmental science and technology. Environ. Sci. Technol. 2008, 42,2221–2232. [CrossRef] [PubMed]
24. Odum, H.T. Environmental Accounting: Emergy and Environmental Decision Making, 1st ed.; John Wiley & Sons:New York, NY, USA, 1996.
25. Rugani, B.; Benetto, E. Improvements to emergy evaluations by using life cycle assessment. Environ. Sci.Technol. 2012, 46, 4701–4712. [CrossRef] [PubMed]
26. Ingwersen, W. Emergy as a life cycle impact assessment indicator. J. Ind. Ecol. 2011, 15, 550–567. [CrossRef]27. Schmidt-Bleek, F. The Fossil Makers; Birkhäuser: Basel, Boston, Berlin, 1993.28. Ritthoff, M.; Rohn, H.; Liedtke, C. MIPS BErechnen: Ressourcen Produktivität von Produkten und Dienstleistungen;
Wuppertal Spezial, Wuppertal Institutfür Klima, Umwelt und Energie 27; Visualisation Lab WuppertalInstitut: Wuppertal, Germany, 2002.
29. Saurat, M.; Ritthoff, M. Calculating MIPS 2.0. Resources 2013, 2, 581–607. [CrossRef]30. Wiesen, K.; Saurat, M.; Lettenmeier, M. Calculating the material input per service unit using the ecoinvent
database. Int. J. Perform. Eng. 2014, 10, 357–366.31. Hau, J.L.; Bakshi, B.R. Expanding exergy analysis to account for ecosystem products and services.
Environ. Sci. Technol. 2004, 38, 3768–3777. [CrossRef] [PubMed]32. Zhang, Y.; Baral, A.; Bakshi, B.R. Accounting for ecosystem services in life cycle assessment, Part II: Toward
an ecologically based LCA. Environ. Sci. Technol. 2010, 44, 2624–2631. [CrossRef] [PubMed]33. Szargut, J.; Morris, D.R.; Steward, F.R. Exergy Analysis of Thermal, Chemical, and Metallurgical Processes;
Springer: Berlin, Germany, 1998.34. Wackernagel, M.; Rees, W. Our Ecological Footprint: Reducing Human Impact on the Earth; NSP: Gabriola Island,
BC, Canada, 1998.35. Huijbregts, M.A.J.; Hellweg, S.; Frischknecht, R.; Hungerbuhler, K.; Hendriks, A.J. Ecological footprint
accounting in the life cycle assessment of products. Ecol. Econ. 2008, 64, 798–807. [CrossRef]36. van Oers, L.; de Koning, A.; Guinee, J.; Huppes, G. Abiotic Resource Depletion in LCA—Improving
Characterization Factors for Abiotic Resource Depletion as Recommended in the New Dutch LCA Handbook; Road andHydraulic Engineering Institute: Leiden, The Netherlands, 2002.
37. Hauschild, M.; Wenzel, H. Environmental Assessment of Products: Scientific background; Chapman & Hall:London, UK, 1998; Volume 2.
38. Klinglmair, M.; Sala, S.; Brandão, M. Assessing resource depletion in LCA: A review of methods andmethodological issues. Int. J. Life Cycle Assess. 2014, 18, 580–592. [CrossRef]
39. Goedkoop, M.; Heijungs, R.; Huijbregts, M.; de Schryver, A.; Struijs, J.; van Zelm, R. ReCiPe 2008—A lifeCycle Impact Assessment Method which Comprises Harmonized Category Indicators at the Midpoint and the EndpointLevel, 1st ed.; Report I: Charaterisation; Ministry of Housing, Spatial Planning and the Environment (VROM):The Hague, The Netherlands, 2009.
40. Swart, P.; Dewulf, J. Quantifying the impacts of primary metal resource use in life cycle assessment based onrecent mining data. Resour. Conserv. Recycl. 2013, 73, 180–187. [CrossRef]
41. Schneider, L.; Berger, M.; Finkbeiner, M. The anthropogenic stock extended abiotic depletion potential(AADP) as a new parameterisation to model the depletion of abiotic resources. Int. J. Life Cycle Assess. 2011,16, 929–936. [CrossRef]
117

Resources 2016, 5, 13
42. Schneider, L.; Berger, M.; Finkbeiner, M. Abiotic resource depletion in LCA—Background and update of theantropogenic stock extended abiotic depletion potential (AADP) model. Int. J. Life Cycle Assess. 2015, 20,709–721. [CrossRef]
43. Vieira, M.D.M.; Goedkoop, M.J.; Storm, P.; Huijbregts, M.A.J. Ore grade decrease as life cycle impact indicatorfor metal scarcity: The case of copper. Environ. Sci. Technol. 2012, 46, 12772–12778.
44. Goedkoop, M.; Spriensma, R. The Eco-Indicator 99—A Damage Oriented Method for Life Cycle Impact Assessment:Methodology Report; PRé Consultants: Amersfoort, The Netherlands, 2000.
45. Chapman, P.F.; Roberts, F. Metal Resources and Energy; Butterworths Monographs in Materials: London,UK, 1983.
46. Ponsioen, T.C.; Vieira, M.D.M.; Goedkoop, M.J. Surplus cost as a life cycle impact indicator for fossil resourcescarcity. Int. J. Life Cycle Assess. 2014, 19, 872–881. [CrossRef]
47. Steen, B. A Systematic Approach to Environmental Priority Strategies in Product Development (EPD). Version2000—General System Characteristics; CPM report. Nr. 4; Centre for Environmental Assessment of Productsand Material Systems, Chalmers University of Technology, Technical Environmental Planning. ChalmersUniversity of Technology: Gothenburg, Sweden, 1999.
48. Steen, B. A Systematic Approach to Environmental Priority Strategies in Product Development (EPD). Version2000—Models and Data of the Default Method; CPM report. Nr. 5; Centre for Environmental Assessment ofProducts and Material Systems, Chalmers University of Technology, Technical Environmental Planning.Chalmers University of Technology: Gothenburg, Sweden, 1999.
49. Ponsioen, T.; PRé Consultants, Amersfoort, The Netherlands. Personal communication. 7 August 2015.50. Valero, A.; Valero, A. Exergoecology: A thermodynamic approach for accounting the earth’s mineral capital.
The case of bauxite-aluminium and limestone-lime chains. Energy 2010, 35, 229–238.51. Valero, A.; Valero, A. From grave to cradle. J. Ind. Ecol. 2012, 17, 43–52. [CrossRef]52. Frischknecht, R.; Steiner, R.; Jungbluth, N. The Ecological Scarcity Method—Eco-Factors 2006. A Method for
Impact Assessment in LCA; Bundesamtfür Umwelt (BAFU): Bern, Switzerland, 2009.53. Berger, M.; Finkbeiner, M. Correlation analysis of life cycle impact assessment indicators measuring resource
use. Int. J. Life Cycle Assess. 2011, 16, 74–81. [CrossRef]54. Vandenbo, C.; Rorbech, J.; Haupt, M.; Frischknecht, R. Abiotic resources: New impact assessment approaches
in view of resource efficiency and resource criticality. Int. J. Life Cycle Assess. 2014, 19, 1686–1692.55. Ecoinvent. Ecoinvent Data v3.0; Swiss Centre for Life Cycle Inventories: Dübendorf, Switzerland, 2015.56. Cavalett, O.; Chagas, M.; Seabra, J.; Bonomi, A. Comparative LCA of ethanol versus gasoline in Brazil using
different LCIA methods. Int. J. Life Cycle Assess. 2012, 18, 647–658. [CrossRef]57. CPM. Center for Environmental Assessment of Product and Material Systems (CPM) LCA Database;
CPM Consortium: Gothenburg, Sweden, 2008.
© 2016 by the authors. Licensee MDPI, Basel, Switzerland. This article is an open accessarticle distributed under the terms and conditions of the Creative Commons Attribution(CC BY) license (http://creativecommons.org/licenses/by/4.0/).
118

resources
Article
Exergy as a Measure of Resource Use in LifeCyclet Assessment and Other SustainabilityAssessment Tools
Goran Finnveden 1,*, Yevgeniya Arushanyan 1 and Miguel Brandão 1,2
1 Department of Sustainable Development, Environmental Science and Engineering (SEED),KTH Royal Institute of Technology, Stockholm SE 100-44, Sweden; [email protected] (Y.A.);[email protected] (M.B.)
2 Department of Bioeconomy and Systems Analysis, Institute of Soil Science and Plant Cultivation,Czartoryskich 8 Str., 24-100 Pulawy, Poland
* Correspondance: [email protected]; Tel.: +46-8-790-73-18
Academic Editor: Mario SchmidtReceived: 14 December 2015; Accepted: 12 June 2016; Published: 29 June 2016
Abstract: A thermodynamic approach based on exergy use has been suggested as a measure forthe use of resources in Life Cycle Assessment and other sustainability assessment methods. It is arelevant approach since it can capture energy resources, as well as metal ores and other materialsthat have a chemical exergy expressed in the same units. The aim of this paper is to illustrate the useof the thermodynamic approach in case studies and to compare the results with other approaches,and thus contribute to the discussion of how to measure resource use. The two case studies are therecycling of ferrous waste and the production and use of a laptop. The results show that the differentmethods produce strikingly different results when applied to case studies, which indicates the needto further discuss methods for assessing resource use. The study also demonstrates the feasibilityof the thermodynamic approach. It identifies the importance of both energy resources, as well asmetals. We argue that the thermodynamic approach is developed from a solid scientific basis andproduces results that are relevant for decision-making. The exergy approach captures most resourcesthat are considered important by other methods. Furthermore, the composition of the ores is shownto have an influence on the results. The thermodynamic approach could also be further developedfor assessing a broader range of biotic and abiotic resources, including land and water.
Keywords: Life Cycle Assessment; resource use; exergy; waste; recycling; metals
1. Introduction
A more efficient utilization of resources, from, e.g., improved waste treatment, is an importantpart of a more circular economy, which is arguably a prerequisite for a sustainable society.Life Cycle Thinking (LCT) and Life Cycle Assessment (LCA) have received prominent positionsin European waste policy, for example in the Waste Framework Directive, as an approach and tool,respectively, for assessing the environmental impacts and resource use associated with alternativewaste management strategies [1].
LCA is a tool to assess the potential environmental impacts and resources used throughouta product’s life cycle, i.e., from raw material extraction, via production and use phases, to wastemanagement [2–4]. The term “product” includes both goods and services, for example wastemanagement. The unique feature of LCA is the focus on a life-cycle perspective. This impliesthat system boundaries should be so wide that inputs to the life-cycle system should be resources aswe find them in nature, and outputs should be emissions to nature.
Resources 2016, 5, 23; doi:10.3390/resources5030023 www.mdpi.com/journal/resources119

Resources 2016, 5, 23
There are four phases in an LCA study: Goal and Scope Definition, Life Cycle InventoryAnalysis (LCI), Life Cycle Impact Assessment (LCIA), and Interpretation. The result from the LCI is acompilation of the inputs (resources) and the outputs (emissions) from the product over its life cycle.The ISO standards [4] further define Life Cycle Impact Assessment (LCIA) as the phase of an LCAstudy that involves classification and characterization of substances, and optionally normalizationand weighting. In the classification the LCI, results on resources and emissions are classified intoimpact categories of environmental relevance (e.g., kg CO2 emissions into Global Warming). In thecharacterization part of the LCIA, the contributions of different inputs and outputs to impact categoriesare modeled quantitatively and expressed as an impact score in a unit common to all contributionswithin the impact category [2]. The relative contribution of a substance to an impact category isestimated with characterization models (e.g., 1 kg of CH4 contributes around 30 times as much tocumulative radiating forcing as 1 kg of CO2). Normalization and weighting are optionally used inorder to enable comparison of results across impacts (e.g., global warming against resource depletion).
The ISO standard for LCA [4] states that “resource use” is one of the categories of environmentalimpacts needing consideration. In the LCA literature, “resource depletion” (including minerals, fossiland renewable energy resources and water) is often described as one impact category that shouldbe included in an LCA study. In principle, the terms “resource use”, “resource consumption” and“resource depletion” should mean different things (resource use can lead to consumption (implyingdestruction of the resource) which could lead to depletion of the stock or fund resource). In practice,however, many scholars and practitioners are using the terms interchangeably, leading to a mixed useof the terms.
The characterization of the use of abiotic resources—such as minerals and non-renewable fuels—isone of the most frequently discussed impact categories and consequently there is a wide varietyof methods available for characterizing contributions to this category (e.g., [2,5–8]). Essentially,four different groups of approaches can be distinguished [9,10]:
1. The impact of the present use of resources is modeled as that of the future use of resources.The rationale for this approach is that the current use of non-renewable resources implies thatmore effort (e.g., energy) to extract the same amount will be required by future generations,assuming that ore grades decrease with greater extraction, and that technology remains thesame. Alternatively, we can adopt other resources that substitute for the ones being assessed asproxies, so that current impacts can be measured in terms of the future impacts. This has been thebasis for several LCIA methods for resources, for example Eco-indicator 99 [11] and ReCiPe [12].However, it has been argued that if current resource use leads to changes in the environmentalinterventions of future extractions, this should be modeled in the Inventory Analysis, and not inthe LCIA [2,13].
2. There are methods related to some measure of available resources or reserves and extractionrates. Different approaches exist based on different measures of the reserves, e.g., technicallyand economically available reserves [14] or ultimately available reserves, as in the CMLapproach [15,16], and extraction rates. For example, the CML approach uses antimonium (Sb) asthe reference of resource extraction rate–to-reserve ratio, such that:
ADPi “ DRi{pRiq2
DRsb{pRsbq2 (1)
where [15]:
ADPi Abiotic Depletion Potential of resource i (dimensionless);Ri ultimate reserve of resource i (kg);DRi extraction rate of resource i
`kg ¨ y´1˘
Rsb ultimate reserve of antimonium (i.e., the reference resource (kg));Dsb extraction rate of antimonium Rsb (i.e., the reference resource
`kg ¨ y´1˘q.
120

Resources 2016, 5, 23
3. There are thermodynamic methods based on exergy decrease or entropy increase. Exergy isa measure of available energy. Entropy can be interpreted in many ways, e.g., as a measureof disorder but also as a measure for the dispersal of energy. In contrast to energy, exergy isdestroyed in all real world processes as entropy is produced [17]. The exergy decrease andthe entropy increase mirror each other. Methods and data based on this approach have beendeveloped for LCA [18–23]. The exergy content of the resources can be assumed to be usedthrough incineration, other chemical reactions and dissipation [18]. Although it may be claimedthat all the approaches rely on thermodynamics, this group will be called the thermodynamicapproach in this paper.
4. The last approach is the aggregation of the total use of energy as in the Cumulative EnergyDemand (CED) [24].
All LCIA methods across all approaches above have in common that they result in characterizationfactors CFi that can be used for calculating the indicator for the use of abiotic resources according toEquation (2) (e.g., [3,9]):
I “ Σ CFi mi (2)
where I is the indicator result and mi is the use of the abiotic resource i in the system under study.The aim of this paper is to contribute to the discussion on different approaches to measure the use
of abiotic natural resources (such as non-renewable fuels and mineral resources) in LCA and othermethods. This is done by illustrating the application of the thermodynamic approach to case studies,and by comparing the results with other approaches. The focus is on the thermodynamic approachwhich is discussed in more detail.
2. Materials and Methods
Two case studies were chosen to illustrate the use of different methods: one on the recycling offerrous waste and one on the production and use of a laptop computer. Since one purpose of recyclingis to save resources, a simple recycling case was chosen to see if the methods would capture thisconcern. A laptop was chosen to illustrate a more complex product, which includes many differenttypes of metals and plastics made from fossil fuels, and which uses significant amounts of electricityduring the use phase. For both cases, data were taken from the Ecoinvent database [25] as implementedin the SimaPro software (Pré, Amersfoort, the Netherlands, www.pre.nl).
2.1. Ferrous Waste Recycling
This case is based on the Ecoinvent 2 dataset “Steel, electric, un- and low-alloyed,at plant/RER” [26] with the addition of avoided virgin production (1 kg of steel, low-alloyed perevery 1.1 kg of material recycled), with removal of steel scrap input. Direct use of electricity has beenreplaced by the Swedish electricity mix [27]. The system studied represents an average of differentprocesses of secondary steel production with EU technology and includes transportation of scrap metaland other input materials to the electric arc furnace, steel-making process and casting.
2.2. Production and Use of a Laptop
The case is based on the Ecoinvent 2 dataset “Use, computer, laptop, office use/RER” [28].The system studied includes laptop production and disposal, transportation to the user and energyconsumption during use, the latter considered over a lifespan of four years and taking into accountdifferent use modes for office use. The functional unit of the assessment was 1 laptop.
121

Resources 2016, 5, 23
The process for laptop production includes raw material extraction and processing, manufacturingof all components, energy and water use required for various processes, transportation for inputmaterials (ship, rail and road), packaging, final disposal of the laptop, and infrastructure required(factory). The dataset is global and describes the manufacturing of a typical laptop computer duringthe years 2002–2005. The final disposal is represented by a mixture of manual and mechanical WEEEtreatment in Switzerland. The benefit of material recovery is not accounted for. Rail and roadtransportation is used for the delivery to a user. For the use phase Swedish electricity is used [27].The office use is calculated according to the share between active (5.5 h/day), standby (2 h/day) andoff (16.5 h/day) modes.
2.3. Characterization Methods
Two versions of the thermodynamic approach were applied here. The first is called Exergy F & Ö,where the exergy data were taken from [18]. These data were calculated from information on thechemical composition of the material, the basic thermodynamic data and the reference state developedby Szargut et al. [29] which is made to be similar to the natural environment, including commoncomponents of the atmosphere, sea and crust of the earth. For fossil fuels, the exergy is close to thelower heating value. For metals, the whole metal ore was considered as an input to the technical systemin line with the life-cycle approach [18]. The second version of the thermodynamic approach was theCumulative Exergy Demand (CExD) method [19], which uses other data for the ore compositions(see below) and an updated version of the reference state including, for example, more recent data onconcentrations of trace elements in sea water (the reader is referred to the references for more details).De Meester et al. [30] have shown that an updated reference state in most cases has only a minorinfluence on the results. For some specific minerals, the differences can, however, be larger.
In addition, several other often-used LCIA methods were included, e.g., Cumulative EnergyDemand (CEnD), CML, Eco-indicator 99 and ReCiPe for minerals and fossil fuels, all as implementedin Simapro. All of these are intended to be used as methods for characterization of the use of abioticresources in LCA and are in that sense comparable. Although different terms may be used in theliterature when describing the methods (e.g., resource use, resource consumption or resource depletion),they are intended and used for this same purpose. All use information about the used amounts of theabiotic resources from the LCIA. The system boundaries for the Ecoindicator 99 and ReCiPe methodsare expanded compared to the other methods since they include also future resource extraction. This isbecause information on impacts from future resource extraction is used for the indicator on the impactsof the current resource use. The methods also differ in the age of underlying data (the readers arereferred to the specific methods for details). It is, however, likely that the difference in age has a minorinfluence in the comparisons since the differences in approaches are large and large parts of the data(e.g., on thermodynamic properties) are not expected to change significantly with time. Many of themare also used on a routine basis by LCA practitioners.
3. Results and Discussion
The results for ferrous recycling are presented in Table 1 and Figure 1. The results are in mostcases negative, indicating that recycling saves resources. The exception is uranium, which is used forthe production of nuclear power. The results thus show that although the total use of abiotic resourcesdecreases, the electricity use is increased.
The results for the production and use of a laptop are presented in Table 2 and Figure 2.
122

Resources 2016, 5, 23
Table 1. Characterization of most important non-renewable resources for ferrous recycling inpercentage of the total result (only resources that contribute to more than 1% of total result accordingto at least one method are included; “0” means less than 0.1% and n/a means that no characterizationfactor for this input was available).
Resources Exergy F & Ö CExD CEnD CML Eco-Indicator 99 ReCiPe Mineral ReCiPe Fossil Fuels
Coal ´46 ´64 ´88 ´88 ´6 n/a ´84Gas ´3 ´5 ´8 ´5 ´9 n/a ´8Oil ´4 ´7 ´9 ´6 ´10 n/a ´9U 2 3 4 0 n/a 0 n/aNi ´48 ´15 n/a ´0.1 ´70 ´20 n/aMo n/a ´2 n/a ´0.1 ´1 ´3 n/aFe ´2 ´9 n/a 0 ´2 ´25 n/aMn n/a ´0.3 n/a 0 ´0.2 ´35 n/aCr ´0.1 ´0.5 n/a 0 ´1 ´16 n/a
Figure 1. Characterization of most important non-renewable resources for ferrous recycling inpercentage of the total result.
Table 2. Characterization of most important non-renewable resources for production and use of alaptop in percentage of the total result (only resources that contribute to more than 1% of total resultaccording to at least one method are included; “0” means less than 0.1% and n/a means that nocharacterization factor for this input was available).
Resources Exergy F & Ö CExD CEnD CML Eco-Indicator ReCiPe Minerals ReCiPe Fossil Fuels
Coal 12 17 18 45 2 n/a 39Gas 9 13 15 27 41 n/a 33Oil 6 12 13 20 34 n/a 27U 24 47 53 0 n/a 0.3 n/a
Cu 6 1 n/a 0.1 9 16 n/aAu 41 8 n/a 7 n/a 49 n/aNi 3 0.8 n/a 0 n/a 0.1 n/aMo n/a 0.1 n/a 0 0.2 1.3 n/aFe 0 0.1 n/a 0 0.1 1.5 n/aMn n/a 0 n/a 0 0 3 n/aCr 0 0 n/a 0 0.1 5 n/aSn n/a 0.3 n/a 0.1 6 18 n/a
123

Resources 2016, 5, 23
Figure 2. Characterization of most important non-renewable resources for the production and use of alaptop in percentage of the total result.
The Exergy F & Ö method and CExD give similar results for traditional energy resources, but partlydifferent results for metals. The CEnD naturally only gives results for energy resources, and the CMLmethod gives the result that energy resources are, in practice, the most important resources, especiallyin the case of ferrous recycling. Conversely, Eco-indicator 99 suggests that metals are more importantthan energy resources in this case. The Exergy F & Ö and CExD methods give weight to both energyand metal resources.
For metals, the Exergy F & Ö and CExD methods give different results. The Exergy F & Ö methodgives higher results than CExD for some metals (e.g., Ni in the case of ferrous recycling and Au inthe laptop case). This is because the two methods have modeled the metal ores in different ways.The Exergy F & Ö method has data for sulphidic ores for some metals (copper, gold and nickel) witha high chemical exergy whereas the CExD method uses a generic average ore matrix with a lowerchemical exergy. The exergy of the generic ore used in the CExD method [19] was the average of theores in [18]. It can therefore be argued that the ore composition adopted in the Exergy F & Ö methodis more specific and relevant for the metal in question. On the other hand, the ore-generic data maybe considered more generally applicable. The ore-specific data used in the Exergy F & Ö method canpossibly be compared with site-dependent data, which is sometimes used in LCIA (cf. [2]). However,both methods are consistent in identifying the same metals as being the most important ones. This ispartly in contrast to the Ecoindicator 99 and ReCiPe methods, which highlight other metals, partlybecause of data gaps. It also interesting to note that U is highlighted in the laptop case by the CEnD,CExD and the Exergy F & Ö methods, but hardly at all by the other methods.
Since different methods produce different answers, it is important to discuss and evaluate differentapproaches. Important questions then are: How can a choice be made between different methodsand when is a specific method more adequate? Unfortunately, there is no simple way of determiningthis. There is no method by which it can be shown that one characterization method is the “correct”one (cf. [31]). Instead, theoretical reasoning must be applied and underlying assumptions should bediscussed. Examples of questions that can be raised include: Is the problem defined in a relevant way?Does the quantification method adequately and reliably quantify the contribution to the problem?
124

Resources 2016, 5, 23
Are there any logical contradictions? Does the method produce reasonable results and can we in anysense judge which results are reasonable?
In the thermodynamic approach, resource use is measured in terms of exergy use (indicated bythe exergy content of the resources) or entropy production. Several ways of thinking can lead to theconclusion that exergy is a relevant measure:
‚ The energetic argument claims that useful energy (i.e., exergy) is the ultimate limiting and scarceresource because every material resource has an energy cost associated with extracting it, whichlimits its scale [32]. Given sufficient amounts, a society can divert exergy, within the currenttechnical possibilities, to the acquisition of whatever material that is in short supply. Exergy,rather than energy, is used in this context since consideration is given to the quality of the energy(i.e., the ability to do work) as well as the chemical exergy of traditionally non-energetic rawmaterials [18]. As ore grades become lower, more exergy will be needed to extract the resource.This is for two reasons. One is because more energy is needed to extract larger amounts of ore(which will have lower grade/concentrations of the resource). The other one is because theamount of chemical exergy that comes with the ore will increase (assuming a constant amount ofexergy per kg of ore) since more ore will be needed to produce a certain product.
‚ The usability argument starts with the question: When we discuss resource depletion orconsumption, what is actually depleted or consumed? [18]. It is neither matter, since mattercannot be destroyed or consumed (except for nuclear reactions), nor energy. A reasonable answermay be that it is the usable energy and matter that is consumed and depleted and transformedto less usable energy and matter. This happens in all real world processes. It could therefore berelevant to have the use of usable energy and matter as an indicator for resource consumption.A measure of useful energy is exergy. For a material to be useful it must normally be ordered,i.e., structured and concentrated. A well-known scientific measure that is often interpreted asa measure of the disorder of a system is entropy. If a material is to be useful, it must normallyhave lower entropy than the surroundings, here defined as the reference state. This implies thatthe material is structured and concentrated, i.e., has a higher order. An example is an ore whichhas a higher concentration and typically a lower entropy than the average crust defined in thereference state used in the methods applied here. Another example is fresh water which has lowerentropy than seawater (which is part of the reference state). Societies and technical systems canbe described as systems feeding on low-entropy matter and energy and converting them intohigh-entropy matter and energy. The entropy production may therefore be considered a relevantmeasure of resource consumption (cf. [33]). Since entropy is increased as exergy is decreasedaccording to Ek 3 (where δE is the decrease of exergy, T0 is the temperature of the surroundingsand ΣΔS is the sum of the entropy increased), exergy can be used instead of entropy [29].
δE “ T0ÿ
ΔS (3)
‚ The reversibility argument starts with the assumption that a relevant measure of resourceconsumption may be the costs required to restore the resource. The exergy of a resource isthe theoretical minimum energy required to produce this resource from the defined referencestate. It may thus be seen as measure of the minimum costs associated with the resource.
Are the results provided by the thermodynamic method reasonable? When applied in practice,it can be noted that the thermodynamic approach as used here can highlight both energetic resources(both fossil fuels and nuclear fuels) as well as metal resources. This is in contrast to some of the othermethods which either only include energetic or metal resources (such as ReCiPe) or in practice highlightonly one of them (such as the CML method) or have significant data gaps (such as Ecoindicator).We believe that that is an indication that the results are relevant to decision-makers and useful. This isbecause both energy and metal resources are on the policy agenda. The method can thus provide
125

Resources 2016, 5, 23
support for decision-making when, for example, different products using different types of resourcesare compared.
However, despite exergy being a feature that is common to both energy and non-energy resources,it is limited in capturing the scarcity of a material, as no indication of abundance and extraction ratesof the material is included therein (e.g., [5,10]). Instead the thermodynamic approach is based onthe assumption that different resources can substitute for each other and that the limited and scarceresource is exergy. So instead of capturing the scarcity of materials, it is focused on the scarcity ofexergy. This is relevant since physical scarcity of materials can be overcome with exergy. If there isenough exergy, materials can be extracted from low-grade ores and seawater.
The thermodynamic approach (or the other methods discussed here) does, however, not captureall resource aspects that are on the political agenda. For example, geopolitical aspects, which are apart of resource criticality assessments (e.g., [34]), are not included. However, there is currently nocommon and clear picture of how to describe the problem of resource use and which aspects shouldbe included and valued (cf. [35]). Since different methods for the characterization of abiotic resourcescapture different aspects, they can also be seen as complementary.
The thermodynamic approach can be further developed. Different types of metal ores havedifferent exergies [18] and the databases should therefore be improved to reflect this variability. This isespecially relevant if changing ore grades also leads to changes in the composition of the ores. This isthe case for many metals typically found in sulphide ores at higher ore grades (e.g., copper), but in oxideores at lower ore grades with corresponding changes in the exergy of the ore [18]. The possibilities ofusing exergy consumption not only as measure of abiotic resources but also for other types of resourcessuch as biotic resources, water and land [20] is also an interesting development. This could involvefurther complexities related, for example, to time for replenishing fund resources, local scarcity ofwater, etc. The advantage is, however, the possibility to integrate different types of resources in acommon framework.
Although characterization methods for the use of abiotic resources have been discussedextensively, there are only a limited number of published studies where comparisons includingthe thermodynamic approach were made (notable exceptions include [6–8] but these were limited indifferent ways). The comparisons made have also focused on the Cad data [19] and not the ExergyF & Ö data [18], although we show here that they can give different results. Since different casestudies illustrate different aspects, new learnings can be made and further studies would be useful.In addition to showing the differences between alternative methods, the case studies here illustratethat the thermodynamic approach can show the importance of both energy and material resources,and that the two datasets used here give similar but not identical results illustrating the importance ofthe ore composition.
LCA and exergy analysis can be linked in many ways, (cf. [21]). Here, the focus has beenon exergy as measure of resource use in the characterization part of the LCIA. In a number ofcase studies (e.g., [36–38]), exergy analysis is used as a characterization method or as a methodfor broadening LCA [39]. It can be used in these ways for both attributional (or accounting)LCA, as well as consequential LCA (cf. [2]). Others have suggested that LCA and exergy analysiscomplement each other (e.g., [40–43]. Exergy analysis can also be used as a stand-alone assessmenttool, e.g., [29,44–47], or linked to other environmental systems analysis tools, such as StrategicEnvironmental Assessment [48], besides its use as an engineering tool for analyzing and optimizingdifferent types of processes [29,49]. This non-exhaustive list indicates that the applications of exergyanalysis are numerous and that it is an established method in many areas. It could therefore also beused with confidence as a characterization method in LCA.
4. Conclusions
There are a number of different methods available for characterizing non-renewable resourcesand they give strikingly different results. The thermodynamic approach is developed from a solid
126

Resources 2016, 5, 23
scientific basis and it is currently operational with, for example, the CExD method with an extensivedatabase. The approach is used by different groups and it produces relevant results. It can be notedthat it captures most abiotic resources that are considered important by other methods. For the casestudies on the recycling of ferrous waste and the production and use of a laptop, both energy resourcesand metals are of importance. Results for the thermodynamic approach depend on the compositionof the ore; more ore-specific data should be developed and their importance evaluated (in parallelto site-specific data for emissions and impacts). Possibilities for using thermodynamic data for otherresources (renewable materials and energy, water and land) should also be explored further.
Revisiting the questions raised above, we draw the conclusions that the thermodynamic approachused here is developed from an established scientific basis, based on a discussion on why exergy isa relevant measure. It is relevant as an indicator both for resource use and resource depletion sinceit is a measure of something that is actually consumed. We also argue that the results are relevantfor decision-making. The calculations can be made in a reliable way and the data necessary is robustand time-independent, except for the composition of the ores which may change with time as the oregrades and types of ores used change.
Acknowledgments: Funding from Vinnova and partners of CESC (Center for Sustainable Communication) atKTH is appreciated. Comments from anonymous reviewers are also gratefully acknowledged.
Author Contributions: G.F. designed the research, Y.A. made the calculations, G.F. drafted the paper withcontributions from Y.A. and M.B.
Conflicts of Interest: The authors declare no conflict of interest.
References
1. Lazarevic, D.; Buclet, N.; Brandt, N. The application of life cycle thinking in the context of European wastepolicy. J. Clean. Product. 2012, 29–30, 199–207. [CrossRef]
2. Finnveden, G.; Hauschild, M.; Ekvall, T.; Guinée, J.; Heijungs, R.; Hellweg, S.; Koehler, A.; Pennington, D.;Suh, S. Recent developments in Life Cycle Assessment. J. Environ. Manag. 2009, 91, 1–21. [CrossRef][PubMed]
3. Curran, M.A., Ed.; Life Cycle Assessment Student Handbook; Wiley-Scivener: Hoboken, NJ, USA;Salen, MA, USA, 2015.
4. Environmental Management—Life Cycle Assessment—Principles and Framework; ISO 14040:2006; ISO Standard:Geneva, Switzerland, 1997.
5. Klinglmair, M.; Sala, S.; Brandão, M. Assessing resource depletion in LCA: A review of methods andmethodological issues. Int. J. Life Cycle Assess. 2014, 19, 580–592. [CrossRef]
6. Rørbech, J.T.; Vadenbo, C.; Hellweg, S.; Aastrup, T.F. Impact assessment of abiotic resources in LCA:Quantitative comparison of selected characterization models. Environ. Sci. Technol. 2014, 48, 11072–11081.[CrossRef] [PubMed]
7. Van Caneghem, J.; Vermeulen, I.; Block, C.; Cramm, P.; Mortier, R.; Vandercasteele, C. Abiotic depletion dueto resource consumption in a steelwork assessed by five different methods. Resour. Conserv. Recycl. 2010,54, 1067–1073. [CrossRef]
8. Alvarenga, R.A.F.; de Oliveira Lins, I.; de Almeida Net, J.A. Evaluation of abiotic resource LCIA methods.Resources 2016, 5. [CrossRef]
9. Finnveden, G. “Resources” and related impact categories. In Towards a Methodology for Life Cycle ImpactAssessment; Udo de Haes, H.A., Ed.; SETAC-Europe: Brussels, Belgium, 1996; pp. 39–48.
10. European Commission-Joint Research Centre—Institute for Environment and Sustainability. InternationalReference Life Cycle Data System (ILCD) Handbook-Recommendations for Life Cycle Impact Assessmentin the European Context, 1st ed.; EUR 24571 EN; Publications Office of the European Union:Luxemburg, Luxemburg, 2011.
11. Goedkoop, M.; Spriensma, R. The Eco-indicator 99—A Damage-oriented Method for Life Cycle Impact Assessment.Methodology Report, 2nd ed.; Pré Consultants, B.V.: Amersfoort, The Netherlands, 2000.
127

Resources 2016, 5, 23
12. Goedkoop, M.J.; Heijungs, R.; Huijbregts, M.; De Schryver, A.; Struijs, J.; Van Zelm, R. ReCiPe 2008, A lifeCycle Impact Assessment Method Which Comprises Harmonised Category Indicators at the Midpoint andthe Endpoint Level, First edition Report I: Characterisation. Available online: http://www.lcia-recipe.net(accessed on 15 June 2016).
13. Weidema, B.P.; Finnveden, G.; Stewart, M. Impacts from Resource Use—A common position paper.Int. J. Life Cycle Assess. 2005, 10, 382. [CrossRef]
14. Wenzel, H.; Hauschild, M.Z.; Alting, L. Methodology, Tools, Techniques and Case Studies. In EnvironmentalAssessment of Products; Chapman & Hall: United Kingdom, UK; Kluwer Academic Publishers: Hingham,MA, USA, 1997; Volume 1, p. 544.
15. Guinée, J.B.; Gorrée, M.; Heijungs, R.; Huppes, G.; Kleijn, R.; de Koning, A.; van Oers, L.; Sleeswijk, A.W.;Suh, S.; Udo de Haes, H.A.; et al. Handbook on Life Cycle Assessment: Operational Guide to the ISO Standards;Kluwer Academic Publishers: Dordrecht, The Netherlands, 2002.
16. Schneider, L.; Berger, M.; Finkbeiner, M. Abiotic resource depletion in LCA—Background and update ofthe anthropogenic stock extended abiotic depletion potential (AADP) model. Int. J. Life Cycle Assess. 2015,20, 709–721. [CrossRef]
17. Szargut, J. International progress in second law analysis. Energy 1979, 5, 709–718. [CrossRef]18. Finnveden, G.; Östlund, P. Exergies of Natural Resources in Life Cycle Assessment and Other Applications.
Energy 1997, 22, 923–931. [CrossRef]19. Bösch, M.E.; Hellweg, S.; Huijbregts, M.; Frischknecht, R. Applying cumulative exergy demand (CExD)
indicators to the ecoinvent database. Int. J. Life Cycle Assess. 2007, 12, 181–190. [CrossRef]20. Dewulf, J.; Bösch, M.E.; De Meester, B.; Van der Vorst, G.; Van Langenhove, H.; Hellweg, S.; Huijbregts, M.A.J.
Cumulative Exergy Extraction from the Natural Environment (CEENE): A comprehensive Life Cycle ImpactAssessment method for resource accounting. Environ. Sci. Technol. 2007, 41, 8477–8483. [CrossRef] [PubMed]
21. Ayres, R.U.; Ayres, L.W.; Martinas, K. Exergy, waste accounting and life-cycle analysis. Energy 1998,23, 355–363. [CrossRef]
22. Gössling-Reisemann, S. Combining LCA with thermodynamics. In Information Technologies in EnvironmentalEngineering; Marx Gomez, J., Sonnenschein, M., Müller, M., Welsch, H., Rautenstrauch, C., Eds.; Springer:Heidelberg, Germany, 2007; pp. 387–396.
23. Valero, A. From grave to cradle. A thermodynamic approach for accounting for abiotic resource depletion.J. Ind. Ecol. 2013, 17, 43–52. [CrossRef]
24. Frischknecht, R.; Wyss, F.; Büsser Knöpfel, S.; Lützkendorf, T.; Balouktsi, M. Cumulative energy demand inLCA: the energy harvested approach. Int. J. Life Cycle Assess. 2015, 20, 957–969. [CrossRef]
25. Frischknecht, R.; Jungbluth, N.; Althaus, H.-J.; Doka, G.; Dones, R.; Hischier, R.; Hellweg, S.; Nemecek, T.;Rebitzer, G.; Spielman, M. Overview and Methodology; Final report ecoinvent data v 2.0, No. 1; Swiss Centrefor Life Cycle Inventories: Dübendorf, Switzerland, 2007.
26. Classen, M.; Althaus, H.-J.; Blaser, S.; Scharnhorst, W.; Jungbluth, N.; Tuchschmid, M.; Faist Emmenegger, M.Life Cycle Inventories of Metals; Final report ecoinvent data v2.1; Swiss Centre for LCI, Empa—TSL: Dübendorf,Switzerland, 2009; Volume 10.
27. Frischknecht, R.; Tuchschmid, M.; Faist Emmenegger, M.; Bauer, C.; Dones, R. Strommix und StromnetzSachbilanzen von Energiesystemen; Final report No. 6 ecoinvent data v2.0; Dones, R., Ed.; Swiss Centre for LCI,PSI: Dübendorf/Villigen, Switzerland, 2007; Volume 6.
28. Hischier, R.; Classen, M.; Lehmann, M.; Scharnhorst, W. Life Cycle Inventories of Electric and ElectronicEquipment—Production, Use & Final report ecoinvent Data v2.0; Swiss Centre for LCI, Empa—TSL:Duebendorf/St. Gallen, Switzerland, 2007; Volume 18.
29. Szargut, J.; Morris, D.R.; Steward, F.R. Exergy Analysis of Thermal, Chemical and Metallurgical Processes;Hemisphere: New York, NY, USA, 1988.
30. De Meester, B.; Dewulf, J.; Janssens, A.; van Langenhove, H. An improved calculation of the exergy of naturalresources for exergetic life cycle assessment (ELCA). Environ. Sci. Technol. 2006, 40, 6844–6851. [CrossRef][PubMed]
31. Finnveden, G. On the Limitations of Life Cycle Assessment and Environmental Systems Analysis Tools inGeneral. Int. J. Life Cycle Assess. 2000, 5, 229–238. [CrossRef]
32. Hall, C.A.S.; Cleveland, C.J.; Kaufman, R. Energy and Resource Quality: The Ecology of the Economic Process;Wiley-Interscience: New York, NY, USA, 1986.
128

Resources 2016, 5, 23
33. Gössling-Reisemann, S. What is resource consumption and how can it be measured? J. Ind. Ecol. 2008,12, 10–25. [CrossRef]
34. Sonnemann, G.; Gemuchu, E.D.; Adibi, N.; De Bruille, V.; Bulle, C. From a critical review to aconceptual framework for integrating the criticality of resources into Life Cycle Sustainability Assessment.J. Clean. Product. 2015, 94, 20–34. [CrossRef]
35. Isacs, L.; Finnveden, G.; Håkansson, C.; Steen, B.; Tekie, H.; Rydberg, T.; Widerberg, A.; Wikström, A.Valuation of abiotic resources in impact assessment. Res. Conserv. Recycl. 2015. Submitted.
36. Achachlouei, M.A.; Moberg, Å.; Hochschorner, E. Life Cycle Assessment of a magazine, part I: Tablet editionin emerging and mature states. J. Ind. Ecol. 2015, 19, 575–589. [CrossRef]
37. Alanya, S.; Dewulf, J.; Duran, M. Comparison of overall resource consumption of biosolids managementsystem processes using exergetic life cycle assessment. Environ. Sci. Technol. 2015, 49, 9996–10006. [CrossRef][PubMed]
38. Reuter, M.A.; von Schalk, A.; Gediga, J. Simulation-based design for resource efficiency of metal productionand recycling systems: Cases—Copper production and recycling, e-waste (LED lamps) and nickel pig iron.Int. J. Life Cycle Assess. 2015, 20, 671–693. [CrossRef]
39. Jeswani, H.K.; Azapagic, A.; Schepelmann, P.; Ritthof, M. Options for broadening and deepening the LCAapproaches. J. Clean. Product. 2010, 18, 120–127. [CrossRef]
40. Portha, J.-F.; Louret, S.; Pons, M.-N.; Jaubert, J.-N. Estimation of the environmental impact of a petrochemicalprocess using coupled LCA and exergy analysis. Resour. Conserv. Recycl. 2010, 54, 291–298. [CrossRef]
41. Hiraki, T.; Akiyama, T. Exergetic life cycle assessment of new waste aluminium treatment system withco-production of pressurized hydrogen and aluminium hydroxide. Int. J. Hydrog. Energy 2009, 34, 153–161.[CrossRef]
42. Yang, L.; Zmeureanu, R.; Rivard, H. Comparison of environmental impacts of two residential heatingsystems. Build. Environ. 2008, 43, 1072–1081. [CrossRef]
43. De Meester, B.; Dewulf, J.; Verbeke, S.; Janssens, A.; van Langenhove, H. Exergetic life-cycle assessment(ELCA) for resource consumption evaluation in the built environment. Build. Environ. 2009, 44, 11–17.[CrossRef]
44. Wall, G. Exergy conversion of the Swedish society. Resour. Energy 1987, 9, 55–73. [CrossRef]45. Chen, G.Q.; Qi, Z.H. Systems account of societal exergy utlilization: China 2003. Ecol. Model. 2007,
208, 102–118. [CrossRef]46. Dewulf, J.; van Langenhove, H.; Muys, B.; Bruers, S.; Bakshi, B.R.; Grubb, G.F.; Paulus, D.M.; Sciubba, E.
Exergy: Its potential and limitations in environmental science and technology. Environ. Sci. Technol. 2008,42, 2221–2232. [CrossRef] [PubMed]
47. Liao, W.; Heijungs, R.; Huppes, G. Thermodynamic analysis of human-environment systems: A reviewfocused on industrial ecology. Ecol. Model. 2012, 228, 76–88. [CrossRef]
48. Finnveden, G.; Nilsson, M.; Johansson, J.; Persson, Å.; Moberg, Å.; Carlsson, T. Strategic EnvironmentalAssessment Methodologies—Applications within the energy sector. Environ. Impact Assess. Rev. 2003,23, 91–123. [CrossRef]
49. Szargut, J.; Morris, D.R. Cumulative exergy consumption and cumulative degree of perfection of chemicalprocesses. Int. J. Energy Res. 1987, 11, 245–261. [CrossRef]
© 2016 by the authors. Licensee MDPI, Basel, Switzerland. This article is an open accessarticle distributed under the terms and conditions of the Creative Commons Attribution(CC BY) license (http://creativecommons.org/licenses/by/4.0/).
129

resources
Article
Dematerialization—A Disputable Strategy forResource Conservation Put under Scrutiny
Felix Müller 1,*, Jan Kosmol 1, Hermann Keßler 1, Michael Angrick 2 and Bettina Rechenberg 3
1 Section for Resource Conservation, Material Cycles, Minerals and Metal Industry, German Environment Agency,Wörlitzer Platz 1, 06844 Dessau-Roßlau, Germany; [email protected] (J.K.); [email protected] (H.K.)
2 Division for Emissions Trading, German Emission Allowance Trading Authority, German Environment Agency,Bismarckplatz 1, 14193 Berlin, Germany; [email protected]
3 Division for Sustainable Production and Products, Waste Management, German Environment Agency,Wörlitzer Platz 1, 06844 Dessau-Roßlau, Germany; [email protected]
* Correspondence: [email protected]; Tel.: +49-340-2103-3854
Received: 5 October 2017; Accepted: 24 November 2017; Published: 4 December 2017
Abstract: Dematerialization is a paradigm in resource conservation strategies. Material useshould be reduced so that resource consumption as a whole can be lowered. The benefit forhumankind should be completely decoupled from the natural expenditure by a definite factor X.Instinctively, this approach is convincing, because our entire value-added chain is based on materialtransformation. Targets for mass-based indicators are found within the context of justification forecological carrying capacity and intergenerational fairness, taking into account the economic andsocio-political expectation of raw material scarcity. However, in light of further development ofmaterial flow indicators and the related dematerialization targets, the question arises as to what theyactually stand for and what significance they have for resource conservation. Can it be assumedthat pressure on the environment will decline steadily if the use of materials is reduced, whether foran economy or at the level of individual products or processes? The present narrative reviewpaper has discussed this issue and takes into account the authors’ experience of the extendedpolitical and scientific discourse on dematerialization in Germany and Europe. As a result, a high“resource relevance” cannot be inferred from high physical material inputs at any of the levelsconsidered. It has been shown that establishing mass-based indicators as control and target variablesis questionable and that dematerialization exclusively based on such indicators without mappingother resources should be critically examined.
Keywords: natural resources; mass-based indicators; dematerialization; MFA; raw materials;resource conservation; resource efficiency; criticality; area of protection; precautionary principle
1. Introduction
Biophysical methods and models suggest that a global safe operating space can be identifiedwhere safe and sustainable life is granted to humankind without exceeding certain ecological limits [1].However, a degradation of ecosystems and ecosystem services shows that those ecological limitshave already been reached [2]. Moreover, humankind has most probably already exceeded the stresslimits for climate change, phosphate and nitrogen nutrient fluxes, land-use changes, and biosphereintegrity—four out of nine specified planetary limits [3]. If this situation is not resolved effectively,it must be assumed that not only will the Earth’s state gradually worsen but also change irreversiblywith devastating consequences for life on this planet.
Making express references to the planetary boundaries as well as resource scarcity and availability,national and international political agendas are increasingly migrating towards acceptance of resourceconservation with a prime focus on increasing the efficiency of its use. European activities—starting
Resources 2017, 6, 68; doi:10.3390/resources6040068 www.mdpi.com/journal/resources130
Resources 2017, 6, 68
from the milestone of the “Thematic Strategy on the Sustainable Use of Natural Resources”in 2005—have provided an implementation roadmap for the “resource-efficient Europe” flagshipinitiative [4–6]. This initiative is aimed at simultaneously enhancing economic performance andreducing the associated resource consumption. The European Environment Agency (EEA) haspublished a comprehensive report to show how 32 European states want to increase their resourceefficiency [7]. The Federal Government of Germany stipulated its own resource efficiency programmeProgRess in 2012 [8]. An evaluation of performance was published on the basis of a progress reportin 2016, and a second resource efficiency programme was adopted at the same time [9]. Countriessuch as Japan developed national strategies [10] many years ago, or—as in the case of India [11]—haverecently developed one.
At an international level, in founding the Resource Efficiency Alliance, the G7 countries havecommitted to ambitious measures to protect natural resources and improve resource efficiency, buildingessentially on the reduce–reuse–recycle framework of the Kobe 3R Action Plan and existing nationalinitiatives [12]. Even more importantly, the G20 launched a Resource Efficiency Dialogue, which willexchange good practices and national experiences to improve the efficiency and sustainability ofnatural resource use across the entire life cycle and to promote sustainable consumption and productionpatterns [13]. Resource efficiency is most prominently represented by the UN Sustainable DevelopmentGoals (SDGs). The 2030 Agenda for Sustainable Development envisages a world in which consumptionand production patterns and use of all natural resources are sustainable [14].
In recent years, the concept of a circular economy has received increasing attention worldwidedue to the recognition that the security of supply of resources and resource efficiency are crucial forthe prosperity of economies [15]. In the meantime, existing strategies for resource efficiency havealready been supplemented or even replaced by those for a circular economy, although there is a verylarge congruence in terms of contents. The EU Commission has presented a new circular economystrategy in line with the existing 2020 Europe Strategy flagship initiatives [16]. The Strategy consistsof an EU Action Plan for the Circular Economy, including revised legislative proposals on waste thatestablishes a concrete and ambitious programme of action, with measures covering the whole cycle:from production and consumption to waste management and the market for secondary raw materials.A declared goal is to implement the paradigm shift from the resource-intensive, linear, “take, make,consume, and dispose” economic model to a resource-efficient circular economy. Initiatives, strategies,programmes, and roadmaps are being pursued to help further the development of a circular economyby organizations, and in many countries such as Finland [17] and the Netherlands [18], with the aim ofstrengthening a resource-efficient economy [19]. Even if the distinction between resource efficiencyand circular economy is not clear, circular economy can be described as a desirable target state ofa resource-conserving economy.
In the programmes and strategies mentioned, there is as yet no generally accepted definition ofthe central object, the natural resources. Depending on their definition and interpretation, they includematerials, raw materials, natural energy flows, land, wildlife, agricultural goods, environmentalmedia, ecosystems, the services they provide, and biodiversity. This results in more or less majoroverlaps between the natural environment, natural resources, natural capital, and, as a consequence,resource use and environmental impact. The strategies often use the terms of resource use and resourceconsumption synonymously or arbitrarily. This unclear terminology is not solely linguistic but raisesfundamental conceptual questions about the relationship between environmental protection andresource conservation and the target parameters of resource conservation.
It is striking that, although a “broad understanding” of natural resources is often considered,an implicit or partly explicit focus is placed on raw materials or materials. For example, thoseindicators concerned with the frugal use of fresh water, land areas, or the protection of geneticdiversity are also included in the final list of coordinated SDG indicators. However, the materialfootprint or its productivity was chosen as the only indicator to represent natural resources underthe central SDG 12 meant to achieve sustainable management and efficient use of natural resources
131

Resources 2017, 6, 68
by 2030 [20]. Similar material flow indicators and their productivities have also been described innational programmes and sustainability strategies, or even prominently set as leading indicators forthe programmes to measure the success of resource conservation or resource efficiency [21–24].
The widespread focus on material in strategies for natural resource use goes back to a 1990sschool of thought that considers dematerialization, i.e., a reduction of material use by a “factor X”,as a guiding principle for a sustainable economy. Such an economy avoids negative environmentalimpacts and faces scarcities in a precautionary way, in responsibility as well, for future generations.The declared objective is to decouple benefits from resource demand, which is equated to materialdemand in this school of thought. This dematerialization approach is propagated not only at theoverall economic level but also at the micro level for products and processes [25]. The discussionof approaches to dematerialization has given a great boost to the development of material flowcalculations and accounting [26,27]. However, the significance of the concept and its material-basedindicators is considered controversial [28–32]. The objectives are the subject of political, societal,and scientific discussions. Although, to the authors’ knowledge, there are so far no binding resourcepolicies that explicitly aim at dematerialization, the above-mentioned focus on material efficiency andthe common synonymous use of the terms resources and material makes an implicit reference to thisschool of thought.
Research Questions and Goals
In light of further developments of the macroeconomic material flow indicators for resourceefficiency assessment and of the analysis of material flows at process and product levels, questions ariseas to what mass-based indicators stand for and what they reveal about the conservation or theefficient use of natural resources. Instinctively and emotionally, they are highly relevant. Our entirevalue-added chain is based on material and substance transformation: we extract material fromthe environment, transform it, and permanently discharge emissions and waste into the naturalenvironment, which influences its state. Even services and non-material goods in the strict sense suchas education are dependent on these material transformation processes: they require infrastructuresuch as roads, railways, heated buildings, computer centers, and much more. In turn, these can beused to fulfil their purpose only with auxiliary materials and fuels, mostly fossil fuels.
If so much depends on our material flows, does reduction of material use by a factor X suit asa guiding principle for a sustainable economy? Is it safe to assume that environmental pressure willdrop steadily and resource scarcity be addressed if material use is reduced across the board by a certainfactor X, as the dematerialization school of thought is assuming? How reliable is the measurementof the success of resource conservation using dematerialization indicators in kilograms, tonnes,and megatonnes and can any connection be made to the relevant areas of protection? Regarding thebreadth of all natural resources, how “resource-relevant” are mass-based indicators? Do they qualifyas control variables for policies that aim at conservation or the efficient use of resources?
Against this background, this paper presents a narrative review of relevant methodologiesand assessments for raw materials. It discusses the current application of material flow indicatorsand juxtaposes concepts for raw materials and safeguard subjects from a micro level. It reflectsthe shortcomings, advantages and main criticism with regard to methodology and transportedmessages. Thereof, conclusions are drawn about the use and interpretation of mass-based indicatorsfor resource policy.
The structure of this paper is as follows: Section 2 discusses the technical background. The authorspresent their classification of resource conservation terminology. The application of economy-widematerial flow accounting (EW-MFA) indicators in political programmes is described using Germanyas an example. This is followed by an outline of the factor X approach and its fundamentals fordematerialization as a strategy. In Section 3, the relevance of material flow indicators for the useof natural resources is discussed on the basis of the author’s experience. Areas of protection andimpact paths of raw material consumption are described. The authors discuss the relevance of
132

Resources 2017, 6, 68
material flow indicators for environmental impacts and raw material scarcities, which are at the coreof the justification for dematerialization and resource efficiency strategies. The extent to which itis legitimate to use the precautionary principle to justify dematerialization strategies and to derivedematerialization targets is additionally discussed. In Section 4, the key findings are summarized,followed by a concluding discussion to put the results into perspective in the resource policy debate inSection 5.
2. Resource Conservation Conceptualization for Materials and the Factor X Approach
2.1. Terminology
The resource conservation policy field has so far been strongly anthropocentric and utilitarian,which is already laid out in the semantics of the resource term and is reflected in different definitionsof the term natural resources [33–37] and in explanations on the subject [6,8,38–40]. This means thatthis policy field does not focus on nature’s intrinsic value and its living beings or the needs of othersentient creatures, but rather on the needs of humans or benefit or value for humans. Natural resourcescreate the material, energy and spatial basis for human life and are indispensable for our economyand welfare. We satisfy our needs by using them as sources of energy, production means, living andrecreational areas, a pool of pharmaceutical active agents, and so on [40]. All these natural resourcescontribute to our natural capital, which must be conserved and enlarged over the long term.
Other definitions do not make this explicit reference to human needs or benefit but definethem as “all components of nature” [9] or are confined to the final and non-exhaustive list of theircomponents [4,9,41,42]. Depending on the definition, natural resources include at least the geologicalstocks of primary raw materials, defined as unprocessed materials or material mixtures which areextracted from nature to be input into production processes [43]. In addition, physical space includingarea, environmental media such as water, soil, and air, flow resources such as solar radiation, wind andwater flows, ecosystems, and ecosystem services for humans are also counted as natural resources [6].
One of the few recent definitions that are not exhausted in an enumeration of its componentsdefines natural resources as “means found in nature that can be beneficial for humans” [43].This paper uses this definition. This conception of natural resources includes environmental mediaand ecosystems, not only in their function as source of material and energy, but also as a sinkfor emissions (sink function) and other functions. They bring us services on a daily basis, ofteninvisibly—be it the soil’s water filter function, the rivers’ self-cleaning capacity, the atmosphere’semission absorption capability, flood control by floodplain forests, the regeneration capability of fishstocks, or the pollination by wind, water, and animals—and must therefore be considered naturalresources in the sense that they are “means found in nature that can be beneficial for humans”.
From this broad understanding of natural resources, however, delineation questions ariseabout the natural environment and, subsequently, conceptual issues about the relationship betweenenvironmental protection and resource conservation. Emissions into environmental media andecosystems are, in this sense, not only environmental impacts but also a resource use. According tothis understanding, resource conservation is merely another, strictly utilitarian–anthropocentricperspective of environmental protection. This is followed by a further terminological blurring ofresource conservation, which is of decisive relevance for the conceptual development of this field ofscience and policy: Is resource conservation aiming at reducing resource use or resource consumption?Resource use means any human access to natural resources, while resource consumption is a form ofresource use that converts resources in such a way that they are not available for any other uses [43].
While resource conservation designates the careful handling of natural resources in order toavoid their depletion or consumption, resource efficiency or resource productivity is the ratio betweena given benefit or result and the natural resource use required to achieve it [43–45]. Resource efficiencyis conceptually based on the decoupling concept shown in Figure 1. However, the arguments in the lastparagraph raise the question whether or not a double decoupling concept is reasonable and necessary,
133

Resources 2017, 6, 68
aiming at decoupling both prosperity and human well-being from resource use as well as resource usefrom environmental impacts (see Figure 1). In contrast to the resources, the benefit is a rather subjectiveor judgemental category. “The benefit of products and services is given by functions that are frequentlydescribed by technical parameters. In economy, the benefit is frequently expressed in monetary termsand given as turnover or product price numbers. Both the technical and monetary assessments ofbenefit do not fully cover all forms of all benefit aspects” [43]. Since the political resource efficiencydebate aims to address economic performance in relation to natural resource use (see Section 1),this article uses the term benefit, which includes technical function but allows monetary valuation.
Figure 1. Absolute and realtive decoupling pathways for well-being, economic activity, resource use,and environmental impacts [46]. In the most desirable case, benefits, i.e., GDP, increase while cost,i.e., environmental impact or resource use, decreases. This constellation is called absolute decoupling.Even if cost in terms of resource use increases, productivity can still increase if benefits increase morestrongly. This constellation is also called relative decoupling. A third case is also conceivable: if bothcost and benefit decrease, but cost decreases more than benefit, productivity increases.
2.2. Productivity Indicators and Decoupling by Germany’s Example
Raw material productivity, a key indicator of the German sustainability strategy from 2002,is a basic element of the German resource efficiency programme [8,9]. Raw material productivitysets the gross domestic product in relation to the abiotic part of direct material input (DMIabiot)from domestic raw material extraction and imports. DMI is an input indicator in the system ofeconomy-wide material flow indicators (Figure 2). Input indicators map the (raw) material inputsused to provide all services of an economy. If imports are recorded not only in their own weight as inthe case of the DMI but also together with the used or even unused foreign extraction, the indicatorsRaw Material Input (RMI) or Total Material Requirement (TMR) are used for this purpose. The samemetabolic system also specifies indicators that map domestic consumption using the DMC, RMC,or TMC indicators, and physical trade balance or stock growth by balancing inputs and outputs indifferent ways [47].
134

Resources 2017, 6, 68
Figure 2. Illustration of economy-wide material flow indicators. The lateral lines indicate the respectivesystem boundaries and balancing items [40].
The indicator for raw material productivity provides information on the efficient handling ofabiotic materials. Through its relationship to GDP the indicator is chiefly considered to be an economicparameter for the production factor of abiotic materials. Raw material productivity is thus analogousto labor and capital productivity.
GDP and DMIabiot show an absolute decoupling over time (Figure 3). However, DMIabiot takesinto account imports at their actual processing level, the so-called direct material flows [47]. Those rawmaterials that were used for the production of imported goods in other countries beyond the deadweight of imports are not accounted for. If resource-intensive processes are relocated abroad and highlyprocessed goods are imported instead, raw material productivity increases [48]. Since the tendency isthat semi-finished and finished products are increasingly imported, the observed absolute decouplingis mainly due to the indicator’s methodological weakness [49].
Figure 3. Raw material productivity in Germany from 1994 to 2014 and the underlying trends of GDP,DMIabiot, and RMIabiot. Data based on [50].
135

Resources 2017, 6, 68
Since 2007, a methodology has been developed to cover raw materials used for imports [49,51,52].This methodology uses input–output analyses and process chain approaches to identify goods togetherwith their raw material equivalents (RMEs). On average, the RME is 2.7 tonnes per 1 tonne of directlyimported material into Germany, which means that 2.7 tonnes of raw material are needed abroad toproduce 1 tonne of physically imported goods [48]. As a comparison, the corresponding imports inRME for the EU-28 on average are estimated as being 2.4 times higher than actual physical imports,thus in the same order of magnitude as in Germany [53]. The primary raw material input (RMI)indicator maps the sum of domestic raw material extraction and direct and indirect imports beyondthe dead weight of the physical imports (Figure 2). RMIabiot is only relatively decoupled from GDPover time [21]—in contrast to DMIabiot (Figure 3). If consumption indicators are taken into account,physical material flow indicators such as domestic material consumption (DMC) may even exhibitdiametrically opposed trends to their analogous indicators in RME (raw material consumption, RMC),i.e., a decrease versus a rise [22].
2.3. “Factor X”
In the context of resource conservation policy, firm objectives for dematerialization are beingdiscussed. These are linked to different material flow indicators (Figure 2) and have very differentambition levels. Bringezu and Mancini et al. provide an overview of more recent proposals [30,54].The dematerialization objectives are rooted in the tradition of a so-called factor X concept. X standsfor a reduction factor in the use of a resource for providing a service. Both should be decoupledfrom each other. This corresponds to the concepts and logic of eco- and resource efficiency orrespective productivity [31]. The factor X approach is applied not only to national economies butalso to products, services, sectors, industries, and needs [55]. Precursors of the factor X approach canbe found in Daly [56] and Ayres [57] whose environmental models also emphasized the necessity ofdematerialization, but above all a significant increase in productivity of natural resources. The actualpioneering work of the factor X approach includes a report to the Club of Rome by von Weizsäcker et al.:“Doubling wealth—halving resource use” [58] and Schmidt-Bleek’s book: “How much environmentdoes man need?” [59]. While the two Wuppertal Institute scientists estimated necessary enhancementfactors “X” to 4, 5 [60], and 10, other factors of up to 50 have been postulated [31]. The factor targetscan hardly be compared since they have different base years depending on the publication date andthey extend to very different time periods, from a few decades up to 100 years. Moreover, the authorsdo not often believe that target horizons and sizes can be made more precise but rather aim at targetcorridors and orders of magnitude.
Very different perceptions are behind the factor approaches as to which kind of resource useshould be reduced. Schmidt-Bleek linked a factor 10 to the concept of material intensity per serviceunit (MIPS) that he developed, i.e., the reciprocal of productivity. Here, abiotic and biotic materials,including air, and water, are balanced over the service life cycle of products and services. This conceptexplicitly includes the so called “unused extraction” such as overburden in mining, soil movementsin agriculture and forestry, erosion as well as soil excavation for construction [61–63]. The categoriesmentioned minus air and water are also called primary materials and are mapped by the material flowindicator total material requirement (TMR) at the national economic level (see Figure 2). The Factor 10concept has also been promoted by the identically named Factor 10 club—starting with a CarnoulesDeclaration in 1994 [64]. However, the references are too general and ambiguous in a terminologicalsense. This leads to an interpretation mismatch as to which resource use or input is being addressed(see Section 2.1).
Schmidt-Bleek’s MIPS-concept is at the core of dematerialization as a strategy for resourceconservation [25,59,61,65]. It is based on the assumptions that the planetary ecological carryinglimits have been exceeded, each man-made material flow causes changes in the ecosphere, and thevolume of man-made material flows (extraction of material from the ecosphere) exceeds the extent ofnatural material flows at the earth’s crust (volcanism, erosion, etc.). Furthermore, Schmidt-Bleek bases
136

Resources 2017, 6, 68
the necessity for dematerialization on the realization that man is a long way from fully understandingthe cause–effect relationships in the interaction between man and nature, our knowledge about specificenvironmental pressures is extremely limited, and environmental problems are only recognized assuch after their occurrence.
Therefore, Schmidt-Bleek proposed that, in addition to emissions and wastes, the focus ofenvironmental policy must be directed towards material inputs into the industrial metabolism since thelaws of conservation of mass and energy imply that any input (material extraction) would inevitablybecome an output (waste, emission, etc.) and thus would address the total environmental impactpotential of human activities, including the still unknown environmental problems. This hypothesishas been questioned by various authors [29,66–68]. Schmidt-Bleek deduces from the precautionaryprinciple the premise that natural systems should be changed by human activities as little and as slowlyas possible and justifies this with the above-mentioned assumptions about the connection betweenmaterial input and environmental impacts and the wide ignorance of cause–effect relationships.He states that, by lowering the industrial metabolism to “an ecologically compatible degree”, not onlyknown and unknown environmental pressures due to raw material extraction and processing butalso environmental impacts during production, use, and disposal of the products produced therefromshould be reduced or avoided, and an “evolutionary balance”, “ecological balance”, or “ecologicalstability” reached [59].
Other factor approaches such as those of von Weizsäcker do not make an explicit reference tomaterial flow indicators and are not restricted to rigid dematerialization as his approach focuses oneco-efficiency [58]. The action proposals are backed by great technological optimism. Energy demandand greenhouse gas emissions have been chosen as the design basis. However, it may be considereda problem that a factor target for certain resources can be achieved, while it may clearly be missed oreven opposing effects may arise for other natural resources within the same system.
Factor approaches must be scrutinized in certain cases because contrasting ambition levelswith different societal, economic, and political implications may result from numerically identicalfactors depending on the consideration’s system boundaries, resources addressed, indicators appliedincluding their specified balance limits, the periods considered, the stipulation of absolute targetsor productivities, which may also be substantially driven by autonomous GDP developments(see Section 2.2).
The discussion on dematerialization initiated by Schmidt-Bleek and others in the 1990s hasgiven a great boost to the development of material flow calculations and accounting [26,27].Mass-based indicators and their productivities are at the heart of most resource-efficiency policies(see Section 1) and make an implicit reference to Schmidt-Bleek’s hypothesis that aggregated masswould constitute a reasonable proxy for potential environmental impact. According to the perceptionof the authors, this bold interpretation of the significance of mass-based indicators still endures indebates on resource efficiency and conservation and is an obstacle for successful resource policies.
3. Assessment
3.1. Areas of Protection
The area of protection (AoP) that is addressed by primary raw materials is ambiguous.What exactly must be prevented by using less primary raw materials [69]? Can this also be bestrepresented by means of mass-based indicators? An insight into the widely developed methoddiscussion of life cycle assessment since the beginning of the 1990s helps answer these questions [70].The logic of life cycle assessment is about the relative reduction of environmental pressures byindividual products or processes. However, in order to cover the impact on the environment asa whole, it is described using AoP. These AoPs are damaged by relevant environmental pressures [71].However, life cycle assessment does not specify which AoP must be respected or why [72]. This issueis addressed by a school of thought that logically argues that the environment is worthy of protection
137

Resources 2017, 6, 68
and must first be defined top-down according to the value system in society before its influence anddamage can be assessed.
In the early phases of life cycle assessment, the Society of Environmental Toxicology andChemistry (SETAC) recognized that raw materials are part of the environment worthy of protection [73].Recently however, different AoP concepts have still led to very diverse approaches for interpretationand definition. The evaluation and preferred selection of certain methods is the subject ofon-going discussions [74]. The fundamental anthropocentric context of justification for the rawmaterials consumption as part of the AoP natural resources can be seen less in the ecologicalimpacts—represented by the ecosystem quality—or human health—which is an AoP on its own—butmore in the actual consumption, availability, and possible shortages of raw materials [75,76].The interest in AoPs can go beyond the purely ecological sector [77]. Societal and social welfareor the fundamental adherence to the precautionary principle is also mentioned in this context [75,78].Both the definition and the logical connection between AoPs contain normative stipulations thatstem from anthropocentric, pathocentric, and biocentric positions [79]. Such issues of valuejudgement can also be supported by ethical, theological, legal, and economic arguments [71].Many established ecological assessment methods allocate environmental impacts to the three AoPs:human health, ecosystem quality, and resource consumption [80]. Some authors argue that theman-made—anthropogenic—environment should also be addressed as an independent AoP thatinherently goes beyond the ecological sphere [81]. In that sense, Dewulf proposes five differentperspectives of natural resources, which comprise not only the natural resources’ asset, theirprovisioning capacity, and their role as constituents in global ecosystem functions but also theirprovisioning function for human welfare and human welfare as an inclusive category itself [78].
The AoPs are intrinsically linked to one another. Thus, the extraction and processing of rawmaterials inevitably leads to reactions with the state of the ecosystem and to a threat to health,for example, through soil changes and mobilized heavy metals. An acidifying emission can causedamage to buildings and thus damage the physical capital of the anthropogenic environment andimpair human welfare (see Section 3.2.1). These relationships lead to the fact that resource use andthe associated material changes and shifts can subsequently affect different safeguard subjects withinthe AoP.
There are four basic notions for the assessment of raw materials use and their interpretation assafeguard subjects in the AoP natural resources that are of particular interest [71].
1. Intrinsic values: Infringing the supply of raw materials as such is understood as an inadmissibleintervention. Each raw material extraction is therefore to be regarded as detrimental to theprotection objective.
2. Reduction: Reducing the raw materials’ availability is regarded as a restriction on the freedomof future generations. In this case, the decision-making freedom of future generations andintergenerational fairness are the overriding protection objective.
3. Devaluation: It is assumed that raw material deposits of lower quality must be exploited infuture. This will cause increased mining costs for future generations.
4. Substitution: From this perspective, the demands of future generations will be equated withtoday’s consumption interests and the substitution options of non-renewable raw materials willbe regarded based on the technical and economic costs for developing alternative technologies.
Although denoted differently, these are congruent to the categories of impact pathways forresource depletion for raw material use, indicator approaches and addressed safeguard subjects inthe AoP natural resources [82]. Accordingly, the scope of ideas ranges from primary raw materialsas safeguard subjects over the purely physical availability for future generations and the anticipatedimpairment by the decreasing quality of deposits and resources, to the functional, intergenerationalfulfilment of purpose as an actual safeguard subject from an anthropocentric consumer perspective.
138

Resources 2017, 6, 68
Indicators in the first category are comparatively easy to determine at the life cycle inventorylevel. However, these indicators do not reveal the scarcity of raw materials, their thermodynamicproperties, the time-related changes to deposit qualities, or the functional and monetary utility valueof the extracted raw materials. This considerably limits their relevance to the safeguard subject of rawmaterial consumption [82]. In contrast, the depreciation of raw material supply and the substitutionof raw materials are of particular interest since they both try to measure actual damage as endpoints. The rationales clearly go beyond environmental considerations [78] into life cycle sustainabilityassessment (LCSA) [74,75].
Economy-wide material flow indicators such as RMI or RMC (see Section 2.2, Figure 2) and themethodically equivalent cumulative raw material demand (CRD) that collect the sum of the primaryraw materials used to produce and transport a product along the value chain at the level of productsand processes can clearly be assigned to a natural resource: primary raw materials. These indicatorsenable all material systems to be traced back to the basic extraction and exploitation of primary rawmaterials from the natural environment. The indicators explicitly address the AoP natural resourcesin terms of raw material consumption for biotic and abiotic raw materials minus water and air inunits of mass without further characterization. Since no impact characterization or weighting thatmay project a scarcity information has been carried out, they can be arranged unequivocally into thecontext of justification: an intrinsic value is attributed to raw materials, expressed by its mass, and anyform of raw material extraction and removal ex aequo impairs the AoP. Resources and deposits of allraw materials are thus regarded equally worthy to protect, irrespective of raw material availability.The indicators map this issue reliably and contradiction free and are appropriate to cover the massof primary raw materials used. The change of state over several periods indicates whether reservesand resources (biotic extractions and crops) are actually more or less used. This is based on a ratheregalitarian assessment approach, which assumes that it makes no difference at which time the rawmaterial is extracted and that each removal can trigger the same potential environmental impacts ina damage model [83,84].
3.2. Relevance and Representativeness of Mass-Based Indicators
As mentioned in Section 1, mass-based material flow indicators are assigned a strongcommunication function in an information hierarchy as indices or key indicators to draw attention andpossibly represent other natural resources [24]. The more these indicators are aggregated, the morethey are subject to a target conflict between their information content and their effectiveness incommunication [85]. This is illustrated by the information pyramid in Figure 4. By choosing andlimiting the analysis to one or a few indicators, other key figures of a system that may also beimportant are disregarded. In the lower part of the pyramid, material flow indicators are analyticallyfar more interesting for the analysis of the socio-economic metabolism. In contrast to the use of highlyaggregated mass-based indicators the concept of the socio-economic metabolism also established asanthropogenic [86] or industrial metabolism [87,88] incorporates MFA-indicators in a systemic way andputs emphasis on the actual transformation of materials [26,27]. For complex systems such as nationaleconomies, material flow indicators, in their functional aggregation and classification accordingto different materials and uses, enable considerable insights into the system conditions, changes,and driving forces [89]. They provide basic structural information about the economy’s materialbasis. Thus, input indicators linked to output indicators provide important systemic information andcontrol variables for exports and inputs into the environment, stock accounting balances and domesticuse, which can also be interpreted by the comparison of different economies and their development.The analytical instruments are essentially based on material flow analyses, accounting and modelingfor comprehensive analysis.
However, when highly aggregated mass-based indicators are used at process and product levelspurely solitarily or at a macro-economic level as headline indicators for natural resources, they arein the context of justification of economic necessities, ecological requirements, and intergenerational
139

Resources 2017, 6, 68
fairness and thus scarcity expectation is significant for economic and societal policy [90]. Beyond theintended signal effect and communication function, two crucial questions arise: How good are thosemass-based indicators at representing environmental impacts and scarcities?
Figure 4. Information pyramid where indicators exercise multiple roles according to their position.Based on [45].
3.2.1. Representation Function for Environmental Impacts
In the environmental policy relevant DPSIR model (Driver-Pressure-State-Impact-Response),mass-based material flow indicators represent environmental pressures that can cause undesirableeffects and condition changes (Figure 5). The DPSIR model is suitable for locating material flows in thehuman–environment set of interactions [91]. This creates an interdependency between socioeconomicdrivers, environmental pressures and impacts, the state of the natural environment and the ecologicaleffects or actual damage. Furthermore, it enables an integrated view of the societal, political,and economic measures that have an impact on the overall set of interactions.
Figure 5. DPSIR-Framework that shows the interplay between the environment and socio-economicactivities, based on [91,92].
Translated into the model logic of DPSIR, a dematerialization strategy now suggests that fewerraw materials are used when modified technologies or changed demand profiles in the economic
140

Resources 2017, 6, 68
system are employed; consequently, not only adverse, degrading changes in the environmentalstatus but above all negative environmental impacts are avoided. As a result, fewer responses andadaptive measures would be required. The approach of dematerializing at all can also be interpretedas a response to an already experienced or expected over-use of natural resources, as suggested byFactor X approaches (see Section 2.3). If this is supposed to be promising, mass-based indicatorswould have to correlate with the actual environmental effects, in spite of the lack of effectivitycharacterization, i.e., they must be ecologically significant. The ecological significance of raw materialsextends to the assessment of further use of natural resources through pressures on the environment(land use and conversion, energy demand, fresh water use, and consumption) and, in particular,environmental impacts (use of the environmental media sink function provided as an ecosystemservice and impairments of biodiversity).
In the following, five scopes are to be systematically differentiated in order to correlate the rawmaterial use of System S 1 with environmental impacts (Figure 6). Opposed to Scopes 1, 3, and 5,Scopes 2 and 4 are based on a consideration of the RME; i.e., cumulative raw material requirements upto the actual extraction and thus the physical pre-chains are taken into account. On the other hand,a kilogram of gold and a kilogram of steel would be included in equal measure in a correlation analysisin approaches 1, 3, and 5. However, the actual specific raw material requirement per ton of material(primary raw material intensity) as defined by the indicator CRD (see Section 3.1) of basic materialsand homogeneous semi-finished and finished products increases in the following order, as an initialapproximation: construction minerals < fuels < biomass < industrial minerals < basic chemicalsand plastics < ferrous and non-ferrous metals < special metals < precious metals [93]. In detail,however, there is a special rank sequence for each environmental pressure or impact category (e.g., landuse, energy use, and greenhouse gas emissions) at the impact level of the respective materials [94,95].With regard to environmental pressures and impacts, Figure 6 shows Scopes 1 and 2 as well as Scopes3 and 4 forming pairs. The crux is whether material or primary raw material use in System S 1 is onlycorrelated to the impacts in the upstream chains (for example, by the extraction, refining, and casting ofa semi-finished metal product outside System S 1, under consideration) or additionally with the effectswhich are described in the following material use in System S 2 (for example, by a car in which saidsemi-finished metal product has been installed). The dematerialization logic of the factor X concept,“any input would become an output”, suggests the latter (see Section 2.3).
The narrow Scope 5 according to Figure 6 was pursued in a study for the EU 27 that wasaimed at identifying threshold indicators in seven environmental action fields [96]. The extent towhich direct abiotic domestic materials consumption (DMCabiot) can serve as a proxy indicatorfor national emission limiting values for different air pollutants was investigated, and it wascompared with the emissions reported according to the territorial principle of the NEC Directive.However, no linearity could be found which would indicate that DMCabiot could represent achievingthe national emission limiting values. Neither DMCabiot nor emission data take account of processesabroad. Therefore, they methodically correspond to each other, although they allow only a limitedperspective of the overall resource consumption.
Numerous studies have performed regression analyses according to Scopes 1 and 2 in Figure 6to systematically check the representation function of mass-based and further resource indicators forother natural resources (e.g., representativeness of (raw) material input for land-take or the emission ofgreenhouse gases). In their study, based on 130 materials and products, Giegrich et al. [97] concludedthat pure mass-based material flow indicators (RMI and TMR) are not suitable as representativeresource indicators. A general representation function of individual indicators for the other resourceindicators has not been established. This applies neither to other input resources (especially energy,land, and water) nor to the use of the sink function. Other studies that performed similar correlationanalyses on up to 100 materials based on their life cycle inventories have arrived at comparableresults [98,99]. In addition to raw materials, the physical input resources such as land, water, and energymust be dealt with separately in order to map the use of physical resources with sufficient reliability [97].
141

Resources 2017, 6, 68
If a single environmental impact indicator is supposed to represent environmental impacts, the mostappropriate indicator is the primary energy demand according to the results. The latter is also the resultof a very complex regression analyses on up to 1200 products and materials. Huijbregts et al. [100,101]found that non-renewable energy demand represents many environmental impacts fairly well. Use ofnon-renewable fossil and nuclear fuels with unambiguous qualitative interactions can be regarded asa key driver for many well-known negative environmental impacts. Conclusions about an inadequaterepresentation function of mass-based indicators apply at a virtual economic system level that containsall materials investigated. A great mix of materials already results in a certain leveling of variousenvironmental characteristics since outliers lose their relevance [99]. This is valid far less at a micro levelof product or process systems, e.g., in the case of paired material substitutions in processes or products,since the heterogeneity of environmental profiles of more similar materials is even more pronounced.An excellent example is the similarity in masses between copper and aluminum: copper meets multipleraw material requirements (in terms of CRD) and acidification potential, while aluminum has highenergy demand and global warming potential (GWP)—which can be retraced to both mineralogicaland technological factors. When substituting copper with aluminum, a decrease in raw material inputand acidification potential comes at the expense of energy demand and greenhouse gas emissions.
In addition, mass-based input indicators do not reflect the environmental burdens or benefitof abatement technologies used within the economy. For example, very specifically mass-intensivematerials in terms of raw material intensity may be accompanied by chemico-physical functionalitieswhich can lead to significant resource efficiency gains and additional benefits in their material life cyclecompared to technologies lacking these materials. Examples to be mentioned include platinum,palladium, and rhodium catalysts, which can significantly reduce the emission of nitric oxidesand volatile hydrocarbons in combustion engines, although they themselves are among the mostresource-intensive materials. A selective catalytic reduction system in diesel cars also representsan additional expense during the entire life cycle, but this leads to significant reductions in nitrogenoxides in exhaust gases. Scopes 3 and 4 should be selected according to Figure 6 as the most elaborateapproaches in order to take account of the effects in the use phase. However, apart from the availabilityof data for such analyses, there is a great allocation problem as to which materials of a good we canattribute to the environmental impacts occurring in its further use. A UNEP study for the EU 27 andTurkey took Scope 3 according to Figure 6 using the actual annual material flows in terms of domesticmaterial consumption [102]. In this case, the consumption phase was taken into account, whichgenerally includes a consuming use of fossil fuels and leads to more intensive environmental pollutionprofiles. Very different characteristic environmental pollution profiles are obtained for various materialcategories such as fossil fuels or agricultural products. The respective material flows over differentresource consumptions and impact categories do not follow a uniform pattern, which explains thebarely existing correlations. This is one explanation that no linearity between material input into theeconomy and emissions out of the economy could be observed in these studies.
Only if the raw material use were lowered in equal measure for all raw materials, in otherwords, if a constant distribution of raw material use were assumed, would the overall environmentalimpact also be consistently reduced. However, this becomes generally invalid as soon as productionand consumption patterns lead to deviating raw material input vectors (for example, by a materialsubstitution from bricks to wood materials or simply technology changes regardless of the actualmaterial input of a good). The actual variability of the macroeconomic material use and the cyclicaldynamics in individual sectors over time, which can be traced back using environmental-economicaccounting data [53,103], render this simplistic assumption seem unjustifiable.
Mass-based indicators are not good proxy indicators for relevant environmental impacts accordingto the studies presented. This makes establishing dematerialization problematic. If mass-basedindicators alone are not very representative, the question arises whether they are important ina dashboard of indicators. A set of a small number of indicators can be determined to best describeenvironmental impacts through a system. This procedure can help reduce effort compared to
142
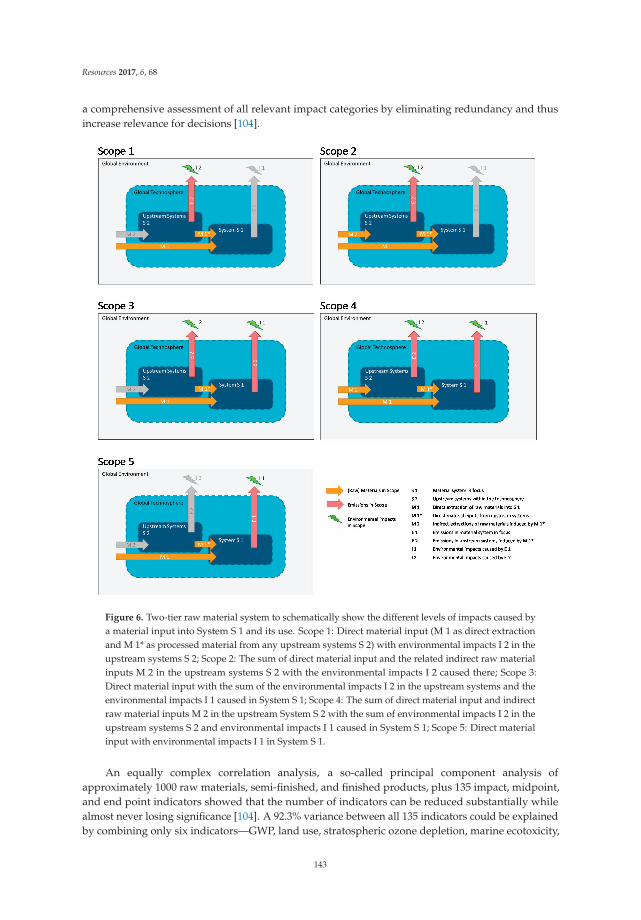
Resources 2017, 6, 68
a comprehensive assessment of all relevant impact categories by eliminating redundancy and thusincrease relevance for decisions [104].
Figure 6. Two-tier raw material system to schematically show the different levels of impacts caused bya material input into System S 1 and its use. Scope 1: Direct material input (M 1 as direct extractionand M 1* as processed material from any upstream systems S 2) with environmental impacts I 2 in theupstream systems S 2; Scope 2: The sum of direct material input and the related indirect raw materialinputs M 2 in the upstream systems S 2 with the environmental impacts I 2 caused there; Scope 3:Direct material input with the sum of the environmental impacts I 2 in the upstream systems and theenvironmental impacts I 1 caused in System S 1; Scope 4: The sum of direct material input and indirectraw material inputs M 2 in the upstream System S 2 with the sum of environmental impacts I 2 in theupstream systems S 2 and environmental impacts I 1 caused in System S 1; Scope 5: Direct materialinput with environmental impacts I 1 in System S 1.
An equally complex correlation analysis, a so-called principal component analysis ofapproximately 1000 raw materials, semi-finished, and finished products, plus 135 impact, midpoint,and end point indicators showed that the number of indicators can be reduced substantially whilealmost never losing significance [104]. A 92.3% variance between all 135 indicators could be explainedby combining only six indicators—GWP, land use, stratospheric ozone depletion, marine ecotoxicity,
143

Resources 2017, 6, 68
terrestrial ecotoxicity, acidification, and eutrophication—in a highly representative set. In the caseof environmental pressure indicators, 82% of the variance of all indicators can be explained bya combination of four variables: fossil CED, land use, water consumption, and raw material input.Thus, such a set of physical input indicators is not as reliable for use as a set as is a verifiable midpoint(impact) indicator set, but can nonetheless be a notable alternative. The fossil CED already represents73%, which confirms the above-mentioned study results [97] as of equal importance to the best possibleproxy indicator. As a comparison, the raw material input represents only 54% of the characteristicsof all 135 indicators, which underlines its rather poor suitability and the availability of other, moreappropriate alternatives. Using one of the proposed indicator sets will be the most robust option ata macroeconomic level. RMI or RMC as the only material flow indicator is of little significance.
3.2.2. Representation Function for Scarcities
The scarcity of raw materials is a keynote for resource conservation. Combined with the perceptionof large price fluctuations for raw materials, concerns are being raised that existing production patternscannot be sustained on a permanent basis due to a critical scarcity of raw material-bound productionfactors that will occur on the input side. In the case of abiotic raw materials, the terminologicaldistinction between actual raw material consumption (“depletion”) and raw material availability isvery important. From a geological point of view, the consumption concept refers to the depletionof a deposit or, at a global scale, to raw material resources combined in the lithosphere. However,availability is defined with regard to technical and economic conditions and is closely linked tomarket price trends and possible opportunity cost [105]. (Another availability term was introducedby Georgescu Roegen (The entropy law and the economic process. Harvard University Press: 1971).He applied the thermodynamic concepts of available and unavailable energy (entropy) to materialsand argues that any kind of material is irrevocably degraded into unavailable states, e.g., by dissipation.For this reason, he concludes that the materials that are vital for current technologies in available stateswill become unavailable eventually. However, the reasoning considers the material transformationand losses within the economy and not just the use of the primary raw materials). Availability andconsumption—expressed in terms of ranges—also refer to very different timelines, from a few years ordecades up to many centuries in the case of the consumption of finite geogenic resources. Against thisbackground, raw material scarcity discussions can be performed at three levels:
• physical depletion;• structural supply risks;• raw material criticality.
Physical Depletion
Measuring physical depletion is closely linked to the paradigm of geological fixed stock.The lithosphere provides a finite geopotential of raw materials. Neoclassical approaches tonatural resource economics and the growth-critical positions taken by representatives of ecologicaleconomics—e.g., the influential “Limits to growth”—emphasize that raw material consumptionexhausts the fixed stock that is assumed to be known [106,107].
A first rough orientation can be provided by the proportion of elements in the lithosphere (andthe atmosphere for gaseous elements). Detached from short-term technological trends and demandsituations, this enables a categorization of the elements that are available to the extent that theycannot be exhausted in human time periods. Accordingly, the elements that occur in typical rockformations—silicon, aluminum, iron, calcium, sodium, potassium, and magnesium—all of which arepresent in the single-digit percentage range and together with oxygen and hydrogen form 98% ofthe lithosphere [108] are also referred to as Elements of Hope [109]. In addition to this categorization,elements are also grouped as scarce and critical elements. When considering these Elements of Hopetogether with carbon, which constitutes approximately 80% of fossil fuels and 50% of biomass, it can
144

Resources 2017, 6, 68
be estimated by the example of Germany and the EU-28 that more than 99% of RMI is characterized bythese 10 elements [52,103]. Approximately 30% of this is carbon. Accordingly, macroeconomic materialflow indicators also significantly represent the elements that are physically most common on Earth.
The geological content of elements does not in itself indicate any economic or technicalextractability. If the top-down approach of the fixed stock is to be adhered to, the geochemicalpostulate of the mineralogical barrier stipulates an average threshold for all elements (particularlyrelevant for scarce and critical elements), which represents the stoichiometric limit concentration in ores.Below this threshold, most of these elements are dispersed thinly in rock, such that extraction couldonly be achieved through wet-chemical separation of the rock rather than by separating accumulatedfractions [110,111]. Even if the postulate of the mineralogical barrier is not scientifically proven and isindirectly questioned by reference to the exploration cycles and technological advances in the miningindustry, it still prompts a fruitful discussion about the increase in extraction costs [112–114]. This looksinto the topic of resource intensity of extraction, particularly with regard to energy demand and theresulting emissions. However, this “environmental scarcity of raw materials” is revealed by othertangible AoPs, not the physical scarcity of extractable raw material amounts per se. Material flowindicators do not have any direct or indirect links in this context.
Only a few exceptions present any empirical evidence for absolute, static, and physicalscarcities—in resource economics, the complete exhaustion of a resource or a raw material. Peak oil isone of these exceptions. The peak oil phenomenon predicted in the 1950s by Hubbert [115] for US oilproduction and in later projections for global production as a whole—described in light of an analysisof new discoveries of conventional oil deposits—is widely regarded as being substantiated [116].However, a transfer of Hubbert’s peak analysis concept with the assumption of a fixed-stock ofmineral raw materials, as occasionally propagated [112,117,118], is regarded by many authors ascritical [119,120]. This is because the concept does not take into account the actual causes of supplyand demand development for mineral, non-fossil raw materials, nor does it consider the variability ofthe reserves and resources parameters [121]. Criticism is directed particularly at the static lifetimes thatare misinterpreted as lifetime up to the exhaustion of a material [122]. Retrospectively, it appears thatthe static lifetimes have remained almost constant or even increased for both fossil energy resourcesand ores in spite of a conspicuously increased consumption development [123] in the second half ofthe 20th century [124]. The fact that the reserve range of rare earth metals is around 1048 years, thatfor copper is around 40 years, and that for lead is only 20 years is not indicative of an alleged earlierexhaustion of global lead deposits [125]. Regardless of this limited significance of static lifetimes forphysical scarcities, they cannot be derived from aggregated mass-based flow indicators.
Structural Supply Risks
In addition to physical depletion, technical-structural aspects that can limit global availabilityof raw materials are also discussed. Some of them can be objectified and are assessed independentlyfrom the players and their use. This method takes into account spatial disparities of distribution, andthe resulting geographical concentrations of the deposits, and of raw material production [126,127].Due to geological and geochemical conditions, the most significant known deposits of some metals,such as tin (soap deposits in Indonesia), niobium (Brazil), platinum (South Africa and Zimbabwe),palladium (Ni-Cu deposits around Norilsk/Russia), and cobalt (Central African copper belt, especiallyin DRC), accumulate in a few districts worldwide. Others—such as rare earths—do not occur in sucha high geological concentration, but in a sizeable concentration in the current mining production(China). Country and enterprise concentrations in an oligopolistic market environment have in thepast repeatedly led to sensitive supply disruptions with high price fluctuations [128].
A further basal structural supply risk affects metals that are present but associated withother materials in their ores. Many metals can only be extracted as by-products or co-products.Exploration, production volumes, and related ranges are thus also bound to the carrier metal [122,129].By-products are present in comparatively lower concentrations and their availability is strongly or
145

Resources 2017, 6, 68
exclusively coupled to the production capacity of one or more carrier elements, for example, galliumin bauxite ores for aluminum production as well as indium and germanium from zinc and leadproduction. On the other hand, co-products have no clear carrier element. The metals concerned suchas platinum group metals (PGMs) and rare earths exist in defined mineralogical ratios, which requirejoint processing and refining in order to purify the individual elements. Due to their large ionicradii, rare earths are not finely dispersed in typical rock formations, but form their own minerals inwhich they are jointly integrated in characteristic ratios [108]. Regardless of the element-specificdemand, actual production is determined by the characteristics of the deposits. As a result,there are production-driving elements—formerly europium and cerium, currently neodymium anddysprosium—that determine the production volume and others whose production volume exceedsdemand, which means that a low market price is highly likely due to the overproduction of suchelements, for example, cerium and lanthanum [130].
The outlined structural risks are to be regarded as element-specific and require a geoscientificstatistical model. Conclusions cannot be drawn about the rise of structural supply risks using materialflow indicators, even in disaggregation, without this complementary model knowledge.
Raw Material Criticality
The assessment of raw material criticality goes beyond the two previous scarcity scales in tworespects. On one hand, supply risks are more complex. In addition to the geological, technical, andstructural criteria, geopolitical, socio-economic, and ecological risks are also integrated [93,131]. On theother hand, the importance of raw materials (and their uses) for a specific system and the impacts inthe event of a manifested supply risk are taken into account.
Against this background, criticality analysis aims to identify the raw materials of a system thatuses them (for example, national economy, industry, and enterprises) to fulfill essential functionsfor this system but whose supply is at risk. This enables a vulnerability assessment of that systemin the face of supply disturbances of specific raw materials [93]. The criticality assessment does notcorrespond to the characterization of total, but relative scarcities, which occur when raw materialdemand of the reference system cannot be satisfied by the raw material supply in terms of time, space,and organization. Linked to this, the impact horizon can also have global, continental, and nationalimpacts, or may only be (supra-) regionally limited.
Such scarcities can occur due to a dynamic supply or demand development as well asa combination of both. The more a raw material suffers from a supply risk and the more inelasticits demand will be, the more critical will it become to the reference system [93]. Relative scarcitiesmust therefore also be assessed depending on the parties involved; for example, diversificationof raw material suppliers or internal recycling can reduce the relative scarcity risk of a singlemarket participant.
The first studies that correspond to today’s logic of criticality analysis were motivated by a rawmaterial security policy and date back to the 1970s [132–134] and the basics even to the 1950s.Numerous new criticality metrics have been developed since 2008 [135]. Different raw materialsare now classified as critical depending on the criteria used within these metrics, the reference systems,and the up-to-dateness of the analyses. Discrete lists of critical and uncritical raw materials—e.g., 20 outof 54 raw materials of an ad hoc working group of the EU COM [136]—can create a strong impactsignal in communication. However, it also counteracts the relative nature of the concept [121].
To allow for a universal and flexible application of the concept on different levels from macro-to micro-scales, i.e., countries, economies, regions, industries, branches, sectors, technologies,companies, product lines, products, and building blocks, an expert group at the Association ofGerman Engineers (VDI) has elaborated a harmonized criticality methodology as part of an industrialguideline on resource efficiency (VDI 4800-2) [93]. The two-dimensional approach clearly distinguishesbetween exogenous geological, technical, structural, geo-political, regulatory, and economic criteria tocharacterize the overall supply risks and subjective endogenous vulnerability criteria for the object
146

Resources 2017, 6, 68
in focus. Current work focuses pragmatically on the future. Thus, the expected demand impulsesdue to dynamically emerging technologies are systematically estimated [123,137,138] or the impactsof climate change on the future supply of raw materials are analyzed in risk assessments [139,140].The results can be integrated in prospective criticality analyses. Other research initiatives do notend with the assessment of criticality but develop approaches to mitigate it by efficiency, recycling,or planned substitution measures [141,142]. These strategy initiatives are aimed at both the supplyand the demand side and are not generic, but they are explicitly aligned to the respective technologicalfunctional materials. Moreover, the assessment of ecological and social impacts of raw material supplyis further developed in criticality analyses [143–147]. This has not been systematically taken intoaccount in existing criticality assessment methods and forms a link to sustainability assessment [148].The example of coltan mining in the Democratic Republic of Congo showed in the past that strategicimportance of raw materials, in this case tantalum, can also aggravate and catalyze armed conflicts inproducer countries [149,150]. In addition, overuse of ecosystems and degradation of further naturalresources by the extraction of raw materials can lead to violent conflicts [124,147,151,152].
In the trend of current studies, raw materials for environmental and emerging technologies areclassified as particularly critical. These include, for example, essential raw materials for thin-filmphotovoltaic technologies such as indium, tellurium, gallium, and germanium. In addition to thesespecialty metals, precious metals such as platinum, rhodium, and gold, or refractory metals requiredin significantly larger amounts such as tungsten, molybdenum, tantalum, niobium, and chromium,are also classified as critical or, from a national perspective, as “economically strategic” [141].
At a global scale, total use of raw materials rose from about 40 billion tonnes to 75 billion tonnesbetween 1993 and 2013 [153]. With its growth factor of approximately 1.9, it has grown slightlystronger than the global economic performance (an increase factor of 1.75 with an average annualgrowth of 2.8%). Thus, there is a minor relative decoupling of the raw material input from the GDPat the aggregated raw material level over the long term. Although significant demand increasesare still expected for many materials considered as critical, their production—including germanium,indium, tantalum, and cobalt—has multiplied between 2 to 5 times in the same 20-year period [123].Consequently, their use is clearly decoupled from the use of the total primary raw materials, whichindicates that broad-brush approaches for dematerialization do not solve criticality issues at all.
Criticality analysis has established itself as a multi-layered and complex, action-orientedsocio-economic raw materials assessment method to deal with scarcities. Thus, it is a highlyrelevant method to address the safeguard subject raw material availability. In principle, intra- andintergenerational availability and distribution fairness can be derived as socio-economic AoPs withinthe criticality concept (see Section 3.1). It could be argued, taking an egalitarian value scale, that criticalfunctional materials should be available to the same extent as a resource for the fulfilment of a benefitboth intra- and intergenerationally. However, conclusions cannot be derived in general—only discreetlylinked to the elements and materials investigated. This action field cannot be addressed using a staticdevelopment of material flow indicators simply because most critical raw materials link to technologicaland specialty metals plus industrial minerals that have relatively small mass flows and can barely bedealt with in aggregated mass flow calculations at this depth. A general dematerialization does notlead to the reduction of criticality of raw materials. Instead, more focused complementary materialflow analyses are required that also take into account the inventory dynamics of product groups andfunctional materials bound in them [154].
3.3. Exegese of the Precautionary Principle
Mass-based indicators failed to provide a strict representation for either environmental impactsor scarcity. One reason may be that qualitative and quantitative relationships and cause–effectrelationships are not sufficiently known or are not mapped by the methods discussed in this article.Some authors, who propagate dematerialization as the central and dominant maxim of action forresource conservation [59], borrow the precautionary principle as a context of justification from
147

Resources 2017, 6, 68
environmental policy. It serves both the derivation for the basic necessity of a reduction of primarymaterial extraction and a determination of different quantitative targets of dematerialization [30].Since the precautionary principle is at the core of justification for dematerialization strategies(see Section 2.3), we take a closer look at this central principle of environmental policy in this section.
The European Union’s environmental policy is based on the precautionary principle (Article 191of the Treaty on the Functioning of the European Union). Internationally, the precautionary principlewas enshrined in the 1992 Rio Declaration on Environment and Development [155] as a principlefor the protection of the environment and human beings. The precautionary principle guidesenvironmental policy towards acting early and with foresight to avoid future environmental pressuresor preserve natural resources for future generations, even if the knowledge of type, extent, likelihood,and cause–effect relationships is incomplete or uncertain.
Despite its importance in the political decision-making process, there is always confusion asto what the principle actually means and in what cases it can be applied as a principle of action.In the case of dematerialization as a strategy for resource conservation three main conditions andone assumption can be initially identified (see Section 2.3): The knowledge about exceeding theplanetary boundaries is incomplete and uncertain [1]. There is an extensive lack of knowledge aboutcause–effect relationships in the environment. Estimations suggest that man-made material flowsexceed the extent of natural material flows. With reference to the laws of conservation of mass andenergy, it can be hypothesized that the material input into the socio-economic-system could be a proxyfor the total environmental impact potential of this system (see Figure 6) [156]. However, do thesearguments suffice to legitimize a dematerialization agenda and formulate dematerialization targetsmaking reference to the precautionary principle?
The European Commission has issued a communication on the applicability of the precautionaryprinciple (COM (2000) 1) [157]. According to the European Commission, the precautionary principlecan legitimize or even impose political acts in such cases where scientific uncertainty is high, but thereis concern due to a scientific risk assessment that dangerous consequences for humans and theenvironment are inconsistent with the EU’s high protection standards. However, the precautionaryprinciple can under no circumstances be used to justify the adoption of arbitrary decisions. In order toapply the precautionary principle, the following prerequisites must be met, unless there is a concreteperception of risk, according to the EU Commission: Before the precautionary principle is invoked,potentially negative effects of a phenomenon, must be identified based on the relevant scientific dataand should be scientifically examined. When considering whether measures are necessary to protectthe environment, every effort should be made to scientifically evaluate the available information.Reliable scientific data and logical reasoning are required to come to a conclusion, which expressesthe possibility of occurrence and the severity of a hazard’s impact. If the available data is sufficient,scientific uncertainties must be determined and assessed at each stage of the procedure. Do theseprerequisites apply in the case of dematerialization?
The dematerialization logic of the factor X concept postulates that the material input measuredin mass units is causally related not only to the environmental impacts of the upstream chains ofmaterial production but also to the total environmental impacts of the system in which the material isused (see Scopes 3 and 4 in Figure 6). The postulated connection between mass and environmentalimpact potential is based solely on plausibility arguments [156]. There is still no scientific evidence(see Section 3.2.1 and [30]). Regression analyses failed to show either a link between direct and indirectmaterial demand and environmental impacts caused in upstream systems, or for the direct materialconsumption of a system and the environmental impacts generated by this system. An explanationfor the first case is the heterogeneity of the environmental profiles of the materials used, which is nottaken into account by the mere addition of the masses. For the second case, an explanation approach isthat the material input into a system does not map the functions of the materials within the systemand the way the materials contribute to environmental impacts or benefits (see Section 3.2.1).
148
Resources 2017, 6, 68
However, the empirical evidence that has not been provided does not yet preclude the application ofthe precautionary principle. On the contrary, it is precisely in this case that legitimation of environmentalprotection measures can be considered if the presumed cause–effect relationships are plausible and canbe described based on reliable scientific data and logical reasoning. However, such a description thatallows a conclusion on the occurrence and severity of a hazard’s impact is not available. In contrast tothe application of the precautionary principle in other environmental policy areas, e.g., in the field ofpotentially dangerous substances, the cause–effect relationships cannot be systematically describedbiophysiochemically in the case of dematerialization logic. Although it is plausible that overall massinput must eventually equal overall mass output, the entire material input into a system cannot bebrought into a logical cause–effect relationship with the environmental impacts exerted by this system.For small systems such as products, the large allocation problem mentioned in Section 3.2.1 should besolved, that is, the impacts of the product along its life cycle ought to be attributed to the materialsentering the product system. Although, for example, the reference to greenhouse gas emissions canbe produced in the case of fuels, nitric oxide emissions cannot be attributed solely to the fuel, but area function of combustion technology and exhaust gas purification technology, which require other rawmaterials. This reference can hardly be established by logical reasoning for constructive or functionalmaterials used, for example, in electronics. In larger, dynamic systems such as economies, a modelingof the cause–effect relationships is an almost impossible undertaking due to the multiplicity of factorcombinations in the use and further processing of materials into products and the environmentalbenefits and environmental impacts of the same products along their entire life cycle, user behavior,and product design decisions. An assessment of the scientific uncertainty is only possible if thesefundamental allocation and modeling problems are solved.
Therefore, most of the EU Commission requirements on the applicability of the precautionaryprinciple are not met. According to these criteria, resource conservation or efficiency policies focusingon mass-based indicators and having the objective of reducing environmental pressure cannot belegitimized by the precautionary principle. Setting global dematerialization as well as materialefficiency targets is, therefore, arbitrary within the meaning of the communication [157], and theprecautionary principle cannot be relied upon. Bringezu also argues that dematerialization targetsshould be set “rather arbitrarily” due to the lack of scientific evidence “void of better alternatives”and should be based on Schmidt-Bleek’s proposals [30,59]. However, there is an alternative togeneral dematerialization by an arbitrary factor as a strategy for the urgently needed response tothe threat of exceeding planetary carrying capacity. The complexity of socio-economic systemsand the planetary ecosystem that oppose the scientific check of the “Schmidt-Bleek conjecture”can be reduced by focusing on the impacts of socioeconomic systems and breaking the planetaryecosystem down into a few large compartments. This has been shown by the work of Rockström et al.on the planetary boundaries [1,3,158]. Although his derivation of the planetary boundaries isalso scientifically controversial, it is based on scientific and at least partly empirically provablecause–impact relationships, which, according to EU-COM (2000) 1, qualifies it for the legitimation bythe precautionary principle and thus as a measure of action for environmental policy. Even though, thedisaggregation of planetary boundaries seems to be more promising for justifying the precautionaryprinciple, whether all relevant environmental impacts and social conflicts in the nexus of land use andraw material extraction are reflected has to be checked.
4. Findings
This paper critically assessed the relevance and representativeness of mass-based indicators’multiple layers as a basis for resource policy. The current application of material flow indicators andtargets was discussed, and concepts for raw materials and safeguard subjects were juxtaposed froma micro-level such as LCA. Thereof, conclusions are drawn about the robustness of dematerializationas a strategy for resource conservation.
149

Resources 2017, 6, 68
• Mass-based indicators that consider primary raw materials as objects of balance and consequentlytrace back all material flows entering a system by raw material equivalents (RMEs) have thegreatest significance since they unambiguously map a specified natural resource, the primary rawmaterials. They explicitly address the AoP natural resources in terms of raw material consumptionfor biotic and abiotic raw materials. An intrinsic value is attributed to raw materials, expressed byits mass, and any form of raw material extraction and removal ex aequo impairs the AoP naturalresources. This does not apply to narrow indicators that only consider direct material inputor even more complex indicators that not only include indirect raw material flows in upstreamsystems but also hidden material flows (unused extractions). In the case of the latter ones, there areasymmetries in balancing and excessive data uncertainties.
• However, raw-material, mass-based indicators to which qualitative relevance has been attributedalso fail to analytically map other resources. It is not tenable to draw a conclusion about high“resource relevance” from high physical material or raw material inputs. One can at most speakof “raw material relevance”.
• All aggregated mass-based material flow indicators including those in RME have at best a weakrepresentation function for negative environmental impacts. According to correlation analyses,input indicators for raw materials and materials do not qualify as provable significant parametersconcerning either environmental impacts of raw material production for a socio-economicsystem or the total environmental impact of this socio-economic system. If the representationfunction is already rudimentary at a macroeconomic level, it is even weaker at the micro level.Basically, the smaller and more fine-grained the system is, the less individual indicators willbe predestined as representatives. System optimization based on material input can lead tosignificant increases in other resource consumptions during production or further uses over thelife cycle. An obvious consensus prevails in the literature that non-renewable primary energydemand as a physical input quantity in units of energy is the best possible solitary representativeof a system’s further environmental impacts.
• In light of methods and findings from the assessment of raw material availability andconsumption, no representation function for avoiding raw material scarcities is available eitherfor absolute, structural, or relative socio-economic scarcities, i.e., criticalities. No general andplausible relationships can be constructed using aggregated material flow indicators for rawmaterial scarcities. On the other hand, this requires a strong material-exact disaggregation.Nonetheless, the criticality concept complements the resource efficiency concept by a relevantaspect: the significance of the raw materials used for a system. The specific criticalities yieldimportant reference points for the prioritization and derivation of effective measures and tools toincrease the efficiency of their use, recycling, or substitution.
• Justifying dematerialization strategies and target setting with reference to the precautionaryprinciple is controversial since it ignores the lack of empirical representativeness of mass-basedmaterial flow indicators for known environmental impacts. In addition, the cause–effectrelationships between mass-based material input into a system and the known and unknownimpacts of a system cannot be reasonably produced using logical reasoning due to major allocationproblems and the complexity of large systems such as economies, which also makes it impossibleto assess the scientific uncertainties.
5. Conclusions
While complementary mass-based indicators, which describe the socio-economic metabolism,provide valuable information for resource policy, there is little evidence to consider solitary physical,aggregated mass-based indicators as control and target variables for achieving a strategy for resourceconservation. For many years, dematerialization representatives have emphasized the merits of theability to apply indicators of the same systematics at all levels of the socio-economic system and tobase design, act, and optimization on them. Although the laws of conservation of mass and energy
150

Resources 2017, 6, 68
indicate that more input eventually must result in more output, the postulated link between theoverall material inputs into a system and its outputs—not in terms of waste generation, but in termsof resource consumption and environmental impacts—is not demonstrable generically or backed byany thermodynamic foundation. This assumption is scientifically controversial, since it is based onbarely comprehensible logical reasoning and lacks a sound empirical foundation. Dematerializationfor its own sake is barely convincing and should not be considered as an end in itself It is only reliableas a strategy for resource efficiency enhancement or resource conservation under almost constant,unrealistic conditions in terms of the qualitative input factors: Only if macroeconomic raw material usewas lowered ceteris paribus for all raw materials could the environmental impact be reliably reducedto the same extent. However, this becomes invalid as soon as production and consumption patternschange and lead to deviating raw material use vectors. The actual variability of the macroeconomicmaterial use and the cyclical dynamics in individual sectors over time make this simplistic assumptionseem unjustifiable.
At the level of individual processes or products, such an approach using indicators such as MIPSis highly questionable. Moreover, for systems as large as national economies, no stringent designbasis is obtained from the size of absolute raw material inputs or material uses. In the opinion of theauthors, the main reason is not a missing life-cycle perspective such as neglecting upstream flowsbeyond a national state boundary (see Sections 2.2 and 3.2.1). It is rather the variety of options forfactor combinations, processing technologies, and utilization of raw materials combined with a vastportfolio of possible abatement technologies and waste management practices that determine theenvironmental and resource implications of a material system of any size.
On the one hand, mass-based indicators are assigned a strong communication function inan information hierarchy and might be the best available indicators for reporting purposes. On theother hand, no conclusions can be drawn about raw material-related AoPs beyond the intrinsic value ofthe raw materials. To give an example, the extraction of bulky building materials such as sand, gravel,and clay may be of minor significance in Germany and countries alike that, compared to India orBangladesh, where severe environmental and social conflicts are evoked, have rather complex licensingprocedures [159]. This is problematic because it does not provide a convincing orientation frameworkfor dematerialization as a resource conservation strategy. Since there is no reason to believe thatdematerialization generally contributes to the conservation of universally accepted guiding principlesand AoPs, or that it prevents adverse effects, it is vehemently rejected by many societal political andeconomic groups, who fervently turn against any form of absolute cap in production and consumption.The vague invocation of the precautionary principle is argumentatively too weak to be convincing,yet the same stakeholders advocate an increase in resource efficiency as a priority strategy [160].
Even if dematerialization is hardly consensual, its narrative—the over-use of the natural resourcesof the Earth and achieving or already transcending planetary boundaries—receives increasing approval.However, rather than indulging too much in the absolute material and raw material inputs andthroughputs of society that cannot represent this degradation and further relevant aspects of resourceuse, more adequate and diverse indicators and methods can be selected. The level of detail must beincreased and the functional resource categories considered must be broadened (see Section 2.1) tobe able to derive reliable conclusions on resource efficiency. As mentioned in Section 3.2.1, there isevidence that the multitude of natural resources might be represented by a reasonable number of equalresource indicators in a set without the need for a hardly consensual normative step of weighting.
Despite the limitations of aggregated material indicators and data, mass-based information ofa system can be the starting point for essential information using disaggregation, standardization,and the application of characterization models. The material-based approaches themselves thusprovide the basis for further, widespread methods, which can be placed in a systematic context,e.g., by applying hybrid MFA-LCA approaches [54]. In concluding the assessment made in thispaper, the authors plead for a systematic and concise use of the different methods and notions asproposed and explained in Figure 7 in resource policy instead of a simplistic dematerialization focus.
151

Resources 2017, 6, 68
The figure shows the logical and semantic linkage of the utility value, the availability as well as thenatural resources with assessment approaches to material efficiency, resource intensity, supply risks,criticality, resource efficiency, resource consumption, and sustainability in a material-economicalsystem. The focus is on material information. None of the assessment approaches can be performedusing solely the aggregated mass as it is recorded in mass-based indicators. However, these targeted,characterized, and impact-oriented approaches are imperative for consistent resource conservationand need further development. In particular, the measurement of resource consumption hits thecore of controversial debates in life cycle impact assessment (LCIA) about the selection of adequateimpact categories, indicators, impact pathways, characterization models, and optional weighting andaggregation steps, for which consensus building is an important and urgent matter.
Figure 7. Relation of material flow information and determination methods for resource conservation.If a material inventory (Material)—such as a product’s bill of materials (BoM)—was determined fora system using material flow analysis, substance flow analysis or inventory analysis methods, this canbe related to a benefit in terms of a technical utility value or a monetary success rate of the productin order to determine its material efficiency (A). Coefficients for resource use (Natural Resources)enable the determination of the resource intensities (B) (for primary raw materials, fresh water, land,greenhouse gases, etc.) up to the provision of the product (as amount/number) from the materialinventory. Using socio-economic data on the materials used (Availability), it is possible to determinethe material’s supply risks (C). Considering the significance of the product for a reference system,for example, a manufacturing company, and the supply risks together enables a criticality analysis (I).Similarly, the resource efficiency can be determined from the benefit of the product for the referencesystem and the resource intensities (II). The actual resource consumptions (III) can be balanced basedon resource use in connection with the supply situation (regional water availability, land quality, etc.)(Availability). Thus, Availability refers to socio-economic and natural occurrences. If all approachesare integrated and dynamized, questions of intra- and intergenerational distribution and resourcefairness can be investigated, which will lead to a sustainability assessment (S).
As Mancini et al. suggest, the choice of accounting methodology and the setting oftargets should be guided by policy objective, be it reducing environmental pressure, enhancing
152

Resources 2017, 6, 68
resource availability, or maximizing benefit from natural resource use, not the other way around,which seems to be the case for dematerialization approaches according to our assessment andfindings [54]. Although numerous environmental policies concentrate on pressures and impactsalready, adding an impact perspective to the so far widely material-focused resource policies wouldcreate an additional benefit. Most environmental policies lack a life-cycle perspective and focus onemissions and wastes within national state boundaries. They neglect upstream pressures and impactsassociated with imported goods and, by doing so, enable burden shifting effects which need to beconsidered when assessing the impacts of consumption and production. Uncovering burden shiftingis, however, a strength of material flow accounting. Combining the two approaches would be anotherstep towards a more complete and robust accounting of natural resources and its use [161].
The rigorous conceptual development of resource conservation as a policy and science field notonly must solve the conceptual node in relation to environmental protection (see Section 2.1) and avoidequating material and natural resources, but also has to answer the question of the relevant targetparameter of resource conservation: If the goal of the sustainable use of natural resources proclaimedin the SDG had been achieved, there would be no need to further reduce resource use. On the otherhand, resource consumption, in the sense of a consuming use of natural capital in the context of local,regional, and planetary ecological sustainability limits, is the relevant target parameter in this respectthat must be decoupled from human well-being in the sense of absolute decoupling. However, this hasnot yet been operationalized using indicators in any of the policy strategies mentioned at the outset inSection 1.
Acknowledgments: The authors would like to acknowledge everyone who contributed to the controversialdiscussion on the topic at the German Environment Agency and the technical support for submission provided.The suggestions and insights from the anonymous reviewers are greatly appreciated. The opinions expressed inthis article are the authors’ own and do not necessarily reflect the views of the German Environment Agency.
Author Contributions: The manuscript was conceived, elaborated, written, and edited for submission by F.M.and J.K. Thoughtful discussion and critical review was provided by H.K., M.A. and B.R.
Conflicts of Interest: The authors declare no conflict of interest.
Abbreviations
The following abbreviations are used in this manuscript:
AoP area of protectionCED cumulative energy demandCRD cumulative raw material demandDMC domestic material consumptionDMCabiot abiotic domestic material consumptionDMI direct material inputDMIabiot abiotic direct material inputLCIA life cycle impact assessmentMIPS material intensity per service unitRME raw material equivalentsRMI primary raw material inputRMIabiot abiotic primary raw material input
References
1. Rockström, J.; Steffen, W.; Noone, K.; Persson, A.; Chapin, F.S.; Lambin, E.F.; Lenton, T.M.; Scheffer, M.;Folke, C.; Schellnhuber, H.J.; et al. A safe operating space for humanity. Nature 2009, 461, 472–475. [CrossRef][PubMed]
2. Faulstich, M.; Foth, H.; Calliess, C.; Hohmeyer, O.; Holm-Müller, K.; Niekisch, M.; Schreurs, M.Environmental Report 2012: Responsibility in a Finite world; Erich Schmidt Verlag: Berlin, Germany, 2012; p. 716.
153

Resources 2017, 6, 68
3. Steffen, W.; Richardson, K.; Rockström, J.; Cornell, S.E.; Fetzer, I.; Bennett, E.M.; Biggs, R.; Carpenter, S.R.;de Vries, W.; de Wit, C.A.; et al. Planetary boundaries: Guiding human development on a changing planet.Science 2015, 347, 1259855. [CrossRef] [PubMed]
4. European Commission. Thematic Strategy on the Sustainable Use of Natural Resources; (COM 670 (2005));European Commission: Brussels, Belgium, 2005.
5. European Commission. Roadmap to a Resource Efficient Europe; European Commission: Brussels, Belgium, 2011.6. European Commission. A Resource-Efficient Europe: Flagship. Initiative under the Europe 2020 Strategy;
European Commission: Brussels, Belgium, 2011.7. Kazmierczyk, P.; Geerken, T.; Bahn-Walkowiak, B.; Vanderreydt, I.; Veen, J.V.; Veneziani, M.;
De Schoenmakere, M.; Arnold, M. More from Less: Material Resource Efficiency in Europe; 2015 Overview ofPolicies, Instruments and Targets in 32 Countries; Publications Office of the European Union: Luxembourg,2016; Volume 10.
8. Federal Ministry for the Environment, Nature Conservation and Nuclear Safety (BMU). German ResourceEfficiency Programme (ProgRess)—Programme for the Sustainable Use and Conservation of Natural Resources;Federal Ministry for the Environment, Nature Conservation and Nuclear Safety (BMU): Berlin, Germany,2012; pp. 1–116.
9. Federal Ministry for the Environment, Nature Conservation, Building and Nuclear Safety (BMUB).German Resource Efficiency Programme II (ProgRess II); Programme for the Sustainable Use and Conservation ofNatural Resources. Progress Report 2012–2015 and Update 2016–2019; Federal Ministry for the Environment,Nature Conservation, Building and Nuclear Safety (BMUB): Berlin, Germany, 2016; pp. 1–158.
10. Government of Japan. Fundamental Plan for Establishing a Sound Material-Cycle Society; Ministry of theEnvironment: Tokyo, Japan, 2003; pp. 1–12.
11. National Institution for Transforming India Aayog. Strategy Paper on Resource Efficiency; National Institutionfor Transforming India: New Delhi, India, 2017; pp. 1–45.
12. G7/G20 Sherpa Office of the Federal Chancellery. Final Report by the Federal Government on the G7 Presidency2015; Press and Information Office of the Federal Government: Berlin, Germany, 2015.
13. European Commission. G20. In Proceedings of the Leaders’ Declaration—Shaping an Interconnected World,Hamburg, Germany, 7–8 July 2017.
14. United Nations. General Assembly. In Transforming Our world: The 2030 Agenda for Sustainable Development;Resolution Adopted by the General Assembly on 25 September 2015; A/RES/70/1; United Nations:Washington, DC, USA, 2015; pp. 1–35.
15. Rizos, V.; Tuokko, K.; Behrens, A. The Circular Economy: A Review of Definitions, Processes and Impacts;Research Report No 2017/8; Customs Excise and Preventive Service: Brussels, Belgium, 2017; pp. 1–44.
16. EU COM. Closing the Loop—An Eu Action Plan for the Circular Economy; European Commission: Brussels,Belgium, 2015.
17. Sitra. Leading the Cycle: Finnish Road Map. to a Circular Economy 2016–2025; Sitra Studies 121; Sitra: Helsinki,Finland, 2016; p. 56.
18. Government The Netherlands. A Circular Economy in the Netherlands by 2050; The Ministry of Infrastructureand the Environment and the Ministry of Economic Affairs, also on Behalf of the Ministry of Foreign Affairsand the Ministry of the Interior and Kingdom Relations: Hague, The Netherlands, 2016; p. 72.
19. Reichel, A.; Schoenmakere, M.D.; Gillabel, J. Circular Economy in Europe: Developing the Knowledge Base;Publications Office of the European Union: Luxembourg, 2016; Volume 2.
20. Report of the Inter-Agency and Expert Group on Sustainable Development Goal Indicators; United Nations Economicand Social Council: New York, NY, USA, 2016; pp. 1–62.
21. Federal Statistical Office (Destatis). Nachhaltige Entwicklung in Deutschland—Indikatorenbericht 2016;Federal Statistical Office (Destatis): Wiesbaden, Germany, 2017; pp. 1–150. (In German)
22. Wiedmann, T.O.; Schandl, H.; Lenzen, M.; Moran, D.; Suh, S.; West, J.; Kanemoto, K. The material footprintof nations. Proc. Natl. Acad. Sci. USA 2015, 112, 6271–6276. [CrossRef] [PubMed]
23. Demurtas, A.; Sousanoglou, A.; Morton, G.; Humphris-Bach, A.; Essig, C.; Harding, L.; Cole, A. EU ResourceEfficiency Scoreboard 2014; European Commission: Brussels, Belgium, 2015; pp. 1–68.
24. The Organisation for Economic Co-operation and Development. Material flow and resource productivityindicators. In Working Party on Environmental Information; OECD: Paris, France, 2012; pp. 1–24.
154

Resources 2017, 6, 68
25. Schmidt-Bleek, F.; Bierter, W. Das MIPS-Konzept : Weniger Naturverbrauch—Mehr Lebensqualität durch Faktor 10;Droemer Knaur: München, Germany, 1998. (In German)
26. Adriaanse, A.; Bringezu, S.; Hammond, A.; Moriguchi, Y.; Rodenburg, E.; Rogich, D.; Schütz, H.Resource Flows: The Material Basis of Industrial Economies; World Resources Institute: Washington, DC,USA, 1997.
27. Matthews, E.; Amann, C.; Bringezu, S.; Hüttler, W.; Ottke, C.; Rodenburg, E.; Rogich, D.; Schandl, H.;Van, E.; Weisz, H. The Weight of Nations-Material Outflows from Industrial Economies; World Resources Institute:Washington, DC, USA, 2000; pp. 1–135.
28. Kågeson, P. Is Factor 10 a Useful Tool in Environmental Policy? Swedish Environmental Protection Agency:Stockholm, Sweden, 1999; pp. 1–31.
29. Kleijn, R. Adding it all up. J. Ind. Ecol. 2001, 4, 7–8. [CrossRef]30. Bringezu, S. Possible target corridor for sustainable use of global material resources. Resources 2015, 4, 25–54.
[CrossRef]31. Reijnders, L. The factor x debate: Setting targets for eco-efficiency. J. Ind. Ecol. 1998, 2, 13–22. [CrossRef]32. Wiedmann, T.; Minx, J.; Barrett, J.; Vanner, R.; Ekins, P. Sustainable Consumption Und Production—Development
of an Evidence Base; Project Ref.: SCP001 Resource Flows; Stockholm Environment Institute:Stockholm, Sweden, 2006; pp. 1–133.
33. European Economic Area. Gemet—Environmental Thesaurus: Term Natural Resource. Available online:https://www.eea.europa.eu/help/glossary/gemet-environmental-thesaurus/natural-resource(accessed on 2 October 2017).
34. Enquete-Kommission Schutz des Menschen und der Umwelt. Die Industriegesellschaft Gestalten—Perspektivenfür Einen Nachhaltigen Umgang mit Stoff—Und Materialströmen; Deutscher Bundestag: Bonn, Germany, 1994.(In German)
35. United Nations. Convention on Biological Diversity; United Nations: New York, NY, USA, 1992.36. Nantke, H.-J.; Gottlob, D.; Summerer, S.; Burger, A.; Dieter, H.H.; Friedrich, A.; Fritz, K.; Greiner, P.; Hahn, J.;
Henseling, K.O. Nachhaltige Entwicklung in Deutschland: Die Zukunft Dauerhaft Umweltgerecht Gestalten;Erich Schmidt Verlag: Berlin, Germany, 2002. (In German)
37. Network of Heads of European Environment Protection Agencies. Delivering the Sustainable Use of NaturalResources; Network of Heads of European Environment Protection Agencies: Copenhagen, Denmark, 2006.
38. European Environment Agency. Well-Being and the Environment: Building a Resource-Efficient and CircularEconomy in Europe; European Environment Agency: Copenhagen, Denmark, 2014; pp. 1–52.
39. Schumacher, E. Small Is Beautiful: A Study of Economics as if People Mattered; Blond & Briggs: London, UK,1973.
40. Kristof, K.; Kanthak, J.; Müller, F.; Rechenberg, B. What matters 2012: Resource efficiency—A keyskill for sustainable societies. In What Matters—Annual Report of the German Environment Agency;German Environment Agency (UBA): Dessau-Rosßlau, Germany, 2012; pp. 34–57.
41. Organization for Economic Cooperation and Development. Material Resources, Productivity and theEnvironment; Organization for Economic Cooperation and Development: Paris, France, 2015; pp. 1–176.
42. European Commission. Communication from the Commission to the Council and the European Parliament—Towardsa Thematic Strategy on the Sustainable Use of Natural Resources; (COM(2003) 572 Final); European Commission:Brussels, Belgium, 2003.
43. Association of German Engineers (VDI). Vdi 4800 Part 1: Resource Efficiency—Methodological Principles andStrategies; Beuth Verlag GmbH: Berlin, Germany, 2016; pp. 1–54.
44. Kosmol, J.; Kanthak, J.; Herrmann, F.; Golde, M.; Alsleben, C.; Penn-Bressel, G.; Schmitz, S.; Gromke, U.Glossar zum Ressourcenschutz; Umweltbundesamt: Dessau-Roßlau, Germany, 2012; pp. 1–44. (In German)
45. Organization for Economic Cooperation and Development. Measuring Material Flows and Resource Productivity.The Oecd Guide; The Organisation for Economic Co-operation and Development (OECD): Paris, France, 2007.
46. Fischer-Kowalski, M.; von Weizsäcker, E.U.; Ren, Y.; Moriguchi, Y.; Crane, W.; Krausmann, F.;Eisenmenger, N.; Giljum, S.; Hennicke, P.; Kemp, R.; et al. Decoupling Natural Resource Use and EnvironmentalImpacts from Economic Growth; United Nations/International Resource Panel: Nairobi, Kenya, 2011; pp. 1–174.
47. European Statistical System. Economy-Wide Material Flow Accounts and Derived Indicators—A MethodologicalGuide; Office for Official Publications of the European Communities: Luxembourg, 2001; p. 85.
155

Resources 2017, 6, 68
48. Balzer, F.; Bünger, D.B.; Dauert, U.; Drosihn, D.; Eckermann, D.F.; Gellrich, A.; Geupel, M.; Gniffke, P.;Günther, J.; Hintzsche, M.; et al. Data on the Environment 2015—Environmental Trends in Germany;Federal Environment Agency (UBA): Dessau-Roßlau, Germany, 2015; pp. 1–144.
49. Buyny, S.; Lauber, U. Further Development of the Indicator “Raw Material Productivity” in the National Strategyfor Sustainable Development. Calculating Imports and Exports in Raw Material Equivalents; Federal StatisticalOffice: Wiesbaden, Germany, 2010.
50. Federal Statistical Office of Germany. Environmental-Economic Accounting, Sustainable Development in Germany,Environmental and Economic Indicators; Federal Statistical Office: Wiesbaden, Germany, 2014.
51. Schoer, K.; Wood, R.; Arto, I.; Weinzettel, J. Estimating raw material equivalents on a macro-level:Comparison of multi-regional input-output analysis and hybrid lci-io. Environ. Sci. Technol. 2013, 47,14282–14289. [CrossRef] [PubMed]
52. Schoer, K.; Giegrich, J.; Kovanda, J.; Lauwigi, C.; Liebich, A.; Buyny, S.; Matthias, J. Conversion of EuropeanProduct Flows into Raw Material Equivalents; Ishares Europe Developed Real Estate ETF: Heidelberg, Germany,2012; pp. 1–148.
53. Eurostat. Material Flow Accounts—Flows in Raw Material Equivalents. Available online: http://ec.europa.eu/eurostat/statistics-explained/index.php/Material_flow_accounts_-_flows_in_raw_material_equivalents(accessed on 13 January 2017).
54. Mancini, L.; Benini, L.; Sala, S. Resource footprint of europe: Complementarity of material flow analysis andlife cycle assessment for policy supp.ort. Environ. Sci. Policy 2015, 54, 367–376. [CrossRef]
55. Lettenmeier, M.; Liedtke, C.; Rohn, H. Eight tons of material footprint—Suggestion for a resource cap forhousehold consumption in Finland. Resources 2014, 3, 488–515. [CrossRef]
56. Daly, H.E. Toward a Steady-State Economy; Herman, E.D., Ed.; W.H. Freeman & Co.: San Francisco, CA, USA,1973.
57. Ayres, R.U. Industrial metabolism. In Technology and Environment; Ausubel, J., Sladovich, H.E., Eds.;National Academies Press: Washington, DC, USA, 1989.
58. Von Weizsäcker, E.U.; Lovins, A.B.; Lovins, L.H. Factor Four: Doubling Wealth, Halving Resource Use: The NewReport to the Club of Rome; Earthscan Publications Ltd.: London, UK, 1997.
59. Schmidt-Bleek, F.; Klüting, R. Wieviel Umwelt Braucht der Mensch?: MIPS—Das Maß für ÖkologischesWirtschaften/How Much Environment does Man Need?: MIPS—The Measure of Ecological Management; Birkhäuser:Berlin, Germany, 1994 (In German).
60. Von Weizsacker, E.U.; Hargroves, K.; Smith, M.; Desha, C.; Stasinopoulos, P. Factor Five: Transforming theGlobal Economy through 80% Improvements in Resource Productivity; Earthscan Publications Ltd.: London, UK;Droemer Munich, Germany, 2009.
61. Spangenberg, J.H.; Hinterberger, F.; Moll, S.; Schütz, H. Material flow analysis, TMR and the MIPS concept:A contribution to the development of indicators for measuring changes in consumption and productionpatterns. Int. J. Sustain. Dev. 1999, 2, 491–505. [CrossRef]
62. Ritthoff, M.; Rohn, H.; Liedtke, C. Calculating Mips: Resource Productivity of Products and Services;Wuppertal Institute for Climate, Environment and Energy: Wuppertal, Germany, 2002.
63. Saurat, M.; Ritthoff, M. Calculating mips 2.0. Resources 2013, 2, 581–607. [CrossRef]64. Factor 10 Club. Carnoules Declaration; Factor 10 Club: Carnoules, France, 1994.65. Hinterberger, F.; Luks, F.; Schmidt-Bleek, F. Material flows vs. ‘natural capital’: What makes an economy
sustainable? Ecol. Econ. 1997, 23, 1–14. [CrossRef]66. Jeske, U.; Kopfmüller, J.; Wintzer, D. Book Review: Wieviel Umwelt Braucht der Mensch?: MIPS—Das Maß
für Ökologisches Wirschaften; TATuP—Zeitschrift des ITAS zur Technikfolgenabschätzung. TATuP 1995,4, 11–16. (In German). Available online: http://www.tatup-journal.de/tadn951_jeua95a.php (accessed on30 November 2017).
67. Schmidt, M. Book Review: Wieviel Umwelt Braucht der Mensch?: MIPS—Das maß fürÖkologisches Wirtschaften. Spektrum der Wissenscahft. Spektrum der Wissenschaft 1995, 6, 116.Available online: http://www.spektrum.de/magazin/wieviel-umwelt-braucht-der-mensch-mips-das-mass-fuer-oekologisches-wirtschaften/822379 (accessed on 30 November 2017). (In German)
68. Coenen, R.; Klein-Vielhauer, S.; Kopfmüller, J. Stellungnahme zur Studie des Wuppertal-Instituts für Klima,Umwelt und Energie: “Zukunftsfähiges Deutschland“. Ein Beitrag zu einer global nachhaltigen Entwicklung.TATuP Zeitschrift des ITAS zur Technikfolgenabschätzung 1996, 5, 1. (In German)
156

Resources 2017, 6, 68
69. Schmidt, M. Zu den Schutzzielen der Ressourceneffizienz. uwf UmweltWirtschaftsForum 2014, 22, 147–152.(In German) [CrossRef]
70. Global Guidance for Life Cycle Impact Assessment Indicators; UNEP/SETAC Life Cycle Initiative: Nairobi, Kenya,2016; Volume 1.
71. Scheringer, M.; Hofstetter, P. Auswahl, Begründung und Vergleich von Schutzgütern in derÖkobilanz-methodik—Ein offenes Problem. In Schutzgüter und Ihre Abwägung aus der Sicht VerschiedenerDisziplinen; Umweltnatur-und Umweltsozialwissenschaften ETH: Zürich, Switzerland, 1997; pp. 4–10.(In German)
72. Hofstetter, P.; Scheringer, M.; Hirsch, G.; Jäggi, C.; Kytzia, S.; Leimbacher, J.; Schaber, P.; Scheringer, M.;Schütz, J.; Seidl, I. Schutzgüter und Ihre Abwägung aus der Sicht Verschiedener Disziplinen; EidgenössischeTechnische Hochschule (ETH): Zürich, Switzerland, 1997; pp. 1–48. (In German)
73. Consoli, F.; Allen, D.; Boustead, I.; Fava, J.; Franklin, W.; Jensen, A.; Oude, N.D.; Parrish, R.; Perriman, R.;Postlethewaite, D.; et al. Guidelines for Life-Cycle Assessment: A “Code of Practice”; Society of EnvironmentalToxicology and Chemistry (SETAC): Brussels, Belgium, 1993; p. 79.
74. Vadenbo, C.; Rørbech, J.; Haupt, M.; Frischknecht, R. Abiotic resources: New impact assessment approachesin view of resource efficiency and resource criticality—55th discussion forum on life cycle assessment, Zurich,Switzerland, April 11, 2014. Int. J. Life Cycle Assess. 2014, 19, 1686–1692. [CrossRef]
75. Drielsma, J.; Allington, R.; Brady, T.; Guinée, J.; Hammarstrom, J.; Hummen, T.; Russell-Vaccari, A.;Schneider, L.; Sonnemann, G.; Weihed, P. Abiotic raw-materials in life cycle impact assessments: An emergingconsensus across disciplines. Resources 2016, 5, 12. [CrossRef]
76. Hauschild, M.Z.; Goedkoop, M.; Guinée, J.; Heijungs, R.; Huijbregts, M.; Jolliet, O.; Margni, M.;De Schryver, A.; Humbert, S.; Laurent, A.; et al. Identifying best existing practice for characterizationmodeling in life cycle impact assessment. Int. J. Life Cycle Assess. 2013, 18, 683–697. [CrossRef]
77. Steen, B. A Systematic Approach to Environmental Priority Strategies in Product Development (Eps) Version2000—Models and Data of the Default Method; Chalmers University of Technology, Centre for EnvironmentalAssessment of Products and material Systems (CPM): Gothenburg, Sweden, 1999.
78. Dewulf, J.; Benini, L.; Mancini, L.; Sala, S.; Blengini, G.A.; Ardente, F.; Recchioni, M.; Maes, J.;Pant, R.; Pennington, D. Rethinking the area of protection “natural resources” in life cycle assessment.Environ. Sci. Technol. 2015, 49, 5310–5317. [CrossRef] [PubMed]
79. Hofstetter, P. Perspectives in Life Cycle Impact Assessment: A Structured Approach to Combine Models of theTechnosphere, Ecosphere and Valuesphere; Kluwer Academic Publishers: Amsterdam, The Netherlands, 1998.
80. European Commission, Joint Research Centre. International Reference Life Cycle Data System (ILCD) Handbook:Framework and Requirements for Life Cycle Impact Assessment Models and Indicators; Publications Office of theEuropean Union: Luxembourg, 2010.
81. Jolliet, O.; Müller-Wenk, R.; Bare, J.; Brent, A.; Goedkoop, M.; Heijungs, R.; Itsubo, N.; Peña, C.;Pennington, D.; Potting, J.; et al. The lcia midpoint-damage framework of the unep/setac life cycle initiative.Int. J. Life Cycle Assess. 2004, 9, 394–404. [CrossRef]
82. European Commission, Joint Research Centre. International Reference Life Cycle Data System (ILCD) Handbook:Recommendations for Life Cycle Impact Assessment in the European Context—Based on Existing EnvironmentalImpact Assessment Models and Factors; Publications Office of the European Union: Luxembourg, 2010.
83. Thompson, M.; Ellis, R.; Wildavsky, A.B.; Wildavsky, M. Cultural Theory; Westview Press: Boulder, CO, USA,1990.
84. Hellweg, S.; Hofstetter, T.B.; Hungerbühler, K. Discounting and the environment: Should current impacts beweighted differently than impacts harming future generations? Int. J. Life Cycle Assess. 2003, 8, 8–18.
85. Grünig, M.; Srebotnjak, T.; Schock, M.; Porsch, L.; Möller-Gulland, J. Plakative und Schnelle UmweltinformationMittels Hochaggregierter Kenngrößen zur Nachhaltigen Entwicklung; Umweltbundesamt: Berlin, Germany, 2011.
86. Baccini, P.; Brunner, P.H. Metabolism of the Anthroposphere: Analysis, Evaluation, Design; The MIT Press:Cambridge, MA, USA, 2012; p. 408.
87. Ayres, R.U.; Ayres, L. A Handbook of Industrial Ecology; Edward Elgar Publishing: Cheltenham, UK,2002; p. 688.
88. Ayres, R.U. Industrial metabolism and global change. Int. Soc. Sci. J. 1989, 41, 363–373.89. Bringezu, S.; Sand, I.V.D.; Schütz, H.; Bleischwitz, R.; Moll, S. Analysing Global Resource Use of National and
Regional Economies Across Various Levels; Bringezu, S., Ed.; Greenleaf: Sheffield, UK, 2009; pp. 10–51.
157

Resources 2017, 6, 68
90. Bundesregierung. Nationale Nachhaltigkeitsstrategie—Fortschrittsbericht 2012; Bundesregierung: Berlin,Germany, 2012; pp. 1–264.
91. Smeets, E.; Weterings, R. Environmental Indicators: Typology and Overview; European EnvironmentAgency (EEA): Copenhagen, Denmark, 1999.
92. Hertwich, E.; van der Voet, E.; Suh, S.; Tukker, A.; Huijbregts, M.; Kazmierczyk, P.; Lenzen, M.; McNeely, J.;Moriguchi, Y. Assessing the Environmental Impacts of Consumption and Production: Priority Products and Materials,a Report of the Working Group on the Environmental Impacts of Products and Materials to the International Panel forSustainable Resource Management; UNEP: Paris, France, 2010.
93. Association of German Engineers (VDI). VDI 4800 Part 2: Resource Efficiency—Evaluation of the Use of RawMaterials; Beuth Verlag GmbH: Berlin, Germany, 2016; pp. 1–38.
94. German Environment Agency (UBA). ProBas-Process-Oriented Basic Data for Environmental ManagementSystems. Available online: http://www.probas.umweltbundesamt.de/ (accessed on 27 October 2017).
95. Wernet, G.; Bauer, C.; Steubing, B.; Reinhard, J.; Moreno-Ruiz, E.; Weidema, B. The ecoinvent databaseversion 3 (part I): Overview and methodology. Int. J. Life Cycle Assess. 2016, 21, 1218–1230. [CrossRef]
96. Srebotnjak, T.; Polzin, C.; Giljum, S.; Herbert, S.; Lutter, S. Establishing Environmental Sustainability Thresholdsand Indicators; Ecologic Institute and SERI: Berlin, Germany, 2010; pp. 1–139.
97. Giegrich, J.; Liebich, A.; Lauwigi, C.; Reinhardt, J. Indicators for the Use of Raw Materials in the Context ofSustainable Development in Germany; 01/2012; German Environment Agency (UBA): Dessau-Roßlau, Germany,2012; pp. 1–248.
98. Berger, M.; Finkbeiner, M. Correlation analysis of life cycle impact assessment indicators measuring resourceuse. Int. J. Life Cycle Assess. 2010, 16, 74–81. [CrossRef]
99. Voet, E.; Oers, L.; Nikolic, I. Dematerialization: Not just a matter of weight. J. Ind. Ecol. 2004, 8, 121–137.[CrossRef]
100. Huijbregts, M.A.J.; Rombouts, L.J.A.; Hellweg, S.; Frischknecht, R.; Hendriks, A.J.; van de Meent, D.;Ragas, A.M.J.; Reijnders, L.; Struijs, J. Is cumulative fossil energy demand a useful indicator for theenvironmental performance of products? Environ. Sci. Technol. 2006, 40, 641–648. [CrossRef] [PubMed]
101. Huijbregts, M.A.J.; Hellweg, S.; Frischknecht, R.; Hendriks, H.W.M.; Hungerbühler, K.; Hendriks, A.J.Cumulative energy demand as predictor for the environmental burden of commodity production.Environ. Sci. Technol. 2010, 44, 2189–2196. [CrossRef] [PubMed]
102. Hertwich, E.G.; Van der Voet, E.; Tukker, B.; Tukker, A. Assessing the Environmental Impacts of Consumptionand Production; United Nations Environment Programme: Paris, France, 2010; pp. 1–108.
103. German Environment Agency (UBA). Domestic Extraction and Imports. Available online: https://www.umweltbundesamt.de/daten/rohstoffe-als-ressource/inlaendische-entnahme-von-rohstoffen#textpart-1(accessed on 17 January 2017).
104. Steinmann, Z.J.N.; Schipper, A.M.; Hauck, M.; Huijbregts, M.A.J. How many environmental impact indicatorsare needed in the evaluation of product life cycles? Environ. Sci. Technol. 2016, 50, 1–23. [CrossRef] [PubMed]
105. Drielsma, J.A.; Russell-Vaccari, A.J.; Drnek, T.; Brady, T.; Weihed, P.; Mistry, M.; Simbor, L.P. Mineral resourcesin life cycle impact assessment—Defining the path forward. Int. J. Life Cycle Assess. 2016, 21, 85–105.[CrossRef]
106. Hotelling, H. The economics of exhaustible resources. J. Political Econ. 1931, 39, 137–175. [CrossRef]107. Costanza, R.; Cumberland, J.; Daly, H.; Goodland, R.; Norgaard, R. An Introduction to Ecological Economics;
St. Lucie Press: Boca Rato, Nepal, 1997.108. Riedel, E.; Janiak, C. Anorganische Chemie; De Gruyter: Berlin, Germany, 2011.109. Diederen, A. Global Resource Depletion—Managed Austerity and the Elements of Hope; Eburon Academic
Publishers: Delft, The Netherlands, 2010.110. Skinner, B.J. A second iron age ahead? The distribution of chemical elements in the earth’s crust sets natural
limits to man’s supply of metals that are much more important to the future of society than limits on energy.Am. Sci. 1976, 64, 258–269.
111. Skinner, B.J. Exploring the Resource Base. Presented at the Workshop on “The Long-Run Availability ofMinerals”, Washington, DC, USA, 22–23 April 2001; pp. 1–25.
112. Bardi, U.; Randers, J. Extracted: How the Quest for Mineral Wealth is Plundering the Planet; A Reportnto theClub of Rome/Ugo Bardi; White River Junction: Windsor County, VT, USA; VT Chelsea Green Publishing:River Junction, VT, USA, 2014; p. 29.
158

Resources 2017, 6, 68
113. Giurco, D.; Prior, T.; Mudd, G.; Mason, L.; Behrisch, J. Peak Minerals in Australia: A Review of ChangingImpacts and Benefits; Institute for Sustainable Futures University of Technology, Sydney & Department ofCivil Engineering (Monash University): Sydney, Australia, 2010; pp. 1–110.
114. Northey, S.; Mudd, G.M.; Weng, Z.; Mohr, S.; Giurco, D. Modelling future copp.er ore grade decline based ona detailed assessment of copp.er resources and mining. Resour. Conserv. Recycl. 2014, 83, 190–201. [CrossRef]
115. Hubbert, M.K. Nuclear energy and the fossil fuels. In Drilling and Production Practice; American PetroleumInstitute: New York, NY, USA, 1956; pp. 1–40.
116. Sorrell, S.; Speirs, J.; Bentley, R.; Brandt, A.; Miller, R. Global Oil Depletion: An Assessment of the Evidence forNear-Term Peak in Global Oil Production; UK Energy Research Centre: London, UK, 2009; pp. 1–228.
117. Sverdrup, H.U.; Ragnarsdottir, K.V.; Koca, D. An assessment of metal supp.ly sustainability as an input topolicy: Security of supply, extraction rates, stocks-in-use, recycling, and risk of scarcity. J. Clean. Prod. 2017,140, 359–372. [CrossRef]
118. May, D.; Prior, T.; Cordell, D.; Giurco, D. Peak minerals: Theoretical foundations and practical application.Nat. Resour. Res. 2012, 21, 43–60. [CrossRef]
119. Giraud, P.-N. A note on hubbert’s thesis on mineral commodities production peaks and derived forecastingtechniques. Procedia Eng. 2012, 46, 22–26. [CrossRef]
120. Rustad, J.R. Peak nothing: Recent trends in mineral resource production. Environ. Sci Technol. 2012, 46,1903–1906. [CrossRef] [PubMed]
121. Graedel, T.; Gunn, G.; Tercero Espinoza, L. Metal resources, use and criticality. In Critical Metals Handbook;John Wiley & Sons: Hoboken, NJ, USA, 2014; pp. 1–19.
122. Wellmer, F.W. Reserves and resources of the geosphere, terms so often misunderstood. Is the life index ofreserves of natural resources a guide to the future? Z. Dtsch. Ges. Geowiss. 2008, 159, 575–590.
123. Marscheider-Weidemann, F.; Langkau, S.; Hummen, T.; Erdmann, L.; Espinoza, L.T.; Angerer, G. Rohstoffe fürZukunftstechnologien 2016—Raw Materials for Emerging Technologies 2016; German Mineral Resources AgencyDERA at the Federal Institute for Geosciences and Natural Resources BGR: Berlin, Germany, 2016; pp. 1–360.
124. Schaffartzik, A.; Mayer, A.; Eisenmenger, N.; Krausmann, F. Global patterns of metal extractivism, 1950–2010:Providing the bones for the industrial society’s skeleton. Ecol. Econ. 2016, 122, 101–110. [CrossRef]
125. U.S. Geological Survey. Mineral Commodity Summaries 2016; U.S. Geological Survey: Reston, VA, USA, 2016;pp. 1–205.
126. Graedel, T.E.; Harper, E.M.; Nassar, N.T.; Nuss, P.; Reck, B.K. Criticality of metals and metalloids. Proc. Natl.Acad. Sci. USA 2015, 112, 4257–4262. [CrossRef] [PubMed]
127. Melcher, F.; Wilken, H. Die Verfügbarkeit von Hochtechnologie-Rohstoffen. Chem. Unserer Zeit 2013, 47,32–49. [CrossRef]
128. Gutzmer, J.; Klossek, A. Die Versorgung mit wirtschaftskritischen Rohstoffen—Eine Ursachensucheund -Analyse. In Strategische Rohstoffe—Risikovorsorge; Kausch, P., Bertau, M., Gutzmer, J., Matschullat, J.,Eds.; Springer: Berlin, Germany, 2014; pp. 61–73.
129. Nassar, N.; Graedel, T.; Harper, E. By-product metals are technologically essential but have problematicsupp.ly. Sci. Adv. 2015, 1, 1–10. [CrossRef] [PubMed]
130. European Commission. Report on Critical Raw Materials for the EU—Critical Raw Material Profiles;European Commission: Brussels, Belgium, 2014; pp. 1–205.
131. Graedel, T.E.; Barr, R.; Chandler, C.; Chase, T.; Choi, J.; Christoffersen, L.; Friedlander, E.; Henly, C.; Jun, C.;Nassar, N.T.; et al. Methodology of metal criticality determination. Environ. Sci. Technol. 2011, 46, 1063–1070.[CrossRef] [PubMed]
132. Buijs, B.; Sievers, H. Critical Thinking About Critical Minerals—Assessing Risks Related to Resource Scarcity;Federal Institute for Geosciences and Natural Resources BGR: Hannover, Germany, 2011; pp. 1–19.
133. Buijs, B.; Sievers, H.; Espinoza, L.A.T. Limits to the critical raw materials app.roach. Proc. ICE WasteRes. Manag. 2012, 165, 201–208.
134. Gandenberger, C.; Glöser, S.; Marscheider-Weidemann, F.; Ostertag, K.; Walz, R. Die Versorgung der DeutschenWirtschaft Mit Roh—und Werkstoffen für Hochtechnologien—Präzisierung und Weiterentwicklung der DeutschenRohstoffstrategie; Arbeitsbericht Nr. 150; TAB—Büro für Technikfolgen-Abschätzung beim DeutschenBundestag: Berlin, Germany, 2012; pp. 1–238. (In German)
135. Erdmann, L.; Graedel, T.E. Criticality of non-fuel minerals: A review of major approaches and analyses.Environ. Sci. Technol. 2011, 45, 7620–7630. [CrossRef] [PubMed]
159

Resources 2017, 6, 68
136. European Commission. Report on Critical Raw Materials for the Eu; European Commission: Brussels, Belgium,2014; pp. 1–41.
137. Angerer, G.; Buchholz, P.; Gutzmer, J.; Hagelüken, C.; Herzig, P.; Littke, R.; Thauer, R.K.; Wellmer, F.-W.Rohstoffe für die Energieversorgung der Zukunft: Geologie—Märkte—Umwelteinflüsse; Deutsche Akademie derTechnikwissenschaften (acatech): Berlin, Germany, 2016.
138. Angerer, G.; Marscheider-Weidemann, F.; Lüllmann, A.; Erdmann, L.; Scharp, M.; Handke, V.; Marwede, M.Raw Materials for Emerging Technologies; The Influence of Sector-Specific Feedstock Demand on Future RawMaterials Consumption in Material-Intensive Emerging Technologies. Final Report Abridged; FraunhoferInstitute for Systems and Innovation Research ISI: Berlin, Germany, 2009; pp. 1–19.
139. Rüttinger, L.; Sharma, V. Cimate Change and Mining; Adelphi Research: Berlin, Germany, 2016.140. Rüttinger, L.; Scholl, C.; Sharma, V.; Vogt, R.; Kämper, C. Klimress: Impacts of climate change on
the ecological criticality of germany’s raw material demand (fkz: 3716 48 324 0). In EnvironmentalResearch Plan (UFOPLAN) of the Federal Ministry for the Environment, Nature Conservation, Building andNuclear Safety; German Environment Agency, Ed.; Adelphi Research & Ifeu—Institute for Energy andEnvironmental Research & The University of Queensland—Centre for Social Responsibility in Mining(CSRM): Dessau-Roßlau, Germany, 2017.
141. Federal Ministry of Education and Research (BMBF). Raw Materials of Strategic Economic Importance forHigh-Tech Made in Germany—BMBF Research and Development Programme for New Raw Material Technologies;Federal Ministry of Education and Research (BMBF): Bonn, Germany, 2013; pp. 1–64.
142. Coulomb, R.; Dietz, S.; Godunova, M.; Nielsen, T.B. Critical Minerals Today and in 2030; OECD Publishing:Paris, France, 2015.
143. Gemechu, E.D.; Sonnemann, G.; Helbig, C.; Thorenz, A.; Tuma, A. Import-based indicator for the geopoliticalsupply risk of raw materials in life cycle sustainability assessments. J. Ind. Ecol. 2016, 20, 154–165. [CrossRef]
144. Tuma, A.; Reller, A.; Thorenz, C.; Kolotzek, C.; Helbig, C. Nachhaltige Ressourcenstrategien inUnternehmen: Identifikation Kritischer Rohstoffe und Erarbeitung Von Handlungsempfehlunge zur UmsetzungEiner Ressourceneffizienten Produktion; University of Augsburg: Augsburg, Germany, 2014; pp. 1–63.
145. Dehoust, G.; Manhart, A.; Vogt, R.; Kämper, C.; Giegrich, J.; Auberger, A.; Priester, M.; Dolega, P. Discussionof the Environmental Limits of Primary Raw Material Extraction and Development of a Method for Assessing theEnvironmental Availability of Raw Materials to Further Develop the Criticality Concept (ÖkoRess I)—Summary;German Environment Agency (UBA): Dessau-Roßlau, Germany, 2017; pp. 1–31.
146. Dehoust, G.; Manhart, A.; Vogt, R.; Kämper, C.; Giegrich, J.; Priester, M.; Rechlin, A.; Rüttinger, L.; Scholl, C.ÖkoRess II: Further development of policy options for an ecological raw materials policy. In EnvironmentalResearch Plan (UFOPLAN) of the Federal Ministry for the Environment, Nature Conservation, Building and NuclearSafety; German Environment Agency, Ed.; Öko Institut—Institute for Applied Ecology; Ifeu—Institute forEnergy and Environmental Research; Projekt-Consult; Adelphi Research: Dessau-Roßlau, Germany, 2017.
147. Rüttinger, L.; Scholl, C. Responsible Mining? Challenges, Perspectives and Approaches—Summary of the Findingsof the Research Project “Approaches to Reducing Negative Environmental and Social Impacts in the Production ofMetal Raw Materials”; German Environment Agency (UBA): Dessau-Roßlau, Germany, 2017; pp. 1–37.
148. Glöser, S.; Tercero Espinoza, L.; Gandenberger, C.; Faulstich, M. Raw material criticality in the context ofclassical risk assessment. Resour. Policy 2015, 44, 35–46. [CrossRef]
149. Behrendt, S.; Scharp, M.; Erdmann, L.; Kahlenborn, W.; Feil, M.; Dereje, C.; Bleischwitz, R.; Delzeit, R.Rare Metal: Measures and Concepts for the Solution of the Problem of Conflict-Aggravating Raw MaterialExtraction—the Example of Coltan; German Environment Agency (UBA): Dessau-Roßlau, Germany, 2007.
150. Franken, G.; Vasters, J.; Dorner, U.; Schütte, P.; Küster, D.; Nüher, U. Certified Trading Chains in MineralProduction. In Competition and Conflicts on Resource Use. Natural Resource Management and Policy; Hartard, S.,Liebert, W., Eds.; Springer International Publishing: Cham, Switzerland, 2015; Volume 46, pp. 177–186.
151. Dupuy, R.; Roman, P.; Mougenot, B. Analyzing socio-environmental conflicts with a commonsiantransactional framework: Application to a mining conflict in peru. J. Econ. Issues 2015, 49, 895–921. [CrossRef]
152. Tänzler, D.; Westerkamp, M. Rohstoffkonflikte Nachhaltig Vermeiden; German Environment Agency (UBA):Dessau-Roßlau, Germany, 2010.
160

Resources 2017, 6, 68
153. Schandl, H.; Fischer-Kowalski, M.; West, J.; Giljum, S.; Dittrich, M.; Eisenmenger, N.; Geschke, A.; Lieber, M.;Wieland, H.P.; Schaffartzik, A.; et al. Global Material Flows and Resource Productivity; An AssessmentStudy of the UNEP; International Resource Panel; United Nations Environment Programme: Paris, France,2016; p. 200.
154. BIO by Deloitte. Study on Data for a Raw Material System Analysis: Roadmap and Test of the Fully Operational Msafor Raw Materials; Prepared for the European Commission, DG GROW; BIO by Deloitte: Neuilly-sur-Seine,France, 2015; pp. 1–179.
155. United Nations. Rio Declaration on Environment and Development; United Nations General Assembly:Rio de Janeiro, Brazil, 1992.
156. Bringezu, S.; Schütz, H.; Moll, S. Rationale for and interpretation of economy-wide materials flow analysisand derived indicators. J. Ind. Ecol. 2003, 7, 43–64. [CrossRef]
157. European Commission. Communication from the Commission on the Precautionary Principle; COM(2000) 1 Final;European Commission: Brussels, Belgium, 2000; pp. 1–28.
158. Rockström, J.; Steffen, W.; Noone, K.; Persson, Å.; Chapin, S.I.; Lambin, E.; Lenton, T.M.; Scheffer, M.;Folke, C.; Schellnhuber, H.J. Planetary boundaries: Exploring the safe operating space for humanity. Ecol. Soc.2009, 14, 1–33. [CrossRef]
159. Peduzzi, P. Sand, rarer than one thinks. In UNEP Global Environmental Alert Service (GEAS); United NationsEnvironment Programme: Nairobi, Kenya, 2014; pp. 1–15.
160. European Commission. Stakeholder Consultation—Options for Resource Efficiency Indicators.Available online: http://ec.europa.eu/environment/resource_efficiency/targets_indicators/stakeholder_consultation/index_en.htm (accessed on 13 January 2017).
161. Federal Office for the Environment. Development of Switzerland’s Worldwide Environmental Impact;Federal Office for the Environment: Bern, Switzerland, 2014.
© 2017 by the authors. Licensee MDPI, Basel, Switzerland. This article is an open accessarticle distributed under the terms and conditions of the Creative Commons Attribution(CC BY) license (http://creativecommons.org/licenses/by/4.0/).
161


MDPISt. Alban-Anlage 66
4052 BaselSwitzerland
Tel. +41 61 683 77 34Fax +41 61 302 89 18
www.mdpi.com
Resources Editorial OfficeE-mail: [email protected]
www.mdpi.com/journal/resources


MDPI St. Alban-Anlage 66 4052 Basel Switzerland
Tel: +41 61 683 77 34 Fax: +41 61 302 89 18
www.mdpi.com ISBN 978-3-03897-546-5