The Most Beneficent, The Merciful
243
In The Name Of Allah T T h h e e M M o o s s t t B B e e n n e e f f i i c c e e n n t t , , T T h h e e M M e e r r c c i i f f u u l l
-
Upload
khangminh22 -
Category
Documents
-
view
0 -
download
0
Transcript of The Most Beneficent, The Merciful

In The Name Of
Allah
TThhee MMoosstt BBeenneeffiicceenntt,,
TThhee MMeerrcciiffuull

EXPLORING THE GROWTH RESPONSE OF MAJOR AGRO-FOREST
TREES AGAINST SOIL COMPACTION IN CENTRAL PUNJAB
By:
MUHAMMAD ASIF
(2000-ag-1088)
M.Sc. (Hons.) Agri. Forestry
A thesis submitted in partial fulfillment of requirements for the degree of
DOCTOR OF PHILOSOPHY
IN
FORESTRY
DEPARTMENT OF FORESTRY AND RANGE MANAGEMENT
FACULTY OF AGRICULTURE,
UNIVERSITY OF AGRICULTURE,
FAISALABAD-PAKISTAN
2019


i
This humble effort is
Dedicated To
HOLY PROPHET HAZRAT MUHAMMAD
(P.B.U.H)
The ocean of knowledge and
The greatest reformer,
AND
To
My Beloved
MOTHER AND THE SACRED SOUL OF MY FATHER
Who taught me the first word to speak and the first alphabet to write
and the first step to take

ii
ACKNOWLEDGEMENTS
All praises and thanks are for ALMIGHTY ALLAH. The compassionate, the
merciful, the only creator of the universe and the source of all knowledge and wisdom who
blessed me with health, thoughts, talented teachers, cooperative friends and family members.
It is the one of his infinite blessings that he bestowed me with potential and ability to
complete the present research program and to make a material contribution to deep oceans of
knowledge already existing.
With trembling lips, wet eyes, all love I have in my heart and soul; with respect, I
have in mind; I praise for the personality who is the cause of creation of this universe, the
Holy Prophet Hazrat Muhammad (Sallallah-o-Allaih-e-Wasallam), the beacon of
enlightenment, the fountain of knowledge, the messenger of peace, biggest benefactor of the
mankind ever had and the best among all of ever born on the universe.
I deem it my utmost pleasure to avail an opportunity to express my heartiest gratitude
and deep sense of obligation to my supervisor Dr. Muhammad Farrakh Nawaz, Department
of Forestry and Range Management, University of Agriculture, Faisalabad, for his kind
behavior, generous transfer of knowledge, moral support and enlightened supervision during
the whole study period. His valuable words will always serve as a beacon of light throughout
my life. I would like to acknowledge International Foundation for Science (IFS Grant #
D5279) for providing this opportunity as well.
I express my deep sense of gratitude to my Supervisory Committee Prof. Dr.
Muhammad Tahir Siddiqui, Chairman Department of Forestry and Dr. Muhammad
Maqsood, Professor in the Department of Agronomy for their kind, sincere and
unprecedented guidance.
My sincere thanks are for a very hardworking and caring person Dr. Shahbaz Talib
Sahi, Professor of the Department of Plant Pathology for his guidance and moral support.
Heartiest thanks are for a very kind, sincere and caring person Dr. Irfan Ahmad, Assistant
Professor Department of Forestry for his time to time constructive criticism and valuable
suggestions during the write up of this thesis. I am thankful to Dr. Shahid Yaqoob (Associate
Professor Retd. Department of Forestry,UAF) for his moral support. It is my pleasure to
thank Dr. Muhammad Kashif, Lecturer, Department of Mathematics and Statistics,
University of Agriculture, Faisalabad for the help in data analysis and assistance during write
up of thesis.
I would like to show my gratitude to my friends Dr. Abdul Jabbar (Assistant
Professor, Department of Agronomy), Wasi-ud –Din (Lecturer, Department of Agronomy),
Dr. Muhammad Atiq (Assistant Professor, Department of Plant Pathology), Dr. Tariq Aziz
(Associate Professor, Institute of Soil and Environmental Sciences), Dr. Allah Rakha
(Assistant Professor, Department of Food Sciences), Dr. Tahseen Azhar (Lecturer,

iii
Department of Plant Breeding and Genetics) and Dr. Qamar Khalil (Senior Medical Officer,
UAF). I am also thankful to my students Mr. Faiz, Mr. Muddassar and Mr. Haroon ur Rashid
who assisted me during the compilation of this research work.
Believe me or not I found no words to adequately express my obligation to my ever
loving, caring and affectionate parents, whose hands always rose in prayers for me. In life’s
journey, I always thought I was right and my dad was wrong. But life’s harsh lessons made
me realize that dad’s words were right all along. Although my dear father Muhammad Ishaq
is not with me but I hope his sacred soul will be very happy with my achievement and his
words will always illuminate the remaining part my life.
I also express my thankful feelings for my dear brothers, my sisters, my wife and my
kids for their prayers and cooperation.
May ALLAH bless all these people with long, happy & peaceful lives (Ameen)
(MUHAMMAD ASIF)

iv

v
3.2.3.3 Stomatal conductance 40
3.2.3.4 Internal carbon dioxide concentration 41
3.2.3.5 Photosynthetic water use efficiency 41
3.2.4 Impact of selected plant species on soil compaction 41
3.3 Study-3 Use of seedlings to analyze the growth response
against various levels of soil compaction
41
4 RESULTS AND DISCUSSION 43
4.1 Study-I (Field survey) 43
4.1.1 Shahdara plantations 43
4.1.2 Farmlands 46
4.1.2.1 Total land holding 46
4.1.2.2 Agro-forestry pattern 46
4.1.2.3 Species abundance 46
4.1.2.4 Trend during last decade 46
4.1.2.5 Willingness to grow trees 47
4.1.2.6 Use of machinery and bulk density 47
4.1.2.7 Soil textural class 48
4.1.2.8 Awareness about mechanization 48
4.2 Growth response of selected agro-forest species (seeds and
cuttings) against soil compaction (Study-2)
50
4.2.1 Germination/Sprouting %age 50
4.2.2 Survival %age 51
4.2.3 Girth/diameter of plant 55
4.2.4 Shoot length/Plant height 56
4.2.5 Shoot fresh weight 60
4.2.6 Shoot dry weight 61
4.2.7 Root length 65
4.2.8 Root fresh weight 66
4.2.9 Root dry weight 70
4.2.10 Root/Shoot ratio 71
4.2.11 Leaf area 75
4.2.12 Number of leaves 76
4.2.13 Number of branches 80
4.2.14 Photosynthetic rate 81
4.2.15 Transpiration rate 85
4.2.16 Stomatal conductance 86
4.2.17 Internal Carbon dioxide concentration 90
4.2.18 Photosynthetic water use efficiency 91
4.2.19 Impact of selected plant species on soil compaction 95
4.3 Growth response of selected agro-forest species (seedlings)
against soil compaction (Study-3)
99
4.3.1 Survival %age 99

vi
4.3.2 Girth/diameter of plant 100
4.3.3 Shoot length/Plant height 104
4.3.4 Shoot fresh weight 105
4.3.5 Shoot dry weight 109
4.3.6 Root length 110
4.3.7 Root fresh weight 114
4.3.8 Root dry weight 115
4.3.9 Root/Shoot ratio 119
4.3.10 Leaf area 120
4.3.11 Number of leaves 124
4.3.12 Number of branches 125
4.3.13 Photosynthetic rate 129
4.3.14 Transpiration rate 134
4.3.15 Stomatal conductance 134
4.3.16 Internal carbon dioxide concentration 135
4.3.17 Photosynthetic water use efficiency 139
4.3.18 Impact of selected plant species on soil compaction 142
4.4 DISCUSSION 143
5 SUMMARY 158
REFERENCES 164
APPENDICES 186

vii
LIST OF TABLES
Number Title Page No.
3.1 Bela Forest Shahdara, Lahore (Punjab Forest Department2013) 29
3.2 Physico-chemical properties of nursery soil 34
3.3 Climatic conditions of experimental site 35
3.4 Bulk densities established in nursery for experimentation 37
4.1 Current status of Shahdara Reserved Forests (Punjab Forest
Department) 43
4.2 Soil properties at four different sites in Shahdara plantation under
livestock (Buffalo etc.) pressure 45
4.3 No. of machines used and compaction classes with their bulk
densities at two depths
46
4.4 Compaction in the field and its classification with respect to soil
type 48
4.5 Overall impact of selected species on soil bulk density 98

viii
LIST OF FIGURES
Number Title Page No.
3.1 Targeted districts of Punjab 29
3.2 Sampling sites of Shahdara (Bela forests), Faisalabad and
Sheikhupura
31
3.3 Collection of samples and use of penetrometer to measure soil
strength
31
3.4 Nursery beds layout and dimensions for controlled experiment 36
3.5 Transformation of field into beds with different treatments 37
3.6 Beds formation 37
3.7 Compaction maintenance 37
3.8 Brick spacing and alignment 37
3.9 Planting of cuttings 37
4.1 Buffalo trail in compartment no. 4 of Shahadara Reserved Forests 43
4.2 Distribution of respondents according to their land holding(Study-1) 49
4.3 Distribution of respondents according to the adoption of agro-forestry
pattern
49
4.4 Species abundance on farmlands 49
4.5 Trend of planting different species during the last decade 49
4.6 Response of the farmers to grow more trees on their farmlands 49
4.7 Response regarding awareness about mechanization Vs soil
compaction, soil compaction Vs trees, soil compaction Vs crop yield
49
4.8 Effect of soil compaction on germination% (Study-2) 53
4.9 Effect of soil compaction on survival% 54
4.10 Effect of soil compaction on diameter 58
4.11 Effect of soil compaction on shoot length 59
4.12 Effect of soil compaction on shoot fresh weight 63
4.13 Effect of soil compaction on shoot dry weight 64
4.14 Effect of soil compaction on root length 68
4.15 Effect of soil compaction on root fresh weight 69
4.16 Effect of soil compaction on root dry weight 73
4.17 Effect of soil compaction on root/shoot ratio 74
4.18 Effect of soil compaction on leaf area 79
4.19 Effect of soil compaction on number of leaves 87

ix
4.20 Effect of soil compaction on number of branches 83
4.21 Effect of soil compaction on photosynthetic rate 84
4.22 Effect of soil compaction on transpiration rate 88
4.23 Effect of soil compaction on stomatal conductance 89
4.24 Effect of soil compaction on internal CO2 concentration 93
4.25 Effect of soil compaction on photosynthetic water use efficiency 94
4.26 Impact of different species on soil bulk density in control (T0) 96
4.27 Impact of different species on soil bulk density in T1 96
4.28 Impact of different species on soil bulk density in T2 97
4.29 Impact of different species on soil bulk density in T3 97
4.30 Impact of different species on soil bulk density in T4 97
4.31 Effect of soil compaction on survival% 102
4.32 Effect of soil compaction on diameter 103
4.33 Effect of soil compaction on shoot length 107
4.34 Effect of soil compaction on shoot fresh weight 108
4.35 Effect of soil compaction on shoot dry weight 112
4.36 Effect of soil compaction on root length 113
4.37 Effect of soil compaction on root fresh weight 117
4.38 Effect of soil compaction on root dry weight 118
4.39 Effect of soil compaction on root/shoot ratio 122
4.40 Effect of soil compaction on leaf area 123
4.41 Effect of soil compaction on number of leaves 127
4.42 Effect of soil compaction on number of branches 128
4.43 Effect of soil compaction on photosynthetic rate 132
4.44 Effect of soil compaction on transpiration rate 133
4.45 Effect of soil compaction on stomatal conductance 137
4.46 Effect of soil compaction on internal CO2 concentration 138
4.47 Effect of soil compaction on photosynthetic water use efficiency 141

x
LIST OF APPENDICES
Number Title Page No.
1 Questionnaire (Exploring the effects of soil compaction on the growth of major agroforest trees of central Punjab in Pakistan)
184
2 Germination/sprouting% 187
3 Survival % 188
4 Diameter 189
5 Shoot length 190
6 Shoot fresh weight 191
7 Shoot dry weight 192
8 Root length 193
9 Root fresh weight 194
10 Root dry weight 195
11 Root/shoot ratio 196
12 Leaf area 197
13 Number of leaves 198
14 Number of branches 199
15 Photosynthetic rate 200
16 Transpiration rate 201
17 Stomatal conductance 202
18 Internal CO2 concentration 203
19 Photosynthetic water use efficiency 204
20 Impact of plants on soil bulk density 205
21 Survival % 206
22 Diameter 207
23 Shoot length 208
24 Shoot fresh weight 209
25 Shoot dry weight 210
26 Root length 211
27 Root fresh weight 212
28 Root dry weight 213
29 Root/shoot ratio 214

xi
30 Leaf area 215
31 Number of leaves 216
32 Number of branches 217
33 Photosynthetic rate 218
34 Transpiration rate 219
35 Stomatal conductance 220
36 Internal CO2 concentration 221
37 Photosynthetic water use efficiency 222

xii
ABSTRACT
Soil compaction has become a global problem affecting the soils throughout the world. More
demands of food and wood, with increased population, has resulted in intensive cultivation
and increased mechanisations of our farmlands and irrigated plantations. Nowadays,
agriculture and forestry, in all developped countries and most of the developing countries is
carried out through vehicular machines. This vehicular traffic causes soil compaction and
affect soils quality physically as well as chemically on every passage. Many studies have
been conducted to study soil compaction tolerant agronomic crops but study reporting soil
compaction tolerance of trees is scarce. This study was conducted to analyze impact of
compacted soil on germination and initial growth stages of principle agro-forest trees of
central Punjab. During the first part a comprehensive survey was conducted to identify
different levels of soil compaction existing in the field (Lahore, Sheikhupura and Faisalabad).
In second part, earthen beds with different compaction levels were prepared to analyse the
growth response of eight major agro-forest tree species (Siris, Beri, Kikar, Sufaida, Poplar,
Simal, Shisham and Mulbree) of central Punjab. The study was attributed by two factor
factorial with RCBD. In the third part of this research work, three month old seedlings were
used in the same earthen beds having same compaction level and data was collected on
regular basis to check growth response and ameliorative effect against soil compaction. From
the survey results it was concluded that livestock has seriously damaged the physico-
chemical properties of soil as well as status and growth of existing vegetation in Shahdara
Plantation. From the field trials of study-2 and study-3, it was concluded that all the eight
species grown had been negatively influenced by different levels of soil compaction. The
response was depicted by decrease in morphological parameter (i.e. plant height/shoot length,
root length, root fresh weight, root dry weight, shoot fresh weight, shoot dry weight,
girth/diameter of plant, germination/sprouting %age, survival %age etc) and physiological
parameters (i.e. leaf area, photosynthetic rate, respiration rate, stomatal conductance, internal
carbon dioxide concentration, photosynthetic water use efficiency etc). The impact of these
plant species on soil compaction was found statistically significant (in T1, T2, T3 and T4)
except control treatment (T0) at the termination of this trial. Overall negative impact of soil
compaction was observed on all the selected species.

1
CHAPTER I
INTRODUCTION
Agriculture, industry and trade are the basis of any developing nation’s economy like
Pakistan. Agriculture is contributing about 19.5% of the total GDP and also providing
employment to 42.3% of the inhabitants (mostly residing in rural areas) along with provision
of raw material to several value added sectors (Economic Survey of Pakistan, 20016-17).
Diverse climatic conditions of Pakistan are not only suitable for agriculture but also
conducive for forestry and agro-forestry. The enormous impact of forests and trees on the
constancy and growth of a country like Pakistan cannot be denied (Sheikh, 1993).
Forest cover of the world as well as of Pakistan is decreasing gradually. The fractional or
absolute forest damage has been brought about by variety of reasons however, the primary
cause is man's need to clear the area for agriculture. There must be 20-25% area under forest
of a country for its proper economic growth and environmental constancy, whereas Pakistan
is having only 4.8% area under forests (Economic Survey of Pakistan, 2006-07). The
productive forests constitute only 2.5%, most of which are inaccessible. It is quite clear that
existing tree wealth is far below the minimum requirements of the nation. In spite of various
efforts undertaken periodically, not much progress has been made in this direction in the last
four decades (Quraishi, 2000).
Soil is one of the most important factor as far as agriculture and forestry is concerned. Soil
quality performs a critical role in the progress and survival of societies in a specific region as
it provides the basic necessities of life and other valuable products to the human beings
(Hillel, 2009). For instance, soils have high degree of depletion rate because these are
nonrenewable resources and their rate of development and reformation is very slow (Van-
Camp et al., 2004). To handle the universal issues like food shortage, environmental and
climatic instability, energy and water crisis and biodiversity the sustainable use of soil is
essential (Lal, 2009). Today’s agriculture and forestry, carried out on variety of soils are
something very different from conventional ones. Rising demands for food and refuge have
resulted in the mechanization of each and every operation right from the start till the end in
all the developed countries. This mechanization of different operations in agriculture and
forestry has resulted in soil compaction (Ishaq et al., 2001; Silva et al., 2008). Deterioration

2
of the land is a worldwide burning issue because of its extent and intensity. It has adverse
effects on the climate and human food production resources (Duran and Pleguezuelo, 2008).
Compaction of soil is referred to the process by which soil bulk density is increased and soil
particles/grains becomes compacted resulting in closer interaction with each other (SSSA,
1996). Soil compaction is the rearrangement of soil particle, which enhances the bulk density; reduce
porosity and volume (Lindemann et al., 1982). Soil compaction occurs when soil particles come close
together due to the pressure applied by external agents like intensive activities by human or by the use
heavy machinery etc. This can be checked on surface level or sub soil surface level limiting plant
growth through different means (Jones et al., 2003). Soil is considered to be compacted when air
filled pores are reduced resulting in limited root penetration and poor soil infiltration and drainage
(Hillel, 1982).
Compaction of soil has become a global issue. More demands of food and wood, with
increased population, has resulted in intensive cultivation and increased mechanisations of
our farmlands and irrigated plantations. Nowadays, agriculture and forestry operations, in all
developped countries and most of the developing countries are carried out by using vehicular
machines. This vehicular intervention causes soil compaction and affects soils physical as
well as chemical quality on every arable operation. In developed countries, the
systematization of the farms and forest areas has become crucial need of the community.
This includes intensive cropping patterns which directly or indirectly affect soil structure and
ultimately results in the degradation of the soil (Ishaq et al., 2001; Silva et al., 2008). It has
been estimated that about 67 million hectare of soil around the globe has been influenced by
soil degradation by the vehicular transportation. Area of about 32 million hectare in Europe,
17 million hectare in Africa, 10 million hectare in Asia, 4 million hectare in Australia and
few parts of Northern America has been estimated as affected by soil compaction (Hamza
and Anderson, 2005, Nawaz et al., 2013).
Many studies have been conducted to study soil compaction tolerant crop plants but studies
reporting soil compaction tolerance of trees are scarce (Drewry et al., 2008). Most of the
reviews investigated the undesirable impacts of compaction on crops and grazing areas
(Unger and Kaspar 1994; Greenwood et al., 2001; Lipiec and Hatano 2003). Local flora is
also seriously affected by this global issue and this has been reported in previous studies of
two bush land species of New Zealand (Bassett et al., 2005), North American Douglas-fir
(Heilman et al., 1981), in woodlands of Pine species which were subjected to heavy

3
vehicular traffic during felling and other silvicultural operations (Kozlowski et al., 1999) and
in severely damaged Eucalyptus salmonophloia forests of Western Australia (Yates, 2000a).
General impact of compacted soil on the growth and development of plant is destructive
(Ishaq et al., 2001; Saqib and Akhtar, 2004b), however, this may bring about no impact or
enhance the production (Greacen et al., 1980). Compacted soil limited root developement,
decreased uptake of minerals, and huge loss of soil nutrients characterized poor plant growth.
Drastic effect of compacted soil has been reported when coupled with salinity etc (Saqib et
al., 2004a). In general, soil compaction adversely affects seedling emergences (Jordan et al.,
2003), limits shoot developement (Ishaq et al., 2001) and it results in stunted root growth
(Kristoffersen and Riley, 2005).
Deterioration of soil can affect the livelihood of the rural community and it also threatens the
global food supply resources (Scherr and Yadav, 1996). Soil degradation has emerged as a
burning issue of the twenty first century due to its adverse effects on to the quality of life of
people with poor agronomic productivity, environmental changes and shortage of food
resources (Eswaran et al., 2001). Water logging and salinity of an area can easily be
characterized visually but soil compaction causes hidden depletion effects on the soil
formation and which may be difficult to unveil and assess the damage by just visual
inspection of the soil surface (McGarry and Sharp, 2003).
Soil compaction basically changes the physical soil structure and this also affects chemical
properties of soil, soil micro organisms, plant growth and its development etc. Mostly upper
layer of the soil is influenced by soil compaction in a well nurtured land but at later stages the
change in the subsoil are also seen by many scientists. Soil compaction produces negative
effects on soil surface quality and rare cases has been reported where the slight removal of
upper layer of compacted soil resulted as advantageous for coarse particle soils (Bouwman
and Arts, 2000). Sub soil compaction has been declared as a major threat by European Union,
because it is expensive as well as difficult to ameliorate the soil condition (Jones et al.,
2003).
According to FAO (2010), in spite of having meager natural forest cover (2.2%), Pakistan is
losing its forests at the rate of 1.66% or 42,000 ha/year during last two decades. The major
causes of deforestation include population pressure, illegal cutting, wood theft, extreme
climatic conditions, poor management of existing forests and non-availability of funds for re-

4
planting the trees. It is also noticeable that principle needs for industrial wood (72 %) and
fuelwood (90%) of Pakistan are met by the farmlands through different agro-forestry
practices (Rahim and Hasnain, 2010).
In Pakistan, agro-forestry is mostly practiced in rows around the farm fields but with
increasing vehicular operations in the farmlands, the sustainability and future of these crop
friendly trees can be in danger. Normally, soil cultivating or soil loosening operations are
carried out before sowing of new crop but farmers avoid to use ploughs/cultivators near trees
(along boundaries) to escape any mechanical problem arising from tree roots. Meanwhile, the
machines pass near the trees repeatedly without ploughing the soil (Ramazan et al., 2012).
Therefore the problem of soil compaction is aggravated near the trees than in the farm field.
Furthermore, continuous use of vehicles for loosening the top soil is causing subsoil
compaction in farmlands (Ramazan et al., 2012). In the farm fields of Central Punjab, the soil
and sub-soil compaction have been recorded in terms of bulk density ranging from 1.54 to
1.71 g/cm3
and in term of cone resistance ranging from 1.3 to ≥2 Mpa (Saqib et al., 2004a;
Ahmad et al., 2009; Ramazan et al., 2012).
As mentioned earlier that that principle needs for industrial wood (72 %) and fuelwood
(90%) of Pakistan are met by the wood coming from farmlands through agro-forestry. Major
plant species used as farm trees include Dalbergia sissoo, Acacia nilotica, Bombax ceiba,
Morus alba, Albizia lebbeck, Populus deltoids, Zyziphus mauritiana and Eucalyptus
camaldulensis (Rahim and Hasnain, 2010). It is worth mentioning that no appreciable
research has been conducted in Pakistan to assess impact of soil compaction on the growth
and yield of crops when integrated with trees. Keeping in view the severity of soil
compaction problem in agro-forestry systems the current research was enacted to assess the
negative impacts of soil compaction on different morpho-physiological mechanisms and
parameters of major farm trees of Central Punjab with following objectives:
To assess the prevailing soil compaction level in the forests, mechanized and non
mechanized farm fields.
Assessment of compaction tolerance potential of major agro-forest trees of central
Punjab.

5
To study impacts of soil compaction on physiological mechanisms of agro-forest
trees
To study the ameliorative effect of agro-forest trees against soil compaction problem.

6
CHAPTER II
REVIEW OF LITERATURE
This chapter encompasses review of past studies. Although there is scarcity of research work
on soil compaction and its impact on growth of different agro forestry trees especially in
Pakistan, yet pertinent findings are discussed in this chapter.
2.1. Soil compaction and its causes:
Compaction of soil is defined as the process by which soil bulk density is increased and soil
particles/grains becomes compacted resulting in closer interaction with each other (SSSA,
1996). Soil compaction is the rearrangement of soil particle, which enhances the bulk density; reduce
porosity and volume (Lindemann et al., 1982). Soil compaction occurs when soil particles come close
together due to the pressure applied by external agents like intensive activities by human or by the use
heavy machinery etc.
Any pressure applied to soil surface may cause compaction. This may happen either naturally
or due to anthropogenic activities or due to trampling by animals. Loose soils may get
compacted due to their particle settlement when they have more water in them. Physical soil
settling is mainly linked with drying and wetting of soil particles by their swelling and
shrinkage and resulting ultimately in rearrangement of soil aggregates (Koolen and Kuipers,
1983; Mullins, 1991). Forest fires also promote conditions that cause compaction of forest
soils. Sometimes exposed surfaces may develop surface crusts due to rain. When pressure is
applied, these crusts are strengthened with increased soil moisture or rain (Wright and
Bailey, 1982; Chen et al., 1980; Hegarty and Royle, 1978).
No doubt mostly the problem of soil compaction arises due to human activities but this can
be natural in some parts of the forest. This problem may have pronounced effects on the first
stage of succession and establishment of woody vegetation later on (Pe'rez-Ramos, 2007;
Quero et al., 2008; Go'mez-Aparicio et al., 2008). Compaction can be natural visible fact that
is mainly caused by drying and freezing of soil moisture contents (Fabiola et al., 2003).
Conservative agronomic practices can damage the soil by compacting it and affecting the
overall yield of the crop. Soils may get compacted due to the application of various heavy
tillage operations performed by different machines. In soils a solid tillage pan is normally
created just below the loose soil surface. Compacted layers are created at different depths
(Quiroga et al., 1999).

7
Normally, trampling cause this issue in upper soil surface, casual traffic in medium and
vibrations of heavy traffic in deep soils (Hillel, 1982; Rolf, 1994). Some external forces are
also considered to be involved in soil compaction. This may happen due to natural and
anthropogenic activities. Grazing animals also exert downward pressure through their hooves
just like heavy machinery. So, bulk density is increased and water infiltration rate decreased,
however soil properties returned to its original form within a year if grazing is banned
(Koolen and Kuipers, 1983; Greenwood and McKenzie, 2001; Wheeler et al., 2002).
In towns and adjacent areas compaction is mainly caused by traffic and humane walk. Soils
are considered to be more susceptible to compaction in wet conditions because of the change
in physical properties. During flood conditions high infiltration rate causes the particles to
settle down thus enhancing the process of compaction. (Mullins, 1991; Hillel, 1982; Jim,
1993; Schuler et al., 2000; Greenwood and McKenzie, 2001).
The level of soil compaction is affected by relative proportion of different soil particles, pH,
current water contents, amount of organic matter and presence of various chemicals that
determine the resultant cohesive forces among soil particles. Any external force applied to
the surface soil, cause bond breaking of these soil aggregates and this ultimately cause
reorientation of soil particles (Assouline et al., 1997; Cassel, 1983). Soils with high amount
of exchangeable Ca and clay particles are readily compacted when having high water
contents whereas dry and coarse textured soils resist this phenomenon due to their strong
bonding or structural arrangements (Snider and Miller, 1985; Kozlowski et al., 1991; Hillel,
1982).
Soil compaction can increase the soil strength, infiltration rate and pore space etc. Soil
compaction be caused by vehicular traffic (Cassel, 1983; Smith, 2001), can be natural
calamity (Koolen and Kuipers, 1983), pedestrian traffic (Patterson, 1977; Jim, 1993), by the
hooves of livestock and wildlife (Rolf, 1994). Soil compaction caused by any mean results in
increased bulk density. In Washington DC pedestrian traffic increased the from 1.20-1.60
g/cm3 at first site and1.70-2.20g/cm
3 at second site (Gomes et al., 2002; Horn et al., 1995).
Different farm operations carried out mechanically right from sowing up to harvesting causes
serious compaction at every step. A lot of military operations and exercises caused heavy soil
compaction and raised its bulk density up to 2.12 Mg/m3 (Williamson and Neilsen. 2003;
Alakukku et al., 2003). On construction sites compaction achieved deliberately by rollers to

8
increase soil bearing capacity but it has harmful effects on tree growth as it reduces
macropores essential for water and air circulation and necessary for root growth as well
(Williamson and Neilsen, 2003).
Because of mechanized operations, soil compaction can be severe in forests but it can have
more spatial variability than in agriculture due to presence of tree stumps and heavy roots in
the soil. In agro-forestry and silvo-pastoral systems, the grazing animals and use of
machinery for planting operations can cause soil compaction while negatively affecting the
plants growth (Wairiu et al., 1993; Atkinson et al., 1985).
Felling process of trees tends to increase degree of compaction and reduces fertility
(Ampoorter et al., 2007). Most of the researches have proved that different cultural
operations tend to compact forest soils. In late nineties, United States forest department first
time realized about the concept of soil management in relation to the productivity (Powers et
al., 1998). Soil compaction level depends on soil type and moisture content present in soil. It
is serious issue of the area having high traffic with no tillage operations this ultimately
reduces the production of perennial plants as well. Wheels of these traffic vehicles directly
affect plants. Recently due to mechanization during harvesting this has emerged as a serious
issue (Zhang et al., 2006; Jorajuria and Draghi, 1997). Excessive use of machinery and tools
during various cultural operations in forests cause serious soil compaction and decrease the
production from these forest trees (Gomez et al., 2002).
Puffiness and shrinking of soil bring the particles close together like during flood sand
particles settle down and come close together enhancing the process of compaction. In the
same way when the trees grow they transfer their weight to soil resulting in compaction. So
thick forest not only play their part in environmental improvement but they also help to
develop water resistant soil surface (Wright and Bailey, 1982; Koolen and Kuipers, 1983).
2.2. Quantification of soil compaction Effects:
It may not be easy to calculate the economic impact of soil compaction due to different
cropping systems, antecedent soil and climatic conditions (Voorhees, 1975). Economic
impact of soil compaction may be assessed directly by reduction in the yield even by the
application of proper inputs (Lal, 2009). Environmental impact of this issue is directly related
to accelerated erosion (Reed, 1983; Conway and pretty, 1991). Compaction of upper soil
surface can seriously affects the physio-chemical properties and other core processes

9
occurring in soil (Boone, 1988; Lal, et al., 2009; Lipiec and Hatano, 2003). Compaction also
affects the ecological worth, productivity and overall efficiency of the soil (Hakansson,
1994).
Reduced soil aeration could also be one factor to assess soil compaction. This can be
measured through parameters like soil pore space, air permeability, oxygen diffusion rate
(ODR) or redox potential (Cannell, 1977). Oxygen diffusion rate (ODR) is considered as a
very good tool to characterize the compaction of soil. But these are only applicable to wet
soil (Feder et al., 2005; Nawaz, 2010).
Compaction of soil is influenced by various factors. For instance, presence of more fine
particles and high water content of the soil can increase the chances of soil compaction,
whereas, presence of organic matter can resist the compaction of soil. Intensive use of heavy
machinery in forests and parks cause serious compaction. Excessive use of logging machines
can increase soil bulk density, reduce air spaces and water permeability which can limit plant
growth depending on soil type (Assouline et al., 1997; Gomes et al., 2002). Depending upon
soil characteristics on the same level of compaction, water infiltration rate and air
permeability may get changed (Feder et al., 2005; Nawaz, 2010). Infiltration capacity is
adversely influenced by the soil compaction because of soil hardness, change in soil
structure, change in quality and diminished number of macro pores (Gerard et al., 1982).
Dry soils offer resistance against compaction. Sub soil compaction due to heavy traffic can
persist up to four years whereas more compacted soils can take more time to recover
naturally (Hillel, 1982; Lowery et al., 1991). Time for recovery of compacted soils changes
with the depth of compacted layer. For example surface of sandy loam soil (0-0.75 cm depth)
requires 5-9 years, however for 15-23 centimeter depth about 8.5 years are required (Thorud
and Frissell, 1976; Shestak et al., 2005).
Soil strength and bulk density are considered very important to assess the compaction but
along with redox potential, water infiltration rate and oxygen diffusion rate (ODR) can give
more precise results for better understanding. At present, instruments (feelers) have been
developed with four flat operating penetrometers to assess position, depth and strength of
hard pan. These days mostly typical resistance indicators are used for the precise
measurement of compaction but in soils with gravels it becomes hard to analyze bulk density

10
for the assessment of compaction, so for precise measurements bulk density alone is not a
correct option to be opted (Lipiec and Hatano, 2003).
2.3. Effects of soil compaction on soil physical properties:
Physical properties of soil such as soil structure and soil strength that ultimately affect all the
biochemical properties of soils are severely affected by soil compaction. Soil strength can be
defined as “the resistance offered by any soil in a specific condition to the applied force’’ and
this strength can be measured by cone- penetrometer. Infiltration capacity of the soil is
negatively influenced by the process of compaction due to which soil particles are rearranged
and number of macro pores is decreased (Gerard et al., 1982).
Compaction caused by vehicular traffic change the characteristics of soil by reducing its
porosity, decreasing hydraulic conductivity increasing bulk density and by enhancing
penetration resistance (Lowery and Schuler, l991; Dickson, 1994). Sub soil compaction may
persist for years and seriously affect the productivity of the site. Compaction changes
favorable conditions to unfavorable conditions by changing bulk density, porosity, soil
infiltration capacity, permeability, resistance to root penetration and ultimately reduced yield
by affecting the overall development of plants (Soane et al., 1990; Gameda et al., 1994). This
problem can be managed up to some extent by increasing organic matter in the soil (Entry et
al., 1996).
A research was conducted to analyze the impact of vehicular traffic. Increased bulk density,
mechanical resistance, decreased infiltration rate, poor permeability and porosity indicated
the problem of soil compaction. Similar studies were undertaken by different scientists and it
was concluded that trafficked areas had much higher bulk densities as compared to non
trafficked areas (i.e.1.7 Vs 1.5 Mg/m3) with low hydraulic conductivity (Hussain, 1977;
Wagger and Denton, 1989).
Compaction reduces aeration and this ultimately leads to reduced microbial biomass
carbon/nitrogen/phosphorus mineralization in the soil. Researchers have also mentioned that
soil strength ranges from 75-3800 KPa has affected soil physically but showed no effect on
soil microbes and their enzymatic activity (Tan and Chang 2007; Entry et al., 1996; Tan et
al., 2008). Forest management practices affect soil organic matter contents and other
physical properties by compacting it. Compaction produced during the process of harvesting
increased bulk density up to 24% and aeration decreased 50%. This increase in bulk density

11
affect the temperature and moisture contents of the soil that may lead to change in soil
microbial activity and other chemical processes (Tan X et al., 2005).
Impact of road traffic was examined on saturation resistance and on bulk density in
Netherland forests. Different compaction levels were developed by using harvester and other
machinery by driving them on different tracks. Saturation resistance and bulk density were
increased where as plant root elongation decreased in the said soils. As compared to any
other soil type sandy soil recovered the issue of compaction much earlier than others
(Ampoorter et al., 2007).
Soil compaction is usually indicated by increase in strength, increase in bulk density,
decreased air spaces, increased soil water stress and reduced infiltration moreover these
impacts may prolong for years up to decades (Braunack et al., 1985; Greenwood et al.,
2001). Decreased porosity increases water retention capacity. Minimum 10% macro pores
are required for proper air or gaseous exchange, root penetration and microbial activity. 30-
50% compaction is assumed to hinder infiltration (Nugent et al., 2003). Soil volume and
porosity changed when other physical properties were changed due to soil compaction.
Infiltration rate of normal soil i.e. 11.4 cm/h can reach to 1.1 cm/h in the compacted areas
which changed the various chemical processes that ultimately inhibited the nutrients
availability (Dickerson, 1976; Arocena, 2000).
Compaction increases soil strength, bulk density, reduces permeability, hydraulic
conductivity and porosity. Macro pores tend to abolish during the process of compaction.
Most of the physical properties are changed by this issue (Marshall and Holmes, 1988). In
forest harvesting we have a constant effort to improve size and power of the machinery to
carry out different activities efficiently. This effort promotes soil compaction process to
many folds. These machines compact the soil by the application of pressure, stress and
vibration. This decreases the porosity up to 20% in general (Kozlowski, 1999).
Besides carefully performing forestry operations, threats remain there to affect forest
ecosystem. Mechanized logging and transportation disturb soil physical properties by altering
the arrangement of soil particles, thus resulting in poor soil quality due to less aeration, poor
hydraulic conductivity and more water retention capacity (Berli et al., 2003; Gaertig et al.,
2002).

12
Compaction of soil increases the soil micro pores and decreases macro pores. Like in
nurseries fine particles are filtered during frequent irrigation into macro pores. This type of
compaction up to 0.15 m depth with a bulk density of 1.93 Mg/m3 was reported to decrease
the wheat grain yield up to 38% (Tuttle et al., 1988; Ishaq, 2001). Thin crust is formed on the
surface soil when there is rain. This crust may have 0.1 millimeter thickness and just below it
a layer of closely spaced particles is formed. With the increase of moisture level the crust is
also strengthened (Chen et al., 1980).
Compaction created by using tractor eight times augmented bulk density from 1.5 Mg/m3 to
1.64 Mg/m3, whereas hydraulic conductivity of the soil was decreased from 0.31 cm/hr to
0.30 cm/hr (Saeed et al., 1998). A research was conducted in field and laboratory to examine
the effects of compaction along with soil water contents. It was revealed that soil water
contents have more deleterious effects than compaction. It was concluded that compaction
increased bulk density from 5% to 15% where as water contents increased 95 g/Kg to 155
g/Kg and the penetration resistance changed with the change in water contents (Shafiq et al.,
1994).
Soil infiltration rate and physical properties were evaluated as affected by two static tyres
load (12.5 and 21 KN). This not only increased the soil strength and cone penetration
resistance but also decreased the infiltration rate beneath tyres as the load and pressure
increased (Abuhamdeh, 2003). Impacts of compaction on soil porosity, water retention and
hydraulic conductivity were investigated. Compaction was created by the movement of
traffic to get contrasting bulk densities (i.e.1.17 Mg/m3 and 1.63 Mg/m
3, respectively). From
the outcomes it was concluded that the compacted soil having high bulk density exhibited
low porosity, high water retention ability, low hydraulic conductivity and vice versa (Richard
et al., 1974; Suzanne, 2001).
Physico-chemical properties can be tailored by the application of fertilizer in compacted soil.
This modifies the availability of minerals, pH and other soil parameters. This modification is
normally depicted in improved crop yield thus by this the organic matter content of soil is
also improved (Schroder et al., 2011; Bronick and Lal, 2005). Researchers have also reported
an increase in hydraulic conductivity, field capacity and other beneficial effects of the soil by
this practice (Hargreaves et al., 2008).

13
Mechanization of different forestry operations (especially felling, logging etc.) seriously
affect the ecosystem existing there in the soil by the induction of rutting, churning and
compacting the upper layer of soil. This also decreases the soil porosity, increases soil bulk
density and ultimately root penetration resistance is also enhanced by many folds (Curry et
al., 2007; Aubert et al., 2005).
Machinery and other vehicular traffic can seriously affect forest soil due to the contact of
their tyres with soil. Different studies have proved detrimental effects of soil compaction on
soil physical characteristics such as poor soil porosity and pore continuity (Berli et al., 2003),
increased mass thickness (Miller et al., 1996; Curry et al., 2007), increased root penetration
resistance and gas exchange (Gaertig et al., 2002; Nugent et al., 2003). These alterations in
soil properties can affect seedling growth, tree growth and other fauna present in the soil
(Buckley et al., 2003; Gebauer and Martinková, 2005; Battigelli et al., 2004).
Forest soils can restore their properties over the period of time due to freezing and thawing of
soil moisture contents and other biological activities (Fisher and Binkley, 2000; Alban et al.,
1994). Plants can modify their environment up to some extent due to their roots and addition
of other biological wastes. Penetration of roots improves pore continuity, lowers bulk density
and soil aeration is enhanced where as biological waste is characterized by rich minerals
(Brais and Camiré, 1998; Lister et al., 2004).
2.4. Effect of soil compaction on root growth:
There are various physical properties which affect plant root growth. These involve soil
aeration, temperature of the soil, its mechanical strength and its porosity. Recent advances in
the field of compaction have shown that upper and sub soil compaction has not only affected
different growth parameters but also reduced the overall yield of these plants (Boone et al.,
1986; Nadian et al., 1996). In the growth and development of plants, proper root growth is
very critical; it also helps in the uptake of water and minerals from roots to other plant parts.
Compaction leads to increased soil strength which inhibits easy root penetration (Hatchell,
1970; Nawaz et al., 2013; Mason, 1988). Soil compaction and root relationships have been
well reviewed in many research articles (Marschner, 1986; Hamza et al., 2005; Kirby et al.,
2002; Masle et al., 1987; Voorhees et al., 1975).
Compacted soils affect the growth and development of roots that changes with the change of
species and also changes for various cultivars of the same species, because of alteration in

14
proper root growth which depends upon the root physiological and morphological
characteristics. For the most part, compacted soil results in limited root growth (Materechera
et al., 1991; Tardieu, 1994; Glinski et al., 1990; Kristoffersen et al., 2005). It has been
estimated that the calcareous loam soils having high bulk density, with 4% natural organic
material resulted in serious destruction of below ground plant parts in the shallow soils
having depth less than 21cm (Bouwman and Arts, 2000). The impacts of compacted soil on
root development and nutrient uptake are more serious in saline areas than in ordinary areas.
Compaction of soil in the upper layer is more constraining element for the root development
than compaction in the deeper soil and this problem of soil has also resulted in the
development of many root diseases in various types of plants (Fritz, 1995; Botta et al., 2006;
Saqib et al., 2004b).
In severe conditions it was noticed that at 2.5 KPa roots were not able to penetrate through
the soil. It was observed that in sandy soils at 1.75 Mg/m3 plant growth stopped completely
while the same happened at 1.46 to 1.63 Mg/m3 in clayey soils. Fine textured soil having
bulk density of 1.4 to 1.6 Mg/m3 did not allow the complete penetration of the roots even in
wet soils, while the same phenomenon of inhibition of root penetration happened at 1.75
Mg/cm3 for coarse textured soil (Hatchel et al., 1970; Taylor, 1971; Cassel, 1983).
Various species responded differently to increase in soil bulk density which ultimately
affected morphology, growth pattern and nutrient uptake (Masle, 2002; Bassett et al., 2005).
Growth of primary and lateral roots was heavily affected by increase in soil strength even
root cap became more round in shape and root diameter just behind meristem increased
distinctively. Tap root became shorter, more lateral roots were formed, xylem vessels were
reduced, weight and volume of roots was reduced thus resulting in shallow root system
developement (Eavis, 1967; Corns, 1988; Kozlowski, 1999; Alameda and Villar, 2009).
A poorly developed shallow root system resulted in low uptake of nutrients and water, low
photosynthetic and transpiration rate and more leaf water loses. These changes directly
influenced the whole plant thus resulting in reduced leaf area, affecting of stomata thus
effecting stomatal conductance (Kozlowski, 1999; Masle, 2002). So in general increased soil
penetration resistance can promote plant stress by reducing growth performance by all means
(plant biomass, shoot/branch weight, shoot length, and stem thickness etc.) and enhancing
seedling mortality (Jordan et al., 2003; Acacio et al., 2007; Alameda et al., 2009).

15
In general, soil compaction adversely affects root growth (Blouin et al., 2008; Kristoffersen
and Riley, 2005), seedling emergences (Jordan et al., 2003) and shoot development (Ishaq et
al, 2001). Soil compaction results in the poor root growth, limited access to nutrients, and
enhanced loss of minerals by various process, which can restrict plant growth (Nawaz et al.,
2013).
Plant roots normally penetrate through small microspores by displacing soil particles and
struggle to root penetration increases with increase of soil bulk density (Young and
Bengough, 1989). There exists normally a converse relation between root growth and soil
bulk density for most of the plants (Misra and Gibbons, 1996). Thickness of the root
diameter is closely associated with soil compaction which normally enhances the mass per
unit of root length (Bengough et al., 1990). Shallow and branchy root system was found
normally in compacted soils (Gilman et al., 1987). Sandy loam soil offering cone resistance
more than 3 MPa can be serious threat to root growth of four tree species (i.e. Larch, Italian
Alder, Birch and Corsican pine) as most of the roots were found near the area having
resistance less than 3 MPa (Sinnett et al., 2008).
Decrease in span of different root portions of Eucalyptus nituns seedlings was recorded due
to increase in soil bulk density, but the ability of root growth may vary among different plant
species e.g. Larix sibirica and Quercus robur were found more gifted to develop roots
system upto the bulk density of 1.89 and 1.84 g/cm3, respectively, Picea abies and Tilia
cordata were the poorest to initiate their root system upto the bulk density of 1.61 and 1.55
g/cm3 respectively (Misra and Gibbons 1996; Korotaev 1992). Root system is highly affected
by root channel formation (Wang, 1986; Van Noordwijk et al., 1991). These channels or
pores mainly comprises of small spaces among soil particles (Edwards et al., 1996). Shallow
rooted crops develop better root system when a deep rooted crop was cultivated previously
(Hullugalle and Lal, 1986). The part of root that penetrates through soil strata varies with the
strength of these layers (Materechera, 1992). Mechanical resistance, O2 contents of the earth
heavily influence the root expansion (Gill et al., 1956; Day and Bassuk, 1994).
Surface water on compacted soils can promote the growth of different fungi that can stand
against poor soil ventilation, these can cause root decay in different plants and ultimately the
death of plants occur (Duniway et al., 1986, Gray et al., 1986). These types of fungi are also
facilitated by different chemicals produced by plants themselves (Stolzy and Sojka, 1984). A

16
poor root system development in wet soils is also linked with root decay by fungus due to O2
deficit environment in compacted soils (Stolzy et al., 1965). Plant root development may be
limited by variety of chemicals produced by plants themselves and anaerobic bacteria in
flooded plains (Ponnamperuma, 1984).
Impact of soil strength that can affect various physiological processes has been discussed by
different scientists. Depending upon soil type and plant species the range of soil strength lies
between 2-2.5MPa that can seriously limit root growth of woody plants (Day and Bassuk,
1994; Masle, 2002). Young seedlings principally needed more developed root system for
nutrients and water uptake therefore these are more susceptible to mortality due to increase in
soil bulk density (Misra and Gibbons, 1996; Skinner et al., 2009).
In proper growth of plants, roots play a very vital role because of its nutrients uptake function
(Marschner, 1986). Nutrient availability and infiltration capacity is adversely influenced by
the soil compaction because of soil hardness, change in soil structure, change in quality and
diminished number of macro pores (Gerard, 1982). Soil and root relationships have been
reviewed in many research articles (Hamza et al., 2005; Kirby et al., 2002; Masle et al.,
1987; Taylor et al., 1969; Voorhees et al., 1975). Compacted soil affects the growth and
development of roots that changes with the change of species and soil type because of
alteration in root penetration capability which depends upon the root physiological and
morphological characteristics (Materechera, 1991; Tardieu et al., 1994).
Limited root growth with more disease susceptibility was shown by variety of plants (Glinski
et al., 1990; Kristoffersen et al., 2005; Fritz et al., 1995). In the upper layer, compaction of
soil is more constraining element for the root development than compaction in the deeper soil
(Botta et al., 2006). Impacts of compacted soil on nutrient uptake and root development are
more serious in saline areas than in ordinary areas (Saqib and Akhtar, 2004b).
Compacted upper layer of sandy soil to a mass thickness of 1.55 from 1.20 Mg/m3 decreased
the root growth, stem thickness of wheat crop seedlings, while the existence of salinity was
more drastic than compacted soil alone. Prominent decrease was recorded in K+ fixations
and the K+/Na+ proportion in foliage because of relationships of salinity and compaction.
Cover plant roots have exhibited great root penetration ability and were found least effected
by soil compaction. The impact of compacted soil can be minimized by the cultivation of
such crop plants (Rosolem et al., 2002).

17
Due to high bulk density and low porosity roots can likewise expand their mass thickness
during the different growth stages (Dexter, 1987) and due to this process soil close to the
roots can be changed physically and chemically (Glinski et al., 1990). Variation in soil
porosity nearby roots can likewise be evaluated by electron microscopy (Bruand et al., 1996).
Persistence of sub soil compaction was investigated in South Western Minnesota. Some plots
were packed from the base and were applied pressure of 7.5 Bars. These plots were cropped
with corn and alfalfa. Bulk density beneath plough blade remained same over 9 years.
Sample of alfalfa root were taken at termination of experiment and it was revealed that
packing reduced root weight by 36% in the upper 40-90 cm layer whereas this reduction was
only 11% in the upper 40cm. Packing of soil particles affected the distribution and growth of
root system in this soil profile (Blake et al., 1976).
A research was conducted on well aggregated Alfisol and Entisol to assess the impact of soil
compaction on growth of maize roots under controlled conditions. Levels were developed by
applying stress of 10, 50, 100 and 200 KPa. Results revealed that bulk density was
significantly increased at all levels for both soils whereas root weight and length was
significantly reduced as the compaction level was increased. Same results were found in two
different wheel traffic research trials (Panayiotopoulos et al., 1992; Gayle et al., 1992).
In an experiment on maize crop it was concluded that compaction of soil harmfully effected
the overall root growth of plants. Roots were adversely affected due to resistance in soil
penetration and nutrient uptake. Shallow cultivation has less chance to improve subsoil
compaction which can prolong up to 40years (Day and Bassuk, 1994). Soil macro pores,
organic matter, root growth and microbial activities are seriously influenced by soil
compaction that generally leads to poor root system development by the plants (Kozlowski,
1999).
Poor primary root growth and seedling mortality were reported due to change in availability
of nutrients, mainly caused by soil compaction (Heilman, 1981; Kozlowski, 1999; Jordan et
al., 2003; Gebauer et al., 2005; Brais, 1998). Compaction caused by heavy machinery affects
root growth by altering the availability and uptake of nutrients (Jones, 2003; Gomez et al.,
2002; Heninger et al., 2002).
Highly compacted soils seriously affect the root respiration process and can change it from
aerobic to anaerobic conditions. Compaction also affects the renewal of forest crops by

18
restricting germination and development of seedling. Poor soil ventilation also affects the
overall growth, yield/biomass from these forest trees (Kozlowski, 1999).
2.5. Soil compaction and plant growth:
Effects of compacted soil are more negative to the plant emergence, survival and
development as compared to mature trees. Increased bulk density of nursery soil from 1.2 to
1.7 Mg/m3 in a trial has shown delayed growth/development of oak plants and death rate of
about 70% (Jordan et al., 2003). The height of the fresh seedlings may be decreased due to
the compaction of soil. However, the response of seedling emergence and growth can also be
altered due to soil type and change of plant species (Alameda and Villar, 2009). At all growth
stages (Seedling, Sapling, Pole and Tree) of the tree, problem of soil compaction was
assumed to have negative impact due to poor root development and its penetration in
problematic soil by different plant species (Day and Bassuk, 1994, Kozlowski, 1999, Bassett
et al., 2005; Verdu et al., 1996; Bejarano et al., 2005).
Limited root development may not inevitably leads to reduced plant biomass production that
is influenced by soil type, texture, plant species, weather conditions, nutrients availability and
soil strength (Blouin et al., 2008; Greacen, 1980; Alameda and Villar, 2009). In fact Quercus
pyrenaica responded positively against increase in soil strength regarding biomass
production under high light conditions. Similarly many other deciduous and evergreen
species responded very well against increase in soil strength upto 0.5 MPa but not beyond
this limit. The relationship may not be linear always for all plant species ((Bejarano, 2010;
Alameda et al., 2009).
Soil density of the forests is the specific feature related to plant growth and development.
When the trees grow in size their above ground biomass directly transfers weight to adhered
soil. As the plant grows the soil in close contact becomes thicker or in other words soil bulk
density will increases (Grable and Siemer, 2008; Greacen et al., 1980: Wright and Bailey,
1982). Another research was carried out to investigate the change in compaction caused by
traffic to the variety of soils. Results demonstrated that increased bulk density and reduced
soil porosity can enhance root penetration resistance and adversely affect the overall growth
response of plants (Richard, 1974; Gysi, 2000).
Photosynthetic rate goes down due to increased soil compaction. Compaction results in poor
growth of plant parts and reduced leaf growth as well. This leads to less leaf area index,

19
resulting in reduced photosynthesis rate in plants. As soil compaction causes less availability
of the minerals to the plants, so less chlorophyll synthesis takes place (Wieniarska et al.,
1987; Kozlowski and Pallardy, 1997a). Thus, photosynthesis rate declines due to less
chlorophyll synthesis, less leaf area index, less availability of life essentials, only because of
soil compaction. Soil compaction may switch respiration of roots to anaerobic phase and it
may proceed even up to physiologically malfunctioning which may alter the growth
hormonal balance and can lead to changes in concentrations of abscisic acid and ethylene
(Kozlowski, 1999). This anaerobic respiration is not capable to meet the whole requirement
of energy required for the synthesis of protoplasm, chloroplast and other structural units
(Kozlowski and Pallardy, 1997b).
Compaction not only changes the structure of the soil but also influence other properties as
well that ultimately results in restricted growth of almost all plant parts under different
growth conditions (different medias) for different crops e.g. wheat, barley, peas, beans and
maize etc. (Canarache, 1984; Logsdon et al., 1987; Groleau-Renaud et al., 1998; Oussible,
1992).
Compaction issues affect root distribution, shoot growth and other physiological functions of
the plants. Reduced leaf area and less biomass production and decrease in photosynthesis due
to poor stomatal conductance was recorded in different plants raised on sites facing this
issue. This decrease was mainly due to the production of abscisic acid in stressed part of the
plants (Ekwue and Stone, 1995; Masle et al., 1990; Tardieu et al., 1992). Some negative
impacts on nitrification have also been reported by different researchers due to soil
compaction (Tan and Chang, 2007; Blumfield et al., 2005). In severe cases this may pose
stern threat to ecosystem performance, root growth, root growth and uptake of water and
minerals. Extreme seedling mortality and reduced biomass production, root rot, low basal
area has also been reported due to soil compaction, especially in wet conditions (Gebauer and
Martinková, 2005; Gomez et al., 2002; Heninger et al., 2002; Kozlowski, 1999).
Impact of bulk density on plant growth relies upon soil texture, cation exchange capacity,
pH, soil organic matter contents, weather conditions and crop type (Assouline et al., 1997:
Hammel, 1994). Plant growth is effected by change in nutrient supply, water movement,
water storage capacity and soil aeration occurred mainly due to soil compaction. Soil

20
compaction may result in poor lateral root growth, low grain yield and poor nutrient uptake
(Rahman et al., 1999).
Field studies showed that forest stand regeneration is seriously affected by soil compaction
problem due to poor seed germination and induced seedling mortality. 40% growth reduction
of tree seedling was recorded on skid trails (Youngberg et al., 1959, Foil and Ralston, 1967).
Root penetration of Pseudotsuga rwerzziesii reduced linearly with the increase of soil
strength and bulk density. Compacted soil seriously affected the architecture and dry weight
of roots of different seedlings (Heilman, 1981; Pan and Bassuk, 1985; Sands and Bowen,
1978). In a field study there was 25% reduction in annual height was recorded in Picea abies
seedlings due to compaction. Nine different growth parameters (including stem diameter,
shoot length, shoot weight, root depth, root/shoot ratio, total biomass and survival of
seedlings) of Pirzus contorta and Picea glauca seedlings were seriously influenced with the
increase of soil compaction (Wasterlund, 1988; Corns, 1988).
The impact of soil compaction on number of trees is quiet significant in Australia as most of
the agricultural lands are affected by this issue up to serious extent (Greenwood, 2001). The
ultimate effects of soil compaction include reduced oxygen and nutrient availability to plants
(Kozlowski, 1999) especially, during initial growth stages (Smith, 2001). Different plant
species have different tolerance level against soil compaction, so, compacted agricultural
lands may limit growth and survival of only few species and vice versa (Ferrero, 1991; Smith
et al., 2001; Williamson and Neilsen, 2003).
Increase in soil compaction from normal to extreme level normally lead to reduced dry
matter production that may exceed up to 50% (Thithamer, 1989). In a field study carried out
in sixteen years on two different skid trails, Pinus ponderosa exhibited 6% less growth on
moderately compacted soil and 12% less on heavily compressed soils (Froehlich, 1979). In
another study, same species at the age of 15 years exhibited 43% and 15% less plant height
on high bulk density and moderate bulk density soils, respectively (Helms et al., 1986).
There was significant decrease in volume by Pinus ponderosa on skid trails (Helms and
Hipkin, 1986). In another trial there was 32% reduction in height on skid trails than off trails
by Pinus radiata trees, moreover, survival was also poor in such areas (Murphy, 1983). By
modeling it was concluded that there was reduction in volume production (up to 8.1%) by
Pseudotsuga menziesii stands during subsequent rotation (Stewart, 1988). In a study carried

21
out in Australia plant survival and basal area was condensed to half on seriously compacted
soils. Good growth performance was exhibited by Gmelina arborea than Terminalia species
on trampled soils (Cheatle et al., 1991). In another field trials stem thickness of tree seedling
was investigated and it was concluded that it took long time (About 80 years) to reach
standard by different tree species on compacted sites (Guariguata and Dupuy, 1997).
Growth and establishment of Pinus tueda seedlings was restricted during the 28th
week after
seed germination due to compaction when bulk density exceeded 1.3 Mg/m3.When bulk
density was greater than 1.9 Mg/m3 seedling growth was reduced by 44-46%. There was
significant decrease in root/shoot weights, root surface area, root collar diameter and height
of Pinus tueda seedlings due to compaction, during the study period (Tuttle, 1988; Mitchell
et al., 1982). Plant height and stem growth of a year old seedlings of Eucalyptus regnans
was negatively associated with soil bulk density and high rates of seedling mortality were
also reported. About 60% Pinus tueda seedling were unable to establish on compacted soils
and were reported dead as their radical was not able to penetrate in compacted soil, on skid
trails there number was reduced to 30000 seedlings/ha from 64000 seedlings/ha, in some
areas there was reduction up to 91% with suppressed growth (Rab, 1994; Pomeroy, 1949;
Hatchell et al., 1970; Wert and Thomas, 1981).
Restricted plant growth and mortality of perennial plants due to compaction on different sites
has been thoroughly investigated (Lunt et al., 1956; Madison et al., 1971; Sills and Carrow,
1983, Carrow et al., 1992), at construction sites (Alberty, 1984; Randrup et al., 1997), in
urban and peri urban areas (Patterson et al., 1977; Yingling, 1979), in tree felling sites
(Cochran et al., 1985; Reisinger et al., 1988; Stewart et al., 1988; Firth et al., 1989; Mohd.
Basri et al.,1992), in fruit orchards (Richards et al., 1974), in different agro forestry systems
(Wairiu et al., 1993) and in different forest nurseries (Boyer et al., 1988).
In highly packed soils roots normally lead to poor growth of shoots and its impact changed
gradually when it crossed the compacted layer. This may lead to reduced photosynthesis due
to reduced leaf area and alteration in source sink relationship. Importance of nutrients
availability cannot be denied under such conditions that regulate different physiological
processes (Tardieu, 1994; Kozlowski and Pallardy, 1997a). Moreover, accumulation of
different phytotoxins in compacted soils inhibits plant physiological processes and adversely
affects growth process (Rosen and Carlson, 1984; Kozlowski and Pallardy, 1997a, 1997b).

22
In woody perennial plants growth response is very complex in relation to increased soil
strength (Bulmer et al., 2005; Siegel-Issem et al., 2005). Increase in soil bulk density can
affect the architecture and overall biomass production of woody plants; generally decreased
root growth was recorded (Kozlowski, 1999; Bassett et al., 2005, Alameda et al., 2009). Soil
compaction can seriously damage plant health and plants may not survive in severe cases
(Kozlowski, 1999). This issue also depends upon field conditions, particle size, water
retention capacity and nutrient uptake. The combined effect of these factors reduces the
overall production from these plants (Greacen and Sands, 1980; Miller et al., 1996; Gomez et
al., 2002; Durr et al., 2000)
Field trial was conducted on clayey loam soil by using tractors passes 0, 1, 2 and 3 times just
two weeks before planting. Various parameters regarding growth were recorded (like
biomass production, plant height and seed yield etc). There was significant increase in bulk
density by these tractor passes and significant decrease in the seed yield from these plants
(i.e. 4117 Kg/ha, 4105 Kg/ha, 3955 Kg/ha and 3854 Kg/ha respectively). Moreover, level of
compaction was also dependent upon amount of precipitation in the growth season
(Lindemann et al., 1982).
About 24% yield reduction was observed in compacted areas where compaction was created
by the use of heavy machinery. A negative relation was recorded between bulk density and
biomass production. In upper compacted soil (0.25 to 0.60m) water uptake was reduced due
to which root growth and distribution were changed. This poor root growth ultimately
affected the overall development and yield of crop (Fawcett et al., 1988; Voorhees et al.,
1975). Negative impacts of subsoil compaction on plant growth and yield were also recorded
in a study. Research was conducted on silt soils which were packed down by 8 and 12.5 Mg
axle load. Plant height was reduced from 13 to 26% on these two levels. Nitrogen and
Potassium uptake was also reduced in the areas (plots) where cone penetration resistance was
high (Lowery et al., 1970).
Studies were conducted to check effects of soil compaction, created by vehicular traffic and
other machinery with different axle loads. Traffic significantly affected the compaction up to
60 cm. Cultivation even up to eleven years did not affect the sub soil compaction. Crop grain
yield was significantly high for traffic free treatments (Stewart, 1988: Etana et al., 1994).
Another research was conducted to analyze the effect of soil compaction on soil physical

23
characteristics and plant growth. Increased soil bulk density was recorded whereas hydraulic
conductivity and micro pores were reduced. At 1.55 Mg/m3 bulk density all the macro pores
were found absent. This overall affected the yield of these plants. The optimum level of root
shoot ratio, nutrient uptake and dry matter yield was observed at 1.35 Mg/m3
bulk density
(Hirekurubar et al., 1991).
Another experiment was conducted on clayey loam soil. Treatments were applied with
different axle loads and compaction was observed up to 0.5m depth. Even after sixth year of
cultivation, compaction was still measureable below the blade of plough. This compaction
seriously affected the crop yield (Alakukka et al., 1994). Field trials were conducted to
investigate the impact of soil compaction on crop yield at about 259 sites. Sites were
compacted by using tractors and trailers at various times of the trial period. This significantly
reduced the porosity and tensile strength of the clay soil aggregate. There was 11.4%
decrease in yield when treatments were compared with control. A significant relation of
treatments was recorded with crop yield (Arvidsson et al., 1999).
A pot trial was conducted to analyze the impact of soil compaction and soil texture on
nutrient uptake and yield of maize plants. Different compaction levels were developed by
using 5Kg weight and dropping it from 2ft on to the soil. When the results were compared
with control, it was concluded that texture and compaction has significantly affected the
morphological parameters and nutrient uptake in all plants (Iqbal et al., 1999).
A study was conducted to determine crop response to soil compaction and its management
practices. All the levels were compacted with 10 Mg axle load in wet conditions except
control level. 6-10 Mg axle load was applied in annual management practices (at 25-30%
soil water contents) significantly reduced the seedling emergence, crop yield, water storage
capacity of the soil and water use efficiency of the crop. On the other hand this application on
dry soil (<22% soil water contents) has shown a very little response. Overall reduction in
yield was recorded up to 23% (Hammel, 1994; Kaspar, 1991; Radford, 2001).
Effect of soil compaction is deleterious to the growth and development of plant and this
effect normally changes with soil type and plant species. Seventeen tree species saplings
belonging to Mediterranean ecosystem were used to check their growth response against
compaction (ranges from 0.1 to 1.0 MPa). Most of the species were ever-green and were
grown in green house under optimum conditions. At moderate soil compaction level 53%

24
species produced good biomass due to better root soil interaction whereas remaining
exhibited reduced root growth. So, two different types of responses were observed at the
same time (Alameda and Villar, 2009).
Usually soil compaction causes decrease in quality and produce of fruit crops. Different fruit
plants responded differently against soil compaction (Wieniarska et al., 1987; Kesik and
Stanek, 1983). In Macississippi river delta, surface compaction and sub soil hard pan
decreased the boll and lint production by Gossypium hirsutum (Lowry et al., 1970). By
controlling the vehicular traffic, increase in yield was recorded for the same specie (Dumas,
1973; Hadas, 1985). Shallow subsoil pans were more damaging to Gossypium hirsutum than
deeper hard pans (McConnell et al., 1989). Some positive impacts have also been reported
about soil compaction. For instance in a study it was reported that initial increase in bulk
density (40%) did not affect survival and growth of Pseudotsuga menziesii and Picea
sitchensis seedlings. Conducive climatic conditions helped to adopt the adverse impacts of
compaction (Miller et al., 1996).
Any type of load applied to forest soils changed the arrangement of its particles; however the
impact of each level is not destructive (Arshad, 1996). USDA Forest service has argued that
any boost in mass concentration of soil over 15% is detrimental. Increase in bulk density
restricted the plant growth at 1.47g/cm3 on the rock, 1.75g/cm
3 on the silt and 1.80g/cm
3 on
the slurry and sand. Root growth was much slower at 2MPa cone penetration resistance and
stopped when it exceeded 3MPa (Powers et al., 1998; Whalley et al., 2008). Negligible
impact of soil compaction was reported on average stand volume of Pinus taeda (Sanchez et
al., 2006). Regeneration of Ficus boliviana and Terminalia oblonga was much better on
compacted soil (Nabe-Nielsen et al., 2007). Much higher biomass was produced by various
species in compacted soils (Alameda and Villar, 2009). Irrespective of climate, excellent
growth and survival of conifers were recorded on compacted soils (Fleming et al., 2006).
Soil compaction benefits seedling growth and endurance that also affects the capability and
range of microspheres in different soil types especially on sandy soils (Agrawal, 1991;
Jordan et al., 1999; Zenner and Berger, 2008; Kara and Bolat, 2007).
Issue of soil compaction is getting importance day by day as different farm operations are
being carried out mechanically, this restricts plant root growth, its penetration, water and

25
nutrient availability. As a result decreased leaf area and yield was recorded (Abu-Hamdeh,
2003; Kim, 2010; Tarawally et al., 2004; Whalley, 2008; Zhao et al., 2007).
2.6. Effect of soil compaction on nutrients uptake and biological processes:
Soils with high bulk density affect the uptake of minerals and supplements. General
impact of the compacted soil on growth of plant is destructive; however this may likewise
bring about no impact or enhance the production (Ishaq et al., 2001; Greacen and Sands,
1980; Lipiec and Stepniewski, 1995). Compacted soil results in limited root development,
diminished availability of minerals, prolonged loss of soil supplements by draining, spillover,
and vaporous form which can influence plant growth.
Nutrient uptake is affected by the compaction of soil due to change in root growth habit and
availability of nutrients. Soil compaction seriously affects the ability of roots to exploit
environment conducive for nutrient uptake. Less nutrients availability and water shortage are
the principle restrictive factors to the plant growth and development in different soils.
Moreover plant diseases are also promoted by the issue of soil compaction (Ahmad et al.,
2009; lshaq et al., 2001a; Harris, 1971).
A pot trial was conducted on spring barley in chernozem compacted soil. Compaction levels
were developed to the bulk density of 1.34 g/cm3, 1.41 g/cm
3, and 1.61 g/cm
3. Plants were
harvested at the termination of trial. Fresh weight, dry weight and phosphorus contents were
calculated. Root distribution was found quite uneven against all treatments and soil aeration
was reduced from 22% to only 8%. Soil resistance to penetrometer was increased from 1.13
to 3.69 MPa and root length was reduced up to 70% in compacted soil. Same results were
found in potassium uptake and yield of maize crop (Muller et al., 2010; Punyawardena and
Yapa, 1991).
A study was conducted to explore effect of sub soil compaction on maize crop growth. There
was significant high penetrometer cone resistance recorded below the plough blade.
Reduction in the height of plants was recorded with increase of cone resistance level.
Nitrogen and Potassium uptake was also reduced which ultimately affected the overall
growth performance and yield of the plants (Lowery and Schuler, 1991).
Level of compaction normally depends upon cation exchange capacity, soil texture, soil
structure, organic matter contents of the soil, presence of Iron/Aluminum oxides which are
responsible for different forces among soil particles (Assouline et al., 1997). Mechanized

26
forestry operation normally leads to soil disturbance/compaction which indirectly
destabilizes the ecosystem for a longer period of time. Due to these mechanized operations
soil infertility increases and nutrients become inaccessible. Because of this disturbance trees
are normally characterized by shorter root system and low height (Froehlich, 1979; Wronski
and Murehy, 1994; Whalley et al., 2008; Bulmer et al., 2005).
Due to soil compaction growth and development of root is seriously affected, because plants
are unable to uptake any nutrients from soil. The damaging effect of soil compaction even in
mature plants is quite visible although they are least effected ones. Therefore it is necessary
to avoid any compaction before the establishment of a forest plantation (Greacen and Sands,
1980; Moffat, 1994). Compaction affects various biological processes. It was concluded that
compaction reduces microbial activity and has adverse effect on plant root growth. Moreover
microbial activity changes from aerobic to anaerobic conditions with increase of compaction
which ultimately effect plant growth by altering the nutrient availability (Whalley et al.,
2008). Soil compaction enhances unfavorable conditions at rhizosphere level for microbial
activity. Negative correlation of soil compaction with microbial activity, biomass production
and total nitrogen has been reviewed by many scientists (Canbolat, 2006; Beare et al., 2009;
Pengthamkeerati et al., 2011).
Process of denitrification is augmented by soil compaction. As a result, oxides of nitrogen
releases into the air in high quantity. Like when nitrogenous fertilizer is applied in wet
conditions these emissions can be enhanced (Soane, 1990). Availability and efficacy of
Nitrogen is reduced due to soil compaction and this increases the fertilizer requirement of the
crop. Increased water contents and inaccessibility of Nitrogen has been reported in
compacted soils due to volatilization of ammonia this lead to poor seedling growth (Tan et
al., 2007; Soane, 1990).
Soil biodiversity is complimented by soil compaction and relies heavily upon climate and
extent of its compaction. Soil microbial activity and C-mineralization are severely affected
when soil bulk density exceeds from 1.7 Mg/m3. Resistance has also been exhibited by the
roots of some cover crops against compaction which could moderate the said effect (Beylich
et al., 2010; Frey et al., 2009).
Poor growth of root and shoot was reported due to inaccessibility to nutrients to plants (Ishaq
et al., 2001; Silva and Barros, 2008). However, no impacts of compacted soil on seedling

27
stature were observed but decreased yield was accounted (Ishaq et al., 2001). The compacted
soil decreases the nutrient uptake because of the offended root system yet this likewise builds
relationship among soil medium and roots. The process of nutrients uptake is regulated by
diffusion which is much influenced by compacted soil than for supplements, regulated by
mass stream (Arvidsson et al., 1999). The assimilation of Phosphorus and Potassium ions in
the agronomic plants can be restricted by compaction of soil or can enhance absorption of
Phosphorus in the rye grass etc. depending upon soil type and its compaction level (Hillel,
2009).
It was studied that three kinds of soils (topsoil, earth soil, and residue) having different levels
of RDC (Rolling Dynamic Compaction) i.e. 70%, 75% and 90%. Substantial soil firmness
lessened the Potassium uptake and production of grain in each of the three kinds of the soils.
Soil compaction adversely influenced the nutrient uptake that resulted in poor plant growth
(Kristoffersen et al., 2005).
As mentioned earlier most of the research work has been done on agronomic crops in
relation to soil compaction and there is scarcity of research work on soil compaction and its
impact on growth of different agro forestry trees especially in Pakistan. Keeping in view the
severity of soil compaction problem in agro-forestry systems the current research was
enacted to appraise negative impacts of soil compaction on various morpho-physiological
mechanisms and parameters of major farm trees of Central Punjab.

28
CHAPTER III
MATERIALS AND METHODS
Materials and method enable a researcher to accomplish the process of collection, analyzing
and interpreting the data. Key objective of this chapter was to highlight different techniques
used for collection, analysis and interpretation of data at various stages. The current research
work was completed in two years (2015-17). It comprises of following three studies:
3.1. Study- 1 (Field Survey):
Study-I was designed with following three objectives:
I. To assess the prevailing soil compaction levels in the field.
II. To assess the awareness level of the farming community about soil
compaction.
III. To assess the different practices performed and type of machinery used on
farmlands during agro-forestry operation/practices.
To achieve these goals, following three districts were selected as representative of the Central
Punjab (Fig. 3.1):
1. Shahdara (Bela Forest): was selected from Lahore District, as representative of
compact plantation under severe grazing pressure of livestock.
2. Faisalabad District (Mechanized and non-Mechanized agro-forest lands at selected
villages).
3. Sheikhupura District (Mechanized and non-Mechanized agro-forest lands at selected
villages).

29
Fig.3.1 Targeted Districts of Punjab
Shahdara plantation is known as Riverine or Bela forest because it lies near and inside the
river bed of River Ravi. Area wise detail of this plantation is given in Table 3.1:
Table.3.1: Bela Forest Shahdara, Lahore (Punjab Forest Department 2013)
Shahdara; translated as “the way of Kings” is a well known town near Lahore, lying in
northern side of Lahore. Earlier, the delta of river Ravi was completely covered by the trees
but with the passage of time and the decision taken by the Provincial as well as District
Government that the livestock farms within the populated areas should be shifted to
somewhere else. So, the whole livestock of this urban area was shifted to this bela forest.
Trees were removed and forest soil was dug out by the natives for their personal benefits.
This practice led to severe destruction of this forest and as a result a barren patch of land
appeared where livestock are reared. Ultimately, the problem of soil compaction has been
aroused due to poor management practices.
Legal
status
Name of
forest
Provincial/District Gross
area
Planted Total
Blank
Plantable
Blank
Unplantable
blank
Encroached
Reserved
forest
Shahdara Provincial 1615
acres
1.84
acres
1613.16
acres
775.78
acres
835.33
acres
2.05 acres

30
Faisalabad district covers more than 1300 square km. Faisalabad is surrounded by Sheikhupura,
Chiniot, Sahiwal, Jhang and Toba Tek Singh. In North West of the city, there flows Chenab River.
About 80% of its cultivated lands are irrigated by lower Chenab Canal. Its soil is comprised of
alluvial deposits. To collect data from the farming community and to assess the problem of soil
compaction following sites/villages from the Faisalabad district were visited:
Faisalabad (Chak no. 5, Chak no. 8, Chak no. 9)
Chak Jhumra (Paharipur, Udhudata, Mitranwali)
Jaranwala (Chak no. 121, Chak no. 19, Chak no. 22)
Samundri (Chak no.442, 443, 441)
Tandlianwala (425GB, 407GB, 412GB)
Sheikhupura is a famous district situated on the outskirts of Lahore, founded by
the Mughal Emperor Jehangir in 1607. This district is surrounded by Lahore, Kasur, Okara,
Narowal, Gujranwala and Nankana from the other side. Currently, it has five tehsils and
covers more than 5960 square km. Mostly, its soil comprises of alluvial deposits. To collect
data from the farming community and to assess the problem of soil compaction following
sites/villages from the Sheikhupura district were visited:
Sheikhupura (Jatri Kuhna, Amba Sharif, Sacha soda)
Ferozwala ( Khanpur, Nokrian, Bhudho)
Muridke (Kirto, Ahdian, Narang)
Sharqpur (Faizpur, Treadewali, Marh)
Safdarabad (Mala Buland, Phularwan, Malianwali)

31
Shahdara Faisalabad
Fig.3.2. Sampling sites of Shahdara (Bela forest), Faisalabad and Sheikhupura
(Agro-forest lands).
Fig.3.3. Collection of samples and use of Penetrometer for measuring soil strength
To achieve first objective of study-I soil sampling was carried out from Shahadara plantation
(Fig. 3.2). As it was a state land under high grazing pressure of livestock so, only soil
sampling was carried out. Site was divided into the following catagories:
Site 1: Soil which is not too much disturbed by the livestock.
Site 2: Around the standing tree where livestock shelter against sun during day.
Site 3: Trail followed by the livestock towards river.
Site 4: Exposed feeding area of livestock without vegetation.
From Faisalabad and Sheikhupura districts various mechanized and non mechanized farms
were visited (Fig. 3.2). A comprehensive and pre-tested (n = 10) questionnaire was prepared
and used for the field survey (Appendix-I). About three hundred respondents were
interviewed to get response about 2nd
and 3rd
objectives. Soil sampling was carried out in
farmer fields respectively. Cone-penetrometer was used to get readings and soil samples
were collected by using metallic ring (Fig. 3.3). Bulk densities of both the mechanized as
well as non-mechanized farms were determined in lab from samples collected at two depths

32
(i.e. 0-15 cm and 15-30 cm). During the visit, some farmers showed great interest in the
study because all farming operations were carried out by heavy machinery.
The farmland where heavy machinery was not employed has been categorized as non-
mechanized farmland and vice versa. As, most of the farmers in Pakistan have less than 5
acres land holding. So, most of the farmers do not use heavy machinery as well as
mechanized practices due to high cost of inputs and in return; low output. A farm in which all
or some of the following types of heavy machinery is being used was considered to be
mechanized:
1. Tractor along with rotavator, cutter, rapper, digger, chiseler, plough.
2. Combined Harvester.
3. Straw Sucker.
4. Boom Sprayer.
5. Picker etc.
3.1.1. Bulk Density:
It was determined by using volumetric ring method (Pedrotti et al., 2005). Samples were
collected from the targeted sites by using calibrated metallic ring, wooden block, trowel, flat
bladed knife and sealable etc. Soil inside the ring was taken out, weighed and readings were
noted. A sub-sample of 50 g from each sample was taken in petri-dish of known weight.
These petri-dishes were put in oven whose thermostat was adjusted at the level of 100 Co
until the constant weight was achieved and it took about 72 hours for oven drying. Dry Sub-
samples were extracted out and weighed. The weights of dry sub-samples were determined
by extracting the dish weights. Moisture %age was determined. Finally, using this moisture
%age the dry mass of soil sample was also determined. As volume and oven dry mass had
been determined already so, bulk density was calculated by using the following formula:
Dry Bulk Density (g/cm3) = Dry Mass/Volume
3.1.2. Soil pH:
It was determined by using following technique (U.S. Salinity Laboratory Staff, 1954):
Soil was poured in gauze of 250 micron and only fine soil grains were obtained in a
beaker, leaving behind the stubbles, gravels, straws and other large particles.
250g of soil was taken in a beaker and distilled water was poured in it with
continuous stirring by a spatula. Adequate water was added in soil to make its slurry.

33
This slurry was kept for 2 hours in shade while stirring was done after each 10-15
minutes.
pH meter was calibrated by using two standard solutions of pH 7 and 10 respectively.
After 2 hours, the electrode of pH meter was dipped in slurry and reading was noted.
3.1.3. EC and TSS:
Soil EC and TSS were determined by using following technique (U.S. Salinity Laboratory
Staff, 1954):
Soil solution extractor was used to separate soil extract from the slurry.
A What’s man filter paper was adjusted on the flask and slurry was filtered through it.
Suction pump was run manually and soil extract was collected drop by drop in a
crucible.
After complete suction, the apparatus was removed and soil extract was collected in a
bottle.
Electrode of EC and TSS meter was dipped and reading was obtained.
3.1.4. Saturation %age:
Soil saturation %age was determined by using following technique (U.S. Salinity Laboratory
Staff, 1954):
Soil was saturated up to its field capacity and put into weighed petri-dish.
This petri-dish was placed in an oven at 100 0C for 40 hours.
Dry weight of the soil was calculated by subtracting the petri-dish weight from total
weight after oven drying.
Following formulas were used to determine the saturation percentage.
Sub-soil sample taken = 50 (g)
Weight of Petri dish = X (g)
Weight of Petri dish + Soil Sub-soil sample = Z (g)
Oven drying at 100 Co for 5 days (total 40 hours with 8 hours of
working/day); to get constant weight after drying.
Dry weight of Sub-soil sample = Z – X = B (g)
Moisture %age =

34
Data were analyzed by using Minitab-2017 and Microsoft Excel and interpreted accordingly.
The results of this study-I provided the base for the next part of present research work i.e.
study-II.
3.2. Study-2: Preparation of earthen beds, development of various compaction levels
and sowing of different species
After the completion of survey and keeping in view field conditions and proposed study plan
a controlled condition trial was conducted at research area of Department of Forestry and
Range Management. In study-II the impact of soil compaction was assessed on bed nursery
where eight selected farm tree species were raised (seeds and cuttings). The selected site was
situated at 73.077o
Longitude and 31.443o Latitude. Complete soil analysis was carried out
for 5 randomly collected soil samples from nursery at two depths as given in Table. 3.2:
Table 3.2: Physico-chemical properties of nursery soil:
Parameters 0-15 cm 15-30 cm
pH 8.0±0.01 8.2±0.02
EC (dSm-1
) 1.68±0.1 1.35±0.1
TSS (ppm) 1176±35 1236±10
Nitrogen (%) 0.077±0.005 0.05±0.005
Phosphorous (ppm) 3.9±0.1 9.8±0.2
Potassium(ppm) 280±5 250±5
Organic matter (%) 1.54±0.05 0.91±0.02
Sand (%) 40±3 69±5
Silt (%) 45±3 18.5±2
Clay (%) 15±2 12.5±2
The climate of Faisalabad is arid to semi-arid. According to Köppen-Geiger classification it
is characterized with hot and humid conditions in summers and dry cool conditions in
winters. In June mean maximum and minimum temperatures range from 40.5 °C and 26.9 °C
respectively. Average minimum and maximum temperatures of January were 4.1 °C and
19.4 °C respectively. Summer starts in April and ends in October. May and June are the
hottest months with dry and dust storms. July and August can be very humid. June is the
hottest and January is coldest month in Faisalabad. Winter season starts in November and

35
ends in February. Spring starts in February and ends in late March. Mean annual rainfall is up
to 375 mm. Rainfall is season specific and approximately half of the total rainfall takes place
in July and August during the monsoon.
Climatic data during study period was collected from nearby meteorological station at
University of Agriculture, Faisalabad, Pakistan (Table 3.3)
Table 3.3: Climatic conditions of experimental site:
Months
/Years
Temperature (ºC) R.H.
(%age) Rainfall
(mm) Sunshine
Duration
(Hours)
Pan
Evap.
(mm)
Evap.
Transp.
(mm)
Wind
Speed
(Km/h) Max. Min. Avg.
Nov/2015 27.1 12.1 19.6 61.5 8.8 6.6 2.4 2.1 2.6
Dec/2015 21.8 7.2 14.5 62.6 0.0 7.0 1.9 1.6 2.3
Jan/2016 17.3 7.7 12.5 74.4 13.1 3.5 1.2 0.8 2.7
Feb/2016 23.3 9.3 16.3 58.1 7.8 8.5 2.3 1.6 3.8
Mar/2016 26.8 15.6 21.2 59.7 66.7 6.6 2.7 1.9 4.7
Apr/2016 34.3 20.2 27.2 34.2 5.6 8.3 6.1 4.3 5.2
May/2016 39.8 25.6 32.8 28.8 25 10.4 9.5 6.4 5.4
Jun/2016 40.2 28.5 34.4 38.9 39.9 9.38 8.7 5.9 4.3
Jul/2016 36.6 27.4 32.0 59.6 193.5 8.2 6.0 4.2 4.6
Aug/2016 35.7 26.5 31.1 62.2 48.1 7.0 5.7 4.0 4.2
3.2.1. Beds preparation:
Nursery soil analysis revealed that soil is loamy having dry bulk densities around 1.3 ± 0.03
Mg/m3. Experiment was conducted in earthen beds to reduce the risk of compaction
variability. Five nursery beds (treatments) were prepared with following methods (Figure
3.4):
Suitable site was selected and its boundary was highlighted and marked by using a
rope and then brick alignment was done.
Soil was dragged for the formation of sub-paths of 2.5 ft wide and 12 ft long along
with the main central path which was 10 ft in width and 38 ft in length.
Sunken beds of dimensions 12 ft long and 6 ft wide were made and lined with bricks.
After removing stubbles and weeding all the paths and beds were leveled.
Five levels of compaction were taken, in which one was assumed as control
(minimum compaction) while other four were adjusted as compacted beds according
to compaction standards proposed in project plan i.e. T0 (control), T1 (10 beatings),
T2 (20 beatings) and T3 (30 beatings), T4 (40 beatings) as given in Table 3.4.

36
A measured weight (10Kg from 10”height) was used to adjust the compaction of the
field.
Penetrometer was used to check compaction levels in the field. Some field activities
are shown in Figure 3.5-3.9.
After achieving the compaction of beds according to the adjusted standards, partitions
within each bed were made by using bricks and each bed was divided into eight equal
parts, where each compartment had dimensions of 2.6 ft * 3ft long. Total 15 beds
were made for replications and to validate the results statistically.
Treatments were replicated three times to achieve desired number of replications.
Figure 3.4. Nursery beds layout and dimensions for controlled experiment

37
Table 3.4: Soil bulk densities determined in nursery for experimentation
Beds Bed-1
Controlled
Bed-2
(10 beatings)
Bed-3
(20 beatings)
Bed-4
(30 beatings)
Bed-5
(40 beatings) B. Densities
(Mg/m3)
1.3 ± 0.03 1.40 ± 0.05 1.55 ± 0.04 1.65 ± 0.08 1.8 ± 0.1
Figrue 3.5: Transformation of field into beds with different treatments.
Figure 3.6: Beds formation Figure 3.7: Compaction maintenance
Figure 3.8: Brick spacing and alignment Figure 3.9:Planting of cuttings
In study-II after the preparation of earthen beds and maintaining various compaction levels
eight selected agro-forest tree species were sown in these beds (Acacia nilotica, Eucalyptus
camaldulensis, Albizia lebbeck, Zyziphus mauritiana by seed and Dalbergia sissoo, Bombax

38
ceiba, Morus alba, Populus deltoides by cuting) after formal treatment. Planting rod was
used for planting cuttings and all four types of cuttings were planted by maintaining the
distance of 3 × 3 inches as P-P and R-R distance. The experiment was attributed by two
factor factorial with randomized complete block design (RCBD). Sixty seeds/ cuttings/
stumps used per species per bed under one treatment. There were five treatments including
control with three replications. Planting material (Seeds of Vachellia nilotica, Eucalyptus
camaldulensis, Albizia lebbeck, Zyziphus mauritiana and cuttings of Dalbergia sissoo,
Bombax ceiba, Morus alba, Populus deltoides) was obtained from the research area of
Department of Forestry and Range Management, UAF. Different cultural practices (weeding,
cleaning and irrigation etc.) were carried out as per requirement. Data regarding following
parameters were recorded on regular basis.
3.2.2. Morphological Parameters:
Apparent features including size, shape and structure of the plants were considered as the key
features to assess the negative impact of soil compaction. These factors directly or indirectly
affect the whole physiology of the plant body. Following were the different morphological
parameters studied (as done by Wasterlund, 1988; Corns, 1988; Tuttle, 1988; Mitchell et al.,
1982; T.T Kozlowski, 1999; Heilman, 1981; Pan & Bassuk, 1985) in present study.
3.2.2.1 Germination/Sprouting %age:
Germination/sprouting %age of eight species (Acacia nilotica, Eucalyptus camaldulensis,
Albizia lebbeck, Zyziphus mauritiana from seed and Dalbergia sissoo, Bombax ceiba, Morus
alba, Populus deltoides raised from cuttings) was recorded on regular basis right from the
start to the mid of experiment.
3.2.2.2 Survival %age:
Survival %age of eight species (Acacia nilotica, Eucalyptus camaldulensis, Albizia lebbeck,
Zyziphus mauritiana from seed and Dalbergia sissoo, Bombax ceiba, Morus alba, Populus
deltoides raised from cuttings) was recorded at the termination of the experiment.
3.2.2.3 Girth/Diameter of plant:
As the stem thickness of the plants was much less so, it was not possible to measure directly
girth or diameter by using diameter tape or simple measuring tape. So, plant diameter was
measured with the help of a digital caliper at the termination of experiment. Average
diameter was calculated for different replications and treatments.

39
3.2.2.4 Plant height/Shoot Length:
At the termination of experiment plants were harvested. Plant height/shoot length was
measured by using a measuring tape right from tip of the shoot to the collar of plant. Average
plant height was calculated for different replications and treatments.
3.2.2.5 Shoot fresh weight:
As the plants were harvested at the termination of this trial, their shoot fresh weight was
recorded immediately. An electrical weighing balance was used to record this shoot fresh
weight. Average shoot fresh weight was calculated for different replications and treatments.
3.2.2.6 Shoot dry weight:
Shoots of the harvested plants were put into paper bags and sun dried till the constant weight
was achieved. Then these paper bags containing shoots were oven dried to a constant weight.
Average shoot dry weight was calculated for different replications and treatments.
3.2.2.7 Root Length:
Root depth/root length was also measured at the termination of experiment. Measuring tape
was used to measure root length from tip of root to the collar of plant after the removal of
soil particles. Average length root was calculated for different replications and treatments.
3.2.2.8 Root fresh weight:
As the plants were harvested their root fresh weight was recorded immediately after washing
them properly. An electrical weighing balance was used to record this root fresh weight.
Average root fresh weight was calculated for different replications and treatments.
3.2.2.9 Root dry weight:
Roots of the harvested plants were put into paper bags and sun dried till the constant weight
was obtained. Then these bags containing roots were oven dried to a constant weight.
Average root dry weight was calculated for different replications and treatments.
3.2.2.10 Root/Shoot ratio:
To analyze the impact of soil compaction on root/shoot ratio for each species in each
replication of each treatment, root length was divided by shoot length at the end of this
research trial. Collected data was analyzed and interpreted accordingly.
3.2.2.11 Leaf area:
Process of photosynthesis is carried out in leaves. This is why leaves are known as food
factory of plants. Any increase or decrease in leaf area due to any plant stress can affect the

40
overall plant growth. Leaf area was measured by using leaf area meter (YAXIN-1241/CI-20-
CID).
3.2.2.12 Number of leaves:
To assess the impact of soil compaction data regarding number of simple leaves and
compound leaves produced by different plants of each species in each replication of each
treatment was recorded at the end of this research trial, when plants were harvested.
3.2.2.13 Number of Branches:
Numbers of branches produced by each plant were assessed just before harvesting the plants.
Data was recorded, analyzed and interpreted accordingly.
3.2.3. Physiological Parameters:
Plant physiology is the discipline mainly deals with the functioning of plant body. It includes
the study of various fundamental processes such as photosynthesis, respiration, stomatal
conductance, internal Carbon dioxide concentration and photosynthetic water use efficiency
etc. To assess the impact of soil compaction following physiological parameters were
recorded by using different tools:
3.2.3.1. Photosynthetic rate:
Photosynthetic rate is the total rate of photosynthetic Carbon dioxide fixation minus the rate
of loss of Carbon dioxide during respiration. As CO2 is found in the atmosphere at very low
concentrations (about 0.04%) so, any increase in its concentration causes a rapid rise in
the photosynthetic rate. This was measured by using IRGA, LCA-4, Analytical Development
Company, Hoddesdon, England. (Arooj Bashir et al., 2018; Muhammad Rizwan et al., 2017;
Ali Asghar Hatamnia et al.,2013).
3.2.3.2. Transpiration rate:
It is the process in which plants absorb water through their roots and lose it from their aerial
parts such as stem, branches, leaves and flowers etc. This was measured by using IRGA,
LCA-4, Analytical Development Company, Hoddesdon, England. (Zahra Rahneshan et al.,
2017; María Sara Mejía de Tafur et al., 2018; A. S. Aziz et al., 2018).
3.2.3.3. Stomatal conductance:
Stomatal conductance estimates the rate of gas exchange (i.e., carbon dioxide uptake) and
transpiration (i.e., water loss) through the leaf stomata as determined by degree of stomatal

41
aperture. This was also measured by using IRGA, LCA-4, Analytical Development Company,
Hoddesdon, England (A. S. Aziz et al., 2018; Zahra Rahneshan et al., 2017)
3.2.3.4. Internal Carbon dioxide concentration
Increase in carbon dioxide concentration directly increases the process of photosynthesis, but
this increase depends on the plant species and other physiological condition of the plant.
Such changes will not only affect photosynthetic rate but can also affect other mechanisms as
well. This was also measured by using IRGA, LCA-4, Analytical Development Company,
Hoddesdon, England (Muhammad Rizwan et al., 2017; Ali Asghar Hatamnia et al., 2013).
3.2.3.5. Photosynthetic water use efficiency
Photosynthetic water-use efficiency (also termed as intrinsic or instantaneous water-use
efficiency), is defined as the ratio of the rate of carbon assimilation (photosynthesis) to the
rate of transpiration. This was also measured by using IRGA, LCA-4, Analytical Development
Company, Hoddesdon, England (Zahra Rahneshan et al., 2017; Muhammad Rizwan et al.,
2017).
Collected data was statistically analyzed by using Minitab-2017 and Microsoft Excel and
interpreted accordingly.
3.2.4. Impact of different species on soil compaction:
At the termination of experiment, soil bulk density was analyzed again (by the same
technique used earlier) to assess the impact of different seedling on soil compaction levels
(Treatments).
Collected data was statistically analyzed by using Minitab-2017 and Microsoft Excel and
interpreted accordingly.
3.3. Study-3: Use of seedlings to analyze the growth response against various levels of
soil compaction
As seedling are being used in the field as planting material so, during study-III of
this research work seedling (3 month old) were used in same earthen beds having same
compaction levels to assess the growth response of eight selected (Acacia nilotica,
Eucalyptus camaldulensis, Albizia lebbeck, Zyziphus mauritiana, Dalbergia sissoo, Bombax
ceiba, Morus alba and Populus deltoides) farm tree species against soil compaction. Planting
material (Three month old seedlings) was obtained from the research area of Department of
Forestry and Range Management, UAF. Different cultural practices (weeding, cleaning and

42
irrigation etc.) were carried out as per requirement. Collected data was analyzed by using
Minitab-2017 and Microsoft Excel and interpreted accordingly.

43
CHAPTER IV
RESULTS
The current research work was completed in two years (2015-17). Results of three studies
were as under:
4.1. Study- 1 (Field Survey):
Results of survey conducted in Shahdara plantation (selected due to heavy grazing pressure)
and mechanized or non-mechanized farmlands (of Faisalabad and Sheikhupura) were as
under:
4.1.1. Shahdara Plantations
Shahdara Reserve Forest comprised of three beats named as Shahdara Beat, Karol Beat and
Jhugian Beat respectively (Table 4.1). There were only 1360 standard trees in the area of 849
acres that showed clearly the poor management of Forest Department. So, most of the
registered forest area was blank whereas grazing pressure to suppress the natural regeneration
was high in the mentioned forest area (Figure 4.1).
Table 4.1: Current status of Shahdara Reserved Forest (Punjab Forest Department)
S.# Beat Name Total area
(Acres)
Area under river
bed (Acres)
Area out of river bed
(Acres)
No. of
Trees
1 Shahdara 678 590 88 671
2 Karol 545 ------- 545 352
3 Jhugian 390 174 216 337
Total 1613 764 849 1360
Figure 4.1: Buffaloes trail in compartment no. 4 of Shahdara Reserved Forests.

44
Results of observations, field measurements and laboratory analysis were given in Table 4.2.
It was clear from the results that livestock can seriously damage the physico-chemical
properties of soil as well as the status and growth of existing vegetation. Soil dry bulk
densities which were taken as the indicator of soil compaction were ranging from 1.2 to 1.53
Mg/m3 while minimum for undisturbed soils and maximum for soil under enormous live
stock pressure. Similarly the lowest values of saturation %age (63.5), TSS (1036 mg/L), EC
(1.2 dS/m) and pH (7.6) were recorded at site 1 (soil without disturbance). Whereas the
highest of these parameters were measured at site 4 which was the most disturbed area as it
was the staying area of the buffalos (Table 4.2)
It was also observed that places under continuous trespassing were without or less number of
trees as compared to undisturbed soils (site 1). Furthermore, in compacted soils (site 2, 3 &
4) trees were not as healthy as in other areas. People living there and forest authorities had
the notion of soil damage by grazing animals but were not aware of soil compaction level and
its consequences on tree growth.

45
Table 4.2: Soil properties at four different sites in Shahdara Plantation under enormous livestock (Buffalo etc.) pressure
Sr. #. Soil
depth
(cm)
Site
location
Site description Observation Saturation
(%)
TSS
(mg/L)
EC
(dS/m)
pH Av. bulk
density
(Mg/m3)
1 0-15 Site 1 Soil without disturbance Diverse trees
were present
63.5 1036 1.2 7.6 1.28 ± 0.14
15-30 68.2 1094 1.8 7.7 1.20 ± 0.09
2 0-15
Site 2 Buffalo’s shelter Place Few old
unhealthy trees
were present
63.8 2147 2.3 7.9
1.40 ± 0.21
15-30 67.2 2340 2.5 7.9 1.30 ± 0.15
3 0-15 Site 3 Buffalo’s daily path to go
to river
Without trees 65.1 2115 2.1 7.7 1.47 ± 0.3
15-30 66.5 2427 2.6 7.6 1.50 ± 0.42
4 0-15 Site 4 Buffalo’s feeding place
(Permanent stay)
Without trees 66.3 3480
6.9 8.1 1.51 ± 0.16
15-30 68.1 3831 5.8 8.3 1.53 ± 0.22

46
4.1.2. Farmlands
Results of farmer’s interview from mechanized and/or non-mechanized farmlands (from
Faisalabad and Sheikhupura) were as below:
4.1.2.1. Total Land Holding
It can be observed from Figure 4.2 that a large number of respondents were small scale
farmers and land holding was less as compared with middle farmers followed by progressive
farmers that were fewer in number. Majority of the respondents (60%) were small land
holders having area less than 10 acres, followed by 21% of the respondents with 11-20 acres,
then 9% of the respondents were having area between 21-40 acres. Only 1% of farmers had
>100 acres of farmlands as depicted in Figure 4.2.
4.1.2.2. Agro-forestry Pattern
Figure 4.3 depicted that majority of the respondents/farmers were growing trees in linear
form around their fields or along water channels. 71% of the respondents grow trees with
different crops, out of which 70% grow linear plantation and 1.5 % of the respondents used
inter planting methods. About 5% of respondents grow only trees in compact or block form
on their farmlands. Whereas 14% of the respondents replied that they don’t need trees on
their farmlands.
4.1.2.3. Species Abundance
Figure 4.4 revealed that Dalbergia sissoo trees were found as the most abundant trees in farm
field (35%) followed by Vachellia nilotica (16%) and Populus deltoides (17%). Eucalyptus
camaldulensis (14%) and Morus alba (10%) were also present in the sizeable numbers on the
farmland. Other trees (8%) included Melia azedarach, Mangifera indica, Ziziphus
mauritiana etc. Figure 4.4 clearly showed that, currently, Dalbergia sissoo was the most
abundant tree found on farmlands.
4.1.2.4. Trend during Last Decade
It can be observed from figure 4.5 that maximum number of respondents/farmers (48%)
planted E. camaldulensis during the last ten years or so, followed by the respondents (24%)
who planted V. nilotica. About 17% of the respondents planted B. ceiba and only fewer (5%)
had grown other species.

47
4.1.2.5. Willingness to grow trees
Results revealed that majority of the respondents/farmers (68%) were enthusiastic to grow
more trees on their farmlands (shown in figure 4.6). Farmers were willing to grow more trees
as they provide extra income and fulfill their domestic needs such as fuel wood and fodder
etc. Others farmers (32%) either had sufficient number of trees on their farmlands or they had
the strong opinion about negative effects of trees on crop yield (due to light, nutrient and
water competition).
4.1.2.6. Use of machinery and bulk density
According to the survey which was conducted in surroundings of Faisalabad and
Sheikhupura, it was found that most of farmers cultivate wheat, cotton, rice, maize,
sugarcane, potato, lucern, berseem, onion and garlic on their fields with some farmers having
fruit orchards of mango and jaman. Machinery used on their farmlands included tractor,
combine harvester, boom sprayer, cutter, disc harrow, rootavator, reaper, thresher, different
ploughs and leveler. Keeping in view the frequency and the machinery used by the farmers,
the lands were categorized into four compaction classes. The bulk densities were determined
in relation to each class following the same method as mentioned earlier. It was found that
heavy use of machinery in farm crops have resulted in soil compaction along tree fields
(Table 4.3). A maximum level of soil compaction 1.74 ± 0.45 Mg/m3 was observed in the farm
fields where more than 4 heavy machineries were used or in compaction class 4. Near trees,
subsoil compaction was slightly more in mechanized farmlands as compared to non-
mechanized farmlands but it was not significantly different that may be attributed to roots
activity of trees. Results for croplands (not presented here) showed the reverse: considerable
subsoil compaction was observed whereas no soil compaction of upper layer was seen. So,
the study validated that heavy use machinery for various farm operations including ploughers
loose the upper soil in farm crops area while at the same time they are compacting the sub
soil more near trees.

48
Table 4.3: No. of machines used and compaction classes with their bulk densities at
two depths No. of
Machinery used
Compaction Class Avg. B. Density
(Mg/m3)
0-15 cm
Avg .Bulk Density
(Mg/m3)
15-30 cm
Penetrometer
readings
Kg/cm2
<2 1 1.19 ± 0.2 1.18 ± 0.11 0.5 ± 0.1
3 2 1.33 ± 0.4 1.14 ± 0.17 0.6 ± 0.2
4 3 1.41 ± 0.3 1.22 ± 0.19 0.8 ± 0.3
>4 4 1.74 ± 0.45 1.31 ± 0.2 > 1
4.1.2.7. Soil textural class
Relation of average dry bulk densities with soil textural class was also examined for all the
visited farmlands. Soils textural class was analyzed from Ayub Research Center, Faisalabad.
It was found that soil textural class has an effect on soil compaction but not as dominant as of
use of machinery (Table 4.3 and Table 4.4).
Table.4.4. Compaction in field and its classification with respect to soil type
No. Soil type Avg. Density
(Mg/m3) 0-15 cm
Avg .Bulk Density
(Mg/m3) 15-30 cm
Penetrometer
reading
(Kg/cm2)
1 Clayey loam 1.45 ± 0.3 1.20 ± 0.2 0.6 ± 0.4
2 Clayey 1.3 ± 0.25 1.15 ± 0.17 0.5 ± 0.5
3 Sandy loam 1.31 ± 0.4 1.3 ± 0.13 0.4 ± 0.4
4 Loam 1.36 ± 0.35 1.26 ± 0.21 0.4 ± 0.5
4.1.2.8. Awareness about mechanization
When Farmers were asked about their awareness about relation between mechanization and
soil compaction, soil compaction and trees, and soil compaction and crops yields; they
responded differently (Figure 4.7). About 45% of the respondents/farmers were aware that
use of more machinery results in more soil compaction and about 80% farmers agreed that
upper or subsoil compaction results in yield reduction of crops and different cultural
operations are necessary to get good yields of next crops. However, only 6% farmers knew
that there could also be negative effects of soil compaction on the trees growing around crops
along boundaries or in other forms (compact or inter planting).

49
Figure 4.2:Distribution of respondents according to
their land holding
Figure 4.3: Distribution of the respondents according
to the adoption of Agro forestry pattern
Figure 4.4: Species abundance on farmlands
Figure 4.5: Trend of planting different species during
the last decade
Figure 4.6: Response of farmers to grow more trees
on their farmlands
Figure 4.7: Response regarding awareness
about mechanization Vs soil compaction, soil
compaction Vs trees and soil compaction Vs
crop yield.

50
4.2. Growth response of selected agro-forest species (seeds and cuttings) against soil
compaction (Study-2):
4.2.1 Germination/Sprouting %age:
Figure 4.8a revealed that response of germination %age of Eucalyptus camaldulensis was
significantly different in all treatments. Maximum germination (93%) was observed in T0,
followed by T1 (78%), T2 (67%) and T3 (38%). Whereas, minimum germination (21%) was
recorded in T4 (having maximum bulk density i.e. 1.8 Mg/m3). Figure 4.8b indicated that the
response of germination %age of Albizia lebbeck was significantly different in all treatments.
Maximum germination (81.67 %) was observed in T0, followed by T1 (77.67 %), T2 (55.67
%) and T3 (38 %). Whereas, minimum germination (21.33%) was recorded in T4 (having
maximum bulk density i.e. 1.8 Mg/m3). It can be observed from figure 4.8c that the response
of germination %age of Vachellia nilotica was significantly different in all treatments.
Maximum germination (96%) was observed in T0, followed by T1 (92%), T2 (83%) and T3
(42%). Whereas, minimum germination (21%) was recorded in T4 (having maximum bulk
density i.e. 1.8 Mg/m3). Figure 4.8d revealed from that the response of germination %age of
Ziziphus mauritiana was significantly different in all treatments. Maximum germination
(40.67%) was observed in T0, followed by T1 (38.67%), T2 (35.67%) and T3 (18.33%).
Whereas, minimum germination (8.33%) was recorded in T4 (having maximum bulk density
i.e. 1.8 Mg/m3).
Figure 4.8e showed that the response of sprouting %age of Bombax ceiba was significantly
different in all treatments. Maximum sprouting (79%) was observed in T0, followed by T1
(62%), T2 (56%) and T3 (28%). Whereas, minimum sprouting (12%) was recorded in T4
(having maximum bulk density i.e. 1.8 Mg/m3). It can be seen from figure 4.8f that the
response of sprouting %age of Dalbergia sissoo was significantly different in all treatments.
Maximum sprouting (96%) was observed in T0, followed by T1 (91%), T2 (86%) and T3
(66%). Whereas, minimum sprouting (54%) was recorded in T4 (having maximum bulk
density i.e. 1.8 Mg/m3). Figure 4.8g revealed that the response of sprouting %age of Populus
deltoides was significantly different in all treatments. Maximum sprouting (87.67%) was
seen in T0, followed by T1 (68.67%), T2 (52.33%) and T3 (23.33%). Whereas, minimum
sprouting (13.67%) was recorded in T4 (having maximum bulk density i.e. 1.8 Mg/m3).
Figure 4.8h depicted that the response of sprouting %age of Morus alba was significantly

51
different in all treatments. Maximum sprouting (96%) was observed in control treatment T0,
followed by T1 (76%), T2 (55.33%) and T3 (17.67%). Whereas, minimum sprouting
(11.67%) was recorded in T4 (having maximum bulk density i.e. 1.8 Mg/m3). Analyses of
variance of all these species are given as Appendix 2.
4.2.2 Survival %
It can be observed from figure 4.9a that the response of survival %age of Eucalyptus
camaldulensis was significantly different in all treatments. Maximum survival (93 %) was
observed in T0, followed by T1 (82.33 %), T2 (70.33 %) and T3 (49.33 %). Whereas,
minimum survival (29.67%) was recorded in T4 (having maximum bulk density i.e. 1.8
Mg/m3). Figure 4.9b revealed that the response of survival %age of Albizia lebbeck was
significantly different in all treatments. Maximum survival (94.67 %) was seen in T0,
followed by T1 (90.33 %), T2 (82.33 %) and T3 (58.33 %). Whereas, minimum survival
(33.33%) was recorded in T4 (having maximum bulk density i.e. 1.8 Mg/m3). Figure 4.9c
indicated that the response of survival %age of Vachellia nilotica was significantly different.
Though T0, T1 and T2 were not much different from each other but these were found
significantly different from T3 and T4. Maximum survival (96 %) was observed in T0,
followed by T1 (95 %), T2 (95 %) and T3 (90 %). Whereas, minimum survival (70%) was
recorded in T4 (having maximum bulk density i.e. 1.8 Mg/m3). It can be observed from
figure 4.9d that the response of survival %age of Ziziphus mauritiana was significantly
different in all treatments except T0 and T1 which were not different from each other
statistically. Maximum survival (97 %) was observed in T0, followed by T1 (96.33 %), T2
(92.67 %) and T3 (83.33 %). Whereas, minimum survival (71%) was recorded in T4 (having
maximum bulk density i.e. 1.8 Mg/m3).
It can be observed from figure 4.9e that the response of survival %age of Bombax ceiba was
significantly different in all treatments except T1 and T2 which were not different from each
other statistically. Maximum survival (95 %) was seen in T0, followed by T1 (92 %), T2
(91.67 %) and T3 (79 %). Whereas, minimum survival (56%) was recorded in T4 (having
maximum bulk density i.e. 1.8 Mg/m3). Figure 4.9f showed that the response of survival
%age of Dalbergia sissoo was significantly different in all treatments except T0 and T1
which were not different from each other statistically. Maximum survival (94 %) was seen in
control treatment T0, followed by T1 (93 %), T2 (86.33 %) and T3 (65 %). Whereas,

52
minimum survival (58.33%) was recorded in T4 (having maximum bulk density i.e. 1.8
Mg/m3). Figure 4.9g revealed that the response of survival %age of Populus deltoides was
significantly different in all treatments except T0 and T1 which were not different from each
other statistically. Maximum survival (92.67 %) was observed in T0, followed by T1 (92.33
%), T2 (71.33 %) and T3 (41.33 %). Whereas, minimum survival (17.67%) was recorded in
T4 (having maximum bulk density i.e. 1.8 Mg/m3). Figure.4.9h showed that the response of
survival %age of Morus alba was significantly different in all treatments. Maximum survival
(94 %) was seen in T0, followed by T1 (72 %), T2 (51 %) and T3 (15 %). Whereas,
minimum survival (9%) was recorded in T4 (having maximum bulk density i.e. 1.8 Mg/m3).
Analyses of variance of all these species are given as Appendix 3.

53
a B
c D
e F
g H
Figure 4.8: Effect of soil compaction on germination%. a) Ecucalyptus camaldulensis; b)
Albizia lebbeck; c) Vachellia nilotica; d) Ziziphus mauritiana; e) Bombax ceiba; f) Dalbergia
sissoo; g) Populus deltoides; h) Morus alba

54
a b
c d
e f
g h
Figure 4.9: Effect of soil compaction on survival %. a) Ecucalyptus camaldulensis; b) Albizia
lebbeck; c) Vachellia nilotica; d) Ziziphus mauritiana; e) Bombax ceiba; f) Dalbergia sissoo;
g) Populus deltoides; h) Morus alba

55
4.2.3 Girth/Diameter of plant:
As evident from figure 4.10a it can be noticed that response of diameter of Eucalyptus
camaldulensis was significantly different from each other. Maximum diameter (0.156 mm)
was seen in T0, followed by T1 (0.125 mm), T2 (0.104 mm) and T3 (0.069 mm). Whereas,
minimum diameter (0.053 mm) was recorded in T4 (having maximum bulk density i.e. 1.8
Mg/m3). Figure 4.10b showed that response of diameter of Albizia lebbeck was significantly
different from each other in all treatments. Maximum diameter (0.195 mm) was observed in
T0, followed by T1 (0.176 mm), T2 (0.153 mm) and T3 (0.121 mm). Whereas, minimum
diameter (0.095 mm) was recorded in T4 (having maximum bulk density i.e. 1.8 Mg/m3). It
can be observed from figure 4.10c that response of diameter of Vachellia nilotica was
significant. Only T0 and T4 were significantly different from each other while rests were not
having much difference among them. Maximum diameter (0.184 mm) was observed in T0,
followed by T1 (0.136 mm), T2 (0.128 mm) and T3 (0.114 mm). Whereas, minimum
diameter (0.102 mm) was recorded in T4 (having maximum bulk density i.e. 1.8 Mg/m3). It
can be observed from figure 4.10d that response of diameter of Ziziphus mauritiana was
significant. Though T0, T1 and T2 were not significantly different from each other but these
were found different from T3 and T4. Maximum diameter (0.238 mm) was seen in T0,
followed by T1 (0.201 mm), T2 (0.181 mm) and T3 (0.127 mm). Whereas, minimum
diameter (0.105 mm) was recorded in T4 (having maximum bulk density i.e. 1.8 Mg/m3).
Figure 4.10e revealed that response of diameter of Bombax ceiba was significant. The
comparison of means indicated that only T0 and T4 were found significantly different from
each other while rest were not much different among themselves, as was evident from.
Maximum diameter (0.479 mm) was observed in T0, followed by T1 (0.463 mm), T2 (0.414
mm) and T3 (0.319 mm). Whereas, minimum diameter (0.244 mm) was recorded in T4
(having maximum bulk density i.e. 1.8 Mg/m3).
Figure 4.10f showed that response of diameter of Dalbergia sissoo was significant but only
T0, T1 and T4 were found significantly different from each other whereas T3 and T4 were
not found much different. Maximum diameter (0.439 mm) was seen in control treatment,
followed by T1 (0.414 mm), T2 (0.382 mm) and T3 (0.302mm). Whereas, minimum
diameter (0.291 mm) was recorded in T4 (having maximum bulk density i.e. 1.8 Mg/m3).

56
Figure 4.10g depicted that response of diameter of Populus deltoides was significantly
different in all treatments. Maximum diameter (0.486 mm) was seen in T0, followed by T1
(0.414 mm), T2 (0.319 mm) and T3 (0.212 mm). Whereas, minimum diameter (0.164 mm)
was recorded in T4 (having maximum bulk density i.e. 1.8 Mg/m3).
It can be observed from figure 4.10h that response of diameter of Morus alba was
significantly different in all treatments. Maximum diameter (0.358 mm) was observed in
control treatment, followed by T1 (0.323 mm), T2 (0.272 mm) and T3 (0.154 mm). Whereas,
minimum diameter (0.100 mm) was recorded in T4 (having maximum bulk density i.e. 1.8
Mg/m3). Analyses of variance of all these species are given as Appendix 4.
4.2.4 Shoot Length/Plant height:
It is evident from figure 4.11a that the response of shoot length of Eucalyptus camaldulensis
was significantly different from each other in all treatments. Maximum shoot length (24.33
cm) was seen in control treatment, followed by T1 (20.67 cm), T2 (17 cm) and T3 (12 cm).
Whereas minimum shoot length (9 cm) was recorded in T4 (having maximum bulk density
i.e. 1.8 Mg/m3). It can be observed from figure 4.11b that the response of shoot length of
Albizia lebbeck was significant against T0, T1 and T2; however T3 and T4 were not found
different statistically. Maximum shoot length (18.33cm) was seen in control treatment,
followed by T1 (15.17 cm), T2 (11.78 cm) and T3 (9.83 cm). Whereas minimum shoot
length (8.33 cm) was recorded in T4 (having maximum bulk density i.e. 1.8 Mg/m3). Figure
4.11c revealed that the response of shoot length of Vachellia nilotica was significant against
T0, T1 and T2 only, however T3 and T4 were not found different statistically. Maximum
shoot length (39.33 cm) was observed in T0, followed by T1 (32.87 cm), T2 (29.33 cm) and
T3 (24.67 cm). Whereas minimum shoot length (23.67 cm) was recorded in T4 (having
maximum bulk density i.e. 1.8 Mg/m3). It can be seen from figure 4.11d that significant
difference in response of shoot length of Ziziphus mauritiana was observed between T0 and
(T1 and T2). T0 was also statistically different from T3 andT4. But T1 and T2 were not
much different from each other as were T3 and T4. Maximum shoot length (28.0 cm) was
observed in T0, followed by T1 (22.0 cm), T2 (20.33 cm) and T3 (16.0 cm). Whereas
minimum shoot length (13.0 cm) was recorded in T4 (having maximum bulk density i.e. 1.8
Mg/m3).

57
Figure 4.11e showed that the response of shoot length of Bombax ceiba was significantly
different in all treatments. Maximum shoot length (38.0cm) was seen in control treatment,
followed by T1 (33.67 cm), T2 (28.67 cm) and T3 (21.33 cm). Whereas minimum shoot
length (15.5 cm) was recorded in T4 (having maximum bulk density i.e. 1.8 Mg/m3). It can
be observed from figure 4.11f that the response of shoot length of Dalbergia sissoo was
significant between T0 and (T1 and T2). T0 was also statistically different from T3 andT4.
But T1 and T2 were not much different from each other as were T3 and T4. Maximum shoot
length (31.33 cm) was observed in T0, followed by T1 (27.0 cm), T2 (24.33 cm) and T3
(19.67 cm). Whereas minimum shoot length (17.33 cm) was recorded in T4 (having
maximum bulk density i.e. 1.8 Mg/m3). Figure 4.11g showed that the response of shoot
length of Populus deltoides was significantly different from each other in all treatments.
Maximum shoot length (36.67 cm) was seen in control treatment, followed by T1 (33.0 cm),
T2 (27.0 cm) and T3 (17 cm). Whereas minimum shoot length (13 cm) was observed in T4
(having maximum bulk density i.e. 1.8 Mg/m3). From the figure 11h significant difference
can be observed for shoot length of Morus alba against T0, T1 and T2 only, however the
response was not significant in T3 and T4. Maximum shoot length (37.33 cm) was observed
in T0, followed by T1 (28.33 cm), T2 (20.67 cm) and T3 (12.67 cm). Whereas minimum
shoot length (10.33 cm) was recorded in T4 (having maximum bulk density i.e. 1.8 Mg/m3).
Analyses of variance of all these species are given as Appendix 5.

58
a b
c d
e f
g h
Figure 4.10: Effect of soil compaction on diameter (mm). a) Ecucalyptus camaldulensis; b)
Albizia lebbeck; c) Vachellia nilotica; d) Ziziphus mauritiana; e) Bombax ceiba; f) Dalbergia
sissoo; g) Populus deltoides; h) Morus alba.

59
a b
c d
e f
g h
Figure 4.11: Effect of soil compaction on shoot length/plant height (cm). a) Ecucalyptus
camaldulensis; b) Albizia lebbeck; c) Vachellia nilotica; d) Ziziphus mauritiana; e) Bombax
ceiba; f) Dalbergia sissoo; g) Populus deltoides; h) Morus alba.

60
4.2.5 Shoot fresh weight:
It can be observed figure 4.12a that that shoot fresh weight of Eucalyptus camaldulensis was
significantly different in all treatments. Maximum shoot fresh weight (0.076 Kg) was
observed in T0, followed by T1 (0.061 Kg), T2 (0.051 Kg) and T3 (0.030 Kg). Whereas
minimum shoot fresh weight (0.023 Kg) was seen in T4 (having maximum bulk density i.e.
1.8 Mg/m3). Figure 4.12b revealed that shoot fresh weight of Albizia lebbeck was
significantly different in all treatments. Maximum shoot fresh weight (0.081 Kg) was seen in
T0, followed by T1 (0.072 Kg), T2 (0.063 Kg) and T3 (0.037 Kg). Whereas minimum shoot
fresh weight (0.026 Kg) was observed in T4 (having maximum bulk density i.e. 1.8 Mg/m3).
For Vachellia nilotica, figure 4.12c showed that only T0 and T4 were found statistically
different, whereas T1, T2 and T3 were not much different from each other. Maximum shoot
fresh weight (0.167 Kg) was observed in T0, followed by T1 (0.153 Kg), T2 (0.130 Kg) and
T3 (0.100 Kg). Whereas minimum shoot fresh weight (0.070 Kg) was seen in T4 (having
maximum bulk density i.e. 1.8 Mg/m3). For Ziziphus mauritiana figure 4.12d revealed that
only T0 and T4 were significantly different whereas T1, T2 and T3 were not much different
from each other. Maximum shoot fresh weight (0.167 Kg) was observed in control treatment,
followed by T1 (0.160 Kg), T2 (0.143 Kg) and T3 (0.093 Kg). Whereas minimum shoot
fresh weight (0.070 Kg) was observed in T4 (having maximum bulk density i.e. 1.8 Mg/m3).
From figure 4.12e it can be observed that though T0 and T1 were not much different from
each other but these were found significantly different from T2, T3 and T4, for Bombax
ceiba. Maximum shoot fresh weight (0.357 Kg) was seen in T0, followed by T1 (0.326 Kg),
T2 (0.286 Kg) and T3 (0.213 Kg). Whereas minimum shoot fresh weight (0.160 Kg) was
observed in T4 (having maximum bulk density i.e. 1.8 Mg/m3). For Dalbergia sissoo figure
4.12f revealed that though T0 was not much different from T1 and T2 but it was found
significantly different from T3 and T4. Maximum shoot fresh weight (0.084 Kg) was
observed in T0, followed by T1 (0.076 Kg), T2 (0.072 Kg) and T3 (0.054 Kg). Whereas
minimum shoot fresh weight (0.037 Kg) was seen in T4 (having maximum bulk density i.e.
1.8 Mg/m3). It can be observed from figure 4.12g that the response of shoot fresh weight of
Populus deltoides was significantly different in all treatments. Maximum shoot fresh weight
(0.098 Kg) was observed in T0, followed by T1 (0.074 Kg), T2 (0.055 Kg) and T3 (0.021
Kg). Whereas minimum shoot fresh weight (0.014 Kg) was observed in T4 (having

61
maximum bulk density i.e. 1.8 Mg/m3). Figure 4.12h depicted that the response of shoot
fresh weight of Morus alba was significantly different in all treatments. Maximum shoot
fresh weight (0.065 Kg) was observed in control treatment T0, followed by T1 (0.053 Kg),
T2 (0.042 Kg) and T3 (0.029 Kg). Whereas minimum shoot fresh weight (0.021 Kg) was
seen in T4 (having maximum bulk density i.e. 1.8 Mg/m3). Analyses of variance of all these
species are given as Appendix 6.
4.2.6 Shoot dry weight:
From figure 4.13a, it can be observed that treatments T0, T1 and T2 were found significantly
different from each other whereas, this response was not significant in T3 and T4. Maximum
shoot dry weight (0.036 Kg) for Eucalyptus camaldulensis was observed in T0, followed by
T1 (0.029 Kg), T2 (0.024 Kg) and T3 (0.013 Kg). Whereas minimum shoot dry weight
(0.010 Kg) was recorded in T4 (having maximum bulk density i.e. 1.8 Mg/m3). Figure 4.13b
revealed that though T0, T1 and T2 were not much different from each other statistically but
these were significantly different from T3 and T4 for Albizia lebbeck. Maximum shoot dry
weight (0.039 Kg) was observed in control treatment T0, followed by T1 (0.035 Kg), T2
(0.031 Kg) and T3 (0.018 Kg). Whereas minimum shoot dry weight (0.014 Kg) was seen in
T4 (having maximum bulk density i.e. 1.8 Mg/m3). From Figure 4.13c, it can be observed
that only T0 and T4 were significantly different from each other, rests were not much
different among themselves for Vachellia nilotica. Maximum shoot dry weight (0.080 Kg)
was seen in T0, followed by T1 (0.070 Kg), T2 (0.060 Kg) and T3 (0.050 Kg). Whereas
minimum shoot dry weight (0.037 Kg) was recorded in T4 (having maximum bulk density
i.e. 1.8 Mg/m3). Figure 4.13d showed that though T0, T1 and T4 were not much different but
these were significantly different from T3 and T4 for Ziziphus mauritiana. Maximum shoot
dry weight (0.083 Kg) was observed in control treatment T0, followed by T1 (0.077 Kg), T2
(0.073 Kg) and T3 (0.047 Kg). Whereas minimum shoot dry weight (0.037 Kg) was observed
in T4 (having maximum bulk density i.e. 1.8 Mg/m3).
Figure 4.13e revealed that response of shoot dry weight of Bombax ceiba was significantly
different in all treatments. Maximum shoot dry weight (0.197 Kg) was observed in control
treatment, followed by T1 (0.167 Kg), T2 (0.147 Kg) and T3 (0.107 Kg). Whereas minimum
shoot dry weight (0.077 Kg) was recorded in T4 (having maximum bulk density i.e. 1.8
Mg/m3). It can be observed from figure 4.13f that the response of shoot dry weight of

62
Dalbergia sissoo was significantly different in all treatments. Maximum shoot dry weight
(0.037 Kg) was observed in T0, followed by T1 (0.032 Kg), T2 (0.028 Kg) and T3 (0.022
Kg). Whereas minimum shoot dry weight (0.018 Kg) was seen in T4 (having maximum bulk
density i.e. 1.8 Mg/m3). From figure 4.13g it can be observed that response of shoot dry
weight of Populus deltoides was significantly different in T0, T1 and T2 whereas not much
difference was observed among T3 and T4. Maximum shoot dry weight (0.043 Kg) was seen
in control treatment T0, followed by T1 (0.035 Kg), T2 (0.025 Kg) and T3 (0.011 Kg).
Whereas minimum shoot dry weight (0.008 Kg) was recorded in T4 (having maximum bulk
density i.e. 1.8 Mg/m3). It can be observed from figure 4.13h that response of shoot dry
weight Morus alba was significantly different in all treatments. Maximum shoot dry weight
(0.032 Kg) was observed in T0, followed by T1 (0.025 Kg), T2 (0.020 Kg) and T3 (0.014
Kg). Whereas minimum shoot dry weight (0.010 Kg) was observed in T4 (having maximum
bulk density i.e. 1.8 Mg/m3). Analyses of variance of all these species are given as Appendix
7.

63
a b
c d
e f
g h
Figure 4.12: Effect of soil compaction on shoot fresh weight (Kg). a) Ecucalyptus
camaldulensis; b) Albizia lebbeck; c) Vachellia nilotica; d) Ziziphus mauritiana; e) Bombax
ceiba; f) Dalbergia sissoo; g) Populus deltoides; h) Morus alba.

64
a b
c d
e f
g h
Figure 4.13: Effect of soil compaction on shoot dry weight (Kg). a) Ecucalyptus
camaldulensis; b) Albizia lebbeck; c) Vachellia nilotica; d) Ziziphus mauritiana; e) Bombax
ceiba; f) Dalbergia sissoo; g) Populus deltoides; h) Morus alba.

65
4.2.7 Root Length:
From figure 4.14a significant difference can be observed for shoot length of Eucalyptus
camaldulensis against T0, T1 and T2 only, however the response was not significant in T3
and T4. Maximum root length (11.83 cm) was observed in control treatment followed by T1
(9.97 cm), T2 (7.45 cm) and T3 (6.07 cm). Whereas minimum root length (5.20 cm) was
observed in T4 (having maximum bulk density i.e. 1.8 Mg/m3). From figure 4.14b, it can be
observed that T1 was not much different from T0 and T2 but T0 and T2 were statistically
different from each other. T3 and T4 were also not much different from each other for
Albizia lebbeck. Maximum root length (11.33 cm) was seen in control treatment, followed by
T1 (10.0 cm), T2 (8.83 cm) and T3 (6.67 cm). Whereas minimum root length (5.0 cm) was
observed in T4 (having maximum bulk density i.e. 1.8 Mg/m3). From figure 4.14c of
Vachellia nilotica, it can be observed that T0 and T1 were found statistically different from
T3 and T4 but these were not much different among themselves. Similarly T2 was not much
different from first and last two treatments as was evident. Maximum root length (19.33 cm)
was observed in T0, followed by T1 (18.0 cm), T2 (15.67 cm) and T3 (13.67 cm). Whereas
minimum root length (12.67 cm) was seen in T4 (having maximum bulk density i.e. 1.8
Mg/m3). Figure 4.14d revealed that only T0 and T4 were found statistically different but
remaining treatments were not much different among themselves of Ziziphus mauritiana.
Maximum root length (10.67 cm) was observed in control treatment T0, followed by T1
(10.0 cm), T2 (9.33 cm) and T3 (7.67 cm). Whereas minimum root length (7.0 cm) was
observed in T4 (having maximum bulk density i.e. 1.8 Mg/m3).
Figure 4.14e of Bombax ceiba showed that only T0 and T4 were found statistically different
but remaining treatments were not much different among themselves. Maximum root length
(16.67 cm) was observed in T0, followed by T1 (14.67 cm), T2 (13.33 cm) and T3 (9.33 cm).
Whereas minimum root length (7.33 cm) was recorded in T4 (having maximum bulk density
i.e. 1.8 Mg/m3). From Figure 4.14f of Dalbergia sissoo it can be observed that only T0 and
T4 were found statistically different but remaining treatments were not much different among
themselves. Maximum root length (16.0 cm) was observed in T0, followed by T1 (14.0 cm),
T2 (13.0 cm) and T3 (10.33 cm). Whereas minimum root length (9.33 cm) was observed in
T4 (having maximum bulk density i.e. 1.8 Mg/m3). Figure 4.14g of Populus deltoides

66
revealed that T0, T1 T2 and T4 were found statistically different but T3 was not much
different from T2 and T4. Maximum root length (13.0 cm) was observed in T0, followed by
T1 (10.0 cm), T2 (7.0 cm) and T3 (5.0 cm). Whereas minimum root length (4.0 cm) was
recorded in T4 (having maximum bulk density i.e. 1.8 Mg/m3). From figure 4.14h of Morus
alba it can be observed that T0 was not only different from T1 and T2 but was also found
different from T3 and T4. T1 and T2 were not found statistically different as were T3 and T4.
Maximum root length (18.33 cm) was observed in T0, followed by T1 (13.0 cm), T2 (11.67
cm) and T3 (5.67 cm). Whereas minimum root length (4.33 cm) was observed in T4 (having
maximum bulk density i.e. 1.8 Mg/m3). Analyses of variance of all these species are given as
Appendix 8.
4.2.8 Root fresh weight:
From figure 4.15a it can be observed that T2 was not only different from T0 and T1 but was
also found much different from T3 and T4. First two and last two treatment were found
statistically non significant among themselves of Eucalyptus camaldulensis. Maximum root
fresh weight (0.035 Kg) was observed in T0, followed by T1 (0.032 Kg), T2 (0.027 Kg) and
T3 (0.015 Kg). Whereas minimum root fresh weight (0.011 Kg) was seen in T4 (having
maximum bulk density i.e. 1.8 Mg/m3). From figure 4.15b, it can be observed that root fresh
weight of Albizia lebbeck was significantly different in all treatments. Maximum root fresh
weight (0.037 Kg) was observed in T0, followed by T1 (0.032 Kg), T2 (0.025 Kg) and T3
(0.017 Kg). Whereas minimum root fresh weight (0.014 Kg) was observed in T4 (having
maximum bulk density i.e. 1.8 Mg/m3). From figure 4.15c, it can be seen that T0 and T4
were significantly different from each other but T1, T2 and T3 were not much different
among themselves of Vachellia nilotica. Maximum root fresh weight (0.073 Kg) was
observed in control treatment, followed by T1 (0.070 Kg), T2 (0.057 Kg) and T3 (0.040 Kg).
Whereas minimum root fresh weight (0.037 Kg) was observed in T4 (having maximum bulk
density i.e. 1.8 Mg/m3). Figure 4.15d of Ziziphus mauritiana showed that only T0 and T4
were found significantly different from each other but T1, T2 and T3 were not much different
among themselves as was evident from. Maximum root fresh weight (0.083 Kg) was
observed in T0, followed by T1 (0.076 Kg), T2 (0.067 Kg) and T3 (0.060 Kg). Whereas
minimum root fresh weight (0.053 Kg) was recorded in T4 (having maximum bulk density
i.e. 1.8 Mg/m3).

67
As evident from figure 4.15e it can be seen that root fresh weight of Bombax ceiba was
significantly different in T0, T1 and T2, but was not much different in T3 and T4. Maximum
root fresh weight (0.179 Kg) was observed in T0, followed by T1 (0.150 Kg), T2 (0.103 Kg)
and T3 (0.058 Kg). Whereas minimum root fresh weight (0.034 Kg) was recorded in T4
(having maximum bulk density i.e. 1.8 Mg/m3). From figure 4.15f, it can be observed that
root fresh weight of Dalbergia sissoo was significantly different in T0, T3 and T4, but was
not much different in T1 and T2. Maximum root fresh weight (0.042 Kg) was observed in
control treatment followed by T1 (0.037 Kg), T2 (0.035 Kg) and T3 (0.028 Kg). Whereas
minimum root fresh weight (0.024 Kg) was recorded in T4 (having maximum bulk density
i.e. 1.8 Mg/m3). Figure 4.15g revealed that root fresh weight of Populus deltoides was
significantly different in T0, T1 and T2, but was not much different in T3 and T4. Maximum
root fresh weight (0.022 Kg) was observed in T0, followed by T1 (0.0170 Kg), T2 (0.011
Kg) and T3 (0.006 Kg). Whereas minimum root fresh weight (0.004 Kg) was recorded in T4
(having maximum bulk density i.e. 1.8 Mg/m3). It can be observed from figure 4.15h that
root fresh weight of Morus alba was significantly different in all treatments. Maximum root
fresh weight (0.038 Kg) was observed in To, followed by T1 (0.032 Kg), T2 (0.027 Kg) and
T3 (0.017 Kg). Whereas minimum root fresh weight (0.011 Kg) was recorded in T4 (having
maximum bulk density i.e. 1.8 Mg/m3). Analyses of variance of all these species are given as
Appendix 9.

68
a b
c d
e f
g h
Figure 4.14: Effect of soil compaction on root length (cm). a) Ecucalyptus camaldulensis; b)
Albizia lebbeck; c) Vachellia nilotica; d) Ziziphus mauritiana; e) Bombax ceiba; f) Dalbergia
sissoo; g) Populus deltoides; h) Morus alba.

69
a b
c d
e f
g h
Figure 4.15: Effect of soil compaction on root fresh weight (Kg). a) Ecucalyptus
camaldulensis; b) Albizia lebbeck; c) Vachellia nilotica; d) Ziziphus mauritiana; e) Bombax
ceiba; f) Dalbergia sissoo; g) Populus deltoides; h) Morus alba.

70
4.2.9 Root dry weight:
From figure 4.16a of Eucalyptus camaldulensis, it can be observed that T0 and T2 treatments
were significantly different from each other but both were not much different from T1.
Similarly non significant response was observed among T3 and T4. Maximum root dry
weight (0.016 Kg) was recorded in T0, followed by T1 (0.014 Kg), T2 (0.012 Kg) and T3
(0.006 Kg). Whereas minimum root dry weight (0.005 Kg) was recorded in T4 (having
maximum bulk density i.e. 1.8 Mg/m3). From figure 4.16b of Albizia lebbeck, it can be
observed that T0 was not much different from T1 and T2 but it was significantly different
from T3 and T4. Similarly non significant response was observed among T3 and T4.
Maximum root dry weight (0.016 Kg) was observed in T0, followed by T1 (0.015 Kg), T2
(0.013 Kg) and T3 (0.007 Kg). Whereas minimum root dry weight (0.006 Kg) was observed
in T4 (having maximum bulk density i.e. 1.8 Mg/m3). Figure 4.16c of Vachellia nilotica,
revealed that only T0 and T4 were found statistically different whereas T1, T2 and T3 were
not significant in response. Maximum root dry weight (0.050 Kg) was observed in T0,
followed by T1 (0.043 Kg), T2 (0.043 Kg) and T3 (0.030 Kg). Whereas minimum root dry
weight (0.023 Kg) was seen in T4 (having maximum bulk density i.e. 1.8 Mg/m3). It can be
observed from figure 4.16d of Ziziphus mauritiana that only T0 and T4 were found
statistically different whereas T1, T2 and T3 were not significant in response. Maximum root
dry weight (0.053 Kg) was observed in control treatment, followed by T1 (0.046 Kg), T2
(0.040 Kg) and T3 (0.037 Kg). Whereas minimum root dry weight (0.033 Kg) was recorded
in T4 (having maximum bulk density i.e. 1.8 Mg/m3).
Figure 4.16e of Bombax ceiba showed that only T0 and T4 were found statistically different
whereas T1, T2 and T3 were not much different in response. Maximum root dry weight
(0.087 Kg) was observed in T0, followed by T1 (0.068 Kg), T2 (0.053 Kg) and T3 (0.031
Kg). Whereas minimum root dry weight (0.021 Kg) was recorded in T4 (having maximum
bulk density i.e. 1.8 Mg/m3). Figure 4.16f of Dalbergia sissoo revealed that T0 was not only
different from T1 and T2 but was also found different from T3 and T4. T1 was not much
different from T2 as were T3 and T4. Maximum root dry weight (0.020 Kg) was observed in
T0, followed by T1 (0.018 Kg), T2 (0.017 Kg) and T3 (0.013 Kg). Whereas minimum root
dry weight (0.012 Kg) was recorded in T4 (having maximum bulk density i.e. 1.8 Mg/m3).
Figure 4.16g of Populus deltoids depicted that only T0 and T4 were found significantly

71
different from each other whereas T1, T2 and T3 were not much different from each other.
Maximum root dry weight (0.008 Kg) was recorded in control treatment followed by T1
(0.007 Kg), T2 (0.005 Kg) and T3 (0.004 Kg). Whereas minimum root dry weight (0.003
Kg) was observed in T4 (having maximum bulk density i.e. 1.8 Mg/m3). It can be observed
from figure 4.16h of Morus alba that though T0 and T1 were not much different from each
other but these were significantly different from T2, T3 and T4. Maximum root dry weight
(0.017 Kg) was observed in T0, followed by T1 (0.015 Kg), T2 (0.013 Kg) and T3 (0.008
Kg). Whereas minimum root dry weight (0.004 Kg) was seen in T4 (having maximum bulk
density i.e. 1.8 Mg/m3). Analyses of variance of all these species are given as Appendix 10.
4.2.10 Root/Shoot ratio:
Figure 4.17a of Eucalyptus camaldulensis indicated that all the treatments were not found
significantly different from each other. Maximum value of root/shoot ratio (0.50) was
recorded in T4 (having maximum bulk density i.e. 1.8 Mg/m3). Followed by T2 (0.49), T1
(0.48) and T3 (0.47). Whereas minimum value (0.43) was recorded in T0 (having minimum
bulk density i.e. 1.3 Mg/m3). From figure 4.17b of Albizia lebbeck it can be observed that
only T3 and T4 were found significantly different from each other while rest were not much
different from each other. Maximum value of root/shoot ratio (0.50) was recorded in T4
(having maximum bulk density i.e. 1.8 Mg/m3). Followed by T1 (0.43), T2 (0.42) and T0
(0.42), whereas minimum value (0.40) was recorded in T3. Figure 4.17c of Vachellia nilotica
revealed that all the treatments were not found significantly different from each other.
Maximum value of root/shoot ratio (0.72) was recorded in T2. Followed by T1 (0.65), T4
(0.63) and T0 (0.63). Whereas the minimum value (0.60) was recorded in T3 (having
minimum bulk density i.e. 1.3 Mg/m3). From figure 4.17d of Ziziphus mauritiana it can be
observed that all the treatments were not found significantly different from each other.
Maximum value of root/shoot ratio (0.94) was recorded in T4 (having minimum bulk density
i.e. 1.3 Mg/m3). Followed by T3 (0.78), T0 (0.64) and T1 (0.60). Whereas the minimum
value (0.54) was recorded in T2.
Figure 4.17e of Bombax ceiba indicated that only T0 and T4 were found significantly
different from each other while rests were not found different from each other. Maximum
value of root/shoot ratio (0.44) was recorded in T0 (having minimum bulk density i.e. 1.3
Mg/m3). Followed by T1 (0.41), T2 (0.36) and T3 (0.29), whereas minimum value (0.23) was
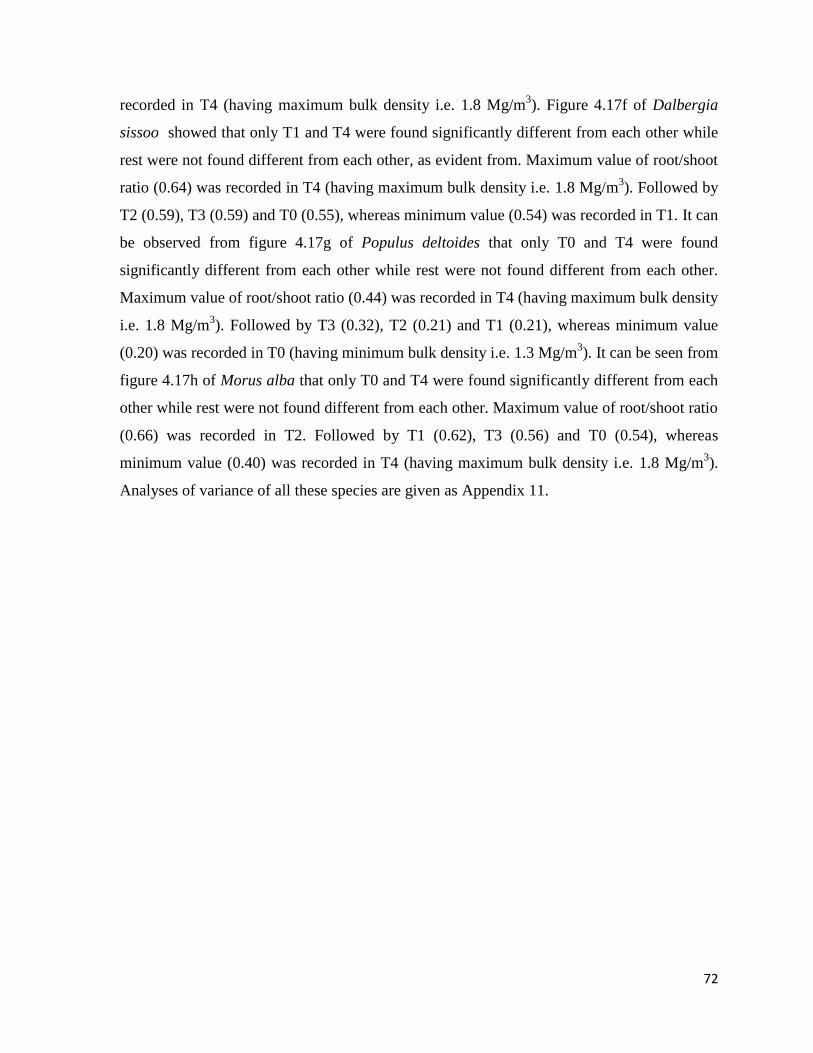
72
recorded in T4 (having maximum bulk density i.e. 1.8 Mg/m3). Figure 4.17f of Dalbergia
sissoo showed that only T1 and T4 were found significantly different from each other while
rest were not found different from each other, as evident from. Maximum value of root/shoot
ratio (0.64) was recorded in T4 (having maximum bulk density i.e. 1.8 Mg/m3). Followed by
T2 (0.59), T3 (0.59) and T0 (0.55), whereas minimum value (0.54) was recorded in T1. It can
be observed from figure 4.17g of Populus deltoides that only T0 and T4 were found
significantly different from each other while rest were not found different from each other.
Maximum value of root/shoot ratio (0.44) was recorded in T4 (having maximum bulk density
i.e. 1.8 Mg/m3). Followed by T3 (0.32), T2 (0.21) and T1 (0.21), whereas minimum value
(0.20) was recorded in T0 (having minimum bulk density i.e. 1.3 Mg/m3). It can be seen from
figure 4.17h of Morus alba that only T0 and T4 were found significantly different from each
other while rest were not found different from each other. Maximum value of root/shoot ratio
(0.66) was recorded in T2. Followed by T1 (0.62), T3 (0.56) and T0 (0.54), whereas
minimum value (0.40) was recorded in T4 (having maximum bulk density i.e. 1.8 Mg/m3).
Analyses of variance of all these species are given as Appendix 11.

73
a b
c d
e f
g h
Figure 4.16: Effect of soil compaction on root dry weight (Kg). a) Ecucalyptus
camaldulensis; b) Albizia lebbeck; c) Vachellia nilotica; d) Ziziphus mauritiana; e) Bombax
ceiba; f) Dalbergia sissoo; g) Populus deltoides; h) Morus alba.

74
a b
c d
e f
g h
Figure 4.17: Effect of soil compaction on root/shoot ratio. a) Ecucalyptus camaldulensis; b)
Albizia lebbeck; c) Vachellia nilotica; d) Ziziphus mauritiana; e) Bombax ceiba; f) Dalbergia
sissoo; g) Populus deltoides; h) Morus alba

75
4.2.11. Leaf area:
Figure 4.18a of Eucalyptus camaldulensis indicated that all the treatments were found
significantly different from each other. Maximum leaf area (936.6 mm2) was observed in T0,
followed by T1 (866.5 mm2), T2 (822.53 mm
2) and T3 (684.26 mm
2). Whereas, minimum
value of leaf area (613.2 mm2) was observed in T4 (having maximum bulk density i.e. 1.8
Mg/m3). It can be observed from figure 4.18b of Albizia lebbeck that all the treatments were
found significantly different from each other. Maximum leaf area (76.4 mm2) was observed
in T0, followed by T1 (70.3 mm2), T2 (62.27 mm
2) and T3 (43.73 mm
2). Whereas, minimum
value of leaf area (31.44 mm2) was seen in T4 (having maximum bulk density i.e. 1.8
Mg/m3). Figure 4.18c of Vachellia nilotica indicated that T0 was not only significantly
different from T1 and T2 but it was also found different from T3 and T4 whereas, T1 and T2
were not found much different from each other as were T3 and T4. Maximum leaf area (6.2
mm2) was observed in T0, followed by T1 (5.8 mm
2), T2 (5.8 mm
2) and T3 (5.5 mm
2).
Whereas, minimum value of leaf area (5.5 mm2) was recorded in T4 (having maximum bulk
density i.e. 1.8 Mg/m3). Figure 4.18d of Ziziphus mauritiana indicated that only T0 and T4
were found significantly different from each other while rest were not found different from
each other. Maximum leaf area (62.37 mm2) was observed in control treatment, followed by
T1 (61.97 mm2), T2 (60.53 mm
2) and T3 (59.07 mm
2). Whereas, minimum value of leaf area
(58.27 mm2) was recorded in T4 (having maximum bulk density i.e. 1.8 Mg/m
3).
It can be observed from figure 4.18e of Bombax ceiba that only T0 and T4 were found
significantly different from each other while rest were not found different from each other.
Maximum leaf area (1050.97 mm2) was observed in T0, followed by T1 (967.20 mm
2), T2
(946.83 mm2) and T3 (913.13 mm
2). Whereas, minimum value of leaf area (877.10 mm
2)
was recorded in T4 (having maximum bulk density i.e. 1.8 Mg/m3). Figure 4.18f of
Dalbergia sissoo revealed that all the treatments were found significantly different from each
other. Maximum leaf area (958.83 mm2) was observed in T0, followed by T1 (930.87 mm
2),
T2 (894.47 mm2) and T3 (755.50 mm
2). Whereas, minimum value of leaf area (614.50 mm
2)
was recorded in T4 (having maximum bulk density i.e. 1.8 Mg/m3). It can be observed from
figure 4.18g of Populus deltoides that though T0, T1 and T2 were not found significantly
different but these were found much different from T3 and T4. Maximum leaf area (1868.8
mm2) was recorded observed in T0, followed by T1 (1856.53 mm
2), T2 (1836.47 mm
2) and

76
T3 (1803.33 mm2). Whereas, minimum value of leaf area (1774.93 mm
2) was recorded in T4
(having maximum bulk density i.e. 1.8 Mg/m3). Figure.4.18h of Morus alba showed that all
the treatments were found significantly different from each other. Maximum leaf area
(1215.47 mm2) was recorded in T0, followed by T1 (1060.03 mm
2), T2 (970.67 mm
2) and T3
(717.67 mm2). Whereas, minimum value of leaf area (581.60 mm
2) was observed in T4
(having maximum bulk density i.e. 1.8 Mg/m3). Analyses of variance of all these species are
given as Appendix 12.
4.2.12 Number of leaves:
It can be observed from figure 4.19a of Eucalyptus camaldulensis that significant difference
was observed against T0, T3 and T4 treatments only whereas T1 and T2 were not found
different in response statistically. Maximum number of leaves (65.67 no.) were observed in
control treatment, followed by T1 (59 no.), T2 (54 no.) and T3 (39.67 no.). Whereas
minimum number of leaves (30 no.) were recorded in T4 (having maximum bulk density i.e.
1.8 Mg/m3). Figure 4.19b of Albizia lebbeck indicated significant difference for number of
leaves produced against T0, T3 and T4 treatments only. T1 and T2 were not significant in
response statistically. Maximum number of leaves (56.0 no.) were recorded in T0, followed
by T1 (49.33 no.), T2 (43.33 no.) and T3 (24 no.). Whereas minimum number of leaves (16.0
no.) were recorded in T4 (having maximum bulk density i.e. 1.8 Mg/m3). Figure 4.19c of
Vachellia nilotica showed that T2 was statistically different from first and last two
treatments. Whereas T0 and T1 were found not much different in response as were T3 and
T4. Maximum number of leaves (47.33 no.) were observed in control treatment, followed by
T1 (43.33 no.), T2 (35.67 no.) and T3 (25 no.). Whereas minimum number of leaves (19.33
no.) were recorded in T4 (having maximum bulk density i.e. 1.8 Mg/m3). It can be observed
from figure 4.19d of Ziziphus mauritiana that only T0 and T4 treatments were found
significantly different from each other whereas T1, T2 and T3 were not much different
among each other. Maximum number of leaves (69.67 no.) were recorded in T0, followed by
T1 (56.33 no.), T2 (49.0 no.) and T3 (42.0 no.). Whereas minimum number of leaves (28.33
no.) were recorded in T4 (having maximum bulk density i.e. 1.8 Mg/m3).
It can be seen from figure 4.19e of Bombax ceiba that only T0 and T4 treatments were found
significantly different from each other whereas T1, T2 and T3 were not much different
among each other. Maximum number of leaves (9.0 no.) were recorded in control treatment

77
followed by T1 (8.0 no.), T2 (6.33 no.) and T3 (5.33 no.). Whereas minimum number of
leaves (4.67 no.) were recorded in T4 (having maximum bulk density i.e. 1.8 Mg/m3). From
figure 4.19f of Dalbergia sissoo it can be seen that only T0 and T4 treatments were found
significantly different from each other whereas T1, T2 and T3 were not significant.
Maximum number of leaves (17.33 no.) were observed in T0, followed by T1 (15.67 no.), T2
(13.67 no.) and T3 (11.33 no.). Whereas minimum number of leaves (10.33 no.) were
recorded in T4 (having maximum bulk density i.e. 1.8 Mg/m3). Figure 4.19g indicated
significant difference for number of leaves produced by Populus deltoides against T0, T3 and
T4 treatments only. T1 and T2 were not found significant in response statistically. Maximum
number of leaves (36.0 no.) were observed in control treatment, followed by T1 (31.33 no.),
T2 (28.0 no.) and T3 (16.33 no.). Whereas minimum number of leaves (11.33 no.) were
recorded in T4 (having maximum bulk density i.e. 1.8 Mg/m3). It can be observed from
figure 4.19h of Morus alba that though the response regarding number of leaves produced in
T1 was not found different statistically from T0 and T2 but all the three treatments were
found different from T3 and T4. Similarly T3 and T4 were also not much different
statistically. Maximum number of leaves (34.33 no.) were recorded in T0, followed by T1
(27.67 no.), T2 (24.0 no.) and T3 (14.33 no.). Whereas minimum no of leaves (10.67 no.)
were seen in T4 (having maximum bulk density i.e. 1.8 Mg/m3). Analyses of variance of all
these species are given as Appendix 13.

78
a b
c d
e f
g h
Figure 4.18: Effect of soil compaction on leaf area (mm2). a) Ecucalyptus camaldulensis; b)
Albizia lebbeck; c) Vachellia nilotica; d) Ziziphus mauritiana; e) Bombax ceiba; f) Dalbergia
sissoo; g) Populus deltoides; h) Morus alba.

79
a b
c d
e f
g h
Figure 4.19: Effect of soil compaction on no. of leaves. a) Ecucalyptus camaldulensis; b)
Albizia lebbeck; c) Vachellia nilotica; d) Ziziphus mauritiana; e) Bombax ceiba; f) Dalbergia
sissoo; g) Populus deltoides; h) Morus alba.

80
4.2.13 Number of Branches:
Figure 4.20a revealed that response regarding number of branches produced by Eucalyptus
camaldulensis was significantly different in T0 and T4 treatments only whereas the said
response was not much different in T1, T2 and T3. Maximum number of branches (6 no.)
were recorded in T0, followed by T1 (5.33 no.), T2 (5 no.) and T3 (3.33 no.). Whereas
minimum no. of branches (2.33 no.) were observed in T4 (having maximum bulk density i.e.
1.8 Mg/m3). Figure 4.20b of Albizia lebbeck indicated that though the response regarding
number of branches produced in T1 was not found different statistically from T0 and T2 but
all the three treatments were found different from T3 and T4. Similarly T3 and T4 were also
statistically non significant. Maximum number of branches (17.33 no.) were observed in T0,
followed by T1 (15.33 no.), T2 (12.33 no.) and T3 (6 no.). Whereas minimum no of branches
(3.67 no.) were observed in T4 (having maximum bulk density i.e. 1.8 Mg/m3). It can be
observed from figure 4.20c of Vachellia nilotica that only T0 and T4 treatments were found
significantly different from each other whereas T1, T2 and T3 were not found different
statistically. Maximum number of branches (12.0 no.) were recorded in T0, followed by T1
(10.33 no.), T2 (9.0 no.) and T3 (7.67 no.). Whereas minimum no of branches (5.67 no.)
were recorded in T4 (having maximum bulk density i.e. 1.8 Mg/m3). It can be seen from
figure 4.20d of Ziziphus mauritiana that only T0 and T4 treatments were found significantly
different from each other whereas T1, T2 and T3 were no found different statistically.
Maximum number of branches (20.67 no.) were observed in control treatment, followed by
T1 (16.0 no.), T2 (14.33 no.) and T3 (12.33 no.). Whereas minimum no of branches (9.0 no.)
were recorded in T4 (having maximum bulk density i.e. 1.8 Mg/m3).
Figure 4.20e of Bombax ceiba showed that only T0 and T4 treatments were found
significantly different from each other whereas T1, T2 and T3 were not significant.
Maximum number of branches (8.0 no.) were recorded in T0, followed by T1 (7.0 no.), T2
(5.33 no.) and T3 (4.33 no.). Whereas minimum no of branches Bombax ceiba (3.67 no.)
were recorded in T4 (having maximum bulk density i.e. 1.8 Mg/m3). Figure.4.20f of
Dalbergia sissoo revealed that only T0 and T4 treatments were found significantly different
from each other whereas T1, T2 and T3 were not significant. Maximum number of branches
(16.0 no.) were observed in T0, followed by T1 (14.33 no.), T2 (12.67 no.) and T3 (10.67

81
no.). Whereas minimum no of branches Dalbergia sissoo (8.67 no.) were recorded in T4
(having maximum bulk density i.e. 1.8 Mg/m3). It can be observed from figure 4.20g of
Populus deltoides that only T0 and T4 treatments were found significantly different from
each other whereas T1, T2 and T3 were not significant as evident. Maximum number of
branches (3.67 no.) were recorded in T0, followed by T1 (3.33 no.), T2 (2.33 no.) and T3
(2.33 no.). Whereas minimum no of branches Populus deltoides (1.33 no.) were seen in T4
(having maximum bulk density i.e. 1.8 Mg/m3). It can be observed from Figure.4.20h of
Morus alba that only T0 and T4 treatments were found significantly different from each
other whereas T1, T2 and T3 were not significant as evident. Maximum number of branches
(2.67 no.) were observed in T0, followed by T1 (2.33 no.), T2 (2.0 no.) and T3 (1.33 no.).
Whereas minimum no of branches Morus alba (1.0 no.) were recorded in T4 (having
maximum bulk density i.e. 1.8 Mg/m3). Analyses of variance of all these species are given as
Appendix 14.
4.2.14 Photosynthetic rate:
It can be observed from figure 4.21a of Ecucalyptus camaldulensis that all the treatments
were found significantly different from each other. Maximum photosynthetic rate (5.91 µmol
CO2 m-2
S-1) was observed in T0, followed by T1 (4.69 µmol CO2 m
-2S
-1), T2 (3.86 µmol CO2 m-
2S
-1) and T3 (2.68 µmol CO2 m-2
S-1). Whereas, minimum photosynthetic rate (2.10 µmol CO2
m-2
S-1) was recorded in T4 (having maximum bulk density i.e. 1.8 Mg/m
3). Figure 4.21b
revealed that all the treatments were found significantly different from each other for Albizia
lebbeck. Maximum photosynthetic rate (6.27 µmol CO2 m-2
S-1) was recorded in T0, followed
by T1 (4.69 µmol CO2 m-2
S-1), T2 (4.08 µmol CO2 m
-2S
-1) and T3 (2.90 µmol CO2 m-2
S-1).
Whereas, minimum photosynthetic rate (1.99 µmol CO2 m-2
S-1) was recorded in T4 (having
maximum bulk density i.e. 1.8 Mg/m3). Figure 4.21c of Vachellia nilotica indicated that
though T0, T1 and T2 were not found significantly different but these were found much
different from T3 and T4. Maximum photosynthetic rate (6.92 µmol CO2 m-2
S-1) was observed
in T0, followed by T1 (5.82 µmol CO2 m-2
S-1), T2 (5.27 µmol CO2 m
-2S
-1) and T3 (3.64 µmol
CO2 m-2
S-1). Whereas, minimum photosynthetic rate (3.19 µmol CO2 m
-2S
-1) was observed in
T4 (having maximum bulk density i.e. 1.8 Mg/m3). It can be observed from Figure 4.21d of
Ziziphus mauritiana that only T0 and T4 were found significantly different from each other
while rest were not found different. Maximum photosynthetic rate (4.65 µmol CO2 m-2
S-1) was

82
recorded in T0, followed by T1 (4.08 µmol CO2 m-2
S-1), T2 (3.43 µmol CO2 m
-2S
-1) and T3
(2.19 µmol CO2 m-2
S-1). Whereas, minimum photosynthetic rate (1.73 µmol CO2 m
-2S
-1) was
recorded in T4 (having maximum bulk density i.e. 1.8 Mg/m3).
Figure 4.21e of Bombax ceiba showed that only T0 and T4 were found significantly different
from each other while rests were not found different. Maximum photosynthetic rate (3.97
µmol CO2 m-2
S-1) was observed in T0, followed by T1 (2.78 µmol CO2 m
-2S
-1), T2 (1.75 µmol
CO2 m-2
S-1) and T3 (1.46 µmol CO2 m
-2S
-1). Whereas, minimum photosynthetic rate (1.27 µmol
CO2 m-2
S-1) was recorded in T4 (having maximum bulk density i.e. 1.8 Mg/m
3). It can be
observed from figure 4.21f of Dalbergia sissoo was found significantly different in all
treatments. Maximum photosynthetic rate (5.87 µmol CO2 m-2
S-1) was seen in T0, followed by
T1 (5.21 µmol CO2 m-2
S-1), T2 (4.66 µmol CO2 m
-2S
-1) and T3 (3.50 µmol CO2 m-2
S-1). Whereas,
minimum photosynthetic rate (2.98 µmol CO2 m-2
S-1) was observed in T4 (having maximum
bulk density i.e. 1.8 Mg/m3). Figure 4.21g of Populus deltoides showed that all the
treatments were found significantly different from each other. Maximum photosynthetic rate
(6.42 µmol CO2 m-2
S-1) was observed in control treatment, followed by T1 (5.37 µmol CO2 m
-
2S
-1), T2 (4.46 µmol CO2 m-2
S-1) and T3 (3.12 µmol CO2 m
-2S
-1). Whereas, minimum
photosynthetic rate (2.48 µmol CO2 m-2
S-1) was observed in T4 (having maximum bulk
density i.e. 1.8 Mg/m3). As evident from figure 4.21h it can be observed that the response
regarding photosynthetic rate of Morus alba was significantly different in all treatments.
Maximum photosynthetic rate (4.9 µmol CO2 m-2
S-1) was observed in T0, followed by T1
(4.41 µmol CO2 m-2
S-1), T2 (3.96 µmol CO2 m
-2S
-1) and T3 (3.13 µmol CO2 m-2
S-1). Whereas,
minimum photosynthetic rate (2.72 µmol CO2 m-2
S-1) was observed in T4 (having maximum
bulk density i.e. 1.8 Mg/m3). Analyses of variance of all these species are given as Appendix
15.

83
a b
c d
e f
g h
Figure 4.20: Effect of soil compaction on no. of branches. a) Ecucalyptus camaldulensis; b)
Albizia lebbeck; c) Vachellia nilotica; d) Ziziphus mauritiana; e) Bombax ceiba; f) Dalbergia
sissoo; g) Populus deltoides; h) Morus alba.

84
a b
c d
e f
g h
Figure 4.21: Effect of soil compaction on photosynthetic rate (µmol CO2 m
-2S
-1). a)
Ecucalyptus camaldulensis; b) Albizia lebbeck; c) Vachellia nilotica; d) Ziziphus mauritiana;
e) Bombax ceiba; f) Dalbergia sissoo; g) Populus deltoides; h) Morus alba.

85
4.2.15 Transpiration rate:
Figure 4.22a revealed that transpiration rate of Eucalyptus camaldulensis was found
significantly different in all treatments. Maximum transpiration rate (41.11 mmol H2O m-2
S-1)
was recorded in T0, followed by T1 (36.67 mmol H2O m-2
S-1), T2 (32.24 mmol H2O m
-2S
-1) and
T3 (24.27 mmol H2O m-2
S-1). Whereas, minimum transpiration rate (19.68 mmol H2O m
-2S
-1)
was observed in T4 (having maximum bulk density i.e. 1.8 Mg/m3). Figure 4.22b showed
that transpiration rate of Albizia lebbeck was found significantly different in all treatments.
Maximum transpiration rate (39.64 mmol H2O m-2
S-1) was observed in T0, followed by T1
(36.7 mmol H2O m-2
S-1), T2 (32.37 mmol H2O m
-2S
-1) and T3 (23.77 mmol H2O m-2
S-1).
Whereas, minimum transpiration rate (19.53 mmol H2O m-2
S-1) was observed in T4 (having
maximum bulk density i.e. 1.8 Mg/m3). It can be observed from figure 4.22c of Vachellia
nilotica that only T0, T1 and T4 treatments were found significantly different from each
other while rest were not found much different. Maximum transpiration rate (37.20 mmol H2O
m-2
S-1) was recorded in T0, followed by T1 (32.41 mmol H2O m
-2S
-1), T2 (31.57 mmol H2O m-
2S
-1) and T3 (28.97 mmol H2O m-2
S-1). Whereas, minimum transpiration rate (26.57 mmol H2O
m-2
S-1) was observed in T4 (having maximum bulk density i.e. 1.8 Mg/m
3). Figure 4.22d of
Ziziphus mauritiana revealed that only T0, T1 and T4 treatments were found significantly
different from each other while rest were not found different, as was evident from. Maximum
transpiration rate (35.42 mmol H2O m-2
S-1) was observed in control treatment, followed by T1
(33.01 mmol H2O m-2
S-1), T2 (30.13 mmol H2O m
-2S
-1) and T3 (25.03 mmol H2O m-2
S-1).
Whereas, minimum transpiration rate (21.38 mmol H2O m-2
S-1) was recorded in T4 (having
maximum bulk density i.e. 1.8 Mg/m3).
It can be observed from figure 4.22e that the response regarding transpiration rate of Bombax
ceiba was found statistically different in all treatments except T3 and T4. Maximum
transpiration rate (37.13 mmol H2O m-2
S-1) was observed in T0, followed by T1 (30.67 mmol
H2O m-2
S-1), T2 (18.57 mmol H2O m
-2S
-1) and T3 (10.51 mmol H2O m-2
S-1). Whereas, minimum
transpiration rate (9.22 mmol H2O m-2
S-1) was recorded in T4 (having maximum bulk density
i.e. 1.8 Mg/m3). Figure 4.22f of Dalbergia sissoo showed that T2 was significantly different
from first two and last two treatments. T0 and T1 were much similar to each other as were T3
and T4 treatments. Maximum transpiration rate (40.42 mmol H2O m-2
S-1) was observed in T0,

86
followed by T1 (38.67 mmol H2O m-2
S-1), T2 (34.53 mmol H2O m
-2S
-1) and T3 (26.69 mmol
H2O m-2
S-1). Whereas, minimum transpiration rate (24.12 mmol H2O m
-2S
-1) was observed in
T4 (having maximum bulk density i.e. 1.8 Mg/m3). It can be observed from figure 4.22g that
the response regarding transpiration rate of Populus deltoides was found significantly
different in all treatments. Maximum transpiration rate (48.03 mmol H2O m-2
S-1) was observed
in T0, followed by T1 (39.83 mmol H2O m-2
S-1), T2 (35.51 mmol H2O m
-2S
-1) and T3 (26.56
mmol H2O m-2
S-1). Whereas, minimum transpiration rate (20.55 mmol H2O m
-2S
-1) was
observed in T4 (having maximum bulk density i.e. 1.8 Mg/m3). Figure 4.22h regarding
transpiration rate of Morus alba indicated that all the treatments were found significantly
different from each other. Maximum transpiration rate (38.36 mmol H2O m-2
S-1) was observed
in control treatment, followed by T1 (32.94 mmol H2O m-2
S-1), T2 (27.76 mmol H2O m
-2S
-1)
and T3 (19.18 mmol H2O m-2
S-1). Whereas, minimum transpiration rate (15.83 mmol H2O m
-2S
-
1) was observed in T4 (having maximum bulk density i.e. 1.8 Mg/m3). Analyses of variance
of all these species are given as Appendix 16.
4.2.16 Stomatal conductance:
It can be observed that the response regarding stomatal conductance of Eucalyptus
camaldulensis was found significantly different in all treatments, as evident from figure
4.23a. Maximum stomatal conductance (1.12 mol m-2
S-1) was observed in T0, followed by T1
(0.85 mol m-2
S-1), T2 (0.74 mol m
-2S
-1) and T3 (0.52 mol m-2
S-1). Whereas, minimum stomatal
conductance (0.41 mol m-2
S-1) was recorded in T4 (having maximum bulk density i.e. 1.8
Mg/m3). It can be seen that the response regarding stomatal conductance of Albizia lebbeck
was found significantly different in all treatments except T3 and T4, as evident from figure
4.23b. Maximum stomatal conductance (1.22 mol m-2
S-1) was observed in T0, followed by T1
(1.01 mol m-2
S-1), T2 (0.83 mol m
-2S
-1) and T3 (0.52 mol m-2
S-1). Whereas, minimum stomatal
conductance (0.42 mol m-2
S-1) was recorded in T4 (having maximum bulk density i.e. 1.8
Mg/m3). Figure 4.23c of Vachellia niliotica indicated that though T0 and T1 treatments were
found not much different from each other but these were found significantly different from
T2, T3 and T4. Similarly T2 was found different from T4 but both of these were not much
different from T3. Maximum stomatal conductance (0.93 mol m-2
S-1) was observed in T0,
followed by T1 (0.84 mol m-2
S-1), T2 (0.65 mol m
-2S
-1) and T3 (0.54 mol m-2
S-1). Whereas,
minimum stomatal conductance (0.48 mol m-2
S-1) was recorded in T4 (having maximum bulk

87
density i.e. 1.8 Mg/m3). It can be observed that the response regarding stomatal conductance
of Ziziphus mauritiana was found significantly different in all treatments, as was evident
from figure 4.23d. Maximum stomatal conductance (1.32 mol m-2
S-1) was recorded in T0,
followed by T1 (1.13 mol m-2
S-1), T2 (0.94 mol m
-2S
-1) and T3 (0.46 mol m-2
S-1). Whereas,
minimum stomatal conductance (0.32 mol m-2
S-1) was recorded in T4 (having maximum bulk
density i.e. 1.8 Mg/m3).
Figure 4.23e of Bombax ceiba indicated that T0, T1 and T2 treatments were not found
statistically different from each other, but these were different from T3 and T4. Maximum
stomatal conductance (0.047 mol m-2
S-1) was observed in T0, followed by T1 (0.043 mol m
-2S
-
1), T2 (0.040 mol m-2
S-1) and T3 (0.026 mol m
-2S
-1). Whereas, minimum stomatal conductance
(0.020 mol m-2
S-1) was recorded in T4 (having maximum bulk density i.e. 1.8 Mg/m
3). Figure
4.23f of Dalbergia sissoo indicated that T0 was not only significantly different from T1 and
T2 treatments but was also found significantly different from T3 and T4. But T1 was not
much different from T2 as were T3 and T4. Maximum stomatal conductance (1.27 mol m-2
S-1)
was observed in control treatment, followed by T1 (1.11 mol m-2
S-1), T2 (1.01 mol m
-2S
-1) and
T3 (0.75 mol m-2
S-1). Whereas, minimum stomatal conductance (0.66 mol m
-2S
-1) was recorded
in T4 (having maximum bulk density i.e. 1.8 Mg/m3). It can be observed that the response
regarding stomatal conductance of Populus deltoides was found significantly different in all
treatments, as evident from figure 4.23g. Maximum stomatal conductance (2.60 mol m-2
S-1)
was observed in T0, followed by T1 (2.34 mol m-2
S-1), T2 (1.95 mol m
-2S
-1) and T3 (1.07 mol
m-2
S-1). Whereas, minimum stomatal conductance (0.91 mol m
-2S
-1) was recorded in T4
(having maximum bulk density i.e. 1.8 Mg/m3). From figure 4.23h of Morus alba it can be
observed that T0, T1 and T2 treatments were found significantly different from each other
but T3 was not found different from T4. Maximum stomatal conductance (1.72 mol m-2
S-1)
was recorded in T0, followed by T1 (1.45 mol m-2
S-1), T2 (1.11 mol m
-2S
-1) and T3 (0.96 mol
m-2
S-1). Whereas, minimum stomatal conductance (0.90 mol m
-2S
-1) was observed in T4
(having maximum bulk density i.e. 1.8 Mg/m3). Analyses of variance of all these species are
given as Appendix 17.

88
a b
c d
e f
g h

89
Figure 4.22: Effect of soil compaction on transpiration rate (mmol H2O m-2
S-1). a) Ecucalyptus
camaldulensis; b) Albizia lebbeck; c) Vachellia nilotica; d) Ziziphus mauritiana; e) Bombax
ceiba; f) Dalbergia sissoo; g) Populus deltoides; h) Morus alba
a b
c d
e f
g h

90
Figure 4.23: Effect of soil compaction on stomatal conductance (mol m-2
S-1). a) Ecucalyptus
camaldulensis; b) Albizia lebbeck; c) Vachellia nilotica; d) Ziziphus mauritiana; e) Bombax
ceiba; f) Dalbergia sissoo; g) Populus deltoides; h) Morus alba
4.2.17 Internal Carbon dioxide concentration
It can be observed that the response regarding internal CO2 concentration of Eucalyptus
camaldulensis was found significantly different in all treatments, as evident from figure
4.24a. Maximum internal CO2 concentration (354 µmol m-2
S-1) was observed in T0, followed
by T1 (309 µmol m-2
S-1), T2 (264 µmol m
-2S
-1) and T3 (179 µmol m-2
S-1). Whereas, minimum
internal CO2 concentration (154 µmol m-2
S-1) was recorded in T4 (having maximum bulk
density i.e. 1.8 Mg/m3). Figure 4.24b showed that the response regarding internal CO2
concentration of Albizia lebbeck was found significantly different in all treatments.
Maximum internal CO2 concentration (369.67 µmol m-2
S-1) was recorded in T0, followed by
T1 (328.33 µmol m-2
S-1), T2 (287.33 µmol m
-2S
-1) and T3 (171.67 µmol m-2
S-1). Whereas,
minimum internal CO2 (117.33 µmol m-2
S-1) was recorded in T4 (having maximum bulk
density i.e. 1.8 Mg/m3). Figure 4.24c of Vachellia nilotica indicated that T0, T1 and T2
treatments were found significantly different from each other but T3 was not found different
from T4. Maximum internal CO2 concentration (286.67 µmol m-2
S-1) was observed in T0,
followed by T1 (258.67 µmol m-2
S-1), T2 (240.67 µmol m
-2S
-1) and T3 (169.33 µmol m-2
S-1).
Whereas, minimum internal CO2 (157.33 µmol m-2
S-1) was recorded in T4 (having maximum
bulk density i.e. 1.8 Mg/m3). Figure 4.24d of Ziziphus mauritiana showed that though T0, T1
and T2 treatments were not found different from each other but these were found statistically
different from T3 and T4. Maximum internal CO2 concentration (359.0 µmol m-2
S-1) was
observed in T0, followed by T1 (344.0 µmol m-2
S-1), T2 (334.33 µmol m
-2S
-1) and T3 (293.33
µmol m-2
S-1). Whereas, minimum internal CO2 (255.0 µmol m
-2S
-1) was observed in T4
(having maximum bulk density i.e. 1.8 Mg/m3).
Figure 4.24e of Bombax ceiba indicated that only T0 and T4 were found statistically different
while rest was not found much different. Maximum internal CO2 concentration (380.67 µmol
m-2
S-1) was recorded in T0, followed by T1 (309.0 µmol m
-2S
-1), T2 (269.0 µmol m-2
S-1) and T3
(250.67 µmol m-2
S-1). Whereas, minimum internal CO2 (214.0 µmol m
-2S
-1) was recorded in T4
(having maximum bulk density i.e. 1.8 Mg/m3). It can be observed that the response

91
regarding internal CO2 concentration of Dalbergia sissoo was found significantly different in
all treatments, as was evident from figure 4.24f. Maximum internal CO2 concentration
(331.33 µmol m-2
S-1) was observed in T0, followed by T1 (313.33 µmol m
-2S
-1), T2 (293.67
µmol m-2
S-1) and T3 (228.33 µmol m
-2S
-1). Whereas, minimum internal CO2 (183.33 µmol m-2
S-
1) was recorded in T4 (having maximum bulk density i.e. 1.8 Mg/m3). It can be observed that
the response regarding internal CO2 concentration of Populus deltoides was found
significantly different in all treatments, as evident from figure 4.24g. Maximum internal CO2
concentration (448.33 µmol m-2
S-1) was observed in T0, followed by T1 (411.67 µmol m
-2S
-1),
T2 (360.67 µmol m-2
S-1) and T3 (261.67 µmol m
-2S
-1). Whereas, minimum internal CO2
(191.33 µmol m-2
S-1) was observed in T4 (having maximum bulk density i.e. 1.8 Mg/m
3). As
evident from figure 4.24h it can be observed that the response regarding internal CO2
concentration of Morus alba was found significantly in all treatments. Maximum internal
CO2 concentration (446.33 µmol m-2
S-1) was observed in control treatment, followed by T1
(406.67 µmol m-2
S-1), T2 (355.33 µmol m
-2S
-1) and T3 (261.33 µmol m-2
S-1). Whereas,
minimum internal CO2 (209.67 µmol m-2
S-1) was recorded in T4 (having maximum bulk
density i.e. 1.8 Mg/m3). Analyses of variance of all these species are given as Appendix 18.
4.2.18 Photosynthetic water use efficiency:
From figure 4.25a, it can be observed that the response regarding photosynthetic water use
efficiency of Eucalyptus camaldulensis was found significantly different in all treatments.
Maximum value of photosynthetic water use efficiency (36.67 %) was observed in T0,
followed by T1 (28.23 %), T2 (19.19 %) and T3 (13.23 %). Whereas, minimum value of
photosynthetic water use efficiency (10.10 %) was recorded in T4 (having maximum bulk
density i.e. 1.8 Mg/m3). It can be observed that the response regarding photosynthetic water
use efficiency of Albizia lebbeck was found significantly different in all treatments, as
evident from figure 4.25b. Maximum value of photosynthetic water use efficiency (35.88 %)
was recorded in T0, followed by T1 (32.45 %), T2 (26.84 %) and T3 (18.04 %). Whereas,
minimum value of photosynthetic water use efficiency (12.74 %) was observed in T4 (having
maximum bulk density i.e. 1.8 Mg/m3). Figure 4.25c of Vachellia nilotica indicated that all
the treatments were found significantly different from each other except T3 and T4.
Maximum value of photosynthetic water use efficiency (17.02 %) was observed in T0,
followed by T1 (15.32 %), T2 (11.12 %) and T3 (9.60 %). Whereas, minimum value of

92
photosynthetic water use efficiency (9.10 %) was recorded in T4 (having maximum bulk
density i.e. 1.8 Mg/m3). Figure 4.25d of Ziziphus mauritiana depicted that though T0 and T1
were not found different but these were found significantly different from T2, T3 and T4.
Maximum value of photosynthetic water use efficiency (39.76 %) was recorded in T0,
followed by T1 (35.56 %), T2 (29.84 %) and T3 (19.80 %). Whereas, minimum value of
photosynthetic water use efficiency (14.01 %) was observed in T4 (having maximum bulk
density i.e. 1.8 Mg/m3).
From figure 4.25e of Bombax ceiba it can be observed that though T2 and T3 and T4 were
not found different but these were found significantly different from T0 and T1, as was
evident. Maximum value of photosynthetic water use efficiency (29.16 %) was observed in
T0, followed by T1 (22.82 %), T2 (16.10 %) and T3 (11.51 %). Whereas, minimum value of
photosynthetic water use efficiency (9.52 %) was recorded in T4 (having maximum bulk
density i.e. 1.8 Mg/m3). It can be observed that the response regarding photosynthetic water
use efficiency of Dalbergia sissoo was found significantly different in all treatments, as
evident from figure 4.25f. Maximum value of photosynthetic water use efficiency (40.76 %)
was observed in T0, followed by T1 (34.56 %), T2 (30.84 %) and T3 (24.13 %). Whereas,
minimum value of photosynthetic water use efficiency (21.35 %) was recorded in T4 (having
maximum bulk density i.e. 1.8 Mg/m3). From figure 4.25g of Populus deltoides it can be
observed that T0 was only different from T1 and T2 but it was also found statistically
different from T3 and T4. T1 was not found different from T2 as were T3 and T4. Maximum
value of photosynthetic water use efficiency (39.96 %) was observed in T0, followed by T1
(34.93 %), T2 (30.05 %) and T3 (20.54 %). Whereas, minimum value of photosynthetic
water use efficiency (16.71 %) was recorded in T4 (having maximum bulk density i.e. 1.8
Mg/m3). As evident from figure 4.25h it can be observed that the response regarding
photosynthetic water use efficiency of Morus alba was found significantly different in all
treatments. Maximum value of photosynthetic water use efficiency (37.29 %) was observed
in T0, followed by T1 (31.92 %), T2 (27.34 %) and T3 (19.60 mm2). Whereas, minimum
value of photosynthetic water use efficiency (14.50 %) was observed in T4 (having
maximum bulk density i.e. 1.8 Mg/m3). Analyses of variance of all these species are given as
Appendix 19.

93
a b
c d
e f
g h

94
Figure 4.24: Effect of soil compaction on Internal CO2 conc. (µmol m-2
S-1). a) Ecucalyptus
camaldulensis; b) Albizia lebbeck; c) Vachellia nilotica; d) Ziziphus mauritiana; e) Bombax
ceiba; f) Dalbergia sissoo; g) Populus deltoides; h) Morus alba
a b
c d
e f
g h

95
Figure 4.25: Effect of soil compaction on photosynthetic water use efficiency(%). a)
Ecucalyptus camaldulensis; b) Albizia lebbeck; c) Vachellia nilotica; d) Ziziphus mauritiana;
e) Bombax ceiba; f) Dalbergia sissoo; g) Populus deltoides; h) Morus alba
4.2.19 Impact of different species on soil compaction
At the termination of experiment soil bulk density was analyzed again to assess the impact of
selected tree seedling on these soil compaction levels (Treatments). As there were five
treatments including control (i.e. T0, T1, T2, T3 and T4) so impacts of eight seedlings were
compared in each treatment and results were as under:
Figure 4.26 revealed that response of all the species was not statistically different in control
treatment. However B. ceiba was top ranked species that loosened the soil, followed by P.
deltoides, E. camaldulensis, V. nilotica, M. alba, A. lebbeck and Z. mauritiana. Dalbergia
sissoo did not have any impact on set level of compaction in control treatment. Figure 4.27
showed that the overall response of all the species was different in T1. It can be observed that
M. alba was top ranked species who loosened the soil in treatment T1, followed by P.
deltoides, Dalbergia sissoo, E. camaldulensis, B. ceiba, A. lebbeck and V. nilotica. Z.
mauritiana had no or very little impact on set level of compaction in treatment T1. It was
concluded from figure 4.28 that response of all the species was different in T2. It can be
observed that M. alba was top ranked species who loosened the soil in treatment T2,
followed by B. ceiba, E. camaldulensis, P. deltoides, Dalbergia sissoo, A. lebbeck and V.
nilotica. Z. mauritiana had no or very little impact on set level of compaction in treatment
T2.
Figure 4.29 revealed that response of all the species was statistically different in T3. It can be
observed that B. ceiba, was top ranked species that loosened the soil in treatment T3,
followed by P. deltoides, M. alba, Dalbergia sissoo, E. camaldulensis, V. nilotica and A.
lebbeck. Z. mauritiana had very little impact on set level of compaction in treatment T3. It
was concluded from figure 4.30 that the response of all the species was statistically
significant in T4. It can be observed that P. deltoides was top ranked species that loosened
the soil in treatment T4, followed by, M. alba, B. ceiba, A. lebbeck, E. camaldulensis, V.

96
nilotica and Z. mauritiana. Dalbergia sissoo had very little impact on set level of compaction
in treatment T4. Analyses of variance of all these species in different treatments are given as
Appendix 20.
Figure 4.26: Impact of different species on soil bulk density in control (T0)

97
Figure 4.27: Impact of different species on soil bulk density (T1)
Figure 4.28: Impact of different species on soil bulk density (T2)

98
Figure 4.29: Impact of different species on soil bulk density (T3)
Figure 4.30: Impact of different species on soil bulk density (T4)
From analysis of variance (Appendix 20-f) it was concluded that not only the response of
treatments and species was significant but the interaction between treatment and species was
also significant. From table 4.5 it can be observed from overall means that P. deltoids, B.
ceiba M. alba were three top species that impacted the compacted soil (loosened the soil)
equally. Whereas the species that had little impact on soil compaction identified by overall
means was Z. mauritiana.
Table 4.5: Overall impact of selected species on soil bulk density
Species/Treatments T0 T1 T2 T3 T4 Overall
Mean

99
E. camaldulensis 1.2567 op 1.3333
klmno
1.4267
ghij
1.5867
cde
1.7800 a 1.4767
cd
A. lebbeck 1.2633 op 1.3600
ijklmn
1.5067
efg
1.6033 cd 1.7767 a 1.5020
bc
V. nilotica 1.2600 op 1.3700
hijklmn
1.5167
def
1.6000 cd 1.7867 a 1.5067 b
Z. mauritiana 1.2933
nop
1.3967
hijklm
1.5667 de 1.6733 bc 1.8100 a 1.5480 a
M. alba 1.2600 op 1.2967
nop
1.4100
hijkl
1.5433 de 1.7533 ab 1.4527 d
P. deltoides 1.2433 p 1.3200
mnop
1.4467
fghi
1.5300
def
1.7533 ab 1.4587 d
B. ceiba 1.2400 p 1.3433
jklmno
1.4167
hijk
1.5200
def
1.7733 a 1.4587 d
D. sissoo 1.3033
nop
1.3233
lmnop
1.4500
fgh
1.5833 de 1.8200 a 1.4960
bc
Overall Means 1.2650 e 1.3429 d 1.4675 c 1.5800 b 1.7817 a ……
4.3. Growth response of selected agro-forest species (seedlings) against soil compaction
(Study-3):
4.3.1. Survival %:
It can be observed from figure 4.31a that the response regarding survival %age of Eucalyptus
camaldulensis was significantly different in all treatments. Maximum survival (92.67 %) was
observed in T0, followed by T1 (82.67 %), T2 (70.33 %) and T3 (47.67 %). Whereas,
minimum survival (27.33 %) was observed in T4 (having maximum bulk density i.e. 1.8
Mg/m3). Figure 4.31b revealed that survival %age of Albizia lebbeck was significantly
different in all treatments. Maximum survival (94.33 %) was observed in T0, followed by T1

100
(90.0 %), T2 (83.33 %) and T3 (58.33 %). Whereas, minimum survival (33.33%) was
recorded in T4 (having maximum bulk density i.e. 1.8 Mg/m3). As evident from figure 4.31c
of Vachellia nilotica that though T0, T1 and T2 were not much different from each other but
these were found significantly different from T3 and T4. Maximum survival (95.33 %) was
observed in T0, followed by T1 (94.0 %), T2 (93.67 %) and T3 (88.67 %). Whereas,
minimum survival (69.33%) was recorded in T4 (having maximum bulk density i.e. 1.8
Mg/m3). From figure 4.31d of Ziziphus mauritiana, it can be observed that that response of
survival %age was significantly different in all treatments except T0 and T1 which were not
different from each other statistically. Maximum survival (97.33 %) was recorded in T0,
followed by T1 (96.33 %), T2 (92.33 %) and T3 (82.33 %). Whereas, minimum survival
(71.33%) was observed in T4 (having maximum bulk density i.e. 1.8 Mg/m3).
Figure4.31e of Bombax ceiba showed that response of survival %age was significantly
different in all treatments except T1 and T2 which were not different from each other
statistically. Maximum survival (94.67 %) was observed in T0, followed by T1 (92.33 %),
T2 (91.33 %) and T3 (78.33 %). Whereas, minimum survival (53.67 %) was recorded in T4
(having maximum bulk density i.e. 1.8 Mg/m3). Figure4.31f of Dalbergia sissoo revealed
that response of survival %age was significantly different in all treatments except T0 and T1
which were not different from each other statistically. Maximum survival (94.67 %) was
observed in control treatment, followed by T1 (93.0 %), T2 (87.33 %) and T3 (65.33 %).
Whereas, minimum survival (58.33%) was recorded in T4 (having maximum bulk density
i.e. 1.8 Mg/m3).
It can be observed from figure 4.31g that the response of survival %age of Populus deltoides
was significantly different in all treatments except T0 and T1 which were not different from
each other statistically. Maximum survival (91.33 %) was observed in T0, followed by T1
(91.0 %), T2 (69.67 %) and T3 (39.33 %). Whereas, minimum survival (18.33 %) was
observed in T4 (having maximum bulk density i.e. 1.8 Mg/m3). Figure4.31h showed that the
response of survival %age of Morus alba was significantly different in all treatments.
Maximum survival (94.33 %) was observed in T0, followed by T1 (72.0 %), T2 (49.33 %)
and T3 (14.67 %). Whereas, minimum survival (11.33 %) was recorded in T4 (having
maximum bulk density i.e. 1.8 Mg/m3). Analyses of variance of all these species are given as
Appendix 21.

101
4.3.2 Diameter:
Figure4.32a revealed that response of diameter of Eucalyptus camaldulensis was
significantly different from each other in all treatments. Maximum diameter (0.167 mm) was
observed in T0, followed by T1 (0.146 mm), T2 (0.124 cm) and T3 (0.0.08 mm). Whereas,
minimum diameter (0.06 mm) was recorded in T4 (having maximum bulk density i.e. 1.8
Mg/m3). It can be observed from figure 4.32b that response of diameter of Albizia lebbeck
was significantly different in all treatments. Maximum diameter (0.186 mm) was recorded in
T0, followed by T1 (0.163 mm), T2 (0.144 mm) and T3 (0.101 mm). Whereas, minimum
diameter (0.090 mm) was recorded in T4 (having maximum bulk density i.e. 1.8 Mg/m3).
From figure 4.32c, it can be observed that response of diameter of Vachellia nilotica was
significant significantly different in all treatments. Maximum diameter (0.243 cm) was
observed in T0, followed by T1 (0.221 mm), T2 (0.207 mm) and T3 (0.176 mm). Whereas,
minimum diameter (0.130 mm) was recorded in T4 (having maximum bulk density i.e. 1.8
Mg/m3). Figure4.32d revealed that response of diameter of Ziziphus mauritiana was
significantly different in all treatments. Maximum diameter (0.234 mm) was observed in T0,
followed by T1 (0.212 mm), T2 (0.197 mm) and T3 (0.145 mm). Whereas, minimum shoot
fresh weight (0.127 mm) was observed in T4 (having maximum bulk density i.e. 1.8 Mg/m3).
It can be observed from figure 4.32e that response of diameter of Bombax ceiba was
significantly different in all treatments. Maximum diameter (0.476 mm) was recorded in T0,
followed by T1 (0.443 mm), T2 (0.405 mm) and T3 (0.309 mm). Whereas, minimum
diameter (0.251 mm) was recorded in T4 (having maximum bulk density i.e. 1.8 Mg/m3). It
can be seen figure 4.32f that response of diameter of Dalbergia sissoo was significantly
different in all treatments. Maximum diameter (0.408 mm) was observed in T0, followed by
T1 (0.371 mm), T2 (0.332 mm) and T3 (0.263 mm). Whereas, minimum diameter (0.242
mm) was recorded in T4 (having maximum bulk density i.e. 1.8 Mg/m3). Figure4.32g
indicated that response of diameter of Populus deltoides was significantly in all treatments.
Maximum diameter (0.466 mm) was observed in control treatment, followed by T1 (0.422
mm), T2 (0.373 mm) and T3 (0.254 mm). Whereas, minimum diameter (0.191 mm) was
recorded in T4 (having maximum bulk density i.e. 1.8 Mg/m3). It can be observed from
figure4.32h that response of diameter of Morus alba was significantly different in all
treatments. Maximum diameter (0.343 mm) was observed in T0, followed by T1 (0.293 mm),

102
T2 (0.247 mm) and T3 (0.180 mm). Whereas, minimum diameter (0.150 mm) was recorded
in T4 (having maximum bulk density i.e. 1.8 Mg/m3). Analyses of variance of all these
species are given as Appendix 22.
a b
c d

103
e f
g h
Figure 4.31: Effect of soil compaction on survival (%). a) Ecucalyptus camaldulensis; b)
Albizia lebbeck; c) Vachellia nilotica; d) Ziziphus mauritiana; e) Bombax ceiba; f) Dalbergia
sissoo; g) Populus deltoides; h) Morus alba.
a b
c d

104
e f
g h
Figure 4.32: Effect of soil compaction on diameter (mm). a) Ecucalyptus camaldulensis; b)
Albizia lebbeck; c) Vachellia nilotica; d) Ziziphus mauritiana; e) Bombax ceiba; f) Dalbergia
sissoo; g) Populus deltoides; h) Morus alba.
4.3.3. Shoot length/Plant height:
Figure 4.33a revealed that the response of shoot length of Eucalyptus camaldulensis was
statistically different in all treatments except T3 and T4. Maximum shoot length (27.0 cm)
was observed in control treatment, followed by T1 (23.0 cm), T2 (18.67 cm) and T3 (12.67
cm). Whereas minimum shoot length (9.67 cm) was recorded in T4 (having maximum bulk
density i.e. 1.8 Mg/m3). Figure 4.33b of Albizia lebbeck indicated that T0 was not only
significantly different from T1 and T2 but it was also found different from T3 and T4. T1

105
was not much different from T2 as were T3 and T4. Maximum shoot length (13.67 cm) was
observed in T0, followed by T1 (11.33 cm), T2 (10.0 cm) and T3 (7.0 cm). Whereas
minimum shoot length (5.33 cm) was recorded in T4 (having maximum bulk density i.e. 1.8
Mg/m3). From figure 4.33c of Vachellia nilotica significant difference was observed for
shoot length against T0, T1 and T2, however the response was not significant in T3 and T4.
Maximum shoot length (34.67 cm) was observed in T0, followed by T1 (31.33 cm), T2
(27.67 cm) and T3 (21.67 cm). Whereas minimum shoot length (20.0 cm) was recorded in T4
(having maximum bulk density i.e. 1.8 Mg/m3). From figure 4.33d of Ziziphus mauritiana, it
was concluded that only T0 was found significantly different from T4, but T1, T2 and T3
were not found much different from each other. Maximum shoot length (23.0 cm) was
observed in control treatment, followed by T1 (18.67 cm), T2 (16.33 cm) and T3 (14.0 cm).
Whereas minimum shoot length (11.33 cm) was recorded in T4 (having maximum bulk
density i.e. 1.8 Mg/m3).
Figure 4.33e of Bombax ceiba revealed that the response of shoot length was found
significantly different from each other in all treatments. Maximum shoot length (35.0cm)
was observed in T0, followed by T1 (31.33 cm), T2 (26.67 cm) and T3 (19.0 cm). Whereas
minimum shoot length (12.33 cm) was observed in T4 (having maximum bulk density i.e. 1.8
Mg/m3). It can be observed from Figure 4.33f that the response of shoot length of Dalbergia
sissoo was significantly different in all treatments. Maximum shoot length (27.67 cm) was
observed in T0, followed by T1 (24.0 cm), T2 (21.0 cm) and T3 (17.5 cm). Whereas
minimum shoot length (13.67 cm) was recorded in T4 (having maximum bulk density i.e. 1.8
Mg/m3). From figure4.33g, it can be observed that the response of shoot length of Populus
deltoides was significantly different in all treatments. Maximum shoot length (35.67cm) was
recorded in T0, followed by T1 (31.67 cm), T2 (26.33 cm) and T3 (18.33 cm). Whereas
minimum shoot length (12.67 cm) was recorded in T4 (having maximum bulk density i.e. 1.8
Mg/m3). From figure 4.33h of Morus alba, significant difference was observed for shoot
length against T0, T1 and T2; however the response was not significant in T3 and T4 as was
evident. Maximum shoot length (25.0 cm) was observed in T0, followed by T1 (21.0 cm), T2
(17.33 cm) and T3 (13.0 cm). Whereas minimum shoot length (11.33 cm) was recorded in T4
(having maximum bulk density i.e. 1.8 Mg/m3). Analyses of variance of all these species are
given as Appendix 23.

106
4.3.4. Shoot fresh weight:
From figure 4.34a of Eucalyptus camaldulensis, it can be observed that only T0 was found
significantly different from T4 while rests were not found much different from each other.
Maximum shoot fresh weight (0.333 Kg) was observed in T0, followed by T1 (0.327 Kg), T2
(0.250 Kg) and T3 (0.170 Kg). Whereas minimum shoot fresh weight (0.120 Kg) was
observed in T4 (having maximum bulk density i.e. 1.8 Mg/m3). Figure 4.34b of Albizia
lebbeck revealed that shoot fresh weight of Albizia lebbeck was significantly different in all
treatments. Maximum shoot fresh weight (0.270 Kg) was observed in control treatment,
followed by T1 (0.233 Kg), T2 (0.206 Kg) and T3 (0.145 Kg). Whereas minimum shoot
fresh weight (0.120 Kg) was observed in T4 (having maximum bulk density i.e. 1.8 Mg/m3).
It can be observed from figure 4.34c that the response of shoot fresh weight of Vachellia
nilotica was significantly different in all treatments. Maximum shoot fresh weight (0.210 Kg)
was observed in T0, followed by T1 (0.193 Kg), T2 (0.173 Kg) and T3 (0.154 Kg). Whereas
minimum shoot fresh weight (0.141 Kg) was recorded in T4 (having maximum bulk density
i.e. 1.8 Mg/m3). Figure4.34d of Ziziphus mauritiana showed that T0 was not only found
different from T1 and T2 but this was also found significantly different from T3 and T4.
Whereas T1 was much similar to T2 as were T3 and T4. Maximum shoot fresh weight (0.213
Kg) was observed in T0, followed by T1 (0.183 Kg), T2 (0.167 Kg) and T3 (0.140 Kg).
Whereas minimum shoot fresh weight (0.130 Kg) was recorded in T4 (having maximum bulk
density i.e. 1.8 Mg/m3).
From figure4.34e of Bombax ceiba, it can be observed that though T3 and T4 were not much
different from each other but these were found significantly different from T0, T1 and T2.
Maximum shoot fresh weight (0.447 Kg) was observed in T0, followed by T1 (0.400 Kg), T2
(0.357 Kg) and T3 (0.260 Kg). Whereas minimum shoot fresh weight (0.220 Kg) was
recorded in T4 (having maximum bulk density i.e. 1.8 Mg/m3). Figure 4.34f of Dalbergia
sissoo showed that all the treatments were found significantly different from each other.
Maximum shoot fresh weight (0.270 Kg) was recorded in T0, followed by T1 (0.217 Kg), T2
(0.193 Kg) and T3 (0.160 Kg). Whereas minimum shoot fresh weight (0.133 Kg) was
recorded in T4 (having maximum bulk density i.e. 1.8 Mg/m3). It can be observed from
figure 4.34g that the response of shoot fresh weight of Populus deltoides was significantly
different in all treatments. Maximum shoot fresh weight (0.360 Kg) was observed in T0,

107
followed by T1 (0.317 Kg), T2 (0.243 Kg) and T3 (0.137 Kg). Whereas minimum shoot
fresh weight (0.083 Kg) was recorded in T4 (having maximum bulk density i.e. 1.8 Mg/m3).
From figure 4.34h of Morus alba, it can be observed that shoot fresh weight was significantly
different in all treatments. Maximum shoot fresh weight (0.220Kg) was observed in T0,
followed by T1 (0.193 Kg), T2 (0.150 Kg) and T3 (0.093 Kg). Whereas minimum shoot
fresh weight (0.070 Kg) was observed in T4 (having maximum bulk density i.e. 1.8 Mg/m3).
Analyses of variance of all these species are given as Appendix 24.
a b

108
c d
e f
g h
Figure 4.33: Effect of soil compaction on shoot length (cm). a) Ecucalyptus camaldulensis;
b) Albizia lebbeck; c) Vachellia nilotica; d) Ziziphus mauritiana; e) Bombax ceiba; f)
Dalbergia sissoo; g) Populus deltoides; h) Morus alba.
a b

109
c d
e f
g h
Figure 4.34: Effect of soil compaction on shoot fresh weight (Kg). a) Ecucalyptus
camaldulensis; b) Albizia lebbeck; c) Vachellia nilotica; d) Ziziphus mauritiana; e) Bombax
ceiba; f) Dalbergia sissoo; g) Populus deltoides; h) Morus alba.
4.3.5. Shoot dry weight:
From figure 4.35a, it can be observed that the response of shoot dry weight of Eucalyptus
camaldulensis was found significantly different in all treatments. Maximum shoot dry weight
(0.167 Kg) was observed in T0, followed by T1 (0.150 Kg), T2 (0.117 Kg) and T3 (0.077
Kg). Whereas minimum shoot dry weight (0.053 Kg) was recorded in T4 (having maximum
bulk density i.e. 1.8 Mg/m3). Figure 4.35b of Albizia lebbeck revealed that T2 was not only
found different from T0 and T1 but this was also found significantly different from T3 and
T4. Whereas, T0 and T1 were not found much different from each other statistically, as were

110
T3 and T4. Maximum shoot dry weight (0.127 Kg) was observed in T0, followed by T1
(0.115 Kg), T2 (0.100 Kg) and T3 (0.065 Kg). Whereas minimum shoot dry weight (0.055
Kg) was observed in T4 (having maximum bulk density i.e. 1.8 Mg/m3). From figure 4.35c
of Vachellia nilotica, it can be observed that T0 was not only found different from T2 and T1
but this was also found significantly different from T3 and T4. Whereas T2 and T1 were not
much different from each other statistically as were T3 and T4. Maximum shoot dry weight
(0.105 Kg) was recorded in T0, followed by T1 (0.088 Kg), T2 (0.080 Kg) and T3 (0.060
Kg). Whereas minimum shoot dry weight (0.058 Kg) was observed in T4 (having maximum
bulk density i.e. 1.8 Mg/m3). Figure 4.35d of Ziziphus mauritiana showed that T0 was not
only found different from T2 and T1 but this was also found significantly different from T3
and T4. Whereas T2 and T1 were not much different from each other statistically as were T3
and T4. Maximum shoot dry weight (0.106 Kg) was observed in T0, followed by T1
(0.087Kg), T2 (0.076 Kg) and T3 (0.057 Kg). Whereas minimum shoot dry weight
(0.053Kg) was observed in T4 (having maximum bulk density i.e. 1.8 Mg/m3).
From figure 4.35e, it can be observed that that the response of shoot dry weight of Bombax
ceiba was found significantly different in all treatments. Maximum shoot dry weight (0.217
Kg) was recorded in T0, followed by T1 (0.193 Kg), T2 (0.163 Kg) and T3 (0.120 Kg).
Whereas minimum shoot dry weight (0.096 Kg) was observed in T4 (having maximum bulk
density i.e. 1.8 Mg/m3). From Figure4.35f of Dalbergia sissoo, it can be observed that though
T0, T1 and T2 were not much different from each other but these were significantly different
from T3 and T4. Similarly T3 and T4 were also found similar statistically. Maximum shoot
dry weight (0.127 Kg) was observed in T0, followed by T1 (0.110 Kg), T2 (0.093 Kg) and
T3 (0.073 Kg). Whereas minimum shoot dry weight (0.063 Kg) was recorded in T4 (having
maximum bulk density i.e. 1.8 Mg/m3). Figure 4.35g revealed that the response of shoot dry
weight of Populus deltoides was significantly different in all treatments. Maximum shoot dry
weight (0.173 Kg) was observed in T0, followed by T1 (0.153 Kg), T2 (0.123 Kg) and T3
(0.063 Kg). Whereas minimum shoot dry weight (0.042 Kg) was recorded in T4 (having
maximum bulk density i.e. 1.8 Mg/m3). Figure 4.35h of Morus alba showed that T2 was not
only found different from T0 and T1 but this was also significantly different from T3 and T4.
Whereas T0 and T1 were similar statistically as were T3 and T4. Maximum shoot dry weight
(0.107 Kg) was recorded in T0, followed by T1 (0.093 Kg), T2 (0.067 Kg) and T3 (0.042

111
Kg). Whereas minimum shoot dry weight (0.033 Kg) was recorded in T4 (having maximum
bulk density i.e. 1.8 Mg/m3). Analyses of variance of all these species are given as Appendix
25.
4.3.6. Root length:
It can be observed from figure 4.36a of Eucalyptus camaldulensis that only T0 and T1 were
found statistically different from T2, T3 and T4 but these were not much different among
themselves. Maximum root length (13.33cm) was observed in T0, followed by T1 (11.33
cm), T2 (9.67 cm) and T3 (7.33 cm). Whereas minimum shoot length (5.67 cm) was recorded
in T4 (having maximum bulk density i.e. 1.8 Mg/m3). From figure 4.36b of Albizia lebbeck,
it can be observed that only T0 and T4 were found significantly different from T2, T3 and T4
but these three were not much different among themselves. Maximum root length (6.67 cm)
was observed in T0, followed by T1 (5.67 cm), T2 (4.67 cm) and T3 (3.33 cm). Whereas
minimum shoot length (2.33 cm) was observed in T4 (having maximum bulk density i.e. 1.8
Mg/m3). Figure 4.36c of Vachellia nilotica revealed that T1 was not found much different
from T0 and T2 but T0 and T2 were statistically different from each other. T3 and T4 were
also not much different from each other. Maximum root length (19.0 cm) was recorded in T0,
followed by T1 (17.0 cm), T2 (15.67 cm) and T3 (13.33 cm). Whereas minimum shoot
length (12.50 cm) was recorded in T4 (having maximum bulk density i.e. 1.8 Mg/m3). From
figure 4.36d of Ziziphus mauritiana, it can be observed that only T0 and T4 were found
significantly different from T2, T3 and T4 but these three were not much different among
themselves. Maximum root length (12.0 cm) was observed in control treatment, followed by
T1 (10.67 cm), T2 (10.0 cm) and T3 (7.66 cm). Whereas minimum shoot length (6.67 cm)
was recorded in T4 (having maximum bulk density i.e. 1.8 Mg/m3).
Figure 4.36e of Bombax ceiba showed that though T2, T3 and T4 were not found different
from each other but these were significantly different from T0 and T1. Maximum root length
(15.0 cm) was observed in T0, followed by T1 (12.0 cm), T2 (9.67 cm) and T3 (7.66 cm).
Whereas minimum shoot length (6.0 cm) was recorded in T4 (having maximum bulk density
i.e. 1.8 Mg/m3). It can be observed from figure 4.36f of Dalbergia sissoo that only T0 and T4
were found statistically different from T2, T3 and T4 but these three were not much different
among themselves, as was evident. Maximum root length (10.89 cm) was observed in T0,
followed by T1 (10.67 cm), T2 (10.0 cm) and T3 (8.50 cm). Whereas minimum shoot length

112
(7.50 cm) was recorded in T4 (having maximum bulk density i.e. 1.8 Mg/m3). Figure 4.36g
of Populus deltoides showed that T0 was not only found different from T1 and T2 but it was
also found different from T3 and T4. T3 and T4 were not having much difference as were
T1 and T2. Maximum root length (11.0 cm) was observed in T0, followed by T1 (8.67 cm),
T2 (7.33 cm) and T3 (5.0 cm). Whereas minimum root length (4.22 cm) was recorded in T4
(having maximum bulk density i.e. 1.8 Mg/m3). From figure4.36h of Morus alba, it can be
observed that T0 was not only found different from T1 and T2 but it was also found
significantly different from T3 and T4. T3 and T4 were not having much difference as were
T1 and T2. Maximum root length (14.33 cm) was observed in T0, followed by T1 (12.0 cm),
T2 (10.33 cm) and T3 (7.67 cm). Whereas minimum root length (6.0 cm) was recorded in T4
(having maximum bulk density i.e. 1.8 Mg/m3). Analyses of variance of all these species are
given as Appendix 26.
a b
c d

113
e f
g h
Figure 4.35: Effect of soil compaction on shoot dry weight (Kg). a) Ecucalyptus
camaldulensis; b) Albizia lebbeck; c) Vachellia nilotica; d) Ziziphus mauritiana; e) Bombax
ceiba; f) Dalbergia sissoo; g) Populus deltoides; h) Morus alba.
a b

114
c d
e f
g h
Figure 4.36: Effect of soil compaction on root length (cm). a) Ecucalyptus camaldulensis; b)
Albizia lebbeck; c) Vachellia nilotica; d) Ziziphus mauritiana; e) Bombax ceiba; f) Dalbergia
sissoo; g) Populus deltoides; h) Morus alba.
4.3.7. Root fresh weight:
It can be observed from figure 4.37a that the response of root fresh weight of Eucalyptus
camaldulensis was found significantly different in all treatments. Maximum root fresh weight
(0.055 Kg) was observed in T0, followed by T1 (0.043 Kg), T2 (0.037 Kg) and T3 (0.026
Kg). Whereas minimum root fresh weight (0.020 Kg) was recorded in T4 (having maximum
bulk density i.e. 1.8 Mg/m3). From figure 4.37b, it can be observed that root fresh weight of
Albizia lebbeck was found statistically different in all treatments except in T0 and T1.

115
Maximum root fresh weight (0.034 Kg) was observed in T0, followed by T1 (0.031 Kg), T2
(0.027Kg) and T3 (0.021 Kg). Whereas minimum root fresh weight (0.017 Kg) was recorded
in T4 (having maximum bulk density i.e. 1.8 Mg/m3). Figure 4.37c revealed that the response
of root fresh weight of Vachellia nilotica was found significantly different in all treatments.
Maximum root fresh weight (0.073 Kg) was recorded in T0, followed by T1 (0.066 Kg), T2
(0.059Kg) and T3 (0.050 Kg). Whereas minimum root fresh weight (0.045 Kg) was recorded
in T4 (having maximum bulk density i.e. 1.8 Mg/m3). From figure 4.37d of Ziziphus
mauritiana, it can be observed that root fresh weight was significantly different in all
treatments. Maximum root fresh weight (0.075 Kg) was observed in T0, followed by T1
(0.067 Kg), T2 (0.059Kg) and T3 (0.050 Kg). Whereas minimum root fresh weight (0.043
Kg) was recorded in T4 (having maximum bulk density i.e. 1.8 Mg/m3).
From the comparison of means, it can be observed from figure 4.37e of Bombax ceiba that
though T0, T1 and T2 were not found much different from each other but these three
treatments were statistically different from T3 and T4. Maximum root fresh weight (0.180
Kg) was observed in control treatment, followed by T1 (0.160 Kg), T2 (0.143 Kg) and T3
(0.106 Kg). Whereas minimum root fresh weight (0.076 Kg) was recorded in T4 (having
maximum bulk density i.e. 1.8 Mg/m3). Figure4.37f revealed that the response of root fresh
weight of Dalbergia sissoo was found significantly different in all treatments. Maximum root
fresh weight (0.073 Kg) was observed in T0, followed by T1 (0.063 Kg), T2 (0.057Kg) and
T3 (0.045 Kg). Whereas minimum root fresh weight (0.039 Kg) was recorded in T4 (having
maximum bulk density i.e. 1.8 Mg/m3). It can be observed from figure 4.37g that the
response of root fresh weight of Populus deltoides was found significantly different in all
treatments. Maximum root fresh weight (0.048 Kg) was observed in T0, followed by T1
(0.042 Kg), T2 (0.036 Kg) and T3 (0.026 Kg). Whereas minimum root fresh weight (0.023
Kg) was recorded in T4 (having maximum bulk density i.e. 1.8 Mg/m3). Response of root
fresh weight of Morus alba was found statistically different in all treatments, as evident from
figure 4.37h. Maximum root fresh weight (0.093 Kg) was recorded in control treatment
followed by T1 (0.080 Kg), T2 (0.072 Kg) and T3 (0.055 Kg). Whereas minimum root fresh
weight (0.042 Kg) was recorded in T4 (having maximum bulk density i.e. 1.8 Mg/m3).
Analyses of variance of all these species are given as Appendix 27.
4.3.8. Root dry weight:

116
Response of root dry weight of Eucalyptus camaldulensis was observed significantly
different in all treatments as evident from figure 4.38a. Maximum root dry weight (0.026 Kg)
was observed in T0, followed by T1 (0.021 Kg), T2 (0.018 Kg) and T3 (0.013 Kg). Whereas,
minimum root fresh weight (0.010 Kg) was recorded in T4 (having maximum bulk density
i.e. 1.8 Mg/m3). Figure 4.38b of Albizia lebbeck revealed that T0 was not found much
different T1 and T2 but it was significantly different from T3 and T4. Similarly non
significant response was observed among T3 and T4. Maximum root dry weight (0.016 Kg)
was observed in T0, followed by T1 (0.014 Kg), T2 (0.012 Kg) and T3 (0.009 Kg). Whereas
minimum root fresh weight (0.008 Kg) was recorded in T4 (having maximum bulk density
i.e. 1.8 Mg/m3). It can be observed from figure 4.38c that the response of root dry weight of
Vachellia nilotica was found significantly different in all treatments. Maximum root dry
weight (0.036 Kg) was recorded in T0, followed by T1 (0.032 Kg), T2 (0.029 Kg) and T3
(0.025 Kg). Whereas minimum root fresh weight (0.022 Kg) was recorded in T4 (having
maximum bulk density i.e. 1.8 Mg/m3). Figure 4.38d showed that the response of root dry
weight of Ziziphus mauritiana was significantly different in all treatments. Maximum root
dry weight (0.036 Kg) was observed in T0, followed by T1 (0.032 Kg), T2 (0.026 Kg) and
T3 (0.024 Kg). Whereas minimum root fresh weight (0.021 Kg) was recorded in T4 (having
maximum bulk density i.e. 1.8 Mg/m3).
From figure 4.38e of Bombax ceiba, it can be observed that only T0 and T4 were found
statistically different whereas T1, T2 and T3 were not found different in response. Maximum
root dry weight (0.080 Kg) was observed in T0, followed by T1 (0.073 Kg), T2 (0.060 Kg)
and T3 (0.043 Kg). Whereas minimum root fresh weight (0.023 Kg) was recorded in T4
(having maximum bulk density i.e. 1.8 Mg/m3). It can be observed from figure 4.38f that the
response of root dry weight of Dalbergia sissoo was found statistically different in all
treatments. Maximum root dry weight (0.035 Kg) was observed in T0, followed by T1 (0.031
Kg), T2 (0.027 Kg) and T3 (0.021 Kg). Whereas minimum root fresh weight (0.018 Kg) was
recorded in T4 (having maximum bulk density i.e. 1.8 Mg/m3). It can be observed from
figure4.38g that the response of root dry weight of Populus deltoides was found significantly
different in all treatments except T3 and T4. Maximum root dry weight (0.023 Kg) was
observed in T0, followed by T1 (0.021 Kg), T2 (0.017 Kg) and T3 (0.012 Kg). Whereas
minimum root fresh weight (0.011 Kg) was recorded in T4 (having maximum bulk density

117
i.e. 1.8 Mg/m3). From figure4.38h, it can be observed that the response of root dry weight of
Morus alba was found significantly different in all treatments except T3 and T4. Maximum
root dry weight (0.045 Kg) was observed in T0, followed by T1 (0.039 Kg), T2 (0.034 Kg)
and T3 (0.027 Kg). Whereas minimum root fresh weight (0.019 Kg) was recorded in T4
(having maximum bulk density i.e. 1.8 Mg/m3). Analyses of variance of all these species are
given as Appendix 28.
a b

118
c d
e f
g h
Figure 4.37: Effect of soil compaction on root fresh weight (Kg). a) Ecucalyptus
camaldulensis; b) Albizia lebbeck; c) Vachellia nilotica; d) Ziziphus mauritiana; e) Bombax
ceiba; f) Dalbergia sissoo; g) Populus deltoides; h) Morus alba.
a b

119
c d
e f
g h
Figure 4.38: Effect of soil compaction on root dry weight (g). a) Ecucalyptus camaldulensis;
b) Albizia lebbeck; c) Vachellia nilotica; d) Ziziphus mauritiana; e) Bombax ceiba; f)
Dalbergia sissoo; g) Populus deltoides; h) Morus alba.
4.3.9 Root/shoot ratio:
Figure 4.39a of Eucalyptus camaldulensis revealed that only T1 and T4 were found
significantly different from each other while rest were not much different from each other
statistically. Maximum value of root/shoot ratio (0.194) was recorded in T4 (having
maximum bulk density i.e. 1.8 Mg/m3). Followed by T3 (0.165), T0 (0.158) and T2 (0.151).
Whereas minimum value (0.140) was recorded in T1 (having minimum bulk density i.e. 1.3

120
Mg/m3). It can be observed from figure 4.39b that the response regarding root/shoot ratio by
Albizia lebbeck was not found statistically different in all treatments. Maximum value of
root/shoot ratio (0.155) was recorded in T4 (having maximum bulk density i.e. 1.8 Mg/m3).
Followed by T3 (0.144), T0 (0.127) and T2 (0.123). Whereas minimum value (0.121) was
recorded in T1 (having minimum bulk density i.e. 1.3 Mg/m3). From figure 4.39c, it can be
observed that the response regarding root/shoot ratio by Vachellia nilotica was found
significantly different in all treatments. Maximum value of root/shoot ratio (0.417) was
recorded in T3. Followed by T4 (0.376), T1 (0.374) and T2 (0.360). Whereas minimum value
(0.349) was recorded in T0 (having minimum bulk density i.e. 1.3 Mg/m3). From figure
4.39d, it can be observed that the response regarding root/shoot ratio by Ziziphus mauritiana
was not found significantly different in all treatments. Maximum value of root/shoot ratio
(0.42) was recorded in T3. Followed by T4 (0.39), T1 (0.37) and T2 (0.34). Whereas the
minimum value (0.33) was recorded in T2.
Figure 4.39e of Bombax ceiba revealed that though T0, T1, T2 and T3 were not found
statistically different from each other but these four were found different from T4. Maximum
value of root/shoot ratio (0.38) was recorded in T1. Followed by T0 (0.37), T2 (0.36) and T3
(0.36), whereas minimum value (0.21) was recorded in T4 (having maximum bulk density
i.e. 1.8 Mg/m3). Figure 4.39f of Dalbergia sissoo indicated that all the treatments were not
found statistically different from each other. Maximum value of root/shoot ratio (0.30) was
recorded in T4 (having maximum bulk density i.e. 1.8 Mg/m3). Followed by T3 (0.29), T2
(0.29) and T1 (0.29). Whereas the minimum value (0.28) was recorded in T0. Figure 4.39g of
Populus deltoides showed that though T0, T1 and T2 were not found different from each
other but these were significantly different from T3 and T4, which were also different from
each other statistically. Maximum value of root/shoot ratio (0.265) was recorded in T4
(having maximum bulk density i.e. 1.8 Mg/m3). Followed by T3 (0.195), T2 (0.140) and T1
(0.134), whereas minimum value (0.134) was recorded in T0 (having minimum bulk density
i.e. 1.3 Mg/m3). Figure 4.39h of Morus alba indicated that only T0 and T4 were found
statistically different from each other while rest were not found different from each other, as
evident from. Maximum value of root/shoot ratio (0.675) was recorded in T4. Followed by
T3 (0.637), T2 (0.523) and T1 (0.418), whereas minimum value (0.40) was recorded in T0

121
(having minimum bulk density i.e. 1.3 Mg/m3). Analyses of variance of all these species are
given as Appendix 29.
4.3.10. Leaf area:
It can be observed from figure 4.40a that the response regarding leaf area of Eucalyptus
camaldulensis was found significantly different in all treatments. Maximum leaf area (936.6
mm2) was observed in T0, followed by T1 (911.53 mm
2), T2 (885.87 mm
2) and T3 (843.93
mm2). Whereas, minimum value of leaf area (822.87 mm
2) was recorded in T4 (having
maximum bulk density i.e. 1.8 Mg/m3). Figure 4.40b indicated that the response regarding
leaf area of Albizia lebbeck was found statistically different in all treatments except T3 and
T4, which were not found much different from each other. Maximum leaf area (73.1 mm2)
was recorded in T0, followed by T1 (62.3 mm2), T2 (55.6 mm
2) and T3 (40.4 mm
2).
Whereas, minimum value of leaf area (35.13 mm2) was recorded in T4 (having maximum
bulk density i.e. 1.8 Mg/m3). It can be observed from figure 4.40c that the response regarding
leaf area of Vachellia nilotica was found significantly different in all treatments except T3
and T4, which were not much different from each other. Maximum leaf area (3.79 mm2) was
observed in T0, followed by T1 (3.26 mm2), T2 (2.77 mm
2) and T3 (2.53 mm
2). Whereas,
minimum value of leaf area (2.48 mm2) was recorded in T4 (having maximum bulk density
i.e. 1.8 Mg/m3). Figure 4.40d of Ziziphus mauritiana indicated that all the treatments were
found significantly different from each other except T0 and T1, which were not much
different from each other. Maximum leaf area (60.32 mm2) was observed in T0, followed by
T1 (59.67 mm2), T2 (58.87 mm
2) and T3 (57.97 mm
2). Whereas, minimum value of leaf area
(56.92 mm2) was recorded in T4 (having maximum bulk density i.e. 1.8 Mg/m
3).
It can be observed from figure 4.40e that the response regarding leaf area of Bombax ceiba
was found significantly different in all treatments. Maximum leaf area (975.62 mm2) was
observed in T0, followed by T1 (950.87 mm2), T2 (927.3 mm
2) and T3 (892.13 mm
2).
Whereas, minimum value of leaf area (871.1 mm2) was recorded in T4 (having maximum
bulk density i.e. 1.8 Mg/m3). Figure 4.40f of Dalbergia sissoo indicated that only T0 and T4
were found statistically different from each other while rests were not found much different
from each other statistically. Maximum leaf area (956.19 mm2) was observed in T0, followed
by T1 (950.67 mm2), T2 (947.13 mm
2) and T3 (941.83 mm
2). Whereas, minimum value of
leaf area (940.17 mm2) was recorded in T4 (having maximum bulk density i.e. 1.8 Mg/m
3).

122
As evident from figure 4.40g, it can be observed that the response regarding leaf area of
Populus deltoides was found significantly different in all treatments. Maximum leaf area
(1863.13 mm2) was observed in T0, followed by T1 (1849.53 mm
2), T2 (1824.8 mm
2) and
T3 (1792.67 mm2). Whereas, minimum value of leaf area (1758.93 mm
2) was recorded in T4
(having maximum bulk density i.e. 1.8 Mg/m3). It can be seen from figure 4.40h that the
response regarding leaf area of Morus alba was found significantly different in all treatments.
Maximum leaf area (1215.47 mm2) was observed in T0, followed by T1 (1188.37 mm
2), T2
(1165.33 mm2) and T3 (1112.33 mm
2). Whereas, minimum value of leaf area (1101.27 mm
2)
was observed in T4 (having maximum bulk density i.e. 1.8 Mg/m3). Analyses of variance of
all these species are given as Appendix 30.
a b

123
c d
e f
g h
Figure 4.39: Effect of soil compaction on root/shoot ratio. a) Ecucalyptus camaldulensis; b)
Albizia lebbeck; c) Vachellia nilotica; d) Ziziphus mauritiana; e) Bombax ceiba; f) Dalbergia
sissoo; g) Populus deltoides; h) Morus alba.

124
a b
c d
e f
g h
Figure 4.40: Effect of soil compaction on leaf area (mm2). a) Ecucalyptus camaldulensis; b)
Albizia lebbeck; c) Vachellia nilotica; d) Ziziphus mauritiana; e) Bombax ceiba; f) Dalbergia
sissoo; g) Populus deltoides; h) Morus alba.

125
4.3.11. No of leaves:
Figure 4.41a revealed that the response regarding number of leaves produced by Eucalyptus
camaldulensis was significantly different in all treatments. Maximum number of leaves
(57.33 no.) were observed in control treatment, followed by T1 (53.67 no.), T2 (48.67 no.)
and T3 (36.0 no.). Whereas minimum number of leaves (31.0 no.) were recorded in T4
(having maximum bulk density i.e. 1.8 Mg/m3). It can be observed from figure 4.41b that the
response regarding number of leaves produced by Albizia lebbeck was significantly different
in all treatments. Maximum number of leaves (53.0 no.) were observed in T0, followed by
T1 (45.0 no.), T2 (39.0 no.) and T3 (22.33 no.). Whereas minimum number of leaves (16.33
no.) were recorded in T4 (having maximum bulk density i.e. 1.8 Mg/m3). From figure 4.41c,
it can be observed that the response regarding number of leaves produced by Vachellia
nilotica was significantly different in all treatments. Maximum number of leaves (47.67 no.)
were observed in T0, followed by T1 (43.33 no.), T2 (39.0 no.) and T3 (30.67 no.). Whereas
minimum number of leaves (27.0 no.) were recorded in T4 (having maximum bulk density
i.e. 1.8 Mg/m3). It can be seen from figure 4.41d that the response regarding number of
leaves produced by Ziziphus mauritiana was significantly different in all treatments.
Maximum number of leaves (67.0 no.) were observed in T0, followed by T1 (61.0 no.), T2
(53.0 no.) and T3 (42.0 no.). Whereas minimum number of leaves (37.0 no.) were recorded
in T4 (having maximum bulk density i.e. 1.8 Mg/m3).
Figure 4.41e of Bombax ceiba indicated that only T0 and T4 treatments were found
statistically different from each other whereas T1, T2 and T3 were not found much different.
Maximum number of leaves (8.0 no.) were observed in T0, followed by T1 (7.0 no.), T2 (6.0
no.) and T3 (4.33 no.). Whereas minimum number of leaves (3.67 no.) were recorded in T4
(having maximum bulk density i.e. 1.8 Mg/m3). It can be observed from figure 4.41f of
Dalbergia sissoo that though T0, T1 and T2 were not found different but these three were
statistically different from T3 and T4. Similarly T3 and T4 were also not found much
different statistically. Maximum number of leaves (18.0 no.) were observed in control
treatment, followed by T1 (16.0 no.), T2 (14.0 no.) and T3 (11.33 no.). Whereas minimum
number of leaves (9.0 no.) were recorded in T4 (having maximum bulk density i.e. 1.8
Mg/m3). Significant difference was observed for number of leaves produced by Populus
deltoides in all treatments, as evident from figure 4.41g. Maximum number of leaves (33.33

126
no.) were observed in T0, followed by T1 (29.0 no.), T2 (25.0 no.) and T3 (17.67 no.).
Whereas minimum number of leaves (12.67 no.) were recorded in T4 (having maximum bulk
density i.e. 1.8 Mg/m3). It can be observed figure 4.41h that the response regarding number
of leaves produced by Morus alba was found statistically different in all treatments.
Maximum number of leaves (32.0 no.) were observed in T0, followed by T1 (28.33 no.), T2
(25.0 no.) and T3 (17.0 no.). Whereas minimum number of leaves (12.33 no.) were observed
in T4 (having maximum bulk density i.e. 1.8 Mg/m3). Analyses of variance of all these
species are given as Appendix 31.
4.3.12. No of branches:
Figure 4.42a of Eucalyptus camaldulensis indicated that response regarding number of
branches produced was statistically different in T0 and T4 treatments only whereas the said
response was not much different in T1, T2 and T3. Maximum number of branches (6 no.)
were observed in To, followed by T1 (5.33 no.), T2 (5 no.) and T3 (3.33 no.). Whereas
minimum no of branches (2.33 no.) were recorded in T4 (having maximum bulk density i.e.
1.8 Mg/m3). Figure4.42b of Albizia lebbeck showed that the response regarding number of
branches produced in T2 was found not only different statistically from T0 and T1 but it was
also found different from T3 and T4. Similarly T0 was not found different from T1 as were
T3 and T4 found. Maximum number of branches (17.33 no.) were observed in T0, followed
by T1 (15.33 no.), T2 (11.33 no.) and T3 (6.33 no.). Whereas minimum no of branches (4.0
no.) were recorded in T4 (having maximum bulk density i.e. 1.8 Mg/m3). Figure 4.42c of
Vachellia nilotica revealed that only T0 and T4 treatments were found statistically different
from each other whereas T1, T2 and T3 were not found much different. Maximum number of
branches (12.0 no.) were observed in T0, followed by T1 (10.33 no.), T2 (9.0 no.) and T3
(7.67 no.). Whereas minimum no of branches Vachellia nilotica (6.33 no.) were observed in
T4 (having maximum bulk density i.e. 1.8 Mg/m3). It can be observed from figure 4.42d of
Ziziphus mauritiana that only T0 and T4 treatments were found significantly different from
each other whereas T1, T2 and T3 were not found much different. Maximum number of
branches (20.0 no.) were observed in T0, followed by T1 (18.0 no.), T2 (16.0 no.) and T3
(13.33 no.). Whereas minimum no of branches Ziziphus mauritiana (11.67 no.) were
recorded in T4 (having maximum bulk density i.e. 1.8 Mg/m3).

127
Figure 4.42e of Bombax ceiba showed that that only T0 and T4 treatments were found
statistically different from each other whereas T1, T2 and T3 were not found much different.
Maximum number of branches (8.0 no.) were observed in T0, followed by T1 (7.0 no.), T2
(6.0 no.) and T3 (4.0 no.). Whereas minimum no of branches Bombax ceiba (3.33 no.) were
recorded in T4 (having maximum bulk density i.e. 1.8 Mg/m3). Figure 4.42f of Dalbergia
sissoo indicated that only T0 and T4 treatments were found statistically different from each
other whereas T1, T2 and T3 were non significant. Maximum number of branches (16.0 no.)
were observed in T0, followed by T1 (14.0 no.), T2 (12.67 no.) and T3 (10.67 no.). Whereas
minimum no of branches Dalbergia sissoo (9.33 no.) were recorded in T4 (having maximum
bulk density i.e. 1.8 Mg/m3). It can be observed from figure 4.42g that the response regarding
number of branches produced by Populus deltoides was not statistically different in all the
treatments. Maximum number of branches (2.0 no.) were recorded in T0, followed by T1
(2.0 no.), T2 (1.66 no.) and T3 (1.33 no.). Whereas minimum no of branches Populus
deltoides (1.0 no.) were recorded in T4 (having maximum bulk density i.e. 1.8 Mg/m3).
Figure 4.42h of Morus alba indicated that only T0 and T4 treatments were found
significantly different from each other whereas T1, T2 and T3 were not found much different
from each other. Maximum number of branches (2.67 no.) were observed in T0, followed by
T1 (2.33 no.), T2 (2.0 no.) and T3 (1.33 no.). Whereas minimum no of branches Morus alba
(1.0 no.) were recorded in T4 (having maximum bulk density i.e. 1.8 Mg/m3). Analyses of
variance of all these species are given as Appendix 32.

128
a b
c d
e f
g h
Figure 4.41: Effect of soil compaction on number of leaves (No.). a) Ecucalyptus
camaldulensis; b) Albizia lebbeck; c) Vachellia nilotica; d) Ziziphus mauritiana; e) Bombax
ceiba; f) Dalbergia sissoo; g) Populus deltoides; h) Morus alba.

129
a b
c d
e f
g h
Figure 4.42: Effect of soil compaction on number of branches (No.). a) Ecucalyptus
camaldulensis; b) Albizia lebbeck; c) Vachellia nilotica; d) Ziziphus mauritiana; e) Bombax
ceiba; f) Dalbergia sissoo; g) Populus deltoides; h) Morus alba.

130
4.3.13. Photosynthetic rate:
It can be observed from figure 4.43a that the response regarding photosynthetic rate of
Eucalyptus camaldulensis was found significantly different in all treatments. Maximum
photosynthetic rate (5.75 µmol CO2 m-2
S-1) was recorded in T0, followed by T1 (5.14 µmol
CO2 m-2
S-1), T2 (4.54 µmol CO2 m
-2S
-1) and T3 (3.27 µmol CO2 m-2
S-1). Whereas, minimum
photosynthetic rate (2.69 µmol CO2 m-2
S-1) was recorded in T4 (having maximum bulk density
i.e. 1.8 Mg/m3). Figure 4.43b showed that the response regarding photosynthetic rate of
Albizia lebbeck was found significantly different in all treatments. Maximum photosynthetic
rate (5.69 µmol CO2 m-2
S-1) was observed in T0, followed by T1 (5.12 µmol CO2 m
-2S
-1), T2
(4.47 µmol CO2 m-2
S-1) and T3 (3.37 µmol CO2 m
-2S
-1). Whereas, minimum photosynthetic rate
(2.85 µmol CO2 m-2
S-1) was observed in T4 (having maximum bulk density i.e. 1.8 Mg/m
3). It
can be seen from figure 4.43c that the response regarding photosynthetic rate of Vachellia
nilotica was found significantly different in all treatments. Maximum photosynthetic rate
(3.66 µmol CO2 m-2
S-1) was observed in T0, followed by T1 (3.25 µmol CO2 m
-2S
-1), T2 (2.85
µmol CO2 m-2
S-1) and T3 (2.20 µmol CO2 m
-2S
-1). Whereas, minimum photosynthetic rate (1.98
µmol CO2 m-2
S-1) was recorded in T4 (having maximum bulk density i.e. 1.8 Mg/m
3). Figure
4.43d of Ziziphus mauritiana indicated that all the treatments were found statistically
different from each other. Maximum photosynthetic rate (3.82 µmol CO2 m-2
S-1) was observed
in T0, followed by T1 (3.43 µmol CO2 m-2
S-1), T2 (3.23 µmol CO2 m
-2S
-1) and T3 (2.42 µmol
CO2 m-2
S-1). Whereas, minimum photosynthetic rate (2.12 µmol CO2 m
-2S
-1) was recorded in
T4 (having maximum bulk density i.e. 1.8 Mg/m3).
Figure 4.43e of Bombax ceiba revealed that all the treatments were statistically different from
each other. Maximum photosynthetic rate (3.95 µmol CO2 m-2
S-1) was observed in T0,
followed by T1 (3.47 µmol CO2 m-2
S-1), T2 (3.12 µmol CO2 m
-2S
-1) and T3 (2.13 µmol CO2 m-2
S-
1). Whereas, minimum photosynthetic rate (1.73 µmol CO2 m-2
S-1) was observed in T4 (having
maximum bulk density i.e. 1.8 Mg/m3). As evident from figure 4.43f, it can be seen that the
response regarding photosynthetic rate of Dalbergia sissoo was significantly different in all
treatments. Maximum photosynthetic rate (4.93 µmol CO2 m-2
S-1) was observed in control
treatment, followed by T1 (4.62 µmol CO2 m-2
S-1), T2 (4.29 µmol CO2 m
-2S
-1) and T3 (3.42
µmol CO2 m-2
S-1). Whereas, minimum photosynthetic rate (3.13 µmol CO2 m
-2S
-1) was
observed in T4 (having maximum bulk density i.e. 1.8 Mg/m3). It can be observed from

131
figure 4.43g that the response regarding photosynthetic rate of Populus deltoides was
significantly different in all treatments. Maximum photosynthetic rate (5.91 µmol CO2 m-2
S-1)
was observed in T0, followed by T1 (5.14 µmol CO2 m-2
S-1), T2 (4.34 µmol CO2 m
-2S
-1) and T3
(3.01 µmol CO2 m-2
S-1). Whereas, minimum photosynthetic rate (2.57 µmol CO2 m
-2S
-1) was
observed in T4 (having maximum bulk density i.e. 1.8 Mg/m3). Figure 4.43h of Morus alba
showed that all the treatments were found significantly different from each other. Maximum
photosynthetic rate (3.90 µmol CO2 m-2
S-1) was observed in T0, followed by T1 (3.65 µmol
CO2 m-2
S-1), T2 (3.14 µmol CO2 m
-2S
-1) and T3 (2.34 µmol CO2 m-2
S-1). Whereas, minimum
photosynthetic rate (2.01 µmol CO2 m-2
S-1) was observed in T4 (having maximum bulk
density i.e. 1.8 Mg/m3). Analyses of variance of all these species are given as Appendix 33.
4.3.14. Transpiration rate:
It can be observed from figure 4.44a that the response regarding transpiration rate of
Eucalyptus camaldulensis was found significantly different in all treatments. Maximum
transpiration rate (38.11 mmol H2O m-2
S-1) was observed in T0, followed by T1 (34.64 mmol
H2O m-2
S-1), T2 (30.24 mmol H2O m
-2S
-1) and T3 (23.28 mmol H2O m-2
S-1). Whereas, minimum
transpiration rate (19.69 mmol H2O m-2
S-1) was recorded in T4 (having maximum bulk density
i.e. 1.8 Mg/m3). Figure 4.44b of Albizia lebbeck indicated that all the treatments were found
significantly different from each other. Maximum transpiration rate (37.63 mmol H2O m-2
S-1)
was observed in T0, followed by T1 (33.36 mmol H2O m-2
S-1), T2 (30.0 mmol H2O m
-2S
-1) and
T3 (20.77 mmol H2O m-2
S-1). Whereas, minimum transpiration rate (17.53 mmol H2O m
-2S
-1)
was recorded in T4 (having maximum bulk density i.e. 1.8 Mg/m3). Figure 4.44c of
Vachellia nilotica showed that although T0, T1 and T2 were not found much different from
each other but these were statistically different from T3 and T4. Similarly T3 and T4 were
also different from each other. Maximum transpiration rate (34.20 mmol H2O m-2
S-1) was
recorded in T0, followed by T1 (32.07 mmol H2O m-2
S-1), T2 (30.56 mmol H2O m
-2S
-1) and T3
(27.30 mmol H2O m-2
S-1). Whereas, minimum transpiration rate (24.90 mmol H2O m
-2S
-1) was
recorded in T4 (having maximum bulk density i.e. 1.8 Mg/m3). Figure 4.44d of Ziziphus
mauritiana indicated that although T0, T1 and T2 were not found much different from each
other but these are significantly different from T3 and T4. Maximum transpiration rate (32.42
mmol H2O m-2
S-1) was observed in T0, followed by T1 (30.0 mmol H2O m
-2S
-1), T2 (28.33

132
mmol H2O m-2
S-1) and T3 (22.03 mmol H2O m
-2S
-1). Whereas, minimum transpiration rate
(19.05 mmol H2O m-2
S-1) was recorded in T4 (having maximum bulk density i.e. 1.8 Mg/m
3).
It can be observed from figure 4.44e that the response regarding transpiration rate of Bombax
ceiba was significantly different in all treatments. Maximum transpiration rate (34.13 mmol
H2O m-2
S-1) was observed in T0, followed by T1 (27.67 mmol H2O m
-2S
-1), T2 (22.23 mmol
H2O m-2
S-1) and T3 (12.85 mmol H2O m
-2S
-1). Whereas, minimum transpiration rate (8.55 mmol
H2O m-2
S-1) was recorded in T4 (having maximum bulk density i.e. 1.8 Mg/m
3). Figure 4.44f
of Dalbergia sissoo indicated that all the treatments were found significantly different from
each other except T0 and T1. Maximum respiration rate (37.42 mmol H2O m-2
S-1) was
observed in T0, followed by T1 (35.67 mmol H2O m-2
S-1), T2 (32.24 mmol H2O m
-2S
-1) and T3
(25.69 mmol H2O m-2
S-1). Whereas, minimum transpiration rate (22.38 mmol H2O m
-2S
-1) was
observed in T4 (having maximum bulk density i.e. 1.8 Mg/m3). It can be seen from figure
4.44g that the response regarding transpiration rate of Populus deltoides was statistically
different in all treatments. Maximum transpiration rate (45.03 mmol H2O m-2
S-1) was observed
in T0, followed by T1 (39.49 mmol H2O m-2
S-1), T2 (33.17 mmol H2O m
-2S
-1) and T3 (23.85
mmol H2O m-2
S-1). Whereas, minimum transpiration rate (19.55 mmol H2O m
-2S
-1) was
observed in T4 (having maximum bulk density i.e. 1.8 Mg/m3). It can be observed from
figure 4.44h that the response regarding transpiration rate of Morus alba was significantly
different in all treatments. Maximum respiration rate (36.63 mmol H2O m-2
S-1) was observed
in T0, followed by T1 (32.61 mmol H2O m-2
S-1), T2 (28.10 mmol H2O m
-2S
-1) and T3 (21.18
mmol H2O m-2
S-1). Whereas, minimum transpiration rate (16.17 mmol H2O m
-2S
-1) was
recorded in T4 (having maximum bulk density i.e. 1.8 Mg/m3). Analyses of variance of all
these species are given as Appendix 34.

133
a b
c d
e f
g h
Figure 4.43: Effect of soil compaction on photosynthetic rate (µmol CO2 m
-2S
-1). a)
Ecucalyptus camaldulensis; b) Albizia lebbeck; c) Vachellia nilotica; d) Ziziphus mauritiana;
e) Bombax ceiba; f) Dalbergia sissoo; g) Populus deltoides; h) Morus alba.

134
a b
c d
e f
g h
Figure 4.44: Effect of soil compaction on transpiration rate (mmol H2O m-2
S-1). a) Ecucalyptus
camaldulensis; b) Albizia lebbeck; c) Vachellia nilotica; d) Ziziphus mauritiana; e) Bombax
ceiba; f) Dalbergia sissoo; g) Populus deltoides; h) Morus alba

135
4.3.15. Stomatal conductance:
Figure 4.45a of Eucalyptus camaldulensis revealed that all the treatments were found
significantly different from each other. Maximum stomatal conductance (1.23 mol m-2
S-1) was
observed in T0, followed by T1 (1.07 mol m-2
S-1), T2 (0.92 mol m
-2S
-1) and T3 (0.69 mol m-2
S-
1). Whereas, minimum stomatal conductance (0.53 mol m-2
S-1) was recorded in T4 (having
maximum bulk density i.e. 1.8 Mg/m3). It can be observed from figure 4.45b that the
response regarding stomatal conductance of Albizia lebbeck was found significantly different
in all treatments. Maximum stomatal conductance (1.22 mol m-2
S-1) was observed in T0,
followed by T1 (1.11 mol m-2
S-1), T2 (0.95 mol m
-2S
-1) and T3 (0.71 mol m-2
S-1). Whereas,
minimum stomatal conductance (0.58 mol m-2
S-1) was recorded in T4 (having maximum bulk
density i.e. 1.8 Mg/m3). Figure 4.45c of Vachellia niliotica indicated that all the treatments
were found significantly different from each other. Maximum stomatal conductance (0.95
mol m-2
S-1) was observed in T0, followed by T1 (0.91 mol m
-2S
-1), T2 (0.85 mol m-2
S-1) and T3
(0.75 mol m-2
S-1). Whereas, minimum stomatal conductance (0.71 mol m
-2S
-1) was recorded in
T4 (having maximum bulk density i.e. 1.8 Mg/m3). Figure4.45d of Ziziphus mauritiana
showed that all the treatments were found significantly different from each other. Maximum
stomatal conductance (1.22 mol m-2
S-1) was recorded in T0, followed by T1 (1.11 mol m
-2S
-1),
T2 (0.97 mol m-2
S-1) and T3 (0.74 mol m
-2S
-1). Whereas, minimum stomatal conductance (0.64
mol m-2
S-1) was observed in T4 (having maximum bulk density i.e. 1.8 Mg/m
3).
It can be seen from figure 4.45e that the response regarding stomatal conductance of Bombax
ceiba was statistically different in all treatments. Maximum stomatal conductance (1.48 mol
m-2
S-1) was observed in T0, followed by T1 (1.17 mol m
-2S
-1), T2 (1.02 mol m-2
S-1) and T3
(0.79 mol m-2
S-1). Whereas, minimum stomatal conductance (0.69 mol m
-2S
-1) was recorded in
T4 (having maximum bulk density i.e. 1.8 Mg/m3). Figure 4.45f of Dalbergia sissoo
indicated that all the treatments were found statistically different except T0 and T1.
Maximum stomatal conductance (1.25 mol m-2
S-1) was observed in T0, followed by T1 (1.20
mol m-2
S-1), T2 (1.06 mol m
-2S
-1) and T3 (0.91 mol m-2
S-1). Whereas, minimum stomatal
conductance (0.84 mol m-2
S-1) was recorded in T4 (having maximum bulk density i.e. 1.8
Mg/m3). It can be observed from figure 4.45g that the response regarding stomatal
conductance of Populus deltoides was found significantly different in all treatments.
Maximum stomatal conductance (3.54 mol m-2
S-1) was recorded in control treatment T0,

136
followed by T1 (3.13 mol m-2
S-1), T2 (2.73 mol m
-2S
-1) and T3 (1.91 mol m-2
S-1). Whereas,
minimum stomatal conductance (1.52 mol m-2
S-1) was recorded in T4 (having maximum bulk
density i.e. 1.8 Mg/m3). Figure 4.45h of Morus alba revealed that all the treatments were
significantly different from each other. Maximum stomatal conductance (1.75 mol m-2
S-1)
was observed in T0, followed by T1 (1.53 mol m-2
S-1), T2 (1.36 mol m
-2S
-1) and T3 (0.96 mol
m-2
S-1). Whereas, minimum stomatal conductance (0.75 mol m
-2S
-1) was recorded in T4
(having maximum bulk density i.e. 1.8 Mg/m3). Analyses of variance of all these species are
given as Appendix 35.
4.3.16. Internal CO2 concentration:
Response regarding internal CO2 concentration of Eucalyptus camaldulensis was found
significantly different in all treatments, as evident from Figure 4.46a. Maximum internal CO2
concentration (289.67 µmol m-2
S-1) was recorded in control treatment T0, followed by T1
(261.67 µmol m-2
S-1), T2 (235.67 µmol m
-2S
-1) and T3 (152.33 µmol m-2
S-1). Whereas,
minimum stomatal conductance (116.33 µmol m-2
S-1) was recorded in T4 (having maximum
bulk density i.e. 1.8 Mg/m3). It can be observed from figure 4.46b that the response
regarding internal CO2 concentration of Albizia lebbeck was significantly different in all
treatments. Maximum internal CO2 concentration (313.0 µmol m-2
S-1) was recorded in control
treatment T0, followed by T1 (262.0 µmol m-2
S-1), T2 (215.33 µmol m
-2S
-1) and T3 (150.0
µmol m-2
S-1). Whereas, minimum internal CO2 concentration (115.0 µmol m
-2S
-1) was recorded
in T4 (having maximum bulk density i.e. 1.8 Mg/m3). Figure4.46c of Vachellia nilotica
indicated that all the treatments were statistically different from each other. Maximum
internal CO2 concentration (222.0 µmol m-2
S-1) was observed in T0, followed by T1 (202.33
µmol m-2
S-1), T2 (187.67 µmol m
-2S
-1) and T3 (162.33 µmol m-2
S-1). Whereas, minimum
internal CO2 concentration (154.0 µmol m-2
S-1) was recorded in T4 (having maximum bulk
density i.e. 1.8 Mg/m3). From figure 4.46d, it can be observed that the response regarding
internal CO2 concentration of Ziziphus mauritiana was significantly different in all
treatments. Maximum internal CO2 concentration (274.33 µmol m-2
S-1) was observed in T0,
followed by T1 (256.0 µmol m-2
S-1), T2 (237.67 µmol m
-2S
-1) and T3 (182.33 µmol m-2
S-1).
Whereas, minimum internal CO2 concentration (141.67 µmol m-2
S-1) was recorded in T4
(having maximum bulk density i.e. 1.8 Mg/m3).

137
It can be observed from figure 4.46e that the response regarding internal CO2 concentration
of Bombax ceiba was significantly different in all treatments. Maximum internal CO2
concentration (327.67 µmol m-2
S-1) was recorded in T0, followed by T1 (295.67 µmol m
-2S
-1),
T2 (254.0 µmol m-2
S-1) and T3 (181.67 µmol m
-2S
-1). Whereas, minimum internal CO2
concentration (144.67 µmol m-2
S-1) was observed in T4 (having maximum bulk density i.e.
1.8 Mg/m3). Figure4.46f of Dalbergia sissoo showed that all the treatments were found
significantly different from each other. Maximum internal CO2 concentration (273.0 µmol m-
2S
-1) was observed in T0, followed by T1 (260.0 µmol m-2
S-1), T2 (242.0 µmol m
-2S
-1) and T3
(202.0 µmol m-2
S-1). Whereas, minimum internal CO2 concentration (175.67 µmol m
-2S
-1) was
recorded in T4 (having maximum bulk density i.e. 1.8 Mg/m3). It can be seen from figure
4.46g that the response regarding internal CO2 concentration of Populus deltoides was
significantly different in all treatments. Maximum internal CO2 concentration (398.33 µmol
m-2
S-1) was observed in T0, followed by T1 (353.33 µmol m
-2S
-1), T2 (303.0 µmol m-2
S-1) and
T3 (224.0 µmol m-2
S-1). Whereas, minimum internal CO2 concentration (182.0 µmol m
-2S
-1)
was recorded in T4 (having maximum bulk density i.e. 1.8 Mg/m3). Figure4.46h of Morus
alba that all the treatments were significantly different from each other. Maximum internal
CO2 concentration (387.67 µmol m-2
S-1) was observed in T0, followed by T1 (352.33 µmol m
-
2S
-1), T2 (312.0 µmol m-2
S-1) and T3 (241.67 µmol m
-2S
-1). Whereas, minimum internal CO2
concentration (204.33 µmol m-2
S-1) was recorded in T4 (having maximum bulk density i.e. 1.8
Mg/m3). Analyses of variance of all these species are given as Appendix 36.

138
a b
c d
e f
g h
Figure 4.45: Effect of soil compaction on stomatal conductance (mol m-2
S-1). a) Ecucalyptus
camaldulensis; b) Albizia lebbeck; c) Vachellia nilotica; d) Ziziphus mauritiana; e) Bombax
ceiba; f) Dalbergia sissoo; g) Populus deltoides; h) Morus alba

139
a b
c d
e f
g h
Figure 4.46: Effect of soil compaction on internal CO2 concentration (µmol m-2
S-1). a)
Ecucalyptus camaldulensis; b) Albizia lebbeck; c) Vachellia nilotica; d) Ziziphus mauritiana;
e) Bombax ceiba; f) Dalbergia sissoo; g) Populus deltoides; h) Morus alba

140
4.3.17. Photosynthetic water use efficiency:
From figure 4.47a, it can be observed that the response regarding photosynthetic water use
efficiency of Eucalyptus camaldulensis was significantly different in all treatments.
Maximum value of photosynthetic water use efficiency (29.67 %) was observed in T0,
followed by T1 (23.56 %), T2 (19.19 %) and T3 (12.16 %). Whereas, minimum value of
photosynthetic water use efficiency (9.43 mm2) was observed in T4 (having maximum bulk
density i.e. 1.8 Mg/m3). It can be observed from figure 4.47b that the response regarding
photosynthetic water use efficiency of Albizia lebbeck was significantly different in all
treatments. Maximum value of photosynthetic water use efficiency (28.71 %) was observed
in T0, followed by T1 (24.78 %), T2 (22.18 %) and T3 (15.37 %). Whereas, minimum value
of photosynthetic water use efficiency (12.40 %) was recorded in T4 (having maximum bulk
density i.e. 1.8 Mg/m3). Figure 47c of Vachellia nilotica indicated that T0 was not only
statistically different from T1 and T2 but was also found different from T3 and T4. Whereas
T1 and T2 were not much different from each other as were T3 and T4. Maximum value of
photosynthetic water use efficiency (12.02 mm2) was observed in T0, followed by T1 (10.67
%), T2 (9.75 %) and T3 (8.07 %). Whereas, minimum value of photosynthetic water use
efficiency (7.83 %) was recorded in T4 (having maximum bulk density i.e. 1.8 Mg/m3). It
can be seen from figure 4.47d that the response regarding photosynthetic water use efficiency
of Ziziphus mauritiana was significantly different in all treatments. Maximum value of
photosynthetic water use efficiency (33.35 %) was observed in T0, followed by T1 (28.89
%), T2 (25.51 %) and T3 (19.01 %). Whereas, minimum value of photosynthetic water use
efficiency (17.68 %) was recorded in T4 (having maximum bulk density i.e. 1.8 Mg/m3).
Figure 4.47e of Bombax ceiba indicated that all the treatments were found statistically
different from each other except T0 and T1. Maximum value of photosynthetic water use
efficiency (23.16 %) was observed in control treatment, followed by T1 (21.16 %), T2 (18.43
%) and T3 (13.18 %). Whereas, minimum value of photosynthetic water use efficiency (9.19
%) was recorded in T4 (having maximum bulk density i.e. 1.8 Mg/m3). Figure4.47f of
Dalbergia sissoo revealed that all the treatments were statistically different from each other
except T3 and T4. Maximum value of photosynthetic water use efficiency (32.42 %) was
observed in T0, followed by T1 (28.22 %), T2 (24.18 %) and T3 (18.80 %). Whereas,
minimum value of photosynthetic water use efficiency (17.68 %) was recorded in T4 (having

141
maximum bulk density i.e. 1.8 Mg/m3). Figure4.47g of Populus deltoides showed that
though T0, T1 and T2 were not found much different from each other but these were found
statistically different from T3 and T4. Whereas, the last two treatments were not having
much difference. Maximum value of photosynthetic water use efficiency (32.62 %) was
observed in T0, followed by T1 (28.93 %), T2 (25.05 %) and T3 (16.21 %). Whereas,
minimum value of photosynthetic water use efficiency (13.38 %) was recorded in T4 (having
maximum bulk density i.e. 1.8 Mg/m3). Figure4.47h of Morus alba indicated that though T0,
T1 and T2 were not found much different from each other but these were found significantly
different from T3 and T4. Whereas the last two treatments were not found much different
statistically. Maximum value of photosynthetic water use efficiency (32.62 %) was observed
in T0, followed by T1 (28.93 %), T2 (25.05 %) and T3 (16.21 %). Whereas, minimum value
of photosynthetic water use efficiency (13.38 %) was recorded in T4 (having maximum bulk
density i.e. 1.8 Mg/m3). Analyses of variance of all these species are given as Appendix 37.

142
a b
c d
e f
g h
Figure 4.47: Effect of soil compaction on PWUE (%). a) Ecucalyptus camaldulensis; b)
Albizia lebbeck; c) Vachellia nilotica; d) Ziziphus mauritiana; e) Bombax ceiba; f) Dalbergia
sissoo; g) Populus deltoides; h) Morus alba

143
4.2.18 Impact of different species on soil compaction
Results of study-3 were not much different from study-2. At the termination of experiment
soil bulk density was analyzed again to assess the impact of selected tree seedling on these
soil compaction levels (Treatments). As there were five treatments including control (i.e. T0,
T1, T2, T3 and T4) so impacts of eight seedlings were compared in each treatment. From
analysis of .variance it was concluded that not only the response of treatments and species
was significant but the interaction between treatment and species was also significant. It was
observed from overall means that P. deltoids, B. ceiba M. alba were three top species that
impacted the compacted soil (loosened the soil) equally. Whereas the species that had little
impact on soil compaction identified by overall means was Z. mauritiana.

144
4.4. DISCUSSION
The current research work was completed in two years (2015-17). Results of three studies are
as under:
1. Exploring the effects of soil compaction on the growth of major agroforest trees
According to FAO (2010), in spite of having meager natural forest cover (2.2%), Pakistan is
losing its forests at the rate of 1.66% or 42,000 ha/year during last two decades. The major
causes of deforestation include population pressure, illegal cutting, wood theft, extreme
climatic conditions, poor management of existing forests and non-availability of funds for re-
planting the trees. It is also noticeable that principle needs for industrial wood (72 %) and
fuelwood (90%) of Pakistan are met by the farmlands through different agro-forestry
practices (Rahim and Hasnain, 2010).
In Pakistan, agro-forestry is mostly practiced in rows around the farm fields but with
increasing vehicular operations in the farmlands, the sustainability and future of these crop
friendly trees can be in danger. Normally, soil cultivating or soil loosening operations are
carried out before sowing of new crop but farmers avoid to use ploughs/cultivators near trees
(along boundaries) to escape any mechanical problem arising from tree roots. Meanwhile, the
machines pass near the trees repeatedly without ploughing the soil. So, the problem of soil
compaction is more aggravated near the trees than in the farm field (Ramazan et al., 2012).
Results of survey conducted in Shahdara plantation (selected due to heavy grazing pressure)
revealed that livestock can seriously damage the physico-chemical properties of soil as well
as the status and growth of existing vegetation. Soil dry bulk densities which were taken as
the indicator of soil compaction were ranging from 1.2 to 1.53 Mg/m3 while minimum for
undisturbed soils and maximum for soil under huge live stock pressure. Similarly the lowest
values of saturation %age (63.5), TSS (1036 mg/L), EC (1.2 dS/m) and pH (7.6) were
recorded at site 1 (soil without disturbance). Whereas the highest of these parameters were
measured at site 4 which was the most disturbed area as it was the staying area of the
buffalos. Furthermore, in compacted soils, trees were not as healthy as in other areas. These
findings are quite in conformity with the results of Greenwood et al., (2001), Wheeler et al.,
(2002), Koolen and Kuipers, (1983). Who said that Grazing animals also exert downward
pressure through their hooves just like heavy machinery making it unfit, but soil properties
returned to its original form within a year if grazing is stopped.

145
To assess the agro-forestry pattern, abundance of different tree species, trend during last
decade, willingness to grow more trees, details of various farming operations carried out, soil
class, penetrometer reading and most importantly farmer’s awareness about soil compaction
(its impact on crop and trees) a well structure questionnaire was used. Socioeconomic
conditions of the respondents significantly play its role towards the adoption or rejection of
an innovation (Ghauri, 1999).
Majority of the respondents (60%) were small scale farmers as they owned less than 10 acres,
followed by 21% of the respondents with 11-20 acres, then 9% of the respondents were
having area between 21-40 acres. Only 1% of farmers had less than 100 acres of farmlands.
These are in line with the study of Shazia (2018) and Sherbaz (2005). As far as agro-forestry/
cropping pattern was concerned most of the farmers (70%) were interested in linear
plantation. About 5% were having trees in block form; only 14% replied that they don’t need
trees on their farmlands because they already have sufficient number of trees or they think
that these trees normally compete with agronomic crops. Most of the respondents having
trees in linear or compact form were medium to large scale farmers. Small scale respondents
were found a little hesitant to have trees on their farmlands as they had more concerns about
tree crop competition and reduction in yield. These results match with the findings of
Noviana and Joshi (2005). They reported that trees have little competition with crops when
grown on field boundaries.
Most of the respondents from the targeted areas were having Dalbergia sissoo trees as most
abundant trees in their farm field (35%) followed by Vachelia nilotica (16%) and Populus
deltoides (17%). Eucalyptus camaldulensis (14%) and Morus alba (10%) were also found in
the sizeable numbers on the farmlands. Other species (8%) were Melia azedarach, Mangifera
indica, Ziziphus mauritiana etc. It was quite evident that, currently, Dalbergia sissoo was the
most abundant tree but when farmers were asked about their preferences; farmers were
preferring more V. nilotica and Eucalyptus camaldulensis instead of Dalbergia sissoo due to
dieback issue. These results are matches with the findings of Shazia (2018) who suggested
that most of the farmers were willing to grow Eucalyptus camaldulensis instead of any other
plant species. As far as the trend of tree planting was concerned maximum number of
respondents/farmers (48%) planted E. camaldulensis during the last ten years or so, followed
by the respondents (24%) who planted V. nilotica. About 17% of the respondents planted B.

146
ceiba and only fewer (5%) had grown other species. Dieback in Dalbergia sissoo and slow
growth in V. nilotica, has pushed the farmers to grow fast growing species like E.
camaldulensis having straight and clear stems. Findings of this study are also in line with the
work of Gebre-Markos (1998); Jagger and Pender (2000); Amare (2002); Zerihun (2002);
Holden et al. (2003); Tesfaye (2009) and Shazia (2018) who analyzed the socioeconomic
impact of E. camaldulensis trees and told that this has significantly contributed to the income
of a farmers particularly, where the area having poor soil characteristics and water shortage.
Results of this study showed that greater part of the respondents (68%) were keen to grow
more trees on their farmlands. Farmers were willing to grow more trees as they provide extra
income and fulfill their domestic needs such as fuel wood and fodder etc. These findings are
supported by Shazia, (2018) who suggested that farmers were found to grow more as they
play critical role in the uplift of their socioeconomic conditions. Others farmers (32%) either
have sufficient number of trees on their farmlands or they have the strong opinion about
negative effects of trees on crop yield (due to light, nutrient and water competition). The
results confirms the conclusions of Hussain and Khaliq (1996) who said that people residing
in mountain areas of Pakistan utilize plants in various ways like medicine, firewood, timber
wood, food and fodder etc. Ahmad et al. (2011) also stated that people are aware of the
benefits of these forest plantations as they fulfill their daily requirements like timber wood,
fuel wood, medicinal use, food, fodder and many others etc.
When the impact of machinery on soil bulk density was analyzed it depicted that site where
less than two number of machines were being used was found to be least affected site (1.19
Mg/m3) and site where more than four number of machines were being used was found to be the most
affected site (1.19 Mg/m3). These results are supported by the findings of Williamson and Neilsen
(2003), Quiroga et al., (1999) who said that different farm operations carried out
mechanically right from sowing up to harvesting causes serious compaction at every step.
Similar findings were reported by Powers et al., (1998) who said that different machinery
used during military operations and exercises caused heavy soil compaction and raised its
bulk density up to 2.12 Mg/m3.
When Farmers were asked about their awareness about relation between mechanization and
soil compaction, soil compaction and trees, and soil compaction and crops yields; they
responded differently. About 45% of the respondents/farmers were aware that use of more

147
machinery results in more soil compaction and about 80% farmers agreed that upper or
subsoil compaction results in yield reduction of crops and different cultural operations are
necessary to get good yields of next crops. However, only 6% farmers knew that there could
also be negative effects of soil compaction on the trees growing around crops along
boundaries or in other forms (compact or interplanting). So, results showed that farmers
don’t have awareness about the impact of soil compaction on trees and this was new concept
for them. They thought that trees are big entities and perennials, so, they could adjust
themselves. Furthermore, they have never heard from their ancestors about soil compaction
effects on trees. These results are supported by the findings of Diogenes et al., (2016).
2. Germination and growth response of selected species against soil compaction:
In current study germination and growth response of eight major agro-forest species
(Dalbergia sissoo, Acacia nilotica, Bombax ceiba, Morus alba, Albizia lebbeck, Populus
deltoids, Zyziphus mauritiana and Eucalyptus camaldulensis) against soil compaction was
assessed. The growth response was assessed with respect to some morphological
(germination %, survival %, shoot length, shoot fresh weight, shoot dry weight, root length,
root fresh weight, root dry weight, root to shoot ratio, leaf area) and physiological parameters
(photo synthetic rate, transpiration rate, stomatal conductance, internal Carbon dioxide
concentration and photosynthetic water use efficiency). Morphology and growth of selected
species was strongly affected by increasing level of soil compaction and this supported the
concept that increasing bulk density would change (decrease) all parameters of the seedlings
morphologically and physiologically.
Size, fresh and dry weights (of shoot and root) of the seedlings revealed that the response of
the said parameters in control treatments was the best and this was worsened with the
increase of soil compaction in almost all the selected species. Changes in root fresh weight
and dry weight were much prominent (with ≥50% reduction in all the species). These results
are consistent with the previous findings that increasing soil bulk density seriously influence
root development (Bassett et al., 2005; Bejarano et al., 2010) this is also in accord with the
concept that compaction is the major straining factor which can seriously damage the
seedling emergence and growth (Kozlowski 1999). Limited root growth leads to restricted
supply of nutrients availability (Blouin et al., 2008), this ultimately results in poor leaf
growth, decrease in photosynthetic rate, decrease in transpiration rate, poor stomatal

148
conductance, low Carbon dioxide concentration and poor water use efficiency. Decline in
these physiological phenomena confers poor survival during early growth stages (Misra et
al., 1996; Gomez et al., 2002; Jordan et al., 2003;, Alameda & Villar 2009).
Lack of significant effects of soil compaction on plant architecture (root to shoot ratio) were
not surprising because recent researches have shown that plant biomass allocation responses
are found to be modest or often not observed in many species. More morphological
alterations have been reported instead of the mechanism of biomass allocation to acclimatize
the environment (Reich 2002; Poorter et al., 2012). So, it was assessed that root to shoot ratio
response to soil compaction is inappropriate to assess its overall impact on plant growth
because it is more reliant on soil type, its water contents and light conditions as well (Blouin
et al., 2008; Bejarano et al., 2010).
Different species responded differently against same level of soil compaction. For instance
Ecucalyptus camaldulensis and Vachellia nilotica showed comparatively high germination
%age as compared to Albizia lebbeck and Ziziphus mauritiana at light compaction (T1) and
in controlled conditions (T0). Similarly Morus alba and Dalbergia sissoo showed
comparatively high sprouting %age than Populus deltoides and Bombax ceiba for the
mentioned levels respectively. At moderate compaction (T2) Vachellia nilotica exhibited
good germination followed by Ecucalyptus camaldulensis. Similarly, Dalbergia sissoo was
the best at said level followed by Bombax ceiba etc. At severe compaction level (T3 and T4)
maximum germination was showed by Vachellia nilotica and Albizia lebbeck whereas from
sprouting point of view Dalbergia sissoo was the best followed by Populus deltoides etc
(Figure 4.8). These findings are supported by the conclusions of Jordan et al., (2003) and
Alameda et al., (2009) who suggested that soil compaction adversely affects seedling
emergences and plant growth.
Ziziphus mauritiana, Albizia lebbeck and Vachellia nilotica plants were found to be highest
in number which survived at normal and light compaction levels after germination and
sprouting. At moderate compaction (T2) Vachellia nilotica, Ziziphus mauritiana and Bombax
ceiba were three top ranked species which showed maximum survival followed by the others.
Same trend was observed at sever compaction level (T3 and T4) (Figure 4.9). Populus
deltoides, Bombax ceiba and Dalbergia sissoo were three top ranked species which showed
maximum diameter growth whereas, Vachellia nilotica, Ecucalyptus camaldulensis and

149
Albizia lebbeck were last three species which exhibited minimum diameter growth in control
conditions and at light compaction level. Same trend was observed at moderate and severe
compaction levels (Figure 4.10). These conclusions are in conformity with the findings of
Jordan et al., (2003), Smith et al., (2001), Whitman et al., (1997) who reported that
compacted soil are more damaging to the plant emergence, survival and diameter growth as
compared to mature plants.
Vachellia nilotica, Bombax ceiba, Morus alba and Populus deltoides were top ranked species
which exhibited maximum shoot growth whereas, Ziziphus mauritiana, Ecucalyptus
camaldulensis and Albizia lebbeck were last three species which showed minimum shoot
growth in control conditions and at light compaction level. At moderate and severe
compaction level Vachellia nilotica, Dalbergia sissoo, Bombax ceiba and Populus deltoids
were the top raked species which exhibited maximum shoot growth (Figure 4.11). Bombax
ceiba, Vachellia nilotica, Ziziphus mauritiana, and Populus deltoides were top ranked
species which produced maximum shoot fresh weight whereas, Ecucalyptus camaldulensis,
Dalbergia sissoo, Morus alba and Albizia lebbeck were the species which exhibited
minimum shoot fresh weight in control conditions and at light compaction level. Same trend
was observed at moderate and severe compaction levels (Figure 4.12). These result are
supported by the conclusions of Jordan et al., (2003), Acacio et al., (2007) and Alameda et
al., (2009) who suggested that increased soil penetration resistance can promote plant stress
by reducing growth performance by all means (plant biomass, shoot/branch weight, shoot
length, and stem thickness etc.) and enhancing seedling mortality.
Bombax ceiba, Vachellia nilotica, Ziziphus mauritiana, and Populus deltoides were top
ranked species which produced maximum shoot dry weight whereas, Ecucalyptus
camaldulensis, Dalbergia sissoo, Morus alba and Albizia lebbeck were the species which
produced minimum shoot dry weight in control conditions and at light compaction level.
Same trend was observed at moderate and severe compaction levels (Figure 4.13). These
results are in line with the findings of Kozlowski (1999) who reported that shoot dry weight
is significantly affected by soil compaction. Vachellia nilotica, Morus alba, Bombax ceiba
and Dalbergia sissoo were the species which exhibited maximum root length whereas,
Ecucalyptus camaldulensis, Populus deltoides and Albizia lebbeck were the species which
produced minimum root length in control conditions and at light compaction level. At

150
moderate compaction levels Vachellia nilotica, Bombax ceiba, Dalbergia sissoo and Morus
alba were top ranked species followed by the others. Whereas at severe compaction level all
the species responded similarly except Morus alba and Populus deltoids (Figure 4.14). These
results are in accordance with the findings of Kozlowski (1999), Bassett et al., (2005) and
Alameda and Villar, 2012, who found that increase in soil strength, can affect the
architecture and overall biomass production of roots of woody plants.
Bombax ceiba, Ziziphus mauritiana, Vachellia nilotica, and Dalbergia sissoo were top
ranked species which produced maximum root fresh weight whereas, Ecucalyptus
camaldulensis, Morus alba and Albizia lebbeck were the species which exhibited minimum
root fresh weight in control conditions and at light compaction level. Same trend was
observed at moderate and severe compaction levels (Figure 4.15). Bombax ceiba, Ziziphus
mauritiana, Vachellia nilotica, and Dalbergia sissoo were top ranked species which
produced maximum root dry weight whereas, Ecucalyptus camaldulensis, Morus alba and
Albizia lebbeck were the species which exhibited minimum root dry weight in control
conditions and at light compaction level. Same trend was observed at moderate and severe
compaction levels (Figure 4.16). These results are in accordance with the findings of
Kozlowski (1999), Bassett et al., (2005), Tuttle, 1988) and Alameda and Villar, 2012, who
found that increase in soil strength, can affect the architecture and overall biomass production
of roots of woody plants.
Maximum value of root to shoot ratio was observed for Ziziphus mauritiana and Vachellia
nilotica in control conditions and at light compaction level. Same trend was observed at
moderate and severe compaction levels. At moderate compaction levels Vachellia nilotica
and Morus alba were top ranked species followed by the others. At severe compaction level
Ziziphus mauritiana, Vachellia nilotica and Dalbergia sissoo were the species which
exhibited highest value for the said parameter (Figure 4.17). These results are in accordance
with the findings of Kozlowski (1999). Maximum leaf area was produced by Populus
deltoides, Morus alba, Bombax ceiba, Dalbergia sissoo and Ecucalyptus camaldulensis
followed by the other species in control conditions and at light compaction level. Same trend
was observed at moderate and severe compaction levels except Morus alba whose leaf area
was reduced drastically (Figure 4.18). These results are in line with the findings of

151
Wieniarska et al., (1987), Kozlowski and Pallardy (1997) who suggested that compaction
results in poor growth of plant parts and reduced leaf growth etc.
Maximum number of leaves was produced by Ziziphus mauritiana, Ecucalyptus
camaldulensis, Albizia lebbeck, Vachellia nilotica and Populus deltoids followed by the other
species in control conditions and at light compaction level. Same trend was observed at
moderate and severe compaction levels (Figure 4.19). Maximum number of branches was
produced by Ziziphus mauritiana, Dalbergia sissoo, Albizia lebbeck and Vachellia nilotica
followed by the other species in control conditions and at light compaction level. Same trend
was observed at moderate and severe compaction levels (Figure 4.20). These results are in
confirmity with the findings of Wieniarska et al., (1987), Kozlowski and Pallardy (1997)
who suggested that soil compaction results in poor growth of almost all plant parts.
Maximum rate of photosynthesis was recorded in Vachellia nilotica, Populus deltoides,
Albizia lebbeck and Ecucalyptus camaldulensis followed by the other species in control
conditions and at light compaction level whereas minimum was seen in Bombax ceiba.
Approximately same trend was observed at moderate and severe compaction levels (Figure
4.21). These results are in conformity with the findings of Wieniarska et al., (1987),
Kozlowski and Pallardy (1997) who suggested that compaction results in poor leaf growth
that leads to poor photosynthetic rate etc.
Maximum transpiration rate was recorded in Populus deltoides, Ecucalyptus camaldulensis,
Dalbergia sissoo and Albizia lebbeck whereas, minimum was seen in Ziziphus mauritiana at
control conditions, light and moderate compaction levels. At severe compaction level
maximum transpiration rate was recorded in Vachellia nilotica, Dalbergia sissoo, Ziziphus
mauritiana and Populus deltoids whereas; minimum was seen in Bombax ceiba (Figure
4.22). Maximum stomatal conductance was recorded in Populus deltoides, Morus alba,
Dalbergia sissoo and Ziziphus mauritiana followed by the remaining species in control
conditions and light compaction level. Approximately same trend was observed at moderate
and severe compaction levels (Figure 4.23). These results are in accordance with the findings
of Ekwue and Stone (1995), Masle et al., (1990) and Tardieu et al., (1992) who suggested
that compaction results in poor leaf growth that leads to poor transpiration rate, stomatal
conductance and other physiological processes of the plants.

152
Maximum internal Carbon dioxide concentration was recorded in Populus deltoides, Morus
alba, Bombax ceiba and Ziziphus mauritiana followed by the remaining species in control
conditions and light compaction level. Approximately same trend was observed at moderate
and severe compaction levels (Figure 4.24). Maximum Photosynthetic water use eficiency
was recorded in Populus deltoides, Dalbergia sissoo, Morus alba and Ziziphus mauritiana
followed by the remaining species in control conditions and light compaction level.
Approximately same trend was observed at moderate and severe compaction levels (Figure
4.25). These results are in accordance with the findings of Ekwue and Stone (1995), Masle et
al., (1990) and Tardieu et al., (1992) who suggested that compaction results in poor leaf
growth that leads to poor CO2 concentration and poor water use efficiency.
Different growth response (regarding morphology and physiology) of above mentioned
species exactly matches with the findings of Ferrero, 1991; Smith et al., 2001; Williamson
and Neilsen, 2003 etc, who stated that different plant species have different tolerance level
against soil compaction, so, compacted agricultural lands may limit growth and survival of
only few species and vice versa.
Though the current study exhibited steady and expected responses to different levels of soil
compactions but across the globe some positive impacts have also been observed. Some
articles reported positive impact of soil compaction on biomass production of different plants
up to a defined level (Alameda & Villar 2009; Bejarano et al., 2010). Negligible impact of
compacted soil was reported on average stand volume of Pinus taeda (Sanchez et al., 2006).
Afforestation of Ficus boliviana and Terminalia oblonga was much better on compacted soil
(Nabe-Nielsen et al., 2007). Penetration of roots improves pore continuity, lowers bulk
density and soil aeration is enhanced where as biological waste is characterized by rich
minerals (Brais and Camiré, 1998; Lister et al., 2004).
Different results of the current study were may be due to difference in soil texture and its
ability to retain water. Along with compaction, soil water content is another principle factor
that determines the survival and morphological characters of the plants. Soil water contents
facilitate the root penetration that reduces the impact of compaction on plant growth and its
biomass production. Moreover moderate compaction of coarse textured soil generally
improves the root contact with soil which helps in better nutrients absorption (Day et al.,
2010; Arvidsson 1999, Gomez et al. 2002).

153
Whereas in current study loamy to clay soil was used that can get compacted easily
(Eckelmann et al., 2006), may have resulted in oxygen deficit soil with low moisture
contents and porosity. This may have seriously influenced the reduction in size and biomass
production of all the seedlings.
3. Growth response of selected seedling against soil compaction:
Results of study-3 were found much similar to results of study-2. In this study survival and
growth response of eight major agro-forest species seedling (Dalbergia sissoo, Vachellia
nilotica, Bombax ceiba, Morus alba, Albizia lebbeck, Populus deltoids, Zyziphus mauritiana
and Eucalyptus camaldulensis) was assessed. The growth response was assessed with respect
to some morphological (germination %, survival %, shoot length, shoot fresh weight, shoot
dry weight, root length, root fresh weight, root dry weight, root to shoot ratio, leaf area) and
physiological parameters (photosynthetic and transpiration rate, stomatal conductance,
internal Carbon dioxide concentration and photosynthetic water use efficiency).
Again morphology and growth of selected species was clearly affected by increasing level of
soil compaction level and this supported the concept that increasing bulk density would
change (decrease) all parameters of the plants morphologically and physiologically.
Size, fresh and dry weights (of shoot and root) of the seedlings revealed that the response of
the said parameters in control treatments was the best and this was worsened with the
increase of soil compaction in almost all the selected species. Changes in root fresh weight
and dry weight were much prominent (with ≥50% reduction in all the species). These results
are in line with the previous findings that increasing soil bulk density seriously influence root
development (Bassett et al., 2005; Bejarano et al., 2010) this is also in accord with the
concept that compaction is the major straining factor which can seriously damage the
seedling emergence and growth (Kozlowski, 1999). Limited root growth leads to restricted
supply of nutrients and water (Blouin et al., 2008), this ultimately results in poor leaf growth,
decrease in photosynthetic rate, decrease in transpiration rate, poor stomatal conductance,
low Carbon dioxide concentration and poor water use efficiency. Decline in these
physiological phenomena confers poor survival during early growth stages (Misra et al.,
1996; Gomez et al., 2002, Jordan et al., 2003, Alameda et al., 2012).
Lack of significant effects of soil compaction on plant architecture (root to shoot ratio) were
not surprising because recent researches have shown that plant biomass allocation responses

154
are found to be modest or often not observed in many species. More morphological
alterations have been reported instead of the mechanism of biomass allocation to acclimatize
the environment (Reich 2002; Poorter et al. 2012). So, it was assessed that root to shoot ratio
response to soil compaction is inappropriate to assess its overall impact on plant growth
because it relies more on soil type, its water contents and light conditions as well (Blouin et
al. 2008; Bejarano et al. 2010).
All the selected species responded differently against same level of soil compaction. For
instance, Ziziphus mauritiana, Vachellia nilotica, Dalbergia sissoo and Bombax ceiba plants
were found to be highest in number which survived at normal and light compaction levels
after transplanting. At moderate compaction (T2) Vachellia nilotica, Ziziphus mauritiana and
Bombax ceiba were three top ranked species which showed maximum survival whereas
minimum was observed in Populus deltoids and Morus alba. Approximately same trend was
observed at sever compaction level (T3 and T4) (Figure 4.31). These conclusions are in
conformity with the findings of Jordan et al., (2003), Smith et al., (2001), Whitman et al.,
(1997) who reported that compacted soil are more damaging to the plant emergence, survival
as compared to mature plants.
Bombax ceiba, Populus deltoides, Dalbergia sissoo and Morus alba were top ranked species
which showed maximum diameter growth whereas, Vachellia nilotica, Ecucalyptus
camaldulensis and Albizia lebbeck were last three species which exhibited minimum
diameter growth in control conditions and at light compaction level. Same trend was
observed at moderate and severe compaction levels (Figure 4.32). Populus deltoids, Bombax
ceiba, Vachellia nilotica, and Ecucalyptus camaldulensis were the species which exhibited
maximum shoot growth whereas, Morus alba and Albizia lebbeck were last two species
which showed minimum shoot growth in control conditions and at light compaction level. At
moderate and severe compaction level Vachellia nilotica, Populus deltoides, Bombax ceiba
and Dalbergia sissoo were the top raked species which exhibited maximum shoot growth
(Figure 4.33). These conclusions are in conformity with the findings of Jordan et al., (2003),
Smith et al., (2001) who reported that compacted soil are more damaging to the plant
emergence, survival plant height and diameter growth etc.
Bombax ceiba, Populus deltoides, Ecucalyptus camaldulensis and Albizia lebbeck were top
ranked species which produced maximum shoot fresh weight whereas, Morus alba, Vachellia

155
nilotica and Ziziphus mauritiana were the species which exhibited minimum shoot fresh
weight in control conditions and at light compaction level. Approximately same trend was
observed at moderate and severe compaction levels (Figure 4.34). Bombax ceiba,
Ecucalyptus camaldulensis and Populus deltoides were top ranked species which produced
maximum shoot dry weight whereas, Dalbergia sissoo, Morus alba and Albizia lebbeck were
the species which produced minimum shoot dry weight in control conditions and at light
compaction level. Same trend was observed at moderate and severe compaction levels
(Figure 4.35). These result are supported by the conclusions of Jordan et al., (2003), Acacio
et al., (2007) and Alameda et al., (2009) who said that increased soil penetration resistance
can promote plant stress by reducing growth performance by all means (plant biomass,
shoot/branch weight, shoot length, and stem thickness etc.).
Vachellia nilotica, Bombax ceiba, Morus alba, Dalbergia sissoo and Ecucalyptus
camaldulensis were the species which exhibited maximum root length whereas, Populus
deltoides, Dalbergia sissoo and Albizia lebbeck were the species which produced minimum
root length in control conditions and at light compaction level. At moderate compaction
levels Vachellia nilotica, Morus alba, and Ziziphus mauritiana were top ranked species
exhibited maximum root length whereas, at severe compaction level Vachellia nilotica,
Dalbergia sissoo, and Ziziphus mauritiana showed maximum root growth (Figure 4.36).
Bombax ceiba, Morus alba, Vachellia nilotica, and Dalbergia sissoo were top ranked species
which produced maximum root fresh weight whereas, Ecucalyptus camaldulensis, Populus
deltoides and Albizia lebbeck were the species which exhibited minimum root fresh weight in
control conditions and at light compaction level. Approximately same trend was observed at
moderate and severe compaction levels (Figure 4.37). These result are supported by the
conclusions of Jordan et al., (2003), Acacio et al., (2007) and Alameda et al., (2009) who
said that increased soil penetration resistance can promote plant stress by affecting different
morphological parameters (plant biomass, shoot/branch weight, shoot length, and stem
thickness etc.).
Bombax ceiba, Morus alba, Ziziphus mauritiana, Vachellia nilotica, and Dalbergia sissoo
were top ranked species which produced maximum root dry weight whereas, Ecucalyptus
camaldulensis, and Albizia lebbeck were the species which exhibited minimum root dry
weight in control conditions and at light compaction level. Approximately same trend was

156
observed at moderate and severe compaction levels (Figure 4.38). These results are in line
with the findings of Kozlowski (1999) who reported that root dry weight is significantly
affected by soil compaction. Maximum value of root to shoot ratio was observed for Morus
alba, Bombax ceiba and Vachellia nilotica whereas minimum was observed Albizia lebbeck
and Populus deltoides in control conditions and at light compaction level. Same trend was
observed at moderate and severe compaction levels. At moderate compaction levels
Vachellia nilotica and Morus alba were top ranked species followed by the others. At severe
compaction level Morus alba, Ziziphus mauritiana, Vachellia nilotica and Dalbergia sissoo
were the species which exhibited highest value for the said parameter (Figure 4.39). These
results are in accordance with the findings of Kozlowski (1999).
Maximum leaf area was produced by Populus deltoides, Morus alba, Bombax ceiba,
Dalbergia sissoo and Ecucalyptus camaldulensis followed by the other species in control
conditions and at light compaction level. Same trend was observed at moderate and severe
compaction levels (Figure 4.40). Maximum number of leaves was produced by Ziziphus
mauritiana, Ecucalyptus camaldulensis, Albizia lebbeck, Vachellia nilotica and Populus
deltoides followed by the other species in control conditions and at light compaction level.
Approximately same trend was observed at moderate and severe compaction levels (Figure
4.41). These results are in line with the findings of Wieniarska et al., (1987), Kozlowski and
Pallardy (1997) who suggested that compaction results in poor growth of plant parts and
reduced leaf growth etc.
Maximum number of branches was produced by Ziziphus mauritiana, Dalbergia sissoo,
Albizia lebbeck and Vachellia nilotica followed by the other species whereas minimum
response was seen in Populus deltoides at control conditions and light compaction level.
Approximately same trend was observed at moderate and severe compaction levels (Figure
4.42). These results are in line with the findings of Wieniarska et al., (1987), Kozlowski and
Pallardy (1997) who suggested that compaction results in poor growth of plant parts etc.
Maximum rate of photosynthesis was recorded in Populus deltoides, Ecucalyptus
camaldulensis, Albizia lebbeck and Dalbergia sissoo whereas minimum was seen in
Vachellia nilotica in control conditions and at light compaction level. Approximately same
trend was observed at moderate and severe compaction levels (Figure 4.43). These results are
in conformity with the findings of Wieniarska et al., (1987), Kozlowski and Pallardy (1997)

157
who suggested that compaction results in poor growth of plant parts and reduced leaf growth
etc that leads to poor photosynthetic rate and other processes.
Maximum transpiration rate was recorded in Populus deltoides, Ecucalyptus camaldulensis,
Dalbergia sissoo and Albizia lebbeck whereas, minimum was seen in Ziziphus mauritiana at
control conditions, light and moderate compaction levels. At sever compaction level
maximum transpiration rate was recorded in Vachellia nilotica, Dalbergia sissoo,
Ecucalyptus camaldulensis and Populus deltoids whereas; minimum was seen in Bombax
ceiba (Figure 4.44). Maximum stomatal conductance was recorded in Populus deltoides,
Morus alba, Dalbergia sissoo and Ziziphus mauritiana followed by the remaining species in
control conditions and light compaction level. Approximately same trend was observed at
moderate and severe compaction levels (Figure 4.45). These results are in accordance with
the findings of Wieniarska et al., (1987), Kozlowski and Pallardy (1997) who suggested that
compaction results in poor growth of plant parts and reduced leaf growth etc that leads to
poor transpiration rate and stomatal conductance etc.
Maximum internal Carbon dioxide concentration was recorded in Populus deltoides, Morus
alba, Bombax ceiba and Albizia lebbeck followed by the remaining species in control
conditions and light compaction level. Approximately same trend was observed at moderate
and severe compaction levels (Figure 4.46). Maximum photosynthetic water use efficiency
was recorded in Ziziphus mauritiana, Populus deltoides, Dalbergia sissoo and Morus alba
followed by the remaining species in control conditions and light compaction level.
Approximately same trend was observed at moderate and severe compaction levels (Figure
4.47). These results are in line with the findings of Ekwue and Stone (1995), Masle et al.,
(1990) and Tardieu et al., (1992) who suggested that compaction results in poor leaf growth
that leads to poor CO2 concentration and poor water use efficiency.
From the above discussion we can understand that growth response (regarding morphology
and physiology) varied from species to species against same level of compaction and these
conclusions are exactly in line with the findings of Ferrero, 1991; Smith et al., 2001;
Williamson and Neilsen, 2003 etc, who stated that different plant species have different
tolerance level against soil compaction, so, compacted agricultural lands may limit growth
and survival of only few species and vice versa.

158
Although this study showed stable and predictable responses to soil compactions but across
the globe some positive impacts have also been observed. Some articles reported positive
impact of soil compaction on biomass production of different plants up to a defined level
(Alameda et al., 2009; Bejarano et al., 2010). Negligible impact of soil compaction was
reported on average stand volume of Pinus taeda (Sanchez et al., 2006). Forest plantation of
Ficus boliviana and Terminalia oblonga was much better on compacted soil (Nabe-Nielsen
et al., 2007). Penetration of roots improves pore continuity, lowers bulk density and soil
aeration is enhanced where as biological waste is characterized by rich minerals (Brais and
Camiré, 1998; Lister et al., 2004).
Different results of the current study were may be due to difference in soil texture and its
ability to retain water. Along with compaction, soil water content is another principle factor
that determines the survival and morphological characters of the plants. Soil water contents
facilitate the root penetration that reduces the impact of compaction on seedling growth and
its biomass production. Moreover moderate compaction of coarse textured soil generally
improves the root contact with soil which helps in better nutrients absorption (Day et al.,
2010; Arvidsson 1999, Gomez et al., 2002).
Whereas in current study loamy to clay soil was used that can get compacted easily
(Eckelmann et al., 2006), may have resulted in oxygen deficit soil with low moisture
contents and porosity. This may have seriously influenced the reduction in size and biomass
production of all the seedlings.

159
CHAPTER V
SUMMARY
Soil is one of the most important factor as far as agriculture and forestry is concerned. Soil
quality performs a critical role in the progress and survival of societies in a specific region as
it provides the basic necessities of life and other valuable products to the human beings. To
handle the universal issues like food shortage, environmental and climatic instability, energy
and water crisis and biodiversity the sustainable use of soil is essential. Today’s agriculture
and forestry, carried out on variety of soils are something very different from conventional
ones. Most of the operations are carried out mechanically. This mechanization of various
operations involved in agriculture and silviculture has resulted in soil compaction.
Compaction of soil has become a global issue. Compaction of soil is a major concern of
many researchers and farmers since it has resulted in reduced yield of most agronomic crops
and trees across the globe. More demands of food and wood, with increased population, has
resulted in intensive cultivation and increased mechanisations of our farmlands and irrigated
plantations. This mechanisation causes soil compaction and affect soils quality physically as
well as chemically on every passage. It has been estimated that about 67 million hectare of
soil around the globe has been influenced by soil compaction by the vehicular transportation.
Area of about 32 million hectare in Europe, 17million hectare in Africa, 10million hectare in
Asia, 4million hectare in Australia and few parts of Northern America has been estimated as
effected by soil compaction.
Pakistan is a forest deficit country and major needs for timber wood (72 %) and firewood
(90%) of the country are satisfied by the wood coming through agro-forestry. In Pakistan,
agro-forestry is mostly practiced in linear form around the fields but with increasing
vehicular operations in the farmlands, the sustainability and future of these crop friendly trees
can be in danger. Normally, soil cultivating or soil loosening operations are carried out
before sowing of new crop but farmers avoid to use ploughs/cultivators near trees (along
boundaries) to escape any mechanical problem arising from tree roots. Meanwhile, the
machines pass near the trees repeatedly without ploughing the soil. So, the problem of soil
compaction is more aggravated near the trees than in the farm field. Furthermore, continuous
use of vehicles for loosening the top soil is causing subsoil compaction as well in farmlands.

160
Major plant species used as farm trees include Dalbergia sissoo, Vachellia nilotica, Bombax
ceiba, Morus alba, Albizia lebbeck, Populus deltoides, Zyziphus mauritiana and Eucalyptus
camaldulensis. It is worth mentioning here that up till now, no appreciable work has been
done in Pakistan to evaluate the effect of soil compaction on these major farm trees against
soil compaction. So, the current research was enacted to appraise the negative impacts of soil
compaction on various morpho-physiological parameters of major farm trees of Central
Punjab.
In first study a field survey was conducted to assess the prevailing soil compaction levels in
the field, awareness level of the farming community about soil compaction and different
practices performed and type of machinery used on farmlands during the agro-forestry
practices. Shahdara (bela forest) was selected as representative of compact plantation under
severe grazing pressure of livestock. Mechanized and non mechanized farms were selected
from districts of Sheikhupura and Faisalabad.
From the results of Shahdara plantation, it was concluded that livestock can seriously damage
the physico-chemical properties of soil as well as the status and growth of existing
vegetation. Soil dry bulk densities which were taken as the indicator of soil compaction were
ranging from 1.2 to 1.53 Mg/m3 while minimum for undisturbed soils and maximum for soil
under huge live stock pressure. Similarly the lowest values of saturation %age (63.5), TSS
(1036 mg/L), EC (1.2 dS/m) and pH (7.6) were recorded at site 1 (soil without disturbance).
Whereas the highest of these parameters were measured at site 4 which was the most
disturbed area as it was the staying area of the buffalos. It was also observed that places
under continuous trespassing pressure were without or less number of trees as compared to
undisturbed soils (site 1). Furthermore, in compacted soils (site 2, 3 & 4), trees were not as
healthy as in other areas. People living there and forest authorities had the notion of soil
damage by grazing animals but were not aware of soil compaction level and its consequences
on tree growth.
From the survey of farmlands, it was observed that a large number of respondents (60%
having <10 acres) were small scale farmers and land holding was less as compared with
middle farmers (21% having 11-20 acres and 9% having 21-40 acres) followed by
progressive farmers (1% having >100 acres) that were few in number. From agroforestry
pattern point of view it was concluded that majority of the respondents/farmers (70%) were

161
growing trees in linear form around their fields or along water channels, 1.5 % of the
respondents used inter planting methods, about 5% of respondents grow only trees in
compact or block form on their farmlands and 14% of the respondents replied that they don’t
need trees on their farmlands. From species abundance point of view, Dalbergia sissoo trees
were found the most abundant trees in farm field (35%) followed by Vachelia nilotica (16%),
Populus deltoides (17%), Eucalyptus camaldulensis (14%) and Morus alba (10%) were also
present in the considerable numbers on the farm fields. Other trees (8%) included Melia
azedarach, Mangifera indica, Ziziphus mauritiana etc. From trend during last decade it was
observed that maximum number of respondents (48%) planted E. camaldulensis, followed by
the respondents (24%) who planted V. nilotica. About 17% of the respondents planted B.
ceiba and only fewer (5%) had grown other species. From willingness point of view it was
observed that majority of the respondents (68%) were willing to grow more trees on their
farmlands. Others farmers (32%) either have sufficient number of trees on their farmlands or
they had strong opinion about negative effects of trees on crop yield (due to light, nutrient
and water competition). When the Farmers were asked about soil compaction they responded
differently. About 45% of the respondents were aware that use of more machinery results in
more soil compaction and about 80% farmers agreed that surface or subsoil compaction
results in yield reduction of crops and different cultural operations are necessary to get good
yields from next crops. However, only 6% farmers knew that there could also be negative
effects of soil compaction on the trees growing around crops along boundaries or in other
forms (compact or interplanting). So, results showed that farmers don’t have awareness about
the impact of soil compaction on trees and this was new concept for them.
In study-2 germination and growth response of eight major agro-forest species (Dalbergia
sissoo, Vachellia nilotica, Bombax ceiba, Morus alba, Albizia lebbeck, Populus deltoids,
Zyziphus mauritiana and Eucalyptus camaldulensis) against soil compaction was assessed.
The growth response was assessed with respect to some morphological (germination %,
survival %, shoot length, shoot fresh/dry weight, root length, root fresh/dry weight, root to
shoot ratio, leaf area) and physiological parameters (photosynthetic rate, transpiration rate,
stomatal conductance, internal Carbon dioxide concentration and photosynthetic water use
efficiency).

162
Morphology and growth of selected species was strongly affected by increasing level of soil
compaction. Almost all the morphological and physiological parameters of each species were
found negatively related with increased level of compaction (as p=0.000) except root to shoot
ratio. It was observed that response regarding size, fresh and dry weights (of shoot and root)
of the seedlings for the said parameters in control treatments was the best and this was
worsened with the increase of soil compaction in almost all the selected species. Changes in
root fresh weight and dry weight were much prominent (with ≥50% reduction in all the
species). Limited root growth lead to restricted supply of nutrients and water that ultimately
resulted in poor leaf growth, decrease in photosynthetic rate, decrease in transpiration rate,
poor stomatal conductance, low CO2 concentration and poor water use efficiency.
At the termination of experiment soil bulk density was analyzed again to assess the impact of
selected tree seedlings on these soil compaction treatments. It was concluded that the
response of all the species was not significantly different from each other in control though
B. ceiba was top ranked species that loosened the soil, followed by P. deltoides, E.
camaldulensis, V. nilotica, M. alba, A. lebbeck and Z. mauritiana. Dalbergia sissoo did not
have any impact on set level of compaction in control treatment. In T1, it was concluded that
the response of all the species was significantly different. It was concluded that M. alba was
top ranked species who loosened the soil in treatment T1, followed by P. deltoides, D. sissoo,
E. camaldulensis, B. ceiba, A. lebbeck and V. nilotica. Whereas, Z. mauritiana had no or very
little impact on set level of compaction in treatment T1. In T2, the response of all the species
was significantly different. It was observed that M. alba was top ranked species who
loosened the soil in treatment T2, followed by B. ceiba, E. camaldulensis, P. deltoides, D.
sissoo, A. lebbeck and V. nilotica. Whereas, Z. mauritiana had no or very little impact on set
level of compaction in treatment T2. The response of all the species was significantly
different in T3. It was concluded that B. ceiba, was top ranked species that loosened the soil
in treatment T3, followed by P. deltoides, M. alba, D. sissoo, E. camaldulensis, V. nilotica
and A. lebbeck. Z. mauritiana had very little impact on set level of compaction in treatment
T3. The response of all the species was significantly different in T4 as well. It was observed
that P. deltoides was top ranked species that loosened the soil in treatment T4, followed by,
M. alba, B. ceiba, A. lebbeck, E. camaldulensis, V. nilotica and Z. mauritiana. Whereas,
Dalbergia sissoo had very little impact on set level of compaction in treatment T4.

163
Results of study-3 were found almost similar to results of study-2. Growth response of eight
major agro-forest species seedling (Dalbergia sissoo, Vachellia nilotica, Bombax ceiba,
Morus alba, Albizia lebbeck, Populus deltoids, Zyziphus mauritiana and Eucalyptus
camaldulensis) against soil compaction was assessed. The growth response was assessed
with respect to same parameters mentioned in study-2.
Again morphology and growth of selected species was found strongly affected by increasing
level of soil compaction. Almost all the morphological and physiological parameters of each
species were found negatively related with increased level of compaction (as p=0.000). Size,
fresh and dry weights (of shoot and root) of the seedlings revealed that the response of the
said parameters in control treatments was the best and this was worsened with the increase of
soil compaction in almost all the selected species. Changes in root fresh weight and dry
weight were much prominent (with ≥50% reduction in all the species). Limited root growth
lead to restricted supply of nutrients and water that ultimately resulted in poor leaf growth,
decrease in photosynthetic rate, decrease in transpiration rate, poor stomatal conductance,
low Carbon dioxide concentration and poor water use efficiency.
At the termination of experiment when the plants were harvested and bulk density was
analyzed again and it was concluded that P. deltoides, B. ceiba M. alba were three top
species that impacted the compacted soil (loosened the soil) equally. Whereas, the species
which had little impact on soil compaction were D. sissoo, Z. mauritiana and V. nilotica etc.
Overall negative impact of soil compaction on all selected species was observed in current
research work.
Recommendations and future research:
From the data analyzed, results concluded and after the discussion of these results following
recommendation were made by the author:
The concept of sustainability for the developing country like Pakistan should not be
ignored to meet the global challenges of poverty reduction and food security along
with the rapid phase of development.
Mechanization of forests plantations and farmlands is crucial and need of time for
intensive cultivation and profit maximization, however, the use of machines should
be very wise and judicious to avoid soil compaction.

164
Use of heavy machinery for different farm operations at field capacity conditions
result in soil compaction that harms the tree health and growth should be avoided.
Most of the farmers are not aware about the detrimental effects of soil compaction on
tree growth so, the co-ordination between farmer and research organization should be
strengthened to create awareness about soil compaction and its impacts (on crops and
trees) among farming community. Free planting materials can be provided to the
farming community at subsidized rate.
Higher level of soil compaction reduces the seed germination, tree survival rate, tree
growth and rooting depth. Soil loosening operations (manual) near trees are essential
to avoid the damaging effects of soil compaction on trees.
Being one of the most important component of a balanced ecosystem trees are
important for researchers so, to recognize the importance of these farm friendly
species, plans can be proposed for the proper use of these fast growing species in
future.
To fulfill the energy and wood demands of the exploding population of Pakistan, the
mention plant species are best that can meet the terms under various agro-forestry
systems.

165
REFRENCES
Abu-Hamdeh, N.H. 2003. Compaction and subsoiling effects on corn growth and soil bulk
density. Soil. Sci. Soc. Am. J. 67(4): 1213–1219.
Acacio, V., M. Holmgren, P.A. Jansen and O. Schrotter. 2007. Multiple recruitment
limitation causes arrested succession in Mediterranean cork oak systems. Ecosystems
10: 1220-1230.
Agrawal, R.P. 1991. Water and nutrient management in sandy soils by compaction. Soil
Tillage Res. 19: 121–130.
Ahmad, N.F. Hassan and R. Belford. 2009. Effect of soil compaction in the sub-humid
cropping environment in Pakistan on uptake of NPK and grain yield in wheat
(Triticum aestivum): Compaction. Field Crops Res. 110: 54-60.
Ahmad, M.F., K. Alam and S. Ahmad. 2011. The studies on medicinal plants of Cholistan
desert Pakistan. LAP Lambart Academic Publishing Gmbh & Co. KG. Saarbrucken,
Germany, 42-130.
Alakukku, L., P.Weisskopf, W.Chamen, F.Tijink, J.VD.Linden, S. Pires, C.Sommer and G.
Spoor. 2003. Prevention strategies for field traffic-induced subsoil compaction by
vehicles with high axle load. Soil Tillage Res. 29(2-3):151-155.
Alakukku, L., P.Elomen. 1994. Finish experiment on subsoil compaction by vehicles with
high axle load. Soil Tillage Res. 29(2-3):151-155.
Alameda, D. and R. Villar. 2009. Moderate soil compaction: implications on growth and
architecture in seedlings of 17 woody plant species. Soil Tillage Res.103: 325-331.
Alban, H.D., G.E. Host, J.D. Elioff and D.A. Shadis. 1994. Soil and vegetation response to
soil compaction and forest floor removal after aspen harvesting. Research paper NC-
315, USDA Forest Service, St. Paul, Minnesota, 11 pp.
Alberty, C., A. Pellett and D.H. Taylor. 1984. Characterization of soil compaction at
construction sites and woody plant responses. J. Environ. Hort. 2: 48-53.
Amare, G., 2002. Eucalyptus farming in Ethiopia: the case for eucalyptus woodlots in the
Amhara region. Bahir Dar Conference Proceedings. Ethiopian Society of Soil Science.
137-153.
Ampoorter, E., R. Goris, W.M. Cornelis and K. Verheyen. 2007. Impact of mechanized
logging on compaction status of sandy forest soils. Forest Ecol. Manag. 241: 162-174.

166
Arshad, M.A., B. Lowery and B. Grossman. 1996. Physical tests for monitoring soil quality.
Methods for assessing soil quality. pp. 123–143. Madison: Soil Science Society of
America (SSSA).
Arvidsson, J. 1999. Nutrient uptake and growth of barley as affected by soil compaction.
Plant Soil. 208 (1): 9-19.
Assouline, S., J. Tavares-Filho and D. Tessier, 1997. Effect of soil compaction on soil
physical and hydraulic properties: experimental results and modeling. Soil Sci. Soc.
Am. J. 61: 390-398.
Atkinson, D.R., F. Herbert and R.P. Gurung. 1985. The effect of pre-planting soil preparation
and soil management on soil physical parameters in an apple orchard. Soil Use
Manag. 1:131—134.
Aubert, M., M. Hedde, T. Decaens, P. Margerie, D. Alard and F. Bureau. 2005. Facteurs
contrôlant la variabilité spatiale dela macrofauna du sol dans une hêtraie pure etune
hêtraie-charmaie. C. R. Biol. 328: 57–74.
Aziz A. A. S., Omari M. A. and Kafawin O. M..2001. Germination and seedling growth of
acacia raddiana and acacia nilotica at different levels of salinity and drought under in
vitro conditions. J Trop For Sci. 13(1):192-201.
Bassett, I.E., R.C. Simcock and N.D. Mitchell. 2005. Consequences of soil compaction for
seedling establishment: implications for natural regeneration and restoration. Austral
Ecol. 30: 827–833.
Bashir A., Rizwan M., Ali S., Zia ur Rehman M., Ishaque M., Riaz M. A. Maqbool A. 2018.
Effect of foliar-applied iron complexed with lysine on growth and cadmium (Cd)
uptake in rice under Cd stress. Environ Sci Pollut Res Int. 25:20691–20699
Battigelli, J.P., J.R. Spence, D.W. Langor and S.M. Berch. 2004. Short-term impact of forest
soil compaction and organic matter removal on soil mesofauna density nitrogen use.
Funct. Ecol. 13: 210–216.
Beare, M.H., E.G. Gregorich and P. Georges. 2009. Compaction effects on CO2 and N2O
production during drying and rewetting of soil. Soil Biol. Bioch. 41(3): 611–621.
Bejarano, L., A.M. Murillo, R. Villar, J.L. Quero and R. Zamora. 2005. Crecimiento de pla´
ntulas de Quercus pyrenaica bajo distintos niveles de radiacio´n y compactacio´n del
suelo. Resumen de Actas del 48 Congreso Forestal. 30: 827–840.

167
Bejarano, M.D., R. Villar, A.M. Murillo and J.L. Quero. 2010. Effects of soil compaction
and light on growth of Quercus pyrenaica Willd. (Fagaceae) seedlings. Soil Tillage
Res.110: 108-114.
Bengough, A.G. and C.E. Mullins, 1990. Mechanical impedance to root growth: a review of
experimental techniques and root growth responses. J. Soil Sci. 41:341-358.
Berli, M., B. Kulli, W. Attinger, M. Keller, J. Leuenberger, H. Flühler, S.M. Springman and
R. Schulin. 2003. Compaction of agricultural and forest soils by tracked heavy
construction machinery Soil Tillage Res.75: 37–52.
Beylich A, H. oberholzer, S. S. Schrader, H. Hoper and B. Wilke. 2010. Evaluation of soil
compaction effects on soil biota and soil biological processes. Soil Tillage Res.
109:133- 143.
Blake, G.R., W.W. Nelson and R.R. Allmaras. 1976. Persistence of subsoil compaction in
Mollisol. Soil Sci. Am. J. 40: 943-948.
Blouin, V.M., M.G. Schmidt, C.E. Bulmer and M. Krzic. 2008. Effects of compaction and
water content on lodge pole pine seedling growth. Forest. Ecol. Manag. 255: 2444-
2452.
Blumfield, T.J., Z.H. Xu and C. Chen. 2005. Mineral nitrogen dynamics following soil
compaction and cultivation during hoop pine plantation establishment. Forest Ecol.
Manag. 204: 129–135.
Boone, F.R. 1988. Weather and other environment factors influencing crop response to
tillage and traffic. Soil Tillage Res. 11: 283-324.
Boone, F.R., H.M.G. Vander Worf. B. Kroesbergen, B.A. Ten Hag and A. BOERS. 1986.
The effect of compaction of the arable layer in sandy soils on the growth of maize
for silage. Matric water potentials in relation to soil aeration and mechanical
impedance. Neth. J. Agric. Sci. 34: 155-171.
Botta, G., D. Jorajuria, H. Rosatto and C. Ferrero. 2006. Light tractor traffic frequency on
soil compaction in the Rolling Pampas region of Argentina. Soil Tillage Res. 86: 9-
14.
Bouwman, L. and W. Arts. 2000. Effects of soil compaction on the relationships between
nematodes, grass production and soil physical properties. Appl. Soil. Ecol. 14: 213-
222.

168
Boyer, J.M. and D.B. South. 1988. Loblolly pine seedling morphology and production at 53
southern forest nurseries. US Department of Agriculture, Forest Service, Tree
Planters Note 13.
Brais, S. and C. Camire. 1998. Soil compaction induced by careful logging in the clay belt
region of northwestern Quebec (Canada). Can. J. Soil Sci. 78: 197–206.
Braunack, M.V. and J. Walker. 1985. Recovery of some surface soil properties of ecological
interest after sheep grazing in semi-arid woodland. Aust. J. Ecol. 10: 451–60.
Bronick, C.J. and R. Lal. 2005. Soil structure and management: Geo-derma.124, 3–22.
Bruand, A., I. Cousin, B. Nicoullaud, O. Duval and J. Begon. 1996. Backscattered electron
scanning images of soil porosity for analyzing soil compaction around roots. Soil Sci.
Soc. Am. J. 60:895–901.
Buckley, D.S., T.R. Crow, E.A. Nauertz and K.E. Schulz. 2003. Influence of skid trails and
haul roads on understory plant richness and composition in managed forest
landscapes in Upper Michigan, USA. Forest. Ecol. Manag. 175: 509–520.
Bulmer, C.E. and D.G. Simpson. 2005. Soil compaction and water content as factors
affecting the growth of lodge pole pine seedlings on sandy clay loam soil. Can. J.
Soil. Sci. 85: 667-679. - doi: 10.4141/S04-055.
Canarache, A., I. Colibas, M. Colibas, I. Horobeanu and V. Patru. 1984. Effect of induced
compaction by wheel traffic on soil physical properties and yield of maize in
Romania. Soil Tillage Res.4: 199–213.
Canbolat, M.Y., S. Bilen, R. Cakmakci, F. Şahin and A. Aydin. 2006. Effect of plant growth-
promoting bacteria and soil compaction on barley seedling growth, nutrient uptake,
soil properties and rhizosphere microflora. Biol. Fert. Soils. 42(4): 350–357.
Cannel, R. 1977. Soil aeration and compaction in relation to root growth and soil
management. Appl. Biol 2: 1-86.
Carrow, R.N. and A.M. Petrovic. 1992. Effects of traffic on turf grasses. IIZ Carrow, R.N.
and Shearman, R.C. (eds.). American Society of Agronomy, Madison, WI. Turfgrass,
pp. 285-330.
Cassel, D. K., 1983. Effects of soil characteristics and tillage practices on water storage and
its availability to plant roots. Crop relations to water and temperature stresses in
humid temperature climates. Westview Press, Boulder, CO, pp. 167-186.

169
Cheatle, R.J. 1991. Tree growth on a compacted oxisol. Soil Tillage Res. 19: 331–344.
Chen, Y., J. Tarchitzky, J. Brouvier, J. Morin and A. Bonin, 1980. Scanning electron
microscope observations on soil crusts and their formation. Soil Sci. 130: 49-55.
Cochran, P.H. and T. Brock. 1985. Soil compaction and initial height growth of planted
ponderosa pine. USDA Forest Service, Pacific Northwest Forest and Range
Experimental Station Research Note PSW 434, Portland.
Corns, G.W. 1988. Compaction by forestry equipment and effects on coniferous seedling
growth on four soils, in the Alberta foothills. Can. J. Forest Res. 18: 75-84.
Conway, G.R. and J. N. Preety. 1991. Unwelcome harvest: Agriculture and pollution. Earth
scan Publ. London. UK. 645P.
Curry, J.P. and O. Schmidt. 2007. The feeding ecology of earthworms. A review.
Pedobiologia 50: 463–477.
Day, S.D., and N.L. Bassuk. 1994. A review of the effects of soil compaction and
amelioration treatments on landscape trees. J. Arboricult. 20: 9-17.
Day, S.D., Wiseman P.E., Dickinson S.B., Harris J.R. 2010. Tree root ecology in the urban
environment and implications for a sustainable rhizosphere. Arboric urb Forest.
36:193-205.
Dexter, A. 1987. Compression of soil around roots. Plant. Soil. 97:401–406.
Dickson, W. 1994. Compaction by a combine harvester operating on moist, loess soil. Soil
Tillage Res. 29: 145-150.
Dickerson, B.P. 1976. Soil compaction after tree length skidding in northern Mississippi. Soil
Sci. Soc. Am. J. 40: 965-966.
Diogenes L. A., John McL., Bennett and Troy A. Jensen. 2016. Soil compaction and
controlled traffic considerations in Australian cotton-farming systems. CROP
PASTURE SCI. 67(1)1-28.
Drewry, J.J., K.C. Cameron and D. Buchan. 2008. Pasture yield and soil physical property
responses to soil compaction from treading and grazing – a review. Aust. J. Soil Res.
46, 237–56.
Dumas, W.T., A.C. Trouse, L.A. Smith, F. A. Kummar and W.R. Gill. 1973. Development
and evaluation of tillage and other cultural practices in a controlled traffic system for
cotton in the southern coastal plains. Trans. Am. Soc. Agric. Eng. 16: 872-875.

170
Duniway, J.M. and T.R. Gordon. 1986. Water relations and pathogen activity in soil. In
Ayres, P. L. and Boddy, L. (eds.). Water, Fungi and Plants, pp. 119-137. Cambridge
University Press, Cambridge.
Duran zuazo, V.H., and C.R. Rodriguez Pleguezuelo. 2008. Soil-erosion and runoff
prevention by plant covers. A review. Agron. Sustain. Dev. 28:65–86.
Dürr, C. and J. Aubertot. 2000. Emergence of seedlings of sugar beet (Beta vulgaris L.) as
affected by the size, roughness and position of aggregates in the seedbed. Plant and
soil 219: 211-220.
Eavis, B.W. 1967. Mechanical impedance to root growth in proceeding of the “Agricultural
Engineering Symposium”. Report no. 4/F/39. The Institute of Agricultural
Engineering, Silsoe, UK, pp. 11.
Eckelmann W., Baritz R., Bialousz S., Bielek P., Carre F., Houškova B., Jones R.J.A.,
Kibblewhite M.G., Kozak J., Le Bas C., Toth G., Toth T., Varallyay G., Yli Halla M.,
Zupan M. 2006. Common criteria for risk area identification according to soil threats.
European Soil Bureau Research Report No. 20, EUR 22185 EN, Office for Official
Publications of the European Communities, Luxembourg, pp. 94.
Edwards, C.A. and P.J. Bohlen. 1996. Biology and Ecology of Earthworms, 3rd edn.
London: Chapman and Hall.
Ekwue, E.I. and R.J. Stone. 1995. Irrigation scheduling for sweet maize relative to soil
compaction conditions. J. Agric. Eng. Res. 62: 85–94.
Entry, J.A., D.W. Reeves. C.B. Backman and R.L. Raper. 1996. Influence of wheel traffic
and tillage on microbial biomass, residue decomposition and extractable nutrients
in a coastal plain soils. Plant Soil. 180: 129-137.
Eswaran, H., R. Lal and P. Reich. 2001. Land degradation: an overview in bridges S (eds)
Responses to land degradation. Oxford Press, New Delhi. pp. 20–35.
Etana, A. and I. Hakaanson. 1994. Swedish experiment on the persistence of subsoil
compaction caused by vehicles with axle load. Soil Tillage Res. 29(2-3): 167-172.
Fabiola, N., B. Giarola, A.P. da Silva, S. Imhoff and A. R. Dexter. 2003. Contribution of
natural soil compaction on hard setting behavior. Geoderma. 113(1): 95-108.
FAO. 2010. Global Forest Resources Assessment, Food and Agriculture Organization
(United Nations). Rome, Italy.

171
Fawcett, R.G., F.R. Maynard and N.R. Pederson. 1988. The effect of traffic and other factors
on wheat yield in South Australia. Proc. 11th
Intl.Conf. July 11-15, 1988. Edinburgh,
UK.
Feder, F., F. Trolard, G., Klingelhofer and G. Bourrie.2005. In situ Mossbauer spectroscopy-
evidence for green rust (Fougerite) in a gleysol and its mineralogical transformations
with time and depth. Geo chem. Ac 69:4463-4483.
Ferrero, A.F. 1991. Effect of compaction simulated by cattle trampling on soil physical
characteristics in woodland. Soil Tillage Res.19: 319–29.
Firth, J. and G. Murphy. 1989. Skid trails and their effects on the growth and management of
young Pinus radiata. N Z J. For. Sci. 19: 22-28.
Fisher, R.F. and D. Binkley. 2000. Ecology and Management of Forest Soils, third ed. Wiley,
New York.
Fleming, R.L., R. F. Powers, N. W. Foster, J.M. Kranabetter, D.A. Scott and F. Ponder.
2006. Effects of organic matter removal, soil compaction, and vegetation control on
5- year seedling performance: a regional comparison of Long-Term Soil Productivity
sites. CAN J FOREST RES. 36, 529–550.
Foil, R.R. and C.W. Ralston, 1967. The establishment and growth of loblolly pine seedlings
on compacted soils. Soil Sci. Soc. Am. Proc. 31: 565-568.
Frey, B., J., Kremer, A., Rudt, S., Sciacca, Matthies and P., Luscher. 2009. Compaction of
forest soils with heavy logging machinery affects soil bacterial community structure.
Eur J. Soil Biol 45:312-320.
Fritz, V.A., R.R. Allmaras, F.L. Pfleger and D.W. Davis. 1995. Oat Residue and Soil
Compaction Influences on Common Root Rot (Aphanomyes Euteiches) of Peas in a
Fine-Textured Soil. Plant Soil. 171 (2): 235–244.
Froehlich, H. A. 1979. Soil compaction from logging equipment. Effects on growth of young
Ponderosa pine. J. Soil Water Conserv. 34: 276-278.
Gaertig, T., H. Schack-Kirchner, E.E. Hildebrand and K. Wilpert. 2002. The impact of soil
aeration on oak decline in southwestern Germany. Forest. Ecol. Manage. 159, 15–25.
Galye, G.A., C.S.W. Raczkowski and R. Mwazi. 1992. Tillage and wheel traffic effects on
soil properties and root growth. Am. Soc. Agri. Engrs. No. 92-1556, 12p.
Gameda, S., Raghaven, G. S. V., McKyes, A. Watson and J. Dural. 1994. Profile

172
characteristics of a clay under heavy axle load compaction. Soil Tillage Res.
29: 189-194.
Gebauer, R. and M. Martinkova. 2005. Effects of pressure on the root systems of Norway
spruce plants Picea abies L. Karst. J. For. Sci. 51: 268–275.
Gebre-Markos, W. 1998. The forest resources of Ethiopia past and present. J.
Ethiop.Wildlife Nat. history Soc. 19: 10-28.
Gerard, C., P. Sexton and G. Shaw. 1982. Physical factors influencing soil strength and root
growth. Agronomy journal 74: 875–879.
Ghauri, M.J.C.B and A.A. Qureshi. 1999. Statistical hand book of Punjab forestry, wildlife
and fisheries department Punjab Forest Dept, Lahore.
Gill, W.R. and R.D. Mittler. 1956. A method for study of the influence of mechanical
impedance and aeration on the growth of seedling roots. Proc. Soil Sci. Soc. Am.
20:154- 157.
Gilman, E.F., I.A. Leone and F.B. Flower. 1987. Effect of soil compaction and oxygen
content on vertical and horizontal root distribution. J. Environ. Hort. 5: 33-36.
Glinski, J. and J. Lipiec. 1990. Soil physical conditions and plant roots. CRC Press, Boca
Raton.
Gomez-Aparicio, L., I.M. Perez-Ramos, I. Mendoza and L. Matias 2008. Oak seedling
survival and growth along resource gradients in Mediterranean forests: implications
for regeneration in current and future environmental scenarios. Oikos 117: 1683–
1699.
Gomez, A., R.F. Powers, M.J. Singer and W.R. Horwath. 2002. Soil compaction effects on
growth of young ponderosa pine following litter removal in California Sierra Nevada.
Soil Sci. Soc. Am. J. 66: 1334-1343.
Government of Pakistan. 2006. Economic Survey 2006-07. Government of Pakistan,
Finance Division, Economic Advisor's Wing, Islamabad. 1-2.
Government of Pakistan. 2016-17. Economic Survey 2016-17. Government of Pakistan,
Finance Division, Economic Advisor's Wing, Islamabad. 4-5.
Gray, L.E. and R.A. Pope. 1986. Influence of soil compaction on soybean stand, yield and
Plzytoplztlzora root rot incidence. Agron. J. 78: 189-191.

173
Grable, A.R. and E.G. Siemer. 2007. Effects of bulk density, aggregate size and soil water
suction on oxygen diffusion, redox potentials and elongation of corn roots. Soil Sci.
Soc. Am. Proc. 32:180-201.
Greacen, E.L. and R. Sands. 1980. Compaction of forest soils: a review. Aust. J. Soil Res. 18:
163–189.
Greenwood, K.L. and B.M. McKenzie. 2001. Grazing effects on soil physical properties and
the consequences for pastures: a review. Aust. J. Exp. Agric. 41: 1231–50.
Groleau-Renaud, V., S. Plantureux and A. Guckert. 1998. Influence of plant morphology on
root exudation of maize subjected to mechanical impedance in hydroponic conditions.
Plant Soil. 201: 231–239.
Guariguata, M.R. and J.M. Dupuy. 1997. Forest regeneration in abandoned logging roads in
lowland Costa Rica. Biotropica 29: 15-28.
Gysi, M., G. Klubertanz and L. Vulliet. 2000. Compaction of a Eutric Cambisol under wheel
traffic in Switzerland. Soil Tillage Res. 56(3-4): 117-129.
Hadas, A., D. Wolf, and E. Rawitz. 1985. Residual compaction effects on cotton stand and
yield. Trans. Am. Soc. Agric. Eng. 28: 691-696.
Hakansson, I. 1994. Subsoil compaction caused by heavy vehicles- A long term threat to soil
productivity. Soil Tillage Res. 11: 349-372.
Hammel, J.E. 1994. Effect of high axle load traffic on sub soil physical properties and crop
yields in the Pacific North West, USA. Soil Tillage Res. 29(2-3): 195-203.
Hamza, M. and W. Anderson. 2005. Soil compaction in cropping systems. A review of the
nature, causes and possible solutions. Soil Tillage Res. 82:121–145.
Hargreaves, J.C., M.S. Adl and P.R. Warman. 2008. A review of the use of composted
municipal solid waste in agriculture. Agric. Ecosyst. Environ. 123: 1–14.
Harris, W.L. 1971. The soil compaction process of agriculture soils. Am. Soc. Agric. Eng.,
St. Joseph, MI.USA. p. 9-44.
Hatchell, G.E, C. WoRalston and R.R. Foil. 1970. Soil Disturbances in Logging. Effects on
Soil Characteristics and Growth of Loblolly Pine in the Atlantic Coastal Plain. J. For.
772–775.
Hatamnia A. A., Abbaspour N., Darvishzadeh R., Rahmani F., Heidari R. 2013. Effect of salt
stress on growth, ion content and photosynthesis of two oriental Tobacco (Nicotiana

174
tobacum) cultivars. Intl J Agri Crop Sci. 6 (11):757-761.
Hegarty, T.W. and S.M. Royle. 1978. Combined effects of moisture content prior to
compaction, comparative effort and rainfall quantity on soil crust strength. J. Soil Sci.
29: 167- 173.
Heilman, P. 1981. Root penetration of Douglas-fir seedlings into compacted soil. For. Sci.
27, 660–666.
Helms, J.A. and C. Hipkin, 1986. Effects of soil compaction on tree volume in a California
ponderosa pine plantation. West. J. Appl. For. 1: 121-124.
Helms, J. A., C. Hipkin and E.B. Alexander. 1986. Effects of soil compaction on height
growth of a California ponderosa pine plantation. West. J. Appl. For. 1: 104-108.
Heninger, R., W. Scott, A. Dobkowski, R. Miller, H. Anderson and S. Duke. 2002. Soil
disturbance and 10-year growth response of coast Douglas-fir on no tilled and tilled
skid trails in the Oregon Cascades. Can. J. For. Res. 32: 233–246.
Hillel, D. 2009. The mission of soil science in a changing world. J. Plant Nutr. Soil Sci. 172:
5–9.
Hillel, D. L. 1982. Introduction to Soil Physics. Academic Press, New York.
Hirekurubar, M.R.,V.S. Doddamani and T. Satynalayana. 1991. Effect of soil texture and
compaction on physical properties. J.Ind.Soc.Soil sci. 39:248-350.
Holden, S., S. Benin, S. Bekele and J. Pender. 2003. Tree Planting for Poverty Reduction in
Lessfavoured Areas of the Ethiopian Highlands. Small-scale Forest Economics,
Management and Policy. 2(1): 63-80.
Horn, R., H. Doma, A. Sowiska-Jurkiewicz and C.O. Van-Ouwerkerk. 1995. Soil
compaction processes and their effects on the structure of arable soils and the
environment. Soil Tillage Res. 35:23–36.
Hullugalle, N.R. and R. Lal. 1986. Root growth of maize in a compacted gravelly tropical
alfisol as affected by rotation with a woody perennial. In seedlings of 17 woody plant
species. Soil. Till. Res. 103:325–331.
Hussain, F. and A. Khaliq. 1996. Ethnobotanical studies on some plants of Dabargai Hills,
Swat. Proceedings of first training workshop on ethnobotany and its application to
conservation. NARC, Islamabad. 207-215.
Iqbal, M. S., A. Hussain and M. Abid. 1999. Effect of soil texture and compaction on

175
nutrients uptake and growth of maize. Pak. J. Agric. Sci. 36(3-4): 254-160.
Ishaq, M., A. Hassan, M. Saeed, M. Ibrahim and R. Lal. 2001. Subsoil compaction effects on
crops in Punjab, Pakistan. Soil physical properties and crop yield. Soil Tillage Res.
59:57–65.
Jagger, P. and J. Pender. 2000. The role of trees for sustainable management of less-favored
lands: the case of eucalyptus in Ethiopia. Forest Policy Econ. 5(1): 83-95.
Jim, C. Y. 1993. Soil compaction as a constraint to tree growth in tropical and subtropical
urban habitats New York. Environ. Conserv. 20: 35-49.
Jones, R., G. Spoor and A. and Thomasson. 2003. Vulnerability of subsoils in Europe to
compaction: a preliminary analysis. Soil Tillage Res. 73:131–143.
Jorajuria, D. and L. Draghi. 1997. The distribution of soil compaction with depth and the
response of a perennial forage crop. J. Agr. Eng. Res. 66: 261–265.
Jordan, D., F. Ponder and V. Hubbard. 2003. Effects of soil compaction, forest leaf litter and
nitrogen fertilizer on two oak species and microbial activity. Appl. Soil Ecol. 23:33–
41.
Jordan, D., F. Li, F.J. Ponder, E.C. Berry, V.C. Hubbard and K.Y. Kim. 1999. The effects of
forest practices on earthworm populations and soil microbial biomass in a hardwood
forest in Missouri. Appl. Soil Ecol. 13, 31–38.
Kara, O. and I. Bolat. 2007. Influence of soil compaction on micro fungal community
structure in two soil types in Bartin Province, Turkey. J Basic Microbiol. 47, 394–
399.
Kaspar, T.C., H.J. Brown and E.M. Kassmeyer. 1991. Corn root distribution as affected by
tillage, wheel traffic and fertilizer placement. Soil Sci. Am.J. 55(5): 1390-1394.
Kesik, T. and R. Stanek. 1983. Reakcja krzewow porzeczek I malin na zageszczenie gleby.
Agrotechnika sadow ze szczegolnym uwzglednieniem terenow erodowanych, Lublin,
Poland, pp. 41-44.
Kim, H., S.H. Anderson, P.P. Motavalli and C.J. Gantzer. 2010. Compaction effects on soil
macro pore geometry and related parameters for an arable field. Geoderma. 160(2):
244–251.
Kirby, J. and A. Bengough. 2002. Influence of soil strength on root growth: experiments and
analysis using a critical-state model. Eur. J. Soil Sci. 53:119–127.

176
Koolen, A.J. and H. Kuipers. 1983. Agricultural Soil Mechanics. Springer, Berlin.
Korotaev, A.A. 1992. Bodenverdichtung und Wurzelwachstum der Baume. Forstarchiv 63:
116- 119.
Kozlowski, T.T. 1999. Soil compaction and growth of woody plants. Scand. J. For. Res. 14,
596–619
Kozlowski, T.T. and S.G. Pallardy. 1997a. Physiology of Woody Plants, 2nd edn. Academic
Press, San Diego, CA.
Kozlowski, T.T. and S.G. Pallardy. 1997b. Growth Control in Woody Plants. Academic
Press, San Diego, CA.
Kozlowski, T.T., P.J. Kramer and S.G. Pallardy. 1991. The Physiological Ecology of Woody
Plants. Academic Press, San Diego, CA.
Kristoffersen, A. and H. Riley. 2005. Effects of soil compaction and moisture regime on the
root and shoot growth and phosphorus uptake of barley plants growing on soils with
varying phosphorus status. Nutr. Cycl. Agroecosys. 72:135–146.
Lal, R. 2009. Soils and food sufficiency, a review. Agron. Sustain. Dev. 29: 113–133.
Lal, R. 2009. Soils and sustainable agriculture: A review in sustainable agriculture, Springer
Netherlands. pp. 15-23.
Lindemann, W.C., G.E. Ham and G.W. Randall. 1982. Soil compaction effect on soybean
nodulation.N2 (C2H4) fixation and seed yield. Agron. J. 74: 307-311.
Lipiec, J. and W. Stepniewski. 1995. Effects of soil compaction and tillage systems on
uptake and losses of nutrients. Soil Tillage Res. 35: 37-52.
Lipiec, J. and R. Hatano. 2003. Quantification of compaction effects on soil physical
properties and crop growth. Geoderma. 116: 107–36.
Lister, T.W., J.A. Burger and S.C. Patterson. 2004. Role of vegetation in mitigating soil
quality impacted by forest harvesting. Soil Sci. Soc. Am. J. 68, 263–271.
Logsdon, S.D., R.B. Reneau and J.C. Parker. 1987. Corn seedling root growth as influenced
by soil physical properties. Agron. J. 79, 221–224.
Lowry, F.E., H.M. Taylor, and M.G. Huck. 1970. Growth rate and yield of cotton as
influenced by depth and bulk density of soil pans. Soil Sci. Soc. Am. Proc. 34: 306-
309.
Lowery, B. and R.T. Schuler. 1991. Temporal effects of subsoil compaction on soil strength

177
and plants growth. Soil Sci. Am. J. 55(1):216-223.
Lunt, R. 1956. Minimizing compaction in putting greens. USDA J. Turf Manage. 9 (5): 25-
30.
Madison, J.H. 1971. Practical Turf grass Management. Van-Nostrand-Reinhold, New York.
Marschner, H. 1986. Mineral nutrition of higher plants. Plant Cell Environ. 11:147-148.
Marshall, T.J. and Holmes, J.W., 1988. Soil Physics, 2nd edn. Cambridge University Press,
Cambridge, 374 pp.
María Sara Mejía de Tafur1, Néstor Miguel Riaño Herrera, John Byron Urrego Mesa, Dora
Mónica Ibarra Espinosa and Claudia Marcela Zapata Duque. 2017. Effect of soil water
availability on gas exchange in young trees of Eucalyptus grandis W. Hill ex Maiden.
Plant Ecophysiology and Crop Production. Acta Agronómica. 66 (4):549-557.
Masle, J. 2002. High soil strength: mechanical forces at play on root morphogenesis and in
root: shoot signaling. In: “Plant roots, the hidden half. 3rd edn” (Waisel Y, Eshel A,
Kafkafi U eds). Marcel Dekker, New York, USA, pp. 807-819.
Masle, J. and J. Passioura. 1987. The effect of soil strength on the growth of young wheat
plants. Australian J. Plant. Physiol. 14:643–656.
Masle, J., G.D. Farquhar and R.M. Gifford. 1990. Growth and carbon economy of wheat
seedlings as affected by soil resistance to penetration and ambient partial pressure of
CO2. Aust. J. Plant Physiol. 17: 465–487.
Mason, E.G.A. W.J. Cullen and W.C. Rijkse. 1988. Growth of Two Pinus Radiata Stock
Types on Ripped and Ripped/bedded Plots at Karioi Forest. N. Z. J. For. Sci. 18 (3):
287–96.
Materechera, S. A., A.M. Alston, J.M. Kirby and A.R. Dexter. 1992. Influence of root
diameter penetration of seminal roots into compacted subsoil. Plant Soil. 144: 297-
303.
Materechera, S., A. Dexter and A. Alston. 1991. Penetration of very strong soils by seedling
roots of different plant species. Plant Soil. 135:31–41.
McConnell, J.S., B.S. Frizzell and M.H. Wilkerson, 1989. Effects of soil compaction and
subsoil tillage of two alfisols on growth and yield of cotton. J. Prod. Agi-ic. 2: 140-
146.

178
McGarry, D. and G. Sharp. 2003. A rapid, immediate, farmer-usable method of assessing soil
structure condition to support conservation agriculture. In Conservation agriculture.
pp. 375.
Miller, R.E., W. Scott and J.W. Hazard. 1996. Soil compaction and conifer growth after
tractor yarding at three coastal Washington locations. Can. J. For. Res. 26: 225-236.
Misra, R.K. and A.K. Gibbons. 1996. Growth and morphology of eucalyptus seedling roots
in relation to soil strength arising from compaction. Plant Soil 182:1-11.
Mitchell, M.L., A.E. Hassan, C.B. Davey and J.D. Gregory, 1982. Loblolly pine growth in
compacted greenhouse soils. Trans. Am. Soc. Agric. Eng. 25: 304-307, 312.
Mohd. Basri, H. and Nik Muhamad, M. 1992. Effects of soil compaction on growth of three-
year old Acacia mangium stand in Setul, Negri Sembilan, Malaysia. Malays. Forester
50: 250-257.
Moffat, A.J, 1994. Forestry and soil protection in the UK. Soil Use Manag.7:145-151.
Mueller, L., U. Schindler, W. Mirschel, T.G. Shepherd, B.C Ball, K. Helming, J. Rogasik, F.
Eulenstein and H. Wiggering. 2010. Assessing the productivity function of soils. A
review. Agron. Sustain. Dev. 30: 601–614.
Mullins, C.E. 1991. Physical properties of soils in urban environments, Blackwell, London.
pp. 87- 11 8.
Murphy, G. 1983. Pinus radiata survival, growth and form after four years planting on skid
trails. N Z J. For. 28: 184-193.
Nabe-Nielsen, J., W. Severiche, T. Fredericksen and L.I. Nabe-Nielsen. 2007. Timber tree
regeneration along abandoned logging roads in a tropical Bolivian forest. New
Forests. 34: 31–40.
Nadian, H., S.E. Smith, A.M. Alston and R.S. Murray. 1996. The effect of soil compaction
on Growth and P uptake by Trifolium subterraneum. Interaction with mycorrhizal
colonization. Plant Soil. 182: 39-40.
Nawaz, M.F., G. Bourrié and F. Trolard. 2013. Soil compaction impact and modelling. A
review. Agron. Sustain. Dev. 33: 291-309.
Nawaz, M.F. 2010. Geochemistry of hydromorphic soils and waters under rice culture and
forest continuous measurements, thermodynamic modelling and kinetics. Thesis,
Marseille University, pp. 211.

179
Noviana, K. and L.S. Joshi. 2005. Land tenure, agroforestry adoption, and reduction of fire
hazard in a forest zone: A case study from Lampung, Sumatra, Indonesia Agroforestry
System. 65:1–11
Nugent, C., C. Kanali, P.M.O. Owende, M. Nieuwenhuis and S. Ward. 2003. Characteristic
site disturbance due to harvesting and extraction machinery traffic on sensitive forest
sites with peat soils. Forest Ecol. Manage. 180: 85–98.
Oussible, M., R.K. Crookston and W.E. Larson. 1992. Subsurface compaction reduces the
root and shoot growth and grain yield of wheat. Agron. J. 84, 34–38.
Pan, E. and Bassuk, N. 1985. Effects of soil type and compaction on the growth of Ailanthus
altissima seedlings. J. Environ. Horticult. 3: 158- 162.
Panayiotopoulos, K.P., C.A. Papadoulous and A.hatjionnidou. 1992. Compaction and
mechanical impedance of an Alfiso and Entisol and their influence on growth of
maize in Problems soil. Proc. Intl. Conf. Aug. 31-Sept., 5, 1192. Hrsovany near
Brno. Czechosovakia. Soil and Fert. Abst. 57(11): 10210; 1194.
Patterson, J.C. 1977. Soil compaction effects on urban vegetation. J. Arboricult. 3: 161 - 167.
Pedrotti A., Pauletto E. A., Crestana S., Holanda F. S. R., Cruvinel P. E., Vaz C. M. P. 2005.
Evaluation of bulk density of Albaqualf soil under different tillage systems using the
volumetric ring and computerized tomography methods. Soil Tillage Res. 80:115–123
Perez-Ramos, I.M. 2007. Factores que condicionan la regeneracio´n natural de especies
len˜osas en un bosque mediterra´neo del sur de la Penı´nsula Ibe´ rica. Ph.D. Thesis.
University of Seville.
Pengthamkeerati, P., P.P. Motavalli and R.J. Kremer. 2011. Soil microbial biomass nitrogen
and ß-glucosaminidase activity response to surface compaction and poultry-litter
application in a claypan soil. Applied. Soil. Ecol. 51: 79– 86.
Pomeroy, K.B. 1949. The germination and initial establishment of loblolly pine under
various surface soil conditions. J. For. 47: 541-543.
Ponnamperuma, F.N. 1984. Flooding and Plant Growth. Academic Press, Orlando, FL. pp. 9-
45.
Poorter H., Niklas K.J., Reich P.B., Oleksyn J., Poot P., Mommer L. 2012. Biomass
allocation to leaves, stems and roots: meta-analyses of interspecific variation and
environmental control. New Phytologist 193: 30-50.

180
Powers, R.F., A.E. Tiarks and J.R. Boyle. 1998. Assessing soil quality: practicable standards
for sustainable forest productivity in the United States. The contribution of soil
science to the development of an implementation of criteria and indicators of
sustainable forest management. pp. 52–80.
Punyawardena, B. V. R. and L.G.G. Yapa. 1991. Effect of soil compaction and potassium
uptake, growth and yield of corn (Zea mays L.). Sri Lankan J. Agric . Sci. 28: 1-10.
Quero, J.L., L. Gomez-Aparicio, R. Zamora and F.T. Maestre. 2008. Shifts in the
regeneration niche of an endangered tree (Acer opalus ssp. granatense) during and
oribatid mite diversity. Can. J. Forest Res. 34: 1136–1149.
Quiroga, A.R., D.E. Buschiazzo and N. Peinemann. 1999. Soil compaction is related to
management practices in the semi-arid Argentine pampas. Soil Tillage Res. 52(1): 21-
28.
Quraishi, M.A.A. 2000. Farm Forestry in Pakistan. A booklet, Department of Forestry,
Range management and Wildlife, University of Agriculture, Faisalabad. (2): 2-5.
Rab, M.A. 1994. Changes in physical properties of a soil associated with logging of
Eucalyptus regans forest in southwestern Australia. For. Ecol. Manage. 70: 215-229.
Radford, B.J., D.F. Yule, D. McGarry and C. Playford. 2001. Crop responses to applied soil
compaction and to compaction repairs treatment. Soil Tillage Res. 61(3-4): 157-166.
Rahim, S.M.A and S. Hasnain. 2010. Agroforestry trends in Punjab, Pakistan. African
Journal of Environmental Science and Technology 4: 639-650.
Rahman, M.H., Kawai, S.Aslam, S. Hoque, A. Tanaka and to compaction repair treatments.
Soil Tillage Res. 61(3-4): 157-166.
Ramazan, M., G. Khan, M. Hanif and S. Ali. 2012. Impact of soil compaction on root length
and yield of corn (Zea mays) under irrigated condition. Middle-East Journal of
Scientific Research 11: 382-385.
Randrup, T.B. 1997. Soil compaction on construction sites. J. Arboricult. 23: 207-210.
Reed, A.H. 1983. The erosion risk of compaction. Soil Water. 11: 29-31:33.
Reich, P. 2002. Root-shoot relations: optimality in acclimation and adaptation or the
“Emperor’s new clothes?” In: “Plant roots, the hidden half (3rd edn)” (Waisel Y,
Eshel A, Kafkafi U eds). Marcel Dekker, New York, USA, pp. 205-220.

181
Reisinger, T.W., G.L. Simmons and P.E. Pope. 1988. The impact of timber harvesting on soil
properties, and seedling growth in the south. South. J. Appl. For. 12: 58-67.
Richards, D. and Cockroft, B. 1974. Soil physical properties and root concentrations in an
irrigated apple orchard. Aust. J. Exp. Agric. Anim. Husb. 14: 103-107.
Rizwan M., Ali S., Abbas T., Adrees M., Rehman M. Z., and Nawaz R. 2018. Residual
effects of biochar on growth, photosynthesis and cadmium uptake in rice (Oryza
sativa L.) under Cd stress with different water conditions. J Environ Manage.206
(2018) 676-683.
Rolf, R.K. 1994. A review of preventative and loosening measures to alleviate soil
compaction in tree planting areas. Arboricult. J. 18: 43 1 -448.
Rosen, C.J. and P.M. Carlson. 1984. Influence of root zone oxygen stress on potassium and
ammonium absorption by Myrobalan plum rootstock. Plant Soil 80: 345-353.
Rosolem, C., J. Foloni and C. Tiritan. 2002. Root growth and nutrient accumulation in cover
crops as affected by soil compaction. Soil Tillage Res. 65:109–115.
Saeed, M. Rashid and G. Mustafa. 1998. Compaction effect on the physical properties of soil
and crop yield. Pak. J. Soil Sci. 8: 19-22.
Sanchez, F.G., D.A. Scott, and K.H. Ludovici. 2006. Negligible effects of severe organic
matter removal and soil compaction on loblolly pine growth over 10 years. For. Ecol.
Manage. 227: 145–154.
Sands, R. and G.D. Bowen. 1978. Compaction of sandy soils in radiate pine forests. Effects
of compaction on root configuration and growth of radiata pine seedlings. Aust. For.
Res. 8: 163-170.
Saqib, M., J. Akhtar and R. Qureshi. 2004a. Pot study on wheat growth in saline and
waterlogged compacted soil. Soil Tillage Res. 77:169–177.
Saqib, M., J. Akhtar and R. Qureshi. 2004b. Pot study on wheat growth in saline and
waterlogged compacted soil II. Root growth and leaf ionic relations. Soil Tillage Res.
77:179–187.
Scherr, S.J. and S. Yadav. 1996. Land degradation in the developing world: Implications for
food, agriculture, and the environment to 2020. Food. Agric. 14:36.

182
Schroder, J.L., H. Zhang, K. Girma, W.R. Raun, C.J. Penn and M.E. Payton. 2011. Soil
acidification from long-term use of nitrogen fertilizers on winter wheat. Soil Sci. Soc.
Am. J. 75: 957–964.
Schuler, R.T., Casady, W.W. and R.L. Raper. 2000. Soil compaction. Chapter 9. IN.
R.C.Reeder (ed.) MWPS special publication: Conservation tillage systems and
management.
Shafiq, M., A. Hassan and S. Ahmad. 1994. Soil physical properties as influenced by induced
compaction under laboratory and field conditions. Soil Tillage Res. 29(1): 13-22.
Shazia A. 2017. Impact of Eucalyptus based agro-forestry systems on soil quality and rural
socio-economic conditions; a thesis. University of Agriculture, Faisalabad, Pakistan
Sheikh, M.I. 1993. Trees of Pakistan. Forestry Planning and Development Project: 1-2.
Sherbaz, Z.Y. 2005. Marketing Efficiency in Indian Agriculture. Allied Publishers Private
Limited, New Delhi.
Shestak, C and M. Busse. 2005. Compaction alters physical but not biological indices of soil
health. Soil SciSoc Am J 69:236-246.
Siegel-Issem, C.M., J.A. Burger R.F. Powers F. Ponder and S.C. Patterson. 2005. Seedling
root growth as a function of soil density and water content. Soil. Sci. Soc. Am. J. 69:
215-226.
Sills, M.J. and R.N. Carrow. 1983. Turf grass growth, N use, and water use under soil
compaction and N fertilization. Agron. J. 75: 488-492.
Silva, S., N. Barros, L. Costa and F. Leite. 2008. Soil compaction and eucalyptus growth in
response to forwarder traffic intensity and load. Rev. Bras. Cienc. Solo. 32: 921–932.
Sinnet, D., G. Morgan, M. Williams and T. Hutchings. 2008. Soil penetration resistance and
tree root development. Soil Use Manage 24:273-280.
Skinner, A.K., I.D. Lunt, P. Spooner and S. McIntyre. 2009. The effect of soil compaction on
germination and early growth of Eucalyptus albens and an exotic annual grass.
Austral. Ecology. 34: 698-704.
Smith, K.D., P.B. May and G.M. Moore. 2001 The influence of compaction and soil strength
on the establishment of four Australian landscape trees. J. Arboric. 27:1–7.
Snider, M.D. and R.F. Miller. 1985. Effects of tractor logging on soils and vegetation in
eastern Oregon. Soil Sci. Soc. Am. J. 49: 1280-1282.

183
Soane, B. 1990. The role of organic matter in soil compatibility: a review of some practical
aspects. Soil Tillage Res. 16:179–201.
SSSA. 1996. Glossary of soil science terms. Soil Science Society of America, (eds.),
Madison.
Stewart, R., H. Froehlich and E. Olsen. 1988. Soil compaction: an economic model. West. J.
Appl. For. 3:20-22.
Stolzy, L.H. and R.E. Sojka. 1984. Effects of flooding in plant disease. In Kozlowski, T. T.
(ed.). Flooding and Plant Growth, pp. 261-264. Academic Press, New York.
Stolzy, L.H., J. Letey, L.J. Klotz and C. K. Labanauskas. 1965. Water and aeration as factors
in root decay of Citrus sinensis. Phytopathology. 55: 270-275.
Suzanne, B.2001.Peristance of soil compaction and effects on seedling growth in North
Western Quebec. Soil sci. Soc. Am. J. 65(4): 1263-1271.
Tan, X. and S.X. Chang. 2007. Soil compaction and forest litter amendment affect carbon
and net nitrogen mineralization in a boreal forest soil. Soil Tillage Res. 93, 77–86.
Tan, X., Chang, S.X., Kabzems, R., 2005. Effects of soil compaction and organic matter
removal on soil microbial properties and N transformations in a boreal forest long-
term soil productivity study. For. Ecol. Manage. 217:158-170.
Tan, X.,S. Chang and R. Kabzems.2008. Soil compaction and forest floor removal reduced
microbial biomass and enzyme activities in a boreal aspen forest soil. Bio.Fert Soils
44:471-479.
Tarawally, M.A., H. Medina, M.E. Frómeta and C.A. Itza. 2004. Field compaction at
different soil-water status: effects on pore size distribution and soil water
characteristics of a Rhodic Ferralsol in Western Cuba. Soil Tillage Res. 76(2): 95–
103.
Tardieu, F. 1994. Growth and functioning of roots and of root systems subjected to soil
compaction. Soil Tillage Res. 30:217–243.
Tardieu, F., J. Zhang, N. Katerji, O. Bethenod, S. Palmer and W.J. Davies. 1992. Xylem
ABA controls the stomatal conductance of field-grown maize subjected to soil
compaction or soil drying. Plant Cell Environ. 15: 193–197.
Taylor, H.M. 1971. Effects of Soil Strength on Seedling Emergence, Root Growth and Crop
Yield. Compaction of Agricultural Soils. St. Joseph, ASAE, 292–305.

184
Taylor, H.M. and L.F. Ratliff. 1969. Root elongation rates of cotton and peanuts as a function
of soil strength and soil water content. Soil. Sci. 108:113–119.
Tesfaye, T. 2009. Is Eucalyptus Ecologically Hazardous Tree Species? Ethiop. J. Res.
Innov.Forest. 1(1): 128-134.
Thithamer, J. 1989. Bedrie Einfliisse der Bodendichte und des Humusgehalts auf die
Wuchsleistungen von Kiefern und Douglasien sandiger Boden in Forstbaumschulen.
Beitriige Forstwirtsch. 23: 25-29.
Thorud, D.B. and S.S.Frissell. 1976. Time changes in soil density following compaction
under an oak forest. Min-nesota Forestry Research Note 257.
Tuttle, C.L., M.S. Golden and R.S. Meldahl. 1988. Soil compaction effects on Pinus taedu
establishment from seed and early growth. Can. J. For. Res. 18: 628-632.
Unger, P.W. and T.C. Kaspar. 1994. Soil compaction and root growth: a review. Agron. J.
86: 759–66.
U. S. Salinity Lab. Staff. 1954. Diagnosis and improvement of saline and alkali soils. USDA
Hand Book No. 60. Washington. D.C., USA.
Van Noordwijk, M., H.M. Widianto and K. Hairiah. 1991. Old tree root channels in acid
soils in the humid tropics: important for crop production, water infiltration and
nitrogen management. Plant Soil. 134: 37-44.
Van-Camp, L., B. Bujarrabal, A.R. Gentile, R.J.A. Jones, L. Montanarella, C. Olazabal and
S.K. Selvaradjou. 2004. Reports of the technical working groups established under
the Thematic Strategy for Soil Protection; pp. 872.
Verdu, M. and P. Garcı´a-Fayos. 1996. Nucleation processes in a Mediterranean bird
dispersed plant. Funct. Ecol. 10: 275–280.
Voorhees, W., D. Farrell and W. Larson. 1975. Soil strength and aeration effects on root
elongation. Soil. Sci. Soc. Am. J. 39: 948–953.
Wagger, M. G. and H.P, Denton, 1989. Influence of wheel traffic on soil physical properties
in continuous no till corn. Soil Sci. Soc. Am. J. 53: 1206-1210.
Wairiu, M, C.E. Mullins and C.D. Campbell. 1993. Soil physical factors affecting the growth
of Sycamore (Acer Pseudoplatanus L.) in a silvopastoral system on a stony upland
soil in North-East Scotland. Agroforest. Syst. 24: 295-306.

185
Wang, J., J.D. Hesketh and J.T. Wooley. 1986. Pre existing channels and soybean rooting
patterns. Soil Sci. 141:432-437.
Wasterlund, I. 1988. Damages and growth effects after selective mechanical clearing. Scand.
J. For. Res. 3:259-272.
Wert, S. and B.R. Thomas. 1981. Effects of skid roads on diameter, height and volume
growth of Douglas fir. Soil Sci. Soc. Am. J. 45: 629-632.
Whalley, W.R., Watts, C.W., Gregory, A.S., Mooney, S.J., Clark, L.J., Whitmore, A.P. 2008.
The effect of soil strength on the yield of wheat. Plant Soil. 306(1-2): 237–247.
Wheeler, M.A. Trlica MJ, Frazier GW, Reeder JD. 2002. Seasonal grazing affects soil
physical properties of a montane riparian community; J. Range Manage 55:pp.49-56.
Wieniarska, J., J. Lipecki, R. Stanek and T. Kesik. 1987. The effects of soil compaction due
to machinery operation on a raspberry plantation. Fruit Sci. Rep.
(Skierniewice)14(2):71-78.
Williamson, J.R. and W.A. Neilsen. 2003. The effect of soil compaction, profile disturbance
and fertilizer application on the growth of eucalypt seedlings in two glasshouse
studies. Soil Tillage Res. 71, 95–107.
Wright, H.A. and Bailey, A.W. 1982. Fire Ecology. Wiley, New York.
Wronski, E.B. and G. Murphy. 1994. Responses of forest crops to soil compaction. pp. 317-
342. Elsevier, New York.
Yates C.J., R.J. Hobbs and L. Atkins 2000. Establishment of perennial shrub and tree species
in degraded Eucalyptus salmonophloia (Salmon Gum) remnant woodlands: effects of
restoration treatments. Restoration Ecol. 8: 135–43.
Yingling, E.L., C.A. Keeley, S. Little and G. Brutis, 1979. Reducing damage to woodland
trees from construction activities. J. Arboricult. 5: 97- 104.
Young, I.A. and A.G. Bengough 1989. Mechanical constraints to root growth. In Roots and
the Soil Environment. Institute of Horticultural Research. Warwick, Scotland. pp. 41-
47. Aspects
Youngberg, C.T. 1959. The influence of soil conditions following tractor logging on the
growth of planted Douglas-fir seedlings. Soil Sci. Soc. Am. Proc. 23: 76-78.
Zahra R., Nasibi F. & Moghadam. A. A. 2018. Effects of salinity stress on some growth,
physiological, biochemical parameters and nutrients in two pistachio (Pistacia vera L.)

186
root stocks. J Plant Interact. 13(1):73-82.
Zenner, E.K., and A.L. Berger. 2008. Influence of skidder traffic and canopy removal
intensities on the ground flora in a clear cut reserves northern hardwood stand in
Minnesota, USA. Forest Ecol. Manage. 256: 1785–1794.
Zerihun, K. 2002. Profitability and household income contribution of growing Eucalyptus
globules (Labill.) to small land holding farmers. The case of central high lands of
Oromia, Ethiopia. Ethiopian M. Sc in Forestry program, thesis report No.2002:69.
Swedish University of Agri. Sciences, Sweden.
Zhang, S., H. Grip and L. Lovdahl. 2006. Effect of soil compaction on hydraulic properties
of two loess soils in China. Soil Tillage Res. 90: 117–125.
Zhao, F.J., F.J. Lopez-Bellido, C.W. Gray, W.R. Whalley, L.J. Clark and S.P. Mcgrath, 2007.
Effects of soil compaction and irrigation on the concentrations of selenium and
arsenic in wheat grains. Sci Total Environ. 372(2-3), 433–439.

187
Appendices
Appendix 1: Questionnaire (Exploring the effects of soil compaction on the growth of
major agroforest trees of central Punjab in Pakistan)
1. General Information
Name of the respondent.
District name
Tehsil name
Name of the village/ Address
2. Agro-forestry pattern/ Crop Species Grown and Area under each crop species?
Sr.
No.
Crop Species Time
(Sowing to
harvest)
Area under
each crop
Average yield
Obtained
Agro-
forestry/Cropping
Pattren
1
2
3
4
5
6
7
8
9

188
3. Area under various tree species
Sr.
No.
Tree Species Area (acres) Age Trees planted during last five
years
1
2
3
4
5
6
7
4. Area under various tree species
On the basis of past experience farmer is willing to grow more trees
i. yes ii. No (please comment)
…………………………………………………………………………………………………
………………………………………………………….
5. Details of various farming Operations
Sr. No. Crop species Name of farming
operation
How many
times
performed
Type of Machinery used
1
2
3
4
5
6

189
6. Major soil types
i. ……………………………. ii. ………………………..
iii. …………………………..
7. Awareness about soil compaction due to mechanization
i. yes ii. No (if yes then please comment)
…………………………………………………………………………………………………
………………………………………………………….
8. Awareness about the effect of soil compaction on crop yield
i. yes ii. No (if yes then please comment)
…………………………………………………………………………………………………
………………………………………………………….
9. Awareness about the effect of soil compaction on tree growth
i. yes ii. No (if yes then please comment)
…………………………………………………………………………………………………
………………………………………………………….
10. Pentrometer reading from target points
Sr.
No.
Cropping pattern Penetrometer reading
1
2
3
4
5
6
7
8

190
Appendix 2 (Germination/sprouting%):
2-a ( Eucalyptus camaldulensis)
Source DF Adj SS Adj MS F-Value P-Value
Treatment 4 10395.6 2598.90 2598.90 0.000
Error 10 10.0 1.00
Total 14 10405.6
2-b (Albizia lebbeck) Source DF Adj SS Adj MS F-Value P-Value
Treatment 4 7943.07 1985.77 4255.21 0.000
Error 10 4.67 0.47
Total 14 7947.73
2-c ( Vachelia nilotica) Source DF Adj SS Adj MS F-Value P-Value
Treatment 4 13388.4 3347.10 3347.10 0.000
Error 10 10.0 1.00
Total 14 13398.4
2-d (Zizyphus mauritiana) Source DF Adj SS Adj MS F-Value P-Value
Treatment 4 2417.60 604.400 1813.20 0.000
Error 10 3.33 0.333
Total 14 2420.93
2-e (Bombax ceiba) Source DF Adj SS Adj MS F-Value P-Value
Treatment 4 8745.60 2186.40 2186.40 0.000
Error 10 10.00 1.00
Total 14 8755.60
2-f (Dalbergia sissoo) Source DF Adj SS Adj MS F-Value P-Value
Treatment 4 3831.33 957.833 513.12 0.000
Error 10 18.67 1.867
Total 14 3850.00
2-g (Poplus deltoides) Source DF Adj SS Adj MS F-Value P-Value
Treatment 4 11400.4 2850.10 2514.79 0.000
Error 10 11.3 1.13
Total 14 11411.7
2-h (Morus alba) Source DF Adj SS Adj MS F-Value P-Value
Treatment 4 15979.3 3994.83 6658.06 0.000
Error 10 6.0 0.60
Total 14 15985.3

191
Appendix 3 (Survival %):
3-a (Eucalyptus camaldulensis)
Source DF Adj SS Adj MS F-Value P-Value
Treatment 4 7820.27 1955.07 946.00 0.000
Error 10 20.67 2.07
Total 14 7840.93
3-b (Albizia lebbeck) Source DF Adj SS Adj MS F-Value P-Value
Treatment 4 7915.07 1978.77 5936.30 0.000
Error 10 3.33 0.33
Total 14 7918.40
3-c (Vachelia nilotica) Source DF Adj SS Adj MS F-Value P-Value
Treatment 4 1448.40 362.100 362.10 0.000
Error 10 10.00 1.000
Total 14 1458.40
3-d (Zizyphus mauritiana) Source DF Adj SS Adj MS F-Value P-Value
Treatment 4 1448.93 362.233 603.72 0.000
Error 10 6.00 0.600
Total 14 1454.93
3-e (Bombax ceiba) Source DF Adj SS Adj MS F-Value P-Value
Treatment 4 3134.27 783.567 904.12 0.000
Error 10 8.67 0.867
Total 14 3142.93
3-f (Dalbergia sissoo) Source DF Adj SS Adj MS F-Value P-Value
Treatment 4 3321.60 830.400 593.14 0.000
Error 10 14.00 1.400
Total 14 3335.60
3-g (Poplus deltoides) Source DF Adj SS Adj MS F-Value P-Value
Treatment 4 13003.6 3250.90 2868.44 0.000
Error 10 11.3 1.13
Total 14 13014.9
3-h (Morus alba) Source DF Adj SS Adj MS F-Value P-Value
Treatment 4 15776.7 3944.17 4550.96 0.000
Error 10 8.7 0.87
Total 14 15785.3

192
Appendix 4 (Diameter):
4-a (Eucalyptus camaldulensis)
Source DF Adj SS Adj MS F-Value P-Value
Treatment 4 0.021131 0.005283 185.58 0.000
Error 10 0.000285 0.000028
Total 14 0.021416
4-b (Albizia lebbeck)
Source DF Adj SS Adj MS F-Value P-Value
Treatment 4 0.019627 0.004907 360.79 0.000
Error 10 0.000136 0.000014
Total 14 0.019763
4-c (Vachelia nilotica)
Source DF Adj SS Adj MS F-Value P-Value
Treatment 4 0.011721 0.002930 82.31 0.000
Error 10 0.000356 0.000036
Total 14 0.012077
4-d (Zizyphus mauritiana)
Source DF Adj SS Adj MS F-Value P-Value
Treatment 4 0.035326 0.008831 0.000357 0.000
Error 10 0.003575 0.000357
Total 14 0.038900
4-e (Bombax ceiba)
Source DF Adj SS Adj MS F-Value P-Value
Treatment 4 0.11997 0.029993 8.65 0.003
Error 10 0.03467 0.003467
Total 14 0.15464
4-f (Dalbergia sissoo) Source DF Adj SS Adj MS F-Value P-Value
Treatment 4 0.052632 0.013158 536.34 0.000
Error 10 0.000245 0.000025
Total 14 0.052878
4-g (Poplus deltoides)
Source DF Adj SS Adj MS F-Value P-Value
Treatment 4 0.216307 0.054077 5877.92 0.000
Error 10 0.000092 0.000009
Total 14 0.216399
4-h (Morus alba)
Source DF Adj SS Adj MS F-Value P-Value
Treatment 4 0.146756 0.036689 740.69 0.000
Error 10 0.000495 0.000050
Total 14 0.147252

193
Appendix 5 (Shoot length):
5-a (Eucalyptus camaldulensis)
Source DF Adj SS Adj MS F-Value P-Value
Treatment 4 448.93 112.233 93.53 0.000
Error 10 12.00 1.200
Total 14 460.93
5-b (Albizia lebbeck)
Source DF Adj SS Adj MS F-Value P-Value
Treatment 4 197.869 49.4673 136.43 0.000
Error 10 3.626 0.3626
Total 14 201.495
5-c (Vachelia nilotica)
Source DF Adj SS Adj MS F-Value P-Value
Treatment 4 456.603 114.151 287.29 0.000
Error 10 3.973 0.397
Total 14 460.576
5-d (Zizyphus mauritiana)
Source DF Adj SS Adj MS F-Value P-Value
Treatment 4 399.07 99.767 68.02 0.000
Error 10 14.67 1.467
Total 14 413.73
5-e (Bombax ceiba)
Source DF Adj SS Adj MS F-Value P-Value
Treatment 4 994.93 248.733 121.33 0.000
Error 10 20.50 2.050
Total 14 1015.43
5-f (Dalbergia sissoo)
Source DF Adj SS Adj MS F-Value P-Value
Treatment 4 378.27 94.567 74.66 0.000
Error 10 12.67 1.267
Total 14 390.93
5-g (Poplus deltoides)
Source DF Adj SS Adj MS F-Value P-Value
Treatment 4 1186.40 296.600 193.43 0.000
Error 10 15.33 1.533
Total 14 1201.73
5-h (Morus alba)
Source DF Adj SS Adj MS F-Value P-Value
Treatment 4 1500.40 375.100 119.71 0.000
Error 10 31.33 3.133
Total 14 1531.73

194
Appendix 6 (Shoot fresh weight):
6-a (Eucalyptus camaldulensis)
Source DF Adj SS Adj MS F-Value P-Value
Treatment 4 0.005769 0.001442 441.51 0.000
Error 10 0.000033 0.000003
Total 14 0.005802
6-b (Albizia lebbeck)
Source DF Adj SS Adj MS F-Value P-Value
Treatment 4 0.006575 0.001644 265.12 0.000
Error 10 0.000062 0.000006
Total 14 0.006637
6-c (Vachelia nilotica)
Source DF Adj SS Adj MS F-Value P-Value
Treatment 4 0.018627 0.004657 34.93 0.000
Error 10 0.001333 0.000133
Total 14 0.019960
6-d (Zizyphus mauritiana)
Source DF Adj SS Adj MS F-Value P-Value
Treatment 4 0.021933 0.005483 24.92 0.000
Error 10 0.002200 0.000220
Total 14 0.024133
6-e (Bombax ceiba)
Source DF Adj SS Adj MS F-Value P-Value
Treatment 4 0.078907 0.019727 134.50 0.000
Error 10 0.001467 0.000147
Total 14 0.080373
6-f (Dalbergia sissoo)
Source DF Adj SS Adj MS F-Value P-Value
Treatment 4 0.004274 0.001069 92.65 0.000
Error 10 0.000115 0.000012
Total 14 0.004390
6-g (Poplus deltoides)
Source DF Adj SS Adj MS F-Value P-Value
Treatment 4 0.014872 0.003718 1014.02 0.000
Error 10 0.000037 0.000004
Total 14 0.014909
6-h (Morus alba)
Source DF Adj SS Adj MS F-Value P-Value
Treatment 4 0.003821 0.000955 234.92 0.000
Error 10 0.000041 0.000004
Total 14 0.003862

195
Appendix 7 (Shoot dry weight):
7-a (Eucalyptus camaldulensis)
Source DF Adj SS Adj MS F-Value P-Value
Treatment 4 0.001385 0.000346 324.63 0.000
Error 10 0.000011 0.000001
Total 14 0.001396
7-b (Albizia lebbeck)
Source DF Adj SS Adj MS F-Value P-Value
Treatment 4 0.001434 0.000358 112.01 0.000
Error 10 0.000032 0.000003
Total 14 0.001466
7-c (Vachelia nilotica)
Source DF Adj SS Adj MS F-Value P-Value
Treatment 4 0.001440 0.000360 6.00 0.010
Error 10 0.000600 0.000060
Total 14 0.002040
7-d (Zizyphus mauritiana)
Source DF Adj SS Adj MS F-Value P-Value
Treatment 4 0.005000 0.001250 37.50 0.000
Error 10 0.000333 0.000033
Total 14 0.005333
7-e (Bombax ceiba)
Source DF Adj SS Adj MS F-Value P-Value
Treatment 4 0.027240 0.006810 127.69 0.000
Error 10 0.000533 0.000053
Total 14 0.027773
7-f (Dalbergia sissoo)
Source DF Adj SS Adj MS F-Value P-Value
Treatment 4 0.000666 0.000166 118.88 0.000
Error 10 0.000014 0.000001
Total 14 0.000680
7-g (Poplus deltoides)
Source DF Adj SS Adj MS F-Value P-Value
Treatment 4 0.002691 0.000673 124.60 0.000
Error 10 0.000054 0.000005
Total 14 0.002745
7-h (Morus alba)
Source DF Adj SS Adj MS F-Value P-Value
Treatment 4 0.000912 0.000228 201.18 0.000
Error 10 0.000011 0.000001
Total 14 0.000923
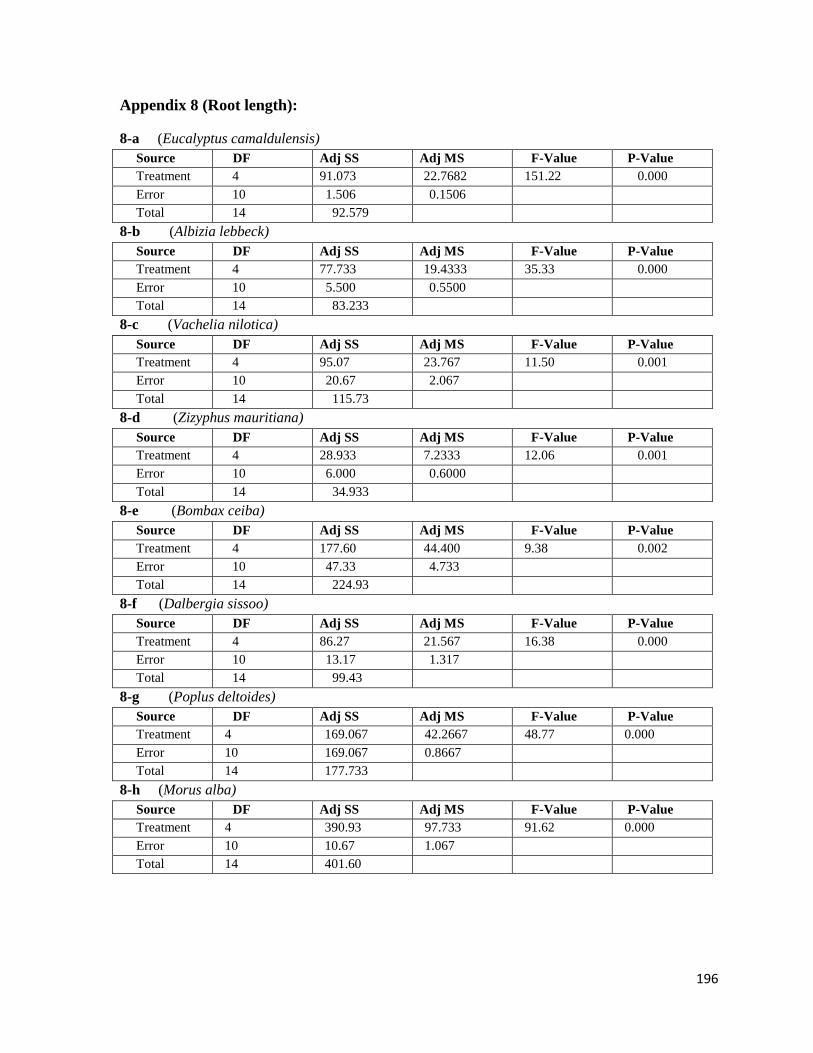
196
Appendix 8 (Root length):
8-a (Eucalyptus camaldulensis)
Source DF Adj SS Adj MS F-Value P-Value
Treatment 4 91.073 22.7682 151.22 0.000
Error 10 1.506 0.1506
Total 14 92.579
8-b (Albizia lebbeck)
Source DF Adj SS Adj MS F-Value P-Value
Treatment 4 77.733 19.4333 35.33 0.000
Error 10 5.500 0.5500
Total 14 83.233
8-c (Vachelia nilotica)
Source DF Adj SS Adj MS F-Value P-Value
Treatment 4 95.07 23.767 11.50 0.001
Error 10 20.67 2.067
Total 14 115.73
8-d (Zizyphus mauritiana)
Source DF Adj SS Adj MS F-Value P-Value
Treatment 4 28.933 7.2333 12.06 0.001
Error 10 6.000 0.6000
Total 14 34.933
8-e (Bombax ceiba)
Source DF Adj SS Adj MS F-Value P-Value
Treatment 4 177.60 44.400 9.38 0.002
Error 10 47.33 4.733
Total 14 224.93
8-f (Dalbergia sissoo)
Source DF Adj SS Adj MS F-Value P-Value
Treatment 4 86.27 21.567 16.38 0.000
Error 10 13.17 1.317
Total 14 99.43
8-g (Poplus deltoides)
Source DF Adj SS Adj MS F-Value P-Value
Treatment 4 169.067 42.2667 48.77 0.000
Error 10 169.067 0.8667
Total 14 177.733
8-h (Morus alba)
Source DF Adj SS Adj MS F-Value P-Value
Treatment 4 390.93 97.733 91.62 0.000
Error 10 10.67 1.067
Total 14 401.60

197
Appendix 9 (Root fresh weight):
9-a (Eucalyptus camaldulensis)
Source DF Adj SS Adj MS F-Value P-Value
Treatment 4 0.001305 0.000326 99.88 0.000
Error 10 0.000033 0.000003
Total 14 0.001338
9-b (Albizia lebbeck)
Source DF Adj SS Adj MS F-Value P-Value
Treatment 4 0.001165 0.000291 198.64 0.000
Error 10 0.000015 0.000001
Total 14 0.001180
9-c (Vachelia nilotica)
Source DF Adj SS Adj MS F-Value P-Value
Treatment 4 0.003373 0.000843 7.03 0.006
Error 10 0.001200 0.000120
Total 14 0.004573
9-d (Zizyphus mauritiana)
Source DF Adj SS Adj MS F-Value P-Value
Treatment 4 0.001773 0.000443 6.65 0.007
Error 10 0.000667 0.000067
Total 14 0.002440
9-e (Bombax ceiba)
Source DF Adj SS Adj MS F-Value P-Value
Treatment 4 0.044118 0.011029 104.58 0.000
Error 10 0.001055 0.000105
Total 14 0.045172
9-f (Dalbergia sissoo)
Source DF Adj SS Adj MS F-Value P-Value
Treatment 4 0.000602 0.000151 173.73 0.000
Error 10 0.000009 0.000001
Total 14 0.000611
9-g (Poplus deltoides)
Source DF Adj SS Adj MS F-Value P-Value
Treatment 4 0.000648 0.000162 101.31 0.000
Error 10 0.000016 0.000002
Total 14 0.000664
9-h (Morus alba)
Source DF Adj SS Adj MS F-Value P-Value
Treatment 4 0.001423 0.000356 213.46 0.000
Error 10 0.000017 0.000002
Total 14 0.001440

198
Appendix 10 (Root dry weight):
10-a (Eucalyptus camaldulensis)
Source DF Adj SS Adj MS F-Value P-Value
Treatment 4 0.000265 0.000066 90.36 0.000
Error 10 0.000007 0.000001
Total 14 0.000272
10-b (Albizia lebbeck)
Source DF Adj SS Adj MS F-Value P-Value
Treatment 4 0.000247 0.000062 77.17 0.000
Error 10 0.000008 0.000001
Total 14 0.000255
10-c (Vachelia nilotica)
Source DF Adj SS Adj MS F-Value P-Value
Treatment 4 0.003427 0.000857 18.36 0.000
Error 10 0.000467 0.000047
Total 14 0.000467
10-d (Zizyphus mauritiana)
Source DF Adj SS Adj MS F-Value P-Value
Treatment 4 0.000773 0.000193 4.14 0.031
Error 10 0.000467 0.000047
Total 14 0.001240
10-e (Bombax ceiba)
Source DF Adj SS Adj MS F-Value P-Value
Treatment 4 0.008760 0.002190 26.73 0.000
Error 10 0.000819 0.000082
Total 14 0.009579
10-f (Dalbergia sissoo)
Source DF Adj SS Adj MS F-Value P-Value
Treatment 4 0.000149 0.000037 43.00 0.000
Error 10 0.000009 0.000001
Total 14 0.000158
10-g (Poplus deltoides)
Source DF Adj SS Adj MS F-Value P-Value
Treatment 4 0.000069 0.000017 36.93 0.000
Error 10 0.000005 0.000000
Total 14 0.000074
10-h (Morus alba)
Source DF Adj SS Adj MS F-Value P-Value
Treatment 4 0.000354 0.000089 189.79 0.000
Error 10 0.000005 0.000000
Total 14 0.000359

199
Appendix 11 (Root/shoot ratio):
11-a (Eucalyptus camaldulensis)
Source DF Adj SS Adj MS F-Value P-Value
Treatment 4 0.008285 0.002071 1.84 0.198
Error 10 0.011270 0.001127
Total 14 0.019555
11-b (Albizia lebbeck)
Source DF Adj SS Adj MS F-Value P-Value
Treatment 4 0.016452 0.004113 4.39 0.026
Error 10 0.009375 0.000938
Total 14 0.025828
11-c (Vachelia nilotica)
Source DF Adj SS Adj MS F-Value P-Value
Treatment 4 0.02612 0.006529 0.25 0.905
Error 10 0.26426 0.026426
Total 14 0.29038
11-d (Zizyphus mauritiana)
Source DF Adj SS Adj MS F-Value P-Value
Treatment 4 0.3105 0.07762 2.87 0.080
Error 10 0.2705 0.02705
Total 14 0.5810
11-e (Bombax ceiba)
Source DF Adj SS Adj MS F-Value P-Value
Treatment 4 0.09101 0.022753 5.14 0.016
Error 10 0.04423 0.004423
Total 14 0.13524
11-f (Dalbergia sissoo)
Source DF Adj SS Adj MS F-Value P-Value
Treatment 4 0.015451 0.003863 4.01 0.034
Error 10 0.009644 0.000964
Total 14 0.025095
11-g (Poplus deltoides)
Source DF Adj SS Adj MS F-Value P-Value
Treatment 4 0.12665 0.031661 12.54 0.001
Error 10 0.02524 0.002524
Total 14 0.15189
11-h (Morus alba)
Source DF Adj SS Adj MS F-Value P-Value
Treatment 4 0.12202 0.030504 16.28 0.000
Error 10 0.01874 0.001874
Total 14 0.14075

200
Appendix 12 (Leaf area):
12-a (Eucalyptus camaldulensis)
Source DF Adj SS Adj MS F-Value P-Value
Treatment 4 212102 53025.6 5011.87 0.000
Error 10 106 10.6
Total 14 212208
12-b (Albizia lebbeck)
Source DF Adj SS Adj MS F-Value P-Value
Treatment 4 4229.97 1057.49 733.32 0.000
Error 10 14.42 1.44
Total 14 4244.39
12-c (Vachelia nilotica)
Source DF Adj SS Adj MS F-Value P-Value
Treatment 4 0.99269 0.248173 41.36 0.000
Error 10 0.06000 0.006000
Total 14 1.05269
12-d (Zizyphus mauritiana)
Source DF Adj SS Adj MS F-Value P-Value
Treatment 4 37.98 9.496 7.83 0.004
Error 10 12.13 1.213
Total 14 50.12
12-e (Bombax ceiba)
Source DF Adj SS Adj MS F-Value P-Value
Treatment 4 51505 12876 4.26 0.029
Error 10 30249 3025
Total 14 81754
12-f (Dalbergia sissoo)
Source DF Adj SS Adj MS F-Value P-Value
Treatment 4 248745 62186.3 1441.30 0.000
Error 10 431 43.1
Total 14 249177
12-g (Poplus deltoides)
Source DF Adj SS Adj MS F-Value P-Value
Treatment 4 17925.0 4481.24 78.81 0.000
Error 10 568.6 56.86
Total 14 18493.6
12-h (Morus alba)
Source DF Adj SS Adj MS F-Value P-Value
Treatment 4 793004 198251 4420.45 0.000
Error 10 448 45
Total 14 793453

201
Appendix 13 (No. of leaves):
13-a (Eucalyptus camaldulensis)
Source DF Adj SS Adj MS F-Value P-Value
Treatment 4 2546.00 636.500 161.82 0.000
Error 10 39.33 3.933
Total 14 2585.33
13-b (Albizia lebbeck)
Source DF Adj SS Adj MS F-Value P-Value
Treatment 4 3481.60 870.400 169.56 0.000
Error 10 51.33 5.133
Total 14 3532.93
13-c (Vachelia nilotica)
Source DF Adj SS Adj MS F-Value P-Value
Treatment 4 1691.07 422.767 55.14 0.000
Error 10 76.67 7.667
Total 14 1767.73
13-d (Zizyphus mauritiana)
Source DF Adj SS Adj MS F-Value P-Value
Treatment 4 2870.9 717.73 26.00 0.000
Error 10 276.0 27.60
Total 14 3146.9
13-e (Bombax ceiba)
Source DF Adj SS Adj MS F-Value P-Value
Treatment 4 39.33 9.833 7.02 0.006
Error 10 14.00 1.400
Total 14 53.33
13-f (Dalbergia sissoo)
Source DF Adj SS Adj MS F-Value P-Value
Treatment 4 102.00 25.500 13.19 0.001
Error 10 19.33 1.933
Total 14 121.33
13-g (Poplus deltoides)
Source DF Adj SS Adj MS F-Value P-Value
Treatment 4 1293.60 323.400 202.12 0.000
Error 10 16.00 1.600
Total 14 1309.60
13-h (Morus alba)
Source DF Adj SS Adj MS F-Value P-Value
Treatment 4 1125.73 281.433 44.91 0.000
Error 10 62.67 6.267
Total 14 1188.40

202
Appendix 14 (No. of branches):
14-a (Eucalyptus camaldulensis)
Source DF Adj SS Adj MS F-Value P-Value
Treatment 4 27.600 6.9000 11.50 0.001
Error 10 6.000 0.6000
Total 14 33.600
14-b (Albizia lebbeck)
Source DF Adj SS Adj MS F-Value P-Value
Treatment 4 418.27 104.567 82.55 0.000
Error 10 12.67 1.267
Total 14 430.93
14-c (Vachelia nilotica)
Source DF Adj SS Adj MS F-Value P-Value
Treatment 4 70.933 17.7333 29.56 0.000
Error 10 6.000 0.6000
Total 14 76.933
14-d (Zizyphus mauritiana)
Source DF Adj SS Adj MS F-Value P-Value
Treatment 4 225.73 56.433 23.51 0.000
Error 10 24.00 2.400
Total 14 249.73
14-e (Bombax ceiba)
Source DF Adj SS Adj MS F-Value P-Value
Treatment 4 39.33 9.833 7.02 0.006
Error 10 14.00 1.400
Total 14 53.33
14-f (Dalbergia sissoo)
Source DF Adj SS Adj MS F-Value P-Value
Treatment 4 101.07 25.267 15.16 0.000
Error 10 16.67 1.667
Total 14 117.73
14-g (Poplus deltoides)
Source DF Adj SS Adj MS F-Value P-Value
Treatment 4 10.267 2.5667 7.70 0.004
Error 10 3.333 0.3333
Total 14 13.600
14-h (Morus alba)
Source DF Adj SS Adj MS F-Value P-Value
Treatment 4 5.733 1.4333 7.17 0.005
Error 10 2.000 0.2000
Total 14 7.733

203
Appendix 15 (Photosynthetic rate):
15-a (Eucalyptus camaldulensis)
Source DF Adj SS Adj MS F-Value P-Value
Treatment 4 28.1418 7.03546 2355.62 0.000
Error 10 0.0299 0.00299
Total 14 28.1717
15-b (Albizia lebbeck)
Source DF Adj SS Adj MS F-Value P-Value
Treatment 4 32.5680 8.14201 2012.03 0.000
Error 10 0.0405 0.00405
Total 14 32.6085
15-c (Vachelia nilotica)
Source DF Adj SS Adj MS F-Value P-Value
Treatment 4 28.640 7.1600 31.90 0.000
Error 10 2.244 0.2244
Total 14 30.884
15-d (Zizyphus mauritiana)
Source DF Adj SS Adj MS F-Value P-Value
Treatment 4 18.400 4.6000 10.84 0.001
Error 10 4.242 0.4242
Total 14 22.642
15-e (Bombax ceiba)
Source DF Adj SS Adj MS F-Value P-Value
Treatment 4 15.176 3.7940 17.37 0.000
Error 10 2.184 0.2184
Total 14 17.360
15-f (Dalbergia sissoo)
Source DF Adj SS Adj MS F-Value P-Value
Treatment 4 17.0991 4.27478 680.70 0.000
Error 10 0.0628 0.00628
Total 14 17.1619
15-g (Poplus deltoides)
Source DF Adj SS Adj MS F-Value P-Value
Treatment 4 30.9587 7.73967 2236.90 0.000
Error 10 0.0346 0.00346
Total 14 30.9933
15-h (Morus alba)
Source DF Adj SS Adj MS F-Value P-Value
Treatment 4 9.6459 2.41148 235.34 0.000
Error 10 0.1025 0.01025
Total 14 9.7484

204
Appendix 16 (Transpiration rate):
16-a (Eucalyptus camaldulensis)
Source DF Adj SS Adj MS F-Value P-Value
Treatment 4 926.89 231.724 185.33 0.000
Error 10 12.50 1.250
Total 14 939.40
16-b (Albizia lebbeck)
Source DF Adj SS Adj MS F-Value P-Value
Treatment 4 873.248 218.312 313.61 0.000
Error 10 6.961 0.696
Total 14 880.209
16-c (Vachelia nilotica)
Source DF Adj SS Adj MS F-Value P-Value
Treatment 4 191.86 47.965 44.35 0.000
Error 10 10.81 1.081
Total 14 202.67
16-d (Zizyphus mauritiana)
Source DF Adj SS Adj MS F-Value P-Value
Treatment 4 397.32 99.331 20.82 0.000
Error 10 47.72 4.772
Total 14 445.04
16-e (Bombax ceiba)
Source DF Adj SS Adj MS F-Value P-Value
Treatment 4 1824.41 456.104 164.86 0.000
Error 10 27.67 2.767
Total 14 1852.08
16-f (Dalbergia sissoo)
Source DF Adj SS Adj MS F-Value P-Value
Treatment 4 624.49 156.122 119.59 0.000
Error 10 13.05 1.305
Total 14 637.54
16-g (Poplus deltoides)
Source DF Adj SS Adj MS F-Value P-Value
Treatment 4 1407.67 351.918 189.78 0.000
Error 10 18.54 1.854
Total 14 1426.22
16-h (Morus alba)
Source DF Adj SS Adj MS F-Value P-Value
Treatment 4 1052.23 263.057 122.75 0.000
Error 10 21.43 2.143
Total 14 1073.66

205
Appendix 17 (Stomatal conductance):
17-a (Eucalyptus camaldulensis)
Source DF Adj SS Adj MS F-Value P-Value
Treatment 4 0.928385 0.232096 997.83 0.000
Error 10 0.002326 0.000233
Total 14 0.930711
17-b (Albizia lebbeck)
Source DF Adj SS Adj MS F-Value P-Value
Treatment 4 1.32111 0.330276 183.83 0.000
Error 10 0.01797 0.001797
Total 14 1.33907
17-c (Vachelia nilotica)
Source DF Adj SS Adj MS F-Value P-Value
Treatment 4 0.46051 0.115129 26.41 0.000
Error 10 0.04360 0.004360
Total 14 0.50411
17-d (Zizyphus mauritiana)
Source DF Adj SS Adj MS F-Value P-Value
Treatment 4 2.22701 0.556752 1222.91 0.000
Error 10 0.00455 0.000455
Total 14 2.23156
17-e (Bombax ceiba)
Source DF Adj SS Adj MS F-Value P-Value
Treatment 4 0.001573 0.000393 19.67 0.000
Error 10 0.000200 0.000020
Total 14 0.001773
17-f (Dalbergia sissoo)
Source DF Adj SS Adj MS F-Value P-Value
Treatment 4 0.76164 0.190410 104.62 0.000
Error 10 0.01820 0.001820
Total 14 0.77984
17-g (Poplus deltoides)
Source DF Adj SS Adj MS F-Value P-Value
Treatment 4 6.85583 1.71396 821.38 0.000
Error 10 0.02087 0.00209
Total 14 6.87669
17-h (Morus alba)
Source DF Adj SS Adj MS F-Value P-Value
Treatment 4 1.44456 0.361140 214.90 0.000
Error 10 0.01680 0.001680
Total 14 1.46136

206
Appendix 18 (Internal CO2 concentration):
18-a (Eucalyptus camaldulensis)
Source DF Adj SS Adj MS F-Value P-Value
Treatment 4 86190.0 21547.5 1399.19 0.000
Error 10 154.0 15.4
Total 14 86344.0
18-b (Albizia lebbeck)
Source DF Adj SS Adj MS F-Value P-Value
Treatment 4 136404 34101.1 4918.43 0.000
Error 10 69 6.9
Total 14 136474
18-c (Vachelia nilotica)
Source DF Adj SS Adj MS F-Value P-Value
Treatment 4 38486.4 9621.60 217.03 0.000
Error 10 443.3 44.33
Total 14 38929.7
18-d (Zizyphus mauritiana)
Source DF Adj SS Adj MS F-Value P-Value
Treatment 4 21592.4 5398.10 121.76 0.000
Error 10 443.3 44.33
Total 14 22035.7
18-e (Bombax ceiba)
Source DF Adj SS Adj MS F-Value P-Value
Treatment 4 48610 12152.5 25.06 0.000
Error 10 4849 484.9
Total 14 53459
18-f (Dalbergia sissoo)
Source DF Adj SS Adj MS F-Value P-Value
Treatment 4 46340.7 11585.2 496.51 0.000
Error 10 233.3 23.3
Total 14 46574.0
18-g (Poplus deltoides)
Source DF Adj SS Adj MS F-Value P-Value
Treatment 4 136196 34048.9 604.42 0.000
Error 10 563 56.3
Total 14 136759
18-h (Morus alba)
Source DF Adj SS Adj MS F-Value P-Value
Treatment 4 117228 29307.1 1348.49 0.000
Error 10 217 21.7
Total 14 117446

207
Appendix 19 (Photosynthetic water use efficiency):
19-a (Eucalyptus camaldulensis)
Source DF Adj SS Adj MS F-Value P-Value
Treatment 4 1427.36 356.839 308.24 0.000
Error 10 11.58 1.158
Total 14 1438.93
19-b (Albizia lebbeck)
Source DF Adj SS Adj MS F-Value P-Value
Treatment 4 1127.88 281.970 173.08 0.000
Error 10 16.29 1.629
Total 14 1144.17
19-c (Vachelia nilotica)
Source DF Adj SS Adj MS F-Value P-Value
Treatment 4 150.702 37.6756 397.59 0.000
Error 10 0.948 0.0948
Total 14 151.650
19-d (Zizyphus mauritiana)
Source DF Adj SS Adj MS F-Value P-Value
Treatment 4 1384.20 346.051 100.07 0.000
Error 10 34.58 3.458
Total 14 1418.79
19-e (Bombax ceiba)
Source DF Adj SS Adj MS F-Value P-Value
Treatment 4 795.69 198.922 44.10 0.000
Error 10 45.11 4.511
Total 14 840.80
19-f (Dalbergia sissoo)
Source DF Adj SS Adj MS F-Value P-Value
Treatment 4 737.912 184.478 265.02 0.000
Error 10 6.961 0.696
Total 14 744.873
19-g (Poplus deltoides)
Source DF Adj SS Adj MS F-Value P-Value
Treatment 4 1131.98 282.995 83.06 0.000
Error 10 34.07 3.407
Total 14 1166.05
19-h (Morus alba)
Source DF Adj SS Adj MS F-Value P-Value
Treatment 4 1012.55 253.138 172.88 0.000
Error 10 14.64 1.464
Total 14 1027.19

208
Appendix 20 (Impact of plants on bulk density)
20-a ANOVA for Treatment = T0
Source DF Adj SS Adj MS F-Value P-Value
Species 7 0.01047 0.001495 1.72 0.175
Error 16 0.01393 0.000871
Total 23 0.02440
20-b ANOVA for Treatment = T1: Source DF Adj SS Adj MS F-Value P-Value
Species 7 0.02116 0.003023 4.34 0.007
Error 16 0.01113 0.000696
Total 23 0.03230
20-c ANOVA for Treatment = T2: Source DF Adj SS Adj MS F-Value P-Value
Species 7 0.06625 0.009464 13.52 0.000
Error 16 0.01120 0.000700
Total 23 0.03230 0.07745
20-d ANOVA for Treatment = T3: Source DF Adj SS Adj MS F-Value P-Value
Species 7 0.05147 0.007352 10.96 0.000
Error 16 0.01073 0.000671
Total 23 0.06220
20-e ANOVA for Treatment = T4: Source DF Adj SS Adj MS F-Value P-Value
Species 7 0.012000 0.001714 3.29 0.023
Error 16 0.008333 0.000521
Total 23 0.020333
20-f ANOVA for Treatment = Overall:
Sources of
Variance
DF Adj. SS Adj. MS F-Value P-Value
Treatment 4 3.98162 0.995405 1439.14 0.000
Species 7 0.10955 0.015650 22.63 0.000
Treatment*Species 28 0.05179 0.001850 2.67 0.000
Error 80 0.05533 0.000692

209
Appendix 21 (Survival %):
21-a (Eucalyptus camaldulensis)
Source DF Adj SS Adj MS F-Value P-Value
Treatment 4 8464.40 2116.10 6348.30 0.000
Error 10 3.33 0.33
Total 14 8467.73
21-b (Albizia lebbeck)
Source DF Adj SS Adj MS F-Value P-Value
Treatment 4 7899.07 1974.77 2278.58 0.000
Error 10 8.67 0.87
Total 14 7907.73
21-c (Vachelia nilotica)
Source DF Adj SS Adj MS F-Value P-Value
Treatment 4 1411.73 352.933 278.63 0.000
Error 10 12.67 1.267
Total 14 1424.40
21-d (Zizyphus mauritiana)
Source DF Adj SS Adj MS F-Value P-Value
Treatment 4 1455.60 363.900 1091.70 0.000
Error 10 3.33 0.333
Total 14 1458.93
21-e (Bombax ceiba)
Source DF Adj SS Adj MS F-Value P-Value
Treatment 4 3511.60 877.900 2633.70 0.000
Error 10 3.33 0.333
Total 14 3514.93
21-f (Dalbergia sissoo)
Source DF Adj SS Adj MS F-Value P-Value
Treatment 4 3366.27 841.567 1803.36 0.000
Error 10 4.67 0.467
Total 14 3370.93
21-g (Poplus deltoides)
Source DF Adj SS Adj MS F-Value P-Value
Treatment 4 12542.3 3135.57 6719.07 0.000
Error 10 4.7 0.47
Total 14 12546.9
21-h (Morus alba)
Source DF Adj SS Adj MS F-Value P-Value
Treatment 4 15538.7 3884.67 4482.31 0.000
Error 10 8.7 0.87
Total 14 15547.3

210
Appendix 22 (Girth/ diameter):
22-a (Eucalyptus camaldulensis)
Source DF Adj SS Adj MS F-Value P-Value
Treatment 4 0.023883 0.005971 131.32 0.000
Error 10 0.000455 0.000045
Total 14 0.024337
22-b (Albizia lebbeck)
Source DF Adj SS Adj MS F-Value P-Value
Treatment 4 0.019857 0.004964 739.10 0.000
Error 10 0.000067 0.000007
Total 14 0.019924
22-c (Vachelia nilotica)
Source DF Adj SS Adj MS F-Value P-Value
Treatment 4 0.023202 0.005801 288.11 0.000
Error 10 0.000201 0.000020
Total 14 0.023404
22-d (Zizyphus mauritiana)
Source DF Adj SS Adj MS F-Value P-Value
Treatment 4 0.024290 0.006072 326.47 0.000
Error 10 0.000186 0.000019
Total 14 0.024476
22-e (Bombax ceiba)
Source DF Adj SS Adj MS F-Value P-Value
Treatment 4 0.106128 0.026532 1753.21 0.000
Error 10 0.000151 0.000015
Total 14 0.106279
22-f (Dalbergia sissoo)
Source DF Adj SS Adj MS F-Value P-Value
Treatment 4 0.059880 0.014970 3939.45 0.000
Error 10 0.000038 0.000004
Total 14 0.059918
22-g (Poplus deltoides)
Source DF Adj SS Adj MS F-Value P-Value
Treatment 4 0.160185 0.040046 7066.98 0.000
Error 10 0.000057 0.000006
Total 14 0.160242
22-h (Morus alba)
Source DF Adj SS Adj MS F-Value P-Value
Treatment 4 0.075693 0.018923 135.17 0.000
Error 10 0.001400 0.000140
Total 14 0.077093

211
Appendix 23 (Shoot length):
23-a (Eucalyptus camaldulensis)
Source DF Adj SS Adj MS F-Value P-Value
Treatment 4 612.40 153.100 76.55 0.000
Error 10 20.00 2.000
Total 14 632.40
23-b (Albizia lebbeck)
Source DF Adj SS Adj MS F-Value P-Value
Treatment 4 133.733 33.4333 55.72 0.000
Error 10 6.000 0.6000
Total 14 139.733
23-c (Vachelia nilotica)
Source DF Adj SS Adj MS F-Value P-Value
Treatment 4 466.267 116.567 249.79 0.000
Error 10 4.667 0.467
Total 14 470.933
23-d (Zizyphus mauritiana)
Source DF Adj SS Adj MS F-Value P-Value
Treatment 4 239.333 59.8333 74.79 0.000
Error 10 8.000 0.8000
Total 14 247.333
23-e (Bombax ceiba)
Source DF Adj SS Adj MS F-Value P-Value
Treatment 4 1017.73 254.433 636.08 0.000
Error 10 4.00 0.400
Total 14 1021.73
23-f (Dalbergia sissoo)
Source DF Adj SS Adj MS F-Value P-Value
Treatment 4 357.600 89.4000 153.26 0.000
Error 10 5.833 0.5833
Total 14 363.433
23-g (Poplus deltoides)
Source DF Adj SS Adj MS F-Value P-Value
Treatment 4 1069.60 267.400 200.55 0.000
Error 10 13.33 1.333
Total 14 1082.93
23-h (Morus alba)
Source DF Adj SS Adj MS F-Value P-Value
Treatment 4 380.400 95.1000 129.68 0.000
Error 10 7.333 0.7333
Total 14 387.733

212
Appendix 24 (Shoot fresh weight):
24-a (Eucalyptus camaldulensis)
Source DF Adj SS Adj MS F-Value P-Value
Treatment 4 0.10687 0.026717 20.98 0.000
Error 10 0.01273 0.001273
Total 14 0.11960
24-b (Albizia lebbeck)
Source DF Adj SS Adj MS F-Value P-Value
Treatment 4 0.046067 0.011517 197.43 0.000
Error 10 0.000583 0.000058
Total 14 0.046650
24-c (Vachelia nilotica)
Source DF Adj SS Adj MS F-Value P-Value
Treatment 4 0.009508 0.002377 648.25 0.000
Error 10 0.000037 0.000004
Total 14 0.009544
24-d (Zizyphus mauritiana)
Source DF Adj SS Adj MS F-Value P-Value
Treatment 4 0.013533 0.003383 56.39 0.000
Error 10 0.000600 0.000060
Total 14 0.014133
24-e (Bombax ceiba)
Source DF Adj SS Adj MS F-Value P-Value
Treatment 4 0.108000 0.027000 106.58 0.000
Error 10 0.002533 0.000253
Total 14 0.110533
24-f (Dalbergia sissoo)
Source DF Adj SS Adj MS F-Value P-Value
Treatment 4 0.033373 0.008343 139.06 0.000
Error 10 0.000600 0.000060
Total 14 0.033973
24-g (Poplus deltoides)
Source DF Adj SS Adj MS F-Value P-Value
Treatment 4 0.164373 0.041093 880.57 0.000
Error 10 0.000467 0.000047
Total 14 0.164840
24-h (Morus alba)
Source DF Adj SS Adj MS F-Value P-Value
Treatment 4 0.048840 0.012210 166.50 0.000
Error 10 0.000733 0.000073
Total 14 0.049573

213
Appendix 25 (Shoot dry weight):
25-a (Eucalyptus camaldulensis)
Source DF Adj SS Adj MS F-Value P-Value
Treatment 4 0.027427 0.006857 257.13 0.000
Error 10 0.000267 0.000027
Total 14 0.027693
25-b (Albizia lebbeck)
Source DF Adj SS Adj MS F-Value P-Value
Treatment 4 0.011677 0.002919 134.73 0.000
Error 10 0.000217 0.000022
Total 14 0.011893
25-c (Vachelia nilotica)
Source DF Adj SS Adj MS F-Value P-Value
Treatment 4 0.004561 0.001140 117.95 0.000
Error 10 0.000097 0.000010
Total 14 0.004657
25-d (Zizyphus mauritiana)
Source DF Adj SS Adj MS F-Value P-Value
Treatment 4 0.005827 0.001457 43.70 0.000
Error 10 0.000333 0.000033
Total 14 0.006160
25-e (Bombax ceiba)
Source DF Adj SS Adj MS F-Value P-Value
Treatment 4 0.029773 0.007443 159.50 0.000
Error 10 0.000467 0.000047
Total 14 0.030240
25-f (Dalbergia sissoo)
Source DF Adj SS Adj MS F-Value P-Value
Treatment 4 0.008067 0.002017 43.21 0.000
Error 10 0.000467 0.000047
Total 14 0.008533
25-g (Poplus deltoides)
Source DF Adj SS Adj MS F-Value P-Value
Treatment 4 0.038588 0.009647 343.72 0.000
Error 10 0.000281 0.000028
Total 14 0.038869
25-h (Morus alba)
Source DF Adj SS Adj MS F-Value P-Value
Treatment 4 0.012279 0.003070 60.59 0.000
Error 10 0.000507 0.000051
Total 14 0.012786

214
Appendix 26 (Root length):
26-a (Eucalyptus camaldulensis)
Source DF Adj SS Adj MS F-Value P-Value
Treatment 4 112.40 28.100 24.79 0.000
Error 10 11.33 1.133
Total 14 123.73
26-b (Albizia lebbeck)
Source DF Adj SS Adj MS F-Value P-Value
Treatment 4 36.400 9.1000 27.30 0.000
Error 10 3.333 0.3333
Total 14 39.733
26-c (Vachelia nilotica)
Source DF Adj SS Adj MS F-Value P-Value
Treatment 4 84.667 21.1667 36.29 0.000
Error 10 5.833 0.5833
Total 14 90.500
26-d (Zizyphus mauritiana)
Source DF Adj SS Adj MS F-Value P-Value
Treatment 4 57.600 14.4000 18.00 0.000
Error 10 8.000 0.8000
Total 14 65.600
26-e (Bombax ceiba)
Source DF Adj SS Adj MS F-Value P-Value
Treatment 4 151.600 37.9000 51.68 0.000
Error 10 7.333 0.7333
Total 14 158.933
26-f (Dalbergia sissoo)
Source DF Adj SS Adj MS F-Value P-Value
Treatment 4 25.600 6.4000 12.64 0.000
Error 10 5.064 0.5064
Total 14 30.664
26-g (Poplus deltoides)
Source DF Adj SS Adj MS F-Value P-Value
Treatment 4 90.959 22.7397 36.07 0.000
Error 10 6.304 0.6304
Total 14 97.263
26-h (Morus alba)
Source DF Adj SS Adj MS F-Value P-Value
Treatment 4 132.933 33.2333 55.39 0.000
Error 10 6.000 0.6000
Total 14 138.933

215
Appendix 27 (Root fresh weight):
27-a (Eucalyptus camaldulensis)
Source DF Adj SS Adj MS F-Value P-Value
Treatment 4 0.002326 0.000581 323.02 0.000
Error 10 0.000018 0.000002
Total 14 0.002344
27-b (Albizia lebbeck)
Source DF Adj SS Adj MS F-Value P-Value
Treatment 4 0.000604 0.000151 83.94 0.000
Error 10 0.000018 0.000002
Total 14 0.000622
27-c (Vachelia nilotica)
Source DF Adj SS Adj MS F-Value P-Value
Treatment 4 0.001581 0.000395 179.65 0.000
Error 10 0.000022 0.000002
Total 14 0.001603
27-d (Zizyphus mauritiana)
Source DF Adj SS Adj MS F-Value P-Value
Treatment 4 0.001873 0.000468 109.75 0.000
Error 10 0.000043 0.000004
Total 14 0.001916
27-e (Bombax ceiba)
Source DF Adj SS Adj MS F-Value P-Value
Treatment 4 0.021014 0.005254 54.54 0.000
Error 10 0.000963 0.000096
Total 14 0.021978
27-f (Dalbergia sissoo)
Source DF Adj SS Adj MS F-Value P-Value
Treatment 4 0.002139 0.000535 138.29 0.000
Error 10 0.000039 0.000004
Total 14 0.002178
27-g (Poplus deltoides)
Source DF Adj SS Adj MS F-Value P-Value
Treatment 4 0.001371 0.000343 223.48 0.000
Error 10 0.000015 0.000002
Total 14 0.001386
27-h (Morus alba)
Source DF Adj SS Adj MS F-Value P-Value
Treatment 4 0.004990 0.001248 263.57 0.000
Error 10 0.000047 0.000005
Total 14 0.005038

216
Appendix 28 (Root dry weight):
28-a (Eucalyptus camaldulensis)
Source DF Adj SS Adj MS F-Value P-Value
Treatment 4 0.000525 0.000131 281.29 0.000
Error 10 0.000005 0.000000
Total 14 0.000530
28-b (Albizia lebbeck)
Source DF Adj SS Adj MS F-Value P-Value
Treatment 4 0.000118 0.000030 37.79 0.000
Error 10 0.000008 0.000001
Total 14 0.000126
28-c (Vachelia nilotica)
Source DF Adj SS Adj MS F-Value P-Value
Treatment 4 0.000354 0.000088 110.54 0.000
Error 10 0.000008 0.000001
Total 14 0.000362
28-d (Zizyphus mauritiana)
Source DF Adj SS Adj MS F-Value P-Value
Treatment 4 0.000457 0.000114 142.79 0.000
Error 10 0.000008 0.000001
Total 14 0.000465
28-e (Bombax ceiba)
Source DF Adj SS Adj MS F-Value P-Value
Treatment 4 0.006335 0.001584 26.66 0.000
Error 10 0.000594 0.000059
Total 14 0.006929
28-f (Dalbergia sissoo)
Source DF Adj SS Adj MS F-Value P-Value
Treatment 4 0.000566 0.000142 303.36 0.000
Error 10 0.000005 0.000000
Total 14 0.000571
28-g (Poplus deltoides)
Source DF Adj SS Adj MS F-Value P-Value
Treatment 4 0.000334 0.000084 179.07 0.000
Error 10 0.000005 0.000000
Total 14 0.000339
28-h (Morus alba)
Source DF Adj SS Adj MS F-Value P-Value
Treatment 4 0.001223 0.000306 655.36 0.000
Error 10 0.000005 0.000000
Total 14 0.001228

217
Appendix 29 (Root/shoot ratio):
29-a (Eucalyptus camaldulensis)
Source DF Adj SS Adj MS F-Value P-Value
Treatment 4 0.005004 0.001251 20.16 0.000
Error 10 0.000620 0.000062
Total 14 0.005624
29-b (Albizia lebbeck)
Source DF Adj SS Adj MS F-Value P-Value
Treatment 4 0.002706 0.000676 2.61 0.100
Error 10 0.002593 0.000259
Total 14 0.005299
29-c (Vachelia nilotica)
Source DF Adj SS Adj MS F-Value P-Value
Treatment 4 0.007943 0.001986 2.73 0.090
Error 10 0.007280 0.000728
Total 14 0.015223
29-d (Zizyphus mauritiana)
Source DF Adj SS Adj MS F-Value P-Value
Treatment 4 0.013671 0.003418 3.45 0.051
Error 10 0.009905 0.000990
Total 14 0.023575
29-e (Bombax ceiba)
Source DF Adj SS Adj MS F-Value P-Value
Treatment 4 0.05837 0.014593 7.87 0.004
Error 10 0.01854 0.001854
Total 14 0.07691
29-f (Dalbergia sissoo)
Source DF Adj SS Adj MS F-Value P-Value
Treatment 4 0.000482 0.000121 0.31 0.866
Error 10 0.003912 0.000391
Total 14 0.004394
29-g (Poplus deltoides)
Source DF Adj SS Adj MS F-Value P-Value
Treatment 4 0.038771 0.009693 206.51 0.000
Error 10 0.000469 0.000047
Total 14 0.039240
29-h (Morus alba)
Source DF Adj SS Adj MS F-Value P-Value
Treatment 4 0.18141 0.045352 14.86 0.000
Error 10 0.03051 0.003051
Total 14 0.21192

218
Appendix 30 (Leaf area):
30-a (Eucalyptus camaldulensis)
Source DF Adj SS Adj MS F-Value P-Value
Treatment 4 26391.7 6597.92 569.44 0.000
Error 10 115.9 11.59
Total 14 26507.5
30-b (Albizia lebbeck)
Source DF Adj SS Adj MS F-Value P-Value
Treatment 4 2920.35 730.087 137.25 0.000
Error 10 53.19 5.319
Total 14 2973.54
30-c (Vachelia nilotica)
Source DF Adj SS Adj MS F-Value P-Value
Treatment 4 3.69629 0.924073 320.12 0.000
Error 10 0.02887 0.002887
Total 14 3.72516
30-d (Zizyphus mauritiana)
Source DF Adj SS Adj MS F-Value P-Value
Treatment 4 21.8438 5.46096 64.95 0.000
Error 10 0.8408 0.08408
Total 14 22.6846
30-e (Bombax ceiba)
Source DF Adj SS Adj MS F-Value P-Value
Treatment 4 21629.4 5407.35 528.49 0.000
Error 10 102.3 10.23
Total 14 21731.7
30-f (Dalbergia sissoo)
Source DF Adj SS Adj MS F-Value P-Value
Treatment 4 513.13 128.281 23.10 0.000
Error 10 55.54 5.554
Total 14 568.66
30-g (Poplus deltoides)
Source DF Adj SS Adj MS F-Value P-Value
Treatment 4 21624.3 5406.06 746.83 0.000
Error 10 72.4 7.24
Total 14 21696.6
30-h (Morus alba)
Source DF Adj SS Adj MS F-Value P-Value
Treatment 4 28715.9 7178.99 1011.79 0.000
Error 10 71.0 7.10
Total 14 28786.9

219
Appendix 31 (No. of leaves):
31-a (Eucalyptus camaldulensis)
Source DF Adj SS Adj MS F-Value P-Value
Treatment 4 1551.33 387.833 149.17 0.000
Error 10 26.00 2.600
Total 14 1577.33
31-b (Albizia lebbeck)
Source DF Adj SS Adj MS F-Value P-Value
Treatment 4 2846.40 711.600 970.36 0.000
Error 10 7.33 0.733
Total 14 2853.73
31-c (Vachelia nilotica)
Source DF Adj SS Adj MS F-Value P-Value
Treatment 4 889.733 222.433 370.72 0.000
Error 10 6.000 0.600
Total 14 895.733
31-d (Zizyphus mauritiana)
Source DF Adj SS Adj MS F-Value P-Value
Treatment 4 1896.00 474.000 474.00 0.000
Error 10 10.00 1.000
Total 14 1906.00
31-e (Bombax ceiba)
Source DF Adj SS Adj MS F-Value P-Value
Treatment 4 39.067 9.7667 13.32 0.001
Error 10 7.333 0.7333
Total 14 46.400
31-f (Dalbergia sissoo)
Source DF Adj SS Adj MS F-Value P-Value
Treatment 4 154.667 38.6667 44.62 0.000
Error 10 8.667 0.8667
Total 14 163.333
31-g (Poplus deltoides)
Source DF Adj SS Adj MS F-Value P-Value
Treatment 4 841.73 210.433 210.43 0.000
Error 10 10.00 1.000
Total 14 851.73
31-h (Morus alba)
Source DF Adj SS Adj MS F-Value P-Value
Treatment 4 789.60 197.400 148.05 0.000
Error 10 13.33 1.333
Total 14 802.93

220
Appendix 32 (No. of branches):
32-a (Eucalyptus camaldulensis)
Source DF Adj SS Adj MS F-Value P-Value
Treatment 4 27.600 6.9000 11.50 0.001
Error 10 6.000 0.6000
Total 14 33.600
32-b (Albizia lebbeck)
Source DF Adj SS Adj MS F-Value P-Value
Treatment 4 390.267 97.5667 112.58 0.000
Error 10 8.667 0.8667
Total 14 398.933
32-c (Vachelia nilotica)
Source DF Adj SS Adj MS F-Value P-Value
Treatment 4 58.933 14.7333 24.56 0.000
Error 10 6.000 0.6000
Total 14 64.933
32-d (Zizyphus mauritiana)
Source DF Adj SS Adj MS F-Value P-Value
Treatment 4 137.067 34.2667 46.73 0.000
Error 10 7.333 0.7333
Total 14 144.400
32-e (Bombax ceiba)
Source DF Adj SS Adj MS F-Value P-Value
Treatment 4 46.667 11.6667 13.46 0.000
Error 10 8.667 0.8667
Total 14 55.333
32-f (Dalbergia sissoo)
Source DF Adj SS Adj MS F-Value P-Value
Treatment 4 83.73 20.933 17.44 0.000
Error 10 12.00 1.200
Total 14 95.73
32-g (Poplus deltoides)
Source DF Adj SS Adj MS F-Value P-Value
Treatment 4 2.267 0.5667 1.06 0.424
Error 10 5.333 0.5333
Total 14 7.600
32-h (Morus alba)
Source DF Adj SS Adj MS F-Value P-Value
Treatment 4 5.733 1.4333 7.17 0.005
Error 10 2.000 0.2000
Total 14 7.733

221
Appendix 33 (Photosynthetic rate):
33-a (Eucalyptus camaldulensis)
Source DF Adj SS Adj MS F-Value P-Value
Treatment 4 19.5040 4.87601 3450.01 0.000
Error 10 0.0141 0.00141
Total 14 19.5182
33-b (Albizia lebbeck)
Source DF Adj SS Adj MS F-Value P-Value
Treatment 4 16.8201 4.20502 1470.29 0.000
Error 10 0.0286 0.00286
Total 14 16.8487
33-c (Vachelia nilotica)
Source DF Adj SS Adj MS F-Value P-Value
Treatment 4 5.89853 1.47463 2353.14 0.000
Error 10 0.00627 0.00063
Total 14 5.90480
33-d (Zizyphus mauritiana)
Source DF Adj SS Adj MS F-Value P-Value
Treatment 4 6.01324 1.50331 3176.01 0.000
Error 10 0.00473 0.00047
Total 14 6.01797
33-e (Bombax ceiba)
Source DF Adj SS Adj MS F-Value P-Value
Treatment 4 10.2935 2.57338 2643.88 0.000
Error 10 0.0097 0.00097
Total 14 10.3032
33-f (Dalbergia sissoo)
Source DF Adj SS Adj MS F-Value P-Value
Treatment 4 7.17197 1.79299 4074.98 0.000
Error 10 0.00440 0.00044
Total 14 7.17637
33-g (Poplus deltoides)
Source DF Adj SS Adj MS F-Value P-Value
Treatment 4 23.7266 5.93164 2164.83 0.000
Error 10 0.0274 0.00274
Total 14 23.7540
33-h (Morus alba)
Source DF Adj SS Adj MS F-Value P-Value
Treatment 4 7.95377 1.98844 3012.79 0.000
Error 10 0.00660 0.00066
Total 14 7.96037

222
Appendix 34 (Transpiration rate):
34-a (Eucalyptus camaldulensis)
Source DF Adj SS Adj MS F-Value P-Value
Treatment 4 707.066 176.766 308.74 0.000
Error 10 5.725 0.573
Total 14 712.791
34-b (Albizia lebbeck)
Source DF Adj SS Adj MS F-Value P-Value
Treatment 4 862.13 215.532 160.29 0.000
Error 10 13.45 1.345
Total 14 875.58
34-c (Vachelia nilotica)
Source DF Adj SS Adj MS F-Value P-Value
Treatment 4 166.172 41.5430 61.38 0.000
Error 10 6.768 0.6768
Total 14 172.940
34-d (Zizyphus mauritiana)
Source DF Adj SS Adj MS F-Value P-Value
Treatment 4 378.58 94.644 51.68 0.000
Error 10 18.31 1.831
Total 14 396.89
34-e (Bombax ceiba)
Source DF Adj SS Adj MS F-Value P-Value
Treatment 4 1319.39 329.848 207.63 0.000
Error 10 15.89 1.589
Total 14 1335.28
34-f (Dalbergia sissoo)
Source DF Adj SS Adj MS F-Value P-Value
Treatment 4 499.85 124.963 118.32 0.000
Error 10 10.56 1.056
Total 14 510.41
34-g (Poplus deltoides)
Source DF Adj SS Adj MS F-Value P-Value
Treatment 4 1345.31 336.328 413.49 0.000
Error 10 8.13 0.813
Total 14 1353.45
34-h (Morus alba)
Source DF Adj SS Adj MS F-Value P-Value
Treatment 4 829.977 207.494 573.57 0.000
Error 10 3.618 0.362
Total 14 833.595

223
Appendix 35(Stomatal conductance):
35-a (Eucalyptus camaldulensis)
Source DF Adj SS Adj MS F-Value P-Value
Treatment 4 0.970560 0.242640 423.21 0.000
Error 10 0.005733 0.000573
Total 14 0.976293
35-b (Albizia lebbeck)
Source DF Adj SS Adj MS F-Value P-Value
Treatment 4 0.856240 0.214060 317.91 0.000
Error 10 0.006733 0.000673
Total 14 0.862973
35-c (Vachelia nilotica)
Source DF Adj SS Adj MS F-Value P-Value
Treatment 4 0.126800 0.031700 279.71 0.000
Error 10 0.001133 0.000113
Total 14 0.127933
35-d (Zizyphus mauritiana)
Source DF Adj SS Adj MS F-Value P-Value
Treatment 4 0.715973 0.178993 357.99 0.000
Error 10 0.005000 0.000500
Total 14 0.720973
35-e (Bombax ceiba)
Source DF Adj SS Adj MS F-Value P-Value
Treatment 4 1.18809 0.297023 696.15 0.000
Error 10 0.00427 0.000427
Total 14 1.19236
35-f (Dalbergia sissoo)
Source DF Adj SS Adj MS F-Value P-Value
Treatment 4 0.380773 0.095193 198.32 0.000
Error 10 0.004800 0.000480
Total 14 0.385573
35-g (Poplus deltoides)
Source DF Adj SS Adj MS F-Value P-Value
Treatment 4 8.43347 2.10837 4273.72 0.000
Error 10 0.00493 0.00049
Total 14 8.43840
35-h (Morus alba)
Source DF Adj SS Adj MS F-Value P-Value
Treatment 4 2.01084 0.502710 2285.05 0.000
Error 10 0.00220 0.000220
Total 14 2.01304

224
Appendix 36 (Internal CO2 concentration):
36-a (Eucalyptus camaldulensis)
Source DF Adj SS Adj MS F-Value P-Value
Treatment 4 65302.4 16325.6 1913.16 0.000
Error 10 85.3 8.5
Total 14 65387.7
36-b (Albizia lebbeck)
Source DF Adj SS Adj MS F-Value P-Value
Treatment 4 77882.3 19470.6 693.73 0.000
Error 10 280.7 28.1
Total 14 78162.9
36-c (Vachelia nilotica)
Source DF Adj SS Adj MS F-Value P-Value
Treatment 4 9447.33 2361.83 621.54 0.000
Error 10 38.00 3.80
Total 14 9485.33
36-d (Zizyphus mauritiana)
Source DF Adj SS Adj MS F-Value P-Value
Treatment 4 36306.9 9076.73 1215.63 0.000
Error 10 74.7 7.47
Total 14 36381.6
36-e (Bombax ceiba)
Source DF Adj SS Adj MS F-Value P-Value
Treatment 4 70406.3 17601.6 1287.92 0.000
Error 10 136.7 13.7
Total 14 70542.9
36-f (Dalbergia sissoo)
Source DF Adj SS Adj MS F-Value P-Value
Treatment 4 19883.1 4970.77 536.41 0.000
Error 10 92.7 9.27
Total 14 19975.7
36-g (Poplus deltoides)
Source DF Adj SS Adj MS F-Value P-Value
Treatment 4 95740.4 23935.1 1264.18 0.000
Error 10 189.3 18.9
Total 14 95929.7
36-h (Morus alba)
Source DF Adj SS Adj MS F-Value P-Value
Treatment 4 69366.9 17341.7 1793.97 0.000
Error 10 96.7 9.7
Total 14 69463.6

225
Appendix 37 (Photosynthetic water use efficiency):
37-a (Eucalyptus camaldulensis)
Source DF Adj SS Adj MS F-Value P-Value
Treatment 4 818.201 204.550 304.66 0.000
Error 10 6.714 0.671
Total 14 824.915
37-b (Albizia lebbeck)
Source DF Adj SS Adj MS F-Value P-Value
Treatment 4 540.930 135.233 168.80 0.000
Error 10 8.012 0.801
Total 14 548.942
37-c (Vachelia nilotica)
Source DF Adj SS Adj MS F-Value P-Value
Treatment 4 37.400 9.3501 53.11 0.000
Error 10 1.761 0.1761
Total 14 39.161
37-d (Zizyphus mauritiana)
Source DF Adj SS Adj MS F-Value P-Value
Treatment 4 523.624 130.906 630.79 0.000
Error 10 2.075 0.208
Total 14 525.699
37-e (Bombax ceiba)
Source DF Adj SS Adj MS F-Value P-Value
Treatment 4 398.637 99.6591 134.13 0.000
Error 10 7.430 0.7430
Total 14 406.066
37-f (Dalbergia sissoo)
Source DF Adj SS Adj MS F-Value P-Value
Treatment 4 466.443 116.611 136.21 0.000
Error 10 8.561 0.856
Total 14 475.004
37-g (Poplus deltoides)
Source DF Adj SS Adj MS F-Value P-Value
Treatment 4 811.28 202.821 83.59 0.000
Error 10 24.26 2.426
Total 14 835.55
37-h (Morus alba)
Source DF Adj SS Adj MS F-Value P-Value
Treatment 4 537.05 134.263 92.20 0.000
Error 10 14.56 1.456
Total 14 551.61