Medical staff perspectives in China - Neurology Asia
27
49 Preferences and values for treatment goals in patients with acute ischemic stroke: Medical staff perspectives in China 1 Yanan Wang MB, 1 Simiao Wu PhD, 1 Shihong Zhang PhD, 1 Bo Wu PhD, 1,2 Rong Yang MD, 3,4,5 Craig Anderson PhD, 1 Ming Liu PhD 1 Department of Neurology, West China Hospital, Sichuan University, Chengdu, China; 2 West China School of Nursing, Sichuan University, Chengdu, China; 3 The George Institute for Global Health, University of New South Wales, Sydney, NSW, Australia; 4 The George Institute China at Peking University Health Science Centre, Beijing, China; 5 Neurology Department, Royal Prince Alfred Hospital, Sydney, NSW, Australia Abstract Individual values and beliefs vary according to cultural and social factors. To better understand clinical decision-making and inform future research, we undertook a survey of preferences in treatment goals for managing patients with acute ischemic stroke among medical professionals in China. We designed a web-based survey through literature search, face-to-face interviews, pilot questionnaire development, and focus group meetings. Key outcomes explored were death, disability, quality of life, neurological impairments, cognitive dysfunction, and hemorrhagic transformation. Participants were asked to rate the importance of each outcome on a 5-point Likert scale to allow calculation of a weighted score of importance: higher scores indicating greater importance. A total of 1,189 participants completed the survey. For established therapies with bleeding risk (e.g. thrombolysis and thrombectomy), death was the most important outcome (weighted score 4.60), followed by disability (4.45), quality of life (4.45), neurological impairments (4.34), cognitive dysfunction (4.03), and hemorrhagic transformation (3.99). For other acute therapies without bleeding risk, quality of life ranked first (4.08), followed by disability (4.03), neurological impairment (3.92), death (3.79), cognitive dysfunction (3.78), and hemorrhagic transformation (3.51). From the perspective of Chinese medical staff, death is the most important outcome measure for patients with acute ischemic stroke. When reduction of death or disability were less likely to be achievable, the improvement in quality of life is an acceptable outcome measure. In contrast to the previously perceived high fear of bleeding in practice, hemorrhagic transformation was the least concerned even for therapies with a potential bleeding risk. Keywords: Survey, opinions, outcome measures, ischemic stroke, China Neurology Asia 2021; 26(1) : 49 – 54 Address correspondence to: Prof Ming Liu, Department of Neurology, West China Hospital, Sichuan University, 37 Guo Xue Xiang, Chengdu, China 610041; Tel. +86 28 85422833. E-mail: [email protected] Date of Submission: 13 November 2020; Date of Acceptance: 7 December 2020 INTRODUCTION While death and disability are the primary outcome measures used to assess the effects of therapies for acute ischemic stroke (AIS) in randomized controlled trials (RTCs) 1-3 , the action of clinicians in interpreting such results depends upon many factors, such as the size, consistency and scope of net benefit over risks, and affordability of treatment. Guidelines recommend thrombolysis and thrombectomy for AIS based on a large body of evidence from RCTs. 4,5 However, these therapies are only available to a small proportion (<20%) of AIS patients worldwide, and even fewer (<10%) in China and other parts of Asia 6-11 , where neuroprotective agents, herbal products, and other therapies are more widely available and popular 6,12,13 despite insufficient supporting evidence. Reasons for the discrepancy between scientific evidence and clinical practice are complex. The choice of treatment therapies is a joint decision between physicians and nurses, and patients and/or their families, where values and preferences over the importance of different outcomes from AIS vary across cultures, experiences and roles. The importance of patient- centered outcomes is now well accepted 14,15 , but
-
Upload
khangminh22 -
Category
Documents
-
view
3 -
download
0
Transcript of Medical staff perspectives in China - Neurology Asia

49
Preferences and values for treatment goals in patients with acute ischemic stroke: Medical staff perspectives in China1Yanan Wang MB, 1Simiao Wu PhD, 1Shihong Zhang PhD, 1Bo Wu PhD, 1,2Rong Yang MD,3,4,5Craig Anderson PhD, 1Ming Liu PhD
1Department of Neurology, West China Hospital, Sichuan University, Chengdu, China; 2West China School of Nursing, Sichuan University, Chengdu, China; 3The George Institute for Global Health, University of New South Wales, Sydney, NSW, Australia; 4The George Institute China at Peking University Health Science Centre, Beijing, China; 5Neurology Department, Royal Prince Alfred Hospital, Sydney, NSW, Australia
Abstract
Individual values and beliefs vary according to cultural and social factors. To better understand clinical decision-making and inform future research, we undertook a survey of preferences in treatment goals for managing patients with acute ischemic stroke among medical professionals in China. We designed a web-based survey through literature search, face-to-face interviews, pilot questionnaire development, and focus group meetings. Key outcomes explored were death, disability, quality of life, neurological impairments, cognitive dysfunction, and hemorrhagic transformation. Participants were asked to rate the importance of each outcome on a 5-point Likert scale to allow calculation of a weighted score of importance: higher scores indicating greater importance. A total of 1,189 participants completed the survey. For established therapies with bleeding risk (e.g. thrombolysis and thrombectomy), death was the most important outcome (weighted score 4.60), followed by disability (4.45), quality of life (4.45), neurological impairments (4.34), cognitive dysfunction (4.03), and hemorrhagic transformation (3.99). For other acute therapies without bleeding risk, quality of life ranked first (4.08), followed by disability (4.03), neurological impairment (3.92), death (3.79), cognitive dysfunction (3.78), and hemorrhagic transformation (3.51). From the perspective of Chinese medical staff, death is the most important outcome measure for patients with acute ischemic stroke. When reduction of death or disability were less likely to be achievable, the improvement in quality of life is an acceptable outcome measure. In contrast to the previously perceived high fear of bleeding in practice, hemorrhagic transformation was the least concerned even for therapies with a potential bleeding risk.
Keywords: Survey, opinions, outcome measures, ischemic stroke, China
Neurology Asia 2021; 26(1) : 49 – 54
Address correspondence to: Prof Ming Liu, Department of Neurology, West China Hospital, Sichuan University, 37 Guo Xue Xiang, Chengdu, China 610041; Tel. +86 28 85422833. E-mail: [email protected]
Date of Submission: 13 November 2020; Date of Acceptance: 7 December 2020
INTRODUCTION
While death and disability are the primary outcome measures used to assess the effects of therapies for acute ischemic stroke (AIS) in randomized controlled trials (RTCs)1-3, the action of clinicians in interpreting such results depends upon many factors, such as the size, consistency and scope of net benefit over risks, and affordability of treatment. Guidelines recommend thrombolysis and thrombectomy for AIS based on a large body of evidence from RCTs.4,5 However, these therapies are only available to a small proportion (<20%) of AIS patients worldwide,
and even fewer (<10%) in China and other parts of Asia6-11, where neuroprotective agents, herbal products, and other therapies are more widely available and popular6,12,13 despite insufficient supporting evidence. Reasons for the discrepancy between scientific evidence and clinical practice are complex. The choice of treatment therapies is a joint decision between physicians and nurses, and patients and/or their families, where values and preferences over the importance of different outcomes from AIS vary across cultures, experiences and roles. The importance of patient-centered outcomes is now well accepted14,15, but

Neurology Asia March 2021
50
few studies have been undertaken on the issue in China. The aim of our study was to determine the preferences and values of Chinese medical staff place upon key clinical outcomes used across treatments for AIS.
METHODS
We conducted a staged study (Figure 1), with approval from the Biomedical Research Ethics Committee of West China Hospital, Sichuan University [No. 2018(100)], and informed consent from all participants.
Stage 1: Face-to-face interviews
Two researchers (YW, SW) independently undertook a literature search and identified 33 common outcome measures used in stroke RCTs (see Supplementary). Next, 31 stroke physicians from the West China Hospital, Sichuan University, participated in 1:1 face-to-face interviews, where they were asked to answer an open question: “which outcome measures do you think are important to assess the treatment effect for AIS during the acute phase” among the list of 33 outcome measures. Participants were required to provide at least 1 and no more than 10 responses, in rank order of clinical importance. A total of
306 responses were collected and these were categorized down to 20 outcome measures.
Stage 2: Pilot questionnaire development
A paper-based questionnaire was developed from the 20 outcome measures (Supplementary Table S1) for testing among 71 neurologists from 17 hospitals. In a round-table discussion, they had to choose 10 key outcome measures and provide feedback on design of the questionnaire.
Stage 3: Focus group meetings
A focus group of 4 stroke neurologists (ML, BW, SZ, and SW) finalized the survey content based upon the clinical importance of each outcome measure in sections: (i) baseline information; (ii) ranking importance of outcome measures in relation to established acute therapies with bleeding risk (thrombolysis, thrombectomy and antithrombotic agents) and other common therapies of neuroprotective agents, rehabilitation, acupuncture, Chinese patent medicine, and traditional Chinese medicine; (iii) three questions on “If an acute therapy may not reduce death or disability at 3 months but improves neurological deficits in short-term, do you think it is worth trying for stroke patients during the acute phase?”
Figure 1. Key stages/steps of study

51
and if ‘Yes’, “which therapies would you like to use?” and “Please specify the outcome measures that you expect to improve with the chosen therapies”.
Stage 4: Web-based surveys
An online questionnaire developed by SurveyStar (Changsha, China) was delivered at 1 national and 6 regional academic, neurology conferences in China from April 2018 to September 2018. A two-dimensional code linked to the questionnaire was promoted in lecture slide presentations and on postcards at the conference venues. Delegates were invited to scan the code and complete the questionnaire via mobile phones.
Statistical analysis
Two researchers (YW, SW) independently coded all interview data and performed thematic analysis of the pilot questionnaire.16 The web questionnaire was then finalized after comparisons of the included categories with disagreements agreed through consensus. Quantitative data are
presented as means and standard deviations for continuous variables, and percentage frequencies for categorical variables. To quantify the importance of each outcome measure ranked by participants, a 5-point Likert scale17 was used: not important at all = 1, not important = 2, neutral = 3, important = 4, very important = 5. A weighted score was calculated using the following equation: (1*a+2*b + 3*c + 4*d + 5*e) / (a + b + c + d + e), where a, b, c, d, and e represent participants’ numbers for ranked each outcome measure. A higher weighted score equated to greater clinical importance. All statistical analyses were performed in SPSS 25.0 (IBM, Chicago, IL, USA).
RESULTS
Among 2,700 delegates across seven conferences, 1,895 accessed the web questionnaire and 1,189 completed the survey. Of 1,189 participants, the mean age was 40 ± 10 years and 53% participants were females. More than half had over 10 years clinical experience and 43% had more than 5 years of research experience in stroke (Table 1).
Table 1: Baseline characteristics of 1189 participants from 30 provinces in China
CharacteristicsAge (years) 40±10Female 631 (53)Highest academic degree
Junior college degree or below 21 (2)Bachelor’s degree 540 (45)Master’s degree 471 (40)Doctor’s degree 157 (13)
OccupationClinician 1141 (96)Nurse 48 (4)
Clinical experience in stroke (years)None 62 (5)≤5 253 (21)6-10 245 (21)11-19 280 (24)≥20 349 (29)
Research experience in stroke (years)None 319 (27)≤5 357 (30)6-10 203 (17)11-19 159 (13≥20 151 (13)
Teaching hospital 914(77)Tertiary level hospital 946 (80)
Data are n (%) or mean (SD)
Neurology Asia March 2021
52
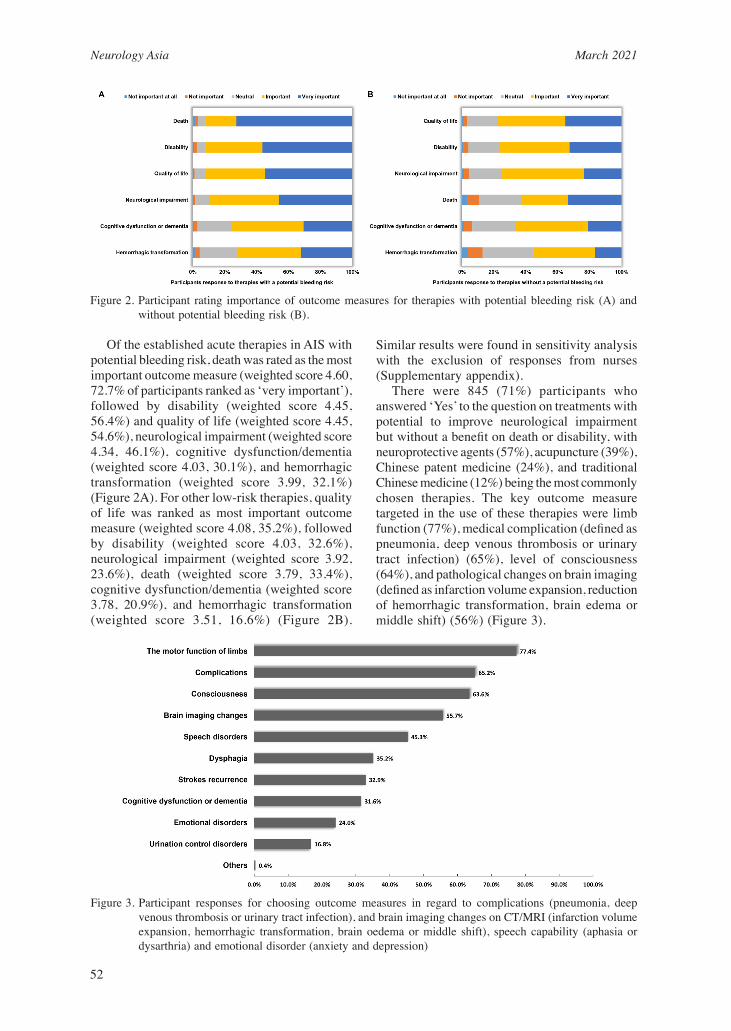
Of the established acute therapies in AIS with potential bleeding risk, death was rated as the most important outcome measure (weighted score 4.60, 72.7% of participants ranked as ‘very important’), followed by disability (weighted score 4.45, 56.4%) and quality of life (weighted score 4.45, 54.6%), neurological impairment (weighted score 4.34, 46.1%), cognitive dysfunction/dementia (weighted score 4.03, 30.1%), and hemorrhagic transformation (weighted score 3.99, 32.1%) (Figure 2A). For other low-risk therapies, quality of life was ranked as most important outcome measure (weighted score 4.08, 35.2%), followed by disability (weighted score 4.03, 32.6%), neurological impairment (weighted score 3.92, 23.6%), death (weighted score 3.79, 33.4%), cognitive dysfunction/dementia (weighted score 3.78, 20.9%), and hemorrhagic transformation (weighted score 3.51, 16.6%) (Figure 2B).
Similar results were found in sensitivity analysis with the exclusion of responses from nurses (Supplementary appendix). There were 845 (71%) participants who answered ‘Yes’ to the question on treatments with potential to improve neurological impairment but without a benefit on death or disability, with neuroprotective agents (57%), acupuncture (39%), Chinese patent medicine (24%), and traditional Chinese medicine (12%) being the most commonly chosen therapies. The key outcome measure targeted in the use of these therapies were limb function (77%), medical complication (defined as pneumonia, deep venous thrombosis or urinary tract infection) (65%), level of consciousness (64%), and pathological changes on brain imaging (defined as infarction volume expansion, reduction of hemorrhagic transformation, brain edema or middle shift) (56%) (Figure 3).
Figure 2. Participant rating importance of outcome measures for therapies with potential bleeding risk (A) and without potential bleeding risk (B).
Figure 3. Participant responses for choosing outcome measures in regard to complications (pneumonia, deep venous thrombosis or urinary tract infection), and brain imaging changes on CT/MRI (infarction volume expansion, hemorrhagic transformation, brain oedema or middle shift), speech capability (aphasia or dysarthria) and emotional disorder (anxiety and depression)

53
DISCUSSION
In our study of the preferences and values of health professionals involved in the management of AIS in China, we have shown that death is the outcome of most importance in the use of reperfusion therapies which are proven to reduce death and disability, whilst quality of life is also important. Hemorrhagic transformation had a low priority for these therapies which have a bleeding risk. The finding that death had a higher priority than disability supports the old adage in Asian cultures that ‘better to live than to die’, whilst the ability to maintain functional independence in everyday life seems more important in Western culture. For example, as a life-saving intervention for malignant cerebral infarction, decompressive craniectomy was only acceptable to 7% of the general population in Germany, because the potential downside was the chance to continue living with severe disability.18 However, recognition that people can change their views when affected is reflected in other studies in other countries showing higher rates of acceptance of decompressive hemicraniectomy: 28% in AIS patients, 47% in relatives19, 16% in nurses20, and 39% in physicians.21 With regard to low-risk therapies, neuroprotection, rehabilitation, acupuncture, Chinese patent medicine, and traditional Chinese medicine, are all widely used alongside Western medicines in China6, despite their limited evidence from RCTs. Our study shows these therapies are primarily used with the intent to improve quality of life. Due to concerns over treatment-related hemorrhagic transformation, many Asian clinicians prefer to use lower doses of intravenous alteplase for thrombolysis treatment of AIS patients.22-24 However, our study suggests this adverse event is regarded as less important than the other clinical outcome measures, which is consistent with findings of dichotomized positive outcomes outweighing the risks of these treatments in RCTs. Education of doctors and patients over hemorrhagic transformation being an acceptable complication in the context of the poor prognosis of AIS may improve the update of reperfusion therapies. Our web-based survey was able to gather opinions from a large number of health professionals at relatively low cost; it was able to overcome the selection bias from those who were highly skilled and experienced, mainly clinicians, who had the opportunity to attend certain neurology conferences.
In summary, our survey of Chinese medical staff shows they rank death as the outcome of most importance for the use of proven reperfusion therapies, and contrary to current perceptions, the risk of hemorrhagic transformation had a low priority. When a therapy is unlikely to reduce the chances of death or disability, quality of life is more meaningful and acceptable outcome to target. These results may help improve the design of stroke RCTs and counselling of patients and families.
DISCLOSURE
Financial support: This study was supported by the Key Research and Development Program, Science & Technology Department of Sichuan Province (2017SZ0007), Science & Technology Department of Sichuan Province (2021YJ0433), National Natural Science Foundation of China (81974181), Major International (Regional) Joint Research Project, National Natural Science Foundation of China (81620108009), the National Key Research and Development Program of China, Ministry of Science and Technology of China (2016YFC1300500-505), the 1·3·5 project for disciplines of excellence, West China Hospital, Sichuan University (ZYGD18009).
Conflicts of interest: None
REFERENCES 1. Anderson CS, Robinson T, Lindley RI, et al. Low-dose
versus standard-dose intravenous alteplase in acute ischemic stroke. N Engl J Med 2016;374:2313-23.
2. Khatri P, Kleindorfer DO, Devlin T, et al. Effect of alteplase vs aspirin on functional outcome for patients with acute ischemic stroke and minor nondisabling neurologic deficits: The prisms randomized clinical trial. JAMA 2018;320:156-66.
3. IST-3 Collaborative group, Sandercock P, Wardlaw JM, et al. The benefits and harms of intravenous thrombolysis with recombinant tissue plasminogen activator within 6 h of acute ischaemic stroke (the third international stroke trial [ist-3]): A randomised controlled trial. Lancet 2012;379:2352-63.
4. Powers WJ, Rabinstein AA, Ackerson T, et al. 2018 guidelines for the early management of patients with acute ischemic stroke: A guideline for healthcare professionals from the american heart association/american stroke association. Stroke 2018;49:e46-e110
5. Chinese Stroke Society of the Chinese Society of Neurology. Chinese guidelines for diagnosis and treatment of acute ischemic stroke 2018. Chinese J Neurol 2018;51:666-82.
6. Wu S, Wu B, Liu M, et al. Stroke in china: Advances and challenges in epidemiology, prevention, and management. Lancet Neurol 2019;18:394-405

Neurology Asia March 2021
54
7. Fonarow GC, Zhao X, Smith EE, et al. Door-to-needle times for tissue plasminogen activator administration and clinical outcomes in acute ischemic stroke before and after a quality improvement initiative. JAMA 2014;311:1632-40
8. Ebinger M, Kunz A, Wendt M, et al. Effects of golden hour thrombolysis: A prehospital acute neurological treatment and optimization of medical care in stroke (phantom-s) substudy. JAMA Neurol 2015;72:25-30.
9. Scherf S, Limburg M, Wimmers R, Middelkoop I, Lingsma H. Increase in national intravenous thrombolysis rates for ischaemic stroke between 2005 and 2012: Is bigger better? BMC Neurol 2016;16:53.
10. Dong Q, Dong Y, Liu L, et al. The Chinese Stroke Association scientific statement: Intravenous thrombolysis in acute ischaemic stroke. Stroke and Vascular Neurology. 2017;2:147-59.
11. Muruet W, Rudd A, Wolfe CDA, Douiri A. Long-term survival after intravenous thrombolysis for ischemic stroke: A propensity score-matched cohort with up to 10-year follow-up. Stroke 2018;49:607-13.
12. Chen CL, Young SH, Gan HH, et al. Chinese medicine neuroaid efficacy on stroke recovery: A double-blind, placebo-controlled, randomized study. Stroke 2013;44:2093-100.
13. Liu T, Ding Y, Wen A. Traditional chinese medicine for ischaemic stroke. Lancet Neurol 2018;17:745.
14. Katzan IL, Thompson NR, Uchino K, Lapin B. The most affected health domains after ischemic stroke. Neurology 2018;90:e1364-e1371
15. Luo Y, Yang J, Zhang Y. Development and validation of a patient-reported outcome measure for stroke patients. Health Qual Life Outcomes 2015;13:53.
16. Boyatzis RE. Transforming qualitative information: Thematic analysis and code development. IL Nuovo Cimento 1998;28:210-4.
17. Likert R. A technique for the measurement of attitudes. Arch Psychol 1932;22 140:1-55.
18. Klein A, Kuehner C, Schwarz S. Attitudes in the general population towards hemi-craniectomy for middle cerebral artery (mca) infarction. A population-based survey. Neurocrit Care 2012;16:456-61.
19. Neugebauer H, Schnabl M, Lulé D, Heuschmann PU, Jüttler E. Attitudes of patients and relatives toward disability and treatment in malignant mca infarction. Neurocritical Care 2017;26:311-8.
20. Neugebauer H, Malakou F, Uttner I, Köpke M, Jüttler E. Attitudes of nurses toward disability and treatment in space-occupying middle cerebral artery stroke. Neurocrit Care 2019;30:132-8.
21. Neugebauer H, Creutzfeldt CJ, Hemphill JC, Heuschmann PU, Jüttler E. Destiny-s: Attitudes of physicians toward disability and treatment in malignant mca infarction. Neurocritical Care. 2014;21:27-34
22. Kim BJ, Han MK, Park TH, Park SS, Lee KB, Lee BC, et al. Low-versus standard-dose alteplase for ischemic strokes within 4.5 hours: A comparative effectiveness and safety study. Stroke. 2015;46:2541-2548
23. Yamaguchi T, Mori E, Minematsu K, Nakagawara J, Hashi K, Saito I, et al. Alteplase at 0.6 mg/kg for acute ischemic stroke within 3 hours of onset: Japan
alteplase clinical trial (j-act). Stroke. 2006;37:1810-1815
24. Chao AC, Liu C-K, Chen C-H, Lin H-J, Liu C-H, Jeng J-S, et al. Different doses of recombinant tissue-type plasminogen activator for acute stroke in chinese patients. Stroke. 2014;45:2359-2365

E1
Supplementary materials
Search strategy and inclusion criteria in Stage 1Two researchers (YW and SW) independently performed an electronic search of literature in PubMed, Ovid EMBASE and the Cochrane Library databases and Chinese Science and Technology Journals Database between January 2008 and April 2018, using the follow keywords: ‘acute ischaemic stroke’, ‘outcome measure’, ‘endpoint’, ‘randomised controlled trials’. We also manually screened specialized journals in neurology and stroke in April 2018, to identify randomised controlled trials of acute phase interventions for ischaemic stroke. These journals include: The Lancet Neurology, JAMA Neurology, Neurology, Stroke, International Journal of Stroke and Cerebrovascular Diseases.
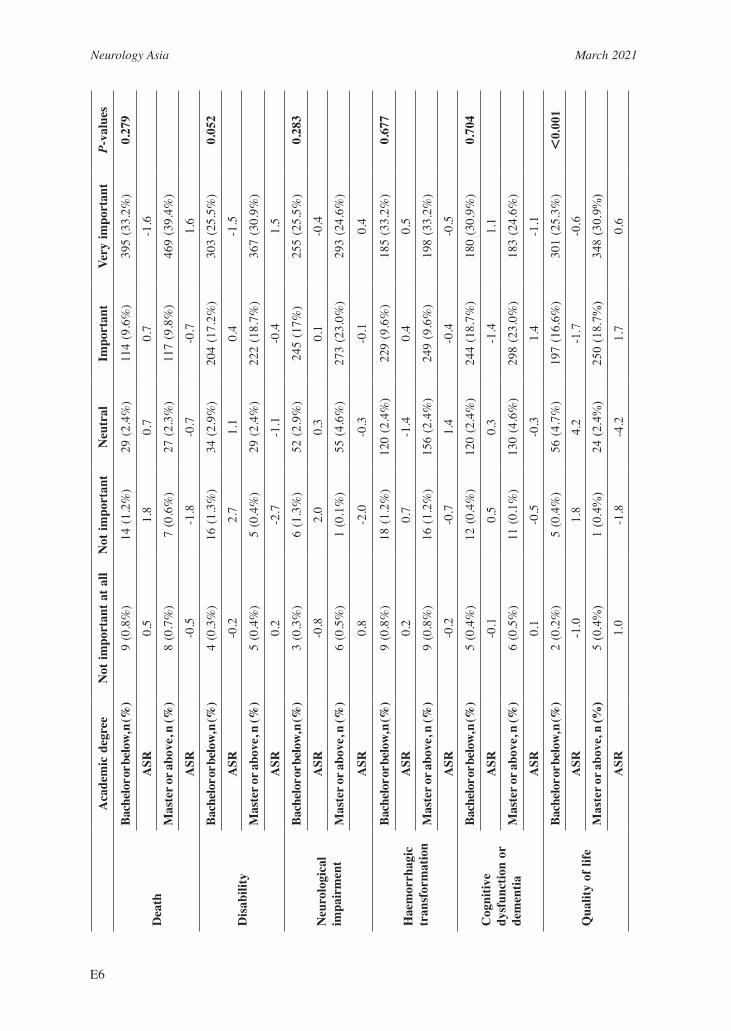
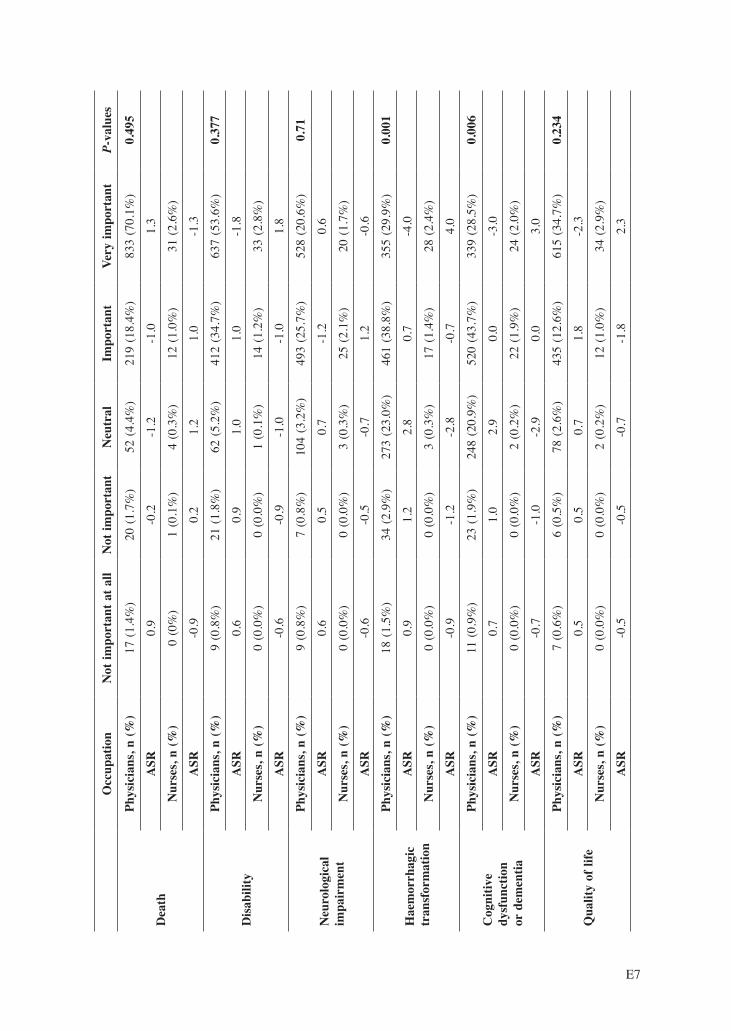
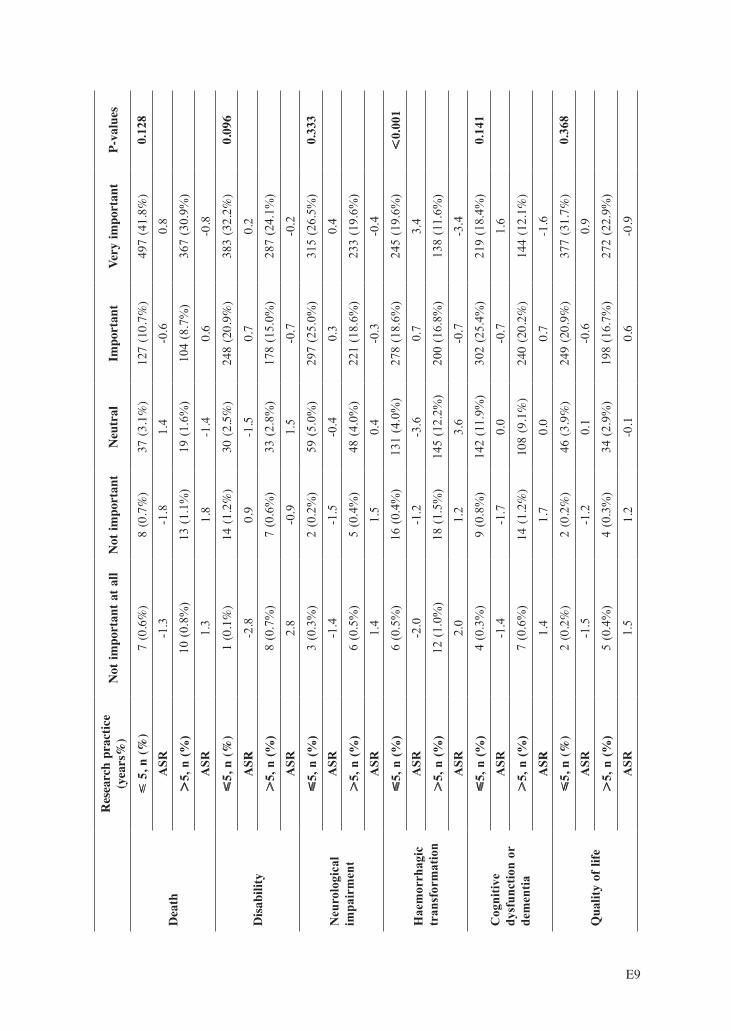
Subgroup analysis and multivariable regression for different ratingsTo explore possible reasons underlying different weighted scores of the listed outcome measures, we performed subgroup analyses and ordinal multi-categorical regression analysis to assess the effect of age (dichotomized by the mean age), sex (male versus female), academic degree (Bachelor or below versus Master or above), occupation (physicians versus nurses), years of clinical practice (dichotomized by the median category of years), years of research practice (dichotomized by the median category of years), whether working in the teaching hospital (yes versus no) or tertiary hospital (yes versus no). We conducted Pearson Chi-square test to assess the association between the distribution of the above subgroup characteristics and the participant’s response to the importance of each listed outcome measures. If significant association was found, the Cramer’s V value (range: 0 – 1; the value closer to 1 indicates the stronger association) was calculated for showing strengths of the association.[1] For each outcome measure, we further calculated adjusted standardized residual (ASR) to identify the between-subgroup difference in each of the five rating categories. The absolute value of ASR > 2 indicated a significant discrepancy and ASR -2 to +2 represented a non-significant difference.[2] A 2-sided P <0.05 was considered statistically significant.
Sensitivity analysis after removing the nurse’ resultsFor the established acute therapies with a potential bleeding risk, the rated importance was different for the six listed outcome measures (Supplementary Fig. 2A). Death was most commonly ranked as the very important outcome measure (73%, 833/1141 of the physicians, weighted score 4.6), followed by disability (55.8%, 637/1141, weighted score 4.44), quality of life (53.9%, 615/1141, weighted score 4.45), neurological impairment (46.3%, 528/1141, weighted score 4.34), cognitive dysfunction or dementia (29.7%, 339/1141, weighted score 4.01), and haemorrhagic transformation (31.1%, 355/114`, weighted score 3.96). For the other type of therapies (Supplementary Fig. 2B), quality of life was the most commonly ranked important outcome measure (by 34.5%, 394/1141 of physicians, weighted score 4.07), followed by disability (32%, 365/1141, weighted score 4.02), neurological impairment (23.3%, 266/1141, weighted score 3.91), death (33%, 376/1141, weighted score 3.77), cognitive dysfunction or dementia (20.2%, 230/1141, weighted score 3.76), and haemorrhagic transformation (16%, 182/1141, weighted score 3.48).
Ordinal multi-categorical regression analysisFor the established acute stroke therapies with a potential bleeding risk, we found females were more likely to rate disability (OR 0.75 95%CI 0.59 - 0.95, P=0.017) and cognitive function (OR 0.64 95%CI 0.51 - 0.80, P<0.001) as very important; nurses were more likely to rate haemorrhagic transformation (OR 0.34 95%CI 0.18 - 0.64, P=0.001) and cognitive function (OR 0.47 95%CI 0.25 - 0.86, P=0.014); Participants with less than 10 years of clinical experience (OR 1.42 95%CI 1.01 - 2.01, P=0.045) were more likely to rate cognitive function as very important; participants with less than 5 years research experience in stroke (OR 1.35 95%CI 1.02 - 1.78, P=0.033); and participants who were working in teaching hospitals (OR 1.40 95%CI 1.01 - 1.94, P=0.047) were more likely to rate death as very important (Supplementary Table 4). For the other type of therapies that are commonly used in practice and without a potential bleeding risk, we found females were more likely to rate death (OR 0.81 95%CI 0.65 - 1, P=0.048), disability (OR 0.66 95%CI 0.53 - 0.83, P<0.001), neurological impairment (OR 0.7 95%CI 0.56 - 0.88, P=0.002),

Neurology Asia March 2021
E2
cognitive function (OR 0.68 95%CI 0.54 - 0.85, P=0.001) and quality of life (OR 0.64 95%CI 0.51 - 0.80, P<0.001) as very important; and nurses were more likely to rate haemorrhagic transformation (OR 0.41 95%CI 0.23 – 0.73, P=0.003) and cognitive function (OR 0.47 95%CI 0.26 - 0.84, P=0.011) as very important (Supplementary Table 4).1 McHugh ML: The chi-square test of independence. Biochem Med (Zagreb) 2013;23:143-149.2 Everitt BS: The Analysis of Contingency Tables. Technometrics 1992;48:977.
Supplementary Figure 2. Physicians rating the importance of outcome measures for therapies with a potential bleeding risk (A) versus therapies without a potential bleeding risk (B)

E3
Supplementary Table 1: The results of preliminary survey
RankPreliminary survey (n=71)
FrequencyOutcomes selected ≥ 5 times
1 Basic activities of daily living 602 Death 593 Brain imaging changes on CT/MRI 564 Cognitive function 525 Complications 476 Disability 457 Overall quality of life 448 Psychological health 439 Consciousness 41
10 Aphasia 3911 The motor function of limb 3912 Strokes recurrence 3513 Dysphagia 2714 Urination control disorder 2415 Vital signs 1916 Social Activities 1617 Degree of vascular stenosis 1618 Instrumental Activities of Daily Living 1519 Blood routine and biochemical examination 620 Vision disorder 5
CT: computed tomography; MRI: magnetic resonance imaging

Neurology Asia March 2021
E4
Supp
lem
enta
ry T
able
2: S
ubgr
oup
anal
yses
for
the
esta
blis
hed
acut
e st
roke
ther
apie
s w
ith a
pot
entia
l ble
edin
g ri
sk (n
=1,1
89)
A
geN
ot im
port
ant a
t all
Not
impo
rtan
tN
eutr
alIm
port
ant
Very
impo
rtan
tP-
valu
es
Dea
th
≤ 40
, n (%
)5
(0.4
%)
9 (0
.8%
)28
(2.4
%)
114
(9.9
%)
469
(40.
5%)
0.10
9A
SR-2
.1-1
.00.
1-1
.31.
9
4
0, n
(%)
12 (1
.0%
)12
(1%
)23
(2.0
%)
113
(9.8
%)
372
(32.
2%)
A
SR2.
11.
0-0
.11.
3-1
.9
Dis
abili
ty
4
0, n
(%)
2 (0
.2%
)8
(0.7
%)
25 (2
.2%
)23
8 (2
0.6%
)35
2 (3
0.4)
0.01
0
ASR
-1.9
-1.5
-2.2
2.0
-0.2
4
40,
n (%
)7
(0.6
)13
(1.1
%)
37 (3
.2%
)17
2 (1
4.9%
)30
3 (2
6.2%
)
ASR
1.9
1.5
2.2
-2.0
0.2
Neu
rolo
gica
l im
pair
men
t
4
0, n
(%)
4 (0
.3%
)2
(0.2
%)
50 (4
.3%
)28
5 (2
4.6%
)28
4 (2
4.5%
)0.
234
ASR
-0.6
-1.4
-1.4
1.6
-0.5
40,
n (%
)5
(0.4
%)
5 (0
.4%
)55
(4.8
%)
217
(18.
8%)
250
(21.
6%)
A
SR0.
61.
41.
4-1
.60.
5
Hae
mor
rhag
ic
tran
sfor
mat
ion
4
0, n
(%)
3 (0
.3%
)14
(1.2
%)
130
(11.
2)25
9 (2
2.4%
)21
9 (1
8.9%
)0.
001
ASR
-3.2
-1.5
-2.1
1.1
2.1
40,
n (%
)15
(1.3
%)
20 (1
.7%
)13
8 (1
1.9%
)20
4 (1
7.6%
)15
5 (1
3.4%
)
ASR
3.2
1.5
2.1
-1.1
-2.1
Cog
nitiv
e dy
sfun
ctio
n or
de
men
tia
4
0, n
(%)
5 (0
.4%
)7
(0.6
%)
129
(11.
1%)
289
(25%
)19
5 (1
6.9%
)0.
296
ASR
-0.6
-2.1
-0.1
0.3
0.5
40,
n (%
)6
(0.5
%)
15 (1
.3%
)11
1 (9
.6%
)24
1 (2
0.8%
)15
9 (1
3.7%
)
ASR
0.6
2.1
0.1
-0.3
-0.5
Qua
lity
of li
fe
4
0, n
(%)
3 (0
.3%
)3
(0.3
%)
33 (2
.9%
)24
0 (2
0.7%
)34
6 (2
9.9%
)0.
230
ASR
-0.6
-0.2
-2.3
0.7
0.6
40,
n (%
)4
(0.3
%)
3 (0
.3%
)46
(4%
)19
4 (1
6.8%
)28
5 (2
4.6%
)
ASR
0.6
0.2
2.3
-0.7
-0.6

E5
Se
xN
ot im
port
ant a
t all
Not
impo
rtan
tN
eutr
alIm
port
ant
Very
impo
rtan
tP-
valu
es
Dea
th
Mal
e, n
(%)
9 (0
.8%
)13
(1.1
%)
23 (1
.9%
)10
4 (8
.7%
)40
9 (3
4.4%
)0.
508
ASR
0.5
1.4
-0.9
-0.6
0.5
Fe
mal
e, n
(%)
8 (0
.7%
)8
(0.7
%)
33 (2
.8%
)12
7 (1
0.7%
)45
5 (3
8.3%
)
ASR
-0.5
-1.4
0.9
0.6
-0.5
Dis
abili
ty
Mal
e, n
(%)
6 (0
.5%
)17
(1.4
%)
36 (0
.9%
)20
5 (0
.6%
)29
4 (0
.5%
)0.
002
ASR
1.2
3.2
1.7
0.6
-2.4
Fe
mal
e, n
(%)
3 (0
.3%
)4
(0.3
%)
27 (2
.3%
)22
1 (1
8.0%
)37
6 (3
1.0%
)
ASR
-1.2
-3.2
-1.7
-0.6
2.4
Neu
rolo
gica
l im
pair
men
t
Mal
e, n
(%)
4 (0
.3%
)7
(0.3
%)
56 (2
.3%
)24
3 (1
8.0%
)24
8 (3
1.0%
)0.
044
ASR
-0.1
2.8
1.2
0.0
-1.1
Fe
mal
e, n
(%)
5 (0
.4%
)0
(0%
)51
(4.3
%)
275
(23.
0%)
300
(25.
0%)
A
SR0.
1-2
.8-1
.20.
01.
1
Hae
mor
rhag
ic
tran
sfor
mat
ion
Mal
e, n
(%)
7 (0
.6%
)21
(1.8
%)
133
(11.
0%)
216
(18.
0%)
181
(15.
0%)
0.37
4A
SR-0
.71.
80.
5-1
.00.
2
Fem
ale,
n (%
)11
(0.9
%)
13 (1
.13%
)14
3 (1
.23%
)26
2 (8
.104
%)
202
(34.
409%
)
ASR
0.7
-1.8
-0.5
1.0
-0.2
Cog
nitiv
e dy
sfun
ctio
n or
de
men
tia
Mal
e, n
(%)
7 (0
.6%
)15
(1.6
%)
147
(1.6
%)
243
(8.6
%)
146
(34.
6%)
,0.
001
ASR
1.1
1.8
4.2
-1.3
-3.1
Fe
mal
e, n
(%)
4 (0
.3%
)8
(0.3
%)
103
(2.3
%)
299
(18.
0%)
217
(31.
0%)
A
SR-1
.1-1
.8-4
.21.
33.
1
Qua
lity
of li
fe
Mal
e, n
(%)
4 (0
.3%
)6
(0.5
%)
54 (4
.5%
)22
1 (1
8.6%
)27
3 (2
3.0%
),
0.00
1
ASR
0.5
2.6
3.8
1.3
-3.7
Fem
ale,
n (%
)3
(0.3
%)
0 (%
)26
(2.2
%)
226
(19%
)37
6 (3
1.6%
)
ASR
-0.5
-2.6
-3.8
-1.3
3.7
Neurology Asia March 2021
E6
A
cade
mic
deg
ree
Not
impo
rtan
t at a
llN
ot im
port
ant
Neu
tral
Impo
rtan
tVe
ry im
port
ant
P-va
lues
Dea
th
Bach
elor
or be
low,
n (%
)9
(0.8
%)
14 (1
.2%
)29
(2.4
%)
114
(9.6
%)
395
(33.
2%)
0.27
9
ASR
0.5
1.8
0.7
0.7
-1.6
Mas
ter o
r abo
ve, n
(%)
8 (0
.7%
)7
(0.6
%)
27 (2
.3%
)11
7 (9
.8%
)46
9 (3
9.4%
)
ASR
-0.5
-1.8
-0.7
-0.7
1.6
Dis
abili
ty
Bach
elor
or be
low,
n (%
)4
(0.3
%)
16 (1
.3%
)34
(2.9
%)
204
(17.
2%)
303
(25.
5%)
0.05
2
ASR
-0.2
2.7
1.1
0.4
-1.5
Mas
ter o
r abo
ve, n
(%)
5 (0
.4%
)5
(0.4
%)
29 (2
.4%
)22
2 (1
8.7%
)36
7 (3
0.9%
)
ASR
0.2
-2.7
-1.1
-0.4
1.5
Neu
rolo
gica
l im
pair
men
t
Bach
elor
or be
low,
n (%
)3
(0.3
%)
6 (1
.3%
)52
(2.9
%)
245
(17%
)25
5 (2
5.5%
)0.
283
ASR
-0.8
2.0
0.3
0.1
-0.4
Mas
ter o
r abo
ve, n
(%)
6 (0
.5%
)1
(0.1
%)
55 (4
.6%
)27
3 (2
3.0%
)29
3 (2
4.6%
)
ASR
0.8
-2.0
-0.3
-0.1
0.4
Hae
mor
rhag
ic
tran
sfor
mat
ion
Bach
elor
or be
low,
n (%
)9
(0.8
%)
18 (1
.2%
)12
0 (2
.4%
)22
9 (9
.6%
)18
5 (3
3.2%
)0.
677
ASR
0.2
0.7
-1.4
0.4
0.5
Mas
ter o
r abo
ve, n
(%)
9 (0
.8%
)16
(1.2
%)
156
(2.4
%)
249
(9.6
%)
198
(33.
2%)
ASR
-0.2
-0.7
1.4
-0.4
-0.5
Cog
nitiv
e dy
sfun
ctio
n or
de
men
tia
Bach
elor
or be
low,
n (%
)5
(0.4
%)
12 (0
.4%
)12
0 (2
.4%
)24
4 (1
8.7%
)18
0 (3
0.9%
)0.
704
ASR
-0.1
0.5
0.3
-1.4
1.1
Mas
ter o
r abo
ve, n
(%)
6 (0
.5%
)11
(0.1
%)
130
(4.6
%)
298
(23.
0%)
183
(24.
6%)
ASR
0.1
-0.5
-0.3
1.4
-1.1
Qua
lity
of li
fe
Bach
elor
or be
low,
n (%
)2
(0.2
%)
5 (0
.4%
)56
(4.7
%)
197
(16.
6%)
301
(25.
3%)
,0.
001
ASR
-1.0
1.8
4.2
-1.7
-0.6
Mas
ter o
r abo
ve, n
(%)
5 (0
.4%
)1
(0.4
%)
24 (2
.4%
)25
0 (1
8.7%
)34
8 (3
0.9%
)
ASR
1.0
-1.8
-4.2
1.7
0.6
E7
O
ccup
atio
nN
ot im
port
ant a
t all
Not
impo
rtan
tN
eutr
alIm
port
ant
Very
impo
rtan
tP-
valu
es
Dea
th
Phys
icia
ns, n
(%)
17 (1
.4%
)20
(1.7
%)
52 (4
.4%
)21
9 (1
8.4%
)83
3 (7
0.1%
)0.
495
ASR
0.9
-0.2
-1.2
-1.0
1.3
Nur
ses,
n (%
)0
(0%
)1
(0.1
%)
4 (0
.3%
)12
(1.0
%)
31 (2
.6%
)
ASR
-0.9
0.2
1.2
1.0
-1.3
Dis
abili
ty
Phys
icia
ns, n
(%)
9 (0
.8%
)21
(1.8
%)
62 (5
.2%
)41
2 (3
4.7%
)63
7 (5
3.6%
)0.
377
ASR
0.6
0.9
1.0
1.0
-1.8
Nur
ses,
n (%
)0
(0.0
%)
0 (0
.0%
)1
(0.1
%)
14 (1
.2%
)33
(2.8
%)
ASR
-0.6
-0.9
-1.0
-1.0
1.8
Neu
rolo
gica
l im
pair
men
t
Phys
icia
ns, n
(%)
9 (0
.8%
)7
(0.8
%)
104
(3.2
%)
493
(25.
7%)
528
(20.
6%)
0.71
ASR
0.6
0.5
0.7
-1.2
0.6
Nur
ses,
n (%
)0
(0.0
%)
0 (0
.0%
)3
(0.3
%)
25 (2
.1%
)20
(1.7
%)
ASR
-0.6
-0.5
-0.7
1.2
-0.6
Hae
mor
rhag
ic
tran
sfor
mat
ion
Phys
icia
ns, n
(%)
18 (1
.5%
)34
(2.9
%)
273
(23.
0%)
461
(38.
8%)
355
(29.
9%)
0.00
1
ASR
0.9
1.2
2.8
0.7
-4.0
Nur
ses,
n (%
)0
(0.0
%)
0 (0
.0%
)3
(0.3
%)
17 (1
.4%
)28
(2.4
%)
ASR
-0.9
-1.2
-2.8
-0.7
4.0
Cog
nitiv
e dy
sfun
ctio
n or
dem
entia
Phys
icia
ns, n
(%)
11 (0
.9%
)23
(1.9
%)
248
(20.
9%)
520
(43.
7%)
339
(28.
5%)
0.00
6
ASR
0.7
1.0
2.9
0.0
-3.0
Nur
ses,
n (%
)0
(0.0
%)
0 (0
.0%
)2
(0.2
%)
22 (1
.9%
)24
(2.0
%)
ASR
-0.7
-1.0
-2.9
0.0
3.0
Qua
lity
of li
fe
Phys
icia
ns, n
(%)
7 (0
.6%
)6
(0.5
%)
78 (2
.6%
)43
5 (1
2.6%
)61
5 (3
4.7%
)0.
234
ASR
0.5
0.5
0.7
1.8
-2.3
Nur
ses,
n (%
)0
(0.0
%)
0 (0
.0%
)2
(0.2
%)
12 (1
.0%
)34
(2.9
%)
ASR
-0.5
-0.5
-0.7
-1.8
2.3

Neurology Asia March 2021
E8
C
linic
al p
ract
ice
(yea
rs%
)N
ot im
port
ant a
t all
Not
impo
rtan
tN
eutr
alIm
port
ant
Very
impo
rtan
tP-
valu
es
Dea
th
10
, n (%
)6
(0.5
%)
7 (0
.6%
)27
(2.3
%)
104
(8.7
%)
416
(35.
0%)
0.50
0
ASR
-1.0
-1.3
0.2
-0.7
1.2
10
, n (%
)11
(0.9
%)
14 (1
.2%
)29
(2.4
%)
127
(10.
7%)
448
(37.
7%)
ASR
1.0
1.3
-0.2
0.7
-1.2
Dis
abili
ty
10
, n (%
)2
(0.2
%)
5 (0
.4%
)24
(2.0
%)
208
(17.
5%)
321
(27.
0%)
0.04
9
ASR
-1.5
-2.2
-1.5
0.9
0.6
10
, n (%
)7
(0.6
%)
16 (1
.3%
)39
(3.3
%)
218
(18.
3%)
349
(29.
4%)
ASR
1.5
2.2
1.5
-0.9
-0.6
Neu
rolo
gica
l im
pair
men
t
10
, n (%
)4
(0.3
%)
1 (0
.1%
)49
(4.1
%)
247
(20.
8%)
259
(21.
8%)
0.05
3
ASR
-0.2
-1.7
-0.3
0.4
0.1
10
, n (%
)5
(0.4
%)
6 (0
.5%
)58
(4.9
%)
271
(22.
8%)
289
(24.
3%)
ASR
0.2
1.7
0.3
-0.4
-0.1
Hae
mor
rhag
ic
tran
sfor
mat
ion
1
0, n
(%)
4 (0
.3%
)10
(0.8
%)
107
(9.0
%)
232
(19.
5%)
207
(17.
4%)
,0.
001
ASR
-2.1
-2.1
-3.2
0.8
3.3
10
, n (%
)14
(1.2
%)
24 (2
.0%
)16
9 (1
4.2%
)24
6 (2
0.7%
)17
6 (1
4.8%
)
ASR
2.1
2.1
3.2
-0.8
-3.3
Cog
nitiv
e dy
sfun
ctio
n or
de
men
tia
10
, n (%
)4
(0.3
%)
6 (0
.5%
)11
0 (9
.3%
)25
1 (2
1.1%
)18
9 (1
5.9%
)0.
055
ASR
-0.7
-2.0
-1.1
-0.5
2.3
10
, n (%
)7
(0.6
%)
17 (1
.4%
)14
0 (1
1.8%
)29
1 (2
4.5%
)17
4 (1
4.6%
)
ASR
0.7
2.0
1.1
0.5
-2.3
Qua
lity
of li
fe
10
, n (%
)3
(0.3
%)
1 (0
.1%
)29
(2.4
%)
211
(17.
7%)
316
(26.
6%)
0.15
1
ASR
-0.2
-1.5
-2.0
0.1
1.2
10
, n (%
)4
(0.3
%)
5 (0
.4%
)51
(4.3
%)
236
(19.
8%)
333
(28.
0%)
ASR
0.2
1.5
2.0
-0.1
-1.2
E9
R
esea
rch
prac
tice
(yea
rs%
)N
ot im
port
ant a
t all
Not
impo
rtan
tN
eutr
alIm
port
ant
Very
impo
rtan
tP-
valu
es
Dea
th
5
, n (%
)7
(0.6
%)
8 (0
.7%
)37
(3.1
%)
127
(10.
7%)
497
(41.
8%)
0.12
8
ASR
-1.3
-1.8
1.4
-0.6
0.8
5,
n (%
)10
(0.8
%)
13 (1
.1%
)19
(1.6
%)
104
(8.7
%)
367
(30.
9%)
ASR
1.3
1.8
-1.4
0.6
-0.8
Dis
abili
ty
5,
n (%
)1
(0.1
%)
14 (1
.2%
)30
(2.5
%)
248
(20.
9%)
383
(32.
2%)
0.09
6
ASR
-2.8
0.9
-1.5
0.7
0.2
5,
n (%
)8
(0.7
%)
7 (0
.6%
)33
(2.8
%)
178
(15.
0%)
287
(24.
1%)
ASR
2.8
-0.9
1.5
-0.7
-0.2
Neu
rolo
gica
l im
pair
men
t
5,
n (%
)3
(0.3
%)
2 (0
.2%
)59
(5.0
%)
297
(25.
0%)
315
(26.
5%)
0.33
3
ASR
-1.4
-1.5
-0.4
0.3
0.4
5,
n (%
)6
(0.5
%)
5 (0
.4%
)48
(4.0
%)
221
(18.
6%)
233
(19.
6%)
ASR
1.4
1.5
0.4
-0.3
-0.4
Hae
mor
rhag
ic
tran
sfor
mat
ion
5,
n (%
)6
(0.5
%)
16 (0
.4%
)13
1 (4
.0%
)27
8 (1
8.6%
)24
5 (1
9.6%
),
0.00
1A
SR-2
.0-1
.2-3
.60.
73.
4
5,
n (%
)12
(1.0
%)
18 (1
.5%
)14
5 (1
2.2%
)20
0 (1
6.8%
)13
8 (1
1.6%
)
ASR
2.0
1.2
3.6
-0.7
-3.4
Cog
nitiv
e dy
sfun
ctio
n or
de
men
tia
5,
n (%
)4
(0.3
%)
9 (0
.8%
)14
2 (1
1.9%
)30
2 (2
5.4%
)21
9 (1
8.4%
)0.
141
ASR
-1.4
-1.7
0.0
-0.7
1.6
5,
n (%
)7
(0.6
%)
14 (1
.2%
)10
8 (9
.1%
)24
0 (2
0.2%
)14
4 (1
2.1%
)
ASR
1.4
1.7
0.0
0.7
-1.6
Qua
lity
of li
fe
5,
n (%
)2
(0.2
%)
2 (0
.2%
)46
(3.9
%)
249
(20.
9%)
377
(31.
7%)
0.36
8
ASR
-1.5
-1.2
0.1
-0.6
0.9
5,
n (%
)5
(0.4
%)
4 (0
.3%
)34
(2.9
%)
198
(16.
7%)
272
(22.
9%)
ASR
1.5
1.2
-0.1
0.6
-0.9

Neurology Asia March 2021
E10
Te
achi
ng h
ospi
tal
Not
impo
rtan
t at a
llN
ot im
port
ant
Neu
tral
Impo
rtan
tVe
ry im
port
ant
P-va
lues
Dea
th
Yes,
n (%
)8
(0.7
%)
10 (0
.8%
)38
(3.2
%)
179
(15.
1%)
679
(57.
1%)
,0.
001
ASR
-2.9
-3.2
-1.6
0.2
2.3
No,
n (%
)9
(0.8
%)
11 (0
.9%
)18
(1.5
%)
52 (4
.4%
)18
5 (1
5.6%
)
ASR
2.9
3.2
1.6
-0.2
-2.3
Dis
abili
ty
Yes,
n (%
)6
(0.5
%)
11 (0
.9%
)47
(4.%
)31
6 (2
6.6%
)53
4 (4
4.9%
)0.
014
ASR
-0.7
-2.7
-0.4
-1.6
2.6
No,
n (%
)3
(0.3
%)
10 (0
.8%
)16
(1.3
%)
110
(9.3
%)
136
(11.
4%)
ASR
0.7
2.7
0.4
1.6
-2.6
Neu
rolo
gica
l im
pair
men
t
Yes,
n (%
)6
(0.5
%)
5 (0
.4%
)83
(7.0
%)
388
(32.
6%)
432
(36.
3%)
0.56
0
ASR
-0.7
-0.3
0.2
-1.4
1.5
No,
n (%
)3
(0.3
%)
2 (0
.2%
)24
(2.0
%)
130
(10.
9%)
116
(9.8
%)
ASR
0.7
0.3
-0.2
1.4
-1.5
Hae
mor
rhag
ic
tran
sfor
mat
ion
Yes,
n (%
)13
(1.1
%)
25 (2
.1%
)21
9 (1
8.4%
)35
7 (3
0.0%
)30
0 (2
5.2%
)0.
537
ASR
-0.5
-0.5
1.1
-1.5
0.8
No,
n (%
)5
(0.4
%)
9 (0
.8%
)57
(4.8
%)
121
(10.
2%)
83 (7
.0%
)
ASR
0.5
0.5
-1.1
1.5
-0.8
Cog
nitiv
e dy
sfun
ctio
n or
de
men
tia
Yes,
n (%
)6
(0.5
%)
18 (1
.5%
)19
6 (1
6.5%
)40
7 (3
4.2%
)28
7 (2
4.1%
)0.
250
ASR
-1.8
0.2
0.6
-1.3
1.2
No,
n (%
)5
(0.4
%)
5 (0
.4%
)54
(4.5
%)
135
(11.
4%)
76 (6
.4%
)
ASR
1.8
-0.2
-0.6
1.3
-1.2
Qua
lity
of li
fe
Yes,
n (%
)4
(0.3
%)
4 (0
.3%
)58
(4.9
%)
342
(28.
8%)
506
(42.
6%)
0.52
3
ASR
-1.2
-0.6
-1.0
-0.2
1.0
No,
n (%
)3
(0.3
%)
2 (0
.2%
)22
(1.9
%)
105
(8.8
%)
143
(12.
0%)
ASR
1.2
0.6
1.0
0.2
-1.0

E11
Te
rtia
ry h
ospi
tal
Not
impo
rtan
t at a
llN
ot im
port
ant
Neu
tral
Impo
rtan
tVe
ry im
port
ant
P-va
lues
Dea
th
Yes,
n (%
)9
(0.8
%)
14 (1
.2%
)41
(3.4
%)
177
(14.
9%)
705
(59.
3%)
0.00
6
ASR
-2.7
-1.5
-1.2
-1.2
2.8
No,
n (%
)8
(0.7
%)
7 (0
.6%
)15
(1.3
%)
54 (4
.5%
)15
9 (1
3.4%
)
ASR
2.7
1.5
1.2
1.2
-2.8
Dis
abili
ty
Yes,
n (%
)5
(0.4
%)
11 (0
.9%
)52
(4.4
%)
325
(27.
3%)
553
(46.
5%)
0.00
1
ASR
-1.8
-3.1
0.6
-2.1
2.9
No,
n (%
)4
(0.3
%)
10 (0
.8%
)11
(0.9
%)
101
(8.5
%)
117
(9.8
%)
ASR
1.8
3.1
-0.6
2.1
-2.9
Neu
rolo
gica
l im
pair
men
t
Yes,
n (%
)7
(0.6
%)
5 (0
.4%
)83
(7.0
%)
409
(34.
4%)
442
(37.
2%)
0.89
7
ASR
-0.1
-0.5
-0.5
-0.5
0.9
No,
n (%
)2
(0.2
%)
2 (0
.2%
)24
(2.0
%)
109
(9.2
%)
106
(8.9
%)
ASR
0.1
0.5
0.5
0.5
-0.9
Hae
mor
rhag
ic
tran
sfor
mat
ion
Yes,
n (%
)13
(1.1
%)
26 (2
.2%
)22
0 (1
8.5%
)38
1 (3
2.0%
)30
6 (2
5.7%
)0.
934
ASR
-0.8
-0.5
0.1
0.1
0.2
No,
n (%
)5
(0.4
%)
8 (0
.7%
)56
(4.7
%)
97 (8
.2%
)77
(6.5
%)
ASR
0.8
0.5
-0.1
-0.1
-0.2
Cog
nitiv
e dy
sfun
ctio
n or
de
men
tia
Yes,
n (%
)6
(0.5
%)
17 (1
.4%
)20
1 (1
6.9%
)43
8 (3
6.8%
)28
4 (2
3.9%
)0.
222
ASR
-2.1
-0.7
0.4
1.0
-0.8
No,
n (%
)5
(0.4
%)
6 (0
.5%
)49
(4.1
%)
104
(8.7
%)
79 (6
.6%
)
ASR
2.1
0.7
-0.4
-10.
8
Qua
lity
of li
fe
Yes,
n (%
)4
(0.3
%)
3 (0
.3%
)60
(5.0
%)
355
(29.
9%)
524
(44.
1%)
0.13
7
ASR
-1.5
-1.8
-1.0
-0.1
1.1
No,
n (%
)3
(0.3
%)
3 (0
.3%
)20
(1.7
%)
92 (7
.7%
)12
5 (1
0.5%
)
ASR
1.5
1.8
1.0
0.1
-1.1

Neurology Asia March 2021
E12
Supp
lem
enta
ry T
able
3: S
ubgr
oup
anal
yses
for t
he o
ther
type
of t
hera
pies
that
are
com
mon
ly u
sed
in p
ract
ice a
nd w
ithou
t a p
oten
tial b
leed
ing
risk
(n=1
,189
)
A
geN
ot im
port
ant a
t all
Not
impo
rtan
tN
eutr
alIm
port
ant
Very
impo
rtan
tP-
valu
es
Dea
th
40
, n (%
)18
(1.6
%)
47 (4
.1%
)15
3 (1
3.20
)17
6 (1
5.2%
)23
1 (2
%)
0.09
2A
SR-0
.7-0
.2-1
.9-0
.62.
7
40
, n (%
)19
(1.6
%)
42 (3
.6%
)15
6 (1
3.5%
)15
8 (1
3.7%
)15
7 (1
3.6%
)
ASR
0.7
0.2
1.9
0.6
-2.7
Dis
abili
ty
40
, n (%
)6
(0.5
%)
18 (1
.6%
)11
3 (9
.8%
)29
2 (2
5.2%
)19
6 (1
6.9%
)0.
17A
SR-0
.3-0
.5-1
.52.
5-1
.1
40
, n (%
)6
(0.5
%)
18 (1
.6%
)11
5 (9
.9%
)21
0 (1
8.2%
)18
3 (1
5.8%
)
ASR
0.3
0.5
1.5
-2.5
1.1
Neu
rolo
gica
l im
pair
men
t
40
, n (%
)6
(0.5
%)
18 (1
.6%
)11
9 (1
0.3%
)34
4 (2
9.7%
)13
8 (1
1.9%
)0.
155
ASR
-1.6
-0.1
-0.9
2.2
-1.2
40, n
(%)
11 (1
%)
16 (1
.4%
)11
3 (9
.8%
)25
8 (2
2.3%
)13
4 (1
1.6%
)
ASR
1.6
0.1
0.9
-2.2
1.2
Hae
mor
rhag
ic
tran
sfor
mat
ion
40
, n (%
)20
(1.7
%)
58 (5
%)
181
(15.
6%)
255
(22%
)11
1 (9
.6%
)0.
087
ASR
-1.6
0.3
-2.1
1.5
1.2
40
, n (%
)27
(2.3
%)
47 (4
.1%
)18
4 (1
5.9%
)19
4 (1
6.8%
)80
(6.9
%)
A
SR1.
6-0
.32.
1-1
.5-1
.2
Cog
nitiv
e dy
sfun
ctio
n or
de
men
tia
40
, n (%
)9
(0.8
%)
29 (2
.5%
)16
3 (1
4.1%
)29
6 (2
5.6%
)12
8 (1
1.1%
)0.
588
ASR
0.2
-0.8
-1.1
1.5
-0.3
40, n
(%)
7 (0
.6%
)30
(2.6
%)
154
(13.
3%)
228
(19.
7%)
113
(9.8
%)
A
SR-0
.20.
81.
1-1
.50.
3
Qua
lity
of li
fe
40
, n (%
)6
(0.5
%)
14 (1
.2%
)10
9 (9
.4%
)27
7 (2
3.9%
)21
9 (1
8.9%
)0.
75A
SR0.
0-0
.2-1
.21.
1-0
.2
40
, n (%
)5
(0.4
%)
13 (1
.1%
)10
7 (9
.2%
)21
8 (1
8.8%
)18
9 (1
6.3%
)
ASR
0.0
0.2
1.2
-1.1
0.2

E13
Se
xN
ot im
port
ant a
t all
Not
impo
rtan
tN
eutr
alIm
port
ant
Very
impo
rtan
tP-
valu
es
Dea
th
Mal
e, n
(%)
17 (1
.4%
)54
(4.5
%)
157
(13.
2%)
160
(13.
5%)
170
(14.
3%)
0.07
1A
SR-0
.12.
41.
0-0
.2-2
.0
Fem
ale,
n (%
)20
(1.7
%)
38 (3
.2%
)16
1 (1
3.5%
)18
5 (1
5.6%
)22
7 (1
9.1%
)
ASR
0.1
-2.4
-1.0
0.2
2.0
Dis
abili
ty
Mal
e, n
(%)
8 (0
.7%
)26
(2.2
%)
118
(9.9
%)
253
(21.
3%)
153
(12.
9%)
,0.
001
ASR
1.4
3.1
1.3
1.0
-3.5
Fe
mal
e, n
(%)
4 (0
.3%
)10
(0.8
%)
115
(9.7
%)
268
(22.
5%)
234
(19.
7%)
A
SR-1
.4-3
.1-1
.3-1
.03.
5
Neu
rolo
gica
l im
pair
men
t
Mal
e, n
(%)
11 (0
.9%
)21
(1.8
%)
125
(10.
5%)
284
(23.
9%)
117
(9.8
%)
0.02
5A
SR1.
51.
81.
9-0
.8-2
.0
Fem
ale,
n (%
)6
(0.5
%)
13 (1
.1%
)11
4 (9
.6%
)33
5 (2
8.2%
)16
3 (1
3.7%
)
ASR
-1.5
-1.8
-1.9
0.8
2.0
Hae
mor
rhag
ic
tran
sfor
mat
ion
Mal
e, n
(%)
26 (2
.2%
)58
(4.9
%)
180
(15.
1%)
204
(17.
2%)
90 (7
.6%
)0.
267
ASR
1.2
1.7
0.2
-1.4
-0.4
Fe
mal
e, n
(%)
21 (1
.8%
)48
(4.0
%)
200
(16.
8%)
255
(21.
4%)
107
(9.0
%)
A
SR-1
.2-1
.7-0
.21.
40.
4
Cog
nitiv
e dy
sfun
ctio
n or
de
men
tia
Mal
e, n
(%)
10 (0
.8%
)40
(3.4
%)
175
(14.
7%)
233
(19.
6%)
100
(8.4
%)
,0.
001
ASR
1.3
3.1
2.7
-2.2
-2.3
Fe
mal
e, n
(%)
6 (0
.5%
)20
(1.1
%)
153
(9.6
%)
304
(28.
2%)
148
(13.
7%)
A
SR-1
.3-3
.1-2
.72.
22.
3
Qua
lity
of li
fe
Mal
e, n
(%)
7 (0
.6%
)18
(1.5
%)
125
(10.
5%)
241
(20.
3%)
167
(14.
0%)
,0.
001
ASR
1.1
1.9
3.1
0.2
-3.6
Fe
mal
e, n
(%)
4 (0
.3%
)10
(0.8
%)
97 (9
.7%
)26
8 (2
2.5%
)25
2 (1
9.7%
)
ASR
-1.1
-1.9
-3.1
-0.2
3.6

Neurology Asia March 2021
E14
A
cade
mic
deg
ree
Not
impo
rtan
t at a
llN
ot im
port
ant
Neu
tral
Impo
rtan
tVe
ry im
port
ant
P-va
lues
Dea
th
Bach
elor
or
abov
e, n
(%
)16
(1.3
%)
45 (3
.8%
)15
5 (1
3.0%
)15
6 (1
3.1%
)18
9 (1
5.9%
)0.
876
ASR
-0.5
0.3
0.7
-0.9
0.2
M
aste
r or
abo
ve, n
(%)
21 (1
.8%
)47
(4.0
%)
163
(13.
7%)
189
(15.
9%)
208
(17.
5%)
A
SR0.
5-0
.3-0
.70.
9-0
.2
Dis
abili
ty
Bach
elor
or
abov
e, n
(%)
2 (0
.2%
)15
(1.3
%)
110
(9.3
%)
248
(20.
9%)
186
(15.
6%)
0.27
9A
SR-2
.1-0
.70.
00.
30.
4
Mas
ter
or a
bove
, n (%
)10
(0.8
%)
21 (1
.8%
)12
3 (1
0.3%
)27
3 (2
3.0%
)20
1 (1
6.9%
)
ASR
2.1
0.7
0.0
-0.3
-0.4
Neu
rolo
gica
l im
pair
men
t
Bach
elor
or
abov
e, n
(%)
4 (0
.3%
)13
(1.1
%)
118
(9.9
%)
282
(23.
7%)
144
(12.
1%)
0.09
ASR
-2.0
-1.1
0.8
-1.2
1.6
M
aste
r or
abo
ve, n
(%)
13 (1
.1%
)21
(1.8
0%)
121
(10.
20%
)33
7 (2
8.30
%)
136
(11.
40%
)
ASR
2.0
1.1
-0.8
1.2
-1.6
Hae
mor
rhag
ic
tran
sfor
mat
ion
Bach
elor
or
abov
e, n
(%)
20 (1
.7%
)49
(4.1
%)
175
(14.
7%)
215
(18.
1%)
102
(8.6
%)
0.67
6A
SR-0
.6-0
.2-0
.5-0
.21.
4
Mas
ter
or a
bove
, n (%
)27
(2.3
%)
57 (4
.8%
)20
5 (1
7.2%
)24
4 (2
0.5%
)95
(8.0
%)
A
SR0.
60.
20.
50.
2-1
.4
Cog
nitiv
e dy
sfun
ctio
n or
de
men
tia
Bach
elor
or
abov
e, n
(%)
5 (0
.4%
)33
(2.8
%)
156
(13.
1%)
235
(19.
8%)
132
(11.
1%)
0.05
5A
SR-1
.31.
20.
2-2
.12.
1
Mas
ter
or a
bove
, n (%
)11
(0.9
%)
27 (2
.3%
)17
2 (1
4.5%
)30
2 (2
5.4%
)11
6 (9
.8%
)
ASR
1.3
-1.2
-0.2
2.1
-2.1
Qua
lity
of li
fe
Bach
elor
or
abov
e, n
(%)
1 (0
.1%
)16
(1.2
1%)
111
(10.
123%
)22
6 (2
3.27
3%)
207
(16.
201%
)0.
031
ASR
-2.5
1.1
0.9
-1.7
1.1
M
aste
r or
abo
ve, n
(%)
10 (0
.8%
)12
(1.8
%)
111
(10.
3%)
283
(23.
0%)
212
(16.
9%)
A
SR2.
5-1
.1-0
.91.
7-1
.1

E15
O
ccup
atio
nN
ot im
port
ant a
t all
Not
impo
rtan
tN
eutr
alIm
port
ant
Very
impo
rtan
tP-
valu
es
Dea
th
Phys
icia
ns, n
(%)
37 (3
.1%
)90
(7.6
%)
306
(25.
7%)
332
(27.
9%)
376
(31.
6%)
0.39
1A
SR1.
30.
90.
30.
3-1
.6
Nur
ses,
n (%
)0
(0.0
%)
2 (0
.2%
)12
(1.0
%)
13 (1
.1%
)21
(1.8
%)
A
SR-1
.3-0
.9-0
.3-0
.31.
6
Dis
abili
ty
Phys
icia
ns, n
(%)
12 (1
.0%
)36
(3.0
%)
227
(19.
1%)
501
(42.
1%)
365
(30.
7%)
0.19
4A
SR0.
71.
21.
30.
3-2
.0
Nur
ses,
n (%
)0
(0.0
%)
0 (0
.0%
)6
(0.5
%)
20 (1
.7%
)22
(1.9
%)
A
SR-0
.7-1
.2-1
.3-0
.32.
0
Neu
rolo
gica
l im
pair
men
t
Phys
icia
ns, n
(%)
17 (1
.4%
)34
(2.9
%)
231
(19.
4%)
593
(49.
9%)
266
(22.
4%)
0.53
3A
SR0.
91.
20.
6-0
.3-0
.9
Nur
ses,
n (%
)0
(0.0
%)
0 (0
.0%
)8
(0.7
%)
26 (2
.2%
)14
(1.2
%)
A
SR-0
.9-1
.2-0
.60.
30.
9
Hae
mor
rhag
ic
tran
sfor
mat
ion
Phys
icia
ns, n
(%)
47 (4
.0%
)10
6 (8
.9%
)37
0 (3
1.1%
)43
6 (3
6.7%
)18
2 (1
5.3%
)0.
003
ASR
1.4
2.2
1.7
-1.4
-2.8
N
urse
s, n
(%)
0 (0
.0%
)0
(0.0
%)
10 (0
.8%
)23
(1.9
%)
15 (1
.3%
)
ASR
-1.4
-2.2
-1.7
1.4
2.8
Cog
nitiv
e dy
sfun
ctio
n or
de
men
tia
Phys
icia
ns, n
(%)
16 (1
.3%
)60
(5.0
%)
323
(27.
2%)
512
(43.
1%)
230
(19.
3%)
0.00
3A
SR0.
81.
62.
7-1
.0-2
.9
Nur
ses,
n (%
)0
(0.0
%)
0 (0
.0%
)5
(0.4
%)
25 (2
.1%
)18
(1.5
%)
A
SR-0
.8-1
.6-2
.71.
02.
9
Qua
lity
of li
fe
Phys
icia
ns, n
(%)
11 (0
.9%
)28
(2.4
%)
213
(17.
9%)
495
(41.
6%)
394
(33.
1%)
0.09
8A
SR0.
71.
10.
01.
9-2
.5
Nur
ses,
n (%
)0
(0.0
%)
0 (0
.0%
)9
(0.8
%)
14 (1
.2%
)25
(2.1
%)
A
SR-0
.7-1
.10.
0-1
.92.
5

Neurology Asia March 2021
E16
C
linic
al p
ract
ice
(yea
rs%
)N
ot im
port
ant a
t all
Not
impo
rtan
tN
eutr
alIm
port
ant
Very
impo
rtan
tP-
valu
es
Dea
th
10
, n (%
)18
(1.5
%)
40 (3
.4%
)14
3 (1
2.0%
)16
1 (1
3.5%
)19
8 (1
6.7%
)0.
671
ASR
0.2
-0.7
-0.9
-0.2
1.4
10
, n (%
)19
(1.6
%)
52 (4
.4%
)17
5 (1
4.7%
)18
4 (1
5.5%
)19
9 (1
6.7%
)
ASR
-0.2
0.7
0.9
0.2
-1.4
Dis
abili
ty
10
, n (%
)7
(0.6
%)
12 (1
.0%
)11
2 (9
.4%
)25
5 (2
1.4%
)17
4 (1
4.6%
)0.
302
ASR
0.8
-1.7
0.3
1.1
-1.0
10, n
(%)
5 (0
.4%
)24
(2.0
%)
121
(10.
2%)
266
(22.
4%)
213
(17.
9%)
A
SR-0
.81.
7-0
.3-1
.11.
0
Neu
rolo
gica
l im
pair
men
t
10
, n (%
)7
(0.6
%)
12 (1
.0%
)11
3 (9
.4%
)30
2 (2
1.4%
)12
6 (1
4.6%
)0.
501
ASR
-0.5
-1.4
0.1
1.2
-0.8
10, n
(%)
10 (0
.8%
)22
(1.9
%)
126
(10.
6%)
317
(26.
7%)
154
(13.
0%)
A
SR0.
51.
4-0
.1-1
.20.
8
Hae
mor
rhag
ic
tran
sfor
mat
ion
10
, n (%
)18
(1.5
%)
49 (3
.4%
)15
9 (1
2.0%
)23
1 (1
3.5%
)10
3 (1
6.7%
)0.
045
ASR
-1.2
-0.2
-2.5
1.8
1.6
10
, n (%
)29
(2.4
%)
57 (4
.8%
)22
1 (1
8.6%
)22
8 (1
9.2%
)94
(7.9
%)
A
SR1.
20.
22.
5-1
.8-1
.6
Cog
nitiv
e dy
sfun
ctio
n or
de
men
tia
10
, n (%
)7
(0.6
%)
24 (1
.0%
)14
3 (9
.4%
)26
5 (2
1.4%
)12
1 (1
4.6%
)0.
370
ASR
-0.3
-1.1
-1.5
1.4
0.6
10, n
(%)
9 (0
.8%
)36
(3.0
%)
185
(15.
6%)
272
(22.
9%)
127
(10.
7%)
A
SR0.
31.
11.
5-1
.4-0
.6
Qua
lity
of li
fe
10
, n (%
)6
(0.5
%)
10 (0
.8%
)10
3 (8
.7%
)24
7 (2
0.8%
)19
4 (1
6.3%
)0.
686
ASR
0.5
-1.2
-0.2
0.9
-0.4
10
, n (%
)5
(0.4
%)
18 (1
.5%
)11
9 (1
0.0%
)26
2 (2
2.0%
)22
5 (1
8.9%
)
ASR
-0.5
1.2
0.2
-0.9
0.4
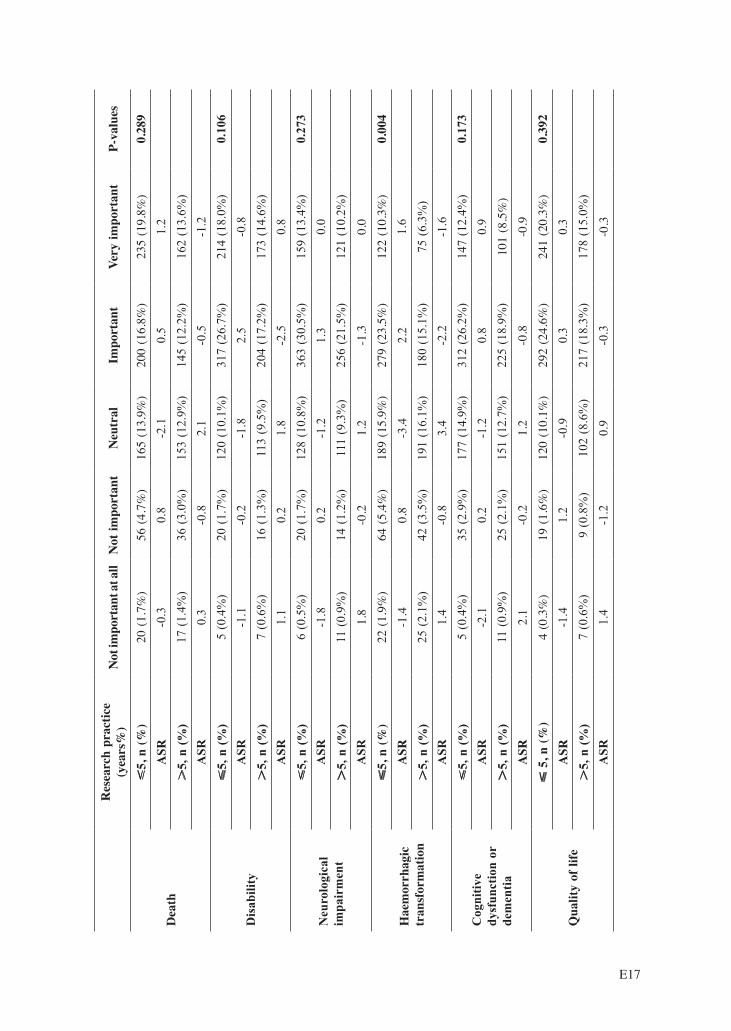
E17
R
esea
rch
prac
tice
(yea
rs%
)N
ot im
port
ant a
t all
Not
impo
rtan
tN
eutr
alIm
port
ant
Very
impo
rtan
tP-
valu
es
Dea
th
5,
n (%
)20
(1.7
%)
56 (4
.7%
)16
5 (1
3.9%
)20
0 (1
6.8%
)23
5 (1
9.8%
)0.
289
ASR
-0.3
0.8
-2.1
0.5
1.2
5,
n (%
)17
(1.4
%)
36 (3
.0%
)15
3 (1
2.9%
)14
5 (1
2.2%
)16
2 (1
3.6%
)
ASR
0.3
-0.8
2.1
-0.5
-1.2
Dis
abili
ty
5,
n (%
)5
(0.4
%)
20 (1
.7%
)12
0 (1
0.1%
)31
7 (2
6.7%
)21
4 (1
8.0%
)0.
106
ASR
-1.1
-0.2
-1.8
2.5
-0.8
5, n
(%)
7 (0
.6%
)16
(1.3
%)
113
(9.5
%)
204
(17.
2%)
173
(14.
6%)
A
SR1.
10.
21.
8-2
.50.
8
Neu
rolo
gica
l im
pair
men
t
5,
n (%
)6
(0.5
%)
20 (1
.7%
)12
8 (1
0.8%
)36
3 (3
0.5%
)15
9 (1
3.4%
)0.
273
ASR
-1.8
0.2
-1.2
1.3
0.0
5, n
(%)
11 (0
.9%
)14
(1.2
%)
111
(9.3
%)
256
(21.
5%)
121
(10.
2%)
A
SR1.
8-0
.21.
2-1
.30.
0
Hae
mor
rhag
ic
tran
sfor
mat
ion
5,
n (%
)22
(1.9
%)
64 (5
.4%
)18
9 (1
5.9%
)27
9 (2
3.5%
)12
2 (1
0.3%
)0.
004
ASR
-1.4
0.8
-3.4
2.2
1.6
5,
n (%
)25
(2.1
%)
42 (3
.5%
)19
1 (1
6.1%
)18
0 (1
5.1%
)75
(6.3
%)
A
SR1.
4-0
.83.
4-2
.2-1
.6
Cog
nitiv
e dy
sfun
ctio
n or
de
men
tia
5,
n (%
)5
(0.4
%)
35 (2
.9%
)17
7 (1
4.9%
)31
2 (2
6.2%
)14
7 (1
2.4%
)0.
173
ASR
-2.1
0.2
-1.2
0.8
0.9
5, n
(%)
11 (0
.9%
)25
(2.1
%)
151
(12.
7%)
225
(18.
9%)
101
(8.5
%)
A
SR2.
1-0
.21.
2-0
.8-0
.9
Qua
lity
of li
fe
5
, n (%
)4
(0.3
%)
19 (1
.6%
)12
0 (1
0.1%
)29
2 (2
4.6%
)24
1 (2
0.3%
)0.
392
ASR
-1.4
1.2
-0.9
0.3
0.3
5,
n (%
)7
(0.6
%)
9 (0
.8%
)10
2 (8
.6%
)21
7 (1
8.3%
)17
8 (1
5.0%
)
ASR
1.4
-1.2
0.9
-0.3
-0.3

Neurology Asia March 2021
E18
Te
achi
ng h
ospi
tal
Not
impo
rtan
t at a
llN
ot im
port
ant
Neu
tral
Impo
rtan
tVe
ry im
port
ant
P-va
lues
Dea
th
Yes,
n (%
)28
(2.4
%)
65 (5
.5%
)24
4 (2
0.5%
)26
9 (2
2.6%
)30
8 (2
5.9%
)0.
666
ASR
-0.2
-1.5
-0.1
0.6
0.4
N
o, n
(%)
9 (0
.8%
)27
(2.3
%)
74 (6
.2%
)76
(6.4
%)
89 (7
.5%
)
ASR
0.2
1.5
0.1
-0.6
-0.4
Dis
abili
ty
Yes,
n (%
)8
(0.7
%)
26 (2
.2%
)17
7 (1
4.9%
)40
1 (3
3.7%
)30
2 (2
5.4%
)0.
818
ASR
-0.8
-0.7
-0.4
0.1
0.7
N
o, n
(%)
4 (0
.3%
)10
(0.8
%)
56 (4
.7%
)12
0 (1
0.1%
)85
(7.1
%)
A
SR0.
80.
70.
4-0
.1-0
.7
Neu
rolo
gica
l im
pair
men
t
Yes,
n (%
)13
(1.1
%)
27 (2
.30%
)18
1 (1
5.20
%)
481
(40.
50%
)21
2 (1
7.80
%)
0.94
5A
SR0.
00.
4-0
.50.
7-0
.5
No,
n (%
)4
(0.3
%)
7 (0
.6%
)58
(4.9
%)
138
(11.
6%)
68 (5
.7%
)
ASR
0.0
-0.4
0.5
-0.7
0.5
Hae
mor
rhag
ic
tran
sfor
mat
ion
Yes,
n (%
)39
(3.3
%)
77 (6
.50%
)29
8 (2
5.10
%)
356
(29.
90%
)14
4 (1
2.10
%)
0.37
1A
SR1.
0-1
.10.
90.
4-1
.4
No,
n (%
)8
(0.7
%)
29 (2
.4%
)82
(6.9
%)
103
(6.7
%)
53 (7
.5%
)
ASR
-1.0
1.1
-0.9
-0.4
1.4
Cog
nitiv
e dy
sfun
ctio
n or
de
men
tia
Yes,
n (%
)12
(1.0
%)
39 (3
.3%
)25
4 (2
1.4%
)42
2 (3
5.5%
)18
7 (1
5.7%
)0.
197
ASR
-0.2
-2.2
0.3
1.3
-0.6
N
o, n
(%)
4 (0
.3%
)21
(1.8
%)
74 (6
.2%
)11
5 (9
.7%
)61
(5.1
%)
A
SR0.
22.
2-0
.3-1
.30.
6
Qua
lity
of li
fe
Yes,
n (%
)8
(0.7
%)
22 (1
.9%
)16
3 (1
3.7%
)40
6 (3
4.1%
)31
5 (2
6.5%
)0.
319
ASR
-0.3
0.2
-1.4
2.0
-1.0
N
o, n
(%)
3 (0
.3%
)6
(0.5
%)
59 (5
.0%
)10
3 (8
.7%
)10
4 (8
.7%
)
ASR
0.3
-0.2
1.4
-2.0
1.0

E19
Te
rtia
ry h
ospi
tal
Not
impo
rtan
t at a
llN
ot im
port
ant
Neu
tral
Impo
rtan
tVe
ry im
port
ant
P-va
lues
Dea
th
Yes,
n (%
)32
(2.7
%)
67 (5
.6%
)25
1 (2
1.1%
)27
6 (2
3.2%
)32
0 (2
6.9%
)0.
400
ASR
1.1
-1.7
-0.3
0.2
0.6
N
o, n
(%)
5 (0
.4%
)25
(2.1
%)
67 (5
.6%
)69
(5.8
%)
77 (6
.5%
)
ASR
-1.1
1.7
0.3
-0.2
-0.6
Dis
abili
ty
Yes,
n (%
)9
(0.8
%)
27 (2
.3%
)18
9 (1
5.9%
)41
5 (3
4.9%
)30
6 (2
5.7%
)0.
907
ASR
-0.4
-0.7
0.7
0.1
-0.3
N
o, n
(%)
3 (0
.3%
)9
(0.8
%)
44 (3
.7%
)10
6 (8
.9%
)81
(6.8
%)
A
SR0.
40.
7-0
.7-0
.10.
3
Neu
rolo
gica
l im
pair
men
t
Yes,
n (%
)15
(1.3
%)
27 (2
.3%
)19
1 (1
6.1%
)50
0 (4
2.1%
)21
3 (1
7.9%
)0.
483
ASR
0.9
0.0
0.2
1.1
-1.7
N
o, n
(%)
2 (0
.2%
)7
(0.6
%)
48 (4
.0%
)11
9 (1
0.0%
)67
(5.6
%)
A
SR-0
.90.
0-0
.2-1
.11.
7
Hae
mor
rhag
ic
tran
sfor
mat
ion
Yes,
n (%
)41
(3.4
%)
75 (6
.3%
)31
3 (2
6.3%
)37
4 (3
1.5%
)14
3 (1
2.0%
)0.
004
ASR
1.3
-2.4
1.6
1.3
-2.7
N
o, n
(%)
6 (0
.5%
)31
(2.6
%)
67 (5
.6%
)85
(7.1
%)
54 (4
.5%
)
ASR
-1.3
2.4
-1.6
-1.3
2.7
Cog
nitiv
e dy
sfun
ctio
n or
de
men
tia
Yes,
n (%
)14
(1.2
%)
44 (3
.7%
)26
2 (2
2.0%
)43
8 (3
6.8%
)18
8 (1
5.8%
)0.
236
ASR
0.8
-1.2
0.2
1.6
-1.6
N
o, n
(%)
2 (0
.2%
)16
(1.3
%)
66 (5
.6%
)99
(8.3
%)
60 (5
.0%
)
ASR
-0.8
1.2
-0.2
-1.6
1.6
Qua
lity
of li
fe
Yes,
n (%
)9
(0.8
%)
22 (1
.9%
)17
9 (1
5.1%
)41
3 (3
4.7%
)32
3 (2
7.2%
)0.
063
ASR
0.2
-0.1
0.4
1.2
-1.6
N
o, n
(%)
2 (0
.2%
)6
(0.5
%)
43 (3
.6%
)96
(8.1
%)
96 (8
.1%
)
ASR
-0.2
0.1
-0.4
-1.2
1.6

Neurology Asia March 2021
E20
The
esta
blis
hed
acut
e st
roke
ther
apie
s w
ith a
pot
entia
l ble
edin
g ri
sk
Dea
thD
isab
ility
Neu
rolo
gica
l im
pair
men
tH
aem
orrh
agic
tr
ansf
orm
atio
nC
ogni
tive
dysf
unct
ion
or d
emen
tiaQ
ualit
y of
life
OR
(95%
CI)
P-va
lues
OR
(95%
CI)
P-va
lues
OR
(95%
CI)
P-va
lues
OR
(95%
CI)
P-va
lues
OR
(95%
CI)
P-va
lues
OR
(95%
CI)
P-va
lues
Age
≤ 4
0 ye
ars
1.20
(0.8
2 - 1
.77)
0.34
9 0
.82
(0.5
8 - 1
.15)
0.
255
0.95
(0.6
8 - 1
.33)
0.77
0.97
(0.7
1 - 1
.34)
0.86
30.
80 (0
.58
- 1.1
0)0.
168
0.93
(0.6
6 - 1
.30)
0.66
6
>40
yea
rsR
efer
ence
Sex
Mal
e1.
08 (0
.83
- 1.4
1)0.
579
0.7
5 (0
.59
- 0.9
5)
0.01
70.
81 (0
.65
- 1.0
2)0.
077
1.09
(0.8
8 - 1
.36)
0.44
10.
64 (0
.51
- 0.8
0)<0
.001
0.64
(0.5
1 - 0
.81)
<0.0
01
Fem
ale
Ref
eren
ce
Aca
dem
ic d
egre
e
Bac
helo
r or
bel
ow0.
92 (0
.68
- 1.2
4)0.
563
0.8
2 (0
.63
- 1.0
7)
0.13
60.
95 (0
.73
- 1.2
3)0.
677
0.98
(0.7
7 - 1
.26)
0.89
81.
02 (0
.79
- 1.3
1)0.
881
0.87
(0.6
7 - 1
.13)
0.29
7
Mas
ter
or
abo
veR
efer
ence
Occ
upat
ion
Phy
sici
ans
1.55
(0.8
0 - 2
.99)
0.19
6 0
.56
(0.2
8 - 1
.11)
0.
098
1.20
(0.6
6 - 2
.18)
0.56
10.
34 (0
.18
- 0.6
4)0.
001
0.47
(0.2
5 - 0
.86)
0.01
40.
57 (0
.29
- 1.1
3)0.
109
Nur
ses
Ref
eren
ce
Clin
ical
pra
ctic
e
≤ 1
0 ye
ars
1.00
(0.6
6 - 1
.51)
0.98
2 1
.11
(0.7
7 - 1
.59)
0.
574
0.97
(0.6
8 - 1
.37)
0.84
41.
39 (0
.99
- 1.9
6)0.
056
1.42
(1.0
1 - 2
.01)
0.04
51.
05 (0
.73
- 1.5
0)0.
806
> 1
0 ye
ars
Ref
eren
ce
Res
earc
h pr
actic
e
≤ 5
yea
rs1.
18 (0
.85
- 1.6
4)0.
322
1.1
7 (0
.87
- 1.5
7)
0.28
91.
16 (0
.87
- 1.5
5)0.
307
1.35
(1.0
2 - 1
.78)
0.03
31.
00 (0
.76
- 1.3
3)0.
985
1.13
(0.8
5 - 1
.52)
0.40
4
> 5
yea
rsR
efer
ence
Teac
hing
ho
spita
l
Yes
1.40
(1.0
1 - 1
.94)
0.04
7 1
.31
(0.9
7 - 1
.76)
0.
079
1.24
(0.9
2 - 1
.66)
0.15
51.
09 (0
.82
- 1.4
5)0.
537
1.09
(0.8
2 - 1
.45)
0.56
81.
00 (0
.75
- 1.3
5)0.
977
No
Ref
eren
ce
Supp
lem
enta
ry T
able
4: O
rdin
al m
ulti-
cate
gori
cal r
egre
ssio
n an
alys
is (n
=118
9)

E21
Tert
iary
hos
pita
l
Yes
0.90
(0.6
6 - 1
.23)
0.49
6 0
.87
(0.6
6 - 1
.15)
0.
317
1.09
(0.8
3 - 1
.44)
0.52
91.
09 (0
.84
- 1.4
1)0.
535
0.99
(0.7
6 - 1
.30)
0.96
0.81
(0.6
1 - 1
.07)
0.13
6
No
Ref
eren
ce
The
othe
r ty
pe o
f the
rapi
es th
at a
re c
omm
only
use
d in
pra
ctic
e an
d w
ithou
t a p
oten
tial b
leed
ing
risk
Dea
thD
isab
ility
Neu
rolo
gica
l im
pair
men
tH
aem
orrh
agic
tr
ansf
orm
atio
nC
ogni
tive
dysf
unct
ion
or d
emen
tiaQ
ualit
y of
life
OR
(95%
CI)
P-va
lues
OR
(95%
CI)
P-va
lues
OR
(95%
CI)
P-va
lues
OR
(95%
CI)
P-va
lues
OR
(95%
CI)
P-va
lues
OR
(95%
CI)
P-va
lues
Age
≤ 4
0 ye
ars
1.33
(0.9
7 - 1
.82)
0.07
41.
07 (0
.78
- 1.4
7)0.
682
0.99
(0.7
1 - 1
.37)
0.92
81.
01 (0
.74
- 1.3
9)0.
944
0.87
(0.6
3 - 1
.19)
0.37
41.
05 (0
.76
- 1.4
5)0.
763
> 4
0 ye
ars
Sex
Mal
e0.
81 (0
.65
- 1.0
0)0.
048
0.66
(0.5
3 - 0
.83)
<0.0
010.
70 (0
.56
- 0.8
8)0.
002
0.91
(0.7
3 - 1
.13)
0.38
50.
68 (0
.54
- 0.8
5)0.
001
0.64
(0.5
1 - 0
.80)
<0.0
01
Fem
ale
Aca
dem
ic d
egre
e
Bac
helo
r or b
elow
1.05
(0.8
2 - 1
.34)
0.71
31.
05 (0
.82
- 1.3
5)0.
711
1.11
(0.8
6 - 1
.43)
0.42
21.
04 (0
.81
- 1.3
3)0.
756
1.05
(0.8
2 - 1
.35)
0.69
51.
02 (0
.79
- 1.3
1)0.
898
Mas
ter o
r abo
ve
Occ
upat
ion
Phy
sici
ans
0.80
(0.4
5 - 1
.43)
0.45
60.
61 (0
.34
- 1.1
1)0.
108
0.83
(0.4
6 - 1
.50)
0.52
90.
41 (0
.23
- 0.7
3)0.
003
0.47
(0.2
6 - 0
.84)
0.01
10.
68 (0
.38
- 1.2
3)0.
204
Nur
ses
Clin
ical
pra
ctic
e
≤ 1
0 ye
ars
0.92
(0.6
6 - 1
.28)
0.61
30.
79 (0
.56
- 1.1
1)0.
168
0.96
(0.6
7 - 1
.35)
0.79
41.
24 (0
.89
- 1.7
3)0.
212
1.20
(0.8
5 - 1
.68)
0.30
70.
86 (0
.61
- 1.2
2)0.
396
> 1
0 ye
ars
Res
earc
h pr
actic
e
≤ 5
yea
rs1.
05 (0
.80
- 1.3
7)0.
733
1.17
(0.8
9 - 1
.54)
0.27
41.
11 (0
.84
- 1.4
7)0.
466
1.12
(0.8
5 - 1
.47)
0.42
71.
08 (0
.82
- 1.4
2)0.
606
1.11
(0.8
4 - 1
.46)
0.47
1
> 5
yea
rs
Teac
hing
hos
pita
l
Yes
1.07
(0.8
1 - 1
.41)
0.64
41.
15 (0
.86
- 1.5
2)0.
347
1.06
(0.7
9 - 1
.41)
0.71
10.
95 (0
.72
- 1.2
5)0.
693
1.05
(0.7
9 - 1
.39)
0.76
0.96
(0.7
3 - 1
.28)
0.8
No
Tert
iary
hos
pita
l
Yes
0.93
(0.7
2 - 1
.20)
0.57
40.
99 (0
.76
- 1.3
0)0.
964
1.07
(0.8
2 - 1
.41)
0.60
41.
12 (0
.87
- 1.4
6)0.
383
0.94
(0.7
2 - 1
.22)
0.61
80.
95 (0
.73
- 1.2
4)0.
705
No