Motoriduttori ortogonali Helical bevel geared motors Motoréducteurs ...

Biomech Model Mechanobiol (2011) 10:339–355DOI 10.1007/s10237-010-0238-2
ORIGINAL PAPER
Mechanistic insight into the physiological relevance of helicalblood flow in the human aorta: an in vivo study
Umberto Morbiducci · Raffaele Ponzini · Giovanna Rizzo ·Marcello Cadioli · Antonio Esposito ·Franco Maria Montevecchi · Alberto Redaelli
Received: 22 December 2009 / Accepted: 30 June 2010 / Published online: 22 July 2010© Springer-Verlag 2010
Abstract The hemodynamics within the aorta of fivehealthy humans were investigated to gain insight into thecomplex helical flow patterns that arise from the existenceof asymmetries in the aortic region. The adopted approach isaimed at (1) overcoming the relative paucity of quantitativedata regarding helical blood flow dynamics in the humanaorta and (2) identifying common characteristics in phys-iological aortic flow topology, in terms of its helical con-tent. Four-dimensional phase-contrast magnetic resonanceimaging (4D PC MRI) was combined with algorithms forthe calculation of advanced fluid dynamics in this study.These algorithms allowed us to obtain a 4D representation ofintra-aortic flow fields and to quantify the aortic helical flow.
Electronic supplementary material The online version of thisarticle (doi:10.1007/s10237-010-0238-2) contains supplementarymaterial, which is available to authorized users.
U. Morbiducci (B) · F. M. MontevecchiDepartment of Mechanics, Politecnico di Torino,Corso Duca degli Abruzzi, 24, 10129 Turin, Italye-mail: [email protected]
R. PonziniCILEA, Interuniversity Consortium, Milan, Italy
G. RizzoIstituto di Bioimmagini e Fisiologia Molecolare,Research National Council, Milan, Italy
M. CadioliPhilips Medical Systems, Milan, Italy
A. EspositoDepartment of Radiology, Scientific Institute H S Raffaele,Milan, Italy
A. RedaelliDepartment of Bioengineering, Politecnico di Milano,Milan, Italy
For our purposes, helicity was used as a measure of the align-ment of the velocity and the vorticity. There were two keyfindings of our study: (1) intra-individual analysis revealeda statistically significant difference in the helical content atdifferent phases of systole and (2) group analysis suggestedthat aortic helical blood flow dynamics is an emerging behav-ior that is common to normal individuals. Our results alsosuggest that helical flow might be caused by natural opti-mization of fluid transport processes in the cardiovascularsystem, aimed at obtaining efficient perfusion. The approachhere applied to assess in vivo helical blood flow could be thestarting point to elucidate the role played by helicity in thegeneration and decay of rotating flows in the thoracic aorta.
Keywords 4D phase-contrast MRI · Perfusion ·Spiral flow · Fluid mechanics · Aortic arch · Hemodynamics
1 Introduction
The human aorta is the major vessel that transports bloodpumped by the left ventricle to the systemic circulation. Thecomplex hemodynamics that are observed in the human aortapartially originate in the complicated geometry, including (1)the non-planar curvatures (Yearwood and Chandran 1982;Chandran 1993), (2) the branches at the apex of the arch, (3)the significant tapering of distensible vessel walls, (4) thedynamic movements of the ascending aorta, (5) the struc-tures projecting into the flowing blood stream at or above theaortic valve (Bellhouse and Talbot 1969), and (6) the ven-tricular twisting and torsion during contraction (Baciewiczet al. 1991). The other reason for the observed complexityis that the thoracic aorta is the site in the healthy cardiovas-cular system where laminar-turbulent transitional flows arepresent.
123

340 U. Morbiducci et al.
All of these reasons could strongly elicit the onset ofhelical patterns in aortic blood flow, which are assumed tofacilitate ventricular ejection even if their relation to physiol-ogy is still unclear (Stonebridge et al. 1996). This conjectureas to the role played by helical flow in the aorta is consistentwith the fundamental role recognized for helicity, a measureof the alignment of velocity and vorticity, (1) in the organiza-tion of both laminar and turbulent flow topologies (Moffatt1969, 1990) and (2) in the arrest of the energy decay (Moffattand Tsinober 1992).
Because blood flow in the aorta is intricate, massive invivo measurement campaigns have been performed in thepast (Seed and Wood 1971; Segadal and Matre 1987; Kilneret al. 1993; Morbiducci et al. 2009a) that demonstrated thathelical flow is predominant in areas from the ascending aortato the aortic arch. This form of blood flow is also a basicpattern for almost all of the subjects, regardless of age andgender (Bogren and Buonocore 1999; Buonocore and Bogren1999; Houston et al. 2003). In the last decades, the PC MRItechnique has become the prevalent imaging technique fornon-invasive and detailed quantification of blood flow. Otherthan its non-invasive procedure, the main reason that PC MRIis an innovative in vivo technique is its good spatial resolutionwith respect to hemodynamic quantities. Additionally, thistechnique allows for the possibility of acquiring time-depen-dent data sets that are necessary to perform reliable and localhemodynamic characterization. Due to its features, PC MRIhas provided insight into the hemodynamics of the aorta inanimal models (e.g., Amirbekian et al. 2009) and in humans(Kilner et al. 1993; Bogren and Buonocore 1999; Markl etal. 2004; Hope et al. 2007; Morbiducci et al. 2009a), whereit has been used to illustrate clinical aortic physiopathologi-cal findings (for example Markl et al. 2004; Frydrychowiczet al. 2007). However, flow patterns may be overlooked ifonly visualization tools are used. All of the in vivo obser-vations of aortic flow topologies associated with commonphysiological and pathological findings that are available inthe literature are based on qualitative visual evaluation; themechanistic role that these emerging flow features play inaorta hemodynamics remains unclear. Recently, to answerquestions regarding the nature and origins of complex flowpatterns in the human aorta, we investigated the distributionof helical blood flow in the aortic arch with 4D PC MRI data(Morbiducci et al. 2009a). In detail, we obtained the com-plete spatio-temporal description of blood flow in the aortaemploying time-resolved PC MRI.
In this paper, we present the results of in vivo helical flowquantification in the aortas of five healthy humans, performedemploying 4D PC MRI. Our study is aimed at identifyingcommon characteristics in healthy aortic flow topology interms of its helical content. Technically, the method pro-posed by the authors in 2009 (Morbiducci et al. 2009a) wasapplied to the data from healthy volunteers, making use of
tools developed for computational fluid dynamics. In particu-lar, we mapped the patterns of the transient flow in the humanaortic arch in detail and quantified helical structures. Thisquantitative approach allowed us to rank the behavior of flow-ing blood and identify emerging physiological flow features.A method for helical flow quantification, which has beendeveloped to reveal the global organization of blood flow, wasapplied to the datasets (Grigioni et al. 2005; Morbiducci et al.2007a; Morbiducci et al. 2007b; Morbiducci et al. 2009a).
The results of this study could help elucidate the roleplayed by helicity in the generation and decay of rotatingflows in the thoracic aorta.
2 Materials and methods
2.1 Theoretical remarks on helicity
In fluid mechanics, mathematical concepts have been bor-rowed from knot theory, graph theory, dynamical systemstheory, and other branches of modern mathematics. Theseconcepts can be usefully employed in the analysis of flows toquantify, estimate, or infer production, transfer, and depletionof physical quantities such as energy and momentum (Moffatt1990; Ricca 2009). The origin of topological fluid mechanicsis most likely rooted in the studies of vortex motion by Helm-holtz in 1858 and Kelvin in 1869. Much of its modern devel-opments are due to recent progress in vector field analysis,mathematical fluid dynamics, and computational visualiza-tion. In fact, in recent years, the demand for advanced diag-nostic tools for computational and experimental bio-fluidshas grown considerably. Detailed analysis of space locali-zation and time evolution of coherent structures, defined bystatistical coherence of physically relevant quantities (vectoror tensor fields, scalars), requires metrics to quantify struc-tural complexity present in flowing blood. In particular, a bet-ter understanding of the critical role of blood flow evolutionthrough the formation and disappearance of spiral patternscan be obtained through helicity, a scalar that is eligible tostudy relationships between complexity and energy. Helicitycan be thought of as the degree to which the velocity fieldlines wrap and coil around each other (Moffatt and Tsinober1992). The physical meaning of this quantity is fundamentalin relation to flow kinematics because it admits topologicalinterpretation in relation to linkages of vortex lines of theflow.
The helicity H(t) of a fluid flow confined to a domain D ofthe three-dimensional Euclidean space R3 is the integratedinternal product of the velocity field V(s; t) and the vorticityfield ω(s; t) = ∇ x V(s; t):
H (t) =∫
DV (s; t) · ω (s; t) ds. (1)
123
Role of helical blood flow in the human aorta 341
The pseudo-scalar quantity Hk(s;t), given by
Hk (s; t) = V (s; t) · ω (s; t) , (2)
is the density per unit volume of kinetic helicity. Both H(t)and Hk(s; t) are pseudo-scalars, i.e., roughly speaking theyhave opposite sign when they are viewed from a right-handedor a left-handed frame of reference.
The law of conservation in fluid flow of H(t) is impor-tant because this quantity organizes the flow and character-ize the changes of its structure over time (Moffatt 1969).However, in a slightly viscous case such as blood flow ingreat vessels (Navier-Stokes flow), the extent of dissipationof the helicity or the kinetic energy is unknown (i.e., thetwo inviscid conserved quantities). The sole “quantitative”method to compute them exactly is simulations that makeuse of patient-specific models, which suffer from limitationsin precisely reproducing the in vivo hemodynamics. Helicityinvolves higher-order spatial derivatives, namely, the smallerscales that are easier to dissipate. Equation 1 incorporatesvorticity, which is given by a combination of velocity gradi-ents. Hence, the helicity may naturally be expected to dissi-pate more quickly than the kinetic energy. In contrast, thereis evidence that only the kinetic energy is transferred to thesmaller scales. Therefore, only the kinetic energy may dis-sipate, while the helicity does not. Therefore, helicity, likeenergy, has a great influence on the evolution and stabilityof both laminar and turbulent flows (Moffatt and Tsinober1992).
2.2 Data acquisition
Five healthy volunteers (men; age range 23–42 years, meanequal to 32 years (SD 9); heart rate range 43–78 bpm, meanequal to 56 bpm (SD 13) were enrolled in this study, whichwas conducted using a 1.5 Tesla scanner equipped with a5-channel SENSE phased-array cardiac coil (Achieva,Philips Healthcare, The Netherlands). All volunteers under-went the entire cardiovascular magnetic resonance exami-nation during a 60–90 min period, which included subjectpreparation, scanner set-up, and image data acquisition. Alldata were acquired during the same examination session toensure comparability.
In vivo blood flow measurements were conducted with athree-directional phase-contrast velocity mapping sequence.The three-dimensional region of interest was set in such away that it covered the aorta from the sinotubular regionto the distal abdominal aorta. Three-dimensional data wereacquired in 20–22 oblique sagittal slices (field of view=280 × 280 mm2) aligned with the aortic arch, and the entireaorta was covered with an isotropic spatial sampling (mea-sured voxel size: 2×2 mm2, with slice thickness=4 mm, andslice spacing=2 mm). The three components of the veloc-ity vector field were measured by acquiring one segment
with no velocity sensitivity and three segments with veloc-ity sensitivity in each direction. The pulse sequence for 4DPC MRI data acquisition was a T1-weighted cardiac-gatedrespiratory-compensated 3D Phase-Contrast Turbo GradientEcho (TR=5.4 ms, TE=3 ms, flip angle=15◦, velocity sen-sitivity=150 cm/s) with velocity encoding along all threespatial directions.
To acquire time-resolved three-dimensional information,a phase-contrast pulse sequence had to be arranged to allowsynchronization of the data to the cardiac cycle to recon-struct a cine series of three-dimensional data sets from mul-tiple phases of the cardiac cycle. In this way, an “equiva-lent cardiac cycle” was obtained. Because breath holdingwas not possible, artifacts induced by respiratory motionwere minimized using a soft band around the upper abdo-men to physically restrict chest movements. A navigator-echo technique was used to further reduce motion artifacts(Firmin and Keegan 2001), with the navigator beam placedacross the diaphragm and the tracking direction set to Feet-Head. The three-dimensional data were acquired in approx-imately 40 min or more with a navigator efficiency of 50%.Hence, for each subject, the resulting cine pulse sequencewas retrospectively gated to the electrocardiographic cycleto obtain 21 cardiac phases with a temporal resolution of38 ms.
2.3 Visualization and data analysis
User-defined tools previously developed by the authors(Morbiducci et al. 2009a; Ponzini et al. 2009) were appliedto both process and analyze PC MRI data: for each subjectunder investigation, the dataset of the three components ofthe blood velocity vector field at different phases of the car-diac cycle was extracted from MRI images.
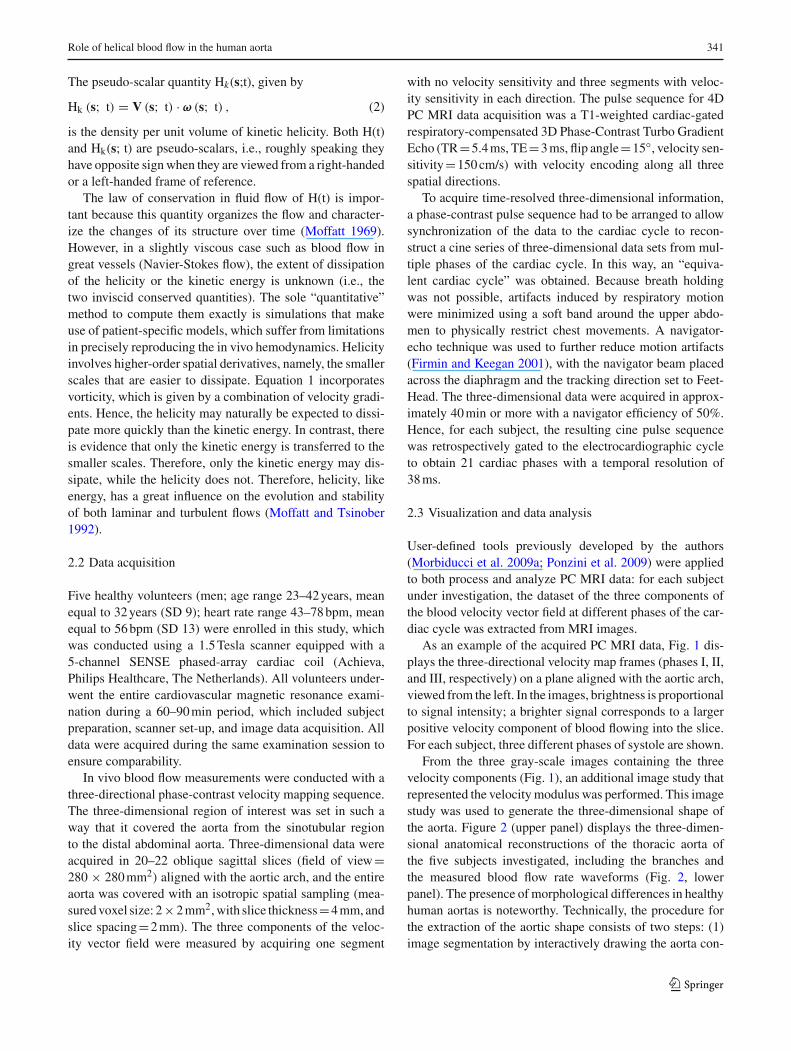
As an example of the acquired PC MRI data, Fig. 1 dis-plays the three-directional velocity map frames (phases I, II,and III, respectively) on a plane aligned with the aortic arch,viewed from the left. In the images, brightness is proportionalto signal intensity; a brighter signal corresponds to a largerpositive velocity component of blood flowing into the slice.For each subject, three different phases of systole are shown.
From the three gray-scale images containing the threevelocity components (Fig. 1), an additional image study thatrepresented the velocity modulus was performed. This imagestudy was used to generate the three-dimensional shape ofthe aorta. Figure 2 (upper panel) displays the three-dimen-sional anatomical reconstructions of the thoracic aorta ofthe five subjects investigated, including the branches andthe measured blood flow rate waveforms (Fig. 2, lowerpanel). The presence of morphological differences in healthyhuman aortas is noteworthy. Technically, the procedure forthe extraction of the aortic shape consists of two steps: (1)image segmentation by interactively drawing the aorta con-
123
342 U. Morbiducci et al.
Fig. 1 Three-directionalvelocity map frames acquired ona plane aligned with the aorticarch, viewed from the left.Phases I and II arerepresentative of the in-planecomponents of the velocityvector field; phase III representsthe through-plane component.For each subject, nine mapframes are displayed, spanningthe entire systole—three phasesat three different times (shownin the lower panel, displayingthe measured blood flow ratewaveforms). Brightness isproportional to signal intensity:the brighter the signal, the largerthe (positive) velocitycomponent of blood flowinginto the slice
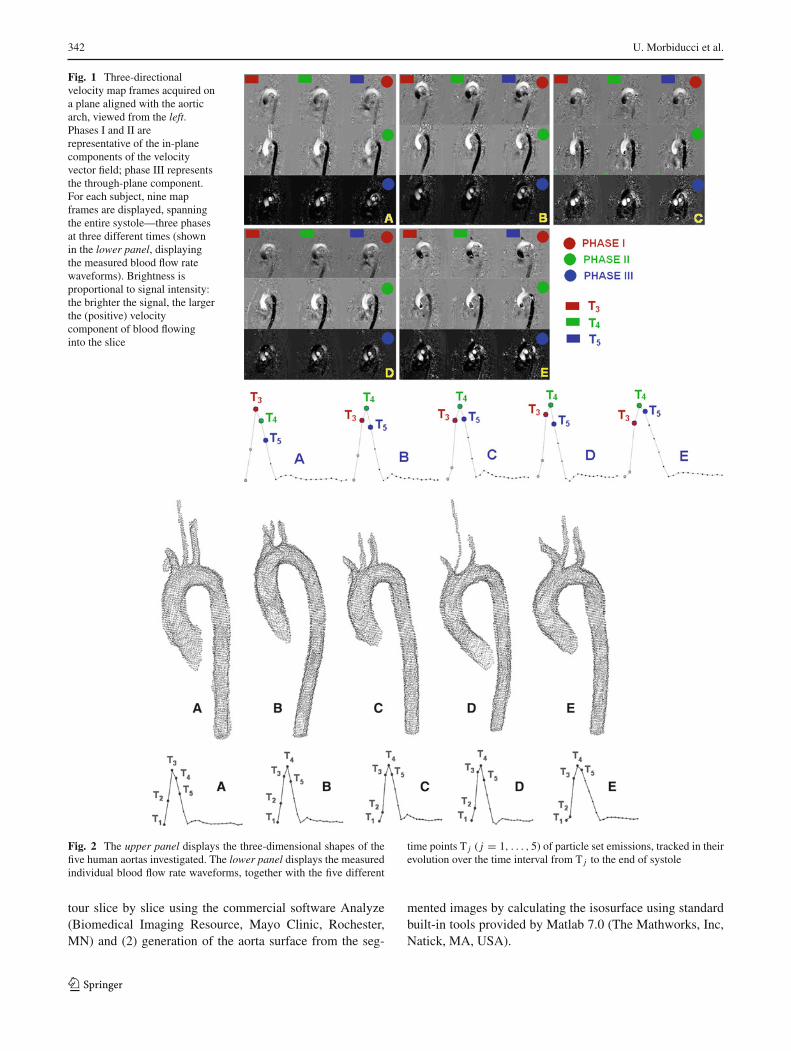
Fig. 2 The upper panel displays the three-dimensional shapes of thefive human aortas investigated. The lower panel displays the measuredindividual blood flow rate waveforms, together with the five different
time points T j ( j = 1, . . . , 5) of particle set emissions, tracked in theirevolution over the time interval from T j to the end of systole
tour slice by slice using the commercial software Analyze(Biomedical Imaging Resource, Mayo Clinic, Rochester,MN) and (2) generation of the aorta surface from the seg-
mented images by calculating the isosurface using standardbuilt-in tools provided by Matlab 7.0 (The Mathworks, Inc,Natick, MA, USA).
123
Role of helical blood flow in the human aorta 343
We took advantage of the ability of particle traces to pro-vide an accurate representation of unsteady features of flowfields (Steinman 2000) by performing a Lagrangian analysisof the acquired 4D PC MRI datasets. Hence, particle traces,the centerpiece of our investigation, were computed by timeintegration of the velocity field, starting from user-specifiedlocations and time frames. Technically, particle trajectorieswere calculated in a velocity field defined by known veloci-ties at a number of points (the measured voxels) and at certaintime instants; between these points, at discrete times, veloc-ities must be interpolated. In this study, we used the bicubicspline method, which has been shown to be accurate (Davidet al. 2002) for the interpolation of the velocity field both inthe spatial and time domain. The particle traces were calcu-lated using a fourth-order Runge-Kutta numerical integrationscheme, which has been shown to produce an accurate par-ticle path (Darmofal and Haimes 1996). We “released” setsof Np immaterial particles at five different time points T j
( j = 1, . . ., 5; Fig. 2, lower panel) of the measured systolicphase and tracked them (as explained above) in their evolu-tion over the time interval from T j to the end of systole Tes .To achieve this, an emitter grid was positioned in the dataset to release particles at a desired time and location. No realtracer was used in this study.
The classic finite difference method was implemented forthe calculation of the velocity gradients’ tensor, which isneeded for the calculation of the vorticity vector.
The algorithms adopted in this work for the calculationof the velocity gradients and for particle tracking, togetherwith the bicubic spline spatio-temporal interpolation scheme,were previously validated, in order to verify their adequacywith respect to the MRI macro-parameters (Morbiducci et al.2009a; Ponzini et al. 2009). For the visualization of vec-tor fields and particle traces, both commercial (TECPLOT,Inc., Bellevue, WA, USA) and open source visualization toolswere used to navigate through the data and analyze blood flowwithin the volumetric acquisition of the entire aorta.
2.4 Helical flow index as a measure of blood flowcomplexity
The velocity vector fields resulting from interpolation of thePC MRI measured dataset were analyzed via computationof the Lagrangian-based descriptor, the helical flow index(HFI), to obtain a “measure” of the helical structure in theblood flow. In fact, HFI has recently been demonstrated to bean effective descriptor of complex, fully three-dimensionalflow fields. HFI, originally applied to computational models(Grigioni et al. 2005; Morbiducci et al. 2007a; Morbiducciet al. 2007b) and very recently tested in vivo on 4D PC MRImeasurements of blood flow in the human aorta (Morbiducciet al. 2009a), calculates the content of helical motion accord-ing to a particle trace analysis of the flow.
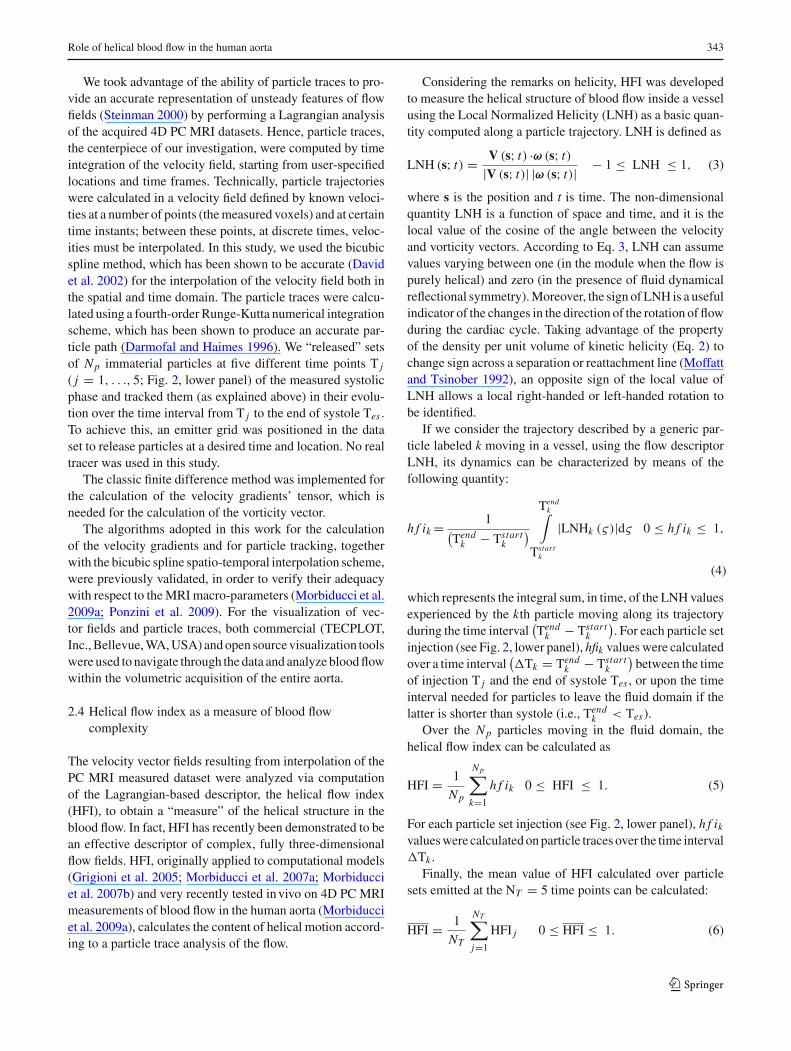
Considering the remarks on helicity, HFI was developedto measure the helical structure of blood flow inside a vesselusing the Local Normalized Helicity (LNH) as a basic quan-tity computed along a particle trajectory. LNH is defined as
LNH (s; t) = V (s; t) ·ω (s; t)
|V (s; t)| |ω (s; t)| − 1 ≤ LNH ≤ 1, (3)
where s is the position and t is time. The non-dimensionalquantity LNH is a function of space and time, and it is thelocal value of the cosine of the angle between the velocityand vorticity vectors. According to Eq. 3, LNH can assumevalues varying between one (in the module when the flow ispurely helical) and zero (in the presence of fluid dynamicalreflectional symmetry). Moreover, the sign of LNH is a usefulindicator of the changes in the direction of the rotation of flowduring the cardiac cycle. Taking advantage of the propertyof the density per unit volume of kinetic helicity (Eq. 2) tochange sign across a separation or reattachment line (Moffattand Tsinober 1992), an opposite sign of the local value ofLNH allows a local right-handed or left-handed rotation tobe identified.
If we consider the trajectory described by a generic par-ticle labeled k moving in a vessel, using the flow descriptorLNH, its dynamics can be characterized by means of thefollowing quantity:
h f ik = 1(Tend
k − Tstartk
)Tend
k∫
Tstartk
|LNHk (ς)|dς 0 ≤ h f ik ≤ 1,
(4)
which represents the integral sum, in time, of the LNH valuesexperienced by the kth particle moving along its trajectoryduring the time interval
(Tend
k − Tstartk
). For each particle set
injection (see Fig. 2, lower panel), hfik values were calculatedover a time interval
(�Tk = Tend
k − Tstartk
)between the time
of injection T j and the end of systole Tes , or upon the timeinterval needed for particles to leave the fluid domain if thelatter is shorter than systole (i.e., Tend
k < Tes).Over the Np particles moving in the fluid domain, the
helical flow index can be calculated as
HFI = 1
Np
Np∑k=1
h f ik 0 ≤ HFI ≤ 1. (5)
For each particle set injection (see Fig. 2, lower panel), h f ik
values were calculated on particle traces over the time interval�Tk .
Finally, the mean value of HFI calculated over particlesets emitted at the NT = 5 time points can be calculated:
HFI = 1
NT
NT∑j=1
HFI j 0 ≤ HFI ≤ 1. (6)
123

344 U. Morbiducci et al.
Equation 6 is the expression, as an average, of the helical con-tent within the streaming blood through the systolic phase.
2.5 Statistical analysis
An intra-individual statistical analysis was performed forthe five aortas under investigation to clarify whether helicalblood flow depends on the phase of the cardiac cycle.
For all subjects and for all of the investigated time pointsT j for release of the particle sets, the values of h f ik (Eq. 4)—the HFI computed along each kth particle trajectory overthe time interval �Tk—were used to investigate differencesin helical flow content in terms of the phase of systole.Statistical analyses (Matlab Statistical toolbox, The Math-works, Natick, MA, USA) were performed by applyingthe non-parametric two-sample Kolmogorov–Smirnov test(Kolmogorov 1956). This test is sensitive to differencesin both the location and shape of the empirical cumula-tive distribution functions of the two samples and does notneed any basic hypotheses for the sample distributions. TheJarque–Bera test (Bera and Jarque 1981), which measures thedeparture from normality based on the sample kurtosis andskewness, was previously performed to verify the hypothesisof normal distribution for each one of the five individual jthsubpopulation of h f ik values. The critical significant levelwas set at α = 0.1 (according to the guidelines for report-ing statistics of the American Physiological Society, aimedat finding an effect that could lead to a promising scientificdiscovery). High-order standardized moments were also cal-culated to obtain a measure of possible differences in percentdistributions of h f ik values.
3 Results
This section is organized in three subsections. In the first sub-section, map frames of the acquired PC MRI data and visu-alization of related velocity vector fields are provided. In thesecond subsection, we describe and compare both the intra-individual and the inter-individual complex blood flow evolu-tion in the five aortas under investigation adopting a Lagrang-ian representation. Results reported in the third subsectionwill illustrate the effectiveness of the algorithm proposed forquantification of helical flow in relation to the investigatedhuman aortas.
3.1 PC MRI data visualization
Figure 1, introduced in the “Materials and Methods” section,displays the map frames (that span mid-systole) of the mea-sured three-directional velocity components (phase I, II, andIII) for each of the healthy subjects under investigation, on aplane aligned with the aortic arch.
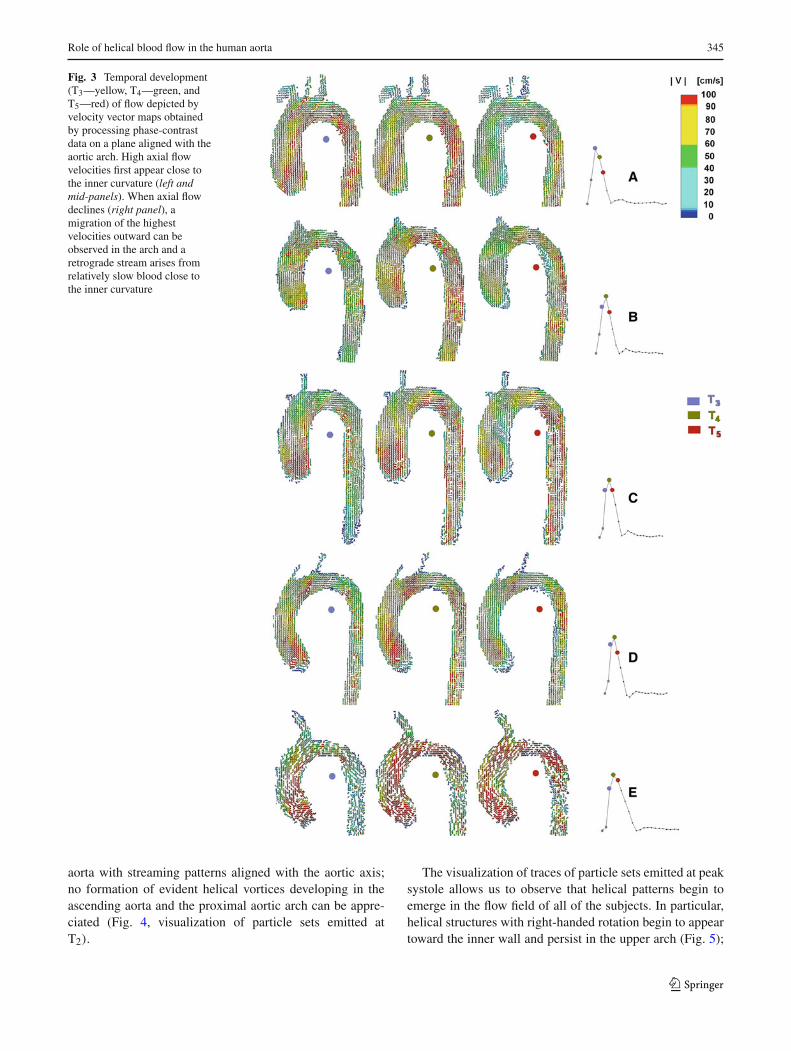
Notably, the out-of-plane velocity component (phase III)exhibits a clearly identifiable light strip against the innerwall of the upper arch during flow deceleration (T5), witha broader dark region near the outer wall of the arch (darkaway from viewer, light toward viewer). This finding is con-sistent with the existence of a rotational flow pattern as afeature common not only to all of the human aortas investi-gated herein but also to previous bidirectional (Kilner et al.1993) and three-directional observations (Markl et al. 2004;Morbiducci et al. 2009a).
A more clear depiction of the temporal development offlow on a plane aligned with the aortic arch (the same asFig. 1) is given in Fig. 3. The visualization of the veloc-ity vector maps obtained by processing phase-contrast datahighlights features common to the five subjects:
(1) High axial flow velocities first appear close to the innercurvature (Fig. 3, left and mid-panel, i.e., T3 and T4);the streaming blood close to the inner wall gains morespeed as a consequence of the transient nature of bloodflow in aorta, which partially inhibits the circulation ofthe velocities and mitigates its centrifugal effects.
(2) When axial flow declines in the second part of systole,a migration of the highest velocities outward can beobserved in the arch, and a retrograde stream (Fig. 3,right panel, i.e., T5) arises from the relatively slow bloodflow close to the inner curvature.
An overall similarity of the data can be observed among thefive subjects under investigation (Figs. 1, 3).
3.2 Lagrangian analysis: three-dimensional evolutionof the aortic flow
Particle traces give both a synthetic spatial and temporaldepiction of the features of unsteady flow fields. As anexample, movie I displays the evolving flow patterns inthe aorta of subject E, obtained by means of Lagrangiananalysis, on the particle set emitted at peak systole andfused to the modulus image of the aorta (see Supplemen-tary Data). Here, we use the definition of the pseudo-scalarquantity LNH (Eq. 3). Color-coding of the particle tracesin terms of LNH can be used to display how helical struc-tures in blood flow rotate; an instantaneous positive (neg-ative) value of the LNH gives evidence of a right- (left-)handed rotation. Like that of a corkscrew, this helix is clock-wise (counter clockwise) when viewed in the direction offorward movement.
From Lagrangian analysis, hemodynamic featuresemerged that are common to the healthy population underinvestigation.
The evolution of particle sets emitted during early sys-tole highlights the fact that blood is conveyed into the
123
Role of helical blood flow in the human aorta 345
Fig. 3 Temporal development(T3—yellow, T4—green, andT5—red) of flow depicted byvelocity vector maps obtainedby processing phase-contrastdata on a plane aligned with theaortic arch. High axial flowvelocities first appear close tothe inner curvature (left andmid-panels). When axial flowdeclines (right panel), amigration of the highestvelocities outward can beobserved in the arch and aretrograde stream arises fromrelatively slow blood close tothe inner curvature
aorta with streaming patterns aligned with the aortic axis;no formation of evident helical vortices developing in theascending aorta and the proximal aortic arch can be appre-ciated (Fig. 4, visualization of particle sets emitted atT2).
The visualization of traces of particle sets emitted at peaksystole allows us to observe that helical patterns begin toemerge in the flow field of all of the subjects. In particular,helical structures with right-handed rotation begin to appeartoward the inner wall and persist in the upper arch (Fig. 5);
123

346 U. Morbiducci et al.
Fig. 4 Evolution of the particle sets emitted during the flow accel-eration phase (T2) fused to the three-dimensional shape of the aortas.Color-coding of the particle traces was used to display the instantaneousvalue of the LNH (right-handed positive value, left-handed negative
value). In all of the subjects, no formation of evident helical vorticesdeveloping in the ascending aorta and the proximal aortic arch can benoticed. Blood streaming patterns are also aligned with the aortic axisin all of the subjects
Fig. 5 Evolution of the particle sets emitted at peak systole, fused tothe three-dimensional shape of the aortas. Color-coding of the particletraces was used to display the instantaneous value of the LNH (right-handed positive value, left-handed negative value). More coherent heli-
cal structures begin to emerge in the aortic flow. In all patients, the onsetof right-handed helical structures at the inner wall of the aorta (fromthis view) is worth noting
additionally, left-handed rotation helices, which vanish in themid-arch, are present toward the outer wall.
The analysis of the five datasets highlights the observationthat the evolution of the particle set emitted after peak systoleis strongly characterized by the onset of more coherent heli-cal structures (Fig. 6). This behavior, which was present in allof the subjects under investigation, supports our hypothesis
(Morbiducci et al. 2009a) that the helical arrangement of theflow at the inner curvature of the arch forms in an attemptto compensate for curling the forward streaming blood to fillthe space left by the flow separation at the inner wall (seeFigs. 1, 3).
The fluid rotational momentum dominates the flow decel-eration phase, resulting in coherent helical and bi-helical pat-
123

Role of helical blood flow in the human aorta 347
Fig. 6 Evolution (two differentviews) of the particle set emittedduring the flow decelerationphase (T5) in the five aortasunder investigation.Color-coding of the particletraces was used to display theinstantaneous value of the LNH.The topology of the flow beginsto assume helical (subject A, E)and bi-helical structures (subjectB, C, D), with an inversion inthe helical rotation going fromthe inner (right-handed positivevalues of LNH) to the outer(left-handed negative values ofLNH) aortic wall
123

348 U. Morbiducci et al.
terns in the ascending aorta. Particle traces relative to particlesets emitted after the peak of systole show that a coherenthelical field characterizes blood flow topology in this phaseof the cardiac cycle, with rotating or counter-rotating heli-cal structures. This phenomenon is clearly visible in Fig. 6,which depicts the evolving flow for particle sets emitted at T5.
In particular, the two different views displayed in Fig. 6highlight that the topology of the flow begins to assume asingle (subject A, E) or double (subject B, C, D) swirl-likestructure, with an inversion in the helical rotation from theinner (right-handed, positive values of LNH) to the outer(left-handed, negative values of LNH) aortic wall.
The onset of helical patterns in the ascending plusproximal aorta in the second half of systole can be viewedin Fig. 7, which displays the first 25 ms of the dynamics ofparticle sets emitted at T5. The image is oriented as if viewedfrom the aortic orifice.
The visualization demonstrates definitively that the com-position of the rotating vortices and the axial flow results inthe helical (subject A, E) and bi-helical (subject B, C, D)arrangement of the flow field in the ascending aorta and theproximal tract of the arch in late systole.
3.3 Helical flow quantitative analysis
Figure 8 summarizes the HFI values calculated over tracesof particle sets emitted at the five time points T j during sys-tole (through the end of systole). Results from the analysis ofall of the healthy individuals investigated herein are shown.In general, the following features are common to all of thesubjects: (1) particle sets emitted after the systolic peak arecharacterized by the highest helical content; (2) particle setsemitted during the first phase of systole (T1 through T3) arecharacterized by similar trends in HFI values (with the soleexception of subject E for the particle set emitted at T3); (3)on average, regarding the subjects investigated, the HFI valuecalculated for the particle set emitted at T5, mid-late systole,is 27% (SD 13) higher than the HFI value calculated for theparticle set emitted at T1 at early systole.
For each subject under investigation, an intra-individualstatistical analysis was carried out on particle sets emitted atphases T j ( j = 1, . . ., 5) of the cardiac cycle and evolvinginto the aorta through systole. The following results wereobtained.
(1) The Jarque–Bera test for goodness-of-fit to a normaldistribution showed that the distributions of h f ik val-ues (Fig. 9) deviate from normality in almost all of theparticle sets T j . The hypothesis of normal distributionfor the h f ik values cannot be rejected only for subject Cat emission T4 (P = 0.99) and T5 (P = 0.54), and forsubject D at T4 (P = 0.44). Notably, the hypothesis of
normal distribution for the h f ik values holds true onlyfor particle sets emitted at mid-late systole.
(2) Significant differences among h f ik values belonging todifferent particle sets were confirmed by the Kolmogo-rov–Smirnov test. We found that there are always sig-nificant statistical differences (see Fig. 9), except in thecases of subject A between particle sets emitted at T4
and T5 (P = 0.49) and subject D in particle sets emittedat T1 and T2 (P = 0.44). Notably, h f ik distributionswith no statistical difference belong to the same phaseof the cardiac cycle (i.e., mid-late systole for subject Aand early systole for subject D).
The results from statistical analysis, together with the indi-vidual HFI values (i.e., the mean of the h f ik values of theparticle set emitted at T j ) summarized in Fig. 8, enforce ourrecent supposition that the helical content strongly dependsupon the evolution of the flow through the aorta (Morbiducciet al. 2009a).
Figure 10 displays the HFI values calculated over particlesets emitted at the five time points (summarized in Fig. 8).
Notably, the aortic hemodynamics of the healthy subjectsinvestigated herein are characterized by very similar valuesof HFI (Fig. 10, lower panel), even if slight differences wereobserved.
4 Discussion
Real blood flow dynamics in the thoracic aorta is an intricateprocess that involves interaction, reconnection, and continu-ous re-organization of helical and vortical fluid structures. In1996, important studies contributed to the discussions on therole played by helical flow patterns in arteries, stating thatrelatively coherent swirling of blood might avoid excessivedissipation of energy by limiting flow instability in arteries(Caro et al. 1996; Stonebridge et al. 1996). For this reason,analyzing and understanding energy transfer and dissipationin the aortic hemodynamics is of fundamental importance.However, the physiological significance of the features ofaortic blood flow is still debated.
From theoretical fluid mechanics, we speculate that dur-ing the cardiac cycle the flow topology changes, altering thehelicity of the system due to a local exchange of writhe andtwist helicity in the interacting tube strands (Moffatt 1969).This is clearly a key mechanism to understanding energy dis-sipation in real fluids. However, thus far, very little work hasbeen done to investigate these aspects in vivo in the humanaorta. Consistent with the fundamental role recognized forhelicity in the organization of both laminar and turbulentflows, we postulated that the onset of helical patterns in aor-tic hemodynamics could also be explained in terms of energydissipation (Morbiducci et al. 2009a). The results of this
123

Role of helical blood flow in the human aorta 349
Fig. 7 First 25 ms of thedynamics of particle sets emittedduring the flow decelerationphase (T5) in the five aortasunder investigation. The imageis oriented as if the observer islooking from the bottom.Color-coding of the particletraces was used to display theinstantaneous value of the LNH(right-handed positive value,left-handed negative value). Thevisualization unambiguouslyshows the presence of helical(subject A, E) and bi-helical(subject B, C, D) flowarrangement of the flow field inthe ascending aorta and theproximal tract of the arch at latesystole
123

350 U. Morbiducci et al.
Fig. 8 HFI helicity indicescalculated over traces of particlesets emitted at five time points,T j , during systole (and overtime intervals Tes–T j ). All ofthe subjects exhibit a similartrend in the HFI dynamicsthrough systole
123

Role of helical blood flow in the human aorta 351
Fig. 9 Percent distribution of particle traces with respect to the heli-cal flow index (hfi) computed along each particle trajectory. Red barsindicate hfi distributions that can be considered the same continuousdistribution. They belong to the same phase of the cardiac cycle—mid-
late systole for subject A and early systole for subject D. The hypothesisof normal distribution for the hfi values cannot be rejected for three * ofthe twenty-five cardiac phases analyzed (five for each subject)
Fig. 10 HFI values calculated over particle sets emitted at five time points (see Fig. 8). Similar HFI values characterize the hemodynamics of thesubjects investigated herein
123

352 U. Morbiducci et al.
study confirm and support this hypothesis; helicity forma-tion might be the consequence of an optimization in naturallyoccurring fluid transport processes in the cardiovascular sys-tem, with the obtainment of an efficient perfusion as a result.
In particular, in the first half of the deceleration phase,when inertial effects determine the enhancement of the heli-cal flow structures (as summarized in Figs. 6, 7), the actionof transitional effects involves helicity to a significant extent.This feature works to mitigate loss of organization in theflow field and, as a consequence, transition to turbulence.Thus, the turbulent kinetic energy is reduced by the helicalflow as it induces the rotational stability in the forward flow.This statement is enforced by the well-consolidated knowl-edge that many properties of systems presenting helicityare related to the reduction of non-linear processes respon-sible for the transfer and redistribution of energy throughvarious scales. A non-zero helicity partially inhibits theenergy flux from larger to smaller scales; helicity is expectedto globally arrest the energy decay (Tsinober and Levich1983; Moffatt and Tsinober 1992; Chen et al. 2003; Mininniet al. 2006; Teitelbaum and Mininni 2009). The extent towhich non-zero helicity is expected to change Kolmogo-rov’s law of energy decay rate (−5/3 slope for the energydecay) in anisotropic transitional viscous flows like blooddepends upon specific cases that are beyond the scope of thiswork.
Hence, both theoretical considerations and our quantita-tive analysis suggest that the helicity in the aortic flow nat-urally develops to avoid excessive energy dissipation. In theprocess of conveying blood flow in the aorta (the site inthe healthy circulatory system where the Reynolds numberreaches the highest value), this characteristic has the bene-ficial consequence of contributing to minimize myocardialoverloading.
The blood flow patterns in the five thoracic aortas showgreat similarity to previously reported measurements inhealthy subjects (Kilner et al. 1993; Frazin et al. 1990; Bogrenand Buonocore 1999; Wigström et al. 1999; Markl et al.2004) and are enriched by quantitative evidence of helicalpatterns in the aorta:
(1) At early systole, no coherent helical patterns emergefrom blood flow fields (Fig. 4);
(2) When the net forward flow is at a maximum, up tothe end of systole, relatively coherent helical structuresappear in the flow field, with the onset of helical struc-tures located at the inner wall (Fig. 5);
(3) In the deceleration phase, when the weight of the iner-tial effects leads to a disorganization of the flow field,we found that the flow field topology in the ascend-ing aorta and in the upper arch is characterized by high,more coherent helicity, associated with an onset of heli-cal and bi-helical structures (Figs. 6, 7).
In recent years, several methods for characterizing flow struc-tures have been successfully applied to cardiovascular flows.To quantify helical blood flow, a Lagrangian-based metric,the HFI, has been applied both in silico (Morbiducci et al.2007a; Morbiducci et al. 2010) and in vivo (Morbiducci et al.2009a). Moreover, the computation of Lagrangian coherentstructures (Shadden and Taylor 2008; Shadden et al. 2010)and of another Lagrangian-based metric (Morbiducci et al.2009b) has been demonstrated to be very useful to charac-terize (1) flow stagnation and separation, (2) partitioning offluid to downstream vasculature, (3) vorticity dynamics, and(4) mechanisms governing stirring and mixing in both vas-cular models (Shadden and Taylor 2008) and in models ofimplanted prosthetic heart valves (Morbiducci et al. 2009b;Shadden et al. 2010). To the best of the authors’ knowledge,only the HFI has been applied in vivo. This study confirmsthe strength of the helical flow index as a method for rankingthe behavior of fluid dynamics within vessels in vivo and forgiving a measurement of the structural complexity of flow-ing blood. While differences between flow patterns duringthe cardiac cycle, or between physiological and pathologicalcases, can be visually noted, an indicator or a metric-like HFImakes the level of comparison easier.
The intra-individual analysis highlights the finding that ageneral and statistically significant difference characterizes(Figs. 8, 9) the helical content of different phases of sys-tole. A very similar behavior common to all of the subjectsemerges from HFI-based quantitative analysis (Figs. 8, 10).This behavior offers a clear indication of the mechanisticallydriven dynamical arrangement of blood flow in helical pat-terns.
The fluid motion observed within these investigatedhuman aortas shows inter-individual variability, which, in theopinion of the authors, could be ascribed to specific anatom-ical features (local subject-specific curvature/non-planarityof the ascending aorta), age, and heart rate of the subjectsunder investigation. In particular, the inter-individual veloc-ity shifts and the non-synchronous arrangement in helicalstructures observed in the second half of systole could beascribed to the different dynamics of the ventricular ejectionamong subjects and the different durations of their cardiaccycle. In fact, after visual inspection of Fig. 10, we noticedthe following trends: (1) subjects B, C, and D, which exhibitvery similar heart rate values (51 through 55 bpm), have com-parable HFI values; (2) the hemodynamics of subjects A andE, which present heart rate of 43 and 78 bpm, respectively,are characterized by lower values of HFI.
Hence, according to our preliminary findings, the schemepresented herein to assess helical blood flow in vivo could behelpful for answering important questions concerning circu-lation. As an example, this scheme could be applied to gaininsight into the role played by hemodynamics in morphogen-esis, where recent findings stated that the asymmetric devel-
123
Role of helical blood flow in the human aorta 353
opment of the aortic arch is governed by the establishmentof hemodynamics determined by a genetically induced mor-phological change in the outflow tract of the heart (Yashiroet al. 2007).
For example, concerning the physiology of the aorta, thecombined information given by the existence of a through-plane velocity component, which is clearly visible in Fig. 1(as explained in the Results section) near the inner wall,joined with the velocity vector field evolution shown in Fig. 3,lead us to infer that the onset of helical flow could contrib-ute to limiting flow separation at the inner curvature of thearch. This phenomenon also aids in enforcing the effect offlow circulation in transversal planes played by secondaryflows, thus limiting/delaying the inversion of velocity at theinner wall. Moreover, this method could be used to inves-tigate whether the basis of aortic helical physiological flowis in the ventricle fluid dynamics. Future studies could per-mit us to clarify to what extent the helicity in the aorta duringearly systole originates from the systolic ventricular function(Kilner et al. 2000; Gharib et al. 2006) and the role playedby non-planarity in the main process of conveying blood inthe axial direction in the aorta.
The proposed method for quantitative in vivo analysiscould allow us also to gain knowledge concerning the natureof flow development in the arch and the presence of branchesat the apex of the aortic arch. We could also investigatewhether spiral flow patterns in the arteries may be more orless efficient in perfusing branch vessels (Stonebridge andBrophy 1991). This last aspect could also have great phys-iological relevance. In addition, it could be useful to evalu-ate the physiological significance of the aortic valve orificeshape, as HFI can quantify the swirling flow, recovering itscritical features such as the slow-down of the axial speed nearthe center and the decay rate of the swirling strength.
We also believe that quantification of the helical contentimposed by the heart on blood flow might allow detectionof anomalies in the expected physiological development ofhelical flow. Accordingly, it could be used in diagnostics,prognostics, and therapeutics (Stonebridge and Brophy 1991;Hope et al. 2007; Markl et al. 2007; Frydrychowicz et al.2008a,b; Weigang et al. 2008). In clinical practice, the use ofa dimensionless index with the capability to both characterizeand rank the flow motion (by assigning a score, for example)could be decisive when comparing patient groups; an anal-ysis of h f ik values similar to the one presented herein anddepicted in Figs. 8 and 9 could become a useful instrumentfor discriminating among blood flow behaviors in the aorta.
The present study has limitations. Namely, we focused onnormal subjects and our conclusions should not be extrapo-lated to the general population. A practical limitation of ourstudy is that the number of subjects is relatively small inthe context of large population studies. However, our resultsare consistent with many of the other studies reported in this
manuscript, and we note that we are able to achieve statisticalsignificance in many of the comparisons. Another limitationis that our study group does not include female subjects: sexdependence of helical flow dynamics will be the object offuture investigations. We also did not explicitly assess thevariability of measurements taken from the same subjects inrepeated and non-consecutive sessions in separate scanningsessions that required subject repositioning. However, previ-ous PC MRI studies suggest little or no difference betweendata acquired with or without repositioning of the subject(Spilt et al. 2002).
Even if simulations are beyond the scope of this paper,patient-specific modeling is the sole way to confirm questionsof fluid mechanics raised in our study; the spatial and tem-poral resolution of state-of-the-art PC MRI scanners do notallow for reliable evaluations of turbulence through-scalestransfer, dissipation, and/or decay. However, from a fluidmechanical standpoint, the theoretical relationships existingamong quantities and parameters describing turbulence andhelicity have not been confirmed by previous in vivo quan-titative observations of cardiovascular flows. Consequently,in the future, we intend to take advantage of the potential ofsimulations and patient-specific modeling to calculate exactquantities, such as turbulence dissipation, and correlate themto helicity patterns.
Recently, in silico and in vitro studies (Grigioni et al. 2005;Fan et al. 2008; Morbiducci et al. 2007a; Morbiducci et al.2007b; Sun et al. 2009; Liu et al. 2009; Zhan et al. 2010;Zheng et al. 2009) have vehemently renewed with quanti-tative results the presumption that the phenomenon of he-licity in aortic hemodynamics also originates from the needfor limiting flow instabilities in the vessels that could elicitfluid-wall interactions, leading to atherogenesis/atheroscle-rosis (Ku and Giddens 1983; Malek et al. 1999).
In the future, the Lagrangian-based determination of keydownstream flow features could provide an efficient tool forranking bulk blood flow in terms of its athero-susceptible/ath-ero-protective potency. Recent studies support the hypothesisthat a link exists between helicity and shear stress on the vas-cular wall. In particular, (1) Morbiducci et al. (Morbiducciet al. 2007a) demonstrated that the arrangement of the flowfield in helical patterns in the aortocoronary bypass mightelicit a damping in shear stress oscillations at the vesselwall, which is involved in flow-related arterial disease; (2)Chen and colleagues (Chen et al. 2009) found that intentionalinduction of helical flow in an endovascular stent reducedthe size of the disturbed flow zones, enhanced the averagewall shear stress, and lowered wall shear stress oscillations,which are adverse factors involved in the development ofarterial restenosis after stent deployment; (3) the study byLiu et al. (28) assessed that the helical flow observed in theaorta may have great influence on the distribution of the lumi-nal surface concentration of low density lipoproteins and, as
123
354 U. Morbiducci et al.
a consequence, on the spatial distribution of atheromatousplaques in the aorta.
Another important issue to be explored in the future isthe incorporation of the metrics HFI and h f ik in appropriatemeasures of performance for cardiovascular surgeries andinterventions to be defined based on fluid mechanics infor-mation, as suggested by the recent developments in opti-mization methods applied to cardiovascular flows (Marsdenet al. 2008). These metrics could also allow scientists to gaininsight into the physiological/pathological development ofhelical flow in the aorta, both from in vivo data and frompatient-specific numeric simulations.
Although the low number of subjects enrolled does notallow us to offer complete answers to questions pertainingto the origin and role played by helical blood flow in thehuman aorta, this study confirms that (1) the application ofalgorithms for the calculation of hemodynamics descriptorsto 4D PC MRI datasets can make the in vivo quantification ofhelical blood flow possible (see Morbiducci et al. 2009a); (2)exploring the relationship between helical flow and hemody-namics is promising and makes the in vivo quantification ofthe helicity content very rewarding; (3) HFI has the potentialfor enriching aortic flow features common to healthy subjectswith quantitative evidence and stands as a candidate metricto study the mechanistic relationships between physiologicalcomplexity and energy in the hemodynamics of the aorta.
Acknowledgments The Authors are sincerely thankful to Jill DianeFriedman for carefully reading the manuscript.
References
Amirbekian S, Long RC, Consolini MA, Suo J, Willett NJ, Fielden SW,Giddens DP, Taylor WR, Oshinski JN (2009) In vivo assessmentof blood flow patterns in abdominal aorta of mice with MRI: impli-cations for AAA localization. Am J Physiol Heart Circ Physiol297:H1290–H1295
Baciewicz FA, Penney DG, Marinelli WA, Marinelli R (1991) Torsionalventricular motion and rotary blood flow. What is the clinical sig-nificance. Card Chron 5:1–8
Bellhouse BJ, Talbot L (1969) The fluid mechanics of the aortic valve.J Fluid Mech 35:721–736
Bera AK, Jarque CM (1981) Efficient tests for normality, homoscedas-ticity and serial independence of regression residuals: Monte Carloevidence. Econ Lett 7(4):313–318
Bogren HG, Buonocore MH (1999) 4D magnetic resonance velocitymapping of blood flow patterns in the aorta in young vs. elderlynormal subjects. J Magn Reson Imaging 10:861–869
Buonocore MH, Bogren HG (1999) Analysis of flow patterns usingMRI. Int J Card Imaging 15:99–103
Caro CG, Doorly DJ, Tarnawski M, Scott KT, Long Q, Dumoulin CL(1996) Non-planar curvature and branching of arteries and non-planar-type flow. Proc R Soc Lond A 452:185–197
Chandran KB (1993) Flow dynamics in the human aorta. J BiomechEng 115:611–616
Chen Q, Chen S, Eyink GL (2003) The joint cascade of energy andhelicity in three-dimensional turbulence. Phys Fluids 15:361–374
Chen ZS, Fan YB, Deng XY, Xu Z (2009) Swirling flow can sup-press flow disturbances in endovascular stents: a numerical study.ASAIO J 55(6):543–549
Darmofal DL, Haimes R (1996) An analysis of 3D particle path inte-gration algorithms. J Comput Phys 123:182–195
David L, Esnault A, Calluaud D (2002) Comparison of techniques ofinterpolation for 2D and 3D velocimetry. In: Proceedings of theeleventh international symposium on applications of laser tech-niques to fluid mechanics, Lisbon
Fan Y, Xu Z, Jiang W, Deng X, Wang K, Sun A (2008) An S-typebypass can improve the hemodynamics in the bypassed arteriesand suppress intimal hyperplasia along the host artery floor. J Bio-mech 41:2498–2505
Firmin D, Keegan J (2001) Navigator echoes in cardiac magnetic reso-nance. J Cardiovasc Magn Reson 3:183–193
Frazin LJ, Lanza G, Vonesh M, Khasho F, Spitzzeri C, McGee S,Mehlman D, Chandran KB, Talano J, McPherson D (1990) Func-tional chiral asymmetry in descending thoracic aorta. Circulation82:1985–1994
Frydrychowicz A, Harloff A, Jung B, Zaitsev M, Weigang E,Bley TA, Langer M, Hennig J, Markl M (2007) Time-resolved,3-dimensional magnetic resonance flow analysis at 3 T: visualiza-tion of normal and pathological aortic vascular haemodynamics.J Comput Assist Tomogr 31:9–15
Frydrychowicz A, Arnold R, Hirtler D, Schlensak C, Stalder AF,Hennig J, Langer M, Markl M (2008a) Multidirectional flow anal-ysis by cardiovascular magnetic resonance in aneurysm develop-ment following repair of aortic coarctation. J Cardiovasc MagnReson 10(1):30
Frydrychowicz A, Arnold R, Harloff A, Schlensak C, Hennig J,Langer M, Markl M (2008b) Images in cardiovascular medicine.In vivo dimensional flow connectivity mapping after extracardiactotal cavopulmonary connection. Circulation 118:e16–e17
Gharib M, Rambod E, Kheradvar A, Sahn DJ, Dabiri JO (2006) Opti-mal vortex formation as an index of cardiac health. Proc Natl AcadSci USA 103:6305–6308
Grigioni M, Daniele C, Morbiducci U, Del Gaudio C, D’Avenio G,Balducci A, Barbaro V (2005) A mathematical description ofblood spiral flow in vessels: application to a numerical study offlow in arterial bending. J Biomech 38:1375–1386
Hope TA, Markl M, Wigström L, Alley MT, Miller DC, Herfkens RJ(2007) Comparison of flow patterns in ascending aortic aneurysmsand volunteers using four-dimensional magnetic resonance veloc-ity mapping. J Magn Reson Imaging 26:1471–1479
Houston JG, Gandy SJ, Sheppard DG, Dick JB, Belch JJ, StonebridgePA (2003) Two-dimensional flow quantitative MRI of aortic archblood flow patterns: Effect of age, sex, and presence of carotidatheromatous disease on prevalence of spiral blood flow. J MagnReson Imaging 18:169–174
Kilner PJ, Yang GZ, Mohiaddin RH, Firmin DN, Longmore DB(1993) Helical and retrograde secondary flow patterns in the aor-tic arch studied by three-directional magnetic resonance velocitymapping. Circulation 88:2235–2247
Kilner PJ, Yang GZ, Wilkes AJ, Mohiaddin RH, Firmin DN,Yacoub MH (2000) Asymmetric redirection of flow through theheart. Nature 404:759–761
Kolmogorov AN (1956) Foundations of the theory of probability, 2ndEnglish edn. Chelsea Publishing Company, New York (translationedited by Nathan Morrison)
Ku DN, Giddens DP (1983) Pulsatile flow in a model carotid bifurca-tion. Arteriosclerosis 3:31–39
Liu X, Pu F, Fan Y, Deng X, Li D, Li S (2009) A numerical study onthe flow of blood and the transport of LDL in the human aorta:
123
Role of helical blood flow in the human aorta 355
the physiological significance of the helical flow in the aortic arch.Am J Physiol Heart Circ Physiol 297:H163–H170
Malek AM, Alper SL, Izumo S (1999) Hemodynamic shear stress andits role in atherosclerosis. JAMA 282:2035–2042
Markl M, Draney MT, Hope MD, Levin JM, Chan FP, Alley MT,Pelc NJ, Herfkens RJ (2004) Time-resolved 3-dimensional veloc-ity mapping in the thoracic aorta: visualization of 3-directionalblood flow patterns in healthy volunteers and patients. J ComputAssist Tomogr 28:459–468
Markl M, Harloff A, Föll D, Langer M, Hennig J, Frydrychowicz A(2007) Sclerotic aortic valve: flow-sensitive 4-dimensional mag-netic resonance imaging reveals 3 distinct flow-pattern changes.Circulation 116:e336–e337
Marsden AL, Feinstein JA, Taylor CA (2008) A computational frame-work for derivative-free optimization of cardiovascular geome-tries. Comput Methods Appl Mech Eng 197:1890–1905
Mininni PD, Alexakis A, Pouquet A (2006) Large scale flow effects,energy transfer, and self-similarity on turbulence. Phys Rev E74:016303
Moffatt HK (1969) The degree of knottedness of tangled vortex lines.J Fluid Mech 36:17–29
Moffatt HK (1990) The energy spectrum of knots and links. Nature347:367–369
Moffatt HK, Tsinober A (1992) Helicity in laminar and turbulent flow.Ann Rev Fluid Mech 24:281–312
Morbiducci U, Ponzini R, Grigioni M, Redaelli A (2007a) Helical flowas fluid dynamic signature for atherogenesis in aortocoronarybypass. A numeric study. J Biomech 40:519–534
Morbiducci U, Lemma M, Ponzini R, Boi A, Bondavalli L, Antona C,Montevecchi FM, Redaelli A (2007b) Does flow dynamics of themagnetic vascular coupling for distal anastomosis in coronaryartery bypass grafting contribute to the risk of graft failure. IntJ Artif Organs 30:628–639
Morbiducci U, Ponzini R, Rizzo G, Cadioli M, Esposito A, De Cobelli F,Del Maschio A, Montevecchi FM, Redaelli A (2009a) In vivoquantification of helical blood flow in human aorta by time-resolved three-dimensional cine phase contrast MRI. Ann BiomedEng 37:516–531
Morbiducci U, Ponzini R, Nobili M, Massai D, Montevecchi FM,Bluestein D, Redaelli A (2009b) Blood damage safety of pros-thetic heart valves. Shear induced platelet activation and localflow dynamics: a fluid-structure interaction approach. J Biomech42(12):1952–1960
Morbiducci U, Gallo D, Ponzini R, Massai D, Antiga L, Redaelli A,Montevecchi FM (2010) Quantitative analysis of bulk flow inimage-based haemodynamic models of the carotid bifurcation: theinfluence of outflow conditions as test case. Ann Biomed Eng.doi:10.1007/s10439-010-0099-y
Ponzini R, Morbiducci U, Iannaccone F, Rizzo G, Cadioli M, Vismara R,Redaelli A (2009) Synthetic 4D phase contrast MRI data-sets: a CFD-based approach for the validation of advancedfluid-dynamics calculations in vivo. In: Tavares JM, Natal JorgeRM (eds) Proceedings of VIPIMAGE 2009, Second Ecomas
Thematic Conference on Computational Vision and MedicalImage Processing, Porto. CRC Press, Taylor & Francis Group,pp 195–199
Ricca RL (2009) Structural complexity and dynamical systems. In:Ricca RL (ed) Lectures on topological fluid mechanics. Lecturenotes in mathematics. Springer, Berlin, pp 167–186
Seed WA, Wood NB (1971) Velocity patterns in the aorta. CardiovascRes 5:319–330
Segadal L, Matre K (1987) Blood velocity distribution in the humanascending aorta. Circulation 76:90–100
Shadden SC, Taylor CA (2008) Characterization of coherent structuresin the cardiovascular system. Ann Biomed Eng 36(7):1152–1162
Shadden SC, Astorino A, Gerbeau JF (2010) Computational analysisof an aortic valve jet with Lagrangian coherent structures. Chaos20:017512
Spilt A, Box FM, van der Geest RJ, Reiber JH, Kunz P, Kamper AM,Blauw GJ, van Buchem MA (2002) Reproducibility of total cere-bral blood flow measurements using phase contrast magnetic res-onance imaging. J Magn Reson Imaging 16:1–5
Steinman DA (2000) Simulated pathline visualization of computedperiodic blood flow patterns. J Biomech 33:623–628
Stonebridge PA, Brophy CM (1991) Spiral laminar flow in arteries.Lancet 338:1360–1361
Stonebridge PA, Hoskins PR, Allan PL, Belch JF (1996) Spiral laminarflow in vivo. Clin Sci (Lond) 91:17–21
Sun A, Fan Y, Deng X (2009) Numerical investigation of blood flow inthe distal end of an axis-deviated arterial bypass model. Biorheol-ogy 46:83–92
Teitelbaum T, Mininni PD (2009) Effect of helicity and rotation on thefree decay of turbulent flows. Phys Rev Lett 103:014501
Tsinober A, Levich E (1983) On the helical nature of three dimensionalcoherent structures in turbulent flows. Phys Lett 99:321–323
Weigang E, Kari FA, Beyersdorf F, Luehr M, Etz CD, Frydrychowicz A,Harloff A, Markl M (2008) Flow-sensitive four-dimensional mag-netic resonance imaging: flow patterns in ascending aortic aneu-rysms. Eur J Cardiothorac Surg 34:11–16
Wigström L, Ebbers T, Fyrenius A, Karlsson M, Engvall J, Wranne B,Bolger AF (1999) Particle trace visualization of intracardiac flowusing time-resolved 3D phase contrast MRI. Magn Reson Med41:793–799
Yashiro K, Shiratori H, Hamada H (2007) Haemodynamics determinedby a genetic programme govern asymmetric development of theaortic arch. Nature 450:285–288
Yearwood TL, Chandran KB (1982) Physiological pulsatile flow exper-iments in a model of the human aortic arch. J Biomech 15(9):683–704
Zhan F, Fan Y, Deng X (2010) Swirling flow created in a glass tubesuppressed platelet adhesion to the surface of the tube: its impli-cation in the design of small-caliber arterial grafts. Thromb Res125(5):413–418
Zheng T, Fan Y, Xiong Y, Jiang W, Deng X (2009) Hemodynamic per-formance study on small diameter helical grafts. ASAIO J 55:192–199
123
Copyright © 2022 FDOKUMEN