Mechanical behaviour of Lixhe chalk partly saturated by oil and water: experiment and modelling
28
INTERNATIONAL JOURNAL FOR NUMERICAL AND ANALYTICAL METHODS IN GEOMECHANICS Int. J. Numer. Anal. Meth. Geomech., 2002; 26:897–924 (DOI: 10.1002/nag.229) Mechanical behaviour of Lixhe chalk partly saturated by oil and water: experiment and modelling F. Collin 1, * ,y , Y. J. Cui 2 , C. Schroeder 3 and R. Charlier 1 1 Departement MSM, University of Li " ege, Liege, Belgium 2 CERMES, Ecole Nationale des Ponts et Chauss ! ees, France 3 Departement LGIH, University of Li " ege, Belgium SUMMARY Two or more different fluids generally saturate chalk in oil reservoir, and therefore its behaviour can be very complicated. In this paper, a constitutive law is proposed for modelling the mechanical behaviour of a chalk saturated by two non-miscible fluids, water and oil. The effects of the capillary pressure or suction are taken into account. They are considered as an independent variable, as in the Barcelona’s basic model developed for unsaturated soils. On the other hand, internal friction and pore collapse are modelled as independent mechanisms. The determination of the parameters is based on triaxial and oedometer tests. Finally, in order to validate the model, predictions are compared with experimental results of water- flooding test. Copyright # 2002 John Wiley & Sons, Ltd. KEY WORDS: chalk compaction; suction; water-flooding tests; multisurface plasticity; numerical modelling 1. INTRODUCTION Chalk is the constituent material of numerous oil reservoirs in North Sea. This soft rock is composed of assemblies of coccolithe skeletons (unicellular organism) or pieces of skeleton. Due to its geological history [1,2], the chalk is partly saturated by oil and water (and sometimes by gas also). Initially, chalk deposited in marine environment was saturated by seawater and during geological time, oil migrated and progressively intruded the pores, remaining some residual water menisci at inter-granular contacts. Ekofisk is one of the main oilfields in North Sea, which is located 200 km west of the Norwegian coasts. Exploitation began in the early 1970s and due to oil production, compactions of reservoir layers were observed since 1985; they implied seabed subsidence. Consequently, offshore stations were endangered and expensive lifting operations were required. The first explanation of subsidence related the compaction to the pore pressure decrease. The solution was the injection of gas and water into the oilfield in order to repressurize the reservoir. But the Received 20 December 2001 Copyright # 2002 John Wiley & Sons, Ltd. Revised 25 March 2002 *Correspondence to: F. Collin, Department MSM, University of Li " ege, Sart Tilman B52/3, Chemin des Chevreuils, 1 B-4000, Liege, Belgium. y E-mail: [email protected] Contract/grant sponsor: EC-Joule programme Contract/grant sponsor: The FNRS, Contract/grant sponsor: Communaut ! e Franc¸aise de Belgique
-
Upload
independent -
Category
Documents
-
view
2 -
download
0
Transcript of Mechanical behaviour of Lixhe chalk partly saturated by oil and water: experiment and modelling

INTERNATIONAL JOURNAL FOR NUMERICAL AND ANALYTICAL METHODS IN GEOMECHANICSInt. J. Numer. Anal. Meth. Geomech., 2002; 26:897–924 (DOI: 10.1002/nag.229)
Mechanical behaviour of Lixhe chalk partly saturated by oiland water: experiment and modelling
F. Collin1,*,y, Y. J. Cui2, C. Schroeder3 and R. Charlier1
1Departement MSM, University of Li"eege, Liege, Belgium2CERMES, Ecole Nationale des Ponts et Chauss!eees, France
3Departement LGIH, University of Li"eege, Belgium
SUMMARY
Two or more different fluids generally saturate chalk in oil reservoir, and therefore its behaviour can bevery complicated. In this paper, a constitutive law is proposed for modelling the mechanical behaviour of achalk saturated by two non-miscible fluids, water and oil. The effects of the capillary pressure or suctionare taken into account. They are considered as an independent variable, as in the Barcelona’s basic modeldeveloped for unsaturated soils. On the other hand, internal friction and pore collapse are modelled asindependent mechanisms. The determination of the parameters is based on triaxial and oedometer tests.Finally, in order to validate the model, predictions are compared with experimental results of water-flooding test. Copyright # 2002 John Wiley & Sons, Ltd.
KEYWORDS: chalk compaction; suction; water-flooding tests; multisurface plasticity; numerical modelling
1. INTRODUCTION
Chalk is the constituent material of numerous oil reservoirs in North Sea. This soft rock iscomposed of assemblies of coccolithe skeletons (unicellular organism) or pieces of skeleton. Dueto its geological history [1,2], the chalk is partly saturated by oil and water (and sometimes bygas also). Initially, chalk deposited in marine environment was saturated by seawater and duringgeological time, oil migrated and progressively intruded the pores, remaining some residualwater menisci at inter-granular contacts.
Ekofisk is one of the main oilfields in North Sea, which is located 200 km west of theNorwegian coasts. Exploitation began in the early 1970s and due to oil production, compactionsof reservoir layers were observed since 1985; they implied seabed subsidence. Consequently,offshore stations were endangered and expensive lifting operations were required. The firstexplanation of subsidence related the compaction to the pore pressure decrease. The solutionwas the injection of gas and water into the oilfield in order to repressurize the reservoir. But the
Received 20 December 2001Copyright # 2002 John Wiley & Sons, Ltd. Revised 25 March 2002
*Correspondence to: F. Collin, Department MSM, University of Li"eege, Sart Tilman B52/3, Chemin des Chevreuils,1 B-4000, Liege, Belgium.
yE-mail: [email protected]
Contract/grant sponsor: EC-Joule programmeContract/grant sponsor: The FNRS, Contract/grant sponsor: Communaut!ee Francaise de Belgique

water flooding induced additional subsidence. These compactions increased the oil recovery(positive aspect) but required new set of platforms (negative aspect). Better understanding of thisphenomenon is important for maximizing the positive aspects and minimizing the negative ones.
Some authors explain the compaction by the capillary pressure defined by the interfacetensions between oil and water. Evidence of capillary pressure effects in geomechanics has beenfirst investigated in fine-grained soils (see Reference [3] for example). More recently, tests wereperformed on chalk samples saturated by oil and water [1]. In the frames of unsaturated soilmechanics, different authors [3,4] developed constitutive elasto-plastic models with the air–water suction taken as an independent model variable.
Experiments performed on chalk samples have shown two plastic mechanisms: the porecollapse and the frictional failure. The pore collapse could be caused by the breakdown ofphysico-chemical bonds between the grains inducing some grain-to-grain slip [5], leading to acontractant behaviour (decrease in porosity). This plastic mode appears for large mean stressesand low shear stresses (for example during oedometer test). The frictional failure corresponds toa plastic distortion inducing an increase of porosity. This plastic mechanism appears for highshear stresses (for example during triaxial test). In most models, the two mechanisms areassumed to be independent [6], and two yield surfaces are defined [6,7]. More recently, someauthors develop constitutive laws with capillary pressure effects: in the Papamichos [8,9] model,the elastic parameters and the yield surface are suction dependent; in the models developed byPiau and co-workers [10–12], Homand and Shoa [13] and Plischke [14], the collapse behaviour isdescribed by assuming a stress jump (additional stress) between the oil-saturated state and thewater-saturated one.
This paper presents a constitutive model developed in the Pasachalk European project. It is acap-type plasticity model coupled with the Barcelona one [3] for taking the suction effect intoaccount. The creep behaviour of chalk will be not considered in the model. Experimental resultsobtained in the project will be used to determine the parameters and to validate the modelassumptions made in the simulations.
2. EXPERIMENTAL EVIDENCES AND PARAMETERS DETERMINATION
In the Pasachalk project, all tests were performed on an outcrop chalk from Upper Campanianage, called ‘Lixhe chalk’ which is sampled in the CBR Company quarry near Li"eege (Belgium).Previous tests showed that its mechanical behaviour is close to that of reservoir chalks [15–17].
Two first series of experiments on chalk samples have been performed along various stressand suction paths: suction-controlled oedometer tests and triaxial tests with chalk samplessaturated either by water or by a specific oil called Soltrol 170TM (kerosene).
2.1. Triaxial test
In the outcrop, the chalk was initially water saturated. In order to obtain oil-saturated sample,chalk plug was oven-dried during 48 h (or until constant weight) at 1058C; and saturated undervacuum with oil. The sample was then put in the triaxial cell and was submitted to oil flowcorresponding to 3 pore-volumes in order to obtain the maximum possible oil saturation.However, some water menisci, that cannot be removed by oil flooding, could remain in thesample.
Copyright # 2002 John Wiley & Sons, Ltd. Int. J. Numer. Anal. Meth. Geomech. 2002; 26:897–924
F. COLLIN ET AL.898

Tests were performed under drained conditions at constant loading rate ð10�3 MPa=sÞ: Thestress path was the following: an isotropic loading was followed by an isotropic unloading, andafterwards, shear stress q ¼ ðs1 � s3Þ was applied either under constant cell pressure or constanteffective mean stress p0 ¼ ðs01þ 2s03Þ=3:
It is observed that the shear strength depends on the saturating fluids: oil-saturated chalk isstiffer and stronger than water-saturated one. Moreover, the transition between ‘oil-like’ and‘water-like’ behaviour is very sharp and appears for water saturation around 1–2%. In general,two types of failures are observed: the pore collapse that engenders plastic volumetricdeformations, and the friction failure that corresponds to a brittle rupture. In the both cases, thepre-failure behaviour is quite elastic, therefore, the failure state can be considered also as yieldstate. Using this plastic criterion, the yield curves of the chalk saturated by water or by oil can bedetermined, as shown in Figures 1 and 2. One can observe in these two figures that (1) there is aisotropic stress hardening phenomenon for the chalk, especially for high p0 values; (2) the brittle
2 4 6 8 10 12 14 16 18 20 22 24 26 28 300
p′ [MPa]
PlasticShear (Brittle)
02468
1012141618202224
q [M
Pa]
Figure 1. Yield curves of water-saturated chalk.
2 4 6 8 10 12 14 16 18 20 22 24 26 28 300
p′ [MPa]
PlasticShear (Brittle)
02468
1012141618202224
q [M
Pa]
Figure 2. Yield curve of oil-saturated chalk.
Copyright # 2002 John Wiley & Sons, Ltd. Int. J. Numer. Anal. Meth. Geomech. 2002; 26:897–924
MODELLING THE MECHANICAL BEHAVIOUR OF CHALK 899

rupture is not associated to any hardening phenomenon: the friction yield curve seems to beindependent of the cell pressure; (3) the frictional angle does not depend on the saturating fluids:the slope of the friction yield curve is the same for the two types of samples; and (4) the oil-saturated chalk has a bigger elastic domain at a given consolidation stress, evidencing an ‘oil’ (orsuction) hardening phenomenon.
2.2. Oedometer tests
Oedometer tests were performed under different controlled suctions using the osmotic method.This method was used successfully for the case of unsaturated soils [18,19] and it was speciallyadapted for chalk saturated by oil and water. All tests were carried out using a triaxial press inorder to have constant compression rate, which is necessary for the suction control.
Typical results are shown in Figure 3(d). It is observed that the pre-consolidation pressure p0
increases with the suction increase. The elastic parameter k corresponding to the small slope andthe plastic parameter l corresponding to large slope seem to be independent on suction. Figure3(a) and 3(b) present the obtained k and l values as a function of suction. Big data scatteringmakes difficult to deduce any functional dependence. For modelling, k is taken constant and l isdecreasing function of suction. The pre-consolidation pressure increase with suction is shown inFigure 3(c), which defines the loading collapse (LC) curve of the Barcelona model.
During some tests (Figure 3(d)), the loading process was stopped in order to perform a waterflooding and to quantify the induced stress–strain modifications of the chalk sample. It can be
0
0.002
0.004
0.006
0.008
0.01
0.012
0.014
0.016
0.018
0 0.5 1 1.5 2.5 3 3.5
Suction [MPa]
Ela
stic
co
mp
ress
ibili
ty κ
(a)
0.00
0.02
0.04
0.06
0.08
0.10
0.12
0.14
0 0.5 1 1.5 2 2.5 3 3.5 4
Suction [MPa]
Co
mp
ress
ibili
ty in
dex
λ
Numerical model
Experiment
(b)
0
1
2
3
0 4 8 10 12
P0 [MPa]
Su
ctio
n [
MP
a]
LC curve
Experiment point
(c)
0.5
0.55
0.6
0.65
0.7
0.75
0.1 1 10 100
Log(σv) [MPa]
Vo
id r
atio
- e
s=3 MPa
s=0.993 MPas=0 MPa
(d)
2
2 6
Figure 3. Suction-controlled oedometer tests.
Copyright # 2002 John Wiley & Sons, Ltd. Int. J. Numer. Anal. Meth. Geomech. 2002; 26:897–924
F. COLLIN ET AL.900

observed that water injection leads to a significant compaction (decreasing void ratio), whilst theassociated decrease in the vertical stress (relaxation) is due to the standstill of loading stage ontriaxial press. It is worth noting that during subsequent loading after water flooding, all thesamples behave as an overconsolidated chalk, and the slope of the compressibility curve reachesthe continuity of the initial virgin compressibility slope.
3. CONSTITUTIVE LAW
Based on the experimental results, in most of constitutive models two plastic mechanisms areconsidered: pore collapse and frictional failure, with two independent yield surfaces [6,20]. Inthis case, special care has to be taken for the intersection of the yield surfaces, which is an apexthat involves numerical difficulties. However, models using only one yield surface have also beendeveloped [8,9]. The expression of these constitutive laws is more complex but including noapex. Difficulties can appear when defining the hardening law, because the two basic physicalmechanisms are necessarily coupled. Another solution for apex problems is the use of anadditional surface to join the two principal yield surfaces, in order to ensure a continuous slope.The apex is avoided, with a total independence between the two mechanisms. In this paper, thefirst approach is used and two different yield surfaces are defined.
In order to account for suction effects, it is necessary to consider the evolution of oil andwater pressures. It can be done by considering in the model the multi-phase flow.
3.1. Mechanical model
The two evidenced plastic mechanisms are modelled by two yield surfaces combined within acap model: the modified cam-clay model is used for pore collapse whereas an internal frictionmodel for friction failure. Considering that the chalk strength under extension can beoverestimated using an internal friction model, a third yield surface is adopted to limit tractionstresses.
Obviously, the so-defined yield curve is not continuously derivable at the intersections,leading to numerical difficulties. However, recent publications provided an elegant way to solvethis problem [21].
As far as the suction effect is concerned, the model adopts the approach developedin the Barcelona model [3] where the suction is considered as an independent variable.Suction modifies yield surfaces and suction variations provide reversible and irreversibledeformations.
3.1.1. General formulation. The general elastoplastic relations are formulated in rate form. Thestrain rate ’EEij is composed of a mechanical part ’EEmij and of a suction one ’EEsij: Each contribution ispartitioned in an elastic ð’EEm;e
ij or ’EEs;eij Þ and a plastic component ð’EEm;pij or ’EEs;pij Þ:
’EEij ¼ ’EEmij þ ’EEsij
¼ ’EEm;eij þ ’EEs;eij þ ’EEm;p
ij þ ’EEs;pij ð1Þ
The mechanical elastic part is related to the stress rate ’sskl through Hooke’s law:
’sskl ¼ Ceklij’EE
m;eij ð2Þ
Copyright # 2002 John Wiley & Sons, Ltd. Int. J. Numer. Anal. Meth. Geomech. 2002; 26:897–924
MODELLING THE MECHANICAL BEHAVIOUR OF CHALK 901

where the compliance elastic tensor is defined by
Ceklij ¼
E1þ n
dikdjl þEn
ð1þ nÞð1� 2nÞdijdkl ð3Þ
with the Young modulus E and the Poisson coefficient n:The elastic deformations induced by suction are given by the following relation which links
the strain rate to the suction rate:
’EEs;eij ¼ks
ð1þ eÞ’ss
ðsþ patÞdij ¼ heij ’ss ð4Þ
where e is the void ratio, pat is the atmospheric pressure and ks is the elastic coefficient defined inBarcelona model.
The suction is by definition equal to the difference of the oil pressure and water pressure.For the frictional plastic part, a general framework of non-associated plasticity is adopted in
order to limit dilatancy. In that case, the plastic flow rate is derived from a plastic potential ga:
’EEm;pij ¼ ’llp
@ga@sij
ð5Þ
where ’llp is a scalar multiplicator and ga is the plastic potential related to the plastic mecha-nism a:
The other yield surfaces are written in an associated plasticity ðfa � gaÞ:Irreversible deformations are induced when the suction becomes higher than a suction level s0:
The plastic strain is linked to suction rate with the following relation:
’EEs;pij ¼ls � ksð1þ eÞ
’ss
ðsþ patÞdij ¼ hpij ’ss ð6Þ
where ls is the plastic coefficient defined in Barcelona model.Equations (1) and (2) can be rewritten as
’EEij ¼ ’EEm;eij þ ’EEs;eij þ ’EEm;p
ij þ ’EEs;pij
¼Ce�1klij ’sskl þ heij ’ssþ ’llp
@ga@sij
þ hpij ’ss ð7Þ
’sskl ¼ Ceklij ’EEij � heij ’ss� ’llp
@ga@sij
� hpij ’ss� �
ð8Þ
Considering a general hardening/softening plastic law depending on the internal variable z;the consistency condition related to the yield function fa can be formulated as
’ff a ¼@fa@sij
’ssij þ@fa@s
’ssþ@fa@z
’zz ¼ 0 ð9Þ
Substituting (8) into (9), the expression of multiplicator ’llp can be found and the stress ratecan be computed as
’sskl ¼ ðCeklij � Cp
klijÞ’EEij �Mkl ’ss ð10Þ
The first term of the right part is the classical expression of an elasto-plastic formulation. Thesecond term is related to the suction.
Copyright # 2002 John Wiley & Sons, Ltd. Int. J. Numer. Anal. Meth. Geomech. 2002; 26:897–924
F. COLLIN ET AL.902

3.1.2. Cam-Clay model. In the modified Cam-Clay model used, the elastic behaviour can beeither linear or non-linear. The Cam-Clay yield surface is an ellipse (Figure 4) in the first andsecond stress invariant plane
Is ¼ sii; II #ss ¼
ffiffiffiffiffiffiffiffiffiffiffiffiffi1
2#ssij #ssij
r; #ssij ¼ sij �
Is
3dij
!:
f1 � II2#ss þ m2 Is þ3c
tan fC
� �ðIs � 3p0Þ ¼ 0
ð11Þ
where c is the cohesion, fC is the friction angle in compression path, p0 is the pre-consolidationpressure which defines the size of the yield surface and m is a coefficient introduced to take intoaccount the effect of the third stress invariant III #ss ¼ 1
3#ssij #ssjk #sski:
The coefficient m is defined by
m ¼ að1þ b sin 3bÞn ð12Þ
where
b ¼ �1
3sin�1 3
ffiffiffi3
p2
III #ss
II3#ss
!ð13Þ
b is the Lode angle which can be derived from the definition of the third stress invariant, andthe three parameters a; b and n must verify some convexity conditions [22]. It should be notedthat the introduction of b leads to a non-circular surface shape in the shear plan.
The plastic flow is supposed to be associated f1 � g1: The internal variable is the pre-consolidation pressure p0; which depends on the volumetric plastic deformations dEpv and hasthe following kinematic equation:
dp0 ¼1þ el� k
p0 dEpv ð14Þ
where l is the compression coefficient and k is the elastic coefficient. The volumetric plasticdeformation rate is given by
’EEpv ¼ ’llp@g1@sij
dij ð15Þ
Using this relation, either hardening or softening could appear according to the sign of thevolumetric plastic deformations (Figure 5). However, in the cap model, the softening zone willnot be considered.
3c/tan φC 3p0
Iσ
II σ
Figure 4. Cam-Clay model}ðIs; II #ssÞ plane.
Copyright # 2002 John Wiley & Sons, Ltd. Int. J. Numer. Anal. Meth. Geomech. 2002; 26:897–924
MODELLING THE MECHANICAL BEHAVIOUR OF CHALK 903

3.1.3. Internal friction model. A more sophisticated model can be built from the cone ofDrucker–Prager by introducing a dependence on the Lode’s angle b; in order to match moreclosely the Mohr–Coulomb criterion. It consists of a smoothed Mohr–Coulomb plasticitysurface. The formulation proposed by Barnichon [23], based on the idea of Van Eekelen [22], isused. It can be written in a very similar way to the criterion of Drucker–Prager:
f2 � II #ss � m Is þ3c
tanfC
� �¼ 0 ð16Þ
A non-associated plasticity is considered here using the dilatancy angle c; which depends onthe hardening process:
g2 � II #ss � m0 Is þ3c
tanfC
� �¼ 0 ð17Þ
where m0 has the same definition of coefficient m (12), using dilatancy angle instead of frictionalangle.
The internal variables are the frictional angles fC (for compression paths), fE (for extensionpaths) and the cohesion c: The following hardening relations are defined using the plasticequivalent deformations Epeq:
fC ¼ fC0 þðfCf � fC0ÞE
peq
Bp þ Epeq
fE ¼ fE0 þðfEf � fE0ÞE
peq
Bp þ Epeq
c ¼ c0 þðcf � c0ÞEpeqBc þ Epeq
ð18Þ
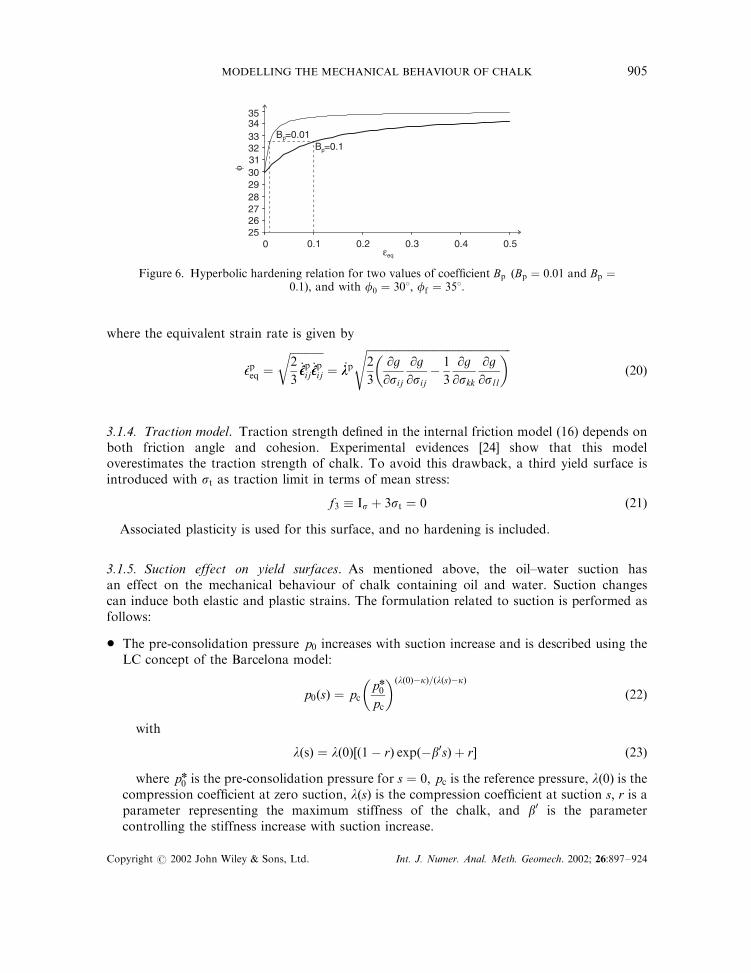
where subscripts 0 and f mean the initial and the final values, respectively; Bp and Bc are theparameters defining the plastic deformation for which half of the internal variable hardening isachieved. Figure 6 presents the effect of Bp on the hyperbolic hardening relation.
The equivalent strain Epeq represents the cumulated equivalent plastic strains during time t:
Epeq ¼Z t
0
’EEpeq dt ð19Þ
3c/tan φC 3p0
Iσ
IIσ
HardeningSoftening εp
εv
p
Figure 5. Hardening–softening zones.
Copyright # 2002 John Wiley & Sons, Ltd. Int. J. Numer. Anal. Meth. Geomech. 2002; 26:897–924
F. COLLIN ET AL.904
where the equivalent strain rate is given by
’EEpeq ¼
ffiffiffiffiffiffiffiffiffiffiffiffi2
3’#EE#EEpij’#EE#EE
pij
r¼ ’llp
ffiffiffiffiffiffiffiffiffiffiffiffiffiffiffiffiffiffiffiffiffiffiffiffiffiffiffiffiffiffiffiffiffiffiffiffiffiffiffiffiffiffiffiffiffiffiffiffiffiffiffiffi2
3
@g@sij
@g@sij
�1
3
@g@skk
@g@sll
� �sð20Þ
3.1.4. Traction model. Traction strength defined in the internal friction model (16) depends onboth friction angle and cohesion. Experimental evidences [24] show that this modeloverestimates the traction strength of chalk. To avoid this drawback, a third yield surface isintroduced with st as traction limit in terms of mean stress:
f3 � Is þ 3st ¼ 0 ð21Þ
Associated plasticity is used for this surface, and no hardening is included.
3.1.5. Suction effect on yield surfaces. As mentioned above, the oil–water suction hasan effect on the mechanical behaviour of chalk containing oil and water. Suction changescan induce both elastic and plastic strains. The formulation related to suction is performed asfollows:
* The pre-consolidation pressure p0 increases with suction increase and is described using theLC concept of the Barcelona model:
p0ðsÞ ¼ pcpn0
pc
� �ðlð0Þ�kÞ=ðlðsÞ�kÞ
ð22Þ
with
lðsÞ ¼ lð0Þ½ð1� rÞ expð�b0sÞ þ r� ð23Þ
where pn0 is the pre-consolidation pressure for s ¼ 0; pc is the reference pressure, lð0Þ is the
compression coefficient at zero suction, lðsÞ is the compression coefficient at suction s; r is aparameter representing the maximum stiffness of the chalk, and b0 is the parametercontrolling the stiffness increase with suction increase.
εeq
φ0 0.1 0.2 0.3 0.4 0.5
26272829303132333435
B =0.1p
B =0.01p
Figure 6. Hyperbolic hardening relation for two values of coefficient Bp ðBp ¼ 0:01 and Bp ¼0:1Þ; and with f0 ¼ 308; ff ¼ 358:
Copyright # 2002 John Wiley & Sons, Ltd. Int. J. Numer. Anal. Meth. Geomech. 2002; 26:897–924
MODELLING THE MECHANICAL BEHAVIOUR OF CHALK 905

* Cohesion increases with suction according to the relationship:
cðsÞ ¼ cð0Þ þ ks ð24Þ
where k is the material constant and cð0Þ is the cohesion at saturated state.* The friction angle is not suction dependent.* Suction is supposed to have no influence on traction strength st:* When suction becomes higher than a suction level s0; irreversible strains are created. A fourth
yield surface, the ‘suction increase’ (SI) curve defined in the Barcelona model, is introduced inour constitutive law:
f4 � s� s0 ¼ 0 ð25Þ
Figure 7 presents all the yield surfaces in the space ðIs; II #ss; sÞ:
3.1.6. Numerical integration. The existence of four yield surfaces in the model leads to complexlaw integration. One has to not only determine which plastic mechanism is active, but alsomanage the case where two surfaces are active. This case occurs at the intersection of twosurfaces: the apex regime is a combination of two mechanisms.
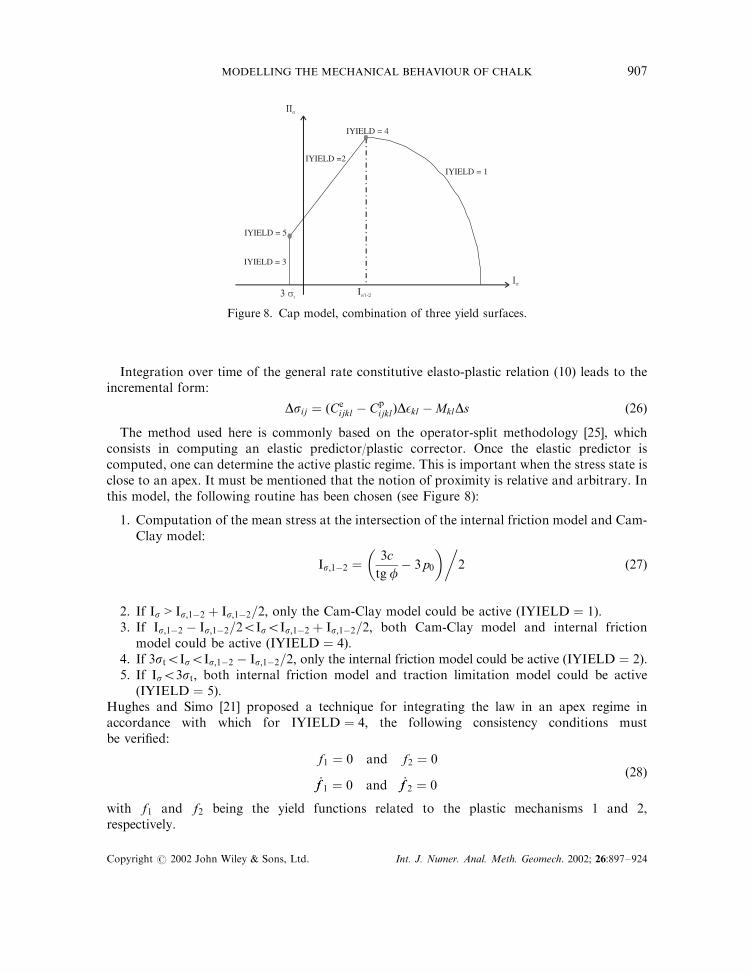
Figure 8 presents the three first yield curves with different possible plastic regimes:
* Cam-Clay mechanism active: IYIELD ¼ 1* Internal friction mechanism active: IYIELD ¼ 2* Traction limitation mechanism active: IYIELD ¼ 3* Both internal friction and Cam-Clay mechanisms active: IYIELD ¼ 4* Both internal friction and traction limitation mechanisms active: IYIELD ¼ 5:The SI curve is not taken into account here for sake of simplicity. Otherwise, the procedurewould be exactly the same.
s0
Figure 7. Yield surfaces in ðIs; II #ss; sÞ space.
Copyright # 2002 John Wiley & Sons, Ltd. Int. J. Numer. Anal. Meth. Geomech. 2002; 26:897–924
F. COLLIN ET AL.906
Integration over time of the general rate constitutive elasto-plastic relation (10) leads to theincremental form:
Dsij ¼ ðCeijkl � Cp
ijklÞDEkl �MklDs ð26Þ
The method used here is commonly based on the operator-split methodology [25], whichconsists in computing an elastic predictor/plastic corrector. Once the elastic predictor iscomputed, one can determine the active plastic regime. This is important when the stress state isclose to an apex. It must be mentioned that the notion of proximity is relative and arbitrary. Inthis model, the following routine has been chosen (see Figure 8):
1. Computation of the mean stress at the intersection of the internal friction model and Cam-Clay model:
Is;1�2 ¼3ctg f
� 3p0
� ��2 ð27Þ
2. If Is > Is;1�2 þ Is;1�2=2; only the Cam-Clay model could be active ðIYIELD ¼ 1Þ:3. If Is;1�2 � Is;1�2=25Is5Is;1�2 þ Is;1�2=2; both Cam-Clay model and internal friction
model could be active ðIYIELD ¼ 4Þ:4. If 3st5Is5Is;1�2 � Is;1�2=2; only the internal friction model could be active ðIYIELD ¼ 2Þ:5. If Is53st; both internal friction model and traction limitation model could be active
ðIYIELD ¼ 5Þ:Hughes and Simo [21] proposed a technique for integrating the law in an apex regime inaccordance with which for IYIELD ¼ 4; the following consistency conditions mustbe verified:
f1 ¼ 0 and f2 ¼ 0
’ff 1 ¼ 0 and ’ff 2 ¼ 0ð28Þ
with f1 and f2 being the yield functions related to the plastic mechanisms 1 and 2,respectively.
IYIELD = 1
IYIELD = 4
IYIELD =2
IYIELD = 5
IYIELD = 3
Figure 8. Cap model, combination of three yield surfaces.
Copyright # 2002 John Wiley & Sons, Ltd. Int. J. Numer. Anal. Meth. Geomech. 2002; 26:897–924
MODELLING THE MECHANICAL BEHAVIOUR OF CHALK 907
The plastic strain is a sum of the plastic strains due to the mechanisms 1 and 2:
’EEpij ¼ ’EEp;1ij þ ’EEp;2ij ¼ ’llp;1@g1@sij
þ ’llp;2@g2@sij
ð29Þ
where g1 and g2 are the plastic potentials associated, respectively, to the plastic mechanisms 1and 2.
Considering that yield surfaces ðfa; a ¼ 1; 2Þ are only function of the stress state ðsijÞ; suctions and hardening variables ðzaÞ; the Taylor’s series expansions for consistency conditions (28) aregiven as
faðsij þ Dspij; sþ Ds; za þ DzaÞ ¼ faðsij; s; zaÞ þ
@fa@sij
Dspij þ@fa@s
Ds
þ@fa@za
Dza; a ¼ 1; 2 ð30Þ
with
Dspij ¼ �CeijklDðE
p;1kl þ Ep;2kl Þ ð31Þ
Dza ¼dza
dEp;aDEp;a ð32Þ
Knowing that Equations (15) and (20) can be expressed in a more general form:
DEp;a ¼ ’llpVala ð33Þ
and using Equations (29), (31) and (32), Equation (30) can be rewritten as
fa ¼ faðsij; s; zaÞ �
@fa@sij
Ceijkl
X2n¼1
Dlp;n@gn@skl
!þ
@fa@s
Ds
þ Vala@fa@za
dza
dEp;aDlp;a ð34Þ
Knowing that in the plastic regime f ¼ 0; the previous relation gives an incrementalconsistency equation for each mechanisms.
f1ðsij; z1Þ �
@f1@sij
Ceijkl Dlp;1
@g1@skl
þ Dlp;2@g2@skl
� �þ
@f1@s
Ds
þ Val1@f1@z1
dz1
dEp;1Dlp;1 ¼ 0
f2ðsij; z2Þ �
@f2@sij
Ceijkl Dlp;1
@g1@skl
þ Dlp;2@g2@skl
� �þ
@f2@s
Ds
þ Val2@f2@z2
dz2
dEp;2Dlp;2 ¼ 0 ð35Þ
The system of equations provide the value of the two plastic multiplicators, Dlp;1 and Dlp;2:When both values are positive, the two mechanisms are activated simultaneously, however, ifone multiplicator is negative, the corresponding mechanism must not be activated, and thecomputation is reiterated only with the other yield surface.
Copyright # 2002 John Wiley & Sons, Ltd. Int. J. Numer. Anal. Meth. Geomech. 2002; 26:897–924
F. COLLIN ET AL.908

3.2. Diffusion model
Unsaturated flow formulation is used here, which is based on works in relation with the problemof nuclear waste disposal [26–28]. For each fluid (water and oil), balance equations are writtenby considering the variation of fluid storage equal to the difference between the input andoutput flows of an elementary volume. The unsaturated flow model derives from equations ofsaturated conditions. The permeability and the storage law have to be modified in partialsaturation conditions [29]. A generalized Darcy’s law defines the fluid motion [30]. Numerouscouplings existing between mechanics and flows are considered.
3.2.1. Water. The generalized Darcy’s law for multiphase porous medium gives liquid watervelocity:
%f w ¼ �
kr;wksatint
mw½gradðpwÞ þ grw gradðyÞ� ð36Þ
where%f w is the water macroscopic velocity, rw is the water density, pw is the liquid water
pressure, y is the vertical upward directed co-ordinate, g is the gravity acceleration, mw is thedynamic viscosity of the liquid water, ksatint is the intrinsic permeability of the medium and kr;w isthe water relative permeability which varies with respect to the saturation degree.
The balance equation includes the variation of water storage and the divergence of waterflows:
@
@tf n
w þ divðrw%f wÞ ¼ 0 ð37Þ
where t is the time and f nw is the water storage:
f n
w ¼ rwnSr;w ð38Þ
with n being the porosity and Sr;w the water saturation degree.The water density is dependent on water pressure according to
rw ¼ rw;0 1þpw � pw;0
ww
� �ð39Þ
where rw;0 is the water density at reference pressure pw;0; rw is the density at pressure pw and wwis the water compressibility.
3.2.2. Oil. Considering the generalized Darcy’s law for multiphase porous medium, oil velocityis given by
%f o ¼ �
kr;oksatint
mo½gradðpoÞ þ grogradðyÞ� ð40Þ
where%f o is the oil macroscopic velocity, ro is the oil density, po is the oil pressure, mo is the
dynamic viscosity of oil and kr;o is the oil relative permeability which depends on the oilsaturation degree Sr;o ¼ 1� Sr;w:
The oil balance equation is given by the relation:
@
@tf n
o þ divðro%f oÞ ¼ 0 ð41Þ
Copyright # 2002 John Wiley & Sons, Ltd. Int. J. Numer. Anal. Meth. Geomech. 2002; 26:897–924
MODELLING THE MECHANICAL BEHAVIOUR OF CHALK 909

and the oil storage is defined by
f n
o ¼ ronSr;o ð42Þ
The oil density is depending on oil pressure according to a relationship similar to Equation (39).
4. DETERMINATION OF PARAMETERS
The constitutive model needs the determination of the mechanical and hydraulic properties.Most of the parameters are defined using the tests performed during the project. For themechanical parameters identification, triaxial and oedometric tests data are used.
4.1. Triaxial test on saturated (by oil or water) samples
The tests were carried out on chalk samples saturated by two fluids: water and SoltrolTM
(normalized oil). Assuming a linear elasticity, the elastic parameters can be determined usingexperimental results presented in the plane ðev;p0Þ and ðeeq; II #ssÞ (Figure 9). According to themodel, the elastic part of the stress path is linear in these planes and the slopes are, respectively,K and 3G where K ¼ E=3ð1� 2nÞ is the bulk modulus and G ¼ E=2ð1þ nÞ is the shear modulus.Figure 9 shows that this assumed linearity is well verified. Table I gives the obtained elasticparameters.
Triaxial tests data are used to determine the pre-consolidation pressure p0 corresponding tothe point of slope change in the plane ðev;p0Þ (Figure 9), and the failure parameters c and f:Table II gives the mean values of these parameters.
Figure 10 shows the comparison between experimental results and numerical modelling fortriaxial tests on water- and oil-saturated samples. The experimental path of Figure 10 shows amechanical hysteresis, which is not captured by the model. However, the qualitative agreementshows that the constitutive law permits to describe the mechanical behaviour of unsaturatedchalk.
4.2. Oedometer tests under unsaturated conditions
Oedometer tests were performed for different suction values. Using the experimental results, theparameters k; l and p0 can be determined in a manner as follows (Figure 11).
Assuming a non-linear elasticity, the three parameters are determined as a function of thesuction (Figure 3). In the Barcelona model [3], the k coefficient is not suction dependent; asshown in Figure 3(a), the measured values of this parameter seem highly scattered.
Important scattering is also observed for the l values in Figure 3(b). A relationship is assumedwith respect to Equation (23). It should be noticed that according to the expression of LC curve(22) the l values has important effects on the shape of LC.
The function lðsÞ and the reference pressure pc were chosen in a manner that the LC curve fitswell with the experimental results (Figure 3(c)). The determined parameters are presented inTable III.
In Figure 12, the experimental results are compared to the numerical simulations at twosuction values (0 and 3 MPaÞ: At 3 MPa of suction, a water flooding was carried out (togetherwith a relaxation phenomenon) during the plastic phase. This flooding was not modelled. Aqualitative good agreement between experimental and numerical results is obtained.
Copyright # 2002 John Wiley & Sons, Ltd. Int. J. Numer. Anal. Meth. Geomech. 2002; 26:897–924
F. COLLIN ET AL.910

Water saturated sample
0
1
2
3
4
5
6
7
8
0 5 10 15 20 25
εV [°/°°]
εeq [°/°°]
p′[
MP
a]pyield
K
Water saturated sample
0
1
2
3
4
5
6
0 2 4 6 8 10 12 14 16 18 20
3G
ΙΙσ [ [
MP
a ]
Figure 9. Determination of the elastic moduli and the yield points.
Table I. Elastic parameters.
Fluid Water SoltrolTM
E (MPa) 1366 1483n 0.20 0.18
Table II. Strength parameters.
Fluid Water SoltrolTM
jð8Þ 25 25c (MPa) 1.5 2.0p0 (MPa) 12 18
Copyright # 2002 John Wiley & Sons, Ltd. Int. J. Numer. Anal. Meth. Geomech. 2002; 26:897–924
MODELLING THE MECHANICAL BEHAVIOUR OF CHALK 911

0
5
10
15
20
25
30
0 10 20 30 40 50 60
εV [°/°°]
εaxial [°/°°]
εeq [°/°°]
p′[
MP
a]
Exp-Water
Model
Exp-Soltroll
Model
0
5
10
15
20
25
30
35
0 10 20 30 40 50 60 70
σaxi
al[M
Pa]
Exp-Water
Model
Exp-Soltroll
Model
0
2
4
6
8
10
12
0 5 10 15 20 25 30 35 40
ΙΙσ [ [
MP
a ]
Exp-Water
Model
Exp-Soltroll
Model
Figure 10. Comparison between triaxial experiments and numerical simulations.
Copyright # 2002 John Wiley & Sons, Ltd. Int. J. Numer. Anal. Meth. Geomech. 2002; 26:897–924
F. COLLIN ET AL.912

4.3. Hydraulic parameters and fluids properties
Suction affects deeply the mechanical behaviour of chalk. Thus, the fluid motion in the chalk isvery important to be considered through the hydraulic properties of the chalk and the propertiesof the pore fluids (water and SoltrolTM).
e
ln p′p′0
virgin lineλ
κ
Figure 11. Determination of parameters k; l and p0 using oedometer test results.
Table III. Parameters determined using oedometer tests.
lð0Þ r b ð1=MPaÞ pc (MPa) k p0 (MPa)
0.11 0.8 2.00 1.65 0.0085 7.05
0.5
0.52
0.54
0.56
0.58
0.6
0.62
0.64
0.66
0.68
0.7
0.1 1 10 100
Log σv
Vo
idra
tio
e Experiment (s=0 MPa)
Model
Experiment (s=3Mpa)
Model
Figure 12. Suction-controlled oedometer tests.
Copyright # 2002 John Wiley & Sons, Ltd. Int. J. Numer. Anal. Meth. Geomech. 2002; 26:897–924
MODELLING THE MECHANICAL BEHAVIOUR OF CHALK 913

4.3.1. Fluids properties. The main properties of the different fluids are the volumetric mass, thecompressibility and the dynamic viscosity. The following values are considered (Table IV).
The volumetric mass and the dynamic viscosity of SoltrolTM are those defined by the producer(PHILLIPS Chemical Company) for Soltrol 170TM: The value of the oil compressibility isunknown but has been taken by default the same as for water.
4.3.2. Hydraulic properties of chalk. The chalk hydraulic characteristics involve the porosity,the intrinsic and the relative permeability and the retention curve. The chalk porosity dependson chalk origin and its geological history. A mean value of 40% is assumed. The intrinsicpermeability ksatint can be calculated from permeability coefficient K in m/s using the followingrelation:
ksatint ¼Kmrg
ð43Þ
For Lixhe chalk, in saturated conditions, the intrinsic permeability ksatint is assumed to be equalto 1:688� 10�15 m2:
Chalk permeability to the different fluids depends on the degree of saturation. The waterpermeability kunsatint;wat and the oil permeability kunsatint;oil are calculated by
kunsatint;wat ¼ kr;water ksatint ; kunsatint;oil ¼ kr;oilksatint ð44Þ
with kr;water and kr;oil as water and oil relative permeability, respectively.Generally in unsaturated soils mechanics, the relative permeability is supposed to be a
function of the saturation degree. Ebeltoft et al. [31] worked on three chalks (A, B and C) andobtained an increase in permeability with the saturation degree (Figures 13 and 14), which is inagreement with common results obtained for unsaturated soils. These experiment data are fitted
Oil relative permeability
0
0.1
0.2
0.3
0.4
0.5
0.6
0.7
0.8
0.9
1
0 0.2 0.4 0.6 0.8 1
Saturation
Rel
ativ
e p
erm
eab
ility
A
B
C
Numerical
Figure 13. Oil relative permeability (A,B,C curves: experiment [31]).
Copyright # 2002 John Wiley & Sons, Ltd. Int. J. Numer. Anal. Meth. Geomech. 2002; 26:897–924
F. COLLIN ET AL.914

using the following expressions [32]:
krel;oil ¼ ð1� SeÞ2ð1� S5=3e Þ ð45Þ
krel;water ¼ðSr;w � SresÞ
6
ðSr;field � SresÞ6
ð46Þ
where Se ¼ ðSrw � SresÞ=ðSr;field � SresÞ is the effective saturation, Sres is the residual saturationand Sr;field is the field saturation.
The experimental curve fitting (see Figures 13 and 14) gives Sres ¼ 0:01; Sr;field ¼ 1:The porosimetric curve of Lixhe chalk (Figure 15) provides us fitting the retention curve. The
following expression is proposed:
Sr;w ¼CSR3
parctan �
sþ CSR2
CSR1
� �þ
CSR3
2ð47Þ
where CSR1, CSR2, and CSR3 are soil constants with values CSR1 ¼ 100 kPa; CSR2 ¼�325 kPa and CSR3 ¼ 1:
Retention curves found in the literature [31] (curves A, B and C in Figure 15) are similar tothat for Lixhe chalk.
Water relative permeability
0
0.1
0.2
0.3
0.4
0.5
0.6
0.7
0.8
0.9
1
0 0.1 0.2 0.3 0.4 0.5 0.6 0.7 0.8 0.9 1Saturation
Rel
ativ
ep
erm
eab
ility
ABCNumerical
Figure 14. Water relative permeability (A, B, C curves: experiment [31]).
Table IV. Fluids properties.
Fluid Water SoltrolTM
Volumetric mass r0 at atmospheric pressure p0 1000 kg=m3 782:551 kg=m3
Compressibility w 3� 109 Pa 3� 109 PaDynamic viscosity m at T ¼ 208C 1:009� 10�3 Pa s 3:0085� 10�3 Pa s
Copyright # 2002 John Wiley & Sons, Ltd. Int. J. Numer. Anal. Meth. Geomech. 2002; 26:897–924
MODELLING THE MECHANICAL BEHAVIOUR OF CHALK 915

It should be mentioned that all these curves are defined for drying paths. However, in the caseof water flooding it involves rather wetting paths. Moreover, during a water-flooding test (seeSection 5), water drives out the oil present in the pores but a residual quantity of oil (about30%) remains in the sample. This corresponds to the well-known hysteresis phenomenon. Tomatch this experimental result, some numerical modifications are necessary, giving rise to theretention curve presented in Figure 16 and defined by the following parameters:
CSR1 ¼ 1:0� 105 Pa; CSR2 ¼ �9:50� 104 Pa and CSR3 ¼ 0:75 for wetting path.Using this curve, ‘negative’ suctions appear for saturation degree more than 70%. Physically,
this negative suction means that a positive water pressure is necessary to increase the watersaturation up to 100%. In the mechanical model, the negative suction is not taken into account;if the suction is lower than zero, its effect on the stress state vanishes.
4.4. Discussions
Information about the mechanical behaviour and about the mechanical parameters has beenobtained thanks to triaxial tests (including an initial isotropic stress path) and to oedometertests. However, these two tests are rather different from the point of view of the devices, of themethod of loading, of the stress state, of the friction effect on measures, and on the loading rate(involving different creep effects). Therefore, the two approaches of the mechanical parametersmay not be fully consistent, and some choices or compromises have to be put.
In the following, we mainly base our model on the triaxial tests, but some data are also givenfrom the oedometer ones. The adopted values are given in the Table V.
In the following section, a water-flooding test will be modelled. During this test, the stressstate will not change highly. Therefore, linear as well as non-linear elasticity should give similarresults, as the bulk modulus is similar for the two kinds of formulation (Figure 17).
0
0.1
0.2
0.3
0.4
0.5
0.6
0.7
0.8
0.9
1
0 200 400 600 800 1000 1200 1400
Suction [kPa]
Saturation
A
B
C
Porosimetric
Numerical
Figure 15. Retention curves of chalk (A, B, C curves [31] and Pasachalk experimental results).
Copyright # 2002 John Wiley & Sons, Ltd. Int. J. Numer. Anal. Meth. Geomech. 2002; 26:897–924
F. COLLIN ET AL.916

The initial pre-consolidation threshold (at the initial suction level) is often given by theproblem idealization. It is especially the case of the water-flooding test described in the nextsection.
Table V. Parameters of the cap model.
Parameter Value Unit Origin
Non-linear elasticityk 0.0085 } Oedometern 0.2 } Oedometer
Frictional plastic mechanismfwater 25 Degree Triaxialfoil 25 Degree Triaxialcwater 15 MPa Triaxialcoil 2.0 MPa Triaxialk 0.167 } }
Cam-Clayþsuction LCpo;water 12 MPa Triaxial-isotropicpo;oil 18 MPa Triaxial-isotropic
Hardening rulelð0Þ 0.18 } Triaxialr 0.95 } Triaxialb0 8.0 MPa�1 Triaxialpc 3� 10�3 MPa Triaxial
0
10
20
30
40
50
60
70
80
90
100
-0.5 -0.3 -0.1 0.1 0.3 0.5 0.7 0.9 1.1 1.3
Suction [MPa]
Sat
ura
tio
n[%
]
POROSIMETRIC
Numerical - DryingpathNumerical - Wettingpath
Figure 16. Modified retention curve for wetting path.
Copyright # 2002 John Wiley & Sons, Ltd. Int. J. Numer. Anal. Meth. Geomech. 2002; 26:897–924
MODELLING THE MECHANICAL BEHAVIOUR OF CHALK 917

5. WATER-FLOODING TEST MODELLING
The water-flooding test performed on Lixhe chalk initially saturated by SoltrolTM [33] allows tovalidate the developed model and to complete the set of parameters.
5.1. Description
The sample with an initial porosity n ¼ 40:55% has a dimension of 25 mm diameter and 50 mmheight. Four strain gauges are glued on the sample (located respectively from the injection sideat a distance of 4, 12, 22 and 30 mm), which aims to monitoring the evolution of the axialdeformation with the water front. In addition, an axial LVDT records the global axialdeformation. Figure 18 shows the sample with the four strain gauges G1, G2, G3 and G4.
Bulk modulus evolution
0
500
1000
1500
2000
2500
3000
3500
4000
4500
0 2 4 6 8 10 12 14 16 18 20
Mean stress [MPa]
Bu
lkm
od
ulu
s[M
Pa]
Non-linear elasticity
Linear elasticity
Figure 17. Comparison between linear and non-linear elasticity.
25 mm
50 m
m
Water
Injection
G1
G2
G3
G4
Figure 18. Sketch of the sample for the water-flooding test.
Copyright # 2002 John Wiley & Sons, Ltd. Int. J. Numer. Anal. Meth. Geomech. 2002; 26:897–924
F. COLLIN ET AL.918

The initial stress state is isotropic at a level of 18 MPa; just below the expected pore collapsefor ‘oil-like’ plug. The injection water pressure is equal to 0:9 MPa: Figure 19 shows the strain-gauges response as a function of the ‘theoretical’ displacement of injection front. Thedisplacement of the injection front was based on the assumption of a piston-like behaviour andof oil saturation behind the front equal to 30% (this value comes from usual results ofpetrophysical laboratory experiments). Just before the front, a small swelling is measured by thestrain gauges but a severe and quasi-instantaneous compaction appears at the water front. Thefinal amplitude of the compaction is around 2–3%.
5.2. Numerical simulations
The modelling of the water-flooding test needs the definition of the initial and boundaryconditions.
* Initial conditions:The oil pressure is fixed at 100 kPa but the water pressure is unknown. As the sample is quiteoil saturated, the initial suction may be estimated using the retention curve. If an initialsuction of 3 MPa is chosen, it corresponds to a water pressure equal to �2:9 MPa and watersaturation equal to 1.23%.
The initial total stress state is isotropic at a level of 18 MPa:* Boundary conditions:
At the bottom of the sample, the water pressure is brought to 0:9 MPa: The oil can go out thesample at the upper part where oil pressure is fixed at 100 kPa: The boundary condition forthe water at top of the plug is difficult to define: if the boundary is considered as impervious,no water goes out of the sample even if the water front reaches the top; if the water pressure isfixed at the top, the pressure will remain at the initial value. A boundary element wasdeveloped for this problem: the boundary is impermeable when the pressure is lower than a
0
10
20
30
40
50
0 5 10 15 20 25 30 35 40
Front displacement (mm)
Def
orm
atio
nof
stra
in-g
ages
(10-
3)
Position of strain-gauge 4
Position of strain-gauge 3
Position of strain-gauge 2
Position of strain-gauge 1
Figure 19. Axial strains during water-flooding test.
Copyright # 2002 John Wiley & Sons, Ltd. Int. J. Numer. Anal. Meth. Geomech. 2002; 26:897–924
MODELLING THE MECHANICAL BEHAVIOUR OF CHALK 919

given value. In our case, the value corresponds to the atmospheric pressure. Figure 20 definesthe relation between the water outflow qw and the water pressure at the top of the sample.
Two types of modelling were performed: a one-dimension axisymetric case and a two-dimensionaxisymetric case. The one-dimension model is useful to perform a sensitivity study.
The permeability coefficients are defined by relation (44). When the sample is oil saturatedaccording to this relation, the water relative permeability coefficient tends to zero. For anumerical reason, the permeability may not be null and a residual minimum value of thepermeability coefficient is defined. This coefficient was proved being important. Indeed,numerical problems can appear due to the severe variation of saturation linked to the shape ofthe retention curve. In that case, the saturation degree, and therefore the permeability which is afunction of saturation, can vary deeply from one element to another.
If a too low value is chosen for this coefficient, the pressure response presents oscillations.Satisfactory numerical results cannot be obtained by using different integration schemes(implicit or Galerkin) and different numbers of elements. A minimum relative permeabilityvalue of 0.01 was proved being satisfactory.
The computations show clearly that the flow is a one-dimension problem. However, the stressand strain fields are bi-dimensional. Indeed, when collapse appears near the water front, thesample is no more cylindrical.
Figure 21 shows the water front, which divides the sample into two parts. The lower part wasreached by the water front corresponding to water saturation near 70% and porosity of about38%, whereas the upper part remains near the initial state.
In Figure 22 the mean stress and the axial stress in the sample are shown. It is observed thatwhen the chalk is reached by the water front, the axial strain is compressive with a value ofabout 2.5% and the axial deformation in the oil-saturated part is a little extensive, about 0.25%.This result is consistent with the porosity change in Figure 21.
The comparison of the numerical results with the experimental data is shown in Figure 23.The injected water volume evolution is similar (Figure 23(a)). After 3500 s; the water frontreaches the top; no more oil is driven out of the sample and the water is produced at the top. Thesaturation profile (Figure 23(b)) shows clearly the water front displacement and the finalsaturation of 70%.
The computed axial strains at the four gauges present a small swelling followed by a severecollapse of around 2.5% (Figure 23(c)). The experiment value of strain stops at 1%, which
pw
qw
100 kPa
Figure 20. Boundary condition for water at the top of the sample.
Copyright # 2002 John Wiley & Sons, Ltd. Int. J. Numer. Anal. Meth. Geomech. 2002; 26:897–924
F. COLLIN ET AL.920

corresponds to the gauge failure. Assuming a piston-like displacement of the water front.Figure 23(d) shows that the compressive strains (measured by gauges) appear when the waterfront reaches the gauges.
Figure 22. Mean stress and axial strain in the sample.
52
105
158
211
263
316
369
422
474
527
580
633
685
* 1.000E-03
378
381
384
386
389
391
394
397
399
402
404
407
* 1.000E-03
Saturation Porosity
Figure 21. Water saturation and porosity in the sample.
Copyright # 2002 John Wiley & Sons, Ltd. Int. J. Numer. Anal. Meth. Geomech. 2002; 26:897–924
MODELLING THE MECHANICAL BEHAVIOUR OF CHALK 921

The good consistence obtained between the numerical simulation and the experimentalresponses shows the validation of the developed model for describing the chalk behaviourduring water injection.
6. CONCLUSIONS
A multimechanism model is developed to describe the chalk behaviour during water flooding.The oil–water suction effects are taken into account by integrating the Barcelona model forunsaturated soils in the model.
Experimental results obtained in the Pasachalk project or found in the literature were used todefine the parameters. A detailed description of the procedure for the determination of themechanical parameters was given, which is based on triaxial and oedometer tests results. Theobtained values of the parameters are discussed and slightly modified in order to define a set ofparameters representing better the chalk behaviour.
The comparison between experimental and numerical results were performed in two levels:triaxial and oedometric tests, and water-flooding test. Satisfactory results were generallyobtained, showing the pertinence of the model for the chalk compaction problem due to waterinjection.
0
1
2
3
4
5
6
7
8
0 500 1000 1500 2000 2500 3000 3500 4000
Time [sec]
Vo
lum
e [c
m3 ]
Injected water
Evacuated Soltrol
Evacuated water
LGIH-Injected Water
(a) Volume evolution
0.000
0.005
0.010
0.015
0.020
0.025
0.030
0.035
0.040
0.045
0.050
0.00 0.10 0.20 0.30 0.40 0.50 0.60 0.70 0.80
Saturation
Y a
xis
Initial
t = 50 s
t = 500 s
t = 1000 s
t = 2000 s
t = 3000 s
t = 4000 s
(b) Saturation profile
-10
-5
0
5
10
15
20
25
0 500 1000 1500 2000 2500 3000 3500
Time [sec]
G1-ExpGauge 1G2-ExpGauge 2G3-ExpGauge 3G4-ExpGauge 4
(c) Axial deformation evolution
-10
-5
0
5
10
15
20
25
0.0 0.5 1.0 1.5 2.0 2.5 3.0 3.5 4.0 4.5 5.0
Water front displacement [cm]
Axi
al s
trai
ns
[°/°
°]
Axi
al d
efo
rmat
ion
[°/
°°]
Gauge 1-Num
Gauge 2-Num
Gauge 3-Num
Gauge 4-Num
Gauge 1 Gauge 2 Gauge 3 Gauge 4
(d) Water front displacement
Figure 23. Numerical simulation of the water-flooding test.
Copyright # 2002 John Wiley & Sons, Ltd. Int. J. Numer. Anal. Meth. Geomech. 2002; 26:897–924
F. COLLIN ET AL.922

ACKNOWLEDGEMENTS
The authors are grateful to the EC-Joule programme, the FNRS and the Communaut!ee Fran-caise de
Belgique for their supports.
REFERENCES
1. Delage P, Schroeder C, Cui YJ. Subsidence and capillary effects in chalk. Proceedings of the Eurock 96, Turin, 1996;1291–1298.
2. Masson P, Laurent LJ, D’Heur M. La g!eeologie, de la mer du Nord, Bilan de 15 ann!eees d’exploitation p!eetroli"eere.Hommage "aa L!eeon Calembert, Georges, (ed.). Thone: Li!eege, 1980; 147–181.
3. Alonso EE, Gens A, Josa A. A constitutive model for partially saturated soils. G!eeotechnique 1990; 40(3):405–430.4. Bolzon G, Schrefler BA. State surfaces of partially saturated soils: an effective pressure approach. Appl. Mech. Rev,
American Society of Mechanical Engineers, October 1995; 48(10):643–649.5. Monjoie A, Schroeder C, Prignon P, Yernaux C, da Silva F, Debande G. Establishment of constitutive laws of chalk
and long term tests. Proceedings of the 3rd Sea Chalk Symposium. Copenhagen, June 1990.6. Shao JF, Henry JP. Development of an elastoplastic model for porous rock. International Journal of Plasticity 1991;
7:1–13.7. Plischke B, Pisarsky L. Numerical simulation of the stress field close to a producing well. Proceedings of the 3rd Sea
Chalk Symposium, Copenhagen, June 1990.8. Papamichos E, Brignoli M, Santarelli FJ. An experimental and theoretical study of partially saturated collapsible
rock. Mechanics of Cohesive-Frictional Materials 1997; 2:251–278.9. Brignoli M, Santarelli FJ, Righetti C. Capillary phenomena in an impure chalk. Proceedings of the Eurock’94, Delft,
1994.10. Piau JM, Maury V. Basic mechanical modelisation of chalk/water interaction. Proceedings of the 1st International
Conference on Unsaturated Soils, Paris, 1995.11. Piau JM, Maury V. Mechanical effects of water injection on chalk reservoirs. Paper SPE/ISRM 28133, EUROCK,
1994.12. Maury V, Piau JM, Halle G. Subsidence induced by water injection in water sensitive reservoir rocks: the example of
Ekofisk. Proceedings of the 5th North Sea Chalk Symposium, Reims, October 1996.13. Homand S, Shao JF. Mechanical behaviour of a porous chalk and effect of saturating fluid. Mechanics of Cohesive-
Frictional Materials 2000; 5:583–606.14. Plischke B. Some aspects of numerical simulation of water-induced chalk compaction. JCR5 Proceedings of the 5th
North Sea Chalk Symposium, Reims, October 1996.15. Monjoie A, Schroeder C, Da Silva F, Debande G, Halleux L, Deti"eege C, Poot B. Mechanical behaviour of chalks.
Proceedings of the North Sea Chalk Symposium, Stavanger, 1985.16. Da Silva F, Monjoie A, Schroeder C, Prignon P, Yernaux C, Debande G. Establishment of constitutive laws of
chalks and long term tests. Third North Sea Chalk Symposium, Copenhaegen, 1990.17. Andersen MA. Petroleum Research in North Sea Chalk}Public. Rogaland Research: Stavanger, 1995.18. Delage P, Suraj De Silva GPR, Vicol T. Suction controlled testing of non saturated soils with an osmotic
consolidometer. Proceedings of the 7th International Conference on Expansive Soils, Dallas, 1992; 206–211.19. Cui YJ. Etude du comportement d’un limon compact!ee non satur!ee et de sa mod!eelisation dans un cadre !eelasto-
plastique. Th"eese de doctorat de l’Ecole Nationale des Ponts et Chauss!eees, 1993; 297.20. Schroeder C, Shao JF. Plastic deformation and capillary effects in chalks. Proceedings of the 5th North Sea Chalk
Symposium, Reims, 1996.21. Simo JC, Hughes TJR. Computational Inelasticity. Interdisciplinary Applied Mathematics 1998; 7:198–218.22. Van Eekelen HAM. Isotropic yield surfaces in three dimensions for use in soil mechanics. International Journal for
Numerical and Analytical Methods in Geomechanics 1980; 4:98–101.23. Barnichon JD. Finite element modelling in structural and petroleum geology. Th"eese de doctorat, MSM, Universit!ee
de Li!eege 1998; 186.24. Risnes R, Korsnes RI, Vatne TA. Tensional strength of chalks in direct and Brazilian tests. Proceedings of the 9th
International Congress on Rock Mechanics, Paris. Balkema: Rotterdam, 1999.25. Simo JC, Taylor RL. Consistent tangent operators for rate-independent elastoplasticity. Computer Methods in
Applied Mechanics and Engineering 1985; 48:101–118.26. Alonso EE, Alcoverro J. CATSIUS CLAY Project}calculation and testing of behaviour of unsaturated clay as
barrier in radioactive waste repositories. Publicacion tecnica num. 10/99, 11/99 & 12/99 ENRESA, Madrid, 1999.27. Olivella S, Gens A, Carrera J, Alonso EE. Numerical formulation for a simulator (CODE BRIGHT) for the coupled
analysis of saline media. Engineering Computations 1996; 13(7):87–112.
Copyright # 2002 John Wiley & Sons, Ltd. Int. J. Numer. Anal. Meth. Geomech. 2002; 26:897–924
MODELLING THE MECHANICAL BEHAVIOUR OF CHALK 923

28. Thomas HR, He Y. Analysis of coupled heat, moisture and air transfer in a deformable unsaturated soil.G!eeotechnique 1995; 45(4):677–689.
29. Fredlund DG, Rahardjo H. Soil Mechanics for Unsaturated Soils. Wiley-Interscience Publication, John Wiley &Sons Inc. New York, 1993.
30. Bear J. Dynamics of Fluids in Porous Media, American Elsevier Environmental Science Series. Elsevier: New York,1972.
31. Ebeltoft E, Nordtvedt JE, Sylte A, Oxnevad IEI. Two- and three-phase relative permeabilities and capillarypressures in chalks. JCR5 Proceedings of the 5th North Sea Chalk Symposium, Reims, 1996.
32. Brooks RH, Corey AT. Hydraulic Properties of Porous Media. Hydrology papers, Colorado State University, 1964.33. Schroeder C, Bois AP, Maury V, Hall!ee G. Water/chalk (or collapsible soil) interaction: Part II. Results of tests
performed in laboratory on Lixhe chalk to calibrate water/chalk models. SPE/ISRM Eurock’98 Trondheim (SPE47587), 1998.
Copyright # 2002 John Wiley & Sons, Ltd. Int. J. Numer. Anal. Meth. Geomech. 2002; 26:897–924
F. COLLIN ET AL.924