Gene regulation mediating fiber-type transformation in skeletal muscle cells is partly glucose-and...
13
Gene regulation mediating fiber-type transformation in skeletal muscle cells is partly glucose- and ChREBP-dependent Nina Hanke a , Renate J. Scheibe b , Georgi Manukjan a , David Ewers c , Patrick K. Umeda d , Kin-Chow Chang e , Hans-Peter Kubis f , Gerolf Gros a , Joachim D. Meissner a, ⁎ a Department of Physiology, Vegetative Physiology 4220, Hannover Medical School, Carl-Neuberg-Str. 1, 30625 Hannover, Germany b Department of Biochemistry, Hannover Medical School, Carl-Neuberg-Str. 1, 30625 Hannover, Germany c Department of Physiology, Neurophysiology, Hannover Medical School, Carl-Neuberg-Str. 1, 30625 Hannover, Germany d Department of Medicine, University of Alabama, 703 South 19th Street, Birmingham, AL 35294, USA e School of Veterinary Medicine and Science, University of Nottingham, Nr Loughborough, LE12 5RD Sutton Bonington, UK f College of Health and Behavioural Sciences, Bangor University, Holyhead Road, LL57 2PX Bangor, UK abstract article info Article history: Received 9 September 2010 Received in revised form 21 December 2010 Accepted 23 December 2010 Available online 4 January 2011 Keywords: Glucose Carbohydrate response element-binding protein (ChREBP) Glucose “Slow-to-fast” metabolic transformation Liver X receptor (LXR) Adaptations in the oxidative capacity of skeletal muscle cells can occur under several physiological or pathological conditions. We investigated the effect of increasing extracellular glucose concentration on the expression of markers of energy metabolism in primary skeletal muscle cells and the C2C12 muscle cell line. Growth of myotubes in 25 mM glucose (high glucose, HG) compared with 5.55 mM led to increases in the expression and activity of glyceraldehyde-3-phosphate dehydrogenase (GAPDH), a marker of glycolytic energy metabolism, while oxidative markers peroxisome proliferator-activated receptor γ coactivator 1α and citrate synthase decreased. HG induced metabolic adaptations as are seen during a slow-to-fast fiber transformation. Furthermore, HG increased fast myosin heavy chain (MHC) IId/x but did not change slow MHCI/β expression. Protein phosphatase 2A (PP2A) was shown to mediate the effects of HG on GAPDH and MHCIId/x. Carbohydrate response element-binding protein (ChREBP), a glucose-dependent transcription factor downstream of PP2A, partially mediated the effects of glucose on metabolic markers. The glucose- induced increase in PP2A activity was associated with an increase in p38 mitogen-activated protein kinase activity, which presumably mediates the increase in MHCIId/x promoter activity. Liver X receptor, another possible mediator of glucose effects, induced only an incomplete metabolic shift, mainly increasing the expression of the glycolytic marker. Taken together, HG induces a partial slow-to-fast transformation comprising metabolic enzymes together with an increased expression of MHCIId/x. This work demonstrates a functional role for ChREBP in determining the metabolic type of muscle fibers and highlights the importance of glucose as a signaling molecule in muscle. © 2011 Elsevier B.V. All rights reserved. 1. Introduction Skeletal muscle is composed of fibers with different contractile and metabolic properties [1]. Depending on these properties, muscle fibers are classified into different types: fast contracting with high glycolytic metabolic capacity (FG), fast contracting with high oxidative as well as high glycolytic metabolic capacity (FOG), and slow contracting with high oxidative metabolic capacity (SO). Adult skeletal muscle fibers show plasticity, which means they have the ability to change their fiber type to adapt to different physiological demands, a process called fiber type transformation. Changes in the metabolic profile can occur during physiological as well as pathological processes. Adaptations of metabolic properties towards higher oxidative capacity can be induced by exercise in vivo [2]. Endurance exercise-induced metabolic fiber type transformation is characterized by increases in muscle oxidative capacity and mitochondrial gene expression [3] in conjunction with a decrease in anaerobic-glycolytic capacity. This transformation is often accompa- nied by changes in the isoform pattern of contractile proteins and many other functionally important muscle proteins. We consider here mainly the changes in metabolic enzymes associated with this process Biochimica et Biophysica Acta 1813 (2011) 377–389 Abbreviations: ACAA-2, mitochondrial acetyl-Coenzyme A acyltransferase 2; ACC, acetyl-CoA carboxylase; AMPK, AMP-activated protein kinase; [Ca 2+ ] i , intracellular Ca 2+ -concentration; ChoRE, carbohydrate response element; ChREBP, carbohydrate response element-binding protein; CS, citrate synthase; [glc] e , extracellular glucose concentration; FAS, fatty acid synthase; G-6-P, glucose-6-phosphate; GAPDH, glycer- aldehyde-3-phosphate dehydrogenase; HG, high glucose; HK-2, hexokinase 2; LG, low glucose; L-PK, liver pyruvate kinase; LXR, liver X receptor; MHC, myosin heavy chain; OA, okadaic acid; p38 MAPK, p38 mitogen-activated protein kinase; PGC-1α, peroxisome proliferator-activated receptor γ coactivator 1α; PP2A, protein phospha- tase 2A; p-p38 MAPK, phosphorylated p38 MAPK; SREBP-1c, sterol regulatory element binding protein 1c; X-5-P, xylulose 5-phosphate ⁎ Corresponding author. Tel.: +49 511 532 2753; fax: +49 511 532 2938. E-mail address: [email protected] (J.D. Meissner). 0167-4889/$ – see front matter © 2011 Elsevier B.V. All rights reserved. doi:10.1016/j.bbamcr.2010.12.021 Contents lists available at ScienceDirect Biochimica et Biophysica Acta journal homepage: www.elsevier.com/locate/bbamcr
-
Upload
independent -
Category
Documents
-
view
1 -
download
0
Transcript of Gene regulation mediating fiber-type transformation in skeletal muscle cells is partly glucose-and...
Biochimica et Biophysica Acta 1813 (2011) 377–389
Contents lists available at ScienceDirect
Biochimica et Biophysica Acta
j ourna l homepage: www.e lsev ie r.com/ locate /bbamcr
Gene regulation mediating fiber-type transformation in skeletal muscle cells is partlyglucose- and ChREBP-dependent
Nina Hanke a, Renate J. Scheibe b, Georgi Manukjan a, David Ewers c, Patrick K. Umeda d, Kin-Chow Chang e,Hans-Peter Kubis f, Gerolf Gros a, Joachim D. Meissner a,⁎a Department of Physiology, Vegetative Physiology 4220, Hannover Medical School, Carl-Neuberg-Str. 1, 30625 Hannover, Germanyb Department of Biochemistry, Hannover Medical School, Carl-Neuberg-Str. 1, 30625 Hannover, Germanyc Department of Physiology, Neurophysiology, Hannover Medical School, Carl-Neuberg-Str. 1, 30625 Hannover, Germanyd Department of Medicine, University of Alabama, 703 South 19th Street, Birmingham, AL 35294, USAe School of Veterinary Medicine and Science, University of Nottingham, Nr Loughborough, LE12 5RD Sutton Bonington, UKf College of Health and Behavioural Sciences, Bangor University, Holyhead Road, LL57 2PX Bangor, UK
Abbreviations: ACAA-2, mitochondrial acetyl-Coenzyacetyl-CoA carboxylase; AMPK, AMP-activated proteinCa2+-concentration; ChoRE, carbohydrate response elresponse element-binding protein; CS, citrate synthasconcentration; FAS, fatty acid synthase; G-6-P, glucose-aldehyde-3-phosphate dehydrogenase; HG, high glucosglucose; L-PK, liver pyruvate kinase; LXR, liver X receptOA, okadaic acid; p38 MAPK, p38 mitogen-activatperoxisome proliferator-activated receptor γ coactivatotase 2A; p-p38 MAPK, phosphorylated p38 MAPK; SREBPbinding protein 1c; X-5-P, xylulose 5-phosphate⁎ Corresponding author. Tel.: +49 511 532 2753; fax
E-mail address: [email protected]
0167-4889/$ – see front matter © 2011 Elsevier B.V. Aldoi:10.1016/j.bbamcr.2010.12.021
a b s t r a c t
a r t i c l e i n f oArticle history:Received 9 September 2010Received in revised form 21 December 2010Accepted 23 December 2010Available online 4 January 2011
Keywords:GlucoseCarbohydrate response element-bindingprotein (ChREBP)Glucose“Slow-to-fast” metabolic transformationLiver X receptor (LXR)
Adaptations in the oxidative capacity of skeletal muscle cells can occur under several physiological orpathological conditions. We investigated the effect of increasing extracellular glucose concentration on theexpression of markers of energy metabolism in primary skeletal muscle cells and the C2C12 muscle cell line.Growth of myotubes in 25 mM glucose (high glucose, HG) compared with 5.55 mM led to increases in theexpression and activity of glyceraldehyde-3-phosphate dehydrogenase (GAPDH), a marker of glycolyticenergy metabolism, while oxidative markers peroxisome proliferator-activated receptor γ coactivator 1α andcitrate synthase decreased. HG induced metabolic adaptations as are seen during a slow-to-fast fibertransformation. Furthermore, HG increased fast myosin heavy chain (MHC) IId/x but did not change slowMHCI/β expression. Protein phosphatase 2A (PP2A) was shown to mediate the effects of HG on GAPDH andMHCIId/x. Carbohydrate response element-binding protein (ChREBP), a glucose-dependent transcriptionfactor downstream of PP2A, partially mediated the effects of glucose on metabolic markers. The glucose-induced increase in PP2A activity was associated with an increase in p38 mitogen-activated protein kinaseactivity, which presumably mediates the increase in MHCIId/x promoter activity. Liver X receptor, anotherpossible mediator of glucose effects, induced only an incomplete metabolic shift, mainly increasing theexpression of the glycolytic marker. Taken together, HG induces a partial slow-to-fast transformationcomprising metabolic enzymes together with an increased expression of MHCIId/x. This work demonstrates afunctional role for ChREBP in determining the metabolic type of muscle fibers and highlights the importanceof glucose as a signaling molecule in muscle.
me A acyltransferase 2; ACC,kinase; [Ca2+]i, intracellular
ement; ChREBP, carbohydratee; [glc]e, extracellular glucose6-phosphate; GAPDH, glycer-e; HK-2, hexokinase 2; LG, lowor; MHC, myosin heavy chain;ed protein kinase; PGC-1α,r 1α; PP2A, protein phospha--1c, sterol regulatory element
: +49 511 532 2938.(J.D. Meissner).
l rights reserved.
© 2011 Elsevier B.V. All rights reserved.
1. Introduction
Skeletal muscle is composed of fibers with different contractile andmetabolic properties [1]. Depending on these properties, muscle
fibers are classified into different types: fast contracting with highglycolytic metabolic capacity (FG), fast contracting with highoxidative as well as high glycolytic metabolic capacity (FOG), andslow contracting with high oxidative metabolic capacity (SO). Adultskeletal muscle fibers show plasticity, which means they have theability to change their fiber type to adapt to different physiologicaldemands, a process called fiber type transformation.
Changes in the metabolic profile can occur during physiological aswell as pathological processes. Adaptations of metabolic propertiestowards higher oxidative capacity can be induced by exercise in vivo[2]. Endurance exercise-induced metabolic fiber type transformationis characterized by increases in muscle oxidative capacity andmitochondrial gene expression [3] in conjunction with a decrease inanaerobic-glycolytic capacity. This transformation is often accompa-nied by changes in the isoform pattern of contractile proteins andmany other functionally important muscle proteins. We consider heremainly the changes inmetabolic enzymes associatedwith this process
378 N. Hanke et al. / Biochimica et Biophysica Acta 1813 (2011) 377–389
and we will therefore call in the following this part of the completetransformation process “metabolic ‘fast-to-slow’ transformation.”AMP-activated protein kinase (AMPK) and the protein phosphatasecalcineurin are thought to play important roles in the regulation ofskeletal muscle energymetabolism in response to changes in the levelof energy status and neural input [4]. An important downstreamtarget of AMPK and calcineurin is the peroxisome proliferator-activated receptor γ coactivator 1α (PGC-1α), a transcriptionalcoactivator and master regulator of mitochondrial oxidative metab-olism [5,6]. Interestingly, several studies have demonstrated thatpatients with type 2 diabetes show an increased ratio of glycolytic tooxidative enzymes associated with a decrease in oxidative capacity[7–9]. In accordance, such patients show a decrease in slow oxidativetype I fibers.
Early evidence that intracellular Ca2+ can mediate the effects ofchronic repetitive muscle contractions on enzymes of energymetabolism has been presented by experiments with cultured ratmyotubes, in which a transformation from glycolytic to oxidativeenergy metabolism was evoked by Ca2+-ionophore [10]. Indeed, wewere able to induce a complete fast-to-slow transformation compris-ing myosin heavy chain (MHC) isoforms and enzymes of energymetabolism in adult primary rabbit skeletal myotubes by increasingthe intracellular Ca2+-concentration ([Ca2+]i) with Ca2+-ionophoreA23187 [11–13]. In addition, a Ca2+-ionophore-induced metabolictransformation was also demonstrated on the promoter level inC2C12 myotubes [14]. Moreover, Ca2+-ionophore treatment has beenshown to lead to protein kinase C (PKC)-dependent increases in theexpression of cytochrome c and cytochrome oxidase (COX) subunitmRNAs as well as in AMPK phosphorylation in L6E9myotubes [15,16].Furthermore, it has been demonstrated that calcineurin-dependentactivation of NFAT and a fast-to-slow transformation of myotubesoccur during the series of intracellular Ca2+-transients elicited byrepetitive contractile activity of primary rabbit myotubes [17]. Thesedata clearly indicate the importance of changes in [Ca2+]i formetabolic transformations.
Recently we showed that primary skeletal muscle cells in cultureadapt to a reduction in glucose supply with an AMPK-independentmetabolic “fast-to-slow” transformation, as demonstrated bydecreases in glyceraldehyde-3-phosphate dehydrogenase (GAPDH)and increases in mitochondrial acetyl-CoA thiolase (MAT), PGC-1α,and citrate synthase (CS) [14]. Indeed, in several systems glucose hasemerged as an important regulator of gene expression [18]. Twomajor candidate transcription factors for the transduction of an effectof intracellular glucose on the expression of metabolic enzymes,carbohydrate response element-binding protein (ChREBP) and liver Xreceptor (LXR), have been discussed [18,19] and are investigated inthe present work. Both have so far mainly been studied inhepatocytes, pancreatic β cells and adipocytes. Dietary uptake ofcarbohydrates increases the expression of more than a dozenglycolytic and lipogenic enzymes in liver, resulting in fatty acidsynthesis. Although insulin has long been known to be critical inregulating the expression of some of these genes, it has been shownthat glucose itself also plays an important role in transcriptionalregulation. This impact of glucose was shown to be transduced via thetranscription factor ChREBP, whereas the sterol regulatory elementbinding protein 1c (SREBP-1c) has emerged as a key mediator of theinsulin effects [20–22]. ChREBP is a basic helix–loop–helix leucinezipper transcription factor that increases expression of liver glycolyticand lipogenic genes in times of glucose abundance [22]. ChREBP ismost highly expressed in liver, brown and white adipose tissue, smallintestine, kidney and skeletal muscle [23]. While the physiologicalfunction of ChREBP has been studied extensively in liver, its role inskeletal muscle remains unclear. The activity of ChREBP is mainlyregulated at the post-transcriptional level by a phosphorylation/dephosphorylation mechanism that controls the nuclear localisationand the DNA-binding activity of ChREBP [24]. This glucose-dependent
activation of ChREBP was originally attributed in hepatocytes todephosphorylation of cAMP-dependent phosphorylation sites. Theprotein phosphatase 2A (PP2A) has been shown to be activated byxylulose 5-phosphate (X-5-P), a product of glucose metabolism, andto be responsible for dephosphorylation of ChREBP [25]. PP2A is aubiquitously expressed major cellular serine/threonine phosphatase[26]. An alternative model was proposed in the pancreatic β-cell line832/13, postulating a release of an N-terminal intramolecularinhibitory domain under high glucose conditions [27–29]. Targetgenes of ChREBP, like liver pyruvate kinase (L-PK), acetyl-CoAcarboxylase (ACC) and fatty acid synthase (FAS), feature so-calledcarbohydrate response elements (ChoREs) in their promoter regionsthat can directly bind ChREBP together with its partner Max-likefactor X [30–32]. Loss of ChREBP in ChREBP−/− mice results inimpaired glucose flux through the glycolytic pathway in liver relatedto diminished expression of L-PK. These mice display glucose andfructose intolerance [23]. Moreover, ChREBP has been linked to insulinresistance in leptin-deficient (ob/ob) mice [33].
Other important transcription factors in glucose-dependent generegulation are LXRα and β. LXRs are key regulators of cholesterol andlipidmetabolism and are also involved in glucose homeostasis [34,35].They belong to the nuclear hormone receptor superfamily and formheterodimers with retinoid X receptors. LXRs are capable of increasingthe transcription of ChREBP [19,36] and of SREBP-1c [37,38] viafunctional LXR-binding sites in the respective promoter regions. It hasbeen demonstrated that in addition to activation by their “classical”ligands, the oxysterols, LXRα and β can be activated by D-glucose andD-glucose-6-phosphate (G-6-P) in vitro [19]. In humans, LXRβ isubiquitously expressed [39], whereas LXRα is restricted to tissueswith important roles in lipid metabolism like adipose tissue, liver,skeletal muscle, kidney, and small intestine [40–42]. So far, severalstudies have indicated a role of LXR in the regulation of cholesterolhomeostasis, lipid and glucose metabolism in skeletal muscle in vivoand in vitro [43–48].
In the present study, we investigate the molecular mechanisms ofthe effects of glucose on the expression of markers of glycolytic andoxidative energy metabolism. We show that an increase in glucoseconcentration induces a metabolic “slow-to-fast” fiber type transfor-mation in cultured myotubes, and we demonstrate importantpromotional roles of ChREBP and PP2A in this glucose-dependentmetabolic adaptation. Interestingly, high glucose concentration alsovincreases MHCIId/x gene expression, which is part of the completeslow-to-fast transformation program as it has been observed in slowrabbit muscles subjected to phasic high frequency electrostimulationin vivo, but high glucose does not reduce MHCI/β gene expression,which would also be expected in the course of slow-to-fasttransformation. The effect on the MHCIId/x promoter appears to bemediated via PP2A and p38 mitogen-activated protein kinase (p38MAPK). Thus, glucose induces a partial slow-to-fast transformation.
2. Materials and methods
2.1. Animals
New Zealand white rabbits were purchased via the Animal Facilityof Hannover Medical School and were euthanized in accordance to § 4Tierschutzgesetz.
2.2. Primary cell culture
Skeletal muscle cells from hind limbs of newborn New Zealandwhite rabbits were isolated and separated from fibroblasts asdescribed previously [11]. Myoblasts were diluted to a finalconcentration of 6.5 x 10⁵ cells/ml in complete Dulbecco's modifiedEagle's medium (DMEM; Invitrogen, Karlsruhe, Germany) containing5.55 mM glucose, supplemented with 10% neonatal calf serum (NCS;
379N. Hanke et al. / Biochimica et Biophysica Acta 1813 (2011) 377–389
Invitrogen). Fifteenml of thismyoblast suspensionwere transferred toa 75 cm2 cell culture flask together with 0.04 g microcarriers (Culti-Spher-GL; Percell Biolytica, Astorp, Sweden). Cellswere grownat 37 °Cwith 8% CO2 and 90% humidity. On day 2 the medium was changed to30 ml of Skeletal Muscle Growth Medium with 5% foetal calf serum(FCS) and supplements (PromoCell, Heidelberg, Germany). On day 4,half of the medium was replaced. On day 7, the medium was changedto DMEMwith 10% rabbit serum (PAN-Biotech, Aidenbach, Germany).On day 9, the medium was changed to DMEMwith 5% NCS. From thisday onwards, half of the medium was replaced every second or thirdday. After 14 days in culture, myotubes had differentiated into adult,fast glycolyticmuscle cells [11,12]. Fromday 14myotubeswere grownin 0 mM, 5.55 mM (low glucose, LG), or 25 mM (high glucose, HG) for4 or 7 additional days. Medium without glucose was supplementedwith 1 mM lactate. In some experiments, cells were treated with0.2 μM Ca2+-ionophore A23187 (Sigma, Taufkirchen, Germany), and/or 5 μM of the LXR agonists T0901317 or GW3965 (both from Sigma),for 4 or 7 days as indicated in the respective figure legends.
2.3. RNA isolation and reverse transcription (RT)-PCR
For isolation of total RNA from primary rabbit myotubes, cells onmicrocarriers were washed with phosphate buffered saline (PBS),covered with RNA-Later (Ambion, Darmstadt, Germany) and stored at−20 °C. RNA isolation was carried out with the RNeasy Kit (Qiagen,Hilden, Germany) including digestion of genomic DNA. cDNA wassynthesized from 1.5 μg of total RNA using Omniscript ReverseTranscriptase (Qiagen), according to the manufacturer's instructions.Semi-quantitativemultiplex PCRwas performed using the HotStarTaqDNA Polymerase Kit (Qiagen), primers for the cDNA of interest andthe QuantumRNA 18S Internal Standards Kit (Ambion) for normal-isation. The PCR program consisted of cycles of 95 °C for 1 minfollowed by 60 °C for 1 min and 72 °C for 1 min, after an initialactivation of the HotStarTaq at 95 °C for 15 min. PCR with primersspecific for 18s rRNA was performed for normalisation of transcriptlevels. For every new set of samples, including controls, theexponential range of PCR amplification and the appropriate ratio of18S primers to 18S competimers (Ambion) was determined inpreliminary experiments. The PCR primers used were as follows:
GAPDH (GenBank accession no. L23961)forward primer: 5′-CCT GCG ACT TCA ACA GTG C-3′reverse primer: 5′-GCC TCT CGT CCT CCT CTG-3′HK-2 (GenBank accession no. NM_012735)forward primer: 5′-TGC TGG TGC GTG TGC GTA ATG G-3′reverse primer: 5′-AGG CTG TTC TGC TGG CAA GGG AAG G-3′PGC-1α (GenBank accession no. AB025784)forward primer: 5′-CAA ACT TGC TAG CGG TCC TC-3′reverse primer: 5′-GTG TGG TTT GCA TGG TTC TG-3′.
PCR products were separated in an 8% total acrylamide-bisacry-lamide/5% bisacrylamide polyacrylamide gelelectrophosis (PAGE),using Low DNA Mass Ladder (Invitrogen) as a marker, followed byhighly sensitive silver staining [49]. Densitometric quantification oftarget cDNA and 18S cDNA bands was performed with an ImageMaster System (GE Healthcare, München, Germany).
For semiquantitative RT-PCR analysis of MHC isoform mRNAexpression, total RNA from C2C12 myotubes was isolated usingNucleoSpin RNAII kit (Macherey & Nagel, Düren, Germany). mRNAwas reverse transcribed and cDNA amplified with Phusion® RT-PCRKit (New England Biolabs, Frankfurt, Germany) according to themanufacturer's instruction. PCR was performed in a reaction of 50 μlwith maximum cycle number of 35. PCR products were analyzed by2% agarose gel electrophoresis and visualized with ethidium bromidestaining. Primer pairs used were: mouseMyHCI/β forward (F): 5′-GCTGAG GCC CAG AAA CAA G-3′, and reverse (R): 5′-TTC CAC GAT GGC
GAT GTT C-3′; mouseMyHCIId/x F: 5′-ACG CTGGAT GCT GAG ATT AG-3′, and R: 5′-GAG TGG TTC AGC TGG ATT TC-3′; mouse 18s rRNA F: 5′-GGA CCA GAG CGA AAG CAT TT-3′, and R: 5′-TGC CAG AGT CTC GTTCGT TAT-3′.
2.4. Analysis of GAPDH and CS enzymatic activities
The GAPDH enzyme activity assay was performed in triethanola-mine buffered solution containing 82.5 mM triethanolamine (pH 7.6),6 mM glycerate-3-phosphate, 1.7 mM MgSO4, 1.1 mM ATP, 0.9 mMEDTA, 0.2 mMNADH, 14.8 U/ml phosphoglycerate kinase and sample,which had been stabilized by 5 mMDTT. ΔE(340 nm)/t wasmeasuredat 30 °C. The CS enzyme activity was analysed photometrically asdescribed [50]. Briefly, the reaction mixture contained 100 μM Tris-EDTA (pH 8.0), 5 μM NAD+, 6 μM malate, 60 μg/ml malate dehydro-genase, sample and 0.22 μM acetyl-coenzyme A. ΔE(340 nm)/t wasmeasured at 30 °C. Enzyme activities were normalised to total proteinconcentration of cell homogenates.
2.5. Analysis of glycogen content
To analyse glycogen content, muscle cell homogenates were firsttreated with 0.4 M KOH at 100 °C for the destruction of intracellularfree glucose and denaturation of cellular protein. This was followed byenzymatic hydrolysis of glycogen and analysis of free glucose fromglycogen as described [51]. For determination of the free glucoseconcentration, absorbance of an assay containing 200 mM Tris, 3 mMATP, 2 mM MgCl2, 0.33 mM NADP+, 0.9 U/ml glucose-6-phosphatedehydrogenase, 0.7 U/ml hexokinase and sample was read at 340 nm.Free glucose concentrations were normalised to total proteinconcentration of cell homogenates.
2.6. Plasmid construction
A −2183 bp mouse GAPDH (EC 1.2.1.12) promoter fragment wasgenerated from Mus musculus genomic DNA by high-fidelity longrange PCR (GeneAmp XL PCR Kit, Perkin Elmer Applied Biosystems,Waltham, MA, USA) using specific primers (forward primer: 5'-ACGTAGATC TAATGACTCAGCCTGGCTAATGG-3', reverse primer: 5'-ACTGAA GCT TTT GCA CAC TTC GCA CCA GCA TC-3'). The promoterfragment was cloned into the luciferase reporter gene vector pGL3-Basic (Promega, Mannheim, Germany). A −2281 bp promoterfragment of mouse mitochondrial acetyl-Coenzyme A acyltransferase2 (ACAA-2; EC 2.3.1.16) was also generated by PCR (forward primer:5'-ACGTAGATC TTAGGTGTACCTACC TAAATAGC-3', reverse primer:5'-ACTGAAGCT TCT TAATGCAAACAGTGTCCACC-3') and cloned intopGL3-Basic. To generate an mGAPDH promoter mutated in theputative carbohydrate response element (ChoRE) (−1545/−1529)the QuikChange II Site-Directed Mutagenesis Kit (Stratagene, Amster-dam, The Netherlands) was used according to the manufacturer'sinstructions. Nucleotides CAC (−1545/−1543 bp) in the 5' half of the5' E-Box-like element of the putative ChoREweremutated to ATA. The−2.4 kb MHCI/ß and the −2.8 kb MHCIId/x promoter luciferaseconstructs were described previously [52]. The mChREBP expressionplasmid pCMVS4-ChREBP was a gift from Dr. H. C. Towle [32].
2.7. Cell culture and transfection
Mouse C2C12 myoblasts (American Type Culture Collection,Wesel, Germany) were cultured on Petri dishes in growth medium(GM), consisting of complete DMEM (Invitrogen) containing 5.55 mM(low glucose, LG) or 25 mM glucose (high glucose, HG) supplementedwith 10% FCS (Sigma). Cells were transfected at 50–60% confluencewith 1.5 μg of reporter plasmid, 1.5 μg of pSV-β-Galactosidase(Promega) and 2.5 μl/μg DNA of Lipofectamine 2000 TransfectionReagent (Invitrogen). In some experiments, 0.75 μg of pCMVS4-
380 N. Hanke et al. / Biochimica et Biophysica Acta 1813 (2011) 377–389
ChREBP or the empty expression vector were also included in thetransfection. The transfection mediumwas removed after 5 hours andreplaced by GM. After a further period of 24 hours, GM was replacedby differentiation medium (DM; DMEM containing 5.55 mM or25 mMglucose and 5% horse serum (HS; Biochrom, Berlin, Germany))for 2 days and cells were subsequently harvested for luciferase assays.In some experiments, cells were treated with 0.1 μM of Ca2+-ionophore A23187 (Sigma), or 10 μM of LXR agonist T0901317(Axxora, Grünberg, Germany), or 10 nM of PP2A inhibitor okadaicacid (Sigma), during the final 2 days of culture.
2.8. Reporter gene assays
Cells were lysed in 400 μl 1× Reporter Lysis Buffer (Promega).Twenty μl of lysate were used in a luciferase assay using a LumatLuminometer (Berthold Technologies, Bad Wildbach, Germany)measuring relative light units (RLU). The luciferase assay reagentwas composed of 200 mM tricine, 10.7 mM (MgCO3)4Mg(OH)2,26.7 mM MgSO4, 333 mM dithiothritol, 5.3 mM ATP, 2.74 mMcoenzyme A and 470 μM D-luciferin (Applichem, Darmstadt,Germany). Cells were co-transfected with pSV-β-Galactosidase(Promega) as an internal reference. The β-galactosidase activity(β-Gal) was estimated by a standard colorimetric assay [53].Alternatively, the Luminescent β-galactosidase Reporter System 3(Clontech, Takara Bio Europe, St. Germain-en-laye, France) was usedaccording to the manufacturer's instructions.
2.9. RNA interference assays
C2C12 myoblasts transfected with mACAA-2 or mGAPDH promot-er reporter plasmid were additionally transfected after 1 day in GMwith 0.825 μg of a pool of doublestranded 20–25 nt siRNA thatspecifically targets mouse ChREBP or LXRα, or with non-specificdouble stranded control siRNA (Santa Cruz Biotechnology, Inc., SantaCruz, CA, USA), and siRNA Transfection Reagent (8 μl/μg of respectivesiRNA; Santa Cruz Biotechnology, Inc.) according to the manufac-turer's instructions. Cells were grown for another 2 days in DM underLG or HG conditions, in some experiments with 10 μM of LXR agonistT0901317.
2.10. Intracellular fractionation and Western blot analysis
C2C12 cells were grown for 2 days in DM containing 5.55 mM or25 mM glucose supplemented with 5% HS in the presence or absenceof okadaic acid (10 nM). In addition, C2C12 cells transfected with theChREBP expression vector or the empty vector were grown for 24hours in GM and then for 2 additional days in DM containing 25 mMglucose. Myotubes were washed with PBS, lysed and denatured withSDS-PAGE sample buffer at 95 °C for 3minutes, followed by cooling onice. Equal amounts of total protein per lane were separatedelectrophoretically in 10% SDS-PAGE and then transferred to anitrocellulose membrane. After blocking in PBS containing 1%Tween and 5% low fat dry milk, blots were probed with anti-p38antibody (Cell Signaling, New England Biolabs GmbH, Frankfurt,Germany), anti-phospho-p38 (Thr-180,Tyr-182) antibody (Cell Sig-naling), or anti-α-tubulin antibody (Santa Cruz Biotechnology, Inc.),followed by incubation with anti-rabbit or anti-mouse horseradishperoxidase-conjugated secondary antibodies (Santa Cruz Biotechnol-ogy, Inc.). Signals were visualized by enhanced chemiluminescencedetection (Santa Cruz Biotechnology, Inc.).
In other experiments, C2C12 cells grown for 2 days in DMcontaining 5.55 mM or 25 mM glucose supplemented with 5% HSwere suspended in cell fractionation buffer containing 5 mM Tris–HCl(pH 7.4), 5 mM KCl, 1.5 mMMgCl2, 0.1 mM EGTA, 1 mM DTT, 0.2 mMPMSF, 2 mM benzamidine and 5% (w/v) Trasylol for 5 min. For cellfractionation, 0.1% NP40 was added into suspension. Cell extracts
were centrifuged at 850 g. Pellet fraction and supernatant fractionwere lysed in Laemmli sample buffer. Western blot analysis wasperformed using anti-ChREBP (Novus Biologicals, Littleton, CO, USA)or anti-p53 (Santa Cruz Biotechnology, Inc.) antibodies. Boundantibodies were detected with either anti-rabbit IgG or anti-mouseIgG conjugated to horseradish peroxidase.
2.11. Chromatinimmunoprecipitation (ChIP) assay
C2C12 muscle cells were grown for 2 days in DM containing5.55 mM or 25 mM glucose. ChIP assays were conducted using theChIP-IT Enzymatic Kit (Active Motif, Rixensart, Belgium) according tothe manufacturer's instructions. Briefly, DNA and associated proteinswere crosslinked with 1% formaldehyde for 10 min at 37 °C. Afterstopping the reaction by addition of 125 mMglycine, cellswerewashedin PBS. Cells scraped from culture plates were re-suspended in LysisBuffer supplemented with Protease Inhibitor Cocktail and homoge-nised. DNA was then enzymatically sheared for 10 min. After pre-clearingwith Protein G beads, lysates were incubatedwith 2 μg of anti-ChREBP antibody (Novus Biologicals) or negative control anti-IgGantibody overnight at 4 °C. An aliquot of pre-cleared chromatin notincubated with antibody served as input control. Antibody-boundprotein-DNA complexes were incubated with Protein G beads for1.5 hours at 4 °C. The captured immunocomplexes, containing boundDNA fragments,were eluted and treatedwithproteinaseK. The purifiedDNA fragmentswere used in a PCRwith primers specifically amplifyingthe native−1650/−1449 bpmouse GAPDH promoter region (forwardprimer: 5'-GAC TCT GAA TCT GCC ATG CCT CTC-3', reverse primer: 5'-CCA AAT CTA GTC TTG CCT TGC-3'). PCR products were separated on a2% agarose gel and stained with ethidium bromide.
2.12. Analysis of metabolite concentrations
To measure intracellular glucose and G-6-P concentrations,metabolites were extracted with 0.5 mM HClO4, 1 mM EDTA andadditional sonication at 0 °C. Extracts were centrifuged for 10 min at0 °C with 15800 g, the supernatants were buffered with 1 Mimidazole, titrated to pH 6.8 by addition of 2.1 M KHCO3 andcentrifuged twice to remove KClO4. For determination of intracellularglucose content the increase in fluorescence of an assay containingsample, 150 mM triethanolamine (pH 7.6), 25 mM MgCl2, 9 mM ATP,3 mMNADP+, 6.3 U/ml G-6-P dehydrogenase (G-6-P-DH) and 22.5 U/ml hexokinase to start the glucose-dependent NADPH formation wasmeasured fluorimetrically with excitation and emission wavelengthsof 354 and 460 nm. The intracellular G-6-P content was measured byreading the increase in fluorescence of an assay containing sample,150 mM triethanolamine (pH 7.6), 25 mM MgCl2, 3 mM NADP+ and6.3 U/ml G-6-P-DH to start the G-6-P-dependent NADPH formationwith excitation and emission wavelengths of 354 and 460 nm.Metabolite contents were normalised to total protein contents ofthe samples as measured by a modified Bradford assay [54]. To obtaincytosolic metabolite concentrations, the correlation between proteincontent and cellular volume was determined and used to deduceintracellular metabolite concentrations in mmol/l. The cellularvolume was calculated via cell count and average cell diameter,which was determined on detached, spherical cells using a micro-scope fitted with a micrometre scale.
2.13. Statistical analysis
Results are expressed as means±SD of three or more independentexperiments. The statistical significance of differences of these meanswas estimated by one-way ANOVA followed by the Newman–Keulsmultiple comparison test, performed using GraphPad Prism softwareversion 3.00.
381N. Hanke et al. / Biochimica et Biophysica Acta 1813 (2011) 377–389
3. Results
To assess the impact of different treatments on energy metabo-lism, we selected two sets of metabolic markers. As a marker ofanaerobic-glycolytic energy metabolism, we measured GAPDH en-zyme activity, mRNA level, and promoter activity. As markers ofaerobic-oxidative energy metabolism we measured PGC-1α mRNAlevel, CS enzyme activity and mitochondrial acetyl-Coenzyme Aacyltransferase 2 (ACAA-2) promoter activity. PGC-1α was measuredas a marker of mitochondrial biogenesis and oxidative muscle fibertype characteristics, CS as a marker of the tricarboxylic acid cycle, andACAA-2 as a marker of mitochondrial fatty acid β-oxidation. Inaddition we measured glycogen content and hexokinase 2 (HK-2)mRNA level. Glycogen content is higher in fast-glycolytic than in slow-oxidative muscle fibers [55]. HK-2 is the first enzyme of glycolysis, butis highly expressed in slow-oxidative skeletal muscle [50]. This isprobably because fast-glycolytic muscle has large glycogen stores [56]and is therefore able to produce sufficient G-6-P from glycogenwithout the action of hexokinase within its relatively short bouts ofactivity. To describe shifts in the pattern of metabolic enzymes, wewill use the following the termsmetabolic “slow-to-fast” or metabolic“fast-to-slow” transformation, indicating that the muscle cellsundergo changes in these enzymes either towards the patternprevailing in fast or in slow muscle fibers. The terms do not implyany changes in contractile protein isoforms.
3.1. High glucose conditions induce a metabolic“slow-to-fast” transformation
To investigate the effects of high glucose concentrations, we used apreviously established primary rabbit skeletal muscle cell culture[11,12]. Myotubes reach an adult state after 14 days in culture and arecharacterized by a fast fiber type in terms of MHC expression and
0
20
40
60
80
100
120
140
0 255.55mM Glucose
GAPDH
*
*
Gly
coge
n co
nten
t (%
of c
ontr
ol)
0
50
100
150
200
250
0 255.55
*
mM Glucose0 5.55 25mM Glucose
+ 0.2 µM A23187
Glycogen *
*
*
BA
mR
NA
(%
of c
ontr
ol)
D
0
20
40
60
80
100
120
255.55mM Glucose
HK-2
*
mR
NA
(%
of c
ontr
ol)
E
0
50
100
150
200
250
300
0 255.55
*
mM Glucose0 5.mM G
+ 0.2 µM
PGC-1
*
*
mR
NA
(%
of c
ontr
ol)
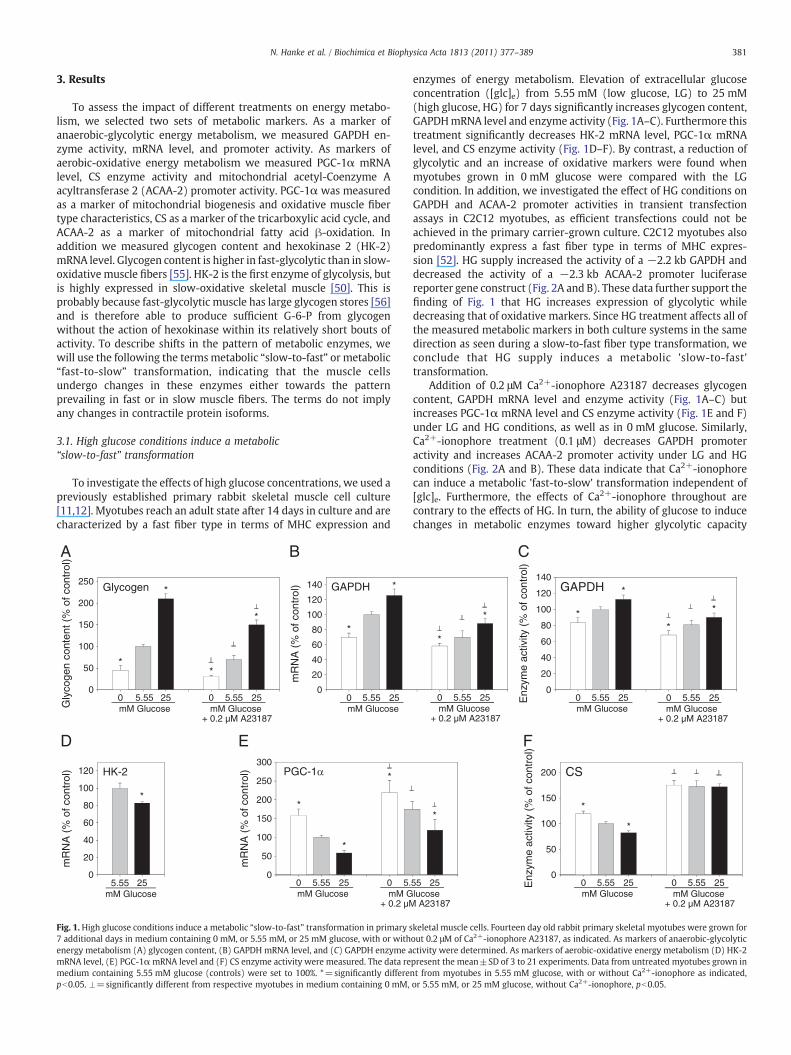
Fig. 1. High glucose conditions induce a metabolic “slow-to-fast” transformation in primary s7 additional days in medium containing 0 mM, or 5.55 mM, or 25 mM glucose, with or withenergy metabolism (A) glycogen content, (B) GAPDH mRNA level, and (C) GAPDH enzyme amRNA level, (E) PGC-1αmRNA level and (F) CS enzyme activity were measured. The data remedium containing 5.55 mM glucose (controls) were set to 100%. *=significantly differepb0.05. ⊥=significantly different from respective myotubes in medium containing 0 mM,
enzymes of energy metabolism. Elevation of extracellular glucoseconcentration ([glc]e) from 5.55 mM (low glucose, LG) to 25 mM(high glucose, HG) for 7 days significantly increases glycogen content,GAPDHmRNA level and enzyme activity (Fig. 1A–C). Furthermore thistreatment significantly decreases HK-2 mRNA level, PGC-1α mRNAlevel, and CS enzyme activity (Fig. 1D–F). By contrast, a reduction ofglycolytic and an increase of oxidative markers were found whenmyotubes grown in 0 mM glucose were compared with the LGcondition. In addition, we investigated the effect of HG conditions onGAPDH and ACAA-2 promoter activities in transient transfectionassays in C2C12 myotubes, as efficient transfections could not beachieved in the primary carrier-grown culture. C2C12 myotubes alsopredominantly express a fast fiber type in terms of MHC expres-sion [52]. HG supply increased the activity of a −2.2 kb GAPDH anddecreased the activity of a −2.3 kb ACAA-2 promoter luciferasereporter gene construct (Fig. 2A and B). These data further support thefinding of Fig. 1 that HG increases expression of glycolytic whiledecreasing that of oxidative markers. Since HG treatment affects all ofthe measured metabolic markers in both culture systems in the samedirection as seen during a slow-to-fast fiber type transformation, weconclude that HG supply induces a metabolic 'slow-to-fast'transformation.
Addition of 0.2 μM Ca2+-ionophore A23187 decreases glycogencontent, GAPDH mRNA level and enzyme activity (Fig. 1A–C) butincreases PGC-1α mRNA level and CS enzyme activity (Fig. 1E and F)under LG and HG conditions, as well as in 0 mM glucose. Similarly,Ca2+-ionophore treatment (0.1 μM) decreases GAPDH promoteractivity and increases ACAA-2 promoter activity under LG and HGconditions (Fig. 2A and B). These data indicate that Ca2+-ionophorecan induce a metabolic 'fast-to-slow' transformation independent of[glc]e. Furthermore, the effects of Ca2+-ionophore throughout arecontrary to the effects of HG. In turn, the ability of glucose to inducechanges in metabolic enzymes toward higher glycolytic capacity
*
0 5.55 25mM Glucose
+ 0.2 µM A23187
*
Enz
yme
activ
ity (
% o
f con
trol
)
0
20
40
60
80
100
120
140
0 255.55
*
mM Glucose0 5.55 25mM Glucose
+ 0.2 µM A23187
GAPDH *
*
*
C
Enz
yme
activ
ity (
% o
f con
trol
)
0
50
100
150
200
0 255.55
*
mM Glucose0 5.55 25mM Glucose
+ 0.2 µM A23187
CS
*
F
55 25lucose A23187
*
keletal muscle cells. Fourteen day old rabbit primary skeletal myotubes were grown forout 0.2 μM of Ca2+-ionophore A23187, as indicated. As markers of anaerobic-glycolyticctivity were determined. As markers of aerobic-oxidative energy metabolism (D) HK-2present the mean±SD of 3 to 21 experiments. Data from untreated myotubes grown innt from myotubes in 5.55 mM glucose, with or without Ca2+-ionophore as indicated,or 5.55 mM, or 25 mM glucose, without Ca2+-ionophore, pb0.05.
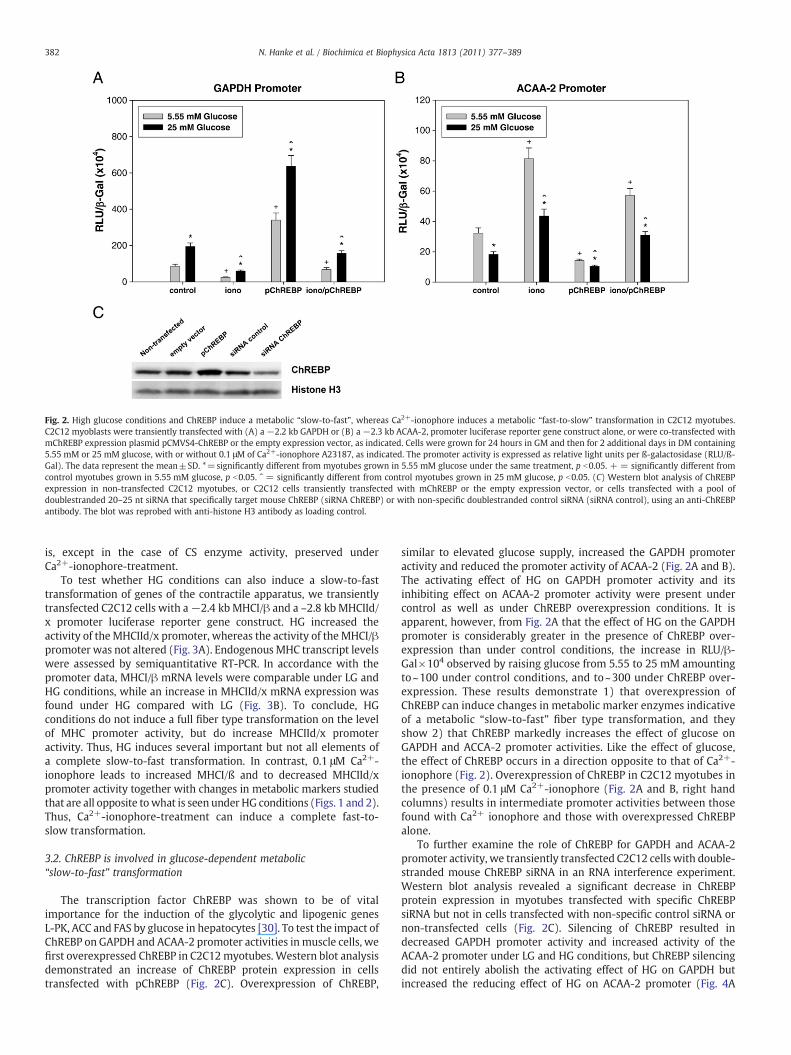
Fig. 2. High glucose conditions and ChREBP induce a metabolic “slow-to-fast”, whereas Ca2+-ionophore induces a metabolic “fast-to-slow” transformation in C2C12 myotubes.C2C12 myoblasts were transiently transfected with (A) a −2.2 kb GAPDH or (B) a −2.3 kb ACAA-2, promoter luciferase reporter gene construct alone, or were co-transfected withmChREBP expression plasmid pCMVS4-ChREBP or the empty expression vector, as indicated. Cells were grown for 24 hours in GM and then for 2 additional days in DM containing5.55 mM or 25 mM glucose, with or without 0.1 μM of Ca2+-ionophore A23187, as indicated. The promoter activity is expressed as relative light units per ß-galactosidase (RLU/ß-Gal). The data represent the mean±SD. *=significantly different from myotubes grown in 5.55 mM glucose under the same treatment, p b0.05. + = significantly different fromcontrol myotubes grown in 5.55 mM glucose, p b0.05. ˆ = significantly different from control myotubes grown in 25 mM glucose, p b0.05. (C) Western blot analysis of ChREBPexpression in non-transfected C2C12 myotubes, or C2C12 cells transiently transfected with mChREBP or the empty expression vector, or cells transfected with a pool ofdoublestranded 20–25 nt siRNA that specifically target mouse ChREBP (siRNA ChREBP) or with non-specific doublestranded control siRNA (siRNA control), using an anti-ChREBPantibody. The blot was reprobed with anti-histone H3 antibody as loading control.
382 N. Hanke et al. / Biochimica et Biophysica Acta 1813 (2011) 377–389
is, except in the case of CS enzyme activity, preserved underCa2+-ionophore-treatment.
To test whether HG conditions can also induce a slow-to-fasttransformation of genes of the contractile apparatus, we transientlytransfected C2C12 cells with a−2.4 kb MHCI/β and a –2.8 kb MHCIId/x promoter luciferase reporter gene construct. HG increased theactivity of the MHCIId/x promoter, whereas the activity of the MHCI/βpromoter was not altered (Fig. 3A). EndogenousMHC transcript levelswere assessed by semiquantitative RT-PCR. In accordance with thepromoter data, MHCI/β mRNA levels were comparable under LG andHG conditions, while an increase in MHCIId/x mRNA expression wasfound under HG compared with LG (Fig. 3B). To conclude, HGconditions do not induce a full fiber type transformation on the levelof MHC promoter activity, but do increase MHCIId/x promoteractivity. Thus, HG induces several important but not all elements ofa complete slow-to-fast transformation. In contrast, 0.1 μM Ca2+-ionophore leads to increased MHCI/ß and to decreased MHCIId/xpromoter activity together with changes in metabolic markers studiedthat are all opposite towhat is seen under HG conditions (Figs. 1 and 2).Thus, Ca2+-ionophore-treatment can induce a complete fast-to-slow transformation.
3.2. ChREBP is involved in glucose-dependent metabolic“slow-to-fast” transformation
The transcription factor ChREBP was shown to be of vitalimportance for the induction of the glycolytic and lipogenic genesL-PK, ACC and FAS by glucose in hepatocytes [30]. To test the impact ofChREBP on GAPDH and ACAA-2 promoter activities inmuscle cells, wefirst overexpressed ChREBP in C2C12myotubes. Western blot analysisdemonstrated an increase of ChREBP protein expression in cellstransfected with pChREBP (Fig. 2C). Overexpression of ChREBP,
similar to elevated glucose supply, increased the GAPDH promoteractivity and reduced the promoter activity of ACAA-2 (Fig. 2A and B).The activating effect of HG on GAPDH promoter activity and itsinhibiting effect on ACAA-2 promoter activity were present undercontrol as well as under ChREBP overexpression conditions. It isapparent, however, from Fig. 2A that the effect of HG on the GAPDHpromoter is considerably greater in the presence of ChREBP over-expression than under control conditions, the increase in RLU/β-Gal×104 observed by raising glucose from 5.55 to 25 mM amountingto~100 under control conditions, and to~300 under ChREBP over-expression. These results demonstrate 1) that overexpression ofChREBP can induce changes in metabolic marker enzymes indicativeof a metabolic “slow-to-fast” fiber type transformation, and theyshow 2) that ChREBP markedly increases the effect of glucose onGAPDH and ACCA-2 promoter activities. Like the effect of glucose,the effect of ChREBP occurs in a direction opposite to that of Ca2+-ionophore (Fig. 2). Overexpression of ChREBP in C2C12 myotubes inthe presence of 0.1 μM Ca2+-ionophore (Fig. 2A and B, right handcolumns) results in intermediate promoter activities between thosefound with Ca2+ ionophore and those with overexpressed ChREBPalone.
To further examine the role of ChREBP for GAPDH and ACAA-2promoter activity, we transiently transfected C2C12 cells with double-stranded mouse ChREBP siRNA in an RNA interference experiment.Western blot analysis revealed a significant decrease in ChREBPprotein expression in myotubes transfected with specific ChREBPsiRNA but not in cells transfected with non-specific control siRNA ornon-transfected cells (Fig. 2C). Silencing of ChREBP resulted indecreased GAPDH promoter activity and increased activity of theACAA-2 promoter under LG and HG conditions, but ChREBP silencingdid not entirely abolish the activating effect of HG on GAPDH butincreased the reducing effect of HG on ACAA-2 promoter (Fig. 4A
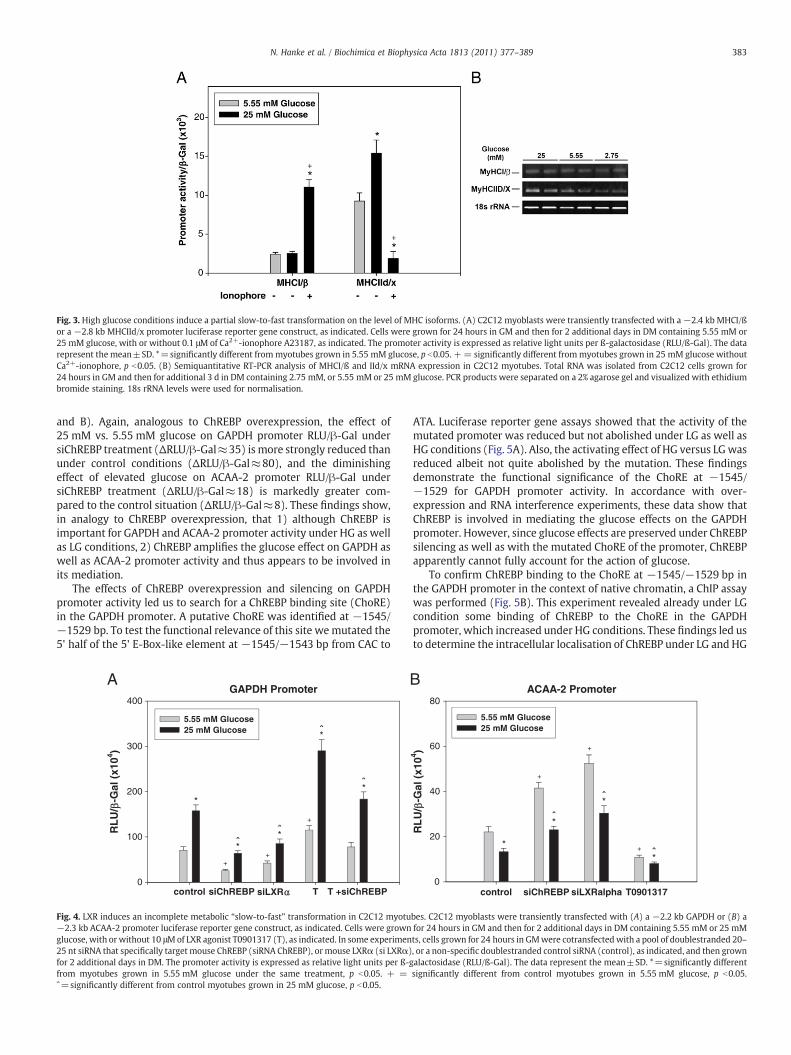
Fig. 3. High glucose conditions induce a partial slow-to-fast transformation on the level of MHC isoforms. (A) C2C12 myoblasts were transiently transfected with a−2.4 kb MHCI/ßor a −2.8 kb MHCIId/x promoter luciferase reporter gene construct, as indicated. Cells were grown for 24 hours in GM and then for 2 additional days in DM containing 5.55 mM or25 mM glucose, with or without 0.1 μM of Ca2+-ionophore A23187, as indicated. The promoter activity is expressed as relative light units per ß-galactosidase (RLU/ß-Gal). The datarepresent the mean±SD. *=significantly different frommyotubes grown in 5.55 mM glucose, p b0.05. += significantly different frommyotubes grown in 25 mM glucose withoutCa2+-ionophore, p b0.05. (B) Semiquantitative RT-PCR analysis of MHCI/ß and IId/x mRNA expression in C2C12 myotubes. Total RNA was isolated from C2C12 cells grown for24 hours in GM and then for additional 3 d in DM containing 2.75 mM, or 5.55 mM or 25 mM glucose. PCR products were separated on a 2% agarose gel and visualized with ethidiumbromide staining. 18s rRNA levels were used for normalisation.
383N. Hanke et al. / Biochimica et Biophysica Acta 1813 (2011) 377–389
and B). Again, analogous to ChREBP overexpression, the effect of25 mM vs. 5.55 mM glucose on GAPDH promoter RLU/β-Gal undersiChREBP treatment (ΔRLU/β-Gal≈35) is more strongly reduced thanunder control conditions (ΔRLU/β-Gal≈80), and the diminishingeffect of elevated glucose on ACAA-2 promoter RLU/β-Gal undersiChREBP treatment (ΔRLU/β-Gal≈18) is markedly greater com-pared to the control situation (ΔRLU/β-Gal≈8). These findings show,in analogy to ChREBP overexpression, that 1) although ChREBP isimportant for GAPDH and ACAA-2 promoter activity under HG as wellas LG conditions, 2) ChREBP amplifies the glucose effect on GAPDH aswell as ACAA-2 promoter activity and thus appears to be involved inits mediation.
The effects of ChREBP overexpression and silencing on GAPDHpromoter activity led us to search for a ChREBP binding site (ChoRE)in the GAPDH promoter. A putative ChoRE was identified at −1545/−1529 bp. To test the functional relevance of this site wemutated the5' half of the 5' E-Box-like element at −1545/−1543 bp from CAC to
GAPDH Promoter
RL
U/
-Gal
(x1
04 )
0
100
200
300
400
5.55 mM Glucose25 mM Glucose
control siChREBP siLXR T T +siChREBP
A
*
+
*̂*̂
+
+
*̂
*̂
Fig. 4. LXR induces an incomplete metabolic “slow-to-fast” transformation in C2C12 myotu−2.3 kb ACAA-2 promoter luciferase reporter gene construct, as indicated. Cells were grownglucose, with or without 10 μMof LXR agonist T0901317 (T), as indicated. In some experimen25 nt siRNA that specifically target mouse ChREBP (siRNA ChREBP), or mouse LXRα (si LXRα)for 2 additional days in DM. The promoter activity is expressed as relative light units per ß-gfrom myotubes grown in 5.55 mM glucose under the same treatment, p b0.05. + =ˆ=significantly different from control myotubes grown in 25 mM glucose, p b0.05.
ATA. Luciferase reporter gene assays showed that the activity of themutated promoter was reduced but not abolished under LG as well asHG conditions (Fig. 5A). Also, the activating effect of HG versus LGwasreduced albeit not quite abolished by the mutation. These findingsdemonstrate the functional significance of the ChoRE at −1545/−1529 for GAPDH promoter activity. In accordance with over-expression and RNA interference experiments, these data show thatChREBP is involved in mediating the glucose effects on the GAPDHpromoter. However, since glucose effects are preserved under ChREBPsilencing as well as with the mutated ChoRE of the promoter, ChREBPapparently cannot fully account for the action of glucose.
To confirm ChREBP binding to the ChoRE at −1545/−1529 bp inthe GAPDH promoter in the context of native chromatin, a ChIP assaywas performed (Fig. 5B). This experiment revealed already under LGcondition some binding of ChREBP to the ChoRE in the GAPDHpromoter, which increased under HG conditions. These findings led usto determine the intracellular localisation of ChREBP under LG and HG
RL
U/
-Gal
(x1
04 )
ACAA-2 Promoter
control siChREBP siLXRalpha T09013170
20
40
60
80
5.55 mM Glucose25 mM Glucose
B
*
+
+
+
*̂
*̂
*̂
bes. C2C12 myoblasts were transiently transfected with (A) a −2.2 kb GAPDH or (B) afor 24 hours in GM and then for 2 additional days in DM containing 5.55 mM or 25 mMts, cells grown for 24 hours in GMwere cotransfected with a pool of doublestranded 20–, or a non-specific doublestranded control siRNA (control), as indicated, and then grownalactosidase (RLU/ß-Gal). The data represent the mean±SD. *=significantly differentsignificantly different from control myotubes grown in 5.55 mM glucose, p b0.05.

Fig. 5. A carbohydrate response element (ChoRE) is important for GAPDH promoter activity under low and high glucose conditions. (A) C2C12myoblasts were transiently transfectedwith a−2.2 kb with type (wt) GAPDH promoter luciferase reporter gene construct or a−2.2 kb GAPDH promoter construct mutated in the putative ChoRE (mut). Cells were grownfor 24 hours in GM and then for 2 additional days in DM containing 5.55 mM or 25 mM glucose. The promoter activity is expressed as relative light units per ß-galactosidase (RLU/ß-Gal). The data represent the mean±SD. *=significantly different frommyotubes grown in 5.55 mM glucose, p b0.05. += significantly different from wt under 5.55 mM glucose, pb0.05. ˆ = significantly different from wt under 25 mM glucose, p b0.05. (B) ChIP assay to show binding of ChREBP to the native GAPDH promoter in C2C12 muscle cells grown inmedium containing 5.55 mM or 25 mM glucose. Soluble chromatin extracts were incubated with anti-ChREBP antibody, or non-immune IgG, or without antibody (input), asindicated. Immunoprecipitated DNA was analysed with PCR using primers spanning the -1650/-1449 bp GAPDH promoter region which contains the putative ChoRE. PCR productswere separated on a 2% agarose gel and stained with ethidium bromide. (C) Western blot analysis of the intracellular localisation of ChREBP in C2C12 myotubes demonstratesincreased nuclear ChREBP under high glucose. C2C12 cells grown for 2 days in DM containing 5.55 mM or 25 mM glucose, were incubated with cell fractionation buffer for 5 min.Cells were incubated in 0.1% NP40, then centrifuged, and pellet fraction (N) and supernatant fraction (C) were treated in Laemmli sample buffer. Aliquots were analysed using anti-ChREBP or p53 (as nuclear control) antibodies, followed by incubation with horseradish peroxidase-conjugated secondary antibodies.
384 N. Hanke et al. / Biochimica et Biophysica Acta 1813 (2011) 377–389
conditions in the C2C12 myotubes. Western Blotting of cytosolic andnuclear proteins showed that, consistent with the ChIP results, a smallamount of ChREBP in the nuclei of myotubes under LG conditions(Fig. 5C). However, under HG a decrease of cytosolic and an increaseof nuclear ChREBP protein were found. Taken together, HG supplyleads to increased nuclear accumulation of ChREBP, which correlateswith increased binding to the GAPDH promoter.
3.3. PP2A mediates glucose effects on GAPDH and MHCIId/xpromoter activity
In liver, the effects of increased [glc]e on the expression oflipogenic genes are mediated via the glucose metabolite X-5-P, whichactivates PP2A and by this leads to dephosphorylation and activationof the transcription factor ChREBP [18]. To investigate a possible roleof PP2A in mediating the glucose effect on GAPDH and MHCIId/xpromoter activities, we used the inhibitor okadaic acid (OA). OA in aconcentration of 10 nM completely inhibits PP2A but has only a minoreffect on protein phosphatase 1 (PP1) [57]. Addition of 10 nM OA tothe medium reduced the activity of the GAPDH promoter significantlyalready under LG, but markedly more under HG (Fig. 6A). It isapparent that under OA the activating effect of HG vs. LG is greatlyreduced but not completely abolished. Analogously, the activity of theMHCIId/x promoter was decreased under LG, but to a much greaterextent under HG conditions by 10 nM OA. Again, the effect of HG vs.LG was greatly reduced but not completely abolished in the presenceof OA (Fig. 6B). These data demonstrate that PP2A mediates at least inpart the activating effects of glucose on the GAPDH and MHCIId/xpromoters.
We have previously shown that p38MAPK is crucial for the activityof the MHCIId/x promoter and MHCIID/X protein expression in C2C12and primarymyotubes [58]. Thus, we checked phosphorylation of p38MAPK to investigate activation under LG and HG conditions. Westernblot analysis demonstrates no change in total p38 MAPK expressionunder HG compared with LG (Fig. 6C). Phosphorylation of p38 MAPK(p-p38 MAPK) however, is increased under HG compared with LG,indicating that p38 MAPK activation is augmented. Inhibition of PP2Aby 10 nM OA under HG decreased p-p38 MAPK to levels observedunder LG, indicating decreased activity of p38 MAPK. Taken together,PP2A inhibition reduces both p-p38 and MHCIId/x promoter activity
under HG, and the change in p-p38 MAPK is presumably responsiblefor the change in MHCIId/x promoter activity.
3.4. LXR induces an incomplete metabolic 'slow-to-fast' transformation
Since the nuclear receptors LXRα and LXRβ have been shown to beactivated by glucose and G-6-P in vitro [19] and are postulated totarget the ChREBP promoter [36], we wanted to establish whetherLXRs contribute to the metabolic transformation induced by glucose.For this purpose, we employed LXR agonists, which can activate bothLXRα and LXRβ [59], in primary myotubes for 4 days. Activation ofLXRs with two different agonists, T0901317 (5 μM) and GW3965(5 μM), increased the mRNA level of the glycolytic marker GAPDHunder LG as well as HG conditions (Fig. 7B). The expression of markersof oxidative metabolism, PGC-1α and CS, did not change undertreatment with T0901317 or GW3965 (Fig. 7D and E), just like theglycogen content of the myotubes (Fig. 7A). This indicates an increasein anaerobic-glycolytic capacity, with oxidative capacity remainingunaffected by LXR activation. Not entirely consistent with thisconclusion is the observation of an increase in HK-2 mRNA aftertreatment with LXR agonists (Fig. 7C). This may be related to thesomewhat ambiguous role of HK-2 as a key enzyme in anaerobic-glycolytic metabolism on one hand, and of being increased in slow-twitch oxidative muscle fibers on the other hand. In contrast totreatment for 7 days with HG (Fig. 1), the effect of HG conditions after4 days on GAPDH and HK-2 mRNA levels was seen but was not yetsignificant (Fig. 7B and C), indicating a time-dependency of thesechanges. In C2C12 myotubes, treatment with 10 μM T0901317resulted in increased GAPDH promoter activity and reduced activityof the ACAA-2 promoter under both LG and HG conditions whilepreserving the effect of HG (Fig. 4A and B). The former is in agreementwith an increased glycolytic energy metabolism (Fig. 7B), and thelatter indicates a decrease in fatty acid oxidation, in contrast to theresults shown for the other oxidative markers PGC-1α and CS (Fig. 7Dand E).
LXRα has been shown to be up-regulated in differentiating C2C12myotubes [43]. We therefore chose LXRα siRNA in an RNAinterference experiment in C2C12 myotubes. In contrast to theagonist effects (Fig. 4), silencing of LXRα with specific siRNAdecreased the GAPDH promoter activity and increased the promoter

Fig. 6. PP2A mediates glucose effects on GAPDH and MHCIId/x. C2C12 myoblasts were transiently transfected with (A) a −2.2 kb GAPDH or (B) a −2.8 kb MHCIId/x promoterluciferase reporter gene construct, as indicated. Cells were grown for 24 hours in GM and then for 2 additional days in DM containing 5.55 mM or 25 mM glucose, with or without 10nM of okadaic acid, as indicated. The promoter activity is expressed as relative light units per ß-galactosidase (RLU/ß-Gal). The data represent the mean±SD. *=significantlydifferent from myotubes grown in 5.55 mM glucose under the same treatment, p b0.05. + = significantly different from control myotubes grown in 5.55 mM glucose, p b0.05,ˆ=significantly different from control myotubes grown in 25 mM glucose, p b0.05. (C) Western blot analysis of p38 MAPK activation. C2C12 cells were grown for 2 days in DMcontaining 5.55 mM or 25 mM glucose, with or without 10 nM okadaic acid, as indicated. Blots were probed with anti-phospho-p38 (Thr-180, Tyr-182) antibody and reprobed withanti-p38 or anti-α-tubulin antibodies, followed by incubation with horseradish peroxidase-conjugated secondary antibodies.
385N. Hanke et al. / Biochimica et Biophysica Acta 1813 (2011) 377–389
activity of ACAA-2. Again, as seen with ChREBP, the effect of HG vs. LGwas preserved under both treatments. Finally, we investigated apossible interference between ChREBP and LXR signalling on GAPDHpromoter activity. Combination of 10 μM T0901317 and ChREBPsiRNA resulted in intermediate GAPDH promoter activities betweenthose found under treatment with T0901317 and siChREBP alone,comparable with the level of untreated controls (Fig. 4A). Theseresults, however, do not offer clues about themechanistic relationshipbetween ChREBP and LXR signalling. To summarize all data on LXReffects, we find an unequivocal increasing effect of LXR activationupon the anaerobic–glycolyticmarker GAPDH as studied in primary orC2C12 muscle cells, while oxidative markers are either unaffected(PGC-1α, CS) or decreased by LXR activation (ACAA-2). Thus, LXRappears to predominantly affect gylcolytic enzymes. These findingsindicate that LXR has a less comprehensive effect on the metabolicmarkers than glucose and ChREBP, and is not able to induce acomplete metabolic “slow-to-fast” transformation.
To assess if the intracellular concentrations of glucose ([glc]i) or G-6-P ([G-6-P]i) are sufficient to activate LXRα or LXRβ in C2C12myotubes, we measured these metabolites in C2C12 myotubes grownwith or without addition of 25 mM glucose for an additional 2 hoursafter having grown for 24 hours in 5.55 mM glucose. Under LGconditions, [glc]i was 0.010 mM, and increased to 6.0 mM under HGconditions (Table 1). [G-6-P]i was 0.015 mM under LG compared with0.061 mM under HG conditions. The [G-6-P]i necessary for half-maximal activation of LXRα or LXRβ in vitro has been reported to be5.0 mM and 1.4 mM, and the [glc]i necessary for half-maximal
activation of LXRα or LXRβ in vitro has been reported to be 3.0 mMand 0.3 mM, respectively [19]. These results indicate that [G-6-P]i istoo low to activate either LXRα or LXRβ under both LG and HGconditions in C2C12 myotubes. On the other hand, [glc]i under HG iswell above the EC50 for activation of LXRβ and also above that forLXRα. These data indicate that G-6-P is not an activator of LXRs underLG or HG conditions in C2C12 myotubes, whereas glucose is able toactivate LXRs at least under HG conditions.
4. Discussion
4.1. Effects of varying glucose exposure on muscle fiber type markers
The effects of increasing extracellular glucose from 5.55 mM to25 mM on the expression and activity of marker enzymes of glycolyticand oxidative energy metabolism have been investigated in apreviously established primary rabbit skeletal muscle culture[11,12] and in the mouse C2C12 muscle cell line. We report herethat HG conditions induce a metabolic “slow-to-fast” transformation,indicating that elevated [glc]e–along with elevated [glc]i–has aprofound influence on energy metabolism in skeletal muscle cells,extending previous results [14]. In addition, glucose causes a markedincrease in MHCIId/x promoter activity and mRNA, while it does notchangeMHCI/β promoter activity andmRNA. Thus, HG conditions cancontribute substantially to a slow-to-fast transformation in culturedskeletal muscle cells, although they do not activate the completetransformation program.

EDC
AG
lyco
gen
cont
ent (
% o
f con
trol
)
0
50
100
150
200
250
300*
mM Glucose+ GW3965
Glycogen
mM Glucose+ T0901317
mM Glucose
**
Enz
yme
activ
ity (
% o
f con
trol
)
0
20
40
60
80
100
120
*
mM Glucose+ GW3965
CS
mM Glucose+ T0901317
mM Glucose
* *
0
20
40
60
80
100
120
140
*
mM Glucose+ GW3965
PGC-1
mM Glucose+ T0901317
mM Glucose
* *
B
0
50
100
150
*
mM Glucose+ GW3965
HK-2
255.55 5.55 255.55 25255.55 5.55 255.55 25255.55 5.55 255.55 25mM Glucose+ T0901317
mM Glucose
*^
0
50
100
150
200
*
mM Glucose+ GW3965
GAPDH
255.55 5.55 255.55 25 255.55 5.55 255.55 25mM Glucose+ T0901317
mM Glucose
*^
^
mR
NA
(%
of c
ontr
ol)
mR
NA
(%
of c
ontr
ol)
mR
NA
(%
of c
ontr
ol)
Fig. 7. LXR induces an incomplete metabolic “slow-to-fast” transformation in primary skeletal myotubes. Fourteen day old rabbit primary skeletal myotubes were grown for 4additional days in medium containing 0 mM, or 5.55 mM, or 25 mM glucose, with or without LXR agonists T0901317 (5 μM) or GW3965 (5 μM), as indicated. As markers ofanaerobic-glycolytic energy metabolism (A) glycogen content and (B) GAPDH mRNA level were determined. As markers of aerobic-oxidative energy metabolism (C) HK-2 mRNAlevel, (D) PGC-1αmRNA level and (E) CS enzyme activity were measured. The data represent the mean±SD of 3 to 9 experiments. Data from untreatedmyotubes grown inmediumcontaining 5,55 mM glucose (controls) were set to 100%. *=significantly different frommyotubes in 5.55 mM glucose under the same treatment, pb0.05. ⊥=significantly differentfrom untreated myotubes grown in 5.55 mM glucose, pb0.05. ˆ=significantly different from untreated myotubes grown in 25 mM glucose, pb0.05.
386 N. Hanke et al. / Biochimica et Biophysica Acta 1813 (2011) 377–389
Can the metabolic “fast-to-slow” transformation observed previ-ously [14] under low glucose supply in vitro be involved in thephysiological fast-to-slow muscle fiber transformation as can beinduced by endurance exercise? In skeletal muscle, it has been shownthat intracellular glucose and G-6-P concentrations can be drasticallylowered after high-intensity and longer-lasting periods of exercise[60,61]. Even in a repetitive exercise model with 6 min of exercise,performed once per hour over a total period 16 hours, after a markedinitial increase in muscular glucose a strong trend of decreasingmuscular glucose and G-6-P concentrations from the end of each cycleto the next one has been observed [62]. In several other relativelymoderate exercise protocols similar initial increases in muscularglucose with a subsequent decrease during continued exercise wereobserved, although final glucose and/or G-6-P concentrations oftendid not or did only slightly fall below their resting values [63–65]. Weconclude that lowered intracellular glucose and G-6-P concentrationscan prevail at the end of prolonged high-intensity endurance exerciseand thus may constitute a signal for induction of a partial fast-to-slowtransformation of skeletal muscle.
The metabolic profile we observe here under HG in culturedmuscle cells is reminiscent of metabolic alterations occurring inpatients with type 2 diabetes showing an increased ratio of glycolytic
Table 1Intracellular metabolite concentrations of C2C12 myotubes grown in 5.55 mM or 25mM glucose for additional 2 hours after 24 hours in 5.55 mM glucose. Data representthe mean±SD of 4–5 experiments. *=significantly different from myotubes in 5.55mM glucose under the same treatment, pb0.05.
Glucose-6-phosphateintracellular (mM)
Glucose intracellular(mM)
5.55 mM Glucose 0.015±0.002 0.010±0.00525 mM Glucose 0.061±0.002 * 6.0±1.0 *
to oxidative enzymes [7–9]. Whether changes in fiber type andoxidative capacity are cause or consequence of the pathophysiology ofinsulin resistance and type 2 diabetes is not yet clear.
4.2. Mediation of glucose effects on fiber type markers by ChREBP
Even though the function and regulation of ChREBP has beenintensively studied in liver, only few reports are available about therole of ChREBP in skeletal muscle. In vivo, a diet high in carbohydratesactivates ChREBP activity in liver, whereas a diet high in fat inhibits it[21]. In human vastus lateralis muscle after fasting, a decrease ofChREBP mRNA has been shown, although this was not significant[66]. Using overexpression, RNA interference and mutation studies,we demonstrate here that ChREBP, like HG, can induce a metabolic“slow-to-fast” transformation. The effects of LG and more so of HG onmetabolic markers were increased by overexpression of ChREBP,leading to an augmented shift of marker enzymes of energymetabolism. The reverse observations were made with ChREBPmRNA interference. A functional ChoRE was identified in the GAPDHpromoter, which further supports a role for ChREBP in the regulationof GAPDH expression. We conclude that ChREBP is important inmediating the glucose effects on the GAPDH promoter, but our dataalso suggest that ChREBP is not the only contributing factor.Interestingly, a paralog of ChREBP, MondoA, has been implicated inthe regulation of glycolytic markers in C2C12 myoblasts [67].Nevertheless, MondoA shows only a minor nuclear translocation inresponse to increased glucose in L6 myoblasts or myotubes [68,69].Thus, whether MondoA can play a role in glucose-dependentmetabolic fiber type transformations of myotubes remains to beelucidated. The molecular basis of the inhibitory action of ChREBP onthe ACAA-2 promoter is not yet clear and needs further investigation.Recently, a repressive effect of ChREBP on aryl hydrocarbon receptor
387N. Hanke et al. / Biochimica et Biophysica Acta 1813 (2011) 377–389
nuclear translocator (ARNT)/hypoxia-inducible factor-1β (HIF-1β)expression has been demonstrated, with ChREBP binding to aproximal promoter region which confers negative glucose respon-siveness [70].
At least in hepatocytes, ChREBP function is regulated by glucose-dependent dephosphorylation of different residues, which inducesnuclear localisation and promotes DNA binding [24]. We nowdemonstrate in cultured muscle cells that HG conditions lead toincreased nuclear accumulation and increased binding of ChREBP tothe GAPDH promoter in C2C12 myotubes. This appears at variancewith a report that ChREBP binding to promoter regions of L-PK andFAS in primary rat hepatocytes is not significantly affected by glucosesupply [71]. Furthermore, small amounts of ChREBPwere found in thenuclei by immunoblotting even in medium containing 0 mM glucose.For primary hepatocytes, on the other hand, it was reportedpreviously from immunofluorescence studies that under low glucose(5.5 mM) ChREBP is nearly completely localised in the cytoplasm [24].Yet another situation was observed in pancreatic MIN6 β-cells, whereChREBP binding to the promoters of L-PK and FASwas absent in 3 mMglucosemedium although around 25% of cells exhibited both cytosolicand nuclear ChREBP; at 30 mM extracellular glucose, however,significant ChREBP binding to these promoters was detected viaChIP assays [72]. Strikingly, in another β-cell line, 832/13, even underhigh glucose a predominantly cytoplasmic localisation of ChREBP wasobserved together with nucleo-cytoplasmic shuttling under high aswell as low glucose [27–29,73]. The authors reported a glucose-dependent relief of intramolecular transcriptional repression inconjunction with an interaction with the molecular chaperone 14-3-3. These findings suggest that the regulation of ChREBP function,including intracellular localisation of ChREBP and glucose-sensitivityof ChREBP-binding to different promoters, depend critically on celltype and may vary from what is observed here in myotubes.
4.3. Role of PP2A in mediating glucose effects
In liver, the effects of increased [glc]e on the expression oflipogenic genes are mediated via the glucose metabolite X-5-P, whichactivates PP2A, and PP2A dephosphorylates and activates thetranscription factor ChREBP [18]. It is likely that in the presentexperiments X-5-P increases with increasing glucose and G-6-Pconcentration (Table 1) and is responsible for the glucose-dependentactivation of ChREBP. Although we failed to measure X-5-P levels inmyotubes, our finding of a role of PP2A in the glucose effects onGAPDH and MHCIId/x promoters shows that glucose presumablyleads to an increase in PP2A activity. Increase of X-5-P is a likelycandidate for the activation of PP2Awhen [glc]e is raised [25,74]. As anadditional mechanism, a direct effect of glucose on the glucose-sensing module of ChREBP [27,28] cannot be excluded.
PP2A is shown here to mediate the effect of HG on MHCIId/xpromoter activities in C2C12 myotubes, and in addition to affect thebasal level of activity under LG conditions (Fig. 6B). We propose p38to constitute the link between PP2A and theMHCIId/x promoter. PP2Ahas been shown to positively influence the level of activated p38MAPK [75], and the present data show indeed that p-p38 is higherunder HG than LG conditions, and this increase is dependent on PP2A.As we have previously demonstrated the importance of p38α/βMAPKfor MHCIID/X protein expression and MHCIId/x promoter activity inprimary and C2C12 myotubes [58], we suggest therefore that theactivating effect of HG on MHCIId/x is caused by increased activationof p38 MAPK.
4.4. Role of LXR in mediating glucose effects
In cultured human myotubes from lean and diabetic (type 2)individuals, LXR has repeatedly been shown to promote intracellularlipid synthesis and accumulation, possibly also by enhanced uptake of
glucose [44–46]. However, the evidence for the latter is equivocal.Taking into account data obtained with the endogenous LXR ligand,22-R-hydroxycholesterol [46], it is also not clear whether LXR favoursglucose oxidation in myotubes. The data presented in our study show,on the basis of the effects of LXR agonists and LXRα silencing, that LXRincreases the effects of LG and HG on the marker of glycolytic energymetabolism (Figs. 4 and 7). We also show that, in contrast to the clearLXR-mediated increase in the glycolytic marker, the effect of LXR onoxidative markers in the presence of glucose is non-uniform: LXRactivators lead to a decrease of ACAA-2 promoter activity in C2C12cells, and LXRα silencing leads to the corresponding increase in ACAA-2 promoter activity (Fig. 4), thus both observations indicate decreasedfatty acid β oxidation. On the other hand, LXR activation shows noeffect on the oxidativemarkers PGC-1α and CS (Fig. 7), where the lackof an effect on PGC-1α is in agreement with Cozzone et al. [45] andLaffitte et al. [76]. Thus, the effects of LXRs on oxidative markers areequivocal, but LXRs can be expected to contribute to the increase inthe glycolytic marker associated with the glucose-mediated “slow-to-fast” metabolic transformation, which is likely to be triggered mainlyby other mechanisms. In conclusion, LXR seems to be an importantmediator of the glucose response of myotubes, but provides only alimited contribution to the overall “slow-to-fast” metabolic transfor-mation induced by glucose.
4.5. Ionophore effects on fiber type markers
Addition of Ca2+-ionophore A23187 to the culture medium leadsto an increase in [Ca2+]i in primary rabbit myotubes [11,17]. Increased[Ca2+]i during muscle activation is thought to underlie fast-to-slowtransformation in muscle gene expression [11,17,77]. Calcineurin hasbeen shown to be involved in mediating changes in the expression ofMHC isoforms as well as enzymes of energy metabolism [3,4,78]. Thepresent paper demonstrates that Ca2+-ionophore can induce ametabolic “fast-to-slow” transformation in medium without glucoseas well as under LG and HG conditions. Thus, the effects of Ca2+-ionophore, which are consistently inverse to the effects of HG, areindependent of [glc]e. Nevertheless, the ability of glucose to inducechanges in metabolic enzymes towards higher anaerobic-glycolyticcapacity is generally preserved under Ca2+-ionophore-treatment.This does not hold for CS enzyme activity, but glucose remains able toreduce PGC-1αmRNA in the presence of ionophore (Fig. 1). Similarly,the effects of ChREBP expression are preserved in Ca2+-ionophore-treated myotubes under LG and HG conditions. Thus, the effects ofglucose and ChREBP onmusclemetabolism andMHC expression seemto be independent of the effects of Ca2+.
5. Conclusions
To summarize, we show that both HG conditions and Ca2+-ionophore are able to induce metabolic transformation in muscle cellcultures, albeit in opposite directions. The fast-to-slow transformationinduced by Ca2+-ionophore is complete with respect to MHC isoformsand markers of energy metabolism. In contrast, HG conditions lead toincreased anaerobic-glycolytic and decreased oxidative capacity inaddition to an activation of fast MHCIId/x expression, but do notchange slow MHCI/β expression. Ca2+-ionophore-treatment caninduce the metabolic transformation independent from [glc]e. Inturn, glucose effects are seen also under Ca2+-ionophore, indicatingthat both signals act independently. The effects of HG on GAPDH andMHCIId/x are mediated by PP2A. PP2A also contributes, presumablyindirectly, to the activation of p38 MAPK, which in turn regulatestranscription of MHCIId/x. The glucose-dependent transcription factorChREBP, which is downstream of PP2A, can increase the glucose effecton GAPDH and ACAA-2 under LG and HG conditions independentlyfrom [Ca2+]i. Our findings lead to the conclusion that ChREBP is amainmediator of the effects of glucose on energy metabolism. In contrast,

388 N. Hanke et al. / Biochimica et Biophysica Acta 1813 (2011) 377–389
LXRs essentially contribute to the glucose-dependent up-regulation ofanaerobic glycolysis. Some effects inverse to those reported here forhigh glucose have been reported previously for the case of low glucose[14]. We speculate that low intramuscular glucose, as it can beobserved at the end of long-lasting intense exercise [49–51], may be anovel trigger of a partial fast-to-slow fiber type transformation, whichmay act in addition to other established trigger mechanisms likeincreased [Ca2+]i [11,17,77].
Acknowledgements
This work was supported by Deutsche Forschungsgemeinschaftgrant GR-489/20-1. We appreciate obtaining an mChREBP expressionplasmid fromDr. Howard C. Towle.We thank Stefanie Reuss, DorotheeKrone and Ernst-August Haller for expert technical assistance.
References
[1] F.W. Booth, K.M. Baldwin, Muscle plasticity: energy demand and supplyprocesses, in: L.B. Rowell, J.T. Shepherd (Eds.), Handbook of Physiology. Section 12Exercise: Regulation and Integration of Multiple Systems, Oxford University Press,Oxford, 1996, pp. 1075–1123.
[2] F.W. Booth, D.B. Thomason, Molecular and cellular adaptation of muscle inresponse to exercise: perspectives of various models, Physiol. Rev. 71 (1991)541–585.
[3] K.S. Rockl, C.A. Witczak, L.J. Goodyear, Signaling mechanisms in skeletal muscle:acute responses and chronic adaptations to exercise, IUBMB Life 60 (2008)145–153.
[4] Y.C. Long, J.R. Zierath, Influence of AMP-activated protein kinase and calcineurinon metabolic networks in skeletal muscle, Am. J. Physiol. Endocrinol. Metab. 295(2008) E545–E552.
[5] S.L. McGee, M. Hargreaves, AMPK-mediated regulation of transcription in skeletalmuscle, Clin. Sci. (Lond) 118 (2010) 507–518.
[6] P. Puigserver, B.M. Spiegelman, Peroxisome proliferator-activated receptor-gamma coactivator 1 alpha (PGC-1 alpha): transcriptional coactivator andmetabolic regulator, Endocr. Rev. 24 (2003) 78–90.
[7] M.S. Hickey, J.O. Carey, J.L. Azevedo, J.A. Houmard, W.J. Pories, R.G. Israel, G.L.Dohm, Skeletal muscle fiber composition is related to adiposity and in vitroglucose transport rate in humans, Am. J. Physiol. 268 (1995) E453–E457.
[8] J.A. Simoneau, D.E. Kelley, Altered glycolytic and oxidative capacities of skeletalmuscle contribute to insulin resistance in NIDDM, J. Appl. Physiol. 83 (1997)166–171.
[9] A. Oberbach, Y. Bossenz, S. Lehmann, J. Niebauer, V. Adams, R. Paschke, M.R.Schon, M. Bluher, K. Punkt, Altered fiber distribution and fiber-specific glycolyticand oxidative enzyme activity in skeletal muscle of patients with type 2 diabetes,Diab. Care 29 (2006) 895–900.
[10] J.C. Lawrence Jr., W.J. Salsgiver, Levels of enzymes of energy metabolism arecontrolled by activity of cultured rat myotubes, Am. J. Physiol. 244 (1983)C348–C355.
[11] H.P. Kubis, E.A. Haller, P. Wetzel, G. Gros, Adult fast myosin pattern and Ca2+-induced slow myosin pattern in primary skeletal muscle culture, Proc. Natl. Acad.Sci. U. S. A. 94 (1997) 4205–4210.
[12] J.D. Meissner, H.P. Kubis, R.J. Scheibe, G. Gros, Reversible Ca2+-induced fast-to-slow transition in primary skeletal muscle culture cells at the mRNA level,J. Physiol. 523 (Pt 1) (2000) 19–28.
[13] J.D. Meissner, G. Gros, R.J. Scheibe, M. Scholz, H.P. Kubis, Calcineurin regulatesslow myosin, but not fast myosin or metabolic enzymes, during fast-to-slowtransformation in rabbit skeletal muscle cell culture, J. Physiol. 533 (2001)215–226.
[14] N. Hanke, J.D. Meissner, R.J. Scheibe, V. Endeward, G. Gros, H.P. Kubis, Metabolictransformation of rabbit skeletal muscle cells in primary culture in response tolow glucose, Biochim. Biophys. Acta 1783 (2008) 813–825.
[15] D. Freyssenet, M. Di Carlo, D.A. Hood, Calcium-dependent regulation ofcytochrome c gene expression in skeletal muscle cells. Identification of a proteinkinase c-dependent pathway, J. Biol. Chem. 274 (1999) 9305–9311.
[16] D. Freyssenet, I. Irrcher, M.K. Connor, M. Di Carlo, D.A. Hood, Calcium-regulatedchanges in mitochondrial phenotype in skeletal muscle cells, Am. J. Physiol. CellPhysiol. 286 (2004) C1053–C1061.
[17] H.P. Kubis, N. Hanke, R.J. Scheibe, J.D. Meissner, G. Gros, Ca2+ transients activatecalcineurin/NFATc1 and initiate fast-to-slow transformation in a primary skeletalmuscle culture, Am. J. Physiol. Cell Physiol. 285 (2003) C56–C63.
[18] H.C. Towle, Glucose as a regulator of eukaryotic gene transcription, TrendsEndocrinol. Metab. 16 (2005) 489–494.
[19] N. Mitro, P.A. Mak, L. Vargas, C. Godio, E. Hampton, V. Molteni, A. Kreusch, E. Saez,The nuclear receptor LXR is a glucose sensor, Nature 445 (2007) 219–223.
[20] S.H. Koo, A.K. Dutcher, H.C. Towle, Glucose and insulin function through twodistinct transcription factors to stimulate expression of lipogenic enzyme genes inliver, J. Biol. Chem. 276 (2001) 9437–9445.
[21] H. Yamashita, M. Takenoshita, M. Sakurai, R.K. Bruick,W.J. Henzel, W. Shillinglaw, D.Arnot, K. Uyeda, A glucose-responsive transcription factor that regulates carbohy-drate metabolism in the liver, Proc. Natl. Acad. Sci. U. S. A. 98 (2001) 9116–9121.
[22] R. Dentin, J. Girard, C. Postic, Carbohydrate responsive element binding protein(ChREBP) and sterol regulatory element binding protein-1c (SREBP-1c): two keyregulators of glucose metabolism and lipid synthesis in liver, Biochimie 87 (2005)81–86.
[23] K. Iizuka, R.K. Bruick, G. Liang, J.D. Horton, K. Uyeda, Deficiency of carbohydrateresponse element-binding protein (ChREBP) reduces lipogenesis as well asglycolysis, Proc. Natl. Acad. Sci. U. S. A. 101 (2004) 7281–7286.
[24] T. Kawaguchi, M. Takenoshita, T. Kabashima, K. Uyeda, Glucose and cAMP regulatethe L-type pyruvate kinase gene by phosphorylation/dephosphorylation of thecarbohydrate response element binding protein, Proc. Natl. Acad. Sci. U. S. A. 98(2001) 13710–13715.
[25] T. Kabashima, T. Kawaguchi, B.E. Wadzinski, K. Uyeda, Xylulose 5-phosphatemediates glucose-induced lipogenesis by xylulose 5-phosphate-activated proteinphosphatase in rat liver, Proc. Natl Acad. Sci. USA 100 (2003) 5107–5112.
[26] E. Sontag, Protein phosphatase 2A: the Trojan Horse of cellular signaling, Cell.Signal. 13 (2001) 7–16.
[27] M.V. Li, B. Chang, M. Imamura, N. Poungvarin, L. Chan, Glucose-dependenttranscriptional regulation by an evolutionarily conserved glucose-sensingmodule, Diabetes 55 (2006) 1179–1189.
[28] M.N. Davies, B.L. O'Callaghan, H.C. Towle, Glucose activates ChREBP byincreasing its rate of nuclear entry and relieving repression of its transcriptionalactivity, J. Biol. Chem. 283 (2003) 24029–24038.
[29] M.V. Li, W. Chen, N. Poungvarin, M. Imamura, L. Chan, Glucose-mediatedtransactivation of carbohydrate response element-binding protein requirescooperative actions from Mondo conserved regions and essential trans-actingfactor 14–3–3, Mol. Endocrinol. (2008) 1658–1672.
[30] S. Ishii, K. Iizuka, B.C. Miller, K. Uyeda, Carbohydrate response element bindingprotein directly promotes lipogenic enzyme gene transcription, Proc. Natl. Acad.Sci. U. S. A. 101 (2004) 15597–15602.
[31] L. Ma, N.G. Tsatsos, H.C. Towle, Direct role of ChREBP. Mlx in regulating hepaticglucose-responsive genes, J. Biol. Chem. 280 (2005) 12019–12027.
[32] A.K. Stoeckman, L. Ma, H.C. Towle, Mlx is the functional heteromeric partner of thecarbohydrate response element-binding protein in glucose regulation of lipogenicenzyme genes, J. Biol. Chem. 279 (2004) 15662–15669.
[33] R. Dentin, F. Benhamed, I. Hainault, V. Fauveau, F. Foufelle, J.R. Dyck, J. Girard, C.Postic, Liver-specific inhibition of ChREBP improves hepatic steatosis and insulinresistance in ob/ob mice, Diabetes 55 (2006) 2159–2170.
[34] J.J. Repa, D.J. Mangelsdorf, The role of orphan nuclear receptors in the regulation ofcholesterol homeostasis, Annu. Rev. Cell Dev. Biol. 16 (2000) 459–481.
[35] S.W. Beaven, P. Tontonoz, Nuclear receptors in lipid metabolism: targeting theheart of dyslipidemia, Annu. Rev. Med. 57 (2006) 313–329.
[36] J.Y. Cha, J.J. Repa, The liver X receptor (LXR) and hepatic lipogenesis. Thecarbohydrate-response element-binding protein is a target gene of LXR, J. Biol.Chem. 282 (2007) 743–751.
[37] J.J. Repa, G. Liang, J. Ou, Y. Bashmakov, J.M. Lobaccaro, I. Shimomura, B. Shan, M.S.Brown, J.L. Goldstein, D.J. Mangelsdorf, Regulation of mouse sterol regulatoryelement-binding protein-1c gene (SREBP-1c) by oxysterol receptors, LXRalphaand LXRbeta, Genes Dev. 14 (2000) 2819–2830.
[38] G. Chen, G. Liang, J. Ou, J.L. Goldstein, M.S. Brown, Central role for liver Xreceptor in insulin-mediated activation of Srebp-1c transcription and stimula-tion of fatty acid synthesis in liver, Proc. Natl. Acad. Sci. U. S. A. 101 (2007)11245–11250.
[39] C. Song, J.M. Kokontis, R.A. Hiipakka, S. Liao, Ubiquitous receptor: a receptor thatmodulates gene activation by retinoic acid and thyroid hormone receptors, Proc.Natl. Acad. Sci. U. S. A. 91 (1994) 10809–10813.
[40] R. Apfel, D. Benbrook, E. Lernhardt, M.A. Ortiz, G. Salbert, M. Pfahl, A novel orphanreceptor specific for a subset of thyroid hormone-responsive elements and itsinteraction with the retinoid/thyroid hormone receptor subfamily, Mol. Cell. Biol.14 (1994) 7025–7035.
[41] P.J. Willy, K. Umesono, E.S. Ong, R.M. Evans, R.A. Heyman, D.J. Mangelsdorf, LXR, anuclear receptor that defines a distinct retinoid response pathway, Genes Dev. 9(1995) 1033–1045.
[42] D. Auboeuf, J. Rieusset, L. Fajas, P. Vallier, V. Frering, J.P. Riou, B. Staels, J. Auwerx,M. Laville, H. Vidal, Tissue distribution and quantification of the expression ofmRNAs of peroxisome proliferator-activated receptors and liver X receptor-alphain humans: no alteration in adipose tissue of obese and NIDDM patients, Diabetes46 (1997) 1319–1327.
[43] G.E. Muscat, B.L. Wagner, J. Hou, R.K. Tangirala, E.D. Bischoff, P. Rohde, M.Petrowski, J. Li, G. Shao, G. Macondray, I.G. Schulman, Regulation of cholesterolhomeostasis and lipid metabolism in skeletal muscle by liver X receptors, J. Biol.Chem. 277 (2002) 40722–40728.
[44] E.T. Kase, A.J. Wensaas, V. Aas, K. Hojlund, K. Levin, G.H. Thoresen, H. Beck-Nielsen,A.C. Rustan, M. Gaster, Skeletal muscle lipid accumulation in type 2 diabetes mayinvolve the liver X receptor pathway, Diabetes 54 (2005) 1108–1115.
[45] D. Cozzone, C. Debard, N. Dif, N. Ricard, E. Disse, J. Vouillarmet, R. Rabasa-Lhoret,M. Laville, D. Pruneau, J. Rieusset, E. Lefai, H. Vidal, Activation of liver X receptorspromotes lipid accumulation but does not alter insulin action in human skeletalmuscle cells, Diabetologia 49 (2006) 990–999.
[46] E.T. Kase, G.H. Thoresen, S. Westerlund, K. Hojlund, A.C. Rustan, M. Gaster Liver, Xreceptor antagonist reduces lipid formation and increases glucose metabolism inmyotubes from lean, obese and type 2 diabetic individuals, Diabetologia 50(2007) 2171–2180.
[47] N.P. Hessvik, M.V. Boekschoten, M.A. Baltzersen, S. Kersten, X. Xu, H. Andersen, A.Rustan, H. Thoresen, Liver X receptor beta (LXRbeta) is the dominant LXR subtypein skeletal muscle regulating lipogenesis and cholesterol efflux, Am. J. Physiol.Endocrinol. Metab. Epub ahead of print (2009).

389N. Hanke et al. / Biochimica et Biophysica Acta 1813 (2011) 377–389
[48] M. Korach-Andre, P. Parini, L. Larsson, A. Arner, K.R. Steffensen, J.A. Gustafsson,Separate and overlapping metabolic functions of LXRalpha and LXRbeta inC57Bl/6 female mice, Am. J. Physiol. Endocrinol. Metab. 298 (2010) E167–E178.
[49] B.J. Bassam, G. Caetano-Anolles, P.M. Gresshoff, Fast and sensitive silver staining ofDNA in polyacrylamide gels, Anal. Biochem. 196 (1991) 80–83.
[50] A. Bass, D. Brdiczka, P. Eyer, S. Hofer, D. Pette, Metabolic differentiation of distinctmuscle types at the level of enzymatic organization, Eur. J. Biochem. 10 (1969)198–206.
[51] J. Katz, S. Golden, P.A. Wals, Stimulation of hepatic glycogen synthesis by aminoacids, Proc. Natl. Acad. Sci. U. S. A. 73 (1976) 3433–3437.
[52] J.D. Meissner, P.K. Umeda, K.C. Chang, G. Gros, R.J. Scheibe, Activation of the betamyosin heavy chain promoter by MEF-2D, MyoD, p300, and the calcineurin/NFATc1 pathway, J. Cell. Physiol. 211 (2007) 138–148.
[53] J. Sambrook, E.F. Fritsch, T. Maniatis, second ed, Molecular Cloning, 3, Cold SpringHarbor Laboratory Press, New York, 1989.
[54] M.M. Bradford, A rapid and sensitive method for the quantitation of microgramquantities of protein utilizing the principle of protein-dye binding, Anal. Biochem.72 (1976) 248–254.
[55] R.K. Conlee, J.A. McLane, M.J. Rennie, W.W. Winder, J.O. Holloszy, Reversal ofphosphorylase activation in muscle despite continued contractile activity, Am. J.Physiol. 237 (1979) R291–R296.
[56] R. Cusso, L.R. Lerner, J. Cadefau, M. Gil, C. Prats, M. Gasparotto, C.R. Krisman,Differences between glycogen biogenesis in fast- and slow-twitch rabbit muscle,Biochim. Biophys. Acta 1620 (2003) 65–71.
[57] C. Bialojan, A. Takai, Inhibitory effect of a marine-sponge toxin, okadaic acid,on protein phosphatases. Specificity and kinetics, Biochem. J. 256 (1988)283–290.
[58] J.D. Meissner, K.C. Chang, H.P. Kubis, A.R. Nebreda, G. Gros, R.J. Scheibe, Thep38alpha /betaMAP kinases mediate recruitment of CBP to preserve fast myosinheavy chain IId/x gene activity in myotubes, J. Biol. Chem. 282 (2007)7265–7275.
[59] J.R. Schultz, H. Tu, A. Luk, J.J. Repa, J.C. Medina, L. Li, S. Schwendner, S. Wang, M.Thoolen, D.J. Mangelsdorf, K.D. Lustig, B. Shan, Role of LXRs in control oflipogenesis, Genes Dev. 14 (2000) 2831–2838.
[60] I. Gigli, L.E. Bussmann, Effects of exercise on muscle metabolites and sarcoplasmicreticulum function in ovariectomized rats, Physiol. Res. 51 (2002) 247–254.
[61] P.T. Fueger, S. Heikkinen, D.P. Bracy, C.M. Malabanan, R.R. Pencek, M. Laakso, D.H.Wasserman, Hexokinase II partial knockout impairs exercise-stimulated glucoseuptake in oxidative muscles of mice, Am. J. Physiol. Endocrinol. Metab. 285 (2003)E958–E963.
[62] H.J. Green, T.A. Duhamel, G.P. Holloway, J. Moule, J. Ouyang, D. Ranney, A.R.Tupling, Muscle metabolic responses during 16 hours of intermittent heavyexercise, Can. J. Physiol. Pharmacol. 85 (2007) 634–645.
[63] A. Katz, K. Sahlin, S. Broberg, Regulation, of glucose utilization in human skeletalmuscle during moderate dynamic exercise, Am. J. Physiol. 260 (1991) E411–E415.
[64] A.E. Halseth, D.P. Bracy, D.H. Wasserman DH, Limitations to exercise- andmaximal insulin-stimulated muscle glucose uptake, J. Appl. Physiol. 85 (1998)2305–2313.
[65] T.A. Duhamel, H.J. Green, R.D. Stewart, K.P. Foley, I.C. Smith, J. Ouyang, Muscle,metabolic, SR Ca(2+)-cycling responses to prolonged cycling, with and withoutglucose supplementation, J. Appl. Physiol. 103 (2007) 1986–1998.
[66] K. Tsintzas, K. Jewell, M. Kamran, D. Laithwaite, T. Boonsong, J. Littlewood, I.Macdonald, A. Bennett, Differential regulation of metabolic genes in skeletalmuscle during starvation and refeeding in humans, J. Physiol. 575 (2006) 291–303.
[67] C.L. Sans, D.J. Satterwhite, C.A. Stoltzman, K.T. Breen, D.E. Ayer, MondoA-Mlxheterodimers are candidate sensors of cellular energy status: mitochondriallocalization and direct regulation of glycolysis,Mol. Cell. Biol. 26 (2006) 4863–4871.
[68] C.A. Stoltzman, C.W. Peterson, K.T. Breen, D.M. Muoio, A.N. Billin, D.E. Ayer,Glucose sensing by MondoA:Mlx complexes: a role for hexokinases and directregulation of thioredoxin-interacting protein expression, Proc. Natl Acad. Sci. USA105 (2008) 6912–6917.
[69] F.X. Yu, S.R. Goh, R.P. Dai, Y. Luo, Adenosine-containing molecules amplify glucosesignaling and enhance txnip expression, Mol. Endocrinol. 23 (2009) 932–942.
[70] N.A. Noordeen, T.K. Khera, G. Sun, E.R. Longbottom, T.J. Pullen, G. da Silva Xavier,G.A. Rutter, I. Leclerc, Carbohydrate-responsive element-binding protein(ChREBP) is a negative regulator of ARNT/HIF-1beta gene expression in pancreaticislet beta-cells, Diabetes 59 (2010) 153–160.
[71] J. Xu, B. Christian, D.B. Jump, Regulation of rat hepatic L-pyruvate kinase promotercomposition and activity by glucose, n-3 polyunsaturated fatty acids, andperoxisome proliferator-activated receptor-alpha agonist, J. Biol. Chem. 281(2006) 18351–18362.
[72] G. da Silva Xavier, G.A. Rutter, F. Diraison, C. Andreolas, I. Leclerc, ChREBP bindingto fatty acid synthase and L-type pyruvate kinase genes is stimulated by glucose inpancreatic beta-cells, J. Lipid Res. 47 (2003) 2482–2491.
[73] N.G. Tsatsos, M.N. Davies, B.L. O'Callaghan, H.C. Towle, Identification and functionof phosphorylation in the glucose-regulated transcription factor ChREBP,Biochem. J. 411 (15-4-2008) 261–270.
[74] M. Nishimura, K. Uyeda, Purification and characterization of a novel xylulose 5-phosphate-activated protein phosphatase catalyzing dephosphorylation offructose-6-phosphate, 2-kinase:fructose-2, 6-bisphosphatase, J. Biol. Chem. 270(1995) 26341–26346.
[75] C.H. Yoon, M.J. Kim, M.T. Park, J.Y. Byun, Y.H. Choi, H.S. Yoo, Y.M. Lee, J.W. Hyunm,S.J. Lee, Activation of p38 mitogen-activated protein kinase is required for deathreceptor-independent caspase-8 activation and cell death in response tosphingosine, Mol. Cancer Res. 7 (2009) 361–370.
[76] B.A. Laffitte, L.C. Chao, J. Li, R. Walczak, S. Hummasti, S.B. Joseph, A. Castrillo, D.C.Wilpitz, D.J. Mangelsdorf, J.L. Collins, E. Saez, P. Tontonoz, Activation of liver Xreceptor improves glucose tolerance through coordinate regulation of glucosemetabolism in liver and adipose tissue, Proc. Natl. Acad. Sci. U. S. A. 100 (2003)5419–5424.
[77] R.S. Williams, P. Rosenberg, Calcium-dependent gene regulation in myocytehypertrophy and remodeling, Cold Spring Harb. Symp. Quant. Biol. 67 (2002)339–344.
[78] J. Mallinson, J.D. Meissner, K.C. Chang, Chapter 2. Calcineurin signaling and theslow oxidative skeletal muscle fiber type, Int. Rev, Cell. Mol. Biol. 277 (2009)67–101.