
Meccanica e scienze avanzate dell'ingegneria ... - AMS Dottorato
150
Alma Mater Studiorum – Università di Bologna DOTTORATO DI RICERCA IN Meccanica e scienze avanzate dell’ingegneria Progetto n° 4: Meccanica dei materiali e processi tecnologici Ciclo XXV Settore scientifico-disciplinare di afferenza: ING-IND/18 INTEGRATED ANALYSIS AND DESIGN OF OPTIMIZATION AND UP-SCALING OF INDUCTIVELY COUPLED PLASMA SYNTHESIS OF NANOPARTICLES Presentata da: Matteo Gherardi Coordinatore Dottorato Relatore Prof. Giangiacomo Minak Prof. Vittorio Colombo Esame finale anno 2013
-
Upload
khangminh22 -
Category
Documents
-
view
4 -
download
0
Transcript of Meccanica e scienze avanzate dell'ingegneria ... - AMS Dottorato
Alma Mater Studiorum – Università di Bologna
DOTTORATO DI RICERCA IN
Meccanica e scienze avanzate dell’ingegneria Progetto n° 4: Meccanica dei materiali e processi tecnologici
Ciclo XXV
Settore scientifico-disciplinare di afferenza: ING-IND/18
INTEGRATED ANALYSIS AND DESIGN OF OPTIMIZATION AND UP-SCALING OF INDUCTIVELY COUPLED PLASMA
SYNTHESIS OF NANOPARTICLES
Presentata da: Matteo Gherardi Coordinatore Dottorato Relatore
Prof. Giangiacomo Minak Prof. Vittorio Colombo
Esame finale anno 2013

2

3

4
It is better to be a human being dissatisfied than a pig satisfied; better to be Socrates dissatisfied than a fool satisfied. And if the fool, or the pig, are of a different opinion, it is because they only know their own side of the question.
John Stuart Mill, Utilitarianism, 1861
On pourvoit à l’éclairage des villes, on allume tous les soirs, et on fait très bien, des réverbères dans les carrefours, dans les places publiques; quand donc comprendra-t-on que la nuit peut se faire aussi dans le monde moral, et qu’il faut allumer des flambeaux pour les esprits?
Victor Hugo, Discours à l’Assemblée constituante, 10 Novembre 1848

5
6
INDEX
Index
6
Introduction
10
1. Nanoparticles: characteristics, market and production processes 1.1. Nanoscience, nanotechnology and nanomaterials 1.2. Nanoparticles and their applications 1.3. Production processes
19 20 21 22
2. Nanoparticle synthesis in RF inductively coupled thermal plasmas
2.1. Technology overview 2.2. RF inductively coupled thermal plasmas
2.2.1. Ignition of the plasma discharge 2.2.2. Characteristic parameters 2.2.3. Modern ICP torch architecture
2.3. Current technological issues 2.4. The SIMBA project
39 40 41 42 43 50 53 56
3. Combined approaches for the characterization of ICP systems for
nanoparticle synthesis 3.1. Thermo-fluid dynamic characterization of RF inductively coupled
thermal plasmas 3.2. Nanopowder synthesis setup 3.3. Enthalpy probe and calorimetric measurements
3.3.1. Enthalpy probe measurements 3.3.2. Calorimetric measurements
3.4. Modeling approach 3.4.1. Computational model 3.4.2. Computational domain, boundary conditions and plasma
properties 3.5. Three- and two-dimensional simulations for the characterization of
the ICP system 3.6. Validation of the computational model
3.6.1. Comparison between two-dimensional modeling and enthalpy probe measurements
3.6.2. Comparison between two-dimensional modeling and calorimetric measurements
3.7. Three-dimensional time dependent modeling of turbulent flows in ICP sources
3.8. Conclusions
63
64 65 67 67 69 70 70
74
76 78
78
81
82 84
7
4. Optimization of nanoparticle synthesis through ICP systems 4.1. The role of modeling in the design and optimization of ICP systems
for nanoparticle synthesis 4.2. Precursor evaporation: a computational investigation on the role of
turbulence and vaporization models 4.2.1. Modeling approach 4.2.2. Results and discussion
4.3. Two-dimensional nodal modeling of nanoparticle synthesis: validation and advantages
4.3.1. Modeling approach 4.3.2. Results and discussion
4.4. The role of turbulent effects on nanoparticle synthesis 4.5. Design oriented modeling of a reaction chamber optimized for the
synthesis of Si nanoparticles 4.5.1. Modelling approach 4.5.2. Results and discussion
4.6. Conclusions
89
90
91 92 97
110 110 120 125
131 132 134 141
Acknowledgements 150

8

9
10
INTRODUCTION
Heart and soul of an ever-increasing amount of industrial processes, plasma is often referred to as the 21st century technology or as the magic wand of modern technology. Relying on its high temperatures, non-equilibrium chemistry or other characteristic features, processes such as plasma spray, plasma cutting and welding, synthesis of nanomaterials, surface etching, ozone production, thin films and polymers deposition have been pushing innovation in many hi-tech fields for more than 150 years. Being true to its pervasive nature, a rising number of studies have been recently devoted to plasma biomedical applications, from the biocompatibilization and decontamination of materials to medical therapies, currently at the front edge of plasma research. All of these very diverse fields have their roots in still not completely understood plasma phenomena and require a highly interdisciplinary approach to find innovative answers to challenging questions. During my Ph.D. studies at Alma Mater Studiorum - Università di Bologna, I have been thoroughly involved in the activities of the Research Group for Industrial Application of Plasmas (AIP group) and I focused my studies mainly on radio-frequency induction thermal plasma (RF-ITP) synthesis of nanoparticles, combining experimental and modelling approaches towards process optimization and industrial scale-up, in the framework of the FP7-NMP SIMBA European project. I also took part in various research activities dealing with other industrial application of thermal plasmas and devoted a fair share of time in setting up a new branch of activities of the AIP group regarding atmospheric pressure non-equilibrium plasmas, both for industrial and biomedical purposes, and in establishing a strong and multidisciplinary network of collaborations, within and without the Università di Bologna. In this dissertation I will discuss results from my activities on nanoparticle synthesis in RF-ITP systems; first, I will briefly summarize the state of the art of nanoparticle production through conventional and plasma routes, then I will focus both on the characterization of the plasma source and on the investigation of the nanoparticle synthesis phenomenon, aiming at highlighting fundamental process parameters while adopting a design oriented modelling approach. These activities have been part of the SIMBA project founded by the 7th European Framework Programme, FP7-NMP-2008-SMALL-2. These results have been reported in the following papers on international journals:
1. Colombo V, Ghedini E, Gherardi M, Sanibondi P and Shigeta M 2011 2-D nodal model with turbulent effects for the synthesis of Si nano-particles in RF thermal plasmas Proceedings of the 20th International Symposium on Plasma Chemistry (ISPC20, Philadelphia, USA, 24-29 July 2011)
2. Colombo V, Concetti C, Deschenaux C, Ghedini E, Gherardi M, Jaeggi C, Leparoux M and Sanibondi P 2011 Validation of 3D modelling of an
11
inductively coupled thermal plasma reactor through enthalpy probe measurements Proceedings of the 20th International Symposium on Plasma Chemistry (ISPC20, Philadelphia, USA, 24-29 July 2011)
3. Colombo V, Concetti A, Ghedini E, Gherardi M and Sanibondi P 2011 3-D Time-Dependent Large Eddy Simulation of Turbulent Flows in an Inductively Coupled Thermal Plasma Torch with Reaction Chamber IEEE Transactions on Plasma Science - Images in Plasma Science 39 (11) 2894-2895
4. Colombo V, Ghedini E, Gherardi M, Sanibondi P and Shigeta M 2012 A two-Dimensional Nodal Model with Turbulent Effects for the Synthesis of Si Nano-Particles by Inductively Coupled Thermal Plasmas Plasma Sources Science and Technology 21 025001
5. Colombo V, Deschenaux C, Ghedini E, Gherardi M, Jaeggi C, Laparoux M, Mani V and Sanibondi P 2012 Fluid-dynamic characterization of a radio-frequency induction thermal plasma system for nanoparticle synthesis Plasma Sources Science and Technology 21 045010
6. Colombo V, Ghedini E, Gherardi M and Sanibondi P 2012 Modelling for the optimization of the reaction chamber in silicon nanoparticle synthesis by radio-frequency induction thermal plasma Plasma Sources Science and Technology 21 055007
7. Colombo V, Ghedini E, Gherardi M and Sanibondi P Evaluation of precursor evaporation in Si nano-particle synthesis by radio-frequency induction thermal plasmas (submitted to Plasma Sources Science and Technology)
8. Colombo V, Delval C, Ghedini E, Gherardi M, Leparoux M and Sanibondi P Diagnostics and modelling for the optimization of precursor evaporation in silicon nano-particle synthesis by radiofrequency induction thermal plasma to be submitted to Plasma Sources Science and Technology
9. Boselli M, Colombo V, Daniëls N, Delval C, Ghedini E, Gherardi M, Jaeggi C, Leparoux M, Put S and Sanibondi P Influence of processing parameters on the properties of silicon nanoparticles synthesized by radio-frequency induction thermal plasma to be submitted to Plasma Sources Science and Technology
Also, some results have been presented at international conferences:
1. Colombo V, Ghedini E, Gherardi M and Sanibondi P 2010 Three-dimensional simulations of RF thermal plasma torches with reaction chamber: process design for powder spheroidization, waste treatment and nanopowder production Poster presentation at the 11th European Plasma Conference (HTPP-11, Brussels, 27 June - 2 July, 2010)
2. Colombo V, Ghedini E, Gherardi M, Sanibondi P, Leparoux M, Deschenaux C, Jäggi C and Delval C 2011 Diagnostics and modelling of an RF thermal plasma reactor for nanoparticles synthesis - Part 1 – diagnostics: enthalpy probe, OES, FTIR, particle sampling Oral presentation at 3rd International Round Table on Thermal Plasmas for Industrial Applications (Johannesburg, South Africa, 31 October - 4 November 2011)
12
3. Colombo V, Ghedini E, Sanibondi P, Gherardi M, Leparoux M, Delval C, Deschenaux C and Jaeggi C 2011 Diagnostics and Modeling of an RF Thermal Plasma Reactor for Nanoparticles Synthesis. Part 2: Modelling of Turbulence, Precursor Evaporation and Nanoparticle Growth for Reaction Chamber Design Oral presentation at 3rd International Round Table on Thermal Plasmas for Industrial Applications (Glenburn Lodge, Johannesburg, South Africa, 31 October–4 November 2011)
4. Colombo V, Ghedini E, Gherardi M, Sanibondi P and Shigeta M 2011 2-D nodal model with turbulent effects for the synthesis of Si nano-particles in RF thermal plasmas Poster presentation at the 20th International Symposium on Plasma Chemistry (ISPC20, Philadelphia, USA, 24-29 July 2011)
5. Colombo V, Concetti C, Deschenaux C, Ghedini E, Gherardi M, Jaeggi C, Leparoux M and Sanibondi P 2011 Validation of 3D modelling of an inductively coupled thermal plasma reactor through enthalpy probe measurements Poster presentation at the 20th International Symposium on Plasma Chemistry (ISPC20, Philadelphia, USA, 24-29 July 2011)
6. Colombo V, Dallavalle S, Deschenaux C, Ghedini E, Gherardi M, Jaeggi C, Leparoux M, Nemchinsky V, Sanibondi P and Vancini M 2012 Design oriented modelling and diagnostics for thermal plasma assisted industrial processes Invited presentation at Plasma-Québec colloquium (Montreal, Canada, 29-31 May 2012)
7. Boselli M, Colombo V, Daniëls N, Delval C, Ghedini E, Gherardi M, Jaeggi C, Leparoux M, Put S and Sanibondi P 2012 Influence of processing parameters on the properties of silicon nanoparticles synthesized by radio-frequency induction thermal plasma Oral presentation at the 12th European Plasma Conference (HTPP12, Bologna, Italia, 24-29 June 2012) & the 2012 International Conference on Plasma Science (ICOPS 2012, Edinburgh, Scotland, 8-12 July 2012)
8. Colombo V, Delval C, Ghedini E, Gherardi M, Leparoux M and Sanibondi P 2012 Diagnostics and modelling for the optimization of precursor evaporation in silicon nano-particle synthesis by radiofrequency induction thermal plasma”, Poster presentation at the 12th European Plasma Conference (HTPP12, Bologna, Italia, 24-29 June 2012) & the 2012 International Conference on Plasma Science (ICOPS 2012, Edinburgh, Scotland, 8-12 July 2012) & at the Gordon Research Conference - Plasma Processing Science and Societal Grand Challenges (GRC, Bryant University, Smithfield, USA, 22-27 July 2012)
9. Colombo V, Ghedini E, Gherardi M and Sanibondi P 2012 Silicon nanopowders synthesis by RF induction thermal plasmas: optimization of solid-vapor and vapor-solid phase transitions by modelling and diagnostics for process up-scaling Invited presentation at the Gordon Research Conference - Plasma Processing Science and Societal Grand Challenges (GRC, Bryant University, Smithfield, USA, 22-27 July 2012)
10. Ceschini L, Colombo V, Ghedini E, Gherardi M, Morri A, Rotundo F, Toschi S, Sanibondi P and Stancampiano A 2012 Plasma assisted integrated
13
production of cast Al-based metal matrix nanocomposites Poster presentation at NanotechItaly 2012 (Venice, Italy, 21-23 November 2012)
11. Boselli M, Colombo V, Ghedini E, Gherardi M, Sanibondi P, Delval C, Jaeggi C, Leparoux M, Put S, Nelis D, Caillon G and Jordy C 2012 Radio-frequency induction thermal plasma system for continuous production of silicon nanopowders for battery application Oral presentation at NanotechItaly 2012 (Venice, Italy, 21-23 November 2012)
In this research field, I’ve been supervisor for the following MA and BA thesis:
1. Gasperini L Modellazione, progettazione e messa in opera di una camera di reazione per la sintesi di nanopolveri assistita da plasma termico induttivo e scale-up industriale di processo Alma Mater Studiorum - Università di Bologna, March 2012
2. Traldi E 2012 Sintesi di nanoparticelle di SiO2 mediante plasma termico ad induzione, caratterizzazione mediante analisi BET, SEM e EDS e studio dell'applicazione nell'ambito delle costruzioni Alma Mater Studiorum - Università di Bologna, December 2012
3. Lo Iacono F Sintesi di nanopolveri di ossido di silicio mediante sorgente di plasma termico ad induzione e studio per l'applicazione nella produzione di membrane selettive Alma Mater Studiorum - Università di Bologna, December 2012
Moreover, I took part into other researches related to thermal plasma industrial processes; through experimental techniques, such as optical emission spectroscopy and high-speed imaging, and modelling I contributed to the investigation of specific issues of plasma cutting, welding and waste treatment. Part of these activities has been performed under the regional research project ENVIREN for the investigation of the treatment of incinerator wastes with RF thermal plasma torches. Finally, during my PhD I had the opportunity to actively pursue the formation of a multidisciplinary research network in the field of non-equilibrium atmospheric pressure plasmas (NTP) for industrial and biomedical application; I coordinated the development and characterization of a large number of NTP sources and participated in the study of various processes assisted by these sources. Since these researches are outside the main line of activities of my PhD as they were not foreseen at its beginning, especially for the case of NTP, results are not presented in this dissertation. Nonetheless, results regarding thermal plasma activities have been reported in the following papers on international journals:
1. Boselli M, Cantoro G, Colombo V, Concetti A, Ghedini E, Gherardi M and Sanibondi P 2011 High-Speed Imaging in PAC: Multiple View and Tomographic Reconstruction of Pilot Arcing Transients IEEE-Transactions on Plasma Science - Images in Plasma Science 39 (11) 2916-2917
2. Colombo V, Concetti A, Ghedini E, Gherardi M, Sanibondi P, Vazquez B, Barbieri L and Lancellotti I 2011 Rf Thermal Plasma Vitrification of
14
Incinerator Bottom and Fly Ashes with Waste Glasses from Fluorescent Lamps Proceedings of the 20th International Symposium on Plasma Chemistry (ISPC20, Philadelphia, USA, 24-29 July 2011)
3. Colombo V, Ghedini E, Gherardi M, Mani V, Sanibondi P and Vazquez B 2012 RF thermal plasma treatment of dredged sediments: vitrification and silicon extraction Journal of Physics: Conference Series 406 012039
4. Colombo V, Concetti A, Ghedini E, Sanibondi P, Dallavalle S, Vancini M, Boselli M and Gherardi M 2012 Advances in Plasma Arc Cutting Technology: the Experimental Part of an Integrated Approach Plasma Chemistry and Plasma Processing 32 (3) 411-426
5. Boselli M, Colombo V, Ghedini E, Gherardi M and Sanibondi P 2012 Dynamic analysis of droplet transfer in gas-metal arc welding: modelling and experiments Plasma Sources Science and Technology 21 055015
6. Boselli M, Colombo V, Ghedini E, Gherardi M, Rotundo F and Sanibondi P High-speed imaging investigation of transient phenomena impacting plasma arc cutting process optimization (accepted for publication in Journal of Physics D: Applied Physics)
7. Boselli M, Colombo V, Ghedini E, Gherardi M and Sanibondi P Two-dimensional time-dependent modelling of fume formation in a pulsed gas metal arc welding process (accepted for publication in Journal of Physics D: Applied Physics)
8. Boselli M, Colombo V, Ghedini E, Gherardi M and Sanibondi P Two-temperature modelling and optical emission spectroscopy of a constant current plasma arc welding process (accepted for publication in Journal of Physics D: Applied Physics)
Also, some results have been presented at international conferences:
1. Colombo V, Concetti A, Ghedini E, Rotundo F, Sanibondi P, Boselli M, Dallavalle S, Gherardi M and Vancini M 2011 Advances in plasma arc cutting technology: the experimental part of an integrated approach Oral presentation at 3rd International Round Table on Thermal Plasmas for Industrial Applications (Johannesburg, South Africa, 31 October - 4 November 2011)
2. Colombo V, Concetti A, Ghedini E, Gherardi M, Sanibondi P, Vazquez B, Barbieri L and Lancellotti I 2011 Rf Thermal Plasma Vitrification of Incinerator Bottom and Fly Ashes with Waste Glasses from Fluorescent Lamps Poster presentation at the 20th International Symposium on Plasma Chemistry (ISPC20, Philadelphia, USA, 24-29 July 2011)
3. Colombo V, Ghedini E, Gherardi M, Mani V, Sanibondi P and Vazquez B 2012 RF thermal plasma treatment of dredged sediments: vitrification and silicon extraction Poster presentation at the 12th European Plasma Conference (HTPP12, Bologna, Italia, 24-29 June 2012)
In this research field, I’ve been supervisor for the following MA and BA thesis:
15
1. Ravegnini F Metodologie industriali e sperimentali per la produzione di silicio di grado metallurgico Alma Mater Studiorum - Università di Bologna, October 2011
While results related to NTP have been reported in the following papers on international journals:
1. Boselli M, Colombo V, De Angelis M G, Ghedini E, Gherardi M, Laurita R, Minelli M, Rotundo F, Sanibondi P and Stancampiano A 2012 Comparing the effects of different atmospheric pressure non- equilibrium plasma sources on PLA oxygen permeability Journal of Physics: Conference Series 406 012038
2. Boselli M, Colombo V, Ghedini E, Gherardi M, Laurita R, Liguori A, Rotundo, Sanibondi P and Stancampiano A Optimization oriented characterization of a dual gas plasma plasma needle device for biomedical applications: effluent composition, thermal output and fluid-dynamics to be submitted to Plasma Sources Science and Technology
3. Boselli M, Colombo V, Ghedini E, Gherardi M, Laurita R, Liguori A, Rotundo, Sanibondi P and Stancampiano A Multi-imaging techniques for the characterization of a nanopulsed DBD system for biomedical applications to be submitted to Plasma Sources Science and Technology
4. Colombo V, Fabiani D, Focarete M L, Ghedini E, Gherardi M, Laurita R, Sanibondi P and Zaccaria M Effect of atmospheric pressure non-equilibrium plasma treatment on poly-L-lactic acid electrospinnability to be submitted to Plasma Processes Polymers
5. Alessandri M, Calzà L, Colombo V, Dolci L S, Fiorani A, Focarete M L, Ghedini E, Gherardi M, Laurita R, Liguori A, Sanibondi P and Zucchelli A Atmospheric plasma surface modification of electrospun poly(L-lactic acid): effect on mat properties and cell culturing to be submitted to ACS Applied Materials and Interfaces / Soft Matter
Also, some results have been presented at international conferences:
1. Boselli M, Colombo V, Ghedini E, Gherardi M, Laurita R, Liguori A, Rotundo F, Sanibondi P and Stancampiano A 2012 Effluent composition, thermal output and fluid-dynamics of a dual gas plasma needle device for biomedical applications: Part I Poster presentation at the International Conference on Plasma Medicine (ICPM4, Orléans, France, 17-21 June 2012) & the 12th European Plasma Conference (HTPP12, Bologna, Italia, 24-29 June 2012)
2. Boselli M, Colombo V, Ghedini E, Gherardi M, Laurita R, Liguori A, Rotundo F, Sanibondi P and Stancampiano A 2012 Effluent composition, thermal output and fluid-dynamics of a dual gas plasma needle device for biomedical applications: Part II Poster presentation at the International Conference on Plasma Medicine (ICPM4, Orléans, France, 17-21 June

16
2012) & the 12th European Plasma Conference (HTPP12, Bologna, Italia, 24-29 June 2012)
3. Boselli M, Colombo V, Ghedini E, Gherardi M, Laurita R, Liguori A, Rotundo F, Sanibondi P and Stancampiano A 2012 Transition from non-uniform to uniform discharge in nanosecond pulsed FE-DBD and linear corona non-equilibrium plasmas Poster presentation at the International Conference on Plasma Medicine (ICPM4, Orléans, France, 17-21 June 2012) & the 12th European Plasma Conference (HTPP12, Bologna, Italia, 24-29 June 2012)
4. Boselli M, Colombo V, Ghedini E, Gherardi M, Laurita R, Liguori A, Rotundo F, Sanibondi P and Stancampiano A 2012 Multi-imaging techniques for the characterization of a nanopulsed DBD system for biomedical applications Oral presentation at Plasma to Plasma! (Leiden, The Netherlands, 7-11 January 2013) & 5P Plasma Processes: Past. Present and Perspectives (Bari, Italia, 21-23 June 2012) & the 12th European Plasma Conference (HTPP12, Bologna, Italia, 24-29 June 2012) & Gordon Research Seminar - Plasmas in Biology and Medicine, Plasma Processing and Plasma Analysis and Diagnostics (GRS, Bryant University, Smithfield, USA, 22-27 July 2012)
5. Boselli M, Colombo V, De Angelis M G, Ghedini E, Gherardi M, Laurita R, Minelli M, Sanibondi P and Stancampiano A 2012 Comparing the effects of different atmospheric pressure non-equilibrium plasma sources on PLA oxygen permeability Poster presentation at the 12th European Plasma Conference (HTPP12, Bologna, Italia, 24-29 June 2012) & the 2012 International Conference on Plasma Science (ICOPS 2012, Edinburgh, Scotland, 8-12 July 2012)
6. Boselli M, Colombo V, Ghedini E, Gherardi M, Laurita R, Liguori A, Sanibondi P and Stancampiano A 2012 Fluid-dynamic characterization of atmospheric pressure non-equilibrium plasma sources for biomedical applications Poster presentation at the 12th European Plasma Conference (HTPP12, Bologna, Italia, 24-29 June 2012) & the 2012 International Conference on Plasma Science (ICOPS 2012, Edinburgh, Scotland, 8-12 July 2012)
7. Boselli M, Colombo V, Ghedini E, Gherardi M, Laurita R and Sanibondi P 2012 Optimization oriented characterization of a dual gas plasma needle device for biomedical applications: effluent composition, thermal output and fluid dynamics Oral presentation at Gordon Research Seminar - Plasmas in Biology and Medicine, Plasma Processing and Plasma Analysis and Diagnostics (GRS, Bryant University, Smithfield, USA, 22-27 July 2012) & Poster presentation at Gordon Research Conference - Plasma Processing Science and Societal Grand Challenges (GRC, Bryant University, Smithfield, USA, 22-27 July 2012)
8. Alessandri M, Calzà L, Colombo V, Dolci L S, Fiorani A, Focarete M L, Ghedini E, Gherardi M, Laurita R, Liguori A, Sanibondi P and Zucchelli A 2012 Atmospheric plasma surface modification of electrospun poly(L-lactic acid): effect on mat properties and cell culturing Oral presentation at
17
BIOINTERFACE 2012 (University College, Dublin, Ireland, 23-25 October 2012)
9. Colombo V, Fabiani D, Focarete M L, Ghedini E, Gherardi M, Laurita R, Sanibondi P and Zaccaria M 2012 Effect of atmospheric pressure non-equilibrium plasma treatment on poly-L-lactic acid electrospinnability Poster presentation at NanotechItaly 2012 (Venice, Italy, 21-23 November 2012)
In this research field, I’ve been supervisor for the following MA and BA thesis:
1. Laurita R The effects of non-equilibrium plasmas in the treatment of biological materials: experimental study, source design and characterization Alma Mater Studiorum - Università di Bologna, December 2011
2. Sabbatucci L Progettazione, realizzazione e caratterizzazione preliminare di una sorgente prototipale di plasma non termico per applicazioni biomedicali Alma Mater Studiorum - Università di Bologna, March 2012
3. Mainardi L Proprietà barriera e superficiali di materiali sostenibili per l’imballaggio alimentare: effetti del trattamento al plasma Alma Mater Studiorum - Università di Bologna, July 2012
4. Stancampiano A Metodi di diagnostica per l'ottimizzazione di processi assistiti da plasmi di non equilibrio per il trattamento di materiali biologici o biocompatibili Alma Mater Studiorum - Università di Bologna, July 2012
5. Liguori A Analisi, caratterizzazione e confronto prestazionale di processi assistiti da sorgenti di plasma di non equilibrio per la biocompatibilizzazione di scaffold elettrofilati Alma Mater Studiorum - Università di Bologna, October 2012
6. Di Giovanni A Trattamento di substrati vetrosi e polimerici mediante sorgenti di plasma di non equilibrio Alma Mater Studiorum - Università di Bologna, December 2012
7. Stevanella D Trattamento di liquidi mediante sorgenti di plasma di non equilibrio Alma Mater Studiorum - Università di Bologna, December 2012

18

19
CHAPTER 1 NANOPARTICLES: CHARACTERISTICS, MARKET
AND PRODUCTION PROCESSES
20
1.1. Nanoscience, nanotechnology and nanomaterials
To discuss about nanoparticles first requires a brief historical and terminological introduction to the nano scaled world. An ancient world that can be traced back at least one thousend years, when gold and silver nanoparticle were used as coloured pigments in glass and ceramics [1]; a world of recurring challenges, where both 10th century chemists and 21st century technologists struggle to produce controlled size nanomaterials. The beginning of modern nanoscience, the branch of studies dedicated to the investigation of phenomena and materials at atomic, molecular and macromolecular scales, is commonly dated 1959, when Richard Feynman, the Nobel prize physicist, gave his lecture ‘There’s plenty of room at the bottom’ [2]; he was laying the foundations of an immense scientific field, theorizing the manipulation of material at the scale of atoms and molecules and foreseeing the whole of the Encyclopaedia Britannica written on the head of a pin. Intrestingly he was already focusing on scaling issues, even though from a physicist perspective and thus totally different from the ones discussed in this dissertation. Fifteen years later, in 1974, the term nanotechnology was coined by Norio Taniguchi [3] to describe the ability to precisely engineer nanoscale materials; in the same years IBM realized 40-70 nm electronic devices by electron beam lithography. Later, during the ‘80s, the discoveries of the scanning tunneling microscope and the atomic force microscope allowed imaging of surfaces at atomic level and had pivotal role in the development of nanotechnologies and their eventual applications.
As a broad definition, materials having at least one dimension less than 100 nm are referred to as nanomaterials; this specific term is required since in the size range from the atomic level to around 100 nm materials may have different properties compared to bulk materials, mainly due to the increased relative surface area and the role played by quantum effects. Indeed, as the size decreases, the proportion of atoms at the surface of the material increases, leading to a greater surface area per unit mass; as a consequence, some nanomaterials are ideal for those processes occurring on surfaces, such as catalytic chemical reactions, while other ones, crystalline solids with nanometric structural components for example, feature increased mechanical and electrical properties. As the size decreases, quantum effects increasingly affect the properties of matter, determining optical, electrical and magnetic behaviour of materials, while other chemical and physical properties are affected by surface tension, stickiness or other effects tipically occurring in the 100 nm size range. Depending on the number of their dimensions falling in this size range, nanomaterials can be divided in categories. Those having one dimension in the nanoscale are called layers, thin films or surface coatings and are widely employed in the electronic industry
21
(components of integrated-circuits), chemistry and engineering (lubricants, fuel cells, catalysts). Materials with two dimensions in the nanoscale, nanowires and nanotubes, are of great interest for their electric and mechanical properties. Carbon nanotubes (CNTs), first observed by Sumio Iijima [4], are tubes of rolled graphene sheets typically a few nanometres in diameter and several micrometres to centimetres long; having high mechanical strength, flexibility and electrical conductivity, CNTs are suitable materials for sensors, nanoelectronics, and reinforced composites. Among the other materials, inorganic nanotubes and oxide-based nanotubes have shown promise for hydrogen and lithium storage and cathalysis respectively, while nanowires potential applications are in high-density data storage, and electronic nanodevices, for metallic interconnects of quantum devices and nanodevices. Finally, materials having three dimensions in the nanoscale are fuellerenes, a carbon material used as a lubricant and in electronic circuits, dendrimers, self-assembled polymeric molecules applied in coatings, inks and as carrier molecules for drug delivery, quantum dots, semiconductor materials having size-dependent properties, and nanoparticles, the main focus of this dissertation that will be discussed more deeply in the following sections.
1.2. Nanoparticles and their applications
The term nanoparticles encompass a broad family of nanomaterials whose common feature is having a diameter less than 100 nm. Depending on their size and material, nanoparticles have a wide range of potential applications, from catalysts to sunscreen, from batteries to nanomedicine; moreover, their size makes them ideal building blocks for many bottom-up nanotechnology production processes, especially in electronics and as composite additives. Many applications of nanoparticles rely on their high specific surface area, catalysis being the first of a long list. Since the catalytic activity is directly related to the number of active sites, hence to the specific surface area of the catalyst, there is a strong industrial interest for nanoparticle, tipically with diameter less than 10 nm; a strong push comes from the automotive sector, where regulations to limit exhaust emission from internal combustion engines impose the use of catalysts in which scarce and expensive precious metals are key components. Nanoparticles are also used as cathode catalysts in fuel cells, aiming to substitute current thermodynamically unstable carbon supported catalysts; again, it is the automotive industry that is pushing in this direction, driven by the public interest for green cars. The last of these applications worth mentioning is in Lithium-ion batteries, widely used in portable electronic devices, hybrid and electrical vehicles (a forecasted $18.6 billion market for 2013 [5]); here nanoparticles are being considered as a

22
replacement of graphite as the anode material in order to increase battery energy density. Other applications rely on the improved mechanical properties of the nanoparticles. Nanocrystalline materials, carbides mainly, are employed for the production of wear and erosion resistant cutting tools, while nanocrystalline ceramics display an increased ductility and machinability. A large number of applications employ nanoparticles as additives; sunscreens are a well-known example, where nanoparticles transparent to visible light but absorbing and reflecting UV light are used. In the construction industry nanoparticles are added to clay and cement to improve their mechanical properties, while they are incorporated in paints to reduce their weight and in coatings for the production of self-cleaning windows or the destruction of chemical agents. Arguably the most important among these applications is in composites, where nanoparticles are used to add optical, magnetical, electrical or mechanical functionalities to a base material. In the environmental and energy fields nanoparticles are employed for soil and groundwater remediation through reaction with pollutants and for gas separation, as an additive to membranes. Nanoparticles are also used as a raw material for spray coating, allowing the production of uniform coatings with few voids, as flux pinners in high temperature super conductors and in the production of high capacity multi-layer ceramic capacitor (MLCC) devices. Finally, to conclude this brief overview, some application relies on the magnetic properties proper of nanoparticles or induced by nanoparticles; to mention a few, magnets fabricated from specific nanocrystalline materials display high coercitivity and are used for computer hard disks, while superparamagnetic nanoparticles (mainly iron oxides) are used as imaging contrast agents in Magnetic Resonance Imaging (MRI), a market expected to reach $2 billion USD by 2020.
1.3. Production processes Many processes have been developed for the production of nanoparticles, allowing accurate control of particle size, shape, crystallinity and surface composition. While some processes are still limited to the laboratory scale due to poor productivity, others have already reached the industrial scale; tipically there is an inverse proportionality between the precision of the production method and its scale. The usual classification divides these processes in top-down techniques, where nanoparticles are produced by progressively reducing the size of the raw material, and bottom-up techniques, where particles are assembled from smaller building blocks (atoms or molecules). A second classification may be done, based on the phase in which the process is carried out; while top-down

23
processes are inherently solid-phase (milling, ablation), bottom-up tecniques may be either liquid-phase (co-precipitation, sonochemical reaction) or gas phase (flame and plasma synthesis). Typically, solid-phase and gas-phase processes are of great industrial interest for their high productivity or high purity, or both, whereas liquid-phase processes have limited purity and require post-processing, but in some cases they are the only route available for the production of higly specific and tailored nanoparticles. Top-down processes Litography is the most widespread top-down process, as well as the one who had the highest impact on technological development due to its use in semiconductor production. Ball milling, spark erosion and laser ablation are the top-down processes for nanoparticle production with the highest industrial impact.
Ball milling During ball-milling the starting material is repeatedly fractured by mechanical collision and friction in a ball mill [6,7]; this process, especially attractive for the manufacture of thermoelectric materials [8,9], is characterized by high production rates, but minimum particle dimension, given by the equilibrium between particle destruction and aggregation forces, is high, with a lower limit in the range 10-300 nm depending on the material [10,11]. To produce finer nanosized particles, milling can be carried out in a cryogenic medium (cryomilling) [12]. As a further issue, nanoparticle purity is limited due to oxygen inclusions, as well as of the material eroded from the milling device [13]. A transmission electron microscopy (TEM) image of silicon nanopowder powders produced by ball milling is presented in Figure 1.1.
Figure 1.1: TEM image of Si nanopowders produced by ball milling [14]
24
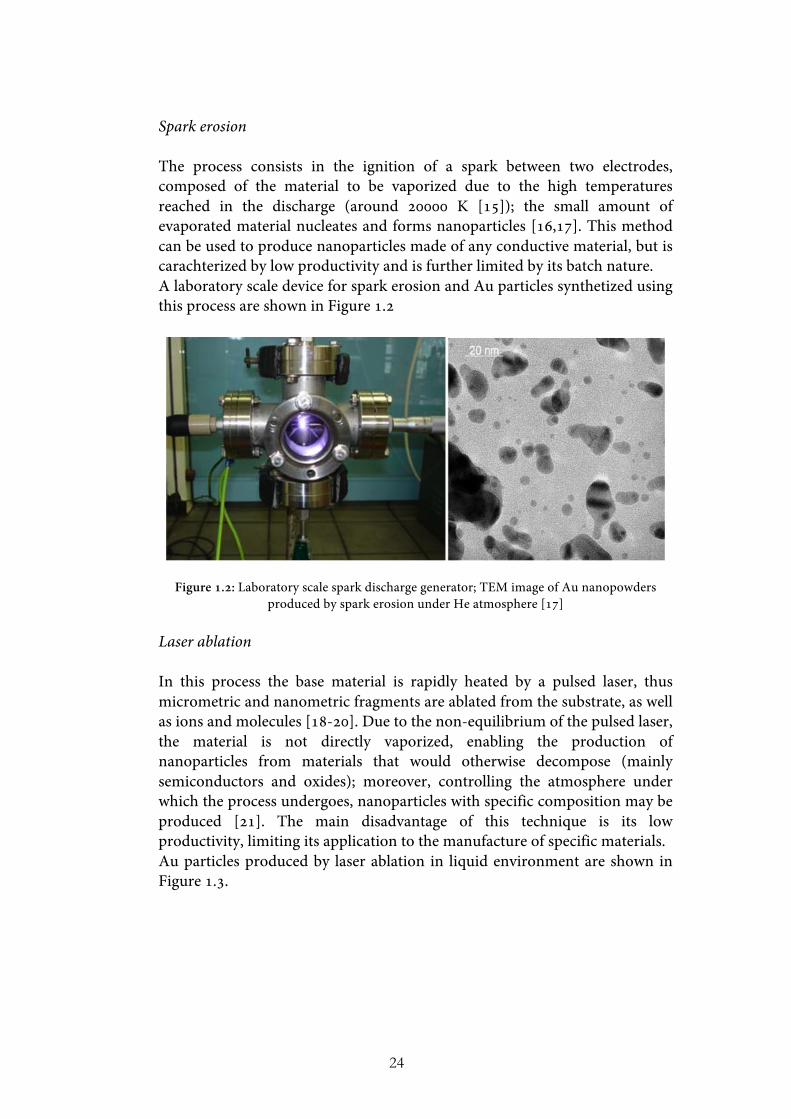
Spark erosion The process consists in the ignition of a spark between two electrodes, composed of the material to be vaporized due to the high temperatures reached in the discharge (around 20000 K [15]); the small amount of evaporated material nucleates and forms nanoparticles [16,17]. This method can be used to produce nanoparticles made of any conductive material, but is carachterized by low productivity and is further limited by its batch nature. A laboratory scale device for spark erosion and Au particles synthetized using this process are shown in Figure 1.2
Figure 1.2: Laboratory scale spark discharge generator; TEM image of Au nanopowders produced by spark erosion under He atmosphere [17]
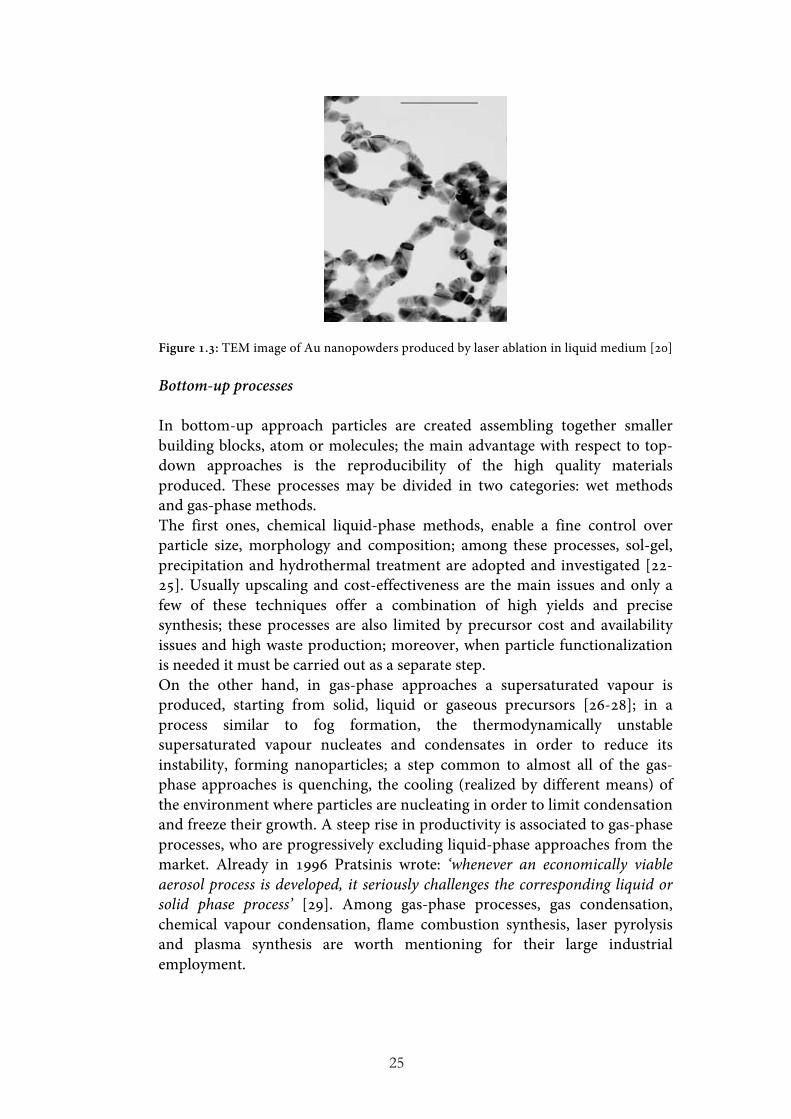
Laser ablation In this process the base material is rapidly heated by a pulsed laser, thus micrometric and nanometric fragments are ablated from the substrate, as well as ions and molecules [18-20]. Due to the non-equilibrium of the pulsed laser, the material is not directly vaporized, enabling the production of nanoparticles from materials that would otherwise decompose (mainly semiconductors and oxides); moreover, controlling the atmosphere under which the process undergoes, nanoparticles with specific composition may be produced [21]. The main disadvantage of this technique is its low productivity, limiting its application to the manufacture of specific materials. Au particles produced by laser ablation in liquid environment are shown in Figure 1.3.
25
Figure 1.3: TEM image of Au nanopowders produced by laser ablation in liquid medium [20] Bottom-up processes
In bottom-up approach particles are created assembling together smaller building blocks, atom or molecules; the main advantage with respect to top-down approaches is the reproducibility of the high quality materials produced. These processes may be divided in two categories: wet methods and gas-phase methods. The first ones, chemical liquid-phase methods, enable a fine control over particle size, morphology and composition; among these processes, sol-gel, precipitation and hydrothermal treatment are adopted and investigated [22-25]. Usually upscaling and cost-effectiveness are the main issues and only a few of these techniques offer a combination of high yields and precise synthesis; these processes are also limited by precursor cost and availability issues and high waste production; moreover, when particle functionalization is needed it must be carried out as a separate step. On the other hand, in gas-phase approaches a supersaturated vapour is produced, starting from solid, liquid or gaseous precursors [26-28]; in a process similar to fog formation, the thermodynamically unstable supersaturated vapour nucleates and condensates in order to reduce its instability, forming nanoparticles; a step common to almost all of the gas-phase approaches is quenching, the cooling (realized by different means) of the environment where particles are nucleating in order to limit condensation and freeze their growth. A steep rise in productivity is associated to gas-phase processes, who are progressively excluding liquid-phase approaches from the market. Already in 1996 Pratsinis wrote: ‘whenever an economically viable aerosol process is developed, it seriously challenges the corresponding liquid or solid phase process’ [29]. Among gas-phase processes, gas condensation, chemical vapour condensation, flame combustion synthesis, laser pyrolysis and plasma synthesis are worth mentioning for their large industrial employment.
26
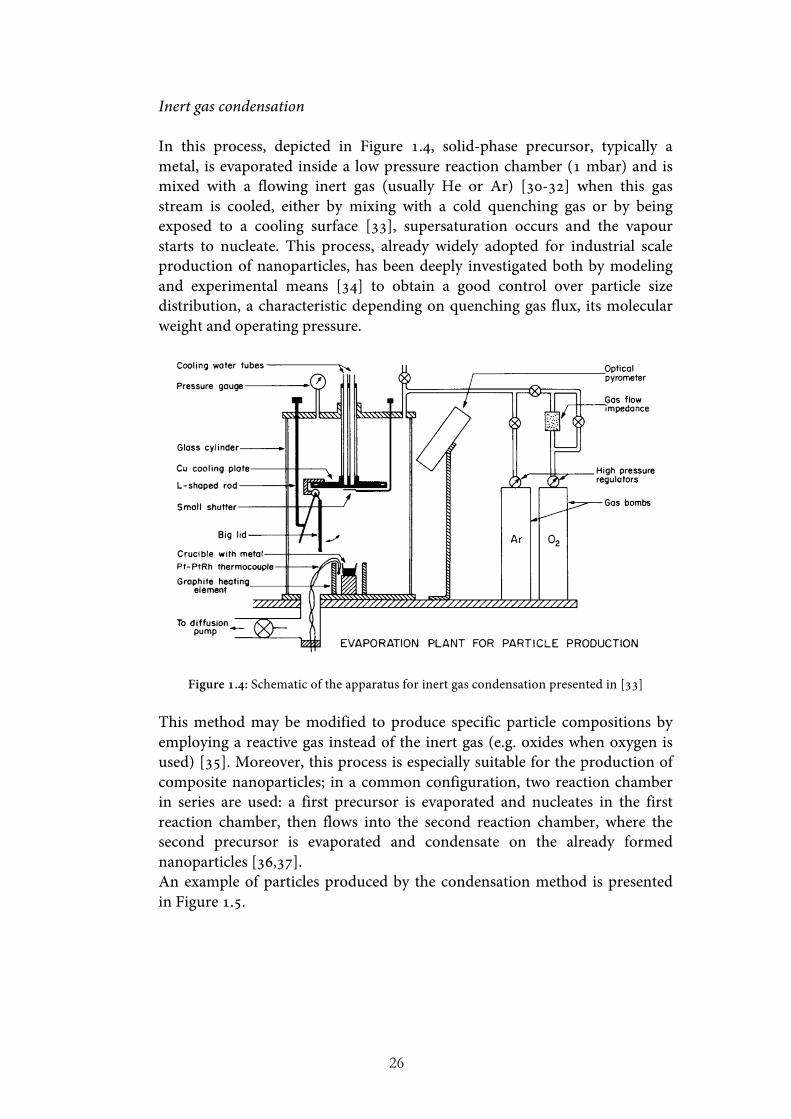
Inert gas condensation In this process, depicted in Figure 1.4, solid-phase precursor, typically a metal, is evaporated inside a low pressure reaction chamber (1 mbar) and is mixed with a flowing inert gas (usually He or Ar) [30-32] when this gas stream is cooled, either by mixing with a cold quenching gas or by being exposed to a cooling surface [33], supersaturation occurs and the vapour starts to nucleate. This process, already widely adopted for industrial scale production of nanoparticles, has been deeply investigated both by modeling and experimental means [34] to obtain a good control over particle size distribution, a characteristic depending on quenching gas flux, its molecular weight and operating pressure.
Figure 1.4: Schematic of the apparatus for inert gas condensation presented in [33]
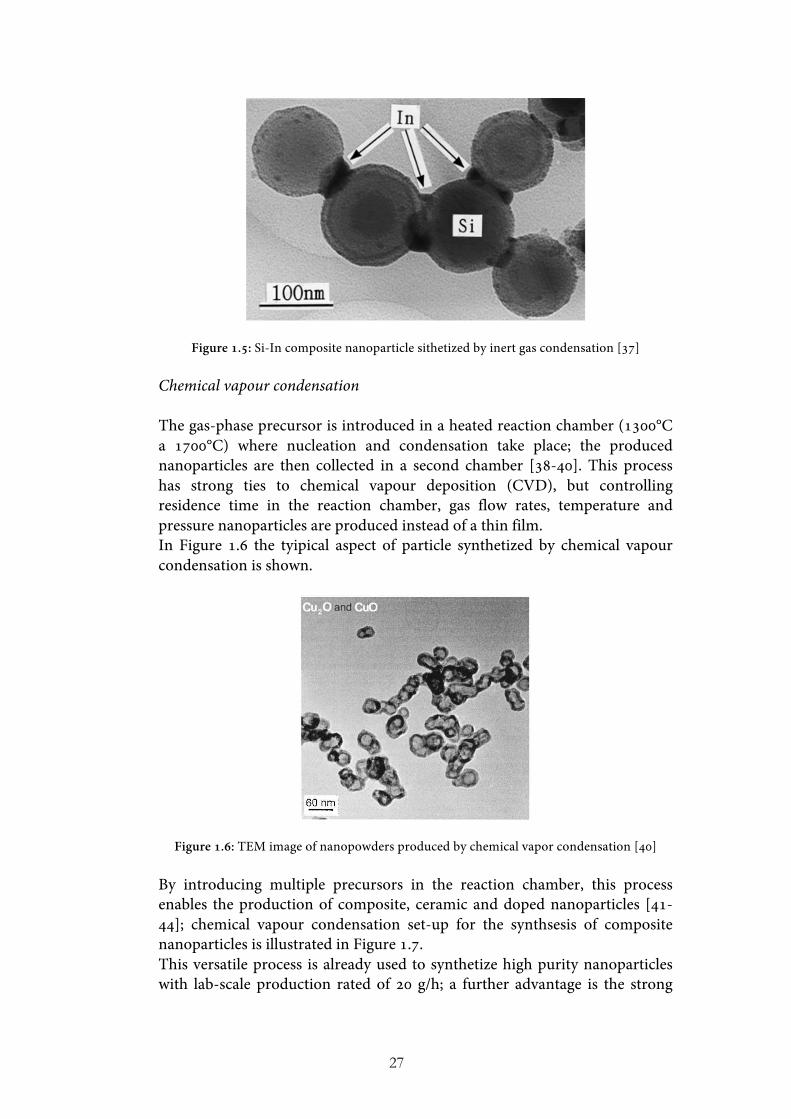
This method may be modified to produce specific particle compositions by employing a reactive gas instead of the inert gas (e.g. oxides when oxygen is used) [35]. Moreover, this process is especially suitable for the production of composite nanoparticles; in a common configuration, two reaction chamber in series are used: a first precursor is evaporated and nucleates in the first reaction chamber, then flows into the second reaction chamber, where the second precursor is evaporated and condensate on the already formed nanoparticles [36,37]. An example of particles produced by the condensation method is presented in Figure 1.5.
27
Figure 1.5: Si-In composite nanoparticle sithetized by inert gas condensation [37]
Chemical vapour condensation The gas-phase precursor is introduced in a heated reaction chamber (1300°C a 1700°C) where nucleation and condensation take place; the produced nanoparticles are then collected in a second chamber [38-40]. This process has strong ties to chemical vapour deposition (CVD), but controlling residence time in the reaction chamber, gas flow rates, temperature and pressure nanoparticles are produced instead of a thin film. In Figure 1.6 the tyipical aspect of particle synthetized by chemical vapour condensation is shown.
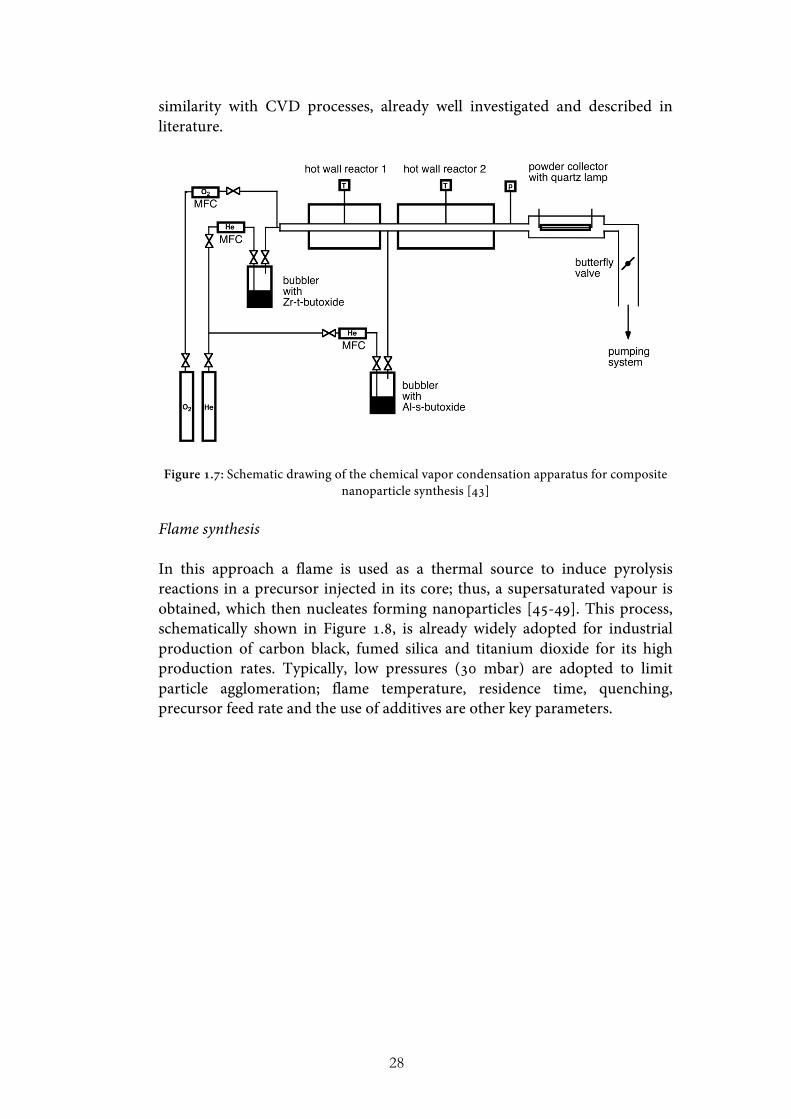
Figure 1.6: TEM image of nanopowders produced by chemical vapor condensation [40] By introducing multiple precursors in the reaction chamber, this process enables the production of composite, ceramic and doped nanoparticles [41-44]; chemical vapour condensation set-up for the synthsesis of composite nanoparticles is illustrated in Figure 1.7. This versatile process is already used to synthetize high purity nanoparticles with lab-scale production rated of 20 g/h; a further advantage is the strong
28
similarity with CVD processes, already well investigated and described in literature.
Figure 1.7: Schematic drawing of the chemical vapor condensation apparatus for composite nanoparticle synthesis [43]
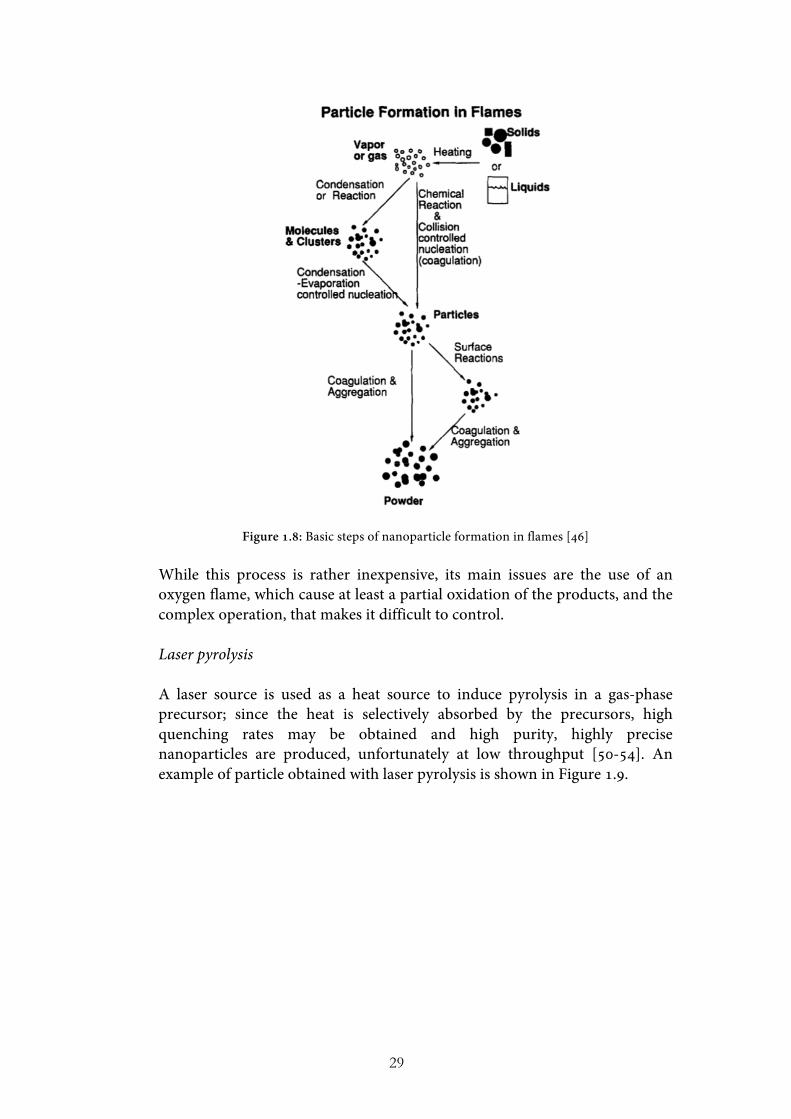
Flame synthesis In this approach a flame is used as a thermal source to induce pyrolysis reactions in a precursor injected in its core; thus, a supersaturated vapour is obtained, which then nucleates forming nanoparticles [45-49]. This process, schematically shown in Figure 1.8, is already widely adopted for industrial production of carbon black, fumed silica and titanium dioxide for its high production rates. Typically, low pressures (30 mbar) are adopted to limit particle agglomeration; flame temperature, residence time, quenching, precursor feed rate and the use of additives are other key parameters.
29
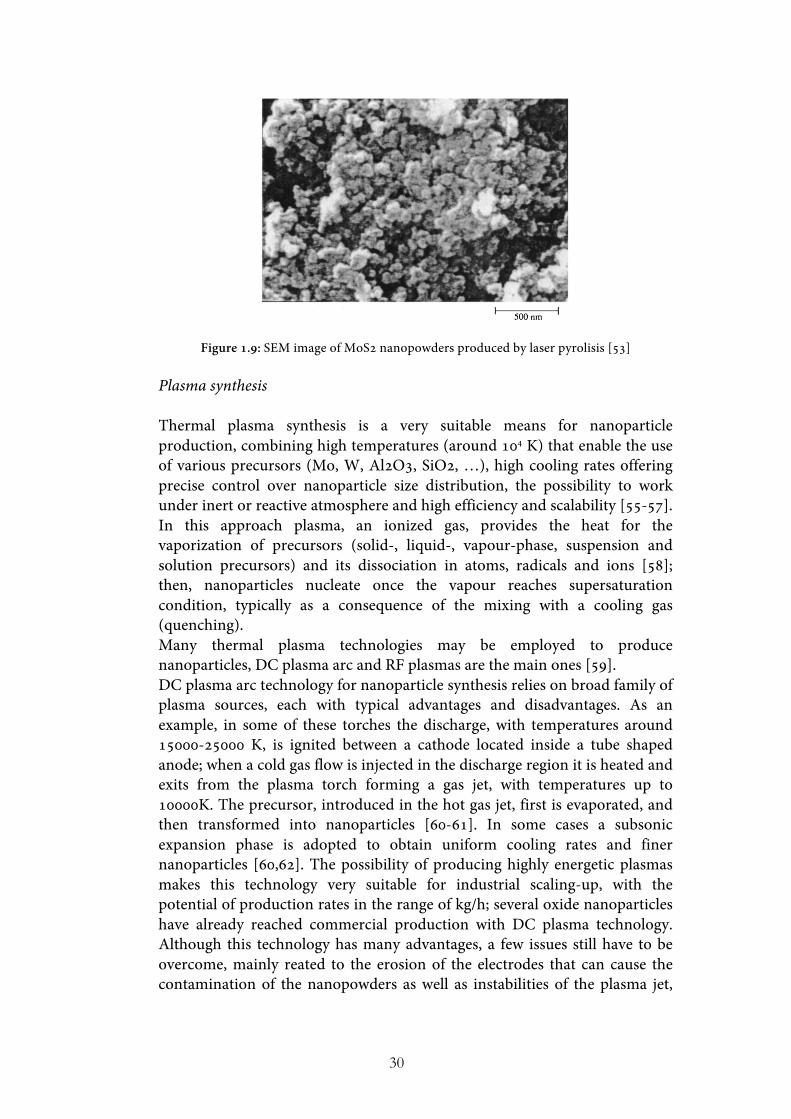
Figure 1.8: Basic steps of nanoparticle formation in flames [46] While this process is rather inexpensive, its main issues are the use of an oxygen flame, which cause at least a partial oxidation of the products, and the complex operation, that makes it difficult to control. Laser pyrolysis A laser source is used as a heat source to induce pyrolysis in a gas-phase precursor; since the heat is selectively absorbed by the precursors, high quenching rates may be obtained and high purity, highly precise nanoparticles are produced, unfortunately at low throughput [50-54]. An example of particle obtained with laser pyrolysis is shown in Figure 1.9.
30
Figure 1.9: SEM image of MoS2 nanopowders produced by laser pyrolisis [53]
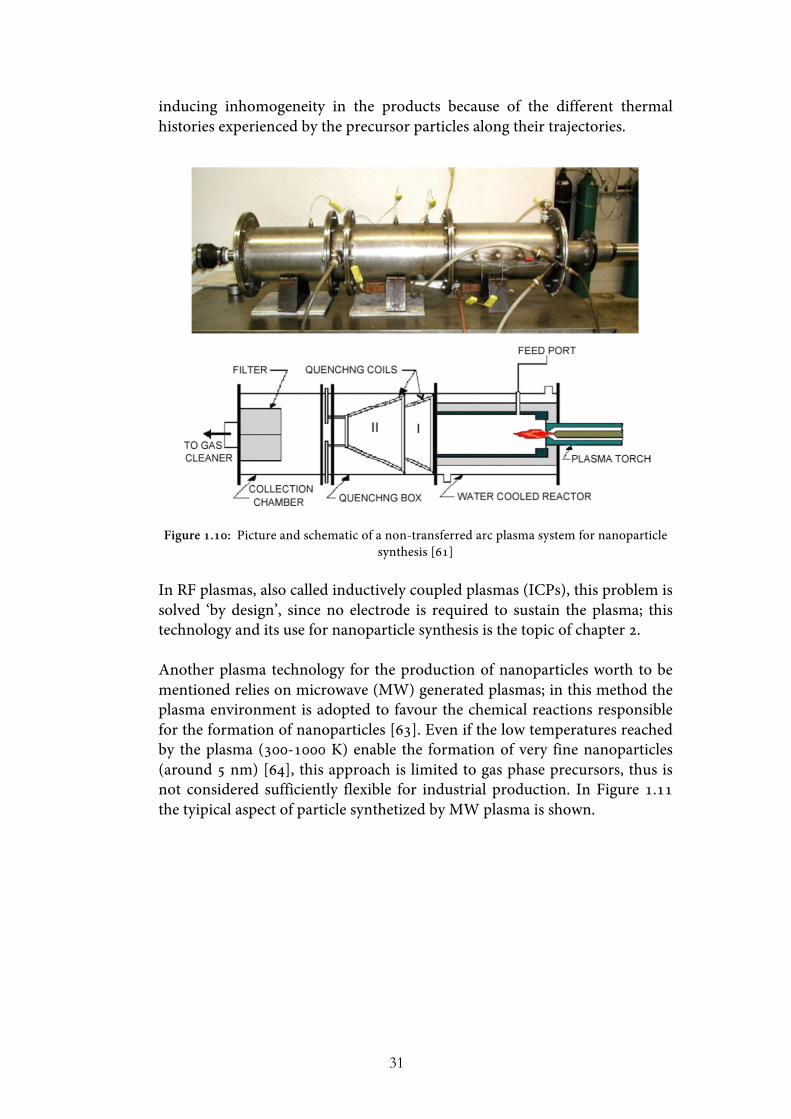
Plasma synthesis Thermal plasma synthesis is a very suitable means for nanoparticle production, combining high temperatures (around 104 K) that enable the use of various precursors (Mo, W, Al2O3, SiO2, …), high cooling rates offering precise control over nanoparticle size distribution, the possibility to work under inert or reactive atmosphere and high efficiency and scalability [55-57]. In this approach plasma, an ionized gas, provides the heat for the vaporization of precursors (solid-, liquid-, vapour-phase, suspension and solution precursors) and its dissociation in atoms, radicals and ions [58]; then, nanoparticles nucleate once the vapour reaches supersaturation condition, typically as a consequence of the mixing with a cooling gas (quenching). Many thermal plasma technologies may be employed to produce nanoparticles, DC plasma arc and RF plasmas are the main ones [59]. DC plasma arc technology for nanoparticle synthesis relies on broad family of plasma sources, each with typical advantages and disadvantages. As an example, in some of these torches the discharge, with temperatures around 15000-25000 K, is ignited between a cathode located inside a tube shaped anode; when a cold gas flow is injected in the discharge region it is heated and exits from the plasma torch forming a gas jet, with temperatures up to 10000K. The precursor, introduced in the hot gas jet, first is evaporated, and then transformed into nanoparticles [60-61]. In some cases a subsonic expansion phase is adopted to obtain uniform cooling rates and finer nanoparticles [60,62]. The possibility of producing highly energetic plasmas makes this technology very suitable for industrial scaling-up, with the potential of production rates in the range of kg/h; several oxide nanoparticles have already reached commercial production with DC plasma technology. Although this technology has many advantages, a few issues still have to be overcome, mainly reated to the erosion of the electrodes that can cause the contamination of the nanopowders as well as instabilities of the plasma jet,
31
inducing inhomogeneity in the products because of the different thermal histories experienced by the precursor particles along their trajectories.
Figure 1.10: Picture and schematic of a non-transferred arc plasma system for nanoparticle synthesis [61]
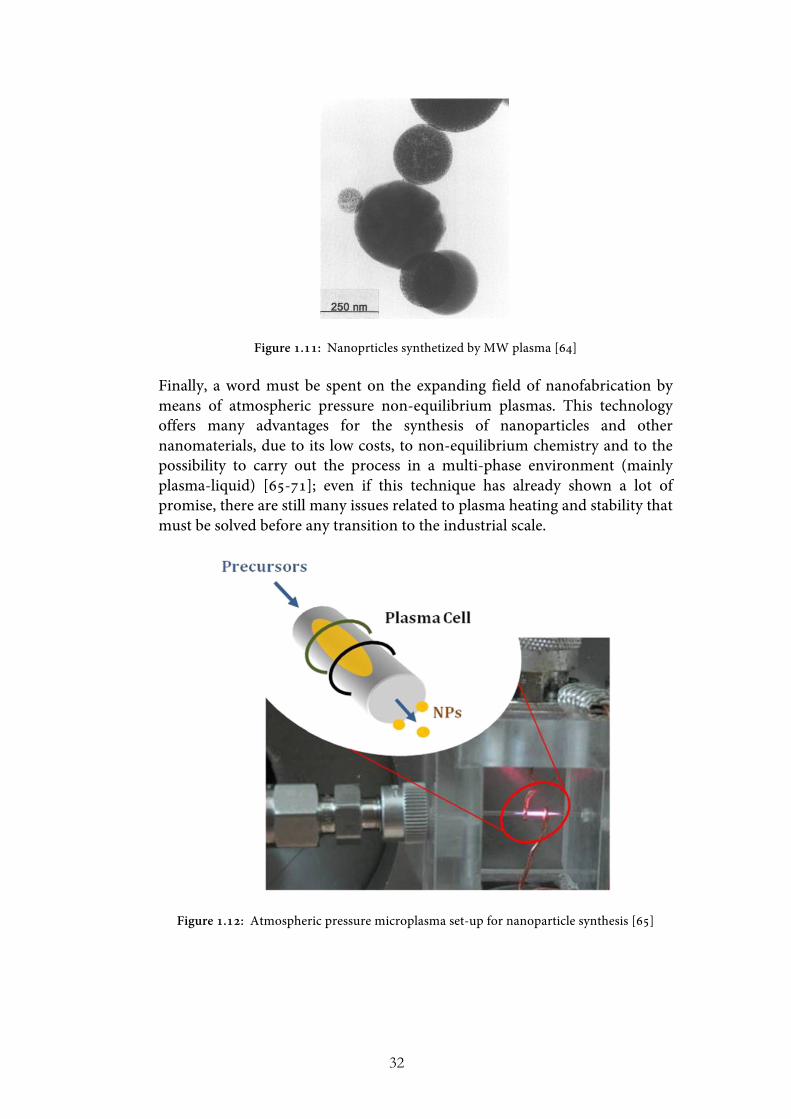
In RF plasmas, also called inductively coupled plasmas (ICPs), this problem is solved ‘by design’, since no electrode is required to sustain the plasma; this technology and its use for nanoparticle synthesis is the topic of chapter 2. Another plasma technology for the production of nanoparticles worth to be mentioned relies on microwave (MW) generated plasmas; in this method the plasma environment is adopted to favour the chemical reactions responsible for the formation of nanoparticles [63]. Even if the low temperatures reached by the plasma (300-1000 K) enable the formation of very fine nanoparticles (around 5 nm) [64], this approach is limited to gas phase precursors, thus is not considered sufficiently flexible for industrial production. In Figure 1.11 the tyipical aspect of particle synthetized by MW plasma is shown.
32
Figure 1.11: Nanoprticles synthetized by MW plasma [64]
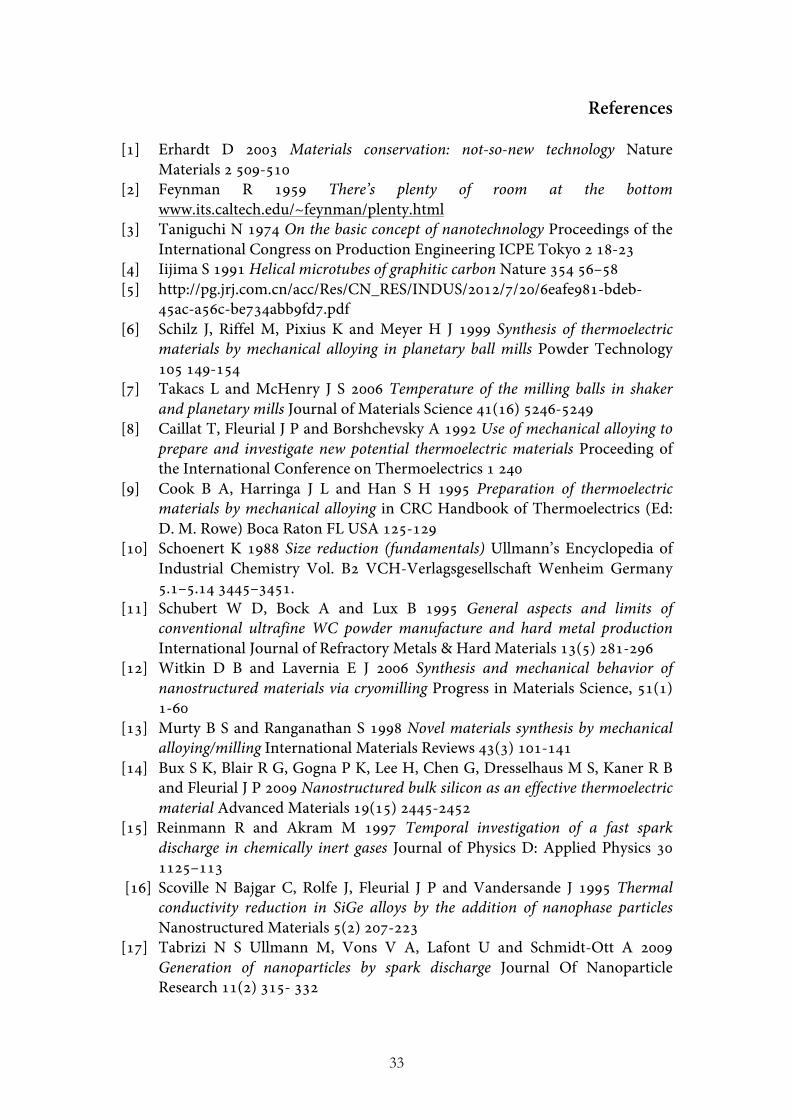
Finally, a word must be spent on the expanding field of nanofabrication by means of atmospheric pressure non-equilibrium plasmas. This technology offers many advantages for the synthesis of nanoparticles and other nanomaterials, due to its low costs, to non-equilibrium chemistry and to the possibility to carry out the process in a multi-phase environment (mainly plasma-liquid) [65-71]; even if this technique has already shown a lot of promise, there are still many issues related to plasma heating and stability that must be solved before any transition to the industrial scale.
Figure 1.12: Atmospheric pressure microplasma set-up for nanoparticle synthesis [65]
33
References [1] Erhardt D 2003 Materials conservation: not-so-new technology Nature
Materials 2 509-510 [2] Feynman R 1959 There’s plenty of room at the bottom
www.its.caltech.edu/~feynman/plenty.html [3] Taniguchi N 1974 On the basic concept of nanotechnology Proceedings of the
International Congress on Production Engineering ICPE Tokyo 2 18-23 [4] Iijima S 1991 Helical microtubes of graphitic carbon Nature 354 56–58 [5] http://pg.jrj.com.cn/acc/Res/CN_RES/INDUS/2012/7/20/6eafe981-bdeb-
45ac-a56c-be734abb9fd7.pdf [6] Schilz J, Riffel M, Pixius K and Meyer H J 1999 Synthesis of thermoelectric
materials by mechanical alloying in planetary ball mills Powder Technology 105 149-154
[7] Takacs L and McHenry J S 2006 Temperature of the milling balls in shaker and planetary mills Journal of Materials Science 41(16) 5246-5249
[8] Caillat T, Fleurial J P and Borshchevsky A 1992 Use of mechanical alloying to prepare and investigate new potential thermoelectric materials Proceeding of the International Conference on Thermoelectrics 1 240
[9] Cook B A, Harringa J L and Han S H 1995 Preparation of thermoelectric materials by mechanical alloying in CRC Handbook of Thermoelectrics (Ed: D. M. Rowe) Boca Raton FL USA 125-129
[10] Schoenert K 1988 Size reduction (fundamentals) Ullmann’s Encyclopedia of Industrial Chemistry Vol. B2 VCH-Verlagsgesellschaft Wenheim Germany 5.1–5.14 3445–3451.
[11] Schubert W D, Bock A and Lux B 1995 General aspects and limits of conventional ultrafine WC powder manufacture and hard metal production International Journal of Refractory Metals & Hard Materials 13(5) 281-296
[12] Witkin D B and Lavernia E J 2006 Synthesis and mechanical behavior of nanostructured materials via cryomilling Progress in Materials Science, 51(1) 1-60
[13] Murty B S and Ranganathan S 1998 Novel materials synthesis by mechanical alloying/milling International Materials Reviews 43(3) 101-141
[14] Bux S K, Blair R G, Gogna P K, Lee H, Chen G, Dresselhaus M S, Kaner R B and Fleurial J P 2009 Nanostructured bulk silicon as an effective thermoelectric material Advanced Materials 19(15) 2445-2452
[15] Reinmann R and Akram M 1997 Temporal investigation of a fast spark discharge in chemically inert gases Journal of Physics D: Applied Physics 30 1125–113
[16] Scoville N Bajgar C, Rolfe J, Fleurial J P and Vandersande J 1995 Thermal conductivity reduction in SiGe alloys by the addition of nanophase particles Nanostructured Materials 5(2) 207-223
[17] Tabrizi N S Ullmann M, Vons V A, Lafont U and Schmidt-Ott A 2009 Generation of nanoparticles by spark discharge Journal Of Nanoparticle Research 11(2) 315- 332
34
[18] Ullmann M, Friedlander S K and Schmidt-Ott A 2002 Nanoparticles formation by laser ablation Journal of Nanoparticle Research 4 499–509
[19] Yoshida T, Takeyama S, Yamada K and Mutoh K 1996 Nanometer-sized silicon crystallites prepared by excimer laser ablation in constant pressure inert gas Applied Physics Letters 68(13) 1772-1774
[20] Simakin A V, Voronov V V, Kirichenko N A and Shafeev G A 2004 Nanoparticles produced by laser ablation of solids in liquid environment Applied Physics A 79 1127-1132
[21] Johnston G P, Muenchausen R, Smith D M, Fahrenholtz W and Foltyn S 1992 Reactive laser ablation synthesis of nanosize alumina powder Journal American Ceramic Society 75 3293-3298
[22] Murray C B, Kagan C R and Bawendi M G 2000 Synthesis and characterization of monodisperse nanocrystals and close-packed nanocrystal assemblies Annual Review of Materials Science 30 545-610
[23] Manna L, Scher E C and Alivisatos A P 2000 Synthesis of soluble and processable rod-, arrow-, teardrop-, and tetrapod-shaped CdSe nanocrystals Journal of the American Chemical Society 122(51) 12700-12706
[24] Wang X, Zhuang J, Peng Q and Li Y 2005 A general strategy for nanocrystal synthesis Nature 437(7055) 121-124
[25] Masala O and Seshadri R 2004 Synthesis routes for large volumes of nanoparticles Annual Review of Material Research 34 41-81
[26] Winterer M 2002 Nanocrystalline Ceramics - Synthesis and Structure Materials Science Berlin Heidelberg: Springer
[27] Swihart M 2003 Vapour phase synthesis of nanoparticles Current Opinion in Colloid and Interface Science 8 127-133
[28] Kruis F E, Fissan H and Peled A 1998 Synthesis of nanoparticles in the gas-phase for electronic, optical and magnetic applications - A review Journal Of Aerosol Science 29(5-6) 511-535
[29] Pratsinis S E and Vemury S 1996 Particle formation in gases: a review Powder Technology 88 267-273
[30] Tasaki A, Tomiyama S, Iida S, Wada N and Uyeda R 1965 Magnetic properties of ferromagnetic metal fine particles prepared by evaporation in argon gas Japanese Journal of Applied Physics 4 707—711
[31] Chow G M, Klemens P G and Strutt P R 1989 Nanometer-size fiber composite synthesis by laser-induced reactions Journal of Applied Physics 66 3304-3308
[32] Hahn H and Averback R S 1990 The production of nanocrystalline powders by magnetron sputtering Journal of Applied Physics 67 1113-1115
[33] Granqvist C G and Buhrman R A 1976 Ultrafine metal particles Journal of Applied Physics 47 2200-2219
[34] Wegner K, Walker B, Tsantilis S and Pratsinis S E 2002 Design of metal nanoparticle synthesis by vapor flow condensation Chemical Engineering Science 57 1753-1762
[35] Siegel R W 1994 Nanophase materials: synthesis, structure, and properties in Series in Material Sciences 26 65-105 Springer Berlin
35
[36] Maisels A, Kruis F E, Fissan H, Rellinghaus B and Zahres H 2000 Synthesis of tailored composite nanoparticles in the gas phase Applied Physics Letters 77 4431-4433
[37] Ohno T 2002 Morphology of composite nanoparticles of immiscible binary systems prepared by gas-evaporation technique and subsequent vapor condensation Journal of Nanoparticle Research 4 255-260
[38] Ostraat M L, De Blauwe J W, Green M L, Bell L D, Atwater H A and Flagan R C 2001 Ultraclean two-stage aerosol reactor for production of oxide-passivated silicon nanoparticles for novel memory devices Journal of the Electrochemical Society 148 G265-G270
[39] Magnusson M H, Deppert K and Malm J O 2000 Single-crystalline tungsten nanoparticles produced by thermal decomposition of tungsten hexacarbonyl Journal of Materials Research 15 1564-1569
[40] Nasibulin A G, Richard O, Kauppinen E I, Brown D P, Jokiniemi J K and Altman I S 2002 Nanoparticle synthesis by copper (II) acetylacetonate vapor decomposition in the presence of oxygen Aerosol Science and Technology 36 899-911
[41] Schmechel R, Kennedy M, von Seggern H, Winkler H, Kolbe M, Fischer R A, Li X, Benker A, Winterer M and Hahn H 2001 Luminescence properties of nanocrystalline Y2O3:Eu3+ in different host materials Journal of Applied Physics 89 1679-1686
[42] Senter R A, Chen Y, Coffer J L and Tessler L R 2001 Synthesis of silicon nanocrystals with erbium-rich surface layers Nano Letters 1 383-386
[43] Srdic V V, Winterer M, Moller A, Miehe G and Hahn H 2001 Nanocrystalline zirconia surface-doped with alumina: chemical vapor synthesis, characterization, and properties Journal of the American Ceramic Society 84 2771 –2776
[44] Ehrman S H, Aquino-Class M I and Zachariah M R 1999 Effect of temperature and vapor-phase encapsulation on particle growth and morphology Journal of Materials Research 14 1664-1671
[45] Zachariah M R, Aquino M I, Shull R D and Steel E B 1995 Formation of superparamagnetic nanocomposites from vapor phase condensation in a flame Nanostructured Materials 5 383-392
[46] Pratsinis S E 1998 Flame aerosol synthesis of ceramic powders Progress In Energy And Combustion Science 24(3) 197-219
[47] Janzen C and Roth P 2001 Formation of Fe2O3 nano-particles in doped low-pressure H2/O2/Ar flames Combustion and Flame 125 1150-1161
[48] Lee D, Choi M 2002 Coalescence enhanced synthesis of nanoparticles to control size, morphology, and crystalline phase at high concentrations Journal of Aerosol Science 33 1-16
[49] Kammler H K, Pratsinis S E, Morrison P W Jr and Hemmerling B 2002 Flame temperature measurements during electrically assisted aerosol synthesis of nanoparticles Combustion and Flame 128 369-381
[50] Cannon W R, Danforth S C, Flint J C, Haggerty J S and Marra R A 1982 Sinterable ceramic powders from laser-driven reactions Journal of the American Ceramic Society 65 324-335
36
[51] Majima T, Miyahara T, Haneda K, Ishii T and Takami M 1994 Preparation of iron ultrafine particles by the dielectric breakdown of Fe(CO)5 using a transversely excited atmospheric CO2 laser and their characteristics Japanese Journal of Applied Physics 33 4759-4763
[52] Tamir S and Berger S 1995 Laser induced deposition of nanocrystalline Si with preferred crystallographic orientation Applied Surface Science 86 514-520
[53] Borsella E, Botti S, Cesile MC, Martelli S, Nesterenko A and Zappelli P G 2001 MoS2 nanoparticles produced by laser induced synthesis from gaseous precursors Journal of Materials Science Letters 20 187-191
[54] Ledoux G, Gong J, Huisken F, Guillois O and Reynaud C 2002 Photoluminescence of size-separated silicon nanocrystals: confirmation of quantum confinement Applied Physics Letters 80 4834-4836
[55] Ostrikov K and Murphy A B 2007 Plasma-Aided Nanofabrication: Where Is the Cutting Edge? Journal of Physics D: Applied Physics 40(8) 2223–2241
[56] Ostrikov K K, Cvelbar U and Murphy A B 2011 Plasma nanoscience: setting directions, tackling grand challenges Journal of Physics D: Applied Physics 44 174001
[57] Seo J H and Hong B G 2012 Thermal plasma synthesis of nano-sized powders Nuclear Engineering and Technology 44 (1) 9-20
[58] Shigeta M and Murphy A B 2011 Thermal plasmas for nanofabrication Journal of Physics D: Applied Physics 44 174025
[59] Young R M and Pfender E 1985 Generation and behavior of fine particles in thermal plasmas-A review Plasma Chemistry and Plasma Processing 5 1-37
[60] Rao N, Girshick S, Heberlein J, McMurry P, Jones S, Hansen D and Micheel B 1995 Nanoparticle Formation using a Plasma Expansion Process Plasma Chemistry and Plasma Processing 15(4) 581-606
[61] Reddy R G 2003 Emerging technologies in extraction and processing of metals Metallurgical and Materials Transactions B 34 137-152
[62] Rao N, Micheel B, Hansen D, Fandrey C, Bench M, Girshick S, Heberlein J and McMurry P 1995 Synthesis of nanophase silicon, carbon, and silicon carbide powders using a plasma expansion process Journal of Materials Research 10 2073-2084
[63] Vollath D 2008 Plasma synthesis of nanopowders Journal of Nanoparticle Research 10 39-57
[64] Vollath D and Sickafus K E 1992 Synthesis of nanosized ceramic oxide powders by microwave plasma reactions Nanostructured Materials 1 427-437
[65] Mariotti D and Sankaran R M 2011 Perspective on atmospheric-pressure plasmas for nanofabrication Journal of Physics D: Applied Physics 44 174023
[66] Mariotti D, Shimizu Y, Sasaki T and Koshizaki N 2006 Method to determine argon metastable number density and plasma electron temperature from spectral emission originating from four 4p argon levels Applied Physics Letters 89 201502
[67] Arnoult G, Belmonte T and Henrion G 2010 Self-organization of SiO2 nanodots deposited by chemical vapor deposition using an atmospheric pressure remote microplasma Applied Physics Letters 96 101505

37
[68] Mariotti D and Sankaran R M 2010 Microplasmas for nanomaterials synthesis Journal of Physics D: Applied Physics 43 323001
[69] Desmet T, Morent R, De Geyter N, Leys C, Schacht E and Dubruel P 2009 Nonthermal Plasma Technology as a Versatile Strategy for Polymeric Biomaterials Surface Modification: A Review Biomacromolecules 10 2351
[70] Kaneko T, Baba K and Hatakeyama R 2009 Gas–liquid interfacial plasmas: basic properties and applications to nanomaterial synthesis Plasma Physics and Controlled Fusion 51 124011
[71] Bruggeman P and Leys C 2009 Non-thermal plasmas in and in contact with liquids Journal of Physics D: Applied Physics 42 053001

38

39
CHAPTER 2 NANOPARTICLE SYNTHESIS IN RF
INDUCTIVELY COUPLED THERMAL PLASMAS
40
2.1. Technology overview
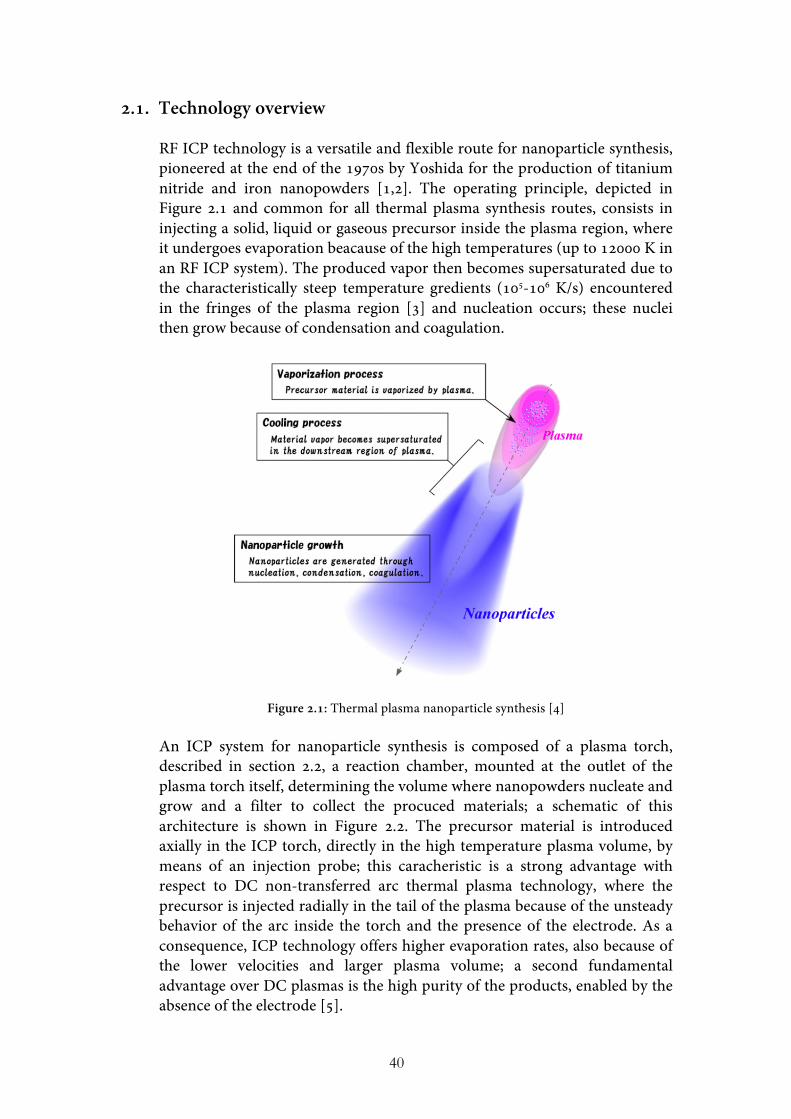
RF ICP technology is a versatile and flexible route for nanoparticle synthesis, pioneered at the end of the 1970s by Yoshida for the production of titanium nitride and iron nanopowders [1,2]. The operating principle, depicted in Figure 2.1 and common for all thermal plasma synthesis routes, consists in injecting a solid, liquid or gaseous precursor inside the plasma region, where it undergoes evaporation beacause of the high temperatures (up to 12000 K in an RF ICP system). The produced vapor then becomes supersaturated due to the characteristically steep temperature gredients (105-106 K/s) encountered in the fringes of the plasma region [3] and nucleation occurs; these nuclei then grow because of condensation and coagulation.
Figure 2.1: Thermal plasma nanoparticle synthesis [4]
An ICP system for nanoparticle synthesis is composed of a plasma torch, described in section 2.2, a reaction chamber, mounted at the outlet of the plasma torch itself, determining the volume where nanopowders nucleate and grow and a filter to collect the procuced materials; a schematic of this architecture is shown in Figure 2.2. The precursor material is introduced axially in the ICP torch, directly in the high temperature plasma volume, by means of an injection probe; this caracheristic is a strong advantage with respect to DC non-transferred arc thermal plasma technology, where the precursor is injected radially in the tail of the plasma because of the unsteady behavior of the arc inside the torch and the presence of the electrode. As a consequence, ICP technology offers higher evaporation rates, also because of the lower velocities and larger plasma volume; a second fundamental advantage over DC plasmas is the high purity of the products, enabled by the absence of the electrode [5].

41
Figure 2.2: Schematic of an ICP system for nanoparticle synthesis [6] During the years, ICP technology has been demonstrated a viable tool for the production of a wide range of metallic and ceramic materials [7-23]; moreover, complex materials have been prepared with ICP systems, such as having core-shell structure, functionalized surfaces or controlled cristallinity, either by properly controlling the process parameters or by employing additional reactive gases [24-30]. Driven by the interest in a flexible technology with high productivity and cost-effectiveness potential, some of these lines have already reached industrial production (Nisshin Engineering Inc., Tekna Advanced Materials); unfortunately, a precise control over particle size and purity may currently be attained only at low production rates (below 1 kg/h), due to limitations discussed in section 2.3.
2.2. RF inductively coupled thermal plasmas
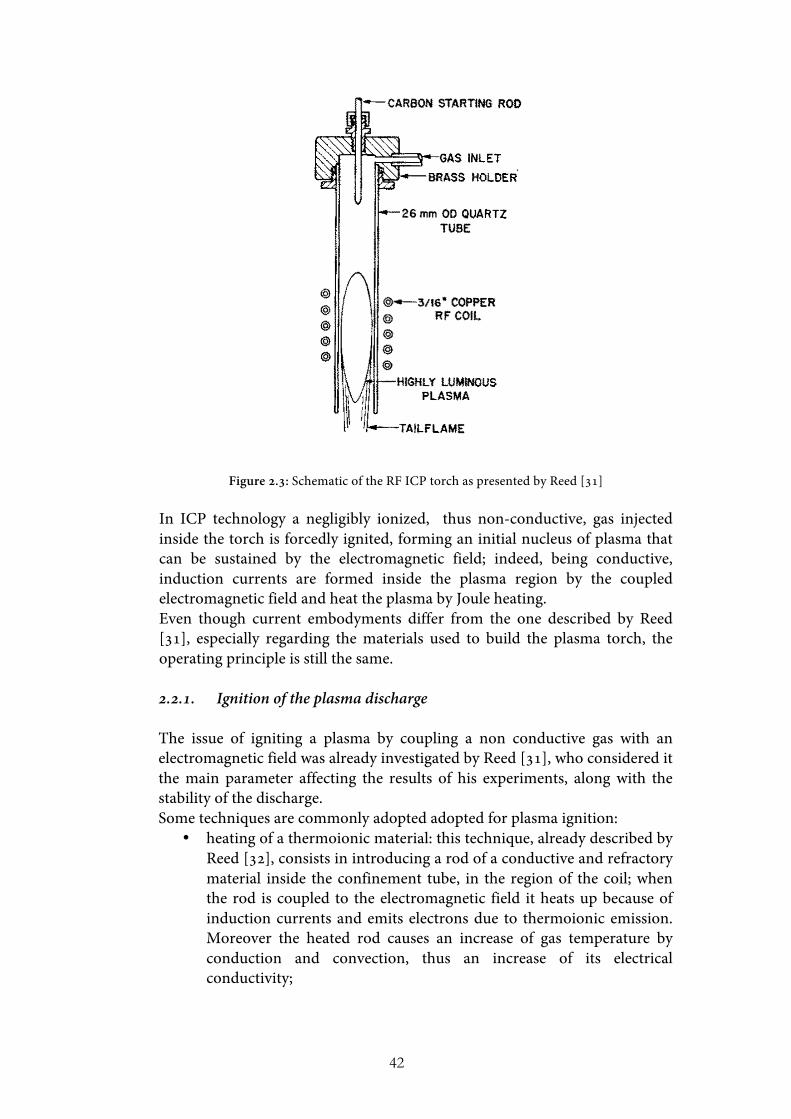
This technology may be traced back to 1961, the publication year of the paper ‘Induction-coupled plasma torch’ by Reed [31], where a method for igniting and sustaining a thermal plasma at atmospheric pressure was presented. The device developed by Reed, shown in Figure 2.3, was composed of a quartz confinement tube, a gas diffuser an electrical generator and a coil.
42
Figure 2.3: Schematic of the RF ICP torch as presented by Reed [31] In ICP technology a negligibly ionized, thus non-conductive, gas injected inside the torch is forcedly ignited, forming an initial nucleus of plasma that can be sustained by the electromagnetic field; indeed, being conductive, induction currents are formed inside the plasma region by the coupled electromagnetic field and heat the plasma by Joule heating. Even though current embodyments differ from the one described by Reed [31], especially regarding the materials used to build the plasma torch, the operating principle is still the same. 2.2.1. Ignition of the plasma discharge The issue of igniting a plasma by coupling a non conductive gas with an electromagnetic field was already investigated by Reed [31], who considered it the main parameter affecting the results of his experiments, along with the stability of the discharge. Some techniques are commonly adopted adopted for plasma ignition:
• heating of a thermoionic material: this technique, already described by Reed [32], consists in introducing a rod of a conductive and refractory material inside the confinement tube, in the region of the coil; when the rod is coupled to the electromagnetic field it heats up because of induction currents and emits electrons due to thermoionic emission. Moreover the heated rod causes an increase of gas temperature by conduction and convection, thus an increase of its electrical conductivity;
43
• low-pressure breakdown: only for the ignition phase, the pressure inside the plasma torch is lowered (to around 0.1 torr); as a consequence, the mean free path of the gas free electrons of the gas is increased, as well as the energy they accumulate from the electro-magnetic field between two collisions. When electrons’ energetic conditions are sufficient to cause an electronic avalanche a plasma discharge is formed and pressure is raised up to atmospheric pressure;
• use of a sharp conductor: when a sharp conductor material is introduced inside an electro-magnetic field, field lines are modified and tend to converge to the tip of the conductor. This originates high gradients of electrical conductivity and may cause a spark and ionize the gas;
• use of a Tesla coil: in this approach a sharp tip connected to a high voltage generator is used to directly introduce electrons inside the gas to be ignited.
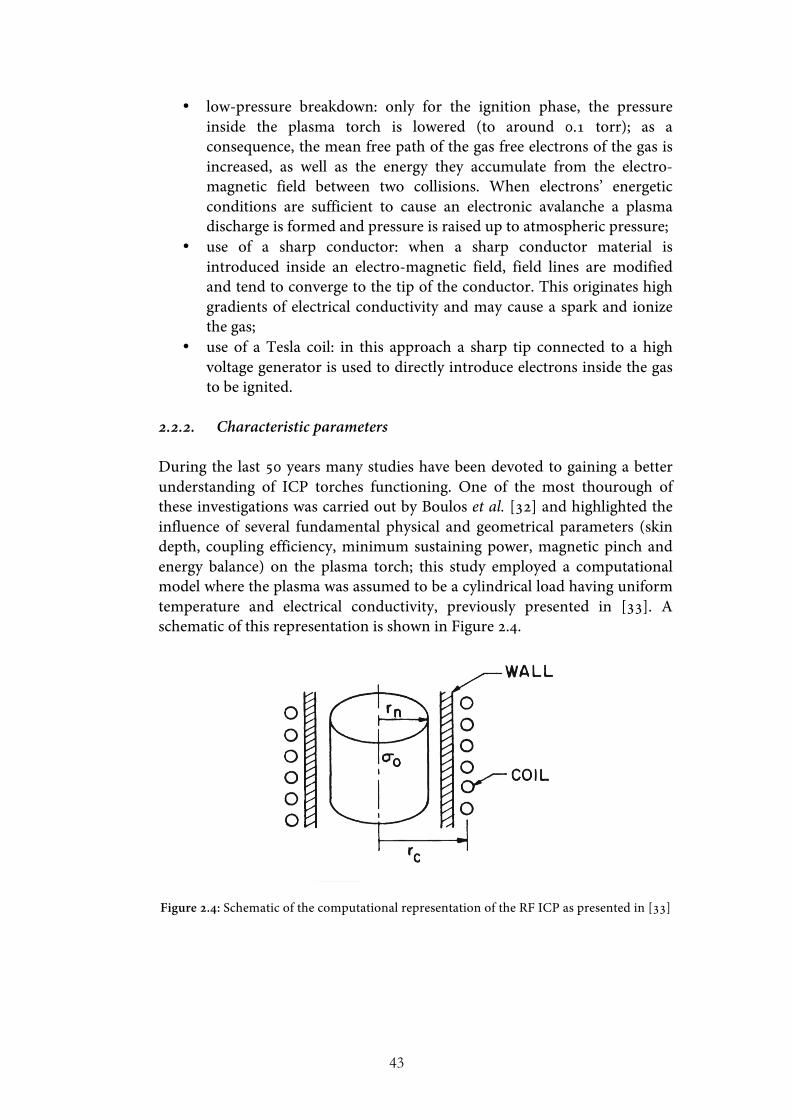
2.2.2. Characteristic parameters During the last 50 years many studies have been devoted to gaining a better understanding of ICP torches functioning. One of the most thourough of these investigations was carried out by Boulos et al. [32] and highlighted the influence of several fundamental physical and geometrical parameters (skin depth, coupling efficiency, minimum sustaining power, magnetic pinch and energy balance) on the plasma torch; this study employed a computational model where the plasma was assumed to be a cylindrical load having uniform temperature and electrical conductivity, previously presented in [33]. A schematic of this representation is shown in Figure 2.4.
Figure 2.4: Schematic of the computational representation of the RF ICP as presented in [33]
44
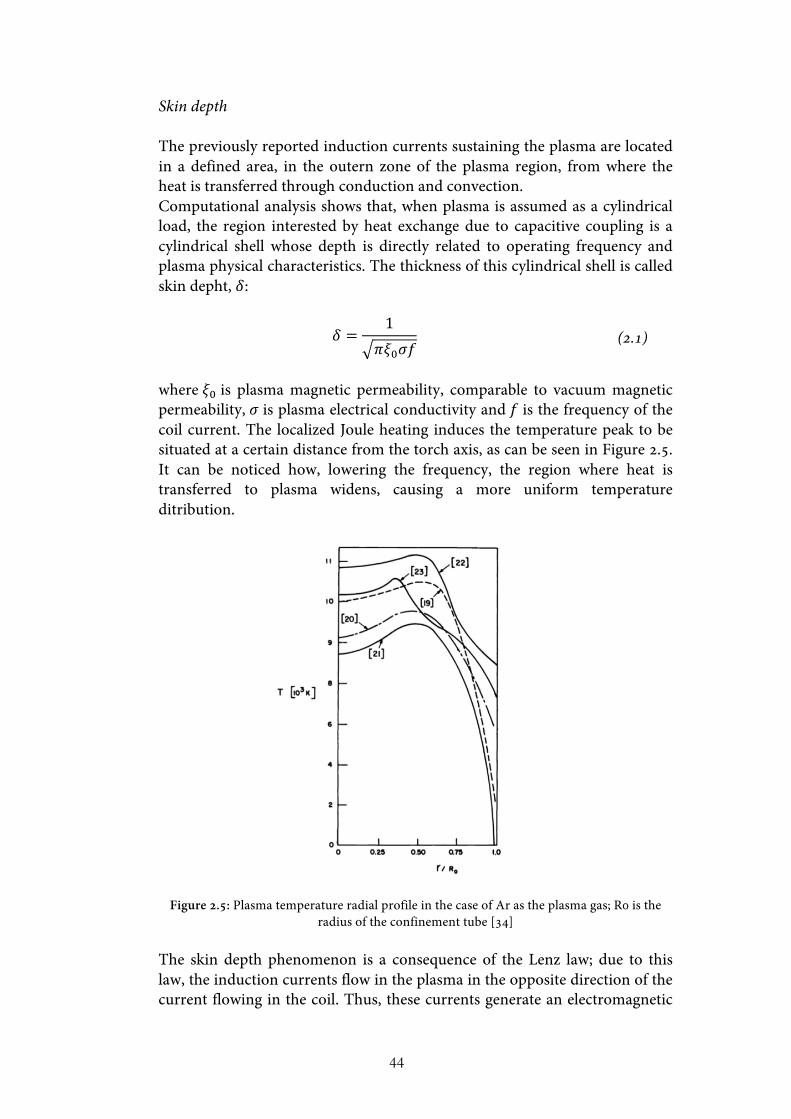
Skin depth The previously reported induction currents sustaining the plasma are located in a defined area, in the outern zone of the plasma region, from where the heat is transferred through conduction and convection. Computational analysis shows that, when plasma is assumed as a cylindrical load, the region interested by heat exchange due to capacitive coupling is a cylindrical shell whose depth is directly related to operating frequency and plasma physical characteristics. The thickness of this cylindrical shell is called skin depht, 𝛿:
𝛿 =1
𝜋𝜉!𝜎𝑓 (2.1)
where 𝜉! is plasma magnetic permeability, comparable to vacuum magnetic permeability, 𝜎 is plasma electrical conductivity and 𝑓 is the frequency of the coil current. The localized Joule heating induces the temperature peak to be situated at a certain distance from the torch axis, as can be seen in Figure 2.5. It can be noticed how, lowering the frequency, the region where heat is transferred to plasma widens, causing a more uniform temperature ditribution.
Figure 2.5: Plasma temperature radial profile in the case of Ar as the plasma gas; R0 is the radius of the confinement tube [34]
The skin depth phenomenon is a consequence of the Lenz law; due to this law, the induction currents flow in the plasma in the opposite direction of the current flowing in the coil. Thus, these currents generate an electromagnetic
45
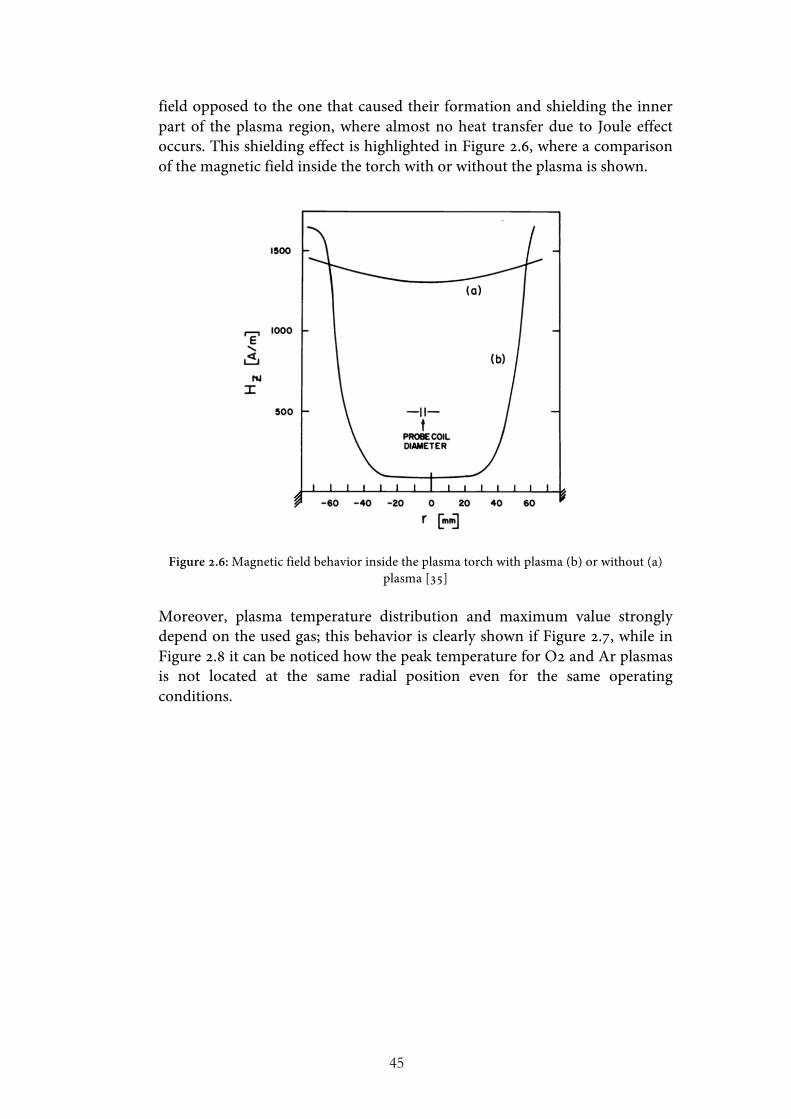
field opposed to the one that caused their formation and shielding the inner part of the plasma region, where almost no heat transfer due to Joule effect occurs. This shielding effect is highlighted in Figure 2.6, where a comparison of the magnetic field inside the torch with or without the plasma is shown.
Figure 2.6: Magnetic field behavior inside the plasma torch with plasma (b) or without (a) plasma [35]
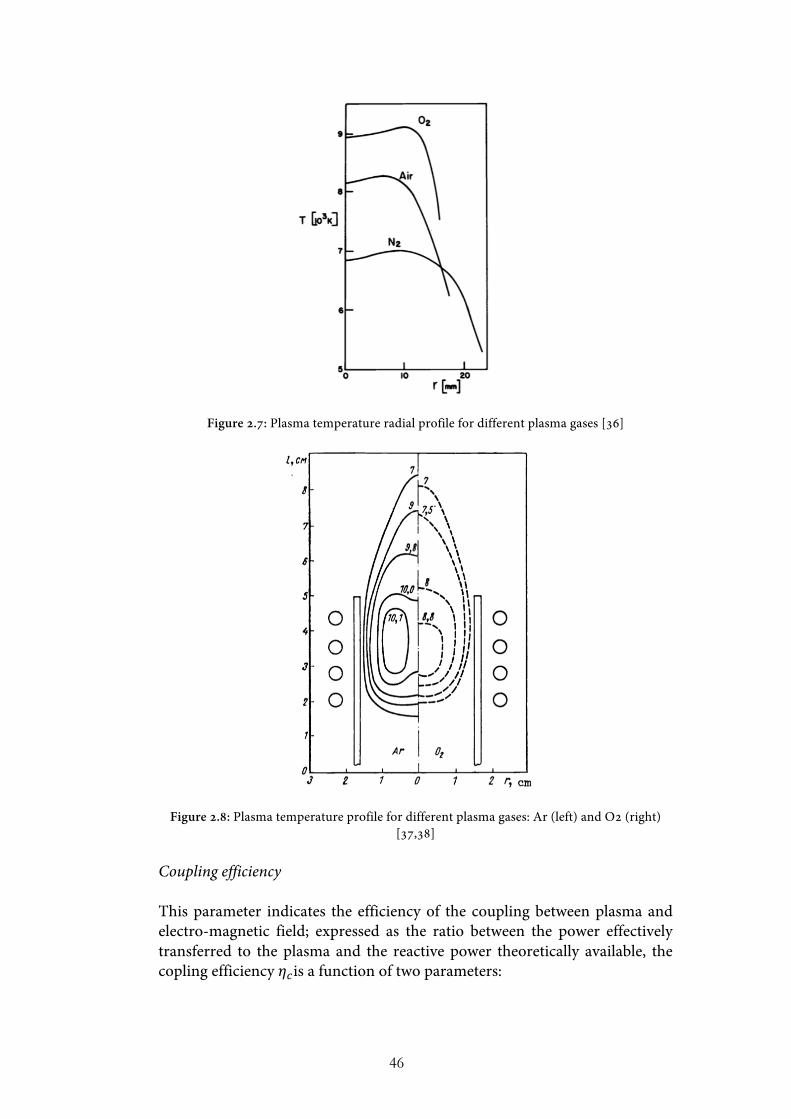
Moreover, plasma temperature distribution and maximum value strongly depend on the used gas; this behavior is clearly shown if Figure 2.7, while in Figure 2.8 it can be noticed how the peak temperature for O2 and Ar plasmas is not located at the same radial position even for the same operating conditions.
46
Figure 2.7: Plasma temperature radial profile for different plasma gases [36]
Figure 2.8: Plasma temperature profile for different plasma gases: Ar (left) and O2 (right) [37,38]
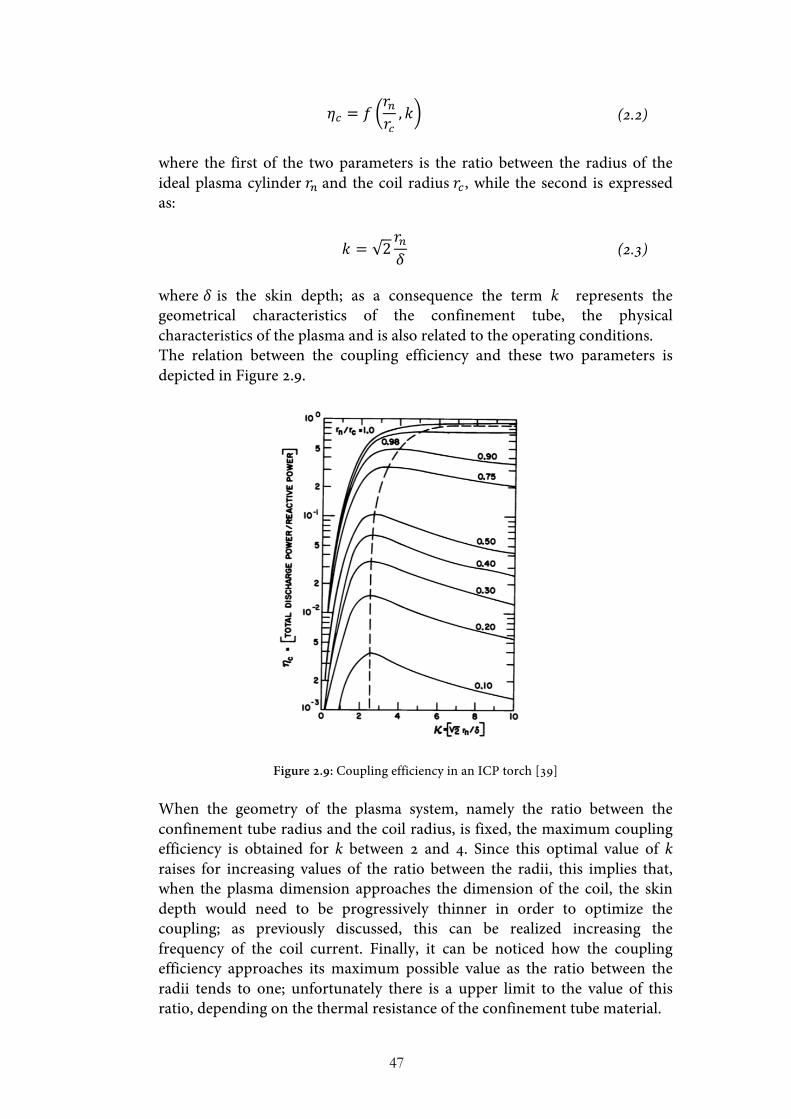
Coupling efficiency This parameter indicates the efficiency of the coupling between plasma and electro-magnetic field; expressed as the ratio between the power effectively transferred to the plasma and the reactive power theoretically available, the copling efficiency 𝜂!is a function of two parameters:
47
𝜂! = 𝑓𝑟!𝑟!, 𝑘 (2.2)
where the first of the two parameters is the ratio between the radius of the ideal plasma cylinder 𝑟! and the coil radius 𝑟!, while the second is expressed as:
𝑘 = 2𝑟!𝛿 (2.3)
where 𝛿 is the skin depth; as a consequence the term k represents the geometrical characteristics of the confinement tube, the physical characteristics of the plasma and is also related to the operating conditions. The relation between the coupling efficiency and these two parameters is depicted in Figure 2.9.
Figure 2.9: Coupling efficiency in an ICP torch [39]
When the geometry of the plasma system, namely the ratio between the confinement tube radius and the coil radius, is fixed, the maximum coupling efficiency is obtained for k between 2 and 4. Since this optimal value of k raises for increasing values of the ratio between the radii, this implies that, when the plasma dimension approaches the dimension of the coil, the skin depth would need to be progressively thinner in order to optimize the coupling; as previously discussed, this can be realized increasing the frequency of the coil current. Finally, it can be noticed how the coupling efficiency approaches its maximum possible value as the ratio between the radii tends to one; unfortunately there is a upper limit to the value of this ratio, depending on the thermal resistance of the confinement tube material.
48
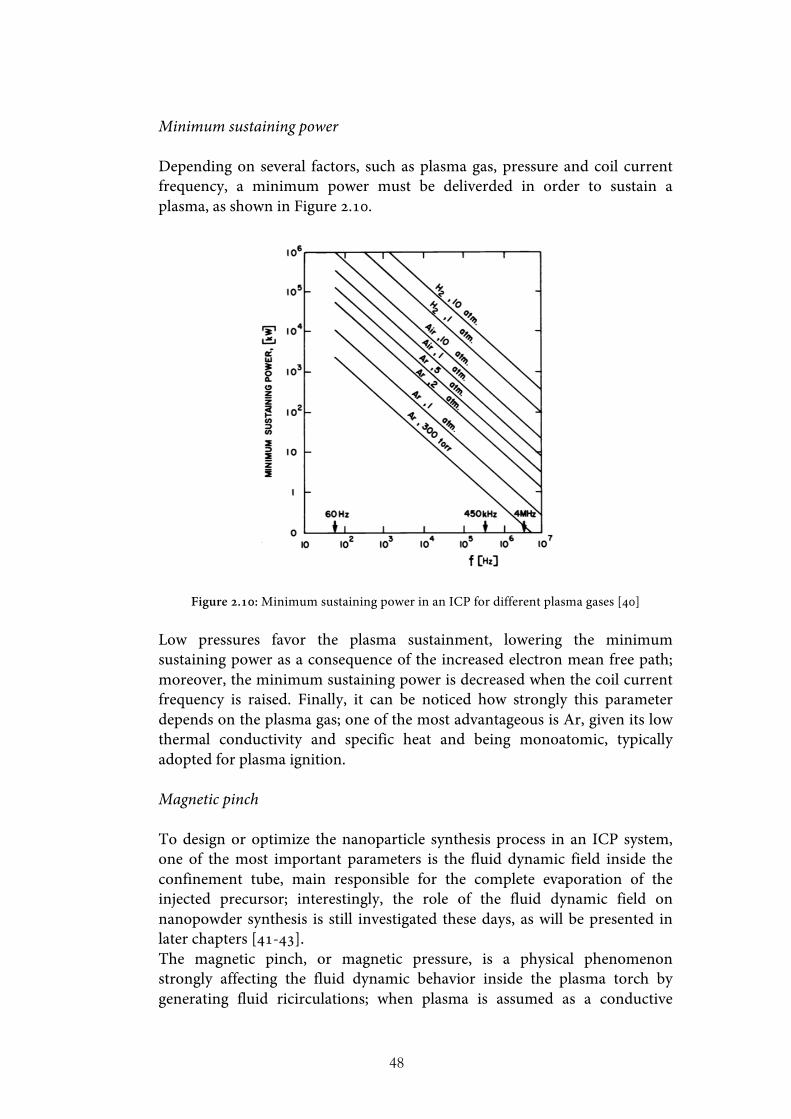
Minimum sustaining power Depending on several factors, such as plasma gas, pressure and coil current frequency, a minimum power must be deliverded in order to sustain a plasma, as shown in Figure 2.10.
Figure 2.10: Minimum sustaining power in an ICP for different plasma gases [40] Low pressures favor the plasma sustainment, lowering the minimum sustaining power as a consequence of the increased electron mean free path; moreover, the minimum sustaining power is decreased when the coil current frequency is raised. Finally, it can be noticed how strongly this parameter depends on the plasma gas; one of the most advantageous is Ar, given its low thermal conductivity and specific heat and being monoatomic, typically adopted for plasma ignition. Magnetic pinch To design or optimize the nanoparticle synthesis process in an ICP system, one of the most important parameters is the fluid dynamic field inside the confinement tube, main responsible for the complete evaporation of the injected precursor; interestingly, the role of the fluid dynamic field on nanopowder synthesis is still investigated these days, as will be presented in later chapters [41-43]. The magnetic pinch, or magnetic pressure, is a physical phenomenon strongly affecting the fluid dynamic behavior inside the plasma torch by generating fluid ricirculations; when plasma is assumed as a conductive
49
metallic cylinder and the coil is simplified to a coaxial arrange of different circular turns, the current density induced in the plasma by the external electro-magnetic field is:
𝑱 = 𝜎𝑬 (2.4) The Lorentz forces, generated by the coupled electro-magnetic field in the skin depth region, can be expressed as:
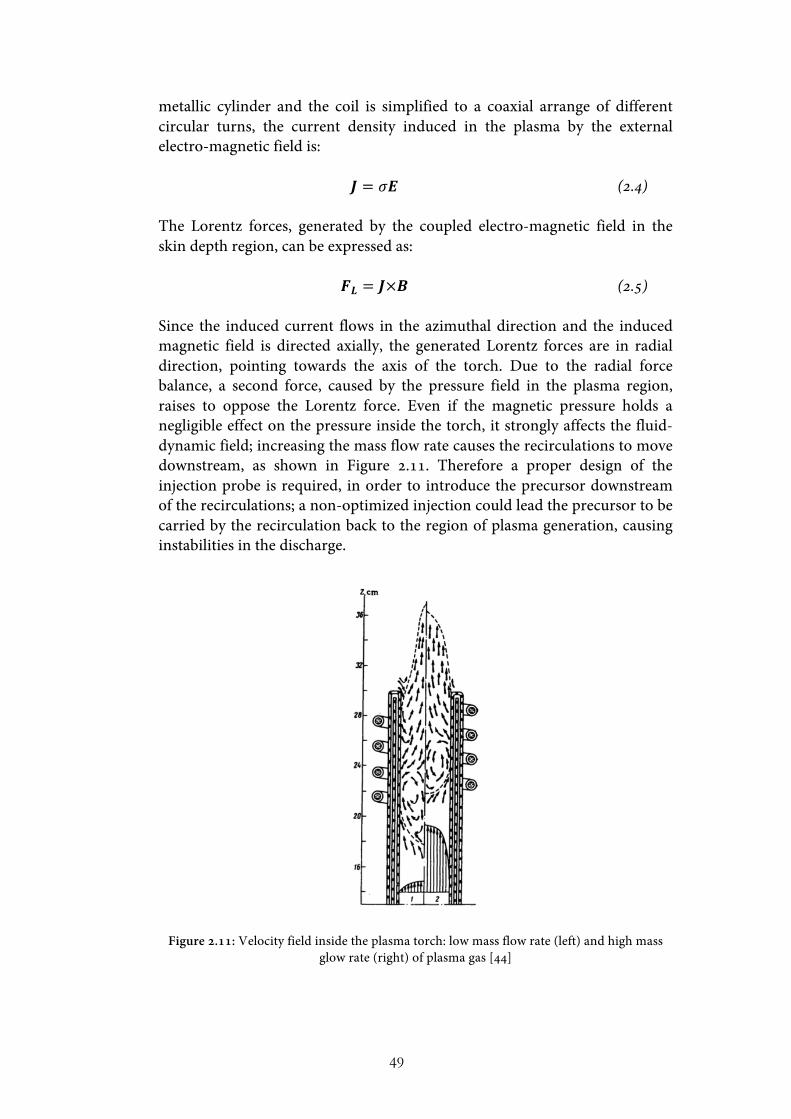
𝑭𝑳 = 𝑱×𝑩 (2.5) Since the induced current flows in the azimuthal direction and the induced magnetic field is directed axially, the generated Lorentz forces are in radial direction, pointing towards the axis of the torch. Due to the radial force balance, a second force, caused by the pressure field in the plasma region, raises to oppose the Lorentz force. Even if the magnetic pressure holds a negligible effect on the pressure inside the torch, it strongly affects the fluid-dynamic field; increasing the mass flow rate causes the recirculations to move downstream, as shown in Figure 2.11. Therefore a proper design of the injection probe is required, in order to introduce the precursor downstream of the recirculations; a non-optimized injection could lead the precursor to be carried by the recirculation back to the region of plasma generation, causing instabilities in the discharge.
Figure 2.11: Velocity field inside the plasma torch: low mass flow rate (left) and high mass glow rate (right) of plasma gas [44]
50
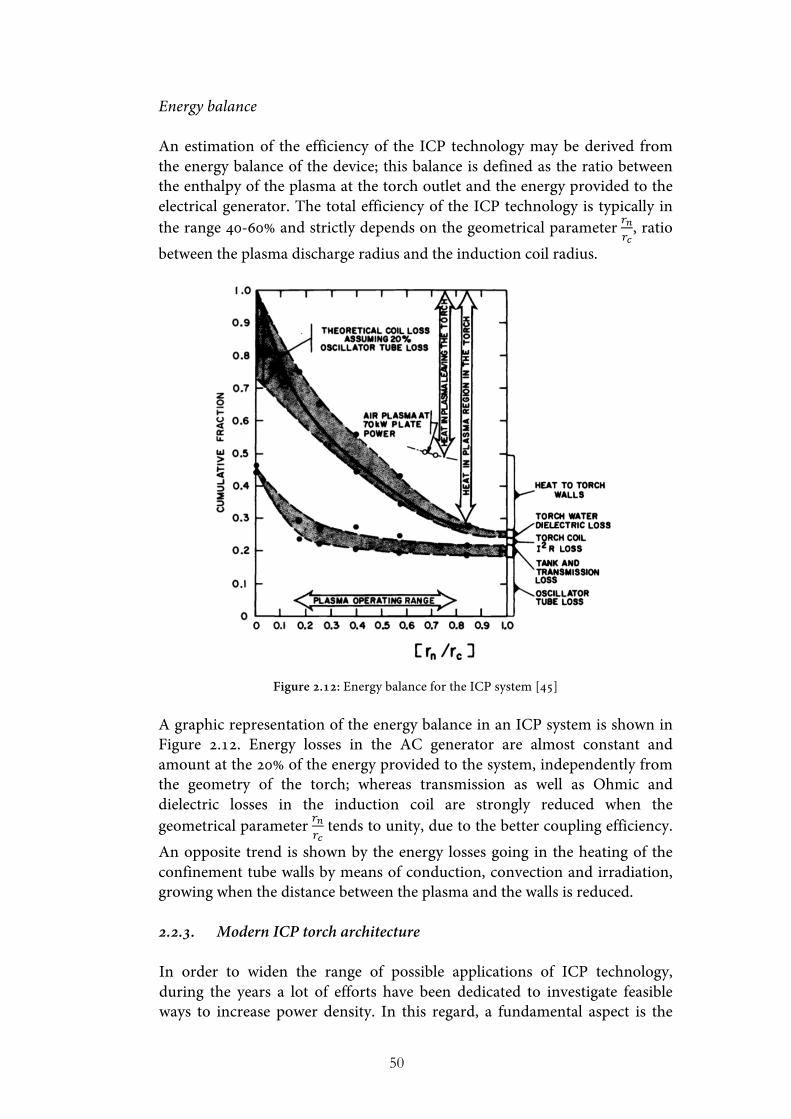
Energy balance An estimation of the efficiency of the ICP technology may be derived from the energy balance of the device; this balance is defined as the ratio between the enthalpy of the plasma at the torch outlet and the energy provided to the electrical generator. The total efficiency of the ICP technology is typically in the range 40-60% and strictly depends on the geometrical parameter !!
!!, ratio
between the plasma discharge radius and the induction coil radius.
Figure 2.12: Energy balance for the ICP system [45]
A graphic representation of the energy balance in an ICP system is shown in Figure 2.12. Energy losses in the AC generator are almost constant and amount at the 20% of the energy provided to the system, independently from the geometry of the torch; whereas transmission as well as Ohmic and dielectric losses in the induction coil are strongly reduced when the geometrical parameter !!
!! tends to unity, due to the better coupling efficiency.
An opposite trend is shown by the energy losses going in the heating of the confinement tube walls by means of conduction, convection and irradiation, growing when the distance between the plasma and the walls is reduced. 2.2.3. Modern ICP torch architecture In order to widen the range of possible applications of ICP technology, during the years a lot of efforts have been dedicated to investigate feasible ways to increase power density. In this regard, a fundamental aspect is the

51
confinement tube, originally made in quartz and refrigerated without adopting external cooling means [31]. Many designs (Figure 2.13) have been explored to protect this critical component, stabilize and contain the plasma in a region sufficiently distant from the torch inner wall and for the cooling of the wall itself.
Figure 2.13: Various ICP torch designs aimed at cooling the confinement tube and stabilizing the plasma discharge [46]
In 1983 a group of researchers of the Los Alamos National Laboratory designed an innovative confinement tube to increase the plasma temperature and synthetize SiC nanoparticles [47]. They covered the inner wall of the quartz confinement tube with copper sheets, in order to limit the radiative heat exchange: moreover, these metallic sheets were intended to work also as transformers, increasing the coupling efficiency between the electromagnetic field and plasma. This confinement tube is represented in Figure 2.14.
52
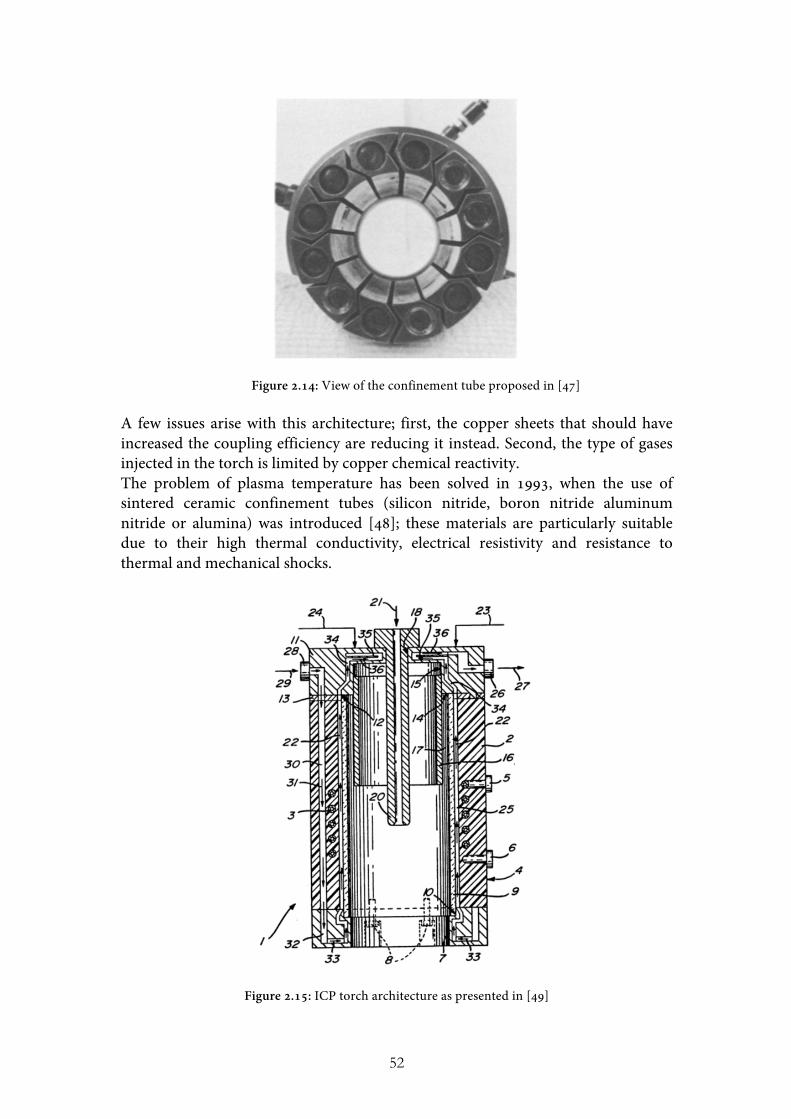
Figure 2.14: View of the confinement tube proposed in [47] A few issues arise with this architecture; first, the copper sheets that should have increased the coupling efficiency are reducing it instead. Second, the type of gases injected in the torch is limited by copper chemical reactivity. The problem of plasma temperature has been solved in 1993, when the use of sintered ceramic confinement tubes (silicon nitride, boron nitride aluminum nitride or alumina) was introduced [48]; these materials are particularly suitable due to their high thermal conductivity, electrical resistivity and resistance to thermal and mechanical shocks.
Figure 2.15: ICP torch architecture as presented in [49]
53
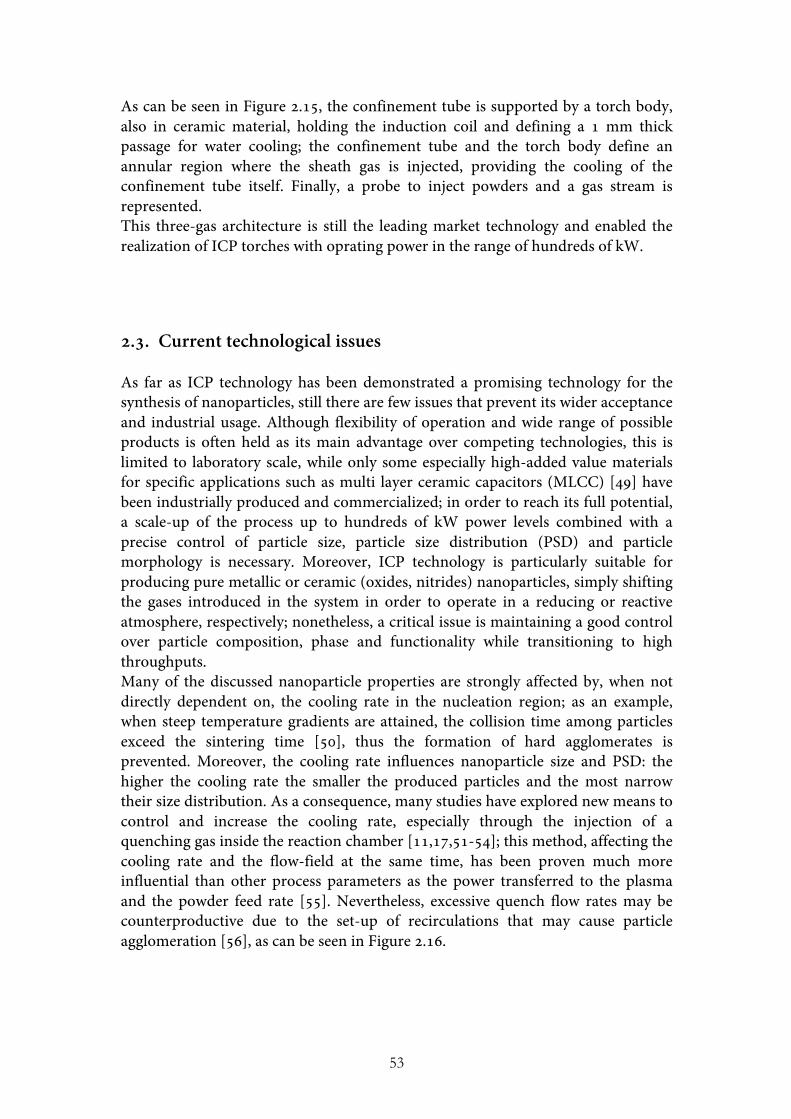
As can be seen in Figure 2.15, the confinement tube is supported by a torch body, also in ceramic material, holding the induction coil and defining a 1 mm thick passage for water cooling; the confinement tube and the torch body define an annular region where the sheath gas is injected, providing the cooling of the confinement tube itself. Finally, a probe to inject powders and a gas stream is represented. This three-gas architecture is still the leading market technology and enabled the realization of ICP torches with oprating power in the range of hundreds of kW.
2.3. Current technological issues As far as ICP technology has been demonstrated a promising technology for the synthesis of nanoparticles, still there are few issues that prevent its wider acceptance and industrial usage. Although flexibility of operation and wide range of possible products is often held as its main advantage over competing technologies, this is limited to laboratory scale, while only some especially high-added value materials for specific applications such as multi layer ceramic capacitors (MLCC) [49] have been industrially produced and commercialized; in order to reach its full potential, a scale-up of the process up to hundreds of kW power levels combined with a precise control of particle size, particle size distribution (PSD) and particle morphology is necessary. Moreover, ICP technology is particularly suitable for producing pure metallic or ceramic (oxides, nitrides) nanoparticles, simply shifting the gases introduced in the system in order to operate in a reducing or reactive atmosphere, respectively; nonetheless, a critical issue is maintaining a good control over particle composition, phase and functionality while transitioning to high throughputs. Many of the discussed nanoparticle properties are strongly affected by, when not directly dependent on, the cooling rate in the nucleation region; as an example, when steep temperature gradients are attained, the collision time among particles exceed the sintering time [50], thus the formation of hard agglomerates is prevented. Moreover, the cooling rate influences nanoparticle size and PSD: the higher the cooling rate the smaller the produced particles and the most narrow their size distribution. As a consequence, many studies have explored new means to control and increase the cooling rate, especially through the injection of a quenching gas inside the reaction chamber [11,17,51-54]; this method, affecting the cooling rate and the flow-field at the same time, has been proven much more influential than other process parameters as the power transferred to the plasma and the powder feed rate [55]. Nevertheless, excessive quench flow rates may be counterproductive due to the set-up of recirculations that may cause particle agglomeration [56], as can be seen in Figure 2.16.
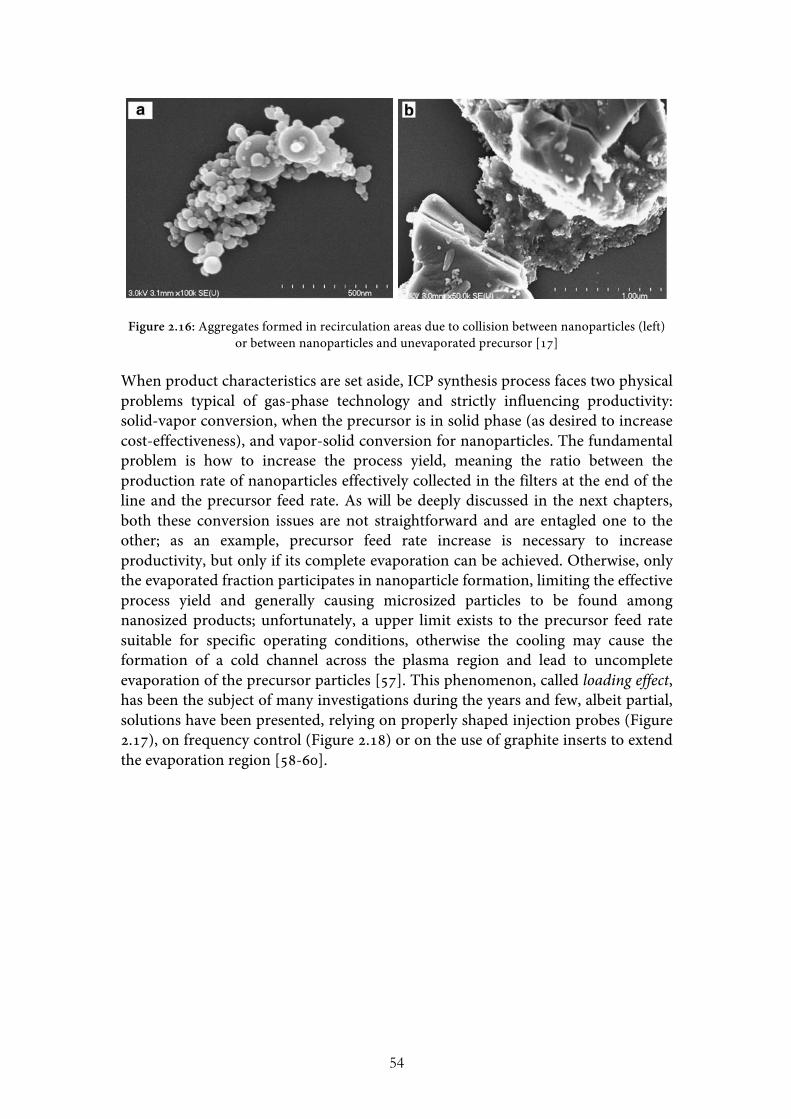
54
Figure 2.16: Aggregates formed in recirculation areas due to collision between nanoparticles (left) or between nanoparticles and unevaporated precursor [17]
When product characteristics are set aside, ICP synthesis process faces two physical problems typical of gas-phase technology and strictly influencing productivity: solid-vapor conversion, when the precursor is in solid phase (as desired to increase cost-effectiveness), and vapor-solid conversion for nanoparticles. The fundamental problem is how to increase the process yield, meaning the ratio between the production rate of nanoparticles effectively collected in the filters at the end of the line and the precursor feed rate. As will be deeply discussed in the next chapters, both these conversion issues are not straightforward and are entagled one to the other; as an example, precursor feed rate increase is necessary to increase productivity, but only if its complete evaporation can be achieved. Otherwise, only the evaporated fraction participates in nanoparticle formation, limiting the effective process yield and generally causing microsized particles to be found among nanosized products; unfortunately, a upper limit exists to the precursor feed rate suitable for specific operating conditions, otherwise the cooling may cause the formation of a cold channel across the plasma region and lead to uncomplete evaporation of the precursor particles [57]. This phenomenon, called loading effect, has been the subject of many investigations during the years and few, albeit partial, solutions have been presented, relying on properly shaped injection probes (Figure 2.17), on frequency control (Figure 2.18) or on the use of graphite inserts to extend the evaporation region [58-60].

55
Figure 2.17: Precursor particle dispersion using three different injection probes [58]
Figure 2.18: Precursor particle trajectories in an ICP torch at 3 MHz (right) and at 13.56 MHz (right); temperature iso-contours (K) on two x-y planes at z = 85 mm and z = 113 mm [59]
In an industrial perspective, yield maximization means more than the simple rate of conversion from vapor to solid phase; when a realistic continuous process is considered, the products are not all the nanoparticles produced, but only that fraction eventually collected in the filters. A characteristic problem in this frame is the deposition of nanoparticles on the walls of the reaction chamber, which can be reduced or prevented by employing proper geometries, additional suitable gas injections (Figure 2.19) or a combination of the two [43,58,60].
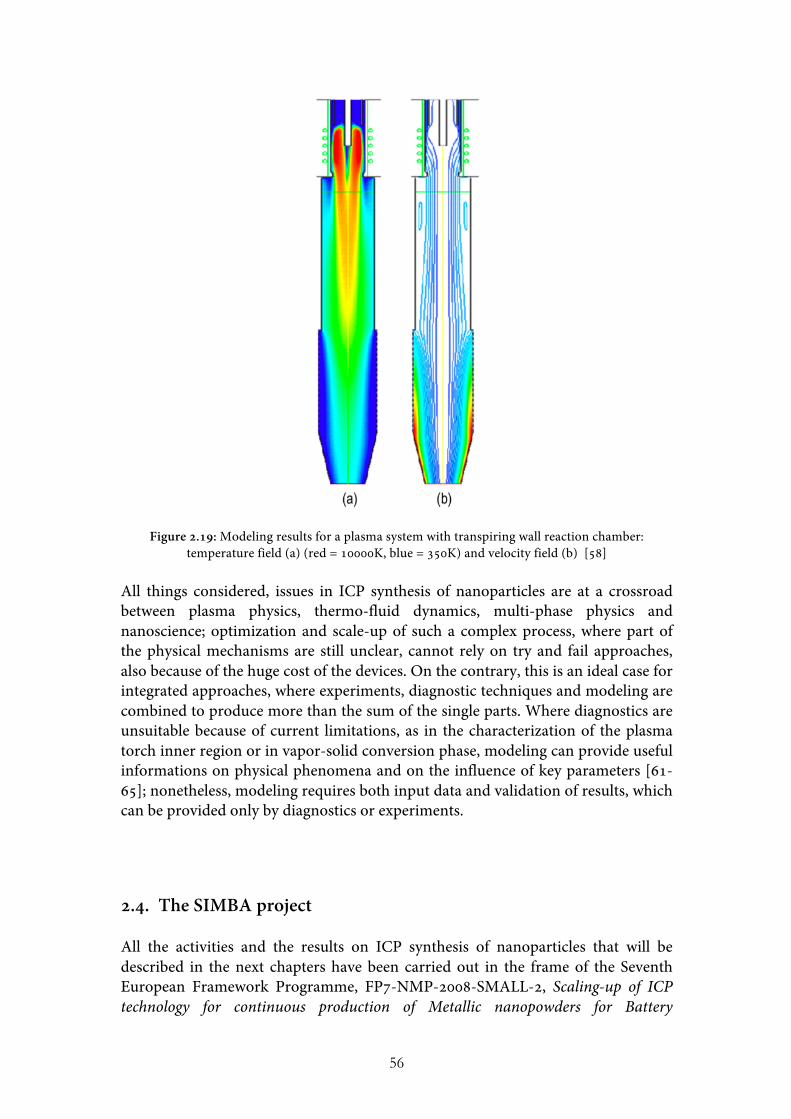
56
Figure 2.19: Modeling results for a plasma system with transpiring wall reaction chamber: temperature field (a) (red = 10000K, blue = 350K) and velocity field (b) [58]
All things considered, issues in ICP synthesis of nanoparticles are at a crossroad between plasma physics, thermo-fluid dynamics, multi-phase physics and nanoscience; optimization and scale-up of such a complex process, where part of the physical mechanisms are still unclear, cannot rely on try and fail approaches, also because of the huge cost of the devices. On the contrary, this is an ideal case for integrated approaches, where experiments, diagnostic techniques and modeling are combined to produce more than the sum of the single parts. Where diagnostics are unsuitable because of current limitations, as in the characterization of the plasma torch inner region or in vapor-solid conversion phase, modeling can provide useful informations on physical phenomena and on the influence of key parameters [61-65]; nonetheless, modeling requires both input data and validation of results, which can be provided only by diagnostics or experiments.
2.4. The SIMBA project All the activities and the results on ICP synthesis of nanoparticles that will be described in the next chapters have been carried out in the frame of the Seventh European Framework Programme, FP7-NMP-2008-SMALL-2, Scaling-up of ICP technology for continuous production of Metallic nanopowders for Battery
57
Applications (SIMBA) project [66]. This 3-year project, aimed at realizing an industrial scale set-up for the production of Si and Si-based alloyed nanoparticles for Li-ion battery application, involved 6 partners from 5 European countries:
• Umicore Research, Brussels, BE • EMPA, Swiss Federal Laboratories for Materials Science and Technology,
Thun, CH • Alma Mater Studiorum – Università di Bologna, Bologna, I • Fraunhofer IWS, Fraunhofer Institute for Material and Beam Technology,
Dresden, DE • SAFT, Bordeaux, F • DACS, Thun, CH
The integrated design-oriented modeling approach described in the previous paragraph has been adopted to investigate nanoparticle synthesis in a scaling-up perspective. The characterization of a laboratory scale 35 kW plant (10-100 g/h) has been carried out in order to pinpoint the key process parameters, predict their influence and, consequently, design a laboratory scale reaction chamber optimized in terms of process yield; then, results have been transitioned to a 50 kW industrial apparatus for the production of 1-10 kg/hour.
58
References [1] Yoshida T, Kawasaki A, Nakagawa K and Akashi K 1979 The synthesis of
ultrafine titanium nitride in an rf plasma Journal of Materials Science 14 1624–1630
[2] Yoshida T and Akashi K 1981 Preparation of ultrafine iron particles using an RF plasma Transactions of the Japan Institute of Metals 22 371–378
[3] Shigeta M, Watanabe T and Nishiyama H 2004 Numerical investigation for nano-particle synthesis in an RF inductively coupled plasma Thin Solid Films 457 192–200
[4] Shigeta M and Murphy A B 2011 Thermal plasmas for nanofabrication Journal of Physics D: Applied Physics 44 174025
[5] Ostrikov K and Murphy A B 2007 Plasma-aided nanofabrication: where is the cutting edge? Journal of Physics D: Applied Physics 40 2223–2241
[6] Leparoux M, Loher M, Schreuders C and Siegmann S 2008 Neural network modelling of the inductively coupled RF plasma synthesis of silicon nanoparticles Powder Technology 185 109-115
[7] Seo J H, Kim D U, Nam J S, Hong S H, Sohn S B and Song S M 2007 Radio frequency thermal plasma treatment for size reduction and spheroidization of glass powders used in ceramic electronic devices Journal of the American Ceramic Society 90(6) 1717-1722
[8] Harbec D, Gitzhofer F and Tagnit-Hamou A 2011 Induction plasma synthesis of nanometric spheroidized glass powder for use in cementitious materials Powder Technology 214 (3) 356-359
[9] Bushier P, Schubert H, Uhlenbusch J and Weiss M 2001 Evaporation of zirconia powders in a thermal radio-frequency plasma Journal of Thermal Spray Technology 10 (4) 666-672
[10] Ishigaki T, Bando Y, Moriyoshi Y and Boulos M I 1993 Deposition from the vapor phase during the induction plasma treatment of alumina powders Journal of Materials Science 28 (15) 4223-4228
[11] Goortani B M, Mendoza-Gonzalez N Y and Proulx P 2006 Synthesis of SiO2 Nanoparticles in RF Plasma Reactors: Effect of Feed Rate and Quench Gas Injection International Journal of Chemical Reactor Engineering 4 (1) A33
[12] Guo J Y, Gitzhofer F and Boulos M I 1995 Induction plasma synthesis of ultrafine SiC powders from silicon and CH4 Journal of Materials Science 30 (22) 5589-5599
[13] Gitzhofer F 1996 Induction plasma synthesis of ultrafine SiC Pure and Applied Chemistry 68 (5) 1113-1120
[14] Leparoux M, Schreuders C, Shin J W and Siegmann S 2005 Induction plasma synthesis of carbide nanopowders Advanced Engineering Materials 7 (5) 349-353
[15] Li J G, Kamiyama H, Wang X H, Moriyoshi Y and Ishigaki T 2006 TiO2 nanopowders via radio-frequency thermal plasma oxidation of organic liquid precursors: synthesis and characterization Journal of the European Ceramic Society 26 423-428
59
[16] Li J G, Wang X H, Kamiyama H, Ishigaki T and Sekiguchi T 2006 RF plasma processing of Er-doped TiO2 luminescent nanoparticles Thin Solid Films 506-507 292–296
[17] Goortani B M, Proulx P, Xue S and Mendoza-Gonzalez N Y 2007 Controlling nanostructure in thermal plasma processing: moving from highly aggregated porous structure to spherical silica nanoparticles Powder Technology 175 22–32
[18] Shin J W, Miyazoe H, Leparoux M, Siegmann S, Dorier J L and Hollenstein C 2006 The influence of process parameters on precursor evaporation for alumina nanopowder synthesis in an inductively coupled rf thermal plasma Plasma Sources Science and Technology 15 441-449
[19] Szepvolgyi J, Mohai I, Karoly Z and Gal L 2008 Synthesis of nanosized ceramic powders in a radiofrequency thermal plasma reactor Journal of the European Ceramic Society 28 895-899
[2o] Ishigaki T, Oh S M, Li J G and Park D W 2005 Controlling the synthesis of TaC nanopowders by injecting liquid precursor into RF induction plasma Science and Technology of Advanced Materials 6 (2) 111-118
[21] Leparoux M, Kihn Y, Paris S and Schreuders C 2008 Microstructure analysis of RF plasma synthesized TiCN nanopowders International Journal of Refractory Metals and Hard Materials 26 (4) 277-285
[22] Swaminathan R, Willard M A and McHenry M E 2006 Experimental observations and nucleation and growth theory of polyhedral magnetic ferrite nanoparticles synthesized using an RF plasma torch Acta Materialia 54 807-816
[23] Mohai I, Gai L, Szepvolgyi J, Gubicza J and Farkas Z 2007 Synthesis of nanosized zinc ferrites from liquid precursors in RF thermal plasma reactor Journal of the European Ceramic Society 27 941-945
[24] Seo J H, Lee M Y and Kim J S 2012 Radio-frequency thermal plasma preparation of nano-sized Ni catalysts supported on MgO nano-rods for partial oxidation of methane Surface and Coating Technology
[25] Nishimura K, Fujii T, Yubuta K and Shinozaki S 2003 Process for producing oxide coated fine metal particles US Patent 6582763
[26] Nishimura K, Fujii T, Yubuta K and Shinozaki S 2003 Fine glass particle containing embedded oxide and process for producing the same US Patent 6578381
[27] Lee M Y, Kim J S and Seo J H 2012 RF thermal plasma synthesis of nano-sized IZTO (Indium Zinc Tin Oxide) powders Thin Solid Films 521 60-64
[28] Wang X H, Li J-G, Kamiyama H, Katada M, Ohashi N, Moriyoshi Y and Ishigaki T 2005 Pyrogenic iron (III)-doped TiO2 nanopowders synthesized in RF thermal plasma: phase formation, defect structure, band gap, and magnetic properties Journal of the American Chemical Society 127 (31) 10982–10990
[29] Zhang C, Li J, Leng Y, Uchikoshi T, Watanabe T and Ishigaki T 2010 (Eu3+-Nb5+)-codoped TiO2 nanopowders synthesized via Ar/O2 radio frequency thermal plasma oxidation processing: phase composition and photoluminescence properties through energy transfer Thin Solid Films 518 3531–3534
60
[30] Leconte Y, Leparoux M, Portier X and Herlin-Boime N 2008 Controlled synthesis of β-SiC nanopowders with variable stoichiometry using inductively coupled plasma Plasma Chemistry and Plasma Processes 28 233-248
[31] Reed T B 1961 InductionCoupled Plasma Torch Journal of Applied Physics 32 (5) 821-824
[32] Boulos M I 1985 The inductively coupled R.F. (radio frequency) plasma Pure & Applied Chemistry 57 (9) 1321-1352
[33] Freeman M P and Chase J D 1968 Energy-transfer mechanism and typical operating characteristics for the thermal rf plasma generator Journal of Applied Physics 39 (1) 180-190
[34] Donskoi A V, Goldfarb V M and Klubnikin V S 1972 Physics and Technology of low-temperature plasmas edited by Dresvin S V English edition: 1977 translated by Cheron T and edited by Eckert H U Iowa State University press
[35] Eckert H U 1971 Measurement of the rf magnetic field distribution in a thermal induction plasma Journal of Applied Physics 42 3108-3113
[36] Goldfarb V M et al. 1967 Investigation of plasma torch of high-frequency argon burner Teplofizika Vysokikh Temperatur 5 (4) 549-556 (in Russian)
[37] Goldfarb V M et al. 1967 Proceedings of the XIV Colloquium Sprectroscopicum Internationale 751
[38] Goykhman V Kh et al. 1966 Proceedings of the I All Union Conference on the Physics of Low-temperature Plasma 33
[39] Mensing A E and Boedeker L R 1969 Theoretical investigations of R-F induction heated plasmas NASA CR-1312
[40] Pool J W Freeman M P, Doak K W and Thorpe M L 1973 Simulator tests to study hot-flow problems related to a gas core reactor NASA CR-2309
[41] Colombo V, Ghedini E, Gherardi M, Sanibondi P and Shigeta M 2012 A two-dimensional nodal model with turbulent effects for the synthesis of Si nano-particles by inductively coupled thermal plasmas Plasma Sources Science and Technology 21 025001
[42] Colombo V, Deschenaux C, Ghedini E, Gherardi M, Jaeggi C, Leparoux M, Mani V and Sanibondi P 2012 Fluid-dynamic characterization of a radio-frequency induction thermal plasma system for nanoparticle synthesis Plasma Sources Science and Technology 21 045010
[43] Colombo V, Ghedini E, Gherardi M and Sanibondi P 2012 Modelling for the optimization of the reaction chamber in silicon nanoparticle synthesis by a radio-frequency induction thermal plasma Plasma Sources Science and Technology 21 055007
[44] Klubnikin V S 1975 Thermal and gasdynamic characteristics of an argon induction discharge Teplofizika Vysokikh Temperatur 13 (3) 439-446
[45] TAFA Eng. data Bull. 52-E5 [46] Dresvin S V 1993 The fundamentals of theory and design of HF plasma
generators (translated from Russian) [47] Hollabaugh C M, Hull D E, Newkirk L R and Petrovic J J 1983 R.F.-plasma
system for the production of ultrafine, ultrapure silicon carbide powder Journal of Materials Science 18 3190-3194
61
[48] Boulos M I and Jurewicz J 1993 High performance induction plasma torch with a water-cooled ceramic confinement tube US 5200595
[49] Paserin V, Adams R S, Boulos M I, Jurewicz J and Guo J 2007 Method for producing metal nanopowders by decomposition of metal carbonyl using an induction plasma torch WO2007137431
[50] Lehtinen K E J, Windeler R S and Friedlander S K 1996 Prediction of nanoparticle size and the onset of dendrite formation using the method of characteristic times Journal of Aerosol Science 27 (6) 883-896
[51] Tsantilis S and Pratsinis S E 2004 Soft- and hard-agglomerated aerosols made at high temperatures Langmuir 20 5933-5939
[52] Leparoux M, Schreuders C and Fauchais P 2008 Improved plasma synthesis of si-nanopowders by quenching Advanced Engineering Materials 10 (12) 1147-1150
[53] Li J-G, Ikeda M, Ye R, Moriyoshi Y and Ishigaki T 2007 Control of particle size and phase formation of TiO2 nanoparticles synthesized in RF induction plasma Journal of Physics D: Applied Physics 40 2348
[54] Gonzalez N Y M, Morsli M E and Proulx P 2008 Production of nanoparticles in thermal plasmas: a model including evaporation, nucleation, condensation, and fractal aggregation Journal of Thermal Spray Technology 17 533–550
[55] Buchner P, Lutzenkirchen-Hecht D, Strehblow H H and Uhlenbusch J 1999 Production and characterization of nanosized Cu/O/SiC composite particles in a thermal r.f. plasma reactor Journal of Materials Science 34 (5) 925-931
[56] Ye R, Li J G and Ishigaki T 2007 Controlled synthesis of alumina nanoparticles using inductively coupled thermal plasma with enhanced quenching Thin Solid Films 515 4251–4257
[57] Proulx P, Mostaghimi J and Boulos M 1987 Heating of powders in an r.f. inductively coupled plasma under dense loading conditions Plasma Chemistry and Plasma Processing 7 29-52
[58] Jiayin G, Xiaobao F, Dolbec R, Siwen X, Jurewicz J and Boulos M 2010 Development of nanopowder synthesis using induction plasma Plasma Science and Technology 12 188
[59] Colombo V, Ghedini E, Gherardi M and Sanibondi P 2010 Three-dimensional simulations of RF thermal plasma torches with reaction chamber: process design for powder spheroidization and nanopowder production Proceedings of the 11th Eropean Plasma Conference HTPP11
[60] Boulos M I, Jurewicz J and Guo J 2011 Induction plasma synthesis of nanopowders US 8013269
[61] Murphy A B, Boulos M I, Colombo V, Fauchais P, Ghedini E, Gleizes A, Mostaghimi J, Proulx P and Schram D C 2008 Advanced thermal plasma modelling High Temperature Material Processes 12 (3-4) 255-336
[62] Bernardi D, Colombo V, Ghedini E and Mentrelli A 2005 Three-dimensional modeling of inductively coupled plasma torches Pure and Applied Chemistry 77 (2) 359-372
[63] Bilodeau J F and Proulx P 1996 A mathematical-model for ultrafine iron-powder growth in a thermal plasma Aerosol Science and Technology 24 (3) 175-189

62
[64] Murphy A B 2004 Formation of titanium nanoparticles from a titanium tetrachloride plasma Journal of Physics D: Applied Physics 37 2841-2847
[65] Shigeta M and Watanabe T 2008 Two-dimensional analysis of nanoparticle formation in induction thermal plasmas with counterflow cooling Thin Solid Films 51 (6) 4415-4422
[66] http://www.simba-project.eu

63
CHAPTER 3 COMBINED APPROACHES FOR THE
CHARACTERIZATION OF ICP SYSTEMS FOR NANOPARTICLE SYNTHESIS
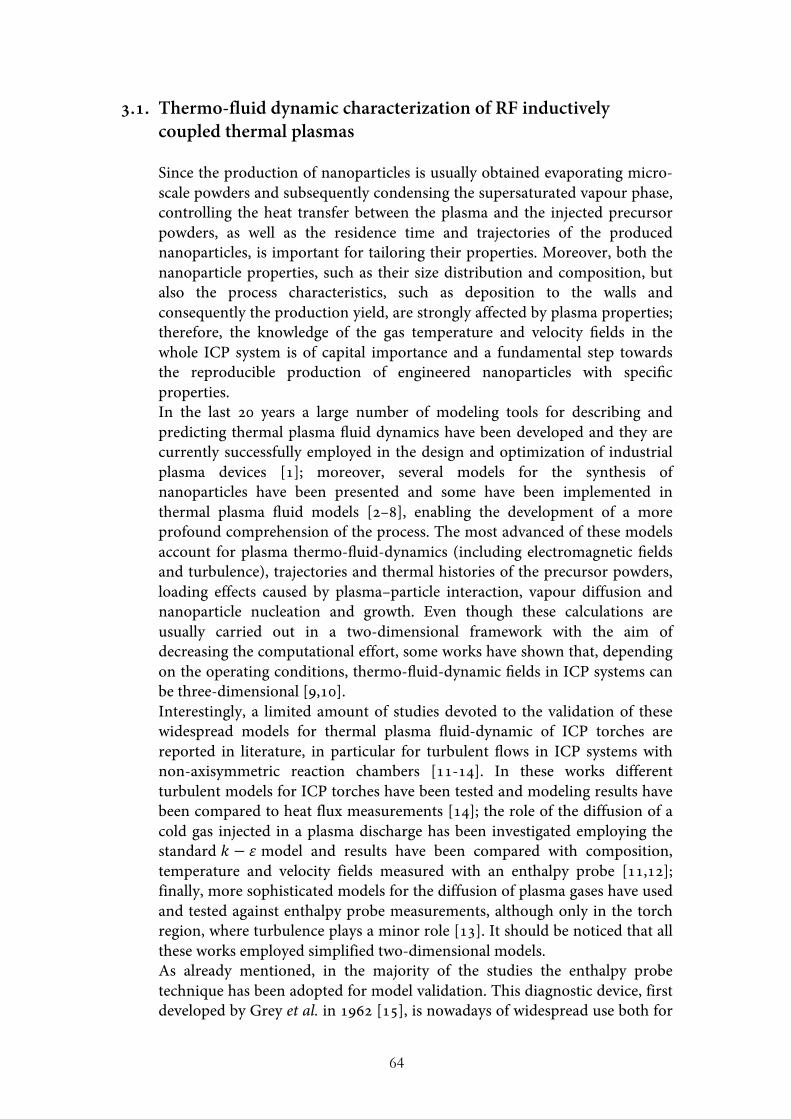
64
3.1. Thermo-fluid dynamic characterization of RF inductively coupled thermal plasmas
Since the production of nanoparticles is usually obtained evaporating micro-scale powders and subsequently condensing the supersaturated vapour phase, controlling the heat transfer between the plasma and the injected precursor powders, as well as the residence time and trajectories of the produced nanoparticles, is important for tailoring their properties. Moreover, both the nanoparticle properties, such as their size distribution and composition, but also the process characteristics, such as deposition to the walls and consequently the production yield, are strongly affected by plasma properties; therefore, the knowledge of the gas temperature and velocity fields in the whole ICP system is of capital importance and a fundamental step towards the reproducible production of engineered nanoparticles with specific properties. In the last 20 years a large number of modeling tools for describing and predicting thermal plasma fluid dynamics have been developed and they are currently successfully employed in the design and optimization of industrial plasma devices [1]; moreover, several models for the synthesis of nanoparticles have been presented and some have been implemented in thermal plasma fluid models [2–8], enabling the development of a more profound comprehension of the process. The most advanced of these models account for plasma thermo-fluid-dynamics (including electromagnetic fields and turbulence), trajectories and thermal histories of the precursor powders, loading effects caused by plasma–particle interaction, vapour diffusion and nanoparticle nucleation and growth. Even though these calculations are usually carried out in a two-dimensional framework with the aim of decreasing the computational effort, some works have shown that, depending on the operating conditions, thermo-fluid-dynamic fields in ICP systems can be three-dimensional [9,10]. Interestingly, a limited amount of studies devoted to the validation of these widespread models for thermal plasma fluid-dynamic of ICP torches are reported in literature, in particular for turbulent flows in ICP systems with non-axisymmetric reaction chambers [11-14]. In these works different turbulent models for ICP torches have been tested and modeling results have been compared to heat flux measurements [14]; the role of the diffusion of a cold gas injected in a plasma discharge has been investigated employing the standard 𝑘 − 𝜀 model and results have been compared with composition, temperature and velocity fields measured with an enthalpy probe [11,12]; finally, more sophisticated models for the diffusion of plasma gases have used and tested against enthalpy probe measurements, although only in the torch region, where turbulence plays a minor role [13]. It should be noticed that all these works employed simplified two-dimensional models. As already mentioned, in the majority of the studies the enthalpy probe technique has been adopted for model validation. This diagnostic device, first developed by Grey et al. in 1962 [15], is nowadays of widespread use both for
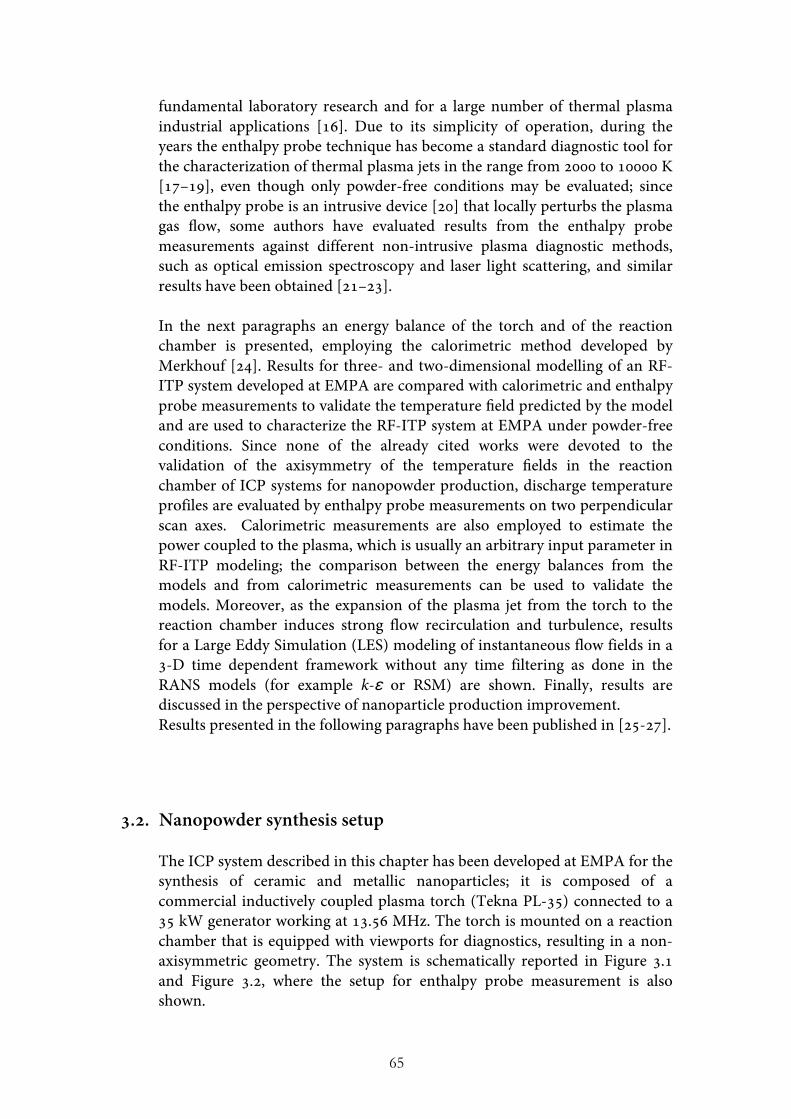
65
fundamental laboratory research and for a large number of thermal plasma industrial applications [16]. Due to its simplicity of operation, during the years the enthalpy probe technique has become a standard diagnostic tool for the characterization of thermal plasma jets in the range from 2000 to 10000 K [17–19], even though only powder-free conditions may be evaluated; since the enthalpy probe is an intrusive device [20] that locally perturbs the plasma gas flow, some authors have evaluated results from the enthalpy probe measurements against different non-intrusive plasma diagnostic methods, such as optical emission spectroscopy and laser light scattering, and similar results have been obtained [21–23]. In the next paragraphs an energy balance of the torch and of the reaction chamber is presented, employing the calorimetric method developed by Merkhouf [24]. Results for three- and two-dimensional modelling of an RF-ITP system developed at EMPA are compared with calorimetric and enthalpy probe measurements to validate the temperature field predicted by the model and are used to characterize the RF-ITP system at EMPA under powder-free conditions. Since none of the already cited works were devoted to the validation of the axisymmetry of the temperature fields in the reaction chamber of ICP systems for nanopowder production, discharge temperature profiles are evaluated by enthalpy probe measurements on two perpendicular scan axes. Calorimetric measurements are also employed to estimate the power coupled to the plasma, which is usually an arbitrary input parameter in RF-ITP modeling; the comparison between the energy balances from the models and from calorimetric measurements can be used to validate the models. Moreover, as the expansion of the plasma jet from the torch to the reaction chamber induces strong flow recirculation and turbulence, results for a Large Eddy Simulation (LES) modeling of instantaneous flow fields in a 3-D time dependent framework without any time filtering as done in the RANS models (for example k-ε or RSM) are shown. Finally, results are discussed in the perspective of nanoparticle production improvement. Results presented in the following paragraphs have been published in [25-27].
3.2. Nanopowder synthesis setup
The ICP system described in this chapter has been developed at EMPA for the synthesis of ceramic and metallic nanoparticles; it is composed of a commercial inductively coupled plasma torch (Tekna PL-35) connected to a 35 kW generator working at 13.56 MHz. The torch is mounted on a reaction chamber that is equipped with viewports for diagnostics, resulting in a non-axisymmetric geometry. The system is schematically reported in Figure 3.1 and Figure 3.2, where the setup for enthalpy probe measurement is also shown.
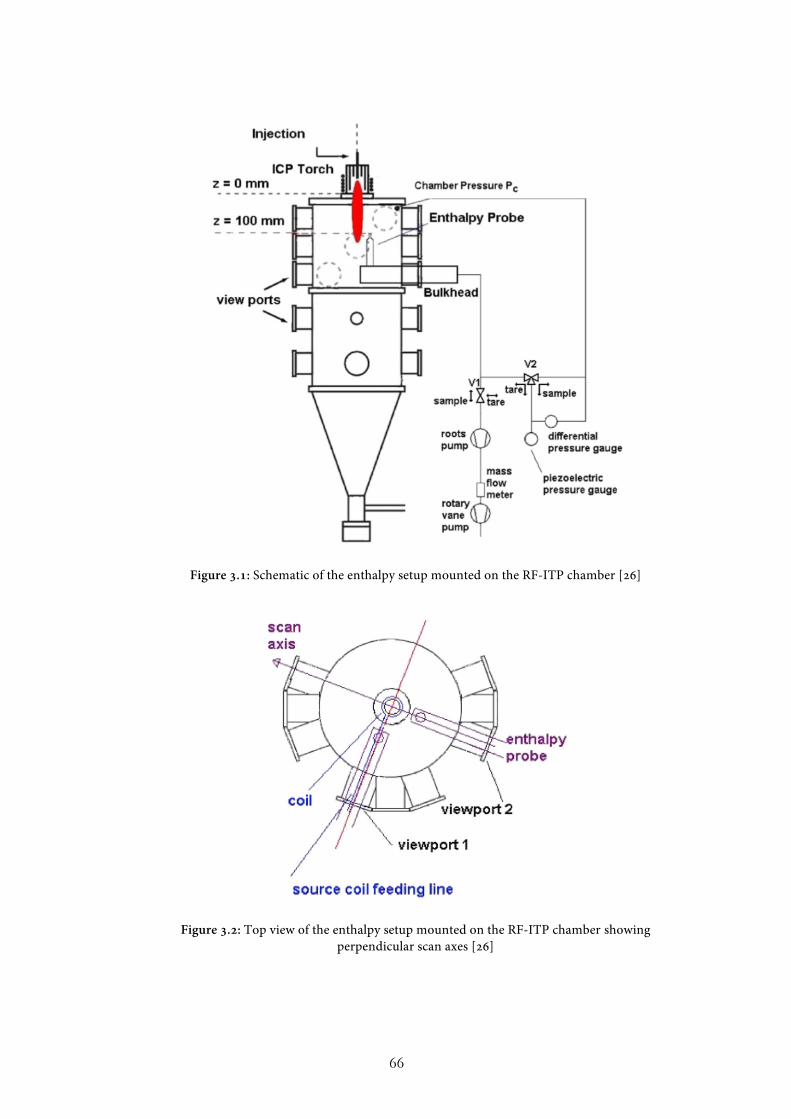
66
Figure 3.1: Schematic of the enthalpy setup mounted on the RF-ITP chamber [26]
Figure 3.2: Top view of the enthalpy setup mounted on the RF-ITP chamber showing perpendicular scan axes [26]
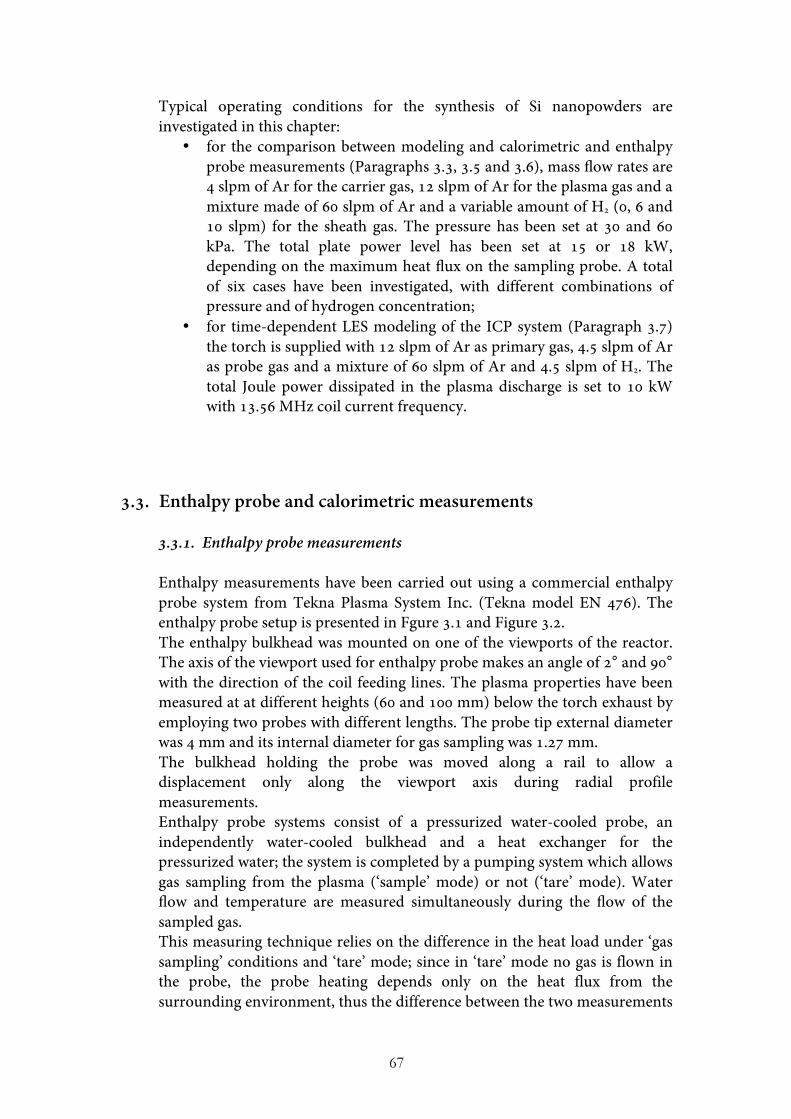
67
Typical operating conditions for the synthesis of Si nanopowders are investigated in this chapter:
• for the comparison between modeling and calorimetric and enthalpy probe measurements (Paragraphs 3.3, 3.5 and 3.6), mass flow rates are 4 slpm of Ar for the carrier gas, 12 slpm of Ar for the plasma gas and a mixture made of 60 slpm of Ar and a variable amount of H2 (0, 6 and 10 slpm) for the sheath gas. The pressure has been set at 30 and 60 kPa. The total plate power level has been set at 15 or 18 kW, depending on the maximum heat flux on the sampling probe. A total of six cases have been investigated, with different combinations of pressure and of hydrogen concentration;
• for time-dependent LES modeling of the ICP system (Paragraph 3.7) the torch is supplied with 12 slpm of Ar as primary gas, 4.5 slpm of Ar as probe gas and a mixture of 60 slpm of Ar and 4.5 slpm of H2. The total Joule power dissipated in the plasma discharge is set to 10 kW with 13.56 MHz coil current frequency.
3.3. Enthalpy probe and calorimetric measurements 3.3.1. Enthalpy probe measurements Enthalpy measurements have been carried out using a commercial enthalpy probe system from Tekna Plasma System Inc. (Tekna model EN 476). The enthalpy probe setup is presented in Fgure 3.1 and Figure 3.2. The enthalpy bulkhead was mounted on one of the viewports of the reactor. The axis of the viewport used for enthalpy probe makes an angle of 2° and 90° with the direction of the coil feeding lines. The plasma properties have been measured at at different heights (60 and 100 mm) below the torch exhaust by employing two probes with different lengths. The probe tip external diameter was 4 mm and its internal diameter for gas sampling was 1.27 mm. The bulkhead holding the probe was moved along a rail to allow a displacement only along the viewport axis during radial profile measurements. Enthalpy probe systems consist of a pressurized water-cooled probe, an independently water-cooled bulkhead and a heat exchanger for the pressurized water; the system is completed by a pumping system which allows gas sampling from the plasma (‘sample’ mode) or not (‘tare’ mode). Water flow and temperature are measured simultaneously during the flow of the sampled gas. This measuring technique relies on the difference in the heat load under ‘gas sampling’ conditions and ‘tare’ mode; since in ‘tare’ mode no gas is flown in the probe, the probe heating depends only on the heat flux from the surrounding environment, thus the difference between the two measurements
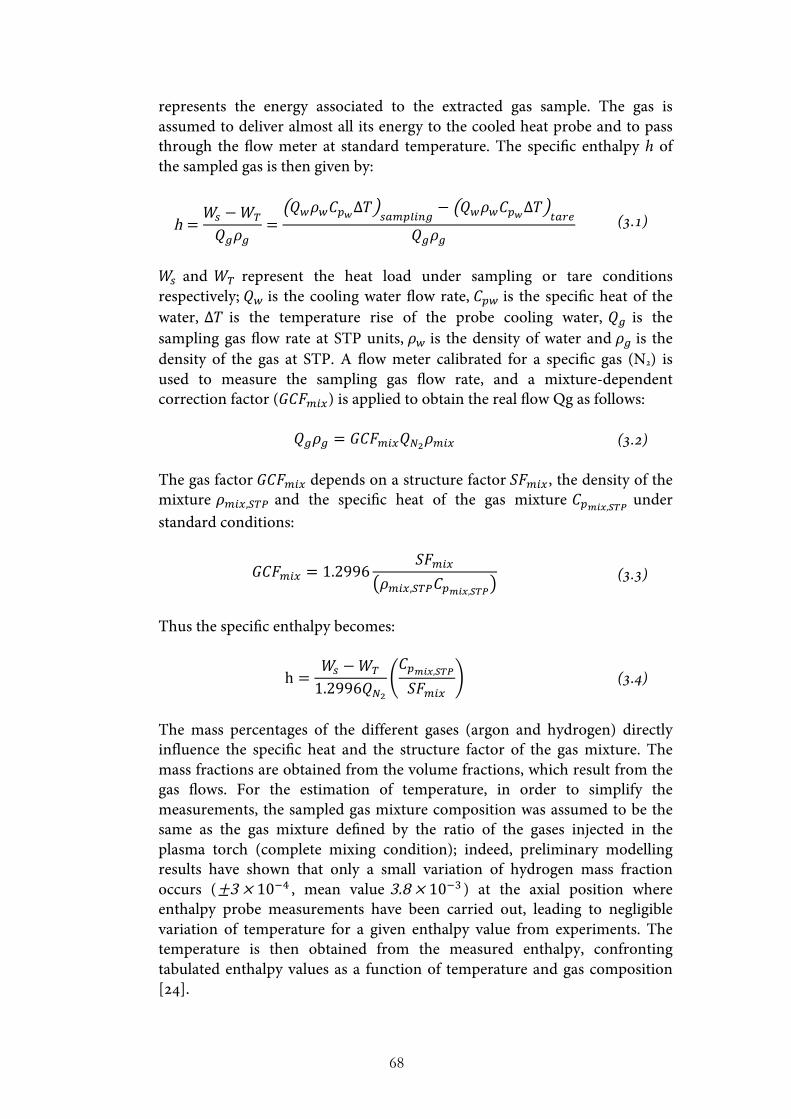
68
represents the energy associated to the extracted gas sample. The gas is assumed to deliver almost all its energy to the cooled heat probe and to pass through the flow meter at standard temperature. The specific enthalpy h of the sampled gas is then given by:
h =𝑊! −𝑊!
𝑄!𝜌!=
𝑄!𝜌!𝐶!!∆𝑇 !"#$%&'(− 𝑄!𝜌!𝐶!!∆𝑇 !"#$
𝑄!𝜌! (3.1)
𝑊! and 𝑊! represent the heat load under sampling or tare conditions respectively; 𝑄! is the cooling water flow rate, 𝐶!" is the specific heat of the water, ∆𝑇 is the temperature rise of the probe cooling water, 𝑄! is the sampling gas flow rate at STP units, 𝜌! is the density of water and 𝜌! is the density of the gas at STP. A flow meter calibrated for a specific gas (N2) is used to measure the sampling gas flow rate, and a mixture-dependent correction factor (𝐺𝐶𝐹!"#) is applied to obtain the real flow Qg as follows:
𝑄!𝜌! = 𝐺𝐶𝐹!"#𝑄!!𝜌!"# (3.2)
The gas factor 𝐺𝐶𝐹!"# depends on a structure factor 𝑆𝐹!"#, the density of the mixture 𝜌!"#,!"# and the specific heat of the gas mixture 𝐶!!"#,!"# under standard conditions:
𝐺𝐶𝐹!"# = 1.2996𝑆𝐹!"#
𝜌!"#,!"#𝐶!!"#,!"#
(3.3)
Thus the specific enthalpy becomes:
h =𝑊! −𝑊!
1.2996𝑄!!
𝐶!!"#,!"#
𝑆𝐹!"# (3.4)
The mass percentages of the different gases (argon and hydrogen) directly influence the specific heat and the structure factor of the gas mixture. The mass fractions are obtained from the volume fractions, which result from the gas flows. For the estimation of temperature, in order to simplify the measurements, the sampled gas mixture composition was assumed to be the same as the gas mixture defined by the ratio of the gases injected in the plasma torch (complete mixing condition); indeed, preliminary modelling results have shown that only a small variation of hydrogen mass fraction occurs (±3 × 10!! , mean value 3.8 × 10!! ) at the axial position where enthalpy probe measurements have been carried out, leading to negligible variation of temperature for a given enthalpy value from experiments. The temperature is then obtained from the measured enthalpy, confronting tabulated enthalpy values as a function of temperature and gas composition [24].
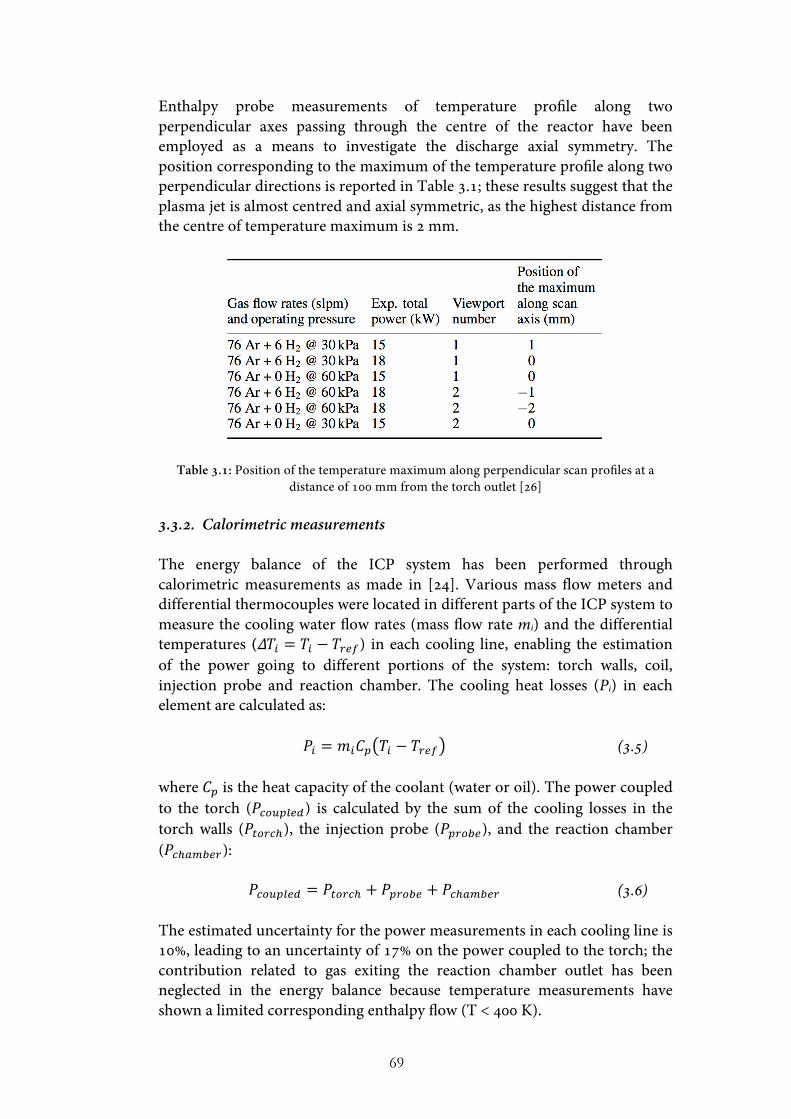
69
Enthalpy probe measurements of temperature profile along two perpendicular axes passing through the centre of the reactor have been employed as a means to investigate the discharge axial symmetry. The position corresponding to the maximum of the temperature profile along two perpendicular directions is reported in Table 3.1; these results suggest that the plasma jet is almost centred and axial symmetric, as the highest distance from the centre of temperature maximum is 2 mm.
Table 3.1: Position of the temperature maximum along perpendicular scan profiles at a distance of 100 mm from the torch outlet [26]
3.3.2. Calorimetric measurements The energy balance of the ICP system has been performed through calorimetric measurements as made in [24]. Various mass flow meters and differential thermocouples were located in different parts of the ICP system to measure the cooling water flow rates (mass flow rate mi) and the differential temperatures (∆𝑇! = 𝑇! − 𝑇!"#) in each cooling line, enabling the estimation of the power going to different portions of the system: torch walls, coil, injection probe and reaction chamber. The cooling heat losses (Pi) in each element are calculated as:
𝑃! = 𝑚!𝐶! 𝑇! − 𝑇!"# (3.5)
where 𝐶! is the heat capacity of the coolant (water or oil). The power coupled to the torch (𝑃!"#$%&') is calculated by the sum of the cooling losses in the torch walls (𝑃!"#$!), the injection probe (𝑃!"#$%), and the reaction chamber (𝑃!!!"#!"):
𝑃!"#$%&' = 𝑃!"#$! + 𝑃!"#$% + 𝑃!!!"#$% (3.6)
The estimated uncertainty for the power measurements in each cooling line is 10%, leading to an uncertainty of 17% on the power coupled to the torch; the contribution related to gas exiting the reaction chamber outlet has been neglected in the energy balance because temperature measurements have shown a limited corresponding enthalpy flow (T < 400 K).
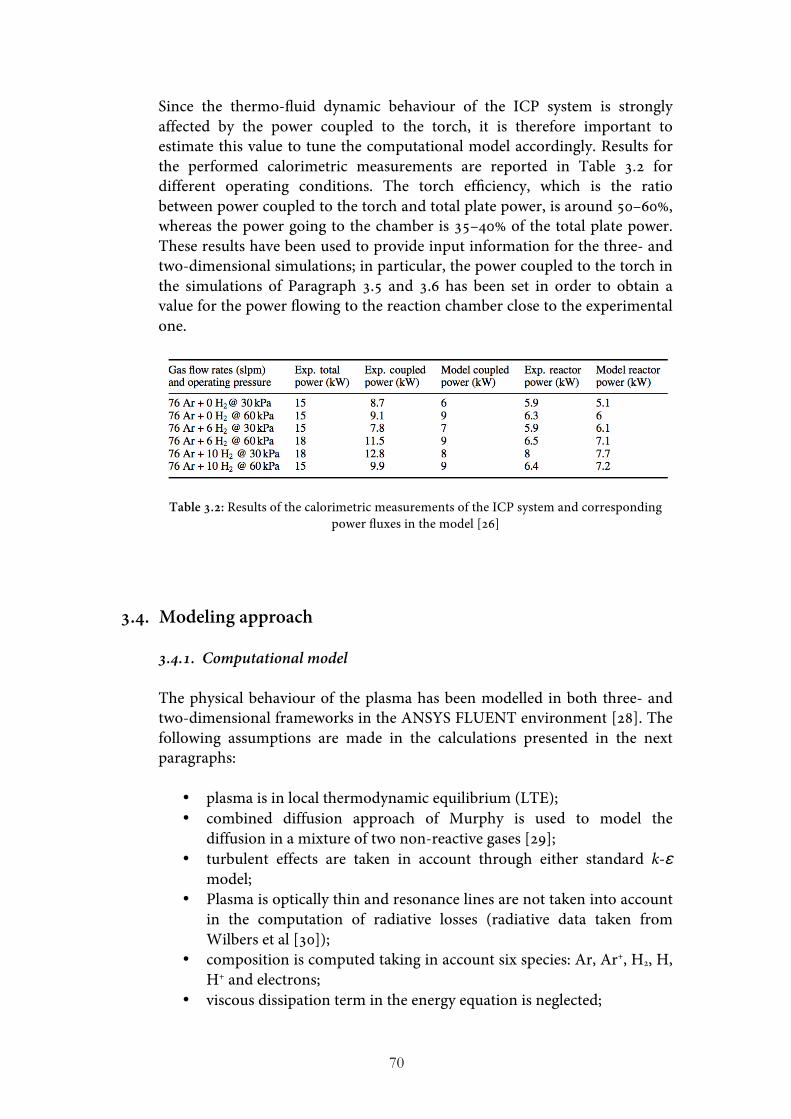
70
Since the thermo-fluid dynamic behaviour of the ICP system is strongly affected by the power coupled to the torch, it is therefore important to estimate this value to tune the computational model accordingly. Results for the performed calorimetric measurements are reported in Table 3.2 for different operating conditions. The torch efficiency, which is the ratio between power coupled to the torch and total plate power, is around 50–60%, whereas the power going to the chamber is 35–40% of the total plate power. These results have been used to provide input information for the three- and two-dimensional simulations; in particular, the power coupled to the torch in the simulations of Paragraph 3.5 and 3.6 has been set in order to obtain a value for the power flowing to the reaction chamber close to the experimental one.
Table 3.2: Results of the calorimetric measurements of the ICP system and corresponding power fluxes in the model [26]
3.4. Modeling approach 3.4.1. Computational model The physical behaviour of the plasma has been modelled in both three- and two-dimensional frameworks in the ANSYS FLUENT environment [28]. The following assumptions are made in the calculations presented in the next paragraphs:
• plasma is in local thermodynamic equilibrium (LTE); • combined diffusion approach of Murphy is used to model the
diffusion in a mixture of two non-reactive gases [29]; • turbulent effects are taken in account through either standard k-ε
model; • Plasma is optically thin and resonance lines are not taken into account
in the computation of radiative losses (radiative data taken from Wilbers et al [30]);
• composition is computed taking in account six species: Ar, Ar+, H2, H, H+ and electrons;
• viscous dissipation term in the energy equation is neglected;
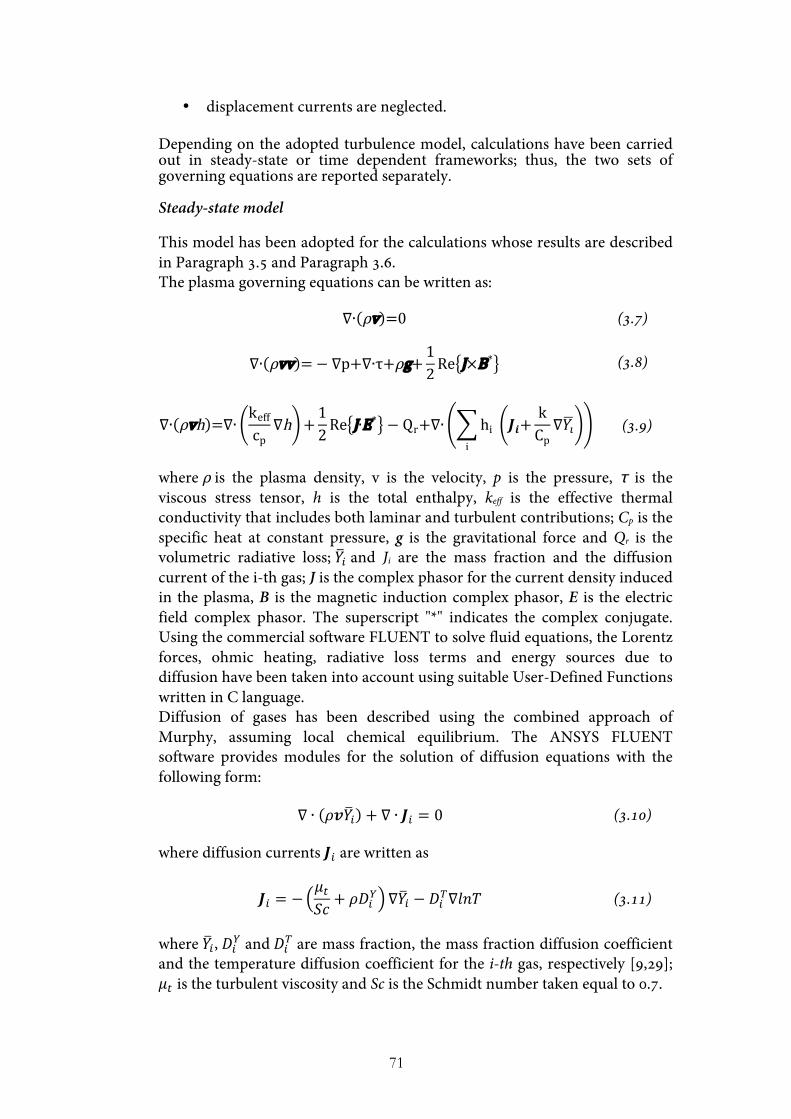
71
• displacement currents are neglected. Depending on the adopted turbulence model, calculations have been carried out in steady-state or time dependent frameworks; thus, the two sets of governing equations are reported separately. Steady-state model This model has been adopted for the calculations whose results are described in Paragraph 3.5 and Paragraph 3.6. The plasma governing equations can be written as:
∇∙ ρv =0 (3.7)
∇∙ ρvv =− ∇p+∇∙τ+ρg+12Re
J×B* (3.8)
∇∙ ρvh =∇∙keffcp∇h +
12Re
J∙E* − Qr+∇∙ hi 𝑱𝒊+kCp∇𝑌!
i
(3.9)
where ρ is the plasma density, v is the velocity, p is the pressure, τ is the viscous stress tensor, h is the total enthalpy, keff is the effective thermal conductivity that includes both laminar and turbulent contributions; Cp is the specific heat at constant pressure, g is the gravitational force and Qr is the volumetric radiative loss; 𝑌! and Ji are the mass fraction and the diffusion current of the i-th gas; J is the complex phasor for the current density induced in the plasma, B is the magnetic induction complex phasor, E is the electric field complex phasor. The superscript "*" indicates the complex conjugate. Using the commercial software FLUENT to solve fluid equations, the Lorentz forces, ohmic heating, radiative loss terms and energy sources due to diffusion have been taken into account using suitable User-Defined Functions written in C language. Diffusion of gases has been described using the combined approach of Murphy, assuming local chemical equilibrium. The ANSYS FLUENT software provides modules for the solution of diffusion equations with the following form:
∇ ∙ 𝜌𝒗𝑌! + ∇ ∙ 𝑱! = 0 (3.10)
where diffusion currents 𝑱! are written as
𝑱! = −𝜇!𝑆𝑐 + 𝜌𝐷!
! ∇𝑌! − 𝐷!!∇𝑙𝑛𝑇 (3.11) where 𝑌!, 𝐷!! and 𝐷!! are mass fraction, the mass fraction diffusion coefficient and the temperature diffusion coefficient for the i-th gas, respectively [9,29]; 𝜇! is the turbulent viscosity and Sc is the Schmidt number taken equal to 0.7.
72
Turbulent effects in the downstream region of the discharge have been evaluated in the flow calculations using the standard k-ε model:
∇∙ ρvk =∇∙ 𝜇 +𝜇!𝜎!
∇k +𝐺! − 𝜌𝜀 (3.12)
∇∙ ρvε =∇∙ 𝜇 +𝜇!𝜎!
∇ε +𝐶!!𝜀𝑘 𝐺! − 𝐶!!𝜌
𝜀!
𝑘 (3.13)
where Gk represents the generation of turbulence kinetic energy due to the mean velocity gradients; C1ε, C2ε, 𝜎! and 𝜎! are constants with values 1.44, 1.92, 0.25, 1.0 and 1.3, respectively. In this model, the turbulent viscosity is computed as:
𝜇! = 𝜌𝐶!𝑘!
𝜀 (3.14)
where 𝐶! is a constant set at 0.09. To model turbulence in the near-wall region the standard wall function approach has been adopted [28]. The electromagnetic field generated by the current flowing in the coil (Jcoil) and by the induced currents in the plasma (J) can be described by means of Maxwell’s equations written in their vector potential formulation:
𝛻!𝑨-i𝜔𝜇!𝜎𝑨+ 𝜇!𝑱!"#$=0 (3.15)
where 𝜇! is the magnetic permeability of the free space, 𝜎 is the plasma electrical conductivity, and 𝜔 = 2𝜋𝑓 , f being the frequency of the electromagnetic field. The electric field complex phasor E and the magnetic field complex phasor B are obtained from the vector potential complex phasor A with the following expressions: 𝐸 = −𝑖𝜔𝑨, 𝑩 = ∇ ∙ 𝑨. In these calculations we have used the simplified Ohm's law 𝑱 = 𝜎𝑬. Time dependent model This model has been adopted for the calculations whose results are described in Paragraph 3.7. Turbulent flows are characterized by eddies with a wide range of length and time scales: the largest eddies, directly predicted by LES, are comparable in size to the characteristic length of the mean flow and are mostly responsible for the transport of mass, momentum and energy; the smallest eddies, predicted by LES using semi empirical models [31], are isotropic and are responsible for the dissipation of turbulence kinetic energy. When tubulence is investigated by employing a time dependent LES model, plasma governing equations can be written as:
73
𝜕ρ𝜕𝑡 +∇∙ ρv =0 (3.16)
𝜕ρv𝜕𝑡 +∇∙ ρvv =− ∇p+∇∙τ+∇∙σ+ρg+
12Re
J×B* (3.17)
𝜕ρvh𝜕𝑡 +∇∙ ρvh =∇∙
keffcp∇h +
12Re
J∙E*
− Qr+∇∙ hi 𝑱𝒊+kCp∇𝑌!
i
(3.18)
where ρ is the plasma density, v is the velocity, p is the pressure, h is the total enthalpy, keff is the effective thermal conductivity that includes both laminar and turbulent contributions; Cp is the specific heat at constant pressure, g is the gravitational force and Qr is the volumetric radiative loss; 𝑌! and Ji are the mass fraction and the diffusion current of the i-th gas; J is the complex phasor for the current density induced in the plasma, B is the magnetic induction complex phasor, E is the electric field complex phasor. The superscript "*" indicates the complex conjugate. The stress tensor due to molecular viscosity σ and the viscous stress tensor τ are defined as:
𝜎!"= 𝜇𝜕𝑣!𝜕𝑥!
+𝜕𝑣!𝜕𝑥!
−23 𝜇
𝜕𝑣!𝜕𝑥!
𝛿!" (3.19)
𝜏!"=𝜌𝑣!𝑣! − 𝜌𝑣!𝑣! (3.20)
Where the subscripts i, j and k denotes the i-th, j-th and k-th component of a vector or tensor, 𝜇 is the laminar viscosity and 𝛿!" is the Kroenecker delta. Subgrid-scale turbulent stresses are computed from:
𝜏!" −13 𝜏!!𝛿!"=− 2𝜇!𝑆!"
(3.21)
Where 𝜇! is the subgrid-scale turbulent viscosity defined as in the Smagorinsky-Lilly model [32] and 𝑆!", the rate-of-strain tensor, is defined as:
𝑆!" =12𝜕𝑣!𝜕𝑥!
+𝜕𝑣!𝜕𝑥!
(3.22)
Using the commercial software FLUENT to solve fluid equations, the Lorentz forces, ohmic heating, radiative loss terms and energy sources due to diffusion have been taken into account using suitable User-Defined Functions written in C language. Diffusion of gases has been described using the combined approach of Murphy, assuming local chemical equilibrium. The ANSYS FLUENT
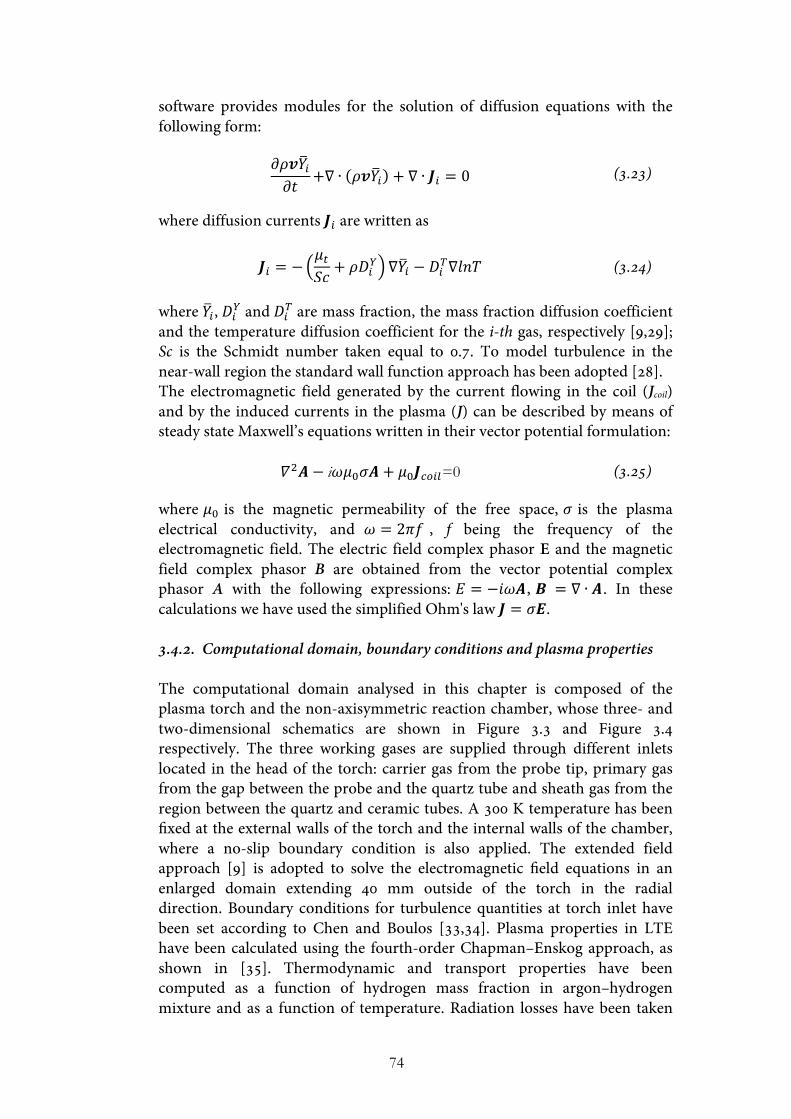
74
software provides modules for the solution of diffusion equations with the following form:
𝜕𝜌𝒗𝑌!𝜕𝑡 +∇ ∙ 𝜌𝒗𝑌! + ∇ ∙ 𝑱! = 0 (3.23)
where diffusion currents 𝑱! are written as
𝑱! = −𝜇!𝑆𝑐 + 𝜌𝐷!
! ∇𝑌! − 𝐷!!∇𝑙𝑛𝑇 (3.24) where 𝑌!, 𝐷!! and 𝐷!! are mass fraction, the mass fraction diffusion coefficient and the temperature diffusion coefficient for the i-th gas, respectively [9,29]; Sc is the Schmidt number taken equal to 0.7. To model turbulence in the near-wall region the standard wall function approach has been adopted [28]. The electromagnetic field generated by the current flowing in the coil (Jcoil) and by the induced currents in the plasma (J) can be described by means of steady state Maxwell’s equations written in their vector potential formulation:
𝛻!𝑨− i𝜔𝜇!𝜎𝑨+ 𝜇!𝑱!"#$=0 (3.25)
where 𝜇! is the magnetic permeability of the free space, 𝜎 is the plasma electrical conductivity, and 𝜔 = 2𝜋𝑓 , f being the frequency of the electromagnetic field. The electric field complex phasor E and the magnetic field complex phasor B are obtained from the vector potential complex phasor A with the following expressions: 𝐸 = −𝑖𝜔𝑨, 𝑩 = ∇ ∙ 𝑨. In these calculations we have used the simplified Ohm's law 𝑱 = 𝜎𝑬. 3.4.2. Computational domain, boundary conditions and plasma properties The computational domain analysed in this chapter is composed of the plasma torch and the non-axisymmetric reaction chamber, whose three- and two-dimensional schematics are shown in Figure 3.3 and Figure 3.4 respectively. The three working gases are supplied through different inlets located in the head of the torch: carrier gas from the probe tip, primary gas from the gap between the probe and the quartz tube and sheath gas from the region between the quartz and ceramic tubes. A 300 K temperature has been fixed at the external walls of the torch and the internal walls of the chamber, where a no-slip boundary condition is also applied. The extended field approach [9] is adopted to solve the electromagnetic field equations in an enlarged domain extending 40 mm outside of the torch in the radial direction. Boundary conditions for turbulence quantities at torch inlet have been set according to Chen and Boulos [33,34]. Plasma properties in LTE have been calculated using the fourth-order Chapman–Enskog approach, as shown in [35]. Thermodynamic and transport properties have been computed as a function of hydrogen mass fraction in argon–hydrogen mixture and as a function of temperature. Radiation losses have been taken
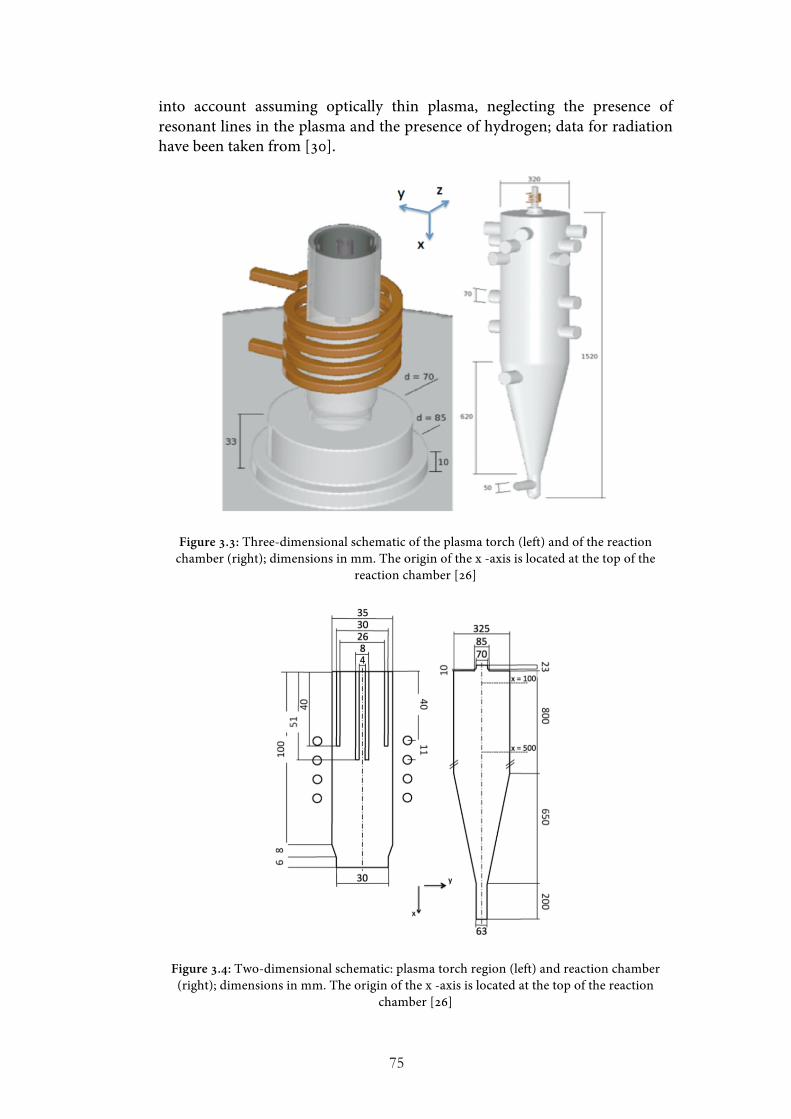
75
into account assuming optically thin plasma, neglecting the presence of resonant lines in the plasma and the presence of hydrogen; data for radiation have been taken from [30].
Figure 3.3: Three-dimensional schematic of the plasma torch (left) and of the reaction chamber (right); dimensions in mm. The origin of the x -axis is located at the top of the
reaction chamber [26]
Figure 3.4: Two-dimensional schematic: plasma torch region (left) and reaction chamber (right); dimensions in mm. The origin of the x -axis is located at the top of the reaction
chamber [26]
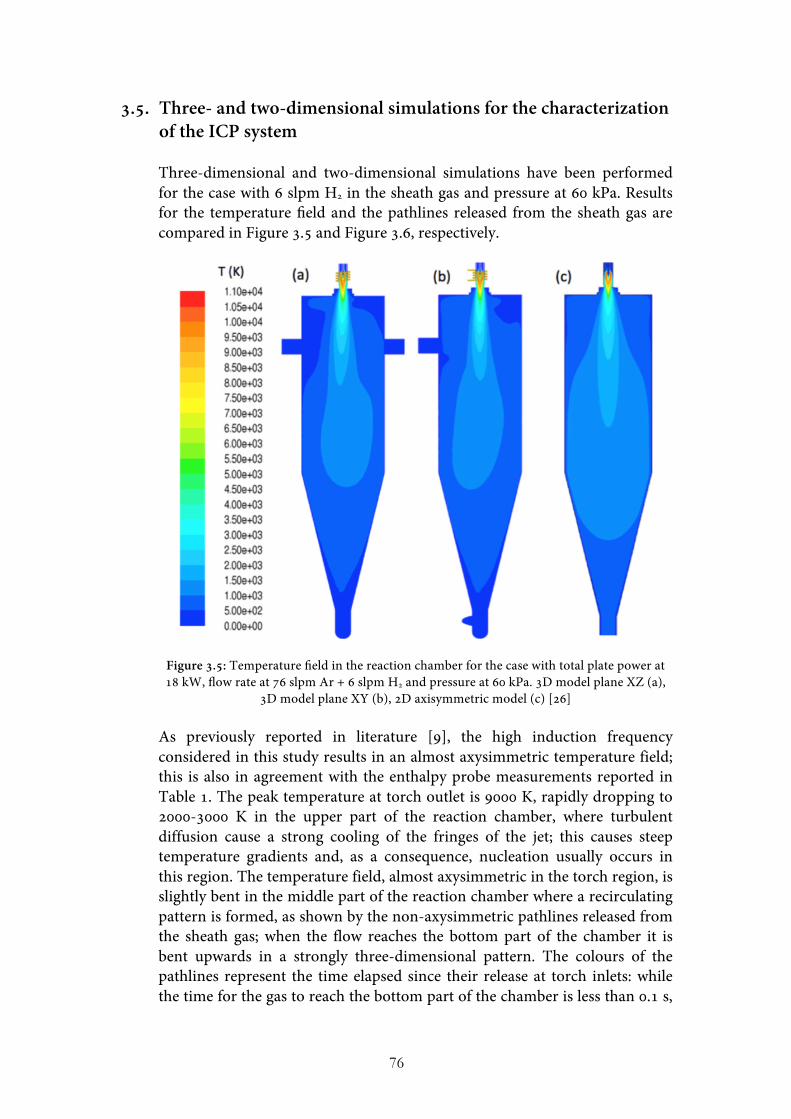
76
3.5. Three- and two-dimensional simulations for the characterization of the ICP system Three-dimensional and two-dimensional simulations have been performed for the case with 6 slpm H2 in the sheath gas and pressure at 60 kPa. Results for the temperature field and the pathlines released from the sheath gas are compared in Figure 3.5 and Figure 3.6, respectively.
Figure 3.5: Temperature field in the reaction chamber for the case with total plate power at 18 kW, flow rate at 76 slpm Ar + 6 slpm H2 and pressure at 60 kPa. 3D model plane XZ (a),
3D model plane XY (b), 2D axisymmetric model (c) [26] As previously reported in literature [9], the high induction frequency considered in this study results in an almost axysimmetric temperature field; this is also in agreement with the enthalpy probe measurements reported in Table 1. The peak temperature at torch outlet is 9000 K, rapidly dropping to 2000-3000 K in the upper part of the reaction chamber, where turbulent diffusion cause a strong cooling of the fringes of the jet; this causes steep temperature gradients and, as a consequence, nucleation usually occurs in this region. The temperature field, almost axysimmetric in the torch region, is slightly bent in the middle part of the reaction chamber where a recirculating pattern is formed, as shown by the non-axysimmetric pathlines released from the sheath gas; when the flow reaches the bottom part of the chamber it is bent upwards in a strongly three-dimensional pattern. The colours of the pathlines represent the time elapsed since their release at torch inlets: while the time for the gas to reach the bottom part of the chamber is less than 0.1 s,
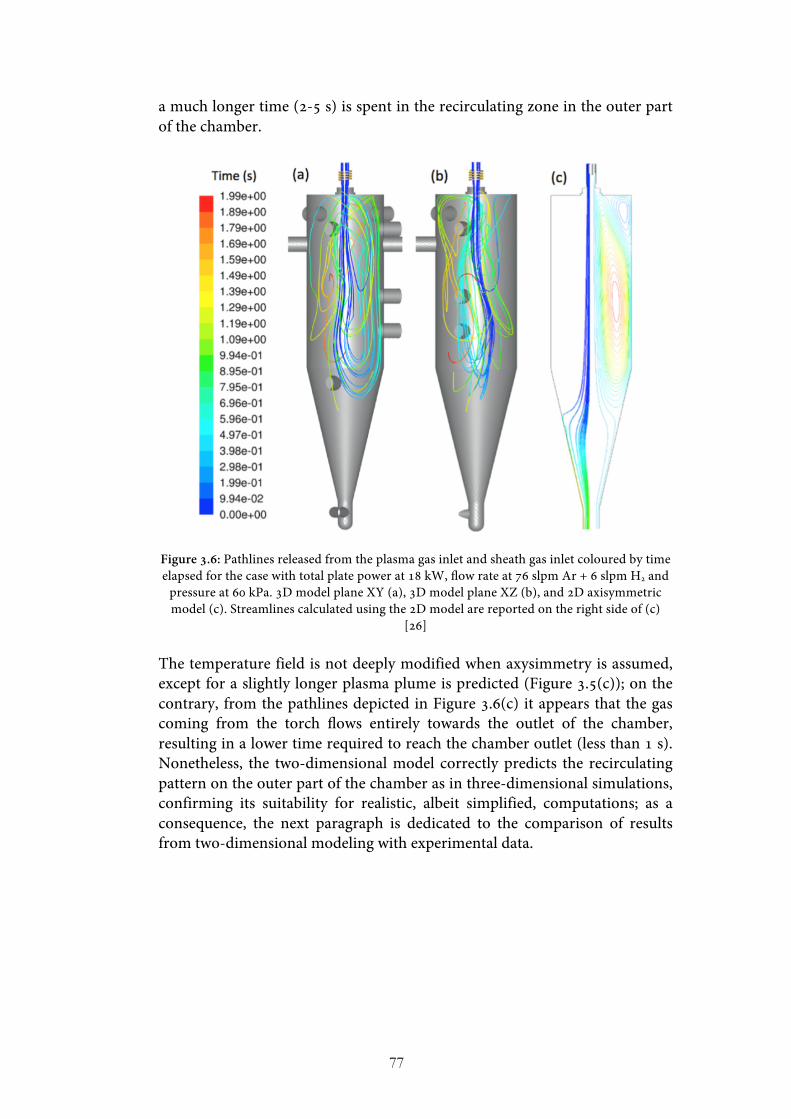
77
a much longer time (2-5 s) is spent in the recirculating zone in the outer part of the chamber.
Figure 3.6: Pathlines released from the plasma gas inlet and sheath gas inlet coloured by time elapsed for the case with total plate power at 18 kW, flow rate at 76 slpm Ar + 6 slpm H2 and
pressure at 60 kPa. 3D model plane XY (a), 3D model plane XZ (b), and 2D axisymmetric model (c). Streamlines calculated using the 2D model are reported on the right side of (c)
[26] The temperature field is not deeply modified when axysimmetry is assumed, except for a slightly longer plasma plume is predicted (Figure 3.5(c)); on the contrary, from the pathlines depicted in Figure 3.6(c) it appears that the gas coming from the torch flows entirely towards the outlet of the chamber, resulting in a lower time required to reach the chamber outlet (less than 1 s). Nonetheless, the two-dimensional model correctly predicts the recirculating pattern on the outer part of the chamber as in three-dimensional simulations, confirming its suitability for realistic, albeit simplified, computations; as a consequence, the next paragraph is dedicated to the comparison of results from two-dimensional modeling with experimental data.
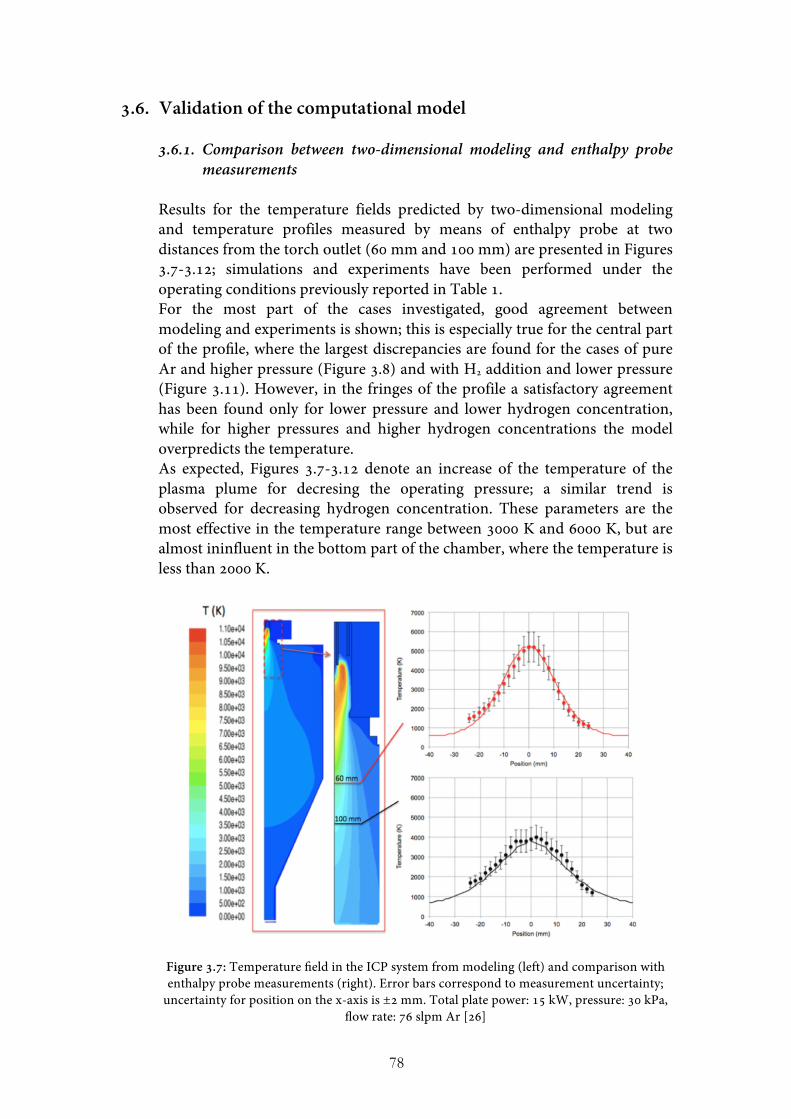
78
3.6. Validation of the computational model
3.6.1. Comparison between two-dimensional modeling and enthalpy probe measurements
Results for the temperature fields predicted by two-dimensional modeling and temperature profiles measured by means of enthalpy probe at two distances from the torch outlet (60 mm and 100 mm) are presented in Figures 3.7-3.12; simulations and experiments have been performed under the operating conditions previously reported in Table 1. For the most part of the cases investigated, good agreement between modeling and experiments is shown; this is especially true for the central part of the profile, where the largest discrepancies are found for the cases of pure Ar and higher pressure (Figure 3.8) and with H2 addition and lower pressure (Figure 3.11). However, in the fringes of the profile a satisfactory agreement has been found only for lower pressure and lower hydrogen concentration, while for higher pressures and higher hydrogen concentrations the model overpredicts the temperature. As expected, Figures 3.7-3.12 denote an increase of the temperature of the plasma plume for decresing the operating pressure; a similar trend is observed for decreasing hydrogen concentration. These parameters are the most effective in the temperature range between 3000 K and 6000 K, but are almost ininfluent in the bottom part of the chamber, where the temperature is less than 2000 K.
Figure 3.7: Temperature field in the ICP system from modeling (left) and comparison with enthalpy probe measurements (right). Error bars correspond to measurement uncertainty;
uncertainty for position on the x-axis is ±2 mm. Total plate power: 15 kW, pressure: 30 kPa, flow rate: 76 slpm Ar [26]
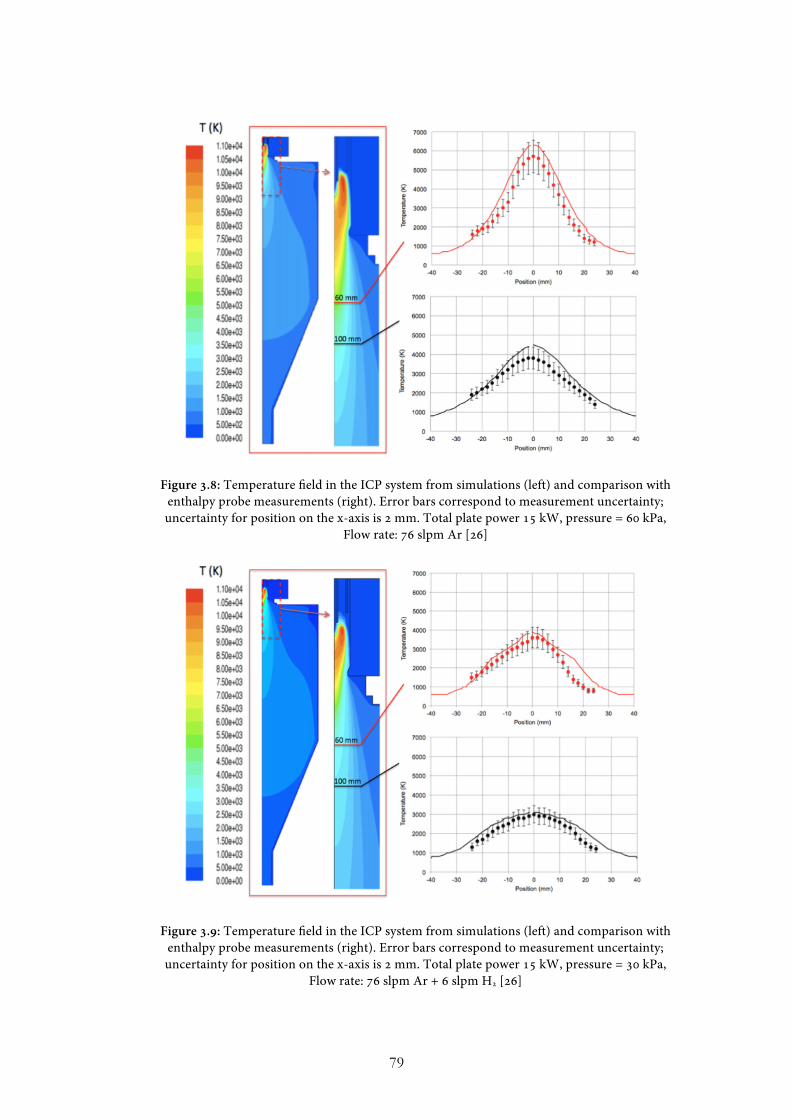
79
Figure 3.8: Temperature field in the ICP system from simulations (left) and comparison with enthalpy probe measurements (right). Error bars correspond to measurement uncertainty; uncertainty for position on the x-axis is 2 mm. Total plate power 15 kW, pressure = 60 kPa,
Flow rate: 76 slpm Ar [26]
Figure 3.9: Temperature field in the ICP system from simulations (left) and comparison with enthalpy probe measurements (right). Error bars correspond to measurement uncertainty; uncertainty for position on the x-axis is 2 mm. Total plate power 15 kW, pressure = 30 kPa,
Flow rate: 76 slpm Ar + 6 slpm H2 [26]
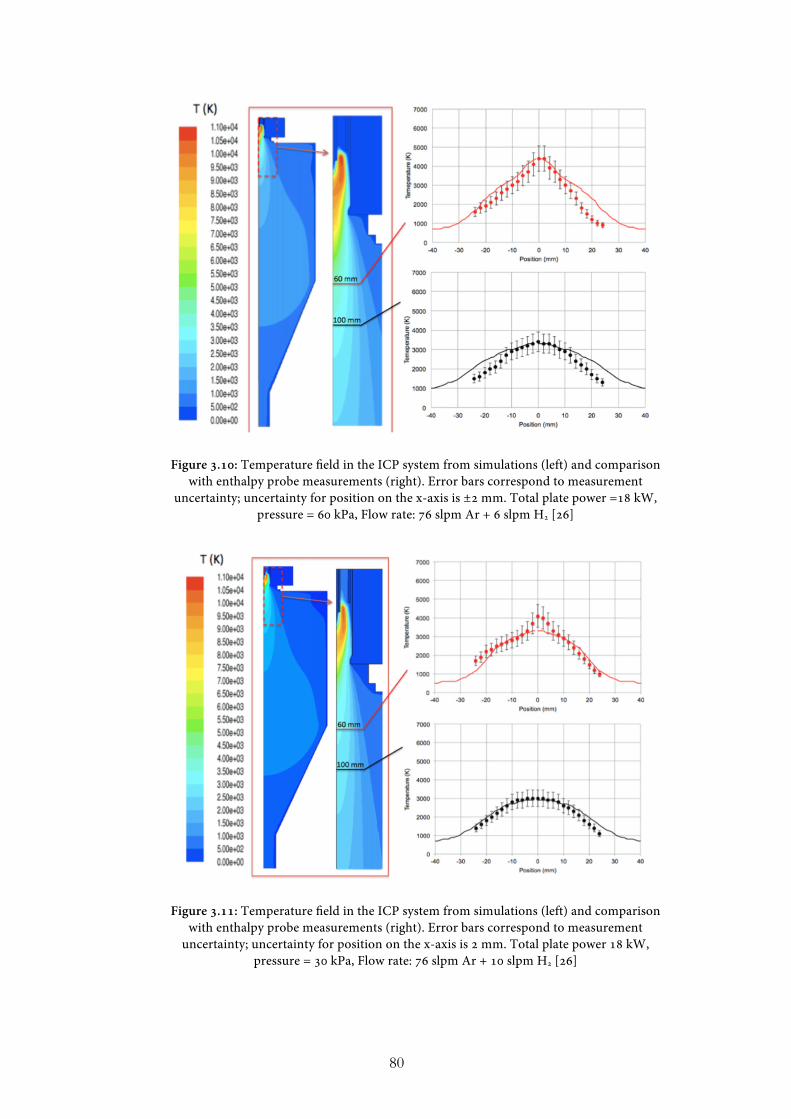
80
Figure 3.10: Temperature field in the ICP system from simulations (left) and comparison with enthalpy probe measurements (right). Error bars correspond to measurement
uncertainty; uncertainty for position on the x-axis is ±2 mm. Total plate power =18 kW, pressure = 60 kPa, Flow rate: 76 slpm Ar + 6 slpm H2 [26]
Figure 3.11: Temperature field in the ICP system from simulations (left) and comparison with enthalpy probe measurements (right). Error bars correspond to measurement
uncertainty; uncertainty for position on the x-axis is 2 mm. Total plate power 18 kW, pressure = 30 kPa, Flow rate: 76 slpm Ar + 10 slpm H2 [26]
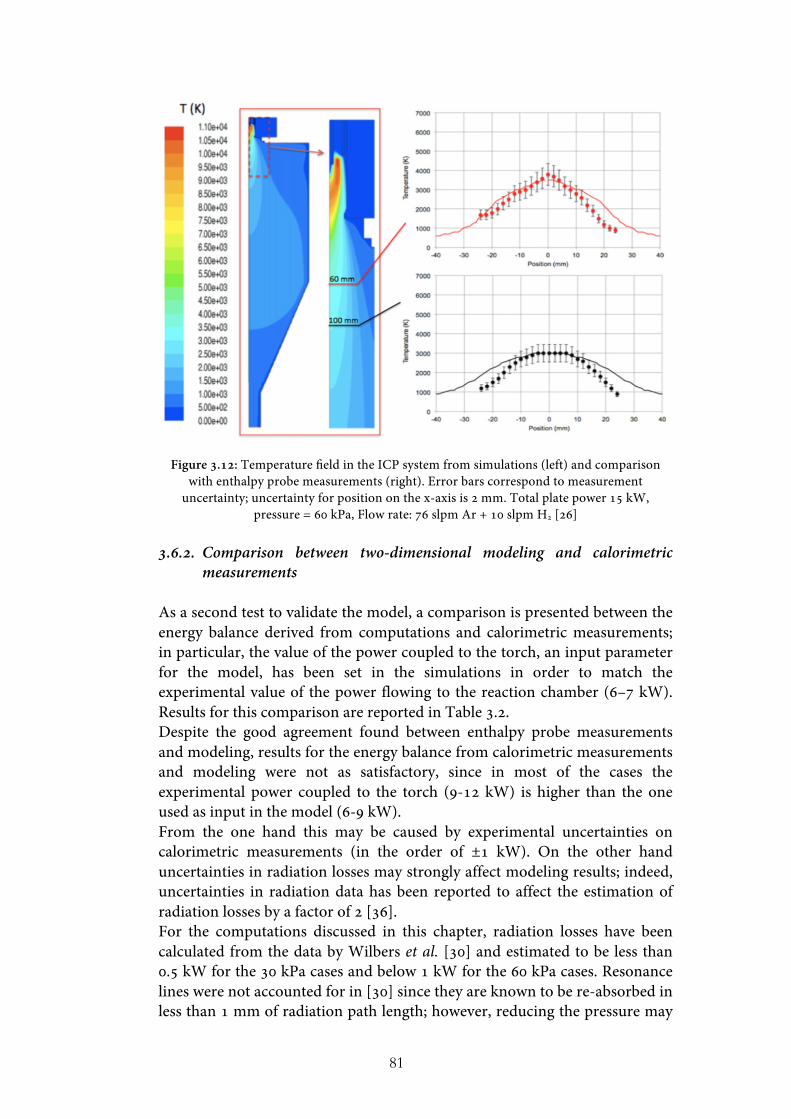
81
Figure 3.12: Temperature field in the ICP system from simulations (left) and comparison with enthalpy probe measurements (right). Error bars correspond to measurement
uncertainty; uncertainty for position on the x-axis is 2 mm. Total plate power 15 kW, pressure = 60 kPa, Flow rate: 76 slpm Ar + 10 slpm H2 [26]
3.6.2. Comparison between two-dimensional modeling and calorimetric
measurements As a second test to validate the model, a comparison is presented between the energy balance derived from computations and calorimetric measurements; in particular, the value of the power coupled to the torch, an input parameter for the model, has been set in the simulations in order to match the experimental value of the power flowing to the reaction chamber (6–7 kW). Results for this comparison are reported in Table 3.2. Despite the good agreement found between enthalpy probe measurements and modeling, results for the energy balance from calorimetric measurements and modeling were not as satisfactory, since in most of the cases the experimental power coupled to the torch (9-12 kW) is higher than the one used as input in the model (6-9 kW). From the one hand this may be caused by experimental uncertainties on calorimetric measurements (in the order of ±1 kW). On the other hand uncertainties in radiation losses may strongly affect modeling results; indeed, uncertainties in radiation data has been reported to affect the estimation of radiation losses by a factor of 2 [36]. For the computations discussed in this chapter, radiation losses have been calculated from the data by Wilbers et al. [30] and estimated to be less than 0.5 kW for the 30 kPa cases and below 1 kW for the 60 kPa cases. Resonance lines were not accounted for in [30] since they are known to be re-absorbed in less than 1 mm of radiation path length; however, reducing the pressure may

82
induce a decrease in the re-absorption process, resulting in a non-negligible radiation heat flux directed to the injection probe and the torch walls and in a significant underestimation of the total radiation losses. Unfortunately, no data of Ar net emission coefficient including resonance lines at pressure lower than 1 atm are available in literature; as a consequence, only limited conclusions can be drawn on the relative importance of emission and absorption of radiation.
3.7. Three-dimensional time dependent modeling of turbulent flows in ICP sources
In this Paragraph results obtained by employing a more sophisticated model for the description of turbulent flows (LES) are presented.
Figure 3.13: Temperature isosurfaces in the reaction chamber region and slices of the temperature field in log scale and for a fixed time-step [27]
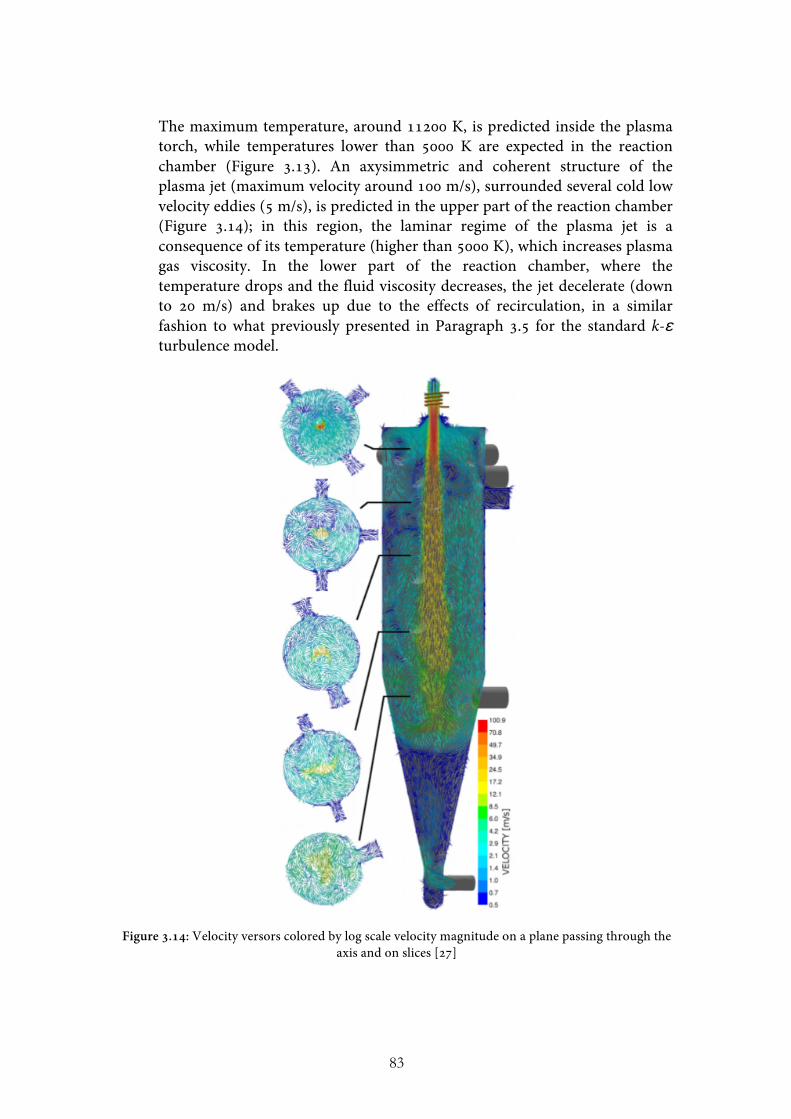
83
The maximum temperature, around 11200 K, is predicted inside the plasma torch, while temperatures lower than 5000 K are expected in the reaction chamber (Figure 3.13). An axysimmetric and coherent structure of the plasma jet (maximum velocity around 100 m/s), surrounded several cold low velocity eddies (5 m/s), is predicted in the upper part of the reaction chamber (Figure 3.14); in this region, the laminar regime of the plasma jet is a consequence of its temperature (higher than 5000 K), which increases plasma gas viscosity. In the lower part of the reaction chamber, where the temperature drops and the fluid viscosity decreases, the jet decelerate (down to 20 m/s) and brakes up due to the effects of recirculation, in a similar fashion to what previously presented in Paragraph 3.5 for the standard k-ε turbulence model.
Figure 3.14: Velocity versors colored by log scale velocity magnitude on a plane passing through the axis and on slices [27]

84
3.8. Conclusions
Since the thermal-fluid dynamic field of an ICP system directly influences the nanoparticle synthesis process, this chapter has been focused on its characterization by means of integrated approaches. Three-dimensional modeling has been employed to garner deeper insights on the flow structure and eventual axisymmetry, while a two-dimensional model, more suitable for design oriented modeling activities, has been validated and adopted for the characterization of the system in a wide range of operating conditions. Indeed, results for the temperature field have been tuned by comparison with enthalpy probe measurements and calorimetric measurements on the cooling water lines have been used as input for modeling activities. While good agreement on temperature profiles has been found between modeling results and experimental measurements, comparisons of energy balances have shown that at low pressures the radiation losses may have been underestimated in the model. This critical point is typical of models employing the power coupled to the plasma torch as an input parameter and may result in a wrong prediction of the absolute value of the temperature field; in order to contain this effect, calorimetric measurements should be adopted to correct the data for radiation losses in order to match the energy balance. Moreover, the overall flow behavior, investigated by means of three-dimensional modeling, displays recirculations and fluctuations of the plasma properties due to turbulence, which may result in the deposition of powder on the walls [37]. Some preliminary conclusions on the synthesis of nanoparticles in the described ICP system may already be drawn, which will be strengthened in the next chapter where appropriate computational modules are introduced in the models, supported by the experimental evidences. Considering Si as the precursor material, synthsis of nanoparticles usually occurs around 3300 K, therefore in the upper part of the reaction chamber; this region, depending on the operating conditions, is located between 60 and 200 mm from the torch outlet in the axial direction and within 30 mm from the axis in the radial direction. Since the steepest temperature gradient is directed radially when no quenching is performed, nanoparticles will be mostly generated in this direction, while the vapour is moving mostly because of turbulent diffusion from the higher temperature region towards the lower temperature one; this synthesis phase is strongly affected by the fluctuations of the plasma temperature and velocity, eventually inducing significant inhomogeneity of the particle properties. Moreover, the nucleated nanoparticles, transported downstream by the flow along the pathlines shown in Figure 3.6, may be ill affected by the recirculations; indeed, in the case nanoparticles are transported back to the upper region of the reaction chamber the occurrance of strong agglomeration, broad PSD or multimodal distributions may happen. In order to better control nanoparticle size, cold gas quenching may be adopted to decrease the surface temperature below their sintering point [37, 38] or the described fluctuations and should be reduced and the recirculating

85
patterns inside the reactor should be avoided; this will be discussed in the next chapter.
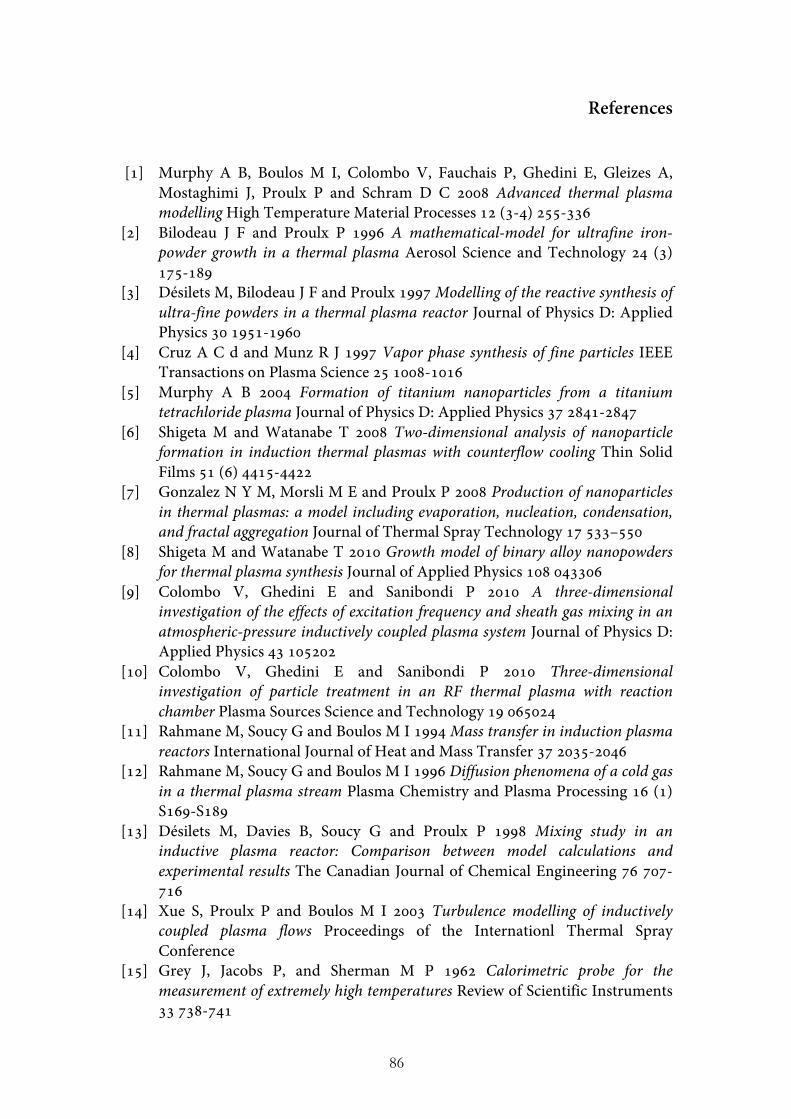
86
References
[1] Murphy A B, Boulos M I, Colombo V, Fauchais P, Ghedini E, Gleizes A,
Mostaghimi J, Proulx P and Schram D C 2008 Advanced thermal plasma modelling High Temperature Material Processes 12 (3-4) 255-336
[2] Bilodeau J F and Proulx P 1996 A mathematical-model for ultrafine iron-powder growth in a thermal plasma Aerosol Science and Technology 24 (3) 175-189
[3] Désilets M, Bilodeau J F and Proulx 1997 Modelling of the reactive synthesis of ultra-fine powders in a thermal plasma reactor Journal of Physics D: Applied Physics 30 1951-1960
[4] Cruz A C d and Munz R J 1997 Vapor phase synthesis of fine particles IEEE Transactions on Plasma Science 25 1008-1016
[5] Murphy A B 2004 Formation of titanium nanoparticles from a titanium tetrachloride plasma Journal of Physics D: Applied Physics 37 2841-2847
[6] Shigeta M and Watanabe T 2008 Two-dimensional analysis of nanoparticle formation in induction thermal plasmas with counterflow cooling Thin Solid Films 51 (6) 4415-4422
[7] Gonzalez N Y M, Morsli M E and Proulx P 2008 Production of nanoparticles in thermal plasmas: a model including evaporation, nucleation, condensation, and fractal aggregation Journal of Thermal Spray Technology 17 533–550
[8] Shigeta M and Watanabe T 2010 Growth model of binary alloy nanopowders for thermal plasma synthesis Journal of Applied Physics 108 043306
[9] Colombo V, Ghedini E and Sanibondi P 2010 A three-dimensional investigation of the effects of excitation frequency and sheath gas mixing in an atmospheric-pressure inductively coupled plasma system Journal of Physics D: Applied Physics 43 105202
[10] Colombo V, Ghedini E and Sanibondi P 2010 Three-dimensional investigation of particle treatment in an RF thermal plasma with reaction chamber Plasma Sources Science and Technology 19 065024
[11] Rahmane M, Soucy G and Boulos M I 1994 Mass transfer in induction plasma reactors International Journal of Heat and Mass Transfer 37 2035-2046
[12] Rahmane M, Soucy G and Boulos M I 1996 Diffusion phenomena of a cold gas in a thermal plasma stream Plasma Chemistry and Plasma Processing 16 (1) S169-S189
[13] Désilets M, Davies B, Soucy G and Proulx P 1998 Mixing study in an inductive plasma reactor: Comparison between model calculations and experimental results The Canadian Journal of Chemical Engineering 76 707-716
[14] Xue S, Proulx P and Boulos M I 2003 Turbulence modelling of inductively coupled plasma flows Proceedings of the Internationl Thermal Spray Conference
[15] Grey J, Jacobs P, and Sherman M P 1962 Calorimetric probe for the measurement of extremely high temperatures Review of Scientific Instruments 33 738-741
87
[16] Swank W D, Finke J R and Haggard D C 1993 Modular enthalpy probe and gas analyzer for thermal plasma measurements Review of Scientific Instruments 64 56-62
[17] Auciello O and Flamm D L 1989 Plasma Diagnostics vol 1 Discharge Parameters and Chemistry (Oxford: Academic)
[18] Capetti A and Pfender E 1989 Probe measurements in argon plasma jets operated in ambient argon Plasma Chemistry and Plasma Processes 9 (2) 329-341
[19] Rhamane M, Soucy G and Boulos M I 1995 Analysis of the enthalpy probe technique for thermal plasma diagnostics Review of Scientific Instruments 66 3424-3431
[20] Dorier J L, Gindrat M, Hollenstein Ch, Loch M, Refke A, Salito A and Barbezat G 2001 Plasma jet properties in a new process at low pressure for large area thin film deposition Proceedings of the 2nd International Thermal Spray Conference
[21] Finke J R, Crawford D M, Snider S C, Swank W D, Haggard D C and Williamson R L 2003 Entrainment in high-velocity, high-temperature plasma jets. Part I: experimental results International Journal of Heat and Mass Transfer 46 (22) 4201-4213
[22] Incropera F P and Leppert G 1967 Investigation of arc jet temperature-measurement techniques Instrument Society of America Transactions 6 35–41
[23] Xiaozhen F 2003 Enthalpy probe technique for thermal plasma diagnostics Plasma Science and Technology 5 (4) 1909-1914
[24] Merkhouf A and Boulos M I 2000 Distributed energy analysis for an integrated radio frequency induction plasma system Journal of Physics D: Applied Physics 33 1581-1587
[25] Colombo V, Concetti C, Deschenaux C, Ghedini E, Gherardi M, Jaeggi C, Leparoux M and Sanibondi P 2011 Validation of 3D modelling of an inductively coupled thermal plasma reactor through enthalpy probe measurements Proceedings of ISPC20, Philadelphia, USA
[26] Colombo V, Deschenaux C, Ghedini E, Gherardi M, Jaeggi C, Laparoux M, Mani V, Sanibondi P 2012 Fluid-dynamic characterization of a radio-frequency induction thermal plasma system for nanoparticle synthesis Plasma Sources Science and Technology 21 045010
[27] Colombo V, Concetti A, Ghedini E, Gherardi M and Sanibondi P 2011 3-D Time-Dependent Large Eddy Simulation of Turbulent Flows in an Inductively Coupled Thermal Plasma Torch with Reaction Chamber IEEE-TPS Images in Plasma Science 39(11) 2894-2895
[28] FLUENT 6.3 User’s Guide 2006 Fluent Inc. [29] Murphy A B 1993 Diffusion in equilibrium mixtures of ionized gases Physical
Review E 48 3594-3603 [30] Wilbers A T M, Beulens J J, and Schram D C 1991 Radiative energy loss in a
two-temperature argon plasma Journal of Quantitative Spectroscopy and Radiative Transfer 46 385-92
[31] Germano M, Piomelli U, Moin P and Cabot W H 1991 A dynamic subgrid‐scale eddy viscosity model Physics of Fluids A 3 1760-1765
88
[32] Smagorinsky J 1963 General circulation experiments with the primitive equations I the basic experiment Monthly Weather Review 91 99-164
[33] Chen K and Boulos M I 1994 Turbulence in induction plasma modelling Journal of Physics D: Applied Physics 27 946
[34] Bernardi D, Colombo V, Ghedini E and Mentrelli A 2003 Comparison of different techniques for the FLUENT©-based treatment of the electromagnetic field in inductively coupled plasma torches European Journal of Physics D 27 55–72
[35] Colombo V, Ghedini E and Sanibondi P 2009 Two-temperature thermodynamic and transport properties of argon–hydrogen and nitrogen–hydrogen plasmas Journal of Physics D: Applied Physics 42 055213
[36] Proulx P, Mostaghimi J and Boulos M I 1989 Radiative effects in induction plasma modeling Proceedings of the 16th IEEE International Conference on Plasma Science
[37] Goortani B M, Proulx P, Xue S and Mendoza-Gonzales N Y 2007 Controlling Nanostructure in thermal plasma processing: moving from highly aggregated porous structure to spherical silica nanoparticles Powder Technology 175 22-32
[38] Leparoux M, Schreuders C, Fauchais P 2008 Improved plasma synthesis of si-nanopowders by quenching Advanced Engineering Materials 10 1147-50

89
CHAPTER 4 OPTIMIZATION OF NANOPARTICLE SYNTHESIS
THROUGH ICP SYSTEMS
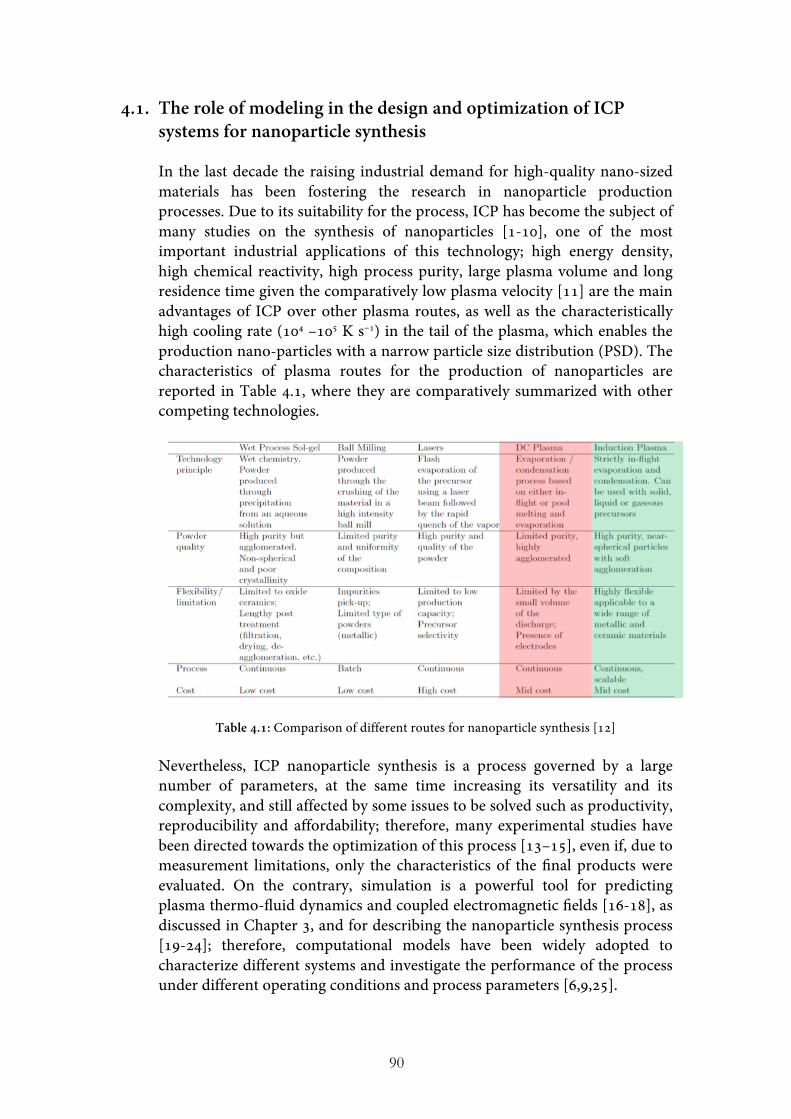
90
4.1. The role of modeling in the design and optimization of ICP systems for nanoparticle synthesis
In the last decade the raising industrial demand for high-quality nano-sized materials has been fostering the research in nanoparticle production processes. Due to its suitability for the process, ICP has become the subject of many studies on the synthesis of nanoparticles [1-10], one of the most important industrial applications of this technology; high energy density, high chemical reactivity, high process purity, large plasma volume and long residence time given the comparatively low plasma velocity [11] are the main advantages of ICP over other plasma routes, as well as the characteristically high cooling rate (104 –105 K s−1) in the tail of the plasma, which enables the production nano-particles with a narrow particle size distribution (PSD). The characteristics of plasma routes for the production of nanoparticles are reported in Table 4.1, where they are comparatively summarized with other competing technologies.
Table 4.1: Comparison of different routes for nanoparticle synthesis [12] Nevertheless, ICP nanoparticle synthesis is a process governed by a large number of parameters, at the same time increasing its versatility and its complexity, and still affected by some issues to be solved such as productivity, reproducibility and affordability; therefore, many experimental studies have been directed towards the optimization of this process [13–15], even if, due to measurement limitations, only the characteristics of the final products were evaluated. On the contrary, simulation is a powerful tool for predicting plasma thermo-fluid dynamics and coupled electromagnetic fields [16-18], as discussed in Chapter 3, and for describing the nanoparticle synthesis process [19-24]; therefore, computational models have been widely adopted to characterize different systems and investigate the performance of the process under different operating conditions and process parameters [6,9,25].

91
In this Chapter results from the modeling of critical phases of ICP synthesis process, such as precursor evaporation, vapour conversion in nanoparticles and nanoparticle growth, are presented, with the aim of providing useful insights both for the design and optimization of the process and on the underlying physical phenomena. Indeed, precursor evaporation, one of the phases holding the highest impact on industrialy feasibility of the process, is discussed; by employing models to describe particle trajectories and thermal histories, adapted from the ones originally developed for other plasma technologies or applications, such as DC non-transferred arc torches [26-35] and powder spherodization [36], the evaporation of micro-sized Si solid precursor in a laboratory scale ICP system is investigated. Moreover, a discussion on the role of thermo-fluid dynamic fields on nano-particle formation is presented, as well as a study on the effect of the reaction chamber geometry on produced nanoparticle characteristics and process yield. Results presented in the following paragraphs have been published in [37-39].
4.2. Precursor evaporation: a computational investigation on the role of turbulence and vaporization models
Precursor evaporation is a fundamental step in ICP synthesis of nanoparticles, the evaporation rate being directly linked to the yield of the process; this is particularly true for processes relying on the use of solid precursors, often preferred for their lower costs, easy handling and continuous running. In the ICP system the precursor material is introduced through an injection probe in the plasma discharge, where it is heated up to the melting point and then starts to evaporate. This process depends on precursor characteristics: the highest the particle dimension, the longer they would travel before the onset of evaporation, eventually flowing out of the hottest region without being completely evaporated; on the other hand, the higher the feed rate, the higher the mass of precursor to be heated and, consequently, the heat flux directed from the plasma to the precursor itself [40]. This may cause a local cooling of the plasma itself and result in only partial evaporation of the particles; this phenomenon, called loading effect, is among the main current issues of the synthesis of nanoparticles through ICP systems, as it strongly limits the efficiency of scaling-up of this technology. Indeed, rising the feed rate up to industrial scale production rates causes a reduction of precursor evaporation efficiency unless plasma power and torch dimensions are increased, raising the need for a non-proportional modification of process parameters such as frequency and inducing a steep rise in equipment and processing costs [12]. In this Paragraph, two-dimensional modeling results for the evaporation of micro-sized silicon solid precursor in the laboratory scale ICP system
92
described in Paragraph 3.2 are presented. In particular, different models are evaluated, both on the side of fluid dynamics and of precursor heating, in order to compare the predicted evaporation rate and evaporation efficiency; here the evaporation rate is defined as the amount of vapour produced per unit time, while the evaporation efficiency is defined as the ratio between evaporation rate and precursor feed rate. 4.2.1 Modeling approach The two-dimensional steady state model for the plasma torch and reaction chamber adopted for the simulations described in this Paragraph has been presented in Chapter 3; nonetheless it is reported here for the ease of the reader, together with the model describing precursor heating and evaporation. The following hypotheses are included on the side of thermo-fluid dynamic computations:
• plasma is in local thermodynamic equilibrium (LTE); • combined diffusion approach of Murphy is used to model the
diffusion in a mixture of two non-reactive gases [41]; • turbulent effects are taken in account through either standard k-ε
model or Reynolds Stress Model; • plasma is optically thin and radiative losses are taken in account
considering only the presence of argon in the mixture; resonance lines are neglected in the computation of radiative losses;
• composition is computed taking in account six species: Ar, Ar+, H2, H, H+ and electrons;
• viscous dissipation term in the energy equation is neglected; • displacement currents are neglected.
The plasma governing equations can be written as:
∇∙ ρv =0 (4.1)
∇∙ ρvv =− ∇p+∇∙τ+ρg+12Re
J×B* (4.2)
∇∙ ρvh =∇∙keffcp∇h +
12Re
J∙E* − Qr+∇∙ hi 𝑱𝒊+kCp∇𝑌!
i
(4.3)
where ρ is the plasma density, v is the velocity, p is the pressure, τ is the viscous stress tensor, h is the total enthalpy, keff is the effective thermal conductivity that includes both laminar and turbulent contributions; Cp is the specific heat at constant pressure, g is the gravitational force and Qr is the volumetric radiative loss; 𝑌! and Ji are the mass fraction and the diffusion current of the i-th gas; J is the complex phasor for the current density induced in the plasma, B is the magnetic induction complex phasor, E is the electric field complex phasor. The superscript "*" indicates the complex conjugate.
93
Using the commercial software FLUENT to solve fluid equations, the Lorentz forces, ohmic heating, radiative loss terms and energy sources due to diffusion have been taken into account using suitable User-Defined Functions written in C language. Diffusion of gases has been described using the combined approach of Murphy, assuming local chemical equilibrium. The ANSYS FLUENT software provides modules for the solution of diffusion equations with the following form:
∇ ∙ 𝜌𝒗𝑌! + ∇ ∙ 𝑱! = 0 (4.4)
where diffusion currents 𝑱! are written as
𝑱! = −𝜇!𝑆𝑐 + 𝜌𝐷!
! ∇𝑌! − 𝐷!!∇𝑙𝑛𝑇 (4.5) where 𝑌!, 𝐷!! and 𝐷!! are mass fraction, the mass fraction diffusion coefficient and the temperature diffusion coefficient for the i-th gas, respectively [41,42]; 𝜇! is the turbulent viscosity and Sc is the Schmidt number taken equal to 0.7. Particle evaporation strongly depends of thermo-fluid dynamic behaviour inside the plasma torch; as the flow field in this region is still not completely characterized, two different turbulence models that predict different flow behaviors are employed and compared: a turbulence model resulting in a high turbulent flow, the standard k-ε model (KE), and a turbulence model resulting in an almost laminar flow inside the torch, the Reynolds Stress Model (RSM). The governing equations for the KE model can be written as:
∇∙ ρ𝒗k =∇∙ 𝜇 +𝜇!𝜎!
∇k +𝐺! − 𝜌𝜀 (4.6)
∇∙ ρ𝒗ε =∇∙ 𝜇 +𝜇!𝜎!
∇ε +𝐶!!𝜀𝑘 𝐺! − 𝐶!!𝜌
𝜀!
𝑘 + 𝑆! (4.7)
where Gk represents the generation of turbulence kinetic energy due to the mean velocity gradients; C1ε, C2ε, 𝜎! and 𝜎! are constants with values 1.44, 1.92, 0.25, 1.0 and 1.3, respectively. The turbulent dissipation in the high temperature region of the plasma tail has been reduced by adding a source term [43] to the dissipation rate equation of the standard KE model:
𝑆! = 𝐶!!𝐺!!
𝜌𝑘 (4.8)
where 𝐶!! has a constant value of 0.25. On the other hand, in the RSM model the equations for the transport of the Reynolds stresses are simultaneously solved [44]:
94
∇· ρ𝒗𝑣!𝑣! =∇· 𝜇 ∇𝑣!𝑣! + 𝐷!,!"+𝑃!" + 𝐺!! + 𝜙!" + 𝜀!" (4.9)
where 𝐷!,!" represents the turbulent diffusion, 𝑃!" is the stress production, 𝐺!" is the production term due to buoyancy, 𝜙!" is the pressure strain term and, finally, 𝜀!" is the dissipation tensor. The last term is modelled with an additional equation similar to Equation 4.7 without the inclusion of the additional source term 𝑆!. The electromagnetic field generated by the current flowing in the coil (Jcoil) and by the induced currents in the plasma (J) can be described by means of Maxwell’s equations written in their vector potential formulation:
𝛻!𝑨− i𝜔𝜇!𝜎𝑨+ 𝜇!𝑱!"#$=0 (4.10) where 𝜇! is the magnetic permeability of the free space, 𝜎 is the plasma electrical conductivity, and 𝜔 = 2𝜋𝑓 , f being the frequency of the electromagnetic field. The electric field complex phasor E and the magnetic field complex phasor B are obtained from the vector potential complex phasor A with the following expressions: 𝐸 = −𝑖𝜔𝑨, 𝑩 = ∇ ∙ 𝑨. In these calculations we have used the simplified Ohm's law 𝑱 = 𝜎𝑬. In modeling precursor trajectories, heating and evaporation, particles are assumed to be spherical and with a negligible internal resistance to heat transfer. The particles trajectory is obtained by solving the equation:
𝑑𝒗!𝑑𝑡 =
3𝜌𝐶!4𝑑!𝜌!
𝒗− 𝒗! 𝒗− 𝒗! + 𝑔 (4.11)
where 𝒗! , 𝑑! , ρp are the velocity, diameter and density of the particle, respectively; 𝑔 is the gravitational acceleration. The first term on the right side represents the fluid drag force, where the drag coefficient CD has been computed as in [45]. Turbulent dispersion on the particles has been taken into account as reported in [46]. The thermal history of precursor particles in the solid-phase is obtained by solving the energy balance:
𝑑𝑇!𝑑𝑡 =
𝑞𝑚!𝑐!
(4.12)
where Tp is the particle temperature, q is the net heat to the particle, mp and cp are the mass and the specific heat of the particle, respectively. Once the particle reaches the melting point, the liquid fraction xp is modified accordingly to the particle heat balance equation:
𝑑𝑥!𝑑𝑡 =
6𝑞𝜌!𝑑!𝜆!
(4.13)
95
where λm is the precursor material melting latent heat. Once the particle is completely in liquid-phase, its evaporation has been modeled with two different approaches; indeed, two mechanisms for vapour mass transfer from the particle surface to the plasma free stream can be applied, as shown in [35]. The first, called boiling model, is a heat-driven mechanism where it is assumed that once the particle has reached the boiling point all the heat delivered to it leads to vapour production. The second, called vaporization model, is a mechanism driven by the vapour concentration gradient between the particle surface and the plasma free stream, accounting also for vaporization below the boiling point; this model assumes that mass transfer between the particle and the plasma starts as soon as the concentration of vapour at the particle surface is higher than the partial pressure of vapour in the free stream plasma:
𝑑𝑚!
𝑑𝑡 = −𝑘! 𝐶! − 𝐶! (4.14)
where 𝑘! is the mass transfer coefficient, 𝐶! is the vapour concentration at particle surface, and 𝐶! is the vapour concentration in the free stream plasma. The mass transfer coefficient 𝑘! can be computed as reported in [25,35], from Sherwood Sh number and vapour diffusion coefficient 𝐷!"#:
𝑘! =𝑆ℎ 𝐷!"#𝑑!
(4.15)
With this model, particle temperature during evaporation is computed according to the following equation that takes into account particle cooling due to evaporation:
𝑑𝑇!𝑑𝑡 =
𝑞𝑚!𝑐!
−𝜆!𝑚!𝑐!
𝑑𝑚!
𝑑𝑡 (4.16)
where λv is the vaporization latent heat for the particle material. On the contrary, the boiling model assumes that mass transfer starts when the particle material reaches its boiling point. Therefore, the particle mass balance can be written as:
𝑑𝑑!𝑑𝑡 = −
2𝑞𝜌!𝜆!
(4.17)
and the temperature is fixed at the material boiling point. The net heat to the particle q is given by:
𝑞 = 𝐴!ℎ! 𝑇 − 𝑇! − 𝐴!𝜖!𝜎 𝑇!! − 𝑇!! (4.18)
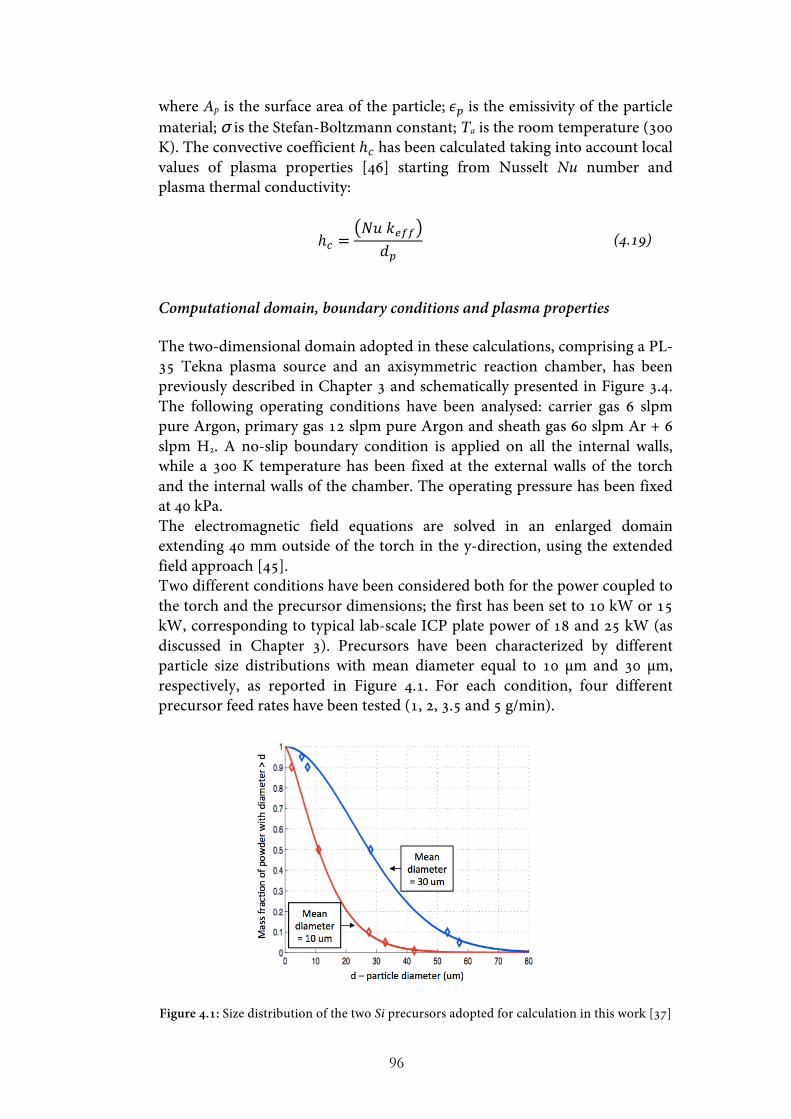
96
where Ap is the surface area of the particle; 𝜖! is the emissivity of the particle material; σ is the Stefan-Boltzmann constant; Ta is the room temperature (300 K). The convective coefficient ℎ! has been calculated taking into account local values of plasma properties [46] starting from Nusselt Nu number and plasma thermal conductivity:
ℎ! =𝑁𝑢 𝑘!""𝑑!
(4.19)
Computational domain, boundary conditions and plasma properties The two-dimensional domain adopted in these calculations, comprising a PL-35 Tekna plasma source and an axisymmetric reaction chamber, has been previously described in Chapter 3 and schematically presented in Figure 3.4. The following operating conditions have been analysed: carrier gas 6 slpm pure Argon, primary gas 12 slpm pure Argon and sheath gas 60 slpm Ar + 6 slpm H2. A no-slip boundary condition is applied on all the internal walls, while a 300 K temperature has been fixed at the external walls of the torch and the internal walls of the chamber. The operating pressure has been fixed at 40 kPa. The electromagnetic field equations are solved in an enlarged domain extending 40 mm outside of the torch in the y-direction, using the extended field approach [45]. Two different conditions have been considered both for the power coupled to the torch and the precursor dimensions; the first has been set to 10 kW or 15 kW, corresponding to typical lab-scale ICP plate power of 18 and 25 kW (as discussed in Chapter 3). Precursors have been characterized by different particle size distributions with mean diameter equal to 10 µm and 30 µm, respectively, as reported in Figure 4.1. For each condition, four different precursor feed rates have been tested (1, 2, 3.5 and 5 g/min).
Figure 4.1: Size distribution of the two Si precursors adopted for calculation in this work [37]
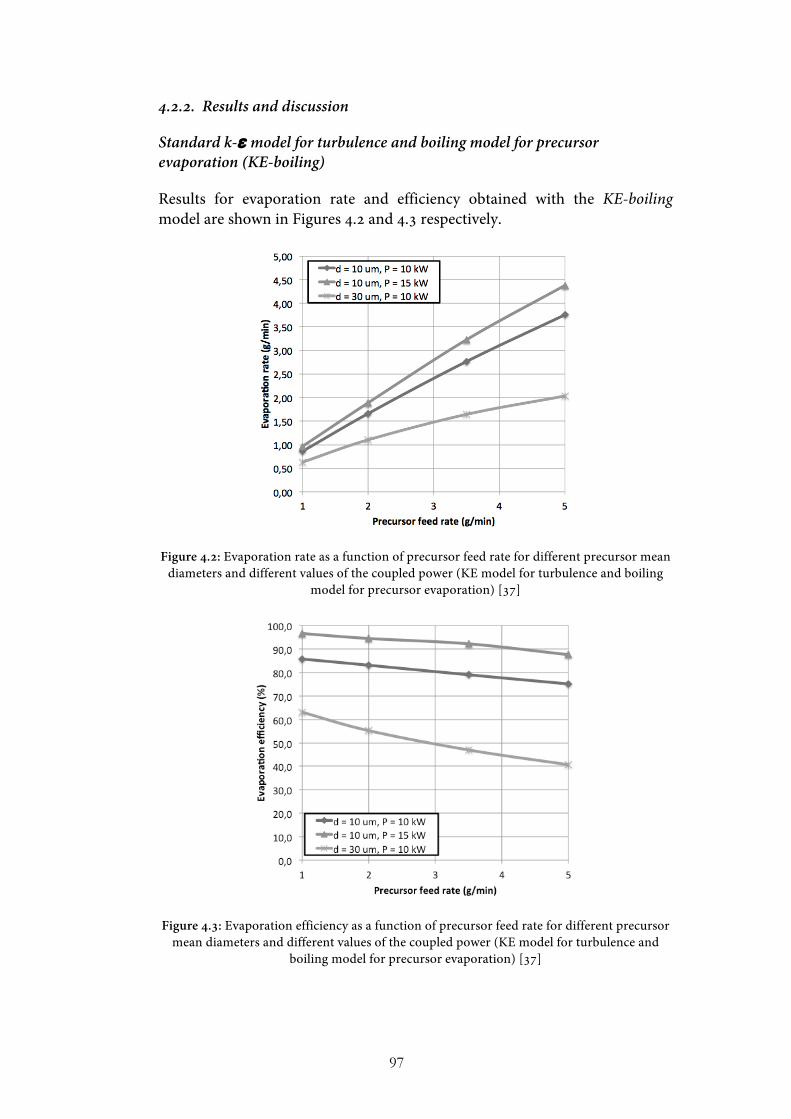
97
4.2.2. Results and discussion
Standard k-ε model for turbulence and boiling model for precursor evaporation (KE-boiling)
Results for evaporation rate and efficiency obtained with the KE-boiling model are shown in Figures 4.2 and 4.3 respectively.
Figure 4.2: Evaporation rate as a function of precursor feed rate for different precursor mean diameters and different values of the coupled power (KE model for turbulence and boiling
model for precursor evaporation) [37]
Figure 4.3: Evaporation efficiency as a function of precursor feed rate for different precursor mean diameters and different values of the coupled power (KE model for turbulence and
boiling model for precursor evaporation) [37]
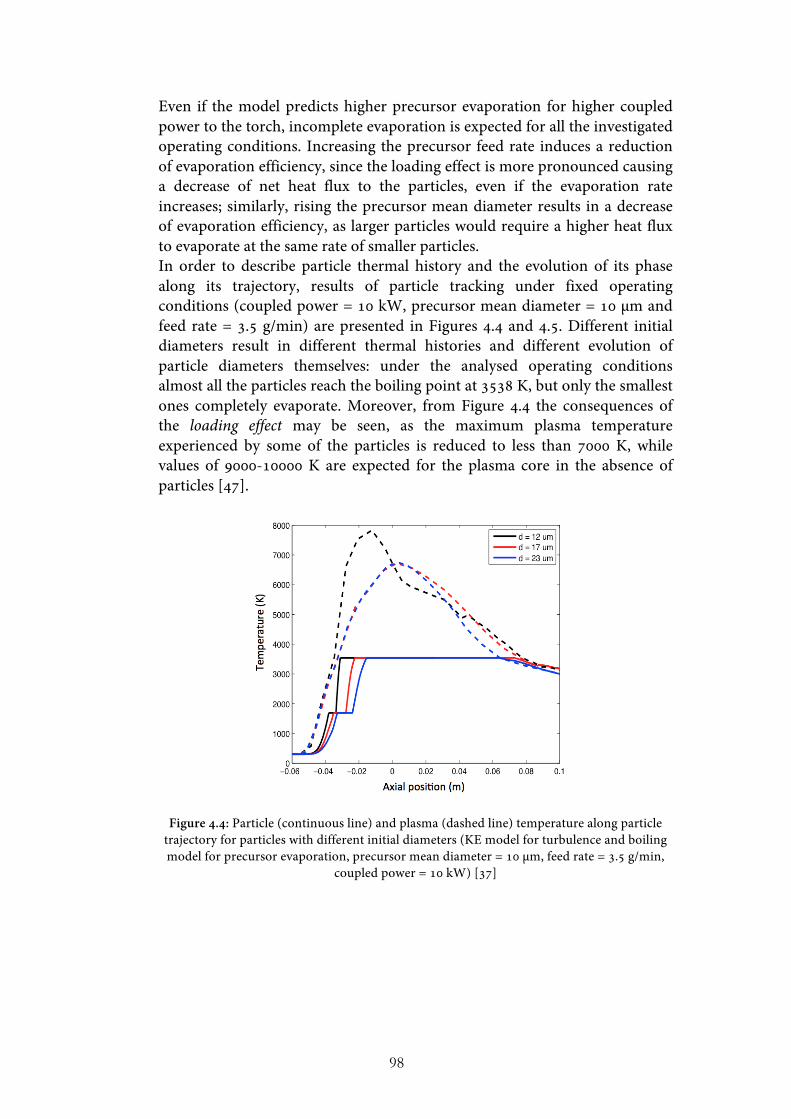
98
Even if the model predicts higher precursor evaporation for higher coupled power to the torch, incomplete evaporation is expected for all the investigated operating conditions. Increasing the precursor feed rate induces a reduction of evaporation efficiency, since the loading effect is more pronounced causing a decrease of net heat flux to the particles, even if the evaporation rate increases; similarly, rising the precursor mean diameter results in a decrease of evaporation efficiency, as larger particles would require a higher heat flux to evaporate at the same rate of smaller particles. In order to describe particle thermal history and the evolution of its phase along its trajectory, results of particle tracking under fixed operating conditions (coupled power = 10 kW, precursor mean diameter = 10 µm and feed rate = 3.5 g/min) are presented in Figures 4.4 and 4.5. Different initial diameters result in different thermal histories and different evolution of particle diameters themselves: under the analysed operating conditions almost all the particles reach the boiling point at 3538 K, but only the smallest ones completely evaporate. Moreover, from Figure 4.4 the consequences of the loading effect may be seen, as the maximum plasma temperature experienced by some of the particles is reduced to less than 7000 K, while values of 9000-10000 K are expected for the plasma core in the absence of particles [47].
Figure 4.4: Particle (continuous line) and plasma (dashed line) temperature along particle trajectory for particles with different initial diameters (KE model for turbulence and boiling model for precursor evaporation, precursor mean diameter = 10 µm, feed rate = 3.5 g/min,
coupled power = 10 kW) [37]
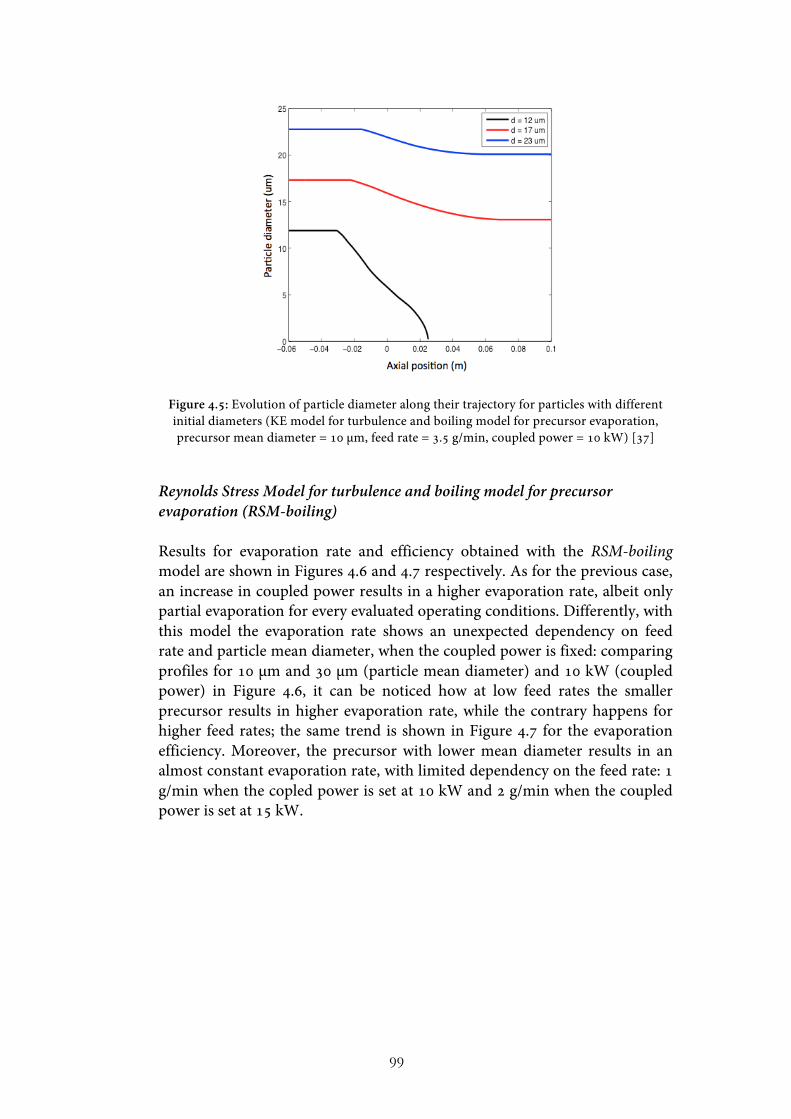
99
Figure 4.5: Evolution of particle diameter along their trajectory for particles with different initial diameters (KE model for turbulence and boiling model for precursor evaporation, precursor mean diameter = 10 µm, feed rate = 3.5 g/min, coupled power = 10 kW) [37]
Reynolds Stress Model for turbulence and boiling model for precursor evaporation (RSM-boiling) Results for evaporation rate and efficiency obtained with the RSM-boiling model are shown in Figures 4.6 and 4.7 respectively. As for the previous case, an increase in coupled power results in a higher evaporation rate, albeit only partial evaporation for every evaluated operating conditions. Differently, with this model the evaporation rate shows an unexpected dependency on feed rate and particle mean diameter, when the coupled power is fixed: comparing profiles for 10 µm and 30 µm (particle mean diameter) and 10 kW (coupled power) in Figure 4.6, it can be noticed how at low feed rates the smaller precursor results in higher evaporation rate, while the contrary happens for higher feed rates; the same trend is shown in Figure 4.7 for the evaporation efficiency. Moreover, the precursor with lower mean diameter results in an almost constant evaporation rate, with limited dependency on the feed rate: 1 g/min when the copled power is set at 10 kW and 2 g/min when the coupled power is set at 15 kW.
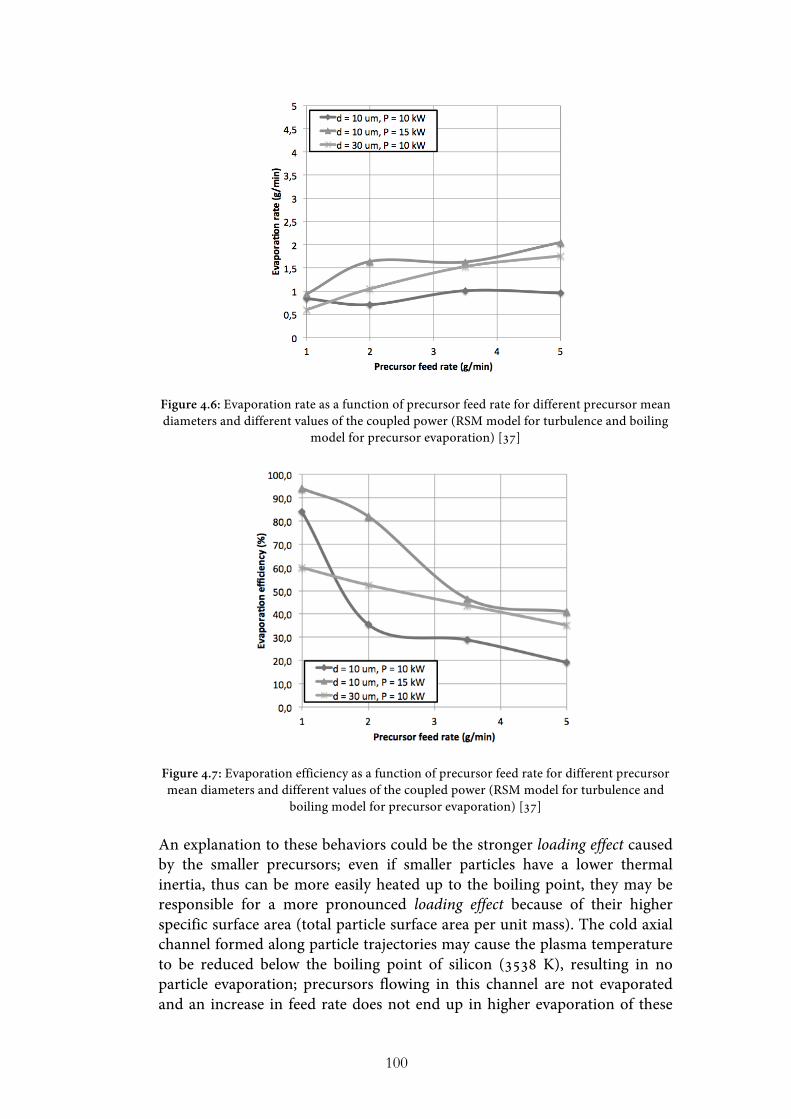
100
Figure 4.6: Evaporation rate as a function of precursor feed rate for different precursor mean diameters and different values of the coupled power (RSM model for turbulence and boiling
model for precursor evaporation) [37]
Figure 4.7: Evaporation efficiency as a function of precursor feed rate for different precursor mean diameters and different values of the coupled power (RSM model for turbulence and
boiling model for precursor evaporation) [37]
An explanation to these behaviors could be the stronger loading effect caused by the smaller precursors; even if smaller particles have a lower thermal inertia, thus can be more easily heated up to the boiling point, they may be responsible for a more pronounced loading effect because of their higher specific surface area (total particle surface area per unit mass). The cold axial channel formed along particle trajectories may cause the plasma temperature to be reduced below the boiling point of silicon (3538 K), resulting in no particle evaporation; precursors flowing in this channel are not evaporated and an increase in feed rate does not end up in higher evaporation of these
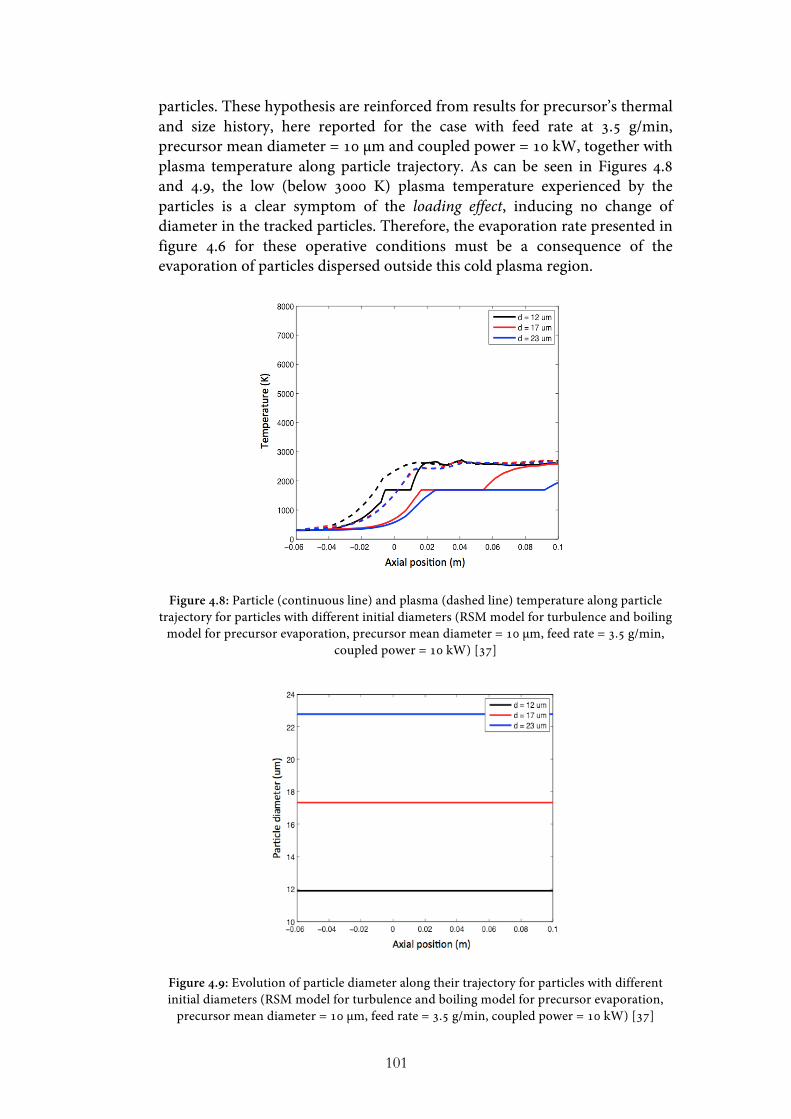
101
particles. These hypothesis are reinforced from results for precursor’s thermal and size history, here reported for the case with feed rate at 3.5 g/min, precursor mean diameter = 10 µm and coupled power = 10 kW, together with plasma temperature along particle trajectory. As can be seen in Figures 4.8 and 4.9, the low (below 3000 K) plasma temperature experienced by the particles is a clear symptom of the loading effect, inducing no change of diameter in the tracked particles. Therefore, the evaporation rate presented in figure 4.6 for these operative conditions must be a consequence of the evaporation of particles dispersed outside this cold plasma region.
Figure 4.8: Particle (continuous line) and plasma (dashed line) temperature along particle trajectory for particles with different initial diameters (RSM model for turbulence and boiling
model for precursor evaporation, precursor mean diameter = 10 µm, feed rate = 3.5 g/min, coupled power = 10 kW) [37]
Figure 4.9: Evolution of particle diameter along their trajectory for particles with different initial diameters (RSM model for turbulence and boiling model for precursor evaporation,
precursor mean diameter = 10 µm, feed rate = 3.5 g/min, coupled power = 10 kW) [37]
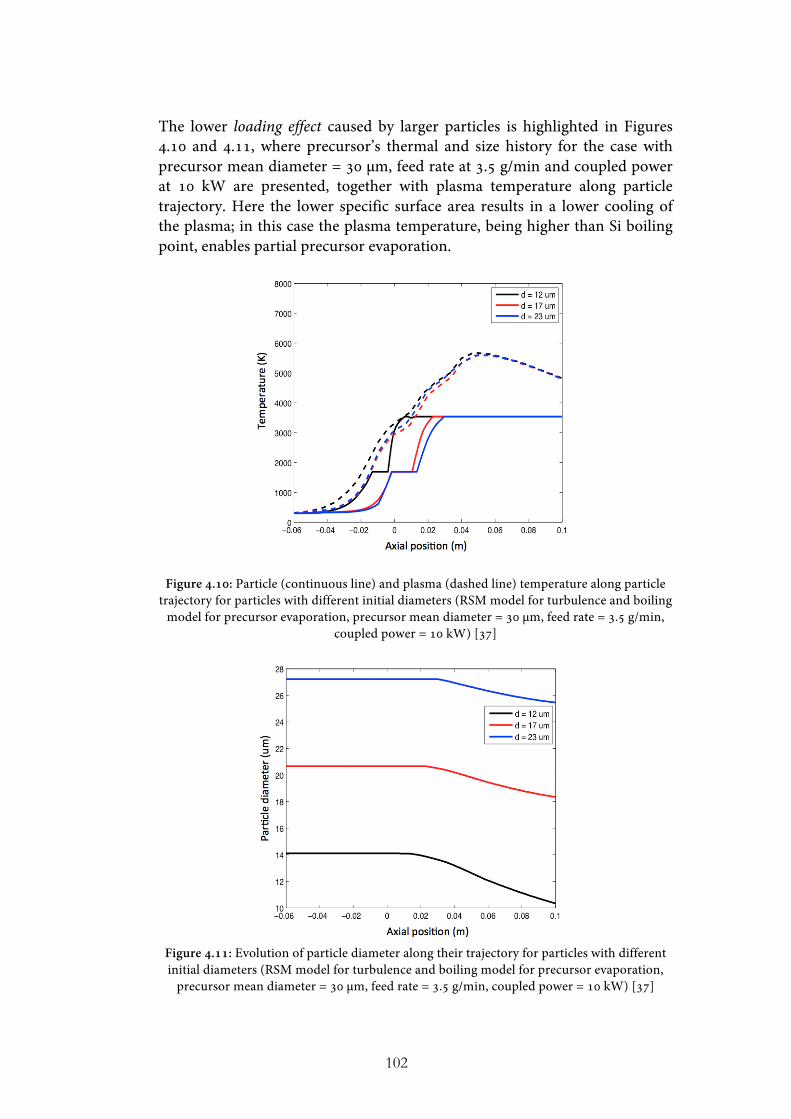
102
The lower loading effect caused by larger particles is highlighted in Figures 4.10 and 4.11, where precursor’s thermal and size history for the case with precursor mean diameter = 30 µm, feed rate at 3.5 g/min and coupled power at 10 kW are presented, together with plasma temperature along particle trajectory. Here the lower specific surface area results in a lower cooling of the plasma; in this case the plasma temperature, being higher than Si boiling point, enables partial precursor evaporation.
Figure 4.10: Particle (continuous line) and plasma (dashed line) temperature along particle trajectory for particles with different initial diameters (RSM model for turbulence and boiling
model for precursor evaporation, precursor mean diameter = 30 µm, feed rate = 3.5 g/min, coupled power = 10 kW) [37]
Figure 4.11: Evolution of particle diameter along their trajectory for particles with different initial diameters (RSM model for turbulence and boiling model for precursor evaporation,
precursor mean diameter = 30 µm, feed rate = 3.5 g/min, coupled power = 10 kW) [37]

103
Standard k-ε model for turbulence and vaporization model for precursor evaporation (KE-vaporization) Results for evaporation rate and efficiency obtained with the KE-vaporization model are shown in Figures 4.12 and 4.13 respectively. Almost complete evaporation efficiency is predicted for particles with diameter 10 µm, for all the considered feed rates, while for larger particles (mean diameter 30 µm), the evaporation rate is lower and decreases for increasing feed rates. Moreover, this model predicts a rise of evaporation rate for increasing feed rate.
Figure 4.12: Evaporation rate as a function of precursor feed rate for different precursor mean diameters and different values of the coupled power (KE model for turbulence and
vaporization model for precursor evaporation) [37]
Figure 4.13: Evaporation efficiency as a function of precursor feed rate for different precursor mean diameters and different values of the coupled power (KE model for
turbulence and vaporization model for precursor evaporation) [37]
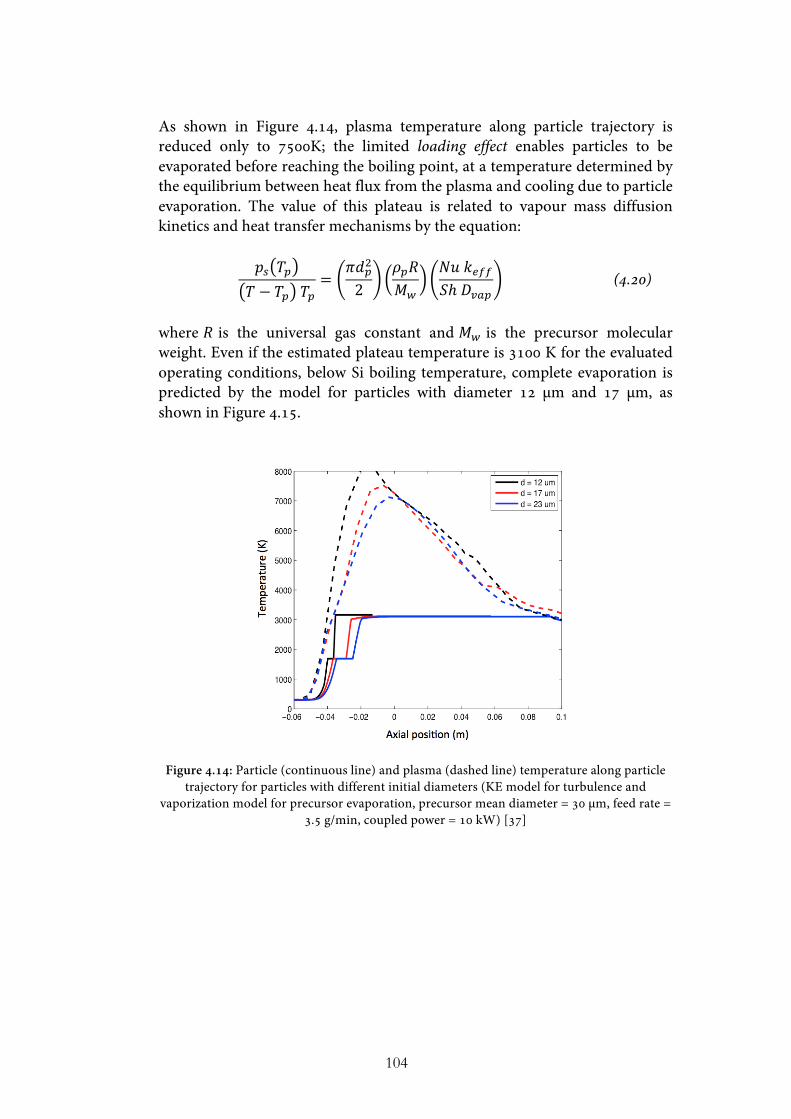
104
As shown in Figure 4.14, plasma temperature along particle trajectory is reduced only to 7500K; the limited loading effect enables particles to be evaporated before reaching the boiling point, at a temperature determined by the equilibrium between heat flux from the plasma and cooling due to particle evaporation. The value of this plateau is related to vapour mass diffusion kinetics and heat transfer mechanisms by the equation:
𝑝! 𝑇!𝑇 − 𝑇! 𝑇!
=𝜋𝑑!!
2𝜌!𝑅𝑀!
𝑁𝑢 𝑘!""𝑆ℎ 𝐷!"#
(4.20)
where 𝑅 is the universal gas constant and 𝑀! is the precursor molecular weight. Even if the estimated plateau temperature is 3100 K for the evaluated operating conditions, below Si boiling temperature, complete evaporation is predicted by the model for particles with diameter 12 µm and 17 µm, as shown in Figure 4.15.
Figure 4.14: Particle (continuous line) and plasma (dashed line) temperature along particle trajectory for particles with different initial diameters (KE model for turbulence and
vaporization model for precursor evaporation, precursor mean diameter = 30 µm, feed rate = 3.5 g/min, coupled power = 10 kW) [37]
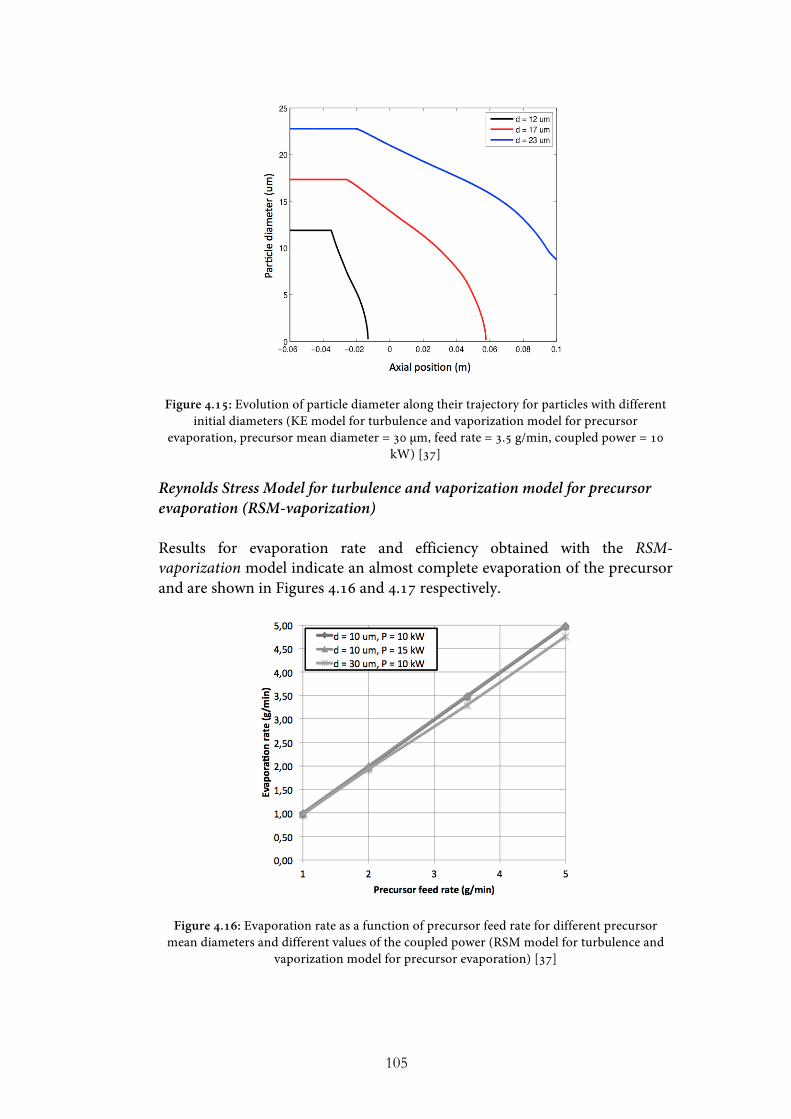
105
Figure 4.15: Evolution of particle diameter along their trajectory for particles with different initial diameters (KE model for turbulence and vaporization model for precursor
evaporation, precursor mean diameter = 30 µm, feed rate = 3.5 g/min, coupled power = 10 kW) [37]
Reynolds Stress Model for turbulence and vaporization model for precursor evaporation (RSM-vaporization) Results for evaporation rate and efficiency obtained with the RSM-vaporization model indicate an almost complete evaporation of the precursor and are shown in Figures 4.16 and 4.17 respectively.
Figure 4.16: Evaporation rate as a function of precursor feed rate for different precursor mean diameters and different values of the coupled power (RSM model for turbulence and
vaporization model for precursor evaporation) [37]
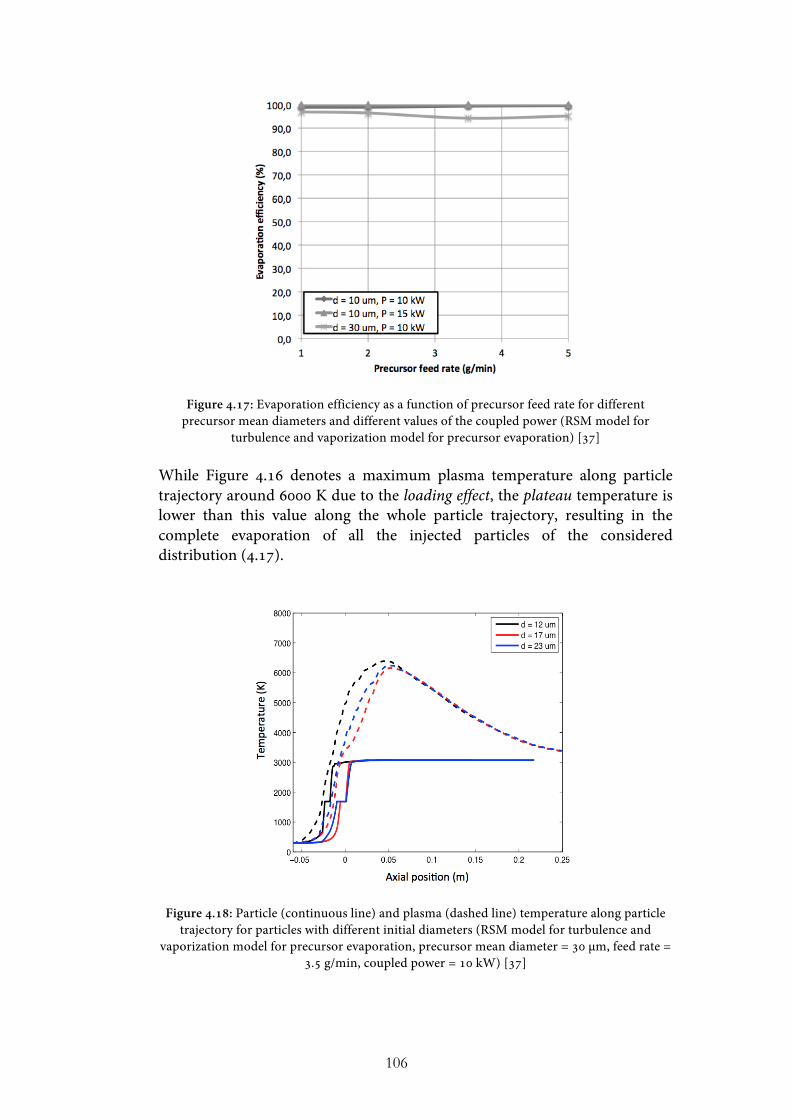
106
Figure 4.17: Evaporation efficiency as a function of precursor feed rate for different precursor mean diameters and different values of the coupled power (RSM model for
turbulence and vaporization model for precursor evaporation) [37] While Figure 4.16 denotes a maximum plasma temperature along particle trajectory around 6000 K due to the loading effect, the plateau temperature is lower than this value along the whole particle trajectory, resulting in the complete evaporation of all the injected particles of the considered distribution (4.17).
Figure 4.18: Particle (continuous line) and plasma (dashed line) temperature along particle trajectory for particles with different initial diameters (RSM model for turbulence and
vaporization model for precursor evaporation, precursor mean diameter = 30 µm, feed rate = 3.5 g/min, coupled power = 10 kW) [37]

107
Figure 4.19: Evolution of particle diameter along their trajectory for particles with different initial diameters (RSM model for turbulence and vaporization model for precursor
evaporation, precursor mean diameter = 30 µm, feed rate = 3.5 g/min, coupled power = 10 kW) [37]
Comparison of results from different models and discussion As shown in the previous sections of this Paragraph, both turbulence models and evaporation models hold a great influence on evaporation rate and evaporation efficiency. While an indirect influence can be appointed to turbulence models, because their direct effect on thermo-fluid dynamic fields inside the plasma source (fully turbulent flows for the KE model, almost laminar flows for the RSM) results in a different evaporation of the particles, the precursor evaporation models directly define the rate of mass reduction of the precursor particles, having as a consequence an indirect influence on plasma characteristics through the loading effect. In order to clearly compare the different models, results for evaporation rate and evaporation efficiency (power coupled to the torch 10kW and precursor mean diameter 10 µm) are presented in Figures 4.20 and 4.21 respectively, while results for particle thermal histories and size (power coupled to the torch 10kW, feed rate 3.5 g/min, precursor mean diameter 10 µm and particle initial diameter 17 µm) are shown in Figures 4.22 and 4.23.
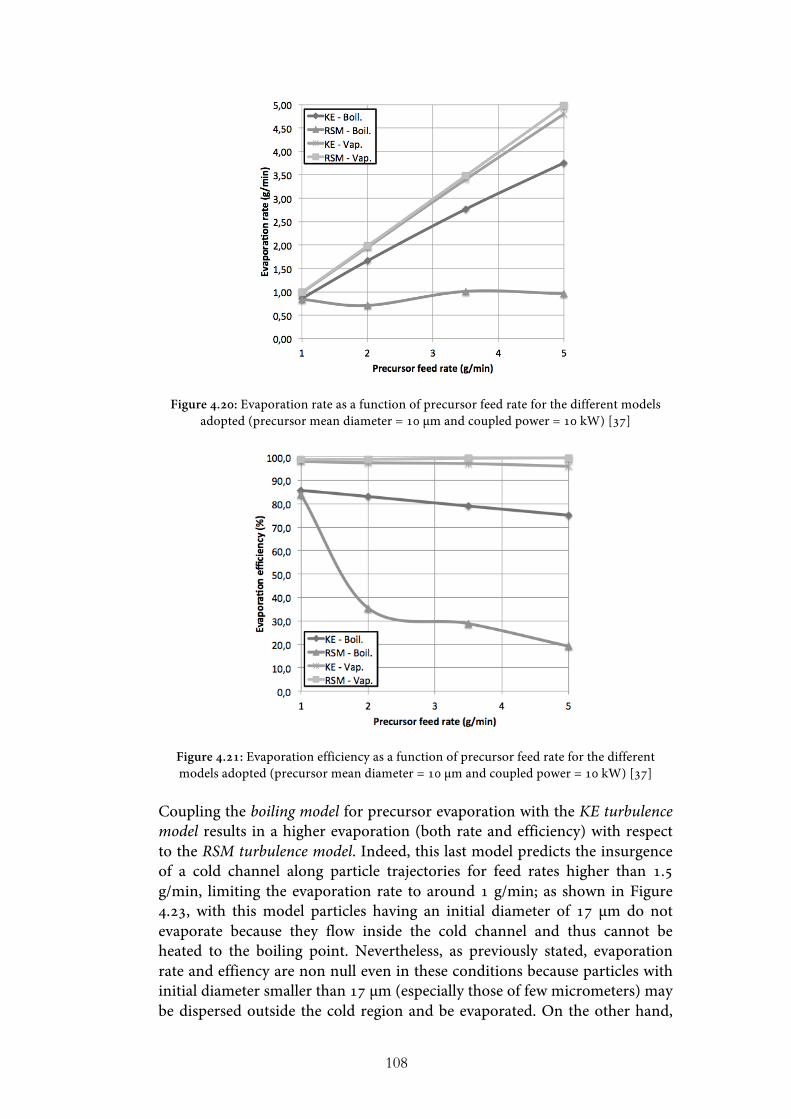
108
Figure 4.20: Evaporation rate as a function of precursor feed rate for the different models adopted (precursor mean diameter = 10 µm and coupled power = 10 kW) [37]
Figure 4.21: Evaporation efficiency as a function of precursor feed rate for the different models adopted (precursor mean diameter = 10 µm and coupled power = 10 kW) [37]
Coupling the boiling model for precursor evaporation with the KE turbulence model results in a higher evaporation (both rate and efficiency) with respect to the RSM turbulence model. Indeed, this last model predicts the insurgence of a cold channel along particle trajectories for feed rates higher than 1.5 g/min, limiting the evaporation rate to around 1 g/min; as shown in Figure 4.23, with this model particles having an initial diameter of 17 µm do not evaporate because they flow inside the cold channel and thus cannot be heated to the boiling point. Nevertheless, as previously stated, evaporation rate and effiency are non null even in these conditions because particles with initial diameter smaller than 17 µm (especially those of few micrometers) may be dispersed outside the cold region and be evaporated. On the other hand,
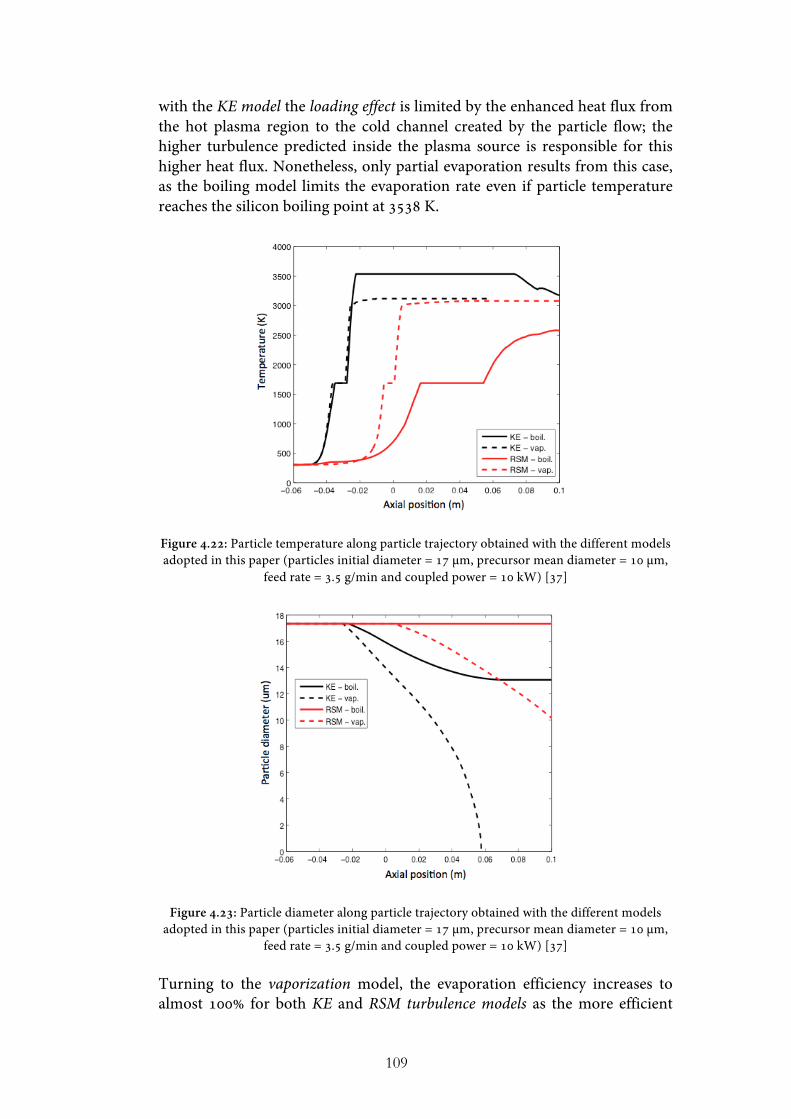
109
with the KE model the loading effect is limited by the enhanced heat flux from the hot plasma region to the cold channel created by the particle flow; the higher turbulence predicted inside the plasma source is responsible for this higher heat flux. Nonetheless, only partial evaporation results from this case, as the boiling model limits the evaporation rate even if particle temperature reaches the silicon boiling point at 3538 K.
Figure 4.22: Particle temperature along particle trajectory obtained with the different models adopted in this paper (particles initial diameter = 17 µm, precursor mean diameter = 10 µm,
feed rate = 3.5 g/min and coupled power = 10 kW) [37]
Figure 4.23: Particle diameter along particle trajectory obtained with the different models adopted in this paper (particles initial diameter = 17 µm, precursor mean diameter = 10 µm,
feed rate = 3.5 g/min and coupled power = 10 kW) [37] Turning to the vaporization model, the evaporation efficiency increases to almost 100% for both KE and RSM turbulence models as the more efficient
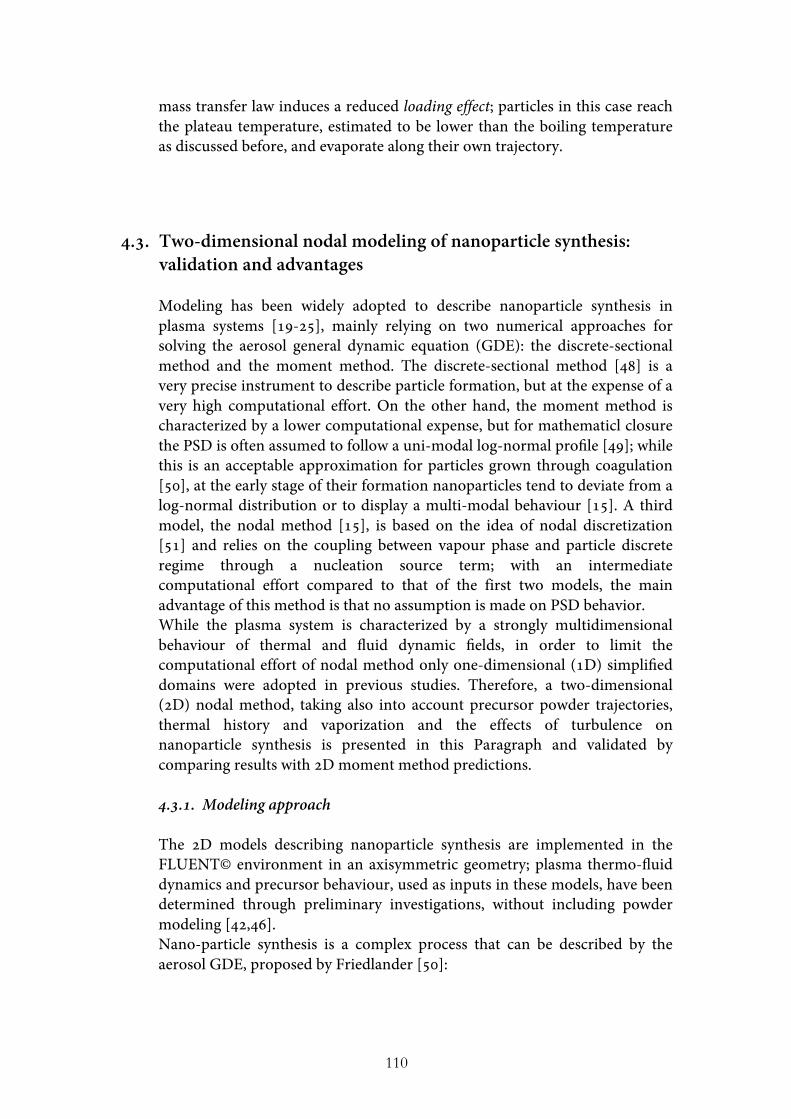
110
mass transfer law induces a reduced loading effect; particles in this case reach the plateau temperature, estimated to be lower than the boiling temperature as discussed before, and evaporate along their own trajectory.
4.3. Two-dimensional nodal modeling of nanoparticle synthesis: validation and advantages
Modeling has been widely adopted to describe nanoparticle synthesis in plasma systems [19-25], mainly relying on two numerical approaches for solving the aerosol general dynamic equation (GDE): the discrete-sectional method and the moment method. The discrete-sectional method [48] is a very precise instrument to describe particle formation, but at the expense of a very high computational effort. On the other hand, the moment method is characterized by a lower computational expense, but for mathematicl closure the PSD is often assumed to follow a uni-modal log-normal profile [49]; while this is an acceptable approximation for particles grown through coagulation [50], at the early stage of their formation nanoparticles tend to deviate from a log-normal distribution or to display a multi-modal behaviour [15]. A third model, the nodal method [15], is based on the idea of nodal discretization [51] and relies on the coupling between vapour phase and particle discrete regime through a nucleation source term; with an intermediate computational effort compared to that of the first two models, the main advantage of this method is that no assumption is made on PSD behavior. While the plasma system is characterized by a strongly multidimensional behaviour of thermal and fluid dynamic fields, in order to limit the computational effort of nodal method only one-dimensional (1D) simplified domains were adopted in previous studies. Therefore, a two-dimensional (2D) nodal method, taking also into account precursor powder trajectories, thermal history and vaporization and the effects of turbulence on nanoparticle synthesis is presented in this Paragraph and validated by comparing results with 2D moment method predictions. 4.3.1. Modeling approach The 2D models describing nanoparticle synthesis are implemented in the FLUENT© environment in an axisymmetric geometry; plasma thermo-fluid dynamics and precursor behaviour, used as inputs in these models, have been determined through preliminary investigations, without including powder modeling [42,46]. Nano-particle synthesis is a complex process that can be described by the aerosol GDE, proposed by Friedlander [50]:
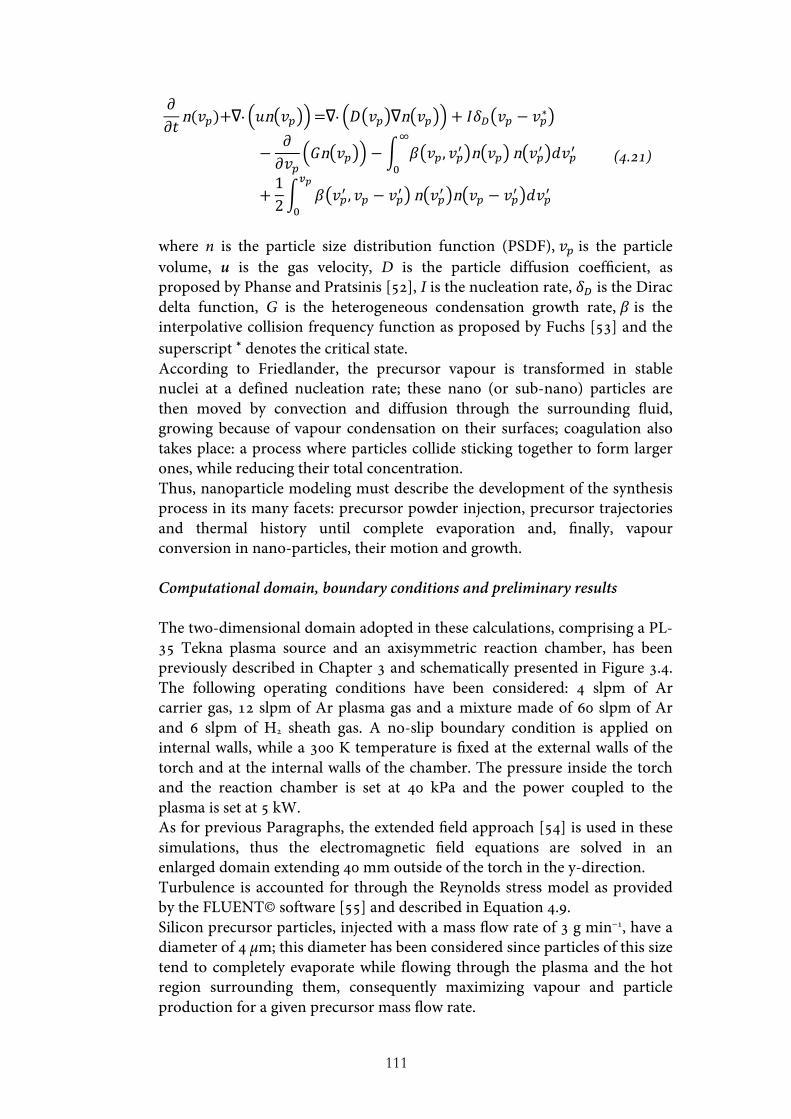
111
𝜕𝜕𝑡 n(𝑣!)+∇∙ 𝑢n 𝑣! =∇∙ 𝐷 𝑣! ∇n 𝑣! + 𝐼𝛿! 𝑣! − 𝑣!∗
−𝜕𝜕𝑣!
𝐺n 𝑣! − 𝛽 𝑣!, 𝑣!! n 𝑣!!
!n 𝑣!! 𝑑𝑣!!
+12 𝛽 𝑣!! , 𝑣! − 𝑣!!
!!
!n 𝑣!! n 𝑣! − 𝑣!! 𝑑𝑣!!
(4.21)
where n is the particle size distribution function (PSDF), 𝑣! is the particle volume, u is the gas velocity, D is the particle diffusion coefficient, as proposed by Phanse and Pratsinis [52], I is the nucleation rate, 𝛿! is the Dirac delta function, G is the heterogeneous condensation growth rate, 𝛽 is the interpolative collision frequency function as proposed by Fuchs [53] and the superscript ∗ denotes the critical state. According to Friedlander, the precursor vapour is transformed in stable nuclei at a defined nucleation rate; these nano (or sub-nano) particles are then moved by convection and diffusion through the surrounding fluid, growing because of vapour condensation on their surfaces; coagulation also takes place: a process where particles collide sticking together to form larger ones, while reducing their total concentration. Thus, nanoparticle modeling must describe the development of the synthesis process in its many facets: precursor powder injection, precursor trajectories and thermal history until complete evaporation and, finally, vapour conversion in nano-particles, their motion and growth. Computational domain, boundary conditions and preliminary results The two-dimensional domain adopted in these calculations, comprising a PL-35 Tekna plasma source and an axisymmetric reaction chamber, has been previously described in Chapter 3 and schematically presented in Figure 3.4. The following operating conditions have been considered: 4 slpm of Ar carrier gas, 12 slpm of Ar plasma gas and a mixture made of 60 slpm of Ar and 6 slpm of H2 sheath gas. A no-slip boundary condition is applied on internal walls, while a 300 K temperature is fixed at the external walls of the torch and at the internal walls of the chamber. The pressure inside the torch and the reaction chamber is set at 40 kPa and the power coupled to the plasma is set at 5 kW. As for previous Paragraphs, the extended field approach [54] is used in these simulations, thus the electromagnetic field equations are solved in an enlarged domain extending 40 mm outside of the torch in the y-direction. Turbulence is accounted for through the Reynolds stress model as provided by the FLUENT© software [55] and described in Equation 4.9. Silicon precursor particles, injected with a mass flow rate of 3 g min−1, have a diameter of 4 µm; this diameter has been considered since particles of this size tend to completely evaporate while flowing through the plasma and the hot region surrounding them, consequently maximizing vapour and particle production for a given precursor mass flow rate.
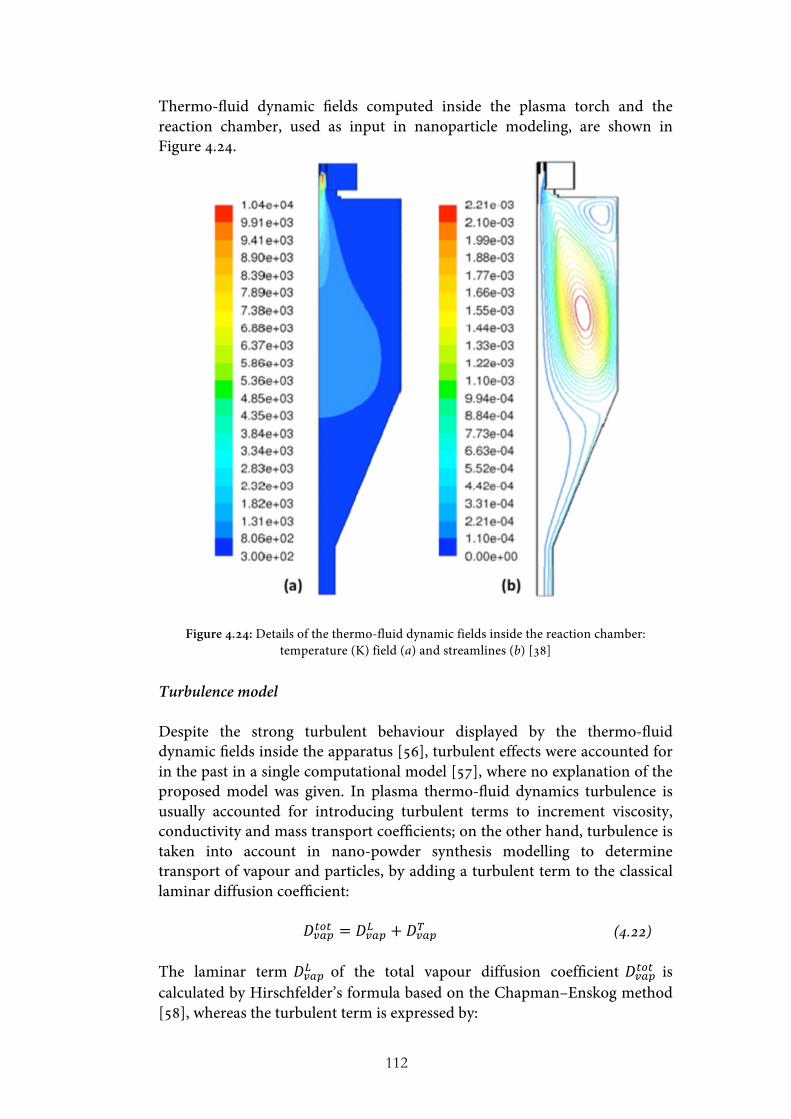
112
Thermo-fluid dynamic fields computed inside the plasma torch and the reaction chamber, used as input in nanoparticle modeling, are shown in Figure 4.24.
Figure 4.24: Details of the thermo-fluid dynamic fields inside the reaction chamber: temperature (K) field (a) and streamlines (b) [38]
Turbulence model Despite the strong turbulent behaviour displayed by the thermo-fluid dynamic fields inside the apparatus [56], turbulent effects were accounted for in the past in a single computational model [57], where no explanation of the proposed model was given. In plasma thermo-fluid dynamics turbulence is usually accounted for introducing turbulent terms to increment viscosity, conductivity and mass transport coefficients; on the other hand, turbulence is taken into account in nano-powder synthesis modelling to determine transport of vapour and particles, by adding a turbulent term to the classical laminar diffusion coefficient:
𝐷!"#!"! = 𝐷!"#! + 𝐷!"#! (4.22) The laminar term 𝐷!"#! of the total vapour diffusion coefficient 𝐷!"#!"! is calculated by Hirschfelder’s formula based on the Chapman–Enskog method [58], whereas the turbulent term is expressed by:
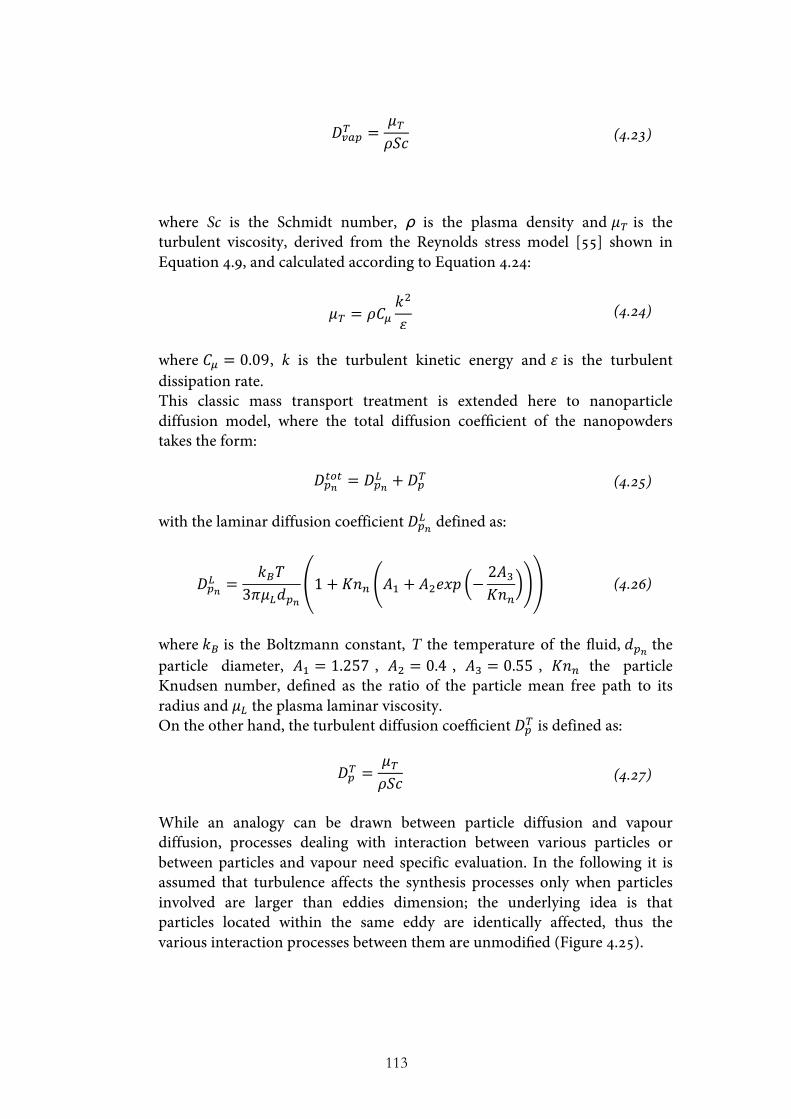
113
𝐷!"#! =𝜇!𝜌𝑆𝑐 (4.23)
where Sc is the Schmidt number, ρ is the plasma density and 𝜇! is the turbulent viscosity, derived from the Reynolds stress model [55] shown in Equation 4.9, and calculated according to Equation 4.24:
𝜇! = 𝜌𝐶!𝑘!
𝜀 (4.24)
where 𝐶! = 0.09, k is the turbulent kinetic energy and 𝜀 is the turbulent dissipation rate. This classic mass transport treatment is extended here to nanoparticle diffusion model, where the total diffusion coefficient of the nanopowders takes the form:
𝐷!!!"! = 𝐷!!
! + 𝐷!! (4.25) with the laminar diffusion coefficient 𝐷!!
! defined as:
𝐷!!! =
𝑘!𝑇3𝜋𝜇!𝑑!!
1+ 𝐾𝑛! 𝐴! + 𝐴!𝑒𝑥𝑝 −2𝐴!𝐾𝑛!
(4.26)
where 𝑘! is the Boltzmann constant, T the temperature of the fluid, 𝑑!! the particle diameter, 𝐴! = 1.257 , 𝐴! = 0.4 , 𝐴! = 0.55 , 𝐾𝑛! the particle Knudsen number, defined as the ratio of the particle mean free path to its radius and 𝜇! the plasma laminar viscosity. On the other hand, the turbulent diffusion coefficient 𝐷!! is defined as:
𝐷!! =𝜇!𝜌𝑆𝑐 (4.27)
While an analogy can be drawn between particle diffusion and vapour diffusion, processes dealing with interaction between various particles or between particles and vapour need specific evaluation. In the following it is assumed that turbulence affects the synthesis processes only when particles involved are larger than eddies dimension; the underlying idea is that particles located within the same eddy are identically affected, thus the various interaction processes between them are unmodified (Figure 4.25).
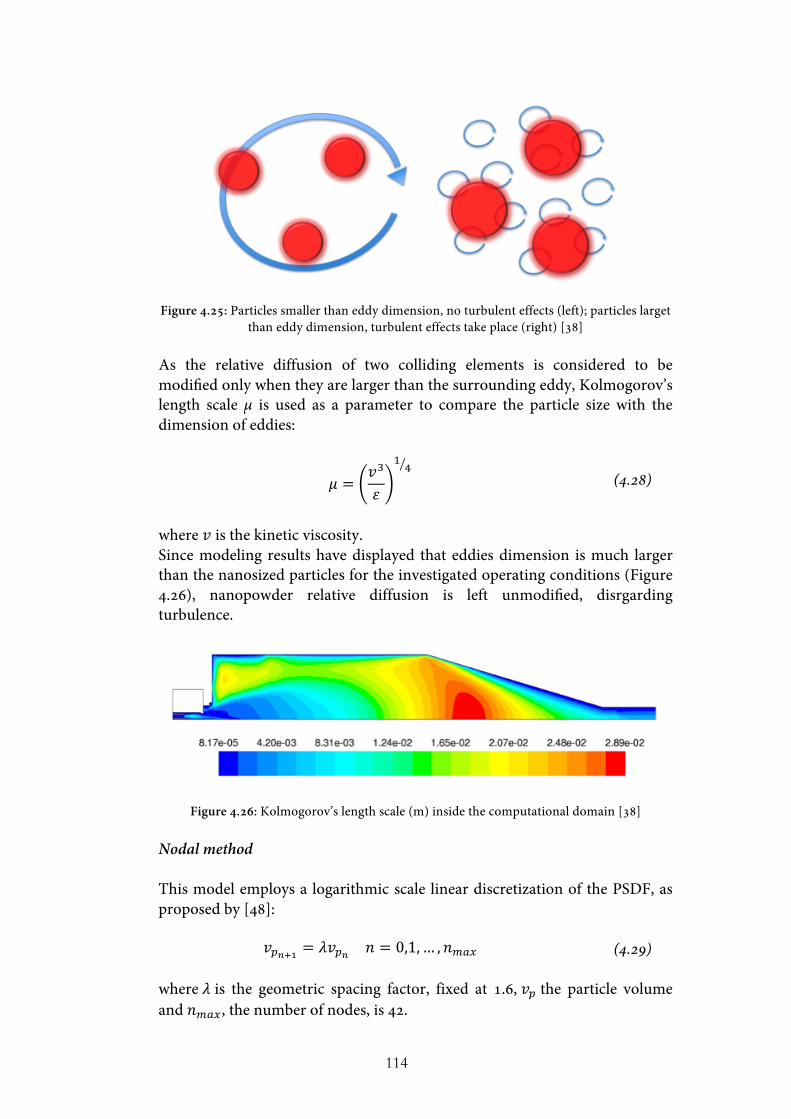
114
Figure 4.25: Particles smaller than eddy dimension, no turbulent effects (left); particles larget than eddy dimension, turbulent effects take place (right) [38]
As the relative diffusion of two colliding elements is considered to be modified only when they are larger than the surrounding eddy, Kolmogorov’s length scale µ is used as a parameter to compare the particle size with the dimension of eddies:
𝜇 =𝑣!
𝜀
!! (4.28)
where 𝑣 is the kinetic viscosity. Since modeling results have displayed that eddies dimension is much larger than the nanosized particles for the investigated operating conditions (Figure 4.26), nanopowder relative diffusion is left unmodified, disrgarding turbulence.
Figure 4.26: Kolmogorov’s length scale (m) inside the computational domain [38] Nodal method This model employs a logarithmic scale linear discretization of the PSDF, as proposed by [48]:
𝑣!!!! = 𝜆𝑣!! 𝑛 = 0,1,… ,𝑛!"# (4.29) where 𝜆 is the geometric spacing factor, fixed at 1.6, 𝑣! the particle volume and 𝑛!"#, the number of nodes, is 42.

115
The value of 𝑣!! , is definded in order to obtain a discretized PSD covering the entire range of particles typically produced in ICP systems; here 𝑣!! is taken as ten times the volume of the Si monomer, 𝑣!. Several assumptions are introduced to simplify the model:
• spherical nanoparticles; • negligible nanoparticle inertia; • heat generated by the condensation process is neglected; • negligible electrical charge of nanoparticles; • identical nanoparticle temperature and velocity to those of the plasma flow;
• condensing vapour is treated as an ideal gas; • thermophoresis is neglected.
Even if thermophoresis is known to play an important role in particle transport processes, it is neglected on purpose here, in order to avoid the mixing with turbulent effects and enabling to highlight their role on nanoparticle synthesis. Therefore, the discretized GDE for the particle distribution 𝑁! at node n, considering turbulent effects, takes the form: ∇∙ 𝒖𝑁!! =∇∙ 𝐷!!!"!∇𝑁!! + 𝑁!!
!"#$ + 𝑁!!!"#$ + 𝑁!!
!"#$ (4.30)
Where u is the velocity vector, 𝑁!! is the particle concentration at node n,
𝐷!!!"! the total diffusion coefficient for particles at node n, 𝑁!!
!"#$ the
nucleation source term, 𝑁!!!"#$
the coagulation net production rate and
𝑁!!!"#$
the condensation source term. The net production rate by nucleation at node n is defined as:
𝑁!!!"#$ = 𝐼𝜉!!"#$ (4.31)
Where I is the homogeneous self-consistent nucleation rate proposed by [59]:
𝐼 = 𝑁!𝑁!𝑣!2𝜎𝑚𝜋 𝑒𝑥𝑝 Θ−
4Θ!
27 𝑙𝑛𝑆 ! (4.32)
Where 𝑁! is the monomer concentration, 𝑁! is the monomer concentration at saturation, S is the supersaturation expressed as the ratio of the previous two terms, 𝜎 is the surface tension, Θ is the normalized surface tension and m is the monomer mass. The volume 𝑣∗ of the stable nuclei generated by nucleation is estimated as in [50]:
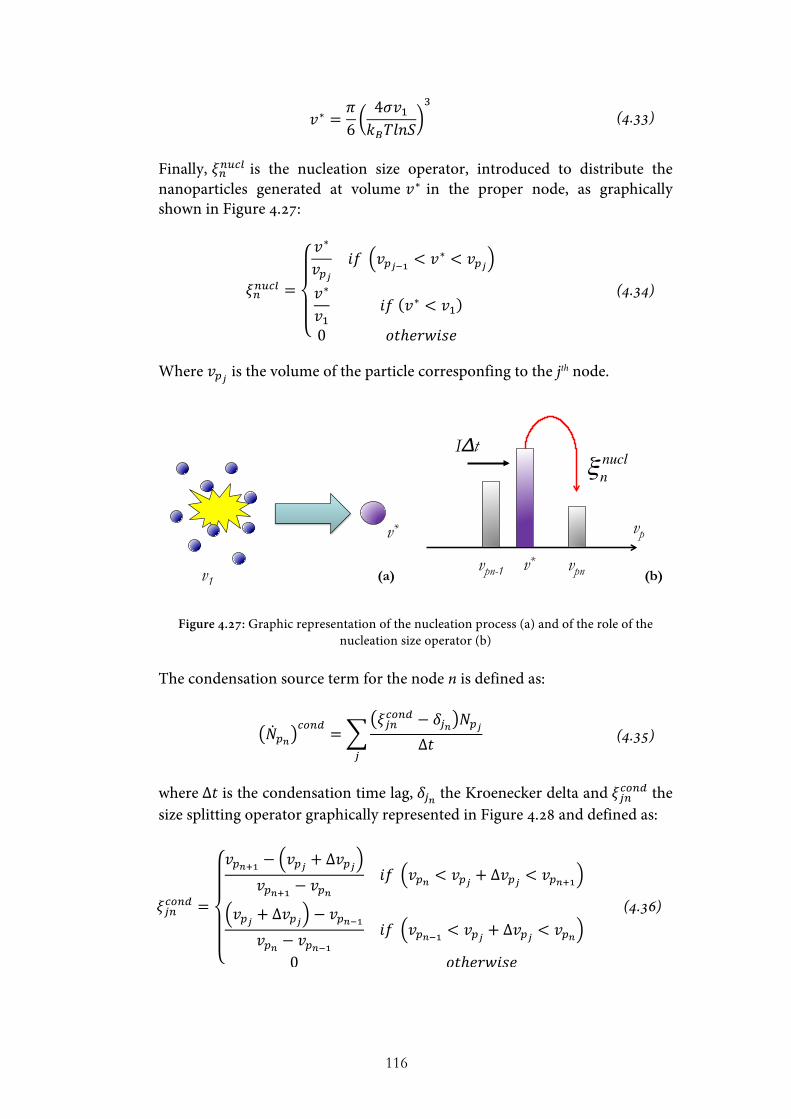
116
𝑣∗ =𝜋6
4𝜎𝑣!𝑘!𝑇𝑙𝑛𝑆
!
(4.33)
Finally, 𝜉!!"#$ is the nucleation size operator, introduced to distribute the nanoparticles generated at volume 𝑣∗ in the proper node, as graphically shown in Figure 4.27:
𝜉!!"#$ =
𝑣∗
𝑣!!𝑖𝑓 𝑣!!!! < 𝑣∗ < 𝑣!!
𝑣∗
𝑣!𝑖𝑓 𝑣∗ < 𝑣!
0 𝑜𝑡ℎ𝑒𝑟𝑤𝑖𝑠𝑒
(4.34)
Where 𝑣!! is the volume of the particle corresponfing to the jth node.
Figure 4.27: Graphic representation of the nucleation process (a) and of the role of the nucleation size operator (b)
The condensation source term for the node n is defined as:
𝑁!!!"#$ =
𝜉!"!"#$ − 𝛿!! 𝑁!!∆𝑡
!
(4.35)
where ∆𝑡 is the condensation time lag, 𝛿!! the Kroenecker delta and 𝜉!"!"#$ the size splitting operator graphically represented in Figure 4.28 and defined as:
𝜉!"!"#$ =
𝑣!!!! − 𝑣!! + ∆𝑣!!𝑣!!!! − 𝑣!!
𝑖𝑓 𝑣!! < 𝑣!! + ∆𝑣!! < 𝑣!!!!
𝑣!! + ∆𝑣!! − 𝑣!!!!𝑣!! − 𝑣!!!!
𝑖𝑓 𝑣!!!! < 𝑣!! + ∆𝑣!! < 𝑣!!
0 𝑜𝑡ℎ𝑒𝑟𝑤𝑖𝑠𝑒
(4.36)
v1
v*
(a) v*
vp
vpn-1 vpn
!n
nuclI!t
(b)
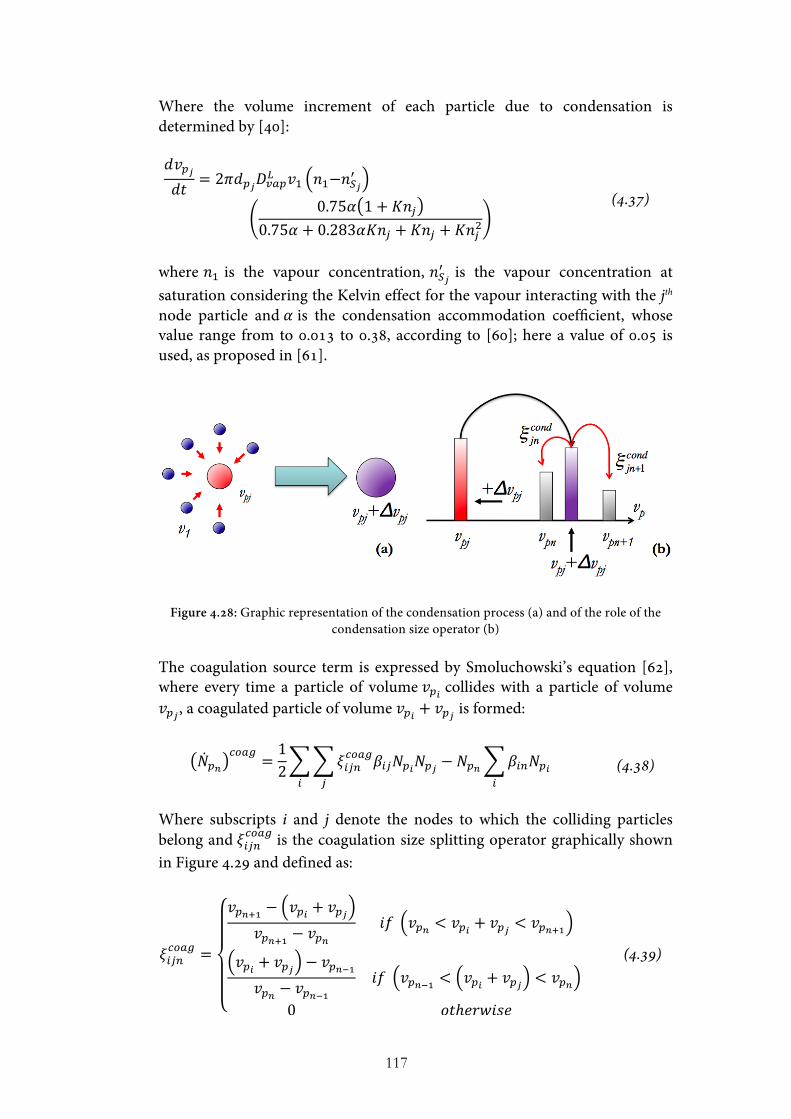
117
Where the volume increment of each particle due to condensation is determined by [40]: 𝑑𝑣!!𝑑𝑡 = 2𝜋𝑑!!𝐷!"#
! 𝑣! 𝑛!−𝑛!!!
0.75𝛼 1+ 𝐾𝑛!0.75𝛼 + 0.283𝛼𝐾𝑛! + 𝐾𝑛! + 𝐾𝑛!!
(4.37)
where 𝑛! is the vapour concentration, 𝑛!!
! is the vapour concentration at saturation considering the Kelvin effect for the vapour interacting with the jth node particle and 𝛼 is the condensation accommodation coefficient, whose value range from to 0.013 to 0.38, according to [60]; here a value of 0.05 is used, as proposed in [61].
Figure 4.28: Graphic representation of the condensation process (a) and of the role of the condensation size operator (b)
The coagulation source term is expressed by Smoluchowski’s equation [62], where every time a particle of volume 𝑣!! collides with a particle of volume 𝑣!! , a coagulated particle of volume 𝑣!! + 𝑣!! is formed:
𝑁!!!"#$ =
12 𝜉!"#
!"#$𝛽!"𝑁!!𝑁!!!!
− 𝑁!! 𝛽!"𝑁!!!
(4.38)
Where subscripts i and j denote the nodes to which the colliding particles belong and 𝜉!"#
!"#$ is the coagulation size splitting operator graphically shown in Figure 4.29 and defined as:
𝜉!"#!"#$ =
𝑣!!!! − 𝑣!! + 𝑣!!𝑣!!!! − 𝑣!!
𝑖𝑓 𝑣!! < 𝑣!! + 𝑣!! < 𝑣!!!!
𝑣!! + 𝑣!! − 𝑣!!!!𝑣!! − 𝑣!!!!
𝑖𝑓 𝑣!!!! < 𝑣!! + 𝑣!! < 𝑣!!
0 𝑜𝑡ℎ𝑒𝑟𝑤𝑖𝑠𝑒
(4.39)
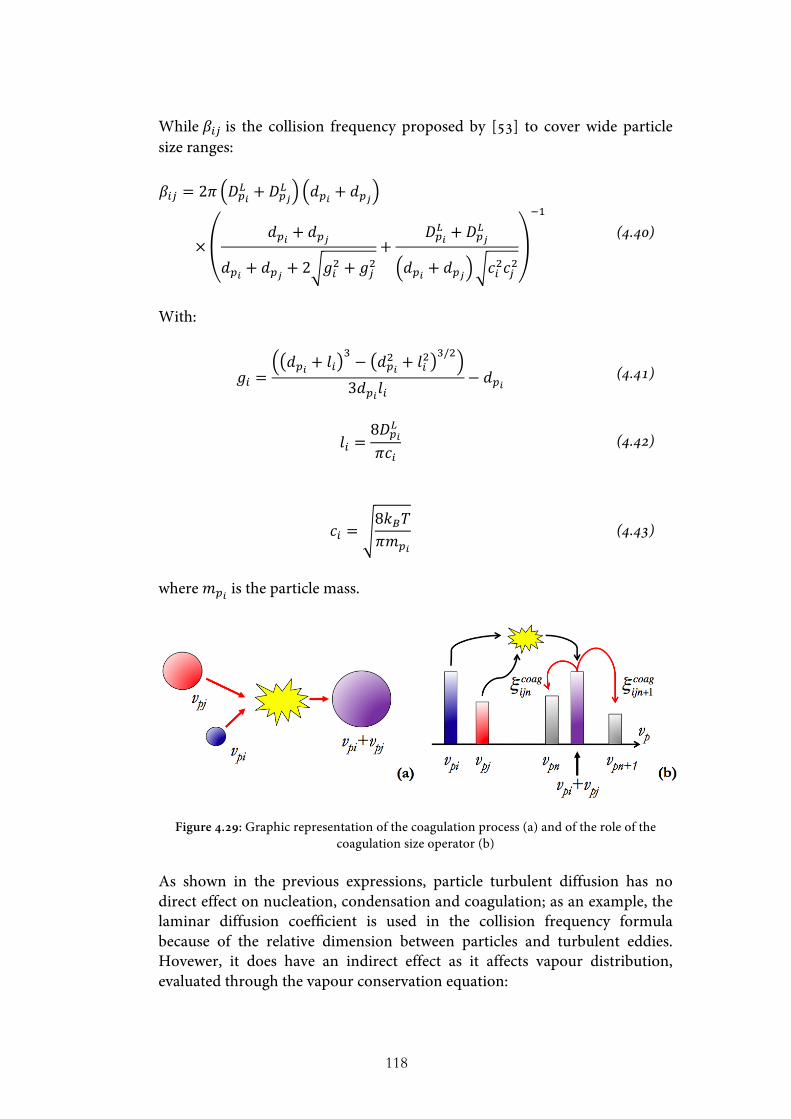
118
While 𝛽!" is the collision frequency proposed by [53] to cover wide particle size ranges: 𝛽!" = 2𝜋 𝐷!!
! + 𝐷!!! 𝑑!! + 𝑑!!
×𝑑!! + 𝑑!!
𝑑!! + 𝑑!! + 2 𝑔!! + 𝑔!!+
𝐷!!! + 𝐷!!
!
𝑑!! + 𝑑!! 𝑐!!𝑐!!
!!
(4.40)
With:
𝑔! =𝑑!! + 𝑙!
! − 𝑑!!! + 𝑙!!
!/!
3𝑑!!𝑙!− 𝑑!! (4.41)
𝑙! =8𝐷!!
!
𝜋𝑐! (4.42)
𝑐! =8𝑘!𝑇𝜋𝑚!!
(4.43)
where 𝑚!! is the particle mass.
Figure 4.29: Graphic representation of the coagulation process (a) and of the role of the coagulation size operator (b)
As shown in the previous expressions, particle turbulent diffusion has no direct effect on nucleation, condensation and coagulation; as an example, the laminar diffusion coefficient is used in the collision frequency formula because of the relative dimension between particles and turbulent eddies. Hovewer, it does have an indirect effect as it affects vapour distribution, evaluated through the vapour conservation equation:
119
∇∙ 𝒖𝑁! =∇∙ 𝐷!"#!"! ∇𝑁! + 𝑁!!"#$ + 𝑁!
!"#$ (4.44)
where 𝑁! is the monomer concentration, 𝑁!
!"#! and 𝑁!
!"#$ are the
vapour negative source terms, accounting for vapour losses due to nucleation and condensation. The total vapour diffusion coefficient 𝐷!"#!"! is used to account for the turbulent effects. The moment method This model employs a system of equations derived from a mathematical reformulation of the aerosol GDE; the model relies on the same set of assumptions of the nodal method, but with the addition of a fixed profile (uni-modal log-normal) for the PSD. This method handles the first three moments of the PSDF, defined as:
𝑀!= 𝑣!!𝑛 𝑣! 𝑑𝑣!!
!𝑘 = 0,1,2 (4.45)
where 𝑣! is the particle volume and 𝑛 𝑣! is the PSDF. Therefore, the moment steady-state transport equations then take the form: 𝛻 ∙ 𝑢𝑀! = 𝑀!
!"#$ + 𝑀!!"#$ + 𝑀!
!"#$ + 𝑀!!"##
for 𝑘 = 0,1,2 (4.46)
Where the terms 𝑀! are the net production rates due to nucleation, condensation, coagulation and diffusion. The mathematical closure of the system is obtained defining the geometric standard deviation 𝜎! , the geometric mean volume 𝑣! and the relation between moments:
𝑙𝑛!𝜎! =19 𝑙𝑛
𝑀!𝑀!
𝑀! (4.47)
𝑣! =𝑀!!
𝑀!!/!𝑀!
!/! (4.48)
𝑀! = 𝑀!𝑣!!𝑒𝑥𝑝92 𝑘
!𝑙𝑛𝜎! (4.49)
While nucleation, condensation and coagulation source terms are not reported because they do not differ from their classic representation [25], the diffusion source term, affected by turbulent effects, is modified as in Equation 4.50:
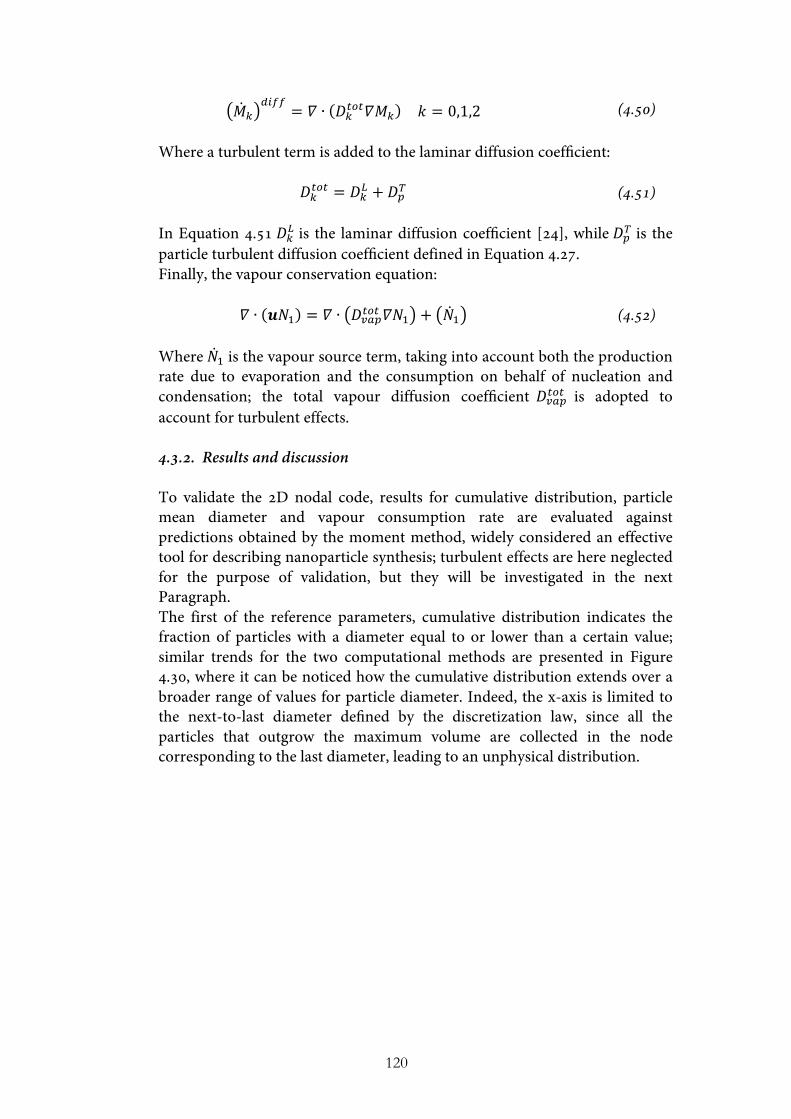
120
𝑀!!"##
= 𝛻 ∙ 𝐷!!"!𝛻𝑀! 𝑘 = 0,1,2 (4.50) Where a turbulent term is added to the laminar diffusion coefficient:
𝐷!!"! = 𝐷!! + 𝐷!! (4.51) In Equation 4.51 𝐷!! is the laminar diffusion coefficient [24], while 𝐷!! is the particle turbulent diffusion coefficient defined in Equation 4.27. Finally, the vapour conservation equation:
𝛻 ∙ 𝒖𝑁! = 𝛻 ∙ 𝐷!"#!"! 𝛻𝑁! + 𝑁! (4.52) Where 𝑁! is the vapour source term, taking into account both the production rate due to evaporation and the consumption on behalf of nucleation and condensation; the total vapour diffusion coefficient 𝐷!"#!"! is adopted to account for turbulent effects. 4.3.2. Results and discussion To validate the 2D nodal code, results for cumulative distribution, particle mean diameter and vapour consumption rate are evaluated against predictions obtained by the moment method, widely considered an effective tool for describing nanoparticle synthesis; turbulent effects are here neglected for the purpose of validation, but they will be investigated in the next Paragraph. The first of the reference parameters, cumulative distribution indicates the fraction of particles with a diameter equal to or lower than a certain value; similar trends for the two computational methods are presented in Figure 4.30, where it can be noticed how the cumulative distribution extends over a broader range of values for particle diameter. Indeed, the x-axis is limited to the next-to-last diameter defined by the discretization law, since all the particles that outgrow the maximum volume are collected in the node corresponding to the last diameter, leading to an unphysical distribution.
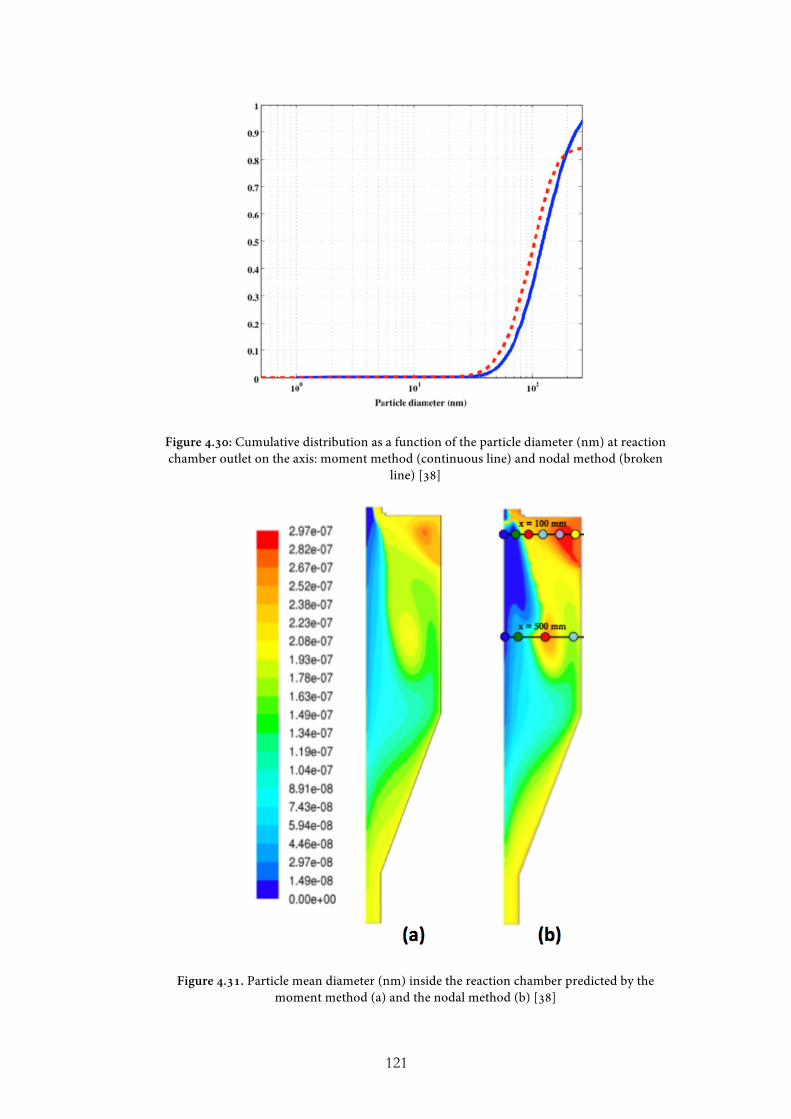
121
Figure 4.30: Cumulative distribution as a function of the particle diameter (nm) at reaction chamber outlet on the axis: moment method (continuous line) and nodal method (broken
line) [38]
Figure 4.31. Particle mean diameter (nm) inside the reaction chamber predicted by the moment method (a) and the nodal method (b) [38]
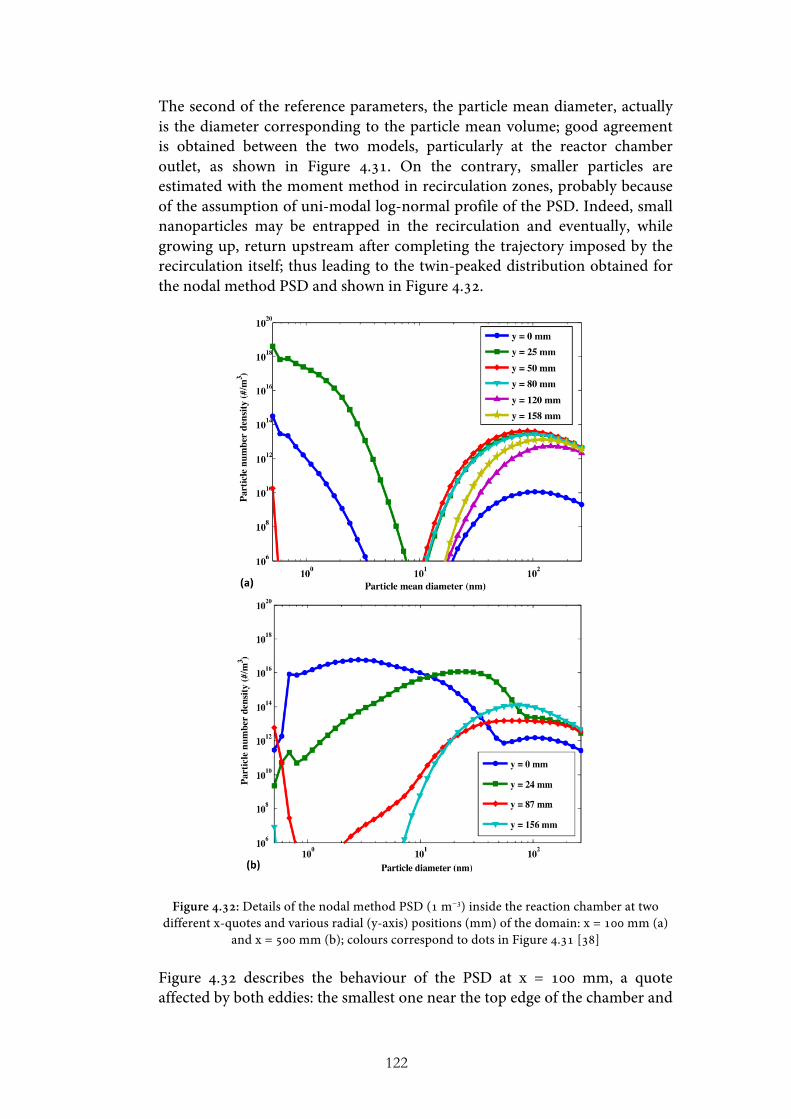
122
The second of the reference parameters, the particle mean diameter, actually is the diameter corresponding to the particle mean volume; good agreement is obtained between the two models, particularly at the reactor chamber outlet, as shown in Figure 4.31. On the contrary, smaller particles are estimated with the moment method in recirculation zones, probably because of the assumption of uni-modal log-normal profile of the PSD. Indeed, small nanoparticles may be entrapped in the recirculation and eventually, while growing up, return upstream after completing the trajectory imposed by the recirculation itself; thus leading to the twin-peaked distribution obtained for the nodal method PSD and shown in Figure 4.32.
Figure 4.32: Details of the nodal method PSD (1 m−3) inside the reaction chamber at two different x-quotes and various radial (y-axis) positions (mm) of the domain: x = 100 mm (a)
and x = 500 mm (b); colours correspond to dots in Figure 4.31 [38] Figure 4.32 describes the behaviour of the PSD at x = 100 mm, a quote affected by both eddies: the smallest one near the top edge of the chamber and

123
the largest one in the middle of the chamber, as shown in Figure 4.31(b). The smallest particle accounted for with the adopted discretization law have maximum concentration away from the axis (y = 25 mm), confirming the radial start-up of nucleation; some of these stable nuclei are found on the axis and even at y = 50 mm, as a consequence of diffusion or nucleation. As previously stated, small particles flow inside the largest eddy, where they grow due to condensation and coagulation; eventually, these enlarged powders are recirculated back to the nucleation region, leading to a twin-peaked distribution; this explanation of the role of recirculation is reinforced by the identical profiles that particles assume at quotes y = 25, 50 and 80 mm, located almost at the same distance from the center of the largest eddy. While a twin-peaked distribution is observed also on the axis, this quote is not affected by the recirculation, therefore the presence of particles larger than 10 nm in this region has to be caused by the diffusion process. Finally, a uni-modal distribution is predicted further away from the axis, where nucleation does not occur; even if at quotes y = 120 and 158 mm a smaller concentration of particles with diameter larger than 10 nm is predicted, these areas are those with the highest mean diameter since no small particles, carrying a high statistical weight, are present. Turning to the PSD behaviour at x = 500 mm, described in Figure 4.32(b), to discuss the role of the largest recirculation, a tri-modal profile is shown for quotes y = 0 mm and y = 25 mm; the first of the peaks has to be appointed to nucleation, as confirmed by the calculated stable nuclei diameter of 0.78 nm. The other two peaks are induced by nanoparticles generated upstream, grown in a bi-modal distribution because on the recirculation and then flown downstream because of convection and diffusion; indeed, the profiles of these two peaks can be easily reconduced to the twin-peaked profiles shown for the same y-quotes in Figure 4.32(a), albeit flattened and shifted to larger diameters. Moreover, a bi-modal distribution is shown inside the largest eddy, at quote y = 87 mm, because of the concurrent effects of nucleation and recirculation; interestingly, the peak caused by nucleation at this y-quote is located at smaller diameters than the ones characterizing the same peaks at quotes y = 0 mm and y = 24 mm. This behaviour can be ascribed to the steeper temperature gradient predicted at quote y = 87 mm compared to the other two quotes. Finally, a bi-modal PSD profile can be seen at quote y = 156 mm; this behaviour has to be appointed to recirculation as no nucleation occurs in this region, as shown in Figure 4.33(a). Moreover, Figure 4.33(a), describing the consumption rate due to nucleation, confirms that nucleation is started away from the axis, in the region characterized by the steepest temperature gradient, while in the downstream region it occurs even in the proximity of the axis, as discussed for Figure 4.32(b). The consumption rate due to condensation, shown in Figure 4.33(b), reaches its maximum value almost in the same region of the nucleation consumption rate; this behaviour is probably caused by the large amount of small particles made available by the nucleation process, characterized by a large surface-to-volume that favours condensation. It should be also noted that most of the vapour
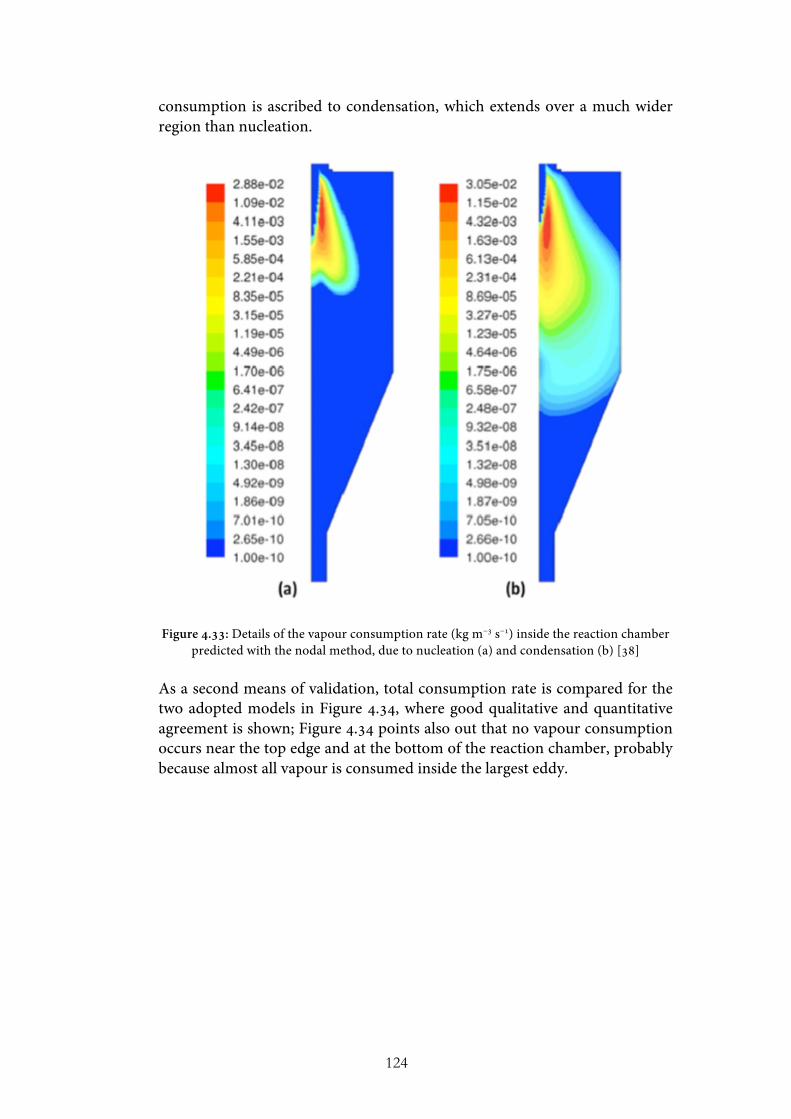
124
consumption is ascribed to condensation, which extends over a much wider region than nucleation.
Figure 4.33: Details of the vapour consumption rate (kg m−3 s−1) inside the reaction chamber predicted with the nodal method, due to nucleation (a) and condensation (b) [38]
As a second means of validation, total consumption rate is compared for the two adopted models in Figure 4.34, where good qualitative and quantitative agreement is shown; Figure 4.34 points also out that no vapour consumption occurs near the top edge and at the bottom of the reaction chamber, probably because almost all vapour is consumed inside the largest eddy.
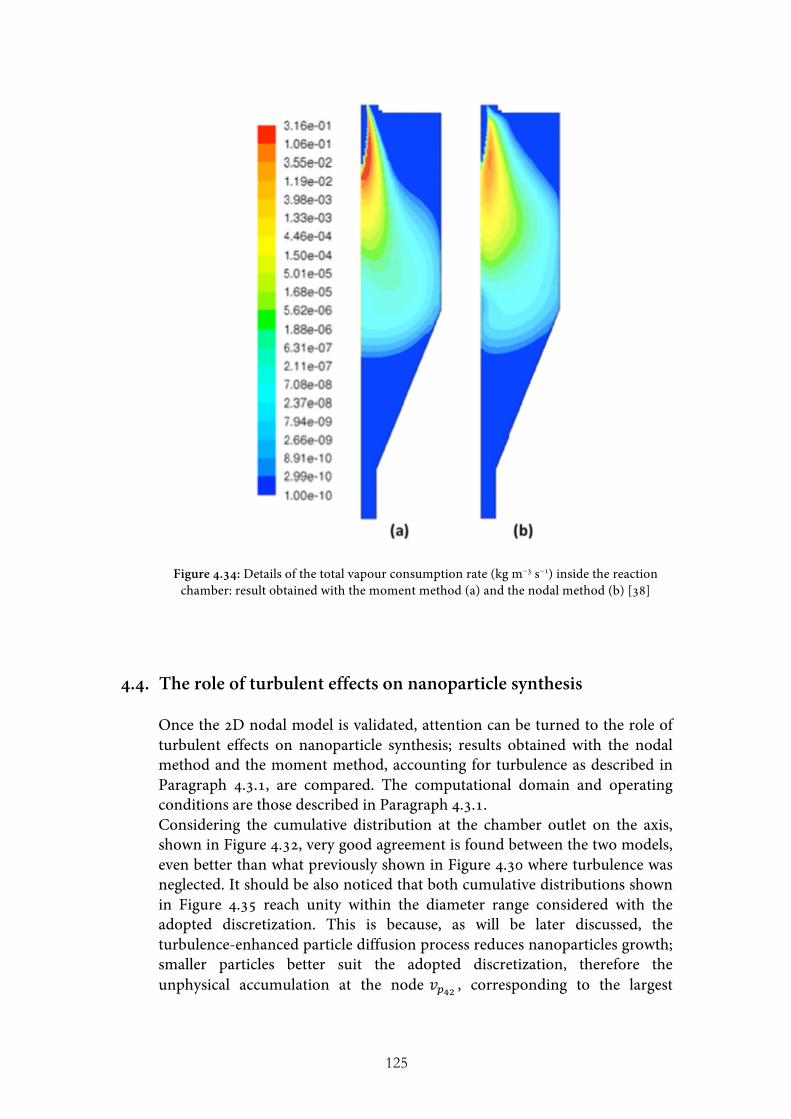
125
Figure 4.34: Details of the total vapour consumption rate (kg m−3 s−1) inside the reaction chamber: result obtained with the moment method (a) and the nodal method (b) [38]
4.4. The role of turbulent effects on nanoparticle synthesis Once the 2D nodal model is validated, attention can be turned to the role of turbulent effects on nanoparticle synthesis; results obtained with the nodal method and the moment method, accounting for turbulence as described in Paragraph 4.3.1, are compared. The computational domain and operating conditions are those described in Paragraph 4.3.1. Considering the cumulative distribution at the chamber outlet on the axis, shown in Figure 4.32, very good agreement is found between the two models, even better than what previously shown in Figure 4.30 where turbulence was neglected. It should be also noticed that both cumulative distributions shown in Figure 4.35 reach unity within the diameter range considered with the adopted discretization. This is because, as will be later discussed, the turbulence-enhanced particle diffusion process reduces nanoparticles growth; smaller particles better suit the adopted discretization, therefore the unphysical accumulation at the node 𝑣!!" , corresponding to the largest
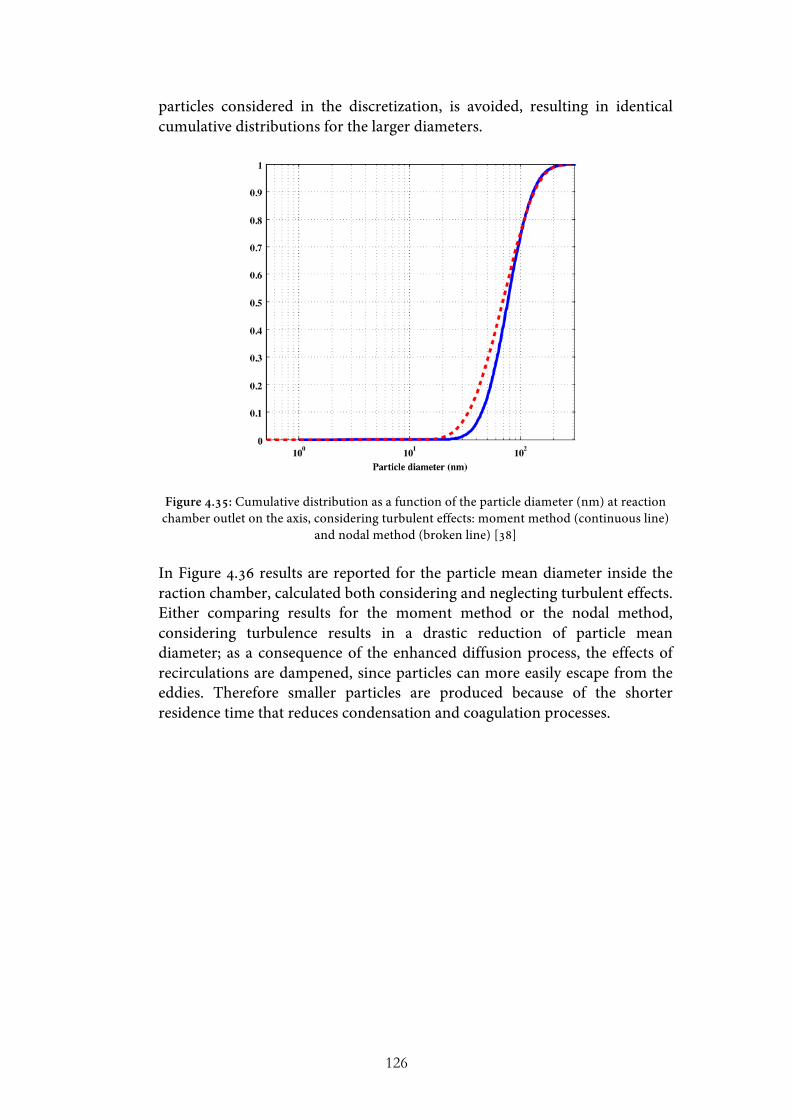
126
particles considered in the discretization, is avoided, resulting in identical cumulative distributions for the larger diameters.
Figure 4.35: Cumulative distribution as a function of the particle diameter (nm) at reaction chamber outlet on the axis, considering turbulent effects: moment method (continuous line)
and nodal method (broken line) [38] In Figure 4.36 results are reported for the particle mean diameter inside the raction chamber, calculated both considering and neglecting turbulent effects. Either comparing results for the moment method or the nodal method, considering turbulence results in a drastic reduction of particle mean diameter; as a consequence of the enhanced diffusion process, the effects of recirculations are dampened, since particles can more easily escape from the eddies. Therefore smaller particles are produced because of the shorter residence time that reduces condensation and coagulation processes.
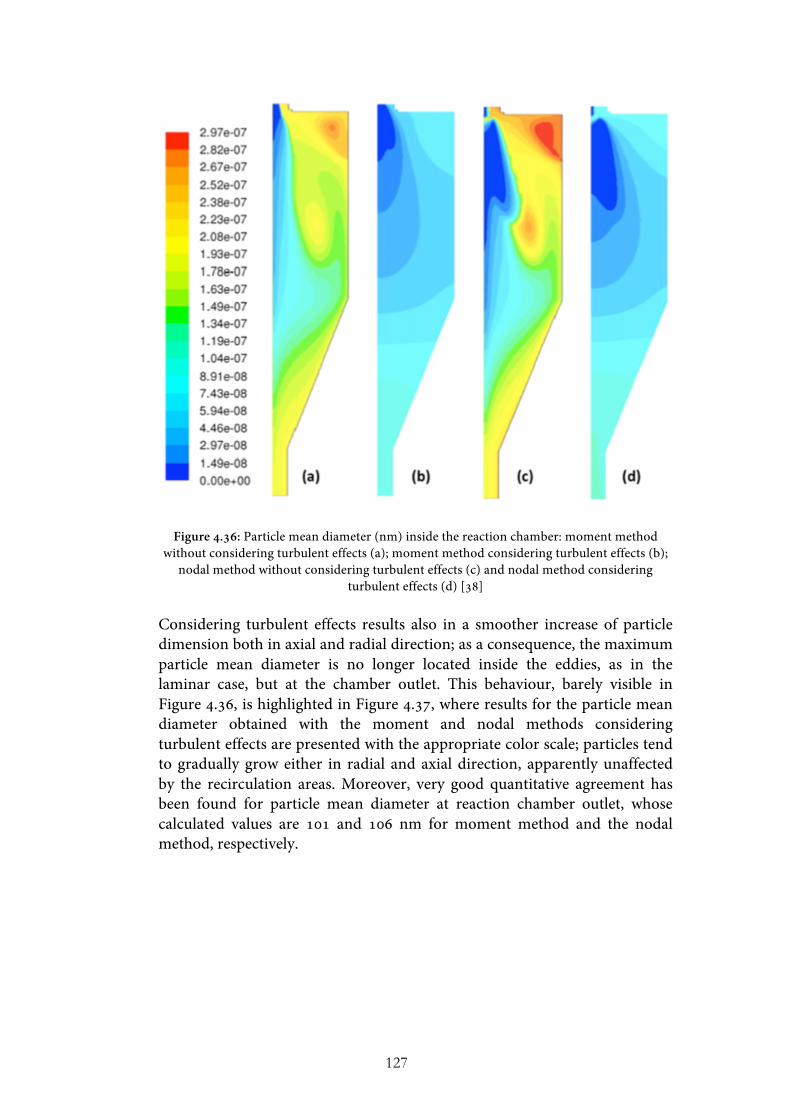
127
Figure 4.36: Particle mean diameter (nm) inside the reaction chamber: moment method without considering turbulent effects (a); moment method considering turbulent effects (b);
nodal method without considering turbulent effects (c) and nodal method considering turbulent effects (d) [38]
Considering turbulent effects results also in a smoother increase of particle dimension both in axial and radial direction; as a consequence, the maximum particle mean diameter is no longer located inside the eddies, as in the laminar case, but at the chamber outlet. This behaviour, barely visible in Figure 4.36, is highlighted in Figure 4.37, where results for the particle mean diameter obtained with the moment and nodal methods considering turbulent effects are presented with the appropriate color scale; particles tend to gradually grow either in radial and axial direction, apparently unaffected by the recirculation areas. Moreover, very good quantitative agreement has been found for particle mean diameter at reaction chamber outlet, whose calculated values are 101 and 106 nm for moment method and the nodal method, respectively.
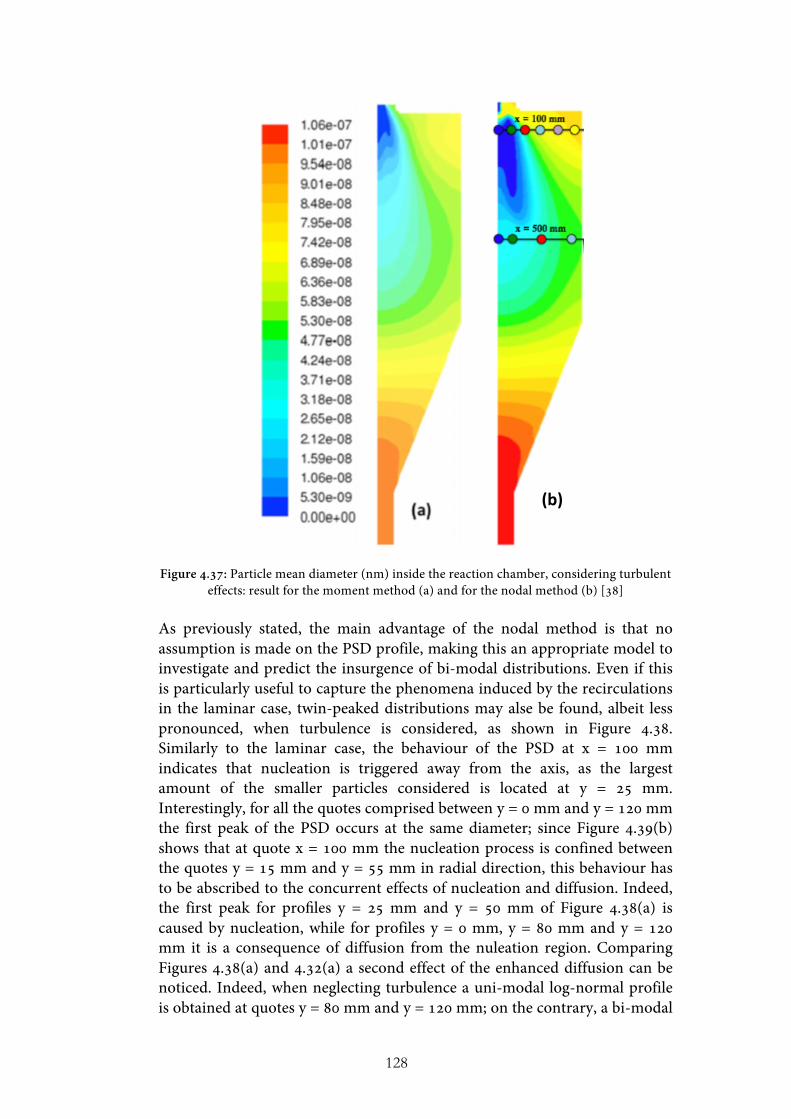
128
Figure 4.37: Particle mean diameter (nm) inside the reaction chamber, considering turbulent effects: result for the moment method (a) and for the nodal method (b) [38]
As previously stated, the main advantage of the nodal method is that no assumption is made on the PSD profile, making this an appropriate model to investigate and predict the insurgence of bi-modal distributions. Even if this is particularly useful to capture the phenomena induced by the recirculations in the laminar case, twin-peaked distributions may alse be found, albeit less pronounced, when turbulence is considered, as shown in Figure 4.38. Similarly to the laminar case, the behaviour of the PSD at x = 100 mm indicates that nucleation is triggered away from the axis, as the largest amount of the smaller particles considered is located at y = 25 mm. Interestingly, for all the quotes comprised between y = 0 mm and y = 120 mm the first peak of the PSD occurs at the same diameter; since Figure 4.39(b) shows that at quote x = 100 mm the nucleation process is confined between the quotes y = 15 mm and y = 55 mm in radial direction, this behaviour has to be abscribed to the concurrent effects of nucleation and diffusion. Indeed, the first peak for profiles y = 25 mm and y = 50 mm of Figure 4.38(a) is caused by nucleation, while for profiles y = 0 mm, y = 80 mm and y = 120 mm it is a consequence of diffusion from the nuleation region. Comparing Figures 4.38(a) and 4.32(a) a second effect of the enhanced diffusion can be noticed. Indeed, when neglecting turbulence a uni-modal log-normal profile is obtained at quotes y = 80 mm and y = 120 mm; on the contrary, a bi-modal
!"#$
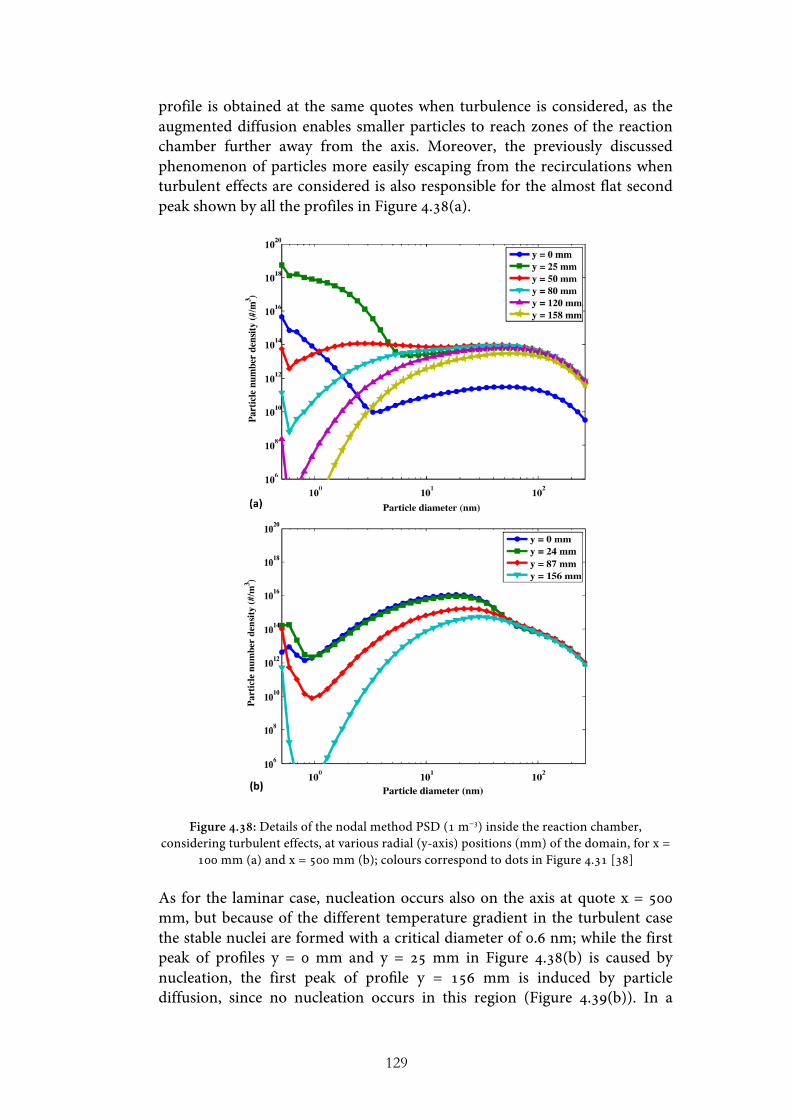
129
profile is obtained at the same quotes when turbulence is considered, as the augmented diffusion enables smaller particles to reach zones of the reaction chamber further away from the axis. Moreover, the previously discussed phenomenon of particles more easily escaping from the recirculations when turbulent effects are considered is also responsible for the almost flat second peak shown by all the profiles in Figure 4.38(a).
Figure 4.38: Details of the nodal method PSD (1 m−3) inside the reaction chamber, considering turbulent effects, at various radial (y-axis) positions (mm) of the domain, for x =
100 mm (a) and x = 500 mm (b); colours correspond to dots in Figure 4.31 [38] As for the laminar case, nucleation occurs also on the axis at quote x = 500 mm, but because of the different temperature gradient in the turbulent case the stable nuclei are formed with a critical diameter of 0.6 nm; while the first peak of profiles y = 0 mm and y = 25 mm in Figure 4.38(b) is caused by nucleation, the first peak of profile y = 156 mm is induced by particle diffusion, since no nucleation occurs in this region (Figure 4.39(b)). In a
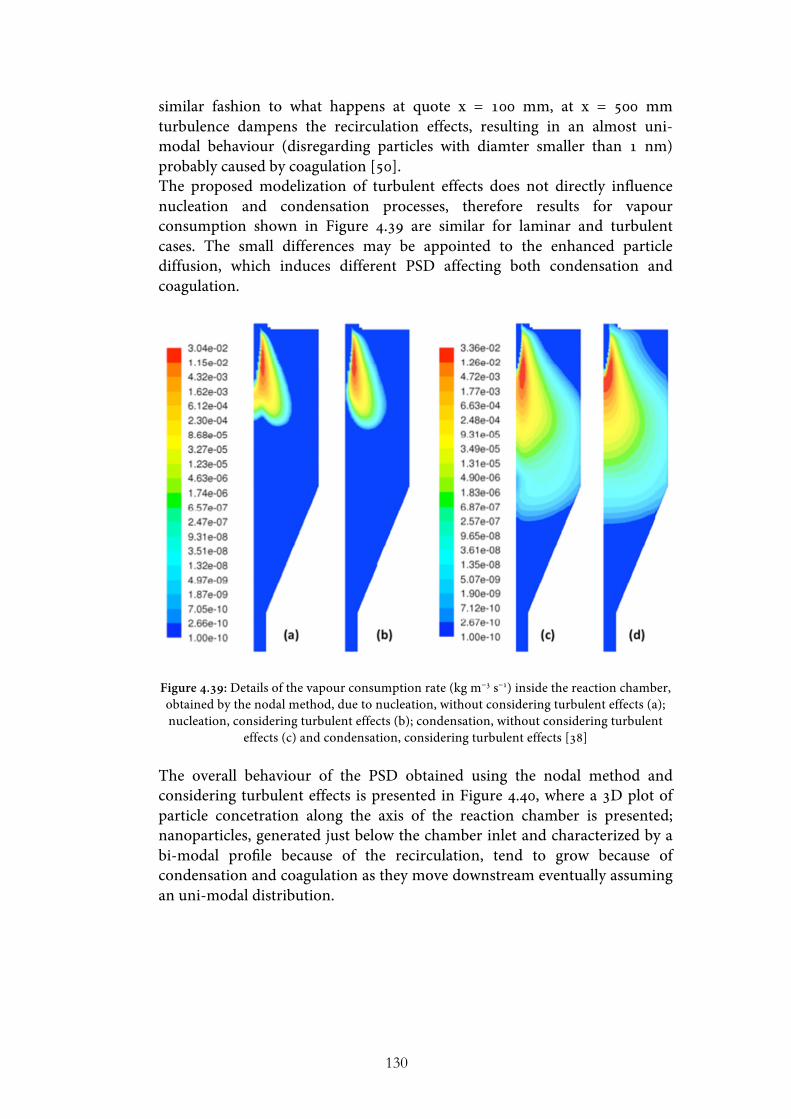
130
similar fashion to what happens at quote x = 100 mm, at x = 500 mm turbulence dampens the recirculation effects, resulting in an almost uni-modal behaviour (disregarding particles with diamter smaller than 1 nm) probably caused by coagulation [50]. The proposed modelization of turbulent effects does not directly influence nucleation and condensation processes, therefore results for vapour consumption shown in Figure 4.39 are similar for laminar and turbulent cases. The small differences may be appointed to the enhanced particle diffusion, which induces different PSD affecting both condensation and coagulation.
Figure 4.39: Details of the vapour consumption rate (kg m−3 s−1) inside the reaction chamber, obtained by the nodal method, due to nucleation, without considering turbulent effects (a); nucleation, considering turbulent effects (b); condensation, without considering turbulent
effects (c) and condensation, considering turbulent effects [38] The overall behaviour of the PSD obtained using the nodal method and considering turbulent effects is presented in Figure 4.40, where a 3D plot of particle concetration along the axis of the reaction chamber is presented; nanoparticles, generated just below the chamber inlet and characterized by a bi-modal profile because of the recirculation, tend to grow because of condensation and coagulation as they move downstream eventually assuming an uni-modal distribution.
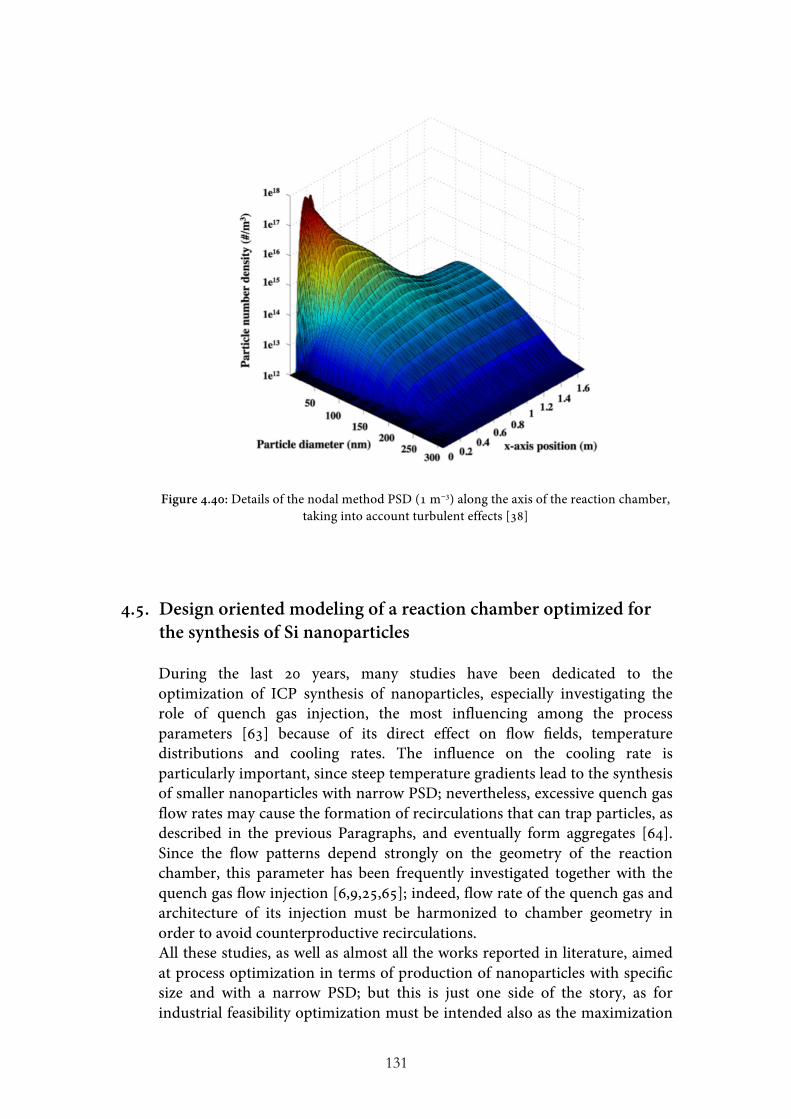
131
Figure 4.40: Details of the nodal method PSD (1 m−3) along the axis of the reaction chamber, taking into account turbulent effects [38]
4.5. Design oriented modeling of a reaction chamber optimized for the synthesis of Si nanoparticles
During the last 20 years, many studies have been dedicated to the optimization of ICP synthesis of nanoparticles, especially investigating the role of quench gas injection, the most influencing among the process parameters [63] because of its direct effect on flow fields, temperature distributions and cooling rates. The influence on the cooling rate is particularly important, since steep temperature gradients lead to the synthesis of smaller nanoparticles with narrow PSD; nevertheless, excessive quench gas flow rates may cause the formation of recirculations that can trap particles, as described in the previous Paragraphs, and eventually form aggregates [64]. Since the flow patterns depend strongly on the geometry of the reaction chamber, this parameter has been frequently investigated together with the quench gas flow injection [6,9,25,65]; indeed, flow rate of the quench gas and architecture of its injection must be harmonized to chamber geometry in order to avoid counterproductive recirculations. All these studies, as well as almost all the works reported in literature, aimed at process optimization in terms of production of nanoparticles with specific size and with a narrow PSD; but this is just one side of the story, as for industrial feasibility optimization must be intended also as the maximization

132
of the yield, meaning the ratio between the production rate of particles that can be collected in the filters and the mass flow rate of precursors. Therefore, in this chapter the focus is on controlling the flow field inside the reaction chamber in order to avoid the insurgence of recirculations, to limit the deposition of particles on the walls of the chamber and to maximize the process yield.
4.5.1. Modelling approach A two-dimensional steady state model for the plasma torch and reaction chamber similar to the one described in Paragraph 4.2.1 has been adopted for the simulations described in this Paragraph. The same assumptions are included on the side of thermo-fluid dynamic computations and the plasma governing equations may be written as Equations 4.1-4.3. The diffusion of gases, using the combined approach of Murphy and assuming local chemical equilibrium, is described by Equations 4.4-4.5; turbulence is accounted for using the standard k-ε model, Equations 4.6-4.8, and the electromagnetic field is computed using Equation 4.10. Precursor particle trajectories are obtained by solving Equation 4.11, while their thermal history by solving the energy balance of Equation 4.12; particles transition from solid to liquid phase is described by Equation 4.13 and the boiling model, Equations 4.17-4.19, is adopted to evaluate the transition from liquid to vapour phase. Finally, the moment method (Equations 4.45-4.52) is adopted to describe nanoparticle synthesis. Computational domain and boundary conditions The computational domain is composed of a lab-scale induction thermal plasma torch (Tekna Plasma System model PL35) and a reaction chamber for the synthesis of nanoparticles. In order to investigate the effect of chamber geometry on the process yield, different geometries, comprising a conical top part and a cylindrical bottom part, are considered; the height of the cone (H) and the diameter of the cylinder (D) are the variable dimensions of the chamber geometry, as shown in Figure 4.41. The conical part of the chamber houses two gas injection points, whose gas feed rates are named Q1 and Q2. The various combinations of H, D, Q1 and Q2 evaluated in the simulations reported in this Paragraph are reported in Table 4.2. The following operating conditions have been analysed: carrier gas 6.5 slpm pure Argon, primary gas 12 slpm pure Argon and sheath gas 60 slpm Ar + 6 slpm H2. The operating pressure, power coupled to the torch and operating frequency have been fixed at 60 kPa, 10 kW and 13.56 MHz, respectively. The electromagnetic field equations are solved in an enlarged domain extending 40 mm outside of the torch in the y-direction, using the extended field approach [42]. Silicon precursors with a mean diameter of 15 µm are injected with a feed rate of 3.5 g min−1. A no-slip boundary condition is applied on all the internal walls, while a 300 K temperature has been fixed at the external
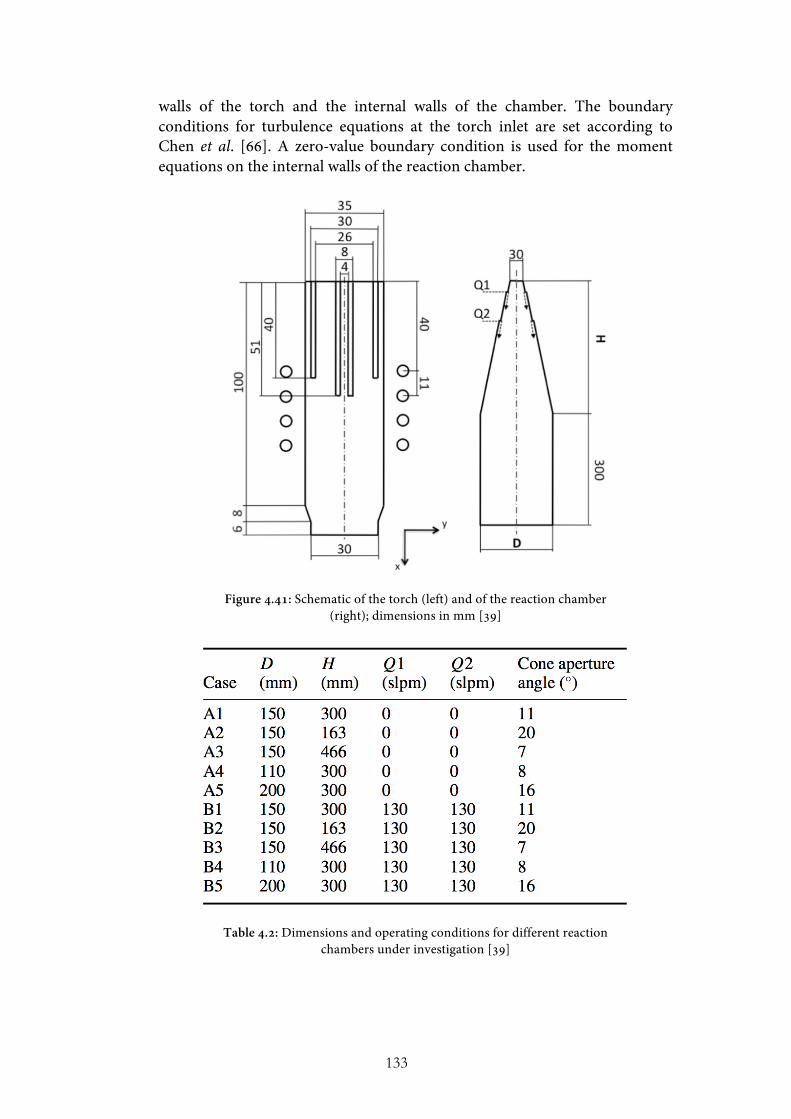
133
walls of the torch and the internal walls of the chamber. The boundary conditions for turbulence equations at the torch inlet are set according to Chen et al. [66]. A zero-value boundary condition is used for the moment equations on the internal walls of the reaction chamber.
Figure 4.41: Schematic of the torch (left) and of the reaction chamber (right); dimensions in mm [39]
Table 4.2: Dimensions and operating conditions for different reaction chambers under investigation [39]
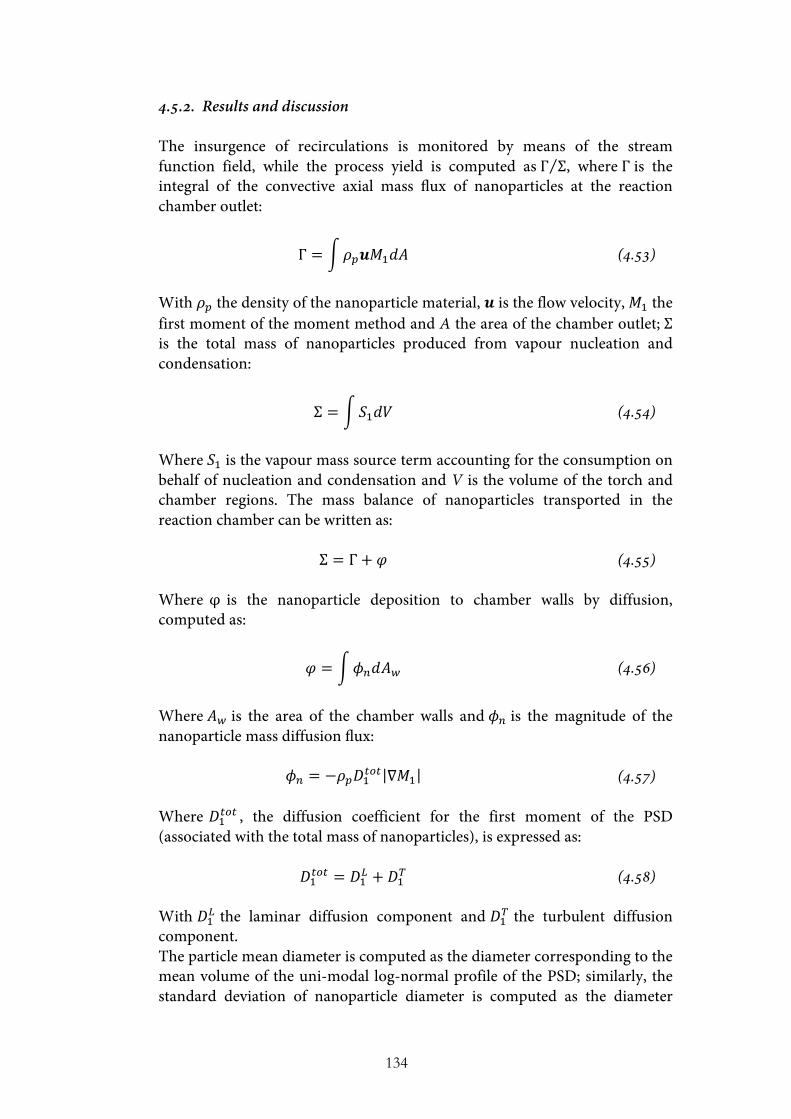
134
4.5.2. Results and discussion The insurgence of recirculations is monitored by means of the stream function field, while the process yield is computed as Γ Σ, where Γ is the integral of the convective axial mass flux of nanoparticles at the reaction chamber outlet:
Γ = 𝜌!𝒖𝑀!𝑑𝐴 (4.53)
With 𝜌! the density of the nanoparticle material, 𝒖 is the flow velocity, 𝑀! the first moment of the moment method and A the area of the chamber outlet; Σ is the total mass of nanoparticles produced from vapour nucleation and condensation:
Σ = 𝑆!𝑑𝑉 (4.54)
Where 𝑆! is the vapour mass source term accounting for the consumption on behalf of nucleation and condensation and V is the volume of the torch and chamber regions. The mass balance of nanoparticles transported in the reaction chamber can be written as:
Σ = Γ+ 𝜑 (4.55) Where φ is the nanoparticle deposition to chamber walls by diffusion, computed as:
𝜑 = 𝜙!𝑑𝐴! (4.56)
Where 𝐴! is the area of the chamber walls and 𝜙! is the magnitude of the nanoparticle mass diffusion flux:
𝜙! = −𝜌!𝐷!!"! ∇𝑀! (4.57) Where 𝐷!!"! , the diffusion coefficient for the first moment of the PSD (associated with the total mass of nanoparticles), is expressed as:
𝐷!!"! = 𝐷!! + 𝐷!! (4.58) With 𝐷!! the laminar diffusion component and 𝐷!! the turbulent diffusion component. The particle mean diameter is computed as the diameter corresponding to the mean volume of the uni-modal log-normal profile of the PSD; similarly, the standard deviation of nanoparticle diameter is computed as the diameter
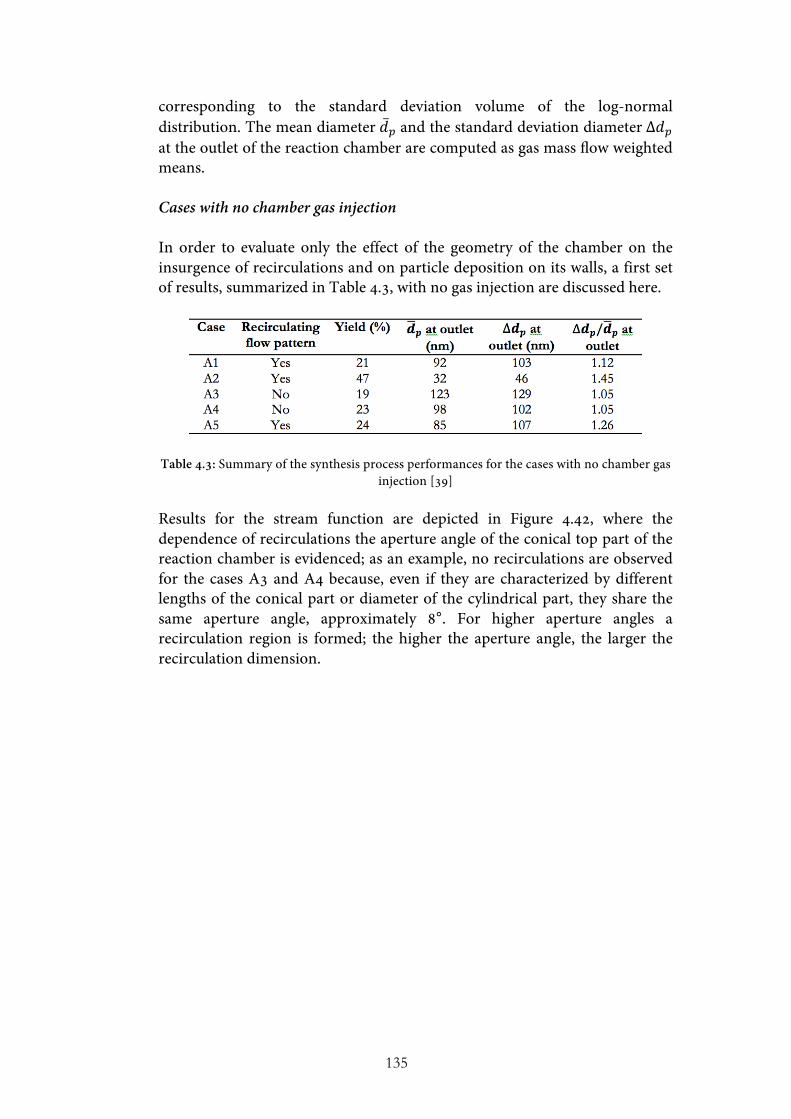
135
corresponding to the standard deviation volume of the log-normal distribution. The mean diameter 𝑑! and the standard deviation diameter ∆𝑑! at the outlet of the reaction chamber are computed as gas mass flow weighted means. Cases with no chamber gas injection In order to evaluate only the effect of the geometry of the chamber on the insurgence of recirculations and on particle deposition on its walls, a first set of results, summarized in Table 4.3, with no gas injection are discussed here.
Table 4.3: Summary of the synthesis process performances for the cases with no chamber gas injection [39]
Results for the stream function are depicted in Figure 4.42, where the dependence of recirculations the aperture angle of the conical top part of the reaction chamber is evidenced; as an example, no recirculations are observed for the cases A3 and A4 because, even if they are characterized by different lengths of the conical part or diameter of the cylindrical part, they share the same aperture angle, approximately 8°. For higher aperture angles a recirculation region is formed; the higher the aperture angle, the larger the recirculation dimension.
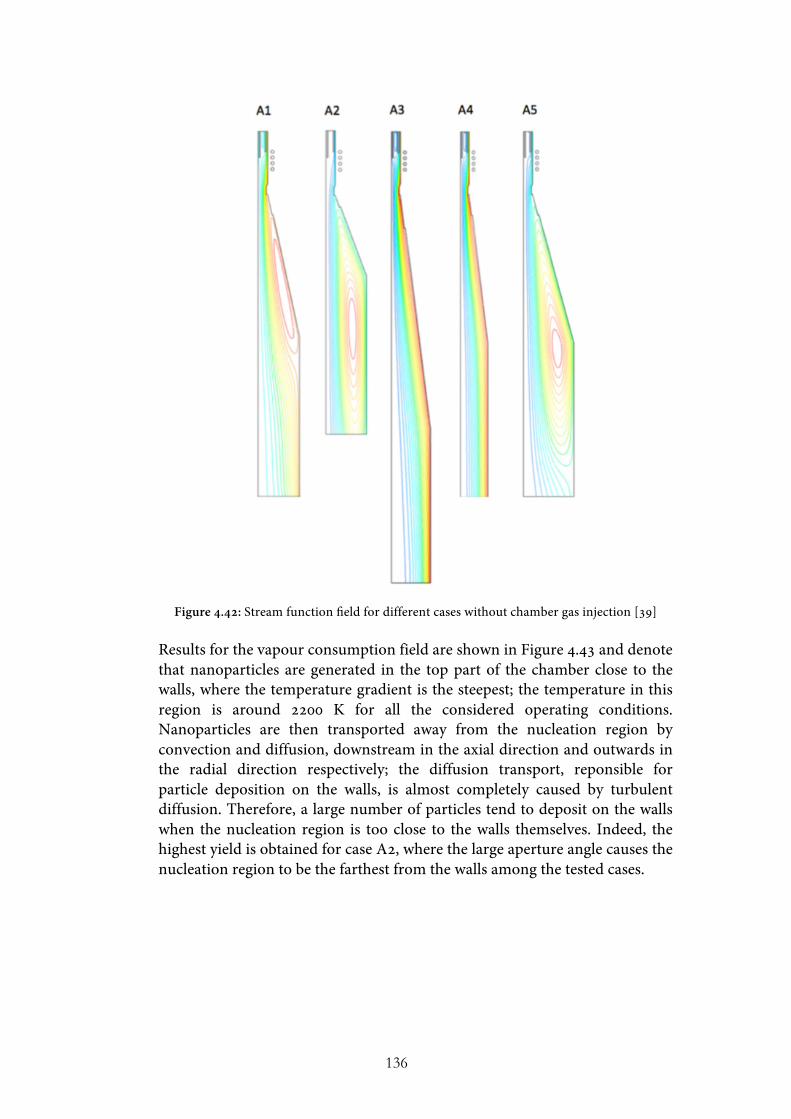
136
Figure 4.42: Stream function field for different cases without chamber gas injection [39] Results for the vapour consumption field are shown in Figure 4.43 and denote that nanoparticles are generated in the top part of the chamber close to the walls, where the temperature gradient is the steepest; the temperature in this region is around 2200 K for all the considered operating conditions. Nanoparticles are then transported away from the nucleation region by convection and diffusion, downstream in the axial direction and outwards in the radial direction respectively; the diffusion transport, reponsible for particle deposition on the walls, is almost completely caused by turbulent diffusion. Therefore, a large number of particles tend to deposit on the walls when the nucleation region is too close to the walls themselves. Indeed, the highest yield is obtained for case A2, where the large aperture angle causes the nucleation region to be the farthest from the walls among the tested cases.
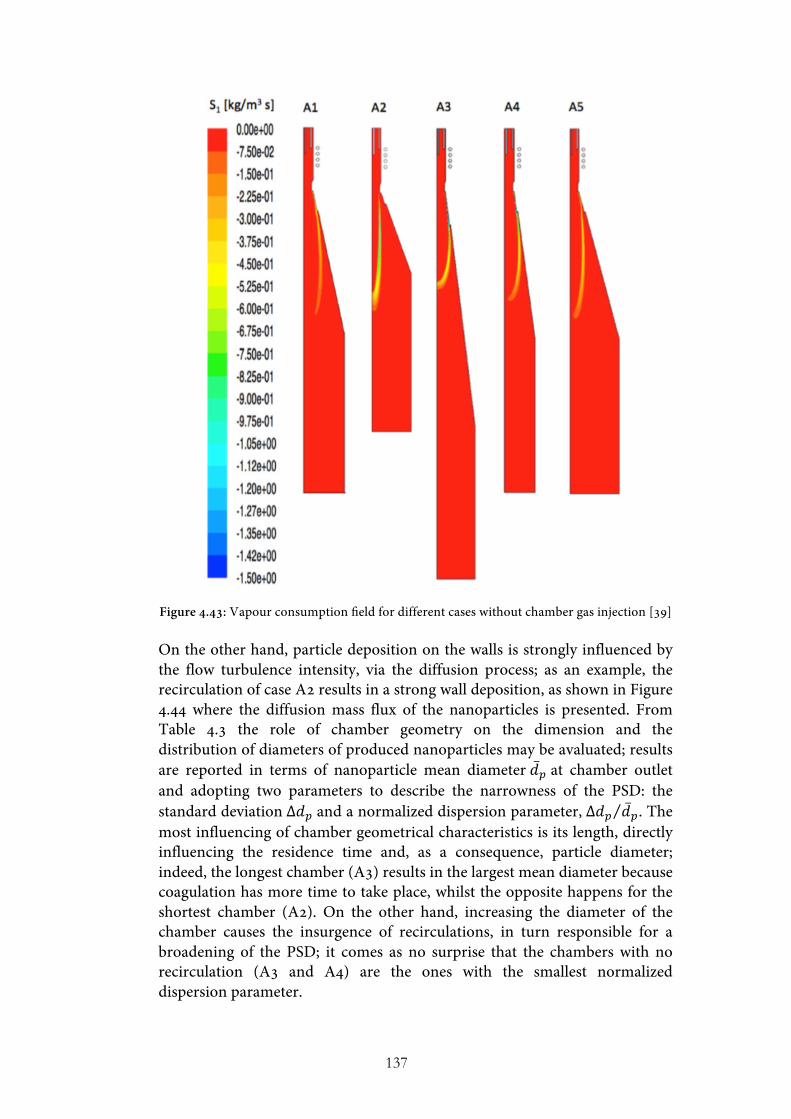
137
Figure 4.43: Vapour consumption field for different cases without chamber gas injection [39]
On the other hand, particle deposition on the walls is strongly influenced by the flow turbulence intensity, via the diffusion process; as an example, the recirculation of case A2 results in a strong wall deposition, as shown in Figure 4.44 where the diffusion mass flux of the nanoparticles is presented. From Table 4.3 the role of chamber geometry on the dimension and the distribution of diameters of produced nanoparticles may be avaluated; results are reported in terms of nanoparticle mean diameter 𝑑! at chamber outlet and adopting two parameters to describe the narrowness of the PSD: the standard deviation ∆𝑑! and a normalized dispersion parameter, ∆𝑑! 𝑑!. The most influencing of chamber geometrical characteristics is its length, directly influencing the residence time and, as a consequence, particle diameter; indeed, the longest chamber (A3) results in the largest mean diameter because coagulation has more time to take place, whilst the opposite happens for the shortest chamber (A2). On the other hand, increasing the diameter of the chamber causes the insurgence of recirculations, in turn responsible for a broadening of the PSD; it comes as no surprise that the chambers with no recirculation (A3 and A4) are the ones with the smallest normalized dispersion parameter.

138
Since the process yield for the cases evaluated is always below 50%, not enough for industrial scale production, attention will now be turned to the use of a quenching gas as a means to increase this value.
Figure 4.44: Diffusion mass flux of nanoparticles for different cases without chamber gas injection [39]
Cases with chamber gas injection The relation between chamber geometry and quenching and its effect on nanoparticle synthesis are investigated here by injecting two gases (Q1 and Q2, with mass flow rate 130 slpm each) in the same reaction chambers previously described in this Paragraph. Results for these simulations are presented in 4.4, where a significant increase of yield with respect to the cases with no gas injection is reported.
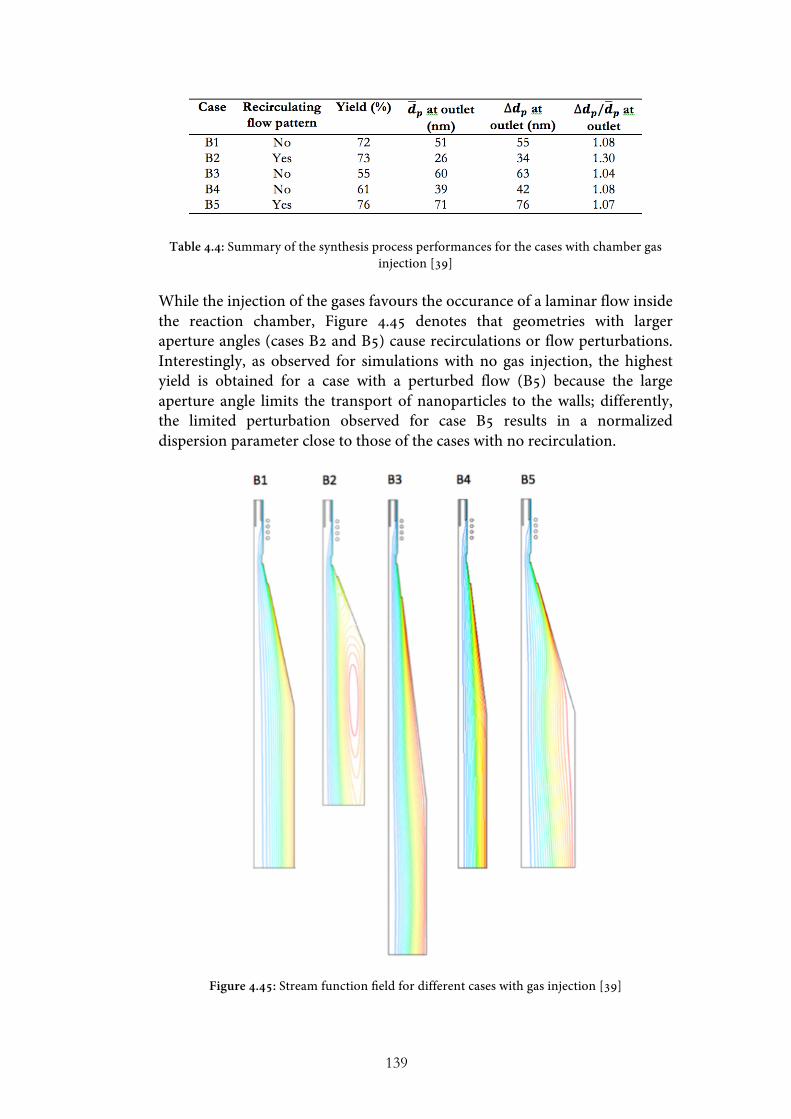
139
Table 4.4: Summary of the synthesis process performances for the cases with chamber gas injection [39]
While the injection of the gases favours the occurance of a laminar flow inside the reaction chamber, Figure 4.45 denotes that geometries with larger aperture angles (cases B2 and B5) cause recirculations or flow perturbations. Interestingly, as observed for simulations with no gas injection, the highest yield is obtained for a case with a perturbed flow (B5) because the large aperture angle limits the transport of nanoparticles to the walls; differently, the limited perturbation observed for case B5 results in a normalized dispersion parameter close to those of the cases with no recirculation.
Figure 4.45: Stream function field for different cases with gas injection [39]
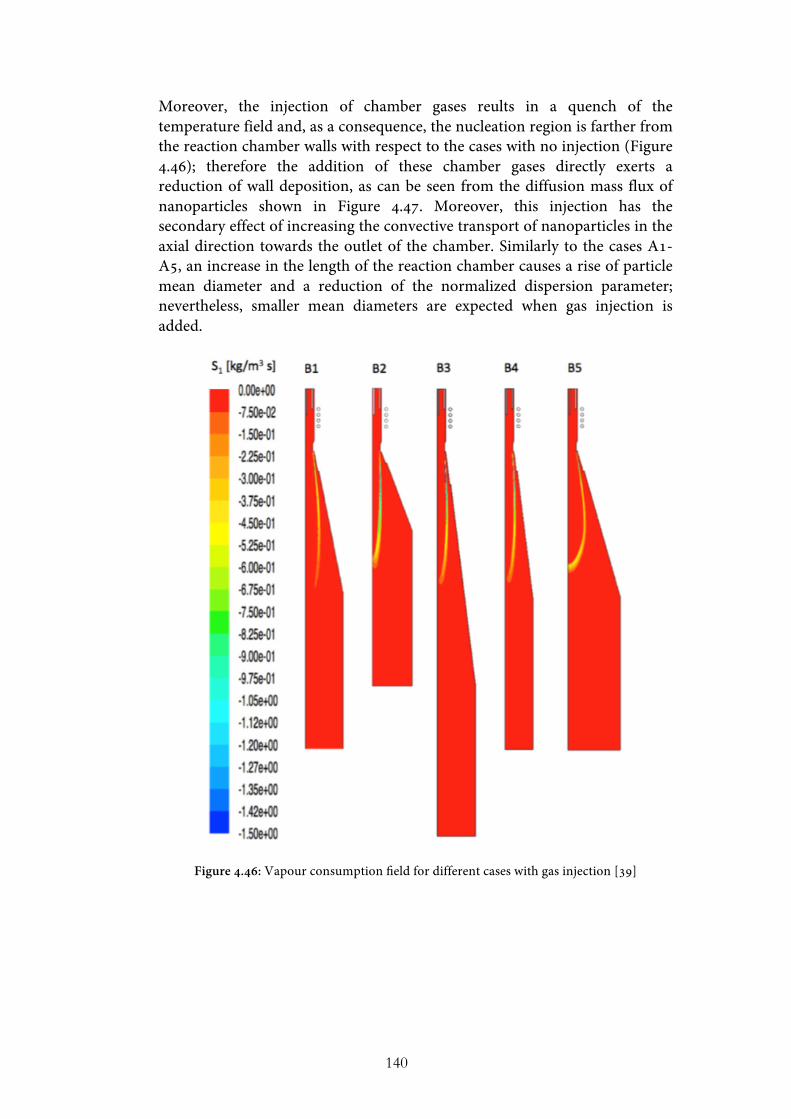
140
Moreover, the injection of chamber gases reults in a quench of the temperature field and, as a consequence, the nucleation region is farther from the reaction chamber walls with respect to the cases with no injection (Figure 4.46); therefore the addition of these chamber gases directly exerts a reduction of wall deposition, as can be seen from the diffusion mass flux of nanoparticles shown in Figure 4.47. Moreover, this injection has the secondary effect of increasing the convective transport of nanoparticles in the axial direction towards the outlet of the chamber. Similarly to the cases A1-A5, an increase in the length of the reaction chamber causes a rise of particle mean diameter and a reduction of the normalized dispersion parameter; nevertheless, smaller mean diameters are expected when gas injection is added.
Figure 4.46: Vapour consumption field for different cases with gas injection [39]
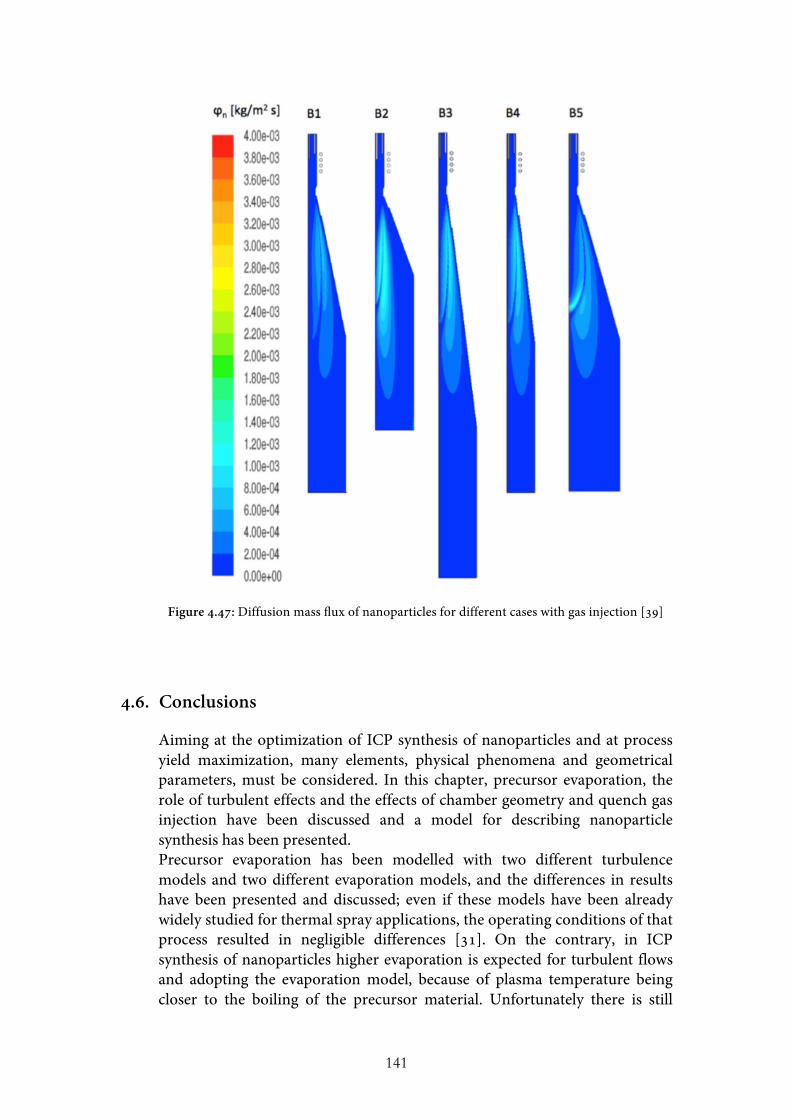
141
Figure 4.47: Diffusion mass flux of nanoparticles for different cases with gas injection [39]
4.6. Conclusions
Aiming at the optimization of ICP synthesis of nanoparticles and at process yield maximization, many elements, physical phenomena and geometrical parameters, must be considered. In this chapter, precursor evaporation, the role of turbulent effects and the effects of chamber geometry and quench gas injection have been discussed and a model for describing nanoparticle synthesis has been presented. Precursor evaporation has been modelled with two different turbulence models and two different evaporation models, and the differences in results have been presented and discussed; even if these models have been already widely studied for thermal spray applications, the operating conditions of that process resulted in negligible differences [31]. On the contrary, in ICP synthesis of nanoparticles higher evaporation is expected for turbulent flows and adopting the evaporation model, because of plasma temperature being closer to the boiling of the precursor material. Unfortunately there is still
142
limited experimental evidence to decide which of the proposed models better suits the description of the real process. Indeed, even if some validation of turbulent models in the region downstream the plasma torch have been reported in literature [47,67,68], on the side of precursor evaporation very few experimental works on the topic have been presented, mainly because of inherent difficulties in measuring the evaporation rate; nevertheless, some measurements of precursor vapour concentration and size distribution of the precursor are available in literature [69,36]. Therefore, validation of these models is still an open issue that will be addressed in future investigations. The process of nanoparticle synthesis has been studied with a 2-D version of the nodal method, whose results have been compared with those of a 2-D moment method; confirming the validity of the proposed nodal model and underlining the advantage of adopting an unconstrained PSD, resulting in a better description of the synthesis process and enabling to predict the formation of multi-modal PSD in recirculation areas. Nonetheless, as particle mean diameter was adopted as a reference in this comparison, few words should be added on the possibility, and the resulting issues, of its use also for experimental validation of nanoparticle modeling; indeed, in the proposed models particles are assumed spherical, but this rarely is the case in the real process, where nanoparticles tend to form aggregates of many spherical particles [70]. During the coagulation process, particles first endure a coalescent growth that results in a spherical shape, followed by an aggregation phase where fractal clusters are formed [71]; therefore, assuming nanoparticles to be spherical means that only coalescence is considered, while fractal aggregates are treated as spherical particles with the same mass. Considering BET and centrifuge analysis and TEM counting, typical instruments for PSD and mean diameter evaluation, the former always results in lower mean diameters with respect to modeling when aggregates are formed, since it is based on the measurement of N2 adsorption on particle surface; indeed, aggregates composed of small nanoparticles, will have a higher surface to volume ratio than spherical nanoparticles having the same overall volume. Moreover, BET analysis doesn’t provide the operator with any information regarding nanoproducts being either aggregates or spherical particles. On the contrary, TEM counting (or other high magnification microscopy techniques) provides an accurate, albeit time consuming, characterization of PSD and mean diameter, where the dimensional range of primary spherical particles and cluster formation and their morphology can be easily pointed out; unfortunately, results from this technique can be related to results from the proposed models only at the additional expense of converting the sum of the volumes of the primary particles composing an aggregate into a spherical particle of the corresponding overall volume. Finally, centrifuge analysis is probably the most appropriate for the task of validating the proposed models, as it is a technique driven by the overall mass of particles/clusters (or their volume, for particles with uniform composition), disregarding their shape; however, failing to capture aggregates
143
formation, this techniques provides a partial picture of reality, even if similar to the one assumed in the models. Moreover, a model has been proposed to describe the effect of turbulence on nanoparticle synthesis; the influence of turbulence on the various physical processes has been evaluated by means of an analysis based on Kolomogorov’s lentgh scale and diffusion has been found to be the only affected process. Considering turbulent effects resulted in the synthesis of smaller particles, weakening the effect of recirculations; moreover, particles distribute along a multi-modal profile in the upper part of the reaction chamber, while a uni-modal PSD characterizes the lower part of the chamber due to coagulation. Turbulence is also suggested to be the main responsible for particle deposition on the walls of the reaction chamber, with a direct influence on the yield of the process. Various chamber geometries have been considered in order to avoid the formation of recirculation areas that leads to poor particle quality; the aperture angle of the conical part has been found to be the most influencing parameter. Finally, the injection of a chamber gas has been proposed as a suitable means for reducing particle deposition on the walls and increasing the yield of the process; even if simulations have been carried out for operating conditions typical of lab-scale processes, the proposed analysis can be extended to industrial-scale processes; where the adoption of high flow rate gas injections might be sustainable through the adoption of recirculation units.
144
References [1] Shigeta M and Murphy A B 2011 Thermal plasmas for nanofabrication
Journal of Physics D: Applied Physics 44 174025 [2] Guo J Y, Gitzhofer F and Boulos M I 1995 Induction plasma synthesis of
ultrafine SiC powders from silicon and CH4 Journal of Materials Science 30 5589-5599
[3] Siegmann S, Girshick S L, Szepvolgyi J, Leparoux M, Shin J W, Schreuders C, Rohr L, Ishigaki T, Jurewicz J W, Habib M, Baroud G, Gitzhofer F, Kambara M, Diaz J M A and Yoshida T 2008 Nano powder synthesis by plasmas High Temperature Material Processes 12 205-254
[4] Leparoux M, Schreuders C, Shin J W and Siegmann S 2005 Induction plasma synthesis of carbide nano-powders Advanced Engineering Materials 7(5) 349-353
[5] Girshick S L, Chiu C P, Muno R, Wu C Y, Yang L, Singh S K and McMurry P H 1993 Thermal plasma synthesis of ultrafine iron particles Journal of Aerosol Science 24 367-382
[6] Goortani B M, Mendoza N Y and Proulx 2006 Synthesis of SiO2 nanoparticles in rf plasma reactors: effect of feed rate and quench gas injection International Journal of Chemical Reactor Engineering 4 (1) A33
[7] Kong P C and Pfender E 1991 Heat transfer in thermal plasma processing (NewYork: ASME)
[8] Vissokov G, Grancharov I and Tsvetanov T 2003 On the plasma-chemical synthesis of nanopowders Plasma Science and Technology 5 2039-2050
[9] Goortani B M, Proulx P, Xue S and Mendoza N Y 2007 Controlling nanostructure in thermal plasma processing: Moving from highly aggregated porous structure to spherical silica nanoparticles Powder Technology 175 22-32
[10] Watanabe T and Fujiwara K 2004 Nucleation and growth of oxide nanoparticles prepared by induction thermal plasmas Chemical Engineering Communications 191 1343-1361
[11] Boulos M I 1996 New frontiers in thermal plasma processing Pure and Applied Chemistry 68 1007-1010
[12] Jiayin G, Xiaobao F, Dolbec R, Siwen X, Jurewicz J and Boulos M 2010 Development of Nanopowder Synthesis Using Induction Plasma Plasma Science and Technology 12 188
[13] Fan X and Ishigaki T 1997 Critical free energy for nucleation from the congruent melt of MoSi2 Journal of Crystal Growth 171 166-173
[14] Fan X, Ishigaki T and Sato Y 1997 Phase formation in molybdenum disilicide powders during in-flight induction plasma treatment Journal of Materials Research 12 1315-1326
[15] Shigeta M and Watanabe T 2007 Growth mechanism of silicon-based functional nanoparticles fabricated by inductively coupled thermal plasmas Journal of Physics D: Applied Physics 40 2407-2419
145
[16] Murphy A B, Boulos M I, Colombo V, Fauchais P, Ghedini E, Gleizes A, Mostaghimi J, Proulx P and Schram D C 2008 Advanced thermal plasma modelling High Temperature Material Processes 12 255-336
[17] Bernardi D, Colombo V, Ghedini E and Mentrelli A Three-dimensional modeling of inductively coupled plasma torches 2005 Pure and Applied Chemistry 77 359-372
[18] Bernardi D, Ghedini E and Colombo V 2004 Three dimensional modelling of inductively coupled plasma torches: comparison with experiments and applications Czechoslovak Journal of Physics 54 C489–C518
[19] Bilodeau J F and Proulx P 1996 A mathematical model for ultrafine iron powder growth in a thermal plasma Aerosol Science and Technology 24 175-189
[20] Desilets M, Bilodeau J F and Proulx 1997 Modelling of the reactive synthesis of ultra-fine powders in a thermal plasma reactor Journal of Physics D: Applied Physics 30 1951-1960
[21] Cruz A C d and Munz R J 1997 Vapor phase synthesis of fine particles IEEE Transactions on Plasma Science 25 1008-1016
[22] Murphy A B 2004 Formation of titanium nanoparticles from a titanium tetrachloride plasma Journal of Physics D: Applied Physics 37 2841-2847
[23] Shigeta M and Watanabe T 2008 Two-dimensional analysis of nanoparticle formation in induction thermal plasmas with counterflow cooling Thin Solid Films 516 4415-4422
[24] Shigeta M and Watanabe T 2008 Numerical investigation of cooling effect on platinum nanoparticle formation in inductively coupled thermal plasmas Journal of Applied Physics 103 074903
[25] Gonzalez N Y M, Morsli M E and Proulx P 2008 Production of nanoparticles in thermal plasmas: a model including evaporation, nucleation, condensation, and fractal aggregation Journal of Thermal Spray Technology 17 533-550
[26] Chen X and Pfender E 1982 Heat transfer to a single particle exposed to a thermal plasma Plasma Chemistry and Plasma Processing 2 185-212
[27] Chen X and Pfender E 1982 Unsteady heating and radiation effects of small particles in a thermal plasma Plasma Chemistry and Plasma Processing 2 293-316
[28] Chen X and Pfender E 1983 Behavior of small particles in a thermal plasma flow Plasma chemistry and plasma processing 3 351-366
[29] Chen X and Pfender E 1983 Effect of the Knudsen number on heat transfer to a particle immersed into a thermal plasma Plasma Chemistry and Plasma Processing 3 97-113
[30] Chen X, Chyou Y, Lee Y and Pfender E 1985 Heat transfer to a particle under plasma conditions with vapor contamination from the particle Plasma chemistry and plasma processing 5 119-41
[31] Lee Y, Chyou Y and Pfender E 1985 Particle dynamics and particle heat and mass transfer in thermal plasmas. Part II. Particle heat and mass transfer in thermal plasmas Plasma chemistry and plasma processing 5 391-414
[32] Pfender E 1985 Heat and momentum transfer to particles in thermal plasma flows Pure and Applied Chemistry 57 1179-1195
146
[33] Pfender E and Lee Y 1985 Particle dynamics and particle heat and mass transfer in thermal plasmas. Part I. The motion of a single particle without thermal effects Plasma chemistry and plasma processing 5 211-237
[34] Lee Y and Pfender E 1987 Particle dynamics and particle heat and mass transfer in thermal plasmas. Part III. Thermal plasma jet reactors and multiparticle injection Plasma chemistry and plasma processing 7 1-27
[35] Pfender E 1989 Particle behavior in thermal plasmas Plasma Chemistry and Plasma Processing 9 167-194
[36] Ye R, Ishigaki T, Jurewicz J, Proulx P and Boulos M I 2004 In-Flight Spheroidization of Alumina Powders in Ar–H2 and Ar–N2 Induction Plasmas Plasma Chemistry and Plasma Processing 24 555-571
[37] Colombo V, Ghedini E, Gherardi M and Sanibondi P Evaluation of precursor evaporation in Si nano-particle synthesis by radio-frequency induction thermal plasmas submitted to Plasma Sources Science and Technology
[38] Colombo V, Ghedini E, Gherardi M, Sanibondi P and Shigeta M 2012 A two-Dimensional Nodal Model with Turbulent Effects for the Synthesis of Si Nano-Particles by Inductively Coupled Thermal Plasmas Plasma Sources Science and Technology 21 025001
[39] Colombo V, Ghedini E, Gherardi M and Sanibondi P 2012 Modelling for the optimization of the reaction chamber in silicon nanoparticle synthesis by radio-frequency induction thermal plasma Plasma Sources Science and Technology 21 055007
[40] Proulx P, Mostaghimi J and Boulos M 1987 Heating of powders in an R.F. inductively coupled plasma under dense loading conditions Plasma Chemistry and Plasma Processing 7 29-52
[41] Murphy A B 1993 Diffusion in equilibrium mixtures of ionized gases Physical Review E 48 3594
[42] Colombo V, Ghedini E and Sanibondi P 2010 A three-dimensional investigation of the effects of excitation frequency and sheath gas mixing in an atmospheric-pressure inductively coupled plasma system Journal of Physics D: Applied Physics 43 105202
[43] Bolot R, Imbert M and Coddet C 2001 On the use of a low-Reynolds extension to the Chen–Kim (k-ε) model to predict thermal exchanges in the case of an impinging plasma jet International Journal of Heat and Mass Transfer 44 1095-1106
[44] ANSYS 2009 ANSYS FLUENT 12.0 Theory guide (Pennsylvania, USA: Canonsburg)
[45] Bernardi D, Colombo V, Ghedini E, Mentrelli A and Trombetti T 2004 3-D numerical simulation of fully-coupled particle heating in ICPTs The European Physical Journal D - Atomic, Molecular, Optical and Plasma Physics 28 423-33
[46] Colombo V, Ghedini E and Sanibondi P 2010 Three-dimensional investigation of particle treatment in an RF thermal plasma with reaction chamber Plasma Sources Science and Technology 19 065024
[47] Colombo V, Deschenaux C, Ghedini E, Gherardi M, Jaeggi C, Leparoux M, Mani V and Sanibondi P 2012 Fluid-dynamic characterization of a radio-

147
frequency induction thermal plasma system for nanoparticle synthesis Plasma Sources Science and Technology 21 045010
[48] Gelbard F, Tambour Y and Seifield J H 1980 Sectional representations for simulating aerosol dynamics Journal of Colloid and Interface Science 76 541-556
[49] Pratsinis S E and Kim K S 1989 Particle coagulation, diffusion and thermophoresis in laminar tube flows Journal of Aerosol Science 20 101-111
[50] Friedlander S K 2000 Smoke, dust and haze, fundamentals of aerosol dynamics 2nd edn (Oxford: Oxford University Press)
[51] Prakash A, Bapat A P and Zachariah M R 2003 A simple numerical algorithm and software for solution of nucleation, surface growth, and coagulation problems Aerosol Science and Technology 37 892-898
[52] Phanse G M and Pratsinis S E 1989 Theory for aerosol generation in laminar flow condensers Aerosol Science and Technology 11 100
[53] Fuchs N A 1964 Mechanics of aerosols (NewYork: Pergamon) [54] Bernardi D, Colombo V, Ghedini E and Mentrelli A 2003 Comparison of
different techniques for the FLUENT©-based treatment of the electromagnetic field in inductively coupled plasma torches European Journal of Physics D 27 55–72
[55] 2006 FLUENT© 6.3 User’s Guide Fluent Inc. [56] Colombo V, Concetti A, Ghedini E, Gherardi M and Sanibondi P 2011 Three-
dimensional time-dependent large eddy simulation of turbulent flows in an inductively coupled thermal plasma torch with a reaction chamber IEEE Transactions on Plasma Science 39 2894-2895
[57] Kim K S, Moradian A, Mostaghimi J, Alinejad Y, Shahverdi A, Simard B and Soucy G 2009 Synthesis of single-walled carbon nanotubes by induction thermal plasma Nano Research 2 800-817
[58] Hirschfelder J O, Curtiss C F and Bird R B 1964 Molecular theory of gases and liquids (NewYork: Wiley)
[59] Girshick S K, Chiu P C and McMurry P H 1990 Time-dependent aerosol models and homogeneous nucleation rates Aerosol Science and Technology 13 465-477
[60] Seinfeld J H and Pandis S N 1998 Atmospheric chemistry and physics, from air pollution to climate change (NewYork: Wiley)
[61] Shigeta M and Watanabe T 2009 Two-directional nodal model for co-condensation growth of multicomponent nanoparticles in thermal plasma processing Journal of Thermal Spray Technology 18 1022-1037
[62] Smoluchowski M 1917 Versuch einer mathematischen theorie der koagulationskinetik kolloider lösungen Zeitschrift für Physikalische Chemie 92 129-168
[63] Buchner P, Lutzenkirchen-Hecht D, Strehblow H H and Uhlenbusch J 1999 Production and characterization of nanosized Cu/O/SiC composite particles in a thermal r.f. plasma reactor Journal of Materials Science 34 925
[64] Ye R, Li J G and Ishigaki T 2007 Controlled synthesis of alumina nanoparticles using inductively coupled thermal plasma with enhanced quenching Thin Solid Films 515 4251-4257
148
[65] Guo J, Fan X, Dolbec R, Xue S, Jurewicz J and Boulos M 2010 Development of nanopowder synthesis using induction plasma Plasma Science and Technology 12 188
[66] Chen K and Boulos M I 1994 Turbulence in induction plasma modelling Journal of Physics D: Applied Physics 27 946
[67] Rahmane M, Soucy G and Boulos M I 1994 Mass transfer in induction plasma reactors International Journal of Heat and Mass Transfer 37 2035-46
[68] Rahmane M, Soucy G and Boulos M I 1995 Diffusion phenomena of a cold gas in a thermal plasma stream Plasma Chemistry and Plasma Processing 16 169-89
[69] Vardelle M, Trassy C, Vardelle A and Fauchais P 1991 Experimental investigation of powder vaporization in thermal plasma jets Plasma Chemistry and Plasma Processing 11 185-201
[70] Kaplan C R and Gentry J W 1988 Agglomeration of chain-like combustion aerosols due to brownian motion Aerosol Science and Technology 8 11-28
[71] Kazakov A and Frenklach M 1998 Dynamic modeling of soot particle coagulation and aggregation: implementation with the methods of moments and application to high-pressure laminar premixed flames Combustion and Flame 114 484-501

149
150
ACKNOWLEDGEMENTS
As always in one’s life, the most gratifying and difficult task is acknowledging others for their role in our experiences, achievements and personal growth, even if often no words can capture their importance and give the proper relevance to their merits. I could never and I would never start these acknowledgements from anyone except Laura, my long-time girlfriend and the most important person I have ever met in my life. She played a fundamental role in my decision of undertaking PhD studies and for that I will never be able to express my gratitude enough. But, most important, she has been the closest person in all the brightest and darkest moments of the last ten years, the lighthouse to help me finding my route. I should also thank my parents for their continuous support and their many useful advice and my friends, particularly Alessandro, for the always too few hours spent together. A word has to be spent to thank all the people I worked with during the last three years. Paolo and Marco, more friends than colleagues, for the many scientific and non-scientific discussions; Fabio, Alessia, Gianmatteo and Emanuele, for their availability to share their experiences; Romolo, Anna and Augusto, younger PhD students whose eyes do shine. This list would never be complete without acknowledging Prof. Vittorio Colombo, for his importance in my growth not only as a young researcher, but also as a person; I am really thankful for the privilege I had in working with him and for the honour of his friendship. Special thanks also go to Prof. Masaya Shigeta and Prof. Alexander Fridman, who I had the opportunity to meet, to learn from and to work with during their brief stay in Bologna and with whom I am eager to work again in near future. Many others should be mentioned and a list, disordered and surely incomplete, of those to whom my thought goes follows.
Brais Vazquez Silvano Dallavalle Mauro Vancini Riccardo Fazzioli Giorgio Dilecce Piero Favia Luca Lusvarghi Joachim Heberlein Thierry Renault
Cataldo De Laurentis Alberto Musso Alain Glaizes Anthony B. Murphy Maher Boulos Javad Mostaghimi
Valerian Nemchinsky Piero Ravetto Marc Leparoux Christian Deschenaux Christian Jaeggi Christoph Delval
Nelis Daniels Stijn Put Maria Letizia Focarete Matteo Minelli Maria Grazia De Angelis Luisa Stella Dolci Marco Zaccaria Laura Calzà Davide Fabiani
Lorella Ceschini