Economia - AMS Dottorato
167
Alma Mater Studiorum – Università di Bologna DOTTORATO DI RICERCA IN Economia Ciclo 29 Settore Concorsuale: 13/A1 Settore Scientifico Disciplinare: SECS-P/01 ESSAYS IN VERTICAL AGREEMENTS AND CONSUMER BEHAVIOR Presentata da: Marco Magnani Coordinatore Dottorato Supervisore Prof. Vincenzo Denicolò Prof. Vincenzo Denicolò Esame finale anno 2018
-
Upload
khangminh22 -
Category
Documents
-
view
1 -
download
0
Transcript of Economia - AMS Dottorato

Alma Mater Studiorum – Università di Bologna
DOTTORATO DI RICERCA IN
Economia
Ciclo 29
Settore Concorsuale: 13/A1
Settore Scientifico Disciplinare: SECS-P/01
ESSAYS IN VERTICAL AGREEMENTS AND CONSUMER BEHAVIOR
Presentata da: Marco Magnani
Coordinatore Dottorato Supervisore
Prof. Vincenzo Denicolò Prof. Vincenzo Denicolò
Esame finale anno 2018

2

Contents
Abstract v
1 Hybrid Allocation of Control Rights over Retail Pricing 1
1.1 Introduction . . . . . . . . . . . . . . . . . . . . . . . . . . . . . . . . . . . . . . . . . 4
1.2 Literature . . . . . . . . . . . . . . . . . . . . . . . . . . . . . . . . . . . . . . . . . . 6
1.3 Model setup . . . . . . . . . . . . . . . . . . . . . . . . . . . . . . . . . . . . . . . . . 17
1.3.1 Market demand . . . . . . . . . . . . . . . . . . . . . . . . . . . . . . . . . . . 18
1.3.2 Market configurations . . . . . . . . . . . . . . . . . . . . . . . . . . . . . . . 19
1.3.3 Timing . . . . . . . . . . . . . . . . . . . . . . . . . . . . . . . . . . . . . . . 21
1.3.4 Vertical integration . . . . . . . . . . . . . . . . . . . . . . . . . . . . . . . . . 21
1.4 Model analysis with per unit linear fees . . . . . . . . . . . . . . . . . . . . . . . . . . 22
1.4.1 Wholesale configuration . . . . . . . . . . . . . . . . . . . . . . . . . . . . . . 23
1.4.2 Agency configuration . . . . . . . . . . . . . . . . . . . . . . . . . . . . . . . . 25
1.4.3 Hybrid configuration . . . . . . . . . . . . . . . . . . . . . . . . . . . . . . . . 27
1.4.4 Comparison and choice of business configurations . . . . . . . . . . . . . . . . 30
1.5 Model analysis with ad valorem fees . . . . . . . . . . . . . . . . . . . . . . . . . . . . 34
1.5.1 Wholesale configuration . . . . . . . . . . . . . . . . . . . . . . . . . . . . . . 34
1.5.2 Agency configuration . . . . . . . . . . . . . . . . . . . . . . . . . . . . . . . . 34
1.5.3 Hybrid configuration . . . . . . . . . . . . . . . . . . . . . . . . . . . . . . . . 38
i

1.5.4 Choice of business configurations . . . . . . . . . . . . . . . . . . . . . . . . . 41
1.6 Concluding remarks and future research . . . . . . . . . . . . . . . . . . . . . . . . . . 43
2 The Choice of Brand Licensing under Double-Sided Moral Hazard 47
2.1 Introduction . . . . . . . . . . . . . . . . . . . . . . . . . . . . . . . . . . . . . . . . . 50
2.2 The choice of brand licensing . . . . . . . . . . . . . . . . . . . . . . . . . . . . . . . . 52
2.3 The model . . . . . . . . . . . . . . . . . . . . . . . . . . . . . . . . . . . . . . . . . . 57
2.3.1 Timing of the contracting game . . . . . . . . . . . . . . . . . . . . . . . . . . 59
2.3.2 Brand licensing . . . . . . . . . . . . . . . . . . . . . . . . . . . . . . . . . . . 59
2.3.3 In-house production . . . . . . . . . . . . . . . . . . . . . . . . . . . . . . . . 67
2.4 Discussion . . . . . . . . . . . . . . . . . . . . . . . . . . . . . . . . . . . . . . . . . . 68
2.4.1 Brand licensing . . . . . . . . . . . . . . . . . . . . . . . . . . . . . . . . . . . 69
2.4.2 In-house development . . . . . . . . . . . . . . . . . . . . . . . . . . . . . . . 72
2.4.3 Optimal choice of the business strategy . . . . . . . . . . . . . . . . . . . . . . 73
2.5 Concluding remarks . . . . . . . . . . . . . . . . . . . . . . . . . . . . . . . . . . . . . 75
3 Social Influence Bias in Ratings: A Field Experiment 81
3.1 Introduction . . . . . . . . . . . . . . . . . . . . . . . . . . . . . . . . . . . . . . . . . 84
3.2 Contribution and Hypotheses . . . . . . . . . . . . . . . . . . . . . . . . . . . . . . . . 87
3.3 Experimental Design and Procedures . . . . . . . . . . . . . . . . . . . . . . . . . . . . 89
3.4 Empirical Analysis . . . . . . . . . . . . . . . . . . . . . . . . . . . . . . . . . . . . . 92
3.5 Discussion and Conclusions . . . . . . . . . . . . . . . . . . . . . . . . . . . . . . . . 99
.1 List of variables . . . . . . . . . . . . . . . . . . . . . . . . . . . . . . . . . . . . . . . 103
.2 Flyer . . . . . . . . . . . . . . . . . . . . . . . . . . . . . . . . . . . . . . . . . . . . . 104
.3 Questionnaire . . . . . . . . . . . . . . . . . . . . . . . . . . . . . . . . . . . . . . . . 105
ii

4 The Economic and Behavioral Consequences of Online User Reviews: A Literature Review109
4.1 Introduction . . . . . . . . . . . . . . . . . . . . . . . . . . . . . . . . . . . . . . . . . 112
4.2 Methodology and organization . . . . . . . . . . . . . . . . . . . . . . . . . . . . . . . 115
4.3 Economic dimension . . . . . . . . . . . . . . . . . . . . . . . . . . . . . . . . . . . . 116
4.3.1 C1: Sales . . . . . . . . . . . . . . . . . . . . . . . . . . . . . . . . . . . . . . 118
4.3.2 Marketing strategies . . . . . . . . . . . . . . . . . . . . . . . . . . . . . . . . 126
4.4 Behavioral dimension . . . . . . . . . . . . . . . . . . . . . . . . . . . . . . . . . . . . 130
4.4.1 C3: Product adoption . . . . . . . . . . . . . . . . . . . . . . . . . . . . . . . . 131
4.4.2 C4: Rating behavior . . . . . . . . . . . . . . . . . . . . . . . . . . . . . . . . 137
4.5 Summary . . . . . . . . . . . . . . . . . . . . . . . . . . . . . . . . . . . . . . . . . . 141
iii

iv

Abstract
This dissertation consists of three original papers and a literature review. Two of them illustrate applied
theoretical models to issues in Industrial Organization and vertical relationships between firms. The third
work presents a field experiment aimed at exploring a relevant question related to consumer behavior in
digital markets.
The first paper investigates a retailer’s choice in allocating the control rights over retail pricing deci-
sions at different levels of the distribution channel. A retailer can internalize this pricing decision acting
as a traditional pure reseller, or let all suppliers to choose the retail price—therefore, acting as a pure
marketplace. Finally, a retailer can also select a hybrid configuration where some prices are chosen at
the downstream level while others are chosen at the upstream level. This market configuration choice
is explored considering the costly extraction of channel surplus, differentiated products and two distinct
pricing schedules: per unit linear fees and ad valorem proportional fees. Results show that retailers adopt
a hybrid configuration as a middle ground between the two extremes, where pricing decisions are dele-
gated, for all products, either to retailer or manufacturers. As a hybrid, retailers can mitigate inefficien-
cies from double marginalization (pure reseller) and from aggressive competition between manufacturers
(pure marketplace). This result arises only when upstream firms compensate retailers via ad valorem pro-
portional fees. The presence of per unit linear fees, indeed, is not enough to incentivize retailers to keep
control over prices: the firm prefers to delegate the choice to manufacturers because the linear fee acts
as a cushion over margins and increases the vertical channel efficiency.
v

The second paper analyzes the make-it-or-license-it choice of a firm under a situation of double-sided
moral hazard. As the brand owner/licensor aims at maximizing profits of all the activities under the parent
brand, the licensee only focuses on the branded extension product; this brings about a disalignement of
interests. The decision is investigated considering spillover effects between the core and the extension
products, which may be either negative (brand dilution) or positive (brand enhancement). Brand licensing
emerges as an equilibrium choice under brand dilution (respectively, enhancement) when the consumer
perceives a large (small) distance between the extension product and parent brand. Furthermore, the
optimal contract under brand licensing is found to be a per unit royalty fee and a fixed payment, in line
with observed contracts. An interesting result of the paper is the existence of an optimal positive fee
even under the situation of one-sided moral hazard and risk-neutrality of the two firms—thanks to the
presence of the spillover effect.
The third paper explores the issue of rating bubbles within online feedback systems. Empirical
findings showed that the distribution of online user reviews on e-commerce and booking websites are
bimodal and that ratings cluster around extremely low and extremely high values. As user ratings are
used during production search and adoption, if they don’t reflect true preferences they might lead to
suboptimal choices. Many explanations were proposed to explain this phenomenon. In this paper, the
focus is on social influence bias: the tendency of people to imitate peers’ actions and to follow the norm.
A field experiment was conducted where subjects were asked to rate a hotel property after they had
completed their stay. Treatments were in the form of different signals about prior customers’ ratings
during the rating phase; e.g., a sentence informing subjects that prior ratings were extremely positive.
The analysis found the presence of positive social influence bias, in that high ratings affect the individual
rating behavior in a significant way (while moderate/negative ratings do not affect the decision). Further,
the bias is stronger for new customers (as they had yet to form an actual opinion about the experience, or
are in the process of doing that); and for people that do not use/read online reviews. This paper advocates
for a strong reform in online rating systems where the tendency is to show too much information that
vi

might affect rating behaviors.
The last paper is accompanied by a thorough and deep review of the literature about the consequences
of online user ratings on product sales/performance (economic dimension) and product adoption/rating
behavior (behavioral dimension). The topic is increasingly investigated by academic researchers and
industry professionals alike. This overview presents established results and insights as issues for future
research.
vii

viii

Chapter 1
Hybrid Allocation of Control Rights over
Retail Pricing
1

2

Abstract
Over the past few years, retail stores have increasingly accommodated the presence of manufactur-
ers that have autonomy over the sale of products to consumers. Third party sellers compete directly
with Amazon on its website, while large department stores have devoted areas managed by companies
in the apparel, cosmetics and consumer electronic industries. A hybrid retailer is a firm that lets some
manufacturers set the retail price of some products while retaining control over the retail prices of other,
possibly competing, products. The drivers of the adoption of such hybrid configurations have received
scant attention by scholars. By means of a theoretical model drawn from the literature of vertical rela-
tions, this paper aims at addressing the main trade-offs a retailer faces when delegating control rights
over retail prices to manufacturers. Results show that retailers adopt a hybrid configuration as a middle
ground between a pure reseller model, where it sells all products, and a marketplace model, where manu-
facturers sells all products. As a hybrid, retailers can mitigate inefficiencies from double marginalization
(pure reseller) and from aggressive competition between manufacturers (pure marketplace). This result
arises only when upstream firms compensate retailers via ad valorem proportional fees. The presence of
per unit linear fees, indeed, is not enough to incentivize retailers to keep control over prices: the firm
prefers to delegate the choice to manufacturers because the linear fee acts as a cushion over margins and
increases the vertical channel efficiency.

1.1 Introduction
While browsing Amazon, one might have realized that the same product can be sold by several sellers.
Amazon typically directly manages the sale of popular products but these are also offered by a plethora
of third party companies. There exists an interlayer competition within the same retailing platform: the
retailer, a downstream firm, competes neck and neck with firms at the upstream level (manufacturers
and suppliers) on the same ground to attract consumers—retail prices, shipping methods and marketing
activities. Amazon, as well as many other online retailers, started as a pure reseller: buying products from
upstream firms and selling them directly to consumers. A few years ago, e-commerce companies started
to incorporate marketplaces where upstream firms could be retailers on their own (Wells et al., 2015).
As of 2017, sales from third party sellers accounted for 50% of total Amazon sales and represented the
second-largest revenue source of the company. 1 Many traditional physical retailers, typically reluctant
in delegating decisions to other firms, have also opened online stores to allow the presence of third party
sellers; e.g., Sears Marketplace.
Such hybrid retailing structures are not exclusive to electronic commerce.2 In fact, many brick-
and-mortar retailers, especially large department stores, have increasingly delegated control rights over
product sale to manufacturers. Companies like Macy’s act as resellers for a portion of their catalogue
and, at the same time, they allow manufacturers to have an autonomous presence within their stores.
Brands can manage in-store operations and pricing, as well as hire their own employees and run in
loco advertising campaigns. Manufacturers might also control inventory and merchandising (Jerath and
Zhang, 2010). This business strategy is often called store-within-a-store or concession model. While very
common for luxury products, cosmetics and apparels, this arrangement has now extended to many other
categories, such as consumer electronics and toys. 3 Similarly to online marketplaces, the retailer offers
a space, which can be utilized by manufacturers as they prefer, and provides foot traffic by attracting
consumers. As Anuj Puri, JLL’s Global Head of Retail Leasing said: “The store-within-a-store concept
improves the appeal of brands among consumers. These stores can attract customers that bring energy
into an otherwise tired business. There are many retailers now pursuing this store-within-a-store concept
1Statista. (2017). Third-party seller share of Amazon platform 2007-2017. statista.com. https://www.statista.com/statistics/259782/third-party-seller-share-of-amazon-platform/ (accessed December 11, 2017)
2The term “hybrid retailer” has been used by scholars and industry professionals alike to identify different situations.Hybridity might arise from the adoption of both physical and digital sales channels (Bhatnagar and Syam, 2014). Or it might bedue to retailers performing both product sale and custom business. Throughout the paper, a hybrid retailer is one which adoptsboth direct sale to final consumers and allow third party sellers to do the same on its retailing platform.
3Iannaccone, G. (2016). Think Tank: Buying Into the Concession Model. JLL. http://wwd.com/business-news/financial/department-stores-concession-model-10357132/ (accessed December 11, 2017)
4

to broaden their retail offerings and attract new consumers.” 4
Whilst being relevant in the retailing industry, the topic of hybrid retailers has received only scant
attention by scholars. This paper aims at understanding under which market conditions a retailer finds
profitable to adopt a hybrid configuration, instead of being a pure reseller or a pure marketplace. The
two extreme situations both present advantages for the retailer, which is assumed to be the architect of
the channel. The theoretical model here presented considers the retailer’s choice in terms of trade-offs
between managing the retail pricing decision and delegating the sale to upstream firms. The hybrid
retailer represents a middle ground able to mediate over efficiencies of reseller and marketplace selling
modes.
Under a traditional reseller configuration, usually called wholesale model, the retailer purchases the
product from upstream firms and typically acquires control of every variable related to the final sale—
including retail prices and discounts. Contractual agreements between retailers and suppliers can be very
complex and contain upfront payments, slotting fees and quantity discounts. The main feature of such
contracts is a linear wholesale price paid by the retailer for each unit bought. Wholesale prices are one of
the main contributors of the final retail price (McShane et al., 2016). On the contrary, agency model refers
to those innovative contracts that give control rights over pricing and marketing to manufacturers. Under
agreements of this kind, the retailer gets compensated for opening up its marketplace to other sellers.
In electronic commerce, retailers usually charge sellers three-part tariffs composed of: a fixed monthly
fee, a fixed linear fee on each product sold and a percentage on revenues generated through the platform
(the referral fee). For example, Amazon charges up to $39.99 a month to sell on the Marketplace plus
a $0.99 fee on each unit sold and a revenue-sharing fee which varies from 4% for consumer electronics
to above 20% for jewelry. Similarly, Sears proportional fees ranges from 5.50% (gaming consoles) to
17.50% (jewelry).
This paper presents a simple model where a pure reseller, a pure marketplace and a hybrid configu-
ration are compared in a vertical channel with two upstream firms and a monopolistic retailer. The three
business models are analyzed considering agency agreements with per unit linear fees and ad valorem
proportional fees, mirroring actual observed contracts. The mediating factors of the analysis, which is
solely focused on retail pricing decisions, are the degree of differentiation between products and the
cost to extract channel surplus, which captures inefficiencies such as the presence of moral hazard and
4Saluja, S. (2015). Stores-within-stores enhance the shopping experience. JLL. http://www.jllrealviews.com/industries/stores-within-stores-enhance-the-shopping-experience/ (accessed December 2, 2017)
5

risk-averse sellers.
The next sections will be organized as follows: Section 1.2 is devoted to a brief review of relevant
papers in the literature of wholesale and agency contracts, and hybrid retailers. Section 1.3 details the
fundamentals of the model. Sections 1.4 and 1.5 present analysis and results of the model considering
two distinct pricing schedules: per unit linear fees and ad valorem proportional fees. Finally, Section 1.6
reports a summary of the findings and directions for future research.
1.2 Literature
This work is related to two emerging streams of the literature in organizational design of vertical chan-
nels. The first one aims at understanding the drivers behind the choice between traditional wholesale
agreements (the retailer decides the retail prices) and newer agency agreements (the choice of the retail
prices is made by manufacturers/suppliers). The topic became relevant in light of recent antitrust cases
where Apple and five publishers were investigated for setting up the conditions to artificially raise retail
prices in the e-book market—a collusive behavior was possible thanks to a shift of control rights over
retail prices from downstream to upstream and to the presence of price parity clauses.
The second stream of literature, instead, considers the possibility for players in the industry to adopt
both wholesale and agency agreements within the same retailing platform, effectively creating a hybrid
retailer. While closely related with the previous topic, this one has been initially explored by referring to
new distribution techniques in physical retailing. In large department stores many products can be found
within boutiques which “sell a particular brand exclusively, and are designed to reflect the image of
that brand” (Jerath and Zhang, 2010, p. 748). At the same time, the sale of other (possibly competing)
products is directly managed by the retailer. The existence of such hybrid structures stimulated the
interest of academic scholars. In fact, research has later been extended to consider the business strategies
of online retailers as well. Amazon is a prime example of hybrid retailer but many others have adopted
the same business model.
Vertical relationships between manufacturers and retailers have been thoroughly covered by prior
scholars. One of the seminal papers in the literature of vertical relationships between retailers and man-
ufacturers is Choi (1991), who considered a duopoly upstream market composed of two manufacturers
selling competing products. The main departure from previous studies was to consider a common, mo-
nopolistic, retailer selling both products rather than exclusively only one of them. Choi (1991) compared
6

three market configurations differing in the relative influence of the retailer with respect to manufacturers
on the market—that is, at which stage wholesale and retail prices are decided. The standard situation is
when manufacturers decides over wholesale prices and the retailer follows in its choice of retail prices.
The opposite case is when the retailer chooses its margin and then manufacturers set wholesale prices.
Considering a linear demand specification, retail prices do not differ across configurations while whole-
sale prices are higher the higher the relative weight of manufacturers. The three examples are considered
in isolation without introducing the possibility of an endogenous choice of channel configuration. Fur-
ther, retail prices are always set by the retailer. Many other aspects have been considered by the litera-
ture since then: channel coordination under different market structures, both upstream and downstream
(Moorthy, 1988); “make-or-buy” decisions; vertical integration (McGuire and Staelin (1983), Bonanno
and Vickers (1988)). The tendency, though, was to consider market structures as given and typically de-
termined ex-ante by manufacturers as “the architects of the channel” (Abhishek et al., 2015, p. 3). The
increasing role of retailers in setting up vertical channels and the peculiarities of online retailers have
urged the needs of exploring further the issue (Inderst and Mazzarotto, 2008).
The rising popularity of agency contracts has pushed scholars to look further in the drivers of their
implementation, especially on digital platforms. Two features of such contracts have particularly been
under scrutiny: the shift of control rights over retail prices from downstream (retailers) to upstream
(manufacturers)—facilitated by electronic channels and the sale of digital goods; and the presence of
revenue-sharing/ad valorem fees instead of more traditional per unit transfer prices. In this strand of the
literature, most of the papers are based on a much talked antitrust case in the e-book industry where the
shift from wholesale to agency contracts was at the core of the investigation.5 During the early phase
of the e-book market, electronic retailers agreed with publishers to adopt wholesale contracts. Amazon,
for example, was purchasing e-books at the same per unit price of printed counterparts; then, it was
setting a retail price below $9.99. In 2010, Apple entered the market by opening its own e-book store
(along with the launch of the iPad), after having signed agency contracts with publishers. The authorities
found that this decision, along with the inclusion of price parity clauses, pressured other retailers to
adopt agency contracts as well. It also eased price coordination among publishers, now in full control of
retail prices. Empirical evidence showed that, indeed, retail prices sharply increased after Apple entry.
Eventually, though banning price parity clauses, antitrust authorities did not explicitly ruled out agency
contracts. Nowadays, retailers and publishers can still decide which contract to implement—whilst in
5See United States v. Apple Inc., 12 Civ. 2826 (DLC) and Case COMP/39.847/E-BOOKS.
7

the e-book market some restrictions were imposed (e.g., retailers can set discounts even if the price is
set by publishers). This policy conclusion was an occasion for academic researchers to understand the
dynamics of these agreements, for which little was actually known.
Liu and Shuai (2015) analyzed equilibrium outcomes of four types of business configurations in a
bilateral duopoly with differentiation both across products (interbrand competition) and retailers (intra-
brand competition) modelled after Dobson and Waterson (2007). Differences are along two dimensions:
which side decides over retail prices; and the type of compensations between manufacturers and retailers
(per unit versus ad valorem fees). The authors found that under standard per unit linear prices firms
always prefer to be first-mover (e.g., manufacturers prefer to charge wholesale prices rather than retail
prices) and retail prices are higher when they are chosen by the side featuring more substitutability be-
tween products (hence, first-mover can compete less on wholesale prices). The opposite occurs under
revenue-sharing fees, where retail prices are higher when they are chosen by the level featuring less sub-
stitutability. It is worth mentioning that, under ad valorem revenue-sharing fees, choices do not depend
on said fees. Without marginal costs, firms choosing retail prices, and taking ad valorem fees as given,
consider the latter as constant parameters multiplying the profit function—thus irrelevant in the maxi-
mization problem. For this reason, firms do not actually choose ad valorem fees and competition is only
in terms of retail prices. The assumption drives results, as under linear pricing competition occurs on
both sides and therefore being the first-mover in setting prices matters.
Investigating the impact of agency contracts on prices, Foros et al. (2017) focused on a bilateral
duopoly again based on Dobson and Waterson (2007). The authors initially compared a situation where
both retailers adopt agency agreements (with symmetric ad valorem fees) with a situation where both
adopt wholesale agreements.6 The main difference between the agreements is the level of the channel
at which retail prices are decided. The authors found that retailers (manufacturers, respectively) care
more about intrabrand (interbrand) competition when competing. When agency agreements are in place,
upstream firms compete with each other and retail prices are higher with respect to the opposite situation
if substitution between retailers is higher with respect to substitution between goods. The result arises
from the fact that each level of the industry is able to internalize one type of substitution effect and there-
fore the degree of competitive pressure affects final decisions. The paper is a strong argument against
6It is worth mentioning that Foros et al. (2017) do not present a proper wholesale model because retailers set both thetransaction fee (i.e., a revenue-sharing fee) and the retail price. In a traditional wholesale agreement, transaction fees are setby manufacturers. The paper, though, is not focused on the choice of intermediate prices and is focused on electronic retailingwhere such contracts are more common.
8

the idea that agency agreements can lead to collusive outcomes—higher retail prices arise because of
inherent features of the market. The authors explored a mixed regime where one retailer sells products
through agency agreements and the other one through wholesale agreements; here, retail prices are ex-
actly between equilibrium prices in the two extreme cases. Retailers simultaneously choosing whether
to adopt agency agreements would never adopt a mixed regime though. When only one retailer imple-
ments agency contracts, there are incentives for the competitor to follow and therefore adopting the same
contractual agreement—similarly to a prisoner’s dilemma situation. Within a similar framework and
considering the same bilateral duopoly, Lu (2017) compared wholesale and agency agreements by also
considering the choice of wholesale prices by manufacturers (Foros et al. (2017) abstracted from this
choice). Unsurprisingly, the author found that the agency model always leads to lower retail prices be-
cause of the absence of a properly defined double marginalization—which also implies higher consumer
surplus. Furthermore, manufacturers lose under agency contracts because they cannot exert their market
power over downstream firms. The author wrote that such contracts may be understood as a retailer
power restraint. [...] Although strong manufacturers have no incentive to do so, insecure manufactures
may use restraints of this kind to induce retail service and brand promotion (Lu, 2017, pp. 166-167).
Gaudin and White (2014) also investigated the conditions behind the different outcomes of wholesale
and agency agreements following the e-book antitrust case. The authors compared the two contracts in
a vertical monopoly where only one product is sold: e-books. The retailer might also control a market
where it sells a complementary product (e.g., an e-book reader), essential for the fruition of the first
product and a fixed entry cost for consumers. The difference in retail prices between the two business
formats hinges on the presence of this complementary product. The agency model leads to higher retail
prices with respect to wholesale pricing when the retailer is able to control the price of the device. The
intuition is based on the fact that the retailer has two pricing instruments, which can balance in order
to maximize the joint surplus; therefore, in the wholesale model, the retailer lowers the wholesale price
and extract consumer surplus using a fixed fee; this leads to a higher agency price, since the publisher
is not able to exploit this complementary market, and set the retail price as usual. This mechanism
cannot be exploited when the retailer is not able to control the sale of the complementary device. The
authors, though, concluded that agency pricing might lead to higher retail prices because of factors other
than mere agreements between upstream firms—therefore adding another theoretical argument against
collusion between manufacturers. Modelling a theoretically more sophisticated e-book industry, Johnson
(2013) drawn a similar conclusion. In this model, differentiation is present both at the retailer level
9

(symmetric duopoly on an Hotelling line) and at the upstream level (a finite number of symmetric firms on
a Salop circle); manufacturers multi-home (i.e., sell through both retailers). In the first period, consumers
decide from which retailer to purchase, and the demand of the product is realized; in the second period,
consumers buy another unit of the product from the same platform. Indeed, one of the main aspect of
the model is the so-called lock-in effect: once consumers have chosen a platform, they cannot switch
to another one (i.e., they must single-home). Contracts between firms are standard; in the wholesale
model, manufacturers set simultaneously wholesale prices, and then retailers sets simultaneously, and
non-cooperatively, retail prices. In the agency model, the retail pricing decision is done by upstream
firms, and the revenue-sharing rule is exogenous and taken as given. The main result of the paper
has agency retail prices being higher than wholesale ones in the first period, but lower in the second
period. The economic reason is the following: upstream and downstream firms value consumer lock-in
differently. Retailers would like to get as many consumers as they can in the first period in order to
have overall higher profits; thus, in the first period of the wholesale model, they compete aggressively
in order to lock-in consumers, and they set low retail prices. Manufacturers do not have this incentive
because they multi-home and potentially can serve all consumers. Henceforth, the wholesale model is
characterized by a first-period subsidization and retailers acting as monopolist in the second period; this
is the reason why retail prices are first higher and then lower in the agency model, since direct competition
is maintained across manufacturers in the second period. As for the choice of the business formats, the
author concluded that retailers prefer nonetheless the agency model whenever upstream substitutability
is weak with respect to downstream substitutability; this result mirrors Foros et al. (2017), where retailers
were willing to shift price control upstream, as a device to avoid destroying channel surplus due to too
high competition.
Even before e-books were a mass-market commercial product, wholesale and agency contract have
been a subject of study by scholars. Hagiu (2007), for example, presented a market composed of an
intermediary and several identical sellers, who can sell their product only through the former. The inter-
mediary can choose to act either as a traditional reseller or as a platform. Borrowing from the two-sided
market literature, the intermediary sets access fees to both sellers and consumers (and a buyout offer to
sellers in the wholesale model)—it has full bargaining power with respect to each side; and the market
demand depends on how many upstream firms join the platform (there are network externalities). Under
wholesale agreements, the retail price is set by the intermediary; instead, under agency agreements, the
price is decided by sellers. In equilibrium, the intermediary prefers a traditional wholesale model when-
10

ever the probability that sellers have unfavourable expectations is high enough; namely, this contract is
a way to avoid the typical coordination problem of a two-sided platform, always concerned in attracting
enough agents on both sides, such that they both benefit with each other. The main economic trade-off,
here, is between the cost of managing by itself the sale of products (wholesale model) and the costs of
attracting sellers (agency model). When the author introduced product differentiation, intermediary’s
attitude towards the reseller mode becomes starker, since the higher the substitutability (or the comple-
mentarity) the more willing the retailer is to act as a multi-product monopolist and internalize all the
cross-effects.
More recently, the strategic choice of wholesale versus agency selling formats has been analyzed
in Abhishek et al. (2015). The authors investigated under which market circumstances retailers del-
egate retail pricing decisions to manufacturers when the latter have an external (traditional) reselling
channel which is subject to spillover effects from sales in the main (electronic) channel. This paper is
methodologically very similar to the model presented here because it considers per unit wholesale prices
in wholesale agreements and ad valorem fees in agency agreements. The market structure considered,
though, is composed of a monopolistic manufacturer and a duopoly at the downstream level. Therefore,
a hybrid configuration is not within-retailer but cross-retailer, similarly to Foros et al. (2017): one re-
tailer adopts agency agreements while the other adopts wholesale agreements. By delegating the pricing
decision to the manufacturer, retailers can mitigate the double marginalization problem, hence without
spillover effects this would be their favorite configuration. Under spillover effects impacting manufac-
turer’s profits, the choice is less clear. For example, if there are negative externalities, the manufacturer
would increase wholesale prices (to make up for losses in the traditional channel), consequently rais-
ing retail prices—retailers, at that point, would be incentivized to choose agency agreements to improve
channel efficiency. Instead, positive externalities combined with agency agreements would lead the man-
ufacturer to decrease the retail price below the efficient level (and therefore negatively impacting retailer
compensation). Retailers, thus, prefer wholesale agreements, because they can retain some pricing power
and avoid the incentive of slashing retail prices. A hybrid market structure emerges as a way to mitigate
both inefficiencies for intermediate values of the spillover effect.
The model presented in this paper is closely related to Jerath and Zhang (2010). The authors con-
sidered a channel structure with an upstream duopoly selling differentiated products to a downstream
monopoly. Firms decide over retail prices and demand-augmenting costly services. They compared
three channel arrangements: retailer-resell, where the retailer buys the product from manufacturers at a
11

linear wholesale price and eventually decides over retail prices and service levels; store-within-a-store,
where manufacturers, instead, decide over both choice variables; and a hybrid structure, where the re-
tailer acts as a reseller for one product and let the other manufacturer to sell through a store-within-
a-store. The authors assumed the retailer has full bargaining power and therefore charges a fixed fee
which makes manufacturers indifferent between selling the product or not. Further, the retailer is also in
charge of deciding which business configuration to adopt. The main result of the paper shows that the
retailer seeks channel efficiency therefore allowing store-within-a-store arrangements at low differenti-
ation (low competition between manufacturers) and retailer-resell arrangements at high differentiation
(double marginalization creates inefficiencies but direct competition between manufacturers would be
too inefficient). In sum, a hybrid configuration emerges when differentiation is at intermediate values,
as a way to mitigate the inefficiencies of the two arrangements. Further, the author illustrated that when
returns to service are high, the hybrid arrangement becomes less desirable because the two inefficiencies
are cushioned by having a more attractive product.
Similar contracts were also explored in Kurtulus and Savaskan (2013), which looked at Direct-Store-
Delivery (DSD) agreements. Under such contracts, manufacturers (instead of retailers) deliver the prod-
uct directly to the store and manage some in-store operations, e.g., marketing and promotion and inven-
tory management. In many stores, DSD agreements are implemented for some products, while some
others within the same category follow a more conventional procedure where the retailer manages all
in-store operations and distribution duties. The authors investigated the incentive for a retailer to adopt
both DSD and conventional agreements in a market structure with an upstream duopoly and a unique
retailer. The difference between the two contracts lies in who bears replenishment costs, which depend
on the quantity delivered and sold. Therefore, the retail pricing decision is always made by the retailer
but under DSD (conventional, respectively) agreements manufacturers (retailer) bear(s) additional costs.
Rather than an actual decision variables, Kurtulus and Savaskan (2013) considered the shift of variable
cost component from downstream to upstream. As under DSD agreements the cost is borne by manufac-
turers (i.e., competing firms), this contract helps in mitigating the double marginalization problem and
therefore leads to higher channel profits. In this model, the retailer does not collect upstream surplus; the
choice of the configuration is made by both levels of the channel. The retailer considers which model
leads the highest profits and takes into account the offer made to manufacturers, which can either accept
a DSD contract or reject it. Eventually, a hybrid configuration emerges when products are neither too
differentiated nor too close with each other. Firms trade off channel efficiency with margins: for exam-
12

ple, when products are too similar, the retailer prefers to shift costs upstream but manufacturers do not
want to bear them as competition would already by too fierce—therefore rejecting the offer. Kurtulus
and Savaskan (2013) proposed an interesting model which is, though, fundamentally different from the
idea behind this paper—the shift of control rights over retail prices.
Hybrid retailing structures have been analyzed outside the traditional vertical channel theoretical
framework by adopting models drawn from the two-sided market literature. Gautier et al. (2016), for
example, analyzed a similar environment by focusing on the type of search consumers face in each
configuration, calling the wholesale structure “middleman” and the agency structure marketmaking”—
therefore referring to the hybrid structure as “marketmaking middleman”. The essential idea behind
the model is the role of the retailer/intermediary in creating more efficient matches between buyers and
sellers—operating as a directed market search. As a middleman, the retailer can increase the sales vol-
ume by buying and stocking inventories from manufacturers, hence providing buyers immediate service.
As a marketmaker, the retailer allows for an efficient spread of information within the platform. When
there exists an outside option in terms of a decentralized market, the retailer feels the competitive pres-
sure and has an incentive to decrease prices. In order to stop the profit bleeding because of lower margins,
the retailer allows a hybrid configuration where allocation efficiency (more transactions) is reached and
rivals join its business. Hagiu and Wright (2014) focused, instead, on the allocation of control rights over
marketing activities (rather retail prices) such as the type of promotional activity or the size of the shelf
space where a monopolist retailer faces a finite, though large, number of upstream firms. The main as-
sumption of the paper is that the each product’s optimal marketing level depends on information privately
owned by the retailer and on information privately owned by the supplier. Under a wholesale configura-
tion (reseller), such marketing activities are chosen by the retailer while under an agency configuration
(marketplace), they are chosen by suppliers. Results showed that the retailer prefers to hand marketing
activities over to suppliers whenever its private information is less precise, that is, it is characterized by
more variability. The intuition is that the party who is more able to efficiently use information about the
decision variable should have control over it. As the private information needs not to be the same across
products, a hybrid configuration emerges when the retailer has an informational advantage on a subset of
products (hence sold under wholesale agreements) and is at a disadvantage for the remaining products,
for which suppliers determine the marketing level. The authors presented some moderating factors that
might push the hybrid configuration towards either extremes. For example, when marketing generates
positive spillover effects, the retailer has an incentive to internalize the choice even for those product
13

for which there might be an informational gap—as the retailer better appropriate such externalities with
respect to competing suppliers. The retailer might want to operate as a hybrid also when there is het-
erogenous valuation of the products (long-tail products with low valuation and short-tail products with
short valuation) and directly manage more popular products when reseller variables costs are lower (leav-
ing more costly and less popular products to suppliers). Hagiu and Wright (2014) provided an empirical
validation of these results. Using data from Amazon, they showed that, indeed, the company directly
sells only a relatively small portion of DVDs and, in particular, the more popular ones, delegating the
sale of niche products to third party seller.
Jiang et al. (2011) offered a different explanation of the reason why retailers should allow third party
sellers on their own platform. In line with empirical evidence presented in the paper, as well as in
Hagiu and Wright (2014), the authors focused on the idea that Amazon, and more generally large online
retailers, tends to sell popular products, leaving niche and “long-tail” products to independent sellers.
Similarly to chains, which directly manage stores in highly profitable areas and leave to franchisees
less attractive places, Amazon might want to leave smaller products to third-party sellers as the latter
can face lower costs (and have more expertise) in managing the sale. The paper focused on mid-tail
products and tried to understand at which point the retailer kicks in. Letting an independent seller on its
platform allows the retailer to gain by charging a fee and by obtaining information about the demand of
the product, which is privately owned by the seller and can be considered its type (similarly to Hagiu
and Wright (2014), the core of the analysis lies on who owns useful information to extract consumer
surplus). Using a framework with asymmetric information, the authors found that the retailer has the
incentive to attract third party sellers and eventually learn the demand of their products—if it is high
enough, the retailer starts to sell that very product by directly competing with sellers. At that point, sellers
find worthwhile to keep demand low in early phases to avoid the retailer to learn their type. Retailer can
counteract by raising the fee to drive high demand sellers out—which is not optimal when the probability
of high-type sellers is low. It is worth mentioning that Jiang et al. (2011) assumed that as soon as the
retailer starts selling the product, independent seller’s sales go to zero. Therefore, the model does not
explicitly model a hybrid structure, rather it considers the entry of the retailer in one of the product
markets already present on its plaform—abstracting from any surrounding environment where the firms
are operating in. The idea that the retailer can infer some useful data of market demand by allowing
sellers to operate on its platform has been modeled also in Muthers and Wismer (2013). The authors
considered a monopolistic retailer primarily acting as a platform hosting sellers’ products under either a
14

two-part tariff or a proportional fee. In the model, first the retailer chooses the optimal tariff to sell on its
platform; then, sellers decide whether to join the platform, as an investment choice where they have to
sustain a fixed randomly drawn cost. Afterwards, the retailer can decide to start selling complementary
products, thus directly competing with sellers on its platforms (here, the hybrid configuration is called
dual mode). The downstream firm can observe how much it would cost to offer a similar product and
consequently whether to enter. When the retailer’s marginal cost of production is low enough (i.e.,
the retailer is relatively more efficient than sellers), it finds profitable to create a hybrid platform, and
an hold-up problem arises. This eventually leads to insufficient seller investment incentives, and poor
seller participation (with respect to an efficiency benchmark where a social planner maximizes expected
welfare). Proportional revenue-based fees represent a way of mitigating the hold-up problem through
which the retailer can commit to not enter into the market and compete with sellers; agency contracts
are modelled as three-part tariffs: alongside a fixed fee and a per-unit price, there is a percentage of
revenues that goes to the retailer. The intuition behind this result relies on how the fee enters a seller’s
decision in setting the retail price; a positive proportional revenue-based fee, indeed, acts as an increase
of the marginal cost of production. This implies that, under a three-part tariff agreement, when deciding
whether to enter product markets, the retailer must not only consider the relative advantage in term of
marginal costs with respect to sellers, but also how much of this very advantage is due to the artificial
increase because of the fee. The retailer, therefore, faces a trade-off: entering the product market and
alienating the seller base, or adjusting the proportional fee and letting sellers to invest. This model is
useful to explain the reason why many electronic retailers have decided to adopt agency agreements and,
in turn, when a retailer should adopt a hybrid business model. There are a couple of assumptions that
limited the analysis though. First, sellers do not compete with each other, and when the retailer decides to
enter product market, it makes agreement with an external seller. Furthermore, the authors focused on a
retailer that is typically more informed than sellers on its platform; the extent to which this informational
advantage is actually exploited is not clear, though—a more common assumption is to let informational
advantage differ across levels of the vertical chain (Hagiu and Wright, 2014) or to have sellers being
more informed (Jiang et al., 2011).
The choice of the allocation of control rights over retail prices has only seen scant empirical attention.
Data to analyze retailer behavior are difficult to collect, especially those necessary to investigate the
drivers of a shift between one configuration to another. However, online retailers provide a fruitful
ground for this research topic because they allow easier tracking of firm strategies across time. Netemeyer
15

et al. (2012) referred to wholesale agreements as retailer-managed retail (RMR) systems and to agency
agreements as manufacturer-managed retail (MMR). Rather that the motives leading retailers to adopt
either or both models, the authors analyzed the effects of the switch from RMR to MMR agreements; to
do so, they used data from a Chinese store which started adopting MMR for all products in the cellphone
category and gradually in the watch category. Consistently with theory, they observed that agency/MMR
agreements lead to lower prices because of intensified competition between manufacturers. Further, sales
also increase—perhaps due to more service offered by manufacturers. Contrarily to the retailer, which
manages a large inventory and cannot train employees to be knowledgeable on each and every product,
manufacturers can focus resources on increasing marketing and service level on their products to the
benefit of demand. DSD arrangements, instead, have been subject of analysis in Chen et al. (2008b),
which estimated demand and cost parameter in the market of carbonated beverages. Using data from
Amazon, Zhu and Liu (2016) assessed the reasons why a retailer should decide to act as a reseller and
directly competing with indipendent sellers on the same platform. In line with theoretical predictions in
Jiang et al. (2011) and Hagiu and Wright (2014), the authors found that Amazon targets popular products:
as the demand increases so is the likelihood of Amazon entering the market. When the retailer becomes
a reseller there is also a general decrease in service/shipping fees, which leads to higher demand. At
the same time, though, third party sellers are discouraged by this aggressive competition and might exit
the platform. Related to store-within-a-store arrangements as detailed by Jerath and Zhang (2010) and
the introduction of a new brand, Li et al. (2016) found support to the idea that such arrangement can
improve commercial performance and consumer satisfaction—hence providing to be useful tools for
manufacturers to increase product demand.
When analyzing agency contracts, this paper considers two different ways of sharing profits across
sides, in line with observed contracts. More specifically, the retailer can be compensated by manufac-
turers either using a per unit fee (similar to a wholesale price) or adopting an ad valorem fee, namely a
revenue-sharing rule. Ad valorem fees have become largely used in online commerce. For example, Ap-
ple takes a 30% cut on all revenues generated through the App Store; Amazon charges third party sellers
from 7% to as high as 25% on transaction price. Recently, scholars have srtarted to investigate the rise of
ad valorem fees as a way to share profits between upstream and downstream—especially looking at the
credit card industry and e-commerce. Shy and Wang (2011) compared per unit fees to proportional/ad
valorem fees in a two-sided payment credit card market with a finite number of merchants and a monop-
olistic card network. The authors found that a proportional fee is preferred by the monopolist because it
16

helps in mitigating the double marginalization problem arising when market power is also present at the
downstream level. When the number of merchants increases (hence double marginalization diminishes
because of higher competition), the two types of fees become more similar in extracting profits. Muthers
and Wismer (2013) also compared per unit and ad valorem fees in a vertical chain. According to the result
of the paper, a proportional fee deters the retailer to directly sell products in its own store competing with
third party sellers (therefore, it prevents the creation of a hybrid retailer). Comparing the two types of
fees, Wang and Wright (2017) offered an explanation based on an inherent characteristic of e-commerce:
the presence of many goods, differentiated in terms of consumer valuation and costs of production. In
this model, a retailer hosts the trade of multiple goods. In each market, products are sold by identical
sellers, and are differentiated according to a scale parameter which increases production costs and con-
sumer valuations. The authors found that the proportional fee schedule maximizes platform revenues.
Unlike a per unit fee, a proportional fee allows to extract more from high-cost high-value products (low
price elasticity) and less from low-cost low-value products (high price elasticity), and therefore improves
the efficiency of revenue extraction. A retailing platform, therefore, is better off in implementing agency
contracts when it hosts the sales of very differentiated products in terms of value and production cost,
and it is not able to perfectly observe such differences.
1.3 Model setup
Consider a vertical chain with one downstream firm, the retailer (R hereafter), and two upstream firms,
the manufacturers (M1 and M2 hereafter). Thence, a downstream monopoly and an upstream duopoly.
The focus on interbrand competition allows to disentangle the main trade-offs of a retailer deciding
which business strategy to pursue. While it is true that the retailer’s choice itself might depend on
strategies undertaken by other retailers, it is assumed that R is big enough and not affected by intrabrand
competition when arranging contracts with manufacturers. A future extension might well consider the
case of downstream competition, in a bilateral duopoly similar to Dobson and Waterson (2007). Also,
it is assumed that M1 and M2 can only sell through R and there are no other channels (unlike Abhishek
et al. (2015), who considered the presence of an external channel facing spillover effects from the primary
one).
Each manufacturer creates a product at marginal cost c≥ 0 (and no fixed cost), which is then sold to
consumers through R (no transformation of the product occurs in the process). The product can be sold
17

by means of wholesale agreements or agency agreements, as detailed in Section 1.3.2. Without loss of
generality, R does not face any variable or fixed distribution/operational cost. Hence, the model doesn’t
include the presence of DSD agreements like in Kurtulus and Savaskan (2013), because it focuses on
the shift of control rights over pricing decisions rather than in-store operations entailing costs to either
upstream or downstream firms.
1.3.1 Market demand
Let qi be the quantity of the product created by Mi, i = 1,2, and pi its market retail price; then, demand
functions are symmetric and given by:
qi(p) =1
1+µ− 1
1−µ2 pi +µ
1−µ2 p j, ∀i, j = 1,2 and i 6= j, (1.1)
where p = (p1, p2). This linear demand specification is widely used in the literature on differentiated
duopolies (Jerath and Zhang (2010), Abhishek et al. (2015)). It is drawn by Shubik and Levitan (1980)
from the maximization problem of a representative consumer with a quadratic utility function.7 The
parameter µ ∈ [0,1) represent horizontal differentiation: the two products are independent if µ = 0 (the
cross-price effect is zero and demand reduces to qi(pi) = 1− pi, ∀i = 1,2) and each firm becomes a
monopolist in the respective market. As µ → 1, the two products become more and more substitutes;
when µ is close to 1, the two products are, in fact, close to be homogeneous. µ , therefore, measures the
degree of competition intensity between M1 and M2: as µ gets larger, their market power diminishes.
The differentiation is inherent to the products, and concerns those features viewed and assessed by con-
sumers; they are not, hence, due to how the products are sold or marketed, as they appear on the shelves
of the same retailer.
The demand specification in Equation 1.1 has some desirable properties, as thoroughly explained
by Abhishek et al. (2015, pp. 4-5). First, the potential market size is decreasing in µ: as the two
products become more and more similar, a lower consumerbase shows up. Moreover, the own-price
7Shubik and Levitan (1980, pp. 68-71) considered the following utility function: U = α
β(q1+q2)− 1
2β(q1+q2)
2− 2σ 2
β (1+γ)−
∑2i=1 piqi where σ2 =
[q1−q2
2
]2and γ is a parameter representing product differentiation. When the representative consumer
maximizes his or her own utility with respect to quantities, it is possible to rearrange the solution in terms of direct marketdemands: qi =
12
[α−β
(1+ γ
2)
pi +βγ
2 p j
], ∀i, j = 1,2 and i 6= j. To obtain the demand specification in Equation 1.1, the
following reparametrization is applied: α = β = 21+µ
and γ = 2µ
1−µ. While the two measures of substitutability are defined
over different intervals (i.e., µ ∈ [0,1) while γ ∈ [0,+∞)), the main intuition holds: when µ (respectively, γ) is zero, thetwo companies are offering independent products; when µ → 1 (γ → +∞), the products becomes more and more similar,approaching perfect substitutability.
18

effect is increasing in µ , signaling a greater sensitiveness to the price when the competing product is
more similar.
1.3.2 Market configurations
The key difference between each market configuration is the layer of the industry at which the control
rights over the retail prices is allocated—that is, which firm is setting the retail price to consumers. R can
decide into which agreement to enter with M1 and M2, effectively acting as the architect of the channel.
This assumption is in line with observed market behavior by players in the industry.8
Figure 1.1: Market configurations
(a) Wholesale configuration
R
M1 M2
Consumers
p1,p2
w1 w2
T1 T2
(b) Agency configuration
R
M1 M2
Consumers
T1 T2
p1 p2
(c) Hybrid configuration
R
M1 M2
Consumers
w1 T2
T1
p1
p2
R can act as a pure reseller as in Figure 1.1a: M1 and M2 sellsthe product at a per unit linear wholesale
8In the context of vertical contracts, Inderst and Mazzarotto (2008) reviewed emerging literature assessing the increasingbargaining power of retailer vis-a-vis manufacturers.
19

price to R which, in turn, sells the product to consumers by setting the final price. This is the conventional
distribution model commonly implemented in physical retailing, and by many e-commerce firms as well.
On the contrary, R can act as a pure marketplace by allowing manufacturers to use its retailing platform
and face directly consumers, as in Figure 1.1b; here, manufacturers are in charge of setting the final price
to consumers. This type of contract has become popular in distributing digital goods (e.g., e-books, apps)
and is now widely adopted by e-tailers selling physical products as well as brick-and-mortar stores.9 A
third market configuration, a middle ground, is possible. R can adopt both types of contract within the
same retailing platform, as shown in Figure 1.1c: for some products, R acts as a reseller, while for some
other it plays the role of a marketplace. In this model, M1 and M2 are symmetric, hence it doesn’t matter
which product is sold under which contract.
In both wholesale and agency contracts, R obtains a compensation from manufacturers, here called
T1 and T2. The payment always contains a fixed fee as a way to formalize the assumption that R has
full market power with respect to upstream firms. Then, in a wholesale contract, the compensation only
includes this fixed fee (the transfer price is paid by R to upstream firms). Contrarily, in an agency contract,
as the retail pricing decision is made by manufacturers, R asks for an additional compensation in terms
of a marginal price—T is, therefore, a two-part tariff. I will consider two distinct types of fee: a per unit
linear fee and an ad valorem proportional fee. The second type of fee is a share of revenues generated
by the manufacturer through the direct sale of the product to consumers. Under a wholesale agreement,
manufacturers sell the product to R at a per unit linear wholesale price, as a traditional vertical contract.
Finally, I will make an important assumption on the extraction of the fixed fee by R. Following Calzo-
lari et al. (2017), I assume that manufacturers sustain an additional cost when paying the fixed fee which,
in turn, is reflected in R sustaining a cost when getting paid; the cost being λ ≥ 0. The cost param-
eter “may capture various imperfections that impede rent extraction by means of fixed fees” (Calzolari
et al., 2017, p. 12). For example, manufacturers cannot perfectly observe the state of demand and are
risk-averse—generating a problem of moral hazard. The cost of extraction will be formalized during the
presentation of each configuration.
In sum, the three market configurations under analysis are:
1. Wholesale (W): R is a reseller for both products. M1 and M2 are distributors of the product
towards the downstream market. w1 and w2 are the wholesale prices and p1 and p2 are the retail
9The reseller/marketplace terminology has been widely adopted by the literature; e.g., Abhishek et al. (2015) and Hagiu andWright (2014). See Section 1.2 for a more detailed discussion.
20

prices. R extract channel surplus by means of fixed compensations: T1 = F1 and T2 = F2. This
configuration is shown in Figure 1.1a.
2. Agency (A): R is a marketplace for both products. M1 and M2 sets the retail price of their re-
spective products and use R’s platform to sell them directly to consumers. R gets a compensation,
T1 and T2, in terms of a fixed fee and a marginal price (either per unit or ad valorem fee). This
configuration is shown in Figure 1.1b.
3. Hybrid (H): R is a reseller for M1’s product (without loss of generality, as the two manufacturers
are symmetric) and a marketplace for M2’s product. In this case there is an interlayer price com-
petition since R and M2 compete over the retail price. Then, R gets a fixed compensation from M1
and a two-part tariff from M2. This configuration is shown in Figure 1.1c.
1.3.3 Timing
In line with observed contracts and previous literature, retail prices are set in the last stage (by the retailer
in a wholesale agreement, and by the manufacturer in an agency agreement). During the initial stages,
firms set intermediate prices and make a take-it-or-leave-it offer to the firm at the other layer of the
chain. When R acts as a reseller, manufacturers are choosing the wholesale price after R has decided
over the fixed fee. In an agency agreement, instead, before the retail pricing decision, R decides over
the compensation manufacturers will need to pay. Contracts are observed across manufacturers and all
actions are public.
In order to choose which market configuration to adopt, R compares equilibrium profits under the
three different situations and chooses the one leading to the highest profits. The decision will depend on
the differentiation parameter, µ , and on the cost of extracting surplus, λ . The presence of manufacturer’s
marginal cost, c, is necessary to have an equilibrium existing in the case of ad valorem fees, but can be
set arbitrarily close to zero without loss of generality.
1.3.4 Vertical integration
The benchmark is represented by a vertically integrated firm producing and selling two products. The
firm’s profit function is:
πV I(p) =
2
∑i=1
[(pi− c)qi(p)] . (1.2)
21

The multi-product monopolist maximizes profits in Equation 1.2 with respect to retail prices. The first-
order conditions are:
∂πV I(p)∂ pi
= qi(p)+(pi− c)∂qi(p)
∂ pi+(p j− c)
∂q j(p)∂ pi
= 0, i, j = 1,2, i 6= j. (1.3)
A firm selling both products can internalize the substitution effect, as shown by the third term in Equa-
tions 1.3.
Equilibrium outcomes are given by:
pV Ii =
1+ c2
,
qV Ii =
1− c2(1+µ)
, i, j = 1,2, i 6= j.(1.4)
Equilibrium prices do not depend on the differentiation parameter; the monopolist is able to fully inter-
nalize the substitution effect between the two products. Quantities are, on the other hand, decreasing
with µ . As the closeness of the two products increase, total quantity decreases, a feature of this demand
specification. Equilibrium profits are:
πV I =
(1− c)2
2(1+µ). (1.5)
The integrated firm prefer to sell both products instead of only one.10 This structure maximizes channel
profits. The reasons why vertical integration is not often possible nor desirable have been extensively cov-
ered in the Industrial Organization literature. For example, Church (2008) covered the anti-competitive
implications of vertical mergers.
1.4 Model analysis with per unit linear fees
For each market configuration described in Section 1.3.2, I computed equilibrium prices and profits.
Each configuration is solved by backward induction as a one-time Stackelberg game—the equilibrium
concept is therefore the Subgame Perfect Nash Equilibrium. In this part, I assume that, under agency
agreements, R asks to manufacturers a per unit linear fee.
10πV I > πV I(p) where p = argmaxp′ πV I(p′) = (p′− c−d)q(p′), for all values of the relevant parameters.
22

1.4.1 Wholesale configuration
R is a traditional reseller for both products. The contractual agreement between R and a manufacturer
takes the form of a per unit linear wholesale price. R collects all channel profits by means of a (costly)
fixed fee: Ti = Fi, ∀i = 1,2. Profit functions are:
πWR (p) =
2
∑i=1
(pi−wi)qi(p)+Fi,
πWMi(p) = wiqi(p)− cqi(p)− (1+λ )Fi, i, j = 1,2, i 6= j,
(1.6)
where w is the wholesale price set by manufacturers. I adopted the reduced form by Calzolari et al.
(2017) when modeling the costly extraction of F : manufacturers pay (1+λ )F ≥ F as λ ≥ 0. The higher
the cost, the higher the fixed compensation to R, the less efficient the extraction of upstream profits. The
timing is as follows:
1. R set F1 and F2, and M1 and M2 accept or reject; outside option is normalized to zero;
2. M1 and M2 set w1 and w2 respectively and R accepts or rejects;11
3. R sets p1 and p2;
4. demand is realized.
As well-known in the literature of vertical relations, wholesale agreements leads to the so-called double
marginalization problem: the final price is higher than the price which would maximize industry profits
because both levels are charging a mark-up over the respective costs. This occurs because there is market
power at both levels of the vertical channel.
R’s first-order conditions are:
∂πWR (p)∂ pi
= qi(p)+(pi−wi)∂qi(p)
∂ pi+(p j−w j)
∂q j(p)∂ pi
= 0, i, j = 1,2, i 6= j. (1.7)
As for the case of vertical integration in Section 1.3.4, R is a downstream multi-product monopolist, and
therefore can choose the retail price of one product by considering the effect this decision has on the sale
of the competing product. By internalizing the cross-price effects, R is able to charge higher prices with
respect to two independent firms competing as a duopoly.
11R’s outside option is selling the product of the other manufacturer as a vertical monopoly. In equilibrium, R always findsprofitable to sell both products instead of only one.
23

Equilibrium wholesale prices are:
wWi =
1+ c−µ
2−µ, ∀i = 1,2. (1.8)
Equilibrium retail prices and quantities are:
pWi =
3+ c−2µ
4−2µ,
qWi =
1− c2(2−µ)(1+µ)
, ∀i = 1,2.(1.9)
Retail prices are decreasing in µ in the relevant parameter space, which is not surprisingly because
wholesale prices are decreasing in µ as well. It is true that R can mitigate the substitution effect between
the two products, but upstream manufacturers are still competing with each other. In turn, quantities are
also decreasing in the differentiation parameter. The rate at which wholesale prices are decreasing in the
differentiation parameter, though, is greater with respect to retail prices (in fact, they decrease twice as
faster as retail prices). This means that R’s mark-up from each product is increasing in µ .
When collecting fixed fees, R takes into account the participation constraint by manufacturers, which
binds in equilibrium:
πWMi = 0→ wW
i qWi − cqW
i − (1+λ )Fi = 0
⇒ FWi =
wWi qW
i − cqWi
1+λ, i, j = 1,2, i 6= j,
(1.10)
FWi is the equilibrium fixed fee, decreasing in the cost of extraction. Note that R’s profits become:
πWR =
2
∑i=1
(pWi −wW
i )qWi +FW
i
=2
∑i=1
pWi qW
i −λwW
i qWi
1+λ− cqW
i1+λ
(1.11)
As expected, R’s ability to collect channel profits is weakened by the presence of costly extraction of fees;
this inefficiency adds to the obvious problem of double marginalization, which also acts as an eroding
force of channel profits. A positive value of λ , on the one hand, increases the cost sustained by R in terms
of the wholesale price (second term in Equation 1.11) and, on the other hand, decreases the amount of the
upstream marginal cost absorbed by R (last term in Equation 1.11). Henceforth, double marginalization
is exacerbated. It enters directly, by means of inefficiently high retail prices, and indirectly, by means of
the decreased mark-up, as seen in Equation 1.11.
24

R’s equilibrium profits are:
πWR =
(1− c)2(3+λ −2µ)
2(1+λ )(2−µ)2(1+µ)(1.12)
The behavior of πWR is worth an analysis. First, ∂πW
R∂λ
is always negative, which is intuitive as λ represents
a de facto cost in appropriating upstream surplus. Furthermore, it is worth mentioning that ∂πWR
∂ µ|λ=0 < 0;
this case mirrors the same market configuration described in Jerath and Zhang (2010) (considering the
absence of demand-augmenting services, which are not present in this model). When, instead, λ > 0
and high enough, the relationship between πWR and µ becomes non-monotone. As λ increases, πW
R goes
from being decreasing in µ , then convex, and then increasing. As differentiation decreases (µ goes
up), prices decreases to the detriment of channel profits. But the pace at which prices decrease is faster
upstream than downstream: manufacturers are competing in wholesale prices, while R acts as multi-
product monopolist and is able to internalize some of the substitution between products. Henceforth,
the negative effect on profits of an increasing µ is artificially mitigated by the fact that the higher λ , the
higher the cost associated in extracting upstream profits.
1.4.2 Agency configuration
Under an agency agreement, R allows the manufacturer to sell products on its (physical or digital) store
and set directly the price to consumers. Hence, R acts as a showroom. In this framework, M1 and M2
compete for setting retail prices, and pay R a per-unit (marginal) price on top of a fixed fee; the total
transfer price is Ti = wiqi +Fi, ∀i = 1,2. Profit functions are given by:
πAR (p) =
2
∑i=1
wiqi(p)+Fi,
πAMi(p) = (pi−wi)qi(p)− cqi(p)− (1+λ )Fi, i, j = 1,2, i 6= j,
(1.13)
The timing of the game is:
1. R set fixed fees, F1 and F2, and linear fees w1 and w2, and M1 and M2 accept or reject; outside
option is normalized to zero;
2. M1 and M2 set p1 and p2 respectively;
3. demand is realized.
25

Unlike the model in Jerath and Zhang (2010), and in line with actual contracts in the retailing industry
as described in Section 4.1, R typically gets compensated by means of two-part tariff schedules: a usage
fee for each unit sold through its store and a fixed (e.g., monthly) payment. The main difference with
respect to the wholesale configuration presented in Subsection 1.4.1 is in the upstream choice of retail
prices, hence decided by two competing firms. Manufacturers will not internalize the substitution effect
between products, as a multi-product monopolist would do; at the same time, transfer marginal prices
are chosen by a monopolist downstream firm, hence the double marginalization problem might become
more severe.12
Manufacturers’ first-order conditions are:
∂πAMi
∂ pi= qi(p)+(pi−wi)
∂qi(p)∂ pi
− c∂qi(p)
∂ pi= 0, ∀i = 1,2. (1.14)
Unlike a multi-product retailer, manufacturers are not able to internalize the cross-price effect on the
competing product. This leads to fiercer downstream competition in retail prices.
R correctly conjectures the manufacturers’ decision, and maximizes its own profit function with
respect to transfer prices. Equilibrium wholesale prices are:
wAi =
(µ +λ (2−µ))(1− c)2(1+λ (1−µ))
, ∀i = 1,2. (1.15)
Contrarily to wholesale prices in Equation 1.8, these intermediate prices depends on λ . For a given µ , wA
increases in λ . In the extreme case where λ = 0, wAi = (1−c)µ
2 , ∀i = 1,2. When λ → ∞, wAi = 1−c
2 , ∀i =
1,2.
Equilibrium retail prices and quantities are:
pAi =
1+ c+3λ + cλ −2λ µ
2+4λ −2λ µ,
qAi =
(−1+ c)(1+λ )
2(−1+λ (−2+µ))(1+µ), ∀i = 1,2.
(1.16)
While retail prices are always decreasing in µ , per unit fees show the opposite behaviour. This means
that (manufacturers’) margins are now decreasing in the differentiation parameter, unlike the wholesale
12It is important to recognize that, in this context, the terms upstream and downstream might sound inappropriate. Indeed,traditionally, a downstream firm is a firm buying a product from a supplier/manufacturer and selling it to final consumers. Here,manufacturers are also selling to consumers, hence they are both upstream and downstream firms. At the same time, they areexploiting R’s downstream presence to interact with consumers. For the sake of coherence, I will always refer to M1 and M2 as“upstream firms” and R as a “downstream firm”, regardless of the configuration under investigation.
26

configuration. As λ → ∞ (fixed fees vanish), pAi = pW
i , ∀i = 1,2 (similarly for quantities).
When collecting fixed fees, R takes into account the participation constraint by manufacturers, which
binds:
πAMi = 0→ (pA
i −wAi )q
Ai − cqA
i − (1+λ )Fi = 0
⇒ FAi =
(pAi −wA
i )qAi − cqA
i
1+λ, i, j = 1,2, i 6= j,
(1.17)
FAi is the equilibrium fixed fee, decreasing in the cost of extraction. Note that R’s profits become:
πAR =
2
∑i=1
wAi qA
i +FAi
=2
∑i=1
λwA
i qAi
1+λ+
pAi qA
i − c1+λ
(1.18)
In Equation 1.18, both terms decreases as λ gets larger. The last term, though, vanishes, as when R is
unable to extract any upstream surplus it will simply gets profits from the linear fee.
R’s equilibrium profits are:
πAR =
(1− c)2(1+λ )
2(1+λ (2−µ))(1+µ)(1.19)
Similarly to Equation 1.12, πAR is decreasing in µ for low values of λ ; as this parameter grows, the
function becomes first convex and then increasing in the differentiation parameter. The presence of
a high cost of extraction makes R less sensibile to the differentiation parameter to the point where it
prefers to host highly similar products on its platform.
1.4.3 Hybrid configuration
The key aspect of a hybrid business strategy is the coexistence of wholesale and agency agreements
within the same retailing platform. Without loss of generality, let R act as a reseller for M1’s product
and as a marketplace for M2’s product as shown in Figure 1.1c. Total compensation to R changes across
manufacturers: a simple fixed fee with zero linear price for M1 and a two-part tariff for M2. Profits
functions are given by:
πHR = (p1−w1)q1(p)+w2q2(p)+F1 +F2,
πHM1 = w1q1(p)− cq1(p)− (1+λ )F1,
πHM2 = (p2−w2)q2(p)− cq2(p)− (1+λ )F2.
(1.20)
27

Therefore, R and M2 compete on retail prices: this can be considered an interlayer price competition,
since R strategically interacts with one of the manufacturers in setting the final price to consumers. The
difference with respect to previous market configurations is that the two competing firms are asymmetric:
while the manufacturer only get profits from the sale of its product, R has two source of profits: the
product for which it is setting the retail price and the portion of profits from the other product. The
timing is:
1. R sets fixed fees, F1 and F2 and linear per unit fee, w2, and M1 and M2 either accepts or rejects;
M1 chooses w1;
2. R and M2 set p1 and p2 respectively;
3. demand is realized.
Again, this sequence of events is realistic and can be inferred from observed contract in the industry.
Under this market configuration, retail prices, as well as wholesale prices, are decided by independent
firms.
R and M2’s first order conditions are:
∂πHR
∂ p1= q1(p)+(p1−w1)
∂q1(p)∂ p1
+w2∂q2(p)
∂ p1= 0
∂πHM2
∂ p2= q2(p)+(p2−w2)
∂q2(p)∂ p2
− c∂q2(p)
∂ p2= 0
(1.21)
M2 is acting no differently than under a pure agency configuration: the objective function is the same
and the first-order condition is the same as Equation 1.14. R, on the contrary, does not solve the same
maximization problem as in Subsection 1.4.1, about the wholesale configuration. While not being able
to set both retail prices, though, R is still able to internalize the cross-price effect of product 1 on product
2 through the compensation it gets from M2. This effect, along with double marginalization occurring
on product 1, leads prices to be higher with respect to an agency structure. Indeed, as prices are strategic
complements, M2 responds to R’s pricing decision by setting a higher price with respect to a situation
where the competitor is in the same condition (i.e., if it was M1 to set the retail price). For this reason,
under a hybrid configuration, the two firms’ best response function have the same slope but different
intercepts. A similar dynamic has been explored in Foros et al. (2017) who showed that asymmetry
between contracts in a duopoly market shifts up best response functions
28

Retail prices as a function of intermediate transfer prices are:
pH1 (w1,w2) =
2+2w1−µ(1− c−3w2 +µ)
4−µ2 ,
pH2 (w1,w2) =
2(1+ c+w2)−µ +w1µ− (1−w2)µ2
4−µ2 .
(1.22)
In the first stage, firms compete in wholesale prices and R chooses the optimal fixed fee such that
manufacturers’ participation constraint is binding. Optimal wholesale prices, set in the first stage, are:
wH1 =
(−2+µ)(−1+µ)(2+µ)(4+µ(2+µ(5+µ))+λ
(8+µ
(2+µ +µ2
)))32+64λ +8(2−3λ )µ2− (12+5λ )µ4 +λ µ6 ,
−c(1+µ)(−16+2λ (−16+µ(4+µ(2+µ)))+µ(8+µ(−16+µ(1+µ)(2+µ))))
32+64λ +8(2−3λ )µ2− (12+5λ )µ4 +λ µ6
wH2 =
(−1+ c)(2+µ)(2µ2(−6+µ(2+µ))+λ (−16+µ(1+µ)(8+(−4+µ)µ))
)32+64λ +8(2−3λ )µ2− (12+5λ )µ4 +λ µ6 .
(1.23)
The convoluted form of Equation 1.23 is due to the fact that the decision-making firms are asymmet-
ric. Then, optimal fixed fees are given by:
πAM1 = 0→ wH
1 qH1 − cqH
1 − (1+λ )F1 = 0
⇒ FH1 =
wH1 qH
1 − cqH1
1+λ
(1.24)
πHM2 = 0→ (pH
2 −wH2 )q
H2 − cqH
2 − (1+λ )F2 = 0
⇒ FH2 =
(pH2 −wH
2 )qH2 − cqH
21+λ
(1.25)
Note that R’s profits become:
πHR = (pH
1 −wH1 )q
H1 +wH
2 qH2 +FH
1 +FH2
= pH1 qH
1 −λwH
1 qH1
1+λ− cqH
11+λ
+λwH
2 qH2
1+λ+
pH2 qH
2 − cqH2
1+λ
(1.26)
Equation 1.26 combines Equations 1.11 and 1.18 as R signs a different contract with each manufacturer.
When λ = 0, Equation 1.26 boils down to πHR = (pH
1 − c)qH1 +(pH
2 − c)qH2 . In the other extreme case,
λ → ∞, it becomes πHR = (pH
1 −wH1 )q
H1 +wH
2 qH2 .
29

Equilibrium retail prices are:
pH1 =
8(3+ c)(1+2λ )+4(−1+ c)(3+λ )µ−2(−5+ c(−3+λ )+11λ )µ2 +4(−1+ c)(−1+λ )µ3
32+64λ +8(2−3λ )µ2− (12+5λ )µ4 +λ µ6 +
+−(8+4c+2λ +3cλ )µ4− (−1+ c)λ µ5 +λ µ6
32+64λ +8(2−3λ )µ2− (12+5λ )µ4 +λ µ6
pH2 =
16(1+ c+(3+ c)λ )+4(−1+ c)(1+2λ )µ +2(7+ c− (11+ c)λ )µ2− (−1+ c)(−1+2λ )µ3− (4(2+λ )
32+64λ +8(2−3λ )µ2− (12+5λ )µ4 +λ µ6 +
++c(4+λ ))µ4− (−1+ c)(1+λ )µ5 +λ µ6
32+64λ +8(2−3λ )µ2− (12+5λ )µ4 +λ µ6
(1.27)
In a hybrid configuration, on the one hand the double marginalization is still present, because both retail
pricing firms charge a mark-up over an intermediate price. On the other hand, though, all variables are
decided by indipendent firms, competing with each other: retail prices are decided through competition
between R and M1; and wholesale/intermediate prices are decided through competition between R and
M2. The result is, therefore, different with respect to Jerath and Zhang (2010) where the product sold
under agency agreements led to channel efficiency (because no intermediate fees were present). Ceteris
paribus, this model generates higher retail prices overall. Surprisingly, though, it also generates higher
channel profits. The presence of a per unit linear fee mitigates competition in retail prices acting as a
cushion on margins.
1.4.4 Comparison and choice of business configurations
Figure 1.2 shows a comparison between retail prices across market configurations. The cost parameter,
c, does not affect the price ordering; hence, without loss of generality, I will set c = 0 during the analysis.
λ , instead, does have an impact on ordering. Note that this cost parameter only affects retail prices under
agency and hybrid configuration as in wholesale agreements R’s initial choice is only about a fixed fee
and therefore λ shows up in profits and not prices. The finding when comparing retail prices can be
summarized as follows:
Proposition 1. Under an upstream duopoly and a downstream monopoly, wholesale agreements gener-
ate higher retail prices with respect to agency agreements. When the extraction of fixed fees is cheap
enough, the wholesale configuration has the highest retail prices, while the agency configuration the
lowest retail prices. The hybrid configuration generates intermediate average retail prices. Instead,
when the extraction cost is high enough, the hybrid configuration produces the highest average prices.
30

Proof. The proof consists in solving combinations of differences between retail prices across market
configurations, considering the relevant set of parameters. E.g., for which values of µ and λ , pW ≥ pA,
pW ≥ pH1 and pW ≥ pH
2 .
Under perfect substitution (i.e., µ → 1), M1 and M2 enter a harsh price competition, regardless the
type of configuration in place, which drives prices towards either 0 (under the wholesale configuration) or
w (under the agency configuration). R, instead, is able to internalize the cross-price effect and therefore
act as a multi-product monopolist with no marginal costs whatsoever. Eventually, retail prices are equal
to 0.5 across all market configurations: pW = pH1 = pA = pH
2 = 12 . As shown in Equation 1.4, equilibrium
prices under vertical integration does not depend on µ .
When µ = 0, the two products are completely independent. The highest retail prices are under whole-
sale agreements, because monopoly power is parallelly exerted at both levels of the retailing channel.
Agency agreements, instead, generate the lowest retail prices, because manufacturers, who are directly
facing consumers, do not internalize the cross-price effect. The hybrid configuration sees retail prices
converge to the two extremes: the price set by R (M2 respectively) is equal to the retail price set under
wholesale (agency) agreements. Hence, when products are independent, pW = pH1 = 3
4 ≥ pA = pH2 =
1+3λ
2+4λ. All prices are equal to 3
4 when λ → ∞.
When µ ∈ (0,1), the pricing order is not as stark, and depends on the parameter λ . In particular,
there exists a threshold, say λ , such that when λ ≤ λ then pW ≥ pH1 and λ < λ then pW ≤ pH
1 :
λ =4(8+µ(4−µ(3+2µ)))
16+(−1+µ)µ(−8+µ(4+µ))
There also exists an additional threshold, say λ , such that when λ ≤ λ then pW ≥ pH2 and λ < λ then
pW ≤ pH2 . In sum, ∀µ ∈ [0,1):
• If 0≤ λ ≤ λ , then pW ≥ pH1 ≥ pA ≥ pH
2 ;
• if λ < λ ≤ λ , then pH1 ≥ pW ≥ pA ≥ pH
2 ;
• if λ > λ , then pH1 ≥ pH
2 ≥ pW ≥ pA;
• if λ → ∞, then pH1 ≥ pH
2 ≥ pW = pA.
31

At the end, under a hybrid configuration, prices are more sensibile to the fixed fee cost parame-
ter. Figure 1.2 shows a comparison according to different values of λ . When the cost is low enough,
as in Figures 1.2a and 1.2b, prices under a wholesale configuration are higher, while hybrid prices are
lower than the corresponding configuration (i.e., the price of the product sold through wholesale (re-
spectively, agency) agreements is lower than prices under wholesale (agency) configuration). When the
cost increases, the ordering changes, as in Figure 1.2c. Here, hybrid prices become higher than the
corresponding contracts under pure configurations.
In terms of profits, again c is normalized to zero without loss of generality. When setting up the
retailing platform, R considers equilibrium outcomes in each configuration, and decides to adopt the
business model leading the highest profit. The choice is in the (µ,λ ) space.
Proposition 2. When the retailer uses per unit linear fees, the agency configuration always leads to
strictly greater profits (unless products become perfect substitutes). This occurs regardless of the extrac-
tion cost of channel surplus.
Proof. R’s preferences are such that configuration k, ∀k = W,A,H is chosen over the others as long as
πkR = max
{πW
R ,πAR ,π
HR}
. First, as µ → 1, πWR = πA
R = πHR = 1
4 . Then, ∀λ and ∀µ ∈ [0,1), πAR > πH
R >
πWR .
Proposition 2 shows that, when per unit fees are implemented, the agency configuration always leads
to greater channel profits. On the one hand, this structure brings efficiency in letting independent firms to
compete in prices. On the other other hand, this competition is mitigated by the presence of a fee which
creates a double marginalization—which is less severe than under a wholesale agreement. Therefore,
without demand-enhancing services as in Jerath and Zhang (2010), and considering the present of two-
part tariffs with positive marginal fees, a hybrid configuration doesn’t emerge in equilibrium.
32

Figure 1.2: Equilibrium retail prices under per unit linear fees
(a) c = 0,λ = 0
0.2 0.4 0.6 0.8 1Μ
p
pH2
p1H
pA
pW
(b) c = 0,λ = .5
0.2 0.4 0.6 0.8 1Μ
p
pH2
p1H
pA
pW
(c) c = 0,λ = 3
0.2 0.4 0.6 0.8 1Μ
p
pH2
p1H
pA
pW
(d) c = .15,λ = 0
0.2 0.4 0.6 0.8 1Μ
p
pH2
p1H
pA
pW
33

Figure 1.3: Equilibrium R profits
(a) c = 0,λ = 0
0.2 0.4 0.6 0.8 1
Μ
ΠR
H
A
W
(b) c = 0,λ = 2
0.2 0.4 0.6 0.8 1
Μ
ΠR
H
A
W
1.5 Model analysis with ad valorem fees
In this section I explore the choice of the retailer when an ad valorem proportional fee is used under
agency agreements, instead of a per unit fee (while per unit prices are still adopted by manufacturers
under wholesale agreements). The analysis mirrors the one in Abhishek et al. (2015) where the opposite
market structure is studied: a monopoly manufacturer and a duopoly in retailing.
1.5.1 Wholesale configuration
As I assume that ad valorem fees are chosen only under agency agreements, in this market configuration
equilibrium outcomes are the same as in Section 1.4.1.
1.5.2 Agency configuration
Under an agency agreement, R allows the manufacturer to use its store and sets directly the price to
consumers. In this framework, M1 and M2 compete for setting retail prices under a revenue-sharing
agreement. Total compensation set by R is Ti = si piqi +Fi, ∀i = 1,2. Profit functions are given by:
πAR (p) =
2
∑i=1
si piqi(p)+Fi,
πAMi(p) = (1− si)piqi(p)− cqi(p)− (1+λ )Fi, i, j = 1,2, i 6= j,
(1.28)
The timing of the game is:
34

1. R sets fixed fees, F1 and F2, and ad valorem fees, s1 and s2, and M1 and M2 accept or reject.
2. M1 and M2 set p1 and p2 respectively;
3. demand is realized.
Contrarily to a traditional per unit fee, the manufacturer’s marginal cost depends on retail price itself;
Equation 1.28 can be rewritten as:
πAMi(p) = piqi(p)− (c+ si pi)qi(p)− (1+λ )Fi
hence the marginal cost is equal to c+ si pi, rather than c+wi. The component of the marginal cost
accruing to the choice of R is si pi versus the per-unit price wi under a wholesale contract. The profit-
maximizing manufacturer is charging a mark-up over c(1−si)
instead of c+wi. This cost add-on depends
on the retail price. First-order conditions are:
∂πAMi
∂ pi= (1− si)
(qi(p)+ pi
∂qi(p)∂ pi
)− c
∂qi(p)∂ pi
= 0, ∀i = 1,2. (1.29)
By totally differentiating 1.29,13 it is possible to study the effect of the fee on the manufacturers’ pricing
decision:dpi
dsi=
qi(p)+ pi∂qi(p)
∂ pi
2(1− si)∂qi(p)
∂ pi
, ∀i = 1,2,
which can be rearranged as:dpi
dsi=
pi
2(1− si)
[1− 1
ηi
], ∀i = 1,2, (1.30)
where ηi =∂qi(p)
∂ pi
piqi(p) . The equilibrium retail price is always increasing in the fee. This is intuitive as the
fee represents an increase in the marginal cost. The rate at which the equilibrium retail price increases
in si, though, is not constant and depends on si and the market elasticity. Under a per-unit price, instead,
dpidwi
= 12 .
In the second stage, Mi’s choice of retail prices leads to the following price function:
pi(s) =(1− si)(1− s j)(1−µ)(2+µ)+ c(2−2s j− (1− si)µ)
(1− si)(1− s j)(4−µ2), i, j = 1,2, i 6= j, (1.31)
where s = (s1,s2). Given these system of demands, retail prices are always increasing in the fee, as
13The market demand is linear in prices, therefore ∂ 2qi(p)∂ pi
2 = 0.
35

shown in Equation 1.30:dpi
dsi=
2c(1− si)2 (4−µ2)
, ∀i = 1,2. (1.32)
R correctly conjectures the manufacturers’ decision, and maximizes its own profit function with respect
to the fees. Imposing symmetry (M1 and M2 are, indeed, symmetric), s1 = s2 = sA, there exists a unique
solution to the maximization problem such that sA ∈ [0,1):
sA = 1− 13(λ −λ µ)
[3
23 cλ (1−µ)(c(2+λ −µ)+(1+λ )µ)
A13
− (3A)13
](1.33)
where
A =−9c2λ
2−9c2λ
3 +18c2λ
2µ +18c2
λ3µ−9c2
λ2µ
2−9c2λ
3µ
2+
+√
3√
c3λ 3(−1+µ)3 (27cλ (1+λ )2(−1+µ)− (c(2+λ −µ)+(1+λ )µ)3).
This agency fee looks similar to the one found by Abhishek et al. (2015, pp. 8), denoted by a∗AA, which
is a result of the competition between retailers to serve the distribution of the product of the monopolist
manufacturer. Here, instead, sA is the choice of a single firm, R. For this reason, when the fees are
comparable,14 sA is always higher than a∗AA, for all values of the differentiation parameter.
As R has full bargaining power in the contractual relationship with manufacturers, and the fee acts
as an upward distortion from the actual marginal cost of production, when c→ 0 then sA→ 1: the only
constraint limiting R in collecting the whole upstream revenue disappears, and the fee can be set at its
maximum level. Indeed, ∂ sA
∂c < 0: when the marginal cost of production increases, R must decrease the
fee to preserve manufacturers’ margin (as a higher fee would bring an even higher marginal cost); since
there is direct competition in retail prices, higher costs would imply lower margins. R must, therefore,
balance the trade-off between the size of revenue-sharing (direct impact of the fee on its profits) and
the effect of the fee on manufacturers’ marginal (indirect impact). Moreover, the equilibrium fee is
always increasing the differentiation parameter: ∂ sA
∂ µ> 0. A fiercer upstream competition in setting retail
prices drives down revenues, giving R incentives to increase the fee. When, instead, products are almost
independent, M1 and M2 have a much greater market power and R has a stronger incentive to keep the
fee low. Finally, ∂ sA
∂λ> 0. The higher the cost in extracting the fixed fee, the more distorted sA is. The
rate at which the fee increases with µ depends on the magnitude of λ . When λ is low, the optimal fee
14When d = 0 and the spillover effect in Abhishek et al. (2015) is greater than zero, i.e., τ > 0.
36
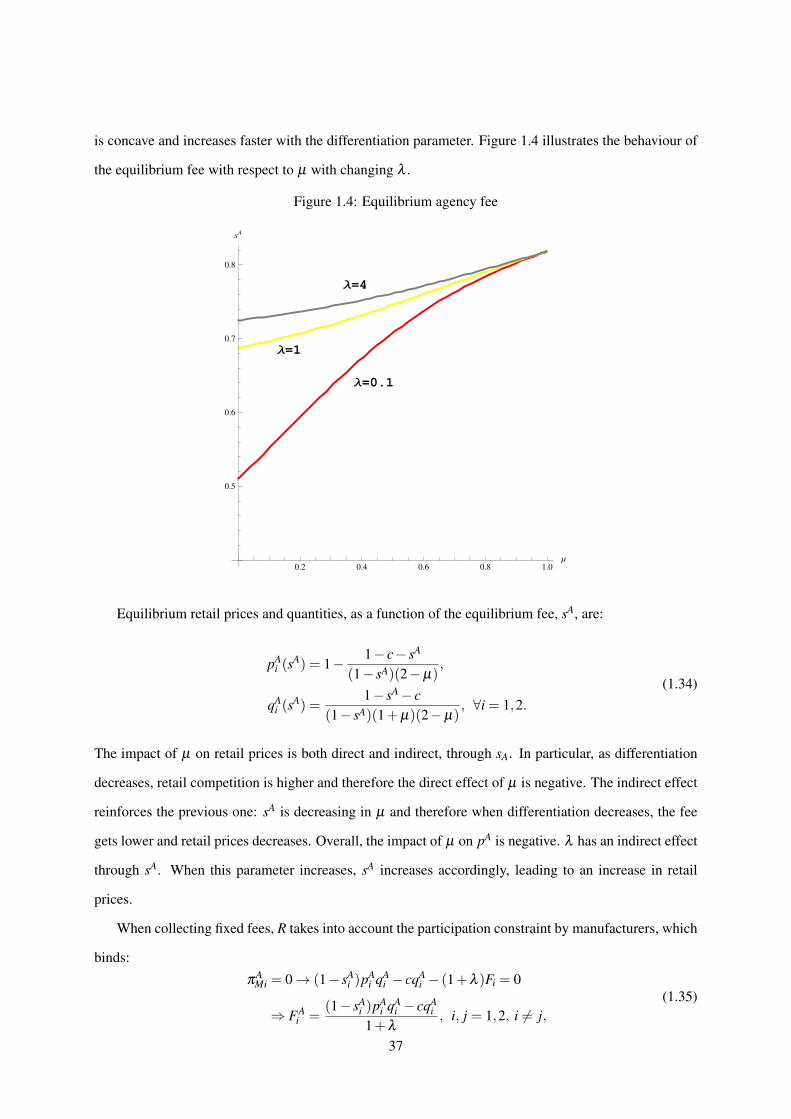
is concave and increases faster with the differentiation parameter. Figure 1.4 illustrates the behaviour of
the equilibrium fee with respect to µ with changing λ .
Figure 1.4: Equilibrium agency fee
Λ=0.1
Λ=1
Λ=4
0.2 0.4 0.6 0.8 1.0
Μ
0.5
0.6
0.7
0.8
sA
Equilibrium retail prices and quantities, as a function of the equilibrium fee, sA, are:
pAi (s
A) = 1− 1− c− sA
(1− sA)(2−µ),
qAi (s
A) =1− sA− c
(1− sA)(1+µ)(2−µ), ∀i = 1,2.
(1.34)
The impact of µ on retail prices is both direct and indirect, through sA. In particular, as differentiation
decreases, retail competition is higher and therefore the direct effect of µ is negative. The indirect effect
reinforces the previous one: sA is decreasing in µ and therefore when differentiation decreases, the fee
gets lower and retail prices decreases. Overall, the impact of µ on pA is negative. λ has an indirect effect
through sA. When this parameter increases, sA increases accordingly, leading to an increase in retail
prices.
When collecting fixed fees, R takes into account the participation constraint by manufacturers, which
binds:
πAMi = 0→ (1− sA
i )pAi qA
i − cqAi − (1+λ )Fi = 0
⇒ FAi =
(1− sAi )pA
i qAi − cqA
i
1+λ, i, j = 1,2, i 6= j,
(1.35)
37

FAi is the equilibrium fixed fee, decreasing in the cost of extraction. Note that R’s profits become:
πAR =
2
∑i=1
sAi pA
i qAi +FA
i
=2
∑i=1
pAi qA
i (1+λ sAi )− cqi
1+λ
=2
∑i=1
pAi qA
i −λ (1− sA
i )pAi qA
i + cqAi
1+λ
(1.36)
The last formula in Equation 1.36 has been derived by adding and subtracting λ pAqA and rearranging.
When extracting fixed fee is not costly (λ = 0), then R is able to efficiently to get the full channel surplurs
pAqA− cqA.
Equilibrium profits, as a function of the equilibrium fee, sA, are:
πAR (s
A) =2(1− c− sA)((−1+ sA)(1+ sAλ )(−1+µ)+ c(−1+ sA(2+λ −µ)+µ))
(1− sA)2(1+λ )(2−µ)2(1+µ)(1.37)
1.5.3 Hybrid configuration
Without loss of generality, let R act as a reseller for M1’s product, and as a marketplace for M2’s product
as in Section 1.4.3. Profits functions are given by:
πHR = (p1−w1)q1(p)+ s2 p2q2(p)+F1 +F2,
πHM1 = w1q1(p)− cq1(p)− (1+λ )F1,
πHM2 = (1− s2)p2q2(p)− cq2(p)− (1+λ )F2.
(1.38)
Again, R and M2 compete on retail prices. R strategically interacts with one of the manufacturers in
setting the final price to consumers. The timing is:
1. R sets fixed fees, F1 and F2, and the ad valorem fee, s1, and M1 chooses w1; both manufacturers
either accept or reject;
2. R and M2 set p1 and p2 respectively;
4. demand is realized.
38

This sequence of events is consistent with observed contract. R and M2’s first order conditions are:
∂πHR
∂ p1= q1(p)+(p1−w1−d)
∂q1(p)∂ p1
+(s2 p2−d)∂q2(p)
∂ p1= 0
∂πHM2
∂ p2= (1− s2)
(q2(p)+ p2
∂q2(p)∂ p2
)− c
∂q2(p)∂ p2
= 0(1.39)
M2 makes his decision no differently than under the previous agency configuration in Section 1.5.2.
Instead, R, while not being able to set both retail prices, is still able to internalize the cross-price effect
of product 1 on product 2 through the share of revenues she receives from M2. This effect, along with
double marginalization occurring on product 1, leads prices to be higher with respect to a pure agency
structure. Indeed, as prices are strategic complements, M2 responds to R’s pricing decision by setting
a higher price with respect to a situation where the competitor shares a symmetric objective function
(namely, if it were M1 to set the retail price).
Unlike the case of per-unit fees and, more general, an agency configuration, under a hybrid con-
figuration with ad valorem fees, the two firms’ best response functions have different slopes.15 More
specifically:
dp1
dp2=−
∂q1(p)∂ p2
+ s2∂q2(p)
∂ p1
2 ∂q1(p)∂ p1
,
dp2
dp1=−
∂q2(p)∂ p1
2 ∂q2(p)∂ p2
.
(1.40)
By asking a compensation from the sale of product 2, R is able to internalize the cross-price effect,
i.e., s2∂q2(p)
∂ p1, which shows up in the slope of the reaction function. Given the symmetric nature of
the demand functions,16 it turns out that dp1dp2
> dp2dp1
: R’s best response function is steeper than M2’s,
indicating a stronger reaction to the rival’s choice. Indeed, a decrease in p2 has two effects from R’s
perspective: increasing the competitive pressure at the downstream level, when battling for consumers;
and affecting revenues coming from product 2 through s2. The first effect is reinforced by the second
effect: by decreasing p1 even more, a higher share of revenues is left to be taken through the agency
15Under a wholesale configuration, the retail pricing choice is made by R, so the concept of best response function is ofno use. Under an agency configuration, the choice is made by manufacturers, who act independently; the slope of Mi’s bestresponse function is dpi
dp j=− ∂qi(p)
∂ p j /2 ∂qi(p)∂ pi
, i, j = 1,2, i 6= j. Given the demand specification in Equation 1.1, the slope is equal
to µ
2 : the lower the level of differentiation between products, the steeper the best response functions. The intuition is that firmsare reacting more strongly to a change in the competitor’s price when the products they are selling are more similar.
16Own- and cross-price effects are the same across products: ∂q1(p)∂ p1
=∂q2(p)
∂ p2and ∂q1(p)
∂ p2=
∂q2(p)∂ p1
.
39

contract. More specifically, in this model:17
dp1
dp2=
(1+ s2)µ
2,
dp2
dp1=
µ
2.
(1.41)
The higher the differentiation parameter, the steeper both reaction functions are, as illustrated in Figure
1.5. This is not surprising, as products become more similar, and competition fiercer. R’s optimal
responsiveness to the competitor’s price is also increasing in s2, as the agency contract provides him a
second stream of revenues which depends negatively on his own price.
Figure 1.5: Best response functions (hybrid configuration)
(a) µ = 0.2 and w1 = s2 = c = 0.2
0.0 0.2 0.4 0.6 0.8 1.0 1.2 1.4
p2
0.2
0.4
0.6
0.8
1.0
1.2
1.4
p1
p2Hp1L
p1Hp2L
(b) µ = 0.9 and w1 = s2 = c = 0.2
0.0 0.2 0.4 0.6 0.8 1.0 1.2 1.4
p2
0.2
0.4
0.6
0.8
1.0
1.2
1.4
p1
p2Hp1L
p1Hp2L
Retail prices as a function of intermediate transfer prices are:
pH1 (w1,s2) =
2+2w1−2s2(1+w1)+(2+ c)s2µ− (1− c+µ)µ− s22(1−µ)µ
(1− s2)(4− (1+ s2)µ2),
pH2 (w1,s2) =
2c+(1− s2)(2−µ +w1µ−µ2
)(1− s2)(4− (1+ s2)µ2)
.
(1.42)
I computed the optimal fees (hereafter, wH1 and sH
2 ) numerically, as the analysis is intensive, considering
17The slope of the reaction function can be found by differentiating the first-order condition of each profit-maximizing firm.Hence:
dp1
dp2=
∂ 2πHR
∂ p1∂ p2
− ∂ 2πHR
∂ p21
anddp2
dp1=
∂ 2πHM2
∂ p2∂ p1
− ∂ 2πHM2
∂ p22
40

the relevant set of parameters. Then, optimal fixed fees are given by:
πAM1 = 0→ wH
1 qH1 − cqH
1 − (1+λ )F1 = 0
⇒ FH1 =
wH1 qH
1 − cqH1
1+λ
(1.43)
πHM2 = 0→ (1− s2)pH
2 qH2 − cqH
2 − (1+λ )F2 = 0
⇒ FH2 =
(1− s2)pH2 qH
2 − cqH2
1+λ
(1.44)
Note that R’s profits become:
πHR = (pH
1 −wH1 )q
H1 + sH
2 pH2 qH
2 +FH1 +FH
2
= pH1 qH
1 + pH2 qH
2 −λwH
1 qH1
1+λ− cqH
11+λ
− λ (1− sH2 )pH
2 qH2 + cqH
21+λ
(1.45)
Equation 1.45 combines Equations 1.11 and 1.36 as R signs a different contract with each manufacturer.
If λ goes to zero, then R is able to fully extract the channel rents.
1.5.4 Choice of business configurations
Similarly to the case of per unit fees, I compare R’s profits under the three different market configuration,
in order to understand which one leads greater channel profits and, therefore, will eventually be chosen.
The effect of manufacturers’ marginal cost is not relevant in the choice of the business configuration
(hence set to an arbitrarily low value) and therefore the analysis focuses on the pair (µ,λ ).
Proposition 3. Adopting ad valorem proportional fees, the retailer chooses to implement a hybrid con-
figuration for intermediate values of the differentiation parameter. The choice is moderated by the cost
of extracting fixed fees: the higher the cost, the more likely to adopt a hybrid configuration. Further,
with a higher cost, the choice occurs for less differentiated products. The choice of a wholesale (agency,
respectively) configuration emerges for low (high) differentiation.
Proof. R’s preferences are such that configuration k, ∀k = W,A,H is chosen over the others as long as
πkR = max
{πW
R ,πAR ,π
HR}
and depends on c, µ and λ . The proof relies on numerical analysis as functional
forms are not tractable.
Figures 1.6a and 1.6b show the results of the proposition as a function of µ for λ = 0 and λ = 2.
The analysis shows that the hybrid configuration emerges for intermediate values of the differentiation
41

parameter, in a similar fashion as Jerath and Zhang (2010). Here, though, the moderating factor is not
demand-enhancing service level but costly extraction of the intermediate fee. Note that R aims at col-
lecting channel profits through the fixed fee hence these two parameters play a role in generating surplus
across upstream and downstream markets. When products are close to be independent, i.e., as µ → 0, a
structure where manufacturers directly compete is optimal because it keeps prices low enough. As dif-
ferentiation decreases, margins shrink and therefore R prefers to switch to wholesale agreements, where
she can regain control over the cross-price effects and therefore avoid destruction of channel profits.
When µ is high, competition among manufacturers becomes too fierce and therefore R has an incentive
to internalize the retail pricing decision. This occurs gradually as µ → 1, first incorporating the decision
for one product and then for both (from hybrid to wholesale configurations). A wholesale agreement
has the drawback of double marginalization, but this inefficiency is easily overcome by losses from
aggressive retail price competition. The extraction cost of the fixed fee mitigates manufacturers’ com-
petition. A higher λ makes the agency configuration more desirable by extending its choice for higher
values of the differentiation parameter. In fact, as Figure 1.4 shows, the cost pushes the optimal revenue
share up, which acts as a driver of higher retail prices downstream and counteracts the aggressiveness
of competition between independent manufacturers. Under a per unit fee, R always prefers the agency
configuration over the other two. The difference between the two contracts lies in how manufacturers
react to the marginal fee. A per unit fee is considered as an increase in the marginal cost and the seller
simply adds a mark-up over this cost. Instead, an ad valorem fee increases the marginal cost through a
gap which depends on the decision variable (i.e., retail price) itself. The rate at which the retail price
increases with the fee is not constant (as under a per unit fee) and depends on the market elasticity which,
in turn, depends on the differentiation parameter. This leads manufacturers to react more strongly to an
ad valorem fee when setting retail prices with respect to a per unit fee to the detriment of channel profits.
42

Figure 1.6: Equilibrium R profits
(a) c = 0.1,λ = 0
0.2 0.4 0.6 0.8 1
Μ
ΠR
H
A
W
(b) c = 0.1,λ = 2
0.2 0.4 0.6 0.8 1
Μ
ΠR
H
A
W
1.6 Concluding remarks and future research
In the past few years, retailers have increasingly delegated control over retail prices and in-store oper-
ations to manufacturers, effectively creating hybrid retailing structures. Amazon, for example, opened
an online marketplace in 2004, where third party sellers can offer their products alongside those sold
directly by Amazon. Other online retailers adopted the same business model shortly after. Physical
retailers pursued a similar strategy through store-within-a-store arrangements: the presence of branded
boutiques within stores that are managed directly by manufacturers. In many categories, similar prod-
ucts are sold by both the retailer and manufacturers (Jerath and Zhang, 2010). For example, the Apple
Watch is sold directly by Apple within Macy’s stores—at the same time, Macy’s sells Garmin and Under
Armour smartwatches. Why should retailers allow direct competition with upstream firms in their own
store? Is the choice of adopting a hybrid structure affected by the type of contract offered to manufac-
turers? These questions have received little-to-none attention by scholars. Most of the work has been
concentrated on analyzing the difference, in terms of prices and welfare, between wholesale and agency
agreements. The former are traditional contracts where retailers purchase products from manufacturers
to sell them directly to consumers. The latter, instead, are newer arrangements where manufacturers sell
directly to consumers and compensate retailers for using their platform as a commercial space. This
paper aimed at understanding under which market conditions the configuration where both contracts co-
43

exist within the same retailing platform emerges as an equilibrium outcome; here the retailer is assumed
to be the architect of the channel (rather than the manufacturers).
The model presented here considers an upstream duopoly offering differentiated products and a
downstream monopoly, and it compares three distinct business models: the wholesale configuration,
where the retailer sets retail prices; the agency configuration, where, instead, manufacturers set retail
prices; and the hybrid configuration, where one product is sold via a wholesale agreement and the other
is sold via an agency agreement. Contrary to prior research, the model focused only on retail pricing
decisions (as a way to avoid confounding factors coming from other choice variables) and considered
positive marginal fees set by the retailer to manufacturers. In particular, two pricing schedules were
compared in agency agreements: per unit linear fees and ad valorem proportional fees. Finally, I as-
sumed that the retailer faces a costly extraction of channel surplus as a way to account for any possible
inefficiency in the vertical channel. In deciding which configuration to adopt, the retailer must trade the
inefficiency coming from double marginalization under wholesale agreements for the inefficiency com-
ing from an aggressive competition under agency agreements. Manufacturers, indeed, are independent
firms and they cannot internalize the substitution effect between products when setting prices.
The analysis showed that a hybrid configuration never emerges under per unit linear fees. Instead,
the agency configuration is the one preferred by the retailer because it leads to greater channel profits.
On the one hand, this structure brings efficiency in letting independent firms compete through prices.
On the other other hand, this competition is mitigated by the presence of a fee which creates a double
marginalization—which is less severe here than under a wholesale agreement. Surprisingly, under an
agency configuration, the case with positive marginal fees dominates, in terms of channel surplus, the
case with zero marginal fees (i.e., only fixed fees are collected). The presence of a positive marginal
compensation pushes up retail prices (set by independent firms) and acts as a cushion to competition
between manufacturers.
If, instead, ad valorem fees are implemented, a hybrid configuration might emerge when differenti-
ation between products is intermediate and the cost of extracting surplus is higher. This is in line with
observed contracts: most major hybrid online retailers adopt proportional (typically revenue-sharing)
fees rather than linear fees. The difference between the two pricing schedules is clear. A per unit fee
is internalized by manufacturers as a simple add-on over the marginal cost. Instead, an ad valorem fee
increases the marginal cost through a wedge which depends on the decision variable itself (i.e., retail
price). The rate at which the retail price increases with the fee is not constant (as under a per unit fee)
44

and depends on the market elasticity which, in turn, depends on the differentiation parameter. This
leads manufacturers to react more strongly to an ad valorem fee when setting retail prices with respect
to a per unit fee to the detriment of channel profits. Indeed, when products become less differentiated,
manufacturers tend to slash their prices too much, while under a per unit fee the degree of competition
is cushioned by the linear added cost. In sum, when ad valorem fees are adopted, the retailer tries to
limit the incentive of manufacturers to destroy channel profits under agency agreements and implements
wholesale agreements gradually as differentiation decreases, first by selling one product only, and then
by selling both. The extraction cost of the fixed fee also mitigates competition between manufacturers.
A higher cost makes the agency configuration more desirable by extending its choice for higher values of
the differentiation parameter. In fact, the cost pushes the optimal fee up, which acts as a driver of higher
retail prices downstream and counteracts the aggressiveness of competition between independent manu-
facturers. It is worth mentioning that these results are independent of the presence of any other choice
variable affecting market demand—hence, they come only from the simple retail pricing decision.
However, the framework presents several shortcomings that can be addressed in future research.
First, other demand specifications can be considered in order to assess whether results are robust and
that they don’t depend on the shape of demand functions. Also, more complex market structures can
be tested; for example the bilateral duopoly presented in Dobson and Waterson (2007), which would
increase the complexity of the analysis but also provide useful predictions on whether, for example, the
choice depends on downstream competitive pressure. Moreover, the symmetricity of manufacturers can
also be relaxed. In fact, manufacturers can have different production technologies or consumers can
have asymmetric preferences over substitute products. This element is important because when the two
upstream firms are symmetric it doesn’t really matter which one adopts agency agreements in a hybrid
configuration. When, instead, they are symmetric, the retailer might favor one manufacturers over the
other for specific arrangements and, consequently, the choice of a hybrid configuration might be affected.
45

46

Chapter 2
The Choice of Brand Licensing under
Double-Sided Moral Hazard1
1This chapter is a joint work with Professor Emanuele Bacchiega, Department of Economics, University of Bologna, andProfessor Mariachiara Colucci, Department of Management, University of Bologna.
47

48

Abstract
Extending a brand within and beyond its original product category represents a major strategy for
companies to obtain long-term profitability. A brand owner can opt to internalize the production of
the extension product, or to license the brand to a third-party company. Brand licensing has been a
very common strategy for growth for many companies, but it does not come without any risk: such
an agreement can in fact expose to the risk of opportunistic behavior, leading to the brand dilution.
Nevertheless, in-house production typically requires the ownership of resources and competences that
may be too expensive to acquire or that the company may not have. We propose a theoretical framework
with two goals: first, we study the design of the optimal licensing contract under double-sided moral
hazard, second we analyze under which market conditions the brand owner relies on brand licensing.
Both choices are investigated in terms of the perceived fit between the core and the extension product
markets, a factor that has been overlooked by previous models, but that has been deemed as highly
relevant in the business literature.

2.1 Introduction
Extending a brand within and beyond its original product category represents a major strategy for com-
panies to obtain long-term profitability. In fact, by leveraging on the brand equity associated to their
brand names, companies can launch new products and enter new markets, thus capturing new opportu-
nities. The benefits from brand extension consist of lower new product introduction expenses, reduced
perceived risks for consumers, and new product’s leg-up for its establishment on the market. Yet, such
a strategy does not confine its effects to the (positive) influence of the parent brand on the extension
product. In fact, a feedback effect exists from the extension product on the parent brand, which can be
either positive or negative. The management literature refers to the former case as positive reciprocal
effect or brand enhancement and to the latter as negative reciprocal effect or brand dilution. While brand
enhancement is a further reason of attractiveness of brand extension, brand dilution, which occurs when
the extension fails, hinders brand equity.
While launching brand extensions has been nevertheless a very common strategy for growth for many
companies in the last decades, offering new products under the same brand name requires the ownership
of resources and competences that the company may not have or that may be too expensive to acquire or
develop internally. This observation leads to the related issue of the way the extension is managed, which,
in turn can directly affect the decision as to whether to extend itself. In fact, companies should evaluate
both the possession of necessary resources and the consequences on current activities and assets. Brand
licensing appears to be an increasingly popular means for expansion in new product categories through
the renting or leasing of the company’s brand name to an external actor.
Under a licensing agreement, a company (the licensor) gives an industrial or retail partner (the li-
censee) the rights to use its brand name in return for a negotiated payment (a fee or royalties, typically
a percentage of wholesale revenues). Agreements can differ in the content (from purely manufacturing,
distribution, all the way to retail), duration and geographical area (Raugust, 2012). In all such agree-
ments, the licensor contributes with reputation, brand image and creativity, while the licensee with its
manufacturing and distribution know-how. The licensor and the licensee have different goals and thus
different strategies. The licensor’s goal is to nurture and to give strategic orientation to the brand. It
searches for an exclusive image and product positioning, aimed at increasing brand awareness. The li-
censee’s goal is to exploit consumers’ brand awareness and push commercial diffusion that is to increase
revenues (Raugust, 2012). In this vein, the success of a brand licensing program depends on the extent to
50

which such an arrangement meets the goals of both parties involved, as the licensor may want to receive
(possibly high) royalties while controlling the use of the brand by the partner, whereas the licensee may
want to maximize its investments in the product category and boost sales.
These agreements are thus open to the risk of opportunistic behavior by either party (Jayachandran
et al. (2013); Robinson et al. (2014)). The licensor, on the one hand may deny support to the partner’s
business, depending, as an instance, on the compensation structure of the contract, on the strategic rele-
vance of the new product for the parent brand, or on the possibility to replace the licensee. This behavior
may damage the profits of the licensee who risks her investments in the product. The licensee, on the
other hand, may use the brand in an inappropriate manner, lowering product quality or using inappro-
priate channels, damaging the brand positioning and eventually the brand value. In the framework of
brand licensing, the misbehavior of the licensee may have effects that go beyond the boundaries of the
market for the licensed product, affecting the brand value (i.e., brand dilution) and, therefore, the profits
obtained by the licensor on the other markets where it operates.
Given the importance and the strategic implications of the decision on how to extend a brand, this
research has a twofold goal. First, we analyze the choice of the optimal contractual agreement under
brand licensing, introducing the feedback effect from the extended product to the parent brand. This is
clearly relevant in the case of brand dilution, but influences the contractual structure and the choice of the
business model in the case of brand enhancement as well. In particular, we introduce the possibility that
either parties of the agreement can behave opportunistically in pursuing their goals that, as said before,
may not overlap (Jayachandran et al., 2013). Our second goal is to examine under what conditions a
brand owner firm prefers to extend its brand through a licensing agreement rather than using in-house
production, that is the choice of make-or-license.
To achieve our goals, we develop a multi-stage contracting model where both the brand owner/licensor
and the licensee face a moral hazard problem as they cannot observe each other’s effort in, respectively,
maintaining the relevance of the brand, and offering a desirable extension product while not putting at
risk the value of the brand. We employ the model to characterize the optimal arrangement in terms of a
royalty rate and a fixed payment, and the brand owner’s choice whether to become a licensor or to extend
the brand via in-house production, basing on the distance of the two markets. We allow for the presence
of a direct effect of the brand owner’s effort in the core market to the extension product market in order
to improve the revenues on both markets. A key feature of our model is that there is a feedback effect
(i.e., a reciprocal effect, e.g., Ahluwalia and Gurhan-Canli (2000); John et al. (1998); Loken and John
51

(1993); Romeo (1991)) stemming from the action of the licensee to the revenue that the brand owner
reaps in the core market, which we model as an externality.
The remainder of this paper is organized as follows. Section 2 illustrates the importance of brand
licensing and reviews the relevant literature developed in both the managerial and industrial organization
research. Section 3 develops a general model of brand licensing. Section 4 analyses the model in a
specific setup and compares brand licensing with in-house development. We conclude with a discussion
of the results and their theoretical and empirical implications.
2.2 The choice of brand licensing
Licensing is a business tool that crosses over different industries, including fashion, sports, entertainment,
music and art, that is now mature and global with retail sales of licensed products estimated in $241.5
billion worldwide in 2014 (LIMA Annual Global Licensing Study). In addition, the value of corporate
brand licensing is very high; the leader in 2013 wasDisney Consumer Productswith $39.3 billion in retail
sales of licensed merchandise. The licensing of brands, in particular, represents the third major sector
of licensed products, being used to support brand extension and brand exposure especially for fashion
labels (Raugust, 2012). In 2015, among the leading fashion companies, as for the revenues growth, are
Luxottica, a well-known eyewear producer as well as distributor and licensee partner of many fashion
brands, and G-III Apparel Group that has the licenses of brands such as Calvin Klein, Kenneth Cole,
Tommy Hilfiger, Guess, Levi’s. While in the past brand licensing has helped many companies with
established brands to grow rapidly and to promote a lifestyle on the market (i.e., offering a wide and
complete product range), it has also been considered responsible for the failure and the brand dilution
of important brands. Pierre Cardin was the epitome of brand extension via licensing, managing 500
licensing agreements, including one for toilet-seat covers; another example is Yves Saint Laurent that
in 2001 managed 60 contracts, and then cut to 15 the next year (Corbellini and Saviolo, 2011). Besides
the product over-saturation phenomenon, brand dilution is typically caused by the loss of control of the
brand by the licensor, for which maintaining brand image and value is paramount (Raugust, 2012). An
instance of this is provided by Calvin Klein that in 2000 charged Warnaco Group, its licensee, with brand
equity dilution for breaching the jeanswear licensing and distribution contract, as the partner distributed
products through warehouse clubs. For the first time, the same year, Warnaco filed countersuit attributing
Calvin Klein for ineffective brand advertising and thus for damaging its business. In more recent years,
52

starting from late 1990s, companies have decided to limit the growth via licensing taking back control
(in-house) of their related businesses, with the aim to control the production cycle and the flow of profits
generated from the brand, that forms the basis of their operations. Today licensing shows its importance
especially for distant business where production and distribution specificities hold, such as eyewear,
watches, fragrances and cosmetics, and accessories (Corbellini and Saviolo (2011), Colucci et al. (2008)).
Despite of its practical importance, the managerial research has paid very little attention to brand
licensing both from the theoretical and empirical standpoint. An exception isJayachandran et al. (2013)
who examine how the risk of moral hazard affects royalty rates that are used as a mechanism to align
goals between licensor and licensee, across international markets. Another paper, by Colucci et al.
(2008), investigates under what conditions brand licensing is preferred to internal development in the
high-end fashion industry, focusing on the risks of licensee’s opportunistic behavior and negative re-
ciprocal effect. Differently, Robinson et al. (2014) analyze how brand licensing announcements affects
licensors’ shareholder values and suggest that investors react more favorably when the brand fit is greater,
ultimately assessing the financial impact of the brand licensing. To the best of our knowledge, though,
no prior study provides a theoretical framework to analyze at once the conditions that shape a (optimal)
licensing agreement and their strategic implications to limit the biggest risk in licensing, the dilution of
the brand (e.g., Robinson et al. (2014)).
Research on brand extensions (e.g., Loken et al., 2010; Vlckner and Sattler 2006) has typically
informed previous works on brand licensing, being the brand licensing a means to launch a new product
pursuing a brand extension strategy. Brand extension has been a central topic in the marketing literature
since the nineties ( Aaker and Keller (1990); Broniarczyk and Alba (1994)) and still represents a vibrant
area of study. The literature has largely examined advantages and disadvantages associated with a brand
extension strategy that has become in the past decades the predominant new product strategy, identifying
as the main advantage the increased acceptance by the market coupled with a reduction in risks and
costs of introductory marketing programs. The main disadvantage, when a brand extension fails, is
the potential damage to the brand’s existing products and to the brand itself, posing the considerable
risk of a brand equity dilution (Aaker and Keller (1990); John et al. (1998); Keller and Sood (2003)).
Recent contributions attempt to offer a comprehensive framework of the determinants of brand extension
success, and to highlight antecedents and consequences of consumer attitude toward a brand extension
(Czellar (2003); Volckner and Sattler (2006)). In the economic literature, starting from the seminal work
by Wernerfelt (1988), a conspicuous stream of the literature has investigated the role of brand extensions
53

(often referred to as umbrella branding, in Industrial Organization) in signaling quality to consumers,
by means of transferring the reputation of the brand to new products. Because consumers are not able
to perfectly observe products’ quality, they make inferences based on the quality of the original branded
product(s). Brands play in fact a relevant role in carrying information (e.g., reputation, quality) and
firms must carefully design business strategies to take into account benefits and costs in exploiting such
opportunity (Hakenes and Peitz (2008); Cabral (2009)). This strand of literature has then mostly focused
on the brand extension decision per se (as branded products vs. new brands) rather than examining how
companies carry out such extensions, that is the make-it-or-license-it decision (assuming, therefore, the
in-house development as the preferable choice); this research has also taken the viewpoint of the brand
owner vis--vis the consumer. The only and closest attempt to look at the relationship between the brand
owner/licensor and the licensee is Buratto and Zaccour (2009), which focuses on advertising strategies
in a fashion licensing contract using a differential game. Here, though, licensing is seen as a win-win
strategy and no brand dilution is present, as advertising generates only positive externalities; furthermore
the contractual agreement (in terms of royalty rates) is exogenous in that analysis.
Many findings in the brand extension literature hold in brand licensing contexts as well, but there are
also critical differences (Robinson et al., 2014). Brand licensing, like brand extension, implies the use of
a brand to produce and sell a new product, that is to take advantage of an established brand to effectively
enter a new product category, but, differently from the brand extension, the licensing involves the lease of
the brand, basing on a contractual agreement between two business entities (i.e., an interorganizational
arrangement). This means that the brand owner, ceding the brand, will have a reduction of the control
over it, becoming exposed to the risk of opportunistic behavior and brand dilution (Colucci et al., 2008).
The brand owner in fact, while aiming at maximizing royalties, fears harming the brand image as well as
adversely affecting sales of other established products marketed with the same brand name.
Drawing from the Management and Industrial Organization literature on brand extension and brand
licensing, in this study we propose a model for analyzing all the dimensions of the decision to pursue
a brand extension: we examine what is the optimal contractual agreement with the licensee, in terms
of royalty rate which has been regarded as the mechanism to reduce the risks perceived by either party
(Jayachandran et al., 2013), considering the case of a double-sided moral hazard; we also analyze what
factors drive the choice of managing extensions via licensing over in-house production. This study
contributes to extant literature by focusing on two factors highlighted in prior research on brand licensing,
but still under-searched especially within a unique theoretical framework.
54

The first factor is represented by the presence of two-sided asymmetric information in the licensing
relationship, which deserves more attention from research: both the brand owner and the licensee cannot
perfectly monitor the partner’s activity, which generates the risk of moral hazard. More in detail, on the
one hand, if the licensee behaves opportunistically she may shirk efforts in maintaining quality, manu-
facturing a poor quality product or using inappropriate distribution channels which would result into a
devaluation of the brand (Jayachandran et al., 2013). On the other hand, we assume that the licensor also
could neglect the licensee’s business, through, as an instance, ineffective advertising, and thus leading
to a decrease in licensee’s sales and revenues. The presence of double-sided opportunistic behavior has
been theoretically modelled in the context of contractual relationships that are similar to brand licens-
ing. (Bhattacharyya and Lafontaine, 1995) demonstrate that linear payments can be optimal in share
contracts such as franchising and sharecropping. Choi (2001) looks at technological licensing where
revenues are optimally shared via a per-unit payment (rather than an ad-valorem fee as in (Bhattacharyya
and Lafontaine, 1995)). In both cases, theoretical predictions are in line with observed practice among
firms. Contrarily to such share contracts, brand licensing differs under two dimensions: first, the brand
owner/principal has two streams of revenues—the original product and the extension product; second,
there are mutual spillover effects on both streams from both firms. The optimal contract between the
licensor and the licensee, therefore, takes into account the misalignment of incentives between partners
in the agency relationship to shape the optimal royalty rate. It is worth noting that, differently from
the standard double-sided moral hazard framework (Bhattacharyya and Lafontaine, 1995), the licensee’s
opportunistic behavior does not only damage the revenues generated by the licensed product, but all the
revenues generated by the brand itself, and therefore it has a negative spillover effect on the licensor’s
brand value (i.e., brand dilution). In our modified set up, we analyze the optimal licensing contract. We
contrast brand licensing with in-house production, where the brand owner must sustain specific costs to
gain the know-how and the technology to produce the extension product, while keeping control over the
brand.
The second factor is represented by the level of fit between the brand and the extension product,
conceptualized with how close the markets of the parent brand in its original application (i.e., the core
product) and of the extension product are. The idea of fit in the marketing literature in fact refers to
the degree of proximity or similarity between the two—parent brand and extension—as perceived by
consumers. Fit has a double relevance: it is the major driver of brand extension success (Volckner and
Sattler, 2006) since consumers would transfer brand perceptions from one product to another basing on
55

the perceived fit between the parent brand and the extension product (Aaker and Keller (1990), Park et al.
(1991), Broniarczyk and Alba (1994)). Fit has also a weight in the feedback effect of brand extensions on
the parent brand. Brand extensions in fact can produce reciprocal effects that can enhance or diminish the
equity of the parent brand (Keller and Sood (2003), Swaminathan et al. (2001), Balachander and Ghose
(2003)). In particular, such reciprocal spillover effects, when they are positive, can both strengthen the
parent brand and influence sales of established products. Similarly, the main risk associated to a brand
extension’s negative evaluation when a brand extension fails does not attain to the possible failure on the
market of the new (extension) product, rather on the potential damage to the parent brand’s established
products and, especially, to the dilution of the brand equity. In particular, unsuccessful brand extensions
can damage the parent brand when there is a high degree of fit involved. Consumers’ confidence in
the parent brand is more likely to be weakened with close extensions that represent an area in which the
company is supposed to have considerable expertise, given the high degree of congruence with the parent
brand (Keller and Sood (2003); Ahluwalia and Gurhan-Canli (2000); Czellar (2003)). Therefore, the fit
in our model affects both the choice of entry in the new market in-house versus via licensing and the risk
of brand dilution.
We find that, under double-sided moral hazard, an optimal licensing agreement exists, where the
licensor proposes a royalty rate and a fixed fee to the licensee, who accepts the offer. The optimal rate
is increasing in the fit: as the core and the extension product markets get closer, the licensor asks for
a greater payment in order to compensate for the risks of brand dilution. Our results suggest that the
royalty rate has a further role besides the ones of creating an incentive structure and extracting (a part
of) the licensee’s profit that are usually acknowledged by the literature. In fact, the royalty rate acts as a
contractual tool to mitigate the negative spillover from the licensee’s activity on the value of the parent
brand. Moreover, we show that the optimal royalty rate increases with the value that can be extracted in
the extension product market. In sum, higher royalty rates must be observed for closer markets because
in such situations the effects for brand dilution are larger. When analyzing the choice of a brand owner
in terms of business model to pursue to extend the parent brand, brand licensing can emerge as an
equilibrium business strategy under a range of the relevant parameters. Not surprisingly, the lower the
brand owner’s cost efficiency, the more inclined she is to license the extension product; on the other hand,
the higher the fit, the less likely the brand owner is willing to pursue brand extension via licensing.
56

2.3 The model
A brand owner wants to extend its brand in order to leverage on the equity associated to the brand name
to launch a new product. The choice is between extending through in-house production or via brand
licensing. The latter involves contracting with a third-party firm, which becomes a licensee (and the
brand owner becomes a licensor; in the model, the two terms will be used interchangeably). We assume
that the extension product market leads to a monopoly, as we do not introduce any form of competition
at this stage. This implies that the brand owner can only rely on a single licensee and that if the product
has not been licensed, the brand owner itself is the sole producer.
The brand generates revenues through the parent brand and the extension product. From the brand
owner’s point of view, the former can be considered his primary market, while the latter a secondary
market. The revenues coming from the parent brand market entirely accrue to the brand owner.2 Under
in-house production, revenues from the extension product are fully appropriated by the brand owner;
under licensing, revenues are split between the two firms under a contractual arrangement. In terms
of notation, the parent brand is denoted by b, and the extension product by ` (whether it is produced
internally or licensed). Then, let eb and e` be the effort levels provided in the respective markets. The
effort is demand-enhancing but costly and is non-contractible. More specifically, eb can be interpreted as
the effort the brand owner exerts in order to maintain brand relevance, which affects both the revenues
coming from the parent brand and those coming from the extension product. e`, on the other hand, is the
effort provided to specifically augment the demand of the extension product; this variable also affects
how the parent brand is perceived, and might create brand dilution; we call this effect spillover/reciprocal
effect. Figure 2.1 shows the relationship between brand owner and licensee in terms of efforts. We are
agnostic about the nature of e`: it can be seen as the effort to improve the quality of the extension product,
to determine its positioning in the market or to select the retail distribution channel which better fits the
brand.
2Without loss of generality, we assume that the parent brand is represented by the core product, and therefore parent brandrevenues are those coming from the core product market.
57

Figure 2.1: Dashed arrows represent unobservable effort
Brand owner HBLeffort
effort
Licensee HLL
Parent brand
Licensed product+
+
+
+�-
The main trade-off between the two business models involves the cost of realizing the extension
product. Under in-house development, the brand owner can perfectly monitor each production phase
(and therefore it can exert the efficient level of effort) but it needs to sustain higher costs since the market
is unproven and far, to a varying degree, with respect to the market of the core product (i.e., parent brand);
hence, when producing the extension product internally, the brand owner is not as efficient as in the core
product market. This cost is avoided under brand licensing as the brand owner selects an experienced
licensee partner; nevertheless, a licensing contract does not imply that the interests of the two firms are
fully aligned and, under imperfect monitoring, this may create a moral hazard problem. We consider the
possibility of the brand owner engaging in opportunistic behavior as well, not supporting appropriately
the licensee, who risks its investment. This creates a damage to the licensee as the extension product will
be less valuable to consumers, and the brand owner can still offset this devaluation by means of higher
royalties. In sum, in-house development entails a higher costs in augmenting the demand of the extension
product, while brand licensing brings about reciprocal effects which depend on the consumers’ perceived
fit between the parent brand and the extension product markets. The closer the markets, the larger the
spillover effect on the licensor’s brand value when the licensee behaves opportunistically. Here, the core
product and the extension product are independent hence the reciprocal effect follows from the fact that
they both fall under the same brand, hence consumers can transfer perceptions across products. The fit is
not related, thus, to differentiation between products, but simply to how close the two product categories
are seen by consumers.
58

2.3.1 Timing of the contracting game
We assume that the brand owner has full bargaining power in designing the contract. This is in line with
observed contracts, as the firm owns and controls the intellectual property. Under brand licensing, the
timing of the game is as follows:
1. the brand owner makes a take-it-or-leave-it contractual offer to the licensee.3 The licensee accepts
or rejects the offer.
2. The brand owner and the licensee set effort levels, eb and e` respectively.
3. The licensee decides how much to produce in the extension product market.
4. Demand and revenues are realized.
Note that under brand licensing, the brand owner is a licensor. Under in-house development, no third
party is involved, and therefore every decision is taken by the brand owner:
1. the brand owner decides how much effort to exert, eb and e`.
2. The brand owner decides how much to produce in the extension product market.
3. Demand and revenues are realized.
In both cases, we look at Subgame Perfect Nash Equilibria in terms of quantities and effort levels. Finally,
the brand owner selects the business model leading to the highest profits. The choice will depend on the
perceived fit between the parent brand and the extension product markets, and on parameters representing
the brand owner’s efficiency under in-house development.
2.3.2 Brand licensing
We model the demand of the extension product as P(q;θ), where q is the quantity, and θ is a parameter
such that ∂P∂θ
> 0. It can be interpreted as the consumers’ maximum willingness to pay; we normalize
the impact of θ on the willingness to pay, such that ∂P∂θ
= 1, which implies that the demand function is
linear in this parameter; we will call θ the consumers’ valuation of the extension product. Effort can be
exerted in order to increase θ : θ ≡ θ(eb,e`), where ∂θ
∂eb, ∂θ
∂e`> 0; the demand externality is, therefore,
always positive. Furthermore, ∂ 2θ
∂eb∂e`= ∂ 2θ
∂e`∂ebare interpreted as cross-partial effect of firms’ efforts on
3We will assume that the contract is a two-part tariff with a fixed fee able to extract all licensee’s rents, F , and a royaltyper-unit fee, s. This contract is optimal.
59

each others’ returns in the extension product market. For example, when ∂ 2θ
∂e`∂eb< 0, there is a conflict
between the two firms because as the brand owner puts more effort to maintain the parent brand, the
licensee sees diminishing marginal returns in his market.
During the third stage, the licensee chooses q as q(θ) = argmaxq π(q;θ) = P(q;θ)q−cq, where c is,
without loss of generality, normalized to zero. Then, we define π(θ)≡ π(q(θ);θ) as equilibrium profits
in the extension product market before any effort is exerted by either parties.
We assume the parent brand generates revenues equal to R(eb,e`;α). In this market, we do not
explicitly model a quantity/price choice by the firm, and we consider revenues as a black box affected by
the effort choices. We assume that ∂R∂eb
> 0. At this stage, we do not make any assumption on how the
licensee’s effort affects the parent brand revenues. Brand dilution may occur when the reciprocal effect
is negative, i.e., ∂R∂e`
< 0; or when the effect is positive but smaller than the corresponding effect under
in-house production.
A third element of R(·) is α: a parameter representing the perceived consumers’ distance between the
core and the extension products. The smaller α , the closer the extension product is to the core product.
We assume that, ceteris paribus, a smaller distance implies higher brand dilution. A main difference
with respect to in-house production is in how e` and α affect R(·). This will be developed in the related
Section.
Effort is costly: let c(ei), i = b, ` be the convex cost function firms face. Finally, we assume that both
firms are risk-neutral, which does not pose any threat to our analysis, as described by Bhattacharyya and
Lafontaine (1995) in the context of franchising contracts.
Complete contract
If effort levels are verifiable, then the brand owner can optimally implement a contract with a positive
fixed fee and a transfer price equal to zero. The former is set such that the licensee’s participation
constraint binds and is left with the outside option, normalized to zero. The transfer price takes the
shape of a per-unit royalty, and acts as a marginal cost for the licensee. Let s be the royalty rate; then, the
licensee extracts θ−s, rather than θ , from consumers in the extension product market. When effort levels
are contractible, the optimal royalty rate is equal to zero, as any other level would dissipate rents and not
allow to reach optimal profits. This is similar to an integrated vertical firm which sets a wholesale price
equal to the marginal cost in order to avoid the double marginalization problem. The complete contract
specifies the effort levels, and the brand owner is able to reach the highest attainable profits. The brand
60

owner’s problem is:
{eFBb ,eFB
` }= argmaxeb,e`
Π(eb,e`) = R(eb,e`;α)+π(θ(eb,e`))− c(eb)− c(e`)
The first-order conditions are:
∂R∂eb
+π′ ∂θ
∂eb− dc
deb= 0
∂R∂e`
+π′ ∂θ
∂e`− dc
de`= 0
where π ′ = dπ
dθ. The first-order conditions can be reduced to:
π′ =
dcdeb− ∂R
∂eb
∂θ
∂eb
=
dcde`− ∂R
∂e`∂θ
∂e`
At this point, we assume that firms do not have any budget constraint. The fact that, in reality, brand
licensing contracts are mainly signed with positive royalty rates is a strong signal that, indeed, effort
levels are not contractible and therefore brand owners need to incentivize licensees.
Optimal contract under non-verifiable effort
When the two firms cannot observe the two effort levels, and therefore the brand owner cannot enforce
a specific level of the licensee’s effort, eFBb and eFB
` cannot be implemented. The contract implemented
under incomplete information is composed by a royalty per-unit fee, s, and a fixed fee, F . This two-part
tariff is strandard in licensing contracts, as shown by Raugust (2012). Also, it has been shown that it is
an optimal contractual form in models with double-sided moral hazard (e.g., Choi (2001), from which
this model imports the main structure). Brand owner’s profits are:
ΠB(eb,e`) = R(eb,e`;α)+ sq(θ(eb,e`)− s)− c(eb)+F.
As under complete information, the brand owner reaps two streams of revenues; nonetheless, while he is
able to fully appropriate revenues coming from the parent brand, R(eb,e`;α), he needs to share revenues
with the licensee in the extension product market. The brand owner receives s for each unit sold of this
61

product: sq(θ(eb,e`)− s).4 The licensee’s profits are:
ΠL(eb,e`) = π(θ(eb,e`)− s)− c(e`)−F
The licensee operates in the extension product market and gets revenues from the direct sale of such
product.
The choice of effort by the licensee affect brand owner’s profits in two ways: directly, in terms of
shared revenues in the extension product market; and indirectly, through the reciprocal effect on the
parent brand. The incentive compatibility constraints requires that both the brand owner and the licensee
exert effort following:
eb(s) = argmaxeb
ΠB(eb,e`) = R(eb,e`;α)+ sq(θ(eb,e`)− s)− c(eb)+F (2.1)
and:
e`(s) = argmaxe`
ΠL(eb,e`) = π(θ(eb,e`)− s)− c(e`)−F (2.2)
First-order conditions are, respectively:
∂R∂eb
+ sq′∂θ
eb− dc
deb= 0 (2.3)
and:
π′ ∂θ
∂e`− dc
de`= 0 (2.4)
From (2.3): sq′ ∂θ
eb= dc
deb− ∂R
∂eb, while from Equation (2.4): π ′ ∂θ
e`= dc
de`. Both firms set effort level to the
point where marginal revenues are equal to marginal costs; brand owner’s marginal revenues are from
both the parent brand and the licensed product.
We are now in a position to describe the effect of the royalty rate on the effort levels exerted by firms.
Let e′b ≡debds and e′` ≡
de`ds . Then:
Proposition 4. e′b is positive as long as:
∂ 2ΠB
∂eb∂e`=
∂ 2R∂eb∂e`
+ sq′∂ 2θ
∂eb∂e`<−
∂θ
∂eb
∂θ
∂e`
· ∂2ΠL
∂e2`
(2.5)
4q(θ(eb,e`)− s) is the equilibrium quantity after the licensee has maximized his profits in the extension product market,and before the effort choice. The optimal quantity level is a function of θ , from which the licensee deducts the royalty rate.
62

while e′` is negative as long as:
∂ 2ΠL
∂e`∂eb= q′
∂θ
∂e`
∂θ
∂eb+q
∂ 2θ
∂e`∂eb<−
∂θ
∂e`∂θ
∂eb
· ∂2ΠB
∂e2b
(2.6)
Proof. Equations 2.5 and 2.6 are found by totally differentiating the first-order conditions. For more
details, see the Appendix.
The cross-partial effect of the effort choice on firms’ profits drives the results in Proposition 4. The
right-hand side of both conditions is always positive, meaning that ∂ 2ΠB∂eb∂e`
and ∂ 2ΠL∂e`∂eb
must be small enough
such that e′b > 0 and e′` < 0. In fact, Proposition 4 is always true when both cross-partial effects are neg-
ative or equal to zero. For example, when ∂ 2ΠB∂eb∂e`
≤ 0, an increase in the licensee’s effort decreases the
marginal returns the brand owner would get by investing more effort to promote the parent brand. In this
situation, the brand owner finds optimal to increase its level of effort when the royalty rate gets higher,
in order to counterbalance this effect. More specifically, this occurs when sq′ ∂ 2θ
∂eb∂e`≤− ∂ 2R
∂eb∂e`; if cross-
partial returns in the extension product market are positive (i.e., ∂ 2θ
∂eb∂e`> 0), then cross-partial returns
from the parent brand must be negative, that is, ∂ 2R∂eb∂e`
< 0. Therefore, e′b > 0 occurs when the damages
created by the licensee in the primary market are greater than the benefit created in the secondary mar-
ket. Similarly, on the licensee’s side, when ∂ 2ΠL∂e`∂eb
≤ 0, it is always true that e′` < 0. This always occurs
when ∂ 2θ
∂e`∂eb≤ 0 because q′ ∂θ
∂e`∂θ
∂eband q are positive. Hence, under decreasing cross-partial returns in the
secondary market, the licensee finds optimal to decrease its effort when s increases. Of course, the two
cases depicted above are not the only ones, as Equations 2.5 and 2.6 simply requires the left-hand sides
to be smaller than the terms on the right-hand side, and not necessarily negative or equal to zero.
Though at first sight complex, these conditions have an interpretation. Equation (2.5) ((2.6), respec-
tively) simply states that e′b > 0 (e′` < 0) when the cross-partial effect of e` (eb) on ΠB (ΠL) is smaller than
the second partial derivative of ΠL (ΠB) filtered by the term ∂θ
∂eb/∂θ
∂e`( ∂θ
∂e`/∂θ
∂eb). This term can be interpreted
as a margin ratio, i.e., the weight of the marginal contribution of the brand owner’s (licensee’s) effort
on the valuation of the extension product with respect to the licensee’s (brand owner’s) own marginal
contribution. Then, by analyzing, for example, Equation 2.5, it turns out that, all things equal, as ∂θ
∂eb
increases (and therefore the marginal ratio gets larger), the condition is more likely to be satisfied, i.e.,
e′b > 0 becomes more likely. This effect is straightforward as no other term in the condition depends on
∂θ
∂eb. This means that as the brand owner’s marginal contribution to the extension product becomes more
relevant, he finds more incentives to increase the effort level with the royalty rate.
63

Equation 2.6, instead, is a bit more complex as the term ∂θ
∂ebis present on both sides. The equation
can be rewritten as:
q′∂θ
∂e`
(∂θ
∂eb
)2
+q∂ 2θ
∂e`∂eb
∂θ
∂eb<
∂θ
∂e`· ∂
2ΠB
∂e2b.
As ∂θ
∂ebincreases, the condition becomes less likely to be satisfied when ∂ 2θ
∂e`∂eb> 0, because the left-hand
side becomes unambiguously larger. Surprisingly, when the brand owner’s contribution to the extension
product gets larger, and the two effort levels are complementary in its consumers’ valuation, the licensee
has more incentive to increase its effort level when the royalty rate increases.
Under the special case where ∂θ
∂eb= ∂θ
∂e`, and therefore the two firms’ marginal contribution to the
extension product valuation are identical, the two conditions can be reduced as follows:
∂ 2ΠB
∂eb∂e`<−∂ 2ΠL
∂e2`
∂ 2ΠL
∂e`∂eb<−∂ 2ΠB
∂e2b
Then, e′b > 0 (e′` < 0, respectively) when licensee’s (brand owner’s) own-partial returns are larger than
cross-partial returns on the brand owner’s (licensee’s) profit function.
In the case where ∂ 2θ
∂eb∂e`= ∂ 2θ
∂e`∂eb= 0, that is, the extension product valuation is linear in efforts (i.e.,
the two effort levels are independent), the brand owner’s cross-partial effect boils down to ∂ 2ΠB∂eb∂e`
= ∂ 2R∂eb∂e`
.
Hence, Equation 2.5 is always satisfied when the two effort levels are negatively related, or independent,
in the primary market. When the licensee damages the revenues from the parent brand, the brand owner
has the incentive to increase the effort level following an increase in the royalty rate.
Prior to effort choice, the brand owner offers a contract to the licensee in the form of two-part tariff
consisting in a royalty rate and a fixed fee. The latter is set such that the participation constraint is binding
and therefore extracts all surplus from the licensee, who is then indifferent between accepting the contract
or getting the outside option (normalized to zero). Then, the brand owner chooses the optimal royalty
rate as:
s∗ = argmaxs
ΠB(s) = R(eb(s),e`(s);α)+ sq(θ(eb(s),e`(s)− s)− c(eb(s))+F(s)
64

where F(s) = π(θ(eb(s),e`(s)− s)− c(e`(s)). The first-order condition is:
∂R∂eb
e′b +∂R∂e`
e′`+q+ sq′[
∂θ
∂eb+
∂θ
∂e`e′`−1
]+π
′[
∂θ
∂eb+
∂θ
∂e`e′`−1
]− dc
deb− dc
de`= 0 (2.7)
Exploiting Equations (2.3) and 2.4, and the Envelope theorem such that π ′ = q, we can rewrite Equation
2.7 as:5
∂R∂e`
e′`+ sq′∂θ
∂e`e′`+q
∂θ
∂ebe′b− sq′ = 0 (2.8)
The choice of the optimal royalty rate s∗ depends on the reciprocal effect on the parent brand (first term);
on the incentives to both the brand owner and the licensee to exert effort (second and third terms); and on
the negative effect on the quantity in the extension product market, because a larger royalty rate decreases
the mark-up firms can extract in the extension product market (i.e. θ − s), and consequently the optimal
quantity. Following Choi (2001), Equation 2.8 can be rewritten as:
s∗ =∂R∂e`
e′`+q ∂θ
∂ebe′b
q′[1− ∂θ
∂e`e′`] (2.9)
The optimal royalty rate needs not to be positive. The brand owner may both extract surplus from the
licensee or subsidize it. The choice will depend on how the effort levels react to s, and the impact of
firm’s effort on each other’s relevant market. Let e′` < 0; then, the denominator in Equation 2.9 is always
positive (as we assumed that ∂θ
∂e`> 0). The sign of s∗ is determined by the sign of the numerator; s∗ > 0
if and only if:
q∂θ
∂ebe′b >−
∂R∂e`
e′`.
Proposition 5. When setting the optimal royalty rate, the brand owner must consider its effect on both
parent brand revenues (via the licensee’s effort) and extension product revenues (via his effort). When
e′b > 0 and e′` < 0, the optimal royalty rate is positive as long as marginal revenues from the action of
the brand owner in the extension product market offsets marginal revenues or damages coming from
the reciprocal effect. When e′b < 0 and e′` < 0, instead, a positive royalty rate is optimal only if the
mitigation of the negative reciprocal effect (through higher royalties) is large enough to counterbalance
the decrease in revenues in the extension product market.
Previously, we assumed that ∂θ
∂eb> 0: firms’ effort always enhance the extension product valuation.
5Remember that ∂P∂θ
= 1.
65

Henceforth, when e′b > 0, the optimal royalty rate is positive when its marginal revenues from the ex-
tension product are greater than marginal revenues/losses coming from the parent brand and due to the
licensee’s activity. Indeed, ∂R∂e`
e′` < 0 when ∂R∂e`
> 0: if the licensee reacts negatively to an increase in s,
but its effort enhance parent brand revenues, then the brand owner suffers a damage for each increase
in the royalty rate. On the contrary, when ∂R∂e`
< 0, then increasing the royalty rate has a positive effect
on brand owner’s profits through discouraging the licensee to exert effort and mitigating the negative
reciprocal effect.
When, instead, e′b < 0, then q ∂θ
∂ebe′b is always negative, and a positive royalty rate occurs if and only if
∂R∂e`
< 0 such that ∂R∂e`
e′` > 0. In this situation, the brand owner must strike a balance between the negative
effect of increasing s on the extension product market (via his effort) and the positive effect of the same
action on parent brand revenues (higher royalty income implies lower effort by the licensee and therefore
mitigates the negative reciprocal effect).
Optimal contract under single-sided moral hazard
When moral hazard is one-sided,6 i.e., only the licensee has to exert unboservable effort to increase the
attractivity of the extension product (with spillovers on the parent brand), Equation 2.9 reduces to:
s∗ =∂R∂e`
e′`
q′[1− ∂θ
∂e`e′`] (2.10)
hence s∗ > 0 if and only if the numerator is positive; that is, when R(·) is decreasing in e` and e′` < 0.
When the effort level itself is negatively related with parent brand revenues (or the revenue function is
concave), then the only way for the brand owner to mitigate this spillover effect is to ask for a positive
royalty rate.
Proposition 6. Under one-sided moral hazard and spillover effects on the brand owner’s external rev-
enues, there exists a positive optimal royalty rate even when firms are risk-neutral.
This shows that when another stream of revenues is present and is fully appropriated by the brand
owner, there is still room for an optimal positive royalty rate.
6This is the case where ∂R∂eb
= ∂θ
∂eb= 0.
66

2.3.3 In-house production
If brand extension is internalized by the brand owner, the firm chooses e` as well. This means that
on the one hand the brand owner can avoid brand dilution: the firm is able to have full control on the
creation of the extension product. On the other hand, though, it is not as efficient in doing so as an
experienced company would be. The brand owner can lack the know-how necessary to produce a high-
quality product, or simply is not able to make the product attractive. Here, brand owner’s profit function
is:
ΠI(eb,e`) = RI(eb,e`)+π(θI(eb,e`))− c(eb)− c(e`)−η
There are three differences in brand owner’s profit function with respect to brand licensing. The for-
mer concerns RI(·), parent brand revenues; under in-house production, we assume brand dilution is not
present and the function does not depend on α . More specifically, RI(·)≡ R(·;α = 0)> 0.
The second difference concerns the marginal effort of e`; we assume that ∂θ
∂e`> ∂θI
∂e`. This signals the
inability of the brand owner in being as efficient as the licensee when providing effort to enhance the
valuation of the extension product. In fact, we might accomodate the presence of a fixed entry cost that
the brand owner must sustain when producing the extension product. Finally, we assume the presence of
a positive fixed cost, η > 0.
The brand owner’s problem is:
{eIb,e
I`}= argmax
eb,e`ΠI(eb,e`) = RI(eb,e`)+π(θI(eb,e`))− c(eb)− c(e`)−η
First-order conditions are:
∂RI
∂eb+π
′ ∂θI
∂eb− dc
deb= 0
∂RI
∂e`+π
′ ∂θI
∂e`− dc
de`= 0
which can be reduced to:
π′ =
dcdeb− ∂RI
∂eb
∂θI∂eb
=
dcde`− ∂RI
∂e`∂θI∂e`
This analysis mirrors the case of complete information in Subsection 2.3.2: both effort levels are chosen
by the brand owner. The difference is in both R(·) and θ(·), so the two situations are not directly
comparable. It might be that brand owner’s equilibrium profits are higher under complete information
67

because internal cost to extend the brand are too large, or the opposite case might be true because brand
dilution is too severe.
2.4 Discussion
In order to investigate these results further, and finally understand under which conditions the brand
owner is relying on brand licensing, we consider an analytical example.
First, we lay the fundations of the revenues generated by the parent brand. When the brand owner
internalizes the process of producing an extension product, it is able to perfectly monitor and control each
phase and therefore the spillover effects on the parent brand are positive and ca be fully appropriated:
RI(eb,e`) = θbeb + θ`e`.
θb (θ`) is the marginal contribution of the brand owner’s effort exerted in the core (extension) market
on parent brand revenues. As both parameters are positive, effort levels increase revenues extracted by
the brand itself. If, instead, the brand owner decides to license the extension product, he will find more
difficult to control the production process. There might be the possibility of either brand dilution or brand
enhancement; both effects are conditional on the distance between the core and the extension products.
We model this by considering the following functional form:
R(eb,e`;α) = θbeb + γθ`
1+αe`.
First, we assume that θb > θ` > θ` > 0. The value of the core product is strictly greater than the value of
the extension product; both are greater than what the brand owner can achieve when producing in-house.
Moreover, without loss of generality, we normalize θb = 1 such that 1 > θ` > θ` > 0.
Further, the licensee’s effort is filtered by the function γ
1+α, which contains two relevant parameters.
γ ∈ [−1,1] represents the magnitude and the direction of the spillover effect. When γ < 0 (γ > 0) there is
brand dilution (brand enhancement), because ∂R∂e`
< 0(
∂R∂e`
> 0)
. As mentioned in the previous Section,
α > 0 represents the distance between the core and the extension/licensed products. The larger α , the
more distant the two products are. The spillover effect is less severe as α → ∞, which indicates distant
markets in terms of consumer perception. For example, under full brand dilution (e.g., γ =−1), a smaller
α implies a greater cost on the brand owner for the same level the licensee’s effort. This function is able
68

to incorporate the effect of the fit (here, as inverse fit, or distance), as previously discussed, within the
spillover/reciprocal effect.
We further assume that the inverse demand function of the extension product is linear and given by
P(q;θ) = θ −q, where θ ≡ θ(eb,e`) = eb +θ`e` (with θ` = θ` under in-house production); effort levels
act as demand-enhancing variables and represent the intercept of the demand.
2.4.1 Brand licensing
Under brand licensing, the brand owner opts for a royalty per-unit rate, s; hence, equilibrium quantity
and profits chosen by the licensee are:
q(θ(eb,e`)− s) =12(θ(eb,e`)− s) =
12(eb +θ`e`− s)
π(θ(eb,e`)− s) =14(θ(eb,e`)− s)2 =
14(eb +θ`e`− s)2
The fee s increases the marginal cost sustained by the licensee when producing the extension product
(here normalized to zero).
Choosing the effort level is costly, and we assume that c(ei) =e2
i2 , i = b, ` (the quadratic form allows
profit functions to be well-behaved). The brand owner and the licensee’s choice of effort levels follows,
respectively:
eb(s) = argmaxeb
ΠB(eb,e`) = R(eb,e`;α)+ sq(θ(eb,e`)− s)− c(eb)+F
= eb + γθ`
1+αe`+ s
12(eb +θ`e`− s)−
e2b
2+F
and:
e`(s) = argmaxe`
ΠL(eb,e`) = π(θ(eb,e`)− s)− c(e`)−F
=14(eb +θ`e`− s)2−
e2`
2−F
69

By solving the two first-order conditions simultaneously:
eb(s) =12(2+ s)
e`(s) =((2+ s)−2s)θ`
2(2−θ 2` )
e′b is always positive, while e′` is always negative.7 In our analysis, θ and R(·) are modelled such
that the two effort levels are independent. Therefore, Equation 2.5 in Proposition 4 is satisfied be-
cause the cross effect on brand owner’s profits is zero. Equation 2.6, instead, is satisfied as long as
∂ 2ΠL∂e`∂eb
= q′(
∂θ
∂eb
)2<− ∂ 2ΠB
∂e2b
. The brand owner has an incentive to increase effort with s because it leads
to an increase in royalty profits. The licensee decreases the optimal effort with s when its marginal profits
are damaged by the brand owner’s effort choice.
Anticipating the decision in the effort stage, the brand owner maximizes its profit function by consid-
ering parent brand revenues, the amount of royalties flowing from the licensee, and the remaining rents
captured through the fixed fee, as shown in Equation 2.7.8 Then:
s∗(α) =2(1+α− γθ 2
`
)(1+α)
(5−θ 2
`
)When γ < 0 (brand dilution), the optimal fee is always positive. The brand owner tries to balance the
damage created by the licensee by means of a positive marginal compensation. If, instead, γ > 0 (brand
enhancement) a positive compensation is due if and only if the magnitude is low enough, i.e., γ < 1+α
θ 2`
.
Since we assumed θ` < 1 and α > 0, the optimal fee is always positive also under brand enhancement.
Nevertheless, under brand enhancement, s∗(α) < 0 when θ` is large enough. This would be the case of
a overly positive spillover effect on parent brand revenues, with the brand owner having an incentive to
subsidized the licensee to exert more effort.
The most interesting result is the relationship between s∗ and α:
s∗′=
2γθ 2`
(1+α)2(5−θ 2` )
.
α represents the distance between the core and the extension products in terms of consumers’ perception.
Then s∗′> 0 (s∗
′< 0) always under brand enhancement (brand dilution). When the spillover effect is
7More specifically, eb =12 and e′` =−
θ`
2(2−θ 2` )
.8ΠB(s) is concave in s as the second derivative is − 1
2 < 0 therefore the function is well-behaved.
70

negative, the farther the markets, the lower the compensation to the licensee must be as the damage is
lower.
Proposition 7. Under brand dilution, the optimal fee decreases with the perceived distance. Under
brand enhancement, the optimal fee increases with the perceived distance.
Figure 2.2 shows the two cases for a specific value of θ` and the different behaviour of s∗ with respect
to α .
Figure 2.2: Brand owner’s optimal choice: colored area—brand licensing
(a) θ` = .9, γ =−0.5
0 1 2 3 4 5Α
0.2
0.4
0.6
0.8
1.0
s*
(b) θ` = .9, γ = 0.5
0 1 2 3 4 5Α
0.2
0.4
0.6
0.8
1.0
s*
Comparison with the complete contract
Optimal effort levels are found by plugging s∗ into eb(s) and e`(s):
e∗b =6(1+α)− (1+α + γ)θ 2
`
(1+α)(5−θ 2
`
)e∗` =
4(1+α)θ`+(−1−α + γ)θ 3`
(1+α)(5−θ 2
`
)(2−θ 2
`
)When effort levels are contractible, first-best levels are:
eFBb =
2(1+α)− (1+α− γ)θ 2`
(1+α)(1−θ 2
`
)eFB` =
(1+α + γ)θ`
(1+α)(1−θ 2
`
)71

Then, total effort exerted in both cases is:
e∗b + e∗` =12(1+α)+4(1+α)θ`−2(4+4α + γ)θ 2
` +(−1−α + γ)θ 3` +(1+α + γ)θ 4
`
(1+α)(−5+θ 2
`
)(−2+θ 2
`
)eFB
b + eFB` =
−2−2α +θ`+αθ`− γθ`
(1+α)(−1+θ`)
The difference between total effort exerted in the first-best and total effort exerted under imperfect infor-
maiton is always positive. Under complete information, effort levels are maximized.
2.4.2 In-house development
When the production of the extension product is internalized by the brand owner, the optimal level of
efforts solves the following problem:
{eIb,e
I`}= argmax
eb,e`ΠI(eb,e`) = eb + θ`e`+
14(eb + θ`e`)2−
e2b
2−
e2`
2−η
The brand owner is not as efficient as the licensee in providing effort to enhance the demand of the
extension product; the marginal benefit of effort is smaller with respect to what a more knowledgeable
third party would induce; i.e., θ` < θ`. Moreover, we introduce a fixed entry cost, signalling the difficulty
of the brand owner to produce a good in an unproven, or far, market. Note that, here, the notion of
distance is technological rather the based on consumers’ perception; hence, the core and the extension
products can be seen as very close by consumers but their production might require completely different
technologies and know-how; e.g., leather bags and sunglasses.
By solving the brand owner’s problem:
ebI =2
1− θ`2
e`I =2θ`
1− θ`2
Equilibrium profits are:
Π∗I =
(1+η)θ 2` +1−η
1− θ 2`
(2.11)
72

2.4.3 Optimal choice of the business strategy
In the first stage, by correctly conjecturing equilibrium profits under brand licensing and in-house pro-
duction, the brand owner decides which business model to adopt. The choice will primarily depend on
the distance parameter, α and on the magnitude/sign of the spillover effect. Formally, we say that the
brand owner has a preference for brand licensing as long as:
Π∗B(α,γ)≥Π
∗I (θ`,η)
where Π∗(α,γ)≡ Π(eb(s∗(α,γ)),e`(s∗(α,γ)),s∗(α,γ)) and Π∗I ≡ ΠI(ebI(θ`),e`I(θ`),η). As the brand
owner aims at maximizing profits flowing from the brand, it needs to strike a balance between diluting
the brand by licensing the product, and encountering a disadvantage by internalizing production. As an
analysis spanning all the parameter space is challenging, in order to deliver stark results in the following
we will make the following assumptions.
Assumption 1. (i) In case of brand dilution γ =−1.
(ii) In case of brand enhancement γ = 1
(iii) η = 0
Assumptions (i) e (ii) amount to restricting the reciprocal effect to its maximum (positive or negative)
value.9 Assumption (iii), instead, increases the profitability of the option of in-house development: this
notwithstanding, the ensuing Proposition shows that brand licensing remains the optimal option in non-
empty parameter constellation, entailing that this remains the case for positive η .
Proposition 8. A positive value of distance between the core and extension markets α exist, such that
1. (Brand Dilution) when γ = −1 the brand owner selects in-house development for all 0 ≤ α ≤ α ,
and brand licensing for all α > α .
2. (Brand enhancement) when γ = 1 the brand owner selects brand licensing for all 0≤ α ≤ α , and
in-house development for all α > α .
Proof. The proof consists in analyzing Π∗B(α,γ)−Π∗I (θ`,η). See the Appendix.
9A numerical analysis confirms the intuition provided by these “extreme” cases in the intermediate range −1 < γ < 1.
73

The threshold of α as identified by Proposition 8 is:
α =( −4+(6+4γ)θ 2` − (1+ γ)θ 4
` −2η(−1+ θ
2`
)(10−7θ
2` +θ
4`
)+
−√
2√−γ2
(−1+ θ 2
`
)(1+ θ 2
` +η(−1+ θ 2
`
))θ 4`
(10−7θ 2
` +θ 4`
)+
+ θ2`
(−36+(22−4γ)θ 2
` +(−3+ γ)θ 4`
))/( 4−6θ
2` +θ
4` +2η
(−1+ θ
2`
)(10−7θ
2` +θ
4`
)+
+ θ2`
(36−22θ
2` +3θ
4`
))
When there is brand dilution, the brand owner prefers to internalize production when the two products
are close (low α). When instead the two products get farther, then the reciprocal effect is small and
the brand owner would like to contract a third-party licensee. The result is not surprising but confirms
the notion that the brand owner should rely on a licensee when the products are far from consumers’
perception.
The choice of the brand owner depends on the parametric space. The analysis will consider the tuple
(α,γ) for different combinations of the marginal effort parameters, i.e., θ` and θ`, and the fixed cost, η .
Figure 2.3: Brand owner’s optimal choice: colored area—brand licensing
(a) θ` = .9, θ` = .05, η = 0
-1.0 -0.5 0.0 0.5 1.0
0
1
2
3
4
5
Γ
Α
(b) θ` = .9, θ` = .15, η = 0
-1.0 -0.5 0.0 0.5 1.0
0
1
2
3
4
5
Γ
Α
Figure 2.3 illustrates the brand owner’s equilibrium arrangement in the (α,γ) space when η = 0
and with a decreasing gap in the marginal efforts, θ`− θ`. The colored area shows all values of (α,γI)
where Π∗B(α,γ) ≥ Π∗I , namely when it is optimal for the brand owner to license the extension product.
As the gap between marginal efforts is tightening, the brand owner finds more attractive to internalize
74

production, even in circumstances where brand enhancement would occur (γ > 0). When the gap is
high, as in Figure 2.3a, keeping constant γ , it is more likely for the brand owner to choose in-house
development when α is low, hence the two product are close with each other. When the gap is relatively
low, as in as in Figure 2.3b, the choice of in-house is increasingly more likely the higher α , hence when
the two products are far from each other.
Figure 2.4 illustrates the optimal choice when also η changes. As expected, the higher the fixed
cost to entry in the extension product market, the more likely the brand owner avoid internalizing the
production process, as can been seen by comparing Figures 2.3a and 2.4a, and Figures 2.3b and 2.4b.
Figure 2.4: Brand owner’s optimal choice: colored area—brand licensing
(a) θ` = .9, θ` = .05, η = 0.05
-1.0 -0.5 0.0 0.5 1.0
0
1
2
3
4
5
Γ
Α
(b) θ` = .9, θ` = .15, η = 0.05
-1.0 -0.5 0.0 0.5 1.0
0
1
2
3
4
5
Γ
Α
Proposition 9. Brand licensing is the preferred business strategy when acquiring resources and compe-
tences is too expensive, i.e., for increasing values of η; and when the gap in marginal efforts increases.
As the proximity between the core product and the extension product markets increases, the brand owner
finds optimal to switch to in-house development, avoiding the risk of brand dilution.
2.5 Concluding remarks
In this paper we have delved into the mechanics and the determinants of the choice whether to extend
a brand internally or through brand licensing. Brand extension is a viable strategy to capture value in
new markets. However, internal development is often expensive, because it might require the adoption
75

and the development of specific resources and competences. Brand licensing, thus, is an alternative,
and less costly, business model. Licensing does not come without risks, though. On the one hand, in
the presence of reciprocal effects the licensee’s decision about the extension product affect, possibly
negatively, the profitability of the parent brand. On the other hand, under moral hazard both the licensee
and the licensor can act opportunistically, failing to maximize the surplus generated by their relationship.
The combination of these features reduces the profitability of both the extension product and, indirectly,
the parent brand. Indeed, as the literature assessed, the risk of a negative reciprocal effect stemming
from the licensee’s opportunistic behavior to the evaluation of the parent brand is one of the factors that
companies consider when deciding which business model to adopt.
Notwithstanding the acknowledged relevance of these features, the extant literature has not yet de-
livered an analysis that simultaneously encompasses them. Our paper delivers several results. A general
conclusion of our model is that, under a set of reasonable assumptions, the royalty rate is positive (hence
the licensee compensates the brand owner/licensor) as long as its negative effect on parent brand’s rev-
enues (channeled through a lower licensee’s effort) is outweighted by the positive effect it has on royalty
income. Furthermore, a positive royalty rate exists also in the special case where moral hazard is one-
sided (only the licensee exerts effort). This result is justified by the presence of an external spillover
effect which enters the brand owner profit function without affecting the licensee’s choice.
Considering a specific model where parent brand revenues are linear while extension product rev-
enues are quadratic, we found that the optimal royalty rate is increasing in the distance between products
when there are positive spillover effect, while it is decreasing when spillover effects are negative. This
result is intuitive: when the licensee’s behavior damages the brand owner, the incentive to exert effort
should increase as the fit is higher. Also, we were able to find an optimal level of the (inverse) fit below
which the brand owner opts to internalize production of the extension product. When the perceived dis-
tance is too small, the brand owner prefers to avoid any risk associated with a licensing contract in terms
of moral hazard.
76

Appendix
Proof of Proposition 4. The optimal effort levels solve the following problems:
eb(s) =argmaxeb
ΠB(eb,e`) = R(eb,e`;α)+ sq(θ(eb,e`)− s)− c(eb)+F
e`(s) =argmaxe`
ΠL(eb,e`) = π(θ(eb,e`)− s)− c(e`)−F
By total differentiating the first-order conditions, Equations 2.3 and 2.4, the following system of equa-
tions is obtained: ∂ 2ΠB∂e2
b
∂ 2ΠB∂eb∂e`
∂ 2ΠL∂e`∂eb
∂ 2ΠL∂e2
`
︸ ︷︷ ︸
=A
debds
de`ds
=
− ∂ 2ΠB∂eb∂ s
− ∂ 2ΠL∂e`∂ s
By solving this system:
deb
ds=−
∂ 2ΠB∂eb∂ s
∂ 2ΠL∂e2
`− ∂ 2ΠB
∂eb∂e`∂ 2ΠL∂e`∂ s
detA(12)
de`ds
=
∂ 2ΠB∂eb∂ s
∂ 2ΠL∂e`∂eb
− ∂ 2ΠB∂e2
b
∂ 2ΠL∂e`∂ s
detA(13)
The equilibrium condition requires that detA > 0, hence the sign of both equations depends on the sign
of the numerator. Therefore, Equation 12 is positive as long as:
∂ 2ΠB
∂eb∂ s∂ 2ΠL
∂e2`
− ∂ 2ΠB
∂eb∂e`
∂ 2ΠL
∂e`∂ s< 0.
Assuming that q′′ = 0,10 and considering the profit functions as specified in Equations 2.1 and 2.2, this
expression simplifies to:
q′∂θ
∂eb︸ ︷︷ ︸>0
q′(
∂θ
∂e`
)2
+q∂ 2θ
∂e2`
− ∂ 2c∂e2
`︸ ︷︷ ︸<0
︸ ︷︷ ︸
<0
+q′∂θ
∂e`︸ ︷︷ ︸>0
[∂ 2R
∂eb∂e`+ sq′
∂ 2θ
∂eb∂e`
](14)
The sign of Equation 14 depends on the last term, that is, on the marginal effect of the licensee’s effort
on brand owner’s ability to increase his revenues via his level of effort. More specifically, Equation 14 is10We assume that the demand function of the extension product is linear in the consumers’ willingness to pay; e.g., q(θ ,P) =
θ −P where θ ≡ θ(eb,e`).
77

negative as long as:
∂ 2R∂eb∂e`
+ sq′∂ 2θ
∂eb∂e`<−
∂θ
∂eb
∂θ
∂e`
·
[q′(
∂θ
∂e`
)2
+q∂ 2θ
∂e2`
− ∂ 2c∂e2
`
]︸ ︷︷ ︸
=∂2ΠL∂e2
`
.
Please note that the right-hand side is always positive, meaning that ∂ 2R∂eb∂e`
+ sq′ ∂ 2θ
∂eb∂e`must be negative,
zero or positive up to the threshold. A sufficient condition under which this occurs is:
∂ 2R∂eb∂e`
< 0.
It is worth noticing that as s→ 0, the condition shrinks to:
∂ 2R∂eb∂e`
<−∂θ
∂eb
∂θ
∂e`
·
[q′(
∂θ
∂e`
)2
+q∂ 2θ
∂e2`
− ∂ 2c∂e2
`
]
and only the cross-marginal returns of the core product revenues matter; this is because the brand owner
would not get any revenue from the extension product.
Equation 13 is negative when its numerator is negative. Again, assuming q′′ = 0 and considering the
aforementioned profit functions, the expression can be reduced to:
q′∂θ
∂eb
[q′
∂θ
∂eb
∂θ
∂e`+q
∂ 2θ
∂e`∂eb
]+q′
∂θ
∂e`︸ ︷︷ ︸>0
∂ 2R∂e2
b+ sq′
∂ 2θ
∂e2b− ∂ 2c
∂e2b︸ ︷︷ ︸
<0
︸ ︷︷ ︸
<0
(15)
The sign of the numerator depends on the sign of q′ ∂θ
∂eb
∂θ
∂e`+q ∂ 2θ
∂e`∂eb, which assesses the contribution of
the brand owner’s effort to the licensee’s revenues. More specifically, Equation 15 is negative as long as:
q′∂θ
∂e`
∂θ
∂eb+q
∂ 2θ
∂eb∂e`<−
∂θ
∂e`∂θ
∂eb
·[
∂ 2R∂e2
b+ sq′
∂ 2θ
∂e2b− ∂ 2c
∂e2b
]︸ ︷︷ ︸
∂2ΠB∂e2
b
A necessary condition under which this is true is that:
∂ 2θ
∂eb∂e`< 0.
78

Proof of Proposition 8. Let ∆Π≡Π∗B(α,γ)−Π∗I (θ`,η). The function is continuous in α . First, note
that η is a shift parameter, i.e., d∆π
dη= 1. Hence, we can set η = 0 without losing generality. Second,
note that:
∂∆Π
∂α
∣∣∣∣γ<0
> 0
∂∆Π
∂α
∣∣∣∣γ=0
= 0
∂∆Π
∂α
∣∣∣∣γ>0
< 0
hence, when γ = 0, the function ∆Π does not have a root in α . When γ < 0 (resp. γ > 0) the function is
increasing (decreasing). Consider the case where γ =−1. Then:
limα→0−
= limα→0+
∆Π =−1+3θ`
2
−1+ θ`2 +
6−5+θ 2
`
limα→∞
∆Π =16
(3+9θ`
2
−1+ θ`2 +
1−5+θ 2
`
− 4−2+θ 2
`
)
The function ∆Π |γ=−1 has a vertical intercept, and an horizontal asymptote as α → ∞. The horizontal
intercept is always negative while the asymptote is positive as long as√
3−√
5 < θ` < 1 and 0 < θ` <√− 4−6θ 2
` +θ 4`
36−22θ 2` +3θ 4
`. As the function is continuous and strictly monotone, this implies that there exists a
unique root in α when γ =−1.
A similar procedure can be applied to the case where γ = 1. Under this assumption, ∆Π is always
decreasing. When α = 0, it crosses the vertical axis on a positive value, while when α → ∞ there is a
negative horizontal asymptote. This implies that there exists a unique root in α also when γ = 1.
Henceforth, ∆Π has a unique root in α when α > 0 and γ ∈ [−1,0)∪ (0,1]. Further, it can be shown
that α > 0 as long as: √3−√
5 < θ` < 1
0 < θ` <
√−
4−6θ 2` +θ 4
`
36−22θ 2` +3θ 4
`
−1 < γ < 1− 4θ 2`
+√
2
√√√√√−(
1+ θ`2)(
10−7θ 2` +θL4)(
−1+ θ`2)
θ 4`
79

80

Chapter 3
Social Influence Bias in Ratings: A Field
Experiment1
1This chapter is a joint work with Simona Cicognani, Ph.D., Department of Economics, University of Verona and ProfessorPaolo Figini, Department of Economics, University of Bologna
81

82

Abstract
We investigate the empirical phenomenon of rating bubbles, i.e., the presence of a disproportionate
number of extremely positive ratings, within user-generated content websites. By means of a field exper-
iment that exogenously manipulated information disclosure, we test whether consumers are influenced
by prior ratings (i.e., social influence bias) when evaluating their stay at a hotel. Results show that social
influence bias is present and asymmetric: excellent ratings have a stronger influence on consumers’ rat-
ing attitude than mediocre ratings. Furthermore, new customers are more susceptible to social influence
bias than repeat customers. Our results support the reform of online rating systems in order to mitigate
social influence bias, especially as these platforms become more and more ubiquitous, particularly in the
tourism sector.

3.1 Introduction
Nowadays, user-generated ratings are an inseparable component of the Web—an essential element of
what is often called Web 2.0. They drive and complement customers’ behaviour and experience in many
diverse economic sectors. Everything can be rated everywhere on the Internet: through review platforms
(e.g., Yelp, TripAdvisor)—businesses mainly devoted to collecting and aggregating User-Generated Con-
tent (hereafter UGC); and through rating systems developed within e-commerce platforms (e.g., Amazon,
eBay, Booking.com), databases (e.g., IMDB, Glassdoor), and social media (e.g., Facebook, Twitter, Dis-
qus). Rating systems allow people to express and publish their opinion through either a binary scale
(like/dislike) or, more commonly, Likert-type scales (the most popular, representing a satisfaction level
ranging from 1 to 5 points), and most of the systems also include the possibility of writing a short review.
Rating systems are so relevant that companies have started to enrich them by including the ability to
upload pictures, rate several sub-categories, take surveys, share and rate reviews (e.g., Amazon’s ‘Was
this review useful?’) and rate reviewers themselves (e.g., eBay’s feedback system).
The absolute importance of user-generated online ratings for businesses and social relationships in
daily life drives the motivation for this paper. Together with being a relevant issue for data science,
the ubiquity of online ratings has important implications in management and marketing, in the orga-
nization of markets, and in the behavioural pattern of users/customers, especially in the tourism in-
dustry. According to a recent report (Nielsen, 2015), consumers’ online opinions are trusted by 66%
of customers—the third most-trusted source of information on products and services after recommen-
dations from friends/relatives and branded websites. In general, consumers tend to trust this type of
word-of-mouth information because of the perceived lack of commercial self-interest, which might bias
information coming from other sources, such as intermediaries or companies (Litvin et al., 2008). More-
over, consumers tend to consider a user-generated rating as a more reliable quality signal than other
observable cues such as price (De Langhe et al., 2016). The relevance of online ratings has recently
propelled a thorough investigation about their integration within official classifications of services (see
UNWTO (2014) for the hotel sector).
Yet, online ratings are not trouble-free and call for specific investigation. This paper focuses on
investigating whether, and how, individual rating behaviour is affected by prior aggregate ratings. The
interaction between individual behaviour and prior rating information might be one of the drivers for
the empirical phenomenon of rating bubbles, or J-shaped rating distributions, i.e., the clustering of user
84

ratings on extremely positive values and, to a lesser extent, on extremely negative values. This empirical
regularity has been found for experience goods (Chevalier and Mayzlin (2006), Hu et al. (2009), Luca
and Zervas (2013)) and search goods (Lafky, 2014) alike, on many popular e-commerce websites. A
consensus has yet to be reached about the reasons behind this phenomenon, and the aim of this paper
is to disentangle and assess one of the possible explanations: social influence bias (hereafter SIB). The
motivation is strong: not only is UGC employed as a trusted source of information and product quality
but extreme ratings are perceived as more useful by people, while moderate ratings are typically ignored
(Park and Nicolau, 2015). Nevertheless, Filieri (2016) showed that when consumers analyze the content
of a review, in addition to the rating, they might find extreme scores less trustworthy under certain con-
ditions; for example, “respondents perceive as untrustworthy negative reviews that discredit a property
and recommend another one in the same review” (Filieri, 2016, p. 54). Furthermore, it has been shown
that, being encouraged by positive ratings, firms are correcting prices to reflect online reputation (Ya-
couel and Fleischer, 2012). This poses an issue as long as online ratings do not reflect the actual quality
of a product or service but are simply a result of behaviour that creates distortion in how the quality is
perceived by consumers.
Several reasons have been proposed in the literature to explain this recurrent empirical evidence: pur-
chasing bias, underreporting bias, observational learning, and herding behaviour. We conducted a field
experiment in order to identify and isolate the impact of SIB on users’ ratings; SIB can be defined as the
tendency to conform to the perceived norm in the community which, in our research, is represented by
prior ratings. The experiment was conducted during the period July–September 2015 in the Riviera of
Rimini, a key Italian tourism destination, in one of the most important sectors for user-generated online
ratings: hotel accommodations.
In the recent literature, the influence of user reviews has been tackled under an economic dimension,
by looking at its effects on sales and marketing strategies, and under a behavioural dimension, that is,
how information about online ratings is incorporated in decisional processes by consumers, both in the
purchasing decision and when rating a product or service that has already been purchased. A statistically
significant relationship between the presence of online user reviews and sales has been established since
the mid-2000s. Chevalier and Mayzlin (2006) identified that more favourable online reviews tend to in-
crease relative sales of books. Similar results have been found in the movie industry (Chintagunta et al.,
2010), for electronic products (Chen et al., 2011), and in software adoption (Duan et al., 2009). Given
the relevance of UGC for experience goods and services, the food and accommodation sectors have also
85

been extensively investigated, and results confirmed the impact of user reviews on popularity of hotel and
restaurants (Zhang et al. (2010b), Ye et al. (2011), Ogut and Onur Tas (2012)). There is no consensus that
the content of reviews alone affects product sales. In fact, it has been demonstrated through experiments
that the number of ratings, rather than content, may be more influential (Viglia et al., 2014). Chen et al.
(2004) and Duan et al. (2008a) suggested that an awareness effect, due to the number of reviews, rather
than a persuasion effect (i.e., the score and content of reviews), affects sales in the markets for books and
films respectively.
Our paper is related to an emerging stream of literature that focuses on whether and how the indi-
vidual rating behaviour itself (not product choice) is affected by user-generated ratings. This is rele-
vant because rating occurs when the consumer is already informed about the quality of the product from
his/her own experience; hence, prior ratings should lose their role as informative signals and be irrelevant
when forming an opinion. Nevertheless, the effect exerted by prior ratings might be relevant and persis-
tent (Cosley et al., 2003). By means of a laboratory experiment in which subjects had to rate movies,
Schlosser (2005) suggested the presence of a self-presentation concern: subjects exposed to negative
reviews reviewed more harshly than those exposed to no reviews or positive ones because they perceived
negative opinions as coming from experts and more objective people. Hu et al. (2009) also conducted a
controlled experiment in which subjects had to rate randomly selected products that showed a J-shaped
rating distribution on Amazon. Their results showed unimodal rating distributions and moderate average
ratings; the authors suggested that the mismatch between the Amazon distribution and the experimental
one was due to a purchasing bias (those who purchase a product are also those who hold more extreme,
typically positive, opinions); and to an underreporting bias, or ‘brag-or-moan effect’ (that is, a rating
self-selection, meaning that only consumers who hold strong opinions end up reviewing the product).
The latter effect has been further explored by Lafky (2014), who identified a concern towards subsequent
buyers and sellers, with ratings becoming signals to channel such altruistic attitude. SIB and herding
effects are explicitly the focus of a study by Lee et al. (2015), who used field data on movie ratings on a
popular social network. They found that friends’ ratings always affect one’s own ratings, while ratings
from the larger cohort of respondents have an effect only when the movie is very popular. Krishnan et al.
(2014) also found SIB on a platform where political ideas are shared and rated, and proposed a method
based on non-parametric testing to mitigate the bias.
The novelty of our research is twofold. On the one hand, we focused on a typical experience good;
this is in direct contrast with most previous studies, in which individual rating behaviour was analyzed
86

for search goods/services or for non-market items such as political opinions or personal comments (see
for instance Muchnik et al. (2013)). Since the sense of ownership plays a relevant role when consumers
are evaluating a product (Ong et al., 2015), it is important to discriminate between products that are
purchased and consumed, and those that are not. In contrast to previous lab experiments, in which the
product was provided to subjects by the experimenter, in the present work subjects self-selected them-
selves into the market.
On the other hand, the experimental design allowed us to assess any different behavioural patterns
between repeat and new customers and between habitual reviewers and non-reviewers. This mirrors
Schlosser (2005), who describes posters as those who write and publish reviews and lurkers as those
who do not contribute—two overlooked topics in current research. To the best of our knowledge, the
present study is one of the first experiments studying individual rating behaviour and SIB in the case of
a real purchasing and consumption experience. The interaction between SIB and the issues of being a
repeat customer or a frequent reviewer represent, therefore, a novelty of our contribution.
The paper is structured as follows: Section 3.2 sets the context for the paper and unfolds the main
research questions together with the contribution of our approach; Section 3.3 describes the experimental
design and the procedures followed; Section 3.4 presents the main results; and Section 3.5 discusses the
findings and offers concluding remarks.
3.2 Contribution and Hypotheses
In contrast to previous studies reported in the literature, this experiment studied individual rating be-
haviour and SIB considering subjects who had self-selected themselves in the market of the service they
were asked to rate. Moreover, we focused on a typical experience good: hotel accommodation. Un-
like a decision regarding standardized products or opinions, booking a room is a multilayered decision
entailing a high risk, since in the majority of cases the service has not been experienced beforehand.
Consumers tend to rely on different forms of word-of-mouth (such as online UGC) to obtain sufficient
information on quality and to reduce their level of uncertainty (Liu and Park, 2015). Hotels have been
one of the first sectors for which online rating platforms and UGC have been developed, and therefore the
issue is particularly relevant. If rating biases exist, consumers cannot properly infer the service quality
during the purchasing phase, and firms are not able to appropriately tailor marketing strategies based on
such information (Bronner and de Hoog, 2011).
87

We conducted a field experiment in order to specifically study the rating behaviour of individuals
after they experienced the service they had chosen to purchase. The true perception about a rated item
can be biased, if individuals are highly susceptible (Cosley et al., 2003), and early adopters of a product
or influential opinion leaders are pivotal in the diffusion of information and behaviours. This possibly
generates SIB. Informational cascades and bias in the perception of quality might imply that ‘aggregate
collective judgment and socialized choice could be easily manipulated, with dramatic consequences for
our markets, our politics, our health’ (Muchnik et al., 2013, p.647). The empirical evaluation of SIB is
not an easy task, and although herding behaviour has been observed in many instances (Anderson and
Holt, 1997; Celen and Kariv, 2004), the main challenge comes from disentangling SIB from homophily,
simultaneity, and other confounding factors. In many cases, individuals may be led to mimic others’
(observed) choices simply because of conformity concerns (Cicognani and Mittone, 2014). Therefore,
our first hypothesis is:
Hypothesis 1. Consumers’ rating behaviour is affected by prior ratings; SIB is present in online rating
platforms.
Moreover, Schlosser (2005) suggested that negative opinions are more effective in distorting people’s
attitude during the rating phase, as discussed in Section 3.1. Muchnik et al. (2013) also found asymmetric
herding: whereas positive social influence accumulates, creating a tendency towards rating bubbles,
negative social influence inspires users to correct negative ratings.2 Therefore, consistent with previous
research, we also tested whether:
Hypothesis 2. SIB is asymmetric; excellent prior ratings have a different effect than mediocre prior
ratings.
In services, a relevant dimension through which the customer base is segmented concerns repeated
purchasing behaviour; thus we compared repeat visitors (i.e., customers who repeated the experience in
the same hotel) against non-repeat visitors. Consistent with the seminal works of Stigler (1961) and Nel-
son (1970), we argue that repeat customers have already internalised their search costs, or, put differently,
having previously purchased the service, they can consider it as a search good. In contrast, the service
represents an experience good for new customers. In the post-experience setting of the experiment, this
difference is important because repeat visitors have more private information about previous stays on
which to build their evaluation. New customers, for whom the service takes the attributes of a credence2On the asymmetry of social influence, see also Coker (2012).
88

good, might be more susceptible to prior ratings in online systems. Hence, this leads us to hypothesize
that:
Hypothesis 3. Repeat customers are less influenced by prior ratings than new customers.
In addition, despite the great availability of online and networked population-based datasets, our
study differed from most of those reported in the literature because it was an online field experiment: the
experiment itself was conducted online but subjects were contacted offline. In this way, we were able
to include customers who were not used to reading online reviews, not to mention actively writing and
posting them. If observational learning drives customers to familiarize themselves with online review
systems and to recognize their limitations and possible biases, the rating behaviour of frequent reviewers
would differ from that of infrequent reviewers. Our setting hence allowed us to distinguish SIB from
underreporting bias (due to the inactivity of moderate customers). Following Hu et al. (2009), who
reported that the J-shaped distribution is also an effect of underreporting bias, we expect that:
Hypothesis 4. Non-reviewers’ and reviewers’ rating behaviours do differ.
Finally, we posit that those customers not acquainted with reviewing online are those who are more
susceptible to SIB, in line with the empirical research by Moe and Schweidel (2012), in which less
frequent reviewers were found to imitate prior reviewers more than frequent ones. Hence:
Hypothesis 5. Non-reviewers are more susceptible than reviewers to prior ratings.
Hypotheses 3 to 5 represent the main novelty of our contribution: the interaction between SIB and
the issues of being a repeat customer or a frequent reviewer have received scant attention so far in the
literature.3
3.3 Experimental Design and Procedures
The goal of the field experiment was to investigate the consequences of being exposed to different in-
formation sets (i.e., data about prior ratings for the same service) when rating an experience good. The
experiment was preceded by a pilot study that framed the experiment; this initial phase was helpful in un-
derstanding the critical parts of the design (such as experimenter effect, compulsory answers, and greater
heterogeneity in terms of information sets across treatments) and in fine-tuning treatments, questions,
3Using data from a popular online apparel company, Anderson and Simester (2014) focused on the action of frequentreviewers in order to understand the incentives to write deceptive reviews.
89

and general accessibility to the questionnaire. The pilot study, conducted in June 2015, consisted of a
paper-based questionnaire administered to restaurant customers just after they had dined and paid.
The field experiment was conducted between August 3, 2015 and September 30, 2015 in a 3-star
superior hotel located in the Riviera of Rimini, an important seaside destination. It consisted of an on-
line questionnaire (developed using the Google Forms platform) that customers could access through a
URL listed in a flyer they received after their stay (the flyer is displayed in Appendix .2, Figure 3). The
procedure of handing out the flyer was always conducted by the hotel manager, at the moment when
customers were checking out; customers were informed that they could fill in the questionnaire within
two weeks using their own computers, smartphones, or tablets. It was a field experiment in that the
purchasing decision was made by subjects on their own, and the study methodology did not affect their
experience at the hotel in any way. It was an online experiment because, although we contacted subjects
offline, the questionnaire was completed online. Due to this design, we confirmed that subjects actually
purchased and experienced the service under analysis, and that they felt comfortable rating the hotel in
an environment that might remind them of actual online rating platforms.
The questionnaire included three parts: in the first part, customers were asked to rate the hotel (the
overall experience and four other categories: sleep quality, value, service, and atmosphere) on a 5-point
scale. This part, and the choice of the categories, aimed at mimicking the rating scale used by TripAd-
visor and other popular rating platforms. The second part included socio-demographic questions, and
the third part included questions about customers’ previous experience in the same hotel and destination
and their attitude towards online reviews (see Questionnaire in Appendix .3, Figures 4-8). The experi-
ment did not offer any reward based on performance, since subjects were simply expressing their opinion
about a service. Furthermore, it is important to highlight that the focus of our study was the presence of
SIB in online rating systems, and not the average rating or the rating distribution per se.
The experiment included three treatments, related to the set of information about prior ratings; the
questionnaires were exactly the same, except for a sentence just above the overall rating question in-
forming subjects about the rating attitude of previous customers. In the control treatment, customers
were asked to fill in the questionnaire without any information about prior ratings. In the 3-point treat-
ment, subjects were informed that at least 17 prior customers of the hotel had provided a rating of 3 on a
5-point scale. In the 5-point treatment, the questionnaire disclosed that at least 17 previous customers had
provided a rating of 5.4 The choice of disclosing only the absolute number of ratings, without referencing
4As of July 2015, the hotel had an average rating of 4.5/5 across 232 reviews on TripAdvisor. Of these reviews, 17 rated the
90

the total number of reviews or the total distribution of ratings, was central to the aim of the experiment;
we did not want to provide too much information on the ratings’ distribution in order to test how a simple
normative message can be read differently across treatments. Two treatments were chosen because the
great majority of scores in online rating systems (including this very hotel) range between 3/5 and 5/5;
a hypothetical 1-point treatment might have been interpreted as suspicious by subjects. Moreover, the
1-point treatment would have been difficult to build without incurring deception, because of the absence
of 1/5 ratings on the hotel’s TripAdvisor page at the time of the experiment. Figure 3.1 displays this
portion of the questionnaire across the three treatments.
Assignment to each of the three treatments was randomized; flyers containing the URLs related to the
different treatments were handed out in sequence at the time of checkout, independently of customers’
characteristics. Out of 400 flyers distributed, 75 questionnaires (19%) were completed. After checking
for the presence and integrity of codes from the flyers, and removing invalid questionnaires, a total of 67
observations were considered in the analysis—21 for the control treatment, and 22 and 24 for the 5-point
and 3-point treatments, respectively.
Figure 3.1: Different informational sets across treatments
Notes: the logo and name of the hotel have been blurred for privacy reasons.
It is worth noting that the questionnaire was built in order to mimic popular rating websites. The
introductory sentences and presentation of ratings (e.g., the terrible/excellent scale) were directly taken
from a standard TripAdvisor rating page at the time. Finally, our experiment was designed around ratings,
hotel as 3, and 130 rated it as 5; 17 was chosen as the reference number for both treatments in order to avoid deception.
91

and not textual reviews; although subjects could write a brief message at the end of the questionnaire,
this was unrelated to the rating phase, not mandatory, and no prior reviews were shown within treat-
ments. While recognizing the relevance of reviews, we opted for design simplicity in order to asses SIB
according to the most commonly used heuristic on rating platforms, i.e., average user rating (Forman
et al., 2008).
3.4 Empirical Analysis
Our results begin with descriptive statistics regarding the subject pool and the overall rating. We then
test our hypotheses by means of non-parametric tests and regression analyses which estimate the impact
of the treatments on the rating attitude, controlling for a set of subjects’ characteristics.
The main respondent characteristics are displayed in Table 3.1. Consistent with the hotel average
profiling, they accurately represent the hotel’s clientele, with balanced gender representation.5 The av-
erage customer is about 46 years old, male, Italian, with upper-secondary education. He mainly travels
with a partner or with family, spending 7–10 days at the hotel. Customers are already quite acquainted
with the destination and with the hotel; on average, they have made previous visits to the destination five
times, and to the hotel four times (12% of customers had visited the hotel and the destination more than
10 times, which is a typical characteristic of the customer base in the Riviera of Rimini). As for their
rating attitudes, half of the respondents had never written an online review, whereas one-third had read
a review about the hotel before booking the stay; 75% of respondents declared to have been affected by
the reviews read.
5A detailed description of the variables is provided in Appendix .1, Table 9.
92

Table 3.1: Summary statistics - selected variables
Variable Dummy Mean (Std. Dev.) Min Max ModeFemale D 0.48 (0.50) 0 1Age 45.58 (14.07) 16 74Italian citizenship D 0.96 (0.21) 0 1Years of schooling 11.51 (2.84) 5 16Travel type FamilyTravel length 4-7 daysFirst time destination D 0.27 (0.45) 0 1Repeat customer D 0.27 (0.45) 0 1Type of stay Half board All inclusiveHotel advice NoneNot reviewer D 0.52 (0.50) 0 1Review read D 0.33 (0.47) 0 1Review source TripAdvisor/ YelpReview influence D 0.75 (0.88) 0 1Other prices D 0.49 (0.50) 0 1Period of stay 10/08-23/08
Notes: D refers to a dummy variable. The mode is reported for categorical variables which encompass more than two categories.
Table 3.2 reports the overall average rating of the hotel and of its characteristics, together with stan-
dard deviations, given by the subjects. Table 3.2 suggests that the average rating is not significantly
different from the actual outcome on TripAdvisor at the time of the experiment, and that there is homo-
geneity in how the characteristics of the hotel are rated; the rating ranges from 4.49 for sleep quality to
4.81 for service.
Table 3.2: Summary statistics - ratings
Rating Mean (Std. Dev.) Min MaxOverall 4.61 (0.70) 2 5Sleep quality 4.49 (0.70) 2 5Value 4.72 (0.60) 2 5Service 4.81 (0.63) 1 5Atmosphere 4.78 (0.65) 1 5
A first hint on whether subjects’ rating behaviour differs across treatments is provided in Table 3.3.
In line with Hypothesis 1, the overall rating mean is the lowest in the 3-point treatment and the highest
in the 5-point treatment, with the mean of the control treatment lying in between the two. Evidence
reported in Table 3.3 suggests that being exposed to information on excellent prior ratings may have
boosted subjects’ overall rating. This is corroborated by Figure 3.2, in which the rating density under the
5-point treatment is strikingly more skewed towards 5/5 than under the 3-point and control treatments.
93

Table 3.3: Summary statistics - overall rating (by treatment)
Treatment Mean (Std. Dev.) ObservationsTotal 4.61 (0.70) 673-point 4.38 (0.82) 24Control 4.52 (0.75) 215-point 4.95 (0.21) 22
This prima facie evidence is supported by non-parametric testing. When comparing the 5-point
treatment overall rating with the overall rating in the control treatment, the difference is statistically
significant at the 1% level (p = 0.007, two-sample Wilcoxon rank-sum test, n1 = 22 and n2 = 21, two-
sided). Similarly, the difference between the 3-point and 5-point treatments is statistically significant at
the 1% level (p = 0.002, two-sample Wilcoxon rank-sum test, n1 = 24 and n2 = 22, two-sided). This
allows us to validate Hypothesis 1:
Result 1. Consumers’ rating behaviour is affected by information on prior ratings.
We now turn to the type of influence of prior ratings (Hypothesis 2), that is, whether excellent prior
ratings have a different effect than mediocre ones on individual rating behaviour. We compare the overall
rating in 3-point v. control, and 5-point v. control. Only the latter comparison is statistically significant
(p = 0.007, two-sample Wilcoxon rank-sum test, n1 = 22 and n2 = 21, two-sided), whereas the former is
not (p = 0.520, two-sample Wilcoxon rank-sum test, n1 = 24 and n2 = 21, two-sided).
Result 2. SIB is asymmetric; being exposed to excellent prior ratings generates a significant positive
bias in ratings, which is not mirrored by a negative bias when being exposed to mediocre prior ratings.
Figure 3.2: Frequency distribution - overall rating (by treatment)
0.5
10
.51
1 2 3 4 5 1 2 3 4 5
1 2 3 4 5 1 2 3 4 5
3−point 5−point
Control Total
Density
Overall rating (by treatment)
94

Table 3.4: Treatment effects on rating behavior
Logit (1) OLS (2) Ordered Logit (3) OLS (4)Dep. variable Excellent rating Overall rating5-point 2.648∗∗∗ 0.319∗∗ 2.913∗∗∗ 0.363∗∗
(0.114) (0.036) (0.466) (0.038)3-point 0.038 -0.010 0.121 -0.025
(0.093) (0.023) (0.308) (0.065)(Pseudo) R2 0.243 0.257 0.238 0.316Num. obs. 67 67 67 67
Notes: ∗∗∗, ∗∗, ∗ indicate the significance at the 1%, 5% and 10% respectively. All
models include as control variables: gender; age; the stay period; being a new cus-
tomer at the hotel; having read a review of the hotel; being an online reviewer. All but
Model 3 also include the constant term. Coefficients are reported. Standard errors are
clustered at the treatment level.
Hence, we find evidence that rating bubbles stem from asymmetric herding, consistent with previ-
ous literature (Muchnik et al., 2013). To corroborate Results 1 and 2, we estimated several econometric
models (Table 3.4) using two alternative dependent variables: a dummy variable called Excellent rat-
ing, which takes the value 1 if the overall rating is 5, and 0 otherwise; and Overall rating, which is a
categorical variable divided into three categories: equal to either 1, 2, or 3; equal to 4; and equal to 5.
The rationale for this partition of Overall rating is due to the small number of observations for ratings
below 4 (results, however, are robust for the use of the full-scale overall rating as a dependent variable);
in order to have an efficient estimation, alternatives that are rarely chosen must be aggregated (Cameron
and Trivedi, 2013). For each outcome variable, we estimated a non-linear model through maximum like-
lihood (Model 1 is a logit model, while Model 3 is an ordered logit model), and a linear regression model
through OLS (Model 2 and 4) as a robustness check. All models in Table 3.4 included as control vari-
ables: gender; age; stay period (considering three parts of the overall period: early August; mid-August,
peak weeks of the tourist season; late August–September); being a new customer at the hotel; having
read a review of the hotel; being an online reviewer. The F-test for the joint significance of regressors
always leads to the rejection of the null hypothesis, which validates the models as specified.
The coefficient of the 5-point treatment in the logit model illustrated in Table 3.4, column (1) shows
the bias of being exposed to information about excellent prior ratings.6 To investigate the magnitude
of the effect, we consider the OLS coefficient of Table 3.4, column (2). The coefficient represents a
marginal effect and is positive, being equal to 0.319; by falling into the 5-point treatment, the probability
6It is worth noting that the 5-point treatment is a proxy for an extremely positive average rating on a UGC online platformsuch as TripAdvisor or Yelp. Likewise, the 3-point treatment is a signal of a mediocre average rating, given the low frequencyof 1 and 2 ratings in online systems.
95

of a 5/5 rating increases by 32%. In contrast, being exposed to information about mediocre prior ratings
does not create a statistically significant impact on the overall rating. Hence, the asymmetric influence
of positive and mediocre prior ratings on consumers’ rating attitude is clear, which is consistent when
moving from OLS to logistic specification.
The ordered logit model shown in Table 3.4, column (3) considers Overall rating as a dependent vari-
able. As before, the coefficient of the 5-point treatment is positive and statistically significant, as well
as the coefficient of the OLS specification in column (4). The OLS coefficient (marginal effect) means
that observing extremely positive prior ratings increases by a substantial amount (0.36) the respondents’
average rating. The 3-point coefficients are not statistically significant, confirming the ineffectiveness of
this treatment. As an alternative way to see these results, we also looked at the 5-point treatment odds
ratio, that is, the change in the ratio of probabilities of rating 5/5 when the treatment is in place and
without; the odds of giving a 5/5 rating versus any other rating is 14.13 times greater, given that all of the
other variables in the model are held constant. The odds ratio is statistically significant at the 1% level.
In sum, the econometric analysis confirms Hypotheses 1 and 2: SIB is a factor driving rating behaviours
within online platforms, and people are more influenced by extremely positive ratings. Among the other
covariates, the only variable that is always significant (and with a positive sign) in all the specifications
and robustness checks is Female; this means that, on average, female reviewers tend to post higher scores
than male ones. However, it is important to recall that our research question relates to the rating bias,
and not to the rating distribution itself; therefore, all individual characteristics are orthogonal to the treat-
ments.
From the information collected through the questionnaires, we are able to investigate whether the in-
dividual rating differs across different segments of the customer base, for example, those who had prior
stays at the hotel, or those who are accustomed to online platforms. As for repeat customers, a natural
behavioural prediction is that they are less likely to be influenced by prior ratings than new customers
(Hypothesis 3), since they have more established and sound private information about the hotel charac-
teristics. We can provide an answer to this question by running an ordered logit model7 which includes
four interaction terms8: New customer/Repeat customer and 5-point and 3-point dummies respectively,
with New customer (Repeat customer) being a dummy variable taking the value 1 if the subject has never
7The ordered logit has been chosen over the logit model as the standard model following the results in Table 3.4, since itholds more information than the logit; however, results are robust for the use of the logit model and Excellent as the dependentvariable.
8We did not conduct non-parametric testing because of the low numerosity of some sub-segments of the subject pool.
96

Table 3.5: Treatment effects on rating behavior - repeat v. new customers
Ordered Logit (1) OLS (2)Dep. variable Overall ratingRepeat customer -0.961 -0.095
(0.655) (0.169)5-point * New customer 15.980∗∗∗ 0.605∗∗∗
(0.987) (0.019)5-point * Repeat customer 3.088∗∗∗ 0.374∗∗
(0.824) (0.026)3-point * New customer −1.838∗∗∗ −0.477∗∗
(0.334) (0.041)3-point * Repeat customer 1.787∗ 0.304
(0.790) (0.101)(Pseudo) R2 0.302 0.404Num. obs. 67 67
Notes: ∗∗∗, ∗∗, ∗ indicate the significance at the 1%, 5% and 10% respec-
tively. Both models include as control variables: gender; age; the stay pe-
riod; having read a review of the hotel; being an online reviewer. Model 2
also includes a constant term. Coefficients are reported. Standard errors are
clustered at the treatment level.
(has already) stayed at the hotel prior to August 2015. Along with a linear model estimated with OLS
including the same regressors, results are shown in Table 3.5, respectively in columns (1) and (2).
Results of this moderation analysis show that repeat customers do not rate differently than new
customers: the Repeat customer coefficient is not statistically significant. In contrast, the interaction
terms are statistically significant. In particular, repeat customers are also influenced by the informational
treatments, but to a lesser extent than new customers.
Table 3.6: Predicted Pr(overall=5) - repeat v. new customers (by treatment)
5-point treatment 3-point treatment / ControlRepeat customer 0.938∗∗∗ 0.840∗∗∗
(0.017) (0.034)New customer 1∗∗∗ 0.476∗∗∗
(0.000) (0.036)
Table 3.6 reports the predicted probabilities of rating 5/5 in the 5-point treatment versus the other
groups across this customer’s characteristic.9 The joint reading of Tables 3.5 and 3.6 suggests that new
customers are more susceptible to SIB, since the difference in predicted probabilities is more pronounced.
In particular, new customers show a stronger SIB to mediocre prior ratings, denoting they are less reli-
93-point and control treatments have been aggregated for the sake of the comparison, since non-parametric testing andregression analysis previously shown how the two groups were not statistically different from each other.
97

Table 3.7: Treatment effects on rating behavior - reviewers v. non-reviewers
Ordered Logit (1) OLS (2)Dep. variable Overall ratingReviewer 1.587 0.349
(1.073) (0.148)5-point * Reviewer 0.707 0.051
(0.628) (0.142)5-point * Not reviewer 17.95∗∗∗ 0.603∗∗
(1.606) (0.075)3-point * Reviewer −0.255∗∗ −0.120∗
(0.110) (0.039)3-point * Not reviewer 0.524 0.046
(0.680) (0.117)(Pseudo) R2 0.275 0.348Num. obs. 67 67
Notes: ∗∗∗, ∗∗, ∗ indicate the significance at the 1%, 5% and 10% re-
spectively. All models include as control variables: gender; age; the
stay period; being a new customer at the hotel; having read a review
of the hotel. Model 2 also includes a constant term. Coefficients are
reported. Standard errors are clustered at the treatment level.
able in evaluating their experience. This leads us to report the importance of SIB, particularly for new
customers, and to confirm Hypothesis 3:
Result 3. Repeat customers are less susceptible to SIB than new customers.
The subject pool included not only people who frequently use websites to post reviews, but also peo-
ple who had never actively used online rating platforms. Understanding whether the ratings of these two
groups of subjects differ would help to shed light on one of the proposed explanations for rating bubbles:
the underreporting bias (also called ‘brag or moan’ effect in the literature); that is, those who write online
reviews have more extreme (and typically more positive) preferences than those who do not bother to
express and share their opinion. If the behaviour of the two types of subjects is not statistically different,
then this type of bias would be excluded from the list of reasons driving J-shaped rating distributions
on UGC platforms. The subject pool was almost equally divided between non-reviewers (35 subjects,
52% of the sample) and reviewers (32 subjects, 48%). The average overall rating for non-reviewers was
4.59/5, versus 4.63/5 for reviewers, a difference that is not statistically significant (p = 0.557, two-sample
Wilcoxon rank-sum tests, n1 = 35 and n2 = 32, two-sided).
These results are confirmed by the regression analyses in Table 3.7. Here, the dummy variable Not
reviewer (Reviewer) takes the value 1 if the subject had never (already) actively used an online rating
98

platform. Interaction terms were built in a similar fashion as model specifications in Table 3.5. Having
experience in posting online reviews does not exert, per se, a significant effect on the rating behaviour of
subjects; Reviewer is never statistically significant. This means that the rating behaviour of non-reviewers
and reviewers do not differ, leading us to reject Hypothesis 4:
Result 4. SIB is not confounded by underreporting bias; non-reviewers and reviewers’ rating behaviours
do not differ.
However, when interacted with the treatment variables, we note that Reviewer is not statistically
significant in the 5-point treatment, while it is only weakly significant in the 3-point treatment. The
opposite result is found for non-reviewers, who seem to be affected by excellent prior ratings and not by
mediocre prior ratings. These results are robust for the use of OLS, as in Table 3.7, column (2).
Table 3.8: Predicted Pr(overall=5) - reviewers v. non-reviewers (by treatment)
5-point treatment 3-point treatment / ControlReviewer 0.774∗∗∗ 0.665∗∗∗
(0.083) (0.008)Not reviewer 1∗∗∗ 0.743∗∗∗
(0.000) (0.059)
Table 3.8 reports the predicted probabilities of rating 5/5 in the 5-point treatment with respect to the
other groups across rating habits. The joint reading of Tables 3.7 and 3.8 suggests that non-reviewers are
more easily influenced by the 5-point treatment than reviewers.
Result 5. Non-reviewers are more susceptible to excellent prior ratings than reviewers.
Hence, the participation in the experiment of subjects who seldom or never used online rating systems
exacerbated the overall level of SIB in the study. This has interesting managerial implications for these
rating platforms, which will be discussed in the concluding section.
3.5 Discussion and Conclusions
The experiment we conducted fits into a stream of recent research tackling the social and economic issues
of UGC and online rating platforms, particularly aimed at addressing the behavioural attitude of review-
ers and assessing the relevance of SIB. If such a bias exists, individual ratings are unreliable proxies for
the true quality of products, especially when distinguishing average from excellent products. Moreover,
99

aggregate ratings might be the result of herding, thus leading to problems such as rating bubbles.
We diverged from a few influential studies and proposed a novel online field experiment in which the
approach mainly aimed at: i) assessing how individual rating behaviour is affected by information about
prior ratings in the context of an important service rated online (hotel accommodation); ii) exposing pre-
vious non-reviewers to a rating system, in order to measure their reaction and to separate underreporting
bias from SIB; iii) disentangling and analysing the rating behaviour of repeat customers of the same
service in comparison to first-time visitors: this allowed us to test whether SIB plays a different role de-
pending on whether the service falls more in the realm of experience (credence) rather than search goods.
We devoted our attention to accommodation since this sector has been a pioneer in the development of
e-commerce and online rating systems and even today plays a leading role through companies such as
Booking, TripAdvisor, Yelp, and Expedia.
Our results are consistent with recent findings and confirm that SIB is a relevant issue in rating sys-
tems, in addition to being asymmetric, which is consistent with Muchnik et al. (2013): while subjects
herd to the display of information about excellent ratings, they are not significantly influenced by in-
formation about mediocre ratings. It is important to stress that the effect we find has no relation with
altruism towards other people (or cannot strictly be interpreted in this sense), because ratings were ex-
plained as confidential in regard to the experimental subjects, that is, they were read only by the hotel
manager and the researchers.10 The novelty and relevance of our results is twofold: first, SIB is not a re-
inforcing effect of underreporting bias, i.e., the tendency of non-reviewers to have less extreme opinions.
Underreporting bias does not play a role in driving rating distributions upwards in our experiment, since
the rating behaviours of reviewers and non-reviewers are not statistically different, contrary to results
suggested by Hu et al. (2009). However, we verified that prior excellent ratings particularly influence
people who are not accustomed to post reviews on online platforms, consistent with Moe and Schweidel
(2012), who found that less frequent posters are more positive and exhibit bandwagon behaviour. This
suggests that the ever-growing involvement of new and naive reviewers in online rating platforms (and
the marketing policy of services and apps to ask customers to rate online) might exacerbate SIB, and
distort rating distributions even more in the future.
Second, we show that new customers are more heavily affected by prior ratings than repeat cus-
tomers. This difference is not surprising, since repeat visitors have more private information stemming
from their previous hotel stays and from their experience at the destination on which to build their evalu-
10Altruism towards other consumers during the rating process has been explored by Lafky (2014).
100

ation. New visitors, on the contrary, lacking this information, are more susceptible to previous opinions
of others and are more subject to herding behaviours. Such customer base segmentation recalls the dif-
ference between search and experience (credence) goods, and suggests that SIB might be particularly
relevant for experience and credence goods for which the set of private information is less reliable and
where customers are more prone to follow the crowd.
Our results hence provide another voice for supporting reforms in the functioning of online rating
systems. Since herding behaviour exists, the design of interfaces that provide little information about
prior ratings to users when they are asked to review, as well as experimentation with machine-learning
algorithms to estimate and automatically correct biases, might diminish the effect of SIB. Our results
also support the implementation of time windows or thresholds in the number of reviews, where reviews
are collected but not shown to other customers; with this type of system, a less biased distribution of
ratings might emerge, and then become public. These data collection periods can be implemented when
a service or product page is just published, but also throughout its online cycle. It is particularly im-
portant that online rating systems are designed such that users can escape rating biases. For instance, it
is common to show average ratings within solicitation e-mails, when users are reminded to review the
service or product they had purchased; according to our results, this type of information is likely to af-
fect individual rating behaviour. Since SIB is particularly relevant for new customers and inexperienced
reviewers, we ring a warning bell for the consequences of those attempts aimed at expanding the volume
of ratings by attracting non-reviewers, a collateral effect of the growing integration of rating platforms
with social networks. This managerial implication contrasts with the emerging literature about UGC
enjoyment (Park and Nicolau, 2015), which calls for rich layouts and very informative websites. The
trade-off between the amount of information which minimizes rating distortions and the amount which
increases content enjoyment might represent a future direction of research.
The present work presents some limitations, particularly related to the small sample size under analy-
sis. However, the fact that results are significant despite the small sample size suggests that the treatment
effect is strong. Hence, the collection of more observations, or the repetition of the same experiment on
a larger scale, would allow us to undertake more convincing and complete within-group analysis. More-
over, the implementation of new sets of treatments, such as public v. private posting of reviews would
allow us to investigate another interesting phenomenon which takes place in online rating platforms: the
multiple-audience effect.
Given the relevance of UGC and online ratings in the market for tourism services, the expansion of
101

the research scope might work through the replication of the experiment across, and within, different
tourism businesses (restaurants, amusement parks, cultural activities), in order to take into account het-
erogeneous rating distributions, and to assess how these affect the overall experience at the destination.
102

.1 List of variables
Table 9: List of variables
Variables Dummy Definition
Socio-demographic variables
Female D The customer is a female
Age Customer’s age in years
Italian citizenship D The customer is Italian
Years of schooling Customer’s years of schooling (from 5, primary education, to 16, university
education)
Tourist variables
Travel type The customer is travelling in business/couple/family/friends/solo
Travel length Number of days spent at the hotel: 2-3 days/4-7 days/more than 7 days
First time destination D The customer has never been to the tourist destination before
Repeat customer D The customer has already been to the hotel before
New customer D The customer has never been to the hotel before
Type of stay Full board/Full board All Inclusive/Half Board/Half Board All Inclusive/B&B
Period of stay Period of stay at the hotel: 20/07-09/08; 10/08-23/08; 24/08-13/09
Rating behaviour variables
Not reviewer D The customer has never written an online review before
Reviewer D The customer has written an online review before
Hotel advice The hotel was recommended to the customer by: no one/family or
friends/advertising/other
Review read D The customer has read an online review of the hotel before booking the stay
Review source The customer has read an online review of the hotel on TripAdvisor or
Yelp/Facebook or social networks/forums/other
Review influence D The customer has been influenced by the review read about the hotel
Other prices D The customer looked at other hotel prices before booking her stay
Rating variables
Overall Hotel overall rating (from 1, terrible, to 5, excellent)
Excellent rating D The hotel overall rating is 5 (excellent)
Sleep quality Rating for hotel sleep quality (from 1, terrible, to 5, excellent)
Value Rating for hotel value (from 1, terrible, to 5, excellent)
Service Rating for hotel service (from 1, terrible, to 5, excellent)
Atmosphere Rating for hotel atmosphere (from 1, terrible, to 5, excellent)
103

.2 Flyer
Figure 3: Flyer handed out to customers
104

.3 Questionnaire
Figure 4: First page of the questionnaire - opening layout
105

Figure 5: First page of the questionnaire - rating
106
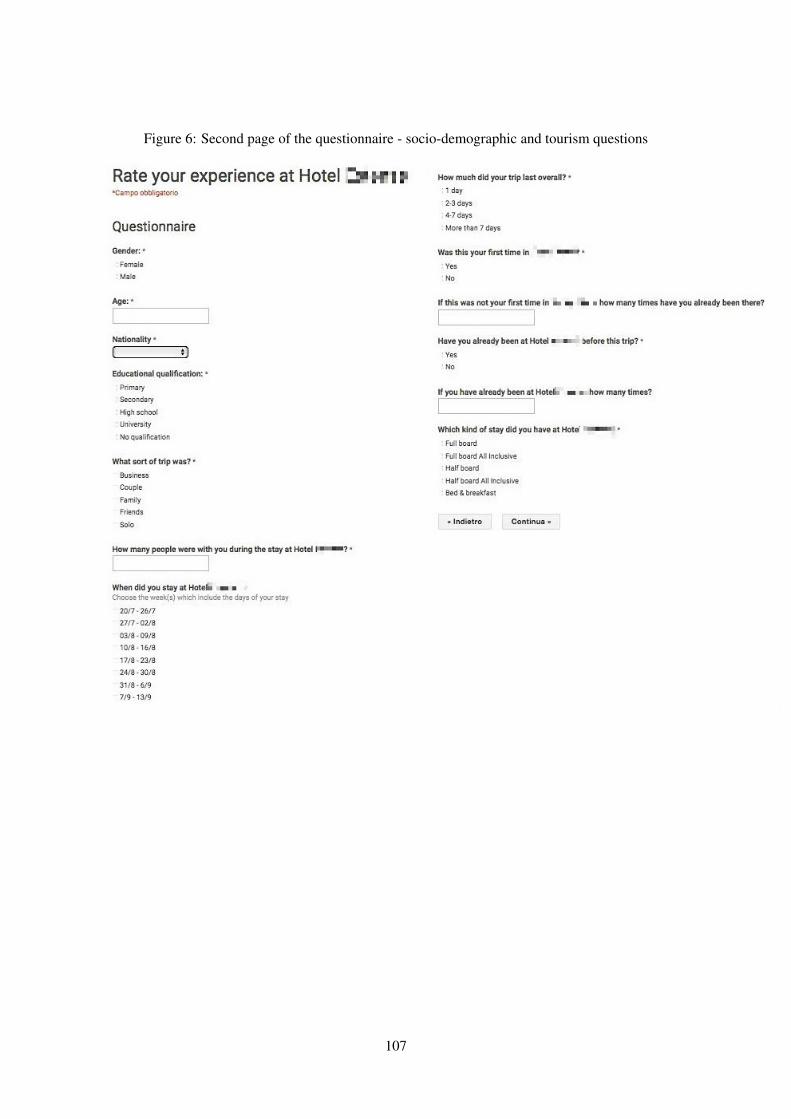
Figure 6: Second page of the questionnaire - socio-demographic and tourism questions
107

Figure 7: Third page of the questionnaire - rating attitude questions
Figure 8: Fourth page of the questionnaire - e-mail and verification code
108

Chapter 4
The Economic and Behavioral
Consequences of Online User Reviews: A
Literature Review
109

110

Abstract
Online user reviews have become an increasingly relevant informational tool during product search and
adoption. Recent surveys have shown that consumers trust and rely on user reviews more than on website
recommendations and experts’ opinions. As a new way of driving consumer purchasing intentions, they
have, therefore, come under scrutiny by researchers. The objective of this paper is to offer an overview
of the literature on the impact of online user reviews on economic indicators (e.g., sales, marketing
strategies) and on consumer behavior, thereby extending on previous works that have taken a less focused
approach. Furthermore, following the growing interest of academics and professionals alike on the
topic, the present work starts an exploratory analysis on the consequences of user reviews on individual
rating behavior—empirical regularities showed that online rating distributions tend to be concentrated
on extreme values, possibly because of rating bias. As consumers and firms incorporate heuristic cues
from such distributions during product search, biased ratings might lead to sub-optimal choices. This
overview presents established results (e.g., the impact of volume on product sales) and insights as issues
for future research.

4.1 Introduction
“You make money when you sell things—why would you allow negative reviews on your website?”
While online user reviews are now an essential part of our daily lives as consumers, people were
highly skeptical when they had first been introduced.1 With the rise of e-commerce and online trans-
actions, and the democratization of communication channels, consumers felt the rising urge to look
for peers’ opinions before opening their wallet, more so than before. On top of the risk-taking nature
characterizing the adoption of some type of goods—e.g., experience goods, for which reputation and
recommendations always played a role, the Internet has introduced additional layers of uncertainty dur-
ing the purchasing phase. First, electronic shopping channels do not allow consumers to physically see
products; online, consumers do not have a first-hand experience with the product which, of course, pre-
vents an initial screening (Ba and Pavlou, 2002). Moreover, the Internet has dramatically decreased the
costs to start a business, with the result that anyone can manage an online store, even behind anonimity.
Reputation and credibility are harder to establish in online markets, as consumers do not directly face
sellers; trust has become a more relevant issue, while more difficult to establish because of the remote
nature of transactions (Fung and Lee, 1999). It is useful to think product search and adoption as a costly
activity (Stiglitz, 1989). While search costs related to prices and other visible product characteristics
have decreased, the Internet was not able per se to eliminate those costs regarding the ascertaining the
quality of the product. Online user reviews became a necessary tool to make online shopping a more safe
and familiar experience.
Nowadays, anything can be rated anywhere online: products are reviewed on e-commerce websites,
but one also finds reviews on restaurants and hotels, movies and music, companies, and even reviews and
reviewers themselves. Communications between peers about common experiences, for example through
forums and chats, were fundamental in establishing the prominence of the World Wide Web. Organized
systems allowing people to express their opinions about their habits as consumers, however, started to
become popular only at the end of the last century. During the so-called dot-com bubble, there was an ex-
plosion of earn-to-review websites, such as Epinions.com and Zagat.com, where users were encouraged
to post reviews about products earning a small payment. As the San Francisco Chronicle commented in
2000, these websites were populist alternative[s] to Consumer Reports, the popular magazine dedicated
1The quote is mentioned by Jeff Bezos, Amazon CEO, as an example of sellers’ initial skepticism towards user reviews.Bezos, J. P. (2003). Letter to shareholders. Amazon.com. http://media.corporate-ir.net/media_files/irol/97/
97664/reports/2003_%20Shareholder_%20Letter041304.pdf (accessed July 26, 2017).
112

to unbiased product testing.2 In the meantime, many e-commerce companies had begun to incorporate
user-generated content (UGC, hereafter) systems within their online stores, thereby allowing consumers,
though often only after having purchased a product, to post reviews—reducing the potential costs asso-
ciated with publicly disclosing their opinions. Over the years, dedicated rating websites lost popularity
to the favor of e-commerce websites. Services like TripAdvisor and Yelp kept growing, but they never-
theless have been starting to sell goods and services, on top of providing consumer reviews, as a way to
leverage the enormous amount of UGC information they owned.
As the data show, the importance of online consumer reviews is a well-established fact. A comScore
2007 survey focused on the tourist industry found that [24% of] Internet users reported using online re-
views prior to paying for a service delivered offline; moreover, about 40% of those who had read online
reviews decided to buy the service (e.g., restaurant meal and hotel accommodation).3 According to a
2016 Nielsen report, online reviews are increasingly incorporated into the product information search as
a way to mitigate the risk of making online purchases and to make better and sounder decisions. Across
categories, on average, half of the survey respondents stated that they look up product information online,
including consumer reviews; travel-related products and services lead the chart. 4 A 2016 BrightLocal
survey confirmed the growing trend of interest in online reviews: in 2010, only 22% of people read re-
views regularly—in 2016, the number jumped to 50%; at the same time, the percentage of people not
interested in online reviews decreased noticeably, from 29% in 2010 to about 9% in 2016. Overall, 91%
of respondents often or occasionally read online reviews. 5 While the use of online reviews is no more
up to debate, their trustworthiness is still a matter of discussion. Both the BrightLocal and the Nielsen re-
ports found that consumers do trust online reviews, at least as much as personal recommendations and/or
branded websites.6 Nevertheless, other recent surveys showed a more a skeptical attitude. According
to Cox et al. (2009), consumers use online reviews as useful source of information, without considering
them particularly trustful. A 2014 YouGov research found that, while 78% of Americans check out the
review section before making a purchase and nearly half of them (44%) are active contributors, only
13% thought that online reviews were credible; among the reasons of this distrust: the possibility that
2Kirby, C. (2000). EVERYONE’S A CRITIC / A Worthy Epinion Can Earn You Some Cash. San Francisco Chronicle.3comScore. (2007). Online Consumer-Generated Reviews Have Significant Impact on Offline Pur-
chase Behavior. comScore.com. https://www.comscore.com/Insights/Press-Releases/2007/11/
Online-Consumer-Reviews-Impact-Offline-Purchasing-Behavior (accessed May 14, 2016)4Nielsen. (2016). Global Connected Commerce. Nielsen.com. http://www.nielsen.com/us/en/insights/
reports/2016/global-connected-commerce.html (accessed July 13, 2017)5BrightLocal. (2016). Local Consumer Review Survey. https://www.brightlocal.com/learn/
local-consumer-review-survey/ (accessed July 12, 2017)6According to the BrightLocal report, 84% of people trust online reviews as much as a personal recommendation.
113

businesses write fake reviews in order to look more desirable or to discredit competitors, and that users
write reviews without actually having purchased the product.7 Despite their skepticism, because genuine
online user reviews lack the self-promotional commercial interests behind the other informational cues
generated by private companie, such as advertising, people continue to read them, to the point of even
feeling an empathic connection to the reviewer.
Online reviews fall into the much wider communicational category of word-of-mouth (WOM, here-
after). Following the conceptualization by Lee and Youn (2009), WOM represents “interpersonal com-
munication about products and services between consumers” concerning their personal experiences;
research on traditional WOM dates back to the Sixties, and was developed in many fields, such as Mar-
keting, Psychology and Economics. More specifically, online user reviews are part of a subcategory of
WOM—electronic WOM (eWOM, hereafter); given their very existence through Web-connected inter-
faces. There are many aspects making online reviews (and eWOM in general) a quite peculiar type of
communication. As eWOM typically occurs between people that do not have any prior relations, it can
be seen as a remote many-to-many communication (Chatterjee, 2001). The possibility of maintaining
anonymity, linked to the fact that people are more comfortable in making their opinions public when
online, might explain the popularity of user reviews. Another aspect that differentiates online reviews
from traditional WOM is their pervasiveness. Real life communication between peers happens in a spe-
cific place and at a specific time, and is typically one-shot. Through eWOM, instead, opinions becomes
available to a large audience; and for a much longer time (at least until the hosting website is online).
For a more detailed discussion about eWOM, King et al. (2014) is a good starting point.
Despite the impact of online user reviews on consumer behavior and market transactions, academic
research has started to devote an increasing amount of attention only during the last decade. The social
and economic aspects of online reviews have been thoroughly examined, leading to useful prescriptions
for both businesses and consumers-as-reviewers alike. Psychology and Marketing scholars started to
understand the motives leading consumers to write online reviews—in order to design more incentivizing
and visually attractive rating platforms. Instead, the Economic literature put effort into investigating
the effect of online user reviews on several market indicators, such as commercial performance. The
influence of eWOM on consumer behavior has also been the subject of recent studies. The evolution
of e-commerce platforms and the impact of UGC on everyday life have required a complete review
7YouGov. (2014). Americans Rely On Online Reviews Despite Not Trusting Them. https://today.yougov.com/news/2014/11/24/americans-rely-online-reviews-despite-not-trusting/ YouGov (accessed July 12, 2017)
114

of related works, as a way to understand where the literature began and where it is heading. Many
issues have yet to find a proper answer while some others can be considered established and not needing
further discussion. In particular, this literature review focuses on the consequences of online reviews
under several aspects. Professionals will appreciate the way the survey covers many industries and gives
insights on how to structure user reviews for online shopping experiences. Academics will find it useful
for understand where to direct future research on the topic.
The next sections will be organized as follows: Section 4.2 is devoted to introducing the methodology
adopted in this review and how contents have been organized. Then, Sections 4.3 and 4.4 and related
subsections are organized as individual literature reviews on a specific topic of interest. Finally, Section
4.5 reports a summary of the findings.
4.2 Methodology and organization
This review follows the concept-centric approach identified by Webster and Watson (2002). While there
are many authors that are focusing specifically on drivers and effects of UGC systems, the topic is too
recent to follow an author-centric approach. Previous scholars have organized studies about online user
reviews in different ways. For example, King et al. (2014) organized key issues according to the unit of
analysis (sender/receiver of eWOM) and the causes/effects of eWOM. In this literature review I create
a taxonomy focused on the consequences of online reviews; therefore expanding on the receiver/effects
area explored by King et al. (2014). Because during the last few years research has expanded in the
area of effects of eWOM, there is the renewed need for tackling this issue more thoroughly. De Maeyer
(2012), instead, focused on the impact of user reviews on sales and price strategies. On the one hand, the
present work aims at updating De Maeyer (2012), providing a review of more recent studies, while, on
the other hand, extending the analysis on the impact of eWOM on consumer behavior.
In particular, I concentrate on the consequences of online user reviews by two dimensions: an eco-
nomic one and a behavioral one. The first dimension concerns the effect of reviews on economic trans-
actions and firms’ strategies. The second dimension regards their effect on consumers’ attitudes. At the
same time, I consider two temporal phases along which research has developed: the purchasing phase and
the after-purchase phase. Table 4.1 shows the concept matrix of this taxonomy. Category 1 (C1) consid-
ers the effect of online reviews on product sales; the unit of analysis is, therefore, the product. Category
2 (C2) contains studies focused on how firms (i.e., the units) react to online reviews in terms of pricing
115

and business strategies. The unit of analysis of Category 3 (C3) and Category 4 (C4) is the consumer.
For the purchase phase, I collected studies regarding which channels online reviews affect consumers’
product adoption; the after-purchase phase quadrant of the behavioral dimension incorporates, instead,
studies about how online reviews affect the individual rating attitude.
Table 4.1: Organizing framework: consequences of online reviews
phasepurchase after-purchase
dimension economic C1: sales C2: marketingbehavioral C3: product adoption C4: rating
In sum, the four categories broadly corresponds to the following research questions:
C1: Do online reviews affect product sales? To what extent?
C2: How do firms incorporate the information about online reviews to shape their marketing strategies?
C3: Do online reviews affect consumers’ decision-making process when searching for a product?
C4: Are consumers affected by prior online reviews when rating a product they had purchased and
consumed?
As online reviews are multidimensional objects, as often recognized by the literature (Dellarocas et al.,
2007), this literature review also pays attention to which review components impact the outcome of in-
terest. This literature review does not aim at being exhaustive on all possible outcomes. For example,
beyond what is covered here, eWOM has been found to have an impact on seller reputation, on helpful-
ness and enjoyment of the online experience, and on the attitude towards repeated purchases. As research
on these topics are still young, a literature review might follow in a few years from now. Nevertheless,
these studies will be briefly mentioned if necessary, as they might be intertwined with the aforementioned
topics.
4.3 Economic dimension
UGC systems have become an inseparable component of e-commerce transactions. By bridging the
informational gap between buyers and sellers, online user reviews can help make a product worth pur-
chasing. On the one hand, websites have already created spaces where such content is readily available,
allowing consumers to incorporate such information immediately into the search/purchasing process. On
116

the other hand, firms have also started to consider user reviews during their strategy-making process, for
example, by adjusting the product quality and features following previous consumers’ requests, or by
charging a premium for those highly-rating products.
Earlier efforts in analyzing the economic consequences of eWOM were mainly focused on the impact
on sellers’ activities, and on the establishment of trust between the parties involved in the transaction.
Indeed, one of the most popular UGC system in the Nineties was the eBay feedback system, where buy-
ers could rate sellers on the basis of the service offered (e.g., accuracy of product description, timeliness
of the delivery). As a result, much attention was devoted to the buyer-seller relationship and the estab-
lishment of reputation systems within online platforms (Jøsang et al., 2007). Only in the early 2000s
did academic interest converge on considering the impact online reviews might have had on product
sales, and thus move the attention from the buyer to the product as the unit of analysis. Propelled by the
desire to understande whether reviews could be a good predictor of sales, throughout the past decade,
researchers have investigated the direct link between user reviews and product performance in the rele-
vant market. Consequently, some attention has been dedicated to understanding the extent to which firms
actually learn from reviews.
Within this area of research, scholars have mainly used empirical and field data from popular web-
sites. In most of the studies, the relationship is analyzed within the same platform, namely as the effect
of reviews on the sales/marketing strategies of products/firms on the same website. E.g., the effect of
Amazon user reviews on the sales of products on Amazon itself (Chevalier and Mayzlin, 2006). In some
other instances, the link was analyzed across outlets. E.g., the effect of movie eWOM on performance at
the box office. Indeed, for some products, that is the only way to establish a relationship.
The impact of eWOM on sales is strongly supported by all studies. While it is true that the re-
lationship between reviews and sales is statistically demonstrated, there exists a great variety in how
researchers have come to explain it. Topics under on-going scrutiny are the effect of negative reviews
on sales, versus the effect of positive reviews and whether it is the volume of reviews, rather than the
valence, that has more influence on sales. The effect on marketing strategies is less clear and might
need more attention; in particular, works analyzing strategies other than pricing are lacking. A useful
question might be if firms are actively incorporating user reviews in ex-ante decisions, such as those on
product quality. More research is necessary to have a full understanding of the response of firms to such
an importantal information tool.
117

4.3.1 C1: Sales
Unsurprisingly, the vast majority of articles investigating the connection between eWOM and sales fo-
cused on goods and services in the entertainment and the tourism industries. Movies/books and ho-
tel/restaurant services are traditional examples of experience goods, for which the quality is unproven
until after consumption has occured. Consumers, thus, are more likely to look for opinions of people that
already experienced the product—especially with respect to search goods, which features can also be
assessed through reviews from professionals or technical tables. However, more recent studies extended
the scope of research by considering goods like electronic devices, exploiting the availability of data
from e-commerce websites. Little attention has been devoted to the comparison between experience and
search goods within the same retailing channel.
Overall, there exists a consensus: online user reviews do affect commercial performance of products.
E-commerce websites hosting reviews do generate a different level of sales with respect to comparable
websites that do not offer the possibility to leave personal messages about the purchase. Heterogeneity
of results arises in terms of what components of eWOM are affecting performance and what is the sign of
the effect. On this, evidence are more mixed. Nevertheless, valence and volume seem the play the largest
role (as websites are typically designed to show average user ratings and number of reviews); positive
reviews have a beneficial effects on sales; and the variance of reviews also matters. Further, it is worth
mentioning that eWOM seems to affect popular products differently with respect to niche products. This
is not surprising as the latter are generally less known and do not enjoy large advertising campaigns from
firms—therefore relying on more direct and inexpensive communication channels.
Studies on the effects of online reviews on product sales do not exist in a vacuum—the causal conse-
quences of any kind of information about products on their commercial performances have been widely
investigated in many contexts. Specifically related to reviews, a stream of literature has focused on ex-
perts’ opinions on magazines, newspapers and other media. Contrarily to consumers, experts have the
knowledge to discern and judge product characteristics in an objective manner. Similarly to consumers,
nevertheless, they are free from commercial purposes and typically independent, as they don’t come from
companies selling products (unlike advertising): experts can generally be trusted.8 Both types of reviews
are trusted by consumers and reasonably have an impact on product adoption. A 2014 Nielsen survey
8The unbiasedness of experts’ opinions is, nonetheless, subject to debate. In some industries, the existence of magazinesand professional websites relies very much on advertisement by the same companies for which they review products. Thisconflict of interest has arised in the video game sector, following several scandals where reviewers were forced or incentivizedto be more lenient during the review process.
118

showed that 85% of consumers read an expert’s review before purchasing a product; the vast majority
of them were influenced by its content. 9 The reach of experts’ opinions, though, is not as wide as user
reviews. Further, consumers relate more to opinions of their peers, rather than those of professionals paid
to review something (De Langhe et al., 2016).
Chen et al. (2004) and Chevalier and Mayzlin (2006) are the first relevant works that tried to empiri-
cally investigate this relationship, and succeeded in doing so through grounded identification strategies.
Chen et al. (2004) considered the role of both user reviews (here called consumer feedback) and recom-
mendation systems on consumer demand.10 On the one hand, the very presence of consumer feedback
should help consumers to reduce uncertainty about product quality; on the other hand, it is driving sales
only when it is credible. The authors collected data from scraping Amazon book section, and used sales
ranking as a proxy for sales volume.11 They drew from the marketing literature in estimating a linear
model linking sales (i.e., ranking position) with three sets of regressors: product characteristics (e.g.,
price and discounts); consumer feedback (average score and volume); and website recommendations.
Across model specifications and book categories, the volume of ratings has a positive impact on sales,
unlike the rating itself, which seems to positively affect sales only for bestsellers. As popular books enjoy
a bandwagon effect, they might be more likely to be subject of external factors. Nevertheless, the esti-
mation technique did not consider the endogeneity problem coming from simultaneity: it is reasonable
to think that consumer feedback is also influenced by sales (in particular, the volume of reviews).
Unlike Chen et al. (2004), Chevalier and Mayzlin (2006) were able to estimate a significant effect
of ratings on sales, meaning that they could disentangle the impact of different rating distributions;
also they looked at the long-lasting effect of reviews: how sales were affected a month after reviews
had been accumulated. Indeed, Chevalier and Mayzlin (2006) used data from two online bookstores,
Amazon and Barnes and Noble, and estimated the effect of valence by looking at the difference in sales
of the same book across websites with the number of reviews being the only difference (i.e., difference-
in-differences approach). This additional analysis complemented the interpretation of standard OLS
9Nielsen. (2014). The Role of Content in Consumer Decision Making Process. Nielsen.com. http://www.inpwrd.com/the_role_of_content_inpowered.pdf (accessed July 14, 2017)
10Recommendation systems are tools implemented by online retailers within their websites that suggests potential purchasesto consumers, based on their own previous searches. Their increasing relevance is nowadays a wide subject of study.
11This practice has become standard in empirical research. Online retailers typically dedicate a section of their websites torank best-selling products (within and across product categories). Starting from the work of Schnapp and Allwine (2001), thereis a long tradition in using information about these rankings to approximate actual sales (the latter not publicly available, unlikeprices). Schnapp and Allwine (2001) identified a linear and positive relationship between the two variables, using proprietarydata from Amazon. More advanced methodologies have been implemented in recent research papers, suggesting a non-linear,but still positive, relationship between the two variables (Wang and Wright, 2017).
119

estimation. In doing so, authors were able to control for unobservables that might have affected sales
and been correlated with reviews. During the exploratory analysis of the data, Chevalier and Mayzlin
(2006) found that rating distributions were skewed towards the highest scores and the average rating
were well above four out of five (the issue of rating bubbles will be widely covered in Section 4.4.2). In
the model specifications, alongside with consumer reviews, Chevalier and Mayzlin (2006) also included
prices, book features and shipping methods. Book-site-specific fixed effects were also accounted for.
Average ratings aside, Chevalier and Mayzlin (2006) also considered the fraction of extremely negative
and extremely positive reviews. Going by the results, Amazon consumer reviews are considered more
reliable than those on the other website: they affect sales in the expected way (the higher the average
score, the more positive the effect on sales). On Barnes and Noble, only extremely negative reviews carry
some weight on sales. These reviews were generally found to have a bigger impact than 5-star rating.
Using a randomized sample of books from Amazon and Barnes and Noble, similar results were found
by Sun (2012). Valence and volume were always positively correlated with sales; variance, instead, was
positively correlated but only for those product which average rating was below 4.1/5 stars.
In the tourism and service industry, scholars have mainly investigated the relationship between user
reviews and hotel room sales/booking. Ye et al. (2009), for example, used data from a popular Chinese
online travel agency. They found that positive average ratings increase hotel bookings and, in turn, the
volume of reviews (confirming the simultaneity issue feared by previous scholars). A related work built
on a much larger data set, Ye et al. (2011), found similar results; in addition, the authors also found
that the variance of ratings does not affect hotel bookings. Ogut and Onur Tas (2012) investigated the
effect of user feedback in conjunction with another, more objective, quality cue: the number of stars
assigned by national agencies to hotels. The authors, using data from the popular platform Booking,
found that an increase in rating valence leads to a statistically significant improvement of hotel room
sales: “a 1% increase in online customer ratings increases Sales per Room up to 2.68% in Paris and up
to 2.62% in London” (Ogut and Onur Tas, 2012, p. 210); instead, the official star rating does not seem
to affect performance. This is line with studies that found consumers do read official certification labels
but eventually put much more weight on peers’ opinions (De Langhe et al., 2016). The role of (positive)
valence has been established in other industries as well. Mo et al. (2015) looked at the sales of cleansers
on a popular Chinese e-commerce website. They found that positive reviews, as well as product image
and description, positively affect sales, while negative and moderate reviews don’t show any significant
impact on sales.
120

While the presence of positive feedbacks certainly translates in a positive effect on sales, negative
reviews are found to either negatively affect sales or being not relevant. In fact, some studies in the
marketing literature have concluded that negative reviews (from experts) might even be beneficial to
commercial performance (Berger et al., 2010). In line with these results, Cui et al. (2010) looked at
data from newly released products on Amazon and monitored the effect on performance across a longer
time span than previous papers. While the valence was positively related to product sales, the authors
found that negative feedback was much more impactful than positive feedback, and that the former might
even spur an increase in sales of new products as long as the average user rating is globally positive. It
seems that initially negative reviews raise product awareness and eventually are considered as valuable
pieces of information by future purchasers: regardless their content, they might finally encourage product
adoption. Further, the results indicated that these effects were not long-lasting and vanished over time.
In addition, the authors analyzed the influence of user feedback across product types. It appeared that
volume affects much more experience goods, while search goods sales are more influenced by the valence
of reviews. Cui et al. (2010) was one of the first attempts to study the different responsiveness to eWOM
of good types.
Framed in the relationship between product proliferation and online communication, Clemons et al.
(2006) analyzed how user reviews affected products in the craft beer industry. The novelty of their ap-
proach was to focus on the variance of rating distributions, typically neglected or scantily covered by
previous scholars. The role of the variance seems relevant in the context of hyperdifferentiated prod-
ucts:12 the proportion of enthusiastic consumers (i.e., those posting a very high score) might be more
relevant than the average rating for those products that cater extreme preferences. The authors used data
from a popular beer review website and sales provided by the Association of Breweries (sales data con-
tained only firm-wide information, and not product-specific); in particular, they focused on sales growth.
The association between reviews and sales was statistically significant; consistently with previous stud-
ies (Chevalier and Mayzlin, 2006), the higher the average rating, the higher the sales. Further, rating
distributions skewed towards extremely positive ratings also have a positive effect on sales, in contrast
with findings in other markets for more generic products (Ye et al., 2009). Finally, negative ratings seem
to not affect much sales. This was in stark contrast with Chevalier and Mayzlin (2006), who found a
more relevant role of negative ratings versus positive ones; this is explained by considering the differ-
12Under hyperdifferentiation, firms produce goods which are able to perfectly fit the tastes of each consumer on the preferencespectrum. Extreme tastes are taken into account within specific products, that might find a limited, though profitable, market(i.e., niches). The fall of search costs thanks to digitization and e-commerce allowed hyperdifferentiated products to proliferate.
121

ences between the book and the craft beer industry and the fact that beer is a repeated-purchase good.
The paper presented a strong case for hyperdifferentiation: if the high-end set of ratings has a positive
impact on sales growth, then firms should offer more niche products and care less about products aimed
at satisfying a wide audience.
Some studies were primariy aimed at introducing user reviews within sales forecasting models, espe-
cially for those goods that have a short lifecycle and sales concentration during the first weeks after the
release. By looking at the movie industry and using review data from Yahoo Movies, Dellarocas et al.
(2007) found that consumer feedback was not correlated with professional ratings, making them an ad-
ditional valuable tool to forecast sales. Indeed, forecasting accuracy improved when user reviews were
considered alongside with more traditional metrics, such as star power, marketing budgets and early
commercial performance; the more favorable the user reviews, the better the box-office performance.
Another interesting result was that the volume of reviews during the first day of release could be used
to proxy early sales, which is particularly important when data are not public or they take some time to
release. Dellarocas et al. (2007) expanded the research by Liu (2006), who considered user reviews from
the same website to predict box-office sales. While Dellarocas et al. (2007) implemented a non-linear
hazard model, Liu (2006) adopted a much simpler (and more tractable) linear model. The author found
that the volume, rather than the valence, had a role in explaining box-office performance. Perhaps, a
smaller range of movies and a less sophisticated model specification drove these results.
After the first wave of researches assessing the importance of eWOM as a driver of commercial per-
formance, scholars have started to enrich their estimation models to account for the endogeneity nature of
user reviews. Duan et al. (2008b), for example, adopted a simultaneous equation model which accounted
for both the pre-release effect of eWOM and the effect of sales on such resource of information—what
they called a positive feedback mechanism. They also considered a dynamic framework, able to deal with
a long time horizon. The analysis confirmed that, indeed, dual causality may be a concern in this type
of research. The data were the from the same source as Dellarocas et al. (2007) and (Liu, 2006): Yahoo
Movies. The authors found that ratings per se do not affect movie performance but they do through vol-
ume: “user ratings do not directly influence box office revenue. However, they affect box office revenue
indirectly through WOM volume.” (Duan et al., 2008b, p. 234). Also, this effect was significant across
time, though vanishing moving away from the release period. The relation went also in the opposite
direction: higher sales led to more reviews and therefore greater volume. Finally, the results suggested
that volume is also affected by average user ratings; it seems that viewers are more willing to spread
122

their opinion when the online community positively welcomes the movie. In sum, revenues and valence
influence volume which, in turn, influences commercial performance. The authors admitted that, being
movies horizontally differentiated products, adoption might have depended more on the content itself of
reviews, rather than the star rating, and that impulse purchasing might have been more likely. Therefore,
only looking at average star ratings and volume might have constrained the analysis. Similarly, Zhu
and Zhang (2010) aimed at verifying whether the significant impact of valence on sales was not due
to unboserved quality, which would affect both indicators. In order to avoid the endogeneity problem,
the authors considered the video game industry and the same titles released on two different platforms,
adopting a difference-in-differences approach ( Chevalier and Mayzlin (2006) did the same considering
the same book sold by two different e-retailers). Further, they adopted a nested logit demand model for
games to estimate the effect of user reviews on sales, in order to control for heterogeneity in consumer
preferences. Even accounting for omitted variable bias, results showed that higher average ratings, and
higher volume, had a positive effect on sales. The research also validated the idea that user reviews were
particularly useful in affecting the performance of niche and less popular games. On the issue of the dy-
namic evolution of reviews and sales, Li and Hitt (2008) considered the fact early adopters are typically
more enthusiastic about the product and therefore have the tendency to leave very positive feedbacks.
Therefore, using data from Amazon, they found that reviews affect sales through this self-selection bias.
At the same time, users do not realize this issue and are affected by biased reviews. The discussion about
how consumer product adoption is affected by reviews is postponed to Section 4.4.1.
Duverger (2013) tried to extend previous literature by considering a dynamic non-linear relationship
between UGC and sales (here, proxied by hotels market share), and including in the analysis the role
of competition between firms and textual reviews in addition to ratings. The rich data set and the ad-
vanced econometric model allowed the author to confirm the hypotheses that ratings are an endogenous
variable in the relationship with market shares and that rating valence improves hotel performance, both
in the current time and across time (though at diminishing returns, confirming most of previous stud-
ies). The most interesting result is, perhaps, the fact that there exists a certain rating threshold above
which hotels start to be negatively affected by valence. It seems there was a too-good-to-be-true effect,
more pronounced for low- and mid-tiered properties. This was also confirmed by the effect of review
length on market shares, on average negative, even when interacted with ratings. The issue of whether
the textual content of reviews might affect sales has been a subject of analysis by Ghose and Ipeirotis
(2011) among others—the analysis of texts has become popular only recently thanks to the adoption of
123

more advanced techniques. In particular, the authors identified factors within reviews that might have
an impact on product adoption and, consequently, on sales. Using text mining techniques on Amazon
product reviews, Ghose and Ipeirotis (2011) found that, on the one hand, subjectivity was positively re-
lated to sales for search goods (and not related at all to experience goods). On the other hand, reviews
containing both subjective and objective sentences had a negative impact on sales of both good types.
Experience goods, though, were negatively affected by the proportion of spelling mistakes, while both
goods were positively affected by readability. On top of these results, the authors found that volume has
a positive effect on sales, while valence has a positive effect only on search goods. The joint analysis of
both ratings and textual contents might help to shed light on some counterintuitive results by previous
scholars (Cui et al., 2010). For example, negative reviews can improve sales “when the reviewer clearly
outlines the pros and cons of the product, thereby providing sufficient information to the consumer to
make a purchase” (Ghose and Ipeirotis, 2011, p. 1505); that is, when the review is readable, does not
contain spelling errors, and subjectively describes the negative attributes, which might not be as relevant
to future purchasers. On the different impact of reviews across good types, Ghose and Ipeirotis (2007),
using data from Amazon, found that reviews with text content focused on objective product features are
affecting more performance of feature-based goods, such as digital cameras; instead, reviews with text
content centered around subjective characteristics affect performance of experience goods such as DVDs.
Chintagunta et al. (2010) explored the issue of endogeneity in the movie industry, as Duan et al.
(2008b). The authors, though, found that the valence, rather than the volume, affects sales. Driving
these results, the fact that the authors decided to consider data at the local level,13 rather than at the
national level. According to Chintagunta et al. (2010), there exists an aggregation bias that hides the
true effect of average user ratings. Indeed, movies typically open in different period across markets;
higher box office sales might result from openings in new territories and, at the same time, average user
ratings might decrease because viewers in those markets where the movie had already opened didn’t like
it. This would basically nullify the effect of interest. It is worth noticing that this phenomenon might
arise only in specific industries or across relatively distant geographic markets. Using a policy shift by
Amazon, framed as a natural experiment, Chen et al. (2011) investigated the role of e-WOM together with
observational learning; while the former pertains other people’s opinions, the latter concerns observing
what others are doing and learn from their actions. In the case of e-commerce, observational learning
arises in terms of purchase recommendations based on other previous consumers’ habits. According to
13The authors used the so-called DMA-level geographic locations.
124

the authors, the true effect of user feedback on sales can be confounded by observational learning if
both are present in the product page and therefore used by consumers as cues during product adoption.
Indeed, results showed how e-WOM and observational learning interact with each other, when volume
is considered: the higher the number of reviews, the stronger the effect on sales of recommendations
based on others’ actions. Further, as previous studies have found (Chevalier and Mayzlin, 2006), online
reviews had an asymmetric effect: negative ratings are much more impactful than positive ratings; and
the influence on product performance is diminishing across product lifecycle.
Forman et al. (2008) suggested that, in addition to valence and volume, the reviewer identity dis-
closure might also be linked to product sales. The authors collected data from Amazon book section,
and retrieved information about reviewer identity. They built dummies signalling whether a reviewer
revealed the true name, the location or both. Results from linear estimation (based on Chevalier and
Mayzlin (2006)) suggested that valence is not a predictor of sales; while identity disclosure is positively
associated with the outcome variable. This effect appears to be stronger within geographical areas; if re-
viewers revealed their spatial location, product sales in the same area increased. It is worth noticing that
the presence per se of source cues positively affects product sales, regardless actual ratings. Nonetheless,
similar results were found by Ghose and Ipeirotis (2011), where identity disclosure was indeed positively
related to sales, even when controlling for the quality of the review (e.g., in terms of readability). The
reasons behind these results were not explained, though. Somehow, this research is in line with the idea
that valence is not affecting in a significant way sales (Liu, 2006).
In addition to reviewer identity, sometimes reviews contain other information along with rating and
textual contents. Many websites allow users to rate the helpfulness of user reviews. According to Chen
et al. (2008a), this might be a factor which strengthens the relationship between reviews and sales. A
positive vote to a review can increase how the review is perceived by potential buyers, affecting their
choices; as with identity, an helpfulness indicator can increase the saliency of the quality signal. More
in details, the authors considered three additional cues: the helpfulness of the review; the quality of
the reviewer; and whether the review was highlighted on the product page. They collected data from
Amazon book section over a period of about seven months. The interaction between average user ratings
and helpfulness led to the expected results: a higher proportion of helpful votes exacerbates the effect
of average scores. The positive (negative) effect of high (low) star ratings is stronger when, on average,
those ratings come from reviews that have been considered useful by the online community. Nonetheless,
the prominence of reviewers does not seem to affect product sales, perhaps because the information is not
125

immediately visible to buyers. Further, reviews in the spotlight play a role: they add to the influence by
star ratings. Interestingly, these factors impacted more niche products than best-sellers, an effect that was
found by previous scholars (Zhu and Zhang, 2010); indeed, less known products are more susceptible to
such signals, while big sellers gain traction from the very fact that they are popular.
Not only sales have attracted the interest of scholars, but also other metrics to measure the success
of a product or a firm. As the outcome variable, Zhang et al. (2010b) considered the online popularity
of restaurant measured in terms of web traffic. By using data from the Chinese counterpart of Yelp, the
authors were able to show that the average user rating has a statistically significant impact on the number
of views of a restaurant’s webpage. This was true across rating categories, as Zhang et al. (2010b)
estimated separately the effect of scores on food quality, atmosphere and service. Volume also had a
positive impact on restaurant’s popularity. One of the factors driving these results might be that all the
information were collected on the same page where the restaurant website could have been accessed—
meaning that users could immediately react to a positive rating at a negligible cost. This is different than
purchasing a product, which requires a different, more costly and engaging, effort.
4.3.2 Marketing strategies
“There is little debate as to whether WOM matters to the firm” (Godes and Mayzlin, 2004, p. 545): as
the link between user reviews and sales has been widely recognized by academic researchs and industry
professionals alike, firms have started considering how to incorporate eWOM into their marketing strate-
gies as a way to increment profits and improve service quality and customer interaction. User reviews,
after all, serve managers as a unique and rich tool to adapt marketing and promotional activities as well
as choices related to the sale of products and services (Chen et al., 2008a); UGC systems act as an im-
portant avenue for no-cost market research (Rupert Hills and Cairncross, 2011, p. 34). Not being able
to extract informational value from user reviews (and other related components of eWOM) may result in
sub-optimal decisions concerning product sales (Kumar et al., 2010). Firms relying only on transaction
information might miss opportunities to make the product/service more desirable and attractive.
I will make two considerations before exploring the issue further. First, I will not focus on the
establishment itself of rating systems. It is important to notice that the existence of user reviews was
necessary for firms to gain trust within electronic channels. According to Fung and Lee (1999, p. 516),
“[t]rust is particularly important in the electronic marketplace where the potential for opportunistic
behavior is high”—hence, user reviews became a tool to enhance company/product reputation alongside
126

official signals such as the company’s name and certifications. The need for these feedback systems
was pushed by online retailers, rather than by individual companies selling through such retailers. For
example, eBay introduced its feedback systems in order to provide consumers additional information
about seller quality. Amazon’s user reviews aimed at increasing transparency and information provision
in an environment characterized by product overload. While such systems impacted sellers’ prospects
within the retailing platform, for example increasing bidding prices (Ba and Pavlou, 2002), it is safe to
assume that their presence is orthogonal to sellers’ response to average ratings—sellers consider UGC
systems as established entities towards which they do not have any power whatsoever. The topic can be
explored in isolation, without referring to the motives that led to the establishment of feedback systems.
Second, I will not consider actions firms can implement to respond or manipulate online user reviews.
Indeed, many websites now allow managers to write a brief clarification to users that had reviewed their
properties; and also to add reviews themselves within personal websites. These relates to additional
tools rating platforms provide to sellers—another layer of analysis which depart from the focus of this
literature review. Wei et al. (2013) showed that hotel managers should create tools to encourage customer
engagement and to control eWOM more directly. The marketing literature has broadly explored this topic
and research is still on-going.
Initial studies on the role of online user ratings on pricing decisions focused on price dispersion
in electronic markets. Traditional theory predicts that e-retailers would be characterized by lower price
dispersion versus traditional brick-and-mortar stores, because of lower search costs. Grover et al. (2006),
citing evidences of great price dispersion in online stores, theorized that e-shopping presents features
that might mitigate/counterbalance the effects of smaller search costs; that is, information overload and
information equivocality. The latter refers to the great variance in consumers’ ratings for a specific
product: “[t]hese differences in product-quality perceptions lead consumers to have differences in the
amount they are willing to pay (reservation price) for the same product ” (Grover et al., 2006, p. 306).
Sellers, in turn, exploit this increase in willingness to pay by raising prices. Using data from Shopzille
(formerly, Bizrate), a popular comparison website, the authors were able to validate the hypothesis that
a greater variability in ratings lead to higher prices.
Yacouel and Fleischer (2012) studied reputation mechanisms within online travel agencies (OTAs),
in particular evaluating the role of user reviews in the hotels’ pricing choice. Broadly speaking, OTAs
show information to potential customers related to the quality of hotels; e.g., the number of official stars
assigned by national authorities, pictures and, of course, user reviews. Unlike traditional operators, OTAs
127

can rely on such type of UGC information and, unlike many other e-commerce websites, OTAs allow
reviews from actual customers only. Using data from Bookings, the authors found that hotels character-
ized by high scores in the staff performance valuation charged higher prices.14 In sum, higher quality
(as signaled by user reviews) allowed firm to ask for a price premium within the platform. Further, the
higher the star ranking, the higher the price mark-up—customers of luxury hotels were more demanding
with respect to customers of cheap hotels, therefore they valued more quality signals such as eWOM.
Yacouel and Fleischer (2012) were able to confirm the theoretical predictions that firms react to a change
in reputation by changing accordingly their strategies in terms of pricing. Similarly, Ogut and Onur Tas
(2012) analyzed Booking reviews and prices to find the same positive significant relationship; and the
same greater sensitivity of prices of higher star hotels. By estimating an hedonic pricing model, and using
data from Booking, Abrate and Viglia (2016) proved the existence of a positive link between average user
rating and price positioning. The study advocates for the inclusion of eWOM in dynamic pricing models,
alongside other reputational variables such as official star ranking, and contextual variables such as the
amount of competition in the same geographic area. In a similar fashion, Yang et al. (2016) found that
better online user reviews brought hotels to charge higher prices, and therefore to overcome difficulties
from selling their services in less busier periods of the year.
The influence of eWOM on firms’ strategies is not limited to the tourism industry. Kocas and Akkan
(2016) considered Amazon data about books and found that booksellers charge lower prices when aver-
age user rating is higher. They justified this result by considering competition between sellers and the
fact that a lower price combined with high ratings can help patronize customers. Jiang and Wang (2008)
built a theoretical model of vertically differentiated products and showed that high user ratings of the
high quality product result in less aggressive price competition and therefore in an overall increase in
prices; while an improvement in ratings of the low quality product will intensify competition therefore
leading to lower prices—user ratings are considered, therefore, a component of the perceived quality
by consumers, and a driver of prices. The authors tested these predictions using Amazon data on dig-
ital cameras and multivitamins, finding support for the idea that user ratings might either mitigate or
strengthen price competition among sellers. This work is interesting because it introduces an element of
competition between firms, and consider eWOM as a product characteristic that can augment/enhance
perceived product quality, therefore leading to a change in firms’ pricing strategies.
14They noted that other categories, such as cleanliness or comfort, were highly correlated with staff performance and there-fore were excluded from the regression analysis.
128

DiRusso et al. (2011) considered a selection of electronic products on Amazon, and investigated
factors determining retail prices; among these factors, reputation signals, such as the brand logo and
the number of ratings sellers received. Unfortunately, the authors found that user ratings are negatively
affecting prices—the explanation may lie in the presence of reverse causality; that is, sellers have higher
ratings because they charge lower prices and therefore they are seen as more benevolent towards con-
sumers, collecting higher scores.
Other than prices, service quality can also be affected by online user reviews. Consumers’ opinions
can, on the one hand, inform sellers about what does not work in their product/service; and, on the other
hand, they can work as a deterrent to offer a bad produt/service, so to avoid bad comments that might
negatively affect sellers’ perception among potential consumers. Contrarily to prices, service quality is a
much more difficult choice variable to measure. Smyth et al. (2010) attempted at understanding whether
hotel managers were improving quality following their presence on TripAdvisor; they found that as the
website had became more widely used (by comparing two cities with different level of TripAdvisor
penetration), hotel ratings improved together with an increase in managers’ responses—signalling the
fact that hotels were sensitive to reviews and, possibly, tried to improve the service they offered. The
analysis, nevertheless, is not rigorous as the authors only looked at correlation between variables. They
could not explicitly rule out other confounding factors, such as the mainstream effect, namely the fact
that as TripAdvisor becomes more popular it also attracts a wider audience, typically less critical and
more apt to leaving higher ratings.
In sum, concerning the link between eWOM and marketing strategies, there are two main directions
for future research. While the issue of endogeneity has been widely explored when investigating the rela-
tion between ratings and sales, the same cannot be said when considering the effect of ratings on prices.
The estimation of more sophisticated model accounting for the issue of reverse causality is needed, as
the simultaneity between user reviews and firms’ strategies is evident. Furthermore, until now, pricing
decisions have been the main subject of analysis. Nevertheless, sellers might also want to alter other
characteristics of their products following consumers’ feedback (Smyth et al., 2010). This is particularly
relevant in the tourism industry, where service quality can be easily adjusted. A more thorough anal-
ysis of whether firms actually incorporate UGC to improve their product, rather than extracting more
consumer surplus, is needed.
129

4.4 Behavioral dimension
“The consequences of WOM communication occur in the behavior of those who receive it—their aware-
ness, beliefs, attitudes and actual decisions” (Chatterjee, 2001, pp. 6-7). As established in the introduc-
tory section, people have become accustomed to reading users reviews when they search for a product
or service online. They might also value online user reviews more than offline counterparts (Cheema
and Papatla, 2010) and find them more trustworthy than website recommendation systems (Senecal and
Nantel, 2004). While browsing, potential consumers become eWOM receivers, and they incorporate
such informal messages within the decision-making process up to the purchase and, possibly, the rating
itself. Rating systems were established to reduce information asymmetries during e-shopping, hence
they were specifically intended to be used by potential consumers— but to what extent do actually they
affect choices? A large strand of the literature has developed in trying to understand the impact of online
user ratings during the purchasing phase (i.e., on product adoption) and after the purchase (e.g., during
rating itself).
The potential impact of WOM on individual purchasing choices depends on a variety of factors. One
of the main drivers is the source of recommendations—e.g., friends and family; the degree of influence
depends on the closeness between the sender and the receiver (Chatterjee, 2001). Nevertheless, online
reviews are typically written by strangers. Henceforth, other factors likely affect the behavior of indi-
viduals: for example, the size of eWOM, which can be measured by the volume of review, and other
informational cues that appear within the rating system such as the identity of the reviewer. Alongside
empirical data, scholars have conducted many laboratory experiments in order to control the drivers
under investigation during consumers’ purchasing and rating intentions. In many instances, rating inter-
faces have been specifically created as a way to stimulate specific responses and disentangle the drivers
of consumer behavior more easily.
Understanding how consumers utilize the information from user reviews is highly relevant as this
information can be biased, and therefore not reflecting of actual preferences. Li and Hitt (2008) tackled
the issue of self-selection in online user reviews. Early adopters might have a different attitude towards
product with respect to late-comers, the fact of which is the reflected in online ratings—as such, there
might exist a correlation between the tendency of buying early and the satisfaction derived from the
product. For example, a digital camera might initially receive low ratings because tech-savvy consumers
did not find its features satisfying, while the same camera might meet the needs of a more generic
130

public. Li and Hitt (2008) found the presence of such biases on the Amazon book section—user reviews
exhibited a time trend, namely, early adopters were more enthusiastic than late-comers and therefore
reviews were initially extremely positive, but then moderated. The presence of self-selection bias greatly
impacts consumer behavior during browsing. Indeed, the authors found evidence that consumers don’t
discount for this bias. This poses a threat for firms and consumers alike, being pushed to sub-optimal
choice through biased signals.
4.4.1 C3: Product adoption
When deciding whether to buy a product and which product to buy, consumers might look for informa-
tion about attributes of the product and for recommendation from different sources. Contrarily to firm-
based recommendations, online user reviews are centered around the experience of actual consumers, and
therefore are closer to what potential buyers are looking for (Bickart and Schindler, 2001). For this rea-
son, consumers tend to conform to the opinion of anonymous reviewers and internalize this information
during the browsing and purchasing process. The extent to which eWOM can affect consumer’s behav-
ior depends on a variety of factors, many of which explored by previous scholars. The topic deserves
attention because the way how consumers are researching products has widely changed throughout the
years thanks to new technologies. In explaining consumer’s decision-making, traditional Marketing lit-
erature has adopted the “funnel metaphor”: consumers become aware of a variety of brands/companies
(awareness phase) and then start systematically to narrow down the set using marketing messages and
other communication signals (e.g., WOM). After becoming familiar and then actively considering cer-
tain brand, the consumer decides from which company to purchase and eventually whether to become
a loyal consumers. A 2009 research by McKinsey 15 challenged this traditional view by theorizing a
circular process called the “consumer decision journey”. Here, the consumer may add or subtract brands
at any given time during the awareness and consideration phases; being exposed to constant advertise-
ment, recommendations and other marketing-related activities on digital devices has destabilized the
linear process of narrowing down the initial set of brands. Further, in today’s landscape, consumers
are empowered agents as they can share their opinions with a large audience and become influential
spokepersons, through rating systems, forums and social networks; they are “becoming more rational
decision makers, making objectively better choices, and becoming less susceptible to the influence of
15Court, D., Elzinga, D., Mulder, S. and Vetvik, O. J. (2009). The consumer decision journey. McKin-sey Quarterly. https://www.mckinsey.com/business-functions/marketing-and-sales/our-insights/
the-consumer-decision-journey (accessed July 29, 2017)
131

marketing and branding” (De Langhe et al., 2016, p. 818). This means that, after the purchase, they
become active users evaluating their experience with the product and, possibly, informing others. The
loyalty step, therefore, is weaker than in the traditional streamlined process. The research aims at indi-
cating firms guidelines in how to change their communication strategies to accomodate this new take on
consumer decision-making. Recent works seem to confirm the theory of the consumer decision journey.
Jang et al. (2012) used a survey and a two-stage estimation model to show that consumers do use online
user reviews during the consideration phase, rather than during the choice stage, and they constantly
update their belief about product quality. Incorporating eWOM during a phase where a lot products are
browsed/considered brings consumers to enlarge and shorten the set until finally convinced about which
product to adopt.
Chatterjee (2001) was the first attempt in analyzing the role of online user reviews in consumers’
decision-making behavior. While eWOM loses direct person-to-person communication, it might recreate
familiarity under different aspects. The authors considered the degree to which retailer patronization
can moderate the effect of online user reviews, especially negative ones. By means of a laboratory
experiment, the author was able to study the behavior of consumers that are familiar with a specific
e-retailer and those that, instead, were attracted by lower prices and therefore were unfamiliar with the
online store. Results showed that the former are less likely to search for online user reviews and are less
affected by them in purchasing intentions. In particular, negative reviews influenced more the second
type of consumers, in terms of considering the retailer credible and eventually proceed to purchase a
product. The work is a strong advocate against the common “lowest price” advertising strategy as it
attracts consumers that are more susceptible to eWOM and therefore more difficult to patronize.
By considering a choice in hotel booking, Vermeulen and Seegers (2009) directly investigated the
impact of eWOM on decision-making behavior. In particular, by means of an experiment, the authors
measured the effect of exposure to online user reviews on hotel awareness, hotel attitude and hotel
consideration—representing the different steps in product adoption decision-making. Results showed
that both positive and negative reviews increase awareness by bringing consumers to, at least, know
more about the hotel. Positive (negative, respectively) reviews, then, improve (worsen) attitudes towards
the hotel. Given higher awareness and better attitude, positive reviews increased hotel consideration
by leading consumers to increasingly consider actually booking. Interestingly, negative reviews did
not impact hotel consideration—the authors suggested that the awareness effect was large enough to
compensate the more adverse attitude. Through the experiment, the authors were also able to collect
132

information about the stance on popular versus less-known properties. In line with what was found in
similar studies (Zhang et al. (2010a) Clemons et al. (2006)), lesser known hotels were more susceptible
to online reviews while familiarity with the hotel made consumers more resilient to being affected by
other people’s opinions, confirming the idea that familiarity with the firm makes consumers less willing
to rely on eWOM (Chatterjee, 2001). Through an experimental study, Mauri and Minazzi (2013) found
similar results. In their research, purchasing intention of subjects was significantly affected by valence
of the message—it improved under positive reviews and deteriorated under negative reviews. The same
effect was found on consumers’ expectation about the product.
Since the role of eWOM as influencer has been established, scholars have started to investigate
moderating factors and channel through which these signals were able to change consumers’ behavior.
While star ratings are indeed an important signal, textual content is also relevant. “[S]entiments expressed
in the text provide more tacit, context-specific explanations of the reviewer’s feelings, experiences, and
emotions about the product or service” (Hu et al., 2014, p. 42) and therefore should be considered when
assessing the influence of eWOM on product adoption. Using sentiment analysis on a sample of Amazon
reviews, Hu et al. (2014) were able to assess the different impact of ratings (numerical attributes) and
textual content (sentiment) on product adoption. They found that ratings themselves do not affect sales,
while sentiment does—and the two variables are positively correlated. These results can be understood
by considering the decision-making process of a consumers: ratings can be used initially to skim through
the many available alternatives—to narrow down the consideration set. And finally, textual reviews are
used to actually direct the choice. They also found that “most helpful” and “most reviews” (typically
highlighted in the product webpage) affect product adoption—they effectively work in raising consumer
attention and convincing him/her to purchase.
Lee et al. (2008) considered the effect of the quantity and the quality of negative online user reviews
on product adoption. Using a laboratory experiment, the authors found that the higher the proportion of
negative reviews, the more skeptical subjects were towards the product, with high-quality reviews being
more trusted than low-quality ones.16 Further, the authors introduced a moderating factor in the analysis:
consumer search involvement. Through a questionnaire, they were able to assess subjects’ effort in com-
pleting the task—high-involvement subjects were more affected by negative reviews and, consequently,
more affected by high-quality than low-quality negative reviews; low-involvement subjects didn’t show
16According to Lee et al. (2008), the quality of reviews refers to the type of information conveyed. High-quality reviewscontain information about specific failures of the product, while low-quality reviews contain inessential and vague information.
133

any difference in attitude across review quality levels). The way high-involvement consumers (more
specifically, travelers) adopt information from online user reviews has been under investigation in Filieri
and McLeay (2014). On top of the quality of reviews, in terms of accuracy, relevance and value-added
information, a strong predictor of travelers incorporating eWOM into their decision-making processes
was product ranking. The huge amount of products readily available online leads consumers to skim
them using simple cues, such as the position on the webpage. Therefore, high-involvement consumers
use a mix of a central and a peripheral route to information adoption, and not only immediate heuristic
cues. A similar consumer trait was analyzed by Gupta and Harris (2010), who called involvement “mo-
tivation”—as the “the amount of thought devoted to an argument” (Gupta and Harris, 2010, p. 1042).
Highly motivated consumers use eWOM as another informative signal to infer the quality of the prod-
uct; while consumers with low motivation acritically internalize eWOM and purchase the recommended
product without second thought. Gupta and Harris (2010) conducted an experiment using a realistic on-
line shopping website where they manipulated the presence and the type of eWOM shown to subjects.
They found that, when exposed to eWOM, high-motivation consumers take more time in searching prod-
ucts in order to make a more informed decision to the point that they might even change their preferences
to accommodate the opinion of previous consumers. Low-motivation consumers, instead, are more sim-
ply affected by user reviews, not incrementing their search time. The former, though, never decided to
buy a suboptimal product even if recommended, while the latter easily followed eWOM whichever prod-
uct was recommended. This result strongly suggests that the acritical adoption of eWOM information
can lead to wrong choices if not properly processed.
Adopting the cognitive fit theory, and considering the traditional product life-cycle, Park and Kim
(2009) aimed at understanding whether eWOM affected consumers with different levels of expertise
about product types in different ways; and which review feature/content were resounding more to which
group. For example, expert consumers seek information about technical attributes while novices prefer
to read about the benefits of the product. The difference between the two types of consumers is impor-
tant as expert consumers tend to write reviews earlier and, with their opinions, can affect subsequent,
less savvy, consumers (Li and Hitt, 2008). The authors conducted an experiment where subjects were
shown reviews of different types and were assessed on their knowledge about the product under analysis
(a portable multmedia player). The experiment showed that “experts seek attribute information because
they want to use their prior knowledge to infer product benefits from the stated attributes [...] By con-
trast, novices prefer the benefits only messages because the specification of product benefits facilitates
134

understanding of the given reviews” (Park and Kim, 2009, p. 404). In terms of product adoption, the cog-
nitive fit theory was demonstrated: experts (novices, respectively) are more likely to purchase a product
when reviews point out intrinsic features of the product (benefit stemming from the usage of the prod-
uct). An interesting result comes from the impact of the number of reviews—while experts’ behaviour
is mainly influenced by the quantity of more technically detailed reviews, novices are simply affected by
the amount of reviews, regardless of their type—again, confirming the intuition regarding the acritical
incorporation of informational cues in the decision-making process of less attentive people. In the hos-
pitality industry, the most relevant product dimensions are core features (i.e., the ability of creating value
for the customer) and relational services (i.e., features related to customer-employee relationship). These
features are also the most talked about dimensions within online user reviews (Sparks and Browning,
2010). By building on these stylized facts, Sparks and Browning (2011) adopted an experimental de-
sign with a simulated rating website and several treatments differing in terms of the type of information
available. Their analysis highlighted the positive influence of favorable hotel user reviews on consumers’
attitudes, as well as the dominance of core features over service quality in terms of persuasion. More
generally, products may have a mix of different attributes: search, experience and credence attributes,
mirroring the product type taxonomy widely adopted in the Economics of Information. Lim and Chung
(2011), using a controlled experiment, found that consumers are more susceptible to comments, within
reviews, about credence attributes—therefore those features that are difficult to properly assess even af-
ter the purchase. Additionally, negative eWOM has a far greater impact than positive, strengthening the
idea that highly disapproving opinions might be viewed as more competent and therefore more credible
(Schlosser, 2005).
The type of review also plays a role in forming the decision-making process of prospective buyers.
The disclosure of reviewers’ identities might affect product adoption too, as mentioned in Section 4.3.1.
Indeed, Forman et al. (2008) found that the impact of user reviews on sales is enhanced when information
about reviewers are available. This is due to the fact that consumers, when faced with a large amount
of information, rely on heuristic cues based on ease of understanding (e.g., star ratings) and familiarity
(e.g., the identity). In these situations, as the authors wrote, “community members process information
heuristically, using source characteristics as a convenient and efficient heuristic device on which to base
their product purchase decisions” (Forman et al., 2008, p. 308). The presence of personal identifying
information increase the perceived credibility (and especially trustworthiness) of online reviews, as well
as their persuasive effect towards product adoption, as demonstrated by Xie et al. (2011). The authors
135

manipulated the presence of personal information disclosure of reviewers to subjects during a laboratory
experiment where they asked to eventually indicate whether to book a hotel room. Further, the authors
found that ambivalent reviews (i.e., those reviews containing contradicting/blurry messages) always neg-
atively affect purchasing intention, even under identity disclosure.
Therefore, the channels through which eWOM might affect product adoption decisions might be
many. For example, well-reviewed products stand out with respect to other similar products with less
or no reviews at all, and are chosen out of their saliency (Hu et al., 2014). Another example is that
consumers want to conform to the choice made by people that they perceive as sharing interests with.
Cai et al. (2009) proposed an alternative channel: observational learning; that is, consumers learn from
the choices of other consumers by observing them. While not being able to disentangle observational
learning from conformity, the authors demonstrated that saliency does not play a role during product
adoption when information about others’ choices are available. The experiment they conducted had
subjects choose dishes during dinner at a restaurant, under different sets of information: a plaque showing
the most popular dishes and a plaque showing the same dishes in random order without any information
about their popularity. Customers were more likely to follow what was written on the first plaque rather
than on the second one, showing that they wanted to learn from previous customers’ choices and adapt
their choices accordingly.
The influence of eWOM on purchase intentions might even start from the choice of the retailer.
Some websites, such as BizRate, are built as aggregators where users can compare products sold through
different retailers and be informed about their characteristics; e.g., shipping methods, ease of browsing.
These websites allow previous consumers to write reviews on their experience with linked retailers.
Gauri et al. (2008) found that the percentage of positive reviews (rather than the mere number of reviews)
positively affected intentions to repurchase—in fact, previous user reviews were the stronger driver in
building loyalty towards a store, more than the speed of shipping and the number of years operating
online.
The main concern with the aforementioned studies is how methodology has been applied. In or-
der to investigate the behavioral consequences of eWOM on product adoption, the most efficient way
is to utilize a controlled environment where the choice of prospective buyers choices can be analyzed.
Laboratory experiments provide a useful tool but, at the same time, they constrain subjects to make de-
cision in an artificial setting with products arbitrarily chosen by the experimenter. Therefore, consumers
might lack intentionality and effects can be confounded with unrelated factors or mitigated to the point
136

of not being statistically significant. They might also otherwise be asked to choose among a variety of
products—and therefore looking for actually desired products. But, as they do not actually pay for the
product and the purchase is only simulated, they might simply lack the incentive to actively incorporate
eWOM (and other types of information) into their decisions.
4.4.2 C4: Rating behavior
According to the consumer decision journey theory, consumers are active agents in the post-purchase
phase as well. Thanks to digital technologies and social networks, they have become producers of content
as well. A recent strand of literature has started to devote more attention to the way consumers are
influenced by information after they have bought and experienced the product. In particular, the rating
behavior itself is now subject to great scrutiny. As previously established, user reviews play a significant
role in shaping consumer decisions and firm strategies alike. If eWOM does not arise from the disclosure
of true preferences (which are, by definition, subjective) and product quality, and, therefore, is biased, it
might lead to inefficient choices. It has been shown that low motivation consumers (i.e., those who do
not spend much time in searching) tend to exclusively rely on heuristic cues when making a purchase
and they are likely to make a suboptimal choice just because the product was suggested by previous
customers (Gupta and Harris, 2010). Furthermore, consumers tend to “place enormous weight on the
average user rating as an indicator of objective quality compared to other cues” (De Langhe et al.,
2016, p. 819), such as official certifications and expert reviews. By framing the experiment as an online
shopping experience, Lee and Youn (2009) found that, indeed, eWOM significantly affects consumer
product judgement when coming from a rating platform rather than a personal, non-branded, blog.
The first work that acknowledged the possibility of consumers being affected by different types
of information during the rating phase is Cosley et al. (2003). In particular, the authors focused on
recommendations within rating interfaces and on the presence of predicted ratings computed by website
algorithms and presented to users (a common practice in the early stages of the Web 2.0). By conducting
an experiment on the website MovieLens, the authors showed that users are consistently influenced by
disclosed information and tend to conform to the predicted rating, even though it was artificially created.
This research paved the way of a new strand of literature focused, indeed, on the rating behavior which
had ramifications in many fields, such as Political Science (e.g., how surveys affect voting behavior) and
Marketing.
Online rating systems differ from offline counterparts in many aspects and, more importantly, in the
137

presence of a large and heterogeneous audience. The interaction between this factor and the presence
of prior consumers’ opinions is the focus of Schlosser (2005) who considered two groups of people:
posters, who expect to publicly disclose their evaluation, and lurkers, who, instead, do not anticipate
such communication. In this experiment, subjects were asked to review a short animation clip after
being exposed to a positive review, a negative review or no information whatsoever—and, at the same
time, were divided in posters and lurkers, based on whether their review would have been publicly shown.
Schlosser (2005) concluded that posters conform to negative reviews (and are not affected by positive
reviews); they “view the author of a negative review as intelligent” (Schlosser, 2005, p. 261) and, given
that their opinion will be publicly disclosed, they adjust their position accordingly, in order to be viewed
equally intelligent. This social pressure lacks in lurkers who are not affected by either type of review.
The impact of negative reviews has long been known by scholars (Mizerski, 1982), and measured in
many other instances as mentioned in Section 4.3.1 and remains a concern for sellers. Schlosser (2005)
was an important work as it showed how public attitude might differ from private attitude when judging
a product.
The concern for rating biases is empirically grounded. Many studies found that online rating dis-
tributions are typically concentrated around either extremely positive or extremely negative ratings or
both—as bimodel distributions (Chevalier and Mayzlin (2006), Godes and Mayzlin (2004)). On many
websites, moderate ratings are almost non-existent. This might be due to quality levels distributed on the
extremes of a spectrum—or because of factors related to the behavior of reviewers. The phenomenon of
rating bubbles has been brought to attention by Hu et al. (2009): they compared rating distributions of
randomly chosen Amazon products and of the same products rated in a laboratory setting. While online
ratings followed a J-shaped distribution, offline ratings were more moderate and followed a unimodal
distribution. The authors proposed two explanations: a purchasing bias, due to a self-selection of those
people who originally had purchased the product (who are more enthusiastic than the average consumer);
and an under-reporting bias, due to a self-selection of those people who had decided to review. The for-
mer has been reported by Li and Hitt (2008), and was supported by the decreasing trend in the rating
data over time.
Another channel that has been proposed to explain rating bubbles is social influence bias, namely
the tendency to imitate peers (i.e., previous consumers) during the rating phase. If such a mechanism is
present, then rating biases can’t be avoided, because cumulated ratings would just converge to the initial
average rating until a steady state is eventually reached. On top of the decision of whether to post a
138

review online, Moe and Schweidel (2012) analyzed the influence of prior ratings on actual evaluation.
Interestingly, they were able to study the behavior of infrequent and frequent posters separately. They
were able to demonstrate that the former are more likely to be influenced by previously expressed opin-
ions (they show a bandwagon effect) and, overall, they tend to post more positive reviews. Instead, active
posters tend to differentiate themselves with respect to the surrounding environment and, being more
overly critical, they post more negative reviews to counterbalance the positivity of previous consumers.
These results expand the conclusion in Schlosser (2005), who had found self-presentational concern in all
posters, by considering the heterogeneity in the reviewer pool. The authors also found that “[i]ndividuals
with either high or low postpurchase evaluations are more likely to contribute, whereas individuals with
moderate postpurchase evaluations are less likely to contribute” (Moe and Schweidel, 2012, p. 383)
and therefore not completely ruling out the underreporting bias theorized in Hu et al. (2009). Sridhar
and Srinivasan (2012) considered the effect of prior ratings on different levels of product experience:
positive features, regular negative features acceptable to the consumer, and product failure. Online social
influence bias is adaptive, rather than passive: consumers react to the crowd because previous consumers
might be considered as opinion leaders, and consumers might think themsevels as being the same. Thus,
they might have an incentive to conform or disagree according to the situation. When product failure
occurs, the authors find that the higher the online user ratings, the more negative the impact on individual
rating attitude is—as a way to punish such positivity, which led to the purchase of a defective prod-
uct. The same, though more moderate, negativity bias can occur for products that meet the consumer’s
need—the authors explained that consumers might want to differentiate themselves from the crowd by
seeking uniqueness. Instead, when products have some negative features, consumers will conform with
the group’s opinion, therefore mitigating the negative opinion. Sridhar and Srinivasan (2012) were able
to find these results using a control function approach and data from the hotel industry.
Ma et al. (2013) introduced reviewer’s personal characteristics in the analysis of the connection
between prior and subsequent reviews on top of review characteristics such as length and time inter-
val. Using data from Yelp, the authors showed that reviewers who are geographically mobile, socially
connected and female, are less likely to be influenced by previous reviews. Also, more experienced re-
viewers, given their knowledge of rating systems, seem to be less affected; a result similar to those of
previous studies (Moe and Schweidel, 2012). Interestingly, they also found that the longer the time since
the last review, the more independent the next review is. Related to the presence of social links, Lee et al.
(2015) studied a setting where users can write reviews after reading opinions from a generic crowd and
139

from friends. While eWOM is typically associated with communications between strangers, on social
networks, it might take a more traditional form, through friends and family connections. Analyzing data
from a social movie-website, the authors demonstrated that, on the one hand, prior ratings from friends
always lead to a herding behavior (or a social influence bias, so to speak). On the other hand, prior rat-
ings from a generic public trigger herding only when volume is large (i.e., for popular movies)—when,
movies are niche, users tend to differentiate themselves from the crowd opinion. This work enriches the
results from Schlosser (2005), by considering the presence of relation between peers and the quantity of
reviews/popularity of the product. Krishnan et al. (2014) proposed a system to mitigate and correct the
social influence bias, wherever relevant. To do so, they proposed a method to identify this distortion: “a
nonparametric model based on the Wilcoxon statistic to test the hypothesis that the group of participants
that changed their ratings are more tightly centered around the median value that those participants
observed” (Krishnan et al., 2014, p. 4). Collecting data from a political platform, they did find that users
are more likely to change their position after having read the community norm, that is the median rating
arising from previous users.
A more careful look at ratings over time show in fact different patterns/trends. Some recent stud-
ies analyzed this aspect in detail, shedding new lights on rating behaviors. Using data from a retailer
selling bath and beauty products, Moe and Trusov (2011) estimated a dynamic ratings model aimed at
understanding whether there are social components during individual rating behavior and then simulated
different scenarios with varying initial rating distributions. The authors showed that regardless of the
initial ratings, average ratings converge on high scores. Godes and Silva (2012) investigated both a se-
quential and a temporal process. By using reviews from the Amazon book section, the authors were
able to confirm that ratings are declining over time due to the fact that consumers have become more
empowered and critical over time. Further, they showed that as reviews accumulate, more purchasing
errors occur which, in turn, lowers ratings.
Most of these studies have considered laboratory experiments (Schlosser (2005), Hu et al. (2009))
or empirical data (Ma et al. (2013), Lee et al. (2015)) to assess the drivers of rating biases. Analyzing
consumer behavior using these methodologies might not always be appropriate. Laboratory experiments
might lack purchasing intentions (the product is arbitrarily chosen by experimenters and assigned to sub-
jects) or saliency (subjects choose a product without paying for it). Data from websites do not allow
for a precise tracking of consumers; e.g., it is impossible to know whether the product has been actually
bought. Addressing these issues, Cicognani et al. (2016) conducted a field experiment in the accom-
140

modation industry. The authors asked hotel customers to rate the experience at the end of their stay.
Randomly assigned questionnaires disclosed positive opinions from prior customers; moderate opinions;
or were free of any opinion. Results showed that when extremely positive ratings were disclosed, sub-
jects were more likely to assign the maximum score to the hotel. At the same, the other treatments
showed no differences with each other and more moderate average scores overall. In line with previous
research (Moe and Schweidel (2012), Ma et al. (2013)), the authors also found that frequent reviewers
seem to be less affected by prior ratings. Repeat customers were also less influenced—perhaps because
they have more solid opinions about the hotel. Field experiments in studying individual rating behavior
are, therefore, an area where research could greatly expand as they provide a fruitful environment to
faithfully track the consumer decision journey.
4.5 Summary
The increasingly relevant role of eWOM during consumer product search and adoption has led re-
searchers and industry professionals to investigate the impact of such informational tools. Online user
reviews are ubiquitous and have became a common and trusted source of information. Consumers are
prone to purchase a product if it’s strongly suggested by user reviews or particularly popular on rating
systems. Firms, instead, have the incentive to charge price premiums on well-reviewed products and,
possibly, to follow consumers’ opinions when choosing the level of quality. While antecedents of re-
views have been extensively covered before (King et al., 2014), consequences of reviews need additional
scrutiny.
In this study, I presented a categorization of the impact of eWOM based on the product cycle
phase (purchase/post-purchase) and on the unit of analysis (firm-product/consumer). The results of this
overview show that scholars have reached a broad consensus on whether online user reviews influence
product sales, and that they have enriched their models to account for the inherent endogeneity of the rela-
tionship. Indeed, the presence of eWOM always impacts commercial performance. Valence and volume
typically play a role in driving sales, and the variance of the distribution also seems to affect reception.
Disclosure of reviewer identity and textual contents might also affect sales. Many studies highlighted
the different impact of eWOM on popular versus niche products (the latter being more affected); and on
search versus experience goods. Future research should pay more attention on the different consequences
of eWOM on different types of goods as the vast majority of works have studied them separately.
141

The effect on marketing strategies has mainly been studied considering firms’ pricing decisions. This
might be considered a limit of the literature and represent a potential for future research. Nevertheless,
the focus on pricing is obvious, considering that, on online retailers, prices, unlike other product char-
acteristics, are public and easy to track. All of the reviewed studies have shown a positive relationship
between the valence of reviews and prices. Firms use eWOM to infer consumer willingness-to-pay, and
change pricing schedules accordingly. This has been widely covered in the hotel industry, where booking
websites tend to rank properties according to user feedback. Fruitful research might extend the scope to
other industries, and even consider pre-production or pre-sale choices, such as the quality of the products
or other intrinsic characteristics. Furthermore, contrary to studies on product sales, in this stream of lit-
erature few attention has been devoted to the endogeneity problem. More positive reviews cause higher
prices but, at the same time, reviews can be affected by the price level. This reverse causality issue has
not been tackled by the literature even though it is relevant to find consistent results. Strong results might
come from the presence of this simultaneity and the issue must be promptly addressed.
Under a behavioral point of view, research has first focused on the impact of eWOM on product
adoption. Differently from traditional WOM, online user reviews rely on different features to influence
consumers—their quantity, for example. Today’s consumer is constantly updating beliefs about products
and is being empowered as an agent, even after the product has been bought. Identity disclosure and
observational learning are two channels through which consumers incorporate online user reviews when
deciding which product to buy. Interestingly, consumers react differently according to their level of
motivation during product search. Many studies have found how low-motivation consumers acritically
adopt eWOM information and therefore might be more subject to fraud and rating biases. This is of
particular relevance because it might lead them to choose products that they would have not considered
otherwise, or that do not satisfy their needs.
The problem of biased rating distributions has been investigated by the last stream of literature, on
the effects of prior ratings on individual rating behaviors. Empirical data have shown that on e-commerce
websites, ratings tend to cluster around extreme scores; instead, experimental data has presented a more
moderate distribution of ratings. Some of the proposed reasons relate to the self-selection of purchasers
(early-adopters are typically more enthusiastic about the product) and of reviewers (the so-called “brag-
or-moan effect”, the tendency to disclose one’s own opinions only in extreme cases). On the other hand,
many researchers have shown that there is a problem of social influence bias, that is, the tendency of con-
sumers to conform to the opinions of prior customers. This creates rating distributions that cumulate over
142

initial ratings towards extreme scores. As consumers trust user reviews, these biases create inefficient
market outcomes. The study of how rating behavior is affected by past reviews is the most promising
one for future research. Indeed, studies in this area have mainly conducted laboratory experiments or
exploited empirical data. Previous scholars have highlighted the importance of inferring consumer be-
havior through real purchasing experiences such that subjects self-select into the market rather than enter
it following arbitrary choices made by experimenters. Furthermore, online data do not typically allow
researchers to follow the consumer decision journey clearly, and might not allow for the control of the
consumer’s actions. For these reasons, field experiments present a unique and fruitful opportunity to bet-
ter understand individual rating behavior, especially in the tourism industry, and to provide new insights
in some yet unanswered questions.
143

144

Bibliography
Aaker, D. A. and Keller, K. L. (1990). Consumer evaluations of brand extensions. The Journal of
Marketing, pages 27–41.
Abhishek, V., Jerath, K., and Zhang, Z. J. (2015). Agency selling or reselling? channel structures in
electronic retailing. Management Science, 62(8):2259–2280.
Abrate, G. and Viglia, G. (2016). Strategic and tactical price decisions in hotel revenue management.
Tourism Management, 55:123–132.
Ahluwalia, R. and Gurhan-Canli, Z. (2000). The effects of extensions on the family brand name: An
accessibility-diagnosticity perspective. Journal of Consumer Research, 27(3):371–381.
Anderson, E. T. and Simester, D. I. (2014). Reviews without a purchase: Low ratings, loyal customers,
and deception. Journal of Marketing Research, 51(3):249–269.
Anderson, L. R. and Holt, C. A. (1997). Information cascades in the laboratory. American Economic
Review, pages 847–862.
Ba, S. and Pavlou, P. A. (2002). Evidence of the effect of trust building technology in electronic markets:
Price premiums and buyer behavior. MIS quarterly, pages 243–268.
Balachander, S. and Ghose, S. (2003). Reciprocal spillover effects: A strategic benefit of brand exten-
sions. Journal of Marketing, 67(1):4–13.
Berger, J., Sorensen, A. T., and Rasmussen, S. J. (2010). Positive effects of negative publicity: When
negative reviews increase sales. Marketing Science, 29(5):815–827.
Bhatnagar, A. and Syam, S. S. (2014). Allocating a hybrid retailer’s assortment across retail stores:
Bricks-and-mortar vs online. Journal of Business Research, 67(6):1293–1302.
145

Bhattacharyya, S. and Lafontaine, F. (1995). Double-sided moral hazard and the nature of share con-
tracts. The RAND Journal of Economics, pages 761–781.
Bickart, B. and Schindler, R. M. (2001). Internet forums as influential sources of consumer information.
Journal of interactive marketing, 15(3):31–40.
Bonanno, G. and Vickers, J. (1988). Vertical separation. The Journal of Industrial Economics, pages
257–265.
Broniarczyk, S. M. and Alba, J. W. (1994). The importance of the brand in brand extension. Journal of
marketing research, pages 214–228.
Bronner, F. and de Hoog, R. (2011). Vacationers and ewom: Who posts, and why, where, and what?
Journal of Travel Research, 50(1):15–26.
Buratto, A. and Zaccour, G. (2009). Coordination of advertising strategies in a fashion licensing contract.
Journal of optimization theory and applications, 142(1):31–53.
Cabral, L. M. (2009). Umbrella branding with imperfect observability and moral hazard. International
Journal of Industrial Organization, 27(2):206–213.
Cai, H., Chen, Y., and Fang, H. (2009). Observational learning: Evidence from a randomized natural
field experiment. American Economic Review, 99(3):864–82.
Calzolari, G., Denicolo, V., and Zanchettin, P. (2017). Exclusive dealing with distortionary pricing.
working paper.
Cameron, A. C. and Trivedi, P. K. (2013). Regression analysis of count data, volume 53. Cambridge
university press.
Celen, B. and Kariv, S. (2004). Distinguishing informational cascades from herd behavior in the labora-
tory. American Economic Review, pages 484–498.
Chatterjee, P. (2001). Online reviews: do consumers use them?
Cheema, A. and Papatla, P. (2010). Relative importance of online versus offline information for internet
purchases: Product category and internet experience effects. Journal of Business Research, 63(9):979–
985.
146

Chen, P.-Y., Dhanasobhon, S., and Smith, M. D. (2008a). All reviews are not created equal: The disag-
gregate impact of reviews and reviewers at amazon. com.
Chen, P.-Y., Wu, S.-y., and Yoon, J. (2004). The impact of online recommendations and consumer
feedback on sales. ICIS 2004 Proceedings, pages 711–724.
Chen, X., John, G., and Narasimhan, O. (2008b). Assessing the consequences of a channel switch.
Marketing Science, 27(3):398–416.
Chen, Y., Wang, Q., and Xie, J. (2011). Online social interactions: A natural experiment on word of
mouth versus observational learning. Journal of Marketing Research, 48(2):238–254.
Chevalier, J. A. and Mayzlin, D. (2006). The effect of word of mouth on sales: Online book reviews.
Journal of Marketing Research, 43(3):345–354.
Chintagunta, P. K., Gopinath, S., and Venkataraman, S. (2010). The effects of online user reviews on
movie box office performance: Accounting for sequential rollout and aggregation across local markets.
Marketing Science, 29(5):944–957.
Choi, J. P. (2001). Technology transfer with moral hazard. International Journal of Industrial Organi-
zation, 19(1):249–266.
Choi, S. C. (1991). Price competition in a channel structure with a common retailer. Marketing Science,
10(4):271–296.
Church, J. (2008). Vertical mergers. Issues in Competition Law and Policy, 2:1455–1501.
Cicognani, S., Figini, P., and Magnani, M. (2016). Social influence bias in online ratings: A field
experiment.
Cicognani, S. and Mittone, L. (2014). Over-confidence and low-cost heuristics: An experimental inves-
tigation of choice behavior. Economics: The Open-Access, Open-Assessment E-Journal, 8(2014-36).
Clemons, E. K., Gao, G. G., and Hitt, L. M. (2006). When online reviews meet hyperdifferentiation: A
study of the craft beer industry. Journal of Management Information Systems, 23(2):149–171.
Coker, B. L. (2012). Seeking the opinions of others online: Evidence of evaluation overshoot. Journal
of Economic Psychology, 33(6):1033–1042.
147

Colucci, M., Montaguti, E., and Lago, U. (2008). Managing brand extension via licensing: An investiga-
tion into the high-end fashion industry. International journal of research in marketing, 25(2):129–137.
Corbellini, E. and Saviolo, S. (2011). Expo 2015 e la moda milanese. Management, 1:3.
Cosley, D., Lam, S. K., Albert, I., Konstan, J. A., and Riedl, J. (2003). Is seeing believing?: How
recommender system interfaces affect users’ opinions. In Proceedings of the SIGCHI conference on
Human factors in computing systems, pages 585–592. ACM.
Cox, C., Burgess, S., Sellitto, C., and Buultjens, J. (2009). The role of user-generated content in tourists’
travel planning behavior. Journal of Hospitality Marketing & Management, 18(8):743–764.
Cui, G., Lui, H.-k., and Guo, X. (2010). Online reviews as a driver of new product sales. In Management
of e-Commerce and e-Government (ICMeCG), 2010 Fourth International Conference on, pages 20–
25. IEEE.
Czellar, S. (2003). Consumer attitude toward brand extensions: an integrative model and research propo-
sitions. International Journal of Research in Marketing, 20(1):97–115.
De Langhe, B., Fernbach, P. M., and Lichtenstein, D. R. (2016). Navigating by the stars: Investigating the
actual and perceived validity of online user ratings. Journal of Consumer Research, 42(6):817–833.
De Maeyer, P. (2012). Impact of online consumer reviews on sales and price strategies: A review and
directions for future research. Journal of Product & Brand Management, 21(2):132–139.
Dellarocas, C., Zhang, X. M., and Awad, N. F. (2007). Exploring the value of online product reviews in
forecasting sales: The case of motion pictures. Journal of Interactive Marketing, 21(4):23–45.
DiRusso, D. J., Mudambi, S. M., and Schuff, D. (2011). Determinants of prices in an online marketplace.
Journal of Product & Brand Management, 20(5):420–428.
Dobson, P. W. and Waterson, M. (2007). The competition effects of industry-wide vertical price fixing
in bilateral oligopoly. International Journal of Industrial Organization, 25(5):935–962.
Duan, W., Gu, B., and Whinston, A. B. (2008a). Do online reviews matter? An empirical investigation
of panel data. Decision Support Systems, 45(4):1007–1016.
Duan, W., Gu, B., and Whinston, A. B. (2008b). The dynamics of online word-of-mouth and product
salesan empirical investigation of the movie industry. Journal of retailing, 84(2):233–242.
148

Duan, W., Gu, B., and Whinston, A. B. (2009). Informational cascades and software adoption on the
internet: an empirical investigation. MIS Quarterly, 33(1):23–48.
Duverger, P. (2013). Curvilinear effects of user-generated content on hotels market share: a dynamic
panel-data analysis. Journal of Travel Research, 52(4):465–478.
Filieri, R. (2016). What makes an online consumer review trustworthy? Annals of Tourism Research,
58:46–64.
Filieri, R. and McLeay, F. (2014). E-wom and accommodation: An analysis of the factors that influence
travelers adoption of information from online reviews. Journal of Travel Research, 53(1):44–57.
Forman, C., Ghose, A., and Wiesenfeld, B. (2008). Examining the relationship between reviews and
sales: The role of reviewer identity disclosure in electronic markets. Information Systems Research,
19(3):291–313.
Foros, Ø., Kind, H. J., and Shaffer, G. (2017). Apple’s agency model and the role of most-favored-nation
clauses. The RAND Journal of Economics, 48(3):673–703.
Fung, R. and Lee, M. (1999). Ec-trust (trust in electronic commerce): exploring the antecedent factors.
AMCIS 1999 Proceedings, page 179.
Gaudin, G. and White, A. (2014). On the antitrust economics of the electronic books industry. Available
at SSRN 2352495.
Gauri, D. K., Bhatnagar, A., and Rao, R. (2008). Role of word of mouth in online store loyalty. Commu-
nications of the ACM, 51(3):89–91.
Gautier, P. A., Hu, B., and Watanabe, M. (2016). Marketmaking middlemen.
Ghose, A. and Ipeirotis, P. G. (2007). Designing novel review ranking systems: predicting the usefulness
and impact of reviews. In Proceedings of the ninth international conference on Electronic commerce,
pages 303–310. ACM.
Ghose, A. and Ipeirotis, P. G. (2011). Estimating the helpfulness and economic impact of product re-
views: Mining text and reviewer characteristics. IEEE Transactions on Knowledge and Data Engi-
neering, 23(10):1498–1512.
149

Godes, D. and Mayzlin, D. (2004). Using online conversations to study word-of-mouth communication.
Marketing Science, 23(4):545–560.
Godes, D. and Silva, J. C. (2012). Sequential and temporal dynamics of online opinion. Marketing
Science, 31(3):448–473.
Grover, V., Lim, J., and Ayyagari, R. (2006). The dark side of information and market efficiency in
e-markets. Decision Sciences, 37(3):297–324.
Gupta, P. and Harris, J. (2010). How e-wom recommendations influence product consideration and
quality of choice: A motivation to process information perspective. Journal of Business Research,
63(9):1041–1049.
Hagiu, A. (2007). Merchant or two-sided platform? Review of Network Economics, 6(2).
Hagiu, A. and Wright, J. (2014). Marketplace or reseller? Management Science, 61(1):184–203.
Hakenes, H. and Peitz, M. (2008). Umbrella branding and the provision of quality. International Journal
of Industrial Organization, 26(2):546–556.
Hu, N., Koh, N. S., and Reddy, S. K. (2014). Ratings lead you to the product, reviews help you clinch it?
the mediating role of online review sentiments on product sales. Decision support systems, 57:42–53.
Hu, N., Zhang, J., and Pavlou, P. A. (2009). Overcoming the J-shaped distribution of product reviews.
Communications of the ACM, 52(10):144–147.
Inderst, R. and Mazzarotto, N. (2008). Buyer power in distribution. In ABA Antitrust Section Handbook,
Issues in Competition Law and Policy, volume 3, pages 1953–1978. ABA.
Jang, S., Prasad, A., and Ratchford, B. T. (2012). How consumers use product reviews in the purchase
decision process. Marketing Letters, 23(3):825–838.
Jayachandran, S., Kaufman, P., Kumar, V., and Hewett, K. (2013). Brand licensing: What drives royalty
rates? Journal of Marketing, 77(5):108–122.
Jerath, K. and Zhang, Z. J. (2010). Store within a store. Journal of Marketing Research, 47(4):748–763.
Jiang, B., Jerath, K., and Srinivasan, K. (2011). Firm strategies in the ”mid tail” of platform-based
retailing. Marketing Science, 30(5):757–775.
150

Jiang, B.-J. and Wang, B. (2008). Impact of consumer reviews and ratings on sales, prices, and profits:
theory and evidence. ICIS 2008 Proceedings, page 141.
John, D. R., Loken, B., and Joiner, C. (1998). The negative impact of extensions: can flagship products
be diluted? The Journal of Marketing, pages 19–32.
Johnson, J. P. (2013). The agency and wholesale models in electronic content markets.
Jøsang, A., Ismail, R., and Boyd, C. (2007). A survey of trust and reputation systems for online service
provision. Decision support systems, 43(2):618–644.
Keller, K. L. and Sood, S. (2003). Brand equity dilution. MIT Sloan Management Review, 45(1):12.
King, R. A., Racherla, P., and Bush, V. D. (2014). What we know and don’t know about online word-of-
mouth: A review and synthesis of the literature. Journal of Interactive Marketing, 28(3):167–183.
Kocas, C. and Akkan, C. (2016). How trending status and online ratings affect prices of homogeneous
products. International Journal of Electronic Commerce, 20(3):384–407.
Krishnan, S., Patel, J., Franklin, M. J., and Goldberg, K. (2014). A methodology for learning, analyz-
ing, and mitigating social influence bias in recommender systems. In Proceedings of the 8th ACM
Conference on Recommender systems, pages 137–144. ACM.
Kumar, V., Aksoy, L., Donkers, B., Venkatesan, R., Wiesel, T., and Tillmanns, S. (2010). Undervalued
or overvalued customers: capturing total customer engagement value. Journal of Service Research,
13(3):297–310.
Kurtulus, M. and Savaskan, R. C. (2013). Drivers and implications of direct-store-delivery in distribution
channels. Available at SSRN 2320674.
Lafky, J. (2014). Why do people rate? Theory and evidence on online ratings. Games and Economic
Behavior, 87:554–570.
Lee, J., Park, D.-H., and Han, I. (2008). The effect of negative online consumer reviews on product
attitude: An information processing view. Electronic commerce research and applications, 7(3):341–
352.
Lee, M. and Youn, S. (2009). Electronic word of mouth (ewom) how ewom platforms influence consumer
product judgement. International Journal of Advertising, 28(3):473–499.
151

Lee, Y.-J., Hosanagar, K., and Tan, Y. (2015). Do I follow my friends or the crowd? Information cascades
in online movie ratings. Management Science, 61(9).
Li, J., Chan, T. Y., and Lewis, M. (2016). What happens when manufacturers perform the retailing
functions? Production and Operations Management, 25(8):1391–1403.
Li, X. and Hitt, L. M. (2008). Self-selection and information role of online product reviews. Information
Systems Research, 19(4):456–474.
Lim, B. C. and Chung, C. M. (2011). The impact of word-of-mouth communication on attribute evalua-
tion. Journal of Business Research, 64(1):18–23.
Litvin, S. W., Goldsmith, R. E., and Pan, B. (2008). Electronic word-of-mouth in hospitality and tourism
management. Tourism Management, 29(3):458–468.
Liu, Q. and Shuai, J. (2015). Reverse pricing and revenue sharing in a vertical market. Managerial and
Decision Economics, 36(5):299–313.
Liu, Y. (2006). Word of mouth for movies: Its dynamics and impact on box office revenue. Journal of
Marketing, 70(3):74–89.
Liu, Z. and Park, S. (2015). What makes a useful online review? Implication for travel product websites.
Tourism Management, 47:140–151.
Loken, B. and John, D. R. (1993). Diluting brand beliefs: when do brand extensions have a negative
impact? The Journal of Marketing, pages 71–84.
Lu, L. (2017). A comparison of the wholesale model and the agency model in differentiated markets.
Review of Industrial Organization, 51(2):151–172.
Luca, M. and Zervas, G. (2013). Fake it till you make it: Reputation, competition, and Yelp review
fraud. Harvard Business School NOM Unit Working Paper, (14-006).
Ma, X., Khansa, L., Deng, Y., and Kim, S. S. (2013). Impact of prior reviews on the subsequent review
process in reputation systems. Journal of Management Information Systems, 30(3):279–310.
Mauri, A. G. and Minazzi, R. (2013). Web reviews influence on expectations and purchasing intentions
of hotel potential customers. International Journal of Hospitality Management, 34:99–107.
152
McGuire, T. W. and Staelin, R. (1983). An industry equilibrium analysis of downstream vertical integra-
tion. Marketing science, 2(2):161–191.
McShane, B. B., Chen, C., Anderson, E. T., and Simester, D. I. (2016). Decision stages and asymmetries
in regular retail price pass-through. Marketing Science, 35(4):619–639.
Mizerski, R. W. (1982). An attribution explanation of the disproportionate influence of unfavorable
information. Journal of Consumer Research, 9(3):301–310.
Mo, Z., Li, Y.-F., and Fan, P. (2015). Effect of online reviews on consumer purchase behavior. Journal
of Service Science and Management, 8(03):419.
Moe, W. W. and Schweidel, D. A. (2012). Online product opinions: Incidence, evaluation, and evolution.
Marketing Science, 31(3):372–386.
Moe, W. W. and Trusov, M. (2011). The value of social dynamics in online product ratings forums.
Journal of Marketing Research, 48(3):444–456.
Moorthy, K. S. (1988). Strategic decentralization in channels. Marketing Science, 7(4):335–355.
Muchnik, L., Aral, S., and Taylor, S. J. (2013). Social influence bias: A randomized experiment. Science,
341(6146):647–651.
Muthers, J. and Wismer, S. (2013). Why do platforms charge proportional fees? commitment and seller
participation.
Nelson, P. (1970). Information and consumer behavior. Journal of Political Economy, 78(2):311–329.
Netemeyer, R. G., Heilman, C. M., and Maxham, J. G. (2012). The impact of a new retail brand in-store
boutique and its perceived fit with the parent retail brand on store performance and customer spending.
Journal of Retailing, 88(4):462–475.
Nielsen (2015). Global trust in advertising. http://www.nielsen.com/us/en/insights/reports/
2015/global-trust-in-advertising-2015.html.
Ogut, H. and Onur Tas, B. K. (2012). The influence of internet customer reviews on the online sales and
prices in hotel industry. The Service Industries Journal, 32(2):197–214.
153

Ong, L. S., Tan, J. H., et al. (2015). Sense and sensibility of ownership: Type of ownership experience
and valuation of goods. Journal of Behavioral and Experimental Economics, 58:171–177.
Park, C. W., Milberg, S., and Lawson, R. (1991). Evaluation of brand extensions: the role of product
feature similarity and brand concept consistency. Journal of consumer research, 18(2):185–193.
Park, D.-H. and Kim, S. (2009). The effects of consumer knowledge on message processing of elec-
tronic word-of-mouth via online consumer reviews. Electronic Commerce Research and Applications,
7(4):399–410.
Park, S. and Nicolau, J. L. (2015). Asymmetric effects of online consumer reviews. Annals of Tourism
Research, 50:67–83.
Raugust, K. (2012). The licensing business handbook: how to make money, protect trademarks, ex-
tend product lines, enhance merchandising, control use of images, and more, by licensing characters,
teams, celebrities, events, trademarks, fashion, likenesses, designs & logos! EPM communications.
Robinson, A. B., Tuli, K. R., and Kohli, A. K. (2014). Does brand licensing increase a licensor’s share-
holder value? Management Science, 61(6):1436–1455.
Romeo, J. B. (1991). The effect of negative information on the evaluations of brand extensions and the
family brand. NA-Advances in Consumer Research Volume 18.
Rupert Hills, J. and Cairncross, G. (2011). Small accommodation providers and ugc web sites: percep-
tions and practices. International Journal of Contemporary Hospitality Management, 23(1):26–43.
Schlosser, A. E. (2005). Posting versus lurking: Communicating in a multiple audience context. Journal
of Consumer Research, 32(2):260–265.
Schnapp, M. and Allwine, T. (2001). Mining of book data from amazon. com. In
Presentation at the UCB/SIMS web mining conference, http://www. sims. berkeley.
edu/resources/affiliates/workshops/webmining/slides/ORA. ppt.
Senecal, S. and Nantel, J. (2004). The influence of online product recommendations on consumers’
online choices. Journal of Retailing, 80(2):159–169.
Shubik, M. and Levitan, R. (1980). Market structure and behavior. JSTOR.
154

Shy, O. and Wang, Z. (2011). Why do payment card networks charge proportional fees? American
Economic Review, 101(4):1575–90.
Smyth, P. C. B., Wu, G., and Greene, D. (2010). Does tripadvisor makes hotels better. Derek Greene
School of Computer Science & Informatics, University College Dublin Belfield.
Sparks, B. A. and Browning, V. (2010). Complaining in cyberspace: The motives and forms of hotel
guests’ complaints online. Journal of Hospitality Marketing & Management, 19(7):797–818.
Sparks, B. A. and Browning, V. (2011). The impact of online reviews on hotel booking intentions and
perception of trust. Tourism Management, 32(6):1310–1323.
Sridhar, S. and Srinivasan, R. (2012). Social influence effects in online product ratings. Journal of
Marketing, 76(5):70–88.
Stigler, G. J. (1961). The economics of information. Journal of Political Economy, 69(3):213–225.
Stiglitz, J. E. (1989). Imperfect information in the product market. Handbook of industrial organization,
1:769–847.
Sun, M. (2012). How does the variance of product ratings matter? Management Science, 58(4):696–707.
Swaminathan, V., Fox, R. J., and Reddy, S. K. (2001). The impact of brand extension introduction on
choice. Journal of Marketing, 65(4):1–15.
UNWTO (2014). Online guest reviews and hotel classification systems - an integrated approach.
Vermeulen, I. E. and Seegers, D. (2009). Tried and tested: The impact of online hotel reviews on
consumer consideration. Tourism Management, 30(1):123–127.
Viglia, G., Furlan, R., and Ladron-de Guevara, A. (2014). Please, talk about it! When hotel popularity
boosts preferences. International Journal of Hospitality Management, 42:155–164.
Volckner, F. and Sattler, H. (2006). Drivers of brand extension success. Journal of marketing, 70(2):18–
34.
Wang, Z. and Wright, J. (2017). Ad valorem platform fees, indirect taxes, and efficient price discrimina-
tion. The RAND Journal of Economics, 48(2):467–484.
155

Webster, J. and Watson, R. T. (2002). Analyzing the past to prepare for the future: Writing a literature
review. MIS quarterly, pages xiii–xxiii.
Wei, W., Miao, L., and Huang, Z. J. (2013). Customer engagement behaviors and hotel responses.
International Journal of Hospitality Management, 33:316–330.
Wells, J. R., Danskin, G., and Ellsworth, G. (August 2015). Amazon.com, 2016. Harvard Business
School Case 716-402.
Wernerfelt, B. (1988). Umbrella branding as a signal of new product quality: An example of signalling
by posting a bond. The RAND Journal of Economics, pages 458–466.
Xie, H. J., Miao, L., Kuo, P.-J., and Lee, B.-Y. (2011). Consumers responses to ambivalent online hotel
reviews: The role of perceived source credibility and pre-decisional disposition. International Journal
of Hospitality Management, 30(1):178–183.
Yacouel, N. and Fleischer, A. (2012). The role of cybermediaries in reputation building and price premi-
ums in the online hotel market. Journal of Travel Research, 51(2):219–226.
Yang, Y., Mueller, N. J., and Croes, R. R. (2016). Market accessibility and hotel prices in the caribbean:
The moderating effect of quality-signaling factors. Tourism Management, 56:40–51.
Ye, Q., Law, R., and Gu, B. (2009). The impact of online user reviews on hotel room sales. International
Journal of Hospitality Management, 28(1):180–182.
Ye, Q., Law, R., Gu, B., and Chen, W. (2011). The influence of user-generated content on traveler
behavior: An empirical investigation on the effects of e-word-of-mouth to hotel online bookings.
Computers in Human Behavior, 27(2):634–639.
Zhang, K. Z., Lee, M. K., and Zhao, S. J. (2010a). Understanding the informational social influence of
online review platforms. In ICIS, pages 1–17.
Zhang, Z., Ye, Q., Law, R., and Li, Y. (2010b). The impact of e-word-of-mouth on the online popular-
ity of restaurants: A comparison of consumer reviews and editor reviews. International Journal of
Hospitality Management, 29(4):694–700.
Zhu, F. and Liu, Q. (2016). Competing with complementors: An empirical look at amazon. com.
156

Zhu, F. and Zhang, X. (2010). Impact of online consumer reviews on sales: The moderating role of
product and consumer characteristics. Journal of marketing, 74(2):133–148.
157