Measuring Factors That Influence the Success of E ...
156
Nova Southeastern University NSUWorks CEC eses and Dissertations College of Engineering and Computing 2007 Measuring Factors at Influence the Success of E- government Initiatives Ronnie Park Nova Southeastern University, [email protected] is document is a product of extensive research conducted at the Nova Southeastern University College of Engineering and Computing. For more information on research and degree programs at the NSU College of Engineering and Computing, please click here. Follow this and additional works at: hps://nsuworks.nova.edu/gscis_etd Part of the Computer Sciences Commons Share Feedback About is Item is Dissertation is brought to you by the College of Engineering and Computing at NSUWorks. It has been accepted for inclusion in CEC eses and Dissertations by an authorized administrator of NSUWorks. For more information, please contact [email protected]. NSUWorks Citation Ronnie Park. 2007. Measuring Factors at Influence the Success of E-government Initiatives. Doctoral dissertation. Nova Southeastern University. Retrieved from NSUWorks, Graduate School of Computer and Information Sciences. (761) hps://nsuworks.nova.edu/gscis_etd/761.
-
Upload
khangminh22 -
Category
Documents
-
view
2 -
download
0
Transcript of Measuring Factors That Influence the Success of E ...
Nova Southeastern UniversityNSUWorks
CEC Theses and Dissertations College of Engineering and Computing
2007
Measuring Factors That Influence the Success of E-government InitiativesRonnie ParkNova Southeastern University, [email protected]
This document is a product of extensive research conducted at the Nova Southeastern University College ofEngineering and Computing. For more information on research and degree programs at the NSU College ofEngineering and Computing, please click here.
Follow this and additional works at: https://nsuworks.nova.edu/gscis_etd
Part of the Computer Sciences Commons
Share Feedback About This Item
This Dissertation is brought to you by the College of Engineering and Computing at NSUWorks. It has been accepted for inclusion in CEC Theses andDissertations by an authorized administrator of NSUWorks. For more information, please contact [email protected].
NSUWorks CitationRonnie Park. 2007. Measuring Factors That Influence the Success of E-government Initiatives. Doctoral dissertation. Nova SoutheasternUniversity. Retrieved from NSUWorks, Graduate School of Computer and Information Sciences. (761)https://nsuworks.nova.edu/gscis_etd/761.
Measuring Factors That Influence the Success of E-government Initiatives
by
Ronnie Park
A dissertation report submitted in partial fulfillment of the requirements for the degree of Doctor of Philosophy
in Information Systems
Graduate School of Computer and Information Sciences Nova Southeastern University
2007
Approval/Signature
We hereby certify that this dissertation, submitted by Ronnie Y. Park, conforms to acceptable standards and is fully adequate in scope and quality to fulfill the dissertation requirements for the degree of Doctor of Philosophy.
_____________________________________________ _______________ Easwar Nyshadham, Ph.D. Date Chairperson of Dissertation Committee
_____________________________________________ _______________ Laurie Dringus, Ph.D. Date Dissertation Committee Member
_____________________________________________ _______________ Yair Levy, Ph.D. Date Dissertation Committee Member
Approved:
_____________________________________________ _______________ Edward Lieblein, Ph.D. Date Dean
An Abstract of a Dissertation Submitted to Nova Southeastern University in Partial Fulfillment of the Requirements for the Degree of Doctor of Philosophy
Measuring Factors That Influence the Success of E-government Initiatives
by
Ronnie Park
March, 2007
The success of e-government initiatives is contingent upon its citizens’ willingness to use the services. Citizens are more likely to use e-government services if they believe that they get better value than from the conventional government services. Understanding how citizens value e-government services is critical to the success of these initiatives. This study utilizes two concepts from the field of decision analysis. These are mean-ends chains and value-focused thinking. The research that follows describes the development of a model to identify factors that influence value judgments of citizens. Based on the data of 210 responses from e-government service users, two instruments were developed to measure perceived e-government value. They were means objectives and fundamental objectives. What is important to e-government users are the fundamental objectives. Means objectives help to achieve the fundamental objectives. The study results suggested a 4-factor 20-item instrument that measures means objectives in terms of public trust, information access, public accessibility, and quality of services. The results also suggested a 4-factor 18-item instrument that measures fundamental objectives in terms of time savings, efficiency of service, service to citizen, and social awareness. The study also showed evidence of content validity, construct validity, and reliability.
Acknowledgements
I have been blessed to work with and learn from many people who have supported
my research effort. First, my advisor, Dr. Easwar Nyshadham, who guided me in the
completion of this project as well as making a great contribution to my personal
development as a researcher. Thanks also to my committee members, Dr. Laurie Dringus,
and Dr. Yair Levy, for their time, their talent, and their help.
I wish to thank Midori, Kenn, and Nelson who helped with proofreading and
editing this paper. I am very grateful to the people who helped by participating in the
surveys. Finally, I would like to thank my wife, Insook, and my family members for their
understanding and emotional support during the long journey of this effort.
v
Table of Contents Abstract iii Acknowledgements iv List of Tables vii List of Figures viii Chapters 1. Introduction 1 Background 1 Problem Statement and Goal 2 Relevance and Significance 4 Definition of Terms 8 Summary 11
2. Review of Literature 12 Decision Analysis 12 E-government Strategy 17 Stages of E-government Transformation 22 Similarities Between E-government and E-commerce 25 Differences Between E-government and E-commerce 28 E-government Measurement Criteria 30 Value Theory (Value-Focused Thinking Approach) 35 Means Objectives and Fundamental Objectives 37 Derivation of E-government Value From Technology 39 3. Methodology 42 Introduction 42 Scope Definition 43 Procedures 44
Generating a List of E-government Objectives and Classifying Them as Means and Fundamental Types 44 Extracting E-government objectives From the Internet Commerce Study 46 Extracting E-government Objectives From the E-government Research Pool
46 Combining E-government Objectives From the Internet Commerce Study and
the E-government Research Pool 54 Conducting Survey and Data Analysis 57
Design of Case Study 57 Type of Investigation 58 Extent of Researcher Interference 58 Measurement 58 Instrument Validation 60 Content Validity 61 Construct Validity 61
vi
Reliability 62 Use of Factor Analysis 63 Data Collection 65
Ethics in Data Collection 68 Time Horizon 69 Unit of Analysis 69
Relating the Means and Ends Factors by Examining the Cross-correlations Among Factors 70
Resources 70 Limitations and Barriers 70 Summary 73 4. Results 75
Data Analysis for Means Objectives 75 Descriptive Statistics 75 Item Purification and Reliability Test 78 Dimensionality 81 Factor Analysis (Principal Component analysis) 82 Findings 90
Data Analysis for Fundamental Objectives 92 Descriptive Statistics 92 Item Purification and Reliability Test 94 Dimensionality 96 Factor analysis (Principal Component analysis) 97 Findings 104
Relating the Means and Ends Factors 106 Summary of Results 108 5. Conclusions, Implications, Recommendations, and Summary 110 Conclusions 110 Implications 112 Recommendations 113 Summary 114 Appendixes A. Measures of Factors That Influence Internet Commerce Success 121 B. E-government Relevant Factors 124 C. The Functional Performance Dimensions That Reflect the Common
Municipality Functions and Services That Can Be Web-enabled 130 D. Survey Instrument 131 E. Research Pool From Which E-government Values Are Drawn 136 F. NSU IRB Approval Letter 137 G. Survey Instrument Sample Screen 138 References 139
vii
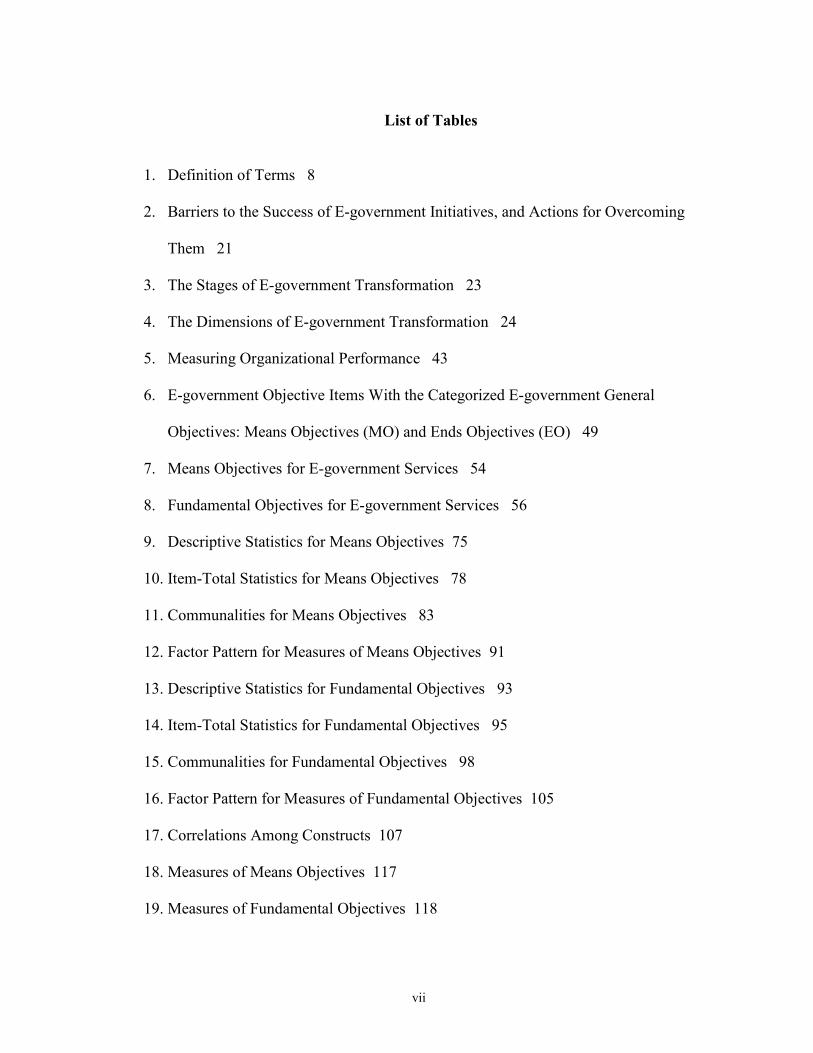
List of Tables
1. Definition of Terms 8
2. Barriers to the Success of E-government Initiatives, and Actions for Overcoming
Them 21
3. The Stages of E-government Transformation 23
4. The Dimensions of E-government Transformation 24
5. Measuring Organizational Performance 43
6. E-government Objective Items With the Categorized E-government General
Objectives: Means Objectives (MO) and Ends Objectives (EO) 49
7. Means Objectives for E-government Services 54
8. Fundamental Objectives for E-government Services 56
9. Descriptive Statistics for Means Objectives 75
10. Item-Total Statistics for Means Objectives 78
11. Communalities for Means Objectives 83
12. Factor Pattern for Measures of Means Objectives 91
13. Descriptive Statistics for Fundamental Objectives 93
14. Item-Total Statistics for Fundamental Objectives 95
15. Communalities for Fundamental Objectives 98
16. Factor Pattern for Measures of Fundamental Objectives 105
17. Correlations Among Constructs 107
18. Measures of Means Objectives 117
19. Measures of Fundamental Objectives 118
viii
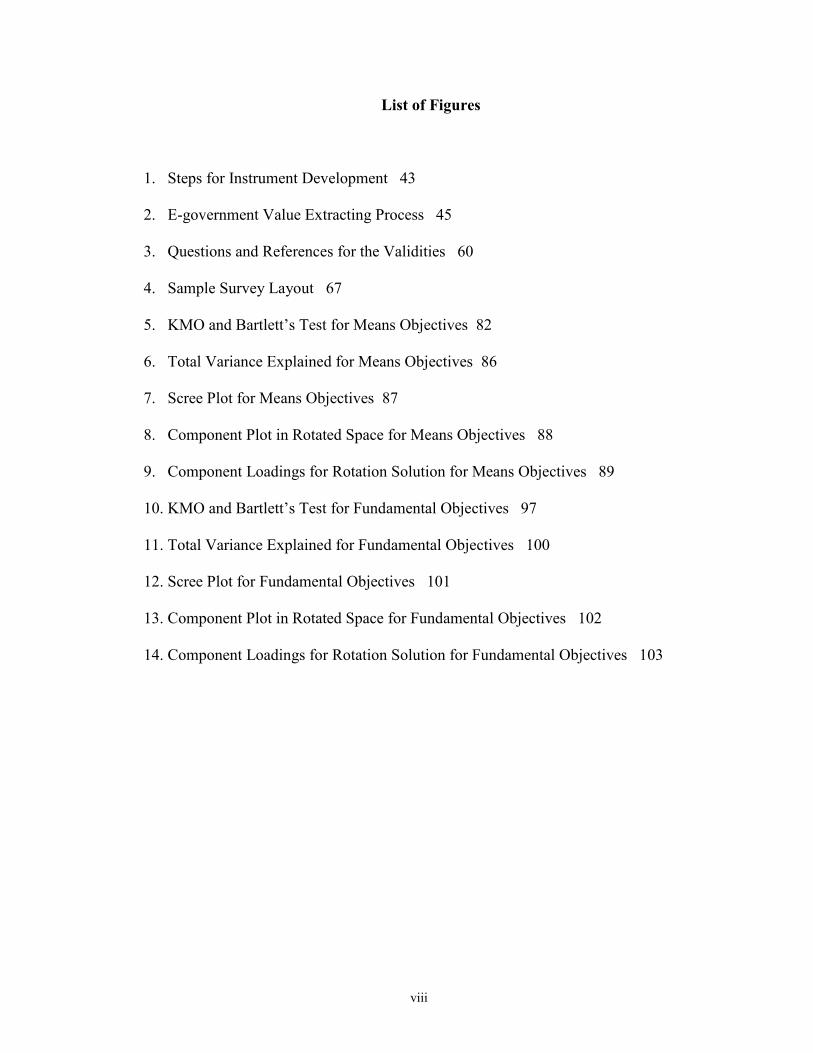
List of Figures
1. Steps for Instrument Development 43
2. E-government Value Extracting Process 45
3. Questions and References for the Validities 60
4. Sample Survey Layout 67
5. KMO and Bartlett’s Test for Means Objectives 82
6. Total Variance Explained for Means Objectives 86
7. Scree Plot for Means Objectives 87
8. Component Plot in Rotated Space for Means Objectives 88
9. Component Loadings for Rotation Solution for Means Objectives 89
10. KMO and Bartlett’s Test for Fundamental Objectives 97
11. Total Variance Explained for Fundamental Objectives 100
12. Scree Plot for Fundamental Objectives 101
13. Component Plot in Rotated Space for Fundamental Objectives 102
14. Component Loadings for Rotation Solution for Fundamental Objectives 103
1
Chapter 1
Introduction
Background
As Information Systems (IS) evolve, government agencies search for better ways
to operate and provide improved services to the public through its use (West, 2004). IS is
being applied vigorously by government units at national, regional, and local levels
around the world (Marchionini, Samet, & Brandt, 2003). In the 1990s, the advent of
network-based IS, represented a turning point in the strategic direction for government
agencies, which now had the opportunity to utilize e-commerce to achieve their
objectives (Kalakota & Whinston, 1997) through e-government.
E-government is narrowly defined as “the delivery of government information
and services online through the Internet or other digital means” (West, 2004, p. 2). The
principles of e-government embrace building services around citizens’ choices,
improving accessibility to government and its services, facilitating social inclusion,
presenting information responsibly, and using government resources effectively and
efficiently (Office of the e-Envoy, 2000). E-government can be viewed as (a)
transformation of the business of governance, i.e. improving service, and renewing
administrative processes, and (b) transformation of governance itself, i.e. re-examining
the functioning of democratic practices and processes (Aichholzer & Schmitzer, 2000).
E-government can be thought of as a conceptual lens through which the changing role
and shape of the public sector in the 21st century can be examined. It is expected to be
2
more digital, knowledge-intensive, driven by innovation, and interdependent than any
previous time (Roy, 2003).
Problem Statement and Goal
Governments are employing network-based IS in the expectation that it will be
cheaper, faster, and more convenient than traditional means of delivering products and
services (McNeal, Tolbert, Mossberger, & Dotterweich, 2003). Having invested an
enormous amount of resources in e-government (Peters, Jansen, & Engers, 2004),
governments strive to succeed in this endeavor. To achieve the success of e-government,
it is critical to understand and influence citizens’ acceptance of e-government services
(Fu, Farn, & Chao, 2006) because the success of e-government initiatives is contingent
upon citizens’ willingness to use these services (Carter & Belanger, 2005; Devadoss, Pan,
& Huang, 2002). The addressable problem of this dissertation study is that it is not clear
whether citizens will embrace the use of such services (Carter & Belanger, 2004). As
values are the basic principles that guide actions and preferences (Keeney, 1992), citizens
are likely to use such services if they feel that they get better value than from the
conventional government services. Thus, e-government value to citizens is an important
factor for the success of e-government. The broad goal of this research was to explore e-
government values from citizens’ perspectives. From the broad goal, the two main goals
of this research were:
1. Conceptualize the value of e-government.
2. Develop two instruments to measure factors that influence the success of e-
government initiatives – ends objectives and means objectives.
3
The specific research question being addressed in this study was “What do
citizens value most in e-government services?” The research question was measured by a
case study that collected e-government values from citizens via online Web surveys. The
collected data reflected what citizens value most when they engage with e-government
service.
To address the goals of this research, the combined research methodology of
literature research and a case study were chosen. Literature research was used to explore
e-government values from the leading refereed literature covering the 6-year period from
2000 to 2005. A case study methodology was used to collect perceived e-government
values from e-government users based on the approach by Keeney (1999), and Torkzadeh
and Dhillon (2002).
Numerous studies have analyzed success factors of e-commerce. Yet to date, no
study has identified the success factors of e-government (Carter & Belanger, 2004) that
focuses on value specially. In this research, a model of factors that influence the success
of e-government initiatives was developed based on the “Value-focused” thinking
approach by Keeney (1999), as well as exploratory studies on the value of Internet
commerce to the customer by Torkzadeh and Dhillon (2002). This research used the
means-ends analysis and Keeney’s “Value-focused” thinking to study the perception of
value from the point of view of e-government users. Survey data were used to develop
two instruments: one for understanding means (means objectives); and a second for
understanding ends (fundamental objectives). The value includes benefits and prices of
the services, benefits and costs of ordering and receiving services (e.g., reduced effort),
and possible benefits and costs to the world (e.g., environmental impacts).
4
Keeney (1992) suggested that the value-focused thinking approach be used to
design Web-based businesses for business-to-consumer commerce. In his preliminary
study, he identified 91 objectives for Internet commerce, grouped into 25 categories, 16
of which are classified as means objectives, and the rest are fundamental objectives.
Torkzadeh and Dhillon (2002) followed up on Keeney’s work with a more
comprehensive data collection effort and derived a more complete set of means and ends
objectives in a business to consumer ecommerce context. They generated 125 objectives
(value items) that influence Internet commerce success. A similar effort to derive
objectives in an e-government context is lacking. This dissertation applied the approach
developed by Keeney and used later by Torkzadeh and Dhillon in a business-to-consumer
(B2C) context to a government-to-citizen (G2C) context. Several new objectives
appropriate for an e-government context were generated, based on existing research on e-
government. Most of the existing e-government studies are not empirical but rhetoric in
nature (Norrise & Moon, 2005; Devadoss et al., 2002). This research conducted an
empirical study.
Relevance and Significance
Given that more government entities invest heavily in e-government, e-
government has become an evolving and important research area in the IS field (Chen,
Chen, Huang, & Ching, 2006). One of the e-government areas worthy of research is to
clarify how the success of e-government can be measured (Peters et al., 2004). This
research develops instruments to measure the factors that influence the success of e-
government initiatives based on e-government value.
5
The theoretical foundation for this research comes from two concepts, which are
well known in Decision Analysis. Decision Analysis (Winterfeldt & Edwards, 1986) is a
field in business which seeks to improve human decision making by developing new
concepts, theories, and tools. One of the concepts of Decision Analysis is means-ends
analysis. Means-ends analysis is a problem solving strategy that attempts to search and
apply an action (means) to achieve a goal (ends). First, it compares the current state and
the goal state to identify the differences between them. Then, it applies the appropriate
action to reduce the differences. The means is the activity to achieve the ends. A second
concept from Decision Analysis is the notion of value, as discussed by Keeney in value-
focused thinking. The value-focused approach stresses that values are fundamentally
important in any decision situation, while alternatives are relevant only because they are a
means to achieve the desired values. Thus, the thinking should focus first on values and
later on alternatives that might achieve them. Value-focused thinking, therefore, asks the
most important question: what do people really value in a given situation? (Keeney,
1992). The two concepts of means-ends chain and value-focused thinking are closely
related. This study proposed a framework for the notion of e-government value using
these two concepts, which can be illustrated using a simple example. Suppose a decision-
maker, such as an e-government consumer, is faced with a choice between two
alternatives, each of the alternatives is characterized by several attributes. One is tempted
to ask the question: which alternative is better? However, if one is using a means-ends
chain, one must ask two questions. What do I want? (ends). And how do I get what I
want? (means). Keeney calls ends “Fundamental Objectives”, and means “Means
Objectives”. In the context of an e-commerce purchase, online security gives the
6
customer the confidence to make use of the innate convenience of e-commerce.
Convenience is an ends objective. Online security and confidence are means objectives.
Ends (end objectives) follow means (means objectives). A second aspect of Keeney’s
value-focused thinking approach is that, instead of focusing on alternatives, it focuses on
attributes of the alternatives. Some attributes characterize the means dimension and
therefore, are called means objectives; others characterize the ends and are called
fundamental objectives. That is, objectives are expressed as a suitably weighted
combination of attributes of alternatives. Therefore, to understand which alternative is
better, a decision maker considers the attributes, and weights their importance.
The following example is used to explain decision analysis approach and the
definition of several terms that will be used throughout the dissertation. Assume that, in
the previous example, an e-government user has identified the attributes of the
alternatives. The user’s model for judging the value of an alternative may be written
down as:
Overall value of alternative = f (Attributes of the e-government service)
Under further assumptions, the following multi-attribute model can be used to evaluate
the user’s judgments:
Overall value = ∑ (wi*xi), where
Wi = weight/ importance of the attribute
xi = level of the attribute
In this dissertation, the word value (in italics) refers to overall value of the
alternative, and value of attribute i to refer to the wi*xi. Attributes can be broken down
further (e.g., xi can be composed of several sub-attributes such as xi1, xi2 etc.) and these
7
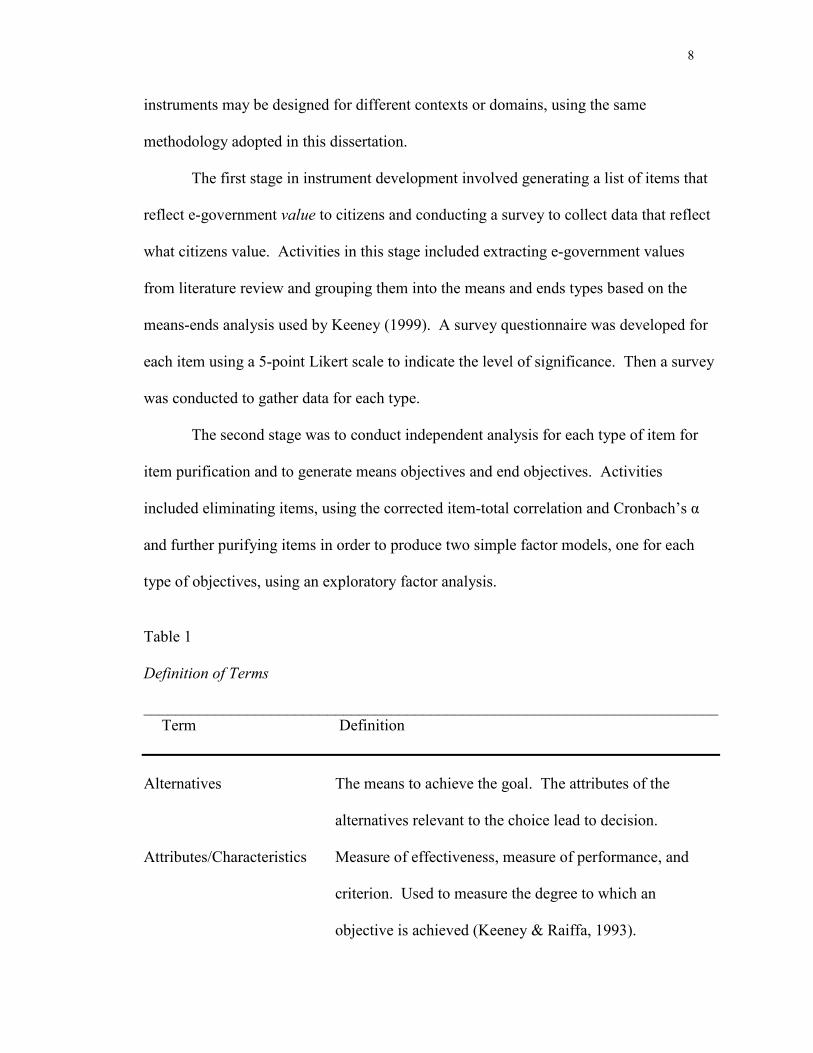
are referred to as value items. Table 1 summarizes the terminology. The above multi-
attribute model can be presented with the e-government example as:
Overall e-government value = ∑ (wi*xi), where
i = attribute (e.g., online convenience)
wi = the weight attached to an attribute(e.g., a subject weights online convenience
as 0.4, and, say, ease of use as 0.7.)
xi = the score of an attribute (e.g., a subject scores attributes as 4 on online
convenience from an e-government service on a Liker scale of 1 to 5.)
value(i) = value of an attribute = wi*xi (e.g., value of online convenience to
citizen is 0.4*4 = 1.6 units)
Value = Sum of individual values = ∑ (wi*xi) (e.g., a subject uses 0.4 and 0.6 as
weights for online convenience and ease of use, and scores alternatives as 4 on
online convenience and 5 on ease of use. Then the value = 0.4*4 + 0.6*5 = 4.6
units).
Using these concepts, one can provide systematic advice in terms of what a
person wants (fundamental objectives or values) and how one achieves value (means
objectives or values). Two instruments were developed, one measures means objectives
and the other measures ends objectives.
These instruments can help an e-government researcher specify and test specific
theories of e-government value. More importantly, they can assist practitioners in
assessing whether their current e-government projects are providing value to users. The
instruments can also be used to proactively assess whether a prototype e-government
project can be a success. The approach used in this dissertation is general, and new
8
instruments may be designed for different contexts or domains, using the same
methodology adopted in this dissertation.
The first stage in instrument development involved generating a list of items that
reflect e-government value to citizens and conducting a survey to collect data that reflect
what citizens value. Activities in this stage included extracting e-government values
from literature review and grouping them into the means and ends types based on the
means-ends analysis used by Keeney (1999). A survey questionnaire was developed for
each item using a 5-point Likert scale to indicate the level of significance. Then a survey
was conducted to gather data for each type.
The second stage was to conduct independent analysis for each type of item for
item purification and to generate means objectives and end objectives. Activities
included eliminating items, using the corrected item-total correlation and Cronbach’s α
and further purifying items in order to produce two simple factor models, one for each
type of objectives, using an exploratory factor analysis.
Table 1 Definition of Terms ________________________________________________________________________
Term Definition
Alternatives The means to achieve the goal. The attributes of the
alternatives relevant to the choice lead to decision.
Attributes/Characteristics Measure of effectiveness, measure of performance, and
criterion. Used to measure the degree to which an
objective is achieved (Keeney & Raiffa, 1993).
9
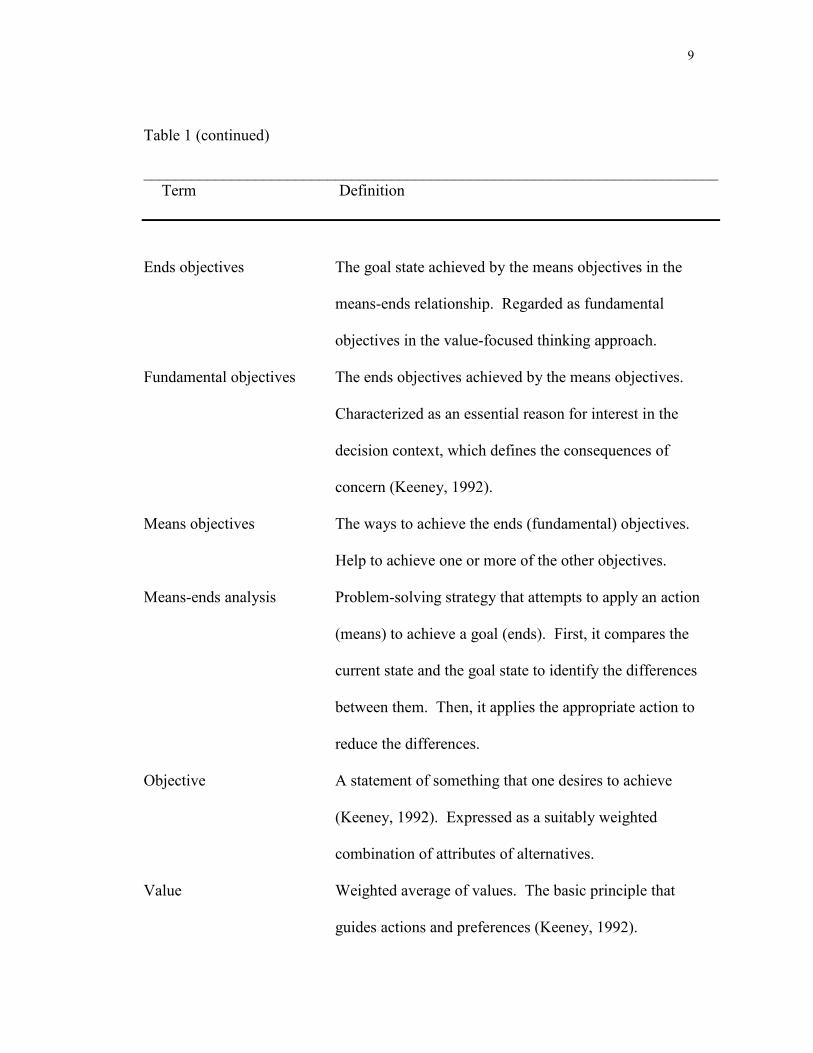
Table 1 (continued)
________________________________________________________________________ Term Definition
Ends objectives The goal state achieved by the means objectives in the
means-ends relationship. Regarded as fundamental
objectives in the value-focused thinking approach.
Fundamental objectives The ends objectives achieved by the means objectives.
Characterized as an essential reason for interest in the
decision context, which defines the consequences of
concern (Keeney, 1992).
Means objectives The ways to achieve the ends (fundamental) objectives.
Help to achieve one or more of the other objectives.
Means-ends analysis Problem-solving strategy that attempts to apply an action
(means) to achieve a goal (ends). First, it compares the
current state and the goal state to identify the differences
between them. Then, it applies the appropriate action to
reduce the differences.
Objective A statement of something that one desires to achieve
(Keeney, 1992). Expressed as a suitably weighted
combination of attributes of alternatives.
Value Weighted average of values. The basic principle that
guides actions and preferences (Keeney, 1992).
10
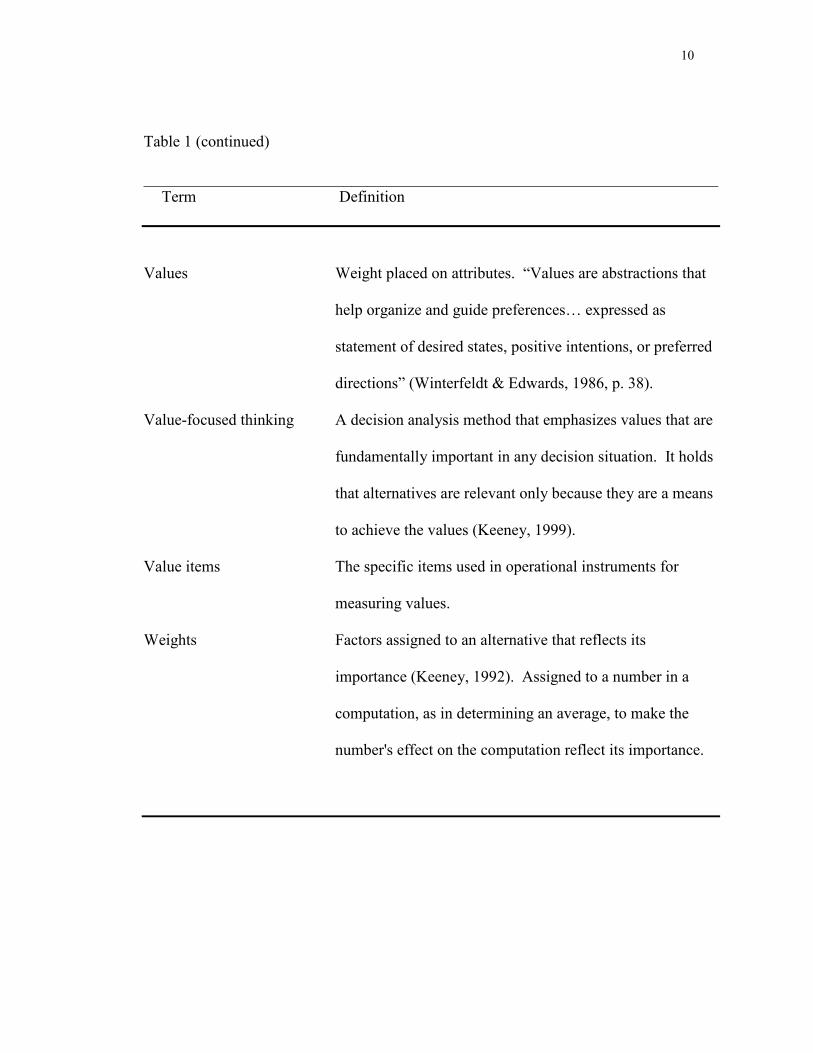
Table 1 (continued)
________________________________________________________________________ Term Definition
Values Weight placed on attributes. “Values are abstractions that
help organize and guide preferences… expressed as
statement of desired states, positive intentions, or preferred
directions” (Winterfeldt & Edwards, 1986, p. 38).
Value-focused thinking A decision analysis method that emphasizes values that are
fundamentally important in any decision situation. It holds
that alternatives are relevant only because they are a means
to achieve the values (Keeney, 1999).
Value items The specific items used in operational instruments for
measuring values.
Weights Factors assigned to an alternative that reflects its
importance (Keeney, 1992). Assigned to a number in a
computation, as in determining an average, to make the
number's effect on the computation reflect its importance.
11
Summary
In this chapter, the background information about e-government, problem
statement and goal, and relevance and significance of this study was addressed.
E-government initiatives are in place or underway in most countries to provide better
government services. Measuring the success of such efforts requires an instrument that
can capture the perceived value that citizens expect from e-government.
The focus of this research was to demonstrate procedures for developing such an
instrument. The theoretical foundation was grounded on two concepts; the means-ends
analysis, and value-focused thinking approach developed by Keeney (1992) in the
decision analysis field. The goal of this study was to conceptualize the value of e-
government, and to develop two instruments to measure factors that influence the success
of e-government initiatives – ends objectives and means objectives.
The development of the instrument began with generating a list of items that
reflect e-government value to citizens for literature review and grouping them into the
means and ends types. Then a survey was conducted to collect data for each type.
Independent analysis was conducted on these items for item purification using factor
analysis and generated two models of factors: one for means objectives, and the other for
end objectives.
12
Chapter 2
Review of Literature
This section starts with a discussion of the value theory in the field of decision
analysis and explores its implications for decision-making as the theoretical foundation of
this study. Next, e-government strategies, stages of e-government transformation, and
the differences and similarities between e-government and e-commerce are discussed to
clarify the concept and progress of e-government initiatives. Then, the e-government
measurement criteria with the implied success factors and values developed in prior e-
government research are addressed, as they provide the foundation for guiding this study.
At the end, this study discusses the value-focused thinking theory (Keeney, 1999) along
with its implications for the fields of e-commerce and e-government.
Decision Analysis
Choosing a course of action in a world of uncertainty is a chore that all people
must perform. Most of these choices are made without careful analysis but there are
those situations where a more systematic way to arrive at a decision would be preferred
(Raiffa, 1968). Today’s decision makers are faced with problems characterized by
increasing demands upon a limited resource base; increasing complexity resulting from
the interacting of biophysical, socio-economic, and institutional systems; and increasing
awareness of the uncertainty that pervades the understanding of these systems. The
decision-making context is further complicated by the now commonplace necessity to
13
involve multiple stakeholders and their multiple objectives in the decision-making
process. Under these complex and dynamic circumstances, a structured approach to
decision making supported by appropriate analytical tools is imperative if good decisions
are to be made (Ohison, 1999).
Winterfeldt and Edwards (1986) posited that many different models used in
helping people make decisions can be distinguished by their topics and by whether they
are descriptive or normative. The topics include modeling people’s behavior, modeling
the environments in which people act, and modeling the tasks people face in these
environments. Descriptive models describe people, environments, or tasks; normative
models prescribe actions for people (or machines) in tasks and specify conditions that
environments should attain.
A descriptive model attempts to predict what people do do; a descriptive model of
decision-making predicts which decision one in fact will make. Almost all of the familiar
psychological models or theories are descriptive. The set of descriptive decision-
theoretic models is called behavioral decision theory (BDT) (Winterfeldt & Edwards,
1986). The original contributions to BDT were simply empirical anomalies, showing
where the expected utility theory made predictions about behavior that were
systematically wrong (Thaler, 1986). Kahneman and Tversky (1979), and Einhorn and
Hogarth (1981) had taken these anomalies and developed descriptive theories that
account for the observed behavior. These explicitly descriptive theories can not be
derived from normative axioms (Thaler, 1986). Behavioral decision research is
concerned with how people make judgments and choices, and with how the processes of
decision might be improved (Einhorn & Hogarth, 1981). The field of behavioral decision
14
research is intensely interdisciplinary, applying concepts and methodologies from
psychology, economics, statistics, and other disciplines, that has had an impact on various
areas, such as economics (Robin, 1998, Kahneman & Tversky, 1979), finance (Thaler,
1987), and game theory (Camerer, 1997).
At present, behavioral economics is one of the most active fields in economics,
building a bridge between research in economics and psychology around experimental
methods and theoretical modeling (Vetenskapsakademien, 2002). Psychology
systematically explores human judgment, behavior, and well-being that can teach us
important facts about how humans differ from the way they are traditionally described by
economists (Robin, 1998). Economics has conventionally assumed that each individual
has stable and coherent preferences, and that she rationally maximizes those preferences.
Given a set of options and probabilistic core beliefs, a person is assumed to maximize the
expected value of a utility function (Robin, 1998). Psychological research suggests
various modifications to this conception of human choice (Robin, 1998). In psychology,
especially cognitive psychology, a human being is commonly regarded as a system,
which does and interprets available information in a conscious and rational way. But
other, less conscious, factors are also assumed to govern human behavior in a systematic
way. This more complex view - where intrinsic incentives help shape human behavior -
has come to penetrate recent developments in economic theory (Vetenskapsakademien,
2002). Kahneman and Tversky (1979) have used insights from cognitive psychology
regarding the mental processes for forming judgements and choices to understand how
people make economic decisions. Behavioral finance also derived from the
psychological study of human decision making, in contrary to the standard assumptions
15
underlying investment forecasting and portfolio management, takes into account the
emotional and psychological biases of the investment decisions – anomalies. For
example, Thaler (1987) presented the anomalies from the seasonal movements in security
prices in January, reflecting that the standard economic paradigm – rational agents in an
efficient market – does not adequately describe behavior in financial market. He posited
that the January effect based on the argument that the prices of firms which have
previously declined in price will decline further in the latter months of the year as owners
sell off the shares to realize capital losses is not derived from rational behavior by all
market participants. Behavioral game theory uses psychological principles and
experiments to describe and help predict strategic behavior that takes the experimental
science of behavioral economics a major step forward. Behavioral game theory aims to
replace descriptively inaccurate modeling principles with more psychologically
reasonable ones, expressed as parsimoniously and formally as possible. The desire to
improve descriptive accuracy that guides behavioral game theory does not mean game
theory is always wrong (Camerer, 1997). Standard equilibrium analyses assume all
players: 1) form beliefs based on analysis of what others might do (strategic thinking); 2)
choose a best response given those beliefs (optimization); 3) adjust best responses and
beliefs until they are mutually consistent (equilibrium) (Camerer, Ho, & Chong, 2001). It
is widely accepted that not every player behaves rationally in complex situations as
player’s fates are intertwined, so assumptions (1) and (2) are sometimes violated. It is
also unlikely that equilibrium (3) is reached instantaneously in one-shot games (Camerer
et al, 2001).
16
A normative model or theory is a set of rules specifying what individuals or
groups should do. A normative model for decision making, then, specifies what
decisions one should make. The set of normative decision-theoretic models together with
the techniques for applying them are usually called decision analysis (DA) (Winterfeldt
& Edwards, 1986). The research carried out in DA has generated a considerable amount
of literature on understanding and improving decision making of individuals, groups, and
organizations. It is generally considered a branch of the engineering discipline of
operations research but also has links to economics, mathematics, psychology (Bichler,
2000), and business and management. Furthermore, among other disciplines, DA
contributed to IS research.
Central to normative theories are the concepts of rationality and optimality
(Einhorn & Hogarth, 1981) that presents cleaner results. This study is based on DA
rather than BDT. DA looks at the paradigm in which an individual decision maker (or
decision unit) contemplates a choice of action in an uncertain environment. The
approach employs systematic analysis, with some number pushing, which helps the
decision maker clarify in his own mind which course of action he should choose (Keeney
& Raiffa, 1993). Howard (1988) stated that the discipline of DA represents a systematic
procedure for transforming opaque decision problems into transparent decision problems
by a sequence of transparent steps. “Opaque means ‘hard to understand, solve, or explain;
not simple, clear, or lucid’ and transparent means ‘readily understood, clear,
obvious’ ”(Howard, 1988, p. 680). In other words, DA offers the decision-maker the
possibility of replacing confusion with clear insight for a desired course of action
(Howard, 1988).
17
Values pervaded in the field of operation research are expressed as objectives,
goals, criteria, performance measures, weights, preferences, and/or objective functions;
they are necessary in theoretical operations-research models and in applications (Keeney,
1992). The focus of the study was on values expressed as objectives. Though values are
clarified with an explicit statement of specific objectives, identifying and structuring
objectives is a difficult task: ends are often confused with means, and objectives with
targets or constraints or even alternatives; the relationships among objectives are unclear;
and the concept of priorities within objectives is easily misconstrued (Keeney, 1992).
Keeney claimed that the process of developing clear objectives requires greater depth,
clear structure, and a sound conceptual base.
Though DA is often boiled down to a set of quantitative techniques for analyzing
alternatives associated with complex decision problems, the qualitative aspects of the DA
approach may also have significant relevance. For the qualitative approach, Keeney
(1992, 1999) emphasizes the importance of concentrating on decision makers’ values.
Values are the basic principles that guide actions and preferences (Keeney, 1992).
Developing a clear understanding of values is essential for properly defining decision
situations, articulating objectives, and creating and evaluating alternatives. Values are
what drive decision makers’ preferences for different outcomes. Only after the front-end
analysis is complete will the quantitative tools and techniques of more traditional DA be
useful in supporting the analysis and selection of appropriate alternatives.
18
E-government Strategy
As e-government initiatives are pervasive at all levels of governments around the
world, strategic agendas vary because each vision is driven by its own unique set of
social, political, and economic factors and requirements. A key factor driving the
achievement of any e-government program is the vision of e-government, articulated and
adopted by a government administration (Grant & Chau, 2005). The mission and
objectives that emanate from these e-government visions variously manifest strong focus
on one or two elements. For example, the United States has placed a major focus on
service delivery and on increasing cross-functional efficiencies (U.S. Office of
Management and Budget, 2002) whereas the Malaysian government concentrates on the
exposure and outreach area (Grant & Chau, 2005). The South African government’s e-
government program is heavily weighted towards service delivery, while e-government
efforts in the United Kingdom have tended to balance several strategic objectives. E-
government in China attempts to bring economic development through administrative
reform (Ma, Chung, & Thorson, 2005) while e-government in Korea is to enhance the
national competitiveness by increasing productivity and transparency (National
Computerization Agency, 2002). This section primarily focuses on e-government service
as that is the purpose of this study.
E-government services can be largely viewed as providing access to information,
transaction services, and citizen participation. Traditional modes of accessing
information are much like viewing highway billboards; that is, static mechanisms to
display information, such as reports and publications. There is little opportunity for the
public to interact with government. Transaction services allow the public to order and
19
execute services online, which offers considerable convenience. These types of services
require emphases on the public’s privacy and security concerns, such as posting privacy
policies online, and implementing security features for preventing unauthorized access
and protecting property. The citizen participation feature enables government Web sites
to move beyond a service-delivery model to system-wide political transformation, such as
providing e-forums. The Public Electronic Network (PEN) in the City of Santa Monica
is one of the most innovative attempts to provide e-forums. It helps citizens to take
advantage of the interactive strengths of the Internet through which democratic
responsiveness and leadership accountability can be boosted (West, 2004). Different
types of applications will, over time, surely alter the way that citizens interact with
governments and will change the work that government agencies do. It has been
recognized that the transformation from traditional government to electronic government
is one of the most important public policy issues (National Academy of Sciences, 2002).
Analogous to what the private market has seen in the new economy with the
diffusion of e-business in almost all forms (e-commerce, online trading, e-banking, e-
insurance, e-finance, e-payment, e-brokerage, e-procurement), e-government has been
conceived as a tool to define and manage the relationships between citizens and the
government and among governments through detailed and capillary services, such as
digital signatures and e-procurement document management (Fugini & Mezzazanica,
2004)
The e-government strategy of the U.S. Federal government (1999) promotes
access to government information organized not by agency, but by the type of service or
information people may be seeking. The data should be identified and organized in a
20
way that makes it easier for the public to find the information it seeks, and make a broad
range of benefits and services available though private and secure use of the Internet.
The strategy focuses on achieving customer satisfaction.
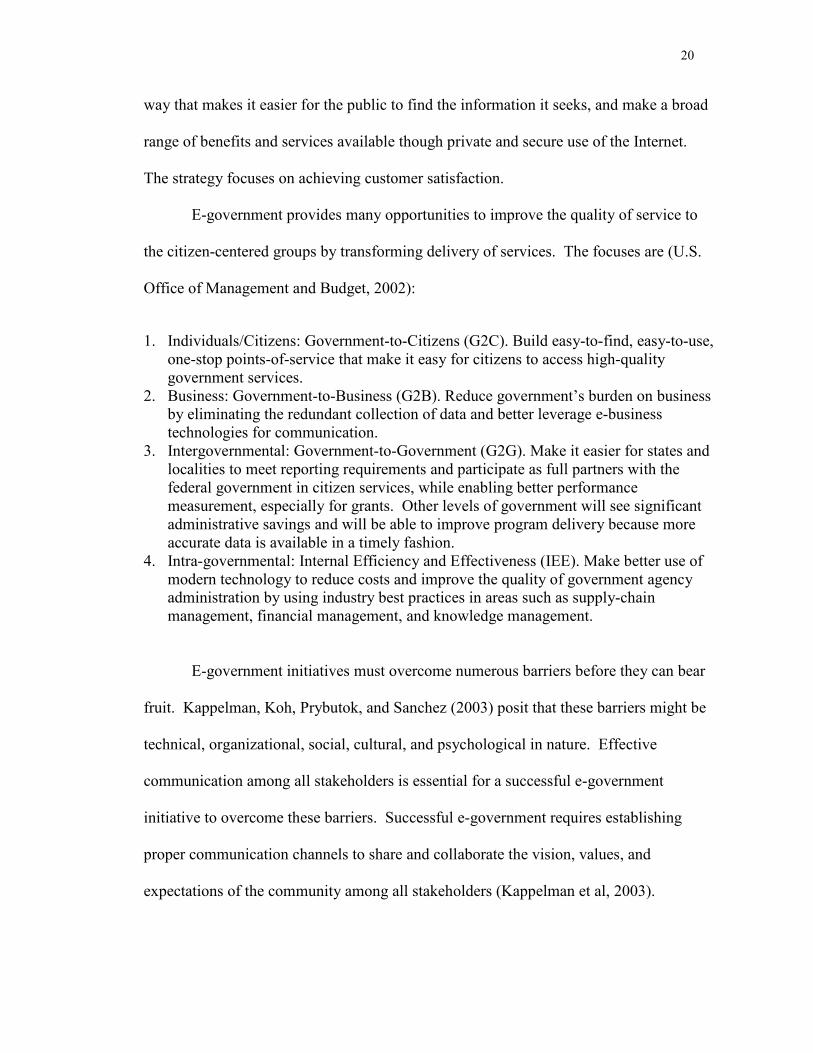
E-government provides many opportunities to improve the quality of service to
the citizen-centered groups by transforming delivery of services. The focuses are (U.S.
Office of Management and Budget, 2002):
1. Individuals/Citizens: Government-to-Citizens (G2C). Build easy-to-find, easy-to-use, one-stop points-of-service that make it easy for citizens to access high-quality government services.
2. Business: Government-to-Business (G2B). Reduce government’s burden on business by eliminating the redundant collection of data and better leverage e-business technologies for communication.
3. Intergovernmental: Government-to-Government (G2G). Make it easier for states and localities to meet reporting requirements and participate as full partners with the federal government in citizen services, while enabling better performance measurement, especially for grants. Other levels of government will see significant administrative savings and will be able to improve program delivery because more accurate data is available in a timely fashion.
4. Intra-governmental: Internal Efficiency and Effectiveness (IEE). Make better use of modern technology to reduce costs and improve the quality of government agency administration by using industry best practices in areas such as supply-chain management, financial management, and knowledge management.
E-government initiatives must overcome numerous barriers before they can bear
fruit. Kappelman, Koh, Prybutok, and Sanchez (2003) posit that these barriers might be
technical, organizational, social, cultural, and psychological in nature. Effective
communication among all stakeholders is essential for a successful e-government
initiative to overcome these barriers. Successful e-government requires establishing
proper communication channels to share and collaborate the vision, values, and
expectations of the community among all stakeholders (Kappelman et al, 2003).
21
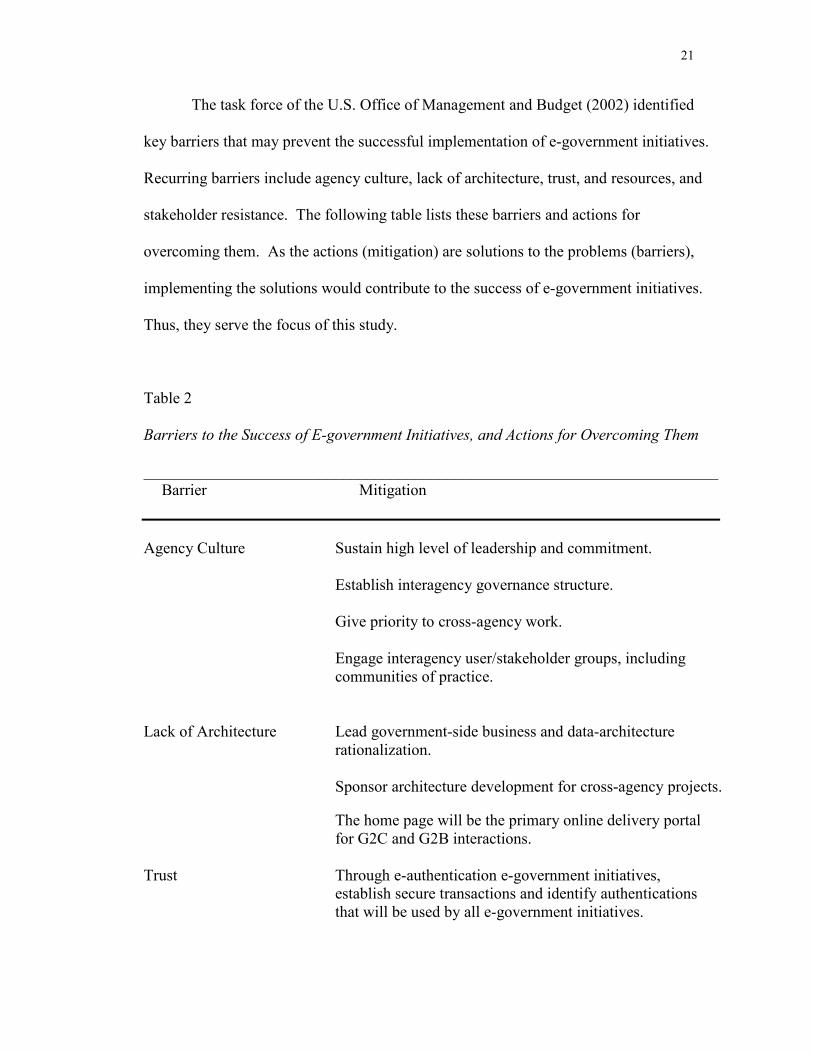
The task force of the U.S. Office of Management and Budget (2002) identified
key barriers that may prevent the successful implementation of e-government initiatives.
Recurring barriers include agency culture, lack of architecture, trust, and resources, and
stakeholder resistance. The following table lists these barriers and actions for
overcoming them. As the actions (mitigation) are solutions to the problems (barriers),
implementing the solutions would contribute to the success of e-government initiatives.
Thus, they serve the focus of this study.
Table 2
Barriers to the Success of E-government Initiatives, and Actions for Overcoming Them
________________________________________________________________________ Barrier Mitigation
Agency Culture Sustain high level of leadership and commitment.
Establish interagency governance structure.
Give priority to cross-agency work.
Engage interagency user/stakeholder groups, including communities of practice.
Lack of Architecture Lead government-side business and data-architecture rationalization.
Sponsor architecture development for cross-agency projects.
The home page will be the primary online delivery portal for G2C and G2B interactions.
Trust Through e-authentication e-government initiatives, establish secure transactions and identify authentications that will be used by all e-government initiatives.
22
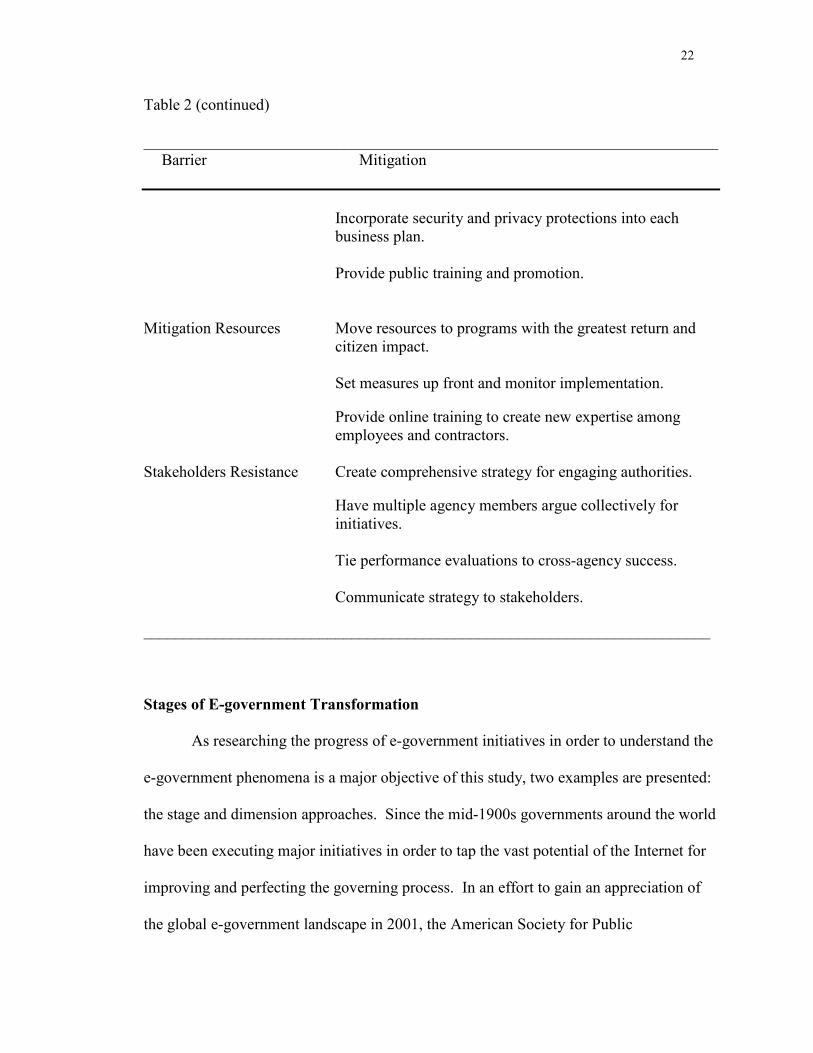
Table 2 (continued)
________________________________________________________________________ Barrier Mitigation
Incorporate security and privacy protections into each business plan. Provide public training and promotion.
Mitigation Resources Move resources to programs with the greatest return and citizen impact.
Set measures up front and monitor implementation.
Provide online training to create new expertise among employees and contractors.
Stakeholders Resistance Create comprehensive strategy for engaging authorities.
Have multiple agency members argue collectively for initiatives. Tie performance evaluations to cross-agency success. Communicate strategy to stakeholders.
_______________________________________________________________________
Stages of E-government Transformation
As researching the progress of e-government initiatives in order to understand the
e-government phenomena is a major objective of this study, two examples are presented:
the stage and dimension approaches. Since the mid-1900s governments around the world
have been executing major initiatives in order to tap the vast potential of the Internet for
improving and perfecting the governing process. In an effort to gain an appreciation of
the global e-government landscape in 2001, the American Society for Public
23
Administration (ASPA) and the United Nations Division for Public Economics and
Public Administration (UNDPEPA) undertook a research study analyzing the progress on
the part of the 190 UN member states. National government Web sites were analyzed
for the content and services available that the average citizen would most likely use. The
presence or absence of specific features contributed to determining a country’s level of
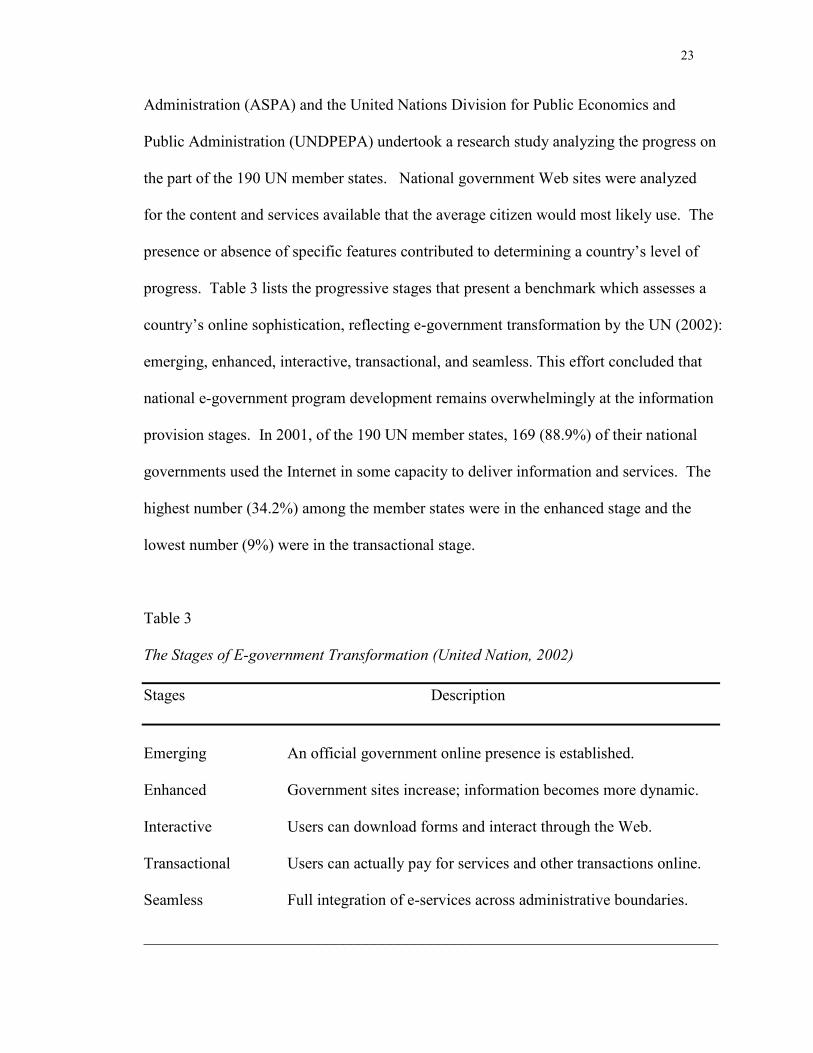
progress. Table 3 lists the progressive stages that present a benchmark which assesses a
country’s online sophistication, reflecting e-government transformation by the UN (2002):
emerging, enhanced, interactive, transactional, and seamless. This effort concluded that
national e-government program development remains overwhelmingly at the information
provision stages. In 2001, of the 190 UN member states, 169 (88.9%) of their national
governments used the Internet in some capacity to deliver information and services. The
highest number (34.2%) among the member states were in the enhanced stage and the
lowest number (9%) were in the transactional stage.
Table 3
The Stages of E-government Transformation (United Nation, 2002)
Stages Description
Emerging An official government online presence is established.
Enhanced Government sites increase; information becomes more dynamic.
Interactive Users can download forms and interact through the Web. Transactional Users can actually pay for services and other transactions online.
Seamless Full integration of e-services across administrative boundaries.
________________________________________________________________________
24
The United Nations report (2002) concluded that a country’s social, political, and
economic composition correlates closely with its e-government program development.
However, there were exceptions, as evidenced by several developing and transitioning
economies. Key factors such as the state of a country’s telecommunications
infrastructure, the strength of its human capital, the political will and commitment of the
national leadership, and shifting policy and administrative priorities play important roles.
Each of these factors influences how decision makers, policy planners, and public-sector
managers elect to approach, develop, and implement e-government programs.
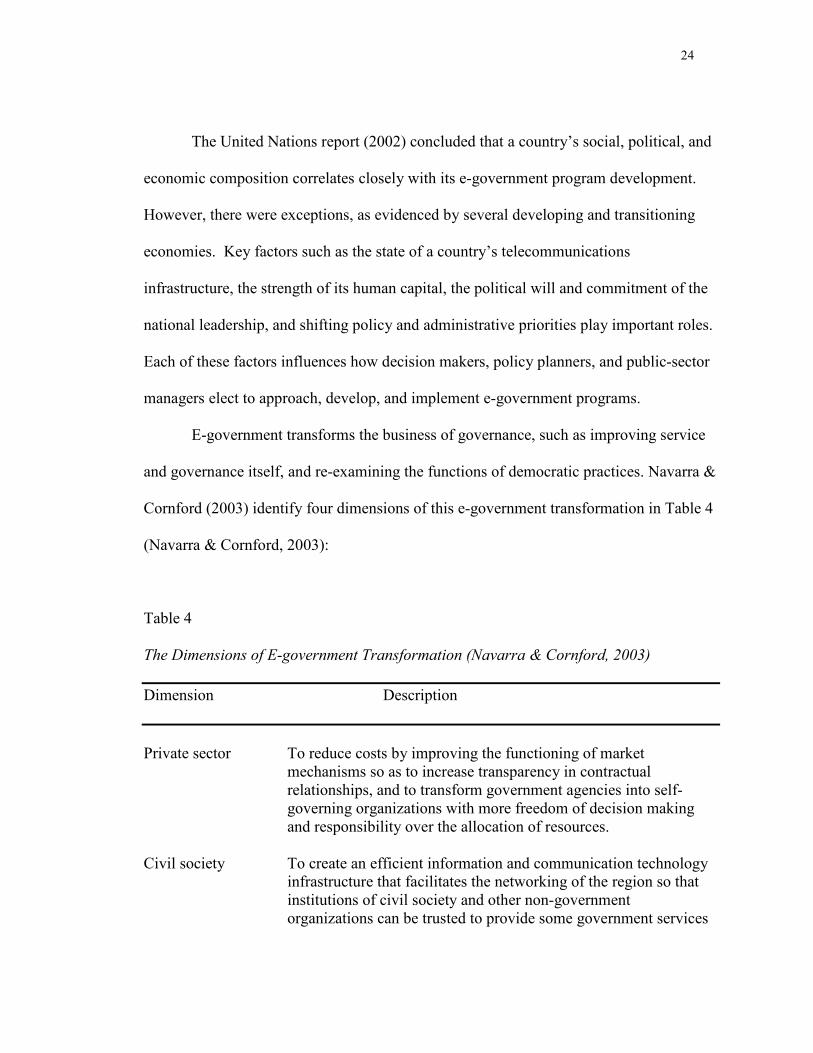
E-government transforms the business of governance, such as improving service
and governance itself, and re-examining the functions of democratic practices. Navarra &
Cornford (2003) identify four dimensions of this e-government transformation in Table 4
(Navarra & Cornford, 2003):
Table 4
The Dimensions of E-government Transformation (Navarra & Cornford, 2003)
Dimension Description
Private sector To reduce costs by improving the functioning of market mechanisms so as to increase transparency in contractual relationships, and to transform government agencies into self-governing organizations with more freedom of decision making and responsibility over the allocation of resources.
Civil society To create an efficient information and communication technology
infrastructure that facilitates the networking of the region so that institutions of civil society and other non-government organizations can be trusted to provide some government services
25
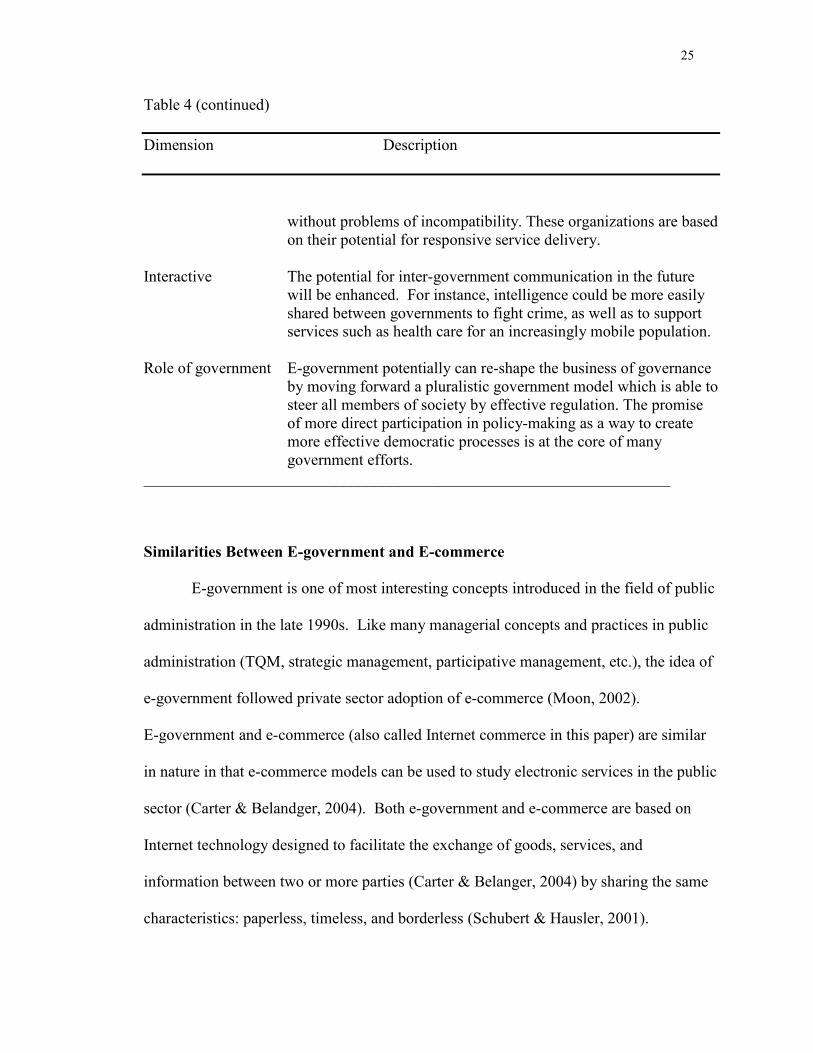
Table 4 (continued)
Dimension Description
without problems of incompatibility. These organizations are based on their potential for responsive service delivery.
Interactive The potential for inter-government communication in the future
will be enhanced. For instance, intelligence could be more easily shared between governments to fight crime, as well as to support services such as health care for an increasingly mobile population.
Role of government E-government potentially can re-shape the business of governance
by moving forward a pluralistic government model which is able to steer all members of society by effective regulation. The promise of more direct participation in policy-making as a way to create more effective democratic processes is at the core of many government efforts.
__________________________________________________________________
Similarities Between E-government and E-commerce
E-government is one of most interesting concepts introduced in the field of public
administration in the late 1990s. Like many managerial concepts and practices in public
administration (TQM, strategic management, participative management, etc.), the idea of
e-government followed private sector adoption of e-commerce (Moon, 2002).
E-government and e-commerce (also called Internet commerce in this paper) are similar
in nature in that e-commerce models can be used to study electronic services in the public
sector (Carter & Belandger, 2004). Both e-government and e-commerce are based on
Internet technology designed to facilitate the exchange of goods, services, and
information between two or more parties (Carter & Belanger, 2004) by sharing the same
characteristics: paperless, timeless, and borderless (Schubert & Hausler, 2001).
26
Governments provide goods and services to citizens the same way e-commerce provides
those things for them as consumers; thus, e-commerce may provide a useful role model
for e-government (Stahl, 2002). In general, there are two major types of e-commerce:
business-to-consumer (B2C) and business-to-business (B2B). In B2C transactions,
online transactions are made between businesses and individual consumers, such as when
airlines sell tickets to travelers; whereas in B2B transactions, businesses make online
transactions with other businesses, such as when businesses purchase parts, fuel, or
services online (King, Lee, Warkentin, & Chung, 2002). Comparable categories for e-
government services are government-to-citizen (G2C), government-to-business (G2B),
and government-to-government (G2G). G2C and G2B are similar to B2C because
citizens and businesses are the public consumers of the e-government services and G2G
is similar to B2B because the interaction between government and government operates
much like the interaction between business and business.
The e-commerce success frameworks developed by Keeney (1999) and
Torkzadeh and Dhillon (2002) provide a foundation for this study of how to build an e-
government success framework. The following examples illustrate the similarities
between e-commerce and e-government. In successful e-commerce transactions,
customers must feel that they get better value with Internet shopping than with
conventional shopping, whereas to achieve successful e-government, citizens must feel
that they get better value with online government service than with conventional
government service. E-commerce and e-government offer the public the same values,
such as reduced cost, reduced time of transaction, increased convenience, and minimized
environmental impact. In his study of e-commerce, Keeney (1999) interviewed over one
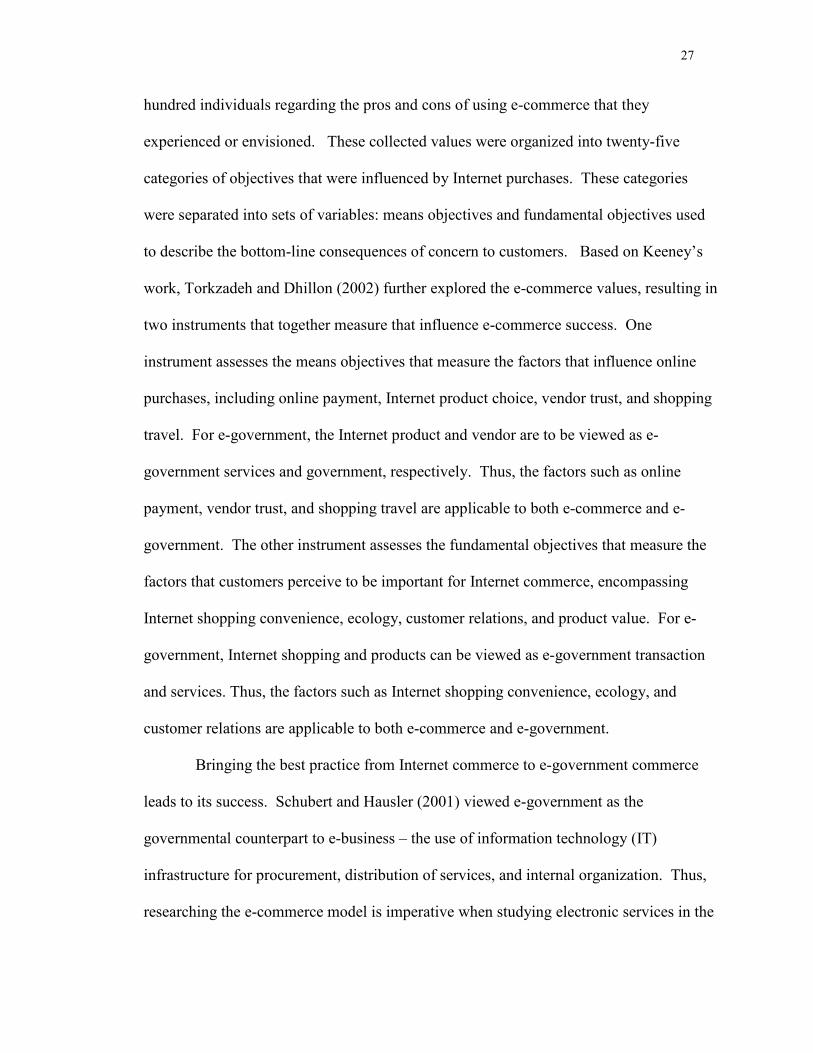
27
hundred individuals regarding the pros and cons of using e-commerce that they
experienced or envisioned. These collected values were organized into twenty-five
categories of objectives that were influenced by Internet purchases. These categories
were separated into sets of variables: means objectives and fundamental objectives used
to describe the bottom-line consequences of concern to customers. Based on Keeney’s
work, Torkzadeh and Dhillon (2002) further explored the e-commerce values, resulting in
two instruments that together measure that influence e-commerce success. One
instrument assesses the means objectives that measure the factors that influence online
purchases, including online payment, Internet product choice, vendor trust, and shopping
travel. For e-government, the Internet product and vendor are to be viewed as e-
government services and government, respectively. Thus, the factors such as online
payment, vendor trust, and shopping travel are applicable to both e-commerce and e-
government. The other instrument assesses the fundamental objectives that measure the
factors that customers perceive to be important for Internet commerce, encompassing
Internet shopping convenience, ecology, customer relations, and product value. For e-
government, Internet shopping and products can be viewed as e-government transaction
and services. Thus, the factors such as Internet shopping convenience, ecology, and
customer relations are applicable to both e-commerce and e-government.
Bringing the best practice from Internet commerce to e-government commerce
leads to its success. Schubert and Hausler (2001) viewed e-government as the
governmental counterpart to e-business – the use of information technology (IT)
infrastructure for procurement, distribution of services, and internal organization. Thus,
researching the e-commerce model is imperative when studying electronic services in the
28
public sector. Two e-commerce research studies by Keeney (1999), and Torkzadeh and
Dhillon (2002) provide a useful list and a meaningful building block for constructs that
can be referenced in this study.
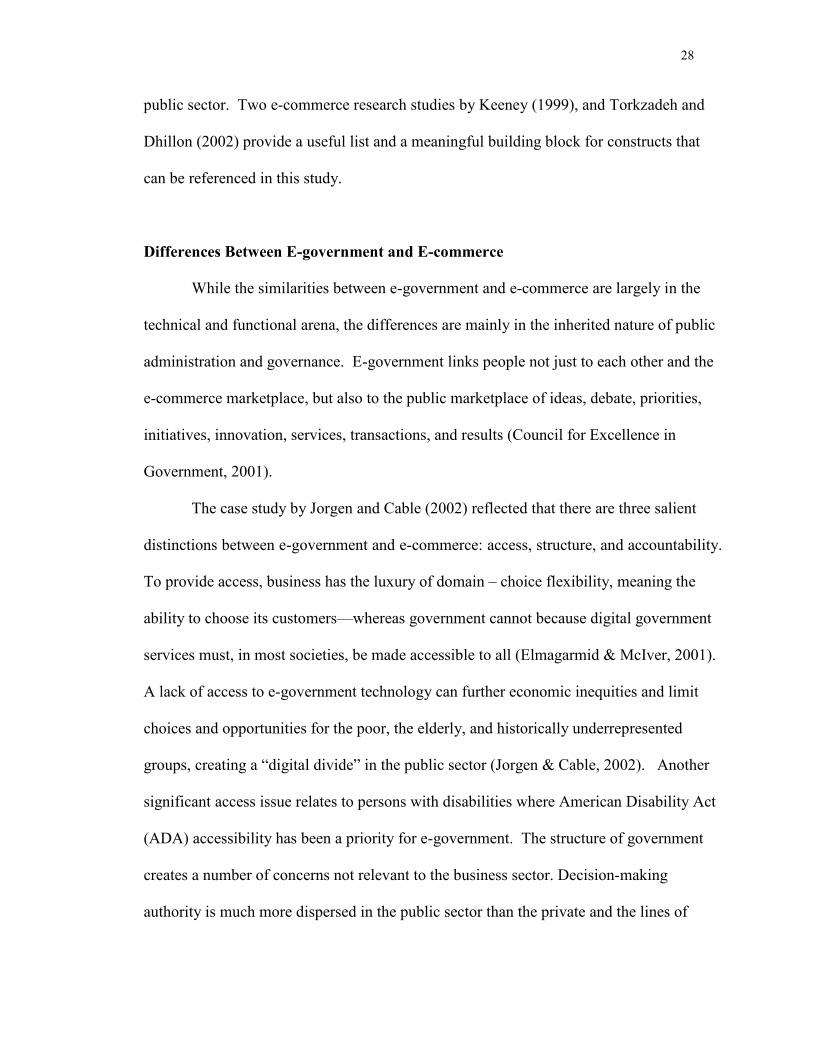
Differences Between E-government and E-commerce
While the similarities between e-government and e-commerce are largely in the
technical and functional arena, the differences are mainly in the inherited nature of public
administration and governance. E-government links people not just to each other and the
e-commerce marketplace, but also to the public marketplace of ideas, debate, priorities,
initiatives, innovation, services, transactions, and results (Council for Excellence in
Government, 2001).
The case study by Jorgen and Cable (2002) reflected that there are three salient
distinctions between e-government and e-commerce: access, structure, and accountability.
To provide access, business has the luxury of domain – choice flexibility, meaning the
ability to choose its customers—whereas government cannot because digital government
services must, in most societies, be made accessible to all (Elmagarmid & McIver, 2001).
A lack of access to e-government technology can further economic inequities and limit
choices and opportunities for the poor, the elderly, and historically underrepresented
groups, creating a “digital divide” in the public sector (Jorgen & Cable, 2002). Another
significant access issue relates to persons with disabilities where American Disability Act
(ADA) accessibility has been a priority for e-government. The structure of government
creates a number of concerns not relevant to the business sector. Decision-making
authority is much more dispersed in the public sector than the private and the lines of
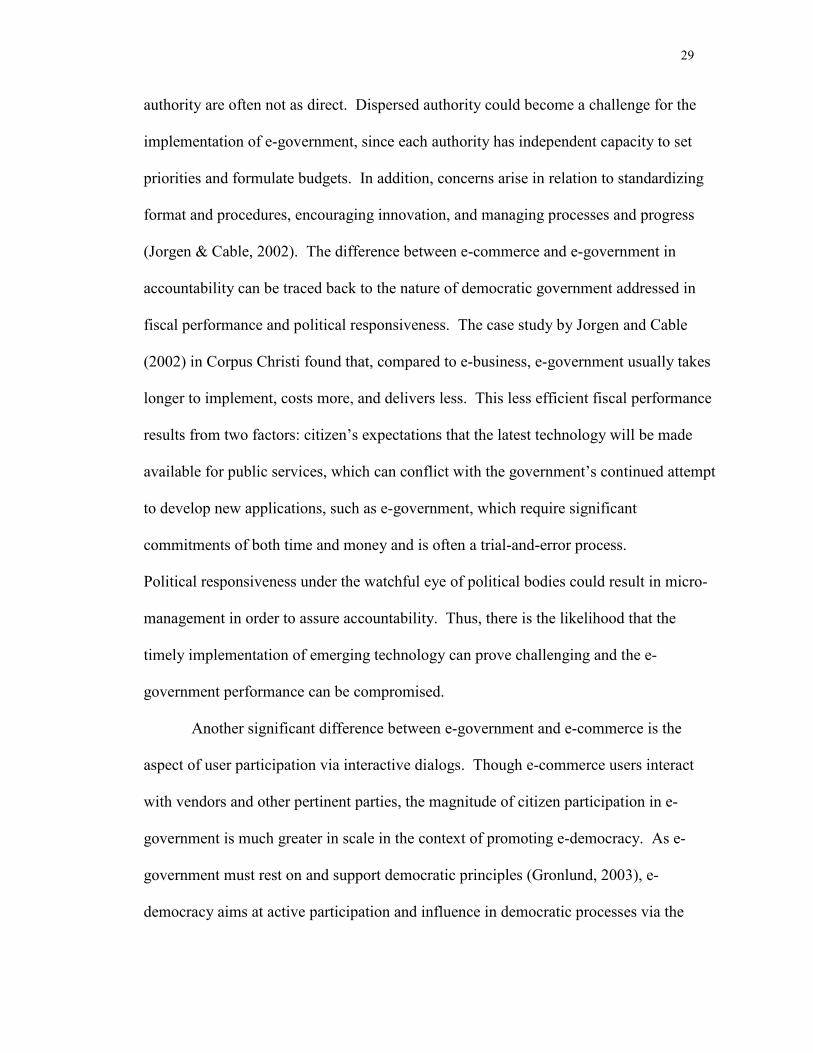
29
authority are often not as direct. Dispersed authority could become a challenge for the
implementation of e-government, since each authority has independent capacity to set
priorities and formulate budgets. In addition, concerns arise in relation to standardizing
format and procedures, encouraging innovation, and managing processes and progress
(Jorgen & Cable, 2002). The difference between e-commerce and e-government in
accountability can be traced back to the nature of democratic government addressed in
fiscal performance and political responsiveness. The case study by Jorgen and Cable
(2002) in Corpus Christi found that, compared to e-business, e-government usually takes
longer to implement, costs more, and delivers less. This less efficient fiscal performance
results from two factors: citizen’s expectations that the latest technology will be made
available for public services, which can conflict with the government’s continued attempt
to develop new applications, such as e-government, which require significant
commitments of both time and money and is often a trial-and-error process.
Political responsiveness under the watchful eye of political bodies could result in micro-
management in order to assure accountability. Thus, there is the likelihood that the
timely implementation of emerging technology can prove challenging and the e-
government performance can be compromised.
Another significant difference between e-government and e-commerce is the
aspect of user participation via interactive dialogs. Though e-commerce users interact
with vendors and other pertinent parties, the magnitude of citizen participation in e-
government is much greater in scale in the context of promoting e-democracy. As e-
government must rest on and support democratic principles (Gronlund, 2003), e-
democracy aims at active participation and influence in democratic processes via the
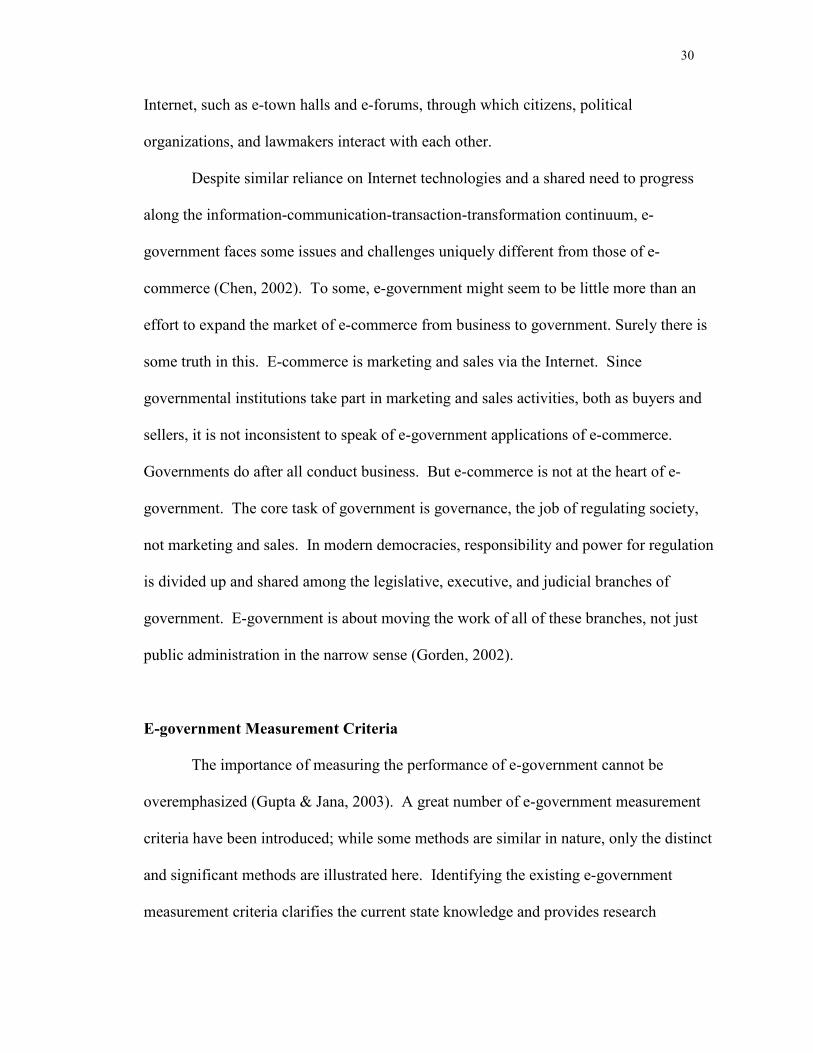
30
Internet, such as e-town halls and e-forums, through which citizens, political
organizations, and lawmakers interact with each other.
Despite similar reliance on Internet technologies and a shared need to progress
along the information-communication-transaction-transformation continuum, e-
government faces some issues and challenges uniquely different from those of e-
commerce (Chen, 2002). To some, e-government might seem to be little more than an
effort to expand the market of e-commerce from business to government. Surely there is
some truth in this. E-commerce is marketing and sales via the Internet. Since
governmental institutions take part in marketing and sales activities, both as buyers and
sellers, it is not inconsistent to speak of e-government applications of e-commerce.
Governments do after all conduct business. But e-commerce is not at the heart of e-
government. The core task of government is governance, the job of regulating society,
not marketing and sales. In modern democracies, responsibility and power for regulation
is divided up and shared among the legislative, executive, and judicial branches of
government. E-government is about moving the work of all of these branches, not just
public administration in the narrow sense (Gorden, 2002).
E-government Measurement Criteria
The importance of measuring the performance of e-government cannot be
overemphasized (Gupta & Jana, 2003). A great number of e-government measurement
criteria have been introduced; while some methods are similar in nature, only the distinct
and significant methods are illustrated here. Identifying the existing e-government
measurement criteria clarifies the current state knowledge and provides research
31
opportunities for further development of the field; it is also a major objective of this study.
Up to the present, no e-government measurement criteria grounded in the DA value
theory as approached by this study was found. Thus, this study advances knowledge and
contributes to understanding the e-government phenomena that are an integral part of
modern IS research.
Research into determining public expectations from e-government and into
determining whether current or proposed e-government systems deliver according to
public expectations may borrow from and progress along the lines of the SERVQUAL
model used in the marketing discipline, which is a good predictor of overall service
quality (Fisk, Brown, & Bitner, 1993). This model uses gap analysis to identify and
measure five different types of gaps that may exist between customers’ expectations and
perceptions of service. The five gaps are (1) the service gap between public expectations
from the e-government services and the perception of service delivered, (2) the
understanding gap between public expectations and management perceptions of what
these public expectations are, (3) the design gap between management’s understanding of
public expectations and the design and specification of service quality, (4) the delivery
gap between the specification of service quality and the actual quality of the service
delivered, and (5) the communication gap between what is actually delivered and what is
promised (Jain & Patnayakuni, 2003).
To assess the breadth and width of the implementation of e-government initiatives,
progress will be measured using a four-stage format (Layne & Lee, 2001) that reflects the
growth model of e-government:
Stage 1, Cataloging (online presence, catalogue presentation, downloadable forms): In this stage, basic and non-transactional information are provided through a one-
32
way interface. Usually, at first, the index site is organized on the basis of functions or departments as opposed to service access points.
Stage 2, Transaction (services and forms are online, working databases support online transactions): This stage empowers citizens to deal with their governments online anytime to save hours of paperwork, the inconvenience of traveling to a government office, and time spent waiting in line. Filing taxes and registering businesses online are only the beginning of such transaction-based services.
Stage 3, Vertical Integration (local systems are linked to higher level systems within similar functionality): Citizens are able to access the service at the higher level of governments (State and Federal) from the same entry as the municipal portal because the local systems are connected to upper level systems directly or indirectly.
Stage 4, Horizontal Integration (systems are integrated across different functions, real one-stop shopping for citizens): The horizontal integration of government services across different functions of government will be driven by visions of efficiency and effectiveness in using IT, but will be pulled by citizens’ demands for an “inside-out” transformation of government functions toward more service-oriented ones. Such integration will facilitate “one-stop shopping” for the citizen. Each organization may have to give up some power to move to this stage.
Steyaert (2004) proposed a marketing model to be used to improve the content
and value of e-government services. Five marketing indicators were used – consumer
awareness, popularity, contact efficiency, conversion, and retention. Awareness deals
with the number of visitors to a site. Popularity refers to the ranking of the site. Contact
efficiency indicates site usability and content. Conversion refers to customer satisfaction,
transaction, and time spent on the site. Retention deals with customer loyalty. Web
traffic reports and customer surveys were used as proxies to analyze and compare a
sample of e-service agencies.
Gupta and Jana (2003) suggested a flexible framework from which to choose an
appropriate strategy to measure the tangible and intangible benefits of e-government.
The broad categorization includes hard measures (cost-benefit analysis and benchmarks
in e-government), soft measures (scoring method, stages of e-government and social
33
angle), and hierarchy of measures (means to measure the variables, such as return on
investment, for which criteria are established).
Doctor and Ankem (1996) identified two dimensions of the taxonomy for
categorizing community information systems. One dimension consists of 14 types of
services: commerce, consumer affairs, education and schooling, employment, financial
matters, governmental processes with politics and policy, health and medical, home and
family, housing, legal matters, nature and environment, recreation and culture, social
services, and transportation. The other dimension consists of five categories of services:
advocacy, counseling, and factual, directional, and interactive communication.
Stowers (2002) examined 148 federal government Web sites based on online
services, user help features, navigation features, and information architecture. The
reviewers used four indices of these categories plus a scale of accessibility to yield the
total excellence score.
The United Nations (2002) conducted a study to assess the progress of e-government
transformation and quality of the e-government Web sites at the global level by
benchmarking various countries. The variables used in this study were based on the
following questions:
1. Does the site link to any other sites, such as different levels of government, and
public and private organizations? 2. Is there a city e-government strategic plan online? 3. How is the site’s content organized? 4. Is the site multi-lingual? 5. Does the site offer a search feature that is easy to use and accurate? 6. Is there a site security feature? 7. What form or method of online payment (for any transaction) is used? 8. Is there a direct link to specific individual services or all available online forms? 9. Can the documents be saved or downloaded? 10. What kind of special features, such as accepting digital signatures and offering
34
streaming media (like live video or audio of events) are available? 11. Does the site offer push technology? 12. How current is the content?
Gartner’s framework (2002) is based on the three e-government strategies: service
levels to constituents (for example: Is the service what they need? Are they using it?
Does it provide greater value at a lower cost than the offline service?), operational
efficiency (for example: Are online transactions reducing government costs?), and
political return (for example: Is the e-government initiative increasing consensus? Are
there any positive effects on the economy and the society at large?). Although this
framework is not designed to rank initiatives from the most to the least valuable, it will
enable governments to reprioritize established initiatives and identify new initiatives that
are required.
Jorgensen and Cable (2002) conducted a case study based on control and
coordination among city departments, service levels, fiscal and political support, and
appropriate and efficient technology. Due to the lack of previous research in the area, the
case study approach allowed the development of an in-depth empirical inquiry of the
subject in a quasi-experimental design.
The 2000 e-government survey conducted by the International City/County
Management Association and Public Technology Inc. reflected that e-government
includes four major internal and external aspects: (1) the establishment of a secure
government Internet and central database for more efficient and cooperative interaction
among governmental agencies, (2) Web-based service delivery, (3) the application of e-
commerce for more efficient government transaction activities, such as procurement and
contract, and (4) digital democracy for more transparent government accountability and
35
increased citizen participation in rule making, where regulations that affect all aspects of
life from food to transportation and the environment are open to comment and debate.
The lifeblood of government is information, and the digital revolution has allowed
government organizations to more effectively and efficiently store, analyze, and retrieve
information (Bretschneider, 2003). At present, access to information is one of the most
popular features of e-government services; thus, increasingly, governments are creating a
presence on the Internet through the use of a Web page or site where a variety of
information is offered to the public. While searches may retrieve a great number of
items, the best-matched items from the search query are placed at the top of the result list.
Result ranking in information retrieval has a major impact on users’ satisfaction with
Web search engines and their success in retrieving relevant documents. Result ranking is
judged by three criteria (Courtois & Berry, 1999):
1. All terms: Does the document contain at least one occurrence of all search terms?
2. Proximity: Is there at least one occurrence of all search terms appearing as a
contiguous phrase?
3. Location: Is there at least one occurrence of all search terms appearing within the
title, headers, or metatags?
Value Theory (Value-Focused Thinking Approach)
Values in the discipline of operation research are expressed as objectives, goals,
criteria, performance measures, weights, preferences, and/or objective functions (Keeney,
1992). The proposed study will focus on values expressed as objectives in the field of DA.
In the DA theory, the decision maker is to make decisions consistent with a certain set of
36
values (Spradlin, 20005). Values might be economic, personal, social, or others. A
common value is economic, from which the decision maker will attempt to increase
wealth. Personal value could be convenience or security while social value could mean
protection of environment. This research focuses on the values that lead citizens (the
decision maker) to use e-government services instead of conventional government
services (the decision context). Values should remain relatively stable unless they are
related to the emergence or alleviation of major issues (Rokeach, 1974).
In recent years, one of the most interesting areas of research has been the
measurement of value systems (Kamakura & Mazzon, 1991). The framework of the value
system for this study is based on the Value-thinking approach by Keeney (1992) in the
field of DA. Keeney (1992) proposed the concept of a value proposition: value-focused
thinking that provides a framework for defining value to the customers. He posited that
many books written about decision-making address how to solve decision problems by
evaluating alternatives given some quantitative objective function, yet do not discuss how
to articulate the qualitative objectives on which any appraisal of alternatives must rest.
Values are fundamentally important in any decision situation. Alternatives are relevant
only because they are a means to achieve the desired values. Thus, the thinking should
focus first on values and later on alternatives that might achieve them. This value-focused
thinking can significantly improve decision-making because the values guide not only the
creation of better alternatives, but also the identification of better decision situations
(Keeney, 1992).
To understand value-focused thinking, three classes of definitions need to be
considered. These are the decision context, values, and fundamental objectives. The
37
decision context presents alternatives appropriate for a given decision situation and is
specified by the range of activities being contemplated (Torkzadeh & Dhillion, 2002).
For example, the decision context is whether or not to make purchases over the Internet
(Keeney, 1999). Values are principles used for evaluating the desirability of possible
alternatives in a specific decision situation (Keeney, 1992). Values come into play prior
to a given decision problem. If the question of whether to purchase on the Internet or
through conventional shopping is to be construed as a decision problem, then values
afforded by the customer will form the basis for evaluating the alternatives (Torkzadeh &
Dhillion, 2002). Fundamental objectives make explicit the values that one cares about
and define the consequences of concern (Keeney, 1992). This study is based on the
value-thinking approach that extracts the e-government values from surveys of citizens
who have experience in using e-government services.
Means Objectives and Fundamental Objectives
Using the value-focused approach, Keeney (1999) conducted an empirical study
to explore the value of Internet commerce and proposed two sets of variables: means
objectives, and fundamental objectives for Internet shopping. He posited that means
objectives are those that help businesses achieve what is important to their customers –
fundamental objectives. Fundamental objectives make explicit the values and define the
consequences of concern (Keeney, 1992). This impacts the ends that a decision maker
may value in a decision context. Therefore, fundamental objectives are the end
objectives, as opposed to the means objectives. Means objectives are the ways to achieve
the ends. Keeney uses the “Why is that important?” test to classify the means and
38
fundamental objectives where there are two possible types of answers. One type of
answers reflects the given objective that is one of the essential reasons for interest in a
situation, whereas the other type reflects the given objective that is important because of
its implication for another objective. Objectives with the former response are
fundamental objectives; and those with the latter are means objectives. For example,
means objectives such as minimizing misuse of credit card or minimizing misuse of
personal information are important because they influence fundamental objectives such
as minimizing personal hassle and minimizing cost (Keeney, 1999). If the answer
reflects different decision contexts, it constitutes a fundamental objective. For example,
saving time is important because saved time can be used for other interests. Other
interests reflect different decision contexts. Therefore, in the context of using e-
government services, saving time (the “minimizing time spent “objective) constitutes a
fundamental objective.
The following examples further describe these two variables applied in different
fields expressed in similar terms. Nah, Siau, and Sheng (2005) in their value research of
mobile applications stated that fundamental objectives, as the name implies, underlie the
essential reasons for the given situation, whereas means objectives are those whose
attainment will help achieve fundamental objectives. For example, the “minimize errors
and mistakes” objective helps achieve the “maximize effectiveness” objective. Thus the
first objective is a means objective, and the other is a fundamental objective. Dhillon and
Lee (2000) in their IS value assessment study categorized the two variables by
determining if an objective is an intermediate one (being a means objective) or a final one
(being a fundamental objective). For example, the “increase system consistency”
39
objective (the intermediate) affects the “increase ease of use” objective (the final).
Therefore, the former is a means objective, and the latter is a fundamental objective.
These two interrelated categories of objectives are components of the same overall
construct, measuring factors that influence the success of e-government initiatives.
Derivation of E-government Value From Technology
One of the most recent significant innovations in IS has been the creation and
ongoing development of the Internet. The Internet increases communication flexibility
while reducing communication cost, by permitting the instantaneous exchange of large
amounts of information regardless of geographic distance and time. It is profoundly
changing the way the society communicates, works, and learns (Council for Excellence in
Government, 2001). Similar to the dramatic changes in e-commerce, the e-government
revolution offers the potential to reshape the public sector and remake the relationship
between citizen and government (West, 2000).
In the context of e-government products and services for citizens, values are
largely derived from enhanced information dissemination, increased transactions online,
and accelerated use of emerging technology. Balutis (2001B) illustrates these values
with examples. Information dissemination can be enhanced by expanding the amount of
information accessible on searchable databases drawing from an enormous amount of
information available to the government. In addition, the information can be provided
“by request.” For example, companies should be able to answer a questionnaire and
automatically receive e-mail informing them of each government procurement
solicitation that matches criteria they entered. Moreover, an “expert system” could be
40
used to provide expert advice to the businesses. For example, the Occupational Safety
and Health Administration has developed a series of online expert “adviser” systems to
help business people identify safety problems in the workplace, from mercury to asbestos,
and determine an appropriate course of action. Online transactions can be increased in
the area of monetary transfer, benefits, and purchasing and services (e.g., paying taxes
and applying for permits). Transferring funds online would not only save government
and businesses both time and money when performing transactions, but also help both
parties reduce record-keeping efforts because it automatically creates an accurate record
of transactions. Automatic allocation of benefits, such as using electronic benefits
transfer, would reduce paperwork and costs. To the extent that governments sell items,
businesses should be able to purchase them online. In addition, the government could
utilize an online auction for disposing of surpluses of government property (Balutis,
2001B). Expanded access to government portals via various emerging technologies
would provide a great value to customers when they interface with government sites,
such as using cell phones and palm computers. Experience in Europe and Asia suggests
that “access anywhere” is increasingly important for citizens, businesses, and employees
(Balutis, 2001B).
E-government value could be derived from the inherent nature of Internet
technology, which facilitates access by reaching far beyond the traditional constraints of
region and time. Thus, a U.S. taxpayer living in Africa could file a federal income tax
return online with the Internal Revenue Service, a tour company in Asia could access up-
to-date sightseeing information in Los Angeles via the Los Angeles city Web site, and an
exporting company in Europe could inquire about marketing opportunities for its
41
products using the New York State Web sites. And reaching beyond traditional business
hours frees citizens to seek information at their own convenience 24 hours a day, seven
days a week, not just when a government office is open (West, 2004).
To achieve success with e-government initiatives, e-government services need to
provide values to their users. E-government and e-commerce are similar in that they are
based on Internet technology designed to facilitate the exchange of goods, services, and
information between two or more parties (Carter & Belanger, 2004). Hence, the
following questions that Keeney (1999) stated based on the values of individual e-
commerce customers are relevant to e-government as well: What does the service offer
the customer? How can it offer more to the customer than is currently available through
conventional means? Keeney said that since Internet commerce is not a product, but a
means to purchase products, there is no value proposition of Internet commerce. Hence,
the value proposition applicable to Internet commerce is a net value of the benefits and
costs of both a product and the processes of finding, ordering, and receiving that product.
E-government products and services offered through Internet have great potential to
provide value to users. E-government value is an important construct for academics and
professionals studying e-government, since it helps to develop success measures (Chang,
Torkzadeh, & Dhillon, 2004).
42
Chapter 3
Methodology
Introduction
Most research on the use of the Internet tends to be conceptual rather than
empirical in nature (Teo & Pian, 2004). This research proposed an empirical study,
focusing on collecting the values citizens assign to e-government services. This study
first generated a list of e-government objectives from the exploratory study of Internet
commerce by Torkzadeh and Dhillon (2002) and the published research pool. Then the
list was grouped into two types: means objectives, and ends objectives. Using this model,
a survey with a total of 76 questions (48 questions for the means and 28 questions for the
fundamental objective types) was conducted focusing on these two different types of
objectives.
Upon collection of the data, data reduction and analysis were performed using
factor analysis on each type of items separately. In addition, this study related the means
and ends factors by examining the cross-correlations among factors. The outcome of this
study was two instruments that together measure the factors that influence the success of
e-government initiatives. One instrument measures the means objectives that influence
using e-government services, and the other measures the fundamental objectives that are
essential reasons for using e-government services. The instrument development process
is shown in Figure 1.
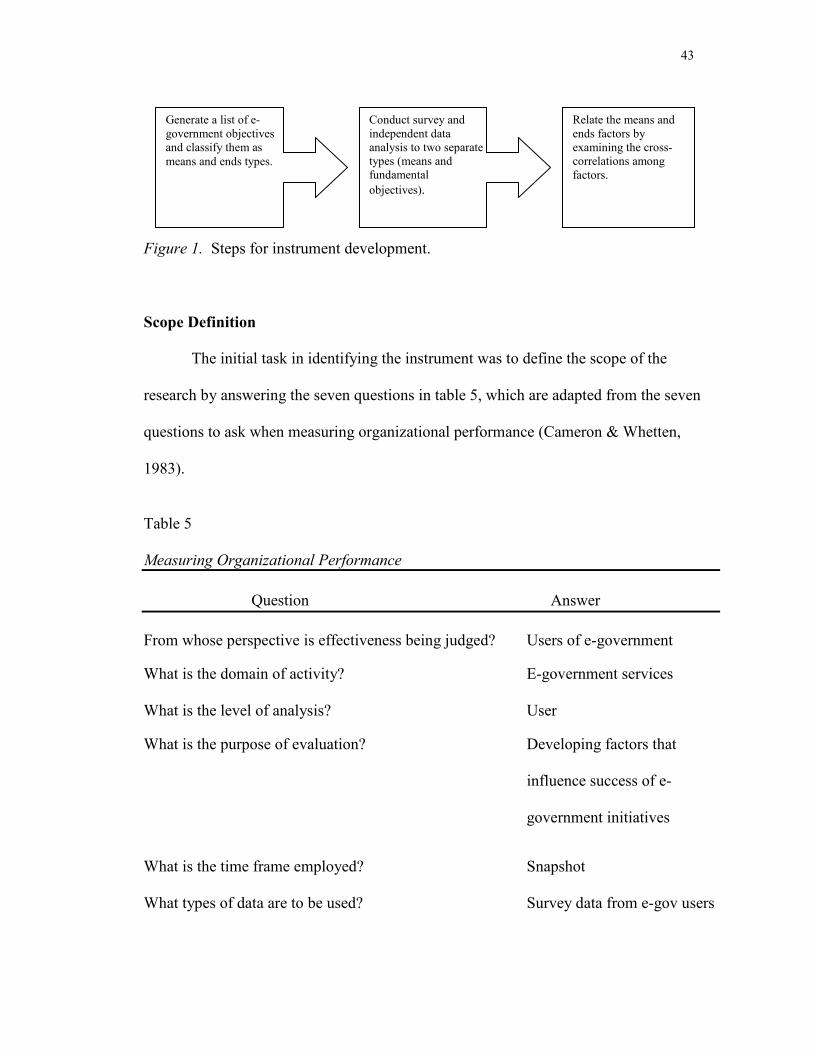
43
Figure 1. Steps for instrument development.
Scope Definition
The initial task in identifying the instrument was to define the scope of the
research by answering the seven questions in table 5, which are adapted from the seven
questions to ask when measuring organizational performance (Cameron & Whetten,
1983).
Table 5 Measuring Organizational Performance
Question Answer
From whose perspective is effectiveness being judged? Users of e-government What is the domain of activity? E-government services What is the level of analysis? User What is the purpose of evaluation? Developing factors that
influence success of e- government initiatives
What is the time frame employed? Snapshot What types of data are to be used? Survey data from e-gov users
Generate a list of e-government objectives and classify them as means and ends types.
Conduct survey and independent data analysis to two separate types (means and fundamental objectives).
Relate the means and ends factors by examining the cross-correlations among factors.
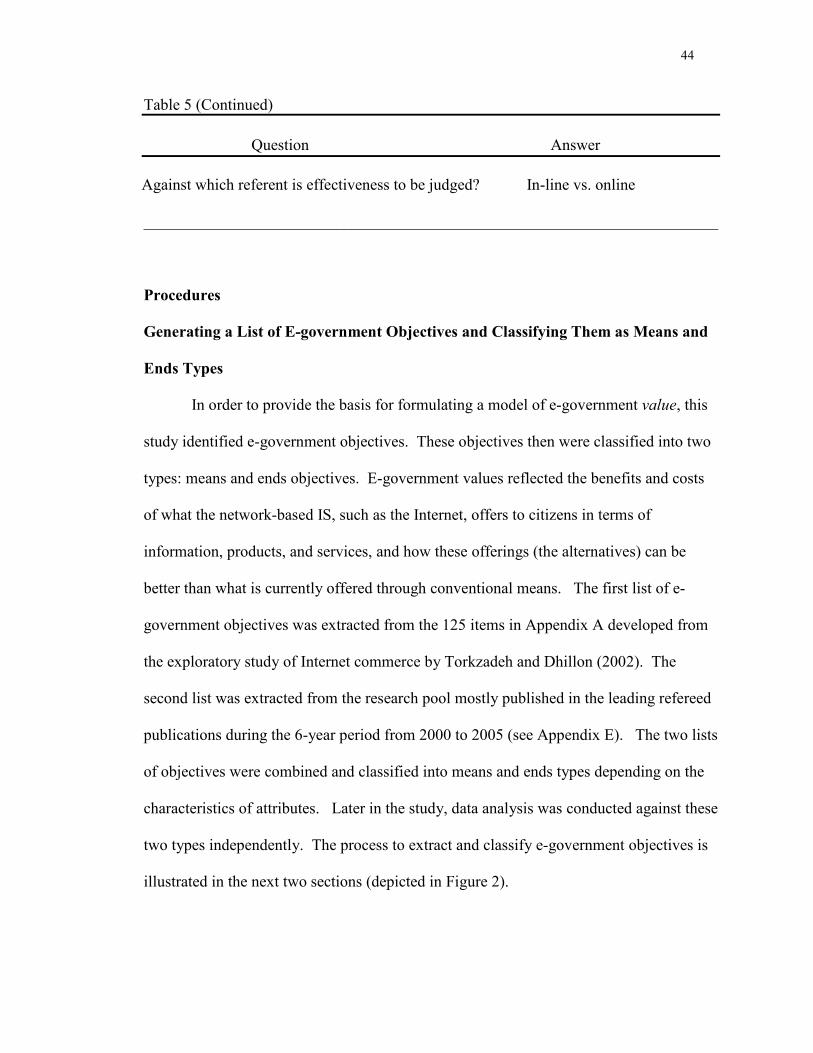
44
Table 5 (Continued)
Question Answer
Against which referent is effectiveness to be judged? In-line vs. online ________________________________________________________________________
Procedures
Generating a List of E-government Objectives and Classifying Them as Means and
Ends Types
In order to provide the basis for formulating a model of e-government value, this
study identified e-government objectives. These objectives then were classified into two
types: means and ends objectives. E-government values reflected the benefits and costs
of what the network-based IS, such as the Internet, offers to citizens in terms of
information, products, and services, and how these offerings (the alternatives) can be
better than what is currently offered through conventional means. The first list of e-
government objectives was extracted from the 125 items in Appendix A developed from
the exploratory study of Internet commerce by Torkzadeh and Dhillon (2002). The
second list was extracted from the research pool mostly published in the leading refereed
publications during the 6-year period from 2000 to 2005 (see Appendix E). The two lists
of objectives were combined and classified into means and ends types depending on the
characteristics of attributes. Later in the study, data analysis was conducted against these
two types independently. The process to extract and classify e-government objectives is
illustrated in the next two sections (depicted in Figure 2).
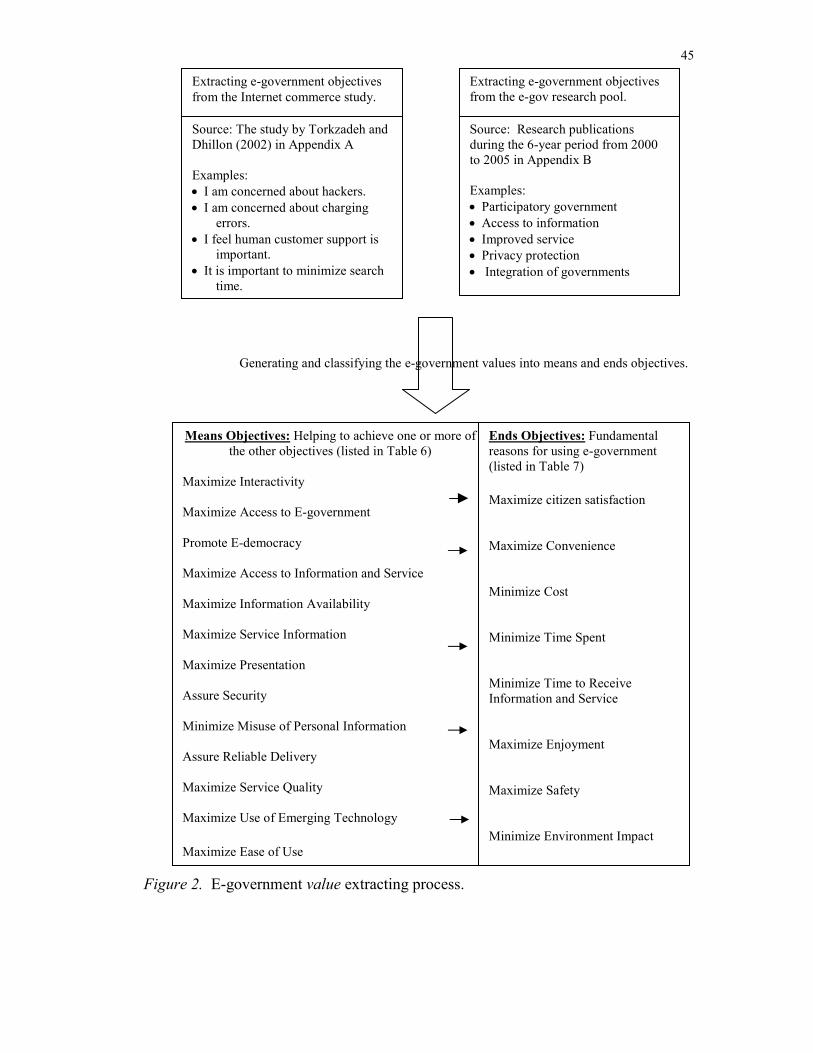
45
Generating and classifying the e-government values into means and ends objectives.
Figure 2. E-government value extracting process.
Extracting e-government objectives from the Internet commerce study.
Extracting e-government objectives from the e-gov research pool.
Source: The study by Torkzadeh and Dhillon (2002) in Appendix A Examples: • I am concerned about hackers. • I am concerned about charging
errors. • I feel human customer support is
important. • It is important to minimize search
time.
Source: Research publications during the 6-year period from 2000 to 2005 in Appendix B Examples: • Participatory government • Access to information • Improved service • Privacy protection • Integration of governments
Means Objectives: Helping to achieve one or more of the other objectives (listed in Table 6)
Maximize Interactivity Maximize Access to E-government Promote E-democracy Maximize Access to Information and Service Maximize Information Availability
Maximize Service Information Maximize Presentation Assure Security Minimize Misuse of Personal Information Assure Reliable Delivery Maximize Service Quality Maximize Use of Emerging Technology
Maximize Ease of Use
Ends Objectives: Fundamental reasons for using e-government (listed in Table 7) Maximize citizen satisfaction
Maximize Convenience
Minimize Cost
Minimize Time Spent
Minimize Time to Receive Information and Service
Maximize Enjoyment
Maximize Safety
Minimize Environment Impact
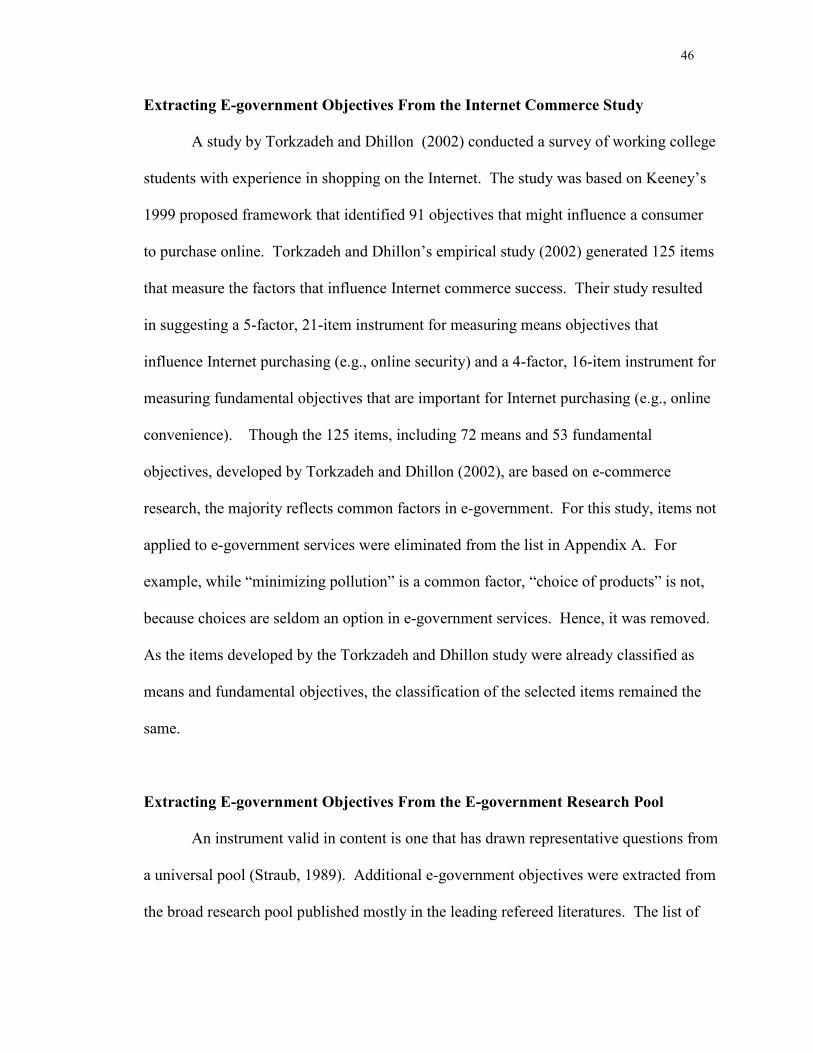
46
Extracting E-government Objectives From the Internet Commerce Study
A study by Torkzadeh and Dhillon (2002) conducted a survey of working college
students with experience in shopping on the Internet. The study was based on Keeney’s
1999 proposed framework that identified 91 objectives that might influence a consumer
to purchase online. Torkzadeh and Dhillon’s empirical study (2002) generated 125 items
that measure the factors that influence Internet commerce success. Their study resulted
in suggesting a 5-factor, 21-item instrument for measuring means objectives that
influence Internet purchasing (e.g., online security) and a 4-factor, 16-item instrument for
measuring fundamental objectives that are important for Internet purchasing (e.g., online
convenience). Though the 125 items, including 72 means and 53 fundamental
objectives, developed by Torkzadeh and Dhillon (2002), are based on e-commerce
research, the majority reflects common factors in e-government. For this study, items not
applied to e-government services were eliminated from the list in Appendix A. For
example, while “minimizing pollution” is a common factor, “choice of products” is not,
because choices are seldom an option in e-government services. Hence, it was removed.
As the items developed by the Torkzadeh and Dhillon study were already classified as
means and fundamental objectives, the classification of the selected items remained the
same.
Extracting E-government Objectives From the E-government Research Pool
An instrument valid in content is one that has drawn representative questions from
a universal pool (Straub, 1989). Additional e-government objectives were extracted from
the broad research pool published mostly in the leading refereed literatures. The list of
47
publications found Appendix E covers the 6-year period from 2000 to 2005. The
extracting process involved:
1. Extracting e-government objectives (values) from the literatures
2. Converting and grouping them into general objectives
3. Classifying the general objectives to means objectives and ends objectives
(fundamental objectives).
Extracting e-government values required exploring the publications listed in
Appendix B and identifying the e-government objective items from them. For example,
the first publication on the list, Government Information Quarterly, was concerned about
two e-government objective items: the digital divide and usefulness of information.
Digital divide refers to concerns about inequities between citizens who do not have
access the Internet, and those who do. Usefulness of information concerns validity,
accuracy, clarity, frequency, sufficiency, timeliness, reliability, relevancy, message
content, and cost. The likelihood of owning a PC with Internet access to embrace
electronic services varies significantly by household income, education level, age, and
region. A thoughtful response by governments to shrink these disparities to promote an
information-rich society will be a major factor in the success of e-government initiatives
in the coming years.
Converting and grouping the e-government objective items into general objectives
required a structured process. As the e-government objective items from the research
pool came in various forms, to develop some consistency in these expressions, each item
was converted into a corresponding objective. To convert, the items were expressed in
the three objective features: decision context, object, and direction of preference (Keeney,
48
1999). The decision context was whether to use e-government services. The object was
a noun and the direction of preference is a verb. Thus, for example, “participatory
government” became “participate in decision-making” and “privacy problem” became
“assure privacy”. Once the items were converted, similar objectives were grouped into
categories. For example, objectives such as “participate in decision-making”, “promote
e-voting”, and “minimize digital divide” were categorized as a part of a general objective
of “promote e-democracy”.
Classifying the general objectives to means objectives and fundamental objectives
required relating categories by means-ends relationships. For each general objective, the
importance of the decision context was grouped into two categories: one helps to achieve
one or more of the other objectives; the other is one of the fundamental reasons for using
e-government services. Objectives in the first category were referred to as means
objectives, and those in the second were referred to as fundamental objectives (Keeney,
1999). Keeney used the “Why is that important?” test to classify the means and
fundamental objectives where there were two possible types of answers. One type of
answer was that the given general objective was the essential reason for using e-
government services, whereas the other type was that the given general objective was
important because of its implication for another objective. Objectives with the former
response are fundamental objectives, and those with the latter are means objectives.
Means objectives help to achieve the ends that are fundamental objectives. For example,
e-voting (the means) helps achieve time flexibility (the ends) as voting can be done in a
wide range of time because the voter needs not to physically appear at the voting booth,
providing convenience (the fundamental objective). For another example, minimizing
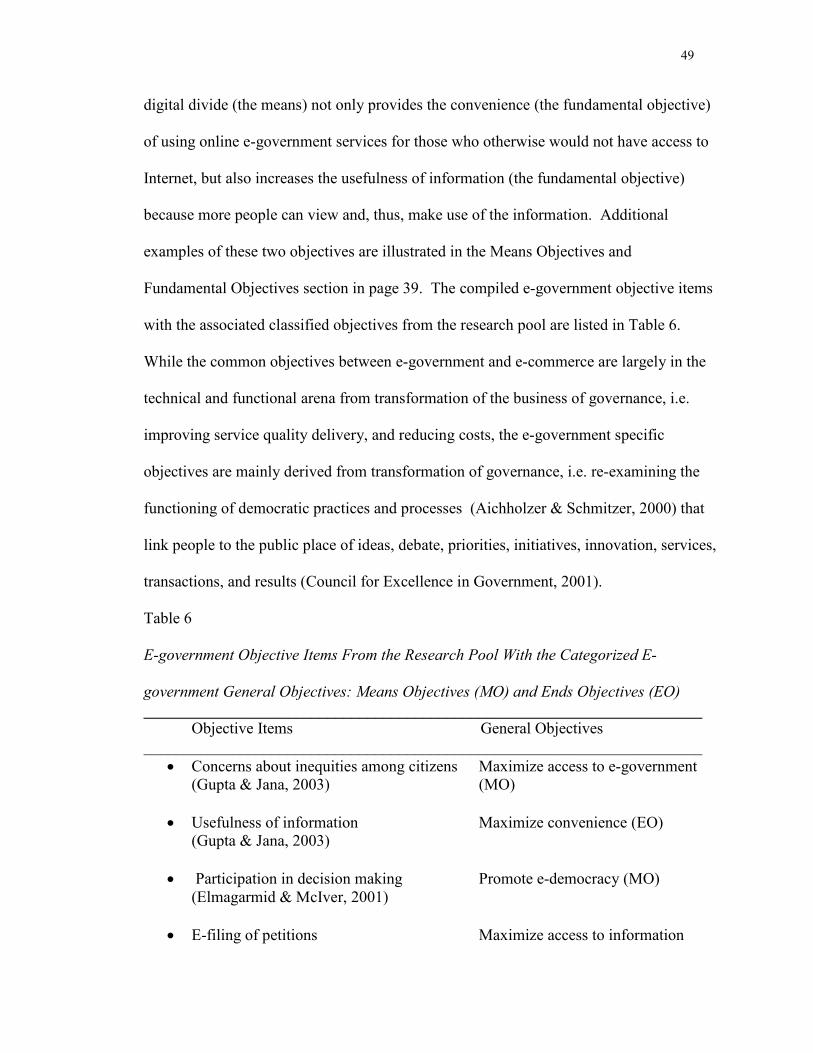
49
digital divide (the means) not only provides the convenience (the fundamental objective)
of using online e-government services for those who otherwise would not have access to
Internet, but also increases the usefulness of information (the fundamental objective)
because more people can view and, thus, make use of the information. Additional
examples of these two objectives are illustrated in the Means Objectives and
Fundamental Objectives section in page 39. The compiled e-government objective items
with the associated classified objectives from the research pool are listed in Table 6.
While the common objectives between e-government and e-commerce are largely in the
technical and functional arena from transformation of the business of governance, i.e.
improving service quality delivery, and reducing costs, the e-government specific
objectives are mainly derived from transformation of governance, i.e. re-examining the
functioning of democratic practices and processes (Aichholzer & Schmitzer, 2000) that
link people to the public place of ideas, debate, priorities, initiatives, innovation, services,
transactions, and results (Council for Excellence in Government, 2001).
Table 6 E-government Objective Items From the Research Pool With the Categorized E- government General Objectives: Means Objectives (MO) and Ends Objectives (EO) ______________________________________________________________________ Objective Items General Objectives ______________________________________________________________________
• Concerns about inequities among citizens Maximize access to e-government (Gupta & Jana, 2003) (MO)
• Usefulness of information Maximize convenience (EO) (Gupta & Jana, 2003)
• Participation in decision making Promote e-democracy (MO)
(Elmagarmid & McIver, 2001)
• E-filing of petitions Maximize access to information
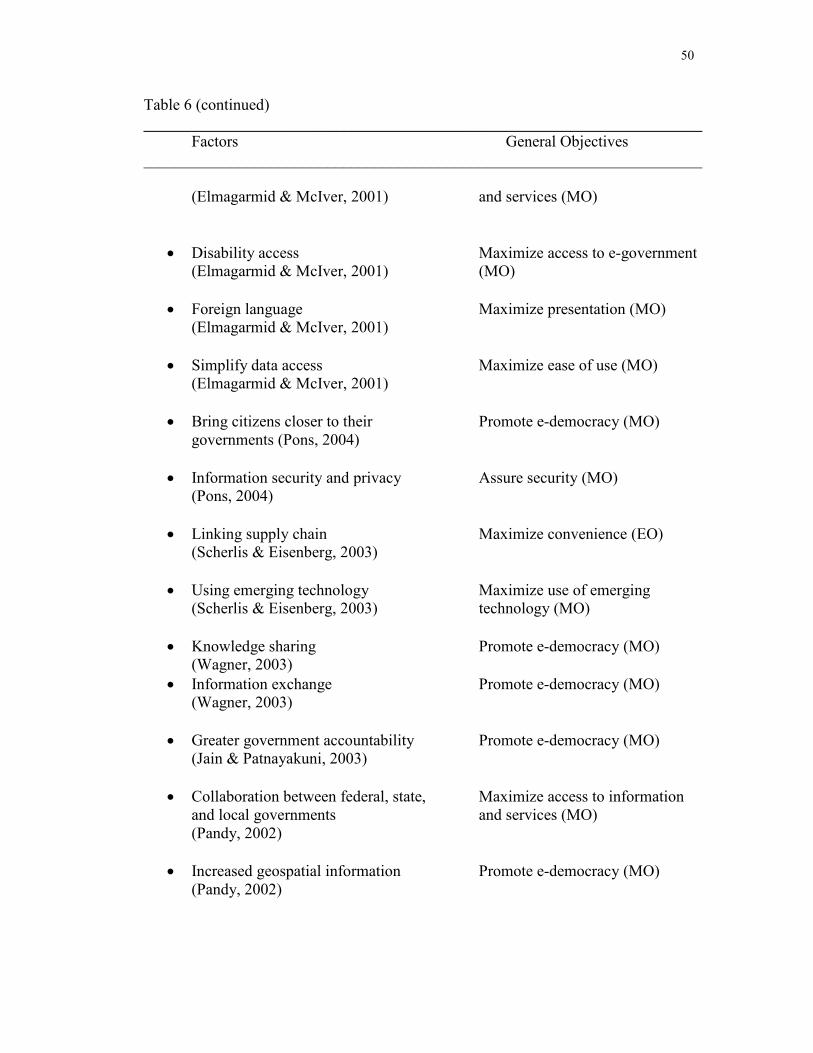
50
Table 6 (continued) ______________________________________________________________________ Factors General Objectives ______________________________________________________________________
(Elmagarmid & McIver, 2001) and services (MO)
• Disability access Maximize access to e-government (Elmagarmid & McIver, 2001) (MO)
• Foreign language Maximize presentation (MO)
(Elmagarmid & McIver, 2001)
• Simplify data access Maximize ease of use (MO) (Elmagarmid & McIver, 2001)
• Bring citizens closer to their Promote e-democracy (MO) governments (Pons, 2004)
• Information security and privacy Assure security (MO) (Pons, 2004)
• Linking supply chain Maximize convenience (EO)
(Scherlis & Eisenberg, 2003)
• Using emerging technology Maximize use of emerging (Scherlis & Eisenberg, 2003) technology (MO)
• Knowledge sharing Promote e-democracy (MO) (Wagner, 2003)
• Information exchange Promote e-democracy (MO) (Wagner, 2003)
• Greater government accountability Promote e-democracy (MO)
(Jain & Patnayakuni, 2003)
• Collaboration between federal, state, Maximize access to information and local governments and services (MO) (Pandy, 2002)
• Increased geospatial information Promote e-democracy (MO)
(Pandy, 2002)
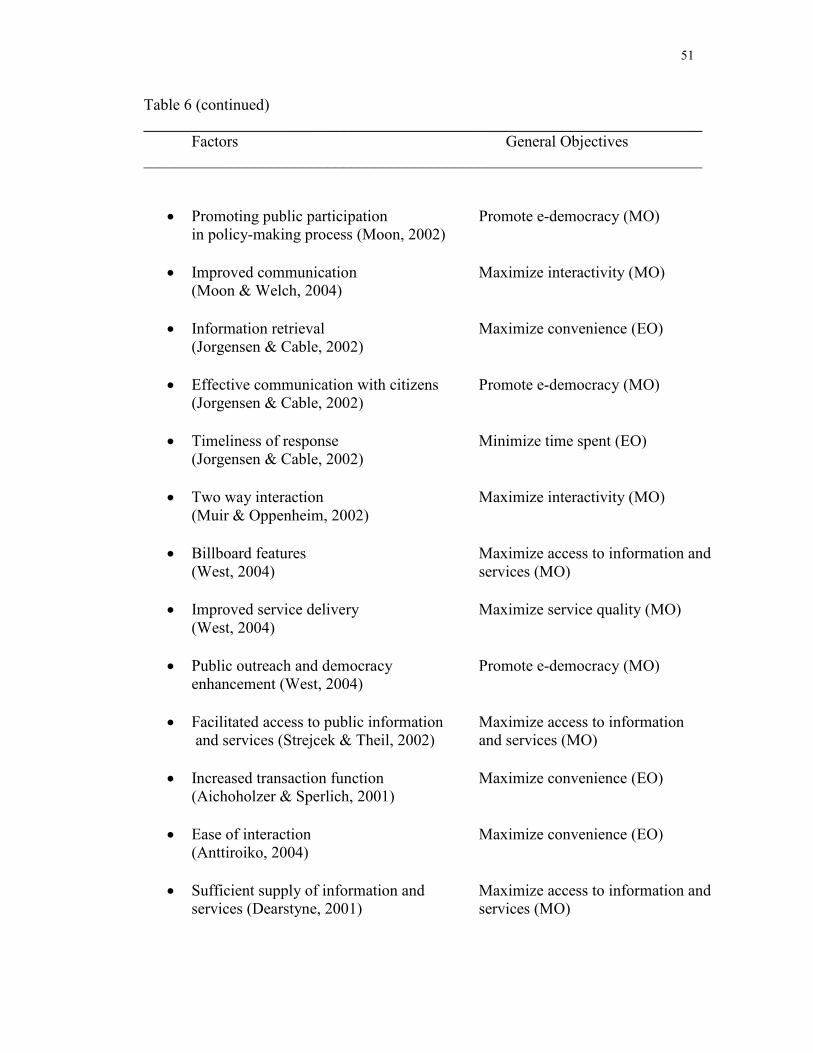
51
Table 6 (continued) ______________________________________________________________________ Factors General Objectives ______________________________________________________________________
• Promoting public participation Promote e-democracy (MO) in policy-making process (Moon, 2002)
• Improved communication Maximize interactivity (MO)
(Moon & Welch, 2004)
• Information retrieval Maximize convenience (EO) (Jorgensen & Cable, 2002)
• Effective communication with citizens Promote e-democracy (MO)
(Jorgensen & Cable, 2002)
• Timeliness of response Minimize time spent (EO) (Jorgensen & Cable, 2002)
• Two way interaction Maximize interactivity (MO)
(Muir & Oppenheim, 2002)
• Billboard features Maximize access to information and (West, 2004) services (MO)
• Improved service delivery Maximize service quality (MO) (West, 2004)
• Public outreach and democracy Promote e-democracy (MO) enhancement (West, 2004)
• Facilitated access to public information Maximize access to information and services (Strejcek & Theil, 2002) and services (MO)
• Increased transaction function Maximize convenience (EO)
(Aichoholzer & Sperlich, 2001)
• Ease of interaction Maximize convenience (EO) (Anttiroiko, 2004)
• Sufficient supply of information and Maximize access to information and services (Dearstyne, 2001) services (MO)
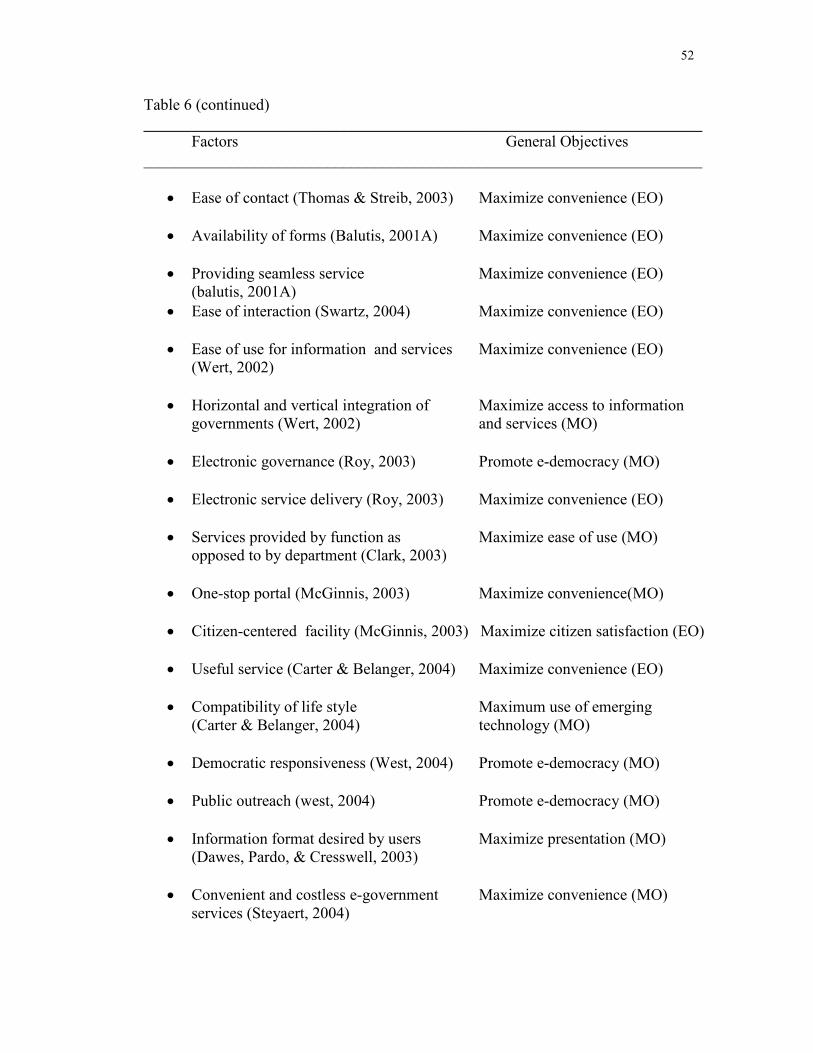
52
Table 6 (continued) ______________________________________________________________________ Factors General Objectives ______________________________________________________________________
• Ease of contact (Thomas & Streib, 2003) Maximize convenience (EO)
• Availability of forms (Balutis, 2001A) Maximize convenience (EO)
• Providing seamless service Maximize convenience (EO) (balutis, 2001A)
• Ease of interaction (Swartz, 2004) Maximize convenience (EO)
• Ease of use for information and services Maximize convenience (EO) (Wert, 2002)
• Horizontal and vertical integration of Maximize access to information governments (Wert, 2002) and services (MO)
• Electronic governance (Roy, 2003) Promote e-democracy (MO)
• Electronic service delivery (Roy, 2003) Maximize convenience (EO)
• Services provided by function as Maximize ease of use (MO) opposed to by department (Clark, 2003)
• One-stop portal (McGinnis, 2003) Maximize convenience(MO)
• Citizen-centered facility (McGinnis, 2003) Maximize citizen satisfaction (EO)
• Useful service (Carter & Belanger, 2004) Maximize convenience (EO)
• Compatibility of life style Maximum use of emerging
(Carter & Belanger, 2004) technology (MO) • Democratic responsiveness (West, 2004) Promote e-democracy (MO)
• Public outreach (west, 2004) Promote e-democracy (MO)
• Information format desired by users Maximize presentation (MO)
(Dawes, Pardo, & Cresswell, 2003)
• Convenient and costless e-government Maximize convenience (MO) services (Steyaert, 2004)
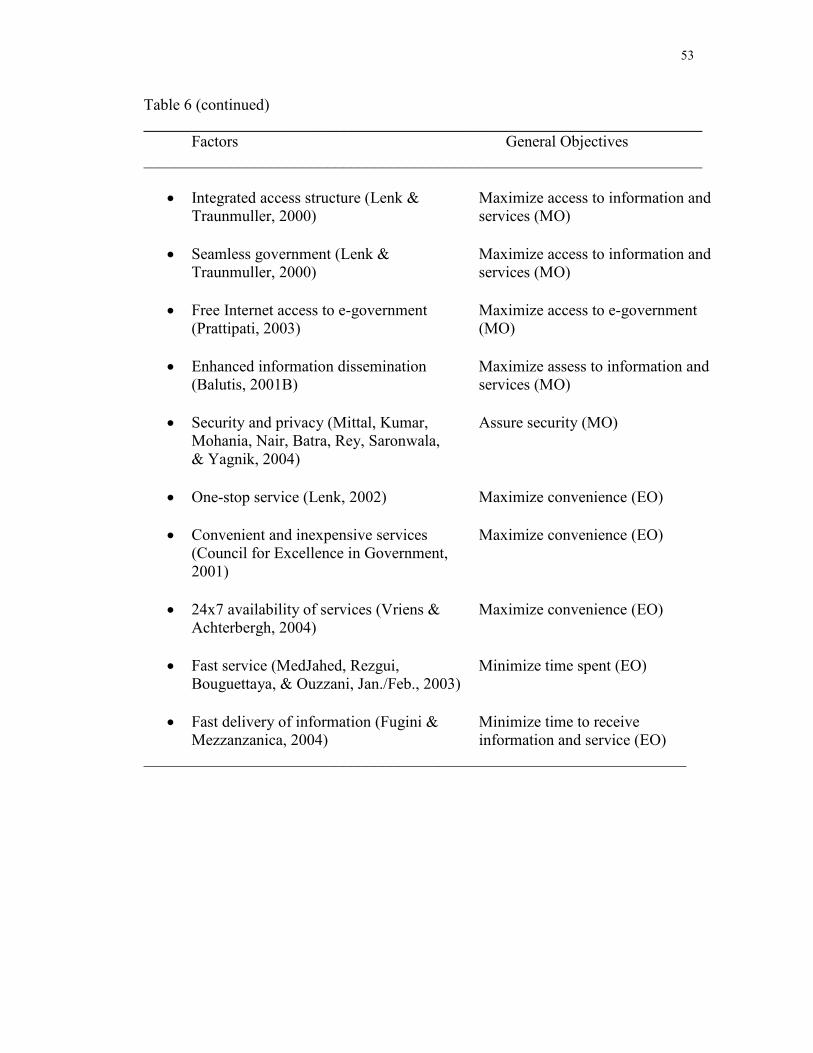
53
Table 6 (continued) ______________________________________________________________________ Factors General Objectives ______________________________________________________________________
• Integrated access structure (Lenk & Maximize access to information and Traunmuller, 2000) services (MO)
• Seamless government (Lenk & Maximize access to information and
Traunmuller, 2000) services (MO)
• Free Internet access to e-government Maximize access to e-government (Prattipati, 2003) (MO)
• Enhanced information dissemination Maximize assess to information and
(Balutis, 2001B) services (MO)
• Security and privacy (Mittal, Kumar, Assure security (MO) Mohania, Nair, Batra, Rey, Saronwala, & Yagnik, 2004)
• One-stop service (Lenk, 2002) Maximize convenience (EO)
• Convenient and inexpensive services Maximize convenience (EO)
(Council for Excellence in Government, 2001)
• 24x7 availability of services (Vriens & Maximize convenience (EO)
Achterbergh, 2004)
• Fast service (MedJahed, Rezgui, Minimize time spent (EO) Bouguettaya, & Ouzzani, Jan./Feb., 2003)
• Fast delivery of information (Fugini & Minimize time to receive
Mezzanzanica, 2004) information and service (EO) ____________________________________________________________________
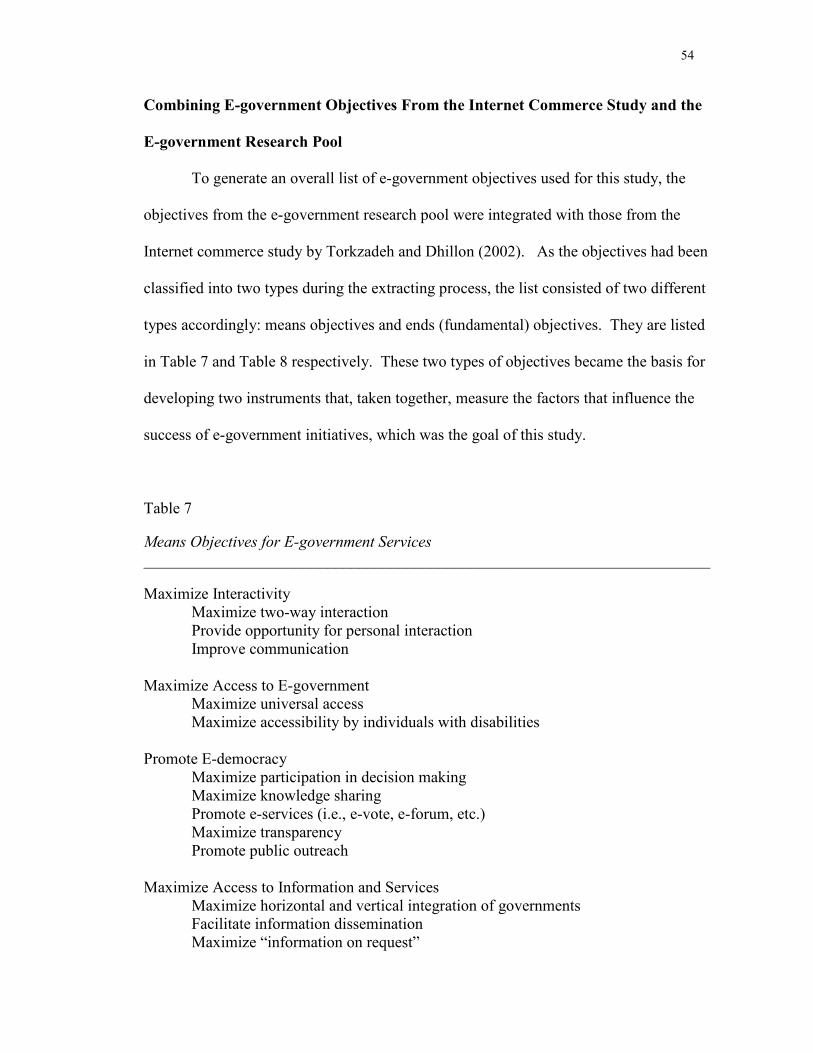
54
Combining E-government Objectives From the Internet Commerce Study and the
E-government Research Pool
To generate an overall list of e-government objectives used for this study, the
objectives from the e-government research pool were integrated with those from the
Internet commerce study by Torkzadeh and Dhillon (2002). As the objectives had been
classified into two types during the extracting process, the list consisted of two different
types accordingly: means objectives and ends (fundamental) objectives. They are listed
in Table 7 and Table 8 respectively. These two types of objectives became the basis for
developing two instruments that, taken together, measure the factors that influence the
success of e-government initiatives, which was the goal of this study.
Table 7 Means Objectives for E-government Services _______________________________________________________________________ Maximize Interactivity Maximize two-way interaction
Provide opportunity for personal interaction Improve communication
Maximize Access to E-government Maximize universal access Maximize accessibility by individuals with disabilities Promote E-democracy Maximize participation in decision making Maximize knowledge sharing Promote e-services (i.e., e-vote, e-forum, etc.) Maximize transparency Promote public outreach Maximize Access to Information and Services Maximize horizontal and vertical integration of governments Facilitate information dissemination Maximize “information on request”
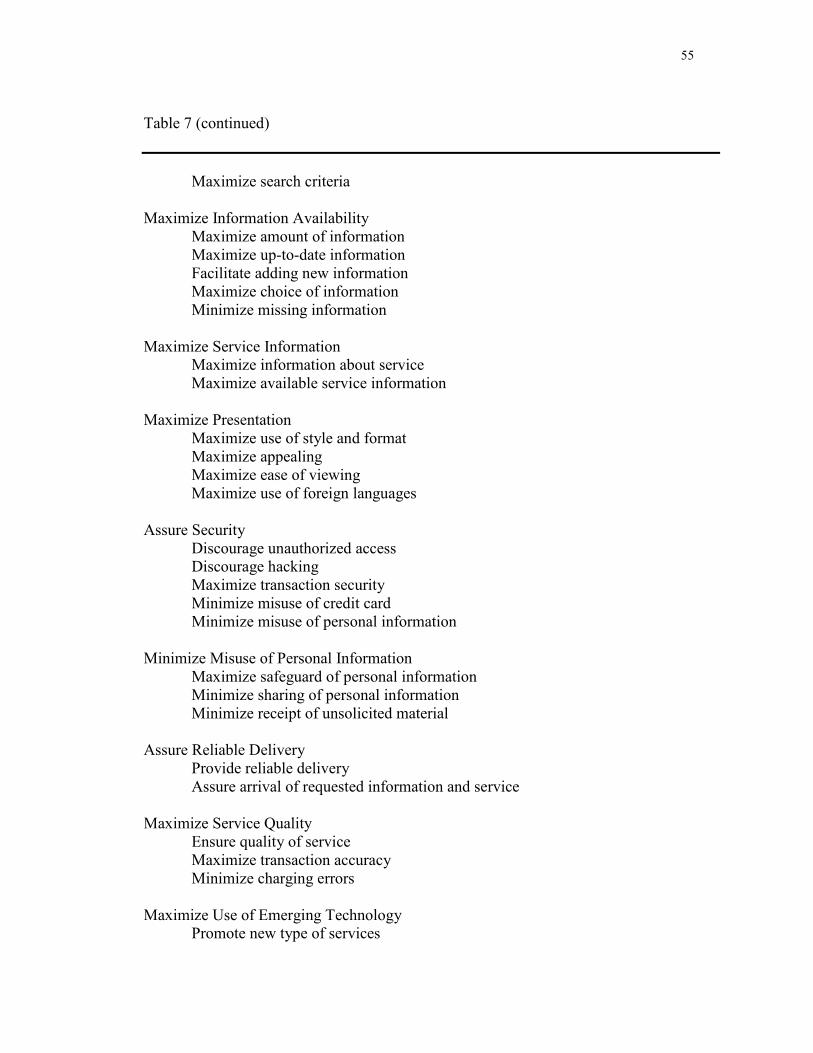
55
Table 7 (continued)
Maximize search criteria Maximize Information Availability
Maximize amount of information Maximize up-to-date information Facilitate adding new information Maximize choice of information Minimize missing information
Maximize Service Information Maximize information about service Maximize available service information Maximize Presentation Maximize use of style and format Maximize appealing Maximize ease of viewing Maximize use of foreign languages Assure Security Discourage unauthorized access Discourage hacking Maximize transaction security Minimize misuse of credit card Minimize misuse of personal information Minimize Misuse of Personal Information Maximize safeguard of personal information Minimize sharing of personal information Minimize receipt of unsolicited material
Assure Reliable Delivery Provide reliable delivery Assure arrival of requested information and service Maximize Service Quality Ensure quality of service Maximize transaction accuracy Minimize charging errors Maximize Use of Emerging Technology Promote new type of services
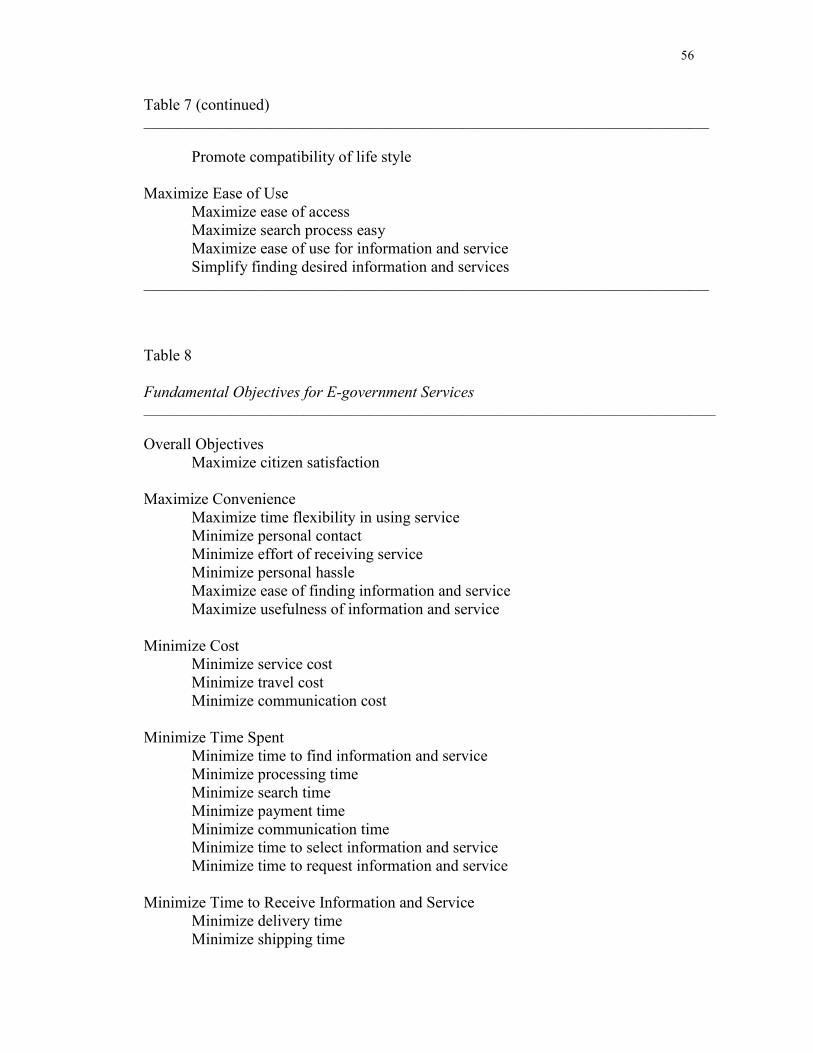
56
Table 7 (continued) _____________________________________________________________________________________
Promote compatibility of life style Maximize Ease of Use Maximize ease of access Maximize search process easy Maximize ease of use for information and service Simplify finding desired information and services _____________________________________________________________________________________
Table 8 Fundamental Objectives for E-government Services ______________________________________________________________________________________ Overall Objectives Maximize citizen satisfaction Maximize Convenience Maximize time flexibility in using service Minimize personal contact Minimize effort of receiving service
Minimize personal hassle Maximize ease of finding information and service Maximize usefulness of information and service Minimize Cost Minimize service cost Minimize travel cost Minimize communication cost Minimize Time Spent Minimize time to find information and service Minimize processing time Minimize search time Minimize payment time Minimize communication time Minimize time to select information and service Minimize time to request information and service Minimize Time to Receive Information and Service Minimize delivery time Minimize shipping time
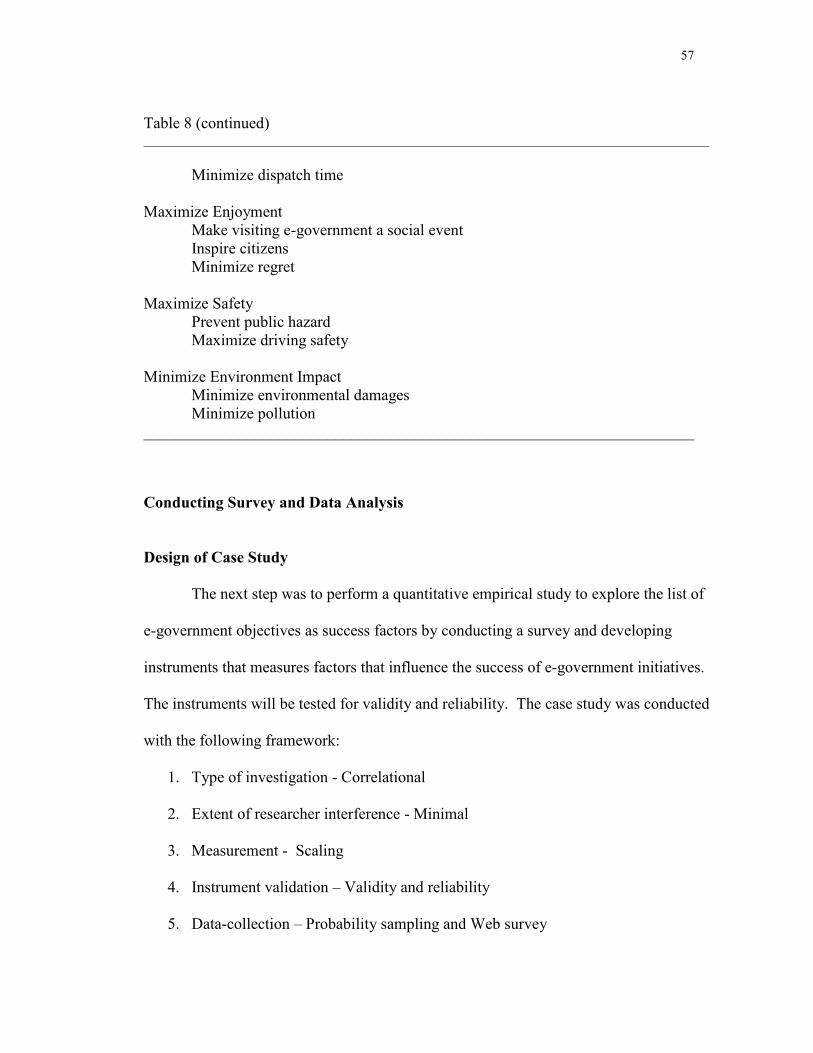
57
Table 8 (continued) _____________________________________________________________________________________
Minimize dispatch time Maximize Enjoyment Make visiting e-government a social event
Inspire citizens Minimize regret
Maximize Safety Prevent public hazard Maximize driving safety Minimize Environment Impact Minimize environmental damages Minimize pollution _____________________________________________________________________
Conducting Survey and Data Analysis
Design of Case Study
The next step was to perform a quantitative empirical study to explore the list of
e-government objectives as success factors by conducting a survey and developing
instruments that measures factors that influence the success of e-government initiatives.
The instruments will be tested for validity and reliability. The case study was conducted
with the following framework:
1. Type of investigation - Correlational
2. Extent of researcher interference - Minimal
3. Measurement - Scaling
4. Instrument validation – Validity and reliability
5. Data-collection – Probability sampling and Web survey
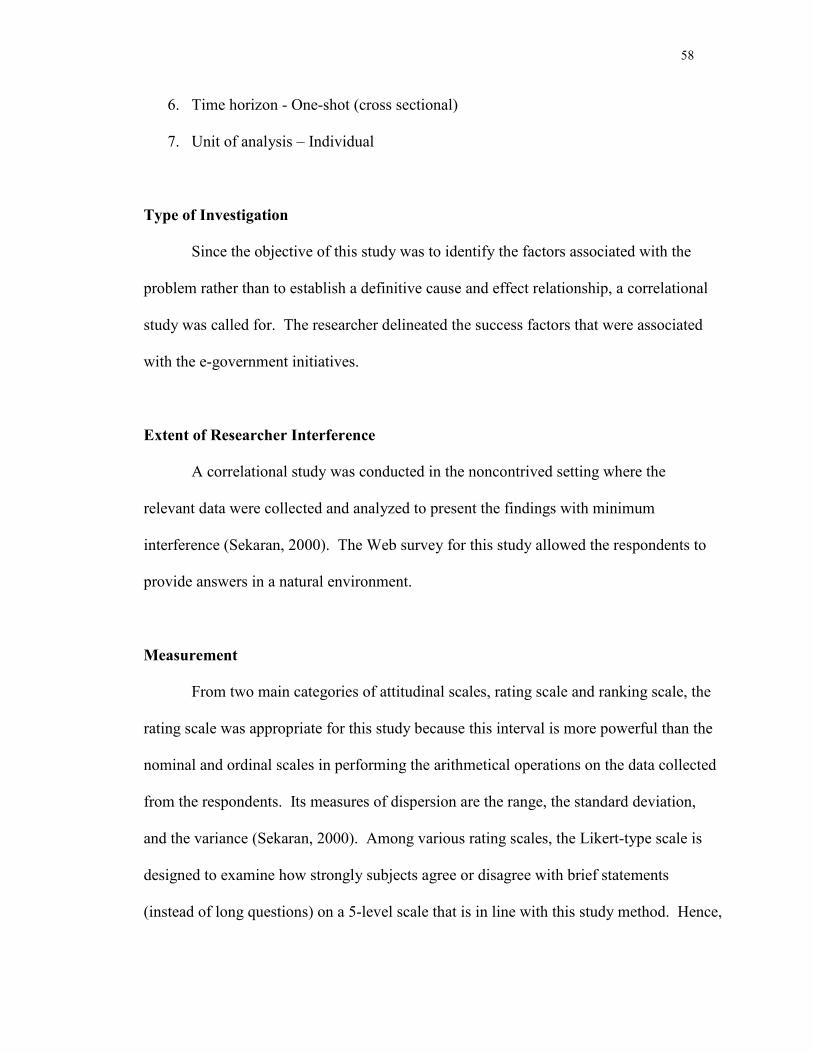
58
6. Time horizon - One-shot (cross sectional)
7. Unit of analysis – Individual
Type of Investigation
Since the objective of this study was to identify the factors associated with the
problem rather than to establish a definitive cause and effect relationship, a correlational
study was called for. The researcher delineated the success factors that were associated
with the e-government initiatives.
Extent of Researcher Interference
A correlational study was conducted in the noncontrived setting where the
relevant data were collected and analyzed to present the findings with minimum
interference (Sekaran, 2000). The Web survey for this study allowed the respondents to
provide answers in a natural environment.
Measurement
From two main categories of attitudinal scales, rating scale and ranking scale, the
rating scale was appropriate for this study because this interval is more powerful than the
nominal and ordinal scales in performing the arithmetical operations on the data collected
from the respondents. Its measures of dispersion are the range, the standard deviation,
and the variance (Sekaran, 2000). Among various rating scales, the Likert-type scale is
designed to examine how strongly subjects agree or disagree with brief statements
(instead of long questions) on a 5-level scale that is in line with this study method. Hence,
59
the instrument used a Likert-type scale with a range from “strongly disagree” to “strongly
agree”, using words in the scale instead of numeric value (e.g. 1, 2, 3, 4, and 5). Once the
selections were made by the respondents, they were assigned corresponding numeric
score, 1 for “strongly disagree” to 5 for “strongly agree”. The responses over a range of
each statement were then summated for every respondent. As the interval scale was used,
the differences in the responses between any two ranges on the scale remained the same.
Though Likert scaling is a commonly used instrument for measuring beliefs
(DeVellis, 2003), it is subject to a response set that reflects the tendency of a respondent
to reply to questions in a certain way independently of the content of the questions. This
tendency is derived from the nature of the Likert-type instrument, in which the question
is presented as a declarative sentence, followed by response options that exhibit varying
degrees of agreement with the statement (DeVellis, 2003). One such response bias is the
tendency to agree rather than disagree, or the tendency to make extreme responses
(Rennie, 1982). Another is the tendency to not focus much attention on subtleties of
language by merely regarding any reasonable response option in the center of the range
as midpoint, regardless of the precise wording (DeVellis, 2003). For example, very mild
statements may cause the tendency for too much agreement because they represent the
absence of belief, while extreme statements may cause extreme views. The latter may be
less of a problem because this study is interested in the presence of some belief, rather
than in its absence. To reduce the response bias, the instruments attempted to state the
beliefs in clear terms. Since the purpose of using Likert scale is not to span the range of
weak to strong assertions of the construct (DeVellis, 2003), the questionnaires were
designed to provide respondents the opportunity for gradations.
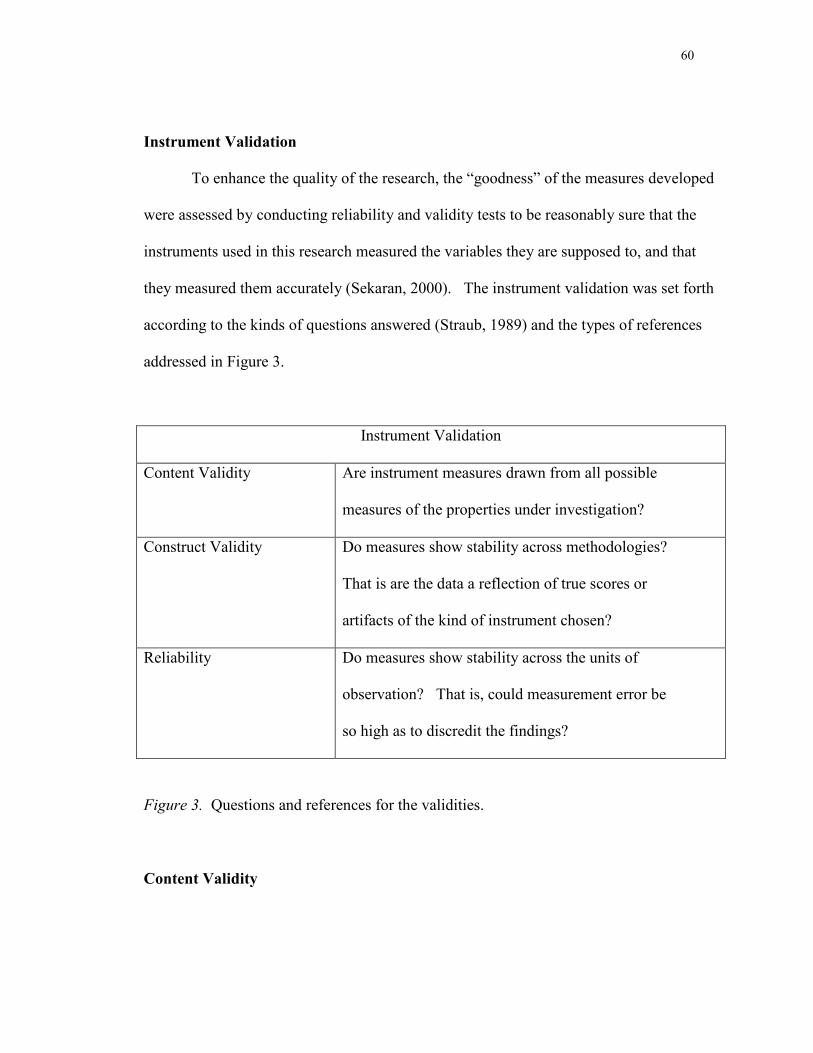
60
Instrument Validation
To enhance the quality of the research, the “goodness” of the measures developed
were assessed by conducting reliability and validity tests to be reasonably sure that the
instruments used in this research measured the variables they are supposed to, and that
they measured them accurately (Sekaran, 2000). The instrument validation was set forth
according to the kinds of questions answered (Straub, 1989) and the types of references
addressed in Figure 3.
Instrument Validation
Content Validity Are instrument measures drawn from all possible
measures of the properties under investigation?
Construct Validity Do measures show stability across methodologies?
That is are the data a reflection of true scores or
artifacts of the kind of instrument chosen?
Reliability Do measures show stability across the units of
observation? That is, could measurement error be
so high as to discredit the findings?
Figure 3. Questions and references for the validities.
Content Validity
61
Content validity concerns item sampling adequacy-that is, the extent to which a
specific set of items reflects a content domain (DeVellis, 2003). Content validity is a
function of how well the dimensions and elements of a concept have been delineated
(Sekaran, 2000). Content-valid instrument is difficult to create and perhaps even more
difficult to verify because the universe of possible content is virtually infinite (Straub,
1989). An instrument valid in content is one that includes an adequate and representative
set of items that tap the concept. The more the scale items represent the domain or
universe of the concept being measured, the greater the content validity. The instrument
proposed in this study was derived from the wide research pool in the leading
publications that reflect the view of experts in the field familiar with the content universe.
To compile comprehensive e-government value, this research was not only based on a
total of 125 items developed by the major Internet commerce study by Torkzadeh and
Dhillon (2002) but also explored the e-government research that had been done during
the 6-year period from 2000 to 2005 in the literatures from IS and reference discipline.
Drawn together, and assigned as the basis for formulating a comprehensive model of e-
government value, these contents should have brought the level of content validity to an
acceptable level for the study.
Construct Validity
Construct validity is directly concerned with the theoretical relationship of a
variable (e.g., a score on same scale) to other variables (DeVellis, 2003). It is in essence
an operational issue (Straub, 1989) in that it testifies to how well the results obtained
62
from the use of the measure fit the theories around which the test is designed (Sekaran,
2000).
Constructs are considered valid when high correlation occurs between measures
of the same construct and low correlation occurs between measures of different
constructs (Straub, 1989). This study established construct validity through (1)
correlational analysis to purify the items and (2) factor analysis to confirm the
dimensions of the concept that had been operationally defined, as well as indicated which
of the items were most appropriate for each dimension (Sekaran, 2000). To purify the
items, the corrected item-total correlation technique was used. If all items in a measure
are drawn from the domain of a single construct, responses to those items should be
highly intercorrelated (Torkzadeh & Dhillon, 2002). The correlation of each item with
the sum of the other items in its category was evaluated.
Reliability
Whereas validity concerns whether the variable is the underlying cause of item
covariation, reliability concerns how much a variable influences a set of items. Reliability
is the proportion of variance attributable to the true score of the latent variable (DeVellis,
2003), reflecting the stability across the units of observation (Straub, 1989). The
reliability of a measure indicates the extent to which the measure is without bias (error
free) and hence offers consistent measurement across time and across the various items in
the instrument (Sekaran, 2000). Internal consistency reliabilities are typically equated
with Cronbach’s coefficient alpha. Thus, the reliability of items comprising each
dimension were examined using Cronbach’s α to see if additional items could be
63
eliminated without substantially lowering reliability. High correlation between
alternative measures or large Cronbach’s α is usually signs that the measures are reliable
(Straub, 1989).
Use of Factor Analysis
The focus of science is theory. Data are meaningless in themselves until they are
linked through propositions that confer meaning (Rummel, 1970). A scientific theory
consists of analytic and empirical components. The analytic component reflects the
linkage of reasoning that follows logical rules without empirical content, whereas the
empirical component reflects the linking of empirical data for a theory to apply to reality
(Rummel, 1970). The empirical component connects the analytic component to the facts.
Factor analysis combines analytic and empirical components in order to connect theory to
social phenomena (Rummel, 1970). For this study, factor analysis helped connect the
value theory to e-government phenomena.
The multivariate statistical technique of factor analysis has found increased use
(Hair, Anderson, Tatham, & Black, 1998) for the purpose of interdependency and pattern
delineation, data reduction, discovery of the basic structure, classification or description
of variables, scaling, hypothesis testing, data transformation, exploration of the complex
interrelations of phenomena, mapping of the social terrain, and theory building (Rummel,
1970). The common objective of factor analysis is to represent a set of variables in terms
of a smaller number of hypothetical variables using various statistical methods (Kim &
Mueller, 1978). The primary functions of factor analysis for this study were to validate
64
data and help determine empirically how many factors underlie a set of items (Devellis,
2003).
There are two types of factor analysis methods: exploratory and confirmatory
factor analysis. The former was used because the purpose of this study was to discover
the factor structure of a measure, and examine its internal reliability as opposed to
confirming a particular pattern of relationships by a hypothesized factor structure
(Devellis, 2003). The analysis examined the interrelationships among variables (e-
government objectives) using correlation coefficients as a measure of association. The
correlation matrix was expected to reveal the structure of relationships among variables.
Principal component analysis (PCA) was used for outlier detection. Outliers could cause
data inconsistency that reflects a sample that behaves quite differently when comparing to
other samples of the same group, and that could disqualify data analysis (Straub, 1989).
PCA also was used to decide the number of factors. This study used PCA because the
objective was to summarize most of the original variance in a minimum number of
factors, as opposed to using common factor analysis (CFA) to identify underlying factors
that reflect what the variables share in common (Hair et al., 1998). The basic assumption
for this study was that the underlying structure of two variables, the means, and the
fundamental objectives, were conceptually valid and appropriate. The outcome of factor
analysis was two models of factor structures: one reflects means objectives, and the other
reflects fundamental objectives.
65
Data Collection
The population was all e-government service users. The sample for this study
included working professionals from metropolitan areas in the United States who had
experience in using e-government services. The target respondents were recruited from
various professional sources, such as university alumni, bankers, lawyers, travel agents,
accountants, IS engineers, and architects who expressed positive support for the study.
Response rate was a major issue in successful survey research. To increase
response rate of its target population, this study attempted to minimize the respondents'
effort in responding to the survey, and to maximize support from the population. To
minimize the respondents' effort, the survey questions were made clear, concise,
unambiguous, and consistent, and the responses can be made fast, less costly, and more
convenient via Web survey. A major advantage of using Web survey for this study was
to maximize convenience for the respondents because the target population (e-
government online users) was Web users who were equipped with the tools and
knowledge of Web use. To maximize support from the population, the cooperation rate
and the contact rate was considered (Langer, 2003). To increase the cooperation rate,
participation of the survey was encouraged by stressing the participants' contribution to
society in developing citizen centered e-government services and fostering e-democracy.
To increase the contact rate, the target respondents were recruited from various
professional sources who expressed positive support for the study. The expectation of the
response rate was high, thus, the problem of nonresponse and its effects on this study was
low. Though the expected responses were about 300, 210 responses were obtained.
66
From two major types of sampling designs, probability and nonprobability
sampling, this study used the probability sampling design because the representativeness
of the sample was important in the interests of wider generalizability (Sekaran, 2000).
The nonprobability sampling can be used when time or other factors rather than
generalizability become critical (Sekaran, 2000). The sample for this study was working
professionals from metropolitan areas in the United States who had experience in using e-
government services, reflecting the knowledge of computer use and access to Internet
service. For a quantitative research such as the proposed, too small a sample size would
not land the meaningful result whereas too large a sample size could reflect weak
relationships in variables. As the sample sizes larger than 30 and less than 500 are
appropriate for most research (Sekaran, 2000), the sample size for this study was 210.
Data collection methods are an integral part of research design each of which has
its own advantages and disadvantages. Data can be collected from interviews by face-to-
face, telephone, and computer-mediated, questionnaires administered in person, mail, and
electronic means, and observations with videotaping and audio recording. This study
conducted on-line questionnaire surveys via the Web site by taking advantages of the
electronic means: ease of administration, ease of reaching distanced respondents,
inexpensive, fast, and flexible time for response. The disadvantages, such as requiring
computer literacy and access to the facility, was overcome by selecting the samples who
were capable in computer response and had access to Internet service.
The survey Web page presented users with radio buttons because the choices were
mutually exclusive, which restricted them to selecting exactly one option for improved
reliability. The respondents were asked to respond based on the best-described belief
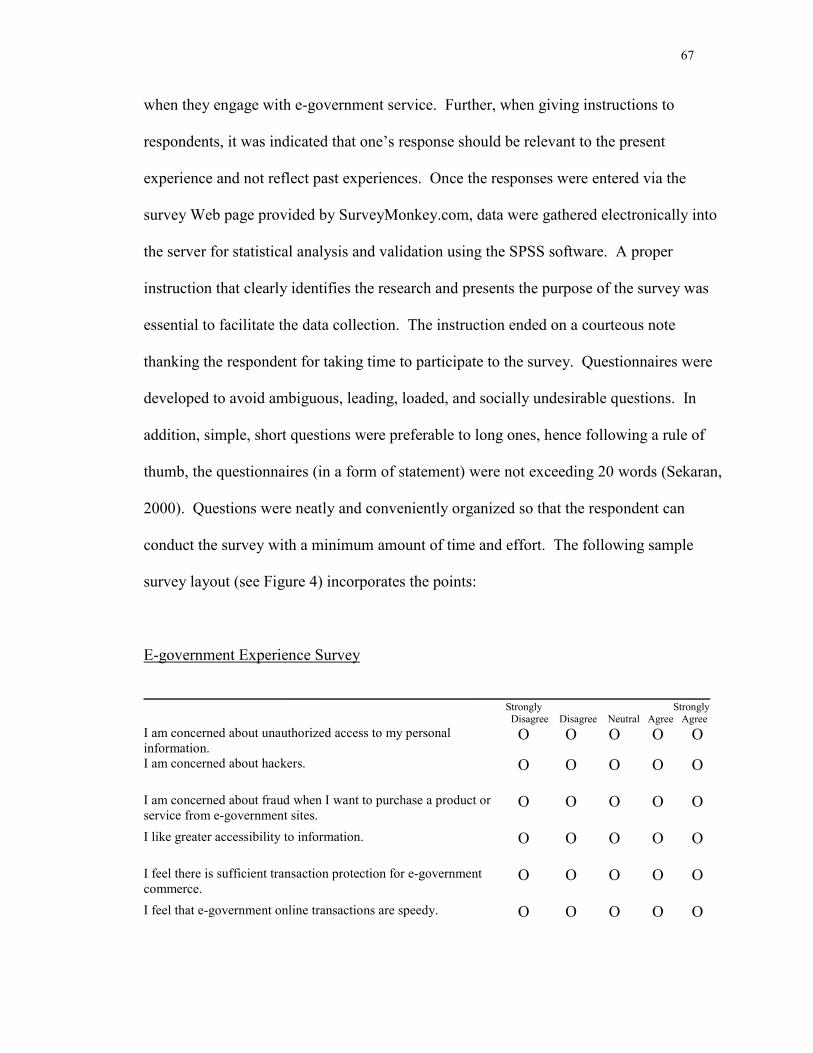
67
when they engage with e-government service. Further, when giving instructions to
respondents, it was indicated that one’s response should be relevant to the present
experience and not reflect past experiences. Once the responses were entered via the
survey Web page provided by SurveyMonkey.com, data were gathered electronically into
the server for statistical analysis and validation using the SPSS software. A proper
instruction that clearly identifies the research and presents the purpose of the survey was
essential to facilitate the data collection. The instruction ended on a courteous note
thanking the respondent for taking time to participate to the survey. Questionnaires were
developed to avoid ambiguous, leading, loaded, and socially undesirable questions. In
addition, simple, short questions were preferable to long ones, hence following a rule of
thumb, the questionnaires (in a form of statement) were not exceeding 20 words (Sekaran,
2000). Questions were neatly and conveniently organized so that the respondent can
conduct the survey with a minimum amount of time and effort. The following sample
survey layout (see Figure 4) incorporates the points:
E-government Experience Survey
_______________________________________________________________________Strongly Strongly
Disagree Disagree Neutral Agree Agree I am concerned about unauthorized access to my personal information.
O O O O O
I am concerned about hackers. O O O O O
I am concerned about fraud when I want to purchase a product or service from e-government sites.
O O O O O
I like greater accessibility to information. O O O O O
I feel there is sufficient transaction protection for e-government commerce.
O O O O O
I feel that e-government online transactions are speedy. O O O O O
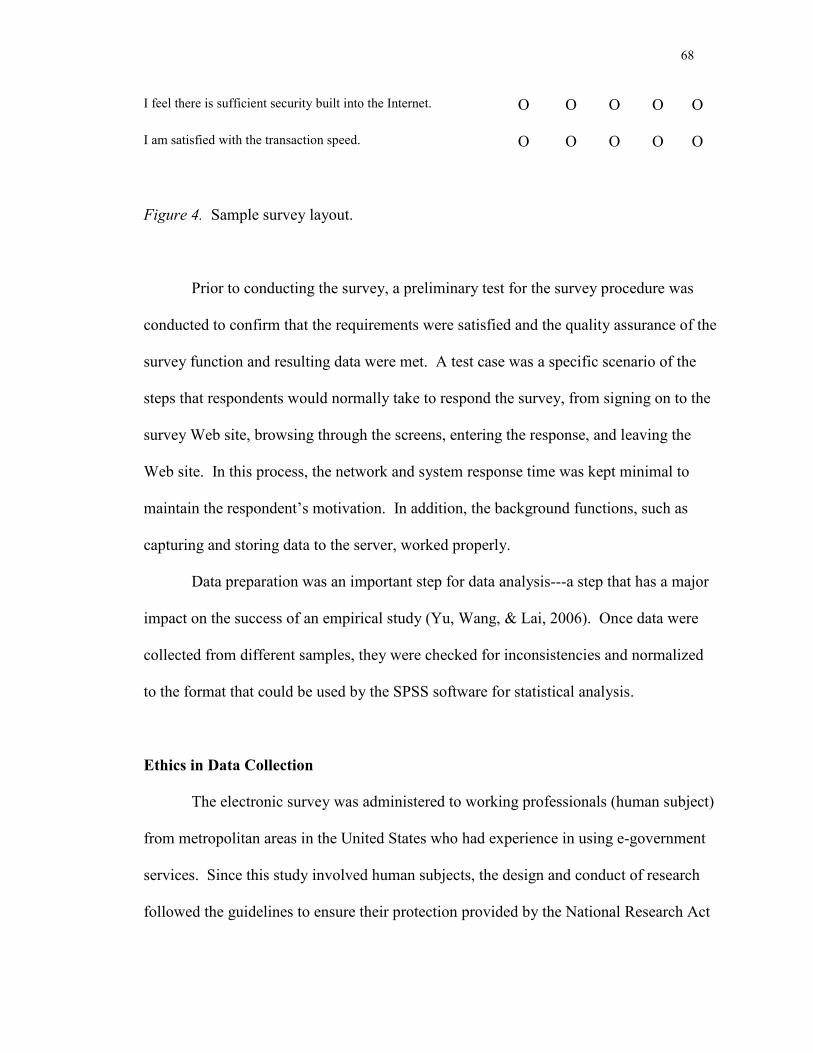
68
I feel there is sufficient security built into the Internet. O O O O O
I am satisfied with the transaction speed. O O O O O
Figure 4. Sample survey layout.
Prior to conducting the survey, a preliminary test for the survey procedure was
conducted to confirm that the requirements were satisfied and the quality assurance of the
survey function and resulting data were met. A test case was a specific scenario of the
steps that respondents would normally take to respond the survey, from signing on to the
survey Web site, browsing through the screens, entering the response, and leaving the
Web site. In this process, the network and system response time was kept minimal to
maintain the respondent’s motivation. In addition, the background functions, such as
capturing and storing data to the server, worked properly.
Data preparation was an important step for data analysis---a step that has a major
impact on the success of an empirical study (Yu, Wang, & Lai, 2006). Once data were
collected from different samples, they were checked for inconsistencies and normalized
to the format that could be used by the SPSS software for statistical analysis.
Ethics in Data Collection
The electronic survey was administered to working professionals (human subject)
from metropolitan areas in the United States who had experience in using e-government
services. Since this study involved human subjects, the design and conduct of research
followed the guidelines to ensure their protection provided by the National Research Act
69
Public Law 99-158, the Health Research Extension Act of 1985, and the National
commission for the Protection of Human Subject of Biomedical and Behavioral Research
(Nova Southeastern University, 2005). In general, it is considered unethical when the
practices cause pressuring individuals to participate through coercion or applying social
pressure, diminishing self-respect, deceiving subjects by deliberately misleading them,
exposing participants to physical or mental stress, exposing respondents to hazardous
environment, and not preserving the privacy and confidentiality of the information given
by the participants (Sekaran, 2000). To ensure confidentiality, this study neither
referred to outsiders nor maintained any form of linkage in order to go back and review
the record at a later time. The only linkage information collected was the IP address of
each respondent for the purpose of validating the integrity of the data source. As the
respondents were somewhat geographically diversified, it was not expected that a great
amount of responses derived from a single IP address. The list of IP addresses was
permanently removed from the server once the validity test was complete. As it
remained unknown who participated in the study, the likelihood of potential risks to the
subjects was virtually none. The Institutional Review Board (IRB) approval letter from
Nova Southeastern university for this survey research is attached in Appendix F.
Time Horizon
This study was a one-shot (cross sectional) instead of longitudinal study because
data collection at one point in time was sufficient rather than two or more points in time
to answer the research question. Data received between August and September in 2006
from the respondents will not be collected again from them for this research.
70
Unit of Analysis
The unit of analysis refers to the level of aggregation of the data collected
(Sekaran, 2000). As this study was interested in finding out the e-government value to
citizens, the unit of analysis was the individual. Hence, the data collected from each
individual was treated as an individual data source.
Relating the Means and Ends Factors by Examining the Cross-correlations
Among Factors
The last step in developing instrument was to analyze the correlation matrix for
convergent and discriminant validity. The magnitude of the correlations observed
revealed the validity; items in one group were highly correlated with the other items in its
group than with any of the items measuring other factors (Torkzadeh & Dhillon, 2002).
Resources
In order to discuss the theoretical antecedents of e-government initiatives,
measurement instruments, and framework, an extensive review of the literature from IS
and other related journals, proceedings, and books on related topics was conducted. To
illustrate the e-government phenomena, information collected by various public and
private organizations were referenced. To complete the empirical study, a survey was
administered to working professionals in the metropolitan area who have experiences in
using the e-government services. Once data were collected, they were analyzed with the
statistical software SPSS for validation.
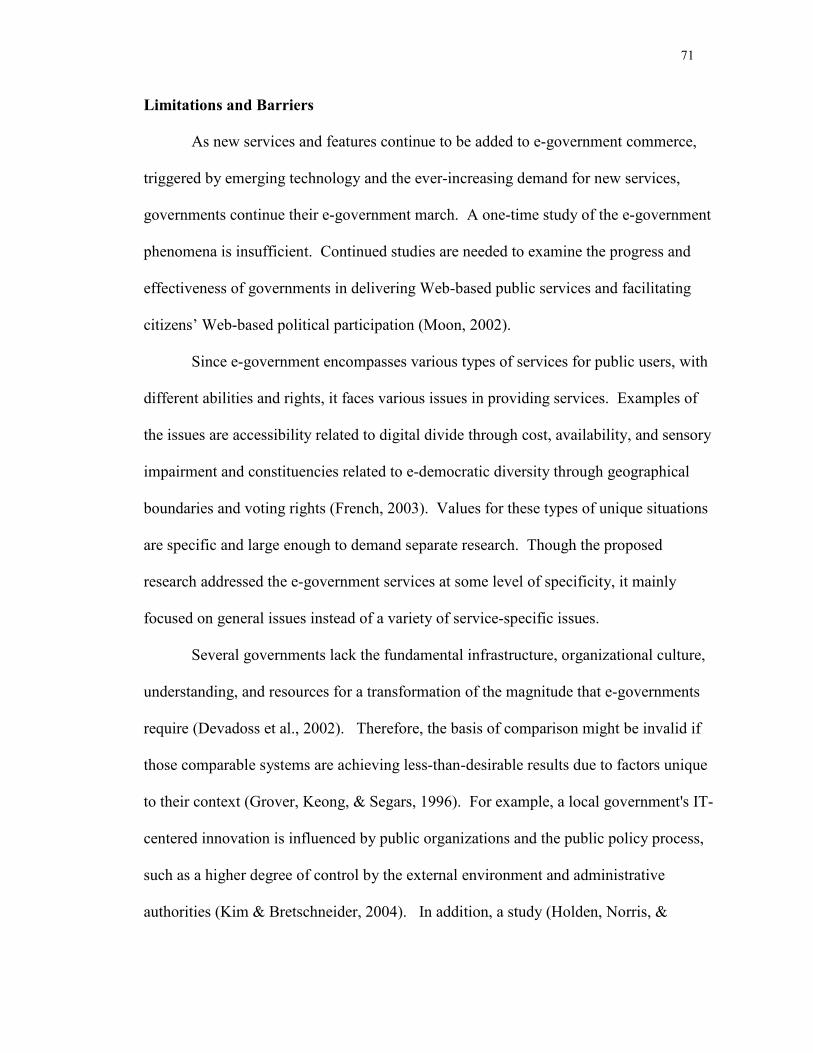
71
Limitations and Barriers
As new services and features continue to be added to e-government commerce,
triggered by emerging technology and the ever-increasing demand for new services,
governments continue their e-government march. A one-time study of the e-government
phenomena is insufficient. Continued studies are needed to examine the progress and
effectiveness of governments in delivering Web-based public services and facilitating
citizens’ Web-based political participation (Moon, 2002).
Since e-government encompasses various types of services for public users, with
different abilities and rights, it faces various issues in providing services. Examples of
the issues are accessibility related to digital divide through cost, availability, and sensory
impairment and constituencies related to e-democratic diversity through geographical
boundaries and voting rights (French, 2003). Values for these types of unique situations
are specific and large enough to demand separate research. Though the proposed
research addressed the e-government services at some level of specificity, it mainly
focused on general issues instead of a variety of service-specific issues.
Several governments lack the fundamental infrastructure, organizational culture,
understanding, and resources for a transformation of the magnitude that e-governments
require (Devadoss et al., 2002). Therefore, the basis of comparison might be invalid if
those comparable systems are achieving less-than-desirable results due to factors unique
to their context (Grover, Keong, & Segars, 1996). For example, a local government's IT-
centered innovation is influenced by public organizations and the public policy process,
such as a higher degree of control by the external environment and administrative
authorities (Kim & Bretschneider, 2004). In addition, a study (Holden, Norris, &
72
Fletcher, 2003) found that that five greatest barriers to the adoption of e-government are
lack of technology or Web staff, lack of financial resources, lack of technology or Web
expertise, issues regarding security, and the need to upgrade existing information
technology.
The instrument development for eliciting responses from subjects for this study
reflected one country. With the globalization of e-government implementations, the
research effort will need to trace the similarities and differences in the behavioral and
attitudinal responses of e-government users at various levels in difference countries.
Certain special issues need to be addressed while designing instruments for collecting
data by each country or from different counties that include vocabulary equivalence,
idiomatic equivalence, conceptual equivalence, and response equivalence (Sekaran,
2000).
Measuring of research constructs is neither simple nor straightforward (Straub,
1989). Due to the inherent nature of conducting user surveys, this study would have a
certain amount of bias. The choice of method (as in online versus off-line instruments)
and components of the chosen method (as in item selection and item phrasing) could have
affected instrumentation. Inaccuracies in measurement could be reflected in the
instrument when items were ambiguously phrased, length of the instrument taxed
respondents’ concentration, or motivation for answering carefully was not induced
(Straub, 1989).
Different e-government users might view the value of the same e-government
services differently. One may have found it convenient, easy to use, and low-cost, while
other experienced the e-government service over the Internet as overly difficult and
73
impersonal. Thus, the net value including benefits and costs of ordering and receiving
the services could significantly differ by individual. In addition, measuring instruments
are not static in nature; they evolve through an ever-changing refinement. Hence, the
instruments developed in this study will need to be refined in the future as technology
and services emerge.
Correlation is a linear measure of association between the variables. The
correlation can be observed by assessing the variations in one variable as another variable
also varies (Sekaran, 2000). Though the zero correlation coefficient value indicates no
strength of the association between two variables (Hair et al., 1998), it does not imply
that there is no relationship at all; it only means that there is no linear relationship
between them. For example, the correlation between y and x would be zero, even though
they are perfectly related: y=sin(x). Hence, correlation is adequate if the relationship is
monotonically increasing or decreasing.
Summary
This chapter delineated the methodology and activities for conducting the study.
In order to develop a basis for formulating a model of e-government value for empirical
study, a list of e-government objectives from the exploratory study by Torkzadeh and
Dhillon (2002) and the published research pool during the 6-year period from 2000 to
2005 was generated. The e-government objectives then were grouped into two categories,
means and ends (fundamental) objectives. Based on this categorization, two instruments
that together measure the factors that influence the success of e-government initiatives
was developed. One instrument measures the means objectives that influence using e-
74
government services, and the other measures the fundamental objectives that are essential
reasons for using e-government services. In addition, the instrument development and
validation steps were addressed.
The components of empirical research design included type of investigation,
extent of interference, measurement type, data-collection method, time horizon, sampling
design, and unit of analysis. The instrument validation included content validity,
construct validity and reliability. Ethics of data collection concerned the respondent’s
privacy and security.
There were various limitations and barriers for the research. One-time study of e-
government phenomena is insufficient; on-going studies are needed to examine the
progress and implications of the e-government evolution. Since e-government
encompasses various types of services for public use, each with its own set of issues and
complexities, a wide range of research is required. Thus, this research will address the
different e-government services at some level of specificity, while also providing an
overview of general issues. The instruments developed in this study will need to be
refined in the future as new technologies and services emerge.
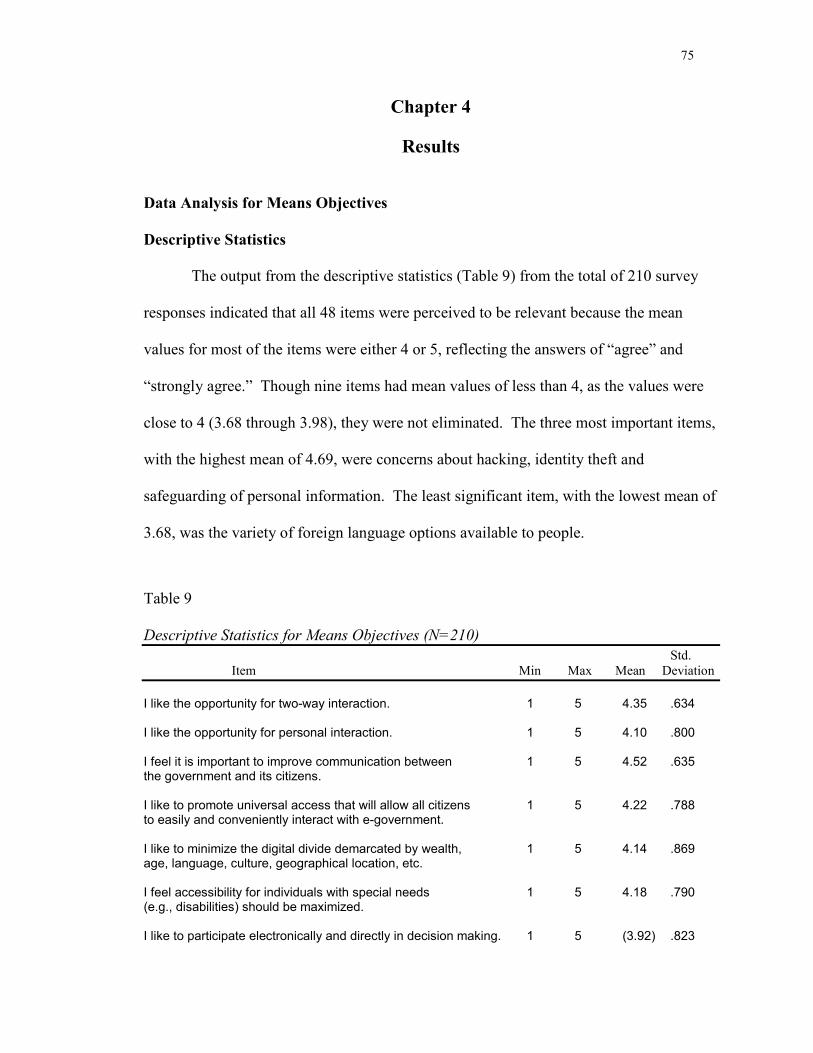
75
Chapter 4
Results
Data Analysis for Means Objectives
Descriptive Statistics
The output from the descriptive statistics (Table 9) from the total of 210 survey
responses indicated that all 48 items were perceived to be relevant because the mean
values for most of the items were either 4 or 5, reflecting the answers of “agree” and
“strongly agree.” Though nine items had mean values of less than 4, as the values were
close to 4 (3.68 through 3.98), they were not eliminated. The three most important items,
with the highest mean of 4.69, were concerns about hacking, identity theft and
safeguarding of personal information. The least significant item, with the lowest mean of
3.68, was the variety of foreign language options available to people.
Table 9 Descriptive Statistics for Means Objectives (N=210)
Std. Item Min Max Mean Deviation
I like the opportunity for two-way interaction. 1 5 4.35 .634 I like the opportunity for personal interaction. 1 5 4.10 .800 I feel it is important to improve communication between 1 5 4.52 .635 the government and its citizens. I like to promote universal access that will allow all citizens 1 5 4.22 .788 to easily and conveniently interact with e-government. I like to minimize the digital divide demarcated by wealth, 1 5 4.14 .869 age, language, culture, geographical location, etc. I feel accessibility for individuals with special needs 1 5 4.18 .790 (e.g., disabilities) should be maximized. I like to participate electronically and directly in decision making. 1 5 (3.92) .823
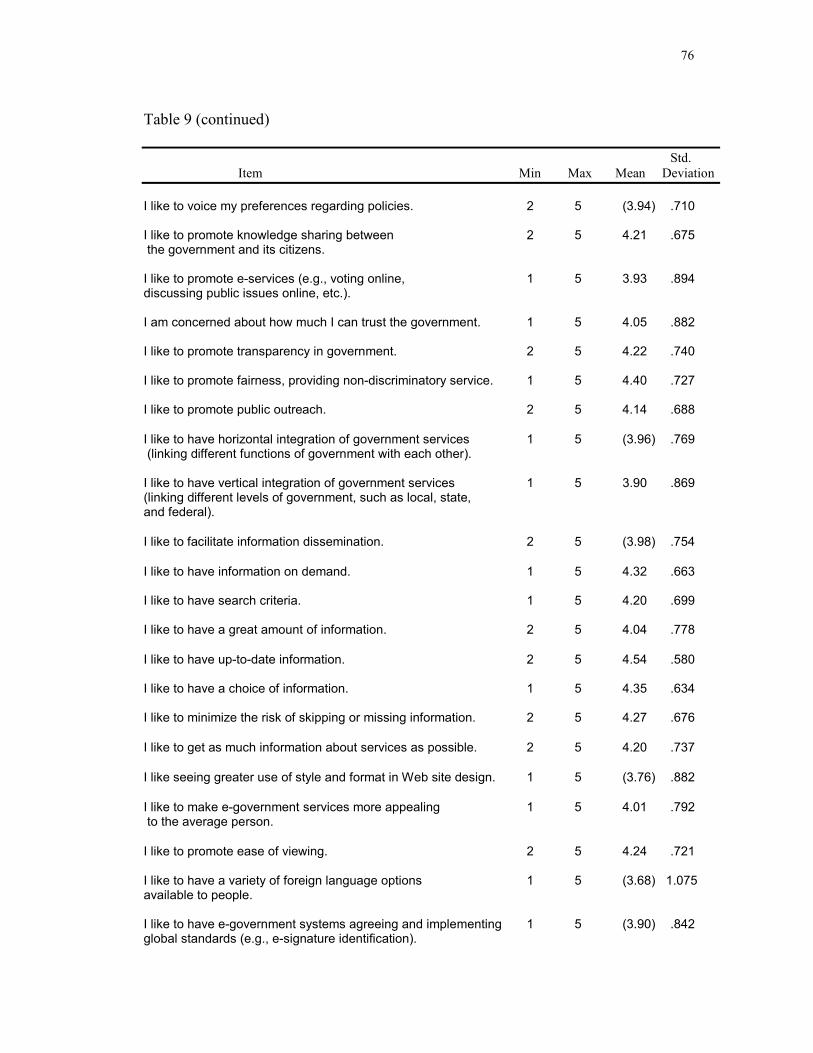
76
Table 9 (continued)
Std. Item Min Max Mean Deviation
I like to voice my preferences regarding policies. 2 5 (3.94) .710 I like to promote knowledge sharing between 2 5 4.21 .675 the government and its citizens. I like to promote e-services (e.g., voting online, 1 5 3.93 .894 discussing public issues online, etc.). I am concerned about how much I can trust the government. 1 5 4.05 .882 I like to promote transparency in government. 2 5 4.22 .740 I like to promote fairness, providing non-discriminatory service. 1 5 4.40 .727 I like to promote public outreach. 2 5 4.14 .688 I like to have horizontal integration of government services 1 5 (3.96) .769 (linking different functions of government with each other). I like to have vertical integration of government services 1 5 3.90 .869 (linking different levels of government, such as local, state, and federal).
I like to facilitate information dissemination. 2 5 (3.98) .754
I like to have information on demand. 1 5 4.32 .663 I like to have search criteria. 1 5 4.20 .699 I like to have a great amount of information. 2 5 4.04 .778
I like to have up-to-date information. 2 5 4.54 .580 I like to have a choice of information. 1 5 4.35 .634 I like to minimize the risk of skipping or missing information. 2 5 4.27 .676
I like to get as much information about services as possible. 2 5 4.20 .737
I like seeing greater use of style and format in Web site design. 1 5 (3.76) .882
I like to make e-government services more appealing 1 5 4.01 .792 to the average person.
I like to promote ease of viewing. 2 5 4.24 .721 I like to have a variety of foreign language options 1 5 (3.68) 1.075 available to people. I like to have e-government systems agreeing and implementing 1 5 (3.90) .842 global standards (e.g., e-signature identification).
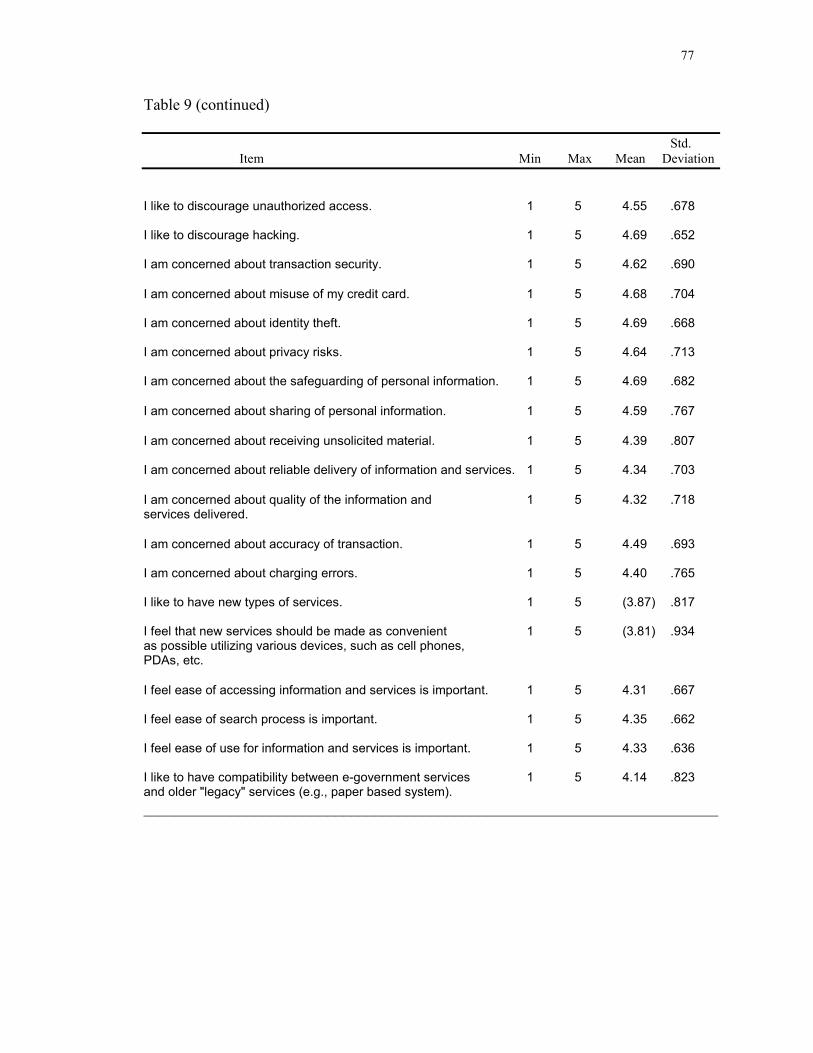
77
Table 9 (continued)
Std. Item Min Max Mean Deviation
I like to discourage unauthorized access. 1 5 4.55 .678 I like to discourage hacking. 1 5 4.69 .652 I am concerned about transaction security. 1 5 4.62 .690
I am concerned about misuse of my credit card. 1 5 4.68 .704 I am concerned about identity theft. 1 5 4.69 .668 I am concerned about privacy risks. 1 5 4.64 .713 I am concerned about the safeguarding of personal information. 1 5 4.69 .682
I am concerned about sharing of personal information. 1 5 4.59 .767
I am concerned about receiving unsolicited material. 1 5 4.39 .807 I am concerned about reliable delivery of information and services. 1 5 4.34 .703
I am concerned about quality of the information and 1 5 4.32 .718 services delivered.
I am concerned about accuracy of transaction. 1 5 4.49 .693 I am concerned about charging errors. 1 5 4.40 .765 I like to have new types of services. 1 5 (3.87) .817 I feel that new services should be made as convenient 1 5 (3.81) .934 as possible utilizing various devices, such as cell phones, PDAs, etc.
I feel ease of accessing information and services is important. 1 5 4.31 .667 I feel ease of search process is important. 1 5 4.35 .662 I feel ease of use for information and services is important. 1 5 4.33 .636 I like to have compatibility between e-government services 1 5 4.14 .823 and older "legacy" services (e.g., paper based system). ________________________________________________________________________
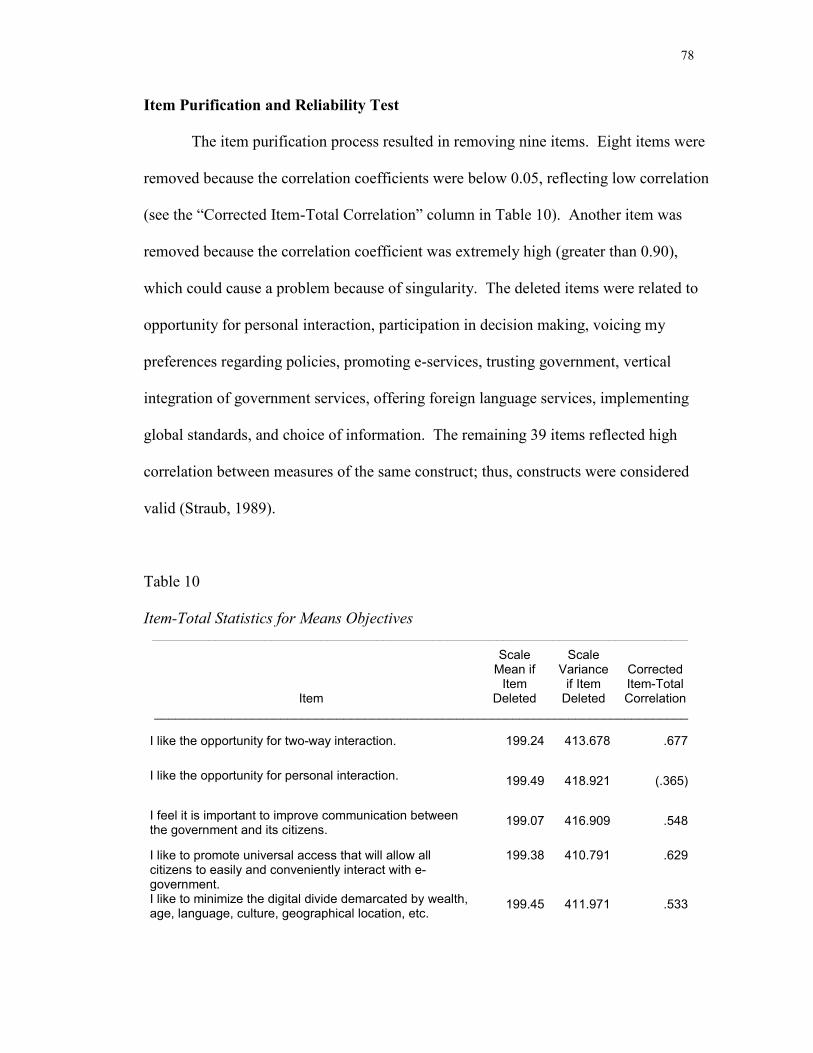
78
Item Purification and Reliability Test
The item purification process resulted in removing nine items. Eight items were
removed because the correlation coefficients were below 0.05, reflecting low correlation
(see the “Corrected Item-Total Correlation” column in Table 10). Another item was
removed because the correlation coefficient was extremely high (greater than 0.90),
which could cause a problem because of singularity. The deleted items were related to
opportunity for personal interaction, participation in decision making, voicing my
preferences regarding policies, promoting e-services, trusting government, vertical
integration of government services, offering foreign language services, implementing
global standards, and choice of information. The remaining 39 items reflected high
correlation between measures of the same construct; thus, constructs were considered
valid (Straub, 1989).
Table 10 Item-Total Statistics for Means Objectives
__________________________________________________________________________________________
Item
Scale Mean if
Item Deleted
Scale Variance
if Item Deleted
Corrected Item-Total Correlation
____________________________________________________________________________
I like the opportunity for two-way interaction. 199.24 413.678 .677
I like the opportunity for personal interaction. 199.49 418.921 (.365)
I feel it is important to improve communication between the government and its citizens.
199.07 416.909 .548
I like to promote universal access that will allow all citizens to easily and conveniently interact with e-government.
199.38 410.791 .629
I like to minimize the digital divide demarcated by wealth, age, language, culture, geographical location, etc.
199.45 411.971 .533
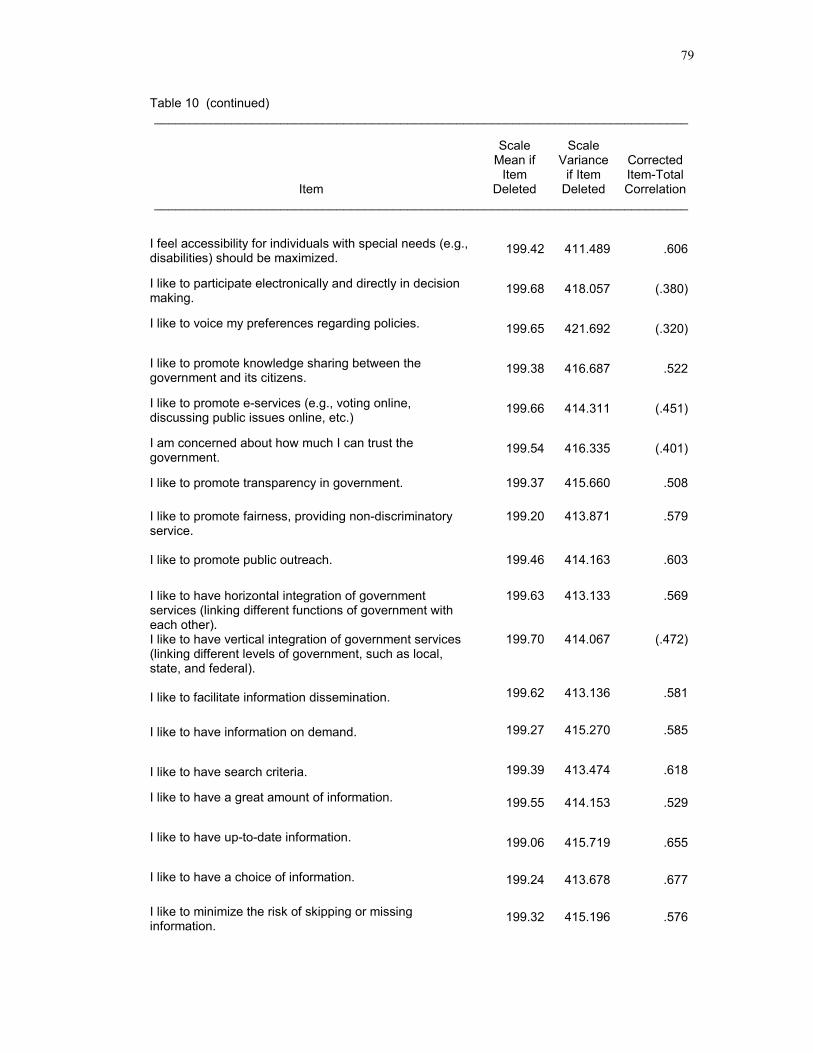
79
Table 10 (continued) ____________________________________________________________________________
Item
Scale Mean if
Item Deleted
Scale Variance
if Item Deleted
Corrected Item-Total Correlation
____________________________________________________________________________
I feel accessibility for individuals with special needs (e.g., disabilities) should be maximized.
199.42 411.489 .606
I like to participate electronically and directly in decision making.
199.68 418.057 (.380)
I like to voice my preferences regarding policies. 199.65 421.692 (.320)
I like to promote knowledge sharing between the government and its citizens.
199.38 416.687 .522
I like to promote e-services (e.g., voting online, discussing public issues online, etc.)
199.66 414.311 (.451)
I am concerned about how much I can trust the government.
199.54 416.335 (.401)
I like to promote transparency in government. 199.37 415.660 .508
I like to promote fairness, providing non-discriminatory service.
199.20 413.871 .579
I like to promote public outreach. 199.46 414.163 .603
I like to have horizontal integration of government services (linking different functions of government with each other).
199.63 413.133 .569
I like to have vertical integration of government services (linking different levels of government, such as local, state, and federal).
199.70 414.067 (.472)
I like to facilitate information dissemination. 199.62 413.136 .581
I like to have information on demand. 199.27 415.270 .585
I like to have search criteria. 199.39 413.474 .618
I like to have a great amount of information. 199.55 414.153 .529
I like to have up-to-date information. 199.06 415.719 .655
I like to have a choice of information. 199.24 413.678 .677
I like to minimize the risk of skipping or missing information.
199.32 415.196 .576
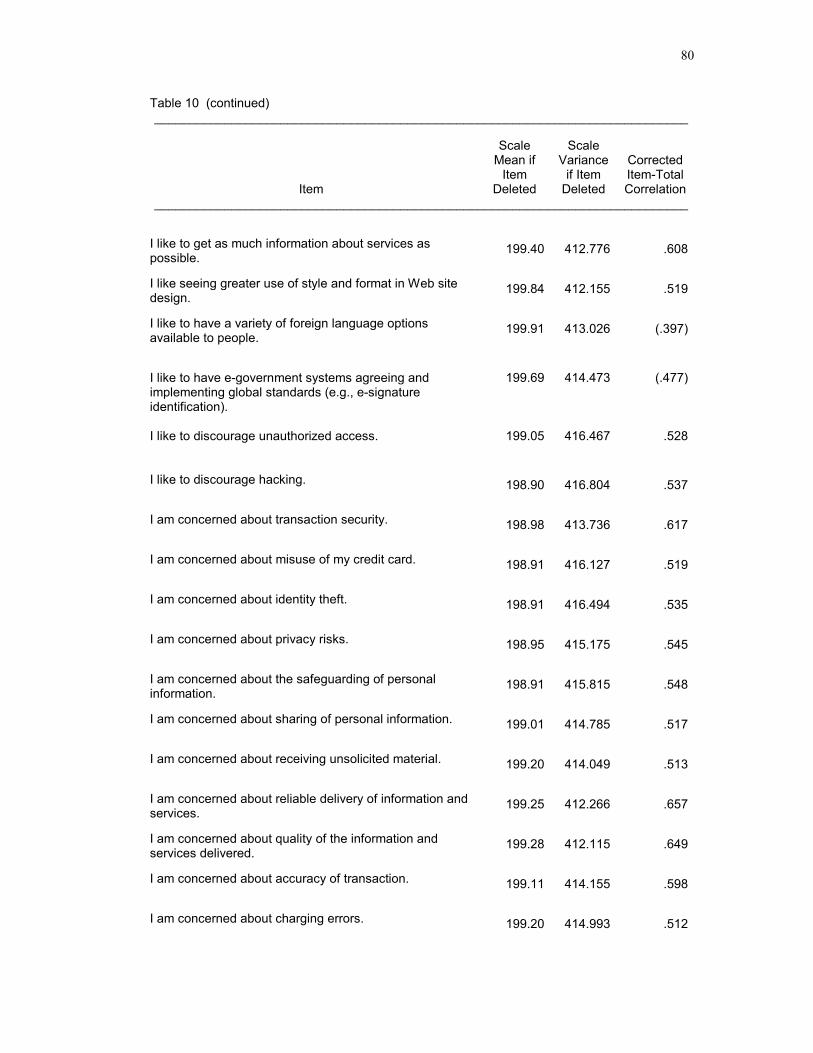
80
Table 10 (continued) ____________________________________________________________________________
Item
Scale Mean if
Item Deleted
Scale Variance
if Item Deleted
Corrected Item-Total Correlation
____________________________________________________________________________
I like to get as much information about services as possible.
199.40 412.776 .608
I like seeing greater use of style and format in Web site design.
199.84 412.155 .519
I like to have a variety of foreign language options available to people.
199.91 413.026 (.397)
I like to have e-government systems agreeing and implementing global standards (e.g., e-signature identification).
199.69 414.473 (.477)
I like to discourage unauthorized access. 199.05 416.467 .528
I like to discourage hacking. 198.90 416.804 .537
I am concerned about transaction security. 198.98 413.736 .617
I am concerned about misuse of my credit card. 198.91 416.127 .519
I am concerned about identity theft. 198.91 416.494 .535
I am concerned about privacy risks. 198.95 415.175 .545
I am concerned about the safeguarding of personal information.
198.91 415.815 .548
I am concerned about sharing of personal information. 199.01 414.785 .517
I am concerned about receiving unsolicited material. 199.20 414.049 .513
I am concerned about reliable delivery of information and services.
199.25 412.266 .657
I am concerned about quality of the information and services delivered.
199.28 412.115 .649
I am concerned about accuracy of transaction. 199.11 414.155 .598
I am concerned about charging errors. 199.20 414.993 .512
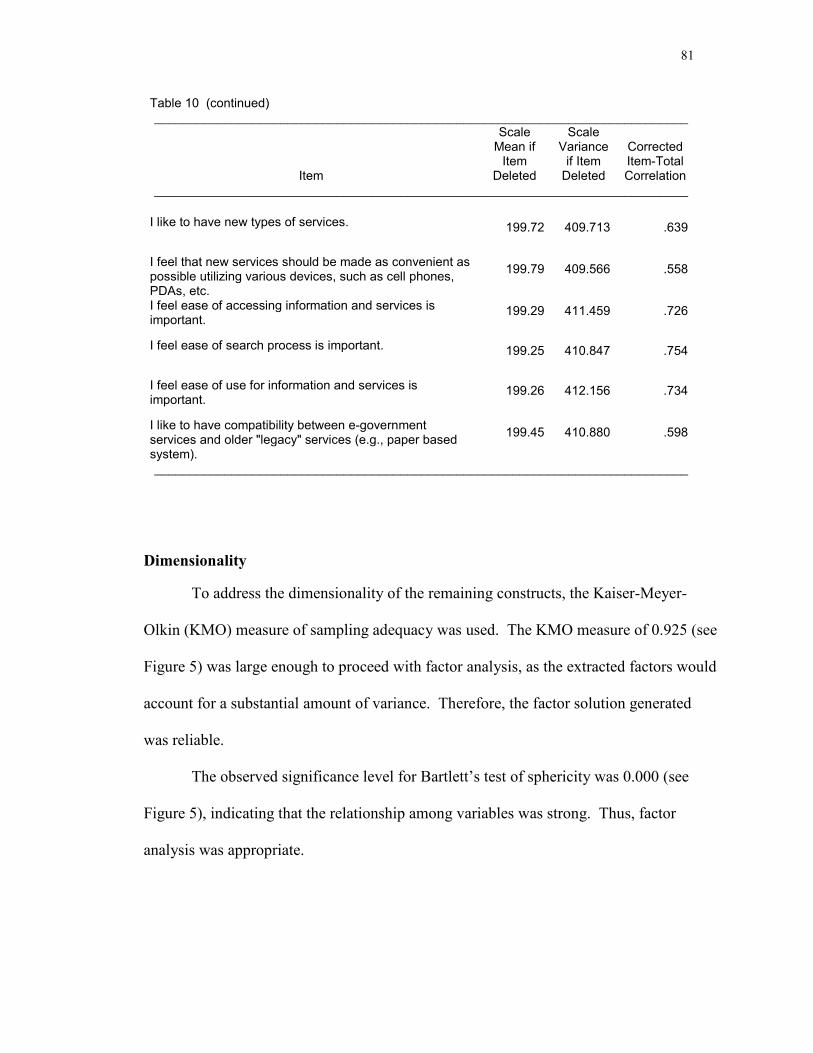
81
Table 10 (continued) ____________________________________________________________________________
Item
Scale Mean if
Item Deleted
Scale Variance
if Item Deleted
Corrected Item-Total Correlation
____________________________________________________________________________
I like to have new types of services. 199.72 409.713 .639
I feel that new services should be made as convenient as possible utilizing various devices, such as cell phones, PDAs, etc.
199.79 409.566 .558
I feel ease of accessing information and services is important.
199.29 411.459 .726
I feel ease of search process is important. 199.25 410.847 .754
I feel ease of use for information and services is important.
199.26 412.156 .734
I like to have compatibility between e-government services and older "legacy" services (e.g., paper based system).
199.45 410.880 .598
____________________________________________________________________________
Dimensionality
To address the dimensionality of the remaining constructs, the Kaiser-Meyer-
Olkin (KMO) measure of sampling adequacy was used. The KMO measure of 0.925 (see
Figure 5) was large enough to proceed with factor analysis, as the extracted factors would
account for a substantial amount of variance. Therefore, the factor solution generated
was reliable.
The observed significance level for Bartlett’s test of sphericity was 0.000 (see
Figure 5), indicating that the relationship among variables was strong. Thus, factor
analysis was appropriate.
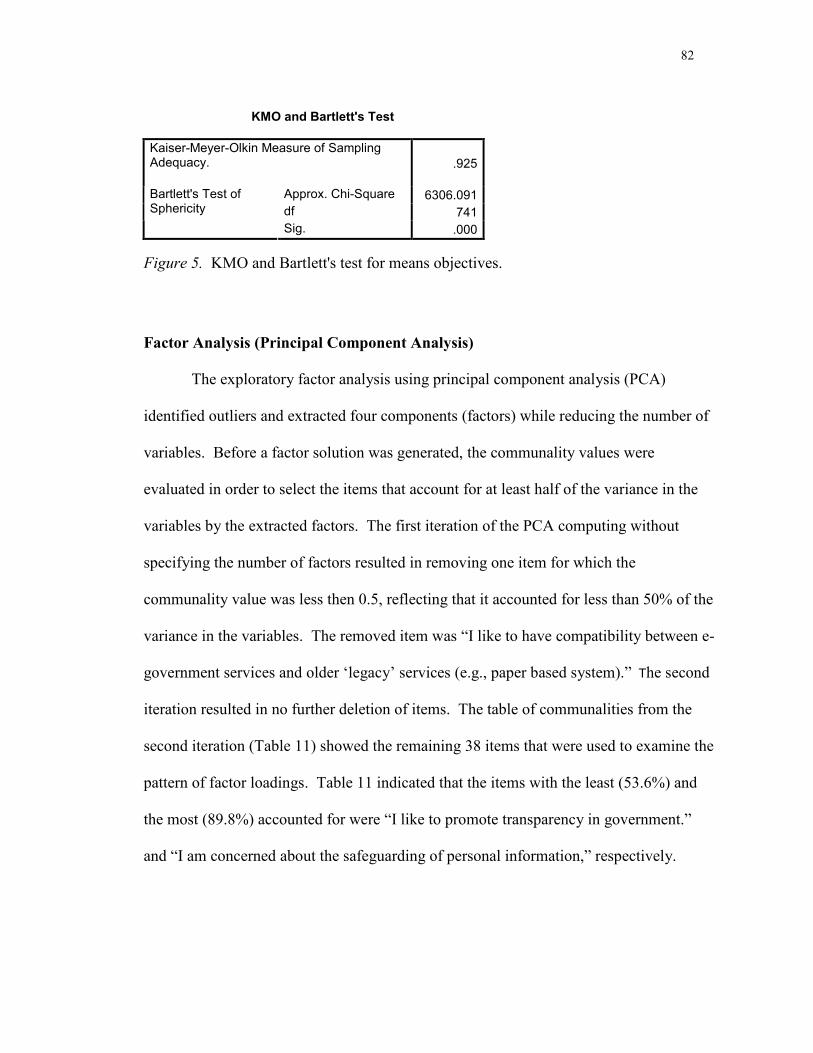
82
KMO and Bartlett's Test Kaiser-Meyer-Olkin Measure of Sampling Adequacy. .925
Approx. Chi-Square 6306.091df 741
Bartlett's Test of Sphericity
Sig. .000
Figure 5. KMO and Bartlett's test for means objectives.
Factor Analysis (Principal Component Analysis)
The exploratory factor analysis using principal component analysis (PCA)
identified outliers and extracted four components (factors) while reducing the number of
variables. Before a factor solution was generated, the communality values were
evaluated in order to select the items that account for at least half of the variance in the
variables by the extracted factors. The first iteration of the PCA computing without
specifying the number of factors resulted in removing one item for which the
communality value was less then 0.5, reflecting that it accounted for less than 50% of the
variance in the variables. The removed item was “I like to have compatibility between e-
government services and older ‘legacy’ services (e.g., paper based system).” The second
iteration resulted in no further deletion of items. The table of communalities from the
second iteration (Table 11) showed the remaining 38 items that were used to examine the
pattern of factor loadings. Table 11 indicated that the items with the least (53.6%) and
the most (89.8%) accounted for were “I like to promote transparency in government.”
and “I am concerned about the safeguarding of personal information,” respectively.
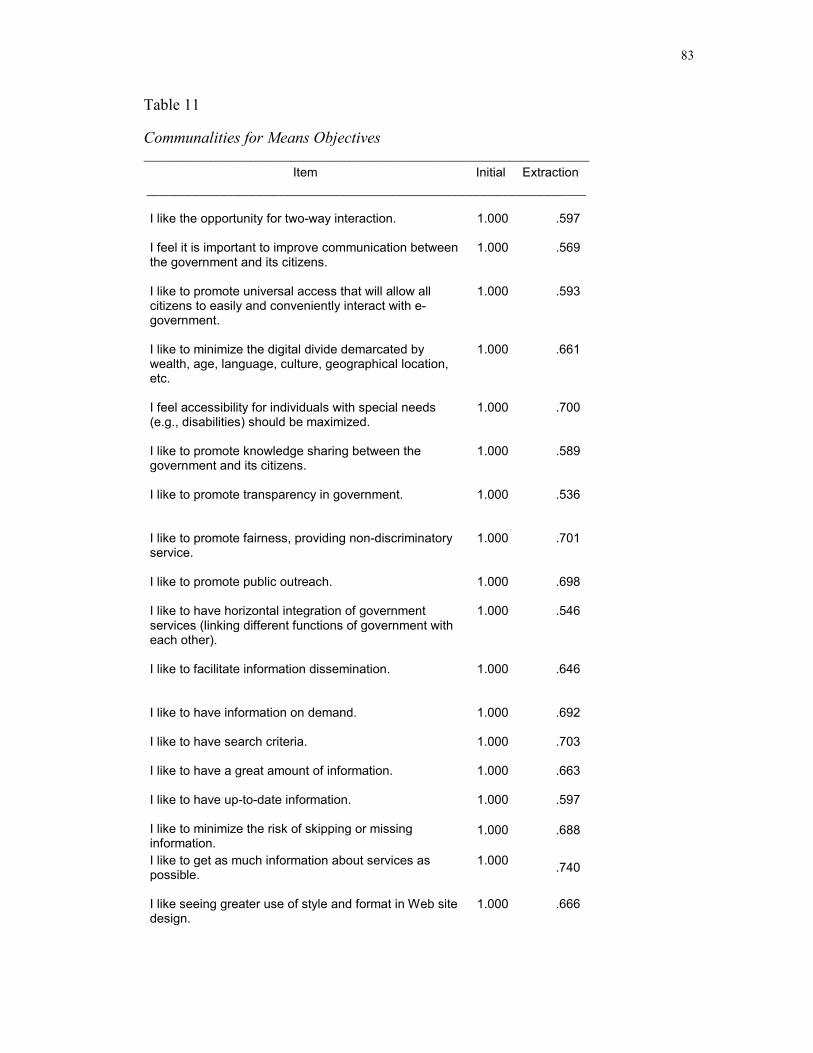
83
Table 11 Communalities for Means Objectives ___________________________________________________________________
Item Initial Extraction _______________________________________________________________
I like the opportunity for two-way interaction. 1.000 .597
I feel it is important to improve communication between the government and its citizens.
1.000 .569
I like to promote universal access that will allow all citizens to easily and conveniently interact with e-government.
1.000 .593
I like to minimize the digital divide demarcated by wealth, age, language, culture, geographical location, etc.
1.000 .661
I feel accessibility for individuals with special needs (e.g., disabilities) should be maximized.
1.000 .700
I like to promote knowledge sharing between the government and its citizens.
1.000 .589
I like to promote transparency in government. 1.000 .536
I like to promote fairness, providing non-discriminatory service.
1.000 .701
I like to promote public outreach. 1.000 .698
I like to have horizontal integration of government services (linking different functions of government with each other).
1.000 .546
I like to facilitate information dissemination. 1.000 .646
I like to have information on demand. 1.000 .692
I like to have search criteria. 1.000 .703
I like to have a great amount of information. 1.000 .663
I like to have up-to-date information. 1.000 .597
I like to minimize the risk of skipping or missing information.
1.000 .688
I like to get as much information about services as possible.
1.000 .740
I like seeing greater use of style and format in Web site design.
1.000 .666
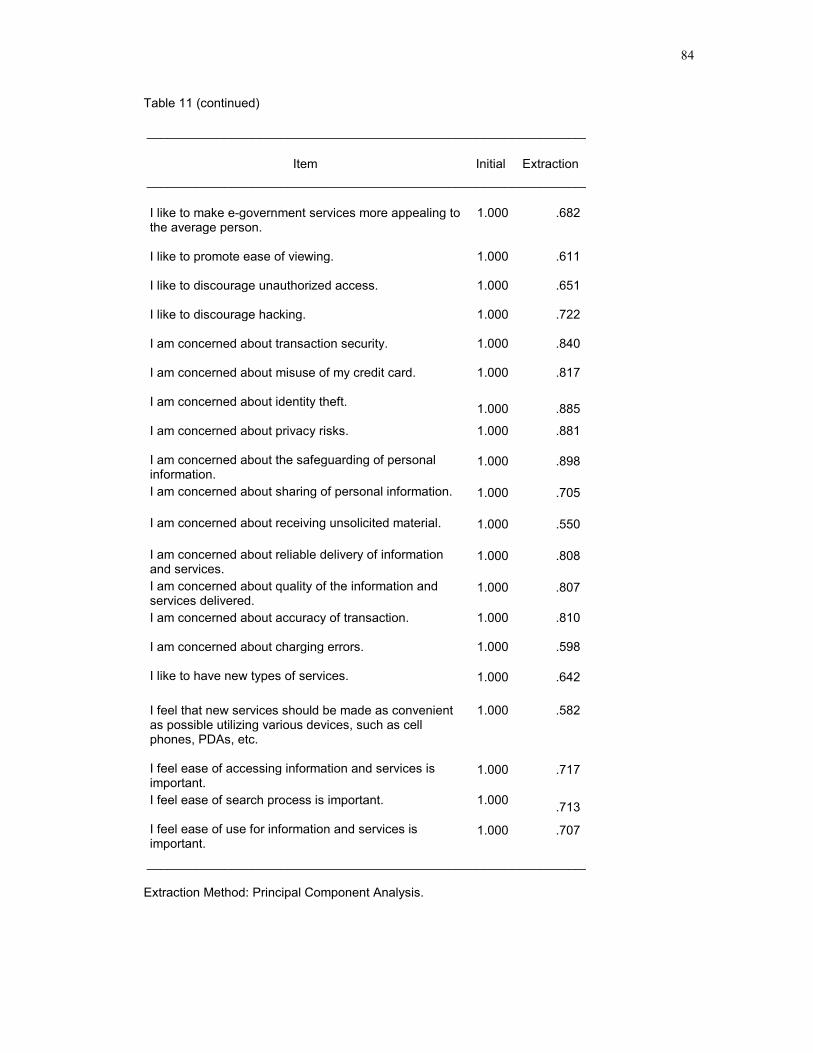
84
Table 11 (continued)
_______________________________________________________________
Item Initial Extraction _______________________________________________________________
I like to make e-government services more appealing to the average person.
1.000 .682
I like to promote ease of viewing. 1.000 .611
I like to discourage unauthorized access. 1.000 .651
I like to discourage hacking. 1.000 .722
I am concerned about transaction security. 1.000 .840
I am concerned about misuse of my credit card. 1.000 .817
I am concerned about identity theft. 1.000 .885
I am concerned about privacy risks. 1.000 .881
I am concerned about the safeguarding of personal information.
1.000 .898
I am concerned about sharing of personal information. 1.000 .705
I am concerned about receiving unsolicited material. 1.000 .550
I am concerned about reliable delivery of information and services.
1.000 .808
I am concerned about quality of the information and services delivered.
1.000 .807
I am concerned about accuracy of transaction. 1.000 .810
I am concerned about charging errors. 1.000 .598
I like to have new types of services. 1.000 .642
I feel that new services should be made as convenient as possible utilizing various devices, such as cell phones, PDAs, etc.
1.000 .582
I feel ease of accessing information and services is important.
1.000 .717
I feel ease of search process is important. 1.000 .713
I feel ease of use for information and services is important.
1.000 .707
_______________________________________________________________
Extraction Method: Principal Component Analysis.
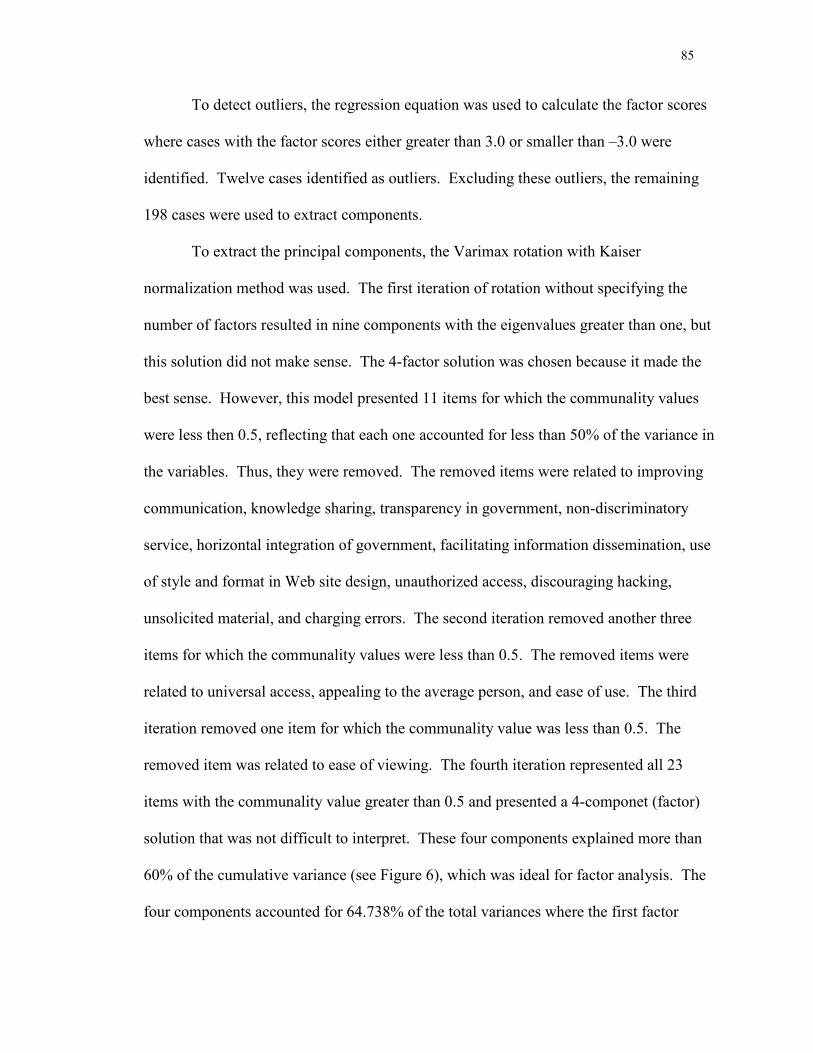
85
To detect outliers, the regression equation was used to calculate the factor scores
where cases with the factor scores either greater than 3.0 or smaller than –3.0 were
identified. Twelve cases identified as outliers. Excluding these outliers, the remaining
198 cases were used to extract components.
To extract the principal components, the Varimax rotation with Kaiser
normalization method was used. The first iteration of rotation without specifying the
number of factors resulted in nine components with the eigenvalues greater than one, but
this solution did not make sense. The 4-factor solution was chosen because it made the
best sense. However, this model presented 11 items for which the communality values
were less then 0.5, reflecting that each one accounted for less than 50% of the variance in
the variables. Thus, they were removed. The removed items were related to improving
communication, knowledge sharing, transparency in government, non-discriminatory
service, horizontal integration of government, facilitating information dissemination, use
of style and format in Web site design, unauthorized access, discouraging hacking,
unsolicited material, and charging errors. The second iteration removed another three
items for which the communality values were less than 0.5. The removed items were
related to universal access, appealing to the average person, and ease of use. The third
iteration removed one item for which the communality value was less than 0.5. The
removed item was related to ease of viewing. The fourth iteration represented all 23
items with the communality value greater than 0.5 and presented a 4-componet (factor)
solution that was not difficult to interpret. These four components explained more than
60% of the cumulative variance (see Figure 6), which was ideal for factor analysis. The
four components accounted for 64.738% of the total variances where the first factor
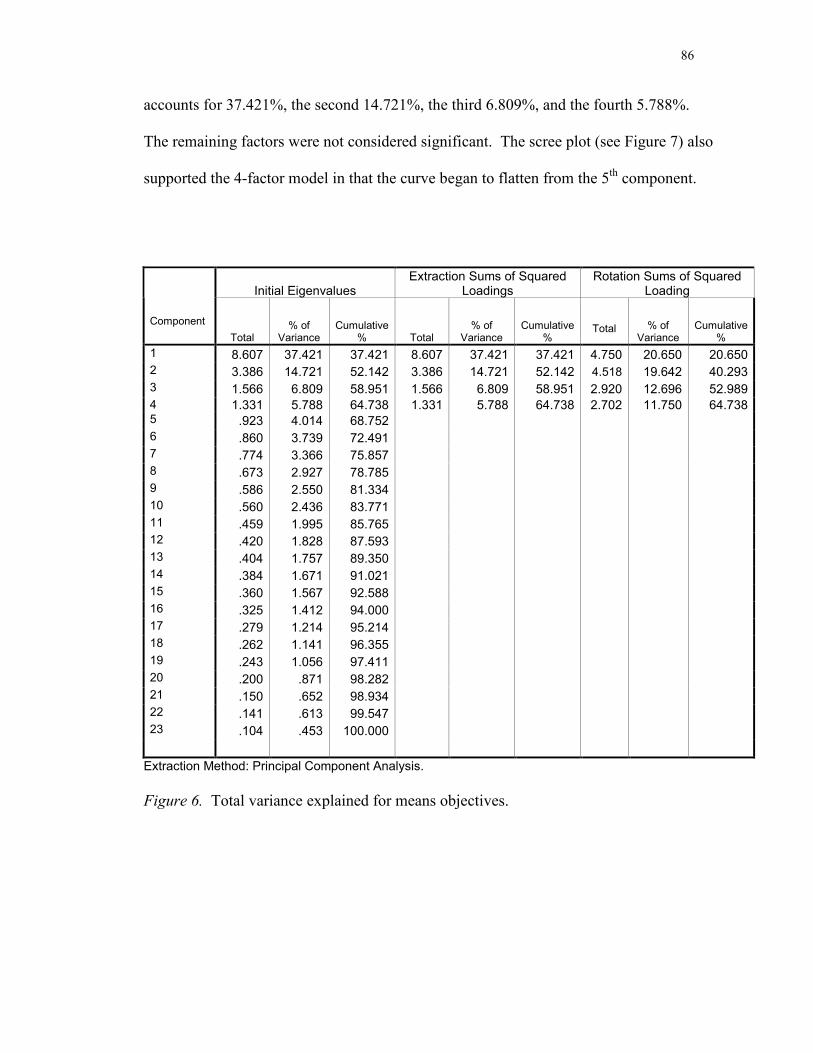
86
accounts for 37.421%, the second 14.721%, the third 6.809%, and the fourth 5.788%.
The remaining factors were not considered significant. The scree plot (see Figure 7) also
supported the 4-factor model in that the curve began to flatten from the 5th component.
Initial Eigenvalues Extraction Sums of Squared
Loadings Rotation Sums of Squared
Loading
Component Total
% of Variance
Cumulative % Total
% of Variance
Cumulative %
Total % of Variance
Cumulative %
1 8.607 37.421 37.421 8.607 37.421 37.421 4.750 20.650 20.6502 3.386 14.721 52.142 3.386 14.721 52.142 4.518 19.642 40.2933 1.566 6.809 58.951 1.566 6.809 58.951 2.920 12.696 52.9894 1.331 5.788 64.738 1.331 5.788 64.738 2.702 11.750 64.7385 .923 4.014 68.7526 .860 3.739 72.4917 .774 3.366 75.8578 .673 2.927 78.7859 .586 2.550 81.33410 .560 2.436 83.77111 .459 1.995 85.76512 .420 1.828 87.59313 .404 1.757 89.35014 .384 1.671 91.02115 .360 1.567 92.58816 .325 1.412 94.00017 .279 1.214 95.21418 .262 1.141 96.35519 .243 1.056 97.41120 .200 .871 98.28221 .150 .652 98.93422 .141 .613 99.54723 .104 .453 100.000
Extraction Method: Principal Component Analysis. Figure 6. Total variance explained for means objectives.
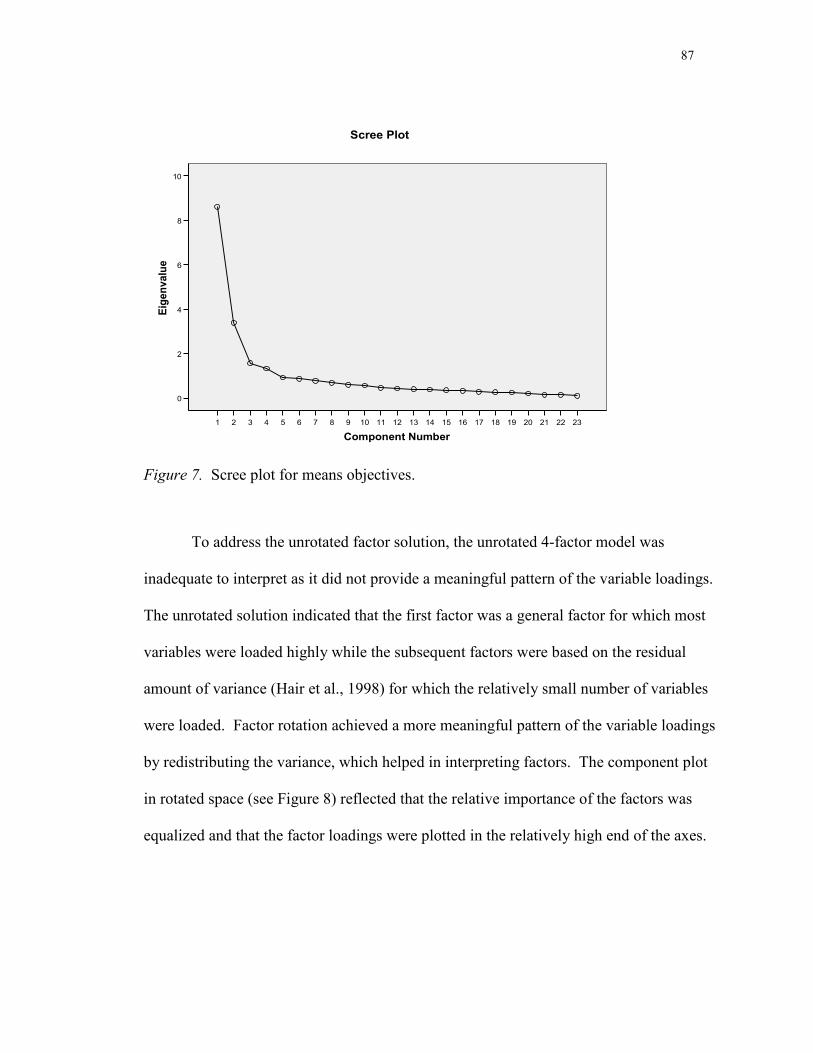
87
2322212019181716151413121110987654321
Component Number
10
8
6
4
2
0
Eige
nval
ue
Scree Plot
Figure 7. Scree plot for means objectives.
To address the unrotated factor solution, the unrotated 4-factor model was
inadequate to interpret as it did not provide a meaningful pattern of the variable loadings.
The unrotated solution indicated that the first factor was a general factor for which most
variables were loaded highly while the subsequent factors were based on the residual
amount of variance (Hair et al., 1998) for which the relatively small number of variables
were loaded. Factor rotation achieved a more meaningful pattern of the variable loadings
by redistributing the variance, which helped in interpreting factors. The component plot
in rotated space (see Figure 8) reflected that the relative importance of the factors was
equalized and that the factor loadings were plotted in the relatively high end of the axes.

88
Component 10.90.60.30.0-0.3-0.6
Component 30.9 0.6 0.3 0.0 -0.3
-0.6
Com
pone
nt2
0.9
0.6
0.3
0.0
-0.3
-0.6
-0.9
-0.9
-0.9
accessibilityforindividualswithspecialneedspublicoutreach
minimizedigitaldivideprivacyriskstransactionsecurity
safeguardingofpersonalinformation
easeofsearchprocess
misuseofmycreditcardidentitytheft
easeofaccessinginformationandservices
newtypesofservicessharingofpersonalinformation
reliabledeliveryofinformationandservices
uptodateinformationsearchcriteriatwowayinteraction
accuracyoftransaction
informationondemandminimizethemissinginformation
qualityoftheinformationandservices
informationaboutservicesgreatamountofinformation
Component Plot in Rotated Space
Figure 8. Component plot in rotated space for means objectives.
The rotated component matrix (see Figure 9) presented the four components with
associated variables sorted by size of the factor loadings. The factor loadings of selected
items were in parenthesis. The higher the factor loadings, the more it contributed to the
variable and the stronger the variable correlated with the factor. Three items were
excluded from this solution. Two of the items resulted in low loadings (less than 0.5) and
one item resulted in a high loading (greater than 0.5) on multiple factors reflecting that
they were not factorially pure. These items were related to ease of search, ease of access
information and services, and promoting new type of services. The first group of
variables was loaded from 0.687 to 0.890, the second group from 0.638 to 0.764, the third
from 0.590 to 0.759, and the fourth from 0.708 to 0.831. The 4-factor model was not
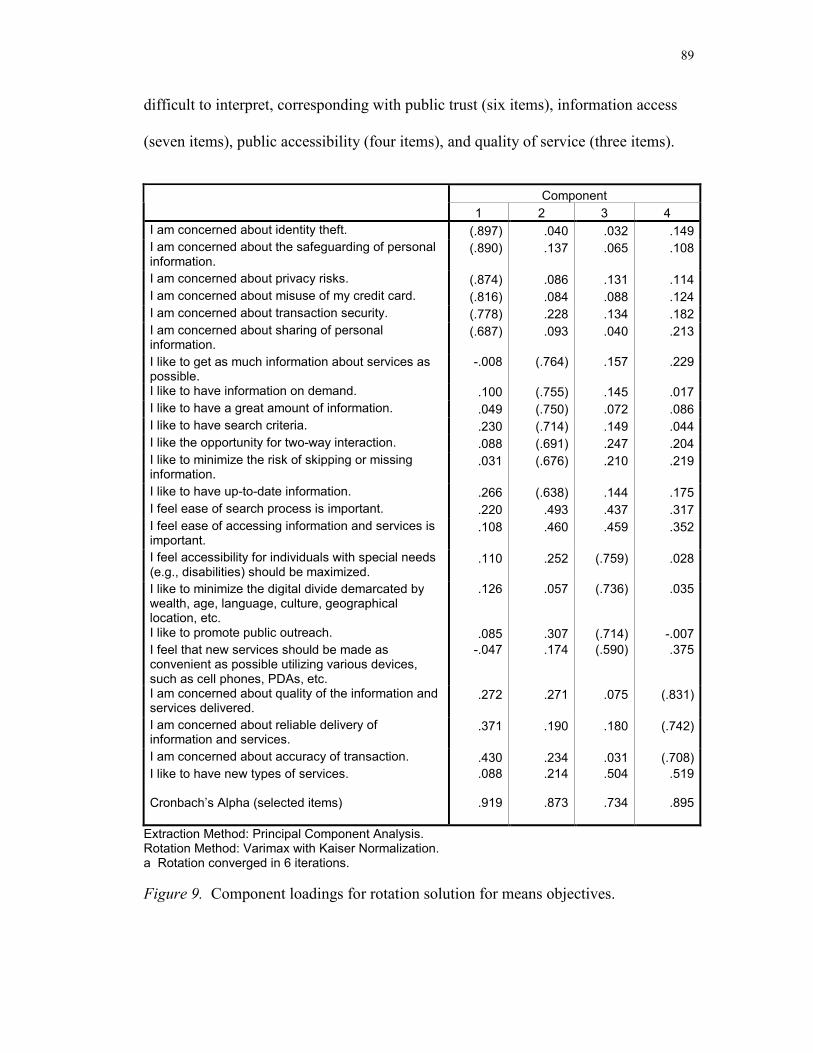
89
difficult to interpret, corresponding with public trust (six items), information access
(seven items), public accessibility (four items), and quality of service (three items).
Component
1 2 3 4I am concerned about identity theft. (.897) .040 .032 .149I am concerned about the safeguarding of personal information.
(.890) .137 .065 .108
I am concerned about privacy risks. (.874) .086 .131 .114I am concerned about misuse of my credit card. (.816) .084 .088 .124I am concerned about transaction security. (.778) .228 .134 .182I am concerned about sharing of personal information.
(.687) .093 .040 .213
I like to get as much information about services as possible.
-.008 (.764) .157 .229
I like to have information on demand. .100 (.755) .145 .017I like to have a great amount of information. .049 (.750) .072 .086I like to have search criteria. .230 (.714) .149 .044I like the opportunity for two-way interaction. .088 (.691) .247 .204I like to minimize the risk of skipping or missing information.
.031 (.676) .210 .219
I like to have up-to-date information. .266 (.638) .144 .175I feel ease of search process is important. .220 .493 .437 .317I feel ease of accessing information and services is important.
.108 .460 .459 .352
I feel accessibility for individuals with special needs (e.g., disabilities) should be maximized.
.110 .252 (.759) .028
I like to minimize the digital divide demarcated by wealth, age, language, culture, geographical location, etc.
.126 .057 (.736) .035
I like to promote public outreach. .085 .307 (.714) -.007I feel that new services should be made as convenient as possible utilizing various devices, such as cell phones, PDAs, etc.
-.047 .174 (.590) .375
I am concerned about quality of the information and services delivered.
.272 .271 .075 (.831)
I am concerned about reliable delivery of information and services.
.371 .190 .180 (.742)
I am concerned about accuracy of transaction. .430 .234 .031 (.708)I like to have new types of services.
Cronbach’s Alpha (selected items)
.088
.919
.214
.873
.504
.734
.519
.895
Extraction Method: Principal Component Analysis. Rotation Method: Varimax with Kaiser Normalization. a Rotation converged in 6 iterations. Figure 9. Component loadings for rotation solution for means objectives.
90
The means objectives scale for the final factor solution included 20 items. The
ratio of sample size (198) to number of items (20) was 10:1, which was an acceptable
size for factor analysis (Hair et al., 1998).
Findings
Exploratory factor analysis reported a 4-factor 20-item model (see Table 12) for
the means objectives scale. Factor one (six items) represented public trust, factor two
(seven items) represented information access, factor three (four items) represented public
accessibility, and factor four (three items) represented quality of service.
Using this data set, the correlated item-total correlation and Cronbach’s α for the
same 4-factor model were calculated. The corrected item-total correlation was 0.466 to
0.625 for public trust, 0.503 to 0.606 for information access, 0.590 to 0.759 for public
accessibility, and 0.623 to 0.638 for quality of service. Reliability statistics (Cronbach’s
α) were 0.919, 0.873, 0.734, and 0.895 for public trust, information access, public
accessibility, and quality of service, respectively (see Figure 9 at the bottom of each
component column). Overall reliability for the entire scales (20 items) was 0.901. The
hotelling’s T-squared test was significant for all 4 subscales (p < 0.001), with F values
being 3.599, 17.724, 14.723, and 15.830 for public trust, information access, public
accessibility, and quality of services, respectively.
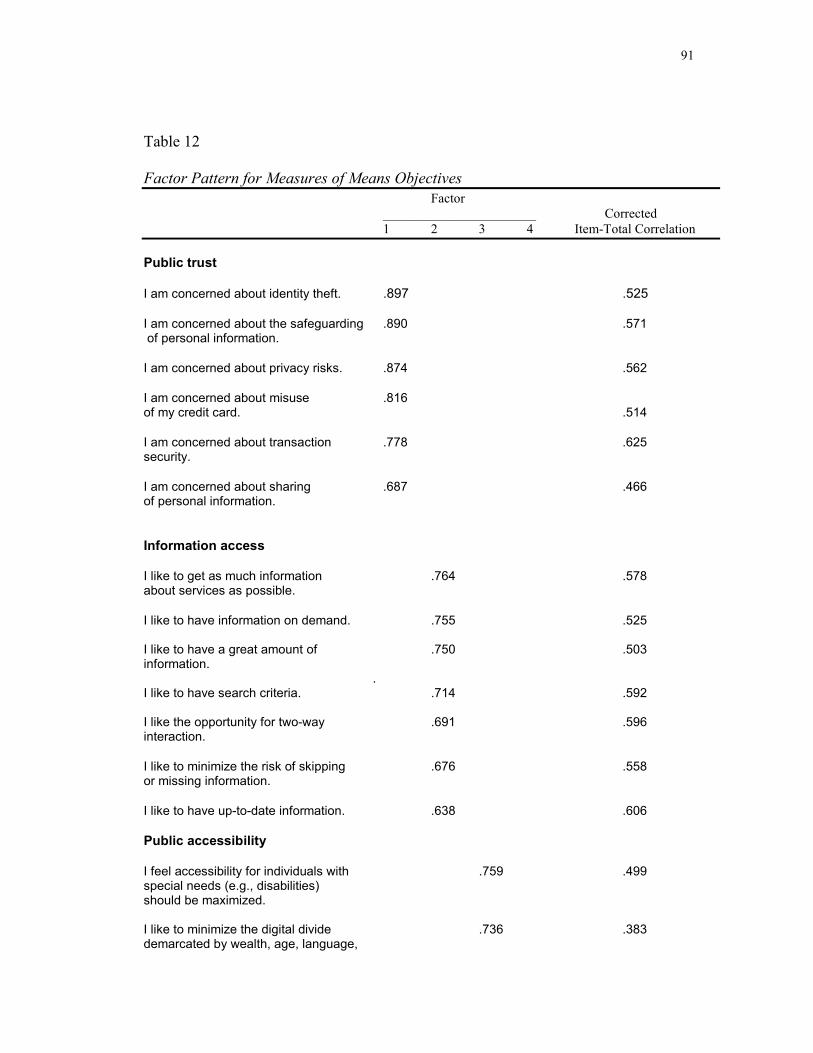
91
Table 12 Factor Pattern for Measures of Means Objectives Factor
_______________________ Corrected 1 2 3 4 Item-Total Correlation
Public trust I am concerned about identity theft. .897 .525
I am concerned about the safeguarding .890 .571 of personal information.
I am concerned about privacy risks. .874 .562 I am concerned about misuse .816 of my credit card. .514 I am concerned about transaction .778 .625 security. I am concerned about sharing .687 .466 of personal information.
Information access I like to get as much information .764 .578 about services as possible. I like to have information on demand. .755 .525 I like to have a great amount of .750 .503 information. . I like to have search criteria. .714 .592 I like the opportunity for two-way .691 .596 interaction. I like to minimize the risk of skipping .676 .558 or missing information.
I like to have up-to-date information. .638 .606
Public accessibility I feel accessibility for individuals with .759 .499 special needs (e.g., disabilities) should be maximized. I like to minimize the digital divide .736 .383 demarcated by wealth, age, language,

92
culture, geographical location, etc. Table 12 (continued)
Factor _______________________ Corrected
1 2 3 4 Item-Total Correlation
I like to promote public outreach. .714 .479 I feel that new services should be .590 .403 made as convenient as possible utilizing various devices, such as cell phones, PDAs, etc. Quality of service I am concerned about quality of .831 .623 the information and services delivered. I am concerned about reliable delivery .742 .638 of information and services. I am concerned about accuracy of .708 .623 transaction. ______________________________________________________________________________________
Data Analysis for Fundamental Objectives
Descriptive Statistics
The output from the descriptive statistics (Table 13) from the total of 210
responses indicated that all 28 items were perceived to be relevant because the mean
values for most items were greater than 4, reflecting the survey answers of “agree” and
“strongly agree.” Though two items had mean values of less than 4, as the values were
close to 4 (3.56 and 3.95), they were not eliminated. The two most important items, with
the highest mean of 4.47, were “It is important to find information and services easily”
and “It is important that information and services are useful.” The least significant item,
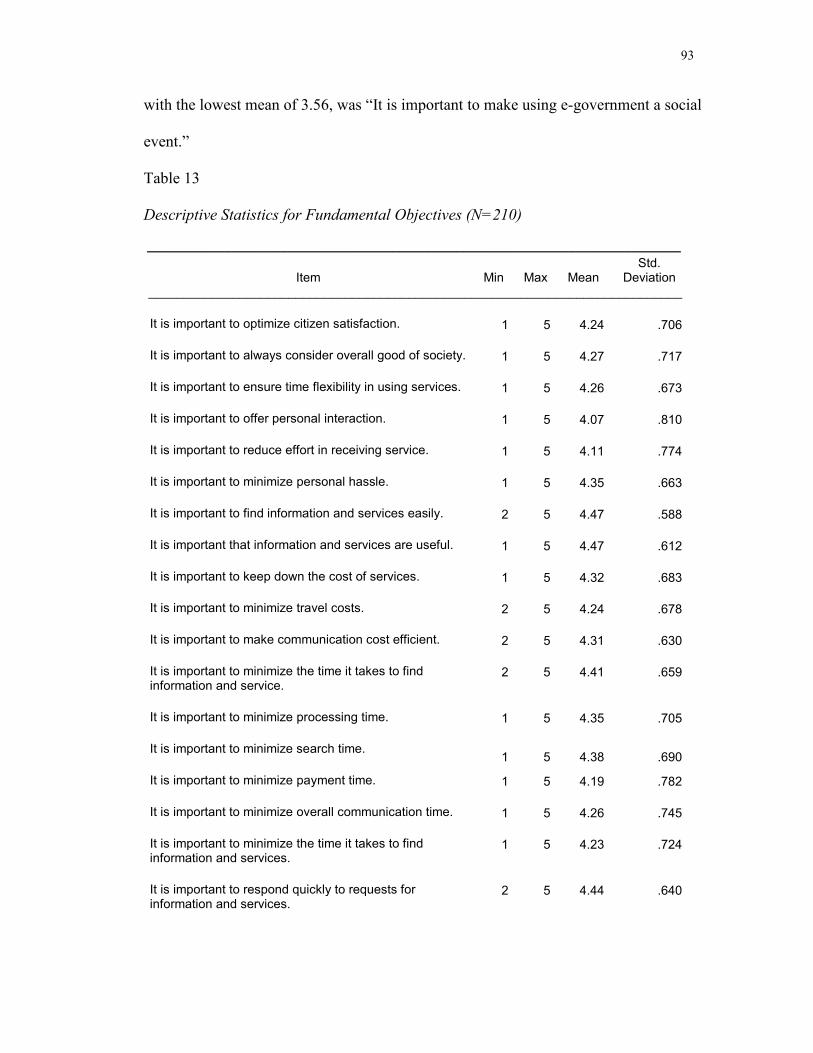
93
with the lowest mean of 3.56, was “It is important to make using e-government a social
event.”
Table 13 Descriptive Statistics for Fundamental Objectives (N=210)
____________________________________________________________________________
Item Min Max Mean Std.
Deviation ____________________________________________________________________________
It is important to optimize citizen satisfaction. 1 5 4.24 .706
It is important to always consider overall good of society. 1 5 4.27 .717
It is important to ensure time flexibility in using services. 1 5 4.26 .673
It is important to offer personal interaction. 1 5 4.07 .810
It is important to reduce effort in receiving service. 1 5 4.11 .774
It is important to minimize personal hassle. 1 5 4.35 .663
It is important to find information and services easily. 2 5 4.47 .588
It is important that information and services are useful. 1 5 4.47 .612
It is important to keep down the cost of services. 1 5 4.32 .683
It is important to minimize travel costs. 2 5 4.24 .678
It is important to make communication cost efficient. 2 5 4.31 .630
It is important to minimize the time it takes to find information and service.
2 5 4.41 .659
It is important to minimize processing time. 1 5 4.35 .705
It is important to minimize search time. 1 5 4.38 .690
It is important to minimize payment time. 1 5 4.19 .782
It is important to minimize overall communication time. 1 5 4.26 .745
It is important to minimize the time it takes to find information and services.
1 5 4.23 .724
It is important to respond quickly to requests for information and services.
2 5 4.44 .640
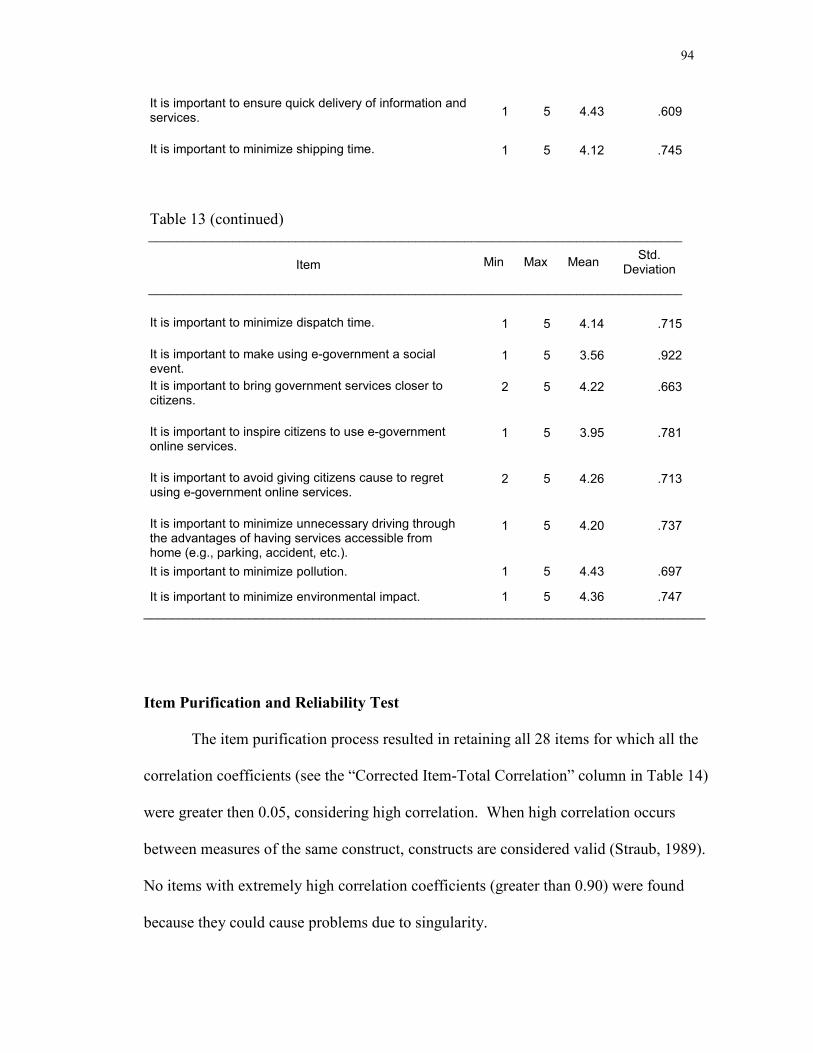
94
It is important to ensure quick delivery of information and services. 1 5 4.43 .609
It is important to minimize shipping time. 1 5 4.12 .745
Table 13 (continued) ____________________________________________________________________________
Item Min Max Mean Std. Deviation
____________________________________________________________________________
It is important to minimize dispatch time. 1 5 4.14 .715
It is important to make using e-government a social event.
1 5 3.56 .922
It is important to bring government services closer to citizens.
2 5 4.22 .663
It is important to inspire citizens to use e-government online services.
1 5 3.95 .781
It is important to avoid giving citizens cause to regret using e-government online services.
2 5 4.26 .713
It is important to minimize unnecessary driving through the advantages of having services accessible from home (e.g., parking, accident, etc.).
1 5 4.20 .737
It is important to minimize pollution. 1 5 4.43 .697
It is important to minimize environmental impact. 1 5 4.36 .747________________________________________________________________________________
Item Purification and Reliability Test
The item purification process resulted in retaining all 28 items for which all the
correlation coefficients (see the “Corrected Item-Total Correlation” column in Table 14)
were greater then 0.05, considering high correlation. When high correlation occurs
between measures of the same construct, constructs are considered valid (Straub, 1989).
No items with extremely high correlation coefficients (greater than 0.90) were found
because they could cause problems due to singularity.
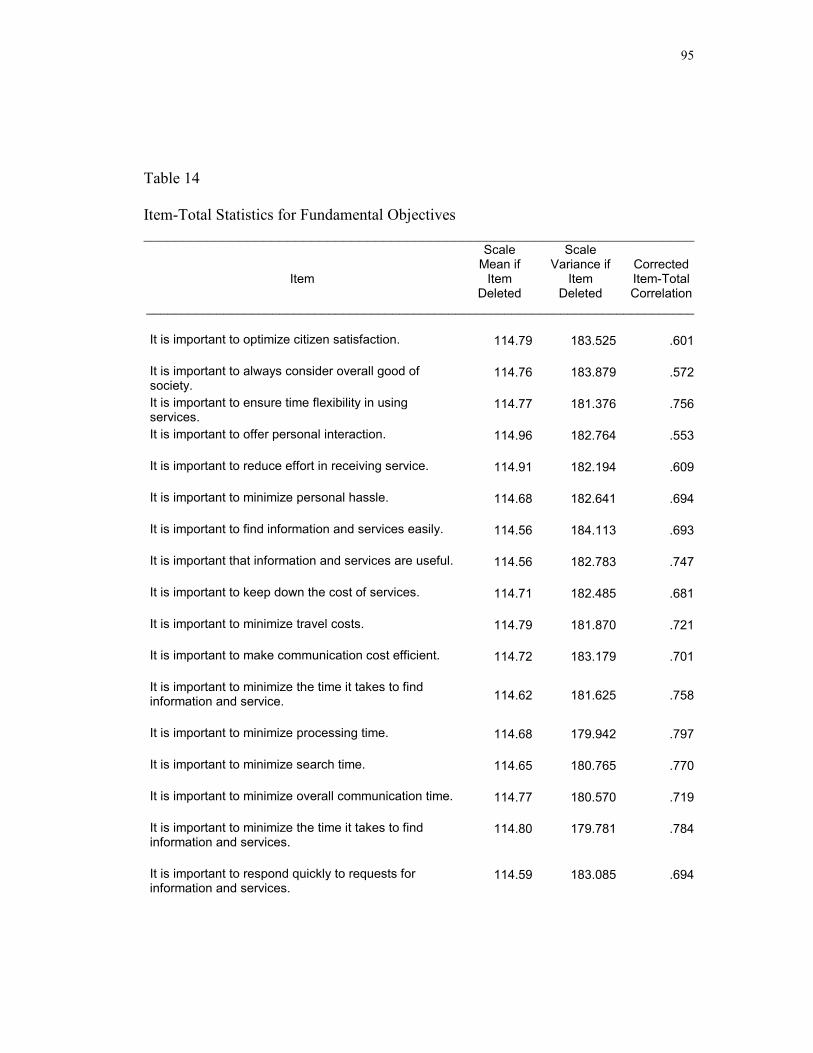
95
Table 14
Item-Total Statistics for Fundamental Objectives _____________________________________________________________________
Item
Scale Mean if
Item Deleted
Scale Variance if
Item Deleted
Corrected Item-Total Correlation
______________________________________________________________________________
It is important to optimize citizen satisfaction. 114.79 183.525 .601
It is important to always consider overall good of society.
114.76 183.879 .572
It is important to ensure time flexibility in using services.
114.77 181.376 .756
It is important to offer personal interaction. 114.96 182.764 .553
It is important to reduce effort in receiving service. 114.91 182.194 .609
It is important to minimize personal hassle. 114.68 182.641 .694
It is important to find information and services easily. 114.56 184.113 .693
It is important that information and services are useful. 114.56 182.783 .747
It is important to keep down the cost of services. 114.71 182.485 .681
It is important to minimize travel costs. 114.79 181.870 .721
It is important to make communication cost efficient. 114.72 183.179 .701
It is important to minimize the time it takes to find information and service. 114.62 181.625 .758
It is important to minimize processing time. 114.68 179.942 .797
It is important to minimize search time. 114.65 180.765 .770
It is important to minimize overall communication time. 114.77 180.570 .719
It is important to minimize the time it takes to find information and services.
114.80 179.781 .784
It is important to respond quickly to requests for information and services.
114.59 183.085 .694
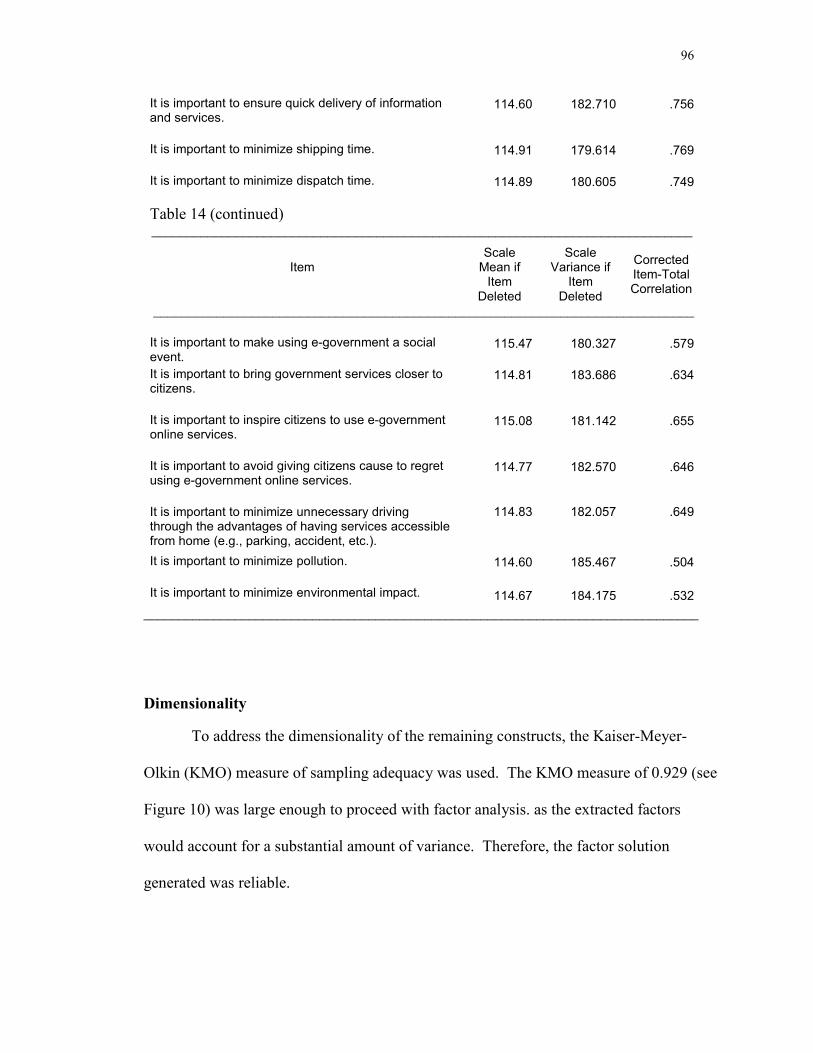
96
It is important to ensure quick delivery of information and services.
114.60 182.710 .756
It is important to minimize shipping time. 114.91 179.614 .769
It is important to minimize dispatch time. 114.89 180.605 .749
Table 14 (continued) _____________________________________________________________________________
Item Scale
Mean if Item
Deleted
Scale Variance if
Item Deleted
Corrected Item-Total Correlation
_____________________________________________________________________________
It is important to make using e-government a social event.
115.47 180.327 .579
It is important to bring government services closer to citizens.
114.81 183.686 .634
It is important to inspire citizens to use e-government online services.
115.08 181.142 .655
It is important to avoid giving citizens cause to regret using e-government online services.
114.77 182.570 .646
It is important to minimize unnecessary driving through the advantages of having services accessible from home (e.g., parking, accident, etc.).
114.83 182.057 .649
It is important to minimize pollution. 114.60 185.467 .504
It is important to minimize environmental impact. 114.67 184.175 .532_______________________________________________________________________________
Dimensionality
To address the dimensionality of the remaining constructs, the Kaiser-Meyer-
Olkin (KMO) measure of sampling adequacy was used. The KMO measure of 0.929 (see
Figure 10) was large enough to proceed with factor analysis. as the extracted factors
would account for a substantial amount of variance. Therefore, the factor solution
generated was reliable.
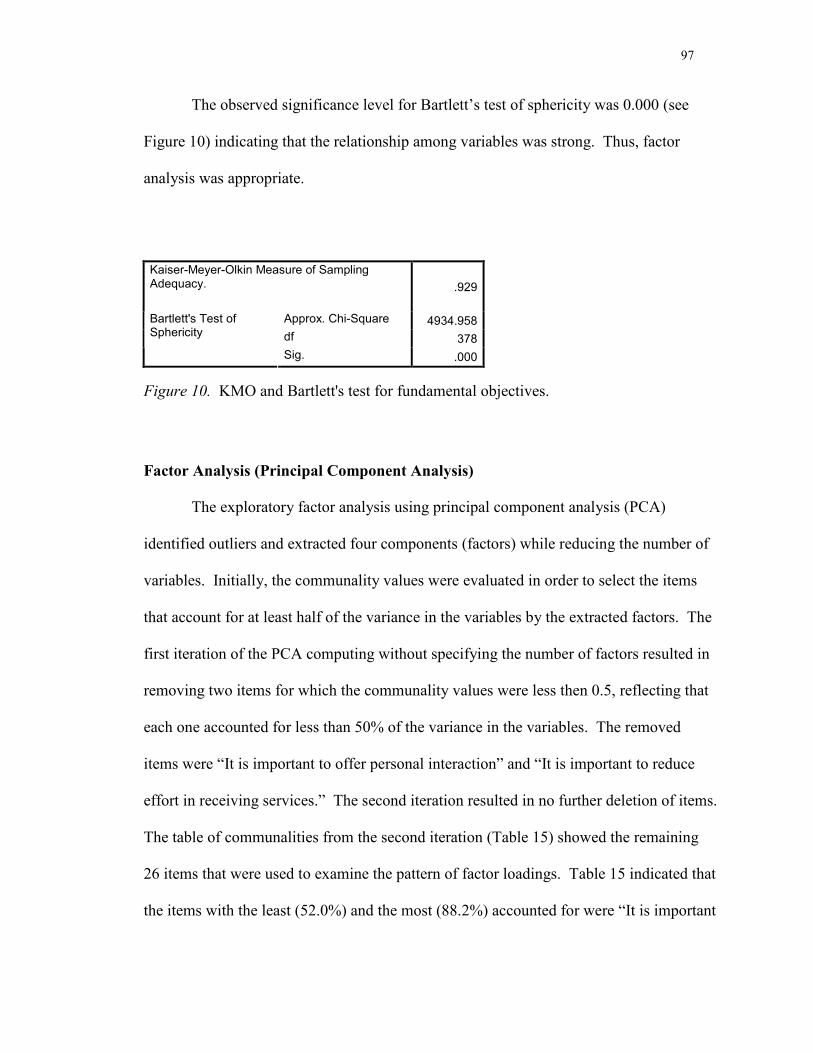
97
The observed significance level for Bartlett’s test of sphericity was 0.000 (see
Figure 10) indicating that the relationship among variables was strong. Thus, factor
analysis was appropriate.
Kaiser-Meyer-Olkin Measure of Sampling Adequacy. .929
Approx. Chi-Square 4934.958df 378
Bartlett's Test of Sphericity
Sig. .000
Figure 10. KMO and Bartlett's test for fundamental objectives.
Factor Analysis (Principal Component Analysis)
The exploratory factor analysis using principal component analysis (PCA)
identified outliers and extracted four components (factors) while reducing the number of
variables. Initially, the communality values were evaluated in order to select the items
that account for at least half of the variance in the variables by the extracted factors. The
first iteration of the PCA computing without specifying the number of factors resulted in
removing two items for which the communality values were less then 0.5, reflecting that
each one accounted for less than 50% of the variance in the variables. The removed
items were “It is important to offer personal interaction” and “It is important to reduce
effort in receiving services.” The second iteration resulted in no further deletion of items.
The table of communalities from the second iteration (Table 15) showed the remaining
26 items that were used to examine the pattern of factor loadings. Table 15 indicated that
the items with the least (52.0%) and the most (88.2%) accounted for were “It is important
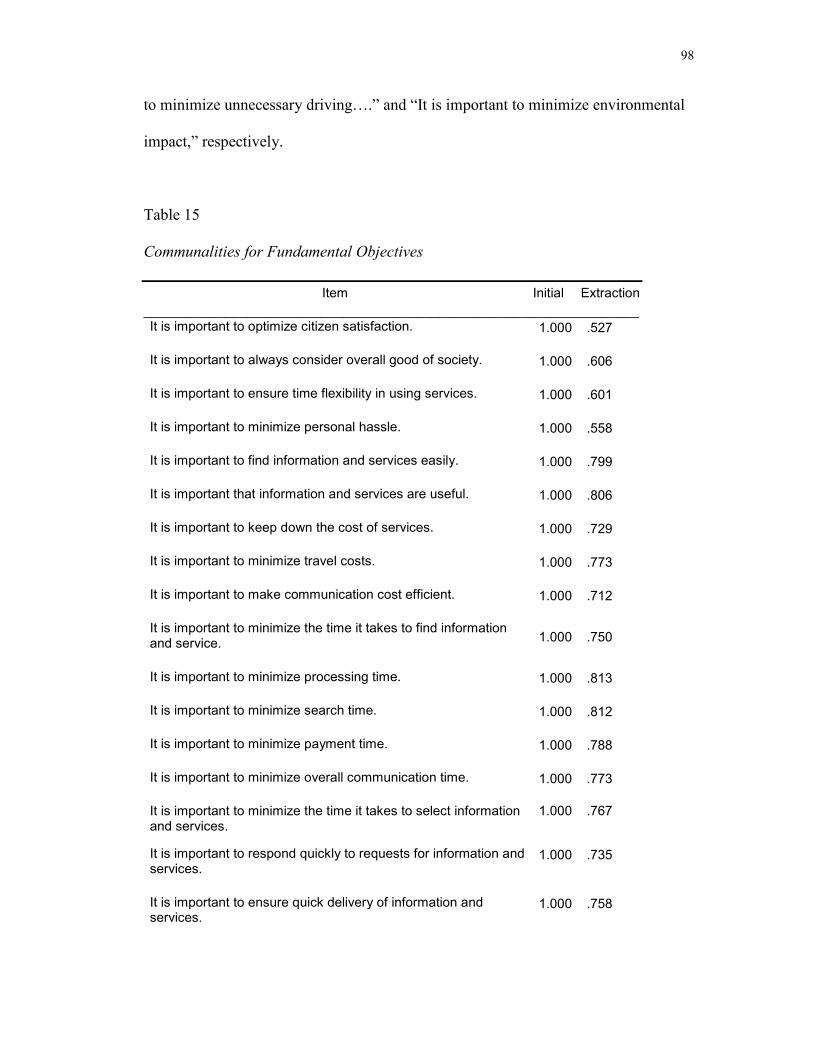
98
to minimize unnecessary driving….” and “It is important to minimize environmental
impact,” respectively.
Table 15
Communalities for Fundamental Objectives
Item Initial Extraction ___________________________________________________________________ It is important to optimize citizen satisfaction. 1.000 .527
It is important to always consider overall good of society. 1.000 .606
It is important to ensure time flexibility in using services. 1.000 .601
It is important to minimize personal hassle. 1.000 .558
It is important to find information and services easily. 1.000 .799
It is important that information and services are useful. 1.000 .806
It is important to keep down the cost of services. 1.000 .729
It is important to minimize travel costs. 1.000 .773
It is important to make communication cost efficient. 1.000 .712
It is important to minimize the time it takes to find information and service. 1.000 .750
It is important to minimize processing time. 1.000 .813
It is important to minimize search time. 1.000 .812
It is important to minimize payment time. 1.000 .788
It is important to minimize overall communication time. 1.000 .773
It is important to minimize the time it takes to select information and services.
1.000 .767
It is important to respond quickly to requests for information and services.
1.000 .735
It is important to ensure quick delivery of information and services.
1.000 .758
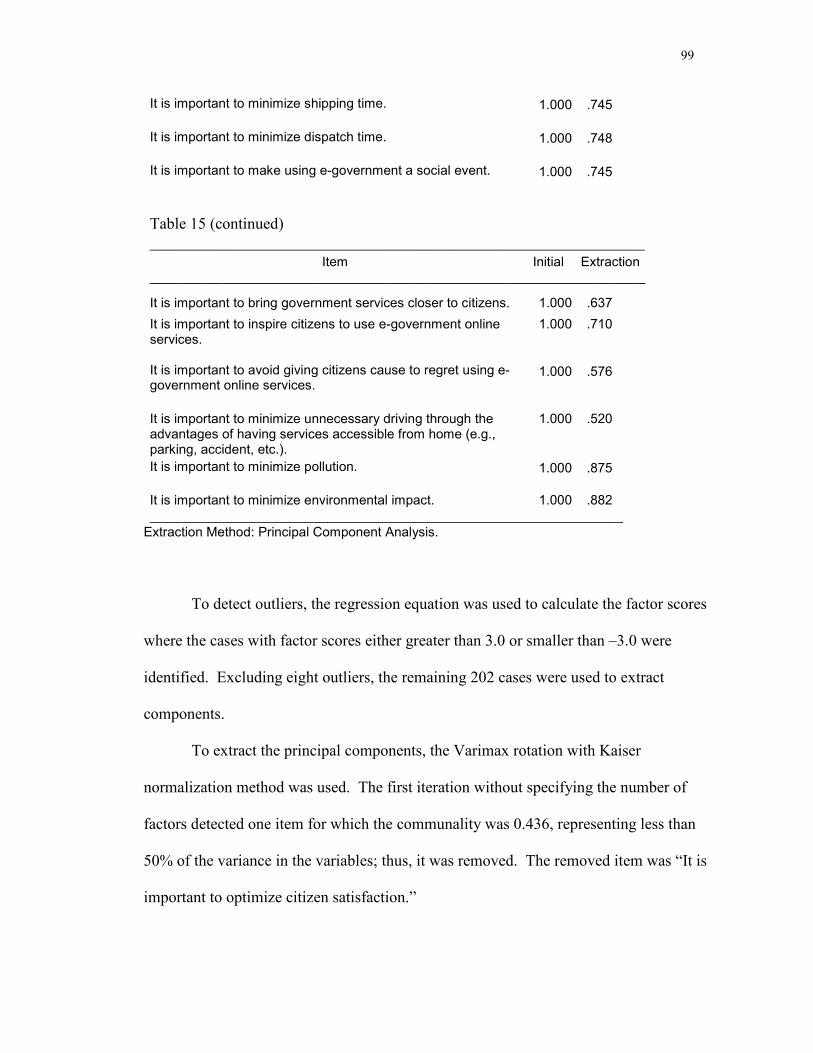
99
It is important to minimize shipping time. 1.000 .745
It is important to minimize dispatch time. 1.000 .748
It is important to make using e-government a social event. 1.000 .745
Table 15 (continued) ______________________________________________________________
Item Initial Extraction ___________________________________________________________________
It is important to bring government services closer to citizens. 1.000 .637 It is important to inspire citizens to use e-government online services.
1.000 .710
It is important to avoid giving citizens cause to regret using e-government online services.
1.000 .576
It is important to minimize unnecessary driving through the advantages of having services accessible from home (e.g., parking, accident, etc.).
1.000 .520
It is important to minimize pollution. 1.000 .875
It is important to minimize environmental impact. 1.000 .882 ________________________________________________________________
Extraction Method: Principal Component Analysis.
To detect outliers, the regression equation was used to calculate the factor scores
where the cases with factor scores either greater than 3.0 or smaller than –3.0 were
identified. Excluding eight outliers, the remaining 202 cases were used to extract
components.
To extract the principal components, the Varimax rotation with Kaiser
normalization method was used. The first iteration without specifying the number of
factors detected one item for which the communality was 0.436, representing less than
50% of the variance in the variables; thus, it was removed. The removed item was “It is
important to optimize citizen satisfaction.”
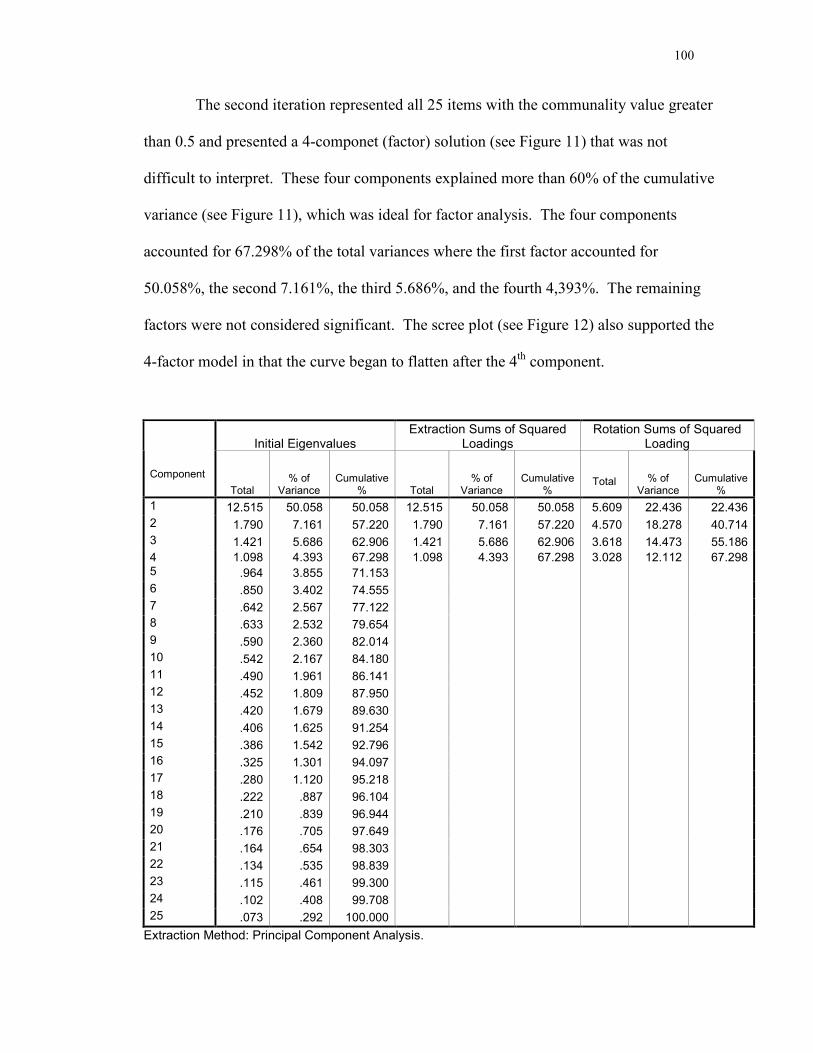
100
The second iteration represented all 25 items with the communality value greater
than 0.5 and presented a 4-componet (factor) solution (see Figure 11) that was not
difficult to interpret. These four components explained more than 60% of the cumulative
variance (see Figure 11), which was ideal for factor analysis. The four components
accounted for 67.298% of the total variances where the first factor accounted for
50.058%, the second 7.161%, the third 5.686%, and the fourth 4,393%. The remaining
factors were not considered significant. The scree plot (see Figure 12) also supported the
4-factor model in that the curve began to flatten after the 4th component.
Initial Eigenvalues Extraction Sums of Squared
Loadings Rotation Sums of Squared
Loading
Component Total
% of Variance
Cumulative % Total
% of Variance
Cumulative %
Total % of Variance
Cumulative %
1 12.515 50.058 50.058 12.515 50.058 50.058 5.609 22.436 22.4362 1.790 7.161 57.220 1.790 7.161 57.220 4.570 18.278 40.7143 1.421 5.686 62.906 1.421 5.686 62.906 3.618 14.473 55.1864 1.098 4.393 67.298 1.098 4.393 67.298 3.028 12.112 67.2985 .964 3.855 71.1536 .850 3.402 74.5557 .642 2.567 77.1228 .633 2.532 79.6549 .590 2.360 82.01410 .542 2.167 84.18011 .490 1.961 86.14112 .452 1.809 87.95013 .420 1.679 89.63014 .406 1.625 91.25415 .386 1.542 92.79616 .325 1.301 94.09717 .280 1.120 95.21818 .222 .887 96.10419 .210 .839 96.94420 .176 .705 97.64921 .164 .654 98.30322 .134 .535 98.83923 .115 .461 99.30024 .102 .408 99.70825 .073 .292 100.000
Extraction Method: Principal Component Analysis.
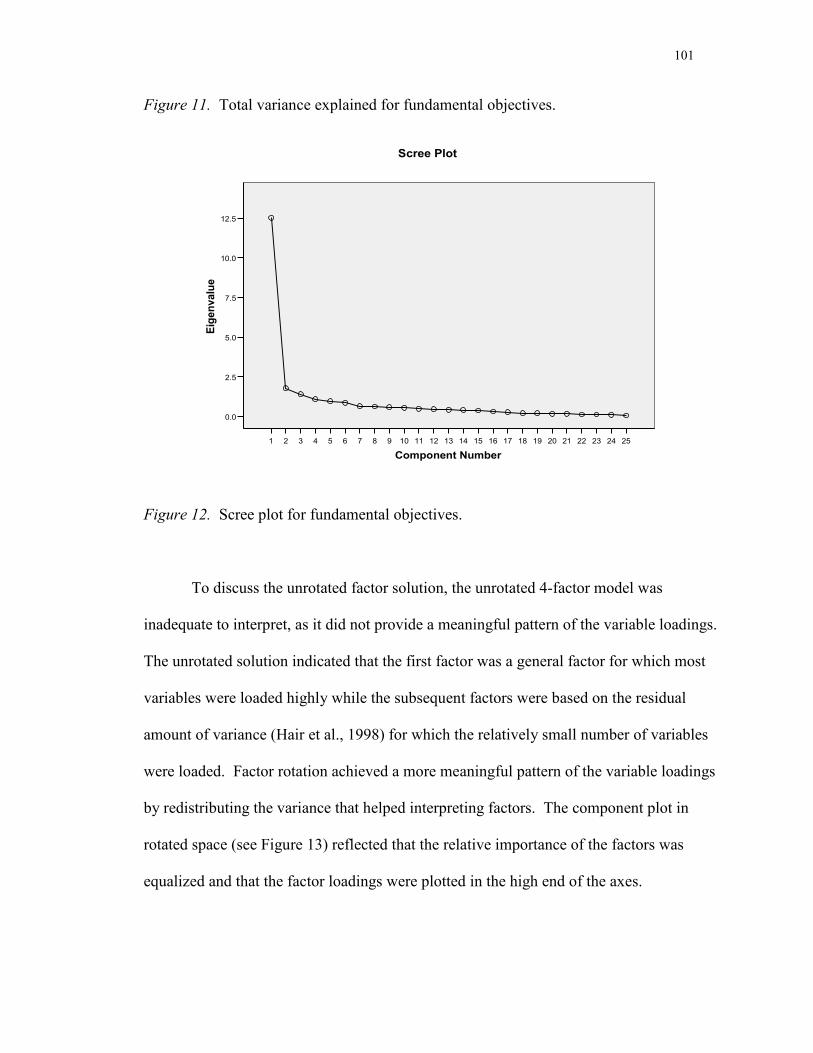
101
Figure 11. Total variance explained for fundamental objectives.
25242322212019181716151413121110987654321
Component Number
12.5
10.0
7.5
5.0
2.5
0.0
Eige
nval
ue
Scree Plot
Figure 12. Scree plot for fundamental objectives.
To discuss the unrotated factor solution, the unrotated 4-factor model was
inadequate to interpret, as it did not provide a meaningful pattern of the variable loadings.
The unrotated solution indicated that the first factor was a general factor for which most
variables were loaded highly while the subsequent factors were based on the residual
amount of variance (Hair et al., 1998) for which the relatively small number of variables
were loaded. Factor rotation achieved a more meaningful pattern of the variable loadings
by redistributing the variance that helped interpreting factors. The component plot in
rotated space (see Figure 13) reflected that the relative importance of the factors was
equalized and that the factor loadings were plotted in the high end of the axes.

102
Component 10.90.60.30.0-0.3-0.6
Component 30.9 0.6 0.3 0.0 -0.3
-0.6
Com
pone
nt2
0.9
0.6
0.3
0.0
-0.3
-0.6
-0.9
-0.9
-0.9
Itisimportanttomakeusingegovernmentasocialevent
ItisimportanttoinspirecitizenstouseegovernmentonlineservicesItisimportanttominimizeshippingtimeItisimportanttominimizedispatchtimeItisimportanttominimizeoverallcommunicationtimeItisimportanttobringgovernmentservicesclosertocitizensItisimportanttominimizethetimeittakestoselectinformationandserviItisimportanttominimizepaymenttimeItisimportanttoavoidgivingcitizenscausetoregretusingegovernmentoItisimportanttominimizeunnecessarydrivingthroughtheadvantagesofh
ItisimportanttominimizesearchtimeItisimportanttorespondquicklytorequestsforinformationandservices
ItisimportanttominimizepersonalhassleItisimportanttominimizeprocessingtimeItisimportanttoensuretimeflexibilityinusingservices
ItisimportanttofindinformationandserviceseasilyItisimportanttominimizethetimeittakestofindinformationandservice
Itisimportanttominimizetravelcosts
ItisimportantthatinformationandservicesareusefulItisimportanttomakecommunicationcostefficient
ItisimportanttoalwaysconsideroverallgoodofsocietyItisimportanttokeepdownthecostofservices
ItisimportanttominimizeenvironmentalimpactItisimportanttominimizepollution
Component Plot in Rotated Space
Figure 13. Component plot in rotated space for fundamental objectives.
The rotated component matrix (see Figure 14) showed the four components with
associated variables sorted by size of the factor loadings. The factor loadings of selected
items were in parenthesis. The higher the factor loadings, the more it contributed to the
variable and the stronger the variable correlated with the factor. Seven items were
excluded from the 4-factor solution because three items showed low loadings (less than
0.5) and four items showed high loadings (greater than 0.5) on multiple factors reflecting
that they were not factorially pure.
The first group of variables was loaded from 0.630 to 0.756, the second group
from 0.585 to 0.804, the third from 0.511 to 0.792, and the fourth from 0.541 to 0.866.
The 4-factor model was not difficult to interpret, corresponding with time savings (seven
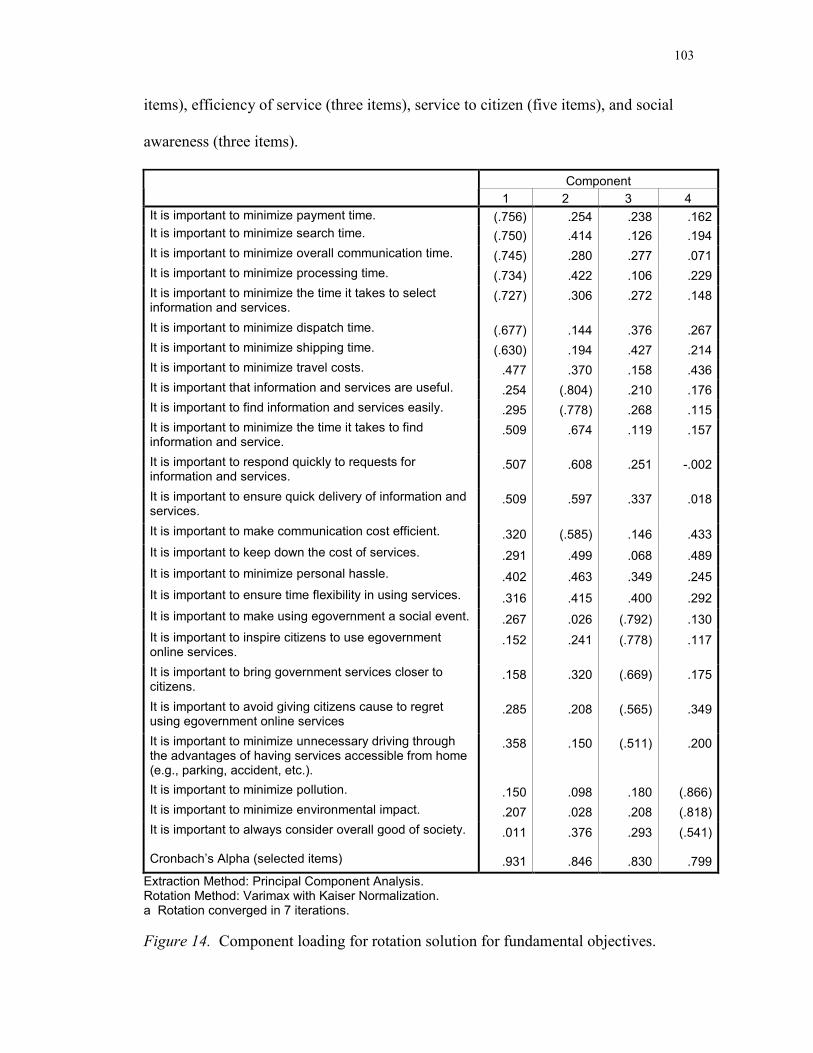
103
items), efficiency of service (three items), service to citizen (five items), and social
awareness (three items).
Component 1 2 3 4
It is important to minimize payment time. (.756) .254 .238 .162It is important to minimize search time. (.750) .414 .126 .194It is important to minimize overall communication time. (.745) .280 .277 .071It is important to minimize processing time. (.734) .422 .106 .229It is important to minimize the time it takes to select information and services.
(.727) .306 .272 .148
It is important to minimize dispatch time. (.677) .144 .376 .267It is important to minimize shipping time. (.630) .194 .427 .214It is important to minimize travel costs. .477 .370 .158 .436It is important that information and services are useful. .254 (.804) .210 .176It is important to find information and services easily. .295 (.778) .268 .115It is important to minimize the time it takes to find information and service.
.509 .674 .119 .157
It is important to respond quickly to requests for information and services.
.507 .608 .251 -.002
It is important to ensure quick delivery of information and services.
.509 .597 .337 .018
It is important to make communication cost efficient. .320 (.585) .146 .433It is important to keep down the cost of services. .291 .499 .068 .489It is important to minimize personal hassle. .402 .463 .349 .245It is important to ensure time flexibility in using services. .316 .415 .400 .292It is important to make using egovernment a social event. .267 .026 (.792) .130It is important to inspire citizens to use egovernment online services.
.152 .241 (.778) .117
It is important to bring government services closer to citizens.
.158 .320 (.669) .175
It is important to avoid giving citizens cause to regret using egovernment online services
.285 .208 (.565) .349
It is important to minimize unnecessary driving through the advantages of having services accessible from home (e.g., parking, accident, etc.).
.358 .150 (.511) .200
It is important to minimize pollution. .150 .098 .180 (.866)It is important to minimize environmental impact. .207 .028 .208 (.818)It is important to always consider overall good of society.
Cronbach’s Alpha (selected items)
.011
.931
.376
.846
.293
.830
(.541)
.799Extraction Method: Principal Component Analysis. Rotation Method: Varimax with Kaiser Normalization. a Rotation converged in 7 iterations. Figure 14. Component loading for rotation solution for fundamental objectives.
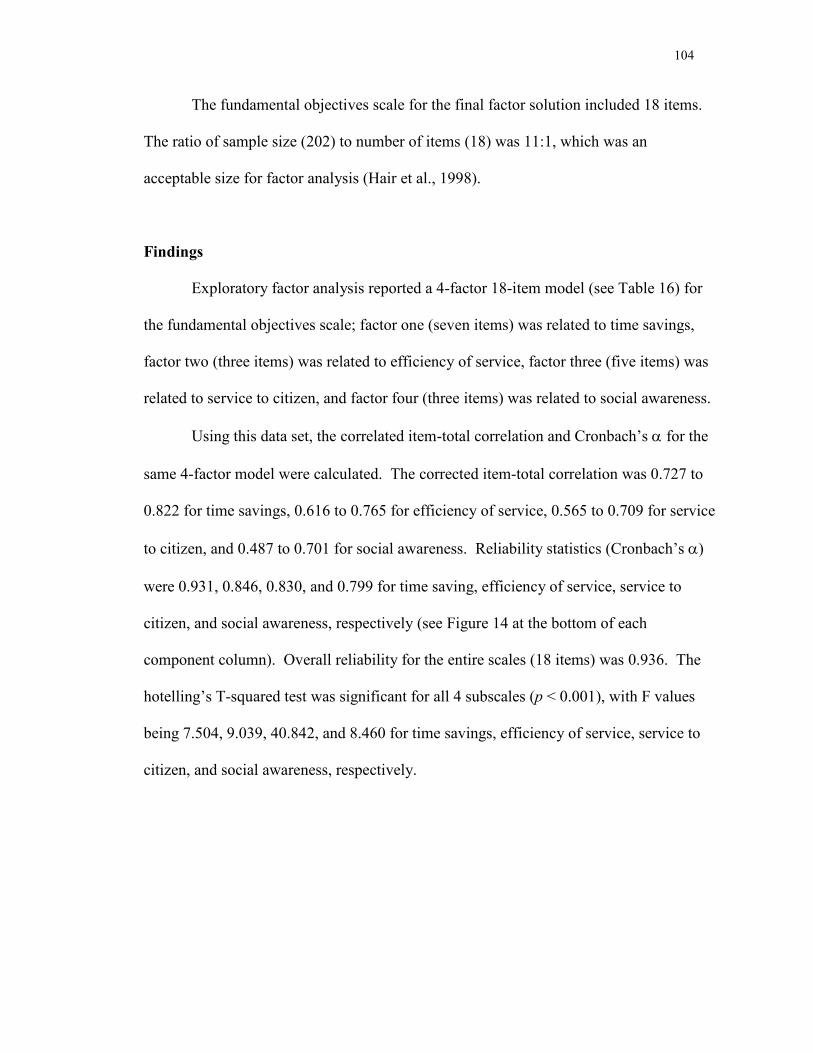
104
The fundamental objectives scale for the final factor solution included 18 items.
The ratio of sample size (202) to number of items (18) was 11:1, which was an
acceptable size for factor analysis (Hair et al., 1998).
Findings
Exploratory factor analysis reported a 4-factor 18-item model (see Table 16) for
the fundamental objectives scale; factor one (seven items) was related to time savings,
factor two (three items) was related to efficiency of service, factor three (five items) was
related to service to citizen, and factor four (three items) was related to social awareness.
Using this data set, the correlated item-total correlation and Cronbach’s α for the
same 4-factor model were calculated. The corrected item-total correlation was 0.727 to
0.822 for time savings, 0.616 to 0.765 for efficiency of service, 0.565 to 0.709 for service
to citizen, and 0.487 to 0.701 for social awareness. Reliability statistics (Cronbach’s α)
were 0.931, 0.846, 0.830, and 0.799 for time saving, efficiency of service, service to
citizen, and social awareness, respectively (see Figure 14 at the bottom of each
component column). Overall reliability for the entire scales (18 items) was 0.936. The
hotelling’s T-squared test was significant for all 4 subscales (p < 0.001), with F values
being 7.504, 9.039, 40.842, and 8.460 for time savings, efficiency of service, service to
citizen, and social awareness, respectively.
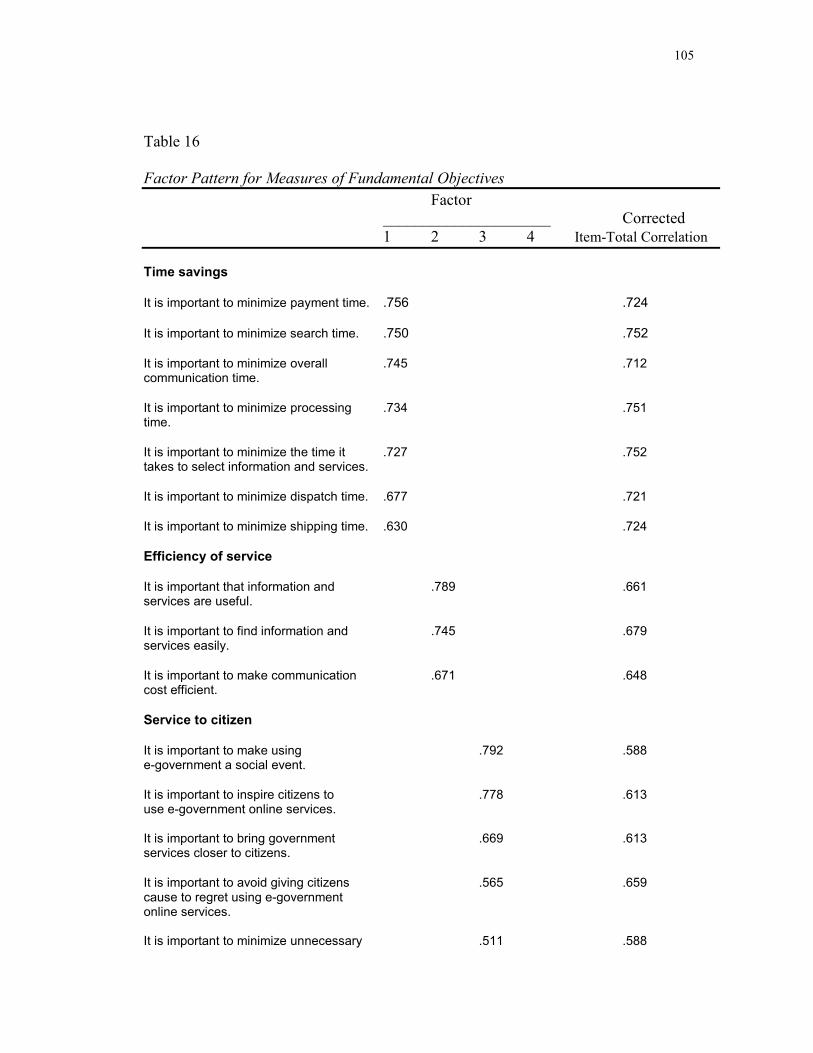
105
Table 16 Factor Pattern for Measures of Fundamental Objectives Factor
_____________________ Corrected 1 2 3 4 Item-Total Correlation
Time savings It is important to minimize payment time. .756 .724
It is important to minimize search time. .750 .752
It is important to minimize overall .745 .712 communication time.
It is important to minimize processing .734 .751 time. It is important to minimize the time it .727 .752 takes to select information and services. It is important to minimize dispatch time. .677 .721 It is important to minimize shipping time. .630 .724
Efficiency of service It is important that information and .789 .661 services are useful. It is important to find information and .745 .679 services easily.
It is important to make communication .671 .648 cost efficient.
Service to citizen It is important to make using .792 .588 e-government a social event. It is important to inspire citizens to .778 .613 use e-government online services. It is important to bring government .669 .613 services closer to citizens.
It is important to avoid giving citizens .565 .659 cause to regret using e-government online services. It is important to minimize unnecessary .511 .588
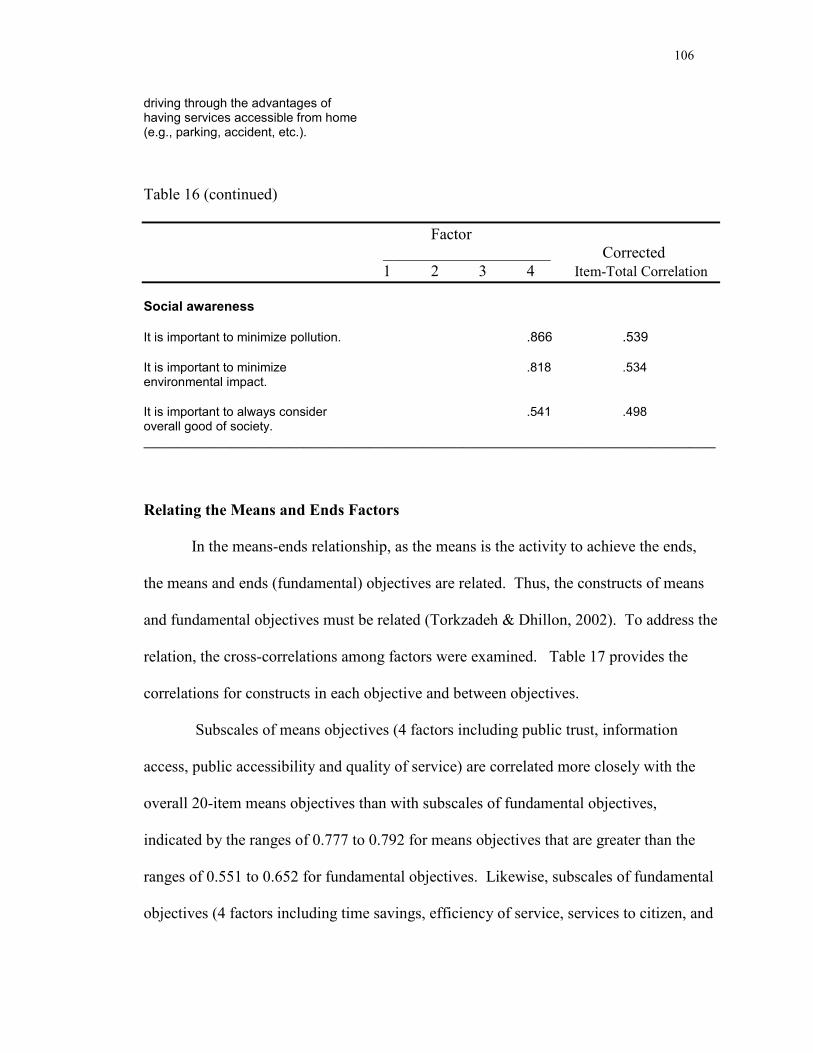
106
driving through the advantages of having services accessible from home (e.g., parking, accident, etc.).
Table 16 (continued)
Factor _____________________ Corrected
1 2 3 4 Item-Total Correlation
Social awareness It is important to minimize pollution. .866 .539 It is important to minimize .818 .534 environmental impact.
It is important to always consider .541 .498 overall good of society. ______________________________________________________________________________________
Relating the Means and Ends Factors
In the means-ends relationship, as the means is the activity to achieve the ends,
the means and ends (fundamental) objectives are related. Thus, the constructs of means
and fundamental objectives must be related (Torkzadeh & Dhillon, 2002). To address the
relation, the cross-correlations among factors were examined. Table 17 provides the
correlations for constructs in each objective and between objectives.
Subscales of means objectives (4 factors including public trust, information
access, public accessibility and quality of service) are correlated more closely with the
overall 20-item means objectives than with subscales of fundamental objectives,
indicated by the ranges of 0.777 to 0.792 for means objectives that are greater than the
ranges of 0.551 to 0.652 for fundamental objectives. Likewise, subscales of fundamental
objectives (4 factors including time savings, efficiency of service, services to citizen, and
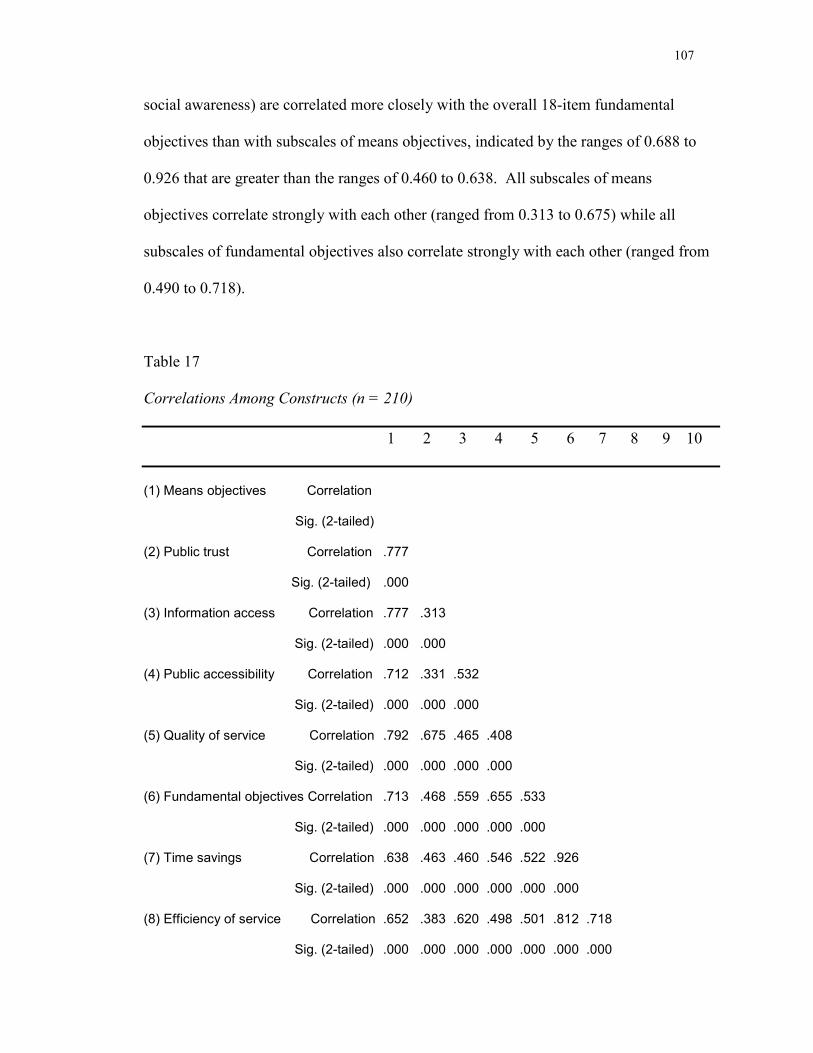
107
social awareness) are correlated more closely with the overall 18-item fundamental
objectives than with subscales of means objectives, indicated by the ranges of 0.688 to
0.926 that are greater than the ranges of 0.460 to 0.638. All subscales of means
objectives correlate strongly with each other (ranged from 0.313 to 0.675) while all
subscales of fundamental objectives also correlate strongly with each other (ranged from
0.490 to 0.718).
Table 17 Correlations Among Constructs (n = 210)
1 2 3 4 5 6 7 8 9 10
(1) Means objectives Correlation
Sig. (2-tailed) (2) Public trust Correlation .777
Sig. (2-tailed) .000
(3) Information access Correlation .777 .313
Sig. (2-tailed) .000 .000 (4) Public accessibility Correlation .712 .331 .532
Sig. (2-tailed) .000 .000 .000 (5) Quality of service Correlation .792 .675 .465 .408
Sig. (2-tailed) .000 .000 .000 .000 (6) Fundamental objectives Correlation .713 .468 .559 .655 .533
Sig. (2-tailed) .000 .000 .000 .000 .000 (7) Time savings Correlation .638 .463 .460 .546 .522 .926
Sig. (2-tailed) .000 .000 .000 .000 .000 .000 (8) Efficiency of service Correlation .652 .383 .620 .498 .501 .812 .718
Sig. (2-tailed) .000 .000 .000 .000 .000 .000 .000
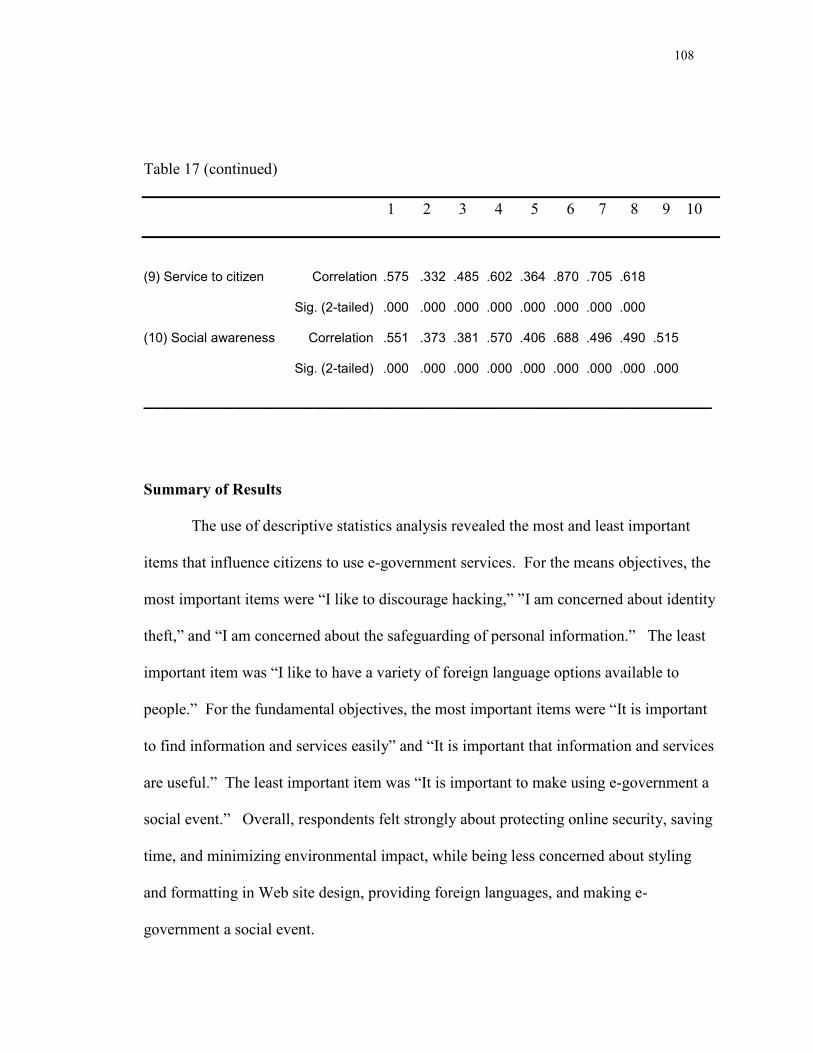
108
Table 17 (continued)
1 2 3 4 5 6 7 8 9 10
(9) Service to citizen Correlation .575 .332 .485 .602 .364 .870 .705 .618
Sig. (2-tailed) .000 .000 .000 .000 .000 .000 .000 .000 (10) Social awareness Correlation .551 .373 .381 .570 .406 .688 .496 .490 .515
Sig. (2-tailed) .000 .000 .000 .000 .000 .000 .000 .000 .000
________________________________________________________________
Summary of Results
The use of descriptive statistics analysis revealed the most and least important
items that influence citizens to use e-government services. For the means objectives, the
most important items were “I like to discourage hacking,” ”I am concerned about identity
theft,” and “I am concerned about the safeguarding of personal information.” The least
important item was “I like to have a variety of foreign language options available to
people.” For the fundamental objectives, the most important items were “It is important
to find information and services easily” and “It is important that information and services
are useful.” The least important item was “It is important to make using e-government a
social event.” Overall, respondents felt strongly about protecting online security, saving
time, and minimizing environmental impact, while being less concerned about styling
and formatting in Web site design, providing foreign languages, and making e-
government a social event.
109
The results provided evidence of construct validity and reliability for the means
and fundamental objectives. The construct validity was provided by the item purification
process where the correlation coefficients reflected high correlation. The reliability was
evidenced by the high Cronbach’s Alpha that implied the internal consistency of the scale
variables.
Using the PCA procedure, the 46 variables were reduced to 20 and 210 cases
were reduced to 198 for the means objectives while the 24 variables were reduced to 18
and 210 cases were reduced to 202 for the fundamental objectives. Then, two factor
models were presented for each type of objective variable. Each factor model accounted
for 64.738% and 67.298% of covariance among variables for the means and fundamental
objectives, respectively. One model measures the means objectives in terms of public
trust, information access, public accessibility, and quality of services. The other
measures the fundamental objectives in terms of time savings, efficiency of service,
service to citizen, and social awareness. The two sets of factor models developed in this
paper together measure the factors that influence the success of e-government initiatives.
110
Chapter 5
Conclusions, Implications, Recommendations, and Summary
Conclusions
The research conceptualized the value of e-government and developed
instruments to measure factors that influence the success of e-government initiatives.
This was an applied research study into ideas suggested by Keeney (1999) that attempted
to develop a sample of customer values for a specific category of products where the
customer was the citizen (e-government services users) and the category was e-
government service. The customer values for e-government services ranged from
benefits and costs of services (e.g., reduced effort) to possible benefits and costs to the
world (e.g., environmental impact). The citizen’s values for e-government services were
generated from the 125 items (see Appendix A) developed from the exploratory study of
Internet commerce by Torkzadeh and Dhillon (2002) and from the research pool
published in the leading refereed publications during the 6-year period from 2000 to 2005
(see Appendix E).
The theoretical foundation for this research came from two concepts in Decision
Analysis. One of the concepts is means-ends analysis. Means-ends analysis is a
problem-solving strategy that attempts to search for and apply an action (means) to
achieve a goal (ends). The means is the activity to achieve the ends. A second concept is
the notion of value, as posited by Keeney (1992) in value-focused thinking. The value-
focused approach stresses that values are fundamentally important in any decision
situation, while alternatives are relevant only because they are a means to achieve the
111
desired values. Thus, the thinking should focus first on values, and later on alternatives
that might achieve them. Value-focused thinking, therefore, asks the most important
question: what do people really value in a given situation? (Keeney, 1992). The two
concepts of means-ends chain and value-focused thinking are closely related.
For the empirical study, the list of values (objectives) were classified into means
and ends types of objectives depending on the characteristics of attributes. The means
objectives help to achieve what is important to the e-government users — fundamental
objectives. Data collection and analysis were conducted against these two types
independently. Using a sample of 210 responses from e-government service users, two
sets of instruments were created that measure the factors that influence the success of e-
government initiatives. One instrument (4-factor 20-item model) measures the means
objectives in terms of public trust, information access, public accessibility, and quality of
services. The other instrument (4-factor 18-item model) measures the fundamental
objectives in terms of time savings, efficiency of service, service to citizen, and social
awareness. Evidence of content validity and construct validity and reliability was
presented.
The measuring of research constructs is neither simple nor straightforward (Straub,
1989). Due to the inherent nature of user surveys, any study would have a certain amount
of bias. Since e-government encompasses many types of services for users with different
abilities, a study of this kind faces various issues in assessing values. One person may
have found online e-government services convenient and easy to use, while another may
have found them difficult and impersonal. Thus, the net value of using the services could
differ by individual. Although the research addressed the e-government services at some
112
level of specificity, it mainly focused on general issues instead of a variety of service-
specific issues, in order to minimize any possible bias.
Implications
The success of e-government is contingent upon citizens’ willingness to use e-
government services (Carter & Belanger, 2005; Devadoss, Pan, & Huang, 2002). As
values are the basic principles that guide actions and preferences (Keeney, 1992), citizens
are likely to use such services if they feel that they get better value than from
conventional government services. As the value of Internet commerce to the customer is
an important construct for academics and practitioners alike (Torkzadeh & Dhillion,
2002), so is the value of e-government services to the citizens. This concept can also be
used as a dependent or independent variable with preceding and ensuing constructs for e-
government research. The multi-dimensional measures discovered by this study can
provide insight for the decision context of whether citizens should use e-government
services and can help people understand the phenomena of e-government, the impact of
this new technology, and its management.
The literature review undertaken in the course of this research found that most of
the existing e-government studies are not empirical but rhetorical in nature (Norrise &
Moon, 2005; Devadoss et al., 2002). Hence, this empirical research contributes to the
body of e-government research in the following ways:
113
1. The study generated a list of e-government values that citizens consider most
important when they engage with e-government services.
2. The study developed two instruments that can be used to measure the factors that
influence the success of overall e-government initiatives.
3. The study demonstrated an instrument development process with reliability and
validity.
4. The study combined analytic and empirical components to connect theory to social
phenomena (Rummel, 1970). Factor analysis helped to connect the value theory to e-
government phenomena.
Recommendations
In the postindustrial setting, scholars contend that the implications for information
technology lie in the nature of work, productivity, and economic growth (Torkzadeh &
Dhillon, 2002). IS could potentially create new ideas, increase values, and more
effectively satisfy customer needs. The instrument developed in this research can be used
as a tool to assess this potential. Because increasing value to citizens is the key
ingredient in the success of e-government, this research provided a useful list of the
comprehensive values for developing and improving the e-government initiatives. To
apply the results, the objectives identified by the instruments can not only be put to use at
a high level, such as developing strategic plans, but also directly be implemented or
tailored to the specific services. In addition, the list of e-government values generated in
this research can be used as a foundation for developing a quantitative model of e-
government value.
114
As new services and features continue to be added to e-government initiatives,
triggered by emerging technology and ever-increasing demand, governments continue
their e-government march. Continued studies are needed to examine the progress and
effectiveness of e-governments in delivering services and facilitating citizens’ political
participation (Moon, 2002). The scale developed in this study might need to be changed
over time. For the means objectives, the public trust factor needs to address new risks
arising from the use of emerging technology; the information access factor needs to
explore the evolution of information retrieval techniques and requirements; the public
accessibility factor needs to consider the impact of using new devices (e.g., wireless);
and the quality of service factor should adopt for an increased level of service. For the
fundamental objectives, factors such as time savings and social awareness remain
relatively the same, as they are less directly affected by the changes than the means
objectives. For both objectives, the instruments developed in this study will need to be
refined to satisfy future research requirements.
Summary
IS is being applied vigorously by government units at national, regional, and
local levels around the world (Marchionini, Samet, & Brandt, 2003). In the 1990s, the
advent of network-based IS represented a turning point in the strategic direction for
government agencies, which now have the immense opportunity to utilize e-commerce to
achieve their objectives (Kalakota & Whinston, 1997) through e-government. E-
government is narrowly defined as “the delivery of government information and services
online through the Internet or other digital means” (West, 2004, p. 2). E-government can
115
be viewed as (a) a transformation of the business of governance, i.e. improving service,
and renewing administrative processes, and (b) a transformation of governance itself, i.e.
re-examining the functioning of democratic practices and processes (Aichholzer &
Schmitzer, 2000).
Governments are employing network-based IS in the expectation that it will be
cheaper, faster, and more convenient than traditional means of delivering products and
services (McNeal, Tolbert, Mossberger, & Dotterweich, 2003). Having invested an
enormous amount of resources in e-government (Peters, Jansen, & Engers, 2004),
governments strive to succeed in this endeavor. To further the success of e-government,
it is critical to understand and influence citizens’ acceptance of e-government services
(Fu, Farn, & Chao, 2006) because the success of e-government initiatives is contingent
upon citizens’ willingness to use these services (Carter & Belanger, 2005; Devadoss, Pan,
& Huang, 2002). However, it is not clear whether citizens will embrace the use of such
services (Carter & Belanger, 2004). As values are the basic principles that guide actions
and preferences (Keeney, 1992), citizens are likely to use such services if they feel that
they get better value than from conventional government services. Thus, e-government
value to citizens is an important factor for the success of e-government. The two main
goals of this research were:
1. To conceptualize the value of e-government.
2. To develop two instruments to measure factors that influence the success of e-
government initiatives — ends objectives and means objectives.
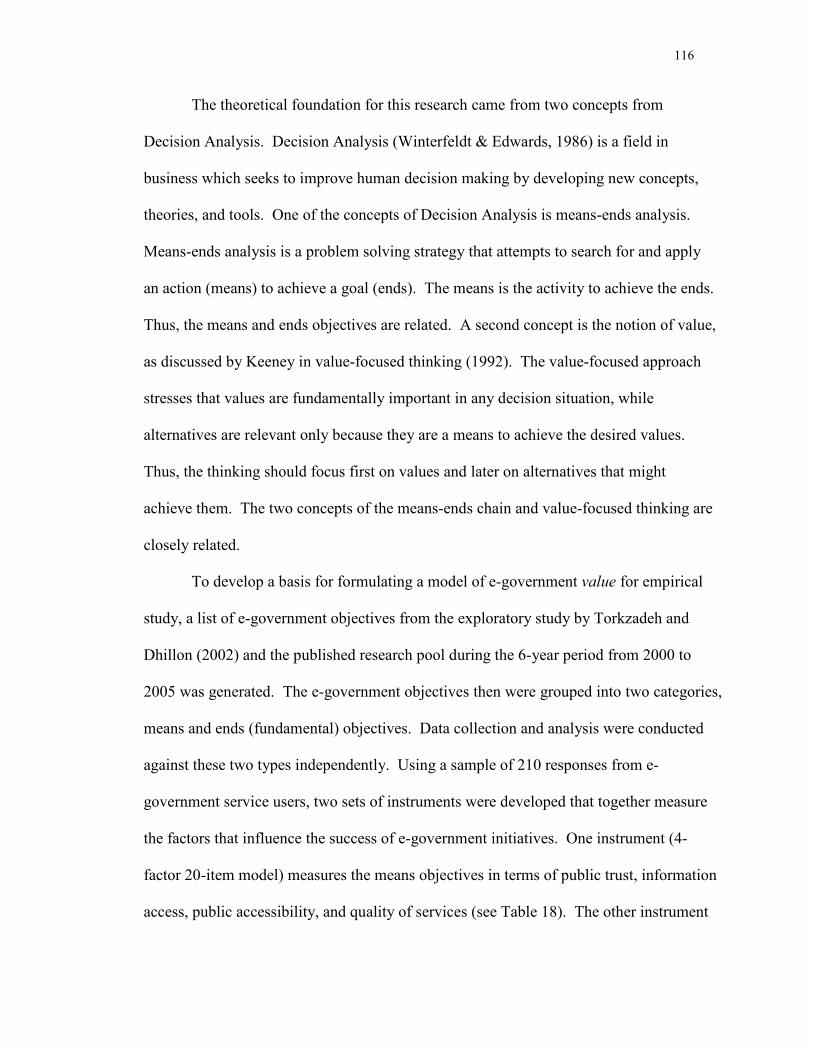
116
The theoretical foundation for this research came from two concepts from
Decision Analysis. Decision Analysis (Winterfeldt & Edwards, 1986) is a field in
business which seeks to improve human decision making by developing new concepts,
theories, and tools. One of the concepts of Decision Analysis is means-ends analysis.
Means-ends analysis is a problem solving strategy that attempts to search for and apply
an action (means) to achieve a goal (ends). The means is the activity to achieve the ends.
Thus, the means and ends objectives are related. A second concept is the notion of value,
as discussed by Keeney in value-focused thinking (1992). The value-focused approach
stresses that values are fundamentally important in any decision situation, while
alternatives are relevant only because they are a means to achieve the desired values.
Thus, the thinking should focus first on values and later on alternatives that might
achieve them. The two concepts of the means-ends chain and value-focused thinking are
closely related.
To develop a basis for formulating a model of e-government value for empirical
study, a list of e-government objectives from the exploratory study by Torkzadeh and
Dhillon (2002) and the published research pool during the 6-year period from 2000 to
2005 was generated. The e-government objectives then were grouped into two categories,
means and ends (fundamental) objectives. Data collection and analysis were conducted
against these two types independently. Using a sample of 210 responses from e-
government service users, two sets of instruments were developed that together measure
the factors that influence the success of e-government initiatives. One instrument (4-
factor 20-item model) measures the means objectives in terms of public trust, information
access, public accessibility, and quality of services (see Table 18). The other instrument
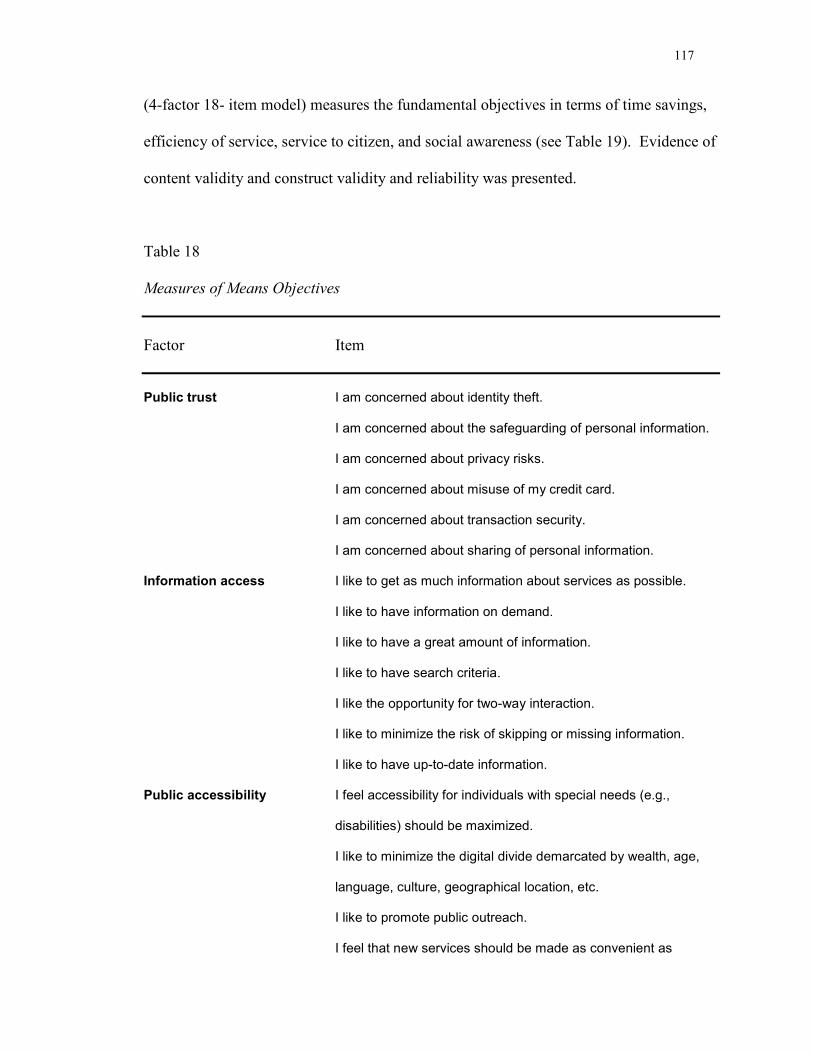
117
(4-factor 18- item model) measures the fundamental objectives in terms of time savings,
efficiency of service, service to citizen, and social awareness (see Table 19). Evidence of
content validity and construct validity and reliability was presented.
Table 18 Measures of Means Objectives
Factor Item
Public trust I am concerned about identity theft.
I am concerned about the safeguarding of personal information.
I am concerned about privacy risks.
I am concerned about misuse of my credit card.
I am concerned about transaction security. I am concerned about sharing of personal information.
Information access I like to get as much information about services as possible.
I like to have information on demand.
I like to have a great amount of information.
I like to have search criteria.
I like the opportunity for two-way interaction.
I like to minimize the risk of skipping or missing information.
I like to have up-to-date information. Public accessibility I feel accessibility for individuals with special needs (e.g.,
disabilities) should be maximized.
I like to minimize the digital divide demarcated by wealth, age, language, culture, geographical location, etc. I like to promote public outreach.
I feel that new services should be made as convenient as

118
Table 18 (continued)
Factor Item
possible utilizing various devices, such as cell phones, PDAs, etc.
Quality of service I am concerned about quality of the information and services
delivered.
I am concerned about reliable delivery of information and services.
I am concerned about accuracy of transaction.
Table 19 Measures of Fundamental Objectives
Factor Item
Time savings It is important to minimize payment time.
It is important to minimize search time.
It is important to minimize overall communication time.
It is important to minimize processing time.
It is important to minimize the time it takes to select information and services. It is important to minimize dispatch time.
It is important to minimize shipping time.
Efficiency of service It is important that information and services are useful.
It is important to find information and services easily.
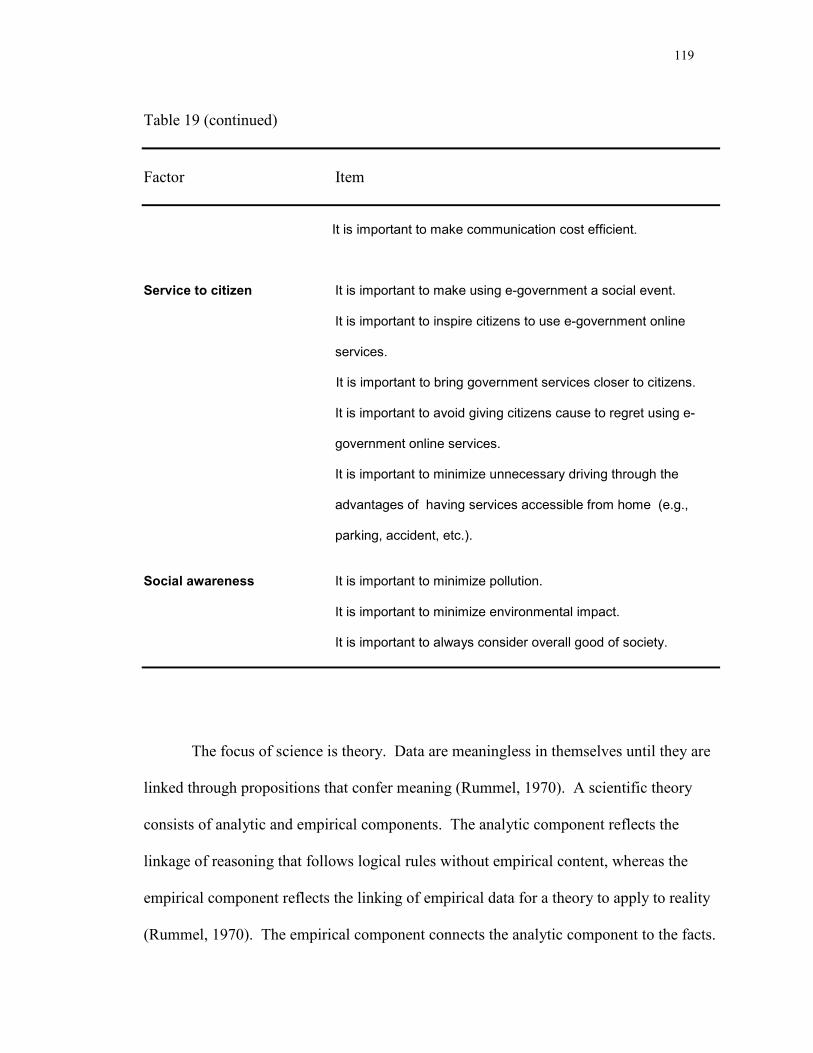
119
Table 19 (continued)
Factor Item
It is important to make communication cost efficient.
Service to citizen It is important to make using e-government a social event.
It is important to inspire citizens to use e-government online services.
It is important to bring government services closer to citizens.
It is important to avoid giving citizens cause to regret using e- government online services.
It is important to minimize unnecessary driving through the advantages of having services accessible from home (e.g., parking, accident, etc.).
Social awareness It is important to minimize pollution.
It is important to minimize environmental impact.
It is important to always consider overall good of society.
The focus of science is theory. Data are meaningless in themselves until they are
linked through propositions that confer meaning (Rummel, 1970). A scientific theory
consists of analytic and empirical components. The analytic component reflects the
linkage of reasoning that follows logical rules without empirical content, whereas the
empirical component reflects the linking of empirical data for a theory to apply to reality
(Rummel, 1970). The empirical component connects the analytic component to the facts.
120
For this research, factor analysis helps to combine the analytic and empirical components
in order to connect theory (value theory) to social phenomena (e-government
phenomena).
As new services and features continue to be added to e-government initiatives,
triggered by emerging technology and ever-increasing demand, governments continue
their e-government march. Continued studies are needed to examine the progress and
effectiveness of governments in delivering Web-based public services and facilitating
citizens’ Web-based political participation (Moon, 2002).
In the postindustrial setting, scholars contend that the implications for information
technology lie in the nature of work, productivity, and economic growth (Torkzadeh &
Dhillon, 2002). IS could potentially create new ideas, increase values, and more
effectively satisfy customer needs. The instrument developed in this research can be used
as a tool to assess this potential. Because increasing value to citizens is the key
ingredient in the success of e-government, this research provided a useful list of the
comprehensive values for developing and improving the e-government initiatives. To
apply the results, the objectives identified by the instruments can not only be put to use at
a high level, such as developing strategic plans, but also directly be implemented or
tailored to the specific services. In addition, the list of e-government values generated in
this research provides a foundation for developing a quantitative model of e-government
value.
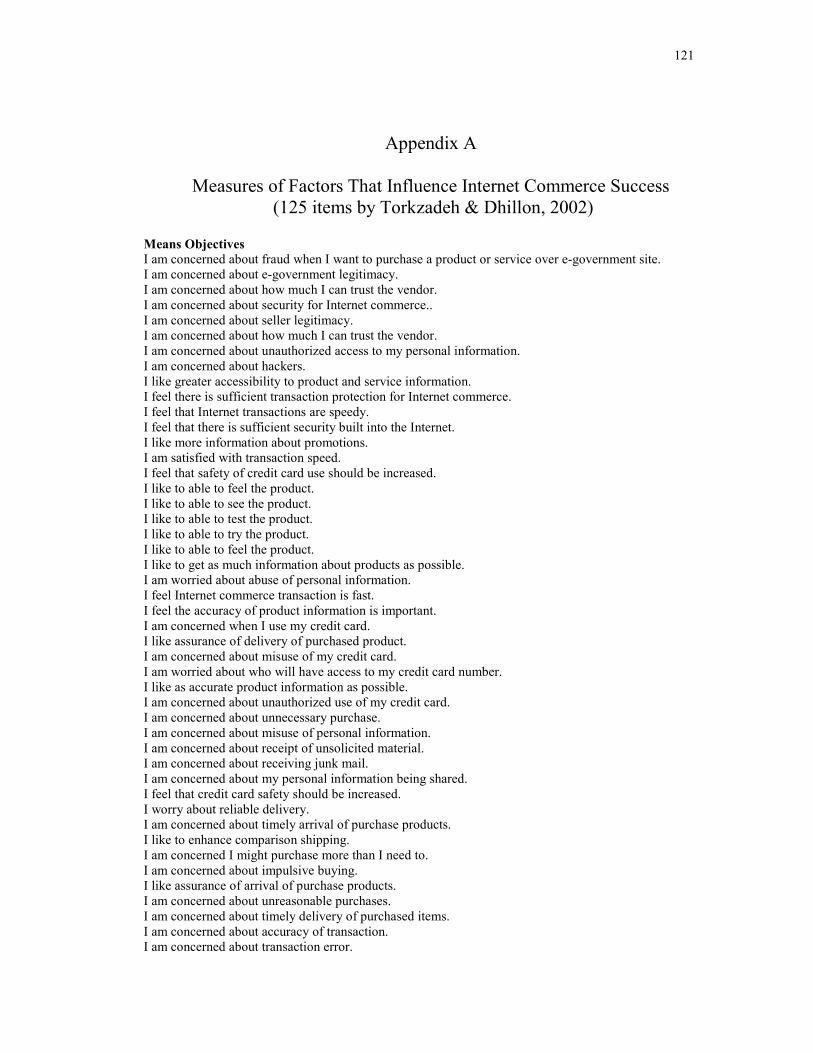
121
Appendix A
Measures of Factors That Influence Internet Commerce Success (125 items by Torkzadeh & Dhillon, 2002)
Means Objectives I am concerned about fraud when I want to purchase a product or service over e-government site. I am concerned about e-government legitimacy. I am concerned about how much I can trust the vendor. I am concerned about security for Internet commerce.. I am concerned about seller legitimacy. I am concerned about how much I can trust the vendor. I am concerned about unauthorized access to my personal information. I am concerned about hackers. I like greater accessibility to product and service information. I feel there is sufficient transaction protection for Internet commerce. I feel that Internet transactions are speedy. I feel that there is sufficient security built into the Internet. I like more information about promotions. I am satisfied with transaction speed. I feel that safety of credit card use should be increased. I like to able to feel the product. I like to able to see the product. I like to able to test the product. I like to able to try the product. I like to able to feel the product. I like to get as much information about products as possible. I am worried about abuse of personal information. I feel Internet commerce transaction is fast. I feel the accuracy of product information is important. I am concerned when I use my credit card. I like assurance of delivery of purchased product. I am concerned about misuse of my credit card. I am worried about who will have access to my credit card number. I like as accurate product information as possible. I am concerned about unauthorized use of my credit card. I am concerned about unnecessary purchase. I am concerned about misuse of personal information. I am concerned about receipt of unsolicited material. I am concerned about receiving junk mail. I am concerned about my personal information being shared. I feel that credit card safety should be increased. I worry about reliable delivery. I am concerned about timely arrival of purchase products. I like to enhance comparison shipping. I am concerned I might purchase more than I need to. I am concerned about impulsive buying. I like assurance of arrival of purchase products. I am concerned about unreasonable purchases. I am concerned about timely delivery of purchased items. I am concerned about accuracy of transaction. I am concerned about transaction error.
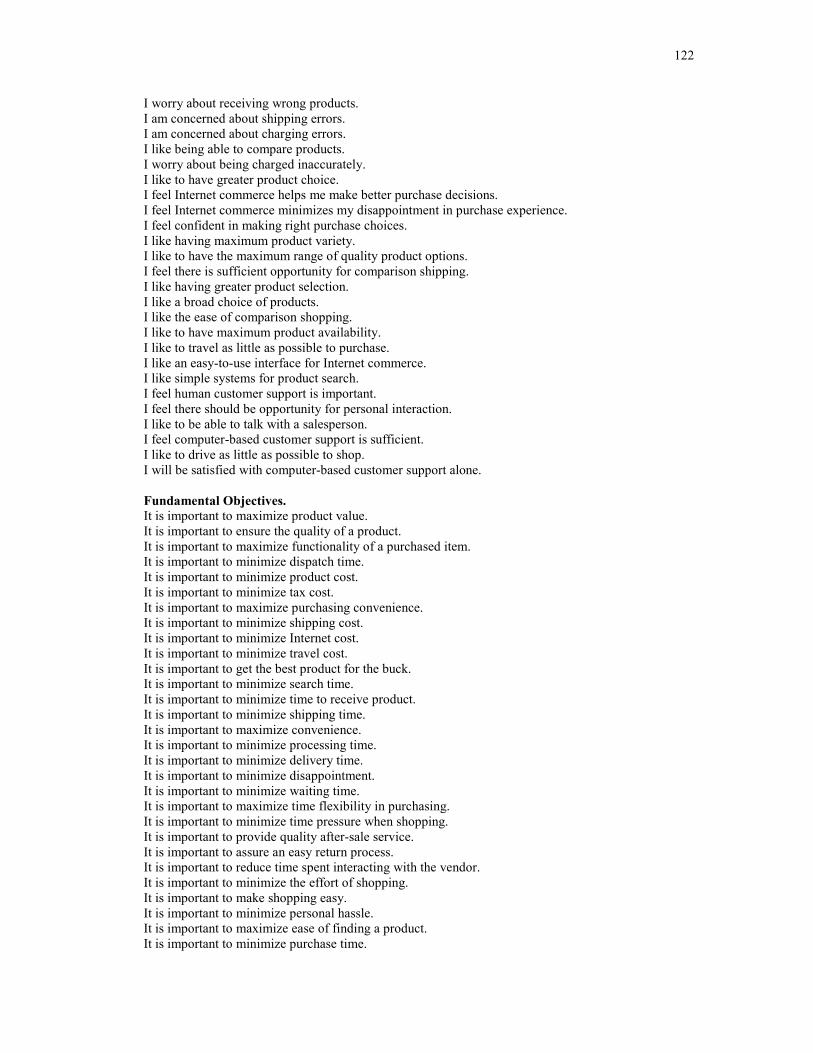
122
I worry about receiving wrong products. I am concerned about shipping errors. I am concerned about charging errors. I like being able to compare products. I worry about being charged inaccurately. I like to have greater product choice. I feel Internet commerce helps me make better purchase decisions. I feel Internet commerce minimizes my disappointment in purchase experience. I feel confident in making right purchase choices. I like having maximum product variety. I like to have the maximum range of quality product options. I feel there is sufficient opportunity for comparison shipping. I like having greater product selection. I like a broad choice of products. I like the ease of comparison shopping. I like to have maximum product availability. I like to travel as little as possible to purchase. I like an easy-to-use interface for Internet commerce. I like simple systems for product search. I feel human customer support is important. I feel there should be opportunity for personal interaction. I like to be able to talk with a salesperson. I feel computer-based customer support is sufficient. I like to drive as little as possible to shop. I will be satisfied with computer-based customer support alone. Fundamental Objectives. It is important to maximize product value. It is important to ensure the quality of a product. It is important to maximize functionality of a purchased item. It is important to minimize dispatch time. It is important to minimize product cost. It is important to minimize tax cost. It is important to maximize purchasing convenience. It is important to minimize shipping cost. It is important to minimize Internet cost. It is important to minimize travel cost. It is important to get the best product for the buck. It is important to minimize search time. It is important to minimize time to receive product. It is important to minimize shipping time. It is important to maximize convenience. It is important to minimize processing time. It is important to minimize delivery time. It is important to minimize disappointment. It is important to minimize waiting time. It is important to maximize time flexibility in purchasing. It is important to minimize time pressure when shopping. It is important to provide quality after-sale service. It is important to assure an easy return process. It is important to reduce time spent interacting with the vendor. It is important to minimize the effort of shopping. It is important to make shopping easy. It is important to minimize personal hassle. It is important to maximize ease of finding a product. It is important to minimize purchase time.
123
It is important to minimize payment time. It is important to minimize queuing time. It is important to avoid getting on electronic mailing lists. It is important to minimize time to find a product. It is important to minimize time to order a product. It is important to minimize regret of shopping. It is important to minimize time to gather information. It is important to minimize time to select a product. It is important to provide an easy return process. It is important to reduce environmental damages. It is important to maximize privacy. It is important to make shopping a social event. It is important to minimize the worry of shopping. It is important to inspire customers. It is important to maximize driving safety for shopping. It is important to enhance customer productivity. It is important to minimize pollution. It is important to give customers new ideas. It is important to minimize regret of online shopping. It is important to maximize customer confidence. It is important to minimize shopping effort. It is important to maximize a safe shopping experience. It is important to minimize the risk of product use. It is important to minimize environment impact.
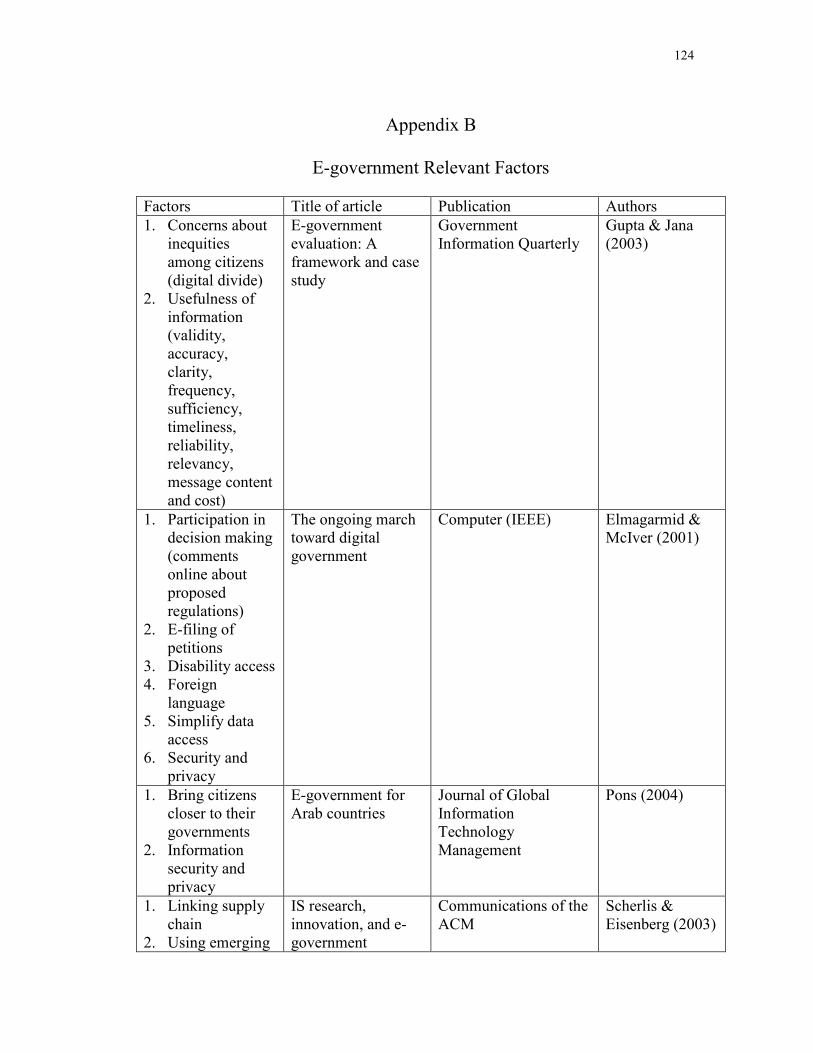
124
Appendix B
E-government Relevant Factors
Factors Title of article Publication Authors 1. Concerns about
inequities among citizens (digital divide)
2. Usefulness of information (validity, accuracy, clarity, frequency, sufficiency, timeliness, reliability, relevancy, message content and cost)
E-government evaluation: A framework and case study
Government Information Quarterly
Gupta & Jana (2003)
1. Participation in decision making (comments online about proposed regulations)
2. E-filing of petitions
3. Disability access 4. Foreign
language 5. Simplify data
access 6. Security and
privacy
The ongoing march toward digital government
Computer (IEEE) Elmagarmid & McIver (2001)
1. Bring citizens closer to their governments
2. Information security and privacy
E-government for Arab countries
Journal of Global Information Technology Management
Pons (2004)
1. Linking supply chain
2. Using emerging
IS research, innovation, and e-government
Communications of the ACM
Scherlis & Eisenberg (2003)
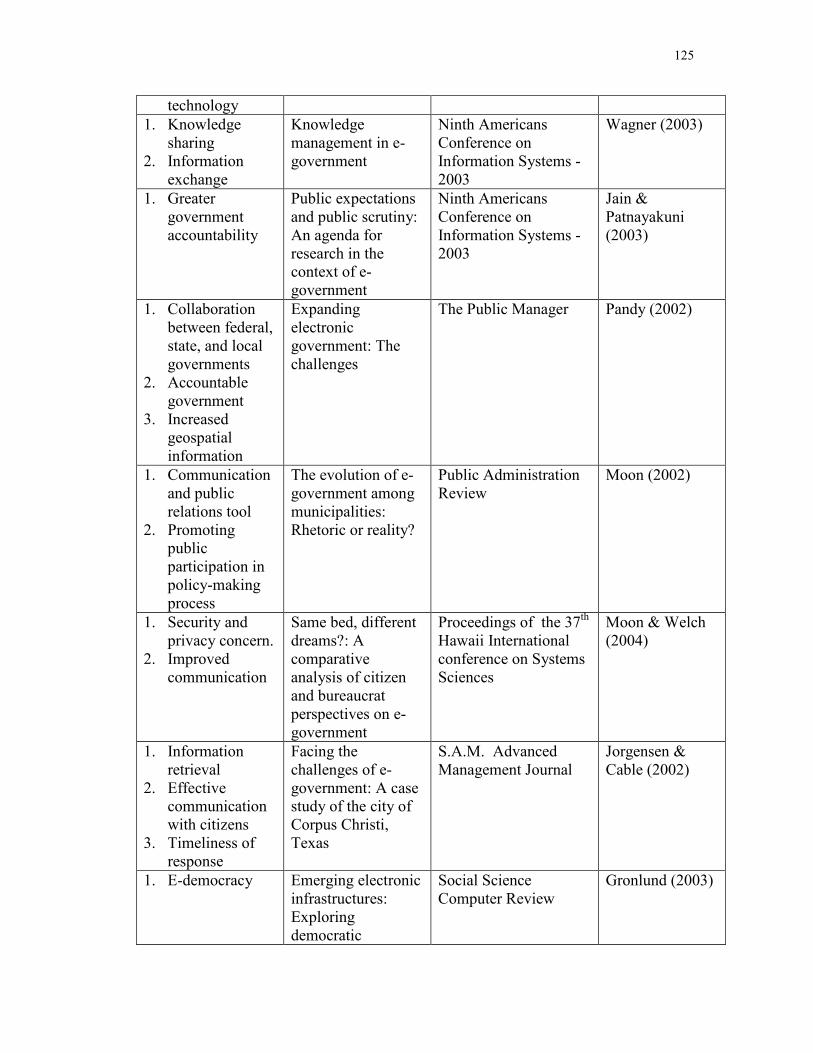
125
technology 1. Knowledge
sharing 2. Information
exchange
Knowledge management in e-government
Ninth Americans Conference on Information Systems -2003
Wagner (2003)
1. Greater government accountability
Public expectations and public scrutiny: An agenda for research in the context of e-government
Ninth Americans Conference on Information Systems -2003
Jain & Patnayakuni (2003)
1. Collaboration between federal, state, and local governments
2. Accountable government
3. Increased geospatial information
Expanding electronic government: The challenges
The Public Manager Pandy (2002)
1. Communication and public relations tool
2. Promoting public participation in policy-making process
The evolution of e-government among municipalities: Rhetoric or reality?
Public Administration Review
Moon (2002)
1. Security and privacy concern.
2. Improved communication
Same bed, different dreams?: A comparative analysis of citizen and bureaucrat perspectives on e-government
Proceedings of the 37th Hawaii International conference on Systems Sciences
Moon & Welch (2004)
1. Information retrieval
2. Effective communication with citizens
3. Timeliness of response
Facing the challenges of e-government: A case study of the city of Corpus Christi, Texas
S.A.M. Advanced Management Journal
Jorgensen & Cable (2002)
1. E-democracy Emerging electronic infrastructures: Exploring democratic
Social Science Computer Review
Gronlund (2003)
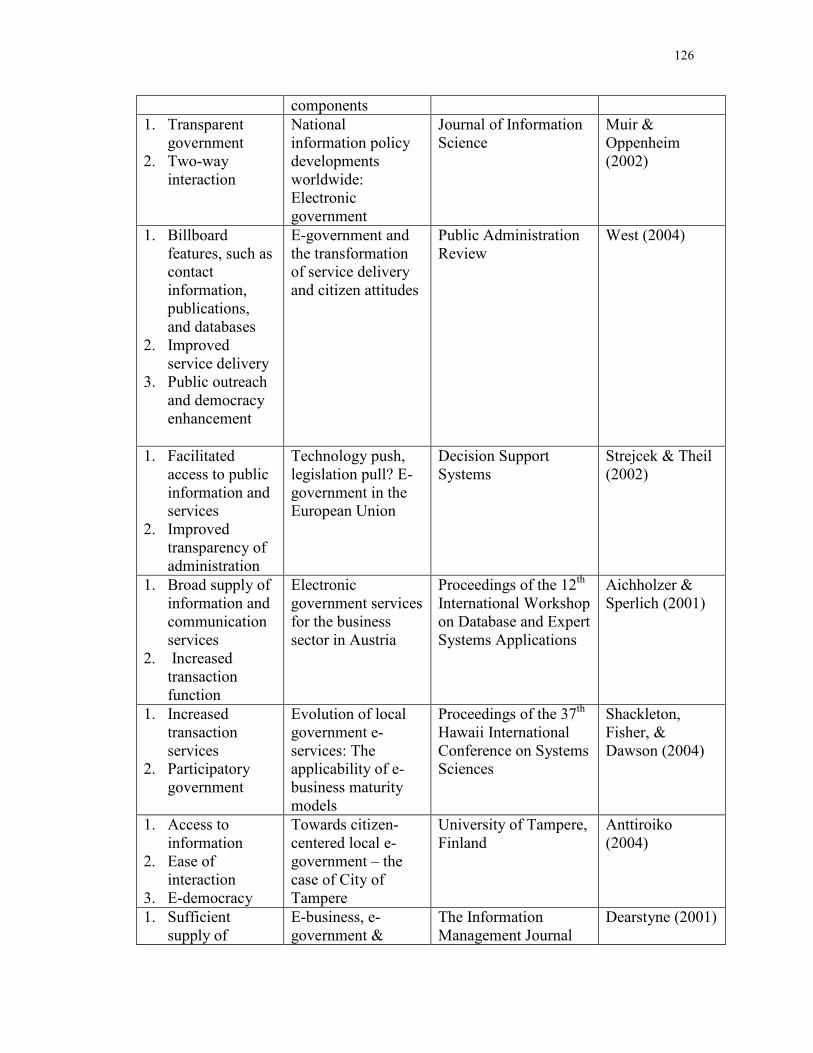
126
components 1. Transparent
government 2. Two-way
interaction
National information policy developments worldwide: Electronic government
Journal of Information Science
Muir & Oppenheim (2002)
1. Billboard features, such as contact information, publications, and databases
2. Improved service delivery
3. Public outreach and democracy enhancement
E-government and the transformation of service delivery and citizen attitudes
Public Administration Review
West (2004)
1. Facilitated access to public information and services
2. Improved transparency of administration
Technology push, legislation pull? E-government in the European Union
Decision Support Systems
Strejcek & Theil (2002)
1. Broad supply of information and communication services
2. Increased transaction function
Electronic government services for the business sector in Austria
Proceedings of the 12th
International Workshop on Database and Expert Systems Applications
Aichholzer & Sperlich (2001)
1. Increased transaction services
2. Participatory government
Evolution of local government e-services: The applicability of e-business maturity models
Proceedings of the 37th Hawaii International Conference on Systems Sciences
Shackleton, Fisher, & Dawson (2004)
1. Access to information
2. Ease of interaction
3. E-democracy
Towards citizen-centered local e-government – the case of City of Tampere
University of Tampere, Finland
Anttiroiko (2004)
1. Sufficient supply of
E-business, e-government &
The Information Management Journal
Dearstyne (2001)
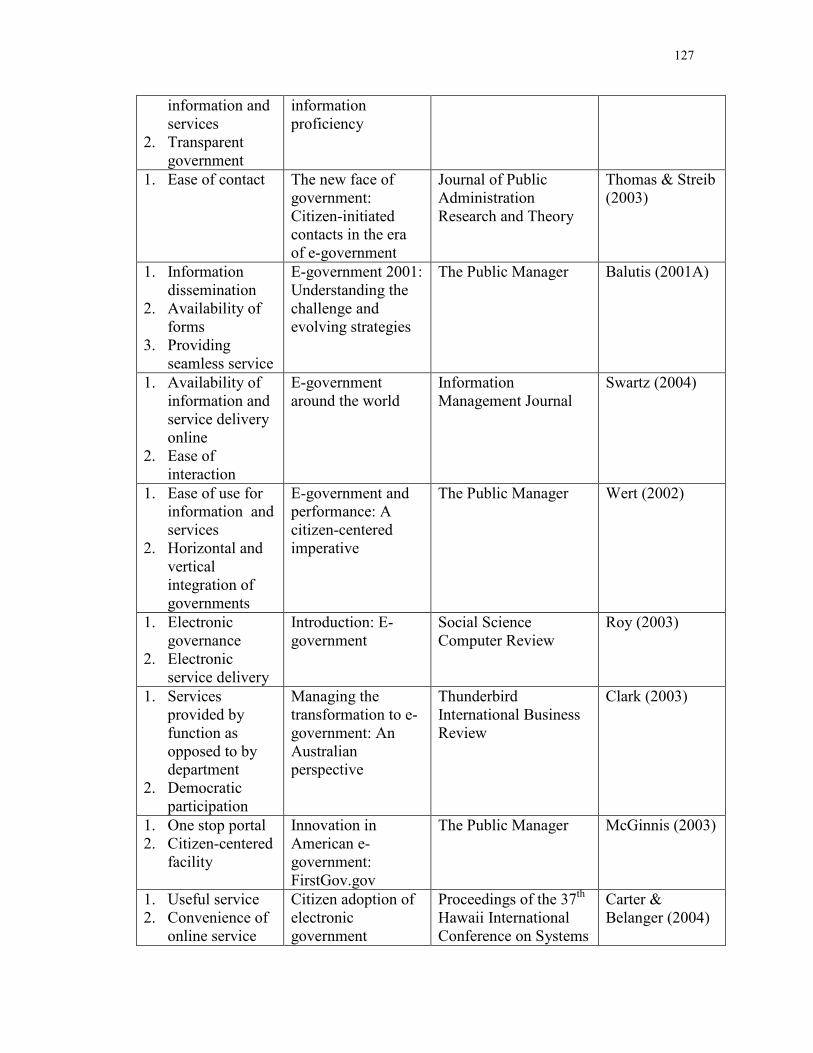
127
information and services
2. Transparent government
information proficiency
1. Ease of contact The new face of government: Citizen-initiated contacts in the era of e-government
Journal of Public Administration Research and Theory
Thomas & Streib (2003)
1. Information dissemination
2. Availability of forms
3. Providing seamless service
E-government 2001: Understanding the challenge and evolving strategies
The Public Manager Balutis (2001A)
1. Availability of information and service delivery online
2. Ease of interaction
E-government around the world
Information Management Journal
Swartz (2004)
1. Ease of use for information and services
2. Horizontal and vertical integration of governments
E-government and performance: A citizen-centered imperative
The Public Manager Wert (2002)
1. Electronic governance
2. Electronic service delivery
Introduction: E-government
Social Science Computer Review
Roy (2003)
1. Services provided by function as opposed to by department
2. Democratic participation
Managing the transformation to e-government: An Australian perspective
Thunderbird International Business Review
Clark (2003)
1. One stop portal 2. Citizen-centered
facility
Innovation in American e-government: FirstGov.gov
The Public Manager McGinnis (2003)
1. Useful service 2. Convenience of
online service
Citizen adoption of electronic government
Proceedings of the 37th Hawaii International Conference on Systems
Carter & Belanger (2004)
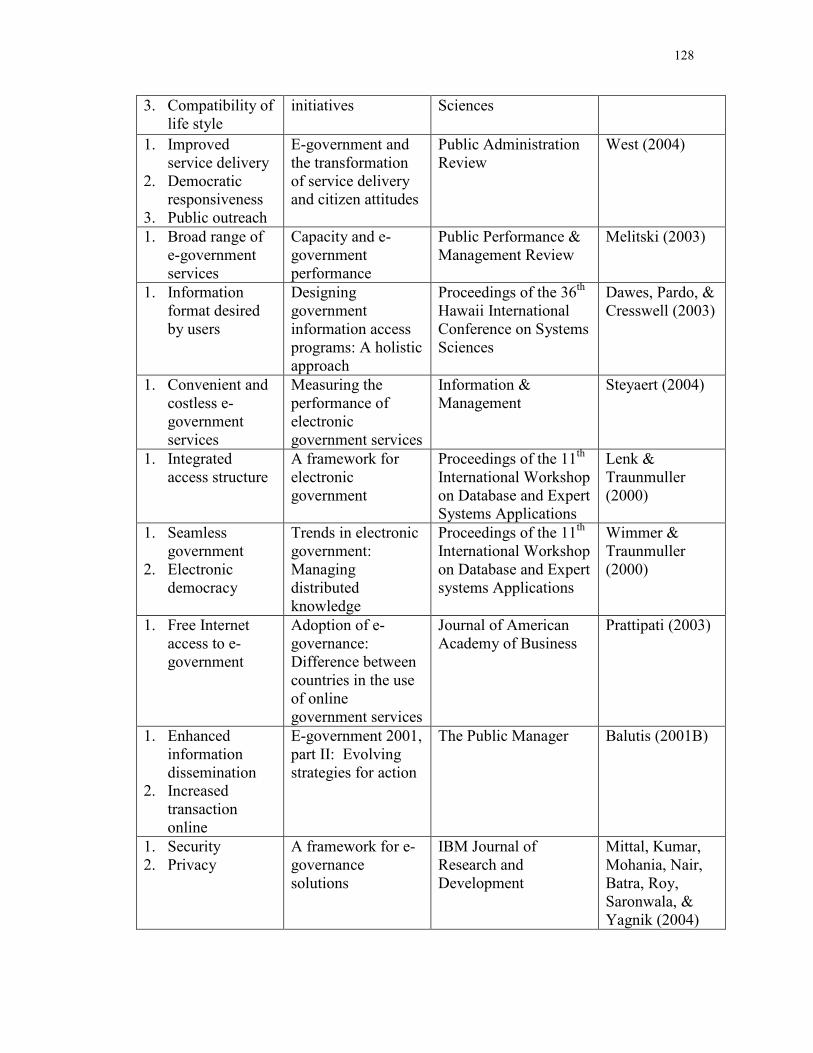
128
3. Compatibility of life style
initiatives Sciences
1. Improved service delivery
2. Democratic responsiveness
3. Public outreach
E-government and the transformation of service delivery and citizen attitudes
Public Administration Review
West (2004)
1. Broad range of e-government services
Capacity and e-government performance
Public Performance & Management Review
Melitski (2003)
1. Information format desired by users
Designing government information access programs: A holistic approach
Proceedings of the 36th Hawaii International Conference on Systems Sciences
Dawes, Pardo, & Cresswell (2003)
1. Convenient and costless e-government services
Measuring the performance of electronic government services
Information & Management
Steyaert (2004)
1. Integrated access structure
A framework for electronic government
Proceedings of the 11th International Workshop on Database and Expert Systems Applications
Lenk & Traunmuller (2000)
1. Seamless government
2. Electronic democracy
Trends in electronic government: Managing distributed knowledge
Proceedings of the 11th International Workshop on Database and Expert systems Applications
Wimmer & Traunmuller (2000)
1. Free Internet access to e-government
Adoption of e-governance: Difference between countries in the use of online government services
Journal of American Academy of Business
Prattipati (2003)
1. Enhanced information dissemination
2. Increased transaction online
E-government 2001, part II: Evolving strategies for action
The Public Manager Balutis (2001B)
1. Security 2. Privacy
A framework for e-governance solutions
IBM Journal of Research and Development
Mittal, Kumar, Mohania, Nair, Batra, Roy, Saronwala, & Yagnik (2004)
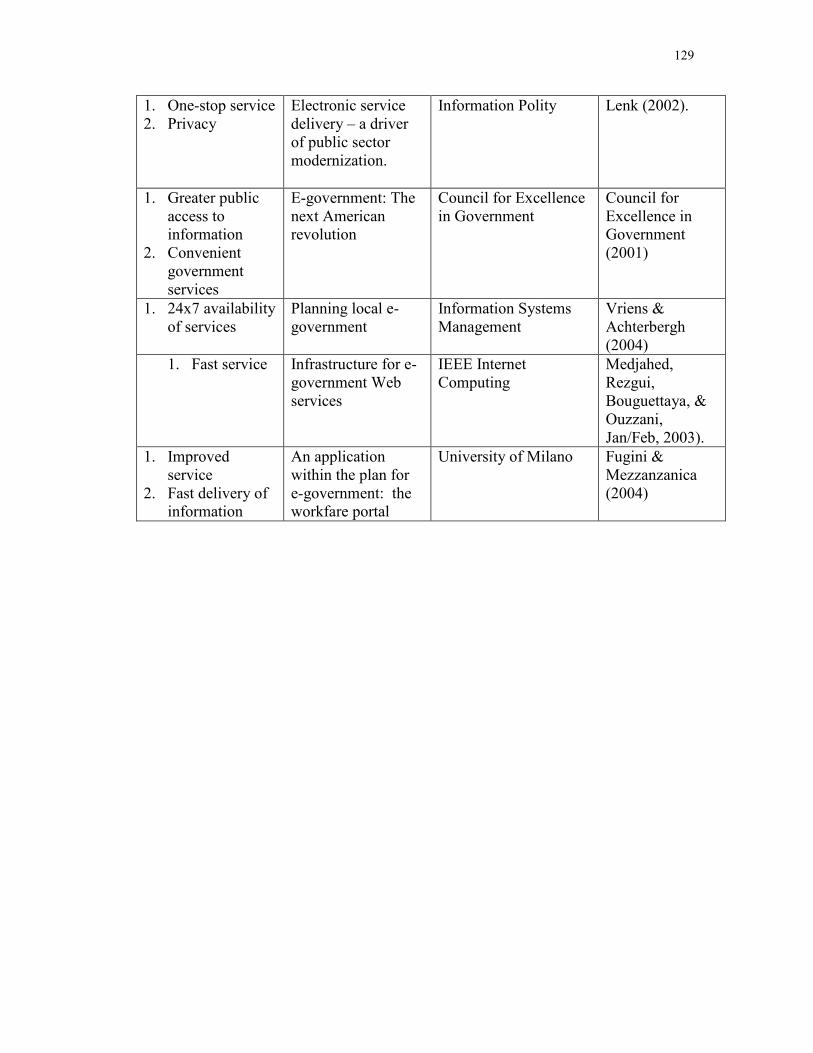
129
1. One-stop service 2. Privacy
Electronic service delivery – a driver of public sector modernization.
Information Polity Lenk (2002).
1. Greater public access to information
2. Convenient government services
E-government: The next American revolution
Council for Excellence in Government
Council for Excellence in Government (2001)
1. 24x7 availability of services
Planning local e-government
Information Systems Management
Vriens & Achterbergh (2004)
1. Fast service Infrastructure for e-government Web services
IEEE Internet Computing
Medjahed, Rezgui, Bouguettaya, & Ouzzani, Jan/Feb, 2003).
1. Improved service
2. Fast delivery of information
An application within the plan for e-government: the workfare portal
University of Milano Fugini & Mezzanzanica (2004)
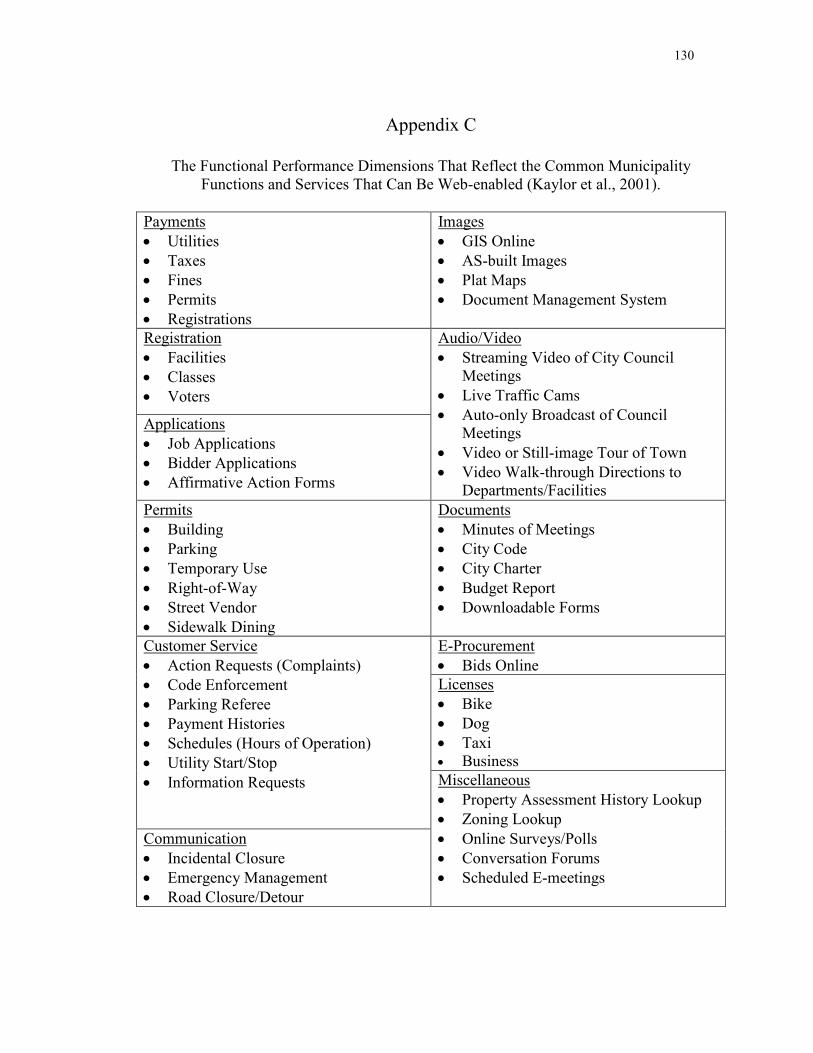
130
Appendix C
The Functional Performance Dimensions That Reflect the Common Municipality Functions and Services That Can Be Web-enabled (Kaylor et al., 2001).
Payments• Utilities • Taxes • Fines • Permits • Registrations
Images• GIS Online • AS-built Images • Plat Maps • Document Management System
Registration• Facilities • Classes • Voters
Applications• Job Applications • Bidder Applications • Affirmative Action Forms
Audio/Video• Streaming Video of City Council
Meetings • Live Traffic Cams • Auto-only Broadcast of Council
Meetings • Video or Still-image Tour of Town • Video Walk-through Directions to
Departments/Facilities Permits• Building • Parking • Temporary Use • Right-of-Way • Street Vendor • Sidewalk Dining
Documents• Minutes of Meetings • City Code • City Charter • Budget Report • Downloadable Forms
E-Procurement• Bids Online Licenses• Bike • Dog • Taxi • Business
Customer Service• Action Requests (Complaints) • Code Enforcement • Parking Referee • Payment Histories • Schedules (Hours of Operation) • Utility Start/Stop • Information Requests
Communication• Incidental Closure • Emergency Management • Road Closure/Detour
Miscellaneous• Property Assessment History Lookup • Zoning Lookup • Online Surveys/Polls • Conversation Forums • Scheduled E-meetings
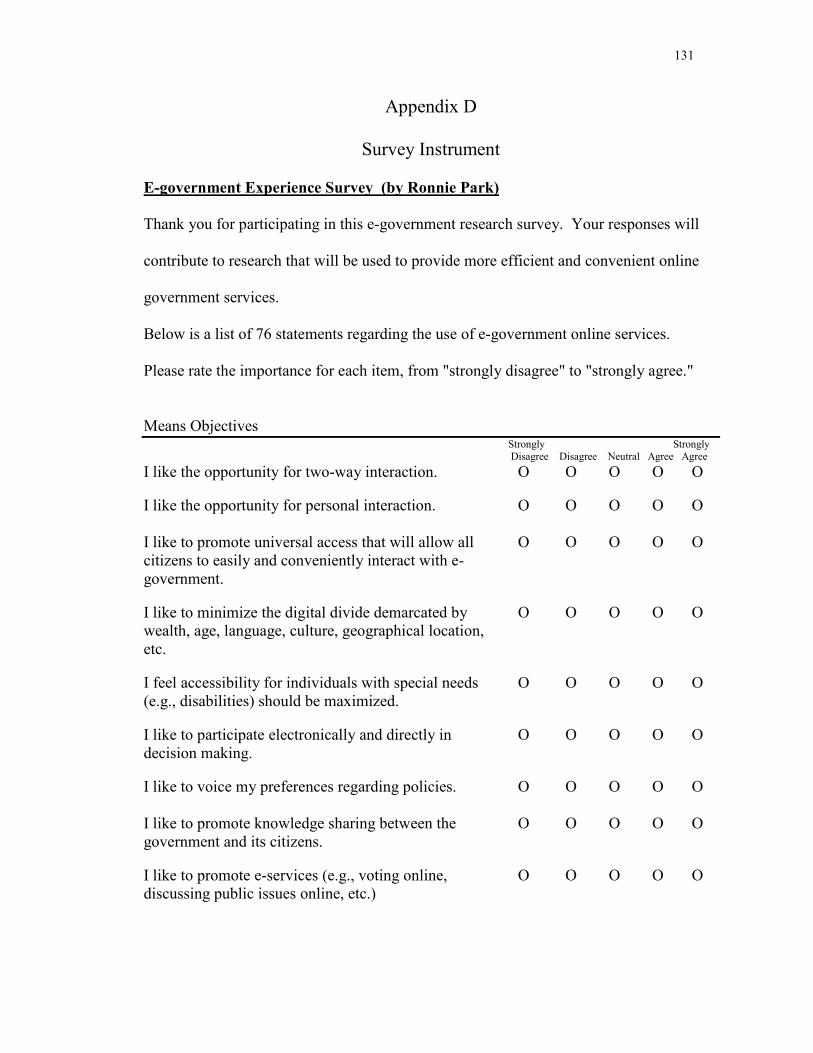
131
Appendix D
Survey Instrument
E-government Experience Survey (by Ronnie Park)
Thank you for participating in this e-government research survey. Your responses will
contribute to research that will be used to provide more efficient and convenient online
government services.
Below is a list of 76 statements regarding the use of e-government online services.
Please rate the importance for each item, from "strongly disagree" to "strongly agree."
Means Objectives
Strongly Strongly Disagree Disagree Neutral Agree Agree
I like the opportunity for two-way interaction.
O O O O O
I like the opportunity for personal interaction. O O O O O
I like to promote universal access that will allow all citizens to easily and conveniently interact with e-government.
O O O O O
I like to minimize the digital divide demarcated by wealth, age, language, culture, geographical location, etc.
O O O O O
I feel accessibility for individuals with special needs (e.g., disabilities) should be maximized.
O O O O O
I like to participate electronically and directly in decision making.
O O O O O
I like to voice my preferences regarding policies.
O O O O O
I like to promote knowledge sharing between the government and its citizens.
O O O O O
I like to promote e-services (e.g., voting online, discussing public issues online, etc.)
O O O O O
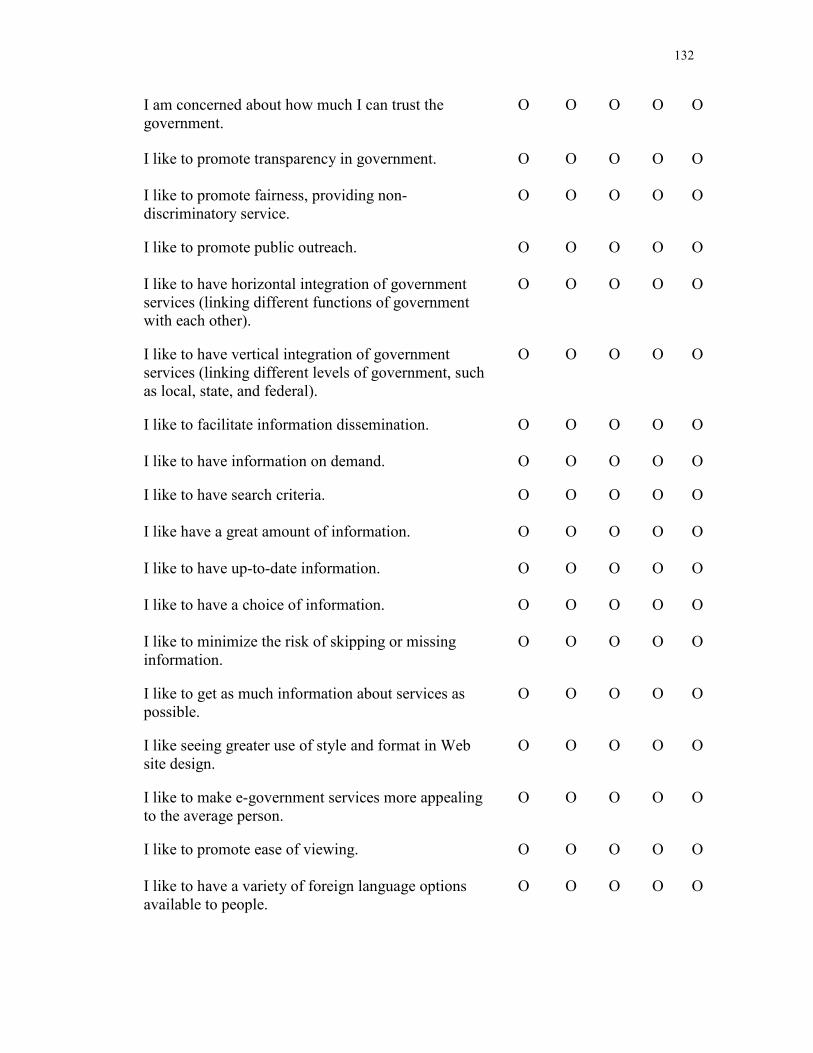
132
I am concerned about how much I can trust the government.
O O O O O
I like to promote transparency in government.
O O O O O
I like to promote fairness, providing non-discriminatory service.
O O O O O
I like to promote public outreach.
O O O O O
I like to have horizontal integration of government services (linking different functions of government with each other).
O O O O O
I like to have vertical integration of government services (linking different levels of government, such as local, state, and federal).
O O O O O
I like to facilitate information dissemination.
O O O O O
I like to have information on demand.
O O O O O
I like to have search criteria.
O O O O O
I like have a great amount of information.
O O O O O
I like to have up-to-date information.
O O O O O
I like to have a choice of information.
O O O O O
I like to minimize the risk of skipping or missing information.
O O O O O
I like to get as much information about services as possible.
O O O O O
I like seeing greater use of style and format in Web site design.
O O O O O
I like to make e-government services more appealing to the average person.
O O O O O
I like to promote ease of viewing.
O O O O O
I like to have a variety of foreign language options available to people.
O O O O O
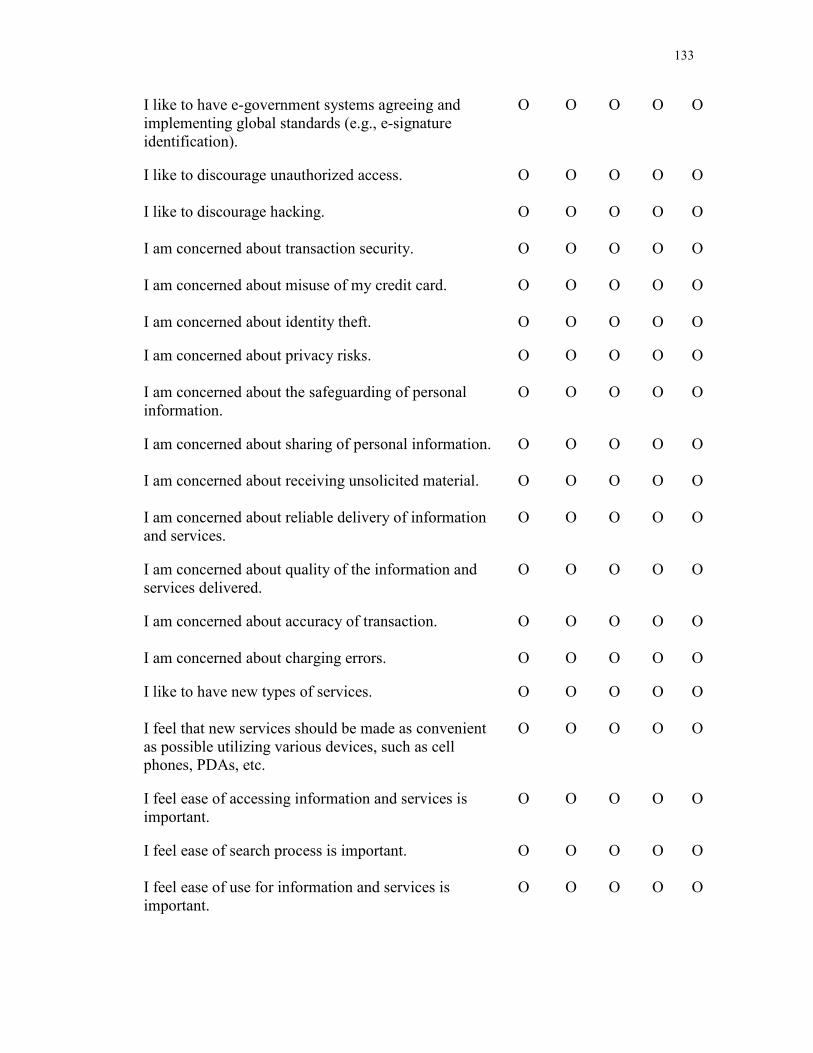
133
I like to have e-government systems agreeing and implementing global standards (e.g., e-signature identification).
O O O O O
I like to discourage unauthorized access.
O O O O O
I like to discourage hacking.
O O O O O
I am concerned about transaction security.
O O O O O
I am concerned about misuse of my credit card. O O O O O
I am concerned about identity theft.
O O O O O
I am concerned about privacy risks.
O O O O O
I am concerned about the safeguarding of personal information.
O O O O O
I am concerned about sharing of personal information. O O O O O
I am concerned about receiving unsolicited material. O O O O O
I am concerned about reliable delivery of information and services.
O O O O O
I am concerned about quality of the information and services delivered.
O O O O O
I am concerned about accuracy of transaction.
O O O O O
I am concerned about charging errors.
O O O O O
I like to have new types of services.
O O O O O
I feel that new services should be made as convenient as possible utilizing various devices, such as cell phones, PDAs, etc.
O O O O O
I feel ease of accessing information and services is important.
O O O O O
I feel ease of search process is important.
O O O O O
I feel ease of use for information and services is important.
O O O O O
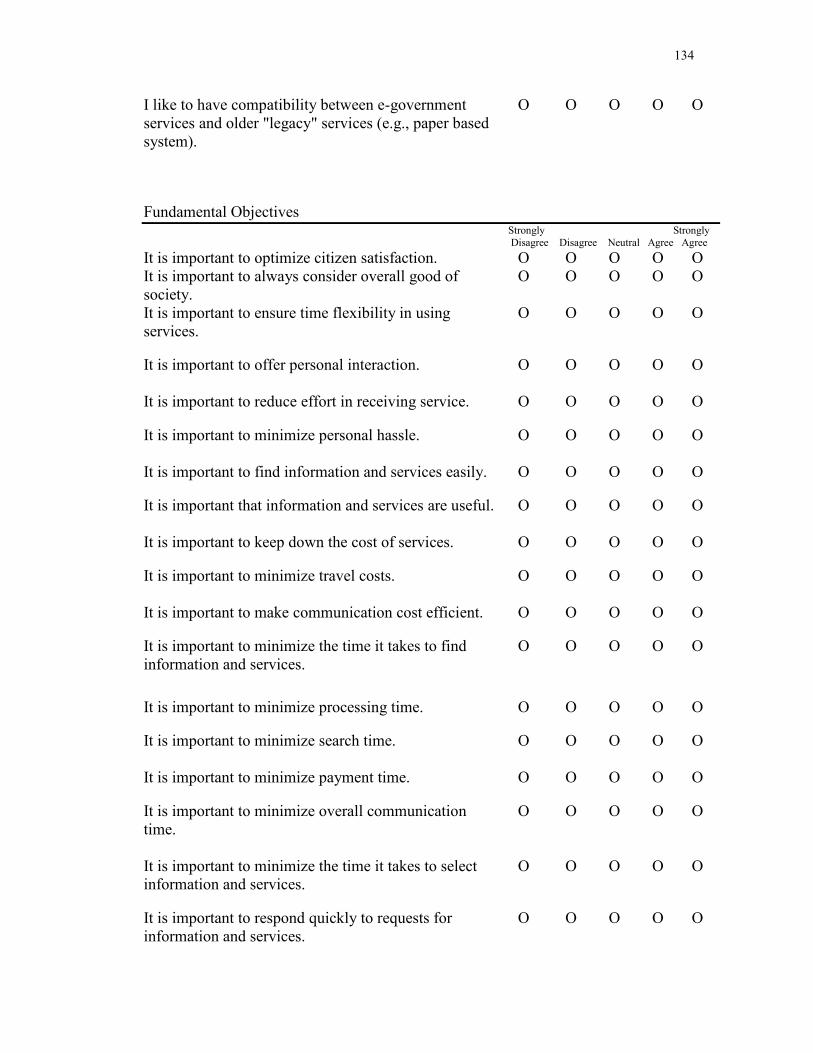
134
I like to have compatibility between e-government services and older "legacy" services (e.g., paper based system).
O O O O O
Fundamental Objectives Strongly Strongly
Disagree Disagree Neutral Agree Agree It is important to optimize citizen satisfaction. O O O O OIt is important to always consider overall good of society.
O O O O O
It is important to ensure time flexibility in using services.
O O O O O
It is important to offer personal interaction.
O O O O O
It is important to reduce effort in receiving service.
O O O O O
It is important to minimize personal hassle.
O O O O O
It is important to find information and services easily.
O O O O O
It is important that information and services are useful.
O O O O O
It is important to keep down the cost of services.
O O O O O
It is important to minimize travel costs.
O O O O O
It is important to make communication cost efficient.
O O O O O
It is important to minimize the time it takes to find information and services.
O O O O O
It is important to minimize processing time.
O O O O O
It is important to minimize search time.
O O O O O
It is important to minimize payment time.
O O O O O
It is important to minimize overall communication time.
O O O O O
It is important to minimize the time it takes to select information and services.
O O O O O
It is important to respond quickly to requests for information and services.
O O O O O
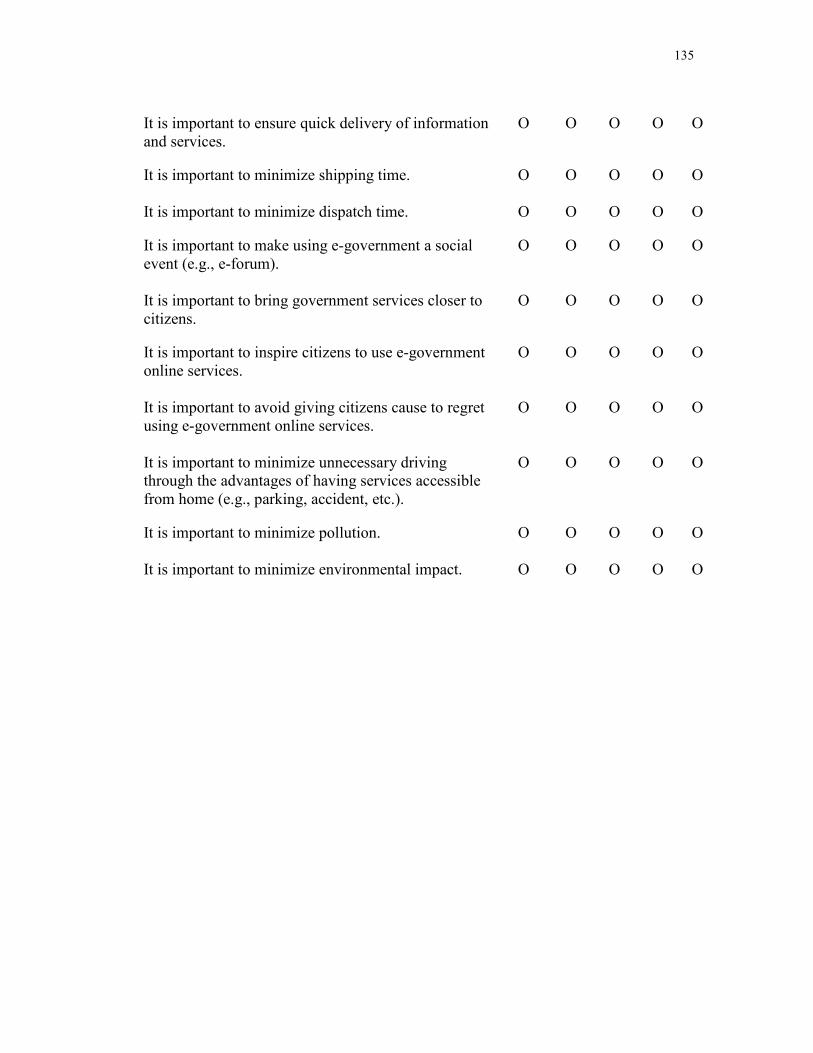
135
It is important to ensure quick delivery of information and services.
O O O O O
It is important to minimize shipping time.
O O O O O
It is important to minimize dispatch time.
O O O O O
It is important to make using e-government a social event (e.g., e-forum).
O O O O O
It is important to bring government services closer to citizens.
O O O O O
It is important to inspire citizens to use e-government online services.
O O O O O
It is important to avoid giving citizens cause to regret using e-government online services.
O O O O O
It is important to minimize unnecessary driving through the advantages of having services accessible from home (e.g., parking, accident, etc.).
O O O O O
It is important to minimize pollution.
O O O O O
It is important to minimize environmental impact. O O O O O
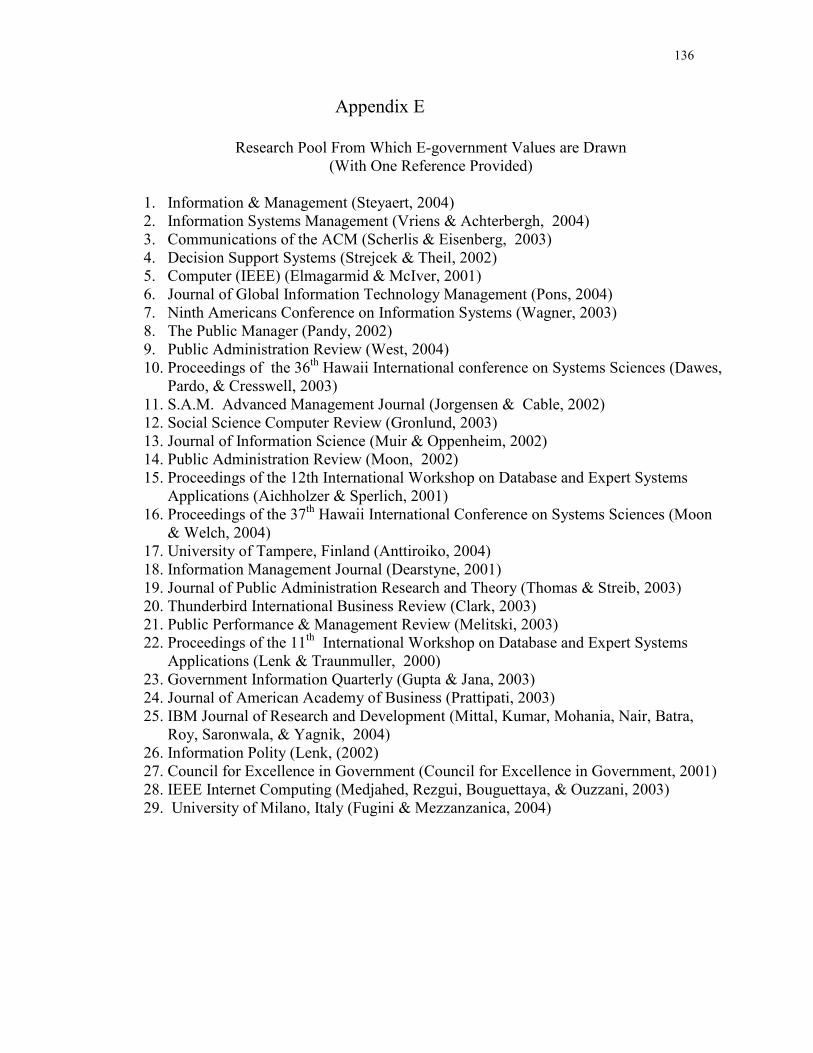
136
Appendix E
Research Pool From Which E-government Values are Drawn (With One Reference Provided)
1. Information & Management (Steyaert, 2004) 2. Information Systems Management (Vriens & Achterbergh, 2004) 3. Communications of the ACM (Scherlis & Eisenberg, 2003) 4. Decision Support Systems (Strejcek & Theil, 2002) 5. Computer (IEEE) (Elmagarmid & McIver, 2001) 6. Journal of Global Information Technology Management (Pons, 2004) 7. Ninth Americans Conference on Information Systems (Wagner, 2003) 8. The Public Manager (Pandy, 2002) 9. Public Administration Review (West, 2004) 10. Proceedings of the 36th Hawaii International conference on Systems Sciences (Dawes,
Pardo, & Cresswell, 2003) 11. S.A.M. Advanced Management Journal (Jorgensen & Cable, 2002) 12. Social Science Computer Review (Gronlund, 2003) 13. Journal of Information Science (Muir & Oppenheim, 2002) 14. Public Administration Review (Moon, 2002) 15. Proceedings of the 12th International Workshop on Database and Expert Systems
Applications (Aichholzer & Sperlich, 2001) 16. Proceedings of the 37th Hawaii International Conference on Systems Sciences (Moon
& Welch, 2004) 17. University of Tampere, Finland (Anttiroiko, 2004) 18. Information Management Journal (Dearstyne, 2001) 19. Journal of Public Administration Research and Theory (Thomas & Streib, 2003) 20. Thunderbird International Business Review (Clark, 2003) 21. Public Performance & Management Review (Melitski, 2003) 22. Proceedings of the 11th International Workshop on Database and Expert Systems
Applications (Lenk & Traunmuller, 2000) 23. Government Information Quarterly (Gupta & Jana, 2003) 24. Journal of American Academy of Business (Prattipati, 2003) 25. IBM Journal of Research and Development (Mittal, Kumar, Mohania, Nair, Batra,
Roy, Saronwala, & Yagnik, 2004) 26. Information Polity (Lenk, (2002) 27. Council for Excellence in Government (Council for Excellence in Government, 2001) 28. IEEE Internet Computing (Medjahed, Rezgui, Bouguettaya, & Ouzzani, 2003) 29. University of Milano, Italy (Fugini & Mezzanzanica, 2004)

137
Appendix F
NSU IRB Approval Letter
May 15, 2005 JDC:jdc
MEMORANDUM
From: James Cannady, Ph.D., Associate Professor, GSCIS To: Ronnie Park Subject: IRB Approval
After reviewing your IRB Submission Form and Research Protocol I have approved your proposed research (“Measuring Factors that Influence the Success of E-government Initiatives”) for IRB purposes (IRB approval number: cannady0515058). Your research has been determined to be exempt from further IRB review based on the following conclusion:
Research using survey procedures or interview procedures where subjects' identities are thoroughly protected and their answers do not subject them to criminal and civil liability. Please note that while your research has been approved, additional IRB reviews of your research will be required if any of the following circumstances occur: 1. If you, during the course of conducting your research, revise the research protocol (e.g., making changes to the informed consent form, survey instruments used, or number and nature of subjects). 2. If the portion of your research involving human subjects exceeds 12 months in duration. Please feel free to contact me in the future if you have any questions regarding my evaluation of your research or the IRB process.
Dr. Cannady Copy: Dr. Nyshadham File
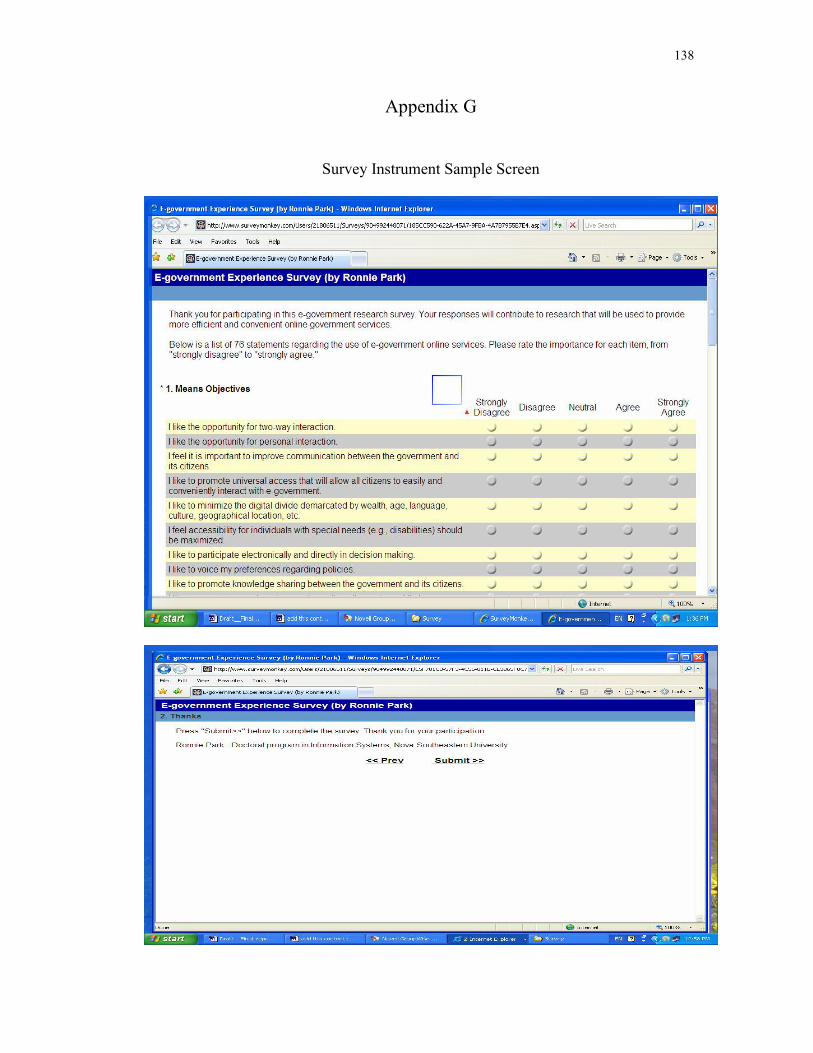
138
Appendix G
Survey Instrument Sample Screen
139
References Aichholzer, G., & Schmitzer, R. (2000). Organizational challenges to the development of electronic government. Proceedings from 11th International Workshop on Database and Expert Systems Applications, London, England, 379-383. Aichholzer, G., & Sperlich, R. (2001). Electronic government services for the business sector in Austria. Proceedings from 12th International Workshop on Database and Expert Systems Applications, Munich, Germany, 402-406. Bailey, J., & Pearson, W. (1983). Development of a tool for measuring and analyzing computer user satisfaction. Management Science, 29(5), 530-545. Balutis, A. P. (2001A). E-government 2001, part I: understanding the challenge and evolving strategies. The Public Manager, 30(1), 33-41. Balutis, A. P. (2001B). E-government 2001, part II: evolving strategies for action. The Public Manager, 30(2), 41-48. Bertot, J. C., McClure, C. R., Moen, W. E., & Rubin, J. (1997). Web usage statistics: measurement issues and analytical techniques. Government Information Quarterly, 14(4), 373-396. Bichler, M. (2000). An experimental analysis of multi-attribute auction. Decision Support Systems, 29(3), 249--268. Bretschneider, S. (2003). Information technology, e-government, and institutional change. Public Administration Review, 63(6), 738-741. Camerer, C. F. (1997). Progress in behavioral game theory. Journal of Economic Perspectives, 11(4), 167-188. Camerer, C. F., Ho, T., & Chong J. K. (2001). Behavioral game theory: thinking, learning, and teaching. Retrieved August 3, 2005, from California Institute of Technology Web site: http://www.hss.caltech.edu/~camerer/Camerer.pdf Cameron, K. S., & Whetten, D. A. (1983). Some conclusions about organizational effectiveness. In K. S. Cameron, and D. A. Whetten, (Eds.), Organizational Effectiveness: A Comparison of Multiple Models (pp.261-277). New York: Academic Press. Carter, L., & Belanger, F. (2004). Citizen adoption of electronic government initiatives. Proceedings of the 37th Hawaii International Conference on Systems Sciences, 50119a,1-10. Honolulu, HI.
140
Carter, L., & Belanger, F. (2005). The utilization of e-government services: citizen trust, innovation and acceptance factors. Information Systems Journal, 15(1), 5-25. Chang, J., Torkzadeh, G., & Dhillon, G. (2004). Re-examining the measurement models of success for Internet commerce. Information & Management, 41(4), 577-584. Chen, H., Chen, Y., Huang, W., & Ching, R. (2006). E-government strategies in developed and developing countries: an implementation framework and case study. Journal of Global Information Management, 14(1), 23-24. Chen, H. (2002). Digital government: technologies and practices. Decision Support Systems, 34(2002), 223-227. Clark, E. (2003). Managing the transformation to e-government: an Australian perspective. Thunderbird International Business Review, 45(4), 377- 397. Council for Excellence in Government (2001). E-government: the next American resolution. Washington, DC: Author. Courtois, M. P., & Berry, M. W. (1999). Results ranking in Web search engines. Online, 23(3), 39-44. Csetenyi, A. (2000). Electronic government: Perspectives from E-commerce. Proceedings of the 11th International Workshop on Database and Expect Systems Applications, 294-299. London, U.K.
Dawes, S. S., Pardo, T. A., & Cresswell, A. M. (2003). Designing government information access programs: a holistic approach. Proceedings of the 36th Hawaii International Conference on Systems Sciences, Big Island, HI. Dearstyne, B. W. (Oct. 2001). E-business, e-government & information proficiency. The Information Management Journal, 16-24. Devadoss, P. R., Pan, S. L., & Huang, J. C. (2002). Structurational analysis of e-government initiatives: a case study of SCO. Decision Support Systems. 34(3), 253-269. Devellis, D. F. (2003). Scale Development: Theory and Applications. Thousand Oaks, CA: Sage Publications. Dhillon, G., & Lee, J. (2000). Value assessment of IS/IT service provision within organizations. Proceeding of the Twenty First International Conference on Information Systems, Las Vegas, NV. Doctor, R., & Ankem, K. (March, 1996). An information need and services taxonomy: For evaluating Computerized Community Information Systems. Presented at Community Networking 96: “Bringing People Together”. Retrieved February 6, 2003 from http://www.laplaza.org/about_lap/archives/cn96/doctor1.html.
141
Einhorn, H. J., & Hogarth, R. M. (1981). Behavioral decision theory: processes of judgment and choice, Journal of Accounting Research, 19(1), 1031. Elmagarmid, A. K., & McIver, W. J. (February, 2001). The ongoing march toward digital government. Computer, 32-38. Fisk, R. P., Brown, S. W., & Bitner, M. J. (1993). Tracking the evolution of the services marketing literature. Journal of Retailing, 69(1), 61-103. French, S. (2003). The challenges of extending the MCDA paradigm to e-democracy. Journal of Multi-Criteria Decision Analysis, 12, 63-64. Fu, J., Farn, C., & Chao, W. (2006). Acceptance of electronic tax filing: a study of taxpayer intentions. Information & Management, 43(1), 109-126. Fugini, M., & Mezzanzanica, A. (2004). An application within the plan for e-government: the workfare portal. University of Milano, Italy. Idea Group Inc. 59-80. Gartner (March, 2002). The Gartner framework for e-government strategy assessment. New York: Gartner. Gorden, T. F. (2002). E-government –Introduction. ERCIM News, Special Theme: E-government, European Research Consortium for Information and Mathematics. Retrieved on March 4, 2005, from http://www.ercim.org/publication/Ercim_News/enw48/intro.html. Grant, G., & Chau, D. (2005). Developing a generic framework for e-government. Journal of Global Information Management, 13(1), 1-30. Gronlund, A. (2003). Emerging electronic infrastructures: exploring democratic components. Social Science Computer Review, 21(1), 55-72. Grover, V., Keong, S. R., & Segars, A. H. (1996). Information systems effectiveness: the construct space and patterns of application. Information & Management, 31(2), 177-191. Gupta, M. P., & Jana, D. (2003). E-government evaluation: a framework and case study. Government Information Quarterly, 20(3), 365-387. Hair, J., Anderson, R., Tatham, R., & Black, W. (1998). Multivariate Data Analysis. Upper Saddle River, NJ: Prentice Hall. Holden, S. H., Norris, D. F., & Fletcher, P. D. (2003). Electronic government at the grass roots: contemporary evidence and future trends. Proceedings of the 38th Hawaii International Conference on Systems Sciences, Honolulu, HI.
142
Howard, R. (1988). Decision analysis: Practice and promise. Management Science, 34(6), 679-695.
Jain, A., & Patnayakuni, R. (2003). Public expectations and public scrutiny: an agenda for research in the context of e-government. Ninth Americas Conference on Information Systems, 811-820. Tempa, FL.
Jorgensen D., & Cable S. (2002). Facing the challenges of e-government: a case study of the city of Corpus Christi, Texas. S.A.M. Advanced Management Journal, 67(1), 34-45.
Kahneman, D., & Tversky, A. (1979). Prospect theory: an analysis of decision under risk. Econometrica, 47(2), 263-291. Kalakota, R., & Whinston, A. B. (1997). Electronic Commerce. Reading, MA: Addison-Wesley. Kamakura, W. A., & Mazzon, J. A. (1991). Value segmentation: a model for the measurement of values and value systems, The Journal of Consumer Research, 18(2), 208-218. Kappelman, L. A., Koh, C. E., Prybutok, V. R., & Sanchez, A. D. (2003). The relationship between IT for communication and e-government barriers. Ninth Americas Conference on Information Systems, Tempa, FL. Kaylor, C., Deshazo, R., & Eck, D. (2001). Gauging e-government: a report on implementing services among American cities. Government Information Quarterly,18(4), 293-307. Keeney, R. L. (1992). Value-Focused Thinking: A Path to Creative Decision Making. Cambridge, MA: Harvard University Press. Keeney, R. L. (1999). The value of Internet commerce to the customer. Management Science, 45(4), 533-542. Keeney, R.L., & Raiffa, H (1993). Decisions with Multiple Objectives: Preferences and Value Tradeoffs. Cambridge, England: Cambridge University Press. Kim, H. J., & Bretschneider, S. (2004). Local government information technology capacity: an exploratory theory. Proceedings of the 37th Hawaii International Conference on Systems Sciences, 50121b, 1-9. Honolulu, HI. Kim, J., & Mueller, C. (1978). Introduction to Factor Analysis. Newbury Park, CA: Sage Publications.
143
King, D., Lee, J., Warkentin, M., & Chung, H. M. (2002). Electronic Commerce a Managerial Perspective. Upper Saddle River, NJ: Prentice Hall. Langer, G. (2003). About response rates. Public Perspective. Retrieved January 2, 2006, from the University of Connecticut Web site: http://www.ropercenter.uconn.edu/pubper/pdf/pp14_3c.pdf. Layne, K., & Lee, J. (2001). Developing fully functional e-government: a four-stage model. Government Information Quarterly, 18(2), 122-136. Lenk, K. (2002). Electronic service delivery – a driver of public sector modernization. Information Polity 7, 87-96. Lenk, K., & Traunmuller, R. (2000). A framework for electronic government. Proceedings of the 11th International Workshop on Database and Expert systems Applications, London, UK. Ma, L., Chung, J., & Thorson, S. (2005). E-government in China: bringing economic development through administrative reform. Government Information Quarterly, 22(2), 20-37. Marchionini, G., Samet, H., & Brandt, L. (2003). Digital government. Communications of the ACM, 46(1), 25-27. McGinnis, P. (Summer, 2003). Innovation in American e-government: FirstGov. gov. The Public Manager, 51- 54.
McNeal, R. S., Tolbert, C. J., Mossberger, K., & Dotterweich, L. J. (2003). Innovating in digital government in the American states. Social Science Quarterly, 84(1), 52-70. Medjahed, B., Rezgui, A., Bouguettaya, A., & Ouzzani, M. (Jan/Feb, 2003). Infrastructure for e-government Web services. IEEE Internet Computing, 58-65. Melitski, J. (2003). Capacity and e-government performance. Public Performance & Management Review, 26(4), 376-390. Mittal, P., Kumar, M., Mohania, M., Nair, M., Batra, N., Roy, P., Saronwala, A., & Yagnik, L. (2004). A framework for eGovernance solutions. IBM Journal of Research and Development, 48(5/6), 717-733. Moon, M. (Jul/Aug, 2002). The evolution of e-government among municipalities: rhetoric or reality? Public Administration Review, 62(4), 424-433. Moon, M. J., & Welch, E. W. (2004). Same bed, different dreams?: a comparative analysis of citizen and bureaucrat perspectives on e-government. Proceedings of the 37th Hawaii International Conference on Systems Sciences, Honolulu, HI.
144
Muir, A., & Oppenheim, C. (2002). National information policy developments worldwide I: electronic government. Journal of Information Science, 28(3), 173-186. Nah, F., Siau, K., & Sheng, H. (2005). The value of mobile applications: a utility company study. Communications of the ACM, 48(2), 85-92. National Academy of Sciences (2002). Information Technology, Research, Innovation and E-government, Washington, DC: National Academy Press. National Computerization Agency (2002). E-government in Korea. Seoul, Republic of Korea.
Navarra, D. D., & Cornford, T. (2003). A policy making view of e-government innovations in public governance. Ninth Americas Conference on Information Systems, Tempa, FL. Norrise, D. F., & Moon, M. J. (2005). Advancing e-government at the grassroots: tortoise or hare? Public Administration 65(1), 64-75. Nova Southern University, Graduate School of Computer and Information Sciences (February, 2005). IRB process overview. Retrieved July 10, 2005, from the Nova Southeastern University Web site: http://www.scis.nova.edu/%7Ecannady/IRB_Info.htm Office of the e-Envoy (2000). Modernizing government: Benchmarking electronic service delivery. Retrieved March 2, 2004, from the United Kingdom government sponsored Web site: http://egov.alentejodigital.pt/Benchmarks/BenchmarkingESD.pdf.
Ohison, D. W. (1999). Exploring the application of adaptive management and decision analysis to integrated waterahed management. Retrieved December 10, 2004, from University of British Columbia, Canada, http://www.scarp.ubc.ca/thesis/ohlson/framework2.htm Pandy, S. (Fall, 2002). Expanding electronic government: The challenges. The Public Manager, 31(3), 17-21. Peters, R., Jansen, M., & Engers, T. (2004). Measuring e-government impact: existing pratices. Sixth International Conference on Electronic Commerce, 480-488. Delft, Netherlands
Pons, A. (2004). E-government for Arab countries. Journal of Global Information Technology Management, 7(1), 30-47. Prattipati, S. N. (2003). Adoption of e-governance: differences between countries in the use of online government services. Journal of American Academy of Business, 3(1/2), 386-391.
145
Raiffa, H. (1968). Decision Analysis: Introductory Lectures on Choices Under Uncertainty. Reading, MA: Addison-Wesley Publishing Company. Rennie, L. (1982). Detecting a response set to Likert-style attitude items with the rating model. Education Research and Perspectives, 9(1), 114-118. Retrieved January 2, 2006, from the University of Western Australia Web site: http://www.rasch.org/erp9.htm. Robin, M. (1998). Psychology and economics, Journal of Economic Literature, 36(1), 11-46.
Rokeach, M. (1974). Change and stability in American value systems, 1968-1971. The Public Opinion Quarterly, 38(2), 222-238. Roy, J. (2003). Introduction e-government. Social Science Computer Review, 21(1), 3-5. Rummel, R. (1970). Understanding factor analysis. Retrieved October 14, 2005 from the University of Hawaii Web site: http://www.hawaii.edu/powerkills/UFA.HTM Scherlis, W. L., & Eisenberg, J. (2003). IT research, innovation, and e-government. Communications of the ACM, 46(1), 67-68. Schubert, P., & Hausler, U. (2001). E-government meets e-business: a portal site for startup companies in Switzerland. Proceedings of the 34th Hawaii International Conference on System Sciences. Big Island, HI. Sekaran, U. (2000). Research Methods for Business. New York: John Wiley & Sons, Inc. Shackleton, P., Fisher, J., & Dawson, L. (2004). Evolution of local government e-services: the applicability of e-business maturity models. Proceedings of the 37th Hawaii International Conference on System Sciences. Big Island, HI. Spradlin, T. (2005). A lexicon of decision making. Decision Analysis Society. Retrieved December 21, 2005, from the Duke University Web site: http://faculty.fuqua.duke.edu/daweb/lexicon.htm#decision_analysis
Steyaert, J. C. (2004). Measuring the performance of electronic government services. Information & Management, 41(3), 369-375. Stowers, G. (2002). The State of Federal Web Sites: The Pursuit of Excellence (E-government Series). San Francisco: San Francisco State University. Straub, D. (1989). Validating instruments in MIS research. MIS Quarterly, 13(2), 147-170. Strejcek, G., & Theil, M. (2002). Technology push, legislation pull? E-government in the European Union. Decision Support Systems, 34(2002), 305-313.
146
Swartz, N. (2004). E-government around the world. Information Management Journal, 38(1), 12-15. Teo, T., & Pian, Y. (2004). A model for Web adoption. Information & Management, 41(5), 457-468. Thaler, R. H. (1986). The psychology and economics conference handbook: comments on Simon, on Einhorn and Hogarth, and on Tversky and Kahneman, The Journal of Business, 59(4), 279-824. Thaler, R. H. (1987). Anomalies: The January effect. The Journal of Economic Perspectives, 1(1), 197-201. Thomas, J. C., & Streib, G. (2003). The new face of government: citizen-initiated contacts in the era of e-government. Journal of Public Administration Research and Theory, 13(1), 83-102. Torkzadeh, G., & Dhillon, G. (2002). Measuring factors that influence the success of Internet commerce. Information Systems Research, 13(2), 187-204. United Nations (2002). Benchmarking e-government: A global perspective. United Nations Division for Public Economics and Public Administration. New York: United Nations. U.S. Federal government (1999). Electronic government. Memorandum to the Heads of Executive Departments and Agencies. Retrieved on January 21, 2004, from http//govinfo.library.unt.edu/npr/library/direct/memos/elecgovrnmnt.html. U.S. Office of Management and Budget (2002). E-government strategy: Simplified delivery of services to citizens. Washington, DC: U.S. Government Printing Office. Vetenskapsakademien, K. (December, 2002). Foundations of behavioral and experimental economics: Daniel Kahneman and Vernon Smith. Retrieved August 2, 2005, from the Advanced information on the Prize in Economic Sciences Web site: http://nobelprize.org/economics/laureates/2002/ecoadv02.pdf Vriens, D., & Achterbergh, J. (2004). Planning local e-government. Information Systems Management, 21(1), 45-57. Wagner, C. (2003). Knowledge management in e-government. Ninth Americans Conference on Information Systems, 845-850. Tempa, FL. Wert, J. M. (2002). E-government and performance: a citizen-centered imperative. The Public Manager, 31(2), 16-21.
147
West, D. M. (2004). E-government and the transformation of service delivery and citizen attitudes. Public Administration Review, 64(1), 15-26.
Wimmer, M., & Traunmuller, R. (2000). Trends in electronic government: managing distributed knowledge. Proceedings of the 11th International Workshop on Database and Expert systems Applications, London, UK. Winterfeldt, D., & Edwards, W. (1986). Decision Analysis and Behavioral Research.Cambridge, England: Cambridge University Press. Yu, L., Wang, S., & Lai, K. (2006). An integrated data preparation scheme for neural network data analysis. IEEE Transactions on Knowledge and Data Engineering, 18(2), 217-230.