Measuring product liking in preschool children: An evaluation of the Smileyometer and This or That...
10
International Journal of Child-Computer Interaction 1 (2013) 61–70 Contents lists available at ScienceDirect International Journal of Child-Computer Interaction journal homepage: www.elsevier.com/locate/ijcci Measuring product liking in preschool children: An evaluation of the Smileyometer and This or That methods Bieke Zaman a,∗ , Vero Vanden Abeele b , Dirk De Grooff a a CUO | Social Spaces - KU Leuven/ iMinds, Parkstraat 45 Bus 3605, 3000 Leuven, Belgium b e-Media Lab, Groep T, CUO, Associatie KU Leuven, Andreas Vesaliusstraat 13, 3000 Leuven, Belgium article info Article history: Received 16 November 2012 Accepted 21 December 2012 abstract This article provides a detailed evaluation of two summative evaluation methods, This or That and Smileyometer. The methods’ reliability and validity were examined, using a sample of 113 preschoolers (ages from 33 to 90 months). The results show considerable promise for This or That for measuring preferences across entertainment products. This or That resulted in reliable and valid responses in preschool children aged four and older. Nevertheless, low reliability and validity scores were obtained for This or That in preschoolers younger than four years old. As for the Smileyometer results, preschoolers’ responses clearly indicated an overrepresentation of extreme positive scores that were inconsistent with their actual product preferences. Consequently, the validity of these young children’s responses evoked through the Smileyometer was not supported. © 2013 Elsevier B.V. All rights reserved. 1. Introduction This research was conducted with the ambition to participate in the methodological quest for evaluation methods to be used in young, preliterate children for measuring product liking. Since the eighties, adults have started to acknowledge children’s capability to provide valuable contributions to research and their right to be directly approached when their behaviour and opinions are being studied [1–7]. This new approach to research with children has been referred to as the ‘new sociology of childhood’, initiated by the Children’s Rights Movement and inspired by the 1989 UN Charter that highlighted that ‘‘children do have valid and valuable views and opinions that deserve to be elicited and taken seriously’’ [8, p. 467]. This competence and right has to be considered for all children, young as they may be [9, p. 822]. It is now recognized as problematic, even though convenient, to work with adult-originated accounts of children’s experiences without complementing this with alternative methods that include children’s voices directly [8, p. 467], [10]. Recent developments in researching children have been looking towards ways of locating children’s lives in the centre of the research process, by strengthening the position of the child as an ‘active research participant’ as opposed to a ‘passive research object’ [11–13], [14, p. 70]. The child-centred approach regards children as competent in reporting their own experiences [15], and ∗ Corresponding author. Tel.: +32 16 32 36 51; fax: +32 16 32 32 10. E-mail address: [email protected] (B. Zaman). consequently it has been marked by the prepositional shift from working ‘on’ to working ‘with’ children at all levels of the research process — from designing the study to data collection and data reporting [13,16]. In this context, child–computer interaction (CCI) researchers have been challenged to find the right methods for involving children in a child-centred design process. Many of these research efforts have been put into finding the right evaluation methods that yield valuable results, on which informed product design decisions can be taken. In the middle and late design phases, empirical evaluative methods have become most prominent, of which verbalization methods, survey methods and observation (in combination with recording and logging of data) are very popular [17]. Verbalization methods and observation are usually of a formative kind whereas survey methods are typically part of the class of summative evaluation methods. Although nowadays, surveys are mainly administered via paper-and-pencil or electronically in research with adults [18, p. 1153], a face-to-face approach is more appropriate in the case of research with child respondents; and this is especially true for user experience evaluations [19]. The quality of such a face- to-face survey approach depends on the child-friendliness of the scales, which relates to the appropriateness of the content of the questions and response items as well as the type of scale. Overall, summative product evaluation methods can be catego- rized in acceptance evaluation methods on the one hand and pref- erence evaluation methods on the other [20]. During acceptance testing, liking for a single product is measured without direct com- parison to another product. In contrast, during preference testing, 2212-8689/$ – see front matter © 2013 Elsevier B.V. All rights reserved. doi:10.1016/j.ijcci.2012.12.001
Transcript of Measuring product liking in preschool children: An evaluation of the Smileyometer and This or That...
International Journal of Child-Computer Interaction 1 (2013) 61–70
Contents lists available at ScienceDirect
International Journal of Child-Computer Interaction
journal homepage: www.elsevier.com/locate/ijcci
Measuring product liking in preschool children: An evaluation of theSmileyometer and This or That methodsBieke Zaman a,∗, Vero Vanden Abeele b, Dirk De Grooff aa CUO | Social Spaces - KU Leuven/ iMinds, Parkstraat 45 Bus 3605, 3000 Leuven, Belgiumb e-Media Lab, Groep T, CUO, Associatie KU Leuven, Andreas Vesaliusstraat 13, 3000 Leuven, Belgium
a r t i c l e i n f o
Article history:Received 16 November 2012Accepted 21 December 2012
a b s t r a c t
This article provides a detailed evaluation of two summative evaluation methods, This or That andSmileyometer. The methods’ reliability and validity were examined, using a sample of 113 preschoolers(ages from 33 to 90 months). The results show considerable promise for This or That for measuringpreferences across entertainment products. This or That resulted in reliable and valid responses inpreschool children aged four and older. Nevertheless, low reliability and validity scores were obtained forThis or That in preschoolers younger than four years old. As for the Smileyometer results, preschoolers’responses clearly indicated an overrepresentation of extreme positive scores that were inconsistent withtheir actual product preferences. Consequently, the validity of these young children’s responses evokedthrough the Smileyometer was not supported.
© 2013 Elsevier B.V. All rights reserved.
1. Introduction
This research was conducted with the ambition to participatein the methodological quest for evaluation methods to be used inyoung, preliterate children for measuring product liking. Since theeighties, adults have started to acknowledge children’s capabilityto provide valuable contributions to research and their rightto be directly approached when their behaviour and opinionsare being studied [1–7]. This new approach to research withchildren has been referred to as the ‘new sociology of childhood’,initiated by the Children’s Rights Movement and inspired by the1989 UN Charter that highlighted that ‘‘children do have validand valuable views and opinions that deserve to be elicited andtaken seriously’’ [8, p. 467]. This competence and right has tobe considered for all children, young as they may be [9, p. 822].It is now recognized as problematic, even though convenient,to work with adult-originated accounts of children’s experienceswithout complementing this with alternative methods thatinclude children’s voices directly [8, p. 467], [10].
Recent developments in researching children have been lookingtowards ways of locating children’s lives in the centre of theresearch process, by strengthening the position of the child asan ‘active research participant’ as opposed to a ‘passive researchobject’ [11–13], [14, p. 70]. The child-centred approach regardschildren as competent in reporting their own experiences [15], and
∗ Corresponding author. Tel.: +32 16 32 36 51; fax: +32 16 32 32 10.E-mail address: [email protected] (B. Zaman).
2212-8689/$ – see front matter© 2013 Elsevier B.V. All rights reserved.doi:10.1016/j.ijcci.2012.12.001
consequently it has been marked by the prepositional shift fromworking ‘on’ to working ‘with’ children at all levels of the researchprocess — from designing the study to data collection and datareporting [13,16].
In this context, child–computer interaction (CCI) researchershave been challenged to find the right methods for involvingchildren in a child-centred design process. Many of these researchefforts have been put into finding the right evaluation methodsthat yield valuable results, on which informed product designdecisions can be taken. In the middle and late design phases,empirical evaluative methods have become most prominent, ofwhich verbalization methods, survey methods and observation(in combination with recording and logging of data) are verypopular [17]. Verbalization methods and observation are usuallyof a formative kind whereas survey methods are typically part ofthe class of summative evaluation methods.
Although nowadays, surveys are mainly administered viapaper-and-pencil or electronically in research with adults [18, p.1153], a face-to-face approach is more appropriate in the caseof research with child respondents; and this is especially truefor user experience evaluations [19]. The quality of such a face-to-face survey approach depends on the child-friendliness of thescales, which relates to the appropriateness of the content of thequestions and response items as well as the type of scale.
Overall, summative product evaluationmethods can be catego-rized in acceptance evaluation methods on the one hand and pref-erence evaluation methods on the other [20]. During acceptancetesting, liking for a single product is measuredwithout direct com-parison to another product. In contrast, during preference testing,
62 B. Zaman et al. / International Journal of Child-Computer Interaction 1 (2013) 61–70
product preferences are measured by comparison of two or moreproducts with each other.
This study evaluates two types of survey scales that have beenused for summative, empirical product liking evaluations in theCCI community, namely smiley-based ordinal rating scales and di-chotomous, nominal scales. Within these two categories, two em-pirical product evaluation methods are selected and investigatedfor their use with preschoolers, namely the Smileyometer [21,19]as an acceptance evaluationmethod and This or That [22] as a pref-erence evaluation method.
This article investigates the reliability and validity of This orThat and Smileyometer in preschool children. Firstly, the maincharacteristics of acceptance and preference evaluation methodsare described, together with their advantages and disadvantages.Then, the Smileyometer and This or That are introduced, followedby an overview of related work in which these methods havebeen evaluated. Secondly, the method of our empirical studyis elaborated on. A presentation and discussion of the resultsfollow, with special attention to reliability and validity testing. Thearticle ends by summarizing the results and suggesting a concreteresearch agenda for further work.
2. Measuring product liking
Two general classes of summative, empirical evaluation meth-ods can be distinguished for the measurement of product liking:acceptance evaluation methods and preference evaluation meth-ods [20]. In the next paragraphs, the main characteristics of theseclasses of methods will be discussed. Then, for each class, onemethod from the CCI domain will be selected for a more detaileddiscussion, namely Smileyometer and This or That respectively.
2.1. Acceptance evaluation methods
In acceptance evaluation methods, participants are presentedwith products individually, for which an evaluative judgement iselicited without direct comparison to other products. This class ofmethods typically relies on some kind of category scaling tech-nique to quantify overall product liking and measure the degreeof liking/disliking. In other words, these methods allow answer-ing the question how well a product is (dis)liked. For instance, a5-point Likert scale ranging from ‘dislike a lot’ to ‘like a lot’ can beemployed to measure overall product liking. In both industry andacademy, acceptance evaluation methods have typically been de-signed with a smiling face scale for research with young children,because they are considered to be more capable of and more mo-tivated by using faces than words or numbers [23,24].
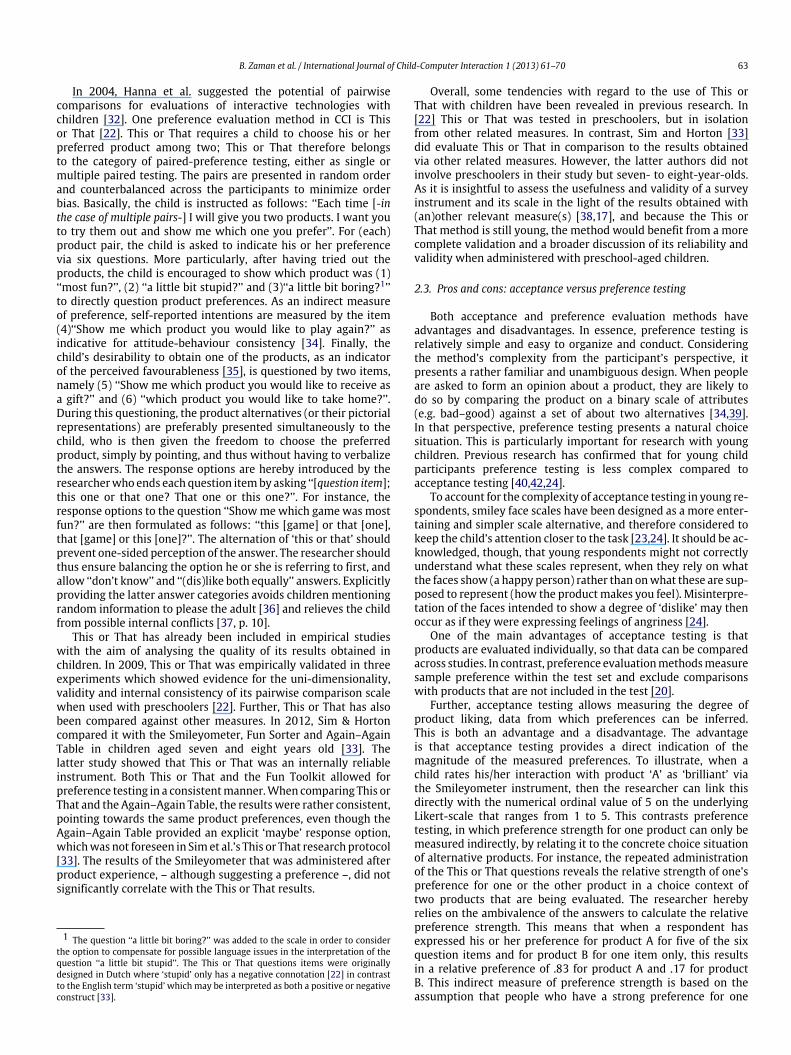
Surveys based on face or smiley scales have a long tradition inmedical research for measuring pain or anxiety (e.g. [25,26]), inpsycho-social investigations for relationship assessment (e.g. [27])and in marketing research (e.g. [23]). In 2001, Read and hercolleagues [28] were inspired by these smiley scales, and intro-duced the Smileyometer in the domain of child–computer in-teraction. The Smileyometer measures how good the productexperience was on a simple scale with smiley faces, as illustratedin Fig. 1 [28,29]. The Smileyometer belongs to the family of 5-point Likert scales. Characterizing is that the typical text-based re-sponse items are replaced by smiley faces representing the child’sperceived level of product liking with the interactive product(s)under investigation [29]. The ordinal response items are scaledwith higher values reflecting a more positive evaluative judge-ment. More particularly, the Smileyometer’s scale ranges from‘awful’ to ‘brilliant’. When using the Smileyometer in comparativeproduct evaluations, a separate Smileyometer scale should be pre-sented for each alternative that is evaluated [21].
Fig. 1. The Smileyometer instrument.
As the Smileyometer has been devised as one particularmethodwithin a ‘Fun Toolkit’ of fun measures, it has been extensivelycompared with those Fun Toolkit instruments. In 2002, the resultsobtained with the Smileyometer, Funometer, Fun Sorter andAgain–Again Table have been evaluated and compared in threestudies with children within the age range of six to ten yearsold [21]. The descriptive statistical analyses suggested that youngchildren scored most things as ‘Brilliant’ on the Smileyometer incomparison to the older children. Further, a correlation acrossthe Funometer and Smileyometer was found, but not across theother measures. Additionally, previous work has shown littlecorrelation between the fun ratings of seven- and eight-year-oldsobtained via ranking and Smileyometer [30]. The latter authorsgave two possible explanations, one related to children’s assumedtendency to select the most positive options on the Smileyometer,another reason related to the fact that the questioning was notconsistent over the measures [30, p. 108]. In 2006, the degree ofvariance in the Smileyometer results was further investigated intwo studies involving children within the age category of seven tothirteen years old [29]. It was shown that the children aged twelveand thirteen showed a much higher degree of variance than thechildren of seven to nine years old.
The studies reviewed above have described the results obtainedin children within the age spectrum of six to thirteen years old.Overall, these findings have indicated that children between nineand thirteen years old showed a higher degree of variance acrossthe Smileyometer as compared to six- to nine-year-olds [29,19]. Todate, the information available within the domain of CCI on howchildren younger than six perform in using summative evaluationmeasures is scarce. Outside the CCI domain, though, it has beenfound that young children respond in an extreme manner – whichmay relate to both the positive or negative pole – when ratingemotion-based tasks [31].
Although the Smileyometer has been analysed in comparativestudies, none of the studies described above have focused on anevaluation of the method within the age category of preschoolers.Overall, the Smileyometer and smiling face scales in generalneed further assessment to clarify their appropriateness andvaliditywhen usedwith preliterate children [23,19].Moreover, theFun Toolkit measures have mainly been validated by measuringcorrelations among themeasures and by focusing on the variabilityobtained in the answers. It would be interesting to focus on othermeasures to judge the quality of the Fun Toolkit methods, such asinternal, test–retest or inter-method reliability and several typesof validity measures.
2.2. Preference evaluation methods
The second class of summative product liking methods consistsof preference evaluation methods. In preference testing, partici-pants are required to choose the product that is preferred over an-other, using the criteria imposed by the researcher. Product likingis then measured relatively, in terms of the explicit preference ofone product over another. Preference testingmeasures can includepaired-preference testing (one product is chosen over another, ei-ther revealed through testing single pairs or multiple pairs) orranked-preference testing in which three or more products areranked in relative order from least to most preferred.
B. Zaman et al. / International Journal of Child-Computer Interaction 1 (2013) 61–70 63
In 2004, Hanna et al. suggested the potential of pairwisecomparisons for evaluations of interactive technologies withchildren [32]. One preference evaluation method in CCI is Thisor That [22]. This or That requires a child to choose his or herpreferred product among two; This or That therefore belongsto the category of paired-preference testing, either as single ormultiple paired testing. The pairs are presented in random orderand counterbalanced across the participants to minimize orderbias. Basically, the child is instructed as follows: ‘‘Each time [-inthe case of multiple pairs-] I will give you two products. I want youto try them out and show me which one you prefer’’. For (each)product pair, the child is asked to indicate his or her preferencevia six questions. More particularly, after having tried out theproducts, the child is encouraged to show which product was (1)‘‘most fun?’’, (2) ‘‘a little bit stupid?’’ and (3)‘‘a little bit boring?1’’to directly question product preferences. As an indirect measureof preference, self-reported intentions are measured by the item(4)‘‘Show me which product you would like to play again?’’ asindicative for attitude-behaviour consistency [34]. Finally, thechild’s desirability to obtain one of the products, as an indicatorof the perceived favourableness [35], is questioned by two items,namely (5) ‘‘Show me which product you would like to receive asa gift?’’ and (6) ‘‘which product you would like to take home?’’.During this questioning, the product alternatives (or their pictorialrepresentations) are preferably presented simultaneously to thechild, who is then given the freedom to choose the preferredproduct, simply by pointing, and thus without having to verbalizethe answers. The response options are hereby introduced by theresearcherwho ends each question itemby asking ‘‘[question item];this one or that one? That one or this one?’’. For instance, theresponse options to the question ‘‘Showmewhich game was mostfun?’’ are then formulated as follows: ‘‘this [game] or that [one],that [game] or this [one]?’’. The alternation of ‘this or that’ shouldprevent one-sided perception of the answer. The researcher shouldthus ensure balancing the option he or she is referring to first, andallow ‘‘don’t know’’ and ‘‘(dis)like both equally’’ answers. Explicitlyproviding the latter answer categories avoids children mentioningrandom information to please the adult [36] and relieves the childfrom possible internal conflicts [37, p. 10].
This or That has already been included in empirical studieswith the aim of analysing the quality of its results obtained inchildren. In 2009, This or That was empirically validated in threeexperiments which showed evidence for the uni-dimensionality,validity and internal consistency of its pairwise comparison scalewhen used with preschoolers [22]. Further, This or That has alsobeen compared against other measures. In 2012, Sim & Hortoncompared it with the Smileyometer, Fun Sorter and Again–AgainTable in children aged seven and eight years old [33]. Thelatter study showed that This or That was an internally reliableinstrument. Both This or That and the Fun Toolkit allowed forpreference testing in a consistentmanner.When comparing This orThat and the Again–Again Table, the results were rather consistent,pointing towards the same product preferences, even though theAgain–Again Table provided an explicit ‘maybe’ response option,whichwas not foreseen in Simet al.’s This or That research protocol[33]. The results of the Smileyometer that was administered afterproduct experience, – although suggesting a preference –, did notsignificantly correlate with the This or That results.
1 The question ‘‘a little bit boring?’’ was added to the scale in order to considerthe option to compensate for possible language issues in the interpretation of thequestion ‘‘a little bit stupid’’. The This or That questions items were originallydesigned in Dutch where ‘stupid’ only has a negative connotation [22] in contrastto the English term ‘stupid’ which may be interpreted as both a positive or negativeconstruct [33].
Overall, some tendencies with regard to the use of This orThat with children have been revealed in previous research. In[22] This or That was tested in preschoolers, but in isolationfrom other related measures. In contrast, Sim and Horton [33]did evaluate This or That in comparison to the results obtainedvia other related measures. However, the latter authors did notinvolve preschoolers in their study but seven- to eight-year-olds.As it is insightful to assess the usefulness and validity of a surveyinstrument and its scale in the light of the results obtained with(an)other relevant measure(s) [38,17], and because the This orThat method is still young, the method would benefit from a morecomplete validation and a broader discussion of its reliability andvalidity when administered with preschool-aged children.
2.3. Pros and cons: acceptance versus preference testing
Both acceptance and preference evaluation methods haveadvantages and disadvantages. In essence, preference testing isrelatively simple and easy to organize and conduct. Consideringthe method’s complexity from the participant’s perspective, itpresents a rather familiar and unambiguous design. When peopleare asked to form an opinion about a product, they are likely todo so by comparing the product on a binary scale of attributes(e.g. bad–good) against a set of about two alternatives [34,39].In that perspective, preference testing presents a natural choicesituation. This is particularly important for research with youngchildren. Previous research has confirmed that for young childparticipants preference testing is less complex compared toacceptance testing [40,42,24].
To account for the complexity of acceptance testing in young re-spondents, smiley face scales have been designed as a more enter-taining and simpler scale alternative, and therefore considered tokeep the child’s attention closer to the task [23,24]. It should be ac-knowledged, though, that young respondents might not correctlyunderstand what these scales represent, when they rely on whatthe faces show (a happy person) rather than onwhat these are sup-posed to represent (how the productmakes you feel). Misinterpre-tation of the faces intended to show a degree of ‘dislike’ may thenoccur as if they were expressing feelings of angriness [24].
One of the main advantages of acceptance testing is thatproducts are evaluated individually, so that data can be comparedacross studies. In contrast, preference evaluationmethodsmeasuresample preference within the test set and exclude comparisonswith products that are not included in the test [20].
Further, acceptance testing allows measuring the degree ofproduct liking, data from which preferences can be inferred.This is both an advantage and a disadvantage. The advantageis that acceptance testing provides a direct indication of themagnitude of the measured preferences. To illustrate, when achild rates his/her interaction with product ‘A’ as ‘brilliant’ viathe Smileyometer instrument, then the researcher can link thisdirectly with the numerical ordinal value of 5 on the underlyingLikert-scale that ranges from 1 to 5. This contrasts preferencetesting, in which preference strength for one product can only bemeasured indirectly, by relating it to the concrete choice situationof alternative products. For instance, the repeated administrationof the This or That questions reveals the relative strength of one’spreference for one or the other product in a choice context oftwo products that are being evaluated. The researcher herebyrelies on the ambivalence of the answers to calculate the relativepreference strength. This means that when a respondent hasexpressed his or her preference for product A for five of the sixquestion items and for product B for one item only, this resultsin a relative preference of .83 for product A and .17 for productB. This indirect measure of preference strength is based on theassumption that people who have a strong preference for one
64 B. Zaman et al. / International Journal of Child-Computer Interaction 1 (2013) 61–70
particular product will significantly link that product more to thepositive pole of the preference construct than the alternative(s).Evaluative judgements formed through a mix of positive andnegative evaluations are weaker than those built up from merelypositive attitudes [34].
The direct measurement of the degree of product liking inacceptance testing has its downside as well. The rating scalesused in acceptance testing require the respondents to providefine-grained intensity judgements, which brings an additionallevel of complexity [31]. Moreover, in acceptance testing, theintervals between the scale parts are not necessarily perceptuallyequal. In user experience testing, in which the user experienceconstruct is typically operationalized with positive aspects, onemaywonderwhether the ‘neutral’ option reflects a true ‘zero’ pointin the measurement. Additionally, although preferences can beinferred fromacceptance testing data, one should realize that thesepreferences are only indirectly defined. Participants are not askedto compare the alternatives directly, which contrasts preferencetesting as the latter does measure preferences based upon directcomparisons of products.
Although one can consider the simplicity of preference testingas its main advantage, the research design becomes more complexand cumbersome in the case of multiple paired comparisons ina product set of more than two alternatives. For instance, in aproduct set of four products, six pairs are formed; this increasesto ten pairs in the case of a product set of five and 15 pairsin a product set of six. Consequently, the time required for thetest greatly increases with the number of product alternativesconsidered in multiple-paired comparison testing. If this is thecase, ranked-preference testing inwhich all products are comparedsimultaneously instead of pairwise can provide a less extensivealternative for preference testing.
Additionally, another disadvantage in preference testing is thatthe respondents’ preference judgements greatly depend on the(meaningfulness of the) alternatives that are given; hence anotherchoice context can elicit different results.
To conclude this discussion on the pros and cons of thesetwo classes of product liking methods, we refer to Guinard [40]who has provided an overview of these methods’ appropriatenessfor sensory evaluations in children. His literature overview hasshown that for the age group of two to three-year-olds, paired-preference testing is the only reliable method. For preschoolersolder than four years old, preference ranking extending over twoor more products, and acceptance scales (3- to 9-points) can alsobe considered [40]. It is not clear, however, whether these resultsthat have proven valid for sensory evaluations such as measuringfood preferences and perceived sweetness intensity, also holdfor preference evaluations related to interactive, entertainmentproduct experiences.
3. Method
3.1. Purpose
The aim of this study is to compare This or That with Smiley-ometer formeasuring product liking in preschoolers andmore par-ticularly to:
– determine the reliability of thesemethods in preschool children.This objective will provide an indication of the internalconsistency of the results obtained by the measures.
– determine how well these methods compare with each otherwith regard to their validity in order to assess whetherthese methods provide a good test of predictability of overtbehaviour.
Table 1Age distribution of participants.
Age (months) 33–35 36–47 48–59 60–71 72–83 84–90n 8 16 39 23 25 2
3.2. Participants
As for the definition of a preschooler, we relied on two definingcharacteristics that have been put forward as relevant in thedefinition of a preschooler-based sample. More particularly, werecruited children along the age spectrum of two to seven yearsold, an age category that in literature has been referred to asthe ‘preoperational phase of children’ and further divided in a‘preconceptual sub stage’ for children between two and four yearsold, and an ‘intuitive sub stage’ for children aged four to sevenyears [41]. Our study aimed at involving children from bothstages, in the remaining parts of this article simply referred toas respectively the youngest and oldest preschoolers. Moreover,in accordance to Miller and Aloise, we also followed the literacycriterion by defining a preschooler as a child who has not yetreceived primary education, and thus cannot yet read or write [43,p. 258].
In total, written parental informed consent was obtained for113 preschoolers, half boys (n = 56) and half girls (n = 57 girls),ranging in age from 33 to 90 months (M = 58.4, SD = 14),see Table 1. The majority of the child participants belonged to theintuitive sub stage (73%), only one quarter of the children belongedto the preconceptual sub stage (27%).
In our sample, all preschoolers were illiterate. The study tookplace during summer holidays, only a few weeks away from thestart of the school year in which the oldest children would startlearning to read. In Belgium, where the study was organized,children start reading and enter primary education in the year thatthey turn seven years old. The study took place at two recreationareas; it concerned local initiatives that take care of children duringholidays at (almost) no fee, bringing together children from avariety of backgrounds.
3.3. Product set
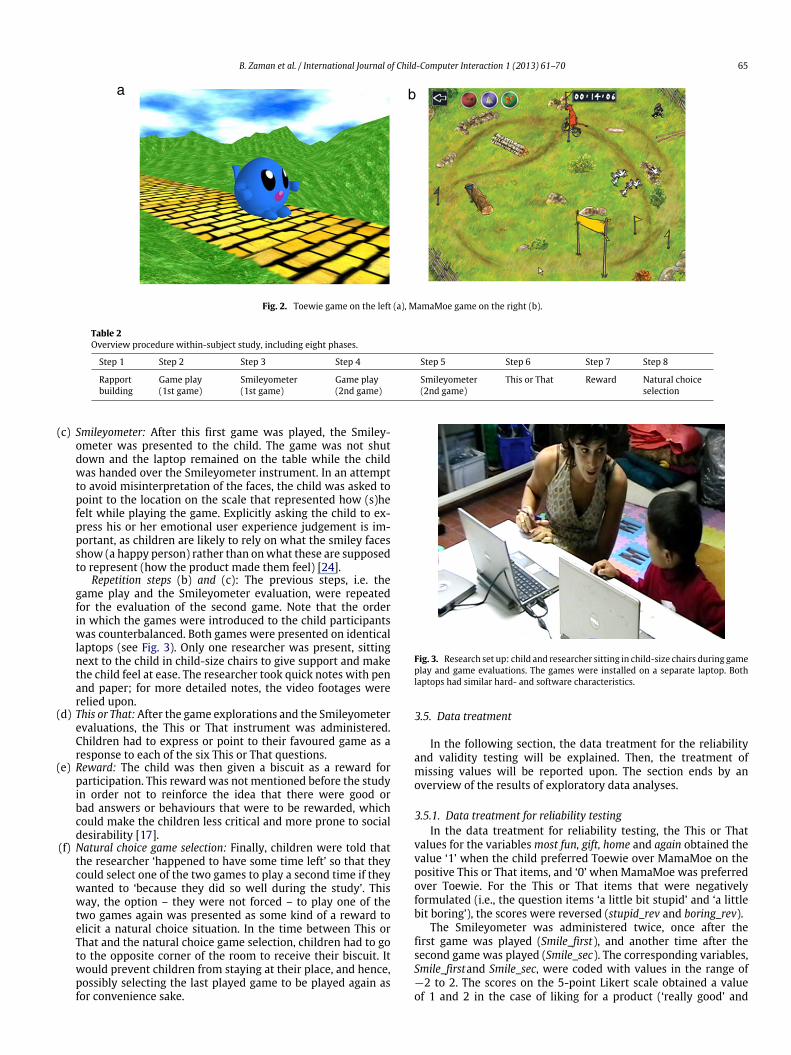
This or That and Smileyometer were surveyed in the context ofan empirical evaluation study of two keyboard interaction gamesthat were designed for a preschool-aged target group: the Toewiegame (see Fig. 2, left) [44] and theMamaMoe en de kraai game (seeFig. 2, right) [45]. None of the children had ever played one of thesegames before.
3.4. Procedure
The study followed a within-subject research design. The mainprocedure consisted of the following steps: (a) rapport building,(b) game play, (c) Smileyometer, – the repetition of step b and c forthe evaluation of the second game –, (d) This or That, (e) reward and(f) natural choice game selection (see also Table 2).
(a) Rapport building: The researcher led each child individually tothe test room and engaged in small talk as a means to buildrapport.
(b) Game play: The actual study started by inviting the child toexplore and play one of the two games until he or she hadfinished the first game level. Finishing the first level took aboutfiveminutes for each game. Half of the children started playingthe Toewie game first, the other half begunwith theMamaMoegame.
B. Zaman et al. / International Journal of Child-Computer Interaction 1 (2013) 61–70 65
Fig. 2. Toewie game on the left (a), MamaMoe game on the right (b).
Table 2Overview procedure within-subject study, including eight phases.
Step 1 Step 2 Step 3 Step 4 Step 5 Step 6 Step 7 Step 8
Rapportbuilding
Game play(1st game)
Smileyometer(1st game)
Game play(2nd game)
Smileyometer(2nd game)
This or That Reward Natural choiceselection
(c) Smileyometer: After this first game was played, the Smiley-ometer was presented to the child. The game was not shutdown and the laptop remained on the table while the childwas handed over the Smileyometer instrument. In an attemptto avoid misinterpretation of the faces, the child was asked topoint to the location on the scale that represented how (s)hefelt while playing the game. Explicitly asking the child to ex-press his or her emotional user experience judgement is im-portant, as children are likely to rely on what the smiley facesshow (a happy person) rather than onwhat these are supposedto represent (how the product made them feel) [24].
Repetition steps (b) and (c): The previous steps, i.e. thegame play and the Smileyometer evaluation, were repeatedfor the evaluation of the second game. Note that the orderin which the games were introduced to the child participantswas counterbalanced. Both games were presented on identicallaptops (see Fig. 3). Only one researcher was present, sittingnext to the child in child-size chairs to give support and makethe child feel at ease. The researcher took quick notes with penand paper; for more detailed notes, the video footages wererelied upon.
(d) This or That: After the game explorations and the Smileyometerevaluations, the This or That instrument was administered.Children had to express or point to their favoured game as aresponse to each of the six This or That questions.
(e) Reward: The child was then given a biscuit as a reward forparticipation. This reward was not mentioned before the studyin order not to reinforce the idea that there were good orbad answers or behaviours that were to be rewarded, whichcould make the children less critical and more prone to socialdesirability [17].
(f) Natural choice game selection: Finally, children were told thatthe researcher ‘happened to have some time left’ so that theycould select one of the two games to play a second time if theywanted to ‘because they did so well during the study’. Thisway, the option – they were not forced – to play one of thetwo games again was presented as some kind of a reward toelicit a natural choice situation. In the time between This orThat and the natural choice game selection, children had to goto the opposite corner of the room to receive their biscuit. Itwould prevent children from staying at their place, and hence,possibly selecting the last played game to be played again asfor convenience sake.
Fig. 3. Research set up: child and researcher sitting in child-size chairs during gameplay and game evaluations. The games were installed on a separate laptop. Bothlaptops had similar hard- and software characteristics.
3.5. Data treatment
In the following section, the data treatment for the reliabilityand validity testing will be explained. Then, the treatment ofmissing values will be reported upon. The section ends by anoverview of the results of exploratory data analyses.
3.5.1. Data treatment for reliability testingIn the data treatment for reliability testing, the This or That
values for the variablesmost fun, gift, home and again obtained thevalue ‘1’ when the child preferred Toewie over MamaMoe on thepositive This or That items, and ‘0’ when MamaMoe was preferredover Toewie. For the This or That items that were negativelyformulated (i.e., the question items ‘a little bit stupid’ and ‘a littlebit boring’), the scores were reversed (stupid_rev and boring_rev).
The Smileyometer was administered twice, once after thefirst game was played (Smile_first), and another time after thesecond game was played (Smile_sec). The corresponding variables,Smile_firstand Smile_sec, were coded with values in the range of−2 to 2. The scores on the 5-point Likert scale obtained a valueof 1 and 2 in the case of liking for a product (‘really good’ and
66 B. Zaman et al. / International Journal of Child-Computer Interaction 1 (2013) 61–70
‘brilliant’ smiley, respectively), a value of −1 and −2 in the case ofdisliking (‘not very good’ en ‘awful’ smiley, respectively); neutral(‘good’ smiley) was scored 0.
3.5.2. Data treatment for validity testingThe natural choice game selection was essential in assessing
the validity of the research methods as it provided a test of themethods’ predictability of overt behaviour. The natural choicegame selection foresaw in amanifest response of game preference,revealing the coherence between the preference assessed by eachmethod on the one hand, and a more natural choice on the other.Therefore, validity of the This or That method is supported if (b)the overall relative This or That score for the selected game (Tsg)is greater than the This or That score for the not-selected game(Tng). Validity of the Smileyometer would be supported if (a) theSmileyometer score for the selected game (i.e. game selected bynatural choice) (Ssg) is greater than the Smileyometer score for thenot-selected game (Sng).
Therefore, post hoc, the results for each This or That questionitem were binary coded with ‘1’ in the case of a match with theselected game and ‘0’ in the case of a mismatch (the values forthe items ‘boring’ and ‘stupid’ were reversed). For instance, whena child indicated that Toewie was the most fun game on This orThat, the question item ‘show me which game was most fun’ wascoded with value 1 in the case that the child also selected Toewieas the natural choice game selection. In this manner, 12 additionalvariables were computed, 6 representing the This or That valuesfor the selected game (Tsg): Tsg-fun, Tsg-StupidRev, Tsg-BoringRev,Tsg-Again, Tsg-Gift and Tsg-home; the other 6 representing the Thisor That values for the game that was not selected to play again(Tng): Tng-fun, Tng-StupidRev, Tng-BoringRev, Tng-Again, Tng-Giftand Tng-home. Finally, from these the overall relative This or Thatscores for the selected game (Tsg) and not-selected game (Tng)were calculated. Obviously, from the above follows that Tng = 6− Tsg.
For the validity testing, the Smileyometer values were alsoconsidered with respect to the game that was chosen as thenatural choice game selection. This resulted in the computationof two additional variables, one variable that represented theSmileyometer values for the selected game (Ssg), and the othervariable represented the Smileyometer values for the game thatwas not selected to play again (Sng).
3.5.3. Treatment of missing valuesThe values of Tsg-fun, Tsg-Stupid_rev, Tsg-Boring_rev, Tsg-Again,
Tsg-Gift and Tsg-home as well as the values of the variables Tsg,Tng, Ssg and Sng-values depended on the selection of the finalgame at the end of the study. We could not include the childrenwho did not select a final game in the analyses on these variables,and consequently nine children, of which three girls and six boys,were not included. Two of them belonged to the preconceptual substage, seven to the intuitive sub stage.
Moreover, in preference testing inwhich the options of ‘(dis)likeboth equally’ and ‘don’t know’ are included, the data analysisshould be performed only on those responses that show a definitepreference for one of the two products [46]. Hence, responses thatcorresponded with one of these three responses were withdrawnfor further analysis in our study. This resulted inmissing values forThis or That in five boys and two girls, two of them belonged to thepreconceptual sub stage, five to the intuitive sub stage.
As for the missing values in Smileyometer, there was one boyfrom the intuitive sub stage and one girl from the preconceptualsub stage who did not provide a rating for the Smileyometer onthe game that was played first (Smile_first).
3.5.4. Exploratory data analysesExploratory data analyses were performed to investigate the
normality distribution of the data in order to select the rightstatistical tests for our analyses. As for the This or That items,the Shapiro–Wilk normality test valueswere significant, indicatingnon-normal data, and this in both age groups. The test statisticfor the items were Wmostfun(107) = .475;Wgift(107) = .485;Wstupid_rev(107) = .575;Whome(107) = .524;Wagain(107) = .515;Wboring_rev(107) = .555; all at p < .001.
A Shapiro–Wilk normality test was also calculated on theSmileyometer variables, resulting in significant values (p < .001),clearly indicating that the distributions for the Ssg-values and Sng-values were not normal (for the youngest preschoolers: W (27) =
.707, p < .001 and W (27) = .773, p < .001, respectively; forthe oldest preschoolers W (80) = .510, p < .001 and W (80) =
.621, p < .001, respectively).This or That has been introduced as a uni-dimensional scale
consisting of various items that all refer to one aspect of a higherordered construct [22]. In order to reveal whether there was anylatent variable, exploratory factor analysis (EFA) was computed.The principal axis factoring method was selected because our datawere significantly non normally-distributed [47]. The calculatedscree plot indicated a point of inflexion on the curve at two,which suggests a uni-dimensional scale. Moreover, the principalaxis factoring extraction method confirmed that no more than onefactor could be extracted using the eigenvalue > 1 rule. The totalvariance that could be explained by the unique factor was 54% ofvariance for initial eigenvalues (eigenvalue = 3.212).
4. Results
In what follows, the results of the reliability and validity testingare discussed in detail.
4.1. Reliability
Firstly, the reliability test results of This or That will be pre-sented, followed by a discussion on the Smileyometer’s reliability.
4.1.1. This or ThatCoefficient alpha was computed for most fun, gift, home, again,
stupid_rev and boring_rev. The overall Cronbach’s alpha of the 6-item dichotomous This or That scale yielded α = .825 (n = 107).Each item correlated with the overall score from the scale. Therewere no corrected item-total correlations below .3. Furthermore,none of the items substantially affected reliability if they weredeleted, since no alpha value for deleted items was greater thanthe overall Cronbach’s alpha. Additionally, we split the sampleby age, into the young and older preschoolers, to investigate agedifferences.We found remarkable lower reliabilities for the 6-pointscale in the youngest subsample – preconceptual sub stage – (α =
.654; n = 28), compared to the α-value in the oldest preschoolersof the intuitive sub stage subsample (α = .850; n = 79).
Table 3 shows the extraction communalities for each This orThat item (M = .447, SD = .124), indicating the proportion ofcommon variance present in each variable accounted for by ourunique factor. Splitting the data by age, the extraction communal-ities were remarkably lower for the youngest preschoolers (M =
.455, SD = .234) in comparisonwith the extraction communalitiesfor the oldest preschoolers (M = .509, SD = .235). The results fur-ther suggested a uni-dimensional scale in the oldest preschoolers,with the eigenvalue of 3.472 that could explain the total varianceof 58%. In contrast, in the youngest children there were two factorsrevealed from the analysis with an eigenvalue of 2.311 and 1.317with the cumulative explained variance reaching 60.452%.
B. Zaman et al. / International Journal of Child-Computer Interaction 1 (2013) 61–70 67
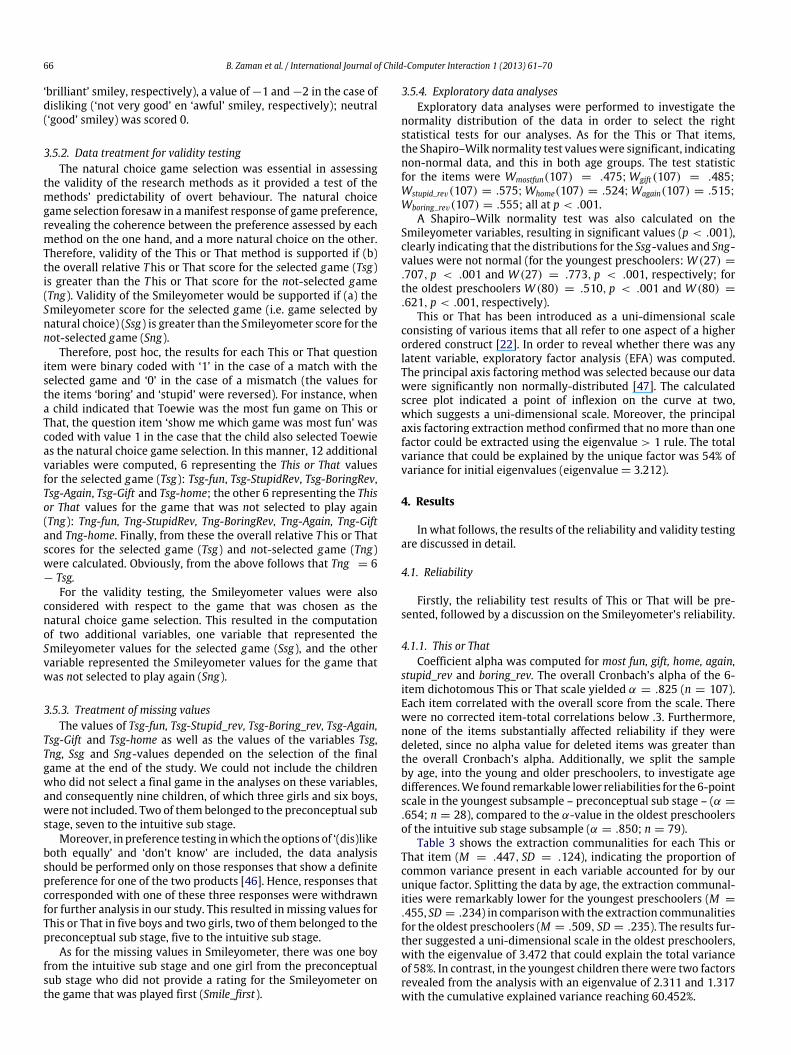
Table 3Communalities of the exploratory factor analysis on the six This or That items via the extraction method: principal axis factoring.
This or That items Most fun Gift Stupid_rev Home Again Boring_rev
Initial .386 .292 .495 .517 .294 .393Extraction .467 .303 .551 .608 .310 .444
10
20
30
40
50
60
70
80
0
Smile_first
Smile_sec
awful not very really good brilliant
Fig. 4. Proportion Smileyometer answers (in percentages) with regard to the game that was played first (Smile_first) and the second game (Smile_sec).
There are two issues that impede a conclusive interpreta-tion of the results, namely the emergence of a second factor inthe youngest preschoolers and the low communalities across allpreschoolers. Given that in social sciences common magnitudes ofcommunalities are between .40 and .70 [47], our data score ratherpoor with an average communality of .447 (SD = .124). Variableswith low extraction communalities are normally potential candi-dates for omission from the final scale. Nevertheless, caution isrequired in interpreting these results. In studies where low com-munalities emerge in the data, it is advisable to select a largersample to determine whether or not the factor structure and in-dividual items are valid [47]. One assumption for factor analysisis that it needs large samples for stable estimates [48]. In addi-tion to the large-sample requirement, it is also questionable whatcommon magnitudes of communalities are for verbalizations insurveys with preschool children. To our knowledge, there are nosimilar results in the CCI domain on product liking scales for youngchildren to compare our results to.
4.1.2. SmileyometerAs the Smileyometer was administered as a single item
measure, the Cronbach’s alpha internal consistency reliability teststatistic could not be calculated. Nevertheless, it is worthwhile toreflect upon the appropriateness of the scale to produce reliableresults that are consistent from one test administration to the next.
A Shapiro–Wilk normality test was calculated on the Smiley-ometer scores for the first administration (Smile_first) and secondadministration (Smile_sec), all resulting in significant values (p <.001), clearly indicating that the distributions were not normal(in the youngest preschoolers: WSmile_first(29) = .590, p < .001and WSmile_sec(29) = .833, p < .001; for the oldest preschool-ers WSmile_first(82) = .518, p < .001 and WSmile_sec(82) = .611,p < .001).
The data distribution shows a negative skew due to theoverrepresentation of the extreme positive rankings (see Fig. 4).For the Smileyometer administered after the first gamewas played(Smile_first), the median value was 2 (M = 1.56, SD = .96).The median value for the Smileyometer administered after thesecond game (Smile_sec) was played was identical, 2 (M =
1.25, SD = 1.12). The category ‘really good’ (16%) and ‘brilliant’(75%) constituted 91% of the answers on the first Smileyometer(Smile_first); these categories represented respectively 29% and56% of the answers on the second Smileyometer (Smile_sec), goodfor 85% of all the answers (see Fig. 4).
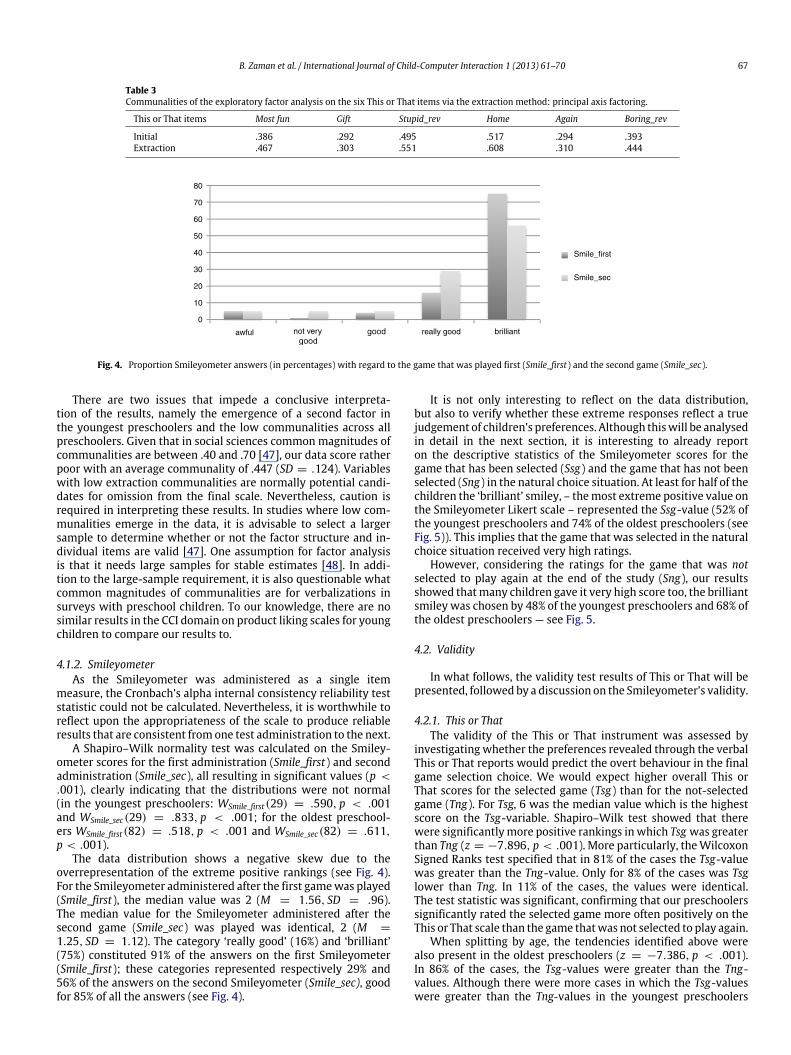
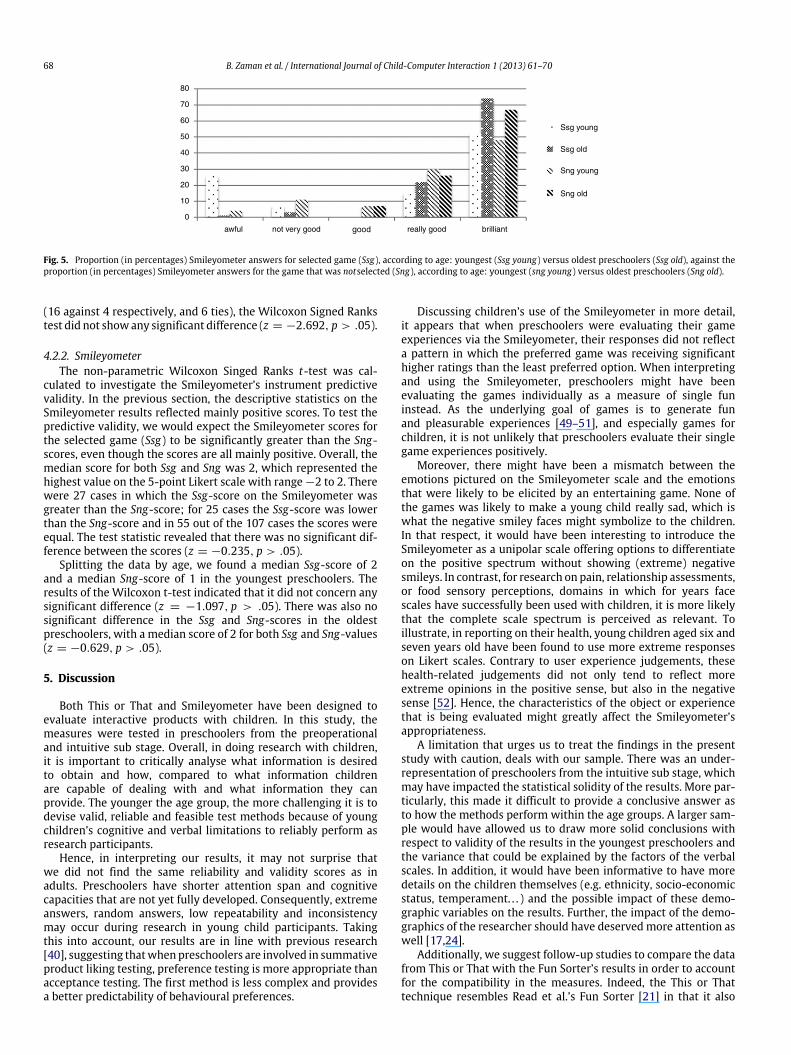
It is not only interesting to reflect on the data distribution,but also to verify whether these extreme responses reflect a truejudgement of children’s preferences. Although thiswill be analysedin detail in the next section, it is interesting to already reporton the descriptive statistics of the Smileyometer scores for thegame that has been selected (Ssg) and the game that has not beenselected (Sng) in the natural choice situation. At least for half of thechildren the ‘brilliant’ smiley, – themost extreme positive value onthe Smileyometer Likert scale – represented the Ssg-value (52% ofthe youngest preschoolers and 74% of the oldest preschoolers (seeFig. 5)). This implies that the game that was selected in the naturalchoice situation received very high ratings.
However, considering the ratings for the game that was notselected to play again at the end of the study (Sng), our resultsshowed thatmany children gave it very high score too, the brilliantsmiley was chosen by 48% of the youngest preschoolers and 68% ofthe oldest preschoolers — see Fig. 5.
4.2. Validity
In what follows, the validity test results of This or That will bepresented, followed by a discussion on the Smileyometer’s validity.
4.2.1. This or ThatThe validity of the This or That instrument was assessed by
investigating whether the preferences revealed through the verbalThis or That reports would predict the overt behaviour in the finalgame selection choice. We would expect higher overall This orThat scores for the selected game (Tsg) than for the not-selectedgame (Tng). For Tsg, 6 was the median value which is the highestscore on the Tsg-variable. Shapiro–Wilk test showed that therewere significantlymore positive rankings in which Tsg was greaterthan Tng (z = −7.896, p < .001). More particularly, theWilcoxonSigned Ranks test specified that in 81% of the cases the Tsg-valuewas greater than the Tng-value. Only for 8% of the cases was Tsglower than Tng. In 11% of the cases, the values were identical.The test statistic was significant, confirming that our preschoolerssignificantly rated the selected game more often positively on theThis or That scale than the game thatwas not selected to play again.
When splitting by age, the tendencies identified above werealso present in the oldest preschoolers (z = −7.386, p < .001).In 86% of the cases, the Tsg-values were greater than the Tng-values. Although there were more cases in which the Tsg-valueswere greater than the Tng-values in the youngest preschoolers
68 B. Zaman et al. / International Journal of Child-Computer Interaction 1 (2013) 61–70
10
20
30
40
50
60
70
80
0
Ssg young
Sng young
Ssg old
Sng old
Fig. 5. Proportion (in percentages) Smileyometer answers for selected game (Ssg), according to age: youngest (Ssg young) versus oldest preschoolers (Ssg old), against theproportion (in percentages) Smileyometer answers for the game that was notselected (Sng), according to age: youngest (sng young) versus oldest preschoolers (Sng old).
(16 against 4 respectively, and 6 ties), the Wilcoxon Signed Rankstest did not showany significant difference (z = −2.692, p > .05).
4.2.2. SmileyometerThe non-parametric Wilcoxon Singed Ranks t-test was cal-
culated to investigate the Smileyometer’s instrument predictivevalidity. In the previous section, the descriptive statistics on theSmileyometer results reflected mainly positive scores. To test thepredictive validity, we would expect the Smileyometer scores forthe selected game (Ssg) to be significantly greater than the Sng-scores, even though the scores are all mainly positive. Overall, themedian score for both Ssg and Sng was 2, which represented thehighest value on the 5-point Likert scale with range −2 to 2. Therewere 27 cases in which the Ssg-score on the Smileyometer wasgreater than the Sng-score; for 25 cases the Ssg-score was lowerthan the Sng-score and in 55 out of the 107 cases the scores wereequal. The test statistic revealed that there was no significant dif-ference between the scores (z = −0.235, p > .05).
Splitting the data by age, we found a median Ssg-score of 2and a median Sng-score of 1 in the youngest preschoolers. Theresults of the Wilcoxon t-test indicated that it did not concern anysignificant difference (z = −1.097, p > .05). There was also nosignificant difference in the Ssg and Sng-scores in the oldestpreschoolers, with a median score of 2 for both Ssg and Sng-values(z = −0.629, p > .05).
5. Discussion
Both This or That and Smileyometer have been designed toevaluate interactive products with children. In this study, themeasures were tested in preschoolers from the preoperationaland intuitive sub stage. Overall, in doing research with children,it is important to critically analyse what information is desiredto obtain and how, compared to what information childrenare capable of dealing with and what information they canprovide. The younger the age group, the more challenging it is todevise valid, reliable and feasible test methods because of youngchildren’s cognitive and verbal limitations to reliably perform asresearch participants.
Hence, in interpreting our results, it may not surprise thatwe did not find the same reliability and validity scores as inadults. Preschoolers have shorter attention span and cognitivecapacities that are not yet fully developed. Consequently, extremeanswers, random answers, low repeatability and inconsistencymay occur during research in young child participants. Takingthis into account, our results are in line with previous research[40], suggesting thatwhenpreschoolers are involved in summativeproduct liking testing, preference testing is more appropriate thanacceptance testing. The first method is less complex and providesa better predictability of behavioural preferences.
Discussing children’s use of the Smileyometer in more detail,it appears that when preschoolers were evaluating their gameexperiences via the Smileyometer, their responses did not reflecta pattern in which the preferred game was receiving significanthigher ratings than the least preferred option. When interpretingand using the Smileyometer, preschoolers might have beenevaluating the games individually as a measure of single funinstead. As the underlying goal of games is to generate funand pleasurable experiences [49–51], and especially games forchildren, it is not unlikely that preschoolers evaluate their singlegame experiences positively.
Moreover, there might have been a mismatch between theemotions pictured on the Smileyometer scale and the emotionsthat were likely to be elicited by an entertaining game. None ofthe games was likely to make a young child really sad, which iswhat the negative smiley faces might symbolize to the children.In that respect, it would have been interesting to introduce theSmileyometer as a unipolar scale offering options to differentiateon the positive spectrum without showing (extreme) negativesmileys. In contrast, for research on pain, relationship assessments,or food sensory perceptions, domains in which for years facescales have successfully been used with children, it is more likelythat the complete scale spectrum is perceived as relevant. Toillustrate, in reporting on their health, young children aged six andseven years old have been found to use more extreme responseson Likert scales. Contrary to user experience judgements, thesehealth-related judgements did not only tend to reflect moreextreme opinions in the positive sense, but also in the negativesense [52]. Hence, the characteristics of the object or experiencethat is being evaluated might greatly affect the Smileyometer’sappropriateness.
A limitation that urges us to treat the findings in the presentstudy with caution, deals with our sample. There was an under-representation of preschoolers from the intuitive sub stage, whichmay have impacted the statistical solidity of the results. More par-ticularly, this made it difficult to provide a conclusive answer asto how the methods perform within the age groups. A larger sam-ple would have allowed us to draw more solid conclusions withrespect to validity of the results in the youngest preschoolers andthe variance that could be explained by the factors of the verbalscales. In addition, it would have been informative to have moredetails on the children themselves (e.g. ethnicity, socio-economicstatus, temperament. . . ) and the possible impact of these demo-graphic variables on the results. Further, the impact of the demo-graphics of the researcher should have deserved more attention aswell [17,24].
Additionally, we suggest follow-up studies to compare the datafrom This or That with the Fun Sorter’s results in order to accountfor the compatibility in the measures. Indeed, the This or Thattechnique resembles Read et al.’s Fun Sorter [21] in that it also
B. Zaman et al. / International Journal of Child-Computer Interaction 1 (2013) 61–70 69
allows for evaluating product preferences on several comparativefun items.
Finally, another line of thinking concerns the deployment ofSmileyometer as a multi-item instrument by defining a list ofitems that are more directly related to the sub constructs of userexperience as employed in This or That. This would allow a bettercomparison with This or That, as well as more nuanced hedonicmeasurements. Besides, previous research on multi-item pictorialscales for preschoolers used in marketing research has shownconsiderable promise [23].
6. Conclusion
New methods are emerging within the domain of child–computer interaction. In order to move the field forward, it is im-perative to critique thesemethods and establish their potential andlimitations, which ultimately aids the community’s understand-ing of the reliability and validity of the evaluation methods. Whileolder children may effectively use verbal scales, – even if some in-terviewer assistance is required –, there is still no consensus onhow best to test preschoolers. The present study examined the va-lidity and reliability of Smileyometer and This or That for evaluat-ing interactive entertainment products with preschoolers.
The results provide evidence for the internal reliability anduni-dimensionality of This or That’s pairwise comparison scale.Furthermore, the scale’s predictive validity was also supported.It should be noted though, that these findings only held true forthe oldest preschoolers, aged four and older. More work is neededto explore the feasibility of this kind of paired-preference testingwhen employed with the youngest preschoolers. With regard tothe Smileyometer, our results did not provide evidence of itspredictive validity. There was an overrepresentation of the mostextreme positive scores for both the preferred and non-preferredgame in the youngest and oldest preschoolers. Consequently,whenused with preschoolers, researchers should guard themselves ininterpreting the Smileyometer results as a prediction of overtbehaviour and preferences or as an indication of preferencestrength.
To conclude, more research is needed on both This or Thatand Smileyometer. To us, the avenues for further work shouldconcentrate on:
(a) deciding upon the final list of This or That question items: Specialattention should be paid to the validity of the This or Thatinstrument for preference evaluations in preschoolers alreadyfrom the age of two onwards.
(b) investigating the potential of multi item pictorial scales: If theSmileyometer is used in isolation of othermethods, one cannotmeasure subtler user experience aspects other than ‘fun’.Hence, it is interesting to analyse how the current use of theSmileyometer as a single itemmeasure of fun can be extendedtowards a multi item measure, accounting for aspects such aschallenge, fantasy or creativity. The importance of designinggood, unambiguous pictorial representations for each of theseaspects may not be underestimated, though.
Acknowledgements
We would like to thank all children who participated in ourstudy as well as the animators of the summer day play initiativefor having given us the possibility to conduct our research on theirplaygrounds. We are also grateful to the TOEWIE developers’ teambecause we could use their game for our research project. Finally,we express our gratitude to the KU Leuven, GroepT and iMinds(Interdisciplinary institute for Technology), a research institutefounded by the Flemish Government, for supporting our work.
References
[1] D. Buckingham, Reading Audiences, Manchester University Press ND, Manch-ester, 1993.
[2] P. Darbyshire, Multiple methods in qualitative research with children:more insight or just more? Qualitative Research 5 (4) (2005) 417–436.http://dx.doi.org/10.1177/1468794105056921.
[3] A. Greig, J. Taylor, Doing Research with Children, Sage Publications, Lodon,1999.
[4] A. Mahon, C. Glendinning, K. Clarke, G. Craig, Researching children: methodsand ethics, Children & Society 10 (2) (1996) 145–154.http://dx.doi.org/10.1111/j.1099-0860.1996.tb00464.x.
[5] M. Morgan, S. Gibbs, K. Maxwell, N. Britten, Hearing children’s voices:methodological issues in conducting focus groups with children aged 7–11years, Qualitative Research 2 (1) (2002) 5–20.http://dx.doi.org/10.1177/1468794102002001636.
[6] V. Morrow, M. Richards, The ethics of social research with children: anoverview, Children & Society 10 (2) (1996) 90–105.
[7] S.J. Neill, Research with children: a critical review of the guidelines, Journal ofChild Health Care 9 (1) (2005) 46–58.http://dx.doi.org/10.1177/1367493505049646.
[8] P. Darbyshire, W. Schiller, C. MacDougall, Extending new paradigm childhoodresearch: meeting the challenges of including younger children, Early ChildDevelopment and Care 175 (6) (2005) 467–472.
[9] L.G. Irwin, J. Johnson, Interviewing young children: explicating our prac-tices and dilemmas, Qualitative Health Research 15 (6) (2005) 821–831.http://dx.doi.org/10.1177/1049732304273862.
[10] B. Lobe, S. Livingstone, L. Haddon, Researching Children’s ExperiencesOnline: Issues and Problems in Methodology (No. D4.1), LSE The Lon-don School of Economics and Political Science, London, 2007, Retrievedfrom http://www.lse.ac.uk/collections/EUKidsOnline/Reports/#generated-subheading2.
[11] N. Borgers, E. De Leeuw, J. Hox, Children as respondents in survey research:cognitive development and response quality 1, Bulletin de MéthodologieSociologique 66 (1) (2000) 60–75.http://dx.doi.org/10.1177/075910630006600106.
[12] A. Druin (Ed.), The Design of Children’s Technology, Morgan Kaufmann, 1998.[13] M.K.E. Lahman, Always Othered: ethical research with children, Journal of
Early Childhood Research 6 (3) (2008) 281–300.http://dx.doi.org/10.1177/1476718X08094451.
[14] C. Pole, Researching children and fashion: an embodied ethnography, Child-hood 14 (1) (2007) 67–84. http://dx.doi.org/10.1177/0907568207072530.
[15] B. Mayall, Children, Health and Social Order, Open University Press,Buckingham, 1996.
[16] B. Lobe, Integration of Online Research Methods, Faculty of Social Sciences,University of Ljubljana, 2008.
[17] P. Markopoulos, J.C. Read, S. MacFarlane, J. Höysniemi, Evaluating Children’sInteractive Products. Principles and Practices for Interaction Designers,Morgan Kaufmann, Amsterdam, Boston, 2008.
[18] A. Ozok, Survey design and implementation in Hci, in: A. Sears, J.A. Jacko (Eds.),The Human-Computer Interaction Handbook Fundamentals, Evolving Tech-nologies and Emerging Applications, 2nd ed., Lawrence Erlbaum AssociatesInc., New York, 2008.
[19] J.C. Read, Validating the Fun Toolkit: an instrument for measuring children’sopinions of technology, Cognition Technology and Work 10 (2) (2008)119–128.
[20] K.A. Hein, S.R. Jaeger, B. TomCarr, C.M. Delahunty, Comparison of five commonacceptance andpreferencemethods, FoodQuality andPreference 19 (7) (2008)651–661. http://dx.doi.org/10.1016/j.foodqual.2008.06.001.
[21] J.C. Read, S. MacFarlane, C. Casey, Endurability, engagement and expectations:measuring children’s Fun, in: Proceedings of the 2nd International Conferenceon Interaction Design and Children, Presented at the Interaction Design andChildren, IDC, Eindhoven, 2002, pp. 189–198.
[22] B. Zaman, Introducing a pairwise comparison scale for ux evaluations withpreschoolers, in: Proceedings of the 12th IFIP TC 13 International Conferenceon Human-Computer Interaction: Part II, Springer-Verlag, Uppsala, Sweden,2009, pp. 634–637. Retrieved from http://portal.acm.org/citation.cfm?id=1616303.
[23] C.M. Macklin, K.A. Machleit, Measuring preschool children’s attitude, Market-ing Letters 1 (2) (1989) 253–265.
[24] R. Popper, J.J. Kroll, Conducting sensory research with children, Journalof Sensory Studies 20 (1) (2005) 75–87. http://dx.doi.org/10.1111/j.1745-459X.2005.00007.x.
[25] A. Bosenberg, J. Thomas, T. Lopez, E. Kokinsky, L.E. Larsson, Validation of a six-graded faces scale for evaluation of postoperative pain in children, PaediatricAnaesthesia 13 (8) (2003) 708–713.
[26] D.L. Wong, C.M. Baker, Pain in children: comparison of assessment scales,Pediatric Nursing 14 (1) (1988) 9–17.
[27] S.A. Denham, S. Auerbach, Mother-child dialogue about emotions andpreschoolers’ emotional competence, Genetic, Social, and General PsychologyMonographs 121 (3) (1995) 311–337.
[28] J.C. Read, S. MacFarlane, C. Casey, Expectations and endurability - measuringfun, in: Computers and Fun, Presented at the Computers and Fun, England,York, 2001.
70 B. Zaman et al. / International Journal of Child-Computer Interaction 1 (2013) 61–70
[29] J.C. Read, S. MacFarlane, Using the Fun Toolkit and other Survey Methodsto Gather Opinions in Child Computer Interaction, ACM Press, 2006, p. 81.http://dx.doi.org/10.1145/1139073.1139096.
[30] S. MacFarlane, G. Sim, M. Horton, Assessing Usability and Fun in EducationalSoftware, ACM Press, 2005, pp. 103–109. http://dx.doi.org/10.1145/1109540.1109554.
[31] C.T. Chambers, C. Johnston, Developmental differences in children’s useof rating scales, Journal of Pediatric Psychology 27 (1) (2002) 27–36.http://dx.doi.org/10.1093/jpepsy/27.1.27.
[32] L. Hanna, D. Neapolitan, K. Risden, Evaluating computer game conceptswith children, in: Proceedings of the 2004 Conference on Interaction Designand Children: Building a Community, ACM, Maryland, 2004, pp. 49–56.http://dx.doi.org/10.1145/1017833.1017840.
[33] G. Sim, M. Horton, Investigating children’s opinions of games: Fun Toolkitvs. This or That, in: Proceedings of the 11th International Conference onInteraction Design and Children, ACM, New York, NY, USA, 2012, pp. 70–77.http://dx.doi.org/10.1145/2307096.2307105.
[34] M. Fishbein, I. Ajzen, Predicting and Changing Behavior: The Reasoned ActionApproach, Psychology Press - Taylor and Francys Group, New York, NY, 2010,Retrieved from http://www.routledge.com/books/details/9780805859249/.
[35] R.L. Hazlett, J. Benedek, Measuring emotional valence to understand the user’sexperience of software, International Journal of Human-Computer Studies 65(4) (2007) 306–314. http://dx.doi.org/10.1016/j.ijhcs.2006.11.005.
[36] P.H. Christensen, A. James, Researchwith Children: Perspectives and Practices,1st ed., Routledge, 2000.
[37] S. Sudman, N. Bradburn, Response Effects in Surveys: A Review and Synthesis,Aldine Pub. Co, Chicago, 1974.
[38] J.P. Hourcade, Interaction design and children, Foundations and Trends R⃝ inHuman-Computer Interaction 1 (2007) 277–392.http://dx.doi.org/10.1561/1100000006.
[39] J. Peter, J.C. Olsen, Consumers’ product knowledge and involvement,in: J.P. Peter, J.C. Olson (Eds.), Consumer Behavior and Marketing Strategy, 3rded., R.D. Irwin, Homewood, IL, 1999, pp. 63–91.
[40] J.-X. Guinard, Sensory and consumer testing with children, Trends in Food Sci-ence & Technology 11 (8) (2000) 273–283. http://dx.doi.org/10.1016/S0924-2244(01)00015-2.
[41] P.H. Mussen (Ed.), Handbook of Child Psychology, Wiley, New York, 1983.[42] F. Leon, T. Couronne, M.C. Marcuz, E.P. Koster, Measuring food liking in
children: a comparison of non verbal methods, Food Q 10 (1999) 93–100.[43] P. Miller, P. Aloise, Young children’s understanding of the psychological causes
of behavior: a review, Child Development 60 (2) (1989) 257–285.[44] Jelle Husson, Toewie-A 3D Computergame for Small Children Based on a
Tangible User Interface, Groep T Internationale Hogeschool Leuven, Leuven,Belgium, 2006.
[45] Mindscape Northern Europe, J. Wieslander, S. Nordqvist, Grammofon Multi-media AB- part of Norstedts Barnmedia, & Published by Lannoo, I. 90 209 5797X. (2007). Mama Moe en de Kraai - cd-rom. Retrieved April 25, 2012, fromhttp://bronnenwijzer.be/records/4c89030e161cc037890ca424.
[46] H.R. Moskowitz, J.H. Beckley, A.V.A. Resurreccion, Sensory and ConsumerResearch in Food Product Design and Development, John Wiley & Sons, 2012.
[47] A.B. Costello, J.W. Osborne, Best practices in exploratory factor analysis:four recommendations for getting the most from your analysis, PracticalAssessment, Research & Evaluation 10 (2005) 173–178.
[48] A.L. Comrey, H.B. Lee, A First Course in Factor Analysis, Routledge, 1992.[49] R. Koster, A Theory of Fun for Game Design, 1st ed., Paraglyph Press, 2004.[50] P. Sherry, K. Lucas, B. Greenberg, K. Lachlan, in: P. Vorderer, J. Bryant (Eds.),
Playing Video Games: Motives, Responses, and Consequences, Routledge,2006.
[51] P. Vorderer, C. Klimmt, U. Ritterfeld, Enjoyment: at the heart of mediaentertainment, Communication Theory 14 (4) (2004) 388–408. http://dx.doi.org/10.1111/j.1468-2885.2004.tb00321.x.
[52] G. Rebok, A. Riley, C. Forrest, B. Starfield, B. Green, J. Robertson, E. Tambor,Elementary school-aged children’s reports of their health: a cognitiveinterviewing study, Quality of Life Research 10 (1) (2001) 59–70.