
Measuring the impact of a university first-year experience program on student GPA and retention
Upload
independentCategory
view
6download
0
480
Measurement of e-Government Impact: Existing practices and shortcomings
Rob M. Peters University of Amsterdam
Faculty of Law Leibniz Center for Law
http://www.lri.jur.uva.nl/ Zenc
Marijn Janssen Faculty of Technology, Policy and
Management, Delft University of Technology Jaffalaan 5, NL-2628 BX, Delft
The Netherlands Tel. +31 (15) 278 1140
Tom M. van Engers University of Amsterdam
Faculty of Law Leibniz Center for Law
http://www.lri.jur.uva.nl/ [email protected]
ABSTRACT Public administrations of all over the world invest an enormous amount of resources in e-government. How the success of e-government can be measured is often not clear. E-government involves many aspects of public administration ranging from introducing new technology to business process (re-)engineering. The measurement of the effectiveness of e-government is a complicated endeavor. In this paper current practices of e-government measurement are evaluated. A number of limitations of current measurement instruments are identified. Measurement focuses predominantly on the front (primarily counting the number of services offered) and not on the back-office processes. Interpretation of measures is difficult as all existing measurement instruments lack a framework depicting the relationships between the indicators and the use of resources. The different measures may fit the aim of the owners of the e-governmental services, however, due to conflicting aims and priorities little agreement exists on a uniform set of measures, needed for comparison of e-government development. Traditional methods of measuring e-government impact and resource usage fall short of the richness of data required for the effective evaluation of e-government strategies.
Categories and Subject Descriptors J.1 [Administrative Data Processing]: Administrative Data Processing - Government; K.4.4 [Computing Milieux]: Computers and Society—Electronic Commerce
General Terms Management, Measurement, Performance, Standardization
Keywords E-government, law, interoperability, architectures, measurement, evaluation
1. INTRODUCTION Public institutions as well as business organizations use the Internet to deliver a wide range of information and services at an increasing level of sophistication [24]. However, Web sites and related business processes and information systems are so complex that it is difficult for governments to determine adequate measures for evaluating the efficiency and effectiveness of the spending of their public money. Moreover only measuring the front of public websites is a too narrow view on e-government. E-government involves the collaboration and communication between stakeholders and integration of cross-agency business processes. An important aim of having a well-funded theory on measuring e-government is to allow comparison or benchmarking. By examining the results of such benchmarks we might be able to distinct good from bad practices and to give directives to designers of e-governmental services. Moreover is should help to identify how effective public money is spend. Thus evaluating the relationship between results and resources used.
Comparison can have different goals. Selecting between options is just one of them. Principally we can distinct three types of comparison: 1) comparison of alternatives (e.g. to make a choice between alternative solutions), 2) vertical comparison over time (e.g. in order to measure improvement of versions) and 3) horizontal comparison (e.g. benchmarking different solutions). Whatever type of comparison we choose, we can only compare if we have a set of preferred outcomes. Many measurement instruments currently applied are not described in such way that the preferences underlying the instrument have been made explicitly. In this research we describe different measurement instruments used and we will discuss their strengths and weaknesses. The goal of this paper is to evaluate how current measurement instruments the impact of e-government. The combined research methodology of literature research and case study was chosen to answer the goal of this research. Case study research can be characterized as qualitative and observatory, using predefined research questions [36]. Case studies were used to examine existing measurement instruments in the Netherlands. The e-government monitor of Accenture and a European Union measurement instrument was also evaluated as thes instruments are used by Dutch agencies to benchmark their situation.
481
2. THE NATURE OF E-GOVERNMENT
Before analyzing instruments developed to measure e-government development, it is necessary to understand the nature of e-government. The organization of public administration involves many, heterogeneous types of business processes. When law or regulations are changed these processes and their supportive systems have to be adapted. Within one policy layer the process of adaptation starts with legislation drafting (adapting the law or regulations) followed by a chain of processes varying from translating these law texts into specifications, design of processes and supporting systems, development of these processes and systems and finally implementation and use (for a recent ‘legal engineering’ approach see [34]). A complicating factor is that more than one governmental layer exists and often interaction between these layers occurs. Especially the need to adapt legislation from the European Union is a more then ever dominant factor that even further complicates this process is.
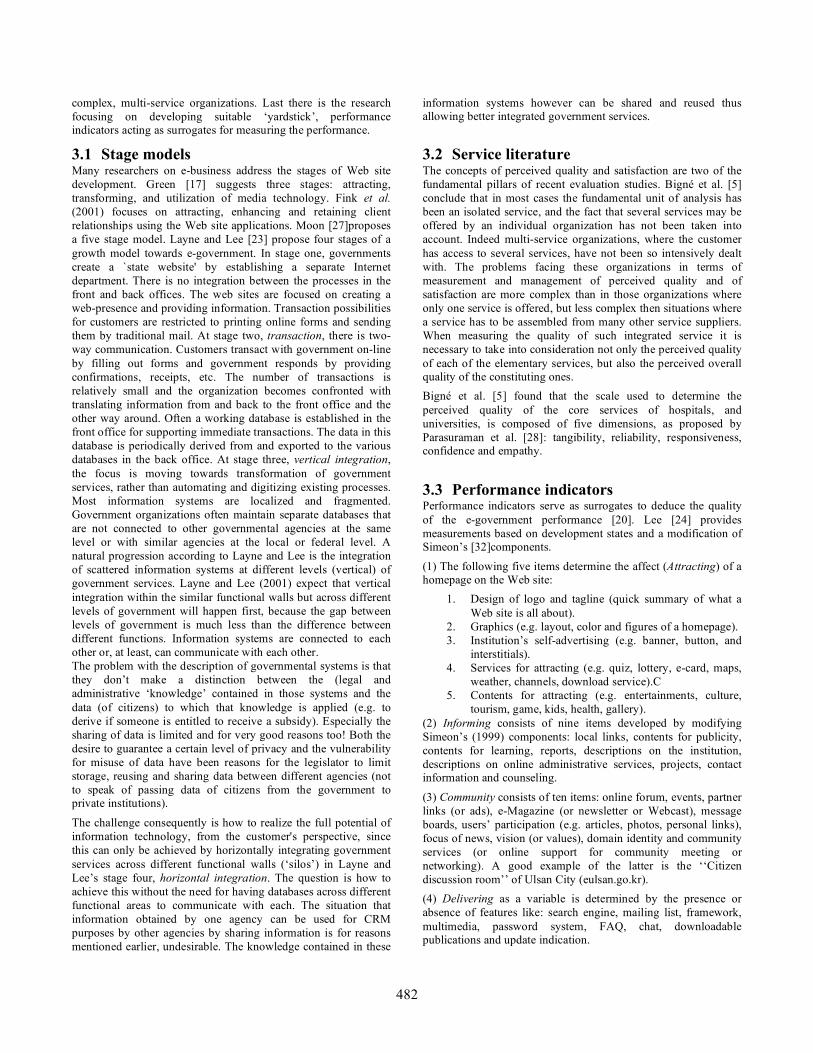
In Figure 1 the fragmented nature of the government is shown. Legislation and service provisioning efforts are distributed over the European, State, Region and local level. The situation is even more complicated as within each level many agencies of various types exists. At a local level municipalities, water boards, chambers of commerce, local taxes and many other public and public-private agencies exists. As such many agencies influence the impact of e-government and measurement should include them all.
EuropeEurope
Europe
Europe
Europe
state
Europeregion
EuropeEuropelocal
inte
roper
ata
bility
inte
roper
ata
bility
inte
ropera
tability
policy and standardization
navigation, service provisioning,
helpdesk and appeal
Aggregation of local initaitves,
navigagtion, geogprahical relevance
standardization, policies, culture,
enforcement
businesses
demand
?
?
?
?
Figure 1: Fragmented nature of public administration Two main types of interactions influence this fragmented landscape, the policy-making, implementation, execution and enforcement of new legislation and the business and citizens searching for information and services. We will denote the creation, implementation, execution, enforcement and maintenance of laws as production cycle in this paper. Governments are looking for ways to increase their efficiency, effectiveness, decrease the administrative burden and reduce the lead times for adopting new legislations. The consequences of new laws at production phase (drafting) are only roughly known. Only after implementing the new regulations in the processes and supporting systems the full meaning of applying
these regulations becomes clear. Certainly when the interpretations and translation into practical applications take place at local government level it often will not be possible to timely inform the businesses or citizens, who are affected by the new law, pro-actively, as no information about concrete effects on their cases is available. A complicating factor is that many times a administrative process is supported by heterogeneous information systems and many different parties can be involved in adapting those systems. Most of the companies’ ERP software components need to be updated quite frequently to be in, and keep being in accordance with small changes in administrative legislation. The same holds for Human Resources software, Time reporting software, Tax reporting software and, more indirectly, Logistics software. All have to be updated due to changes in legislation. It does not require extensive explanation to stress the need for smart public-private networks from a production chain perspective. Nowadays businesses expect that the governments reduce the administrative burden for businesses. Governments can achieve this goal by creating a smart, service oriented, public administration. To be able to provide these integrated services access to different legal sources or better to the formal models that could be derived from those models is needed (see e.g. [7]). Standardization initiatives like the Metalex standard for describing legal sources (see www.metalex.nl) and the Power method for modeling normative systems (see www.belastingdienst.nl/epower) are essential first steps towards this. They provide a basis for interoperable and contextual better understandable and accessible legal sources that could easier be connected to the context of business activities.
From the demand perspective, citizens and businesses find it very hard to access relevant legislation, local procedures and rules, policy documents etc. Governmental bodies are engaged in a flurry of policy and law making activities. Not only is this a complex myriad of legal issues, but the information is produced at different levels of public administration, including local, regional, national and European union. A commonly accepted requirement however is that online state legislative information is equally accessible to all (Fage & Fagan, 2004) and of course in the first place it should be accessible. Many governments currently are searching for ways to make their information accessible and retrievable. This involves issues regarding terminology, explaining the type of legislative document, understandable and easy-to-use search interfaces and accessing the official status of online documents.
A central question for researchers working in the field of e-government is how to measure the progress made in complying to the requirements mentioned before. In this paper we examine some examples of measurement instruments that were developed to measure progress in e-Government. But before describing these instruments we will discuss some literature on measuring e-Government first.
3. LITERATURE REVIEW
There is a diversity of literature focusing on measurements. Stage models are often used to positioning and evaluate the current status of e-government development. Services literature focusing on the measurement to of perceived quality, satisfaction of
482
complex, multi-service organizations. Last there is the research focusing on developing suitable ‘yardstick’, performance indicators acting as surrogates for measuring the performance.
3.1 Stage models Many researchers on e-business address the stages of Web site development. Green [17] suggests three stages: attracting, transforming, and utilization of media technology. Fink et al. (2001) focuses on attracting, enhancing and retaining client relationships using the Web site applications. Moon [27]proposes a five stage model. Layne and Lee [23] propose four stages of a growth model towards e-government. In stage one, governments create a `state website' by establishing a separate Internet department. There is no integration between the processes in the front and back offices. The web sites are focused on creating a web-presence and providing information. Transaction possibilities for customers are restricted to printing online forms and sending them by traditional mail. At stage two, transaction, there is two-way communication. Customers transact with government on-line by filling out forms and government responds by providing confirmations, receipts, etc. The number of transactions is relatively small and the organization becomes confronted with translating information from and back to the front office and the other way around. Often a working database is established in the front office for supporting immediate transactions. The data in this database is periodically derived from and exported to the various databases in the back office. At stage three, vertical integration, the focus is moving towards transformation of government services, rather than automating and digitizing existing processes. Most information systems are localized and fragmented. Government organizations often maintain separate databases that are not connected to other governmental agencies at the same level or with similar agencies at the local or federal level. A natural progression according to Layne and Lee is the integration of scattered information systems at different levels (vertical) of government services. Layne and Lee (2001) expect that vertical integration within the similar functional walls but across different levels of government will happen first, because the gap between levels of government is much less than the difference between different functions. Information systems are connected to each other or, at least, can communicate with each other. The problem with the description of governmental systems is that they don’t make a distinction between the (legal and administrative ‘knowledge’ contained in those systems and the data (of citizens) to which that knowledge is applied (e.g. to derive if someone is entitled to receive a subsidy). Especially the sharing of data is limited and for very good reasons too! Both the desire to guarantee a certain level of privacy and the vulnerability for misuse of data have been reasons for the legislator to limit storage, reusing and sharing data between different agencies (not to speak of passing data of citizens from the government to private institutions).
The challenge consequently is how to realize the full potential of information technology, from the customer's perspective, since this can only be achieved by horizontally integrating government services across different functional walls (‘silos’) in Layne and Lee’s stage four, horizontal integration. The question is how to achieve this without the need for having databases across different functional areas to communicate with each. The situation that information obtained by one agency can be used for CRM purposes by other agencies by sharing information is for reasons mentioned earlier, undesirable. The knowledge contained in these
information systems however can be shared and reused thus allowing better integrated government services.
3.2 Service literature The concepts of perceived quality and satisfaction are two of the fundamental pillars of recent evaluation studies. Bigné et al. [5] conclude that in most cases the fundamental unit of analysis has been an isolated service, and the fact that several services may be offered by an individual organization has not been taken into account. Indeed multi-service organizations, where the customer has access to several services, have not been so intensively dealt with. The problems facing these organizations in terms of measurement and management of perceived quality and of satisfaction are more complex than in those organizations where only one service is offered, but less complex then situations where a service has to be assembled from many other service suppliers. When measuring the quality of such integrated service it is necessary to take into consideration not only the perceived quality of each of the elementary services, but also the perceived overall quality of the constituting ones. Bigné et al. [5] found that the scale used to determine the perceived quality of the core services of hospitals, and universities, is composed of five dimensions, as proposed by Parasuraman et al. [28]: tangibility, reliability, responsiveness, confidence and empathy. 3.3 Performance indicators Performance indicators serve as surrogates to deduce the quality of the e-government performance [20]. Lee [24] provides measurements based on development states and a modification of Simeon’s [32]components.
(1) The following five items determine the affect (Attracting) of a homepage on the Web site:
1. Design of logo and tagline (quick summary of what a Web site is all about).
2. Graphics (e.g. layout, color and figures of a homepage). 3. Institution’s self-advertising (e.g. banner, button, and
interstitials). 4. Services for attracting (e.g. quiz, lottery, e-card, maps,
weather, channels, download service).C 5. Contents for attracting (e.g. entertainments, culture,
tourism, game, kids, health, gallery). (2) Informing consists of nine items developed by modifying Simeon’s (1999) components: local links, contents for publicity, contents for learning, reports, descriptions on the institution, descriptions on online administrative services, projects, contact information and counseling.
(3) Community consists of ten items: online forum, events, partner links (or ads), e-Magazine (or newsletter or Webcast), message boards, users’ participation (e.g. articles, photos, personal links), focus of news, vision (or values), domain identity and community services (or online support for community meeting or networking). A good example of the latter is the ‘‘Citizen discussion room’’ of Ulsan City (eulsan.go.kr). (4) Delivering as a variable is determined by the presence or absence of features like: search engine, mailing list, framework, multimedia, password system, FAQ, chat, downloadable publications and update indication.
483
(5) Innovation. Public institutions have to utilize the Internet for actual service innovation. Hence, two variables indicating innovation results are selected: transformation level of existing services and frequency of new innovative services. These are each rated on a five-point scale: ‘‘(1) never; (2) only descriptions; (3) online request; (4) partial; (5) full processing’’ for the first item and’’ (1) never to (5) many new systems’’, for the second item. Such quantification is possible because the introduction of new innovative systems on public sector Web sites is growing, for example, Docket Access, View Property Assessments, and Request for Proposals of Philadelphia (phila.gov) and Citizen
Assessment Systems, Citizen Satisfaction Monitor, Online Procedures Enhancement (OPEN) System of Seoul (metro.seoul.kr).
These measures focus mainly on components visible to users and do not take into account back-office components like integration.
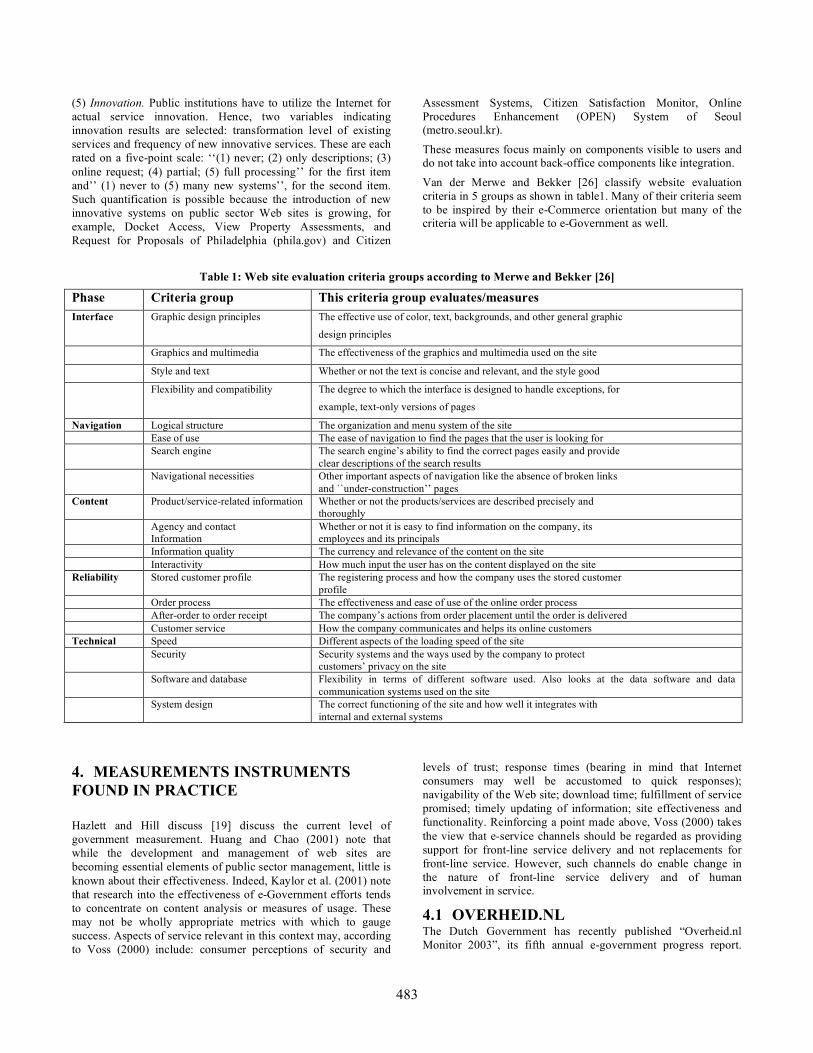
Van der Merwe and Bekker [26] classify website evaluation criteria in 5 groups as shown in table1. Many of their criteria seem to be inspired by their e-Commerce orientation but many of the criteria will be applicable to e-Government as well.
Table 1: Web site evaluation criteria groups according to Merwe and Bekker [26]
Phase Criteria group This criteria group evaluates/measures Interface Graphic design principles The effective use of color, text, backgrounds, and other general graphic
design principles
Graphics and multimedia The effectiveness of the graphics and multimedia used on the site
Style and text Whether or not the text is concise and relevant, and the style good
Flexibility and compatibility The degree to which the interface is designed to handle exceptions, for
example, text-only versions of pages
Navigation Logical structure The organization and menu system of the site Ease of use The ease of navigation to find the pages that the user is looking for Search engine The search engine’s ability to find the correct pages easily and provide
clear descriptions of the search results Navigational necessities Other important aspects of navigation like the absence of broken links
and ``under-construction’’ pages Content Product/service-related information Whether or not the products/services are described precisely and
thoroughly Agency and contact
Information Whether or not it is easy to find information on the company, its employees and its principals
Information quality The currency and relevance of the content on the site Interactivity How much input the user has on the content displayed on the site Reliability Stored customer profile The registering process and how the company uses the stored customer
profile Order process The effectiveness and ease of use of the online order process After-order to order receipt The company’s actions from order placement until the order is delivered Customer service How the company communicates and helps its online customers Technical Speed Different aspects of the loading speed of the site Security Security systems and the ways used by the company to protect
customers’ privacy on the site Software and database Flexibility in terms of different software used. Also looks at the data software and data
communication systems used on the site System design The correct functioning of the site and how well it integrates with
internal and external systems
4. MEASUREMENTS INSTRUMENTS FOUND IN PRACTICE
Hazlett and Hill discuss [19] discuss the current level of government measurement. Huang and Chao (2001) note that while the development and management of web sites are becoming essential elements of public sector management, little is known about their effectiveness. Indeed, Kaylor et al. (2001) note that research into the effectiveness of e-Government efforts tends to concentrate on content analysis or measures of usage. These may not be wholly appropriate metrics with which to gauge success. Aspects of service relevant in this context may, according to Voss (2000) include: consumer perceptions of security and
levels of trust; response times (bearing in mind that Internet consumers may well be accustomed to quick responses); navigability of the Web site; download time; fulfillment of service promised; timely updating of information; site effectiveness and functionality. Reinforcing a point made above, Voss (2000) takes the view that e-service channels should be regarded as providing support for front-line service delivery and not replacements for front-line service. However, such channels do enable change in the nature of front-line service delivery and of human involvement in service.
4.1 OVERHEID.NL The Dutch Government has recently published “Overheid.nl Monitor 2003”, its fifth annual e-government progress report.
484
While highlighting a number of encouraging developments, the report concludes that much remains to be done in areas such as user-friendliness, transactional services and e-democracy.
Overheid.nl focused on all government agencies, and mentions the following agencies explicitly.
• Municipalities • Ministries • Provinces • Water boards
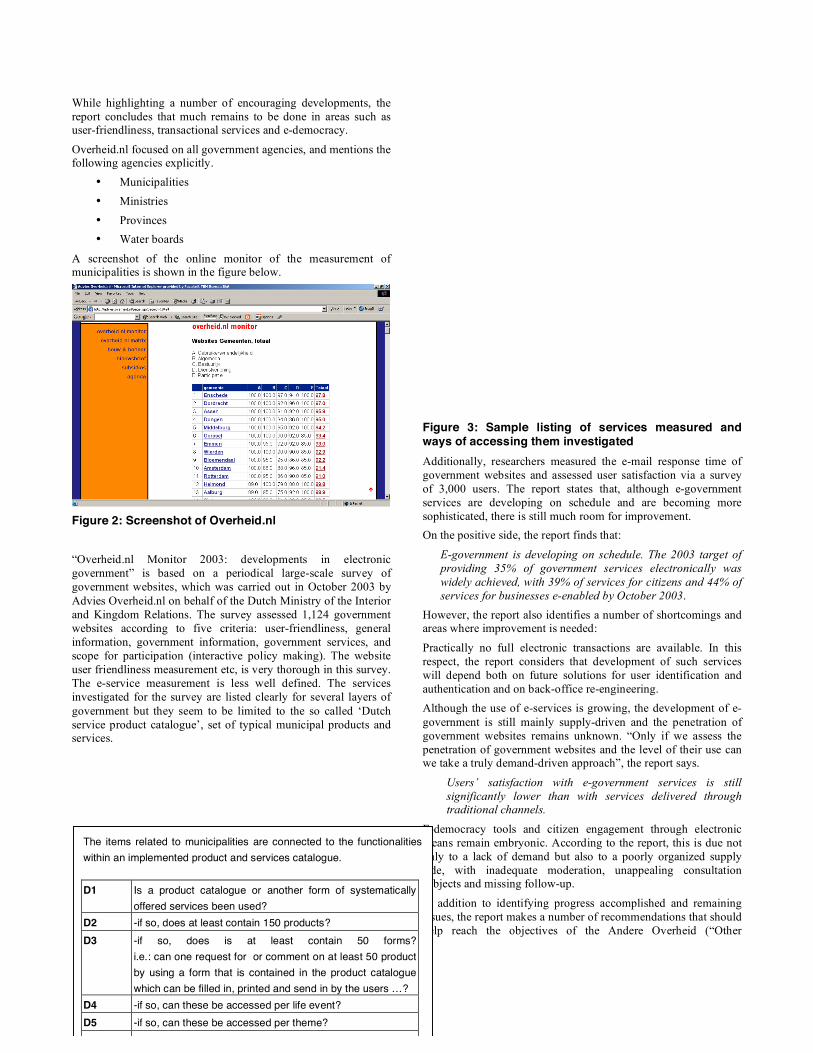
A screenshot of the online monitor of the measurement of municipalities is shown in the figure below.
Figure 2: Screenshot of Overheid.nl
“Overheid.nl Monitor 2003: developments in electronic government” is based on a periodical large-scale survey of government websites, which was carried out in October 2003 by Advies Overheid.nl on behalf of the Dutch Ministry of the Interior and Kingdom Relations. The survey assessed 1,124 government websites according to five criteria: user-friendliness, general information, government information, government services, and scope for participation (interactive policy making). The website user friendliness measurement etc, is very thorough in this survey. The e-service measurement is less well defined. The services investigated for the survey are listed clearly for several layers of government but they seem to be limited to the so called ‘Dutch service product catalogue’, set of typical municipal products and services.
Figure 3: Sample listing of services measured and ways of accessing them investigated Additionally, researchers measured the e-mail response time of government websites and assessed user satisfaction via a survey of 3,000 users. The report states that, although e-government services are developing on schedule and are becoming more sophisticated, there is still much room for improvement. On the positive side, the report finds that:
E-government is developing on schedule. The 2003 target of providing 35% of government services electronically was widely achieved, with 39% of services for citizens and 44% of services for businesses e-enabled by October 2003.
However, the report also identifies a number of shortcomings and areas where improvement is needed:
Practically no full electronic transactions are available. In this respect, the report considers that development of such services will depend both on future solutions for user identification and authentication and on back-office re-engineering. Although the use of e-services is growing, the development of e-government is still mainly supply-driven and the penetration of government websites remains unknown. “Only if we assess the penetration of government websites and the level of their use can we take a truly demand-driven approach”, the report says.
Users’ satisfaction with e-government services is still significantly lower than with services delivered through traditional channels.
E-democracy tools and citizen engagement through electronic means remain embryonic. According to the report, this is due not only to a lack of demand but also to a poorly organized supply side, with inadequate moderation, unappealing consultation subjects and missing follow-up.
In addition to identifying progress accomplished and remaining issues, the report makes a number of recommendations that should help reach the objectives of the Andere Overheid (“Other
The items related to municipalities are connected to the functionalities within an implemented product and services catalogue. D1 Is a product catalogue or another form of systematically
offered services been used? D2 -if so, does at least contain 150 products? D3 -if so, does is at least contain 50 forms?
i.e.: can one request for or comment on at least 50 product by using a form that is contained in the product catalogue which can be filled in, printed and send in by the users …?
D4 -if so, can these be accessed per life event? D5 -if so, can these be accessed per theme? D6 -if so, can these be accessed by using a lexicon (a-z)? D7 -if so, does it contain a specific search function? (fill in the
search term)
485
Government”) action programme, presented in December 2003. Such recommendations include the following:
E-government services must become more user-friendly and easier to find. Metadata standards should be defined to make them easier to find through search engines. FAQs and lists of the most searched terms and documents should also be made more widely available.
E-government services must be permanently improved: even once all government websites are fully functional, government should still constantly aim to improve e-government and consult target groups about new services they might require, says the report. E-government must be further developed through service integration across government bodies, which is currently still in its infancy. According to the report, the Dutch supply-driven approach has so far sought solutions within the limits and administrative competencies of single bodies.
Emphasis must be shifted from the breadth of services to their depth. Rather than aiming to run every electronic product and service conceivable, government bodies should aim to integrate services as deeply as possible, especially those in frequent and popular demand, the report says. This implies developing seamless links from the front to the back office and fostering a more customer-minded culture.
From the perspective of the policymakers we may conclude that the benchmark takes into account individual agencies and their websites, number of services and to a certain degree also service levels, but the aim is to integrate horizontally, something which is not measured by www.overheid.nl.
4.2 WEBDAM.NL In the year 2000 the ministry of interior decided that all municipalities should be online by 2002 and 25% of the services provisioning should be support by websites. In order to help municipalities to achieve this, the Webdam project was started in March 2000 aiming at stimulating municipalities to develop websites. These websites should deliver better and improved services provisioning over the Internet as citizens expected.
One of the activities in the Webdam project has been the development of a website that allowed municipalities to share knowledge and make better use of the Internet. To further stimulate municipalities Webdam started a Top 50 for municipalities’ websites, using criteria such as design, content, service level and communication. Assessment and ranking of each municipality is performed by representatives coming from three groups; civil servants, citizens and experts. Webdam uses a panel of experts to judge the public agencies’ web pages. The stakeholders include the following groups:
1. Webdam employees (experts) 2. Public servants municipality under study 3. –Citizens
These stakeholders judges the web pages based on fie main groups
1. Layout, 2. Content, 3. Communication, 4. services and,
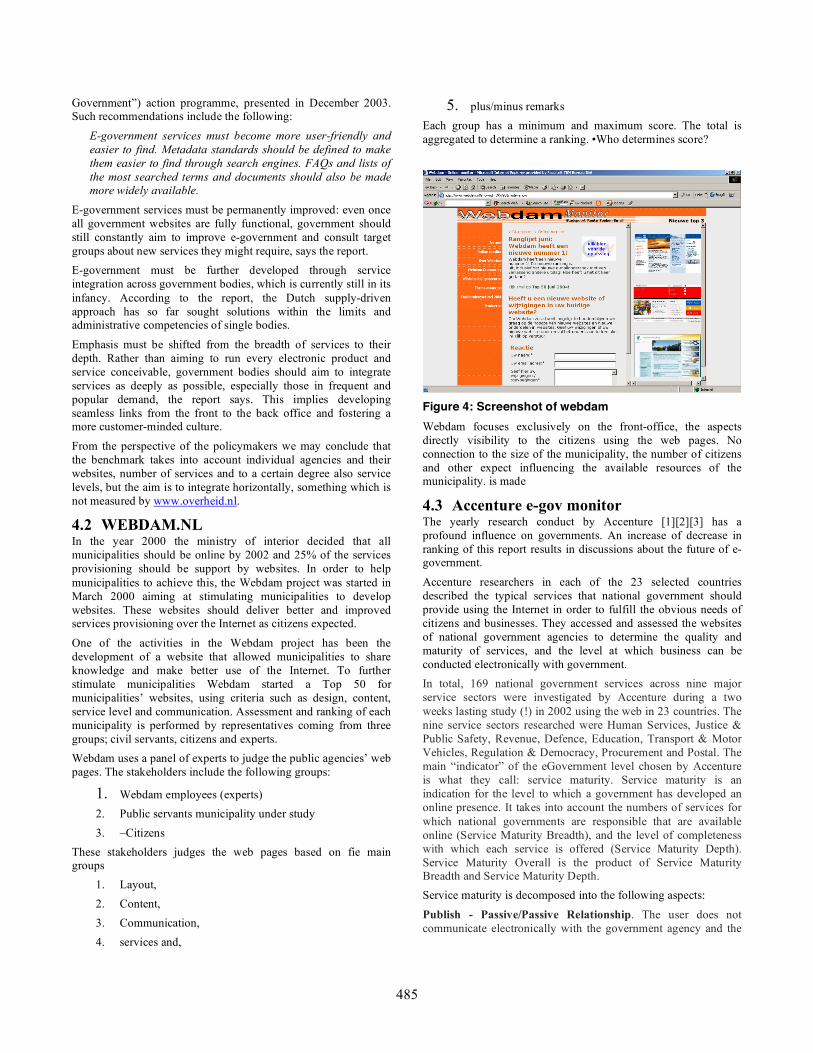
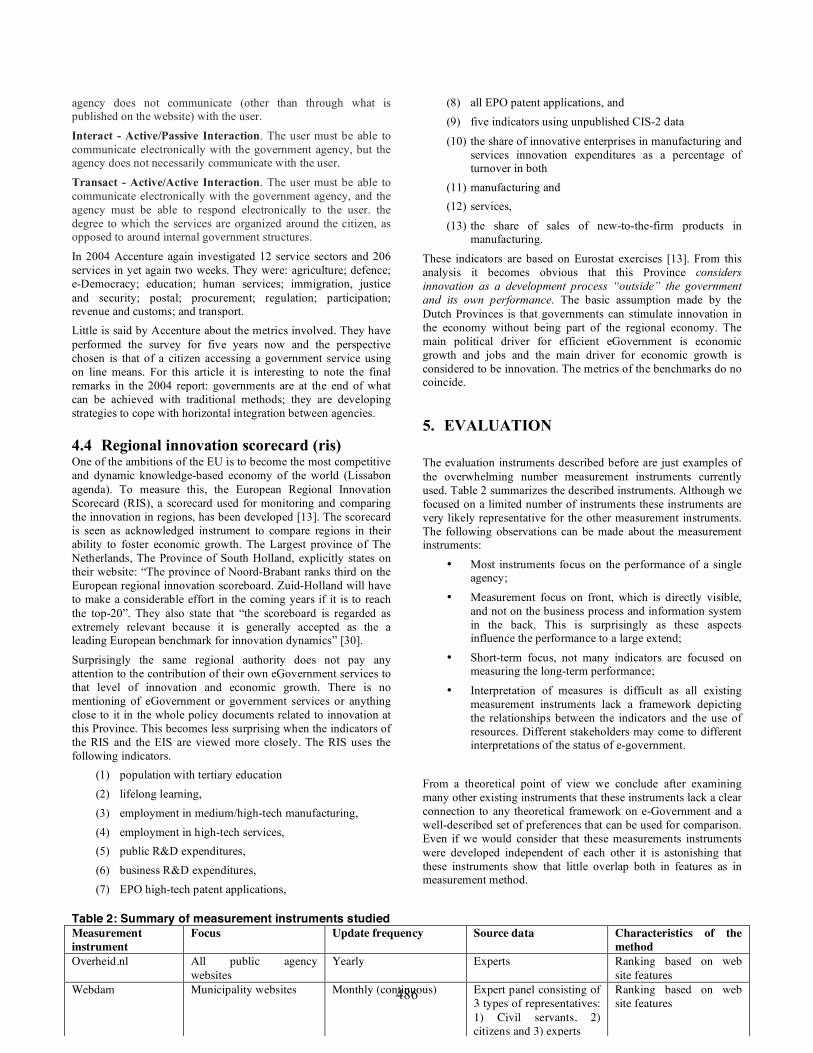
5. plus/minus remarks Each group has a minimum and maximum score. The total is aggregated to determine a ranking. •Who determines score?
Figure 4: Screenshot of webdam Webdam focuses exclusively on the front-office, the aspects directly visibility to the citizens using the web pages. No connection to the size of the municipality, the number of citizens and other expect influencing the available resources of the municipality. is made
4.3 Accenture e-gov monitor The yearly research conduct by Accenture [1][2][3] has a profound influence on governments. An increase of decrease in ranking of this report results in discussions about the future of e-government.
Accenture researchers in each of the 23 selected countries described the typical services that national government should provide using the Internet in order to fulfill the obvious needs of citizens and businesses. They accessed and assessed the websites of national government agencies to determine the quality and maturity of services, and the level at which business can be conducted electronically with government. In total, 169 national government services across nine major service sectors were investigated by Accenture during a two weeks lasting study (!) in 2002 using the web in 23 countries. The nine service sectors researched were Human Services, Justice & Public Safety, Revenue, Defence, Education, Transport & Motor Vehicles, Regulation & Democracy, Procurement and Postal. The main “indicator” of the eGovernment level chosen by Accenture is what they call: service maturity. Service maturity is an indication for the level to which a government has developed an online presence. It takes into account the numbers of services for which national governments are responsible that are available online (Service Maturity Breadth), and the level of completeness with which each service is offered (Service Maturity Depth). Service Maturity Overall is the product of Service Maturity Breadth and Service Maturity Depth. Service maturity is decomposed into the following aspects:
Publish - Passive/Passive Relationship. The user does not communicate electronically with the government agency and the
486
agency does not communicate (other than through what is published on the website) with the user.
Interact - Active/Passive Interaction. The user must be able to communicate electronically with the government agency, but the agency does not necessarily communicate with the user.
Transact - Active/Active Interaction. The user must be able to communicate electronically with the government agency, and the agency must be able to respond electronically to the user. the degree to which the services are organized around the citizen, as opposed to around internal government structures.
In 2004 Accenture again investigated 12 service sectors and 206 services in yet again two weeks. They were: agriculture; defence; e-Democracy; education; human services; immigration, justice and security; postal; procurement; regulation; participation; revenue and customs; and transport. Little is said by Accenture about the metrics involved. They have performed the survey for five years now and the perspective chosen is that of a citizen accessing a government service using on line means. For this article it is interesting to note the final remarks in the 2004 report: governments are at the end of what can be achieved with traditional methods; they are developing strategies to cope with horizontal integration between agencies.
4.4 Regional innovation scorecard (ris) One of the ambitions of the EU is to become the most competitive and dynamic knowledge-based economy of the world (Lissabon agenda). To measure this, the European Regional Innovation Scorecard (RIS), a scorecard used for monitoring and comparing the innovation in regions, has been developed [13]. The scorecard is seen as acknowledged instrument to compare regions in their ability to foster economic growth. The Largest province of The Netherlands, The Province of South Holland, explicitly states on their website: “The province of Noord-Brabant ranks third on the European regional innovation scoreboard. Zuid-Holland will have to make a considerable effort in the coming years if it is to reach the top-20”. They also state that “the scoreboard is regarded as extremely relevant because it is generally accepted as the a leading European benchmark for innovation dynamics” [30].
Surprisingly the same regional authority does not pay any attention to the contribution of their own eGovernment services to that level of innovation and economic growth. There is no mentioning of eGovernment or government services or anything close to it in the whole policy documents related to innovation at this Province. This becomes less surprising when the indicators of the RIS and the EIS are viewed more closely. The RIS uses the following indicators.
(1) population with tertiary education (2) lifelong learning, (3) employment in medium/high-tech manufacturing, (4) employment in high-tech services, (5) public R&D expenditures, (6) business R&D expenditures, (7) EPO high-tech patent applications,
(8) all EPO patent applications, and (9) five indicators using unpublished CIS-2 data
(10) the share of innovative enterprises in manufacturing and services innovation expenditures as a percentage of turnover in both
(11) manufacturing and (12) services,
(13) the share of sales of new-to-the-firm products in manufacturing.
These indicators are based on Eurostat exercises [13]. From this analysis it becomes obvious that this Province considers innovation as a development process “outside” the government and its own performance. The basic assumption made by the Dutch Provinces is that governments can stimulate innovation in the economy without being part of the regional economy. The main political driver for efficient eGovernment is economic growth and jobs and the main driver for economic growth is considered to be innovation. The metrics of the benchmarks do no coincide.
5. EVALUATION The evaluation instruments described before are just examples of the overwhelming number measurement instruments currently used. Table 2 summarizes the described instruments. Although we focused on a limited number of instruments these instruments are very likely representative for the other measurement instruments. The following observations can be made about the measurement instruments:
• Most instruments focus on the performance of a single agency;
• Measurement focus on front, which is directly visible, and not on the business process and information system in the back. This is surprisingly as these aspects influence the performance to a large extend;
• Short-term focus, not many indicators are focused on measuring the long-term performance;
• Interpretation of measures is difficult as all existing measurement instruments lack a framework depicting the relationships between the indicators and the use of resources. Different stakeholders may come to different interpretations of the status of e-government.
From a theoretical point of view we conclude after examining many other existing instruments that these instruments lack a clear connection to any theoretical framework on e-Government and a well-described set of preferences that can be used for comparison. Even if we would consider that these measurements instruments were developed independent of each other it is astonishing that these instruments show that little overlap both in features as in measurement method.
Table 2: Summary of measurement instruments studied Measurement instrument
Focus Update frequency Source data Characteristics of the method
Overheid.nl All public agency websites
Yearly Experts Ranking based on web site features
Webdam Municipality websites Monthly (continuous) Expert panel consisting of 3 types of representatives: 1) Civil servants, 2) citizens and 3) experts
Ranking based on web site features
Accenture Comparison of countries Yearly Accenture researchers based on judgment of a selected services
Ranking based inventory of services
487
Governmental performance is dependent on a complex of interlinked processes and dependencies between these processes, the stakeholders involved including civil servants and their departments. The legal and political context which is very dominant in a governmental setting furthermore increases complexity. Sometimes obvious improvements in a service provision chain may be blocked because data may not be shared due to data protection regulations. The system of checks an balances that is fundamental to governments’ functioning and essential for maintaining citizens’ trust in the government can be troublesome if we want to redesign inefficient processes. A combination of factors such as the volume of regulations and the lack of understanding of their original aims, the lack of formal process models that could help to get insights in the dependencies between processes and explain how the legal requirements are translated into process requirements and the lack of formally described legal models, don’t really help if we want to explicitly formulate the criteria that determine e-Government success. These criteria determine e-Government success (or failure) are exactly the ones that should be the ones in our measurement instruments.
But even if we would have had a better theory on performance of e-Government processes and we would have had well funded measurement instruments, interpretation of the outcomes of applying those instruments would be problematic, especially within the political context within these instruments are generally used. Bruin [10] showed that when the distance between the interpreters and providers of information is bigger, it is more difficult to interpret information.
Politicians do not always steer on rational grounds but suppose they would then their control system (or policy making process see figure 5) would include a comparison and control function.
We stated before that comparison is based upon a set of preferences. Public services can consequently be evaluated using competing norms and values [18]. A court for example might be asked to deal with cases as efficiently as possible, to maximize the number of cases dealt with, within a certain time period on the one hand, while on the other hand the sentence should be carefully made, funded with the right arguments and understandable. Performance measurement instruments that lack an explicit set of preferences (or norms for comparison) might give a wrong view on reality if looked at with other preferences in mind.
6. CONCLUSIONS AND FURTHER RESEARCH We investigate the current e-government measurement practice in the Netherlands and investigated some theoretical work in this field. Our analyzes shows a messy picture on the measurement of e-government. Many measurement instruments take a too simplistic view and focus on measuring what is easy to measure. Many of the instruments focus on measuring the visible front of e-government and ignore the performance of the cross-agency business processes. None of the instruments focus on measuring multi-service organizations. The instruments focus on one (type of) agency and do not provide an overall picture.
Interpretation of measures is difficult as all existing measurement instruments lack a framework depicting the relationships between the indicators and the use of resources. The different measures may fit the aim of the owners of the e-governmental services, however, due to conflicting aims and priorities little agreement exists on a uniform set of measures, needed for comparison of e-government development. Different stakeholders may come to different interpretations of the status of e-government. As such the existing instruments provide a picture of the status of e-government that may not useful as surrogates for deducing the e-government performance Traditional methods of measuring e-government impact and resource usage fall short of the richness of data required for the effective evaluation of e-government strategies. A good theoretical framework for measuring the impact of e-government and the use of resources is still lacking. Due to this fact and the many reports that are produced on e-Government developments, based on different measurement instruments that used different criteria, we can hardly learn from existing practices. It would be beneficial for both citizens as for governments if such a theoretical framework would be developed and a more or less standardized measurement instrument could become available. This would allow governments and designers to compare different e-government approaches and learn from them and learning from our experiences certainly fits within the ambition of the European Union to become the most competitive and dynamic knowledge-based economy of the world.
7. REFERENCES [1] Accenture (2001). Governments Closing Gap Between
Political Rhetoric and eGovernment Reality, http://www.accenture.com/xdoc/en/industries/government/2001FullReport.pdf.
[2] Accenture (2002). eGovernment Leadership -Realizing the Vision, http://www.accenture.com/xd/xd.asp?it=enWeb&xd=industries/government/gove_welcome.xml
[3] Accenture (2003). eGovernment Leadership: Engaging the Customer, http://www.accenture.com/xd/xd.asp?it=enweb&xd=industries/government/gove_capa_egov.xml
[4] Armour, F.J. Kaisler, S.H. and Liu, S.Y. (1999). A big-picture look at Enterprise Architectures, IEEE IT Professional, 1(1): 35-42.
[5] Bigné, E., Moliner, M.A., and Sánchez, J. (2003) Perceived Quality and satisfaction in multiservice organizations. The case of Spanish public services. Journal of Services Marketing, 17(4), pp. 420-442.
[6] Boer, A. Engers, T. van and R. Winkels (2003). Using Ontologies for Comparing and Harmonizing Legislation. In Proceedings of the International Conference on Artificial Intelligence and Law (ICAIL), Edinburgh (UK), ACM Press.
[7] Alexander Boer, Radboud Winkels, Rinke Hoekstra, and Tom M. van Engers. Knowledge Management for Legislative Drafting in an International Setting. In D. Bourcier, editor, Legal Knowledge and Information Systems.
488
Jurix 2003: The Sixteenth Annual Conference., pages 91-100, Amsterdam, 2003. IOS Press.
[8] Bons R., Ronald M.Lee and Tan, Yua-Hua, (1999). A Formal Specification of Automated Auditing of Trustworthy Trade Procedures for Open Electronic Commerce. Hawaii International Conference on System Sciences (HICCS).
[9] Buckland and F. Gey (1994). The relationship between recall and precision. Journal of the American Society for Information Science, 45(1):12-19.
[10] Bruin, H. de (2002). Performance measurement in the public sector: strategies to cope with the risks of performance measurement. The International Journal of Public Sector Management, vol. 15, no. 7, pp. 578-594.
[11] Checkland, P. (1981). Systems Thinking, Systems Practice. Wiley, Chichester.
[12] Coase, R. (1937). The Nature of the Firm. Economia, 4: 386-405.
[13] European Commissions (2002). 2003 European Innovation Scoreboard: European Trend Chart on Innovation. Innovation/SMEs Programme.
[14] European Commission (2004). Green paper on Public private partnerships and community law on public contracts and concessions, European Commission, no. 327.
[15] Fagan, J.C. & Fagan, B. (2004). An accessibility study of state legislative web sites. Government Information Quarterly, 21: 65-85.
[16] Galliers, R.D. (1992). Information Systems Research. Issues, methods and practical guidelines. Alfred Waller, Fawley, England.
[17] Green, S.H.B. (1998), Cyberspace winners: how they did it, Business Week, 22 June, pp. 154-60.
[18] Groot, H., de and R. Goudriaan (1991). De productiviteit van de overheid: over prestaties, personeel en uitgaven in de publieke sector. Academic Service, Schoonhoven, The Netherlands.
[19] Hazlett, S.A. and Hill, F. (2003). E-government: the realities of using IT to transform the public sector. Managing Service Quality, Vol. 13, No. 6, pp. 445-452.
[20] Janssen, M.F.W.H.A. (2001). Designing Electronic Intermediaries. Doctoral Dissertation, Delft University of Technology.
[21] Janssen, Marijn & Davidse, Anouk (2004). Evaluation of a Performance-based Accountability System. The 4th European Conference on E-government (ECEG), Dublin Castle, Dublin, Ireland, 17-18 June 2004
[22] Jensen, M. and Meckling, W. (1976). Theory of the Firm: Managerial behavior, agency costs, and capital structure, Journal of Financial Economics, 5: 305-360.
[23] Layne, KJL & Lee, J. (2001) “Developing fully functional E-government: A four stage model”, Government Information Quarterly, Vol 18, No. 2, pp 122-136.
[24] Lee, J.K. (2003). A model for monitoring public sector web site strategy. Internet Research. Electronic networking application and policy. Vol. 13, no. 4, pp259-266.
[25] Malone, T.W. & Crowston, K. (1994). The Interdisciplinary Study of Coordination. ACM Computing Surveys, vol. 26, no. 2, pp. 87-119.
[26] Merwe, R. van der, and Bekker,J. (2003). A framework and methodology for evaluating e-commerce web sites. Internet Research: electronic Networking Applications and Policy. Vol. 13, No.5, pp. 330-341.
[27] Moon, M.J. (2002). The Evolution of E-Government Among Municipalities; Rhetoric or reality? Public Administration Review. Vol. 62, no. 4, pp. 424-433.
[28] Parasuraman, A., Zeithaml, V.A. and Berry, L.L. (1988). SERVQUAL: a multiple item scale for measuring consumer perceptions of service quality, Journal of Retailing, Vol. 64, pp. 12-40.
[29] Peters, Rob and Wilson, Frank (2003). Natural Language access to regional information sources: the PortofRotterdam case: 4th International Workshop on Image Analysis for Multimedia Interactive Services, WIAMIS 2003.
[30] Provincial council (2003) Innovatiebrief kenniseconomie Zuid-Holland “Kennismaken met Kenniszaken, http://www.zuid-holland.nl/images/126_107822.pdf, page 14.
[31] Rohleder, S.J. et al. (2004). eGovernment Leadership: High Performance, Maximum Value. Fifth Annual Accenture eGovernment Study. Accenture Government Executive Studies, http://www.accenture.com/xdoc/en/industries/government/gove_egov_value.pdf
[32] Simeon, R. (1999), ``Evaluating domestic and international Web site strategies’’, Internet Research, Vol. 9 No. 4, pp. 297-308.
[33] Quinn, R.E. and Rohrbaugh, J.W. (1983). A Spatial Model of Effectiveness criteria: Towards a competing values approach to organizational effectiveness. Management Science 29: 363-377.
[34] Van Engers, T.M., 2004, Legal Engineering: A Knowledge Engineering Approach To Improving Legal Quality, in eGovernment and eDemocracy: Progress and Challenges, Padget, J., Neira, R., De León, J.L., Editors, Instituto Politéchnico Nacional Centro de Investigacion en Computación, ISBN 970-36-0152-9, p189-206.
[35] Williamson, O.E. (1975). Market and Hierarchies, Analysis and Antitrust Implications. A study in the economics of internal organization. Macmillan, New York.
[36] Yin, R.K. (1989). Case Study Research: Design and methods. Sage publications, Newbury Park, California.
Copyright © 2022 FDOKUMEN