Horticultural, Landscape, and Ornamental Crops - Pacific ...
Upload
independentCategory
view
0download
0
MEASURING THE ECONOMIC IMPACT OF CLIMATECHANGE ON AFRICAN AGRICULTURAL
PRODUCTION SYSTEMS
CHARLES NHEMACHENA*
Council for Scientific and Industrial ResearchP. O. Box 395 BrummeriaPretoria 0001, South Africa
[email protected]@csir.co.za
RASHID HASSAN
Centre for Environmental Economicsand Policy in Africa (CEEPA)
University of Pretoria, Department of AgriculturalEconomics and Rural Development
Pretoria 0002, South [email protected]
PRADEEP KURUKULASURIYA
Energy and Environment Group/Climate Change AdaptationUnited Nations Development Programme, New York
This study measured the economic impacts of climate change on crop and livestock farming inAfrica based on a cross-sectional survey of over 8000 farming households from 11 countries ineast, west, north and southern Africa. The response of net revenue from crop and livestockagriculture across various farm types and systems in Africa to changes in climate normals (i.e.mean rainfall and temperature) is analysed. The analyses controlled for effects of key socio-economic, technology, soil and hydrological factors influencing agricultural production. Resultsshow that net farm revenues are in general negatively affected by warmer and drier climates. Thesmall-scale mixed crop and livestock system predominantly typical in Africa is the most tolerantwhereas specialized crop production is the most vulnerable to warming and lower rainfall.These results have important policy implications, especially for the suitability of the increasingtendency toward large-scale mono-cropping strategies for agricultural development in Africaand other parts of the developing world in light of expected climate changes. Mixed crop andlivestock farming and irrigation offered better adaptation options for farmers against furtherwarming and drying predicted under various future climate scenarios.
Keywords: Climate change; impacts; agriculture; Africa; Ricardian model.
*Corresponding author.
Climate Change Economics, Vol. 1, No. 1 (2010) 33–55© World Scientific Publishing CompanyDOI: 10.1142/S2010007810000066
33
1. Introduction
Local ecosystems provide the main source of livelihoods for many of the world’s poor.Most of the rural poor in Sub-Saharan Africa rely, for their livelihoods and foodsecurity, on highly climate-sensitive, rain-fed, small-scale subsistence farming, pastoralherding and direct harvesting of natural services of ecosystems such as forests andwetlands (Mitchell and Tanner, 2006; IPCC, 2001). The productivity of this livelihoodbase is highly vulnerable to climate-related stresses such as changes in temperature,precipitation (both amount and variability) and increased frequency of droughts andfloods (IPCC, 2001).
Higher temperatures declining rainfall patterns, as well as an increasing frequencyof extreme climate events (such as droughts and floods) are expected to be found in thefuture climate of the tropics (Mitchell and Tanner, 2006; IPCC, 2001). In southernAfrica, for example, rainfall patterns show a declining trend of summer rainfall (about20%) from 1950–1999 and a high frequency of droughts predicted to intensify in the21st century. Predictions for 2050 by the US National Center for AtmosphericResearch show that the declining trend in rainfall is set to continue and the region isexpected to be 10–20% drier than in the previous 50 years (Mitchell and Tanner,2006). These predicted changes in climate are expected to have differential impacts onagricultural productivity and food security and other sectors across spatial and tem-poral scales. In the tropics, and Africa in particular, changes in climate are expected tobe detrimental to agricultural livelihoods (Dinar et al., 2008; Dixon et al., 2001). Thevulnerability of the majority of the poor in Africa to climate-related stresses is wor-sened by widespread poverty, HIV/AIDS, lack of access to resources (e.g. land andwater) and management capabilities, low levels of wealth, technology and education,ineffective institutional arrangements and lack of social safety nets (IPCC, 2001).
Methods and results of recent continent-wide research efforts tomeasure the economicimpacts of climate change on African agriculture are summarized in (Dinar et al., 2008).Recent studies suggest that agricultural crop productivity in a number of regions in Africawill be adversely affected by warming above current levels (Kurukulasuriya et al., 2006;Kurukulasuriya and Mendelsohn, 2008; Seo and Mendelsohn, 2008). These studiesanalysed impacts on dryland crops, irrigated crops and livestock separately. This rep-resents an important limitation since the choice between crop and livestock production ortheir combination (mixed systems) is a non-separable choice endogenous to agriculturalproducers’ responses to varying climates and other circumstances. The decision of whatto produce, and how, is accordingly an important adaptation mechanism in the face of achanging climate and other ecological and economic circumstances. This is of particularimportance to Africa where the majority of poor, small-scale farmers practice mixedcrop-livestock agriculture and few specialize in crop or livestock only.
The primary objective of this study is therefore to measure the aggregate impact ofclimate change on income from all agricultural production systems (crop, livestockand mixed) in Africa and predict future impacts under various climate scenarios. In
34 C. Nhemachena, R. Hassan & P. Kurukulasuriya
addition, the study also measures and compares impacts on specialized crop andlivestock farms. The results will be contrasted with findings of other regional studiesusing the same data but generating different climate response functions for cropand livestock farming separately (Kurukulasuriya et al., 2006; Kurukulasuriya andMendelsohn, 2008) and (Seo and Mendelsohn, 2008). The study adopts the cross-sectional (Ricardian) approach to measure the impact of changes in climate attributes(rainfall and temperature levels) on net revenue from crop and livestock farming,controlling for other production factors. Responses of different production systems areanalysed under irrigation and dryland conditions.
2. Study Approach and Methods
Impacts of climate change have been estimated using two main approaches: (a)structural modeling of crop and farmer response, which combines crop agronomicresponse with economic/farmer management decisions and practices; and (b) spatialanalogue models that measure observed spatial differences in agricultural production(Adams et al., 1998; Schimmelpfennig et al., 1996). Other impact assessment methodsthat have been used are the integrated impact assessment method and the agro-ecological zone method (Mendelsohn, 2000; Kurukulasuriya and Mendelsohn, 2008).
The main problem with using structural approaches (agronomic-economic models)is that in aggregate studies, inferences made to large areas and diverse agriculturalproduction systems are based on results from very few laboratory and experimentalsites (Adams et al., 1998; Schimmelpfennig et al., 1996). The spatial analogueapproach, on the other hand, uses cross-section evidence to make statistical (econo-metric) estimations of how changes in climate would affect agricultural productionacross different climatic zones. The main advantage of this approach is that it givesevidence of changes in farmer management practices and decisions in response tochanging climatic conditions (Mendelsohn and Dinar, 2003; Mendelsohn et al., 1994).
An example of the spatial analogue approach is the Ricardian cross-sectionalapproach that measures the performance of farmers, households and firms acrossspatial scales with different climates. The technique draws heavily on the underlyingobservation by Ricardo that under competition, land values reflect the productivityof the land (Mendelsohn and Dinar, 1999, 2003; Mendelsohn, 2000; Mendelsohnet al., 1996, 1994).
This study adopts the cross-sectional Ricardian approach to measure the economicimpacts of climate on net farm revenue in Africa. It uses cross-section data and econo-metric analyses to estimate the impacts of climate variables (temperature and precipi-tation), soils, hydrological and socio-economic factors on net farm revenue. The studyconsidered impacts on three production systems: (a) specialized crop, (b) specializedlivestock and (c) mixed crop-livestock farming. Due to lack of African data on land rents,the study uses total net farm revenue, defined as the sum of net revenues from three mainfarming activities: (a) dryland crops, (b) irrigated crops and (c) livestock, as the measure
Measuring the Economic Impact of Climate Change on African Agricultural Production Systems 35
of farm performance. Farm net revenue (R) is assumed to reflect the present value offuture net productivity and costs of individual crops and livestock:
R ¼Z
PLEe�tdt ¼
Z XPiQiðX,F, Z,H,GÞ �
XPxX
h ie�tdt ð1Þ
where PLE is the net revenue per farm, Pi is the market price of crop i,Qi is output of cropi, F is a vector of climate variables, Z is a set of soil variables, H is a set of hydrologicalvariables, G is a set of economic variables, Px is a vector of purchased input prices, t istime, and � is the discount rate. The Ricardian method assumes that each farmer will seekto maximize net farm revenues by choosing inputs (X) subject to climate, soil andeconomic factors. The resulting net revenue function observes the loci of maximumprofits subject to a set of climate, soil and economic factors and the Ricardian model is areduced-form hedonic price model of the observed loci of profits. The standard Ricardianmodel relies on a quadratic formulation of climatic variables:
R ¼ �0 þ �1F þ �2F2 þ �3Z þ �4Gþ �5 logðHÞ þ u ð2Þ
where u is the error term. To capture the nonlinear relationship between net farm revenuesand climate variables, the estimation includes both the linear and quadratic terms forclimate variables, F (temperature and precipitation).1
3. The Data and Empirical Specifications of Model Variables
This study is based on cross-section data obtained from the Global EnvironmentFacility/World Bank (GEF/WB)–CEEPA-funded project: Climate, Water and Agri-culture: Impacts on and Adaptations of Agro-Ecological Systems in Africa. The studyinvolved 11 African countries: Burkina Faso, Cameroon, Egypt, Ethiopia, Ghana,Kenya, Niger, Senegal, South Africa, Zambia and Zimbabwe. For more information onthe survey method and the data collected, see Dinar et al. (2008) and Kurukulasuriyaet al. (2006). Over 9000 household surveys were conducted in the study, of whichabout 8000 surveys were found usable after data cleaning. It is important also to notethat none of the interviewed farmers kept livestock only. However, we attempted toseparate those specialized in livestock production from those practicing mixed crop-livestock farming as discussed below (see categorization of farm types in the entiresample (Table 1) and the accompanying discussion).
As mentioned earlier, this study used net farm revenue to measure farm perform-ance due to lack of African data on land rents. Total net farm revenue is defined as thesum of net revenues from crop and livestock production activities.2 The Ricardian
1See Dinar et al. (2008) for more details on the cross-section (Ricardian) method.2We considered impacts of climate change on two main datasets, one including negative net revenues up to �US$200and another one with only positive net revenues. The results of the two samples were not all that different and theanalyses in this study are based on the sample with positive net revenues.
36 C. Nhemachena, R. Hassan & P. Kurukulasuriya
approach is traditionally based on analysing net revenue or land value per hectare. Asmost farmers in Africa graze livestock on open-access, communal land, it was verydifficult to measure the amount of land farmers allocate to livestock production. Sincethis study combined net revenues from both crop and livestock production, we couldnot use net revenue per hectare and instead used net revenue per farm, making the unitof analysis in this study the farm.
The explanatory variables consist of seasonal climate variables, soils, water flow andsocio-economic factors (for details, see Nhemachena, 2009). The study relied on long-term average climate (normals) for districts in Africa (see Dinar et al., 2008;Kurukulasuriya et al., 2006 for details). Soil data came from the Food and AgricultureOrganization (FAO, 2003). Data on hydrological variables (e.g. flow and runoff for eachdistrict) were obtained from Strzepek andMcCluskey (2007). The explanatory variablesincluded in this study have been shown to affect net farm revenue in many other AfricanRicardian models (Dinar et al., 2008; Kurukulasuriya and Mendelsohn, 2008; Manoand Nhemachena, 2007).
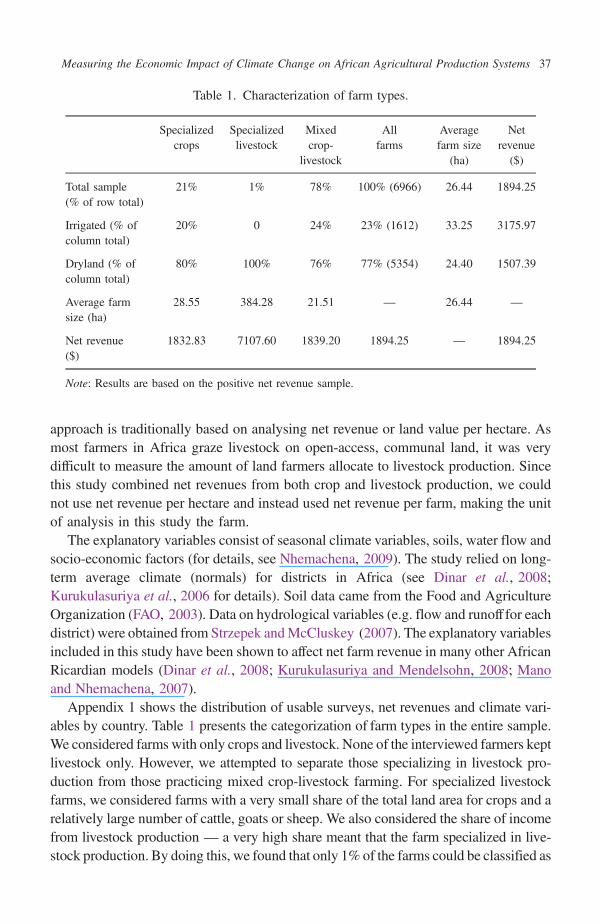
Appendix 1 shows the distribution of usable surveys, net revenues and climate vari-ables by country. Table 1 presents the categorization of farm types in the entire sample.We considered farms with only crops and livestock. None of the interviewed farmers keptlivestock only. However, we attempted to separate those specializing in livestock pro-duction from those practicing mixed crop-livestock farming. For specialized livestockfarms, we considered farms with a very small share of the total land area for crops and arelatively large number of cattle, goats or sheep. We also considered the share of incomefrom livestock production — a very high share meant that the farm specialized in live-stock production. By doing this, we found that only 1% of the farms could be classified as
Table 1. Characterization of farm types.
Specialized Specialized Mixed All Average Netcrops livestock crop- farms farm size revenue
livestock (ha) ($)
Total sample 21% 1% 78% 100% (6966) 26.44 1894.25(% of row total)
Irrigated (% of 20% 0 24% 23% (1612) 33.25 3175.97column total)
Dryland (% of 80% 100% 76% 77% (5354) 24.40 1507.39column total)
Average farm 28.55 384.28 21.51 — 26.44 —
size (ha)
Net revenue 1832.83 7107.60 1839.20 1894.25 — 1894.25($)
Note: Results are based on the positive net revenue sample.
Measuring the Economic Impact of Climate Change on African Agricultural Production Systems 37
specialized livestock farms. We also found that all of these specialized livestock farmswere under dryland farming and none had irrigation.
Specialized crop farms were defined as those with crops only and no livestock orthose with small livestock numbers such as two sheep or a few chickens. Mixed crop-livestock farms were defined as farms where neither of the two clearly dominate. Thetables also present the distribution of dryland and irrigated farms in each country andfarm type. The analyses in this study distinguish between the impacts of climatechange on these two main farm types. This helps us to assess the importance ofirrigation in responding to changes in climate.
The economic impacts of climate change were estimated on each of the classifiedfarming systems (mixed crop-livestock and specialized crop or livestock) as well as allthe farms. The analyses presented in this study start with an analysis of impacts on allthe farms (the entire sample) and then an examinination of each farming system. Weestimated multiple regression models of net revenue across three samples for each farmtype (dryland, irrigation and total sample for each farm type).
4. Results of the Economic Impact Analyses
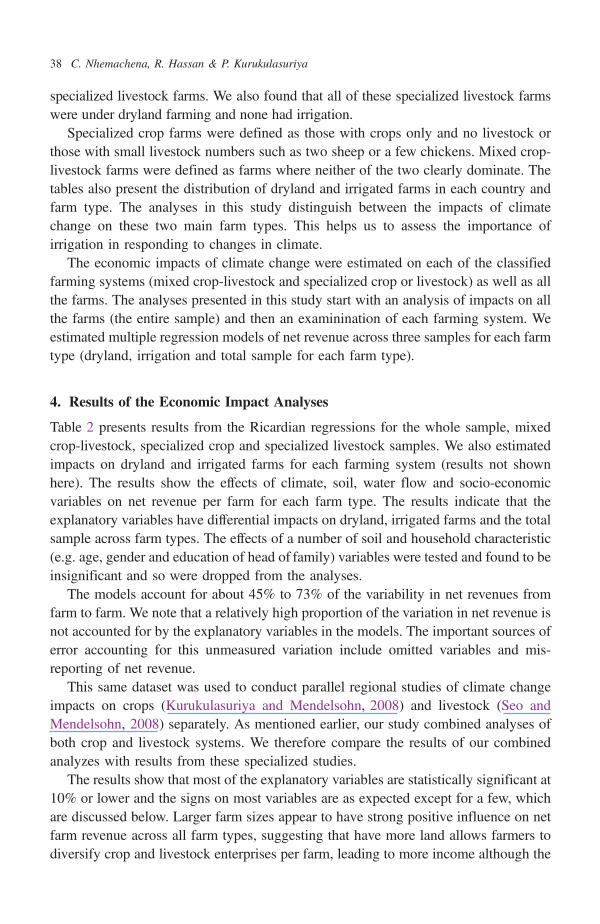
Table 2 presents results from the Ricardian regressions for the whole sample, mixedcrop-livestock, specialized crop and specialized livestock samples. We also estimatedimpacts on dryland and irrigated farms for each farming system (results not shownhere). The results show the effects of climate, soil, water flow and socio-economicvariables on net revenue per farm for each farm type. The results indicate that theexplanatory variables have differential impacts on dryland, irrigated farms and the totalsample across farm types. The effects of a number of soil and household characteristic(e.g. age, gender and education of head of family) variables were tested and found to beinsignificant and so were dropped from the analyses.
The models account for about 45% to 73% of the variability in net revenues fromfarm to farm. We note that a relatively high proportion of the variation in net revenue isnot accounted for by the explanatory variables in the models. The important sources oferror accounting for this unmeasured variation include omitted variables and mis-reporting of net revenue.
This same dataset was used to conduct parallel regional studies of climate changeimpacts on crops (Kurukulasuriya and Mendelsohn, 2008) and livestock (Seo andMendelsohn, 2008) separately. As mentioned earlier, our study combined analyses ofboth crop and livestock systems. We therefore compare the results of our combinedanalyzes with results from these specialized studies.
The results show that most of the explanatory variables are statistically significant at10% or lower and the signs on most variables are as expected except for a few, whichare discussed below. Larger farm sizes appear to have strong positive influence on netfarm revenue across all farm types, suggesting that have more land allows farmers todiversify crop and livestock enterprises per farm, leading to more income although the
38 C. Nhemachena, R. Hassan & P. Kurukulasuriya
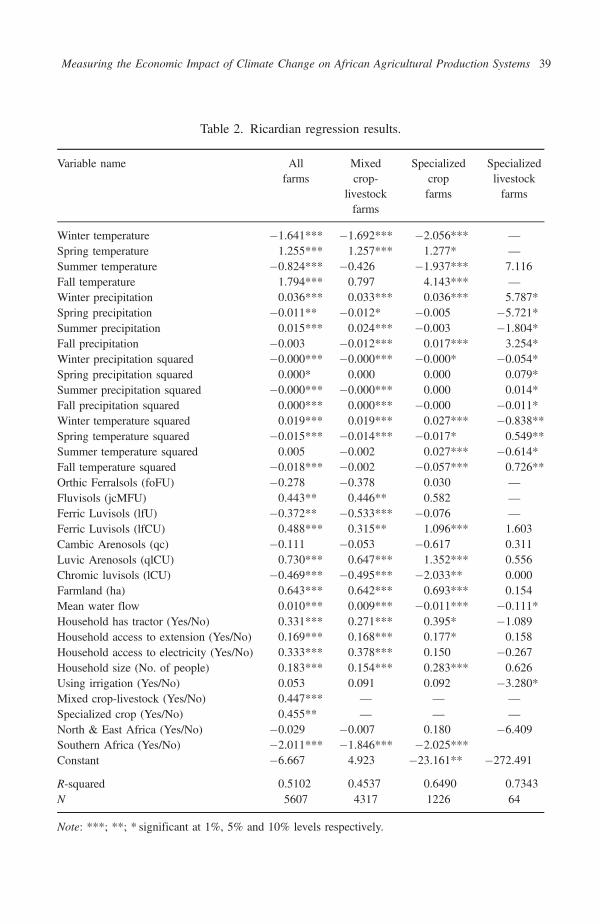
Table 2. Ricardian regression results.
Variable name All Mixed Specialized Specializedfarms crop- crop livestock
livestock farms farmsfarms
Winter temperature �1.641*** �1.692*** �2.056*** —
Spring temperature 1.255*** 1.257*** 1.277* —
Summer temperature �0.824*** �0.426 �1.937*** 7.116Fall temperature 1.794*** 0.797 4.143*** —
Winter precipitation 0.036*** 0.033*** 0.036*** 5.787*Spring precipitation �0.011** �0.012* �0.005 �5.721*Summer precipitation 0.015*** 0.024*** �0.003 �1.804*Fall precipitation �0.003 �0.012*** 0.017*** 3.254*Winter precipitation squared �0.000*** �0.000*** �0.000* �0.054*Spring precipitation squared 0.000* 0.000 0.000 0.079*Summer precipitation squared �0.000*** �0.000*** 0.000 0.014*Fall precipitation squared 0.000*** 0.000*** �0.000 �0.011*Winter temperature squared 0.019*** 0.019*** 0.027*** �0.838**Spring temperature squared �0.015*** �0.014*** �0.017* 0.549**Summer temperature squared 0.005 �0.002 0.027*** �0.614*Fall temperature squared �0.018*** �0.002 �0.057*** 0.726**Orthic Ferralsols (foFU) �0.278 �0.378 0.030 —
Fluvisols (jcMFU) 0.443** 0.446** 0.582 —
Ferric Luvisols (lfU) �0.372** �0.533*** �0.076 —
Ferric Luvisols (lfCU) 0.488*** 0.315** 1.096*** 1.603Cambic Arenosols (qc) �0.111 �0.053 �0.617 0.311Luvic Arenosols (qlCU) 0.730*** 0.647*** 1.352*** 0.556Chromic luvisols (lCU) �0.469*** �0.495*** �2.033** 0.000Farmland (ha) 0.643*** 0.642*** 0.693*** 0.154Mean water flow 0.010*** 0.009*** �0.011*** �0.111*Household has tractor (Yes/No) 0.331*** 0.271*** 0.395* �1.089Household access to extension (Yes/No) 0.169*** 0.168*** 0.177* 0.158Household access to electricity (Yes/No) 0.333*** 0.378*** 0.150 �0.267Household size (No. of people) 0.183*** 0.154*** 0.283*** 0.626Using irrigation (Yes/No) 0.053 0.091 0.092 �3.280*Mixed crop-livestock (Yes/No) 0.447*** — — —
Specialized crop (Yes/No) 0.455** — — —
North & East Africa (Yes/No) �0.029 �0.007 0.180 �6.409Southern Africa (Yes/No) �2.011*** �1.846*** �2.025***Constant �6.667 4.923 �23.161** �272.491
R-squared 0.5102 0.4537 0.6490 0.7343N 5607 4317 1226 64
Note: ***; **; * significant at 1%, 5% and 10% levels respectively.
Measuring the Economic Impact of Climate Change on African Agricultural Production Systems 39
value per hectare may be low. Similar studies found contrasting results of the impact offarm size on net revenue (per hectare). For example, Kurukulasuriya and Mendelsohn(2008) found that a greater farm area reduces the value per hectare of farms but at adecreasing rate. In contrast, Seo and Mendelsohn (2008) found that the dummy forlarge farms was insignificant, implying no difference in the net revenue per animal forsmall and big farms.
Similarly, larger families seem to be associated with higher net farm revenue acrossall farm types. This suggests that agriculture in Africa is more labor-demanding. Betteraccess to other farm assets, such as heavy machinery like tractors, appear to strongly andpositively influence net farm revenues for all farms, mixed crop-livestock farms andspecialized crop farms. These results suggest that capital, land and labor serve asimportant production factors in African agriculture. Attaining higher net farm revenuesstrongly depends on factor endowments (i.e. family size, land area and capital resour-ces) at the disposal of farming households. Kurukulasuriya and Mendelsohn (2008);Seo and Mendelsohn (2008) and Kurukulasuriya et al. (2006) found similar positiveeffects from access to technology variables (electricity and heavy machinery) onnet revenue. Kurukulasuriya and Mendelsohn (2008) and Kurukulasuriya et al.(2006) also found similar positive effects from household size. In contrast, Seo andMendelsohn (2008) found that large households tend to have lower livestock net rev-enue per farm.
Better access to extension services seems to have a strong positive influence on netfarm revenue a across all farms, mixed crop-livestock farms and specialized cropfarms. The effect on net revenue from specialized livestock farms, though positive, isinsignificant. Both mixed crop-livestock and specialized crop variables positivelyaffect net farm revenues. Among the regional dummies, southern Africa appears tohave a strong negative influence on net farm revenue.
Water flow had a significant positive effect on the total sample and mixed crop-livestock system. Kurukulasuriya and Mendelsohn (2008) also found that water flowstrongly influenced net farm revenue, especially for irrigated farms. We expect allfarms and mixed farms to benefit from year-round water flow, for example, forwatering livestock during dry seasons and also for irrigation. Using irrigation appearsto positively influence net farm revenue for all farm types except specialized livestockfarms. The possible explanation is that during the dry season, water flow helps toprovide water for livestock watering and irrigation. The soil variables show that are-nosols (qlCU), fluvisols (jcMFU) and ferric luvisols (lfCU), which are extensivelydeveloped and are usually highly productive soils, have a strong positive influence onnet farm revenues across all farming systems.
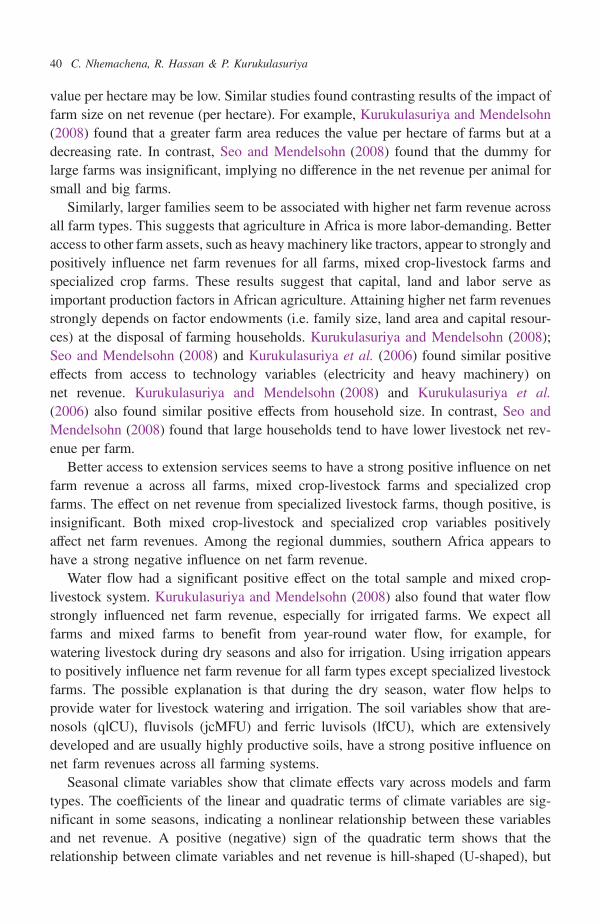
Seasonal climate variables show that climate effects vary across models and farmtypes. The coefficients of the linear and quadratic terms of climate variables are sig-nificant in some seasons, indicating a nonlinear relationship between these variablesand net revenue. A positive (negative) sign of the quadratic term shows that therelationship between climate variables and net revenue is hill-shaped (U-shaped), but
40 C. Nhemachena, R. Hassan & P. Kurukulasuriya
the effect of quadratic seasonal climate variables on net revenue cannot be easilyconcluded as both linear and quadratic terms influence net revenue.
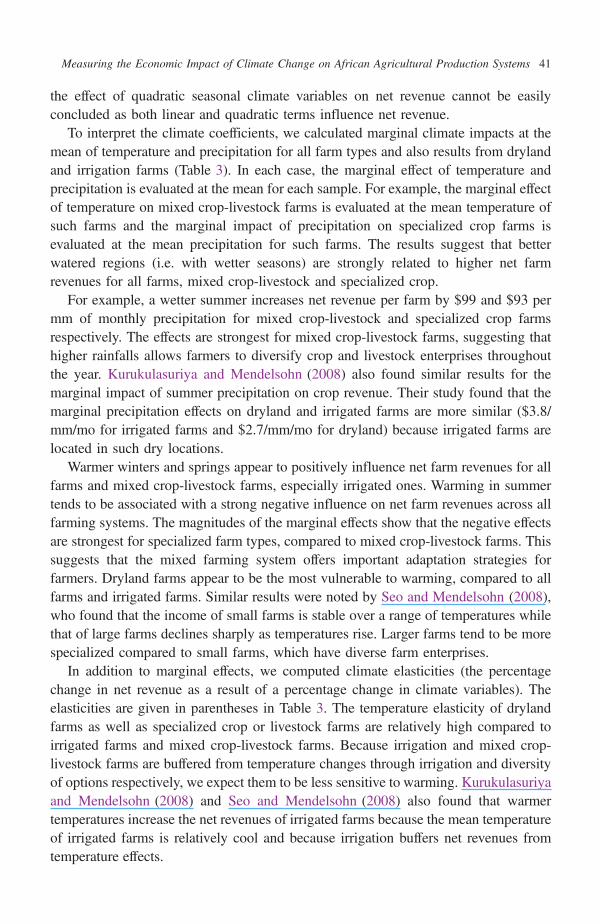
To interpret the climate coefficients, we calculated marginal climate impacts at themean of temperature and precipitation for all farm types and also results from drylandand irrigation farms (Table 3). In each case, the marginal effect of temperature andprecipitation is evaluated at the mean for each sample. For example, the marginal effectof temperature on mixed crop-livestock farms is evaluated at the mean temperature ofsuch farms and the marginal impact of precipitation on specialized crop farms isevaluated at the mean precipitation for such farms. The results suggest that betterwatered regions (i.e. with wetter seasons) are strongly related to higher net farmrevenues for all farms, mixed crop-livestock and specialized crop.
For example, a wetter summer increases net revenue per farm by $99 and $93 permm of monthly precipitation for mixed crop-livestock and specialized crop farmsrespectively. The effects are strongest for mixed crop-livestock farms, suggesting thathigher rainfalls allows farmers to diversify crop and livestock enterprises throughoutthe year. Kurukulasuriya and Mendelsohn (2008) also found similar results for themarginal impact of summer precipitation on crop revenue. Their study found that themarginal precipitation effects on dryland and irrigated farms are more similar ($3.8/mm/mo for irrigated farms and $2.7/mm/mo for dryland) because irrigated farms arelocated in such dry locations.
Warmer winters and springs appear to positively influence net farm revenues for allfarms and mixed crop-livestock farms, especially irrigated ones. Warming in summertends to be associated with a strong negative influence on net farm revenues across allfarming systems. The magnitudes of the marginal effects show that the negative effectsare strongest for specialized farm types, compared to mixed crop-livestock farms. Thissuggests that the mixed farming system offers important adaptation strategies forfarmers. Dryland farms appear to be the most vulnerable to warming, compared to allfarms and irrigated farms. Similar results were noted by Seo and Mendelsohn (2008),who found that the income of small farms is stable over a range of temperatures whilethat of large farms declines sharply as temperatures rise. Larger farms tend to be morespecialized compared to small farms, which have diverse farm enterprises.
In addition to marginal effects, we computed climate elasticities (the percentagechange in net revenue as a result of a percentage change in climate variables). Theelasticities are given in parentheses in Table 3. The temperature elasticity of drylandfarms as well as specialized crop or livestock farms are relatively high compared toirrigated farms and mixed crop-livestock farms. Because irrigation and mixed crop-livestock farms are buffered from temperature changes through irrigation and diversityof options respectively, we expect them to be less sensitive to warming. Kurukulasuriyaand Mendelsohn (2008) and Seo and Mendelsohn (2008) also found that warmertemperatures increase the net revenues of irrigated farms because the mean temperatureof irrigated farms is relatively cool and because irrigation buffers net revenues fromtemperature effects.
Measuring the Economic Impact of Climate Change on African Agricultural Production Systems 41
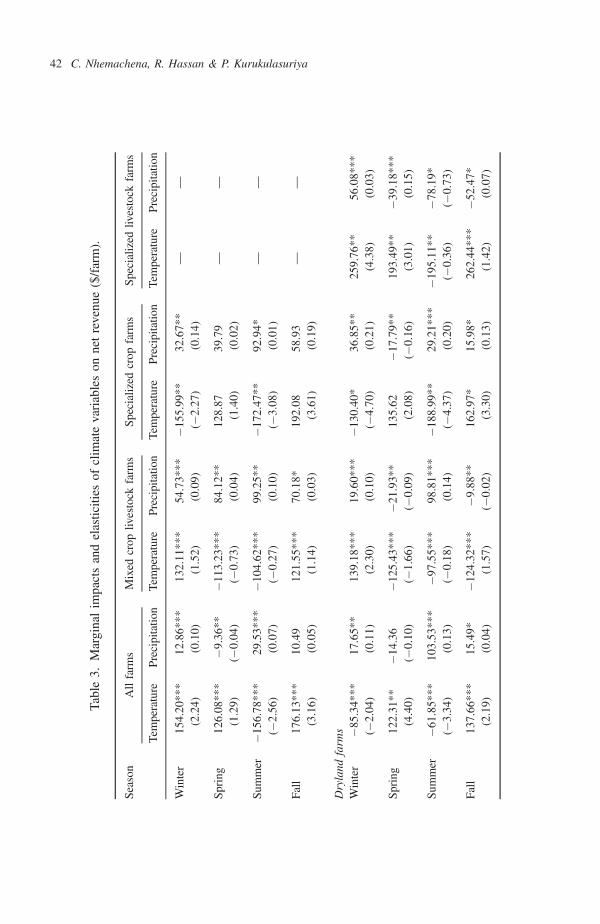
Table3.
Marginalim
pactsandelasticities
ofclim
atevariableson
netrevenue($/farm).
Season
Allfarm
sMixed
crop
livestock
farm
sSpecialized
crop
farm
sSpecialized
livestock
farm
s
Temperature
Precipitatio
nTemperature
Precipitatio
nTemperature
Precipitatio
nTemperature
Precipitatio
n
Winter
154.20
***
12.86*
**13
2.11
***
54.73*
**�1
55.99**
32.67*
*—
—
(2.24)
(0.10)
(1.52)
(0.09)
(�2.27
)(0.14)
Spring
126.08
***
�9.36*
*�1
13.23*
**84
.12*
*12
8.87
39.79
——
(1.29)
(�0.04
)(�
0.73
)(0.04)
(1.40)
(0.02)
Sum
mer
�156
.78*
**29
.53*
**�1
04.62*
**99
.25*
*�1
72.47**
92.94*
——
(�2.56
)(0.07)
(�0.27
)(0.10)
(�3.08
)(0.01)
Fall
176.13
***
10.49
121.55
***
70.18*
192.08
58.93
——
(3.16)
(0.05)
(1.14)
(0.03)
(3.61)
(0.19)
Dryland
farm
sWinter
�85.34
***
17.65*
*13
9.18
***
19.60*
**�1
30.40*
36.85*
*25
9.76
**56
.08*
**(�
2.04
)(0.11)
(2.30)
(0.10)
(�4.70
)(0.21)
(4.38)
(0.03)
Spring
122.31
**�1
4.36
�125
.43*
**�2
1.93
**13
5.62
�17.79
**19
3.49
**�3
9.18
***
(4.40)
(�0.10
)(�
1.66
)(�
0.09
)(2.08)
(�0.16
)(3.01)
(0.15)
Sum
mer
�61.85
***
103.53
***
�97.55
***
98.81*
**�1
88.99**
29.21*
**�1
95.11*
*�7
8.19
*(�
3.34
)(0.13)
(�0.18
)(0.14)
(�4.37
)(0.20)
(�0.36
)(�
0.73
)
Fall
137.66
***
15.49*
�124
.32*
**�9
.88*
*16
2.97
*15
.98*
262.44
***
�52.47
*(2.19)
(0.04)
(1.57)
(�0.02
)(3.30)
(0.13)
(1.42)
(0.07)
42 C. Nhemachena, R. Hassan & P. Kurukulasuriya
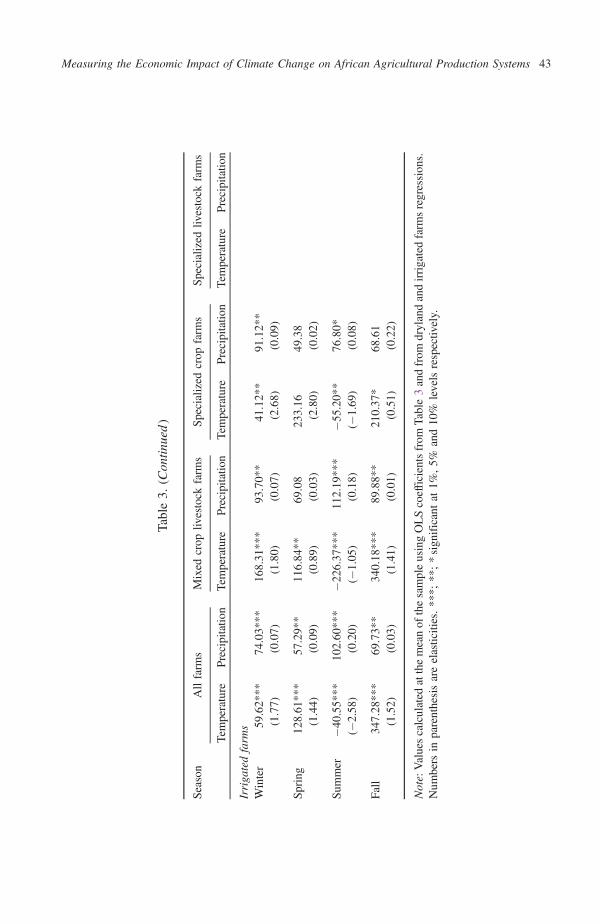
Table3.
(Contin
ued)
Season
Allfarm
sMixed
crop
livestock
farm
sSpecialized
crop
farm
sSpecialized
livestock
farm
s
Temperature
Precipitatio
nTemperature
Precipitatio
nTemperature
Precipitatio
nTemperature
Precipitatio
n
Irriga
tedfarm
sWinter
59.62*
**74
.03*
**16
8.31
***
93.70*
*41
.12*
*91
.12*
*(1.77)
(0.07)
(1.80)
(0.07)
(2.68)
(0.09)
Spring
128.61
***
57.29*
*11
6.84
**69
.08
233.16
49.38
(1.44)
(0.09)
(0.89)
(0.03)
(2.80)
(0.02)
Sum
mer
�40.55
***
102.60
***
�226
.37*
**11
2.19
***
�55.20
**76
.80*
(�2.58
)(0.20)
(�1.05
)(0.18)
(�1.69
)(0.08)
Fall
347.28
***
69.73*
*34
0.18
***
89.88*
*21
0.37
*68
.61
(1.52)
(0.03)
(1.41)
(0.01)
(0.51)
(0.22)
Note:Valuescalculated
atthemeanof
thesampleusingOLScoefficientsfrom
Table3andfrom
drylandandirrigatedfarm
sregression
s.Num
bers
inparenthesisareelasticities.**
*;**
;*sign
ificantat
1%,5%
and10
%levelsrespectiv
ely.
Measuring the Economic Impact of Climate Change on African Agricultural Production Systems 43
A marginal increase in precipitation increases net revenue for all farm types. Theprecipitation elasticity is relatively high for dryland farms across farm types and forspecialized crop and livestock farms. Because mixed crop-livestock farms are morediverse in their enterprises and options with the ability to shift easily between cropsand livestock, we expect them to be less sensitive to warming and drying. From anadaptation perspective, mixed crop-livestock farming becomes a good alternative tospecialized crop or livestock farms.
An interesting observation from the results is that net revenue decreases with fallingprecipitation (in spring, summer and fall) for specialized livestock farms. This is incontrast to findings from the regional Ricardian livestock analysis (Seo andMendelsohn,2008) where net revenue increased with falling precipitation as farmers shifted fromlivestock to crops, forests to grasslands, and diseases became less prevalent. We, how-ever, note that while wet conditions are expected to improve the quantity and quality ofgrazing pastures, they may also be associated with high levels of disease that may reducethe gains from improved pastures. The sensitivity of dryland farms and specialized cropor livestock farms is relatively high compared to irrigated farms.
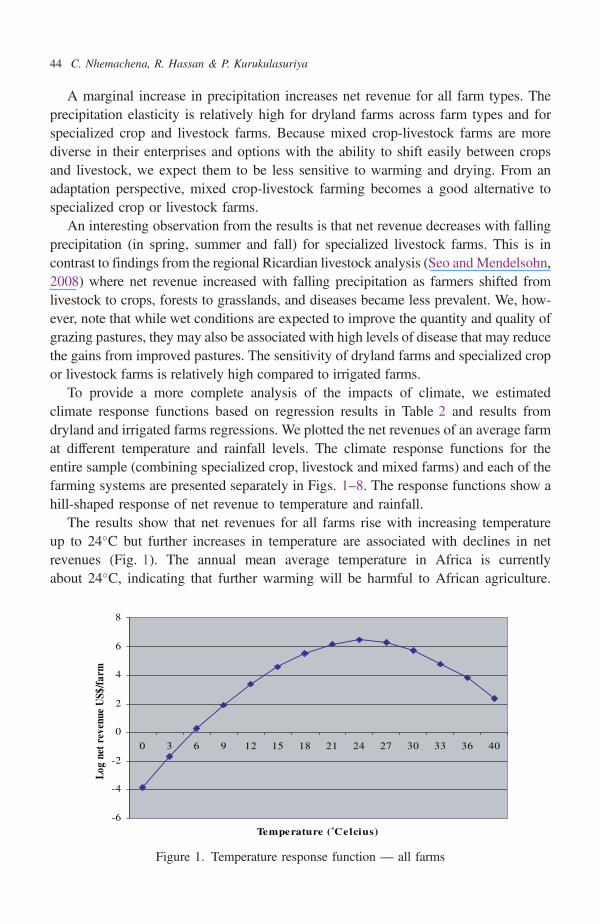
To provide a more complete analysis of the impacts of climate, we estimatedclimate response functions based on regression results in Table 2 and results fromdryland and irrigated farms regressions. We plotted the net revenues of an average farmat different temperature and rainfall levels. The climate response functions for theentire sample (combining specialized crop, livestock and mixed farms) and each of thefarming systems are presented separately in Figs. 1–8. The response functions show ahill-shaped response of net revenue to temperature and rainfall.
The results show that net revenues for all farms rise with increasing temperatureup to 24�C but further increases in temperature are associated with declines in netrevenues (Fig. 1). The annual mean average temperature in Africa is currentlyabout 24�C, indicating that further warming will be harmful to African agriculture.
-6
-4
-2
0
2
4
6
8
0 3 6 9 12 15 18 21 24 27 30 33 36 40
Temperature (˚Celcius)
Log
net r
even
ue U
S$/fa
rm
Figure 1. Temperature response function — all farms
44 C. Nhemachena, R. Hassan & P. Kurukulasuriya
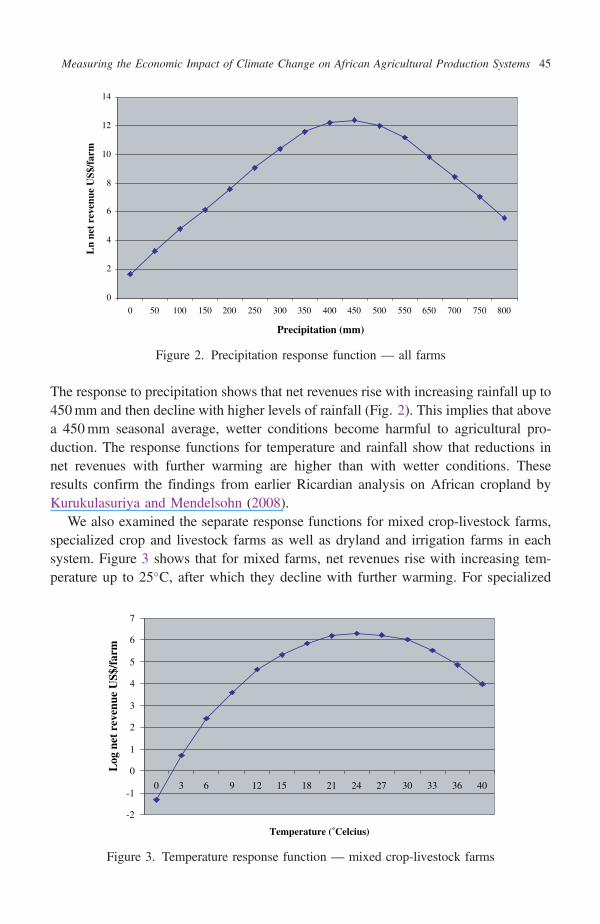
The response to precipitation shows that net revenues rise with increasing rainfall up to450mm and then decline with higher levels of rainfall (Fig. 2). This implies that abovea 450mm seasonal average, wetter conditions become harmful to agricultural pro-duction. The response functions for temperature and rainfall show that reductions innet revenues with further warming are higher than with wetter conditions. Theseresults confirm the findings from earlier Ricardian analysis on African cropland byKurukulasuriya and Mendelsohn (2008).
We also examined the separate response functions for mixed crop-livestock farms,specialized crop and livestock farms as well as dryland and irrigation farms in eachsystem. Figure 3 shows that for mixed farms, net revenues rise with increasing tem-perature up to 25�C, after which they decline with further warming. For specialized
0
2
4
6
8
10
12
14
0 50 100 150 200 250 300 350 400 450 500 550 650 700 750 800
Precipitation (mm)
Ln
net
reve
nue
US$
/far
m
Figure 2. Precipitation response function — all farms
-2
-1
0
1
2
3
4
5
6
7
0 3 6 9 12 15 18 21 24 27 30 33 36 40
Temperature (˚Celcius)
Log
net
rev
enue
US$
/far
m
Figure 3. Temperature response function — mixed crop-livestock farms
Measuring the Economic Impact of Climate Change on African Agricultural Production Systems 45
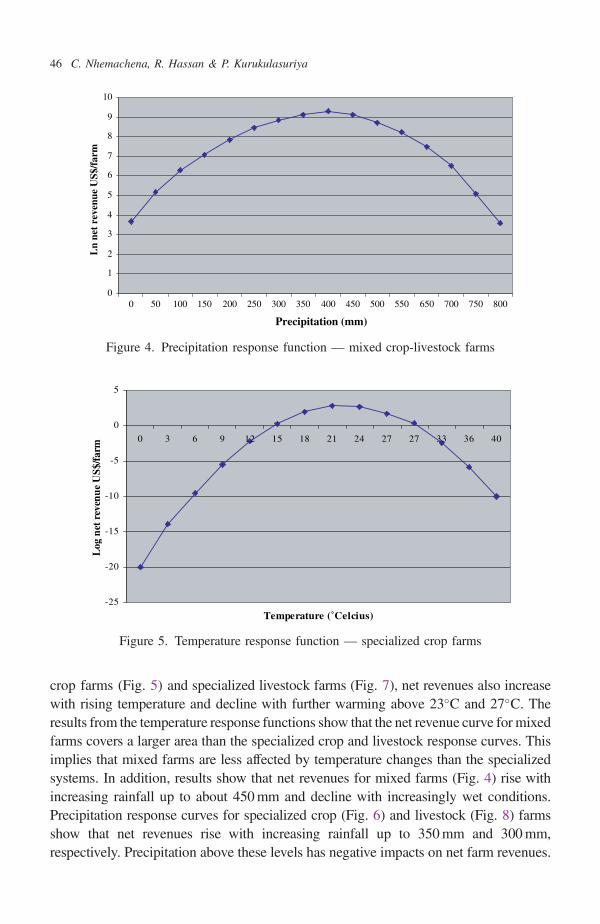
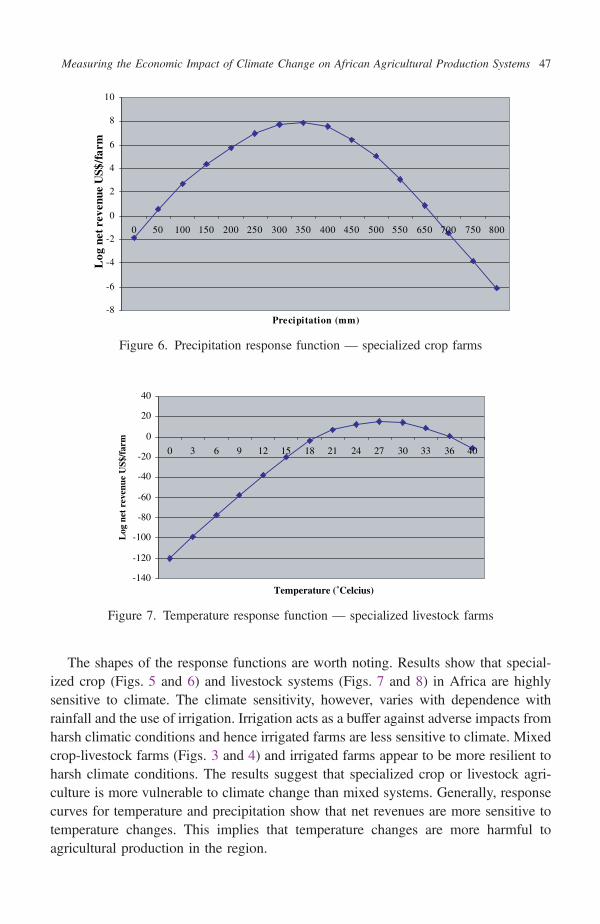
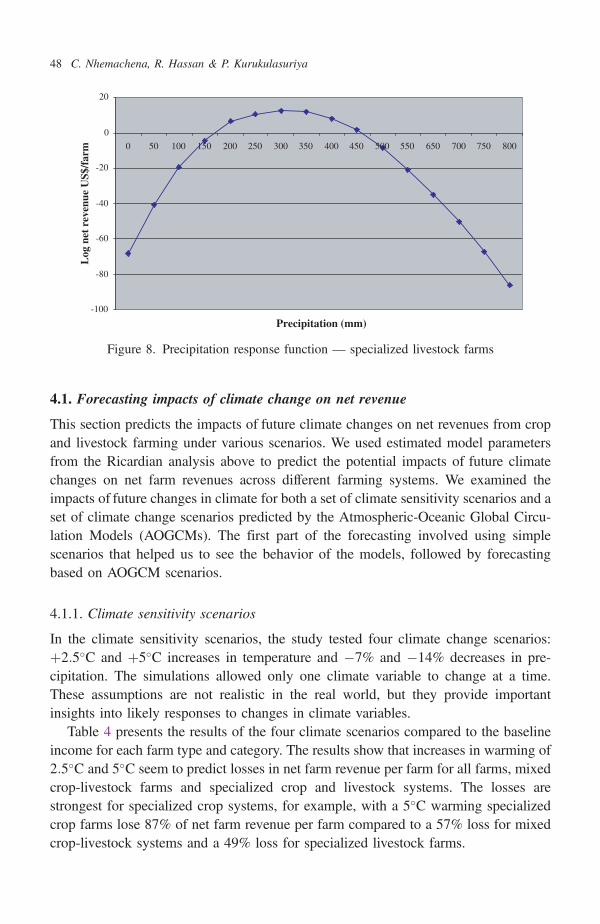
crop farms (Fig. 5) and specialized livestock farms (Fig. 7), net revenues also increasewith rising temperature and decline with further warming above 23�C and 27�C. Theresults from the temperature response functions show that the net revenue curve for mixedfarms covers a larger area than the specialized crop and livestock response curves. Thisimplies that mixed farms are less affected by temperature changes than the specializedsystems. In addition, results show that net revenues for mixed farms (Fig. 4) rise withincreasing rainfall up to about 450mm and decline with increasingly wet conditions.Precipitation response curves for specialized crop (Fig. 6) and livestock (Fig. 8) farmsshow that net revenues rise with increasing rainfall up to 350mm and 300mm,respectively. Precipitation above these levels has negative impacts on net farm revenues.
0
1
2
3
4
5
6
7
8
9
10
0 50 100 150 200 250 300 350 400 450 500 550 650 700 750 800
Precipitation (mm)
Ln
net
reve
nue
US$
/far
m
Figure 4. Precipitation response function — mixed crop-livestock farms
-25
-20
-15
-10
-5
0
5
0 3 6 9 12 15 18 21 24 27 27 33 36 40
Temperature (˚Celcius)
Log
net
rev
enue
US$
/farm
Figure 5. Temperature response function — specialized crop farms
46 C. Nhemachena, R. Hassan & P. Kurukulasuriya
The shapes of the response functions are worth noting. Results show that special-ized crop (Figs. 5 and 6) and livestock systems (Figs. 7 and 8) in Africa are highlysensitive to climate. The climate sensitivity, however, varies with dependence withrainfall and the use of irrigation. Irrigation acts as a buffer against adverse impacts fromharsh climatic conditions and hence irrigated farms are less sensitive to climate. Mixedcrop-livestock farms (Figs. 3 and 4) and irrigated farms appear to be more resilient toharsh climate conditions. The results suggest that specialized crop or livestock agri-culture is more vulnerable to climate change than mixed systems. Generally, responsecurves for temperature and precipitation show that net revenues are more sensitive totemperature changes. This implies that temperature changes are more harmful toagricultural production in the region.
-8
-6
-4
-2
0
2
4
6
8
10
0 50 100 150 200 250 300 350 400 450 500 550 650 700 750 800
Precipitation (mm)
Log
net
rev
enue
US$
/far
m
Figure 6. Precipitation response function — specialized crop farms
-140
-120
-100
-80
-60
-40
-20
0
20
40
0 3 6 9 12 15 18 21 24 27 30 33 36 40
Temperature (˚Celcius)
Log
net
rev
enue
US$
/far
m
Figure 7. Temperature response function — specialized livestock farms
Measuring the Economic Impact of Climate Change on African Agricultural Production Systems 47
4.1. Forecasting impacts of climate change on net revenue
This section predicts the impacts of future climate changes on net revenues from cropand livestock farming under various scenarios. We used estimated model parametersfrom the Ricardian analysis above to predict the potential impacts of future climatechanges on net farm revenues across different farming systems. We examined theimpacts of future changes in climate for both a set of climate sensitivity scenarios and aset of climate change scenarios predicted by the Atmospheric-Oceanic Global Circu-lation Models (AOGCMs). The first part of the forecasting involved using simplescenarios that helped us to see the behavior of the models, followed by forecastingbased on AOGCM scenarios.
4.1.1. Climate sensitivity scenarios
In the climate sensitivity scenarios, the study tested four climate change scenarios:þ2:5�C and þ5�C increases in temperature and �7% and �14% decreases in pre-cipitation. The simulations allowed only one climate variable to change at a time.These assumptions are not realistic in the real world, but they provide importantinsights into likely responses to changes in climate variables.
Table 4 presents the results of the four climate scenarios compared to the baselineincome for each farm type and category. The results show that increases in warming of2:5�C and 5�C seem to predict losses in net farm revenue per farm for all farms, mixedcrop-livestock farms and specialized crop and livestock systems. The losses arestrongest for specialized crop systems, for example, with a 5�C warming specializedcrop farms lose 87% of net farm revenue per farm compared to a 57% loss for mixedcrop-livestock systems and a 49% loss for specialized livestock farms.
-100
-80
-60
-40
-20
0
20
0 50 100 150 200 250 300 350 400 450 500 550 650 700 750 800
Precipitation (mm)
Log
net
rev
enue
US$
/far
m
Figure 8. Precipitation response function — specialized livestock farms
48 C. Nhemachena, R. Hassan & P. Kurukulasuriya
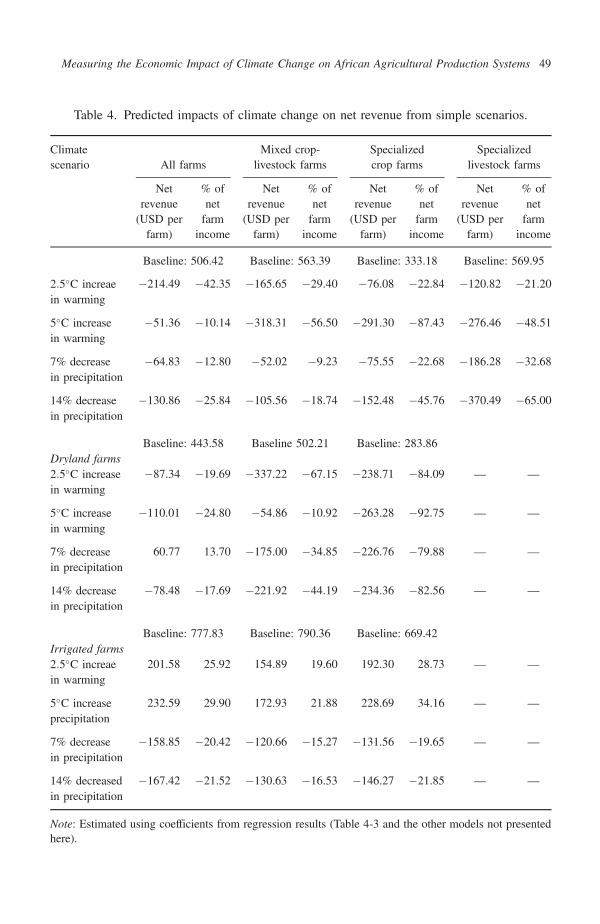
Table 4. Predicted impacts of climate change on net revenue from simple scenarios.
Climate Mixed crop- Specialized Specializedscenario All farms livestock farms crop farms livestock farms
�Net % of �Net % of �Net % of �Net % ofrevenue net revenue net revenue net revenue net(USD per farm (USD per farm (USD per farm (USD per farmfarm) income farm) income farm) income farm) income
Baseline: 506.42 Baseline: 563.39 Baseline: 333.18 Baseline: 569.95
2:5�C increae �214.49 �42.35 �165.65 �29.40 �76.08 �22.84 �120.82 �21.20in warming
5�C increase �51.36 �10.14 �318.31 �56.50 �291.30 �87.43 �276.46 �48.51in warming
7% decrease �64.83 �12.80 �52.02 �9.23 �75.55 �22.68 �186.28 �32.68in precipitation
14% decrease �130.86 �25.84 �105.56 �18.74 �152.48 �45.76 �370.49 �65.00in precipitation
Baseline: 443.58 Baseline 502.21 Baseline: 283.86Dryland farms2:5�C increase �87.34 �19.69 �337.22 �67.15 �238.71 �84.09 — —
in warming
5�C increase �110.01 �24.80 �54.86 �10.92 �263.28 �92.75 — —
in warming
7% decrease 60.77 13.70 �175.00 �34.85 �226.76 �79.88 — —
in precipitation
14% decrease �78.48 �17.69 �221.92 �44.19 �234.36 �82.56 — —
in precipitation
Baseline: 777.83 Baseline: 790.36 Baseline: 669.42Irrigated farms2:5�C increae 201.58 25.92 154.89 19.60 192.30 28.73 — —
in warming
5�C increase 232.59 29.90 172.93 21.88 228.69 34.16 — —
precipitation
7% decrease �158.85 �20.42 �120.66 �15.27 �131.56 �19.65 — —
in precipitation
14% decreased �167.42 �21.52 �130.63 �16.53 �146.27 �21.85 — —
in precipitation
Note: Estimated using coefficients from regression results (Table 4-3 and the other models not presentedhere).
Measuring the Economic Impact of Climate Change on African Agricultural Production Systems 49
Reductions in precipitation (7% and 14%) predict higher losses in net farm revenueper farm for specialized crop and livestock systems compared to all farms and mixedcrop-livestock farms. For example, a 14% reduction in precipitation predicts 65% and46% losses in net revenue per farm for specialized crop and livestock systems,respectively, compared to 26% for all farms and 19% for mixed crop-livestock farms.These results suggest that specialized crop or livestock systems tend to suffer mostfrom increases in warming and drying. Mixed crop-livestock farms that are less sen-sitive to climate changes suffer minimal damages compared to other farm types.
Results also show that increases of 2:5�C and 5�C in temperature tend to predictlosses for dryland systems and gains for irrigated systems. The magnitudes of thelosses are highest for specialized crop systems compared to all farms and mixed crop-livestock systems, suggesting that the risk of specialized systems is higher withwarming in general. Reductions of 7% and 14% in precipitations appear to lead tolosses both for dryland and irrigated farming systems. Similarly, the magnitudes of thepredicted losses suggest that drying has strong negative effects on specialized cropsystems compared to all farms and mixed crop-livestock farms.
4.1.2. AOGCM climate scenarios
The study also examined a set of climate change scenarios fromAOGCMs.We used twoscenarios that predict a wide range of outcomes consistent with the most recent IPCCreport (Houghton et al., 2001). The specific scenarios used in this study are A1 scen-arios from the following models: Parallel Climate Model (PCM) (Washington et al.,2000) and Canadian Climate Centre (CCC) (Boer et al., 2000). We examined country-level impacts for each of these scenarios for the year 2100. We added the climate model-predicted change in temperature to the baseline temperature in each district under eachclimate scenario. For changes in precipitation wemultiplied the climate model-predictedchange by the baseline precipitation in each district. When examining actual climatescenarios, there will also be a change in water supply; however, we did not take this intoaccount in the study and this is a caveat when promoting irrigation.
The models have a range of predictions: the PCM predicts a 3�C increase intemperature for 2100 and the CCC an increase of 6�C. Both models show a rising trendin temperature over time. The PCM predicts an increase in precipitation of 4% by 2100and the CCC a reduction of 15% for the same year. However, rainfall distributiongreatly varies across countries. An important point to note is the spatial and temporalvariability in predictions of temperature and precipitation in Africa.
To predict the impact of each climate scenario on net revenue, we calculated thechange in net farm revenues from baseline values in Table 3 and under each newclimate scenario. The difference between the two levels of net revenues gave us thechange in net revenue per farm in each district. The predictions were based onRicardian regression results from Table 2 and results from dryland and irrigated farmsregressions.
50 C. Nhemachena, R. Hassan & P. Kurukulasuriya
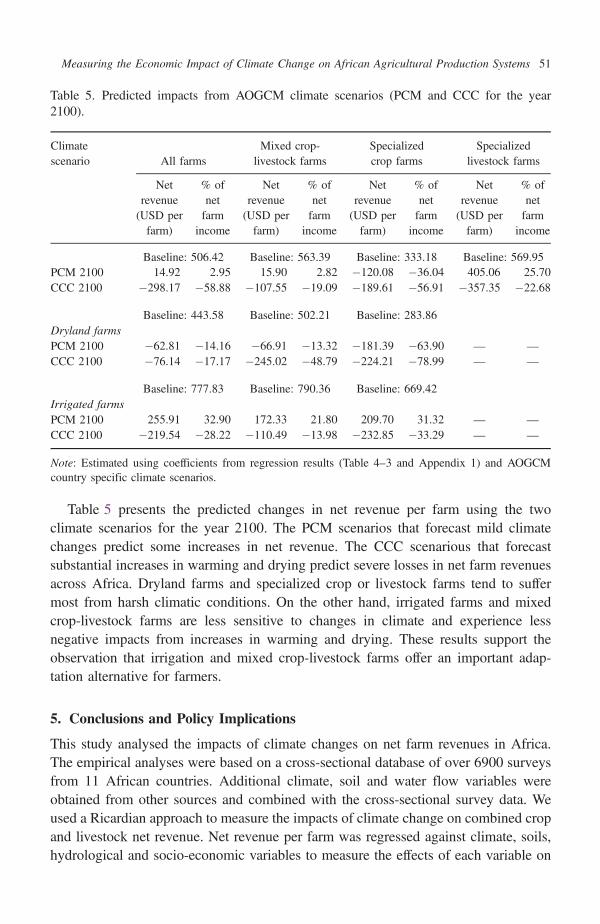
Table 5 presents the predicted changes in net revenue per farm using the twoclimate scenarios for the year 2100. The PCM scenarios that forecast mild climatechanges predict some increases in net revenue. The CCC scenarious that forecastsubstantial increases in warming and drying predict severe losses in net farm revenuesacross Africa. Dryland farms and specialized crop or livestock farms tend to suffermost from harsh climatic conditions. On the other hand, irrigated farms and mixedcrop-livestock farms are less sensitive to changes in climate and experience lessnegative impacts from increases in warming and drying. These results support theobservation that irrigation and mixed crop-livestock farms offer an important adap-tation alternative for farmers.
5. Conclusions and Policy Implications
This study analysed the impacts of climate changes on net farm revenues in Africa.The empirical analyses were based on a cross-sectional database of over 6900 surveysfrom 11 African countries. Additional climate, soil and water flow variables wereobtained from other sources and combined with the cross-sectional survey data. Weused a Ricardian approach to measure the impacts of climate change on combined cropand livestock net revenue. Net revenue per farm was regressed against climate, soils,hydrological and socio-economic variables to measure the effects of each variable on
Table 5. Predicted impacts from AOGCM climate scenarios (PCM and CCC for the year2100).
Climate Mixed crop- Specialized Specializedscenario All farms livestock farms crop farms livestock farms
�Net % of �Net % of �Net % of �Net % ofrevenue net revenue net revenue net revenue net(USD per farm (USD per farm (USD per farm (USD per farmfarm) income farm) income farm) income farm) income
Baseline: 506.42 Baseline: 563.39 Baseline: 333.18 Baseline: 569.95PCM 2100 14.92 2.95 15.90 2.82 �120.08 �36.04 405.06 25.70CCC 2100 �298.17 �58.88 �107.55 �19.09 �189.61 �56.91 �357.35 �22.68
Baseline: 443.58 Baseline: 502.21 Baseline: 283.86Dryland farmsPCM 2100 �62.81 �14.16 �66.91 �13.32 �181.39 �63.90 — —
CCC 2100 �76.14 �17.17 �245.02 �48.79 �224.21 �78.99 — —
Baseline: 777.83 Baseline: 790.36 Baseline: 669.42Irrigated farmsPCM 2100 255.91 32.90 172.33 21.80 209.70 31.32 — —
CCC 2100 �219.54 �28.22 �110.49 �13.98 �232.85 �33.29 — —
Note: Estimated using coefficients from regression results (Table 4–3 and Appendix 1) and AOGCMcountry specific climate scenarios.
Measuring the Economic Impact of Climate Change on African Agricultural Production Systems 51
net farm revenue. The impacts of climate change were examined for three mainfarming types: specialized crop; specialized livestock and mixed crop and livestock aswell as the total sample and for dryland and irrigated farms within each farm type. Thestudy also examined some climate sensitivity scenarios as well as two climate scen-arios from Atmospheric-Oceanic General Circulation Models (AOGCMs).
The results showed that larger farm sizes appear to have a strong positive influenceon net farm revenues across all farm types, suggesting that having more land allowsfarmers to produce more crop and livestock enterprises per farm, thus leading to moreincome although the value per hectare may be low. Larger families seem to beassociated with higher net farm revenues across all farm types. Better access to otherfarm assets, such as heavy machinery like tractors, appear to strongly and positivelyinfluence net farm revenues for all farms, mixed crop-livestock farms and specializedcrop farms. These results suggest that capital, land and labor serve as important pro-duction factors in African agriculture. National policies need to invest more inimproving factor endowments (i.e. land area and capital resources) at the disposal offarming households to enhance farm performances in the face of climate change.
Better access to extension services seems to have a strong positive influence on netfarm revenues across all farms, mixed crop-livestock farms and specialized crop farms.Improving access to extension services ensures that farmers have the information tomake decisions that improve their production activities. Policies aimed at improvingfarm-level performance need to emphasize the critical role of providing information(through extensions services) to help decision making at the farm level.
Improving access to technology (in this case, electricity) has significant potential inimproving farm-level production activities and hence net revenues. For example, theuse of irrigation and intensive livestock production systems (which are usually capital-intensive) increases when farmers have access to electricity and other machinery.Improving access to technology such as electricity and machines is therefore importantto enhancing agricultural production in the face of climate change. The soil variablesarenosols, fluvisols and ferric luvisols, which are extensively developed and areusually highly productive soils, appear to have a strong positive influence on net farmrevenues across all farming systems.
Marginal analyses of the impacts of seasonal climate variables show that African netfarm revenues are highly sensitive to changes in climate. The sensitivity is relativelyhigh for changes in temperature. Further warming and drying have severe adverseeffects on net farm revenues. The results show variations in sensitivity to climate basedon the type of farm and whether it is dryland or irrigated. Dryland and specialized cropor livestock farms suffer more from further increases in warming and drying comparedto irrigated and mixed crop-livestock farms. Predictions of future climate impacts alsoindicate that mixed crop-livestock and irrigated farms are less sensitive to climatechanges and will experience less damages compared to highly sensitive dryland andspecialized crop or livestock farms. Results show that net farm revenues are in generalnegatively affected by warmer and dryer climates. The small-scale mixed crop and
52 C. Nhemachena, R. Hassan & P. Kurukulasuriya
livestock system typical in Africa is the most tolerant whereas specialized crop pro-duction is the most vulnerable to warming and decreased rainfall.
Generally, farming systems located in dry, semi-arid and arid regions (for example,most of the southern parts of the continent) will suffer more from increases in warmingand drying compared to those in more humid regions. It is therefore important forAfrica to enhance adaptation efforts both at the micro (farm) and macro (national)levels. Governments need to integrate adaptation into national economic policies aswell as strengthening community-based adaptations to help farmers minimize thepotential damages from climate change. These results have important policy impli-cations, especially for the suitability of the increasing tendency toward large-scale,mono-cropping strategies for agricultural development in Africa and other parts of thedeveloping world, in light of the expected climate changes. Mixed crop and livestockfarming and irrigation offer better adaptation options for farmers against furtherwarming and drying as predicted under various future climate scenarios.
Acknowledgments
This paper was funded by GEF and the World Bank. It is part of a larger study on theeffect of climate change on African agriculture coordinated by the Centre forEnvironmental Economics and Policy in Africa (CEEPA), University of Pretoria,South Africa. The authors are very grateful for the comments from anonymousreviewers. All remaining errors should be attributed solely to the authors.
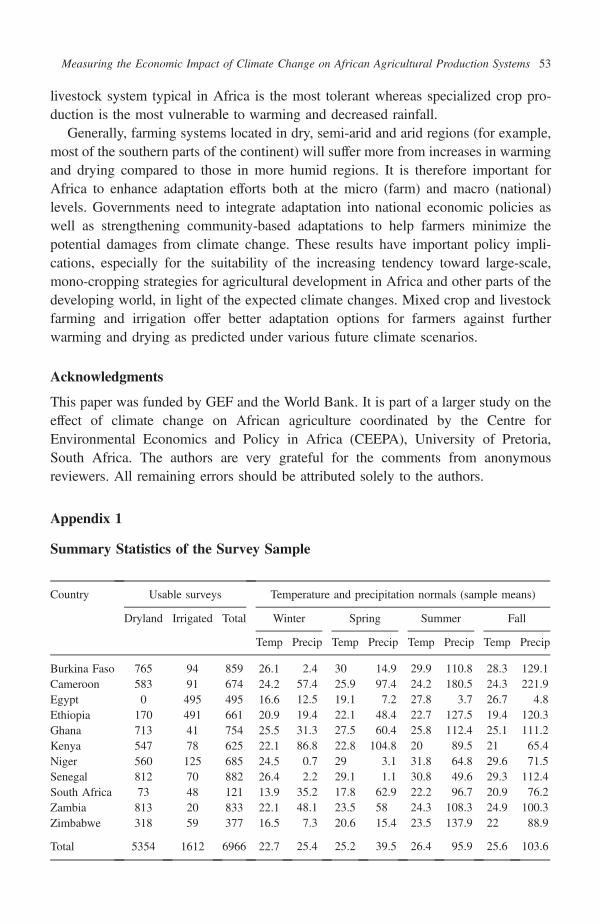
Appendix 1
Summary Statistics of the Survey Sample
Country Usable surveys Temperature and precipitation normals (sample means)
Dryland Irrigated Total Winter Spring Summer Fall
Temp Precip Temp Precip Temp Precip Temp Precip
Burkina Faso 765 94 859 26.1 2.4 30 14.9 29.9 110.8 28.3 129.1Cameroon 583 91 674 24.2 57.4 25.9 97.4 24.2 180.5 24.3 221.9Egypt 0 495 495 16.6 12.5 19.1 7.2 27.8 3.7 26.7 4.8Ethiopia 170 491 661 20.9 19.4 22.1 48.4 22.7 127.5 19.4 120.3Ghana 713 41 754 25.5 31.3 27.5 60.4 25.8 112.4 25.1 111.2Kenya 547 78 625 22.1 86.8 22.8 104.8 20 89.5 21 65.4Niger 560 125 685 24.5 0.7 29 3.1 31.8 64.8 29.6 71.5Senegal 812 70 882 26.4 2.2 29.1 1.1 30.8 49.6 29.3 112.4South Africa 73 48 121 13.9 35.2 17.8 62.9 22.2 96.7 20.9 76.2Zambia 813 20 833 22.1 48.1 23.5 58 24.3 108.3 24.9 100.3Zimbabwe 318 59 377 16.5 7.3 20.6 15.4 23.5 137.9 22 88.9
Total 5354 1612 6966 22.7 25.4 25.2 39.5 26.4 95.9 25.6 103.6
Measuring the Economic Impact of Climate Change on African Agricultural Production Systems 53
References
Adams, RM, BH Hurd, S Lenhart and N Leary (1998). Effects of global change on agriculture:An interpretative review. Climate Research, 11, 19–30.
Boer, G, G Flato and D Ramsden (2000). A transient climate change simulation with green-house gas and aerosol forcing: Projected climate for the 21st century. Climate Dynamics, 16,427–50.
Dixon, J, A Gulliver and D Gibbon (2001). Farming Systems and Poverty: Improving Farmers’Livelihoods in a Changing World. Rome and Washington, D.C.: FAO and World Bank.
Dinar, A, R Mendelsohn, R Hassan and J Benhin (2008). Climate Change and Agriculture inAfrica: Impacts Assessment and Adaptation Strategies. Earthscan: London.
FAO (Food and Agriculture Organization) (2003). The Digital Soil Map of the World: Version3.6 (January), Rome, Italy.
Houghton JT et al. (eds), (2001). Climate Change 2001: The Scientific Basis. Contribution ofWorking Group I to the third assessment report of the Intergovernmental Panel on ClimateChange. Cambridge: Cambridge University Press.
IPCC (2001). Climate Change 2001: Impacts, Adaptation, and Vulnerability. Intergovern-mental Panel on Climate Change, Cambridge University Press, Cambridge, UK.
Kurukulasuriya, P et al. (2006). Will African agriculture survive climate change? The WorldBank Economic Review, 20(3), 367–388.
Kurukulasuriya, P and R Mendelsohn (2008). A Ricardian analysis of the impact of climatechange on African cropland. African Journal of Agricultural and Resource Economics, 2(1),1–23.
Mano, R and C Nhemachena (2007). Assessment of the economic impacts of climate changeon agriculture in Zimbabwe: A Ricardian approach. Policy Research Working Paper 4292,Development Research Group, Sustainable Rural and Urban Development Team. The WorldBank, Washington, DC.
Mendelsohn, R and A Dinar (2003). Climate, water, and agriculture. Land Economics, 79(3),328–341.
Mendelsohn, R (2000). Measuring the effect of climate change on developing country agri-culture. Two essays on climate change and agriculture: A developing country perspective.FAO Economic and Social Development Paper 145.
Mendelsohn, R and A Dinar, (1999). Climate change, agriculture, and developing countries:Does adaptation matter? The World Bank Research Observer, 14(2), 277–293.
Mendelsohn, R, W Nordhaus and D Shaw (1996). Climate impacts on aggregate farm values:Accounting for adaptation. Agriculture and Forest Meteorology, 80, 55–67.
Mendelsohn, R, W Nordhaus and D Shaw (1994). The impact of global warming on agri-culture: A Ricardian analysis. American Economic Review, 84, 753–771.
Mitchell, T and T Tanner (2006). Adapting to Climate Change-Challenges and Opportunitiesfor the Development Community. Institute of Development Studies and Tearfund,Teddington, UK.
Nhemachena C (2009). Agriculture and future climate dynamics in Africa: Impacts andadaptation options. PhD thesis, Department of Agricultural Economics, Extension and RuralDevelopment, University of Pretoria.
Schimmelpfennig, D, J Lewandrowski, J Reilly, M Tsigas and I Parry (1996). Agriculturaladaptation to climate change: Issues of long-run sustainability. Agricultural EconomicReport No. (AER740), United States Department of Agriculture, USA.
Seo, N and R Mendelsohn (2008). Animal husbandry in Africa: Climate change impacts andadaptations. African Journal of Agricultural and Resource Economics, 2(1), 65–82.
54 C. Nhemachena, R. Hassan & P. Kurukulasuriya
Strzepek, K and A McCluskey (2007). District level hydroclimatic time series and scenarioanalysis to assess the impacts of climate change on regional water resources and agriculturein Africa. Policy Research Working Paper 4290, Development Research Group, SustainableRural and Urban Development Team. The World Bank, Washington, DC.
Washington, WM, JWWeatherly, GA Meehl, AJ Semtner Jr, TW Bettge, AP Craig, WG StrandJr, JM Arblaster, VB Wayland, R James and Y Zhang (2000). Parallel climate model (PCM)control and transient simulations. Climate Dynamics, 16, 755–74.
Measuring the Economic Impact of Climate Change on African Agricultural Production Systems 55
Copyright © 2022 FDOKUMEN