Measuring consumer detriment and the impact of ... - OECD
62
Organisation for Economic Co-operation and Development DSTI/CP(2019)13/FINAL Unclassified English - Or. English 9 April 2020 DIRECTORATE FOR SCIENCE, TECHNOLOGY AND INNOVATION COMMITTEE ON CONSUMER POLICY Measuring consumer detriment and the impact of consumer policy Feasibility study JT03460584 OFDE This document, as well as any data and map included herein, are without prejudice to the status of or sovereignty over any territory, to the delimitation of international frontiers and boundaries and to the name of any territory, city or area.
-
Upload
khangminh22 -
Category
Documents
-
view
2 -
download
0
Transcript of Measuring consumer detriment and the impact of ... - OECD
Organisation for Economic Co-operation and Development
DSTI/CP(2019)13/FINAL
Unclassified English - Or. English
9 April 2020
DIRECTORATE FOR SCIENCE, TECHNOLOGY AND INNOVATION
COMMITTEE ON CONSUMER POLICY
Measuring consumer detriment and the impact of consumer policy
Feasibility study
JT03460584
OFDE
This document, as well as any data and map included herein, are without prejudice to the status of or sovereignty over any territory,
to the delimitation of international frontiers and boundaries and to the name of any territory, city or area.
2 DSTI/CP(2019)13/FINAL
MEASURING CONSUMER DETRIMENT AND THE IMPACT OF CONSUMER POLICY Unclassified
Foreword
This paper examines possible methodologies for estimating consumer detriment, as well as
the impacts of consumer agency actions and consumer policy more broadly. It also provides
practical guidance for developing and strengthening the effectiveness of consumer
policymaking frameworks. The report was prepared to inform a project by the OECD
Committee on Consumer Policy (CCP) to explore ways to ensure that consumer
policymaking is based on the best available data on likely costs and benefits.
This paper was prepared by Anna Barker, under the supervision of Brigitte Acoca, of the
OECD Secretariat. It was approved and declassified by the CCP by written procedure on
2 March 2020, and prepared for publication by the OECD Secretariat.
Note to Delegations:
This document is also available on iLibrary as:
OECD (2020), “Measuring consumer detriment and the impact of consumer policy:
Feasibility study”, OECD Digital Economy Papers, No. 293, OECD Publishing, Paris,
https://doi.org/10.1787/0c2e643b-en
This document, as well as any data and map included herein, are without prejudice to the status of
or sovereignty over any territory, to the delimitation of international frontiers and boundaries and
to the name of any territory, city or area.
The statistical data for Israel are supplied by and under the responsibility of the relevant Israeli
authorities. The use of such data by the OECD is without prejudice to the status of the Golan
Heights, East Jerusalem and Israeli settlements in the West Bank under the terms of international
law.
@ OECD 2020
You can copy, download or print OECD content for your own use, and you can include excerpts
from OECD publications, databases and multimedia products in your own documents, presentations,
blogs, websites and teaching materials, provided that suitable acknowledgment of OECD as source
and copyright owner is given. All requests for commercial use and translation rights should be
submitted to [email protected]
DSTI/CP(2019)13/FINAL 3
MEASURING CONSUMER DETRIMENT AND THE IMPACT OF CONSUMER POLICY Unclassified
Table of Contents
Foreword ................................................................................................................................................ 2
Overview................................................................................................................................................. 4
1. Introduction ....................................................................................................................................... 7
2. Consumer detriment ....................................................................................................................... 10
3. Consumer agency actions................................................................................................................ 27
4. Consumer policy .............................................................................................................................. 42
Annex A. Agenda for CCP’s Roundtable on Measuring Consumer Detriment and Consumer
Agency Actions, 23 October 2019 ....................................................................................................... 48
Annex B. Methodology used to estimate the impact of actions undertaken by the (former)
Office of Fair Trading of the United Kingdom ................................................................................. 52
References ............................................................................................................................................ 54
Endnotes ............................................................................................................................................... 62
Tables
Table 2.1. Types of personal detriment ................................................................................................. 11 Table 2.2. Consumer detriment surveys ................................................................................................ 17 Table 2.3. Survey modes ....................................................................................................................... 22 Table B.1. Sector multipliers ................................................................................................................. 52
Figures
Figure 2.1. Overview of consumer detriment survey ............................................................................ 23
Boxes
Box 3.1. Assumptions associated with the impact of drip pricing ........................................................ 36 Box 3.2. Impact of enforcement in the grocery sector in Israel ............................................................ 38 Box 3.3. Estimating the impact of competition authority actions ......................................................... 40 Box B.1. CMA equation for calculating the total benefit ...................................................................... 53
4 DSTI/CP(2019)13/FINAL
MEASURING CONSUMER DETRIMENT AND THE IMPACT OF CONSUMER POLICY Unclassified
Overview
The OECD Committee on Consumer Policy (CCP) has been working for over a decade on
improving the evidence base for consumer policymaking to ensure that it is based on the
best available data concerning the likely costs and benefits. The purpose of this feasibility
study is to continue this work by looking at possible methodologies for estimating:
consumer detriment associated with consumer issues or problems, which could be
used to inform policymaking and the prioritisation of enforcement activities
(Chapter 2)
the impact of consumer agency actions, which could be used to demonstrate the
benefits of providing sufficient funding to these bodies, especially in a budget
constrained environment (Chapter 3)
the impact of consumer policy more broadly, to ensure that such policies provide a
net benefit to society, and to facilitate comparison and prioritisation between
different types of consumer policies and between jurisdictions (Chapter 4).
An earlier draft of this paper was prepared to support discussion at a roundtable on
measurement held on 23 October 2019, as part of the CCP’s 98th Session (see Annex A for
the roundtable agenda). This revised version reflects input from roundtable participants, as
well as from the CCP Bureau and advisory group on measurement.1 Further background to
the study, including scope and objectives, is outlined in Chapter 1.
The report highlights that a number of measurement activities are already being undertaken
in a number of OECD countries and partner economies. These include the collection of
consumer complaints data and the undertaking of consumer surveys covering consumer
views, experiences, behaviour, awareness and competencies, and consumer detriment. In
addition, consumer agencies hold other information relevant to the measurement of impact,
costs and benefits, including case-specific information, market information, budget data,
and data on the impact of education and awareness campaigns. These information sources
can be used to inform estimates of consumer detriment, consumer agency actions, and
consumer policy.
Measuring consumer detriment
Consistent with the OECD Recommendation on Consumer Policy Decision Making
(OECD, 2014[1]), consumer detriment is the loss or damage experienced by a consumer
when she encounters a problem relating to the purchase of a good or service. This could be
because the good or service does not meet her requirements, is faulty, is over-priced, or is
otherwise sub-optimal in some way. Consumer detriment can be defined as comprising
personal and structural detriment. In addition, consumer detriment can be financial or non-
financial. Further, there can be “hidden” detriment. As discussed in Chapter 2, while
consumer detriment may be a broad concept, not all forms of consumer detriment may
warrant a consumer policy response or enforcement action. Hence, measurement should
focus on those aspects of consumer detriment that are more relevant to consumer
policymaking and/or enforcement action.
A number of jurisdictions have used consumer surveys to estimate the level of personal
detriment associated with specific problems encountered by consumers. In most cases, such
DSTI/CP(2019)13/FINAL 5
MEASURING CONSUMER DETRIMENT AND THE IMPACT OF CONSUMER POLICY Unclassified
surveys have focussed on more measurable aspects of consumer detriment, including
financial personal detriment, and in some instances, non-financial personal detriment. In
some cases these estimates are supplemented with data collected from consumer
complaints.
There are fewer examples of studies measuring structural or hidden detriment, which are
more difficult to measure. For this reason, the CCP agreed to focus attention on developing
a methodology for measuring personal financial detriment in the short term. In particular,
it was suggested that the methodology focus on a consumer survey, which would identify
both quantitative and qualitative aspects of consumer detriment, and consumer experience
more generally. This survey would build on previous surveys undertaken across the OECD,
including, in particular, the European Commission’s 2017 survey, and the CCP’s survey
on consumer trust in peer platform markets (EC, 2017[2]; OECD, 2017[3]). Given the CCP’s
focus on issues in the digital economy, it was decided that the survey should focus on
consumer detriment in e-commerce in the short term.
Measuring the impact of consumer agency activities
Chapter 3 looks at methodologies for measuring the impact of consumer agency actions. A
number of consumer agencies already publish information on the estimated impact of their
activities. However, there is little guidance on the methodologies used for this purpose.
Further, estimation of the benefits is usually confined to consumer agency actions that lend
themselves to measurement. For example, actions that correct a price increase or otherwise
reduce the costs incurred by consumers. For this project to be progressed, work will need
to be undertaken to better understand the methodologies used by relevant consumer
agencies in estimating the impact of their activities. Such work could help identify whether
robust but simple methodologies could be developed or whether case-by-case
methodologies are required. If the latter, it may be useful to look at which types of
consumer agency actions (or market conduct) lend themselves to estimation and/or
measurement. In the medium term, the CCP agreed to further develop methodologies for
estimating the impact of consumer agency actions, with a view to demonstrating the value
of consumer agencies and to help prioritise their activities.
Measuring the impact of consumer policy
Last, Chapter 4 of the report looks at the qualitative benefits of consumer policy and
potential ways to measure its impacts. In particular, consumer policy has the potential to
reduce structural detriment associated with market failures such as imperfect and
asymmetric information and externalities. In addition, it can reduce personal detriment by
offering a host of consumer protections, which stop personal detriment from occurring in
the first place, or otherwise reduce its likelihood or severity. To date, there have been few
attempts to quantify the benefits of consumer policy on the macro economy. In theory,
econometric modelling and simulation modelling could potentially be used to assess
structural detriment. However, there are a number of potential limitations with these
approaches, including a lack of relevant data, difficulties in ensuring that the models are
capturing the right effects, and the technical nature of the modelling making the
methodology and results less accessible to many audiences. Alternatively, work on
consumer detriment could potentially be the starting point to inform estimates of impact at
an economy-wide level. However, it might be difficult to ensure that such an approach is
robust. For this reason, in its October 2019 meeting, the CCP did not propose any further

6 DSTI/CP(2019)13/FINAL
MEASURING CONSUMER DETRIMENT AND THE IMPACT OF CONSUMER POLICY Unclassified
work on measuring the impact of consumer policy on the macro economy in the short to
medium term.
DSTI/CP(2019)13/FINAL 7
MEASURING CONSUMER DETRIMENT AND THE IMPACT OF CONSUMER POLICY Unclassified
1. Introduction
This chapter provides background on the project, including past CCP work on improving
the evidence base, a discussion on what to measure and why, ex ante versus ex post
measurement, and the project’s objectives and scope.
Background
The CCP has been working on improving the evidence base for consumer policy for almost
15 years, including through:
Roundtables on economics for consumer policy held in 2005 (OECD, 2006[4]) and
2006 (OECD, 2007[5]).
The Consumer Policy Toolkit (OECD, 2010[6]), which provides an overview of the
types of information that can inform consumer policymaking (including a
discussion on consumer detriment), and features a six-step consumer policymaking
process.
A Consumer Policy Toolkit Workshop on Communication Services held in 2011
(OECD, 2013[7]).
Reports focusing on protecting consumers in communication services (OECD,
2005[8]), and on the role of consumer complaints (OECD, 2012[9]), and consumer
surveys (OECD, 2012[10]).
Calls to improve the evidence base for consumer policy were also made in the OECD
Recommendation on Consumer Policy Decision Making (OECD, 2014[1]), and the
Recommendation on Consumer Protection in E-commerce (OECD, 2016[11]).
What to measure?
As discussed at the roundtable, it is important to ensure that there is a clear link between
what is being measured and the choice of methodology. In particular, there is no “off the
shelf” approach that will work in all circumstances and settings. Hence, one of the key
criteria in selecting an appropriate methodology is that it should be “fit for purpose”. In
addition, the methodology should ideally be relatively standardised, defensible and
systematic. Given this, a key question when looking at measurement in relation to
consumer policy is what are we trying to achieve with the measurement? Possible
objectives include:
To identify instances and measure the magnitude of consumer detriment across
different parts of the economy so as to highlight gaps in consumer policy and
enforcement. This could then be used to improve and prioritise consumer
policymaking and enforcement. If this is the objective then developing
methodologies for estimating consumer detriment (see Chapter 2) would be most
useful.
To demonstrate the benefit of consumer agencies. In which case, methodologies to
improve the measurement of the impact of consumer agency actions would be most
useful.
8 DSTI/CP(2019)13/FINAL
MEASURING CONSUMER DETRIMENT AND THE IMPACT OF CONSUMER POLICY Unclassified
To identify best practice consumer policy and to understand what consumer
policies lead to the greatest consumer benefits. In this case, methodologies for
measuring the impact of consumer policy would be most useful.
In determining which methodologies are appropriate, a number of factors should be
considered, as highlighted in the October 2019 roundtable. These include:
The intended audience of the results – this is relevant to the choice of methodology
as less technical and complex approaches may be favourable for less technical
audiences.
The ability to identify relationships between actual/expected detriment to the cause
– which is particularly important for approaches relying on econometric and
simulation modelling.
The identification of an appropriate counterfactual, which is of particular
importance when considering the impact of a policy change or a consumer agency
action.
The time horizon over which to measure the impacts.
Ex ante versus ex post measurement
Measurement can be undertaken ex ante (i.e. before a policy or action is implemented or
undertaken) or ex post (i.e. after a policy or action is implemented or undertaken).
Ex ante measurement
In the case of ex ante assessments, measurement could inform the making of consumer
policy or the prioritisation of consumer authority actions.
Consistent with the OECD’s Consumer Policy Toolkit (OECD, 2010[6]), if a government is
considering whether to revise an existing consumer policy or introduce a new one, they
should first look at the existing level of consumer detriment and other economic and social
costs relating to the consumer issue under investigation. They should then look at what the
likely costs and benefits of the change would be (alongside the costs and benefits of
alternative options) to determine whether to implement it. Alternatively, (rather than
looking at overall detriment) governments may wish to consider the change in consumer
detriment that would likely occur from a change in consumer policy. Such assessments
need to take into account the specific circumstances in which the policy or enforcement
action will be implemented, including circumstances specific to the relevant jurisdiction.
In the case of consumer agency actions, estimates of consumer detriment (and other
economic and social costs) associated with specific consumer problems could be used to
inform the prioritisation of enforcement and other consumer agency actions (see
Chapter 3). In addition, data on the costs of the various activities, and their effects on the
related conduct, could be used to ensure that agencies are putting efforts into the most
cost-effective areas.
In either case, developing a counterfactual for what outcomes could be expected to prevail
without the policy change or intervention is a key issue. In some cases this is easier with
ex ante assessments than with ex post assessments (see below). Specifically, ex ante
assessments are likely to be easier where existing conditions can be taken as the
counterfactual, and where those conditions can be easily represented with available data.
However, in other circumstances, the existing conditions may not represent a realistic
DSTI/CP(2019)13/FINAL 9
MEASURING CONSUMER DETRIMENT AND THE IMPACT OF CONSUMER POLICY Unclassified
counterfactual (or relevant data may not exist), and other counterfactuals may need to be
developed. As noted by Ormosi (2012, p. 23[12]):
The issue of the counterfactual has both conceptual and empirical dimensions –
which counterfactuals are theoretically tenable, and how do we calibrate them with
plausible estimates of key parameters?
In addition, since ex ante assessments involve trying to predict what might occur in the
future, there is likely to be some level of uncertainty, and assumptions may need to be made
in respect of key parameters in order to estimate the likely benefits and costs. Such
assumptions should be based on available literature and expert opinion (including agency
experience) and should be transparent (and ideally, the sensitivity of assumptions should
be tested and reported on). In addition, some form of risk assessment may be relevant.
Ex post measurement
In comparison, ex post assessments can be used to determine the impacts of existing
policies or authority actions that have already been implemented. A key issue for ex post
assessments is determining plausible counterfactuals. As noted by Hahn and Hird (1991,
p. 237[13]):
Perhaps the most difficult task in estimating the impact of a regulatory change is
specifying what would have happened in the absence of that change. The
researcher must engage in the delicate art of constructing a “counterfactual,”
which describes what might have happened if the change had not occurred. By
comparing the effects of the counterfactual with those of the proposed activity, it is
possible to estimate the differences in costs and benefits between the real and the
hypothetical states of the world.
This is likely to be particularly difficult with respect to measuring the cumulative impact
of all consumer policy, as it is difficult to imagine a world without any consumer protection
law. However, determining an appropriate counterfactual is likely to be easier in the case
of incremental policy change or a specific consumer authority action where consumer
detriment could be estimated before and after implementing the policy or action.
Alternatively, it may be easier to estimate the change in consumer detriment (and/or
benefits and costs) directly. This is discussed in more detail in Chapters 3 and 4.
Scope and objectives
The key objective of this report is to consider possible methodologies for measuring:
consumer detriment (Chapter 2)
the impact of consumer agency actions (Chapter 3)
the impact of consumer policy (Chapter 4).
In addition, Chapters 3 and 4 include a qualitative discussion of the relevant benefits and
costs to set up the framework for what it is that we are ultimately trying to measure.
Regarding scope, the report includes a wide range of consumer issues and potential
consumer agency actions. In particular, where relevant, measurement of costs and benefits
relating to product safety have been included, building on work being developed in this
area by the Working Party on Consumer Product Safety (WPCPS).
10 DSTI/CP(2019)13/FINAL
MEASURING CONSUMER DETRIMENT AND THE IMPACT OF CONSUMER POLICY Unclassified
2. Consumer detriment
Measuring consumer detriment is a fundamental building block for assessing the impacts
of consumer policies and consumer agency actions. Indeed, Step 2 of the OECD’s
Consumer Policy Toolkit is to ‘Measure consumer detriment’. This chapter introduces the
concept of consumer detriment and discusses possible ways of measuring it.
What is consumer detriment?
According to the OECD Recommendation on Consumer Policy Decision Making (OECD,
2014, pp. 3-4[1]):
“Consumer detriment” means the harm or loss that consumers experience, when,
for example, i) they are misled by unfair market practices into making purchases
of goods or services that they would not have otherwise made; ii) they pay more
than what they would have, had they been better informed, iii) they suffer from
unfair contract terms or iv) the goods and services that they purchase do not
conform to their expectations with respect to delivery or performance. This may
occur, for example, when the goods or services that they have purchased do not
conform to their reasonable expectations with respect to quality, performance or
conditions of delivery. This also may occur if the goods or services are not
provided in a timely fashion, are defective or dangerous, do not meet operational
expectations or are inconsistent with information provided to the consumer prior
to the transaction. Consumer detriment can take many forms: it can be structural
in nature (i.e. affecting all consumers) or personal; apparent to consumers or
hidden; and financial or non-financial. Consumer detriment may be apparent to
consumers immediately, may take time to emerge, or remain hidden.
While this definition is quite broad, this does not imply that all instances of consumer
detriment necessarily require a policy or enforcement response. For example, consumer
detriment that occurs due to an avoidable consumer mistake or misjudgement, rather than
some action or inaction by a business or in the market, may not require any policy or
enforcement response. Further, jurisdictions may view what constitutes actionable
consumer detriment differently. When looking to measure consumer detriment, the priority
should be to focus on those types of detriment that occur due to a market failure or an action
or inaction by a business (or businesses), rather than on detriment associated with consumer
misjudgement or regret. That is, measurement should focus on those aspects of consumer
detriment that are relevant to consumer policy and/or enforcement action.
Personal detriment
Personal detriment is the negative outcomes experienced by individual consumers relative
to some benchmark such as reasonable expectations (OECD, 2010[6]; Europe Economics,
2007[14]). The relevant comparison (i.e. the counterfactual) used to calculate personal
detriment is “reasonable expectations”. Hence, anything that falls short of what consumers
reasonably expect, given the circumstances of the transaction, counts as detriment (Europe
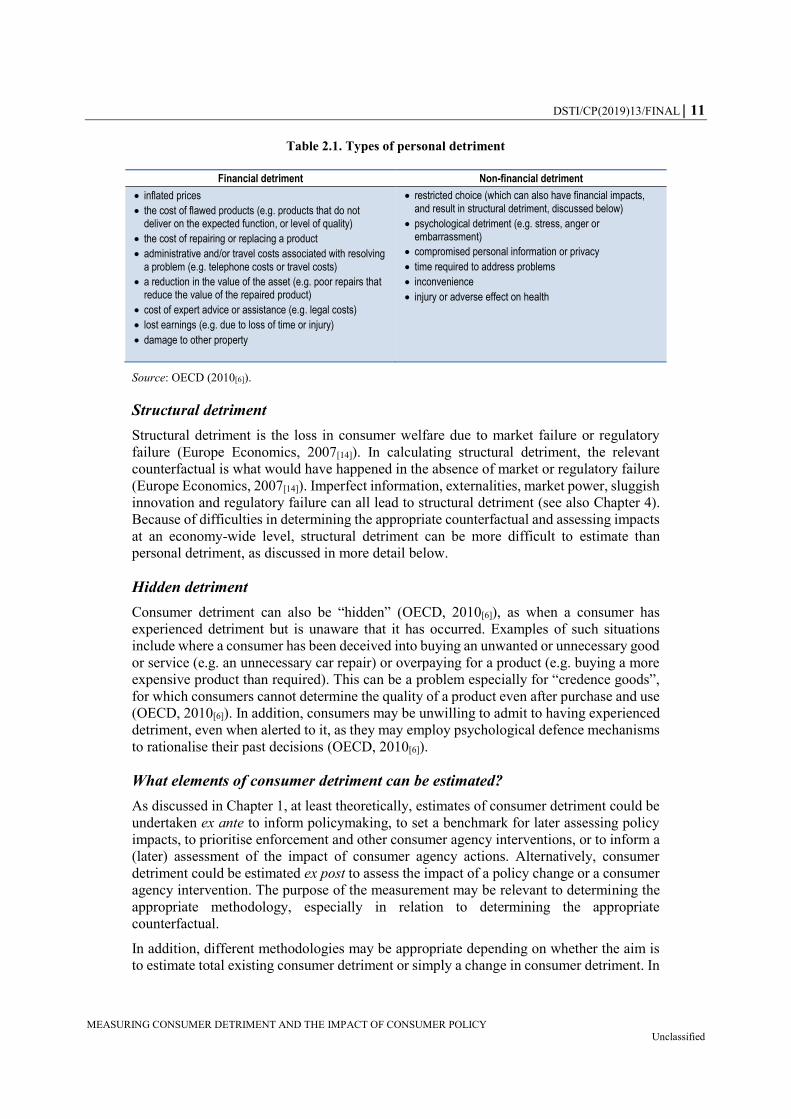
Economics, 2007[14]). Personal detriment can be financial or non-financial (see Table 2.1).
Non-financial components of personal detriment tend to be more difficult to measure than
financial aspects.
DSTI/CP(2019)13/FINAL 11
MEASURING CONSUMER DETRIMENT AND THE IMPACT OF CONSUMER POLICY Unclassified
Table 2.1. Types of personal detriment
Financial detriment Non-financial detriment
inflated prices
the cost of flawed products (e.g. products that do not deliver on the expected function, or level of quality)
the cost of repairing or replacing a product
administrative and/or travel costs associated with resolving a problem (e.g. telephone costs or travel costs)
a reduction in the value of the asset (e.g. poor repairs that reduce the value of the repaired product)
cost of expert advice or assistance (e.g. legal costs)
lost earnings (e.g. due to loss of time or injury)
damage to other property
restricted choice (which can also have financial impacts, and result in structural detriment, discussed below)
psychological detriment (e.g. stress, anger or embarrassment)
compromised personal information or privacy
time required to address problems
inconvenience
injury or adverse effect on health
Source: OECD (2010[6]).
Structural detriment
Structural detriment is the loss in consumer welfare due to market failure or regulatory
failure (Europe Economics, 2007[14]). In calculating structural detriment, the relevant
counterfactual is what would have happened in the absence of market or regulatory failure
(Europe Economics, 2007[14]). Imperfect information, externalities, market power, sluggish
innovation and regulatory failure can all lead to structural detriment (see also Chapter 4).
Because of difficulties in determining the appropriate counterfactual and assessing impacts
at an economy-wide level, structural detriment can be more difficult to estimate than
personal detriment, as discussed in more detail below.
Hidden detriment
Consumer detriment can also be “hidden” (OECD, 2010[6]), as when a consumer has
experienced detriment but is unaware that it has occurred. Examples of such situations
include where a consumer has been deceived into buying an unwanted or unnecessary good
or service (e.g. an unnecessary car repair) or overpaying for a product (e.g. buying a more
expensive product than required). This can be a problem especially for “credence goods”,
for which consumers cannot determine the quality of a product even after purchase and use
(OECD, 2010[6]). In addition, consumers may be unwilling to admit to having experienced
detriment, even when alerted to it, as they may employ psychological defence mechanisms
to rationalise their past decisions (OECD, 2010[6]).
What elements of consumer detriment can be estimated?
As discussed in Chapter 1, at least theoretically, estimates of consumer detriment could be
undertaken ex ante to inform policymaking, to set a benchmark for later assessing policy
impacts, to prioritise enforcement and other consumer agency interventions, or to inform a
(later) assessment of the impact of consumer agency actions. Alternatively, consumer
detriment could be estimated ex post to assess the impact of a policy change or a consumer
agency intervention. The purpose of the measurement may be relevant to determining the
appropriate methodology, especially in relation to determining the appropriate
counterfactual.
In addition, different methodologies may be appropriate depending on whether the aim is
to estimate total existing consumer detriment or simply a change in consumer detriment. In
12 DSTI/CP(2019)13/FINAL
MEASURING CONSUMER DETRIMENT AND THE IMPACT OF CONSUMER POLICY Unclassified
particular, while personal detriment may be estimated in either case, total structural
detriment (as opposed to changes in structural detriment) may be difficult to estimate given
difficulties in setting an appropriate benchmark (Europe Economics, 2007[14]). When
looking at the impact of specific consumer agency actions or consumer policies, either as
part of an ex ante or ex post assessment, it may be sufficient to estimate the change in
consumer detriment. In such cases, it may be possible to estimate both personal and
structural detriment. In comparison, if estimates of consumer detriment are being used to
identify problematic issues across the economy, either to inform policymaking or to
prioritise enforcement and other consumer agency actions, an estimate of the existing level
of consumer detriment may be more useful. In these cases, it may be more practical to
concentrate on measuring personal detriment (rather than structural detriment). Further,
most methodologies are unlikely to be useful in identifying hidden detriment. This is
especially the case for methodologies that rely on consumer views, such as consumer
complaints or consumer surveys, for example.
Possible information sources
There are already a number of information sources that can potentially inform the
measurement of consumer detriment including consumer complaints; consumer surveys;
consumer agency data, and; product safety data.
Consumer complaints
The OECD has previously undertaken work on the role of consumer complaints in
consumer policy (OECD, 2012[9]). Consumer complaints could be a useful input to
measuring consumer detriment since they “are likely to be a reflection of a consumer’s
unfulfilled expectations” (Europe Economics, 2007, p. 326[14]). However, as noted by
Europe Economics (2007, p. 326[14]):
… a consumer’s decision to complain is based on a consumer’s expectation about
the costs and benefits of complaining, whereas our definition of consumer detriment
is negative outcomes for a consumer relative to his reasonable expectations
concerning the consumption of a good or service. There may therefore not be a
perfect link between consumer complaints and personal detriment.
In particular, the effort required to complain, and the potential payoff from complaining,
will influence a consumer’s decision about whether to complain. In addition, external
factors, such as an awareness raising campaign undertaken by a consumer agency, can
impact the number of complaints received even where there has been no change in
underlying detriment (Ormosi, 2012[12]).
There are a number of avenues through which consumers may seek redress. Most
consumers will first contact the relevant retailer or manufacturer before contacting another
third-party such as a regulatory body, trade association, ombudsmen, the media, a consumer
organisation or a consumer affairs centre. Data from Australia suggests that as few as
4 per cent of consumers experiencing a problem contacted the relevant consumer affairs
agency (Consumer Affairs Victoria, 2011[15]). Data from the latest European Union
Consumer Conditions Scoreboard found that, of those consumers that encountered a
problem, only 5.4 per cent complained to a public authority, 5.0 per cent to an out-of-court
dispute resolution body, and only 1.9 per cent took it to court (EC, 2019[16]). Hence, any
estimate of consumer detriment based on consumer complaints made to a consumer agency
or other third-party organisation would need to be scaled up to reflect the fact that very few
DSTI/CP(2019)13/FINAL 13
MEASURING CONSUMER DETRIMENT AND THE IMPACT OF CONSUMER POLICY Unclassified
consumers that experience consumer detriment actually contact a consumer agency. At the
same time, the consumers that have gone on to contact a consumer agency may have done
so because they experienced greater detriment than the average consumer. For this reason,
where complaints data includes an estimate of detriment, these estimates may not reflect
average levels of detriment across the economy more broadly.
Another potential limitation of complaints data is that it does not necessarily represent the
experiences of all (or even average) consumers. In particular, certain demographics are
likely to be overrepresented in complaints databases, including older, educated, affluent,
and more urban consumers who speak the country’s predominant language (OECD,
2012[9]; Raval, 2019[17]). Hence, while complaints data can be very useful to inform the
understanding of consumer detriment, complaint rates may reflect differences in the
incidence of consumer reporting rather than consumer victimisation. For example, data
from the Consumer Sentinel Network (CSN) of the Federal Trade Commission of the
United States (US FTC) suggest that certain communities of vulnerable consumers may
complain less to government and other reporting agencies relative to their victimisation due
to lower levels of trust or general social capital (Raval, 2019[17]). To remedy this, consumer
agencies could consider using a statistical weighting approach to take into account
differences in reporting in order to use complaints to evaluate victimisation.
The method for collecting complaints may also impact the representativeness of complaints
data. For example, Portugal has a system whereby businesses are required to keep a
complaints book in their place of business, in which consumers can write complaints.
Complaints are then shared with the Consumer Directorate General within 15 days. Such a
system, which makes complaining relatively easy for consumers, could potentially yield
more representative data. This is likely to be especially true for businesses in which
consumers are aware of whether they have experienced detriment straight away (e.g. it
might be more useful in the case of a restaurant, than for a business that provides durable
goods where detriment may be experienced later). Portugal is also commencing work on
an electronic complaints book, which will allow for consumers to make complaints online.
There is variation in the type of complaints (and enquiries) data collected by consumer
agencies in different jurisdictions. A lack of uniformity on the type of information that
agencies collect makes comparisons across jurisdictions difficult (OECD, 2012[9]). Even
within the European Union, attempts to harmonise and report on standardised consumer
complaints data ceased in early 2019. In addition, few jurisdictions collect information on
estimated detriment, or even pricing information, which would be useful data for estimating
consumer detriment (OECD, 2012[9]). Hence, consumer complaints data in most
jurisdictions is unlikely to be sufficient to determine either the number of consumers
affected, or the likely detriment experienced. However, depending on the type of
information gathered, they may be useful in identifying:
the type of detriment that has occurred
the types of consumers that have experienced detriment
which sectors appear to be most problematic
the types of transactions associated with problems
how problems have changed over time (Europe Economics, 2007[14]).
Further, in some cases complaints data can be used as a lower-bound estimate of consumer
detriment. This is particularly the case where individual experiences of financial detriment
are easy to identify. One such example is for scams, where it is relatively easy for a
14 DSTI/CP(2019)13/FINAL
MEASURING CONSUMER DETRIMENT AND THE IMPACT OF CONSUMER POLICY Unclassified
consumer to identify what the direct financial detriment resulting from the scam was. The
Australian Competition and Consumer Commission (ACCC) publishes an annual report on
scams, which includes a lower-bound estimate of the amount of money lost to scams each
year, totalling $489.7 million AUD in 2018 (ACCC, 2019[18]). This estimate is derived from
complaints made to the ACCC and other relevant consumer agencies across Australia.
While the estimate likely understates the impact of scams, it does at least provide an order
of magnitude, which can highlight the importance of initiatives to address scams. It also
provides information on the types of scams and frauds that are being reported.
Similarly, the US FTC collects information on financial loss in its complaints database as
an optional field in the online complaint assistant, and it reports on aggregate financial
losses in its annual Consumer Sentinel Network Data Book (US FTC, 2019[19]). Although
such estimates do not reflect total detriment, it does provide a lower bound estimate. For
example, in 2018, people reported losing nearly USD $1.48 billion to fraud, with a median
loss (for all fraud reported) of USD $375 (US FTC, 2019[19]). Between 2014 and 2018,
consumers in the United States filed complaints with the US FTC’s CSN, reporting over
USD $6.25 billion lost to consumer fraud. The CSN Data Book also provides data on the
types of scams encountered, average amounts lost, and incidence of fraud, including as
experienced by different socio-economic groups (e.g. older consumers versus younger
consumers).
Consumer surveys
Data from consumer surveys may also be useful in estimating consumer detriment.
Consumer surveys can include surveys on consumer views, experiences (including
detriment), behaviours, awareness and competencies (OECD, 2012[10]). While these four
categories of surveys represent slightly different focuses, they may in some cases overlap.
The first three of these categories of survey are likely to be relevant to estimating consumer
detriment and are discussed below. Consumer awareness and competencies are less
relevant to consumer detriment but may be relevant to measuring the impact of consumer
agency actions (see Chapter 3).
Consumer views surveys
Consumer views surveys are used to solicit consumer views on market conditions
generally, or on specific consumer issues. Countries have used these surveys to improve
understanding of consumer satisfaction in the market generally, or in specific markets, and
to screen markets. General market condition surveys have been undertaken in Denmark,
the European Union, Japan and the United Kingdom (OECD, 2012[10]). In particular, every
second year (since 2008), the EC has produced a consumer conditions scoreboard which is
based on surveys of consumers’ and retailers’ attitudes towards cross-border trade and
consumer protection (EC, n.d.[20]). The Australian Government also undertook consumer
views surveys before and after the implementation of changes to the Australian Consumer
Law (The Australian Government the Treasury and EY Sweeney, 2016[21]). Among other
things, the survey considered consumer confidence with regards to being treated fairly in
the market and being supplied safe and reliable goods and services.
In addition, market-specific surveys have been undertaken in Australia (on the value of
cooling-off periods, opinions on warranties, and factors influencing consumer complaints),
the European Union (on cross-border shopping), and in the United Kingdom (on broadband
uptake). Further, for the 2017 G20 Consumer Summit, the German Federation of Consumer
Organisations (vzbv) commissioned a feasibility study on “Indicators of consumer
DSTI/CP(2019)13/FINAL 15
MEASURING CONSUMER DETRIMENT AND THE IMPACT OF CONSUMER POLICY Unclassified
protection and empowerment in the digital world” (Thorun et al., 2017[22]). A number of
the suggested indicators were to be based on a consumer survey which asked participants
to rate their agreement with a number of statements. Such indicators could potentially be
useful to corroborate other information used in relation to consumer detriment, including
to inform the measurement of more subjective issues, such as consumer trust.
Consumer views surveys can also be used to inform non-market valuations, such as
willingness to pay. In these cases, consumers are asked how much they would be willing
to pay to receive something (e.g. a longer warranty period), or to avoid something (e.g.
spam). This approach was applied by the United Kingdom’s Ofcom in estimating the
detriment from silent and abandoned calls, where survey participants were asked how much
they would be willing to pay to avoid these types of calls (see Annexes 7 and 8 of Ofcom
(2016[23])). More broadly, there are a range of non-market valuation methodologies
available, which could potentially be used to inform estimates of consumer detriment.
Consumer experience surveys (including consumer detriment surveys)
Consumer experience surveys gather information on the actual experiences of consumers
in markets, including where consumers have been misled, unfairly treated or affected by
deficient goods and services (OECD, 2012[10]). These types of surveys have been
undertaken in Australia on unsafe products and across a range of consumer issues in 24
selected markets. In addition, surveys on consumer scams and fraud have been undertaken
in Canada, Japan, the United Kingdom and the United States (OECD, 2012[10]; Anderson,
2019[24]). The OECD has also undertaken a consumer survey on trust in peer platform
markets (OECD, 2017[3]). This was done by focussing on the experiences of consumers in
specific peer platform market transactions.
In addition, every alternative year (since 2012; from 2008-12 it was every year), the
European Commission undertakes a markets monitoring scoreboard which tracks
performance in over 40 markets. It does so by asking consumers about their recent
purchasing experiences to understand: whether they trust sellers to respect consumer
protection rules; the comparability of offers; choice available in the market; fulfilment of
consumer expectations; and detriment caused by problems (EC, n.d.[20]).
Consumer experience surveys can also focus on estimating consumer detriment – so-called
“consumer detriment surveys”. Such surveys are designed to estimate the magnitude and
scope of consumer detriment, either within a specific market or across the economy more
broadly. As outlined in Table 2.2, a number of consumer detriment surveys have been
undertaken across the OECD, including in Australia, the European Union, Ireland, Japan,
the Netherlands, and the United Kingdom (including by Citizen’s Advice). There is
variability in the methodologies used, including in respect of the number of participants
surveyed, how detriment is estimated, survey coverage (i.e. the whole economy or just
specific markets) and resulting estimates. In the case of Japan, for example, an annual
survey of 10 000 consumers is used to estimate the incidence of detriment. Complaints
data, which captures estimates of detriment, is then used to determine the average
magnitude of detriment. The incidence of detriment is then multiplied by the average
magnitude of detriment to estimate overall detriment in Japan. There are also surveys (not
included in Table 2.2) that only estimate the incidence of detriment. For example, results
from the 2018 Canadian Internet Use Survey, found that 55% of online shoppers
encountered some sort of problem after completing an online order (Statistics Canada,
2019[25]).
16 DSTI/CP(2019)13/FINAL
MEASURING CONSUMER DETRIMENT AND THE IMPACT OF CONSUMER POLICY Unclassified
A number of jurisdictions have undertaken surveys to evaluate the impact of specific forms
of conduct, such as scams and fraud. For example, the US FTC’s Economics Bureau
recently released its fourth report on mass-market consumer fraud in the US that was based
on a 2017 survey (surveys were also undertaken in 2004, 2007 and 2013) (Anderson,
2019[24]). Among other things, these surveys look at how various consumer characteristics,
including demographics, relate to the likelihood of victimisation by the surveyed frauds.
The surveys also seek information about how such transactions occur, including: how
sellers first contact victims; how victims enter into these transactions, and; how victims
pay. The most recent survey estimated that there were 61.8 million incidents of fraud in the
United States in 2017, affecting 40 million adult consumers, with a median loss of
USD$100 (see also Table 2.2). Another survey was undertaken to look at the impact of
fraud interventions. The survey of 1 408 Americans and Canadians showed that 20 per cent
of consumers that engaged with a scam said that a third-party tried to intervene to stop the
scam. Further, about half of those who reported a third-party intervention were able to avoid
losing money (Deliema et al., 2019[26]).
DSTI/CP(2019)13/FINAL 17
MEASURING CONSUMER DETRIMENT AND THE IMPACT OF CONSUMER POLICY Unclassified
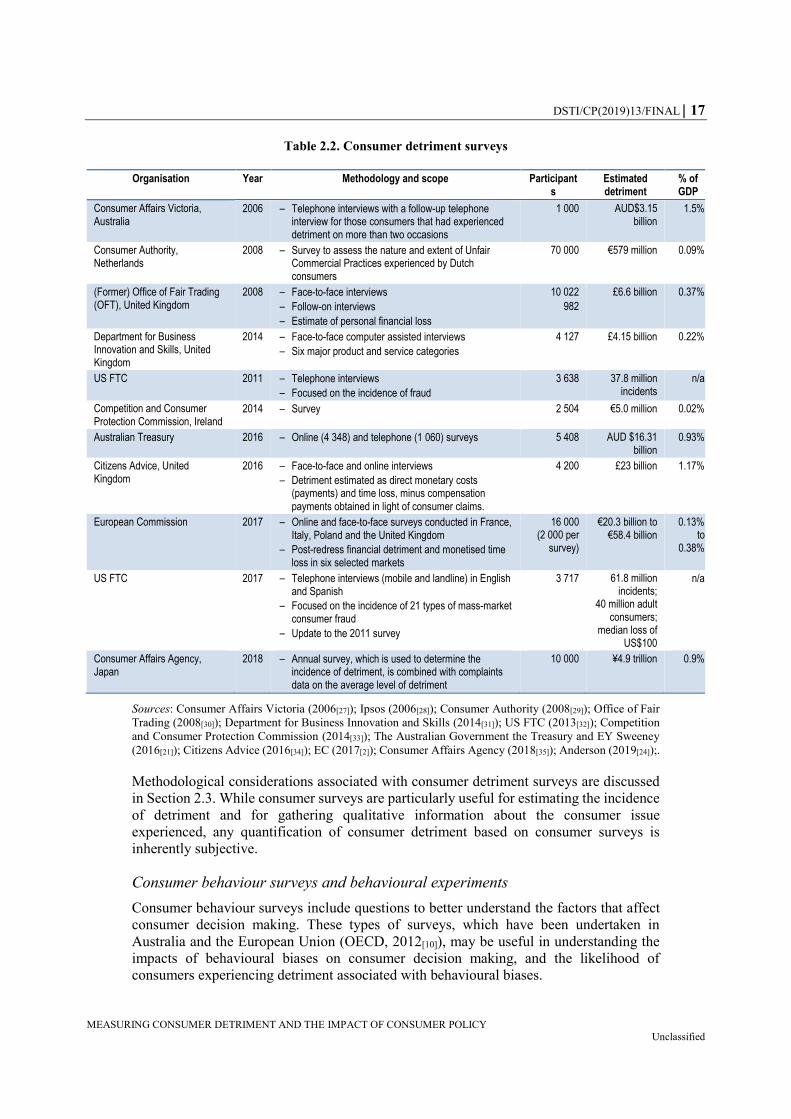
Table 2.2. Consumer detriment surveys
Organisation Year Methodology and scope Participants
Estimated detriment
% of GDP
Consumer Affairs Victoria, Australia
2006 ‒ Telephone interviews with a follow-up telephone interview for those consumers that had experienced detriment on more than two occasions
1 000 AUD$3.15 billion
1.5%
Consumer Authority, Netherlands
2008 ‒ Survey to assess the nature and extent of Unfair Commercial Practices experienced by Dutch consumers
70 000 €579 million 0.09%
(Former) Office of Fair Trading (OFT), United Kingdom
2008 ‒ Face-to-face interviews
‒ Follow-on interviews
‒ Estimate of personal financial loss
10 022
982
£6.6 billion 0.37%
Department for Business Innovation and Skills, United Kingdom
2014 ‒ Face-to-face computer assisted interviews
‒ Six major product and service categories
4 127 £4.15 billion 0.22%
US FTC 2011 ‒ Telephone interviews
‒ Focused on the incidence of fraud
3 638 37.8 million incidents
n/a
Competition and Consumer Protection Commission, Ireland
2014 ‒ Survey 2 504 €5.0 million 0.02%
Australian Treasury 2016 ‒ Online (4 348) and telephone (1 060) surveys 5 408 AUD $16.31 billion
0.93%
Citizens Advice, United Kingdom
2016 ‒ Face-to-face and online interviews
‒ Detriment estimated as direct monetary costs (payments) and time loss, minus compensation payments obtained in light of consumer claims.
4 200 £23 billion 1.17%
European Commission 2017 ‒ Online and face-to-face surveys conducted in France, Italy, Poland and the United Kingdom
‒ Post-redress financial detriment and monetised time loss in six selected markets
16 000 (2 000 per
survey)
€20.3 billion to €58.4 billion
0.13% to
0.38%
US FTC 2017 ‒ Telephone interviews (mobile and landline) in English and Spanish
‒ Focused on the incidence of 21 types of mass-market consumer fraud
‒ Update to the 2011 survey
3 717 61.8 million incidents;
40 million adult consumers;
median loss of US$100
n/a
Consumer Affairs Agency, Japan
2018 ‒ Annual survey, which is used to determine the incidence of detriment, is combined with complaints data on the average level of detriment
10 000 ¥4.9 trillion 0.9%
Sources: Consumer Affairs Victoria (2006[27]); Ipsos (2006[28]); Consumer Authority (2008[29]); Office of Fair
Trading (2008[30]); Department for Business Innovation and Skills (2014[31]); US FTC (2013[32]); Competition
and Consumer Protection Commission (2014[33]); The Australian Government the Treasury and EY Sweeney
(2016[21]); Citizens Advice (2016[34]); EC (2017[2]); Consumer Affairs Agency (2018[35]); Anderson (2019[24]);.
Methodological considerations associated with consumer detriment surveys are discussed
in Section 2.3. While consumer surveys are particularly useful for estimating the incidence
of detriment and for gathering qualitative information about the consumer issue
experienced, any quantification of consumer detriment based on consumer surveys is
inherently subjective.
Consumer behaviour surveys and behavioural experiments
Consumer behaviour surveys include questions to better understand the factors that affect
consumer decision making. These types of surveys, which have been undertaken in
Australia and the European Union (OECD, 2012[10]), may be useful in understanding the
impacts of behavioural biases on consumer decision making, and the likelihood of
consumers experiencing detriment associated with behavioural biases.
18 DSTI/CP(2019)13/FINAL
MEASURING CONSUMER DETRIMENT AND THE IMPACT OF CONSUMER POLICY Unclassified
In some circumstances, behavioural experiments can shed light on the likely impact of
particular forms of business conduct, where these prey on behavioural biases. A number of
experiments and studies have investigated the impact of a range of pricing practices
including drip pricing, time limited offers, bait pricing and reference pricing (Ahmetoglu,
Furnham and Fagan, 2014[36]; Ahmetoglu et al., 2010[37]; Laibson, 2012[38]; Office of Fair
Trading (UK), 2010[39]). An experiment commissioned by the OFT, in particular, included
estimates of the welfare impact of each of these practices (OFT, 2010[40]). In addition, the
CCP is currently looking at the impact of online disclosures about personalised pricing on
consumer decision making. The European Commission has also undertaken work on the
impact of disclosure in relation to online personalised pricing and offers (EC, 2018[41]).
There is also potential for behavioural experiments to inform our understanding of hidden
detriment. For example, hidden detriment could potentially occur where consumers agree
to problematic terms and conditions, perhaps because they did not read them or did not
understand them. Conducting systematic experiments, ideally with actual purchases based
on randomly selected traders’ terms and conditions, could help get a sense of how many
disadvantageous terms and conditions consumers are unknowingly signed up to. Ideally,
such an experiment would also identify whether consumers actually suffered detriment as
a result of the terms and conditions, as opposed to being put theoretically in a
disadvantageous position. For example, a paid subscription trap is likely to cause detriment
whereas a contract that limited a seller’s legal liability in a way that violated unfair contract
terms legislation may or may not cause consumer detriment. Such an experiment would
clearly require further consideration but could potentially be a useful method for better
understanding hidden detriment.
To the extent that such studies quantify the impact on consumers, they may inform
estimates of consumer detriment associated with these types of conduct, or changes in
consumer detriment as a result of consumer policy (e.g. disclosure). However, these studies
are not always reliable across time and between jurisdictions and the results are not always
able to be generalised (OECD, 2017[42]). In addition, these experiments can be costly and
time consuming, which makes them less likely to be used routinely by consumer agencies.
Consumer agency data
When consumer agencies undertake an investigation, they tend to gather a range of
information that may be useful in estimating consumer detriment. For example, they may
be able to gather information from businesses about consumer complaints and the outcomes
of such complaints, and most businesses are likely to have detailed pricing information.
Such information could potentially be useful if it can be used for this purpose (i.e. if there
are not legal limitations on the use of the information) and to the extent that any
commercially sensitive information is protected. In relation to specific cases, and consumer
agency actions (discussed in more detail in Chapter 3), consumer agencies may have
information that can be used to estimate consumer detriment more directly (especially
where these involve a price impact).
Product safety data
There are a number of data collected by agencies and the OECD on product safety,
including the following information sources:
Data from the OECD GlobalRecalls portal, which contains more than 24000
product recall notices from 46 jurisdictions (OECD, n.d.[43]). Data on the number
DSTI/CP(2019)13/FINAL 19
MEASURING CONSUMER DETRIMENT AND THE IMPACT OF CONSUMER POLICY Unclassified
of recalls per year and in particular product categories, for example, may help to
measure the extent of consumer harm in relation to product safety.
Similarly, the Safety Gate rapid alert system of the European Union enables quick
exchange of information between EU/EEA member states and the European
Commission about dangerous non-food products posing a risk to health and safety
of consumers, and may have relevant data (EC, n.d.[44]).
OECD global awareness campaign results: Every year, the WPCPS organises a
global awareness campaign on a key product safety issue. After the event,
jurisdictions report on their activities and the number of consumers reached.
Consumer reach may be indicative of consumer awareness, leading to more
informed decision-making by consumers, and a reduced risk of consumer harm.
The 2015 OECD product safety e-commerce sweep involving 25 jurisdictions
revealed that of the 685 banned and recalled products inspected, 68% were
available via e-commerce. If such data were collected over time, this could be
indicative of trends in potential consumer detriment.
Injury and consumer complaint data: Some consumer product safety authorities
collect and analyse injury and consumer complaint data. Many authorities also have
a mechanism for consumers to report a safety issue with a product. While this data
may not be comparable across jurisdictions, it can provide valuable insights on
consumer detriment. For example, an overall decrease in consumer complaints or
in the number of injuries may be indicative of improved consumer product safety.
Cost of injury and death: Some jurisdictions, such as the United States and
Australia, have developed methodologies to measure the annual societal cost of
injury and death caused by unsafe consumer products. If such data were collected
over time, it could highlight trends in consumer detriment. For example, a reduction
in this cost could be a key indicator of a reduction in consumer harm.
Data from online consumer reviews: Consumers can potentially use online reviews
to share concerns about product safety, including injuries (Kumara Bhat and
Culotta, 2017[45]). Data over time could potentially help prioritise enforcement and
education and awareness campaigns. Some consumer product safety authorities
have developed partnerships with online platforms to detect and remove unsafe
products from the platforms (OECD, 2018[46]).
Other data
An alternative approach for prioritising consumer policymaking and enforcement, in the
absence of information on consumer detriment, would be to look at national statistical
expenditure data to identify areas of the economy in which consumers spend most of their
income. In addition, one could consider expenditure by income to identify areas of the
economy in which low income consumers are more likely to be vulnerable, to the extent
that there is poor conduct in these markets. This was the approach taken by Israel’s
Consumer Protection and Fair Trade Authority. In particular, it decided to focus its annual
work plan in the area of retail sales of grocery products to consumers given the high level
of relative expenditure in this area of the economy, especially as a share of income for less
wealthy consumers (see Box 3.2). Such approaches are evident in other jurisdictions where
grocery and fuel markets are often the subject of market studies or enforcement priority.
20 DSTI/CP(2019)13/FINAL
MEASURING CONSUMER DETRIMENT AND THE IMPACT OF CONSUMER POLICY Unclassified
Measuring consumer detriment
In assessing the various methodologies for estimating consumer detriment, Europe
Economics (2007[14]) considered a wide range of options both in terms of methodology and
information sources. Options considered included consumer complaints data, consumer
surveys, word-of-mouth, mystery shopping, methods and models associated with
measuring market power, simulation models, game theoretic models, sectoral macro
models, computable general equilibrium (CGE) models, benchmarking, legal precedents
and expert opinion.
In assessing these alternative methodologies, Europe Economics (2007[14]) considered
whether each was:
Conceptually robust: does the methodology measure the right thing?
Measurable in practice: are the data likely to be obtainable in practice?
Simple to apply: would non-specialist desk officers find the methodology easy to
use?
Quick and low cost: can the methodology be applied quickly and at low cost?
Transparent to stakeholders: is the methodology intuitive, such that stakeholders
are likely to understand the results?
Widely applicable: is the methodology flexible enough to apply to multiple
situations and purposes?
Repeatable: can the methodology be repeated in new situations, or is it reliant on
one-off data from the past?
Having considered the alternatives against the criteria, Europe Economics decided that
consumer surveys were the most appropriate methodology for estimating consumer
detriment. Consumer surveys indeed have the advantage that they can provide a rich
understanding of an in issue by combining quantitative and qualitative questions. In
addition, they can be relatively straightforward to use and they offer a particular advantage
where there is limited existing data (or access to data). However, there are a number of
potential limitations. In particular, Europe Economics (2007[14]) noted that consumer
surveys can be time consuming, costly, and subjective. Further, consumer surveys, while
effective for estimating personal detriment, are not well-suited to estimating structural
detriment or hidden detriment (Europe Economics, 2007[14]). Other options for measuring
structural detriment are discussed in Chapter 4.
Methodological considerations for consumer detriment surveys
In recommending that consumer surveys be used to estimate consumer detriment, Europe
Economics (2007[14]) reviewed a consumer detriment survey undertaken by the OFT in
1999 and a survey on the impact of scams and fraud undertaken by the US FTC. These
surveys highlighted a number of methodological limitations and lessons for future surveys,
as discussed below.
Ensuring estimates are representative
One key limitation of the surveys studied by Europe Economics was that a small number
of high estimates had a big impact on the overall level of detriment (Europe Economics,
DSTI/CP(2019)13/FINAL 21
MEASURING CONSUMER DETRIMENT AND THE IMPACT OF CONSUMER POLICY Unclassified
2007[14]). Further, some categories of detriment were encountered infrequently, with a lot
of variability around the level of detriment. This meant that overall detriment could not be
estimated with a high degree of confidence, suggesting that, if the survey were carried out
at different times, differences in consumer detriment could be due to differences in
sampling rather than actual differences. In addition, given the high margins of error,
estimates of detriment for individual types of goods and services would not be meaningful.
As a consequence, these surveys could not allow for time-series or cross-sectional analysis
with any degree of certainty.
There are a number of ways to address this issue (Europe Economics, 2007[14]). One way
is to increase the sample size. However, the OFT (2000[47]) estimated that a sample size of
around 100,000 consumers would be required, at an estimated cost of 3 million GBP per
annum. Another way is to include a split sample whereby respondents would be asked
questions about either a random issue, or the worst issue they had experienced to shed more
light on those experiences that had the most impact on consumers. Yet another option is to
undertake a wide sample to gather data on the overall characteristics of consumer problems,
use the survey to identify respondents that have experienced large financial detriment, and
then survey these people in more detail (Europe Economics called this the “omnibus
filter”). The subsequent survey undertaken by the OFT in 2008 (see Table 2.2) used this
omnibus approach to estimate consumer detriment at the sectoral level (Office of Fair
Trading, 2008[30]), as did the 2017 survey undertaken by the EC (EC, 2017[2]). Such
approaches are particularly useful for estimating the prevalence of consumer issues and to
gather qualitative details associated with consumer detriment.
To ensure that adequate sample sizes are used in respect of specific markets, the European
Commission (2017[48]) suggests looking at both the incidence of problems incurred in the
market, as well as the market penetration rate. This can be done by looking at past surveys
on consumer detriment, for example. In some cases, this analysis will identify that a
particular market (or issue) is not well-suited to analysis through a survey due to a very low
incidence of problems or the small size of the market. To the extent that there is particular
interest in the experiences of a subset of consumers, such as a specific vulnerable consumer
group, an economy-wide survey may also not be fit-for-purpose. In such cases, targeted
focus groups or mystery shopping (discussed in more detail below) may be more
appropriate to the extent that a problem has been identified (for example, through consumer
complaints).
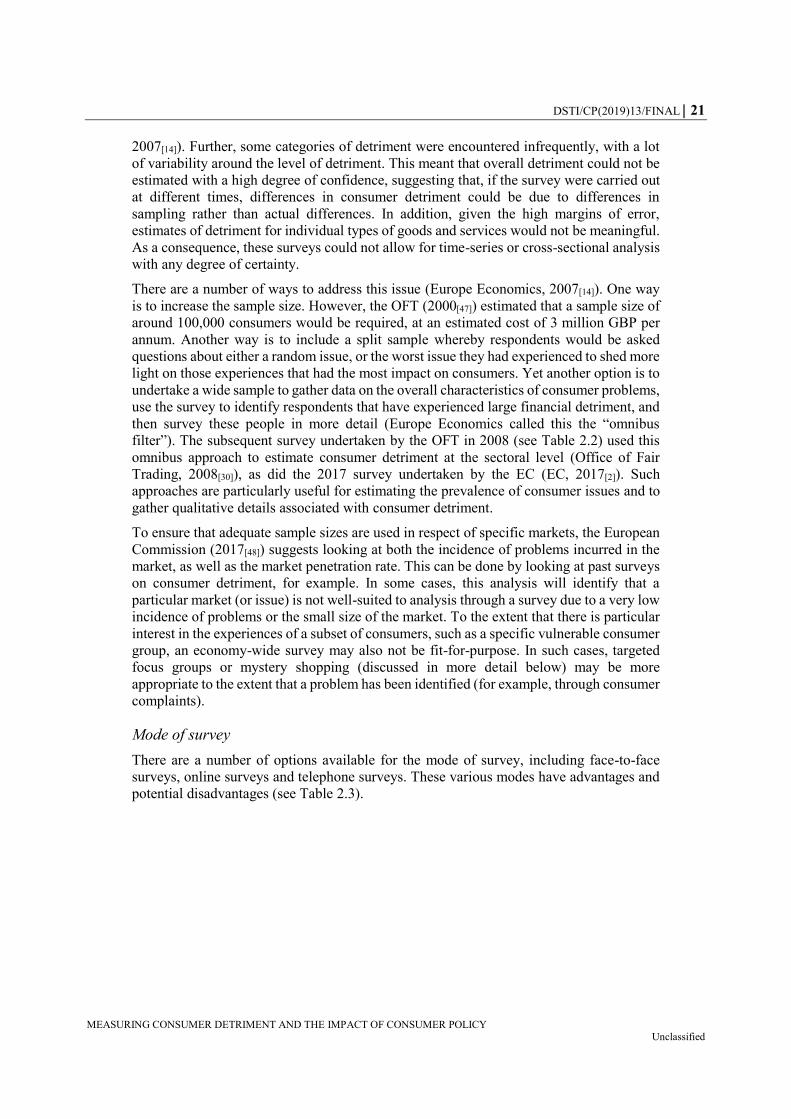
Mode of survey
There are a number of options available for the mode of survey, including face-to-face
surveys, online surveys and telephone surveys. These various modes have advantages and
potential disadvantages (see Table 2.3).
22 DSTI/CP(2019)13/FINAL
MEASURING CONSUMER DETRIMENT AND THE IMPACT OF CONSUMER POLICY Unclassified
Table 2.3. Survey modes
Mode Advantages Disadvantages
Face-to-face surveys - Can be designed so as to be representative of the entire population
- Considered to be the most robust approach
- Interviewer can verify answers
- Presence of the interviewer can result in less accurate or less detailed responses in some circumstances
- Consumers may be more likely to decline these types of interviews
- Highest cost
Online surveys - Provides anonymity
- Allows respondents to go at their own pace
- Lowest cost
- No ability to ensure respondents have considered questions
- More prone to self-selection biases (if they self-select)
- Not necessarily representative of the broader population
Telephone surveys - Can be designed so as to be representative of the entire population
- Interviewer can verify answers
- Presence of the interviewer can result in less accurate or less detailed responses in some circumstances
- Consumers may be more likely to decline these types of interviews
- Second most costly approach
- Less well-suited to longer surveys
Sources: Europe Economics (2007[14]); European Commission (2017[48]).
In its 2007 report, Europe Economics recommended undertaking face-to-face surveys
(Europe Economics, 2007[14]). It considered that telephone interviews were not suited to
such a long survey and that online surveys would not be representative of the general
population. However, it may be that different modes are appropriate for different purposes,
or there may be benefit in using multiple modes. As noted by the European Commission
(2017, p. 13[48]), while face-to-face surveys are the:
… gold standard in market research … potential biases in all modes do not make
it possible to state definitively and for all situations the degree to which results
obtained in one mode are more accurate than results obtained in another.
For this reason, the European Commission (2017[2]) used both an online panel and
face-to-face interviews for its most recent survey on consumer detriment.
Survey questions
Europe Economics (2007[14]) provided some general guidance on consumer detriment
surveys, including that: questions should be clear; the order should be considered; answers
to multiple choice questions should be complete; estimates should be verified; and a pilot
should be undertaken.
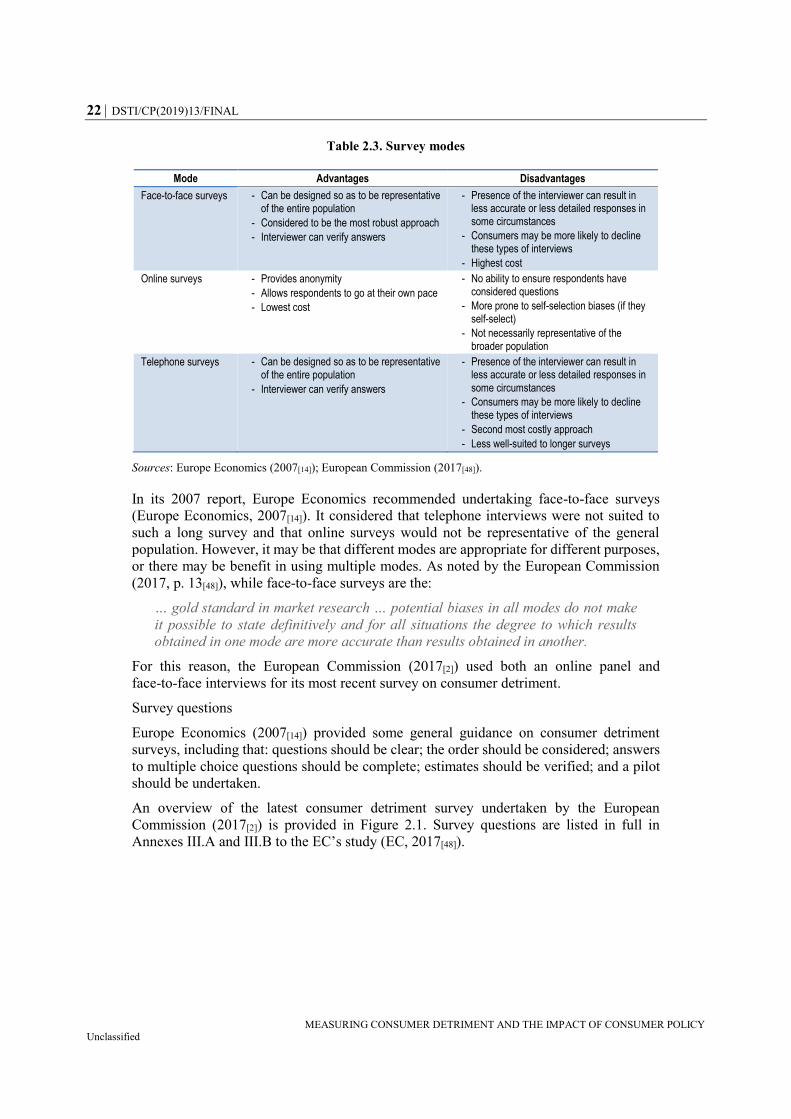
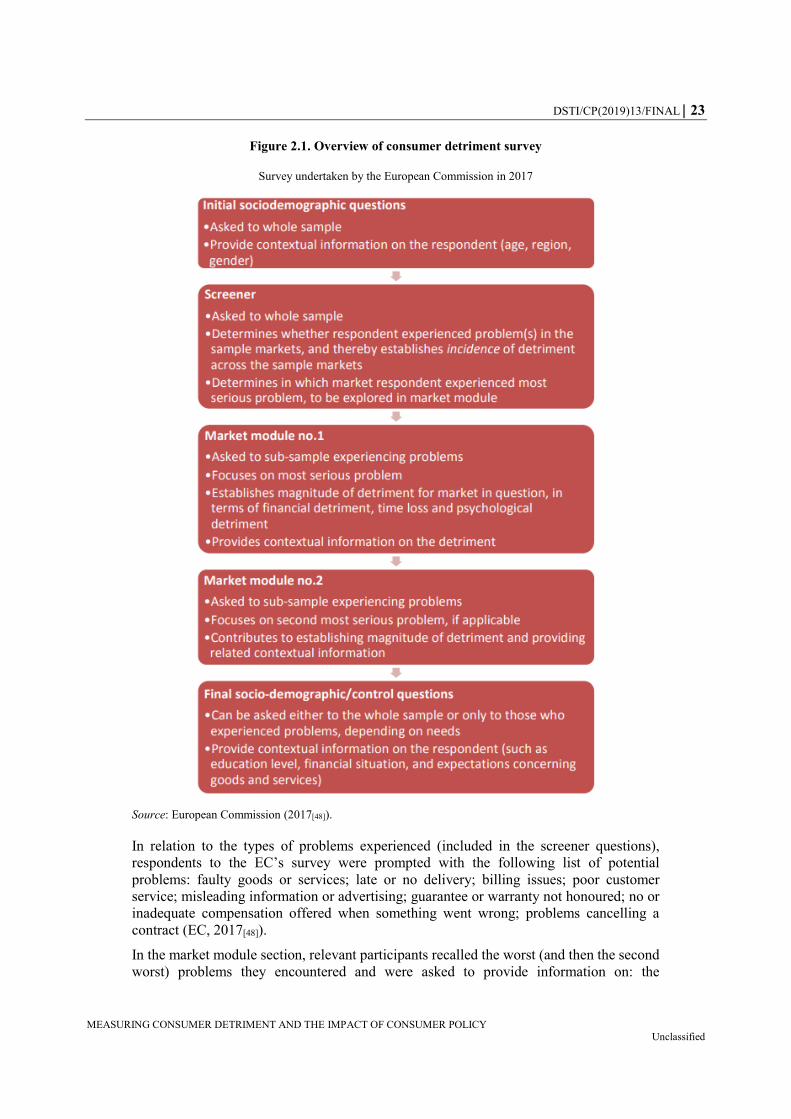
An overview of the latest consumer detriment survey undertaken by the European
Commission (2017[2]) is provided in Figure 2.1. Survey questions are listed in full in
Annexes III.A and III.B to the EC’s study (EC, 2017[48]).
DSTI/CP(2019)13/FINAL 23
MEASURING CONSUMER DETRIMENT AND THE IMPACT OF CONSUMER POLICY Unclassified
Figure 2.1. Overview of consumer detriment survey
Survey undertaken by the European Commission in 2017
Source: European Commission (2017[48]).
In relation to the types of problems experienced (included in the screener questions),
respondents to the EC’s survey were prompted with the following list of potential
problems: faulty goods or services; late or no delivery; billing issues; poor customer
service; misleading information or advertising; guarantee or warranty not honoured; no or
inadequate compensation offered when something went wrong; problems cancelling a
contract (EC, 2017[48]).
In the market module section, relevant participants recalled the worst (and then the second
worst) problems they encountered and were asked to provide information on: the
24 DSTI/CP(2019)13/FINAL
MEASURING CONSUMER DETRIMENT AND THE IMPACT OF CONSUMER POLICY Unclassified
good/service; the problem encountered; actions taken by the consumer or reasons for not
taking action; the impact on the consumer (including time loss, psychological detriment
and money spent trying to sort out the problem), and; actions taken by the trader, including
any reimbursement or compensation (EC, 2017[48]). The survey contained many questions
to get at these issues. Some questions were tailored to the specific product/service and the
type of problem experienced by the respondent. Markets covered included mobile
telephone services; electricity services; loans and credit (not including mortgages) and
credit cards; large household appliances; train services; clothing, footwear and bags; and
other goods or services.
Last, socio-demographic questions were included to provide context and to allow for
analysis of detriment along socio-demographic characteristics. As noted at the CCP’s
October 2019 roundtable on measurement, including these types of questions allows for an
analysis of detriment to be undertaken between socio-demographic groups. For example,
to understand the impacts on more vulnerable consumers, such as those on lower incomes,
those in financial difficulty, less educated consumers, and younger and older consumers.
Qualitative questions on barriers to consumers seeking and obtaining appropriate redress
could also be useful.
Estimating the incidence and magnitude of detriment
Consistent with the EC’s approach in 2017, consumer detriment surveys can be used to
estimate both the incidence and magnitude of consumer detriment.
The incidence of personal consumer detriment refers to the number of consumers that have
experienced a problem, as a percentage of total consumers. This can be estimated by
looking at the number of survey respondents that reported having experienced a problem,
as a percentage of the total sample surveyed (EC, 2017[48]). Where sample sizes, market
data and survey questions permit, the incidence of detriment can be calculated across
sectors, industries or markets, as well as across the different categories of problems
encountered.
The calculation of the magnitude of detriment will depend somewhat on the survey
questions. However, the first step is usually to calculate detriment for each respondent that
experienced a problem. In undertaking this calculation, the European Commission
(2017[48]) started by calculating each respondent’s pre-redress financial detriment, which
was the sum of:
any reduction in value or loss of service relating to loss in usability of a good or
service, as a result of the problem
any overcharge, extra charges or hidden fees
any costs incurred by the consumer trying to sort out the problem.
It then calculated the value of any substantial redress, which was the sum of any monetary
redress and the value of any repairs or replacement by the trader. Post-redress financial
detriment was then calculated by subtracting the substantial redress from the pre-redress
financial detriment.
In addition, the European Commission (2017[48]) estimated the cost of time losses by
deriving a population-weighted mean hourly earnings rate for the European Union using
country-specific mean hourly earnings from Eurostat. The calculation yields a
population-weighted mean hourly earnings rate for the European Union of EUR 13.40. This
approach differed from that taken by Ipsos for Consumer Affairs Victoria, which instead
DSTI/CP(2019)13/FINAL 25
MEASURING CONSUMER DETRIMENT AND THE IMPACT OF CONSUMER POLICY Unclassified
based time cost on the individual’s stated pre-tax income (Ipsos, 2006[28]). Where income
was not provided, income was estimated based on the individual’s employment status using
data from the Australian Bureau of Statistics (Ipsos, 2006, p. 9[28]).
An estimate of financial detriment at the country level was calculated by multiplying
average financial detriment per capita, by the population. Average financial detriment per
capita was calculated by multiplying average financial detriment per problem, by the
incidence of problems in each market. The same approach was applied to time loss.
Last, the European Commission (2017[48]) extrapolated the results to estimate detriment at
the European Union level. It did so using data from its market monitoring survey on the
incidence of problems at the country level, and pricing data. Both data sources were
population weighted.
Non-survey based methods for evaluating consumer detriment
In addition to consumer detriment surveys, there have been some attempts to estimate
consumer detriment associated with specific consumer issues through more direct means.
In some cases, this has been done as part of estimating the impact consumer agency actions
(see Section 3.3). Other examples include:
Work by the Economics Bureau of the US FTC on the consumer detriment
associated with deceptive claims made by the Volkswagen Group of America (VW)
regarding its supposedly “clean diesel” VWs and Audis, which had actually been
fitted with emissions defeat devices to mask high emissions during government
tests (Carlson et al., 2017[49]). To remedy the deceptive claim, consumers could
participate in a buy back scheme or have their vehicle repaired or modified to
comply with the claim. The counterfactual in this case was that consumers would
have bought a different vehicle, and the detriment was identified as i) the price
premium for the clean emissions claims; ii) the lost opportunity to avoid creating
excess emissions iii) for consumers who accessed a repair or modification, any loss
in performance or resale value, and; iv) any associated transaction costs. US FTC
staff developed a simple conceptual model to ensure that the remedies offered
would at least compensate for the consumer detriment experienced.
Development of a model by the US FTC’s Economics Bureau to identify content
providers who are more likely to be engaging in “cramming”, which is the
fraudulent practice of charging consumers for text messages that the did not
authorise (Balan et al., 2015[50]). Focussing on refund rate as a measure of revenue,
it used a non-parametric finite mixture model to sort content providers into groups
depending on their likelihood of being crammers.
Work on estimating the impact of drip pricing, as noted in the previous section on
consumer behaviour surveys and behavioural experiments. In addition, an US FTC
conference on drip pricing in 2012 brought together a number of examples of
attempts to understand the impacts of drip pricing (Shelanski et al., 2012[51]).
Complaints data could also be used to inform detriment estimates in specific cases.
This has for example been the case in Portugal in 2017, where complainants
provided information on price increases imposed by four telecommunications
operators without warning or the ability for consumers to terminate their contracts.
In this example, the stated price increases, multiplied by the number of effected
consumers, could be used as an estimate of personal financial detriment.
26 DSTI/CP(2019)13/FINAL
MEASURING CONSUMER DETRIMENT AND THE IMPACT OF CONSUMER POLICY Unclassified
Triangulation of estimates
Triangulation, which involves using two or more sources of data or research methodologies
to validate and verify results, may be a useful exercise to undertake with any resulting
estimates of consumer detriment. As noted in the European Commission Better Regulation
Toolbox (Tool #4)“the application and combination of several research methodologies in
the study of the same phenomenon … enhances confidence in results if different methods
lead to the same result” (EC, n.d., p. 20[52]).
In relation to the verification of results from a consumer detriment survey, the European
Commission (2017[48]) suggested the following sources for triangulation:
literature review of previous surveys and reports
data on consumer complaints (discussed above)
interviews with experts, consumer organisations and complaint handling bodies
mystery shopping, which involves the collection of information by field workers
posing as shoppers (see the Consumer Policy Toolkit (OECD, 2010[6]) for some
examples of mystery shopping)
court awards for cases of harm or injury, in cases where the measurement of
detriment from adverse effects on health is included in the assessment.
As noted at the CCP’s roundtable in October 2019, qualitative and case study approaches
can be useful for developing a granular understanding of why, how, and under what
conditions consumer policies, programs and specific actions succeed or fail. In particular,
such approaches, which could include focus groups, consumer diaries, in-depth interviews,
observation or qualitative surveys, can complement more quantitative approaches.
However, such approaches cannot be relied upon in isolation since they: cannot always be
used to infer causality; can be difficult to “scale up” the results to draw general conclusions,
and; are not always easy to replicate and verify.
Conclusions
There are a number of examples of surveys being used to estimate both the incidence and
magnitude of consumer (personal) detriment. While such approaches can be somewhat
subjective, the results can be useful for identifying areas in which consumers are suffering
from detriment, and the types of consumers that are most at risk. Such information can be
useful in prioritising consumer policy making or review, as well as the actions of consumer
agencies, be it greater enforcement or consumer education. Further, given that surveys can
also be used to elicit qualitative information, they can also help to identify barriers to
effective redress that consumers face when they encounter a problem, as well as providing
qualitative information about the types of problems being experienced and the consumer
and business roles and responsibilities in relation to this. For this reason, while potentially
more expensive than some other methodologies, consumer surveys offer a good
opportunity for consumer authorities and policymakers to get a better understanding of
(personal) consumer detriment. Other sources of information, such as complaints data, may
also be useful in certain contexts.
DSTI/CP(2019)13/FINAL 27
MEASURING CONSUMER DETRIMENT AND THE IMPACT OF CONSUMER POLICY Unclassified
3. Consumer agency actions
Measuring the impact of consumer agency actions could be used to demonstrate the value
of consumer agencies. In particular, it could be used to justify expenditure on consumer
protection given its value for money/return on investment. It may also be a requirement
from government to ensure accountability (Ormosi, 2012[12]). While this type of
measurement may not be well suited to cross-country comparison, it could be used to
highlight trends over time and to prioritise the work of consumer agencies.
At least four consumer agencies have experience in measuring the impact of their
enforcement actions. These are the United Kingdom’s Competition and Markets Authority
(CMA), the US FTC, the Authority for Consumers & Markets (ACM) in the Netherlands,
and the Competition and Consumer Commission of Singapore (CCCS). In addition, a
number of competition agencies undertake these types of assessments in respect of their
competition functions, consistent with the OECD’s Guide for helping competition
authorities assess the expected impact of their activities (OECD, 2014[53]).
This chapter explores the types of actions that consumer authorities can undertake and
possible ways to measure their impact, drawing on the methodologies followed by the
CMA, the US FTC, the ACM, and the CCCS.
Policy tools
There are a range of tools available to consumer agencies in enforcing consumer policy
(OECD, 2010[6]). Tools can be categorised as demand-side or supply-side: demand-side
tools work on the consumer side of the market whereas supply-side tools work on the
business/supplier side of the market. The feasibility of measuring the effect of these
different tools is discussed in more detail below. In addition to the policy tools available to
consumer agencies, consumers may also seek redress by contacting a business directly, or
by taking private action against a business.
Demand-side tools
Demand-side tools include consumer education and awareness, information provision and
disclosure, and dispute resolution. Consumer education and awareness, as well as
information provision and disclosure, aim to empower consumers, which can lead to more
effective markets, thus addressing structural detriment. On the other hand, dispute
resolution is more directly aimed at ensuring that consumers that have experienced
detriment have processes available by which they can seek redress, thus addressing
personal detriment.
Awareness campaigns tend to be short-term media-oriented actions that focus on a specific
issue (OECD, 2010[6]). The benefit of awareness campaigns is that they can be targeted at
a specific consumer response (for example, to encourage consumers to compare energy
offers), making them potentially able to be measured in terms of outcomes. For example,
the effectiveness of an awareness campaign encouraging the return of a product recall could
theoretically be tested by monitoring the number of returns made before and after the
campaign. As long as a metric can be used as a proxy for the intended outcome, there is the
potential to measure the benefit of an awareness campaign by looking at the metric both
28 DSTI/CP(2019)13/FINAL
MEASURING CONSUMER DETRIMENT AND THE IMPACT OF CONSUMER POLICY Unclassified
before and after the campaign. However, it may still be difficult to translate these types of
metrics to a measure of consumer detriment or another type of financial benefit or cost.
Education initiatives tend to be more long-term in approach, making it difficult to evaluate
their impacts, especially in relation to consumer competencies and outcomes (OECD,
2010[6]). Surveys which test consumer competencies could potentially be informative but
linking this to a change in consumer outcomes (or detriment) is likely to be difficult.
In relation to information disclosure, while businesses in many jurisdictions have
information disclosure responsibilities and requirements (see Chapter 4), there may also be
cases where there is a role for the government in providing information to consumers. For
example, government provision of information may be beneficial where there are
insufficient incentives for the market to provide unbiased information. For this reason, there
are a number of government-run comparison tools across the OECD (OECD, 2010[6]). Such
tools may save consumers money by identifying products or service plans that better suit a
consumer’s needs at lesser cost. Such consumer benefits may be relatively easy to measure
to the extent that the tool collects information on a consumer’s current plan and the plan
that they are switching to.
Dispute resolution can be facilitated by the business itself, or through a third-party, such as
an ombudsman, civil society organisation or consumer protection agency. In addition,
consumers may seek resolution through private or collective actions. Given these options,
consumer agencies may wish to consider which types of consumer issues are best dealt
with through agency initiated actions as compared to consumer-initiated actions.
Supply-side tools
Supply-side tools include moral suasion, codes of conduct, standards, prohibitions and
enforcement.
Moral suasion can be used by governments seeking to influence or pressure firms into
meeting a particular objective involving consumers without directly regulating the firms
(OECD, 2010[6]). This could be achieved by promoting corporate responsibility,
recognising consumer-friendly initiatives (e.g. through awards), criticising firms that have
a bad consumer record, or threatening firms with regulation. Codes of conduct, trust marks
and standards can also improve consumer outcomes, either by lifting the standard of quality
in respect of a particular issue (or issues), clarifying processes, or (on the demand-side)
improving consumer understanding and trust. Similarly, prohibitions can help to protect
consumers by ensuring that particularly detrimental forms of conduct are illegal.
Supply-side measures may also address ways in which businesses resolve issues directly
with consumers. For example, by requiring a business or industry to put in place systems
for alternative dispute resolution and/or online dispute resolution (with and without
mediation).
The effectiveness of supply-side measures can potentially be estimated by measuring the
extent of a consumer problem before or after a consumer agency takes a supply side
intervention. How easy this is and the level of confidence around the results would depend
on the specific form of intervention applied.
Enforcement measures
Enforcement measures include persuasion, warning letters, civil penalties (and monetary
restitution), cease and-desist orders, bans, licence suspension and licence revocation, and
DSTI/CP(2019)13/FINAL 29
MEASURING CONSUMER DETRIMENT AND THE IMPACT OF CONSUMER POLICY Unclassified
criminal sanctions (OECD, 2010[6]). Enforcement actions can be informed by consumer
complaints, market monitoring, and other coordinated approaches to gathering relevant
information, including through Internet “sweeps”. Such sweeps involve undertaking a set
of predefined checks on a specific category of websites at a particular point in time to
identify breaches of consumer law. In general, the results of the sweep will be used to
inform further enforcement action. These types of sweeps have been undertaken across the
European Union each year since 2007 (EC, n.d.[54]).
Enforcement actions tend to involve a specific issue or form of conduct that the consumer
agency is trying to address. For these reasons, the impacts of enforcement actions may be
easier to measure (at least in some way) as compared with some of the other types of actions
that can be undertaken by consumer agencies. In particular, if the scope of the problem had
been measured in some way prior to enforcement occurring, then this could also be
measured after the enforcement action to see what effect the enforcement action had.
Alternatively, some estimate of average consumer detriment could be calculated and
applied to the estimated number of affected consumers. However, in practice, such
measurement is still likely to be difficult, as will be discussed below in the examples from
the relevant consumer agencies.
Product safety tools
New digital tools that enable authorities to detect and deter issues with consumer products
at an early point are also available, such as domestic recall databases in a number of
countries, and the OECD GlobalRecalls portal. In addition to these informational tools,
authorities also have at their disposal a range of regulatory and corrective action tools,
including:
information orders
product safety alerts and warnings for consumers
interim and permanent bans (i.e. prohibition to supply a specific product that is
deemed unsafe)
mandatory regulations that specify key safety requirements
orders to change a product to make it safe
orders to seize unsafe products
product withdrawal
product recalls.
Use of the above tools is subject to an authority’s risk assessment of a product safety issue,
which combines the probability of a product safety incident occurring and the severity of
harm if such an incident is to occur (OECD, 2013[55]). The impact of such tools may be
measured by the number of times they are utilised by an authority and the level of risk of
consumer harm that is being mitigated by the tool each time it is implemented, for example.
Possible information sources
Relevant estimates of consumer detriment are likely to be useful to estimating the impact
of consumer agency actions. Hence, consumer surveys and complaints data (discussed in
Chapter 2) remain relevant. In addition, information on consumer awareness and
30 DSTI/CP(2019)13/FINAL
MEASURING CONSUMER DETRIMENT AND THE IMPACT OF CONSUMER POLICY Unclassified
competencies may be relevant. Such information could come from targeted consumer
awareness and competencies surveys, or from tracking the impact of awareness raising in
other ways (see below). Further, agency information on resources devoted to specific
actions, and detailed case-specific information, are likely to be particularly useful sources
of information.
Consumer awareness and competencies surveys
Consumer awareness and competencies surveys are used to evaluate consumers’
knowledge about key issues, and their ability to address the challenges that arise. These
types of surveys have been undertaken to assess baseline levels of consumer knowledge
regarding consumer rights in Australia, the European Union, New Zealand, and the United
Kingdom (OECD, 2012[10]).
Such surveys could potentially be used as an input to assessing the impact of awareness
raising and education efforts undertaken by consumer agencies. However, it might be
difficult to isolate the effects of such campaigns from other influences such as media reports
and coverage, for example (in such cases, direct measures of how consumers have
interacted with a campaign may be more useful – see section below). Even with this
limitation, such surveys could potentially be informative where they focus on an issue that
a consumer agency has been trying to raise awareness around and where the survey is
undertaken both before and after the agency action, to see how awareness has changed as
a result of the campaign. Alternatively, such surveys can be used to identify gaps in
consumer knowledge and understanding which can be used to prioritise the efforts of
consumer agencies in relation to education and awareness raising activities.
Other consumer agency data
In estimating the costs associated with agency actions, consumer agency budget data is
likely to be an important input. Budget data should help to identify staffing costs,
overheads, and legal and other expert consultancy costs incurred in relation to a particular
action, or administration more broadly.
Consumer agencies may also have information that could be indicative of the effectiveness
of some forms of intervention. For example, consumer agencies could track the number of
times that an online resource has been viewed to see how many consumers it is potentially
reaching. For awareness campaigns on social media, consumer agencies could analyse the
engagement level of a post, for example.
Further, information gathered as part of an investigation will also be very useful for
determining consumer detriment and hence, the impact of any consumer agency action
undertaken to address that detriment. Similarly, information gathered as part of any Internet
sweep, may be useful.
Measuring the impact of consumer agency actions
The impact of consumer agency actions can be initiated ex ante, to decide whether to take
a particular action, or ex post to determine the impact of an intervention. As noted by the
International Consumer Protection Enforcement Network (ICPEN) (2017[56]), in the case
of ex ante assessments, three key factors that an agency may wish to consider are:
the estimated size of the affected turnover associated with the issue
DSTI/CP(2019)13/FINAL 31
MEASURING CONSUMER DETRIMENT AND THE IMPACT OF CONSUMER POLICY Unclassified
the (expected) benefit of the intervention (for example, removing or avoiding a
price increase)
the length of time that the benefit could be attributed to the agency.
However, in some cases these factors will be difficult to determine, especially where the
perceived benefits do not directly relate to a change in price. Hence, undertaking such
assessments usually relies on a number of simplifying assumptions in place of relevant
data.
In comparison, ex post assessments tend to assess the impact of an intervention by looking
at the situation before the intervention as compared to the situation after the intervention.
Impacts could be on the demand (i.e. consumer) or supply (i.e. business) side of the market,
depending on the intervention.
The various methodologies followed by the CMA, the US FTC, the ACM and the CCCS,
in assessing the impacts of various interventions are discussed below.
Approach of the CMA
Where possible, the CMA uses case specific data to estimate the impact of its interventions.
In general, it looks to quantify the average or individual personal financial consumer
detriment related to the conduct and apply this to the number of affected consumers for the
relevant period, using discounting as appropriate (see below for some examples).
Where data is not available, the CMA instead estimates a percentage price effect (normally
1-2%, but up to 5 % - see examples below) and applies this to the turnover that was affected
by the abuse. The CMA multiplies the resulting estimate by the assumed duration of the
impact. It conservatively assumes that, absent any intervention, the conduct would have
continued for at least two years. Where evidence, usually gathered during the investigation,
indicates that a different duration is appropriate, for example, due to the length of contracts
in the industry, then a different duration may be used. Impacts beyond the first year are
discounted using a standard government discount rate. This methodology, while generally
carried out after an intervention has occurred, is essentially an ex ante assessment since it
does not actually assess what the impact was over the relevant time period, but rather, the
expected impact.
To demonstrate these two methodologies, here are some examples:
In 2016, the CMA intervened in the elderly care home sector to prevent care homes
from charging for the remainder of the billing period after a resident had died
(CMA, 2016[57]). In this case, the number of residents involved, the billing periods
used by the providers targeted by the intervention, and their prices, were known
from the initial investigation. Combined with survey evidence on the number of
days left on residents’ contracts once they depart, a precise figure for annual
detriment could be calculated ex ante.
In 2016, the CMA also performed an evaluation of a consumer case concerning
unfair gym contracts that was previously carried out by the OFT (CMA, 2016[58]).
In this case, the benefit was calculated by estimating the number of consumers who
were able to cancel their contracts as a result of the intervention (who were unable
to do so before), multiplied by the amount of money this saved them. A mixture of
evidence gathered during the initial investigation, and surveys of both gyms and
consumers, was used. This ex post assessment was conducted in 2016 to evaluate
the impact of interventions made between 2011 and 2013.
32 DSTI/CP(2019)13/FINAL
MEASURING CONSUMER DETRIMENT AND THE IMPACT OF CONSUMER POLICY Unclassified
In 2015, the CMA led a project with the European Commission and Consumer
Protection Cooperation (CPC) network authorities to engage with the five largest
car rental companies in the United Kingdom (and their subsidiaries) to address a
range of unfair practices in the short term car hire market (CMA, 2015[59]). It
conducted an ex ante review of the impact of the project using data from market
research (for example, Mintel (2015[60]) and Moody’s (2015[61])), complaints data
from Citizen’s Advice, and commercial data from the companies themselves.
In a case about unfair cancellation terms for weddings and events (CMA, 2016[62]),
the CMA estimated the (ex ante) impact using the following methodology. Average
detriment was estimated as the average amount of money lost (through retained
deposits and cancellation fees) by complainants. This represented the average cost
incurred by a person cancelling a wedding absent the intervention. The number of
weddings per relevant business was estimated, as was the proportion of weddings
which may be cancelled. This figure was multiplied by the average detriment, and
scaled down to account for a proportion of businesses not engaging in harmful
conduct prior to the intervention, and scaled down further since the intervention
was not expected to address all of the detriment. Since the CMA acted alongside
seven other members of the CPC network, 50 % of the impact was ascribed to the
CMA (as it was responsible for the bulk of the work).
As outlined at the CCP’s October 2019 roundtable, the CMA also looked at the
impact of opaque contracts, unfair auto renewals and misleading pricing by ten
consumer cloud storage businesses. In this case it looked at affected revenues, and
multiplied this by an assumed price effect to determine the prevented detriment.
The price effect was assumed to be 5 % for serious or multiple practices, and 1-2 %
for other practices (e.g. a lack of transparency).
As was also noted at the CCP’s roundtable, quantification of the impacts of an action is
sometimes extremely difficult. For example, consider an example of commitments made
by high-profile influencers to properly label paid-for posts on social media. The impact of
this could potentially be estimated by multiplying the number of incorrectly labelled ads,
by the number of consumers who saw those posts, by the proportion who did not realise
that the post was an ad, by the proportion of consumers who made a purchase due to the
ad, by the financial detriment from making a sub-optimal purchase. However, it is not clear
how many of the parameters could be estimated, making it challenging to measure the
impact of this intervention.
The following learnings from the CMA’s experience in undertaking these types of
estimates were noted at the CCP’s roundtable:
The best estimates usually come from case-specific methodologies that are applied
with close involvement of the case team, preferably soon after the intervention.
Where there is less case-specific data available, there is a need to rely on
assumptions. For example, to assume that a percentage of revenue represents the
likely detriment. In respect of this, there is a need for more research to provide an
empirical basis for these assumptions. Possible research could include laboratory
experiments or analysis of businesses’ internal documents.
There is more work to be done for the more difficult cases where there is little
available data and research to support any necessary assumptions.
DSTI/CP(2019)13/FINAL 33
MEASURING CONSUMER DETRIMENT AND THE IMPACT OF CONSUMER POLICY Unclassified
The CMA has been estimating the impact of its actions for many years now and has
changed its methodology over time. Back in 2010, the (former) OFT (now the CMA),
published a guide for the methodology used at that time (OFT, 2010[63]). The guide
describes a process of estimating the impact of consumer interventions using complaints
data; treating the (de-trended) fall in the number of complaints following the intervention
as indicative of the decrease in consumer detriment which may be attributed to it (see
Annex B for an overview of this methodology). This methodology was found to lack
robustness since the number of complaints about a firm might not be linked to the extent
of detriment in a clear way (as was discussed in Chapter 2). For example, a successful
intervention may cause an increase in complaints due to increased awareness (Ormosi,
2012[12]). This led the OFT/CMA to abandon this methodology in favour of the two
approaches outlined above.
Approach of the US FTC
As part of its annual financial report, the US FTC assesses its performance compared to a
target goal through, for instance, estimating total consumer savings compared to the amount
of its resources allocated to consumer protection law enforcement (US FTC, 2017[64]). The
US FTC’s “total consumer savings” figures are composed of: i) the amount of money the
US FTC returned to consumers, and; ii) an estimate of the amount of harm that would have
occurred but for the US FTC’s enforcement action. To calculate the latter, the US FTC
assumes that the harm would have continued for only 12 additional months and that the
amount of harm that would have occurred in that period is the same as what occurred in the
past. The US FTC’s case managers then divide the total estimated economic injury by the
years the business operated to derive an annualised estimate of consumer injury for the
agency’s annual financial report.
The US FTC also publishes the total amount of refunds to consumers from its enforcement
actions each year (US FTC, 2017[65]). Once an US FTC lawsuit or settlement is finalised,
and the defendants have paid the money, the US FTC’s Office of Claims and Refunds
attempts to return the money to affected consumers. US FTC court orders facilitate this by
requiring the firm to provide a list of customers, their contact information, and how much
each customer paid. Where such lists are reliable, the US FTC sends monies to the relevant
consumers. In the absence of a reliable list, refunds are made using a claims process, usually
involving a media campaign to raise awareness. Alternatively, the US FTC may use its
internal complaints data to contact affected consumers directly. And, in some cases, the
business administers the redress. Any money left over at the conclusion of the refund
program is sent to the US Treasury.
Approach of the Netherlands’ ACM
Each year the ACM publishes a report on the effects of its law enforcement as part of its
annual report (see e.g. ACM (2017[66])). In the field of consumer protection, the report
covers both interventions and consumer outreach. As noted at the October 2019 roundtable,
the ACM has followed a standard method for calculating the effects of its actions since
2013, and a key objective of the approach is simplicity. Its standard methods of calculation
are published (in Dutch) (ACM, 2013[67]).
In general, the ACM’s approach focusses on the effects on price, quality and choice over
the short-term (e.g. 2 years), and aims to underestimate (rather than overestimate) the
impact. The ACM analyses the market situation before and after the intervention, as well
as the extent to which businesses comply with the rules. The ACM uses different methods
34 DSTI/CP(2019)13/FINAL
MEASURING CONSUMER DETRIMENT AND THE IMPACT OF CONSUMER POLICY Unclassified
depending on the type of intervention. Methodologies generally involve an assessment of
the consumer detriment addressed through the ACM intervention and can include the use
of quantitative and qualitative information gathered through questionnaires, requests,
inquiries and sweeps (ACM, 2017[66]). For example:
In one case, the ACM intervened to address incorrect termination fees and other
administrative errors in charges levied by a firm in the energy sector. The benefit
from this intervention was calculated as the differences in charges once the errors
had been addressed, and these benefits were assumed to last for three years (ACM,
2014[68]).
There was a drip pricing case in 2013 which resulted in consumers incurring extra
search costs and potentially making a wrong purchase. The ACM calculated that
the costs associated with this would be approximately equal to 0.75 % of realised
turnover and it assumed that these costs would be addressed by the enforcement
action (ACM, 2014[68]). The assumptions behind this calculation are outlined in
Box 3.1.
In another case, the amount of compensation paid out by a business was used as a
proxy for the harm that would have occurred in the next year if the ACM had not
intervened.
As noted in the roundtable, for cases involving unfair commercial practices (for
example, subscription traps), the general approach is to determine the likely
average detriment per consumer, and to multiple this by the number of affected
consumers. Where there is no data on the number of affected consumers, the ACM
multiplies the number of complaints by a factor of 20, based past research
undertaken by the former Office of Fair Trading of the United Kingdom.
The ACM also calculates the benefit from electricity and gas tariff regulation as the
difference between the initial tariff and the capped tariff multiplied by the average
household use and the number of contracts, as discussed in the roundtable.
In relation to consumer campaigns, the ACM aims to assess whether campaigns have
achieved their goals. However, where this is not possible, it looks at other indicators such
as the number of website visits and media reach. In some cases, the ACM has
commissioned external parties to assess the impact of campaigns through the use of online
tracking and surveying of consumers (ACM, 2017[66]).
The ACM notes that the actual gains are likely to be much higher than its estimates since
it does not calculate the effects of all of its interventions and since many benefits are hard
to measure in monetary terms (ACM, 2014[68]).
Approach of the CCCS
The CCCS has estimated consumer detriment in a number of instances, as a part of its
enforcement activities in Singapore. In particular, the CCCS is required to quantify the
consumer benefits that have arisen as a result of its decisions and interventions as part its
key performance indicators. Examples of CCCS initiatives include:
A case taken against a car importer who had misrepresented delivery dates and the
cost of the Certificate of Entitlement (COE). In this case, the counterfactual was
that consumers received their cars on the agreed date and paid the original agreed
prices. The calculation of harm (per consumer) was then the difference in the COE
DSTI/CP(2019)13/FINAL 35
MEASURING CONSUMER DETRIMENT AND THE IMPACT OF CONSUMER POLICY Unclassified
premium that car owners had to pay, the car rental cost to cover the delayed
delivery, and the time-cost of deposits. This was then multiplied by the number of
affected consumers.
A case involving the use of pre-ticked boxes for insurance by low cost airlines. To
assess the harm from this, it looked at the number of passengers using these low
cost airline services,2 and the number of passengers who purchased insurance.3 It
then looked to the literature and found a study which looked at the effect of pre-
ticked boxes on the number of passengers who paid for seat selection in rail travel.
This study showed that paid seat selection jumped from 9 % of passengers to 47 %
of passengers, a difference of 37 % (Goldstein et al., 2008[69]). It used this
benchmark to estimate the impact of the conduct.
In addition, as noted in Chapter 2, behavioural experiments can help to understanding how
consumers respond to certain commercial practices. Better understanding of consumer
behaviour can input into assessments about the consumer detriment before and after an
intervention (i.e. with and without the commercial practice). It is important to do these
experiments in multiple jurisdictions to test whether the results are influenced by
jurisdictional differences. In this respect, the CCCS is considering future behavioural
experiments on:
The impact of greater transparency in search ranking results and ownership links
between online travel agents and metasearch engines on consumer behaviour. This
was flagged as a potential issue in the CCCS’s market study on online travel
booking (CCCS, 2019[70]).
Improving information disclosures, building on the work undertaken by the CCCS
in developing its draft pricing transparency guidelines (CCCS, 2019[71]).
Reliance on consumer reviews in purchasing decisions, given the prevalence of
fake reviews and consumers’ limited ability to potentially identify fake reviews, as
uncovered by investigative journalists in Singapore.
36 DSTI/CP(2019)13/FINAL
MEASURING CONSUMER DETRIMENT AND THE IMPACT OF CONSUMER POLICY Unclassified
Box 3.1. Assumptions associated with the impact of drip pricing
In 2013, the ACM took enforcement action against Ryanair. In particular, airfares on
Ryanair’s website did not include all foreseeable and unavoidable costs, as was required
under regulation. This practice can result in consumers incurring higher search costs or
making a wrong purchasing decision.
To calculate the impact of this, the ACM first estimated Ryanair’s turnover in the
Netherlands. It then assumed that the costs of extra searching and wrong choices were equal
to 0.75 percent of realised turnover over two years. This assumption was made on the basis
of literature on search costs and assumptions around the costs of wrong decisions:
Hong and Shum (2006[72]) estimated the search costs associated with purchasing
books online to be between 3–4 % of the average price.
Koulayev (2009[73]) estimated the search costs of booking a hotel online to be about
$2.50 per hotel; about 3 % of the median hotel price and 2.5% of the average hotel
price.
Therefore, the ACM assumed that search costs are about 2.5 % of the average price. It then
assumed that around 20 % of search costs are due to non-transparent prices. Hence, the
additional search costs were estimated to be 20 % of 2.5 %, which is 0.5 % of the value of
a purchase.
The ACM found that there was a lack of literature on the costs associated with making a
wrong decision, or the impacts of drip pricing on the likelihood of making a wrong decision.
It therefore made the following assumptions to estimate the impacts of a wrong choice:
5 % of sales are due to a wrong decision to purchase
5 % of the price represents the value of a wrong purchase.
Five percent of 5% is equal to 0.25% of the value of the purchase.
Adding these two costs together gives 0.75 % of realised turnover. It then assumed that its
enforcement action addressed the entire consumer detriment associated with the conduct.
Source: Consultation with ACM staff.
Other approaches
While only a few consumer agencies undertake in-depth estimates of the benefits of their
interventions, many collect and report on other types of indicators of impact. For example,
the benefits of demand-side interventions can potentially be measured with reference to the
number of consumers reached via the various tools. This approach has been used previously
in Canada, where media coverage was used to indicate the impact of the policy (OECD,
2013[7]). Consumer agencies could also track the number of times that an online resource
has been viewed or consumer engagement with a social media post, for example.
On the supply-side, the number of businesses that have changed their practices could be
indicative of the benefits. Such an approach was used by the Israel Consumer Protection
and Fair Trade Authority to understand the impact of increased enforcement in the retail
grocery sector (see Box 3.2).
DSTI/CP(2019)13/FINAL 37
MEASURING CONSUMER DETRIMENT AND THE IMPACT OF CONSUMER POLICY Unclassified
The potential role of business surveys to understand business perceptions of and responses
to enforcement was discussed at the October 2019 roundtable, with this seen as a potential
way to understand the deterrent effect of consumer agency actions. In this regard, the Israel
Consumer Protection and Fair Trade Authority together with Professor Ariel from the
Institute of Criminology at Hebrew University, have designed a Business Deterrence
Survey, intended to examine the Authority's impact on businesses, from knowledge of the
law to compliance and deterrence.
The survey, which consists of an anonymous questionnaire within an academic research
project, examines a variety of issues including:
business familiarity with the Authority and the Consumer Protection Law
the level of compliance of the business and among similar businesses
compliance and deterrence questions including reasons for noncompliance, level of
deterrence, how businesses perceive their chances of being caught and how they
estimate the sanction that will be imposed in case of violation of the law
motivation for complying with the Law and about pro-active actions taken by the
business to comply with the Law.
The Authority has carried out a pilot telephone survey on a limited number of participants
in order to test its feasibility, and plans to circulate the survey online to tens of thousands
of businesses, with the aim of obtaining a representative sample, and to conduct the survey
periodically.
In a similar vein, the EC asks businesses about their views on consumer markets as part of
its Consumer Market Scoreboard publication. In 2017, the results showed a high positive
correlation between retailers’ views on enforcement and their assessment of compliance,
suggesting that enforcement does have a positive impact on compliance (EC, 2017[74]).
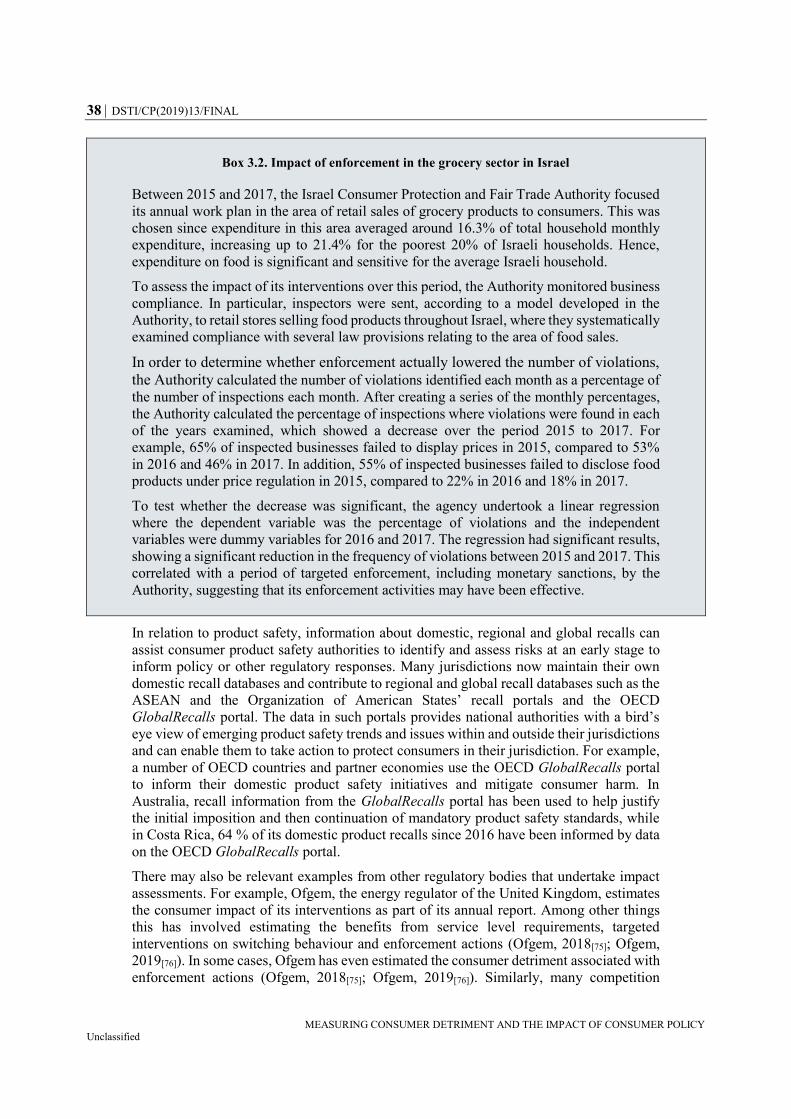
38 DSTI/CP(2019)13/FINAL
MEASURING CONSUMER DETRIMENT AND THE IMPACT OF CONSUMER POLICY Unclassified
Box 3.2. Impact of enforcement in the grocery sector in Israel
Between 2015 and 2017, the Israel Consumer Protection and Fair Trade Authority focused
its annual work plan in the area of retail sales of grocery products to consumers. This was
chosen since expenditure in this area averaged around 16.3% of total household monthly
expenditure, increasing up to 21.4% for the poorest 20% of Israeli households. Hence,
expenditure on food is significant and sensitive for the average Israeli household.
To assess the impact of its interventions over this period, the Authority monitored business
compliance. In particular, inspectors were sent, according to a model developed in the
Authority, to retail stores selling food products throughout Israel, where they systematically
examined compliance with several law provisions relating to the area of food sales.
In order to determine whether enforcement actually lowered the number of violations,
the Authority calculated the number of violations identified each month as a percentage of
the number of inspections each month. After creating a series of the monthly percentages,
the Authority calculated the percentage of inspections where violations were found in each
of the years examined, which showed a decrease over the period 2015 to 2017. For
example, 65% of inspected businesses failed to display prices in 2015, compared to 53%
in 2016 and 46% in 2017. In addition, 55% of inspected businesses failed to disclose food
products under price regulation in 2015, compared to 22% in 2016 and 18% in 2017.
To test whether the decrease was significant, the agency undertook a linear regression
where the dependent variable was the percentage of violations and the independent
variables were dummy variables for 2016 and 2017. The regression had significant results,
showing a significant reduction in the frequency of violations between 2015 and 2017. This
correlated with a period of targeted enforcement, including monetary sanctions, by the
Authority, suggesting that its enforcement activities may have been effective.
In relation to product safety, information about domestic, regional and global recalls can
assist consumer product safety authorities to identify and assess risks at an early stage to
inform policy or other regulatory responses. Many jurisdictions now maintain their own
domestic recall databases and contribute to regional and global recall databases such as the
ASEAN and the Organization of American States’ recall portals and the OECD
GlobalRecalls portal. The data in such portals provides national authorities with a bird’s
eye view of emerging product safety trends and issues within and outside their jurisdictions
and can enable them to take action to protect consumers in their jurisdiction. For example,
a number of OECD countries and partner economies use the OECD GlobalRecalls portal
to inform their domestic product safety initiatives and mitigate consumer harm. In
Australia, recall information from the GlobalRecalls portal has been used to help justify
the initial imposition and then continuation of mandatory product safety standards, while
in Costa Rica, 64 % of its domestic product recalls since 2016 have been informed by data
on the OECD GlobalRecalls portal.
There may also be relevant examples from other regulatory bodies that undertake impact
assessments. For example, Ofgem, the energy regulator of the United Kingdom, estimates
the consumer impact of its interventions as part of its annual report. Among other things
this has involved estimating the benefits from service level requirements, targeted
interventions on switching behaviour and enforcement actions (Ofgem, 2018[75]; Ofgem,
2019[76]). In some cases, Ofgem has even estimated the consumer detriment associated with
enforcement actions (Ofgem, 2018[75]; Ofgem, 2019[76]). Similarly, many competition
DSTI/CP(2019)13/FINAL 39
MEASURING CONSUMER DETRIMENT AND THE IMPACT OF CONSUMER POLICY Unclassified
authorities attempt to estimate the impact of their interventions. The OECD has released a
Guide for helping competition authorities assess the expected impact of their activities
(OECD, 2014[53]). Some of the key principles from the guide are summarised in Box 3.3.
In the roundtable in October 2019 (see Annex A for the roundtable agenda) a number of
delegates expressed their support for developing a similar methodology for the
measurement of consumer agency actions.
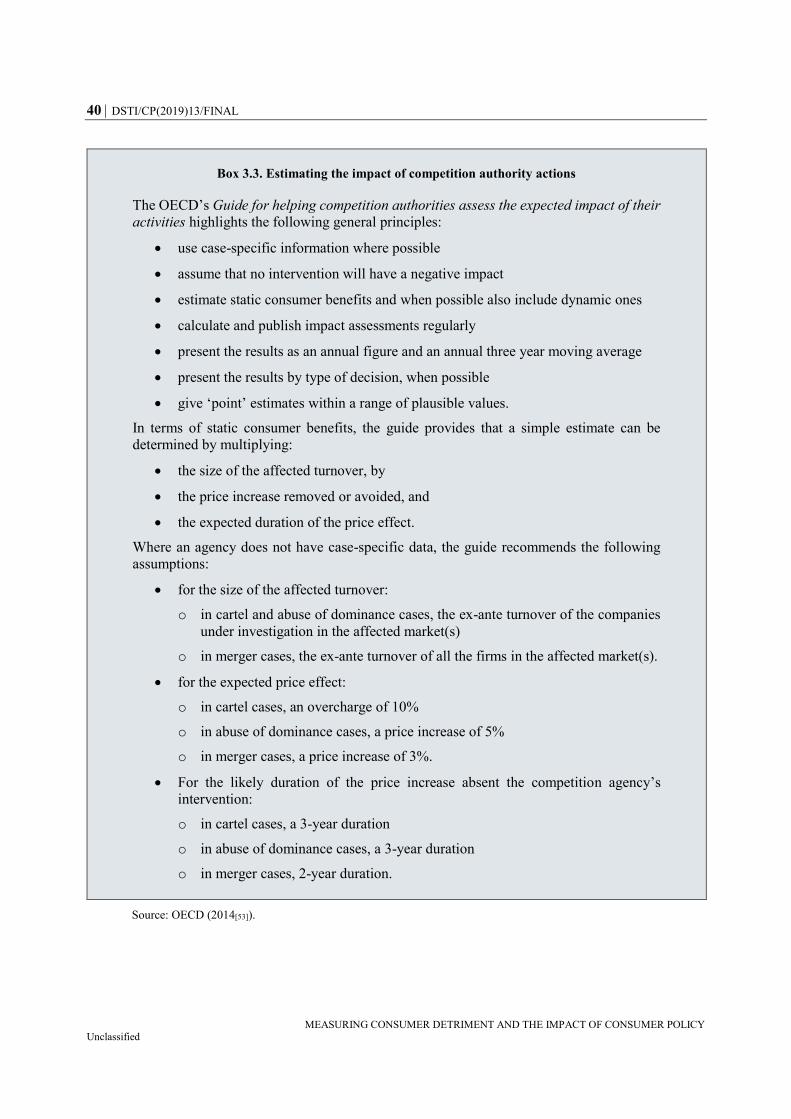
40 DSTI/CP(2019)13/FINAL
MEASURING CONSUMER DETRIMENT AND THE IMPACT OF CONSUMER POLICY Unclassified
Source: OECD (2014[53]).
Box 3.3. Estimating the impact of competition authority actions
The OECD’s Guide for helping competition authorities assess the expected impact of their
activities highlights the following general principles:
use case-specific information where possible
assume that no intervention will have a negative impact
estimate static consumer benefits and when possible also include dynamic ones
calculate and publish impact assessments regularly
present the results as an annual figure and an annual three year moving average
present the results by type of decision, when possible
give ‘point’ estimates within a range of plausible values.
In terms of static consumer benefits, the guide provides that a simple estimate can be
determined by multiplying:
the size of the affected turnover, by
the price increase removed or avoided, and
the expected duration of the price effect.
Where an agency does not have case-specific data, the guide recommends the following
assumptions:
for the size of the affected turnover:
o in cartel and abuse of dominance cases, the ex-ante turnover of the companies
under investigation in the affected market(s)
o in merger cases, the ex-ante turnover of all the firms in the affected market(s).
for the expected price effect:
o in cartel cases, an overcharge of 10%
o in abuse of dominance cases, a price increase of 5%
o in merger cases, a price increase of 3%.
For the likely duration of the price increase absent the competition agency’s
intervention:
o in cartel cases, a 3-year duration
o in abuse of dominance cases, a 3-year duration
o in merger cases, 2-year duration.
DSTI/CP(2019)13/FINAL 41
MEASURING CONSUMER DETRIMENT AND THE IMPACT OF CONSUMER POLICY Unclassified
Conclusions
A number of consumer agencies have been estimating the impact of their activities for some
years. Such assessments tend to be case-specific and the choice of methodology is
somewhat determined by information availability. The best estimates tend to be for cases
where there is good data on the incidence of detriment, the magnitude of detriment, and the
likely time horizon for the conduct (absent the intervention). In these cases, data is often
provided by the relevant business(es) as part of the investigation. In some cases, this
information has been supplemented with data and information from surveys.
In general, the magnitude of detriment is much easier to estimate where the case involves
a clear price impact, such as an overcharge, or a fee for an unwanted service. Detriment
associated with issues such as misinformation, misleading information, opaque pricing, and
some forms of unfair contract terms may be more difficult to quantify from the information
gathered as part of the investigation. In some of these cases, assumptions have been drawn
from the literature. For example, the ACM looked to the literature to inform its assumptions
on the impact of drip pricing (it assumed an impact of 0.75 % of revenue). Further, the
CCCS looked at the literature on the impacts of pre-checked boxes (one study found that
the purchase of pre-paid seating jumped from 9 % of passengers to 47 % of passengers with
pre-checked boxes). In other cases, rules of thumb have been used as a proxy of the price
impacts of these forms of conduct (e.g. the CMA’s use of a multiplier of 1-5 % of revenue,
depending on the conduct). Assumptions regarding the duration of the conduct range from
one to three years, except where there is information to support an alternative period.
As noted at the CCP’s roundtable, where assumptions are made, these need to be presented
transparently to allow for scrutiny of the results and continual improvement to the
methodology. Ideally, any important assumptions should also be subject to a sensitivity
analysis. Other methodological considerations requiring more attention include how to
account for any deterrent effect (if at all); what time frame to consider; how to consider any
gains to business at the expense of consumers (if at all); whether it matters if fines may go
to affected consumers or to government revenues, and; how to determine the
counterfactual.
42 DSTI/CP(2019)13/FINAL
MEASURING CONSUMER DETRIMENT AND THE IMPACT OF CONSUMER POLICY Unclassified
4. Consumer policy
This chapter outlines the qualitative benefits and costs of consumer policy and then
considers potential ways of measuring these benefits and costs. In most OECD countries,
consumer spending accounts for approximately 60% of Gross Domestic Product (GDP)
(OECD, 2019[77]); hence, consumer policy applies to a substantial proportion of the
economy and its impacts could potentially be wide-ranging.
Benefits of consumer policy
Consumer policy can result in a range of benefits, including:
Informed consumer decision-making: Some consumer policies address market
failures associated with imperfect and asymmetric information (OECD, 2010[6]).
For example, many jurisdictions require that businesses i) provide adequate
information about the business, product and the transaction; and ii) ensure that
information is not false, misleading or deceptive. These protections can help
consumers avoid financial and non-financial personal detriment associated with
making a poor purchase due to insufficient, false or misleading information. In this
context, financial detriment may be the cost involved in buying the wrong product
or paying too much, and non-financial detriment may be the hassle and stress
associated with buying an unsuitable product. More informed consumer decision-
making can also foster effective competition between businesses bringing greater
and lower prices for consumers, as well as increased productivity and economic
growth (OECD, 2014, p. 2[78]).
Improved consumer confidence and trust: Consumer policy can promote
consumer confidence and trust in markets, thereby contributing to greater consumer
engagement and economic growth (OECD, 2015[79]; Algan and Cahuc, 2013[80]).
For example, it can remedy market failures associated with externalities that occur
when the costs or benefits of an action are not entirely borne by the party making
the decision about whether to undertake the action as in the case of spam, and poor
data security. It can also address power imbalances between businesses and
consumers that might diminish consumer trust through, for example, contract terms
regulation and cooling off periods (UNCTAD, 2016[81]; OECD, 2010[6]). It can also
help to address practices (such as drip pricing) that may take advantage of
consumers’ behavioural biases (OECD, 2017[42]; OECD, 2018[82]). Such protections
can in part address some forms of structural detriment that would otherwise occur.
Consumer protections from frauds, scams and unsafe products: Coupled with
effective enforcement and education, prohibitions and other protections against
frauds, scams and unsafe products can also protect consumers. In particular, such
protections can reduce the risk of consumers suffering from financial and
non-financial detriment, and can otherwise compensate consumers where they do
suffer from these types of detriment. Addressing such issues can also promote
consumer confidence and trust, discussed above.
Analysis by the EC suggests that consumer conditions influence the economic and social
environment. In particular, while a direct causal link may be difficult to establish, there
appears to be a positive correlation between consumer conditions and i) gross adjusted
DSTI/CP(2019)13/FINAL 43
MEASURING CONSUMER DETRIMENT AND THE IMPACT OF CONSUMER POLICY Unclassified
disposable income per capita, ii) global competitiveness, iii) innovation, and iv) a number
of other social indicators. In addition, there appears to be a negative correlation between
consumer conditions and i) material deprivation, and ii) inequality (EC, 2017[74]).
Costs
While consumer policy brings a range of benefits, it can also impose direct and indirect
costs. These costs can be one-off or ongoing. Potential costs include:
Compliance costs: Including the costs of buying new equipment; employing staff,
consultants or experts to work on compliance; changing production processes, or;
collecting and storing information, for example (OECD, 2008[83]). Estimates of
compliance costs should ideally be informed through consultation with businesses.
Government costs: Including the costs borne by government in administering and
enforcing consumer policy including staff costs, overheads, and legal costs (OECD,
2008[83]).
Competition: Consumer policy could potentially have negative or unintended
impacts on competition if, for example, it sets rules that: restrict price competition
or advertising; raise barriers to entry, or; otherwise reduce competition between
businesses (OECD, 2008[83]). There may also be substitution effects to the extent
that one market is regulated and another is not (OECD, 2008[83]). However,
effective consumer policy, which empowers consumers and addresses information
asymmetries, is also a precursor to effective competition.
Innovation: Consumer policy could unintentionally stifle innovation if it makes it
more difficult for new businesses to enter a market, for example, by imposing
regulatory requirements that are costly or difficult to meet (OECD, 2008[83]).
However, consumer policy could potentially drive innovation to the extent that it
increases competition, as noted above.
Possible information sources
To the extent that estimates of consumer detriment are used as inputs to estimate the
impacts of consumer policy, the information sources and methodology discussed in
Chapter 2 remain relevant here. In addition, while not discussed below as a separate
methodology, surveys could be used to inform qualitative information around the impact
of consumer policy. For example, as noted at the October 2019 roundtable, in 2014, the
Consumer Directorate General of Portugal sent out surveys to arbitration centres, consumer
associations and local consumer information centres to evaluate the application of the
Consumer Rights Directive.
In addition, macroeconomic data (such as GDP and productivity estimates, for example)
may be required if the aim is to measure the macroeconomic impacts of consumer policy.
The OECD has access to a range of macroeconomic and other data that would likely suit
this purpose. To the extent that a specific consumer policy issue has competition impacts,
market power indicators may also be worth consideration. Of course, even where such data
exists, a key issue for measuring the impact of consumer policy would be to establish clear
links between these indicators/data and changes in consumer policy.
44 DSTI/CP(2019)13/FINAL
MEASURING CONSUMER DETRIMENT AND THE IMPACT OF CONSUMER POLICY Unclassified
Measuring the impact of consumer policy
This section looks at possible approaches to estimating the impacts of consumer policy.
Some of these approaches would be more appropriate for measuring the impacts of
consumer policy at a general level, whereas others could look at the effects of a change in
consumer policy (or new piece of consumer legislation), or to predict the impact of a new
type of consumer policy.
Some of the approaches canvassed below involve modelling. Econometric modelling and
simulation modelling are two broad approaches. There are some potential limitations with
these approaches, as discussed below. These limitations led the Competition Committee to
focus on qualitative analysis when looking at the impact of competition policy broadly
(OECD, 2014[78]).
More generally, measuring impacts over a longer time horizon can be difficult. As noted
by Ormosi (2012, p. 17[12]):
In general it is always difficult to assess the long-term effect of any public policy,
given the exponential rise of possible compounding effects with time, which makes
it difficult to distinguish effects that were caused by the intervention from effects
triggered by exogenous factors.
Econometric modelling
Econometric modelling can be used to estimate the impacts of various types of policy based
on actual changes in key indicators using historic data. For example, the OECD has done
work on looking at the impact of structural reforms in relation to product market regulation
and labour market policies (Égert and Gal, 2016[84]). Such analyses look at the impacts of
changes in policy on macroeconomic outcomes such as productivity, GDP and
employment, for example. This is done by constructing an econometric model of the
demand and supply conditions in the macro economy.
In theory, this type of modelling could be used to estimate the impacts of consumer policy
generally, as measured by an index of consumer policy stringency. Such an approach would
involve an assessment of the effectiveness of consumer policy in the various OECD
countries (and any other countries that might be included in the analysis), possibly by
considering a country’s performance on a range of indicators (which would need to be
developed and measured or assessed by subject matter experts). However, creating a robust
and defensible index of this type is likely to be challenging. Further, even with a robust
index, it may be difficult to isolate the impacts of consumer policy from the impacts from
other (potentially correlating) policies. For example, a country with strong consumer
protections may also have strong institutions and human rights protections, which could
also be expected to improve economic impacts. This may be especially difficult where the
modelling is undertaken at an economy-wide level, which is likely to be the case with
consumer policy, which tends to apply across a broad range of consumer markets.
Alternatively, this type of modelling could be used to look at the macroeconomic effects
from a significant change in consumer policy, or a new piece of consumer legislation. This
is more likely to be effective where the policy or legislative change is expected to have a
significant impact on the economy, and where other changes can be controlled for. What
might be more promising would be to look at industry or market-wide impacts where a
change in consumer policy impacts as specific industry or market. However, in practice,
consumer protections tend not to be industry or market specific.
DSTI/CP(2019)13/FINAL 45
MEASURING CONSUMER DETRIMENT AND THE IMPACT OF CONSUMER POLICY Unclassified
Econometric modelling has been used by the European Commission in a number of impact
assessments:
It was used (alongside simulation modelling – see below) to determine the impact
of its proposed “Digital contracts” package on cross-border online purchases by
consumers (EC, 2015[85]; Cardona et al., 2015[86]). In particular, using survey data
(EC, 2015[87]), Cardone et al. (2015[86]) developed a logit model to determine the
influence of the various barriers to engaging in cross-border e-commerce. They
then used an Ordinary Least Squares regression to determine the amount spent on
cross-border e-commerce from other European Union countries. The estimated
change in the number of consumers that buy online abroad, and spending on online
purchases from other European Union countries was then combined in a single
figure as an input into the simulation modelling (see below). A similar approach
was employed to determine the impact on cross-border online sales by businesses.
It was used in the assessment of the European Union’s “New Deal for consumers”
(EC, 2018[88]). In particular, to assess the extent to which implementation of
contractual or extra-contractual remedies in a country is associated with a lower
probability of a consumer experiencing an unfair commercial practice. This was
done by developing a Linear Probability Model (LPM) which used data from the
Consumer Conditions Scoreboard and data on the extent of remedies in each
European Union country. Combining results from this regression with other sources
of statistical information, the European Commission was able to estimate the
reduction in consumer detriment corresponding to a situation where all European
Union Member States would provide remedies linked to breaches of the Unfair
Commercial Practices Directive.
It was used to assess the impact of removing geo-blocking practices in the European
Union (EC, 2016[89]; Duch-Brown and Martens, 2016[90]). The core model was
based on discrete choice models of product differentiation (i.e. they used a
two-level nested-logit model). Data came from GfK Retail and Technology, an
European Union Mystery Shopping Survey and Euromonitor International’s
Passport Database.
While not specific to consumer policy, modelling has also been undertaken to
assess the impacts of a digital single market. See, for example, Civic Consulting
(2011[91]) and European Parliamentary Research Service (2017[92]).
As noted at the CCP’s roundtable, there are a number of potential benefits from
econometric modelling including that it can allow for a “bespoke” model to be built from
the bottom-up; it can provide flexibility in that the key parameter values can easily be
changed (and assumptions tested); and, it requires less data than is typically required in
simulation modelling (see below). However, there are potential limitations including that
these models tend to be partial analyses that do not capture wider indirect impacts (that are
better captured with simulation modelling), and that model specification is critical to the
validity of the results (key issues include omitted variables and endogeneity problems).
Further scoping work would need to be undertaken to understand whether econometric
modelling could be a useful tool for measuring the impact of consumer policy, and in what
circumstances. A cursory assessment suggests that this method might be useful in specific
circumstances where there is adequate data but that it may be less useful for determining
the impact of consumer policy generally on the macro economy.
46 DSTI/CP(2019)13/FINAL
MEASURING CONSUMER DETRIMENT AND THE IMPACT OF CONSUMER POLICY Unclassified
Simulation modelling
Simulation modelling is a type of modelling that looks at economic (or other) outcomes
with and without a type of policy (or other) intervention. Examples include computable
general equilibrium (CGE) models and agent-based models (ABMs).
CGE models are computer simulation models that use data to explore the economic
impact of changes in policy, technology and other factors (OECD, n.d.[93]).
Normally, CGE models work by implementing a “shock” to a variable in the model
to assess the economy-wide impacts of the shock. Common uses are to assess the
impacts of tariff changes or changes to productivity, for example. It is unclear how
consumer policy at a general level could be linked to the variables in a CGE model
without undertaking further work. Further, the OECD’s CGE trade model
(METRO) might not be fit-for-purpose (OECD, 2015[94]). That said, the European
Commission has used CGE modelling (using a version of the Global Trade
Analysis Project (GTAP) model) to estimate the impact of its “Digital contracts”
package on the economy (EC, 2015[85]; Cardona et al., 2015[86]). In this case, the
estimated impact on cross-border e-commerce (estimated using survey data and
econometric modelling) was inputted as a shock into the model to determine the
economy-wide impacts.
ABMs use a dynamic system of interacting, autonomous agents to allow
macroscopic behaviour to emerge from microscopic rules (OECD, n.d.[95]). Each
agent (person, institution or object) individually assesses its situation and makes
decisions consistent with rules assigned to it. The agents’ actions change the
environment. In the next period, each agent sees its new environment and takes
action again. Thus, there is an interaction between the agents and the environment,
and between one agent and another. Unlike many economic models, ABMs do not
assume that people are rational. Instead, they can include behavioural biases. There
have been ABMs built to look at consumer behaviour in markets (see, e.g. Baptista
et. al. (2014[96])), and one could imagine using ABMs to look at the effects of
specific issues such as imperfect information (albeit in a highly simplified
environment). However, it is less clear that ABM would be a good tool for
measuring the impacts of consumer policy overall at an economy-wide level.
As noted at the CCP’s roundtable, there are a number of potential benefits from simulation
modelling. One key benefit is that, if properly specified, such approaches can capture both
direct and indirect impacts from a policy change, including feedback effects across sectors
and other “spill over” effects. However, there are a number of potential limitations,
including that such models are based on an assumed set of relationships (that may not hold
in reality); require a significant amount of data (which are not always available); and, are
highly complex and technical.
Approaches based on estimates of consumer detriment
Another approach is the model developed by the Productivity Commission in Australia
(2008[97]), and later adapted by the ICF GHK (2013[98]). This model was built to estimate
the likely net benefit of the reforms recommended as part of its 2008 review of Australia’s
consumer laws and policy, as required in its terms of reference. The starting point was an
estimate of total consumer detriment, derived from a state-based survey undertaken in 2006
(Consumer Affairs Victoria, 2006[27]), and extrapolated for all of Australia. It then:
DSTI/CP(2019)13/FINAL 47
MEASURING CONSUMER DETRIMENT AND THE IMPACT OF CONSUMER POLICY Unclassified
reduced the detriment by 10% in case the reforms did not address the entire
detriment, to be on the conservative side (the figure of 10% was chosen based on
the Productivity Commission’s best judgement)
increased the detriment by 25% to account for emotional costs, drawing on relevant
literature and examples
increased the detriment by 10% to account for the fact that perceived risk is greater
than actual risk (the reasoning for this was supported by behavioural literature
generally, but the value of the reduction was a best guess by the Productivity
Commission).
The Productivity Commission used the above as a base and then assumed that the reforms
could reduce the resulting (overall) detriment by 5% (based on their judgement regarding
the likely impact), less transfers from businesses to consumers. It also accounted for
indirect benefits such as increased productivity, reduced transaction costs and reduced
compliance costs (from simplifying and harmonising consumer laws across jurisdictions).
While this approach was useful for developing a “ball park” estimate of the benefits from
the proposed reforms, the results are sensitive to the Productivity Commission’s
assumptions, which could not always be supported by data or literature. Further, while this
approach allowed the Productivity Commission to estimate the impact of the proposed
reforms, it would be less suited to determining the impact of consumer policy more broadly.
The main reason for this is that determining a counterfactual is likely to be particularly
difficult. In particular, identifying what level of detriment would be present in the absence
of any consumer policy would be challenging. Further, the Productivity Commission
included many qualifiers to note that the methodology was “experimental”. The report by
ICF GHK (2013[98]) applied the Productivity Commission’s methodology in a context of
the United Kingdom.
Conclusions
To date, it does not appear that anyone has attempted to assess the impact of consumer
policy (in entirety) on the macro economy. However, there have been several attempts to
assess the impacts of consumer policy changes, or new consumer policies. In many of these
examples the impacts largely came from harmonising consumer laws between jurisdictions
which can improve cross-border trade and reduce compliance costs on businesses.
Theoretically, a number of methodologies, including econometric modelling or simulation
modelling, could be used to measure the impacts of consumer policy. However, in both
cases, there would need to be more work on identifying and proving the links between
changes in consumer policy and changes in macroeconomic outcomes. Further, it is not
clear that there is sufficient existing data (or indicators) available that could easily be used
for these purposes. Last, these approaches are inherently more complex and technical,
making them potentially less accessible for some audiences.
For the above reasons, much more work would need to be undertaken to further develop
methodologies for measuring the macro economic impact of consumer policy. The benefits
and costs of undertaking such work should be carefully considered given consumer
agencies’ limited resources and competing demands. In the October 2019 roundtable, the
CCP did not support further work in this area over the short-to-medium term.
48 DSTI/CP(2019)13/FINAL
MEASURING CONSUMER DETRIMENT AND THE IMPACT OF CONSUMER POLICY Unclassified
Annex A. Agenda for CCP’s Roundtable on Measuring Consumer Detriment
and Consumer Agency Actions, 23 October 2019
The OECD’s Committee on Consumer Policy (CCP) has been working for over a decade
on improving the evidence base for consumer policymaking to ensure that it is based on
the best available data concerning likely costs and benefits. In an effort to continue this
work, the CCP has started looking at the feasibility of measuring consumer detriment and
the impact of consumer policy and consumer agency actions.
The purpose of this roundtable is for delegates to share their experiences in relation to
measurement, especially in relation to measuring consumer detriment and the impact of
consumer agency actions. A draft feasibility study has been prepared to support the
discussion [DSTI/CP(2019)13].
Background
Building on work already undertaken by the CCP, including in developing the Consumer
Policy Toolkit, the draft feasibility study looks at possible methodologies for estimating:
1. consumer detriment (Chapter 2)
1. the impact of consumer agency actions (Chapter 3)
2. the impact of consumer policy more broadly (Chapter 4).
The main findings of the draft feasibility study are summarised below.
Estimating consumer detriment
Consumer detriment is the loss or damage experienced by a consumer as a result of a
problem relating to the purchase of a good or service (“product”). This may be the case
when a product does not meet the consumer’s requirements, is faulty, or over-priced.
Consumer detriment comprises personal and structural detriment. Personal detriment
focuses on the negative outcomes experienced by individual consumers relative to some
benchmark such as reasonable expectations. In comparison, structural detriment is the loss
in consumer welfare due to market or regulatory failure. Consumer detriment can be
financial or non-financial. Further, there can be “hidden” detriment when a consumer has
experienced detriment but does not realise it. These concepts are discussed in Chapter 2 of
the draft feasibility study. If jurisdictions are able to estimate consumer detriment they can
use this to identify areas in which consumers are experiencing problems and to quantify
the magnitude of these impacts. This can allow for more informed policymaking and better
prioritisation of consumer agency actions.
A number of information sources are relevant to estimating consumer detriment. These
include consumer complaints data and consumer surveys covering consumer views,
experiences (including consumer detriment) and behaviours. Consumer detriment surveys,
in particular, are especially useful for estimating financial personal detriment, and could
potentially inform non-financial personal detriment (e.g. in relation to lost time). However,
they are less useful for estimating structural detriment. A number of jurisdictions, including
Australia, the European Union, Japan, the Netherlands, the United Kingdom and the United
States, have undertaken consumer detriment surveys and there has already been much work
DSTI/CP(2019)13/FINAL 49
MEASURING CONSUMER DETRIMENT AND THE IMPACT OF CONSUMER POLICY Unclassified
undertaken to refine and improve these methodologies, as will be discussed by the
roundtable participants. Future work in this area could build on the considerable work
already undertaken.
Estimating the impact of consumer agency actions
Developing methodologies to estimate the impact of consumer agency actions could be
useful for demonstrating the value of consumer agencies and to help prioritise enforcement
and other activities. As discussed in Chapter 3 of the draft feasibility study, a number of
consumer agencies already publish information on the estimated impact of their activities,
including the Competition and Markets Authority in the United Kingdom, the Federal
Trade Commission in the United States, and the Authority for Consumers and Markets
(ACM) in the Netherlands. However, there is little publicly available guidance on the
methodologies used for this purpose. Further, estimation of the benefits is usually confined
to consumer agency actions that lend themselves to measurement. For example, actions
that correct a price increase or otherwise reduce the costs incurred by consumers. Panellists
on this topic will share their experiences in undertaking these types of measurement
activities.
If this work is progressed, more work would need to be undertaken to better understand the
methodologies used by relevant consumer agencies in estimating the impact of their
activities. Such work could help identify whether robust but simple methodologies could
be developed or whether case-by-case methodologies are required. If the latter, it may be
useful to look at which types of consumer agency actions (or market conduct) lend
themselves to estimation and/or measurement.
Estimating the impact of consumer policy
Consumer policy has the potential to reduce structural detriment associated with market
failures such as imperfect and asymmetric information and externalities. In addition, it can
reduce personal detriment by offering a host of consumer protections which stop personal
detriment from occurring in the first place, or otherwise reduce its likelihood or severity.
Econometric modelling and simulation modelling (including computable general
equilibrium models and agent based modelling) could potentially be used to assess
structural detriment. Indeed, some of these approaches have been used by the European
Commission to estimate the impacts of a range of proposed consumer protections, usually
looking at the specific effects on trade (by removing barriers to trade). However, these
approaches may be less suitable when looking at consumer policy as a whole, given that it
may be difficult to isolate those impacts from other exogenous impacts, as discussed in
Chapter 4. Alternatively, consumer detriment estimates could be used to inform estimates
of impact at an economy-wide level. Such an approach was applied by Australia’s
Productivity Commission. This suggests that work on estimating the impact of consumer
policy should be sequenced after work on measuring consumer detriment.
50 DSTI/CP(2019)13/FINAL
MEASURING CONSUMER DETRIMENT AND THE IMPACT OF CONSUMER POLICY Unclassified
Roundtable agenda
Introductory comments from the Secretariat (5 minutes)
The Chair will introduce the roundtable and the Secretariat will provide a brief summary
of the key findings from the draft feasibility study.
Measurement and consumer policy (10 minutes)
Dr Christopher Decker, Centre for Socio-Legal Studies, Oxford University, will provide an
overview of some of the key issues and potential difficulties associated with measuring
consumer detriment and the impact of consumer agency actions, as well as consumer policy
more generally. He will also provide a brief overview of economic approaches to
measurement both in microeconomic and macroeconomic contexts.
Dr Christopher Decker is an economist who specialises in regulation, competition
economics, law and economics, behavioural economics and institutional economics. He
has recently been involved in reviewing the annual assessments of the Competition and
Markets Authority of the United Kingdom (CMA) and has also worked with
regulators/policymakers in the areas of energy, medicines, legal services and financial
services on how to approach the task of measuring the impact of their activities on
consumers.
Discussion questions (10 min)
1. What topics and methodologies provide the most promise from an academic perspective?
2. What are some of the potential difficulties that we should be mindful of?
Panel 1: Experiences in measuring consumer detriment (20 minutes)
In the first panel, delegates will share their experiences in measuring consumer detriment.
The European Commission will talk about its experience in measuring consumer
detriment.
Japan will briefly intervene on its experience with measuring consumer detriment.
Portugal will share its experience in developing and using its consumer complaints
database.
The United States will share its experience in measuring consumer detriment in
respect of fraud.
DSTI/CP(2019)13/FINAL 51
MEASURING CONSUMER DETRIMENT AND THE IMPACT OF CONSUMER POLICY Unclassified
Discussion questions (15 min)
1. Do consumer surveys offer the most promising avenue for quantifying consumer detriment?
2. Do such surveys work better when focussed on specific issue areas or when conducted more
broadly?
3. What are some of the key methodological issues to be mindful in undertaking consumer
detriment surveys? Are there any potential problems associated with consumer detriment
surveys? How often should such surveys ideally be undertaken?
4. What other information (e.g. consumer complaints data) can inform estimates of consumer
detriment?
Panel 2: Experiences in measuring the impact of agency activities (15 minutes)
The second panel will allow delegates to share their experiences in measuring the impact
of their respective agency activities. The discussion will be supported by presentations
from:
The United Kingdom.
The Netherlands.
Singapore.
Discussion questions (15 min)
1. Is there potential to develop one or more simple methodologies to estimate the impact of
consumer agency actions, or can such estimates only be developed on a case-by-case basis?
2. If simple rules of thumb are unlikely to apply in all cases, to what degree could methodologies
be based on the type of consumer detriment being experienced (e.g. scams, fraud, drip pricing)?
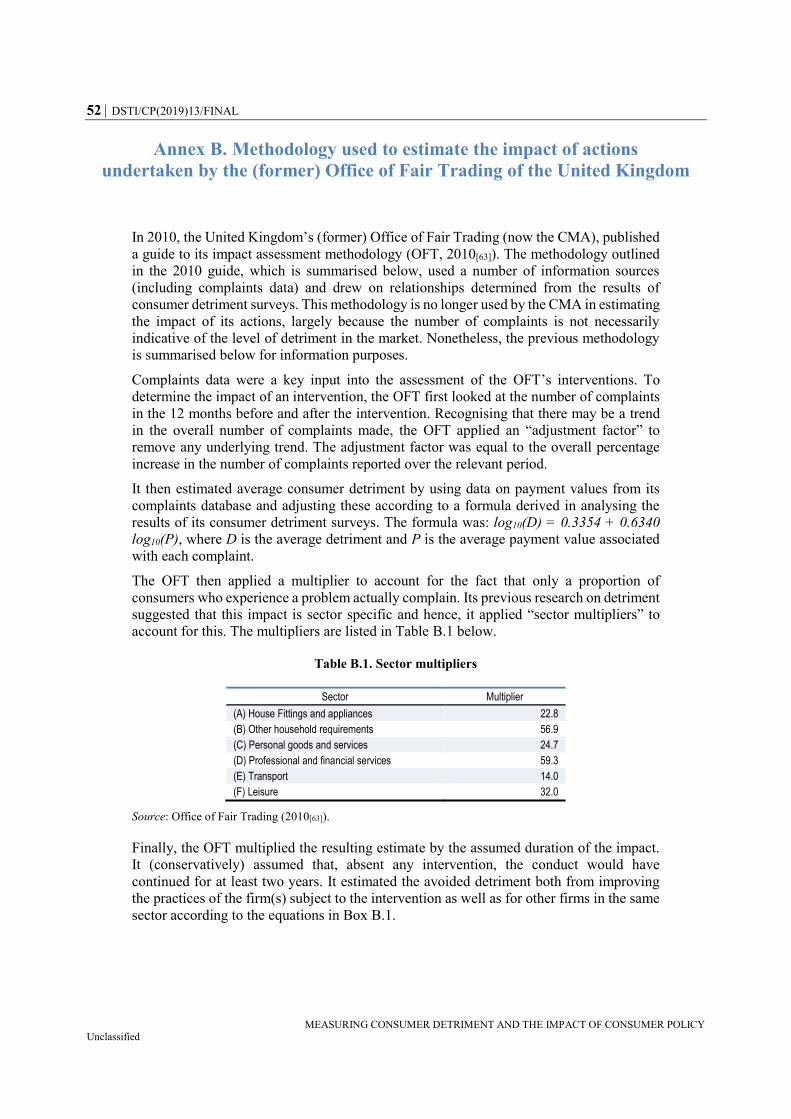
52 DSTI/CP(2019)13/FINAL
MEASURING CONSUMER DETRIMENT AND THE IMPACT OF CONSUMER POLICY Unclassified
Annex B. Methodology used to estimate the impact of actions
undertaken by the (former) Office of Fair Trading of the United Kingdom
In 2010, the United Kingdom’s (former) Office of Fair Trading (now the CMA), published
a guide to its impact assessment methodology (OFT, 2010[63]). The methodology outlined
in the 2010 guide, which is summarised below, used a number of information sources
(including complaints data) and drew on relationships determined from the results of
consumer detriment surveys. This methodology is no longer used by the CMA in estimating
the impact of its actions, largely because the number of complaints is not necessarily
indicative of the level of detriment in the market. Nonetheless, the previous methodology
is summarised below for information purposes.
Complaints data were a key input into the assessment of the OFT’s interventions. To
determine the impact of an intervention, the OFT first looked at the number of complaints
in the 12 months before and after the intervention. Recognising that there may be a trend
in the overall number of complaints made, the OFT applied an “adjustment factor” to
remove any underlying trend. The adjustment factor was equal to the overall percentage
increase in the number of complaints reported over the relevant period.
It then estimated average consumer detriment by using data on payment values from its
complaints database and adjusting these according to a formula derived in analysing the
results of its consumer detriment surveys. The formula was: log10(D) = 0.3354 + 0.6340
log10(P), where D is the average detriment and P is the average payment value associated
with each complaint.
The OFT then applied a multiplier to account for the fact that only a proportion of
consumers who experience a problem actually complain. Its previous research on detriment
suggested that this impact is sector specific and hence, it applied “sector multipliers” to
account for this. The multipliers are listed in Table B.1 below.
Table B.1. Sector multipliers
Sector Multiplier
(A) House Fittings and appliances 22.8
(B) Other household requirements 56.9
(C) Personal goods and services 24.7
(D) Professional and financial services 59.3
(E) Transport 14.0
(F) Leisure 32.0
Source: Office of Fair Trading (2010[63]).
Finally, the OFT multiplied the resulting estimate by the assumed duration of the impact.
It (conservatively) assumed that, absent any intervention, the conduct would have
continued for at least two years. It estimated the avoided detriment both from improving
the practices of the firm(s) subject to the intervention as well as for other firms in the same
sector according to the equations in Box B.1.
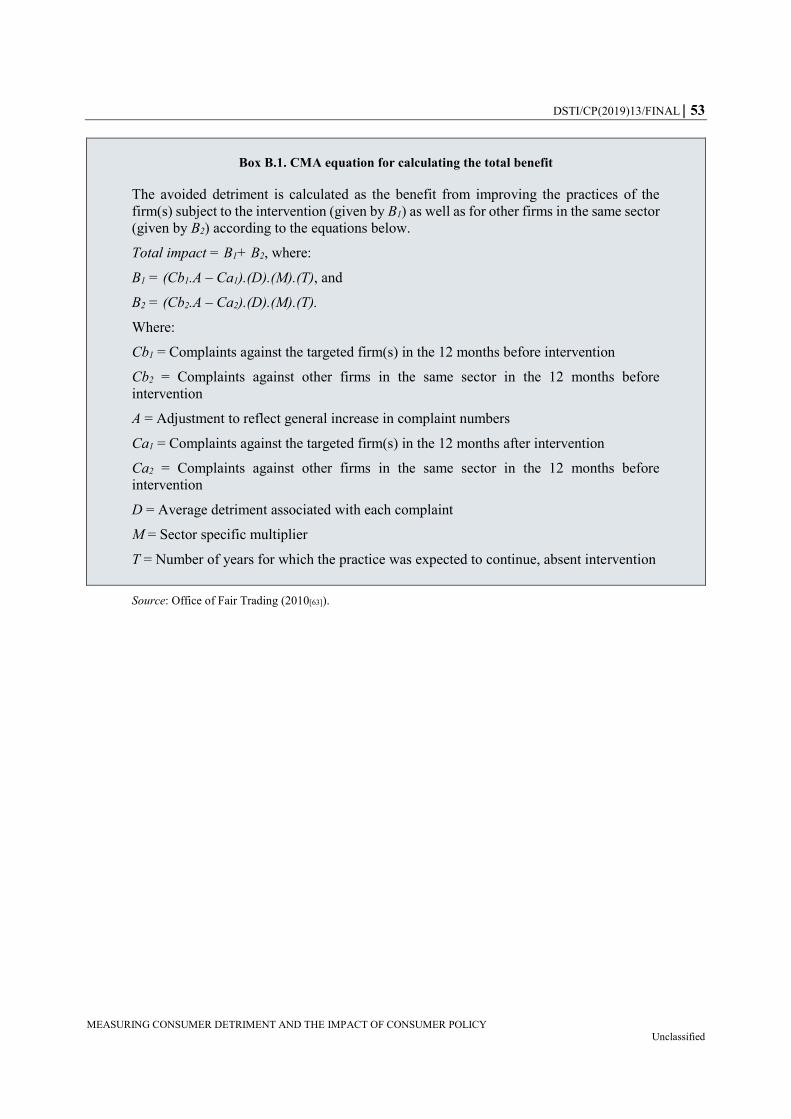
DSTI/CP(2019)13/FINAL 53
MEASURING CONSUMER DETRIMENT AND THE IMPACT OF CONSUMER POLICY Unclassified
Box B.1. CMA equation for calculating the total benefit
The avoided detriment is calculated as the benefit from improving the practices of the
firm(s) subject to the intervention (given by B1) as well as for other firms in the same sector
(given by B2) according to the equations below.
Total impact = B1+ B2, where:
B1 = (Cb1.A – Ca1).(D).(M).(T), and
B2 = (Cb2.A – Ca2).(D).(M).(T).
Where:
Cb1 = Complaints against the targeted firm(s) in the 12 months before intervention
Cb2 = Complaints against other firms in the same sector in the 12 months before
intervention
A = Adjustment to reflect general increase in complaint numbers
Ca1 = Complaints against the targeted firm(s) in the 12 months after intervention
Ca2 = Complaints against other firms in the same sector in the 12 months before
intervention
D = Average detriment associated with each complaint
M = Sector specific multiplier
T = Number of years for which the practice was expected to continue, absent intervention
Source: Office of Fair Trading (2010[63]).
54 DSTI/CP(2019)13/FINAL
MEASURING CONSUMER DETRIMENT AND THE IMPACT OF CONSUMER POLICY Unclassified
References
ACCC (2019), Targeting scams—Report of the ACCC on scams activity 2018, Australian
Competition and Consumer Commission, https://www.accc.gov.au/publications/targeting-
scams-report-on-scam-activity (accessed on 8 August 2019).
[18]
ACM (2017), Annual Report ACM in 2017, The Netherlands Authority for Consumers and
Markets, https://www.acm.nl/sites/default/files/documents/2019-01/2017-acm-annual-
report.pdf (accessed on 14 July 2019).
[66]
ACM (2014), 2013 Annual Report: The Netherlands Authority for Consumers and Markets
(ACM), The Netherlands Authority for Consumers and Markets,
https://www.acm.nl/sites/default/files/documents/2019-01/2013-acm-annual-report.pdf
(accessed on 14 July 2019).
[68]
ACM (2013), Outcome ACM: Working Paper, The Netherlands Authority for Consumers and
Markets,
https://www.acm.nl/sites/default/files/old_publication/publicaties/12714_berekeningsmethod
e-outcome-acm-en-resultaten-2013-2014-03-13.pdf (accessed on 14 July 2019).
[67]
ACM (2008), Onderzoeksrapport Oneerlijke Handelspraktijken (OHP’s) in Nederland,
https://www.acm.nl/sites/default/files/old_publication/publicaties/13442_onderzoeksrapport-
oneerlijke-handelspraktijken-2008.pdf.
[29]
Ahmetoglu, G. et al. (2010), Pricing Practices: Their Effects on Consumer Behaviour and
Welfare, Prepared for the Office of Fair Trading,
http://webarchive.nationalarchives.gov.uk/20140402172955/http://oft.gov.uk/shared_oft/busi
ness_leaflets/659703/Advertising-of-prices/Pricing-Practices.pdf (accessed on
2 August 2017).
[37]
Ahmetoglu, G., A. Furnham and P. Fagan (2014), “Pricing practices: A critical review of their
effects on consumer perceptions and behaviour”, Journal of Retailing and Consumer
Services, http://dx.doi.org/10.1016/j.jretconser.2014.04.013.
[36]
Algan, Y. and P. Cahuc (2013), “Trust, Institutions and Economic Development”, Handbook of
Economic Growth, Vol. 1A, http://econ.sciences-
po.fr/sites/default/files/file/yann%20algan/HB_FinalVersion1.pdf (accessed on
26 June 2019).
[80]
Anderson, K. (2019), “Mass Market Consumer Fraud in the United States: A 2017 Update”, Staff
Report of the Bureau of Economics, Federal Trade Commission,
https://www.ftc.gov/reports/mass-market-consumer-fraud-united-states-2017-update.
[24]
Balan, D. et al. (2015), “Economics at the FTC: Fraud, Mergers and Exclusion”, Review of
Industrial Organization, Vol. 47/4, pp. 371-398, http://dx.doi.org/10.1007/s11151-015-9488-
6.
[50]
DSTI/CP(2019)13/FINAL 55
MEASURING CONSUMER DETRIMENT AND THE IMPACT OF CONSUMER POLICY Unclassified
Baptista, M. et al. (2014), An Agent-based Model of Consumer Behavior Based on the BDI
Architecture and Neoclassical Theory,
https://www.researchgate.net/publication/299369573_An_Agent-
based_Model_of_Consumer_Behavior_Based_on_the_BDI_Architecture_and_Neoclassical_
Theory (accessed on 14 July 2019).
[96]
Cardona, M. et al. (2015), “The Macro-economic Impact of e-Commerce in the EU Digital
Single Market”, Digital Economy Working Paper, No. 2015/09, Joint Research Centre,
European Commission, https://ec.europa.eu/jrc/sites/jrcsh/files/JRC98272.pdf (accessed on
12 August 2019).
[86]
Carlson, J. et al. (2017), “Economics at the FTC: Deceptive Claims, Market Definition, and
Patent Assertion Entities”, Review of Industrial Organization, Vol. 51/4, pp. 487-513,
http://dx.doi.org/10.1007/s11151-017-9596-6.
[49]
CCCS (2019), CCCS Guidelines on Price Transparency: Draft, https://www.cccs.gov.sg/media-
and-consultation/newsroom/media-releases/otb-and-price-transparency-guidelines-30-sept-
19.
[71]
CCCS (2019), Online Travel Booking Sector in Singapore,
https://www.cccs.gov.sg/resources/publications/market-studies.
[70]
Citizens Advice (2016), Consumer Detriment: Counting the cost of consumer problems,
https://www.citizensadvice.org.uk/Global/CitizensAdvice/Consumer%20publications/Final_
ConsumerDetriment_OE.pdf.
[34]
Civic Consulting (2011), Consumer market study on the functioning of e-commerce and Internet
marketing and selling techniques in the retail of goods, http://www.civic-
consulting.de/reports/study_ecommerce_goods_en.pdf (accessed on 12 August 2019).
[91]
CMA (2016), Care homes market study, Competition and Markets Authority cases,
https://www.gov.uk/cma-cases/care-homes-market-study (accessed on 12 August 2019).
[57]
CMA (2016), Evaluation of the OFT’s enforcement action on health and fitness contract,
https://assets.publishing.service.gov.uk/government/uploads/system/uploads/attachment_data/
file/557129/evaluation-report-of-oft-action-in-gyms-sector.pdf (accessed on 9 August 2019).
[58]
CMA (2016), Wedding and event venue providers: letter from the CMA on contract terms,
GOV.UK, https://www.gov.uk/government/publications/wedding-and-event-venue-providers-
letter-from-the-cma-on-contract-terms (accessed on 12 August 2019).
[62]
CMA (2015), Short-term car rental in the European Union, Competition & Markets Authority,
London, http://www.nationalarchives.gov.uk/doc/open-government- (accessed on
12 August 2019).
[59]
Competition and Consumer Protection Commission (2014), Study of consumer detriment in
Ireland, https://www.ccpc.ie/consumers/2014/12/10/study-consumer-detriment-ireland/.
[33]
56 DSTI/CP(2019)13/FINAL
MEASURING CONSUMER DETRIMENT AND THE IMPACT OF CONSUMER POLICY Unclassified
Consumer Affairs Agency (2018), Experience of consumer harm and problems / estimated
amounts of losses from harm and problems,
https://www.caa.go.jp/en/publication/annual_report/2018/white_paper_summary_04.html.
[35]
Consumer Affairs Victoria (2011), Consumer Confidence and Market Experience Study 2010 –
2011, https://www.consumer.vic.gov.au/resources-and-tools/research-studies.
[15]
Consumer Affairs Victoria (2006), Consumer detriment in Victoria: a survey of its nature, costs
and implications, https://www.consumer.vic.gov.au/library/publications/resources-and-
education/research/consumer-detriment-in-victoria-a-survey-of-its-nature-costs-and-
implications-2006.pdf.
[27]
Deliema, M. et al. (2019), Exposed to Scams: What separates victims from non-victims?,
https://www.bbb.org/globalassets/local-bbbs/council-113/media/financial-
fraud/pdf/ScamTrackerIssueBrief-ExposedToScams-09.12.19.pdf.
[26]
Department for Business Innovation and Skills (2014), Consumer Engagement and Detriment
Survey 2014,
https://assets.publishing.service.gov.uk/government/uploads/system/uploads/attachment_data/
file/319043/bis-14-881-bis-consumer-detriment-survey.pdf.
[31]
Duch-Brown, N. and B. Martens (2016), The Economic Impact of Removing Geo-blocking
Restrictions in the EU Digital Single Market, Join Research Centre, European Commission,
https://ec.europa.eu/jrc/sites/jrcsh/files/JRC101100.pdf (accessed on 12 August 2019).
[90]
EC (2019), Consumer Conditions Scoreboard: Consumers at home in the Single Market: 2019
Edition, https://ec.europa.eu/info/sites/info/files/consumers-conditions-scoreboard-
2019_en_1.pdf.
[16]
EC (2018), “Consumer market study on online market segmentation through personalised
pricing/offers in the European Union”, http://dx.doi.org/10.2818/990439.
[41]
EC (2018), “Impact Assessment on the “New Deal for Consumers””, No. Document
52018SC0096, European Commission, https://eur-lex.europa.eu/legal-
content/EN/ALL/?uri=CELEX%3A52018SC0096.
[88]
EC (2017), Consumer Conditions Scoreboard: Consumers at home in the Single Market: 2017
Edition, European Commission, https://ec.europa.eu/info/sites/info/files/consumer-
conditions-scoreboard-2017-edition_en_0.pdf.
[74]
EC (2017), Operational guidance document on measuring personal consumer detriment, Civic
Consulting, Brussels, https://ec.europa.eu/info/sites/info/files/consumer-detriment-study-
final-report-part-2-guidance_en.pdf (accessed on 11 July 2019).
[48]
EC (2017), Study on Measuring Consumer Detriment in the European Union,
http://dx.doi.org/10.2818/87261.
[2]
EC (2016), “Impact assessment accompanying the proposed Regulation on geo-blocking”,
European Commission, https://ec.europa.eu/digital-single-market/en/news/impact-
assessment-accompanying-proposed-regulation-geo-blocking (accessed on 12 August 2019).
[89]
DSTI/CP(2019)13/FINAL 57
MEASURING CONSUMER DETRIMENT AND THE IMPACT OF CONSUMER POLICY Unclassified
EC (2015), Identifying the main cross-border obstacles to the Digital Single Market and where
they matter most: DSM consumer survey, Directorate-General for Justice and Consumers,
http://data.europa.eu/euodp/data/dataset/dsm-consumer-survey-2015 (accessed on
12 August 2019).
[87]
EC (2015), Impact Assessment Accompanying the document: Proposals for Directives of the
European Parliament and of the Council (1) on certain aspects concerning contracts for the
supply of digital content and (2) on certain aspects concerning contracts for the online and
other distance sales of goods, European Commission, Brussels, https://eur-
lex.europa.eu/legal-content/EN/TXT/PDF/?uri=CELEX:52015SC0274R(01)&from=EN
(accessed on 12 August 2019).
[85]
EC (n.d.), Consumer Scoreboards, https://ec.europa.eu/info/policies/consumers/consumer-
protection/evidence-based-consumer-policy/consumer-scoreboards_en.
[20]
EC (n.d.), Safety Gate: the rapid alert system for dangerous non-food products,
https://ec.europa.eu/consumers/consumers_safety/safety_products/rapex/alerts/repository/con
tent/pages/rapex/index_en.htm.
[44]
EC (n.d.), Sweeps, https://ec.europa.eu/info/live-work-travel-eu/consumers/enforcement-
consumer-protection/sweeps_en.
[54]
EC (n.d.), “Tool #4. Evidence-Based Better Regulation”, in Better Regulation Toolbox,
http://ec.europa.eu/research/participants/data/ref/h2020/legal_basis/sp/h2020-sp_en.pdf;
(accessed on 11 July 2019).
[52]
Égert, B. and P. Gal (2016), “The Quantification of Structural Reforms in OECD Countries: A
New Framework”, Economics Department Working Papers, No. 1354, OECD,
http://www.oecd.org/eco/workingpapers (accessed on 14 July 2019).
[84]
Europe Economics (2007), An analysis of the issue of consumer detriment and the most
appropriate methodologies to estimate it, http://www.europe-
economics.com/publications/study_consumer_detriment.pdf.
[14]
European Parliamentary Research Service (2017), Mapping the Cost of Non-Europe, 2014-19,
European Parliament, http://dx.doi.org/10.2861/35381.
[92]
Goldstein, D. et al. (2008), “Nudge Your Customers Toward Better Choices”, Harvard Business
Review, Vol. December, https://hbr.org/2008/12/nudge-your-customers-toward-better-choices
(accessed on 8 August 2017).
[69]
Hahn, R. and J. Hird (1991), “The Costs and Benefits of Regulation: Review and Synthesis”,
Yale Journal on Regulation, Vol. 8/I, pp. 233-278,
http://digitalcommons.law.yale.edu/yjreghttp://digitalcommons.law.yale.edu/yjreg/vol8/iss1/9
(accessed on 12 August 2019).
[13]
Hong, H. and M. Shum (2006), “Can Search Cost Rationalize Equilibrium Price Dispersion in
Online Markets?”, Rand Journal of Economics, Vol. 37/2, pp. 258-276,
http://citeseerx.ist.psu.edu/viewdoc/download?doi=10.1.1.15.5264&rep=rep1&type=pdf
(accessed on 14 July 2019).
[72]
58 DSTI/CP(2019)13/FINAL
MEASURING CONSUMER DETRIMENT AND THE IMPACT OF CONSUMER POLICY Unclassified
ICF GHK (2013), Consumer rights and economic growth: ICF GHK report,
http://www.ghkint.com (accessed on 14 July 2019).
[98]
ICPEN (2017), Impact Assessment: Information document for ICPEN Members. [56]
Ipsos (2006), Consumer Detriment Survey, https://www.consumer.vic.gov.au/resources-and-
tools/research-studies.
[28]
Koulayev, S. (2009), “Estimating Demand in Search Markets: The Case of Online Hotel
Bookings”, FRB of Boston Working Paper, No. 09-16,
http://dx.doi.org/10.2139/ssrn.1523926.
[73]
Kumara Bhat, S. and A. Culotta (2017), Identifying Leading Indicators of Product Recalls from
Online Reviews Using Positive Unlabeled Learning and Domain Adaptation,
http://www.aaai.org (accessed on 12 July 2019).
[45]
Laibson, D. (2012), Drip pricing: A behavioral economics perspective, Federal Trade
Commission (US),
https://www.ftc.gov/sites/default/files/documents/public_events/economics-drip-
pricing/dlaibson.pdf (accessed on 4 August 2017).
[38]
Mintel (2015), Holiday Car Hire - UK - May 2015 - Market Research Report,
https://reports.mintel.com/display/715829/ (accessed on 12 August 2019).
[60]
Moody’s (2015), Research: Announcement: Moody’s: Tourists to drive growth in European car
rental market by nearly 3% in 2015-16, https://www.moodys.com/research/Moodys-Tourists-
to-drive-growth-in-European-car-rental-market--PR_328850 (accessed on 12 August 2019).
[61]
OECD (2019), Household spending, https://data.oecd.org/hha/household-spending.htm. [77]
OECD (2018), Enhancing product recall effectiveness globally: OECD background report,
OECD, Paris, http://dx.doi.org/10.1787/23074957.
[46]
OECD (2018), “Improving online disclosures with behavioural insights”, OECD Digital
Economy Papers, No. 269, OECD Publishing, Paris, https://dx.doi.org/10.1787/39026ff4-en.
[82]
OECD (2017), “Trust in peer platform markets: Consumer survey findings”, OECD Digital
Economy Papers, No. 263, OECD Publishing, Paris, https://dx.doi.org/10.1787/1a893b58-en.
[3]
OECD (2017), “Use of Behavioural Insights in Consumer Policy”, OECD Science, Technology
and Industry Policy Papers, No. 36, OECD Publishing, Paris,
https://dx.doi.org/10.1787/c2203c35-en.
[42]
OECD (2016), OECD Recommendation of the Council on Consumer Protection in E-Commerce,
OECD Publishing, Paris, https://dx.doi.org/10.1787/9789264255258-en.
[11]
OECD (2015), METRO Version 1 Model Documentation, OECD, Paris,
http://www.oecd.org/officialdocuments/publicdisplaydocumentpdf/?cote=TAD/TC/WP(2014
)24/FINAL&docLanguage=En (accessed on 14 July 2019).
[94]
DSTI/CP(2019)13/FINAL 59
MEASURING CONSUMER DETRIMENT AND THE IMPACT OF CONSUMER POLICY Unclassified
OECD (2015), “Diffusion of online purchases including via handheld devices, 2007 and 2014:
Individuals having ordered goods or services online as a percentage of all individuals”, in
OECD Digital Economy Outlook 2015, OECD Publishing, Paris,
https://dx.doi.org/10.1787/9789264232440-en.
[79]
OECD (2014), Factsheet on how competition policy affects macro-economic outcomes, OECD
Publishing, Paris, http://oe.cd/J3 (accessed on 26 June 2019).
[78]
OECD (2014), Guide for helping competition authorities assess the expected impact of their
activities, https://www.oecd.org/daf/competition/Guide-competition-impact-
assessmentEN.pdf (accessed on 15 July 2019).
[53]
OECD (2014), OECD Recommendation on Consumer Policy Decision Making,
http://www.oecd.org/sti/consumer/Toolkit-recommendation-booklet.pdf (accessed on
12 February 2018).
[1]
OECD (2013), “OECD Consumer Policy Toolkit Workshop on Communication
Services: Summary of Proceedings”, OECD Digital Economy Papers, No. 221, OECD
Publishing, Paris, https://dx.doi.org/10.1787/5k480t1g546j-en.
[7]
OECD (2013), Product risk assessment practices of regulatory agencies,
http://www.oecd.org/sti/consumer/product-risk-assessment-practices-regulatory-agencies.pdf.
[55]
OECD (2012), Enhancing Consumer Policy Making: The Role of Consumer Complaints, OECD,
Paris,
http://www.oecd.org/officialdocuments/publicdisplaydocumentpdf/?cote=DSTI/CP(2011)22/
FINAL&docLanguage=En (accessed on 20 June 2019).
[9]
OECD (2012), Enhancing Consumer Policy Making: The Role of Consumer Surveys, OECD,
Paris,
http://www.oecd.org/officialdocuments/publicdisplaydocumentpdf/?cote=DSTI/CP(2011)3/F
INAL&docLanguage=En (accessed on 20 June 2019).
[10]
OECD (2010), Consumer Policy Toolkit, OECD Publishing, Paris,
https://dx.doi.org/10.1787/9789264079663-en.
[6]
OECD (2008), Introductory Handbook for Undertaking Regulatory Impact Analysis (RIA),
OECD Publishing, Paris, https://www.oecd.org/gov/regulatory-policy/44789472.pdf
(accessed on 27 June 2019).
[83]
OECD (2007), “Report on Second Roundtable on Economics for Consumer Policy”, OECD
Digital Economy Papers, No. 132, OECD Publishing, Paris,
https://dx.doi.org/10.1787/230744208356.
[5]
OECD (2006), Roundtable on Demand-Side Economics for Consumer Policy: Summary Report,
http://www.oecd.org/sti/consumer/36581073.pdf (accessed on 5 February 2018).
[4]
OECD (2005), Enhancing Competition in Telecommunications: Protecting and Empowering
Consumer, http://www.oecd.org/dataoecd/31/46/36581073.pdf. (accessed on 4 August 2017).
[8]
60 DSTI/CP(2019)13/FINAL
MEASURING CONSUMER DETRIMENT AND THE IMPACT OF CONSUMER POLICY Unclassified
OECD (n.d.), Global Portal on Product Recalls, https://globalrecalls.oecd.org/#/. [43]
OECD (n.d.), Improving online disclosures with behavioural insights. [99]
OECD (n.d.), METRO trade model, OECD, https://www.oecd.org/trade/topics/metro-trade-
model/ (accessed on 14 July 2019).
[93]
OECD (n.d.), NAEC Innovation Lab: Workshop on agent based modelling: applications in
labour markets, https://www.oecd.org/naec/Agent-based_models_background.pdf (accessed
on 14 July 2019).
[95]
Ofcom (2016), Review of how we use our persistent misuse powers: Focus on silent and
abandoned calls, Ofcom, https://www.ofcom.org.uk/consultations-and-statements/category-
1/review-of-how-we-use-persistent-misuse-powers (accessed on 19 August 2019).
[23]
Office of Fair Trading (2008), Consumer detriment: Assessing the frequency and impact of
consumer problems with goods and services,
https://webarchive.nationalarchives.gov.uk/20140402190150/http:/www.oft.gov.uk/shared_of
t/reports/consumer_protection/oft992.pdf.
[30]
Office of Fair Trading (UK) (2010), Advertising of Prices,
http://webarchive.nationalarchives.gov.uk/20140402173016/http://oft.gov.uk/shared_oft/mark
et-studies/AoP/OFT1291.pdf (accessed on 2 August 2017).
[39]
Ofgem (2019), Consumer Impact Report: Financial Year 2018-19,
https://www.ofgem.gov.uk/system/files/docs/2019/06/20190626_consumer_impact_report.pd
f (accessed on 26 September 2019).
[76]
Ofgem (2018), Consumer Impact Report: Financial Year 2017-18,
https://www.ofgem.gov.uk/system/files/docs/2018/07/consumer_impact_report_-
_published0307.pdf (accessed on 26 September 2019).
[75]
OFT (2010), A guide to OFT’s Impact Estimation methods, Office of Fair Trading, UK,
https://webarchive.nationalarchives.gov.uk/20140402172157/http://www.oft.gov.uk/OFTwor
k/publications/publication-categories/reports/Evaluating/oft1250 (accessed on 3 July 2019).
[63]
OFT (2010), The impact of price frames on consumer decision making, Office of Fair Trading,
London,
https://webarchive.nationalarchives.gov.uk/20140402165040/http://oft.gov.uk/shared_oft/eco
nomic_research/OFT1226.pdf (accessed on 9 August 2019).
[40]
OFT (2000), Consumer Detriment. [47]
Ormosi, P. (2012), “Stocktaking on Evaluation”, Working Party No. 2 on Competition and
Regulation, OECD, Paris,
http://www.oecd.org/officialdocuments/publicdisplaydocumentpdf/?cote=DAF/COMP/WP2
%282012%295&doclanguage=en (accessed on 9 August 2019).
[12]
DSTI/CP(2019)13/FINAL 61
MEASURING CONSUMER DETRIMENT AND THE IMPACT OF CONSUMER POLICY Unclassified
Productivity Commission (2008), Review of Australia’s Consumer Policy Framework,
Productivity Commission, Canberra, http://www.pc.gov.au/inquiries/completed/consumer-
policy/ (accessed on 6 July 2017).
[97]
Raval, D. (2019), “Which Communities Complain to Policymakers? Evidence from Consumer
Sentinel”, Economic Inquiry, https://doi.org/10.1111/ecin.12838.
[17]
Shelanski, H. et al. (2012), “Economics at the FTC: Drug and PBM Mergers and Drip Pricing”,
Review of Industrial Organization, Vol. 41/4, pp. 303-319, http://dx.doi.org/10.1007/s11151-
012-9360-x.
[51]
Statistics Canada (2019), Special tabulation. [25]
The Australian Government the Treasury and EY Sweeney (2016), Australian Consumer Survey
2016, http://www.consumerlaw.gov.au/sites/consumer/files/2016/05/ACL-Consumer-Survey-
2016.pdf (accessed on 13 September 2019).
[21]
Thorun, C. et al. (2017), Indicators of consumer protection and empowerment in the digital
world, ConPolicy GmbH, Berlin,
https://www.bmjv.de/G20/DE/ConsumerSummit/_documents/Downloads/Studie.pdf;jsessioni
d=4B40AED34D25B03591746872B48A10FB.1_cid334?__blob=publicationFile&v=1
(accessed on 9 July 2019).
[22]
UNCTAD (2016), United Nations Guidelines for Consumer Protection, United Nations, New
York and Geneve, https://unctad.org/en/PublicationsLibrary/ditccplpmisc2016d1_en.pdf
(accessed on 27 June 2019).
[81]
US FTC (2019), Consumer Sentinel Network Data Book 2018, Federal Trade Commission,
Washington, https://www.ftc.gov/system/files/documents/reports/consumer-sentinel-network-
data-book-2018/consumer_sentinel_network_data_book_2018_0.pdf (accessed on
9 August 2019).
[19]
US FTC (2017), Agency Financial Report: Fiscal Year 2017,
https://www.ftc.gov/system/files/documents/reports/agency-financial-report-
fy2017/ftc_agency_financial_report_fy2017_0.pdf (accessed on 14 July 2019).
[64]
US FTC (2017), Office of Claims and Refunds Annual Report 2017, Federal Trade Commission,
https://www.ftc.gov/system/files/documents/reports/bureau-consumer-protection-office-
claims-refunds-annual-report-2017-consumer-refunds-effected-
july/redressreportformattedforweb122117.pdf (accessed on 14 July 2019).
[65]
US FTC (2013), Consumer Fraud in the United States, 2011: The Third FTC Survey, Federal
Trade Commission, Washington,
https://www.ftc.gov/sites/default/files/documents/reports/consumer-fraud-united-states-2011-
third-ftc-survey/130419fraudsurvey_0.pdf (accessed on 10 September 2019).
[32]
62 DSTI/CP(2019)13/FINAL
MEASURING CONSUMER DETRIMENT AND THE IMPACT OF CONSUMER POLICY Unclassified
Endnotes
1 The AG is composed of representatives from Brazil, Canada, Columbia, the European
Commission, Israel, the Netherlands, Peru, Portugal, Sweden, the United Kingdom, and the United
States.
2 Using data from the Centre for Aviation for 2018.
3 Using data from the Singapore Tourism Board for 2018.