Measuring Up Annual Rail Consumer Report for July 2017
143
OFFICE OF RAIL AND ROAD ‘MEASURING UP’ ANNUAL RAIL CONSUMER REPORT JULY 2017
-
Upload
khangminh22 -
Category
Documents
-
view
1 -
download
0
Transcript of Measuring Up Annual Rail Consumer Report for July 2017

OFFICE OF RAIL AND ROAD
‘MEASURING UP’ ANNUAL RAIL CONSUMER REPORT
JULY 2017


‘MEASURING UP’ ANNUAL RAIL CONSUMER REPORT
JULY 2017
OFFICE OF RAIL AND ROAD

1. Foreword .............................................................................................................................6
2. Executive summary .........................................................................................................7
3. Background ......................................................................................................................12
3.1 Our role.......................................................................................................................12
3.2 Our approach to regulation ................................................................................13
3.3 The regulatory environment ..............................................................................14
3.4 Structure and scope ...............................................................................................15
4. Our passenger work ......................................................................................................16
4.1 Ticket retailing .........................................................................................................17
4.2 Passenger information .........................................................................................23
4.3 Passenger assistance ............................................................................................27
4.4 Complaints and compensation .........................................................................36
5. Network Rail .....................................................................................................................50
6. Findings by train company .........................................................................................54
Guidance notes ...............................................................................................................55
Arriva Trains Wales .......................................................................................................58
c2c ........................................................................................................................................61
Caledonian Sleeper .......................................................................................................64
Chiltern Railways ...........................................................................................................67
CrossCountry ...................................................................................................................70
East Midlands Trains .....................................................................................................73
Govia Thameslink Railway ..........................................................................................76
Grand Central ..................................................................................................................79
Great Western Railway ................................................................................................82
CONTENTS

Greater Anglia .................................................................................................................85
Heathrow Express ..........................................................................................................88
Hull Trains .........................................................................................................................91
London Midland .............................................................................................................94
London Overground .....................................................................................................97
Merseyrail ...................................................................................................................... 100
Northern......................................................................................................................... 103
ScotRail ........................................................................................................................... 106
South West Trains ....................................................................................................... 109
Southeastern ................................................................................................................ 112
TfL Rail ............................................................................................................................. 115
TransPennine Express ............................................................................................... 118
Virgin Trains East Coast ............................................................................................ 121
Virgin Trains West Coast .......................................................................................... 124
Annexes and glossary ..................................................................................................... 127
Glossary of terms ........................................................................................................ 127
Annex A - Passenger and station licences and ORR’s consumer law enforcement powers ....................................................... 129
Annex B - Compensation gap: methodology and background .................. 130
Annex C – Update on status of planned actions to improve rail fares and ticketing ....................................................................... 134
Annex D - Regulatory statements and guidance ............................................ 137
Annex E - Core data indicators ............................................................................... 138
Annex F - Consumer team publications 2016-17 ............................................ 140
Annex G – ORR’s Highways role ............................................................................. 141

6
Office of Rail and Road | Annual Rail Consumer Report July 2017
1. MEASURING UP: FOREWORD With rail passengers today funding three quarters of the total costs of running the railway there is rightly a very public focus on fares, value for money and the level of service and performance that passengers expect in return.
An important part of our role is protecting the interests of rail users. In this report we look at the performance of Network Rail and train companies in four important areas: ticket retailing; how they provide passenger information; passenger assistance; and complaints handling and compensation.
In all of these areas it’s good service which makes the difference between a good experience or frustration. Providing poor help or assistance means some people could have difficulty accessing the rail network at all. All this reinforces the importance of our work to set standards in these areas, monitor whether these standards are met, and report on them. Through this we are able to drive improvements where necessary.
In gathering the evidence for this report, we have found examples of both good practice on the part of the train operators and areas requiring improvement. By collecting evidence on how the industry is performing in a number of areas, we seek to highlight the instances of good practice as an example for others, while drawing attention to poor practice to seek improvement.
We have found promising examples of where train companies have sought to improve services on their own initiative. For example, we found examples of good practice in providing help from train companies and asked experts to provide input on the impact of these practices, and any others which could be implemented, including from other sectors. We will now share these good practices more widely to encourage other train companies to take action.
In other areas, we saw improvement from train companies following ORR’s own intervention. For example, at our request train companies and Network Rail have begun to provide us with more in-depth data, allowing us to monitor areas such as assistance provision and complaints handling in greater detail. We have agreed with companies they will provide us with even more data from the 2017-18 reporting year. Our ticket machine research identified a number of areas of good practice where train companies should focus their efforts. We recommended that they make a price guarantee for these passengers; 11 train companies have done so.
There are however areas where we have found there has been little improvement and still much work to do. For example, we commissioned independent research on passenger satisfaction of how complaints are handled. We found generally low levels of satisfaction with both the process of complaints handling and the outcome achieved. This year we will increase our understanding of why some train companies are consistently performing better than others and will share good practices to raise standards in this area.
So whilst there are areas where performance is good, the overall picture is still mixed and as many passengers who use the railway regularly will know; there is still room for improvement. These challenges are only going to increase as passenger numbers grow – albeit at a slower rate than in recent years – and funding for improving the rail network remains tight.

7
Office of Rail and Road | Annual Rail Consumer Report July 2017
2. EXECUTIVE SUMMARY 1. The Office of Rail and Road (ORR) is the
combined economic and health and safety regulator for Great Britain’s rail network and the economic monitor for England’s strategic road network. This report covers our work for rail passengers, which derives from the passenger-facing obligations in train companies’ and Network Rail’s operating licences and from our consumer law role.
2. Our strategic objective is to support better customer service in the specific areas that we regulate. Therefore, we focus on:
■ Ticket retailing, specifically the ease with which passengers can buy tickets;
■ The provision of passenger information, including at times of disruption;
■ The provision of assistance to passengers who require additional support to make their journey; and
■ The provision of an accessible, effective and efficient complaints handling service, including providing compensation where passengers are subject to delay.
3. This report demonstrates the work we are doing to recognise success and build a clear evidence base on which to press for improvement. We monitor performance over time in particular by improving the range and quality of data provided to us. We carry out targeted research to tell us what is happening in practice and through this create insights needed to effect change for rail passengers.
4. The industry has continued to engage constructively with us in collecting data and carrying out research, and we have observed good practices in a number of areas.
5. Throughout the report we have given examples of where we have, or intend to use this evidence base to support better customer service in the areas that we regulate. Table 1 below sets out a summary of our next steps in key areas.
Ticket retailing and ticket vending machines6. In the last year passenger complaints about
online ticket sales, ticket booking offices or ticket vending machines, and smartcards increased to 17.5% of all complaints received (this is up from 11.5% in the previous year). In 2016 we worked with the Department for Transport (DfT), the Rail Delivery Group (RDG), Which?, and Transport Focus to identify actions that will improve fares and ticketing for passengers1. The resulting Action Plan is being implemented by train companies now and is reported against in section 4.
7. As part of this work we commissioned an audit of train company websites against the retail information Code of Practice2 (the ‘Code’). The Code was designed to help improve standards for providing passengers with information when they choose, buy and use rail tickets. Overall, the audit3 found that most of the information that passengers are likely to need when planning journeys and buying tickets is provided on websites. However, there are exceptions to this, with some information not always being available or made suitably prominent. This specifically relates to information about:
■ GroupSave discounts (discounts for groups of people travelling together);
■ Live journey information; and
■ Key terms and conditions.
8. We have therefore asked companies to make improvements in these areas. We will undertake a further review of websites and publish an update in December.
9. In February, we also published the results of our research into passengers’ experience of Ticket Vending Machines (TVMs).4 Across the industry the results showed that although 80% of mystery shoppers selected the most
1. https://www.gov.uk/government/uploads/system/uploads/attachment_data/file/579850/action-plan-for-information-on-rail-fares-and-ticketing.pdf
2. https://www.raildeliverygroup.com/media-centre/press-releases/2015/186-2015-03-25-1.html3. http://www.orr.gov.uk/rail/publications/reports/audit-of-train-company-websites-against-the-retail-information-code-of-practice4. http://orr.gov.uk/__data/assets/pdf_file/0018/24048/ticket-vending-machines-review-february-2017.pdf
https://www.gov.uk/government/uploads/system/uploads/attachment_data/file/579850/action-plan-for-inf

8
Office of Rail and Road | Annual Rail Consumer Report July 2017
appropriate ticket for their journey from a TVM, one in five mystery shoppers were unable to do this. 13% of shoppers would have suffered financial detriment as a result of not selecting the cheapest fare for their journey.
10. Many train companies are already improving their TVMs to make them easier to use and provide better information so that the most appropriate ticket can be purchased. However, our research identified specific areas of good practice where all train companies need to take action. These include:
■ The provision of clear, useable and timely information on the range of products available from TVMs;
■ Information about ticket restrictions and validities; and
■ Information in relation to on and off peak sales.
11. We have asked all companies what actions they have taken in light of the research findings and what further improvements they have planned. We have also recommended to train companies that they introduce a voluntary TVM price guarantee to give a refund of the additional ticket costs to passengers who find that they could have bought a cheaper ticket for the same journey. At this time 12 train companies have a TVM price guarantee in place.
12. We will repeat our mystery shopping research later this year to see what improvements have been made over the last 12 months. We expect to publish the results early next year.
Passenger information 13. Since the publication of detailed research by
Transport Focus5 in 2014 into rail passengers’ experiences and needs when trains are unexpectedly disrupted, train companies and Network Rail have been working towards the delivery of 46 industry actions (such as using banners to highlight disruption information on website homepages) to improve the provision
of information to passengers. We have worked with train companies, Network Rail, and Rail Delivery Group (RDG) to ensure the effective delivery of these actions. Most have now been delivered. We have also clarified the coverage of the passenger information licence condition with the industry to make it clear that the condition applies to all aspects of the passenger journey, including the provision of information regarding passenger compensation.
14. However, recent research published6 by RDG for the period April 2016 to March 2017 (sample of 12,690 customers) has found that the overall rating of how a train company deals with delays and cancellations is poor, with four times as many negative ratings as positive. Information provision is rated poorly, particularly when given at stations, whilst information provided by text alerts is rated best overall. The areas of information provision that most need to be looked at are:
■ The availability of alternative transport if the train service could not continue;
■ The time taken to resolve the problem;
■ The amount of information provided; and
■ The frequency of updates.
15. In the coming months we will establish the gaps between the current industry work and what actions train companies and Network Rail may need to prioritise to deliver improvement in each of these areas.
Passenger assistance16. Over the past year we have been undertaking a
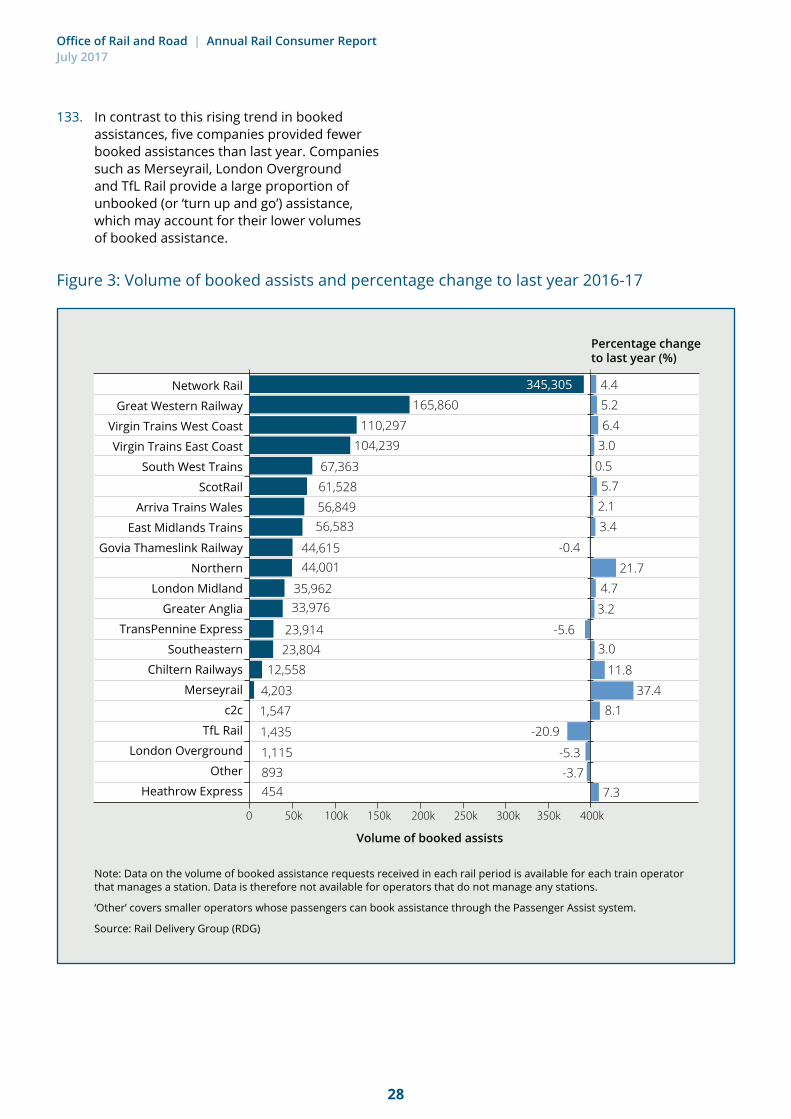
large-scale programme of consumer research looking in depth at the provision of access and travel assistance for passengers with disabilities. This is a key area for passengers and in 2016-17, 1.2 million instances of passenger assistance were booked to help passengers complete their journey, a 4.4% increase compared to 2015-16.
17. The findings of this wide-ranging research will be published in the autumn, together with a plan of our future work in this area.
5. https://www.transportfocus.org.uk/research-publications/publications/passenger-information-when-trains-are-disrupted/6. http://www.raildeliverygroup.com/about-us/publications.html?task=file.download&id=469772316

9
Office of Rail and Road | Annual Rail Consumer Report July 2017
Complaints and compensation18. The complaints rate7 has increased to 29.4
complaints per 100,000 passenger journeys for franchised companies in 2016-17. Whilst this is an increase of 7.5% when compared to 2015-16, it is just above levels in 2014-15. Overall this represents just over 500,000 complaints for franchised operators.
19. Train companies are required to provide a full response to 95% of complaints within 20 working days. 12 of 24 train companies have failed to achieve this regulatory obligation consistently in 2016-17. Over the last year we have worked with train companies to gain better insight into the passenger experience of making a complaint. We commissioned an independent research company to measure passenger satisfaction over a range of indicators relating to the complaints process and outcome.
20. A summary of the national results compared with individual company performance can be found in the data sheets in section 6. Overall, the survey highlights some positive aspects of complaint handling, such as the ease of making a complaint and the politeness of staff. However, while performance across the participating companies varies, it shows there is generally a greater level of passenger dissatisfaction than satisfaction with both the process of complaints handling and the outcome achieved.
21. We will continue to concentrate on improving train companies’ complaints handling, with a key focus on the obligation to respond to complaints within the required timescales.
22. We intend to increase our understanding of why some train companies are consistently performing better than others and will be sharing more widely their good practices as a way of raising standards in this area.
23. In other sectors, binding Alternative Dispute Resolution (ADR) offers a quicker and cheaper alternative to resolving individual complaints instead of having to go to the small claims court. It can strengthen consumer protection
and improve consumer confidence. We welcome the discussions the Rail Minister has been leading in this area and have fed in our views of what a good ADR scheme looks like; to both support its development for passengers and make things clear and workable for train companies.
24. We will continue to be proactively involved in discussions as arrangements for ADR in the rail sector are further explored.
25. Following our work on the rail passenger super-complaint on delay compensation,8 train companies have improved information against the five standards we identified as good practice. Our latest mystery shopping survey showed that one third (34%) of mystery shoppers received accurate information on all four of the main elements of their customer enquiry on the arrangements and conditions for claiming compensation. This represents an improvement of 4 percentage points from 2016 for the headline measure of train company staff performance.
26. Based on a range of evidence we have concluded that since March 2016, when we published our response to the rail passenger super-complaint on delay compensation arrangements there has been an increase of around 10 percentage points in the proportion of due compensation that has been paid to passengers. This represents important progress, although a substantial proportion of potential payouts still goes unclaimed.
27. We will now look to RDG to reflect the findings from our compensation work within the industry good practice guidelines currently under development and due to be completed in summer 2017.
28. We have notified train companies that we are intending to expand our current core data requirement to include key performance indicators relating to delay compensation. This will help us track the volume of delay compensation claims each train company receives, the methods used to submit claims, the speed with which they process claims, and the methods they use to pay compensation.
7. The complaint correspondence per 100,000 passenger journeys. Complaints are normalised by passenger journeys to allow effective comparison of data between time periods and train operating companies.
8. http://www.orr.gov.uk/__data/assets/pdf_file/0009/21141/which-super-complaint-response-report.pdf
10
Office of Rail and Road | Annual Rail Consumer Report July 2017
29. The Consumer Rights Act 2015 (CRA) came fully into force in rail on 1 October 2016. It provides consumers with remedies where services are not provided to the required standard. This includes the right to a refund in the original payment method. We have worked with RDG and individual train companies to help them meet this new requirement and also to expand the range of methods by which they pay compensation for delays.
30. Over the coming year, we will continue to work with stakeholders to promote awareness and understanding of the CRA and its application to rail passenger services. We will also be reviewing key passenger terms and conditions in order to identify, for example, where there might be scope to improve their clarity and prominence.
Case studies31. Finally, the ‘business as usual’ work we
carry out day to day engaging with train companies to effect improvements for passengers is illustrated via a selection of case studies throughout this report. These are highlighted in the relevant sections below and demonstrate some of the ongoing work we do along with the outcomes for passengers.
Next steps32. This is our second report in this area. In our
first report we set out our overall strategy and approach in carrying out our consumer role. Over the last year we have been working to implement this strategy. We will continue to recognise success and build a clear evidence base on which to press for improvements in the service passengers receive in areas such as ticket machines, complaint handling and compensation for delays. We will sharpen our focus on outcomes for passengers, ensuring that train companies and Network Rail comply with their regulatory obligations and deliver better customer service in the key areas that we regulate. Table 1 summarises some of the key actions that we will now be taking forward.
33. We welcome views to assist us in the development of future publications. We would be grateful for comments on the content, format and scope of this document. Responses should be sent to [email protected] no later than 29 September 2017.

11
Office of Rail and Road | Annual Rail Consumer Report July 2017
Area ORR next steps Timing
Ticket retailing Undertake a further review of train company websites to make sure that passengers can find the information they need when planning journeys and buying tickets, and publish an update.
December 2017
Ticket retailing Repeat our TVM mystery shopping research to see what improvements have been made over the last 12 months.
Spring 2018
Passenger information
Establish the actions train companies/Network Rail may need to take to deliver improvements to information provided to passengers in light of new research findings.
Autumn 2017
Passenger assistance
Publish the findings of our wide-ranging research, together with a plan of our future work in this area.
Autumn 2017
Complaints and compensation
Focus on improving complaints handling with a key focus on the obligation to respond to complaints within the required timescales.
Ongoing
Complaints and compensation
Increase our understanding of why some train companies perform better than others. Share good practices to raise standards.
January 2018
Complaints and compensation
Continue to be proactively involved in discussions as arrangements for ADR in the rail sector are further explored.
Ongoing
Complaints and compensation
Continue to promote awareness and understanding of the Consumer Rights Act 2015 and its application to rail passenger services.
Ongoing
Complaints and compensation
Expand our current core data requirement to include key performance indicators relating to delay compensation.
April 2018
Table 1: Summary of ORR next steps in key areas

12
Office of Rail and Road | Annual Rail Consumer Report July 2017
3. BACKGROUND
3.1 Our role 34. The Office of Rail and Road (ORR) is the combined
economic and health and safety regulator for the UK’s rail network and the economic monitor for England’s strategic road network.
35. The rising number of rail passengers increases the importance of our role in protecting their interests. Our consumer work derives from our statutory responsibilities around consumer and competition law, and from the provisions made in train companies’ and Network Rail’s licences. These statutory responsibilities require us to focus on four important aspects of the customer experience that feed into our strategic objective of better rail customer service as shown in Figure 1.
36. We are not responsible for setting fares, franchising train companies, or setting the level of public subsidy in the railway. Government sets these parameters.
We are working to ensure:
■ Ticket retailing - the provision of clear, accurate and complete information on rail products and services sold through, for example, ticket offices, ticket vending machines and websites. Consumers should be able to choose the most appropriate ticket for their journey, understand how they can use their ticket and where necessary exercise their rights, for example under the National Rail Conditions of Travel.
■ Passenger information - the provision of appropriate, accurate and timely information to enable railway passengers (and prospective passengers) to plan and
make their journeys with a reasonable degree of assurance, including when there is disruption to services. In this we include the provision of information about compensation in the event of disruption (whether this information is given during or after the journey itself).
■ Passenger assistance - the ability for passengers with a disability to make their journeys easily and confidently, whether those journeys are made on a ‘turn up and go’ basis or where travel assistance has been booked in advance.
■ Complaints and compensation - the provision of an easily accessible, effective and efficient complaints and compensation service. We aim to ensure continuous improvements in passengers’ experience of rail, through train and station companies acting on the feedback received through customer complaints.
37. Our consumer responsibilities cover the franchised train operating companies as well as a number of concession and open access train companies. In addition, Network Rail owns and operates 18 of Great Britain’s largest and busiest stations - including 10 stations in London - and is subject to similar regulatory obligations as train companies in relation to passenger information, the provision of passenger assistance, and the handling of passenger complaints.
38. Annex A provides detail on our consumer law powers that have particular relevance to ticket retailing and passenger rights, and describes the specific regulatory obligations in train companies’ and Network Rail’s licences.
Figure 1: Better rail customer service
Ticket Retailing
Passenger Information
Passenger assistance
Complaints and compensation

13
Office of Rail and Road | Annual Rail Consumer Report July 2017
3.2 Our approach to regulation39. We engage with train companies and Network
Rail to seek improvement to customer service by providing guidance on what is required, challenging understanding and ensuring clarity. Our approach depends on individual circumstances but can include regulatory statements, formal guidance, the identification and sharing of best practice, and contributing to the development of codes of practice. This is in addition to the ‘business as usual’ work we carry out day to day, engaging with companies, illustrated via a selection of case studies throughout this report.
40. We monitor performance over time to ensure there is a clear evidence base, in particular by improving the range and quality of data provided to us by train companies and Network Rail. We support this by targeting consumer research to tell us what is happening in practice and through this create insights to effect real change for rail passengers.
41. Our analysis enables us to strengthen incentives for companies to deliver better outcomes for their passengers, and by putting more information into the public domain in a systematic way we can create a clear reputational incentive for companies to deliver better customer service. We also use our evidence and analysis to strengthen our engagement with companies where it is clear that improvement and behavioural change is necessary to provide better customer service. This can include:
■ Stakeholder workshops;
■ Site visits;
■ Use of independent auditors;
■ Targeted reporting from individual companies; and
■ Corrective action plans.
42. Where an issue has not been resolved in a timely manner or if we are not satisfied with explanations or planned corrective action we can add it to our internal register of concerns which is visible to the ORR Board. This enables us to formally rate, track and record issues that if unresolved may then be subject to enforcement action.
43. Where we discuss with train companies their performance or compliance with regulatory obligations, we balance the need for transparency with the need for productive engagement and investigation of potential concerns. We are committed to ensuring that our decision-making is clear and predictable and where appropriate we will publish formal correspondence (ORR letters and company responses) on such issues at an appropriate time, likely to be when we have concluded our formal consideration of the issues raised. This approach will provide useful insight for stakeholders and enable other companies to consider the issues raised and compare these to their own particular circumstances.
44. Where appropriate we can also use our enforcement powers, to ensure that train companies and Network Rail comply with their licences and so work in the public interest. Our economic enforcement policy and penalties statement9 explains our policy. It sets out in detail what powers we have to enforce compliance with licences, the remedies available to us if licence holders are not compliant, and how we will decide whether and when to use them.
45. Our overall approach to carrying out our regulatory functions is set out in Figure 2 below.
9. http://www.orr.gov.uk/__data/assets/pdf_file/0018/4716/economic-enforcement-statement.pdf

14
Office of Rail and Road | Annual Rail Consumer Report July 2017
3.3 The regulatory environment 46. Our statutory responsibilities around
consumer and competition law, and the provisions made in train companies’ and Network Rail’s licences shape the way we focus on passengers and the benefits we can deliver.
47. Franchising involves the government setting out what it would like a rail franchise to deliver over a set period (level of service, upgrades, performance etc.). Companies then bid for the right to operate a franchise to that specification. The government selects whichever company it thinks will deliver the best overall package for the franchise and give the best value for money. Franchise agreements include details of the performance standards that franchisees must meet and arrangements for the termination of a
franchise in the case of failure to meet these standards. While ORR does not have a role in specifying franchises, we work closely with the DfT, Transport Scotland, the Welsh Government, and Transport for London, as well as sub-national transport bodies, since our role interfaces with the services and obligations set out in the franchise agreements that they manage.
48. We also work closely with Transport Focus, the independent watchdog representing the interests of Britain’s rail passengers, and with London TravelWatch, the independent, statutory watchdog for transport users in and around London. These organisations provide valuable insight and evidence on key passenger issues and through this enable further work with the industry to deliver improvement in a wide range of areas.
Figure 2: ORR approach to regulatory functions
Engagement ■ provide guidance on
what is required
■ challenge understanding and ensure clarity
Transparency ■ put information in the public
domain to give confidence to users and funders
■ strenghten incentives for companies to deliver better outcomes for their passengers and ousers
Analysis and action ■ seek improvement and
behavioural change where weaknesses are identified
■ regulatory action
Monitor ■ develop a clear evidence base
■ do this by improving the range and quality of data provided to us by train operating companies Network Rail and Highways England

15
Office of Rail and Road | Annual Rail Consumer Report July 2017
3.4 Structure and scope 49. This is our second Annual Consumer Report.
Our initial report10 was an interim report and this is the first time that we have included a full year of monitoring data in the areas of passenger assistance and complaints handling.
50. The report covers the reporting year from April 2016 to March 2017.
51. It is broadly structured to follow the potential passenger experience (recognising that not all passengers will require assistance or choose to make a complaint or compensation claim) and focuses on the following areas:
■ Ticket retailing;
■ Passenger information;
■ Passenger assistance; and
■ Complaints and compensation.
52. We have provided separate information and data on Network Rail in section 5. The data sheets in section 6 show how each train company has performed across the key consumer areas that we regulate. We have also given examples of where we already have, or intend to use this monitoring data to work with the industry to:
■ Identify where policy may need to be clarified or developed to improve outcomes for consumers;
■ Understand more fully the experience of consumers, providing a basis for specific actions, or wider change to deliver better customer service; and
■ Improve compliance with relevant legislation, licences and codes and through this ensure that consumers receive the quality and consistency of service that they expect.
53. Finally, we report on further progress on the super-complaint (Compensation arrangements in the market for passenger rail services) concerning passengers’ awareness and experience of claiming compensation from train companies as a result of train delays.
54. We have not included information of smaller heritage railways, charter companies or smaller station licence holders (such as Prestwick Airport).
55. We are currently formulating our response to a consultation on regulation for some smaller categories of licence holder on Complaints Handling Procedures and Disabled People’s Protection Policies and will reconsider their inclusion in further reports once this consultation has concluded. For this reason we report on Tyne and Wear Metro in the main report but we have not provided a data sheet in section 6, as currently Tyne and Wear Metro do not report the full core data set.
56. This report does not cover ORR’s role in relation to England’s strategic road network. Annex G provides further detail on this aspect.
10. http://www.orr.gov.uk/__data/assets/pdf_file/0012/22116/measuring-up-annual-rail-consumer-report-june-2016.pdf

16
Office of Rail and Road | Annual Rail Consumer Report July 2017
4. OUR PASSENGER WORK
ORR works to ensure better service on the railways 57. It is important that passengers can get the
information they need to help them plan their journey, choose and buy tickets, receive assistance where they need it, and redress when things go wrong.
58. This section sets out the work that we have undertaken across the passenger facing areas for which we are responsible. This includes licence obligations dealing with how train companies provide assistance and journey information, how they deal with complaints, and general consumer law that applies to things like the selling of tickets and passenger rights.
59. We have dealt with each of these in turn below. The performance of individual train companies against their licence obligations is set out in section 6.
Figure 1: Better rail customer service
4.1 Ticket retailing
4.2 Passenger information
4.3 Passenger assistance
4.4 Complaints and compensation

17
Office of Rail and Road | Annual Rail Consumer Report July 2017
4.1 Ticket retailing Introduction60. Over the last year we looked at various aspects
of ticket retailing, including via ticket vending machines and websites. Here we set out the work that we have undertaken over this period to make ticket retailing easier and clearer, and why this is important for rail consumers.
Retail market review 61. The rail retail market has developed since
privatisation with passengers now having a wider range of ways to buy tickets and more choice in what form of ticket they use. Much of this reflects the efforts the industry is making to drive innovation. Improving rail ticketing will deliver a better customer experience and also facilitate cost efficiencies for the industry.
62. Government and the industry committed to deliver smart ticketing11 on the national rail network in England and Wales by the end of 2018. With this in mind we wanted to review the regulations, conduct, processes and systems in the retail market to consider whether they created any undue barriers to the development of ticketing and retailing for the benefit of passengers.
63. Our Retail Market Review was launched in February 2014 and concluded in October 2016. It involved three public consultations, two industry workshops and primary research including research on passengers’ views on ticketing.
64. Our full recommendations are set out in our Retail Market Review Conclusions.12 Together with longer term recommendations around ticketing strategy we made a number of other nearer term recommendations designed to ensure that third party retailers continue to play a full role in the market. These recommendations included:
■ The establishment of a formal working group for online third party retailers;
■ The establishment of an enhanced dispute mechanism to provide independent arbitration for third party retailers;
■ That train companies should actively consider the merits of making all fares and products available to third party retailers; and
■ The industry should identify and address the barriers smaller retailers face from selling tickets.
65. Other recommendations relate to the industry processes through which new products are introduced and the procurement processes that can suppress the potential for innovation from providers of ticket vending machines.
66. Most of our nearer term recommendations have now been adopted by the industry and government. RDG has, for example, developed a more consultative approach with third party retailers in the delivery of change. A number of the other recommendations are being taken forward by way of an Action Plan for Information on Rail Fares and Ticketing, which we report on below.
Progress review: action plan for information on rail fares and ticketing67. In 2016, we worked with the Department for
Transport (DfT), Which?, RDG and Transport Focus to identify actions that will improve fares and ticketing for passengers. The resulting Action Plan13 is being implemented now.
68. These organisations have met monthly to provide oversight and to monitor progress. The Action Plan is designed to run for 12 months and has set out a series of actions in four themes.
69. This report is an interim update on delivery against the Action Plan objectives. There are different timescales for each separate action to be completed.
How you choose your ticket70. Work is progressing to remove jargon and
provide clearer names for tickets, and definitions that passengers can understand. In May 2017, the first tranche of a phased series of changes removed and simplified over 90% of some jargon terms from TVMs, and this work-stream remains on course to complete by the end of 2017.
11. Smart tickets include products such as mobile tickets, e-tickets, barcodes, and Oystercard style tickets.12. http://orr.gov.uk/__data/assets/pdf_file/0003/22935/retail-market-review-conclusions-october-2016.pdf13. https://www.gov.uk/government/uploads/system/uploads/attachment_data/file/579850/action-plan-for-information-on-rail-fares-
and-ticketing.pdf
18
Office of Rail and Road | Annual Rail Consumer Report July 2017
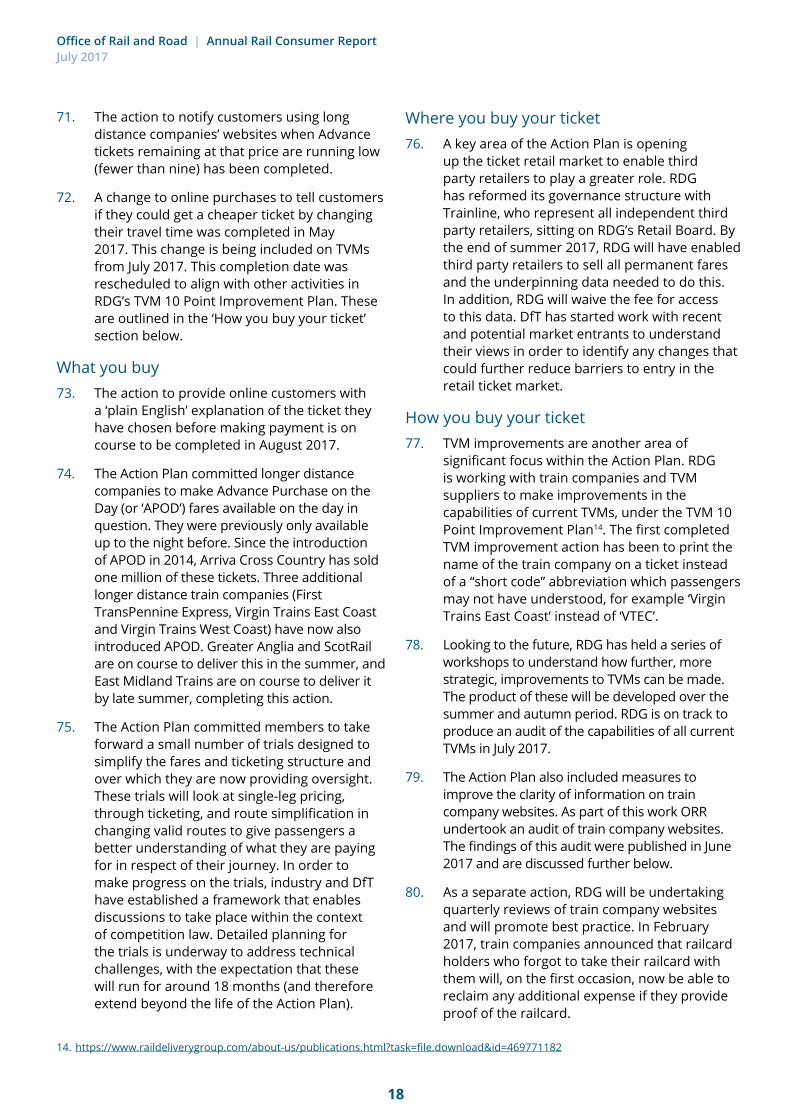
71. The action to notify customers using long distance companies’ websites when Advance tickets remaining at that price are running low (fewer than nine) has been completed.
72. A change to online purchases to tell customers if they could get a cheaper ticket by changing their travel time was completed in May 2017. This change is being included on TVMs from July 2017. This completion date was rescheduled to align with other activities in RDG’s TVM 10 Point Improvement Plan. These are outlined in the ‘How you buy your ticket’ section below.
What you buy73. The action to provide online customers with
a ‘plain English’ explanation of the ticket they have chosen before making payment is on course to be completed in August 2017.
74. The Action Plan committed longer distance companies to make Advance Purchase on the Day (or ‘APOD’) fares available on the day in question. They were previously only available up to the night before. Since the introduction of APOD in 2014, Arriva Cross Country has sold one million of these tickets. Three additional longer distance train companies (First TransPennine Express, Virgin Trains East Coast and Virgin Trains West Coast) have now also introduced APOD. Greater Anglia and ScotRail are on course to deliver this in the summer, and East Midland Trains are on course to deliver it by late summer, completing this action.
75. The Action Plan committed members to take forward a small number of trials designed to simplify the fares and ticketing structure and over which they are now providing oversight. These trials will look at single-leg pricing, through ticketing, and route simplification in changing valid routes to give passengers a better understanding of what they are paying for in respect of their journey. In order to make progress on the trials, industry and DfT have established a framework that enables discussions to take place within the context of competition law. Detailed planning for the trials is underway to address technical challenges, with the expectation that these will run for around 18 months (and therefore extend beyond the life of the Action Plan).
Where you buy your ticket76. A key area of the Action Plan is opening
up the ticket retail market to enable third party retailers to play a greater role. RDG has reformed its governance structure with Trainline, who represent all independent third party retailers, sitting on RDG’s Retail Board. By the end of summer 2017, RDG will have enabled third party retailers to sell all permanent fares and the underpinning data needed to do this. In addition, RDG will waive the fee for access to this data. DfT has started work with recent and potential market entrants to understand their views in order to identify any changes that could further reduce barriers to entry in the retail ticket market.
How you buy your ticket77. TVM improvements are another area of
significant focus within the Action Plan. RDG is working with train companies and TVM suppliers to make improvements in the capabilities of current TVMs, under the TVM 10 Point Improvement Plan14. The first completed TVM improvement action has been to print the name of the train company on a ticket instead of a “short code” abbreviation which passengers may not have understood, for example ‘Virgin Trains East Coast’ instead of ‘VTEC’.
78. Looking to the future, RDG has held a series of workshops to understand how further, more strategic, improvements to TVMs can be made. The product of these will be developed over the summer and autumn period. RDG is on track to produce an audit of the capabilities of all current TVMs in July 2017.
79. The Action Plan also included measures to improve the clarity of information on train company websites. As part of this work ORR undertook an audit of train company websites. The findings of this audit were published in June 2017 and are discussed further below.
80. As a separate action, RDG will be undertaking quarterly reviews of train company websites and will promote best practice. In February 2017, train companies announced that railcard holders who forgot to take their railcard with them will, on the first occasion, now be able to reclaim any additional expense if they provide proof of the railcard.
14. https://www.raildeliverygroup.com/about-us/publications.html?task=file.download&id=469771182
19
Office of Rail and Road | Annual Rail Consumer Report July 2017
81. Finally, DfT has started work, including reviewing research and liaising with stakeholders such as the Disabled Persons Transport Advisory Committee, to identify what improvements could be made to the ticket buying process for disabled and vulnerable passengers.
82. The Action Plan final report on the progress achieved is due to be published in December 2017.
83. Annex C provides an update on all of the planned actions to improve rail fares and ticketing.
Audit of websites against the retail information code of practice 84. In February 2017, we commissioned an audit
of train company websites against the retail information Code of Practice15 (the ‘Code’). The Code was designed to help improve standards for providing passengers with information when they choose, buy and use rail tickets. It reflects consumer law and complements industry obligations to retail fairly and impartially.
85. The purpose of the audit was to evaluate train company websites against the principles set out in the Code to help understand the extent to which these websites provide the information that passengers need. The audit was an action from the Action Plan for information on rail fares and ticketing16 that was published in December 2016 and is discussed above.
86. Overall, the audit carried out by independent research company Deeson,17 found that most of the information that passengers are likely to need when planning journeys and buying tickets is provided.
87. However, there were exceptions to this, with some information not always being available or suitably prominent, for example only found by hovering over a word or area or the explanation for it was behind a small (or unintuitive) icon, and some use of potentially unclear industry jargon.
88. The audit also found good practice where, for example, relevant discounts were added automatically and were clearly explained, passengers were advised when a cheaper option was available, and additional information was prominent and well sign-posted.
Next steps89. We have written to train companies to
highlight the general findings of the audit and to recommend that they review these in the context of their own websites and consider what actions they can take to improve the information they provide to passengers.
90. In addition to this, there are three specific issues that we think warrant immediate attention. These relate to the provision of information about:
■ GroupSave discounts (discounts for groups of people travelling together);
■ Live journey information; and
■ Key terms and conditions.
91. For each of these areas we have asked train companies to confirm the issues as they relate to their website and provide details of how they intend to address them, where relevant, and the time scales for doing so.
92. We will also work with RDG to help develop its website best practice guidance for train companies.
93. We will continue to work with DfT, RDG, Transport Focus and Which? to monitor the delivery of other actions18 to which the industry has already committed, some of which relate to issues identified in the audit. These are:
■ Reducing/explaining jargon and plain English ticket explanations;
■ Identifying cheaper tickets; and
■ Better information about terms and conditions.
94. We have asked companies to make improvements in these areas. We will undertake a further review of websites and publish an update report in December.
15. https://www.raildeliverygroup.com/media-centre/press-releases/2015/186-2015-03-25-1.html16. https://www.gov.uk/government/publications/action-plan-for-information-on-rail-fares-and-ticketing17. http://www.orr.gov.uk/rail/consumers/what-we-do-for-consumers/audit-of-train-company-websites-against-the-retail-information-
code-of-practice18. https://www.gov.uk/government/publications/action-plan-for-information-on-rail-fares-and-ticketing

20
Office of Rail and Road | Annual Rail Consumer Report July 2017
Ticket vending machines (TVMs)
Introduction 95. For some time there have been concerns
expressed about the quality of information provided to passengers using TVMs to enable them to select the most appropriate ticket for their journey. We therefore committed in our Business Plan for 2016-17 to publish a report19 on the information train companies provide to passengers when they are buying tickets from TVMs. As part of this we conducted mystery shopping research, and worked directly with train companies, RDG, and TVM suppliers.
Mystery shopping research96. 721 mystery shops were carried out covering
the most popular journey routes and ticket types on TVMs for each train company. Mystery shoppers were given a range of travel time and priority scenarios covering the cheapest ticket, flexibility of route or train company, and flexibility for time of return.
Findings97. The results showed that whilst the majority of
shoppers (80%) selected the most appropriate ticket for their journey from the TVM, across the industry one in five mystery shoppers were unable to do so. 7% did not select the most flexible ticket for their journey (with the majority risking a penalty fare). 13% of shoppers would have suffered financial detriment as a result of not selecting the cheapest fare for their journey.
98. The research also identified a number of areas of good practice where train companies should focus their efforts. These include:
■ On the range of products available, where many mystery shoppers did not see any information about the types of tickets that could be purchased from the TVM or that other, possibly cheaper fares might be available from the ticket office;
■ On the information about ticket restrictions and validities, where many mystery shoppers could not find any information alongside ticket prices and of those that did, many found it difficult to locate; and
■ In relation to on and off-peak tickets, where many mystery shoppers found it difficult to get information about times, could not find information about when tickets could be used, and did not understand the restrictions on travel.
Areas for action99. It is important that rail passengers can be
confident that they are paying the right amount for their ticket when making a purchase using a TVM. We therefore called upon train companies to introduce a price guarantee, refunding the additional ticket costs where a passenger finds that they could have bought a cheaper ticket for their journey. Most train companies responded positively to our recommendation, and 12 have introduced a price guarantee.
19. http://orr.gov.uk/__data/assets/pdf_file/0018/24048/ticket-vending-machines-review-february-2017.pdf

21
Office of Rail and Road | Annual Rail Consumer Report July 2017
Train company
TVM Price Guarantee
for passengers
Web link to TVM Price Guarantee
Arriva Trains Wales https://www.arrivatrainswales.co.uk/Refunds/
Chiltern https://www.chilternrailways.co.uk/ticket-types-fares
c2c* http://www.c2c-online.co.uk/about-us/our-policies/right-ticket-right-price-commitment/
East Midlands Trains https://www.eastmidlandstrains.co.uk/frequently-asked-questions/#wrong-ticket
Govia Thameslink Railway
Greater Anglia https://www.greateranglia.co.uk/tickets-fares/ticket-vending-machine-price-promise
Great Western Railway https://www.gwr.com/plan-journey/tickets-railcards-and-season-tickets/ticket-types
Heathrow Express https://www.heathrowexpress.com/faqs/ticket-faqs
London Midland
Merseyrail https://www.merseyrail.org/tickets-passes/refunds.aspx
Northern https://www.northernrailway.co.uk/faq/tickets
Scotrail* https://www.scotrail.co.uk/about-scotrail/our-price-promise
Southeastern
South West Trains
Transpennine Express http://www.tpexpress.co.uk/help/contact-us/price-promise
Virgin Trains East Coast https://www.virgintrainseastcoast.com/faq/tickets-booking/#cid_9272_0__832
Virgin Trains West Coast
Table 2: Ticket Vending Machine price guarantee
*Note: c2c and Scotrail had a TVM Price Guarantee in place prior to publication of the ORR report in February 2017.

22
Office of Rail and Road | Annual Rail Consumer Report July 2017
100. We also wrote to RDG to ask that they set out what improvements they expect to be delivered at an individual train company level in the good practice areas in the next six months. Their response predominately focused on fares reform rather than ticket vending machines. We published this on our website.20 As a result we will be following up instead with individual train companies to understand what improvements they expect to deliver at an individual train company level in the good practice areas. In the meantime, as noted earlier, in July 2017 RDG will be producing an audit of the capabilities of all current TVMs as part of the action plan for information on rail fares and ticketing.
20. http://www.orr.gov.uk/__data/assets/pdf_file/0015/25152/rdg-ticket-machines-response-letter-2017-03-10.pdf
Next steps101. We will now follow up with individual train
companies to understand what improvements they expect to deliver in the good practice areas.
102. We will repeat our mystery shopping research to see what improvements have been made over the last 12 months. We expect to publish the results early next year.
23
Office of Rail and Road | Annual Rail Consumer Report July 2017
4.2 Provision of passenger information
Introduction103. Having correct and relevant information is a
key requirement for those planning or making a journey. The passenger information licence condition in passenger, station and Network Rail’s licences was introduced in 2012. Since then numerous initiatives to improve the provision of information have been delivered. However, in the same period, the expectations of passengers have increased. Information is now available at their fingertips, whether at home, on the train or at the station. As new technology is introduced, the industry must continue to review the services that can be provided, whilst also ensuring that the basic information at the heart of the system is correct, especially when services are disrupted.
Progress this year104. Last year in our first annual rail consumer
report we set out the detail of work carried out under the passenger information licence condition since it was introduced. This year we focus on changes since the last report.
Clarification of the passenger information licence condition105. In 2012, we published guidance to support
the passenger information licence condition that gave more information about what is expected and how it will be enforced.
106. We updated the guidance21 in June 2016, following a super-complaint about compensation for passengers who have been delayed. While the licence conditions did not change, we clarified that the condition applies to all parts of a passenger journey. This is discussed further in section 4.4 below.
Revised code of practice on provision of information 107. Our licence condition on passenger
information requires companies to publish a
code of practice (‘the Code’) that sets out how they will deliver information to passengers, including during disruption. The Association of Train Operating Companies (now known as RDG) code of practice from July 2014, was the current version when our guidance was updated. All train companies currently follow this industry Code which is principles-based.
108. During the summer of 2016, the industry revised its Code to reflect the stages of the passenger journey and include a variety of improvements. We recommended this approach to ensure that improvements to passenger information are embedded in the operating practices of companies, including when rail franchises change and when new companies enter the market. The new document has a wider scope including the need to provide information about station facilities, delay compensation and the use of station help points. The new version of the Code was published by RDG in October 2016.22
109. A ‘local plan’ based on the Code sets out how individual train companies will provide information and is tailored to how they run their services. To ensure compliance with the passenger information licence condition we ensure that every train company has a local plan which conforms to the Code. Local plans should be published on the train company’s website, along with a link to the Code itself and an annual statement of progress. We have included this information in the data sheets (in section 6), following a review of train company websites carried out in May 2017.
110. Although train companies should review their local plans annually, few plans were updated during summer 2016 while the Code was being revised. This has resulted in some temporary non compliance. We have said that we are content for the plans to be updated as their annual review becomes due and therefore expect all train companies to have published a plan that complies with the new Code by autumn 2017.
111. Network Rail has a similar licence condition and has published its own guidance which applies to its managed stations and regional control centres.
21. Information for passengers, guidance on meeting the licence condition: http://www.orr.gov.uk/__data/assets/pdf_file/0015/4353/information-for-passengers-guidance-on-meeting-the-licence-condition.pdf
22. The approved code of practice for the provision of customer information (ACOP014 version 2 – October 2016) may be downloaded from RDG’s website - http://www.raildeliverygroup.com/about-us/publications.html?task=file.download&id=469771025
http://www.orr.gov.uk/__data/assets/pdf_file/0015/4353/information-for-passengers-guidance-on-meetin
24
Office of Rail and Road | Annual Rail Consumer Report July 2017
Progress with delivery of industry actions112. Following the Transport Focus report into
passenger information in 2014, the industry developed a set of actions designed to address the issues Transport Focus had identified. There are 46 industry actions in total. The majority of these were due to be delivered before the end of 2017. In 2016-17, there were six actions that were due for completion and RDG told us that all have been delivered by the industry. Their full descriptions can be found in the back of the Code, listed in order of their action number, for example PIDD-01. A summary of the six actions with a March 2017 completion date are:
■ Prominent disruption warning banners on websites, apps and mobile sites during disruption (PIDD-01);
■ Integration of a real time feed into journey planners so that passengers cannot book onto trains that have already been cancelled (PIDD-03);
■ Integration of a national disruption feed into the live information parts of company websites so that disruption information for other train companies used on a planned journey is available (PIDD-07);
■ Manual announcements to be made during disruption including messages to passengers on trains from control centres (PIDD-15);
■ Passengers should not be forced to pay more because of disruption (PIDD-25); and
■ Allow train company controllers to make live broadcasts to passengers on trains (PIDD-39).
113. However, our retail code of practice audit23 in February 2017 (see above section 4.1 on the website audit), found that not all journey planners showed when services were disrupted. As this should have been delivered by actions PIDD 03 and PIDD 07 we will be looking again for evidence that the train companies have delivered these actions.
114. Some actions from previous years have yet to be delivered by all companies, often because of funding issues:
■ List of revised reasons for delay to be implemented in station information screens and automated announcements (PIDD-13B24. PIDD-13A allowed new reasons to be used in freeform systems such as websites and Twitter in May 2015);
■ Removal of repeated automated apologies (PIDD-16); and,
■ Changing the way the industry communicates suicides on the railway – use of “emergency services dealing with an incident” rather than “person hit by a train” (PIDD-50).
115. Of particular note has been the completion in 2016 of the technically complex ‘Darwin25 Customer Information Screens’ project which linked station information screens and company websites to the central Darwin system for the first time – ensuring what passengers see on their phones is the same as the information at the station.
Industry governance116. Governance of the industry’s programme was
under the National Task Force but during 2016 this was changed to RDG. Their Customer Experience During Disruption Programme has the aim that:
“Customers will receive timely, accurate and relevant information through the channel of their choice enabling them to make decisions that are right for them and the journey they wish to make. Should, for whatever reason, the customer require additional support to make that journey the industry will ensure it is resourced to assist and to make that journey easy.”
117. The remaining industry actions and new initiatives to improve the information that passengers receive have now been divided into three workstreams:
23. http://www.orr.gov.uk/rail/consumers/what-we-do-for-consumers/audit-of-train-company-websites-against-the-retail-information-code-of-practice
24. A group of train companies that use the Worldline Customer Information System are progressing delivery of this action for their systems.25. Darwin is the rail industry’s official train running information engine, providing real-time arrival and departure predictions, platform
numbers, delay estimates, schedule changes and cancellations. It powers National Rail Enquiries and train company customer facing information systems as well as apps developed by third parties.

25
Office of Rail and Road | Annual Rail Consumer Report July 2017
■ Empower customers – giving them the information and tools to make the right decision.
■ Empower staff – giving them the tools and training to support customers when they need it.
■ Enablers – providing a good customer experience during disruption through efficient processes, technology and procedures.
Industry research118. RDG has recently published research,26
undertaken between April 2016 and March 2017, which records the views of passengers who have experienced disruption. The overall rating of how a train company deals with delays/cancellations is poor, with four times as many negative ratings as positive.
119. Information provision was rated poorly, particularly when given at stations. The report suggests that the areas of information provision that need most attention are:
■ The availability of alternative transport if the train service could not continue;
■ The time taken to resolve the problem;
■ The amount of information provided; and
■ Frequency of updates.
120. Information provided by text alerts was best-rated overall and information provided by staff on train tended to receive more positive ratings than that given through social media, websites, apps or station departure screens. Information provided by email was also well-rated in comparison to other information sources and notably rated better than information provided by staff at stations.
121. Those passengers who receive information about disruptions or cancellations from departure screens at station (the primary source of information) gave relatively low ratings for all aspects.
122. The passenger survey remains open and a link27 is provided for all incidents reported on the National Rail Enquiries website.
123. We continue to monitor the provision of information during disruption by focusing on major incidents on the network. This gives an opportunity to see how the train companies put their published plans into practice. Our prioritisation criteria looks not only for the largest number of delay minutes but also the impact on passengers, taking into account the time of day, type of passengers affected, local geography and whether any passengers were trapped on trains outside stations. These reviews can be shared with the train companies – who commit in their local plan to reviewing serious incidents and learning lessons from a passenger perspective.
26. Research undertaken as a result of industry action PIDD-29 was published by RDG in May 2017 and may be downloaded from http://www.raildeliverygroup.com/about-us/publications.html?task=file.download&id=469772316.
27. The survey for passengers that have been disrupted may be completed online at http://survey3.accent-mr.com/D4/(S(wec52ceth5je0tqktmingpm5))/2908m.aspx?urn=opensurveyNRwebsite
26
Office of Rail and Road | Annual Rail Consumer Report July 2017
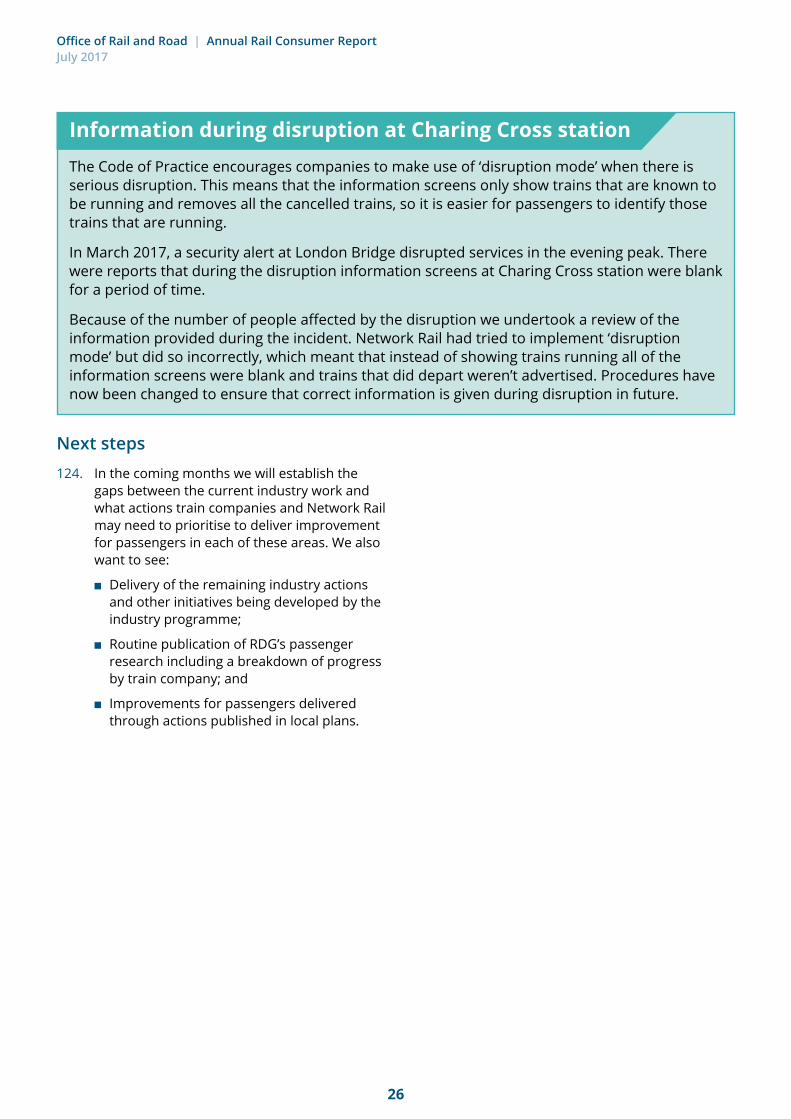
The Code of Practice encourages companies to make use of ‘disruption mode’ when there is serious disruption. This means that the information screens only show trains that are known to be running and removes all the cancelled trains, so it is easier for passengers to identify those trains that are running.
In March 2017, a security alert at London Bridge disrupted services in the evening peak. There were reports that during the disruption information screens at Charing Cross station were blank for a period of time.
Because of the number of people affected by the disruption we undertook a review of the information provided during the incident. Network Rail had tried to implement ‘disruption mode’ but did so incorrectly, which meant that instead of showing trains running all of the information screens were blank and trains that did depart weren’t advertised. Procedures have now been changed to ensure that correct information is given during disruption in future.
Next steps124. In the coming months we will establish the
gaps between the current industry work and what actions train companies and Network Rail may need to prioritise to deliver improvement for passengers in each of these areas. We also want to see:
■ Delivery of the remaining industry actions and other initiatives being developed by the industry programme;
■ Routine publication of RDG’s passenger research including a breakdown of progress by train company; and
■ Improvements for passengers delivered through actions published in local plans.
Information during disruption at Charing Cross station

27
Office of Rail and Road | Annual Rail Consumer Report July 2017
4.3 Passenger assistance Introduction 125. Train companies and Network Rail need to
comply with an operating licence condition which supports improvements in the accessibility of rail travel. We approve policies and monitor compliance with this condition:
■ To empower confident use of the railway by passengers with disabilities; and
■ To promote awareness of the advice and help available.
126. This year we completed a large-scale review of Disabled People's Protection Policies (DPPPs) to make sure they comply with the standards for rail passengers that we expect. The result is that all the written policies are now published, available to passengers online and at stations, and are compliant with guidance28 in this area. Through this process of approval we ensure that companies have policies that set out to passengers that they will receive a consistent level of assistance throughout their journey, even where this involves different train companies.
127. This year we have collated good practices that we have found via our stakeholder engagement and we have consulted on these with:
■ Industry - to check it represented all of the good practices in use; and
■ Specialist stakeholders – to provide input on the impact of the practices and any others which could be implemented, including from other sectors.
128. We will share these practices more widely with companies to consider when reviewing their DPPPs annually and with DfT for consideration when creating franchise specifications in order to further our aim to empower confident use of the railways by passengers with disabilities. For example in recent franchises, DfT has begun to specify reductions to the booking time of 24 hours’, and will look to procure further reductions through forthcoming franchise competitions.
129. A number of improvements to policies have been made following our discussions with companies during this process of approval. Our focus is now on ensuring that these written policies are consistently carried out in practice and that passengers receive the services that are outlined by train companies and Network Rail in this area. In line with our commitments to monitor performance and develop a clear evidence base, we continue to:
■ Engage with train companies and Network Rail to provide clarity on what is required and to drive improvements where needed. Our work throughout the year is illustrated using case studies;
■ Collect core data on the:
- Number of assisted journeys booked by passengers;
- Proportion of complaints concerning accessibility;
- Number of staff who undertook disability awareness training; and
- Volume of alternative accessible transport (such as taxis) booked by each train company.
■ Carry out bespoke research where necessary to provide further insight.
130. Our work in these areas is set out in more detail below.
Core data 131. Providing data on performance is an important
way in which train companies and Network Rail can demonstrate that they are complying with their regulatory obligations.
132. Sometimes passengers who need assistance prefer to book ahead using the Passenger Assist system (a central system provided by RDG which means passengers can book assistance without having to contact more than one company). We receive data on assistances booked through Passenger Assist from RDG. This data shows a total of 1.2 million booked assists in 2016-17, a 4.4% increase compared to 2015-16 (1.1 million booked assists).29
28. Guidance on How to write your Disabled People’s Protection Policy, a Guide for Train and Station Operators is available here: http://www.orr.gov.uk/__data/assets/pdf_file/0015/5604/how-to-write-your-dppp.pdf.
29. We define assists as the number of assists which have been requested through the Passenger Assist system. Passenger bookings relate to the number of bookings made through the Passenger Assist system. F`or each booking there can be several assists requested.
28
Office of Rail and Road | Annual Rail Consumer Report July 2017
Figure 3: Volume of booked assists and percentage change to last year 2016-17
133. In contrast to this rising trend in booked assistances, five companies provided fewer booked assistances than last year. Companies such as Merseyrail, London Overground and TfL Rail provide a large proportion of unbooked (or ‘turn up and go’) assistance, which may account for their lower volumes of booked assistance.
0%
50k0 100k 150k 200k 250k 300k 350k 400k
10% 20% 30%
345,305165,860 5.2
6.43.00.55.7
2.13.4
-0.4
-5.6
-20.9
-5.3-3.7
21.74.7
3.2
3.0
11.837.4
8.1
7.3
4.4
110,297104,239
67,36361,52856,84956,583
44,61544,001
35,96233,976
23,91423,804
12,558
4,2031,547
1,4351,115893454
40% 50% 60% 70% 80% 90%
Percentage change to last year (%)
Volume of booked assists
Network Rail
Great Western Railway
Virgin Trains West Coast
Virgin Trains East Coast
South West Trains
ScotRail
Arriva Trains Wales
East Midlands Trains
Govia Thameslink Railway
Northern
London Midland
Greater Anglia
TransPennine Express
Southeastern
Chiltern Railways
Merseyrail
c2c
TfL Rail
London Overground
Other
Heathrow Express
Caledonian SleeperCrossCountryGrand CentralHull Trains
Note: Data on the volume of booked assistance requests received in each rail period is available for each train operator that manages a station. Data is therefore not available for operators that do not manage any stations.
‘Other’ covers smaller operators whose passengers can book assistance through the Passenger Assist system.
Source: Rail Delivery Group (RDG)

29
Office of Rail and Road | Annual Rail Consumer Report July 2017
134. In addition to booked assists, many passengers also arrive without having booked assistance ahead. We refer to this as unbooked assistance or ‘turn up and go’ and we intend to measure this in future. This will help us to understand the overall volume of assists that happen and over time to assess whether there are trends in preference between booked or unbooked assistance.
135. In June 2015, we agreed with industry that it would provide us with this information on unbooked assistance as part of our core data compliance monitoring. Specifically, we requested data on the number of unbooked assistance requests each train company received in each rail period, how many of those requests were met and passenger feedback on their level of satisfaction with the assistance provided. At the time we acknowledged that this was a challenge for industry because the vast majority of train companies had no formal processes in place to record the information. In practice, only four companies had working arrangements in place for their staff to log when an unbooked assistance had been requested and delivered.
136. To meet our requirements, in late 2015, RDG proposed to initiate a long-term mystery shopping survey of unbooked assistance provision across Great Britain to assess the quality of assistance being provided by its members. However, by spring 2016, RDG alerted us that they could not deliver this research as planned since the funding they had allocated to this was no longer available. For 2016-17 this resulted in a gap in our unbooked assistance core data monitoring.
137. Nonetheless, four companies subsequently provided data on unbooked assistance volumes for 2016-17:
■ Merseyrail provided 67,978 unbooked assists;
■ London Overground provided 20,939 unbooked assists;
■ Hull Trains provided 1,646 unbooked assists (data from August 2016 to March 2017 only); and
■ TfL Rail provided 772 unbooked assists.
138. We have now reached an agreement with RDG and its members that they will provide us with data on unbooked assists. This will include RDG collating data from a central webform which train companies and Network Rail will be able to update for their respective stations.
139. In the longer-term, the solution we have agreed with industry to address the compliance reporting gap is for it to be met by the new Rail Accessibility Reservation System, which is due to replace the current Passenger Assist system in September 2018. The new system should record both booked and unbooked assistance requests, assistance completions, and will automatically request passenger feedback on the quality of the assistance they received.
140. We measure complaints made to train companies about accessibility issues. The volume of complaints which concern accessibility is relatively low, less than 1 complaint per 100,000 journeys for the majority of companies. However, in some cases a single complaint can indicate a serious issue. In this context we intend to take a closer look at some sub-categories of assistance-related complaints where we have noted an increase in volume. We will wish to examine, for example, whether this is a continuing trend.

30
Office of Rail and Road | Annual Rail Consumer Report July 2017
Figure 4: Accessibility complaints per 100,000 journeys 2016-17
141. ORR receives complaints and intelligence directly in some instances and (although we do not generally intervene in individual complaints) sometimes this can alert us to wider issues. This year, for example, we received a complaint from a local access group regarding Shenfield station. We visited the station in question and engaged with the
train company to resolve the issue. Following this, we will remind all train companies of their obligations under the DfT Code of Practice on Design Standards for Accessible Railway Stations and provide clarification on when the Code is likely to be triggered. More detail is provided in the following case study.
Accessibility complaints per 100,000 journeys
0 21
2.3
1.8
1.4
0.8
0.7
0.6
0.6
0.5
0.5
0.4
0.3
0.3
0.3
0.20.2
0.2
0.2
0.1
0.0
0.0
0.0
0.3
Virgin Trains East Coast
Virgin Trains West Coast
Grand Central
East Midlands Trains
Arriva Trains Wales
TransPennine Express
Hull Trains
Chiltern Railways
Great Western Railway
Southeastern
Govia Thameslink Railway
CrossCountry
Greater Anglia
Northern
London Midland
ScotRail
Merseyrail
c2c
South West Trains
TfL Rail
London Overground
Tyne Wear Metro
Note: Heathrow Express do not provide data on accessibility complaints. Caledonian Sleeper did not provide data for the full reporting year 2016-17 and so have not been included in this table.Source: Train Operating Companies

31
Office of Rail and Road | Annual Rail Consumer Report July 2017
142. We continue to engage with companies to ensure that the data provided to us is consistent and reliable. We have noted an improvement in the information on training provided by companies this year, including clearer information on what type of training was undertaken, what this entailed, and how it helped staff to provide a good service. Our own research and conversations with our stakeholders underline just how important a good standard of training is, and that a good experience with an assisting staff member can have a huge impact in terms of the passenger experience.
143. Training is equally important for staff in call centres and managers responsible for setting policy, as well as for front line staff delivering assistance on the ground. We monitor both the volume of staff undertaking disability and equality training each year and the type of training provided. This is highlighted in the individual train company data sheets in section 6 of this report. All companies carried out some form of training this year.
When train companies and Network Rail carry out work at stations they need to have regard to the Department for Transport Code of Practice on Design Standards for Accessible Railway Stations (the Code). This makes sure that when work at stations is carried out recognition of accessibility needs is incorporated. The Code applies at the point at which a company installs, renews or replaces infrastructure or facilities. In addition to complying with the Code, we also expect companies to consult with key organisations such as local access groups, in particular when planning and undertaking works at stations.
We received a complaint from a local access group that Abellio Greater Anglia had not complied with the Code at Shenfield station and had not listened when they tried to engage with the company to resolve the problem. This included issues with Blue Badge parking spaces and signage. We visited Shenfield station to see the situation in practice.
We then worked with the train company to resolve the situation at this station, and identify works across its station estate which may engage the Code and make sure that in future these are carried out in compliance. We are pleased that AGA and latterly the new holder of the franchise Abellio East Anglia (AEA) agreed to address a number of the issues at Shenfield including by way of a pilot exercise that is designed to see whether relocation of the Blue Badge Parking spaces will attract more passengers. This pilot is, we understand, currently underway and a number of other issues including signage have also been addressed.
We are still working with AEA towards achieving compliance at other stations.
This year we will be reminding all station and train companies of their obligations under the Code, in particular to refresh understanding of the low threshold at which the Code is triggered and the process for seeking a derogation or dispensation where this is appropriate. In addition we will consider our own approach to ensure that companies are held to account for their responsibilities in this area.
Making stations accessible

32
Office of Rail and Road | Annual Rail Consumer Report July 2017
Website audit 144. We expect train companies and Network
Rail to provide accurate and consistent information to passengers who require assistance, and take their needs into account when doing so. This year we carried out a review of the information provided online to ensure it is accessible and clear in promoting the assistance available, and communicates effectively with passengers who may have different communication needs. We assessed:
■ The technical accessibility of websites using both screen reader and magnification technology; and
■ The navigability, readability and content of websites with a particular focus on the provision of information for those with cognitive impairments.30
145. Screen readers allow users to access text that is displayed on the computer screen via speech and are used by people who prefer to use audio instead of text. Magnification software is used by people who need the information on screen to be larger.
146. The technical website review highlighted that websites may not be accessible for users of screen readers or magnification technology. This may prevent users with visual impairments in particular from accessing information on assistance and even from booking journeys and their required assistance online.
147. Common issues occurring were:
■ The use of calendars which were often inaccessible for screen reader users;
■ The use of form fields which passengers fill out to book tickets or assistance. These are often not labelled clearly if at all, meaning that screen reader users do not know how to use or fill in these fields; and
■ Text only booking sites can be easier to access for screen reader users, but companies providing these should ensure they are structured in a logical way allowing users to move through the required fields.
30. A cognitive impairment is when a person has difficulty remembering, learning new things or concentrating.
It is important that all train companies and Network Rail meet the standards set out in the guidance, and that passengers receive consistent messages about how much notice they need to give to book assistance.
We were concerned that although all policy documents complied with the guidance and stated that people booking assistance would not be asked to give more than 24 hours’ notice, in practice some companies were asking for more via certain booking channels (such as on e-booking forms) and in information provided on websites.
In February 2017, we wrote to five train companies (Arriva Trains Wales, East Midlands Trains, London Midland, ScotRail and Virgin Trains East Coast) setting out our concerns and asking them to make changes. Following our engagement, all five companies quickly amended the relevant information to make clear that passengers do not need to give more than 24 hours’ notice.
We also asked RDG to update the assistance page on the National Rail Enquiries website. This now makes clear that passengers can book assistance at short notice and do not need to give more than 24 hours’ notice.
We will continue to keep this area under review.
Notice periods for booking assistance

33
Office of Rail and Road | Annual Rail Consumer Report July 2017
148. The website content review looked at navigability (the effectiveness of signposting to accessibility and assistance information); content (the usefulness and comprehensiveness of the information provided); and readability (the extent to which the information provided is clear and well presented). We recommended a series of improvements under each of these headings. These included:
■ Ensuring information on station and train accessibility is available;
■ Including more rounded information on the assistance which can be provided for passengers with a range of different impairments;
■ Providing information on notice periods for assistance bookings;
■ Better provision of information on unbooked assistance;
■ Providing information on personal safety and security when travelling;
■ Making information available using shorter sentences, free from jargon and set out clearly using pictures to support understanding; and
■ Using augmented and alternative communication such as films or easy-read content.
149. We shared our review findings with individual train companies to make sure they are aware of the specific steps they can take to improve the accessibility and provision of information on their websites.
150. We will continue to keep this area under review as operators now make changes to their websites.
Awareness of assistance 151. In autumn 2016, we commissioned ComRes,
a specialist research agency, to undertake primary research to help us better understand if current, or prospective, passengers who require support to travel by rail were aware of the assisted travel services offered by train companies. The research covered:
■ Disabled people’s awareness of the assistance available to them on the rail network;
■ The barriers to awareness that exist;
■ Factors that deter people with disabilities from using the rail network; and
■ What can be done to overcome barriers to awareness and concerns that prevent rail use.
152. The fieldwork involved quantitative telephone and online surveys with 1,000 people who were both current users and non-users of rail but who self-identified as requiring support when travelling by train. The respondents were broadly representative of the population of those who would most likely require assistance to access the railway. The quantitative phase was then followed up with ten qualitative depth interviews to explore some respondents’ views and experiences in more detail.
153. While the detailed findings will be published in the full research report, to be published in autumn 2017, the main findings were as follows:
■ Awareness of current assistance programmes is low. Just half (51%) of respondents had heard of assistance schemes at all, only two in five (43%) had heard of Passenger Assist and just one in six (16%) had heard of the option to ‘turn up and go’. 14% of all disabled adults surveyed had used Passenger Assist and 5% had used unbooked assistance.
■ However, once those currently ‘unaware’ were made aware of the services available, there were high levels of interest in making use of Passenger Assist and ‘turn up and go’ in the future. To enable this they requested that more information is made available to them on the types of assistance available, how to book, and on what arrangements there are for when things do not go as planned.
■ Those passengers who have made use of these assistance schemes tend to be positive about their experiences, suggesting that the assistance currently available does meet the needs of most of those who use it.
154. The principal recommendation from the report, therefore, is for industry to do more to promote Passenger Assist and unbooked assistance more widely and proactively to prospective passengers. This should in turn lead to a natural increase in the uptake of assisted travel services.
34
Office of Rail and Road | Annual Rail Consumer Report July 2017
Experience of unbooked assistance 155. In January 2017 we commissioned Aecom to
conduct research into passengers’ experience of unbooked assistance. While conducting research with ‘real’ users was preferable, the challenges associated with this, in the sense that there is no formal database with user details due to the nature of unbooked assistance, meant we instead had to employ a mystery shopping strategy for the fieldwork. Aecom subsequently recruited 65 members of the public who self-identified as requiring assistance when travelling by rail to act as mystery shoppers. The fieldwork was conducted in March and April 2017.
156. Each mystery shopper was asked to undertake 2-3 return journeys on pre-selected services and to produce a detailed account of what they observed and experienced. This resulted in a total of 318 mystery shops overall, covering all the main train companies in Great Britain as well as the majority of the large Network Rail managed stations. To ensure the research was as representative as possible, Aecom recruited a cohort of mystery shoppers with a wide range of impairments and assistance requirements.
157. We specified that the mystery shoppers should test as many aspects of unbooked assistance as possible, including where possible:
■ Accessing the station;
■ Finding information about turn-up-and-go assistance in the station;
■ Requesting assistance and reporting on how effectively it was subsequently provided whether in the station or on train;
■ Testing the arrangements for assistance at journey interchange points such as changing trains;
■ Testing station and on-train staff knowledge by way of pre-agreed lines of questioning and generally assessing the helpfulness of staff during any interactions; and
■ Testing the arrangements for assistance during disruption (if disruption occurred).
158. We also sought to understand how experiences of the above vary in relation to the following factors:
■ Geography;
■ Journey type;
■ Disability type;
■ Assistance requirement;
■ Station type; and
■ Train staffing arrangements.
159. The research report is in the process of being finalised and we plan to publish it in the autumn alongside our work on awareness of assistance and our survey of Passenger Assist users.
Experience of Passenger Assist 160. We are in the process of completing a large-scale
piece of primary research into the experiences of users of the booked assistance scheme, Passenger Assist. This involves quantitative online and telephone interviews with 4,000 Passenger Assist users to better understand their views, experiences and preferences relating to the service. The scale of the research means we can generate results for each train company and use the insight to inform our wider compliance monitoring as to how well individual train companies are meeting booked assistance requirements. It also means we can get a much deeper understanding of how passengers’ experiences vary when booking assistance at different points across the network.
161. In particular, the research will help us to understand:
■ Who Passenger Assist users are, including their demographic characteristics, assistance needs, journey purpose, frequency of rail travel and booked assistance use;
■ Users’ experiences of the Passenger Assist booking process, including their reflections on what could be done to improve it;
■ Users’ experiences of actual assistance provision such as boarding and alighting trains;
■ Users’ experiences of interactions with train company staff for example their attitude, helpfulness and awareness of how to assist a passenger with additional support requirements; and
■ Users’ overall satisfaction with the quality of assistance provided to them, and their general reflections on how well Passenger Assist is working for them in so far as meeting their needs and preferences.
35
Office of Rail and Road | Annual Rail Consumer Report July 2017
162. The fieldwork was undertaken by research company Breaking Blue from February 2017 to July 2017. The final research report is being finalised and we expect it to be published alongside our work on unbooked assistance and awareness of assistance in autumn 2017.
Next steps163. The findings of our wide-ranging research will
be published in autumn, together with a plan of our future work in this area. Depending on the results of the research, we may also consider reviewing the 2009 Guidance on How to Write your Disabled People’s Protection Policy, a Guide for Train and Station Operators, which was published in 2009, and which we use as the basis for our approval of policies.
164. We will continue to collect and improve core data. This year our focus will particularly be on receiving data on unbooked assists and on ensuring that the new Rail Accessibility Reservation System is designed and set up in a way that means our data reporting requirements are met.
165. We will focus on complaints concerning accessibility, including looking in depth at any trends within sub-categories of this complaints category and reasons.
166. Staff training also continues to be an important focus. This year we will review in depth the information provided by train companies on staff training and we will consider how good training practices could be better recognised and disseminated.
167. This year we will work with the DfT and remind all train companies of their obligations under the Code of Practice on Design Standards for Accessible Railway Stations and provide clarification on when the Code is likely to be triggered.
168. In addition to this we are working to understand more around the systems and process being employed in relation to Driver Controlled Operation services and will be returning to this in the autumn, once we have finalised and published the results of our research, detailed above.

36
Office of Rail and Road | Annual Rail Consumer Report July 2017
4.4 Complaints and compensation
Introduction 169. Effective redress is important. It provides
consumers with a means to expose companies to failings in service provision and to claim compensation where appropriate. It also provides important insight for companies so that they know where to make improvements. To be effective, a complaints system must be accessible and individual complaints should be dealt with in a fair, effective and timely manner. Information about complaints should also be used to drive service improvements through service providers acting on the feedback received. When a complaint cannot be easily resolved, any appeal mechanism or dispute resolution scheme should be able to offer quick, fair and effective redress and provide transparency about company performance and wider trends.
Complaints handling170. For the reasons set out above, it is important
that we understand the reasons for, and take prompt and effective action to address, individual train companies’ poor complaints handling performance. We also want to help train companies to improve their service which should prevent issues from arising in the first place.
171. In September 2015, we published updated guidance on Complaints Handling Procedures. All companies then updated their own complaints handling documents to comply with the new guidance. We reviewed and approved these revised policies throughout 2016. Following completion of this process our focus is now on monitoring compliance to ensure that passengers receive the level of service that they have committed to provide to passengers.
Data quality172. We have worked to improve the quality of the
data provided to us. We use core data to check that companies are doing what they have said they will. Our visits to companies have been useful in helping us identify a number of inconsistencies, for example, in the way that complaints are recorded between companies. We held a workshop with all train companies in February 2017 to set out what we had found and to agree processes that should be adopted across the industry. Following that workshop we published new data guidance.31 We have also improved our internal data collection and validation procedures. These new procedures allow us to identify any data errors as soon as we receive the data, and for the train company to then resolve these in a timely manner.
Core data173. There were 29.4 complaints per 100,000
journeys in 2016-17 for franchised companies. Overall 13 train companies had a lower complaints rate, and eight train companies had a higher complaints rate, than 2015-16.
31. http://www.orr.gov.uk/__data/assets/pdf_file/0004/3874/Reference-guide-for-complaints-data-2017-18.pdf
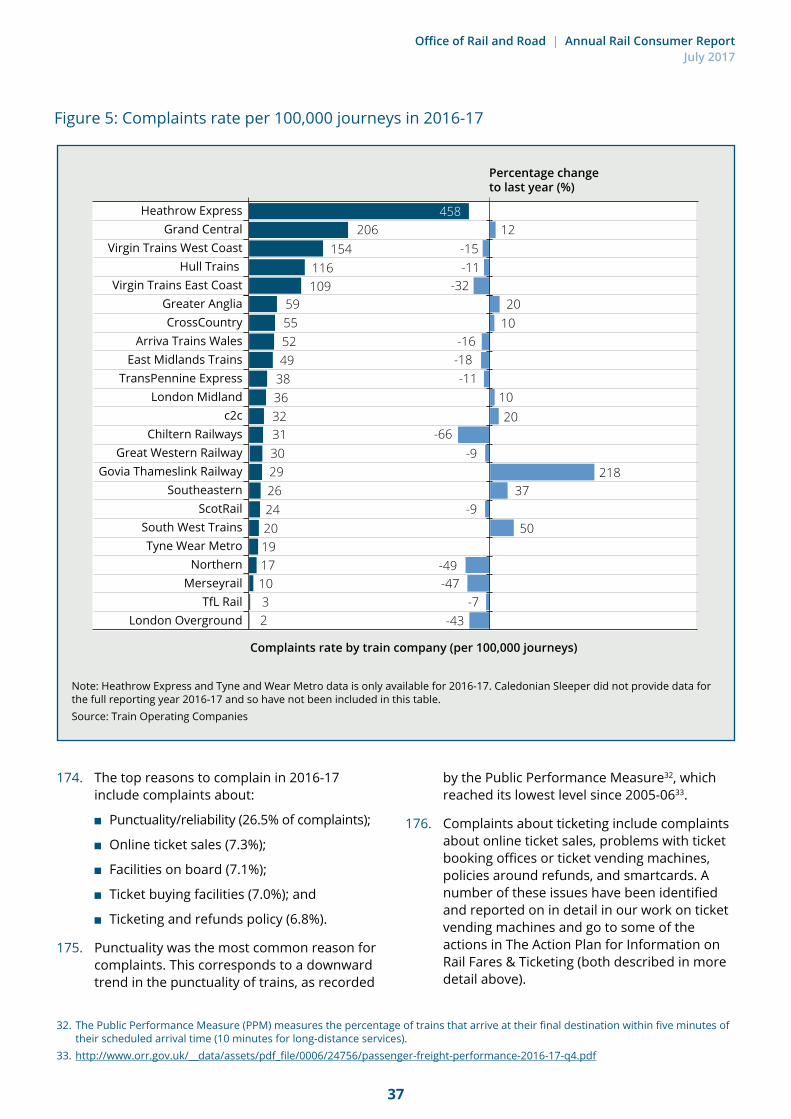
37
Office of Rail and Road | Annual Rail Consumer Report July 2017
174. The top reasons to complain in 2016-17 include complaints about:
■ Punctuality/reliability (26.5% of complaints);
■ Online ticket sales (7.3%);
■ Facilities on board (7.1%);
■ Ticket buying facilities (7.0%); and
■ Ticketing and refunds policy (6.8%).
175. Punctuality was the most common reason for complaints. This corresponds to a downward trend in the punctuality of trains, as recorded
by the Public Performance Measure32, which reached its lowest level since 2005-0633.
176. Complaints about ticketing include complaints about online ticket sales, problems with ticket booking offices or ticket vending machines, policies around refunds, and smartcards. A number of these issues have been identified and reported on in detail in our work on ticket vending machines and go to some of the actions in The Action Plan for Information on Rail Fares & Ticketing (both described in more detail above).
Figure 5: Complaints rate per 100,000 journeys in 2016-17
32. The Public Performance Measure (PPM) measures the percentage of trains that arrive at their final destination within five minutes of their scheduled arrival time (10 minutes for long-distance services).
33. http://www.orr.gov.uk/__data/assets/pdf_file/0006/24756/passenger-freight-performance-2016-17-q4.pdf
0% 10% 20% 30%
206 12-15-11
-32
-16-18-11
-66-9
-9
-49-47
-43-7
2010
1020
21837
50
154116109
59555249
38363231302926242019171032
458
40% 50% 60% 70% 80% 90%
Percentage change to last year (%)
Complaints rate by train company (per 100,000 journeys)
Caledonian SleeperCrossCountryGrand CentralHull Trains
Heathrow ExpressGrand Central
Virgin Trains West CoastHull Trains
Virgin Trains East CoastGreater AngliaCrossCountry
Arriva Trains WalesEast Midlands Trains
TransPennine ExpressLondon Midland
c2cChiltern Railways
Great Western RailwayGovia Thameslink Railway
SoutheasternScotRail
South West TrainsTyne Wear Metro
NorthernMerseyrail
TfL RailLondon Overground
Note: Heathrow Express and Tyne and Wear Metro data is only available for 2016-17. Caledonian Sleeper did not provide data for the full reporting year 2016-17 and so have not been included in this table.Source: Train Operating Companies
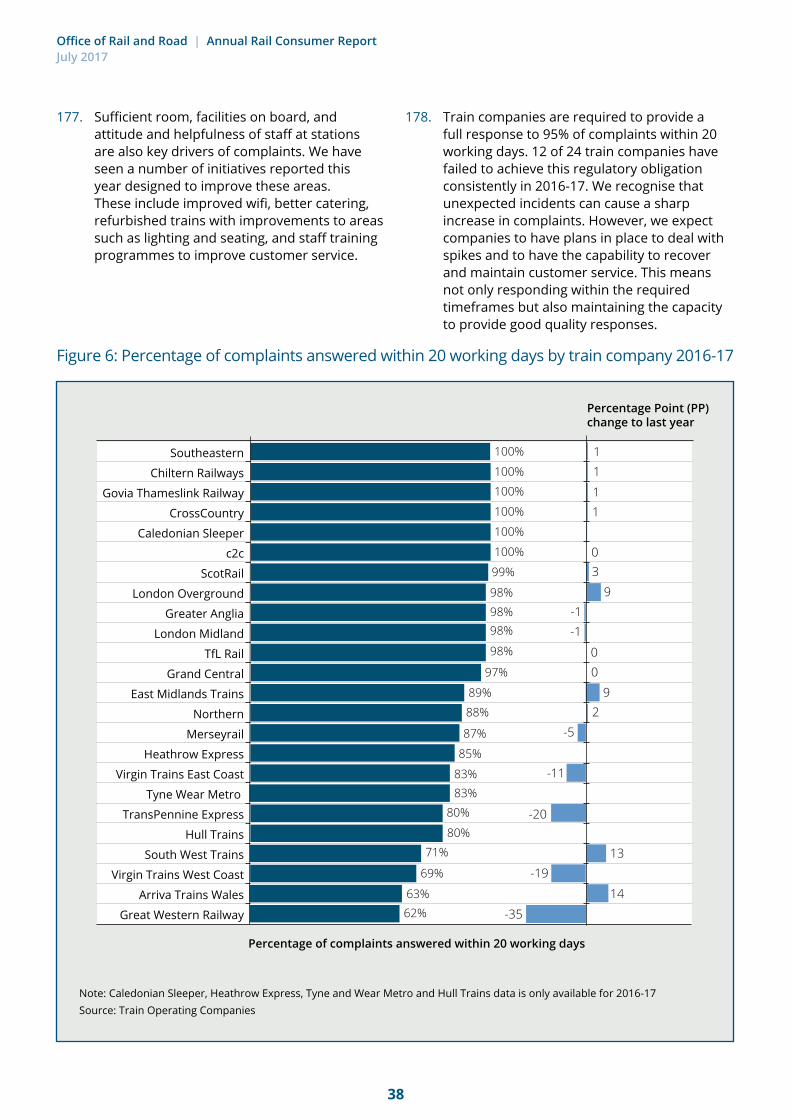
38
Office of Rail and Road | Annual Rail Consumer Report July 2017
Figure 6: Percentage of complaints answered within 20 working days by train company 2016-17
177. Sufficient room, facilities on board, and attitude and helpfulness of staff at stations are also key drivers of complaints. We have seen a number of initiatives reported this year designed to improve these areas. These include improved wifi, better catering, refurbished trains with improvements to areas such as lighting and seating, and staff training programmes to improve customer service.
178. Train companies are required to provide a full response to 95% of complaints within 20 working days. 12 of 24 train companies have failed to achieve this regulatory obligation consistently in 2016-17. We recognise that unexpected incidents can cause a sharp increase in complaints. However, we expect companies to have plans in place to deal with spikes and to have the capability to recover and maintain customer service. This means not only responding within the required timeframes but also maintaining the capacity to provide good quality responses.
0% 10% 20% 30%
1
11
03
9-1
9
-20
-1
00
2-5
-11
13-19
14
-35
1
40% 50% 60% 70% 80% 90%
100%
100%
100%
100%
100%
100%
99%
98%
98%98%
98%
89%
88%
85%
87%
83%83%
80%
80%
71%
69%
63%62%
97%
Southeastern
Chiltern Railways
Govia Thameslink Railway
CrossCountry
Caledonian Sleeper
c2c
ScotRail
London Overground
Greater Anglia
London Midland
TfL Rail
Grand Central
East Midlands Trains
Northern
Merseyrail
Heathrow Express
Virgin Trains East Coast
Tyne Wear Metro
TransPennine Express
Hull Trains
South West Trains
Virgin Trains West Coast
Arriva Trains Wales
Great Western Railway
Caledonian SleeperCrossCountryGrand CentralHull Trains
Percentage Point (PP) change to last year
Percentage of complaints answered within 20 working days
Note: Caledonian Sleeper, Heathrow Express, Tyne and Wear Metro and Hull Trains data is only available for 2016-17Source: Train Operating Companies

39
Office of Rail and Road | Annual Rail Consumer Report July 2017
Companies have a regulatory obligation to respond to 95% of complaints within 20 working days. Through our compliance monitoring we identified that Arriva Trains Wales (ATW) had failed to meet its complaints handling obligations and that the trend in performance was downward. A backlog of responses to complaints and contacts of over 9,400 had also built up.
We had been in contact with ATW to understand the situation and decided to visit ATW to conduct an end-to-end review of its complaint handling process. This thorough review, and ATW’s positive approach to this engagement, enabled the areas where ATW’s current arrangements for handling complaints could be improved to be identified, such as arrangements for dealing with the backlog in complaints which had developed.
Progress against ATW’s resulting improvement plans has been monitored through weekly reporting and ATW has swiftly now returned to compliance with its complaints performance obligations. This took effect from the start of the 2017-18 reporting year and so is not reflected in the reporting data in this report.
In November 2016, FirstGroup companies Great Western Railway (GWR) and TransPennine Express (TPE) proactively complied with the requirement to inform us where regulatory regulatory obligations are unlikely to be met.
The failure to deal with 95% of complaints within 20 working days arose as a result of FirstGroup companies moving their contact centre, which created a backlog in complaints. At its peak, the outstanding caseload of contacts and complaints was more than 53,000 cases.
Following dialogue with ORR, both TPE and GWR provided a detailed action plan and recovery milestones. We subsequently met with them to test their ambition to put matters right for consumers.
Through weekly monitoring reports and engagement with Transport Focus we were able to gauge progress and identify further areas where consumers were not getting the required service, such as the quality of responses and information about delays. This collaborative approach proved successful with both train companies returning to full compliance with their obligations by the start of the 2017-18 reporting year.
Complaints backlog
Contact centre move
40
Office of Rail and Road | Annual Rail Consumer Report July 2017
179. It is important that consumers are able to take their complaints further when they remain unhappy with train companies’ complaints handling. In their second substantive response to complainants, train companies are required to inform (or signpost) consumers that they can seek assistance from the appeals bodies Transport Focus and London TravelWatch as appropriate. Through our data gathering we identified that complainants were not being told consistently that this option existed. As a result, we reaffirmed train companies’ obligations to signpost and clarified reporting requirements to strengthen our monitoring data. We have now seen an increase in the number of consumers correctly signposted to the appeals bodies, and appeals have increased by 33% compared to the year before.34
Satisfaction with complaints handling survey180. In order to gain better insight into the
passenger experience of making a complaint, we have been conducting a survey of passenger satisfaction with train companies’ complaints handling. We commissioned an independent research company to carry out this research and satisfaction is measured over a range of indicators relating to the complaints
process and outcome. Participation in the survey has grown over time, and all train companies will shortly be full participants in this important research.
181. A summary of the national results compared with individual train company performance has been published in the train companies tables in section 6.35 Overall there were some welcome positive aspects of complaints handling highlighted in the survey findings, such as the ease of making a complaint and the politeness of staff. However, performance across the participating companies generally showed a greater level of dissatisfaction than satisfaction with train companies complaints handling. One important aspect to note is how the way the complaint is handled affects how the passenger feels about the train company.
182. The survey is an important part of our compliance monitoring. We expect that companies will also make use of this valuable information to gain a better insight into what is driving complainant dissatisfaction. Focusing attention and making improvements in these areas of performance provides an opportunity for companies to meet passengers’ expectations and increase trust in their business.
34. Source: Transport Focus and London TravelWatch. 35. https://dataportal.orr.gov.uk/displayreport/report/html/bc4b0c6b-956e-4bce-9bdf-5b81545734f6
In October 2016 we formally raised concerns with Merseyrail that it had not been meeting the timescales for responding to complaints for an extended period of time. Merseyrail took actions to implement a new Customer Relationship management system, appointed a new team leader and better matched resources to projected demand, assigned extra staff to complaints handling, and made sure oversight of the team’s performance became more visible to the Executive Leadership team to ensure challenge. This meant it was able to return to meeting the relevant timescales for responding to complaints.
In addition, between January and June 2017 Merseyrail undertook a significant programme of engineering works as part of the Wirral Loop Line Track Renewal. Merseyrail took proactive steps to inform ORR of its plans to let consumers know about the upcoming works. It also explained how it planned to deal with any associated uplift in complaints. Steps taken included forming a new team to support the provision of real time customer information during the work. Merseyrail also worked with other companies to understand the impact of similar programmes of work on their networks. Although Merseyrail has experienced some increase in complaints since the start of the track works it has met the relevant timescales for responding to complaints since December 2016 (rail period 9, 2016-17).
Planned engineering works

41
Office of Rail and Road | Annual Rail Consumer Report July 2017
Alternative dispute resolution183. Where consumers are unable to reach a
satisfactory outcome to their complaint it is important that they can get redress in a way which is independent of the company. Transport Focus and London TravelWatch currently act as the appeals bodies for complainants who are unhappy with the train company’s response to their complaint. However, they have no formal powers to compel train companies to act or compensate individual passengers and the only form of binding outcome for passengers is via the Courts.
184. Binding Alternative Dispute Resolution (ADR) arrangements have become more widespread in both the regulated and non-regulated sectors. The results of our satisfaction survey show a disappointing level of passenger satisfaction with complaints handling and support the case for the introduction of ADR in the rail sector. We therefore welcome the discussions the Rail Minister has been leading in this area and have fed in views of what a good ADR scheme looks like, to support developments and improve redress for consumers. These include key features that we would expect to see in a good ADR scheme such as:
■ Independence;
■ Decisions which are binding on the company but not the consumer;
■ Accessible – the consumer should have to make minimal effort in order to get to the scheme;
■ Free to the consumer;
■ Visible, accountable, and effective; and
■ Be a driver for improved complaints handling and performance.
Next steps 185. We intend to increase our understanding of
why some train companies are consistently performing better than others and will be sharing more widely their good practices as a way of raising standards in this area. We will also focus on ensuring that train companies respond to complaints within the required timescales.
186. We will publish the results of our complaints satisfaction survey on a quarterly basis so that passengers are able to see how each train company is performing. We will use the information it provides to obtain a more rounded view of how train companies are meeting their passengers’ expectations.
187. We will also establish whether there are any lessons to be learnt and shared from contact centre moves, and work to understand what preparations train companies are making to handle increases in complaints arising from known events such as planned track closures.
188. We will continue to be proactively involved in discussions as arrangements for ADR in the rail sector are further explored.
Compensation 189. In December 2015, Which? submitted a super-
complaint to us which raised concerns that most delayed rail passengers are not aware of, nor apply for, the compensation to which they are entitled and that there are features of the passenger rail market in Great Britain, which contributed to this. We published the results36 of our investigation and recommendations in March 2016. We published an update report37 in December 2016 (the December report) setting out progress against the recommendations and what further actions were needed. We committed in the December report to provide details of any further progress by way of this report.
36. http://www.orr.gov.uk/__data/assets/pdf_file/0009/21141/which-super-complaint-response-report.pdf

42
Office of Rail and Road | Annual Rail Consumer Report July 2017
Claims process information190. In the December report, we identified five
standards of good practice which would provide passengers with simple, clear and accessible information and an easy-to-use claims process (‘static information’).38
191. We completed a follow-up audit in March 2017 which included verifying the accuracy of our audit information with the train companies, to identify any further improved adherence to the five standards.
192. We found that, since our December report, train companies have improved the information they provide on delay compensation in relation to the five standards we identified. In summary:
■ Two more companies now have a dedicated paper delay claim form (leaving a residual two companies without);
■ Three more companies now have a dedicated information poster or contact card (leaving a residual one company without);
■ Two more train companies now have a website home page link to delay compensation information (leaving a residual one company without);
■ One more train company now has a PDF delay claim form available on the website (leaving a residual three companies without); and
■ Two more companies now have a dedicated online claim process which means that all companies have now adopted this good practice standard.
193. The table below shows progress since March 2016.
37. http://www.orr.gov.uk/__data/assets/pdf_file/0020/23555/rail-compensation-update-report-december-2016.pdf 38. The five standards are published at paragraph 14 of Rail Compensation – update report, December 2016.
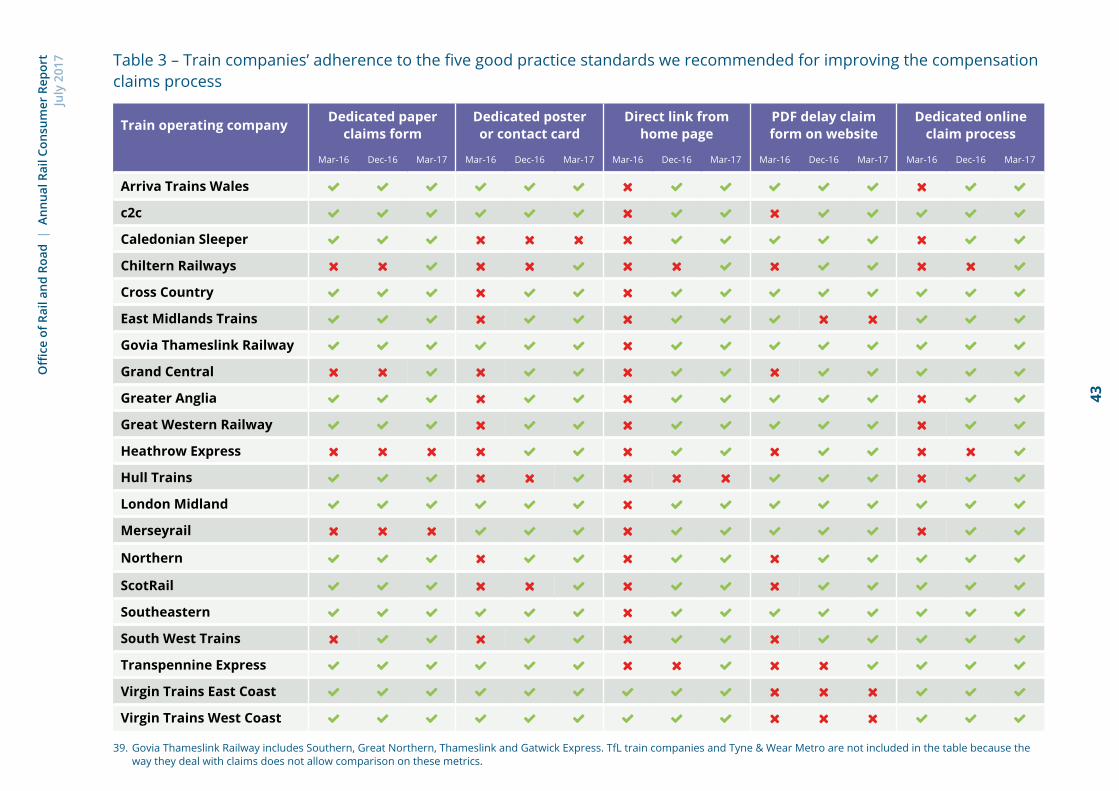
43
Offi
ce o
f Rai
l and
Roa
d |
Ann
ual R
ail C
onsu
mer
Rep
ort
July
201
7 Table 3 – Train companies’ adherence to the five good practice standards we recommended for improving the compensation claims process
39. Govia Thameslink Railway includes Southern, Great Northern, Thameslink and Gatwick Express. TfL train companies and Tyne & Wear Metro are not included in the table because theway they deal with claims does not allow comparison on these metrics.
Train operating company Dedicated paper claims form
Dedicated poster or contact card
Direct link from home page
PDF delay claim form on website
Dedicated online claim process
Mar-16 Dec-16 Mar-17 Mar-16 Dec-16 Mar-17 Mar-16 Dec-16 Mar-17 Mar-16 Dec-16 Mar-17 Mar-16 Dec-16 Mar-17
Arriva Trains Wales
c2c
Caledonian Sleeper
Chiltern Railways
Cross Country
East Midlands Trains
Govia Thameslink Railway
Grand Central
Greater Anglia
Great Western Railway
Heathrow Express
Hull Trains
London Midland
Merseyrail
Northern
ScotRail
Southeastern
South West Trains
Transpennine Express
Virgin Trains East Coast
Virgin Trains West Coast

44
Office of Rail and Road | Annual Rail Consumer Report July 2017
194. We acknowledge the positive engagement from train companies in working towards meeting our five standards. We continue to encourage train companies to adhere to all five of the standards but appreciate that some information and claim methods may not be relevant across the whole range of business models. We will, however, continue to keep this under review and may contact companies in response to passenger concern or where, for example, the data shows that the way that passengers make compensation claims across the industry as a whole is at variance with the way in which passengers make compensation claims to companies who do not have the full range of claiming methods.
Standard response timescales and keeping passengers informed about their claim’s progress195. In our December report, we committed to
“work with train companies to understand what more can be done to keep passengers informed about the progress of their claim and discuss the possibility of publishing standard response timescales”.
196. The National Rail Conditions of Travel40 set out a commitment by train companies to pay a compensation claim within 14 days of having agreed it, within an overall commitment of one month from receipt of the claim to final payment.
197. Passenger research showed that only half of eligible passengers were satisfied with the speed of the response to their delay compensation claim and a quarter who had received a response needed to prompt the train company about their claim.
198. In March 2017 we asked train companies for information on the current position on their target response timescales and how they kept passengers informed of progress with their claim.
199. Our information request found that:
■ Companies all commit to keeping within the maximum timescales set out in the National Rail Conditions of Travel but in practice generally process claims as they would complaints. This means that most companies
aim to pay compensation within 20 working days of receipt of a claim, which is consistent with our regulatory requirement on complaints41, with a number of companies aiming for much shorter timescales than that. The lowest target for the number of days between application to payment is five working days and the highest is 20, though this number varied between companies. The most common receipt to payment period is around 10 days.
■ Consistent with good practice, all but one company acknowledge receipt of the claim and of these, all but two companies do that as an automatic process for claims submitted electronically.
■ All but two companies confirm validation of the claim and that payment will be made in one contact (most told us that this also includes information about the timescale for payment). The remaining two train companies contact the passenger at the point that the payment is being processed. Greater Anglia and Scotrail allow passengers to check the progress of their claim online.
■ Most companies proactively contact passengers (by email, letter or phone) when target timescales might be missed and some companies post a message on their website (but this requires the passenger to actively look for this information). Some companies update their auto-acknowledgement email (but obviously this would not by itself inform those who already had claims in the system). Five train companies do not inform the passenger. However, two of these train companies told us that they are making changes to their systems to enable an update to be provided.
200. We recognise that the processing of claims is affected by peaks in volume resulting from disruption and that some claims are more complex to process than others particularly where there is a suspicion of fraud. However, improvements are clearly needed. Our research has shown that the time taken to process a claim and the lack of information when published timescales are not met is a leading driver of passenger concern. The different ways in which train companies
40. Condition 32.4 of the National Rail Conditions of Travel.41. Paragraph 3.31, Guidance on complaints handling procedures for licence holders, September 2015.
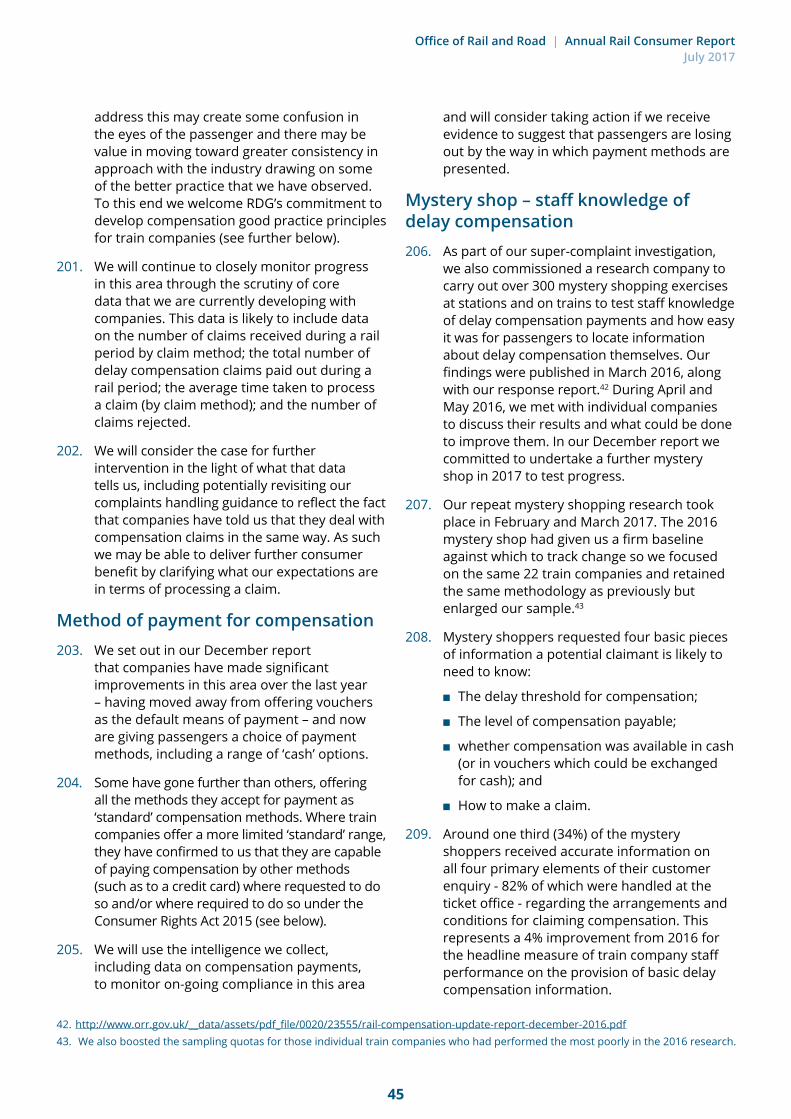
45
Office of Rail and Road | Annual Rail Consumer Report July 2017
address this may create some confusion in the eyes of the passenger and there may be value in moving toward greater consistency in approach with the industry drawing on some of the better practice that we have observed. To this end we welcome RDG’s commitment to develop compensation good practice principles for train companies (see further below).
201. We will continue to closely monitor progress in this area through the scrutiny of core data that we are currently developing with companies. This data is likely to include data on the number of claims received during a rail period by claim method; the total number of delay compensation claims paid out during a rail period; the average time taken to process a claim (by claim method); and the number of claims rejected.
202. We will consider the case for further intervention in the light of what that data tells us, including potentially revisiting our complaints handling guidance to reflect the fact that companies have told us that they deal with compensation claims in the same way. As such we may be able to deliver further consumer benefit by clarifying what our expectations are in terms of processing a claim.
Method of payment for compensation 203. We set out in our December report
that companies have made significant improvements in this area over the last year – having moved away from offering vouchers as the default means of payment – and now are giving passengers a choice of payment methods, including a range of ‘cash’ options.
204. Some have gone further than others, offering all the methods they accept for payment as ‘standard’ compensation methods. Where train companies offer a more limited ‘standard’ range, they have confirmed to us that they are capable of paying compensation by other methods (such as to a credit card) where requested to do so and/or where required to do so under the Consumer Rights Act 2015 (see below).
205. We will use the intelligence we collect, including data on compensation payments, to monitor on-going compliance in this area
and will consider taking action if we receive evidence to suggest that passengers are losing out by the way in which payment methods are presented.
Mystery shop – staff knowledge of delay compensation 206. As part of our super-complaint investigation,
we also commissioned a research company to carry out over 300 mystery shopping exercises at stations and on trains to test staff knowledge of delay compensation payments and how easy it was for passengers to locate information about delay compensation themselves. Our findings were published in March 2016, along with our response report.42 During April and May 2016, we met with individual companies to discuss their results and what could be done to improve them. In our December report we committed to undertake a further mystery shop in 2017 to test progress.
207. Our repeat mystery shopping research took place in February and March 2017. The 2016 mystery shop had given us a firm baseline against which to track change so we focused on the same 22 train companies and retained the same methodology as previously but enlarged our sample.43
208. Mystery shoppers requested four basic pieces of information a potential claimant is likely to need to know:
■ The delay threshold for compensation;
■ The level of compensation payable;
■ whether compensation was available in cash (or in vouchers which could be exchanged for cash); and
■ How to make a claim.
209. Around one third (34%) of the mystery shoppers received accurate information on all four primary elements of their customer enquiry - 82% of which were handled at the ticket office - regarding the arrangements and conditions for claiming compensation. This represents a 4% improvement from 2016 for the headline measure of train company staff performance on the provision of basic delay compensation information.
42. http://www.orr.gov.uk/__data/assets/pdf_file/0020/23555/rail-compensation-update-report-december-2016.pdf 43. We also boosted the sampling quotas for those individual train companies who had performed the most poorly in the 2016 research.

46
Office of Rail and Road | Annual Rail Consumer Report July 2017
210. Visual information on delays and delay compensation arrangements was seen at a greater proportion of stations than in 2016:
■ 39% of staffed stations (up 9% on 2016);
■ 29% of un-staffed stations (up 15% on 2016); and
■ On 30% of trains (the same level as 2016).
211. When asked to evaluate the content of this written information, 86% of the mystery shoppers said that they believed the information available was sufficient to inform them as to when they would be entitled to claim, and 91% felt it was sufficient to inform them how to claim. This suggests that when the written information was available, it was normally considered to be useful to a potential claimant.
212. The results of the mystery shopping will be published in autumn 2017.
Clarification of the Information for passengers licence condition213. As noted previously, a further action from the
compensation super-complaint work in early 2016 was to clarify the Passenger Information licence condition to make it clear that it covered all the stages of the journey. Although compensation for delays was not mentioned in the original version of the Regulatory
Statement we issued in 2012, we noted that most companies referred to actions under passenger information related workstreams when we asked them about the work they were doing to promote compensation.
214. We therefore published new guidance44 (‘the guidance’) in June 2016, after receiving acceptance from all licence holders that information about compensation did indeed fall within scope. During the process we were able to clarify some concerns raised by train companies:
■ The need to provide customers with information about their rights to compensation in the event of disruption or delay only applies when the relevant compensation threshold has been exceeded.
■ Although DfT franchise agreements include the requirement to promote compensation arrangements when due, the range of franchise agreements that currently exist impose different requirements across the industry. The clarification about compensation in the guidance was made with the agreement of DfT and the guidance makes provision to ensure that there is no double jeopardy should enforcement on this issue be required.
Source: ORR researchQuestion: Did the member of staff provide a full explanation, including (1) how long a delay needs to be to claim compensation, (2) the proportion of ticket costs the passenger might receive, (3) that compensation can be paid in cash or that vouchers can be exchanged for cash, and (4) how to make a claim?Base: All Staff Enquiries = 537
44. The guidance may be downloaded from http://www.orr.gov.uk/__data/assets/pdf_file/0015/4353/information-for-passengers-guidance-on-meeting-the-licence-condition.pdf
Figure 7: 2017 delay compensation mystery shopping research: Did the mystery shopper receive a full explanation of the relevant conditions and arrangements for claiming delay compensation?
Yes
No 66%
34%

47
Office of Rail and Road | Annual Rail Consumer Report July 2017
215. Further to this, train companies have now put actions around delivering various improvements to information provision, such as website banners and announcements on trains to let people know when they have been delayed and are entitled to claim compensation, into a new code (ACOP014)45 which was published in October 2016. Further information on this can be found in section 4.2.
216. We recommended this approach since it ensures that improvements to information provision are embedded in delivery, including when franchises change and when new companies enter the market. ACOP014 includes compensation, help points and also publishes the industry actions as an appendix.
Government commitments on compensation 217. In its November 2016 report, “Improving
access to passenger compensation for delays and cancellations: Response following the ORR’s investigation of the Which? super-complaint”,46 DfT made a number of commitments in response to our recommendations. We note progress against each commitment below:
■ Commitment 1: DfT would work to complete the roll-out, at the earliest available opportunity, of the franchise requirement to use all reasonable endeavours to make passengers aware of their right to compensation, using harmonised wording for this requirement where possible.’
- Update since November 2016: The latest ‘all reasonable endeavours’ text is included in the new South Western franchise agreement and will be included in franchise agreements when other new franchises are let, for example, West Midlands and South Eastern. DfT is working towards including this text when introducing Delay Repay 15 through negotiated changes to franchise agreements.
■ Commitment 2: DfT would require franchisees to deliver a report outlining the steps they are, and will be, taking to fulfil the requirement and use the available evidence and industry best practice to evaluate compliance and would repeat the exercise after a further 18 months.
- Update since November 2016: DfT wrote to franchisees in March 2017 requesting that they provide a report on the steps that they are taking, or are planning to take, to ensure that passengers are aware of their right to claim compensation; and including evidence on levels of awareness among passengers of their right to compensation. DfT is discussing these reports with the franchisees and, if needed, seeking to agree further steps to raise passenger awareness of their right to claim compensation.
Promoting awareness218. Following our March 2016 report and in
response to our recommendation, RDG worked with all train companies to run an eight week compensation awareness campaign, and to increase the quality and frequency of their compensation communications across a number of customer touch points.
219. It ran a series of adverts in the printed national press, and displayed information on station posters and screens to raise awareness, and through social media promoted both awareness and the eligibility to make specific claims. RDG worked with train companies to increase the quality and frequency of their compensation communications, supplementing them with RDG’s materials where necessary.
220. Over 2,000 people were interviewed online on RDG’s behalf in October 2016, before it ran the campaign and an equivalent group were interviewed online in December 2016, on completion of the campaign, and awareness was found to have been raised by 6 percentage points (from 44% to 50%).
221. RDG has stated it is committed to seeing awareness of compensation continue to rise. It is currently producing a compensation best practice guide for train companies which will be used to drive further improvements. This best practice guide is due to be completed in summer 2017, and we are told will include best practice on how to present information online and on printed forms, and principles for raising awareness.
45. https://www.raildeliverygroup.com/about-us/publications.html?task=file.download&id=469771025 46. https://www.gov.uk/government/publications/improving-access-to-passenger-compensation-response-following-the-orrs-
investigation-of-the-which-super-complaint

48
Office of Rail and Road | Annual Rail Consumer Report July 2017
Compensation gap222. One of the mechanisms we are using to assess
the extent to which the actions described above are having an impact in terms of passengers actually making claims is what we call our ‘compensation gap’ analysis, which measures the difference between compensation that is due and compensation that is paid.
223. In our March 2016 response to the rail passenger super-complaint on delay compensation arrangements we summarised a range of evidence on the compensation gap. This range included:
■ Survey evidence, obtained by asking eligible passengers whether they had claimed delay compensation; and
■ The results of original top-down analysis carried out by ORR in early 2016.
224. As described in Annex B, we have now updated our analysis with a view to determining how the take-up of compensation is changing over time.
225. The evidence that we looked at during our update suggested that there has been an increase in the proportion of potential claims that is successfully claimed by delayed passengers. We estimate this increase to represent around 10 percentage points of all potential claims. A substantial proportion of potential payouts still goes unclaimed, however.
Next steps 226. We have notified industry via the Information
Request issued in March 2017, that we are intending to expand our current core data requirement to include key performance indicators relating to delay compensation. The final composition of this data and its date for implementation are yet to be confirmed, but at a basic level it will help us track the volume of delay compensation claims each train company receives, the methods used to submit claims, the speed with which they process claims, and the methods they use to pay compensation.
227. We will monitor trends from this data to check the effectiveness of delay compensation claim processes and information. We will also use consumer insight gained by way of individual consumer complaints made to us, Transport Focus and London TravelWatch, and from any future research studies or audits.
228. We will now look to RDG to reflect the findings from our compensation work within the industry good practice guidelines currently under development and due to be completed in summer 2017.
47. As in our update report we mean estimates calculated using train company-level statistics on delay payouts and on the number of delays to train services.
48. See Annex B for details.49. See above for a reference to the change in methodology between the 2013 and 2016 Transport Focus surveys. It is also important
to note that unlike ORR’s top-down results the 2016 Transport Focus survey presents results based on number of passengers rather than number of journeys on the basis that the latter approach, “…over-represents commuters and requires weighting to deliver a representative sample of passengers”.

49
Office of Rail and Road | Annual Rail Consumer Report July 2017
Consumer Rights Act and the rail sector 229. In addition to the industry-specific
arrangements for compensation for delays, referred to above, the Consumer Rights Act 2015 (‘the Act’), which came fully into force in the rail sector on 1 October 2016 provides consumers with remedies where services are not provided to the required standard.
230. The Act requires that services must be provided “with reasonable care and skill” and in conformity with information that is provided about the service (if the consumer has taken it into account when making a decision about the service).
231. Where a service does not comply with these requirements, the Act provides consumers with remedies, which include repeat performance (receiving the service again) or a reduction in price (or refund where the service has already been paid for).
232. The amount by which the price may be reduced, or the amount of any refund, is not stipulated in the Act but may be an “appropriate amount” up to the price paid for the service.
233. Under the Act, any such refund must be paid within 14 days of a claim having been agreed by the company concerned and must be paid in the same form as the consumer used to pay for the service (unless the consumer agrees otherwise).
What the Act means for train companies and rail passengers234. With regard to delays, most train companies
are now signed-up to the ‘Delay Repay’ scheme, which provides compensation where a passenger’s journey is delayed by a certain amount of time, regardless of the cause of the delay or the ‘fault’ of the train company.
235. Passengers will continue to benefit from these industry-specific compensation arrangements but the Act may provide an additional route of redress. For example, where passengers experience a delay below the relevant time threshold, they do not think the amount of delay compensation they have received is appropriate or they experience a problem with another aspect of their service.
236. However, the application of the Act will depend, as described above, on the train company not providing the service with reasonable care and skill or in conformity with what the passenger has been told about the service.
237. In addition to the remedies provided for in the Act, the Act does not prevent consumers from seeking other remedies, including claiming damages over and above the price they paid for the service, although train companies may seek to limit their liability in this regard.
ORR’s work in this area 238. It is the responsibility of train companies (and
other relevant service providers) to ensure that they are compliant with their obligations under the Act.
239. However, given that the Act creates some new obligations, we have worked with RDG, train companies, and other key stakeholders over the last year to help develop an understanding of some of its key provisions.
240. In the context of our work on passenger compensation more generally, this has led train companies to now offer a much wider range of payment methods ‘as standard’ and, where they do not offer all possible methods (such as credit card payments) as standard, being capable of making such payments where the Act requires it.
241. We also held a workshop in November 2016, with train companies and representatives of RDG, DfT, Transport Focus, and London TravelWatch, to discuss the key provisions of the Act and their implications for rail passenger services. One of the conclusions of the discussion was the need for train companies to review their current policies and approaches relating to complaints handling to ensure consistency with the Act.
Next steps242. Over the coming year, we will continue to work
with stakeholders to promote awareness and understanding of the Act and its application to rail passenger services. We are currently developing our approach to how we could monitor compliance with consumer law generally across the sector.
50
Office of Rail and Road | Annual Rail Consumer Report July 2017
5. NETWORK RAIL
Network Rail’s role 243. The national rail network (track and related
infrastructure, including 18 main line stations) is owned and operated by Network Rail. Network Rail is regulated by ORR under both a network and station licence. The company owns and operates 18 of Britain’s largest and busiest stations - including 10 stations in London - and it is this passenger facing role that is the key area of focus for this report.
244. Network Rail has a devolved structure that is now organised around eight geographic route businesses, a freight and national passenger operator route, a system operator function, and centrally-based business units providing services to the routes such as infrastructure projects.
245. This structure presents an opportunity for us to improve how we regulate Network Rail. It will allow us to put a greater reliance on comparison between the route businesses and to make more use of reputational incentives by formally and transparently recognising the achievement of route teams in delivering improvements. We are currently developing our approach to route-level regulation as part of our 2018 periodic review, which we will implement in control period 6.50
Network Rail’s licence obligations 246. The key passenger facing obligations that
apply to Network Rail fall within its station licence51 and therefore relate only to its managed stations. These obligations impose requirements on Network Rail to:
■ Provide information to passengers during service disruption (condition 3 of Network Rail’s station licence). Network Rail is required to provide appropriate, accurate and timely information to enable passengers to plan and make their journeys, including when there is train service disruption;
■ Establish and comply with a Disabled People's Protection Policy (DPPP) which sets out how Network Rail will support improvements in the accessibility of rail for users of its managed stations (condition 4 of Network Rail’s station licence); and
■ Establish and comply with a procedure for handling complaints relating to licensed activities from customers (condition 5 of Network Rail’s station licence).
247. In addition, we monitor whether Network Rail’s commitments are being delivered in practice by focusing on the outcomes that are being achieved. As part of this, we look at a core data set of measures against which Network Rail reports.
Information for passengers 248. Like the train companies, Network Rail has
to set out how it will provide information for passengers in a Code of Practice. The Network Rail guidance note for the provision of information during disruption applies to its control, response and station staff. This is published on the Network Rail website.52
249. While many of the industry actions to improve the provision of passenger information during disruption are to be delivered by train companies, a number are specifically related to Network Rail. Last year Network Rail delivered the following actions:
■ Making manual announcements at its stations during disruption;
■ Removing an apology message where repeated automated announcements are broadcast;
■ Providing additional coaching for staff who produce the prioritised plans ;53
50. ORR, 2018 periodic review of Network Rail (PR18): Initial consultation, 2016. Available here: http://www.orr.gov.uk/__data/assets/pdf_file/0009/21996/pr18-initial-consultation-document-may-2016.pdf.
51. Available at: https://www.networkrail.co.uk/delay-information/guidance-note-information-during-disruption.pdf?cd=1.52. Available at: https://www.networkrail.co.uk/delay-information/guidance-note-information-during-disruption.pdf?cd=1.53. During significant disruption it is normally appropriate for Network Rail route control to produce a Prioritised Plan. This plan takes
information from the staff on site and develops milestones which can be used to help estimate the duration of the incident.

51
Office of Rail and Road | Annual Rail Consumer Report July 2017
■ Reporting on the number of prioritised plans that have been produced;
■ Publication of a Network Rail Guidance note for control, response and station staff: information during disruption on its website;
■ Holding periodic cross industry reviews of local plans; and
■ Ensuring that customers have access to the full details of their journey when there are engineering works.
250. In addition, each Network Rail managed station has its own customer information plan which is developed with the train companies that use the station. We have continued our programme of local plan audits including meeting the local station teams in Edinburgh, Charing Cross and Liverpool Lime Street.
Passenger assistance 251. Network Rail had its DPPP reviewed and
finalised by us on 4 August 2016.54 Areas of good practice were identified, such as Network Rail’s Built Environment Accessibility Panel that provides both technical and experiential advice on the design and management of Network Rail built environment proposals and plans. Network Rail notes that it has also introduced Diversity Impact Assessments, which help to identify and reduce barriers to inclusion, particularly the physical and attitudinal barriers related to the built environment.
252. Although passengers book assistance via the train company, Network Rail is responsible for providing this assistance at its managed stations. Data received from RDG (Figure 8 below) shows there were 345,305 booked assistances requested at Network Rail managed stations in 2016-17, an increase of 4.4% compared to the same period in the previous year. This is 29% of all booked assistance requests made nationally in 2016-17.
Figure 8: Total volume of assisted journeys booked at Network Rail stations by rail period 2015-16 and 2016-17
Source: RDGNote: A ‘rail period’ is normally 28 days, or four weeks, for business reporting purposes (Sunday to Saturday) and there are 13 rail periods in a financial year.
This accounted for 28.9% of all booked assists made
nationally in 2016-17
Network Rail received 345,305 booked assistance
requests in 2016-17
Change on last year
54. A copy of Network Rail’s DPPP is available here: http://www.orr.gov.ukW/__data/assets/pdf_file/0020/22592/network-rail-dppp-review-letter.pdf
0
5,000
10,000
15,000
20,000
25,000
30,000
35,000
P1 P2 P3 P4 P5 P6 P7 P8 P9 P10 P11 P12 P13
4.4%
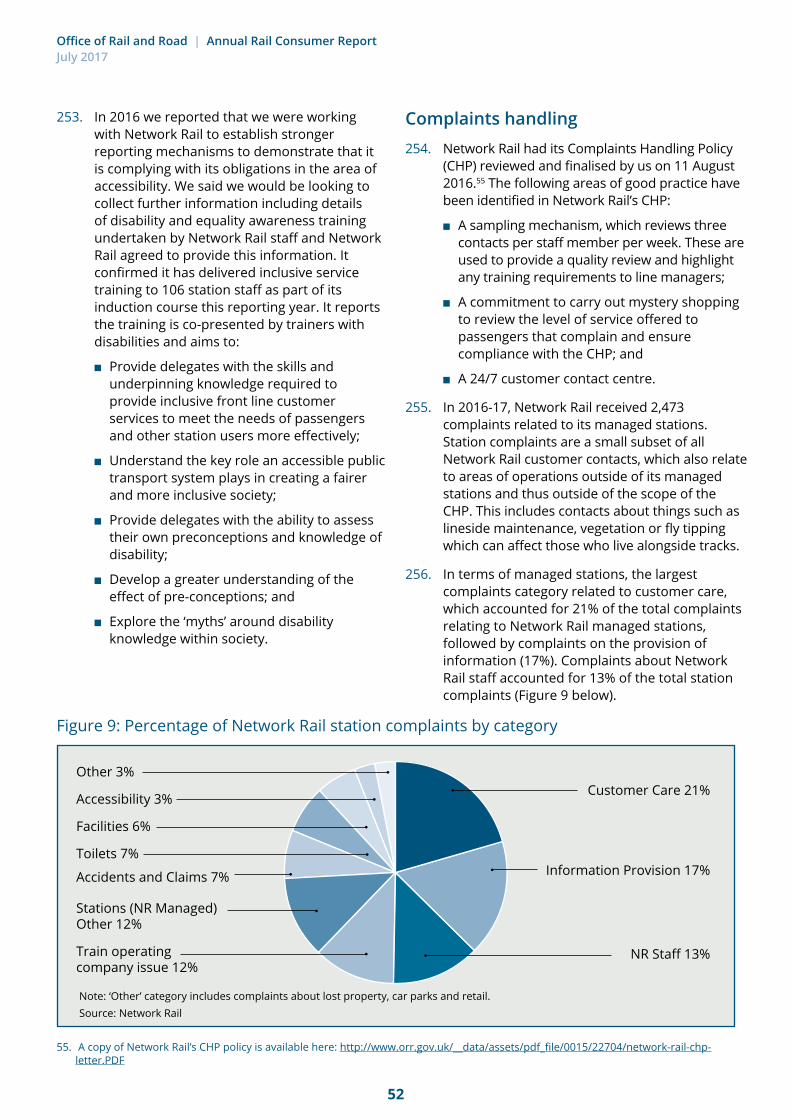
52
Office of Rail and Road | Annual Rail Consumer Report July 2017
253. In 2016 we reported that we were working with Network Rail to establish stronger reporting mechanisms to demonstrate that it is complying with its obligations in the area of accessibility. We said we would be looking to collect further information including details of disability and equality awareness training undertaken by Network Rail staff and Network Rail agreed to provide this information. It confirmed it has delivered inclusive service training to 106 station staff as part of its induction course this reporting year. It reports the training is co-presented by trainers with disabilities and aims to:
■ Provide delegates with the skills and underpinning knowledge required to provide inclusive front line customer services to meet the needs of passengers and other station users more effectively;
■ Understand the key role an accessible public transport system plays in creating a fairer and more inclusive society;
■ Provide delegates with the ability to assess their own preconceptions and knowledge of disability;
■ Develop a greater understanding of the effect of pre-conceptions; and
■ Explore the ‘myths’ around disability knowledge within society.
Complaints handling 254. Network Rail had its Complaints Handling Policy
(CHP) reviewed and finalised by us on 11 August 2016.55 The following areas of good practice have been identified in Network Rail’s CHP:
■ A sampling mechanism, which reviews three contacts per staff member per week. These are used to provide a quality review and highlight any training requirements to line managers;
■ A commitment to carry out mystery shopping to review the level of service offered to passengers that complain and ensure compliance with the CHP; and
■ A 24/7 customer contact centre.
255. In 2016-17, Network Rail received 2,473 complaints related to its managed stations. Station complaints are a small subset of all Network Rail customer contacts, which also relate to areas of operations outside of its managed stations and thus outside of the scope of the CHP. This includes contacts about things such as lineside maintenance, vegetation or fly tipping which can affect those who live alongside tracks.
256. In terms of managed stations, the largest complaints category related to customer care, which accounted for 21% of the total complaints relating to Network Rail managed stations, followed by complaints on the provision of information (17%). Complaints about Network Rail staff accounted for 13% of the total station complaints (Figure 9 below).
Figure 9: Percentage of Network Rail station complaints by category
Note: ‘Other’ category includes complaints about lost property, car parks and retail.Source: Network Rail
55. A copy of Network Rail’s CHP policy is available here: http://www.orr.gov.uk/__data/assets/pdf_file/0015/22704/network-rail-chp-letter.PDF
Other 3%
Accessibility 3%
Facilities 6%
Toilets 7%
Accidents and Claims 7%
Stations (NR Managed) Other 12%
Train operating company issue 12%
Customer Care 21%
Information Provision 17%
NR Staff 13%

53
Office of Rail and Road | Annual Rail Consumer Report July 2017
257. Licence holders are required to respond to 95% of complaints within 20 working days. In June 2016 Network Rail set a target of resolving all contacts (including station complaints) within 20 working days by March 2017.
258. Our monitoring of Network Rail’s performance on complaints handling in 2016-17 showed that 91.4% of complaints were responded to within 20 working days. Network Rail reports that the average age of all contacts received was at 29 days (20 working days) at the end of the reporting year.
259. In order to ensure licence holders are learning from the valuable feedback that complaints provide, we ask them to provide us with explanations of the steps they are taking to address the issues that are generating the highest numbers of complaints from passengers.
260. In the 2015-16 reporting year Network Rail outlined how it was seeking to address complaints about the impact of upgrades and maintenance work being carried out across the network by improving the way it notified people in advance of the works. In 2016-17 Network Rail reports that the highest volume of contact related to issues such as ticket information and refund requests, which would fall to train companies to deal with rather than Network Rail itself.
261. Aside from these issues, and information requests, the category that Network Rail is contacted about most is ‘railway work’. Network Rail has committed to reducing the volume of railway work complaints on each of its route scorecards in 2017-18. Additionally, it reports its station managers meet regularly to share best practice to continually improve passenger satisfaction at its managed stations.
262. Following discussion with Network Rail in 2016, we reached agreement that it would not participate in the complaints handling survey for train companies. This is because we only require complaints data relevant to Network Rail’s large managed stations. Complaints about other aspects of Network Rail’s business, such as complaints from line side residents, fall outside scope of our monitoring. However, Network Rail finds it difficult to extract this complaints data about managed stations
in isolation. As an alternative, therefore, Network Rail agreed that it would provide us with ‘equivalent data’ by implementing its own complaints handling survey that largely replicated our own, and provide the survey outputs to us to satisfy our compliance reporting requirement.
263. We only began receiving this data in February 2017 and it is still being assessed in terms of whether or not it meets our reporting standards, so it is not ready for publication at this time. We will continue to engage with Network Rail on this issue with a view to publishing its survey results later this year.
264. We will continue to engage with Network Rail through reporting and monitoring, as it aims to continue to improve its complaints handling, with a key focus on the obligation to respond to complaints within the required timescales. We intend to increase our understanding of why some train companies are performing better than others and will be sharing more widely, including with Network Rail, good practices as a way of raising standards in complaints handling across the industry.
265. Finally, we anticipate that Network Rail complaints handling will be part of any discussions about arrangements for ADR in the rail sector as they are further explored.

54
Office of Rail and Road | Annual Rail Consumer Report July 2017
6. FINDINGS BY TRAIN COMPANY266. For each train company, below, we have
provided both quantitative and qualitative data alongside relevant narrative. This shows how each company is fulfilling its obligations to provide information to passengers; assistance for those passengers who need it; and an effective and accessible process for managing passenger complaints.
267. The data sheets also contain relevant contextual information for each train company including the owning group, number of stations it operates, the number of staff, the operating sector, and the number of passenger journeys per annum.
268. The example data sheet below provides further guidance on how to read the data and information presented for each train company.
269. It is important to note that the rail industry reports data on a periodic basis different to the widely recognised reporting cycles such as monthly or quarterly. A ‘rail period’ is normally 28 days, or four weeks, for business reporting purposes (Sunday to Saturday) and there are 13 rail periods in a financial year. The length of a rail period may differ at the end of the financial year, 31 March, and the beginning of the financial year, 1 April, to ensure that a break is made at 31 March.
270. Some of the data used in our data sheets comes from the National Rail Passenger Survey (NRPS), carried out by Transport Focus. The NRPS takes place twice a year, in spring and autumn. We used data up to autumn 2016, which is the latest published. The next data is due to be published in late July 2017.
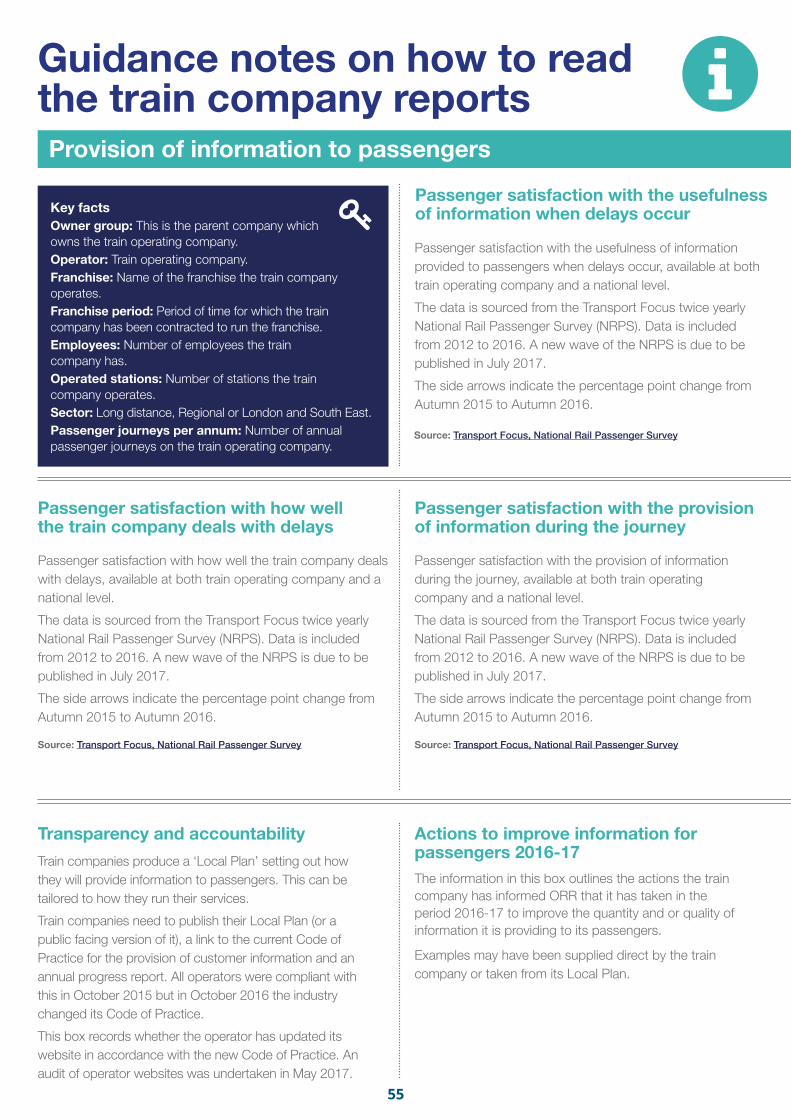
55
Actions to improve information for passengers 2016-17The information in this box outlines the actions the train company has informed ORR that it has taken in the period 2016-17 to improve the quantity and or quality of information it is providing to its passengers.
Examples may have been supplied direct by the train company or taken from its Local Plan.
Transparency and accountability Train companies produce a ‘Local Plan’ setting out how they will provide information to passengers. This can be tailored to how they run their services.
Train companies need to publish their Local Plan (or a public facing version of it), a link to the current Code of Practice for the provision of customer information and an annual progress report. All operators were compliant with this in October 2015 but in October 2016 the industry changed its Code of Practice.
This box records whether the operator has updated its website in accordance with the new Code of Practice. An audit of operator websites was undertaken in May 2017.
Provision of information to passengers
Key factsOwner group: This is the parent company which owns the train operating company.Operator: Train operating company.Franchise: Name of the franchise the train company operates.Franchise period: Period of time for which the train company has been contracted to run the franchise.Employees: Number of employees the train company has.Operated stations: Number of stations the train company operates.Sector: Long distance, Regional or London and South East. Passenger journeys per annum: Number of annual passenger journeys on the train operating company.
Guidance notes on how to read the train company reports
Passenger satisfaction with the usefulness of information when delays occur
Passenger satisfaction with the usefulness of information provided to passengers when delays occur, available at both train operating company and a national level.
The data is sourced from the Transport Focus twice yearly National Rail Passenger Survey (NRPS). Data is included from 2012 to 2016. A new wave of the NRPS is due to be published in July 2017.
The side arrows indicate the percentage point change from Autumn 2015 to Autumn 2016.
Source: Transport Focus, National Rail Passenger Survey
Source: Transport Focus, National Rail Passenger Survey Source: Transport Focus, National Rail Passenger Survey
Passenger satisfaction with how well the train company deals with delays
Passenger satisfaction with how well the train company deals with delays, available at both train operating company and a national level.
The data is sourced from the Transport Focus twice yearly National Rail Passenger Survey (NRPS). Data is included from 2012 to 2016. A new wave of the NRPS is due to be published in July 2017.
The side arrows indicate the percentage point change from Autumn 2015 to Autumn 2016.
Passenger satisfaction with the provision of information during the journey
Passenger satisfaction with the provision of information during the journey, available at both train operating company and a national level.
The data is sourced from the Transport Focus twice yearly National Rail Passenger Survey (NRPS). Data is included from 2012 to 2016. A new wave of the NRPS is due to be published in July 2017.
The side arrows indicate the percentage point change from Autumn 2015 to Autumn 2016.
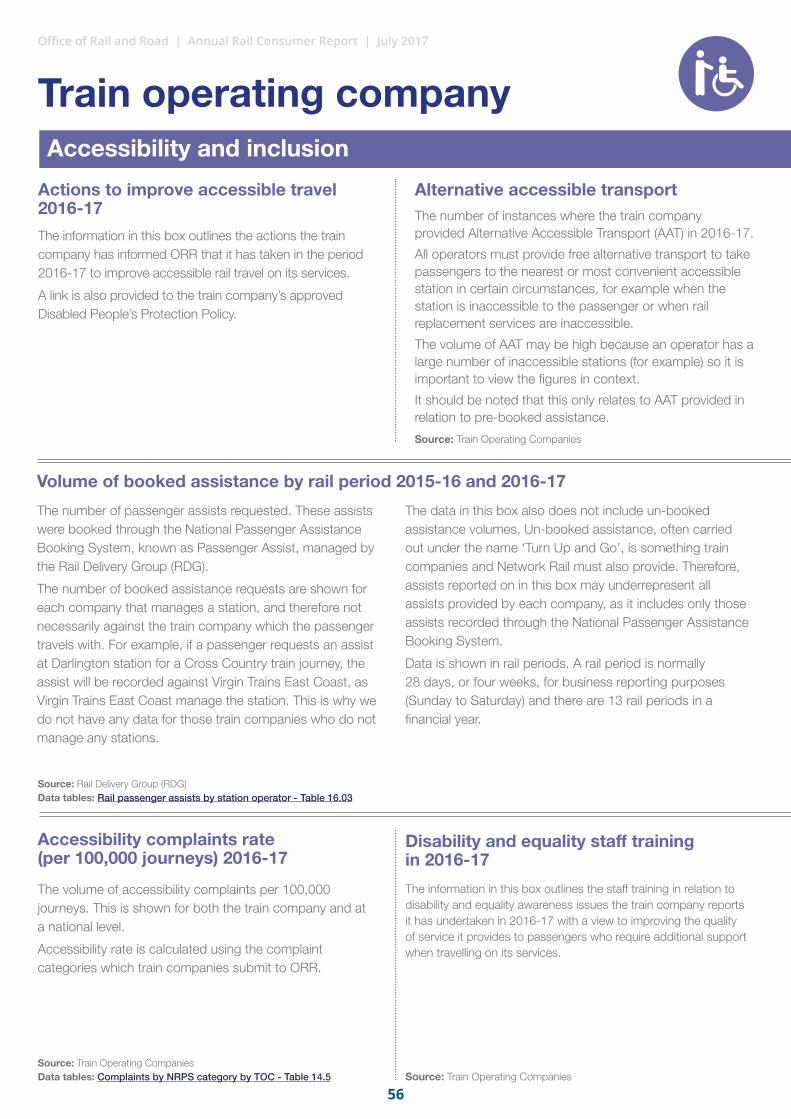
56
Office of Rail and Road | Annual Rail Consumer Report | July 2017
Actions to improve accessible travel 2016-17The information in this box outlines the actions the train company has informed ORR that it has taken in the period 2016-17 to improve accessible rail travel on its services.
A link is also provided to the train company’s approved Disabled People’s Protection Policy.
Alternative accessible transport The number of instances where the train company provided Alternative Accessible Transport (AAT) in 2016-17.
All operators must provide free alternative transport to take passengers to the nearest or most convenient accessible station in certain circumstances, for example when the station is inaccessible to the passenger or when rail replacement services are inaccessible.
The volume of AAT may be high because an operator has a large number of inaccessible stations (for example) so it is important to view the figures in context.
It should be noted that this only relates to AAT provided in relation to pre-booked assistance.
Source: Train Operating Companies
The information in this box outlines the staff training in relation to disability and equality awareness issues the train company reports it has undertaken in 2016-17 with a view to improving the quality of service it provides to passengers who require additional support when travelling on its services.
Source: Train Operating Companies Data tables: Complaints by NRPS category by TOC - Table 14.5
Source: Rail Delivery Group (RDG)Data tables: Rail passenger assists by station operator - Table 16.03
Accessibility and inclusion
Train operating company
Volume of booked assistance by rail period 2015-16 and 2016-17 The number of passenger assists requested. These assists were booked through the National Passenger Assistance Booking System, known as Passenger Assist, managed by the Rail Delivery Group (RDG).
The number of booked assistance requests are shown for each company that manages a station, and therefore not necessarily against the train company which the passenger travels with. For example, if a passenger requests an assist at Darlington station for a Cross Country train journey, the assist will be recorded against Virgin Trains East Coast, as Virgin Trains East Coast manage the station. This is why we do not have any data for those train companies who do not manage any stations.
The data in this box also does not include un-booked assistance volumes. Un-booked assistance, often carried out under the name ‘Turn Up and Go’, is something train companies and Network Rail must also provide. Therefore, assists reported on in this box may underrepresent all assists provided by each company, as it includes only those assists recorded through the National Passenger Assistance Booking System.
Data is shown in rail periods. A rail period is normally 28 days, or four weeks, for business reporting purposes (Sunday to Saturday) and there are 13 rail periods in a financial year.
The volume of accessibility complaints per 100,000 journeys. This is shown for both the train company and at a national level.
Accessibility rate is calculated using the complaint categories which train companies submit to ORR.
Accessibility complaints rate (per 100,000 journeys) 2016-17
Disability and equality staff training in 2016-17
Source: Train Operating Companies
57
Office of Rail and Road | Annual Rail Consumer Report | July 2017
Complaints handling
Source: Train Operating Companies Data tables: Complaints by NRPS category by TOC - Table 14.5
Source: Train Operating Companies
Passenger satisfaction with complaint handling process 2016-17
Source: Train Operating Companies and LENNON (the rail industry’s ticketing and revenue database)Data tables: Complaints rate by train operating company - Table 14.9
Source: ORR – Passenger satisfaction with complaint handling survey
Data tables: Passenger satisfaction with complaints handlingNote: Figures may not total exactly 100% due to rounding.
Source: ORR – Passenger satisfaction with complaint handling survey
Data tables: Passenger satisfaction with complaints handlingNote: Figures may not total exactly 100% due to rounding.
Source: ORR – Passenger satisfaction with complaint handling survey
Data tables: Passenger satisfaction with complaints handlingNote: Figures may not total exactly 100% due to rounding.
Train operating company
Complaints rate (per 100,000 journeys) and complaints response rateThe volume of complaint correspondence closed per 100,000 journeys. Complaints are normalised by passenger journeys to allow effective comparison of data between time periods and train operating companies.
Our regulatory requirement is to provide a full response to 95% of complaints within 20 working days.
This survey asks passengers who have complained to a train company to offer feedback on how well they felt the company handled their complaint.
The first chart shows how passengers rated their satisfaction with the train company’s overall complaints handling process. The second chart shows how passengers rated their satisfaction with the outcome of the complaint they made to the train company.
‘Satisfied’ is a combination of ‘satisfied’ and ‘very satisfied’. ‘Dissatisfied’ is a combination of ‘dissatisfied’ and ‘very dissatisfied’.
The number of survey respondents for each train company is also shown. National results are weighted by complaint volumes to ensure the survey is representative of the complaints received by train companies.
TOC stands for Train Operating company.
Passenger satisfaction with each aspect of complaint handling process 2016-17 This survey asks passengers who have complained to a train company to offer feedback on how well they felt the company handled their complaint.
The chart in this box shows how passengers rated their satisfaction with each aspect of the train company’s complaint handling process.
‘Satisfied’ is a combination of ‘satisfied’ and ‘very satisfied’. ‘Dissatisfied’ is a combination of ‘dissatisfied’ and ‘very dissatisfied’. Arrows indicate how the train company compares to the national average of those ‘satisfied’.
The number of survey respondents for each train company is also shown. National results are weighted by complaint volumes to ensure the survey is representative of the complaints received by train companies.
How did the passenger feel about the train company in light of how their complaint was handled 2016-17This survey asks passengers who have complained to a train company to offer feedback on how well they felt the company handled their complaint.
The chart in this box shows how passengers rated their view of the train company in light of how it handled their complaint, namely: more positive about them; no different; more negative about them.
The number of survey respondents for each train company is also shown. National results are weighted by complaint volumes to ensure the survey is representative of the complaints received by train companies.
Top 5 reasons for complaints 2016-17
The data in this box shows the top five causes of complaints for the train company in 2016-17. The table also shows what proportion of complaints each of the top five complaints issues accounted for and the percentage point change for each complaint category versus 2015-16.
Actions to improve services for passengers 2016-17 The information in this box outlines the steps that each train company reports it has taken in 2016-17 to address issues highlighted in passenger complaints. This relates to the requirement for each licensee to demonstrate how it is embedding a culture of continuous improvement in its complaint handling.
A link to the company’s approved Complaints Handling Procedure is also provided.

58
Office of Rail and Road | Annual Rail Consumer Report | July 2017
Passenger satisfaction with the usefulness of information when delays occur
Passenger satisfaction with how well the train company deals with delays
Passenger satisfaction with the provision of information during the journey
Actions to improve information for passengers 2016-17ATW has created a ticket acceptance arrangement with local bus services. This means during periods of disruption, passengers can show their rail ticket and continue their journey without having to wait for rail replacement bus services.
A pool of volunteers from head office can be called upon to provide information to passengers at times of major disruption at Cardiff Central.
Transparency and accountability All train operators should publish the actions they are taking to improve passenger information in a Local Plan, together with the industry Code of Practice and an Annual Progress Report. Local Plans should be reviewed annually.
• Code of Practice – October 2016 • Local Plan – March 2017
https://goo.gl/9X3juP
Change on last year
PP = percentage point changeSource: Transport Focus, National Rail Passenger SurveyThe NRPS takes place twice a year, in Spring (S) and Autumn (A)
PP = percentage point changeSource: Transport Focus, National Rail Passenger SurveyThe NRPS takes place twice a year, in Spring (S) and Autumn (A)
PP = percentage point changeSource: Transport Focus, National Rail Passenger SurveyThe NRPS takes place twice a year, in Spring (S) and Autumn (A)
Arriva Trains Wales
Arriva Trains Wales
National
National
50%
44%
Arriva Trains Wales
-2.7 PP
13.0 PP
Provision of information to passengers
Source: Train Operating Companies and LENNON (the rail industry’s ticketing databaseData tables: TOC Key statistics
Key factsOwner group: Arriva UK Trains
Operator: Arriva Trains Wales (ATW)
Franchise: Wales & Borders
Franchise period: : 8 December 2003 – 13 October 2018
Employees: 2,169
Operated stations: 247
Sector: Regional
Passenger journeys per annum: 32.3 million
2012 2013 2014 2015 2016
Change on last year
S A S A S A S A S A
42%
35% -3.4 PP
4.3 PP
100%
75%
50%
25%
0%
2012 2013 2014 2015 2016S A S A S A S A S A
63%
70%
-0.4 PP
-2.0 PP
100%
75%
50%
25%
0%
S A S A S A S A S A
100%
75%
50%
25%
0%
2012 2013 2014 2015 2016
Arriva Trains Wales National
Change on last year
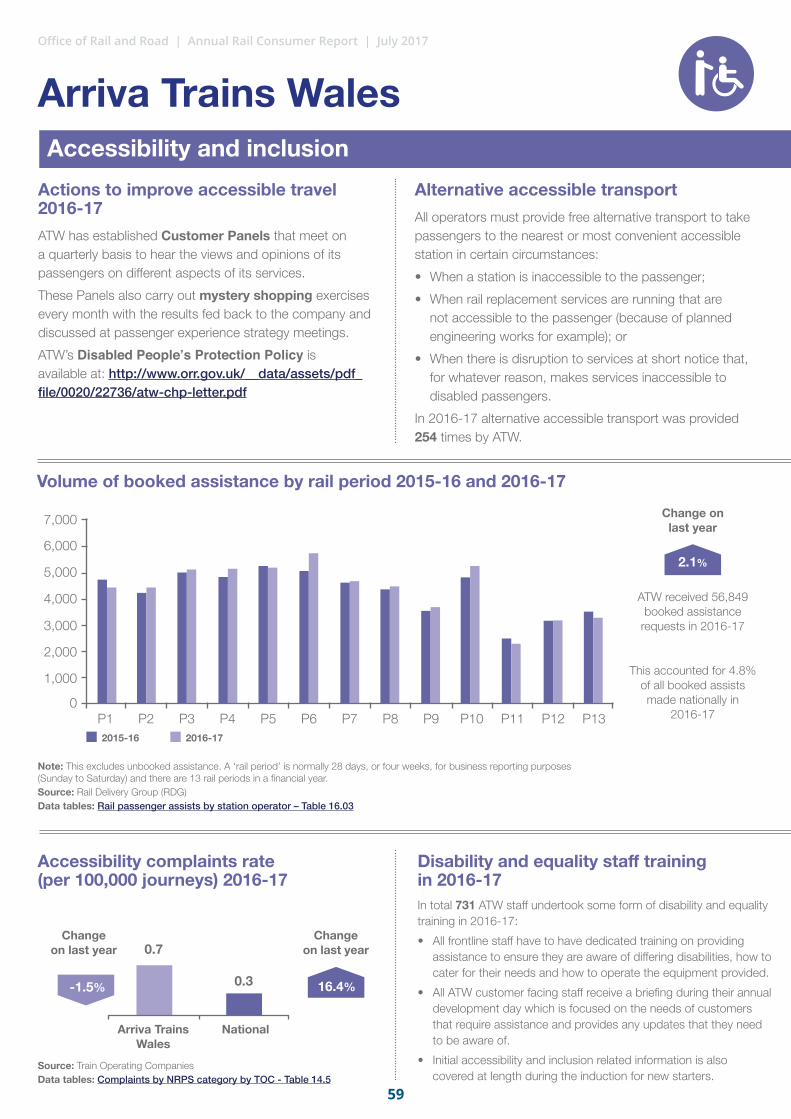
59
Office of Rail and Road | Annual Rail Consumer Report | July 2017
Actions to improve accessible travel 2016-17ATW has established Customer Panels that meet on a quarterly basis to hear the views and opinions of its passengers on different aspects of its services.
These Panels also carry out mystery shopping exercises every month with the results fed back to the company and discussed at passenger experience strategy meetings.
ATW’s Disabled Peopleʼs Protection Policy is available at: http://www.orr.gov.uk/__data/assets/pdf_file/0020/22736/atw-chp-letter.pdf
Alternative accessible transport All operators must provide free alternative transport to take passengers to the nearest or most convenient accessible station in certain circumstances:
• When a station is inaccessible to the passenger;
• When rail replacement services are running that are not accessible to the passenger (because of planned engineering works for example); or
• When there is disruption to services at short notice that, for whatever reason, makes services inaccessible to disabled passengers.
In 2016-17 alternative accessible transport was provided 254 times by ATW.
ATW received 56,849 booked assistance
requests in 2016-17
This accounted for 4.8% of all booked assists made nationally in
2016-17
Volume of booked assistance by rail period 2015-16 and 2016-17
Disability and equality staff training in 2016-17In total 731 ATW staff undertook some form of disability and equality training in 2016-17:
• All frontline staff have to have dedicated training on providing assistance to ensure they are aware of differing disabilities, how to cater for their needs and how to operate the equipment provided.
• All ATW customer facing staff receive a briefing during their annual development day which is focused on the needs of customers that require assistance and provides any updates that they need to be aware of.
• Initial accessibility and inclusion related information is also covered at length during the induction for new starters.
Accessibility complaints rate (per 100,000 journeys) 2016-17
Source: Train Operating Companies Data tables: Complaints by NRPS category by TOC - Table 14.5
Note: This excludes unbooked assistance. A ‘rail period’ is normally 28 days, or four weeks, for business reporting purposes (Sunday to Saturday) and there are 13 rail periods in a financial year.Source: Rail Delivery Group (RDG)Data tables: Rail passenger assists by station operator – Table 16.03
Change on last year
Change on last year
Accessibility and inclusion
Arriva Trains Wales
National
Arriva Trains Wales
Change on last year
2.1%5,000
6,000
7,000
4,000
3,000
2,000
1,000
0P1 P2 P3 P4 P5 P6 P7 P8 P9 P10 P11 P12 P13
-1.5% 16.4%
0.7
0.3
2015-16 2016-17

60
Office of Rail and Road | Annual Rail Consumer Report | July 2017
61.752.0
Arriva Trains WalesComplaints handling
Top 5 reasons for complaints 2016-17
PP = percentage point changeSource: Train Operating Companies Data tables: Complaints by NRPS category by TOC - Table 14.5
Percentage of complaints
Complaint type Change on last year
45.2% Punctuality/reliability
9.5% Sufficient room for all passengers to sit/stand
4.1% Ticket buying facilities
3.7% The helpfulness and attitude of staff on train
3.1% Provision of information about train times/platforms
Passenger satisfaction with complaint handling process 2016-17
Passenger satisfaction with each aspect of complaint handling process 2016-17
How did the passenger feel about the train company in light of how their complaint was handled 2016-17
Complaints rate (per 100,000 journeys) and complaints response rate
PP = percentage point changeSource: Train Operating Companies and LENNON (the rail industry’s ticketing and revenue database)Data tables: Complaints rate by train operating company - Table 14.9
Change on last year
2015-16 2016-17
-15.7%
14.2 PP
-2 PP
-4 PP
-3 PP
-22 PP
-5 PP
3 PP
2 PP4 PP
49.3
63.4
Satisfaction with how the complaints handled overall
Satisfaction with outcome of complaint
Sample size: 1,123Source: ORR – Passenger satisfaction with complaint handling survey Data tables: Passenger satisfaction with complaints handling
Sample size: 1,123PP = percentage point changeSource: ORR - Passenger satisfaction with complaint handling survey Data tables: Passenger satisfaction with complaints handling
Sample size: 1,123PP = percentage point changeSource: ORR – Passenger satisfaction with complaint handling surveyData tables: Passenger satisfaction with complaints handling
Arriva Trains Wales
The ease with which you were able to make the complaint More positive
about them
National
Arriva Trains Wales
TOC was helpful / knowledgeable
No different
National
The time taken to deal with your complaint
Your complaint was fully addressed by TOC
0% 0%50% 50%100% 100%
More negative about them
Satisfied
Neither
Dissatisfied
52%
19%
31%
37%
29%
13%
17%
14%
12%
52%
49%
59%
27%
8%
35%
57%
10%
34% 50%
7%
16%
84%
29% 44%
16% 32%
Actions to improve services for passengers 2016-17ATW’s Complaints Handling Procedure is available at: http://www.orr.gov.uk/__data/assets/pdf_file/0020/22736/atw-chp-letter.pdfATW reports it has taken some of the following actions to address issues highlighted in passenger complaints:
• Worked with the TVM supplier to change the internal mechanism to dispense tickets which has improved the functionality and reliability of the 10 worst performing machines.
• Committed to investing £1,000,000 in 2017 to further improving the ticket buying facilities by updating TVM software.
• Invested £400,000 to enhance the on-board environment of their older fleet.
-4.6 PP
0.6 PP
-1.8 PP
0.3 PP
0.9 PP
Complaints rate (per 100,000
journeys)68%
% answered in 20
working days
‘Satisfied’ compared to
national averageSatisfied Neither Dissatisfied
Comparison to national average

61
Office of Rail and Road | Annual Rail Consumer Report | July 2017
Passenger satisfaction with the usefulness of information when delays occur
Passenger satisfaction with how well the train company deals with delays
Passenger satisfaction with the provision of information during the journey
Actions to improve information for passengers 2016-17Information screens at stations have been upgraded to show the “next fastest train to…” when a train is cancelled.
A further upgrade means screens also warn passengers where a train is likely to be delayed after leaving the station.
c2c is working to introduce announcements to alert passengers when they may be due compensation for delays. Service pattern and compensation threshold will be considered before the automatic announcements are made.
Transparency and accountability All train operators should publish the actions they are taking to improve passenger information in a Local Plan, together with the industry Code of Practice and an Annual Progress Report. Local Plans should be reviewed annually.
• Code of Practice – no link published • Local Plan – February 2017
https://goo.gl/rKpwnDAlthough updated in 2017, the Local Plan refers to the previous Code of Practice. A fully compliant version needs to be shared with ORR by Autumn 2017.
Change on last year
PP = percentage point changeSome data not available due to low response rateSource: Transport Focus, National Rail Passenger SurveyThe NRPS takes place twice a year, in Spring (S) and Autumn (A)
PP = percentage point changeSource: Transport Focus, National Rail Passenger Survey The NRPS takes place twice a year, in Spring (S) and Autumn (A)
PP = percentage point changeSome data not available due to low response rateSource: Transport Focus, National Rail Passenger SurveyThe NRPS takes place twice a year, in Spring (S) and Autumn (A)
c2c National
59%
44%
c2c
-2.7 PP
3.6 PP
Provision of information to passengers
Source: Train Operating Companies and LENNON (the rail industry’s ticket and revenue database)Data tables: TOC Key statistics
Key factsOwner group: Trenitalia
Operator: c2c
Franchise: Essex Thameside
Franchise period: 9 November 2014 – 10 November 2029
Employees: 652
Operated stations: 25
Sector: London and South East
Passenger journeys per annum: 46.6 million
2012 2013 2014 2015 2016
Change on last year
c2c National
S A S A S A S A S A
44%
35% -3.4 PP
-2.5 PP
100%
75%
50%
25%
0%
2012 2013 2014 2015 2016
Change on last year
c2c National
S A S A S A S A S A
78%
70% -2.0 PP
-1.1 PP
100%
75%
50%
25%
0%
S A S A S A S A S A
100%
75%
50%
25%
0%
2012 2013 2014 2015 2016
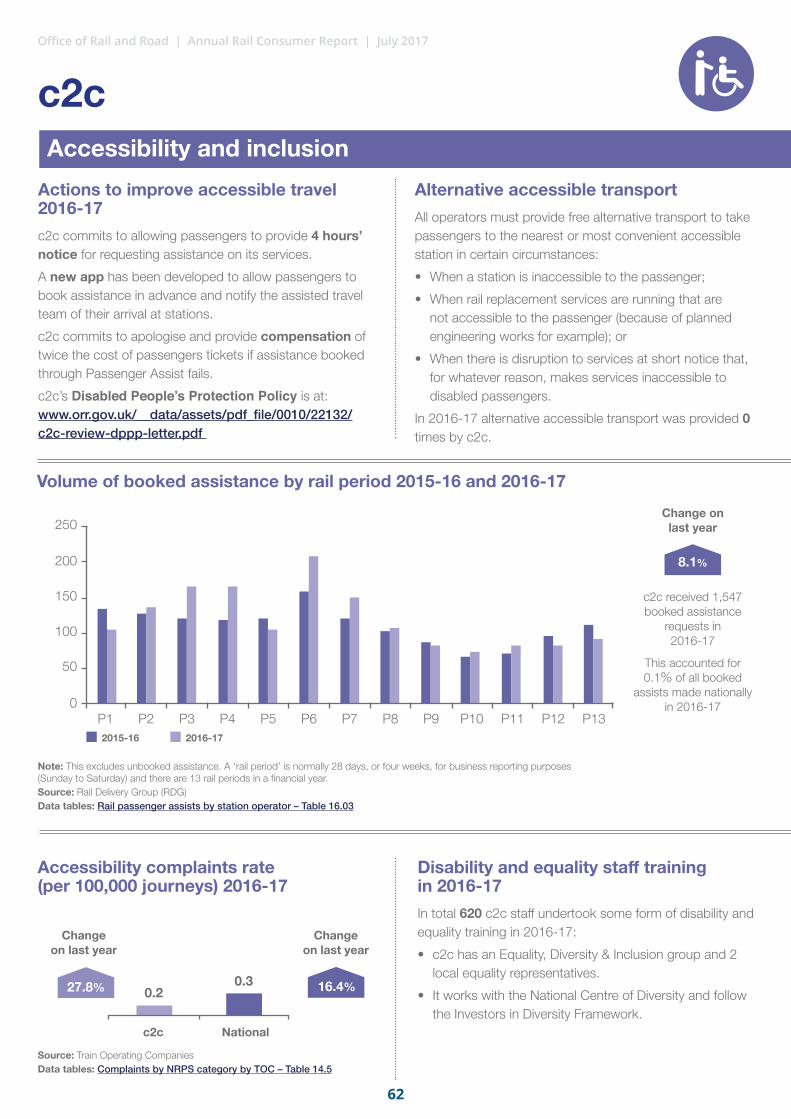
62
Office of Rail and Road | Annual Rail Consumer Report | July 2017
Actions to improve accessible travel 2016-17c2c commits to allowing passengers to provide 4 hours’ notice for requesting assistance on its services.
A new app has been developed to allow passengers to book assistance in advance and notify the assisted travel team of their arrival at stations.
c2c commits to apologise and provide compensation of twice the cost of passengers tickets if assistance booked through Passenger Assist fails.
c2c’s Disabled People’s Protection Policy is at: www.orr.gov.uk/__data/assets/pdf_file/0010/22132/c2c-review-dppp-letter.pdf
Alternative accessible transport All operators must provide free alternative transport to take passengers to the nearest or most convenient accessible station in certain circumstances:
• When a station is inaccessible to the passenger;
• When rail replacement services are running that are not accessible to the passenger (because of planned engineering works for example); or
• When there is disruption to services at short notice that, for whatever reason, makes services inaccessible to disabled passengers.
In 2016-17 alternative accessible transport was provided 0 times by c2c.
c2c received 1,547 booked assistance
requests in 2016-17
This accounted for 0.1% of all booked
assists made nationally in 2016-17
Volume of booked assistance by rail period 2015-16 and 2016-17
Disability and equality staff training in 2016-17In total 620 c2c staff undertook some form of disability and equality training in 2016-17:
• c2c has an Equality, Diversity & Inclusion group and 2 local equality representatives.
• It works with the National Centre of Diversity and follow the Investors in Diversity Framework.
Accessibility complaints rate (per 100,000 journeys) 2016-17
Source: Train Operating Companies Data tables: Complaints by NRPS category by TOC – Table 14.5
Note: This excludes unbooked assistance. A ‘rail period’ is normally 28 days, or four weeks, for business reporting purposes (Sunday to Saturday) and there are 13 rail periods in a financial year.Source: Rail Delivery Group (RDG)Data tables: Rail passenger assists by station operator – Table 16.03
Change on last year
Change on last year
Accessibility and inclusion
c2c National
c2c
Change on last year
8.1%200
250
150
100
50
0P1 P2 P3 P4 P5 P6 P7 P8 P9 P10 P11 P12 P13
27.8% 16.4%0.20.3
2015-16 2016-17

63
Office of Rail and Road | Annual Rail Consumer Report | July 2017
c2cComplaints handling
Top 5 reasons for complaints 2016-17
PP = percentage point changeSource: Train Operating Companies Data tables: Complaints by NRPS category by TOC – Table 14.5
Percentage of complaints
Complaint type Change on last year
32.2% Smartcards
11.8% Punctuality/reliability
10.1% Ticketing and refunds policy
9.6% No response from train company
4.4% How request to station staff was handled
Passenger satisfaction with complaint handling process 2016-17
Passenger satisfaction with each aspect of complaint handling process 2016-17
How did the passenger feel about the train company in light of how their complaint was handled 2016-17
Complaints rate (per 100,000 journeys) and complaints response rate
PP = percentage point changeSource: Train Operating Companies and LENNON (the rail industry’s ticketing and revenue database)Data tables: Complaints rate by train operating company – Table 14.9
Change on last year
2015-16
26.4 31.7
2016-17
-0.1PP
19.7%
10 PP
-2 PP
-4 PP
0 PP
-3 PP
-3 PP
6 PP
99.7 99.6
% answered in 20
working days
Complaints rate (per 100,000
journeys)
Satisfaction with complaints handling process
Satisfaction with outcome of complaint
Sample size: 28Source: ORR – Passenger satisfaction with complaint handling survey Data tables: Passenger satisfaction with complaints handling
Sample size: 28PP = percentage point changeSource: ORR – Passenger satisfaction with complaint handling survey Data tables: Passenger satisfaction with complaints handling
Sample size: 28PP = percentage point changeSource: ORR – Passenger satisfaction with complaint handling surveyData tables: Passenger satisfaction with complaints handling
c2c
The ease with which you were able to make the complaint
‘Satisfied’ compared to
national averageComparison to
national average
More positive about them
National
c2c
TOC was helpful / knowledgeable
No different
National
The time taken to deal with your complaint
Your complaint was fully addressed by TOC
0% 0%50% 50%100% 100%
More negative about them
Satisfied
Neither
Dissatisfied
Satisfied Neither Dissatisfied
64%
29%
21%
29%
18%
43%
61%
30%
11%
29%
61%
32%
25% 61%
18%
14%
50%
26% 44%
25% 11%
Actions to improve services for passengers 2016-17c2c’s Complaints Handling Procedure is available at: www.orr.gov.uk/__data/assets/pdf_file/0011/19694/chp-approval-c2c-essex-thameside-nxet-20141027.pdf c2c reports it has taken some of the following actions to address issues highlighted in passenger complaints:
• Delivered training to telephone and customer relations staff, and implemented processes to quickly identify and report faults, reducing smartcard complaints.
• Increased frequency of services within peak times.
• Is rolling out a new system to highlight potential issues with trains before failure so that maintenance can be carried out proactively.
• Designed a training module for all front line staff, focused on the customer journey and highlighting role model behaviour for front line staff so more complaints can be dealt with at the station.
15.8 PP
2.2 PP
0.9 PP
4.6 PP
-1.1 PP
31%
29%
17%
12%
52%
59%

64
Office of Rail and Road | Annual Rail Consumer Report | July 2017
Passenger satisfaction with the usefulness of information when delays occur
Passenger satisfaction with how well the train company deals with delays
Passenger satisfaction with the provision of information during the journey
Actions to improve information for passengers 2016-17Caledonian Sleeper has not provided any information on the actions it has taken to improve the information it provides to passengers.
Transparency and accountability All train operators should publish the actions they are taking to improve passenger information in a Local Plan, together with the industry Code of Practice and an Annual Progress Report. Local Plans should be reviewed annually.
• Code of Practice – no link published • Local Plan – no link published
ORR is working with Caledonian Sleeper to ensure that they have a compliant local plan by the Autumn 2017 deadline.
Q4 refers to 7 February to 30 April 2016Source: Caledonian Sleeper passenger satisfaction*see note above for information about the source of this data
Q4 refers to 7 February to 30 April 2016Source: Caledonian Sleeper passenger satisfaction*see note above for information about the source of this data
Caledonian Sleeper Provision of information to passengers
Source: Train Operating Companies and LENNON (the rail industry’s ticketing and revenue database)Data tables: TOC Key statistics
Key factsOwner group: Serco
Operator: Caledonian Sleeper
Franchise: Caledonian Sleeper
Franchise period: 31 March 2015 – 31 March 2030
Employees: 142
Operated stations: 0Sector: Scotland
Passenger journeys per annum: 0.3 million
Q4 refers to 7 February to 30 April 2016Source: Caledonian Sleeper passenger satisfaction*Note: Caledonian Sleeper does not participate in the National Rail Passenger Survey. Instead, Transport Focus carry out an individual survey for Caledonian Sleeper. Comparisons with the NRPS should therefore be treated with caution due to some differences in methodology.
These differences include the Caledonian Sleeper survey being online only, some differences in the questions asked, data collected every rail period rather than just Spring and Autumn, and differences in timings for completion of the survey following the journey.
54%63%
100% 100%
75% 75%
50% 50%
25% 25%
0% 0%Q4 Q4
49%
100%
75%
50%
25%
0%Q4

65
Office of Rail and Road | Annual Rail Consumer Report | July 2017
Actions to improve accessible travel 2016-17Caledonian Sleeper is working to install Totem information points at all the stations it serves by 2018.
Caledonian Sleeper’s Disabled People’s Protection Policy is available at: http://www.orr.gov.uk/__data/assets/pdf_file/0009/24597/caledonian_sleeper_dppp.pdf
Alternative accessible transport All operators must provide free alternative transport to take passengers to the nearest or most convenient accessible station in certain circumstances:
• When a station is inaccessible to the passenger;
• When rail replacement services are running that are not accessible to the passenger (because of planned engineering works for example); or
• When there is disruption to services at short notice that, for whatever reason, makes services inaccessible to disabled passengers.
In 2016-17 alternative accessible transport was provided 0 times by Caledonian Sleeper.
Volume of booked assistance by rail period 2015-16 and 2016-17
Disability and equality staff training in 2016-1728 Caledonian Sleeper staff undertook some form of disability and equality training in 2016-17:
• All new staff received general disability training at their induction. An annual refresher course is also in place for all existing staff.
• Managers involved in the Guest Experience function have been trained to ensure that decisions they take affecting disabled passengers are evidence based and consistent.
• A dedicated disability and equality training programme has recently been developed and is in the process of being implemented.
Accessibility complaints rate (per 100,000 journeys) 2016-17
Note: Caledonian Sleeper did not provide data for the full reporting year 2016-17 but reports it received 1 complaint on accessibility in rail periods 8-13 2016-17. Caledonian Sleeper data not available for 2015-16.Source: Train Operating Companies Data tables: Complaints by NRPS category by TOC – Table 14.5
Change on last year
Change on last year
Data not available for
last year
Accessibility and inclusion
Caledonian Sleeper
National
Caledonian Sleeper
16.4%0.3
Data on the volume of booked assistance is available from the Rail Delivery Group for each train company that manages a station. Caledonian Sleeper does not currently manage any stations which means this data is not available to report on.
Data not available

66
Office of Rail and Road | Annual Rail Consumer Report | July 2017
Caledonian Sleeper Complaints handling
Top 5 reasons for complaints 2016-17
*Data is not available for last yearPP = percentage point change Source: Train Operating Companies Data tables: Complaints by NRPS category by TOC – Table 14.5
Percentage of complaints
Complaint type Change on last year*
19.8% Punctuality/reliability
13.2% Ticketing and refunds policy
10.3% Ticket buying facilities
8.2% Miscellaneous
7.8% Aspects of complaints handling
Passenger satisfaction with complaint handling process 2016-17
Passenger satisfaction with each aspect of complaint handling process 2016-17
How did the passenger feel about the train company in light of how their complaint was handled 2016-17
Complaints rate (per 100,000 journeys) and complaints response rate
Note: Caledonian Sleeper did not provide data for the full reporting year 2016-17 so the complaints rate is not available. Caledonian Sleeper data not available for 2015-16.PP = percentage point changeSource: Train Operating Companies and LENNON (the rail industry’s ticketing and revenue database)Data tables: Complaints rate by train operating company – Table 14.9
2015-16
Data not available
2016-17
Complaints rate (per 100,000
journeys)
Actions to improve services for passengers 2016-17 Caledonian Sleeper’s Complaints Handling Procedure is available at: http://www.orr.gov.uk/__data/assets/pdf_file/0010/19693/orr-approval-to-serco-chp-and-dppp.pdf
Caledonian Sleeper reports it has taken some of the following actions to address issues highlighted in passenger complaints:
• Appointed a dedicated manager within the customer contact centre, with the specific remit of improving customer interaction.
• Working to meet their commitment to replace their full fleet with new trains in 2018.
• Committed to enhance the station facilities open to passengers at key locations by mid-2018.
% answered in 20
working days
Caledonian Sleeper did not participate in our complaint handling survey during 2016-17. This has recently been resolved and they have been participating in the survey since rail period 2 2017-18.
Caledonian Sleeper did not participate in our complaint handling survey during 2016-17. This has recently been resolved and they have been participating in the survey since rail period 2 2017-18.
Caledonian Sleeper did not participate in our complaint handling survey during 2016-17. This has recently been resolved and they have been participating in the survey since rail period 2 2017-18.
99.7

67
Office of Rail and Road | Annual Rail Consumer Report | July 2017
Passenger satisfaction with the usefulness of information when delays occur
Passenger satisfaction with how well the train company deals with delays
Passenger satisfaction with the provision of information during the journey
Actions to improve information for passengers 2016-17Chiltern is working with Aston University to review its disruption management plans and information provision. The project is due to complete with recommendations in December 2017.
Station ‘disruption kits’ have been introduced at stations to ensure staff have the resources they need to inform passengers during disruption.
The on train wifi upgrade will be completed by September 2017 and will enable passengers to access live train running information while they are on the train.
Transparency and accountability All train operators should publish the actions they are taking to improve passenger information in a Local Plan, together with the industry Code of Practice and an Annual Progress Report. Local Plans should be reviewed annually.
• Code of Practice – October 2016 • Local Plan – October 2016
https://goo.gl/556YsQ
As the Code of Practice has changed since the Local Plan was published, a fully compliant version needs to be shared with ORR by Autumn 2017.
Change on last year
PP = percentage point changeSource: Transport Focus, National Rail Passenger SurveyThe NRPS takes place twice a year, in Spring (S) and Autumn (A)
PP = percentage point changeSource: Transport Focus, National Rail Passenger Survey The NRPS takes place twice a year, in Spring (S) and Autumn (A)
PP = percentage point changeSource: Transport Focus, National Rail Passenger SurveyThe NRPS takes place twice a year, in Spring (S) and Autumn (A)
Chiltern Railways National
59%
44%
Chiltern Railways
-2.7 PP
2.5 PP
Provision of information to passengers
Source: Train Operating Companies and LENNON (the rail industry’s ticketing and revenue database)Data tables: TOC Key statistics
Key factsOwner group: Arriva UK Trains
Operator: Chiltern Railways
Franchise: Chiltern Railways
Franchise period: 21 July 1996 – 11 December 2021
Employees: 843
Operated stations: 35
Sector: London and South East
Passenger journeys per annum: 26.4 million
2012 2013 2014 2015 2016
Change on last year
S A S A S A S A S A
49%
35% -3.4 PP
-5.2 PP
100%
75%
50%
25%
0%
2012 2013 2014 2015 2016
Change on last year
S A S A S A S A S A
70%
77% -3.1 PP
-2.0 PP
100%
75%
50%
25%
0%
S A S A S A S A S A
100%
75%
50%
25%
0%
2012 2013 2014 2015 2016
Chiltern Railways Chiltern Railways National National

68
Office of Rail and Road | Annual Rail Consumer Report | July 2017
Actions to improve accessible travel 2016-17Passengers who have used booked assistance are asked to complete a survey on the service provided. Comments are monitored and actions are taken where assistance has not been provided to the expected level.
Chiltern’s Disabled People’s Protection Policy is at: http://www.orr.gov.uk/__data/assets/pdf_file/0019/24436/chiltern_railways_dppp_review_letter.pdf
Alternative accessible transport All operators must provide free alternative transport to take passengers to the nearest or most convenient accessible station in certain circumstances:
• When a station is inaccessible to the passenger;
• When rail replacement services are running that are not accessible to the passenger (because of planned engineering works for example); or
• When there is disruption to services at short notice that, for whatever reason, makes services inaccessible to disabled passengers.
In 2016-17 alternative accessible transport was provided 147 times by Chiltern.
Chiltern received 12,558 booked assistance
requests in 2016-17
This accounted for 1.0% of all booked assists made
nationally in 2016-17
Volume of booked assistance by rail period 2015-16 and 2016-17
Disability and equality staff training in 2016-17In total 71 staff undertook some form of disability and equality training in 2016-17: • All new entrants are trained in Disability Awareness as part of
their induction. • The course is a half-day session delivered by an external
company. • It covers 5 areas, including awareness of the Equality Act
2010, understanding the social model of disability, being able to suggest practical ways to reduce barriers, and encouraging good practice within the organisation.
• Resources used to complete the training include presentations, classroom discussion and practical experience such as how to position a ramp.
Accessibility complaints rate (per 100,000 journeys) 2016-17
Source: Train Operating Companies Data tables: Complaints by NRPS category by TOC – Table 14.5
Note: This excludes unbooked assistance. A ‘rail period’ is normally 28 days, or four weeks, for business reporting purposes (Sunday to Saturday) and there are 13 rail periods in a financial year.Source: Rail Delivery Group (RDG)Data tables: Rail passenger assists by station operator – Table 16.03
Change on last year
Change on last year
Accessibility and inclusion
Chiltern Railways National
Chiltern Railways
Change on last year
11.8%
800
1,000
1,200
1,400
600
400
200
0P1 P2 P3 P4 P5 P6 P7 P8 P9 P10 P11 P12 P13
-64.4% 16.4%
0.50.3
2015-16 2016-17

69
Office of Rail and Road | Annual Rail Consumer Report | July 2017
Chiltern Railways Complaints handling
Top 5 reasons for complaints 2016-17
PP = percentage point changeSource: Train Operating Companies Data tables: Complaints by NRPS category by TOC – Table 14.5
Percentage of complaints
Complaint type Change on last year
19.4% Punctuality/reliability
11.8% Ticket buying facilities
7.7% Company policy (misc)
6.2% Sufficient room for all passengers to sit/stand
5.8% Facilities for car parking
Passenger satisfaction with complaint handling process 2016-17
Passenger satisfaction with each aspect of complaint handling process 2016-17
How did the passenger feel about the train company in light of how their complaint was handled 2016-17
Complaints rate (per 100,000 journeys) and complaints response rate
PP = percentage point changeSource: Train Operating Companies and LENNON (the rail industry’s ticketing and revenue database)Data tables: Complaints rate by train operating company – Table 14.9
Change on last year
2015-16
89.4
30.5
2016-17
1.2 PP
-65.9%
13 PP
11 PP
6 PP
10 PP
4 PP
6 PP
-10 PP
98.8 100.0
Complaints rate (per 100,000
journeys)
Satisfaction with complaints handling process
Satisfaction with outcome of complaint
Sample size: 673Source: ORR – Passenger satisfaction with complaint handling survey Data tables: Passenger satisfaction with complaints handling
Sample size: 673PP = percentage point changeSource: ORR – Passenger satisfaction with complaint handling survey Data tables: Passenger satisfaction with complaints handling
Sample size: 673PP = percentage point changeSource: ORR – Passenger satisfaction with complaint handling surveyData tables: Passenger satisfaction with complaints handling
Chiltern Railways
The ease with which you were able to make the complaint More positive
about them
National
Chiltern Railways
TOC was helpful / knowledgeable
No different
National
The time taken to deal with your complaint
Your complaint was fully addressed by TOC
0% 0%50% 50%100% 100%
More negative about them
Satisfied
Neither
Dissatisfied
67%
41%
31%
34%
29%
19%
17%
14%
12%
40%
52%
52%
59%
42%
17%
38%
45%
42%
35% 52%
17%
13%
42%
23% 35%
13% 20%
Actions to improve services for passengers 2016-17 Chiltern’s Complaints Handling Procedure is at: http://www.orr.gov.uk/__data/assets/pdf_file/0005/22919/chiltern_railway_chp_approval_letter.pdfChiltern reports it has taken some of the following actions to address issues highlighted in passenger complaints:
• Introducing new TVMs throughout 2017.
• Introduced performance schemes to demonstrate the importance of trains running on time to front line staff.
• Ensures an amended timetable is in place when events take place along the route to cater for additional passengers wishing to travel.
• Introduced additional car parking spaces at two locations and is trialling a scheme to make car parking quicker and easier to pay for.
-46.8 PP
8.4 PP
5.4 PP
2.4 PP
4.8 PP
% answered in 20
working days
‘Satisfied’ compared to
national averageSatisfied Neither Dissatisfied
Comparison to national average

70
Office of Rail and Road | Annual Rail Consumer Report | July 2017
Passenger satisfaction with the usefulness of information when delays occur
Passenger satisfaction with how well the train company deals with delays
Passenger satisfaction with the provision of information during the journey
Actions to improve information for passengers 2016-17All frontline staff have access to real-time information via a smartphone with customer information apps.
All announcements on trains are made by staff who have a duty to be visible to passengers during the journey.
CrossCountry’s ‘HELPER’ process reminds staff what they need to do during disruption.
The @crosscountryUK twitter account is managed from within the control centre which helps to ensure the social media team have up to date information.
Transparency and accountability All train operators should publish the actions they are taking to improve passenger information in a Local Plan, together with the industry Code of Practice and an Annual Progress Report. Local Plans should be reviewed annually.
• Code of Practice – October 2016 • Local Plan – August 2016
https://goo.gl/96GHDs
As the Code of Practice has changed since the Local Plan was published, a fully compliant version needs to be shared with ORR by Autumn 2017
Change on last year
PP = percentage point changeSource: Transport Focus, National Rail Passenger SurveyThe NRPS takes place twice a year, in Spring (S) and Autumn (A)
PP = percentage point changeSource: Transport Focus, National Rail Passenger Survey The NRPS takes place twice a year, in Spring (S) and Autumn (A)
PP = percentage point changeSource: Transport Focus, National Rail Passenger SurveyThe NRPS takes place twice a year, in Spring (S) and Autumn (A)
CrossCountry National
56%
44%
CrossCountry
-2.7 PP
-2.7 PP
Provision of information to passengers
Source: Train Operating Companies and LENNON (the rail industry’s ticketing and revenue database)Data tables: TOC Key statistics
Key factsOwner group: Arriva UK Trains
Operator: CrossCountry
Franchise: New CrossCountry
Franchise period: 16 October 2016 – 13 October 2019
Employees: 1,854
Operated stations: 0Sector: Long distance
Passenger journeys per annum: 38.7 million
2012 2013 2014 2015 2016
Change on last year
S A S A S A S A S A
47%
35% -3.4 PP
-7.1 PP
100%
75%
50%
25%
0%
2012 2013 2014 2015 2016
Change on last year
S A S A S A S A S A
70%
77% 0.5 PP
-2.0 PP
100%
75%
50%
25%
0%
S A S A S A S A S A
100%
75%
50%
25%
0%
2012 2013 2014 2015 2016
CrossCountry CrossCountryNational National

71
Office of Rail and Road | Annual Rail Consumer Report | July 2017
Actions to improve accessible travel 2016-17CrossCountry now enables passengers to book assistance up until 8pm the night before travel.
CrossCountry’s Disabled People’s Protection Policy is available at: http://www.orr.gov.uk/__data/assets/pdf_file/0004/22729/xc-trains-dppp-letter.pdf
Alternative accessible transport All operators must provide free alternative transport to take passengers to the nearest or most convenient accessible station in certain circumstances:
• When a station is inaccessible to the passenger;
• When rail replacement services are running that are not accessible to the passenger (because of planned engineering works for example); or
• When there is disruption to services at short notice that, for whatever reason, makes services inaccessible to disabled passengers.
In 2016-17 alternative accessible transport was provided 141 times by CrossCountry.
Volume of booked assistance by rail period 2015-16 and 2016-17 Data on the volume of booked assistance requests received in each rail period is available for each train operator that manages a station. This data is therefore not available for CrossCountry because they do not manage any stations.
Disability and equality staff training in 2016-17131 CrossCountry staff undertook some form of disability and equality training in 2016-17:
• All new staff receive mandatory disability awareness and equality training.
• All Frontline Managers have attended a one day course on equality training.
• All call centre staff who handle Passenger Assist bookings have ongoing disability awareness and equality training.
• Staff are also regularly taken out on the network to build up their practical understanding of the hazards and obstacles that disabled customers may experience when travelling.
CrossCountry are in the process of launching a new Equality, Diversity and Inclusion training and briefing initiative/module to all customer facing staff incorporating the latest thinking and industry expert advice.
Accessibility complaints rate (per 100,000 journeys) 2016-17
Source: Train Operating Companies Data tables: Complaints by NRPS category by TOC – Table 14.5
Change on last year
Change on last year
Accessibility and inclusion
CrossCountry National
CrossCountry
2.8% 16.4%0.3 0.3

72
Office of Rail and Road | Annual Rail Consumer Report | July 2017
CrossCountryComplaints handling
Top 5 reasons for complaints 2016-17
PP = percentage point changeSource: Train Operating Companies Data tables: Complaints by NRPS category by TOC – Table 14.5
Percentage of complaints
Complaint type Change on last year
38.4% Punctuality/reliability
26.5% Facilities on board
13.5% Sufficient room for all passengers to sit/stand
5.3% The helpfulness and attitude of staff on train
2.8% The toilet facilities
Passenger satisfaction with complaint handling process 2016-17
Passenger satisfaction with each aspect of complaint handling process 2016-17
How did the passenger feel about the train company in light of how their complaint was handled 2016-17
Complaints rate (per 100,000 journeys) and complaints response rate
PP = percentage point changeSource: Train Operating Companies and LENNON (the rail industry’s ticketing and revenue database)Data tables: Complaints rate by train operating company – Table 14.9
Change on last year
2015-16
50.3 55.5
2016-17
0.5 PP
10.4%
6 PP
21 PP
21 PP
23 PP
14 PP
1 PP
-14 PP
99.2 99.7
Complaints rate (per 100,000
journeys)
Satisfaction with complaints handling process
Satisfaction with outcome of complaint
Sample size: 350Source: ORR – Passenger satisfaction with complaint handling survey Data tables: Passenger satisfaction with complaints handling
Sample size: 350PP = percentage point changeSource: ORR – Passenger satisfaction with complaint handling survey Data tables: Passenger satisfaction with complaints handling
Sample size: 350PP = percentage point changeSource: ORR – Passenger satisfaction with complaint handling surveyData tables: Passenger satisfaction with complaints handling
CrossCountry
The ease with which you were able to make the complaint More positive
about them
National
CrossCountry
TOC was helpful / knowledgeable
No different
National
The time taken to deal with your complaint
Your complaint was fully addressed by TOC
0% 0%50% 50%100% 100%
More negative about them
Satisfied
Neither
Dissatisfied
60%
51%
31%
51%
29%
13%
17%
7%
12%
37%
52%
42%
59%
52%
27%
32%
41%
55%
50% 40%
16%
10%
29%
17% 31%
16% 25%
Actions to improve services for passengers 2016-17 CrossCountry’s Complaints Handling Procedure is available at: http://www.orr.gov.uk/__data/assets/pdf_file/0012/22251/crosscountry-chp-letter.pdf CrossCountry reports it has taken the following actions to address issues highlighted in passenger complaints
• Introduced additional catering resource on Sundays around Birmingham area.
• Committed to undertaking some research on what customers value from their catering service.
• Established quarterly reliability surveys on the operation of each train.
• Offered advance tickets on the day of purchase, up to 15 minutes before the customers starts their journey.
-9.1 PP
3.3 PP
3.2 PP
3.5 PP
0.4 PP
% answered in 20
working days
‘Satisfied’ compared to
national averageSatisfied Neither Dissatisfied
Comparison to national average
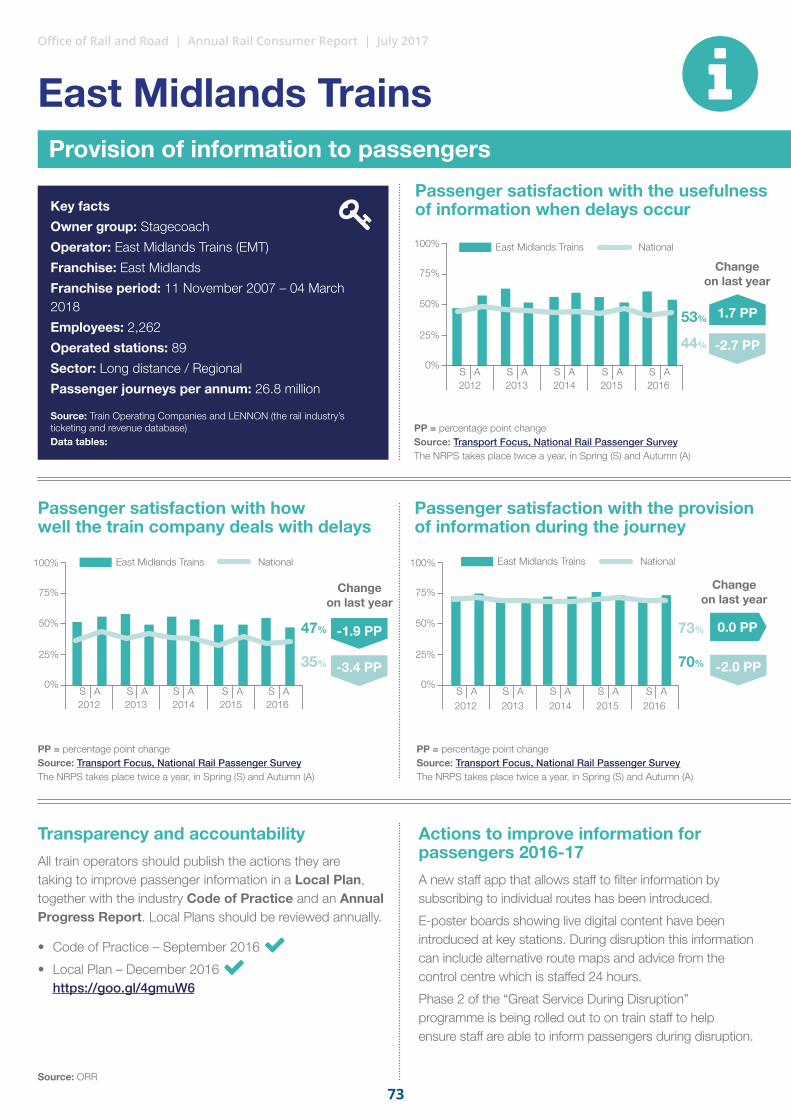
73
Office of Rail and Road | Annual Rail Consumer Report | July 2017
Passenger satisfaction with the usefulness of information when delays occur
Passenger satisfaction with how well the train company deals with delays
Passenger satisfaction with the provision of information during the journey
Actions to improve information for passengers 2016-17A new staff app that allows staff to filter information by subscribing to individual routes has been introduced.
E-poster boards showing live digital content have been introduced at key stations. During disruption this information can include alternative route maps and advice from the control centre which is staffed 24 hours.
Phase 2 of the “Great Service During Disruption” programme is being rolled out to on train staff to help ensure staff are able to inform passengers during disruption.
Transparency and accountability All train operators should publish the actions they are taking to improve passenger information in a Local Plan, together with the industry Code of Practice and an Annual Progress Report. Local Plans should be reviewed annually.
• Code of Practice – September 2016 • Local Plan – December 2016
https://goo.gl/4gmuW6
Change on last year
PP = percentage point changeSource: Transport Focus, National Rail Passenger SurveyThe NRPS takes place twice a year, in Spring (S) and Autumn (A)
Source: ORR
PP = percentage point changeSource: Transport Focus, National Rail Passenger SurveyThe NRPS takes place twice a year, in Spring (S) and Autumn (A)
PP = percentage point changeSource: Transport Focus, National Rail Passenger SurveyThe NRPS takes place twice a year, in Spring (S) and Autumn (A)
53%
44%
East Midlands Trains
-2.7 PP
1.7 PP
Provision of information to passengers
Source: Train Operating Companies and LENNON (the rail industry’s ticketing and revenue database)Data tables: TOC Key statistics
Key factsOwner group: Stagecoach
Operator: East Midlands Trains (EMT)
Franchise: East Midlands
Franchise period: 11 November 2007 – 04 March 2018
Employees: 2,262
Operated stations: 89
Sector: Long distance / Regional
Passenger journeys per annum: 26.8 million
2012 2013 2014 2015 2016
Change on last year
S A S A S A S A S A
47%
35% -3.4 PP
-1.9 PP
100%
75%
50%
25%
0%
2012 2013 2014 2015 2016
Change on last year
S A S A S A S A S A
70%
73%
-2.0 PP
100%
75%
50%
25%
0%
East Midlands Trains National
East Midlands Trains National East Midlands Trains National
S A S A S A S A S A
100%
75%
50%
25%
0%
2012 2013 2014 2015 2016
0.0 PP

74
Office of Rail and Road | Annual Rail Consumer Report | July 2017
Actions to improve accessible travel 2016-17Passengers booking assistance need to provide 12 hours’ notice when traveling on EMT services.
If booked assistance is not provided then EMT will provide passengers with a full refund for their journey.
EMT has established a ‘Customer Voice’ forum which allows passengers to meet with Senior Management to discuss their views on the service being provided.
East Midlands Trains’ Disabled People’s Protection Policy is available at: www.orr.gov.uk/__data/assets/pdf_file/0014/21065/emt-review-of-dppp-letter.pdf
Alternative accessible transport All operators must provide free alternative transport to take passengers to the nearest or most convenient accessible station in certain circumstances:
• When a station is inaccessible to the passenger;
• When rail replacement services are running that are not accessible to the passenger (because of planned engineering works for example); or
• When there is disruption to services at short notice that, for whatever reason, makes services inaccessible to disabled passengers.
In 2016-17 alternative accessible transport was provided 3,906 times by EMT.
EMT received 56,583 booked assistance
requests in 2016-17
This accounted for 4.7% of all booked assists made nationally in
2016-17
Volume of booked assistance by rail period 2015-16 and 2016-17
Disability and equality staff training in 2016-17In total 78 EMT staff undertook some form of disability and equality training in in 2016-17:
• As part of induction training frontline staff (including customer hosts, train guards, train managers and gateline staff) undertook a dedicated module on disability awareness and equality.
• EMT aims to make this dedicated module mandatory for all Customer Experience staff.
• Training is delivered in-house and involves both classroom training and practical elements such as use of equipment.
Accessibility complaints rate (per 100,000 journeys) 2016-17
Source: Train Operating Companies Data tables: Complaints by NRPS category by TOC - Table 14.5
Note: This excludes un-booked assistance. A ‘rail period’ is normally 28 days, or four weeks, for business reporting purposes (Sunday to Saturday) and there are 13 rail periods in a financial year. Source: Rail Delivery Group (RDG)Data tables: Rail passenger assists by station operator – Table 16.03
Change on last year
Change on last year
Accessibility and inclusion
East Midlands Trains
National
East Midlands Trains
Change on last year
3.4%
2,000
4,000
3,000
5,000
6,000
1,000
0P1 P2 P3 P4 P5 P6 P7 P8 P9 P10 P11 P12 P13
1.3% 16.4%
0.8
0.3
2015-16 2016-17

75
Office of Rail and Road | Annual Rail Consumer Report | July 2017
47%
29%
11%
12%
42%
59%
15%
31%
45%
17%
41%
52%
East Midlands TrainsComplaints handling
Top 5 reasons for complaints 2016-17
PP = percentage point changeSource: Train Operating Companies Data tables: Complaints by NRPS category by TOC - Table 14.5
Percentage of complaints
Complaint type Change on last year
30.0% Punctuality/reliability
16.9% Facilities on board
14.0% Sufficient room for all passengers to sit/stand
6.6% Ticket buying facilities
4.3% The helpfulness and attitude of staff on train
Passenger satisfaction with complaint handling process 2016-17
Passenger satisfaction with each aspect of complaint handling process 2016-17
How did the passenger feel about the train company in light of how their complaint was handled 2016-17
Complaints rate (per 100,000 journeys) and complaints response rate
PP = percentage point changeSource: Train Operating Companies and LENNON (the rail industry’s ticketing and revenue database)Data tables: Complaints rate by train operating company - Table 14.9
Change on last year
2015-16
59.2 48.8
2016-17
8.7 PP
-17.6%
8 PP
16 PP
17 PP
6 PP
11 PP
2 PP
-14 PP
80.389.0
Complaints rate (per 100,000
journeys)
Satisfaction with complaints handling process
Satisfaction with outcome of complaint
Sample size: :1,673Source: ORR – Passenger satisfaction with complaint handling survey Data tables: Passenger satisfaction with complaints handling
Sample size: 1,673PP = percentage point changeSource: ORR – Passenger satisfaction with complaint handling survey Data tables: Passenger satisfaction with complaints handling
Sample size: 1,673PP = percentage point changeSource: ORR – Passenger satisfaction with complaint handling survey Data tables: Passenger satisfaction with complaints handling
East Midlands Trains
The ease with which you were able to make the complaint More positive
about them
National
East Midlands Trains
TOC was helpful / knowledgeable
No different
National
The time taken to deal with your complaint
Your complaint was fully addressed by TOC
0% 0%50% 50%100% 100%
More negative about them
Satisfied
Neither
Dissatisfied
62%
47%
25%
34%
41%
38%
46% 43%11%
48%
20% 33%
15% 23%
Operator actions to improve services for passengers 2016-17 EMT’s Complaints Handling Procedure is available at: www.orr.gov.uk/__data/assets/pdf_file/0018/20835/approval-emt-chp-letter.pdf EMT reports it has taken some of the following actions to address issues highlighted in passenger complaints:
• Introduced free 15 minutes of WiFi in standard class to address complaints about provision of WiFi.
• Proactively issues customer information on Twitter and website about services which will have short formations.
• Offers compensation for passengers who had a seat reservation but could not access their seat.
• Introduced a new customer experience training program for front line staff called ‘Permission to Act’ to empower all employees to make decisions on the spot to help customers.
-10.6 PP
6.7 PP
2.4 PP
-0.6 PP
0.5 PP
% answered in 20
working days
‘Satisfied’ compared to
national averageSatisfied Neither Dissatisfied
Comparison to national average
14%
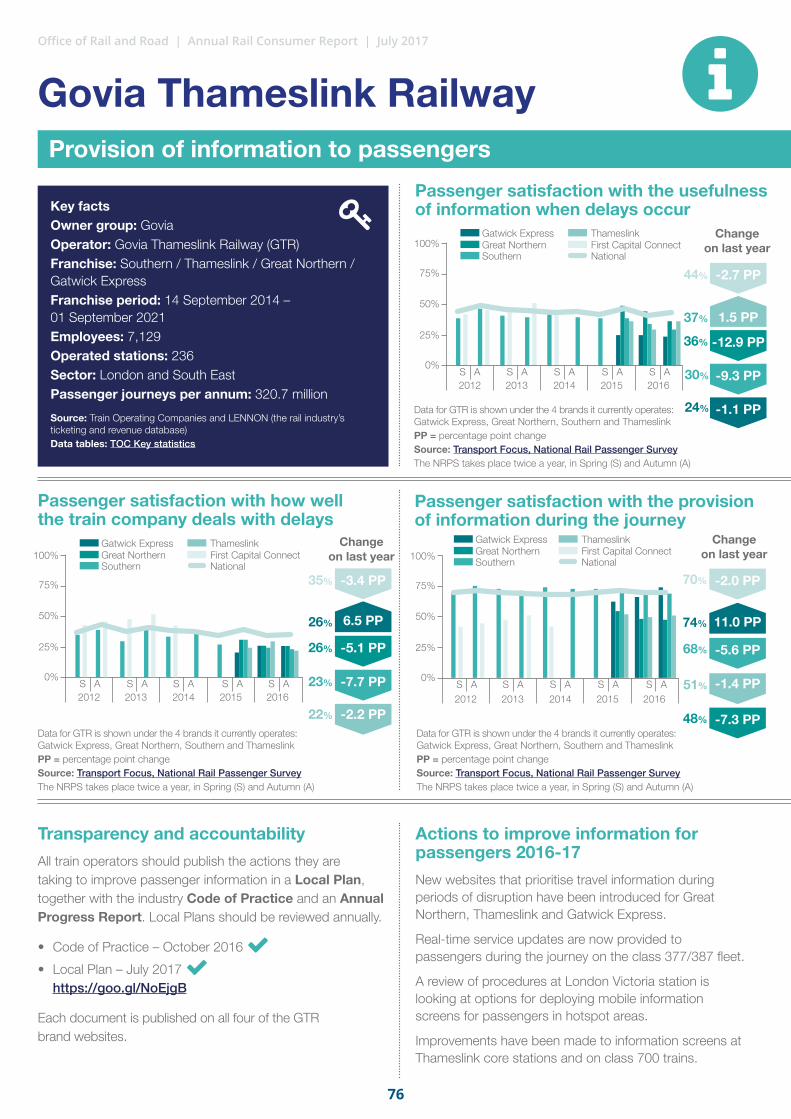
76
Office of Rail and Road | Annual Rail Consumer Report | July 2017
Passenger satisfaction with the usefulness of information when delays occur
Passenger satisfaction with how well the train company deals with delays
Passenger satisfaction with the provision of information during the journey
Actions to improve information for passengers 2016-17New websites that prioritise travel information during periods of disruption have been introduced for Great Northern, Thameslink and Gatwick Express.
Real-time service updates are now provided to passengers during the journey on the class 377/387 fleet.
A review of procedures at London Victoria station is looking at options for deploying mobile information screens for passengers in hotspot areas.
Improvements have been made to information screens at Thameslink core stations and on class 700 trains.
Transparency and accountability All train operators should publish the actions they are taking to improve passenger information in a Local Plan, together with the industry Code of Practice and an Annual Progress Report. Local Plans should be reviewed annually.
• Code of Practice – October 2016 • Local Plan – July 2017
https://goo.gl/NoEjgB
Each document is published on all four of the GTR brand websites.
Change on last year
Data for GTR is shown under the 4 brands it currently operates: Gatwick Express, Great Northern, Southern and ThameslinkPP = percentage point changeSource: Transport Focus, National Rail Passenger SurveyThe NRPS takes place twice a year, in Spring (S) and Autumn (A)
Data for GTR is shown under the 4 brands it currently operates: Gatwick Express, Great Northern, Southern and ThameslinkPP = percentage point changeSource: Transport Focus, National Rail Passenger Survey The NRPS takes place twice a year, in Spring (S) and Autumn (A)
Data for GTR is shown under the 4 brands it currently operates: Gatwick Express, Great Northern, Southern and ThameslinkPP = percentage point changeSource: Transport Focus, National Rail Passenger SurveyThe NRPS takes place twice a year, in Spring (S) and Autumn (A)
Gatwick ExpressGreat NorthernSouthern
ThameslinkFirst Capital ConnectNational
37%
44%
36%
30%
24%
26% 74%
22%
51%
-2.7 PP
-12.9 PP
-9.3 PP
-1.1 PP
6.5 PP 11.0 PP
-2.2 PP
-1.4 PP
1.5 PP
Provision of information to passengers
Source: Train Operating Companies and LENNON (the rail industry’s ticketing and revenue database)Data tables: TOC Key statistics
Key factsOwner group: GoviaOperator: Govia Thameslink Railway (GTR)Franchise: Southern / Thameslink / Great Northern / Gatwick ExpressFranchise period: 14 September 2014 – 01 September 2021 Employees: 7,129Operated stations: 236Sector: London and South East Passenger journeys per annum: 320.7 million
2012 2013 2014 2015 2016
Change on last year
S A S A S A S A S A
35%
26%
48%
23%
68%
-3.4 PP
-5.1 PP
-7.3 PP
-7.7 PP
-5.6 PP
100%
75%
50%
25%
0%
2012 2013 2014 2015 2016
Change on last year
S A S A S A S A S A
70% -2.0 PP
100%
75%
50%
25%
0%
S A S A S A S A S A
100%
75%
50%
25%
0%
2012 2013 2014 2015 2016
Govia Thameslink Railway
Gatwick ExpressGreat NorthernSouthern
ThameslinkFirst Capital ConnectNational
Gatwick ExpressGreat NorthernSouthern
ThameslinkFirst Capital ConnectNational

77
Office of Rail and Road | Annual Rail Consumer Report | July 2017
Actions to improve accessible travel 2016-17GTR has relaunched its priority seat card initiative. This is a mechanism that allows passengers with accessibility needs to seek dedicated seating on all GTR services.
GTR has appointed members of its front line teams to its Accessibility Ambassador scheme to ensure consistency across all assisted travel services.
Delivered 12 ‘Try a Train’ days to give disabled passengers the opportunity to experience travelling by train.
Established an assisted travel support team within its Control to provide dedicated support to disabled customers on Southern services.
GTR’s Disabled People’s Protection Policy is available at: http://www.orr.gov.uk/__data/assets/pdf_file/0011/22043/gtr-dppp-review-letter.pdf
Alternative accessible transport All operators must provide free alternative transport to take passengers to the nearest or most convenient accessible station in certain circumstances:
• When a station is inaccessible to the passenger;
• When rail replacement services are running that are not accessible to the passenger (because of planned engineering works for example); or
• When there is disruption to services at short notice that, for whatever reason, makes services inaccessible to disabled passengers.
In 2016-17 alternative accessible transport was provided 617 times by GTR.
GTR received 44,615 booked assistance
requests in 2016-17
This accounted for 3.7% of all booked
assists made nationally in 2016-17
Volume of booked assistance by rail period 2015-16 and 2016-17
Disability and equality staff training in 2016-17696 GTR staff undertook some form of disability and equality training in 2016-17:
• Since integration of the GTR franchise all new staff complete accessibility awareness training as part of their induction training.
• The scope of the induction training includes topics such as: what is disability?, differences between disabilities and impairments, hidden vs visible impairments and how to approach people with access needs.
• A new eLearning module has also been developed with 590 staff (240 managers) so far having completed it. The e-learning will be undertaken every two years.
Accessibility complaints rate (per 100,000 journeys) 2016-17
Source: Train Operating Companies Data tables: Complaints by NRPS category by TOC – Table 14.5
Note: This excludes unbooked assistance. A ‘rail period’ is normally 28 days, or four weeks, for business reporting purposes (Sunday to Saturday) and there are 13 rail periods in a financial year.Source: Rail Delivery Group (RDG)Data tables: Rail passenger assists by station operator – Table 16.03
Change on last year
Change on last year
Accessibility and inclusion
Govia Thameslink
Railway
National
Change on last year
-0.4%
1,000
2,000
3,000
4,000
5,000
0P1 P2 P3 P4 P5 P6 P7 P8 P9 P10 P11 P12 P13
155.2% 16.4%0.30.3
2015-16 2016-17
Govia Thameslink Railway
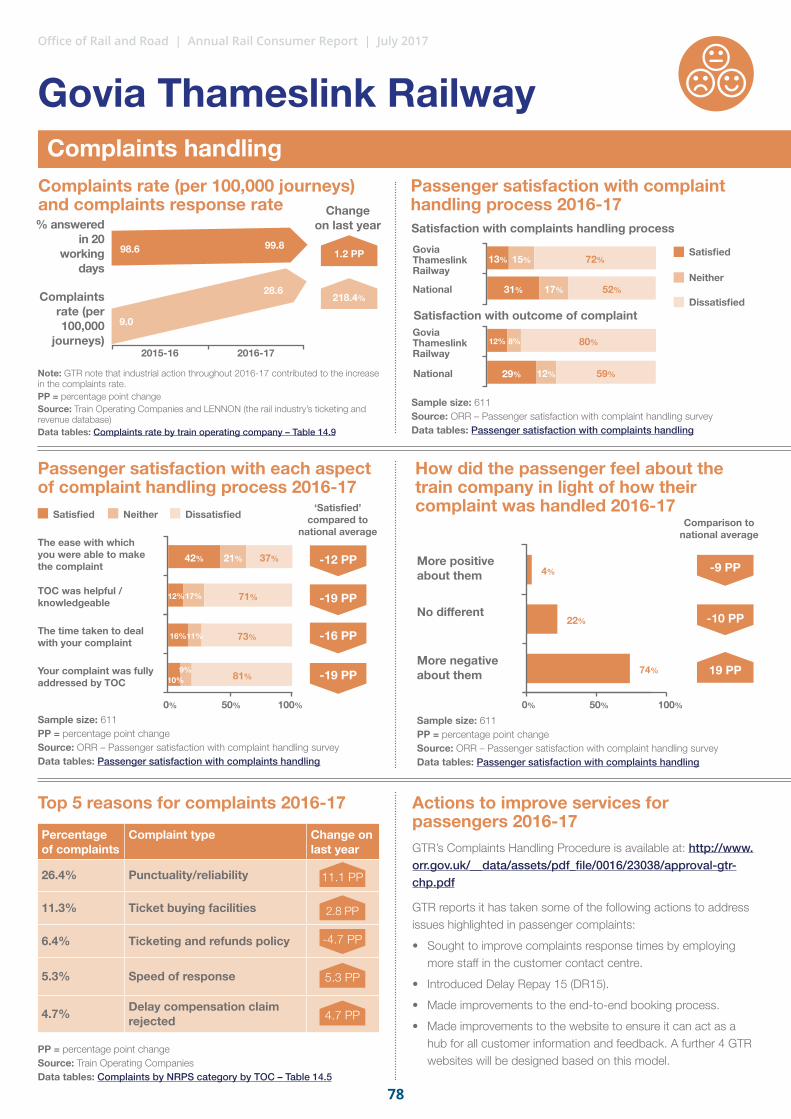
78
Office of Rail and Road | Annual Rail Consumer Report | July 2017
Complaints handling
Top 5 reasons for complaints 2016-17
PP = percentage point changeSource: Train Operating Companies Data tables: Complaints by NRPS category by TOC – Table 14.5
Percentage of complaints
Complaint type Change on last year
26.4% Punctuality/reliability
11.3% Ticket buying facilities
6.4% Ticketing and refunds policy
5.3% Speed of response
4.7% Delay compensation claim rejected
Passenger satisfaction with complaint handling process 2016-17
Passenger satisfaction with each aspect of complaint handling process 2016-17
How did the passenger feel about the train company in light of how their complaint was handled 2016-17
Complaints rate (per 100,000 journeys) and complaints response rate
Note: GTR note that industrial action throughout 2016-17 contributed to the increase in the complaints rate.PP = percentage point changeSource: Train Operating Companies and LENNON (the rail industry’s ticketing and revenue database)Data tables: Complaints rate by train operating company – Table 14.9
Change on last year
2015-16
9.0
28.6
2016-17
1.2 PP
218.4%
-12 PP
-19 PP
-19 PP
-16 PP
-9 PP
-10 PP
19 PP
98.6 99.8
Complaints rate (per 100,000
journeys)
Satisfaction with complaints handling process
Satisfaction with outcome of complaint
Sample size: 611Source: ORR – Passenger satisfaction with complaint handling survey Data tables: Passenger satisfaction with complaints handling
Sample size: 611PP = percentage point changeSource: ORR – Passenger satisfaction with complaint handling survey Data tables: Passenger satisfaction with complaints handling
Sample size: 611PP = percentage point changeSource: ORR – Passenger satisfaction with complaint handling surveyData tables: Passenger satisfaction with complaints handling
Govia Thameslink Railway
Govia Thameslink Railway
The ease with which you were able to make the complaint More positive
about them
National
TOC was helpful / knowledgeable
No different
National
The time taken to deal with your complaint
Your complaint was fully addressed by TOC
0% 0%50% 50%100% 100%
More negative about them
Satisfied
Neither
Dissatisfied
42%
13%
31%
12%
29%
15%
17%
8%
12%
72%
52%
80%
59%
12%
4%
22%
74%
16%
10% 81%
11%
9%
73%
17% 71%
21% 37%
Actions to improve services for passengers 2016-17 GTR’s Complaints Handling Procedure is available at: http://www.orr.gov.uk/__data/assets/pdf_file/0016/23038/approval-gtr-chp.pdf
GTR reports it has taken some of the following actions to address issues highlighted in passenger complaints:
• Sought to improve complaints response times by employing more staff in the customer contact centre.
• Introduced Delay Repay 15 (DR15).
• Made improvements to the end-to-end booking process.
• Made improvements to the website to ensure it can act as a hub for all customer information and feedback. A further 4 GTR websites will be designed based on this model.
11.1 PP
2.8 PP
-4.7 PP
5.3 PP
4.7 PP
% answered in 20
working days
‘Satisfied’ compared to
national averageSatisfied Neither Dissatisfied
Comparison to national average
Govia Thameslink Railway
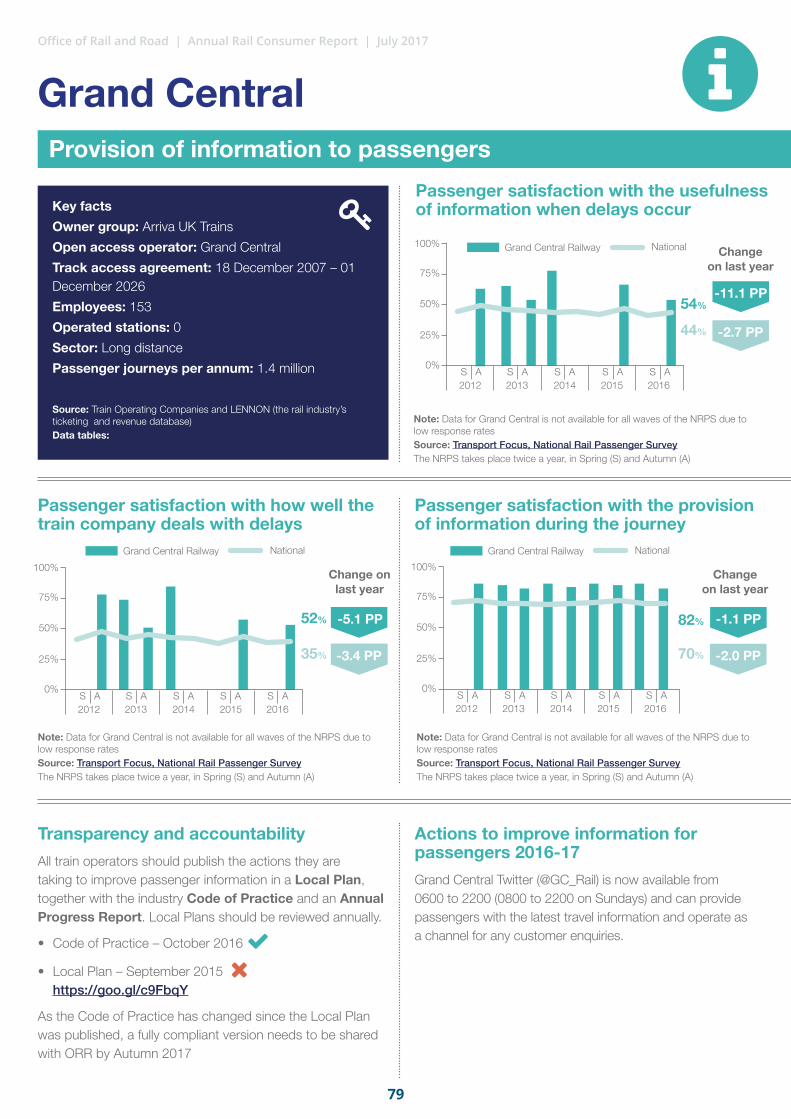
79
Office of Rail and Road | Annual Rail Consumer Report | July 2017
Passenger satisfaction with the usefulness of information when delays occur
Passenger satisfaction with how well the train company deals with delays
Passenger satisfaction with the provision of information during the journey
Change on last year
Note: Data for Grand Central is not available for all waves of the NRPS due to low response ratesSource: Transport Focus, National Rail Passenger SurveyThe NRPS takes place twice a year, in Spring (S) and Autumn (A)
Note: Data for Grand Central is not available for all waves of the NRPS due to low response ratesSource: Transport Focus, National Rail Passenger SurveyThe NRPS takes place twice a year, in Spring (S) and Autumn (A)
Note: Data for Grand Central is not available for all waves of the NRPS due to low response ratesSource: Transport Focus, National Rail Passenger SurveyThe NRPS takes place twice a year, in Spring (S) and Autumn (A)
54%
44%
Grand Central
-2.7 PP
-11.1 PP
Provision of information to passengers
Source: Train Operating Companies and LENNON (the rail industry’s ticketing and revenue database)Data tables: TOC Key statistics
Key factsOwner group: Arriva UK Trains
Open access operator: Grand Central
Track access agreement: 18 December 2007 – 01 December 2026
Employees: 153
Operated stations: 0Sector: Long distance Passenger journeys per annum: 1.4 million
Change on last year
82%
70% -2.0 PP
-1.1 PP
Grand Central Railway National
Grand Central Railway National Grand Central Railway National
Actions to improve information for passengers 2016-17Grand Central Twitter (@GC_Rail) is now available from 0600 to 2200 (0800 to 2200 on Sundays) and can provide passengers with the latest travel information and operate as a channel for any customer enquiries.
Transparency and accountability All train operators should publish the actions they are taking to improve passenger information in a Local Plan, together with the industry Code of Practice and an Annual Progress Report. Local Plans should be reviewed annually.
• Code of Practice – October 2016 • Local Plan – September 2015
https://goo.gl/c9FbqY
As the Code of Practice has changed since the Local Plan was published, a fully compliant version needs to be shared with ORR by Autumn 2017
S A S A S A S A S A
100%
75%
50%
25%
0%
2012 2013 2014 2015 2016
Change on last year
-3.4 PP
-5.1 PP
-3.4 PP
52%
35%
S A S AS A S AS A S AS A S AS A S A
100% 100%
75% 75%
50% 50%
25% 25%
0% 0%
2012 20122013 20132014 20142015 20152016 2016

80
Office of Rail and Road | Annual Rail Consumer Report | July 2017
Actions to improve accessible travel 2016-17Grand Central have committed to ensuring their website and information for passengers is updated within 24 hours of any changes.
Grand Central’s Disabled People’s Protection Policy is available at: http://www.orr.gov.uk/__data/assets/pdf_file/0004/23962/grand-central-review-dppp.pdf
Alternative accessible transport All operators must provide free alternative transport to take passengers to the nearest or most convenient accessible station in certain circumstances:
• When a station is inaccessible to the passenger;
• When rail replacement services are running that are not accessible to the passenger (because of planned engineering works for example); or
• When there is disruption to services at short notice that, for whatever reason, makes services inaccessible to disabled passengers.
In 2016-17 alternative accessible transport was only provided 1 time by Grand Central.
Data on the volume of booked assistance is available from the Rail Delivery Group for each train company that manages a station. Grand Central does not currently manage any stations which means this data is not available to report on.
Volume of booked assistance by rail period 2015-16 and 2016-17
Disability and equality staff training in 2016-177 Grand Central staff undertook some form of disability and equality training in 2016-17:
• 7 Senior Conductors were trained as part of Grand Central’s ongoing Senior Conductor training programme on disability awareness.
• The classroom based training module includes role play exercises, followed by a group discussion, which identifies best practice.
Accessibility complaints rate (per 100,000 journeys) 2016-17
PP = percentage point changeSource: Train Operating CompaniesData tables: Complaints by NRPS category by TOC - Table 14.5
Change on last year
Change on last year
Accessibility and inclusion
Grand Central National
Grand Central
16.4%-7.5%
1.4
0.3

81
Office of Rail and Road | Annual Rail Consumer Report | July 2017
Grand Central Complaints handling
Top 5 reasons for complaints 2016-17
PP = percentage point changeSource: Train Operating Companies Data tables: Complaints by NRPS category by TOC – Table 14.5
Percentage of complaints
Complaint type Change on last year
34.9% Facilities on board
23.1% Punctuality/reliability
8.9% Sufficient room for all passengers to sit/stand
5.0% The helpfulness and attitude of staff on train
3.9% Ticketing and refunds policy
Passenger satisfaction with complaint handling process 2016-17
Passenger satisfaction with each aspect of complaint handling process 2016-17
How did the passenger feel about the train company in light of how their complaint was handled 2016-17
Complaints rate (per 100,000 journeys) and complaints response rate
PP = percentage point changeSource: Train Operating Companies and LENNON (the rail industry’s ticketing and revenue database)Data tables: Complaints rate by train operating company – Table 14.9
Change on last year
2015-16
96.7
2016-17
11.7%
-0.1 PP
2 PP
12 PP
13 PP
13 PP
8 PP
-3 PP
-6 PP
184.7
96.8
206.3
Complaints rate (per 100,000
journeys)
Satisfaction with complaints handling process
Satisfaction with outcome of complaint
Sample size: 111Source: ORR – Passenger satisfaction with complaint handling survey Data tables: Passenger satisfaction with complaints handling
Sample size: 111PP = percentage point changeSource: ORR – Passenger satisfaction with complaint handling survey Data tables: Passenger satisfaction with complaints handling
Sample size: 111PP = percentage point changeSource: ORR – Passenger satisfaction with complaint handling survey Data tables: Passenger satisfaction with complaints handling
Grand Central
More positive about them
National
Grand Central
No different
National
0% 50% 100%
More negative about them
Satisfied
Neither
Dissatisfied
41%
31%
44%
29%
13%
17%
9%
12%
46%
52%
47%
59%
22%
26%
52%
Actions to improve services for passengers 2016-17Grand Central’s Complaints Handling Procedure is available at: http://www.orr.gov.uk/__data/assets/pdf_file/0020/24158/grand-central-chp-dec-letter.pdf Grand Central reports it has taken some of the following actions to address issues highlighted in passenger complaints:
• Upgraded Wi-Fi on every train and have introduced a Wi-Fi portal that offers a range of TV shows, movies, music and books.
• Enhanced the on-board cleaning service
• Developed a new mobile website to offer a faster and simpler way to purchase tickets.
-9.8 PP
-5.3 PP
-1.3 PP
2.4 PP
The ease with which you were able to make the complaint
TOC was helpful / knowledgeable
The time taken to deal with your complaint
Your complaint was fully addressed by TOC
0% 50% 100%
43%
39%
49%
14%
16%
9%
28%16%55%
43%
45%
42%
7.7 PP
% answered in 20
working days
‘Satisfied’ compared to
national averageSatisfied Neither Dissatisfied
Comparison to national average

82
Office of Rail and Road | Annual Rail Consumer Report | July 2017
Passenger satisfaction with the usefulness of information when delays occur
Passenger satisfaction with how well the train company deals with delays
Passenger satisfaction with the provision of information during the journey
Actions to improve information for passengers 2016-17GWR drivers in the Thames Valley can now receive announcements direct from the control centre during disruption allowing them to give better information to passengers.
To assist staff to answer customer queries, on-train hosts and station staff are being given hand held devices which will provide up-to-date and accurate information.
Transparency and accountability All train operators should publish the actions they are taking to improve passenger information in a Local Plan, together with the industry Code of Practice and an Annual Progress Report. Local Plans should be reviewed annually.
• Code of Practice – October 2016 • Local Plan – April 2016
https://goo.gl/JJXLtR
A new Local Plan is currently being reviewed by ORR and should be published shortly.
Change on last year
PP = percentage point changeSource: Transport Focus, National Rail Passenger SurveyThe NRPS takes place twice a year, in Spring (S) and Autumn (A)
PP = percentage point changeSource: Transport Focus, National Rail Passenger Survey The NRPS takes place twice a year, in Spring (S) and Autumn (A)
PP = percentage point changeSource: Transport Focus, National Rail Passenger SurveyThe NRPS takes place twice a year, in Spring (S) and Autumn (A)
Great Western Railway
Great Western Railway
National
National
44% -2.7 PP
50% -0.7 PP
Provision of information to passengers
Source: Train Operating Companies and LENNON (the rail industry’s ticketing and revenue database)Data tables: TOC Key statistics
Key factsOwner group: FirstGroup
Operator: Great Western Railway
Franchise: Greater Western
Franchise period: 26 September 2015 – 31 March 2019
Employees: 6,105
Operated stations: 207
Sector: Long distance / London and South East / Regional
Passenger journeys per annum: 104.9 million
2012 2013 2014 2015 2016
Change on last year
S A S A S A S A S A
45%
35% -3.4 PP
-0.1 PP
100%
75%
50%
25%
0%
2012 2013 2014 2015 2016
Change on last year
S A S A S A S A S A
71%
70% -2.0 PP
2.8 PP
100%
75%
50%
25%
0%
S A S A S A S A S A
100%
75%
50%
25%
0%
2012 2013 2014 2015 2016
Great Western Railway
Great Western Railway National

83
Office of Rail and Road | Annual Rail Consumer Report | July 2017
Actions to improve accessible travel 2016-17GWR provide passengers with a full refund if their booked assistance is not provided and provides free parking for passengers holding disabled parking badges.
GWR carries out independent research to monitor the quality of its assisted travel service.
It has also established customer panels and stakeholder advisory groups to look at improvements to the things customers are concerned about.
GWR’s Disabled People’s Protection Policy is available at: http://www.orr.gov.uk/__data/assets/pdf_file/0004/24943/first_gwr_dpp_review_letter.pdf
Alternative accessible transport All operators must provide free alternative transport to take passengers to the nearest or most convenient accessible station in certain circumstances:
• When a station is inaccessible to the passenger;
• When rail replacement services are running that are not accessible to the passenger (because of planned engineering works for example); or
• When there is disruption to services at short notice that, for whatever reason, makes services inaccessible to disabled passengers.
In 2016-17 alternative accessible transport was provided 822 times by GWR.
GWR received 165,860 booked
assistance requests in 2016-17
This accounted for 13.9% of all
booked assists made nationally in 2016-17
Volume of booked assistance by rail period 2015-16 and 2016-17
Disability and equality staff training in 2016-17In total 186 GWR staff undertook some form of disability and equality training:
• All new staff in a customer facing role received 1 day training on vulnerable customers as part of their induction.
• The course focuses on elements such as: the Equality Act 2010, ways in which GWR trains and stations are accessible, recognising different types of disability and being able to explain how different needs can be met, and being able to explain the GWR Priority Seat Card.
• The course has been reviewed (and content supplied by) organisations including Purple Angels; MyGuide; Autism West Midlands and Parkinsons UK.
Accessibility complaints rate (per 100,000 journeys) 2016-17
Source: Train Operating Companies Data tables: Complaints by NRPS category by TOC – Table 14.5
Note: This excludes unbooked assistance. A ‘rail period’ is normally 28 days, or four weeks, for business reporting purposes (Sunday to Saturday) and there are 13 rail periods in a financial year.Source: Rail Delivery Group (RDG)Data tables: Rail passenger assists by station operator – Table 16.03
Change on last year
Change on last year
Accessibility and inclusion
Great Western Railway
National
Change on last year
5.2%
5,000
10,000
15,000
20,000
0P1 P2 P3 P4 P5 P6 P7 P8 P9 P10 P11 P12 P13
-22.9% 16.4%0.30.5
2015-16 2016-17
Great Western Railway
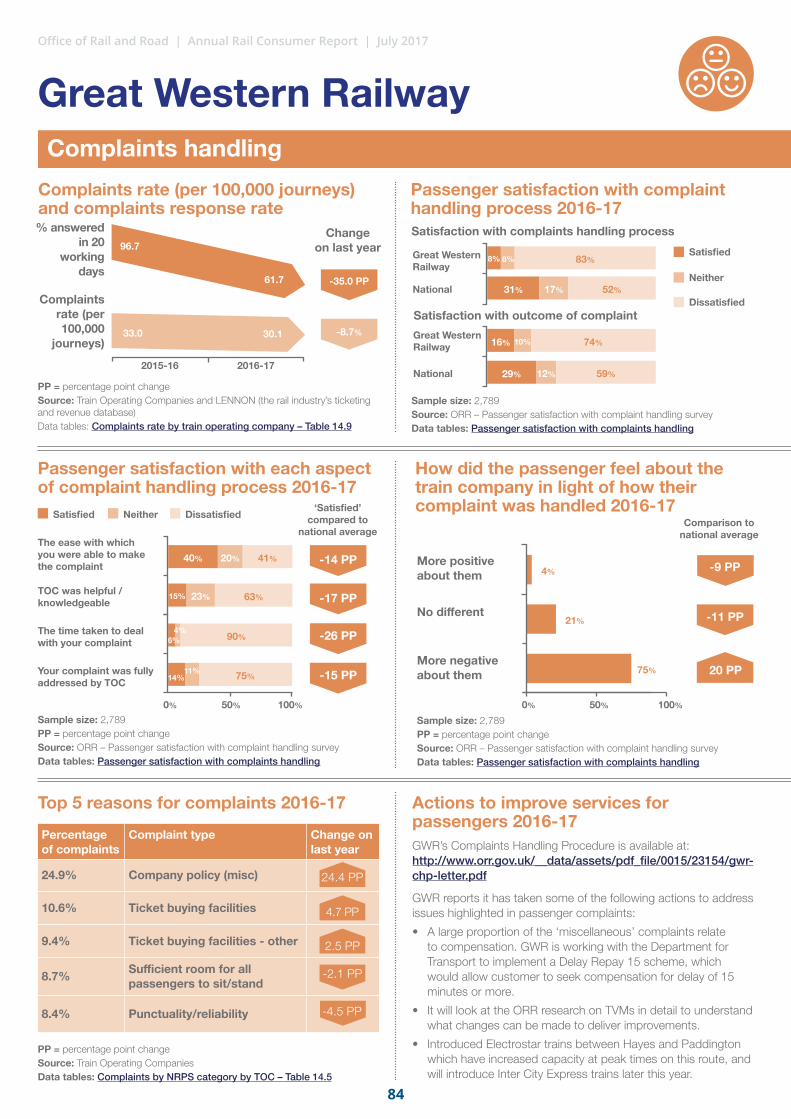
84
Office of Rail and Road | Annual Rail Consumer Report | July 2017
Complaints handling
Top 5 reasons for complaints 2016-17
PP = percentage point changeSource: Train Operating Companies Data tables: Complaints by NRPS category by TOC – Table 14.5
Percentage of complaints
Complaint type Change on last year
24.9% Company policy (misc)
10.6% Ticket buying facilities
9.4% Ticket buying facilities - other
8.7% Sufficient room for all passengers to sit/stand
8.4% Punctuality/reliability
Passenger satisfaction with complaint handling process 2016-17
Passenger satisfaction with each aspect of complaint handling process 2016-17
How did the passenger feel about the train company in light of how their complaint was handled 2016-17
Complaints rate (per 100,000 journeys) and complaints response rate
PP = percentage point changeSource: Train Operating Companies and LENNON (the rail industry’s ticketing and revenue database)Data tables: Complaints rate by train operating company – Table 14.9
Change on last year
2015-16
33.0 30.1
2016-17
-35.0 PP
-8.7%
-14 PP
-17 PP
-15 PP
-26 PP
-9 PP
-11 PP
20 PP
96.7
61.7
Complaints rate (per 100,000
journeys)
Satisfaction with complaints handling process
Satisfaction with outcome of complaint
Sample size: 2,789Source: ORR – Passenger satisfaction with complaint handling survey Data tables: Passenger satisfaction with complaints handling
Sample size: 2,789PP = percentage point changeSource: ORR – Passenger satisfaction with complaint handling survey Data tables: Passenger satisfaction with complaints handling
Sample size: 2,789PP = percentage point changeSource: ORR – Passenger satisfaction with complaint handling surveyData tables: Passenger satisfaction with complaints handling
Great Western Railway
The ease with which you were able to make the complaint More positive
about them
National
Great Western Railway
TOC was helpful / knowledgeable
No different
National
The time taken to deal with your complaint
Your complaint was fully addressed by TOC
0% 0%50% 50%100% 100%
More negative about them
Satisfied
Neither
Dissatisfied
40%
8%
31%
16%
29%
8%
17%
10%
12%
83%
52%
74%
59%
15%
4%
21%
75%
6%
14% 75%
4%
11%
90%
23% 63%
20% 41%
Actions to improve services for passengers 2016-17 GWR’s Complaints Handling Procedure is available at: http://www.orr.gov.uk/__data/assets/pdf_file/0015/23154/gwr-chp-letter.pdf
GWR reports it has taken some of the following actions to address issues highlighted in passenger complaints:
• A large proportion of the ‘miscellaneous’ complaints relate to compensation. GWR is working with the Department for Transport to implement a Delay Repay 15 scheme, which would allow customer to seek compensation for delay of 15 minutes or more.
• It will look at the ORR research on TVMs in detail to understand what changes can be made to deliver improvements.
• Introduced Electrostar trains between Hayes and Paddington which have increased capacity at peak times on this route, and will introduce Inter City Express trains later this year.
24.4 PP
4.7 PP
2.5 PP
-2.1 PP
-4.5 PP
% answered in 20
working days
‘Satisfied’ compared to
national averageSatisfied Neither Dissatisfied
Comparison to national average
Great Western Railway
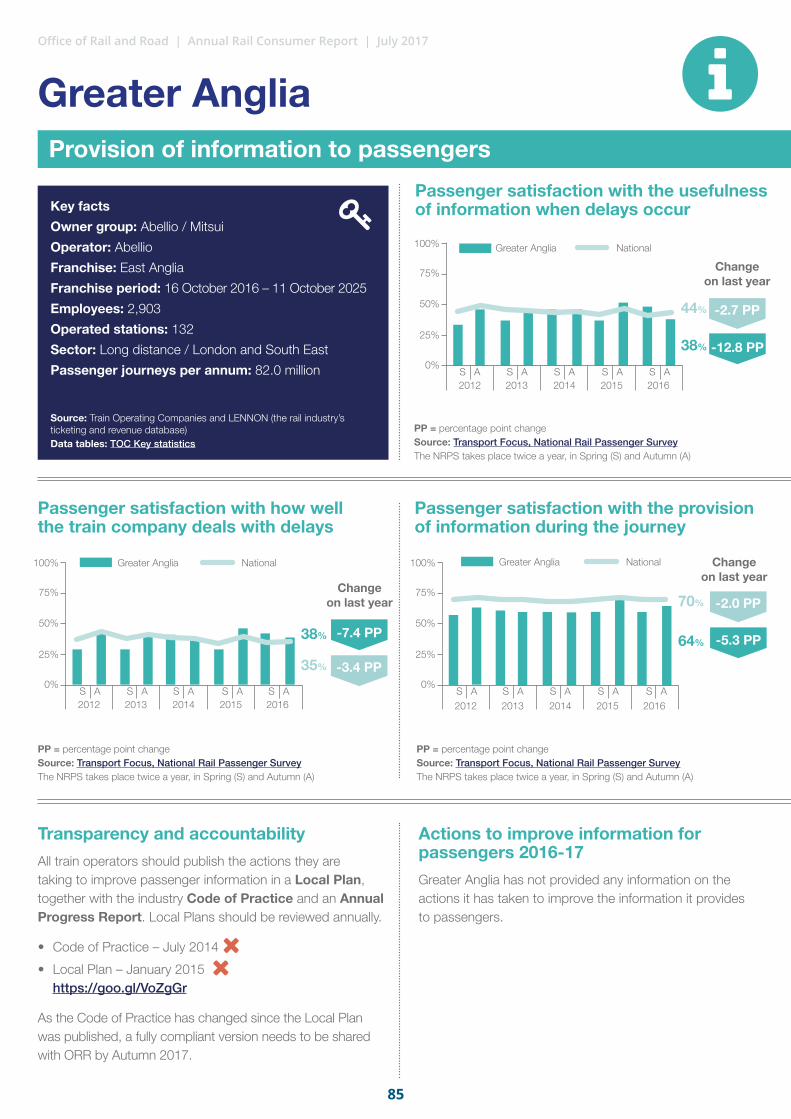
85
Office of Rail and Road | Annual Rail Consumer Report | July 2017
Passenger satisfaction with the usefulness of information when delays occur
Passenger satisfaction with how well the train company deals with delays
Passenger satisfaction with the provision of information during the journey
Actions to improve information for passengers 2016-17Greater Anglia has not provided any information on the actions it has taken to improve the information it provides to passengers.
Transparency and accountability All train operators should publish the actions they are taking to improve passenger information in a Local Plan, together with the industry Code of Practice and an Annual Progress Report. Local Plans should be reviewed annually.
• Code of Practice – July 2014 • Local Plan – January 2015
https://goo.gl/VoZgGr
As the Code of Practice has changed since the Local Plan was published, a fully compliant version needs to be shared with ORR by Autumn 2017.
Change on last year
PP = percentage point changeSource: Transport Focus, National Rail Passenger SurveyThe NRPS takes place twice a year, in Spring (S) and Autumn (A)
PP = percentage point changeSource: Transport Focus, National Rail Passenger Survey The NRPS takes place twice a year, in Spring (S) and Autumn (A)
PP = percentage point changeSource: Transport Focus, National Rail Passenger SurveyThe NRPS takes place twice a year, in Spring (S) and Autumn (A)
Greater Anglia National
38%
44% -2.7 PP
-12.8 PP
Provision of information to passengers
Source: Train Operating Companies and LENNON (the rail industry’s ticketing and revenue database)Data tables: TOC Key statistics
Key factsOwner group: Abellio / Mitsui
Operator: Abellio
Franchise: East Anglia
Franchise period: 16 October 2016 – 11 October 2025
Employees: 2,903
Operated stations: 132
Sector: Long distance / London and South East
Passenger journeys per annum: 82.0 million
2012 2013 2014 2015 2016
Change on last year
S A S A S A S A S A
38%
35% -3.4 PP
-7.4 PP
100%
75%
50%
25%
0%
2012 2013 2014 2015 2016
Change on last year
S A S A S A S A S A
64%
70% -2.0 PP
-5.3 PP
100%
75%
50%
25%
0%
S A S A S A S A S A
100%
75%
50%
25%
0%
2012 2013 2014 2015 2016
National National
Greater Anglia
Greater Anglia Greater Anglia

86
Office of Rail and Road | Annual Rail Consumer Report | July 2017
Actions to improve accessible travel 2016-17Greater Anglia call back 5% of users of pre-booked assistance. Feedback is then used to monitor performance and data will be shared with stakeholders.
Greater Anglia also uses an external organisation to complete mystery shops to help assess and monitor the accessibility of its services.
Greater Anglia’s Disabled People’s Protection Policy is available at: http://www.orr.gov.uk/__data/assets/pdf_file/0014/23036/greater-anglia-dppp-letter.pdf
Alternative accessible transport All operators must provide free alternative transport to take passengers to the nearest or most convenient accessible station in certain circumstances:
• When a station is inaccessible to the passenger;
• When rail replacement services are running that are not accessible to the passenger (because of planned engineering works for example); or
• When there is disruption to services at short notice that, for whatever reason, makes services inaccessible to disabled passengers.
In 2016-17 alternative accessible transport was provided 392 times by Greater Anglia.
Greater Anglia received 33,976
booked assistance requests in 2016-17
This accounted for 2.8% of all booked
assists made nationally in 2016-17
Volume of booked assistance by rail period 2015-16 and 2016-17
Disability and equality staff training in 2016-17In total 978 staff undertook some form of disability and equality training in 2016-17:
• Induction training
• Refresher courses
• Ticket office and train dispatch courses
Greater Anglia reports using DVDs and PowerPoint presentations, as well as referring to Rail Delivery Group training materials.
Some use is made of practical sessions, including how to escort a partially sighted person, as well as safe use of ramps and wheelchairs.
Accessibility complaints rate (per 100,000 journeys) 2016-17
Source: Train Operating Companies Data tables: Complaints by NRPS category by TOC - Table 14.5
Note: This excludes unbooked assistance. A ‘rail period’ is normally 28 days, or four weeks, for business reporting purposes (Sunday to Saturday) and there are 13 rail periods in a financial year.Source: Rail Delivery Group (RDG)Data tables: Rail passenger assists by station operator - Table 16.03
Change on last year
Change on last year
Accessibility and inclusion
Greater Anglia National
Change on last year
3.2%
1,000
1,500
2,000
2,500
3,000
3,500
500
0P1 P2 P3 P4 P5 P6 P7 P8 P9 P10 P11 P12 P13
11.8% 16.4%0.30.3
2015-16 2016-17
Greater Anglia

87
Office of Rail and Road | Annual Rail Consumer Report | July 2017
Greater AngliaComplaints handling
Top 5 reasons for complaints 2016-17
PP = percentage point changeSource: Train Operating Companies Data tables: Complaints by NRPS category by TOC - Table 14.5
Percentage of complaints
Complaint type Change on last year
41.8% Punctuality/reliability
14.2% Ticket buying facilities
8.3% Ticketing and refunds policy
5.7% Compensation claims process
3.3% Compensation claim rejected
Passenger satisfaction with complaint handling process 2016-17
Passenger satisfaction with each aspect of complaint handling process 2016-17
How did the passenger feel about the train company in light of how their complaint was handled 2016-17
Complaints rate (per 100,000 journeys) and complaints response rate
PP = percentage point changeSource: Train Operating Companies and LENNON (the rail industry’s ticketing and revenue database)Data tables: Complaints rate by train operating company - Table 14.9
Change on last year
2015-16
49.2 59.1
2016-17
-0.8 PP
20.2%
12 PP
16 PP
19 PP
24 PP
11 PP
8 PP
-19 PP
98.9 98.1
Complaints rate (per 100,000
journeys)
Satisfaction with complaints handling process
Satisfaction with outcome of complaint
Sample size: 2,774Source: ORR – Passenger satisfaction with complaint handling survey Data tables: Passenger satisfaction with complaints handling
Sample size: 2,774PP = percentage point changeSource: ORR – Passenger satisfaction with complaint handling survey Data tables: Passenger satisfaction with complaints handling
Sample size: 2,774PP = percentage point changeSource: ORR – Passenger satisfaction with complaint handling surveyData tables: Passenger satisfaction with complaints handling
Greater Anglia
The ease with which you were able to make the complaint More positive
about them
National
Greater Anglia
TOC was helpful / knowledgeable
No different
National
The time taken to deal with your complaint
Your complaint was fully addressed by TOC
0% 0%50% 50%100% 100%
More negative about them
Satisfied
Neither
Dissatisfied
66%
52%
31%
47%
29%
17%
17%
11%
12%
31%
52%
42%
59%
47%
25%
39%
36%
56%
48% 40%
16%
12%
28%
23% 30%
15% 19%
Actions to improve services for passengers 2016-17 Greater Anglia’s Complaints Handling Procedure is available at: http://www.orr.gov.uk/__data/assets/pdf_file/0013/23035/greater-anglia-chp-letter.pdf
Greater Anglia reports it has taken some of the following actions to address issues highlighted in passenger complaints:
• A ‘Right Time Railway’ project to work with Network Rail on initiatives including: increased vegetation clearance, trespass and vandalism prevention measures, proactive cable testing, flooding prevention measures and fencing improvements.
• A ‘one strike’ policy for forgotten Railcard refund requests and relaxation of the duplicate season ticket policy, as well as staff training on how to deal with claims.
• A working group to improve processing of Delay Repay claims.
3.2 PP
-7.0 PP
-8.9 PP
5.7 PP
3.3 PP
% answered in 20
working days
‘Satisfied’ compared to
national averageSatisfied Neither Dissatisfied
Comparison to national average

88
Office of Rail and Road | Annual Rail Consumer Report | July 2017
Passenger satisfaction with the usefulness of information when delays occur
Passenger satisfaction with how well the train company deals with delays
Passenger satisfaction with the provision of information during the journey
Actions to improve information for passengers 2016-17Heathrow Express has not provided any information on the actions it has taken to improve the information it provides to passengers.
Transparency and accountability All train operators should publish the actions they are taking to improve passenger information in a Local Plan, together with the industry Code of Practice and an Annual Progress Report. Local Plans should be reviewed annually.
• Code of Practice – no link published • Local Plan – no link published
ORR is working with Heathrow Express to ensure that it has a compliant local plan by the Autumn 2017 deadline.
Change on last year
*Not all data available due to low response ratePP = percentage point changeSource: Transport Focus, National Rail Passenger SurveyThe NRPS takes place twice a year, in Spring (S) and Autumn (A)
PP = percentage point changeSource: Transport Focus, National Rail Passenger SurveyThe NRPS takes place twice a year, in Spring (S) and Autumn (A)
*Not all data available due to low response ratePP = percentage point changeSource: Transport Focus, National Rail Passenger SurveyThe NRPS takes place twice a year, in Spring (S) and Autumn (A)
Heathrow Express National
69%
44%
Heathrow Express
-2.7 PP
Provision of information to passengers
Source: Heathrow ExpressData tables: TOC Key statistics
Key factsOwner group: Heathrow Airport Holdings
Operator: Heathrow Express
Operation start date: 28 June 1998
Employees: data not provided
Operated stations: 0Sector: Provides an airport rail link between London Heathrow Airport and Paddington
Passenger journeys per annum: data not provided
2012 2013 2014 2015 2016
Change on last year*
S A S A S A S A S A
66%
35% -3.4 PP
100%
75%
50%
25%
0%
2012 2013 2014 2015 2016
Change on last year
S A S A S A S A S A
70%
90% 2.5 PP
-2.0 PP
100%
75%
50%
25%
0%
S A S A S A S A S A
100%
75%
50%
25%
0%
2012 2013 2014 2015 2016
Heathrow Express Heathrow ExpressNational National

89
Office of Rail and Road | Annual Rail Consumer Report | July 2017
Actions to improve accessible travel 2016-17The Heathrow Express Disabled People’s Protection Policy is currently in the process of being reviewed.
Alternative accessible transport All operators must provide free alternative transport to take passengers to the nearest or most convenient accessible station in certain circumstances:
• When a station is inaccessible to the passenger;
• When rail replacement services are running that are not accessible to the passenger (because of planned engineering works for example); or
• When there is disruption to services at short notice that, for whatever reason, makes services inaccessible to disabled passengers.
In 2016-17 alternative accessible transport was provided 0 times by Heathrow Express.
Heathrow Express received 454 booked assistance requests in
2016-17 This accounted for less than 0.1% of all booked
assists made nationally in 2016-17
Volume of booked assistance by rail period 2015-16 and 2016-17
Disability and equality staff training in 2016-17All staff receive disability awareness training as part of their induction into the company. Refresher training for all staff takes place annually.
Accessibility complaints rate (per 100,000 journeys) 2016-17This data is not available for Heathrow Express.
Note: This excludes un-booked assistance. A ‘rail period’ is normally 28 days, or four weeks, for business reporting purposes (Sunday to Saturday) and there are 13 rail periods in a financial year. Source: Rail Delivery Group (RDG)Data tables: Rail passenger assists by station operator - Table 16.03
Accessibility and inclusion
Heathrow Express
Change on last year
7.3%
40
50
60
30
20
10
0P1 P2 P3 P4 P5 P6 P7 P8 P9 P10 P11 P12 P132015-16 2016-17

90
Office of Rail and Road | Annual Rail Consumer Report | July 2017
Heathrow ExpressComplaints handling
Top 5 reasons for complaints 2016-17
*Data is not available for last yearPP = percentage point changeSource: Train Operating Companies Data tables: Complaints by NRPS category by TOC - Table 14.5
Percentage of complaints
Complaint type Change on last year*
37.7%Punctuality/reliability (i.e. the train arriving/departing on time)
27.3% Ticket buying facilities
25.3% Ticketing and refunds policy
6.0%Provision of information on website or mobile apps
1.3%The attitude and helpfulness of the staff at station
Passenger satisfaction with complaint handling process 2016-17 Heathrow Express did not participate in our complaint handling survey during 2016-17. This has recently been resolved and they have been participating in the survey since rail period 2 2017-18.
Passenger satisfaction with each aspect of complaint handling process 2016-17Heathrow Express did not participate in our complaint handling survey during 2016-17. This has recently been resolved and they have been participating in the survey since rail period 2 2017-18.
How did the passenger feel about the train company in light of how their complaint was handled 2016-17Heathrow Express did not participate in our complaint handling survey during 2016-17. This has recently been resolved and they have been participating in the survey since rail period 2 2017-18.
Complaints rate (per 100,000 journeys) and complaints response rate
PP = percentage point change*Data not available for last yearSource: Heathrow Express Data tables: Complaints rate by train operating company - Table 14.9
Actions to improve services for passengers 2016-17 The Heathrow Express Complaints Handling Procedure is available at: www.orr.gov.uk/__data/assets/pdf_file/0008/24200/approval-heathrow-express-cph.pdfHeathrow Express reports it has taken some of the following actions to address issues highlighted in passenger complaints:
• Rectified fleet issues to ensure a full service can be run.
• Committed to re-evaluating the company’s refund policy.
• Created a new website and mobile app to improve how tickets can be purchased
2015-16 2016-17
457.7
Data not available 85.2
Complaints rate (per 100,000
journeys)
% answered in 20
working days
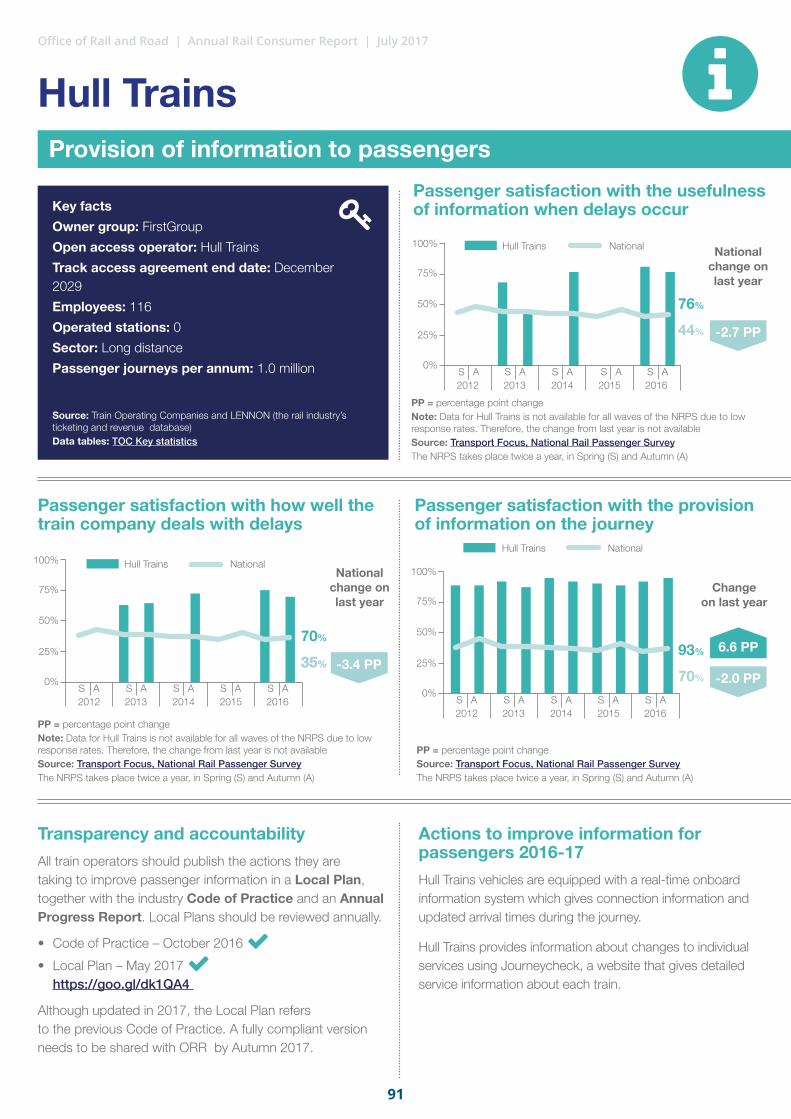
91
Office of Rail and Road | Annual Rail Consumer Report | July 2017
Passenger satisfaction with the usefulness of information when delays occur
Passenger satisfaction with how well the train company deals with delays
Passenger satisfaction with the provision of information on the journey
National change on last year
PP = percentage point changeNote: Data for Hull Trains is not available for all waves of the NRPS due to low response rates. Therefore, the change from last year is not availableSource: Transport Focus, National Rail Passenger SurveyThe NRPS takes place twice a year, in Spring (S) and Autumn (A)
PP = percentage point changeSource: Transport Focus, National Rail Passenger SurveyThe NRPS takes place twice a year, in Spring (S) and Autumn (A)
PP = percentage point changeNote: Data for Hull Trains is not available for all waves of the NRPS due to low response rates. Therefore, the change from last year is not availableSource: Transport Focus, National Rail Passenger SurveyThe NRPS takes place twice a year, in Spring (S) and Autumn (A)
Hull Trains National
76%
44%
Hull Trains
-2.7 PP
Provision of information to passengers
Source: Train Operating Companies and LENNON (the rail industry’s ticketing and revenue database)Data tables: TOC Key statistics
Key factsOwner group: FirstGroup
Open access operator: Hull Trains
Track access agreement end date: December 2029
Employees: 116
Operated stations: 0Sector: Long distance Passenger journeys per annum: 1.0 million
National change on last year
-3.4 PP93%
70% -2.0 PP
6.6 PP
Actions to improve information for passengers 2016-17Hull Trains vehicles are equipped with a real-time onboard information system which gives connection information and updated arrival times during the journey.
Hull Trains provides information about changes to individual services using Journeycheck, a website that gives detailed service information about each train.
Transparency and accountability All train operators should publish the actions they are taking to improve passenger information in a Local Plan, together with the industry Code of Practice and an Annual Progress Report. Local Plans should be reviewed annually.
• Code of Practice – October 2016 • Local Plan – May 2017
https://goo.gl/dk1QA4
Although updated in 2017, the Local Plan refers to the previous Code of Practice. A fully compliant version needs to be shared with ORR by Autumn 2017.
S A S A S A S A S A
100%
75%
50%
25%
0%
2012 2013 2014 2015 2016
-3.4 PP
Hull Trains
Hull Trains
National
National
70%
35%35%
S AS A
S AS A
S AS A
S AS A
S AS A
100%100%
75%75%
50%50%
25%25%
0%0%
20122012
20132013
20142014
20152015
20162016
Change on last year
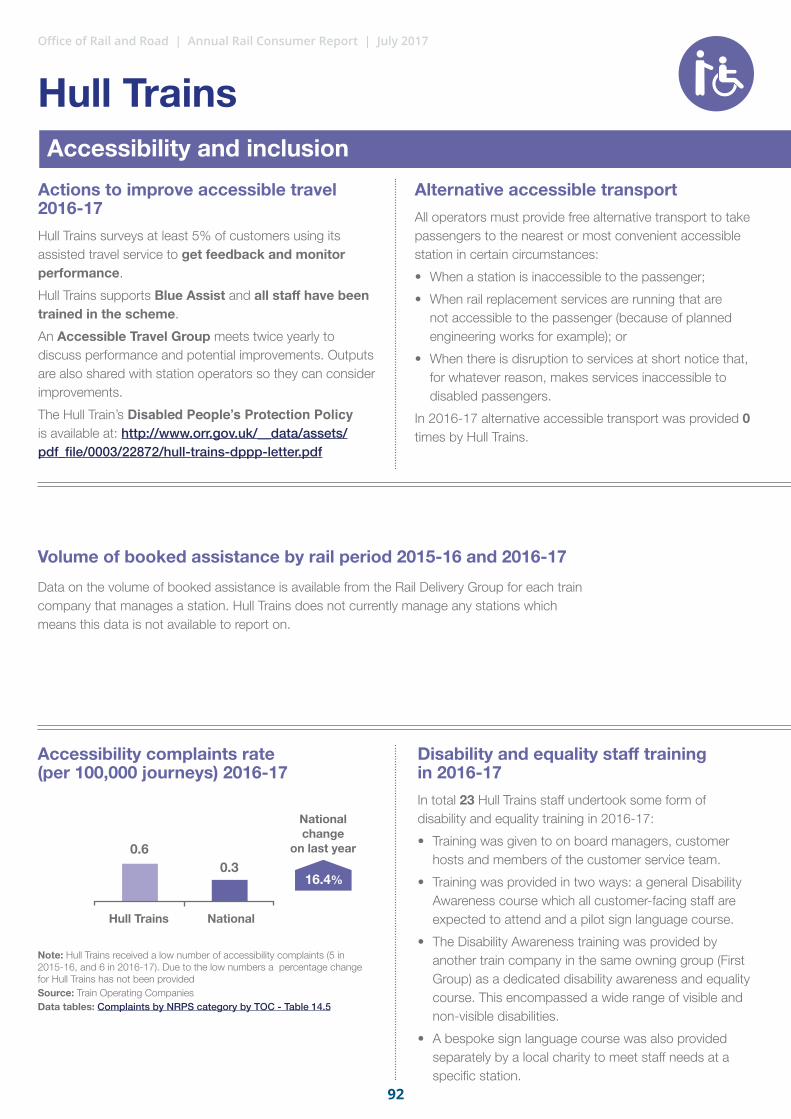
92
Office of Rail and Road | Annual Rail Consumer Report | July 2017
Actions to improve accessible travel 2016-17Hull Trains surveys at least 5% of customers using its assisted travel service to get feedback and monitor performance.
Hull Trains supports Blue Assist and all staff have been trained in the scheme.
An Accessible Travel Group meets twice yearly to discuss performance and potential improvements. Outputs are also shared with station operators so they can consider improvements.
The Hull Train’s Disabled People’s Protection Policy is available at: http://www.orr.gov.uk/__data/assets/pdf_file/0003/22872/hull-trains-dppp-letter.pdf
Alternative accessible transport All operators must provide free alternative transport to take passengers to the nearest or most convenient accessible station in certain circumstances:
• When a station is inaccessible to the passenger;
• When rail replacement services are running that are not accessible to the passenger (because of planned engineering works for example); or
• When there is disruption to services at short notice that, for whatever reason, makes services inaccessible to disabled passengers.
In 2016-17 alternative accessible transport was provided 0 times by Hull Trains.
Data on the volume of booked assistance is available from the Rail Delivery Group for each train company that manages a station. Hull Trains does not currently manage any stations which means this data is not available to report on.
Volume of booked assistance by rail period 2015-16 and 2016-17
Disability and equality staff training in 2016-17In total 23 Hull Trains staff undertook some form of disability and equality training in 2016-17:
• Training was given to on board managers, customer hosts and members of the customer service team.
• Training was provided in two ways: a general Disability Awareness course which all customer-facing staff are expected to attend and a pilot sign language course.
• The Disability Awareness training was provided by another train company in the same owning group (First Group) as a dedicated disability awareness and equality course. This encompassed a wide range of visible and non-visible disabilities.
• A bespoke sign language course was also provided separately by a local charity to meet staff needs at a specific station.
Accessibility complaints rate (per 100,000 journeys) 2016-17
Note: Hull Trains received a low number of accessibility complaints (5 in 2015-16, and 6 in 2016-17). Due to the low numbers a percentage change for Hull Trains has not been providedSource: Train Operating Companies Data tables: Complaints by NRPS category by TOC - Table 14.5
National change
on last year
Accessibility and inclusion
Hull Trains National
Hull Trains
16.4%
0.60.3

93
Office of Rail and Road | Annual Rail Consumer Report | July 2017
Hull Trains Complaints handling
Top 5 reasons for complaints 2016-17
PP = percentage point changeSource: Train Operating Companies Data tables: Complaints by NRPS category by TOC – Table 14.5
Percentage of complaints
Complaint type Change on last year
37.3% Punctuality/reliability
11.1% Upkeep and repair of the train
9.0% Ticket buying facilities - other
8.9% Sufficient room for all passengers to sit/stand
8.5% The helpfulness and attitude of staff on train
Passenger satisfaction with complaint handling process 2016-17
Passenger satisfaction with each aspect of complaint handling process 2016-17
How did the passenger feel about the train company in light of how their complaint was handled 2016-17
Complaints rate (per 100,000 journeys) and complaints response rate
Note: Data on percentage answered within 20 working days is not available for 2015-16 for Hull Trains.PP = percentage point changeSource: Train Operating Companies and LENNON (the rail industry’s ticketing and revenue database)Data tables: Complaints rate by train operating company – Table 14.9
Change on last year
2015-16
80.1
2016-17
-10.8%
5 PP
11 PP
10 PP
1 PP0 PP
10 PP
-10 PP
130.3116.3
Complaints rate (per 100,000
journeys)
Satisfaction with complaints handling process
Satisfaction with outcome of complaint
Sample size: 95Source: ORR - Passenger satisfaction with complaint handling survey Data tables: Passenger satisfaction with complaints handling
Sample size: 95PP = percentage point change Source: ORR - Passenger satisfaction with complaint handling survey Data tables: Passenger satisfaction with complaints handling
Sample size: 95PP = percentage point changeSource: ORR – Passenger satisfaction with complaint handling survey Data tables: Passenger satisfaction with complaints handling
Hull Trains
The ease with which you were able to make the complaint More positive
about them
National
Hull Trains
TOC was helpful / knowledgeable
No different
National
The time taken to deal with your complaint
Your complaint was fully addressed by TOC
0% 0%50% 50%100% 100%
More negative about them
Satisfied
Neither
Dissatisfied
59%
35%
31%
38%
29%
23%
17%
20%
12%
42%
52%
42%
59%
42%
23%
32%
45%
33%
39% 50%
15%
11%
52%
25% 33%
17% 24%
Actions to improve services for passengers 2016-17Hull Trains’ Complaints Handling Procedure is available at: http://www.orr.gov.uk/__data/assets/pdf_file/0019/22861/hull-trains-chp-letter.pdf Hull Trains reports it has taken some of the following actions to address issues highlighted in passenger complaints:
• A programme of staff training to improve the helpfulness and attitude of staff, and make sure all passengers have face to face contact with a member of staff before boarding a train.
• To address performance areas within its control Hull Trains reports it has tackled key areas of failure by making sure trains can couple better, overhauling wheelsets, and improving the systems which cool the engines so they don’t overheat.
• Improvements have been made to toilets, plug sockets, air conditioning, and cleaning on trains.
-3.7 PP
6.0 PP
2.3 PP
1.6 PP
4.1 PP
% answered in 20
working days
‘Satisfied’ compared to
national averageSatisfied Neither Dissatisfied
Comparison to national average

94
Office of Rail and Road | Annual Rail Consumer Report | July 2017
Passenger satisfaction with the usefulness of information when delays occur
Passenger satisfaction with how well the operator deals with delays
Passenger satisfaction with the provision of information during the journey
Actions to improve information for passengers 2016-17Station based staff have been equipped with tablets to give them easier access to real-time travel information.
London Midland Twitter is now available between 7am and 7pm on weekdays to provide information to passengers.
Transparency and accountability All train operators should publish the actions they are taking to improve passenger information in a Local Plan, together with the industry Code of Practice and an Annual Progress Report. Local Plans should be reviewed annually.
• Code of Practice – October 2016 • Local Plan – December 2016
https://goo.gl/MySn3N
The Local Plan refers to the previous Code of Practice. A fully compliant version needs to be shared with ORR by Autumn 2017.
Change on last year
PP = percentage point changeSource: Transport Focus, National Rail Passenger SurveyThe NRPS takes place twice a year, in Spring (S) and Autumn (A)
PP = percentage point changeSource: Transport Focus, National Rail Passenger Survey The NRPS takes place twice a year, in Spring (S) and Autumn (A)
PP = percentage point changeSource: Transport Focus, National Rail Passenger SurveyThe NRPS takes place twice a year, in Spring (S) and Autumn (A)
London Midland National
58%
44%
London Midland
-2.7 PP
2.1 PP
Provision of information to passengers
Source: Train Operating Companies and LENNON (the rail industry’s ticketing and revenue database)Data tables: TOC Key statistics
Key factsOwner group: Govia
Operator: London Midland
Franchise: West Midlands
Franchise period: 11 November 2007 – 15 October 2017
Employees: 2,563
Operated stations: 150
Sector: London and South East / Regional
Passenger journeys per annum: 73.6 million
2012 2013 2014 2015 2016
Change on last year
S A S A S A S A S A
48%
35% -3.4 PP
7.2 PP
100%
75%
50%
25%
0%
2012 2013 2014 2015 2016
Change on last year
S A S A S A S A S A
70%
70% -2.0 PP
-3.4 PP
100%
75%
50%
25%
0%
S A S A S A S A S A
100%
75%
50%
25%
0%
2012 2013 2014 2015 2016
London Midland London MidlandNational National

95
Office of Rail and Road | Annual Rail Consumer Report | July 2017
Actions to improve accessible travel 2016-17London Midland commits to providing free access to its services for guide dogs in training.It provides a refund of the full cost of the affected journey if booked assistance is not carried out.
It also provides posters at stations showing the morning peak trains on which it is easier to find a seat.London Midland’s Disabled People’s Protection Policy is available at: http://www.orr.gov.uk/__data/assets/pdf_file/0007/22687/london-midland-dppp-review-letter.pdf
Alternative accessible transport All operators must provide free alternative transport to take passengers to the nearest or most convenient accessible station in certain circumstances:
• When a station is inaccessible to the passenger;
• When rail replacement services are running that are not accessible to the passenger (because of planned engineering works for example); or
• When there is disruption to services at short notice that, for whatever reason, makes services inaccessible to disabled passengers.
In 2016-17 alternative accessible transport was provided 179 times by London Midland.
London Midland received 35,962 booked assistance requests in
2016-17
This accounted for 3% of all booked assists
made nationally in 2016-17
Volume of booked assistance by rail period 2015-16 and 2016-17
Disability and equality staff training in 2016-17172 staff undertook some form of disability and equality training in total:
• Training is provided in-house and the London Midland ‘Making Rail Accessible’ booklet is given to relevant staff.
• Some Rail Delivery Group training materials are also used.
• Ramp deployment is covered as part of safety training.
Accessibility complaints rate (per 100,000 journeys) 2016-17
Source: Train Operating Companies Data tables: Complaints by NRPS category by TOC - Table 14.5
Note: This excludes unbooked assistance. A ‘rail period’ is normally 28 days, or four weeks, for business reporting purposes (Sunday to Saturday) and there are 13 rail periods in a financial year.Source: Rail Delivery Group (RDG)Data tables: Rail passenger assists by station operator - Table 16.03
Change on last year
Change on last year
Accessibility and inclusion
London Midland National
London Midland
Change on last year
4.7%
2,000
2,500
3,000
3,500
1,500
1,000
500
0P1 P2 P3 P4 P5 P6 P7 P8 P9 P10 P11 P12 P13
-9.2% 16.4%0.20.3
2015-16 2016-17

96
Office of Rail and Road | Annual Rail Consumer Report | July 2017
London MidlandComplaints handling
Top 5 reasons for complaints 2016-17
PP = percentage point changeSource: Train Operating Companies Data tables: Complaints by NRPS category by TOC - Table 14.5
Percentage of complaints
Complaint type Change on last year
50.4% Punctuality/reliability
10.7% Sufficient room for all passengers to sit/stand
7.4% Ticket buying facilities
4.9% Ticket buying facilities - other
4.7% Ticketing and refunds policy
Passenger satisfaction with complaint handling process 2016-17
Passenger satisfaction with each aspect of complaint handling process 2016-17
How did the passenger feel about the train company in light of how their complaint was handled 2016-17
Complaints rate (per 100,000 journeys) and complaints response rate
PP = percentage point changeSource: Train Operating Companies and LENNON (the rail industry’s ticketing and revenue database)Data tables: Complaints rate by train operating company - Table 14.9
Change on last year
2015-16
32.4 35.5
2016-17
-0.9PP
9.8%
10 PP
3 PP
-1 PP
8 PP
-2 PP
8 PP
-5 PP
98.8 97.9
Complaints rate (per 100,000
journeys)
Satisfaction with complaints handling process
Satisfaction with outcome of complaint
Sample size: 1,181Source: ORR – Passenger satisfaction with complaint handling survey Data tables: Passenger satisfaction with complaints handling
Sample size: 1,181PP = percentage point changeSource: ORR – Passenger satisfaction with complaint handling survey Data tables: Passenger satisfaction with complaints handling
Sample size: 1,181PP = percentage point changeSource: ORR – Passenger satisfaction with complaint handling surveyData tables: Passenger satisfaction with complaints handling
London Midland
The ease with which you were able to make the complaint More positive
about them
National
London Midland
TOC was helpful / knowledgeable
No different
National
The time taken to deal with your complaint
Your complaint was fully addressed by TOC
0% 0%50% 50%100% 100%
More negative about them
Satisfied
Neither
Dissatisfied
64%
41%
31%
25%
29%
23%
17%
17%
12%
36%
52%
58%
59%
34%
11%
40%
49%
40%
29% 56%
21%
16%
39%
27% 39%
18% 18%
Operator actions to improve services for passengers 2016-17 London Midland’s Complaints Handling Procedure is available at: http://www.orr.gov.uk/__data/assets/pdf_file/0020/23069/approval-london-and-birmingham-chp-letter.pdf London Midland reports it has taken some of the following actions to address issues highlighted in passenger complaints:
• Worked to drive down the number of cancelled trains to improve reliability.
• Implemented a number of short term actions to resolve short formations and taken steps to ensure the busiest services are not short-formed.
• Installed 28 new TVMs.
• Taken steps to improve problems with a new booking engine, including putting FAQs on the website and briefing staff.
6.9 PP
-1.6 PP
-1.0 PP
0.1 PP
-0.3 PP
% answered in 20
working days
‘Satisfied’ compared to
national averageSatisfied Neither Dissatisfied
Comparison to national average

97
Office of Rail and Road | Annual Rail Consumer Report | July 2017
Passenger satisfaction with the usefulness of information when delays occur
Passenger satisfaction with how well the operator deals with delays
Passenger satisfaction with the provision of information during the journey
Actions to improve information for passengers 2016-17Online activities including Twitter are provided by TfL.
All London Overground stations are staffed when trains are running and the station staff can make local announcements to keep passengers informed.
An upgrade to class 378 trains to allow them to report passengers loadings in real-time for each carriage was completed in June 2017. This will help staff to direct passengers to less busy parts of the train.
Transparency and accountability All train operators should publish the actions they are taking to improve passenger information in a Local Plan, together with the industry Code of Practice and an Annual Progress Report. Local Plans should be reviewed annually.
• Code of Practice – October 2016 • Local Plan – November 2016
https://goo.gl/J2TNEE
The Local Plan refers to the previous Code of Practice. A fully compliant version needs to be shared with ORR by Autumn 2017.
Documents are on the ARL website not TfL.
Change on last year
PP = percentage point changeSource: Transport Focus, National Rail Passenger SurveyThe NRPS takes place twice a year, in Spring (S) and Autumn (A)
PP = percentage point changeSource: Transport Focus, National Rail Passenger SurveyThe NRPS takes place twice a year, in Spring (S) and Autumn (A)
PP = percentage point changeSource: Transport Focus, National Rail Passenger SurveyThe NRPS takes place twice a year, in Spring (S) and Autumn (A)
London Overground National
54%
44%
London Overground
-2.7 PP
16.7 PP
Provision of information to passengers
Source: Train Operating Companies and LENNON (the rail industry’s ticketing and revenue database)Data tables: TOC Key statistics
Key factsOwner group: Arriva UK Trains
Operator: Arriva Rail London (ARL)
TfL concession: London Overground
Concession period: 13 November 2016 – May 2024
Employees: 1,413
Operated stations: 81
Sector: London and South East
Passenger journeys per annum: 188.8 million
2012 2013 2014 2015 2016
Change on last year
S A S A S A S A S A
37%
35% -3.4 PP
8.8 PP
100%
75%
50%
25%
0%
2012 2013 2014 2015 2016
Change on last year
S A S A S A S A S A
81%
70% -2.0 PP
-1.5 PP
100%
75%
50%
25%
0%
S A S A S A S A S A
100%
75%
50%
25%
0%
2012 2013 2014 2015 2016
National NationalLondon Overground London Overground

98
Office of Rail and Road | Annual Rail Consumer Report | July 2017
Actions to improve accessible travel 2016-17London Overground advertises a ‘Turn Up and Go’ service for assisting disabled and older passengers who wish to arrive and travel on its services without booking in advance.
It also carries out accessibility mystery traveller surveys in order to ensure continuous improvement to its services.
London Overground’s Disabled People’s Protection Policy is available at: http://www.orr.gov.uk/__data/assets/pdf_file/0019/23068/arriva-rail-london-dppp-approval-letter.pdf
Alternative accessible transport All operators must provide free alternative transport to take passengers to the nearest or most convenient accessible station in certain circumstances:
• When a station is inaccessible to the passenger;
• When rail replacement services are running that are not accessible to the passenger (because of planned engineering works for example); or
• When there is disruption to services at short notice that, for whatever reason, makes services inaccessible to disabled passengers.
In 2016-17 alternative accessible transport was provided once by London Overground.
London Overground received 1,115 booked assistance requests in
2016-17
This accounted for 0.1% of all booked
assists made nationally in 2016-17
Volume of booked assistance by rail period 2015-16 and 2016-17
Disability and equality staff training in 2016-17London Overground has committed to ensuring all of its employees undertake Diversity, Equality and Inclusion training by November 2017.
Currently 46% of employees have undertaken this training. 45 more training sessions are planned for remaining employees.
London Overground will also provide refresher training every two years.
The training takes the form of drama based sessions. It also covers the Equality Act 2010 and unconscious bias.
Accessibility complaints rate (per 100,000 journeys) 2016-17
Note: London Overground received a low number of accessibility complaints (26 in 2015-16, and 44 in 2016-17). Due to the low numbers a percentage change for London Overground has not been providedSource: Train Operating Companies Data tables: Complaints by NRPS category by TOC - Table 14.5
Note: London Overground provided 20,939 unbooked assists during 2016-17, these are excluded from the statistics above. A ‘rail period’ is normally 28 days, or four weeks, for business reporting purposes (Sunday to Saturday) and there are 13 rail periods in a financial year. Source: Rail Delivery Group (RDG)Data tables: Rail passenger assists by station operator - Table 16.03
Change on last year
Accessibility and inclusion
London Overground
National
Change on last year
-5.3%400
500
300
200
100
0P1 P2 P3 P4 P5 P6 P7 P8 P9 P10 P11 P12 P13
16.4%0.0
0.3
2015-16 2016-17
London Overground

99
Office of Rail and Road | Annual Rail Consumer Report | July 2017
Complaints handling
Top 5 reasons for complaints 2016-17
PP = percentage point changeSource: Train Operating Companies Data tables: Complaints by NRPS category by TOC - Table 14.5
Percentage of complaints
Complaint type Change on last year
34.7% Punctuality/reliability
11.7% The attitudes and helpfulness of the staff at station
7.7% Ticket buying facilities
6.1% Provision of information about train times/platforms
3.8% How request to station staff was handled
Passenger satisfaction with complaint handling process 2016-17
Passenger satisfaction with each aspect of complaint handling process 2016-17
How did the passenger feel about the train company in light of how their complaint was handled 2016-17
Complaints rate (per 100,000 journeys) and complaints response rate
PP = percentage point changeSource: Train Operating Companies and LENNON (the rail industry’s ticketing and revenue database)Data tables: Complaints rate by train operating company - Table 14.9
Change on last year
2015-16
3.8 2.2
2016-17
9 PP
-43.2%
7 PP
3 PP
-6 PP
9 PP
1 PP
6 PP
-7 PP
89.198.2
Complaints rate (per 100,000
journeys)
Satisfaction with complaints handling process
Satisfaction with outcome of complaint
Sample size: 404Note: London Overground participated in the survey from P1-P8 in 2016-17 and then for reasons beyond their control had to suspend participation. We are currently in discussions with London Overground and Transport for London about them rejoining the survey.Source: ORR – Passenger satisfaction with complaint handling survey Data tables: Passenger satisfaction with complaints handling
Sample size: 404. See note on sample above. PP = percentage point changeSource: ORR – Passenger satisfaction with complaint handling survey Data tables: Passenger satisfaction with complaints handling
Sample size: 404. See note on sample above.PP = percentage point changeSource: ORR – Passenger satisfaction with complaint handling surveyData tables: Passenger satisfaction with complaints handling
London Overground
London Overground
The ease with which you were able to make the complaint More positive
about them
National
TOC was helpful / knowledgeable
No different
National
The time taken to deal with your complaint
Your complaint was fully addressed by TOC
0% 0%50% 50%100% 100%
More negative about them
Satisfied
Neither
Dissatisfied
61%
35%
31%
19%
29%
22%
17%
21%
12%
43%
52%
61%
59%
34%
15%
38%
47%
41%
24% 59%
18%
17%
42%
27% 39%
15% 24%
Actions to improve services for passengers 2016-17 London Overground’s Complaints Handling Procedure is available at: http://www.orr.gov.uk/__data/assets/pdf_file/0013/23143/arl-chp-letter.pdf London Overground reports it has taken some of the following actions to address issues highlighted in passenger complaints:
• Worked closely with other train companies across its network to minimise the effects of disruption.
• Invested in staff training for all front line staff.
• Provided prompts for staff to use for announcements during disruption.
• Started carrying out proactive servicing of its TVMs.
• Explored the idea of enabling staff to carry out announcements via portable devices.
-0.8 PP
3.4 PP
-4.7 PP
0.1 PP
0.3 PP
% answered in 20
working days
‘Satisfied’ compared to
national averageSatisfied Neither Dissatisfied
Comparison to national average
London Overground

100
Office of Rail and Road | Annual Rail Consumer Report | July 2017
Passenger satisfaction with the usefulness of information when delays occur
Passenger satisfaction with how well the train company deals with delays
Passenger satisfaction with the provision of information during the journey
Actions to improve information for passengers 2016-17The Wirral Line renewals work presented a challenge with the Central Liverpool Loop closed. An extensive and dedicated marketing campaign was undertaken to inform passengers about the disruption and to make them aware of the alternative arrangements, such as replacement bus services, that were being put in place.
Twitter operating hours were also increased during the Wirral Line works to give extra information and support to passengers.
Transparency and accountability All train operators should publish the actions they are taking to improve passenger information in a Local Plan, together with the industry Code of Practice and an Annual Progress Report. Local Plans should be reviewed annually.
• Code of Practice – July 2014 • Local Plan – October 2015
https://goo.gl/1Qhtpn
As the Code of Practice has changed since the Local Plan was published, a fully compliant version needs to be shared with ORR by Autumn 2017.
Change on last year
*Not all data available for Merseyrail due to low response rate for this questionPP = percentage point changeSource: Transport Focus, National Rail Passenger SurveyThe NRPS takes place twice a year, in Spring (S) and Autumn (A)
PP = percentage point changeSource: Transport Focus, National Rail Passenger SurveyThe NRPS takes place twice a year, in Spring (S) and Autumn (A)
*Not all data available for Merseyrail due to low response rate for this questionPP = percentage point changeSource: Transport Focus, National Rail Passenger SurveyThe NRPS takes place twice a year, in Spring (S) and Autumn (A)
Merseyrail National
Notavailable*74%
44%
Merseyrail
-2.7 PP
Provision of information to passengers
Source: Train Operating Companies and LENNON (the rail industry’s ticketing and revenue database)Data tables: TOC Key statistics
Key factsOwner group: Serco / Abellio
Operator: Merseyrail
Franchise: Merseyrail
Franchise period: 20 July 2003 – 22 July 2028
Employees: 1,325
Operated stations: 66
Sector: Regional
Passenger journeys per annum: 42.8 million
2012 2013 2014 2015 2016
Change on last year
S A S A S A S A S A
61%
35% -3.4 PP
100%
75%
50%
25%
0%
2012 2013 2014 2015 2016
Change on last year
S A S A S A S A S A
87%
70% -2.0 PP
-3.3 PP
100%
75%
50%
25%
0%
S A S A S A S A S A
100%
75%
50%
25%
0%
2012 2013 2014 2015 2016
MerseyrailMerseyrail
NationalNational
Notavailable*

101
Office of Rail and Road | Annual Rail Consumer Report | July 2017
Actions to improve accessible travel 2016-17Passengers requiring booked assistance only need to give 1 hours notice.
Merseyrail have installed help points with induction loops on all platforms.
Merseyrail record and report on the number of unbooked assistances their staff deliver.
Merseyrail’s Disabled People’s Protection Policy is available at: http://www.orr.gov.uk/__data/assets/pdf_file/0006/22767/review-merseyrail-dppp-letter.pdf
Alternative accessible transport All operators must provide free alternative transport to take passengers to the nearest or most convenient accessible station in certain circumstances:
• When a station is inaccessible to the passenger;
• When rail replacement services are running that are not accessible to the passenger (because of planned engineering works for example); or
• When there is disruption to services at short notice that, for whatever reason, makes services inaccessible to disabled passengers.
In 2016-17 alternative accessible transport was provided 351 times by Merseyrail.
Merseyrail received 4,203 booked assistance
requests in 2016-17
This accounted for 0.4% of all booked
assists made nationally in 2016-17
Volume of booked assistance by rail period 2015-16 and 2016-17
Disability and equality staff training in 2016-1768 Merseyrail staff undertook some form of disability and equality training in 2016-17, including:
• Inclusion Training being run as a refresher to all managers in Merseyrail.
• Disability Awareness Refresher training for all station grades will be rolled out in 2017.
• Disability awareness training is delivered by an in house trainer and the inclusion training is provided by a trainer from the National Centre for Diversity.
Accessibility complaints rate (per 100,000 journeys) 2016-17
Source: Train Operating Companies Data tables: Complaints by NRPS category by TOC - Table 14.5
Note: Merseyrail provided 67,978 unbooked assists during 2016-17, these are excluded from the statistics above. A ‘rail period’ is normally 28 days, or four weeks, for business reporting purposes (Sunday to Saturday) and there are 13 rail periods in a financial year. Source: Rail Delivery Group (RDG)Data tables: Rail passenger assists by station operator – Table 16.03
Change on last year
Change on last year
Accessibility and inclusion
Merseyrail National
Change on last year
37.4%400
500
300
200
100
0P1 P2 P3 P4 P5 P6 P7 P8 P9 P10 P11 P12 P13
-50% 16.4%0.20.3
2015-16 2016-17
Merseyrail

102
Office of Rail and Road | Annual Rail Consumer Report | July 2017
MerseyrailComplaints handling
Top 5 reasons for complaints 2016-17
PP = percentage point changeSource: Train Operating Companies Data tables: Complaints by NRPS category by TOC - Table 14.5
Percentage of complaints
Complaint type Change on last year
44.8% Punctuality/reliability
5.2% The attitudes and helpfulness of the staff at station
4.9% Miscellaneous
3.6% Ticket buying facilities
3.5% Connections with other forms of public transport
Passenger satisfaction with complaint handling process 2016-17
Passenger satisfaction with each aspect of complaint handling process 2016-17
How did the passenger feel about the train company in light of how their complaint was handled 2016-17
Complaints rate (per 100,000 journeys) and complaints response rate
PP = percentage point changeSource: Train Operating Companies and LENNON (the rail industry’s ticketing and revenue database)Data tables: Complaints rate by train operating company - Table 14.9
Change on last year
2015-16
18.79.9
2016-17
-4.6 PP
-47.2%
4 PP
-2 PP
-6 PP
-10 PP
-4 PP
5 PP
-1 PP
91.3 86.6
Complaints rate (per 100,000
journeys)
Satisfaction with complaints handling process
Satisfaction with outcome of complaint
Sample size: 224Source: ORR – Passenger satisfaction with complaint handling survey Data tables: Passenger satisfaction with complaints handling
Sample size: 224PP = percentage point changeSource: ORR – Passenger satisfaction with complaint handling survey Data tables: Passenger satisfaction with complaints handling
Sample size: 224PP = percentage point changeSource: ORR – Passenger satisfaction with complaint handling surveyData tables: Passenger satisfaction with complaints handling
Merseyrail
The ease with which you were able to make the complaint More positive
about them
National
Merseyrail
TOC was helpful / knowledgeable
No different
National
The time taken to deal with your complaint
Your complaint was fully addressed by TOC
0% 0%50% 50%100% 100%
More negative about them
Satisfied
Neither
Dissatisfied
58%
25%
31%
18%
29%
19%
17%
18%
12%
56%
52%
64%
59%
29%
9%
37%
54%
22%
23% 58%
13%
18%
65%
30% 42%
13% 29%
Actions to improve services for passengers 2016-17 Merseyrail’s Complaints Handling Procedure is available at: http://www.orr.gov.uk/__data/assets/pdf_file/0014/21353/merseyrail-chp-dec-letter.pdfMerseyrail reports it has taken some of the following actions to address issues highlighted in passenger complaints:
• Developed a customer relations improvement plan to ensure complaint response times are met.
• Introduced periodic quality checks with staff.
• Set up a periodic Service Improvement Group to review disruption from a customer’s perspective.
• Developed a new communications approach between customer relations and station staff.
• Produced a new leaflet and online delay compensation claim form to provide more information on refunds and make the claims process easier for passengers.
15.5 PP
3.4 PP
-2.8 PP
1.6 PP
3.5 PP
% answered in 20
working days
‘Satisfied’ compared to
national averageSatisfied Neither Dissatisfied
Comparison to national average

103
Office of Rail and Road | Annual Rail Consumer Report | July 2017
Passenger satisfaction with the usefulness of information when delays occur
Passenger satisfaction with how well the company deals with delays
Passenger satisfaction with the provision of information during the journey
Actions to improve information for passengers 2016-17Northern has implemented a ‘2468’ training programme which reminds guards of the need to keep passengers informed when trains are late.
To make claiming delay compensation easier for passengers, Northern have created a dedicated web address at www.northernrailway.co.uk/delayrepayMobile tickets are now available for passengers using the Northern app.
Transparency and accountability All train operators should publish the actions they are taking to improve passenger information in a Local Plan, together with the industry Code of Practice and an Annual Progress Report. Local Plans should be reviewed annually.
• Code of Practice – October 2016 • Local Plan – April 2016
https://goo.gl/q782js
As the Code of Practice has changed since the Local Plan was published, a fully compliant version needs to be shared with ORR by Autumn 2017.
Change on last year
PP = percentage point changeSource: Transport Focus, National Rail Passenger SurveyThe NRPS takes place twice a year, in Spring (S) and Autumn (A)
PP = percentage point changeSource: Transport Focus, National Rail Passenger SurveyThe NRPS takes place twice a year, in Spring (S) and Autumn (A)
PP = percentage point changeSource: Transport Focus, National Rail Passenger SurveyThe NRPS takes place twice a year, in Spring (S) and Autumn (A)
52%
44%
Northern
-2.7 PP
-0.8 PP
Provision of information to passengers
Source: Train Operating Companies and LENNON (the rail industry’s ticketing and revenue database)Data tables: TOC Key statistics
Key factsOwner group: Arriva UK Trains
Operator: Northern
Franchise: Northern
Franchise period: 01 April 2016 – 31 March 2025
Employees: 5,687
Operated stations: 477
Sector: Regional
Passenger journeys per annum: 107.7 million
2012 2013 2014 2015 2016
Change on last year
S A S A S A S A S A
41%
35% -3.4 PP
-2.7 PP
100%
75%
50%
25%
0%
2012 2013 2014 2015 2016
Change on last year
S A S A S A S A S A
64%
70% -2.0 PP
-0.4 PP
100%
75%
50%
25%
0%
Northern National
Northern National Northern National
S A S A S A S A S A
100%
75%
50%
25%
0%
2012 2013 2014 2015 2016

104
Office of Rail and Road | Annual Rail Consumer Report | July 2017
Actions to improve accessible travel 2016-17Northern have committed to participating in the Blue Assist card scheme.
Northern has provided a step free map of its network.
Northern has committed to carry out post travel surveys for passengers who have booked assistance to ensure that the assistance was provided satisfactorily and to seek suggestions for further improvements.
Northern’s Disabled People’s Protection Policy is available at: http://www.orr.gov.uk/__data/assets/pdf_file/0005/24953/arriva-rail-north-dppp-approval.pdf
Alternative accessible transport All operators must provide free alternative transport to take passengers to the nearest or most convenient accessible station in certain circumstances:
• When a station is inaccessible to the passenger;
• When rail replacement services are running that are not accessible to the passenger (because of planned engineering works for example); or
• When there is disruption to services at short notice that, for whatever reason, makes services inaccessible to disabled passengers.
In 2016 -17 alternative accessible transport was provided 278 times by Northern.
Northern received 44,001 booked assistance
requests in 2016-17
This accounted for 3.7% of all booked
assists made nationally in 2016-17
Volume of booked assistance by rail period 2015-16 and 2016-17
Disability and equality staff training in 2016-17338 Northern staff undertook some form of disability and equality training in 2016-17:
• 225 staff attended a drop-in roadshow.
• Roadshows were completed at 17 depots on a total of 33 days, including the Customer Experience Centre in Sheffield.
• 80 new staff attended a 1 day Disability Awareness course
• 32 staff completed level 1 Deaf awareness training.
• Northern have recently formed a partnership with UK disabled persons charity ‘Enhance the UK’ and Blue Assist.
Accessibility complaints rate (per 100,000 journeys) 2016-17
Source: Train Operating Companies Data tables: Complaints by NRPS category by TOC – Table 14.5
Note: This excludes un-booked assistance. A ‘rail period’ is normally 28 days, or four weeks, for business reporting purposes (Sunday to Saturday) and there are 13 rail periods in a financial year. Source: Rail Delivery Group (RDG)Data tables: Rail passenger assists by station operator – Table 16.03
Change on last year
Change on last year
Accessibility and inclusion
Northern National
Northern
Change on last year
21.7%
2,000
4,000
3,000
5,000
1,000
0P1 P2 P3 P4 P5 P6 P7 P8 P9 P10 P11 P12 P13
19.5% 16.4%0.3 0.3
2015-16 2016-17
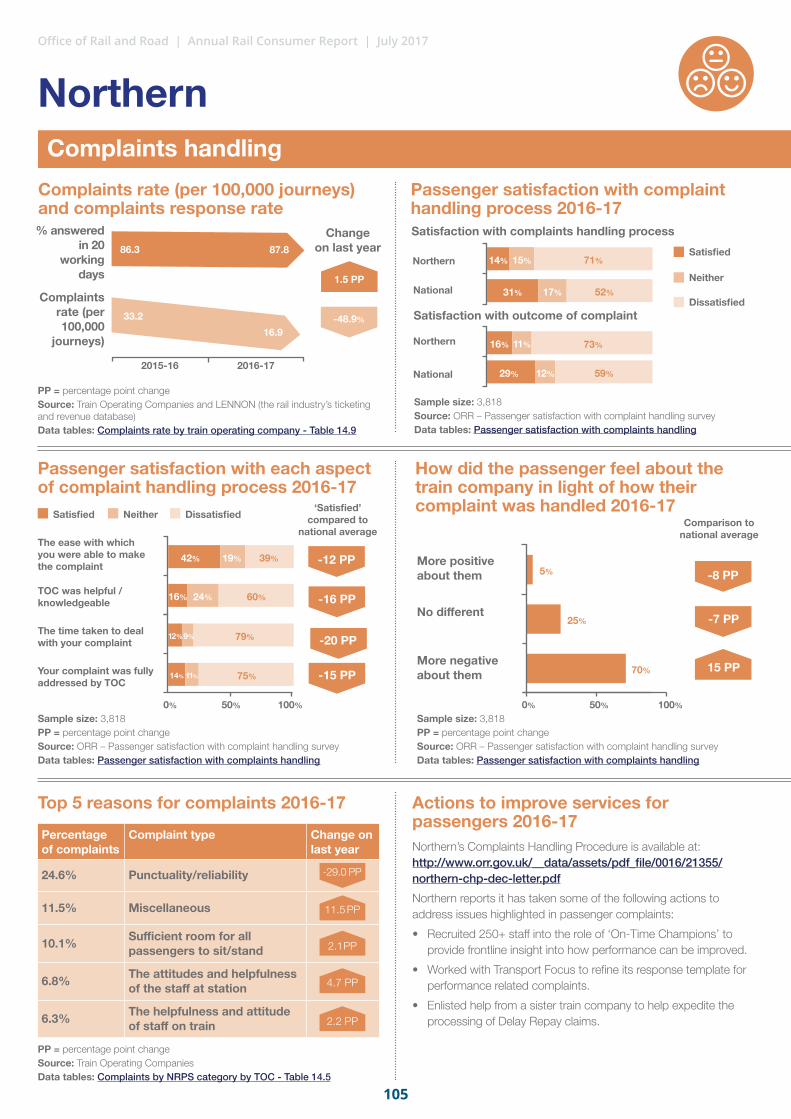
105
Office of Rail and Road | Annual Rail Consumer Report | July 2017
16%
29%
11%
12%
73%
59%
14%
31%
15%
17%
71%
52%
NorthernComplaints handling
Top 5 reasons for complaints 2016-17
PP = percentage point changeSource: Train Operating Companies Data tables: Complaints by NRPS category by TOC - Table 14.5
Percentage of complaints
Complaint type Change on last year
24.6% Punctuality/reliability
11.5% Miscellaneous
10.1% Sufficient room for all passengers to sit/stand
6.8% The attitudes and helpfulness of the staff at station
6.3% The helpfulness and attitude of staff on train
Passenger satisfaction with complaint handling process 2016-17
Passenger satisfaction with each aspect of complaint handling process 2016-17
How did the passenger feel about the train company in light of how their complaint was handled 2016-17
Complaints rate (per 100,000 journeys) and complaints response rate
PP = percentage point changeSource: Train Operating Companies and LENNON (the rail industry’s ticketing and revenue database)Data tables: Complaints rate by train operating company - Table 14.9
Change on last year
2015-16
33.216.9
2016-17
1.5 PP
-48.9%
-12 PP
-16 PP
-15 PP
-20 PP
-8 PP
-7 PP
15 PP
86.3 87.8
Complaints rate (per 100,000
journeys)
Satisfaction with complaints handling process
Satisfaction with outcome of complaint
Sample size: 3,818Source: ORR – Passenger satisfaction with complaint handling survey Data tables: Passenger satisfaction with complaints handling
Sample size: 3,818PP = percentage point changeSource: ORR – Passenger satisfaction with complaint handling survey Data tables: Passenger satisfaction with complaints handling
Sample size: 3,818PP = percentage point changeSource: ORR – Passenger satisfaction with complaint handling survey Data tables: Passenger satisfaction with complaints handling
Northern
The ease with which you were able to make the complaint More positive
about them
National
Northern
TOC was helpful / knowledgeable
No different
National
The time taken to deal with your complaint
Your complaint was fully addressed by TOC
0% 0%50% 50%100% 100%
More negative about them
Satisfied
Neither
Dissatisfied
42%
16%
5%
25%
70%
12%
14% 75%11%
79%
24% 60%
19% 39%
Actions to improve services for passengers 2016-17 Northern’s Complaints Handling Procedure is available at: http://www.orr.gov.uk/__data/assets/pdf_file/0016/21355/northern-chp-dec-letter.pdfNorthern reports it has taken some of the following actions to address issues highlighted in passenger complaints:
• Recruited 250+ staff into the role of ‘On-Time Champions’ to provide frontline insight into how performance can be improved.
• Worked with Transport Focus to refine its response template for performance related complaints.
• Enlisted help from a sister train company to help expedite the processing of Delay Repay claims.
-29.0 PP
11.5 PP
2.1 PP
4.7 PP
2.2 PP
% answered in 20
working days
‘Satisfied’ compared to
national averageSatisfied Neither Dissatisfied
Comparison to national average
9%

106
Office of Rail and Road | Annual Rail Consumer Report | July 2017
Passenger satisfaction with the usefulness of information when delays occur
Passenger satisfaction with how well the train company deals with delays
Passenger satisfaction with the provision of information during the journey
Actions to improve information for passengers 2016-17Research showed that passengers were reluctant to press the Help Point, thinking it was for emergency use only. These are now being rebranded to make their purpose clearer and a poster campaign has been run.
Onward connection screens are to be provided at 16 stations and an updated passenger app was launched in April 2017.
Countdown mode (e.g. ‘next train departs in X minutes’) has been introduced at Glasgow low level stations where frequent services operate.
Transparency and accountability All train operators should publish the actions they are taking to improve passenger information in a Local Plan, together with the industry Code of Practice and an Annual Progress Report. Local Plans should be reviewed annually.
• Code of Practice – September 2016 • Local Plan – May 2017
https://goo.gl/pPwUWa
Change on last year
PP = percentage point changeSource: Transport Focus, National Rail Passenger SurveyThe NRPS takes place twice a year, in Spring (S) and Autumn (A)
PP = percentage point changeSource: Transport Focus, National Rail Passenger Survey (NRPS)The NRPS takes place twice a year, in Spring (S) and Autumn (A)
PP = percentage point changeSource: Transport Focus, National Rail Passenger SurveyThe NRPS takes place twice a year, in Spring (S) and Autumn (A)
ScotRail National
49%
44%
ScotRail
-2.7 PP
-12.7 PP
Provision of information to passengers
Source: Train Operating Companies and LENNON (the rail industry’s ticketing and revenue database)Data tables: TOC Key statistics
Key factsOwner group: Abellio
Operator: Abellio ScotRail
Franchise: ScotRail
Franchise period: 01 April 2015 – 21 March 2025
Employees: 4,907
Operated stations: 356
Sector: Scotland
Passenger journeys per annum: 94.2 million
2012 2013 2014 2015 2016
Change on last year
S A S A S A S A S A
38%
35% -3.4 PP
-13.3 PP
100%
75%
50%
25%
0%
2012 2013 2014 2015 2016
Change on last year
S A S A S A S A S A
70%
72% -6.6 PP
-2.0 PP
100%
75%
50%
25%
0%
S A S A S A S A S A
100%
75%
50%
25%
0%
2012 2013 2014 2015 2016
ScotRail ScotRailNational National

107
Office of Rail and Road | Annual Rail Consumer Report | July 2017
Actions to improve accessible travel 2016-17Abellio ScotRail has set up a Stakeholder Equality Group to improve involvement with disabled people and customers with reduced mobility. The group offers guidance on matters relating to equality, social inclusion and accessibility.
Abellio ScotRail provides free parking for all disabled badge holders at station car parks.
Abellio ScotRail’s Disabled People’s Protection Policy is available at: http://www.orr.gov.uk/__data/assets/pdf_file/0008/22013/scotrail-dppp-review-letter.pdf
Alternative accessible transport All operators must provide free alternative transport to take passengers to the nearest or most convenient accessible station in certain circumstances:
• When a station is inaccessible to the passenger;
• When rail replacement services are running that are not accessible to the passenger (because of planned engineering works for example); or
• When there is disruption to services at short notice that, for whatever reason, makes services inaccessible to disabled passengers.
In 2016-17 alternative accessible transport was provided 1,097 times by Abellio ScotRail.
Abellio ScotRail received 61,528 booked assistance requests in
2016-17.
This accounted for 5.1% of all booked assists made nationally in
2016-17.
Volume of booked assistance by rail period 2015-16 and 2016-17
Disability and equality staff training in 2016-17• All customer facing Abellio ScotRail staff receive disability
awareness training when they join the company.
• Ongoing refresher training is given through Operations Learning and Development Teams.
• Training is delivered by ScotRail Accredited Trainers and Deaf Blind Scotland.
Accessibility complaints rate (per 100,000 journeys) 2016-17
Source: Train Operating Companies Data tables: Complaints by NRPS category by TOC – Table 14.5
Note: This excludes unbooked assistance. A ‘rail period’ is normally 28 days, or four weeks, for business reporting purposes (Sunday to Saturday) and there are 13 rail periods in a financial year.Source: Rail Delivery Group (RDG)Data tables: Rail passenger assists by station operator – Table 16.03
Change on last year
Change on last year
Accessibility and inclusion
ScotRail National
ScotRail
Change on last year
5.7%
4,000
5,000
6,000
3,000
2,000
1,000
0P1 P2 P3 P4 P5 P6 P7 P8 P9 P10 P11 P12 P13
-21.2% 16.4%0.20.3
2015-16 2016-17
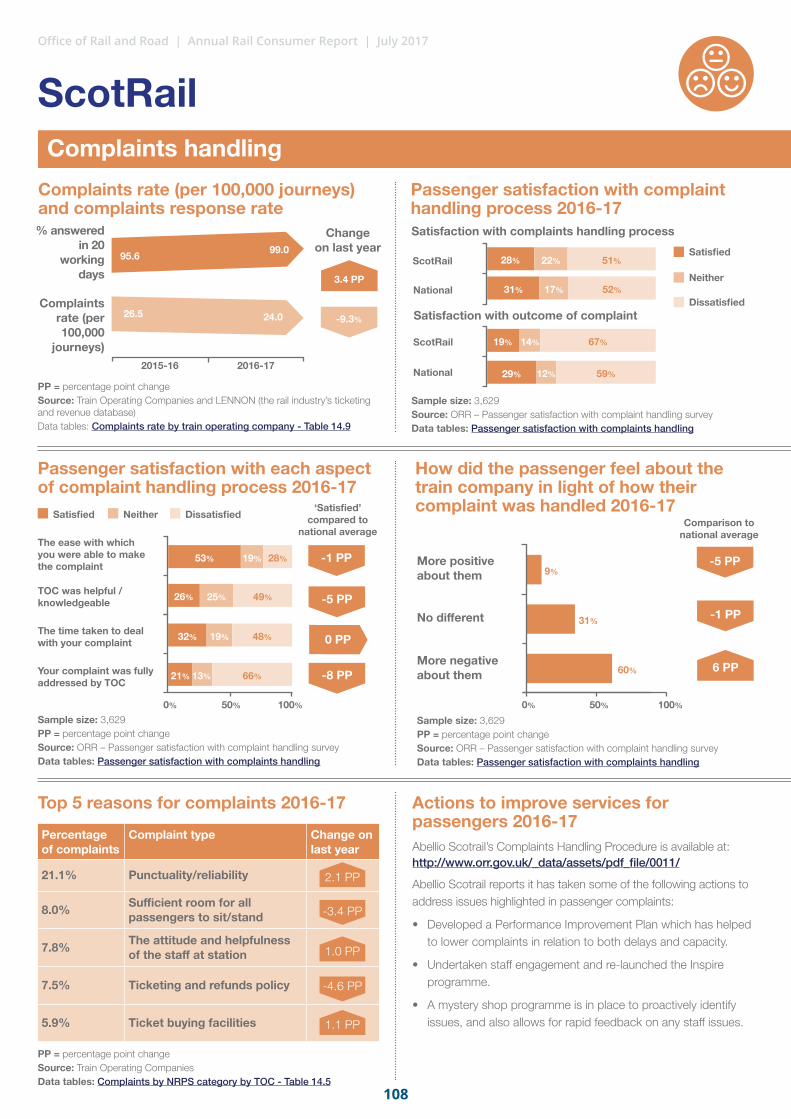
108
Office of Rail and Road | Annual Rail Consumer Report | July 2017
ScotRailComplaints handling
Top 5 reasons for complaints 2016-17
PP = percentage point changeSource: Train Operating Companies Data tables: Complaints by NRPS category by TOC - Table 14.5
Percentage of complaints
Complaint type Change on last year
21.1% Punctuality/reliability
8.0% Sufficient room for all passengers to sit/stand
7.8% The attitude and helpfulness of the staff at station
7.5% Ticketing and refunds policy
5.9% Ticket buying facilities
Passenger satisfaction with complaint handling process 2016-17
Passenger satisfaction with each aspect of complaint handling process 2016-17
How did the passenger feel about the train company in light of how their complaint was handled 2016-17
Complaints rate (per 100,000 journeys) and complaints response rate
PP = percentage point changeSource: Train Operating Companies and LENNON (the rail industry’s ticketing and revenue database)Data tables: Complaints rate by train operating company - Table 14.9
Change on last year
2015-16
26.5 24.0
2016-17
3.4 PP
-9.3%
-1 PP
-5 PP
-8 PP
0 PP
-5 PP
-1 PP
6 PP
95.6 99.0
Complaints rate (per 100,000
journeys)
Satisfaction with complaints handling process
Satisfaction with outcome of complaint
Sample size: 3,629Source: ORR – Passenger satisfaction with complaint handling survey Data tables: Passenger satisfaction with complaints handling
Sample size: 3,629PP = percentage point changeSource: ORR – Passenger satisfaction with complaint handling survey Data tables: Passenger satisfaction with complaints handling
Sample size: 3,629PP = percentage point changeSource: ORR – Passenger satisfaction with complaint handling surveyData tables: Passenger satisfaction with complaints handling
ScotRail
The ease with which you were able to make the complaint More positive
about them
National
ScotRail
TOC was helpful / knowledgeable
No different
National
The time taken to deal with your complaint
Your complaint was fully addressed by TOC
0% 0%50% 50%100% 100%
More negative about them
Satisfied
Neither
Dissatisfied
53%
28%
31%
19%
29%
22%
17%
14%
12%
51%
52%
67%
59%
26%
9%
31%
60%
32%
21% 66%
19%
13%
48%
25% 49%
19% 28%
Actions to improve services for passengers 2016-17 Abellio Scotrail’s Complaints Handling Procedure is available at: http://www.orr.gov.uk/_data/assets/pdf_file/0011/
Abellio Scotrail reports it has taken some of the following actions to address issues highlighted in passenger complaints:
• Developed a Performance Improvement Plan which has helped to lower complaints in relation to both delays and capacity.
• Undertaken staff engagement and re-launched the Inspire programme.
• A mystery shop programme is in place to proactively identify issues, and also allows for rapid feedback on any staff issues.
2.1 PP
-3.4 PP
1.0 PP
-4.6 PP
1.1 PP
% answered in 20
working days
‘Satisfied’ compared to
national averageSatisfied Neither Dissatisfied
Comparison to national average

109
Office of Rail and Road | Annual Rail Consumer Report | July 2017
Passenger satisfaction with the usefulness of information when delays occur
Passenger satisfaction with how well the train company deals with delays
Passenger satisfaction with the provision of information during the journey
Actions to improve information for passengers 2016-17In addition to promoting the national disruption survey, SWT runs its own which can be accessed at www.tellswt.co.uk/In response to passenger feedback from its surveys, SWT has changed the way it reports incidents to reduce the use of railway jargon.
Transparency and accountability All train operators should publish the actions they are taking to improve passenger information in a Local Plan, together with the industry Code of Practice and an Annual Progress Report. Local Plans should be reviewed annually.
• Code of Practice – October 2016 • Local Plan – June 2017
https://goo.gl/5Lb98w
Change on last year
PP = percentage point changeSource: Transport Focus, National Rail Passenger SurveyThe NRPS take places twice a year, in Spring (S) and Autumn (A)
PP = percentage point changeSource: Transport Focus, National Rail Passenger Survey The NRPS takes place twice a year, in Spring (S) and Autumn (A)
PP = percentage point changeSource: Transport Focus, National Rail Passenger SurveyThe NRPS takes place twice a year, in Spring (S) and Autumn (A)
South West Trains National
44%
44% -2.7 PP
0.5 PP
Provision of information to passengers
Source: Train Operating Companies and LENNON (the rail industry’s ticketing and revenue database)Data tables: TOC Key statistics
Key factsOwner group: Stagecoach
Operator: South West Trains
Franchise: South Western
Franchise period: 04 February 2007 – 20 August 2017
Employees: 5,055
Operated stations: 186
Sector: London and South East
Passenger journeys per annum: 229.9 million
2012 2013 2014 2015 2016
Change on last year
S A S A S A S A S A
38%
35% -3.4 PP
-1.9 PP
100%
75%
50%
25%
0%
2012 2013 2014 2015 2016
Change on last year
S A S A S A S A S A
70%
70% -2.0 PP
-1.9 PP
100%
75%
50%
25%
0%
S A S A S A S A S A
100%
75%
50%
25%
0%
2012 2013 2014 2015 2016
South West Trains South West TrainsNational National
South West Trains

110
Office of Rail and Road | Annual Rail Consumer Report | July 2017
Actions to improve accessible travel 2016-17SWT allows passengers travelling with an assistance dog to upgrade to First Class for free if there are no Standard Class seats available.
A new type of ticket machine at some stations provides video connection with a remote ticket agent who can assist with the ticket purchase if necessary.
SWT commits to ensuring passengers who cannot access the on-train catering are able to buy refreshments.
SWT’s Disabled People’s Protection Policy is available at: http://www.orr.gov.uk/__data/assets/pdf_file/0020/22871/swt-dppp-letter.pdf
Alternative accessible transport All operators must provide free alternative transport to take passengers to the nearest or most convenient accessible station in certain circumstances:
• When a station is inaccessible to the passenger;
• When rail replacement services are running that are not accessible to the passenger (because of planned engineering works for example); or
• When there is disruption to services at short notice that, for whatever reason, makes services inaccessible to disabled passengers.
In 2016-17 alternative accessible transport was provided 145 times by SWT.
SWT received 67,363 booked assistance
requests in 2016-17
This accounted for 5.6% of all booked
assists made nationally in 2016-17
Volume of booked assistance by rail period 2015-16 and 2016-17
Disability and equality staff training in 2016-17At least 253 SWT staff undertook some form of disability and equality training in 2016-17:
• 253 staff new to customer facing roles received disability and equality training.
• The training was one full day and consisted of a mix of powerpoint, flipchart and video clips.
• Practical training was also part of the training day and staff practiced assisting visually impaired customers and wheelchair users.
• In February 2017 an internal accessibility awareness campaign also took place where staff were re-briefed. These figures are not included in the above total as the numbers were not recorded reliably.
Accessibility complaints rate (per 100,000 journeys) 2016-17
Source: Train Operating Companies Data tables: Complaints by NRPS category by TOC – Table 14.5
Note: This excludes unbooked assistance. A ‘rail period’ is normally 28 days, or four weeks, for business reporting purposes (Sunday to Saturday) and there are 13 rail periods in a financial year.Source: Rail Delivery Group (RDG)Data tables: Rail passenger assists by station operator – Table 16.03
Change on last year
Change on last year
Accessibility and inclusion
South West Trains
National
Change on last year
0.5%
4,000
5,000
6,000
7,000
3,000
2,000
1,000
0P1 P2 P3 P4 P5 P6 P7 P8 P9 P10 P11 P12 P13
7.7% 16.4%0.1
0.3
2015-16 2016-17
South West Trains
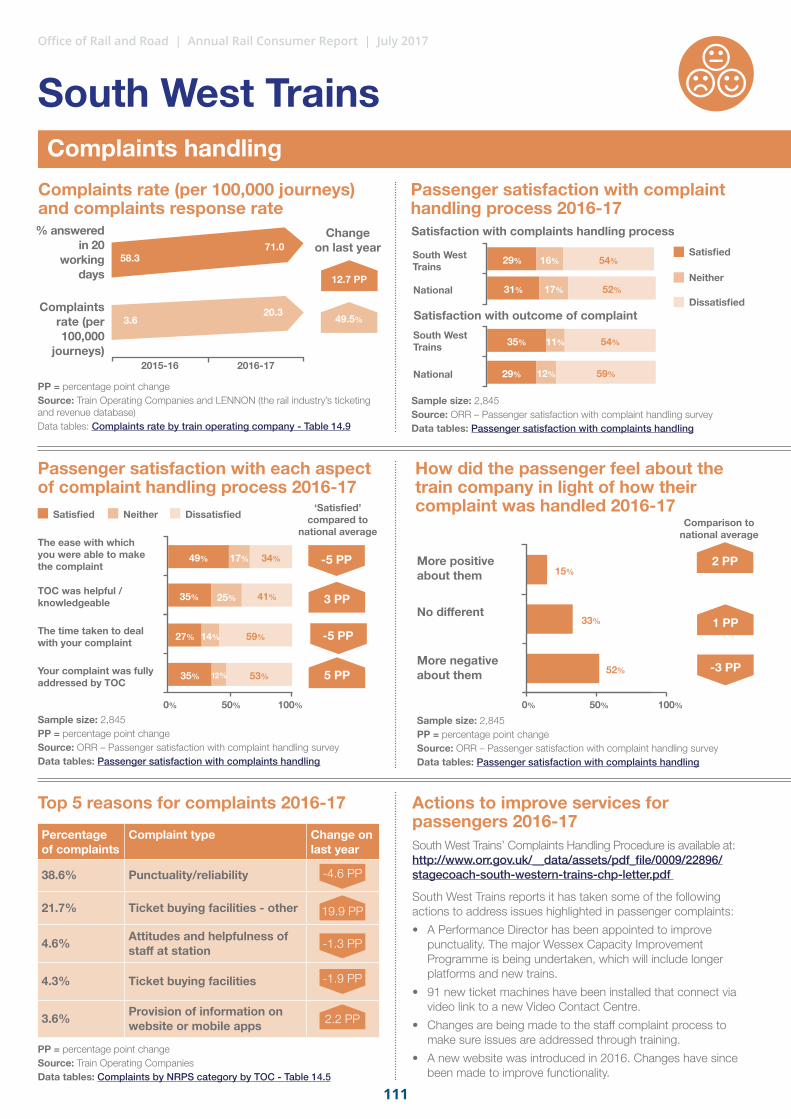
111
Office of Rail and Road | Annual Rail Consumer Report | July 2017
South West TrainsComplaints handling
Top 5 reasons for complaints 2016-17
PP = percentage point changeSource: Train Operating Companies Data tables: Complaints by NRPS category by TOC - Table 14.5
Percentage of complaints
Complaint type Change on last year
38.6% Punctuality/reliability
21.7% Ticket buying facilities - other
4.6% Attitudes and helpfulness of staff at station
4.3% Ticket buying facilities
3.6% Provision of information on website or mobile apps
Passenger satisfaction with complaint handling process 2016-17
Passenger satisfaction with each aspect of complaint handling process 2016-17
How did the passenger feel about the train company in light of how their complaint was handled 2016-17
Complaints rate (per 100,000 journeys) and complaints response rate
PP = percentage point changeSource: Train Operating Companies and LENNON (the rail industry’s ticketing and revenue database)Data tables: Complaints rate by train operating company - Table 14.9
Change on last year
2015-16
3.620.3
2016-17
12.7 PP
49.5%
-5 PP
3 PP
5 PP
-5 PP
2 PP
1 PP
-3 PP
58.371.0
Complaints rate (per 100,000
journeys)
Satisfaction with complaints handling process
Satisfaction with outcome of complaint
Sample size: 2,845Source: ORR – Passenger satisfaction with complaint handling survey Data tables: Passenger satisfaction with complaints handling
Sample size: 2,845PP = percentage point changeSource: ORR – Passenger satisfaction with complaint handling survey Data tables: Passenger satisfaction with complaints handling
Sample size: 2,845PP = percentage point changeSource: ORR – Passenger satisfaction with complaint handling surveyData tables: Passenger satisfaction with complaints handling
South West Trains
The ease with which you were able to make the complaint More positive
about them
National
South West Trains
TOC was helpful / knowledgeable
No different
National
The time taken to deal with your complaint
Your complaint was fully addressed by TOC
0% 0%50% 50%100% 100%
More negative about them
Satisfied
Neither
Dissatisfied
49%
29%
31%
35%
29%
16%
17%
11%
12%
54%
52%
54%
59%
35%
15%
33%
52%
27%
35% 53%
14%
12%
59%
25% 41%
17% 34%
Actions to improve services for passengers 2016-17 South West Trains’ Complaints Handling Procedure is available at: http://www.orr.gov.uk/__data/assets/pdf_file/0009/22896/stagecoach-south-western-trains-chp-letter.pdf
South West Trains reports it has taken some of the following actions to address issues highlighted in passenger complaints:
• A Performance Director has been appointed to improve punctuality. The major Wessex Capacity Improvement Programme is being undertaken, which will include longer platforms and new trains.
• 91 new ticket machines have been installed that connect via video link to a new Video Contact Centre.
• Changes are being made to the staff complaint process to make sure issues are addressed through training.
• A new website was introduced in 2016. Changes have since been made to improve functionality.
-4.6 PP
19.9 PP
-1.3 PP
-1.9 PP
2.2 PP
% answered in 20
working days
‘Satisfied’ compared to
national averageSatisfied Neither Dissatisfied
Comparison to national average

112
Office of Rail and Road | Annual Rail Consumer Report | July 2017
Passenger satisfaction with the usefulness of information when delays occur
Passenger satisfaction with how well the train company deals with delays
Passenger satisfaction with the provision of information during the journey
Actions to improve information for passengers 2016-17A new website was launched in 2016 giving full integration of the National Rail Enquiries disruption feed.
A new format for disruption messages has been introduced and is being used by National Rail Enquiries for Southeastern incidents.
Realtime information is incorporated in the journey planner, offering consistent information with National Rail Enquiries.
Transparency and accountability All train operators should publish the actions they are taking to improve passenger information in a Local Plan, together with the industry Code of Practice and an Annual Progress Report. Local Plans should be reviewed annually.
• Code of Practice – October 2016 • Local Plan – October 2015
https://goo.gl/DbofX1
As the Code of Practice has changed since the Local Plan was published, a fully compliant version needs to be shared with ORR by Autumn 2017
Change on last year
PP = percentage point changeSource: Transport Focus, National Rail Passenger SurveyThe NRPS takes place twice a year, in Spring (S) and Autumn (A)
PP = percentage point changeSource: Transport Focus, National Rail Passenger Survey The NRPS takes place twice a year, in Spring (S) and Autumn (A)
PP = percentage point changeSource: Transport Focus, National Rail Passenger SurveyThe NRPS takes place twice a year, in Spring (S) and Autumn (A)
Southeastern National
40%
44%
Southeastern
-2.7 PP
4.6 PP
Provision of information to passengers
Source: Train Operating Companies and LENNON (the rail industry’s ticketing and revenue database)Data tables: TOC Key statistics
Key factsOwner group: Govia
Operator: Southeastern
Franchise: South Eastern
Franchise period: 01 April 2006 – 24 June 2018
Employees: 4,356
Operated stations: 165
Sector: London and South East
Passenger journeys per annum: 182.4 million
2012 2013 2014 2015 2016
Change on last year
S A S A S A S A S A
29%
35% -3.4 PP
-1.3 PP
100%
75%
50%
25%
0%
2012 2013 2014 2015 2016
Change on last year
S A S A S A S A S A
65%
70% -2.0 PP
-0.8 PP
100%
75%
50%
25%
0%
S A S A S A S A S A
100%
75%
50%
25%
0%
2012 2013 2014 2015 2016
Southeastern SoutheasternNational National

113
Office of Rail and Road | Annual Rail Consumer Report | July 2017
Volume of booked assistance by rail period 2015-16 and 2016-17
Actions to improve accessible travel 2016-17Southeastern ask for 12 hours’ notice to book assistance on their own services.
The Southeastern website includes the ‘Recite Me’ app which makes information more accessible by including a screen reader to assist the visually impaired and the ability to increase font size and change background colours to suit users’ requirements.
A priority seat card initiative allows disabled passengers to find seats on services more easily.
Southeastern’s Disabled People’s Protection Policy is available at: http://orr.gov.uk/__data/assets/pdf_file/0017/21770/southeastern-dppp-review-letter.pdf
Alternative accessible transport All operators must provide free alternative transport to take passengers to the nearest or most convenient accessible station in certain circumstances:
• When a station is inaccessible to the passenger;
• When rail replacement services are running that are not accessible to the passenger (because of planned engineering works for example); or
• When there is disruption to services at short notice that, for whatever reason, makes services inaccessible to disabled passengers.
In 2016-17 alternative accessible transport was provided 1,194 times by Southeastern.
Southeastern received 23,804 booked
assistance requests in 2016-17
This accounted for 2% of all booked assists made
nationally in 2016-17
Disability and equality staff training in 2016-17475 Southeastern staff undertook a 2-day course,1.5 days of which covered disability issues and how these affect customer service, this included:
• 426 operational staff such as drivers, conductors, station staff and revenue protection staff;
• 14 ‘customer ambassadors’ who play a customer facing assistance role; and
• 35 staff based at the customer services call centre.
Training is classroom based, with opportunities for the trainees to carry out practical tasks such as assisting a wheelchair user. Hidden disabilities are also covered so that delegates have a better appreciation of how this may affect individuals and what they can do to make a difference.
Accessibility complaints rate (per 100,000 journeys) 2016-17
Source: Train Operating Companies Data tables: Complaints by NRPS category by TOC - Table 14.5
Note: This excludes unbooked assistance. A ‘rail period’ is normally 28 days, or four weeks, for business reporting purposes (Sunday to Saturday) and there are 13 rail periods in a financial year.Source: Rail Delivery Group (RDG)Data tables: Rail passenger assists by station operator - Table 16.03
Change on last year
Change on last year
Accessibility and inclusion
Southeastern National
Southeastern
Change on last year
3.0%2,000
2,500
1,500
1,000
500
0P1 P2 P3 P4 P5 P6 P7 P8 P9 P10 P11 P12 P13
131.8% 16.4%0.4 0.3
2015-16 2016-17

114
Office of Rail and Road | Annual Rail Consumer Report | July 2017
SoutheasternComplaints handling
Top 5 reasons for complaints 2016-17
PP = percentage point changeSource: Train Operating Companies Data tables: Complaints by NRPS category by TOC - Table 14.5
Percentage of complaints
Complaint type Change on last year
18.1% Punctuality/reliability
8.3% Smartcards
6.8% Ticketing and refunds policy
5.9% Delay claim rejected
5.7% Facilities on board
Passenger satisfaction with complaint handling process 2016-17
Passenger satisfaction with each aspect of complaint handling process 2016-17
How did the passenger feel about the train company in light of how their complaint was handled 2016-17
Complaints rate (per 100,000 journeys) and complaints response rate
PP = percentage point changeSource: Train Operating Companies and LENNON (the rail industry’s ticketing and revenue database)Data tables: Complaints rate by train operating company - Table 14.9
Change on last year
2015-16
18.925.8
2016-17
0.5 PP
37.1%
-5 PP
-11 PP
-13 PP
-8 PP
-7 PP
3 PP
4 PP
99.5 100.0
Complaints rate (per 100,000
journeys)
Satisfaction with complaints handling process
Satisfaction with outcome of complaint
Sample size: : 1,589Source: ORR – Passenger satisfaction with complaint handling survey Data tables: Passenger satisfaction with complaints handling
Sample size: : 1,589PP = percentage point changeSource: ORR – Passenger satisfaction with complaint handling survey Data tables: Passenger satisfaction with complaints handling
Sample size: : 1,589PP = percentage point changeSource: ORR – Passenger satisfaction with complaint handling surveyData tables: Passenger satisfaction with complaints handling
Southeastern
The ease with which you were able to make the complaint More positive
about them
National
Southeastern
TOC was helpful / knowledgeable
No different
National
The time taken to deal with your complaint
Your complaint was fully addressed by TOC
0% 0%50% 50%100% 100%
More negative about them
Satisfied
Neither
Dissatisfied
49%
23%
31%
17%
29%
21%
17%
13%
12%
57%
52%
70%
59%
20%
6%
35%
58%
24%
16% 71%
19%
3%
56%
25% 56%
19% 32%
Actions to improve services for passengers 2016-17 Southeastern’s Complaints Handling Procedure is available at: http://orr.gov.uk/__data/assets/pdf_file/0020/22727/southeastern-chp-letter.pdf Southeastern reports it has taken some of the following actions to address
issues highlighted in passenger complaints :
• Working with Network Rail to more efficiently diagnose root causes of
delays to reduce their frequency and impact.
• Moving to the ‘Right Time’ metric to measure performance, and being
one of the first companies to do so.
• Making improvements to ‘Key’ smartcard in response to passenger
complaints.
• The penalty fares appeals process has been made easier and moved online.
• The main area of complaint around ‘facilities on board’ has been over-
crowding and Southeastern is in discussions to run longer trains with
more capacity.
-14.3PP
8.3 PP
-4.0 PP
5.9 PP
1.0 PP
% answered in 20
working days
‘Satisfied’ compared to
national averageSatisfied Neither Dissatisfied
Comparison to national average

115
Office of Rail and Road | Annual Rail Consumer Report | July 2017
Passenger satisfaction with the usefulness of information when delays occur
Passenger satisfaction with how well the operator deals with delays
Passenger satisfaction with the provision of information during the journey
Actions to improve information for passengers 2016-17New Crossrail trains were introduced during 2017. Their advanced passenger information system includes connection information when arriving at stations.
Upgrades of the station information system at stations on the Shenfield line will allow local announcements to be made by staff at the station during disruption
This year the Customer Experience Director and Head of Customer Experience delivered communication during disruption training to all customer facing staff.
Transparency and accountability All train operators should publish the actions they are taking to improve passenger information in a Local Plan, together with the industry Code of Practice and an Annual Progress Report. Local Plans should be reviewed annually.
• Code of Practice – October 2016 • Local Plan – May 2015
https://goo.gl/dWG9Qe
As the Code of Practice has changed since the Local Plan was published, ORR is working with TfL Rail to produce a updated Local Plan. Documents are published on the MTR Crossrail website rather than TfL.
Change on last year
Note: not all data available due to low response for this questionPP = percentage point changeSource: Transport Focus, National Rail Passenger SurveyThe NRPS takes place twice a year, in Spring (S) and Autumn (A)
*Note: This data is not published in the National Rail Passenger Survey due to a low response rate of fewer than 50 people.PP = percentage point changeSource: Transport Focus, National Rail Passenger SurveyThe NRPS takes place twice a year, in Spring (S) and Autumn (A)
*Note: This data is not published in the National Rail Passenger Survey due to a low response rate of fewer than 50 people.PP = percentage point changeSource: Transport Focus, National Rail Passenger SurveyThe NRPS takes place twice a year, in Spring (S) and Autumn (A)
TfL Rail data not available*
TfL Rail data not available*
National
44%
TfL Rail
-2.7 PP
Provision of information to passengers
Source: Train Operating Companies and LENNON (the rail industry’s ticketing and revenue database)Data tables: TOC Key statistics
Key factsOwner group: MTR Corporation
Operator: MTR Crossrail
TfL concession: TfL Rail
Concession period: May 2015 to May 2023
Employees: 754
Operated stations: 12
Passenger journeys per annum: 44.6 million
2012 2013 2014 2015 2016
Change on last year
Not available*
S A S A S A S A S A
35% -3.4 PP
100%
75%
50%
25%
0%
2012 2013 2014 2015 2016
Change on last year
S A S A S A S A S A
70%
72% 4.1 PP
-2.0 PP
100%
75%
50%
25%
0%
S A S A S A S A S A
100%
75%
50%
25%
0%
2012 2013 2014 2015 2016
TfL RailNational National

116
Office of Rail and Road | Annual Rail Consumer Report | July 2017
Actions to improve accessible travel 2016-17TfL Rail advertises a ‘Turn Up and Go’ service for assisting disabled and older passengers who wish to arrive and travel on TfL Rail services without booking in advance. This includes help with luggage.
TfL Rail’s Disabled People’s Protection Policy is available at: http://www.orr.gov.uk/__data/assets/pdf_file/0013/23044/review-tfl-rail-dppp.pdf
Alternative accessible transport All operators must provide free alternative transport to take passengers to the nearest or most convenient accessible station in certain circumstances:
• When a station is inaccessible to the passenger;
• When rail replacement services are running that are not accessible to the passenger (because of planned engineering works for example); or
• When there is disruption to services at short notice that, for whatever reason, makes services inaccessible to disabled passengers.
In 2016-17 alternative accessible transport was provided 55 times by TfL Rail.
TfL Rail received 1,435 booked assistance
requests in 2016-17
This accounted for 0.1% of all booked
assists made nationally in 2016-17
Volume of booked assistance by rail period 2015-16 and 2016-17
Disability and equality staff training in 2016-17TfL Rail reports that all 754 employees attended a company induction which included disability and equality training. In addition all employees attended an equality workshop.
TfL Rail reports that it runs specific accessibility training four times per year for frontline staff and managers. This covers the Social Model of Disability within a railway context.
260 staff and managers completed ramp training during April and May 2017
Accessibility complaints rate (per 100,000 journeys) 2016-17
Note: TfL Rail received a low number of accessibility complaints (9 in 2015-16, and 21 in 2016-17). Due to the low numbers a percentage change for TfL Rail has not been providedSource: Train Operating Companies Data tables: Complaints by NRPS category by TOC - Table 14.5
Note: TfL Rail provided 772 unbooked assistances during 2016-17. These are excluded from the statistics above. A ‘rail period’ is normally 28 days, or four weeks, for business reporting purposes (Sunday to Saturday) and there are 13 rail periods in a financial year.Source: Rail Delivery Group (RDG)Data tables: Rail passenger assists by station operator - Table 16.03
Change on last year
Accessibility and inclusion
TfL Rail National
TfL Rail
Change on last year
-20.9%
150
200
250
100
50
0P1 P2 P3 P4 P5 P6 P7 P8 P9 P10 P11 P12 P13
16.4%0.05
0.3
2015-16 2016-17

117
Office of Rail and Road | Annual Rail Consumer Report | July 2017
TfL Rail Complaints handling
Top 5 reasons for complaints 2016-17
PP = percentage point changeSource: Train Operating Companies Data tables: Complaints by NRPS category by TOC - Table 14.5
Percentage of complaints
Complaint type Change on last year
36.9% Punctuality/reliability
9.0% Attitudes and helpfulness of staff at station
5.6% Personal security whilst using station
5.2% Facilities and services
4.3% Personal security on board
Passenger satisfaction with complaint handling process 2016-17
Passenger satisfaction with each aspect of complaint handling process 2016-17
How did the passenger feel about the train company in light of how their complaint was handled 2016-17
Complaints rate (per 100,000 journeys) and complaints response rate
PP = percentage point changeSource: Train Operating Companies and LENNON (the rail industry’s ticketing and revenue database)Data tables: Complaints rate by train operating company - Table 14.9
Change on last year
2015-16
3.1 2.9
2016-17
0.1 PP
-6.5%
97.7 97.8
Complaints rate (per 100,000
journeys)
Actions to improve services for passengers 2016-17 TfL Rail’s Complaints Handling Procedure is available at: http://www.orr.gov.uk/__data/assets/pdf_file/0013/23125/approval-mtr-corporation-trading-as-tfl-chp-letter.pdf
TfL Rail reports it has taken some of the following actions to address issues highlighted in passenger complaints:
• Reviewed all service performance complaints to identify how improvements to communication during disruption could be made and invested in a new employee app and a new radio system so that teams can communicate easily during disruption.
• Developed a new procedure to investigate complaints about staff.
• Implemented measures to prevent crowding on stations and trains.
• Closely managing cleaning standards and recently changed cleaning supplier.
2.2 PP
-2.0 PP
1.6 PP
0.2 PP
0.2 PP
% answered in 20
working days
TfL did not participate in the ORR complaints handling survey in 2016-17 but are in discussions with us to join the survey for 2017-18.
TfL did not participate in the ORR complaints handling survey in 2016-17 but are in discussions with us to join the survey for 2017-18.
TfL did not participate in the ORR complaints handling survey in 2016-17 but are in discussions with us to join the survey for 2017-18.

118
Office of Rail and Road | Annual Rail Consumer Report | July 2017
Passenger satisfaction with the usefulness of information when delays occur
Passenger satisfaction with how well the train company deals with delays
Passenger satisfaction with the provision of information during the journey
Actions to improve information for passengers 2016-17A new customer app was launched in 2016 which includes a real-time multi-modal journey planner.
New ticket machines that include real time departure information have been introduced.
New customer information screen software is rolling out to all 19 TPE stations, including Manchester Airport for the first time.
Transparency and accountability All train operators should publish the actions they are taking to improve passenger information in a Local Plan, together with the industry Code of Practice and an Annual Progress Report. Local Plans should be reviewed annually.
• Code of Practice – October 2016 • Local Plan – June 2014
https://goo.gl/1ahVGp
As the Code of Practice has changed since the Local Plan was published, a fully compliant version needs to be shared with ORR by Autumn 2017. An early draft has been reviewed.
Change on last year
PP = percentage point changeSource: Transport Focus, National Rail Passenger SurveyThe NRPS takes place twice a year, in Spring (S) and Autumn (A)
PP = percentage point changeSource: Transport Focus, National Rail Passenger Survey The NRPS takes place twice a year, in Spring (S) and Autumn (A)
PP = percentage point changeSource: Transport Focus, National Rail Passenger SurveyThe NRPS takes place twice a year, in Spring (S) and Autumn (A)
TransPennine Express National
59%
44% -2.7 PP
-2.2 PP
Provision of information to passengers
Source: Train Operating Companies and LENNON (the rail industry’s ticketing and revenue database)Data tables: TOC Key statistics
Key factsOwner group: FirstGroup
Operator: TransPennine Express
Franchise: TransPennine Express
Franchise period: 01 April 2016 – 21 March 2023
Employees: 1,111
Operated stations: 19
Sector: Regional / Long distance
Passenger journeys per annum: 26.8 million
2012 2013 2014 2015 2016
Change on last year
S A S A S A S A S A
53%
35% -3.4 PP
1.5 PP
100%
75%
50%
25%
0%
2012 2013 2014 2015 2016
Change on last year
S A S A S A S A S A
81%
70% -2.0 PP
3.3 PP
100%
75%
50%
25%
0%
S A S A S A S A S A
100%
75%
50%
25%
0%
2012 2013 2014 2015 2016
National National
TransPennine Express
TransPennine Express TransPennine Express

119
Office of Rail and Road | Annual Rail Consumer Report | July 2017
Actions to improve accessible travel 2016-17TPE provides free car parking for blue badge holders.
It provides compensation for passengers if booked assistance is not provided.
It runs an Accessibility Consultation Forum, made up of a group of passengers with accessibility needs with whom it consults on access improvements.
TPE’s Disabled People’s Protection Policy is available at: http://www.orr.gov.uk/__data/assets/pdf_file/0010/21142/tpe-review-of-dppp-letter.pdf
Alternative accessible transport All operators must provide free alternative transport to take passengers to the nearest or most convenient accessible station in certain circumstances:
• When a station is inaccessible to the passenger;
• When rail replacement services are running that are not accessible to the passenger (because of planned engineering works for example); or
• When there is disruption to services at short notice that, for whatever reason, makes services inaccessible to disabled passengers.
In 2016-17 alternative accessible transport was provided 50 times by TPE.
TPE received 23,914 booked assistance
requests in 2016-17
This accounted for 2.0% of all booked
assists made nationally in 2016-17
Volume of booked assistance by rail period 2015-16 and 2016-17
Disability and equality staff training in 2016-17In total 564 members of staff undertook some form of disability and equality training in 2016-17:• As part of their new franchise TPE committed to providing
disability awareness training for all customer service staff.
• 564 staff (91% of frontline staff) undertook disability and equality training in total, including conductors, catering hosts, revenue protection staff and managers.
• The course lasts 1 day and is delivered in-house. It was developed in partnership with Action on Hearing Loss, RNIB and Dementia Friends. Part of the programme involves e-learning which takes place in advance of the course using materials from Action on Hearing Loss and Dementia Friends. Materials supplied by RNIB for a practical exercise are also used.
Accessibility complaints rate (per 100,000 journeys) 2016-17
Source: Train Operating Companies Data tables: Complaints by NRPS category by TOC - Table 14.5
Note: This excludes unbooked assistance. A ‘rail period’ is normally 28 days, or four weeks, for business reporting purposes (Sunday to Saturday) and there are 13 rail periods in a financial year.Source: Rail Delivery Group (RDG)Data tables: Rail passenger assists by station operator - Table 16.03
Change on last year
Change on last year
Accessibility and inclusion
TransPennine Express
National
Change on last year
-5.6%
4,000
6,000
8,000
10,000
12,000
2,000
0P1 P2 P3 P4 P5 P6 P7 P8 P9 P10 P11 P12 P13
76.1% 16.4%
0.60.3
2015-16 2016-17
TransPennine Express

120
Office of Rail and Road | Annual Rail Consumer Report | July 2017
TransPennine ExpressComplaints handling
Top 5 reasons for complaints 2016-17
PP = percentage point changeSource: Train Operating Companies Data tables: Complaints by NRPS category by TOC – Table 14.5
Percentage of complaints
Complaint type Change on last year
21.2% Sufficient room for all passengers to sit/stand
10.4% Punctuality/reliability
9.3% Facilities on board
8.5% Ticketing and refunds policy
6.7% Ticket buying facilities - other
Passenger satisfaction with complaint handling process 2016-17
Passenger satisfaction with each aspect of complaint handling process 2016-17
How did the passenger feel about the train company in light of how their complaint was handled 2016-17
Complaints rate (per 100,000 journeys) and complaints response rate
PP = percentage point changeSource: Train Operating Companies and LENNON (the rail industry’s ticketing and revenue database)Data tables: Complaints rate by train operating company – Table 14.9
Change on last year
2015-16
42.7 37.9
2016-17
-19.9 PP
-11.3%
-12 PP
-9 PP
-6 PP
-14 PP
-5 PP
-8 PP
13 PP
100.080.1
Complaints rate (per 100,000
journeys)
Satisfaction with complaints handling process
Satisfaction with outcome of complaint
Sample size: 832Source: ORR – Passenger satisfaction with complaint handling survey Data tables: Passenger satisfaction with complaints handling
Sample size: 832PP = percentage point changeSource: ORR – Passenger satisfaction with complaint handling survey Data tables: Passenger satisfaction with complaints handling
Sample size: 832PP = percentage point changeSource: ORR – Passenger satisfaction with complaint handling surveyData tables: Passenger satisfaction with complaints handling
TransPennine Express
The ease with which you were able to make the complaint More positive
about them
National
TransPennine Express
TOC was helpful / knowledgeable
No different
National
The time taken to deal with your complaint
Your complaint was fully addressed by TOC
0% 0%50% 50%100% 100%
More negative about them
Satisfied
Neither
Dissatisfied
42%
18%
31%
25%
29%
13%
17%
10%
12%
69%
52%
65%
59%
22%
8%
24%
68%
18%
23% 66%
11%
11%
71%
23% 55%
18% 40%
Actions to improve services for passengers 2016-17 TPE’s Complaints Handling Procedure is available at: http://www.orr.gov.uk/__data/assets/pdf_file/0012/21144/tpe-review-of-chp-letter.pdf
TPE reports it has taken some of the following actions to address issues highlighted in passenger complaints:
• 220 new trains on order to provide more seats. Until it starts to receive the first new trains in Spring 2018 it will ensure planning of service capacity and train maintenance maximises current rolling stock.
• On-board catering has been improved, including by opening a depot for customer hosts in Edinburgh.
• Introduction of a ‘buy on board’ card for times when the booking office is busy. Staff have been deployed to floor walk, sell tickets and train customers on new TVMs.
• Changes have been made to the mobile app, including improvements to the Live Departure boards information.
10.6 PP
-12.1 PP
-8.7 PP
3.0 PP
1.5 PP
% answered in 20
working days
‘Satisfied’ compared to
national averageSatisfied Neither Dissatisfied
Comparison to national average

121
Office of Rail and Road | Annual Rail Consumer Report | July 2017
Passenger satisfaction with the usefulness of information when delays occur
Passenger satisfaction with how well the train company deals with delays
Passenger satisfaction with the provision of information during the journey
Actions to improve information for passengers 2016-17The @Virgin_trainsEC Twitter account now provides a 24 hour service to over 136,000 followers to provide service information updates and answer queries.
Transparency and accountability All train operators should publish the actions they are taking to improve passenger information in a Local Plan, together with the industry Code of Practice and an Annual Progress Report. Local Plans should be reviewed annually.
• Code of Practice – October 2016 • Local Plan – March 2017
https://goo.gl/zcfmfC Although updated in 2017, the Local Plan refers to the previous Code of Practice. A fully compliant version needs to be shared with ORR by Autumn 2017.
Change on last year
PP = percentage point changeSource: Transport Focus, National Rail Passenger SurveyThe NRPS takes place twice a year, in Spring (S) and Autumn (A)
PP = percentage point changeSource: Transport Focus, National Rail Passenger SurveyThe NRPS takes place twice a year, in Spring (S) and Autumn (A)
PP = percentage point changeSource: Transport Focus, National Rail Passenger SurveyThe NRPS takes place twice a year, in Spring (S) and Autumn (A)
Virgin Trains East Coast
Virgin Trains East Coast
National
National
61%
44%
Virgin Trains East Coast
-2.7 PP
0.0 PP
Provision of information to passengers
Source: Train Operating Companies and LENNON (the rail industry’s ticket and revenue database)Data tables: TOC Key statistics
Key factsOwner group: Virgin Group & Stagecoach
Operator: Virgin Trains East Coast (VTEC)
Franchise: InterCity East Coast
Franchise period: 01 March 2015 – 31 March 2023
Employees: 3,294
Operated stations: 11
Sector: Long distance
Passenger journeys per annum: 21.7m
2012 2013 2014 2015 2016
Change on last year
S A S A S A S A S A
61%
35% -3.4 PP
-1.7 PP
100%
75%
50%
25%
0%
2012 2013 2014 2015 2016
Change on last year
S A S A S A S A S A
78%
70% -2.0 PP
-2.8 PP
100%
75%
50%
25%
0%
S A S A S A S A S A
100%
75%
50%
25%
0%
2012 2013 2014 2015 2016
Virgin Trains East Coast National

122
Office of Rail and Road | Annual Rail Consumer Report | July 2017
Actions to improve accessible travel 2016-17VTEC commit to providing a free upgrade to the first class wheelchair space (if available) for a passenger and companion when a standard wheelchair space is not available to book.
VTEC is piloting the Virgin Explorer App at King’s Cross and Peterborough stations. It is designed to help with wayfinding around the stations and provide location based engagement e.g. relevant notifications.
VTEC’s Disabled People’s Protection Policy is available at: http://www.orr.gov.uk/__data/assets/pdf_file/0019/22906/vtec-dppp.pdf
Alternative accessible transport All operators must provide free alternative transport to take passengers to the nearest or most convenient accessible station in certain circumstances:
• When a station is inaccessible to the passenger;
• When rail replacement services are running that are not accessible to the passenger (because of planned engineering works for example); or
• When there is disruption to services at short notice that, for whatever reason, makes services inaccessible to disabled passengers.
In 2016-17 alternative accessible transport was provided 80 times by VTEC.
VTEC received 104,239 booked assistance
requests in 2016-17
This accounted for 8.7% of all booked
assists made nationally in 2016-17
Volume of booked assistance by rail period 2015-16 and 2016-17
Disability and equality staff training in 2016-17352 VTEC staff undertook some form of disability and equality training in 2016-17:
• 299 staff attended induction training covering an introduction to disability awareness. Of these 119 front line staff went on to attend the full disability awareness training course.
• A ‘Front Line Ready’ training workshop also took place and was attended by 53 non-frontline mangers and covered aspects of disability awareness.
VTEC are also piloting a new practice-based approach to training staff who assist disabled passengers. It is intended to make staff more confident when interacting with passengers in real life situations.
Accessibility complaints rate (per 100,000 journeys) 2016-17
Source: Train Operating Companies Data tables: Complaints by NRPS category by TOC - Table 14.5
Note: This excludes unbooked assistance. A ‘rail period’ is normally 28 days, or four weeks, for business reporting purposes (Sunday to Saturday) and there are 13 rail periods in a financial year.Source: Rail Delivery Group (RDG)Data tables: Rail passenger assists by station operator - Table 16.03
Change on last year
Change on last year
Accessibility and inclusion
Virgin Trains East Coast
National
Virgin Trains East Coast
Change on last year
3.0%8,000
10,000
12,000
6,000
4,000
2,000
0P1 P2 P3 P4 P5 P6 P7 P8 P9 P10 P11 P12 P13
-11.9% 16.4%
2.3
0.3
2015-16 2016-17

123
Office of Rail and Road | Annual Rail Consumer Report | July 2017
160.8
108.8
Virgin Trains East Coast Complaints handling
Top 5 reasons for complaints 2016-17
PP = percentage point changeSource: Train Operating Companies Data tables: Complaints by NRPS category by TOC - Table 14.5
Percentage of complaints
Complaint type Change on last year
23.9% Facilities on board
12.8% Ticket buying facilities - other
10.7% Sufficient room for all passengers to sit/stand
5.9% Company policy (misc)
5.6% Ticketing and refunds policy
Passenger satisfaction with complaint handling process 2016-17
Passenger satisfaction with each aspect of complaint handling process 2016-17
How did the passenger feel about the train company in light of how their complaint was handled 2016-17
Complaints rate (per 100,000 journeys) and complaints response rate
PP = percentage point changeSource: Train Operating Companies and LENNON (the rail industry’s ticketing and revenue database)Data tables: Complaints rate by train operating company - Table 14.9
Change on last year
2015-16 2016-17
-32.3%
-11.0 PP
-1 PP
-3 PP
-3 PP
-4 PP
-2 PP
-5 PP
7 PP
94.0 83.0
Satisfaction with complaints handling process
Satisfaction with outcome of complaint
Sample size: 4,857Source: ORR – Passenger satisfaction with complaint handling survey Data tables: Passenger satisfaction with complaints handling
Sample size: 4,857PP = percentage point changeSource: ORR – Passenger satisfaction with complaint handling survey Data tables: Passenger satisfaction with complaints handling
Sample size: 4,857PP = percentage point changeSource: ORR – Passenger satisfaction with complaint handling surveyData tables: Passenger satisfaction with complaints handling
Virgin Trains East Coast
More positive about them
National
Virgin Trains East Coast
No different
National
0% 50% 100%
More negative about them
Satisfied
Neither
Dissatisfied
27%
31%
27%
29%
16%
17%
11%
12%
52%
62%
59%
12%
27%
61%
The ease with which you were able to make the complaint
TOC was helpful / knowledgeable
The time taken to deal with your complaint
Your complaint was fully addressed by TOC
0% 50% 100%
53%
29%
28%
26% 62%
13%
12%
59%
24% 47%
17% 31%
Actions to improve services for passengers 2016-17VTEC’s Complaints Handling Procedure is available at: http://www.orr.gov.uk/__data/assets/pdf_file/0019/22933/vtec-chp-letter.pdfVTEC reports it has taken some of the following actions in 2016-17 to address issues highlighted in passenger complaints:
• Refurbished all trains with new seats and lighting, improved wifi and quality of food.
• Made improvements to on-board toilets.
• Installed new, easier to use ticket machines.
• Improved information screens to give arrival time information.
• Introduced an infographic to help customers without a reservation find a seat.
5.0 PP
8.2 PP
4.8 PP
5.6 PP
-1.1 PP
Complaints rate (per 100,000
journeys)57%
% answered in 20
working days
‘Satisfied’ compared to
national averageSatisfied Neither Dissatisfied
Comparison to national average

124
Office of Rail and Road | Annual Rail Consumer Report | July 2017
Passenger satisfaction with the usefulness of information when delays occur
Passenger satisfaction with how well the train company deals with delays
Passenger satisfaction with the provision of information during the journey
Actions to improve information for passengers 2016-17Smart devices continue to be rolled out to frontline staff to give them access to the latest information during periods of disruption.
Train Managers have been through a refresher training programme to remind them of their responsibilities during periods of disruption.
Transparency and accountability All train operators should publish the actions they are taking to improve passenger information in a Local Plan, together with the industry Code of Practice and an Annual Progress Report. Local Plans should be reviewed annually.
• Code of Practice – July 2014 • Local Plan – September 2015
https://goo.gl/K8ZQ3z
As the Code of Practice has changed since the Local Plan was published, a fully compliant version needs to be shared with ORR by Autumn 2017.
Change on last year
PP = percentage point changeSource: Transport Focus, National Rail Passenger SurveyThe NRPS takes place twice a year, in Spring (S) and Autumn (A)
PP = percentage point changeSource: Transport Focus, National Rail Passenger Survey The NRPS takes place twice a year, in Spring (S) and Autumn (A)
PP = percentage point changeSource: Transport Focus, National Rail Passenger SurveyThe NRPS takes place twice a year, in Spring (S) and Autumn (A)
Virgin Trains West Coast
National
65%
44%
Virgin Trains West Coast
-2.7 PP
0.3 PP
Provision of information to passengers
Source: Train Operating Companies and LENNON (the rail industry’s ticketing and revenue database)Data tables: TOC Key statistics
Key factsOwner group: Virgin Group & Stagecoach
Operator: Virgin Trains West Coast (VTWC)
Franchise: InterCity West Coast
Franchise period: 09 March 1997 – 01 April 2018
Employees: 3,510
Operated stations: 17
Sector: Long distance
Passenger journeys per annum: 37.7 million
2012 2013 2014 2015 2016
Change on last year
S A S A S A S A S A
60%
35% -3.4 PP
-1.3 PP
100%
75%
50%
25%
0%
2012 2013 2014 2015 2016
Change on last year
S A S A S A S A S A
70%
84% 1.9 PP
-2.0 PP
100%
75%
50%
25%
0%
S A S A S A S A S A
100%
75%
50%
25%
0%
2012 2013 2014 2015 2016
Virgin Trains West Coast
Virgin Trains West Coast
National National
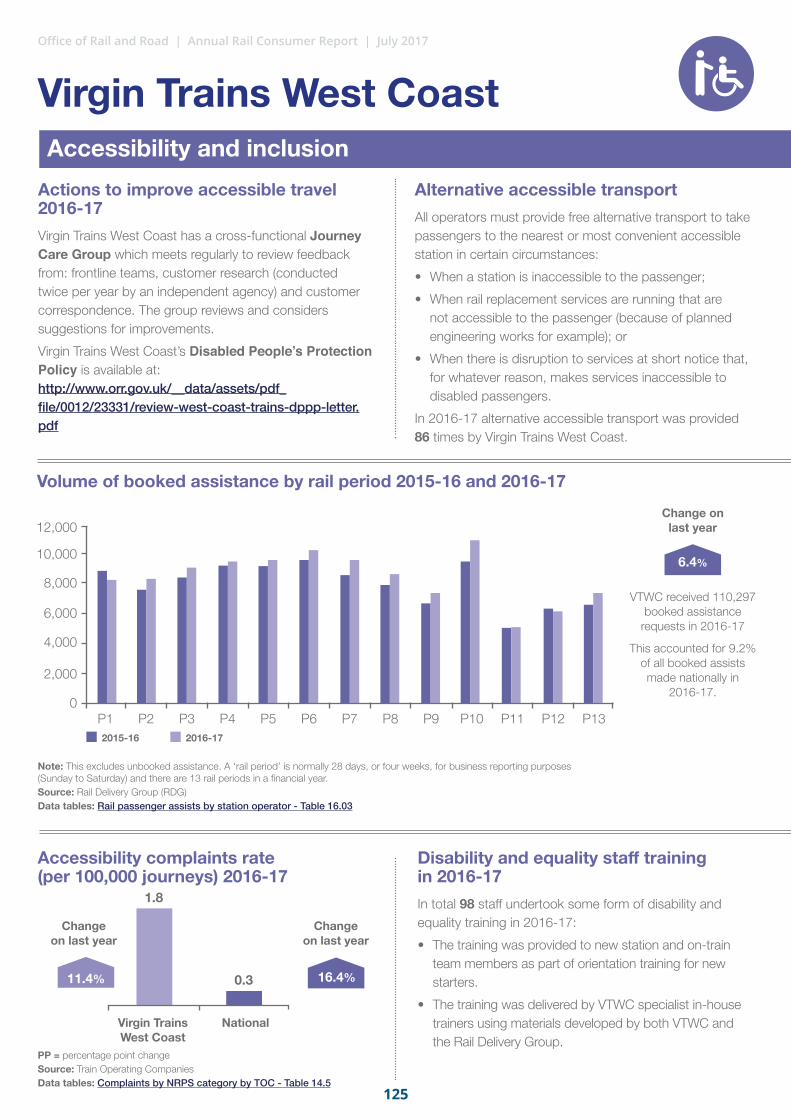
125
Office of Rail and Road | Annual Rail Consumer Report | July 2017
Actions to improve accessible travel 2016-17Virgin Trains West Coast has a cross-functional Journey Care Group which meets regularly to review feedback from: frontline teams, customer research (conducted twice per year by an independent agency) and customer correspondence. The group reviews and considers suggestions for improvements.
Virgin Trains West Coast’s Disabled People’s Protection Policy is available at: http://www.orr.gov.uk/__data/assets/pdf_file/0012/23331/review-west-coast-trains-dppp-letter.pdf
Alternative accessible transport All operators must provide free alternative transport to take passengers to the nearest or most convenient accessible station in certain circumstances:
• When a station is inaccessible to the passenger;
• When rail replacement services are running that are not accessible to the passenger (because of planned engineering works for example); or
• When there is disruption to services at short notice that, for whatever reason, makes services inaccessible to disabled passengers.
In 2016-17 alternative accessible transport was provided 86 times by Virgin Trains West Coast.
VTWC received 110,297 booked assistance
requests in 2016-17
This accounted for 9.2% of all booked assists made nationally in
2016-17.
Volume of booked assistance by rail period 2015-16 and 2016-17
Disability and equality staff training in 2016-17In total 98 staff undertook some form of disability and equality training in 2016-17:
• The training was provided to new station and on-train team members as part of orientation training for new starters.
• The training was delivered by VTWC specialist in-house trainers using materials developed by both VTWC and the Rail Delivery Group.
Accessibility complaints rate (per 100,000 journeys) 2016-17
PP = percentage point changeSource: Train Operating Companies Data tables: Complaints by NRPS category by TOC - Table 14.5
Note: This excludes unbooked assistance. A ‘rail period’ is normally 28 days, or four weeks, for business reporting purposes (Sunday to Saturday) and there are 13 rail periods in a financial year.Source: Rail Delivery Group (RDG)Data tables: Rail passenger assists by station operator - Table 16.03
Change on last year
Change on last year
Accessibility and inclusion
Virgin Trains West Coast
National
Virgin Trains West Coast
Change on last year
6.4%
6,000
8,000
10,000
12,000
4,000
2,000
0P1 P2 P3 P4 P5 P6 P7 P8 P9 P10 P11 P12 P13
11.4% 16.4%
1.8
0.3
2015-16 2016-17

126
Office of Rail and Road | Annual Rail Consumer Report | July 2017
Virgin Trains West Coast Complaints handling
Top 5 reasons for complaints 2016-17
PP = percentage point changeSource: Train Operating Companies Data tables: Complaints by NRPS category by TOC - Table 14.5
Percentage of complaints
Complaint type Change on last year
20.6% Facilities on board
11.7% Ticketing and refunds policy
11.3% Punctuality/reliability
11.0% Ticket buying facilities - other
7.2% Ticket buying facilities
Passenger satisfaction with complaint handling process 2016-17
Passenger satisfaction with each aspect of complaint handling process 2016-17
How did the passenger feel about the train company in light of how their complaint was handled 2016-17
Complaints rate (per 100,000 journeys) and complaints response rate
PP = percentage point changeSource: Train Operating Companies and LENNON (the rail industry’s ticketing and revenue database)Data tables: Complaints rate by train operating company – Table 14.9
Change on last year
2015-16
181.8154.3
69.1
2016-17
-15.1%
-19.3 PP88.4
Complaints rate (per 100,000
journeys)
Actions to improve services for passengers 2016-17 Virgin Trains West Coast’s Complaints Handling Procedure is available at: http://www.orr.gov.uk/__data/assets/pdf_file/0008/22895/virgin-trains-chp-letter.pdfVirgin Trains West Coast reports it has taken some of the following actions to address issues highlighted in passenger complaints:
• Mobile ticketing is promoted as one of the easiest methods for customers and in November 2016 the e-ticket was added to the Apple Wallet to make it easier to access.
• An app called BEAM can now be downloaded to provide free onboard entertainment.
• Where customers are delayed by more than 30 minutes, automatic compensation is reimbursed to those who booked Advance tickets via its website or app.
0.3 PP
-0.7 PP
-10.1 PP
4.3 PP
2.6 PP
% answered in 20
working days
Virgin Trains West Coast currently conducts its own customer satisfaction survey into complaints handling, and did not participate in the ORR complaints handling survey during 2016-17. It has since committed to joining the ORR survey during the course of 2017-18.
Virgin Trains West Coast currently conducts its own customer satisfaction survey into complaints handling, and did not participate in the ORR complaints handling survey during 2016-17. It has since committed to joining the ORR survey during the course of 2017-18.
Virgin Trains West Coast currently conducts its own customer satisfaction survey into complaints handling, and did not participate in the ORR complaints handling survey during 2016-17. It has since committed to joining the ORR survey during the course of 2017-18.
127
Office of Rail and Road | Annual Rail Consumer Report July 2017
ANNEXES AND GLOSSARY
Glossary of termsAlternative Dispute Resolution (ADR) – Refers to ways of resolving disputes between consumers and traders that do not involve going to court. Common forms of ADR are: mediation, where an independent third party helps the disputing parties to come to a mutually acceptable outcome; and arbitration, where an independent third party considers the facts and takes a decision that is often binding on one or both parties.
Complaints Handling Procedure (CHP) -Train and station companies are required by their operating licences to establish and comply with a procedure for handling complaints relating to licensed activities from customers and potential customers. This procedure is known as the 'complaints handling procedure' (CHP). The CHP is approved and monitored by ORR.
Concession train companies – A concession involves an agreement between government or a local authority and a train company to supply rail services. The main difference from a franchise is that the train company is paid a fee to run the service rather than relying on revenue from the passengers or government subsidy. Typically, revenue raised is passed back to the public body that appointed the concession. Concessions are usually very tightly specified, using incentive or penalty regimes (based on meeting certain targets) to encourage good performance. An example of a concession currently operating in the rail market is Merseyrail, which runs services for Merseytravel, the body that manages integrated transport in and around Liverpool.
Consumer Law – Protection in place to ensure the rights of consumers as well as fair trade, competition and accurate information in the marketplace. In this document referring to The Enterprise Act 2002, The Consumer Rights Act 2015, and The Consumer Protection (from Unfair Trading) Regulations 2008.
DfT – The Department for Transport; a ministerial department within government.
Disabled People's Protection Policy (DPPP) – Train and station companies are required by their operating licences to establish and comply with a Disabled People's Protection Policy (DPPP), approved by ORR. A DPPP sets out, amongst other things, the
arrangements and assistance that a company will provide to protect the interests of disabled people using its services and to facilitate such use.
Disabled Persons Transport Advisory Committee (DPTAC) – Advises the government on transport legislation, regulations and guidance concerning the transport needs of disabled people, and works to ensure disabled people have the same access to transport as everyone else.
Franchised passenger train companies – A rail franchise is a contract between government or a public authority and a train company to run services within a specified geographic area or route for an agreed period of time. Franchises are awarded through a bidding process where the franchising authority specifies the length of the franchise, service schedules and performance standards, and other requirements such as the passenger compensation scheme that it considers should be in place for passengers within that franchise.
London TravelWatch – The independent, statutory body for transport users in and around London. It is funded by the London Assembly and investigates complaints from people unhappy with the response they have received from their transport provider.
National Rail Conditions of Travel – An agreement between a passenger and train company which applies to all domestic (non-international) journeys by scheduled passenger train services on the railway network of Great Britain. They set out passengers’ and train companies’ rights and obligations when travelling by train.
National Rail Enquiries (NRE) – The source of customer information for all passenger rail services on the National Rail network in England, Wales and Scotland. The National Rail Enquiries website, run by RDG, includes a real-time journey planner, fares and live departure information.
National Task Force (NTF) – The body through which the industry cooperated to improve performance. It brought together passenger and freight operators, Network Rail, the Office of Rail and Road and the Department for Transport. It had set three overarching national themes for attention: better timetables; better operations; and better assets. It has now been transferred to RDG.

128
Office of Rail and Road | Annual Rail Consumer Report July 2017
Network Rail – The national rail network (track and related infrastructure) is owned and operated by Network Rail. It derives its revenue primarily from charges levied on train operators for access to its network and stations, and from a direct financial ‘network grant’ from the government. Network Rail also owns and operates 18 of Britain’s largest and busiest stations – including 10 stations in London. Part 5 of this report sets out how Network Rail is fulfilling its obligations to passengers under its station licence.
Open access train companies – Open access companies do not operate services under a franchise or a concession agreement but they are authorised by ORR to have access to the network on certain routes for a specified amount of time. There are currently three open access companies: Grand Central and First Hull Trains (which operate a small number of services on specified routes in competition to the franchisee on the East Coast main line) and Heathrow Express which runs services from Paddington to Heathrow Terminals. Together they represent less than 1% of passenger miles.
Other non-franchised companies – These include heritage railways, such as those using steam locomotives, and operating as tourist attractions.
Passenger Assist – The central system provided by RDG which is used by people booking help. It means passengers are able to book assistance without having to contact more than one company.
Passenger Information During Disruption (PIDD) – In 2012, ORR introduced a new condition on the provision of information for passengers into train company and station licences. The purpose was to ensure that passengers receive appropriate, accurate and timely information about train services so they can plan and make journeys with a reasonable degree of assurance. A code of practice was subsequently published and operators published their own local plans to show how they would comply with this. To ensure the code is delivering benefits for passengers we have worked with stakeholders to develop a list of improvement actions to ensure passengers get the information they need when services are disrupted, at the right time, and through appropriate channels.
Rail Delivery Group (RDG) – ATOC (Association of Train Operating Companies) was set up in 1993, as the official voice of passenger train companies. In 2011, it was joined by the Rail Delivery Group which was responsible for policy formulation and communications on behalf of the whole rail industry. In October 2016, the single name of Rail Delivery Group was adopted to describe the two organisations.
Rail Period – The rail industry reports data on a periodic basis different to the widely recognised reporting cycles such as monthly or quarterly. A ‘period’ is normally 28 days, or four weeks, for business reporting purposes (Sunday to Saturday) and there are 13 periods in a financial year. The length of a period may differ at the end of the financial year, 31 March, and the beginning of the financial year, 1 April, to ensure that a break is made at 31 March.
Train company – The term ‘company’ instead of ‘operator’ has been used throughout this report to refer to passenger and/or station licence holders.
Transport Focus – Transport Focus (previously Passenger Focus) is the independent transport user representative body. It is structured as an executive non-departmental public body, sponsored by DfT. Its mission is to get the best deal for passengers and road users.
Transport for London (TfL) – TfL is the local government organisation responsible for most aspects of London's transport system.
Ticket Vending Machine (TVM) – A machine that dispenses train tickets at railway stations, transit tickets at metro stations, and tram tickets at some tram stops and in some trams. The typical transaction consists of using the display interface to select the type and quantity of tickets and then choosing a payment method of cash, credit/debit card or smartcard. It also provides for the collection of pre-purchased tickets. The ticket or tickets are printed and dispensed to the user.

129
Office of Rail and Road | Annual Rail Consumer Report July 2017
Annex A - Passenger and station licences and ORR’s consumer law enforcement powersPassenger and station licences Licensing is one of ORR’s core statutory functions. Any entity that wants to operate a train, station, network or light maintenance depot must be covered by a licence or licence exemption.
In relation to our consumer role, there are three important passenger and station licence conditions: passenger information including during disruption (PIDD), disabled people’s protection policies (DPPP) and complaints handling procedures (CHP). These conditions are covered in the main report, as well as in the individual data sheets for each train company.
Model licences and more information can be found on our website: http://www.orr.gov.uk/rail/licensing/licensing-the-railway/model-licences-and-statements-of-national-regulatory-provisions-snrps.
Consumer law
Enterprise Act 2002ORR is a designated enforcer of consumer law under Part 8 of the Enterprise Act 200256. As such, ORR can take action in relation to breaches of certain pieces of consumer law, where there is evidence of “harm to the collective interests of consumer”. We have published guidance on our approach to the enforcement of consumer law in the rail sector57.
The most relevant pieces of consumer law are the Consumer Rights Act 201558 and the Consumer Protection (from Unfair Trading Regulations) 200859.
The Consumer Rights Act 2015The Consumer Rights Act 2015 came fully into force in rail on 1 October 2016. The Act provides individual consumers with rights in relation to the sale and supply of goods, services, and digital content and contains provisions relating to the fairness of contract terms.
For example, services must be provided with “reasonable care and skill” and in accordance with how the trader describes the service. Where services don’t comply with these requirements, the Act provides remedies to consumers, which include a reduction in the price (or a refund where the consumer has already paid for the service).
The Consumer Protection (from Unfair Trading) Regulations 2008 (CPRs)The Regulations prohibit unfair, misleading, and aggressive commercial practices. Commercial practices can mislead by act or omission and traders are effectively required to provide consumers with the information that is material to their decision, for example to buy a ticket or exercise their rights, and to do so in a way that is clear, unambiguous, and timely.
The industry’s Retail Information Code of Practice provides guidance on how these information requirements translate to the rail context60.
56. http://www.legislation.gov.uk/ukpga/2002/40/contents57. http://www.orr.gov.uk/__data/assets/pdf_file/0017/5552/guidance_on_our_consumer_law_role_310310.pdf58. http://www.legislation.gov.uk/ukpga/2015/15/contents/enacted59. http://www.legislation.gov.uk/uksi/2008/1277/contents/made60. https://www.raildeliverygroup.com/media-centre/press-releases/2015/186-2015-03-25-1.html

130
Office of Rail and Road | Annual Rail Consumer Report July 2017
Annex B - Compensation gap: methodology and backgroundOne of the mechanisms we are using to assess the extent to which the actions and progress described above are having an impact in terms of passengers actually making claims is what we call our ‘compensation gap’ analysis, which measures the difference between compensation that is due and compensation that is paid.
In our March 2016 response report61 we summarised a range of evidence on the compensation gap. This range included:
■ Survey evidence, obtained by asking eligible passengers whether they had claimed delay compensation; and
■ The results of original top-down analysis carried out by ORR in early 2016.
In our March 2016 response report we noted that the full range of estimates available at the time was wide and sufficiently uncertain to make it inappropriate for us to arrive at a single point estimate of the size of the gap. In summing up we said that “overall it seemed fairly likely to us that on the basis of volume around 80% or more of potential claims go unclaimed… but … value-based estimates are suggestive of a considerably smaller compensation gap.” We reached this view based on our assessment of all of the information available to us at the time.
In the March 2016 response report we committed to carrying out an update, described in the remainder of this Annex, specifically to, “…working with the industry to agree…indicators that will show how the take-up of compensation is changing over time”.
In June 2016 we wrote to train companies asking for their comments on a proposed framework for our update. The proposal was essentially to carry out a repeat of our March 2016 exercise. This proposal received broad agreement from train companies, albeit with some concerns, particularly regarding the potential for misleading comparisons to be made between train companies. Reflecting these concerns we said in December 201662 that we, “…[did] not plan to publish any train company-specific estimates of the compensation gap without further engagement with the relevant stakeholders.”
In our update we looked for progress by comparing:
■ Estimates of the compensation gap that were available in March 2016, i.e. at the time we published our response report, with
■ Estimates of the compensation gap obtained from surveys carried out subsequent to March 2016, and from ORR’s own estimates updated by drawing on the most recent data possible.
Updated top down analysis - approachOur update closely followed the previous methodology, meaning that the key description and caveats set out in Chapter 7 of the March 2016 response report apply equally to this update. The principal refinements that we made in our update were as follows:
■ Unit of measurement – in our March 2016 response report we published estimates calculated based on both the monetary value and number of pay-outs. In this 2017 update we focus on the latter measure only.
- A first reason for this was to facilitate comparison with the available survey estimates, which are all measured in terms of number rather than value of claims.
- A second and more important reason reflects the limitations of the approach used in our March 2016 response report, whereby we assumed that all delayed passengers had paid the average fare for the train company they were travelling with. This means that:
■ Focusing on the number of pay-outs rather than their value reduces the number of approximate assumptions used in our calculations.
■ Given that average fares only change slowly over time, trends over time in volume and value-based results would be very similar.
61. http://www.orr.gov.uk/__data/assets/pdf_file/0009/21141/which-super-complaint-response-report.pdf 62. http://www.orr.gov.uk/__data/assets/pdf_file/0020/23555/rail-compensation-update-report-december-2016.pdf

131
Office of Rail and Road | Annual Rail Consumer Report July 2017
■ Time period – in this update we restricted our analysis to data from rail periods 9 through 13 inclusive only, i.e. between mid-November and the end of March. We collected a dataset that included these periods in three financial years: 2014-15, 2015-16, and 2016-17. We followed this approach in order to:
- Use the newest possible data at the time of writing, so as to attempt to capture the impact of the measures put in place by train companies in the months following the March 2016 response report; and also to
- Make comparisons with earlier years without the need for seasonal adjustment.
■ Range of estimates - in March 2016 we estimated the amount of compensation due by assuming that train companies would be liable to pay delay compensation for all delays of 30 minutes63 or more, calculated as the sum of both delay minutes and deemed minutes64. In our update we present figures as a range whereby we estimate:
- Firstly, compensation due calculated using delay minutes only, and hence an upper bound for the proportion of compensation that train companies have paid out; and
- Secondly, compensation due calculated (as in our March 2016 response report) as the sum of delay minutes and deemed minutes, and `hence a lower bound for the proportion of compensation that train companies have paid out; and
■ Other – various, most notably:
- We modified our approach in order to arrive at more accurate estimates of the average number of passengers per service by stop; and
- Due to data issues we arrived at our final estimates of the compensation gap by excluding the information submitted to us by GTR.
Results and conclusions
Survey evidenceThe survey evidence that has become available since we wrote the March 2016 response report suggests that there has been an increase in the proportion of due compensation that is claimed.
Between March and April 2016 we, together with Transport Focus and DfT, conducted passenger research into delay compensation. This research showed that 35% of eligible passengers claimed compensation or received automatic compensation for their most recent delay. This represented a significant increase from the 12% of eligible passengers found to be claiming in previous Transport Focus research65 carried out in 2013.
We have additionally considered newer results from Transport Focus’s bi-annual National Rail Passenger Survey (NRPS)66. As shown in the Figure at the end of this Annex, this source also shows an increased take-up in delay compensation.
Results of our updated top-down analysisWe describe the results of our updated analysis in the paragraphs below. In the light of the limitations of our approach and the important differences that exist between train companies67 we have not published results relating to individual firms.
We estimated the ‘payout ratio’ (the proportion of compensation due that is paid out by train companies) for all train companies individually, and found, across our three years of comparison, an improved payout ratio for around three quarters of train companies. This still left around a quarter of train companies for whom we had observed a fall in the proportion of due compensation, but for all of these there were possible mitigating circumstances, for example that:
■ The fall in the payout ratio was small enough (e.g. around a single percentage point) to fall within the possible margins of error given the limitations of our approach;
■ The number of successful claims had increased but this increase had been outweighed by an increase in the number of passengers eligible to claim; and
■ The fall in the payout ratio had been at least in part caused by a move from a passenger charter to delay repay scheme, leading to a significant increase in the number of eligible passengers that had been accompanied by a proportionately smaller increase in the number of potential claims.
63. The threshold at which most compensation schemes become available.64. A pre-determined value in delay-minutes given to the cancellation of a train.65. ORR/Transport Focus research 2013 66. See http://www.transportfocus.org.uk/research/national-passenger-survey-introduction67. e.g. in terms of average fares, performance levels, and the generosity of their compensation schemes

132
Office of Rail and Road | Annual Rail Consumer Report July 2017
At an aggregate (all train companies) level the proportion of potential compensation claims that were paid out increased as follows (as above, periods 9 to 13 inclusive only). The ranges of our estimate of the compensation paid are detailed in the Figure at the end of this Annex:
■ 2014-15: between 13% and 31%;
■ 2015-16: between 17% and 39%; and
■ 2016-17: between 21% and 53%.
The bottom ends of these ranges, calculated using the sum of delay minutes and deemed minutes, correspond to the estimates cited in the March 2016 response report.
All evidence - summary and conclusionsAs outlined in the previous section, all the data sources (surveys and our own top-down analysis) described in this Annex show an increase in the proportion of potential claims that are successfully claimed by delayed passengers. This improvement is summarised in the Figure at the end of this section.
In summary:
■ The April 2016 ORR/Transport Focus survey shows a claim rate (35%) some 23 percentage points higher than in the findings of the 2013 survey evidence (12%). It is not possible for us to determine how much of this improvement was due to ORR’s intervention following the Which? super-complaint. Firstly, the two results were obtained three years apart68, and, secondly, methodological differences between the two mean that results are not directly comparable69. But at a minimum the improvement offers support to the increases found using other methods (see below).
■ Successive waves of the NRPS show a continued improvement over 2013-2016, with an improvement of around 3 percentage points occurring between the autumn 2015 and autumn 2016 survey waves, i.e. since the publication of our March 2016 response report. In our final assessment we have placed less weight on this result than either our top-down analysis or the survey evidence referred to in the previous bullet, which was focused on compensation issues and had a much larger sample size.
■ The ORR top down analysis shows an increase in claim rates as follows between 2014-15 rail periods 9-13 and 2016-17 rail periods 9-13 with an overall range of 7 to 22 percentage points:
- Bottom of range: 7 percentage points;
- Midpoint of range: 15 percentage points; and
- Top of range: 22 percentage points.
The high increase in the top of the ORR range relative to the bottom reflects significantly greater growth in the volume of payouts than in the number of services that were significantly late, which was partly offset by a relatively high increase in the number of services that were cancelled.
Given the measurement difficulties summarised in our response report it would be not be possible for us to arrive at a single definitive estimate of the proportion of due compensation that is now being claimed. The various available results were obtained using in some cases very different methodologies and datasets. We consider, however, based on the available evidence, that it would be reasonable for us to conclude that since March 2016 when we published our response to the Which? super-complaint there has been an increase of around 10 percentage points in the proportion of due compensation that has paid to passengers. This represents important progress.
We reached this view by rounding up the 7% increase at the bottom of the ORR analysis range to the nearest 10%. We carried out this rounding up in order to place some weight on the improvements in takeup implied by the ORR/Transport Focus survey evidence (23%) and also to some extent the increases shown by our survey results , whilst taking the view that:
■ We should place relatively low weight on the survey results given the issues involved in comparing the 2013 and 2016 results (see above); and
■ Within the ORR top-down ranges we should place most weight on the bottom ends of the ranges, where, as explained above, we estimated total compensation liability using the sum of delay minutes and deemed minutes. These represent in some respects our single best estimate of the payout ratio, given that both delays and cancellations have the potential to lead to
68. In this regard we note that the 2016 result is fairly similar to that of the 2015 Which? survey (see Figure below), which in our March 2016 response report we been inclined to place relatively little weight on, due to its relatively small sample size and status as something of an outlier when compared to other volume-based results.
69. See Rail delays and compensation – what passengers want - comparison between 2016 and 2013 results Prepared for Transport Focus, June 2016, https://www.transportfocus.org.uk/research-publications/publications/rail-delays-compensation/

133
Office of Rail and Road | Annual Rail Consumer Report July 2017
compensation liabilities. But we have also placing some weight on the midpoint of our range, whereby less than 100% weight is given to deemed minutes, given the potential for over-estimation of the total compensation liability using this method.
It remains the case, however, that a substantial proportion of potential payouts still go unclaimed.
Figure 10: Proportion of compensation due that is paid out (%)
ORR top down Which survey 2015 ORR/TF survey NRPS Xxxx
0%
10%
20%
30%
40%
50%
60%
Spring 2013 Autumn 2013 Spring 2014 Autumn 2014 Spring 2015 Autumn 2015 Spring 2016 Autumn 2016 Spring 2017
RHS: estimates newly available as of June 2017 (the cutoff for our update)
LHS: estimates available to our March 2016 response report
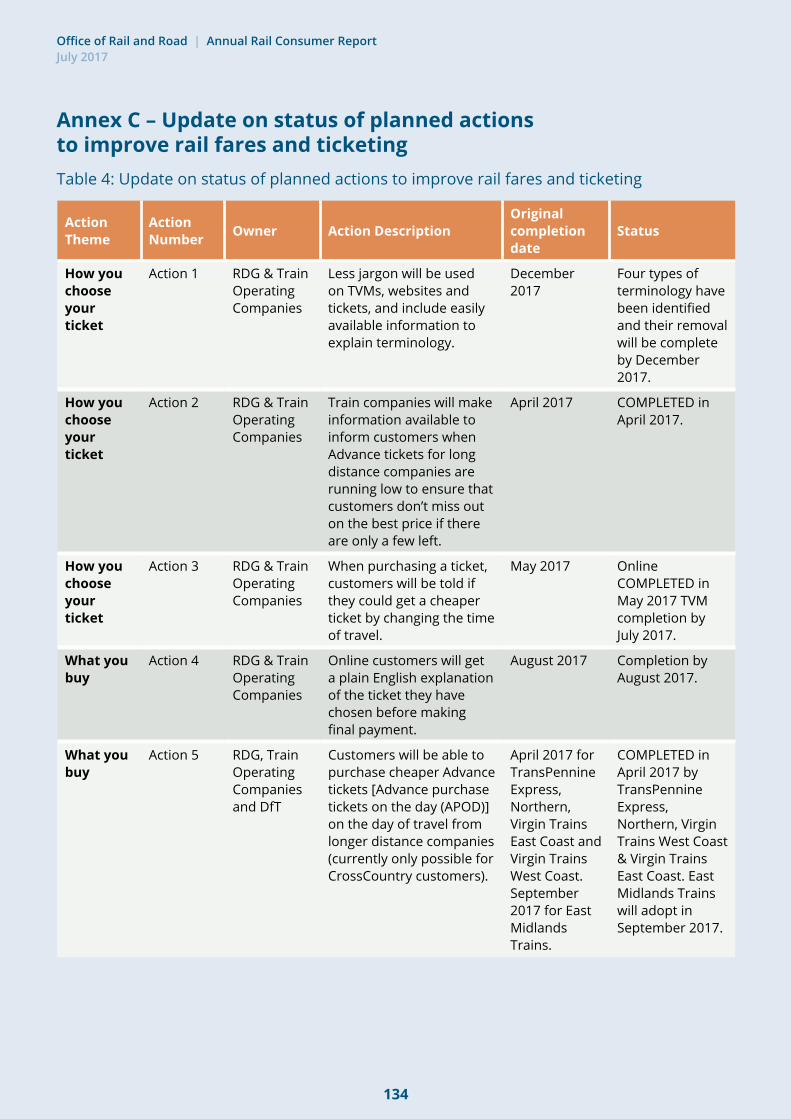
134
Office of Rail and Road | Annual Rail Consumer Report July 2017
Annex C – Update on status of planned actions to improve rail fares and ticketingTable 4: Update on status of planned actions to improve rail fares and ticketing
Action Theme
Action Number Owner Action Description
Original completion date
Status
How you choose your ticket
Action 1 RDG & Train Operating Companies
Less jargon will be used on TVMs, websites and tickets, and include easily available information to explain terminology.
December 2017
Four types of terminology have been identified and their removal will be complete by December 2017.
How you choose your ticket
Action 2 RDG & Train Operating Companies
Train companies will make information available to inform customers when Advance tickets for long distance companies are running low to ensure that customers don’t miss out on the best price if there are only a few left.
April 2017 COMPLETED in April 2017.
How you choose your ticket
Action 3 RDG & Train Operating Companies
When purchasing a ticket, customers will be told if they could get a cheaper ticket by changing the time of travel.
May 2017 Online COMPLETED in May 2017 TVM completion by July 2017.
What you buy
Action 4 RDG & Train Operating Companies
Online customers will get a plain English explanation of the ticket they have chosen before making final payment.
August 2017 Completion by August 2017.
What you buy
Action 5 RDG, Train Operating Companies and DfT
Customers will be able to purchase cheaper Advance tickets [Advance purchase tickets on the day (APOD)]on the day of travel from longer distance companies (currently only possible for CrossCountry customers).
April 2017 for TransPennine Express, Northern, Virgin Trains East Coast and Virgin Trains West Coast. September 2017 for East Midlands Trains.
COMPLETED in April 2017 by TransPennine Express, Northern, Virgin Trains West Coast & Virgin Trains East Coast. East Midlands Trains will adopt in September 2017.

135
Office of Rail and Road | Annual Rail Consumer Report July 2017
Action Theme
Action Number Owner Action Description
Original completion date
Status
What you buy
Action 6 RDG & DfT The industry will run a small number of fares pilots to test some key strategic principles that could form the basis of fares reform.
May 2017 Planning meetings are being held with the 4 train companies involved - CrossCountry, East Midlands Trains, Virgin Trains West Coast and Virgin Trains East Coast.
Where to buy your ticket
Action 7 RDG We will provide better and more targeted information to website and app developers to enable them to develop new products and services for consumers. This information includes timetable and fares data and live running information.
December 2017
Completion by December 2017.
Where to buy your ticket
Action 8 RDG & DfT We will take steps to open up the ticket retail market, enabling third party retailers to play a greater role, and removing barriers to entry for new market entrants. This should lead to increased competition, and better outcomes for consumers.
June 2017 RDG reforming its governance structure: COMPLETED in April 2017. Third Party Retailers to have access to fares data by Summer 2017DfT has initiated liaison with Third Party Retailers to identify market barriers.
How to buy your ticket
Action 9 RDG, Train Operating Companies and DfT
Customers should have access to a clear and understandable choice of tickets when buying from vending machines, including information on relevant cheaper options that could be bought by waiting a short time or travelling on a different service.
July 2017 RDG will produce a description of current TVM capability by July 2017. RDG and train operating companies engaged in delivering on TVM 10 Point Plan.

136
Office of Rail and Road | Annual Rail Consumer Report July 2017
Action Theme
Action Number Owner Action Description
Original completion date
Status
How to buy your ticket
Action 10 ORR Train company websites will be reviewed against existing industry code of practice to ensure that they are fully compliant in meeting the required standards for customers
March 2017 Audit COMPLETED in March 2017Publication in Summer 2017.
How to buy your ticket
Action 11 RDG Train company websites will be monitored by RDG, and best practice will be promoted to all train operating companies
Quarterly Commencing Summer 2017.
How to buy your ticket
Action 12 RDG & DfT Customers will have access to all relevant terms and conditions in a simple to understand format when choosing and buying ticket
June 2017 Completion in June 2017.
How to buy your ticket
Action 13 RDG Where a customer holding a valid railcard forgets it at the time of travel, they will on the first occasion be able to claim back any additional expense, including the cost of any extra fare and any penalty fare issued.
February 2017 COMPLETED in February 2017.
How to buy your ticket
Action 14 DfT We will work with the Disabled Persons Transport Advisory Committee (DPTAC) to assess what we can do to improve the experience for disabled and vulnerable passengers and build awareness of passenger rights, acting on research from Transport Focus, ORR and DfT, including through the franchising process.
December 2017
DfT and DPTAC liaison has begun, due for completion in December 2017.
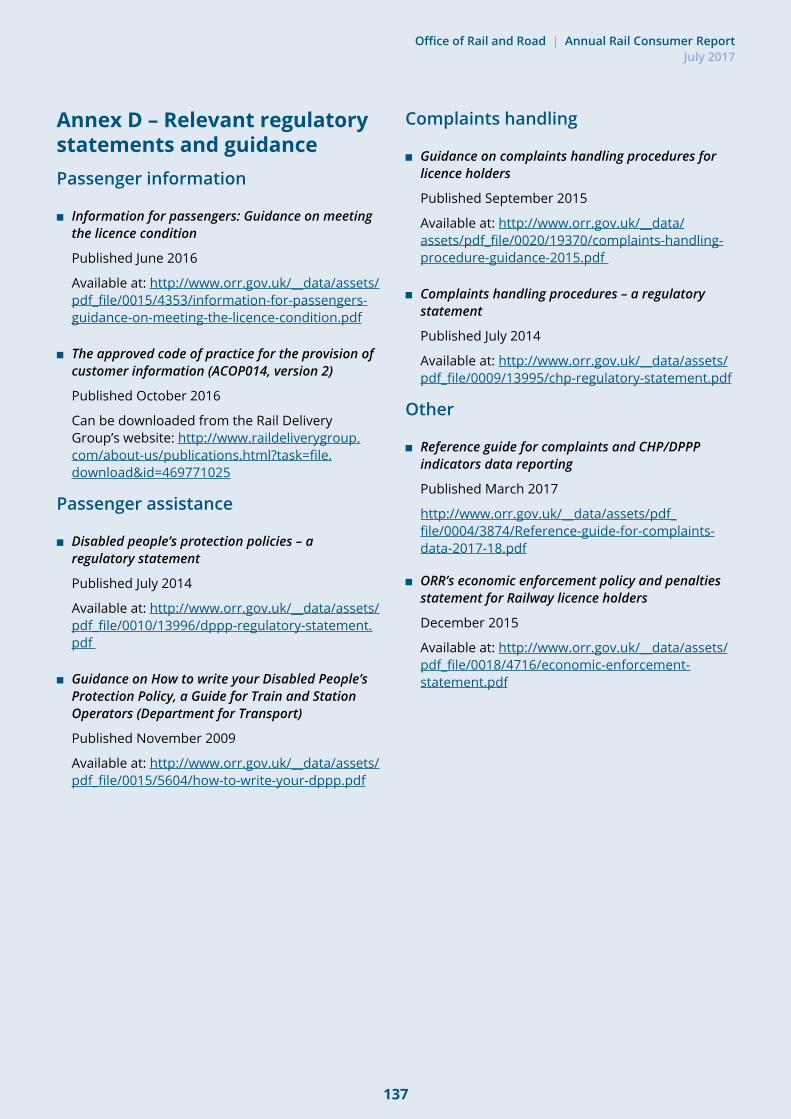
137
Office of Rail and Road | Annual Rail Consumer Report July 2017
Annex D – Relevant regulatory statements and guidance Passenger information
■ Information for passengers: Guidance on meeting the licence condition
Published June 2016
Available at: http://www.orr.gov.uk/__data/assets/pdf_file/0015/4353/information-for-passengers-guidance-on-meeting-the-licence-condition.pdf
■ The approved code of practice for the provision of customer information (ACOP014, version 2)
Published October 2016
Can be downloaded from the Rail Delivery Group’s website: http://www.raildeliverygroup.com/about-us/publications.html?task=file.download&id=469771025
Passenger assistance
■ Disabled people’s protection policies – a regulatory statement
Published July 2014
Available at: http://www.orr.gov.uk/__data/assets/pdf_file/0010/13996/dppp-regulatory-statement.pdf
■ Guidance on How to write your Disabled People’s Protection Policy, a Guide for Train and Station Operators (Department for Transport)
Published November 2009
Available at: http://www.orr.gov.uk/__data/assets/pdf_file/0015/5604/how-to-write-your-dppp.pdf
Complaints handling
■ Guidance on complaints handling procedures for licence holders
Published September 2015
Available at: http://www.orr.gov.uk/__data/assets/pdf_file/0020/19370/complaints-handling-procedure-guidance-2015.pdf
■ Complaints handling procedures – a regulatory statement
Published July 2014
Available at: http://www.orr.gov.uk/__data/assets/pdf_file/0009/13995/chp-regulatory-statement.pdf
Other
■ Reference guide for complaints and CHP/DPPP indicators data reporting
Published March 2017
http://www.orr.gov.uk/__data/assets/pdf_file/0004/3874/Reference-guide-for-complaints-data-2017-18.pdf
■ ORR’s economic enforcement policy and penalties statement for Railway licence holders
December 2015
Available at: http://www.orr.gov.uk/__data/assets/pdf_file/0018/4716/economic-enforcement-statement.pdf
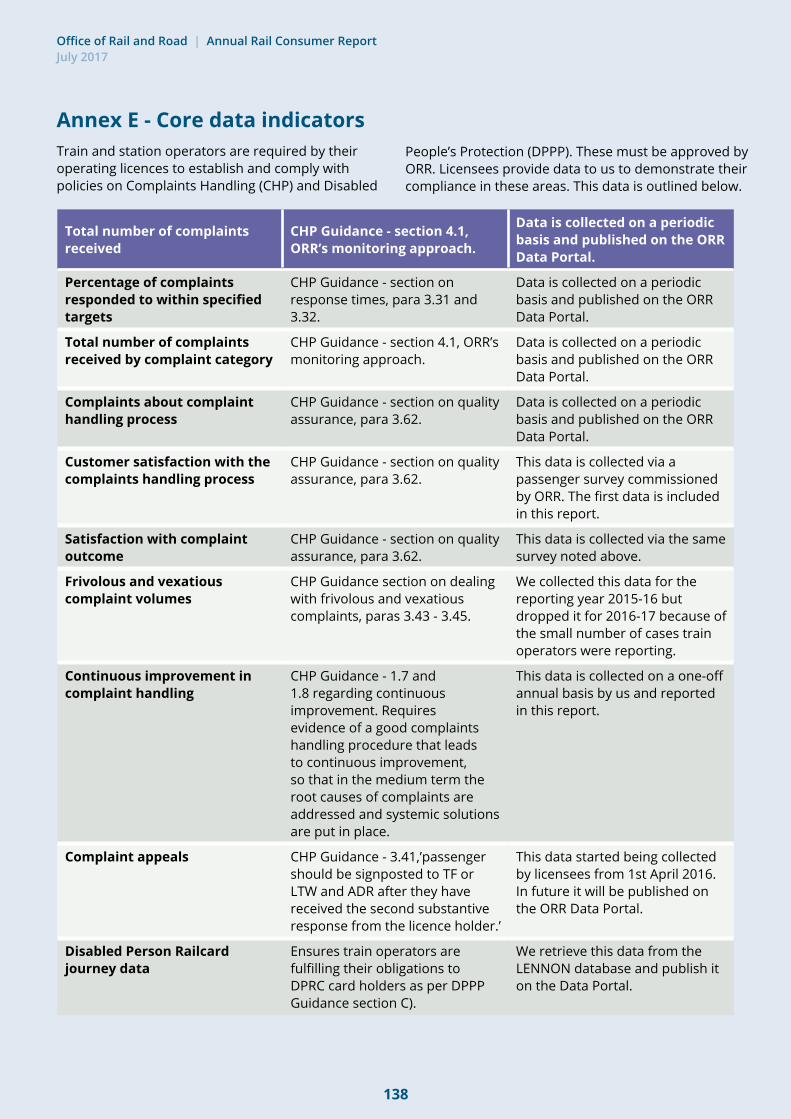
138
Office of Rail and Road | Annual Rail Consumer Report July 2017
Annex E - Core data indicatorsTrain and station operators are required by their operating licences to establish and comply with policies on Complaints Handling (CHP) and Disabled
People’s Protection (DPPP). These must be approved by ORR. Licensees provide data to us to demonstrate their compliance in these areas. This data is outlined below.
Total number of complaints received
CHP Guidance - section 4.1, ORR’s monitoring approach.
Data is collected on a periodic basis and published on the ORR Data Portal.
Percentage of complaints responded to within specified targets
CHP Guidance - section on response times, para 3.31 and 3.32.
Data is collected on a periodic basis and published on the ORR Data Portal.
Total number of complaints received by complaint category
CHP Guidance - section 4.1, ORR’s monitoring approach.
Data is collected on a periodic basis and published on the ORR Data Portal.
Complaints about complaint handling process
CHP Guidance - section on quality assurance, para 3.62.
Data is collected on a periodic basis and published on the ORR Data Portal.
Customer satisfaction with the complaints handling process
CHP Guidance - section on quality assurance, para 3.62.
This data is collected via a passenger survey commissioned by ORR. The first data is included in this report.
Satisfaction with complaint outcome
CHP Guidance - section on quality assurance, para 3.62.
This data is collected via the same survey noted above.
Frivolous and vexatious complaint volumes
CHP Guidance section on dealing with frivolous and vexatious complaints, paras 3.43 - 3.45.
We collected this data for the reporting year 2015-16 but dropped it for 2016-17 because of the small number of cases train operators were reporting.
Continuous improvement in complaint handling
CHP Guidance - 1.7 and 1.8 regarding continuous improvement. Requires evidence of a good complaints handling procedure that leads to continuous improvement, so that in the medium term the root causes of complaints are addressed and systemic solutions are put in place.
This data is collected on a one-off annual basis by us and reported in this report.
Complaint appeals CHP Guidance - 3.41,’passenger should be signposted to TF or LTW and ADR after they have received the second substantive response from the licence holder.’
This data started being collected by licensees from 1st April 2016. In future it will be published on the ORR Data Portal.
Disabled Person Railcard journey data
Ensures train operators are fulfilling their obligations to DPRC card holders as per DPPP Guidance section C).
We retrieve this data from the LENNON database and publish it on the Data Portal.

139
Office of Rail and Road | Annual Rail Consumer Report July 2017
Total number of complaints received
CHP Guidance - section 4.1, ORR’s monitoring approach.
Data is collected on a periodic basis and published on the ORR Data Portal.
Staff who have received relevant disability awareness training or disability equality training
DPPP Guidance - D6 on staff training.
This data is collected on a one-off annual basis by us and reported in this report.
Assisted journeys DPPP Guidance - C2 'assistance for passengers'
We receive data on the number of requests (bookings) made for assisted travel received by each train operator via the Rail Delivery Group. We publish this information on our Data Portal.
We are continue to engage with industry to receive further data (such as the volume of volume of turn-up-and-go assistance provided by each train operator) and have recently reached agreement – this is set out in detail in section 4.3 of the main report.
Number of complaints where there was a service problem relating to a passenger’s disability
CHP Guidance - section 4.1, ORR’s monitoring approach.
Data is collected on a periodic basis and published on the ORR Data Portal.
Passenger Assist satisfaction data
DPPP Guidance - D3 'monitoring and evaluation of performance in delivering services and facilities to disabled passengers'.
Data is being gathered by us via research with real users of the Passenger Assist system and will be published in autumn 2017.
Alternative accessible transport
DPPP Guidance - C3 requirements around the provision of Alternative Accessible Transport.
This data is collected on a one-off annual basis by us and reported in this report.
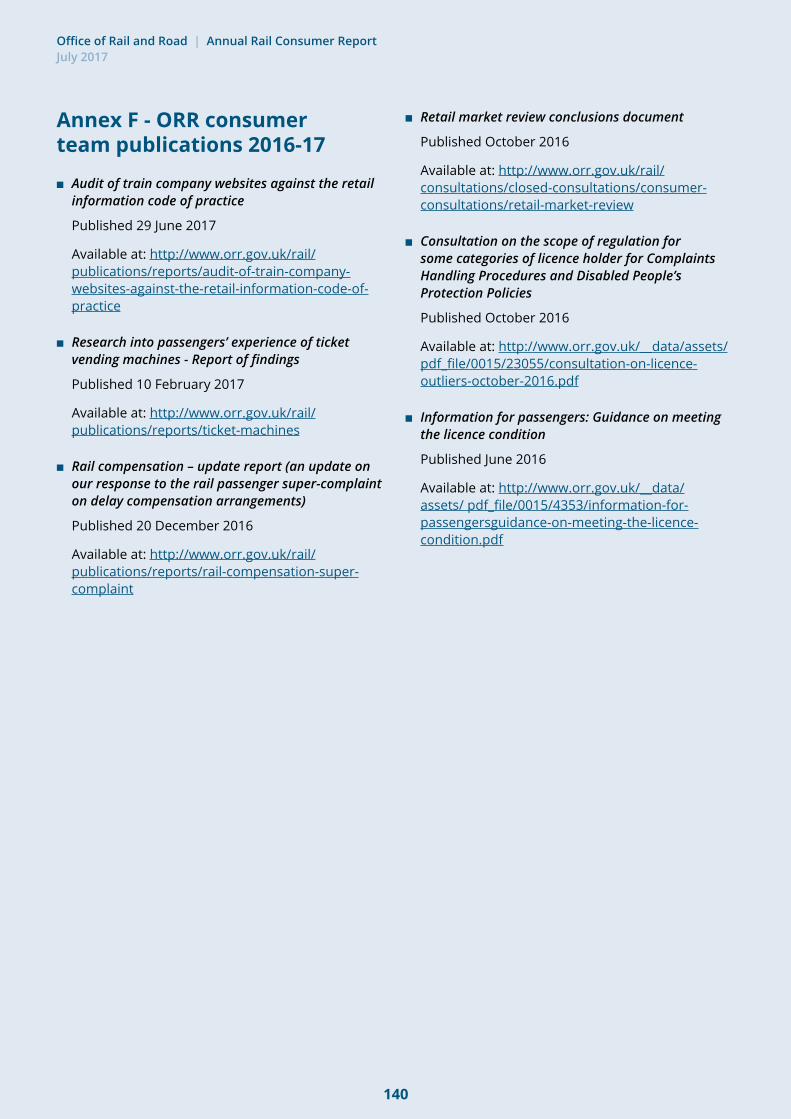
140
Office of Rail and Road | Annual Rail Consumer Report July 2017
Annex F - ORR consumer team publications 2016-17
■ Audit of train company websites against the retail information code of practice
Published 29 June 2017
Available at: http://www.orr.gov.uk/rail/publications/reports/audit-of-train-company-websites-against-the-retail-information-code-of-practice
■ Research into passengers’ experience of ticket vending machines - Report of findings
Published 10 February 2017
Available at: http://www.orr.gov.uk/rail/publications/reports/ticket-machines
■ Rail compensation – update report (an update on our response to the rail passenger super-complaint on delay compensation arrangements)
Published 20 December 2016
Available at: http://www.orr.gov.uk/rail/publications/reports/rail-compensation-super-complaint
■ Retail market review conclusions document
Published October 2016
Available at: http://www.orr.gov.uk/rail/consultations/closed-consultations/consumer-consultations/retail-market-review
■ Consultation on the scope of regulation for some categories of licence holder for Complaints Handling Procedures and Disabled People’s Protection Policies
Published October 2016
Available at: http://www.orr.gov.uk/__data/assets/pdf_file/0015/23055/consultation-on-licence-outliers-october-2016.pdf
■ Information for passengers: Guidance on meeting the licence condition
Published June 2016
Available at: http://www.orr.gov.uk/__data/assets/ pdf_file/0015/4353/information-for-passengersguidance-on-meeting-the-licence-condition.pdf

141
Office of Rail and Road | Annual Rail Consumer Report July 2017
Annex G – ORR’s Highways role ORR independently monitors Highways England’s management of the strategic road network – the motorways and main A-roads in England – holding Highways England to account for its performance and efficiency targets. Our focus is on securing better performance and value for money from the strategic road network, to benefit road users and the wider public. We aim to ensure that Highways England is delivering a road network which meets the needs of road users.
The Road Investment Strategy specifies the eight outcomes that Highways England must deliver during the road period up to 2020. It sets 11 key performance indicators, against which we measure Highways England’s performance. This includes a target to achieve, and maintain, user satisfaction of at least 90% by March 2017, as measured by the National Road User Satisfaction Survey. Our work on monitoring the road user satisfaction measure has focussed on interventions Highways England has put in place to achieve and maintain its target and how it plans to improve areas that the survey shows as having the lowest level of satisfaction.
We are also responsible for providing advice to government on the development of the second Road Investment Strategy (RIS2). We are pressing the need for RIS2 to be based on strong evidence and stakeholder engagement, to develop a robust and resilient set of proposals. Therefore, In March 2017, ORR and Transport Focus jointly published “Measuring Performance of England’s Strategic Roads: what users want”. This research focuses on what road users want from England’s motorways and major A-roads, and how they would like to see that measured and reported to help deliver better outcomes. Highways England is using these findings to influence and inform the development of its proposed metrics.
For more information on our highways role, our annual assessment of Highways England’s performance for 2016-17 is due to be published in July 2017.

142
Office of Rail and Road | Annual Rail Consumer Report July 2017
© Crown copyright 2017
This publication is licensed under the terms of the Open Government Licence v3.0 except where otherwise stated. To view this licence, visit nationalarchives.gov.uk/doc/open-government-licence/version/3 or write to the Information Policy Team, The National Archives, Kew, London TW9 4DU, or email: [email protected].
Where we have identified any third party copyright information you will need to obtain permission from the copyright holders concerned.
This publication is available at orr.gov.uk
Any enquiries regarding this publication should be sent to us at orr.gov.uk