Measurements of Natural Radioactivity and Radon Levels in Water samples from Upper Egypt
203
Physics Department Faculty of Science Natural Radioactivity for Different Water Samples in Qena Governorate A Thesis Submitted to the Faculty of Science South Valley University For The Degree of M. Sc. in Physics By Khaled Ali Mohammed Ali B.Sc. Physics, Faculty of Science Supervised by Prof. Dr. Abd El Baset Abbady Mohamed Prof. of Radiation and Nuclear Physics Phys. Dept. Faculty of Sci. South Valley University Dr. Shaban Ramadan Mohamed Harb Dr. Khaled Salah El Din Ebrahim Assist. Prof. of Radiation Physics Assist. Prof. of Radiation Physics Phys. Dept. Faculty of Sci. Phys. Dept. Faculty of Sci. South Valley University South Valley University Head of Physics Department Dean of the Faculty Dr. A. A. Ebnalwaled Prof. Dr. Abd El hady M. Ibrahim 2014
Transcript of Measurements of Natural Radioactivity and Radon Levels in Water samples from Upper Egypt

Physics Department Faculty of Science
Natural Radioactivity for Different Water Samples in Qena Governorate
A Thesis
Submitted to the Faculty of Science South Valley University
For
The Degree of M. Sc. in Physics
By
Khaled Ali Mohammed Ali
B.Sc. Physics, Faculty of Science
Supervised by
Prof. Dr. Abd El Baset Abbady Mohamed
Prof. of Radiation and Nuclear PhysicsPhys. Dept. Faculty of Sci. South Valley University
Dr. Shaban Ramadan Mohamed Harb Dr. Khaled Salah El Din Ebrahim
Assist. Prof. of Radiation Physics Assist. Prof. of Radiation Physics Phys. Dept. Faculty of Sci. Phys. Dept. Faculty of Sci. South Valley University South Valley University
Head of Physics Department Dean of the Faculty Dr. A. A. Ebnalwaled Prof. Dr. Abd El hady M. Ibrahim
2014
بسم اهللا الرحمن الرحيم
ري ــــي أمــــسر لــي ويدر ــي صـــرح لــشإرب
ي ــــوا قولــــــاني يفقهــــن لســلل عقدة مـــحأ و
صدق اهللا العظيم

Faculty of SciencePhysics Department
Approval Sheet
Candidate: Khaled Ali Mohammed Ali
Thesis title: Natural Radioactivity for Different Water
Samples in Qena Governorate
Prof. Dr. Abd El Baset Abbady Mohamed Prof. of Radiation and Nuclear Physics Phys. Dept. Faculty of Sci.
South Valley University
Dr. Shaban Ramadan Mohamed Harb Assist. Prof. of Radiation Physics Phys. Dept. Faculty of Sci.
South Valley University
Dr. Khaled Salah El Din Ebrahim Assist. Prof. of Radiation Physics Phys. Dept. Faculty of Sci.
South Valley University
Examiners:
1-
2-
3-
4-
Faculty board of postgraduate studies

1
CONTENTS
CONTENTS
II
CONTENTS
Subject Page
CONTENTS-----------------------------------------------------------------------------------------II
ACKNOWLEDGEMENT------------------------------------------------------------------------X
ABSTRACT-------------------------------------------------------------------------------------- XII
LIST OF TABLES ------------------------------------------------------------------------------XV
LIST OF FIGURES----------------------------------------------------------------------------XIX
INTRODUCTION ----------------------------------------------------------------------------------1
1 Radioactivity and Radionuclides ------------------------------------------------1
1.1 Cosmic Radiation -------------------------------------------------------------------1
1.2 Cosmogenic Radiation -------------------------------------------------------------2
1.3 Terrestrial Radiation ---------------------------------------------------------------3
1.3.1 Potassium ----------------------------------------------------------------------------3
1.3.2 Thorium ------------------------------------------------------------------------------5
1.3.2.1 232Th ----------------------------------------------------------------------------------6
1.3.2.2 228Ra ----------------------------------------------------------------------------------6
1.3.3 Uranium ------------------------------------------------------------------------------8
1.3.3.1 Uranium-238 ------------------------------------------------------------------------9
1.3.3.2 226Ra -------------------------------------------------------------------------------- 10
1.3.3.3 222Rn -------------------------------------------------------------------------------- 11
1.4 The Actinium Series-------------------------------------------------------------- 11
1.5 Radon and Thorn Decay Chains------------------------------------------------ 12
1.5.1 Radon ------------------------------------------------------------------------------- 15
1.5.2 Chemistry of Radon -------------------------------------------------------------- 16

CONTENTS
III
1.5.3 Sources of Radon ----------------------------------------------------------------- 17
1.5.3.1 Soil ---------------------------------------------------------------------------------- 17
1.5.3.2 Building Materials ---------------------------------------------------------------- 17
1.5.3.3 Water Supplies -------------------------------------------------------------------- 18
1.5.4 Radon in Water-------------------------------------------------------------------- 21
Radon as a Tracer for Ground Water Movement ---------------------------- 22
Mitigation Strategies ------------------------------------------------------------ 23
1.5.5 Health Effect and Risk ----------------------------------------------------------- 23
1.6 Exposure from Radiation Sources---------------------------------------------- 24
1.6.1 Exposures by Cosmic Radiation and Cosmogenic Radionuclides--------- 25
1.6.2 Exposure by Terrestrial Radiation --------------------------------------------- 25
1.6.2.1 External Exposure from Terrestrial Gamma Radiation --------------------- 26
Outdoors --------------------------------------------------------------------------- 26
Indoors ----------------------------------------------------------------------------- 26
1.6.2.2 Internal Exposure from Terrestrial Radiation -------------------------------- 27
Internal Exposure due to Radon and Thoron --------------------------------- 27
EXPERIMENTAL WORK --------------------------------------------------------------------- 30
2 Materials and Method------------------------------------------------------------ 30
2.1 Samples Collection and Preparation ------------------------------------------- 30
2.1.1 Ground Water Samples ---------------------------------------------------------- 30
2.1.1.1 222Rn Measurements-------------------------------------------------------------- 30
2.1.1.2 Natural Radionuclides Measurements ----------------------------------------- 33
2.1.2 Drinking Water Samples (Tap and Mineral)---------------------------------- 34
2.2 Measuring Systems --------------------------------------------------------------- 34

CONTENTS
IV
2.2.1 Alpha GUARD -------------------------------------------------------------------- 34
2.2.1.1 Radon Detector-------------------------------------------------------------------- 35
2.2.1.2 Ionization Chamber -------------------------------------------------------------- 35
2.2.1.3 Digital Signal Processing -------------------------------------------------------- 36
2.2.1.4 AquaKIT --------------------------------------------------------------------------- 37
Degassing Vessel ----------------------------------------------------------------- 38
Security Vessel ------------------------------------------------------------------- 38
Injection for Sample Taking ---------------------------------------------------- 38
Mounting Socket ----------------------------------------------------------------- 38
Connecting Tubes ---------------------------------------------------------------- 39
Measuring Cylinder --------------------------------------------------------------- 39
Thermometer ---------------------------------------------------------------------- 40
Active Coal Filter Cartridge----------------------------------------------------- 40
2.2.1.5 Alpha PUMP ---------------------------------------------------------------------- 40
Alpha PUMP Operating Elements --------------------------------------------- 41
Operating Switch ---------------------------------------------------------------- 41
Switch Output Level ------------------------------------------------------------- 42
Nozzle (IN and OUT) ------------------------------------------------------------ 42
2.2.1.6 Set-up of the Measuring Equipment ------------------------------------------- 42
Operation of the Three-Way Taps --------------------------------------------- 43
Positioning of Taps during Sample Injection --------------------------------- 43
Positioning of the Tap during Measurement---------------------------------- 44
2.2.1.7 Using the Active Coal Filter Cartridge ---------------------------------------- 45
2.2.1.8 General Aspects of Measuring-------------------------------------------------- 46

CONTENTS
V
Alternatives in Sampling -------------------------------------------------------- 46
Direct Transfer of Samples------------------------------------------------------ 46
Multistage Sample Transfer----------------------------------------------------- 47
2.2.1.9 Determinations of Radon Activity Concentrations -------------------------- 48
General Basics of the Calculation ---------------------------------------------- 48
Marginal Conditions ------------------------------------------------------------- 48
Relation of Volume Sample/Measurement set-up --------------------------- 49
Tightness of the Measurement Set-up ----------------------------------------- 49
K Factor ---------------------------------------------------------------------------- 50
Radon Level in the Measurement Setup before Injecting the Sample --- 51
Procedures for Quick Measurements ------------------------------------------ 52
2.2.2 Gamma Spectroscopy ------------------------------------------------------------ 53
2.2.3 Scintillation Detectors------------------------------------------------------------ 54
2.2.3.1 Activity Measurement ----------------------------------------------------------- 57
2.2.3.2 Spectrometer Adjustment-------------------------------------------------------- 58
Energy Calibration --------------------------------------------------------------- 58
Efficiency Calibration------------------------------------------------------------ 59
Preparation of Standard Water Sample Procedure-------------------------- 60
The Efficiency Calculations----------------------------------------------------- 61
Background Measurements ----------------------------------------------------- 64
2.2.3.3 Calculation of Activity Concentrations---------------------------------------- 65
2.2.3.4 Experimental Uncertainties ----------------------------------------------------- 67
2.2.3.5 Minimum Detectable Activity -------------------------------------------------- 72

CONTENTS
VI
RESULTS & DISCUSSION -------------------------------------------------------------------- 78
3.1 222Rn Activity Concentrations in Ground water Samples using Alpha
GUARD ---------------------------------------------------------------------------- 79
3.1.1 Qift and Qus Area----------------------------------------------------------------- 85
3.1.2 Nakada Area ----------------------------------------------------------------------- 85
3.1.3 Dishna Area------------------------------------------------------------------------ 86
3.1.4 Nagahammady and El-Waqf Area---------------------------------------------- 87
3.1.5 Correlations between 222Rn Activity Concentrations and the Geochemical
Parameters in Ground water----------------------------------------------------- 88
3.1.5.1 TDS --------------------------------------------------------------------------------- 88
3.1.5.2 Conductivity----------------------------------------------------------------------- 89
3.1.5.3 PH----------------------------------------------------------------------------------- 90
3.1.6 Comparison with similar studies in other countries-------------------------- 92
3.2 222Rn Activity Concentrations in Ground Water using Gamma
Spectroscopy ---------------------------------------------------------------------- 93
3.3 Natural Radionuclides Activity Concentrations in Ground Water -------- 96
3.3.1 Qift and Qus Area---------------------------------------------------------------101
3.3.2 Nakada Area ----------------------------------------------------------------------102
3.3.3 Dishna Area-----------------------------------------------------------------------105
3.3.4 Nagahammady and El-Waqf Area -------------------------------------------105
3.3.5 Relation between 226Ra and 222Rn Activity Concentrations in Ground
Water Samples -------------------------------------------------------------------111
3.3.6 Comparison with similar studies in other countries ------------------------114
3.4 222Rn Activity Concentrations in Tap water Samples using Alpha GUARD
--------------------------------------------------------------------------------------116

CONTENTS
VII
3.4.1 Correlations between 222Rn Activity Concentrations and the Geochemical
Parameters in Tap Water -------------------------------------------------------120
3.4.1.1 TDS --------------------------------------------------------------------------------120
3.4.1.2 Conductivity----------------------------------------------------------------------123
3.5 222Rn Activity Concentrations in Mineral Water using Alpha GUARD 124
3.5.1 Comparison of results with similar in other countries ---------------------126
3.6 Annual Effective Doses---------------------------------------------------------127
3.6.1 Annual Effective Doses due to Ingestion of Ground water ----------------127
3.6.2 Annual Effective Doses due to Ingestion of 222Rn in Tap Water ---------131
3.6.3 Annual Effective Doses due to Ingestion of 222Rn in the Mineral water-136
SUMMARY & CONCLUSION ---------------------------------------------------------------141
4.1 The Measured Samples ---------------------------------------------------------142
4.1.1 The Samples for Alpha GUARD Measurements----------------------------142
4.1.2 The Samples for Gamma Spectroscopy Measurements --------------------143
4.2 Measuring Systems --------------------------------------------------------------143
4.2.1 Alpha GUARD -------------------------------------------------------------------143
4.2.2 Gamma Spectrometer -----------------------------------------------------------144
4.3 222Rn Activity Concentrations in Ground Water Samples using Alpha
GUARD ---------------------------------------------------------------------------144
4.3.1 222Rn Activity Concentrations in Ground Water using Gamma
Spectroscopy ---------------------------------------------------------------------146
4.3.2 Natural Radionuclides Activity Concentrations in Ground Water--------147
4.3.3 222Rn Activity Concentrations in Drinking Tap Water Samples----------149
4.3.4 222Rn Activity Concentrations in Mineral Water Samples-----------------150
4.4 Annual Effective Doses---------------------------------------------------------151
CONTENTS
VIII
4.4.1 Annual Effective Doses due to Ingestion of Ground Water --------------151
4.4.2 Annual Effective Doses due to Ingestion of Drinking Tap Water --------152
4.4.3 Annual Effective Doses due to Ingestion of Mineral Water --------------152
References-----------------------------------------------------------------------------------------155
Arabic Summary -----------------------------------------------------------------------------------1

AKNOWLEDGEMENT

ACKNOWLEDGEMENT
X
ACKNOWLEDGEMENT
Above all, I do indeed thank ALLAH who guided and aided me to bring-forth to
light this humble work through his lights.
I am indebted to Prof. Dr. Abd El-Basset Abbady Mohamed, Professor of nuclear
and radiation physics, Physics Department, Faculty of Science, South Valley University,
for his kind supervision and guidance during the progress of the work.
My deep thanks and gratitude to Dr. Shaban Ramadan Mohamed Harb, Assist.
Prof. of radiation physics, Physics Department, Faculty of Science, South Valley
University, for his supervising, grateful assistance, continues encouragement and
valuable advises and discussions throughout the work.
I would like to express my deep thanks and utmost appreciated to Dr. Khaled
Salah El Din Ebrahim, Assist. Prof. of radiation physics, Physics Department, Faculty of
Science, South Valley University, for continuous help, encouragement and human
kindness and his continuous supervision and fruitful discussions are also acknowledged.
I wish to express my great thanks to Prof. Dr. Abd El hady M. Ibrahim, Dean of
Faculty of Science, South Valley University, and I wish to thank Dr. A. A. Ebnalwaled
head of Physics Department., Faculty of Science, South Valley University, for their
sponsoring of this work.
I am grateful to my family for their love and support, I wish also to thank my
lovely wife Hoda for her love and support.
I am grateful to my dear friends and to my colleague and all staff members at
faculty of science for their encouragement and for their assistance.

ABSTRACT

ABSTRACT
XII
ABSTRACT
Radionuclides are naturally present throughout all environments, in varying
amounts in air, water, plants, soil, rocks and etc. Naturally – occurring radionuclide’s are
mainly derived from three separate decay chains (238U, 235U, and 232Th), and singly
occurring 40K. These radionuclides may enter the human body from eating, drinking,
external exposure or by inhaling. Then they penetrate into tissue and its cells, which
causes ionization effects to its basic matter "cytoplasm".
222Rn is a colorless, odorless, tasteless, radioactive noble gas, which arises from
the radioactive decay of 226Ra (itself a decay product of 238U). It is present in almost all
rock, soil, and water, and typically moves up through the ground to the air above and into
buildings through cracks and other holes in the underlying foundation. 222Rn is one of the
most significant of the avoidable hazards in the environment, typically accounting for
more than 50% of the dose to an average population.
Measurements of natural radioactivity and radon levels in water samples from
Qena governorate, Egypt, and their human impact are outlined in this thesis. This was
performed by collecting two hundred twenty water samples (ground, drinking tap and
mineral water) from different sites in Qena, and employing Alpha GUARD monitoring
system to determine the activity concentrations of 222Rn, also gamma spectrometry
"NaI(Tl)" was used to determine the activity concentrations of 222Rn, 226Ra, 232Th and 40K
in ground water.
In ground water samples 222Rn activity concentrations were fluctuated between
0.04±0.025 and 10.07±0.219 Bq/l, with an average value of 3.57±0.077 Bq/l.
In order to check the obtained results, two radon measuring techniques (Alpha
GUARD and gamma spectrometry) were applied for measure some ground water
samples from all sites, and the obtained results show that the two radon measuring
techniques results are in a good agreement.
In the measuring ground water samples, the obtained measuring results for 226Ra, 232Th and 40K activity concentrations were fluctuated between (0.126±0.007 and
1.93±0.117), (0.037±0.003 and 0.899±0.077) and (3.18±0.273 and 7±0.602), with

ABSTRACT
XIII
averages values of 0.54±0.029, 0.4±0.027 and 5.10±0.44 Bq/l, for 226Ra, 232Th and 40K,
respectively.
In the investigated drinking tap water samples, the obtained results for 222Rn
activity concentrations show that, the activity concentrations were ranged between
0.006±0.0005 and 0.117±0.0027 Bq/l, with an average value of 0.049±0.003 Bq/l.
The obtained results for 222Rn activity concentrations in the investigated mineral
water samples show that, the activity concentrations were fluctuated between
0.014±0.003 and 0.237±0.005 Bq/l, with an average value of 0.077±0.002 Bq/l.
The impacts of geochemical parameters of water such as PH, conductivity and
TDS on the natural radionuclides activity concentration were studied, a reasonable
correlation between pH and the 222Rn, 226Ra and 232Th activity concentrations were found,
in which the activity concentrations decreased with increasing PH, whereas no general
trend was observed that related the radionuclides activity concentrations with
conductivity and TDS.
Health aspects are discussed, based on calculation of the annual effective doses
for different age groups, which found in values lower than the reference level.

LIST OF TABLES

LIST OF TABLES
XV
LIST OF TABLES
Table label Page
Table1.1 Some cosmogenic radionuclides, their production rates, and decay
characteristics.............................................................................................. 3
Table 1.2 Key isotopes of potassium .......................................................................... 4
Table 1.3 Key isotopes of thorium.............................................................................. 6
Table 1.4 Key isotopes of uranium............................................................................. 8
Table 1.5 Sources of global atmospheric 222Rn sources ........................................... 19
Table 2.1 Position power amplifier switch ............................................................... 42
Table 2.2 Volumes of AquaKIT system components, and calculated total volumes of
measurement set-up.................................................................................. 49
Table 2.3 Physical properties of a few representative scintillators materials ........... 56
Table 2.4 Radionuclide's used for efficiency calibration.......................................... 60
Table 2.5 Efficiency-energy values for water sample .............................................. 63
Table 2.6 Calculated values of the lower confidence limit (LCL), upper confidence
limit (UCL), detectionn limit (Dl) and minimum detectable activity
(MDA)....................................................................................................... 75
Table 2.7 Calculation of characteristics limits for 40K for the sample water G1.......76
Table 3.1 222Rn activity concentrations as well as geochimical parameters in ground
water samples ........................................................................................... 80
Table 3.2 The ranges and average values of 222Rn activity concentrations for the
ground water samples under investigation in the study areas................... 88
Table 3.3 222Rn activity concentrations with PH values in ground water samples.. 90
Table 3.4 222Rn activity concentration for ground water samples in the present
investigation in comparison with other countries. .................................... 92
LIST OF TABLES
XVI
Table 3.5 222Rn concentrations by using the two radon measurements techniques .. 94
Table 3.6 Natural radionuclides activity concentrations as well as the geochimical
parameters ................................................................................................. 97
Table 3.7 The ranges and average values of natural radinuclides concentrations for
ground water samples ............................................................................. 109
Table 3.8 Correlation between 222Rn with 226Ra activity concentrations in ground
water samples.......................................................................................... 111
Table 3.9 The activity concentration of water samples in the present investigation in
comparison with other countries............................................................. 115
Table 3.10 222Rn activity concentrations in drinking tap water samples ................. 116
Table 3.11 222Rn concentrations in drinking tap water samples before and after the
chemical treatment process ..................................................................... 119
Table 3.12 222Rn activity concentrations with the geochemical parameters in Qena
drinking tap water ................................................................................... 119
Table 3.13 222Rn concentrations with the chemical parameters in mineral water ... 125
Table 3.14 222Rn concentration of water samples in the present investigation in
comparison with other countries............................................................. 126
Table 3.15 Consumption rates and the conversion factors ....................................... 127
Table 3.16 Estimates of the annual effective doses due to ingestion of natural
radionuclides in ground water................................................................. 129
Table 3.17 Annual effective doses for different age groups due to ingestion of 222Rn in
drinking tap water ................................................................................... 131
Table 3.18 The Annual effective doses for different age groups due to ingestion of 222Rn in the mineral water ...................................................................... 137
Table 3.19 Comparison between the annual effective doses for different age groups
due to ingression of natural radionuclide's in the different kinds of water
................................................................................................................. 139
LIST OF TABLES
XVII
Table 4.1 The statistical parameters of 222Rn concentrations in ground water....... 145
Table 4.2 The statistical parameters of natural radionuclides activity concentrations
in ground water ....................................................................................... 148
Table 4.3 The statistical parameters of 222Rn concentrations in tap water ............. 150
Table 4.4 The statistical parameters of 222Rn concentrations in mineral water ...... 151

LIST OF FIGURES
LIST OF FIGURES
XIX
LIST OF FIGURES
Figure Label Page
Figure 1.1 Decay scheme oFf 40K................................................................................. 5
Figure 1.2 Diagram schematic of thorium series .......................................................... 7
Figure 1.3 Diagram schematic of 238U series................................................................ 9
Figure 1.4 Schematic diagram of actinium radioactive decay series.......................... 11
Figure 1.5 Radon and Thoron Decay scheme..............................................................13
Figure 1.6 The average annual doses to the world population from various sources . 16
Figure 1.7 Radon concentration versus depth calculated for zero vertical flow......... 20
Figure 2.1 Map of ground water sampling sites ......................................................... 31
Figure 2.2 Alpha GUARD spectrum .......................................................................... 32
Figure 2.3 Spectrum of 222Rn measurements using gamma spectroscopy.................. 33
Figure 2.4 Alpha GUARD .......................................................................................... 35
Figure 2.5 Alpha GUARD ionization chamber .......................................................... 36
Figure 2.6 Block diagram of digital signal processing ............................................... 37
Figure 2.7 Mounting socket ........................................................................................ 39
Figure 2.8 Alpha PUMP ............................................................................................. 41
Figure 2.9 Measuring set-up ....................................................................................... 43
Figure 2.10 Three-Way taps-position of the taps when the sample is injected ............ 44
Figure 2.11 Three-way taps positions of the taps during measurement ....................... 45
Figure 2.12 Measuring set-up (section with enclosed active filter cartridge)............... 45
Figure 2.13 Temperature dependency of the diffusion coefficient K........................... 50
Figure 2.14 Block diagram of a low level back ground gamma ray spectrometer ....... 54

LIST OF FIGURES
XX
Figure 2.15 Schematic representation of (a) a pulse-mode scintillation detector and (b)
a linear focused photomultiplier tube showing the cascade effect due to
amplification of electrons from the photocathode by increasing secondary
emission when the electrons strike the dynodes....................................... 55
Figure 2.16 Calibration peaks energies......................................................................... 59
Figure 2.17 Gamma-ray Spectrum of the standard efficiency calibration for water in
marinelli beaker 1.4 liter of NaI (Tl) detector .......................................... 62
Figure 2.18 Full energy peak efficiency as a function of gamma ray energy for a typical
NaI(Tl) detector for water sample in marinelli beaker............................. 63
Figure 2.19 Back ground spectrum............................................................................... 65
Figure 2.20 The meaning of the critical detection limit (CDL) and minimum detectable
activity (MDA) in terms of the confidence limits defined by α and
β.................................................................................................................73
Figure 3.1 222Rn activity concentration ranges in Qift and Quse area ....................... 85
Figure 3.2 222Rn activity concentration ranges in Nakada area.................................. 86
Figure 3.3 222Rn activity concentration ranges in Dishna area................................... 86
Figure 3.4 222Rn activity concentration ranges in Nagahammady and El-Waqf area 87
Figure 3.5 222Rn concentrations for ground water samples in the study areas ........... 88
Figure 3.6 TDS values with 222Rn concentrationin in ground water samples ............ 89
Figure 3.7 Conductivity with 222Rn activity concentration in ground water samples 89
Figure 3.8 PH values with 222Rn activity concentrations in ground water samples ... 89
Figure 3.9 Relation between the two radon measurements techniques ...................... 95
Figure 3.10 Natural radionuclides concentration ranges in Qift and Quse area ......... 103
Figure 3.11 Natural radionuclides activity concentration ranges in Nakada area ...... 104
Figure 3.12 Natural radionuclides activity concentration ranges in Dishna area ....... 106

LIST OF FIGURES
XXI
Figure 3.13 Natural radionuclides activity concentration ranges in Nagahammady and
El-Waqf area........................................................................................... 108
Figure 3.14 Natural radinuclides activity concentrations in the study areas .............. 110
Figure 3.15 226Ra with 222Rn Activity Concentrations in Ground Water ................... 114
Figure 3.16 222Rn activity concentration ranges in Qena drinking tap water ............. 118
Figure 3.17 222Rn activity concentrations (Bq/l) in drinking tap water samples before
and after the chemical treatment process ............................................... 120
Figure 3.18 TDS Values with 222Rn concentrations in drinking tap water samples ... 123
Figure 3.19 Conductivity values with 222Rn activity concentrations in drinking tap
water samples ......................................................................................... 123
Figure 3.20 The annual effective doses considering the ingestion of 222Rn, 226Ra and 232Th radionuclides for different age groups in ground water................ 130
Figure 3.21 The annual effective doses for different age groups due to ingession of 222Rn in drinking tap water for some samples ....................................... 136
Figure 3.22 The annual effective dose for different groups due to ingession of 222Rn in
the mineral water ....................................................................................138

INTRODUCTION

INTRODUCTION
1
INTRODUCTION
1 Radioactivity and Radionuclides
Radiations are with us all the time. They are present in varying amounts in air,
water, plants, animals, soil and rocks. We are radioactive; we ingest appreciable amounts
of radioactive potassium (40K) and radiocarbon (14C), as well as minute amounts of
radioactive uranium, thorium, tritium, polonium and radium. We inhale radioactive 222Rn
and its daughters, other naturally occurring radioactive gases and particulates, and small
amounts of radioactive materials present in the atmosphere from nuclear weapons use,
and testing of decades ago. In addition, we are bombarded by cosmic rays, and we
receive radiation from the ground, consumed products such as smoke detector, color
television, and the medical x–rays (Douglas 1990).
The study of natural sources of radiation dates back to the year 1896, when Henri
Becquerel, a French physicist, found that photographic plate was fogged when a sample
of potassium sulphate uranyl was placed on top of it. After five years, radioactivity of
uranium, thorium, polonium, radium and radon had been established (Stephen 1995).
Rutherford showed that the emitted radiation was of three types: Alpha (α), beta (β)
particles, and gamma (γ) rays. These rays are created in one of two types of spontaneous
nuclear processes. It is known as radioactive decay process (As’ad 2004).
Every person on earth is exposed to natural radiation; majority of this radiation is
naturally occurring and arises from three sources:
Cosmic Radiation
Cosmogenic Radiation
Terrestrial Radiation
1.1 Cosmic Radiation
Cosmic radiation is the radiation originates from the sun and from outer space.
The primary cosmic rays incident on the top of the earth’s atmosphere are mainly protons
(86%), α particles (11%) and electrons (2%), heavier nuclei make up the small remainder.
These primary cosmic rays have a spectrum that extends from 1×10⁸ to over 1×10²⁰ eV.

INTRODUCTION
2
In spite of extensive investigations, the various sources of cosmic rays are not well
understood. However, all but the most energetic (above 1×10¹⁵ eV) are thought to
originate in our own galaxy, possibly energized by the shock waves from supernovae
(Thorne 2003). A still lower energy component of cosmic rays is generated near the
surface of the sun by magnetic disturbances. The magnetic field of the Earth modulates
cosmic ray intensity, resulting in minimum intensities and dose rates at the equator and
maximum near the geomagnetic poles (UNSCEAR 2000).
1.2 Cosmogenic Radiation
Radionuclides formed by the interaction of cosmic rays with atoms in the
atmosphere are known as cosmogenic radionuclides. These nuclides are produced in the
stratosphere, as well as in the upper troposphere. Some of these cosmogenic
radionuclides with half-lives above 1 day are listed in the following table 1. 1.
Because of their importance for human exposure 3H, 14C, 7Be and 22Na are of
special interest. Natural 3H is produced by the interaction of neutrons produced by cosmic
radiation with nitrogen 14N (n, 3H) 12C, or by 6Li (n, α) 3H interaction. 3H is a radioactive
isotope of hydrogen and predominately found in the atmosphere in water vapor and falls
to earth in rain or snow. In nature, about 1 atom of 3H exists for every 1018 atoms of 1H.
Because we are continuously ingesting foods and drinks containing hydrogen we will
always have trace amounts of 3H in our bodies. Natural 14C is generated by 14N (n, p) 14C
interaction. In the atmosphere 14C is present in carbon dioxide, when it reaches the earth
it becomes part of the carbon cycle. Since we continuously eat and breathe carbon-
containing matter, we will always have some 14C in our bodies. The specific activity of 14C in natural samples has been assumed to be relatively constant at 7.5 pCi/g of total
carbon for at least 15,000 years, prior to the advent of nuclear weapons testing
(Hutchison 1997). 7Be and 22Na produced by cosmic radiation have not been studied as
extensively as 14C and 3H and are not major contributors to our radiation exposure. The
activity concentrations of 7Be and 22Na in surface air are stated to be 3000 and 0.3 μ
Bq/m3, respectively (UNSCEAR 1982).

INTRODUCTION
3
Table1. 1 Some cosmogenic radionuclides, their production rates, and decay
characteristics (UNSCEAR 1999, Rudolf 2012)
Progeny nuclideDecay modet½ (year)Production rate
(Atoms cm-2.s-1)Radionuclide
3Heß-12.340.22/0.32³H
7LiEC0.1460.0407Be
10Bß-1.387x100.02110Be
14Nß-5,7302.0214C
26MgEC7.2x1054.7x10-526Al
36S
36Ar
EC (1.9%)
ß- (98.1%)3.01x1051.12x10-436Cl
1.3 Terrestrial Radiation
Terrestrial radiation radionuclides are mainly derived from three separate decay
chains, Thorium–232 (232Th), Uranium–238 (238U) and Uranium–235 (235U), addition to
the single radioactive potassium (40K). The half-life times (t½) of those radionuclide’s are
comparable to the age of the earth. The uranium decay series begins with 238U which has
a relative isotopic abundance of 99.27% and a half-life of 4.5×10⁹ y. Thorium decay
series begins with 232Th, which has a half-life of 1.4×10¹⁰ y, and relative abundance of
essentially 100%. 40K has a relative isotopic abundance of 0.0118% and a half-life of
1.3×10⁹ y (Hutchison 1997).
1.3.1 Potassium
Potassium was discovered by Sir Humphry Davy in 1807 in London, by the
electrolysis of potassium hydroxide (potash). This was the first metal to be isolated by
electrolysis. This element is the seventh most abundant metal, it makes up 2.4% of earth
crusts mass. Most minerals which containing potassium are sparingly soluble, but it is
difficult to obtain the metal from them. However, certain minerals such as sylvite,
sylvinite and carnallite were found in deposits formed by evaporation of old seas or lakes.

INTRODUCTION
4
Potassium salts can be easily recovered from these minerals. This element is also found
in the ocean with small amounts compared with sodium. Potassium appear as a soft,
white metal which is silver when cut, but it rapidly oxidizes, so it must be preserved in a
mineral oil such as kerosene. Potassium is the least dense metal known. It is also one of
the most reactive and electropositive of metals. Because of rapidly oxidization of
potassium in air, its reaction with water is vigorous. It catches fire spontaneously and
decomposes with the evolution of hydrogen. Potassium and its salts give a violet color to
a suitable flame. The greatest uses for potassium compounds are in fertilizers, nitrate,
carbonate, chloride, bromide, cyanide and sulphates (Lide 2002).
Potassium is a member of the highly reactive group 1A alkali metal family. As
shown in table 1. 2, potassium has three isotopes with mass numbers 39, 40, and 41. Only 40K (t½ = 1.28x10⁹ y) is radioactive. It is essential to life, it is found in all living and
formerly living things.
Table1. 2 Key isotopes of potassium (Lide 2002)
Nuclide 39K 40K 41K
Atomic mass 38.964 39.974 40.962
Natural abundance 93.258% 0.0117% 6.730%
Half-Life time Stable 1.28x10⁹ y Stable
The isotopic abundance of 40K is small, only 0.012% of naturally occurring
potassium, which gives a specific activity of 31.6 Bq/g of natural potassium, undergoes
decay to stable 40Ca (89%) of the time, emitting a 1.314 MeV max beta particle in the
process. With the exception of a tiny fraction of decays (1xl0-3%) by electron capture
(EC), 40K undergoes decay by positron emission the remaining 11% of the time, emitting
a characteristic photon with energy of 1460 keV. This photon is highly useful for
identification and quantification of 40K by gamma spectrometry, and makes an excellent
calibration point because of the presence of potassium in essentially all environmental
samples (Kathren 1984). The potassium decay scheme is illustrated in the following
figure 1. 1.

INTRODUCTION
5
Figure 1. 1 Decay scheme of 40K (Lederer 1977)
1.3.2 Thorium
Thorium was discovered by J. J. Berzelius in 1828 in Stockholm, Sweden. Pure
thorium Appear as radioactive silvery, white metal, which retains its luster for several
months. When contaminated with the oxide, thorium slowly tarnishes in air, it becoming
first grey and then black. Thorium is found in large deposits in the USA and elsewhere,
but these have not been exploited as a source of the element. Several methods are used to
produce the metal, such as reducing thorium oxide with calcium by the electrolysis of
anhydrous thorium chloride.
The principal use of thorium is in the Wels Bach mantle, which consists of
thorium oxide amongst other compounds. This type of mantle glows with a dazzling
flame when heated by gas so it used in portable gas lights. Thorium is also an important
alloying agent in magnesium, as it imparts greater strength and creep resistance at high
temperatures. Thorium can be used as a source of nuclear power. It is about three times as
abundant as uranium and about as abundant as lead, and there is probably more energy
available from thorium than both uranium and fossil fuels.

INTRODUCTION
6
Pure thorium one of the highest melting points of all elements. It is slowly
attacked by water and acids. Powdered thorium metal is often pyrophoric. It turnings
ignite when heated in air and burn with a brilliant white light (Lide 2002).
About the natural radioactivity of thorium, as shown in table 1. 3, the series
includes alpha and beta emitting radionuclides. Longest lived member of the series is 232Th (t½ = 1.391010 y). Its half-life time is about three times longer than the currently
estimated age of the earth, permitting it and its decay products to occur in nature. The
immediate parent of 232Th is the alpha-emitter 236U, but its half-life is only 2.4107 y,
therefore it no longer found in the nature. 236U produced artificially in a variety of nuclear
reactions, the thorium series terminates with the stable nuclide 208Pb (Lide 2002).
Table1. 3 Key isotopes of thorium (Lide 2002)
Nuclide 228Th 229Th 230Th 231Th 232Th 234Th
Atomic mass 228.03 229.03 230.03 231.03 232.04 234.04
Natural abundance trace 0% trace trace 100% trace
Half-life time 1.9 y 7340 y 8x10⁴ y 25.5 h 1.41x10¹⁰ y 24.1 d
1.3.2.1 232Th
The thorium series could be extended indefinitely to elements above 232Th as
follows: It is quite possible that several of these higher members of the series were
present at the time the elements were formed, but 4.5xl09 y later these precursors of 232Th
have decayed completely to the much longer-lived 232Th. The accepted half-life of 232Th
is 1.39x10¹⁰ y. The main alpha particle group is 4.007 MeV (76%) and a weaker group
has been detected with energy of 3.952 MeV (24%). A third alpha group has been
observed with 0-2% intensity at energy 125 keV below the main group (Majumdar 1990).
1.3.2.2 228Ra
The daughter product of 232Th decay is the 6.7% a beta-emitter 228Ra. Since the
total decay energy is only 55 keV, the radiations of 228Ra are extremely weak and are

INTRODUCTION
difficult to detect. The difficulty in the measure
presence of its short lived daughter
decay energy of 2110 keV and decays with the emission of a complex mixture of
electrons and gamma rays. The daughter product of the
product of the alpha decay of
these two precursors of 228
uranium and thorium disequilibria as a radiochemica
stable alpha-emitter. The alpha spectrum of
5.318 MeV (68%), 5.261 MeV (32%) and 5.132 MeV (0.32
A fourth group with energy 4.998 MeV (0.01
measurements. The alpha spectrum of
5.421 MeV (71%), 5.338 MeV (28
MeV (0.03%). The immediate daughter of
emitter with two prominent alpha particle groups: 5.68
(5.1%). There are three others of very low intensity: 5.159, 5.049 and 5.032 MeV. The
second of the two main groups (5.447 MeV) is of particular impor
alpha-spectra containing 228
peak (Ivanovich 1992). The thorium series is illustrated
Figure 1. 2
7
difficult to detect. The difficulty in the measurement of this isotope i
presence of its short lived daughter 228Ac (t½ = 6.13 h). The latter nuclide has a total beta
decay energy of 2110 keV and decays with the emission of a complex mixture of
electrons and gamma rays. The daughter product of the 228Ac decay is
product of the alpha decay of 232U and the electron capture decay of 228
228Th is of particular interest to the techniques of measurement of
uranium and thorium disequilibria as a radiochemical tracer. 232U (t½
emitter. The alpha spectrum of 232U consists of three observable groups
5.318 MeV (68%), 5.261 MeV (32%) and 5.132 MeV (0.32%).
oup with energy 4.998 MeV (0.01%) is deduced from gamma
measurements. The alpha spectrum of 228Th (t½ = 1.913 y) consists of fi
5.421 MeV (71%), 5.338 MeV (28%), 5.208 MeV (0.4%), 5.173 MeV (0.2
The immediate daughter of 228Th is 224Ra (t½ = 3.64 d). It is an alpha
emitter with two prominent alpha particle groups: 5.684 MeV (94%) and 5.447 MeV
%). There are three others of very low intensity: 5.159, 5.049 and 5.032 MeV. The
second of the two main groups (5.447 MeV) is of particular importance in the analysis of 228Th groups because it appears hidden under the
peak (Ivanovich 1992). The thorium series is illustrated in the following
Diagram schematic of thorium series (ISO 200
ment of this isotope is caused by the
6.13 h). The latter nuclide has a total beta-
decay energy of 2110 keV and decays with the emission of a complex mixture of 228Th. It is also the
228Pa. The former of
Th is of particular interest to the techniques of measurement of
½ = 72 y) is a beta-
U consists of three observable groups
%) is deduced from gamma-ray
) consists of five energy groups:
208 MeV (0.4%), 5.173 MeV (0.2%), and 5.137
3.64 d). It is an alpha-
4 MeV (94%) and 5.447 MeV
%). There are three others of very low intensity: 5.159, 5.049 and 5.032 MeV. The
tance in the analysis of
Th groups because it appears hidden under the 228Th alpha
following figure 1. 2.
2005)

INTRODUCTION
8
1.3.3 Uranium
Uranium was discovered by M. H. Klaproth in 1789 in Berlin, Germany, and
isolated by E. M. Péligot in Paris, France in 1842. It appears as silvery metal. It is the
most massive of the naturally occurring elements with intensity 18.8 g/cm3. It is the
fourth element in the actinide series which is analogous to the lanthanide series of rare
earth elements structurally and geochemically. Uranium occurs naturally in several
minerals such as pitchblende, uraninite and carnotite. It is also found in phosphate rock
and monazite sands. It can be prepared by reducing uranium halides with Group 1 or
Group 2 metals, or by reducing uranium oxides with calcium or carbon at high
temperatures. Uranium appears to be concentrated in the upper lithosphere, particularly in
sialicigneous rocks and in late magmatic fluids. Uranium does not occur as a native
element, nor does it form sulfides, tellundes, or arsenide. It behaves geochemically as a
strongly oxyphile element (Lide 2002).
Uranium has a great importance, as it provides us with nuclear fuel. Although
Uranium-235 has very low abundance, it is the only naturally occurring fissionable fuel
and use in a breeder reactor. Uranium-238 can capture a neutron and undergo negative
beta decay to become Plutonium-239. This synthetic, fissionable element can sustain a
chain reaction, and the resultant heat is used to create steam to work turbines and
generate electrical power. Uranium is the major material from which other synthetic
Tran's uranium elements are made, and is also used to make isotopes for peaceful
purposes, and to make nuclear weapons. The isotopes of uranium are shown in the
following table 1. 4.
Table1. 4 Key isotopes of uranium (Lide 2002)
Nuclide 234U 235U 238U
Atomic mass 234.04 235.04 238.05
Natural abundance 0.005% 0.720% 99.28%
Half-life time 2.47x10⁵ y 7x10⁸ y 4.51x10⁹ y

INTRODUCTION
1.3.3.1 Uranium-238
Uranium-238 series begins with the heaviest naturally occurring nuclide
the most abundant uranium isotope 99.2%; It has a half
primordial nuclides of the crust.
successive alpha transitions. At the end of the series, the alpha
repeated twice, and then the uranium series terminates on the lightest of the radiogenic
lead isotopes 206Pb. 238U corresponding to a specific activity of 0.747 disintegrations per
minute per microgram. The energy of the main group of alpha particles is 4.195 Me
(77% abundance). Conversion electrons of 48 KeV gamma ray have been observed
indicating that the alpha decay is complex; another two alpha groups have been observed
with respective energies of 4.147 MeV (23%) and 4.038 MeV (0.23
decay chain of 238U is shown in
particles but energetic beta and gamma radiation are soon introduced by the ingrowths of
the immediate daughters
undisturbed samples several months after the last purification of the uranium sample. 234Th (t½ = 24.1 d) is a beta
end-point energy of 191 keV, but
Gamma transitions with energies of 30, 60 and 93 keV have been reported.
Figure 1.
9
238 series begins with the heaviest naturally occurring nuclide
uranium isotope 99.2%; It has a half-life (45109
primordial nuclides of the crust. 238U is an alpha-emitter, followed by a sequence of five
successive alpha transitions. At the end of the series, the alpha-beta
ed twice, and then the uranium series terminates on the lightest of the radiogenic
U corresponding to a specific activity of 0.747 disintegrations per
minute per microgram. The energy of the main group of alpha particles is 4.195 Me
(77% abundance). Conversion electrons of 48 KeV gamma ray have been observed
indicating that the alpha decay is complex; another two alpha groups have been observed
ctive energies of 4.147 MeV (23%) and 4.038 MeV (0.23%). The radioactive
U is shown in the following figure 1. 3. Pure uranium emits no beta
particles but energetic beta and gamma radiation are soon introduced by the ingrowths of
the immediate daughters 234Th and 234Pa. This beta activity reaches equilibrium in
undisturbed samples several months after the last purification of the uranium sample.
24.1 d) is a beta-emitter, the main group of beta particles in its spectrum has
point energy of 191 keV, but there is another group complex 10
Gamma transitions with energies of 30, 60 and 93 keV have been reported.
Figure 1. 3 Diagram schematic of 238U series (ISO 200
238 series begins with the heaviest naturally occurring nuclide 238U. It is
y), it is one of the
emitter, followed by a sequence of five
beta-beta sequence is
ed twice, and then the uranium series terminates on the lightest of the radiogenic
U corresponding to a specific activity of 0.747 disintegrations per
minute per microgram. The energy of the main group of alpha particles is 4.195 MeV
(77% abundance). Conversion electrons of 48 KeV gamma ray have been observed
indicating that the alpha decay is complex; another two alpha groups have been observed
%). The radioactive
Pure uranium emits no beta
particles but energetic beta and gamma radiation are soon introduced by the ingrowths of
Pa. This beta activity reaches equilibrium in
undisturbed samples several months after the last purification of the uranium sample.
he main group of beta particles in its spectrum has
there is another group complex 103 keV energy.
Gamma transitions with energies of 30, 60 and 93 keV have been reported.
2005)

INTRODUCTION
10
In the beta decay of 234Th, the principal daughter product is the 1.18 min 234Pa.
However, in 0.14% of its disintegrations an isomeric form of 234Pa with (t½ = 6.66 h) is
produced. The 1.18 min 234Pa decays directly to the ground state of 234U in 98% of its
transitions. The continuous beta spectrum accompanying this decay has the high end-
point energy of 2290 keV. The isomer 234Pa has an extremely complex beta, gamma and
conversion-electron spectrum. The fourth member of the uranium decay series is 234U (t½
= 2.48x10⁵ a). It is a beta-stable alpha-emitter. The energy of the first group is 4.768
MeV (72%), and of the second group is 4.717 MeV (28%). An additional group with
energy of 4.6 MeV (0.3%) has been observed and gamma-ray groups of 53 and 118 keV
have been measured (Ivanovich 1992).
1.3.3.2 226Ra
Radium is a divalent alkaline-earth metal (Group IIA of the periodic table). It
shares the chemical properties of beryllium, magnesium, calcium and strontium, and
exhibits very strong geochemical coherence with barium. Radium is produced by the
radioactive decay of uranium and thorium, and it occurs primarily in rocks bearing those
elements, most notably the sialic (alkaline) igneous rocks, pegmatite and certain
hydrothermal veins. Like the other elements in the group, radium forms a wide range of
minerals, most of which have more familiar calcium, magnesium or barium analogues;
the radium-bearing minerals are usually characterized by high melting points and very
low solubility in water. Radium commonly replaces the other alkaline-earth metals
didactically, substituting for calcium, magnesium and barium in common carbonate,
sulfate and phosphate minerals.
There are four naturally-occurring radium isotopes, three of which have relatively
short half-lives (223Ra, 11.4 d), (224Ra, 3.6 d) and (228Ra, 5.75 y). The fourth and most
abundant isotope, 226Ra, has a half-life of 1.620 years, long enough to allow significant
activity concentrations of radium to persist in geologically recent deposits without a
supporting concentration of uranium or thorium. It is an alpha-emitter with four known
alpha groups: 4.781 MeV (94%), 4.598 MeV (5.1%), 4.340 MeV (710-3 %) and 4.191
MeV (1l0-3 %). Several gammas are observed in the energy region between 186 and 610
keV. Thus, the radium concentration in certain post-Pleistocene marine deposits and in

INTRODUCTION
11
some modern marine organisms is greater than the amount in equilibrium with the
coexisting uranium. Except for some recent deposits, the distribution of radium is
determined by the occurrence of uranium or thorium, modified somewhat by the
chemical properties of radium itself. In Pleistocene and older rocks, the element is
invariably found in association (and usually in radioactive equilibrium) with its parent
nuclides (Majumdar 1990).
1.3.3.3 222Rn
Every person on earth is exposed to natural radiation. The most important source
of radiation is radon gas 222Rn. It discovered in 1900 by Ernst Dorn, who named it
Radium Emanation gas. It was later renamed neutron. The present name radon was first
used in early 1920. 222Rn is a daughter product of 226Ra which in turn is derived from 238U. We will explain 222Rn in detail in the Part 1.5 (UNSCEAR 1977).
1.4 The Actinium Series 235U makes up approximately 0.7% of natural uranium. This isotope has a half-life
of 7.1x10⁸ y, and is one of the primordial nuclides in the earth's crust. 235U will undergo
fission with slow neutrons and because it can sustain a chain fission reaction with the
release of large amounts of energy, it is important as a nuclear fuel. 235U yields 219Rn as
an intermediate daughter in the 235U decay series figure 1. 4.
Figure 1. 4 Schematic diagram of actinium radioactive decay series (ISO 2005)
INTRODUCTION
12
The actinium series begins in nature with its longest-lived nuclide 235U, and ends
with the stable lead isotope 207Pb. 235U It is conceivable that higher-mass nuclides in the
actinium series like 239Pu, 234Cm, 234Am, 247Bk, etc. were also present when the elements
were first formed, but of all the nuclides of this serious above lead, only 235U is
sufficiently long-lived to have persisted throughout geologic time. Any sample of natural
uranium, no matter what its source, contains 235U in a constant amount relative to 235U,
namely 0.72 atom per cent (a no able exception are the samples from a fossil, natural 235U
fission reactor site at Oklo, Gabon). Thus 1 mg of pure natural uranium emits exactly
1501 alpha particles per minute. Of these 733.6 are emitted by 238U, an equal number by 234U in equilibrium with 238U, and 33.7 by 235U.
235U is an alpha-emitter with a complex alpha spectrum and a correspondingly
complex gamma spectrum. About ten alpha groups have been observed, all in the energy
region between 4.1 and 4.6 MeV. Of these the two most prominent groups have energies
of 4.391 MeV (57%) and 4.361 MeV (18%). The immediate decay product of 235U is 231Th (t½ = 26.64 h), it is a beta-emitter with a complicated decay scheme. The most
energetic beta group has end-point energy of 300 keV and the total decay energy is 383
keV. The next nuclide in the actinium decay chain is 321Pa (t½ = 3.43104 y). It is also an
alpha-emitter and the longest-lived of the protactinium isotopes. The alpha spectrum of 231Pa is complex with the highest-intensity alpha-group energies of 5.05 MeV (11%),
5.016 MeV (up to 20%), 4.999 MeV (25.4%), 4.938 MeV (22.8%), and 4.724 MeV
(8.4%). Its daughter is 227Ac (t½ = 22 y). Actinium-227 is a beta-emitter with end-point
energy of about 45 keV (98.8%). Alpha-decay branching occurs with only 1.2% intensity.
The most prominent alpha-group energies are 4.949 MeV (48.7%), 4.937 MeV (36.1%),
4.866 MeV (6.9%), and 4.849 MeV (5.5%) (Ivanovich 1992).
1.5 Radon and Thorn Decay Chains
All three of the natural decay chains 235U, 232Th and 238U include isotopes of
radon. 219Rn or Actinon is a link in the 235U chain. We will probably never encounter
Actinon due to its scarcity and short half-life. 220Rn or thoron is part of the 232Th decay
chain. We will sometimes encounter thoron in indoor air, particularly near radon entry
points, and more often in soil gas. 222Rn or familiar radon is part of the 238U decay chain.

INTRODUCTION
13
We will almost always be able to detect this gas water. The radon isotope is the first
element in each of the decay chains that is not a metal. So it can escape any chemical
compound its parent 222Ra was in, and diffuse into the air. To focus on these inert gases,
the 220Rn and 222Rn decay chains are shown in the following figure 1. 5.
Figure 1. 5 222Rn and 220Rn decay chains (RAD 2009)
Every nucleus of 222Rn eventually decays through the sequence 218Po, 214Pb, 214Bi, 214Po and 210Pb. With each transformation along this path the nucleus emits characteristic
radiations: alpha, beta particles, gamma rays, or combinations of these. A particular radon
nucleus may decay at any time, but it is most likely to decay between now and 8 days.
When the radon nucleus decays, it releases an alpha particle with 5.49 MeV of energy,

INTRODUCTION
14
and the nucleus transforms to 218Po. This nucleus can never go back to 222Rn again.
Polonium atoms are metals and tend to stick to surfaces they come in contact with a dust
particle in the air, or a wall, or the inside of the lung. 218Po nuclei have a short half-life,
only 3.05 minutes, which means that most of them will decay within 6 minutes of their
formation. The average 218Po nucleus lives for only 4.40 minutes before it decays (1.443
times the half-life gives the mean life).
Like 222Rn, 218Po emits an alpha particle when it decays, but with an energy of
6.00 MeV rather than radon's 5.49 MeV. When 218Po decays, it transforms to 214Pb, also a
radioactive solid. But it has a half-life of 26.8 minutes, and it emits beta radiation rather
than alpha radiation. When it decays, it becomes 214Bi, also a radioactive solid and a beta
emitter. It has a half-life of 19.8 minutes, and transforms to 214Po when it decays. 214Po is
a bit different. It has a half-life of only 164 micro seconds, and it emits a 7.69 MeV alpha
particle when it decays to become 210Pb, which has a half-life of 22.3 years. This means
that an average 210Pb nucleus takes 1.443 times 22.3 years, or 32.2 years, to decay.
Because of its long half-life, we usually ignore these nuclei as a factor in radon
measurement. 210Pb eventually undergoes beta decay to 210Bi which quickly (5 days half-
life) undergoes a further beta decay to 210Po (138 days half-life) and decays with a 5.30
MeV alpha particle to stable 206Pb. Similarly to 222Rn every 220Rn nucleus eventually
decays through a sequence of 5 transformations to 208Pb. The main distinction is the very
different half-lives involved.
Thoron has a half-life of only 55.6 seconds. It emits a 6.29 MeV alpha particle
and transforms to 216Po, which in turn has only a 0.15 second half-life before emitting a
6.78 MeV alpha particle and transforming to 212Pb. it hangs around for a long time, with a
half-life of 10.6 hours. It transforms by beta decay to 212Bi (60.6 min half-life). it has a
2:1 split, with two thirds transforming by beta decay to 212Po and one third transforming
by 6.05 MeV alpha decay to 208Ti (3 minute half-life ). The 212Po decays immediately to 208Pb, emitting an 8.78 MeV alpha particle in the process, while the 208Tl undergoes a
beta decay to the same destination 208Pb (RAD 2009).

INTRODUCTION
15
1.5.1 Radon
Radon exists in the earth's crust with varying concentration in different locations.
It is believed that underlying soil is the main source of radon in the atmosphere of
dwelling, office and public places (Khan 1993). Radon isotopes [219Rn (Actinon), 220Rn
(Thoron) and 222Rn (Radon)] are produced naturally within the grains of the bedrock of
the earth crust, which contains the ores of uranium in secular equilibrium, (reached when
the activity of each radioactive daughters is equal to the activity of radioactive parent).
Because of its short half-life (~4s), and because of very low abundance (235U) of
its forerunner, 219Rn may be ignored entirely. But the half- life of 222Rn (3.82 d) is much
longer than that of 220Rn (56 s). Therefore, there is a great probability for 220Rn to decay
in its cradle before finding its way out to the atmosphere. In consequence the entrance
rate of 222Rn to the environment is much greater than that of 220Rn. So 220Rn and its
daughters are normally neglected in studying the "Radon problem" although their
concentration is not trivial as that from 219Rn (Abumurad 1997). It is widely accepted that
the primary effect is not due to 222Rn as such since inhaled 222Rn is mostly expelled, but
from the decay of alpha active nongaseous daughters of radon, 218Po and 214Po which is
attached to aerosols. It can be lodged in lungs when inhaled. It has two immediate
progeny, 214Pb and 214Bi decayed by relatively low energy beta–particle emission.
Although beta particle may be energetic, they produce very low ionization density and so
contribute little to biological hazard compared to alpha particles. The radiation from
radon and its daughters cause a risk of lung cancer by inhalation of air with high radon
and its daughter's concentration over a long period of time. The activity corresponds to
about 25 year at radon daughter’s activity of 400 Bq/m3. This activity corresponds to
about 2×10⁸ radon daughter atoms per m3 of air (Maged 1993, Maurice 1987). Over last
decade; more emphasis has been placed on measuring 222Rn levels in soil and attempting
to correlate the resultant concentration to local geology. This is due to the fact that most
of the radon in dwellings comes from the underground soil. The danger to the human
health upon exposure to radon and its daughter's products is the main motivation behind
the vast number of studies performed to find the concentration in our living environment.
In the last two decades, there has been a great deal of awareness about the health risks
from exposure to radon radioactive gas and its decay product. Figure 1. 6 shows the

INTRODUCTION
16
sources of radioactive risk, the relative contributions sources: natural and man–made. It
could be seen that natural sources provide about 82%, while the non–natural sources
provide 18% of the average total dose that a human being commonly receives. The
largest artificial sources are the medical. Most of the average dose comes from radon,
which comes from the alpha decay of radium in the ground (Kamel 1998).
Figure 1. 6 The average annual doses to the world population from various sources
(WNA 2011)
1.5.2 Chemistry of Radon
222Rn is colorless, odorless, tasteless, and is a noble gas. Therefore, all these
characteristics made it difficult to detect it. Radon is widely dispersed in the environment.
It is highly radioactive and decays by the emission of energetic alpha particles. It is the
heaviest of the noble or chemically inert gases. It is heavier than air by 7.5 times. Its
chemical inertness is due to its stable electronic configuration [5s2 5p6 5d10 6s2 6p6].
Under normal condition; it does not react chemically with other substances. We must
think of radon, not as a substance, but as isolated atoms whose transport is brought about
by other gases (e.g.: CO2, CH4 and N2), in which they may diffuse being within a fluid

INTRODUCTION
17
that may itself be moving. Radon is unique natural element in being a gas, noble and
radioactive in all of its isotopes (Lide 2002).
1.5.3 Sources of Radon
1.5.3.1 Soil
Soil is a very complex material, and it varies in both physical and chemical
properties to a very high degree. Soil may be considered a mixture of rock and mineral
fragments and/or organic matter and liquid and/or gas. Soils and rocks rich in uranium
are the main sources of radon to which people are exposed. A soil radon activity
unnatural environmental condition is influenced by soil moisture content, barometric
pressure variations and temperature and structure of soil. Loose sandy soil allows the
maximum diffusion of radon gas, whereas frozen, compacted or clay soil inhibits its flow.
The radon potential for a given region is likely to be the result of combination of
properties of the soil and of the underlying rocks, such as the distribution of uranium and
radium, porosity, permeability and moisture content of the soil, as well as metrological
and seasonal variation. Radon moves in the ground either by diffusion or by transpiration
mechanisms or by both. The dominate mechanism is determined by geological structure.
Radon concentration depends on depth. The concentration increases with depth and may
reach a maximum at depth of about 2 meter in the soil (Deepanjan 2000, Badr 1996,
Abumurad 2001, Khan 1987, Jonsson 1987).
1.5.3.2 Building Materials
Building materials that are made from stone and sand contain uranium and radium
and generate radon. Many of these materials, such as brick, wallboard or concrete are
sufficiently porous to allow the radon to escape into the air. The diffusion of 222Rn from
building material is influenced by moisture content of the material, density, the presence
of sealants, the material itself and the nature of the substances with which it is mixed
(Douglas 1990).

INTRODUCTION
18
1.5.3.3 Water Supplies
The ground water is the second most important potential source of atmospheric
radon. Water supply can be a route of entry if there is a significant amount of radon in the
ground water, and if the home water supply is derived directly from deep wells. Ground
water in contact with crust rock penetrates into the pores and voids present in rocks and
soils and dissolves radon that emanates into these spaces following radium decay. Radon
is quite soluble in water. In equilibrium with radon gas at a partial pressure of one
atmosphere, the solubility's range from 51 cm3 of radon per 100 cm3 of water at 0 ºC to 13
cm3 of radon per 100 cm3 of water at 50 ºC. Thus, the concentration of radon in
underground water is not solubility limited even at high temperatures. When this water
reaches the surface, most of the radon is released into the atmosphere, due to the
reduction in the radon partial pressure, but the remaining small fraction can still
correspond to a very large amount of radioactivity. This is one reason why very high
concentration of radon can be found in some hot springs and well waters.
The concentration of radon in ground or well water depends strongly on the
character of the host rock. (Hess 1982) measured radon contents of some two thousand
samples from public and privately drilled wells in Maine and reported values ranging
from 200 to 50,000 pCi/liter of water. The average water radon values obtained from 10
different granite bodies ranged from 1500 to 39,000 pCi/liter. Most surface waters have 222Rn concentrations less than 2 Bq/liter, and rarely do concentrations exceed 75 Bq/liter
(Nazaroff 1987). On a nationwide basis (Cothern 1986) have estimated that the
population-weighted-average radon concentration in drinking water is between 2 and 10
Bq/liter. The estimated airborne radon concentrations in houses using these waters,
assuming a transfer coefficient of 1x10⁻⁴ (Hess 1985), would be in the range of 0.2 to 1Bq
m-3. Because of the solubility of radon in water, very high levels of radon can occur even
at the boiling point of water or higher temperatures, as reached in some hot springs.
These spas have been used traditionally for therapeutic purposes, sometimes specifically
with radon as the intended therapeutic agent. In studies of two Austrian spas, air activities
in the periphery of the spa were 0.1 to 1.5 pCi/liter outdoors and 1 to 5 pCi/liter indoors,
while in the bathhouse itself they reached as high as 3000 pCi/liter. In general, the health
risks due to consumption of waters containing elevated concentration of radon are

INTRODUCTION
19
insignificant. The dose to stomach due to the ingestion radon-rich water, for example, has
been estimated to be less than 10 percent of that the lungs from breathing the
accompanying air borne radon and its decay products (Cross 1985). As an interesting
representation table 1. 5 shows the sources of global atmospheric radon and their
contribution per years.
Table1. 5 Sources of global atmospheric 222Rn sources (Cross 1985)
Sources Million Ci per year
Emanation from soil 2000
Ground water (potential) 500
Emanation from oceans 30
Phosphate residues 3
Uranium mill tailings 2
Coal residues 0.02
Natural gas 0.01
Coal combustion 0.0009
Radon Transport
Radon moves by two basic means, diffusion and forced flow. Diffusion inevitably
occurs, even though its extent may be limited. Hence diffusive migration sets a lower
limit on the transport of radon. Forced flow depends on pressure gradient, which may or
may not be present in a given situation. Numerous hypothetical origins of such gradients
have been proposed, but only occasionally are they dependably known to be active. In
any such case diffusive effects superimposed on those of pressure gradients.
Forced transport of radon in soil and rock
Pressure gradients can cause flow of the gas or liquid in interstitial space in the
Earth, the ease of such flow being given by the hydraulic permeability Phy

INTRODUCTION
20
)/(
)/(
dxdpA
dtdvphy
Where ŋ is the viscosity, (dv/dt)/A the volume moved per unit time and per unit
area, and dP/dx the pressure gradient. Phy is in units of (length) 2, usually either cm2 or
Darcys, where 1 Darcy = 10-8 cm2 (Scheidiger 1960).
Detection of vertical transport of radon in the earth
How does one learn whether transport is occurring? The procedure is to note what
gradients exist in the ground in the absence of flow and then look for changes. Since in a
uniform earth the primary reproducible gradients near the surface will be vertical, those
are the gradients that are usually sought. The result is shown in figure 1. 7. The near
surface zero radon concentration grows and by exponential decay approaches the
concentration C at depth, with the characteristic distance (Dt)1/2, which is 1.2 m for D =
0.03 cm2 s-1 (Fleischer 1984).
The radon lost to the atmosphere in each mean life is equivalent to an upward flux
at the surface at a velocity (D/t)1/2, which in this example is 2.5x10⁻⁴ cm s-1 (or 1.2 m/5.5
days). This is the velocity that any systematic up-flow (or down-flow) must exceed
decisively in order to be easily recognized.
Figure 1. 7 Radon concentration (102 cm-2 month-1) versus depth calculated for zero
vertical flow

INTRODUCTION
21
Mechanisms of forced transport in the earth
What physical processes in the earth might produce pressure gradients and
thereby affect radon flow? A number of observations of flow have been made and
mechanistic models proposed. Although most of these processes no doubt occur at some
times and places, it is difficult to prove for any single observation that in fact a particular
mechanism was clearly responsible. Three main categories are gas emission, stresses, and
fluid convection. Gases can be released by oil deposits (Fleischer 1984), and they can be
generated and pressurized by hot regions such as volcanoes. Stress can be generated by
the build-up of strains that precede earthquakes (Dobrovolsky 1979) and volcanic
eruptions, and the stress gradients in turn can encourage fluid flow in the earth. Fluid
convection could produce flows if there were sufficiently steep geothermal gradients and
high enough perm abilities (Mogro 1977). Such flows could deliver signals from uranium
deposits from greater depths than would allow detection of ore solely by diffusion of
radon. Here again volcanic effects (in this case thermal) could reveal impending activity.
A fourth contributor to pressure-induced flow is atmospheric pumping in the near surface
soil by the pressure fluctuations that are associated with weather systems (Clements
1974).
1.5.4 Radon in Water
In a typical house, with typical water usage patterns, water borne radon
concentration of 10,000 pCi/L will yield an average increase to indoor air concentrations
of about 1 pCi/L. The 10,000:1 ratio, while not to be considered a hard rule, has been
verified through theoretical models and empirical evidence (Hess 1990). In a house with
a high radon in water content, air radon concentrations tend to rise dramatically with
water usage, especially in the vicinity of the water-using appliance, but decline steadily
after the water usage tails off (Henschel 1988). In most houses, water borne radon is a
secondary source of indoor radon, far exceeded by soil gas infiltration. It is an exception,
though not a rare one, that water borne radon is the major contributor to elevated radon in
air. A home owner who has discovered elevated air concentrations, and whose house uses
private well water, should test the water for radon content to assess the water's
contribution to the air borne radon. This test ought to be done before any attempt to

INTRODUCTION
22
mitigate soil gas infiltration, particularly if other wells in the area have been found to
have radon (Henschel 1988).
Radon gas is, in physical terminology, soluble in water in the sense that the gas is
transported by the water into the house. Its solubility in water is about ten times more
than for oxygen gas. The gas follows the water from its source, where the surrounding
bedrock and soil are producing the gas. As 226Ra, the mother atom of the 222Rn atom is
soluble in water, the 226Ra content in the bedrock and soil plays in important role. Water
in rivers and reservoirs usually contain very little radon, because it escapes readily into
the air. Homes, using surface water, usually do not have radon problem from the water
supply. In cities where water processing in large municipal systems aerates the water
allowing radon to escape, while the small water supply systems are often closed systems
with short water transit times, that do not allow radon to be completely removed or
decayed. Radon then escapes from the water into the indoor environment as people use
the water for showers and washing (Abumurad 2001).
The rate of radon transfer from water to air increases with temperature, agitation,
mixing, and surface area. In household water usage, showers, baths, dishwashers,
laundries, and toilets all provide adequate aeration to release a high percentage of the
water's radon content into household air (Prichard 1987). In principle, the radon will
continue to be released from water as the aeration process continues, until a state of
equilibrium develops.
Radon as a Tracer for Ground Water Movement
Soil and rock typically contain significant concentrations of uranium and radium.
Radon is continually being created in the ground so that groundwater often has high
radon content. By contrast, open water contains very little dissolved radium. That,
together with the proximity of the water surface, means that the background
concentration of radon in sea and lake water far from land is very low. Radon then is an
almost perfect tracer for measuring and monitoring the movement of groundwater into
lake and sea water along the shore (Lane 2002, Burnett 1995). While open water
monitoring often requires continuous and fast-response radon measurement at high
INTRODUCTION
23
sensitivity, for groundwater in situ it is usually more convenient to use the Alpha
GUARD.
Mitigation Strategies
Two main strategies have emerged for the removal of radon from water. Both of
these are applicable to point-of-entry (POE) water treatment in residences and small
public water supplies. Granular Activated Carbon (GAC) attempts to filter the water by
adsorbing radon on a charcoal bed that holds onto the radon until the radon decays. GAC
systems can be effective and relatively inexpensive for residential use, but can create new
problems. As the radon and its progeny decay in the GAC column, they give off gamma
radiation. The gamma radiation may be a health concern to residents when the influent
radon concentration is high, the GAC column is poorly shielded for high energy
radiation, and the residents are likely to spend significant periods of time in the radiation
field. Over time, a long lived decay product, lead-210, builds up in the column, which
may pose disposal problems in systems with moderate to high radon concentrations in the
influent. For that reason GAC is most often recommended for influent concentrations of
up to around 5,000 pCi/L. GAC maintenance is simple and inexpensive, and the GAC
bed has an expected service life of 5 to 10 years. (Henschel 1988, Lowry 1987, Rydell
1989) Aeration brings water into contact with a stream of low radon air, which strips the
radon from the water, then exhausts the radon bearing air to the atmosphere. Aeration
systems offer effective removal of radon without the buildup of gamma radiation or
waste material, but tend to be substantially more expensive than GAC to install and
maintain in a residential setting. Aeration can be used over the entire range of influent
concentrations, though very high influent concentration may require a multiple stage
system to reduce the effluent concentration to acceptable levels (Henschel 1988, Lowry
1987).
1.5.5 Health Effect and Risk
Inhalation of radon gas and its daughters will expose the lung tissue to short-lived
alpha emitting radionuclide, which will increase the risk of lung cancer. Radon is also
suspected to be a major factor increasing skin cancer, where alpha particles are suspected

INTRODUCTION
24
to induce damage to epithelial cells due to deposition of radon on the skin. Kidney related
diseases have also been observed in some people exposed to radon and this is due to the
fact that kidney receives the highest dose, among the body organs, after radon being
transferred from the lung to the kidney by blood. Inhaled radon may be transported to
various organs after dissolving in blood. The concentration of radon in organs and the
consequent dose both depend on the fat content of the organs, since radon is about 16
times more soluble in fat than in blood (As‘ad 2004, Al-Sharif 2001).
Water borne radon leads to health risk by two pathways:
Inhalation of radon and its decay products following the release of radon gas from
water into household air.
Direct ingestion of radon in drinking water.
The risk of lung cancer due to inhaled radon decay products has been well
documented through the study of undergrounds mine workers. The cancer risk due to
ingestion, primarily cancer of the stomach and digestive organs, has been estimated from
studies of the movement of radon through the gas to intestinal tract and blood stream.
Radon has not been linked to any disease other than cancer. The cancer risk from the
inhalation pathway probably far exceeds that from the ingestion pathway (Crawford
1990, Federal 1991).
1.6 Exposure from Radiation Sources
The exposure to ionizing radiation from natural sources is a continuing and
inescapable feature of live on earth. For most individuals, these natural back ground
exposures are much more significant than the exposures caused by man-made sources.
Exceptions that apply to certain individuals are some exposures caused by medical
radiation procedures, through mishandling of radiation sources, in accidents allowing
radionuclides to be released to the environment, and at some workplaces. In all cases, the
natural back ground source form the baseline upon which all man-made exposures are
added, and it is a common level against which these exposures may be compared.
Essentially there are two main contributors to the natural radiation exposure of
man: charged and uncharged particles generated by high-energy particles of cosmic

INTRODUCTION
25
origin incident on the earth's atmosphere, and radioactive nuclides originating either by
interaction of cosmic-ray particles in the earth's atmosphere or being naturally present in
the earth's crust everywhere in the environment, including the human body itself. From
these sources dose to man arise from both external and internal exposure (Kaul 2005).
1.6.1 Exposures by Cosmic Radiation and Cosmogenic Radionuclides
Primary cosmic rays interact in the atmosphere producing a nucleonic cascade
comprising protons, neutrons, pions and low-Z nuclei. The neutral pions decay to
energetic photons. Through pair production, these generate a subsequent electromagnetic
cascade of electrons and photons. Meanwhile, the charged pions decay to muons. The
long free path of these muons and their relativistic ally expanded life time make them the
dominant component of charged particle flux at ground level. In broad terms, at sea level,
muons deliver just over 70% of the dose equivalent, electrons and photons about 15%
and neutrons about 10%. Protons and charged pions contribute at the 1-2% level (Thorne
2003, UNSCEAR 2000).
1.6.2 Exposure by Terrestrial Radiation
Irradiation of the human body from external sources is mainly by gamma
radiation from radionuclides in the 238U, 232Th series and from 40K. These radionuclides
are also present in the human body from ingestion and inhalation, and irradiate the
various organs with alpha and beta particles, as well as gamma rays. Some other
terrestrial radionuclides, including those of the 235U series, 87Rb, 138La, 147Sm, and 176Lu
exist in nature, but at such low levels that their contributions to the dose are small
(UNSCEAR 2000). The 238U series includes 222Rn, which is of particular relevance to
internal exposure by inhalation. 232Th series includes 220Rn, which is also of relevance to
inhalation exposures. However because of its half-life (55 second), it tends to be less
important than 222Rn.
INTRODUCTION
26
1.6.2.1 External Exposure from Terrestrial Gamma Radiation
Outdoors
External exposure outdoors arise from terrestrial radionuclides present at trace
levels in all soils depending on the types of rock from which the soils originate. Gamma-
spectrometric measurements indicate that the three components of the external radiation
field, i.e. from the gamma emitting radionuclides in the 238U, 232Th series and 40K, make
approximately equal contributions to the externally incident gamma radiation dose to
individuals in typical situations both outdoors and indoors. Direct measurements of
absorbed dose rates in air from terrestrial gamma radiation have been carried out in many
countries of the world. Average values outdoors for the different countries surveyed
range from 18 to 93 nGy/h. The population weighted average is 59 nGy/h (Thorne 2003,
UNSCEAR 2000). The lowest values of the absorbed dose rate in air outdoor are in
Cyprus, Iceland, Egypt, Netherlands, Brunei and United Kingdom, all less than 40 nGy/h,
and higher values are in Australia, Malaysia and Portugal, all greater than 80 nGy/h. In
addition to variations from place to place, the ambient back ground gamma dose rate in
air at any specific location is not constant in time. It is subject to considerable fluctuation,
in particular from the removal of 222Rn progeny in air by rainfall, soil moisture and snow
cover. There are small areas of markedly high absorbed dose rate in air throughout the
world that are associated with monazite sand deposits, which have high levels of thorium,
and radium deposited from waters flowing from hot springs (UNSCEAR 2000).
Indoors
Indoor exposure to gamma rays is mainly determined by the materials of
construction and their surrounding configuration indoors, and inherently greater than
outdoor exposure if earth materials have been used. When the duration of occupancy is
taken into account, indoor exposure becomes even more significant.
From surveys of absorbed dose rates in air inside dwellings the population-weighted
average of the absorbed dose rate proved to be 84 nGy/h with national averages ranging
from 20-200 nGy/h. The lowest values are in New Zealand, Iceland and the United

INTRODUCTION
27
States, all below 40 nGy/h, which probably reflects the preponderance of wood-frame
houses.
Overall UNSCEAR 2000 estimates a worldwide average effective dose rate of
0.48 mSv/a (0.41 mSv/a indoors and 0.07 mSv/a outdoors) (UNSCEAR 2000).
1.6.2.2 Internal Exposure from Terrestrial Radiation
Internal exposures arise from the intake of terrestrial radionuclides by inhalation
and ingestion. Doses by inhalation result from the presence in air of dust particles
containing radionuclide’s of the 238U and 232Th decay chains. The dominant component
of inhalation exposure is the short-lived decay products of radon, which is considered
separately below. Doses by ingestion are mainly due to 40K and to 238U and 232Th series
radionuclides present in foods and drinking water. The dose rate from 40K can be
determined directly from external measurements in vivo of its concentration in the human
body. The dose rate from uranium and thorium series radionuclides in the body is
estimated either from measured activity concentrations after chemical analyses of tissues
or from results of analyses of radionuclide contents of foods and drinking water, along
with bioassay data and the knowledge of the metabolic and bio kinetic behavior of the
radionuclides (UNSCEAR 2000).
Internal Exposure due to Radon and Thoron
Inhalation of radon and its short-lived decay products in the atmosphere are the
most important contributors to human exposure from natural sources. Inhalation of the
short-lived decay products of 222Rn, and to a lesser extent of the decay products of 220Rn
(Thoron), and their subsequent deposition along the walls of the various airways of the
bronchia tree provide the main pathway for radiation exposure of the lungs.
The total global annual average of the effective dose from inhalation of 222Rn and
its decay products present in air, from dissolution of radon gas in blood and ingestion of
radon gas with tap water is 1148 μSv with fractions of about 95% from inhalation
outdoors and indoors and 5% from dissolved radon gas in blood and from ingestion of tap
water. The annual effective dose from 220Rn is 101 μSv with fractions of about 90% from
inhalation and 10% from thoron dissolution in blood (UNSCEAR 1993). These estimates

INTRODUCTION
28
of the global averages of the annual effective doses for radon only define the normal
radon and thoron exposures. One may expect to find many large populations around the
world in the order of 106 individuals, whose average exposures differ from the above
global averages by a factor of more than 2, and up to a factor of more than 10 for many
smaller populations in the order of 104 individuals (UNSCEAR 2000).

EXPERIMENTAL WORK

EXPREMENTAL WORK
30
EXPERIMENTAL WORK
2 Materials and Method
2.1 Samples Collection and Preparation
Two hundred twenty water samples from different sites in Qena governorate,
Egypt, have been collected and prepared, for measuring the activity concentrations of222Rn, 226Ra, 232Th and 40K, by using two methods:
Ionization Chamber "Alpha GUARD PQ2000PRO"
Gamma ray spectrometry "NaI (Tl) Scintillation Counter"
These samples are classified as following:
109 ground water samples were collected from four areas in Qena:
26 sample from Qift and Qus area. This area extended between the souths
of Hagaza village in Qus area to the north of El-Salhia village.
15 sample from Nakada area. This area extended between the souths of
Nakada city to the south of El-Ashraf El-Baharia village.
13 sample from Dishna area. This area extended between the begin of
Qena-Safaga High way to Ezbit Ismail village in the north of Dishna area
55 sample from Nagahammady and El-Waqf area. This area extended
between the norths's of Dandara area to Naga-Zanaty in the north of
Farshot area.
97 Drinking Tap water samples were collected from the city of Qena.
14 Different Kinds of Mineral water bottles were collected from Qena markets.
2.1.1 Ground Water Samples
2.1.1.1 222Rn Measurements
The collection of water sample requires particular care because 222Rn is a short-
lived gaseous nuclide that tends to escape from water during sampling. For 222Rn activity
concentrations measurements by using Alpha GUARD, the samples were collected from
four areas in Qena governorate, east and west of the river Nile, as shown in the map
figure 2. 1.

EXPREMENTAL WORK
31
Figure 2. 1 Map of ground water sampling sites

EXPREMENTAL WORK
32
At each site the well tap was opened, and the water was allowed to run for at least
20 minutes, in order to ensure that the water came directly from the well, and was not
delayed in the well pipes. The taken samples were stored in bottles with 500 ml volume,
that which completely filled, to avoid diffusion of radon from the water into an air
pocket. During the process of samples transferring from the field to the laboratory, the
samples were placed inside a closed box away from direct sunlight to avoid overheating.
The samples were analyzed for 222Rn as soon as possible after collection, to avoid
uncertainties that may be introduced by radioactive decay of radon and losses from the
sample container, the activity concentrations of 222Rn were estimated using Expert
software, for evaluating the alpha spectra figure 2. 2. All measurements were decay
corrected to the time of sampling.
Figure 2. 2 Alpha GUARD spectrum for 222Rn concentrations (Bq/m3) with counting time

EXPREMENTAL WORK
33
For 222Rn activity concentrations measurements by using gamma spectroscopy,
standard polyethylene Marinelli beakers (1.4 liters) were used as a sampling and
measuring container. Before use, the containers were washed with dilute hydrochloric
acid and rinsed with distilled water. Each beaker was filled up to brim and a tight cap was
pressed on so that the air was completely removed from it. 222Rn in water samples was
determined at least four hours after sampling, using gamma spectrometry based on an NaI
(Tl) detector, The 222Rn activity concentration of water samples is assayed for 8 hour
counting followed by analysis of gamma peaks from 214Bi (609 keV) and 214Pb (295, 352
keV) using GENEE 2000 software, for e valuating the gamma Spectra figure 2. 3.
Figure 2. 3 Spectrum of 222Rn measurements using gamma spectroscopy
2.1.1.2 Natural Radionuclides Measurements
The same samples have been measured for 222Rn activity concentrations using
gamma spectroscopy were stored for more than one month to reach secular equilibrium
between 226Ra, 232Th and their daughter products before radiometric analysis of the
natural radionuclides.

EXPREMENTAL WORK
34
2.1.2 Drinking Water Samples (Tap and Mineral)
For tap water samples, the tap was opened, and the water was allowed to run for
at least 20 minutes in order to ensure that the water not delayed in the pipes, the sample
taken directly and slowly to the degassing vessel 500 ml in the AquaKIT measuring
system, to avoid diffusion of radon from the water into the air. In the mineral water
samples, every bottle was opened, and the sample was injected to degassing vessel. 222Rn
activity concentrations in drinking and mineral water samples were estimated at the
moment of uses, so the measurements were not corrected for delay time.
2.2 Measuring Systems
2.2.1 Alpha GUARD
The Alpha GUARD is the center piece of a compact portable measuring system
for the continuous determination of the 222Rn Activity concentrations and climatic
parameters; Temperature, Humidity and Air pressure, It can be operated mains
independently as well as by mains power supply. This device uses the proven principle of
the pulse ionization chamber. Alpha GUARD impresses by its high detection efficiency
for 222Rn, fast response to concentration gradients, as well as maintenance free long term
operation, also in extreme air humidity. Alpha GUARD delivers reliable measuring
values, and is insensitive to both vibrations and shock. The radon progeny measuring
head TN-WL-02 is a professional sensor module for the recording of the air borne radon
progeny concentration. The handy sensor unit is applicable for long term measurements
as building examinations. The Pumping unit integrated in the measuring head sucks the
air stream continuously. By this the radon progeny products are separated on a filter
platelet. The alpha activity of the accumulated progeny products is measured by an alpha
sensitive microchip which is located on the opposite of the filter platelet. Then the alpha
activity is transferred as a TTL signal to the counter module of the connected Alpha
GUARD PQ2000PRO. For routine graphical work up, evaluation, archiving and
presentation of the measured data Alpha VEW-EXPERT is used as a comfortable, user-
friendly (WINDOWS-similar) PC-software package. It includes an automatic
transformation of the 222Rn progeny concentration into the equilibrium equivalent 222Rn
concentration (Bq/m³). The Alpha GUARD monitoring system can be completed by

EXPREMENTAL WORK
35
further external sensors for the continuous registration of ambient parameters, for
example differential pressure and temperature. Figure 2. 4 shows Alpha GUARD center
piece.
Figure 2. 4 Alpha GUARD (AquaKIT 1999)
2.2.1.1 Radon Detector
The radon detector of the Alpha GUARD is based on a design optimized pulse
ionization chamber. In regular operation the measuring gas gets in diffusion mode via a
large surface glass fiber filter into the ionization chamber. Through this filter only the
gaseous 222Rn passes, while the radon progeny products and dusty particles are prevented
to enter the ionization chamber.
2.2.1.2 Ionization Chamber
The cylindrical ionization chamber of the Alpha GUARD as shown in figure 2. 5
has an active volume of 0.56 L. Its metallic interior has a potential of +750 V when the
instrument is turned on. Along the longitudinal axis the stiff center electrode is located
which lies on a potential of 0 V. The center electrode is connected with the signal input of
the highly sensitive preamplifier unit. The worked up measuring signals of the
preamplifier unit are transmitted to an electronic network for further digital processing.

EXPREMENTAL WORK
36
Figure 2. 5 Alpha GUARD ionization chamber (AquaKIT 1999)
2.2.1.3 Digital Signal Processing
For digital signal processing (DSP) there are three independent signal processing
channels as shown in figure 2. 6. To each channel belongs a specific analog digital
converter. This network concept allows analyzing the entering preamplifier signals
simultaneously according to three different feature complexes.
Channel 1 is the spectrometric channel of the Alpha GUARD. Here, there is not
only a signal characterization according to the pulse depth, but also a classification
according to the pulse form. The result of this pulse analysis is a three-dimensional
spectrum. Along the X-axis there is a classification of the pulse depth, (alpha energy). By
the Y-coordinate the number of pulses per unit of time is described. The Z-coordinate
stands for the classes of pulse forms. Because of this complex pulse characterization, a
highly effective differentiation between real alpha events and different interference
effects is possible (for example: micro phonic phenomena).
Signal processing via channel 2 is only effected with high 222Rn concentrations.
The dimensioning of the used band pass filter grants that the amplitude of the signal noise
level is with high pulse densities direct proportional to the square root of the total
ionization stream. By determined use of this relation, the current measurement in the Pico
ampere range can be done with extremely high precision. Simultaneously by this a

EXPREMENTAL WORK
37
regularly appearing source of errors is eliminated, the drift of the preamplifier offset,
which results of the temperature sensitive FET-structure of the preamplifier.
Channel 3 stands for a classic direct current measurement. Its use is bound to the
appearance of extremely high radon concentrations. Moreover it is a guarantee for a high
fold back tightness of the measuring system. On the basis of these three signal
characteristics six different analyzing algorithms are processed. Finally, via an optimized
density procedure the real radon concentration is determined of them. By this any of the
displayed radon values of Alpha GUARD is the final result of ca. 50.000.000 arithmetic
operations. Only by use of latest semiconductor generation it is possible to keep the
energy consumption of the Alpha GUARD down do the low level of 3 m ampere when
handling such heaps of figures.
Figure 2. 6 Block diagram of digital signal processing (AquaKIT 1999)
2.2.1.4 AquaKIT
AquaKIT is an optional accessory to the 222Rn monitoring system Alpha GUARD
PQ2000PRO. In combination with the radon monitor and Alpha PUMP, electronic
Pumping unit AquaKIT allows determining the 222Rn concentration in water samples
directly, and precisely, and stored in its memory in form of a concentration time series.
The portable combination AquaKIT-Alpha PUMP-Alpha GUARD can be used for
operation in the field. The batteries of Alpha GUARD and Alpha PUMP assist mains-
independent operation of more than 12 hours.

EXPREMENTAL WORK
38
The components of the AquaKIT measuring set-up and the use are described in
the following:
Degassing vessel
Security vessel
Plastic injections for sampling
Mounting socket
Connecting tubes
Measuring cylinder
Active coal filter cartridge
Degassing Vessel
Degassing vessel is a gas washing vessel of DURAN modified for the particular
measuring task. It takes up measuring samples of water. Out of this the radon is driven
out of the sample. The standard set-up consists of:
the cylindrical glass bulb with a volume of 200 ml
the degassing cap with ascending tube, frit, three-way tap as well as three
connecting sockets for tubes by interior quarter 4 mm The gas-tight connection
between the two glass parts is assured via a cut clutch of the type NS 29/32.
Security Vessel
Security vessel is coupled at the outlet side of the degassing vessel. All water
drops shall deposit in it if they have got into the gas cycle during the degassing process.
By this the stress of the water vapor is minimized for the radon monitor. Besides for the
frit (which is not included) and a shortened ascending tube the security vessel is of the
same layout as the degassing vessel.
Injection for Sample Taking
As a particular device for sample taking four 100 ml plastic injections are
enclosed. They allow a sufficiently exact portioning of the samples.
Mounting Socket
Mounting socket assists a stable set-up of the measuring equipment. As shown in
figure 2. 7 it fixes the degassing vessel, security vessel and the Alpha PUMP in a vertical

EXPREMENTAL WORK
39
position. The mounting socket is a square shaped hard foam body with properly fitting
sinking to take up the above mentioned parts of the measuring equipment.
Figure 2. 7 Mounting socket (AquaKIT 1999)
Connecting Tubes
Seven tube pieces of different lengths belong to the basic equipment. They serve
as the way for the gas between degassing vessel, security vessel, Alpha PUMP and Alpha
GUARD as well as the active coal filter cartridge. The plastic tubes are made of Tygon
with an interior diameter of 4 mm. This plastic material has a particularly high resistance
in diffusion for radon in contrary to the often used tube materials on silicon bases. The
lengths of the different parts are 2x150 mm, 400 mm, 3x500 mm, and 600 mm.
The two 150 mm as well as the two 500 mm tube pieces are made with quick Fit
quick-lock couplings (consisting of tube nipple and tube coupling). These couplings are
equipped with internal valves which automatically close when the clutch is separated. By
this an uncontrolled escape of radon resp. inflow of outer gas into the measurement set-up
is prevented.
Measuring Cylinder
The enclosed measuring cylinder (volume 250 ml) shall enable to exactly
determine the volume of the sample after finalizing the 222Rn measurement.

EXPREMENTAL WORK
40
Thermometer
The enclosed thermometer allows especially with precision measurements to
exactly determine the temperature of the inspected water sample. The measuring range of
the thermometer is from -10°C to +50°C.
Active Coal Filter Cartridge
The active coal filter cartridge serves for the supply of radon-poor air. It is used
with precision measurements for the exact determination of the intrinsic detector effect of
the radon monitor, as well as for minimizing the radon level in the measurement set-up
before sampling. The active coal filter cartridge consists of a plastic cylinder (Q/L: 75
mmx300 mm) with stable footings as well as tube nozzles at each front side.
Its interior is filled by Ca (1000 cm³) active coal. The diameter of the grain is 1.5
mm and the filling density is 0.4 g/cm³. The loading capacity of the used active coal is
≈1.25x10⁻³m³/g. With this the active coal cartridge is equivalent to an air volume of
approximately 500 L.
2.2.1.5 Alpha PUMP
Alpha PUMP is a battery operated electronically powered handy Pumping unit for
gases. It can be gradually adjusted from 0, 03 to 1 Liter/minute. The electronics is
optimized for minimal power consumption which grants a long life time of the storage
battery. Alpha PUMP was developed as an accessory to the radon monitor Alpha
GUARD and for the Alpha GUARD soil gas unit. It serves for sampling (once through
filling of the ionization chamber), as well as for cycle operation when measuring the 222Rn emanation in barrels or vessels (storage vessel for radium containing substances
and waste materials, exhalators etc.).
An internal aqua-stop filter prevents that possibly sucked in liquidity enters into
the system. Thus the ionization chamber of the Alpha GUARD connected in series is
protected from water break-in and thus makes expensive repairs superfluous. The PUMP
is impermeable to gas and therefore also suited for calibration jobs with the Alpha
GUARD. Figure 2. 8 show the alpha PUMP.
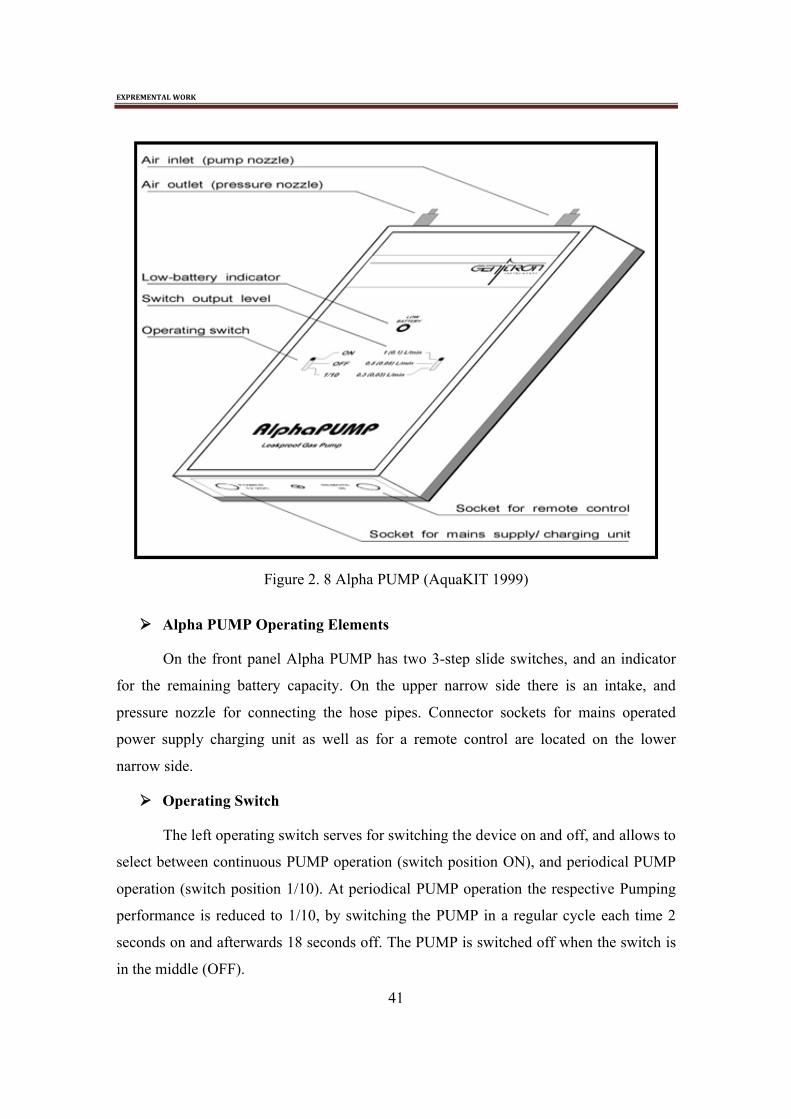
EXPREMENTAL WORK
41
Figure 2. 8 Alpha PUMP (AquaKIT 1999)
Alpha PUMP Operating Elements
On the front panel Alpha PUMP has two 3-step slide switches, and an indicator
for the remaining battery capacity. On the upper narrow side there is an intake, and
pressure nozzle for connecting the hose pipes. Connector sockets for mains operated
power supply charging unit as well as for a remote control are located on the lower
narrow side.
Operating Switch
The left operating switch serves for switching the device on and off, and allows to
select between continuous PUMP operation (switch position ON), and periodical PUMP
operation (switch position 1/10). At periodical PUMP operation the respective Pumping
performance is reduced to 1/10, by switching the PUMP in a regular cycle each time 2
seconds on and afterwards 18 seconds off. The PUMP is switched off when the switch is
in the middle (OFF).

EXPREMENTAL WORK
42
Switch Output Level
The right hand slide switch (power amplifier switch) allows varying the output of
the PUMP. In combination with the operating switch 6 different PUMP rates can be set in
the range of 1.0 to 0.03 L/min as shown in the following table 2. 1.
Table 2. 1 Position power amplifier switch (L/min) (AquaKIT 1999)
Position Operating Switch 1 (0.1) 0.5 (0.05) 0.3 (0.03)
ON 1.0 0.5 0.3
1/10 0.1 0.05 0.03
Nozzle (IN and OUT)
Intake and pressure stack are prepared with screw caps. To connect the hose pipes
turn off the screw caps, and put in inverted position over the tubes. After mounting the
tubes screw on screw caps on the respective nozzle and tighten only manually. The
nozzles are prepared for tubes of 4 mm inside and 6 mm exterior diameter.
2.2.1.6 Set-up of the Measuring Equipment
For a well-functioning and stable set-up the degassing, security vessel and Alpha
PUMP have to be set into the respective fittings of the mounting socket as shown in
figure 2. 9. The tightness of the grounded clutches of degassing and security vessel
should be granted via the grounded security clamps. The Alpha GUARD monitor is to be
placed next to the mounting socket that the enclosed connecting tubes for creating a
closed gas cycle can be used.
The tube connection should be done the following way:
1. The lower nozzle at the side of the top of the degassing vessel has to be connected
with the lower nozzle of the top of the security vessel. This connection consists of
the two 150 mm tube pieces with quick-lock clutch.
2. The lower nozzle at the side of the top of the security vessel has to be connected
with the nozzle ‘IN’ of Alpha PUMP (tube length 400 mm).
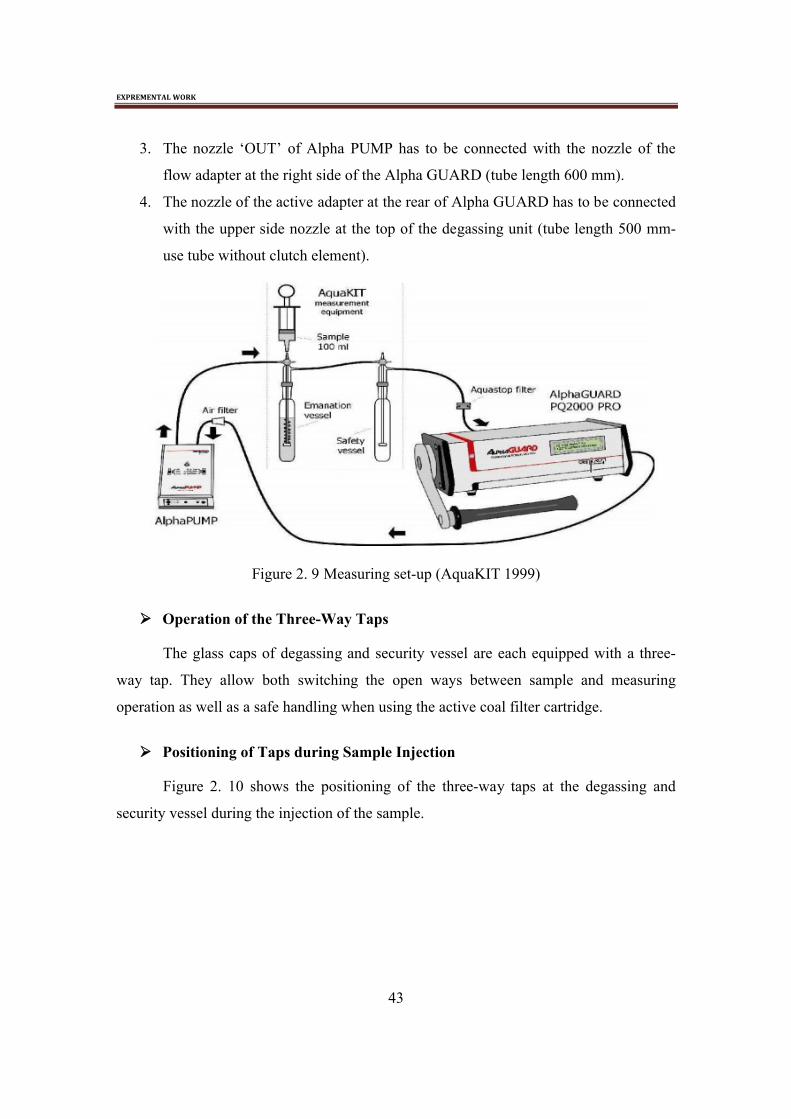
EXPREMENTAL WORK
43
3. The nozzle ‘OUT’ of Alpha PUMP has to be connected with the nozzle of the
flow adapter at the right side of the Alpha GUARD (tube length 600 mm).
4. The nozzle of the active adapter at the rear of Alpha GUARD has to be connected
with the upper side nozzle at the top of the degassing unit (tube length 500 mm-
use tube without clutch element).
Figure 2. 9 Measuring set-up (AquaKIT 1999)
Operation of the Three-Way Taps
The glass caps of degassing and security vessel are each equipped with a three-
way tap. They allow both switching the open ways between sample and measuring
operation as well as a safe handling when using the active coal filter cartridge.
Positioning of Taps during Sample Injection
Figure 2. 10 shows the positioning of the three-way taps at the degassing and
security vessel during the injection of the sample.

EXPREMENTAL WORK
44
Figure 2. 10 Three-Way taps-position of the taps when the sample is injected
(AquaKIT 1999)
Notes:
Deviations of the described tap operation scheme for injecting the sample could
lead to pushing the liquidity into the gas way. This could lead to an undefined
contamination of the measuring devices resulting in costly cleaning measures.
The 3 o’clock position of the three-way tap at the security vessel during the
injection of the sample assures the required pressure balance during this step.
The three-way tap at the security vessel has immediately to be brought into the
position for the measuring process after finishing the injection of the sample. By
this uncontrolled escape of radon out of the measuring set-up is prevented.
The three-way tap at the degassing unit must be switched to the position for
measuring operation before separating the emptied plastic injection. By this
uncontrolled escape of radon out of the measuring set-up is prevented.
Positioning of the Tap during Measurement
Figure 2. 11 shows the positions of the three-way taps at the degassing and
security vessel during the measurement.

EXPREMENTAL WORK
45
Figure 2. 11 Three-way taps positions of the taps during measurement (AquaKIT 1999)
2.2.1.7 Using the Active Coal Filter Cartridge
Normally for precision measurement it is necessary to diminish the radon level in
the measuring set up before entering the sample. For this the supplied active coal filter
cartridge (figure 2. 12) is bound into the gas cycle of the measuring set-up for some time.
The radon in the measuring set-up is absorbed by the active coal and by this excluded of
the gas cycle.
Figure 2. 12 Measuring set-up (section with enclosed active filter cartridge) (AquaKIT
1999)

EXPREMENTAL WORK
46
The active coal filter cartridge shall be placed in the gas way between the lower
connection nozzle of degassing and security vessel. For this the quick-lock clutch of its
connecting tube is separated. Onto the active coal filter cartridge the two 500-mm tubes
are placed which have at its ends a tube nipple resp. a tube clutch, with these clutch
elements the filter cartridge is placed into the gas way between degassing and security
vessel. The three-way taps are placed into 6 o`clock position and Alpha PUMP is
switched on by switching the performance level switch to ‘1 L/min’ and the operation
mode switch to ‘ON’. After the required "zero level" is reached Alpha PUMP is switched
off, the active coal filter cartridge taken off the gas way and the tube clutch in the gas
way between degassing and security vessel is reconnected.
2.2.1.8 General Aspects of Measuring
The main condition for correctness and exactness of the measurement is qualified
sampling. In particularly the 222Rn losses on the way between sampling and the
measurement have to be minimized. For the actual procedure the following aspects which
are signified by a general conflict of targets have to be taken into account:
1. Exactness and correctness of measurement (quality aspect)
2. Sample throughput / rapidity of analysis (quantity aspect)
Alternatives in Sampling
In the following the alternatives for sampling with AquaKIT are described. There
is a direct and multistage transfer of samples which have to be differed. The direct
transfer of samples emphasizes the quality aspect. The multistage procedure stands for a
significant faster throughput of samples where the therefore caused elevation of the error
rate can be neglected for quick measurements.
Direct Transfer of Samples
For the direct transfer of samples the supplied 100 ml plastic injections can be
disposed of. E.g. 100 ml of the liquidity to be measured are taken up with the injection
and afterwards directly injected into the upper nozzle of the degassing unit. Afterwards
the measurement operation is started. But we Take care that the correct position of the
three way taps is kept at the degassing and security vessel during sampling.
EXPREMENTAL WORK
47
Multistage Sample Transfer
In order to take as many samples as possible and to safely store them until the
measurement in the laboratory also the other lower parts of the glass vessels supplied
may be used (2x100 and 2x500 ml). For this the vessels shall be filled with overflowing
water samples and later be closed with the enclosed glass stoppers and security clamps.
For the measurement of the samples the following procedure shall be taken:
100 ml Lower Glass Vessel
Take off the glass stopper and immediately enter the degassing cap. Afterwards
reduce the quantity of the sample in the degassing vessel to approximately 100 ml with
the plastic injection placed on the upper filler socket. The three-way taps are set to 3
o’clock at the degassing vessel and to 9 o’clock at the security vessel (for a pressure
balance). Taking off the closing stopper of the sample storage vessel and putting up the
degassing cap must be done without interruption in order to minimize the escape of radon
of the water sample and the transition into the surrounding air. The three way taps of
degassing and security vessels are switched on to 3 o’clock position when the degassing
cap is placed (pressure balance). After the end of the 222Rn measurement the exact sample
volume has to be determined with the measuring cylinder.
500 ml Lower Glass Parts
About the 500 ml vessel we take off the glass stopper and tear the liquidity from
the ground of the bottle with the 100 ml plastic injection. Then we inject the part of the
sample taken up into the degassing vessel. Removing the part of the sample has to be
done immediately after taking off the stopper in order to minimize radon escape of the
sample into the surrounding air. The three-way taps of degassing and security vessel shall
be in 3 o’clock position when the sample is placed (pressure balance).
Further Samples Can also kept for a short time in the supplied four plastic
injections. The storage time of the samples in the plastic injections is determined by the
characteristics of absorption and the permeability towards radon. Thus on one hand the
plastic takes up radon of the water sample and leads it to the surrounding air. On the other
hand the radon taken up of the plastic parts can diffuse again in a following measuring
sample. By these processes the measuring results can be tampered when they remain too
long in the plastic injections. The plastic injections in which samples with high 222Rn

EXPREMENTAL WORK
48
concatenations tents have been stored can only be reused after one-day heating in a shelf
drier at 60 °C.
2.2.1.9 Determinations of Radon Activity Concentrations
General Basics of the Calculation
Determination of the radon activity concentration in the water samples is based on
the 222Rn activity concentration indicated on the radon monitor. E.g. this measuring value
is not yet the 222Rn activity concentration in the measured sample because the radon
driven out has been diluted by the air within the measurement set-up and a small part of
the radon remains diluted in the watery phase. For quantifying the dilution effect the
exact interior volume in the measurement set-up (Vsystem) is required. The quantity of
radon remaining in the sample can be determined by the introduction of the distributing
coefficient K, which describes the temperature dependent quantity of the sample which
remains chemically dissolved. Thus the general approach as presented in the followed
equation for the determination of the 222Rn concentration in the measured water sample is
valid:
1000
0CKV
VVCair
Csample
samplesystem
water
................................... Eq.1
Where Cwater = 222Rn (Bq/l) in water sample, Cair = the Indicated 222Rn (Bq/m³) by
Alpha GUARD, C0 = 222Rn (Bq/m³) in the measuring set-up before sampling (zero level),
Vsystem = interior volume (ml) of the measurement set-up, Vsample = volume (ml) of the
water sample, K = Radon distribution coefficient.
Marginal Conditions
The exactness and correctness of the Alpha GUARD indicated values and thus
also for the determined 222Rn activity concentration of the water sample depends on the
following marginal conditions:
Relation of volume sample/measurement set-up
Tightness of measurement set-up
Temperature of sample

EXPREMENTAL WORK
49
Radon level in the set-up before sampling
Background (intrinsic effect) of Alpha GUARD
Relation of Volume Sample/Measurement set-up
Determination of the relation of sample and measurement set-up is based on the
exact knowledge of the interior volume of the set-up. The interior volume of the set-up
results from the sum of the interior volumes of the components integrated into the set-up
as shown in the following table 2. 2. It is differed between the measurements set up for
the execution of so-called quick measurements and precision measurements:
Table 2. 2 Volumes of AquaKIT system components (ml), and calculated total volumes
of measurement se-tup (AquaKIT 1999)
Quick Measurement Volume Precision Measurement Volume
Ionization Chamber of
Alpha GUARD680
Ionization Chamber of Alpha
GUARD680
Alpha PUMP 18 Alpha PUMP 18
100 ml Degassing Vessel 190 500 ml Degassing Vessel 618
Security Vessel 191 Security Vessel 191
Tube Connection (1.8 m) 23 Tube Connection (1.8 m) 23
Total Volume 1102 Total Volume 1530
Error in the Total Volume ±1%. Error in the Total Volume ±1%.
Tightness of the Measurement Set-up
The components combined in AquaKIT and the layout of the gas ways are
targeted on the best available minimization of radon losses by leakage and diffusion. The
fulfillment of this goal can be proofed with the results of respective tightness tests. Thus
the user can be assured practically a measurement setup free of leakage if the set-up was
done correctly. For quick measurements, the radon losses in consequence of the relatively
slow radon diffusion in and through the tube walls can be neglected.

EXPREMENTAL WORK
50
K Factor
According to Henry's law of dilute solutions, equilibrium will occur when the 222Rn concentration in water and the 222Rn concentration in the air were reaching to a
fixed ratio for a certain temperature. This ratio derivable from the Henry's law constant
for radon dissolved in water is known as the distribution coefficient, partition coefficient
or Ostwald coefficient, and given by the following equation:
phasegasin theion Concentrat
phaseliquiedin theion ConcentratK ....................................... Eq.2
For radon in water at 20° C the distribution coefficient is about 0.25, so radon will
continue to release from the water until the water concentration drops to about 25% of the
air concentration. Remember that as the radon leaves the water into the air it raises the air
concentration and lowers the water concentration. At lower temperatures the distribution
coefficient increases, rising to 0.51 at 0°C. At higher temperatures the distribution
coefficient decreases, to about 0.11 at 100°C. Figure 2. 13 shows the temperature
dependency of the diffusion coefficient K. An empirical expression for the distribution
coefficient of radon in water as a function of temperature can be found in Weigel formula
(Weigel 1978):
K = 0.105 + 0.405 x e -0.0502T.................................................. Eq. 3
Figure 2. 13 Temperature dependency of the diffusion coefficient K (Clever 1985)

EXPREMENTAL WORK
51
Radon Level in the Measurement Setup before Injecting the Sample
Applying the 222Rn activity concentrations equation it is strictly speaking based on
the assumption that the air inside the measurement setup is free of radon. In general,
however this will not be the case if the measurement set-up has been flushed with room
air before the start of the measurement. In most cases it is assumed that the 222Rn activity
concentration in the room air is below 100 Bq/m³. “Zero levels” in this order can be
neglected with quick measurements as long as for the samples 222Rn Activity
concentrations above several Bq/L resp. of several k Bq/m³ can be expected. If however
for the samples lower 222Rn activity concentrations are to be expected or significantly
higher radon air concentrations have to be assumed it is necessary to measure the “zero
level” of the measurement set-up before injecting the sample.
For this a 10-minute measuring time is sufficient by which the air enclosed in the
“empty” measurement set-up is rotated by switching on Alpha PUMP, conducted through
the ionization chamber of Alpha GUARD and measured. In the mean value of the
adjacent measuring series the current “zero level” of the measurement set-up is reflected.
E.g. this offset has to be subtracted of the determined 222Rn activity concentration for the
subsequent sampling. With the analysis of the measuring series for the determination of
the “zero level” it should be abstained from the measuring value of the 1-minute cycle
which follows immediately after switching on Alpha GUARD as long as it cannot be
assured that already at the beginning of the measuring series the radon activity
concentration of the measurement set-up is reflected in the ionization chamber of Alpha
GUARD.
The variation of the single 1-minute values for 222Rn Activity concentrations in
the range below 300 Bq/m³ are of statistic nature and determined by the accidental
diffusion of the appearing alpha pulses in the 1-minute cycle. Applying the precision
method and here particularly for the lowering of the detection limit before sampling the
radon resting in the measurement set-up shall be removed.
For this the delivered active coal filter cartridge shall be included into the gas
cycle. In the gas cycle closed to the exterior the air shall be rotated with Alpha PUMP as
long as the 222Rn level has reached <5 Bq/m³.

EXPREMENTAL WORK
52
Procedures for Quick Measurements
The following description contains the steps for executing quick measurements in
a systematic order.
Measuring steps
1. Set up the equipment consisting of AquaKIT, Alpha PUMP and Alpha GUARD
as described in the figure 2. 9.
2. Switch on the Alpha GUARD monitor and select measuring mode "10 min
FLOW" (setting is done via the Alpha GUARD menu or by using Alpha
EXPERT-VEW software).
3. Bring the three-way taps at degassing and security vessel into the 3 o’clock
position foreseen for sampling.
4. Dock the plastic injection with the water sample which is to be measured to the
vertical connecting socket of the degassing vessel.
5. Empty the plastic injection slowly into the degassing vessel.
6. Bring the three-way taps of the degassing and security vessel immediately into the
6 o’clock position for measuring mode. By this the gas cycle is closed.
7. Remove the plastic injection of the vertical connecting socket of the degassing
vessel.
8. Set the Alpha PUMP performance level switch to a flow rate of 0.3 L/min.
9. Bring the operation mode switch of Alpha PUMP in position ON and start of
sampling measurement.
10. After 10 minute rotating operation switch the operation mode of Alpha PUMP to
position ‘OFF’. Alpha GUARD remains switched on for another 20 min, e.g. the
radon measurement is continued.
11. Repeat this cycle three times in order to obtain a better precision (Elzbieta 2004).
Which 222Rn values up to the maximum value, then it down again.
12. Remove the measured water sample of the degassing unit and reassemble the
equipment. Disconnect the tube from the active adapter at the rear of Alpha
GUARD.

EXPREMENTAL WORK
53
13. Set the Alpha PUMP performance level switch to a flow rate of 1 L/min and the
operation mode switch to position ‘ON’ (rinsing of measurement setup with room
air).
Rinsing of the measurement setup is continued until radon values are reached in
the range of room air concentrations. Afterwards the next measurement procedure of a
sample can be started. After starting the rinsing procedure the data series produced during
the operation can be transferred by Alpha GUARD into the connected PC and its analysis
can be started. In the data series visualized by Alpha VEW-EXPERT the time range has
to be marked of which the data points reflect the 222Rn activity concentration resulting
from the finished degassing process in the gas phase of the measurement setup. For these
data points the arithmetic mean has to be calculated (AquaKIT 1999).
2.2.2 Gamma Spectroscopy
Radioactive analysis in environmental samples often encounters with difficulty in
measuring low levels of radioactivity. However gamma spectrometry is a useful tool in
the analysis of natural radionuclide's at environmental concentrations. It is a relative
method of analysis and has the advantage of being simple and essentially nondestructive.
The method is based on the fact that the decay of the radioelements is accompanied by
the emission of high energy gamma rays.
The applied low level background gamma ray spectrometer consists basically of
33 inch NaI (Tl), S-1212-I model, with a 1024 micro computer multichannel analyzer,
5510 Ortec Norland. The applied detector has a peak gamma ray efficiency of 2.3×10⁻² at
1332 keV, energy resolution of 7.5% at 662 keV and operation bias voltage 805 V dc.
The detector was housed inside a massive cylindrical lead shield with quarter 50 cm to
reduce the background radiation.
The detector is connected to preamplifier, main amplifier, analogue to digital
converter and multichannel analyzer as shown in the block diagram in figure 2. 14. The
preamplifier integrates the current resulting from the photomultiplier tube produced by
the absorption of gamma ray photons, and produces in turn an output voltage pulses with
height proportional to the energy of the incident photon. Since the typical output voltage
range from zero to around tenths of a volt, therefore, the pulses must be amplified in

EXPREMENTAL WORK
54
order for them to fall within the input voltage range of the analog to digital converter
ADC by connecting the detector to the external amplifier. The main amplifier should be
adjusted to a known calibration source (so that the energy peaks are positioned in specific
channels). The energy range of the data memory is known. The pulses are not counted
simultaneously but are processed sequentially as the arrival at the analog to digital
converter (ADC) from the main amplifier.
With the conversion gain of the ADC set to 1024, the full scale range (0-10 volts)
is divided into 1024 discrete segments. Conversion gain is also referred to as resolution.
The system automatically computes and displays the elapsed real time and life time, the
total counts including the background, net total counts, background counts and the
counting rate in each peak. The obtained data can be selectively acquired in separate
memory groups ranging in size from 0-1023 channels.
Figure 2. 14 Block diagram of a low level background gamma ray spectrometer
2.2.3 Scintillation Detectors
The major limitation of gas-filled counters, namely the low detection efficiency
for X- or γ-rays, can be overcome by the use of solid or liquid detector materials, which
have a much higher density than gases. Scintillation materials are frequently utilized for
photon or neutron detection. In these materials a small fraction of the energy deposited by
charged particles will be emitted as visible or ultraviolet light on a time scale of
nanoseconds to milliseconds, whereby the intensity of the light flash is proportional to the
energy deposited in the scintillators. As shown in the following figure 2. 15, a

EXPREMENTAL WORK
55
scintillation detector consists basically of scintillators material that is optically coupled to
a photomultiplier tube to convert the light photons released in the scintillators into an
electrical pulse which can then be amplified and analyzed electronically.
Figure 2. 15 Schematic representation of (a) a pulse-mode scintillation detector and (b) a
linear focused photomultiplier tube showing the cascade effect due to amplification of
electrons from the photocathode by increasing secondary emission when the electrons
strike the dynodes
Scintillators fall into two major categories: inorganic and organic materials, the
choice of which depends strongly on the type of measurement to be performed. Physical
properties of a few representative scintillators materials are given in table 2. 3; a more
comprehensive list can be found in (Knoll 2000, Leo 1994).
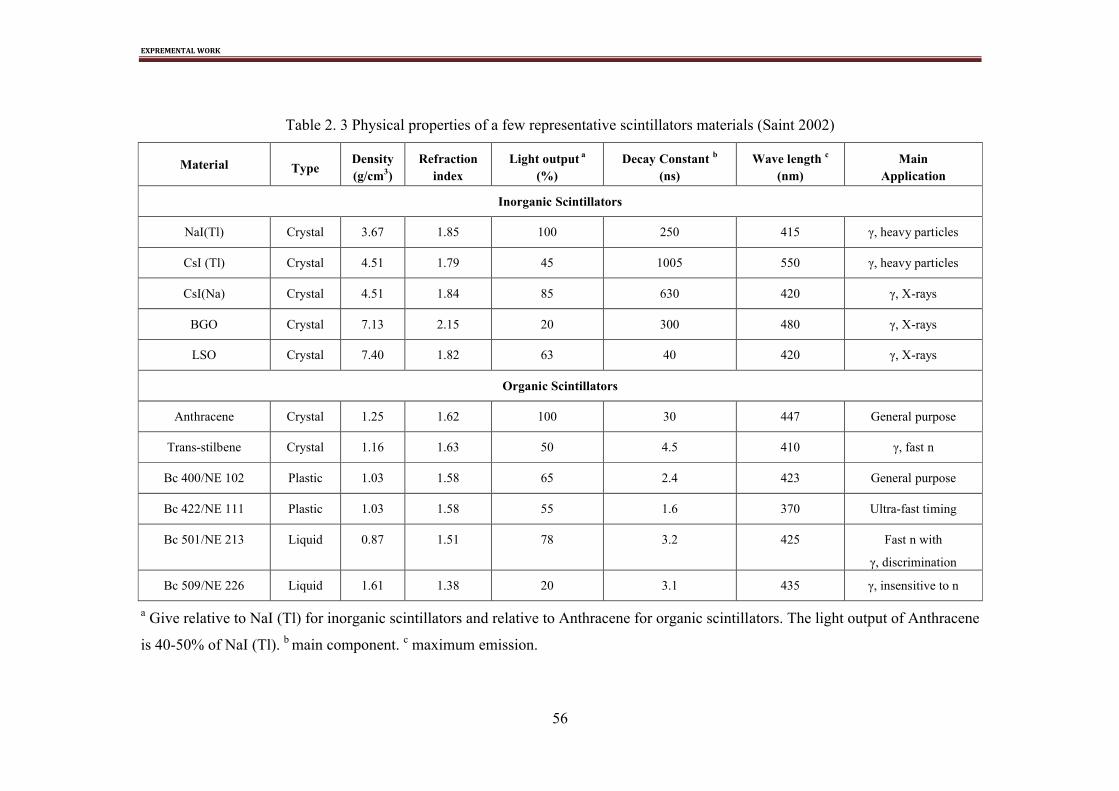
EXPREMENTAL WORK
56
Table 2. 3 Physical properties of a few representative scintillators materials (Saint 2002)
Material TypeDensity(g/cm3)
Refractionindex
Light output a
(%)Decay Constant b
(ns)Wave length c
(nm)Main
Application
Inorganic Scintillators
NaI(Tl) Crystal 3.67 1.85 100 250 415 γ, heavy particles
CsI (Tl) Crystal 4.51 1.79 45 1005 550 γ, heavy particles
CsI(Na) Crystal 4.51 1.84 85 630 420 γ, X-rays
BGO Crystal 7.13 2.15 20 300 480 γ, X-rays
LSO Crystal 7.40 1.82 63 40 420 γ, X-rays
Organic Scintillators
Anthracene Crystal 1.25 1.62 100 30 447 General purpose
Trans-stilbene Crystal 1.16 1.63 50 4.5 410 γ, fast n
Bc 400/NE 102 Plastic 1.03 1.58 65 2.4 423 General purpose
Bc 422/NE 111 Plastic 1.03 1.58 55 1.6 370 Ultra-fast timing
Bc 501/NE 213 Liquid 0.87 1.51 78 3.2 425 Fast n with
γ, discrimination
Bc 509/NE 226 Liquid 1.61 1.38 20 3.1 435 γ, insensitive to n
a Give relative to NaI (Tl) for inorganic scintillators and relative to Anthracene for organic scintillators. The light output of Anthracene
is 40-50% of NaI (Tl). b main component. c maximum emission.

EXPREMENTAL WORK
57
Inorganic scintillators are crystals of alkali halides (such as NaI, CsI) or oxides
(such as Bi4 Ge3 O12, ‘BGO’) grown at high temperatures. In these materials, scintillation
is a property of the electronic band structure of the crystals. When an ionizing particle
enters the scintillators, it can raise electrons from the valence into the conduction band.
The electrons and holes formed by this excitation process recombine and emit a photon.
In the pure scintillators material, however, de-excitation is an inefficient process due to
self-absorption. Therefore, small amounts of an ‘activator’ (e.g., thallium in the case of
NaI) are added. These impurities create energy states within the forbidden band gap of
the scintillators over which electrons can alternatively de-excite from the conduction
band into the valence band. A more detailed description of the scintillation process can be
found in (Knoll 2000, Tsoulfanidis 1995).
2.2.3.1 Activity Measurement
Each sample was placed in face to face geometry over the detector for 8 hours for 222Rn measurements, and at least 24 hours for natural radionuclide's (226Ra, 232Th and 40K) measurements. Signals produced by the gamma ray detector were amplified, stored
and display by multichannel analyzer as well as the energy spectra, i.e., the number of
counts per unit time per energy interval.
The activity concentrations are calculated from the intensity of each line taking
into account the volume of the sample, the branching ratio for the gamma decay, and the
efficiency of the detector. The branching ratio is the statistical chance that a gamma ray is
emitted per decaying nucleus. The efficiency of the detector represents the probability
that the emitted gamma ray contributes to the line in the spectrum. Activity
concentrations calculated from the intensity of several gamma rays emitted by a nucleus,
are grouped together to produce a weighted average activity per nuclide. For Activity
concentrations of nuclides in the same decay series, the activity concentrations are
grouped in a similar way.
The 222Rn activity concentration of water samples is assayed by analysis of
gamma peaks from 214Bi (609 keV) and 214Pb (295, 352 keV) (Isam 2002). The analysis
of 226Ra and 232Th depends upon the peaks of the decay products in equilibrium with their
parent nuclides. The content of 226Ra was measured using gamma-lines of 351.92 keV

EXPREMENTAL WORK
58
(35.1%) 214Pb, 609.32 keV (44.6%) 214Bi, 1120 keV (15%) 214Bi and 1765 keV (16%) 214Bi. The activity concentration of 232Th was determined using gamma energies of 238
keV (43%) 212Pb and 911.16 keV (26.6%) 228Ac. 40K directly measured from its single
peak at 1460.8 keV (10.67%) (El-Arabi 2001).
2.2.3.2 Spectrometer Adjustment
Before using the spectrometer for measurements, it's important to take into
account the following considerations:
1. Energy calibration
2. Efficiency calibration
3. Background measurements
Energy Calibration
Detectors measure the intensity of radiation as a function of photon energy,
therefore the instrument requires to be calibrated before measurements. Calibration
should be carried out for various gamma ray energies, because the indication of most
instruments is energy dependent (Kiefer 1972). To calibrate the applied spectrometer for
energy measurements, it is necessary to know the approximate energies of the radiation
source being analyzed. Two standard point sources, one should have a relatively low
energy peak and the other with a relatively high energy peak.
In the present study 137Cs (662 keV) and 60Co (1173 and 1332 keV) have been
used, and the spectra is shown in the following figure 2. 16. Sources with widely
separated energy peak will give better results than sources with narrowly separated
energy peaks. The standard source was located over the detector on face-to-face
geometry. After the data collection and filled on the display, the amplifier gain control is
adjusted to position the higher energy peak of the two sources near the upper limit of the
data display, and the data lower energy peak near the lower limit. Once the calibration
peaks have been positioned, enough spectrum data from the calibration standard was
collected to produce two well resolved and well defined peaks.

EXPREMENTAL WORK
59
Figure 2. 16 Calibration peaks energies
Efficiency Calibration
An accurate efficiency calibration of the system is necessary to quantify
radionuclide's present in a sample. It is essential that this calibration be performed with
great care because the accuracy of all quantitative results will depend on it. It is also
essential that all system settings and adjustments be made prior to determining the
efficiencies and be maintained until a new calibration is undertaken. Small changes in the
settings of the system components may have slight but direct effects on counting
efficiency.
Samples should be counted only in the types of container used to acquire the
counting efficiencies. The density, volume and height of the sample in the container must
be the same as that of the standards used for calibration. Any change of these factors will
require additional calibrations to match the characteristics of the sample. In present work,
it was determined the efficiency for water sample with Marinelli beaker 1.4 liter with the
same geometry of the measured water samples.

EXPREMENTAL WORK
60
Preparation of Standard Water Sample Procedure
In order to make a standard water sample, first fill a standard polyethylene
Marinelli beakers (1.4 liters) with distill water. Then a well-defined amount of the
standard solution QCY48 (2 ml) of radionuclide's was added to water sample (Harb
2004), this standard solution was obtained from Physikalisch Technische Bundesanstalt
PTB, Germany. It is mixed radionuclide gamma ray reference standard consist of a
solution in 4 M HCl of the ten radionuclide's listed in the table 2. 4.
Table 2. 4 Radionuclide's used for efficiency calibration, which prepared in 4 Feb. 2010
Parent
Radionuclide
Gamma ray
Energy (KeV)
Gamma
ray/sec./gUncertainty t½
Americium-241 59.54 1132 ±1.5% 158047
Cadmium-109 88.03 656 ±5.7% 462.6
Cobalt-57 122.1 624 ±1.4% 271.4
Cerium-139 165.9 714 ±1.4% 137.64
Mercury-203 279.2 2073 ±1.6% 46.6
Tin-113 391.7 2191 ±4.0% 115.09
Strontium-85 514 4105 ±1.6% 64.84
Caesuim-137 661.6 2601 ±1.6% 10958
Ytturim-88 898 6639 ±1.5% 106.6
Cobalt-60 1173 3468 ±1.5% 1924.9
Cobalt-60 1333 3742 ±1.5% 1924.9
Ytturim-88 1836 7023 ±1.4% 106.61

EXPREMENTAL WORK
61
The Efficiency Calculations
The efficiency calibration of the spectra obtained from the analysis of various
background samples on detector was utilized to create distinct background files. For any
calibration standard analyzed on a given detector, the corresponding background file was
used to subtract contributions of background peaks from the sample peaks. The net full-
energy-peak area was calculated using the efficiency calibration procedure for each
background subtracted peak in the standard spectrum which corresponds to a calibrated
gamma-ray emission.
The absolute detector efficiency at that energy was then calculated by dividing the
net count rate in the full-energy peak by the decay corrected gamma-ray-emission rate of
the standard source. After the absolute detection efficiency was determined for each
calibration peak, weighted least-squares fit was made to a polynomial expression of log
of efficiency vs. log of energy. Efficiency curves were constructed from these full energy
peak efficiencies (Wilson 1992).
al)(theoreticsourcesby emittedquantaradiation ofNumber
tal)(ExperimenrecordedpulsesofNumber ............... Eq.4
2
1
2ln
t
t
s
ss
eG
tN ........................................................... Eq.5
Where NS is the Count in standard water sample, ts is the time in a counting of
standard water sample, Gs is the Counting of gamma ray of used standard solution, t is
the time of decay, t1/2 is the half-life time of radionuclide.
We used Eq. 5 for all energy of radionuclides in table 2. 4 from the measurement
of calibration sources, experimental efficiencies are calculated. The experimental
efficiency at energy E for a given set of measuring conditions can be computed by the
formula (Negm 2009):
BEA ................................................................ Eq.6
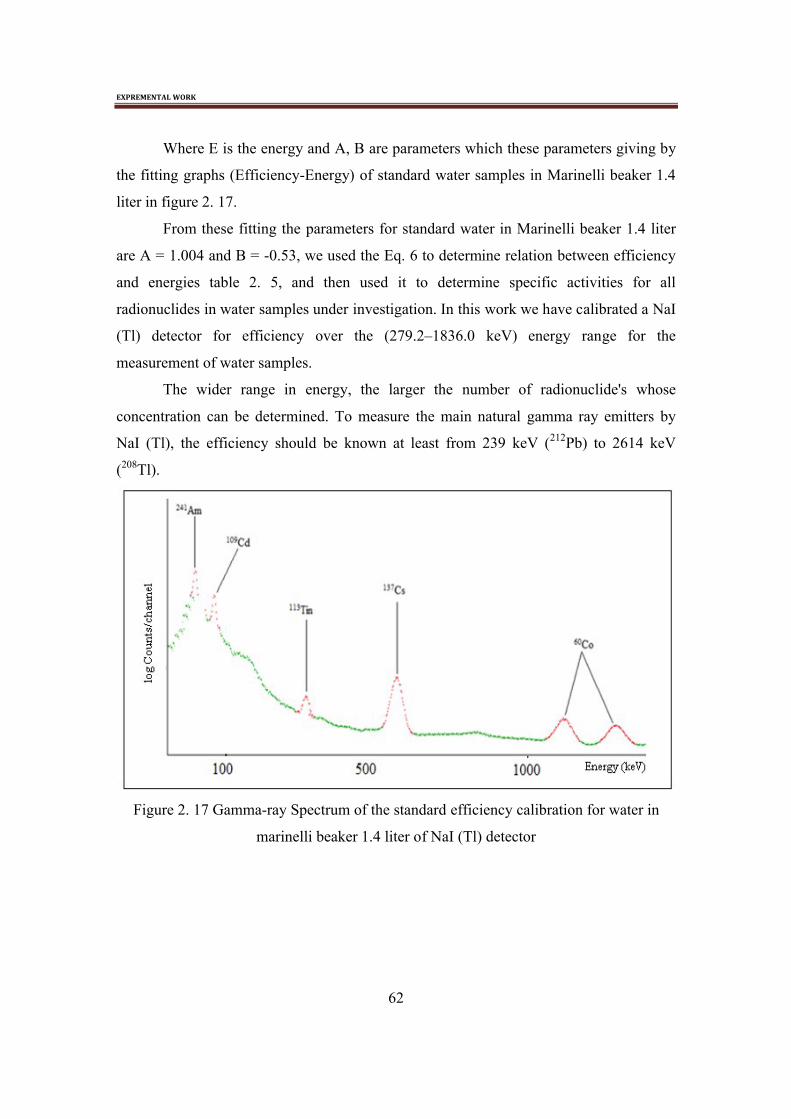
EXPREMENTAL WORK
62
Where E is the energy and A, B are parameters which these parameters giving by
the fitting graphs (Efficiency-Energy) of standard water samples in Marinelli beaker 1.4
liter in figure 2. 17.
From these fitting the parameters for standard water in Marinelli beaker 1.4 liter
are A = 1.004 and B = -0.53, we used the Eq. 6 to determine relation between efficiency
and energies table 2. 5, and then used it to determine specific activities for all
radionuclides in water samples under investigation. In this work we have calibrated a NaI
(Tl) detector for efficiency over the (279.2–1836.0 keV) energy range for the
measurement of water samples.
The wider range in energy, the larger the number of radionuclide's whose
concentration can be determined. To measure the main natural gamma ray emitters by
NaI (Tl), the efficiency should be known at least from 239 keV (212Pb) to 2614 keV
(208Tl).
Figure 2. 17 Gamma-ray Spectrum of the standard efficiency calibration for water in
marinelli beaker 1.4 liter of NaI (Tl) detector

EXPREMENTAL WORK
63
Table 2. 5 Efficiency-Energy values for water sample in marinelli beaker 1.4 liter
for NaI (Tl) scintillation detector
NuclidesEnergy
(keV)Efficiency
241Am 59.54 0.027700
109Cd 88.03 0.093114
113Tin 391.7 0.047142
137Cs 661.6 0.031287
60Co 1173 0.023403
60Co 1333 0.022635
Figure 2. 18 Full energy peak efficiency as a function of gamma ray energy for a typical
NaI(Tl) detector for water sample in marinelli beaker 1.4 Liter
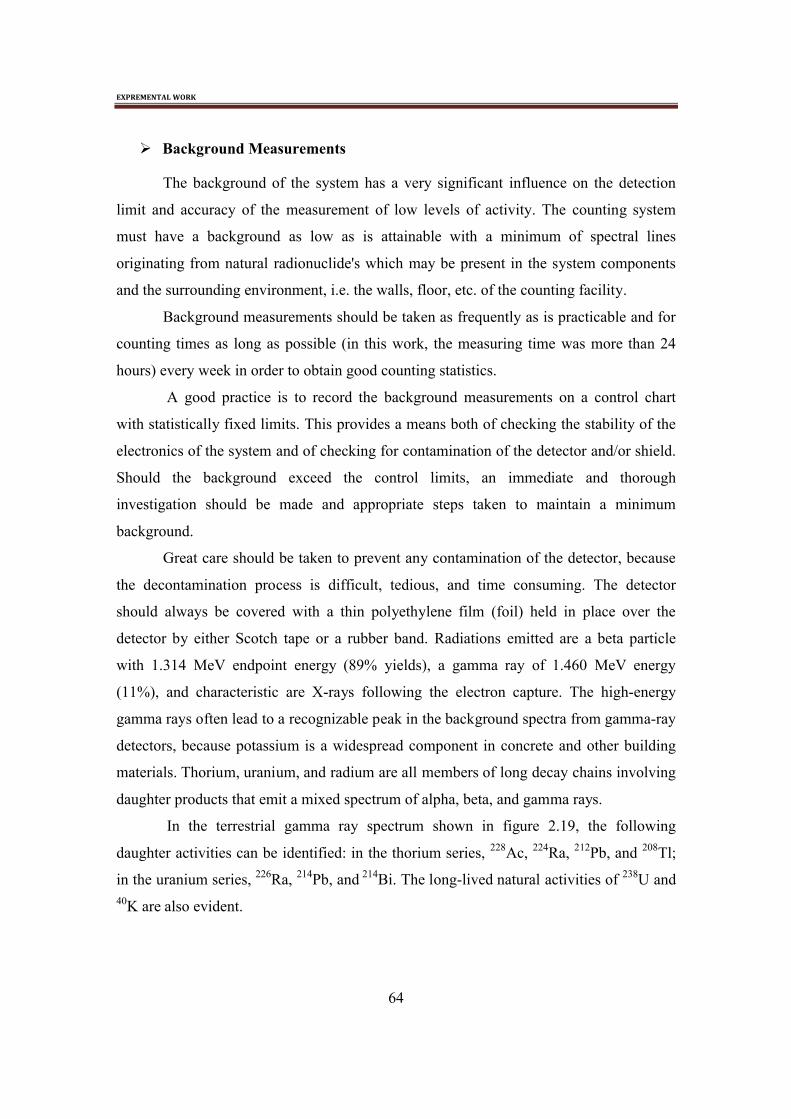
EXPREMENTAL WORK
64
Background Measurements
The background of the system has a very significant influence on the detection
limit and accuracy of the measurement of low levels of activity. The counting system
must have a background as low as is attainable with a minimum of spectral lines
originating from natural radionuclide's which may be present in the system components
and the surrounding environment, i.e. the walls, floor, etc. of the counting facility.
Background measurements should be taken as frequently as is practicable and for
counting times as long as possible (in this work, the measuring time was more than 24
hours) every week in order to obtain good counting statistics.
A good practice is to record the background measurements on a control chart
with statistically fixed limits. This provides a means both of checking the stability of the
electronics of the system and of checking for contamination of the detector and/or shield.
Should the background exceed the control limits, an immediate and thorough
investigation should be made and appropriate steps taken to maintain a minimum
background.
Great care should be taken to prevent any contamination of the detector, because
the decontamination process is difficult, tedious, and time consuming. The detector
should always be covered with a thin polyethylene film (foil) held in place over the
detector by either Scotch tape or a rubber band. Radiations emitted are a beta particle
with 1.314 MeV endpoint energy (89% yields), a gamma ray of 1.460 MeV energy
(11%), and characteristic are X-rays following the electron capture. The high-energy
gamma rays often lead to a recognizable peak in the background spectra from gamma-ray
detectors, because potassium is a widespread component in concrete and other building
materials. Thorium, uranium, and radium are all members of long decay chains involving
daughter products that emit a mixed spectrum of alpha, beta, and gamma rays.
In the terrestrial gamma ray spectrum shown in figure 2.19, the following
daughter activities can be identified: in the thorium series, 228Ac, 224Ra, 212Pb, and 208Tl;
in the uranium series, 226Ra, 214Pb, and 214Bi. The long-lived natural activities of 238U and 40K are also evident.
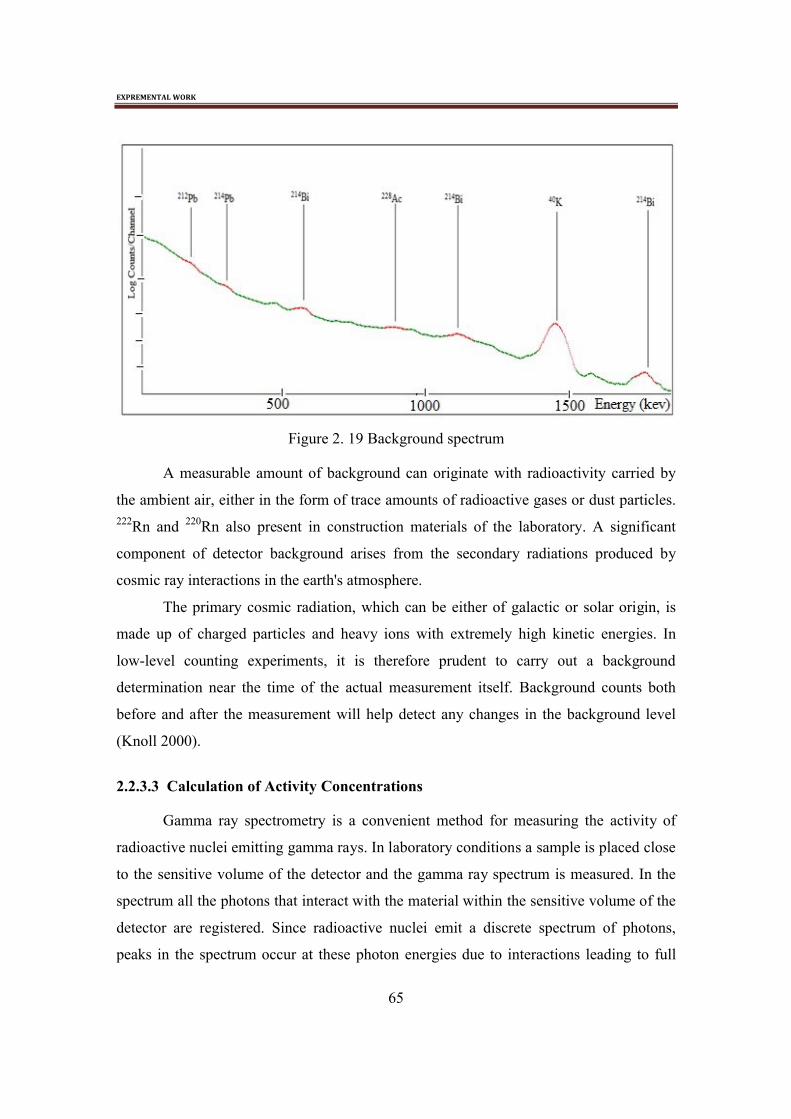
EXPREMENTAL WORK
65
Figure 2. 19 Background spectrum
A measurable amount of background can originate with radioactivity carried by
the ambient air, either in the form of trace amounts of radioactive gases or dust particles. 222Rn and 220Rn also present in construction materials of the laboratory. A significant
component of detector background arises from the secondary radiations produced by
cosmic ray interactions in the earth's atmosphere.
The primary cosmic radiation, which can be either of galactic or solar origin, is
made up of charged particles and heavy ions with extremely high kinetic energies. In
low-level counting experiments, it is therefore prudent to carry out a background
determination near the time of the actual measurement itself. Background counts both
before and after the measurement will help detect any changes in the background level
(Knoll 2000).
2.2.3.3 Calculation of Activity Concentrations
Gamma ray spectrometry is a convenient method for measuring the activity of
radioactive nuclei emitting gamma rays. In laboratory conditions a sample is placed close
to the sensitive volume of the detector and the gamma ray spectrum is measured. In the
spectrum all the photons that interact with the material within the sensitive volume of the
detector are registered. Since radioactive nuclei emit a discrete spectrum of photons,
peaks in the spectrum occur at these photon energies due to interactions leading to full

EXPREMENTAL WORK
66
absorption of the photon energy within the sensitive volume. Only quantities describing
the intensity of peaks in the spectra are the subject of this work.
After the measurement has been completed, the peak areas in the spectrum are
calculated and corrected for counting losses. The corrected peak areas are proportional to
the number of radioactive nuclei that have decayed in the sample during the time of the
measurement. Neglecting the probability for coincident detection of two or more gamma
rays, the factor of proportionality is given by the product of two probabilities: the
probability that during the decay a gamma ray with energy E is emitted and the
probability that this gamma ray is registered in the spectrum in the full-energy peak.
Following the spectrum analysis, count rates for each detected photo-peak and
activity per volume unit (radiological concentration) for each of the detected nuclides are
calculated. The specific activity A (Bq/l), of a nuclide and for a peak at energy E, is given
by the following formula (Harb 2004):
MPt
n
T
N
A
........................................................... Eq.7
Where A is the activity concentration Bq/l, N is the number of counts in a given
peak area, T the sample counting lifetime, n is the number of counts in background peaks,
t is the background counting time, P The number of gammas per disintegration of this
nuclide (emission probability), M is volume in liter of the measured sample, Ɛ is the
detection efficiency at measured energy.
If there is more than one peak in the energy analysis range for a nuclide, then an
attempt to average the peak activities is made by using the weighted average nuclide
activity. Based on the measured gamma ray photo-peaks, emitted by specific
radionuclide's in the 232Th and 226Ra decay series and in 40K, their radiological
concentrations in samples collected were determined.
Calculations relied on establishment of secular equilibrium in the samples, due to
the much smaller lifetime of daughter radionuclides in the decay series of 232Th and 226Ra. More specifically, the 232Th concentration was determined from the average
Activity concentrations of 212Pb, 208Tl and 228Ac in the samples, and that of 226Ra was
determined from the average activity concentrations of the 214Pb and 214Bi decay

EXPREMENTAL WORK
67
products. Thus, an accurate measurement of 232Th and 226Ra radiological activity
concentrations was made, whereas a true measurement of 40K concentration was
achieved.
Each tabulated value for the 232Th series concentration was an average of three
values obtained from the photo peaks of the 212Pb (238.63 keV), 228Ac (911.2 keV) and 208Tl (2614 keV). The 1461 keV gamma of 40k was used to determine the activity
concentration of 40k in different samples.
About 222Rn measurements each tabulated value for the 222Rn activity
concentration was an average of three values obtained from the photo peaks of the 214Pb
(295 and 352 keV) and 214Bi (609 keV) (Isam 2002).
2.2.3.4 Experimental Uncertainties
In order to comply with the standard testing laboratories are obliged to estimate
the uncertainty of their measurement results (ISO 1999). The uncertainty budget used in
laboratories engaged in gamma ray spectrometric measurements usually includes
uncertainties from counting statistics, nuclear decay data, the counting efficiency
calibration, corrections for counting losses and sample quantity. The uncertainties of the
sample properties don't enter the budget explicitly but via the uncertainty of the counting
efficiency calibration and uncertainty of the specific activity for radionuclides in soil
samples. Namely the efficiency calibration curves are measured with calibrated samples
which resemble the unknown samples as closely as possible.
It is supposed that the uncertainties of the efficiency calibration curve introduced
in the process of preparation of the calibration sample resemble the uncertainties in the
process of the preparation of unknown samples. If this assumption is not valid or if the
efficiency calibration curves are calculated using a detector model, the uncertainties of
the sample properties must explicitly enter the uncertainty budget. Frequently the samples
are prepared as homogeneous cylinders by pressing or pouring the sample material into
cylindrical vial which during counting is placed near the detector, coaxially along its
symmetry axis. Such counting geometry can be described by the sample properties of
sample radius, thickness, density and composition. It has been shown by (Korun 2001,
Michel 2000), the case of interest is where the quantity Y being measured, called the

EXPREMENTAL WORK
68
measured, is not measured directly, but is determined from N other quantities X1, X2, . . .
, XN through a functional relation f, often called the measurement equation:
),....,,( 321 NXXXXfY ............................................. Eq.8
Included among the quantities Xi are corrections (or correction factors), as well as
quantities that take into accountother sources of variability, such as different observers,
instruments, samples, laboratories, and times. Thus the function f of eq. 8 should express
not simply a physical law but a measurement process, and in particular, it should contain
all quantities that can contribute a significant uncertainty to the measurement result. An
estimate of the measured or output quantity Y, denoted by y, is obtained from eq. 5 using
input estimates x1, x2, . . . , xN for the values of the N input quantities X1, X2, . . . , XN.
Thus, the output estimate y, which is the result of the measurement, is given by
),....,,( 321 NxxxxfY .................................................... Eq.9
In general, components of uncertainty may be categorized according to the
method used to evaluate them.
Standard uncertainty Type A
An uncertainty component obtained by a Type A evaluation is represented by a
statistically estimated standard deviation si, equal to the positive square root of the
statistically estimated variance si2, and the associated number of degrees of freedom vi.
For such a component the standard uncertainty is ui = si.
Standard uncertainty Type B
In a similar manner, an uncertainty component obtained by a Type B evaluation is
represented by a quantity uj, which may be considered an approximation to the
corresponding standard deviation; it is equal to the positive square root of uj2, which may
be considered an approximation to the corresponding variance and which is obtained
from an assumed probability distribution based on all the available information. Since the
quantity uj2 is treated like a variance and uj like a standard deviation, for such a
component the standard uncertainty is simply uj.
A Type A evaluation of standard uncertainty may be based on any valid statistical
method for treating data. Examples are calculating the standard deviation of the mean of a
series of independent observations; using the method of least squares to fit a curve to data
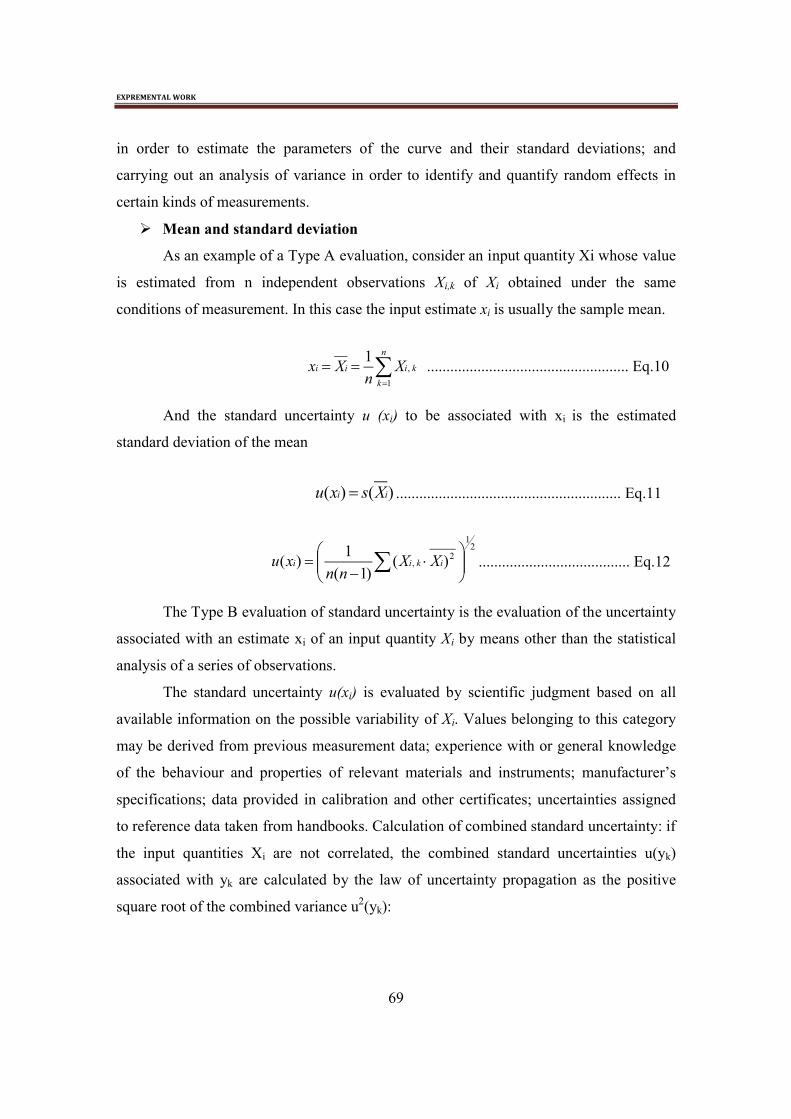
EXPREMENTAL WORK
69
in order to estimate the parameters of the curve and their standard deviations; and
carrying out an analysis of variance in order to identify and quantify random effects in
certain kinds of measurements.
Mean and standard deviation
As an example of a Type A evaluation, consider an input quantity Xi whose value
is estimated from n independent observations Xi,k of Xi obtained under the same
conditions of measurement. In this case the input estimate xi is usually the sample mean.
n
k
kiii Xn
Xx1
,1
.................................................... Eq.10
And the standard uncertainty u (xi) to be associated with xi is the estimated
standard deviation of the mean
)()( ii Xsxu .......................................................... Eq.11
21
2, )(
)1(
1)(
ikii XX
nnxu ....................................... Eq.12
The Type B evaluation of standard uncertainty is the evaluation of the uncertainty
associated with an estimate xi of an input quantity Xi by means other than the statistical
analysis of a series of observations.
The standard uncertainty u(xi) is evaluated by scientific judgment based on all
available information on the possible variability of Xi. Values belonging to this category
may be derived from previous measurement data; experience with or general knowledge
of the behaviour and properties of relevant materials and instruments; manufacturer’s
specifications; data provided in calibration and other certificates; uncertainties assigned
to reference data taken from handbooks. Calculation of combined standard uncertainty: if
the input quantities Xi are not correlated, the combined standard uncertainties u(yk)
associated with yk are calculated by the law of uncertainty propagation as the positive
square root of the combined variance u2(yk):

EXPREMENTAL WORK
70
n
i
ii
kk xu
x
Gyu
1
22
2 )()(
......................................... Eq.13
nk ,......1
If the input quantities Xi are not independent but correlated the combined standard
uncertainty u(yk) has to be calculated according using covariance. If the partial
derivatives are not explicitly available, they can be numerically sufficiently approximated
by using the standard uncertainty u(xi) as increment of xi:
miik
niik
ii
k
xxuxxG
xxuxxG
xu
i
x
G
,......2/)(,....(
,......2/)(,......(
)( 1
1
.............................. Eq.14
The standard uncertainties for specific concentration generally have to be
evaluated according to the ISO Guide well in accordance with guidelines of other
international bodies. In the ISO Guide, uncertainties are evaluated either by statistical
methods, (type A) or by, other means, (type B), i.e., by methods of conventional statistics
or Bayesian statistics. Type A uncertainties can be evaluated from repeated or counting
measurements, while Type B uncertainties cannot. They are for instance uncertainties
given in certificates of standard reference materials or of calibration radiation sources
which are used in the evaluation of a measurement.
The evident contradiction in using different types of statistics in the definitions of
the two types of uncertainties was recently overcome by the establishment of a Bayesian
theory of measurement uncertainty. In this theory, uncertainties are consistently
determined. They quantitatively express the actual state of incomplete knowledge of the
quantities involved. The combined standard uncertainty of the measurement result y,
designated by uc(y) and taken to represent the estimated standard deviation of the result,
is the positive square root of the estimated variance uc2(y) obtained from. Used here a
somewhat simplified model of the evaluation in order to keep equations short: the
combined standard uncertainty u2(As) associated with as Eq. 7 is calculated by:

EXPREMENTAL WORK
71
)()()(
))(()()(
))(()()(
)()()(
)()().(
1)(
2
2
2
2
2
22
2
2
2
2
2
2
22
MuMEEIt
NP
EuMEEIt
NPEIu
MEEIt
NP
tuMEEIt
NPNPu
MEEItAu
c
cc
ccc
s
2
22
2
22
2
22
2
22
2
22
2
)(
)().(
)(
))((
)().()(
))((
)().(
)(
)().()(
)(
)().()(
M
Mu
MEEIt
Np
E
Eu
MEEIt
Np
EI
EIu
MEEIt
NP
t
tu
MEEIt
Np
NP
NPu
MEEIt
NPAu
c
cc
c
c
ccs
22
2
)(
)(
))((
)(
))(()(
)(
)(
)().()(
22
2
2
2
2
2
2
2
M
Mu
E
Eu
EI
EIu
t
tu
Np
Npu
MEEIt
NPAu
c
c
cs
................. Eq.15
We can get the relative uncertainties of input value.
222
)(
)(
))((
)(
))(()(
)(
)()( 222
2
2
2
2
2
2
M
Mu
E
Eu
EI
EIu
t
tu
Np
Npu
A
Au
c
c
s
s
..................... Eq.16
Where:
Np
Npu )(2
From spectra evaluation
NP = NP+N0-N0 ........................................................... Eq.17
Where the NP is net peak and N0 is counting of background
u2 (NP) = u2 (NP + N0) + u2 (N0)

EXPREMENTAL WORK
72
= u2 (NP) + u2 (N0) + u2 (N0)
= u2 (NP) + 2 u2 (N0)
Where )(2 NPu is called variance and )(NPu is the standard uncertainty
610)(
c
c
t
tu is neglected ............................................... Eq.18
)(
))((
EI
EIu From table of intensity of gamma ray (Firestone 1996)
%5.2
)(
))((
E
Eu &
%21
)(
M
Mu(González 2005) .................... Eq.19
We can use Eq. 16 to get the standard uncertainties for activity of water samples.
2.2.3.5 Minimum Detectable Activity
The minimum detectable activity (MDA) is the smallest net count that can be
reported with a certain degree of confidence that represents a true activity from a sample
and is not a statistical variation of the background. The term MDA is not universally
acceptable. In the general case, in measurements not necessarily involving radioactivity,
other terms such as lowest detection limit have been used. Here, the notation and
applications will be presented with the measurement of a radioactive sample in mind.
Obviously, MDA is related to low count rates. In such cases of low count rates,
the person who performs the experiment faces two possible errors:
Type 1: to state that the true activity is greater than zero when, in fact, it is zero. If
this is a suspected contaminated item, the person doing the measurement will
report that the item is indeed contaminated when, in fact, it is not. This error is
called false positive.
Type 2: to state that the true activity is zero when, in fact, it is not. Using the
previous example, the person doing the measurement reports that the item is clean
when, in fact, it is contaminated. This error is called false negative.

EXPREMENTAL WORK
73
The outcomes of radiation measurements follow Poisson statistics, which
become, essentially, Gaussian when the average is greater than about 20. For this reason,
the rest of this discussion will assume that the results of individual measurements follow
a normal distribution and the confidence limits set will be interpreted with that
distribution in mind. Following the notation used earlier,
B = background with standard deviation σB
G = gross signal with standard deviation σG
n = G - B = net signal with standard deviation σn = 2B
2G +
When the net signal is zero (and has a standard deviation σn = σ0), a critical
detection limit (CDL) is defined in terms of σ0 with the following meaning:
1. A signal lower than CDL is not worth reporting.
2. The decision that there is nothing to report has a confidence limit of 1 - α, where α
is a certain fraction of the normalized Gaussian distribution (Figure 2. 20). Take
as an example α = 0.05. Then
CDL = kα σ0................................................. Eq.20
With k, = 1.645, If n < CDL, one decides that the sample is not contaminated,
and this decision has a 95% confidence limit.
The MDA should obviously be greater than the CDL. Keeping in mind that the
possible MDA values also follow a normal distribution, a fraction β is established,
meaning that a signal equal to MDA is reported as a correct/true signal with a confidence
limit 1-β. The value of MDA is given by
MDA = CDL + kβ σD ..................................... Eq. 21
Where σD, is the standard deviation of MDA (Figure 2. 20). Again, if β = 0.05, k,
= 1.645.
In most cases, in practice, a = β = 0.05; then the CDL and MDA are defined with
a 95% confidence limit. For radioactivity specifically, remember that:

EXPREMENTAL WORK
74
σ2 = σG2 + σB
2 = (σn2 + σB
2) + σB2
And for n = 0, σn = √ = 0 and σ = σ0 = 2B
2n + = √ B.
Then, if the 95% confidence limit is applied (a = β = 0.05), CDL = 1.645 σ0 = 2
.326 σB. Values of Dl.Th, St. and Dl turn out to be as follow:
RMtDl B
Th
2. ........................................ Eq.22
ThDlSt .2. .
222
22
2
Th 02.0025.0005.0
.)(
2.Dl.Dl
RSt
MRtMRt
St B
..................................................................................................................................... Eq.23
Where Dl.Th is the detection limit threshold, St. is the starting value for detection limit
Figure 2. 20 The meaning of the critical detection limit (CDL) and minimum detectable
activity (MDA) in terms of the confidence limits defined by α and β.

EXPREMENTAL WORK
75
The values of the detection limit of the gamma-ray spectrometry system were
determined from the background measurement by counting an inactive blank sample
which was a 550 ml Marinelli Beaker with same geometry as the sample measurements,
filled with de ionized water. The critical level, detection limit and minimum detectable
activity of the gamma-ray spectrometry set-up used in the current work are reported in
the following table 2. 6.
Table 2. 6 Calculated values of the lower confidence limit (LCL), upper confidence limit
(UCL), detection limit (Dl) and minimum detectable activity (MDA) (Bq/l)
Energy (keV) Radionuclide LCL UCL Dl MDA
609.3 214Bi 0.3837 0.4853 0.051 0.074
1120.2 214Bi 0.3561 0.6019 0.163 0.237
1764.5 214Bi 0.2409 0.6040 0.274 0.399
238.6 212Pb 1.0125 1.2166 0.062 0.093
911.2 228Ac 0.2034 0.2695 0.031 0.035
1460.8 40K 3.1107 5.0680 1.336 1.942
The final column in table 2. 6 is the minimum detectable activity (MDA) which
converts the detection limit (in counts) to specific activity (Bq/l). The values from table
show the minimum activity that can be detected from the blank sample. The minimum
detectable activity depends on the gamma-ray energies of interest and the counting
efficiency of the detector at that energy. Table 2. 7 show the Calculations of LCL, UCL,
and Dl.

EXPREMENTAL WORK
76
Characteristic Limits according to ISO 11929-7: Model for activity per sample volume As=(Ng-N0)/(epsilon*I*M*t)Preselected parameters Calculated parameters kappa 1alpha 0.05 k_1-alpha 1.64485363 u~(0) 0.41967139 p(kappa) 0.975beta 0.05 k_1-beta 1.64485363 a 0.71450647 k_p 1.959963981 - gamma 0.95 k_1-gamma/2 1.95996398 y/u(y) 8.19011884 q(kappa) 0.975guideline value 1 Bq/l xsi 0.26848471 k_q 1.95996398
quantity symbol x (input) unit u(x) (input) u_rel(x) type Cx Cx*u(x)AERA+BClD Ng 8210 90.6090503 0.01103643 A 0.003480444 0.31535973Time of Count t 95164.61 s 0 0 0 0BClD No 6595 81.2096053 0.01231381 A 0.003712674 0.30150475Time of Count t 89212.02 s 0 0 0 0branching ratio I 0.1 0.005 0.05 B 40.89364105 0.20446821counting efficiency epsilon 0.02195804 s**-1/Bq 0.00054895 0.025 composite 186.2354255 0.1022341sample mass M 1.37498 l 0.0274996 0.02 B 2.974126245 0.08178728
quantity symbol x (input) unit u(x) (input) u_rel(x)Activity per unit mass As 4.0894 Bq/l 0.49930 0.122best estimate z 4.0894 Bq/l 0.49930 0.122 #REF!decision threshold y* 0.6903 Bq/l A contribution from the sample has been observed.detection limit eta* 1.4290 Bq/l The prodedure is not suited for the measuring task.lower confidence limit eta_l 3.1107 Bq/lupper confidence limit eta_u 5.0680 Bq/lMeasurement of the counting efficiency Model: epsilon=(Ne/te-No/to)/(Acal*Ical)
symbol x (input) unit u(x) (input) u_rel(x) type Cx u(x)*CxNe 23456 153.153518 0.0065294 A 1.6683E-06 0.00025551te 3600 s 0 0 0 0No 6595 81.2096053 0.01231381 A 6.7323E-08 5.4673E-06to 89212.02 0 0 0
Acal 3700 Bq 185 0.05 B 1.0456E-05 0.00193442Ical 0.045 0.001 0.02222222 B 0.85974382 0.00085974
epsilon 0.03869 s**-1/Bq 0.00213 0.05511 compositedecision threshold y* 0.65748268Starting value for detection limit 1.31496536detection limit eta* 1.33656784 1st iteration
noch nicht an gamma-spec angepasst
Results
Evaluation of the measurement and calculation of characteristic limits
Table 2. 7 Calculation of characteristics limits for 40K (1460 keV) for the sample water G1 (Cristina 2000)

RESULTS
&
DISCUSSTION
RESULLTS & DISCUSSION
78
RESULTS & DISCUSSION
Measurements of natural radioactivity and radon levels in water samples from
Qena governorate, Egypt, are mainly concerned with many issues:
The first concern is to investigate the activity concentrations of 222Rn in ground
water and drinking water (Tap and mineral), using the ionization chamber "Alpha
GUARD".
The second concern is to determine the activity concentrations of 222Rn in ground
water, using gamma spectroscopy "NaI (Tl)", and make comparison between the
two radon measurements techniques results.
The third concern is to investigate the activity concentrations of natural
radionuclides in the ground water samples, such as 40K, as well as radionuclides
from the 226Ra and 232Th series.
The fourth concern is to estimate the radiation hazard health, by calculate the
annual effective doses for human, by intake 222Rn and the natural radionuclide's226Ra, 232Th, and compare between the obtained results and the other published
data.
Finally, the obtained data makes it possible to study the correlations between the
geochemical parameters such as PH, TDS, and conductivity, with the 222Rn, 226Ra,232Th, and 40K activity concentrations in the investigated water samples.
The focus, from the radiation protection view point, is to study the activity
concentrations naturally occurring radionuclides, and the extent of their exposure to
population. Regarding the great benefits from the studies of natural radioactivity, and to
continue the program of measuring natural radioactivity in different environmental media
started in the Environmental Radioactivity Measurements Laboratory (ERML), physics
department, Faculty of Science, South Valley University, Qena, Egypt since 1990
(Abbady 1995, Ahmed 1995, El-Arabi 2001, El-Arabi 2005, Mageed 2013), a survey of
radon activity concentrations and the naturally occurring radionuclide's in different kinds
of water samples, from different sites in Qena governorate, were conducted, and the
obtained results were present in the following parts.

RESULLTS & DISCUSSION
79
3.1 222Rn Activity Concentrations in Ground water Samples using Alpha
GUARD
Radon originates from the radioactive decay of naturally occurring uranium, and
radium deposits, these elements can be found in trace amounts in almost all soils and
rocks. Being radon gas can escape from mineral surfaces, and dissolve in ground water,
which can carry it away from its point of origin. We rarely find radon in significant
concentrations in the surface waters, due to its rapid dispersal into the atmosphere.
Smaller water system appears to be disproportionally affected by high radon (Milvy
1990, EPA 1991). Radon was first noticed in water supplies by J. J. Thomson, a pioneer
in the science of radioactivity in the first decade of the 1900.
Study of environmental radioactivity revealed unusually high ground water radon
concentrations in the vicinity of Raymond, Maine. In 1960, scientists began to investigate
the effect of ingested and inhaled radon gas, observing the uptake of radon by digestive
organs and its dispersal through the blood stream (Crawford 1990). Radon was widely
recognized as a major component of our natural radiation exposure. By the late 1970,
Maine had initiated a program to attempt to reduce public exposure to water borne radon,
having discovered cases in which ground water concentration exceeded 1 million pCi/l
(Hess 1990).
Federal action on the problem of radon in drinking water picked up in the 1980,
with a nationwide program to survey drinking water supplies for radioactivity and to
assess the risk to public health. Congress directed the Environmental Protection Agency
(EPA 1991), to take action on radioactivity in drinking water, and in 1991 the EPA
officially proposed a maximum contaminant level for radon in public drinking water of
300 pCi/l. This Level may one day become bind on public water supplies (EPA 1991).
The present investigation samples were collected from 109 ground water wells,
east and west of the river Nile, within Qena governorate, Egypt. The samples sites were
precisely recorded using global positioning system "GPS", as shown in figure 2. 1.

RESULLTS & DISCUSSION
80
The geochemical properties of water (PH, conductivity, and total dissolved solids
“TDS”) were measured in the field, at the moment of sampling using portable
"SensoDirect pH 200" and "Jenway Model 4520 Laboratory Conductivity/TDS Meter".
The obtained results of 222Rn activity concentration, coordinates, conductivity, TDS, and
the well depths are presented in the following table 3. 1.
Table 3. 1 222Rn activity concentrations as well as geochimical parameters in ground
water samples
222Rn
(Bq/l)
TDS
(mg/l)
Conductivity
(mg/l)
Depth
(m)
CoordinatesSample No.
LongitudeLatitude
Qift and Qus Area
3.30±0.053582969450E33.14201N25.89482 G1
2.77±0.046562939350E33.14548N25.89026 G2
3.83±0.083574956480E33.13607N25.89325 G3
2.10±0.035568946480E33.13043N25.88557 G4
2.18±0.050227037907E33.07744N25.88019 G5
2.67±0.065577962450E33.12976N25.88657 G6
0.04±0.025170.628540E32.83353N25.88849 G7
2.03±0.05014323840E32.82660N25.84729 G8
1.18±0.029191.331730E32.82684N25.84715 G9
1.46±0.037299500840E32.80464N25.82979 G10
3.71±0.08410411740100E32.86623N25.96652 G11
1.09±0.030114.1190.445E32.84304N25.96528 G12
3.15±0.06925141834E32.84185N26.04686 G13
2.32±0.052160.426754E32.84055N26.06557 G14
1.96±0.042657109440E32.89098N26.01813 G15
4.37±0.093866144375E32.87781N26.05649 G16
Continuo to the next page

RESULLTS & DISCUSSION
81
3.16±0.0691033172025E32.75415N26.16799 G17
1.02±0.02353188545E32.78475N26.13941 G18
2.70±0.05850283352E32.80450N26.16634 G21
2.50±0.05451085057E32.80719N26.16399 G22
4.97±0.107745124350E32.78566N26.16644 G23
3.02±0.065783130011E32.75622N26.16528 G24
2.61±0.057173.9288-E32.77442N26.14728 G25
1.52±0.03445575520E32.79344N26.11864 G26
1.56±0.034600100040E32.79843N26.10910 G27
3.25±0.0709301540 -E32.80996N26.09370 G28
Nakada Area
5.27±0.11319903300 -E32.70723N26.12289 G29
1.94±0.04332554112.5E32.72631N26.11743 G30
0.65±0.01550183214.5E32.72662N26.11740 G31
2.66±0.05725542512E32.72829N26.11659 G32
0.68±0.01664510558E32.74951N26.02278 G33
2.35±0.052925154025E32.70576N25.91814 G35
2.55±0.0571035173013.5E32.70522N25.91802 G36
3.25±0.0711627271030E32.70407N25.91923 G37
6.59±0.143999164526E32.70083N25.93018 G38
1.48±0.032--25E32.71640N25.94468 G39
1.32±0.0302130356012E32.71714N25.94542 G40
5.89±0.12928547610E32.68326N26.13491 G46
4.42±0.0946601093 -E32.68208N26.13502 G47
8.35±0.187911151830E32.66696N26.13379 G58
7.51±0.1591647274035E32.66735N26.13360 G59
Continuo to the next page

RESULLTS & DISCUSSION
82
Dishna Area
7.22±0.155558930 -E32.78561N26.26677 G19
6.74±0.1442120347060E32.78344N26.25661 G20
5.29±0.114460770 -E32.71924N26.18366 G34
0.06±0.0027651280 -E32.72376N26.18460 G41
2.98±0.06614802360 -E32.71317N26.18509 G42
8.67±0.1879071516 -E32.71298N26.17638 G43
2.24±0.05165.8110 -E32.72363N26.18247 G44
1.86±0.041424704 -E32.73911N26.18994 G45
3.31±0.073965160520E32 41.766N26 10.496 G105
3.31±0.07345475840E32 34.325N26 11.405 G106
4.99±0.10616522770-E32 29.146N26 10.972 G107
4.10±0.0901630272022E32 25.814N26 09.294 G108
4.00±0.0851060177030E32 25.713N26 09.337 G109
Nagahammady and El-Waqf Area
2.79±0.059838140316E32.58715N26.11220 G48
5.11±0.116592990 -E32.58140N26.11100 G49
3.59±0.08156794417E32.57325N26.11037 G50
4.03±0.0861785297020E32.50017N26.08424 G51
3.36±0.07320803450 -E32.49827N26.08069 G52
4.29±0.0971321220072E32.50301N26.07686 G53
7.57±0.1691621270029E32.50501N26.07661 G54
3.63±0.078860143928E32.50992N26.07499 G55
2.53±0.05513352220 -E32.51557N26.08091 G56
2.50±0.0572220371085E32.51322N26.08750 G57
9.10±0.194565915110E32.50873N26.06381 G60
Continuo to the next page

RESULLTS & DISCUSSION
83
8.55±0.186474789100E32.49473N26.05874 G61
3.00±0.0661065177580E32.48327N26.05268 G62
2.42±0.054633105666E32.53300N26.08936 G63
5.14±0.110340568 -E32.59238N26.10662 G64
2.98±0.066711123496E32.49408N26.02805 G65
5.17±0.1118831472100E32.43481N25.99093 G66
5.64±0.1208731455100E32.43309N25.99089 G67
3.67±0.0808331388115E32.42750N25.98317 G68
6.18±0.132706117980E32.40778N25.97070 G69
4.52±0.1021959326095E32.35483N25.95908 G70
5.16±0.11420503420100E32.35122N25.95750 G71
2.08±0.04550083470E32 17.821N25 59.606 G72
3.14±0.06911871981 -E32 17.577N25 59.253 G73
6.77±0.144566919 -E32 17.492N25 59.477 G74
5.20±0.1101400234080E32 16.701N25 59.348 G75
2.25±0.048813135050E32 15.986N25 59.063 G76
3.07±0.0677961327 -E32 15.660N25 58.809 G77
4.30±0.093677112922E32 15.791N25 58.967 G78
3.46±0.07415272550 -E32 15.207N25 58.877 G79
4.27±0.09218243040 -E32 14.954N25 58.957 G80
10.07±0.219439732 -E32 14.558N25 58.912 G81
1.52±0.03310391732 -E32 13.946N25 58.931 G82
1.59±0.03554991430E32 13.789N25 58.072 G83
5.31±0.116732121830E32 12.084N25 58.056 G84
8.69±0.194697116230E32 11.669N25 58.295 G85
2.35±0.05246066729E32 11.555N25 58.329 G86
Continuo to the next page

RESULLTS & DISCUSSION
84
1.20±0.02743672730E32 08.121N26 00.093 G87
1.81±0.0391193198830E32 09.737N25 59.315 G88
2.90±0.0611420237045E32 09.743N25 59.383 G89
1.88±0.040725120860E32 11.661N25 58.660 G90
3.70±0.079750124560E32 11.870N25 58.274 G91
2.05±0.0461103183560E32 06.920N26 00.746 G92
2.92±0.065378630-E32 07.449N26 01.167 G93
3.93±0.088535892-E32 07.609N26 00.673 G94
3.86±0.08613712290-E32 09.854N25 59.590 G95
1.80±0.041712119040E32 10.412N25 59.080 G96
1.39±0.031652108635E32 10.545N25 58.962 G97
4.97±0.11050984635E32 11.879N25 58.728 G98
4.10±0.09458096762E32 11.969N25 58.738 G99
2.26±0.0489421563-E32 11.937N25 58.980 G100
1.23±0.02642070036E32 18.395N26 05.673 G101
1.62±0.03648480840E32 18.830N26 05.844 G102
2.19±0.047281968-E32 18.886N26 05.878 G103
3.36±0.074699116620E32 22.178N26 05.113 G104
0.040±0.025Minimum
10.07±0.219Maximum
3.74±0.077Average
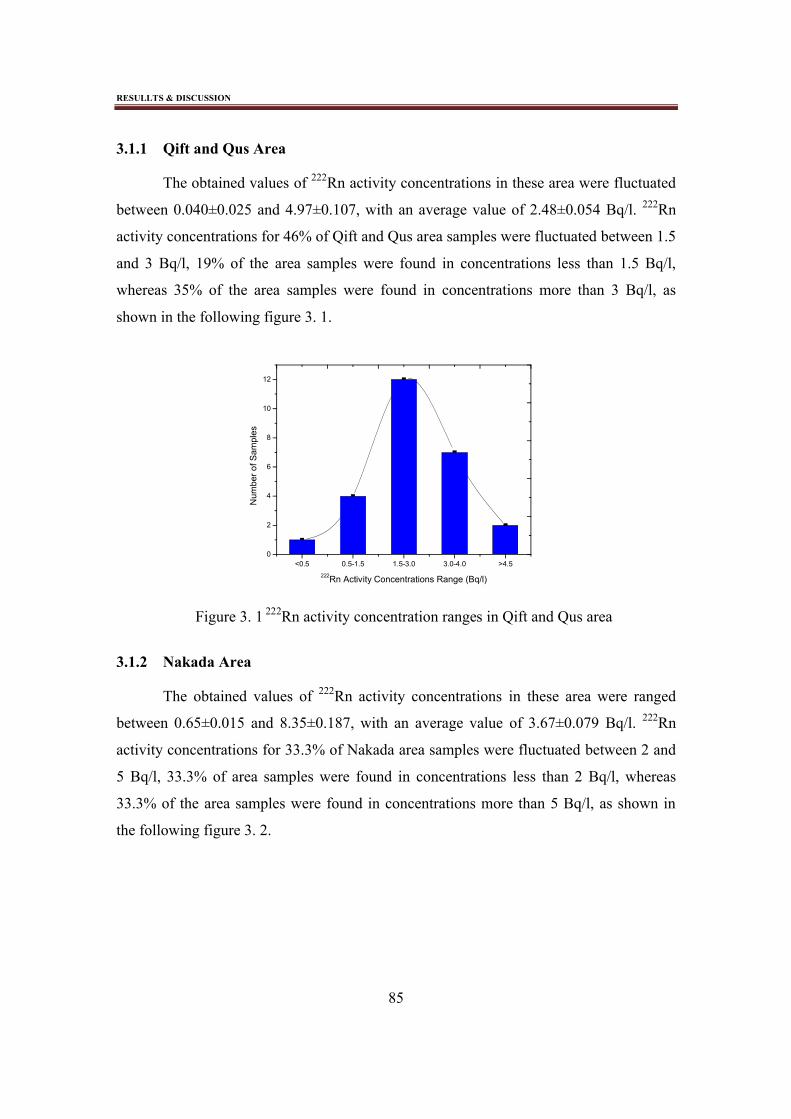
RESULLTS & DISCUSSION
85
3.1.1 Qift and Qus Area
The obtained values of 222Rn activity concentrations in these area were fluctuated
between 0.040±0.025 and 4.97±0.107, with an average value of 2.48±0.054 Bq/l. 222Rn
activity concentrations for 46% of Qift and Qus area samples were fluctuated between 1.5
and 3 Bq/l, 19% of the area samples were found in concentrations less than 1.5 Bq/l,
whereas 35% of the area samples were found in concentrations more than 3 Bq/l, as
shown in the following figure 3. 1.
<0.5 0.5-1.5 1.5-3.0 3.0-4.0 >4.50
2
4
6
8
10
12
Num
ber
of S
ampl
es
222Rn Activity Concentrations Range (Bq/l)
Figure 3. 1 222Rn activity concentration ranges in Qift and Qus area
3.1.2 Nakada Area
The obtained values of 222Rn activity concentrations in these area were ranged
between 0.65±0.015 and 8.35±0.187, with an average value of 3.67±0.079 Bq/l. 222Rn
activity concentrations for 33.3% of Nakada area samples were fluctuated between 2 and
5 Bq/l, 33.3% of area samples were found in concentrations less than 2 Bq/l, whereas
33.3% of the area samples were found in concentrations more than 5 Bq/l, as shown in
the following figure 3. 2.

RESULLTS & DISCUSSION
86
<1 1.0-2.0 2.0-5.0 5.0-7.0 >7.0
2.0
2.5
3.0
3.5
4.0
4.5
5.0
Nu
mb
er o
f Sa
mp
les
222Rn Activity Concentrations Range (Bq/l)
Figure 3. 2 222Rn activity concentration ranges in Nakada area
3.1.3 Dishna Area
The obtained values of 222Rn activity concentrations in these area were ranged
between 0.060±0.002 and 8.67±0.187 with an average value of 4.21±0.091 Bq/l. 222Rn
activity concentrations for 39% of Dishna area samples were fluctuated between 3 and 5
Bq/l, 30% of the area samples were found in concentrations less than 3 Bq/l, whereas
31% of the area samples were found in concentrations more than 5 Bq/l, as shown in the
following figure 3. 3.
<1.5 1.5-3.0 3.0-5.0 5.0-8.0 >8
1
2
3
4
5
Nu
mb
er o
f Sa
mp
les
222Rn Activity Concentrations Range
Figure 3. 3 222Rn activity concentration ranges in Dishna area

RESULLTS & DISCUSSION
87
3.1.4 Nagahammady and El-Waqf Area
The obtained values of 222Rn activity concentrations in these area were fluctuated
between 1.20±0.027 and 10.07±0.219 Bq/l with an average value of 3.86±0.084 Bq/l.222Rn activity concentrations for 44% of Nagahammady and El-Waqf area samples were
fluctuated between 2.5 and 5 Bq/l, 30% of the area samples were found in concentrations
less than 2.5 Bq/l, whereas 26% of the area samples were found in values more than 5
Bq/l, as shown in the following figure 3. 4.
<1.5 1.5-2.5 2.5-5.0 5.0-7.0 >70
5
10
15
20
25
Num
ber
of S
ampl
es
222Rn Activity Concentrations Range (Bq/l)
Figure 3. 4 222Rn activity concentration ranges in Nagahammady and El-Waqf area
Evidenced by measuring 222Rn activity concentrations for the investigated ground
water samples in the four areas under investigation, that the average values, are
2.48±0.054, 3.67±0.079, 4.21±0.091 and 3.86±0.08 Bq/l, in Qift and Qus, Nakada,
Dishna, and Nagahammady and El-Waqf Areas, respectively, as shown in the table 3. 2,
and presented in figure 3. 5.
It is noted that, the maximum average value was observed in the Dishna area,
which is due to that, this area is characterized by shortness of the area enclosed between
mountainous areas and the river Nile, this mountainous region is characterized as close to
Wadi Qena. Wadi Qena contain granite rocks, and found in a higher natural background
than other regions in Upper Egypt, which leads to increase of activity concentrations of
natural radionuclides in this area compared to the other three areas under study (Saied
1994).

RESULLTS & DISCUSSION
88
Table 3. 2 The ranges and average values of 222Rn activity concentrations (Bq/l) for the
ground water samples under investigation in the study areas
Areas
222Rn activity concentrations
Minimum Maximum Average
Qift and Qus Area 0.040±0.025 4.97±0.107 2.48±0.054
Nakada Area 0.650±0.015 8.35±0.187 3.67±0.079
Dishna Area 0.060±0.002 7.22±0.155 4.21±0.091
Nagahammady and El-Waqf Area 1.200±0.027 10.07±0.219 3.86±0.084
Total Area 0.04±0.025 10.07±0.219 3.57±0.077
Qift and Quse Nakada Dishna Nagahammady and El-Wakf0
1
2
3
4
5
22
2 Rn
Act
ivity
Co
nce
ntra
tions
(B
q/l)
Study Areas
Figure 3. 5 222Rn activity concentrations for ground water samples in the study areas
3.1.5 Correlations between 222Rn Activity Concentrations and the Geochemical
Parameters in Ground water
3.1.5.1 TDS
TDS values were measured for ground water samples using portable Jenway
Model 4520 Laboratory TDS Meter. The obtained values were fluctuated from 65.8 to
2270 mg/l. In order to study the correlation between TDS values with 222Rn activity
concentrations in ground water samples, it is noted that, there is no obviously correlation
between them was observed, as shown in the following figure 3. 6.

RESULLTS & DISCUSSION
89
0 500 1000 1500 2000 2500
0
2
4
6
8
10
12
222 R
n A
ctiv
ity C
once
ntra
tion
in (
Bq/
l)
TDS (mg/l)
Figure 3. 6 TDS values with 222Rn activity concentrationin in ground water samples
3.1.5.2 Conductivity
Conductivity values were measured for ground water samples using portable
Jenway Model 4520 Laboratory TDS Meter. The obtained values were ranged between
110 and 3790 µs/cm. In order to study the correlation between conductivity values with 222Rn activity concentrations in ground water samples, it is noted that there is no
correlation between them was observed, as shown in the following figure 3. 7.
0 1000 2000 3000 4000
0
2
4
6
8
10
12
222 R
n A
ctiv
ity C
onc
entr
atio
nin
(Bq/
l)
Conductivity (µs/cm)
Figure 3. 7 Conductivity with 222Rn activity concentration in ground water samples

RESULLTS & DISCUSSION
90
3.1.5.3 PH
PH values were measured for some samples in the field at the moment of
sampling, using portable Senso Direct PH 200 meter, in different sites, east and west of
the River Nile, and listed with 222Rn activity concentrations in table 3. 3.
In order to study the correlation between PH values and 222Rn activity
concentrations in the investigated samples, from figure 3. 8 it is noted that, there are a
reasonable correlation between PH and 222Rn activity concentrations, it decreased with
increasing PH. This result can be ascribed to acid leaching and to the effect of PH on the
different chemical behavior of 238U and its daughters.
As PH increases, fewer minerals including U were leached from the neighboring
rock or sediment. Moreover, U (VI) usually forms the UO22+ ion or its complexes which
are soluble in water. When PH rises, uranium hydrolyzes and less (UO22+) will present in
the water (Khaled 2006, Lin 2003).
Table 3. 3 222Rn activity concentrations (Bq/l) with PH values in ground water samples
Sample No. pH 222Rn Sample No. pH 222Rn
W1 6.94 3.3±0.053 W13 7.5 1.81±0.039
W2 6.96 2.77±0.046 W14 7.37 2.9±0.061
W3 6.95 3.83±0.083 W15 7.41 1.88±0.04
W4 7.25 2.18±0.05 W16 7.39 2.05±0.046
W5 7.03 2.67±0.065 W17 7.59 1.8±0.041
W6 7.22 2.03±0.05 W18 7.5 1.39±0.031
W7 7.55 1.46±0.037 W19 7.55 1.23±0.026
W8 7.57 2.32±0.052 W20 7.55 1.62±0.036
W9 7.36 1.96±0.042 W21 7.66 2.19±0.047
W10 7 3.16±0.069 W22 7.11 3.31±0.073
Continuo to the next page

RESULLTS & DISCUSSION
91
W11 7.5 2.35±0.052 W23 7.2 3.41±0.078
W12 7.52 1.2±0.027 W24 7.41 1.03±0.029
W25 7.38 3.15±0.069 W32 7.25 1.84±0.039
W26 7.41 3.73±0.08 W33 7.45 1.33±0.028
W27 7.58 2.92±0.065 W34 7.5 2.81±0.06
W28 7.35 3.86±0.086 W35 6.98 6.6±0.14
W29 7.44 2.97±0.068 W36 7.34 3.51±0.075
W30 7.54 2.91±0.064 W37 7.31 4.03±0.086
W31 7.55 3.31±0.073 W38 7.48 3.72±0.079
6.9 7.0 7.1 7.2 7.3 7.4 7.5 7.6 7.7
1
2
3
4
5
6
7
222R
n a
ctiv
ity c
on
cen
tra
tion
s (B
q/l)
PH
Figure 3. 8 PH values with 222Rn activity concentrations in ground water samples

RESULLTS & DISCUSSION
92
3.1.6 Comparison with similar studies in other countries
In order to compare between the obtained results of 222Rn activity concentrations
in ground water from the present work with the other published data in the other
countries, table 3. 4 summarized the values of 222Rn activity concentrations in some
countries and those from the present wok. As can be seen from table, 222Rn activity
concentrations values in the present work are higher than that reported by Abbady (1995)
for ground water within Qena, Egypt, Sarrou (2003) in Cyprus, and Otwoma (1998) in
Kenya. Whereas the obtained values of 222Rn activity concentrations are lower than that
reported by Dana, (1994) in North Carolina, USA, Buchli (1989) in Switzerland, Watson
(1987) in North Carolina, Field (1998) in Iowa, Galan (2004) in Spain, and by
Mäkeläinen (2002) in Finland.
Table 3. 4 222Rn activity concentration in Bq/ l for ground water samples in the present
investigation in comparison with other countries.
Reference222Rn Activity Concentrations (Bq/l)Region
Present work0.04±0.025-10.07±0.219
(3.57±0.077)Egypt
Watson 19877.30North Carolina, USA
Dana 19877.90North Carolina, USA
Buchli 198910.4–38.3Switzerland
Nguelem 20130.037-0.67 (0.39)Ghana
Abbady 19950.074–2.33Egypt
Field 19980.85–87.0 (16.0)Iowa
Otwoma 19980.8–4.7Kenya
Alam 19992.04–9.38 (4.46)Bangladesh
Amrani 20022.6–14Algeria
Continuo to the next page

RESULLTS & DISCUSSION
93
Sarrou 20030.1–5.0Cyprus
Lowry 198759-200 (155)Maine (USA)
Mäkeläinen 20024-400 (60)Finland
Galan 20041-200 (98)Spain
Gans 19871-165 )111(Germany
Zhuo 20013-735 )229(China
Watson 19877.30USANorth Carolina
Buchli 198910.4-38.3 (3.21)Switzerland
Saumande 19733-330 (296)France
3.2 222Rn Activity Concentrations in Ground Water using Gamma Spectroscopy
Gamma spectroscopy technique is widely used to investigate many radionuclides
in different kinds of the environmental samples. In this part from our study, 222Rn activity
concentrations in ground water samples were determined using a low level gamma
spectrometry, based on NaI (Tl) scintillation detector. 222Rn activity concentrations of
samples were assayed after two hours of sampling for 8 hour counting, followed by
analysis of gamma peaks from 214Bi (609 keV) and 214Pb (295, 352 keV) (Isam 2002),
using GENEE 2000 software, for evaluating the gamma spectra.
The samples were collected from 15 ground water wells. These samples sites
were chosen by random method from the whole study sites, and measured first by using
Alpha GUARD. The obtaines results of 222Rn activity concenterations by usning the two
radon measurements techniques: ionisation chamber “Alpha GUARD” and gamma
spectroscopy "NaI (Tl)", are listed in the following table 3. 5, and drown with each other
in the figure 3. 9.

RESULLTS & DISCUSSION
94
Table 3. 5 222Rn activity concentrations (Bq/l) by using the two radon measurements
techniques
Sample No. 222Rn using Gamma Spectroscopy 222Rn using Alpha GUARD
1 3.03±0.187 3.30±0.050
2 1.99±0.100 2.10±0.030
3 2.54±0.154 2.67±0.060
4 0.48±0.024 0.04±0.030
5 1.15±0.057 1.18±0.030
6 0.92±0.046 1.09±0.030
7 2.97±0.170 3.15±0.070
8 4.13±0.252 4.37±0.090
9 0.99±0.060 1.02±0.020
10 2.68±0.133 2.70±0.060
11 3.11±0.158 3.25±0.070
12 5.20±0.317 5.27±0.110
13 2.37±0.145 2.35±0.050
14 1.90±0.097 1.86±0.040
15 0.93±0.057 1.39±0.030
Minimum 0.48±0.024 0.04±0.030
Maximum 5.20±0.317 5.27±0.110
Average 2.3±0.13 2.38±0.052

RESULLTS & DISCUSSION
95
2 4 6 8 10 12 14
0
1
2
3
4
5
622
2 Rn
Act
ivity
Con
cent
ratio
ns (
Bq/
l)
Samples Code
Gamma SpectrometryAlpha GUARD
Figure 3. 9 Relation between the two radon measurements techniques
From the obtained results, It is noted that, the two radon measurements techniques
results are in a good agreement. In the most invistigated samples, Alpha GUARD results
are slightly higher than the obtained results from gamma spectrometry; the reason may be
due to that, the chance of radon escaping from samples to surrounding air in gamma
spectroscopy technique is higher than Alpha GUARD technique, which is reflected on the
lack of gamma spectroscopy results.
Another reason may leads to the higher results obtained from Alpha GUARD
measurements than those results obtained from gamma spectrometer, 222Rn
concentrations in Alpha GUARD measuring technique were calculated due to directly
registration of alpha particles, due to 222Rn decay, but in gamma spectrometer measuring
technique, 222Rn concentrations were calculated due to 222Rn daughters decay (214Bi, 214Pb), which leads to a high error rate in gamma results.

RESULLTS & DISCUSSION
96
3.3 Natural Radionuclides Activity Concentrations in Ground Water
Water in the natural environment are variable in uranium content, depending
mainly on factors such as contact time with U-bearing rock, U content of the contact
rock, amount of evaporation and availability of complexion ions. Due to its proximity to
rock and soil, ground water are somewhat enriched in respect of uranium when compared
to surface waters especially in mineralized areas.
Determination of naturally occurring radionuclide's in ground water is useful as a
direct input to environmental and public health studies (Isam 2002). Considering the high
radio toxicity of 226Ra and 228Ra, their presence in water and the associated health risks
require particular attention. When humans ingest radium, about 20% is absorbed into the
blood stream.
Absorbed radium is initially distributed to soft tissues and bone, but its retention
is mainly in growing bone (Oliveira 2001, ICRP 1993, EPA 1991). Experimental works
suggested that the number of fatal cancers due to 222Rn, a daughter of 226Ra, ingested
from drinking water may equal the fatal lung cancers due to the inhalation of indoor 222Rn
(Correia 1987).
Thus, high quantities of these nuclides in water necessitate the use of appropriate
methods of elimination like those summarized by Sorg (Sorg 1988, 1991).
The activity concentrations of 226Ra, 232Th and 40K were determined over 108 sites
in Qena governorate, as shown in the map figure 2. 1. The activity concentrations of
radionuclides together with the values of TDS, conductivity, and well depths, are
presented in the following table 3. 6.

RESULLTS & DISCUSSION
97
Table 3. 6 Natural radionuclides activity concentrations (Bq/l) as well as the geochimical
parameters
Sample
No.
Well Depth
(m)
TDS
(mg/l)
Conductivity
(µg/l)
226Ra 232Th 40K
Qift and Qus Area
G1 450 582 969 0.443±0.022 0.451±0.027 4.09±0.352
G2 350 562 939 0.349±0.017 0.284±0.017 4.19±0.360
G3 480 574 956 0.393±0.02 0.325±0.020 4.72±0.406
G4 480 568 946 0.41±0.021 0.224±0.014 4.78±0.412
G5 7 2270 3790 0.585±0.029 0.359±0.022 5.48±0.471
G6 450 577 962 0.616±0.031 0.495±0.030 5.01±0.431
G7 40 170.6 285 < MDA 0.037±0.003 5.33±0.459
G8 40 143 238 0.457±0.023 0.410±0.025 4.52±0.389
G9 30 191.3 317 0.297±0.015 0.313±0.019 4.74±0.407
G10 30-40 299 500 0.251±0.013 0.148±0.013 5.53±0.475
G11 100 1041 1740 0.478±0.024 0.375±0.032 3.18±0.273
G12 45 114.1 190.4 0.308±0.015 0.257±0.016 4.68±0.403
G13 34 251 418 0.538±0.027 0.365±0.022 4.50±0.387
G14 54 160.4 267 0.414±0.021 0.225±0.019 4.61±0.396
G15 40 657 1094 0.126±0.007 0.334±0.029 5.32±0.458
G16 75 866 1443 0.687±0.034 0.503±0.031 6.02±0.518
G17 25 1033 1720 0.579±0.029 0.442±0.027 5.06±0.435
G18 45 531 885 0.154±0.009 0.224±0.014 5.76±0.496
G21 52 502 833 0.349±0.017 0.354±0.022 5.29±0.455
G22 57 510 850 0.322±0.016 0.239±0.015 5.53±0.476
G23 50 745 1243 0.511±0.026 0.145±0.013 5.44±0.468
Continuo to the next page

RESULLTS & DISCUSSION
98
G24 11 783 1300 0.606±0.030 0.601±0.037 6.19±0.533
G25 - 173.9 288 0.386±0.020 0.416±0.025 4.56±0.392
G26 20 455 755 0.209±0.010 0.206±0.013 6.39±0.550
G27 40 600 1000 0.213±0.011 0.342±0.021 4.06±0.349
G28 - 930 1540 0.523±0.026 0.499±0.030 4.41±0.379
Nakada Area
G29 - 1990 3300 0.816±0.041 0.677±0.041 4.95±0.426
G30 12.5 325 541 0.137±0.050 0.191±0.012 6.45±0.555
G31 14.5 501 832 0.166±0.050 0.154±0.013 4.65±0.400
G32 12 255 425 0.328±0.016 0.323±0.020 5.76±0.495
G33 8 645 1055 0.126±0.007 0.251±0.015 5.10±0.439
G35 25 925 1540 0.371±0.019 0.239±0.015 5.59±0.481
G36 13.5 1035 1730 0.381±0.019 0.262±0.016 5.54±0.476
G37 30 1627 2710 0.402±0.020 0.575±0.035 4.85±0.417
G38 26 999 1645 0.747±0.038 0.663±0.057 4.31±0.371
G39 25 - - 0.257±0.013 0.166±0.010 4.43±0.381
G40 12 2130 3560 0.215±0.011 0.128±0.009 4.19±0.360
G46 10 285 476 0.776±0.039 0.348±0.021 5.40±0.464
G47 - 660 1093 0.588±0.030 0.467±0.029 5.83±0.502
G58 30 911 1518 1.353±0.082 0.817±0.070 4.22±0.363
G59 35 1647 2740 1.205±0.073 0.693±0.060 4.51±0.388
Dishna Area
G19 - 558 930 1.219±0.074 0.712±0.043 5.15±0.443
G20 60 2120 3470 0.964±0.049 0.899±0.077 6.03±0.518
G34 - 460 770 0.732±0.036 0.577±0.035 6.75±0.581
G41 - 765 1280 0.042±0.002 0.068±0.004 5.46±0.469
Continuo to the next page

RESULLTS & DISCUSSION
99
G42 - 1480 2360 0.422±0.021 0.268±0.016 5.63±0.485
G43 - 907 1516 1.540±0.094 0.757±0.065 5.46±0.470
G44 - 65.8 110 0.409±0.020 0.490±0.030 4.54±0.390
G45 - 424 704 0.219±0.011 0.117±0.008 6.46±0.556
G105 10 965 1605 0.455±0.023 0.228±0.014 4.20±0.361
G106 40 454 758 0.604±0.030 0.250±0.016 4.32±0.372
G107 - 1652 2770 0.619±0.031 0.197±0.017 4.82±0.415
G108 22 1630 2720 0.620±0.031 0.476±0.041 4.09±0.351
G109 30 1060 1770 0.507±0.025 0.423±0.026 4.46±0.384
Nagahammady and El-Waqf Area
G48 16 838 1403 0.483±0.024 0.340±0.029 4.74±0.408
G49 - 592 990 0.801±0.049 0.657±0.040 4.36±0.375
G50 17 567 944 0.508±0.026 0.352±0.030 4.46±0.384
G52 - 2080 3450 0.353±0.019 0.521±0.032 3.50±0.301
G53 72 1321 2200 0.559±0.028 0.583±0.036 4.56±0.392
G54 29 1621 2700 1.221±0.074 0.755±0.047 4.85±0.417
G55 28 860 1439 0.573±0.028 0.352±0.030 4.65±0.400
G56 - 1335 2220 0.356±0.018 0.360±0.022 6.37±0.548
G57 85 2220 3710 0.361±0.018 0.514±0.032 4.77±0.41
G60 110 565 915 1.880±0.114 0.783±0.048 5.27±0.454
G61 100 474 789 1.409±0.086 0.627±0.041 6.49±0.558
G62 80 1065 1775 0.478±0.024 0.385±0.024 6.89±0.593
G63 66 633 1056 0.322±0.016 0.330±0.020 4.57±0.393
G64 - 340 568 0.719±0.036 0.531±0.046 4.33±0.372
G65 96 711 1234 0.482±0.024 0.218±0.019 5.73±0.493
G66 100 883 1472 0.784±0.039 0.834±0.072 4.95±0.426
Continuo to the next page

RESULLTS & DISCUSSION
100
G67 100 873 1455 0.694±0.036 0.842±0.072 5.21±0.448
G68 115 833 1388 0.442±0.023 0.684±0.042 4.67±0.402
G69 80 706 1179 0.785±0.039 0.561±0.034 4.65±0.400
G70 95 1959 3260 0.601±0.030 0.505±0.043 6.07±0.522
G71 100 2050 3420 0.889±0.054 0.322±0.028 5.94±0.511
G72 70 500 834 0.416±0.021 0.240±0.015 6.31±0.543
G73 - 1187 1981 0.395±0.020 0.427±0.026 5.83±0.501
G74 - 566 919 1.062±0.065 0.747±0.064 6.10±0.524
G75 80 1400 2340 0.768±0.038 0.579±0.036 7.00±0.602
G76 50 813 1350 0.442±0.022 0.350±0.021 5.66±0.487
G77 - 796 1327 0.608±0.030 0.523±0.032 6.02±0.518
G78 22 677 1129 0.578±0.029 0.529±0.032 5.21±0.448
G79 - 1527 2550 0.484±0.024 0.524±0.032 6.17±0.531
G80 - 1824 3040 0.561±0.034 0.513±0.031 5.13±0.441
G81 - 439 732 1.930±0.117 0.725±0.044 5.14±0.442
G82 - 1039 1732 0.204±0.010 0.215±0.013 6.42±0.552
G83 30 549 914 0.179±0.009 0.246±0.015 5.44±0.468
G84 30 732 1218 0.818±0.041 0.872±0.075 5.03±0.433
G85 30 697 1162 1.246±0.076 0.605±0.052 5.68±0.489
G86 29 460 667 0.378±0.019 0.418±0.026 4.17±0.359
G87 30 436 727 0.131±0.008 0.110±0.007 4.78±0.411
G88 30 1193 1988 0.212±0.011 0.268±0.023 6.03±0.519
G89 45 1420 2370 0.325±0.020 0.143±0.009 5.23±0.450
G90 60 725 1208 0.157±0.010 0.115±0.007 4.07±0.350
G91 60 750 1245 0.422±0.021 0.312±0.019 5.16±0.444
G92 60 1103 1835 0.411±0.021 0.164±0.010 4.71±0.405
Continuo to the next page

RESULLTS & DISCUSSION
101
G93 - 378 630 0.495±0.025 0.110±0.009 5.29±0.455
G94 - 535 892 0.474±0.029 0.362±0.031 5.25±0.452
G95 - 1371 2290 0.613±0.030 0.504±0.031 5.23±0.450
G96 40 712 1190 0.137±0.007 0.191±0.012 4.29±0.369
G97 35 652 1086 0.123±0.007 0.109±0.007 4.39±0.378
G98 35 509 846 0.586±0.029 0.298±0.026 4.24±0.365
G99 62 580 967 0.497±0.025 0.170±0.010 4.13±0.355
G100 - 942 1563 0.277±0.014 0.118±0.007 5.42±0.466
G101 36 420 700 0.185±0.010 0.246±0.016 4.8±0.413
G102 40 484 808 0.222±0.011 0.187±0.012 4.17±0.359
G103 - 281 968 0.455±0.023 0.162±0.010 4.13±0.356
G104 20 699 1166 0.664±0.033 0.121±0.008 5.73±0.493
Minimum 0.042±0.002 0.067±0.004 3.18±0.273
Maximum 1.93±0.117 0.899±0.077 6.99±0.602
Average 0.54±0.029 0.4±0.027 5.10±0.44
3.3.1 Qift and Qus Area
The obtained values of 226Ra activity concentrations in the area were fluctuated
between 0.126±0.007 and 0.687±0.034 Bq/l with an average value of 0.41±0.019 Bq/l. 226Ra activity concentrations for 36% of Qift and Qus area samples were fluctuated
between 0.3 and 0.45 Bq/l, 24% of the area samples were found in values less than 0.3
Bq/l, whereas 40% of the area samples were found in concentrations more than 0.45 Bq/l,
as shown in the following figure 3. 10 (a).
The obtained values of 232Th activity concentrations in the area were fluctuated
between 0.037±0.003 and 0.601±0.037, with an average value of 0.33±0.021 Bq/l. 232Th
activity concentrations for 38.5% of the area samples were fluctuated between 0.4 and 0.5
Bq/l, 31% of the area samples were found in values less than 0.4 Bq/l, whereas 30.5% of
the area samples were found in values higher than 0.5 Bq/l as shown in the following
figure 3. 10 (b).

RESULLTS & DISCUSSION
102
The obtained values of 40K activity concentrations in the area were found in
higher values, which fluctuated between 3.18±0.273 and 6.39±0.55 Bq/l, with an average
value of 4.97±0.43 Bq/l. 40K activity concentrations for 54% of the area samples were
fluctuated between 4.5 and 5.5 Bq/l, 23% of the area samples were found in values less
than 4.5 Bq/l, whereas 22% of the area samples were found in values more than 5.5 Bq/l
as shown in the following figure 3. 10 (C).
3.3.2 Nakada Area
The obtained values of 226Ra activity concentrations in the area were ranged from
0.126±0.007 to 1.353±0.082 Bq/l, with an average value of 0.53±0.034 Bq/l. 226Ra
activity concentrations of 33.3% for Nakada area samples were fluctuated between 0.3
and 0.7 Bq/l, 33.3% of the area samples were found in values less than 0.3 Bq/l, whereas
33.3% of the area samples were found in values more than 0.7 Bq/l as shown in the
following figure 3. 11 (a).
The obtained values of 232Th activity concentrations in the area were ranged from
0.128±0.009 to 0.817±0.07 Bq/l, with an average value of 0.39±0.028 Bq/l. 232Th activity
concentrations for 40% of the area samples were fluctuated between 0.25 and 0.65 Bq/l,
33% of the area samples were found in values less than 0.25 Bq/l, whereas 27% of the
area samples were found in values more than 0.65 Bq/l as shown in the following figure
3. 11 (b).
The obtained values of 40K activity concentrations in the area were found in
higher values, which fluctuated between 4.19±0.36 and 6.45±0.555 Bq/l with an average
value of 5.1±0.43 Bq/l. 40K activity concentrations for 40% of the area samples were
fluctuated between 4.5 and 5.5 Bq/l, 27% of the area samples were found in values less
than 4.5 Bq/l, whereas 33% of the area samples were found in values more than 5.5 Bq/l
as shown in the following figure 3. 11 (C).

RESULLTS & DISCUSSION
103
<0.2 0.2-0.3 0.3-0.45 0.45-0.58 >0.581
2
3
4
5
6
7
8
9
10
Num
ber
of S
amp
les
226Ra Activity Concentrations Range (Bq/l)
(a)
<0.15 0.15-0.4 0.4-0.5 0.4-0.5 >0.5
2
4
6
8
10
Num
ber
of S
amp
les
232Th Activity Concentrations Range (Bq/l)
(b)
<3.5 3.5-4.5 4.5-5.5 5.5-6.2 >6.2
0
2
4
6
8
10
12
14
16
Num
ber
of S
am
ples
40K Activity Concentrations Range (Bq/l)
(c)
Figure 3. 10 Natural radionuclides activity concentration ranges in Qift and Qus area

RESULLTS & DISCUSSION
104
<0.15 0.15-0.3 0.3-0.7 0.7-0.9 >0.9
2.0
2.5
3.0
3.5
4.0
4.5
5.0
Num
ber
of S
amp
les
226Ra Activity Concentrations Range (Bq/l)
(a)
<0.16 0.16-0.25 0.25-0.65 0.65-0.7 >0.7
1
2
3
4
5
6
Num
ber
of S
amp
les
232Th Activity Concentrations Range (Bq/l)
(b)
<4.2 4.2-4.5 4.5-5.5 5.5-5.8 >5.8
1
2
3
4
5
6
Num
ber
of S
am
ples
40K Activity Concentrations Range (Bq/l)
(c)
Figure 3. 11 Natural radionuclides activity concentration ranges in Nakada area

RESULLTS & DISCUSSION
105
3.3.3 Dishna Area
The obtained values of 226Ra concentrations in the area were fluctuated between
0.042±0.002 and 1.54±0.094 Bq/l, with an average value of 0.64±0.034 Bq/l. 226Ra
activity concentrations of 46% for Dishna area samples were fluctuated between 0.44 and
0.8 Bq/l, 31% of the area samples were found in values less than 0.44 Bq/l, whereas 23%
of the area samples were found in values more than 0.8 Bq/l as shown in the following
figure 3. 12 (a).
The obtained values of 232Th activity concentrations in the area were fluctuated
between 0.068±0.004 and 0.899±0.077 Bq/l, with an average value of 0.42±0.03 Bq/l.232Th activity concentrations of 54% of the area samples were fluctuated between 0.2 and
0.6 Bq/l, 23% of the area samples were found in values less than 0.2 Bq/l, whereas 23%
of the area samples were found in values more than 0.6 Bq/l as shown in the following
figure 3. 12 (b).
The obtained values of 40K concentrations in the area were found in higher values,
which fluctuated between 4.09±0.351 and 6.75±0.581 Bq/l, with an average value of
5.18±0.44 Bq/l. 40K activity concentrations for 46% of the area samples were fluctuated
between 4.5 and 5.5 Bq/l, 23% of the area samples were found in values less than 4.5
Bq/l, whereas 31% of the area samples were found in values more than 5.5 Bq/l as shown
in the following figure 3. 12 (C).
3.3.4 Nagahammady and El-Waqf Area
The obtained values of 226Ra activity concentrations in the area were fluctuated
between 0.123±0.007 and 1.93±0.117 Bq/l, with an average value of 0.58±0.031 Bq/l. 226Ra activity concentrations for 35% of Nagahammady and El-Waqf area samples were
fluctuated between 0.4 and 0.6 Bq/l, 31% of the area samples were found in values less
than 0.4 Bq/l, whereas 34% of the area samples were found in values more than 0.6 Bq/l
as shown in the following figure 3. 13 (a).

RESULLTS & DISCUSSION
106
<0.2 0.2-0.44 0.44-0.8 0.8-1.3 >1.3
1
2
3
4
5
6
Num
ber
of S
amp
les
226Ra Activity Concentrations Range (Bq/l)
(a)
<0.1 0.1-0.2 0.2-0.6 0.6-0.8 >0.8
1
2
3
4
5
6
7
Num
ber
of S
amp
les
232Th Activity Concentrations Range (Bq/l)
(b)
<4.1 4.1-4.4 4.4-5.5 5.5-6.5 >6.5
1
2
3
4
5
6
Num
ber
of S
ampl
es
40K Activity Concentrations Range (Bq/l)
(c)
Figure 3. 12 Natural radionuclides activity concentration ranges in Dishna area

RESULLTS & DISCUSSION
107
The obtained values of 232Th activity concentrations in the area were fluctuated
between 0.109±0.007 and 0.872±0.075 Bq/l, with an average value of 0.41±0.028 Bq/l.232Th activity concentrations for 54% of the area samples were fluctuated between 0.22
and 0.6 Bq/l 26% of the area samples were found in values less than 0.22 Bq/l, whereas
20% of the area samples were found in values more than 0.6 Bq/l as shown in the
following figure 3. 13 (b).
The obtained values of 40K activity concentrations in the area were found in
higher values, which fluctuated between 3.5±0.301 and 7±0.602 Bq/l, with an average
value of 5.17±0.44 Bq/l. 40K activity concentrations for 46% of the area samples were
fluctuated between 4.5 and 5.5 Bq/l, 22% of the area samples were found in values less
than 4.5 Bq/l, whereas 32% of the area samples were found in values more than 5.5 Bq/l
as shown in the following figure 3. 13 (C).
Evidenced by 226Ra, 232Th and 40K activity concentrations measurements for
ground water samples, which collected from the four areas under investigation, that the
average values are (0.41±0.019, 0.33±0.021, and 4.98±0.42), (0.52±0.033, 0.39±0.028,
and 5.05±0.43), (0.64±0.034, 0.42±0.03, and 5.18±0.44) and (0.58±0.031, 0.41±0.028
and 5.170.44) Bq/l for 226Ra, 232Th and 40K, in Qift and Qus, Nakada, Dishna, and
Nagahammady and El-Waqf Areas, respectively, as shown in the following table 3. 7,
and presented in figures 3. 14.
These low levels of the radionuclide's activity concentrations are due to that, the
natural radioactivity of the subsoil in Qena area is generally low (Ahmed 2004). It is
noted that, the maximum average values of natural radionuclides were observed in
Dishna area, due to that, this area is characterized by shortness of the area enclosed
between mountainous areas and the river Nile, this mountainous region is characterized
as close to Wadi Qena. Wadi Qena contain granite rocks, and found in a higher natural
background than other regions in Upper Egypt, which leads to increase of activity
concentrations of natural radionuclides in this area compared to the other three areas
under study (Saied 1994).
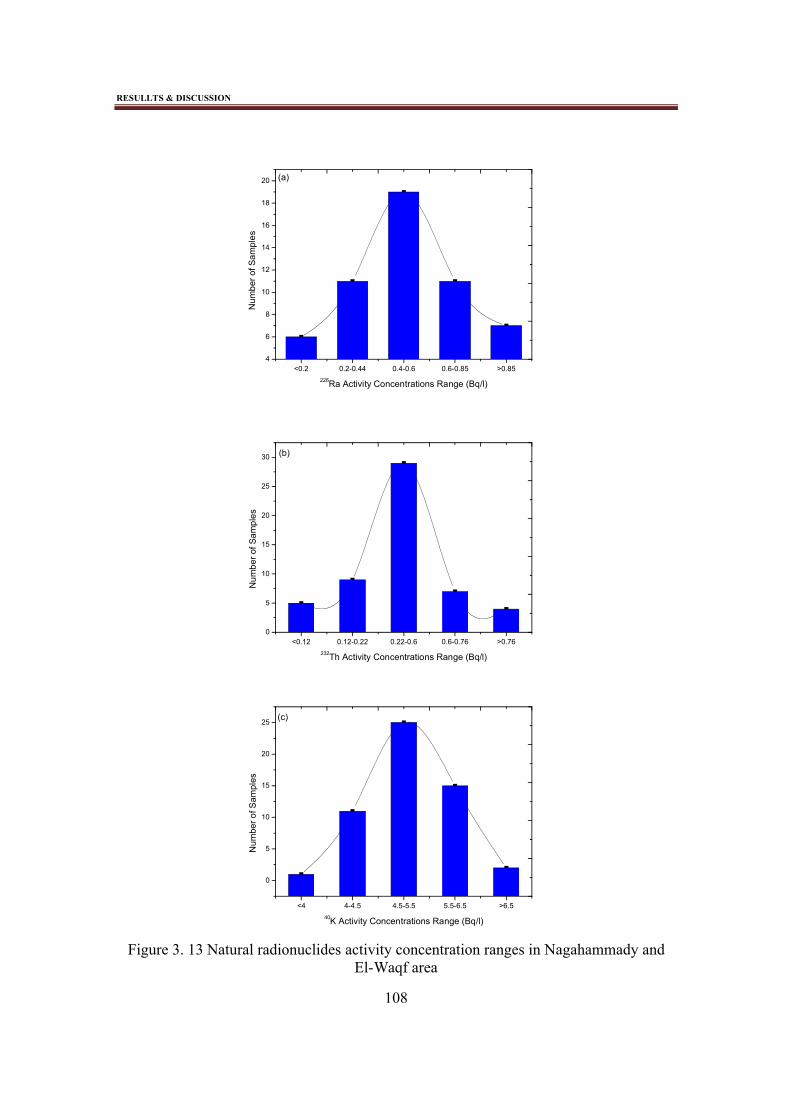
RESULLTS & DISCUSSION
108
<0.2 0.2-0.44 0.4-0.6 0.6-0.85 >0.854
6
8
10
12
14
16
18
20
Nu
mb
er o
f Sa
mp
les
226Ra Activity Concentrations Range (Bq/l)
(a)
<0.12 0.12-0.22 0.22-0.6 0.6-0.76 >0.760
5
10
15
20
25
30
Nu
mb
er o
f Sa
mp
les
232Th Activity Concentrations Range (Bq/l)
(b)
<4 4-4.5 4.5-5.5 5.5-6.5 >6.5
0
5
10
15
20
25
Num
ber
of S
ampl
es
40K Activity Concentrations Range (Bq/l)
(c)
Figure 3. 13 Natural radionuclides activity concentration ranges in Nagahammady and El-Waqf area

RESULLTS & DISCUSSION
109
Table 3. 7 The ranges and average values of natural radinuclides activity concentrations (Bq/l) for ground water samples
Study Areas
226Ra 232Th 40K
Minimum Maximum Average Minimum Maximum Average Minimum Maximum Average
Qift and Qus 0.126±0.007 0.687±0.034 0.41±0.019 0.037±0.003 0.601±0.037 0.33±0.021 3.18±0.273 6.39±0.55 4.97±0.42
Nakada 0.126±0.007 1.205±0.073 0.53±0.033 0.128±0.009 0.817±0.07 0.4±0.028 4.19±0.360 6.45±0.555 5.1±0.43
Dishna 0.042±0.002 1.54±0.094 0.64±0.034 0.068±0.004 0.899±0.077 0.42±0.03 4.09±0.351 6.75±0.581 5.18±0.44
Nagahammady
and El-Waqf0.123±0.007 1.93±0.117 0.58±0.031 0.109±0.007 0.872±0.075 0.41±0.028 3.50±0.301 7.00±0.602 5.17±0.44
Total Area 0.042±0.002 1.93±0.117 0.54±0.029 0.067±0.004 0.899±0.077 0.4±0.027 3.18±0.273 6.99±0.602 5.10±0.44

RESULLTS & DISCUSSION
110
Qift and Quse Nakada DishnaNagahammady and El-Wakf 0.0
0.1
0.2
0.3
0.4
0.5
0.6
0.7
226
Ra
Act
ivity
Co
nce
ntr
atio
ns
(Bq
/l)
Study Areas
(a)
Qift and Quse Nakada DishnaNagahammady and El-Wakf 0.0
0.1
0.2
0.3
0.4
0.5
232 T
h A
ctiv
ity C
once
ntr
atio
ns
(Bq
/l)
Study Areas
(b)
Qift and Quse Nakada DishnaNagahammady and El-Wakf 0
1
2
3
4
5
6
40K
Act
ivity
Co
nce
ntr
atio
ns
(Bq
/l)
Study Areas
(c)
Figure 3. 14 Natural radinuclides activity concentrations in the study areas

RESULLTS & DISCUSSION
111
3.3.5 Relation between 226Ra and 222Rn Activity Concentrations in Ground Water
Samples
The natural radioactive 238U series and its products distribute overall the earth’s
crust. The activity concentrations of these radioactive elements are transferred from the
earth crust to ground water. Radon is produced naturally within the grains of the bedrock
of the earth crust, which contains the ores of uranium in secular equilibrium (reached
when the activity of each radioactive daughter is equal to the activity of radioactive
parent). So if uranium rich in the earth crust and the neighbors’ ground water, the radium
concentration will be rich in the same materials, by its turn the 222Rn activity
concentrations will be rich.
In order to study the correlation between 226Ra activity concentrations and the
measured 222Rn activity concentrations in ground water, the results were presented in the
following table 3. 8, and plotted in the figure 3. 15. It is noted that, there are a linear
correlation between 226Ra and 222Rn activity concentrations. The obtained linear
correlations are due to the fact that, radon is produced naturally within the grains of the
bedrock of the earth crust, which contains the ores of uranium in secular equilibrium.
Table 3. 8 Correlation between 222Rn with 226Ra activity concentrations (Bq/l) in ground
water samples
Sample No. 222Rn 226Ra Sample No. 222Rn 226Ra
G1 3.3±0.053 0.443±0.022 G56 2.53±0.055 0.356±0.018
G2 2.77±0.046 0.349±0.017 G57 2.50±0.057 0.361±0.018
G3 3.83±0.083 0.393±0.02 G58 8.35±0.187 1.353±0.082
G4 2.10±0.035 0.41±0.021 G59 7.51±0.159 1.205±0.073
G5 2.18±0.050 0.585±0.029 G60 9.10±0.194 1.880±0.114
G6 2.67±0.065 0.616±0.031 G61 8.55±0.186 1.409±0.086
G7 0.04±0.025 0.03±0.002 G62 3.00±0.066 0.478±0.024
Continuo to the next page

RESULLTS & DISCUSSION
112
G8 2.03±0.050 0.457±0.023 G63 2.42±0.054 0.322±0.016
G9 1.18±0.029 0.297±0.015 G64 5.14±0.110 0.719±0.036
G10 1.46±0.037 0.251±0.013 G65 2.98±0.066 0.482±0.024
G11 3.71±0.084 0.478±0.024 G66 5.17±0.111 0.784±0.039
G12 1.09±0.030 0.308±0.015 G67 5.64±0.12 0.694±0.036
G13 3.15±0.069 0.538±0.027 G68 3.67±0.08 0.442±0.023
G14 2.32±0.052 0.414±0.021 G69 6.18±0.132 0.785±0.039
G15 1.96±0.042 0.126±0.007 G70 4.52±0.102 0.601±0.030
G16 4.37±0.093 0.687±0.034 G71 5.16±0.114 0.889±0.054
G17 3.16±0.069 0.579±0.029 G72 2.08±0.045 0.416±0.021
G18 1.02±0.023 0.154±0.009 G73 3.14±0.069 0.395±0.020
G19 7.22±0.155 1.219±0.074 G74 6.77±0.144 1.062±0.065
G20 6.74±0.144 0.964±0.049 G75 5.20±0.110 0.768±0.038
G21 2.70±0.058 0.349±0.017 G76 2.25±0.048 0.442±0.022
G22 2.50±0.054 0.322±0.016 G77 3.07±0.067 0.608±0.030
G23 4.97±0.107 0.511±0.026 G78 4.30±0.093 0.578±0.029
G24 3.02±0.065 0.606±0.03 G79 3.46±0.074 0.484±0.024
G25 2.61±0.057 0.386±0.02 G80 4.27±0.092 0.561±0.034
G26 1.52±0.034 0.209±0.01 G81 10.07±0.219 1.929±0.118
G27 1.56±0.034 0.213±0.011 G82 1.52±0.033 0.204±0.010
G28 3.25±0.07 0.523±0.026 G83 1.59±0.035 0.179±0.009
G29 5.27±0.113 0.816±0.041 G84 5.31±0.116 0.818±0.041
G30 1.94±0.043 0.137±0.05 G85 8.69±0.194 1.246±0.076
G31 0.65±0.015 0.166±0.05 G86 2.35±0.052 0.378±0.019
Continuo to the next page

RESULLTS & DISCUSSION
113
G32 2.66±0.057 0.328±0.016 G87 1.20±0.027 0.131±0.008
G33 0.68±0.016 0.126±0.007 G88 1.81±0.039 0.212±0.011
G34 5.29±0.114 0.732±0.036 G89 2.90±0.061 0.325±0.020
G35 2.35±0.052 0.371±0.019 G90 1.88±0.04 0.157±0.010
G36 2.55±0.057 0.381±0.019 G91 3.70±0.079 0.422±0.021
G37 3.25±0.071 0.402±0.02 G92 2.05±0.046 0.411±0.021
G38 6.59±0.143 0.747±0.038 G93 2.92±0.065 0.495±0.025
G39 1.48±0.032 0.257±0.013 G94 3.93±0.088 0.474±0.029
G40 1.32±0.030 0.215±0.011 G95 3.86±0.086 0.613±0.030
G41 0.06±0.002 0.042±0.002 G96 1.80±0.041 0.137±0.007
G42 2.98±0.066 0.422±0.021 G97 1.39±0.031 0.123±0.007
G43 8.67±0.187 1.54±0.094 G98 4.97±0.110 0.586±0.029
G44 2.24±0.051 0.409±0.02 G99 4.10±0.094 0.497±0.025
G45 1.86±0.041 0.219±0.011 G100 2.26±0.048 0.277±0.014
G46 5.89±0.129 0.776±0.039 G101 1.23±0.026 0.185±0.010
G47 4.42±0.094 0.588±0.03 G102 1.62±0.036 0.222±0.011
G48 2.79±0.059 0.483±0.024 G103 2.19±0.047 0.455±0.023
G49 5.11±0.116 0.801±0.049 G104 3.36±0.074 0.664±0.033
G50 3.59±0.081 0.508±0.026 G105 3.31±0.073 0.455±0.023
G52 3.36±0.073 0.353±0.019 G106 3.31±0.073 0.604±0.030
G53 4.29±0.097 0.559±0.028 G107 4.99±0.106 0.619±0.031
G54 7.57±0.169 1.221±0.074 G108 4.10±0.090 0.620±0.031
G55 3.63±0.078 0.573±0.028 G109 4.00±0.085 0.507±0.025

RESULLTS & DISCUSSION
114
0 2 4 6 8 10
0.0
0.5
1.0
1.5
2.0
226
Ra
Act
ivity
Con
cen
trat
ions
(B
q/l)
222Rn Activity Concentrations (Bq/l) using Alpha Spectroscopy
Figure 3. 15 226Ra with 222Rn Activity Concentrations in Ground Water
3.3.6 Comparison with similar studies in other countries
Table 3. 9 summarized the values of 226Ra, 232Th and 40K activity concentrations
in other countries and those from the present wok. As can be seen from table 3. 9, 226Ra
activity concentrations were found in values higher than that reported by Ahmed (2004)
for ground water in Qena and Qus, Egypt, and lower than that reported by Khaled (2006)
in Egypt, and by Mageed (2013) in Yemen.
Also 232Th activity concentrations were found in values higher than that reported
by Ahmed (2004) in Egypt, and lower than that reported by Ononugbo (2013) in Nigeria.
Whereas 40K activity concentrations were found in values lower than that obtained by
Ononugbo (2013) in Nigeria and Khaled (2006) in Egypt.

RESULLTS & DISCUSSION
115
Table 3. 9 The activity concentration in Bq/ l of water samples in the present investigation in comparison with other countries
CountryActivity concentrations (Bq/l)
Reference226Ra 232Th 40K
Egypt0.042±0.002 - 1.93±0.117
(0.54±0.029)
0.067±0.004-0.899±0.077
(0.4±0.027)
3.18±0.273-6.99±0.602
(5.10±0.44)Present work
Egypt 1.6-11.1 0.21-0.97 9.7-23 Khaled 2006
Yemen 2.25-3.45 0.3–1.43 26.73–43.7 Mageed 2013
Nigeria9.22±0.82 - 16.32±0.89
(5.18±0.54)
8.46±0.61-15.18±1.72
(3.12±0.30)
44.27±2.34-67.25±3.82
(27.73±2.16)Ononugbo 2013
Nigeria6.03±2.10 - 14.46±5.12
(1.52±0.69)
5.54±1.76-8.43±3.01
(2.28±0.57)
100.13±26.82-225.25±52.97
(22.05±8.09)
Ajayi 2012
Ghana -0.25±0.006-1.2±0.38
(0.57±0.07)
0.88±0.05-8.86±0.16
(3.67±0.211)Nguelem 2013
Jordan 3.8-6.8 1.42-2.37 23.2-34.8 Saqan 2001
Egypt
(Qena)Mean 0.08 Mean 0.04 -
Ahmed 2004Egypt
(Safaga- Quseir)Mean 0.1 Mean 0.05 -

RESULLTS & DISCUSSION
116
3.4 222Rn Activity Concentrations in Tap water Samples using Alpha GUARD
Measurements of 222Rn activity concentrations in drinking tap water from Qena
governorate, Egypt which comes from the River Nile are important, because this water is
the main sources of potable water in this region, due to inadequate supply of treated
water. In this part of our study 222Rn activity concentrations in tap water, were measured
using Alpha GUARD. The obtained results are listed in the following table 3. 10.
Table 3. 10 222Rn activity concentrations (Bq/l) in tap water samples
Measurements During the Month of February
Sample Number 222Rn Sample Number 222Rn
D1 0.050±0.0150 D21 0.047±0.0048
D2 0.047±0.0206 D22 0.035±0.0048
D3 0.062±0.014 D23 0.053±0.005
D4 0.057±0.0168 D24 0.026±0.0047
D5 0.075±0.0185 D25 0.047±0.0013
D6 0.051±0.0076 D26 0.061±0.0016
D7 0.057±0.0089 D27 0.048±0.0013
D8 0.054±0.0078 D28 0.042±0.0012
D9 0.036±0.0032 D29 0.046±0.0012
D10 0.073±0.0036 D30 0.062±0.0015
D11 0.056±0.0034 D31 0.063±0.0016
D12 0.026±0.0145 D32 0.061±0.0015
D13 0.054±0.0167 D33 0.057±0.0015
D14 0.063±0.0146 D34 0.062±0.0023
continuo to the next page

RESULLTS & DISCUSSION
117
D15 0.04±0.0066 D35 0.091±0.0023
D16 0.035±0.0022 D36 0.061±0.0018
D17 0.046±0.0024 D37 0.062±0.0018
D18 0.057±0.0025 D38 0.08±0.0019
D19 0.044±0.0024 D39 0.053±0.0018
D20 0.044±0.0024 -
Measurements During the Month of March
D40 0.068±0.0017 D52 0.05±0.0014
D41 0.065±0.0029 D53 0.068±0.0018
D42 0.044±0.0026 D54 0.061±0.0018
D43 0.064±0.0029 D55 0.072±0.0018
D44 0.064±0.0016 D56 0.067±0.0017
D45 0.068±0.0017 D57 0.066±0.0017
D46 0.091±0.0022 D58 0.062±0.0016
D47 0.073±0.0018 D59 0.077±0.0024
D48 0.063±0.0016 D60 0.056±0.0021
D49 0.038±0.0011 D61 0.04±0.0018
D50 0.085±0.0032 D62 0.041±0.0013
D51 0.049±0.0013 -
Measurements during the month of April and May
D63 0.057±0.0014 D71 0.059±0.0015
D64 0.046±0.0012 D72 0.115±0.0028
continuo to the next page

RESULLTS & DISCUSSION
118
D65 0.055±0.0014 D73 0.118±0.0027
D66 0.052±0.0013 D74 0.062±0.0016
D67 0.05±0.0013 D75 0.022±0.0007
D68 0.078±0.0018 D76 0.043±0.0011
D69 0.06±0.0014 D77 0.061±0.0014
D70 0.052±0.0013 -
The obtained values of 222Rn activity concentrations in tap water were ranged
between 0.006±0.00051 and 0.117±0.002 Bq/l, with an average value of 0.049±0.003 Bq/l. 222Rn activity concentrations in 57% of samples were fluctuated between 0.045 and 0.065
Bq/l, whereas 19% of the samples were found in values less than 0.045 Bq/l, and 24% of
the samples were found in values more than 0.065 Bq/l, as shown in the following figure
3. 16.
<0.01 0.01-0.025 0.025-0.062 0.062-0.075 >0.10
20
40
60
Num
ber
of S
ampl
es
222Rn Activity Concentrations Range (Bq/l)
Figure 3. 16 222Rn activity concentration ranges in Qena drinking tap water

RESULLTS & DISCUSSION
119
The low levels of 222Rn in the obtained results are attribute to the fact that, the
River Nile is considered the main source of tap water in Qena, and all tap water come
from the River Nile, after passing many analyzing processes, this give a chance to escape222Rn from water, in addition, the open water contains very little dissolved radium, so we
rarely find radon in significant concentrations in surface waters, due to its rapid dispersal
into the atmosphere.
A set of samples have been compiled from the company drinking water and
sanitation facilities at El-Himadat in the city of Qena, directly from the river Nile before
entering to the chemicals treatment process inside the station, and also the same samples
were collected in the same time after graduating from the treatment process. The obtained
values of 222Rn activity concentrations in this set of samples are shown in the following
table 3. 11, and presented in figure 3. 17. It is noted that, the obtained values of 222Rn
activity concentrations for the samples before the chemical treatment are higher than
those values obtained from the samples after the treatment process.
Table 3. 11 222Rn activity concentrations (Bq/l) in drinking tap water samples before and
after the chemical treatment process
Samples before the chemical treatment
process
Samples after the chemical treatment
process
Sample No. 222Rn Sample No. 222Rn
DC1 0.016±0.0006 DC2 0.012±0.0006
DC3 0.022±0.0007 DC4 0.008±0.0005
DC5 0.02±0.0007 DC6 0.006±0.0005
DC7 0.018±0.0007 DC8 0.006±0.0005
DC9 0.026±0.0008 DC10 0.012±0.0006
DC11 0.02±0.0007 DC12 0.012±0.0006
Continuo to the next page

RESULLTS & DISCUSSION
120
DC13 0.027±0.0008 DC14 0.011±0.0006
DC15 0.03±0.0009 DC16 0.018±0.0007
DC17 0.024±0.0008 DC18 0.013±0.0006
DC19 0.014±0.0006 DC20 0.008±0.0005
Minimum 0.014±0.0006 Minimum 0.006±0.0005
Maximum 0.03±0.0009 Maximum 0.018±0.0007
Average 0.022±0.0007 Average 0.011±0.0006
D C 1 D C 2 D C 3 D C 4 D C 5 D C 6 D C 7 D C 8 D C 9 D C 1 00 .0 0
0 .0 1
0 .0 2
0 .0 3
222 R
n A
ctiv
ity C
once
ntr
atio
ns
(Bq/
l)
S a m p le s C o d e s
B e f o r e T r e a te m e n tA f te r T r e a te m e n
Figure 3. 17 222Rn activity concentrations (Bq/l) in drinking tap water samples before and
after the chemical treatment process
3.4.1 Correlations between 222Rn Activity Concentrations and the Geochemical
Parameters in Tap Water
3.4.1.1 TDS
TDS values were measured for tap water samples using portable Jenway Model
4520 Laboratory TDS Meter. As shown in the following table 3. 12, the obtained values
were fluctuated between 101.4 and 121.4 mg/l, with an average value of 109.74 mg/l. In
order to study the correlation between TDS values with 222Rn activity concentrations in
tap water samples, it is noted that, there is no obviously correlation was observed, as
shown in figure 3. 18.

RESULLTS & DISCUSSION
121
Table 3. 12 222Rn activity concentrations (Bq/l) with the geochemical parameters (mg/l)
in Qena drinking tap water
Sample No. 222Rn TDS Conductivity
D41 0.065±0.0029 118.8 198.1
D42 0.044±0.0026 103 172.2
D43 0.064±0.0029 101.4 169
D44 0.064±0.0016 107.4 179
D45 0.068±0.0017 110.4 186.7
D46 0.091±0.0022 108.9 181.5
D47 0.073±0.0018 112.7 187.5
D48 0.063±0.0016 111.3 185.7
D50 0.085±0.0032 121.4 202
D52 0.05±0.0014 110.2 183.7
D53 0.068±0.0018 109.1 181.9
D54 0.061±0.0018 110 183.4
D55 0.072±0.0018 109 181.6
D56 0.067±0.0017 109.2 182
D57 0.066±0.0017 108.8 181.4
D58 0.062±0.0016 109.6 182.6
D59 0.077±0.0024 115 191.6
D60 0.056±0.0021 109.5 182.5
D61 0.04±0.0018 109.5 182.5
D62 0.041±0.0013 109 187
continuo to the next page

RESULLTS & DISCUSSION
122
D63 0.057±0.0014 109.1 181.9
D64 0.046±0.0012 109.5 182.3
D65 0.055±0.0014 111.7 185.5
D66 0.052±0.0013 111.1 185.1
D67 0.05±0.0013 108.4 182.2
D68 0.078±0.0018 108.4 182.2
D69 0.06±0.0014 110.1 183.2
D70 0.052±0.0013 111 185.6
D71 0.059±0.0015 108.2 180.7
D72 0.115±0.0028 110.3 183.8
D73 0.118±0.0027 106.3 178.1
D74 0.062±0.0016 105.2 175.6
D75 0.022±0.0007 111.7 185.5
D76 0.043±0.0011 108.8 181.3
D77 0.061±0.0014 106.9 178.1
Minimum 0.022±0.0007 101.4 169
Maximum 0.118±0.0027 121.4 202
Average 0.063±0.001 109.74 183.32

RESULLTS & DISCUSSION
123
100 105 110 115 120 125
0.02
0.04
0.06
0.08
0.10
0.12
222 R
n A
ctiv
ity C
onc
entr
atio
ns (
Bq/
l)
TDS (mg/l)
Figure 3. 18 TDS values with 222Rn activity concentrations in drinking tap water samples
3.4.1.2 Conductivity
Conductivity values were measured for tap water samples using portable Jenway
Model 4520 Laboratory TDS Meter. As shown in the table 3.12, the obtained values were
fluctuated between 169 and 202, with an average value of 183.2 mg/l. In order to study
the correlation between conductivity values with 222Rn activity concentrations in tap
water samples, it is noted that, there is no obviously correlation was observed, as shown
in figure 3. 19.
170 180 190 200
0.02
0.04
0.06
0.08
0.10
0.12
222 R
n ac
tivity
Con
cent
ratio
ns
(Bq
/l)
Conductivity (µs/cm)
Figure 3. 19 Conductivity values with 222Rn activity concentrations in drinking tap water
samples

RESULLTS & DISCUSSION
124
3.5 222Rn Activity Concentrations in Mineral Water using Alpha GUARD
In this part from our study 222Rn activity concentrations in mineral water samples
collected from Qena governorate markets were estimated. For each sample the bottle was
opened, and the sample was injected to degassing vessel of the Alpha GUARD AquaKIT
system by the same method of the ground water measuring.
222Rn concentrations in the mineral water samples were estimated at the moment
of usage, so the measurements were not corrected for delay time. The values of 222Rn
activity concentrations and the geochemical parameters (Calcium, Manganese, sodium,
Potassium, Bicarbonate, sulfate, Chlorides, silicate and TDS) were listed in the following
table 3. 13.
The values of 222Rn activity concentration in the mineral water were ranged from
0.014±0.003 to 0.237±0.005 Bq/l, with an average value of 0.077±0.0024 Bq/l. From
these results, it is noted that, all mineral water results for 222Rn activity concentrations are
small due to that, the original sources of the measured mineral waters are ground water
wells, in different places in Egypt, and this water passes many analyzing processes before
using it for drinking, which give a chance for 222Rn to escape from water, addition to that
the half life time of 222Rn is 3.82 day, so the gas will completely decay after four weeks
of extracting from the well, and the calculations were performed for 222Rn activity
concentration at the moment of usage, without any correction for delay time.

RESULLTS & DISCUSSION
125
Table 3. 13 222Rn activity concentrations (Bq/l) with the chemical parameters in mineral water (mg/l)
Sample Number Sample Name 222Rn Ca Mg Na K HCo3 S Cl Silica TDS
M1 Baraka 0.078±0.0013 24 9.6 19 1.8 115.9 26 12 11 178
M2 Dassani 0.014±0.0037 32 8 17.5 2.2 134 13 14 10 170
M3 Aquafina 0.055±0.0053 5.2 13.2 14.5 0.8 6 65 17 2 120
M4 Shiwips 0.177±0.0070 38 19 71 4.5 205 38 86 22 402
M5 Nestleh 0.237±0.0053 16.3 6.28 16 1.4 87.8 17 88 9 132
M6 Aqua delta 0.115±0.0026 30 13.44 43 3.6 200.08 14.5 17.7 24 262
M7 Siwa 0.030±0.0010 4.8 6.36 42 16 109.8 14 29 19 200
M8 Aqua 0.017±0.0005 32 12.96 48 4.5 201.3 23 36 22 296
M9 Hayah 0.062±0.0015 5.2 8.4 37 17 95.16 14 33 19 197
M10 Aqua Paris 0.019±0.0006 - - - - - - - - -
M11 Aqua Siwa 0.020±0.0007 8 7.2 51 19 124.44 17 36 20 235
M12 Vera 0.072±0.0016 12.5 4.8 42 1.5 31.72 26 60 3 180
M13 Nahl 0.026±0.001 8 5.16 50 1.3 51.24 19 56 9 190
M14 Aman Siwa 0.160±0.002 10.4 7.2 40 17 114 16 29 20 212
Minimum 0.014±0.003 4.8 4.8 14.5 0.8 6 13 12 2 120
Maximum 0.237±0.005 38 19 71 18.5 205 65 88 24 402
Average 0.077±0.002 17.42 9.35 37.77 6.93 113.57 23.27 40 14.6 213.38

RESULLTS & DISCUSSION
126
3.5.1 Comparison of results with similar in other countries
Table 3. 14 summarized the values of 222Rn activity concentrations in drinking
water in other countries and those from the present wok. As can be seen from table, 222Rn
activity concentration values in drinking tap water are much higher than that reported by
Karahan (2000) in Turkey. Whereas 222Rn activity concentrations were found in values
lower than that reported by Asaad (2008) in Iraq, Cevik (2006) in Turkey, Navjeet (2013)
in India, and Otwoma (1998) in Kenya. The obtained values of 222Rn activity
concentration in mineral water are lower than that reported by Gans 1985 in Portugal,
Tayyeb (1998) in Saudi Arabia and Ali (2013) in Iraq.
Table 3. 14 222Rn activity concentration in Bq/ l of water samples in the present
investigation in comparison with other countries
References
222Rn activity concentrationCountries
Typ
e
MeanMaximumMinimum
Present work0.077±0.0020.118±0.00270.0061±0.0005Egypt
Tap
Wat
er
Abbady 1995-2.330.07Egypt
Asaad 20084.693±2.2139.612.01Iraq
Cevik 200610.8218.46±1.195.31±0.58Turkey
Navjeet 201345.5123.28.7 (pCi/L)India
Karahan 2000-0.0410.019Turkey
Otwoma 1998-4.70.8Kenya
Present work0.049±0.0250.118±0.00270.006±0.0005Egypt
Min
eral
Wat
er Amrani 2002-142.6Algeria
Gans 198516.7--Portugal
Tayyeb 19989.9214.875.56KSA
Ali 2013-142±10.381.2±0.42Iraq
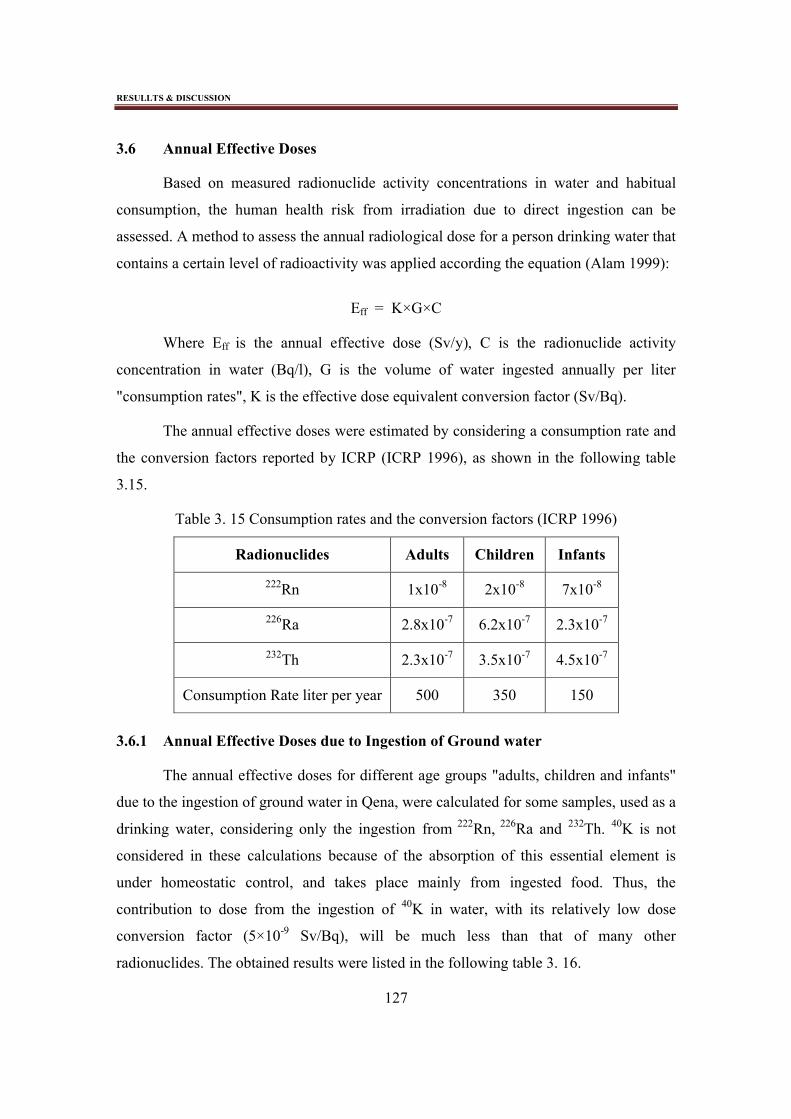
RESULLTS & DISCUSSION
127
3.6 Annual Effective Doses
Based on measured radionuclide activity concentrations in water and habitual
consumption, the human health risk from irradiation due to direct ingestion can be
assessed. A method to assess the annual radiological dose for a person drinking water that
contains a certain level of radioactivity was applied according the equation (Alam 1999):
Eff = K×G×C
Where Eff is the annual effective dose (Sv/y), C is the radionuclide activity
concentration in water (Bq/l), G is the volume of water ingested annually per liter
"consumption rates", K is the effective dose equivalent conversion factor (Sv/Bq).
The annual effective doses were estimated by considering a consumption rate and
the conversion factors reported by ICRP (ICRP 1996), as shown in the following table
3.15.
Table 3. 15 Consumption rates and the conversion factors (ICRP 1996)
Radionuclides Adults Children Infants
222Rn 1x10⁻⁸ 2x10⁻⁸ 7x10⁻⁸
226Ra 2.8x10⁻⁷ 6.2x10⁻⁷ 2.3x10⁻⁷
232Th 2.3x10⁻⁷ 3.5x10⁻⁷ 4.5x10⁻⁷
Consumption Rate liter per year 500 350 150
3.6.1 Annual Effective Doses due to Ingestion of Ground water
The annual effective doses for different age groups "adults, children and infants"
due to the ingestion of ground water in Qena, were calculated for some samples, used as a
drinking water, considering only the ingestion from 222Rn, 226Ra and 232Th. 40K is not
considered in these calculations because of the absorption of this essential element is
under homeostatic control, and takes place mainly from ingested food. Thus, the
contribution to dose from the ingestion of 40K in water, with its relatively low dose
conversion factor (5×10⁻⁹ Sv/Bq), will be much less than that of many other
radionuclides. The obtained results were listed in the following table 3. 16.

RESULLTS & DISCUSSION
128
Table 3. 16 Estimates of annual effective doses (µSv/y) due to ingestion of natural radionuclides in Qena ground water
Sample
No.
222Rn 226Ra 232Th Total
Adults Children Infants Adults Children Infants Adults Children Infants Adults Children Infants
G8 10.13 14.18 21.26 64.03 99.24 65.85 47.15 50.22 27.67 121.3 163.64 114.79
G9 5.92 8.29 12.43 41.58 64.45 42.77 35.97 38.32 21.11 83.47 111.05 76.31
G10 7.32 10.25 15.38 35.18 54.52 36.18 17.05 18.16 10.01 59.55 82.94 61.57
G12 5.43 7.6 11.41 43.18 66.94 44.42 29.52 31.44 17.32 78.13 105.98 73.15
G13 15.73 22.03 33.04 75.3 116.72 77.45 41.93 44.67 24.61 132.97 183.41 135.1
G14 11.59 16.23 24.35 57.98 89.86 59.63 25.83 27.52 15.16 95.4 133.61 99.14
G25 13.06 18.29 27.43 54.03 83.75 55.57 47.89 51.01 28.11 114.98 153.05 111.12
G26 7.61 10.65 15.98 29.19 45.25 30.03 23.66 25.21 13.89 60.46 81.11 59.89
G30 9.69 13.56 20.35 19.16 29.69 19.7 21.97 23.41 12.9 50.82 66.66 52.95
G32 13.31 18.63 27.95 45.91 71.15 47.22 37.18 39.61 21.82 96.4 129.4 96.99
G34 26.44 37.01 55.52 102.49 158.85 105.41 66.38 70.71 38.96 195.3 266.57 199.89
G43 43.33 60.66 90.99 215.61 334.2 221.77 87.05 92.73 51.1 346 487.59 363.86
G44 11.22 15.7 23.55 57.28 88.79 58.92 56.32 59.99 33.06 124.82 164.48 115.53
G45 9.32 13.05 19.57 30.64 47.5 31.52 13.46 14.34 7.9 53.42 74.88 58.99
Continuo to the next page

RESULLTS & DISCUSSION
129
G46 29.43 41.2 61.79 108.65 168.41 111.75 40.02 42.63 23.49 178.1 252.23 197.04
G61 42.77 59.88 89.81 197.23 305.71 202.87 72.05 76.75 42.29 312.05 442.34 334.97
G64 25.7 35.98 53.96 100.7 156.08 103.57 61.12 65.1 35.87 187.51 257.16 193.41
G81 50.37 70.52 105.77 270.1 418.66 277.82 83.38 88.81 48.94 403.85 577.99 432.53
G86 11.76 16.47 24.7 52.92 82.02 54.43 48.05 51.18 28.2 112.73 149.67 107.33
G87 5.98 8.38 12.57 18.4 28.52 18.93 12.7 13.53 7.46 37.09 50.43 38.95
G93 14.58 20.42 30.63 69.24 107.33 71.22 12.68 13.51 7.44 96.51 141.26 109.29
G101 6.13 8.58 12.87 25.85 40.07 26.59 28.32 30.17 16.62 60.31 78.82 56.09
G102 8.11 11.35 17.03 31.04 48.11 31.93 21.55 22.95 12.65 60.7 82.42 61.61
G103 10.93 15.3 22.95 63.67 98.69 65.49 18.66 19.87 10.95 93.26 133.86 99.39
G106 16.55 23.17 34.75 84.55 131.06 86.97 28.8 30.68 16.91 129.9 184.91 138.63
Minimum 5.43 7.6 11.41 18.4 28.52 18.93 12.86 13.51 7.44 37.09 50.43 38.95
Maximum 50.37 70.52 105.77 270.1 418.66 277.82 87.1 92.37 51.1 403.85 577.99 432.53
Average 16.49 23.1 34.64 75.75 117.42 77.92 39.1 41.7 22.97 131.4 182.21 135.54

RESULLTS & DISCUSSION
130
The obtained values of the annual effective dose of ground water samples for
adults, children and infants were ranged from 37.1 to 403.85, 50.4 to 578 and 39 to
432.53, with average values of 131.4, 182.2 and 135.5 µSv/y, for adults, children and
infants, respectively. The annual effective dose values in the investigated ground water
samples, for the different age groups "Adults, children and infants", are presented in the
following figure 3. 20.
G 1 2 G 2 6 G 4 3 G 6 1 G 8 7 G 1 0 30
1 0 0
2 0 0
3 0 0
4 0 0
5 0 0
6 0 0
Ann
ual E
ffect
ive
Dos
e (µ
s/y)
S a m p le C o d e
A d u ltsC h ild re n In fa n ts
Figure 3. 20 The annual effective doses considering the ingestion of 222Rn, 226Ra and232Th radionuclides for different age groups in ground water
From the last figure, it is noted that, the doses received due to the ingestion of
radionuclide's in ground water by children are higher than that received by infants and
adults. Thus the age group at risk is children because of their intensive bone growth and
action should be taken to restrict their intake. These values can be considered as
important contributors to the daily incorporation of radionuclide's by ingestion, and it’s
also relevant when compared to the recommended reference level for the effective dose
published by IAEA (IAEA 2002), from one year consumption of drinking water, the
obtained doses due to ingestion of 222Rn in ground water are less than the recommended
reference level, consequently, Qena ground waters are acceptable for life-long human
consumption.

RESULLTS & DISCUSSION
131
3.6.2 Annual Effective Doses due to Ingestion of 222Rn in Tap Water
The annual effective dose for different age groups, infants, children, and adults
due to intake of 222Rn in tap water were calculated and listed in the table 3. 17.
Table 3. 17 Annual effective doses (µSv/y) for different age groups due to ingestion of 222Rn in drinking tap water
Sample No. 222Rn (Bq/l)Annual Effective Dose
Adults Children Infants
D1 0.050±0.0150 0.251 0.352 0.528
D2 0.047±0.0206 0.235 0.328 0.492
D3 0.062±0.014 0.311 0.435 0.653
D4 0.057±0.0168 0.285 0.399 0.598
D5 0.075±0.0185 0.377 0.528 0.792
D6 0.051±0.0076 0.253 0.355 0.532
D7 0.057±0.0089 0.286 0.401 0.601
D8 0.054±0.0078 0.272 0.381 0.572
D9 0.036±0.0032 0.18 0.252 0.378
D10 0.073±0.0036 0.365 0.511 0.767
D11 0.056±0.0034 0.282 0.395 0.592
D12 0.026±0.0145 0.128 0.18 0.27
D13 0.054±0.0167 0.27 0.378 0.567
D14 0.063±0.0146 0.317 0.443 0.665
D15 0.04±0.0066 0.2 0.281 0.421
D16 0.035±0.0022 0.177 0.248 0.372
continuo to the next page
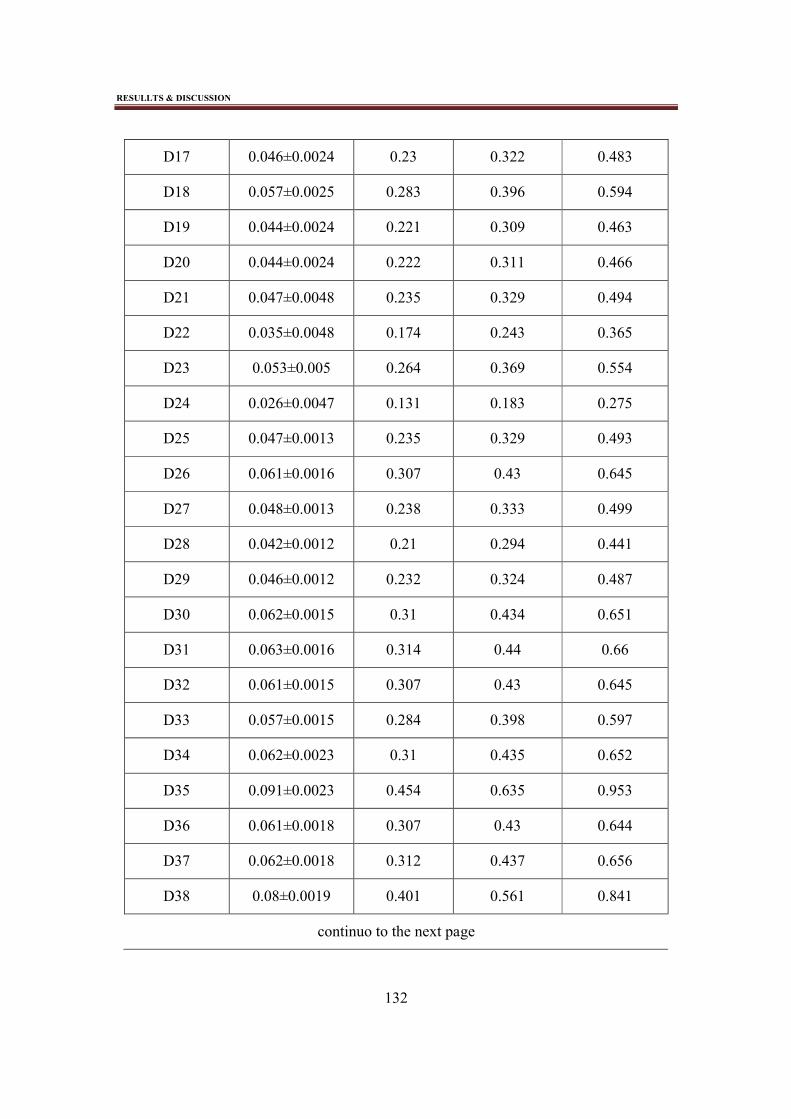
RESULLTS & DISCUSSION
132
D17 0.046±0.0024 0.23 0.322 0.483
D18 0.057±0.0025 0.283 0.396 0.594
D19 0.044±0.0024 0.221 0.309 0.463
D20 0.044±0.0024 0.222 0.311 0.466
D21 0.047±0.0048 0.235 0.329 0.494
D22 0.035±0.0048 0.174 0.243 0.365
D23 0.053±0.005 0.264 0.369 0.554
D24 0.026±0.0047 0.131 0.183 0.275
D25 0.047±0.0013 0.235 0.329 0.493
D26 0.061±0.0016 0.307 0.43 0.645
D27 0.048±0.0013 0.238 0.333 0.499
D28 0.042±0.0012 0.21 0.294 0.441
D29 0.046±0.0012 0.232 0.324 0.487
D30 0.062±0.0015 0.31 0.434 0.651
D31 0.063±0.0016 0.314 0.44 0.66
D32 0.061±0.0015 0.307 0.43 0.645
D33 0.057±0.0015 0.284 0.398 0.597
D34 0.062±0.0023 0.31 0.435 0.652
D35 0.091±0.0023 0.454 0.635 0.953
D36 0.061±0.0018 0.307 0.43 0.644
D37 0.062±0.0018 0.312 0.437 0.656
D38 0.08±0.0019 0.401 0.561 0.841
continuo to the next page

RESULLTS & DISCUSSION
133
D39 0.053±0.0018 0.265 0.371 0.557
D40 0.068±0.0017 0.342 0.478 0.717
D41 0.065±0.0029 0.327 0.458 0.686
D42 0.044±0.0026 0.222 0.31 0.466
D43 0.064±0.0029 0.319 0.446 0.67
D44 0.064±0.0016 0.318 0.445 0.668
D45 0.068±0.0017 0.341 0.478 0.717
D46 0.091±0.0022 0.455 0.638 0.956
D47 0.073±0.0018 0.367 0.514 0.771
D48 0.063±0.0016 0.317 0.444 0.665
D49 0.038±0.0011 0.19 0.266 0.399
D50 0.085±0.0032 0.425 0.595 0.893
D51 0.049±0.0013 0.246 0.344 0.516
D52 0.05±0.0014 0.251 0.352 0.528
D53 0.068±0.0018 0.339 0.474 0.711
D54 0.061±0.0018 0.306 0.428 0.642
D55 0.072±0.0018 0.359 0.502 0.754
D56 0.067±0.0017 0.336 0.47 0.705
D57 0.066±0.0017 0.33 0.462 0.694
D58 0.062±0.0016 0.31 0.434 0.651
D59 0.077±0.0024 0.387 0.542 0.813
D60 0.056±0.0021 0.278 0.389 0.584
continuo to the next page

RESULLTS & DISCUSSION
134
D61 0.04±0.0018 0.199 0.278 0.418
D62 0.041±0.0013 0.203 0.284 0.426
D63 0.057±0.0014 0.286 0.401 0.601
D64 0.046±0.0012 0.23 0.322 0.483
D65 0.055±0.0014 0.273 0.383 0.574
D66 0.052±0.0013 0.259 0.362 0.543
D67 0.05±0.0013 0.248 0.348 0.521
D68 0.078±0.0018 0.389 0.545 0.817
D69 0.06±0.0014 0.3 0.419 0.629
D70 0.052±0.0013 0.262 0.367 0.551
D71 0.059±0.0015 0.294 0.412 0.617
D72 0.115±0.0028 0.574 0.804 1.205
D73 0.118±0.0027 0.588 0.823 1.235
D74 0.062±0.0016 0.31 0.434 0.651
D75 0.022±0.0007 0.112 0.157 0.236
D76 0.043±0.0011 0.215 0.302 0.452
D77 0.061±0.0014 0.306 0.429 0.643
DC1 0.016±0.0006 0.082 0.115 0.172
DC2 0.012±0.0006 0.062 0.086 0.129
DC3 0.022±0.0007 0.109 0.153 0.23
DC4 0.008±0.0005 0.041 0.058 0.086
DC5 0.02±0.0007 0.099 0.139 0.209
continuo to the next page

RESULLTS & DISCUSSION
135
DC6 0.006±0.0005 0.032 0.045 0.068
DC7 0.018±0.0007 0.091 0.128 0.192
DC8 0.006±0.0005 0.031 0.043 0.064
DC9 0.026±0.0008 0.132 0.185 0.278
DC10 0.012±0.0006 0.06 0.084 0.127
DC11 0.02±0.0007 0.101 0.141 0.211
DC12 0.012±0.0006 0.062 0.086 0.13
DC13 0.027±0.0008 0.135 0.189 0.283
DC14 0.011±0.0006 0.055 0.077 0.115
DC15 0.03±0.0009 0.151 0.211 0.316
DC16 0.018±0.0007 0.09 0.126 0.188
DC17 0.024±0.0008 0.119 0.167 0.25
DC18 0.013±0.0006 0.066 0.093 0.14
DC19 0.014±0.0006 0.07 0.098 0.147
DC20 0.008±0.0005 0.042 0.059 0.088
Minimum 0.006±0.0005 0.031 0.043 0.064
Maximum 0.117±0.002 0.588 0.823 1.235
Average 0.049±0.003 0.246 0.345 0.517
The obtained values of the annual effective dose of tap water due to ingestion of 222Rn were ranged between 0.031 to 0.588, 0.043 to 0.823 and 0.064 to 1.235, with
averages values of 0.246, 0.345 and 0.517 µSv/y, for adults, children and infants,
respectively. The annual effective doses for the different age groups "adults, children, and
infants" are presented in the following figure 3. 21.

RESULLTS & DISCUSSION
136
It is noted that, the received doses due to the ingestion of 222Rn in Qena drinking
tap water by infants are higher than that received by children and adults. According to the
recommended reference level of 0.26, 0.2 and 0.1 mSv/y for effective dose for infants,
children and adults respectively, published by IAEA (IAEA 2002), from one year
consumption of drinking water, it is noted that the obtained doses due to ingestion of 222Rn in drinking tap water are less than the recommended reference level, consequently,
Qena drinking tap waters are acceptable for life-long human consumption.
D2 D4 D6 D8 D100.0
0.2
0.4
0.6
0.8
An
nua
l Effe
ctiv
e D
ose
(µ
s/y)
Sam ples Code
AdultsChildrenInfants
Figure 3. 21 The annual effective doses for different age groups due to ingession of 222Rn in drinking tap water for some samples
3.6.3 Annual Effective Doses due to Ingestion of 222Rn in the Mineral water
The annual effective dose for different age groups, "infants, children and adults"
due to intake of 222Rn in the mineral water were calculated and listed in the following
table 3. 18.

RESULLTS & DISCUSSION
137
Table 3. 18 The Annual effective doses (µSv/y) for different age groups due to ingestion
of 222Rn in the mineral water
Sample No. Sample Name 222Rn (Bq/l)Annual Effective Doses
Adults Children Infants
M1 Baraka 0.078±0.0013 0.388 0.544 0.816
M2 Dassani 0.014±0.0037 0.071 0.099 0.148
M3 Aquafina 0.055±0.0053 0.277 0.388 0.582
M4 Shiwips 0.177±0.0070 0.251 0.351 0.527
M5 Nestleh 0.237±0.0053 1.187 1.661 2.492
M6 Aqua delta 0.115±0.0026 0.574 0.803 1.205
M7 Siwa 0.030±0.0010 0.151 0.212 0.317
M8 Aqua 0.017±0.0005 0.083 0.116 0.174
M9 Hayah 0.062±0.0015 0.311 0.435 0.653
M10 Aqua Paris 0.019±0.0006 0.094 0.131 0.197
M11 Aqua Siwa 0.020±0.0007 0.098 0.137 0.205
M12 Vera 0.072±0.0016 0. 36 0. 504 0.76
M13 Nahl 0.026±0.001 0.132 0.185 0.278
M14 Aman Siwa 0.160±0.002 0.8 1.22 1.68
Minimum 0.014±0.003 0.071 0.098 0.148
Maximum 0.237±0.005 1.18 1.66 2.49
Average 0.077±0.002 0.386 0.54 0.81

RESULLTS & DISCUSSION
138
The obtained values of the annual effective doses due to ingestion 222Rn in the
bottles mineral water were ranged between 0.071 to 1.187, 0.099 to 1.661 and 0.148 to
2.492, with average values of 0.355, 0.496 and 0.745 µSv/y, for adults, children and
infants, respectively. The maximum value for the annual effective dose was observed in
the mineral water bottle Nestleh, whereas the minimum was observed in the mineral
water bottle Dassani. The annual effective dose values for the different age groups
"adults, children and infants" are presented in the figure 3. 22.
According to the recommended reference level of 0.26, 0.2 and 0.1 mSv/y for
effective dose for infants, children and adults respectively, published by IAEA (IAEA
2002), from one year consumption of drinking water, it is noted that the obtained doses
due to ingestion of 222Rn in the mineral water are less than the recommended reference
level, consequently, , the investigated bottles mineral water in Qena governorate, Egypt,
are acceptable for life-long human consumption.
Table 3.19 shows comparison between the annual effective doses for different age
groups due to ingression of natural radionuclide's in the different kinds of water, which
presented in this study.
M 3 M 6 M 9 M 1 20 .0
0 .5
1 .0
1 .5
2 .0
2 .5
Ann
ual E
ffect
ive
Dos
e (
µs/
y)
S a m p le N u m b e r
A d u ltsC h ild re nIn fa n ts
Figure 3. 22 The annual effective dose for different groups due to ingession of 222Rn in
the mineral water

RESULLTS & DISCUSSION
139
Table 3. 19 Comparison between the annual effective doses (µSv/y) for different age groups due to ingression of natural radionuclide's
in the different kinds of water
InfantsChildrenAdults
Water Type
MeanMinimumMaximumMeanMinimumMaximumMeanMinimumMaximum
135.539432.53182.250.4578131.437.1403.85Ground Water
0.610.2361.2350.40.1570.8230.290.1120.588Tap Water
0.8120.1482.490.5410.0981.660. 3860.0711.186Mineral Water
SUMMARY
&
CONCLUSION

SUMMARY & CONCLUSION
141
SUMMARY & CONCLUSION
Regarding to the great benefits from the studies of natural radioactivity and to
continue the program of measuring natural radioactivity in different environmental media
started in the Environmental Radioactivity Measurements Laboratory (ERML), Faculty
of Science, south valley university, Qena, Egypt since 1990, measurement of natural
radioactivity and radon levels in water samples from Qena governorate, Egypt were
considered in this thesis.
This work is mainly concerned with many issues:
The first concern is to investigate the 222Rn activity concentrations in different
kinds of water (ground water and drinking water) using Ionization Chamber
"Alpha GUARD".
The second concern is to investigate 222Rn activity concentrations in ground water
using gamma spectroscopy, and make a comparison between the two 222Rn
measurements techniques results.
The third concern is to investigate the activity concentrations of natural
radionuclides in the ground water samples. Such as 40K, as well as radionuclides
from the 226Ra and 232Th series.
The fourth concern, the study makes it possible to study the correlations between
the geochemical parameters such as PH, TDS and conductivity, with the activity
concentrations of 222Rn, 226Ra, 232Th and 40K in water samples.
Finally, 222Rn and the natural radionuclides are considered as external sources of
radiation to the human body. So this study estimate the annual effective dose for
human by intake 222Rn gas and the natural radionuclides 226Ra, 232Th and 40K.
Addition to make a comparison between the obtained results and the other
published data.

SUMMARY & CONCLUSION
142
4.1 The Measured Samples
Two hundred and twenty water samples from different sites in Qena governorate,
have been collected, prepared, and measured at the Environmental Radioactivity
Measurements Laboratory (ERML). These samples were classified as follow:
109 Ground water samples were collected from different sites in Qena, east and
west of the Nile River.
97 Drinking Tap water samples were collected from Qena.
14 kinds of bottles water samples were collected from Qena markets.
4.1.1 The Samples for Alpha GUARD Measurements
4.1.1.1 Ground Water Samples
During the samples collection, the site was recorded preciously using the global
positioning system (GPS). The geochemical parameters of water such as PH,
conductivity and total dissolved solids “TDS” were measured in the field using portable
SensoDirect PH 200 and Jenway Model 4520 Laboratory Conductivity/TDS Meter. At
each site the well tap was opened, and the water was allowed to run for at least 20
minutes before the sample filling. The samples were stored in bottles with volume 500 ml
or more, that which completely.
During the process of samples transferring from the field to laboratory, the
samples were placed inside a closed box, away from direct sunlight. The samples were
analyzed for radon as soon as possible after collection, the 222Rn concentrations were
estimated using Alpha EXPERT-WEW software, for evaluating the alpha spectra. All
radon measurements were decay corrected to the time of sampling.
4.1.1.2 Drinking Water Samples
At each site in drinking tap water samples, the tap was opened, and the water was
allowed to run for at least 20 minutes, the sample taken directly and slowly to the
degassing vessel in the AquaKIT measuring system.
For the mineral water samples, every bottle was opened, and the sample was
injected to degassing For the mineral water samples, every bottle was opened, and the

SUMMARY & CONCLUSION
143
sample was injected to degassing vessel by the same method of the ground water
measuring, 222Rn activity concentrations in drinking tap and mineral water samples were
estimated at the moment of usage, so the measurements were not corrected for the delay
time.
4.1.2 The Samples for Gamma Spectroscopy Measurements
4.1.2.1 222Rn Activity Concentrations Measurements
Standard polyethylene Marinelli beakers (1.4 liters) were used as a sampling and
measuring container. Firstly the containers were washed with dilute hydrochloric acid
and rinsed with distilled water. Each Marinelli beaker was filled up to brim and a tight
cap was pressed on so that the air was completely removed from it. 222Rn concentrations
in ground water samples are determined at least four hours after sampling, using gamma
spectrometry based on an NaI(Tl) detector, 222Rn concentration of ground water samples
is assayed by 8 hour counting followed by analysis of gamma peaks using GENEE 2000
software.
4.1.2.2 Natural Radionuclides Measurements
The same samples which have been measured for 222Rn activity concentration by
using gamma spectroscopy were stored for over one month to reach secular equilibrium
between 226Ra, 232Th and their daughter products before radiometric analysis.
4.2 Measuring Systems
4.2.1 Alpha GUARD
The ionization chamber Alpha GUARD PQ2000PRO along with the additional
special equipment AquaKIT was used for determining 222Rn concentration in the water
samples. The measuring system consists of two vessels (degassing and security), Alpha
PUMP, Alpha GUARD, and the progeny filter. Prior to each measurement, the system is
flushed with normal air until 222Rn values are reached in the range of room air 222Rn
concentration.

SUMMARY & CONCLUSION
144
The background of empty set-up was measured for a few minutes before every
sample measuring. After that, the injected into the degassing vessel and the Alpha PUMP
was switched on. All drops would deposit in the security vessel if they had got into the
gas cycle during the degassing process. Through this way, the stress of the water vapor
was minimized for the radon monitor. After 10 min the PUMP was switched off and the
Alpha GUARD remained switched on for another 20 minutes, so the radon measurement
was continued. This cycle was repeated three times in order to obtain a better precision.
The Alpha GUARD monitor worked in a flow mode and 222Rn concentration was
recorded every 10 minute. The flow rate of the PUMP was 0.3 l/min.
4.2.2 Gamma Spectrometer
Low-level gamma ray spectrometer was used. It consists of ″3x3″ NaI (Tl). The
system was calibrated for energy using standard point sources (60Co, 137Cs), and
calibrated for efficiency using standard solution QCY48. Every sample was placed in
face to face geometry over the detector for 8 hour for 222Rn concentrations measurements,
and for more than 24 hour for (226Ra, 232Th and 40K) concentrations measurements.
Prior to sampling counting, background were normally taken every week under
the same condition of sample measurement. The analysis of 222Rn concentrations depends
on the peaks of the decay products in equilibrium with their parent nuclides, it was
measured from 214Bi (609.32 keV) and 214Pb (295, 351.92 keV).
The content of 226Ra concentrations was measured using gamma-lines of 214Bi
(609.32, 1120 and 1765 KeV). The concentration of 232Th was determined using gamma-
lines of 228Ac (911.16 KeV), and 212Pb (238 KeV). The concentration of 40K was
determined by measuring its single peak at 1460.8 KeV.
4.3 222Rn Activity Concentrations in Ground Water Samples using Alpha
GUARD
The study area was divided to four main areas, by geography method, depending
on its location from the city of Qena.

SUMMARY & CONCLUSION
145
The first region is Qift and Qus area, which locates in the south east of Qena. 26
samples from this area have been collected, prepared, and measured. The obtained values
of 222Rn concentrations in this area were fluctuated between 0.04±0.025 and 4.97±0.107
Bq/l, with an average value of 2.48±0.054 Bq/l.
The second region is Nakada area, which locates in the south west of the city of
Qena. 15 samples from this area have been collected, prepared, and measured. The
obtained values of 222Rn concentrations in this area were fluctuated between 0.65±0.015
and 8.35±0.187 Bq/l with an average value of 3.67±0.079 Bq/l.
The Third region is Dishna area, which locates in the North east of the city of
Qena. 13 samples from this area have been collected, prepared, and measured. The
obtained values of 222Rn concentrations in this area were fluctuated between 0.06±0.002
and 7.22±0.155 Bq/l, with an average value of 4.21±0.091 Bq/l.
The Fourth region is Nagahammady and El-Waqf area, which locates in the North
West of the city of Qena. 55 samples from this area have been collected, prepared and
measured. The obtained values of 222Rn activity concentrations in these area were
fluctuated between 1.20±0.027 and 10.07±0.219 Bq/l, with an average value of
3.86±0.084 Bq/l. Table 4.1 shows the statistical parameters of 222Rn activity
concentrations in the investigated ground water samples.
Table 4. 1 The statistical parameters of 222Rn activity concentrations in ground water
Number of Samples 109
Minimum Activity 0.04±0.025
Maximum Activity 10.07±0.219
Arithmetic Mean 3.57±0.077
Geometric Mean 2.87
Harmonic Mean 1.28
Median 3.14
Standard Deviation 2.06

SUMMARY & CONCLUSION
146
It is evident that, the average values of 222Rn concentrations are 2.48±0.054,
3.67±0.079, 4.21±0.091 and 3.86±0.08 Bq/l, in Qift and Qus, Nakada, Dishna, and
Nagahammady and El-Waqf Areas, respectively, it is noted that, 222Rn concentrations
observed in low levels, due to the natural radioactivity of the subsoil in Qena area is
generally low.
The maximum average value was observed in the Dishna area, which is due to
that, this area is characterized by shortness of the area enclosed between mountainous
areas and the river Nile, this mountainous region is characterized as close to Wadi Qena.
Wadi Qena contain granite rocks, and found in a higher natural background than other
regions in Upper Egypt, which leads to increase of activity concentrations of natural
radionuclides in this area compared to the other three areas under study.
The correlations between 222Rn concentrations in the samples with the water
geochemical parameters (PH, conductivity and TDS) were examined. A reasonable
correlation between PH and the content of 222Rn concentrations was found, in which 222Rn contents decreased with increasing PH. On the other hand no reasonable
correlations between 222Rn activity concentrations with the conductivity and TDS were
observed.
4.3.1 222Rn Activity Concentrations in Ground Water using Gamma Spectroscopy
Make a comparison between the two radon measurements techniques is the main
concern of this part from our study. The samples were collected from some ground water
wells. These samples sites were taken by random method from the same sites which the 222Rn activity concentrations by using Alpha GUARD were measured.
It is noted that, the two radon measurements techniques results are in a good
agreement. In the most invistigated samples, Alpha GUARD results are slightly higher
than the obtained results from gamma spectrometry, due to that, the chance of radon
escaping from samples to surrounding air in gamma spectroscopy technique is higher
than Alpha GUARD technique, which is reflected on the lack of gamma spectroscopy
results.

SUMMARY & CONCLUSION
147
Another reason may leads to the higher results obtained from Alpha GUARD
measurements than those results obtained from gamma spectrometer, 222Rn
concentrations in Alpha GUARD measuring technique were calculated due to directly
registration of alpha particles, due to 222Rn decay, but in gamma spectrometer measuring
technique, 222Rn concentrations were calculated due to 222Rn daughters decay (214Bi, 214Pb), which leads to a high error rate in gamma results.
4.3.2 Natural Radionuclides Activity Concentrations in Ground Water
The obtained values of 226Ra concentrations in Qift and Qus area were fluctuated
between 0.126±0.007 and 0.687±0.034 Bq/l, with an average value of 0.41±0.019 Bq/l.
The obtained values of 232Th concentrations in this area were fluctuated between
0.037±0.003 and 0.601±0.037 Bq/l, with an average value of 0.33±0.021 Bq/l. The
obtained values of 40K concentrations in this area were found in higher values than 226Ra
and 232Th concentrations, which fluctuated between 3.18±0.273 and 6.39±0.55 Bq/l, with
an average value of 4.97±0.43 Bq/l.
The obtained values of 226Ra concentrations in Nakada area were fluctuated
between 0.126±0.007 and 1.205±0.073 Bq/l, with an average value of 0.53±0.034 Bq/l.
The obtained values of 232Th activity concentrations in this area were fluctuated between
0.128±0.009 and 0.817±0.07 Bq/l, with an average value of 0.39±0.028 Bq/l. The
obtained values of 40K activity concentrations in this area were found in higher values,
which fluctuated between 4.19±0.36 and 6.45±0.555 Bq/l, with an average value of
5.1±0.43 Bq/l.
The obtained values of 226Ra concentrations in Dishna area were fluctuated
between 0.042±0.002 and 1.54±0.094 Bq/l, with an average value of 0.64±0.034 Bq/l.
The obtained values of 232Th concentrations in this area were fluctuated between
0.068±0.004 and 0.899±0.077 Bq/l, with an average value of 0.42±0.03 Bq/l. The
obtained values of 40K concentrations in this area were found in higher values, which
fluctuated between 4.09±0.351 Bq/l and 6.75±0.581 Bq with an average value of
5.18±0.44 Bq/l.

SUMMARY & CONCLUSION
148
The obtained values of 226Ra concentrations in Nagahammady and El-Waqf area
were fluctuated between 0.123±0.007 and 1.93±0.117 Bq/l, with an average value of
0.58±0.031 Bq/l. The obtained values of 232Th concentrations in this area were fluctuated
between 0.109±0.007 and 0.872±0.075 Bq/l, with an average value of 0.41±0.028 Bq/l.
The obtained values of 40K concentrations in this area were found in higher values, which
fluctuated between 3.5±0.301 and 7±0.602 Bq/l, with an average value of 5.17±0.44 Bq/l.
Table 4. 2 shows the statistical parameters of natural radionuclides activity concentrations
in the investigated ground water samples.
Table 4. 2 The statistical parameters of natural radionuclides activity concentrations in
ground water
Radionuclide 226Ra 232Th 40K
Number of Samples 108 108 108
Minimum Activity 0.042±0.002 0.067±0.004 3.18±0.273
Maximum Activity 1.93±0.117 0.899±0.077 6.99±0.602
Arithmetic Mean 0.54±0.029 0.4±0.027 5.10±0.44
Geometric Mean 0.44 0.331 5.05
Harmonic Mean 0.35 0.267 4.99
Median 0.47 0.352 5.078
Standard Deviation 0.35 0.209 0.77
From the obtained results it is noted that the 226Ra, 232Th and 40K concentrations
are varying in small and narrow range, this similarity comes from that the study area has
the same geological properties and the natural radioactivity of the subsoil in Qena area is
generally low. The maximum average values of natural radionuclides were observed in
Dishna area. It should be noted that in all studied sites 226Ra activity concentrations are
higher than 232Th concentrations, because 226Ra is more soluble in ground water than its
thorium and uranium precursors.

SUMMARY & CONCLUSION
149
From the comparison between the obtained results and the other published data in
the same area, it is evident that the investigated ground water samples have normal and
similar values with the concentrations of 226Ra, 232Th and 40K. An attempt was made to
correlate the concentrations of 226Ra, 232Th and 40K. A reasonable correlation was found
between 226Ra and 232Th concentrations, and poor correlations between (40K with232Th)
and (40K with 226Ra) could be observed.
The correlations between 226Ra, 232Th and 40K concentrations with the water
geochemical parameters, (PH, conductivity and TDS) were examined. Reasonable
correlations between PH and the content of 226Ra and 232Th concentrations were found in
which 226Ra and 232Th concentrations decreased with increasing PH. On the other hand,
no reasonable correlation between 40K content and PH was observed. Also, no general
trend was observed that related the activity concentrations of natural radionuclides with
the conductivity and TDS. The correlation between 226Ra concentrations and the
measured 222Rn concentrations in ground water samples were examined. It is noted that,
there are a linear correlation was observed.
4.3.3 222Rn Activity Concentrations in Drinking Tap Water Samples
The obtained values were fluctuated between 0.006±0.0005 and 0.117±0.002 Bq/l
with an average value of 0.049±0.003 Bq/l. A set of drinking water samples have been
compiled before and after the chemicals treatment process, it is noted that, the obtained
results of 222Rn concentrations for the samples before the treatment process are higher
than those values obtained after the treatment process.
This low levels and the similarity between the obtained results is due to that, the
river Nile is considered the main source of drinking tap water in Qena, and all this part
samples come from the Nile river, after passing many analyzing processes, this give a
chance to 222Rn to escape from water surface, addition to, the open water contains very
little dissolved radium, so we rarely find radon in significant concentrations in surface
waters, due to its rapid dispersal into the atmosphere.
On the other hand no reasonable correlations between 222Rn concentrations in
Qena drinking tap water with the water geochemical parameters (conductivity and TDS)

SUMMARY & CONCLUSION
150
were observed. Table 4.3 shows the statistical parameters of 222Rn activity concentrations
in the investigated tap water samples.
Table 4. 3 The statistical parameters of 222Rn activity concentrations in tap water
Number of Samples 97
Minimum Activity 0.006±0.0005
Maximum Activity 0.117±0.002
Arithmetic Mean 0.049±0.003
Geometric Mean 0.042
Harmonic Mean 0.032
Median 0.052
Standard Deviation 0.023
4.3.4 222Rn Activity Concentrations in Mineral Water Samples
The obtained values of 222Rn concentration in the mineral water were fluctuated
between 0.014±0.003 and 0.237±0.005 Bq/l, with an average value of 0.077±0.002 Bq/l.
From these results, it is noted that, all mineral water results for 222Rn concentrations are
small, due to that, the original sources of the measured mineral waters is ground water
wells, in different places in Egypt, and this water passes many analyzing processes before
using it for drinking, that give a chance for 222Rn to escape from water, addition to that
the half life time of 222Rn is 3.82 day, so the gas will completely decay after a few weeks
of extracting from the well.
Table 4. 4 shows the statistical parameters of 222Rn activity concentrations in the
investigated mineral water samples.

SUMMARY & CONCLUSION
151
Table 4. 4 The statistical parameters of 222Rn activity concentrations in mineral water
Number of Samples 14
Minimum Activity 0.014±0.003
Maximum Activity 0.237±0.005
Arithmetic Mean 0.077±0.002
Geometric Mean 0.052
Harmonic Mean 0.036
Median 0.058
Standard Deviation 0.07
4.4 Annual Effective Doses
When analyzing the total annual effective dose to the human population from
natural sources, the dose received by ingestion of 222Rn and the long-lived natural
radionuclides must be considered. Effective doses resulting from the intake of 222Rn, 226Ra, 232Th and 40K may be determined directly from external measurements of their
concentrations in the body or estimated from concentrations in intake materials such as
air, food and water. Intakes of 222Rn and the natural radionuclides 226Ra and 232Th from
different kinds of water in Qena governorate, Egypt were calculated, assuming the
consumption rate and the conversion factors reported by ICRP and WHO. The
calculation outcomes of dose rates are given in the following parts.
4.4.1 Annual Effective Doses due to Ingestion of Ground Water
The annual effective doses for different age groups "adults, children and infants"
due to the ingestion of ground water in Qena, were calculated for some samples, which
are used as a drinking water, considering only the ingestion from 222Rn, 226Ra and 232Th.
The obtained values of the annual effective doses were ranged between 37.1 to 403.85,
50.4 to 578 and 39 to 432.53, with average values of 131.4, 182.2 and 135.5 µSv/y, for
Adults, children and infants, respectively.
SUMMARY & CONCLUSION
152
From the obtained results it is noted that, the doses received due to the ingestion
of radionuclide's in ground water by children are higher than that received by infants and
adults, thus the age group at risk is children because of their intensive bone growth and
action should be taken to restrict their intake. These values can be considered as
important contributors to the daily incorporation of radionuclide's by ingestion, and it’s
also relevant when compared to the recommended reference level, for the effective dose
published by WHO and IAEA from one year consumption of drinking water, the obtained
doses in the study of ground water in Qena, are lower than the recommended reference
level, consequently, the investigated ground water in Qena governorate, Egypt, are
acceptable for life-long human consumption.
4.4.2 Annual Effective Doses due to Ingestion of Drinking Tap Water
Considering 222Rn concentrations in drinking tap water and habitual consumption,
the human health risk from irradiation due to direct ingestion was assessed. It’s observed
that doses received by infants are higher than that received by children and adults. The
obtained values of the annual effective dose of drinking tap water were ranged between
0.031 to 0.588, 0.043 to 0.823 and 0.064 to 1.235, with averages values of 0.246, 0.345
and 0.517 µSv/y, for adults, children and infants, respectively. According to the
recommended reference level for the annual effective dose, published by WHO and
IAEA from one year consumption of drinking water. The obtained doses are lower than
this recommended reference level, and consequently, we recommended that, the
investigated tap waters are acceptable as drinking water for life-long human
consumption.
4.4.3 Annual Effective Doses due to Ingestion of Mineral Water
Appling measured 222Rn concentrations in mineral water and habitual
consumption, the human health risk from irradiation due to direct ingestion was assessed.
The obtained values of the annual effective doses due to ingestion 222Rn in the mineral
water were ranged between 0.071 to 1.187, 0.099 to 1.661 and 0.148 to 2.492, with
average values of 0.355, 0.496 and 0.745 µSv/y, for adults, children and infants,
respectively It’s observed that doses received by infants are higher than that received by

SUMMARY & CONCLUSION
153
children and adults. According to the recommended reference level for the annual
effective dose, published by WHO and IAEA from one year consumption of drinking
water, the doses obtained in this part are lower than those recommended reference level,
and consequently, the investigated mineral waters are acceptable as drinking water for
life-long human consumption.

REFERENCES

REFERENCES
155
REFERENCES
Abbady Abbady A., Ahmed N. K., Saied M. H., El-Kamel, A. H. and Harb S.,
Variation of 222Rn concentration in drinking water in Qena, Bull. FAC. SCI,
24 (1-A), 101-106, 1995.
Abumurad Abumurad K. M., Atallah M., Kullab M. K., and Ismial A., Determination
of radon soil concentration levels in the governorate of Irbid, Jordan,
Radiation Measurements, Vol 28, No., 1-6, pp. 585-588, 1997.
Abumurad Abumurad K. M., Al-Tamimi M. H., Emanation power of radon and its
concentration in soil and rocks, Radiation Measurements, 34, 423–42, 2001.
Ahmed Ahmed N. K., Abbady A., Saied M. H., El-Kamel A. H., and Harb S., 222Rn
concentration of some ground water samples in Upper Egypt, Bull. FAC.
SCI., 24 (1-A), 89-96, 1995.
Ahmed Ahmed N. K., Natural radioactivity of ground and drinking water in some
areas of Upper Egypt, Turkish Journal of Engineering and Environmental
Science, 28, 345- 354, 2004.
Ajayi Ajayi J. O., Adedokun O., and Balogun B. B., Levels of radionuclide contents
in stream waters of some selected rivers in Ogbomoso land, south west
Nigeria, Research Journal of Environmental and Earth Sciences 4(9): 835-
837, ISSN: 2041-0492, 2012.
Alam Alam M. N., Chowdhury M. I., Kamal M., Ghose S., Islam M. N., Anwaruddin
M., Radiological assessment of drinking water of the Chittagong region of
Bangladesh, Radiation Protection Dosimetry 82 (3), 207–214, 1999.
Ali Ali A. Al-Hamidawi, Determining the concentrations of radon and the rate
of annual effective dose in some types of drinking water available in the
Iraqi markets, Iraqi Journal of Physics, Vol. 11, No. 20, PP. 75-80, 2013.

REFERENCES
156
Al-Sharif Al-Sharif A., Abdelrahman Y. S., Factors affecting radon concentration in
houses, Turk Journal Physics., 25, 153-158, 2001.
Amrani Amrani D., Natural radioactivity in Algerian bottled mineral waters, Journal
of Radio analytical and Nuclear Chemistry, 252, 597–600, 2002.
As'ad As’ad Hameid Ismail, Measurement of radon activity concentration in Iraq-
Kurdistan soil by using CR-39 Plastic track detector, Master Thesis, Physics
Determent, University of Salahaddin-Erbil, Iraq, 2004.
Asaad Asaad Hamid Ismail and Salih Omer Haji, Analysis of radon concentrations
in drinking water in Erbil governorate (Iraqi Kurdistan) and its health
effects, Tikrit Journal of Pure Science, Vol. 13 No. (3), 2008.
AquaKIT AquaKIT Manual, Genitron Instruments GmbH, Germany 09/97, 1999.
Badr Badr I., Oliver M. A., and Durrani S. A., Statistical evidence of the geological
control over radon soil gas concentration and its implications for mapping
radon potential, Radiation Protection Dosimetry, Vol. 36. No. 4. pp. 28-321,
1996.
Burnett Burnett M. J., Holbert K. E., Stewart B. D., Hood W. K., Lung dose estimates
from radon in Arizona ground water based on liquid scintillation
measurements, Health Physics, 68, 699–703, 1995.
Buchli Buchli R., Burkart W., Correlation among the terrestrial radiation, the indoor
air 222Rn, and the tap water 222Rn in Switzerland, Health Physics., 57 (5),
753–759, 1989.
Cevik Cevik U., Damla N., Karahan G., Celebi N. and Kobya1 A. I., Natural
radioactivity in tap waters of eastern black sea region of Turkey, Radiation
Protection Dosimetry, Vol. 118, No. 1, pp. 88–92, 2006.

REFERENCES
157
Clements Clements WE, Wilkening MH., Atmospheric pressure effects on 222Rn
transport across the air-earth interface, Journal of Geophysical Research
79:5025, 1974.
Clever Clever H. L. U. A., Solubility Data Series, Vol. 2, Krypton, Xenon, Radon
gas solubility, p. 463-468, Pergamon Press, Oxford, 1985.
Correia Correia J. A., Weise S. B, Callahan R. J., and Strauss H. W., The kinetics of
ingested 222Rn in humans determined from measurements with X-133,
Cooperative Agreement, CR 8109427, U. S. EPA, and Health Affects
Research Laboratoriesand Cincinnati, 1987.
Cothern Cothern C. R., Lappenbush W. L., and Michel J., Drinking water contribution
to natural background, Health Physics, 50, 33–39, 1986.
Crawford Crawford-Brown D. J., Analysis of the health risk from ingested radon,
chapter 2 in Cothern and Rebers, 1990.
Cristina Cristina Figl, Analytik von 210Pb in Umweltproben, Master Thesis,
durchgeführt am Zentrum für Strahlenschutz und Radioö kologie,
Universität Hannover, 2000.
Cross Cross F. T., Harley N. H., and Hofmann W., Health effects and risks from 222Rn in drinking water, Health Physics, 48, 649, 1985.
Dana Dana P. L., The relationship between water system size and 222Rn consumption
in the North Carolina phosphate lands, Health Physics. 52 (1), 69–71, 1987.
Deepanjan Deepanjan Majumdar, Radon in the environment and associated health
problems, Resonance (44-55), NRL Building, Indian Agricultural Research
Institute, New Delhi 110 012, Indian, 2000.

REFERENCES
158
Dobrovolsky Dobrovolsky I. P., Zubkov S. I., and Myachkin V. I., Estimation of the size
of earthquake preparation zones, Pure Appl. Geophys., 117, 1025–1044,
1979.
Douglas Douglas G. Brookins, the indoor radon problem, Columbia University press,
New York, 1990.
El-Arabi El- Arabi A. M., Prediction of the expected inhalation doses by measuring
the natural radioactivity of building materials used in Upper Egypt, Nuclear
Science Journal, Vol. 38, No. 2, 141-146, 2001.
El-Arabi El-Arabi A. M., Ahmed N. K., and El-Kamel A. H., Gamma spectroscopic
analysis of powdered granite samples in some eastern desert’s areas, Arab J.
Nuclear Science applications, Vol. 34, part II, 245-255, 2001.
El-Arabi El-Arabi A. M., Natural radioactivity in sand used in thermal therapy at red
sea coast, Journal of Environmental Radioactivity, 51, 11-19, 2005.
Elzbieta Elzbieta Kochowska, Jadwiga Mazur, Krzysztof Kozak and Miroslaw Janik,
Radon in Well Waters in the Krakow Area, Isotopes Environmental Health
Stud. Vol. 40, No. 3, pp. 207–212, 2004.
EPA EPA. a. Final draft for the drinking water criteria document on radium. Us
Environmental Protection Agency, Washington, DC., TR-1241- 85, 1991.
Federal Federal Register, National primary drinking water regulations; radionuclides;
proposed Rule, (40 CFR Parts 141 and 142), 56(138):33050- 33127, 1991.
Field Field W. R., Kross B. C., Iowa survey of water borne 222Rn concentration in
private wells, Health Physics, 74, 249–252, 1998.
Firestone Firestone R. B., and V. S. Shirley, table of isotopes. 8th Edition, volume II:
A, 151-272, 1996.
REFERENCES
159
Fleischer Fleischer R. L. and Turner L. G., Indoor radon measurements in the New
York Capital District, Health Physics, Vol. 46, pp. 999-1011, 1984.
Galan Galan Lopez, M., Martin Sanchez, A., Gomez Escobar, V., Estimates of the
dose due to 222Rn concentrations in water, Radiation Protection Dosimetry,
111 (1), 37, 2004.
Gans Gans I., Natural radionuclides in mineral waters, Sci. Total Environ., 45,
93–99, 1985.
Gans Gans I., Fusban HU, Wollenhaupt H., Kiefer J., Glö bel B., Berlich J.,
Porstendö rfer J., 226Ra und Andere Natürliche Radionuklide im
Trinkwasser und in Getränken in der Bundesrepublik Deutschland,
WaBoLu-Hefte 4/87, Institut für Wasser- Boden- und Lufthygiene des
Bundesgesund-heitsamtes, 1987.
González González A. G., Herrador M. Á . and Asuero A. G., Estimation of the
uncertainty of mass measurements from inhouse calibrated analytical
balances, Accred Qual Assur 10: pp (386–391), DOI 10. 1007/s00769-005-
0012-9, 2005.
Harb Harb S., On the human radiation exposure as derived from the analysis of
natural and man-made radionuclides in soils, PHD Thesis, Hannover
University, 2004.
Henschel Henschel D. B., Radon reduction techniques for detached houses: technical
guidance, 2nd Edition, U.S. EPA, EPA/625/5-87/019, 1988.
Hess Hess C. T., Weiffenbach CV, Norton SA., Variations of air borne and water
bone radon in houses in Maine, Environment International 8:59-66, 1982.
Hess Hess C. T., Michel J., Horton T. R., Prichard H. M., and Coniglio V. A., The
occurrence of radioactivity in public water supplies in the United States,
Health Phys. 48, 553–586, 1985.

REFERENCES
160
Hess Hess C. T., and Beasley S. M., Setting up a laboratory for radon in water
measurements, Chapter 13 in Cothern and Rebers, 1990.
Hess Hess C. T., et al., Radon transferred from drinking water into house Air,
Chapter 5 in Cothern and Rebers, 1990.
Hutchison Hutchison F. I. and Hutchison S. G., Radioactivity in everyday life, Journal
of Chemical Education, 74 (5), 501-505, 1997.
IAEA IAEA, Internal Atomic Energy Agency, Specification of radionuclide content
in commodities requiring regulation for purposes of radiation protection.
Safety Guide (draft), Vienna, 2002.
ICRP ICRP, Age-dependent doses to members of the public from intake of
radionuclides: Part 2. Ingestion dose coefficients. Publication 67, Pergamon
Press. Oxford, 1993.
ICRP ICRP, Age-dependent doses to members of the public from intake of
radionuclides: Part 5. Compilation of ingestion and inhalation dose
coefficients. Annals of the ICRP 26 (1). ICRP Publication 72, Pergamon
Press. Oxford, 1996.
Isam Isam Salih M. M., Pettersson H. B. L. and Lund E., Uranium and thorium
series radionuclides in drinking water from drilled bedrock wells:
Correlation to geology and bedrock radioactivity and dose estimation,
Radiation Protection Dosimetry, Vol. 102, No. 3, 249- 258, 2002.
ISO General Requirements for the competence of testing and calibration laboratories
(ISO/IEC 17025), International Standards Organization, European
Committee for Standardization, Brussels, 1999.
ISO Measurement of radioactivity in the environment, Soil Part 1: General
guidelines and definitions, BS ISO, 18589-1, 2005.

REFERENCES
161
Ivanovich Ivanovich M. and Harmon R. S., Uranium-series disequilibrium: applications
to earth marine and environmental sciences, oxford: Clarendon Press, 2th,
1992.
Jonsson Jonsson G., Soil radon survey in solid state nuclear track detection: Principles,
methods and application, eds. Durrani S. A. and Bull R. K., Pergamon
press, Oxford, PP. 3-20, 1987.
Khaled Khaled Salah El Din Ebrahim, Radioactivity measurements of some
environmental samples from Elba Protective area, south eastern desert -
Upper Egypt. PHD Thesis, South Valley University, Egypt, 2006.
Kamel Kamel Wassef R., Physics for life, Dar Al Nashr, Cairo, 1998.
Karahan Karahan G., O., zturk N. and Bayulken A., Natural radioactivity in various
surface waters in Istanbul, Turkey, Wat. Res. 34, 4367–4370, 2000.
Kathren Kathren R. L., Radioactivity in the environment sources, distribution, and
surveillance, Harwood Academic Publishers, New York, 1984.
Kaul Kaul A., Radiological protection, Springer-Verlag Gmbh (editor, Becker,
D). Vol. 4, Chapter 11, 2005.
Khan Khan H. A., Qureshi A. A., and Qureshi I. E., Radon and mineral exploration
in solid state nuclear track detection: principles, methods and application
(eds. Durrani S. A. and Bull R. K.) Pergamon press, Oxford, PP. 319-343,
1987.
Khan Khan H. A., Qureshi I. E., Tufail M., Passive dosimetry of radon and its
daughters using solid state nuclear track detectors, Radiation Protection
dosimetry, Vol. 46 No. 3 pp. 149-170, 1993.
Kiefer Kiefer H. and Maushart R., Radiation Protection Measurement. First Edition,
Pergamon Press, Oxford, 239, 27, 1972.

REFERENCES
162
Knoll Knoll G. F., Radiation Detection and Measurement, third Edition. New York:
John Wiley & Sons, 2000.
Korun Korun M., Propagation of uncertainties in sample properties to the uncertainty
of the counting efficiency in gamma ray spectrometry, Applied Radiation
and Isotopes, 55, 685-691, 2001.
Lane Lane-Smith D. R., et al., Continuous radon measurements in the coastal
zone, sea Technology Magazine, October, 2002.
Lederer Lederer C. M., et al., Table of isotopes, seventh Edition, Wiley, New York,
1977.
Leo Leo W. R., Techniques for nuclear and particle physics experiments, 2nd
edition. Berlin: Springer-Verlag, 1994.
Lide Lide David R. CRC Hand book of Chemistry and Physics, 83rd ed.; CRC
Press: Boca Raton, FL, p 4: 24, 4: 25, 4: 31, 4: 32, 4: 34, 2002.
Lin Lin C. C., Chu T. C. and Huang Y. F., Variations of U/Th- series nuclides
with associated chemical factors in the hot spring area of northern Taiwan,
Journal of Radio analytical Nuclear Chemistry, Vol. 258, No. 2, 281- 286,
2003.
Lowry Lowry J. D., et al., Point of entry removal of radon from drinking water,
Journal AWWA 79(4):162-169, 1987.
Mageed El-Mageed A. I. A., Abd El-Hadi El-Kamel, Abbady A. , Harb S. , Imran I.
S., Natural radioactivity of ground and hot spring water in some areas in
Yemen, Radioactive Decontamination of Water, Desalination, Volume 321,
Issue null, Pages 28-31, 2013.
Maged Maged A. F., Takao Tsuruta and Durraani S. A., Experimental and theoretical
considerations on the calibration factor K between α-activity concentration

REFERENCES
163
track densities for application in radon dosimetry, Journal of radioanalytical
and nuclear chemistry, Vol. 170, No.2, 423-431, 1993.
Majumdar Majumdar S. K., Schmalz R. F. and Easton P., Environmental radon
occurrence, control, and health hazards, Pennsylvania Academy of Science,
1990.
Mäkeläinen Mäkeläinen I., Salonen L, Huikuri P, Arvela H., Dose received and cancer
risk from natural radionuclides in drinking water in Finland, Proceedings of
the 5th International Conference on High Levels of Natural Radiation and
Radon Areas held in Munich, Germany on Sep 4-7, 2000. BfS Schriften.
Strahlenhygine, High levels of natural radiation and radon areas, Radiation
Dose and Health Effects, Volume II: Poster Presentations. General
Exposure Assessment; 24: 28-30, 2002.
Maurice Maurice A. Robkin, Terminology for describing radon concentrations and
exposures, In Indoor Radon and its Hazards (eds. David bodansky et al.).
Washington, Seattle and London, 1987.
Michel Michel R., Quality assurance of nuclear analytical techniques based on
Bayesian characteristic limits, Journal of Radio analytical and Nuclear
Chemistry, 245 (1), 137-144, 2000.
Milvy Milvy P. and Cothern C. R., Scientific Back ground for the development of
regulations for radionuclides in drinking water, Chapter 1 in Cothern and
Rebers, 1990.
Mogro Mogro Campero, A., Fleischer R. L., Sub terrestrial fluid convection: a
hypothesis for long-distance migration of radon within the earth, Earth
Planet. Sci. Lett., 34: 321-325, 1977.

REFERENCES
164
Navjeet Navjeet Sharma and Rajesh Kumar Sharma, Survey of radon concentration
in drinking water samples of Hoshiarpur and Ropar districts of Punjab,
India. Advances in Applied Science Research, 4(3):226-231, 2013.
Nazaroff Nazaroff W. W., Doyle S. M., Nero A. V., and Sextr R. G., Potable water as
a source of airborne 222Rn in US dwellings, Health Physics, 52, 281-
295,1987.
Negm Hani Negm studies of the natural radioactivity levels and radiological levels
and radiological effects of some local fertilizers, Master Thesis, Assiut
University, 2009.
Nguelem Nguelem E. J. M., Darko E. O., Ndontchueng M. M., Schandorf C., Akiti T.
T., Muhulo A. P. and Dogbey R. O. G., Assessment of natural radioactivity
level in ground water from selected areas in Accra metropolis, Research
Journal of Environmental and Earth Sciences, 5(2): 85-93, 2013.
Oliveira De Oliveira J., Paci Mazzilli B., Da Costa P., and Akiko Tanigava P., Natural
radioactivity in Brazilian bottled mineral waters and consepuent doses.
Journal of Radio analytical and Nuclear Chemistry, Vol. 249, No. 1, 173-
176, 2001.
Ononugbo Ononugbo C. P., Avwiri G. O., Egieya J. M., Evaluation of natural
radionuclide content in surface and ground water and excess lifetime cancer
risk due to gamma radioactivity, Academic Research International, ISSN-L:
2223-9553, ISSN: 2223-9944, 2013.
Otwoma Otwoma D., Mustapha A. O., Measurement of 222Rn concentration in Kenyan
ground water, Health Phys., 74, 91–95, 1998.
Prichard Prichard H. M, the Transfer of radon from domestic water to indoor air,
Journal AWWA 79(4):159-161, 1987.

REFERENCES
165
RAD Leaders in professional radon instrumentation and analysis solutions,
http://www.durridge.com/.
Rudolf Rudolf von Steiger, Ju¨rg Beer, Ken McCracken, Cosmogenic radionuclides
theory and applications in the terrestrial and space environments, Springer
Heidelberg Dordrecht London New York, ISSN 1610-1677, 2012.
Rydell Rydell S., Keene B., and Lowry J., Granulated activated carbon water
treatment and potential radiation hazards, Journal NEWWA: 234-248, 1989.
Saied Saied M. H., Abbady A., EL-Kamel A. H. and EL-Arabi A., Natural
radioactivity of granite rocks in Wadi Qena, Radiation Physics and
chemistry, Vol. 44, No. I/2, pp. 95-98, 1994.
Saint Saint-Gobain, Crystals & Detectors: Product Data Sheets, www.detectors.saint-
gobain.com, 2002.
Saqan Saqan S. A., Kullab M. K. and Ismail A. M., Radionuclides in hot mineral
spring waters in Jordan, Environmental Radioactivity, 52, 99–107, 2001.
Sarrou Sarrou I., Pashalidis I., Radon levels in Cyprus. J. Environmental radioactivity,
64, 269–277, 2003.
Saumande Saumande P., Reix F., Beck C., Etude de la radioactivté des eaux naturelles
du Limousin: Le 226Ra, l´uranium et le radon. Bulletin De La Societe de
Pharmacie de Strasbourg, XVI (2): 141–152, 1973.
Singh Singh J., Singh H., Kumar A., Mahajan S., Bijwa B. S., Singh S., Radon
measurement in ground water and mineral water of Amritsar district by
alpha scintillometry, J. Environmental Geochemical, 1&2, 126–129, 2005.
Sorg Sorg T. J., Methods for removing uranium from drinking water, JAWWA,
105, 1988.

REFERENCES
166
Sorg Sorg T. J., Removal of uranium from drinking water by conventional treatment
methods, ed. Cothern, C. R. and Rebers, P. A, Radon, radium and uranium
in drinking water, Lewis Publishers, Inc., MI, 97, 1991.
Stephen Stephen Chong KetMin, Annie Tan Soo Lian, and Ng Ti Lik, Radon review
and indoor survey Singapore- Introduction: Natural source of radiation,
from http:// home.pacific.net.sg, 1995.
Tayyeb Z. A. Tayyeb, Kinsara A. R. and Farid S. M., Study on the radon
concentrations in water in Jeddah (Saudi Arabia) and the associated health
Effects, Journal of Environmental Radioactivity, Vol. 38, No. 1, pp. 97-104,
1998.
Thorne Thorne M. C., Background radiation: natural and man-made, Journal of
Radiological Protection, 23, 29-42, 2003.
Tsoulfanidis Tsoulfanidis N., Measurement and detection of radiation, 2nd edition.
Washington: Taylor & Francis, 1995.
UNSCEAR United Nations Scientific Committee on the Effects of Atomic Radiation,
Report to the General Assembly, United Nations, New York UNSCEAR,
1977.
UNSCEAR United Nations Scientific Committee on the Effects of Atomic Radiation,
Exposures to radon and Thoron and their decay products, United Nations
Scientific Committee on the Effects of Atomic Radiation, United Nations,
New York, 1982.
UNSCEAR UNSCEAR, United Nations Scientific Committee on the effects of Atomic
Radiation, Sources, effects and risks of ionizing radiation, New York:
United Nations, 1993.

REFERENCES
167
UNSCEAR UNSCEAR, United Nations Scientific Committee on the effects of Atomic
Radiation, Exposure from natural radiation sources, Report 80110, Vienna,
Austria, 1999.
UNSCEAR UNSCEAR, United Nations Scientific Committee on the effects of Atomic
Radiation. Report to general assembly, Annex B: exposure from natural
radiation sources, New York: United Nations, 2000.
Watson Watson J. E., Mitsch B. F., Ground water concentrations of 226Ra and 222Rn
in North Carolina phosphate lands, Health Phys., 52, 361–365, 1987.
Weigel Weigel F., Radon, Chemiker-Zeitung 102, 287–299, 1978.
Wilson Wilson A. J. and Scott L. M., Characterization of Radioactive Petroleum
Piping Scale with an Evaluation of Subsequent Land Contamination, Health
physics, 63 (6), 681-685, 1992.
WNA World Nuclear Association, Radiation and nuclear energy, http://www.world-
nuclear.org/info/inf30.html, 2011.
Zhuo Zhuo W., Iida T., Yang X., Occurrence of 222Rn, 226Ra, 228Ra and U in ground
water in Fujian Province, China, Journal of Environmental Radioactivity
53: 111–120, 2001.

ARABIC SUMMARY

الملخص العربي
1
الملخص العربي
جامعة جنوب –معمل قیاسات اإلشعاع البیئي بكلیة العلوم لطار تنفیذ الخطة البحثیة إفي
فقد قمنا في ھذا العمل بتنفیذ أحد عناصرتلك الخطة وھو قیاس مستوي النشاط اإلشعاع ،الوادي
حیث شملت تلك ،البیئي ومستویات غاز الرادون لعینات من المیاه من محافظة قنا بصعید مصر
وذلك بإستخدام األجھزة ،المیاه كال من المیاه الجوفیة ومیاه الشرب ومیاه النیل والمیاه المعدنیة
من . المتوافرة بالمعمل ومنھا بشكل رئیسي جھاز ألفاجارد وجھاز یودید الصودیوم المطعم بالثالیوم
غیر اإلشعاعالمؤین ومثالّ اإلشعاعمنھا ،بعدة طرق مختلفةاإلشعاعیمكن تقسیم المعروف أنھ
اإلشعاع في ویتواجد . الخ.. غیر الضاراإلشعاعالضار واإلشعاع،الجسیمات والموجات،المؤین
وتمثل . والنباتاتوالماء والتربة والصخور وساط المختلفة مثل الھواء الطبیعة من حولنا في األ
ساسي األالمصدر232- والثوریوم235-موالیورانیو238-الیورانیوم،یة الثالثةاإلشعاعل السالس
وتمثل تلك النویات المشعة خطراً كبیراً . 40- باالضافة لعنصر البوتاسیوم،الطبیعياإلشعاعللنشاط
و الشرب أاألكل مثال الجسم البشري بعدة طرق مختلفة منھا دخول ھاحیث یمكن،نسانعلي صحة اإل
وھو ،للخالیا مسببة تلفھاوصوالتخترق أعضاء الجسم حیث ،عرض الخارجيأو التنفس أو الت
اإلشعاعي وتقدیر النشاط اتدراسأصبحتولذلك . صابة بمرض السرطانمایؤدي بدوره لإل
غاز . في السنوات االخیرةخصوصا إھتمام كبیر جداً لرار التي یتعرض لھا االنسان محضاأل
عمره ،ئحةاوھو غاز خامل عدیم اللون و الر،238-ھو أحد نواتج سلسلة الیورانیومالرادون
نسبة لحوالي نصفبتمثیلھالموجودة في الطبیعة خطر النویات المشعة أویعتبر،یوم3.82النصفي
ھذا یة یعتبر موطبقا لتقریر منظمة الصحة العال،یة الكلیة التي یتعرض لھا االنساناإلشعاعالجرعة
.من أھم مسببات مرض السرطانواحداً الغاز
عینات الدراسة
غاز الرادون للمیاه في اتي الطبیعي ومستویاإلشعاعتقوم تلك الدراسة علي قیاس النشاط
:لثالث أنواع قسیمھاتتم عینة میاه 220محافظة قنا وذلك بتجمیع
109 میاه أبار جوفیة عینة
97 عینة میاه شرب
14 عینة میاه معدنیة

الملخص العربي
2
تجھیز العینات للقیاس
جھاز ألفاجارد ستخدام إبعینات المیاه الجوفیة غاز الرادون في لالشدة اإلشعاعیةقیاس : أوال
حتي ،دقیقة20مفتوح لمدة ال تقل عن البئرفي كل موقع من مواقع العینات یتم ترك صنبور
وتمأل العینة .مواسیر السحبتأتي مباشرة من البئر وأال تكون متراكمة في أن المیاهكد منأیتم الت
وذلك ي فراغات بین العینة وبین غطاء العبوة أعدم وجود مع مراعاةیتم تعبئتھا للنھایة في عبوات
صندوق مغلق بعیدا من مكان التجمیع للمعمل باستخداموتتم عملیة نقل العینات ،الغازتسرب امنع
قیاس العینات في أسرع وقت ویتم،العیناتة رعن أشعة الشمس المباشرة لتجنب ارتفاع درجة حرا
حساب فارق وبعد قیاس العینات یتم . نحاللإلعملیة الحدوث بعد التجمیع لتجنب فقدان الغاز نتیجة
.بالنسبة للزمنالتركیز تصحیح عمل جراء إمن ثم القیاس ووقت التجمیع ووقت الزمن بین
اإت میاه الشرب والمیاه المعدنیة بالرادون في عیناغاز لالشدة اإلشعاعیةقیاس : ثانیا ستخدام األف
جارد
التأكد من ویتم ،دقیقة20تقل عن بالنسبة لعیانات میاه الشرب یتم فتح صنبور المیاه لمدة ال
،القیاسفي نظامببطءالعینةوتمأل عبوة،ھواءتحتوي علي أي فقاقیع ن خراطیم التوصیل الأ
ویتم . لعبوة العینةأیضاستخدام المحقن ببطءإتفتح عبوة المیاه وتنقل بالمعدنیةوبالنسبة لعینت المیاه
.ستخدام وعدم عمل أي تصحیح بالنسبة للزمنإلاوقتحساب تركیز غاز الرادون في كال النوعین
ستخدام مطیاف جاماإالجوفیة بالرادون في المیاه غازلاإلشعاعیةالشدة قیاس : ثالثا
یتم غسلھا ،لتر1.4ذات سعة ) (Marinelli beakerیتم تعبئة العینات في عبوات خاصة
وبعدھا یتم ملئ ،ناءإلمالح عالقة بجدران اأزالة أي إللویك مخفف كأوال باستخدام حمض ھیدرو
للعبوةالعلوي طحأثار للھواء یتم الضغط علي السوللتخلص من أي،الحد العلوينھایة العینة حتي
.ساعات8قیاس العینات بعد ساعتین من التجمیع لمدة ویتم،حكام غلقھا جیداإمع مراعاة
في عینات 40-موالبوتاسیو232-والثوریوم226-ة االشعاعیة لكال من الرادیومقیاس الشد: رابعا
NaI (Tl)الومیضي باستخدام مطیاف جاماالمیاه الجوفیة
ستعمال مطیاف جاما یتم تخزینھا إمیعھا لقیاس تركیز غاز الرادون بنفس العینات التي تم تج
خري علي أنحاللھا قبل بدء قیاسھا مرة إلمدة شھر للوصول لحالة االتزان بین تلك النویات ونواتج
.ساعة24مطیاف جاما لمدة التقل عن

الملخص العربي
3
القیاسطرق
:ي في عینات المیاه عشعاإلین لقیاس النشاط اتمختلفطریقتینستخدامإتقوم الدراسة علي
وھو ،نواع المختلفة من المیاهھ لقیاس تركیز غاز الرادون في األستعمالإتم :الطریقة األولي
علي سلوب ذلك األعتمد وی،كیتأكواالمصحوب بالوحدة ،ألفاجاردعبارة عن جھاز غرفة التأین
للعینة وضخ الغاز لداخل حداث تقلیب إستعمال مضخة للھواء غرضھا إستخراج الغاز من العینة بإ
تعمل علي ،بعد مروره بمجموعة من الفالترستخدام مجموعة من أنابیب التوصیل إبین أغرفة الت
وبدخول الغاز . لرادون بالمرورلغاز اوتسمح فقط ،أو من الرطوبةتنقیة الغاز من حبیبات التراب
لغرفة التأین تتولد النبضة الكھربیة التي تتحول لنبضة تناظریة یتم قراءتھا من خالل برنامج
.األلفجارد
عنصر ودید الصودیوم المطعم بمطیاف جاما والمكون من كاشف یھو:الطریقة الثانیة
" ستخدام المصادر العیاریة إرتھ بمعایحیث تمت. والمتصل بمحلل عدید القنوات،الثالیوم
. Qcy48كما تم تقدیر كفاءة الكاشف باستخدام مصدر عیاري ،"60والكوبالت137السیزیوم
. ةعدل العد لكل عینة مقاسجري تصحیح مأو،یة أسبوعیااإلشعاعأیضا تم قیاس الخلفیة
أشعة جاما المنبعثة ستعمال مطیاف جاما من خالل قیاس إوقد تم تقدیر تركیز غاز الرادون ب
ولقد تم تقدیر ،295،352اتبالطاق214ومن الرصاص ،609.32بالطاقة 214من البزموث
609،1120،1765بطاقات214من خالل قیاس أشعة جاما المنبعثة من البزموت 226الرادیوم
.238بطاقة 212-والرصاص،911بالطاقة 228- كتینیومألفتم تقدیره من ا232- أما الثوریوم.
حیث ان كل الطاقات ،1460أشعة جاما ذات الطاقة تم تقدیره مباشرة من 40بینما البوتاسیوم
.ف.ا.كبوحدات مقدرة
تم قیاس بعض الخواص الجیوكیمیائیة ،باإلضافة إلى قیاس تركیز النویات السالفة الذكر
وتمت تلك القیاسات ،مجمل األمالح الذائبةوالموصلیة الكھربیة ومثل الرقم الھیدروجینيللعینات
الكھربیة ومجمل أحدھما لقیاس الرقم الھیدروجیني واألخر لقیاس الموصلیةینستخدام جھازإحقلیا ب
.جھاز تحدید المواقعباستخدام بدقة أیضا تم تحدید موقع اآلبار قید الدراسةو،االمالح الذائبة

الملخص العربي
4
نتائج البحث
الشدة اإشعاعیة لغاز الرادون في المیاه الجوفیة باستخدام جھاز األفاجارد نتائج قیاس أظھرت
بقیمة متوسطة ،0.219±10.07الي0.025±0.04لتر تتراوح مابین /البیكرلوحدة أن الشدة ب
یمیائیة الخواص الجیوكبین وغاز الرادون أیضا دراسة العالقة بین تركیز تتم. 3.57±0.077
وبین الرقم الھیدروجیني الغاز بین تركیزعكسیة وتبین وجود عالقة ،بحثلعینات المیاه قید ال
وأالكھربیة الموصلیةوبین الرادون غاز عالقة بین تركیز أي وجود حین لم یتبینفي ،للعینات
. مجمل األمالح الذائبة
غرفة التأین الرادون وھما الشدة اإلشعاعیة لغاز مختلفین لقیاس السلوبین لألعمل مقارنة بین ل
بطریقة عشوائیة من مواقع العینات التي تم مجموعة من العیناتختیار إتم ،ومطیاف جاماجاردألفا
عدادھا لقیاس تركیز إوتم تجھیزھا و،جھاز ألفاجاردستعمال إقیاس تركیز غاز الرادون فیھا ب
غاز الرادونلالشدة اإلشعاعیةأنحیث أظھرت النتائج ،ستعمال مطیاف جاماإالرادون فیھا ب
بینت حیث . 0.13±2.29بقیمة متوسطة ،0.32±5.2و 0.02±0.48بینتتراوح ما لتر/بیكریلبال
وان كانت النتائج المتحصل ،متقاربة جداالطریقتینالتركیزات المتحصل علیھا بكال نأالدراسة
ن ھذا الفارق یمكن أإال،في معظم العینات المقاسةتبدو أعلي قلیالفاجاردلجھاز األستعمل إعلیھا ب
.لھ في التركیزات العالیة للرادونھماإ
قیم الشدة اإلشعاعیة تراوح أسفر قیاس النشاط اإلشعاعي لعینات المیاه الجوفیة عن
،0.029±0.54بقیمة متوسطة،0.117±1.93و0.002±0.042ما بین رادیوم لتر لل/بالبیكرل
بقیمة متوسطة،0.077±0.899و0.004±0.067بینثوریومتراوحت الشدة اإلشعاعیة للبینما
،0.602±6.99و 0.273±3.18تراوحت قیم الشدة اإلشعاعیة للبوتاسیوم بینبینما . 0.4±0.027
بین نویات المشعة وللالشدة اإلشعاعیةتم أیضا دراسة العالقة بین .0.44±5.10بقیمة متوسطة
بین تركیز كل عكسیة وتبین وجود عالقة ،قید البحثالجوفیة اص الجیوكیمیائیة لعینات المیاه الخو
في نفس الوقت بینت الدراسة عدم وجود عالقة بین . من الرادیوم والثوریوم وبین الرقم الھیدروجیني
لم یستدل علي وجود أي عالقة واضحة تربط وأیضا. تركیز البوتاسیوم وبین الرقم الھیدروجیني
نتائج أظھرت وأیضا . مجمل األمالح الذائبةالكھربیة أو تركیز النویات المشعة وبین الموصلیة
كیزات قیاس الشدة اإلشعاعیة لغاز الرادون لعینات میاه الشرب في محافظة قنا أن قیم التر
.0.003±0.049بقیمة متوسطة،0.002±0.117و0.0005±0.006لتر تتراوح مابین/بالبیكرل

الملخص العربي
5
یائیة داخل محطة متم قیاس مجموعة من عینات میاه الشرب قبل وبعد دخولھا لعملیة المعالجة الكی
میاه الحمیدات ومن النتائج المتحصل علیھا وجدنا ان عینات المیاه بعد دخول عملیة المعالجة تعطي
أیضا دراسة العالقة بین تركیز غاز الرادون في عینات میاه الشرب تتم. من ذي قبلأقلنتائج
ي أالمقاسة وبین والخواص الجیوكیمیائیة مثل مجمل األمالح الذائبة والموصلیة وتبین عدم وجود
نتائج قیاس الشدة اإلشعاعیة لغاز الرادون لعینات المیاه المعدنیة في أظھرت كما .عالقة بینھم
،0.005±0.237الي 0.003±0.014لتر تتراوح مابین/قیم التركیزات بالبیكرلأن محافظة قنا
.0.002±0.077بقیمة متوسطة
حسابات الجرعة
وذلك عن ،المختلفة من المیاه قید الدراسةتم تقدیر الخطر الناتج عن استخدام ھذه األنواع
المتواجدة و،الثوریوموالرادیوموالرادونكال من بتالع إطریق حساب الجرعة السنویة الناتجة من
وأسفرت الحسابات ."األطفال والبالغینوالرضع"وذلك للفئات العمریة المختلفة ،في ھذه المیاه
سنة /بالمیكروسیفرتالسنویة التي یتلقاھا اإلنسان نتیجة لتناول المیاه الجوفیة قیم الجرعة لي أن ع
ومن578الي11.34ومن403.85الي8.86بینتتراوحلكال من البالغین واألطفال والرضع
تیبرعلي التللفئات العمریة الثالثة 126.68،175.65،130.6بقیم متوسطات ،578الي 7.22
نتیجة لتناول میاه الشرب من صنابیر المیاه في محافظة الجرعة السنویة قیم أن الدراسةأظھرت و.
بمتوسطات ،1.235الي 0.236ومن 0.823الي 0.157ومن0.588إلى0.112من قنا تتراوح
أما الجرعات الناتجة عن تناول المیاه .تیبرعلي التللفئات العمریة الثالثة 0.29،0.4،0.61
ومن1.187إلى0.071سنة فتراوحت قیمھا بین/المعدنیة للفئات العمریة الثالثة بالمیكروسیفرت
.تیبرعلي الت0.312،0.44،0.65بمتوسطات 2.492الي 1.0146ومن 1.661الي 0.099
بالقیمة المسموح بھا طبقا لتقریر منظمة دراستناقیم الجرعات المتحصل علیھا منوبمقارنة
یتضح أن قیم الجرعة 2002وتقریر الوكالة الدولیة للطاقة الذریة لسنة 1996الصحة العالمیة لسنة
أقل من القیمة المسموح بھا في محافظة قنا الشرب لمیاه األنواع المختلفة السنویة المحسوبة لعینات
.االنسان من الناحیة االشعاعیة صحةة عليرمما یدل علي عدم وجود أي خطو

ربيــــــص العالملخــــ

اءــم الفیزیـقس لوم ـــــكلیة الع
:رسالة ماجستیر
خالد علي محمد علي :الب ـــــسم الطإ
محافظة قنابمن المیاه مختلفة لعینات الطبیعيشعاعيالنشاط اإل:عنوان الرسالة
اجستیرـــالم:ة ـالدرجة العلمی
:شراف لجنـة اإل
عة جنوب الواديـوویة بكلیة العلوم جامـشعاعیة والنأستاذ الفیزیاء اإل عبد الباسط عبــــادي محمد / أ د.1
عة جنوب الواديـاعیة بكلیة العلوم جامــــشعأستاذ مساعد الفیزیاء اإل د حربــرمضان محمنشعبا/ د .2
اعیة بكلیة العلوم جامعة جنوب الواديـــــشعستاذ مساعد الفیزیاء اإلأ یمــبراھإالح الدین ـالد صـخ/ د .3
:لجنة فحص وتقییم الرسالة
1-
2-
3- 4-
/ / اقشة ـــتاریخ المن
جازة ختم اإل / /أجیزت الرسالة بتاریخ

وم ـة العلــكلی م الفیزیاءـقس
صفحة العنوان
خالد علي محمد علي : ـب الـــم الطــسإ
الماجستیر : ةـالدرجة العلمی
الفیزیاء : م التابع لھ ـالقس
كلیة العلوم : ـــــــیة م الكلـسإ
جنوب الوادي : ــــامعة م الجـسإ
2007: رجــــسنة التخ
: ح ـــــنة المنـــس

بسم اهللا الرحمن الرحيم
ي مدخل صدق ــــــــــأدخلن وقـل رب
ي من ـــجعل لإ ي مخرج صدق و ــــــــــــوأخرجن
¤را ــــــــــــــــــــــنصي اناً ــــلدنك سلط
صدق اهللا العظيم

اءـقسم الفیزی وم ـة العلــكلی
افظة ـــــمحباه ــمن المیمختلفة ات ـلعینالطبیعي شعاعي النشاط اإل
اـــــــقن لي إة مقدمة ـــرسال
كلیة العلوم بجامعة جنوب الوادي
اءیالـفـیزللحصول علي درجة الماجستیر في ة منـــــمقدم
لي ـد عـمـي محـالد علــخ بكالوریوس علوم الفیزیاء
شرافإتحت محمداديــــط عبــــعبد الباس/ د.أ
لوم جامعة جنوب الواديـشعاعیة والنوویة بكلیة العأستاذ الفیزیاء اإل
براھیمإخالد صالح الدین / د شعبان رمضان محمد حرب/ د الفیزیاء األشعاعیة المساعد بكلیة العلوم أستاذ الفیزیاء األشعاعیة المساعد بكلیة العلوم أستاذ
جامعة جنوب الوادي جامعة جنوب الوادي
كلیة العلومعمید الفیزیاءقسم رئیس
محمد إبراھیمعبد الھادي / د.أ خالد بن الولید عبد الفتاح / د
2014